Adaptivity of 3D Web Content in Web-Based Virtual Museums
364
ADAPTIVITY OF 3D WEB CONTENT IN WEB-BASED VIRTUAL MUSEUMS A QUALITY OF SERVICE AND QUALITY OF EXPERIENCE PERSPECTIVE Hussein Bakri A Thesis Submitted for the Degree of PhD at the University of St Andrews 2019 Full metadata for this item is available in St Andrews Research Repository at: http://research-repository.st-andrews.ac.uk/ Please use this identifier to cite or link to this item: http://hdl.handle.net/10023/18453 This item is protected by original copyright
-
Upload
khangminh22 -
Category
Documents
-
view
0 -
download
0
Transcript of Adaptivity of 3D Web Content in Web-Based Virtual Museums
ADAPTIVITY OF 3D WEB CONTENT IN WEB-BASED VIRTUAL MUSEUMS
A QUALITY OF SERVICE AND QUALITY OF EXPERIENCE PERSPECTIVE
Hussein Bakri
A Thesis Submitted for the Degree of PhD
at the University of St Andrews
2019
Full metadata for this item is available in St Andrews Research Repository
at: http://research-repository.st-andrews.ac.uk/
Please use this identifier to cite or link to this item: http://hdl.handle.net/10023/18453
This item is protected by original copyright
Adaptivity of 3D Web Content in Web-Based Virtual Museums
A Quality of Service and Quality of Experience Perspective
Hussein Bakri
This thesis is submitted in partial fulfilment for the degree of
Doctor of Philosophy (PhD)
at the University of St Andrews
December 2018
Abstract
The 3D Web emerged as an agglomeration of technologies that broughtthe third dimension to the World Wide Web. Its forms spanned from beingsystems with limited 3D capabilities to complete and complex Web-BasedVirtual Worlds.
The advent of the 3D Web provided great opportunities to museums bygiving them an innovative medium to disseminate collections’ informationand associated interpretations in the form of digital artefacts, and virtualreconstructions thus leading to a new revolutionary way in culturalheritage curation, preservation and dissemination thereby reaching awider audience.
This audience consumes 3D Web material on a myriad of devices (mobiledevices, tablets and personal computers) and network regimes (WiFi, 4G,3G, etc.). Choreographing and presenting 3D Web components across allthese heterogeneous platforms and network regimes present a significantchallenge yet to overcome.
The challenge is to achieve a good user Quality of Experience (QoE)across all these platforms. This means that different levels of fidelity ofmedia may be appropriate. Therefore, servers hosting those media typesneed to adapt to the capabilities of a wide range of networks and devices.
To achieve this, the research contributes the design and implementationof Hannibal, an adaptive QoS & QoE-aware engine that allows Web-BasedVirtual Museums to deliver the best possible user experience across thoseplatforms.
In order to ensure effective adaptivity of 3D content, this researchfurthers the understanding of the 3D web in terms of Quality of Service(QoS) through empirical investigations studying how 3D Web componentsperform and what are their bottlenecks and in terms of QoE studying thesubjective perception of fidelity of 3D Digital Heritage artefacts. Resultsof these experiments lead to the design and implementation of Hannibal.


Acknowledgements
I would like to express my gratitude to Prof Aaron Quigley for being alovely and supportive supervisor.
I would like to express my deepest gratitude to the Head of School ofComputer Science, Prof Simon Dobson for all his support. In similar vein,I would like to thank Mr Alex Bain, the school manager for his support.
I also want to thank from every cell of my heart, the lovely mentorsand angels: Ms Janie Brooks, Ms Lisa Dow, Ms Mary Carr and Ms AnneCampbell. I am also indebted for the guidance and encouragement that Ihave received from a beautiful soul Dr Juliana Bowles.
I would like to express my gratitude to Dr Alice Toniolo for her feedbackand comments that helped hone chapter 6. I would like also to expressmy thanks to the Open Virtual Worlds group for providing me with 3Ddigitised models and environments for the experiments conducted in thisthesis.
I would like to express my thanks to all friends, colleagues and staffmembers of the school of Computer Science just to mention few names:Dr Ishbel Duncan, Dr Oche Ojembi, Ms Sarah Kennedy, Dr ElizabethRhodes, Dr Adeola Fabola, Dr Iain Oliver, and Dr Amjad Al Tobi.
A big thank you goes to Prof Iain Gent and Dr Tom Kelsey for theirfeedback on the mock Viva.
I am grateful to my family, whom have provided me enormous emotionalsupport all my life and encouraged me to finish up the undertaking of aPhD.
Finally, I would like to mention Dr Colin Allison and Dr Alan Miller whocontributed greatly to my knowledge.
Funding
A very special gratitude goes out to my funder the University of StAndrews for their financial support of this research through the StLeonard Scholarship and thanks also goes to the School of ComputerScience for funding all the conferences trips and registrations.
Candidate's declaration
I, Hussein Bakri, do hereby certify that this thesis, submitted for the degree of PhD, which is approximately 64,445 words in length, has been written by me, and that it is the record of work carried out by me, or principally by myself in collaboration with others as acknowledged, and that it has not been submitted in any previous application for any degree.
I was admitted as a research student at the University of St Andrews in September 2014.
I, Hussein Bakri, received assistance in the writing of this thesis in respect of grammar and spelling, which was provided by Ms Janie Brooks.
I received funding from an organisation or institution and have acknowledged the funder(s) in the full text of my thesis.
Date Signature of candidate
Supervisor's declaration
I hereby certify that the candidate has fulfilled the conditions of the Resolution and Regulations appropriate for the degree of PhD in the University of St Andrews and that the candidate is qualified to submit this thesis in application for that degree.
Date Signature of supervisor
Permission for publication
In submitting this thesis to the University of St Andrews we understand that we are giving permission for it to be made available for use in accordance with the regulations of the University Library for the time being in force, subject to any copyright vested in the work not being affected thereby. We also understand, unless exempt by an award of an embargo as requested below, that the title and the abstract will be published, and that a copy of the work may be made and supplied to any bona fide library or research worker, that this thesis will be electronically accessible for personal or research use and that the library has the right to migrate this thesis into new electronic forms as required to ensure continued access to the thesis.
I, Hussein Bakri, confirm that my thesis does not contain any third-party material that requires copyright clearance.
The following is an agreed request by candidate and supervisor regarding the publication of this thesis:

Printed copy
No embargo on print copy.
Electronic copy
No embargo on electronic copy.
Date Signature of candidate
Date Signature of supervisor
Underpinning Research Data or Digital Outputs
Candidate's declaration
I, Hussein Bakri, understand that by declaring that I have original research data or digital outputs, I should make every effort in meeting the University's and research funders' requirements on the deposit and sharing of research data or research digital outputs.
Date Signature of candidate
Permission for publication of underpinning research data or digital outputs
We understand that for any original research data or digital outputs which are deposited, we are giving permission for them to be made available for use in accordance with the requirements of the University and research funders, for the time being in force.
We also understand that the title and the description will be published, and that the underpinning research data or digital outputs will be electronically accessible for use in accordance with the license specified at the point of deposit, unless exempt by award of an embargo as requested below.
The following is an agreed request by candidate and supervisor regarding the publication of underpinning research data or digital outputs:
No embargo on underpinning research data or digital outputs.
Date Signature of candidate
Date Signature of supervisor
I dedicate my work to any hope of removing hypocrisy
from academia...

Publications
A large proportion of this work has been published in peer-reviewedpublications of which I am the main author and contributor:
• Chapter 2: Bakri, H., Allison C., Miller A., Oliver I. (2016) VirtualWorlds and the 3D Web - Time for Convergence?. In: ImmersiveLearning Research Network. iLRN 2016. Communications inComputer and Information Science, vol 621. Springer, Cham [32].
• Chapter 3 & 4: Bakri, H., and Allison, C. "Measuring QoS inweb-based virtual worlds: an evaluation of unity 3D web builds." Pro-ceedings of the 8th International Workshop on Massively MultiuserVirtual Environments. ACM, 2016. [30].
• Chapter 5 & 7: Bakri, H., Miller A., Oliver I. (2018) FidelityPerception of 3D Models on the Web. In: Beck D. et al. (eds) Immer-sive Learning Research Network. iLRN 2018. Communications inComputer and Information Science, vol 840. Springer, Cham [28].
I authored and contributed material to the following tangential works:
• Bakri, H., Allison, C., Miller, A., & Oliver, I. (2015). HTTP/2 andQUIC for Virtual Worlds and the 3D Web?. Procedia ComputerScience, 56, 242-251. [31].
• Allison, C. and Bakri, H., 2015, October. How the Web was Won:Keeping the computer networking curriculum current with HTTP/2.In Frontiers in Education Conference (FIE), 2015. 32614 2015. IEEE(pp. 1-9). IEEE [15].


Note on Web Resources
Due to the relatively new concepts discussed in this corpus of work,some resources are only available on the World Wide Web. All URIswere verified at the time of the submission of this thesis. However, dueto the nature of such resources their longevity cannot be guaranteed.Such references have only been used where citations to more traditionalpeer-reviewed published material were not possible.


Contents
Contents i
List of Figures vi
List of Tables ix
Listings xi
Abbreviations xiii
Glossary xvii
I Motivation and Overview 1
1 Introduction 31.1 Overview . . . . . . . . . . . . . . . . . . . . . . . . . . . . . . . . . . . 3
1.1.1 Heritage . . . . . . . . . . . . . . . . . . . . . . . . . . . . . . . . 31.1.2 Museums . . . . . . . . . . . . . . . . . . . . . . . . . . . . . . . 91.1.3 Virtual Museums . . . . . . . . . . . . . . . . . . . . . . . . . . . 121.1.4 Web-Based Virtual Museums (WBVMs) . . . . . . . . . . . . . . 161.1.5 3D Web . . . . . . . . . . . . . . . . . . . . . . . . . . . . . . . . 17
1.2 Motivation . . . . . . . . . . . . . . . . . . . . . . . . . . . . . . . . . . 191.3 Research Scope . . . . . . . . . . . . . . . . . . . . . . . . . . . . . . . 221.4 Thesis Statement . . . . . . . . . . . . . . . . . . . . . . . . . . . . . . . 231.5 Research Questions . . . . . . . . . . . . . . . . . . . . . . . . . . . . . 241.6 Contributions of this research . . . . . . . . . . . . . . . . . . . . . . . 251.7 Thesis Structure . . . . . . . . . . . . . . . . . . . . . . . . . . . . . . . 281.8 How to read this thesis . . . . . . . . . . . . . . . . . . . . . . . . . . . 30
II Background & Methodology 33
2 Literature Review 352.1 Introduction . . . . . . . . . . . . . . . . . . . . . . . . . . . . . . . . . . 36
i
ii CONTENTS
2.2 Digital Heritage & 3D Web Technologies . . . . . . . . . . . . . . . . . 382.2.1 Rendering Technologies and Languages . . . . . . . . . . . . . . 392.2.2 3D Assets File Formats suitable for the 3D Web . . . . . . . . . 422.2.3 Digital Heritage Web-Based Virtual Worlds . . . . . . . . . . . . 44
2.3 Web-Based Virtual Museums (WBVMs) . . . . . . . . . . . . . . . . . . 462.4 QoS of the 3D Web . . . . . . . . . . . . . . . . . . . . . . . . . . . . . . 532.5 QoE of the 3D Web . . . . . . . . . . . . . . . . . . . . . . . . . . . . . . 572.6 Adaptivity of the 3D Web . . . . . . . . . . . . . . . . . . . . . . . . . . 61
2.6.1 Network-Based Solutions . . . . . . . . . . . . . . . . . . . . . . 622.6.2 Client Capability Solutions . . . . . . . . . . . . . . . . . . . . . 68
2.7 Digital Heritage & 3D Modelling Semantic Ontologies . . . . . . . . . 742.7.1 CIDOC-CRM . . . . . . . . . . . . . . . . . . . . . . . . . . . . . 752.7.2 ARCO and ViMCOX . . . . . . . . . . . . . . . . . . . . . . . . . 762.7.3 3D Modelling Ontology . . . . . . . . . . . . . . . . . . . . . . . 76
2.8 Summary . . . . . . . . . . . . . . . . . . . . . . . . . . . . . . . . . . . 77
3 Methodology 793.1 Introduction . . . . . . . . . . . . . . . . . . . . . . . . . . . . . . . . . . 803.2 Research Questions and Methodological Rationale . . . . . . . . . . . 813.3 Methodological Review of Relevant Literature . . . . . . . . . . . . . . 833.4 Experimental Procedures . . . . . . . . . . . . . . . . . . . . . . . . . . 84
3.4.1 Investigating the QoS of Digital Heritage WBVWs . . . . . . . . 863.4.2 Investigating the QoS/QoE of DH Artefacts . . . . . . . . . . . . 89
3.5 Summary . . . . . . . . . . . . . . . . . . . . . . . . . . . . . . . . . . . 109
III Empirical Studies 111
4 3D Web-Based Digital Heritage Environments 1134.1 Introduction . . . . . . . . . . . . . . . . . . . . . . . . . . . . . . . . . . 1144.2 Results . . . . . . . . . . . . . . . . . . . . . . . . . . . . . . . . . . . . 117
4.2.1 Frame Rates and Frame Times . . . . . . . . . . . . . . . . . . . 1174.2.2 CPU, GPU and Memory . . . . . . . . . . . . . . . . . . . . . . . 1194.2.3 Initial Download Time . . . . . . . . . . . . . . . . . . . . . . . . 121
4.3 Discussion . . . . . . . . . . . . . . . . . . . . . . . . . . . . . . . . . . . 1224.4 Limitations . . . . . . . . . . . . . . . . . . . . . . . . . . . . . . . . . . 125
4.4.1 Toward Plugin-less 3D Web . . . . . . . . . . . . . . . . . . . . . 1264.4.2 Unity WebGL Limitations . . . . . . . . . . . . . . . . . . . . . . 127
4.5 Summary . . . . . . . . . . . . . . . . . . . . . . . . . . . . . . . . . . . 127
5 3D Digital Heritage Artefacts 1295.1 Introduction . . . . . . . . . . . . . . . . . . . . . . . . . . . . . . . . . . 1305.2 QoS of Digital Heritage Models . . . . . . . . . . . . . . . . . . . . . . . 131
5.2.1 Initial Download & Processing Times . . . . . . . . . . . . . . . 131

CONTENTS iii
5.2.2 Summary & Recommendations . . . . . . . . . . . . . . . . . . . 1385.3 QoE of Digital Heritage Models . . . . . . . . . . . . . . . . . . . . . . 139
5.3.1 Perception of Visual Latency . . . . . . . . . . . . . . . . . . . . 1405.3.2 Subjective Perception of Fidelity . . . . . . . . . . . . . . . . . . 1425.3.3 Conclusions . . . . . . . . . . . . . . . . . . . . . . . . . . . . . . 1615.3.4 Future-proof Discussion . . . . . . . . . . . . . . . . . . . . . . . 162
5.4 Summary . . . . . . . . . . . . . . . . . . . . . . . . . . . . . . . . . . . 165
IV Semantic 3D Web & QoS Metadata 167
6 QoS-Aware Semantic Digital Heritage 1696.1 Introduction . . . . . . . . . . . . . . . . . . . . . . . . . . . . . . . . . . 1696.2 Metadata and Linked Data . . . . . . . . . . . . . . . . . . . . . . . . . 1716.3 Dublin Core Metadata Standard . . . . . . . . . . . . . . . . . . . . . . 1726.4 Europeana Data Model . . . . . . . . . . . . . . . . . . . . . . . . . . . 1766.5 Web-Based Virtual Museum Media and 3D Objects . . . . . . . . . . . 1776.6 Virtual Museum Quality of Service Ontology . . . . . . . . . . . . . . . 181
6.6.1 Usage . . . . . . . . . . . . . . . . . . . . . . . . . . . . . . . . . 1816.7 Omeka DAMS & QoS Metadata . . . . . . . . . . . . . . . . . . . . . . . 183
6.7.1 Dublin Core & EDM in Omeka . . . . . . . . . . . . . . . . . . . 1846.7.2 Custom Metadata through Omeka Item Types . . . . . . . . . . 185
6.8 Summary . . . . . . . . . . . . . . . . . . . . . . . . . . . . . . . . . . . 186
V Hannibal 189
7 Hannibal - an Adaptive Engine for Virtual Museums 1917.1 Introduction . . . . . . . . . . . . . . . . . . . . . . . . . . . . . . . . . . 1917.2 The Hannibal Solution . . . . . . . . . . . . . . . . . . . . . . . . . . . . 1957.3 Hannibal and Findings From QoS & QoE Studies . . . . . . . . . . . . 1977.4 Hannibal and QoS-related Metadata . . . . . . . . . . . . . . . . . . . . 2027.5 High Level Architecture . . . . . . . . . . . . . . . . . . . . . . . . . . . 2037.6 System View . . . . . . . . . . . . . . . . . . . . . . . . . . . . . . . . . 206
7.6.1 Client Side View . . . . . . . . . . . . . . . . . . . . . . . . . . . 2067.6.2 Data and Control Flow of Hannibal . . . . . . . . . . . . . . . . 207
7.7 Classifications used by Hannibal . . . . . . . . . . . . . . . . . . . . . . 2097.7.1 Network Profiles . . . . . . . . . . . . . . . . . . . . . . . . . . . 2097.7.2 Client Device Capability Categories . . . . . . . . . . . . . . . . 2107.7.3 Resolution Decimation Levels . . . . . . . . . . . . . . . . . . . . 213
7.8 YouTube Adaptive System VS. Hannibal . . . . . . . . . . . . . . . . . . 2157.8.1 Analogy of Hannibal to YouTube . . . . . . . . . . . . . . . . . . 2157.8.2 Differences from YouTube . . . . . . . . . . . . . . . . . . . . . . 217
7.9 Implementation . . . . . . . . . . . . . . . . . . . . . . . . . . . . . . . . 218
iv CONTENTS
7.9.1 Front-End of the WBVM . . . . . . . . . . . . . . . . . . . . . . . 2187.9.2 Middle-ware . . . . . . . . . . . . . . . . . . . . . . . . . . . . . 2237.9.3 Back-end . . . . . . . . . . . . . . . . . . . . . . . . . . . . . . . 225
7.10 Evaluation of Hannibal . . . . . . . . . . . . . . . . . . . . . . . . . . . 2317.10.1 QoS Evaluation of Hannibal . . . . . . . . . . . . . . . . . . . . . 2317.10.2 Advantages and Disadvantages of Hannibal . . . . . . . . . . . . 241
7.11 Summary . . . . . . . . . . . . . . . . . . . . . . . . . . . . . . . . . . . 242
VI Summary and Final Words 243
8 Conclusion And Future Work 2458.1 Summary of the Work . . . . . . . . . . . . . . . . . . . . . . . . . . . . 2458.2 Thesis Statement . . . . . . . . . . . . . . . . . . . . . . . . . . . . . . . 2468.3 Research Questions Addressed . . . . . . . . . . . . . . . . . . . . . . . 2478.4 Research Contributions . . . . . . . . . . . . . . . . . . . . . . . . . . . 2498.5 Limitations of the Work . . . . . . . . . . . . . . . . . . . . . . . . . . . 2508.6 Future Work . . . . . . . . . . . . . . . . . . . . . . . . . . . . . . . . . 251
8.6.1 Effect of Textures Resolutions on QoS & QoE . . . . . . . . . . . 2518.6.2 Effect of Models Types and Compression on QoS & Fidelity . . 2528.6.3 Systematically Calculating VRAM Consumption . . . . . . . . . 2538.6.4 Decimation Algorithms for WebGL WBVWs . . . . . . . . . . . . 2538.6.5 Subjective Perception of Fidelity of LODs of WebGL WBVWs . . 2548.6.6 Extensions to ViMQO and Creation of DAMSs Plug-ins . . . . . 2548.6.7 Machine Learning in Hannibal . . . . . . . . . . . . . . . . . . . 2558.6.8 QoE study on Hannibal and further extensions . . . . . . . . . . 255
8.7 Final Thoughts . . . . . . . . . . . . . . . . . . . . . . . . . . . . . . . . 256
VII Appendices 259
Appendix A - Ethics Approval 261
Appendix B - Perception of Fidelity Experiment 263
Appendix C - 3D Web Technologies 267C.1 3D Web Technologies . . . . . . . . . . . . . . . . . . . . . . . . . . . . 267
C.1.1 VRLM, X3D and X3DOM . . . . . . . . . . . . . . . . . . . . . . 267C.1.2 XML3D & Xflow . . . . . . . . . . . . . . . . . . . . . . . . . . . 268C.1.3 WebGL . . . . . . . . . . . . . . . . . . . . . . . . . . . . . . . . . 269C.1.4 HTML5 & CSS3 3D Features . . . . . . . . . . . . . . . . . . . . 270C.1.5 3D Markup Language for the Web (3DMLW) . . . . . . . . . . . 271C.1.6 Java 3D and Java OpenGL (JOGL) . . . . . . . . . . . . . . . . . 271C.1.7 O3D and Oak3D . . . . . . . . . . . . . . . . . . . . . . . . . . . 271
CONTENTS v
C.1.8 PDF3D . . . . . . . . . . . . . . . . . . . . . . . . . . . . . . . . . 272C.1.9 Web-Generated Builds from Traditional Game Engines . . . . . 273
C.2 Web-Based Virtual Worlds . . . . . . . . . . . . . . . . . . . . . . . . . . 274C.3 Taxonomies and Classifications of the 3D Web . . . . . . . . . . . . . . 274
C.3.1 Language Paradigm Taxonomy . . . . . . . . . . . . . . . . . . . 275C.3.2 Installation and Deployment Taxonomy . . . . . . . . . . . . . . 276C.3.3 Rendering Taxonomy . . . . . . . . . . . . . . . . . . . . . . . . 277C.3.4 Use Case Taxonomy . . . . . . . . . . . . . . . . . . . . . . . . . 278C.3.5 User Interaction Modes Taxonomy . . . . . . . . . . . . . . . . . 279
Appendix D - WebGL Benchmark 281D.1 WebGL Benchmark across 18 devices . . . . . . . . . . . . . . . . . . . 281
References 285
Index 331

List of Figures
1.1 Map Showing Average World Internet Broadband Speed . . . . . . . . . . 81.2 VMs Based on Location and Mode of Access . . . . . . . . . . . . . . . . . 161.3 Smithsonian Museum X 3D WBVM on Desktop Screen - Mozilla Firefox . 161.4 Smithsonian Museum X 3D WBVM on iPhone 7 Plus - Apple Safari . . . . 161.5 Hannibal QoS & QoE Aware Adaptive Engine . . . . . . . . . . . . . . . . 221.6 Research Overview . . . . . . . . . . . . . . . . . . . . . . . . . . . . . . . 231.7 Tradeoff between Fidelity and QoS . . . . . . . . . . . . . . . . . . . . . . 271.8 Overall Thesis Block Diagram . . . . . . . . . . . . . . . . . . . . . . . . . 31
2.1 Block Diagram of Chapter 2 Structure . . . . . . . . . . . . . . . . . . . . 372.2 Timeline of Technologies of the World Wide Web . . . . . . . . . . . . . . . 392.3 Timeline of Key 3D Web Technologies . . . . . . . . . . . . . . . . . . . . . 402.4 Venn Diagram of WBVMs vs. WBVWs . . . . . . . . . . . . . . . . . . . . . 472.5 Snapshot of the Smithsonian Digitization Museum X 3D . . . . . . . . . . 492.6 Snapshot of the CyArk WBVM . . . . . . . . . . . . . . . . . . . . . . . . . 492.7 The ARCO Project WBVM & WBVW . . . . . . . . . . . . . . . . . . . . . . 522.8 Compression Rates vs Download Durations vs Decompression Durations . 66
3.1 Timespan Longhouse Web-Based Virtual World . . . . . . . . . . . . . . . 863.2 Garland and Heckbert Decimation Algorithm . . . . . . . . . . . . . . . . . 983.3 Meshlab - Quadric Edge Collapse Decimation . . . . . . . . . . . . . . . . 993.4 Achavanich Beaker at 20K faces . . . . . . . . . . . . . . . . . . . . . . . . 1033.5 Fidelity Grading Example . . . . . . . . . . . . . . . . . . . . . . . . . . . . 107
4.1 The Timespan Longhouse WBVW . . . . . . . . . . . . . . . . . . . . . . . 1164.2 FPS Distributions of the Timespan Longhouse World . . . . . . . . . . . . 1174.3 FT Distribution while Avatar Standing (ms) . . . . . . . . . . . . . . . . . . 1184.4 FT Distribution while Avatar Walking (ms) . . . . . . . . . . . . . . . . . . 1184.5 Physical Memory Load (%) . . . . . . . . . . . . . . . . . . . . . . . . . . . 1194.6 Physical Memory Usage (MB) . . . . . . . . . . . . . . . . . . . . . . . . . 1204.7 CPU Usage (%) . . . . . . . . . . . . . . . . . . . . . . . . . . . . . . . . . . 1204.8 GPU Core Load (%) . . . . . . . . . . . . . . . . . . . . . . . . . . . . . . . 1214.9 GPU D3D Use (%) . . . . . . . . . . . . . . . . . . . . . . . . . . . . . . . . 1214.10 GPU Memory Usage (%) . . . . . . . . . . . . . . . . . . . . . . . . . . . . 122
vi

List of Figures vii
5.1 IDPTs for Alcatel Pop 4 on Different Network Connections . . . . . . . . . 1325.2 IDPTs for LG Nexus 5x on WiFi, 4G, 3G and 2G . . . . . . . . . . . . . . . 1335.3 IDPTs for LG Nexus 5x on GPRS & 2G . . . . . . . . . . . . . . . . . . . . . 1345.4 IDPTs for Broadband WiFi on LG Nexus 5x VS. Alcatel Pop 4 . . . . . . . . 1345.5 IDPTs for Alcatel Pop 4, Nexus 5x & MacBook Pro on WiFi Networks . . . 1355.6 IDPTs for 4G Network on LG Nexus 5x VS. Alcatel Pop 4 . . . . . . . . . . 1355.7 IDPTs for 3G Network on LG Nexus 5x VS. Alcatel Pop 4 . . . . . . . . . . 1365.8 Barchart of Visual Latency of different Web3D Models . . . . . . . . . . . 1415.9 Gender Distribution of Participants - Experiment 1 . . . . . . . . . . . . . 1445.10 Age Distribution of Participants - Experiment 1 . . . . . . . . . . . . . . . 1445.11 Participants Eye Correction Information - Experiment 1 . . . . . . . . . . 1455.12 Primary Screen Types - Experiment 1 . . . . . . . . . . . . . . . . . . . . . 1465.13 Primary Screen Sizes - Experiment 1 . . . . . . . . . . . . . . . . . . . . . 1465.14 Resolutions of the Primary Screens - Experiment 1 . . . . . . . . . . . . . 1475.15 3D Content Usage Ratio - Experiment 1 . . . . . . . . . . . . . . . . . . . . 1475.16 Gender Distribution of Participants - Experiment 2 . . . . . . . . . . . . . 1485.17 Age Distribution of Participants - Experiment 2 . . . . . . . . . . . . . . . 1485.18 Participants Eye Correction Information - Experiment 2 . . . . . . . . . . 1495.19 Primary Screen Types - Experiment 2 . . . . . . . . . . . . . . . . . . . . . 1495.20 Primary Screen Sizes - Experiment 2 . . . . . . . . . . . . . . . . . . . . . 1505.21 Resolutions of the Primary Screens - Experiment 2 . . . . . . . . . . . . . 1505.22 3D Content Usage Ratio - Experiment 2 . . . . . . . . . . . . . . . . . . . . 1515.23 Comparison Between Models - Big Screen - No Interaction Mode . . . . . 1525.24 Comparison Between Models - Big Screen - Interaction Mode . . . . . . . 1525.25 Effect of Interaction - Achavanich Beaker Model - Big Screen . . . . . . . 1535.26 Effect of Interaction - Mercury Model - Big Screen . . . . . . . . . . . . . 1535.27 Effect of Screen Size - Achavanich Model . . . . . . . . . . . . . . . . . . . 1545.28 Effect of Screen Size - Mercury Model . . . . . . . . . . . . . . . . . . . . 1545.29 Ranking - Achavanich Beaker - Big Screen (Absolute Errors) . . . . . . . . 1555.30 Ranking - Achavanich Beaker - Big Screen (Ranks Distribution) . . . . . . 1555.31 Ranking - Achavanich Beaker - iPad Pro (Absolute Errors) . . . . . . . . . 1565.32 Ranking - Achavanich Beaker - iPad Pro (Ranks Distribution) . . . . . . . 1565.33 Ranking - Achavanich Beaker - iPhone 7 Plus (Absolute Errors) . . . . . . 1575.34 Ranking - Achavanich Beaker - iPhone 7 Plus (Ranks Distribution) . . . . 157
6.1 The Corn Bird 3D Model . . . . . . . . . . . . . . . . . . . . . . . . . . . . 1756.2 Adding Dublin Core Metadata to a New Item in Omeka . . . . . . . . . . . 1846.3 Adding EDM Metadata to a New Item in Omeka . . . . . . . . . . . . . . . 1856.4 Adding New Item Types and Metadata in Omeka . . . . . . . . . . . . . . 187
7.1 Hannibal Block Diagram . . . . . . . . . . . . . . . . . . . . . . . . . . . . 1937.2 Hannibal Flow Diagram . . . . . . . . . . . . . . . . . . . . . . . . . . . . . 1977.3 Abstract View of the WBVM . . . . . . . . . . . . . . . . . . . . . . . . . . 204
viii List of Figures
7.4 Influencing Factors on Performance . . . . . . . . . . . . . . . . . . . . . . 2057.5 Flowshart Showing the Operation of the Adaptive Engine . . . . . . . . . 2087.6 Flowchart Showing the Operation of Overriding a Fidelity . . . . . . . . . 2097.7 WBVM Management Interface . . . . . . . . . . . . . . . . . . . . . . . . . 2147.8 YouTube Qualities for a Flat MP4 Video . . . . . . . . . . . . . . . . . . . . 2167.9 Governing Parameters Considered by YouTube . . . . . . . . . . . . . . . 2177.10 YouTube Qualities for a 360◦ MP4 Video (Videosphere) . . . . . . . . . . . 2177.11 The Shetland WBVM Leaflet Map . . . . . . . . . . . . . . . . . . . . . . . 2187.12 Popup Menu of the WBVM . . . . . . . . . . . . . . . . . . . . . . . . . . . 2187.13 Shetland WBVM Available Models . . . . . . . . . . . . . . . . . . . . . . . 2197.14 Pre-historic Cup 3D Model shown in the WBVM . . . . . . . . . . . . . . . 2197.15 Prehistoric Bone Cup Model - Omeka DAMS . . . . . . . . . . . . . . . . . 2267.16 Prehistoric Bone Cup Model - Dublin Core and Europeana . . . . . . . . . 2267.17 QoS-Related Metadata - Omeka . . . . . . . . . . . . . . . . . . . . . . . . 2277.18 Part of a 360◦ Sprite Image - Bone Cup Model . . . . . . . . . . . . . . . . 2317.19 The Pre-historic Bone Cup Model . . . . . . . . . . . . . . . . . . . . . . . 2327.20 The Wireless Battery Model . . . . . . . . . . . . . . . . . . . . . . . . . . 2327.21 Bone Cup on iPad Across Networks With and Without Hannibal . . . . . . 2357.22 Bone Cup on Nexus 4 Across Networks With and Without Hannibal . . . . 2367.23 Bone Cup on PC Across Networks With and Without Hannibal . . . . . . . 2377.24 Battery Model on iPad Across Networks With and Without Hannibal . . . 2387.25 Battery Model on Nexus 4 Across Networks With and Without Hannibal . 2397.26 Battery Model on PC Across Networks With and Without Hannibal . . . . 240
C.1 Taxonomy of 3D Web User Tasks . . . . . . . . . . . . . . . . . . . . . . . . 279

List of Tables
2.1 3D Web Technologies Synopses . . . . . . . . . . . . . . . . . . . . . . . . 412.2 3D Web Technologies Usage in DH . . . . . . . . . . . . . . . . . . . . . . 412.3 3D Assets File Formats Synopses . . . . . . . . . . . . . . . . . . . . . . . 442.4 WBVMs Based on 3D Web Usage . . . . . . . . . . . . . . . . . . . . . . . 542.5 Pros and Cons of Remote Rendering . . . . . . . . . . . . . . . . . . . . . . 70
3.1 Research Methods across Chapters & Sections . . . . . . . . . . . . . . . 843.2 Rendering Parameters of 2 Minute Random Walk . . . . . . . . . . . . . . 893.3 Characteristics of Networks Used in the Experiments . . . . . . . . . . . . 913.4 RTT in ms on JANET (Ethernet) . . . . . . . . . . . . . . . . . . . . . . . . 913.5 Broadband Download/Upload Speeds on WiFi . . . . . . . . . . . . . . . . 923.6 Broadband Download/Upload Speeds on Ethernet . . . . . . . . . . . . . . 923.7 Characteristics of Sketchfab Models-QoS Experiment . . . . . . . . . . . 933.8 Characteristics of the two reference 3D Models . . . . . . . . . . . . . . . 963.9 Decimated Models of Achavanich Beaker . . . . . . . . . . . . . . . . . . . 1023.10 Five Level Fidelity Scale . . . . . . . . . . . . . . . . . . . . . . . . . . . . 108
4.1 Average RTT & Downlink Bandwidths for Timespan Longhouse . . . . . . 1224.2 Initial Download Times (ms) for TL Builds . . . . . . . . . . . . . . . . . . 122
5.1 IDPTs of Sketchfab Models across all Network Regimes and Devices . . . 1375.2 Perception of the Visual Latency Scale . . . . . . . . . . . . . . . . . . . . 1415.3 Hardware Resolution Limits of both models . . . . . . . . . . . . . . . . . 161
7.1 3D Web Adaptivity Solutions VS. Hannibal . . . . . . . . . . . . . . . . . . 1967.2 Summary of Hannibal QoS & QoE Considerations . . . . . . . . . . . . . . 2027.3 Network Profiles used by Hannibal . . . . . . . . . . . . . . . . . . . . . . 2107.4 Client Capability Categories adpopted by Hannibal . . . . . . . . . . . . . 2127.5 Discrete Resolution Levels (number of faces) used by Hannibal . . . . . . 2137.6 Characteristics of the 3D Models considered for Hannibal Evaluation . . 2327.7 Network Scenarios Used for the Evaluation of Hannibal . . . . . . . . . . 2347.8 Bone Cup on iPad Across Networks With and Without Hannibal . . . . . . 2357.9 Bone Cup on Nexus 4 Across Networks With and Without Hannibal . . . . 2377.10 Bone Cup on PC Across Networks With and Without Hannibal . . . . . . . 2387.11 Battery Model on iPad Across Networks With and Without Hannibal . . . 238
ix

x List of Tables
7.12 Battery Model on Nexus 4 Across Networks With and Without Hannibal . 2397.13 Battery Model on PC Across Networks With and Without Hannibal . . . . 2407.14 Pros and Cons of Hannibal . . . . . . . . . . . . . . . . . . . . . . . . . . . 241
C.1 3D Web based on Language Paradigm . . . . . . . . . . . . . . . . . . . . . 276
Listings6.1 DC metadata of the Corn Bird 3D Model in RDF/XML from Omeka . . . 1746.2 Intergrating Dublin Core into HTML5 with RDFa 1.1 . . . . . . . . . . . 1746.3 RDF Turtle expression of the Wireless Battery Model in ViMQO . . . . 1816.4 RDF Turtle expression of the Bone Cup Model in ViMQO . . . . . . . . 1827.1 Web Browsers Finger Printing Functions . . . . . . . . . . . . . . . . . 2227.2 Capturing WebGL Parameters . . . . . . . . . . . . . . . . . . . . . . . . 2227.3 Setting facts and running the PHP Expert System . . . . . . . . . . . . 2247.4 Decimating following the Quadric Edge Collapse algorithm using
MeshlabXML . . . . . . . . . . . . . . . . . . . . . . . . . . . . . . . . . 2277.5 Retrieving size, faces, vertices from 3D Models in OBJ format . . . . . 229
xi

List of Abbreviations
2D Two Dimensional3D Three Dimensional3D Web Three Dimensional Web
AJAJ Asynchronous Javascript and JSONAJAX Asynchronous Javascript and XMLAPI Application Programming InterfaceAR Augmented RealityASCII American Standard Code for Information Interchange
CAD Computer Aided DesignCH Cultural HeritageCOLLADA COLLAborative Design ActivityCPU Central Processing UnitCSV Comma Separated Values
DAMS Digital Asset Management SystemDBMS Database Management SystemDC Dublin CoreDCMI Dublin Core Metatada InitiativeDCS Dublin Core SchemaDH Digital Heritage
EDM Europeana Data Model
FPS Frame per SecondFT Frame Time
GIF Graphics Interchange FormatglTF Graphics Library Transmission FormatGPU Graphics Processing Unit
HAS HTTP Adaptive StreamingHD High Definition
xiii
xiv ABBREVIATIONS
HTML HyperText Markup LanguageHTTP HyperText Transfer Protocol
ICOM International Council of MuseumsICT Information and Communication TechnologyIDPT Initial Download & Processing TimeIRI Internationalized Resource Identifier
JANET Joint Academic NetworkJSON Javascript Object Notation
LD Low DefinitionLOD Level of Detail
MAE Mean Absolute ErrorMBVM Mobile-Based Virtual MuseumMOS Mean Opinion ScoreMUVW Multi-User Virtual World
OCR Optical Character RecognitionOS Operating SystemOWL Web Ontology Language
PDA Personal Digital AssistantPM Progressive Mesh
QoE Quality of ExperienceQoS Quality of Service
RDF Resource Description FrameworkReST Representational State TransferRR Remote RenderingRTT Round-Trip Time
SD Standard DefinitionSVG Scalar Vector Graphics
U3D Universal 3DURI Uniform Resource Identifier
ViMQO Virtual Museum Quality of Service OntologyVM Virtual MuseumVR Virtual Reality

ABBREVIATIONS xv
VRML Virtual Reality Modelling Language
W3C World Wide Web ConsortiumWBVM Web-Based Virtual MuseumWBVW Web-Based Virtual WorldWebAR Web Augmented RealityWebGL Web Graphics LibraryWebRTC Web Real-Time CommunicationWebVR Web Virtual Reality
X3D eXtensible 3DXML Extensible Markup Language

Glossary3D Scanning is the task of digitally reconstructing 3D structures using commercial
laser scanners [447]. This technique is used in digitising cultural heritagearetacts, sculptures and buildings.
3D Web A set of technologies for providing 3D material on the World Wide Web.
European Union Latin America and Caribbean Foundation Virtual MuseumA cross-country project involving many community museums across Europe,Latin America, and the Caribbean countries. It has received funding from theEuropean Union’s Horizon 2020 Research and innovation programme undergrant agreement No 693669. The Web-Based Virtual Museum was built by theOpen Virtual World Research Group at the University of St Andrews. Hannibal(Chapter 7) is implemented in only a small subset clone of it.
Ontology is a machine-readable vocabulary of terms, rules and definitions used ina specific domain of knowledge. Upper Ontology is a high-level ontology thatis very general covering many domains [150, 168].
Photogrammetry is the task of digitally reconstructing 3D structures from a set ofinput images [447]. It is one of the most famous techniques used in digitisingcultural heritage aretacts, sculptures and buildings.
Panorama a.k.a Photo Sphere is a special pseudo-photograph obtained by stitch-ing together several images taken from the same point and covering a field ofview of up to 360◦, which is then mapped with an equi-rectangular projectionin a plane [328]. Many cameras (both inside mobile devices and specialisedones) can produce Photo Spheres with ease.
Quality of Experience “is the degree of delight or annoyance of the user of anapplication or service. It results from the fulfilment of his or her expectationswith respect to the utility and/or enjoyment of the application or service in thelight of the user’s personality and current state” [243].
Quality of Service is the study of quality attributes that are measured objectivelysuch as the execution time, response time, processing time, latency, throughput,jitter, packet loss among others of a service or system [232, 324].
xvii


Part I
Motivation and Overview
1


1Chapter One
Introduction
1.1 Overview
This thesis investigates web-based cultural heritage digitisations (3D artefacts and
environments) from the perspectives of Quality of Service (QoS) and Quality of
Experience (QoE). It also provides a solution to adapt the dissemination of Digital
Heritage (DH) artefacts over the world wide web across devices and network
regimes.
In order to contextualise the research foci of this thesis, it is pertinent to initially
define and discuss the major overarching salient terms pertaining to the domain of
heritage in general and to that of museums and by extension Virtual Museums (VMs)
in particular. The concepts of heritage, the challenges facing its preservation, the
prominence of digitising heritage, the concepts of museums, and virtual museums
are discussed in the following sections. The next section starts by defining the
different types of heritage.
1.1.1 Heritage
A community without heritage is a community without identity. Preserving heritage
is essential to the pride of any nation and through understanding and appreciating
it, the future of a community is envisioned and sustained. In a global world,
communities’ ways of life and artistic expression are in continuous danger of being
diluted. Heritage provides communities a necessary cohesion, social learning and a
cultural identity.
3
4 CHAPTER 1. INTRODUCTION
Heritage is a semantically laden term. Heritage is associated with everything
inherited by the community from the past which is deemed of value and significance
and which can be passed onto next generations. Heritage has been classified into
many categories [147, 203, 234]: the first higher level classification is between
natural heritage and cultural heritage.
The United Nations Educational, Scientific and Cultural Organisation (UNESCO) de-
fines natural heritage as to involve “natural features, geological and physiographical
formations and delineated areas that constitute the habitat of threatened species
of animals and plants and natural sites of value from the point of view of science,
conservation or natural beauty. It includes nature parks and reserves, zoos, aquaria
and botanical gardens” [407].
On the other hand, cultural heritage is defined as:
“the legacy of physical artefacts and intangible attributes of a group
or society that are inherited from past generations, maintained in the
present and bestowed for the benefit of future generations”
UNESCO [406]
The second major classification of heritage is between tangible heritage and
intangible heritage. Tangible heritage include artefacts, monuments and buildings
of archaeological, historical, technological or scientific significance while intangible
heritage include oral history and traditions, folk life, dance, customs, religious
ceremonies, music, fashion, languages, storytelling among many other activities that
have no actual physical presence but nevertheless have significance [147].
A motivation for this work is that neither geographical locations nor device
constraints should limit our access to cultural heritage. Unfortunately, there are
many challenges to the access, promotion and preservation of heritage in all its
forms. The following section discusses to some extent these major challenges.
1.1.1.1 Challenges and Dangers
There are constant dangers for preserving intangible heritage. Many traditions,
languages [100], religious practices, folk customs among many others are facing
extinction due to many reasons such as cultural hegemony, wars and conflicts and

1.1. OVERVIEW 5
political oppression. An example can be given is that of the Syriac Aramaic language
which is still spoken in very few villages in Syria and Iraq. The language was
historically oppressed and now faces the danger of complete extinction [183].
Tangible heritage has a plethora of challenges of its own. Many are human-made
while others are natural. Many artefacts are fragile and difficult to present to the
public in museums. Earthquakes, floods, and fires are among the major natural
challenges for the preservation of cultural heritage artefacts and monuments.
Wars and conflicts, pollution, climate change, acid rain, day to day use and
inappropriate handling of artefacts and monuments are among the major human-
made challenges to preserve cultural heritage. There are also a set of challenges
that are economical in nature such as the lack of funding that hinders the repairment
of monuments, the uncontrolled urbanization where sizeable populations inhabit
historical cities and the unchecked tourist development [13].
The world was shocked by the barbaric acts of destruction of thousands of precious
Neo-Assyrian artefacts, shrines, old churches and mosques in Iraq and Syria by
terrorist organisations [101]. Another painful example can be seen in the destruction
of the 6th century Buddhas of Bamiyan in 2001 [438]. Even if we remove wars and
conflicts out of the picture, many cultural heritage sites have serious problems with
accessibility due to geographical barriers and disabilities. We should consider if
digitisation can act as a social insurance policy for future generations when time,
decay and destruction may remove the artefact but a digital surrogate can remain.
In addition, there are real challenges that endanger physical artefacts inside
museums [86] such as degradation from day to day use (i.e. wear and tear),
and sensitivity to humidity and light conditions [296] which leads to artefacts’
deterioration, in addition, to sensitivity to fluctuations in temperatures [156].
Furthermore, museums often do not have sufficient exhibition space to show
their large collections thus a large number of cultural heritage artefacts remain
hidden and stored in archives while only a small percentage is shown to the public.
For example, the Smithsonian collection alone constitutes more than 150 million
artefacts/specimen with less than 2% on display to the public [380] and only 12% are
actually prioritised for digitisation [379]. The question is can digital technologies
help liberate the 98% from the shadows?
In contrast, open air sites and buildings have their own problems in terms of potential
6 CHAPTER 1. INTRODUCTION
destruction from extreme weather conditions (hurricanes, tornadoes etc.), and from
pollution driven problems such as global warming [156] and acid rain, in addition
to serious damage from earthquakes, vandalism and wars and conflicts [13]. For
example, the marble of many Greek historic monuments including the Acropolis has
been unfortunately eroded by the acid rain [13].
In addition, collection based institutions such as zoos, aquariums, botanical gardens
and natural history museums are becoming more concerned with conservation
issues during the last four decades due to the accelerate rate of deterioration to the
environment and the loss of a big variety of animal and plant species [273].
With such pressing challenges, digitisation provides a needed rescue. The follow-
ing section discusses the importance of digitising heritage for preservation and
dissemination purposes.
1.1.1.2 Heritage and the Digital Domain
The digitisation of a heritage artefact or a monument involves creating a digital
surrogate representation of it. Digitisation makes artefacts available to cultural and
digital heritage stakeholders such as scholars, historians, museum curators, and
members of the community. There is a recent trend for democratising all the aspects
involved in the digitisation and dissemination of digital heritage assets. A trend
supported by many mobile applications [448], commodity cameras and phones and
free open source software.
In the past, digitisation of heritage artefacts required specialist equipment and
expertise, but nowadays it is as easy as using commonly available phones, cameras
and freely available software. Digital heritage artefacts, sculptures and buildings
are captured and digitally reconstructed through techniques such as Photogram-
metry [338], 3D Scanning [55] often called laser scanning and topographical
techniques [314].
Digital heritage artefacts and virtual reconstructions are used by scholars, profes-
sionals in culture heritage, and museum curators to document museum artefacts,
heritage sites and archaeological finds. They help facilitate the study of heritage
material without being bound to physical access and temporal constraints. Digital
reconstructions can restore lost heritage such as the example of the Buddhas
of Bamiyan which were digitally reconstructed from images after their destruc-
1.1. OVERVIEW 7
tion [438]. In addition, virtual spaces act in some respect as a valid surrogate of the
actual physical space [200]. For this thesis, one aspect we are concerned with is the
quality of service in the provision of such digital experiences.
In addition, digital technologies serve a role to engage the community and foster
participation, and preserve local cultural heritage which is viewed to be at risk. 3D
models and reconstructions can be effective in promoting useful discussions and
dialogues concerning heritage significance and where users can engage with new
and novel perspectives of the history of the area and local heritage.
However with all the benefits of digitisation, there are understandably many fears,
concerns and even sometimes anathema from a part of the heritage research
community when it comes to digitisation or simulation of heritage [438]. There
is a concern that the real interpretation, meaning and context of the heritage
material would be stripped away by the surrogate digital reconstruction. People
would attribute a fake, inaccurate and sometimes misleading interpretation to the
simulation. As a concrete example, the virtual reconstruction of the St Andrews
Cathedral in OpenSim [298] created by the Open Virtual World research group
which the author of this thesis is part of, might create the impression of authenticity
while in actuality the reconstruction is nothing but a hypothesis of how the cathedral
might have looked like in its pristine days based on historical, and architectural
records.
Another concern raised usually by archaeologists is that 3D reconstructions could
become “closed boxes” thus could not be evaluated adequately and scientifically.
Furthermore, these reconstructions can be without any particular purpose and
would focus more on sophisticated computer graphics and artistic beauty rather
than on being useful tools to help solve particular scientific challenges [75].
These concerns are highly debatable as many consider simulations and digital
duplications of authentic artefacts a stimulus to increase their fame and awareness
in the public [438]. In this thesis, we are concerned only with the quality of service of
such environments in heterogeneous devices such as phones and desktop platforms
and not with their authenticity or the debate surrounding that.
Despite the benefits of digitisation in cultural heritage, it is by no mean a long term
preservation solution nor is a substitute for preservation efforts from the dangers
and challenges explained in Section 1.1.1.1.
8 CHAPTER 1. INTRODUCTION
Today there is a broader use of end devices such as tablets and phones. As of 2018,
19.1 exabyte of Internet traffic per month comes from mobile devices [389] and as
of February 2019, total web traffic of mobile devices excluding tablets accounted for
47.96 % of web page views worldwide. Over 60% of mobile phone web page views
comes from the Asia continent [390]. These statistics show how much these devices
are becoming a daily reality in our life. In many countries around the world such as
the USA, mobile usage superseded the usage of desktop personal computers when it
comes to the number of web visits [401].
This shows that the penetration of mobile devices is getting higher with each year.
People connect their phones to a myriad of network connections ranging from WiFi
broadband, 4G, 3G to 2G especially in rural areas. This leads to a major concern of
how to view and engage with digitised material on the web for people in rural areas
or in places with average or low internet speed. The average Internet broadband
speed in 2017 varied enormously across the globe with countries on one side of the
spectrum such as Yemen with an average speed of just 0.31 Mbps and Niger with
average speed of 0.83 Mbps and on the other side, countries benefiting from high
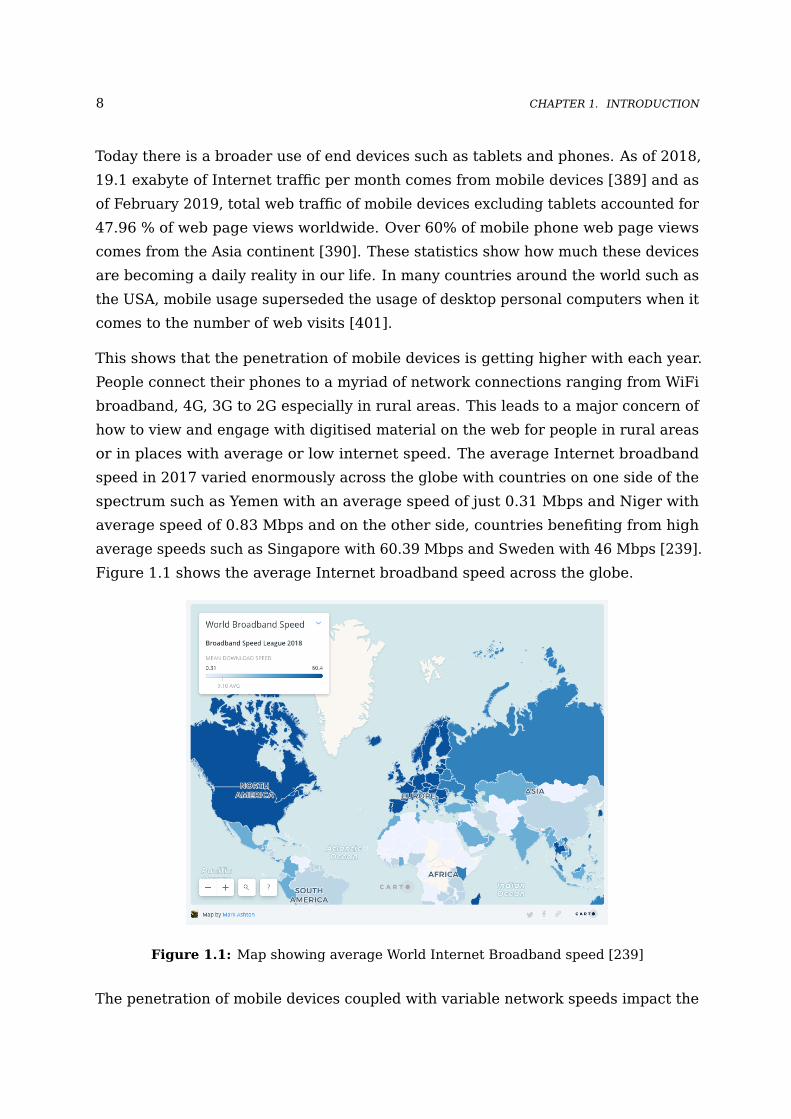
average speeds such as Singapore with 60.39 Mbps and Sweden with 46 Mbps [239].
Figure 1.1 shows the average Internet broadband speed across the globe.
Figure 1.1: Map showing average World Internet Broadband speed [239]
The penetration of mobile devices coupled with variable network speeds impact the

1.1. OVERVIEW 9
ability to deliver digital heritage. A person in rural areas of Inverness in Scotland, is
interested and willing to engage with high-end digital heritage objects in a virtual
museum in Athens as much as a person living in London. Same can be said about
countries in Africa or Asia. There is a need for a system that could adapt the
delivery of the content to the device and network situation thereby achieving the
best possible user experience.
The central aim of this thesis is to provide a solution that achieves
adaptivity for 3D Web content in Web-Based Virtual Museums across
heterogeneous devices and network regimes while achieving the best
possible user experience. The thesis investigates the Quality of Service
(QoS) and Quality of Experience (QoE) of the 3D Web used in Digital
Heritage (DH) applications, particularly in Web-Based Virtual Museums.
This research adopts an empirical-based approach as defined by Campbell and
Stanley [68] aiming to further the understanding of cultural heritage stakeholders
and computer scientists of the QoS and QoE of different 3D Web components through
a set of experiments culminating in the design and development of Hannibal, a QoS
& QoE aware adaptive engine implemented in a virtual museum context.
One of the trends in digital heritage is dedicated to the design and implementation
of Virtual Museums (VMs) [167]. In order to define and understand what a “Virtual
Museum” is, it is pertinent to formally define first what a “Museum” is.
1.1.2 Museums
Museums are charged with the custodianship of local, regional, national and
international collections. The International Council of Museums (ICOM) [202]
defines a museum as:
“a non-profit, permanent institution in the service of society and its
development, open to the public, which acquires, conserves, researches,
communicates and exhibits the tangible and intangible heritage of
humanity and its environment for the purposes of education, study and
enjoyment”
International Council of Museums (ICOM) [202]

10 CHAPTER 1. INTRODUCTION
According to Burcaw [63], museums exhibit and collect objects of artistic, historical,
educational and aesthetic values. The main characteristic of a museum is that it is
bound by presenting physical objects to visitors in a physical space. Museums are
by nature, information providers interpreting the history and culture of artefacts
and collections to their visitors [58].
Historically speaking, one of the prominent examples of the ancient world museums
was the museum of Alexandria in Egypt called the “Mouseion of Alexandria” founded
in the third century AD. It had a collection of statuettes of thinkers, astronomical and
medical instruments and botanical and zoological specimen. Access to the museum
was limited to only the intellectuals and philosophers of that time.
During the middle ages, objects of religious significance were venerated and kept
in churches, cathedrals, monasteries and royal palaces [14, 23]. These did not
constitute museums in the modern sense of the term.
The switch to the modern form of public museums happened gradually over a long
period of time. Private collections previously owned by the nobility, the royalty and
the religious institutions of Europe began to be put gradually on display to the public.
Museums became public in the late seventeenth century with the appearance of the
first university museum in Oxford in 1671. The Vatican established several museums
around the 1750s across Europe. The British Museum was founded in 1753 when
the parliament purchased the natural science collection of Sir Hans Sloane and thus
made the collection public. Another example can be given is that of the Palace of the
Louvre designated as the museum of the republic in France in 1793. A big number of
museums across Europe and the Americas started to emerge afterwards (Charleston
Museum - 1773, Smithsonian - 1846, American Museum of natural history - 1870
among many others) [14].
The role of museums is to collect and preserve material of cultural and religious
importance and to present it to the public. The aim is usually educational and
recreational. Museums tell the story of man, that of nature and that of the cultural
identity of a nation. They assist future generations to understand the history and
culture of their forebearers [23].
Many researchers [255, 370] linked the role of museums to that of mass media by
drawing the analogy of them being tools for informing, educating, entertaining and
storytelling visitors thus making what is “unfamiliar and inaccessible” into “familiar
and accessible”. However, museums differ from mass media like newspapers, books,
1.1. OVERVIEW 11
radio and television in the fact that they are bound to physical space whilst still
providing the ability for their visitors to wander and interact with their exhibits.
The behaviour of visitors in museums is also similar to that of consuming mass
media in the sense of the “active dozing” behaviour of cultural heritage artefacts.
Visitors normally spent more time in front of the objects that they have a-priori
knowledge or a-priori interest in and less time on other objects. This leads to a
less valuable experience. There is not much learning in what the visitor already
knows. Visitors experience could be easily enhanced by providing edutainment
approaches. The need for a remunerative, efficient and attractive use of information
and entertainment in museums, leads to the use of Information Technologies as a
way to allow museums to compete with other leisure pursuits and mass media [356].
Storytelling in museums is taking a new dimension catalysed by the need of museums
to make their cultural products more appealing to visitors. Therefore, museums
can act as a “primus inter pares” meaning “first among equals” [308]. This means
that another defining role of museums is to establish a direct, fruitful, even personal
communication channel between, the museum as a communicator and the visitor
as a receiver. These roles can be switched and the visitor can communicate his/her
own experience and personal views with the museum. This becomes prominent with
stories presented inside Virtual Reality, Augmented Reality and Web3D applications
used in situ (i.e. inside the museum) or via the world wide web through the
intermediary of Web-Based Virtual Museums.
The World Wide Web provides great opportunities to present and offer remote access
to objects, collections and their corresponding information adding new enriching
dimensions to traditional museums [212]. The web offers also a tacit advantage
which is providing random access to heritage material at the ease of users. There
is no “sequentiality” in the web the way physical museums often impose on their
visitors through specific paths or exhibits. If a user is interested in a certain type of
art or culture, she can directly access, engage and learn about specific artefacts and
skim or ignore others.
The Web and other Information Technologies, such as serious games, mobile
applications among others provide the new dimension of “Virtuality ” which
supplement the physical nature of museums. The following section is an exposition
of this dimension that took the form of what become known as Virtual Museums.
12 CHAPTER 1. INTRODUCTION
1.1.3 Virtual Museums
There has been for decades much discussion and debate [167] on the definition of
a Virtual Museum (VM). This is due to the fact that the concept has evolved with
the practices and the advancement of Information and Communication Technologies
(ICTs). One of the relatively older definitions is that of Schweibenz, who defined a
Virtual Museum (VM) as:
“A logically related collection of digital objects composed in a variety of
media, and, because of its capacity to provide connectedness and various
points of access, it lends itself to transcending traditional methods of
communicating and interacting with the visitors being flexible toward
their needs and interests; it has no real place or space, its objects and
the related information can be disseminated all over the world.”
Werner Schweibenz [356]
From the above definition, Sylaiou et al. [394] ascertain that a Virtual Museum is
essentially a related collection of digital artefacts of different media, thus it can
take the form of a digital collection that is presented over the Web, a type of Virtual
Museum known as Web-Based Virtual Museum (WBVM).
In a similar vein, a Virtual Museum can take the form of an informational kiosk
(tethered maybe to a Personal Computer), or a Personal Digital Assistant (PDA)
or mobile device system or even in the form of CDROM or other storage media
as an extension of a physical museum. All of these forms can remain completely
“imaginary” or completely “virtual” [394].
More recent works that underscore the process of theorising and defining more
clearly and rigidly virtual museums are those conducted by the V-MusT Network. The
Virtual MUSeum Transnational Network (V-MUST.NET) is a network of excellence
funded by the European Commission under the 7th framework. Its objectives is to
underpin the development of different types of VMs for educational and recreational
purposes across Europe. In addition, it aims to study and define VMs on practical
and theoretical levels [320]. V-MUST aims also to transform the next generation
of VMs into systems that are more communicative, effective, and accessible [319].
V-MusT.net defined a VM in 2011 as:
1.1. OVERVIEW 13
“a new model of communication that aims at creating a personalized,
immersive, interactive way to enhance our understanding of the world
around us ... A VM is a "short-cut" commonly used to identify different
digital creations (i.e. VR applications, CG animations, multimedia, web-
based presentations, etc.) ... VMs are built as aggregations of content
(digital libraries of 3D models, texts, images, geospatial data, audio,
videos, etc.) and they are based on the use of ICT solutions for their
development and deployment. ”
V-MUST Network [320, pp. 47–48]
Hazan and Hermon [187] proposed an updated working definition of the term Virtual
Museum (VM) out of series of workshops, public debates and online discussions:
“A virtual museum is a digital entity that draws on the characteristics of
a museum, in order to complement, enhance, or augment the museum
experience through personalization, interactivity, and richness of content.
Virtual museums can perform as the digital footprint of a physical
museum, or can act independently, while maintaining the authoritative
status as bestowed by ICOM in its definition of a museum. In tandem
with the ICOM mission of a physical museum, the virtual museum is also
committed to public access; to both the knowledge systems imbedded
in the collections and the systematic, and coherent organization of their
display, as well as to their long-term preservation.”
Hazan and Hermon [187, p. 6]
Hazan and Hermon [187] drew their definition on the characteristics of the physical
museums. The VM is a location of rich content orchestrated to the display of
collections prioritized to the needs and experiences of the visitors across a myriad
of technologies and devices. A VM can either act a digital footprint representing
an actual museum or can be a digital entity that do not represent anything in the
physical world.
According to Hazan and Hermon, the VM opens up novel possibilities to harness user-
driven approaches as well as innovative ways to interact with the physical and the
non-physical. These users have different kinds of expectations and different modes
of engagement when it comes to VMs. For example, the expectation from interacting
14 CHAPTER 1. INTRODUCTION
with an art virtual museum is different from interacting with a science virtual
museum. Virtual museums are committed to promoting intellectual accessibility of
culture. The VM replicates and reformulates the intellectual scholarly interpretations
of artefacts and narratives.
Virtual Museums rely on presenting to their visitors, multimedia-based virtual
exhibitions that might mirror actual temporary or permanent exhibitions thereto
allowing easy access to objects that might not be available in the physical museums
or might be too sensitive and fragile to display. Virtual Exhibitions can be “a draw”
for all visitors who are local to the vicinity of the museum and can be beneficial in
providing remote access for international visitors [58].
Traditionally, digital virtual museums presented cultural heritage artefacts on the
web in multimedia forms such as audio commentaries, educational videos and images.
In comparison to traditional media, 3D models and environments provide a more
interactive and richer user experience.
Digital virtual museums mitigate many of the resources and space constraints found
in traditional physical museums. In such museums, physical artefacts may be too
large, harmful, fragile or incomplete to be presented to the public [404].
Virtual Museums on the World Wide Web, connect visitors from all around the
globe giving them valuable information on objects and collections [270, 356]. In
contrast with traditional physical museums, which have limited opening hours,
limited physical space and incur a cost of travel; Web-Based Virtual Museums
transcend all spatio-temporal limitations [58].
The web is the most democratic and accessible medium among all the Information
and Communication Technologies (ICTs) that are purposed for digital heritage media
dissemination. This provided the impetus to shift the role of the museum from being
a passive repository to a more active and engaging one [356].
It should noted that what is meant by the web as being democratic is not in the
sense of being available to all countries or to all classes of society or being available
in all contexts or situations. To illustrate this, the percentage of Internet usage in
general and web usage in particular although on the rise globally, it is still lacking
in many rural and impoverished areas especially in third world countries. Internet
usage in many Sub-Saharan countries especially countries such as Tanzania is as low
as 25%. The Internet Penetration in Africa in general as of March 2019 according

1.1. OVERVIEW 15
to Internet World Stats [391] is only 35.9%. This means over 60% of the continent
remains without access to the Internet.
It is pertinent to situate the work in this thesis in its right context to avoid
ambiguity since the term Virtual Museum (VM) used in some contexts by museology
scholars [393] covers also the in situ Augmented Reality and Virtual Reality
exhibitions.
This thesis focuses solely on the usage of the 3D Web for Virtual Museums
and for Digital Heritage. VMs on the web are also called Web-Based
Virtual Museums and will be referred throughout the thesis as such.
Please refer to Section 2.3 for an exposition on Web-Based Virtual Museums. On the
one hand, Virtual Museums can be visited on-line through access over the Internet
or over an Intranet by either: (1) web browsers (such museums are referred to as
WBVMs as mentioned previously) (2) another mode of access is via native mobile
applications such as Android or iOS applications (such museum applications are
referred to as Mobile-Based Virtual Museums (MBVMs)), examples: Rubino et al.
[345] and Madsen and Madsen [257]. On the other hand, Virtual Museums could be
completely in-situ, meaning bound to physical locations inside physical museums,
normally in kiosks. Examples of an in-situ setup are shown in the studies [8, 263,
340].
Figure 1.2 shows the three categories of Virtual Museums based on their location
and mode of access. The work in this thesis is in the domain of Web-Based Virtual
Museums (WBVMs) denoted in blue and underlined. It is possible to have a Digital
Heritage (DH) system that involves both an on-line access and in-situ access in the
same time. As an example, the system may present an on-line web-based virtual tour
and a mobile-based virtual tour working in tandem using a location-aware navigation
of the actual physical museum [153, 236, 288, 428].
Representative sample works in the category of WBVMs are that of the ARCO project
(Augmented Representation of Cultural Objects) [427], Patias et al. [311], Goodall
et al. [169] and Liarokapis et al. [247]. In Chapter 2, we survey and classify many
WBVMs.
16 CHAPTER 1. INTRODUCTION
In-situ Virtual Museums Web-Based Virtual Museums
Virtual Museums
Mobile-Based Virtual Museums
Figure 1.2: Virtual Museums based on location and mode of access
1.1.4 Web-Based Virtual Museums (WBVMs)
The advantage of using the web for CH dissemination was mentioned in the previous
section. It boils down to being globally accessible especially compared to other ICTs
purposed for the dissemination of heritage media. 3D Web technologies especially
the ones that are plugin-free meaning they do not require the installation of a plug-in
inside the web browser, such as WebGL, provide another advantage of using these
technologies in WBVMs: which is the fact that they benefit a big part of museum
visitors who are “au courant” and have the necessary digital literacies concerning
using a web browser for banking, social media and purchases but do not have the
“savoir-faire” in what concerns installing complicated software or plug-ins inside
their web browsers to consume 3D cultural material.
It is now possible to host 3D heritage artefacts and disseminate them more easily
on the web than it was possible in the past. 3D on-line social repositories such as
Sketchfab [374] contribute to the democratisation of 3D material for any web usage
or audience and more specifically in the context of cultural heritage and Web-Based
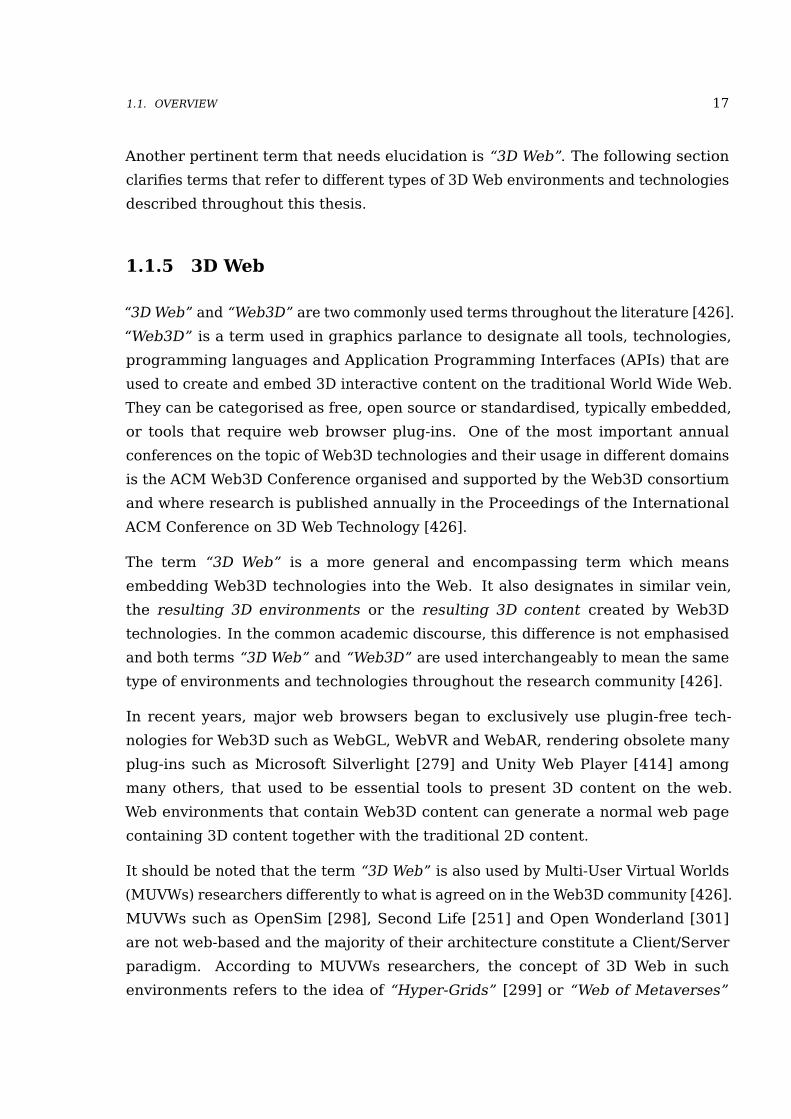
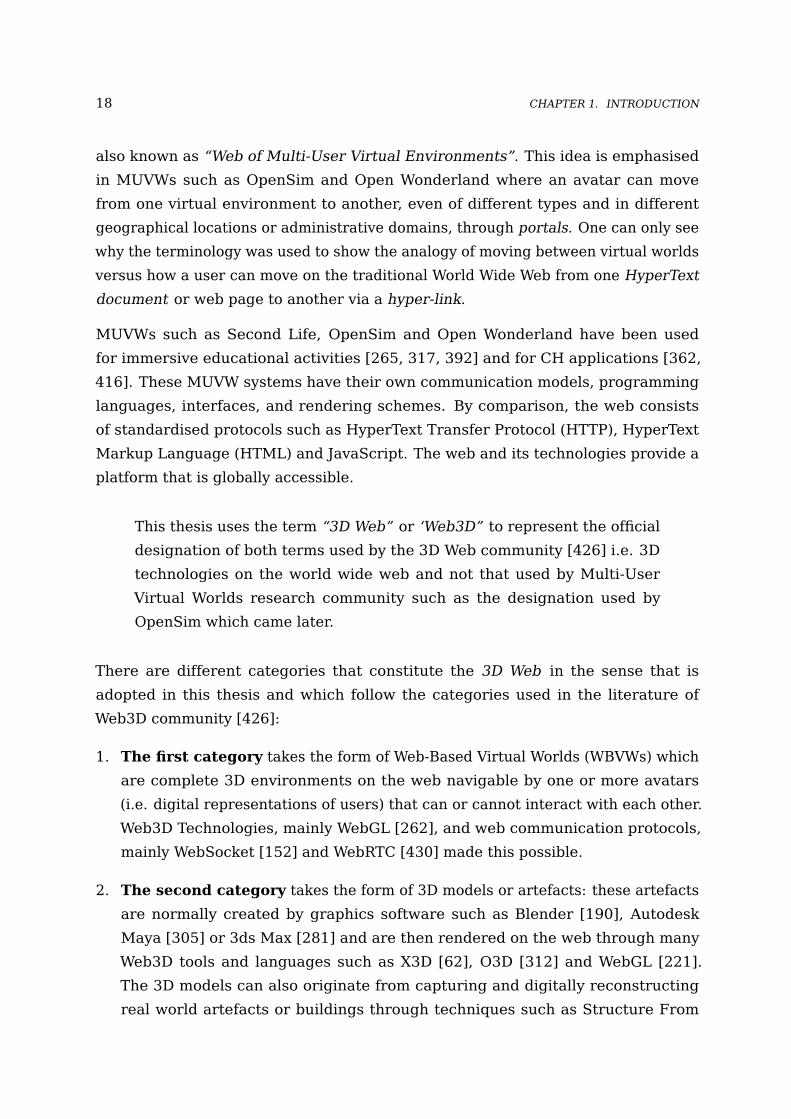
Virtual Museums. Figures 1.3 and 1.4 show snapshots from the Smithsonian Museum
X 3D WBVM [381] in web browsers on a desktop PC and a mobile device.
Figure 1.3: Smithsonian Museum X 3DWBVM on Desktop Screen - Mozilla Fire-fox
Figure 1.4: Smithsonian Museum X 3DWBVM on iPhone 7 Plus - Apple Safari
1.1. OVERVIEW 17
Another pertinent term that needs elucidation is “3D Web”. The following section
clarifies terms that refer to different types of 3D Web environments and technologies
described throughout this thesis.
1.1.5 3D Web
“3D Web” and “Web3D” are two commonly used terms throughout the literature [426].
“Web3D” is a term used in graphics parlance to designate all tools, technologies,
programming languages and Application Programming Interfaces (APIs) that are
used to create and embed 3D interactive content on the traditional World Wide Web.
They can be categorised as free, open source or standardised, typically embedded,
or tools that require web browser plug-ins. One of the most important annual
conferences on the topic of Web3D technologies and their usage in different domains
is the ACM Web3D Conference organised and supported by the Web3D consortium
and where research is published annually in the Proceedings of the International
ACM Conference on 3D Web Technology [426].
The term “3D Web” is a more general and encompassing term which means
embedding Web3D technologies into the Web. It also designates in similar vein,
the resulting 3D environments or the resulting 3D content created by Web3D
technologies. In the common academic discourse, this difference is not emphasised
and both terms “3D Web” and “Web3D” are used interchangeably to mean the same
type of environments and technologies throughout the research community [426].
In recent years, major web browsers began to exclusively use plugin-free tech-
nologies for Web3D such as WebGL, WebVR and WebAR, rendering obsolete many
plug-ins such as Microsoft Silverlight [279] and Unity Web Player [414] among
many others, that used to be essential tools to present 3D content on the web.
Web environments that contain Web3D content can generate a normal web page
containing 3D content together with the traditional 2D content.
It should be noted that the term “3D Web” is also used by Multi-User Virtual Worlds
(MUVWs) researchers differently to what is agreed on in the Web3D community [426].
MUVWs such as OpenSim [298], Second Life [251] and Open Wonderland [301]
are not web-based and the majority of their architecture constitute a Client/Server
paradigm. According to MUVWs researchers, the concept of 3D Web in such
environments refers to the idea of “Hyper-Grids” [299] or “Web of Metaverses”
18 CHAPTER 1. INTRODUCTION
also known as “Web of Multi-User Virtual Environments”. This idea is emphasised
in MUVWs such as OpenSim and Open Wonderland where an avatar can move
from one virtual environment to another, even of different types and in different
geographical locations or administrative domains, through portals. One can only see
why the terminology was used to show the analogy of moving between virtual worlds
versus how a user can move on the traditional World Wide Web from one HyperText
document or web page to another via a hyper-link.
MUVWs such as Second Life, OpenSim and Open Wonderland have been used
for immersive educational activities [265, 317, 392] and for CH applications [362,
416]. These MUVW systems have their own communication models, programming
languages, interfaces, and rendering schemes. By comparison, the web consists
of standardised protocols such as HyperText Transfer Protocol (HTTP), HyperText
Markup Language (HTML) and JavaScript. The web and its technologies provide a
platform that is globally accessible.
This thesis uses the term “3D Web” or ‘Web3D” to represent the official
designation of both terms used by the 3D Web community [426] i.e. 3D
technologies on the world wide web and not that used by Multi-User
Virtual Worlds research community such as the designation used by
OpenSim which came later.
There are different categories that constitute the 3D Web in the sense that is
adopted in this thesis and which follow the categories used in the literature of
Web3D community [426]:
1. The first category takes the form of Web-Based Virtual Worlds (WBVWs) which
are complete 3D environments on the web navigable by one or more avatars
(i.e. digital representations of users) that can or cannot interact with each other.
Web3D Technologies, mainly WebGL [262], and web communication protocols,
mainly WebSocket [152] and WebRTC [430] made this possible.
2. The second category takes the form of 3D models or artefacts: these artefacts
are normally created by graphics software such as Blender [190], Autodesk
Maya [305] or 3ds Max [281] and are then rendered on the web through many
Web3D tools and languages such as X3D [62], O3D [312] and WebGL [221].
The 3D models can also originate from capturing and digitally reconstructing
real world artefacts or buildings through techniques such as Structure From
1.2. MOTIVATION 19
Motion, also known as Photogrammetry [338], 3D Scanning [55], often called
laser scanning, and topographical techniques [314].
In this category, navigation through avatars is completely absent as the aim is to
provide the ability to interact with the 3D models from different vantage points
(i.e. zooming in and out, panning and rotating).
Well-known social web repositories such as Sketchfab [374], Microsoft
remix3d [102] and Google Poly [170] can host myriad types of 3D models
on the web.
3. The third category takes the form of spherical/stereoscopic media, which can
constitute spherical image scenery such as Panoramas or Photospheres [18] (also
known as 360◦ images). Spherical media can also consist of 360◦ videos [323]
(also known as Videospheres). Famous social web repositories for 3D image
scenery such as Roundme [343] and Google Poly [170] allow users to upload and
share Photospheres and tours of Photospheres. Social Video repositories, such
as YouTube [172], allow users to upload, playback and stream 360◦ videos.
1.2 Motivation
3D Web content is becoming an integral part of any Web-Based Virtual Museum
(WBVM) [271]. Furthermore, mobile devices are being used more and more in the
domain of virtual museums and cultural heritage [177, 344]. Choreographing and
presenting 3D Web components across multiple platforms (mobile devices, tablets
and personal computers) and network regimes (WiFi, Ethernet, 4G, 3G and 2G)
present a significant challenge yet to overcome.
The challenge is to achieve a good user Quality of Experience (QoE) across all these
platforms which have different characteristics and capabilities. This means that
different levels of fidelity and complexity of media may be appropriate. Therefore
servers hosting those media types need to adapt to the capabilities of a wide range
of networks and devices.
To achieve this, there is a need to design and develop an adaptive QoS and QoE
aware engine that allows Web-Based Virtual Museums to deliver the best user
experience across those platforms.
20 CHAPTER 1. INTRODUCTION
In order to ensure effective adaptivity, we need to know what matters to the user in
terms of fidelity and in terms of QoS such as responsiveness of the 3D Web categories
used in Web-Based Virtual Museums (WBVMs). We need to know that, for different
media types, there are perceptible and particular qualities in terms of service and in
terms of user experience.
The way in which this thesis proposes to approach achieving adaptivity in
Web-Based Virtual Museums is by supplementing existing semantic 3D
Web metadata vocabularies with QoS-related metadata. This metadata
will make available the characteristics of the media to applications which
will enable them to make decisions about what is the right resolution to
fetch to client devices.
An “intermediate” approach as described in [175] was used to keep the descriptions
of 3D Web artefacts separate from them. This allows us to have complementary
information about digital artefacts that helps us in improving the Quality of Service
delivered and allows us easily to use management tools to search and locate 3D
media information.
It would be useful for WBVMs to represent 3D scenes and artefacts across multiple
platforms and network regimes at the best possible user experience.
An important characteristic of virtual museums is the ability to document and
supplement additional information to digital artefacts. This is done by enriching
digital artefacts semantically with what is called “Metadata” . Metadata is data about
data or data that comes alongside with other data.
Meta a prefix coming from Greek origins means alongside or with. This prefix was
also used in some contexts to mean “transcendental” or “beyond a certain realm”.
Metadata normally are presented in the form of attributes or characteristics of
artefacts. Such metadata are machine-readable (i.e. can be read and processed by
applications) and are human-readable.
Metadata play important roles in the context of virtual museums:
1. They facilitate the task of searching and retrieving digital artefacts from
repositories thus making the process more intelligent and efficient.
2. They add semantics to those artefacts, thus insuring more complex relationships
1.2. MOTIVATION 21
between them.
3. They document important information pertaining to their provenance, authorship,
contributorship, creation and issuance dates, accrual method and periodicity,
access rights, heritage significance, copyright licences among many other
important characteristics.
“Paradata” can also be supplemented to digital heritage artefacts. “Paradata” are
all the processes or methodologies of how particular data came to be. Paradata for
instance, in the context of 3D Digital Heritage artefacts, detail all methodological
and processual information that underpins the 3D digitisation and visualisation.
They can include the people involved, the duration of the process, the time of the
day of when the process is conducted in the case of digitisation and the equipment
and software used [76]. In addition, they document also any intellectual research
capital [35, 110, 111].
QoS metadata of 3D Web components could be derived from 3D Web data charac-
teristics and may constitute information about 3D Web components such as size,
fidelity (i.e. resolution), Average Frame Rate, and compression types among other
data that would characterise a specific 3D Web component in question.
A Web-Based Virtual Museum for instance, would have different instantiations (i.e.
resolutions) of particular 3D Web components and would choose the “best possible
instantiation” with the “best possible resolution” to fetch depending on the graphical
capabilities of the client devices, depending on the network regimes and depend on
QoE considerations. More importantly, the decisions are made based on the results
that were gathered from the Quality of Service and Quality of Experience studies
conducted in this research corpus, emphasising the pertinence of the subjective
perception of fidelity of DH 3D Web content from users’ perspective.
Can casual WBVMs users notice the difference in perception of resolution between
a 3D model that has a fidelity of 5 million faces and another same exact replica
which has a fidelity of 450 thousand faces or even less on a 5 inch screen mobile
device? If not why send the 3D model with the 5 million faces? That would mean
overcommitting unnecessary hardware resources that do not add much to the user
experience, in addition to resulting in lower performance and higher download and
processing time. The subjective perception of fidelity is examined in Chapter 5 and
the results were published in [28].
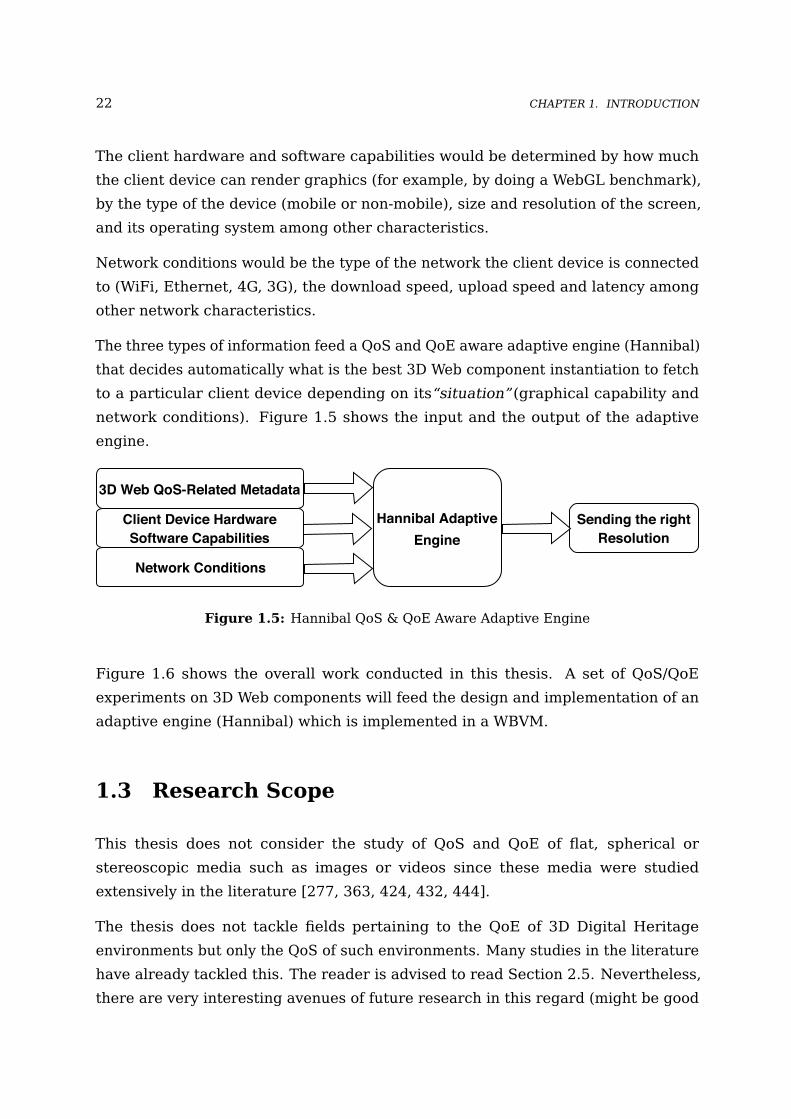
22 CHAPTER 1. INTRODUCTION
The client hardware and software capabilities would be determined by how much
the client device can render graphics (for example, by doing a WebGL benchmark),
by the type of the device (mobile or non-mobile), size and resolution of the screen,
and its operating system among other characteristics.
Network conditions would be the type of the network the client device is connected
to (WiFi, Ethernet, 4G, 3G), the download speed, upload speed and latency among
other network characteristics.
The three types of information feed a QoS and QoE aware adaptive engine (Hannibal)
that decides automatically what is the best 3D Web component instantiation to fetch
to a particular client device depending on its“situation” (graphical capability and
network conditions). Figure 1.5 shows the input and the output of the adaptive
engine.
Hannibal AdaptiveEngine
3D Web QoS-Related Metadata
Client Device HardwareSoftware Capabilities
Network Conditions
Sending the rightResolution
Figure 1.5: Hannibal QoS & QoE Aware Adaptive Engine
Figure 1.6 shows the overall work conducted in this thesis. A set of QoS/QoE
experiments on 3D Web components will feed the design and implementation of an
adaptive engine (Hannibal) which is implemented in a WBVM.
1.3 Research Scope
This thesis does not consider the study of QoS and QoE of flat, spherical or
stereoscopic media such as images or videos since these media were studied
extensively in the literature [277, 363, 424, 432, 444].
The thesis does not tackle fields pertaining to the QoE of 3D Digital Heritage
environments but only the QoS of such environments. Many studies in the literature
have already tackled this. The reader is advised to read Section 2.5. Nevertheless,
there are very interesting avenues of future research in this regard (might be good

1.4. THESIS STATEMENT 23
QoS/QoE Studies of DigitalHeritage 3D Models
Hannibal QoS-awareAdaptive Engine
Web-Based Virtual Museum
Implemented
Feed
Figure 1.6: Research Overview
Ph.D topics), particularly the perception of fidelity of different Levels of Detail (LODs)
of DH WBVWs which could feed an adaptation engine such as Hannibal (Chapter 7)
that would decimate into lower resolutions an environment.
This thesis opens a new field: perception of fidelity of digital heritage 3D Web
content across devices of different screen sizes, across 3D Assets file types among
many other angles mentioned throughout the thesis.
Please refer to the conclusion Chapter 8 for many ideas worthy of research that
spawn from the investigations conducted throughout this thesis. It is believed that
the normal readers of a PhD thesis, other than the examiners, are after all future
Masters, PhD candidates and the public.
1.4 Thesis Statement
The thesis statement of this research is that: “through supplementing
digital heritage semantic web vocabularies to include Quality of Service
related metadata, we can achieve adaptivity of 3D Web content in Web-
Based Virtual Museums and this leads to improved Quality of Experience
across the range of network regimes and client devices.”

24 CHAPTER 1. INTRODUCTION
1.5 Research Questions
Given the antecedent statement, the main research questions that shaped this
research are stated as follows:
• RQ1: What are the main digital heritage 3D Web technologies used throughout
the literature and what taxonomies can the 3D Web be classified upon?
• RQ2: How do digital heritage Web-Based Virtual Worlds (WBVWs) perform and
what are their bottlenecks and limitations?
• RQ3: How does the QoS relate to the QoE for 3D Web components used in Digital
Heritage across the range of QoS regimes?
• RQ4: How can semantic web digital heritage vocabularies be extended to provide
the sort of information required for adaptive 3D Web content?
• RQ5: How to utilise cross-aware 3D Web adaptive engines in Web-Based Virtual
Museums that achieves the best possible user experience?
These questions are addressed in the thesis as follows:
RQ1: is addressed in [Chapter 2] which defines and clarifies the 3D Web. Appendix C
classifies technologies of 3D Web into different taxonomies.
RQ2 & RQ3: is investigated through a set of empirical studies investigating the
QoS of Digital Heritage Web-Based Virtual Worlds [Chapter 4] and QoS and
QoE of 3D Digital Heritage Models on the web [Chapter 5].
RQ4: is addressed in [Chapter 6] on two levels. The first level is a theoretical one,
involving the proposal of Virtual Museum Quality of Service Ontology (ViMQO),
a QoS-related metadata ontology that encompasses the Europeana Data Model
(EDM) [141, 144], a digital heritage semantic vocabulary which itself is built on
the Dublin Core Schema (DCS) [126]. The second level is a practical one which
involves providing custom QoS metadata in Omeka Digital Asset Management
System [87]. Omeka is used extensively for managing and storing web-based
digital media and documents by museums, libraries, archives, and scholarly
collections and exhibitions.
1.6. CONTRIBUTIONS OF THIS RESEARCH 25
RQ5: is addressed with the design and implementation of Hannibal [Chapter 7]
which showcases and gives a proof of concept of a cross-platforms adaptive
engine for the 3D Web implemented in a subset of an actual WBVM which was
created by the Open Virtual World Group of the University of St Andrews as
part of the EULAC Web-Based Virtual Museum initiative [138].
1.6 Contributions of this research
The following major contributions of the thesis can be summarised as follows:
C1: Surveying 3D Web technologies, the types of environments they constitute, and
their benefits. This contributed to the literature in this regard [Chapter 2]. The
work was published in [32].
C2: Developing our understanding through measurement studies of the perfor-
mance, limitations and bottlenecks of digital heritage WBVWs [Chapter Chap-
ter 4]. The work in Chapter 4 was published in [30].
C3: Developing our understanding through measurement studies of the perfor-
mance, limitations and bottlenecks of digital heritage 3D models [Chapter 5].
The subjective perception of fidelity work in Chapter 5 was published in [28].
C4: Developing the relation between fidelity, Quality of Service (QoS) and Quality of
Experience (QoE) for each media that forms up the 3D Web [Chapters 4 and 5].
C5: Developing Hannibal, an adaptive engine that optimises the QoE for a particular
QoS of 3D digital heritage models [Chapter 7].
C6: Proposing a new ontology dubbed Virtual Museum Quality of Service Ontology
(ViMQO) that supplements semantic web vocabularies such as Dublin Core
(DC) and EDM to include QoS-related metadata in the context of Web-Based
Virtual Museums [Chapter 6].
C7: Creating and discussing a set of best practice recommendations to guide
WBVMs stakeholders concerning DH artefacts and environments, mainly in the
context of web dissemination [Chapters 4, 5, and 7].
There are also secondary contributions that resulted from conducting the work in
this thesis:
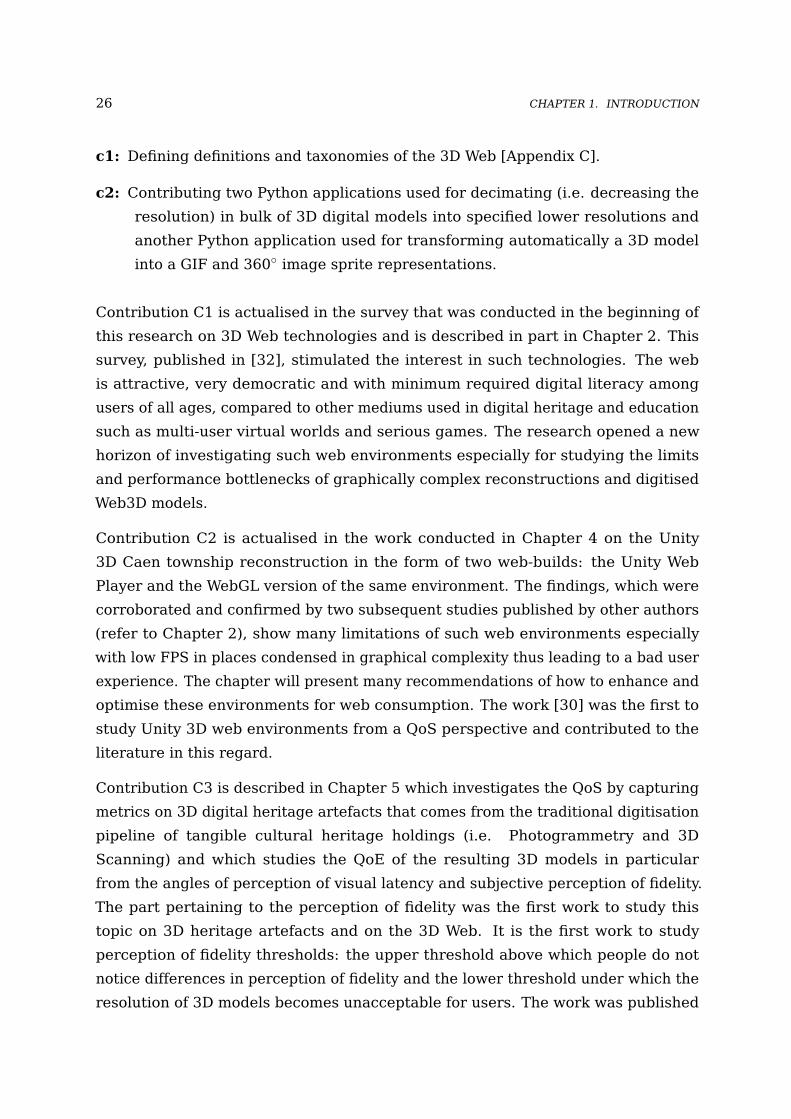
26 CHAPTER 1. INTRODUCTION
c1: Defining definitions and taxonomies of the 3D Web [Appendix C].
c2: Contributing two Python applications used for decimating (i.e. decreasing the
resolution) in bulk of 3D digital models into specified lower resolutions and
another Python application used for transforming automatically a 3D model
into a GIF and 360◦ image sprite representations.
Contribution C1 is actualised in the survey that was conducted in the beginning of
this research on 3D Web technologies and is described in part in Chapter 2. This
survey, published in [32], stimulated the interest in such technologies. The web
is attractive, very democratic and with minimum required digital literacy among
users of all ages, compared to other mediums used in digital heritage and education
such as multi-user virtual worlds and serious games. The research opened a new
horizon of investigating such web environments especially for studying the limits
and performance bottlenecks of graphically complex reconstructions and digitised
Web3D models.
Contribution C2 is actualised in the work conducted in Chapter 4 on the Unity
3D Caen township reconstruction in the form of two web-builds: the Unity Web
Player and the WebGL version of the same environment. The findings, which were
corroborated and confirmed by two subsequent studies published by other authors
(refer to Chapter 2), show many limitations of such web environments especially
with low FPS in places condensed in graphical complexity thus leading to a bad user
experience. The chapter will present many recommendations of how to enhance and
optimise these environments for web consumption. The work [30] was the first to
study Unity 3D web environments from a QoS perspective and contributed to the
literature in this regard.
Contribution C3 is described in Chapter 5 which investigates the QoS by capturing
metrics on 3D digital heritage artefacts that comes from the traditional digitisation
pipeline of tangible cultural heritage holdings (i.e. Photogrammetry and 3D
Scanning) and which studies the QoE of the resulting 3D models in particular
from the angles of perception of visual latency and subjective perception of fidelity.
The part pertaining to the perception of fidelity was the first work to study this
topic on 3D heritage artefacts and on the 3D Web. It is the first work to study
perception of fidelity thresholds: the upper threshold above which people do not
notice differences in perception of fidelity and the lower threshold under which the
resolution of 3D models becomes unacceptable for users. The work was published

1.6. CONTRIBUTIONS OF THIS RESEARCH 27
in [28]. We suggest this work opens the door to a completely new field for digital
heritage and for 3D Web quality studies.
Contribution C4 is described in both empirical chapters 4 and 5 by studying
the relationship that is sometimes tacit between fidelity (i.e resolution of the
3D model/environment) and performance and QoS. There is a trade-off between
performance and fidelity. High fidelity of 3D content leads to bad performance and
by consequence bad user experience, while low fidelity content although benefits
directly performance and download time, is intolerable by users and leads to a bad
user experience. This thesis is concerned with the study of this trade-off. With that
in mind, the matter is a bit complicated: where is this middle sweet spot region
across different devices and network regimes? The work in this thesis tackles that
and opens the door for further work to be done in this regard.
Figure 1.7 is a diagram that presents the trade-off between QoS (Download time,
Processing time, Performance etc.) and fidelity of 3D Web content and shows the
sweet region of fidelities or resolutions that achieve the best possible trade-off. This
region is different across a wide spectrum of client devices and network conditions.
Good QoS
Low Quality3D Content
Sweet SpotBest Fidelity vs QoS
Changes depending onDevice & Network
Conditions
Bad QoS
High Quality3D Content
Figure 1.7: Tradeoff between Fidelity and QoS
Contribution C5 is actualised in the work reported in Chapter 7. Hannibal, the
first adaptive engine for 3D Web that is actually QoS and QoE-aware. The work in
Hannibal constitutes a major contribution to the literature in the field of adaptivity
of 3D Web in digital heritage and non digital heritage contexts.
Contribution C6 is actualised in the work reported in Chapter 6. A new ontology
called Virtual Museum Quality of Service Ontology (ViMQO) that encompasses the
QoS related metadata on 3D heritage models needed for adaptivity and other system
level purposes. The ontology is Resource Description Framework (RDF) compliant

28 CHAPTER 1. INTRODUCTION
and is expendable to other media and environments pertaining to WBVMs. To
the best of my knowledge this is the first ontology that takes the QoS aspect into
consideration and in the same time is contextualised for web-based virtual museums.
Contribution C7 is actualised in the suggestion of recommendations and best
practices when it comes to disseminating environments and 3D models on the
web. It aims to guide cultural heritage stakeholders and computer scientists on the
best fidelity knowing the performance and download times.
1.7 Thesis Structure
A short description of each chapter in this thesis is given below.
Chapter 1 - Introduction gives the motivation, overview and scope of this work.
It presents the thesis statement and then expounds its salient components.
The chapter delineates also the research questions and discusses where they
were addressed in the thesis. Furthermore, the contributions of the current
research are stated.
Chapter 2 - Literature Review begins by surveying 3D Web technologies used
in digital heritage including Web-Based Virtual Worlds. Then the chapter
proceeds with surveying Web-Based Virtual Museums and discussing their
importance for disseminating to a larger audience cultural heritage substance.
Then the chapter details previous work on the 3D Web in terms of Quality of
Service and Quality of Experience. Afterwards, previous attempts to achieve
adaptivity of 3D Web content in the literature are exposed, comparing and
contrasting the pros and cons of the myriad methods used. Finally, a cursory
discussion is presented of the most important semantic digital heritage and 3D
modelling vocabularies that are germane to the work reported in this thesis.
Chapter 3 - Methodology The first part of this chapter details the overall research
methodology used throughout the thesis. It restates the research questions and
provides the rationale behind the research methods employed in this work. The
second part is an overarching exposition of all the experimental procedures
used for the QoS experiments of DH WBVWs and for the QoS/QoE experiments
of 3D Digital Heritage artefacts.
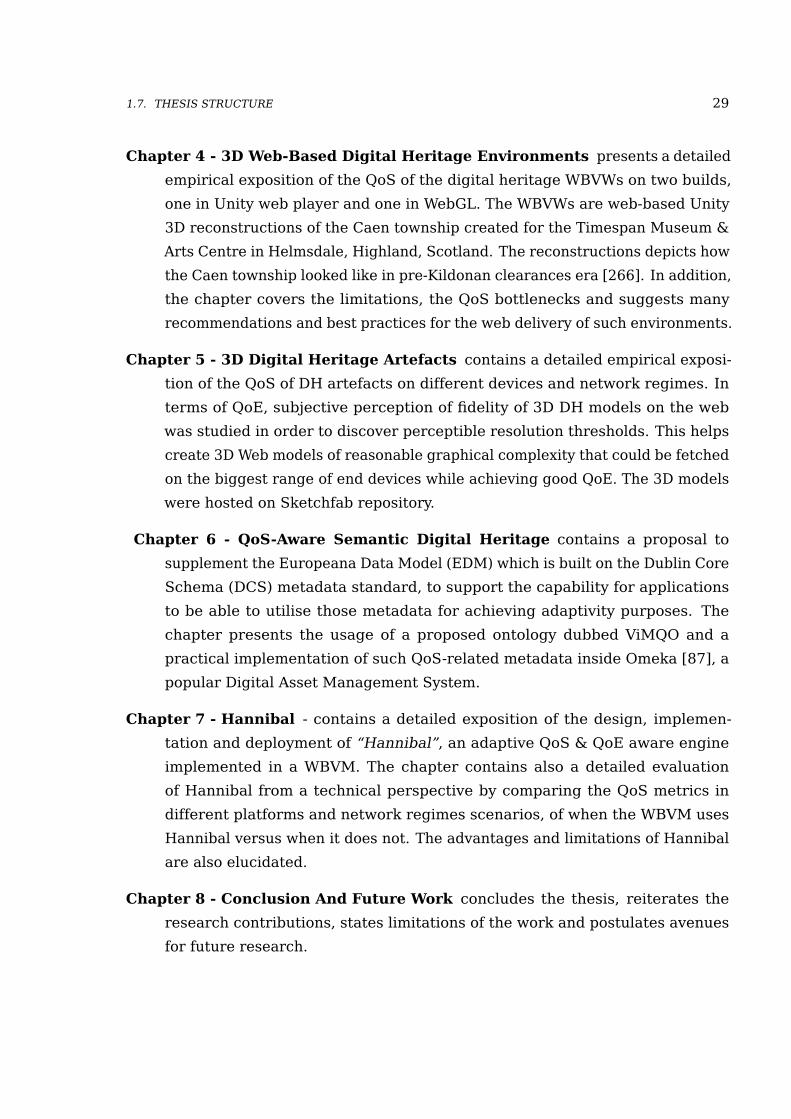
1.7. THESIS STRUCTURE 29
Chapter 4 - 3D Web-Based Digital Heritage Environments presents a detailed
empirical exposition of the QoS of the digital heritage WBVWs on two builds,
one in Unity web player and one in WebGL. The WBVWs are web-based Unity
3D reconstructions of the Caen township created for the Timespan Museum &
Arts Centre in Helmsdale, Highland, Scotland. The reconstructions depicts how
the Caen township looked like in pre-Kildonan clearances era [266]. In addition,
the chapter covers the limitations, the QoS bottlenecks and suggests many
recommendations and best practices for the web delivery of such environments.
Chapter 5 - 3D Digital Heritage Artefacts contains a detailed empirical exposi-
tion of the QoS of DH artefacts on different devices and network regimes. In
terms of QoE, subjective perception of fidelity of 3D DH models on the web
was studied in order to discover perceptible resolution thresholds. This helps
create 3D Web models of reasonable graphical complexity that could be fetched
on the biggest range of end devices while achieving good QoE. The 3D models
were hosted on Sketchfab repository.
Chapter 6 - QoS-Aware Semantic Digital Heritage contains a proposal to
supplement the Europeana Data Model (EDM) which is built on the Dublin Core
Schema (DCS) metadata standard, to support the capability for applications
to be able to utilise those metadata for achieving adaptivity purposes. The
chapter presents the usage of a proposed ontology dubbed ViMQO and a
practical implementation of such QoS-related metadata inside Omeka [87], a
popular Digital Asset Management System.
Chapter 7 - Hannibal - contains a detailed exposition of the design, implemen-
tation and deployment of “Hannibal”, an adaptive QoS & QoE aware engine
implemented in a WBVM. The chapter contains also a detailed evaluation
of Hannibal from a technical perspective by comparing the QoS metrics in
different platforms and network regimes scenarios, of when the WBVM uses
Hannibal versus when it does not. The advantages and limitations of Hannibal
are also elucidated.
Chapter 8 - Conclusion And Future Work concludes the thesis, reiterates the
research contributions, states limitations of the work and postulates avenues
for future research.

30 CHAPTER 1. INTRODUCTION
1.8 How to read this thesis
This thesis aims to further the understanding of many types of readers belonging
to diverse stakeholder communities with different foci of this research. Figure 1.8
shows a block diagram of three different reading paths. It is strongly advisable to
read all the chapters in order to get the best out of this thesis but one can choose a
certain path for an abridging effect according to the reader’s specific interests as
shown in Figure 1.8. Readers interested in the investigation of QoS and QoE of the
3D Web would be advised to follow Path A with emphasis on empirical chapters 4
and 5. Readers who are just interested in adaptivity approaches of 3D Web in the
literature and the adaptivity approach provided in this corpus of work are advised to
follow path B with an emphasis on Chapter 2 (Section 2.6), Chapter 6 (Section 6.7)
and more importantly on Hannibal, the adaptive engine (Chapter 7). Museum
stakeholders who are interested in metadata that document artefacts, and who want
to get a quick overview of the most important recommendations and conclusions
especially when it comes to the quality of delivery of heritage 3D content on the
web, can appreciate following Path C.

1.8. HOW TO READ THIS THESIS 31
Chapter 3Methodology
3.2 Research Methodology3.3 Investigation QoS of
DH WBVWs3.4 Investigation QoS/QoE
of DH 3D artefacts
Chapter 1Introduction
Chapter 4 - DHWBVWs
Chapter 5 - DHArtefacts Chapter 7 - Hannibal
Conclusion
Chapter 2 LiteratureReview
2.4 QoS of the 3D Web 2.5 QoE of the 3D web
QoS
/QoE
Em
piric
al C
hapt
ers
Chapter 2 LiteratureReview
2.6 Adaptivity of the 3D Web
Chapter 6 - QoSaware semantic DH
6.7 Omeka DAMS & QoSMetadata
Chapter 2 LiteratureReview
2.2 DH & 3D Web Technologies 2.3 Web-Based Virtual Museums
2.7 DH Semantic Ontologies
Chapter 3Methodology
3.2 Research Methodology
Chapter 4 - DHWBVWs
4.3 Discussion 4.4 Limitations
Chapter 5 - 3D DHArtefacts
5.2.2 Summary &Recommendations 5.3.3 Conclusions
Chapter 6 - QoS-aware semantic DH
Chapter 3Methodology
3.2 Research Methodology
Figure 1.8: Overall thesis block diagram - Path A for readers interested in QoS and QoE,Path B for readers interested in adaptivity approaches of 3D Web, and Path C for readersinterested in metadata and recommendations.


Part II
Background & Methodology
33


2Chapter Two
Literature Review
X3D and WebGL are two standards for the 3D Web which have allowed
more access to low level graphics hardware thus making Virtual Museums
(VMs), games and 3D modelling on the web, a tangible reality. Adaptive
content delivery of web-based 3D material remains an important challenge
especially in the context of virtual museums. Many attempts in the literature
have approached this challenge from different perspectives, leading to many
solutions such as remote rendering, mesh compression and decompression
methods, progressive multi resolution meshes, progressive transmission
and streaming approaches. Unfortunately, all of these solutions solved
some aspects of the challenge but left others unsolved. This chapter
starts by shedding light on the state of the art technologies of the 3D Web
without which webizing the dissemination of 3D heritage artefacts would
be impossible. Then, the chapter proceeds to review web-based virtual
museums and their importance for disseminating, to a larger audience,
cultural heritage substance. This chapter also presents studies undertaken
on the QoS and QoE of the 3D Web situating the current work in this thesis
in these two under-researched fields which constitute empirical quantitative
metrics and user-based research. Different adaptivity techniques achieved
on the 3D Web are also presented, contrasting and comparing them in
terms of merits and flaws, in order to contextualise the proposed technique
adopted in this work and to show its benefits. Finally, an overview of the
most important 3D models and virtual museum ontologies relevant to the
work in this thesis is presented.
35
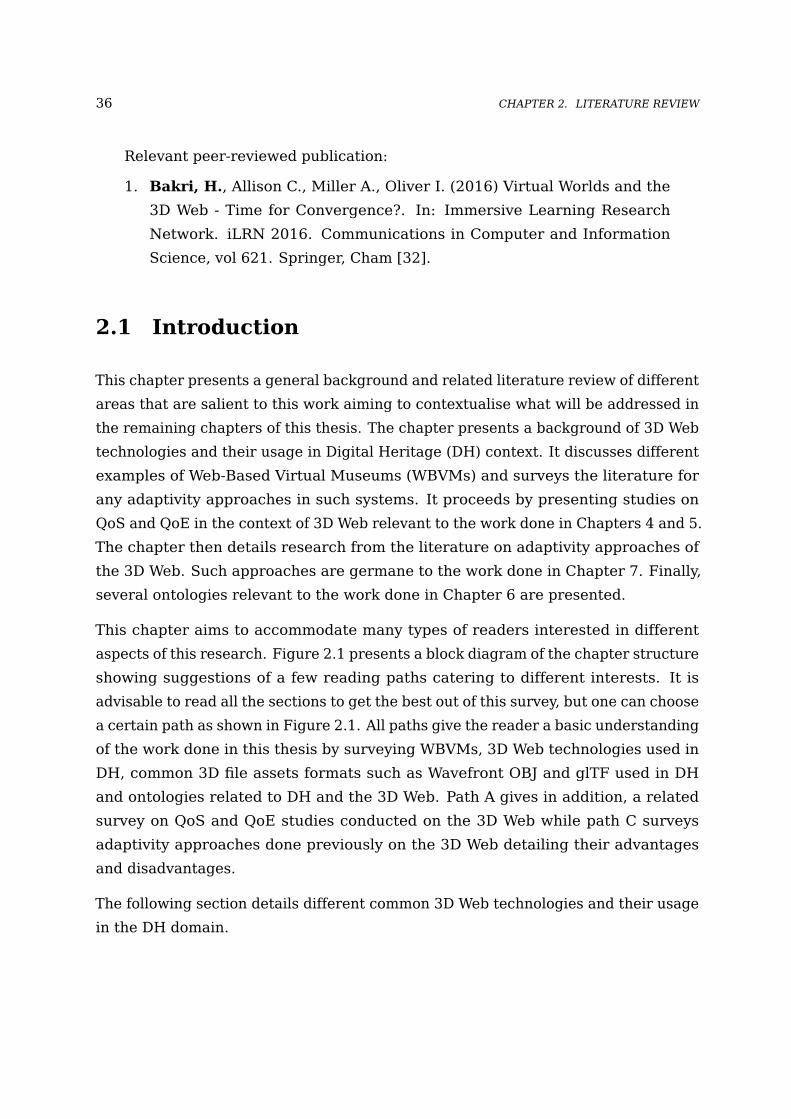
36 CHAPTER 2. LITERATURE REVIEW
Relevant peer-reviewed publication:
1. Bakri, H., Allison C., Miller A., Oliver I. (2016) Virtual Worlds and the
3D Web - Time for Convergence?. In: Immersive Learning Research
Network. iLRN 2016. Communications in Computer and Information
Science, vol 621. Springer, Cham [32].
2.1 Introduction
This chapter presents a general background and related literature review of different
areas that are salient to this work aiming to contextualise what will be addressed in
the remaining chapters of this thesis. The chapter presents a background of 3D Web
technologies and their usage in Digital Heritage (DH) context. It discusses different
examples of Web-Based Virtual Museums (WBVMs) and surveys the literature for
any adaptivity approaches in such systems. It proceeds by presenting studies on
QoS and QoE in the context of 3D Web relevant to the work done in Chapters 4 and 5.
The chapter then details research from the literature on adaptivity approaches of
the 3D Web. Such approaches are germane to the work done in Chapter 7. Finally,
several ontologies relevant to the work done in Chapter 6 are presented.
This chapter aims to accommodate many types of readers interested in different
aspects of this research. Figure 2.1 presents a block diagram of the chapter structure
showing suggestions of a few reading paths catering to different interests. It is
advisable to read all the sections to get the best out of this survey, but one can choose
a certain path as shown in Figure 2.1. All paths give the reader a basic understanding
of the work done in this thesis by surveying WBVMs, 3D Web technologies used in
DH, common 3D file assets formats such as Wavefront OBJ and glTF used in DH
and ontologies related to DH and the 3D Web. Path A gives in addition, a related
survey on QoS and QoE studies conducted on the 3D Web while path C surveys
adaptivity approaches done previously on the 3D Web detailing their advantages
and disadvantages.
The following section details different common 3D Web technologies and their usage
in the DH domain.
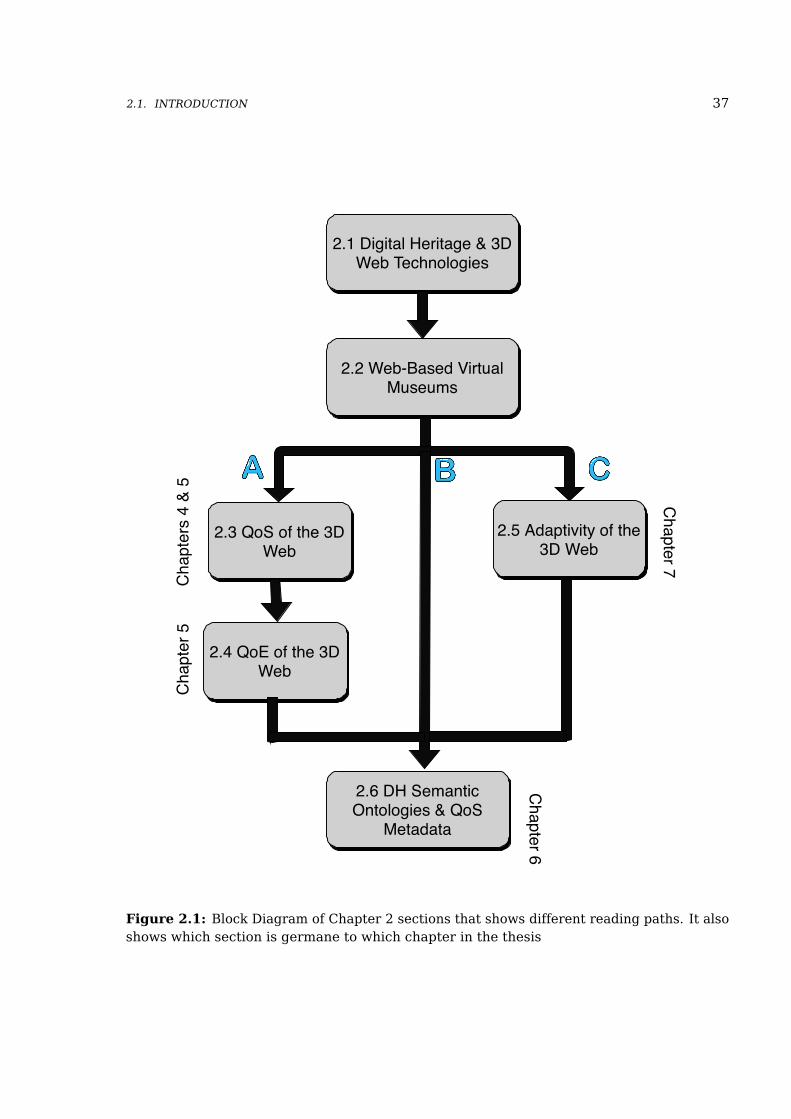
2.1. INTRODUCTION 37
2.1 Digital Heritage & 3DWeb Technologies
2.2 Web-Based VirtualMuseums
2.3 QoS of the 3DWeb
2.4 QoE of the 3DWeb
2.5 Adaptivity of the3D Web
2.6 DH SemanticOntologies & QoS
Metadata
Cha
pter
s 4
& 5
Cha
pter
5
Chapter 7
Chapter 6
Figure 2.1: Block Diagram of Chapter 2 sections that shows different reading paths. It alsoshows which section is germane to which chapter in the thesis

38 CHAPTER 2. LITERATURE REVIEW
2.2 Digital Heritage & 3D Web Technologies
The web began in a very humble state back in the early nineties where static text
and images where the only reality of many web sites. Content and new technologies
were added to the web stack pushed and catalysed by the need for more interactive
and visually appealing content. The web became convenient, lucrative and attractive
to many businesses, thus leading to quick developments in web-based multimedia
technologies and applications. The appearance of languages such as Cascading
Style Sheet (CSS), Java, JavaScript and techniques such as Asynchronous Javascript
and XML (AJAX)/Asynchronous Javascript and JSON (AJAJ) became an inevitable
sequitur of the World Wide Web technological progress, thus making hosting rich
and responsive multimedia content on the web possible and desirable by users.
Rich multimedia, animations and 2D games began to appear in the mid-nineties.
They were facilitated by technologies such as Adobe Flash [3] which was previously
Macromedia Flash. One major nuisance for many users at that time was the
requirement to install and continuously update plug-ins needed for the technology
to work in web browsers.
Standards such as Scalar Vector Graphics (SVG) which is a format based on
Extensible Markup Language (XML), allowed 2D content drawing to be possible on
the web. SVG files were easily integrated into the Document Object Model (DOM)
of HTML web pages. SVG is not controlled by JavaScript but instead has its own
mark-up language to draw 2D in a declarative manner [151].
The canvas element was introduced at a later stage into HTML to allow drawing 2D
content and animations easily but the difference from SVG is that the canvas uses
an imperative paradigm of programming meaning it is controlled by a procedural
language such as JavaScript [65].
There has been a considerable delay in the emergence of 3D content on web
platforms in terms of delivery and visualisation compared to traditional digital
media such as images and videos and this is due to higher requirements of 3D
graphics in terms of computation powers of client devices [113].
This began to change in recent years as we witnessed a steady and continuous
proliferation of processing power, graphical capabilities of personal computers and
mobile devices and a massive increase in available bandwidth. In addition, we
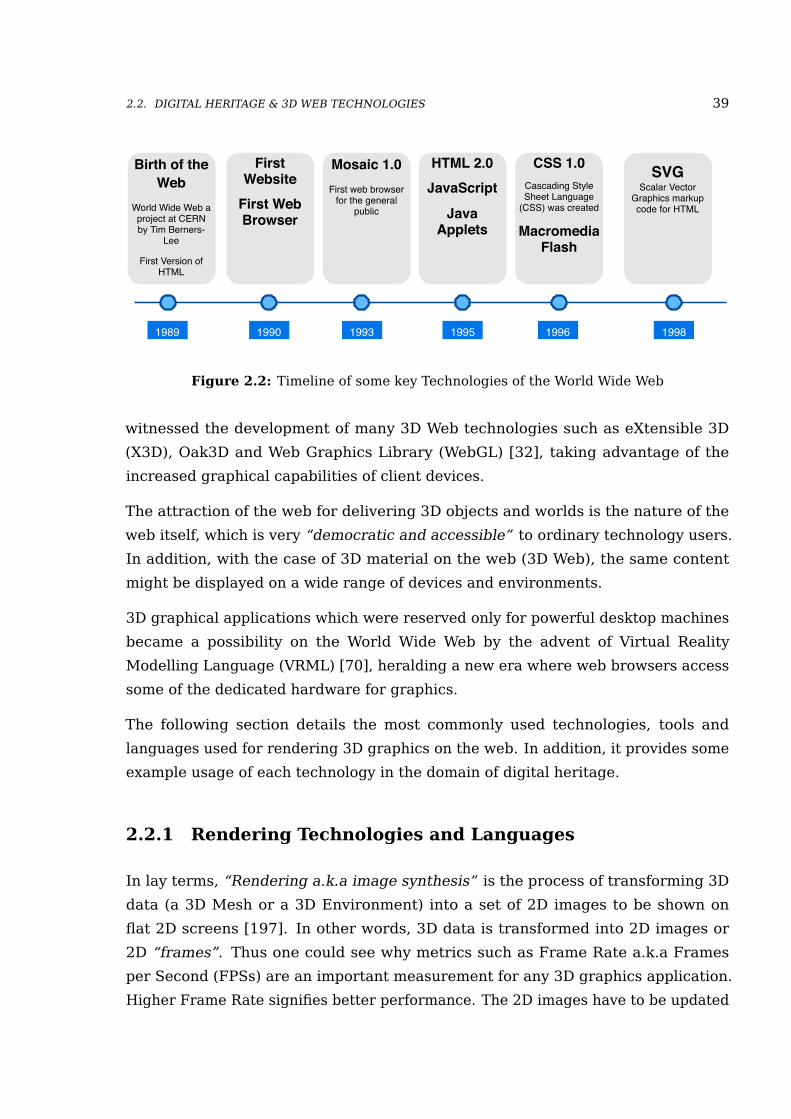
2.2. DIGITAL HERITAGE & 3D WEB TECHNOLOGIES 39
Birth of theWeb
World Wide Web aproject at CERNby Tim Berners-
Lee
First Version ofHTML
1989
FirstWebsite
First WebBrowser
1990
Mosaic 1.0First web browser
for the generalpublic
1993
HTML 2.0JavaScript
JavaApplets
1995
CSS 1.0Cascading StyleSheet Language
(CSS) was created
MacromediaFlash
1996
SVGScalar Vector
Graphics markupcode for HTML
1998
Figure 2.2: Timeline of some key Technologies of the World Wide Web
witnessed the development of many 3D Web technologies such as eXtensible 3D
(X3D), Oak3D and Web Graphics Library (WebGL) [32], taking advantage of the
increased graphical capabilities of client devices.
The attraction of the web for delivering 3D objects and worlds is the nature of the
web itself, which is very “democratic and accessible” to ordinary technology users.
In addition, with the case of 3D material on the web (3D Web), the same content
might be displayed on a wide range of devices and environments.
3D graphical applications which were reserved only for powerful desktop machines
became a possibility on the World Wide Web by the advent of Virtual Reality
Modelling Language (VRML) [70], heralding a new era where web browsers access
some of the dedicated hardware for graphics.
The following section details the most commonly used technologies, tools and
languages used for rendering 3D graphics on the web. In addition, it provides some
example usage of each technology in the domain of digital heritage.
2.2.1 Rendering Technologies and Languages
In lay terms, “Rendering a.k.a image synthesis” is the process of transforming 3D
data (a 3D Mesh or a 3D Environment) into a set of 2D images to be shown on
flat 2D screens [197]. In other words, 3D data is transformed into 2D images or
2D “frames”. Thus one could see why metrics such as Frame Rate a.k.a Frames
per Second (FPSs) are an important measurement for any 3D graphics application.
Higher Frame Rate signifies better performance. The 2D images have to be updated
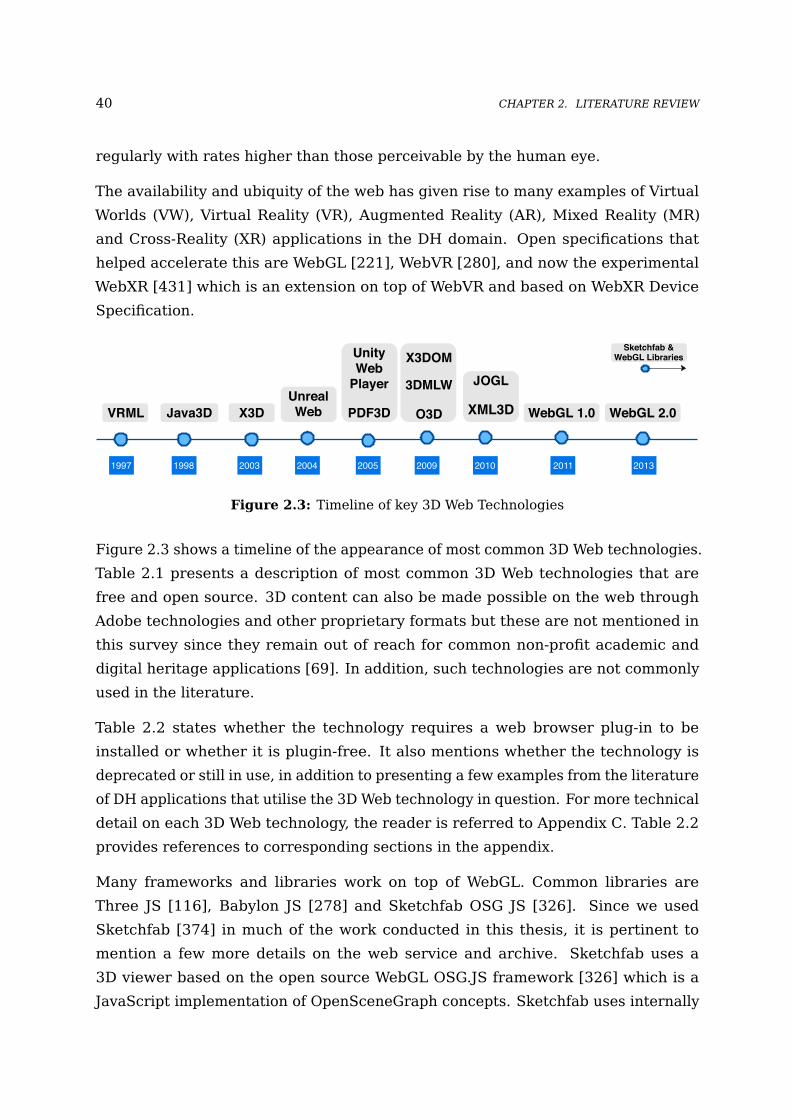
40 CHAPTER 2. LITERATURE REVIEW
regularly with rates higher than those perceivable by the human eye.
The availability and ubiquity of the web has given rise to many examples of Virtual
Worlds (VW), Virtual Reality (VR), Augmented Reality (AR), Mixed Reality (MR)
and Cross-Reality (XR) applications in the DH domain. Open specifications that
helped accelerate this are WebGL [221], WebVR [280], and now the experimental
WebXR [431] which is an extension on top of WebVR and based on WebXR Device
Specification.
VRML
1997
Java3D
1998
X3D
2003
X3DOM
3DMLW
O3D
2009
WebGL 1.0
2011
UnityWeb
Player
PDF3D
2005
UnrealWeb
2004
JOGL
XML3D
2010
WebGL 2.0
2013
Sketchfab &WebGL Libraries
Figure 2.3: Timeline of key 3D Web Technologies
Figure 2.3 shows a timeline of the appearance of most common 3D Web technologies.
Table 2.1 presents a description of most common 3D Web technologies that are
free and open source. 3D content can also be made possible on the web through
Adobe technologies and other proprietary formats but these are not mentioned in
this survey since they remain out of reach for common non-profit academic and
digital heritage applications [69]. In addition, such technologies are not commonly
used in the literature.
Table 2.2 states whether the technology requires a web browser plug-in to be
installed or whether it is plugin-free. It also mentions whether the technology is
deprecated or still in use, in addition to presenting a few examples from the literature
of DH applications that utilise the 3D Web technology in question. For more technical
detail on each 3D Web technology, the reader is referred to Appendix C. Table 2.2
provides references to corresponding sections in the appendix.
Many frameworks and libraries work on top of WebGL. Common libraries are
Three JS [116], Babylon JS [278] and Sketchfab OSG JS [326]. Since we used
Sketchfab [374] in much of the work conducted in this thesis, it is pertinent to
mention a few more details on the web service and archive. Sketchfab uses a
3D viewer based on the open source WebGL OSG.JS framework [326] which is a
JavaScript implementation of OpenSceneGraph concepts. Sketchfab uses internally
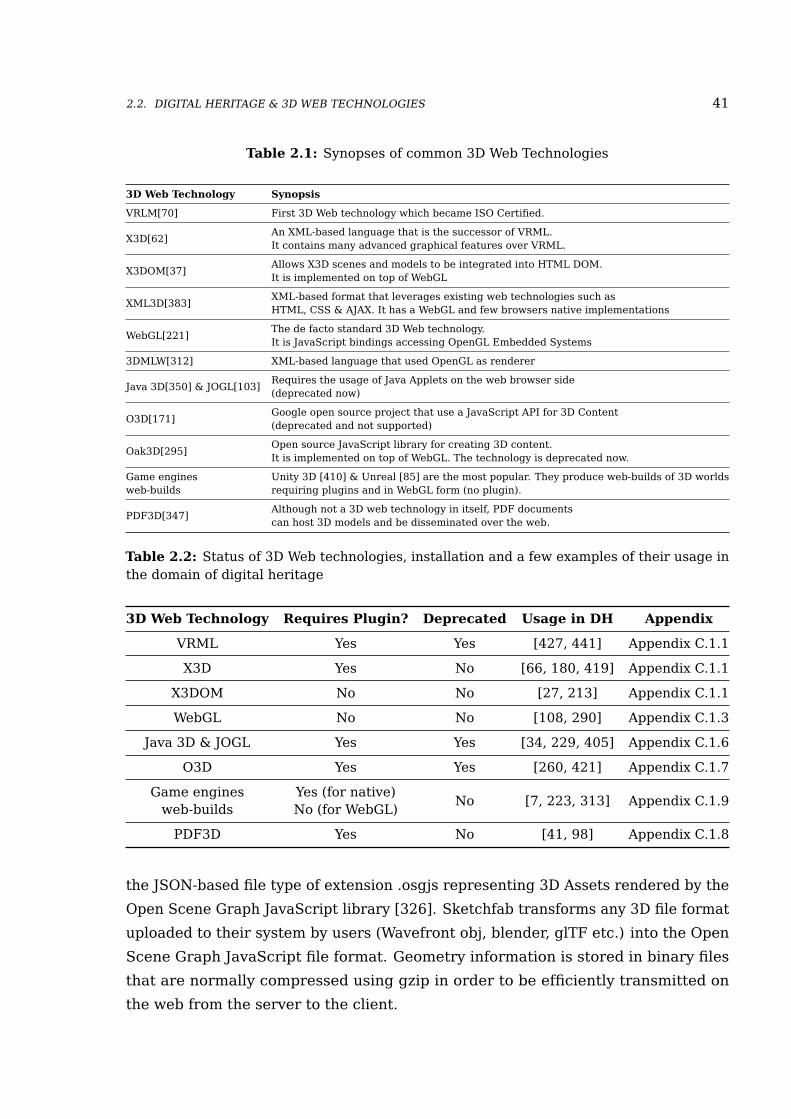
2.2. DIGITAL HERITAGE & 3D WEB TECHNOLOGIES 41
Table 2.1: Synopses of common 3D Web Technologies
3D Web Technology Synopsis
VRLM[70] First 3D Web technology which became ISO Certified.
X3D[62]An XML-based language that is the successor of VRML.It contains many advanced graphical features over VRML.
X3DOM[37]Allows X3D scenes and models to be integrated into HTML DOM.It is implemented on top of WebGL
XML3D[383]XML-based format that leverages existing web technologies such asHTML, CSS & AJAX. It has a WebGL and few browsers native implementations
WebGL[221]The de facto standard 3D Web technology.It is JavaScript bindings accessing OpenGL Embedded Systems
3DMLW[312] XML-based language that used OpenGL as renderer
Java 3D[350] & JOGL[103]Requires the usage of Java Applets on the web browser side(deprecated now)
O3D[171]Google open source project that use a JavaScript API for 3D Content(deprecated and not supported)
Oak3D[295]Open source JavaScript library for creating 3D content.It is implemented on top of WebGL. The technology is deprecated now.
Game enginesweb-builds
Unity 3D [410] & Unreal [85] are the most popular. They produce web-builds of 3D worldsrequiring plugins and in WebGL form (no plugin).
PDF3D[347]Although not a 3D web technology in itself, PDF documentscan host 3D models and be disseminated over the web.
Table 2.2: Status of 3D Web technologies, installation and a few examples of their usage inthe domain of digital heritage
3D Web Technology Requires Plugin? Deprecated Usage in DH Appendix
VRML Yes Yes [427, 441] Appendix C.1.1
X3D Yes No [66, 180, 419] Appendix C.1.1
X3DOM No No [27, 213] Appendix C.1.1
WebGL No No [108, 290] Appendix C.1.3
Java 3D & JOGL Yes Yes [34, 229, 405] Appendix C.1.6
O3D Yes Yes [260, 421] Appendix C.1.7
Game enginesweb-builds
Yes (for native)No (for WebGL)
No [7, 223, 313] Appendix C.1.9
PDF3D Yes No [41, 98] Appendix C.1.8
the JSON-based file type of extension .osgjs representing 3D Assets rendered by the
Open Scene Graph JavaScript library [326]. Sketchfab transforms any 3D file format
uploaded to their system by users (Wavefront obj, blender, glTF etc.) into the Open
Scene Graph JavaScript file format. Geometry information is stored in binary files
that are normally compressed using gzip in order to be efficiently transmitted on
the web from the server to the client.
42 CHAPTER 2. LITERATURE REVIEW
VRML was the first 3D Web technology to be used in a large number of digital
heritage applications. A few examples from the literature are that of the ARCO
project [427] and Zara [441]. Unfortunately VRML is completely deprecated now.
X3D was used in Cabral et al. [66], Archeoguide [419] and Guarnieri et al. [180].
X3D scenes need a plug-in to be installed in web browsers. They could also be
rendered via X3DOM framework and WebGL which do not necessitate a plug-in.
X3DOM is a technology used in many heritage applications. X3DOM allows X3D
scenes to be integrated easily into the DOM of HTML pages. A few examples from
the literature are that of Jung et al. [213] and Baglivo et al. [27]. Jung et al. [213]
explained their experience in using the X3DOM technology for a myriad of virtual
heritage applications and described how heritage artefacts, digitised through a 3D
scanner, were processed through the Meshlab [81] open source mesh processing
application and then exported as X3D scenes. The resulting X3D meshes were then
integrated in the HTML pages through the X3DOM framework. The technology
allows web developers to supplement the 3D model with manipulation capabilities
and GUI elements provided usually by JavaScript libraries such as JQuery. In a sense,
this allows the creation of HTML popup elements that shows points of interest on
the 3D model.
Java 3D & JOGL involves the usage of Java applets in web browsers. An example of
such usage in digital heritage is that of Barbieri and Paolini [34]. Java applets are
deprecated in web browsers.
The following section is a background section of the most common 3D assets file
formats used for the contexts of the 3D Web and DH applications. The rationale
of including such a background section is due to the fact that the core ambit of
this thesis involves studying perception of fidelity, download and processing times,
metadata and adaptation approaches of 3D digital heritage models in Chapters 5, 6
and 7.
2.2.2 3D Assets File Formats suitable for the 3D Web
There is a surfeit of file formats for storing 3D data in the literature. They can be
divided into three main categories:
• Raw 3D data formats obtained from 3D equipment such as 3D scanners usually
2.2. DIGITAL HERITAGE & 3D WEB TECHNOLOGIES 43
in proprietary formats.
• Proprietary formats pertaining to Computer Aided Design (CAD) systems or to 3D
authoring tools such as Blender [190], Autodesk 3ds Max [281] or Maya [305].
• Standardised formats that can be used across many applications and domains
such Alias Wavefront (.OBJ), COLLADA and glTF.
Furthermore, a 3D file format can be stored on disc in text-based format (ASCII or
Unicode) or in a binary format or in a combination of both. A 3D model has three
overarching characteristics: geometry, appearance and scene.
The three-dimensional geometry of a model is formed of many points called vertices.
These surface points form a series of faces called polygons. Triangular faces are
a common type of surface shapes found in 3D models [268] and thus such models
are called triangular models. The number of faces and the number of vertices
constitute a measure of the resolution of the 3D mesh i.e. the model’s geometry or
topology. The higher these numbers are, the higher the resolution or the quality of
presentation or the fidelity of the 3D model is. One can compare this concept of
fidelity with the number of pixels (picture elements) in an image: the higher the
number of pixels, the higher the resolution of the image and vice versa.
The appearance of a 3D model is expressed in the form of applying what is dubbed
as materials. The most common type of materials involves an image also known as a
texture to the surface of the 3D model. Each 3D vertex is mapped to a point in the 2D
texture or image. At the time of the rendering, vertices of faces are interpolated to
the points of the textures and the colours of these points are used to corresponding
locations on the 3D model. Other types of materials are surface colours, certain
characteristics of the surface such as bumpiness, lights and reflections, among many
other properties. The scene of a model involves information concerning the camera
properties, the light sources, and other 3D models [268].
There are many applications that can create, edit, view, import and export 3D file
formats as well as build 3D models from scratch and combine many of them to
create 3D scenes. Common authoring tools used are Blender, Autodesk 3ds Max,
Autodesk Maya and Meshlab [81]. These tools among others are employed and
suggested by many cultural heritage researchers in the literature [149, 180] to be
used in proposed pipeline procedures for the acquisition and creation of the 3D
digital heritage models. Many CH applications [2, 106, 158] use the Alias Wavefront
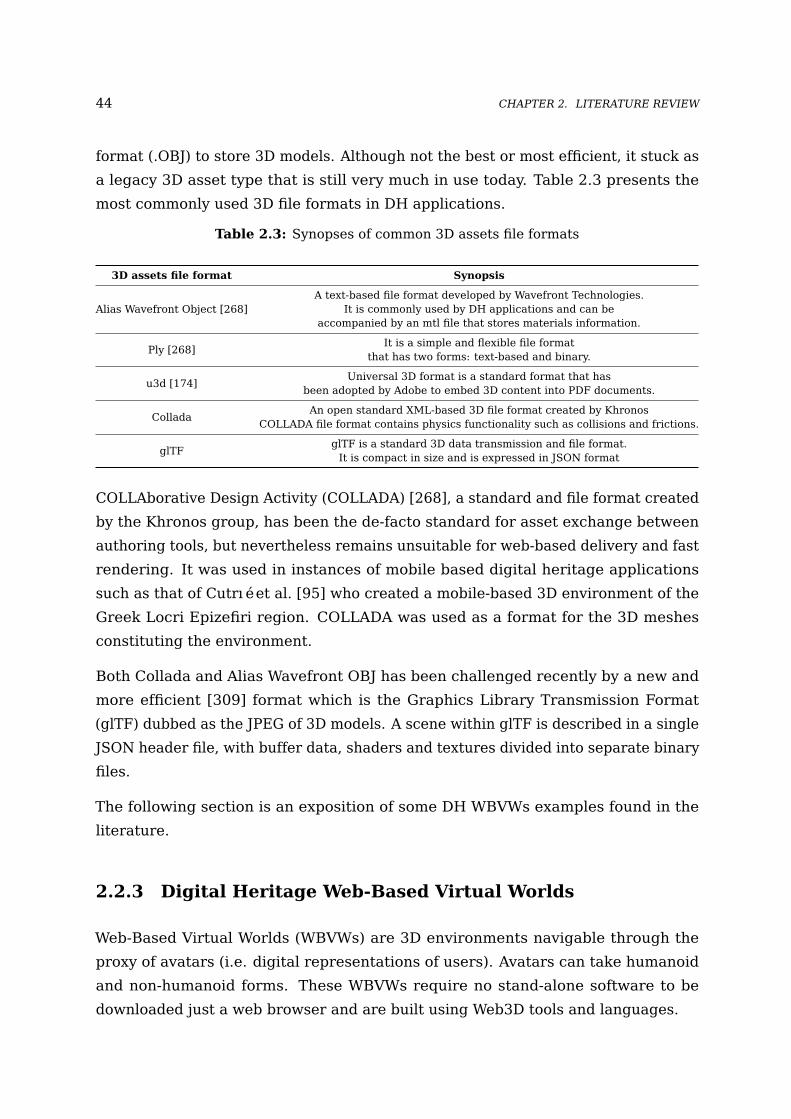
44 CHAPTER 2. LITERATURE REVIEW
format (.OBJ) to store 3D models. Although not the best or most efficient, it stuck as
a legacy 3D asset type that is still very much in use today. Table 2.3 presents the
most commonly used 3D file formats in DH applications.
Table 2.3: Synopses of common 3D assets file formats
3D assets file format Synopsis
Alias Wavefront Object [268]A text-based file format developed by Wavefront Technologies.
It is commonly used by DH applications and can beaccompanied by an mtl file that stores materials information.
Ply [268]It is a simple and flexible file format
that has two forms: text-based and binary.
u3d [174]Universal 3D format is a standard format that has
been adopted by Adobe to embed 3D content into PDF documents.
ColladaAn open standard XML-based 3D file format created by Khronos
COLLADA file format contains physics functionality such as collisions and frictions.
glTFglTF is a standard 3D data transmission and file format.
It is compact in size and is expressed in JSON format
COLLAborative Design Activity (COLLADA) [268], a standard and file format created
by the Khronos group, has been the de-facto standard for asset exchange between
authoring tools, but nevertheless remains unsuitable for web-based delivery and fast
rendering. It was used in instances of mobile based digital heritage applications
such as that of Cutrıé et al. [95] who created a mobile-based 3D environment of the
Greek Locri Epizefiri region. COLLADA was used as a format for the 3D meshes
constituting the environment.
Both Collada and Alias Wavefront OBJ has been challenged recently by a new and
more efficient [309] format which is the Graphics Library Transmission Format
(glTF) dubbed as the JPEG of 3D models. A scene within glTF is described in a single
JSON header file, with buffer data, shaders and textures divided into separate binary
files.
The following section is an exposition of some DH WBVWs examples found in the
literature.
2.2.3 Digital Heritage Web-Based Virtual Worlds
Web-Based Virtual Worlds (WBVWs) are 3D environments navigable through the
proxy of avatars (i.e. digital representations of users). Avatars can take humanoid
and non-humanoid forms. These WBVWs require no stand-alone software to be
downloaded just a web browser and are built using Web3D tools and languages.
2.2. DIGITAL HERITAGE & 3D WEB TECHNOLOGIES 45
DH WBVWs allow the public to engage with cultural material while overcoming
hindrances of space and time. Virtual visitors (i.e. avatars) can appreciate fragile
relics and virtual reconstructions of archaeological remains, and simulations of
historical events while providing an active engagement which leads to a better
learning experience. These environments provide users the sensation of “being
there” [395] in an immersive experience of virtual locations they could not physically
reach.
WBVWs offer several benefits over desktop counterparts mainly in a cultural heritage
setting. These include:
• The nature of the web makes them available from all around the world.
• No need for stand-alone client installations thus making these environments
easily usable.
• Given the myriad types and the large numbers of end devices, the web is the
one connecting technology for such environments to provide device-independent
consumption of cultural heritage material [353].
• Unanimity of quality through web browsers and the suitability of these environ-
ments for regular web users with no technical expertise.
• These environments present an easy means of access from mobile devices with
limited resources (only a web browser is needed which is always available) thus
promoting pervasiveness and ubiquity.
• The advantage of having web-based cloud technologies and streaming services
means that users do not have to download complete WBVWs or 3D applications.
DH Web-Based Virtual Worlds (WBVWs) are complete 3D spaces on the web. The
Virtual 3D Dublin Street [73] is a VRML WBVW depicting the reconstruction of
the streets and facades of the buildings of Dublin city in Ireland. The WBVW work
in tandem with a mobile device application where the avatar coordinates inside
the virtual environment are sent to query a database in order to retrieve historical
information about a certain place. The information is sent back to the mobile device.
Visintini et al. [418] created a WBVW in VRML of the Victoria Square of Gorizia
in Italy obtained from processes involving photogrammetry and 3D scanning of
actual buildings. Chittaro et al. [79] created a similar VRML WBVW but provided

46 CHAPTER 2. LITERATURE REVIEW
personalised tours in a 3D computer science WBVM. In such a case, we can see a
WBVM hosting or being hosted by a WBVW, a kind of mixed paradigm between the
two types of environments. WBVMs will be detailed further in Section 2.3.
Pecchioli et al. [316] built a WBVM hosting models of 700 fragments of sarcophagi
and a WBVW using the Unity web player of the Basilica of St. Silvestro at the
Catacombs of Priscilla in Rome, Italy.
Agugiaro et al. [7] built a complete Unity 3D reconstruction of a Maya archaeological
site, located in Copan (Honduras). The reconstruction is accessed via the Unity web
player and a PHP web application connected to a PostgreSQL database containing
virtual world objects and other multimedia.
In Chapter 4, the QoS of similar environments mentioned above are studied. In
particular, we studied a Unity 3D environment of the reconstruction of the Caen
township in Scotland depicting the town before the clearances era. Two web-based
virtual worlds builds were used: a Unity web player and Unity WebGL of the same
virtual environment.
The following section details a cohort of examples from the literature of WBVMs
and classifies their types into different categories. Particularly, the section surveys
several dimensions such as whether the WBVM is adaptive or not, whether it is still
alive on the web, or whether it uses 3D Web technologies and finally whether it is
mixed inside a WBVW.
2.3 Web-Based Virtual Museums (WBVMs)
The advantage of using the web for CH dissemination relies on it being globally
available. The advent of 3D Web technologies especially the ones that are plugin-free
such as WebGL, brought to users the capability of consuming three-dimensional
heritage material in WBVMs.
The technology used to document and economically mass digitise cultural heritage
holdings and annotate them and supplement them with metadata has yet to be
improved. Artefacts require large amount of time to pre-process, digitise and post-
process. For instance, according to the Victoria & Albert museum, it can take easily
around 5 to 20 hours with the state of the art structural light acquisition techniques
to construct only the geometry and textures of a 3D model out of an artefact with a
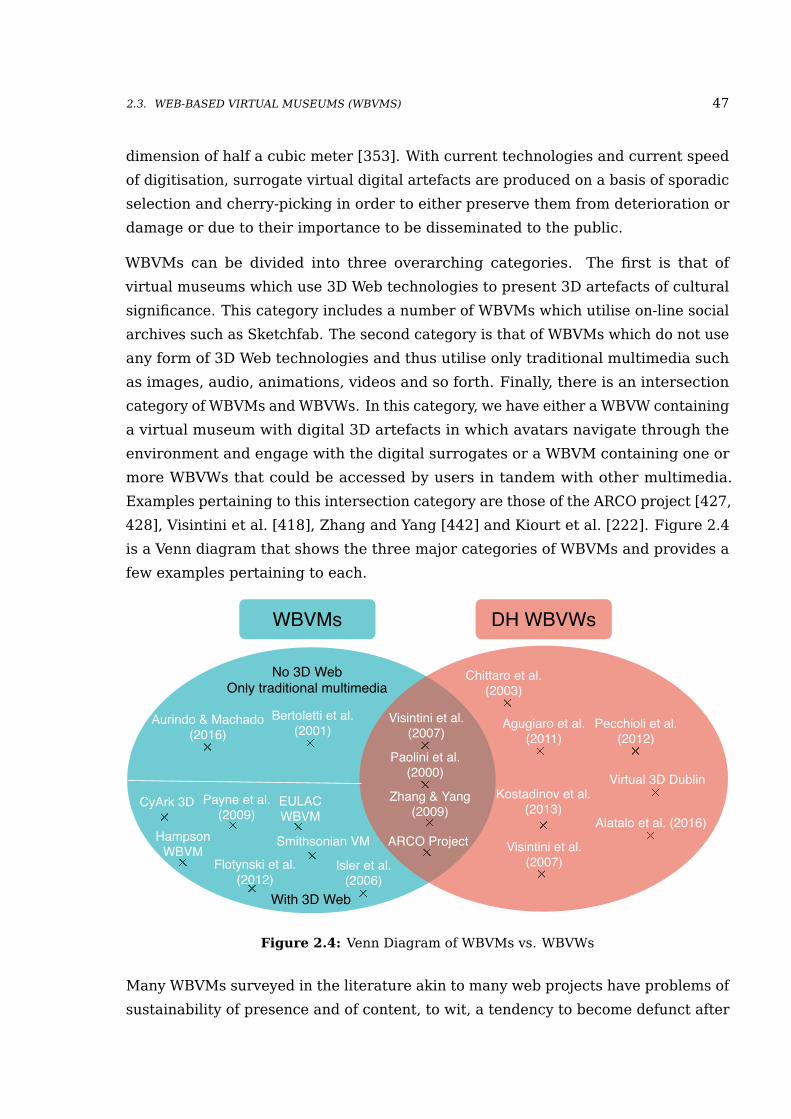
2.3. WEB-BASED VIRTUAL MUSEUMS (WBVMS) 47
dimension of half a cubic meter [353]. With current technologies and current speed
of digitisation, surrogate virtual digital artefacts are produced on a basis of sporadic
selection and cherry-picking in order to either preserve them from deterioration or
damage or due to their importance to be disseminated to the public.
WBVMs can be divided into three overarching categories. The first is that of
virtual museums which use 3D Web technologies to present 3D artefacts of cultural
significance. This category includes a number of WBVMs which utilise on-line social
archives such as Sketchfab. The second category is that of WBVMs which do not use
any form of 3D Web technologies and thus utilise only traditional multimedia such
as images, audio, animations, videos and so forth. Finally, there is an intersection
category of WBVMs and WBVWs. In this category, we have either a WBVW containing
a virtual museum with digital 3D artefacts in which avatars navigate through the
environment and engage with the digital surrogates or a WBVM containing one or
more WBVWs that could be accessed by users in tandem with other multimedia.
Examples pertaining to this intersection category are those of the ARCO project [427,
428], Visintini et al. [418], Zhang and Yang [442] and Kiourt et al. [222]. Figure 2.4
is a Venn diagram that shows the three major categories of WBVMs and provides a
few examples pertaining to each.
WBVMs DH WBVWs
Visintini et al.(2007)
ARCO Project
No 3D WebOnly traditional multimedia
With 3D Web
Agugiaro et al.(2011)
Virtual 3D DublinKostadinov et al.
(2013)CyArk 3D
Smithsonian VM
Flotynski et al.(2012)
Payne et al.(2009)
Aurindo & Machado(2016)
Bertoletti et al.(2001)
EULACWBVM
Isler et al.(2006)
HampsonWBVM
Paolini et al.(2000)
Zhang & Yang(2009)
Visintini et al.(2007)
Chittaro et al.(2003)
Pecchioli et al.(2012)
Alatalo et al. (2016)
Figure 2.4: Venn Diagram of WBVMs vs. WBVWs
Many WBVMs surveyed in the literature akin to many web projects have problems of
sustainability of presence and of content, to wit, a tendency to become defunct after

48 CHAPTER 2. LITERATURE REVIEW
a period of time. Many of them no longer have any active presence due to maybe
lack of funding or maintenance. However, others remain active and stood the test of
time.
WBVMs that use 3D Web technologies for the dissemination of heritage are numerous.
Many do not rely on social archives such as Sketchfab to host and render 3D content.
The Smithsonian Digitization Museum X 3D [381], is a Web-Based Virtual Museum
designed to be used by educators, museum curators, researchers and students
in the sciences, archaeology and cultural heritage domains. The system hosts a
large number of scientific visualisations, digitised artefacts and tours on 3D models.
Different 3D models are annotated with textual information and other multimedia on
particular points of interest. Tours on many models are present. A tour in this sense
is a sequential step by step educational process where the camera view is moved
in each step to a particular location of interest or hotspot on the artefact shown in
order to explain a feature. Hotspots on models have annotations. Furthermore, many
articles, images and videos are provided by experts who worked on the digitisation of
an artefact or of an archaeological site. The graphics visualizer is very configurable
in the sense that it allows users to change the lighting and shadows among many
other rendering features. The Smithsonian virtual museum is not adaptive in terms
of client devices and network regimes. In similar vein, it is not QoS or QoE aware.
Nevertheless, it suggests to its visitors to use always high performance mobile
devices to view successfully the digitised artefacts. Figure 2.5 shows a snapshot of
the WBVM in the Mozilla Firefox web browser.
Another example is the CyArk 3D digital archive and WBVM [96] which contains
many WebGL builds exported from Unity 3D of numerous world’s heritage sites.
CyArk aims to preserve the most important cultural heritage sites and artefacts in
the world. Sites and artefacts are digitised through laser scanning, photogrammetry
and digital modelling [226]. CyArk does not adapt the delivery of digital models to
client devices or according to network regimes. Figure 2.6 shows a snapshot of the
WBVM in the Mozilla Firefox web browser.
Another example would be that of Flotynski et al. [154] who presented a WBVM
that utilises 3D Web Technologies such as X3D, X3DOM, Adobe Flash SWF file
format and PDF3D. The WBVM is not adaptive in terms of delivery of the convenient
resolutions to client devices depending on their capabilities nor according to network
regimes and conditions. Nevertheless, Flotynski et al. WBVM is adaptive in terms
of choosing to deliver different types of 3D objects based on what the web browser
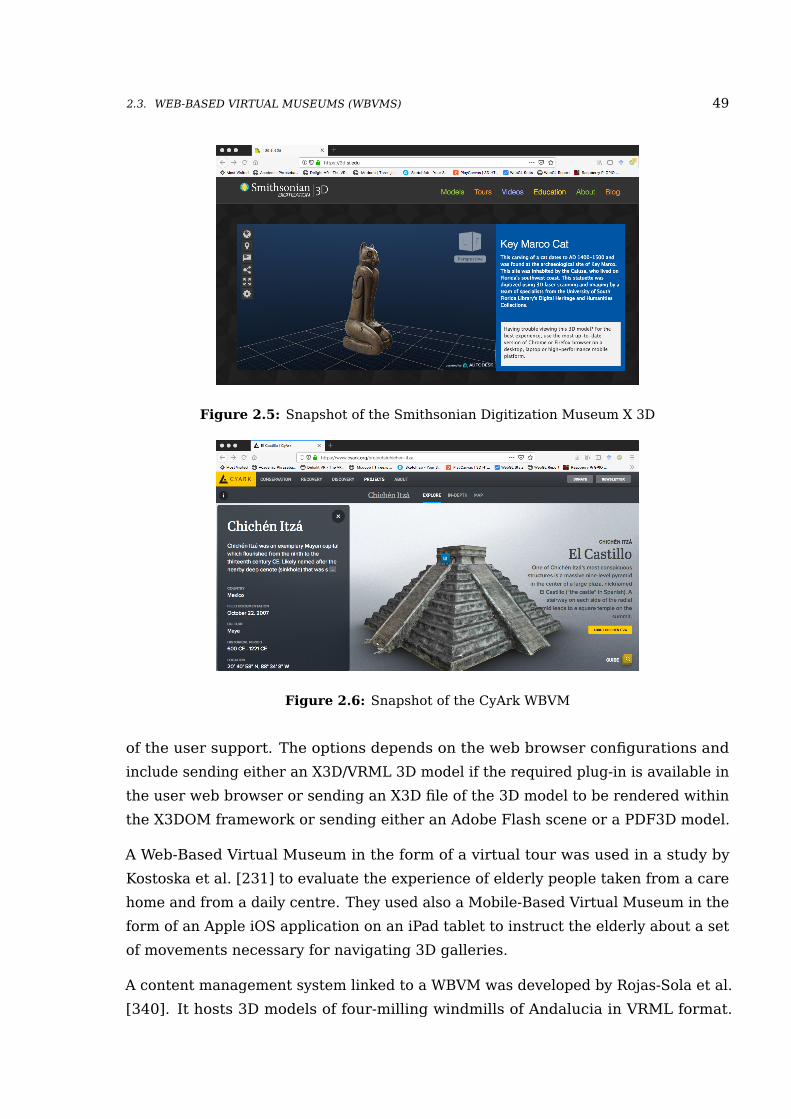
2.3. WEB-BASED VIRTUAL MUSEUMS (WBVMS) 49
Figure 2.5: Snapshot of the Smithsonian Digitization Museum X 3D
Figure 2.6: Snapshot of the CyArk WBVM
of the user support. The options depends on the web browser configurations and
include sending either an X3D/VRML 3D model if the required plug-in is available in
the user web browser or sending an X3D file of the 3D model to be rendered within
the X3DOM framework or sending either an Adobe Flash scene or a PDF3D model.
A Web-Based Virtual Museum in the form of a virtual tour was used in a study by
Kostoska et al. [231] to evaluate the experience of elderly people taken from a care
home and from a daily centre. They used also a Mobile-Based Virtual Museum in the
form of an Apple iOS application on an iPad tablet to instruct the elderly about a set
of movements necessary for navigating 3D galleries.
A content management system linked to a WBVM was developed by Rojas-Sola et al.
[340]. It hosts 3D models of four-milling windmills of Andalucia in VRML format.
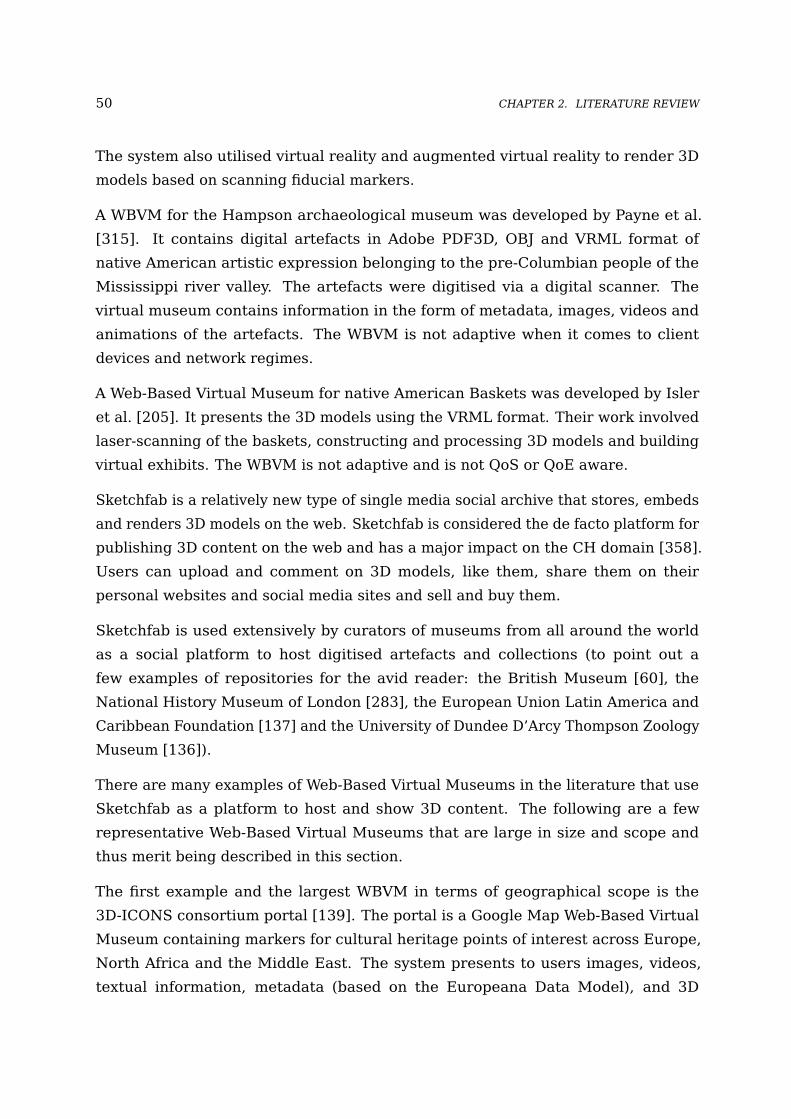
50 CHAPTER 2. LITERATURE REVIEW
The system also utilised virtual reality and augmented virtual reality to render 3D
models based on scanning fiducial markers.
A WBVM for the Hampson archaeological museum was developed by Payne et al.
[315]. It contains digital artefacts in Adobe PDF3D, OBJ and VRML format of
native American artistic expression belonging to the pre-Columbian people of the
Mississippi river valley. The artefacts were digitised via a digital scanner. The
virtual museum contains information in the form of metadata, images, videos and
animations of the artefacts. The WBVM is not adaptive when it comes to client
devices and network regimes.
A Web-Based Virtual Museum for native American Baskets was developed by Isler
et al. [205]. It presents the 3D models using the VRML format. Their work involved
laser-scanning of the baskets, constructing and processing 3D models and building
virtual exhibits. The WBVM is not adaptive and is not QoS or QoE aware.
Sketchfab is a relatively new type of single media social archive that stores, embeds
and renders 3D models on the web. Sketchfab is considered the de facto platform for
publishing 3D content on the web and has a major impact on the CH domain [358].
Users can upload and comment on 3D models, like them, share them on their
personal websites and social media sites and sell and buy them.
Sketchfab is used extensively by curators of museums from all around the world
as a social platform to host digitised artefacts and collections (to point out a
few examples of repositories for the avid reader: the British Museum [60], the
National History Museum of London [283], the European Union Latin America and
Caribbean Foundation [137] and the University of Dundee D’Arcy Thompson Zoology
Museum [136]).
There are many examples of Web-Based Virtual Museums in the literature that use
Sketchfab as a platform to host and show 3D content. The following are a few
representative Web-Based Virtual Museums that are large in size and scope and
thus merit being described in this section.
The first example and the largest WBVM in terms of geographical scope is the
3D-ICONS consortium portal [139]. The portal is a Google Map Web-Based Virtual
Museum containing markers for cultural heritage points of interest across Europe,
North Africa and the Middle East. The system presents to users images, videos,
textual information, metadata (based on the Europeana Data Model), and 3D
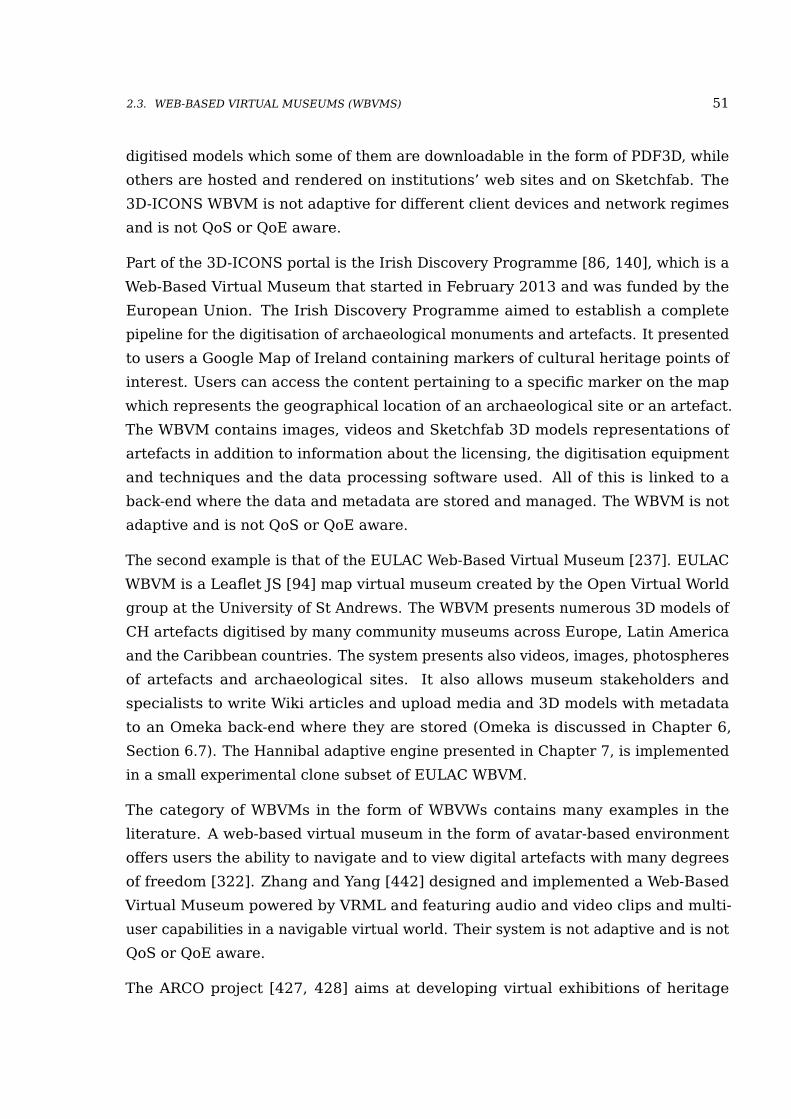
2.3. WEB-BASED VIRTUAL MUSEUMS (WBVMS) 51
digitised models which some of them are downloadable in the form of PDF3D, while
others are hosted and rendered on institutions’ web sites and on Sketchfab. The
3D-ICONS WBVM is not adaptive for different client devices and network regimes
and is not QoS or QoE aware.
Part of the 3D-ICONS portal is the Irish Discovery Programme [86, 140], which is a
Web-Based Virtual Museum that started in February 2013 and was funded by the
European Union. The Irish Discovery Programme aimed to establish a complete
pipeline for the digitisation of archaeological monuments and artefacts. It presented
to users a Google Map of Ireland containing markers of cultural heritage points of
interest. Users can access the content pertaining to a specific marker on the map
which represents the geographical location of an archaeological site or an artefact.
The WBVM contains images, videos and Sketchfab 3D models representations of
artefacts in addition to information about the licensing, the digitisation equipment
and techniques and the data processing software used. All of this is linked to a
back-end where the data and metadata are stored and managed. The WBVM is not
adaptive and is not QoS or QoE aware.
The second example is that of the EULAC Web-Based Virtual Museum [237]. EULAC
WBVM is a Leaflet JS [94] map virtual museum created by the Open Virtual World
group at the University of St Andrews. The WBVM presents numerous 3D models of
CH artefacts digitised by many community museums across Europe, Latin America
and the Caribbean countries. The system presents also videos, images, photospheres
of artefacts and archaeological sites. It also allows museum stakeholders and
specialists to write Wiki articles and upload media and 3D models with metadata
to an Omeka back-end where they are stored (Omeka is discussed in Chapter 6,
Section 6.7). The Hannibal adaptive engine presented in Chapter 7, is implemented
in a small experimental clone subset of EULAC WBVM.
The category of WBVMs in the form of WBVWs contains many examples in the
literature. A web-based virtual museum in the form of avatar-based environment
offers users the ability to navigate and to view digital artefacts with many degrees
of freedom [322]. Zhang and Yang [442] designed and implemented a Web-Based
Virtual Museum powered by VRML and featuring audio and video clips and multi-
user capabilities in a navigable virtual world. Their system is not adaptive and is not
QoS or QoE aware.
The ARCO project [427, 428] aims at developing virtual exhibitions of heritage
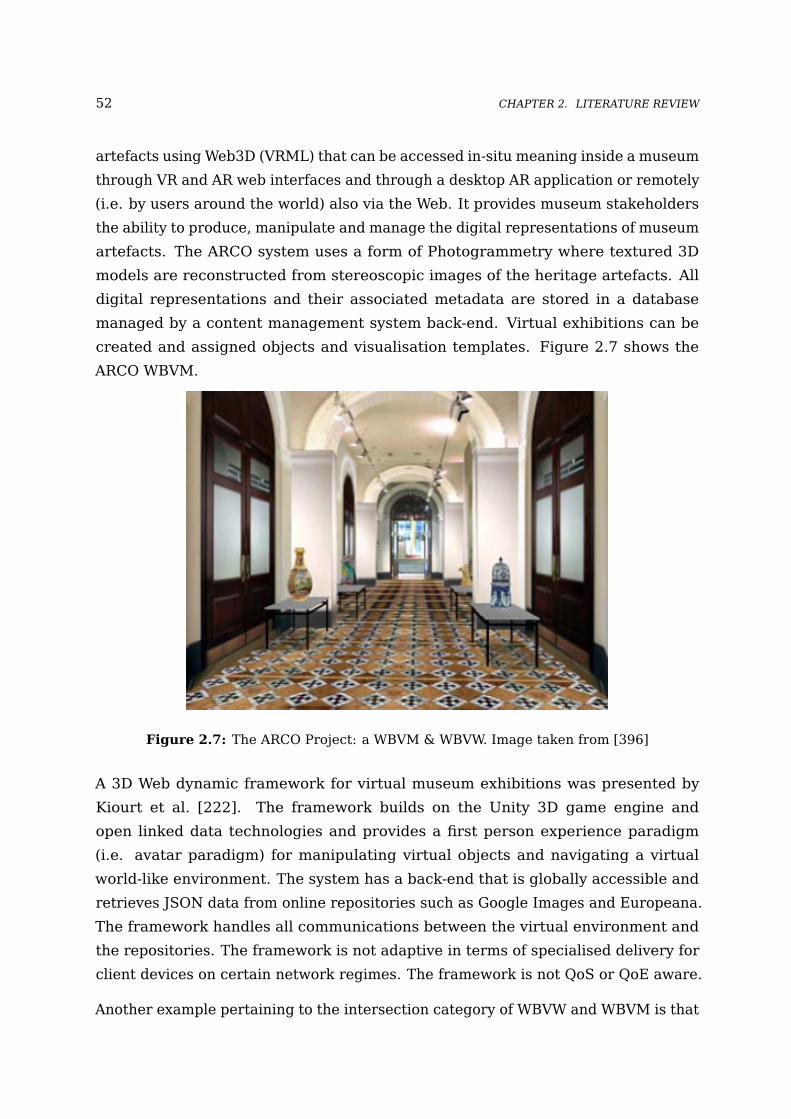
52 CHAPTER 2. LITERATURE REVIEW
artefacts using Web3D (VRML) that can be accessed in-situ meaning inside a museum
through VR and AR web interfaces and through a desktop AR application or remotely
(i.e. by users around the world) also via the Web. It provides museum stakeholders
the ability to produce, manipulate and manage the digital representations of museum
artefacts. The ARCO system uses a form of Photogrammetry where textured 3D
models are reconstructed from stereoscopic images of the heritage artefacts. All
digital representations and their associated metadata are stored in a database
managed by a content management system back-end. Virtual exhibitions can be
created and assigned objects and visualisation templates. Figure 2.7 shows the
ARCO WBVM.
Figure 2.7: The ARCO Project: a WBVM & WBVW. Image taken from [396]
A 3D Web dynamic framework for virtual museum exhibitions was presented by
Kiourt et al. [222]. The framework builds on the Unity 3D game engine and
open linked data technologies and provides a first person experience paradigm
(i.e. avatar paradigm) for manipulating virtual objects and navigating a virtual
world-like environment. The system has a back-end that is globally accessible and
retrieves JSON data from online repositories such as Google Images and Europeana.
The framework handles all communications between the virtual environment and
the repositories. The framework is not adaptive in terms of specialised delivery for
client devices on certain network regimes. The framework is not QoS or QoE aware.
Another example pertaining to the intersection category of WBVW and WBVM is that
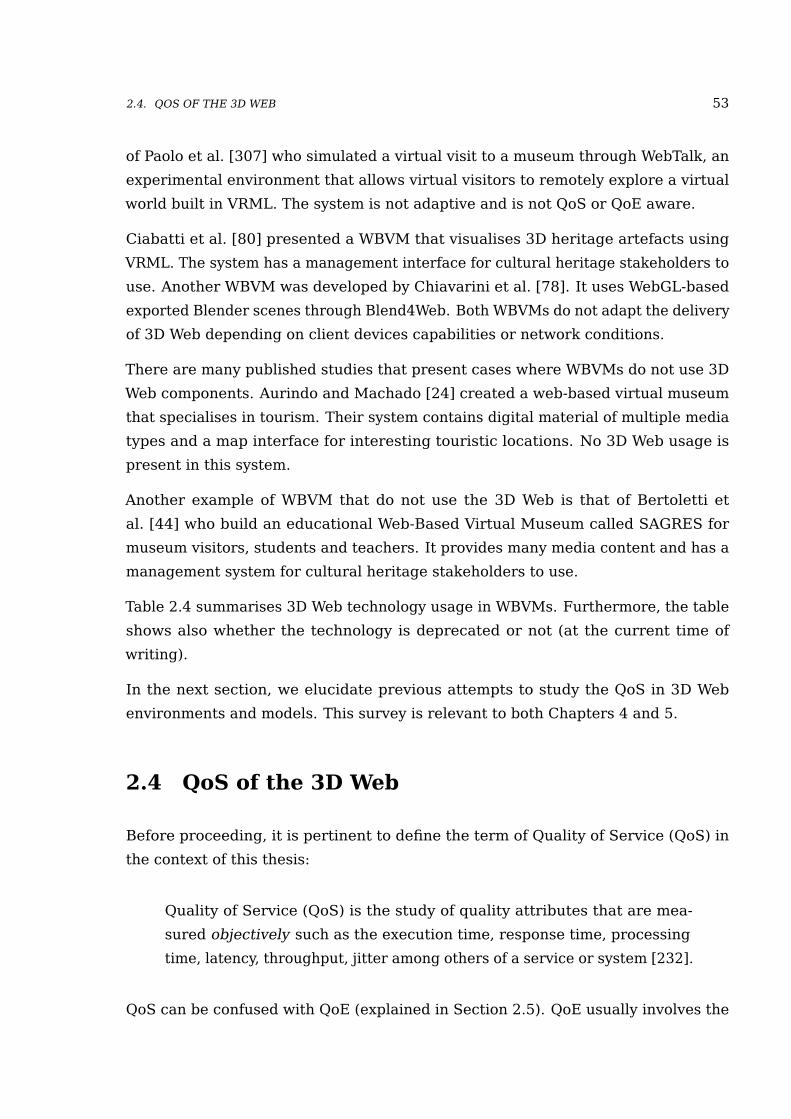
2.4. QOS OF THE 3D WEB 53
of Paolo et al. [307] who simulated a virtual visit to a museum through WebTalk, an
experimental environment that allows virtual visitors to remotely explore a virtual
world built in VRML. The system is not adaptive and is not QoS or QoE aware.
Ciabatti et al. [80] presented a WBVM that visualises 3D heritage artefacts using
VRML. The system has a management interface for cultural heritage stakeholders to
use. Another WBVM was developed by Chiavarini et al. [78]. It uses WebGL-based
exported Blender scenes through Blend4Web. Both WBVMs do not adapt the delivery
of 3D Web depending on client devices capabilities or network conditions.
There are many published studies that present cases where WBVMs do not use 3D
Web components. Aurindo and Machado [24] created a web-based virtual museum
that specialises in tourism. Their system contains digital material of multiple media
types and a map interface for interesting touristic locations. No 3D Web usage is
present in this system.
Another example of WBVM that do not use the 3D Web is that of Bertoletti et
al. [44] who build an educational Web-Based Virtual Museum called SAGRES for
museum visitors, students and teachers. It provides many media content and has a
management system for cultural heritage stakeholders to use.
Table 2.4 summarises 3D Web technology usage in WBVMs. Furthermore, the table
shows also whether the technology is deprecated or not (at the current time of
writing).
In the next section, we elucidate previous attempts to study the QoS in 3D Web
environments and models. This survey is relevant to both Chapters 4 and 5.
2.4 QoS of the 3D Web
Before proceeding, it is pertinent to define the term of Quality of Service (QoS) in
the context of this thesis:
Quality of Service (QoS) is the study of quality attributes that are mea-
sured objectively such as the execution time, response time, processing
time, latency, throughput, jitter among others of a service or system [232].
QoS can be confused with QoE (explained in Section 2.5). QoE usually involves the
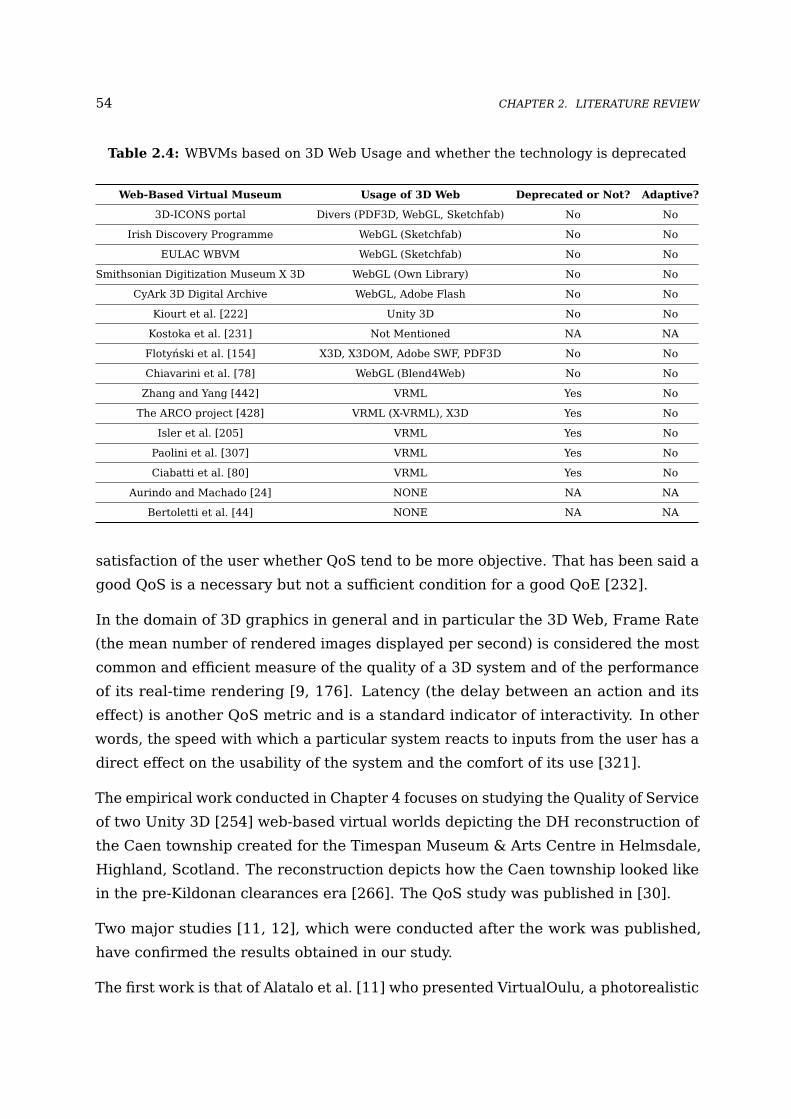
54 CHAPTER 2. LITERATURE REVIEW
Table 2.4: WBVMs based on 3D Web Usage and whether the technology is deprecated
Web-Based Virtual Museum Usage of 3D Web Deprecated or Not? Adaptive?
3D-ICONS portal Divers (PDF3D, WebGL, Sketchfab) No No
Irish Discovery Programme WebGL (Sketchfab) No No
EULAC WBVM WebGL (Sketchfab) No No
Smithsonian Digitization Museum X 3D WebGL (Own Library) No No
CyArk 3D Digital Archive WebGL, Adobe Flash No No
Kiourt et al. [222] Unity 3D No No
Kostoka et al. [231] Not Mentioned NA NA
Flotynski et al. [154] X3D, X3DOM, Adobe SWF, PDF3D No No
Chiavarini et al. [78] WebGL (Blend4Web) No No
Zhang and Yang [442] VRML Yes No
The ARCO project [428] VRML (X-VRML), X3D Yes No
Isler et al. [205] VRML Yes No
Paolini et al. [307] VRML Yes No
Ciabatti et al. [80] VRML Yes No
Aurindo and Machado [24] NONE NA NA
Bertoletti et al. [44] NONE NA NA
satisfaction of the user whether QoS tend to be more objective. That has been said a
good QoS is a necessary but not a sufficient condition for a good QoE [232].
In the domain of 3D graphics in general and in particular the 3D Web, Frame Rate
(the mean number of rendered images displayed per second) is considered the most
common and efficient measure of the quality of a 3D system and of the performance
of its real-time rendering [9, 176]. Latency (the delay between an action and its
effect) is another QoS metric and is a standard indicator of interactivity. In other
words, the speed with which a particular system reacts to inputs from the user has a
direct effect on the usability of the system and the comfort of its use [321].
The empirical work conducted in Chapter 4 focuses on studying the Quality of Service
of two Unity 3D [254] web-based virtual worlds depicting the DH reconstruction of
the Caen township created for the Timespan Museum & Arts Centre in Helmsdale,
Highland, Scotland. The reconstruction depicts how the Caen township looked like
in the pre-Kildonan clearances era [266]. The QoS study was published in [30].
Two major studies [11, 12], which were conducted after the work was published,
have confirmed the results obtained in our study.
The first work is that of Alatalo et al. [11] who presented VirtualOulu, a photorealistic
2.4. QOS OF THE 3D WEB 55
3D collaborative and immersive virtual world reconstructing the city of Oulu in
Finland. The authors presented the design and implementation of the user interface
based on dynamic unloading of assets which is executed only on demand. This was
done with the aim of reducing the memory consumption of the client device. Digital
sources for the virtual city were acquired by photographing buildings’ facades in
the city, digitising the floor plans and facades and digitising the different open areas
though 3D laser scanning. The system was implemented in the realXtend Tundra
eco-system and used on the server side, the Tundra multi-user server and on the
client side, the WebTundra. The Tundra server & WebTundra function on top of the
WebGL library Three JS.
The authors have also conducted QoS measurements on the user interface of
VirtualOulu in terms of download times, memory consumption, GPU consumption
& number of HTTP requests, and frame rate on 3 different devices (i.e. laptops)
with different graphical capabilities at different stages of navigation in their system
(bird eye, stationary position of the avatar in street view mode and avatar walking
a particular route). In addition, measurements were taken on different network
connections simulated by throttling download speeds in Google Chrome Developers’
tools to fit estimated downloads in Finland simulating 3G, 4G and xDSL connections.
The work in Alatalo et al. [11] addressed the problem of large amount of data to be
downloaded to clients by: creating first a lightweight bird’s eye view of the whole
3D environment that has the ability of loading fast. In addition, they advocated not
to use large textures for web usage. These ideas have been proposed before in our
work presented in Chapter 4 and in the resulting published work in [30].
As will be shown in the QoS experiments presented in Chapter 4, a 60 FPS rate can
be achieved in regions which are low on graphical details and where the avatar is idle.
This FPS leads to a very good user experience. However, when the avatar navigates
in the VitualOulu case toward complex regions while loading and unloading assets
into memory, frame rates suffer and are reduced to less than 5 FPS, at this stage the
authors realised that the environment becomes unusable. These observations and
results confirmed the study conducted in Chapter 4.
Alatalo et al. [12] in another work also published after the study conducted in
Chapter 4 was published, explored the maturity of the 3D Web technologies in
the domain of urban planning. They assessed different Unity web builds in two
real world case studies. They studied on a technical level the download times,
56 CHAPTER 2. LITERATURE REVIEW
runtime performance and memory use. They assessed the general feasibility of
3D Web technologies in the domain and discipline of web-based urban planning by
studying qualitative feedback responses obtained from participants based on users’
expectations of the system usability and response times. Similar low FPS were seen
on the Surface pro device used in their experiment, in which the authors realised
that the world becomes sluggish especially in the case of a graphically complex
scene (Serge Park Scene) reaching as low as 2 FPS. The authors found that native
builds of Unity meaning the Web Player plug-in build runs 2 to 5 times faster than
the WebGL counterpart. Results of QoS metrics in Chapter 4 & in [30] showed
before their study that the Unity web player outperforms the WebGL counterpart.
Another work that studies the QoS of 3D Web worlds mainly the frame rate metric is
that of Stamoulias et al. [387] which evaluated the relationship between the number
of rigid bodies and the frame rate inside X3D models rendered using the X3DOM
(WebGL renderer) framework and the ammo.js physics engine. They used four web
browsers for their benchmark experiments on a personal computer: Google Chrome,
Mozilla Firefox, Opera and Maxthon. The results show that the higher the number of
rigid bodies, the lower the FPS would be reaching almost 0 for numbers above 1000.
Llorach et al. [252] presented a 3D visualization of the paths of 1700 participants
of massive virtual regatta using an HTML5 and WebGL virtual globe on the web.
The 1700 participants were part of an online game for the Barcelona Race 2015.
The authors measured the relationship between the number of vertices along
participants’ paths versus the frame rate.
Sánchez et al. [351] studied two 3D Web technologies used in industrial applications:
O3D and X3DOM. They conducted two benchmark tests where they captured in
the first benchmark the worst case and best case frame rate of a complex scene of
15000 geometrical nodes using technologies such as O3D and X3DOM. The second
benchmark consisted of the creation of cubes in the scene using transform nodes.
From the results obtained, O3D outperformed X3DOM with higher frame rates.
Araujo et al. [22] evaluated a web-based simulation of a city built using Java 3D
and X3D. They measured the average frame rate (FPS) every time ten objects (cars)
were added to the 3D scene. They observed that each time a new car is added to
the scene, the frame rate drops during the loading of the geometries and textures.
The frame rate is obtained while the objects are visible but when the objects are
hidden the frame rate would reach a capped FPS of 60 which constitutes an optimum
2.5. QOE OF THE 3D WEB 57
performance in web browsers.
Finally, Kostadinov and Vassilev [230] measured download times of a world depicting
a reconstruction of the fortress of the medieval town Cherven built using the X3DOM
framework and Java OpenGL though the proxy of Java applets. The devices used
were two mobile phones, one tablet and one personal computer.
The following section is an exposition of relevant material pertaining to the study of
QoE which is one of the subjects of Chapter 5.
2.5 QoE of the 3D Web
Quality of Experience (QoE) can be defined as:
“the degree of delight or annoyance of the user of an application or
service. It results from the fulfilment of his or her expectations with
respect to the utility and/or enjoyment of the application or service in
the light of the user’s personality and current state.”
Qualinet White Paper on Definitions of Quality of Experience (2012) [243]
Another definition of Quality of Experience given by the International Telecommuni-
cation Union (ITU-T) Study group as:
“The overall acceptability of an application or service, as perceived
subjectively by the end user.”
ITU-T Study Group 2007 [204]
Both definitions agree on the fact that QoE is a discipline that echoes the subjective
perception of a service or application from the perspective of the users. QoE
attributes are quality metrics that can be measured subjectively. Common QoE
categories in the literature are: Usability, Perception of Fidelity, and Reputation
of a Service or Application [232]. In the context of the 3D Web, the perception of
immersion and presence [395], can also be added to the list.
It is shown that in certain contexts users spend 50% more time on a web site
that contains interactive 3D models than 2D images with page views significantly

58 CHAPTER 2. LITERATURE REVIEW
increased [199]. Yoon et al. [437] have tested the impact of interactive 3D graphics
user interaction and usability in comparison to 2D graphics trying to understand the
3D Web from interdisciplinary views of technology acceptance, sense of presence
and Human Computer Interaction (HCI). Their study showed a clear benefit of the 3D
Web in the context of market research on consumer product demonstrations. Kelle
and Garcıéa [218] proposed a model for usability/accessibility evaluation metrics
and methods for assessing Web 3D social applications. The concept of experience is
thus an evolving area.
Despite the benefits of the 3D Web, there is still a scarcity of research on assessing
systematically the 3D Web in terms of Quality of Experience. In addition, there is
a need to assess subjective and objective visual quality assessment metrics of 3D
models on the web and more holistically a need to be able to assess these metrics
on web-based virtual worlds.
This thesis contributes to further the understanding of QoE of 3D digital heritage
models on the web in terms of perception of fidelity thresholds. The study is
presented in Chapter 5.
Some researchers have tackled the scarcity of assessing the 3D Web from an
information quality perspective. Hassanian-esfahani and Kargar [186] have assessed
the 3D Web from a descriptive approach of Information Quality (IQ) by proposing
information quality aspects based on informational attributes of the Web3D. They
pointed out that there is indeed a lack of awareness of 3D Web information quality
issues and the need of assessing the quality of 3D Web information which requires
new methods and techniques more suitable to the nature of such environments.
Section 2.5.0.1 covers studies from the literature on perception of fidelity of 3D
models. Such studies are relevant to the perception of fidelity experiments conducted
in Chapter 5. Section 2.5.0.2 presents usability studies conducted on 3D Web
applications in the DH field.
2.5.0.1 Fidelity Perception
Research has been undertaken to assess objectively and subjectively 3D static and
dynamic models but the majority of those research studies were completely separate
from a 3D Web context. Although some of them have used Web3D tools in their
subjective tests, the usage of such tools was not an aim in itself. The majority of
2.5. QOE OF THE 3D WEB 59
cases involved measuring the effect of certain graphical algorithms on distorted 3D
models. No research has tackled assessing the fidelity of visual perception of 3D
models on the 3D Web in terms of discovering perception thresholds.
The work in this thesis, particularly in Chapter 5 and which is published in [28],
is the “first” to investigate subjective perception of fidelity (i.e levels of detail)
thresholds (both upper and lower thresholds) of 3D digital heritage models on the
web. We believe the perception of fidelity work opens the door to a completely new
field for digital heritage and for 3D Web quality studies.
Knowing upper and lower resolution thresholds on different devices is pertinent
to achieve a trade-off between fidelity and performance of 3D Web content, and
thus results in improving the overall performance and user experience of web-based
virtual museums. This will be detailed further in Chapters 5 and 7.
Outside a 3D Web context, Guo et al. [181] evaluated the subjective perceptual
quality of textured 3D mapped models using a paired comparison protocol (2 stimuli
side by side) on video sets of 136 texture and geometry distorted models of 5
reference models on a total of 101 subjects. They also proposed two new metrics for
visual quality assessment of textured meshes. Their interface was developed as a
web platform using JavaScript.
Corsini et al. [91] studied the problem of assessing distortions produced by
watermarking 3D meshes. Watson et al. [425] and Rogowitz and Rushmeier
[339] focused on studying simplification algorithms using a double stimulus rating
scenarios where the subjects rate the fidelity of simplified models in comparison
with original ones.
We refer the reader to a recent survey [242] on objective and subjective visual quality
assessment in computer graphics in 2D and 3D outside the 3D Web eco-system. The
survey in [242] presented many studies on key image quality metrics and 3D model
quality metrics found throughout the literature.
Another sub-field of QoE is the study of the usability of systems. The following is a
review of some examples from the literature of studies conducted on the usability of
3D Web applications in the DH domain.

60 CHAPTER 2. LITERATURE REVIEW
2.5.0.2 Usability of DH applications
Usability can be defined as follows:
“The extent to which a product can be used by specified users to achieve
specified goals with effectiveness, efficiency and satisfaction in a specified
context of use.”
International Organization for Standardization (ISO 9241-11:1998) [211]
Applied to web technology, this means providing the user with easy to use, easy
to learn and easy to remember web interfaces. According to Jacob Nielsen [291],
usability has five quality components that help define it: learnability (how easily do
users accomplish tasks when they first encounter them?), efficiency (how quickly
can they perform those tasks?), memorability (how easy it is to remember the tasks
after not using them?), the number of errors users make and finally satisfaction (how
pleasant do the users find the system?).
The major trait of a well-designed system is that it minimises the use of instruction
manuals. A system is usable when it requires a minimum use of instructions given
to the user in order to operate it [294].
Usability of 3D models and environments on the web has been studied in the
literature. Sylaiou et al. [395] presented a usability study on the ARCO project based
on an existing gallery from the Victoria and Albert Museum in London. The focus of
this work was to explore and understand the participants perceived sense of “being
there” or sense of presence and of their enjoyment both in virtual and in augmented
reality modes. In addition, the study measured the intuitiveness of the web-based
system and the naturalness of the control. Participants completed a standardised
presence questionnaire related to perceived realism of digital heritage artefacts as
well as their perceived presence in the WBVW. They recruited 29 paid volunteers
(16 males and 13 females between the age of 19 and 33) mainly undergraduate
and postgraduate students. The users were asked to perform specific tasks and to
answer questions afterwards.
Carrozzino et al. [72] took feedback from 50 Internet volunteers to check the quality
and the usability of 3D methods in CH applications on the web. 22% abandoned the
DH applications before finishing the navigation of the environments, due either to

2.6. ADAPTIVITY OF THE 3D WEB 61
frustrations in installing web browsers plug-ins or incompatibility of these plug-ins
with users’ browsers. Some stated that the navigation and the download time of
applications are taking too long.
Bacim et al. [26] described a usability study of a web-based learning system dubbed
as SAFAS (Structure and Form Analysis System) that teaches the relationship
between form and structure in long-span systems. Jankowski and Decker [208]
ran a usability study on the 2LIP system, a virtual 3D Web encyclopaedia. They
recruited 14 participants with normal and corrected to normal vision. Three of them
were female. The study showed that 2LIP provides users with a better experience
and has a positive effect on their visual and associative memory.
Another usability study on 3D Web was conducted by Tait et al. [397]. The
participants navigated an interactive web-based virtual 3D environment and provided
commentary and feedback on their experience in terms of usability and functionality
of the system. Their sessions were video recorded and qualitative thematic analysis
was conducted on them.
The following section details adaptivity approaches for the 3D Web. This section
is germane to the work reported in Chapter 7. A comparison between Hannibal
(the adaptive engine) and the approaches presented in this section are elucidated in
Section 7.2, Chapter 7.
2.6 Adaptivity of the 3D Web
Most existing 3D Web systems suffer from latency (data download time) and lack of
adaptation of levels of details of 3D content to different transmission networks and
hardware and software capabilities of end devices [241].
Handling 3D Web content has to support the shift from users relying on desktop
standalone, fixed and resourceful machines towards the usage of the web and mobile
devices [38]. When it takes too long time to load 3D content on a web page, it
is declared unresponsive by today’s web browsers standards which means users
may cancel the rendering attempt [248]. This lack of response presents a usability
problem.
The problem of adaptivity of 3D Web content across heterogeneous client devices
and network regimes is contextualised in the following salient points:
62 CHAPTER 2. LITERATURE REVIEW
• Stress on the client device: The memory limitation of mobile devices, and the
memory constraints imposed by mobile web browsers.
• Stress on the network: rendering large number of 3D meshes result in a large
number of network requests.
Different approaches have been suggested in the literature to achieve adaptivity
of 3D Web content. Nevertheless, many of them solved aspects of the challenges
while exaggerating others. The following sections present a detailed survey of the
approaches adopted by researchers.
2.6.1 Network-Based Solutions
2.6.1.1 Streaming
The following sections discuss the different streaming approaches used for achieving
adaptivity of 3D Web content.
Progressive Streaming
This type of streaming transmits lower-quality graphics and texture data and then
follow that by transmitting refinements. Two examples of such approach are
contextualised in the works of Scully et al. [359, 360] who attempted to solve both
the network problem and to a certain degree the challenge of graphical capability
of client devices. They focused on finding a solution using mainly video memory
in X3DOM environments built on top of 3drepo.io [117, 359], an open source 3D
revision control system for building information modelling. There were many efforts
to create a suitable 3D format for transmission. Despite the fact that users wait
for considerable amount of time to download 3D assets in CAD editors, they expect
instant rendering of 3D objects in their web browsers. In order to create a better
user experience, the authors advocated the use of a 3D streaming transmission
format with progressive encoding methods.
Scully et al. presented a novel technique for transmitting glTF 3D assets in the 3D
Repo. The technique involved extending glTF to stream data in binary buffers using
progressive encoding techniques. In addition, it introduces into the format multi-part
optimizations so that similar gouging of smaller meshes are gathered together into

2.6. ADAPTIVITY OF THE 3D WEB 63
a super-mesh and sent on the wire thus reducing the amount of transmission time
and the amount of draw calls. This happens in tandem on a parallel thread to the
rendering thread. In addition, they have extended X3DOM so that it supports glTF.
The authors also have investigated memory management devising a new memory
graphics manager aiming to reduce X3DOM video memory requirements with some
success since in terms of memory management, no data is changed upfront only
multi-part meshes block size is changed when sub-meshes are being added or
removed. The 3D models and associated metadata were stored in Binary JSON
(BSON).
Another example in this category is that of Friston et al. [157] who presented a
system to populate dynamically at runtime a Unity environment using X3DOM by
generating dynamically the resources from remote 3D repositories through a ReST
API. They compared their system with the 3drepo.io system, an X3DOM based
Renderer. Unity provides beneficial optimisation not available in common used
WebGL frameworks such as Babylon JS, Three JS and X3DOM outperforming them
but comes bundled with many libraries that present a processing overhead which
affects the display and rendering of assets. Their implementation is based on X3D
but their system can support in the future 3D assets formats like glTF.
The use of MPEG-4 & MPEG-DASH standards
The Moving Picture Experts Group (MPEG) is a working group formed by ISO
to set standards for audio, video and 3D graphics compression and transmission.
The MPEG standards are numerous starting with MPEG 1 in 1993 which was a
compression standard for audio and video only. MPEG-4, which was launched in
1998, integrated 3D computer graphics transmission and compression mechanisms.
Parts 25 and 27 of the standard dealt specifically with that [64].
MPEG Dynamic Adaptive Streaming over HTTP (MPEG-DASH) is an adaptive
streaming protocol for multimedia which was introduced in 2011. The adaptation
is based on network conditions of the client device. The media content is divided
into small segments of different bit rates (i.e. resolutions) and while the content is
being played, the protocol adapts by switching to different bit rates according to the
network conditions and buffer status of the client [382].
The study conducted by Celakovski and Davcev [74], incorporated MPEG4-defined
64 CHAPTER 2. LITERATURE REVIEW
3D content into the real-time rendering engine Microsoft XNA. Their rendering
system implementation can handle graphical hardware in standard PCs and Xbox
game consoles. The aim of the study is to propose a new 3D content based on the
MPEG standard (the .mp4 format). The 3D objects were encoded and then decoded.
Microsoft XNA then visualises the decompressed MPEG-4 3D scene.
This approach has barriers in the sense, that Digital Heritage experts use already
file formats such as Alias Wavefront OBJ, COLLADA and glTF and there is scarcity
of tools to convert and represent a 3D model into an MPEG-4 BInary Format for
Scenes (BIFS) description language. In addition, and more importantly, the graphical
capability of the client could still not cope with the complexity of a large 3D scene,
even if MPEG-4 could facilitate 3D compression and streaming.
Tizon et al. [402] proposed an MPEG-4-based adaptive framework for remote
rendering of video games (please refer to Section 2.6.2.1 for limitations of remote
rendering approaches). The framework which is implemented in the Kusanagi
gaming platform, provides many adaptive approaches that fit with various network
constraints. They have proposed an adaptive algorithm to optimize the quality of the
video encoding based on network conditions of each user. The proposed adaptive
framework which was not implemented yet, proposes using RTP Control Protocol
(RTCP) standards. Their proposed adaptation does not take into consideration the
graphical and processing capability of client devices.
Many authors such as Zampoglou et al. [440], Kapetanakis et al. [215] and Noimark
and Cohen-Or [292] have used a form or another of adaptive streaming of complex
Web 3D scenes based on the MPEG-DASH standard to MPEG enabled devices.
Nevertheless, all of these approaches do not solve the client capability challenge
and instead focus more on finding a solution for the network challenge.
Kapetanakis et al. [215] presented an implementation which they developed to
bridge the X3DOM and MPEG-DASH technologies. Thus allowing the delivery of
high resolution video stream (video textures) adaptively on top of 3D models.
2.6.1.2 3D Meshes Compression
3D mesh compression is a mechanism that reduces the total data size of a model,
thus minimising the 3D data sent on the wire. Many types of algorithms were
proposed in the literature [259], each one has a different compression rate in terms
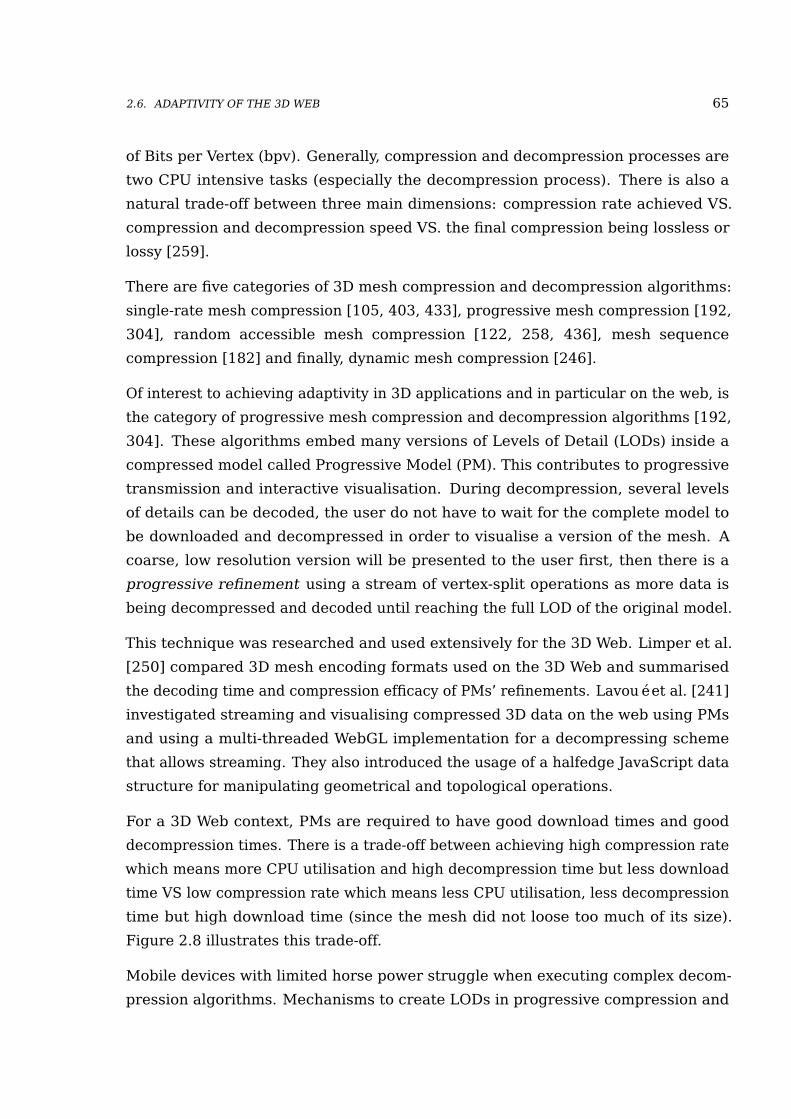
2.6. ADAPTIVITY OF THE 3D WEB 65
of Bits per Vertex (bpv). Generally, compression and decompression processes are
two CPU intensive tasks (especially the decompression process). There is also a
natural trade-off between three main dimensions: compression rate achieved VS.
compression and decompression speed VS. the final compression being lossless or
lossy [259].
There are five categories of 3D mesh compression and decompression algorithms:
single-rate mesh compression [105, 403, 433], progressive mesh compression [192,
304], random accessible mesh compression [122, 258, 436], mesh sequence
compression [182] and finally, dynamic mesh compression [246].
Of interest to achieving adaptivity in 3D applications and in particular on the web, is
the category of progressive mesh compression and decompression algorithms [192,
304]. These algorithms embed many versions of Levels of Detail (LODs) inside a
compressed model called Progressive Model (PM). This contributes to progressive
transmission and interactive visualisation. During decompression, several levels
of details can be decoded, the user do not have to wait for the complete model to
be downloaded and decompressed in order to visualise a version of the mesh. A
coarse, low resolution version will be presented to the user first, then there is a
progressive refinement using a stream of vertex-split operations as more data is
being decompressed and decoded until reaching the full LOD of the original model.
This technique was researched and used extensively for the 3D Web. Limper et al.
[250] compared 3D mesh encoding formats used on the 3D Web and summarised
the decoding time and compression efficacy of PMs’ refinements. Lavoué et al. [241]
investigated streaming and visualising compressed 3D data on the web using PMs
and using a multi-threaded WebGL implementation for a decompressing scheme
that allows streaming. They also introduced the usage of a halfedge JavaScript data
structure for manipulating geometrical and topological operations.
For a 3D Web context, PMs are required to have good download times and good
decompression times. There is a trade-off between achieving high compression rate
which means more CPU utilisation and high decompression time but less download
time VS low compression rate which means less CPU utilisation, less decompression
time but high download time (since the mesh did not loose too much of its size).
Figure 2.8 illustrates this trade-off.
Mobile devices with limited horse power struggle when executing complex decom-
pression algorithms. Mechanisms to create LODs in progressive compression and

66 CHAPTER 2. LITERATURE REVIEW
Figure 2.8: Trade-off between compression rate vs download time vs decompression time
decompression algorithms work by either using edge-collapse decimation or by
using the technique of vertex removals of the mesh [259] normally followed by some
method to restore lost vertex data (like patch retriangulation).
The idea of storing and compressing many resolutions or LODs into one single
file is not new. It was used before in image formats such as FlashPix [162] and
JPEG2000 [399]. JPEG2000 is a progressive image file format. The disadvantages of
such a technique is the demand of more computational power for the decoding and
encoding and as one can deduce, another disadvantage is that the resulting file size is
considerably bigger than the size of a file containing only the compressed maximum
resolution. In addition, the two image formats were never widely adopted on the web.
It is also pertinent to mention that JPEG2000 [399] has progressive transmission
by pixel which allows users to view a coarse low resolution version of the image as
long as a small part was downloaded. The quality keeps improving with more data
downloaded and decoded. One can only see the similarities between progressive
3D mesh compression and JPEG2000 image compression scheme. JPEG2000 is
used by many cultural heritage applications due to its main feature of storing many
LODs [378].
The advantage of progressive 3D mesh compression/decompression is mainly in
terms of rationalisation of network resources in the sense of minimising bandwidth
consumption. Despite the fact that many LODs are stored in the model, the technique
provides the luxury of seeing the model almost immediately although at a low
resolution.
There are mainly two disadvantages for such algorithms. First, the user can not
access a specific part of a very large mesh before the mesh is completely downloaded
and decompressed. Second, if the highest LOD can not be supported initially on
a client device due to limited hardware and software capability, progressive mesh
compression and decompression will fall into the same problem when the model will
2.6. ADAPTIVITY OF THE 3D WEB 67
reach after a period of time the original resolution [259]. The first disadvantage is
solved by random access compression progressive algorithms like the ones presented
in [122, 258]. The second disadvantage remains an open question.
In the Context of 3D Web
Lavoué et al. [241] used a progressive compression algorithm and a new JavaScript
data structures (halfedge JavaScript structure) for the remote streaming and
visualisation of 3D data on the Web. The approach involved implementing a complex
geometry processing technique directly integrated into JavaScript using multi-
threaded mechanism for progressive streaming and decompression into levels
of details (LODs). They based their implementation on the Three JS WebGL
Library. They proved in this work, a gain in removing latency and in providing
an approximation of a 3D model shortly with arriving data even for high resolution
vertices models. The authors developed tools using Web Workers, Arrays Buffers,
and a Three JS implementation of a halfedge JavaScript structure. The disadvantage
of their method is that it is CPU intensive. In addition, they did not address the
problem of high resolutions on limited client devices.
2.6.1.3 Using Peer to Peer
Peer to Peer (P2P) communication in a web context is achieved through the use of
WebRTC [430]. The protocol allows web browsers to communicate in a peer to peer
bidirectional manner. Few researchers in the literature tried to use this technique in
order to achieve adaptation of virtual 3D scenes.
An example of P2P approaches is used by Desprat et al. [112], who proposed a
framework for collaborative virtual environments called 3DEvent that allows the
collaborative manipulation of 3D content in real-time on the web. The communication
architecture used is an event-based history aware Peer to Peer delivery of dynamic
3D content via WebRTC. The system can provide through the benefits of event-based
approach adaptation and personalization of complex 3D.
The problem with this approach is that first WebRTC support in web browsers is still
very limited and the protocol is still a young communication technology. Second,
the 3DEvent handles scenes of very small models (less than 15MB) but not bigger
models. The choice of bigger models if not resolved by the developer will introduce
68 CHAPTER 2. LITERATURE REVIEW
more processing. Nevertheless, the authors argue that P2P eases the “absorption of
traffic” in comparison to the client/server paradigm. The authors tried to solve the
network problem by comparing Client-Server approaches to P2P approaches but the
problem remains lopsided in the sense that it is at best considered a solution for the
network challenge but not for the graphical capability challenge of client devices.
Another P2P approach involves the usage of P2P WebTorrent transmission. An
example of that is the work of Hu et al. [194] who proposed a new fine grained
preprocessing procedure for dealing on the server side with WebVR scenes. In
addition, they proposed a packaging mechanism and a P2P WebTorrent transmission
suitable for mobile Internet bandwidth. Their solution is based on merging
techniques for light-weight progressive transmission and WebTorrent based P2P
transmission. Unfortunately with this approach, the time of download/load is higher
with it than without it especially for lower number of users (such as less than 30).
Above that number of users, the opposite becomes true. Another limitation of
this approach is the fact that even if large WebVR scenes have been downloaded
successfully, it is still impossible to render them in real time on web browsers due to
weak computing capability of some client devices.
The following section details different adaptivity approaches pertaining to client
capability solutions found in the literature.
2.6.2 Client Capability Solutions
This section addresses the challenge of letting commodity mobile devices even old
and deprecated Personal Digital Assistants (PDAs) render complex and large 3D
models. In other words, how the challenge of rendering 3D models on limited
graphical capability devices was addressed by researchers?
2.6.2.1 Remote & Mixed Rendering
The simplest definition of “Remote Rendering (RR)” is rendering all the 2D or 3D
graphics on one computing machine known as the rendering server while visualising
the result or the outcome on other computing machines. All machines are connected
through a network. An “interactive remote rendering” system is a system capable of
accepting user controls from input devices [367].
2.6. ADAPTIVITY OF THE 3D WEB 69
RR was used extensively for 2D graphics in systems that share remote desktops
and applications’ elements (as an example, Virtual Network Computing (VNC)
clients such as TightVNC [165]). 3D Remote rendering applications are a lot more
complex than their 2D counterparts and usually refresh the screen at a much higher
rate [367].
RR was used as a realistic approach for achieving adaptivity of 3D content on the
web [334, 385, 435], in the sense of providing a solution for the problem of incapable
client devices with limited hardware and software resources. In fact, compared to
traditional approaches where the rendering happens locally on the client machine,
the biggest selling point of “Remote Rendering” is the fact that it actually solves the
problem of low computational power or graphical capability of “thin client devices”
such as mobile devices since with this technique very complex 3D models could
be visualized easily on these types of client devices even on devices with no GPU.
The client device in this situation, is used only for remote visualisation acting as a
front-end that sends control signals from user input to the server. All the storage
and 3D computations happen on the server side [226, 367]. Another advantage is
the ability of a remote rendering system to be cross-platform, in the sense that once
client programs are developed and deployed, the same quality of 3D rendering could
be actualised on all the client systems [367]. In lay terms, this means that RR allows
the possibility of mobile devices with very limited capabilities to consume 3D content
of a quality similar to that rendered on powerful computers with powerful graphics
cards.
Yet another advantage can be mentioned, which is the fact that RR helps preventing,
a-priori, piracy of 3D content by malicious users. Remote Rendering provides a good
level of copyright protection of 3D models and 3D environments since users do not
have the 3D content stored on their machines but can only access the 2D images or
video streams rendition of the 3D content. One example of such system is actualized
in the ScanView Remote Rendering system of Koller et al. [228] and DeepView from
IBM [225].
RR has many prominent disadvantages. First, it stresses considerably on the demand
of network bandwidth [367], in addition to the problems of long interaction latency
and sporadic images or video frames bitrate [402]. “Interaction Latency” is defined,
in the context of RR, as the time it takes for the appearance of the first updated frame
on the client device screen after a user interaction request was sent to the renderer
server (from per example, input devices like mice, keyboards, touch screens or game
70 CHAPTER 2. LITERATURE REVIEW
controllers). Long interaction latency leads to bad performance and lower QoE. It is
shown in interactive first person shooting games that a latency higher than 100ms
is considered intolerable by users [39].
Second, no off-line usage of a 3D model is possible compared to other approaches
in which users can interact with it while off-line meaning after the 3D model is
completely downloaded or progressively streamed [226].
Third, Remote Rendering is not very beneficial in 3D environments where continuous,
dynamic and real-time visualisation is required such as 3D walk-through, virtual
environments with avatars and VR applications designed for exploring large
archaeological sites [226]. However, this is changing lately with the advent of
on-line cloud gaming services which can host games and 3D environments. One
prominent example is GamingAnywhere [196], an open source cloud gaming service
which sends to the clients, video streams of games of 720p High Definition (HD)
quality or even a higher quality, if needed, while achieving a frame rate > 35
FPSs [195].
A fourth disadvantage is that complete remote rendering requires a capable server
with a powerful GPU to handle all the processing load and interaction commands
from the clients. Scalability and delay can also constitute serious issues especially if
the RR system has to serve a big number of clients [367].
Table 2.5 is a table that summarises the pros and cons of the remote rendering
approach for adaptivity of 3D Web content.
Table 2.5: Pros and Cons of Remote Rendering
Advantages Disadvantages
Low computational devicescan see 3D
Consuming a lot of bandwidth
Privacy and copyright protection High Interaction Latency
Same 3D rendering quality No offline usage
Need powerful server
In what follows, a cursory exposition of the types of RR found throughout the
literature is presented.
2.6. ADAPTIVITY OF THE 3D WEB 71
Complete Remote Rendering
A technique proposed by many researchers such as Lamberti et al. [240], Diepstraten
et al. [115], Quax et al. [333] and Doellner et al. [119] which keeps the 3D scenes
rendering load on the server while the client plays the role of receiving rendered
images. The idea is similar to the one used by VNC viewers.
RR allows devices with limited resources such as smart phones and tablets to render
large models. This requires large amount of bandwidth and network resources [335].
According to Räsch et al. [335], latency can be compensated when viewing 3D
artefacts in Depth-Image-Based Rendering, and by using and transmitting G-Buffers.
The drawback of this approach is that G-Buffers have very high size at least twice as
much data as an image. In this work, Räsch et al. propose a method to compress
the G-Buffers thus allowing efficient decoding which runs on the GPU directly and
suitable for web applications. They used only WebGL for their implementations.
WebSockets protocol was used to stream the compressed G-Buffers in the form of
binary frames sent to the client device.
Their method applies a bespoke compression method in addition to using the
compression methods available in the WebSockets protocol. They call the combined
method: Sampling Compression. The result of compression ratios (i.e size of the
compressed data relative to the uncompressed) is between 8% and 11%. The authors
developed an algorithm to compress G-Buffers, and executed test cases to compare
compression rates.
Nevertheless in such approach, bandwidth and latency remain two challenges to
address. In addition there is a need for enough computing power to accommodate
all the decompression overhead on the client.
The nature of transmitted data between the client and the server in RR varies
between being graphics commands, 2D pixels, 2D primitives, 3D vectors, single 3D
objects or multiple 3D objects.
Pixels For this type of data, the rendering has to happen on the server. The
server renders the 3D scene as 2D pixels, and send them to the client. These pixels
could be encoded differently for the sake of the client consumption. Lamberti et al.
[240] per example, proposes an accelerated remote graphics architecture for PDAs
by having a cluster of PCs do the rendering of parts of the images that are sent to
72 CHAPTER 2. LITERATURE REVIEW
the PDAs. On the PDA side, the user can interact with the 3D scene rendition. They
encoded the 2D rendered images as a video stream sent to the client. Aranha et al.
[21] for example have used only 2D still images. In other types of systems such as
that of Simoens et al. [371], a hybrid approach in complete remote rendering is used.
If the 3D content is static, 2D pixels are sent to the client. If 3D scene content has
many animations or motion, h.264 video is sent to the client. This would minimise
the Latency constraint especially with animated 3D content.
Primitives or Vectors Other scholars have proposed sending primitives or
vectors to the client. The client in this situation plays a certain role in rendering.
Feature extraction techniques are utilised in order to extract vectors from the scene
and then send them to the client device to render them either in 2D akin to the
system developed by Diepstraten et al. [115] which generates a simplified model
from a group of line primitives for clients that have no graphical capability at all; or
to be rendered in 3D akin to the system of Quillet et al. [334], which uses this type
of rendering approach for remote visualisation of large city 3D models on the web.
Graphics Commands Streaming One of the techniques of RR employs the
use of graphics commands as data interchange between the server and the client.
Low level draw calls or operations between the server application and its own
graphics card are intercepted and sent to be rendered on the client [198, 286].
Partial, Mixed and Combined Approaches
In partial or mixed rendering, part of the rendering happens on the client side
while other rendering processes occur on the server side. In particular, the scene
rendering remains on the client side but processes such as baking which computes
light-maps, textures, lights, and reflections are computed on the server side.
A pertinent example of such system can be seen in Spini et al. [385]. In Spini’s
approach, the baking service is on the server implemented as Node JS and Express
Web server which receives the scene from the client as a JSON file and Three JS
for the authoring and exploration tools. The authors introduced a novel 3D work-
flow designed to address the need of VR users. Their work-flow incorporates the
authoring and production of quasi photo-realistic 3D content. They use a mixed on
demand remote rendering approach, which is different than traditional approaches
2.6. ADAPTIVITY OF THE 3D WEB 73
as the scene rendering remains on the client-side instead of the server. Geometry
data are stored in binary buffer files and the textures and image maps are presented
as base64 URLs in the JSON file.
As a side effect to the baking service on the server, the strain on bandwidth demand
remains an important issue in Spini et al. [385] approach.
Another adaptivity approach of interest for CH and 3D Web is that of Frame by
Frame View Dependent Rendering. This stems from the fact that such technique
aims to render high resolution 3D digital heritage models in web browsers.
Frame by Frame View Dependent Rendering is a method utilised by 3DHOP [330–
332] tool, which is built on top of the Nexus Multi-Resolution meshes engine [329].
The system is dedicated to view very high resolution 3D meshes and point clouds
(above the 50M faces) on the web. It is targeted for specialists who require to view
such high resolution models for scientific inquiry (i.e. specialists that need high
zooming capabilities on rendered frames of hotspots to detect minute features in
artefacts). It can also be used in kiosks with large interactive displays in-situ inside
a physical museum [332].
The 3DHOP system is not a universal platform that can support any visual project
but specifically designed to achieve the needs mentioned above. It can not manage
3D complex scenes with many 3D objects. It is based on using Progressive Multi-
resolution meshes of the format that is only specific to the Nexus framework (.nxs).
It can take a large mono-resolution file format in .ply extension and then through a
set of many processes, transform that mono-resolution file into a Multi-resolution
progressive .nxs file (which can be further compressed if the resulting file is massive
in size) [358]. Concerning the WebGL viewer, 3DHOP based their implementation
on using SpiderGL [113], although recently support was added for the Three JS
Library [116].
3DHOP on top of the Nexus system is a visualisation technique based on view
dependent rendering. View dependent means the chunk rendered depends on the
observer position view, the orientation of the user camera and the distance from
the 3D model. In addition, the technique uses multi-resolution progressive mesh
transmission. It solves the problem of limited graphical capabilities of the client
devices due to the type of rendering used. The assumption of the system is based
on it not being targeted for casual WBVM users since perception of fidelity of 3D
models above certain thresholds could not be noticed any more even with extreme

74 CHAPTER 2. LITERATURE REVIEW
zooming on commodity devices screens. The tool is more targeted for specialists for
whom the visualisation of extremely high fidelity models is an aim in itself.
Many problems still need fine-tuning in frame by frame view dependent rendering.
Despite the fact that the small “observed” chunk of the 3D mesh is the only part
being streamed to the client device, the same part or chunk when viewed again could
be totally resent or streamed to the client especially if the receiving web browser
disabled caching thus exaggerating the demand on bandwidth in such cases. In
addition, the quality of presentation or fidelity is not good as many parts of the 3D
mesh get stuck on certain LODs especially on LODs of low resolution. In addition,
view dependant rendering systems have a serious limitation of increased runtime
load since they aim to choose and extract a certain resolution at runtime which is a
CPU-intensive operation. This also leads to low frame rate [253].
It is pertinent to mention that, at the time of writing, all the major on-line social
3D repositories such as Sketchfab, Google Poly and Microsoft remix3d only support
mono-resolution formats such as Wavefront OBJ, Collada, gLTF, ply, vel cetera. These
platforms do not support multi-resolution meshes of any kind yet.
2.6.2.2 Divers 3D Mesh Optimisations
Gobbetti et al. [166] introduced a remote rendering approach to convert large input
textured geometric meshes into multi-resolution representations of quad patches
of equal sizes while preserving the information necessary about vertices, colours,
and normals, and storing them in an image format. They optimised the rendering of
the meshes by using mip-map operations and tightly packed texture atlas to enable
multi-resolution.
The following section surveys few semantic ontologies pertaining to digital heritage
and 3D modelling. This section is relevant to the work reported in Chapter 6.
2.7 Digital Heritage & 3D Modelling Semantic
Ontologies
In Chapter 6, the Virtual Museum Quality of Service Ontology (ViMQO) is proposed
to fill the gap of many ontologies found in the literature that lack the expressiveness

2.7. DIGITAL HERITAGE & 3D MODELLING SEMANTIC ONTOLOGIES 75
when it comes to QoS metadata in a WBVMs context.
Two important ontologies relevant to this thesis: Dublin Core Schema (DCS) and
Europeana Data Model (EDM) are discussed in Chapter 6, Sections 6.3 and 6.4
respectively. In this chapter we survey ontologies germane to Chapter 6 mainly the
ones describing 3D Web models or the ones used in the domain of WBVMs.
Section 2.7.1 describes a common ontology for cultural heritage holdings. Sec-
tion 2.7.2 presents the ARCO project ontology, an ontology for virtual museums.
Section 2.7.3 is an exposition of 3D Web ontology for X3D format. Both Sections 2.7.2
and 2.7.3 are similar to the work done in Chapter 6.
The proposed ViMQO ontology in Chapter 6 is unique in the sense that it is the first
ontology to focus on the QoS metadata pertaining to 3D models in web-based virtual
museums. The proposed ontology encompasses the DC and EDM ontologies and
can be extended to support a myriad of QoS-related metadata for other multimedia
found in a WBVM context.
The following sections presents CIDOC-CRM, an ontology used to describe cultural
heritage artefacts.
2.7.1 CIDOC-CRM
CIDOC Conceptual Reference Model (CRM) [51, 201] is an ISO certified event
centric empirical ontology for describing concepts and relationships pertaining to
the cultural heritage domain.
CIDOC-CRM has many extensions such as CRMig to document provenance of
artefacts in addition to authors, locations, time, and methods used to produce
the artefact [353].
CIDOC-CRM lacks expressiveness in terms of QoS-related metadata needed for
adaptivity in WBVMs and this is due to the fact that the ontology describes CH
artefacts on a high level and does not specify technical characteristics of 3D models
or environments useful for achieving adaptivity in the context of this thesis.
76 CHAPTER 2. LITERATURE REVIEW
2.7.2 ARCO and ViMCOX
The Augmented Representation of Cultural Objects (ARCO) [427] is a virtual
museum and set of tools. it resulted in the creation of an ontology [46] for
describing metadata of VMs holdings, rooms and buildings. The ARCO metadata
element set is an extension that is based or encompass the DC metadata and the
CIDOC-CRM (Commite Internationale pour la Documentation Conceptual Reference
Model) ontology. The ARCO metadata element set contains different categories of
metadata terms spanning from resource discovery to presentation, curatorial and
administrative metadata. The metadata is implemented in an XML-based format
which allows the tools of ARCO project to use it.
ViMCOX (Virtual Museum and Cultural Object Exchange Format) [47] uses an
enhanced version of the ARCO ontology but supplements it with metadata pertaining
to user-exhibit interactions types. It also encompasses ontologies such as DC,
Learning Objects Metadata IEEE standard (LOM) [84] and SPECTRUM [269], the
UK museum documentation standard. Additional refinements were added in future
versions [48] of ViMCOX ontology to support the description of virtual museum
outdoor exhibitions.
2.7.3 3D Modelling Ontology
The 3D Modelling Ontology [369] is an ontology proposed by Leslie Sikos and aims
to describe metadata for X3D scenes and models from a system perspective. It
is an upper ontology that provides machine-interpretable definitions for 3D scene
annotations. The limitation of this ontology is that it deal only with X3D and X3DOM
and is limited only to 3D models of such types, in other words, in its current form it
does not cover other 3D Web technologies and other WBVMs multimedia and 3D
environments.
ViMQO in a sense aims to be both a WBVM ontology and a 3D ontology in the
same time focusing on providing a vocabulary encompassing QoS-related metadata.
ViMQO is easily expandable to encompass other multimedia of DH nature.
2.8. SUMMARY 77
2.8 Summary
This chapter has provided examples of Web-Based Virtual Museums in Section 2.3
from the literature. The work of this thesis was situated into the context of Web-
Based Virtual Museums. The chapter moved on to talk about the different 3D Web
technologies especially the ones used in DH in Section 2.2. Literature pertaining
to both the QoS and QoE of the 3D Web has been discussed in Sections 2.4 and 2.5
especially the literature germane to both Chapters 4 and 5. Different adaptivity
approaches used for 3D Web content were presented in Section 2.6 contrasting their
pros and cons. Finally, a review of the Digital Heritage semantic vocabularies that
are relevant to this work were presented in Section 2.7. The reader is advised to
refer back to the block diagram (Figure 2.1) in the introduction of this chapter
to investigate further alternative reading paths. The next chapter elucidates
the methodology adopted in this thesis and details the experimental procedures
utilised in the experiments conducted on QoS and QoE of digital heritage 3D web
environments and models.

3Chapter Three
Methodology
This chapter provides an overview of the research methodology adopted
throughout this thesis. It starts by restating the research questions and
briefly describes how they are actualised across the different chapters. The
main aim of this chapter is to provide the rationale behind the research
methods employed in this work. An overview of methodological approaches
is presented showing the research methods employed by relevant studies
in the literature and how and why the work in this thesis embraced such
methods. In addition, it describes all the experimental procedures used for
the empirical studies investigating the QoS of DH Web-Based Virtual Worlds
and the QoS/QoE of 3D Digital Heritage artefacts presented in Chapters 4
and 5.
A large proportion of this chapter appeared in the following peer-reviewed
publications:
1. Bakri, H., and Allison, C. "Measuring QoS in web-based virtual worlds:
an evaluation of unity 3D web builds." Proceedings of the 8th Interna-
tional Workshop on Massively Multiuser Virtual Environments. ACM,
2016. [30].
2. Bakri, H., Miller, A., & Oliver, I. (2018, June). Fidelity Perception of 3D
Models on the Web. In International Conference on Immersive Learning
(pp. 113-130). Springer, Cham. [28].
79
80 CHAPTER 3. METHODOLOGY
3.1 Introduction
The methodological philosophy adopted in this thesis is that of the pragmatism
research philosophy which is based on the tenets that any research inquiry requires
a combination of practical and useful methodological approaches to get a well-
rounded understanding of the world. Pragmatists aim to overcome non-productive
dichotomies such as objectivism-subjectivism in their research and acknowledge that
all knowledge is approximate and incomplete and thus merits combining whatever
research method needed to illuminate the research problem or space that the
researcher is trying to address. They recognise that there are many ways to interpret
the world, and no single point of view or research method can ever give the entire
picture [130, 355]. Deep into the research onion [118, 185, 355], the thesis employs
a mixed methods approach of empiricism: system-level investigations and user-based
studies.
Computer Science is a multi-disciplinary field of study with an identity crisis pointed
out by many scholars in the literature [109, 130, 185, 366]. The field takes and
recycles many research methods from natural sciences, social and behavioural
sciences, engineering and mathematics. This is why the methodology chapter in
many Ph.D theses of Computer Science is either absent or diluted into a form
which would be dubbed by many social and natural science scholars [40, 348, 354]
as mere research instruments or research procedures. Nevertheless, due to the
interdisciplinary nature of this work, we followed research methods that are either
advocated by recommendations [337] or used by studies investigating the QoS and
QoE of multimedia [398] and 3D models [181, 306, 339, 425]. The nature of the
research questions and the types of investigation required to address each one of
them, dictated the research methods that are employed.
A set of empirical studies pertaining to the Quality of Service (QoS) and Quality of
Experience (QoE) of different 3D Web components used in CH context is conducted
throughout the thesis leading to the development of an adaptive middleware engine
which bases its design on the findings of the system-level measurements and those
of the user-based studies. Experiments in Chapter 4 are of quantitative system-level
QoS nature. In a similar vein, empirical studies in Section 5.2 of Chapter 5 are also
of a system-level quantitative nature while Section 5.3 involves user-based studies
of both perception of visual latency and subjective perception of fidelity of Web3D
digital heritage models.
3.2. RESEARCH QUESTIONS AND METHODOLOGICAL RATIONALE 81
This chapter elucidates the rationale behind the methodological approaches em-
ployed in this work. It links back to the research questions asked in Chapter 1, and
this is in order to elucidate and to buttress the choices of the research methods
employed in this thesis which help us to answer such questions. In addition, the
chapter builds on a methodological review showing the research methods employed
by relevant studies in the literature and how and why the work in this thesis
embraced such methods.
The remainder of this chapter is structured as follows: Section 3.2 reminds the
reader of the research questions of this work and how they were actualised in the
different chapters of this thesis. It then proceeds in Section 3.3 with an overview
of most common research methods employed by germane works of adaptivity of
the 3D Web, and by works of QoS and QoE. Section 3.4 presents the experimental
procedures of all the empirical studies conducted in Chapters 4 and 5. Finally,
Section 3.5 summarises and concludes the chapter.
3.2 Research Questions and Methodological
Rationale
In Chapter 2, we addressed the first Research Question RQ1 of this work by
surveying the literature in order to define 3D Web technologies and 3D Web
environments and their usage in digital heritage. 3D Web technologies were
classified into different taxonomies based on four dimensions of 3D Web tools
and languages (Language Paradigm, Installation and Deployment, Rendering mode
and Use case) and those taxonomies coupled with additional survey material are
presented in Appendix C.
Research Question RQ2 involves the investigation, from a system-level perspec-
tive, of the performance of DH WBVWs which will be reported in Chapter 4. This
investigation was published in [30]. This is in order to further our understanding
of the capabilities and limitations of such environments. This chapter will utilise
a quantitative experimental approach involving capturing many system-level QoS
metrics such as the Initial Download & Processing Times (IDPTs), CPU, GPU and
physical memory consumption among others on web-based builds of the Caen
Township virtual reconstruction in Unity 3D game engine. The research method
adopted in Chapter 4 is quantitative. This method was espoused due to the nature of
82 CHAPTER 3. METHODOLOGY
Quality of Service (QoS) which is the study of quality attributes that are measured
objectively such as the execution time, response time, processing time, latency,
throughput, jitter among others of a service or system [232]. Thus it is convenient to
use a positivist quantitative approach which was also used by many relevant studies
in the literature. The research methods of some of the germane studies are briefly
discussed in Section 3.3.
Research Question RQ3 which investigates the relationship (trade-off) between
the QoS and the QoE of 3D Web components used in Digital Heritage across the range
of QoS regimes. RQ3 is addressed in Chapter 5. In order to answer RQ3, the chapter
employs a mixed method approach of quantitative system-level measurements and
user-based studies. The quantitative approach is convenient to use in studying
the QoS of Web3D digital heritage models, and this is due to the same rationale
mentioned in the previous paragraph. The user-based approach is a qualitative
approach that is based on collecting answers from a cohort of participants and
asking them to grade the fidelity (i.e. resolution) of Web3D digital heritage models
using an ordinal scale of rates (i.e. involving intrinsic ranking). The user-based
study also asks the participants to rank the fidelities from the lowest to the highest.
The results were published in [28]. Recall, QoE is defined as how much delight
or annoyance a user perceives in an application or a service. Such judgement
results “from the fulfilment of his or her expectations with respect to the utility
and/or enjoyment of the application or service in the light of the user’s personality
and current state” [243]. The nature of QoE, dictates the usage of qualitative
methodological approaches when studying it. Furthermore, the perception of fidelity
study in Chapter 5 followed methods advocated by multimedia recommendations,
video perception studies, and perception studies conducted on 3D models outside
the web ecosystem. The research methods employed in some of the germane studies
are briefly discussed in Section 3.3. For a detailed discussion of the relevant work on
QoS and QoE, the reader is advised to refer back to Chapter 2, Sections 2.4 and 2.5.
Research Question RQ4 involves investigating how to supplement semantic
vocabularies with information that can help achieve adaptivity of 3D Web content
in WBVMs. RQ4 is addressed in both Chapters 6 and 7. A formal proposal of an
ontology called ViMQO that is RDF-compliant is given in Chapter 6 and this follows
the same approach of formalism used in germane works of other proposed ontologies
discussed in Section 2.7 (Chapter 2). The methodological angle of defining such
ontologies is discussed briefly in Section 3.3.
3.3. METHODOLOGICAL REVIEW OF RELEVANT LITERATURE 83
Research Question RQ5 involves investigating achieving adaptivity in WBVMs
that is cross-aware meaning network regime aware and client device aware while
achieving the best possible user experience (i.e. QoE-aware). This research
question is addressed in Chapter 7 with the design, implementation and evaluation
of Hannibal, a QoS and QoE aware adaptive engine for 3D Web content in
WBVMs. Chapter 7 involves developing software which is categorised in the
literature of computer science methodologies under what is dubbed as the build
methodology [134, 185]. Hannibal is evaluated using a system-level positivist
quantitative QoS approach (mainly in terms of download and processing times of 3D
models), while a user-based evaluation of it was left for a future work.
The very nature of the research questions dictates the research philosophy and
methodological approaches adopted. Many system-level quantitative measurements
are conducted in this thesis with a pure positivist stance [130] while user-based
QoE studies employed a qualitative stance in a controlled experimental setting thus
making it possible to combine the insights of human-based quality perception and
computerised system-level quality of delivery.
The following section presents a cursory methodological review of research methods
employed in some of the relevant literature.
3.3 Methodological Review of Relevant Literature
The thesis adopted a combination of mixed research methods (quantitative system-
level measurements and user based studies). A case in point, two relevant works
for Chapter 4 are the empirical studies presented in [11, 12, 387]. These works
use quantitative system-level measurements to capture different QoS metrics.
Kostadinov and Vassilev [230] is an example of a related study that uses quantitative
system level measurements. This study is relevant to the work conducted in
Chapter 5, Section 5.2 which investigates the QoS of DH 3D models.
Concerning the examination of QoE, many studies have used a user-based method-
ological approach. A few examples can be seen in [181, 339, 425]. In Chapter 6, we
propose ViMQO which we formally define following similar approaches in defining
metadata classes and sub-classes and in terms of the presentation of the data
model akin to the way other proposed ontologies were defined and proposed in
the literature. A few relevant examples can be given are those of the ViMCOX
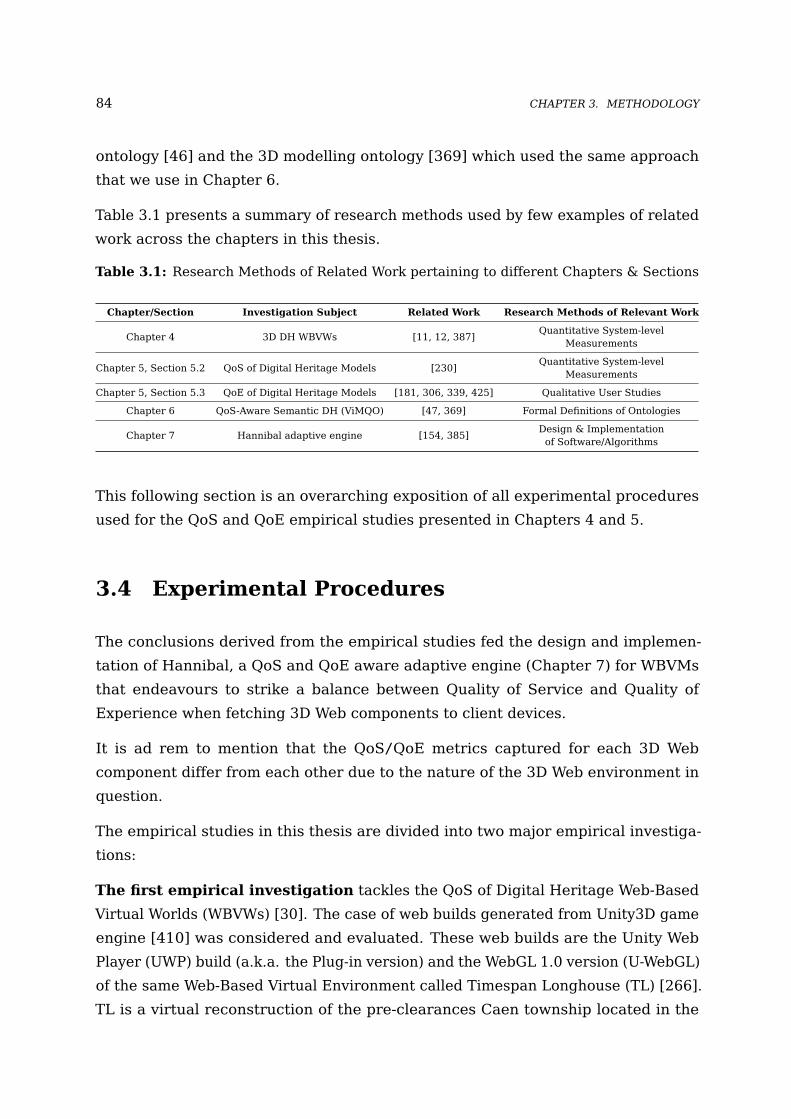
84 CHAPTER 3. METHODOLOGY
ontology [46] and the 3D modelling ontology [369] which used the same approach
that we use in Chapter 6.
Table 3.1 presents a summary of research methods used by few examples of related
work across the chapters in this thesis.
Table 3.1: Research Methods of Related Work pertaining to different Chapters & Sections
Chapter/Section Investigation Subject Related Work Research Methods of Relevant Work
Chapter 4 3D DH WBVWs [11, 12, 387]Quantitative System-level
Measurements
Chapter 5, Section 5.2 QoS of Digital Heritage Models [230]Quantitative System-level
Measurements
Chapter 5, Section 5.3 QoE of Digital Heritage Models [181, 306, 339, 425] Qualitative User Studies
Chapter 6 QoS-Aware Semantic DH (ViMQO) [47, 369] Formal Definitions of Ontologies
Chapter 7 Hannibal adaptive engine [154, 385]Design & Implementation
of Software/Algorithms
This following section is an overarching exposition of all experimental procedures
used for the QoS and QoE empirical studies presented in Chapters 4 and 5.
3.4 Experimental Procedures
The conclusions derived from the empirical studies fed the design and implemen-
tation of Hannibal, a QoS and QoE aware adaptive engine (Chapter 7) for WBVMs
that endeavours to strike a balance between Quality of Service and Quality of
Experience when fetching 3D Web components to client devices.
It is ad rem to mention that the QoS/QoE metrics captured for each 3D Web
component differ from each other due to the nature of the 3D Web environment in
question.
The empirical studies in this thesis are divided into two major empirical investiga-
tions:
The first empirical investigation tackles the QoS of Digital Heritage Web-Based
Virtual Worlds (WBVWs) [30]. The case of web builds generated from Unity3D game
engine [410] was considered and evaluated. These web builds are the Unity Web
Player (UWP) build (a.k.a. the Plug-in version) and the WebGL 1.0 version (U-WebGL)
of the same Web-Based Virtual Environment called Timespan Longhouse (TL) [266].
TL is a virtual reconstruction of the pre-clearances Caen township located in the
3.4. EXPERIMENTAL PROCEDURES 85
Strath of Kildonan in the county of Sutherland, Scotland. The reconstruction aimed to
commemorate the bicentenary anniversary of the forcible Highland clearances which
constituted one of the darkest periods of Scottish History. The TL reconstruction
was part of a museum exhibit for the Timespan Museum and Arts Centre in the
village of Helmsdale. Two web builds as mentioned previously (UWP and U-WebGL)
were exported from the Unity 3D World. Frames per Second (FPSs), Frame Times
(FTs), Initial Download Times (IDTs), CPU, GPU, and physical memory consumption
were captured.
The second empirical investigation tackles the QoS and QoE of many Digital
Heritage artefacts of different resolutions fetched from Sketchfab repository [374].
On the QoS level of Web3D Digital Heritage models, initial download &
processing times were captured for different 3D models of different resolutions
expressed in number of faces and number of vertices on different devices (PC,
Laptop and mobile devices). A detailed methodology on how these metrics were
captured in web browsers on PCs and mobile devices is detailed in Section 3.4.2.1.
On the QoE level of Web3D Digital Heritage models, two experiments were
conducted. In the first experiment, participants were asked to grade on a scale from
1 (Bad resolution) to 5 (Excellent resolution), 2 reference models each one decimated
to lower resolution versions grouped into 2 sets. This grading was conducted on a
big screen tethered to a PC with a powerful graphics card. Participants were asked
also to rank these models’ decimations from the worst fidelity (i.e. resolution) to the
best fidelity.
In the second experiment, participants were asked to do the same grading and
ranking of the 3D models mentioned above on a iPad Pro tablet and on an iPhone 7
Plus mobile device. This is was undertaken in order to see what effect the screen size
of the device has on user perception of fidelity of Web3D Digital Heritage models.
The main aim of the QoE investigation is to measure the differences in terms of
fidelity across different categories of graphical complexity (i.e. resolutions) of
different models on the web. This is in order to see if on the level of QoE, there
are noticeable differences detected by users between these categories and to what
degree and at which thresholds, those differences become either unnoticeable and/or
intolerable.
Section 3.4.1 presents the detailed methodological procedures of the QoS experi-
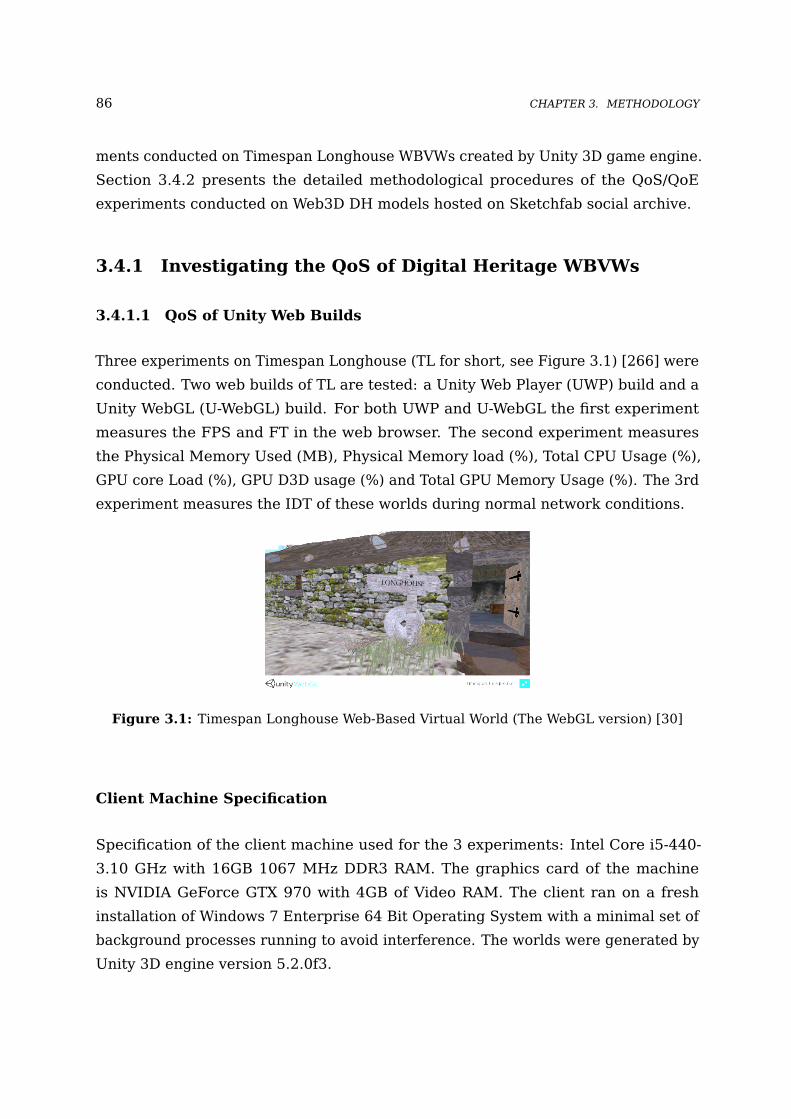
86 CHAPTER 3. METHODOLOGY
ments conducted on Timespan Longhouse WBVWs created by Unity 3D game engine.
Section 3.4.2 presents the detailed methodological procedures of the QoS/QoE
experiments conducted on Web3D DH models hosted on Sketchfab social archive.
3.4.1 Investigating the QoS of Digital Heritage WBVWs
3.4.1.1 QoS of Unity Web Builds
Three experiments on Timespan Longhouse (TL for short, see Figure 3.1) [266] were
conducted. Two web builds of TL are tested: a Unity Web Player (UWP) build and a
Unity WebGL (U-WebGL) build. For both UWP and U-WebGL the first experiment
measures the FPS and FT in the web browser. The second experiment measures
the Physical Memory Used (MB), Physical Memory load (%), Total CPU Usage (%),
GPU core Load (%), GPU D3D usage (%) and Total GPU Memory Usage (%). The 3rd
experiment measures the IDT of these worlds during normal network conditions.
Figure 3.1: Timespan Longhouse Web-Based Virtual World (The WebGL version) [30]
Client Machine Specification
Specification of the client machine used for the 3 experiments: Intel Core i5-440-
3.10 GHz with 16GB 1067 MHz DDR3 RAM. The graphics card of the machine
is NVIDIA GeForce GTX 970 with 4GB of Video RAM. The client ran on a fresh
installation of Windows 7 Enterprise 64 Bit Operating System with a minimal set of
background processes running to avoid interference. The worlds were generated by
Unity 3D engine version 5.2.0f3.
3.4. EXPERIMENTAL PROCEDURES 87
Measurement Tools
Experiment 1: Google Chrome version 44.0.2403.125 and Fraps were used to
measure the FPS and FT. Fraps [36] is a popular real-time video and game
benchmarking tool.
Experiment 2: used HWiNFO64 and TechPowerUp GPU-Z to measure: Physical
Memory Used (MB), Physical Memory load (%), Total CPU Usage (%), GPU core Load
(%), GPU Memory Usage (%) and GPU D3D Memory usage (%). HWiNFO64 [336] is
a system information utility tool that provides in-depth hardware analysis, real-time
monitoring and reporting. TechPowerUp GPU-Z [400] is a lightweight system utility
that provides real-time information about video cards and graphics processors. Both
tools presented similar measurement values. As in Experiment 1 the client was
Google Chrome v. 44.0.2403.125.
Experiment 3: This used the built-in Network Monitor tool in Mozilla Firefox
version 39, Network Inspector in Opera 30 and the Network tool in Google Chrome
v. 44.0.2403.125 to measure the Initial Download Time. Two Mozilla Firefox add-ons
were also used to further check the results: app.telemetry Page Speed Monitor
version 15.2.5 [20]; and Extended Statusbar 2.0.3.1-signed extension [235].
Experimental Procedure
Experiment 1: A PowerShell script managed the timing of runs, opened the selected
web browser, and set the specific link of each 3D world to navigate. The script ran
Fraps and logged the data into Comma Separated Values (CSV) files. In this scenario,
pseudo-random navigation moved the avatar from non-dense areas toward areas
dense in 3D objects. The PowerShell script then closed the web browser. Fraps was
configured to capture the FPS and FT every second. FT numbers were recorded in
the CSVs as cumulative numbers. A simple repetitive subtraction equation was used
to calculate the actual time of each frame numbered sequentially.
Experiment 2: A PowerShell script regulated timings, launched measurement
applications (TechPowerUp GPU-Z and HWinfo64), the browser and 3D worlds,
logged measurements into text files (.txt) and into CSV files and then closed after a
predetermined time. Measurements were taken ten times in each mode or scenario
(listed below). It was found that ten times gave an acceptable variation for each
mode. In addition, the number of iterations used in these modes is higher than the
88 CHAPTER 3. METHODOLOGY
number used by system-level empirical studies such as [133]. The modes were:
1: Baseline mode: Measurements of all CPU/GPU and Physical Memory metrics
were completed immediately after a fresh OS installation. No antivirus or other
applications were running, no folders were opened and an absolute minimum of
services and background processes were present. Each run’s duration was two
minutes.
2: Baseline mode + the Web Browser: Measurements of all CPU/GPU and
physical memory metrics were conducted on the OS and only a web browser was
opened (Google Chrome). Each run’s duration was two minutes.
3: Baseline mode + Web Browser + a 3D world: All measurements were taken
for two minutes (standing with yawing1) and three minutes random walking. Values
were taken every two seconds. Compared with mode #2 this gave the actual
consumption in CPU/GPU and physical memory of the 3D world in question.
Experiment 3: caches were entirely cleaned from inside the web browsers
themselves in addition to using CCleaner [327] before every run. Measurements
were taken after everything was downloaded. The tools gave the initial download
time and all the timings of each resource in detail. The results from the range of
tools used showed that the measurements were accurate and reliable.
Avatar Mobility
Two mobility models were used in experiments 1 and 2:
1. Standing: Avatar remained standing still with continuous yawing for 2 minutes.
2. Random Walking: Avatar randomly walked for 3 minutes in different directions
(from non-dense towards dense areas) and with a constant speed.
Unity Web-Build Sizes and Complexity
This section describes the sizes and complexity of the worlds measured. Unity
generates the HTML file for UWP. The default page is usually very simple. UWP
is divided into 3 components: the mono, the player and the plug-in. The plug-in is
1Yaw is the change in the avatar orientation or the change in the “look at” view
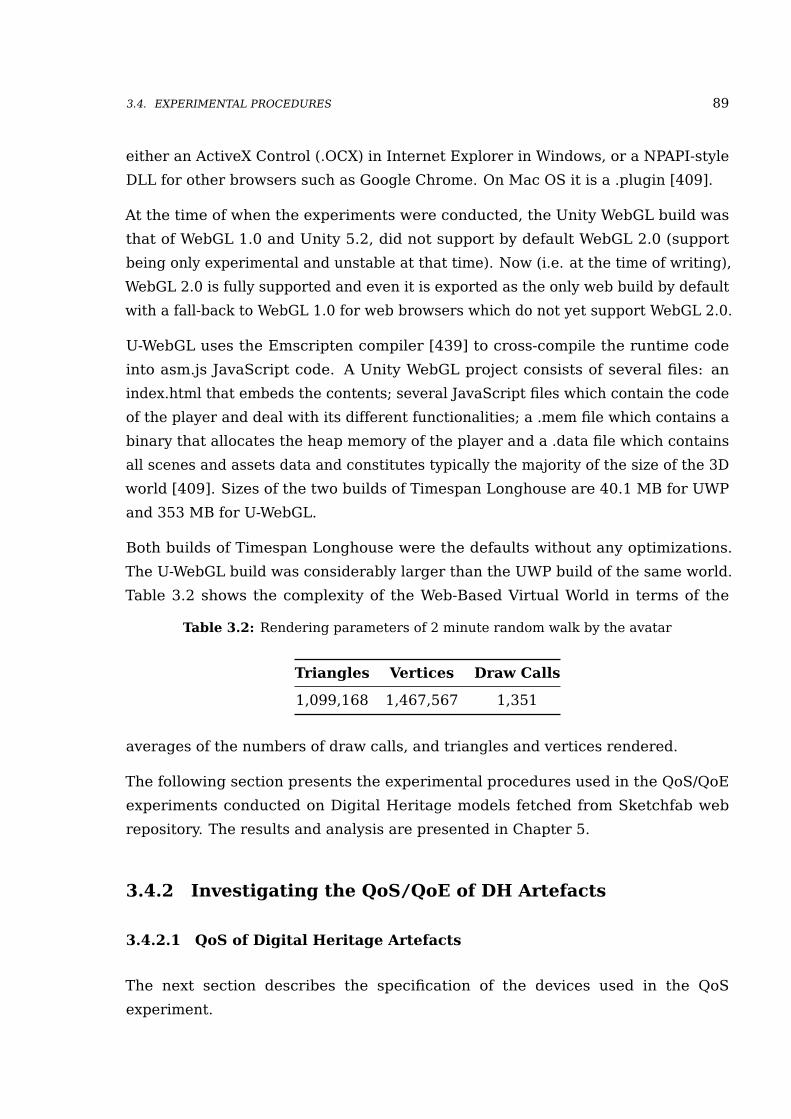
3.4. EXPERIMENTAL PROCEDURES 89
either an ActiveX Control (.OCX) in Internet Explorer in Windows, or a NPAPI-style
DLL for other browsers such as Google Chrome. On Mac OS it is a .plugin [409].
At the time of when the experiments were conducted, the Unity WebGL build was
that of WebGL 1.0 and Unity 5.2, did not support by default WebGL 2.0 (support
being only experimental and unstable at that time). Now (i.e. at the time of writing),
WebGL 2.0 is fully supported and even it is exported as the only web build by default
with a fall-back to WebGL 1.0 for web browsers which do not yet support WebGL 2.0.
U-WebGL uses the Emscripten compiler [439] to cross-compile the runtime code
into asm.js JavaScript code. A Unity WebGL project consists of several files: an
index.html that embeds the contents; several JavaScript files which contain the code
of the player and deal with its different functionalities; a .mem file which contains a
binary that allocates the heap memory of the player and a .data file which contains
all scenes and assets data and constitutes typically the majority of the size of the 3D
world [409]. Sizes of the two builds of Timespan Longhouse are 40.1 MB for UWP
and 353 MB for U-WebGL.
Both builds of Timespan Longhouse were the defaults without any optimizations.
The U-WebGL build was considerably larger than the UWP build of the same world.
Table 3.2 shows the complexity of the Web-Based Virtual World in terms of the
Table 3.2: Rendering parameters of 2 minute random walk by the avatar
Triangles Vertices Draw Calls
1,099,168 1,467,567 1,351
averages of the numbers of draw calls, and triangles and vertices rendered.
The following section presents the experimental procedures used in the QoS/QoE
experiments conducted on Digital Heritage models fetched from Sketchfab web
repository. The results and analysis are presented in Chapter 5.
3.4.2 Investigating the QoS/QoE of DH Artefacts
3.4.2.1 QoS of Digital Heritage Artefacts
The next section describes the specification of the devices used in the QoS
experiment.
90 CHAPTER 3. METHODOLOGY
Devices Specifications
The specification of the devices used in this experiment is as follows:
1. Device 1: Intel Core i5-440- 3.10 GHz with 16GB 1067 MHz DDR3 RAM. The
graphics card of the machine is NVIDIA GeForce GTX 970 with 4GB of Video
RAM. The client ran on an installation of Windows 7 Enterprise 64 Bit Operating
System with a minimal set of background processes running to avoid interference.
The web browser used on this client is Google Chrome Version 54.0.2840.71 m.
2. Device 2: MacBook Pro 8.1 with Intel i7-2640 M 2.80 GHz and 8GB RAM. The
client ran on an installation of Windows 7 Ultimate 64 bit (bootcamp) with the
latest drivers. The GPU is Intel HD Graphics (256 MB). The web browser used
on this client is Google Chrome Version 54.0.2840.71 m.
3. Device 3: Alcatel Pop 4 mobile phone (model 5051X) with 5 inch HD IPS full
lamination display and a 1.1 Ghz Quad-core Qualcomm Snapdragon 210 CPU.
The RAM capacity of the device is 1 GB LPDDR3. It has as a GPU the Adreno 304.
The phone is equipped with 4G LTE capability. The Android OS on the device
is 6.0.1 (Marshmallow). The web browser used on this client is Google Chrome
Version 53.0.2785.124. This device was considered at the time of conducting the
experiment (2016) as a low end device as it costs in the United Kingdom around
£60.
4. Device 4: LG Nexus 5x with Qualcomm Snapdragon 808 1.8 Ghz hexa-core 64
Bit CPU. It has as a GPU the Adreno 418. The RAM capacity of the device is 2
GB LPDDR3. The phone used in the experiments comes with an internal storage
of 32 GB. The phone is equipped with 4G LTE capability. The Android OS on the
device is 6.0.1 (Marshmallow). The web browser used on this client is Google
Chrome version 53.0.2785.124. This phone which was normally used by Android
developers to test applications, was considered at the time of conducting the
experiment (2016) as an average middle range device. It costs in the United
Kingdom around £250.
Characteristics of Networks Measured
Table 3.3 shows the characteristics of the networks used by the client devices in
terms of average actual download speed and upload speed in Mbps.
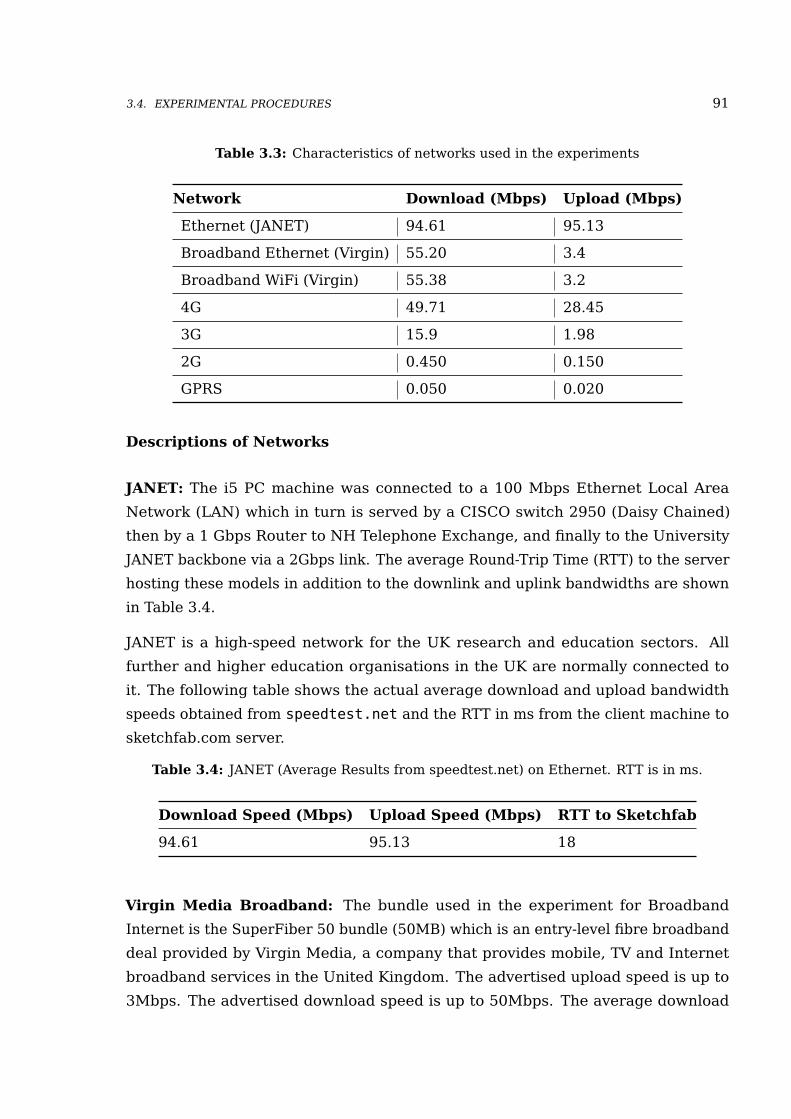
3.4. EXPERIMENTAL PROCEDURES 91
Table 3.3: Characteristics of networks used in the experiments
Network Download (Mbps) Upload (Mbps)
Ethernet (JANET) 94.61 95.13
Broadband Ethernet (Virgin) 55.20 3.4
Broadband WiFi (Virgin) 55.38 3.2
4G 49.71 28.45
3G 15.9 1.98
2G 0.450 0.150
GPRS 0.050 0.020
Descriptions of Networks
JANET: The i5 PC machine was connected to a 100 Mbps Ethernet Local Area
Network (LAN) which in turn is served by a CISCO switch 2950 (Daisy Chained)
then by a 1 Gbps Router to NH Telephone Exchange, and finally to the University
JANET backbone via a 2Gbps link. The average Round-Trip Time (RTT) to the server
hosting these models in addition to the downlink and uplink bandwidths are shown
in Table 3.4.
JANET is a high-speed network for the UK research and education sectors. All
further and higher education organisations in the UK are normally connected to
it. The following table shows the actual average download and upload bandwidth
speeds obtained from speedtest.net and the RTT in ms from the client machine to
sketchfab.com server.
Table 3.4: JANET (Average Results from speedtest.net) on Ethernet. RTT is in ms.
Download Speed (Mbps) Upload Speed (Mbps) RTT to Sketchfab
94.61 95.13 18
Virgin Media Broadband: The bundle used in the experiment for Broadband
Internet is the SuperFiber 50 bundle (50MB) which is an entry-level fibre broadband
deal provided by Virgin Media, a company that provides mobile, TV and Internet
broadband services in the United Kingdom. The advertised upload speed is up to
3Mbps. The advertised download speed is up to 50Mbps. The average download
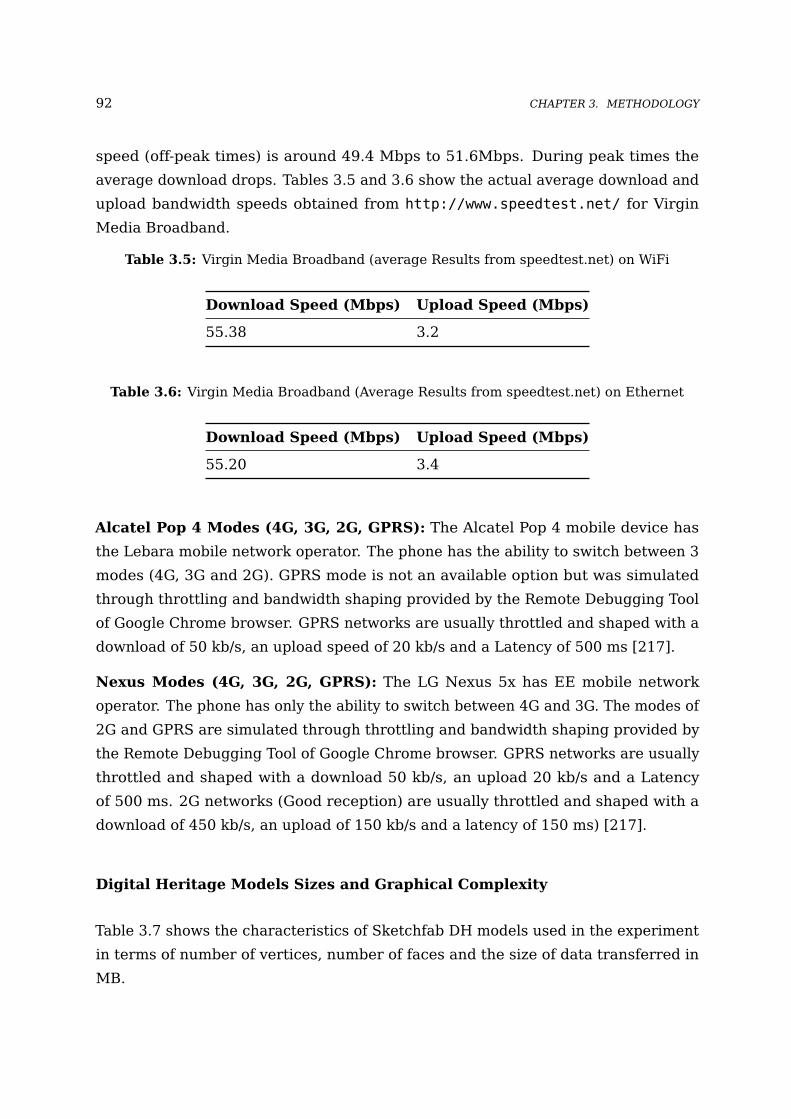
92 CHAPTER 3. METHODOLOGY
speed (off-peak times) is around 49.4 Mbps to 51.6Mbps. During peak times the
average download drops. Tables 3.5 and 3.6 show the actual average download and
upload bandwidth speeds obtained from http://www.speedtest.net/ for Virgin
Media Broadband.
Table 3.5: Virgin Media Broadband (average Results from speedtest.net) on WiFi
Download Speed (Mbps) Upload Speed (Mbps)
55.38 3.2
Table 3.6: Virgin Media Broadband (Average Results from speedtest.net) on Ethernet
Download Speed (Mbps) Upload Speed (Mbps)
55.20 3.4
Alcatel Pop 4 Modes (4G, 3G, 2G, GPRS): The Alcatel Pop 4 mobile device has
the Lebara mobile network operator. The phone has the ability to switch between 3
modes (4G, 3G and 2G). GPRS mode is not an available option but was simulated
through throttling and bandwidth shaping provided by the Remote Debugging Tool
of Google Chrome browser. GPRS networks are usually throttled and shaped with a
download of 50 kb/s, an upload speed of 20 kb/s and a Latency of 500 ms [217].
Nexus Modes (4G, 3G, 2G, GPRS): The LG Nexus 5x has EE mobile network
operator. The phone has only the ability to switch between 4G and 3G. The modes of
2G and GPRS are simulated through throttling and bandwidth shaping provided by
the Remote Debugging Tool of Google Chrome browser. GPRS networks are usually
throttled and shaped with a download 50 kb/s, an upload 20 kb/s and a Latency
of 500 ms. 2G networks (Good reception) are usually throttled and shaped with a
download of 450 kb/s, an upload of 150 kb/s and a latency of 150 ms) [217].
Digital Heritage Models Sizes and Graphical Complexity
Table 3.7 shows the characteristics of Sketchfab DH models used in the experiment
in terms of number of vertices, number of faces and the size of data transferred in
MB.

3.4. EXPERIMENTAL PROCEDURES 93
Table 3.7: Characteristics of Sketchfab Models Used in the Experiments. Sizes are theSizes Transferred in MB
Sketchfab Model # faces # Vertices Size (MB)
Head 112 98 1.9
Statue of Ramesses 30.6k 17.1k 3.9
Statue of Gudea 300.9k 150.4k 5.9
70’s Shoe 3M 1.5M 34.6
Ava’s Skull 4.8M 2.4M 57.4
Measuring IDT on the i5 PC and MacBook Pro
Two web pages deal with choosing the models, embedding them and launching them.
The first page called Select.html makes it possible to choose from a drop-down list
five DH Sketchfab 3D models. The selected model URLID is then sent to the second
web page called SketchfabTester.html which contains the necessary JavaScript code
to embed the sketchfab model, to initialize it and load it automatically (no other
resources are included on the page). There is a return link on the page to return
back to the Select.html for measuring other DH models. A third file is included in the
application which is the sketchfab-viewer-1.0.0.js JavaScript file which contains the
Sketchfab Viewer API (instead of fetching it on-line every request). The download
time of the model is obtained by retrieving the “finish time” provided by the network
inspector in Google Developer Tools of the Chrome web browser. Measurements
were taken five times for each scenario. A scenario consists of a certain Sketchfab
DH 3D model on a certain network and on a certain device. The cache was entirely
cleared from inside the web browser itself in addition to using CCleaner [327] before
every run.
Measuring IDT on Android Mobile Phones
The methodology of measuring the IDT is simple and consists of using the remote
debugging feature for Android devices that are present in Google Chrome (the PC
versions). This is done by connecting the phone in question to a PC via a USB cable.
ADB drivers and Interfaces of the specific Android phone need to be installed on
the PC. In addition, remote debugging via USB should be enabled on the mobile
device. Measurements were taken five times for each scenario (a certain Sketchfab
94 CHAPTER 3. METHODOLOGY
model on a certain network on a certain mobile device). The PC version of Google
Chrome receives all debugging data from the mobile version of Google Chrome when
inspecting any page that renders the 3D model on the mobile device web browser.
On the mobile device side: resides the same JavaScript web application as in
Section 3.4.2.1. To deal with the cache of the mobile web browser, many precautions
have been taken. SketchfabTester.html has JavaScript functionality that clears the
cache of the HTML page itself. In addition, caches were cleared also from inside the
mobile browser on every iteration.
On the PC side: The web page of the 3D model on the mobile device is loaded
and the network inspector in Google Chrome Developer Tools in the PC version is
launched showing all the timings of all resources including the “Finish Time”.
The following section presents the methodological procedures used in the QoE
experiments conducted on Web3D Digital Heritage Artefacts fetched from the
Sketchfab repository. The results and the analysis of the experiments are presented
in Chapter 5, Section 5.3.
3.4.2.2 QoE of Digital Heritage Artefacts
Perception of fidelity is considered in the domain of Quality of Experience. Studying
the perception of fidelity of Digital Heritage artefacts on the web, is purposed for
measuring the differences in terms of fidelity across different categories of graphical
complexity (i.e. resolutions). Chapter 5 investigates if there are any noticeable
differences in perception of fidelity detected by users between these categories
and to what degree and at which resolution thresholds or ranges those differences
become either unnoticeable or intolerable.
This investigation was divided into two experiments. The first experiment (Exper-
iment 1) was conducted on a PC with a powerful graphics card tethered to a 60"
screen. The second experiment (Experiment 2) was conducted on an iPad Pro tablet
and on a mobile phone which was an iPhone 7 Plus (256GB model).
We aim from the two aforementioned experiments to study the effect of screen
sizes on the perception of fidelity from the point of view of users. The following
sections present the methodological procedures of two QoE experiments conducted
on Web3D Digital Heritage artefacts.

3.4. EXPERIMENTAL PROCEDURES 95
Participants demographics
In order to obtain representative ratings, recommendations from the multimedia
discipline for choosing the number of participants in quality perception experiments
were followed. According to the recommendation “P910 - Subjective video quality
assessment methods for multimedia applications” [337] which is authored by the
Video Quality Experts Group (VQEG), the number should be above 4 for statistical
reasons and below 40. There is no added value of having more than 40 participants
according to the recommendation.
For experiment 1 (PC tethered to a big screen), 22 participants were recruited. This
comprised of 7 females, 14 males and 1 classified as other; between the age of 22
and 50, all with normal or corrected to normal vision. The mean age of participants
was µ = 30 and the standard deviation was σ = 5.9.
For experiment 2 (on tablet and phone), 10 participants were recruited. This
comprised of 3 females and 7 males between the age of 21 and 40, all with normal
or corrected to normal vision. The mean age of participants was µ = 27.4 and the
standard deviation was σ = 5.04.
Participants were all students and staff from the School of Computer Science in
the University of St Andrews except 2 participants who were acquaintances of the
researcher and who were not involved in academia.
Some of the participants in Experiment 2 were the same participants in Experiment 1.
Learning effect is not present in the experiments because all the models were
randomised in both the grading and ranking phases. In addition, experiment 1
and 2 were conducted separately from each other (approximately more than 2 weeks
apart).
Concerning the background and area of expertise of participants in both experiments
(1 and 2): three of the participants were specialising on a postgraduate level in
Digital Heritage studies particularly in creating and digitising heritage artefacts
and reconstructing monuments for scholarly, scientific and educational purposes.
Another participant has a postgraduate degree in Scottish heritage history. Yet
another two of the participants were specialised in data visualisations and Human
Computer Interaction (HCI). Nevertheless, the experiments dealt with studying
perception of fidelity which do not require per se specialised knowledge in a specific
field as they deal more with the human eyes capacity for perceiving differences

96 CHAPTER 3. METHODOLOGY
in resolution thresholds. That has been said, it should be emphasised that CH
practitioners might pay attention to specific details such as ornamentations or
inscriptions in a certain artefact which might not be of an emphasis to the normal
users. Nevertheless, the thesis in Chapter 1, in the motivation section (1.2) asked
the question: can casual WBVMs users notice the difference between the resolutions
of 3D digital heritage models across devices? the emphasis of this corpus of work
as a whole and which this chapter is a building block is on enabling efficient and
adaptive mass dissemination of heritage digitisations to all sort of users including
the casual users of web-based virtual museums.
Reference 3D Models
The reference 3D digital artefacts were digitised using traditional CH digitisation
pipeline (Photogrammetry and 3D Scanning). They were reconstructed from real-
world cultural heritage artefacts.
The two reference models used for both experiments were digitised by the Open
Virtual World research group at the University of St Andrews:
1. Roman Mercury model: depicting a bronze statuette of the deity. This model
was chosen because of its simple and loosely defined topological features and
its darker textures. The choice would help us understand the effect of those
features. Mercury was digitally scanned using a 3D laser scanner.
2. Achavanich Beaker model: depicting the Achavanich Beaker which was found
buried with the remains of a 4,000 year old Bronze Age woman, Ava, in the
Northern Highlands of Scotland. Achavanich Beaker is a model with brighter
textures and more complex topological features than that of the Mercury model.
The Achavanich beaker was digitized through Photogrammetry.
Graphical characteristics and sizes in MB of the reference 3D models are shown in
Table 3.8.
Table 3.8: Characteristics of the two reference 3D models used in the experiments. Sizesare in MB.
Sketchfab Model # faces # Vertices Size (MB)
Mercury 1.5M 733.5k 38.0Achavanich Beaker 6.1M 3M 116
3.4. EXPERIMENTAL PROCEDURES 97
The raw textures resolutions of these two models were of the same order of 1536 x
2048.
Decimation is the process of reducing the number of faces of a 3D model’s mesh
also known as mesh simplification. Each reference model was decimated into lower
resolutions using the Quadric Edge Collapse Decimation algorithm preserving UV
parametrisations [160, 161]. A filter in Meshlab application [81] implements the
algorithm. Textures were unaffected.
The rationale for the choice of 3D models originating from cultural heritage
digitisation pipelines (Photogrammetry and 3D Scanning) instead of studying the
perception of fidelity of any type of 3D models constructed from scratch in classical
3D graphics authoring tools such as Blender or Maya, is very pertinent. Digital
heritage models help scholars study, document and digitally archive the physical
artefacts. They can help in keeping track of the degradation of artefacts through
time. They can also help them in the restoration process such as the restoration and
patching of fragments of artefacts after their destruction. An example can be given
in the case of the restoration of the statute of the Madonna of Pietranico [357].
From a computer graphics perspective, Digital Heritage artefacts digitised through
3D Scanning or Photogrammetry result usually in 3D models that are big in size
and that have very high fidelity. In addition, they are usually more noisier and can
contain many topological imperfections [56, 373].
We chose these two particular models (Mercury statuette and Achavanich beaker)
to study the perception of fidelity for two reasons. The first is to study how the
fidelity of a darker textured model vs a lighter textured model is perceived by the
users. The second dimension is that of how a loosely defined topology model vs a
more complex topology model is perceived. These models comes from two different
digitisation pipelines (Photogrammetry vs 3D Scanning). These digitisation pipelines
are commonly used among heritage practitioners for digitising actual real-world
physical artefacts.
Initial textures of the unimpaired reference models were kept the same for all the
decimated versions and this is due to the importance of the textures’ information
relative to the geometry information of the meshes. Being able to reduce the
resolution of the mesh while keeping the resolution of the textures intact would lead
to a 3D model of less storage space while still holding a lot of detail which remains
in the textures even as the geometry of the model is simplified. This is pertinent for
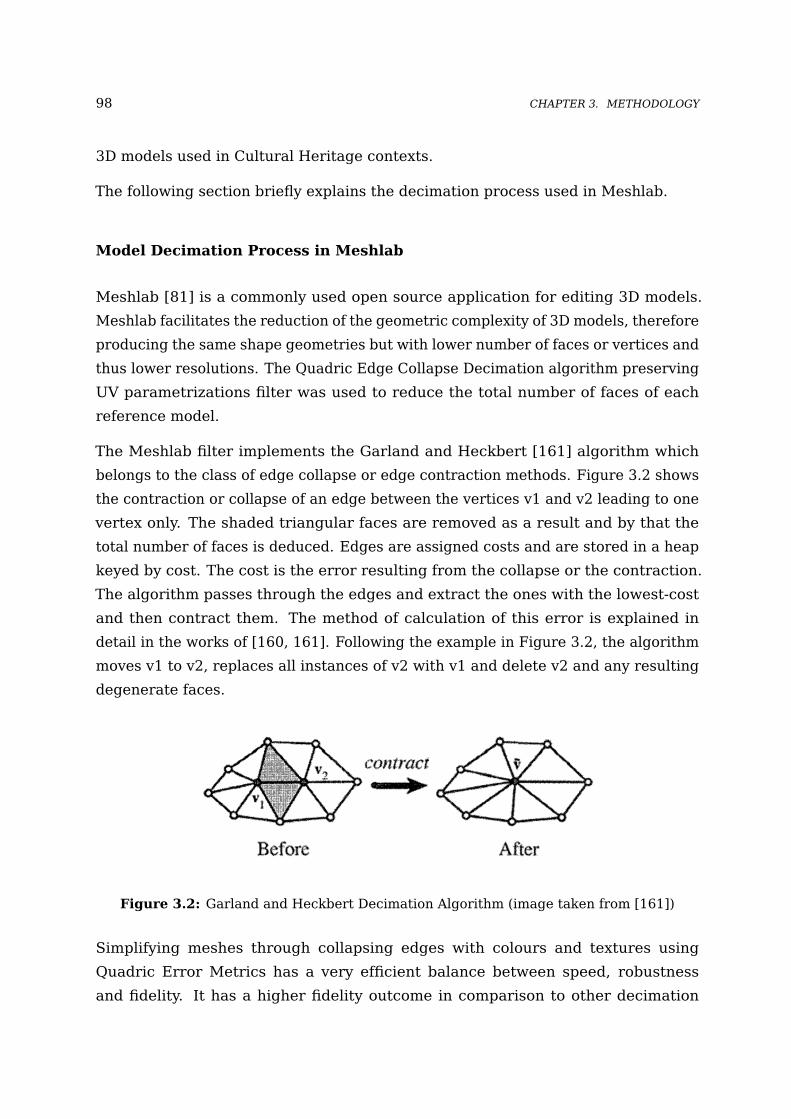
98 CHAPTER 3. METHODOLOGY
3D models used in Cultural Heritage contexts.
The following section briefly explains the decimation process used in Meshlab.
Model Decimation Process in Meshlab
Meshlab [81] is a commonly used open source application for editing 3D models.
Meshlab facilitates the reduction of the geometric complexity of 3D models, therefore
producing the same shape geometries but with lower number of faces or vertices and
thus lower resolutions. The Quadric Edge Collapse Decimation algorithm preserving
UV parametrizations filter was used to reduce the total number of faces of each
reference model.
The Meshlab filter implements the Garland and Heckbert [161] algorithm which
belongs to the class of edge collapse or edge contraction methods. Figure 3.2 shows
the contraction or collapse of an edge between the vertices v1 and v2 leading to one
vertex only. The shaded triangular faces are removed as a result and by that the
total number of faces is deduced. Edges are assigned costs and are stored in a heap
keyed by cost. The cost is the error resulting from the collapse or the contraction.
The algorithm passes through the edges and extract the ones with the lowest-cost
and then contract them. The method of calculation of this error is explained in
detail in the works of [160, 161]. Following the example in Figure 3.2, the algorithm
moves v1 to v2, replaces all instances of v2 with v1 and delete v2 and any resulting
degenerate faces.
Figure 3.2: Garland and Heckbert Decimation Algorithm (image taken from [161])
Simplifying meshes through collapsing edges with colours and textures using
Quadric Error Metrics has a very efficient balance between speed, robustness
and fidelity. It has a higher fidelity outcome in comparison to other decimation
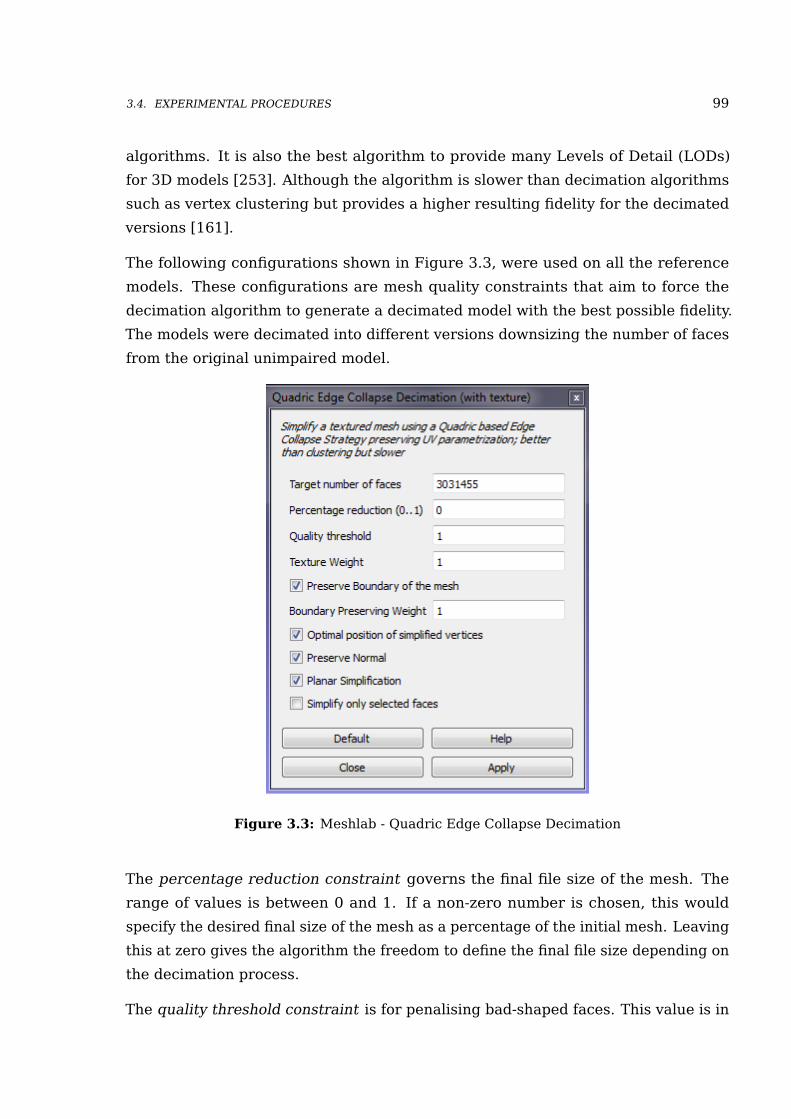
3.4. EXPERIMENTAL PROCEDURES 99
algorithms. It is also the best algorithm to provide many Levels of Detail (LODs)
for 3D models [253]. Although the algorithm is slower than decimation algorithms
such as vertex clustering but provides a higher resulting fidelity for the decimated
versions [161].
The following configurations shown in Figure 3.3, were used on all the reference
models. These configurations are mesh quality constraints that aim to force the
decimation algorithm to generate a decimated model with the best possible fidelity.
The models were decimated into different versions downsizing the number of faces
from the original unimpaired model.
Figure 3.3: Meshlab - Quadric Edge Collapse Decimation
The percentage reduction constraint governs the final file size of the mesh. The
range of values is between 0 and 1. If a non-zero number is chosen, this would
specify the desired final size of the mesh as a percentage of the initial mesh. Leaving
this at zero gives the algorithm the freedom to define the final file size depending on
the decimation process.
The quality threshold constraint is for penalising bad-shaped faces. This value is in
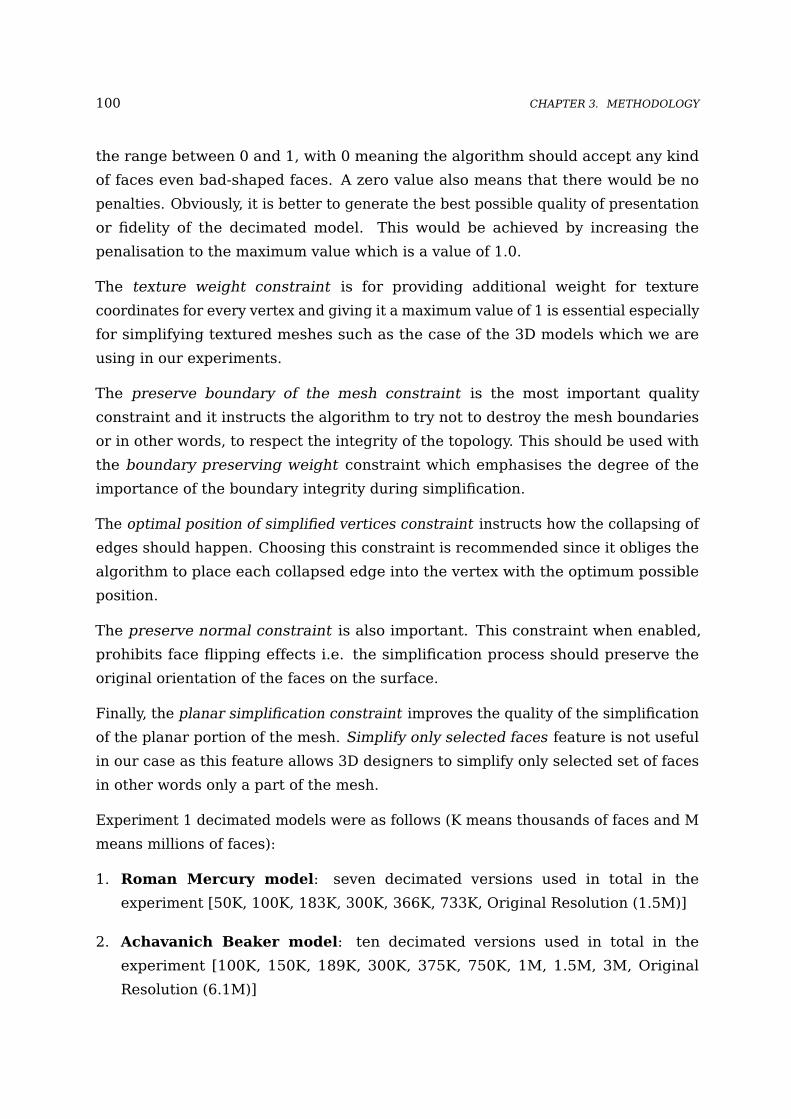
100 CHAPTER 3. METHODOLOGY
the range between 0 and 1, with 0 meaning the algorithm should accept any kind
of faces even bad-shaped faces. A zero value also means that there would be no
penalties. Obviously, it is better to generate the best possible quality of presentation
or fidelity of the decimated model. This would be achieved by increasing the
penalisation to the maximum value which is a value of 1.0.
The texture weight constraint is for providing additional weight for texture
coordinates for every vertex and giving it a maximum value of 1 is essential especially
for simplifying textured meshes such as the case of the 3D models which we are
using in our experiments.
The preserve boundary of the mesh constraint is the most important quality
constraint and it instructs the algorithm to try not to destroy the mesh boundaries
or in other words, to respect the integrity of the topology. This should be used with
the boundary preserving weight constraint which emphasises the degree of the
importance of the boundary integrity during simplification.
The optimal position of simplified vertices constraint instructs how the collapsing of
edges should happen. Choosing this constraint is recommended since it obliges the
algorithm to place each collapsed edge into the vertex with the optimum possible
position.
The preserve normal constraint is also important. This constraint when enabled,
prohibits face flipping effects i.e. the simplification process should preserve the
original orientation of the faces on the surface.
Finally, the planar simplification constraint improves the quality of the simplification
of the planar portion of the mesh. Simplify only selected faces feature is not useful
in our case as this feature allows 3D designers to simplify only selected set of faces
in other words only a part of the mesh.
Experiment 1 decimated models were as follows (K means thousands of faces and M
means millions of faces):
1. Roman Mercury model: seven decimated versions used in total in the
experiment [50K, 100K, 183K, 300K, 366K, 733K, Original Resolution (1.5M)]
2. Achavanich Beaker model: ten decimated versions used in total in the
experiment [100K, 150K, 189K, 300K, 375K, 750K, 1M, 1.5M, 3M, Original
Resolution (6.1M)]
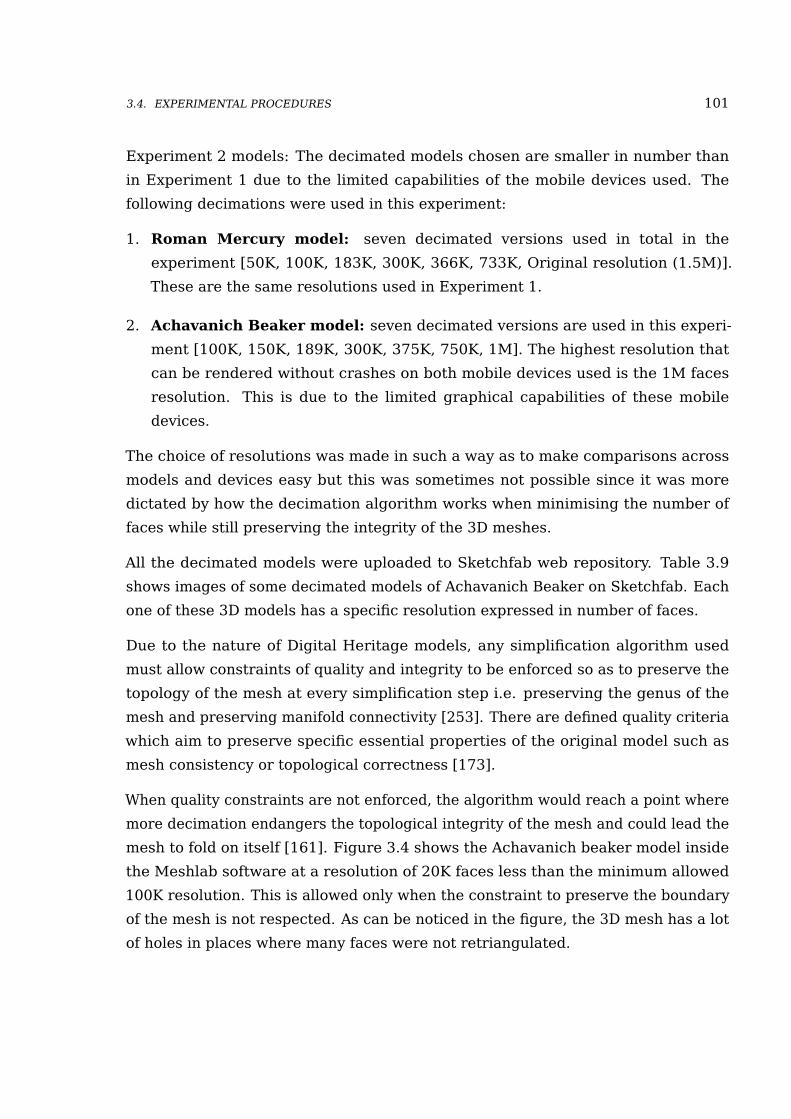
3.4. EXPERIMENTAL PROCEDURES 101
Experiment 2 models: The decimated models chosen are smaller in number than
in Experiment 1 due to the limited capabilities of the mobile devices used. The
following decimations were used in this experiment:
1. Roman Mercury model: seven decimated versions used in total in the
experiment [50K, 100K, 183K, 300K, 366K, 733K, Original resolution (1.5M)].
These are the same resolutions used in Experiment 1.
2. Achavanich Beaker model: seven decimated versions are used in this experi-
ment [100K, 150K, 189K, 300K, 375K, 750K, 1M]. The highest resolution that
can be rendered without crashes on both mobile devices used is the 1M faces
resolution. This is due to the limited graphical capabilities of these mobile
devices.
The choice of resolutions was made in such a way as to make comparisons across
models and devices easy but this was sometimes not possible since it was more
dictated by how the decimation algorithm works when minimising the number of
faces while still preserving the integrity of the 3D meshes.
All the decimated models were uploaded to Sketchfab web repository. Table 3.9
shows images of some decimated models of Achavanich Beaker on Sketchfab. Each
one of these 3D models has a specific resolution expressed in number of faces.
Due to the nature of Digital Heritage models, any simplification algorithm used
must allow constraints of quality and integrity to be enforced so as to preserve the
topology of the mesh at every simplification step i.e. preserving the genus of the
mesh and preserving manifold connectivity [253]. There are defined quality criteria
which aim to preserve specific essential properties of the original model such as
mesh consistency or topological correctness [173].
When quality constraints are not enforced, the algorithm would reach a point where
more decimation endangers the topological integrity of the mesh and could lead the
mesh to fold on itself [161]. Figure 3.4 shows the Achavanich beaker model inside
the Meshlab software at a resolution of 20K faces less than the minimum allowed
100K resolution. This is allowed only when the constraint to preserve the boundary
of the mesh is not respected. As can be noticed in the figure, the 3D mesh has a lot
of holes in places where many faces were not retriangulated.
102 CHAPTER 3. METHODOLOGY
Table 3.9: Table showing the decimated models of Achavanich Beaker (original resolutionwas 6.1M faces - 1st picture on the left)
3.4. EXPERIMENTAL PROCEDURES 103
Figure 3.4: Achavanich Beaker with no respect to the integrity of the mesh (20K faces)
Devices Specifications
The following presents devices specifications (the hardware setup, the networks that
the devices are connected to and specifications of the tethered screen).
Experiment 1:
Hardware set-up: The system that rendered the models was an Intel Core i5-440-
3.10 GHz with 16GB 1067 MHz DDR3 RAM. The graphics card of the machine was
NVIDIA GeForce GTX 970 with 4GB of Video RAM. The system had an installation of
Windows 7 Enterprise 64 Bit with a minimal set of background processes running to
avoid interference. The system had the latest drivers installed and the web browser
used was Google Chrome version 57.0.2987.98 (64-bit).
The network connection of the system is to a 100 Mbps Ethernet Local Area Network
which, in turn, is separated by four 1 Gbps router hops, and finally to the United
Kingdom University JANET backbone.
The screen used to display the models was a Sharp Screen 60-inch Full HD with
1920x1080 native resolution. The system was connected to the screen with an HDMI
104 CHAPTER 3. METHODOLOGY
2.0 connection. The use of relatively powerful consumer hardware was necessary to
render the complex 3D models with millions of faces and vertices.
Experiment 2: Two devices were chosen that pertain to two categories (smart
phones and tablets) in this experiment. Both mobiles devices were connected to a
stable WiFi network connected to Access Points that support data rates of around
600Mbps:
iPad Pro (9.7 inch) WiFi 32GB MLMN2B/A model: has as a processor the Apple
A9X (64 bit architecture). The GPU inside the A9X chip is the PowerVR Series 7XT
GT7600 (six-core).
The OS on the iPad Pro was the latest version at the time when the experiment
was conducted (iOS 10.3(14E277)). The mobile web browser used was Opera Mini
version 14.0.0.104835 (64-bit). Opera Mini was the best WebGL browser on the
iPad compared to other 4 common mobile browsers benchmarked for the purpose of
the experiment (Apple Safari, Mozilla Firefox, Google Chrome and Dolphin). The
experiments were conducted on this device, with a portrait screen orientation.
iPhone 7 Plus 256 GB: has a 5.5-inch LED-backlit wide screen with Retina HD
Display technology. It has as a processor, the A10 Fusion chip 64-bit architecture
(Embedded M10 motion coprocessor). The GPU inside this chip is the PowerVR
Series 7XT GT7600 Plus (hexa-core). The OS version on the iPhone 7 Plus was iOS
10.3-14E277. The experiments were conducted on this device with a portrait screen
orientation.
The mobile web browser used on this device was Safari (64-bit). Apple Safari was
found to be the best WebGL browser on the iPhone 7 Plus compared to other 4
common mobile browsers benchmarked for the sake of the experiment (Opera Mini,
Mozilla Firefox, Google Chrome and Dolphin).
The iPhone 7 Plus was considerably better in terms of graphical processing power
than the aforementioned iPad Pro. This was shown by the fact that it was able to
render a resolution even higher than the 1M faces, which is the highest that iPad
Pro can render reliably.
Software: A PHP web application connected to a MySQL database captured partici-
pants responses. On the front end, JavaScript frameworks such as Bootstrap [45] and
JQuery [54] were used also to make the application responsive and interactive. The
same web application was used with relatively minor changes for the experiments
3.4. EXPERIMENTAL PROCEDURES 105
conducted on the iPad Pro tablet and the iPhone 7 Plus. This is due to bootstrap [45]
being one of the best web frameworks for scaling web applications to fit on a wide
range of screen sizes. All the models were fetched from the Sketchfab [374] web
repository.
Experimental Procedure
The study took place in a tutorial room in the Jack Cole building in the school of
Computer Science at the University of St Andrews. The room was booked for the
purpose of the experiment and to ensure that participants were not disturbed during
their sessions which lasted on average one hour.
The participants were presented with a questionnaire concerning basic demographic
information (age and gender) in addition to information about eyesight. The
questionnaire included also information about regular viewing preferences of
participants for 3D content.
Each participant session took around 35 minutes. It included time taken to fill the
initial questionnaire, sign the ethics forms, time to grade and rank the two reference
models and their decimations (in two sets) and time for debriefing and questions.
In Experiment 1, participants were sat at a distance of 2 meters from the big screen
(i.e a distance of around 2.5H, where H is the height of the display H= 80cm). This
is due to the sheer size of the screen (60 inches) on which 3D models were being
viewed. Each participant were asked if he or she were comfortable in this setting and
whether lights, room temperature and other environmental factors were satisfactory.
All participants found this setting comfortable.
The PHP web application played the role of rendering the Sketchfab models in
different views and resolutions. Furthermore, it captured the questionnaire answers,
the grades and the ranks and stored them in different tables in the MySQL database
for later statistical analysis.
Each experiment (both 1 & 2) was divided in two phases:
1. Phase A: Participants were asked to grade the models, one at a time, based on
the 5-level scale presented in Table 3.10. All model variations were randomised
on different web pages and the participants used the scale of 1 to 5 to grade each
one alone in terms of the quality of fidelity. Subjects graded each model first
106 CHAPTER 3. METHODOLOGY
without interaction (i.e. based on look only). Then they were asked to interact
with the models (zoom in and out, pan and drag) and then to grade it on the
same scale. The idea here is that participants might change their grading (either
downgrading or upgrading the model) after interaction. One of the models in
each set, acted as “reference model” which was the model with the original
resolution (i.e. before decimation). Figure 3.5 shows an example of how the
grading was done. No clues were provided concerning the resolution or fidelity
of the models. Table 3.10 shows the 5-level quality of presentation scale used in
the experiment.
2. Phase B: Participants were then asked after the grading phase to rank models
pertaining to the same reference model from worst fidelity to best fidelity. The
original model (or the “unimpaired model” ) is hidden between them. No clues
were provided concerning the resolution or fidelity of any of the models. Five 3D
model decimations labelled A to E were present on the same web page where
participants could interact with any model resolution they wished to. The aim
was to identify resolutions above which participants began to confuse the correct
ranks.
The participants were made aware that they were grading and ranking only the
quality of presentation or fidelity of the 3D model and they were not supposed neither
to grade nor to rank the beauty of the actual artefact that the model realistically
represents, or the responsiveness of the 3D model.
The ranking phase played the role of buttressing the grading results with the aim
of studying at which resolution participants began to confuse the correct ranks. It
should be mentioned that in the second experiment (i.e. on mobile devices) the
“original resolution models or unimpaired models” were not used because they have
considerably higher resolutions that the mobile devices could not render due to their
limited graphical capabilities.
In the two experiments, we asked the participants to grade the models based on a
5-level quality of presentation scale shown in Table 3.10. The rationale behind that is
that it is a typical scale widely used in the perception of fidelity of multimedia [398]
and 3D models [306] and recommended by P910 [337]. The 9-level quality scale
which is another typical and more sensitive scale was not used due to the fact that
both of scales classify scores in the same manner, meaning in 5 fixed categories. In
addition, the 9-level scale can involve more guessing on the part of the participant,

3.4. EXPERIMENTAL PROCEDURES 107
Figure 3.5: Fidelity Grading Phase Example
as per instance, a grade of “Excellent” given to a model resolution might be a score
of either 8 or 9 whether on the 5-point scale, grades are more discrete.
In the grading phase, the Mean Opinion Scores (MOSs) for each resolution were
calculated. The MOS is defined as follows:
MOS =∑
Nn=0 Rn
N(3.1)
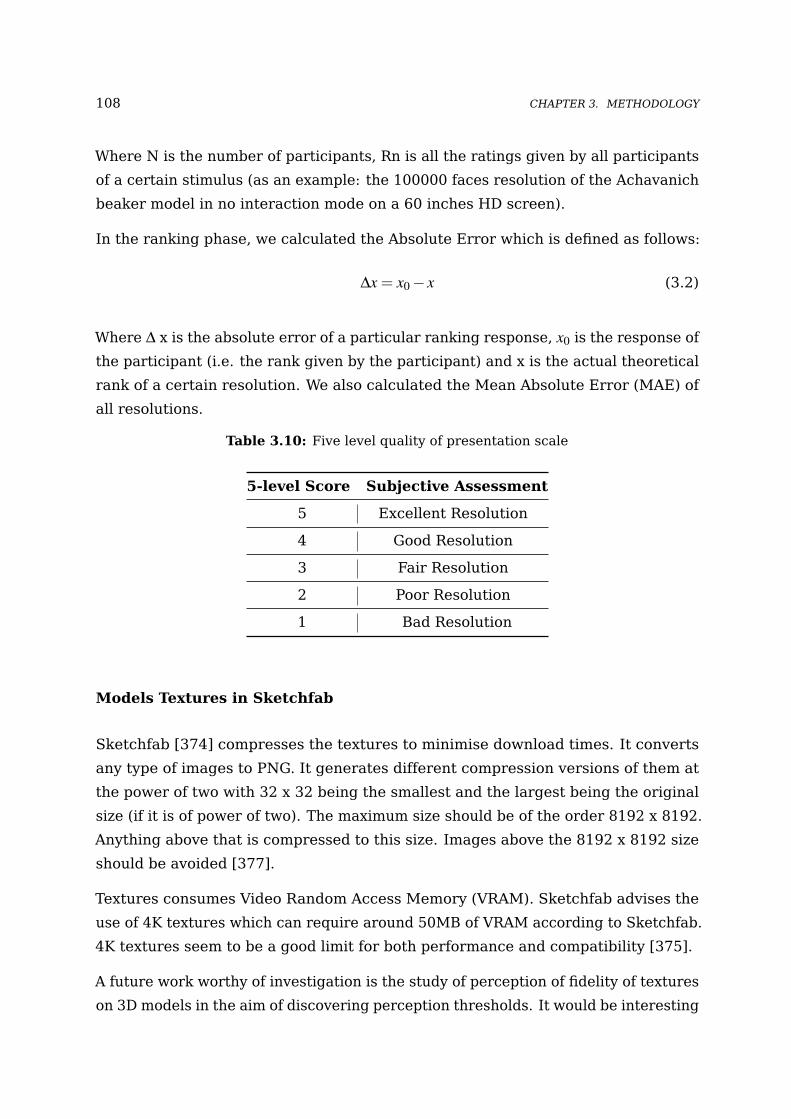
108 CHAPTER 3. METHODOLOGY
Where N is the number of participants, Rn is all the ratings given by all participants
of a certain stimulus (as an example: the 100000 faces resolution of the Achavanich
beaker model in no interaction mode on a 60 inches HD screen).
In the ranking phase, we calculated the Absolute Error which is defined as follows:
∆x = x0 − x (3.2)
Where ∆ x is the absolute error of a particular ranking response, x0 is the response of
the participant (i.e. the rank given by the participant) and x is the actual theoretical
rank of a certain resolution. We also calculated the Mean Absolute Error (MAE) of
all resolutions.
Table 3.10: Five level quality of presentation scale
5-level Score Subjective Assessment
5 Excellent Resolution
4 Good Resolution
3 Fair Resolution
2 Poor Resolution
1 Bad Resolution
Models Textures in Sketchfab
Sketchfab [374] compresses the textures to minimise download times. It converts
any type of images to PNG. It generates different compression versions of them at
the power of two with 32 x 32 being the smallest and the largest being the original
size (if it is of power of two). The maximum size should be of the order 8192 x 8192.
Anything above that is compressed to this size. Images above the 8192 x 8192 size
should be avoided [377].
Textures consumes Video Random Access Memory (VRAM). Sketchfab advises the
use of 4K textures which can require around 50MB of VRAM according to Sketchfab.
4K textures seem to be a good limit for both performance and compatibility [375].
A future work worthy of investigation is the study of perception of fidelity of textures
on 3D models in the aim of discovering perception thresholds. It would be interesting

3.5. SUMMARY 109
to see if the “4K texture resolution” is an upper resolution threshold for textures
above which users do not notice any difference in the resolution or quality of
presentation of the 3D model as a whole. In a similar vein, it is pertinent to know
what relationships can we deduce in terms of perception of fidelity when we fix
the resolution of the model’s geometry (i.e. mesh resolution in number of faces
and vertices) and change the resolution of the textures (following the power of two
rule or any other rule for that matter) and check how the fidelity is perceived from
the perspective of the users. This is a future work for the researcher. It should
be mentioned that many other interesting future research directions for Ph.D and
Masters candidates are presented in the conclusion chapter(Section 8.6).
The compression of textures made by Sketchfab corresponds to the pixel budgets
under the three categories: Low Definition (LD), Standard Definition (SD) and High
Definition (HD) that the user sees when fetching a Sketchfab model.
Sketchfab adaptively chooses the right pixel budget to use depending on the type
and GPU capabilities of the device. Normally the majority of 3D Web models are
fetched on mobiles devices as LD with some exceptions.
The user can manually override a pixel budget through a ReST API GET function of
the form: modelURL/embed? pixelbudget=x. Whenever x is 0 it enforces fetching
HD (no pixel budget for HD).
Pixel budgets lesser than 2048 are for the LD textures and those strictly lesser than
8192 are for the SD. Usually models with texture resolutions higher than 8K will
have the 3 options (LD, SD and HD). Whenever the full original texture resolutions
are within the SD "pixel budget" range, the SD is shown to the user as HD [376].
3.5 Summary
This chapter started by restating the research questions of this thesis and discussed
different research methods used to answer these questions across the different
chapters and sections. The thesis uses a mixed method approach consisting of
quantitative system-level measurements and user-based studies culminating in the
development of Hannibal, a QoS and QoE aware adaptive engine for WBVMs. The
chapter presented and discussed in Sections 3.2 and 3.3 the rationale of using the
methodological approaches adopted and contrasted them to research methods used

110 CHAPTER 3. METHODOLOGY
in some of the related works.
The chapter proceeded with detailing the empirical procedures which involves
investigating the QoS and QoE of 3D Digital Heritage Web (3D Heritage Artefacts
and 3D Heritage WBVW), aimed at investigating the research questions identified in
Chapter 1.
The next part of this thesis discusses the results and analysis of all the empirical
studies.
Part III
Empirical Studies
111


4Chapter Four
3D Web-Based DigitalHeritage Environments
This chapter investigates the Quality of Service of Digital Heritage Web-
Based Virtual Worlds (WBVWs) with the aim of furthering the understanding
of the limitations and bottlenecks that these systems have. WBVWs became
a possibility due the constant improvement of graphical capabilities of client
devices and the progress achieved in 3D Web technologies especially in
WebGL. Web-Based Virtual Worlds provide an immersive 3D experience to
users in their regular web browsers. In order to navigate such environments,
users take the form of avatars in either a first-person view [446] or a
third person view [445] or a VR view [194, 423]. Web-Based Virtual Worlds
whether requiring the installation of a web browser plug-in or which function
without a plug-in (i.e. WebGL) are still less capable graphically than their
counterpart in MUVWs (Second Life, OpenSim, vel cetera) or stand-alone
desktop serious games, which constitute the ne plus ultra systems of 3D
graphical complexity. In addition, they remain limited by their size and
scope due to being bound by what can be rendered efficiently to users in
web browsers. However, this did not diminish their useful role especially
in web applications for CH domains both in a strict academic sense i.e. per
instance, to document, visualise and disseminate a hypothesis of how a
site’s ruins used to look like in the past [110, 111] or as an attractive and
educational means for both physical museums and virtual ones to engage
and to fascinate their visitors.
113
114 CHAPTER 4. 3D WEB-BASED DIGITAL HERITAGE ENVIRONMENTS
A large proportion of this chapter appeared in the following peer-reviewed
publication:
1. Bakri, H., and Allison, C. "Measuring QoS in web-based virtual worlds:
an evaluation of unity 3D web builds." Proceedings of the 8th Interna-
tional Workshop on Massively Multiuser Virtual Environments. ACM,
2016. [30].
4.1 Introduction
The world wide web is gradually becoming more suitable for hosting interactive and
complex 3D content in the form of Web-Based Virtual Worlds (WBVWs) navigable
by avatars. This is achieved through numerous Web3D technologies such as
X3DOM [37], XML3D [383], Unity 3D and WebGL [262]. WBVWs are similar to
traditional MUVWs such as Second Life [251] and OpenSim [298] albeit do not
require any standalone installation as they appear to be integrated completely into
the standard web fabric from the perspective of the user. All the user has to do is
to navigate and interact with the immersive 3D environment via the proxy of their
web browsers. Some tools and technologies of the 3D Web require a plug-in to
be installed, which can discourage potential users, in contrast to others which are
plugin-free such as WebGL which is now supported as a standard in all major web
browsers.
The area of the countryside of Strath of Kildonan in the Highlands of Scotland was
ab initio inhabited by many communities. Two hundreds years ago, traumatic land
clearances were forced upon the population to make room for sheep farming. This
event is still ingrained in the conscience of the community to this day.
To commemorate the Bicentenary anniversary of the Highland clearances, the
Timespan Museum and Arts Centre in the village of Helmsdale in the county of
Sutherland, in Scotland has developed the Translocation program which was a year
long series of installations, exhibits and events. The reconstruction of the Caen
township (i.e. one of the town that suffered the clearances) was part of this program.
This reconstruction represents the final domestic phase of inhabitants occupation
and was based on findings from the archaeological excavations of the Caen Township
and on the community engagement and feedback [266]. It showed how the buildings
and life of community members looked like in this period.
4.1. INTRODUCTION 115
Two web builds were exported from the reconstruction of the ruins of the Caen
Township in Unity 3D. These web builds are the Unity Web Player (UWP) build (a.k.a.
Plug-in version) and the WebGL 1.0 version (U-WebGL) of the same WBVW dubbed
as Timespan Longhouse (TL). Key Quality of Service metrics were measured on the
two web builds: Unity Web Player and Unity WebGL.
Metrics include Frame per Second (FPS), Frame Time (FT), CPU usage, GPU usage,
memory usage and Initial Download Time. The ability to transform virtual worlds
from the Unity 3D engine into builds for web consumption has great potential to
bring 3D immersive interaction capabilities to all web users but the results show
that there are many bottlenecks and limitations of these environments. In addition,
there is a significant performance difference between the Unity Web Player (plug-in
needed) and Unity WebGL 1.0 (no plug-in required), in terms of all the metrics listed
above.
Unity [410] is a leading general purpose game engine for creating immersive 3D
environments. It gives developers the ability to export any Unity game or 3D world
in different formats for different platforms. In particular, it has the ability to host a
3D world in a web browser through the Web Player plug-in or to generate a WebGL
build. Unity 3D has been used considerably throughout the literature in diverse DH
applications [222, 226] and in web-based digital heritage environments [7, 12, 316].
Unity 5.2 can generate two types of builds suitable for web browsers: Unity Web
Player (UWP) and WebGL (U-WebGL). The crucial difference is that UWP requires a
plug-in to be installed whereas U-WebGL can be run directly in any web browser that
supports WebGL. This is the case of all major browsers such as Mozilla Firefox, Apple
Safari or Google Chrome. A U-WebGL view of the Timespan Longhouse displayed in
Google Chrome is shown in Figure 4.1.
The Initial Download Time (IDT) in the context of this work is the 3D Web equivalent
of the widely used Page Load Time (PLT) metric in the 2D Web. IDT is important
as existing 2D web pages aim to load within a few seconds at most, lest a visitor
loses interest and goes elsewhere. Hence the proliferation of Page Load Time
monitoring and analysis tools for the 2D web as evidenced by the built-in facilities
in major web browsers and web sites such as www.webpagetest.org. FPS and FT
are important QoS metrics for performance in real time immersive 3D environments.
Understanding the demands on the CPU, GPU and memory are important also with
real-time 3D graphics.

116 CHAPTER 4. 3D WEB-BASED DIGITAL HERITAGE ENVIRONMENTS
This work discusses what could affect the QoS of WBVWs built in Unity and proposes
possible optimisations to improve their performance.
Figure 4.1: The Timespan Longhouse WBVW [30]
The methodology of how these metrics were captured is presented in the previous
chapter 3, section 3.4.2.1.
The remainder of this chapter is organised as follows: Section 4.2 presents the results
of the captured QoS metrics of DH WBVWs that cover the graphical performance
(FPS, FT, GPU consumption), in addition to QoS metrics that cover CPU consumption,
physical memory consumption and download times. These results are discussed in
detail in Section 4.3, along with possible optimisations. Section 4.4 highlights the
limitations of this investigation. Finally, Section 4.5 concludes.

4.2. RESULTS 117
4.2 Results
4.2.1 Frame Rates and Frame Times
FPS is the average number of frames rendered in a second while FT is the time taken
to render a frame. These are key QoS indicators of the performance of a virtual
world system or a 3D game [9, 176]. The box plots in Figure 4.2 summarise the FPS
Figure 4.2: FPS Distributions of the Timespan Longhouse World
distributions of Timespan Longhouse virtual world for both UWP and U-WebGL when
the avatar is standing with random yaw1 and when she is walking randomly from
a non-dense to a dense area. It can be seen that there are wide box-and-whisker
diagrams with highs of around 60 FPS which is very good performance whether
standing or walking and also very low FPS whiskers reaching 0. FPS of around
60 characterise non-dense areas in TL whereas FPS around 0 characterise very
complex regions with complex geometry where the number of triangles (i.e. faces)
and vertices is high. It is interesting that the FPS median (i.e. 50th percentile, the
thick whisker line) while walking stays around 50 in the UWP version but is less
than 30 in the U-WebGL version.
1Yaw is the change in the avatar orientation or the change in the “look at” view
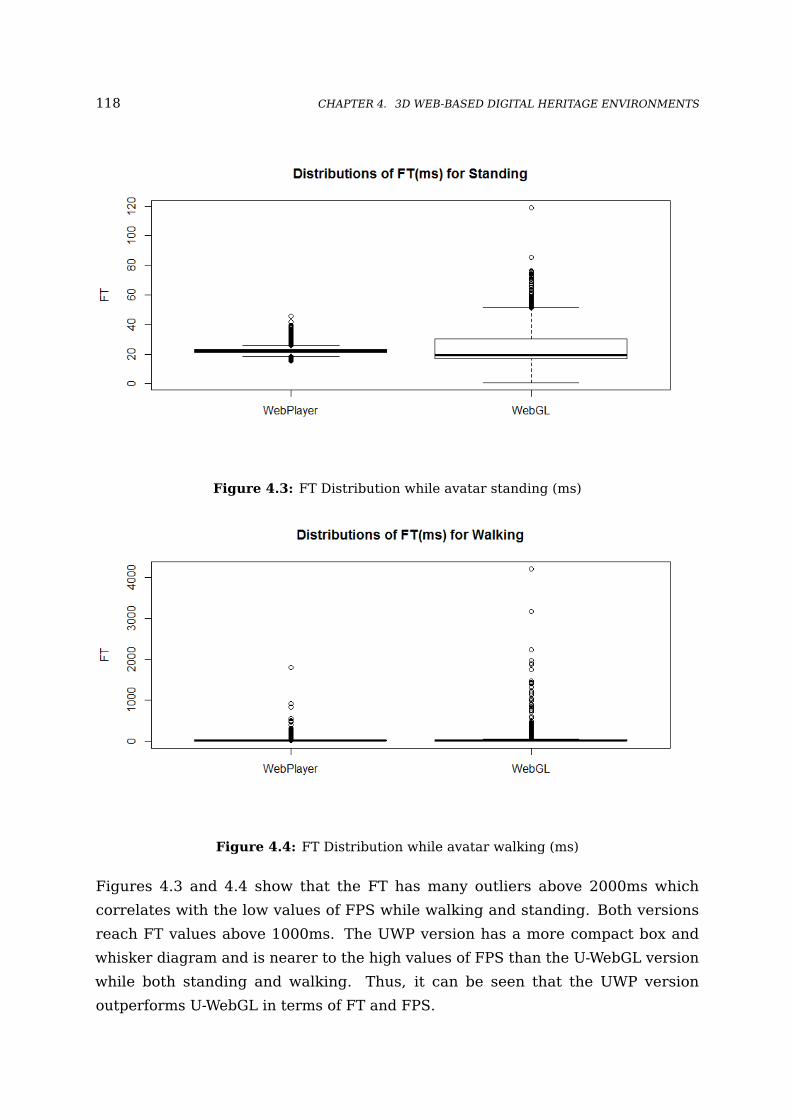
118 CHAPTER 4. 3D WEB-BASED DIGITAL HERITAGE ENVIRONMENTS
Figure 4.3: FT Distribution while avatar standing (ms)
Figure 4.4: FT Distribution while avatar walking (ms)
Figures 4.3 and 4.4 show that the FT has many outliers above 2000ms which
correlates with the low values of FPS while walking and standing. Both versions
reach FT values above 1000ms. The UWP version has a more compact box and
whisker diagram and is nearer to the high values of FPS than the U-WebGL version
while both standing and walking. Thus, it can be seen that the UWP version
outperforms U-WebGL in terms of FT and FPS.
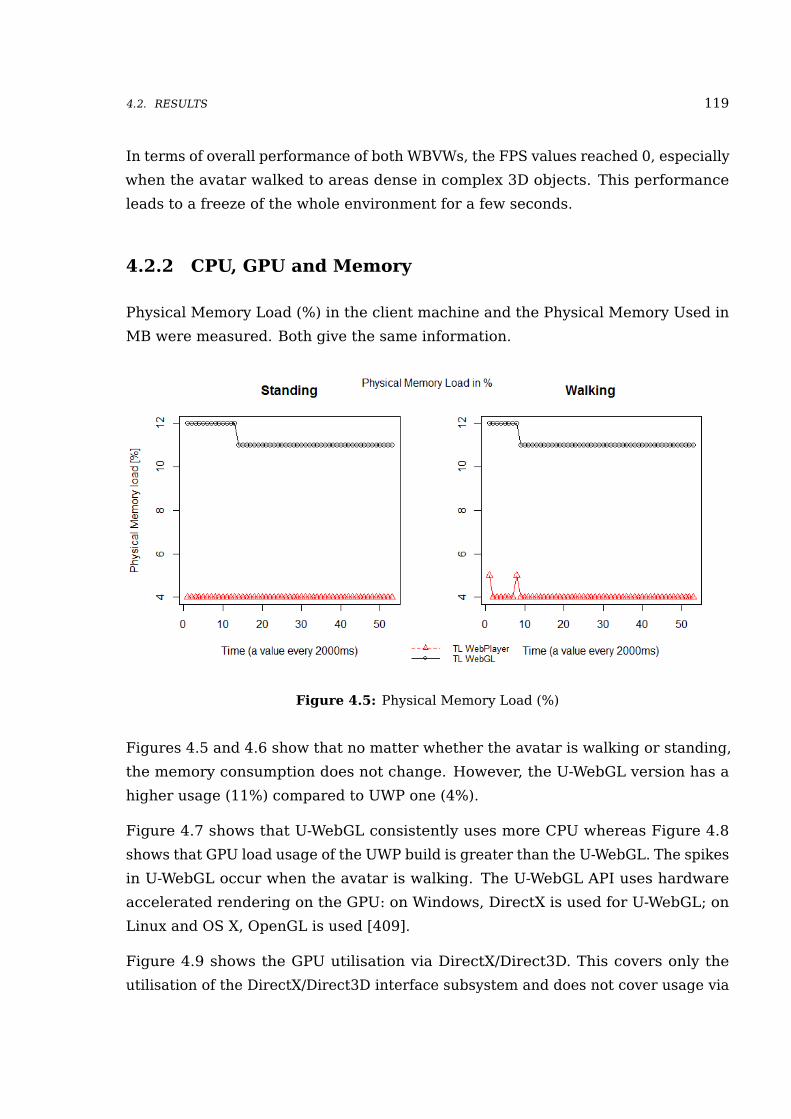
4.2. RESULTS 119
In terms of overall performance of both WBVWs, the FPS values reached 0, especially
when the avatar walked to areas dense in complex 3D objects. This performance
leads to a freeze of the whole environment for a few seconds.
4.2.2 CPU, GPU and Memory
Physical Memory Load (%) in the client machine and the Physical Memory Used in
MB were measured. Both give the same information.
Figure 4.5: Physical Memory Load (%)
Figures 4.5 and 4.6 show that no matter whether the avatar is walking or standing,
the memory consumption does not change. However, the U-WebGL version has a
higher usage (11%) compared to UWP one (4%).
Figure 4.7 shows that U-WebGL consistently uses more CPU whereas Figure 4.8
shows that GPU load usage of the UWP build is greater than the U-WebGL. The spikes
in U-WebGL occur when the avatar is walking. The U-WebGL API uses hardware
accelerated rendering on the GPU: on Windows, DirectX is used for U-WebGL; on
Linux and OS X, OpenGL is used [409].
Figure 4.9 shows the GPU utilisation via DirectX/Direct3D. This covers only the
utilisation of the DirectX/Direct3D interface subsystem and does not cover usage via
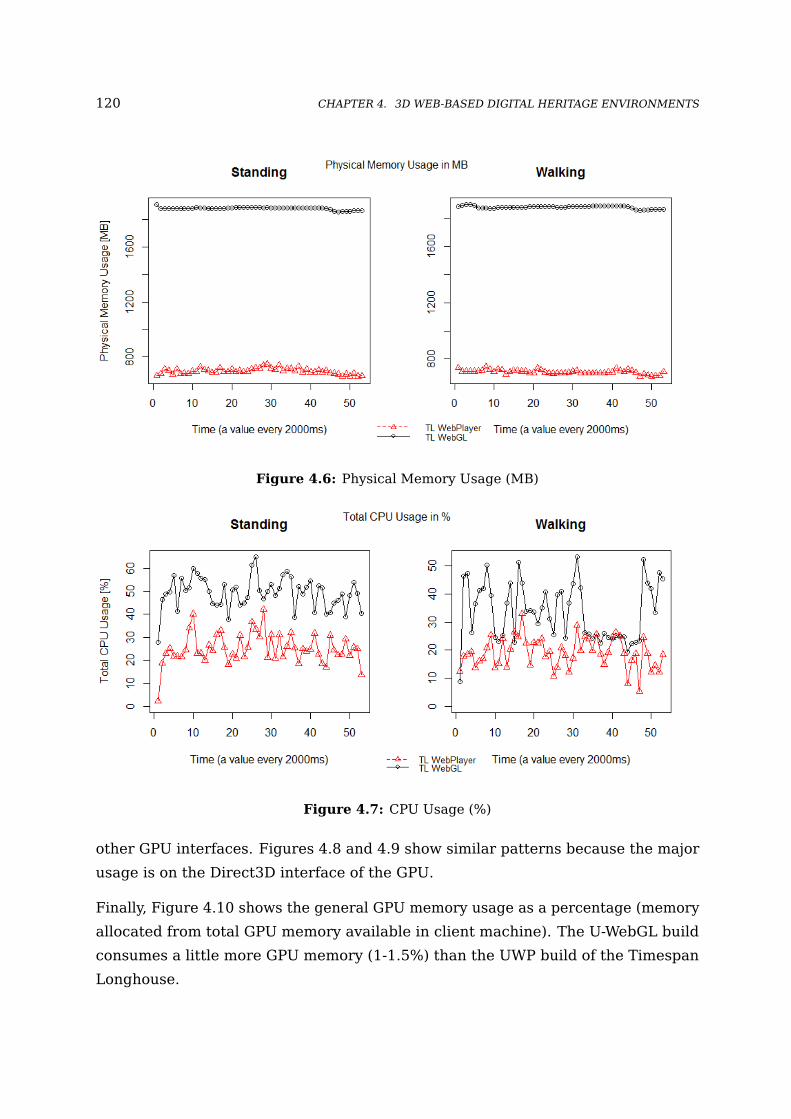
120 CHAPTER 4. 3D WEB-BASED DIGITAL HERITAGE ENVIRONMENTS
Figure 4.6: Physical Memory Usage (MB)
Figure 4.7: CPU Usage (%)
other GPU interfaces. Figures 4.8 and 4.9 show similar patterns because the major
usage is on the Direct3D interface of the GPU.
Finally, Figure 4.10 shows the general GPU memory usage as a percentage (memory
allocated from total GPU memory available in client machine). The U-WebGL build
consumes a little more GPU memory (1-1.5%) than the UWP build of the Timespan
Longhouse.
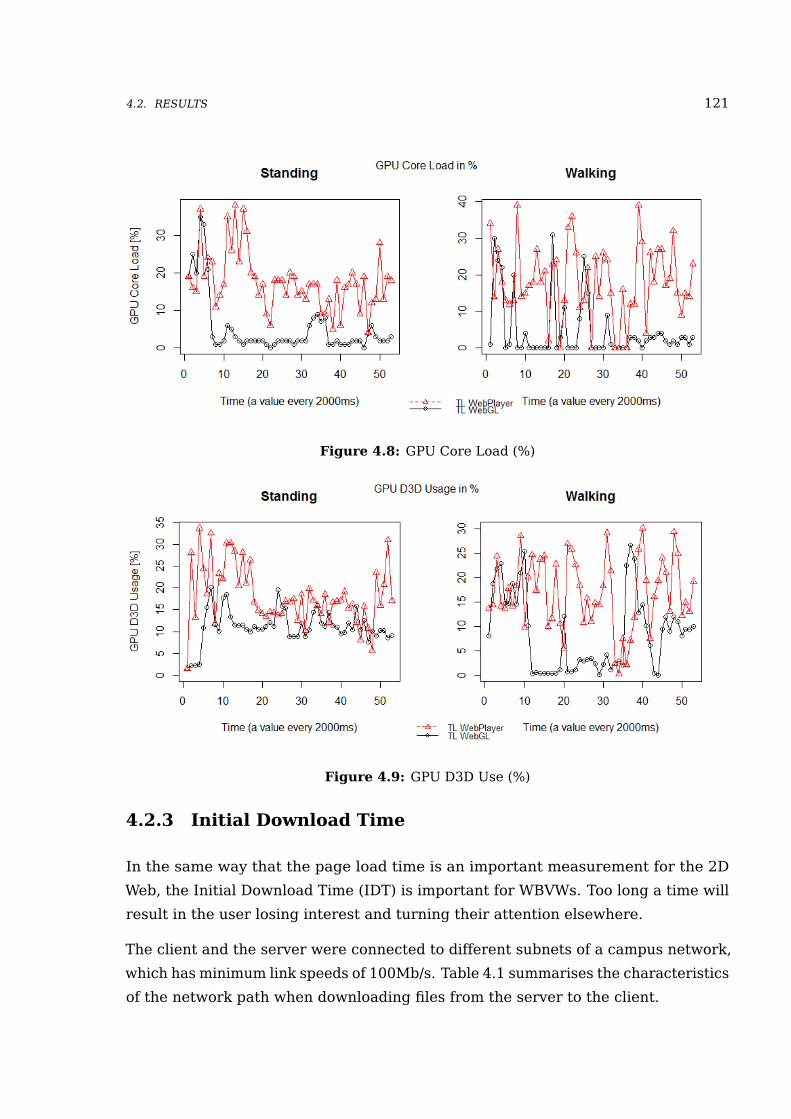
4.2. RESULTS 121
Figure 4.8: GPU Core Load (%)
Figure 4.9: GPU D3D Use (%)
4.2.3 Initial Download Time
In the same way that the page load time is an important measurement for the 2D
Web, the Initial Download Time (IDT) is important for WBVWs. Too long a time will
result in the user losing interest and turning their attention elsewhere.
The client and the server were connected to different subnets of a campus network,
which has minimum link speeds of 100Mb/s. Table 4.1 summarises the characteristics
of the network path when downloading files from the server to the client.
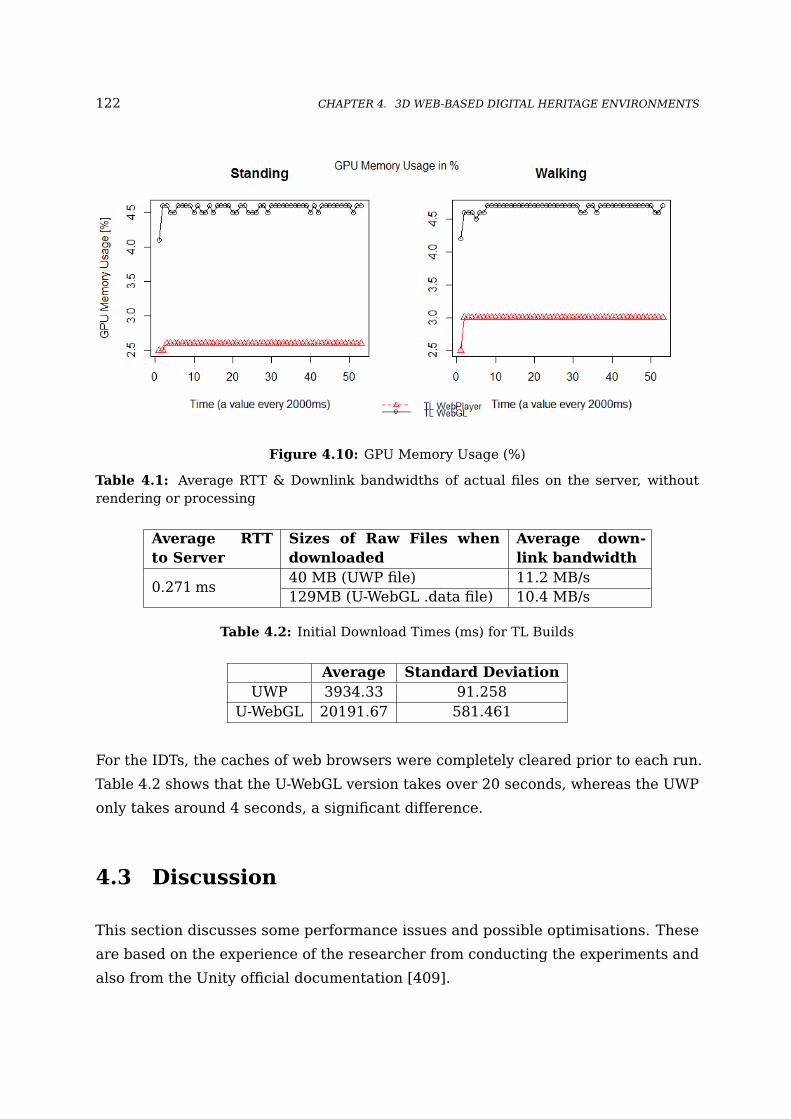
122 CHAPTER 4. 3D WEB-BASED DIGITAL HERITAGE ENVIRONMENTS
Figure 4.10: GPU Memory Usage (%)
Table 4.1: Average RTT & Downlink bandwidths of actual files on the server, withoutrendering or processing
Average RTTto Server
Sizes of Raw Files whendownloaded
Average down-link bandwidth
0.271 ms40 MB (UWP file) 11.2 MB/s129MB (U-WebGL .data file) 10.4 MB/s
Table 4.2: Initial Download Times (ms) for TL Builds
Average Standard DeviationUWP 3934.33 91.258
U-WebGL 20191.67 581.461
For the IDTs, the caches of web browsers were completely cleared prior to each run.
Table 4.2 shows that the U-WebGL version takes over 20 seconds, whereas the UWP
only takes around 4 seconds, a significant difference.
4.3 Discussion
This section discusses some performance issues and possible optimisations. These
are based on the experience of the researcher from conducting the experiments and
also from the Unity official documentation [409].
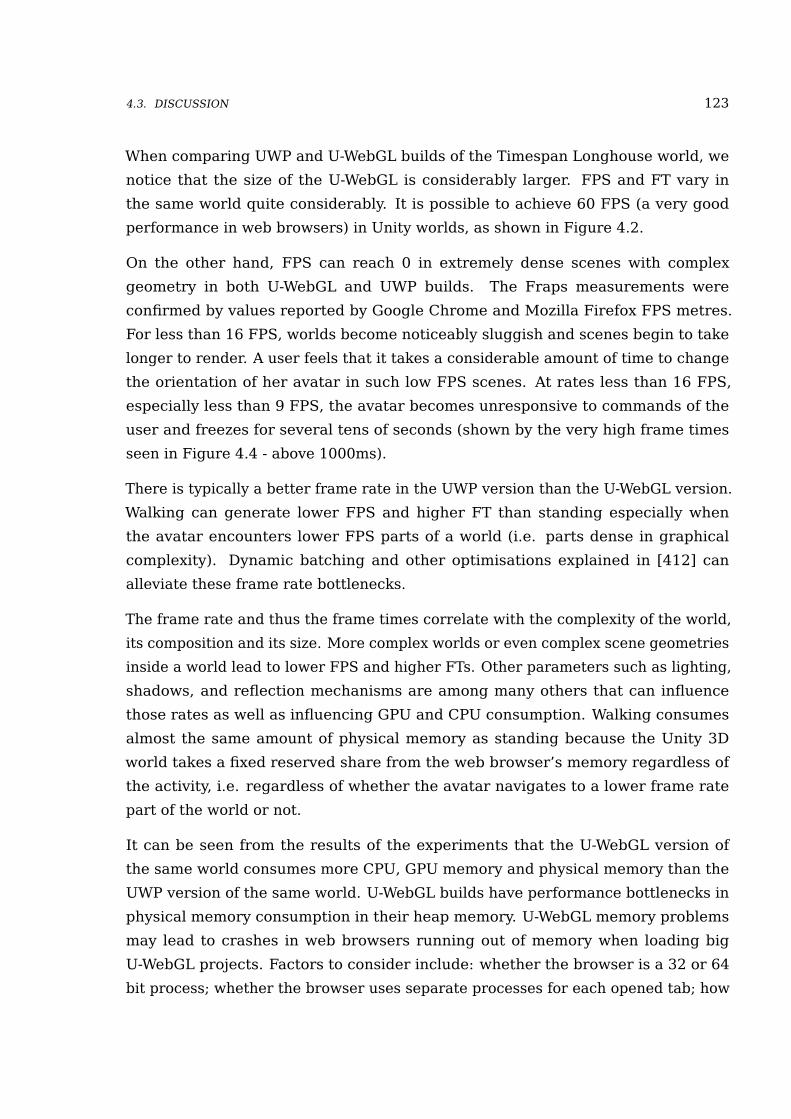
4.3. DISCUSSION 123
When comparing UWP and U-WebGL builds of the Timespan Longhouse world, we
notice that the size of the U-WebGL is considerably larger. FPS and FT vary in
the same world quite considerably. It is possible to achieve 60 FPS (a very good
performance in web browsers) in Unity worlds, as shown in Figure 4.2.
On the other hand, FPS can reach 0 in extremely dense scenes with complex
geometry in both U-WebGL and UWP builds. The Fraps measurements were
confirmed by values reported by Google Chrome and Mozilla Firefox FPS metres.
For less than 16 FPS, worlds become noticeably sluggish and scenes begin to take
longer to render. A user feels that it takes a considerable amount of time to change
the orientation of her avatar in such low FPS scenes. At rates less than 16 FPS,
especially less than 9 FPS, the avatar becomes unresponsive to commands of the
user and freezes for several tens of seconds (shown by the very high frame times
seen in Figure 4.4 - above 1000ms).
There is typically a better frame rate in the UWP version than the U-WebGL version.
Walking can generate lower FPS and higher FT than standing especially when
the avatar encounters lower FPS parts of a world (i.e. parts dense in graphical
complexity). Dynamic batching and other optimisations explained in [412] can
alleviate these frame rate bottlenecks.
The frame rate and thus the frame times correlate with the complexity of the world,
its composition and its size. More complex worlds or even complex scene geometries
inside a world lead to lower FPS and higher FTs. Other parameters such as lighting,
shadows, and reflection mechanisms are among many others that can influence
those rates as well as influencing GPU and CPU consumption. Walking consumes
almost the same amount of physical memory as standing because the Unity 3D
world takes a fixed reserved share from the web browser’s memory regardless of
the activity, i.e. regardless of whether the avatar navigates to a lower frame rate
part of the world or not.
It can be seen from the results of the experiments that the U-WebGL version of
the same world consumes more CPU, GPU memory and physical memory than the
UWP version of the same world. U-WebGL builds have performance bottlenecks in
physical memory consumption in their heap memory. U-WebGL memory problems
may lead to crashes in web browsers running out of memory when loading big
U-WebGL projects. Factors to consider include: whether the browser is a 32 or 64
bit process; whether the browser uses separate processes for each opened tab; how
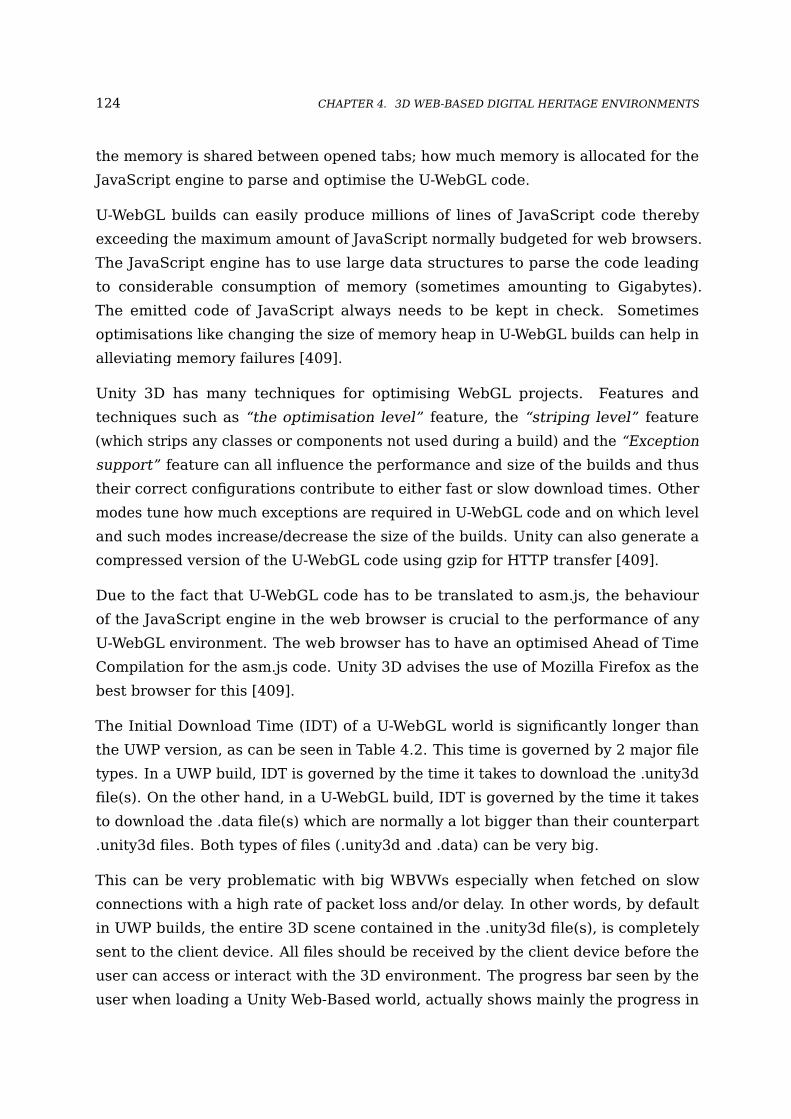
124 CHAPTER 4. 3D WEB-BASED DIGITAL HERITAGE ENVIRONMENTS
the memory is shared between opened tabs; how much memory is allocated for the
JavaScript engine to parse and optimise the U-WebGL code.
U-WebGL builds can easily produce millions of lines of JavaScript code thereby
exceeding the maximum amount of JavaScript normally budgeted for web browsers.
The JavaScript engine has to use large data structures to parse the code leading
to considerable consumption of memory (sometimes amounting to Gigabytes).
The emitted code of JavaScript always needs to be kept in check. Sometimes
optimisations like changing the size of memory heap in U-WebGL builds can help in
alleviating memory failures [409].
Unity 3D has many techniques for optimising WebGL projects. Features and
techniques such as “the optimisation level” feature, the “striping level” feature
(which strips any classes or components not used during a build) and the “Exception
support” feature can all influence the performance and size of the builds and thus
their correct configurations contribute to either fast or slow download times. Other
modes tune how much exceptions are required in U-WebGL code and on which level
and such modes increase/decrease the size of the builds. Unity can also generate a
compressed version of the U-WebGL code using gzip for HTTP transfer [409].
Due to the fact that U-WebGL code has to be translated to asm.js, the behaviour
of the JavaScript engine in the web browser is crucial to the performance of any
U-WebGL environment. The web browser has to have an optimised Ahead of Time
Compilation for the asm.js code. Unity 3D advises the use of Mozilla Firefox as the
best browser for this [409].
The Initial Download Time (IDT) of a U-WebGL world is significantly longer than
the UWP version, as can be seen in Table 4.2. This time is governed by 2 major file
types. In a UWP build, IDT is governed by the time it takes to download the .unity3d
file(s). On the other hand, in a U-WebGL build, IDT is governed by the time it takes
to download the .data file(s) which are normally a lot bigger than their counterpart
.unity3d files. Both types of files (.unity3d and .data) can be very big.
This can be very problematic with big WBVWs especially when fetched on slow
connections with a high rate of packet loss and/or delay. In other words, by default
in UWP builds, the entire 3D scene contained in the .unity3d file(s), is completely
sent to the client device. All files should be received by the client device before the
user can access or interact with the 3D environment. The progress bar seen by the
user when loading a Unity Web-Based world, actually shows mainly the progress in
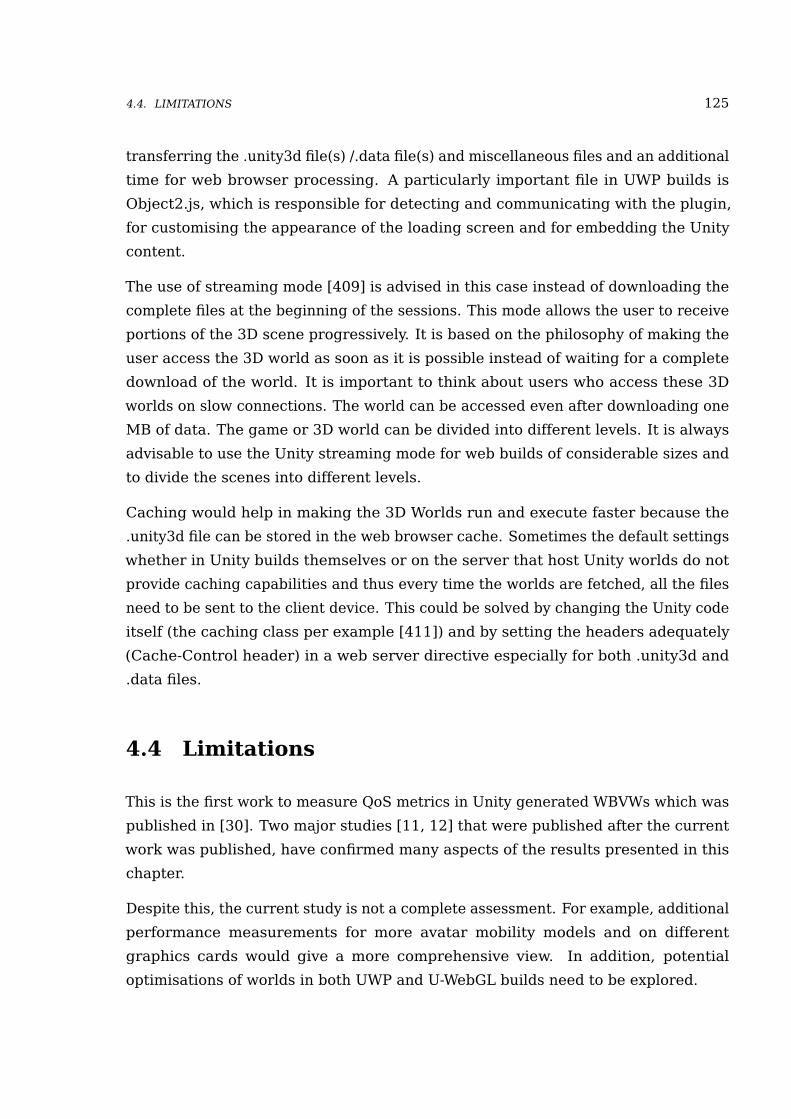
4.4. LIMITATIONS 125
transferring the .unity3d file(s) /.data file(s) and miscellaneous files and an additional
time for web browser processing. A particularly important file in UWP builds is
Object2.js, which is responsible for detecting and communicating with the plugin,
for customising the appearance of the loading screen and for embedding the Unity
content.
The use of streaming mode [409] is advised in this case instead of downloading the
complete files at the beginning of the sessions. This mode allows the user to receive
portions of the 3D scene progressively. It is based on the philosophy of making the
user access the 3D world as soon as it is possible instead of waiting for a complete
download of the world. It is important to think about users who access these 3D
worlds on slow connections. The world can be accessed even after downloading one
MB of data. The game or 3D world can be divided into different levels. It is always
advisable to use the Unity streaming mode for web builds of considerable sizes and
to divide the scenes into different levels.
Caching would help in making the 3D Worlds run and execute faster because the
.unity3d file can be stored in the web browser cache. Sometimes the default settings
whether in Unity builds themselves or on the server that host Unity worlds do not
provide caching capabilities and thus every time the worlds are fetched, all the files
need to be sent to the client device. This could be solved by changing the Unity code
itself (the caching class per example [411]) and by setting the headers adequately
(Cache-Control header) in a web server directive especially for both .unity3d and
.data files.
4.4 Limitations
This is the first work to measure QoS metrics in Unity generated WBVWs which was
published in [30]. Two major studies [11, 12] that were published after the current
work was published, have confirmed many aspects of the results presented in this
chapter.
Despite this, the current study is not a complete assessment. For example, additional
performance measurements for more avatar mobility models and on different
graphics cards would give a more comprehensive view. In addition, potential
optimisations of worlds in both UWP and U-WebGL builds need to be explored.
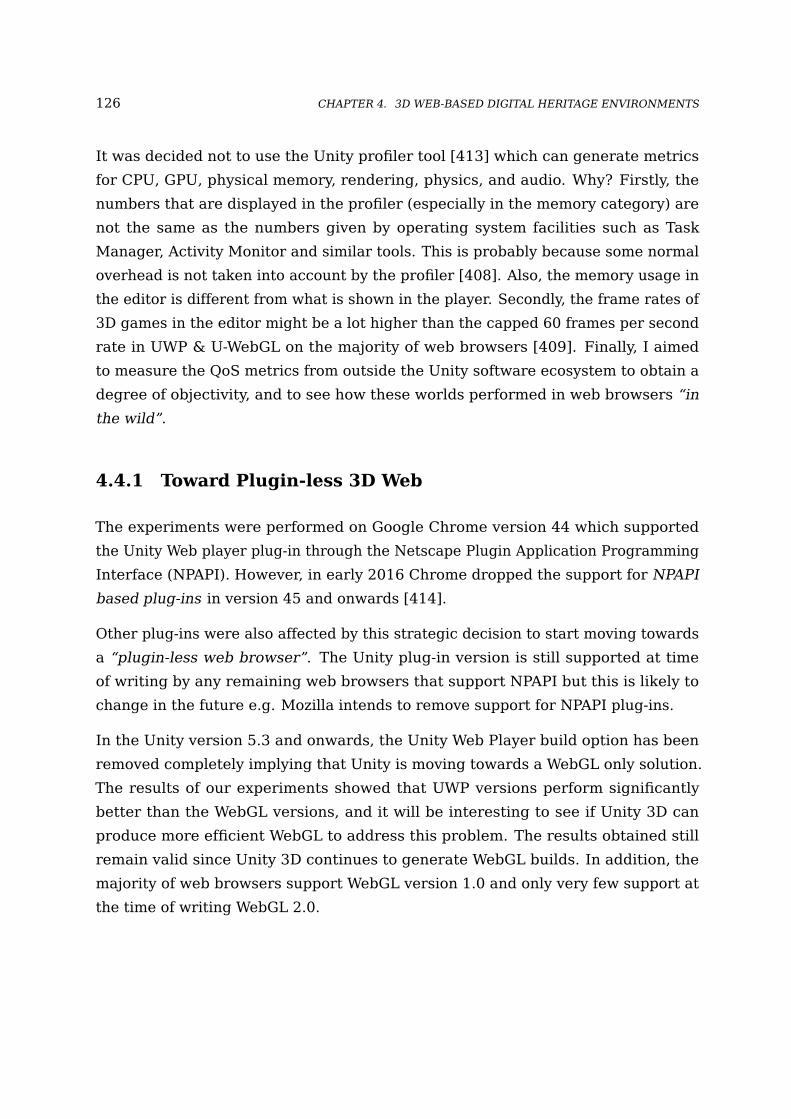
126 CHAPTER 4. 3D WEB-BASED DIGITAL HERITAGE ENVIRONMENTS
It was decided not to use the Unity profiler tool [413] which can generate metrics
for CPU, GPU, physical memory, rendering, physics, and audio. Why? Firstly, the
numbers that are displayed in the profiler (especially in the memory category) are
not the same as the numbers given by operating system facilities such as Task
Manager, Activity Monitor and similar tools. This is probably because some normal
overhead is not taken into account by the profiler [408]. Also, the memory usage in
the editor is different from what is shown in the player. Secondly, the frame rates of
3D games in the editor might be a lot higher than the capped 60 frames per second
rate in UWP & U-WebGL on the majority of web browsers [409]. Finally, I aimed
to measure the QoS metrics from outside the Unity software ecosystem to obtain a
degree of objectivity, and to see how these worlds performed in web browsers “in
the wild”.
4.4.1 Toward Plugin-less 3D Web
The experiments were performed on Google Chrome version 44 which supported
the Unity Web player plug-in through the Netscape Plugin Application Programming
Interface (NPAPI). However, in early 2016 Chrome dropped the support for NPAPI
based plug-ins in version 45 and onwards [414].
Other plug-ins were also affected by this strategic decision to start moving towards
a “plugin-less web browser”. The Unity plug-in version is still supported at time
of writing by any remaining web browsers that support NPAPI but this is likely to
change in the future e.g. Mozilla intends to remove support for NPAPI plug-ins.
In the Unity version 5.3 and onwards, the Unity Web Player build option has been
removed completely implying that Unity is moving towards a WebGL only solution.
The results of our experiments showed that UWP versions perform significantly
better than the WebGL versions, and it will be interesting to see if Unity 3D can
produce more efficient WebGL to address this problem. The results obtained still
remain valid since Unity 3D continues to generate WebGL builds. In addition, the
majority of web browsers support WebGL version 1.0 and only very few support at
the time of writing WebGL 2.0.
4.5. SUMMARY 127
4.4.2 Unity WebGL Limitations
WebGL is supported by the majority of web browsers which makes WebGL Worlds
very accessible. Nevertheless, there are few limitations in WebGL itself as a 3D Web
technology and in JavaScript as a language for 3D Graphics. JavaScript does not
support multithreading or direct access to IP sockets of web browsers for security
and privacy concerns. WebGL supports only baked global illumination and not
real-time ones. In addition, it does not support procedural materials or linear colour
rendering. It supports basic Web audio API which has many limited audio features
compared to other platforms. The initial download time of a Unity WebGL world is a
lot bigger than that of its plug-in counterpart of the same world due to build sizes
being a lot bigger in many instances.
Another concern is the memory used by Unity 3D WebGL builds. First the heap
memory which Unity 3D uses to store loaded assets and scenes needs to be at a
convenient size to fit all data required to play the content in web browser. Tweaking
the WebGL heap memory size avoids many out-of-memory problems encountered
normally in big WebGL builds. Another issue related to memory in WebGL is the
memory used by the JavaScript engines for parsing and optimising WebGL codes in
browsers.
Compression and optimisation techniques of Unity WebGL builds minimise the
emitted JavaScript code and thus result in smaller download times and lesser memory
consumption. WebGL 2.0 (based on OpenGL ES 3.0) mitigates some of the limitations
of WebGL 1.0 but is still experimental and is not yet supported in the majority of
web browsers [409, 410].
4.5 Summary
This chapter investigated the QoS of DH WBVWs. QoS metrics were captured for two
Unity 3D DH WBVWs which include FPS, FT, CPU, GPU, memory usage and Initial
Download Times. Many limitations and bottlenecks found in these environments
were identified and discussed and optimizations were proposed.
In the following chapter, 3D Digital Heritage artefacts, another type of 3D Web
content used extensively in CH applications and WBVMs, will be investigated.

5Chapter Five
3D Digital HeritageArtefacts
Cultural heritage artefacts act as a gateway helping people learn about their
social traditions and history. However, preserving these artefacts involves
many difficulties, including potential destruction or damage from global
warming, pollution, wars and conflicts, and degradation from day to day use.
In addition, artefacts can only be present in one place at a time, and many
of them can not be exhibited due to the limited physical space of museums.
The digital domain offers opportunities to capture and represent the form
and texture of these artefacts and to overcome the previously mentioned
constraints by allowing people to access and interact with them on multiple
devices and network regimes. The first part of this chapter investigates the
QoS of DH artefacts mainly by capturing the download and processing times
of different 3D models of different resolutions fetched from the Sketchfab
web repository. In the second part of the chapter, a preliminary investigation
of the perception of Visual Latency of 3D models is reported. Furthermore,
the subjective perception of the fidelity of 3D digital heritage artefacts
in web browsers is studied through two experiments in order to discover
perceptible resolution thresholds. This helps CH stakeholders to create
models of reasonable graphical complexity that could be fetched on the
biggest range of end devices. It also enables the design of systems which
efficiently optimise the user experience by adapting their behaviour based
upon users’ perception of fidelity and models’ characteristics.
129
130 CHAPTER 5. 3D DIGITAL HERITAGE ARTEFACTS
A large proportion of this chapter appeared in the following peer-reviewed
publication:
1. Bakri, H., Miller, A., & Oliver, I. (2018, June). Fidelity Perception of 3D
Models on the Web. In International Conference on Immersive Learning
(pp. 113-130). Springer, Cham. [28].
5.1 Introduction
The work presented in this chapter furthers the knowledge of Cultural Heritage
stakeholders of the download and processing times, user perception of visual latency
and subjective perception of fidelity of 3D digital heritage models of different levels
of detail on a wide range of client devices and network regimes. This knowledge
enables us to design digital heritage applications with the aforementioned areas in
mind thus meeting the demands of different user bases.
This also paves the way for developing Hannibal, an adaptive engine that strikes the
best possible balance between QoS and QoE. Hannibal is presented in Chapter 7.
This chapter presents an investigation into the Quality of Service (QoS) and Quality
of Experience (QoE) of Web3D Digital Heritage models that are fetched from the
Sketchfab social repository on mobile devices and standalone PCs. The aim is
to understand responsiveness mainly in terms of Initial Download & Processing
Times (IDPTs) of the DH models and to understand the user-based perception of
visual latency (a preliminary study conducted in Section 5.3.1) and the subjective
perception of fidelity of DH models by users (a study presented in Section 5.3.2 and
published in [28]).
The detailed methodological procedures of how to capture the Initial Download
and Processing Times (IDPTs) of the digital heritage Web3D models on personal
computers and mobile devices are detailed in Chapter 3, Section 3.4.2.1. The
subjective perception of fidelity of DH Web3D models is studied through two major
experiments. The methodological procedures pertaining to those two experiments
are detailed in Chapter 3, Section 3.4.2.2.
The remainder of this chapter is organised as follows: Section 5.2 presents the
results and analysis of the QoS empirical studies conducted on DH Web3D models.
In addition, this section presents best-practice recommendations following the
5.2. QOS OF DIGITAL HERITAGE MODELS 131
analysis of download & processing times. Section 5.3 studies the QoE in particular
the subjective perception of fidelity of heritage artefacts in two experiments (one
on a PC tethered to a big screen) and the other is on mobile devices (a tablet and a
phone).
We start first by investigating the Quality of Service (QoS) of DH Web3D models in
the following section.
5.2 QoS of Digital Heritage Models
5.2.1 Initial Download & Processing Times
The Initial Download & Processing Time (IDPT) is the time it takes any 3D model
to download completely and to become usable in the web browser. The “Finish
Time” in the Network Inspector in Google Chrome was found to provide such a time
because it includes all asynchronously non-blocking resources on the page even
after the DOM of the page is completely loaded.
It should be noted that this time is different then the “Load time” and the
“DOMContentLoaded time” given by the Network Inspector tool. In the majority of
cases, the “Finish Time” is longer than these timings.
The reader can refer back to Section 3.4.2.1 in Chapter 3 for a detailed method-
ological procedure of how to capture download times on web browsers of personal
computers and mobile devices and for a description of the network regimes and
devices used.
Five 3D models hosted on Sketchfab were used. One of the models, which is the
Human Head model, is a very low resolution 3D model (Resolution: 112 faces).
Models of such resolutions are unlikely to be found in any CH context but this model
was chosen because it constitutes a baseline to show how a very low resolution
model behaves across connections especially slow ones.
The other four 3D models resulted from digital heritage digitisation procedures. Two
of these 3D Digital Heritage artefacts belong to the British Museum Sketchfab col-
lection [60]: The Statue of Ramesses II, the ’Younger Memnon’ Model1 (Resolution:
1Annotations & sound commentary were added to the Model by the British Museum after thecurrent experiment was conducted
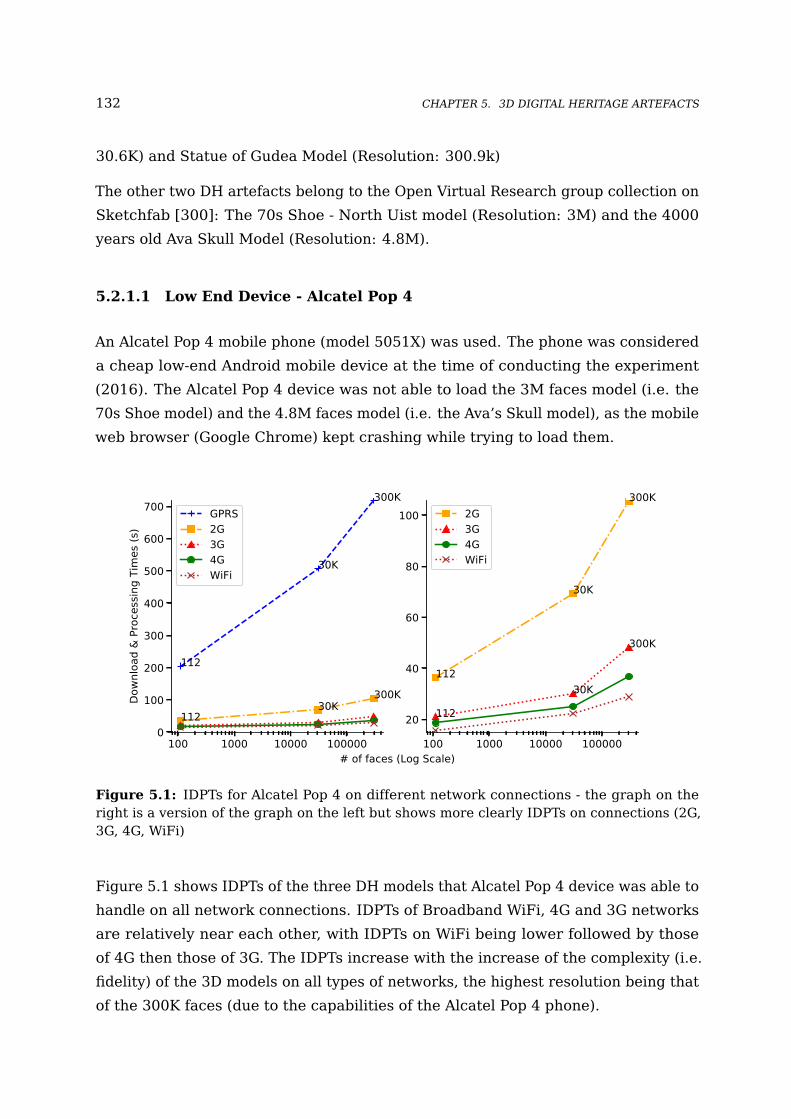
132 CHAPTER 5. 3D DIGITAL HERITAGE ARTEFACTS
30.6K) and Statue of Gudea Model (Resolution: 300.9k)
The other two DH artefacts belong to the Open Virtual Research group collection on
Sketchfab [300]: The 70s Shoe - North Uist model (Resolution: 3M) and the 4000
years old Ava Skull Model (Resolution: 4.8M).
5.2.1.1 Low End Device - Alcatel Pop 4
An Alcatel Pop 4 mobile phone (model 5051X) was used. The phone was considered
a cheap low-end Android mobile device at the time of conducting the experiment
(2016). The Alcatel Pop 4 device was not able to load the 3M faces model (i.e. the
70s Shoe model) and the 4.8M faces model (i.e. the Ava’s Skull model), as the mobile
web browser (Google Chrome) kept crashing while trying to load them.
100 1000 10000 1000000
100
200
300
400
500
600
700
Down
load
& P
roce
ssin
g Ti
mes
(s)
112
30K
300K
11230K
300K
GPRS2G3G4GWiFi
100 1000 10000 100000
20
40
60
80
100
112
30K
300K
112
30K
300K2G3G4GWiFi
# of faces (Log Scale)
Figure 5.1: IDPTs for Alcatel Pop 4 on different network connections - the graph on theright is a version of the graph on the left but shows more clearly IDPTs on connections (2G,3G, 4G, WiFi)
Figure 5.1 shows IDPTs of the three DH models that Alcatel Pop 4 device was able to
handle on all network connections. IDPTs of Broadband WiFi, 4G and 3G networks
are relatively near each other, with IDPTs on WiFi being lower followed by those
of 4G then those of 3G. The IDPTs increase with the increase of the complexity (i.e.
fidelity) of the 3D models on all types of networks, the highest resolution being that
of the 300K faces (due to the capabilities of the Alcatel Pop 4 phone).

5.2. QOS OF DIGITAL HERITAGE MODELS 133
On WiFi Broadband, IDPT is around 15 seconds for the 112 faces model and it
reaches 30 seconds for the 300K faces model. These figures increase for the 4G
network on the Alcatel Pop 4 from around 18 seconds for the 112 faces, to around
40 seconds for the 300K faces model. 3G IDPTs, as expected, are relatively slightly
higher than the 4G numbers.
In all cases, these numbers are not impressive compared to the normal page load
time expected in a web setting. Too long a time will result the user losing interest
and turning their attention elsewhere. It is interesting to see how much time DH
models take to download and to become usable on mobile devices with limited
capabilities such as Alcatel Pop 4 on the WiFi entry level Broadband in UK.
Figure 5.1 shows that on 2G networks, IDPTs are high and vary from around 35
seconds for the 112 faces model to over 100 seconds (more than 1 minute and a
half) for the 300K model. 2G networks are a reality in rural areas with too weak
signals for 3G and 4G networks to be operational.
Figure 5.1 shows also that on GPRS (General Packet Radio Service) connection, the
IDPTs are extremely high with over 200 seconds for the 112 faces model and over
700 seconds for the 300K model. Although GPRS normally becomes the default
network when other mobile networks fail mainly in the case of 2G, this service in a
lot of cases becomes the only reality network in rural areas. We can deduce that it is
inefficient to fetch any 3D models on such network connections.
100 1000 10000 10000010000000
100
200
300
400
500
600
700
800
Down
load
& P
roce
ssin
g Ti
mes
(s)
11230K
300K
3M
4.8M
11230K 300K 3M
4.8M
2G3G4GWiFi
100 1000 10000 1000001000000
20
40
60
80
100
120
11230K
300K
3M
4.8M3G4GWiFi
# of faces (Log Scale)
Figure 5.2: IDPTs for LG Nexus 5x on WiFi, 4G, 3G and 2G network connections - thegraph on the right is a version of the graph on the left that shows more clearly IDPTs onconnections (3G, 4G, WiFi)

134 CHAPTER 5. 3D DIGITAL HERITAGE ARTEFACTS
100 1000 10000 100000 1000000# of faces (Log scale)
0
2000
4000
6000
8000
10000
12000
14000
16000
Down
load
& P
roce
ssin
g Ti
mes
(s)
112 30K 300K
3M
4.8M
112 30K 300K 3M4.8M
GPRS2G
Figure 5.3: IDPTs for the LG Nexus 5x on GPRS & 2G
100 1000 10000 100000 1000000# of faces (Log scale)
20
40
60
80
100
Down
load
& P
roce
ssin
g Ti
mes
(s)
11230K
300K
11230K
300K
3M
4.8MWiFi Broadband Alcatel Pop 4WiFi Broadband LG Nexus 5x
Figure 5.4: IDPTs for Broadband WiFi on LG Nexus 5x VS. Alcatel Pop 4
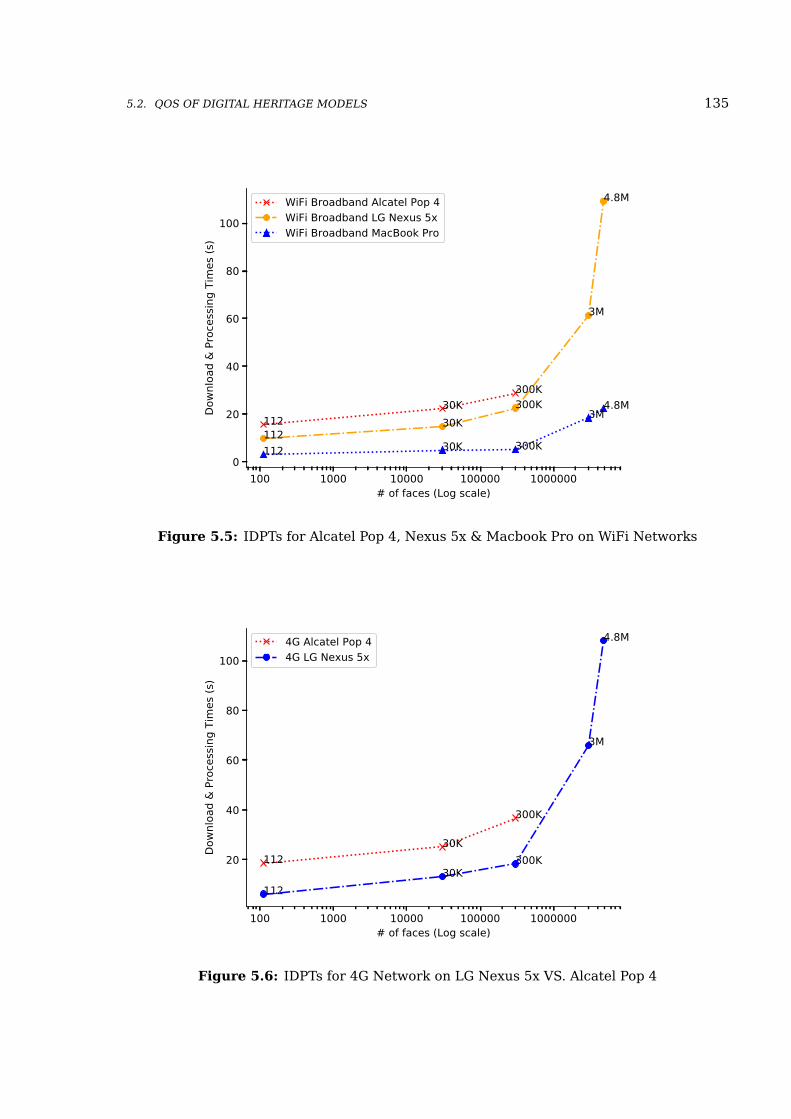
5.2. QOS OF DIGITAL HERITAGE MODELS 135
100 1000 10000 100000 1000000# of faces (Log scale)
0
20
40
60
80
100Do
wnlo
ad &
Pro
cess
ing
Tim
es (s
)
11230K
300K
11230K
300K
3M
4.8M
112 30K 300K
3M4.8M
WiFi Broadband Alcatel Pop 4WiFi Broadband LG Nexus 5xWiFi Broadband MacBook Pro
Figure 5.5: IDPTs for Alcatel Pop 4, Nexus 5x & Macbook Pro on WiFi Networks
100 1000 10000 100000 1000000# of faces (Log scale)
20
40
60
80
100
Down
load
& P
roce
ssin
g Ti
mes
(s)
11230K
300K
11230K
300K
3M
4.8M4G Alcatel Pop 44G LG Nexus 5x
Figure 5.6: IDPTs for 4G Network on LG Nexus 5x VS. Alcatel Pop 4
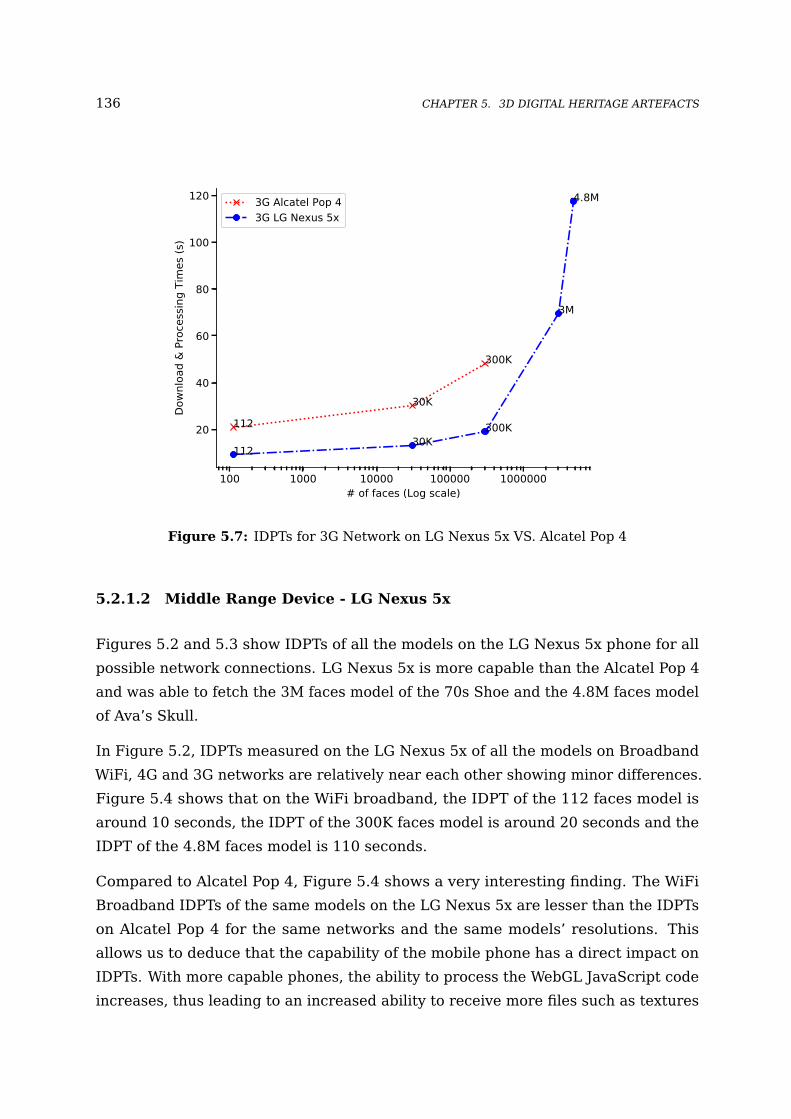
136 CHAPTER 5. 3D DIGITAL HERITAGE ARTEFACTS
100 1000 10000 100000 1000000# of faces (Log scale)
20
40
60
80
100
120Do
wnlo
ad &
Pro
cess
ing
Tim
es (s
)
11230K
300K
11230K
300K
3M
4.8M3G Alcatel Pop 43G LG Nexus 5x
Figure 5.7: IDPTs for 3G Network on LG Nexus 5x VS. Alcatel Pop 4
5.2.1.2 Middle Range Device - LG Nexus 5x
Figures 5.2 and 5.3 show IDPTs of all the models on the LG Nexus 5x phone for all
possible network connections. LG Nexus 5x is more capable than the Alcatel Pop 4
and was able to fetch the 3M faces model of the 70s Shoe and the 4.8M faces model
of Ava’s Skull.
In Figure 5.2, IDPTs measured on the LG Nexus 5x of all the models on Broadband
WiFi, 4G and 3G networks are relatively near each other showing minor differences.
Figure 5.4 shows that on the WiFi broadband, the IDPT of the 112 faces model is
around 10 seconds, the IDPT of the 300K faces model is around 20 seconds and the
IDPT of the 4.8M faces model is 110 seconds.
Compared to Alcatel Pop 4, Figure 5.4 shows a very interesting finding. The WiFi
Broadband IDPTs of the same models on the LG Nexus 5x are lesser than the IDPTs
on Alcatel Pop 4 for the same networks and the same models’ resolutions. This
allows us to deduce that the capability of the mobile phone has a direct impact on
IDPTs. With more capable phones, the ability to process the WebGL JavaScript code
increases, thus leading to an increased ability to receive more files such as textures
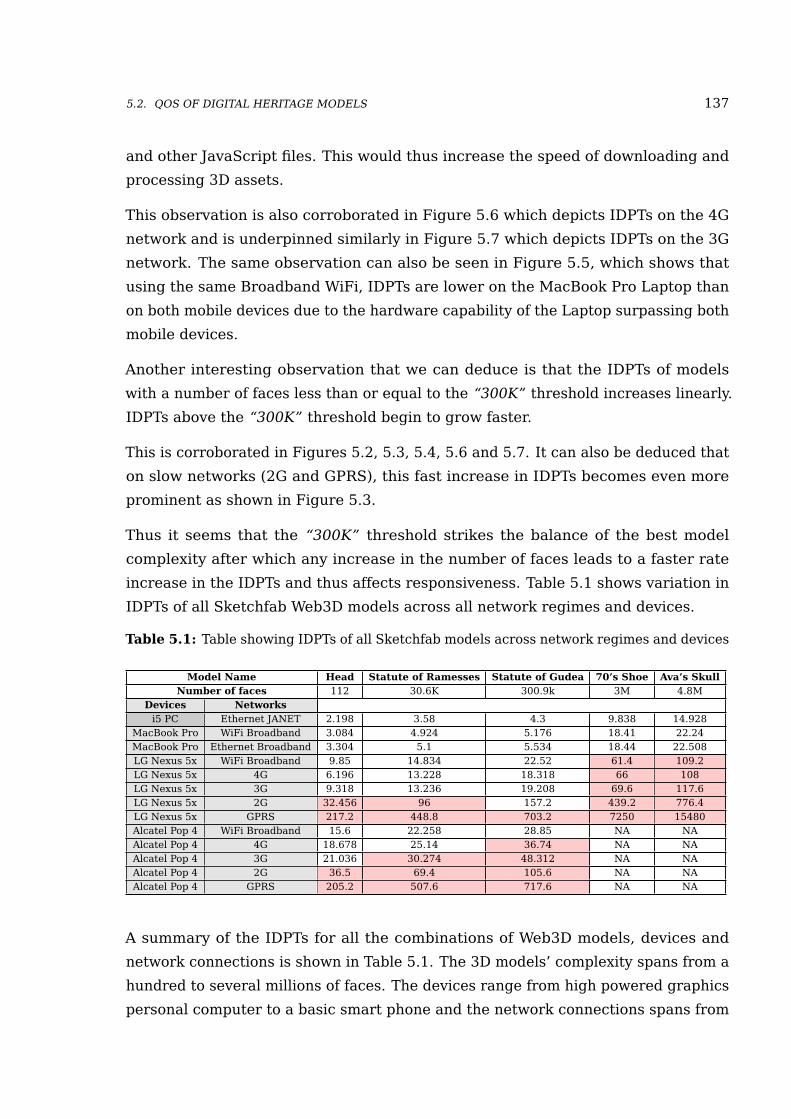
5.2. QOS OF DIGITAL HERITAGE MODELS 137
and other JavaScript files. This would thus increase the speed of downloading and
processing 3D assets.
This observation is also corroborated in Figure 5.6 which depicts IDPTs on the 4G
network and is underpinned similarly in Figure 5.7 which depicts IDPTs on the 3G
network. The same observation can also be seen in Figure 5.5, which shows that
using the same Broadband WiFi, IDPTs are lower on the MacBook Pro Laptop than
on both mobile devices due to the hardware capability of the Laptop surpassing both
mobile devices.
Another interesting observation that we can deduce is that the IDPTs of models
with a number of faces less than or equal to the “300K” threshold increases linearly.
IDPTs above the “300K” threshold begin to grow faster.
This is corroborated in Figures 5.2, 5.3, 5.4, 5.6 and 5.7. It can also be deduced that
on slow networks (2G and GPRS), this fast increase in IDPTs becomes even more
prominent as shown in Figure 5.3.
Thus it seems that the “300K” threshold strikes the balance of the best model
complexity after which any increase in the number of faces leads to a faster rate
increase in the IDPTs and thus affects responsiveness. Table 5.1 shows variation in
IDPTs of all Sketchfab Web3D models across all network regimes and devices.
Table 5.1: Table showing IDPTs of all Sketchfab models across network regimes and devices
Model Name Head Statute of Ramesses Statute of Gudea 70’s Shoe Ava’s SkullNumber of faces 112 30.6K 300.9k 3M 4.8M
Devices Networksi5 PC Ethernet JANET 2.198 3.58 4.3 9.838 14.928
MacBook Pro WiFi Broadband 3.084 4.924 5.176 18.41 22.24MacBook Pro Ethernet Broadband 3.304 5.1 5.534 18.44 22.508LG Nexus 5x WiFi Broadband 9.85 14.834 22.52 61.4 109.2LG Nexus 5x 4G 6.196 13.228 18.318 66 108LG Nexus 5x 3G 9.318 13.236 19.208 69.6 117.6LG Nexus 5x 2G 32.456 96 157.2 439.2 776.4LG Nexus 5x GPRS 217.2 448.8 703.2 7250 15480Alcatel Pop 4 WiFi Broadband 15.6 22.258 28.85 NA NAAlcatel Pop 4 4G 18.678 25.14 36.74 NA NAAlcatel Pop 4 3G 21.036 30.274 48.312 NA NAAlcatel Pop 4 2G 36.5 69.4 105.6 NA NAAlcatel Pop 4 GPRS 205.2 507.6 717.6 NA NA
A summary of the IDPTs for all the combinations of Web3D models, devices and
network connections is shown in Table 5.1. The 3D models’ complexity spans from a
hundred to several millions of faces. The devices range from high powered graphics
personal computer to a basic smart phone and the network connections spans from
138 CHAPTER 5. 3D DIGITAL HERITAGE ARTEFACTS
GPRS to 100Mbps Ethernet. IDPTs of higher than 30 seconds are shaded in red in
the table. With IDPTs greater than 30 seconds, the user satisfaction rate is lower.
A direct observation from Table 5.1 is that the 2G and GPRS network connections
are not suitable for fetching 3D models no matter what graphical complexities
these models have. The head model with the lowest resolution (112 faces) can not
represent models of cultural heritage artefacts. The 3M and 4.8M models have
IDPTs above 30 seconds thus can not be fetched on mobile devices.
We can conclude that on one hand, high resolution models give acceptable results in
download times on personal computers whether standalone or laptops on high-speed
connections such as Ethernet JANET. On the other hand, medium resolution models
can have reasonable results on only 4G and 3G regimes depending also on the mobile
graphical and processing capability. No model can be fetched on the 2G or GPRS
networks, instead a GIF of the model or an image might be more suitable.
Therefore if we have a one size model to fit all environments, then it needs to be
a low resolution but that will mean it will not look good on big screens with high
screen physical resolutions. Therefore there is a need for an adaptive engine to
decide in lay terms “the sweet spot” for every scenario: network conditions - device
capability.
The following section summarises the results and provides recommendations on the
quality of delivery of DH artefacts on different network regimes and devices.
5.2.2 Summary & Recommendations
This section presents a summary of the analysis of results obtained. It proposes a
few recommendations following the analysis of download and processing times.
1. Observation 1: Fetching Sketchfab 3D DH models is inefficient on networks
such as GPRS no matter what the phone device capability is and for all types of
Sketchfab 3D DH models even the smallest resolution. In the case of a limited
capability phone, the IDPTs are extremely high for the GPRS even for the simplest
model (around 200 seconds).
This observation can be extended to the 2G network (although better than GPRS),
as the simplest possible model (112 faces) requires in both cases, low-end and
middle-end phone devices, 1/2 minute to download. It is rare to see such models

5.3. QOE OF DIGITAL HERITAGE MODELS 139
with low complexity in a real context.
In an adaptive engine, if such connections are detected - no matter what the
hardware/software capability of end devices - it is better to inform the user of the
inefficiency of fetching 3D Web content and thus it is better to provide her with
different alternatives (traditional multimedia forms or mere 3D image rendition
of the model in the form of a GIF).
2. Observation 2: The capability of the end device has a direct impact on IDPTs
even on the same networks with the same model sizes and complexity.
In an adaptive engine, this has a very interesting application. It shows that what
can be fetched on a PC is different from what can be fetched on a Laptop and is
different from what can be fetched on each mobile client. At this particular point,
we are not looking at the network connections but the end device hardware and
software capabilities.
3. Observation 3: It seems that the “300K threshold” is the best fidelity of 3D
Digital Heritage model after which any increase in the number of faces leads to
fast sharp increase in IDPTs.
In an adaptive engine, the resolution of Sketchfab DH model to fetch is the 300K
faces that appears from a QoS perspective to strike a good balance between
good perception of visual latency and IDPTs for mobile devices. There is no need
for Sketchfab models with millions of faces from a QoS perspective.
The QoS study of DH in itself is not sufficient for deciding the right resolution to
send to client devices as convenient resolutions might be found intolerable from
a subjective user perspective (i.e QoE perceptive).
In the next section, we study the Quality of Experience of DH Web3D models.
5.3 QoE of Digital Heritage Models
The following section presents a brief preliminary study of the perception of visual
latency of Web3D models.
140 CHAPTER 5. 3D DIGITAL HERITAGE ARTEFACTS
5.3.1 Perception of Visual Latency
A preliminary investigation was conducted by the author of this thesis on the
perception of visual latency [17, 104] or the perception of the smoothness of the
interaction or in other words, the user-based perception of the degree of lag2 of
Web3D models.
The investigation is conducted on the five Web3D models used previously in
Section 5.2 across the following two mobile devices: LG Nexus 5x and Alcatel
Pop 4.
Latency is the time that passes between the user input action on the system and
the system’s response to that particular action [256]. Visual Latency or Perceived
Latency is the latency of the action observed by the users.
The scale used is based on how much time it takes a user to see an immediate
visual effect on the mobile phone screen after she slides or rotate any point on the
Sketchfab Web3D model in question.
A likert scale from 1 to 5 defined in Table 5.2 was used, 1 being the highest visual
latency possible or the worst smoothness of interaction and 5 being the lowest visual
latency or the highest smoothness of interaction with the 3D models. The aim of
this study is to investigate the suitability of a more expanded study. The preliminary
study nevertheless presented very interesting results. The results are presented in
Section 5.3.1.2.
5.3.1.1 Likert Scale
The scale and the explanation of the grades are presented in Table 5.2.
5.3.1.2 Results
Figure 5.8 shows that on a mid-range level phone device such the LG Nexus 5X, the
optimum smoothness of interaction of value 5 was observed for all Sketchfab models
below and equal to the “300K” threshold. Resolutions of the models that are higher
2’lag’ in computer graphics, 3D modelling, games and virtual worlds parlance is the freeze in the3D model or 3D environment that users notice for a certain period of time in which the environmentor model becomes unresponsive. This is due to delay between the action of users and reaction of theenvironment or model. That delay is called latency [82, 349]

5.3. QOE OF DIGITAL HERITAGE MODELS 141
Table 5.2: Perception of the Visual Latency scale and explanations of the grades
Scale Description5 I was able to interact with the Sketchfab model smoothly
(less than 1 second to see effect when rotating model)4 I was able to interact with the Sketchfab model but with a
tiny delay to see effect (1 or 11/2 seconds)3 I was able to interact with the model but with a delay to see
effect (2 or 3 seconds)2 I was able to interact with the model but unfortunately the
delay to see any effect after I slide on the model is big (morethan 3 seconds)
1 The model is completely unusable
Figure 5.8: Barchart of visual latency of different Web3D models
than the 300K lead to higher visual latency or higher lag or to a lower grade on the
scale of smoothness of interaction. We also observe that on a low end phone device
such as the Alcatel Pop 4, visual latency is lower than the optimum value of 5 at the
level of the 30K resolution.
The following section details the experiments conducted on the subjective perception
of fidelity of DH 3D models.
142 CHAPTER 5. 3D DIGITAL HERITAGE ARTEFACTS
5.3.2 Subjective Perception of Fidelity
One of the best expressions of Greek wisdom is actualised in the saying “Ariston
Metron” meaning the middle course is the best to take or all things are good in
moderation and that is in essence the concept of the sweet spot that achieves the
balance between performance of digital heritage artefacts and fidelity.
In this section, we investigate the subjective perception of the fidelity (i.e resolution)
of 3D digital models in web browsers and how this affects the user experience. By
studying the perception of fidelity of digital heritage artefacts on the web, we aim to
measure the differences in terms of fidelity across different categories of graphical
complexity (i.e. resolutions). We therefore investigate if there are any noticeable
differences detected by users between these categories and to what degree and at
which resolution thresholds or ranges those differences become either unnoticeable
or intolerable.
As anchor points for our study, we are interested in investigating the following:
1. The resolution limit or range that a device hardware & software can
support.
2. The resolution limit or range below which the fidelity of the model becomes
unacceptable. I will call such limit the lower resolution threshold.
3. The resolution limit or range above which users will not notice any difference
in fidelity. I will call such limit the upper resolution threshold.
I aim to discover if hard limits (i.e. thresholds) actually exist or if they fall into a range
of values. Creating 3D models in the range of acceptable resolutions (between lower
and upper thresholds) allows us to fetch to client devices lower levels of acceptable
quality of 3D models thus improving the Quality of Service (QoS) mainly in terms
of better download and processing times and better responsiveness especially on
mobile devices. In addition, this helps us not to overcommit hardware resources that
do not add much to the user experience hence achieving a trade-off between the
fidelity of the 3D model and its responsiveness knowing that the higher the fidelity
of the model, the lower the degree of its responsiveness and performance.
There is no need once the upper resolution threshold or range is discovered to fetch
higher resolutions than that. In addition, we want to see if there is indeed a one size
fits all solution, in other words, if there is a range of acceptable resolutions that we
5.3. QOE OF DIGITAL HERITAGE MODELS 143
can fetch on the majority of end devices.
The results of these experiments have helped us design and implement Hannibal, a
QoS & QoE aware adaptive engine for Web-Based Virtual Museums (WBVMs) that
aims to strike the best balance between QoS and QoE taking into consideration the
capability of client devices and of network conditions. Please refer to Chapter 7.
The main contribution of this work is the investigation of subjective
perception of fidelity of 3D cultural heritage models on the Web with
the aim of discovering resolution thresholds at which the fidelity of the
models becomes either unnoticeable or unacceptable. This information
may be of particular interest to curators of digital material in museums.
For the methodological procedures of the experiments presented in this section,
please refer back to Chapter 3, Section 3.4.2.2. The following section describes the
distributions of participants’ demographics in both experiment 1 (on a big screen
tethered to a PC) and experiment 2 (on an iPad Pro tablet and iPhone 7 Plus).
5.3.2.1 Participants’ Demographics and Descriptive Statistics
Experiment 1
Gender and Age: Descriptive statistics about the gender and age of the participants
are illustrated in Figures 5.9 and 5.10 respectively. Figure 5.9 is bar plot showing
the gender distribution of the participants. Figure 5.10 is a histogram showing the
age distribution of the participants.

144 CHAPTER 5. 3D DIGITAL HERITAGE ARTEFACTS
Fem
ale
Male
Oth
er
Percentage (%)0 10 30 50 70
Figure 5.9: Gender Distribution of Participants - Experiment 1
Age of Participants (Years)
Perc
en
tag
e(%
)
0 10 20 30 40 50
01
02
03
04
0
Figure 5.10: Age Distribution of Participants - Experiment 1
The mean age of participants was µ = 30, standard deviation was σ = 5.9. Total
number of participants N=22. 14 participants were males, 7 were females and 1
classified as other.
Most participants were involved in academia as lecturers or students (mainly
postgraduate). Only two participants were not part of this category. This suggests
they were all well educated and conversant with technology.
Vision acuity of participants: Descriptive statistics involving whether vision
of participants required eyes correction (glasses, lenses...) are presented in
Figure 5.11.
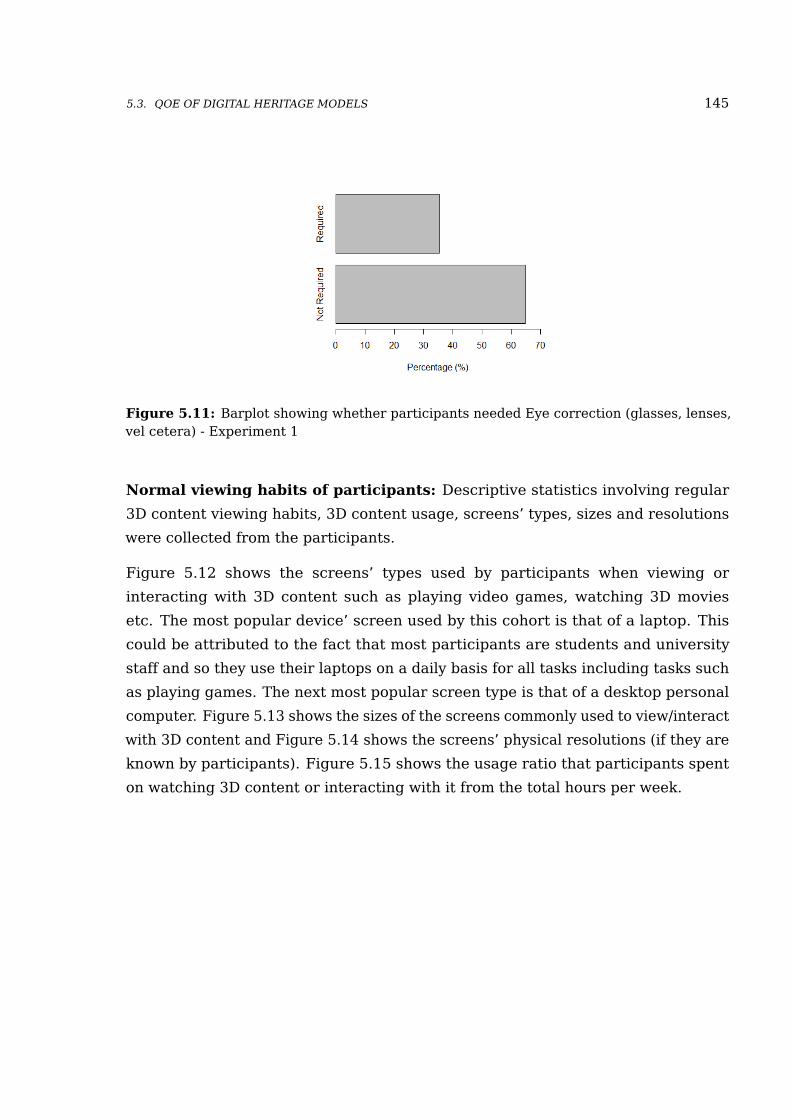
5.3. QOE OF DIGITAL HERITAGE MODELS 145
Figure 5.11: Barplot showing whether participants needed Eye correction (glasses, lenses,vel cetera) - Experiment 1
Normal viewing habits of participants: Descriptive statistics involving regular
3D content viewing habits, 3D content usage, screens’ types, sizes and resolutions
were collected from the participants.
Figure 5.12 shows the screens’ types used by participants when viewing or
interacting with 3D content such as playing video games, watching 3D movies
etc. The most popular device’ screen used by this cohort is that of a laptop. This
could be attributed to the fact that most participants are students and university
staff and so they use their laptops on a daily basis for all tasks including tasks such
as playing games. The next most popular screen type is that of a desktop personal
computer. Figure 5.13 shows the sizes of the screens commonly used to view/interact
with 3D content and Figure 5.14 shows the screens’ physical resolutions (if they are
known by participants). Figure 5.15 shows the usage ratio that participants spent
on watching 3D content or interacting with it from the total hours per week.
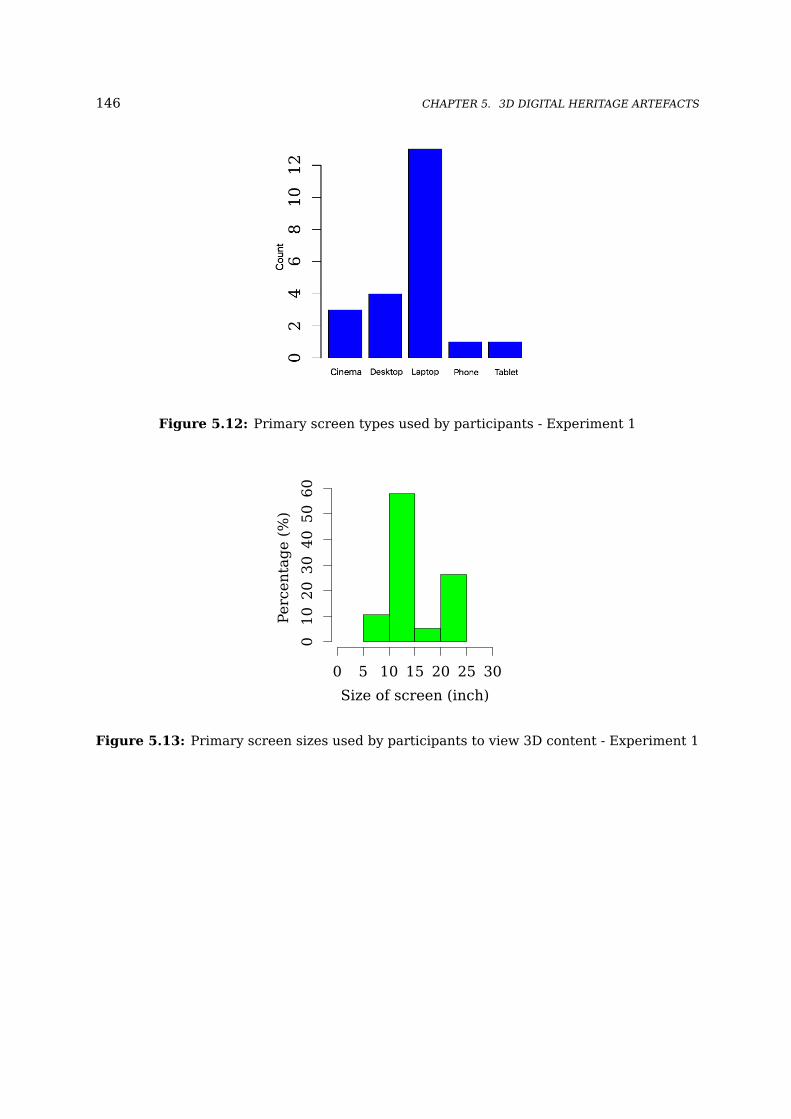
146 CHAPTER 5. 3D DIGITAL HERITAGE ARTEFACTS
Figure 5.12: Primary screen types used by participants - Experiment 1
Size of screen (inch)
Perc
en
tag
e(%
)
0 5 10 15 20 25 30
01
02
03
04
05
06
0
Figure 5.13: Primary screen sizes used by participants to view 3D content - Experiment 1

5.3. QOE OF DIGITAL HERITAGE MODELS 147
4k
720p
900p
hd
hdready
ipadpro
iphone6
macbookpro
sxga
uhd
unknown
wuxga
Percentage (%)
0 5 10 15 20 25
Figure 5.14: Resolutions of the Primary screens used by participants - Experiment 1
Figure 5.15: 3D content usage ratio from total hours spent per week by participants -Experiment 1
Experiment 2
Gender and Age: Descriptive statistics about the gender and age of the participants
are illustrated in Figures 5.16 and 5.17 respectively. Total number of participants
for this experiment on mobile devices (a tablet and a phone) is N=10. 7 participants
were males, 3 were females. The mean age of participants was µ = 27.4, standard
deviation was σ = 5.04.
In experiment 2, all participants were involved in academia as students (mainly
postgraduate), and only 3 were undergraduates. This suggests they were all well
educated and conversant with technology. Figure 5.16 is bar plot showing the

148 CHAPTER 5. 3D DIGITAL HERITAGE ARTEFACTS
gender distribution of the population. Figure 5.17 is a histogram showing the age
distribution of the participants.
Fem
ale
Male
Percentage (%)0 10 30 50 70
Figure 5.16: Gender distribution of participants - experiment 2
Age of Participants (Years)
Perc
en
tag
e(%
)
0 10 20 30 40 50
01
02
03
04
05
0
Figure 5.17: Age Distribution of Participants - Experiment 2
Vision acuity of participants: Descriptive statistics involving whether vision of
participants required eyes correction (glasses, lenses, vel cetera) are presented in
Figure 5.18.
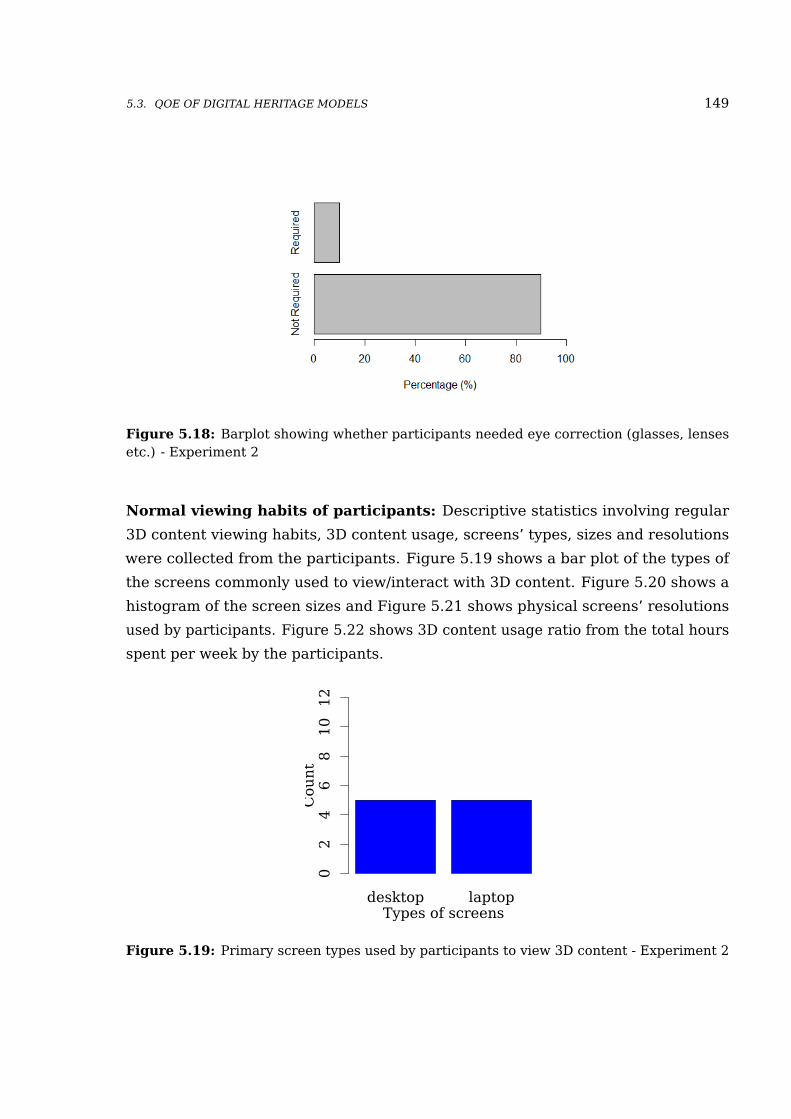
5.3. QOE OF DIGITAL HERITAGE MODELS 149
Figure 5.18: Barplot showing whether participants needed eye correction (glasses, lensesetc.) - Experiment 2
Normal viewing habits of participants: Descriptive statistics involving regular
3D content viewing habits, 3D content usage, screens’ types, sizes and resolutions
were collected from the participants. Figure 5.19 shows a bar plot of the types of
the screens commonly used to view/interact with 3D content. Figure 5.20 shows a
histogram of the screen sizes and Figure 5.21 shows physical screens’ resolutions
used by participants. Figure 5.22 shows 3D content usage ratio from the total hours
spent per week by the participants.
desktop laptopTypes of screens
Cou
nt
02
46
81
01
2
Figure 5.19: Primary screen types used by participants to view 3D content - Experiment 2
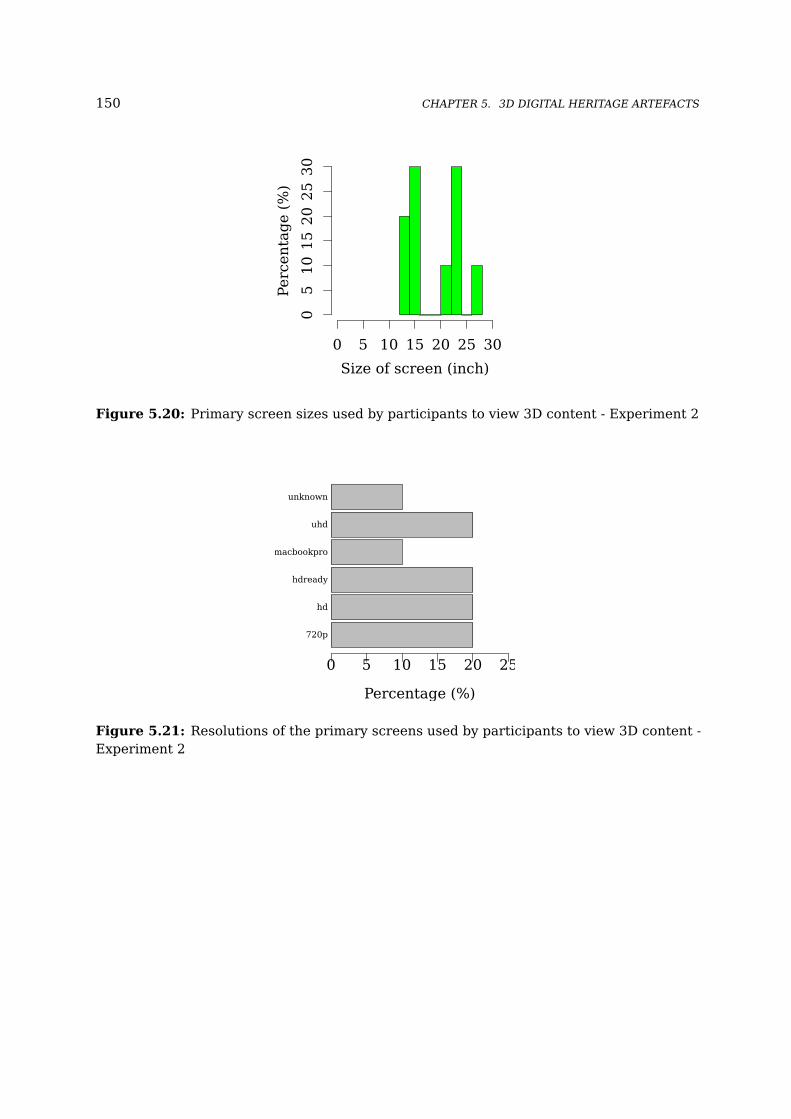
150 CHAPTER 5. 3D DIGITAL HERITAGE ARTEFACTS
Size of screen (inch)
Perc
en
tag
e(%
)
0 5 10 15 20 25 30
05
10
15
20
25
30
Figure 5.20: Primary screen sizes used by participants to view 3D content - Experiment 2
720p
hd
hdready
macbookpro
uhd
unknown
Percentage (%)
0 5 10 15 20 25
Figure 5.21: Resolutions of the primary screens used by participants to view 3D content -Experiment 2

5.3. QOE OF DIGITAL HERITAGE MODELS 151
Figure 5.22: 3D content usage ratio from total hours spent per week by participants -experiment 2
5.3.2.2 Grading and Ranking Results and Analysis
This section presents the results obtained from grading and ranking the decimated
Web3D models on the 60 inches screen, on the iPad Pro and on the iPhone 7 Plus.
Hardware & Software Resolution Limits
Concerning hardware limits: The iPhone 7 Plus and the iPad Pro were able to
fetch successfully the 1.5M resolution (i.e. original resolution) of the Mercury
model, which is a simple model with loosely defined topological features and darker
textures. The iPhone 7 Plus and the iPad Pro could not fetch successfully more than
the 1M resolution of the Achavanich Beaker, a model with brighter textures and
more complex topological features than that of the Mercury model. The PC with
a high-end graphics card was able to fetch all the decimated versions of the two
models.
Concerning software limits: We benchmarked five web browsers on the devices
used (PC, iPad Pro and iPhone 7 Plus). The web browsers were Google Chrome,
Opera (for PC), Opera mini (for mobile devices), Mozilla Firefox, Apple Safari, and
the Dolphin Browser.
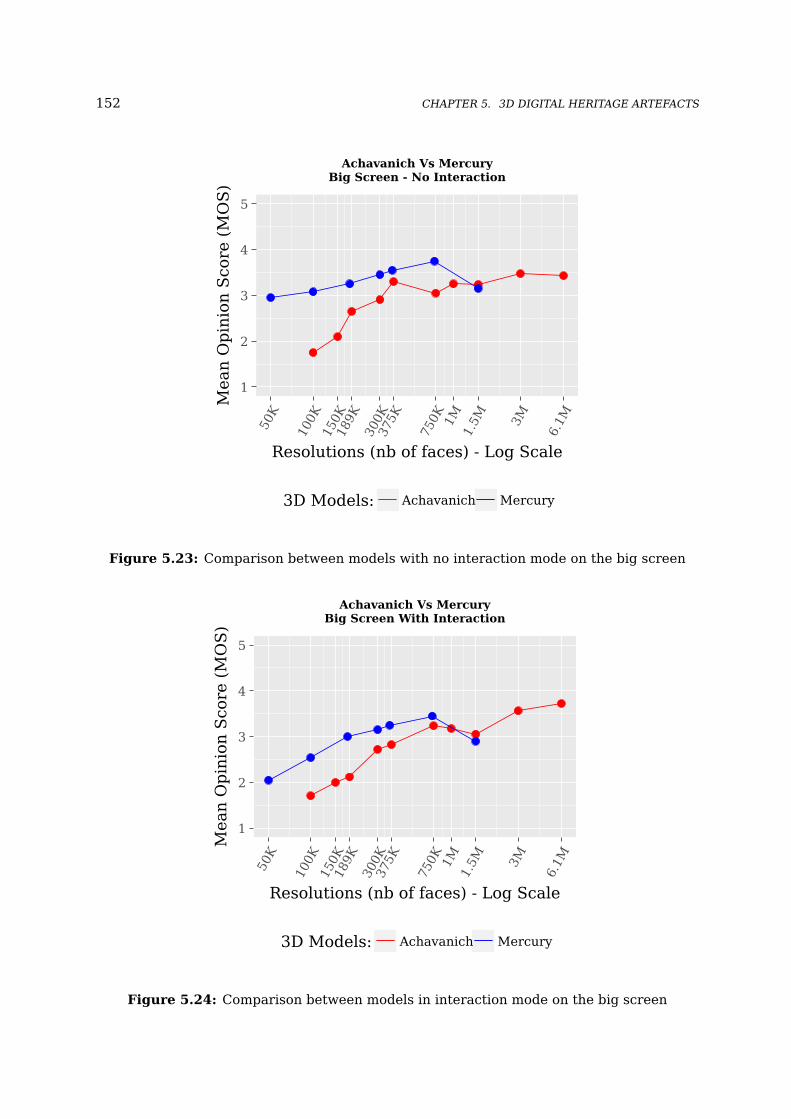
152 CHAPTER 5. 3D DIGITAL HERITAGE ARTEFACTS
1
2
3
4
5
50K
100K
150K
189K
300K
375K
750K 1M
1.5M 3M
6.1M
Resolutions (nb of faces) - Log Scale
Mean
Op
inio
nS
core
(MO
S)
3D Models: Achavanich Mercury
Achavanich Vs MercuryBig Screen - No Interaction
Figure 5.23: Comparison between models with no interaction mode on the big screen
1
2
3
4
5
50K
100K
150K
189K
300K
375K
750K 1M
1.5M 3M
6.1M
Resolutions (nb of faces) - Log Scale
Mean
Op
inio
nS
core
(MO
S)
3D Models: Achavanich Mercury
Achavanich Vs MercuryBig Screen With Interaction
Figure 5.24: Comparison between models in interaction mode on the big screen
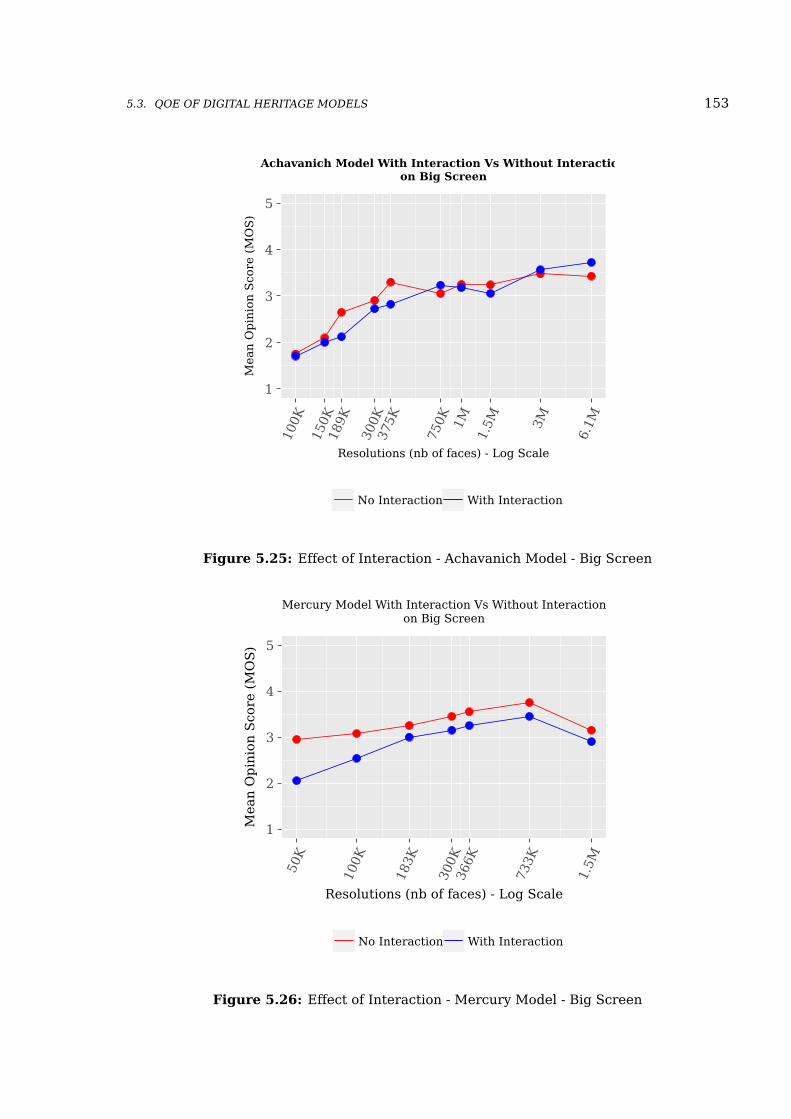
5.3. QOE OF DIGITAL HERITAGE MODELS 153
1
2
3
4
5
100K
150K
189K
300K
375K
750K 1M
1.5M 3M
6.1M
Resolutions (nb of faces) - Log Scale
Mean
Op
inio
nS
core
(MO
S)
No Interaction With Interaction
Achavanich Model With Interaction Vs Without Interactionon Big Screen
Figure 5.25: Effect of Interaction - Achavanich Model - Big Screen
1
2
3
4
5
50K
100K
183K
300K
366K
733K
1.5M
Resolutions (nb of faces) - Log Scale
Mean
Op
inio
nS
core
(MO
S)
No Interaction With Interaction
Mercury Model With Interaction Vs Without Interactionon Big Screen
Figure 5.26: Effect of Interaction - Mercury Model - Big Screen
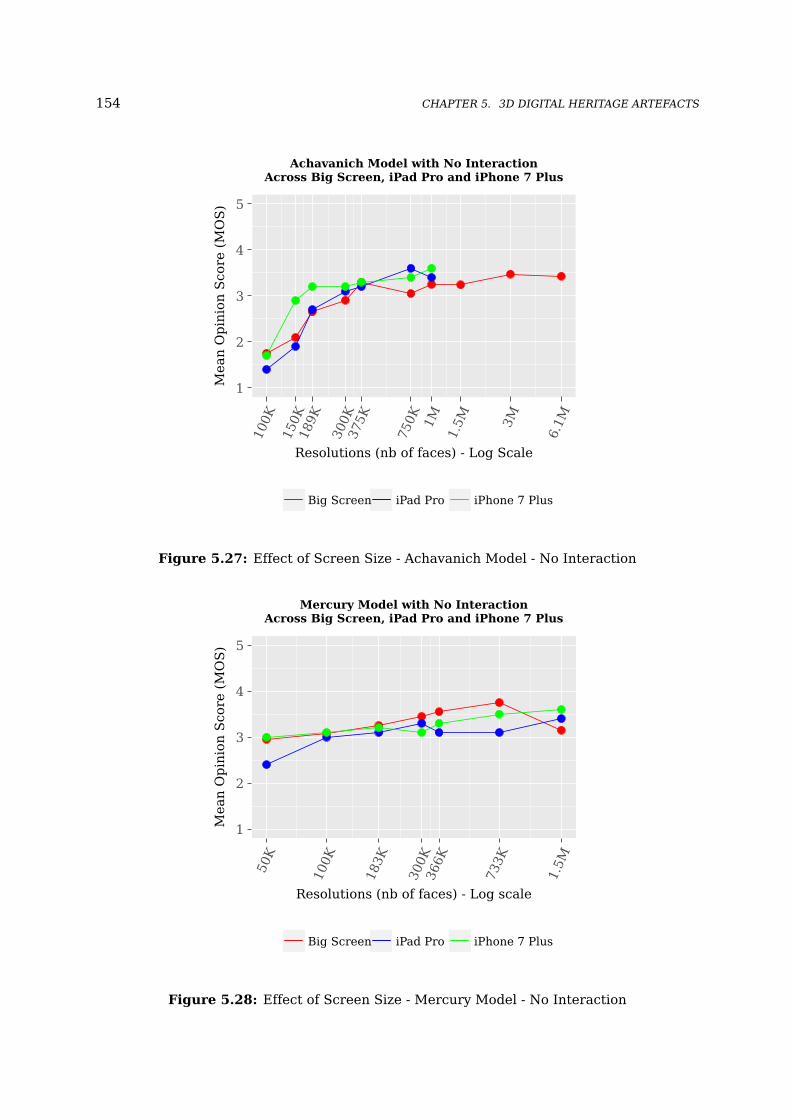
154 CHAPTER 5. 3D DIGITAL HERITAGE ARTEFACTS
1
2
3
4
5
100K
150K
189K
300K
375K
750K 1M
1.5M 3M
6.1M
Resolutions (nb of faces) - Log Scale
Mean
Op
inio
nS
core
(MO
S)
Big Screen iPad Pro iPhone 7 Plus
Achavanich Model with No InteractionAcross Big Screen, iPad Pro and iPhone 7 Plus
Figure 5.27: Effect of Screen Size - Achavanich Model - No Interaction
1
2
3
4
5
50K
100K
183K
300K
366K
733K
1.5M
Resolutions (nb of faces) - Log scale
Mean
Op
inio
nS
core
(MO
S)
Big Screen iPad Pro iPhone 7 Plus
Mercury Model with No InteractionAcross Big Screen, iPad Pro and iPhone 7 Plus
Figure 5.28: Effect of Screen Size - Mercury Model - No Interaction
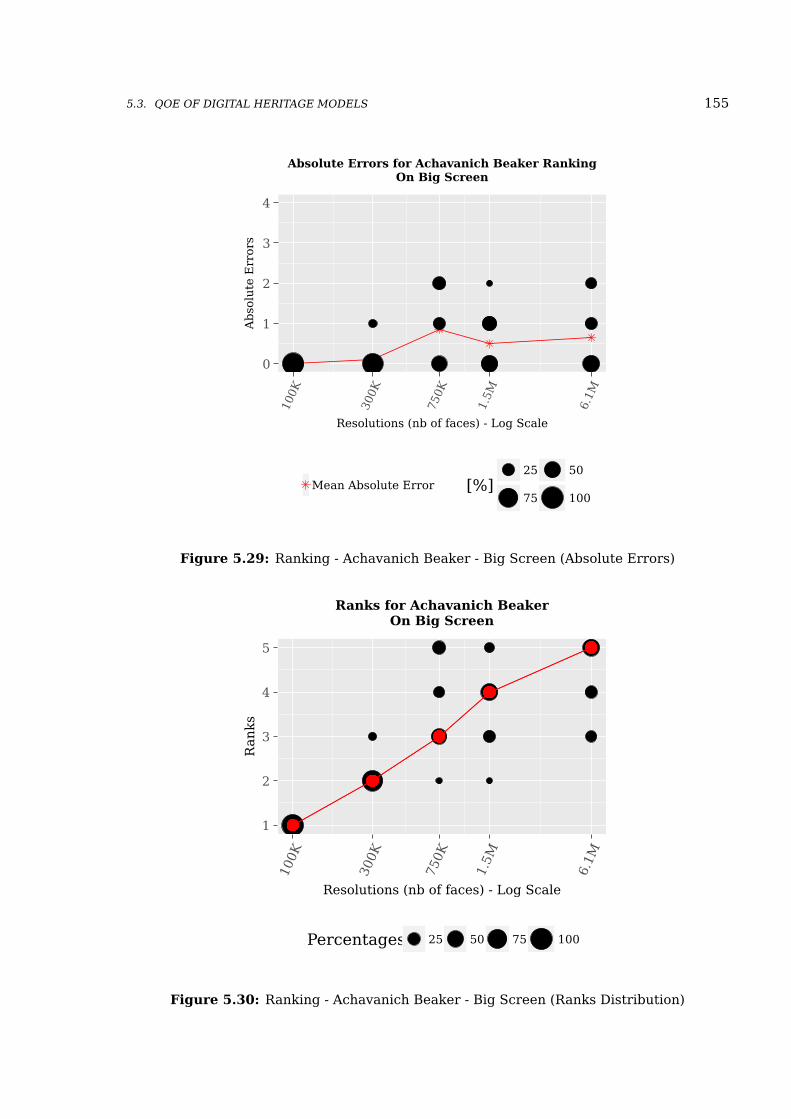
5.3. QOE OF DIGITAL HERITAGE MODELS 155
0
1
2
3
4
100K
300K
750K
1.5M
6.1M
Resolutions (nb of faces) - Log Scale
Ab
solu
teE
rrors
Mean Absolute Error [%]25 50
75 100
Absolute Errors for Achavanich Beaker RankingOn Big Screen
Figure 5.29: Ranking - Achavanich Beaker - Big Screen (Absolute Errors)
1
2
3
4
5
100K
300K
750K
1.5M
6.1M
Resolutions (nb of faces) - Log Scale
Ran
ks
Percentages 25 50 75 100
Ranks for Achavanich BeakerOn Big Screen
Figure 5.30: Ranking - Achavanich Beaker - Big Screen (Ranks Distribution)
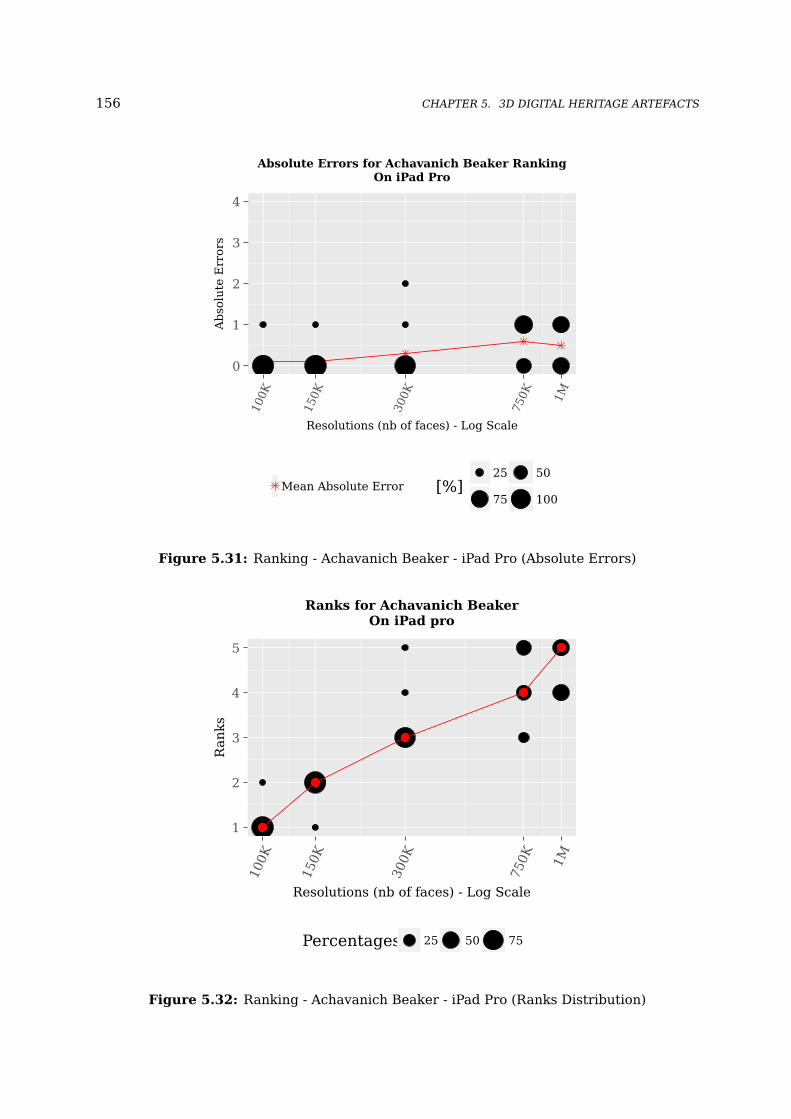
156 CHAPTER 5. 3D DIGITAL HERITAGE ARTEFACTS
0
1
2
3
4
100K
150K
300K
750K 1M
Resolutions (nb of faces) - Log Scale
Ab
solu
teE
rrors
Mean Absolute Error [%]25 50
75 100
Absolute Errors for Achavanich Beaker RankingOn iPad Pro
Figure 5.31: Ranking - Achavanich Beaker - iPad Pro (Absolute Errors)
1
2
3
4
5
100K
150K
300K
750K 1M
Resolutions (nb of faces) - Log Scale
Ran
ks
Percentages 25 50 75
Ranks for Achavanich BeakerOn iPad pro
Figure 5.32: Ranking - Achavanich Beaker - iPad Pro (Ranks Distribution)

5.3. QOE OF DIGITAL HERITAGE MODELS 157
0
1
2
3
4
100K
150K
300K
750K 1M
Resolutions (nb of faces) - Log Scale
Ab
solu
teE
rrors
Mean Absolute Error [%]25 50
75 100
Absolute Errors for Achavanich Beaker RankingOn iPhone 7 Plus
Figure 5.33: Ranking - Achavanich Beaker - iPhone 7 Plus (Absolute Errors)
1
2
3
4
5
100K
150K
300K
750K 1M
Resolutions (nb of faces) - Log Scale
Ran
ks
Percentages 25 50 75 100
Ranks for Achavanich BeakerOn iPhone 7 Plus
Figure 5.34: Ranking - Achavanich Beaker - iPhone 7 Plus (Ranks Distribution)
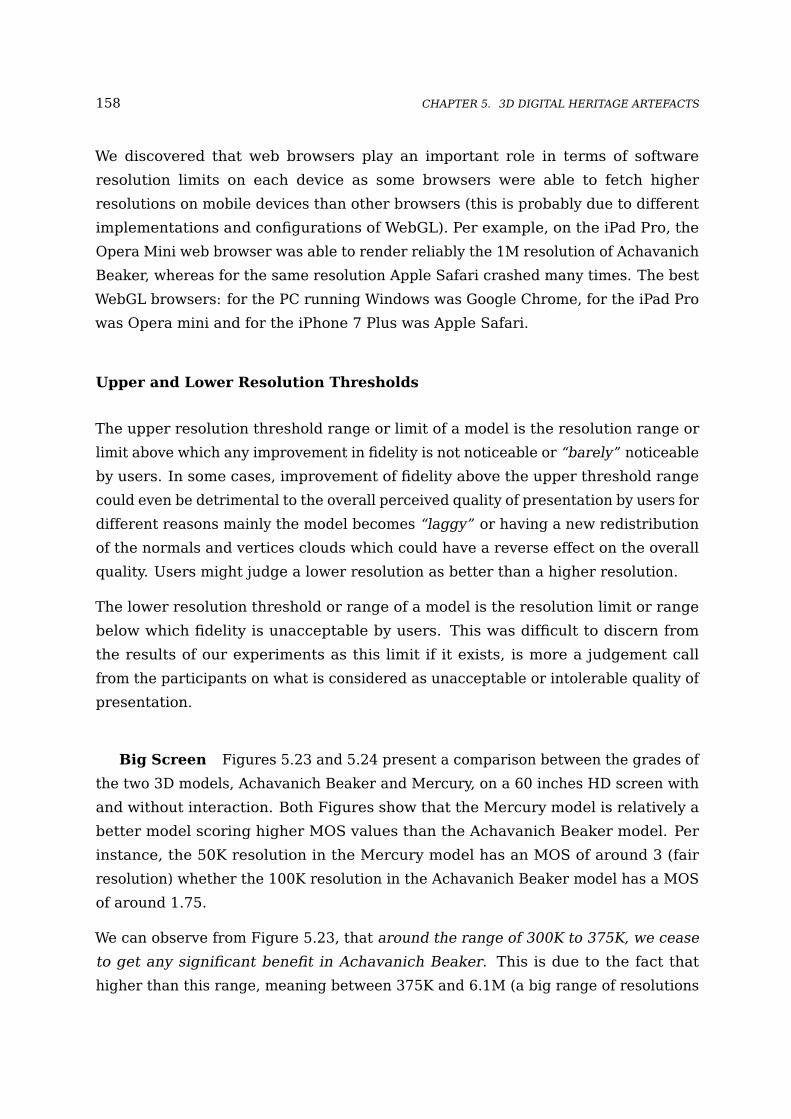
158 CHAPTER 5. 3D DIGITAL HERITAGE ARTEFACTS
We discovered that web browsers play an important role in terms of software
resolution limits on each device as some browsers were able to fetch higher
resolutions on mobile devices than other browsers (this is probably due to different
implementations and configurations of WebGL). Per example, on the iPad Pro, the
Opera Mini web browser was able to render reliably the 1M resolution of Achavanich
Beaker, whereas for the same resolution Apple Safari crashed many times. The best
WebGL browsers: for the PC running Windows was Google Chrome, for the iPad Pro
was Opera mini and for the iPhone 7 Plus was Apple Safari.
Upper and Lower Resolution Thresholds
The upper resolution threshold range or limit of a model is the resolution range or
limit above which any improvement in fidelity is not noticeable or “barely” noticeable
by users. In some cases, improvement of fidelity above the upper threshold range
could even be detrimental to the overall perceived quality of presentation by users for
different reasons mainly the model becomes “laggy” or having a new redistribution
of the normals and vertices clouds which could have a reverse effect on the overall
quality. Users might judge a lower resolution as better than a higher resolution.
The lower resolution threshold or range of a model is the resolution limit or range
below which fidelity is unacceptable by users. This was difficult to discern from
the results of our experiments as this limit if it exists, is more a judgement call
from the participants on what is considered as unacceptable or intolerable quality of
presentation.
Big Screen Figures 5.23 and 5.24 present a comparison between the grades of
the two 3D models, Achavanich Beaker and Mercury, on a 60 inches HD screen with
and without interaction. Both Figures show that the Mercury model is relatively a
better model scoring higher MOS values than the Achavanich Beaker model. Per
instance, the 50K resolution in the Mercury model has an MOS of around 3 (fair
resolution) whether the 100K resolution in the Achavanich Beaker model has a MOS
of around 1.75.
We can observe from Figure 5.23, that around the range of 300K to 375K, we cease
to get any significant benefit in Achavanich Beaker. This is due to the fact that
higher than this range, meaning between 375K and 6.1M (a big range of resolutions
5.3. QOE OF DIGITAL HERITAGE MODELS 159
on a logarithmic scale), there is hardly any significant increase in MOS values (only
around 0.25).
In a similar vein, for the Mercury model in no interaction mode, the range between
300K and 375K seems also to be the range of resolutions above which there is no
significant or apparent benefit. This is due to the fact that there is barely an increase
between 375K and 750K and after the 750K resolution, the MOS value decreased to
around 3.
In interaction mode, the range between 375K and 750K resolutions is the range
above which we cease to get any significant benefit in the quality of presentation.
This is shown in Figure 5.24, where the increase in MOS between 750K and 6.1M
in Achavanich beaker model is only around 0.4. Figure 5.25 shows the effect of
interaction on the Achavanich beaker model.
This is was not apparent in the Mercury model as the upper resolution range
remained with interaction between 300K and 375K. This can be seen in Figures 5.26
and 5.24.
When resolutions are ranked, Figure 5.29 shows that for the Achavanich Beaker
model on a big screen, participants begin to confuse ranking after the resolution of
300K. In addition, Figure 5.29 shows that the 700K resolution has a Mean Absolute
Error (MAE) of around 1 and that the absolute errors are distributed between 0, 1
and 2. This means that some participants ranked this model 2 positions offset.
Mobile Devices (iPad and iPhone) Figures 5.27 and 5.28 show the variation
of MOS values for the iPhone 7 Plus and the iPad Pro in no interaction mode for
both models. We can observe for the Achavanich Beaker model on iPhone 7 Plus
(5.5 inches), that after the range of 150K to 189K, we cease to get any significant
benefit in the quality of presentation. This is due to the fact that higher than this
range, meaning between 189K and 1M (a big range of resolutions on a logarithmic
scale), there is hardly any significant increase in MOS values. For the Achavanich
model on the iPad Pro (9.7 inches), the upper range is between 189K and 300K. On
the other hand, for the Mercury model almost the same range can be observed for
mobile devices (183K to 300K).
When resolutions are ranked, Figure 5.31 shows that participants begin to confuse
ranking after the resolution of 150K for the Achavanich Beaker on the iPad Pro.
In addition, Figure 5.31 shows that the 300K resolution has absolute errors taking

160 CHAPTER 5. 3D DIGITAL HERITAGE ARTEFACTS
values between 0, 1 and 2, meaning some participants ranked this model 2 positions
offset. For the 150K resolution, absolute errors take values of 0 (no error) and 1.
Concerning the ranking on the iPhone 7 Plus, Figure 5.33 shows that for the 100K
resolution we see absolute errors taking values of 0 (no error), 1 (rank offset by 1)
and 2 (rank offset by 2) . This shows that it is more difficult to detect differences in
fidelity for screen sizes of 5.5 inches.
Effect of Interaction
In this section, we study the effect of interaction on both models. Figure 5.25
shows the effect of interaction on the Achavanich model fetched on a 60 inches HD
screen. In interaction mode, lower resolutions of the Achavanich Beaker model have
higher MOS values compared to when interaction is not allowed. In other words,
interaction lowers the MOS value of a resolution. On the other hand, interaction
seems not to have any apparent effect on the MOS of higher resolutions (above
the 375K resolution) for the Achavanich Beaker model. This is due to the fact that
we see the 2 lines representing interaction mode fluctuate after the 375K while
increasing.
Figure 5.26 shows the effect of interaction on the Mercury model fetched on a 60
inches HD screen, and it seems clear that with interaction, all resolutions (lower
and higher) have lower MOS values than their counterparts in no interaction mode.
At higher resolutions in a brighter textured model, interaction (zoom in, zoom out,
panning) seems to have little effect on the perception of fidelity. This is not the case
for a darker textured model.
Interaction plays a big role in the perception of fidelity for lower resolutions where
we can see in both Figures 5.26 and 5.25 a big gap of MOS values in lower resolutions
of each model. After the upper threshold range, interaction has little effect on the
perception of differences in fidelity. This is shown by the smaller gap of MOS
between the 2 lines representing the interaction and non-interaction modes.
Effect of Screen Sizes
In this section, we investigate if screen size has any effect on the perception of
fidelity. Figure 5.27 shows a variation in MOS values of the Achavanich Beaker
5.3. QOE OF DIGITAL HERITAGE MODELS 161
resolutions in no interaction mode across devices (big screen, iPad Pro and iPhone
7 Plus). Figure 5.28 shows a variation in MOS values of Mercury resolutions in no
interaction mode across all devices (big screen, iPad Pro and iPhone 7 Plus).
In the Achavanich Beaker model, the big screen seems to have lower MOS values
than the mobile devices (a counter-intuitive observation), while in the Mercury model
the opposite is apparent for a big number of resolutions. This is maybe due to the
fact that having participants sit at 2m away from a very large HD screen (60 inches)
seems to have the same effect as letting people interact with models on screens
of 9.7 inch for iPad and 5.5 inch for iPhone. In addition, two parameters may be
involved here: the resolution of the screen in question and its size. The iPhone 7
Plus has a 4K fidelity but a small screen size.
5.3.3 Conclusions
We have presented the design and results of QoE experiments conducted on DH
Web3D models. The subjective perception of these models was investigated on a big
screen, on a tablet and on a mobile device. We also presented the analysis of the
results of these experiments.
We discovered from our experiments that each device has a hardware and software
limit of fetching certain resolutions. This is important when it comes to mobile
devices with limited graphical capabilities. Table 5.3 presents the hardware
resolution limits of the 3 devices used in the experiment (PC with Big Screen,
an iPad Pro and iPhone 7 Plus). It shows clearly that mobile devices (tablet and
phone) were not capable of fetching all the range of resolutions that the PC with a
high-end graphics card was able to render.
Table 5.3: Hardware Resolution Limits of both models
Models iphone 7 Plus iPad Pro PC
Achavanich 1M 1M 6.1MMercury 1.5M 1.5M 1.5M
We discovered that with lower screen sizes like those of mobile and tablet devices,
users tolerate lower resolutions because they could not tell the difference between
many of them.
162 CHAPTER 5. 3D DIGITAL HERITAGE ARTEFACTS
We could not discover lower resolution thresholds or ranges as hard limits. This
was difficult to discern as such a limit if it exist is more a judgement call from
the participants on what is considered as unacceptable or intolerable quality of
presentation.
The upper resolution range is discernible. For a big screen, it is between 300K and
375K. For an iPad Pro (9.7 inches screen), this range becomes roughly between
189K and 300K. For an iPhone 7 Plus, this range is between 150K and 189K. These
results were strengthened by the results that we have obtained from the ranking
phase.
Finding such results allows us when designing an adaptive engine to fetch lower
resolutions to mobile devices knowing that users will find these models’ resolutions
acceptable.
Interaction lowers the perception of fidelity of the models as people zoom in and
out and thus discover imperfections in the models. We discovered that this effect
(Interaction effect) is more apparent in lower resolutions below the upper range
threshold than in higher resolutions. In higher resolutions, interaction plays little
effect on the perception of the overall quality of presentation of a model.
The experiments gave us important insights into how a dark textured and loosely
defined model in terms of surface topology and features like the Mercury model
would be graded and ranked. We also, investigated the same for a brightly textured
model with a more complex topology (Achavanich Beaker). Latency affects the
QoS and thus the overall QoE, but this did not have any effect on perception of
fidelity as all the Web3D models were pre-downloaded and rendered in the web
browsers before participants graded or ranked them. In the following section, we
provide future-proof discussion of the results of the perception of fidelity experiments
detailed previously.
5.3.4 Future-proof Discussion
In the last decade, there has been great strides towards improving hardware
capabilities of mobile devices mainly in video memory and GPU capabilities. This
is projected to continue at an accelerated pace due to a large market demand
for Augmented Reality, Virtual Reality and interactive 3D applications [99, 135].
Furthermore, people are using more mobile devices than resourceful desktop
5.3. QOE OF DIGITAL HERITAGE MODELS 163
computers (cf. Chapter 1 where we have discussed few statistics on mobile
penetration especially in web browsing). This means that what is conceived at
the current moment as a limitation in hardware capabilities, will be surpassed in the
future by more powerful smart phones.
In addition, with the advent of 5G, the 5th generation mobile network which will
bring high speed data rates and low latency, the Internet speed would reach speeds
higher than 10 Gbps [324]. This would greatly improve streaming and consuming
3D content on the go. The signal strength in 5G network is a lot higher than the 4G
system which would allow high cell throughput and better performance [146]. 5G
will facilitate many low-latency and real-time applications such as tactile Internet
and real-time VR and AR applications [121], Internet of Things (IoT), vehicle to
vehicle communications, instant ultra high definition video downloading and sharing
among many others.
Despite that; the issues that deal with what resolution to send to what device
will remain the same. This is due to the fact that not being able to perceive high
fidelities of DH 3D models on screen sizes mainly on mobile devices’ screens would
remain the same even if the hardware capabilities of mobile devices improve to allow
them to render higher resolutions. Furthermore, it is still very wasteful (hardware
resources-wise and energy-wise) to send a high resolution 3D model instead of a
lower acceptable resolution especially when users can not notice the difference
between of them.
In a Cultural Heritage and Virtual Museums context, we add another dimension
to this discussion. There has been a trend of fostering participatory heritage
approaches in digital heritage systems and VMs. This is especially prominent in
multimedia and 3D. Participatory heritage is defined by Roued-Cunliffe and Copeland
[342] as “a space in which individuals engage in cultural activities outside of formal
institutions for the purpose of knowledge sharing and co-creating with others”.
It is the equivalent of Do it Yourself (DIY) movement but for cultural heritage
contexts. Participatory heritage involves either ordinary members of the community
or specialised members with specific expertise such as historians, archaeologists or
scientists. The defining characteristic of such groups of users is the fact that they
are not part of the formal cultural institutions such as museums [342].
Many participatory heritage approaches adopted in the literature pertain to the type
of material that we have just studied in this chapter which is DH models produced by

164 CHAPTER 5. 3D DIGITAL HERITAGE ARTEFACTS
digitisation pipelines such as Photogrammetry and 3D Scanning. These approaches
were represented in crowdsourced, co-created and co-curated digitisation projects.
Crowdsourcing is a portmanteau of crowd and outsourcing. It is outsourcing specific
activities in the form of an open call to members of the community who would
participate in creating and editing digital heritage content [132, 297]. This is in
order to harness their work, knowledge and experience [50]. Examples of digital
heritage crowdsourcing in the literature involve transcribing old documents [297]
or correcting the OCR text of old manuscripts [10] or social tagging multimedia by
the public [293].
In a sense, crowdsourcing is utilising the wisdom and labour of the crowd. It aims
to reduce costs and time. Crowdsourcing in digital heritage contexts could involve
users contributing ideas to digital heritage systems, or to contribute images, videos,
3D models, or metadata.
Co-creation is a collaborative task which is similar to crowdsourcing but seeks
information, ideas and contributions from a limited group of people usually with
specialised skills and expertise. Volunteers could be in house curators or software
engineers who contribute digital material and metadata or they could be volunteers
from the public with appropriate needed knowledge [49, 50].
The availability of commodity cameras and free open source software tailored for
Photogrammetry have facilitated the production of 3D models from images by
non-specialists [76]. There are many examples in the literature of crowdsourced
projects employing images and videos from the public to digitise artefacts for
Photogrammetry purposes.
Alsadik [16] presented three case studies that focused on obtaining crowdsourced
web-based videos and images from the public in order to create 3D models via
low-cost Photogrammetry. Echavarria et al. [131] described a crowdsourced project
where the public was invited to take photos of the prominent sculptures and
monuments in the UK city of Brighton and Hove and upload them to a web platform
along with adequate metadata about provenance. In this way, many images were
taken of the same objects in different periods of time and from different vantage
points. The images helped digitise 18 objects [214].
Digital heritage crowdsourced projects help preserve local cultural heritage by
digitally reconstructing destroyed or lost sites or monuments from collections
5.4. SUMMARY 165
of images available only to the community. An example of this can be seen in
Stathopoulou et al. [388] work where a crowdsourced project successfully produced
textured 3D models of the stone bridge of Plaka, a bridge that does not exist anymore.
The project used images of the bridge available to the community.
Tourists take a considerable number of photos of artefacts in museums, of monu-
ments and of sites from different vantage points and share them in mass on social
media platforms. This unintentionally and fortunately lead to massive collections of
photos that could be harnessed efficiently and from which 3D DH models could be
created [76].
Relating back to the perception of fidelity experiments reported in this chapter, the
results obtained detail from a QoE perspective acceptable resolutions perceived by
users on PCs, tablets and mobile devices. These resolutions are tailored for web
dissemination. Crowdsourced digital heritage systems and WBVMs mainly employing
Photogrammetry and 3D Scanning would benefit from the results obtained. These
will inform members of the community that are involved in such projects of what
are the most suitable fidelities to contribute to in order to maximise the ability to
disseminate them successfully on the web.
In addition, the thesis aims to provide a practical solution for web dissemination
which is of great utility especially for crowdsourced projects where users upload 3D
models of high resolutions digitised through commodity phones or cameras. These
resolutions would be too high and thus inappropriate for web dissemination. In
addition, these resolutions will not benefit users who want to view them on mobile
devices.
5.4 Summary
This chapter investigated the QoS and QoE of 3D DH artefacts on the web. Download
and processing times were captured for different 3D models of different resolutions
on different devices (desktop and mobile) and on different network regimes (GPRS,
2G, 3G, 4G, WiFi and Broadband Ethernet). A preliminary study on the perception
of visual latency or the perception of the smoothness of the interaction of Web3D
models was conducted. The chapter went on to investigate the subjective perception
of fidelity of 3D digital heritage artefacts in web browsers in the aim of discovering
perceptible resolution thresholds.

166 CHAPTER 5. 3D DIGITAL HERITAGE ARTEFACTS
The QoS and QoE studies presented in this chapter allow CH stakeholders to produce
models of reasonable quality and performance to be fetched on the biggest range
of users’ devices. Furthermore, the studies constituted the pillars upon which the
Hannibal adaptive engine (presented in Chapter 7) was based.
Part IV
Semantic 3D Web & QoS Metadata
167

6Chapter Six
QoS-Aware SemanticDigital Heritage
This chapter presents a proposal to enable adaptation of 3D Web applications
by means of supplementing existing semantic vocabularies used in DH
applications with QoS-related metadata. It starts with a brief technical
background on two popular schemas: the Dublin Core Schema (DCS) and
the Europeana Data Model (EDM). This chapter proposes an ontology dubbed
Virtual Museum Quality of Service Ontology (ViMQO). The usage of ViMQO
is also presented. Furthermore, the chapter discusses how custom QoS-
metadata can be created inside Omeka [87], a Digital Asset Management
System (DAMS) and how this approach was used by Hannibal, as will be
described in Chapter 7.
6.1 Introduction
This work proposes supplementing existing semantic metadata vocabularies with
QoS-related metadata for the 3D Web in order to achieve adaptivity in Web-Based
Virtual Museums (WBVMs). This metadata makes available the characteristics of
the media to consuming applications which enables them to make decisions about
what is the “right resolution” to fetch to client devices across multiple platforms
and network regimes at the best possible user experience.
The aspect of what is the “right resolution of 3D models” to send to client devices was
studied in Chapter 5 by investigating the QoS of 3D artefacts in terms of download
169
170 CHAPTER 6. QOS-AWARE SEMANTIC DIGITAL HERITAGE
and processing times and by investigating the QoE particularly the perception
of fidelity of 3D models by users on different devices with different screen sizes.
Users can not notice many high resolutions and as a consequence it makes sense to
fetch lower acceptable resolutions thus not overcommitting unnecessary hardware
and network resources that do not add much to the user experience, in addition
this will result in lower download and processing times of 3D models and better
responsiveness.
This requires the availability of different resolutions of 3D models in order for web
servers to perform the adaptation and requires similarly that such resolutions are
quantified by metrics supplemented as metadata alongside the 3D models. The
number of faces and number of vertices are the major quantification metrics of the
resolution of a 3D model. We employ these in ViMQO.
Metadata has always been pertinent in the description of museum holdings and their
digital representations. They help in the process of management, discovery and
identification of such holdings and they foster interoperability between tools and
applications. Information about works of art and cultural objects are usually stored
in archives and DAMSs by museum registrars and curators. Metadata describes
two types of material: physical material such as sculptures, paintings etc. and
born-digital material such as images or electronic documents. Metadata of heritage
material can be about dimensions, provenance, physical location, authorship, access
rights among many others.
Metadata pertaining to well-established ontologies such as the Dublin Core (DC) and
the Europeana Data Model (EDM), lack expressiveness when it comes to 3D model
types and lack similarly, the availability of characterising QoS metadata such as the
number of faces, number of vertices among others. In addition, 3D models could
be stored as binary or as ASCII files and applications might need to accommodate
their behaviour according to the type of 3D models they are dealing with or based
on client devices conditions and requirements.
The aim of this chapter is to help achieve automatic QoS-aware adaptation in digital
heritage applications by proposing the inclusion of metadata that characterises
3D artefacts. The proposed ontology ViMQO is DC and EDM compatible and
interoperable with any DC-compatible vocabulary.
The remainder of this chapter is organised as follows: the concept of metadata and
how it fits with Linked Data as an approach to describe data and relationships is
6.2. METADATA AND LINKED DATA 171
explained in Section 6.2. Section 6.3 presents briefly the Dublin Core (DC) standard
along with its shortcomings in efficiently describing 3D models, in addition to the
absence of explicit QoS-related metadata. Section 6.4 elucidates the Europeana
Data Model (EDM) and some of the prominent semantic properties and classes. The
section also shows the lack of expressiveness of this ontology when it comes to
QoS-related metadata and the lack of specificity in describing media types and forms.
Sections 6.3 and 6.4 which both describe two common ontologies used in DH and
WBVMs, showing the lack of such common ontologies to take into consideration the
QoS aspect. Section 6.5 describes what type of multimedia and digital artefacts can
be encountered traditionally in WBVMs. In addition, the section gives a discussion
on QoS-related metadata that are useful for adaptation purposes for the different
multimedia and 3D artefacts/environments. Section 6.6 describes ViMQO and its
usage for describing 3D models. Section 6.7 explains the Omeka Digital Asset
Management System (DAMS) and how the availability of QoS-related metadata
lay the groundwork for Hannibal, the adaptive engine for 3D Web presented in
Chapter 7.
6.2 Metadata and Linked Data
The aim of any metadata is to describe data. From a machine perspective, this is
expressed in machine-readable and machine-processable “statements” describing
characteristics of data and how every datum in such data relates.
The backbone of the field of the “Semantic Web” which is also known as the “Web of
Data”, relies on such statements to describe machine-readable linked data between
different resources and locations on the world wide web. Machine readability is
implemented with inference engines and ontology-based applications.
Linked Data (LD) statements are normally expressed through two major standard-
ised information modelling languages: the first being the Resource Description
Framework (RDF) [97] and the second being Web Ontology Language (OWL) [191].
In lay terms, these are formal languages understood mainly by computers (and by
humans) to describe relationships between semantic data.
RDF has many serialisations. A serialisation means a format structured in a
particular way such as to accommodate the different needs of data applications.
Common serialisations of RDF are the Notation3 (N3) [42], the N-Quads [71],

172 CHAPTER 6. QOS-AWARE SEMANTIC DIGITAL HERITAGE
the TriG notation [52], the XML-based serialization [159] which is also known
as RDF/XML, the Turtle Notation [261], the RDFa serialization [189] a.k.a as
the notation injectable into HTML, and JSON-LD [386] which is the JSON-based
serialization of RDF.
RDF is expressed in the form of triples: Subject, Predicate and Object. In addition,
describing triples requires the usage of Uniform Resource Identifiers (URIs) and
by extension Internationalized Resource Identifiers (IRIs). IRIs are similar to URIs
except they allow Unicode characters pertaining to languages other than English.
In the remainder of this chapter and in the proposed ontology we will focus on using
the turtle serialization of RDF to describe our proposed ontology (i.e. ViMQO). This
is due to the fact that this notation has a good level of readability.
6.3 Dublin Core Metadata Standard
Dublin Core is an International metadata standard created and helmed by the
Dublin Core Metatada Initiative (DCMI) which is incorporated in a non-profit
organisation in the National Library Board of Singapore. Dublin Core is endorsed by
many international standards such as ISO 15836:2009 [206], ANSI/NISO Z39.85-
2012 [284] and IETF RFC 5013-2007 [233]. Dublin Core is considered an upper
Ontology. The first workshop of DCMI was held in the town of Dublin, Ohio, USA in
1995 which gave the standard its name. The workshop was used as a platform to
discuss a core set of semantics for categorizing web resources in order to help in
the discovery, retrieval and management of these resources [123].
The term “Core” is used to designate the nature of the elements being essential
and at the same time broad, generic and intentionally vague allowing the metadata
vocabulary to be used in a myriad of domains. The core or basic elements are 15 in
number [123, 126].
The vocabulary of Dublin Core contains four types of terms: properties, classes,
data types and concept schemes [127]. These four types of DC terms can be used
in tandem with ViMQO (presented in Section 6.6) which encompasses all the DC
vocabulary. The inclusion of DC terms with ViMQO is shown in Listing 6.3.

6.3. DUBLIN CORE METADATA STANDARD 173
DC Elements and Properties: The 15 “core” elements or properties1 of Dublin
Core Schema are: Creator, Contributor, Title (as shown for example in
Listing 6.1), Publisher, Date, Language, Format, Subject, Description, Identifier,
Relation, Source, Type, Coverage, and Rights. Additional properties were
added later to the DCMI basic terms. These are defined in the Dublin Core
Element Set [124]. The refinement terms usually referred as the extended set
of DC provided metadata-consuming applications with more semantic power.
The refinement terms are: accessRights, accrualMethod, accrualPeriodicity,
accrualPolicy, alternative, audience, available, bibliographicCitation, con-
formsTo, created, dateAccepted, dateCopyrighted, dateSubmitted, education-
Level, extent, hasFormat, hasPart, hasVersion, identifier, instructionalMethod,
isFormatOf, isPartOf, isReferencedBy, isReplacedBy, isRequiredBy, issued,
isVersionOf, license, mediator, medium, modified, provenance, references,
replaces, requires, rightsHolder, spatial, tableOfContents, temporal, and valid.
As can be seen, these metadata terms are very generic and made to constitute
“passe-partout” fields that fit the needs of many knowledge domains.
For example, in a WBVM context, curators and museum documentation staff
can use the provenance metadata to describe from where an artefact was
obtained and how it arrived at the museum (i.e. acquisition method), in
addition to describing its current custody arrangements. The accrual method
metadata field can be used to describe the method by which artefacts are
added to specific museum collections. The accrual periodicity metadata would
then be the temporal frequency (i.e. every Monday, every week, every month
etc.) with which such artefacts are added.
DC Classes: group resources which have certain characteristics in common. A
property in DC may be related to one or more classes by what is dubbed as
a domain relationship indicating a describing class of resources or a range
relationship indicating a range of values that a property can have. The major
classes used by DC are: Agent, AgentClass, BibliographicResource, FileFor-
mat, Frequency, Jurisdiction, LicenseDocument, LinguisticSystem, Location,
LocationPeriodOrJurisdiction, MediaType, MediaTypeOrExtent, MethodOfAc-
crual, MethodOfInstruction, PeriodOfTime, PhysicalMedium, PhysicalResource,
Policy, ProvenanceStatement, RightsStatement, SizeOrDuration, and Standard.
1In Dublin Core parlance the two terms: “element” and “property” are used interchangeably andhave the same meaning
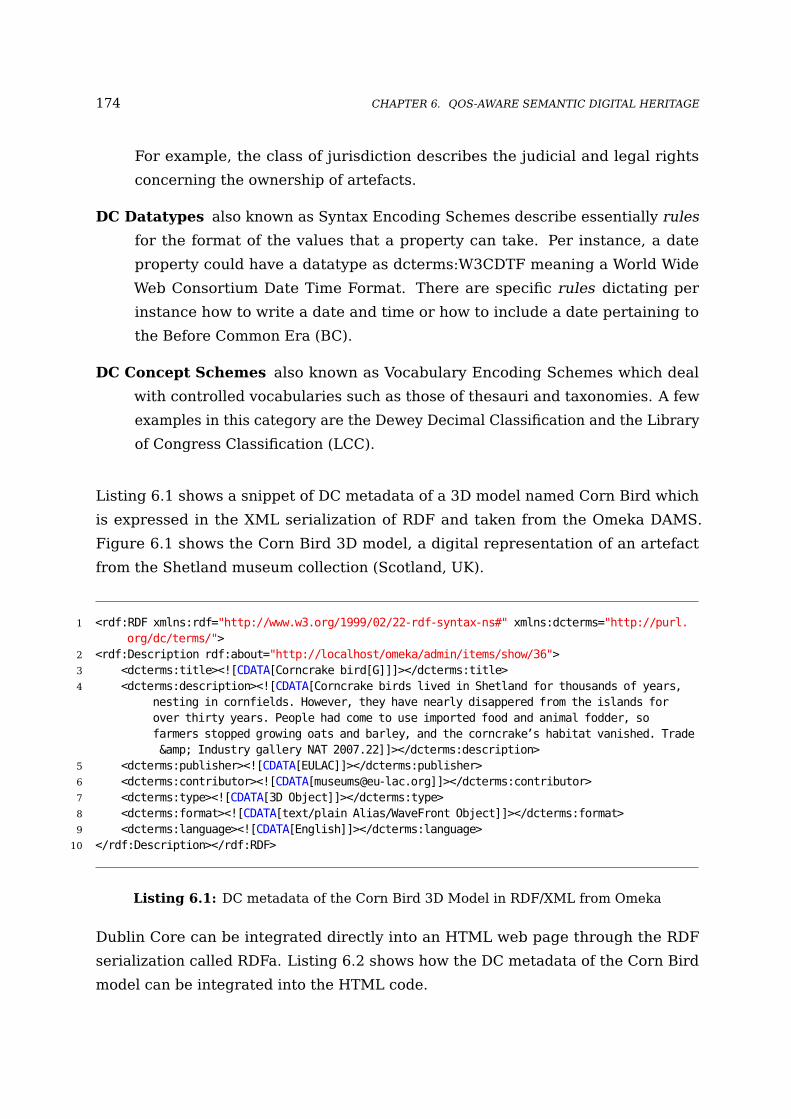
174 CHAPTER 6. QOS-AWARE SEMANTIC DIGITAL HERITAGE
For example, the class of jurisdiction describes the judicial and legal rights
concerning the ownership of artefacts.
DC Datatypes also known as Syntax Encoding Schemes describe essentially rules
for the format of the values that a property can take. Per instance, a date
property could have a datatype as dcterms:W3CDTF meaning a World Wide
Web Consortium Date Time Format. There are specific rules dictating per
instance how to write a date and time or how to include a date pertaining to
the Before Common Era (BC).
DC Concept Schemes also known as Vocabulary Encoding Schemes which deal
with controlled vocabularies such as those of thesauri and taxonomies. A few
examples in this category are the Dewey Decimal Classification and the Library
of Congress Classification (LCC).
Listing 6.1 shows a snippet of DC metadata of a 3D model named Corn Bird which
is expressed in the XML serialization of RDF and taken from the Omeka DAMS.
Figure 6.1 shows the Corn Bird 3D model, a digital representation of an artefact
from the Shetland museum collection (Scotland, UK).
1 <rdf:RDF xmlns:rdf="http://www.w3.org/1999/02/22-rdf-syntax-ns#" xmlns:dcterms="http://purl.org/dc/terms/">
2 <rdf:Description rdf:about="http://localhost/omeka/admin/items/show/36">3 <dcterms:title><![CDATA[Corncrake bird[G]]]></dcterms:title>4 <dcterms:description><![CDATA[Corncrake birds lived in Shetland for thousands of years,
nesting in cornfields. However, they have nearly disappered from the islands forover thirty years. People had come to use imported food and animal fodder, sofarmers stopped growing oats and barley, and the corncrake’s habitat vanished. Trade& Industry gallery NAT 2007.22]]></dcterms:description>
5 <dcterms:publisher><![CDATA[EULAC]]></dcterms:publisher>6 <dcterms:contributor><![CDATA[[email protected]]]></dcterms:contributor>7 <dcterms:type><![CDATA[3D Object]]></dcterms:type>8 <dcterms:format><![CDATA[text/plain Alias/WaveFront Object]]></dcterms:format>9 <dcterms:language><![CDATA[English]]></dcterms:language>
10 </rdf:Description></rdf:RDF>
Listing 6.1: DC metadata of the Corn Bird 3D Model in RDF/XML from Omeka
Dublin Core can be integrated directly into an HTML web page through the RDF
serialization called RDFa. Listing 6.2 shows how the DC metadata of the Corn Bird
model can be integrated into the HTML code.
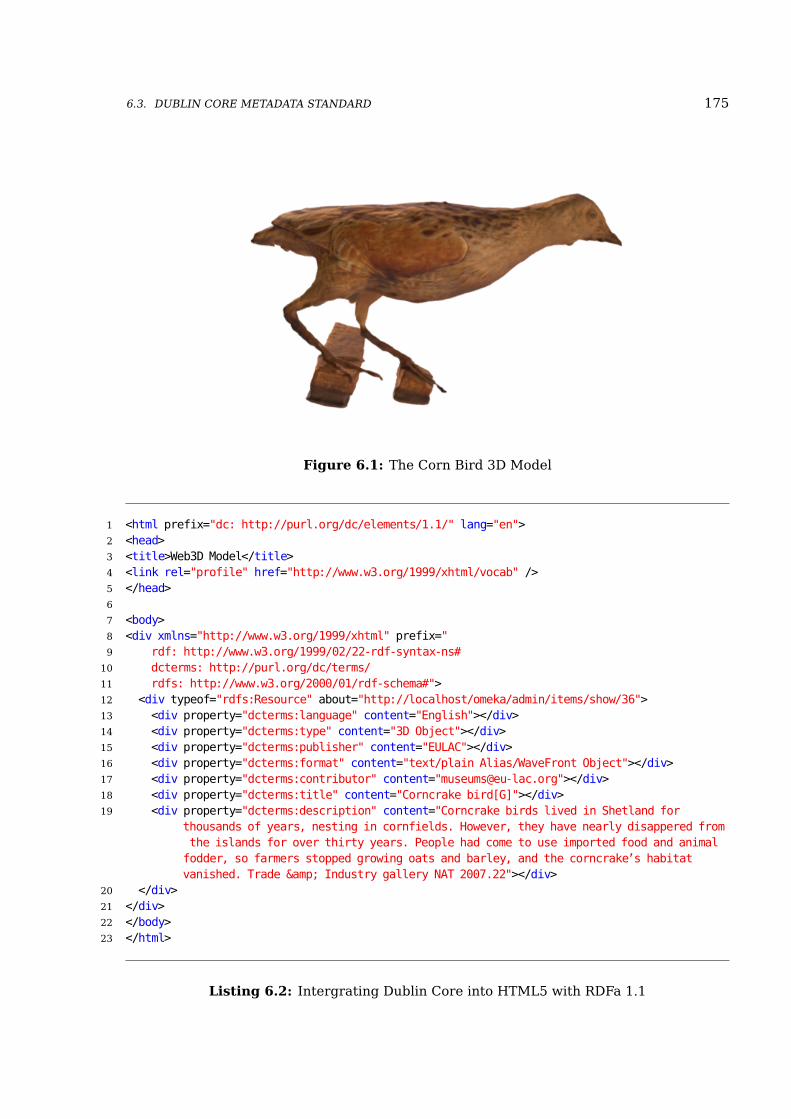
6.3. DUBLIN CORE METADATA STANDARD 175
Figure 6.1: The Corn Bird 3D Model
1 <html prefix="dc: http://purl.org/dc/elements/1.1/" lang="en">2 <head>3 <title>Web3D Model</title>4 <link rel="profile" href="http://www.w3.org/1999/xhtml/vocab" />5 </head>6
7 <body>8 <div xmlns="http://www.w3.org/1999/xhtml" prefix="9 rdf: http://www.w3.org/1999/02/22-rdf-syntax-ns#
10 dcterms: http://purl.org/dc/terms/11 rdfs: http://www.w3.org/2000/01/rdf-schema#">12 <div typeof="rdfs:Resource" about="http://localhost/omeka/admin/items/show/36">13 <div property="dcterms:language" content="English"></div>14 <div property="dcterms:type" content="3D Object"></div>15 <div property="dcterms:publisher" content="EULAC"></div>16 <div property="dcterms:format" content="text/plain Alias/WaveFront Object"></div>17 <div property="dcterms:contributor" content="[email protected]"></div>18 <div property="dcterms:title" content="Corncrake bird[G]"></div>19 <div property="dcterms:description" content="Corncrake birds lived in Shetland for
thousands of years, nesting in cornfields. However, they have nearly disappered fromthe islands for over thirty years. People had come to use imported food and animalfodder, so farmers stopped growing oats and barley, and the corncrake’s habitatvanished. Trade & Industry gallery NAT 2007.22"></div>
20 </div>21 </div>22 </body>23 </html>
Listing 6.2: Intergrating Dublin Core into HTML5 with RDFa 1.1
176 CHAPTER 6. QOS-AWARE SEMANTIC DIGITAL HERITAGE
DC metadata are too generic for efficiently describing 3D models. In addition, DC
does not provide a framework to describe QoS-related metadata. Same applies to
other types of media that are available in modern WBVMs such as Photospheres and
VideoSpheres.
The following section discusses EDM, an ontology used to describe cultural heritage,
archival and digital library resources designed to be used in a multi-lingual European
context.
6.4 Europeana Data Model
The challenge that EDM is trying to solve is the duplication of effort which results
from using many heterogeneous metadata standards to describe data from a
wide range of providers such as museums, libraries, archives and audio-visual
sectors [142]. EDM aims to be panoptic by providing an all-inclusive vast vocabulary
for the domains of libraries, museums, archives and audio-visual sectors.
EDM has its own classes (similar to the DC concept of classes explained in
Section 6.3) [143]. They are the Agent, Europeana Aggregation, Europeana Object,
Event, Information Resource, Non-Information Resource, Physical Thing, Place,
Provided Cultural Heritage Object, Time Span, and Web Resource.
Europeana incorporates also classes and properties from many ontologies such as
the Creative Commons (CC) [93] which describes copyright licenses in RDF, Data
Catalogue Vocabulary [429] which is a W3C ontology that describes data catalogues
on the web, Open Archives Initiative Object Reuse and Exchange (OAI-ORE) [238]
which is an ontology that describes aggregations of web resources and Simple
Knowledge Organization System (SKOS) [272] which is an ontology that describes
concepts, ideas, notions and units of thoughts.
EDM metadata properties and ranges encompass the DC properties and ranges.
The type property of EDM (edm:type) is of interest in a WBVM context since it
categorises the media available under five Europeana types values: text, image,
sound, video or 3D. This is considerably better than the vague metadatum of DC
type and format properties but similar to the case of DC, EDM lacks the QoS angle
when it comes to metadata. In addition, EDM lacks expressiveness and specificity in
terms of media types and forms. Per instance, the EDM video type does not specify
6.5. WEB-BASED VIRTUAL MUSEUM MEDIA AND 3D OBJECTS 177
if the video is spherical, stereoscopic or simply flat.
The shortcomings of DC and that of EDM metadata show the lack of expressiveness
of metadata of DH media and 3D objects types. In addition, these common ontologies
lack essential QoS-related metadata that facilitates adaptivity in the delivery of such
media by web servers. In order to propose extensions to these common vocabularies
(as will be shown in ViMQO), it is pertinent to discuss first the types of media that
are normally encountered in Web-Based Virtual Museums.
6.5 Web-Based Virtual Museum Media and 3D
Objects
Web-Based Virtual Museums present to consumers of cultural heritage a plethora
of multimedia, textual material and digital 3D artefacts. Textual material could be
presented in numerous forms such as simple web pages or wiki articles editable by
curators and CH experts.
It is common in many WBVMs and DH applications to use audio files for commen-
taries or speeches. Audio files could be presented in different file formats that are
either compressed or non-compressed with either lossy or loss-less compression.
Audio files are either streamed via external services or streamed by the WBVM web
server.
In a similar vein, videos can be streamed from external services such as YouTube or
Vimeo or can be streamed from the web server hosting the WBVM or can provided
as a download for users. The advent of spherical videos (i.e. 360◦ videos) facilitated
by commodity cameras and phone cameras and the availability of many JavaScript
libraries that renders such videos in web browsers, made the usage of such videos
in WBVMs and CH quite attractive. Spherical videos can be hosted on popular video
on demand services such as YouTube or other similar platforms.
VR technologies added a new viewing paradigm when it comes to viewing videos
and that is the stereoscopic viewing mode (i.e. viewing a replica of the video scenes
off-setted for each eye), a paradigm designed to be viewed using a VR headset.
Images, similar to videos, can be seen in three viewing modes: Flat, Spherical and
Stereoscopic. A spherical image is also known by the term Photosphere. There
178 CHAPTER 6. QOS-AWARE SEMANTIC DIGITAL HERITAGE
are many external services such as Roundme [343] that can host images of the
three types mentioned above. In addition, many JavaScript libraries especially the
ones that are based on WebGL and WebVR can render quite easily spherical and
stereoscopic images in web browsers.
It is important to note that the content of different multimedia and 3D artefacts
in a WBVM is of standard simple formats but it is interpreted differently by the
consuming applications on the client side to give users a different experience. To
elucidate this idea better, for example, a 3D model of the type OBJ Wavefront is
from the system point of view a large text file containing information about the
vertices, faces and normals of the 3D model. The 3D model file is then rendered in
3 dimensions on the client side. The following is a list of the characteristics and
attributes of media and objects encountered in WBVMs:
Flat images : They are traditional 2D images. These could be of different sizes and
resolutions. They could be compressed through a lossy compression such as
the JPEG format or they could be loss-less such as PNG, GIF and TIFF.
From the back-end system point of view, QoS-related metadata for images are:
size on disk, image file type, image resolution, image file compression, colour
depth and exif metadata.
Spherical images : also called Photospheres or equirectangular panoramas are
image(s) of any image format type PNG, JPG or tiff, presented as a single
photosphere or stitched together as a collection of photosphere tours on the
client side through JavaScript technologies such as WebGL in case of a web
platform or through per example, OpenGL in the case of mobile or desktop
application.
From the back-end system point of view, they are exactly treated as flat
images in terms of Quality of Service Metadata. If the user opens such files
with a normal image viewer, she will only see a skewed image. Client side
manipulation algorithms render such images in a spherical view when the
right file metadata are present. Tools dubbed as metadata injectors such as
ExifTool [184] can add such metadata to images. Normally cameras add such
metadata automatically when taking spherical images. A lot of spherical images
viewers are based on WebGL libraries such as Three JS or Babylon JS. Additional
examples of libraries that allow the creation and rendering of spherical images
are the Photosphere viewer [384] and krpano [163].
6.5. WEB-BASED VIRTUAL MUSEUM MEDIA AND 3D OBJECTS 179
Stereoscopic images : are images made to be used in a VR setting, they are
viewed as two distinct equirectangular images directed individually to each
eye. Normally each eye is made to see the same image with an offset on
opposing sides.
From the back-end system point of view, they are just similar to flat images in
terms of Quality of Service metadata.
Flat videos : These are the traditional monoscopic videos. They could be of
different types mp4, wav, etc. Technically speaking a video is a large group of
frames (or images) in a duration of time.
From the back-end system point of view, QoS-related metadata for videos
are: size on disk, video file type, video resolution, bit rate, frame rate and
compression and encoding codecs.
Spherical videos : also called videospheres or equirectangular videos or 360◦
videos are video(s) of different types (mp4, wav, webm or any other video
format) where a view in every direction is recorded at the same time, shot
using an omnidirectional camera or a collection of cameras. During playback
the viewer has control of the viewing direction. It is stitched on the client side
through JavaScript technologies such as WebGL in case of a web platform or
through OpenGL in the case of mobile or desktop application.
From the back-end system point of view, they are just similar to flat videos in
terms of Quality of Service metadata.
Stereoscopic videos : same explanation as the above for stereoscopy in images
but in this case it is for video.
From the back-end system point of view, they are just similar to flat videos in
terms of Quality of Service metadata.
Web 3D models : by this category we mean standalone 3D models viewed in
web browsers. These 3D models could technically use a declarative 3D Web
scripting language such as X3D to construct them and transform them into
meshes, or they could be in the form of 3D Asset files (.obj, .gltf. .collada etc.)
rendered using WebGL built-in viewers. There is no navigation capability by
avatars in this 3D Web category, and the way to view them and interact with
them is limited to different vantage points.
180 CHAPTER 6. QOS-AWARE SEMANTIC DIGITAL HERITAGE
The relevant QoS-related metadata for 3D models are: size on disk, number of
faces and number of vertices. Such metadata can be extracted programmati-
cally from the meshes files.
Web-Based Virtual Worlds (WBVWs) : this could be virtual environments built
in WebGL or any other native Web3D technology. These environments normally
are navigable by one or more avatars which can or cannot interact with each
others.
WBVWs can have as QoS-related metadata: size on disk, average frame rate,
average frame time, total CPU/GPU consumption and memory consumption.
QoS metrics that were measured and studied in Chapter 4 on Unity3D
Environments and were published in [30] are the type of metadata that
are useful in such environments. The challenge for extracting such type
of metadata/metrics from WBVWs is to create automated tools that can actually
do that in a timely and efficient manner.
Text : traditional text could be encoded in ASCII or Unicode. In a WBVM, the text
normally constitutes web pages or Wiki articles which could be linked to other
textual documents or other Wikis.
Audio files : which normally constitute commentaries about artefacts. Audio
files are of different formats that are uncompressed also known as raw or
compressed using either a lossy or loss-less mechanism.
Audio files can have as QoS-related metadata: file type, size on disk, compres-
sion algorithm, sample rate, constant bitrate (CBR), variable bitrate (VBR),
Mono/Stereo and metadata dealing with multichannel audio.
For audio files and video files most relevant technical and tag data that come from
video and audio files formats constitute the useful QoS-metadata for such media.
There are many open source web projects in Java [285] and Ruby [188] that set or
retrieve metadata of files.
From the ten multimedia and digital types presented above, we only focus in this
thesis on 3D digital heritage models when it comes to QoS-related metadata. ViMQO
which has a generalised name to accommodate future extensions, only contains
QoS-related metadata for 3D digital heritage artefacts in its current form.
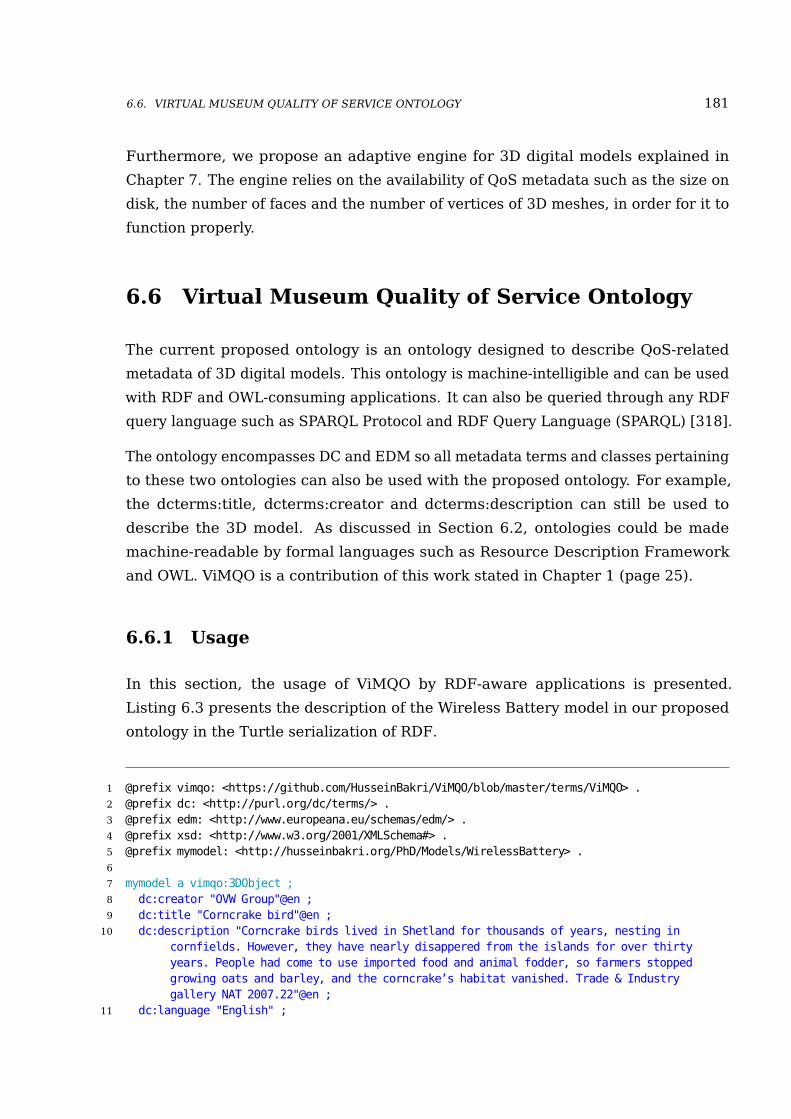
6.6. VIRTUAL MUSEUM QUALITY OF SERVICE ONTOLOGY 181
Furthermore, we propose an adaptive engine for 3D digital models explained in
Chapter 7. The engine relies on the availability of QoS metadata such as the size on
disk, the number of faces and the number of vertices of 3D meshes, in order for it to
function properly.
6.6 Virtual Museum Quality of Service Ontology
The current proposed ontology is an ontology designed to describe QoS-related
metadata of 3D digital models. This ontology is machine-intelligible and can be used
with RDF and OWL-consuming applications. It can also be queried through any RDF
query language such as SPARQL Protocol and RDF Query Language (SPARQL) [318].
The ontology encompasses DC and EDM so all metadata terms and classes pertaining
to these two ontologies can also be used with the proposed ontology. For example,
the dcterms:title, dcterms:creator and dcterms:description can still be used to
describe the 3D model. As discussed in Section 6.2, ontologies could be made
machine-readable by formal languages such as Resource Description Framework
and OWL. ViMQO is a contribution of this work stated in Chapter 1 (page 25).
6.6.1 Usage
In this section, the usage of ViMQO by RDF-aware applications is presented.
Listing 6.3 presents the description of the Wireless Battery model in our proposed
ontology in the Turtle serialization of RDF.
1 @prefix vimqo: <https://github.com/HusseinBakri/ViMQO/blob/master/terms/ViMQO> .2 @prefix dc: <http://purl.org/dc/terms/> .3 @prefix edm: <http://www.europeana.eu/schemas/edm/> .4 @prefix xsd: <http://www.w3.org/2001/XMLSchema#> .5 @prefix mymodel: <http://husseinbakri.org/PhD/Models/WirelessBattery> .6
7 mymodel a vimqo:3DObject ;8 dc:creator "OVW Group"@en ;9 dc:title "Corncrake bird"@en ;
10 dc:description "Corncrake birds lived in Shetland for thousands of years, nesting incornfields. However, they have nearly disappered from the islands for over thirtyyears. People had come to use imported food and animal fodder, so farmers stoppedgrowing oats and barley, and the corncrake’s habitat vanished. Trade & Industrygallery NAT 2007.22"@en ;
11 dc:language "English" ;
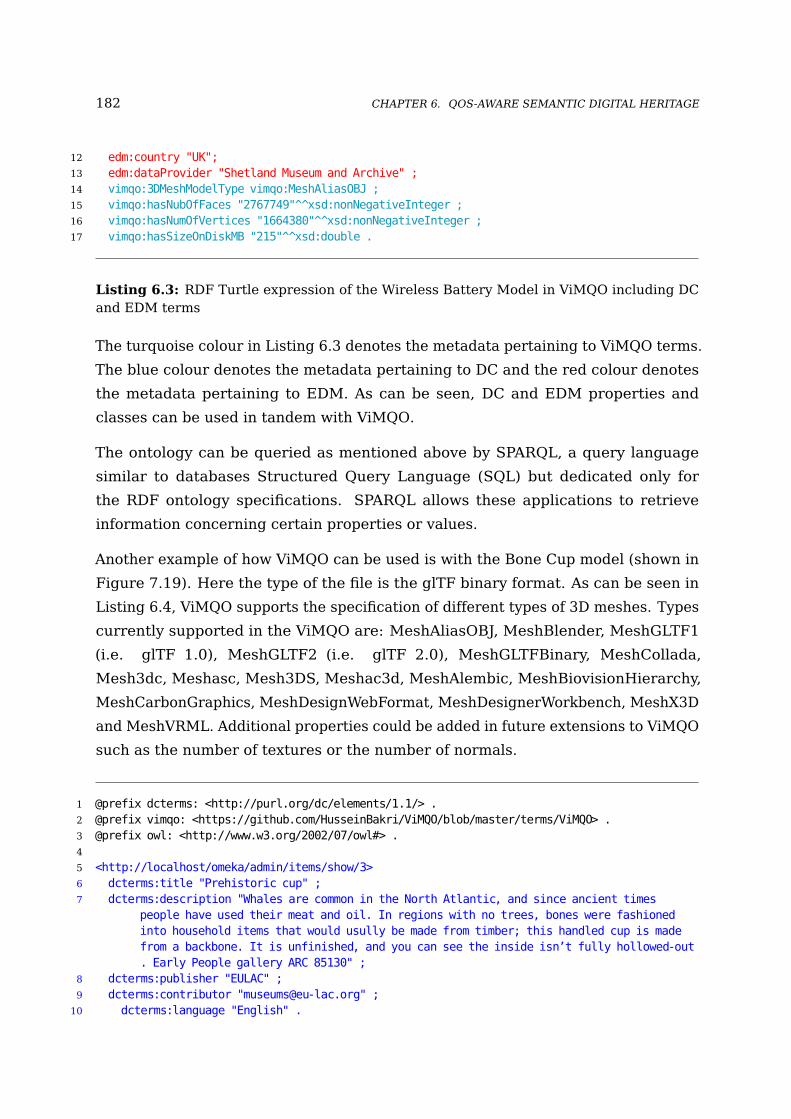
182 CHAPTER 6. QOS-AWARE SEMANTIC DIGITAL HERITAGE
12 edm:country "UK";13 edm:dataProvider "Shetland Museum and Archive" ;14 vimqo:3DMeshModelType vimqo:MeshAliasOBJ ;15 vimqo:hasNubOfFaces "2767749"^^xsd:nonNegativeInteger ;16 vimqo:hasNumOfVertices "1664380"^^xsd:nonNegativeInteger ;17 vimqo:hasSizeOnDiskMB "215"^^xsd:double .
Listing 6.3: RDF Turtle expression of the Wireless Battery Model in ViMQO including DCand EDM terms
The turquoise colour in Listing 6.3 denotes the metadata pertaining to ViMQO terms.
The blue colour denotes the metadata pertaining to DC and the red colour denotes
the metadata pertaining to EDM. As can be seen, DC and EDM properties and
classes can be used in tandem with ViMQO.
The ontology can be queried as mentioned above by SPARQL, a query language
similar to databases Structured Query Language (SQL) but dedicated only for
the RDF ontology specifications. SPARQL allows these applications to retrieve
information concerning certain properties or values.
Another example of how ViMQO can be used is with the Bone Cup model (shown in
Figure 7.19). Here the type of the file is the glTF binary format. As can be seen in
Listing 6.4, ViMQO supports the specification of different types of 3D meshes. Types
currently supported in the ViMQO are: MeshAliasOBJ, MeshBlender, MeshGLTF1
(i.e. glTF 1.0), MeshGLTF2 (i.e. glTF 2.0), MeshGLTFBinary, MeshCollada,
Mesh3dc, Meshasc, Mesh3DS, Meshac3d, MeshAlembic, MeshBiovisionHierarchy,
MeshCarbonGraphics, MeshDesignWebFormat, MeshDesignerWorkbench, MeshX3D
and MeshVRML. Additional properties could be added in future extensions to ViMQO
such as the number of textures or the number of normals.
1 @prefix dcterms: <http://purl.org/dc/elements/1.1/> .2 @prefix vimqo: <https://github.com/HusseinBakri/ViMQO/blob/master/terms/ViMQO> .3 @prefix owl: <http://www.w3.org/2002/07/owl#> .4
5 <http://localhost/omeka/admin/items/show/3>6 dcterms:title "Prehistoric cup" ;7 dcterms:description "Whales are common in the North Atlantic, and since ancient times
people have used their meat and oil. In regions with no trees, bones were fashionedinto household items that would usully be made from timber; this handled cup is madefrom a backbone. It is unfinished, and you can see the inside isn’t fully hollowed-out. Early People gallery ARC 85130" ;
8 dcterms:publisher "EULAC" ;9 dcterms:contributor "[email protected]" ;
10 dcterms:language "English" .
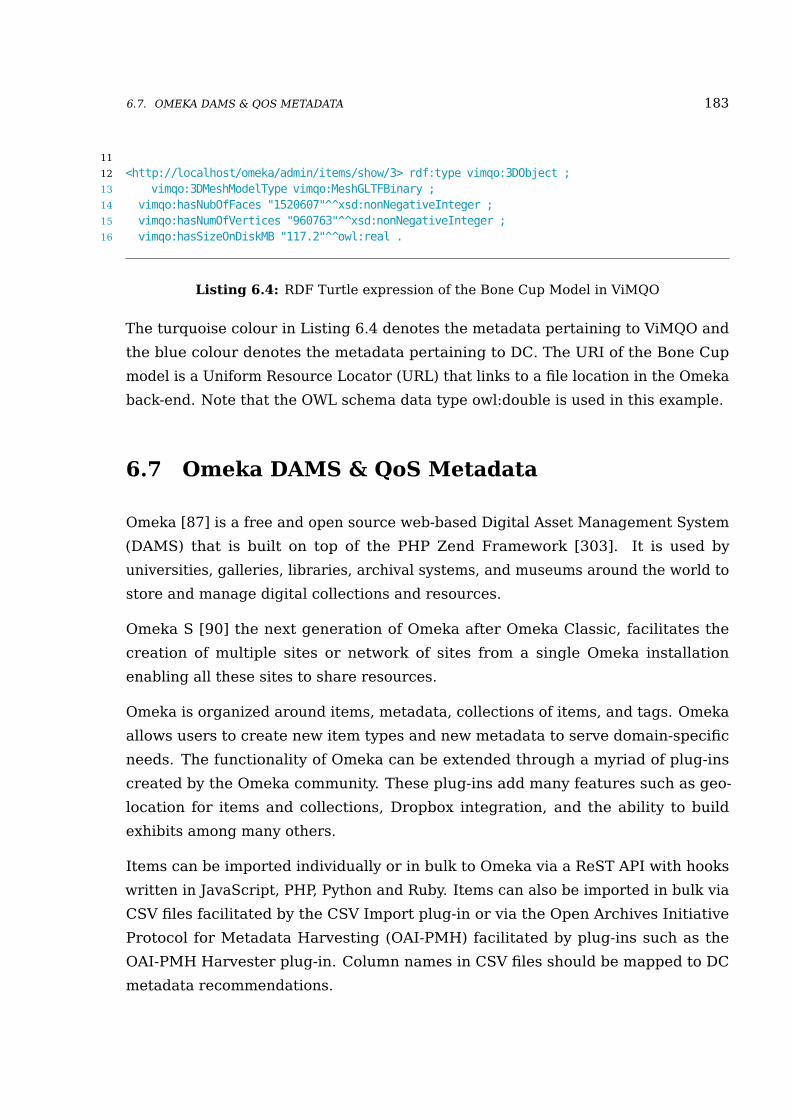
6.7. OMEKA DAMS & QOS METADATA 183
11
12 <http://localhost/omeka/admin/items/show/3> rdf:type vimqo:3DObject ;13 vimqo:3DMeshModelType vimqo:MeshGLTFBinary ;14 vimqo:hasNubOfFaces "1520607"^^xsd:nonNegativeInteger ;15 vimqo:hasNumOfVertices "960763"^^xsd:nonNegativeInteger ;16 vimqo:hasSizeOnDiskMB "117.2"^^owl:real .
Listing 6.4: RDF Turtle expression of the Bone Cup Model in ViMQO
The turquoise colour in Listing 6.4 denotes the metadata pertaining to ViMQO and
the blue colour denotes the metadata pertaining to DC. The URI of the Bone Cup
model is a Uniform Resource Locator (URL) that links to a file location in the Omeka
back-end. Note that the OWL schema data type owl:double is used in this example.
6.7 Omeka DAMS & QoS Metadata
Omeka [87] is a free and open source web-based Digital Asset Management System
(DAMS) that is built on top of the PHP Zend Framework [303]. It is used by
universities, galleries, libraries, archival systems, and museums around the world to
store and manage digital collections and resources.
Omeka S [90] the next generation of Omeka after Omeka Classic, facilitates the
creation of multiple sites or network of sites from a single Omeka installation
enabling all these sites to share resources.
Omeka is organized around items, metadata, collections of items, and tags. Omeka
allows users to create new item types and new metadata to serve domain-specific
needs. The functionality of Omeka can be extended through a myriad of plug-ins
created by the Omeka community. These plug-ins add many features such as geo-
location for items and collections, Dropbox integration, and the ability to build
exhibits among many others.
Items can be imported individually or in bulk to Omeka via a ReST API with hooks
written in JavaScript, PHP, Python and Ruby. Items can also be imported in bulk via
CSV files facilitated by the CSV Import plug-in or via the Open Archives Initiative
Protocol for Metadata Harvesting (OAI-PMH) facilitated by plug-ins such as the
OAI-PMH Harvester plug-in. Column names in CSV files should be mapped to DC
metadata recommendations.
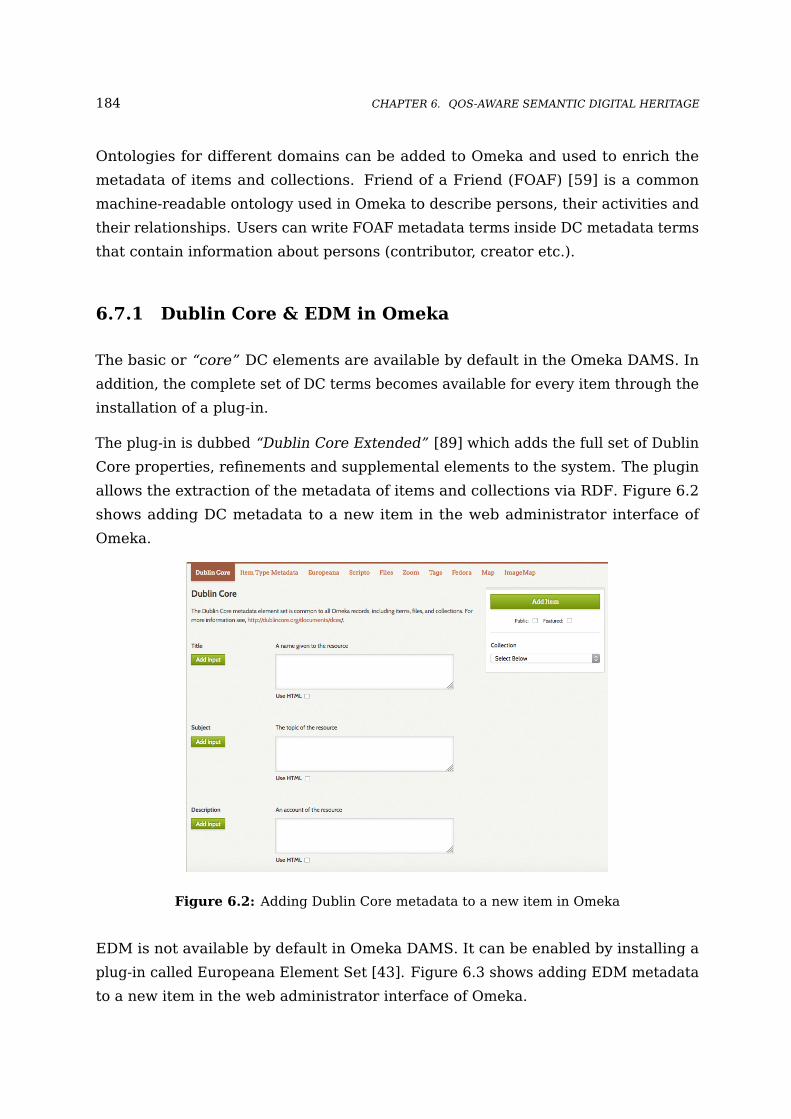
184 CHAPTER 6. QOS-AWARE SEMANTIC DIGITAL HERITAGE
Ontologies for different domains can be added to Omeka and used to enrich the
metadata of items and collections. Friend of a Friend (FOAF) [59] is a common
machine-readable ontology used in Omeka to describe persons, their activities and
their relationships. Users can write FOAF metadata terms inside DC metadata terms
that contain information about persons (contributor, creator etc.).
6.7.1 Dublin Core & EDM in Omeka
The basic or “core” DC elements are available by default in the Omeka DAMS. In
addition, the complete set of DC terms becomes available for every item through the
installation of a plug-in.
The plug-in is dubbed “Dublin Core Extended” [89] which adds the full set of Dublin
Core properties, refinements and supplemental elements to the system. The plugin
allows the extraction of the metadata of items and collections via RDF. Figure 6.2
shows adding DC metadata to a new item in the web administrator interface of
Omeka.
Figure 6.2: Adding Dublin Core metadata to a new item in Omeka
EDM is not available by default in Omeka DAMS. It can be enabled by installing a
plug-in called Europeana Element Set [43]. Figure 6.3 shows adding EDM metadata
to a new item in the web administrator interface of Omeka.
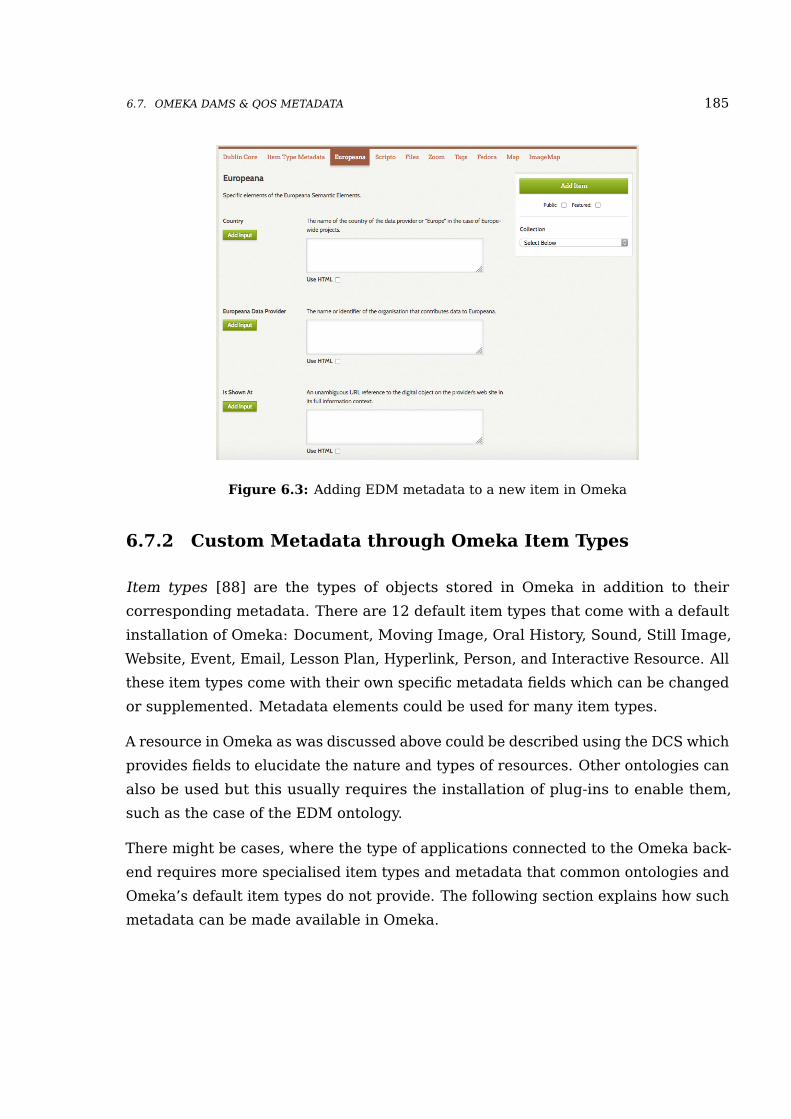
6.7. OMEKA DAMS & QOS METADATA 185
Figure 6.3: Adding EDM metadata to a new item in Omeka
6.7.2 Custom Metadata through Omeka Item Types
Item types [88] are the types of objects stored in Omeka in addition to their
corresponding metadata. There are 12 default item types that come with a default
installation of Omeka: Document, Moving Image, Oral History, Sound, Still Image,
Website, Event, Email, Lesson Plan, Hyperlink, Person, and Interactive Resource. All
these item types come with their own specific metadata fields which can be changed
or supplemented. Metadata elements could be used for many item types.
A resource in Omeka as was discussed above could be described using the DCS which
provides fields to elucidate the nature and types of resources. Other ontologies can
also be used but this usually requires the installation of plug-ins to enable them,
such as the case of the EDM ontology.
There might be cases, where the type of applications connected to the Omeka back-
end requires more specialised item types and metadata that common ontologies and
Omeka’s default item types do not provide. The following section explains how such
metadata can be made available in Omeka.

186 CHAPTER 6. QOS-AWARE SEMANTIC DIGITAL HERITAGE
6.7.2.1 Omeka & QoS-Related metadata
Hannibal, an adaptive engine for 3D digital heritage models is presented in
Chapter 7. Hannibal is integrated into a small subset clone of a WBVM built
for the EULAC Web-Based Virtual Museum initiative, a complete web-based virtual
museum infrastructure.
The WBVM uses Omeka as a back-end to store all the heritage media and 3D models.
The WBVM has a management interface that allows the curators of the museum to
upload media including 3D models and their metadata (title, description, publisher,
contributor etc.)
A new Omeka item type dubbed “3D Object” was created and supplemented the meta-
data fields: Wiki, Social Media, Nb_of_vertices, Nb_of_faces and Size_On_Disk_MB.
These metadata fields are available for any item of the type “3D Object”.
The Wiki metadata field is for a link to the wiki article that describes the 3D
model. The social media field normally contains a list of social media web pages
pertaining to the 3D model, separated by semi-colons. The list is parsed by the
WBVM application. The presence of the other three QoS-related metadata (the
number of faces, number of vertices and the size on disk of the 3D model in MB) is
important for the adaptive engine to function properly. These fields are never filled
by curators but retrieved by an algorithm that decimates the uploaded 3D model
into lower resolutions and stores all the produced models of different resolutions in
Omeka with all the metadata: the ones supplemented by curators in addition to the
QoS-metadata that were automatically captured. Figure 6.4 shows the process of
adding new item types and custom metadata on the administrator web interface of
Omeka.
6.8 Summary
This chapter discussed the DC and EDM ontologies and their current semantic
properties and classes. It proceeded to explain the myriad media normally available
in WBVMs. It presented Virtual Museum Quality of service Ontology (ViMQO), an
ontology that describes the QoS-related metadata aspect of digital heritage 3D
artefacts. Then an explanation of Omeka DAMS, the ontologies, item types and
metadata available in it was given. The chapter explained then how the QoS-related
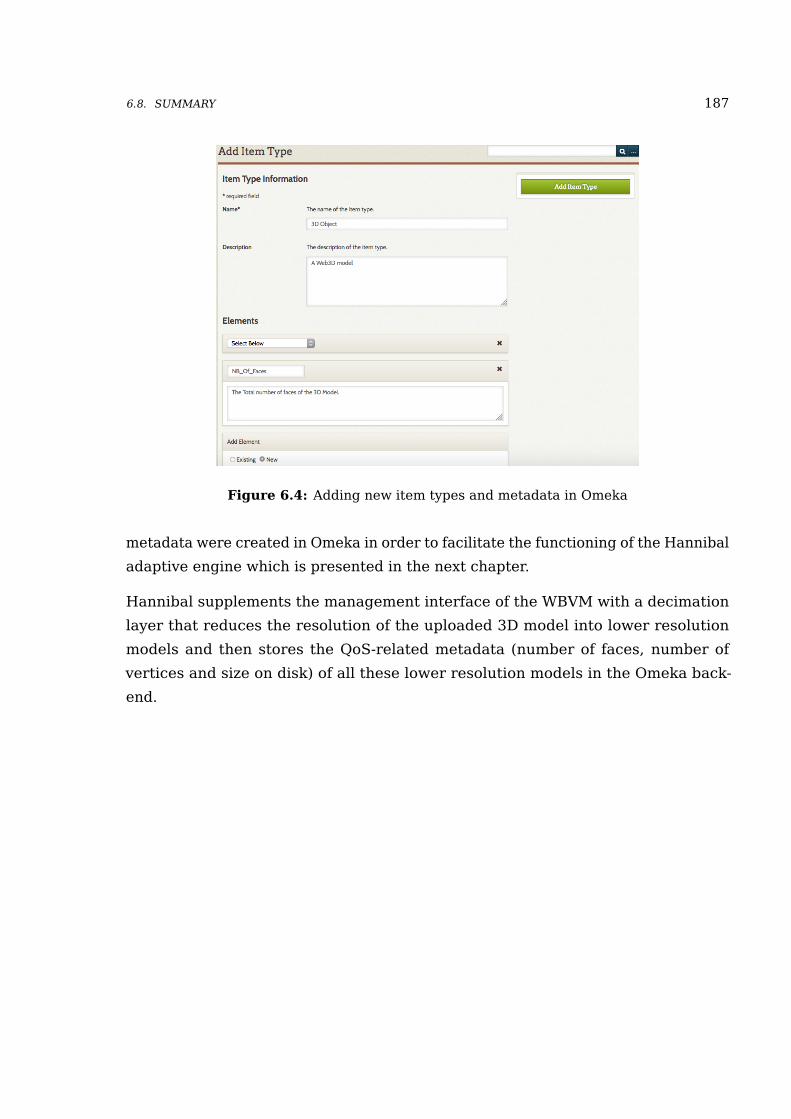
6.8. SUMMARY 187
Figure 6.4: Adding new item types and metadata in Omeka
metadata were created in Omeka in order to facilitate the functioning of the Hannibal
adaptive engine which is presented in the next chapter.
Hannibal supplements the management interface of the WBVM with a decimation
layer that reduces the resolution of the uploaded 3D model into lower resolution
models and then stores the QoS-related metadata (number of faces, number of
vertices and size on disk) of all these lower resolution models in the Omeka back-
end.


Part V
Hannibal
189


7Chapter Seven
Hannibal - an AdaptiveEngine for Virtual
Museums
This chapter describes the design & implementation of Hannibal, a QoS
and QoE-aware adaptive engine for 3D Web content in Web-Based Virtual
Museums. The chapter begins by explaining the Hannibal solution. It then
goes on to describe how results from QoS and QoE studies conducted in
previous chapters fed its design. Then the architecture, implementation, and
evaluation of the system are presented. Finally, the limitations of Hannibal
and avenues for future improvements are elucidated.
7.1 Introduction
This chapter is an exposition of the architecture, design and implementation of
an adaptive engine for 3D Web content used specifically in the context of Web-
Based Virtual Museums (WBVMs). The adaptive engine is named “Hannibal” after
“Hannibal Barca” [193], the hero of the Phoenician Carthaginians who was himself
adaptive in his war tactics against the Romans during the Punic wars.
Fetching 3D Web components presents a significant challenge. This is because
nowadays these types of media are fetched on multiple platforms (mobile devices,
tablets and personal computers) with varying levels of graphical and processing
191
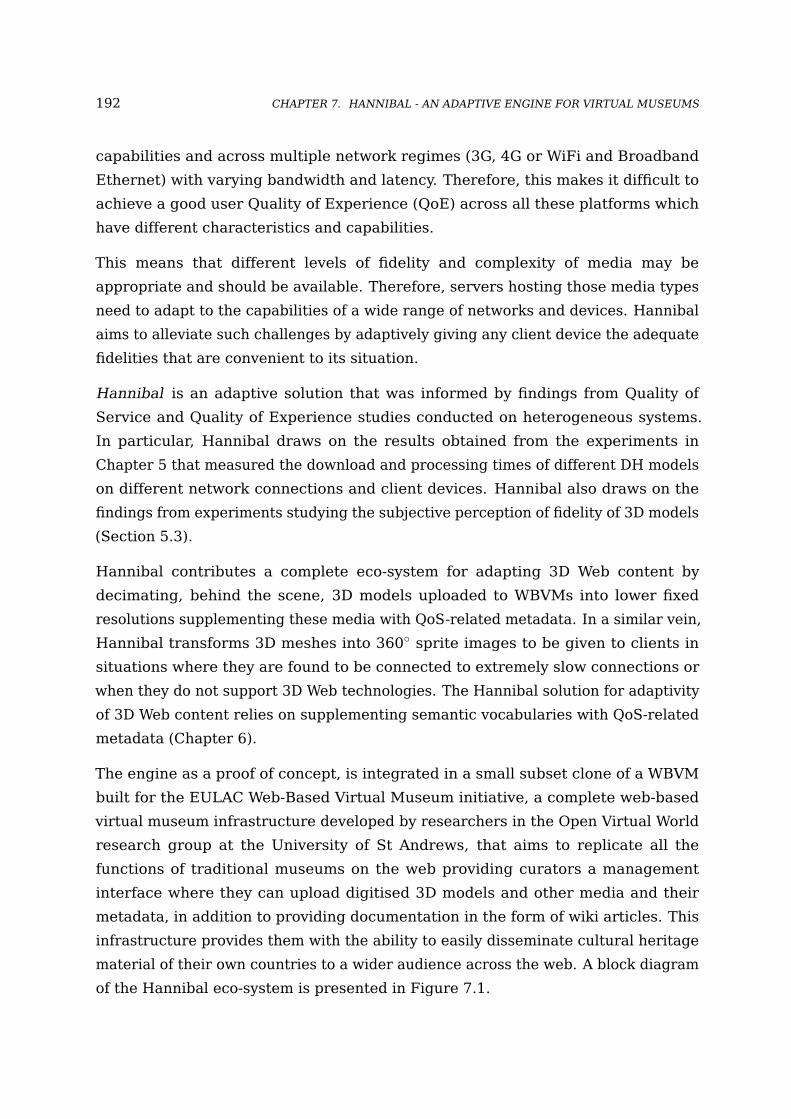
192 CHAPTER 7. HANNIBAL - AN ADAPTIVE ENGINE FOR VIRTUAL MUSEUMS
capabilities and across multiple network regimes (3G, 4G or WiFi and Broadband
Ethernet) with varying bandwidth and latency. Therefore, this makes it difficult to
achieve a good user Quality of Experience (QoE) across all these platforms which
have different characteristics and capabilities.
This means that different levels of fidelity and complexity of media may be
appropriate and should be available. Therefore, servers hosting those media types
need to adapt to the capabilities of a wide range of networks and devices. Hannibal
aims to alleviate such challenges by adaptively giving any client device the adequate
fidelities that are convenient to its situation.
Hannibal is an adaptive solution that was informed by findings from Quality of
Service and Quality of Experience studies conducted on heterogeneous systems.
In particular, Hannibal draws on the results obtained from the experiments in
Chapter 5 that measured the download and processing times of different DH models
on different network connections and client devices. Hannibal also draws on the
findings from experiments studying the subjective perception of fidelity of 3D models
(Section 5.3).
Hannibal contributes a complete eco-system for adapting 3D Web content by
decimating, behind the scene, 3D models uploaded to WBVMs into lower fixed
resolutions supplementing these media with QoS-related metadata. In a similar vein,
Hannibal transforms 3D meshes into 360◦ sprite images to be given to clients in
situations where they are found to be connected to extremely slow connections or
when they do not support 3D Web technologies. The Hannibal solution for adaptivity
of 3D Web content relies on supplementing semantic vocabularies with QoS-related
metadata (Chapter 6).
The engine as a proof of concept, is integrated in a small subset clone of a WBVM
built for the EULAC Web-Based Virtual Museum initiative, a complete web-based
virtual museum infrastructure developed by researchers in the Open Virtual World
research group at the University of St Andrews, that aims to replicate all the
functions of traditional museums on the web providing curators a management
interface where they can upload digitised 3D models and other media and their
metadata, in addition to providing documentation in the form of wiki articles. This
infrastructure provides them with the ability to easily disseminate cultural heritage
material of their own countries to a wider audience across the web. A block diagram
of the Hannibal eco-system is presented in Figure 7.1.

7.1. INTRODUCTION 193
Omeka Backend
QoS-RelatedMetadata
Dublin Core &EuropeanaMetadata
Knowledge Base
DetectionComponent
QoS/QoEExperimental
Results (Chap 5)
Rules
Fetch Models Decimations
Asks about convenientResolution
Web-Based Virtual Museum
CategoriserHannibal
User
Web Browsers
Forward Chaining Expert System
Populate the WBVM
Contributions
Main Contribution
Partial ContributionManagement
Interface
Figure 7.1: Hannibal Block Diagram
The current version of Hannibal bases the rules used in its knowledge base on
previous results obtained from experiments conducted in this thesis that fed the
decision process of its expert system. This is depicted in Figure 7.1.
The contributions presented in Figure 7.1 depict main and partial contributions to
the WBVM. It shows the main contributions of this work which are located in the
middleware layer of the system: mainly the detection component, the categoriser
component and the expert system. Furthermore, we have partially contributed to the
management interface of the WBVM which already exists and was built by members
of the Open Virtual World research group at the University of St Andrews. The
contributions to the management interface which are shown in a more detailed way
in Figure 7.2 include several integrated tools. The first tool captures QoS-related
metadata such as size, number of faces and number of vertices. The second is a
decimation tool that works in bulk to decimate an uploaded model into the lower
resolutions required by Hannibal. Finally, the third tool creates out of 3D model a
360◦ sprite images that gives a 360 view or a spherical Photosphere like view of
the model for cases where 3D Web is not supported or in case of very low speed
networks.
194 CHAPTER 7. HANNIBAL - AN ADAPTIVE ENGINE FOR VIRTUAL MUSEUMS
Hannibal detects the graphical capability of the client device it is communicating
with in addition to the network conditions. It then categorises this client under
certain categories that are sent to the expert system to receive back the decision of
the most convenient resolution suitable for the client.
This chapter also describes the high level overview of the system architecture which
is further decomposed into low-level detailed depictions of system components,
including the flow of data and control in the system.
The current focus of Hannibal is on achieving good adaptation of 3D Digital Heritage
models rendered with WebGL frameworks such as Sketchfab [374], Babylon JS [278]
or Three JS [116]. 3D models, which are uploaded through a management interface
provided by the WBVM, are decimated behind the scenes into lower specific
resolutions and into 360◦ sprite images of 3D models. A 360◦ sprite is a collection of
snapshots or image frames taken from different angles forming in total 360◦ of the
3D model. These images are then stitched together.
In this chapter, the term “decimations” is used to refer to “lower levels of detail” or
to “lower resolutions” of a particular 3D model.
Furthermore, Hannibal mandates that the resolutions of 3D models are specific,
fixed and standardised and more importantly are the same for every single 3D model
uploaded to the WBVM. This is an idea inspired by YouTube HAS [244, 364] which
decimates an uploaded video into specific standardised segments of video bit rates
(a.k.a video resolutions). These bit rates or resolutions are always the same across
all videos that are uploaded by users.
QoS-related metadata are stored in the Omeka back-end accompanying all the
decimated 3D models. By QoS-related metadata we refer to characterising
information about 3D models such as size and fidelity (number of faces and number
of vertices).
Omeka [87], is a Digital Asset Management System (DAMS) used by WBVMs and
by Hannibal. Omeka supports Dublin Core Schema (DCS) [123, 125] which is a
metadata vocabulary for describing digital assets. The WBVM front-end interface
mainly the interface that deals with uploading 3D Web artefacts is mapped to the
Europeana Data Model (EDM) [144] which in its turn builds on Dublin Core Schema
(DCS).
The remainder of this chapter is organised as follows: the following section elucidates

7.2. THE HANNIBAL SOLUTION 195
the Hannibal solution. Section 7.3 presents a summary of the findings from Chapter 5
that fed the design of Hannibal. Section 7.4 explains the importance of QoS-
related metadata to be available to Hannibal. The high level architecture of the
adaptive system is explained in Section 7.5, the system views are depicted in
Section 7.6 and the classifications used by Hannibal are discussed in Section 7.7.
The implementation of Hannibal is explained in Section 7.9. Finally, the system
is appraised in Section 7.10 on a systematic level and in terms of advantages and
disadvantages of the adaptivity technique achieved.
7.2 The Hannibal Solution
The problem we are seeking to address is to achieve a good QoE across heteroge-
neous devices and network regimes in the context of WBVMs.
The solution for adaptivity of 3D Web content adopted in this work is based on
utilising the already rich semantic vocabularies used in DH applications and in
WBVMs, and this is done by supplementing them with QoS-related metadata as
described in Chapter 6. On a practical level in this work, these metadata are created
in Omeka [87]. The same procedure used by Hannibal could be applicable to any
DAMS used by WBVMs.
The Hannibal system solves both the problem of intensive network requirements and
that of the heterogeneity of graphical capabilities of client devices. This is a core
contribution of this thesis. Our literature review presented in Chapter 2 suggests
that Hannibal is the only adaptive solution that follows findings of Quality of Service
studies on heterogeneous systems and more importantly, follows findings from the
Quality of Experience field in 3D Web. In particular, the Quality of Experience that
deals with the subjective perception of fidelity of 3D digital heritage models, which
is a study that was presented in Chapter 5 and was published in [28]. Table 7.1
provides a comparison framework of Hannibal with other adaptivity approaches
available in the literature.
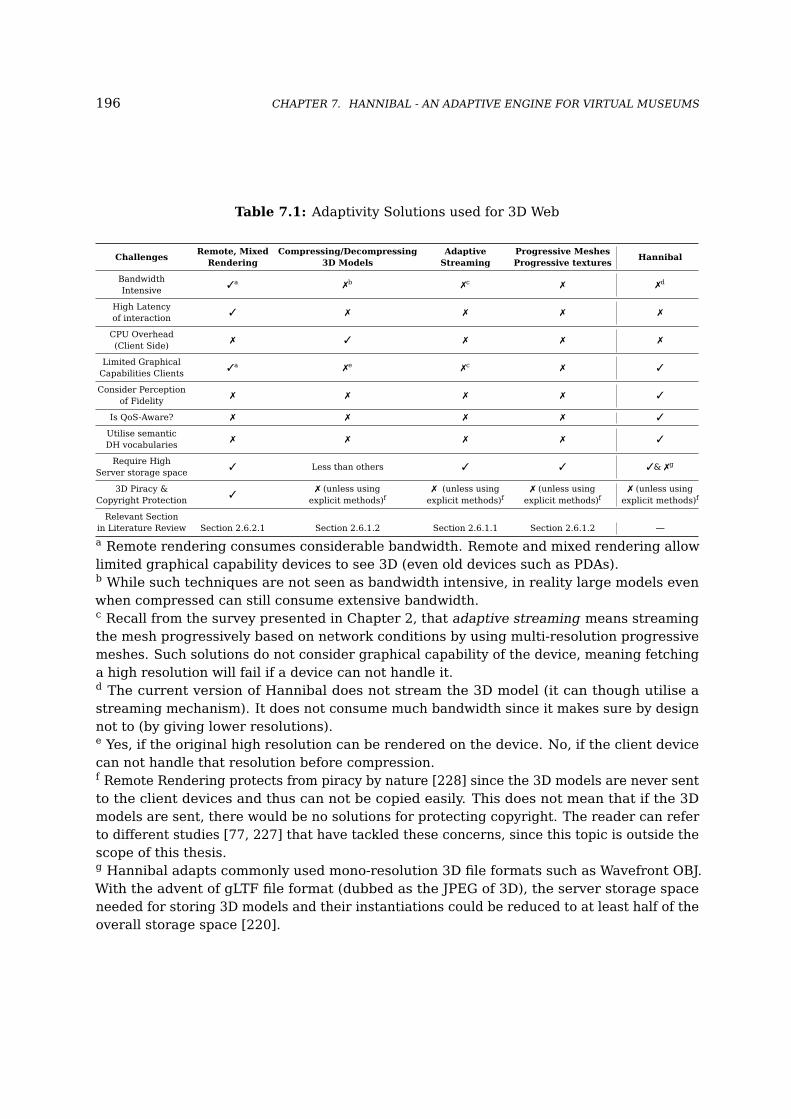
196 CHAPTER 7. HANNIBAL - AN ADAPTIVE ENGINE FOR VIRTUAL MUSEUMS
Table 7.1: Adaptivity Solutions used for 3D Web
ChallengesRemote, Mixed
RenderingCompressing/Decompressing
3D ModelsAdaptive
StreamingProgressive MeshesProgressive textures
Hannibal
BandwidthIntensive
3a 7b 7c 7 7d
High Latencyof interaction
3 7 7 7 7
CPU Overhead(Client Side)
7 3 7 7 7
Limited GraphicalCapabilities Clients
3a 7e 7c 7 3
Consider Perceptionof Fidelity
7 7 7 7 3
Is QoS-Aware? 7 7 7 7 3
Utilise semanticDH vocabularies
7 7 7 7 3
Require HighServer storage space
3 Less than others 3 3 3& 7g
3D Piracy &Copyright Protection
37 (unless using
explicit methods)f7 (unless using
explicit methods)f7 (unless using
explicit methods)f7 (unless using
explicit methods)f
Relevant Sectionin Literature Review Section 2.6.2.1 Section 2.6.1.2 Section 2.6.1.1 Section 2.6.1.2 —
a Remote rendering consumes considerable bandwidth. Remote and mixed rendering allowlimited graphical capability devices to see 3D (even old devices such as PDAs).b While such techniques are not seen as bandwidth intensive, in reality large models evenwhen compressed can still consume extensive bandwidth.c Recall from the survey presented in Chapter 2, that adaptive streaming means streamingthe mesh progressively based on network conditions by using multi-resolution progressivemeshes. Such solutions do not consider graphical capability of the device, meaning fetchinga high resolution will fail if a device can not handle it.d The current version of Hannibal does not stream the 3D model (it can though utilise astreaming mechanism). It does not consume much bandwidth since it makes sure by designnot to (by giving lower resolutions).e Yes, if the original high resolution can be rendered on the device. No, if the client devicecan not handle that resolution before compression.f Remote Rendering protects from piracy by nature [228] since the 3D models are never sentto the client devices and thus can not be copied easily. This does not mean that if the 3Dmodels are sent, there would be no solutions for protecting copyright. The reader can referto different studies [77, 227] that have tackled these concerns, since this topic is outside thescope of this thesis.g Hannibal adapts commonly used mono-resolution 3D file formats such as Wavefront OBJ.With the advent of gLTF file format (dubbed as the JPEG of 3D), the server storage spaceneeded for storing 3D models and their instantiations could be reduced to at least half of theoverall storage space [220].
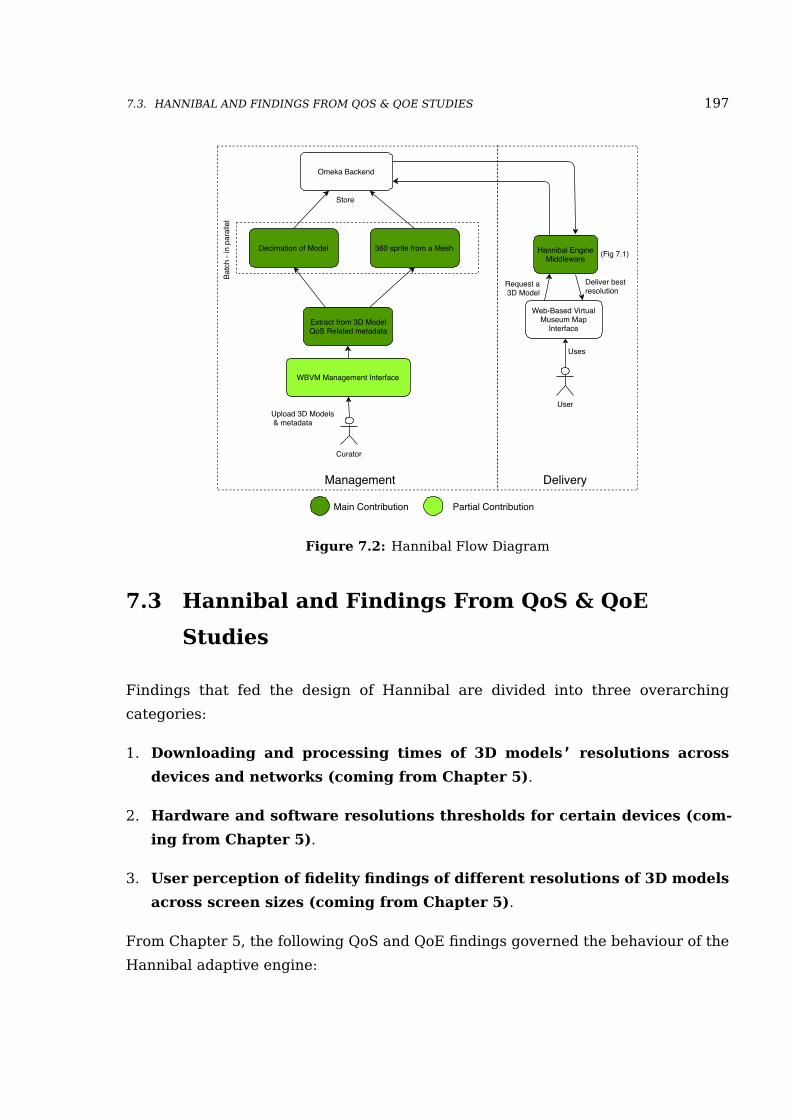
7.3. HANNIBAL AND FINDINGS FROM QOS & QOE STUDIES 197
Decimation of Model
WBVM Management Interface
Upload 3D Models & metadata
360 sprite from a Mesh
Omeka Backend
Batc
h - i
n pa
ralle
l
Hannibal EngineMiddleware
Web-Based VirtualMuseum Map
Interface
Curator
Store
User
Uses
Request a 3D Model
Deliver bestresolution
Extract from 3D ModelQoS Related metadata
DeliveryManagement
(Fig 7.1)
Main Contribution Partial Contribution
Figure 7.2: Hannibal Flow Diagram
7.3 Hannibal and Findings From QoS & QoE
Studies
Findings that fed the design of Hannibal are divided into three overarching
categories:
1. Downloading and processing times of 3D models’ resolutions across
devices and networks (coming from Chapter 5).
2. Hardware and software resolutions thresholds for certain devices (com-
ing from Chapter 5).
3. User perception of fidelity findings of different resolutions of 3D models
across screen sizes (coming from Chapter 5).
From Chapter 5, the following QoS and QoE findings governed the behaviour of the
Hannibal adaptive engine:
198 CHAPTER 7. HANNIBAL - AN ADAPTIVE ENGINE FOR VIRTUAL MUSEUMS
QoS Studies Considerations for Hannibal
The following is an exposition of the QoS considerations obtained from the results of
previous experiments conducted in this regard. Some of the considerations buttress
the findings of others.
C1: 3D Models and Slow Connections There should be no fetching of any 3D
model on network connections such as GPRS and 2G or their equivalent in
the network profile categories shown in Section 2.6.1, no matter what the
client device capability is. This is due to the large amount of time taken to
download and process these 3D models. Recall from Chapter 5, the statute
of Rameses model which is of resolution 30K faces, took 507 seconds (8.45
minutes) on a GPRS connection to download and become usable on the mobile
device Alcatel Pop 4. The statute of Gudea model with resolution 300K faces,
took 717 seconds (around 12 minutes) to load on the GPRS connection on the
same device. Same model took 105 seconds (1.75 minutes) to load on a 2G
network connection. Even a simple and low resolution model such as the Head
model (only 112 faces), took 1/2 minute to download and become usable on a
2G network connection, on both a low-end device such as the Alcatel Pop 4
and a middle-end device such as the LG Nexus 5x. A 3D model of such low
resolution is unlikely to be found in any CH context. GPRS and 2G networks
are a reality in many rural areas in which signals are too weak for 3G and 4G
networks to be operational. Hannibal on such networks always sends to the
user a 360◦ sprite image representation of the 3D model in question.
C2: Mobile Devices and High Resolution Models Capable mobile devices that
could fetch 3D models of resolutions higher than 1M faces (usually models
with loosely defined topologies) spend considerable time downloading and
processing the models. Per instance, on a WiFi broadband connection with a
download speed of 55 Mbps, such times could reach easily a complete minute
for a 3M faces model to download (eg. 70s Shoe model - 3M faces), and can
take more than 105 seconds for a model such as the Ava Skull model which
has a resolution of 4.8M faces. Such durations are not convenient for any web
usage since web pages aim to load within few seconds lest the users loose
interest or think there is something wrong with the web application. 3D models
of a resolution of 3M faces took on a fast WiFi broadband connection (download
speed of 55 Mbps) for a mobile device such as the LG Nexus 5x more than
7.3. HANNIBAL AND FINDINGS FROM QOS & QOE STUDIES 199
60 seconds (more than a minute) to render and become usable in the web
browser. Thus it can be deduced that it is better not to fetch for mobile devices
in general, resolutions higher than 1M faces (this finding will be refined further
when discussing fidelity perception findings and hardware resolution limits).
C3: Resolutions on PCs and Laptops It can be seen that even with fast Ethernet
and WiFi download speeds (Ethernet of JANET: 94 Mbps, Broadband Ethernet
and WiFi: 55Mbps) on PCs and Laptops, it is still time consuming to fetch a 3D
model of 4.8M faces which takes around 22 seconds to become usable in the
web browser. It should be noted fidelity perception (see QoE consideration C7)
tells us that it is a waste of computational resources to send such a resolution
even to PCs and Laptops, since users could not tell the difference in the quality
of presentation between this resolution and many lower resolutions. Hannibal
allows users to override fetched resolutions if the user specifically wanted a
higher resolution.
C4: Hardware Resolution Limits Mobile devices have an upper hardware res-
olution limit above which the resolution can not be fetched reliably. Per
instance, as shown in Chapter 5, the Apple iPhone 7 Plus and the iPad Pro
mobile devices have an upper resolution limit of 1M faces above which any
higher resolution either does not load or load for few seconds and when the
user interact with the model, the web browser crashes. This consideration
buttresses QoS consideration presented in C2 in the fact that resolutions for
mobile devices should not exceed the 1M faces. The iPhone 7 Plus and the iPad
Pro were able to load the 1.5M faces of the Mercury model (a loosely defined
model) but were not able to load the 1M faces of the Achavanich Beaker (a 3D
model with complex topology and textures).
C5: Software Resolution Limits It was found from results obtained in Chapter 5,
that web browsers play a role in limiting the highest resolution that could be
rendered successfully. Per instance, from benchmarking five web browsers
(Google Chrome, Opera (for PC), Opera Mini (for mobile devices only), Mozilla
Firefox, Apple Safari and the Dolphin browser, it was found that a resolution
could be fetched reliably on one web browser while could make another web
browser crash (bear in mind it is same mobile device with the same resolution
of the 3D model). Per instance, on the iPad Pro tablet, the Opera Mini web
browser was able to render reliably the 1M faces resolution of the Achavanich
Beaker model, whether for the same resolution, Apple Safari crashed many
200 CHAPTER 7. HANNIBAL - AN ADAPTIVE ENGINE FOR VIRTUAL MUSEUMS
times. The best WebGL browser for the PC running MS Windows was Google
Chrome. For the iPad Pro tablet, it was Opera mini and for the iPhone 7 Plus,
it was Apple Safari. Thus, it can be seen that it is not an easy task to find the
maximum software resolution limit for web browsers. It suffices to say, that it
is better to stay under resolution limits than to fetch resolutions above them
(risking crashes of 3D models on certain web browsers).
Hardware & Software resolution limits (QoS considerations C4 & C5) constitute
one maximum resolution limit, we call it the Maximum Resolution Limit which is a
fidelity that can be fetched reliably on a certain client device no matter what the web
browser is. The use of the word reliably is intentional due to the fact that sometimes
a resolution can be fetched but on other occasions it can not, or can be fetched
on some web browsers but not on others or finally can be fetched successfully but
during later interaction with the 3D model, the web browser would freeze or crash.
QoE Studies Contributions for Hannibal
The following is an exposition of the QoE considerations obtained from results of
the experiments conducted in this regards. Some of the considerations buttress the
findings of others.
C6: Perception of Visual Latency study Chapter 5 showed that a 3D model of
resolution 30K faces on low end mobile device such as the Alcatel Pop 4 has
a visual latency grade of 3. This means that the user sees a delay of 2 to 3
seconds between the moment the user initiates a rotate action on the 3D model
and the time to see the effect of that action. Therefore, on a low end device
such as the Alcatel Pop 4, such 3D model’s resolution behave in a laggy way.
On a mid range mobile device such as the LG Nexus 5x, the interaction with
the 30K model is extremely smooth with a grade of 5 (less than one second
to see the effect of a rotate action). However on the LG Nexus 5x, a model
of 3M faces has a visual latency grade of 3. Meaning between 2 to 3 seconds
have to pass until the user sees the effect of the rotate action. This tells us
also that 3D models with resolutions of millions of faces on commonly used
middle range mobile devices have usability and performance issues and that it
seems from a perception of visual latency perspective mobiles devices should
not have a resolution higher than 300K. Subsequent considerations that deals

7.3. HANNIBAL AND FINDINGS FROM QOS & QOE STUDIES 201
with perception of fidelity on mobile devices will refine this further to exact
ranges of fidelities that are perceptible and tolerable by users).
C7: Subjective Perception of Fidelity on PCs and Laptops studied in Chap-
ter 5, the discovery of upper resolution and lower resolution thresholds across
screens with and without interaction. The upper resolution threshold range
or limit is the resolution range or limit above which any improvement in
perception of fidelity is not noticeable or barely noticeable by users. The
lower resolution threshold or range of a 3D model is the resolution limit or
range below which fidelity is unacceptable by users. In non interaction mode
where users just look at the 3D model and for the two 3D models studied in
Chapter 5, on a big screen, the range of resolutions between 300K and 375K
constitutes the upper resolution threshold range above which there is barely
any improvement in perception of fidelity. With interaction, understandably
this range changes since users zoom in and begin to discover imperfections
in 3D models. In interaction mode and on a big screen, the upper resolution
range shifts upward to be between 375K faces and 750K faces. That means
above the 750K resolution there is little difference in perception of fidelity. This
leads Hannibal to cap the highest resolution given by it to PCs and Laptops to
just 750K faces (unless the user overrides the adaptive automatic resolution
fetched and chooses to see the original resolution instead - which is a feature
that Hannibal allows and is explained in further detail in Section 7.6.2.2).
C8: Subjective Perception of Fidelity on Mobile Devices it is shown from pre-
vious results that users tolerate lower resolutions on screen sizes pertaining
to the category of mobile devices and tablets, since users could not tell the
difference between many of the resolutions (please refer back to Chapter 5).
On a 5.5 inches screen (iPhone 7 Plus) and in no interaction mode, the
upper resolution threshold is between 150K faces and 189K faces. On a
9.7 inches screen, and in no interaction mode, the upper resolution threshold
is between 189K and 300K. Hannibal can fetch lower resolutions to mobile
devices, confident that users will not notice any difference in fidelity.
Table 7.2 shows a summary of the QoS and QoE considerations taken from the
experiments conducted before in the thesis. The table also presents the priority of
each consideration and how such consideration is taken into account as either a
feature of Hannibal or as a rule in the knowledge base of the expert system.

202 CHAPTER 7. HANNIBAL - AN ADAPTIVE ENGINE FOR VIRTUAL MUSEUMS
Table 7.2: Summary of QoS & QoE considerations, their priorities and their translationsinto either Hannibal features or rules in the expert system
Consideration Priority Feature(s) or rule(s)
C1 High
Translated into a feature that transforms3D meshes into 360◦ sprite images
Rule: 360◦ sprite images for models onGPRS and 2G Networks (no matter
what the graphical capability of the client is)
C2 HighNo decimation on the back-end isproduced higher than 1M faces
C3 MediumDetection component of Hannibal will
send resolutions lower than the 1M faceseven when encountering fast networks
C4 HighMobile devices should not
receive higher than 1M faces
C5 Medium Consideration buttresses C4
C6 Low Consideration buttresses C4
C7 HighRule: 750K faces is the upper resolution
threshold for PC and Laptops
C8 High
Rule: 189K faces is the upper resolutionthreshold for mobile devices
Rule: 300K faces is the upper resolutionthreshold for tablets
7.4 Hannibal and QoS-related Metadata
In order for the Hannibal solution to work effectively, 3D models need to have
QoS-related metadata stored in tandem with the models in a similar fashion as other
semantic metadata about provenance, authorship, dimensions etc. are stored. These
QoS-related metadata provide Hannibal or any other application characterising
information necessary for achieving adaptivity.
Chapter 6 proposes ViMQO, an ontology that supplements existing semantic DH
vocabularies such as EDM and DCS with QoS-related metadata. In terms of what
concerns DH models, QoS-related metadata such as the number of faces, the number
of vertices and the size on disc of a 3D model are captured in addition to metadata
of textures (images) such as the exif metadata, which are the metadata of images
7.5. HIGH LEVEL ARCHITECTURE 203
stored with 3D model in the back-end.
In this thesis, we used the number of faces as a 3D mesh resolution metric to
characterise a 3D model in all the experiments. Hannibal uses many batch tools that
were developed to decimate a 3D model into lower fixed resolutions by minimising
the number of faces. Another tool was developed to transform a 3D mesh into 360◦
image sprites. Furthermore, a tool captures characteristics of 3D models such as
the number of faces and textures metadata and store them in the back-end.
7.5 High Level Architecture
Setting the engine in its general architectural context is essential and necessary.
The system is decomposed based on 4 perspectives describing 4 main components:
the client device, the network, the server and the 3D models and their metadata.
These system’s perspectives shed the light on the type and flow of information in
the system and what each major component contributes to that flow. The following
diagram shows an abstract view of the WBVM in which Hannibal is integrated
showing the 4 main components mentioned above.
Influencing factors are very important for each perspective. These factors are
summarised in Figure 7.4.
CPU & GPU characteristics, memory, screen size, screen resolution in addition to
Web3D support and Web3D performance are among the main influencing factors for
client devices. Due to the complexity and variety of these client factors, they were
abstracted and contextualised under what is termed as “client capability categories”
corresponding to only 5 general categories (Labelled from A to E). Please refer to
Section 7.7.2 for more information on this.
Network influencing factors are important as client devices operate on a myriad of
network regimes with varying bandwidth, jitter, RTT and levels of loss. The WBVM
could be in a local network (Ethernet or WiFi) and hosted on a local server. In local
network scenario, the bandwidth would be the bandwidth of the network where the
WBVM lives. For instance, the WiFi 802.11b has a theoretical speed of 11 Mpbs and
actual speed of 5.5 Mbps. The WiFi 802.11a has a theoretical downlink bandwidth
of 54 Mbps and actual of 20 Mbps [275].
For a remote scenario, traditional common network connection types range from
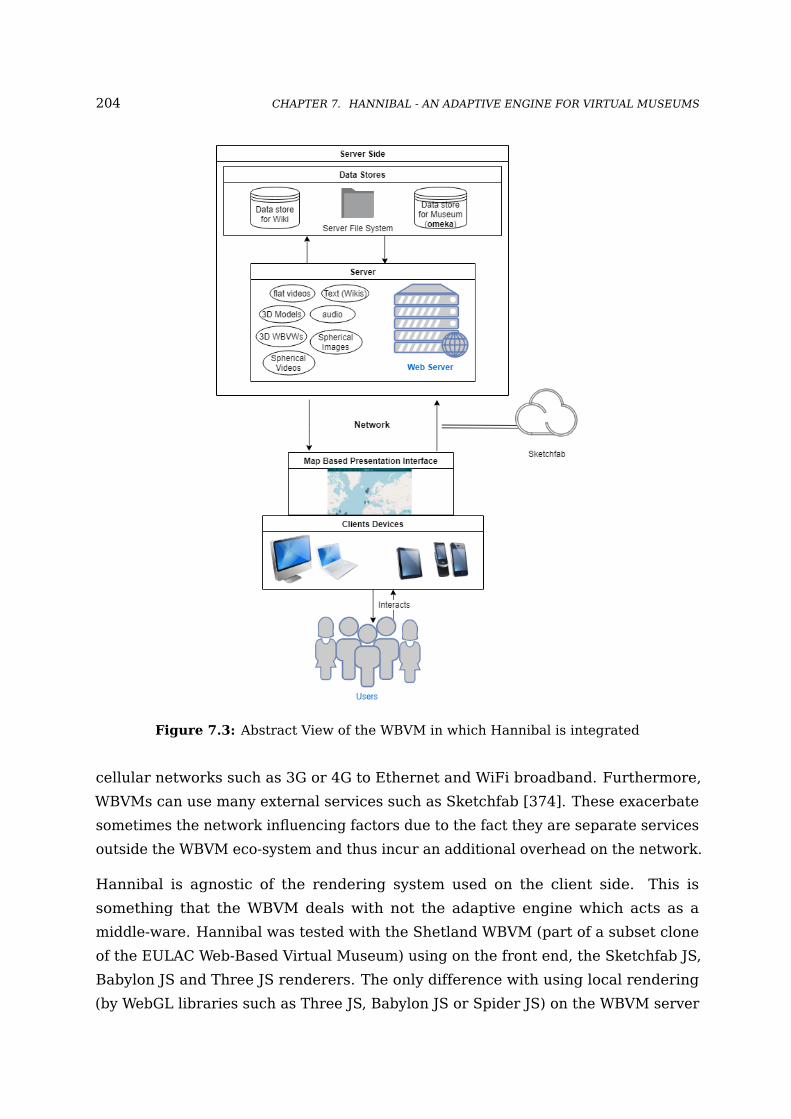
204 CHAPTER 7. HANNIBAL - AN ADAPTIVE ENGINE FOR VIRTUAL MUSEUMS
Figure 7.3: Abstract View of the WBVM in which Hannibal is integrated
cellular networks such as 3G or 4G to Ethernet and WiFi broadband. Furthermore,
WBVMs can use many external services such as Sketchfab [374]. These exacerbate
sometimes the network influencing factors due to the fact they are separate services
outside the WBVM eco-system and thus incur an additional overhead on the network.
Hannibal is agnostic of the rendering system used on the client side. This is
something that the WBVM deals with not the adaptive engine which acts as a
middle-ware. Hannibal was tested with the Shetland WBVM (part of a subset clone
of the EULAC Web-Based Virtual Museum) using on the front end, the Sketchfab JS,
Babylon JS and Three JS renderers. The only difference with using local rendering
(by WebGL libraries such as Three JS, Babylon JS or Spider JS) on the WBVM server
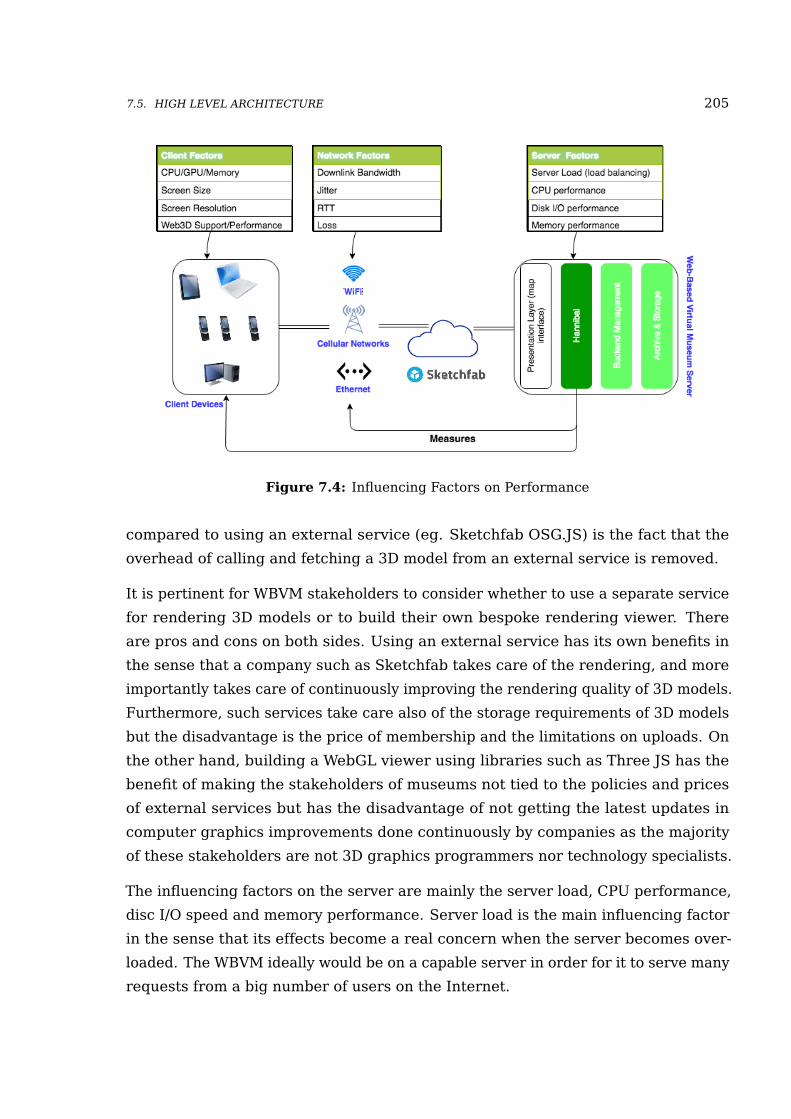
7.5. HIGH LEVEL ARCHITECTURE 205
Figure 7.4: Influencing Factors on Performance
compared to using an external service (eg. Sketchfab OSG.JS) is the fact that the
overhead of calling and fetching a 3D model from an external service is removed.
It is pertinent for WBVM stakeholders to consider whether to use a separate service
for rendering 3D models or to build their own bespoke rendering viewer. There
are pros and cons on both sides. Using an external service has its own benefits in
the sense that a company such as Sketchfab takes care of the rendering, and more
importantly takes care of continuously improving the rendering quality of 3D models.
Furthermore, such services take care also of the storage requirements of 3D models
but the disadvantage is the price of membership and the limitations on uploads. On
the other hand, building a WebGL viewer using libraries such as Three JS has the
benefit of making the stakeholders of museums not tied to the policies and prices
of external services but has the disadvantage of not getting the latest updates in
computer graphics improvements done continuously by companies as the majority
of these stakeholders are not 3D graphics programmers nor technology specialists.
The influencing factors on the server are mainly the server load, CPU performance,
disc I/O speed and memory performance. Server load is the main influencing factor
in the sense that its effects become a real concern when the server becomes over-
loaded. The WBVM ideally would be on a capable server in order for it to serve many
requests from a big number of users on the Internet.
206 CHAPTER 7. HANNIBAL - AN ADAPTIVE ENGINE FOR VIRTUAL MUSEUMS
With the advancement in hardware capabilities of servers and progress in cloud
computing services, bottleneck of performance are more emphasised on other
parts of the system rather than on the server level. The two main bottlenecks in
performance lies on the client side in terms of client device capability and on the
level of the network.
Hannibal measures the graphical capabilities of the client devices and the network
parameters as depicted in Figure 7.4. The dark green area depicts the Hannibal
layer which is the main contribution of this work. This work also contributed tools
used for decimating 3D models into lower resolutions and a tool that produces
360◦ sprite images out of a 3D model. All of these tools were integrated into the
management interface (built for the WBVM) and the resulting models and media
are stored in the back-end. 3D models stored in Omeka has been supplemented
also with QoS-related metadata. The lighter green layers are layers that depict the
partial contributions subject of this work.
7.6 System View
This section explains the view from the perspective of each of the main components
in the system.
7.6.1 Client Side View
The client device has many attributes or characteristics that are useful to the
Hannibal adaptive engine. The client screen size and screen resolution are of
usefulness since fidelity perception studies make obvious the need to send different
maximum resolutions for different screen sizes.
Information on graphics memory and processing units (GPU & CPU) are very useful
but unfortunately or fortunately depending on how a person sees this, are not
accessible from web server side languages (PHP, Ruby, Python, JavaScript vel cetera)
or client side languages (JavaScript) due to privacy and security concerns. This is
called in security parlance, fingerprinting the client device web browser [61]. The
majority of web browsers (except web browsers on Apple devices) do not share this
information. Thus the detection component of Hannibal has to rely in its decision on
the screen size and resolution of the client device. In a first prototype of Hannibal
7.6. SYSTEM VIEW 207
few rules containing GPU architectures were included in the forward chaining engine
ruleset (please refer for Section 7.9.2.1) but it was found that this solution could not
be generalised especially for devices where this type of information could not be
detected.
An important consideration for Hannibal is to check whether the device supports
Web3D technologies mainly WebGL in order for the user to consume 3D content. In
the absence of Web3D, a 360◦ sprite image of the 3D model is sent to the client.
WebGL benchmark is the main method which Hannibal relies on to categorise
the graphical capability of the client device. This is done by capturing WebGL
parameters on the client side and sending them via AJAX to the server. This is in
order to discover which graphical capability category the client device belongs to.
The graphical capability categories are presented in Section 7.7.2.
Many WebGL parameters were captured from 18 devices (please refer to Appendix D,
Appendix D.1) which were used to classify the different graphical capability
categories of the client devices in tandem with using data captured on the client
concerning device screen size and screen resolution.
7.6.2 Data and Control Flow of Hannibal
7.6.2.1 Default Adaptive Mode
The scenario presented in Figure 7.5 is called the adaptation scenario. It is the
default behaviour adopted by Hannibal. The characteristics of the clients (i.e. client
screen sizes, screen resolutions and WebGL metrics) are captured on the client side
and then sent to the server via AJAX. The server then classifies the client under a
quality/fidelity category based on these characteristics (check Section 7.7.2).
Network conditions (download speed, upload speed, jitter and RTT) are captured
between the client device and the server. The server then classifies the client device
connection status under a network profile category (please refer to Section 7.7.1).
The forward chaining expert system (please refer to Section 7.9.2.1) decides then
the specific resolution to send based on the rules in the knowledge base.
The idea of categorization which is explained in more detail in sections: client
capability categories (Section 7.7.2) and Network Profiles (Section 7.7.1) is used
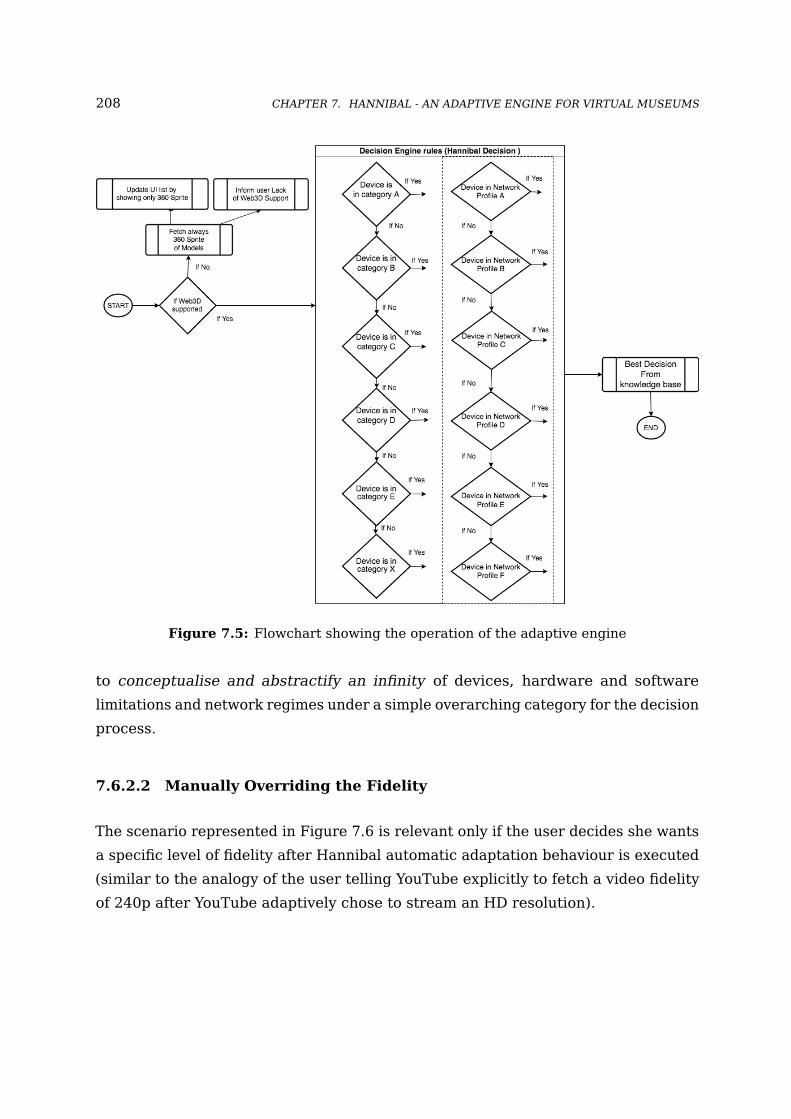
208 CHAPTER 7. HANNIBAL - AN ADAPTIVE ENGINE FOR VIRTUAL MUSEUMS
Figure 7.5: Flowchart showing the operation of the adaptive engine
to conceptualise and abstractify an infinity of devices, hardware and software
limitations and network regimes under a simple overarching category for the decision
process.
7.6.2.2 Manually Overriding the Fidelity
The scenario represented in Figure 7.6 is relevant only if the user decides she wants
a specific level of fidelity after Hannibal automatic adaptation behaviour is executed
(similar to the analogy of the user telling YouTube explicitly to fetch a video fidelity
of 240p after YouTube adaptively chose to stream an HD resolution).
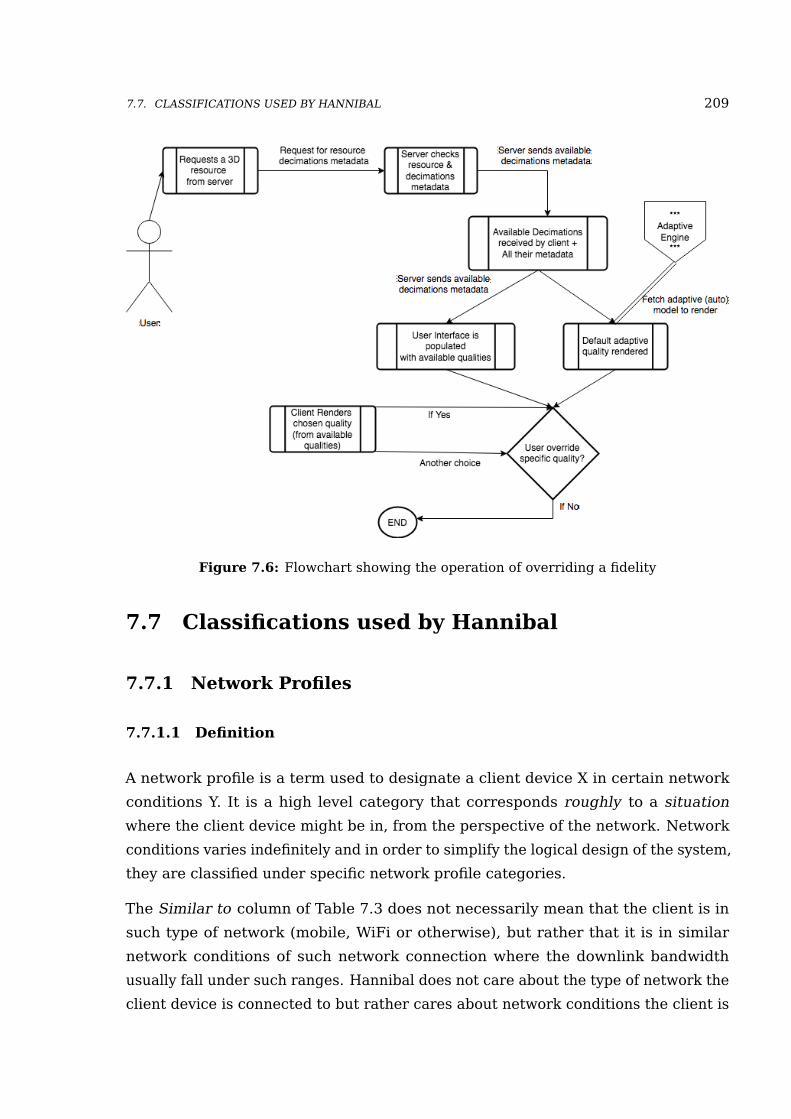
7.7. CLASSIFICATIONS USED BY HANNIBAL 209
Figure 7.6: Flowchart showing the operation of overriding a fidelity
7.7 Classifications used by Hannibal
7.7.1 Network Profiles
7.7.1.1 Definition
A network profile is a term used to designate a client device X in certain network
conditions Y. It is a high level category that corresponds roughly to a situation
where the client device might be in, from the perspective of the network. Network
conditions varies indefinitely and in order to simplify the logical design of the system,
they are classified under specific network profile categories.
The Similar to column of Table 7.3 does not necessarily mean that the client is in
such type of network (mobile, WiFi or otherwise), but rather that it is in similar
network conditions of such network connection where the downlink bandwidth
usually fall under such ranges. Hannibal does not care about the type of network the
client device is connected to but rather cares about network conditions the client is
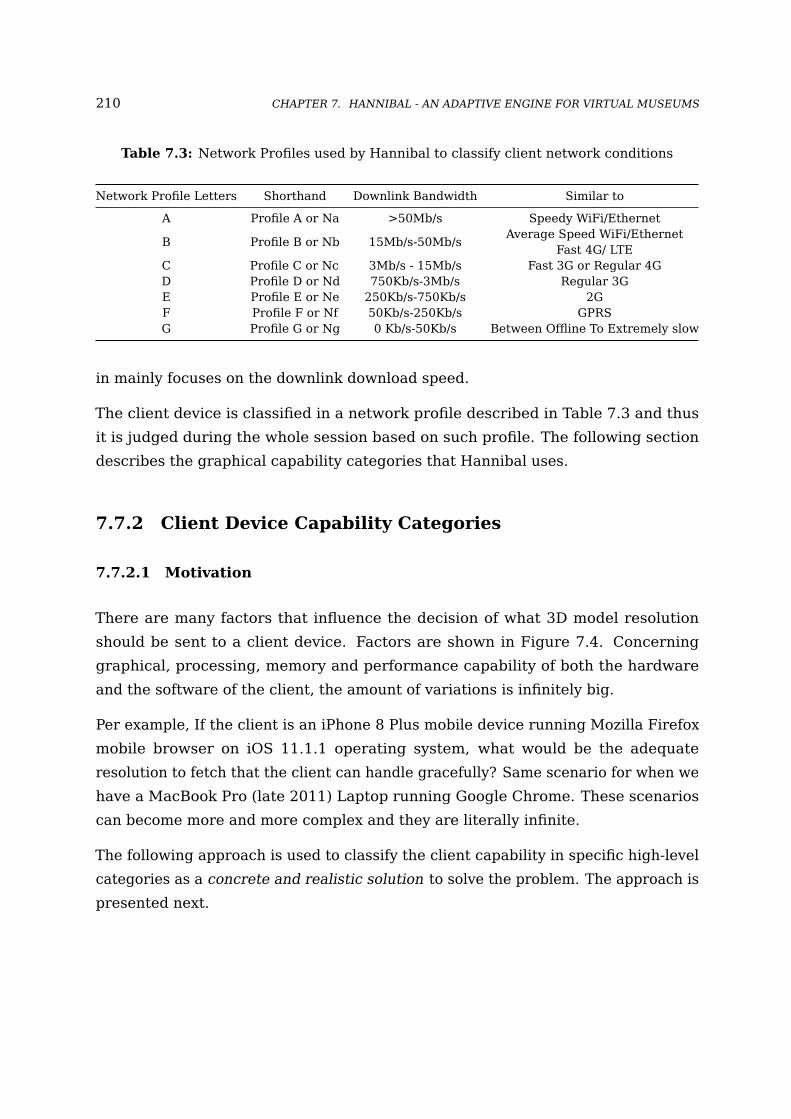
210 CHAPTER 7. HANNIBAL - AN ADAPTIVE ENGINE FOR VIRTUAL MUSEUMS
Table 7.3: Network Profiles used by Hannibal to classify client network conditions
Network Profile Letters Shorthand Downlink Bandwidth Similar to
A Profile A or Na >50Mb/s Speedy WiFi/Ethernet
B Profile B or Nb 15Mb/s-50Mb/sAverage Speed WiFi/Ethernet
Fast 4G/ LTEC Profile C or Nc 3Mb/s - 15Mb/s Fast 3G or Regular 4GD Profile D or Nd 750Kb/s-3Mb/s Regular 3GE Profile E or Ne 250Kb/s-750Kb/s 2GF Profile F or Nf 50Kb/s-250Kb/s GPRSG Profile G or Ng 0 Kb/s-50Kb/s Between Offline To Extremely slow
in mainly focuses on the downlink download speed.
The client device is classified in a network profile described in Table 7.3 and thus
it is judged during the whole session based on such profile. The following section
describes the graphical capability categories that Hannibal uses.
7.7.2 Client Device Capability Categories
7.7.2.1 Motivation
There are many factors that influence the decision of what 3D model resolution
should be sent to a client device. Factors are shown in Figure 7.4. Concerning
graphical, processing, memory and performance capability of both the hardware
and the software of the client, the amount of variations is infinitely big.
Per example, If the client is an iPhone 8 Plus mobile device running Mozilla Firefox
mobile browser on iOS 11.1.1 operating system, what would be the adequate
resolution to fetch that the client can handle gracefully? Same scenario for when we
have a MacBook Pro (late 2011) Laptop running Google Chrome. These scenarios
can become more and more complex and they are literally infinite.
The following approach is used to classify the client capability in specific high-level
categories as a concrete and realistic solution to solve the problem. The approach is
presented next.

7.7. CLASSIFICATIONS USED BY HANNIBAL 211
7.7.2.2 Classification Approach
All Web3D models and Web3D environments which are used in the WBVM are
based on WebGL as a main Web3D language. In addition, a lot of other Web3D
technologies which were surveyed in Chapter 2 and Appendix C are basing their
current implementations on WebGL. Some examples of such technologies would
be O3D [171] and Oak3D [295]. The majority of famous game engines such as
Unity [410], Unreal [85], Shiva Engine [368] and CryEngine [276] are generating
only WebGL builds in their newest versions for their 3D environments (at the time
of writing). Most importantly, web-based game engines based on JavaScript uses
WebGL as a renderer (Babylon JS [278], Three JS [116] etc..). 3DMLW is completely
deprecated and Java applets running Java 3D or other Java based 3D technologies
are deprecated for some time now.
In addition, all major web browsers are moving toward becoming completely plugin-
less. 3rd party technologies such as Adobe Flash will have an end of life in 2020 [4]),
in addition, Microsoft Silverlight is now deprecated [69].
All this leads us to safely assume that WebGL is the most used standard for 3D Web
now and may be the only 3D Web language after 2020. WebGL 2.0, a better version
of WebGL 1.0, is based on OpenGL ES 3.0 which is officially enabled in only very few
web browsers such as Mozilla Firefox (at the time of writing). WebGL 2.0 contains
many performance enhancements and features.
Therefore, it makes sense to base the classification of the graphical capability of the
client devices on the benchmarking parameters of WebGL 1.0 itself. In addition, we
need to take into consideration the screen resolution and screen size of the client
device which can be programmatically measured via JavaScript. All this contributes
to the classification criteria.
In addition, it is pertinent to mention that Sketchfab [374], DelightVR [107],
PlayCanvas [129] among many other services that are involved in 3D Web content
rely on WebGL parameters as a way to classify hardware and software capability.
As a concrete example, we refer the avid reader to check WebGL Stats library [57]
which the aforementioned companies are contributing to in order to facilitate the
challenge of classifying client devices’ hardware and software capabilities.
Different WebGL 1.0 parameters across 18 devices were benchmarked. Please refer
to Appendix D for more information. This is in order to discover what are the ranges
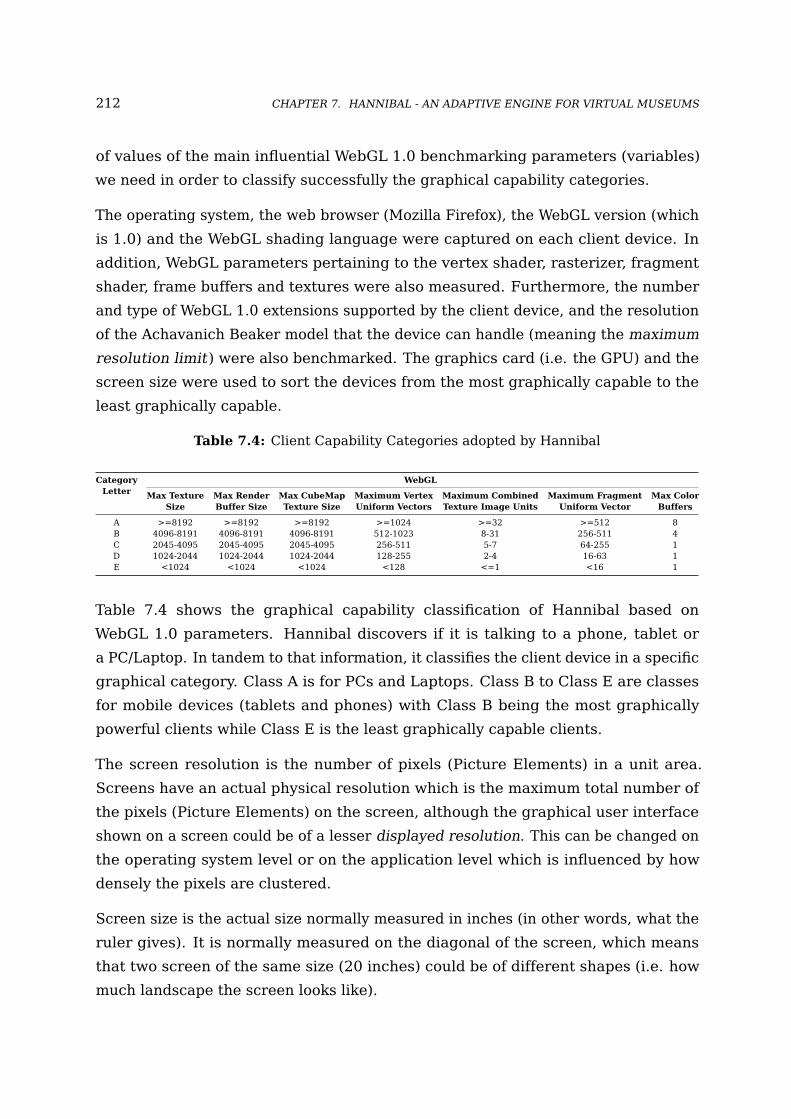
212 CHAPTER 7. HANNIBAL - AN ADAPTIVE ENGINE FOR VIRTUAL MUSEUMS
of values of the main influential WebGL 1.0 benchmarking parameters (variables)
we need in order to classify successfully the graphical capability categories.
The operating system, the web browser (Mozilla Firefox), the WebGL version (which
is 1.0) and the WebGL shading language were captured on each client device. In
addition, WebGL parameters pertaining to the vertex shader, rasterizer, fragment
shader, frame buffers and textures were also measured. Furthermore, the number
and type of WebGL 1.0 extensions supported by the client device, and the resolution
of the Achavanich Beaker model that the device can handle (meaning the maximum
resolution limit) were also benchmarked. The graphics card (i.e. the GPU) and the
screen size were used to sort the devices from the most graphically capable to the
least graphically capable.
Table 7.4: Client Capability Categories adopted by Hannibal
CategoryLetter
WebGL
Max TextureSize
Max RenderBuffer Size
Max CubeMapTexture Size
Maximum VertexUniform Vectors
Maximum CombinedTexture Image Units
Maximum FragmentUniform Vector
Max ColorBuffers
A >=8192 >=8192 >=8192 >=1024 >=32 >=512 8B 4096-8191 4096-8191 4096-8191 512-1023 8-31 256-511 4C 2045-4095 2045-4095 2045-4095 256-511 5-7 64-255 1D 1024-2044 1024-2044 1024-2044 128-255 2-4 16-63 1E <1024 <1024 <1024 <128 <=1 <16 1
Table 7.4 shows the graphical capability classification of Hannibal based on
WebGL 1.0 parameters. Hannibal discovers if it is talking to a phone, tablet or
a PC/Laptop. In tandem to that information, it classifies the client device in a specific
graphical category. Class A is for PCs and Laptops. Class B to Class E are classes
for mobile devices (tablets and phones) with Class B being the most graphically
powerful clients while Class E is the least graphically capable clients.
The screen resolution is the number of pixels (Picture Elements) in a unit area.
Screens have an actual physical resolution which is the maximum total number of
the pixels (Picture Elements) on the screen, although the graphical user interface
shown on a screen could be of a lesser displayed resolution. This can be changed on
the operating system level or on the application level which is influenced by how
densely the pixels are clustered.
Screen size is the actual size normally measured in inches (in other words, what the
ruler gives). It is normally measured on the diagonal of the screen, which means
that two screen of the same size (20 inches) could be of different shapes (i.e. how
much landscape the screen looks like).

7.7. CLASSIFICATIONS USED BY HANNIBAL 213
Screen size is always fixed but screen resolution varies under an upper fixed physical
resolution limit. Screen sizes and screen resolutions don’t have a direct effect on the
rendering process of the 3D models (i.e they are not in theory a hardware hinderer
for Quality of Service), but have a bigger influence on the Quality of Experience of
users particularly in terms of perception of fidelity. Per instance, a high fidelity 3D
model, fetched on an 24 inches CRT screen from 1995 with a low physical resolution,
would have a negative effect on the perceived quality of the models fetched on such
screen by users.
Screens resolutions and sizes are retrieved by getting the viewport resolution and
size of the client through JavaScript. A lot of famous front end framework such as
Bootstrap [45] and Semantic UI [361] uses CSS3 media queries and JavaScript to
retrieve this information and make websites responsive across devices.
Hannibal measures the screen sizes and resolutions. It does not send a resolution
higher than 300K faces for all devices of screens of 9.7 inches and below (of course
depends on network conditions also). Once screens detected are 5.5 inches and
less, the highest resolution fetched is the 200K (of course depends on network
conditions also). For client capability category A (meaning PCs and Laptops), the
highest resolution sent to client devices is that of 750K faces.
The following section presents the resolution decimation levels adopted by the
Hannibal engine. These are fixed across all 3D models.
7.7.3 Resolution Decimation Levels
Table 7.5: Discrete Resolution Levels (number of faces) used by Hannibal Engine
Resolution Levels
Original Resolution750K600K500K400K300K200K100K
Table 7.5 shows the discrete resolution levels (in number of faces) used across the
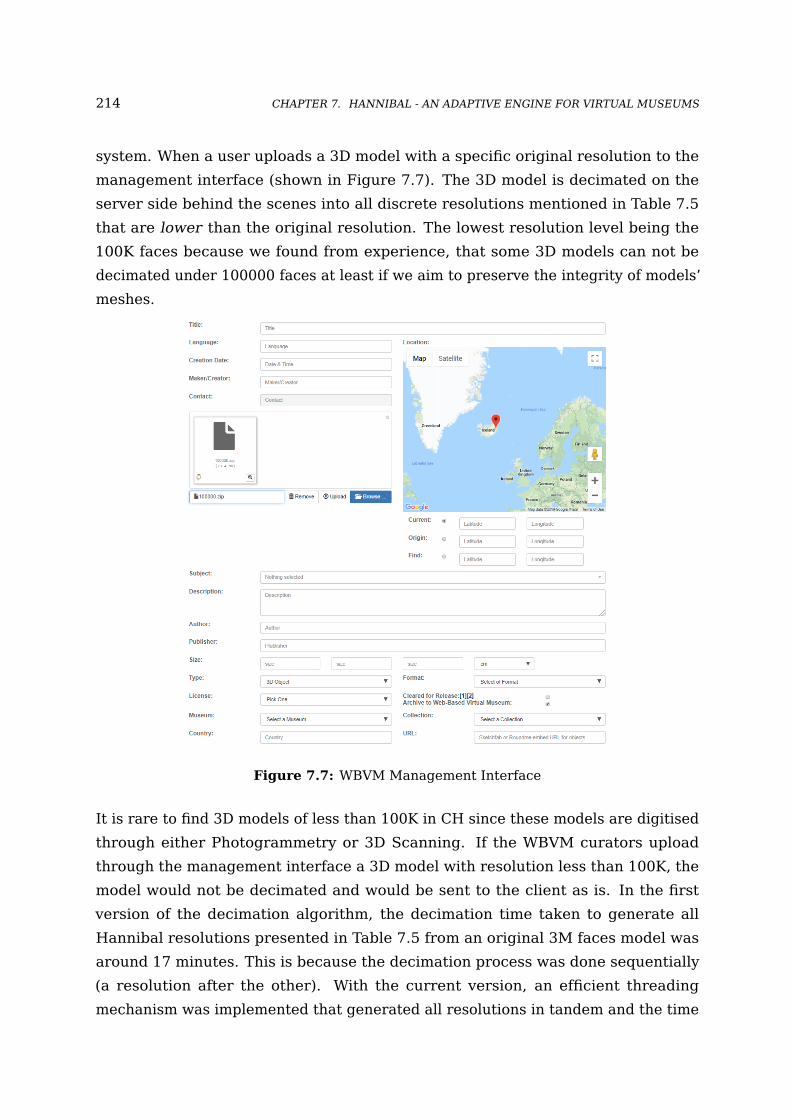
214 CHAPTER 7. HANNIBAL - AN ADAPTIVE ENGINE FOR VIRTUAL MUSEUMS
system. When a user uploads a 3D model with a specific original resolution to the
management interface (shown in Figure 7.7). The 3D model is decimated on the
server side behind the scenes into all discrete resolutions mentioned in Table 7.5
that are lower than the original resolution. The lowest resolution level being the
100K faces because we found from experience, that some 3D models can not be
decimated under 100000 faces at least if we aim to preserve the integrity of models’
meshes.
Figure 7.7: WBVM Management Interface
It is rare to find 3D models of less than 100K in CH since these models are digitised
through either Photogrammetry or 3D Scanning. If the WBVM curators upload
through the management interface a 3D model with resolution less than 100K, the
model would not be decimated and would be sent to the client as is. In the first
version of the decimation algorithm, the decimation time taken to generate all
Hannibal resolutions presented in Table 7.5 from an original 3M faces model was
around 17 minutes. This is because the decimation process was done sequentially
(a resolution after the other). With the current version, an efficient threading
mechanism was implemented that generated all resolutions in tandem and the time
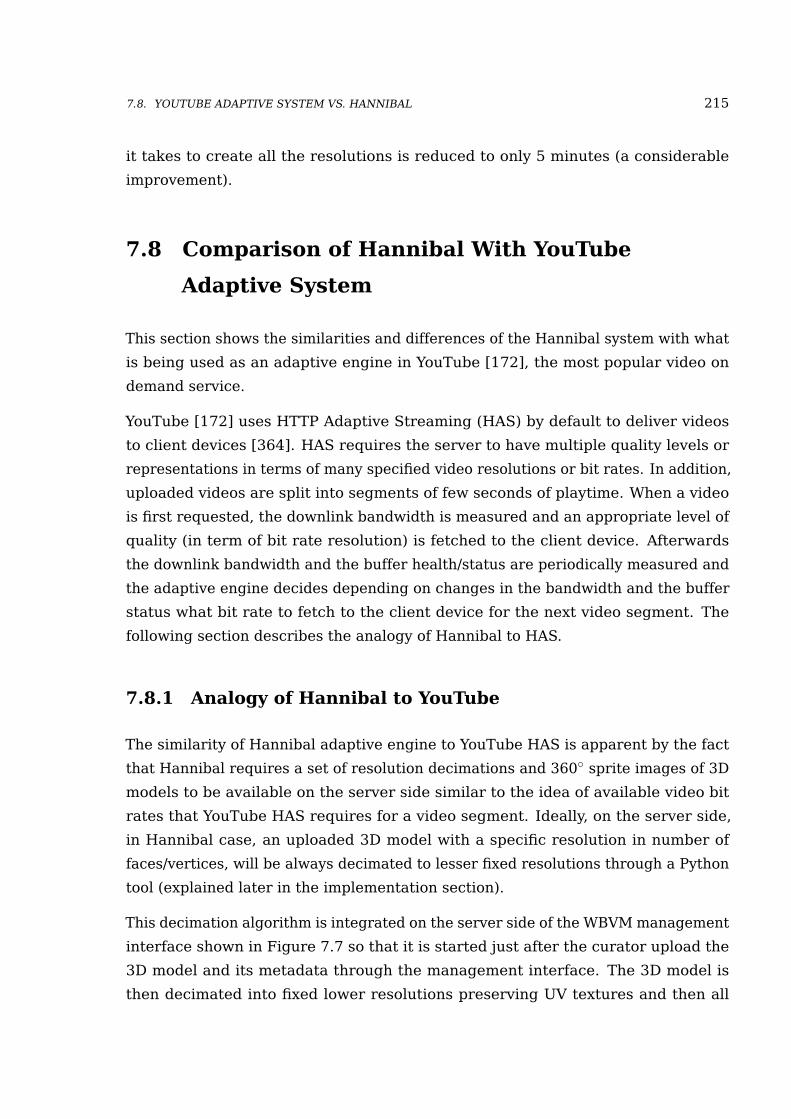
7.8. YOUTUBE ADAPTIVE SYSTEM VS. HANNIBAL 215
it takes to create all the resolutions is reduced to only 5 minutes (a considerable
improvement).
7.8 Comparison of Hannibal With YouTube
Adaptive System
This section shows the similarities and differences of the Hannibal system with what
is being used as an adaptive engine in YouTube [172], the most popular video on
demand service.
YouTube [172] uses HTTP Adaptive Streaming (HAS) by default to deliver videos
to client devices [364]. HAS requires the server to have multiple quality levels or
representations in terms of many specified video resolutions or bit rates. In addition,
uploaded videos are split into segments of few seconds of playtime. When a video
is first requested, the downlink bandwidth is measured and an appropriate level of
quality (in term of bit rate resolution) is fetched to the client device. Afterwards
the downlink bandwidth and the buffer health/status are periodically measured and
the adaptive engine decides depending on changes in the bandwidth and the buffer
status what bit rate to fetch to the client device for the next video segment. The
following section describes the analogy of Hannibal to HAS.
7.8.1 Analogy of Hannibal to YouTube
The similarity of Hannibal adaptive engine to YouTube HAS is apparent by the fact
that Hannibal requires a set of resolution decimations and 360◦ sprite images of 3D
models to be available on the server side similar to the idea of available video bit
rates that YouTube HAS requires for a video segment. Ideally, on the server side,
in Hannibal case, an uploaded 3D model with a specific resolution in number of
faces/vertices, will be always decimated to lesser fixed resolutions through a Python
tool (explained later in the implementation section).
This decimation algorithm is integrated on the server side of the WBVM management
interface shown in Figure 7.7 so that it is started just after the curator upload the
3D model and its metadata through the management interface. The 3D model is
then decimated into fixed lower resolutions preserving UV textures and then all
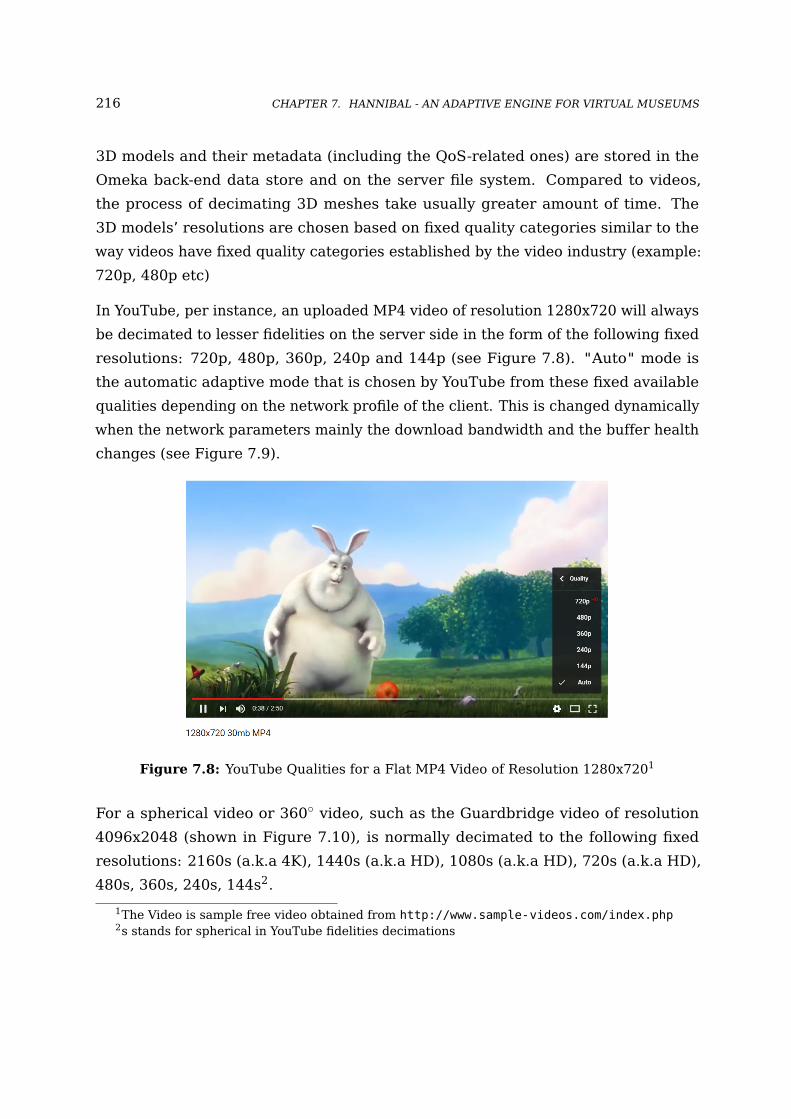
216 CHAPTER 7. HANNIBAL - AN ADAPTIVE ENGINE FOR VIRTUAL MUSEUMS
3D models and their metadata (including the QoS-related ones) are stored in the
Omeka back-end data store and on the server file system. Compared to videos,
the process of decimating 3D meshes take usually greater amount of time. The
3D models’ resolutions are chosen based on fixed quality categories similar to the
way videos have fixed quality categories established by the video industry (example:
720p, 480p etc)
In YouTube, per instance, an uploaded MP4 video of resolution 1280x720 will always
be decimated to lesser fidelities on the server side in the form of the following fixed
resolutions: 720p, 480p, 360p, 240p and 144p (see Figure 7.8). "Auto" mode is
the automatic adaptive mode that is chosen by YouTube from these fixed available
qualities depending on the network profile of the client. This is changed dynamically
when the network parameters mainly the download bandwidth and the buffer health
changes (see Figure 7.9).
Figure 7.8: YouTube Qualities for a Flat MP4 Video of Resolution 1280x7201
For a spherical video or 360◦ video, such as the Guardbridge video of resolution
4096x2048 (shown in Figure 7.10), is normally decimated to the following fixed
resolutions: 2160s (a.k.a 4K), 1440s (a.k.a HD), 1080s (a.k.a HD), 720s (a.k.a HD),
480s, 360s, 240s, 144s2.
1The Video is sample free video obtained from http://www.sample-videos.com/index.php2s stands for spherical in YouTube fidelities decimations
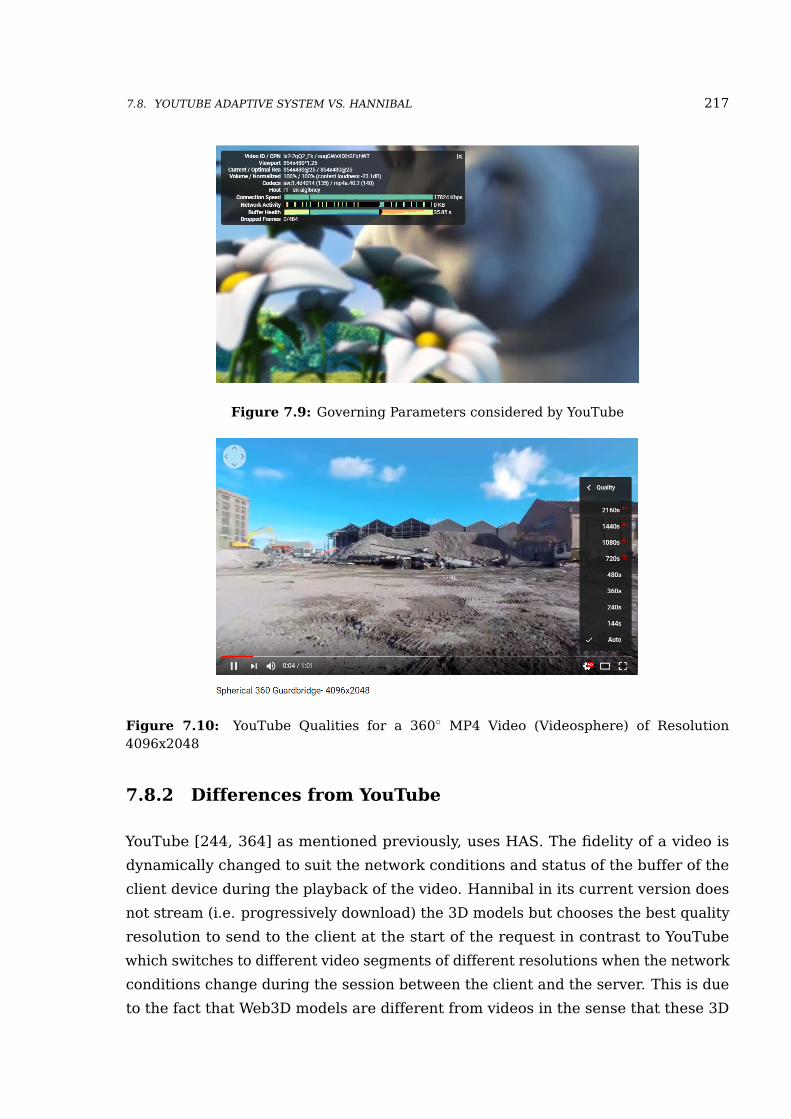
7.8. YOUTUBE ADAPTIVE SYSTEM VS. HANNIBAL 217
Figure 7.9: Governing Parameters considered by YouTube
Figure 7.10: YouTube Qualities for a 360◦ MP4 Video (Videosphere) of Resolution4096x2048
7.8.2 Differences from YouTube
YouTube [244, 364] as mentioned previously, uses HAS. The fidelity of a video is
dynamically changed to suit the network conditions and status of the buffer of the
client device during the playback of the video. Hannibal in its current version does
not stream (i.e. progressively download) the 3D models but chooses the best quality
resolution to send to the client at the start of the request in contrast to YouTube
which switches to different video segments of different resolutions when the network
conditions change during the session between the client and the server. This is due
to the fact that Web3D models are different from videos in the sense that these 3D
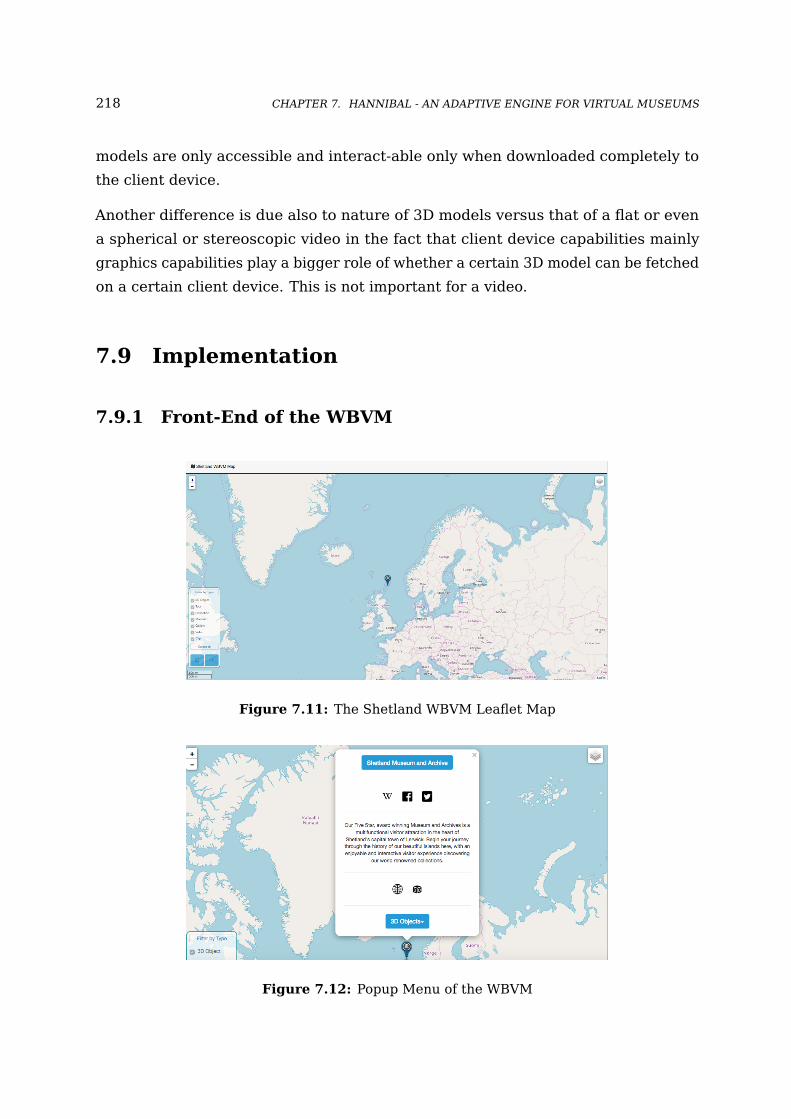
218 CHAPTER 7. HANNIBAL - AN ADAPTIVE ENGINE FOR VIRTUAL MUSEUMS
models are only accessible and interact-able only when downloaded completely to
the client device.
Another difference is due also to nature of 3D models versus that of a flat or even
a spherical or stereoscopic video in the fact that client device capabilities mainly
graphics capabilities play a bigger role of whether a certain 3D model can be fetched
on a certain client device. This is not important for a video.
7.9 Implementation
7.9.1 Front-End of the WBVM
Figure 7.11: The Shetland WBVM Leaflet Map
Figure 7.12: Popup Menu of the WBVM
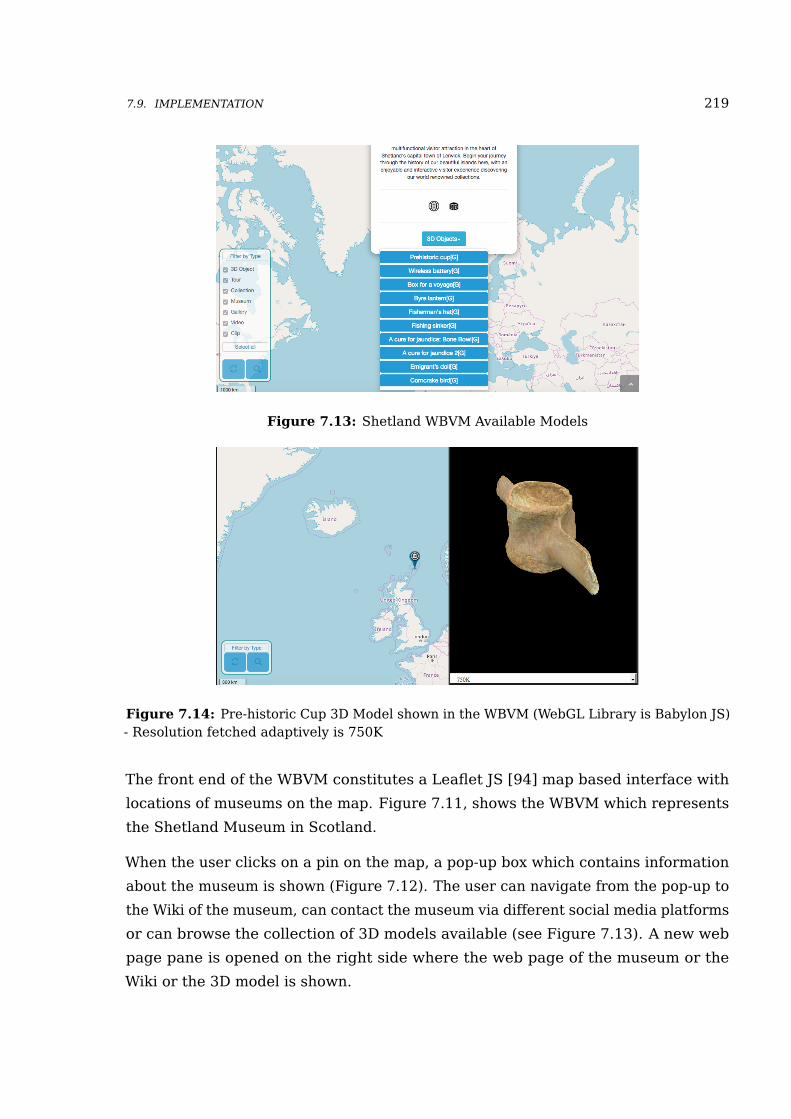
7.9. IMPLEMENTATION 219
Figure 7.13: Shetland WBVM Available Models
Figure 7.14: Pre-historic Cup 3D Model shown in the WBVM (WebGL Library is Babylon JS)- Resolution fetched adaptively is 750K
The front end of the WBVM constitutes a Leaflet JS [94] map based interface with
locations of museums on the map. Figure 7.11, shows the WBVM which represents
the Shetland Museum in Scotland.
When the user clicks on a pin on the map, a pop-up box which contains information
about the museum is shown (Figure 7.12). The user can navigate from the pop-up to
the Wiki of the museum, can contact the museum via different social media platforms
or can browse the collection of 3D models available (see Figure 7.13). A new web
page pane is opened on the right side where the web page of the museum or the
Wiki or the 3D model is shown.
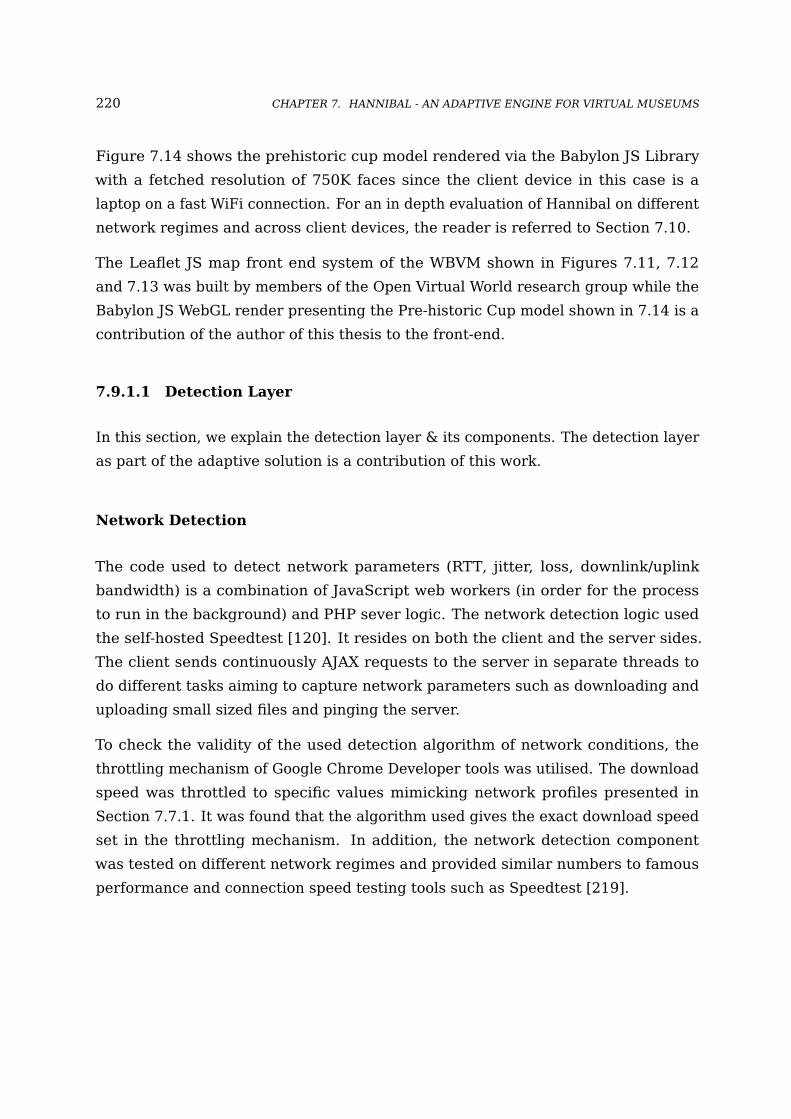
220 CHAPTER 7. HANNIBAL - AN ADAPTIVE ENGINE FOR VIRTUAL MUSEUMS
Figure 7.14 shows the prehistoric cup model rendered via the Babylon JS Library
with a fetched resolution of 750K faces since the client device in this case is a
laptop on a fast WiFi connection. For an in depth evaluation of Hannibal on different
network regimes and across client devices, the reader is referred to Section 7.10.
The Leaflet JS map front end system of the WBVM shown in Figures 7.11, 7.12
and 7.13 was built by members of the Open Virtual World research group while the
Babylon JS WebGL render presenting the Pre-historic Cup model shown in 7.14 is a
contribution of the author of this thesis to the front-end.
7.9.1.1 Detection Layer
In this section, we explain the detection layer & its components. The detection layer
as part of the adaptive solution is a contribution of this work.
Network Detection
The code used to detect network parameters (RTT, jitter, loss, downlink/uplink
bandwidth) is a combination of JavaScript web workers (in order for the process
to run in the background) and PHP sever logic. The network detection logic used
the self-hosted Speedtest [120]. It resides on both the client and the server sides.
The client sends continuously AJAX requests to the server in separate threads to
do different tasks aiming to capture network parameters such as downloading and
uploading small sized files and pinging the server.
To check the validity of the used detection algorithm of network conditions, the
throttling mechanism of Google Chrome Developer tools was utilised. The download
speed was throttled to specific values mimicking network profiles presented in
Section 7.7.1. It was found that the algorithm used gives the exact download speed
set in the throttling mechanism. In addition, the network detection component
was tested on different network regimes and provided similar numbers to famous
performance and connection speed testing tools such as Speedtest [219].
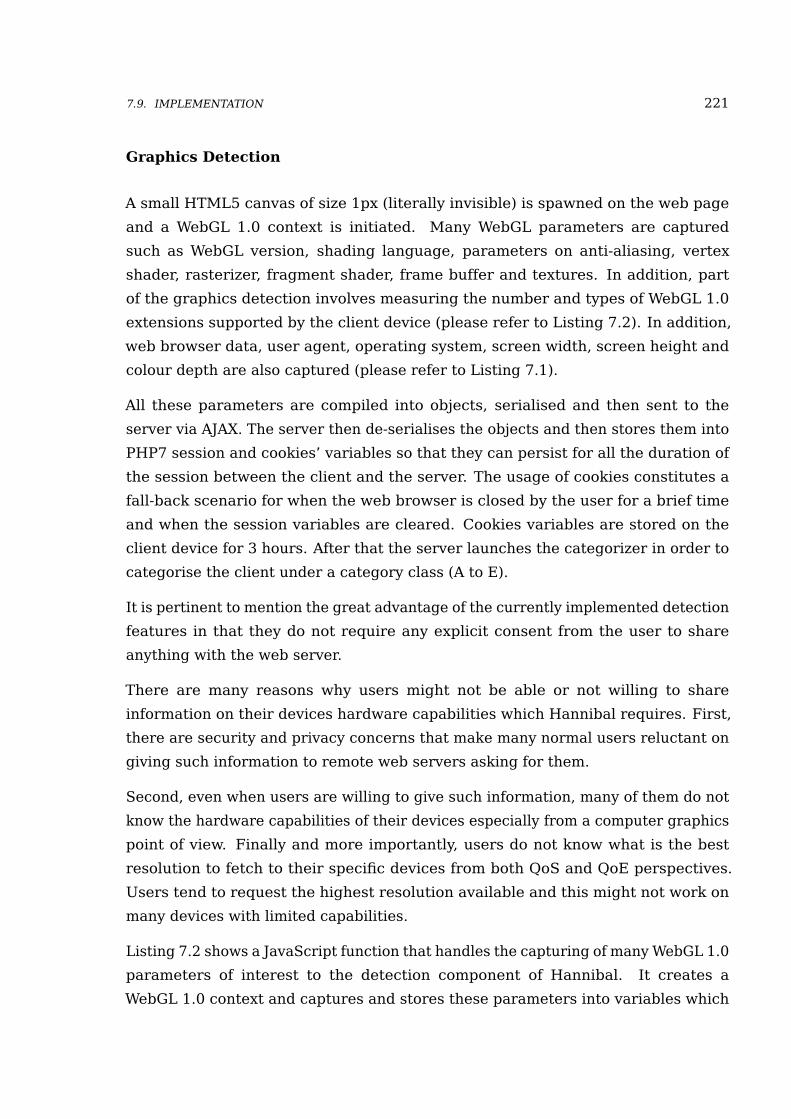
7.9. IMPLEMENTATION 221
Graphics Detection
A small HTML5 canvas of size 1px (literally invisible) is spawned on the web page
and a WebGL 1.0 context is initiated. Many WebGL parameters are captured
such as WebGL version, shading language, parameters on anti-aliasing, vertex
shader, rasterizer, fragment shader, frame buffer and textures. In addition, part
of the graphics detection involves measuring the number and types of WebGL 1.0
extensions supported by the client device (please refer to Listing 7.2). In addition,
web browser data, user agent, operating system, screen width, screen height and
colour depth are also captured (please refer to Listing 7.1).
All these parameters are compiled into objects, serialised and then sent to the
server via AJAX. The server then de-serialises the objects and then stores them into
PHP7 session and cookies’ variables so that they can persist for all the duration of
the session between the client and the server. The usage of cookies constitutes a
fall-back scenario for when the web browser is closed by the user for a brief time
and when the session variables are cleared. Cookies variables are stored on the
client device for 3 hours. After that the server launches the categorizer in order to
categorise the client under a category class (A to E).
It is pertinent to mention the great advantage of the currently implemented detection
features in that they do not require any explicit consent from the user to share
anything with the web server.
There are many reasons why users might not be able or not willing to share
information on their devices hardware capabilities which Hannibal requires. First,
there are security and privacy concerns that make many normal users reluctant on
giving such information to remote web servers asking for them.
Second, even when users are willing to give such information, many of them do not
know the hardware capabilities of their devices especially from a computer graphics
point of view. Finally and more importantly, users do not know what is the best
resolution to fetch to their specific devices from both QoS and QoE perspectives.
Users tend to request the highest resolution available and this might not work on
many devices with limited capabilities.
Listing 7.2 shows a JavaScript function that handles the capturing of many WebGL 1.0
parameters of interest to the detection component of Hannibal. It creates a
WebGL 1.0 context and captures and stores these parameters into variables which
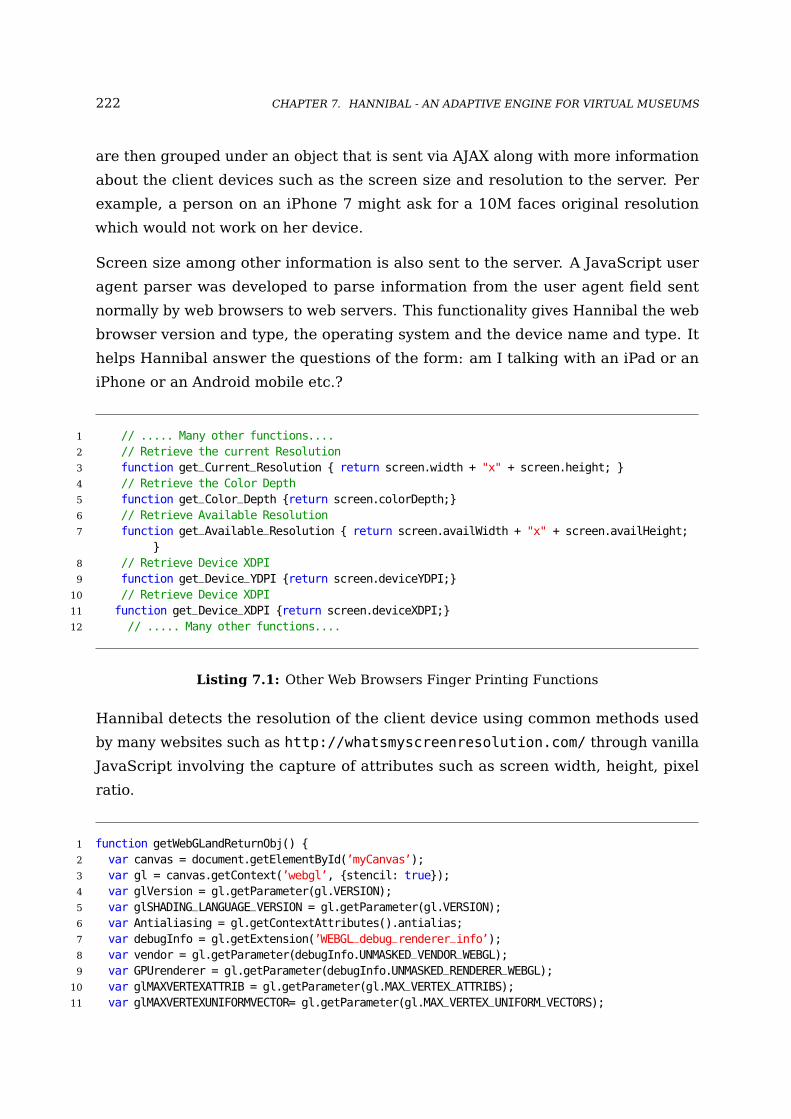
222 CHAPTER 7. HANNIBAL - AN ADAPTIVE ENGINE FOR VIRTUAL MUSEUMS
are then grouped under an object that is sent via AJAX along with more information
about the client devices such as the screen size and resolution to the server. Per
example, a person on an iPhone 7 might ask for a 10M faces original resolution
which would not work on her device.
Screen size among other information is also sent to the server. A JavaScript user
agent parser was developed to parse information from the user agent field sent
normally by web browsers to web servers. This functionality gives Hannibal the web
browser version and type, the operating system and the device name and type. It
helps Hannibal answer the questions of the form: am I talking with an iPad or an
iPhone or an Android mobile etc.?
1 // ..... Many other functions....2 // Retrieve the current Resolution3 function get_Current_Resolution { return screen.width + "x" + screen.height; }4 // Retrieve the Color Depth5 function get_Color_Depth {return screen.colorDepth;}6 // Retrieve Available Resolution7 function get_Available_Resolution { return screen.availWidth + "x" + screen.availHeight;
}8 // Retrieve Device XDPI9 function get_Device_YDPI {return screen.deviceYDPI;}
10 // Retrieve Device XDPI11 function get_Device_XDPI {return screen.deviceXDPI;}12 // ..... Many other functions....
Listing 7.1: Other Web Browsers Finger Printing Functions
Hannibal detects the resolution of the client device using common methods used
by many websites such as http://whatsmyscreenresolution.com/ through vanilla
JavaScript involving the capture of attributes such as screen width, height, pixel
ratio.
1 function getWebGLandReturnObj() {2 var canvas = document.getElementById(’myCanvas’);3 var gl = canvas.getContext(’webgl’, {stencil: true});4 var glVersion = gl.getParameter(gl.VERSION);5 var glSHADING_LANGUAGE_VERSION = gl.getParameter(gl.VERSION);6 var Antialiasing = gl.getContextAttributes().antialias;7 var debugInfo = gl.getExtension(’WEBGL_debug_renderer_info’);8 var vendor = gl.getParameter(debugInfo.UNMASKED_VENDOR_WEBGL);9 var GPUrenderer = gl.getParameter(debugInfo.UNMASKED_RENDERER_WEBGL);
10 var glMAXVERTEXATTRIB = gl.getParameter(gl.MAX_VERTEX_ATTRIBS);11 var glMAXVERTEXUNIFORMVECTOR= gl.getParameter(gl.MAX_VERTEX_UNIFORM_VECTORS);

7.9. IMPLEMENTATION 223
12 var glMAXVERTEXTEXTUREIMAGEUNITS = gl.getParameter(gl.MAX_VERTEX_TEXTURE_IMAGE_UNITS);13 var glMAXVARYINGVECTORS = gl.getParameter(gl.MAX_VARYING_VECTORS);14 var glALIASEDLINEWIDTHRANGE = gl.getParameter(gl.ALIASED_LINE_WIDTH_RANGE);15 var glALIASEDPOINTSIZERANGE = gl.getParameter(gl.ALIASED_POINT_SIZE_RANGE);16 var glMAXFRAGMENTUNIFORMVECTORS = gl.getParameter(gl.MAX_FRAGMENT_UNIFORM_VECTORS);17 var glMAXTEXTUREIMAGEUNITS = gl.getParameter(gl.MAX_TEXTURE_IMAGE_UNITS);18 var glFloatPrecision = gl.getShaderPrecisionFormat(gl.FRAGMENT_SHADER, gl.HIGH_FLOAT).
precision;19 var glINTPrecision = gl.getShaderPrecisionFormat(gl.FRAGMENT_SHADER, gl.HIGH_INT).precision
;20 var FragmentShaderPrecision = gl.getShaderPrecisionFormat(gl.FRAGMENT_SHADER, gl.HIGH_FLOAT
).precision;21 var FragmentShaderrangeMax = gl.getShaderPrecisionFormat(gl.FRAGMENT_SHADER, gl.HIGH_FLOAT)
.rangeMax;22 var FragmentShaderrangeMin = gl.getShaderPrecisionFormat(gl.FRAGMENT_SHADER, gl.HIGH_FLOAT)
.rangeMin;23 var glMaxColorBuffers = getMaxColorBuffers(gl);24 var glRGBABits = [gl.getParameter(gl.RED_BITS), gl.getParameter(gl.GREEN_BITS), gl.
getParameter(gl.BLUE_BITS), gl.getParameter(gl.ALPHA_BITS)];25 var glDepthBits = gl.getParameter(gl.DEPTH_BITS);26 var glStencilBits = gl.getParameter(gl.STENCIL_BITS);27 var glMAXRENDERBUFFER_SIZE = gl.getParameter(gl.MAX_RENDERBUFFER_SIZE);28 var glMAXVIEWPORTDIMS = gl.getParameter(gl.MAX_VIEWPORT_DIMS);29 var glMAXTEXTURESIZE = gl.getParameter(gl.MAX_TEXTURE_SIZE);30 var glMAXCUBEMAPTEXTURESIZE = gl.getParameter(gl.MAX_CUBE_MAP_TEXTURE_SIZE);31 var glMAXCOMBINEDTEXTUREIMAGE_UNITS = gl.getParameter(gl.MAX_COMBINED_TEXTURE_IMAGE_UNITS);32 var glMaxAnisotropy = getMaxAnisotropy(gl);33 var glSupportedExtensions = gl.getSupportedExtensions();34 //creating a JavaScript Object and putting all above variables in it35 //...CODE OMITTED FOR BREVITY36 return ClientParameters; }
Listing 7.2: Capturing WebGL Parameters
The following section explains further the adaptive engine developed. It elucidates
the middle-ware which is the heart of the system.
7.9.2 Middle-ware
7.9.2.1 Hannibal Forward Chaining Expert System
We rely on experts in our daily life because of their unique knowledge and expertise.
When confronted with a situation or a problem, we seek guidance from people with
expertise such as lawyers, doctors, mechanics, engineers and so forth.
Hannibal uses an expert system. To put it simply, the expert system has a set of

224 CHAPTER 7. HANNIBAL - AN ADAPTIVE ENGINE FOR VIRTUAL MUSEUMS
rules or conditions; this set of rules is referred in Artificial Intelligence parlance as a
knowledge base. The inference engine of Hannibal takes facts about the situation
of the client device particularly in the form of category grades (network profile
category and client capability category) and then deduces through a process of
forward chaining the right resolution to send to the client device.
Forward chaining is a type of reasoning used in inference engines that relies
basically on executing or applying continuously the modus ponen inference rule.
In other words, it repeatedly goes from conditions or available data to either a
goal or outcome or inferring additional data leading to an outcome as opposed to
the backward chaining process. A forward chaining engine is suited better for
the situations where conditions change or new facts are added to the knowledge
base [346].
In lay terms, conditions or rules are “chained” forward toward a goal which would
be in this situation the most convenient resolution to send to the client device. The
rules in Hannibal came from the findings of the QoS and QoE studies conducted
previously in Chapter 5.
This choice of 3D models by the adpative engine should always establish the best
acceptable trade-off between the QoS (download time, processing time etc...) of
the 3D models and the QoE of such models from the perspective of the users (good
perception of fidelity).
This work implemented its own version of a forward chaining expert system in PHP 7
based on the unlicensed implementation of Felerminoali PHP 5 expert system which
can be found on Github [148].
1 //*******************Bootstraping the expert system*********2 // Set the include path3 $includepath = ini_get( "include_path" );4 ini_set( "include_path", $includepath . PATH_SEPARATOR . "classes/phpexpertsystem" );5
6 // Let the class files be located correctly7 function __autoload( $class_name ) {8 include $class_name . ’.php’;9 }
10
11 //include Databased configurations12 include( "./util/mysql.php" );13
14 $ie = new InferenceEngine( "adaptive" );15 $wm = $ie->getWorkingMemory();

7.9. IMPLEMENTATION 225
16 $wm->setFact( "Client_Capability_Category", Get_Client_Capability($Client_Capabilities_Session_Cookie, $fingerprint_Session ) );
17 $wm->setFact( "Network_Profile", Get_Network_Profile( $download_Session_Cookie ) );18
19 //Running the inference engine20 $ie->run();21
22 $Chosen_Resolution = $wm->getFact( "Chosen_Resolution" );
Listing 7.3: Setting facts and running the PHP Expert System
In the current version of Hannibal, the rules in the expert system Knowledge Base
(KB) do not involve any forward chaining from one rule to the other. Each rule is a
flat conditional rule consisting of mainly two conditions: a client capability condition
and a network profile condition which then entails a certain resolution outcome. Few
example rules are similar to the following:
• Client Capability E && Network Profile A would lead to an outcome resolution of
a model of 200K faces. The client capability E is akin to that of for example, the
Nexus 4 mobile device fetching the model on the School of Computer Science
WiFi network (Kindly refer to the download speeds of networks in Table 7.7)
• Client Capability A && Network Profile B would lead to an outcome of a 500K
resolution. This is akin to a PC with NVidia GTX 970 graphics card on a network
with a download speed varying between 15Mb/s and 50Mb/s.
There are currently 36 rules in the knowledge base that governs the decisions of the
Hannibal expert system. These rules could be honed further in future versions of
the adaptive engine to include more conditions.
7.9.3 Back-end
Many scripts in PHP 7 and Python 2 server side languages were used to communicate
with Omeka [87]. Omeka uses MySQL DBMS as a data store. The Python API client
of Omeka [267] was used by Hannibal to communicate with the DAMS back-end
via HTTP verbs such as POST, GET and PUT. Omeka DAMS provides a ReST API
for applications to communicate with and there are many high level libraries in
JavaScript and Python that makes communicating with Omeka easy.
When a 3D model is uploaded by curators of the WBVM to Omeka via the
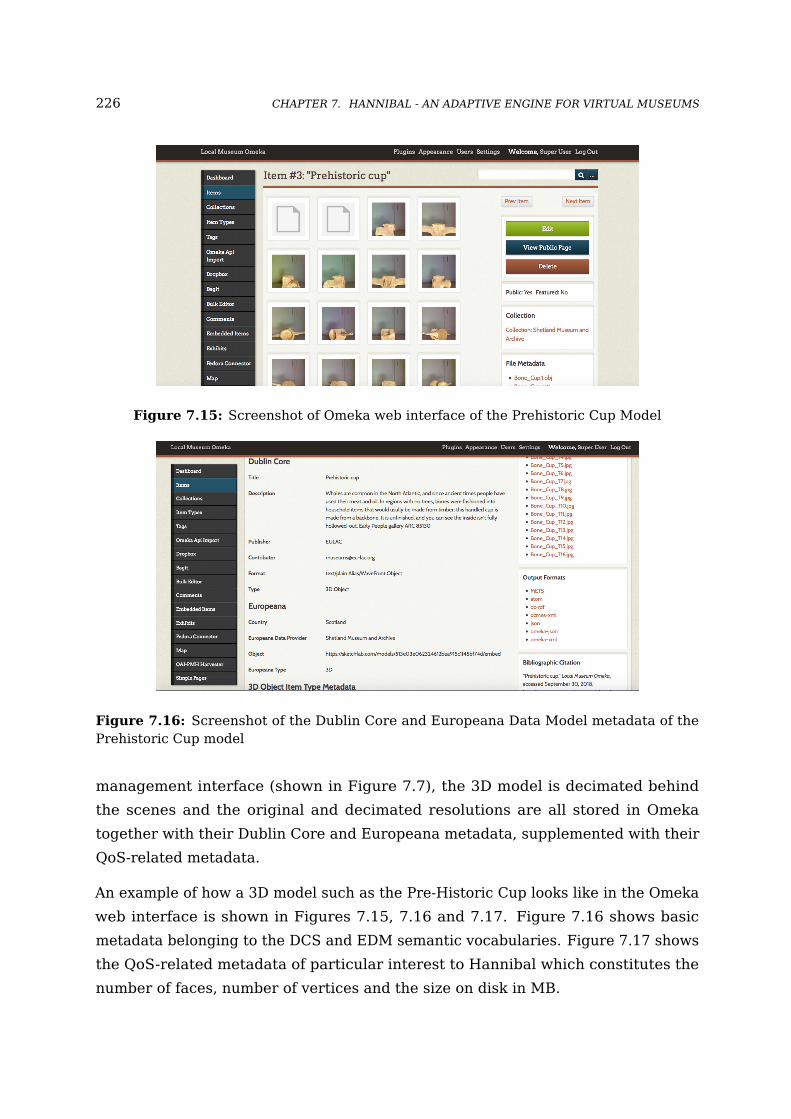
226 CHAPTER 7. HANNIBAL - AN ADAPTIVE ENGINE FOR VIRTUAL MUSEUMS
Figure 7.15: Screenshot of Omeka web interface of the Prehistoric Cup Model
Figure 7.16: Screenshot of the Dublin Core and Europeana Data Model metadata of thePrehistoric Cup model
management interface (shown in Figure 7.7), the 3D model is decimated behind
the scenes and the original and decimated resolutions are all stored in Omeka
together with their Dublin Core and Europeana metadata, supplemented with their
QoS-related metadata.
An example of how a 3D model such as the Pre-Historic Cup looks like in the Omeka
web interface is shown in Figures 7.15, 7.16 and 7.17. Figure 7.16 shows basic
metadata belonging to the DCS and EDM semantic vocabularies. Figure 7.17 shows
the QoS-related metadata of particular interest to Hannibal which constitutes the
number of faces, number of vertices and the size on disk in MB.

7.9. IMPLEMENTATION 227
Figure 7.17: QoS-Related Metadata of the Pre-historic Cup model
With such QoS information available for all 3D models and their decimations,
Hannibal can query the Omeka DAMS and retrieve the convenient resolution,
fetching all meshes files that it wants via the Omeka Python ReST API discussed
before.
The contributions to the management interface are tools that decimate the 3D
models, that create 360◦ sprite images and that capture QoS-related metadata
necessary for the functioning of Hannibal.
7.9.3.1 Batch Decimation into Lower Resolutions
A Python tool was developed that decimates a 3D Model/Mesh (with and without
textures) into lower resolution meshes using the MeshlabXML Library [1], an
interface to Meshlab Python API. A Meshlab server is hosted on the same virtual
museum server. The Quadric Edge Collapse Decimation filter is implemented via the
mlx.remesh.simplify method (Listing 7.4, Line 22) which decimates a 3D model into a
lesser resolution which then is stored into the Omeka back-end with all the metadata.
This tool uses threading to decimate efficiently the uploaded model by running a
thread for each resolution thus improving considerably the speed of decimation.
1 def simplify(originalMeshName, NumberOfFaces, WithTexture):2 FilterScript = ’SimplificationFilter.mlx’3 original_mesh = originalMeshName # input file4 simplified_mesh_name = (originalMeshName + str(Num_Of_Faces)) # filename (original+
Nboffaces)
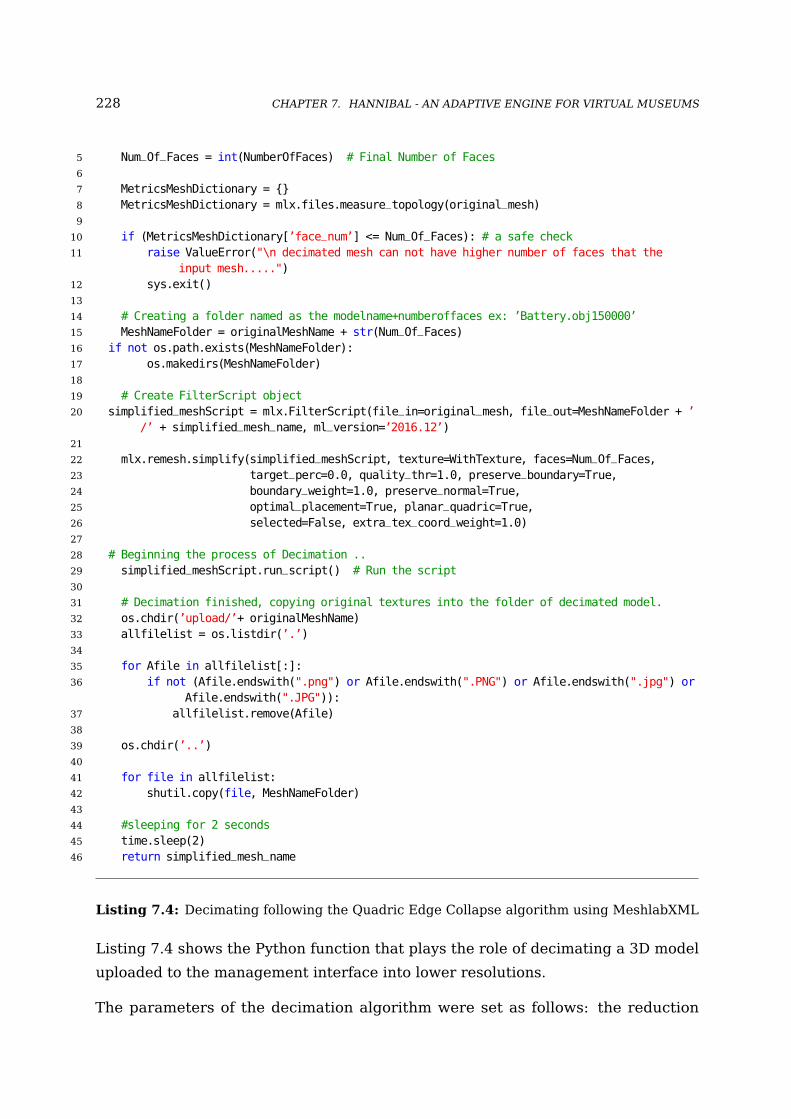
228 CHAPTER 7. HANNIBAL - AN ADAPTIVE ENGINE FOR VIRTUAL MUSEUMS
5 Num_Of_Faces = int(NumberOfFaces) # Final Number of Faces6
7 MetricsMeshDictionary = {}8 MetricsMeshDictionary = mlx.files.measure_topology(original_mesh)9
10 if (MetricsMeshDictionary[’face_num’] <= Num_Of_Faces): # a safe check11 raise ValueError("\n decimated mesh can not have higher number of faces that the
input mesh.....")12 sys.exit()13
14 # Creating a folder named as the modelname+numberoffaces ex: ’Battery.obj150000’15 MeshNameFolder = originalMeshName + str(Num_Of_Faces)16 if not os.path.exists(MeshNameFolder):17 os.makedirs(MeshNameFolder)18
19 # Create FilterScript object20 simplified_meshScript = mlx.FilterScript(file_in=original_mesh, file_out=MeshNameFolder + ’
/’ + simplified_mesh_name, ml_version=’2016.12’)21
22 mlx.remesh.simplify(simplified_meshScript, texture=WithTexture, faces=Num_Of_Faces,23 target_perc=0.0, quality_thr=1.0, preserve_boundary=True,24 boundary_weight=1.0, preserve_normal=True,25 optimal_placement=True, planar_quadric=True,26 selected=False, extra_tex_coord_weight=1.0)27
28 # Beginning the process of Decimation ..29 simplified_meshScript.run_script() # Run the script30
31 # Decimation finished, copying original textures into the folder of decimated model.32 os.chdir(’upload/’+ originalMeshName)33 allfilelist = os.listdir(’.’)34
35 for Afile in allfilelist[:]:36 if not (Afile.endswith(".png") or Afile.endswith(".PNG") or Afile.endswith(".jpg") or
Afile.endswith(".JPG")):37 allfilelist.remove(Afile)38
39 os.chdir(’..’)40
41 for file in allfilelist:42 shutil.copy(file, MeshNameFolder)43
44 #sleeping for 2 seconds45 time.sleep(2)46 return simplified_mesh_name
Listing 7.4: Decimating following the Quadric Edge Collapse algorithm using MeshlabXML
Listing 7.4 shows the Python function that plays the role of decimating a 3D model
uploaded to the management interface into lower resolutions.
The parameters of the decimation algorithm were set as follows: the reduction
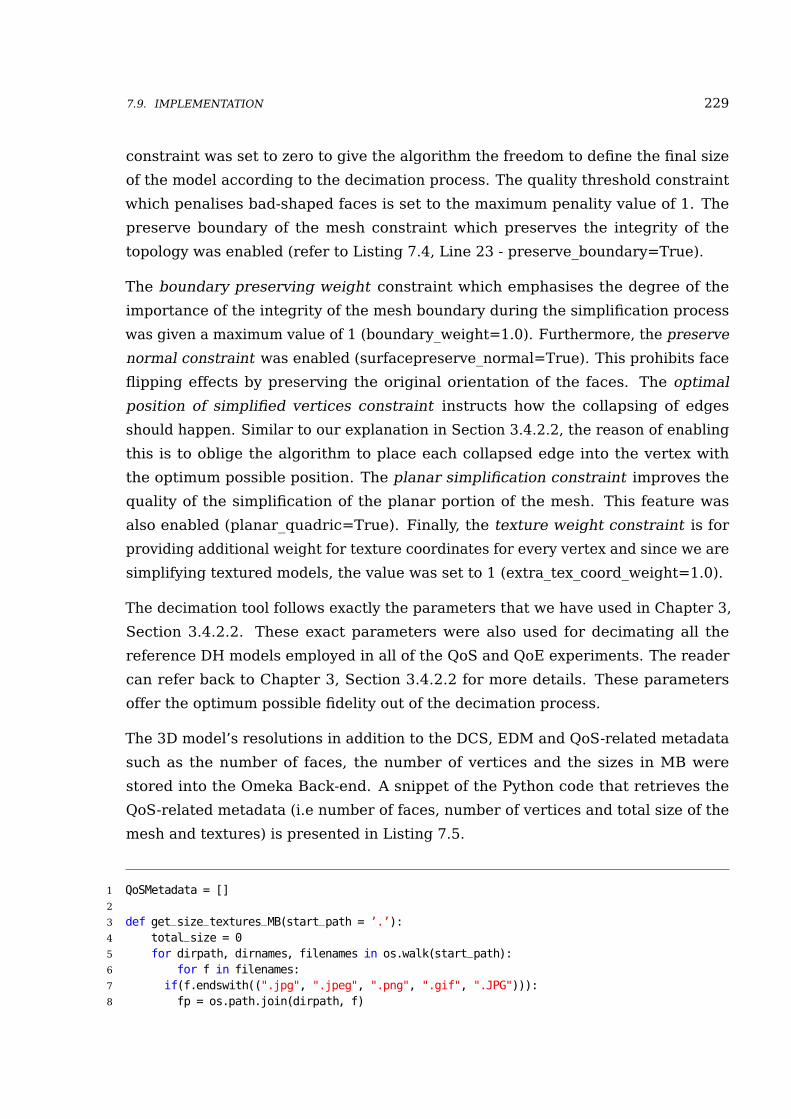
7.9. IMPLEMENTATION 229
constraint was set to zero to give the algorithm the freedom to define the final size
of the model according to the decimation process. The quality threshold constraint
which penalises bad-shaped faces is set to the maximum penality value of 1. The
preserve boundary of the mesh constraint which preserves the integrity of the
topology was enabled (refer to Listing 7.4, Line 23 - preserve_boundary=True).
The boundary preserving weight constraint which emphasises the degree of the
importance of the integrity of the mesh boundary during the simplification process
was given a maximum value of 1 (boundary_weight=1.0). Furthermore, the preserve
normal constraint was enabled (surfacepreserve_normal=True). This prohibits face
flipping effects by preserving the original orientation of the faces. The optimal
position of simplified vertices constraint instructs how the collapsing of edges
should happen. Similar to our explanation in Section 3.4.2.2, the reason of enabling
this is to oblige the algorithm to place each collapsed edge into the vertex with
the optimum possible position. The planar simplification constraint improves the
quality of the simplification of the planar portion of the mesh. This feature was
also enabled (planar_quadric=True). Finally, the texture weight constraint is for
providing additional weight for texture coordinates for every vertex and since we are
simplifying textured models, the value was set to 1 (extra_tex_coord_weight=1.0).
The decimation tool follows exactly the parameters that we have used in Chapter 3,
Section 3.4.2.2. These exact parameters were also used for decimating all the
reference DH models employed in all of the QoS and QoE experiments. The reader
can refer back to Chapter 3, Section 3.4.2.2 for more details. These parameters
offer the optimum possible fidelity out of the decimation process.
The 3D model’s resolutions in addition to the DCS, EDM and QoS-related metadata
such as the number of faces, the number of vertices and the sizes in MB were
stored into the Omeka Back-end. A snippet of the Python code that retrieves the
QoS-related metadata (i.e number of faces, number of vertices and total size of the
mesh and textures) is presented in Listing 7.5.
1 QoSMetadata = []2
3 def get_size_textures_MB(start_path = ’.’):4 total_size = 05 for dirpath, dirnames, filenames in os.walk(start_path):6 for f in filenames:7 if(f.endswith((".jpg", ".jpeg", ".png", ".gif", ".JPG"))):8 fp = os.path.join(dirpath, f)
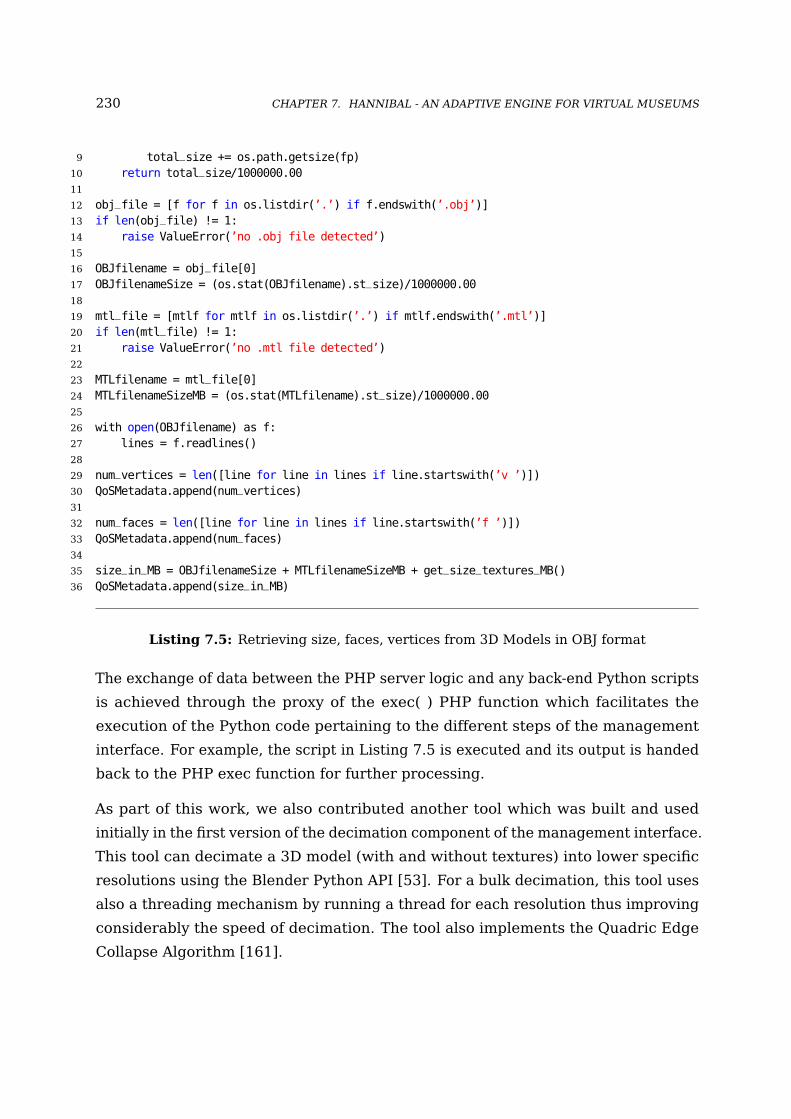
230 CHAPTER 7. HANNIBAL - AN ADAPTIVE ENGINE FOR VIRTUAL MUSEUMS
9 total_size += os.path.getsize(fp)10 return total_size/1000000.0011
12 obj_file = [f for f in os.listdir(’.’) if f.endswith(’.obj’)]13 if len(obj_file) != 1:14 raise ValueError(’no .obj file detected’)15
16 OBJfilename = obj_file[0]17 OBJfilenameSize = (os.stat(OBJfilename).st_size)/1000000.0018
19 mtl_file = [mtlf for mtlf in os.listdir(’.’) if mtlf.endswith(’.mtl’)]20 if len(mtl_file) != 1:21 raise ValueError(’no .mtl file detected’)22
23 MTLfilename = mtl_file[0]24 MTLfilenameSizeMB = (os.stat(MTLfilename).st_size)/1000000.0025
26 with open(OBJfilename) as f:27 lines = f.readlines()28
29 num_vertices = len([line for line in lines if line.startswith(’v ’)])30 QoSMetadata.append(num_vertices)31
32 num_faces = len([line for line in lines if line.startswith(’f ’)])33 QoSMetadata.append(num_faces)34
35 size_in_MB = OBJfilenameSize + MTLfilenameSizeMB + get_size_textures_MB()36 QoSMetadata.append(size_in_MB)
Listing 7.5: Retrieving size, faces, vertices from 3D Models in OBJ format
The exchange of data between the PHP server logic and any back-end Python scripts
is achieved through the proxy of the exec( ) PHP function which facilitates the
execution of the Python code pertaining to the different steps of the management
interface. For example, the script in Listing 7.5 is executed and its output is handed
back to the PHP exec function for further processing.
As part of this work, we also contributed another tool which was built and used
initially in the first version of the decimation component of the management interface.
This tool can decimate a 3D model (with and without textures) into lower specific
resolutions using the Blender Python API [53]. For a bulk decimation, this tool uses
also a threading mechanism by running a thread for each resolution thus improving
considerably the speed of decimation. The tool also implements the Quadric Edge
Collapse Algorithm [161].

7.10. EVALUATION OF HANNIBAL 231
7.9.3.2 Transforming 3D Meshes Into GIFs and 360◦ Sprite Images
A Python application was developed to transform behind the scenes a 3D model into
a GIF file and into a CSS3 360◦ Sprite image file using the Blender Python API. It
should be mentioned that the tool, although used by Hannibal, could be used in
any project that requires generating from 3D models, GIFs and 360◦ sprite image
representations for the consumption of 3D in devices that do not support the 3D
Web.
The developed tool reads the 3D model OBJ file with all its textures into a Blender
scene. It then cleans the scene and centres the 3D model. It then rotates each
time the 3D model by 22.5◦ on its vertical axis and takes a snapshot (i.e. captures a
frame) of it with the view camera being fixed. The result is 16 images showing all
angles (spanning 360◦). All generated images are then fed automatically to another
Python script which creates from them a 360 sprite image and a GIF representation.
On the client side, a JavaScript library called CodyHouse 360◦ product viewer [83]
was used to show the 360◦ image sprite of the 3D model.
Figure 7.18: Part of a 360◦ Sprite Image - Bone Cup Model
The following section presents the evaluation done on the Hannibal adaptive engine
implemented in the Shetland WBVM. It is divided into two parts. The first is an
appraisal of Hannibal from a systematic QoS perspective while the second part is
more abstract and states the advantages and disadvantages of Hannibal.
7.10 Evaluation of Hannibal
7.10.1 QoS Evaluation of Hannibal
The engine is assessed based on a quantitative approach by gathering QoS metrics
in particular download and processing times of 3D Digital Heritage models in both
scenarios when Hannibal is used and when it is absent in order to compare if any
benefit is achieved and noticeable.

232 CHAPTER 7. HANNIBAL - AN ADAPTIVE ENGINE FOR VIRTUAL MUSEUMS
7.10.1.1 Methodology
This section presents the methodological procedures of the evaluation experiment.
The section starts by presenting the characteristics of the 3D models that were
chosen from the collection of the Shetland WBVM. It then proceeds with describing
the device specification and finally, the procedures used to measure the download
and processing times are elucidated.
Chosen Models
The Shetland web-based museum has a collection of 3D models (please refer to
Figure 7.13). We chose two 3D models: the pre-historic cup dubbed as the Bone Cup
model and the Wireless Battery model.
Figure 7.19: Pre-historic Bone Cup Model Figure 7.20: Wireless Battery Model
Table 7.6 shows the characteristics of the original models of the Bone Cup and
Wireless Battery in terms of the number of faces, number of vertices and sizes on
disk in MB.
Table 7.6: Characteristics of the 3D Models considered for Hannibal Evaluation
Model Number of faces Number of vertices Size on Disk (MB)
Bone Cup Model (1.5M) 1520607 960763 117
Battery Model (2.7M) 2767749 1664380 215
7.10. EVALUATION OF HANNIBAL 233
7.10.1.2 Devices’ Specifications
Device 1 - PC: Intel Core i5-440- 3.10 GHz with 16GB 1067 MHz DDR3 RAM. The
graphics card of the machine was NVIDIA GeForce GTX 970 with 4GB of Video
RAM. The system had an installation of MS Windows 10 64 Bit with a minimal
set of background processes running to avoid interference. The system had the
latest drivers installed and the web browser used was Google Chrome version
69.0.3497.100 (64-bit). The network connection of the system is to a 100 Mbps
Ethernet Local Area Network which, in turn, is separated by four 1 Gbps router
hops, and finally connected to the United Kingdom University JANET backbone.
Device 2 - iPad Pro Tablet: iPad Pro (9.7 inch) WiFi 32GB MLMN2B/A model has
as a processor the Apple A9X (64 bit architecture). The GPU inside the A9X chip is
the PowerVR Series 7XT GT7600 (six-core). The OS on the iPad Pro was the latest
version at the time when the experiment was conducted (iOS 11.4.1). The mobile
web browser used was Apple Safari (64-bit).
Device 3 - LG Android Nexus 4 Phone: has a GPU Qualcomm Snapdragon(TM)
S4 Pro. LG Nexus 4 is a low-end mobile device. The web browser is Google Chrome.
7.10.1.3 Network Connections’ Scenarios
Table 7.7 shows the 6 network scenarios used to evaluate Hannibal. The 4G EE is a
real 4G connection speed that was measured. EE is a UK mobile service provider.
The 3G, 2G and GPRS were simulated through throttling the bandwidth in Google
Chrome Developers Tools similar to the procedure that was used in Chapter 3. In the
case of the PC, even the 4G was simulated since obviously the PC does not support
mobile networks but we simulated the other network connections on the PC which
is the most graphically capable device among the devices used for evaluation. We
wanted to see how such a device behaves with network connections pertaining to
mobile devices. The CS WiFi is the School of Computer Science WiFi.
234 CHAPTER 7. HANNIBAL - AN ADAPTIVE ENGINE FOR VIRTUAL MUSEUMS
Table 7.7: Network scenarios used for the evaluation of Hannibal
Network Connection Average Download (Mbps) Average Upload (Mbps)
Ethernet Janet 94.85 94.62CS WiFi 144 1544G (EE) 49.71 28.45
3G (Simulated) 15.9 22G (Simulated) 0.45 0.15
GPRS (Simulated) 0.05 0.02
7.10.1.4 Experimental Procedures
Measuring Download Times on iOS
Measuring download times on an iOS device requires an Apple Safari web browser
on a Mac Laptop or iMac and another mobile version of the web browser on the iOS
device. The iOS version of the web browser network inspector is used to capture
the IDPTs. The web inspector feature should be enabled on the PC version of the
web browser.
Afterwards, the iOS device is connected to Apple XCode in order to designate
it as a development device. Apple XCode is the main integrated development
environment used to create the myriad applications on Apple devices. This process
(i.e. designating a device for development) will force the developer settings on the
iOS device (iPhone/iPad) to appear and thus revealing the “Network Link Conditioner”
tool. The Network Link Conditioner allows the creation of network profiles in
which network conditions are emulated by changing the following parameters: In
Bandwidth, In Packet Loss, In Delay, Out Bandwidth, Out Packet Loss, Out Delay,
DNS Delay, the Internet Protocol (IPv4 or IPv6) and the Interface (Wi-Fi or Cellular).
Measuring Download Times on Android
The procedure of how to capture the IDPTs on Android devices is explained in detail
in Chapter 3.
The following section presents the results obtained when simulating network
scenarios presented in Table 7.7 while first using Hannibal and then without using
it.
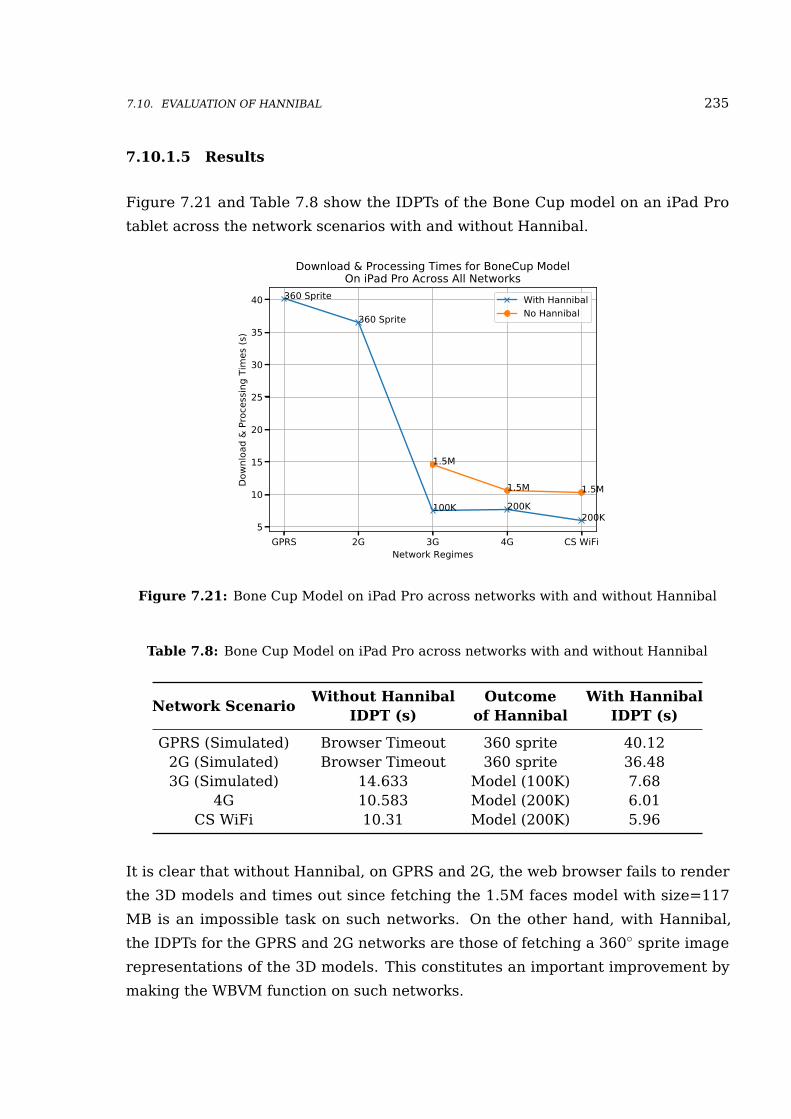
7.10. EVALUATION OF HANNIBAL 235
7.10.1.5 Results
Figure 7.21 and Table 7.8 show the IDPTs of the Bone Cup model on an iPad Pro
tablet across the network scenarios with and without Hannibal.
GPRS 2G 3G 4G CS WiFiNetwork Regimes
5
10
15
20
25
30
35
40
Down
load
& P
roce
ssin
g Ti
mes
(s)
360 Sprite
360 Sprite
100K 200K200K
1.5M
1.5M 1.5M
Download & Processing Times for BoneCup ModelOn iPad Pro Across All Networks
With HannibalNo Hannibal
Figure 7.21: Bone Cup Model on iPad Pro across networks with and without Hannibal
Table 7.8: Bone Cup Model on iPad Pro across networks with and without Hannibal
Network ScenarioWithout Hannibal
IDPT (s)Outcome
of HannibalWith Hannibal
IDPT (s)
GPRS (Simulated) Browser Timeout 360 sprite 40.122G (Simulated) Browser Timeout 360 sprite 36.483G (Simulated) 14.633 Model (100K) 7.68
4G 10.583 Model (200K) 6.01CS WiFi 10.31 Model (200K) 5.96
It is clear that without Hannibal, on GPRS and 2G, the web browser fails to render
the 3D models and times out since fetching the 1.5M faces model with size=117
MB is an impossible task on such networks. On the other hand, with Hannibal,
the IDPTs for the GPRS and 2G networks are those of fetching a 360◦ sprite image
representations of the 3D models. This constitutes an important improvement by
making the WBVM function on such networks.

236 CHAPTER 7. HANNIBAL - AN ADAPTIVE ENGINE FOR VIRTUAL MUSEUMS
For the network scenarios: 3G, 4G and Computer Science School WiFi, Hannibal
improves the IDPTs considerably with an improvement of over 50% for the 3G
network, over 43% for the 4G network and finally over 42% for the CS WiFi.
Figure 7.22 and Table 7.9 show the IDPTs of the Bone Cup model on Nexus 4 Android
phone across networks regimes with and without Hannibal. We can observe the
same behaviour manifested on the iPad Pro tablet in terms of web browser times out.
The Android Nexus 4, a phone that was released in 2012, is less capable graphically
than the iPad Pro tablet and thus has higher IDPTs. Hannibal only delivers on mobile
phones of such screen sizes, either the 360◦ sprite image, the 100K face resolution or
the 200K faces resolution. Recall, the upper resolution threshold on mobile devices
from results of Chapter 5 is the 189K faces.
We can observe on the Nexus 4 phone that with Hannibal on a 3G network connection
there is an improvement in IDPTs of over 43% than when the WBVM do not use
Hannibal. On the 4G connection, the improvement is around 51%. Finally on the
Computer Science School WiFi, the improvement is over 50% when using Hannibal,
from the case when it is not used by the WBVM.
GPRS 2G 3G 4G CS WiFiNetwork Regimes
20
25
30
35
40
45
Down
load
& P
roce
ssin
g Ti
mes
(s)
360 Sprite
360 Sprite
100K
200K200K
1.5M
1.5M
1.5M
Download & Processing Times for BoneCup ModelOn Nexus 4 Across All Networks
With HannibalNo Hannibal
Figure 7.22: Bone Cup Model on Nexus 4 across networks With and Without Hannibal
Figure 7.23 and Table 7.10 show the IDPTs of the Bone Cup model on PC across
network regimes with and without Hannibal. The improvement of using Hannibal
on a simulated 3G network connection on a PC is around 26% of when not using
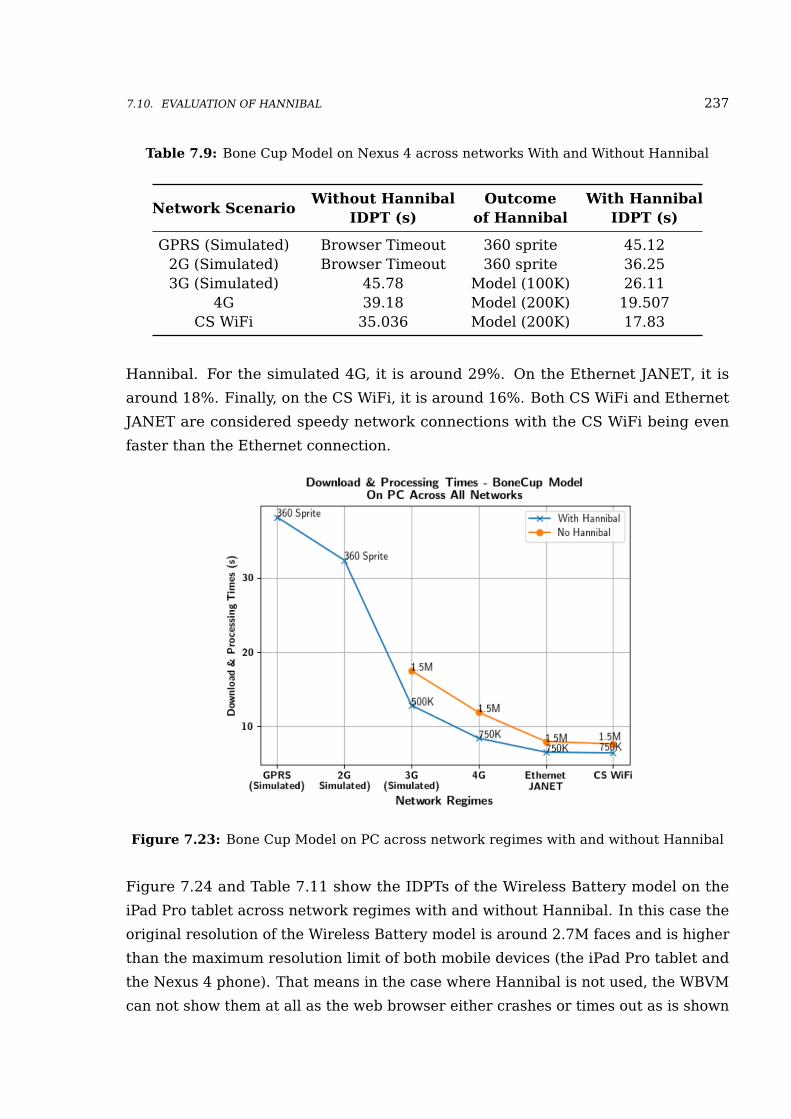
7.10. EVALUATION OF HANNIBAL 237
Table 7.9: Bone Cup Model on Nexus 4 across networks With and Without Hannibal
Network ScenarioWithout Hannibal
IDPT (s)Outcome
of HannibalWith Hannibal
IDPT (s)
GPRS (Simulated) Browser Timeout 360 sprite 45.122G (Simulated) Browser Timeout 360 sprite 36.253G (Simulated) 45.78 Model (100K) 26.11
4G 39.18 Model (200K) 19.507CS WiFi 35.036 Model (200K) 17.83
Hannibal. For the simulated 4G, it is around 29%. On the Ethernet JANET, it is
around 18%. Finally, on the CS WiFi, it is around 16%. Both CS WiFi and Ethernet
JANET are considered speedy network connections with the CS WiFi being even
faster than the Ethernet connection.
Figure 7.23: Bone Cup Model on PC across network regimes with and without Hannibal
Figure 7.24 and Table 7.11 show the IDPTs of the Wireless Battery model on the
iPad Pro tablet across network regimes with and without Hannibal. In this case the
original resolution of the Wireless Battery model is around 2.7M faces and is higher
than the maximum resolution limit of both mobile devices (the iPad Pro tablet and
the Nexus 4 phone). That means in the case where Hannibal is not used, the WBVM
can not show them at all as the web browser either crashes or times out as is shown
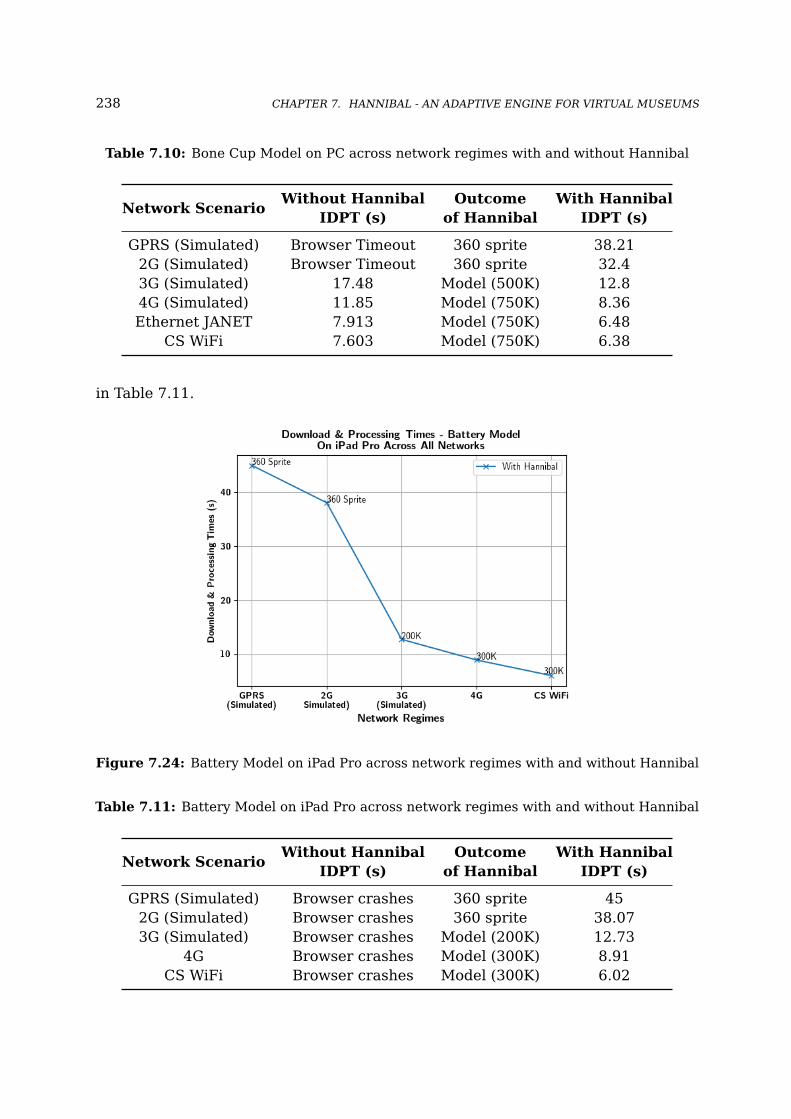
238 CHAPTER 7. HANNIBAL - AN ADAPTIVE ENGINE FOR VIRTUAL MUSEUMS
Table 7.10: Bone Cup Model on PC across network regimes with and without Hannibal
Network ScenarioWithout Hannibal
IDPT (s)Outcome
of HannibalWith Hannibal
IDPT (s)
GPRS (Simulated) Browser Timeout 360 sprite 38.212G (Simulated) Browser Timeout 360 sprite 32.43G (Simulated) 17.48 Model (500K) 12.84G (Simulated) 11.85 Model (750K) 8.36Ethernet JANET 7.913 Model (750K) 6.48
CS WiFi 7.603 Model (750K) 6.38
in Table 7.11.
Figure 7.24: Battery Model on iPad Pro across network regimes with and without Hannibal
Table 7.11: Battery Model on iPad Pro across network regimes with and without Hannibal
Network ScenarioWithout Hannibal
IDPT (s)Outcome
of HannibalWith Hannibal
IDPT (s)
GPRS (Simulated) Browser crashes 360 sprite 452G (Simulated) Browser crashes 360 sprite 38.073G (Simulated) Browser crashes Model (200K) 12.73
4G Browser crashes Model (300K) 8.91CS WiFi Browser crashes Model (300K) 6.02
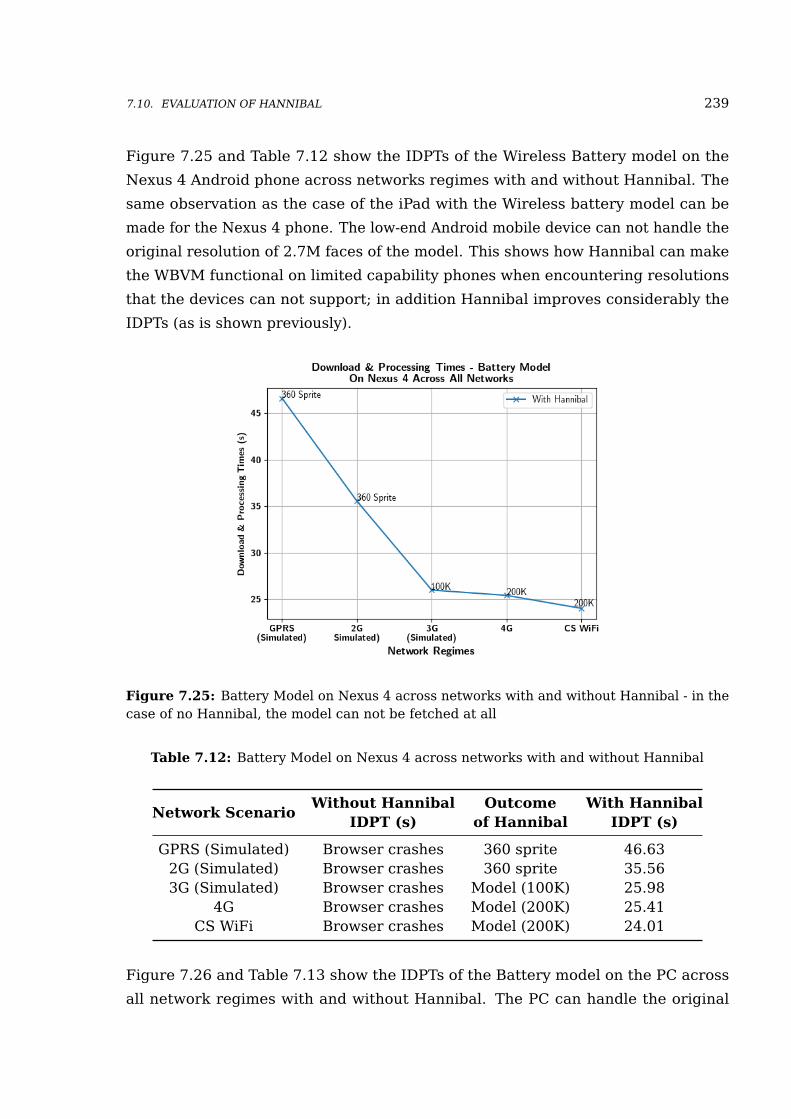
7.10. EVALUATION OF HANNIBAL 239
Figure 7.25 and Table 7.12 show the IDPTs of the Wireless Battery model on the
Nexus 4 Android phone across networks regimes with and without Hannibal. The
same observation as the case of the iPad with the Wireless battery model can be
made for the Nexus 4 phone. The low-end Android mobile device can not handle the
original resolution of 2.7M faces of the model. This shows how Hannibal can make
the WBVM functional on limited capability phones when encountering resolutions
that the devices can not support; in addition Hannibal improves considerably the
IDPTs (as is shown previously).
Figure 7.25: Battery Model on Nexus 4 across networks with and without Hannibal - in thecase of no Hannibal, the model can not be fetched at all
Table 7.12: Battery Model on Nexus 4 across networks with and without Hannibal
Network ScenarioWithout Hannibal
IDPT (s)Outcome
of HannibalWith Hannibal
IDPT (s)
GPRS (Simulated) Browser crashes 360 sprite 46.632G (Simulated) Browser crashes 360 sprite 35.563G (Simulated) Browser crashes Model (100K) 25.98
4G Browser crashes Model (200K) 25.41CS WiFi Browser crashes Model (200K) 24.01
Figure 7.26 and Table 7.13 show the IDPTs of the Battery model on the PC across
all network regimes with and without Hannibal. The PC can handle the original

240 CHAPTER 7. HANNIBAL - AN ADAPTIVE ENGINE FOR VIRTUAL MUSEUMS
resolution of the Battery model. On both GPRS and 2G connections, the web browser
times out. For the simulated 3G, the improvement in IDPTs is around 44% and for
the simulated 4G, it is around 35%. For speedy connections, the improvements
respectively are of 32% and 37% for the Ethernet and CS WiFi.
Figure 7.26: Battery Model on the PC across networks with and without Hannibal
Table 7.13: Battery Model on PC across networks with and without Hannibal
Network ScenariosWithout Hannibal
IDPT (s)Outcome
of HannibalWith Hannibal
IDPT (s)
GPRS (Simulated) Browser Timeout 360 sprite 39.432G (Simulated) Browser Timeout 360 sprite 33.323G (Simulated) 22.24 Model (500K) 12.34G (Simulated) 13.12 Model (750K) 8.53Ethernet JANET 10.37 Model (750K) 7.03
CS WiFi 10.28 Model (750K) 6.43
The following section presents the advantages of Hannibal. It also discusses one
disadvantage of the adaptivity method of Hannibal and how this disadvantage can
be mitigated.
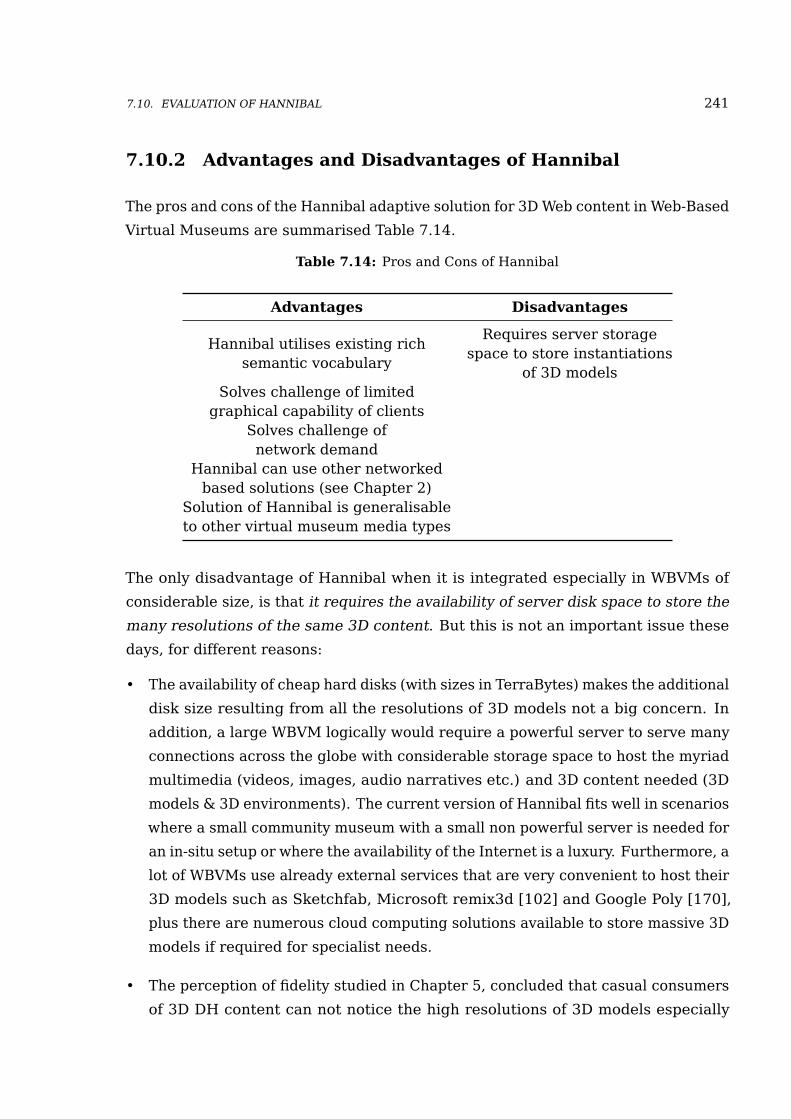
7.10. EVALUATION OF HANNIBAL 241
7.10.2 Advantages and Disadvantages of Hannibal
The pros and cons of the Hannibal adaptive solution for 3D Web content in Web-Based
Virtual Museums are summarised Table 7.14.
Table 7.14: Pros and Cons of Hannibal
Advantages Disadvantages
Hannibal utilises existing richsemantic vocabulary
Requires server storagespace to store instantiations
of 3D modelsSolves challenge of limited
graphical capability of clientsSolves challenge ofnetwork demand
Hannibal can use other networkedbased solutions (see Chapter 2)
Solution of Hannibal is generalisableto other virtual museum media types
The only disadvantage of Hannibal when it is integrated especially in WBVMs of
considerable size, is that it requires the availability of server disk space to store the
many resolutions of the same 3D content. But this is not an important issue these
days, for different reasons:
• The availability of cheap hard disks (with sizes in TerraBytes) makes the additional
disk size resulting from all the resolutions of 3D models not a big concern. In
addition, a large WBVM logically would require a powerful server to serve many
connections across the globe with considerable storage space to host the myriad
multimedia (videos, images, audio narratives etc.) and 3D content needed (3D
models & 3D environments). The current version of Hannibal fits well in scenarios
where a small community museum with a small non powerful server is needed for
an in-situ setup or where the availability of the Internet is a luxury. Furthermore, a
lot of WBVMs use already external services that are very convenient to host their
3D models such as Sketchfab, Microsoft remix3d [102] and Google Poly [170],
plus there are numerous cloud computing solutions available to store massive 3D
models if required for specialist needs.
• The perception of fidelity studied in Chapter 5, concluded that casual consumers
of 3D DH content can not notice the high resolutions of 3D models especially

242 CHAPTER 7. HANNIBAL - AN ADAPTIVE ENGINE FOR VIRTUAL MUSEUMS
on commodity devices. Normally, high resolution models are the main culprit in
taking high storage space from hundreds of MBs to even GBs.
• The advent of 3D formats that are efficient in binary mesh compression such as
the Khronos gLTF [220] format for 3D files assets which has over 50% reduction
in size compared to traditional mono-resolution file formats which are heavily
used by CH stakeholders such as Wavefront OBJ and COLLADA files formats.
Server hardware requirements are a matter of judgement call from museum
management to make especially on what Information Technology infrastructure
they are willing to invest in and the number of visitors they wish to handle gracefully.
7.11 Summary
This chapter presented Hannibal, an adaptive engine for Web-Based Virtual
Museums. The chapter started by exposing the architecture of the system then
went on to elucidate the implementation of the different components that constitute
the system. This was followed by an evaluation of Hannibal in terms of capturing
QoS metrics to gauge the performance of the adaptive engine by comparing the
3D models in terms of IDPTs in two scenario when Hannibal is used and when it is
absent on different network regimes and devices. Appraisal of the system in terms
of advantages and disadvantages is also presented in this chapter.

Part VI
Summary and Final Words
243

8Chapter Eight
Conclusion And FutureWork
This chapter summarises the work done in this research and provides
concluding thoughts. It reiterates the thesis statement and the contributions
of this thesis. The chapter restates the research questions, elucidates how
they were addressed, presents the limitations of this work and suggests
avenues for further research.
8.1 Summary of the Work
This thesis provides an underpinning empirical foundation for the investigation of
the QoS and the QoE of Digital Heritage 3D Web components. The results have led
to the development of Hannibal, an adaptive engine for 3D digital heritage artefacts
in WBVMs. DH WBVWs were also studied on the level of QoS in order to discover
their bottlenecks and limitations.
The work resulted in a proposed ontology dubbed ViMQO, which supplements
describing 3D artefacts with QoS-related metadata needed for adaptation purposes.
ViMQO is born out of the lack of expressiveness of DH semantic ontologies when
it comes to different 3D models’ types and from the lack of the availability of
characterising QoS metadata such as the number of faces, and number of vertices
among others. ViMQO ontology is unique in the sense that it is an ontology that
focuses on the QoS metadata pertaining to 3D models in web-based virtual museums.
The ontology encompasses the Dublin Core (DC) and Europeana Data Model (EDM)
245

246 CHAPTER 8. CONCLUSION AND FUTURE WORK
ontologies and can be extended to support a myriad of QoS-related metadata for
other multimedia found usually in a WBVM context.
This research furthers the understanding of museum stakeholders and computer
scientists of the different technologies involved in the digitisation, simulation and
dissemination of heritage content over the web. Quality and efficiency are two
major concerns for achieving possible and good acceptable user experience. One
of the important takeaways of this work is how resolutions under upper resolution
perception threshold of a certain device can be tolerably used by users in lieu of the
original resolutions which could be high-detailed and could be above what a device
hardware and software can support. This is a totally new dimension in the research
domain of the 3D Web and that of DH quality investigations and was actualised by
Hannibal. We should allude to the need of the continuous evolution of the subject of
perception of fidelity when it comes to such contexts.
The work in this thesis has contributed an adaptive engine and set of tools that came
with it and which can be used separately. These tools decimate digital artefacts and
transform them into lighter formats such as 360◦ sprite images. The findings of
this research have contributed to best practices and recommendations concerning
quality and performance of digital heritage artefacts across devices and networks
suitable for web consumption.
The following section reiterates the thesis statement of this research.
8.2 Thesis Statement
The thesis statement of this work is that:
“through supplementing digital heritage semantic web vocabularies to
include Quality of Service related metadata, we can achieve adaptivity of
3D Web content in Web-Based Virtual Museums and this leads to improved
Quality of Experience across the range of networks and client devices
regimes.”
This work has demonstrated that adaptivity of 3D Web content can be achieved
through the availability of QoS-related metadata. In similar vein, it has demonstrated
8.3. RESEARCH QUESTIONS ADDRESSED 247
how such adaptivity is in tune with the best possible user experience and best
possible quality of delivery.
Adaptivity was actualised through Hannibal a QoS and QoE aware adaptive engine
integrated into a Web-Based Virtual Museum (WBVM). QoS-aware means it is aware
of the device it is communicating with and the network conditions it is functioning
in. QoE-aware means it does not deliver a resolution that can not be perceived
by the user or that is detrimental to the user experience thus leading to a better
responsiveness and shorter download time of the model and by consequence a better
user experience. The Hannibal system solves both the problem of intensive network
requirements and that of the heterogeneity of graphical capabilities of client devices
at the same time in contrast to other adaptivity approaches surveyed in the literature
(please refer back to Chapter 7, Section 7.2, and to the literature review in Chapter 2,
Section 2.6). Hannibal builds on the findings of a set of system-level empirical and
user-based studies reported in Chapter 5 which described what constitutes the
“optimum resolution” for each client device and network regime scenario.
Hannibal decimates behind the scene Web3D models uploaded to the WBVM
management interface into lower fixed resolutions supplementing these media
with QoS-related metadata. In a similar vein, Hannibal transforms 3D meshes into
360◦ sprite images to be given to clients in situations where they are found to be
connected to extremely slow connections or when they do not support 3D Web
technologies.
The system-level QoS evaluation of Hannibal showed that the adaptive engine
minimises considerably the download and processing times of DH heritage models.
The engine can preclude many cases of crashes and timeouts in web browsers which
were a serious problem in the case of its absence especially for engaging with high
detailed Web3D heritage material on mobile devices with limited capabilities.
8.3 Research Questions Addressed
The research conducted and reported in this thesis set out to answer five pertinent
research questions:
• Q1: What are the main 3D Web technologies used throughout the literature and
what taxonomies can the 3D Web be classified upon?
248 CHAPTER 8. CONCLUSION AND FUTURE WORK
This was addressed in the literature review (Chapter 2) which aimed at defining
the myriad 3D Web technologies and 3D Web environments and their usage
in digital heritage. 3D Web technologies were classified further into different
taxonomies based on four dimensions of 3D Web tools and languages (Language
Paradigm, Installation and Deployment, Rendering mode and Use case) and those
taxonomies coupled with additional survey material are presented in Appendix C.
• Q2: How do digital heritage Web-Based Virtual Worlds (WBVWs) perform and
what are their bottlenecks and limitations?
The importance of this question stems from the fact that these environments are
used throughout the CH literature in a strict academic sense i. e. per instance,
to document, visualise and disseminate a hypothesis of what a site’s ruins used
to look like in the past [110, 111] or as an attractive and educational means for
both physical and virtual museums to engage, educate and fascinate visitors. The
work conducted in Chapter 4 that addressed this question is the first to study the
limitations and bottlenecks of Unity 3D WBVWs. The work was published in [30].
• Q3: How does the QoS relate to the QoE for 3D Web components used in Digital
Heritage across the range of QoS regimes?
This question is addressed through the investigation of the relationship (trade-off)
between the QoS and the QoE of 3D Web components used in Digital Heritage
across the range of QoS regimes. The question was addressed in Chapter 5.
There is a trade-off between performance and fidelity. High fidelity of 3D content
leads to a bad performance and by consequence a bad user experience, while
low fidelity content although benefiting directly performance and download time,
is intolerable for users and thus leads to a bad user experience. The chapter
shed the lights on investigating the middle sweet spot region of resolutions
across different devices and network regimes that achieve the best possible user
experience.
• Q4: How can semantic web digital heritage vocabularies be extended to provide
the sort of information required for adaptive 3D Web content?
This question is addressed in both Chapters 6 and 7. A formal proposal of an
ontology called ViMQO that is RDF-compliant is given in Chapter 6 which filled
the lack of expressiveness in other ontologies when it comes to QoS-related
metadata of 3D digital heritage models of many types in WBVMs. A practical
8.4. RESEARCH CONTRIBUTIONS 249
approach to creating custom QoS-metadata inside Omeka [87] DAMS, the back-
end that is used by Hannibal, was also presented in Chapter 6. This is in order
to provide a concrete example of how the Hannibal solution works with the
supplementation of such necessary QoS-related metadata.
• Q5: How to utilise cross-aware 3D web adaptive engines in Web-Based Virtual
Museums that achieves the best possible user experience?
The question has been addressed in the course of Chapter 7, a cross-aware
adaptive engine for 3D Web in WBVMs.
8.4 Research Contributions
The following is a list of major contributions of this work:
C1: Surveying 3D Web technologies, and the types of environments they constitute.
This contributed to the literature in this regard [Chapter 2]. A large portion of
the survey in Chapter 2 and Appendix C was published in [32].
C2: Developing our understanding through measurement studies of the perfor-
mance, limitations and bottlenecks of digital heritage WBVWs [Chapter 4]. The
work in Chapter 4 was published in [30].
C3: Developing our understanding through measurement studies of the perfor-
mance, limitations and bottlenecks of digital heritage 3D models [Chapter 5].
The subjective perception of fidelity work in Chapter 5 was published in [28].
C4: Developing the relation between fidelity, Quality of Service (QoS) and Quality of
Experience (QoE) for each media that forms up the 3D Web [Chapters 4 and 5].
C5: Developing Hannibal, an adaptive engine that optimises the QoE for a particular
QoS of 3D digital heritage models [Chapter 7].
C6: Proposing a new ontology dubbed Virtual Museum Quality of Service Ontology
(ViMQO) that supplements semantic web vocabularies such as Dublin Core
(DC) and EDM to include QoS-related metadata in the context of Web-Based
Virtual Museums [Chapter 6].
250 CHAPTER 8. CONCLUSION AND FUTURE WORK
C7: Creating and discussing a set of best practice recommendations to guide
WBVMs stakeholders concerning DH artefacts and environments, mainly in the
context of web dissemination [Chapters 4, 5, and 7].
There are also secondary contributions that resulted from conducting the work in
this thesis:
c1: Defining definitions and taxonomies of the 3D Web [Appendix C].
c2: Contributing two Python applications used for decimating (i.e. decreasing the
resolution) in bulk of 3D digital models into specified lower resolutions and
another Python application used for transforming automatically a 3D model
into a GIF and 360◦ image sprite representations.
8.5 Limitations of the Work
Hannibal (Chapter 7) solved only the adaptation aspect of 3D Web digital heritage
artefacts. Adaptation of DH WBVWs is still an open question worthy of a complete
Ph.D. Streaming a very complex WebGL world does not solve the client capability
problem of limited client devices. There are many solutions presented in the
Literature (please refer back to Chapter 2) for adapting 3D Web in this regard but
none of them are QoS-aware and none of them are QoE-aware especially concerning
the perception of fidelity of WBVWs.
Digital Heritage Web-Based Virtual Worlds were studied in Chapter 4. However,
these findings could not be included in the current version of Hannibal since this
requires the existence of different LODs decimated worlds in the back-end which
would require a systematic “passe-partout” method of a decimation process that
works gracefully on all types of WebGL WBVWs (i.e. whether exported from game
engines such as Unity3D or Unreal, or built from scratch from libraries such as
Three JS and Babylon JS). It also requires capturing the same QoS metrics across
many resolutions (i.e. LODs) of the WBVWs. Hannibal at the current stage uses
decimations for 3D models only.
There is a need to conduct additional QoS empirical investigations and more
importantly there is a need to conduct QoE fidelity perception studies on different
level of details of such environments which is not done yet to the best of our
8.6. FUTURE WORK 251
knowledge. Please refer to future work Sections 8.6.4 and 8.6.5 for more details on
how to approach the adaptation of these environments in a systematic way.
The experiments of perception of fidelity conducted in Chapter 5 would require a
larger set of models and a larger population to give a more detailed insight. For
example, additional 3D models with different categorised topologies would give a
more comprehensive view. The two models chosen were obtained from digitising
actual historical heritage artefacts through Photogrammetry and 3D Scanning. They
might be different from 3D models constructed in authoring applications such as
Blender or Maya as “photogrammetised” or scanned models tend to have more
complex texture seams. There is also the need to address the effect of texture
resolutions and 3D assets file types on the overall subjective perception of fidelity
of 3D models on the web and what the thresholds are then in this regard. These
are two interesting ideas worthy of investigation (please refer to the future work
Sections 8.6.1 and 8.6.2 for more details).
In addition, more benchmarking of mobile and non-mobile devices and network
regimes would enhance the engine knowledge base of Hannibal.
Future works are elucidated in the following section.
8.6 Future Work
The following sections are an exposition of different future avenues for research.
Many of these ideas warrant a complete Ph.D while others could be done in a
Masters project. Some of the work will hopefully be conducted by the researcher in
the future.
8.6.1 Effect of Textures Resolutions on QoS/QoE of DH
artefacts
There is a need to study the effect of textures’ resolutions on the overall perceived
resolution of the 3D model. Recall in Chapter 5, I kept the textures intact (i.e.
unaffected) while I decimated the 3D meshes into lower resolutions; in other words
only the resolution of the geometry of the 3D model changed. Now a few worthy
questions to be asked here: what happens if I did the opposite? How does that

252 CHAPTER 8. CONCLUSION AND FUTURE WORK
affect the QoS and QoE mainly in terms of the perceived perception of fidelity of
the artefacts? If textures’ resolutions play a more important role than that of 3D
mesh resolution, that means tangibly: we can have high resolution textures mapped
to a low resolution 3D mesh and still have a good overall quality of presentation
perceived by users. More importantly Skechfab claims that the 4K texture resolution
can require around 50MB of VRAM (please review Section 3.4.2.2, in Chapter 3).
This texture resolution is considered according to Sketchfab a good limit for both
performance and compatibility.
It would be interesting to see if the “4K texture resolution” is an upper resolution
threshold for textures above which users do not notice any difference in the
resolution or quality of presentation of the 3D model as a whole and that of the
textures in particular. In similar vein, it is pertinent to know what relationships
we can deduce in terms of perception of fidelity when we fix the resolution of the
model’s geometry (i.e. mesh resolution in number of faces and vertices) and change
the resolution of the textures (following the power of two rule or any other rule
for that matter) and check how the fidelity is perceived from the perspective of the
users. This future work can be coupled with the work presented in Section 8.6.3.
8.6.2 Effect of 3D Models Types and Compression on
QoS/QoE of DH Artefacts
This includes the investigation of the effect of 3D models’ types (example: Wavefront
OBJ vs glTF vs COLLADA etc.) and their compression schemes on the QoS and on the
subjective perception of fidelity of 3D models on the web and what the perception
thresholds are then in this regard.
The idea here is that if we know that per example the Khronos glTF is the JPEG of 3D
models with a significant reduction in size (according to Knronos [220]) compared
with the other commonly used mono-resolution 3D models types in CH (Wavefront
OBJ and COLLADA) and if people can not notice any difference in the fidelity between
different versions of the same 3D model with same mesh and textures resolution but
with different file types (Wavefront OBJ Vs COLLADA Vs glTF), then we can strongly
confirm that there is no need to send between the 3 types exemplified here other
than the glTF format thus leading to less storage footprint and less download time.

8.6. FUTURE WORK 253
8.6.3 Systematically Calculating VRAM Consumption of 3D
Models & Textures
It is interesting to investigate the Video Random Access Memory (VRAM) consump-
tion of different variations of 3D model meshes - textures of different fidelity levels.
This would allow us to quantify these levels in terms of VRAM consumption and
this would constitute a very useful information for the Hannibal adaptive engine to
actualise in its knowledge base. Not to mention that there is a clear benefit of such
study in figuring out what affects the VRAM more: is it the 3D mesh or the textures
and how? In Chapter 3, I gave many methodological procedures of how to capture
QoS metrics through different tools. These tools can capture VRAM also. There
is a need in this regard to systematically and accurately capture the VRAM metric
across models and textures in order to study what relationships could be discovered.
8.6.4 Decimation Algorithms for Different LODs of WebGL
WBVWs
The idea of creating many LODs has been actualised in a few recent works in the
literature. One example is that of Wang et al. [420] who developed a workflow for
rendering WebGL GIS geo-visualization of a forest landscape. The environment is
built using the X3DOM framework and HTML5 in two LODs switching techniques
and has a navigation aid to help users. They conducted an evaluation recruiting 15
participants with the aim of studying the usability and accessibility of the different
LODs of the trees. To increase the interest of participants in the virtual environment,
they employed a “gamification” approach by including a deer hunting task. They
provided two hypotheses: the first is that the navigation aid will have a positive
improvement on users’ performance in the game. The second is about how the
exponential cut-off function will provide smoother transition between the different
LODs.
Very recently Unity 3D has added mechanisms for creating many LODs of a game or
3D world [415].
The idea here is to export the build of a certain LOD as a separate WebGL build
from Unity. It would be nice to be able to create systematically a system that has
a decimator algorithm, akin to what I did for Hannibal, that passes through all

254 CHAPTER 8. CONCLUSION AND FUTURE WORK
3D objects and textures in a uploaded WebGL avatar-based world to the WBVM
management interface and then decimates the whole world into different specific
LODs.
Hannibal (Chapter 7) could then be changed to detect what is needed from a user
request: i.e. a 3D model or a 3D world and then invokes the right complete LOD
of the WBVW suitable to the client device and network conditions. This of course
needs to be coupled with research similar to what is suggested in Section 8.6.5.
8.6.5 Subjective Perception of Fidelity of LODs of WebGL
WBVWs
It is pivotal to study the subjective perception of fidelity of different LODs of WebGL
WBVWs in order to discover LODs resolution thresholds (upper & lower thresholds).
This of course requires a way to decimate successfully and systematically a complete
WebGL WBVW into low resolution worlds as stated in Section 8.6.4.
The same questions that this research addressed of the type: Do people notice a
certain high resolution of 3D Digital Heritage model on an iPhone 7 Plus screen?,
can be applied this time to the context of WBVWs. Can people notice the different
LODs of these avatar-based environments? How can we quantify a resolution of
a WBVW LOD? Can we automate a decimation process that minimises the overall
resolution of a WebGL avatar-based environment into different LODs?
8.6.6 Extensions to ViMQO and Creation of DAMSs Plug-ins
Avenues for future work constitute extending the Virtual Museum Quality of Service
Ontology (ViMQO) to support all multimedia, file types and the QoS-related metadata
that are normally encountered in a WBVM context. This is in order to allow
applications to adapt multimedia such as videos not just 3D models.
The creation of an Omeka plug-in is of great need to facilitate the automatic inclusion
of the ViMQO ontology into the Omeka eco-system. This would allow DH applications
that use Omeka as a back-end to utilise ViMQO without going into configuring and
creating manually the item types and specific metadata needed.
Other common DH DAMSs might also benefit from developing extensions or plug-ins
8.6. FUTURE WORK 255
to actualise ViMQO in their systems.
8.6.7 Machine Learning in Hannibal
The use of machine learning algorithms in Hannibal might be an interesting avenue
for further improvement of the engine. Hannibal in its current proof of concept
version presented in this thesis uses a forward-chaining expert system [128],
implemented in the PHP 7 language. Machine learning can be used in Hannibal,
where users can grade on the client side whether the resolution fetched by Hannibal
was convenient for them or not, in addition to stating the degree of that convenience.
Hannibal will then learn and alter the rules of its decision engine accordingly.
8.6.8 QoE study on Hannibal and further extensions
Hannibal was only evaluated on a systematic QoS level and proven to decrease the
download and processing times considerably. A user-based study would be a great
future addition in this regard which could involve creating scenarios for users to
test the WBVM while using Hannibal and without using it.
Hannibal can be extended further in many ways. Hannibal can use many of the
network-based solutions presented in Section 2.6.1, mainly mesh compression
techniques and the use of progressive meshes.
The Hannibal solution can be generalised to other media such as flat images and
videos, and spherical images and videos, while utilising the approach adopted for
3D DH artefacts. Adapting Photospheres and Videospheres per instance can be
achieved with the same logic used for Web3D models, as Photospheres are at the
end of day from the system perspective, just mere image files and Videospheres are
just mere video files, with specific metadata which allow the client side to process
them and show them differently to users, using WebGL, giving them the desired
effect needed (Spherical or Stereoscopic).
The same logic of adaptation would apply when having many levels of detail for
both photospheres and videospheres available on the server side. Adaptation in
this situation is easier than the case of Web3D models due to the fact that only
network considerations are relevant to this kind of media not quite so much the
client processing or graphical capability as is shown in the way YouTube adapts
256 CHAPTER 8. CONCLUSION AND FUTURE WORK
videospheres (this is discussed in YouTube Section 7.8). 360◦ videos and 360◦
images can still be consumed with no problems on the lowest end mobile devices in
the market. Someone would argue that even the network aspect is not a problem,
the size of the images of Photospheres sent is not of great concern and the flat or
spherical videos are streamed already to the client devices adaptively (the case of
YouTube).
The same questions that this research addressed: do people notice a certain high
resolution of a 3D DH model on an iPhone 7 Plus screen? can be applied to fidelity
perception of videos and images. Can people notice the difference between a 4K
Video and 2K or HD video on an iPhone 7 screen? if not, why stream the 4K or 2K
resolutions? Many studies have addressed QoE particularly perception of fidelity in
multimedia such as flat videos [277, 363, 424], spherical videos [444], flat images [33,
341] and spherical and stereoscopic images [432]. Others studies have investigated
extensively the QoS angle [443]. Hannibal, in future versions, can actualise those
perception of fidelity and QoS studies for multimedia and embrace them in the
rules of its adaptive engine. Many instantiations of the media in question could be
decimated also by batch algorithms to lower resolutions, similar to 3D models and
then could be stored in the DAMS back-end. The Hannibal rule-based engine can
decide then for these media what resolution to send armed with confident decisions
supported by QoS/QoE findings from the Literature.
8.7 Final Thoughts
This thesis has demonstrated that it is possible to achieve a good degree of adaptivity
of 3D Web models through balancing network demands, client devices capabilities
and QoE needs of users. No system has done this before.
This work has also deepened our understanding of the many technologies, aspects
of digitisation and dissemination of heritage across platforms and networks and
provided us with many best practices and guidelines. It has provided knowledge and
insights into the fields of Quality of Service (QoS) and Quality of Experience (QoE)
of digital heritage 3D content tailored to be used on the most democratic digital
system which is the World Wide Web.
It is my hope that the insights here presented can guide the design of better
digital heritage applications and better adaptive systems and could motivate further

8.7. FINAL THOUGHTS 257
research in many under-studied areas exposed in this work.

Part VII
Appendices
259


AAppendix A
Appendix A - EthicsApproval
261

BAppendix B
Appendix B - Perceptionof Fidelity Experiment
Questionnaire, gradingand ranking
263
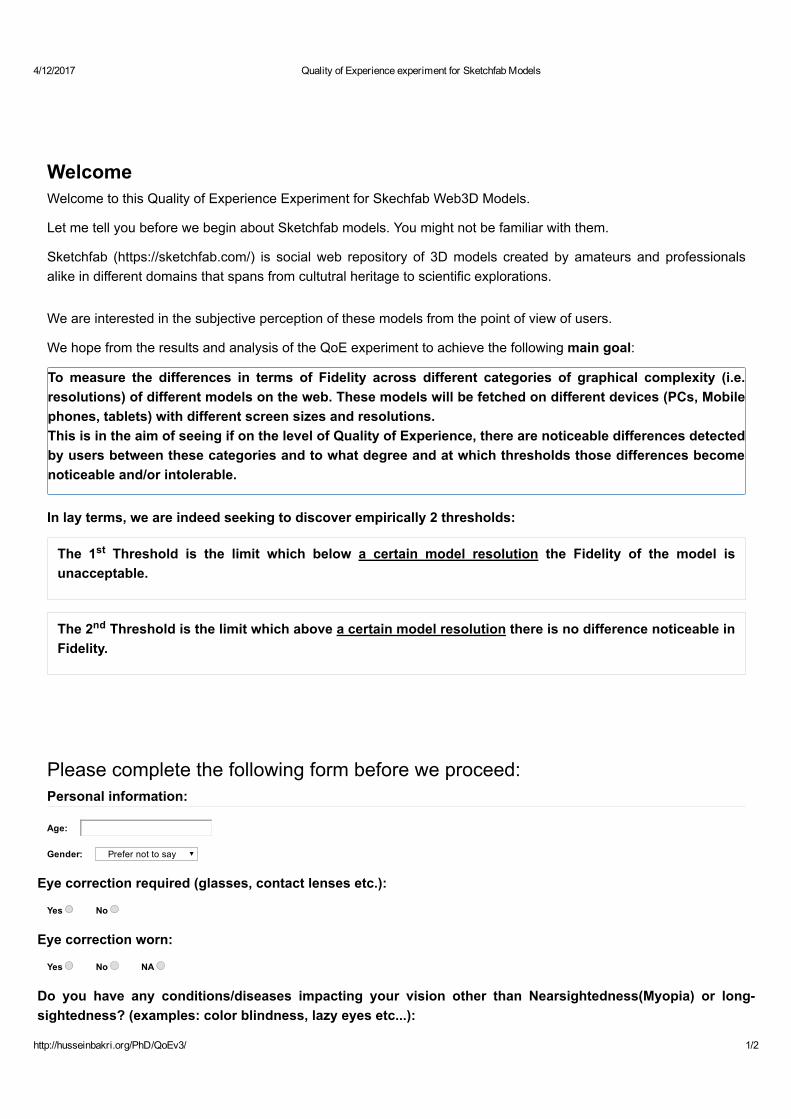
4/12/2017 Quality of Experience experiment for Sketchfab Models
http://husseinbakri.org/PhD/QoEv3/ 1/2
WelcomeWelcome to this Quality of Experience Experiment for Skechfab Web3D Models.
Let me tell you before we begin about Sketchfab models. You might not be familiar with them.
Sketchfab (https://sketchfab.com/) is social web repository of 3D models created by amateurs and professionalsalike in different domains that spans from cultutral heritage to scientific explorations.
We are interested in the subjective perception of these models from the point of view of users.
We hope from the results and analysis of the QoE experiment to achieve the following main goal:
To measure the differences in terms of Fidelity across different categories of graphical complexity (i.e.resolutions) of different models on the web. These models will be fetched on different devices (PCs, Mobilephones, tablets) with different screen sizes and resolutions. This is in the aim of seeing if on the level of Quality of Experience, there are noticeable differences detectedby users between these categories and to what degree and at which thresholds those differences becomenoticeable and/or intolerable.
In lay terms, we are indeed seeking to discover empirically 2 thresholds:
Please complete the following form before we proceed:Personal information:
Eye correction required (glasses, contact lenses etc.):
Eye correction worn:
Do you have any conditions/diseases impacting your vision other than Nearsightedness(Myopia) or longsightedness? (examples: color blindness, lazy eyes etc...):
The 1 Threshold is the limit which below a certain model resolution the Fidelity of the model isunacceptable.
st
The 2 Threshold is the limit which above a certain model resolution there is no difference noticeable inFidelity.
nd
Age:
Gender: Prefer not to say
Yes No
Yes No NA
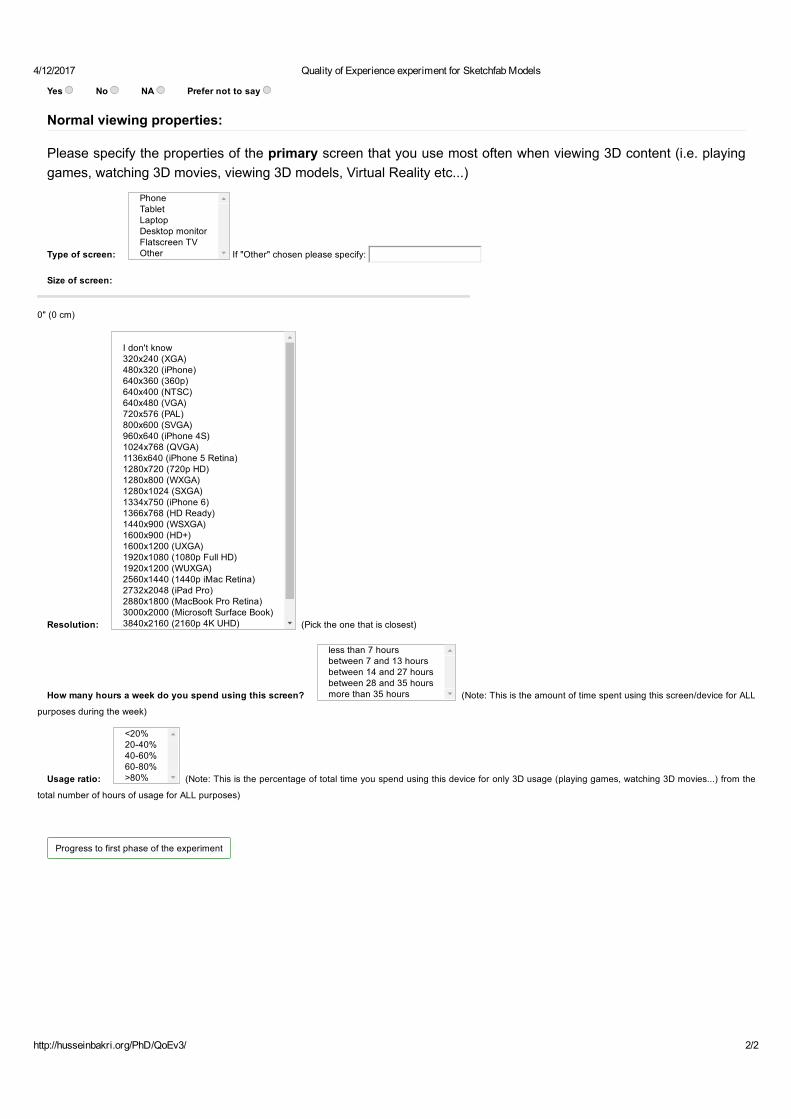
4/12/2017 Quality of Experience experiment for Sketchfab Models
http://husseinbakri.org/PhD/QoEv3/ 2/2
Normal viewing properties:
Please specify the properties of the primary screen that you use most often when viewing 3D content (i.e. playinggames, watching 3D movies, viewing 3D models, Virtual Reality etc...)
If "Other" chosen please specify:
(Pick the one that is closest)
(Note: This is the amount of time spent using this screen/device for ALL
purposes during the week)
(Note: This is the percentage of total time you spend using this device for only 3D usage (playing games, watching 3D movies...) from the
total number of hours of usage for ALL purposes)
Progress to first phase of the experiment
Yes No NA Prefer not to say
Type of screen:
PhoneTabletLaptopDesktop monitorFlatscreen TVOther
Size of screen:
0" (0 cm)
Resolution:
I don't know320x240 (XGA)480x320 (iPhone)640x360 (360p)640x400 (NTSC)640x480 (VGA)720x576 (PAL)800x600 (SVGA)960x640 (iPhone 4S)1024x768 (QVGA)1136x640 (iPhone 5 Retina)1280x720 (720p HD)1280x800 (WXGA)1280x1024 (SXGA)1334x750 (iPhone 6)1366x768 (HD Ready)1440x900 (WSXGA)1600x900 (HD+)1600x1200 (UXGA)1920x1080 (1080p Full HD)1920x1200 (WUXGA)2560x1440 (1440p iMac Retina)2732x2048 (iPad Pro)2880x1800 (MacBook Pro Retina)3000x2000 (Microsoft Surface Book)3840x2160 (2160p 4K UHD)
How many hours a week do you spend using this screen?
less than 7 hoursbetween 7 and 13 hoursbetween 14 and 27 hoursbetween 28 and 35 hoursmore than 35 hours
Usage ratio:
<20%2040%4060%6080%>80%

CAppendix C
Appendix C - 3D WebTechnologies
This appendix provides additional survey material on different 3D Web
technologies and Web-Based Virtual Worlds (WBVWs). The appendix
contributes to the literature by proposing taxonomies that classify 3D Web
technologies on four dimensions: Languages paradigms, Installation and
Deployment, Rendering and Use cases.
A large proportion of this appendix appeared in the following peer-reviewed
publication:
1. Bakri, H., Allison C., Miller A., Oliver I. (2016) Virtual Worlds and the
3D Web - Time for Convergence?. In: Immersive Learning Research
Network. iLRN 2016. Communications in Computer and Information
Science, vol 621. Springer, Cham [32].
C.1 3D Web Technologies
C.1.1 VRLM, X3D and X3DOM
Virtual Reality Modelling Language (VRML) [70] was the first technology used
for building and delivering 3D Web content. It was proposed in 1994 and was later
ISO certified in 1997 under the name of VRML97 or VRML version 2.0. The language
267

268 APPENDIX C. - 3D WEB TECHNOLOGIES
incorporated the capability to define 2D and 3D graphical scenes, in addition to
running a myriad of multimedia file formats combined with a powerful XML-based
scripting language.
VRML is based on a declarative paradigm [245] meaning the 3D scene is presented
by describing its geometry and the interactions inside the 3D model in an XML-
based encoding, instead of using an imperative language such as JavaScript which
describes the low level details of how vertices and triangles get built and rendered.
VRML code is injected inside the hosting HTML code itself. VRML was very attractive
in the nineties till the beginning of the 2000s, due to the fact that it supported multi-
user networked worlds, avatars and 3D communities (through per example, the
Blaxxun ecosystem [114]). VRML was never a core technology implemented inside
web browsers and thus needed a plug-in to be installed in the host web browser in
order for VRML to work [69]. VRML is deprecated as it is now superseded by the
X3D standard.
eXtensible 3D (X3D) [62] is a royalty-free standard that joined in 2001 the family
of declarative XML-based encodings on the web. It became the successor of
VRML. X3D advances over VRML include techniques such as humanoid animations,
programmable shaders, the ability to provide multi-textures, geo-location and
tagging. Its XML-based encoding makes it easy to incorporate into web pages
similar to VRML. X3D scenes and models on their own require a plug-in to be
installed in web browsers in order for the X3D code to work.
The X3DOM framework [37] integrates X3D scenes and models into the HTML
Document Object Model (DOM) tree. With this technology, X3D can be fully
integrated into any web page in the same way as SVG can. Nodes of X3D can
be declared inside basic HTML elements and scenes of X3D can be modified
using JavaScript. The implementation of X3DOM is based on WebGL thus with
the majority of web browsers now supporting WebGL 1.0 by default, X3DOM code
can be embedded and manipulated without any need to install a web browser’s
plug-in.
C.1.2 XML3D & Xflow
XML3D [383] is portable cross-platform declarative approach [245] that leverages
the existing web technologies stack such as HTML, CSS, Document Object Model
C.1. 3D WEB TECHNOLOGIES 269
(DOM), and AJAX for creating 3D content on the web. XML3D can be used in a
separate file linked to the HTML web page or can be embedded directly into HTML
using a separate XML namespace.
Xflow [224] is a high performance data processing system for declarative 3D Web
usually used in conjunction with XML3D [383]. It provides the ability to describe
data flows in 3D scenes.
C.1.3 WebGL
WebGL [210, 262, 312] is a standard introduced by the Khronos Group for web
browsers. It consists of large set of JavaScript bindings accessing a limited subset of
OpenGL dubbed as Open Graphics Library Embedded System (OpenGL ES). WebGL
is rendered in the canvas element of the HTML5 page. WebGL allows browsers
to render 3D environments and models without any installation of web browsers’
plug-ins [302]. WebGL features sophisticated 3D graphical hardware accelerated
capabilities rendered in real-time.
WebGL Frameworks and Game Engines
WebGL has many high-level frameworks and JavaScript game engines on top of it.
The rationale of having these high-level frameworks or JavaScript game engines
is the fact that programming in pure low level WebGL (a.k.a using vanilla low
level WebGL) is an anathema for many programmers not to mention the fact that
programming at such level is inefficient and cumbersome for many medium to large
scale projects [310]. There are many WebGL frameworks tailored to many tasks and
tastes that would require complete books to list and explain them. The following
present briefly the most commonly used WebGL frameworks.
Three JS [116]: is one of the most commonly used and most stable high-level WebGL
frameworks. It provides a stable API that allows programmers to create rich 3D
graphics applications and games on the web.
The stability of Three JS made it suitable for many WebVR frameworks to be built
on top of it. One example of such powerful virtual reality web frameworks is the
declarative entity component library dubbed A-Frame [289].
270 APPENDIX C. - 3D WEB TECHNOLOGIES
Babylon JS [278]: is a real-time 3D game engine and a WebGL high-level framework.
The Babylon JavaScript library allows programmers to use powerful JavaScript
physics engines such Cannon JS [287] and Oimo JS [19] to mimic complex networked
simulations of the laws of physics in their games and WBVWs.
OSG.JS and Sketchfab: Sketchfab [374] is a single media social repository that
hosts Web3D models online. Sketchfab is akin to social media websites but dedicated
to Web3D models only. Users can engage with the 3D models, share them on their
websites and other social media, comment on them, and buy and sell them. Sketchfab
is used extensively by CH memory institutions such as museums and galleries as
a platform to host and disseminate their digitised collections. It uses a Web3D
viewer based on the open source framework OSG.JS [326]. OSG.JS is a WebGL
framework which was created by the founder of the Sketchfab company (Cedric
Pinson). OSG.JS implements OpenSceneGraph concepts in a WebGL context. Cedric
and other members of the public are continuously updating and maintaining the
framework.
Open Scene Graph [422] is an open source cross 3D graphics toolkit and an extensive
API. It is used to create computer graphics applications and games. It is based on
a C++ implementation of OpenGL. It basically use the scene graph approach to
represent 3D content.
C.1.4 HTML5 & CSS3 3D Features
In HTML5 [178, 325] the “canvas” element is the only facility that allows web
browsers to render 2D and 3D content without the need of installing a web browser
plugin. 3D content in the canvas element is rendered frame by frame as bitmap
images. Solutions that don’t require plug-ins to be installed and in which the HTML
canvas element is used to render 3D are those of the X3DOM framework (i.e. the
X3D code is directly injected into the HTML DOM) or those using JavaScript bindings
to the OpenGL graphics library such as that of WebGL [210].
CSS3 3D transformations and animations extends CSS3 rules with 3D capabili-
ties. It is possible with CSS3 to scale, rotate, and define the 3D perspective view of
almost any DOM element [155].
C.1. 3D WEB TECHNOLOGIES 271
C.1.5 3D Markup Language for the Web (3DMLW)
3D Markup Language for the Web (3DMLW) is an open source XML-based
language for integrating 2D and 3D dynamic scenes into web pages. The render
used by the technology is based on the OpenGL graphics library. Programmers
can use the Lua scripting language [274], to control and animate the 3D scenes.
Plug-ins are needed for different web browsers in order for 3DMLW material to be
executed [312]. The technology is now deprecated.
C.1.6 Java 3D and Java OpenGL (JOGL)
Java3D is a runtime scene graph 3D API bindings for both OpenGL library (all
Operating Systems) and DirectX library (only Microsoft OS). Java3D integrated
VRML/X3D into Java applets that would be run on the client side. Sun (the company
of Java language before it was bought by Adobe) stopped supporting the development
of Java3D in mid-2003 and it became afterwards a community-driven open source
project. In 2012, Java3D became Java OpenGL (JOGL) a low level binding to
the OpenGL library [312]. All Java 3D technologies can be integrated on the web
browser side via Java applets. Unfortunately. Java applets’ usage in web browsers is
deprecated now.
C.1.7 O3D and Oak3D
O3D
O3D [171, 312] is a Google open source project. In its initial versions, O3D required
a plug-in to be installed in the web browser. O3D is JavaScript API that allows
programmers to create 3D interactive content on the web. It takes advantage of
hardware accelerated graphics and supports advanced rendering capabilities. O3D
code can be edited in real-time. Recent implementations of the framework [171]
utilise WebGL and thus do not require any plug-in.
272 APPENDIX C. - 3D WEB TECHNOLOGIES
Oak3D
Oak3D [295] is an open source JavaScript framework for creating interactive Web3D
applications with GPU acceleration. Oak3D runs on top of WebGL and thus do not
require any plug-in to be installed. The framework provides many libraries helping
developers in many tasks needed for 3D applications such as Math operations, and
skeletal animations among many others.
C.1.8 PDF3D
PDF3D a.k.a 3D PDF is integrating a 3D model into a Portable Document Format
(PDF) file [347]. PDF documents are widely used across many disciplines which
makes them attractive for sharing information and 3D models across the web,
mobile devices and desktop platforms. All the user needs to do in order to view PDF
documents is to install a free software such as Acrobat Reader which installs also
many plug-ins for web browsers.
According to the PDF specification [5], the supported 3D model file types which can
be integrated into PDF documents across all versions of Acrobat Reader, are the
Universal 3D (U3D) file format and the Adobe PRC file format. Once a 3D model is
embedded into a PDF document, the Adobe PDF engine provides basic interaction
tasks such as zooming in and out, panning and rotating the 3D model. 3D PDFs can
be manipulated via JavaScript as shown in this example [264], in addition, models
can be manipulated through many APIs in other programming languages.
Any 3D model of a file type different than U3D has to be transformed into U3D in
order for it to be embedded into the PDF. This can be done via applications such as
Meshlab [81] or the paid version of Acrobat Reader DC Pro.
PDF3D are used commonly in anatomical and biological studies. An example of such
usage is the work of Mavar-Haramija et al. [264] who created presentation tools
that produce interactive PDF documents containing embryonic craniofacial models
(reconstructed from historical section images). The tools utilised the JavaScript API
to provide the ability to highlight points of main interest on the 3D models.
There are few examples of the usage of PDF3D in Digital Heritage applications [179,
315] and in Virtual Museums [249].

C.1. 3D WEB TECHNOLOGIES 273
The author of this thesis have created a blog article [29] that teaches users how to
embed a 3D model into an Adobe PDF document via the LaTeX system. This allows
them to host 3D models via PDF online.
C.1.9 Web-Generated Builds from Traditional Game Engines
Unity 3D and Unreal are two of the most popular game engines. They can export
web builds of games and 3D worlds to different platforms such as mobile devices,
game consoles, and smart TVs. They can also generate 3D worlds and games that
can work using bespoke web browser plug-ins or WebGL. Recently, all these game
engines dropped the web browser plug-in solution in favour of supporting only a
WebGL build.
Unity 3D Engine
Unity3D [410] supports the development of 2D, 3D, VR, AR games and environments.
The game engine is quite known in the game and film industry due its astonishing
graphics, advanced lighting and shadows, particle systems and its powerful physics
engine. Unity is a game engine that adopt the philosophy of “develop once run
everywhere” in the sense of giving the ability to developers to export their games
and 3D environments into many platforms including WebGL. Unity uses the C#
language as a main development language.
CyArk [96], an organisation that aims to document and digitise the most endangered
world’s heritage sites, has a 3D archive containing many WebGL builds exported
from the Unity 3D game engine.
There are also many examples of DH applications and WBVWs that have used Unity
3D game engine. The interested reader could check the works of Giles et al. [164],
Kiourt et al. [222], Koller et al. [226], Pecchioli et al. [316], Agugiaro et al. [7],
Alatalo et al. [12] and of course the work in Chapter 4.
Unreal Engine
Unreal Engine [85] is developed by Epic Games. It is written in C++ and uses the
language as the main game programming language. The Blueprint visual coding
274 APPENDIX C. - 3D WEB TECHNOLOGIES
language was created to facilitate access to a wider community of developers.
Blueprint helps developers write complex games without even writing a single line of
C++ code. Unreal engine games and 3D worlds can be exported as a WebGL builds
which allow them to be run in web browsers without the installation of plug-ins.
C.2 Web-Based Virtual Worlds
KataSpace: Kataspace [216] is an open source multi-user 3D WBVW which runs
on top of WebGL via the Kata JS library. KataSpace is built using the Sirikata
MUVW.
Virtual World Framework (VWF): [417] is a governmental project for the US
secretary of defence. It allows the creation of 3D multi-user networked WBVWs
via technologies such WebGL, WebRTC and WebSockets. It is an open source
platform written in JavaScript (Node JS) and Ruby.
3D Web technologies play a main role in bringing the 3rd dimension to the web. In
order to further our understanding of the way these technologies are classified into
different diversified categories, we contribute several taxonomies obtained from
surveying the literature of 3D Web technologies. The following section elucidates
these taxonomies.
C.3 Taxonomies and Classifications of the 3D Web
This work contributes to the literature by proposing taxonomies or classifications
based on four dimensions of 3D Web tools and languages (Language Paradigm,
Installation and Deployment, Rendering mode and Use case). In addition, a fifth
taxonomy [207] found already in the literature that states the myriad user interaction
modes in 3D Web avatar-based environments is also elucidated.
The term “taxonomy” is used to denote the branch of science concerned with
classification [282]. The Cambridge Online English dictionary defines a taxonomy
as “a system for naming and organizing things, ... into groups that share similar
qualities” [67].

C.3. TAXONOMIES AND CLASSIFICATIONS OF THE 3D WEB 275
The act of classifying the literature or creating taxonomies is a very useful research
outcome since it sheds the lights on the many similarities and differences of
technologies and systems and help in grouping them under categories.
A language paradigm taxonomy of 3D Web technologies is presented in Ap-
pendix C.3.1, it divides the technologies under three overarching categories: the
declarative paradigm, the imperative paradigm and the mixed paradigm of both
imperative and declarative. The section also presents few examples from the
literature. Appendix C.3.2 presents a second taxonomy based on installation
and deployment processes of the myriad 3D Web technologies or the resulting
environments from these technologies. Appendix C.3.3 is a rendering taxonomy
where it situates and classifies 3D Web systems based on the location of where the
rendering process is executed. Appendix C.3.4 is a use case taxonomy classifying the
different uses found in the literature of the 3D Web. Finally, Appendix C.3.5 presents
Jankowski [207] taxonomy on user interaction mode found in 3D Web systems.
C.3.1 Language Paradigm Taxonomy
Programming languages of the 3D Web are divers and have been improving since
VRML. They can be classified under three categories: Declarative, Imperative and
Mixed.
A declarative paradigm of 3D Web languages involves the code being part of the
HTML document and integrated into Document Object Mode (DOM) of web page
code. The 3D graphics programmer expresses what the outcome of the 3D scene or
model will be (especially based on the concept of scene graph) instead of the step
by step procedure of how the 3D scene will be constructed. The majority of these
languages are based on using tags and attributes usually using XML-based schemas.
The advantages of the declarative paradigm in 3D Web development is the fact that
this paradigm facilitates development and takes less time to create 3D scenes [248],
while the disadvantages are that such languages tend to be overly verbose and less
powerful than their counterpart in the imperative camp.
The Imperative paradigm of languages also known as “procedural paradigm”
constitutes the dominant old school paradigm in the history of computing. The idea
of imperative paradigm is to give machines sequential instructions to be executed
or a series of statements that change the program state. WebGL [221] is the major
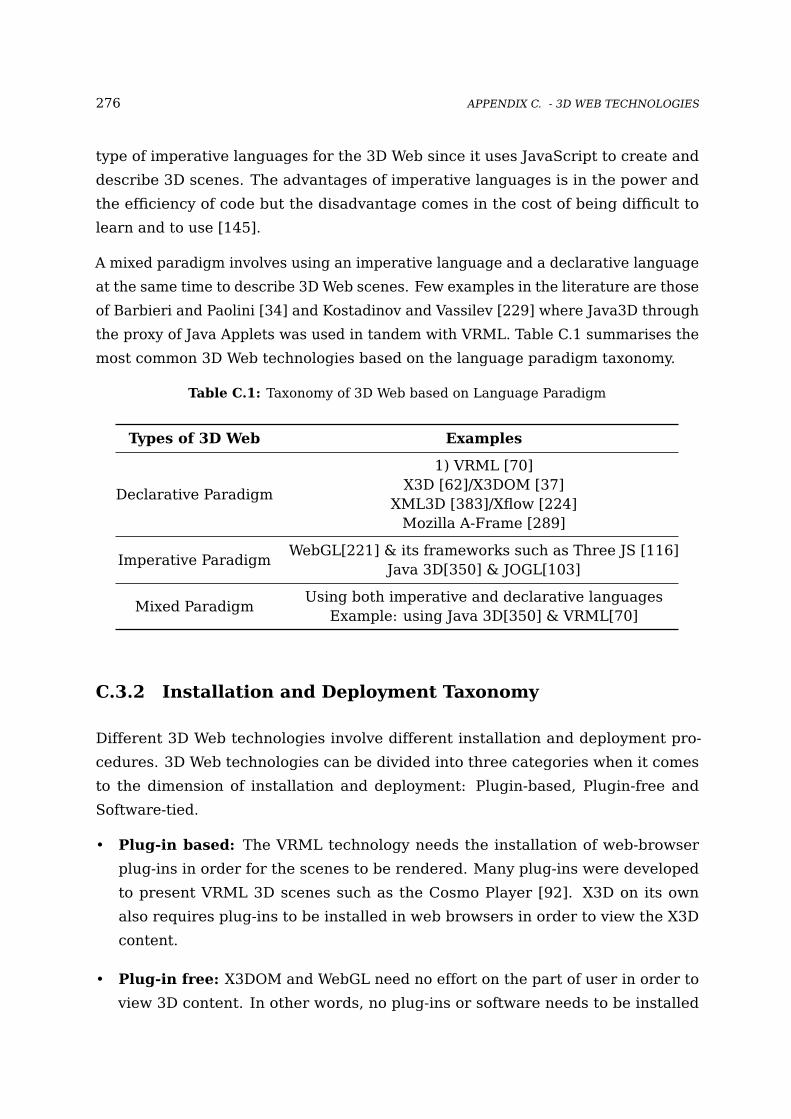
276 APPENDIX C. - 3D WEB TECHNOLOGIES
type of imperative languages for the 3D Web since it uses JavaScript to create and
describe 3D scenes. The advantages of imperative languages is in the power and
the efficiency of code but the disadvantage comes in the cost of being difficult to
learn and to use [145].
A mixed paradigm involves using an imperative language and a declarative language
at the same time to describe 3D Web scenes. Few examples in the literature are those
of Barbieri and Paolini [34] and Kostadinov and Vassilev [229] where Java3D through
the proxy of Java Applets was used in tandem with VRML. Table C.1 summarises the
most common 3D Web technologies based on the language paradigm taxonomy.
Table C.1: Taxonomy of 3D Web based on Language Paradigm
Types of 3D Web Examples
Declarative Paradigm
1) VRML [70]X3D [62]/X3DOM [37]
XML3D [383]/Xflow [224]Mozilla A-Frame [289]
Imperative ParadigmWebGL[221] & its frameworks such as Three JS [116]
Java 3D[350] & JOGL[103]
Mixed ParadigmUsing both imperative and declarative languages
Example: using Java 3D[350] & VRML[70]
C.3.2 Installation and Deployment Taxonomy
Different 3D Web technologies involve different installation and deployment pro-
cedures. 3D Web technologies can be divided into three categories when it comes
to the dimension of installation and deployment: Plugin-based, Plugin-free and
Software-tied.
• Plug-in based: The VRML technology needs the installation of web-browser
plug-ins in order for the scenes to be rendered. Many plug-ins were developed
to present VRML 3D scenes such as the Cosmo Player [92]. X3D on its own
also requires plug-ins to be installed in web browsers in order to view the X3D
content.
• Plug-in free: X3DOM and WebGL need no effort on the part of user in order to
view 3D content. In other words, no plug-ins or software needs to be installed
C.3. TAXONOMIES AND CLASSIFICATIONS OF THE 3D WEB 277
on the user’ machine in order to consume Web3D applications. WebGL [221] is
supported by default in all major web browsers.
• Software-tied are 3D Web technologies where no plug-in is required in web
browsers but a software or toolkit needs to be installed or to be available on
the user’ machine outside the web browser ecosystem. One example from the
literature is that of Jara et al. [209] system which works on Java technologies
such as JOGL and thus requires the Java Virtual Machine to be installed in order
for the system to work but the system works over WebGL so no need for a web
browser plug-in to be installed.
C.3.3 Rendering Taxonomy
Rendering the 3D scene can happen on the client side, or on server side or can be
distributed between the client and the server.
• Browser-Based Rendering or Client Side Rendering: In this scenario, web
browsers play the role of 3D graphics fat client software meaning the rendering
completely happens on the client side (i.e. the web browser).
• Remote Rendering or Server Side Rendering: Remote rendering as a
technique allows the streaming of large 3D scenes on a myriad of end devices
where the rendering process happens on the server side. In remote based
rendering, the rendering burden is taken from the client side. Remote rendering
utilises the server processing muscles (i.e. the server GPU and CPU) to do the
rendering and not those of the client machine. Remote rendering is used as a
solution to adapting 3D Web content and is explained in detail in Section 2.6.2.1.
• Mixed Rendering: Part of the processes of the rendering occur on the client
side (i.e. the web browser) and other intensive processes occur on the server
side. One example from the literature is that of Santos et al. [352] system which
generates the local views on the client side while the actual scene rendering
remains on the server side.
278 APPENDIX C. - 3D WEB TECHNOLOGIES
C.3.4 Use Case Taxonomy
The academic literature on 3D Web usage has revealed the emergence of several
use case modalities that used to require from users in the past to download and
install a separate software for the tasks they solve. The taxonomy presented here is
a taxonomy of use cases, meaning it deals with what 3D Web tools and languages
are capable of doing for users (things that used to require in the past installing a
fully-fledged fat software on desktop machines).
The use cases in this section form a quick cursory review out of a large number
of use cases that could be found in the literature where the 3D Web plays the role
of Software as a Service. Per instance: 3D Modelling can be done now in a web
browser via WebGL while in the past users needed to install a desktop software such
as Blender or a complex CAD system in order to do the modelling. The following
present a few of the use cases of the 3D Web extracted from the literature.
C.3.4.1 3D Modelling on the Web
3D modelling is now a reality with integrated development environment on the web.
As an example, Agenjo et al. [6] presented a WebGL editor called WebGL studio, an
open source 3D graphics editor which allows editing 3D models directly inside the
web browser. A prototypical mobile app for searching for shapes or 3D models via
snapshots was also developed.
There are also many CAD tools developed with WebGL in the literature. One example
is that of Xu et al. [434] who created a Web3D visualization CAD tool for visualising
and edition Building Information Modeling (BIM) models in web browsers via WebGL.
C.3.4.2 3D Printing and Digitising on the Web
The web is becoming a hospitable environment to a lot of services pertaining to
3D hardware pipeline such as 3D Printing tools. Examples in this category would
be shapeways [365]. Many on-line 3D Scanning and Photogrammetry tools that
facilitate 3D reconstructions of actual real objects are now available on the web via
services such as Autodesk Recap [25] and simscale [372].
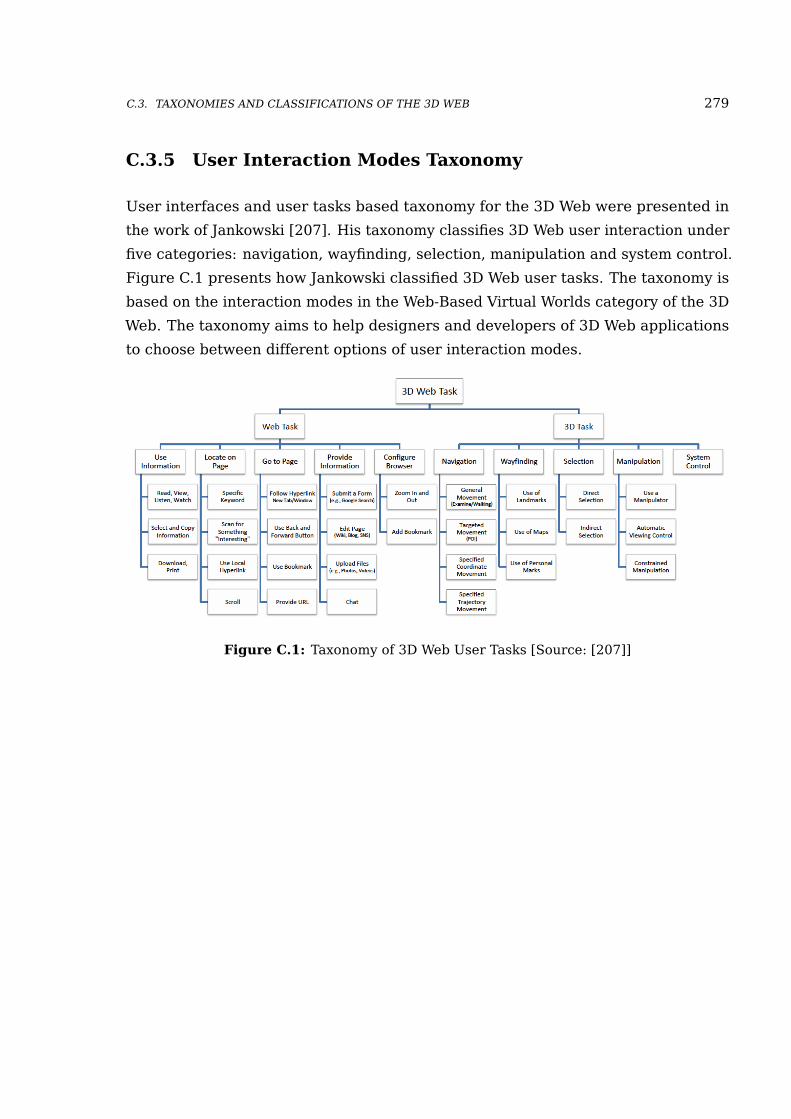
C.3. TAXONOMIES AND CLASSIFICATIONS OF THE 3D WEB 279
C.3.5 User Interaction Modes Taxonomy
User interfaces and user tasks based taxonomy for the 3D Web were presented in
the work of Jankowski [207]. His taxonomy classifies 3D Web user interaction under
five categories: navigation, wayfinding, selection, manipulation and system control.
Figure C.1 presents how Jankowski classified 3D Web user tasks. The taxonomy is
based on the interaction modes in the Web-Based Virtual Worlds category of the 3D
Web. The taxonomy aims to help designers and developers of 3D Web applications
to choose between different options of user interaction modes.
Figure C.1: Taxonomy of 3D Web User Tasks [Source: [207]]

DAppendix D
Appendix D - WebGLBenchmark
D.1 WebGL Benchmark across 18 devices
281
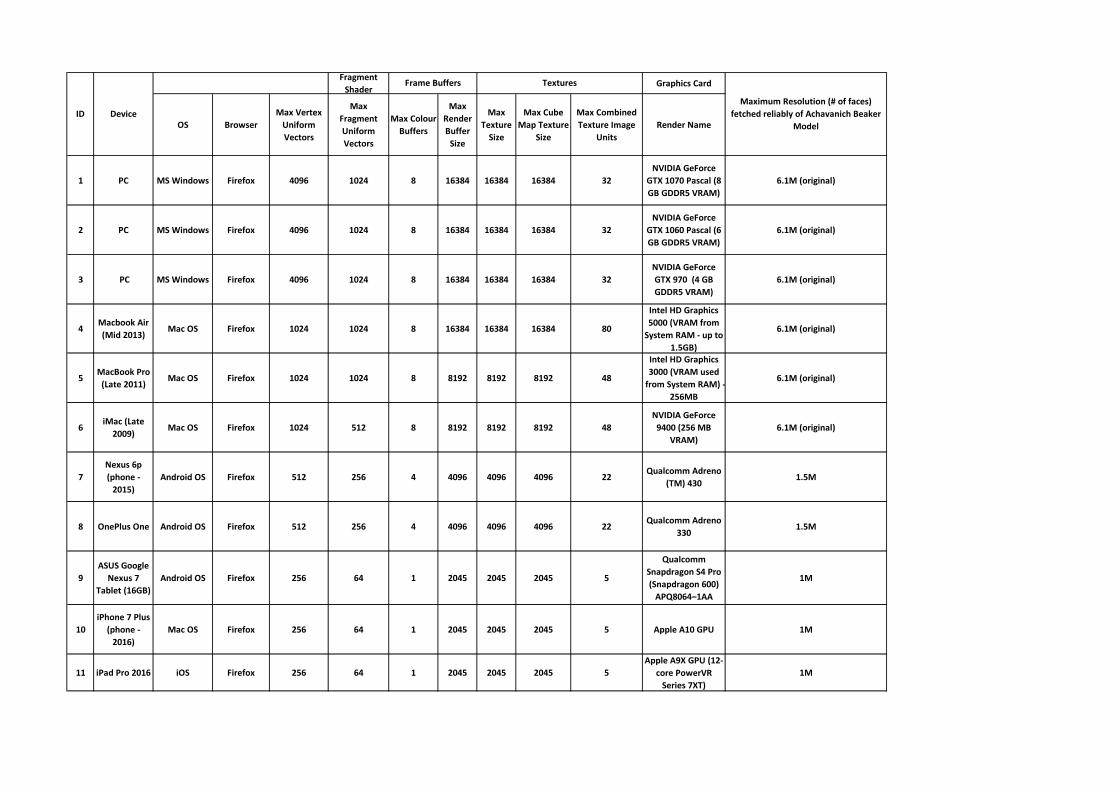
Fragment
ShaderGraphics Card
OS Browser
Max Vertex
Uniform
Vectors
Max
Fragment
Uniform
Vectors
Max Colour
Buffers
Max
Render
Buffer
Size
Max
Texture
Size
Max Cube
Map Texture
Size
Max Combined
Texture Image
Units
Render Name
1 PC MS Windows Firefox 4096 1024 8 16384 16384 16384 32
NVIDIA GeForce
GTX 1070 Pascal (8
GB GDDR5 VRAM)
6.1M (original)
2 PC MS Windows Firefox 4096 1024 8 16384 16384 16384 32
NVIDIA GeForce
GTX 1060 Pascal (6
GB GDDR5 VRAM)
6.1M (original)
3 PC MS Windows Firefox 4096 1024 8 16384 16384 16384 32
NVIDIA GeForce
GTX 970 (4 GB
GDDR5 VRAM)
6.1M (original)
4Macbook Air
(Mid 2013)Mac OS Firefox 1024 1024 8 16384 16384 16384 80
Intel HD Graphics
5000 (VRAM from
System RAM - up to
1.5GB)
6.1M (original)
5MacBook Pro
(Late 2011)Mac OS Firefox 1024 1024 8 8192 8192 8192 48
Intel HD Graphics
3000 (VRAM used
from System RAM) -
256MB
6.1M (original)
6iMac (Late
2009)Mac OS Firefox 1024 512 8 8192 8192 8192 48
NVIDIA GeForce
9400 (256 MB
VRAM)
6.1M (original)
7
Nexus 6p
(phone -
2015)
Android OS Firefox 512 256 4 4096 4096 4096 22Qualcomm Adreno
(TM) 4301.5M
8 OnePlus One Android OS Firefox 512 256 4 4096 4096 4096 22Qualcomm Adreno
3301.5M
9
ASUS Google
Nexus 7
Tablet (16GB)
Android OS Firefox 256 64 1 2045 2045 2045 5
Qualcomm
Snapdragon S4 Pro
(Snapdragon 600)
APQ8064–1AA
1M
10
iPhone 7 Plus
(phone -
2016)
Mac OS Firefox 256 64 1 2045 2045 2045 5 Apple A10 GPU 1M
11 iPad Pro 2016 iOS Firefox 256 64 1 2045 2045 2045 5
Apple A9X GPU (12-
core PowerVR
Series 7XT)
1M
Maximum Resolution (# of faces)
fetched reliably of Achavanich Beaker
Model
ID Device
Frame Buffers Textures
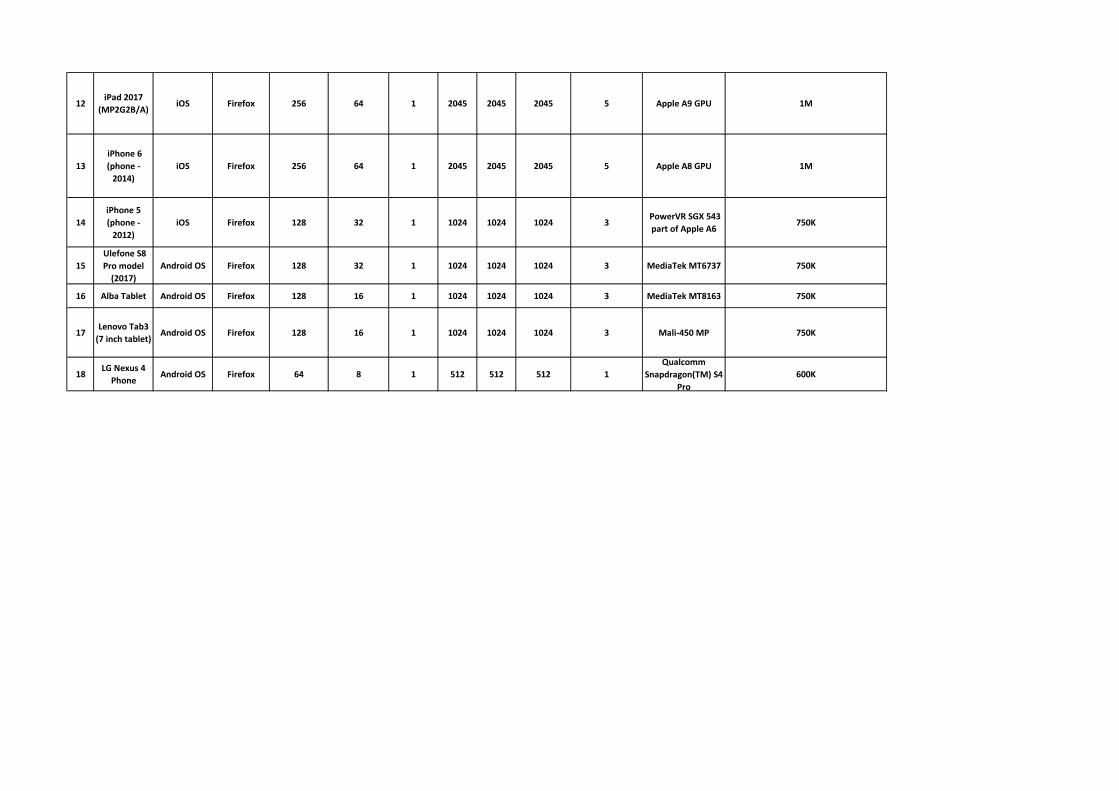
12iPad 2017
(MP2G2B/A)iOS Firefox 256 64 1 2045 2045 2045 5 Apple A9 GPU 1M
13
iPhone 6
(phone -
2014)
iOS Firefox 256 64 1 2045 2045 2045 5 Apple A8 GPU 1M
14
iPhone 5
(phone -
2012)
iOS Firefox 128 32 1 1024 1024 1024 3 PowerVR SGX 543
part of Apple A6 750K
15
Ulefone S8
Pro model
(2017)
Android OS Firefox 128 32 1 1024 1024 1024 3 MediaTek MT6737 750K
16 Alba Tablet Android OS Firefox 128 16 1 1024 1024 1024 3 MediaTek MT8163 750K
17Lenovo Tab3
(7 inch tablet)Android OS Firefox 128 16 1 1024 1024 1024 3 Mali-450 MP 750K
18LG Nexus 4
PhoneAndroid OS Firefox 64 8 1 512 512 512 1
Qualcomm
Snapdragon(TM) S4
Pro
600K

References
[1] 3DLirious, LLC. MeshLabXML a Python scripting interface to MeshLab. 2016.
url: https://github.com/3DLIRIOUS/MeshLabXML (visited on 06/27/2019).
[2] Dante Abate, Roberto Ciavarella, Graziano Furini, Guido Guarnieri, Silvio
Migliori, and Samuele Pierattini. “3D Modeling and Remote Rendering
Technique of a High Definition Cultural Heritage Artefact”. In: Procedia
Computer Science 3 (2011), pp. 848–852.
[3] Adobe. Adobe Flash PLayer. 1996. url: https : / / www . adobe . com / uk /
products/flashplayer.html (visited on 06/27/2019).
[4] Adobe. Adobe will finally kill Flash in 2020. 2017. url: https : / / www .
theverge.com/2017/7/25/16026236/adobe-flash-end-of-support-2020
(visited on 06/27/2019).
[5] Adobe. “Document management—Portable Document 493 Format—Part 1:
PDF 1.7”. In: (2008).
[6] Javi Agenjo, Alun Evans, and Josep Blat. “WebGLStudio: a pipeline for WebGL
scene creation”. In: Proceedings of the 18th International Conference on 3D
Web Technology. ACM. 2013, pp. 79–82.
[7] Giorgio Agugiaro, Fabio Remondino, G Girardi, J Von Schwerin, Heather
Richards-Rissetto, and R De Amicis. “A Web-Based Interactive Tool for Multi-
Resolution 3D Models of a Maya Archaeological Site”. In: Proceedings of the
4th ISPRS International Workshop 3D-ARCH. Vol. 2011. 2011, p. 3D.
[8] Marco Agus, Fabio Marton, Fabio Bettio, Markus Hadwiger, and Enrico Gob-
betti. “Data-Driven Analysis of Virtual 3D Exploration of a Large Sculpture
Collection in Real-World Museum Exhibitions”. In: Journal on Computing and
Cultural Heritage (JOCCH) 11.1 (2017), p. 2.
[9] Tomas Akenine-Moller, Eric Haines, and Naty Hoffman. Real-time rendering.
AK Peters/CRC Press, 2008.
285
286 REFERENCES
[10] Sultana Lubna Alam, John Campbell, et al. “Crowdsourcing motivations
in a not-for-profit GLAM context: the Australian newspapers digitisation
program”. In: Australasian Conference on Information Systems. 2012.
[11] Toni Alatalo, Timo Koskela, Matti Pouke, Paula Alavesa, and Timo Ojala.
“VirtualOulu: Collaborative, Immersive and Extensible 3D City Model on
the Web”. In: Proceedings of the 21st International Conference on Web3D
Technology. Web3D ’16. Anaheim, California: ACM, 2016, pp. 95–103. isbn:
978-1-4503-4428-9. doi: 10.1145/2945292.2945305. url: http://doi.acm.
org/10.1145/2945292.2945305.
[12] Toni Alatalo, Matti Pouke, Timo Koskela, Tomi Hurskainen, Ciprian Florea,
and Timo Ojala. “Two Real-world Case Studies on 3D Web Applications for
Participatory Urban Planning”. In: Proceedings of the 22Nd International
Conference on 3D Web Technology. Web3D ’17. Brisbane, Queensland,
Australia: ACM, 2017, 11:1–11:9. isbn: 978-1-4503-4955-0. doi: 10.1145/
3055624.3075950. url: http://doi.acm.org/10.1145/3055624.3075950.
[13] Heike C Alberts and Helen D Hazen. “Maintaining authenticity and integrity
at cultural world heritage sites”. In: Geographical Review 100.1 (2010),
pp. 56–73. doi: 10.1111/j.1931-0846.2010.00006.x. eprint: https://
onlinelibrary.wiley.com/doi/pdf/10.1111/j.1931-0846.2010.00006.
x. url: https://onlinelibrary.wiley.com/doi/abs/10.1111/j.1931-
0846.2010.00006.x.
[14] Edward P Alexander, Mary Alexander, and Juilee Decker. Museums in
motion: An introduction to the history and functions of museums. Rowman &
Littlefield, 2017.
[15] Colin Allison and Hussein Bakri. “How the Web was Won: Keeping the
computer networking curriculum current with HTTP/2”. In: 2015 IEEE
Frontiers in Education Conference (FIE). IEEE. Oct. 2015, pp. 1–9. doi:
10.1109/FIE.2015.7344059.
[16] Bashar Alsadik. “Crowdsource and web-published videos for 3D documenta-
tion of cultural heritage objects”. In: Journal of Cultural Heritage 21 (2016),
pp. 899–903. issn: 1296-2074. doi: https://doi.org/10.1016/j.culher.
2016.03.010.
[17] Glen Anderson, Rina Doherty, and Subhashini Ganapathy. “User Perception
of Touch Screen Latency”. In: International Conference of Design, User
Experience, and Usability. Springer. 2011, pp. 195–202.
REFERENCES 287
[18] Android Central. Photo Sphere. 2016. url: https://www.androidcentral.
com/photo-sphere (visited on 06/27/2019).
[19] Joni Anttila et al. “Creating room designer proof of concept with Three JS”.
In: (2017).
[20] app.telemetry. app.telemetry Page Speed Monitor. 2012. url: https://
addons.mozilla.org/en-US/firefox/addon/apptelemetry/ (visited on
06/27/2019).
[21] Matt Aranha, Piotr Dubla, Kurt Debattista, Thomas Bashford-Rogers, and
Alan Chalmers. “A Physically-based Client-server Rendering Solution for
Mobile Devices”. In: Proceedings of the 6th International Conference on
Mobile and Ubiquitous Multimedia. MUM ’07. Oulu, Finland: ACM, 2007,
pp. 149–154. isbn: 978-1-59593-916-6. doi: 10.1145/1329469.1329489. url:
http://doi.acm.org/10.1145/1329469.1329489.
[22] Regina B Araujo, Fabio M Iwasaki, Ednaldo B Pizzolato, and Azzedine
Boukerche. “Framework for 3D web-based visualization of HLA-compliant
simulations”. In: Proceedings of the 13th International Symposium on 3D
Web Technology. ACM. 2008, pp. 83–90.
[23] Emmanuel N Arinze. “The role of the museum in society”. In: Lecture
delivered at the National Museum, Georgetown, Guyana 17 (1999).
[24] Maria José Aurindo and Conceição Machado. “MUVITUR®(virtual museum
of tourism): a new approach to tourism history”. In: Journal of Tourism
History 8.3 (2016), pp. 300–309. doi: 10.1080/1755182X.2017.1288763.
eprint: https://doi.org/10.1080/1755182X.2017.1288763. url: https:
//doi.org/10.1080/1755182X.2017.1288763.
[25] Autodesk, Inc. Recap Autodesk tool. 2008. url: https://www.autodesk.co.
uk/products/recap/overview (visited on 06/27/2019).
[26] Felipe Bacim, Nicholas Polys, Jian Chen, Mehdi Setareh, Ji Li, and Lee Ma.
“Cognitive Scaffolding in Web3D Learning Systems: a case study for form
and structure”. In: Proceedings of the 15th International Conference on Web
3D Technology. ACM. 2010, pp. 93–100.
[27] Antonio Baglivo, Francesca Delli Ponti, Daniele De Luca, Antonella Guidazzoli,
Maria Chiara Liguori, and Bruno Fanini. “X3D/X3DOM, Blender Game
Engine and OSG4WEB: Open Source Visualisation for Cultural Heritage
288 REFERENCES
Environments”. In: Digital Heritage International Congress (DigitalHeritage),
2013. Vol. 2. IEEE. 2013, pp. 711–718.
[28] Hussein Bakri, Alan Miller, and Iain Oliver. “Fidelity Perception of 3D Models
on the Web”. In: Immersive Learning Research Network. Cham: Springer
International Publishing, 2018, pp. 113–130. isbn: 978-3-319-93596-6.
[29] Hussein Bakri. How to embed Interactive 3D Models, Movies and Sound
clips into a PDF via LaTeX? 2018. url: http://husseinbakri.org/how-to-
embed-interactive-3d-models-movies-and-sound-clips-into-a-pdf-
via-latex/ (visited on 06/27/2019).
[30] Hussein Bakri and Colin Allison. “Measuring QoS in Web-based Virtual
Worlds: An Evaluation of Unity 3D Web Builds”. In: Proceedings of the 8th
International Workshop on Massively Multiuser Virtual Environments. MMVE
’16. Klagenfurt, Austria: ACM, 2016, 1:1–1:6. isbn: 978-1-4503-4358-9. doi:
10.1145/2910659.2910660. url: http://doi.acm.org/10.1145/2910659.
2910660.
[31] Hussein Bakri, Colin Allison, Alan Miller, and Iain Oliver. “HTTP/2 and
QUIC for Virtual Worlds and the 3D Web?” In: Procedia Computer Science
56 (2015). The 10th International Conference on Future Networks and
Communications (FNC 2015) / The 12th International Conference on Mobile
Systems and Pervasive Computing (MobiSPC 2015) Affiliated Workshops,
pp. 242–251. issn: 1877-0509. doi: https://doi.org/10.1016/j.procs.
2015.07.204. url: http://www.sciencedirect.com/science/article/
pii/S1877050915016853.
[32] Hussein Bakri, Colin Allison, Alan Miller, and Iain Oliver. “Virtual Worlds
and the 3D Web – Time for Convergence?” In: Immersive Learning Research
Network. Cham: Springer International Publishing, 2016, pp. 29–42. isbn:
978-3-319-41769-1.
[33] Hynek Bakstein and Tomas Pajdla. “Visual Fidelity of Image Based Ren-
dering”. In: Center for Machine Perception, Czech Technical University,
Proceedings of the Computer Vision, Winter (2004).
[34] Thimoty Barbieri and Paolo Paolini. “Reconstructing Leonardo’s Ideal City
- From Handwritten Codexes to Webtalk-II: A 3D Collaborative Virtual
Environment System”. In: Proceedings of the 2001 Conference on Virtual
Reality, Archeology, and Cultural Heritage. VAST ’01. Glyfada, Greece: ACM,
REFERENCES 289
2001, pp. 61–66. isbn: 1-58113-447-9. doi: 10.1145/584993.585003. url:
http://doi.acm.org/10.1145/584993.585003.
[35] Richard Beacham, Hugh Denard, and Francesco Niccolucci. “An Introduction
to the London Charter”. In: Joint Event CIPA/VAST/EG/EuroMed (2006).
[36] Beepa Pty Ltd. Fraps Real-time video capture and benchmarking. 1999. url:
http://www.fraps.com/ (visited on 06/27/2019).
[37] Johannes Behr, Peter Eschler, Yvonne Jung, and Michael Zöllner. “X3DOM:
A DOM-based HTML5/X3D Integration Model”. In: Proceedings of the 14th
International Conference on 3D Web Technology. Web3D ’09. Darmstadt,
Germany: ACM, 2009, pp. 127–135. isbn: 978-1-60558-432-4. doi: 10.1145/
1559764.1559784. url: http://doi.acm.org/10.1145/1559764.1559784.
[38] Johannes Behr, Max Limper, and Timo Sturm. “MoST: A 3D Web Architectural
Style for Hybrid Model Data”. In: Proceedings of the 23rd International ACM
Conference on 3D Web Technology. Web3D ’18. Poznan, Poland: ACM, 2018,
21:1–21:8. isbn: 978-1-4503-5800-2. doi: 10.1145/3208806.3208823. url:
http://doi.acm.org/10.1145/3208806.3208823.
[39] Tom Beigbeder, Rory Coughlan, Corey Lusher, John Plunkett, Emmanuel Agu,
and Mark Claypool. “The Effects of Loss and Latency on User Performance
in Unreal Tournament 2003®”. In: Proceedings of 3rd ACM SIGCOMM
Workshop on Network and System Support for Games. NetGames ’04.
Portland, Oregon, USA: ACM, 2004, pp. 144–151. isbn: 1-58113-942-X. doi:
10.1145/1016540.1016556. url: http://doi.acm.org/10.1145/1016540.
1016556.
[40] Emma Bell, Alan Bryman, and Bill Harley. Business research methods. Oxford
university press, 2018.
[41] René Berndt, Gerald Buchgraber, Sven Havemann, Volker Settgast, and
Dieter W Fellner. “A Publishing Workflow for Cultural Heritage Artifacts
from 3D-Reconstruction to Internet Presentation”. In: Euro-Mediterranean
Conference. Springer. 2010, pp. 166–178.
[42] Tim Berners-Lee and Dan Connolly. “Notation3 (N3): A readable RDF syntax”.
In: W3C team submission 28 (2011).
[43] Daniel Berthereau. Omeka Plugin - Europeana Element Set. 2015. url: https:
//github.com/Daniel-KM/Omeka-plugin-EuropeanaElementSet (visited
on 06/27/2019).

290 REFERENCES
[44] Ana Carolina Bertoletti, Marcia Cristina Moraes, and Antonio Carlos da Rocha
Costa. “Providing Personal Assistance in the SAGRES Virtual Museum”. In:
Museums and the Web (2001).
[45] Snig Bhaumik. Bootstrap Essentials. Packt Publishing Ltd, 2015.
[46] Daniel Biella, Wolfram Luther, and Nelson Baloian. “Beyond the ARCO stan-
dard”. In: Virtual Systems and Multimedia (VSMM), 2010 16th International
Conference on. IEEE. 2010, pp. 184–191.
[47] Daniel Biella, Wolfram Luther, and Nelson Baloian. “Virtual Museum Exhi-
bition Designer Using Enhanced ARCO Standard”. In: Chilean Computer
Science Society (SCCC), 2010 XXIX International Conference of the. IEEE.
2010, pp. 226–235.
[48] Daniel Biella, Wolfram Luther, and Daniel Sacher. “Schema migration into a
web-based framework for generating virtual museums and laboratories”.
In: Virtual Systems and Multimedia (VSMM), 2012 18th International
Conference on. IEEE. 2012, pp. 307–314.
[49] Daniel Biella, Thomas Pilz, Daniel Sacher, Benjamin Weyers, Wolfram Luther,
Nelson Baloian, and Tobias Schreck. “Crowdsourcing and Co-curation in
Virtual Museums: A Practice-driven Approach”. In: J. UCS 22.10 (2016),
pp. 1277–1297.
[50] Daniel Biella, Daniel Sacher, Benjamin Weyers, Wolfram Luther, Nelson
Baloian, and Tobias Schreck. “Crowdsourcing and Knowledge Co-creation in
Virtual Museums”. In: CYTED-RITOS International Workshop on Groupware,
Collaboration and Technology. Ed. by Nelson Baloian, Yervant Zorian, Perouz
Taslakian, and Samvel Shoukouryan. Springer International Publishing, 2015,
pp. 1–18. isbn: 978-3-319-22747-4.
[51] Ceri Binding, Keith May, and Douglas Tudhope. “Semantic interoperability in
archaeological datasets: Data mapping and extraction via the CIDOC CRM”.
In: International Conference on Theory and Practice of Digital Libraries.
Springer. 2008, pp. 280–290.
[52] Chris Bizer and Richard Cyganiak. “RDF 1.1 TriG”. In: W3C recommendation
110 (2014).
[53] Blender Foundation. Blender Python API Documentation. 2018. url: https:
//docs.blender.org/api/blender2.7/ (visited on 06/27/2019).
REFERENCES 291
[54] Adam Boduch, Jonathan Chaffer, and Karl Swedberg. Learning JQuery 3.
Packt Publishing Ltd, 2017.
[55] Wolfgang Böhler and Andreas Marbs. “3D Scanning and Photogrammetry for
Heritage Recording: A Comparison”. In: Proceedings of the 12th International
Conference on Geoinformatics. Gavle University Press, Sweden. 2004,
pp. 291–298.
[56] Marcello Bolognesi, Alessio Furini, Viviana Russo, Alberto Pellegrinelli, and
Paolo Russo. “Accuracy of cultural heritage 3D models by RPAS and terres-
trial photogrammetry”. In: The International Archives of Photogrammetry,
Remote Sensing and Spatial Information Sciences 40.5 (2014), p. 113.
[57] Florian Bösch. WebGL Stats Library. 2014. url: https://webglstats.com/
(visited on 06/27/2019).
[58] Jonathan P Bowen, Jim Bennett, and James Johnson. “Virtual visits to virtual
museums”. In: Museums and the Web. Vol. 98. 1998.
[59] Dan Brickley and Libby Miller. “FOAF Vocabulary Specification 0.99 (2014)”.
In: Namespace Document. Available online: http://xmlns. com/foaf/spec/
(2015).
[60] British Museum. The British Museum Sketchfab Repository. 2014. url: https:
//sketchfab.com/britishmuseum (visited on 06/27/2019).
[61] BrowserLeaks. BrowserLeaks - Web Browser Fingerprinting. 2011. url:
https://browserleaks.com/ (visited on 06/27/2019).
[62] Don Brutzman and Leonard Daly. X3D: extensible 3D graphics for Web
authors. Elsevier, 2010.
[63] George Ellis Burcaw. Introduction to museum work. Rowman Altamira, 1997.
[64] Ian S Burnett, Fernando Pereira, Rik Van de Walle, and Rob Koenen. The
MPEG-21 book. John Wiley & Sons, 2006.
[65] Rik Cabanier, Eliot Graff, Jay Munro, Tom Wiltzius, and I Hickson. “HTML
canvas 2D context”. In: W3C Candidate Recommendation (work in progress)
21 (2014).
[66] Marcio Cabral, Marcelo Zuffo, Silvia Ghirotti, Olavo Belloc, Leonardo No-
mura, Mario Nagamura, Fernanda Andrade, Regis Faria, and Leandro Ferraz.
“An experience using X3D for virtual cultural heritage”. In: Proceedings
of the twelfth international conference on 3D web technology. ACM. 2007,
pp. 161–164.

292 REFERENCES
[67] Cambridge University Press. Taxonomy definition. url: https://dictionary.
cambridge.org/dictionary/english/taxonomy (visited on 06/27/2019).
[68] Donald T Campbell and Julian C Stanley. Experimental and quasi-experimental
designs for research. Ravenio Books, 2015.
[69] Vitor Cardoso. “3D and the Web The last twenty years and the future”. In:
Sciences and Technologies of Interaction (2015).
[70] Rikk Carey and Gavin Bell. The Annotated VRML 2.0 Reference Manual.
Addison-Wesley, 1997.
[71] Gavin Carothers. “RDF 1.1 N-Quads: A line-based syntax for RDF datasets”.
In: W3C Recommendation 25 (2014).
[72] Marcello Carrozzino, Nicoletta Bruno, and Massimo Bergamasco. “Designing
interaction metaphors for Web3D cultural dissemination”. In: Journal of
Cultural Heritage 14.2 (2013), pp. 146–155.
[73] James D Carswell, Alan Eustace, Keith Gardiner, Eoin Kilfeather, and
Marco Neumann. “An Environment for Mobile Context-Based Hypermedia
Retrieval”. In: Database and Expert Systems Applications, 2002. Proceedings.
13th International Workshop on. IEEE. 2002, pp. 532–536.
[74] Sasko Celakovski and Danco Davcev. “Multiplatform Real-Time Rendering of
MPEG-4 3D Scenes With Microsoft XNA”. In: ICT Innovations 2009. Ed. by
Danco Davcev and Jorge Marx Gómez. Springer Berlin Heidelberg, 2010,
pp. 337–344.
[75] Ivana Cerato and Sofia Pescarin. “Reconstructing Past Landscapes for Virtual
Museums”. In: Good Practice in Archaeological Diagnostics: Non-invasive
Survey of Complex Archaeological Sites. Ed. by Cristina Corsi, Božidar
Slapšak, and Frank Vermeulen. Springer International Publishing, 2013,
pp. 285–296. isbn: 978-3-319-01784-6. doi: 10.1007/978-3-319-01784-
6_17. url: https://doi.org/10.1007/978-3-319-01784-6_17.
[76] Eugene Ch’ng, Shengdan Cai, Tong Evelyn Zhang, and Fui-Theng Leow.
“Crowdsourcing 3D Cultural Heritage: Best Practice for Mass Photogram-
metry”. In: Journal of Cultural Heritage Management and Sustainable
Development 9.1 (2019), pp. 24–42.
[77] Hung-Kuang Chen and Yung-Hung Chen. “Progressive Watermarking on
3D Meshes”. In: Broadband Multimedia Systems and Broadcasting (BMSB),
2010 IEEE International Symposium on. IEEE. 2010, pp. 1–7.
REFERENCES 293
[78] Beatrice Chiavarini, Maria Chiara Liguori, A Guidazzoli, L Verri, S Imboden,
and D De Luca. “On-Line Interactive Virtual Environments in Blend4web. the
Integration of Pre-Existing 3D Models in the MUVI-Virtual Museum of Daily
Life Project”. In: Proc. Electronic Imaging and the Visual Arts-EVA (2017),
pp. 117–124.
[79] Luca Chittaro, Roberto Ranon, and Lucio Ieronutti. “Guiding visitors of
Web3D worlds through automatically generated tours”. In: Proceedings of
the Eighth International Conference on 3D Web Technology. Web3D ’03.
Saint Malo, France: ACM, 2003, pp. 27–38. isbn: 1-58113-644-7. doi: 10.
1145/636593.636598. url: http://doi.acm.org/10.1145/636593.636598.
[80] E Ciabatti, Paolo Cignoni, Claudio Montani, and Roberto Scopigno. “Towards
a distributed 3D virtual museum”. In: Proceedings of the working conference
on Advanced visual interfaces. ACM. 1998, pp. 264–266.
[81] Paolo Cignoni, Marco Callieri, Massimiliano Corsini, Matteo Dellepiane,
Fabio Ganovelli, and Guido Ranzuglia. “Meshlab: An Open-Source Mesh
Processing Tool”. In: Eurographics Italian chapter conference. Vol. 2008.
2008, pp. 129–136.
[82] Mark Claypool and Kajal Claypool. “Latency Can Kill: Precision and Deadline
in Online Games”. In: Proceedings of the First Annual ACM SIGMM Confer-
ence on Multimedia Systems. MMSys ’10. Phoenix, Arizona, USA: ACM, 2010,
pp. 215–222. isbn: 978-1-60558-914-5. doi: 10.1145/1730836.1730863. url:
http://doi.acm.org/10.1145/1730836.1730863.
[83] CodyHouse. 360 degrees product viewer. 2016. url: https://github.com/
CodyHouse/360-degrees-product-viewer (visited on 06/27/2019).
[84] Learning Technology Standards Committee et al. “IEEE Standard for learning
object metadata”. In: IEEE Standard 1484.1 (2002), pp. 2007–04.
[85] Aram Cookson, Ryan DowlingSoka, and Clinton Crumpler. Unreal Engine
4 Game Development in 24 Hours, Sams Teach Yourself. Sams Publishing,
2016.
[86] Anthony Corns, Aaron Deevy, Gary Devlin, Louise Kennedy, and Robert Shaw.
“3D-ICONS: Digitizing Cultural Heritage Structures”. In: New Review of
Information Networking 20.1-2 (2015), pp. 59–65. doi: 10.1080/13614576.
2015 . 1115232. eprint: https : / / doi . org / 10 . 1080 / 13614576 . 2015 .
1115232. url: https://doi.org/10.1080/13614576.2015.1115232.
294 REFERENCES
[87] Corporation for Digital Scholarship. Omeka Digital Asset Management
System. 2008. url: http://omeka.org/ (visited on 06/27/2019).
[88] Corporation for Digital Scholarship. Omeka Item Types. 2008. url: https://
omeka.org/classic/docs/Content/Item_Types/ (visited on 06/27/2019).
[89] Corporation for Digital Scholarship. Omeka Plugin - Dublin Core Ex-
tended. 2009. url: https : / / omeka . org / classic / docs / Plugins /
DublinCoreExtended/ (visited on 06/27/2019).
[90] Corporation for Digital Scholarship. Omeka S Digital Asset Management
System. 2017. url: http://omeka.org/ (visited on 06/27/2019).
[91] Massimiliano Corsini, Elisa Drelie Gelasca, Touradj Ebrahimi, and Mauro
Barni. “Watermarked 3-D mesh quality assessment”. In: IEEE Transactions
on Multimedia 9.2 (2007), pp. 247–256.
[92] Cosmo. Cosmo VRML player. 1999. url: https : / / cosmo - player . en .
softonic.com/? (visited on 06/27/2019).
[93] Creative Commons Corporation. “Describing Copyright in RDF”. In: Creative
Commons (2013).
[94] Paul Crickard. Leaflet. js essentials. Packt Publishing Ltd, 2014.
[95] Giuseppe Cutrıé, Giuseppe Naccarato, and Eleonora Pantano. “Mobile
Cultural Heritage: the case study of Locri”. In: International Conference
on Technologies for E-Learning and Digital Entertainment. Springer. Berlin,
Heidelberg: Springer Berlin Heidelberg, 2008, pp. 410–420.
[96] CyArk. CyArk projects archive. 2003. url: https : / / www . cyark . org /
projects/ (visited on 06/27/2019).
[97] Richard Cyganiak, David Wood, Markus Lanthaler, Graham Klyne, Jeremy J
Carroll, and Brian McBride. “RDF 1.1 Concepts and Abstract Syntax”. In:
W3C recommendation 25.02 (2014).
[98] A. D’Andrea, F. Niccolucci, S. Bassett, and K. Fernie. “3D-ICONS: World
Heritage sites for Europeana: Making complex 3D models available to
everyone”. In: 2012 18th International Conference on Virtual Systems and
Multimedia. Sept. 2012, pp. 517–520. doi: 10.1109/VSMM.2012.6365966.
[99] Sumesh S Dadwal and Azizul Hassan. “The augmented reality marketing: A
merger of marketing and technology in tourism”. In: Mobile Computing and
Wireless Networks: Concepts, Methodologies, Tools, and Applications. IGI
Global, 2016, pp. 63–80.
REFERENCES 295
[100] Andrew Dalby. Language in danger: The loss of linguistic diversity and the
threat to our future. Columbia University Press, 2003.
[101] Michael D Danti. “Ground-based observations of cultural heritage incidents
in Syria and Iraq”. In: Near Eastern Archaeology 78.3 (2015), pp. 132–141.
[102] Khalid A Darabkh, Farah H Alturk, and Saadeh Z Sweidan. “VRCDEA-TCS:
3D virtual reality cooperative drawing educational application with textual
chatting system”. In: Computer Applications in Engineering Education 26.5
(2018), pp. 1677–1698.
[103] Gene Davis. Learning Java Bindings for OpenGL (JOGL). AuthorHouse, 2004.
[104] Jonathan Deber, Ricardo Jota, Clifton Forlines, and Daniel Wigdor. “How
Much Faster is Fast Enough?: User Perception of Latency & Latency
Improvements in Direct and Indirect Touch”. In: Proceedings of the 33rd
Annual ACM Conference on Human Factors in Computing Systems. CHI ’15.
Seoul, Republic of Korea: ACM, 2015, pp. 1827–1836. isbn: 978-1-4503-3145-
6. doi: 10.1145/2702123.2702300. url: http://doi.acm.org/10.1145/
2702123.2702300.
[105] Michael Deering. “Geometry Compression”. In: Proceedings of the 22Nd
Annual Conference on Computer Graphics and Interactive Techniques.
SIGGRAPH ’95. New York, NY, USA: ACM, 1995, pp. 13–20. isbn: 0-89791-
701-4. doi: 10.1145/218380.218391. url: http://doi.acm.org/10.1145/
218380.218391.
[106] Fabien Dekeyser, François Gaspard, M Florenzano, L De Luca, Xin Chen, and
Pascal Leray. “Cultural heritage recording with laser scanning, computer
vision and exploitation of architectural rules”. In: International Archives of
Photogrammetry Remote Sensing and Spatial Information Sciences 34.5/W12
(2003), pp. 145–149.
[107] Delight XR. Delight VR Video Operating System - One unified Video Infras-
tructure for regular, AR and VR Video. url: https://delight- vr.com/
(visited on 06/27/2019).
[108] M Dellepiane, F Niccolucci, S Pena Serna, H Rushmeier, L Van Gool, et
al. “WebGL-based streaming and presentation framework for bidirectional
texture functions”. In: The 12th International Symposium on Virtual Reality,
Archaeology and Cultural Heritage VAST (2011).
296 REFERENCES
[109] Serge Demeyer. “Research Methods in Computer Science”. In: ICSM. 2011,
p. 600.
[110] Hugh Denard. “A New Introduction to the London Charter”. In: Paradata and
transparency in virtual heritage. Routledge, 2016, pp. 83–98.
[111] Hugh Denard et al. “The London Charter for the Computer-Based Visualisa-
tion of Cultural Heritage”. In: no. February (2009), pp. 1–13.
[112] Caroline Desprat, Jean-Pierre Jessel, and Hervé Luga. “3DEvent: A Frame-
work Using Event-sourcing Approach for 3D Web-based Collaborative Design
in P2P”. In: Proceedings of the 21st International Conference on Web3D
Technology. Web3D ’16. Anaheim, California: ACM, 2016, pp. 73–76. isbn:
978-1-4503-4428-9. doi: 10.1145/2945292.2945310. url: http://doi.acm.
org/10.1145/2945292.2945310.
[113] Marco Di Benedetto, Federico Ponchio, Fabio Ganovelli, and Roberto
Scopigno. “SpiderGL: A JavaScript 3D Graphics Library for Next-generation
WWW”. In: Proceedings of the 15th International Conference on Web 3D
Technology. Web3D ’10. Los Angeles, California: ACM, 2010, pp. 165–174.
isbn: 978-1-4503-0209-8. doi: 10.1145/1836049.1836075. url: http://doi.
acm.org/10.1145/1836049.1836075.
[114] Michele D Dickey. “3D virtual worlds and learning: an analysis of the impact
of design affordances and limitations in active worlds, Blaxxun interactive,
and OnLive! traveler; and a study of the implementation of active worlds for
formal and informal education”. PhD thesis. The Ohio State University, 1999.
[115] Joachim Diepstraten, Martin Gorke, and Thomas Ertl. “Remote line rendering
for mobile devices”. In: Computer Graphics International, 2004. Proceedings.
IEEE. 2004, pp. 454–461.
[116] Jos Dirksen. Learning Three. js–the JavaScript 3D Library for WebGL. Packt
Publishing Ltd, 2015.
[117] Jozef Doboš, Kristian Sons, Dmitri Rubinstein, Philipp Slusallek, and Anthony
Steed. “XML3DRepo: A REST API for Version Controlled 3D Assets on the
Web”. In: Proceedings of the 18th International Conference on 3D Web
Technology. Web3D ’13. San Sebastian, Spain: ACM, 2013, pp. 47–55. isbn:
978-1-4503-2133-4. doi: 10.1145/2466533.2466537. url: http://doi.acm.
org/10.1145/2466533.2466537.
REFERENCES 297
[118] Gordana Dodig-Crnkovic. “Scientific Methods in Computer Science”. In:
Proceedings of the Conference for the Promotion of Research in IT at New
Universities and at University Colleges in Sweden, Skövde, Suecia. 2002,
pp. 126–130.
[119] Juergen Doellner, Benjamin Hagedorn, and Jan Klimke. “Server-based
Rendering of Large 3D Scenes for Mobile Devices Using G-buffer Cube
Maps”. In: Proceedings of the 17th International Conference on 3D Web
Technology. Web3D ’12. Los Angeles, California: ACM, 2012, pp. 97–100.
isbn: 978-1-4503-1432-9. doi: 10.1145/2338714.2338729. url: http://doi.
acm.org/10.1145/2338714.2338729.
[120] Federico Dossena. Self-hosted Speedtest. 2016. url: https://github.com/
adolfintel/speedtest (visited on 06/27/2019).
[121] Tony Driscoll, Suzanne Farhoud, Sean Nowling, et al. Enabling mobile
augmented and virtual reality with 5G networks. Tech. rep. Tech. Rep.,
Jan, 2017.
[122] Z. Du, P. Jaromersky, Y. J. Chiang, and N. Memon. “Out-of-Core Progressive
Lossless Compression and Selective Decompression of Large Triangle
Meshes”. In: 2009 Data Compression Conference. Mar. 2009, pp. 420–429.
doi: 10.1109/DCC.2009.73.
[123] Dublin Core Metadata Initiative. DC Metadata Element Set. 2012. url: http:
//www.dublincore.org/documents/dces/ (visited on 06/27/2019).
[124] Dublin Core Metadata Initiative. DCMI Metadata Terms. 2012. url: http:
//dublincore.org/documents/dcmi-terms/ (visited on 06/27/2019).
[125] Dublin Core Metadata Initiative. DCMI Vocabulary. 2012. url: http://www.
dublincore.org/specifications/dublin-core/dcmi-type-vocabulary/
(visited on 06/27/2019).
[126] Dublin Core Metadata Initiative. Dublin Core Metadata Initiative. 1995. url:
http://dublincore.org/ (visited on 06/27/2019).
[127] Dublin Core Metadata Initiative. Github official repository - User guide of
Dublin Core. 2011. url: https://github.com/dcmi/repository/blob/
master/mediawiki_wiki/User_Guide.md (visited on 06/27/2019).
[128] John Durkin and John Durkin. Expert systems: design and development.
Macmillan New York, 1994.
298 REFERENCES
[129] Will Eastcott, Dave Evans, Vaios Kalpias-Illias, Kevin Rooney, and Maksims
Mihejevs. PlayCanvas WebGL Game Engine. url: https://playcanvas.com/
(visited on 06/27/2019).
[130] Steve Easterbrook, Janice Singer, Margaret-Anne Storey, and Daniela
Damian. “Selecting Empirical Methods for Software Engineering Research”.
In: Guide to advanced empirical software engineering. Springer, 2008,
pp. 285–311.
[131] Karina Rodriguez Echavarria, Maria Theodoridou, Christos Georgis, David
Arnold, Martin Doerr, Andre Stork, and Sebastian Peña Serna. “Semantically
rich 3D documentation for the preservation of tangible heritage”. In:
Proceedings of the International Symposium on Virtual Reality, Archaeology
and Intelligent Cultural Heritage. 2012, pp. 041–048.
[132] Maria Economou. “Heritage in the Digital Age”. In: A companion to heritage
studies 15 (2015), pp. 215–228.
[133] Oche Ejembi and Saleem N Bhatti. “Client-side Energy Costs of Video
Streaming”. In: Data Science and Data Intensive Systems (DSDIS), 2015
IEEE International Conference on. IEEE. 2015, pp. 252–259.
[134] Renee Elio, Jim Hoover, Ioanis Nikolaidis, Mohammad Salavatipour, Lorna
Stewart, and Ken Wong. “About Computing Science Research Methodology”.
In: (2011).
[135] L Miguel Encarnacao, Yung-Yu Chuang, André Stork, Dave Kasik, Theresa-
Marie Rhyne, Lisa Avila, Jorn Kohlhammer, Joseph J LaViola, Melanie Tory,
John Dill, et al. “Future Directions in Computer Graphics and Visualization:
From CG&A’s Editorial Board”. In: IEEE Computer Graphics and Applications
35.1 (2015), pp. 20–32.
[136] Caroline Erolin, Matthew Jarron, and Laszlo J Csetenyi. “Zoology 3D:
Creating a digital collection of specimens from the D’Arcy Thompson Zoology
Museum”. In: Digital Applications in Archaeology and Cultural Heritage 7
(2017), pp. 51–55. issn: 2212-0548.
[137] EULAC. The European Union Latin America and Caribbean Museums
Sketchfab Repository. 2016. url: https://sketchfab.com/eu- lac- 3D
(visited on 06/27/2019).
[138] EULAC Foundation. Europe, Latin America and the Caribbean Museums.
2010. url: https://eulacfoundation.org/en (visited on 06/27/2019).

REFERENCES 299
[139] European Commission. 3D-ICONS - 3D Digitisation of Icons of European
Architectural and Archaeological Heritage. 2007. url: http://3dicons.ceti.
gr/ (visited on 06/27/2019).
[140] European Commission. The Irish Discovery Programme - 3D ICONS portal.
2013. url: http://www.3dicons.ie/3d-content (visited on 06/27/2019).
[141] Europeana Foundation. Data Model Documentation. 2009. url: http://pro.
europeana.eu/page/edm-documentation (visited on 06/27/2019).
[142] Europeana Foundation. Europeana Data Model Factsheet. 2009. url: https:
//pro.europeana.eu/files/Europeana_Professional/Share_your_
data/Technical_requirements/EDM_Documentation/EDM_Factsheet.pdf
(visited on 06/27/2019).
[143] Europeana Foundation. The Definition of the Europeana Data Model. 2017.
url: https : / / pro . europeana . eu / files / Europeana _ Professional /
Share_your_data/Technical_requirements/EDM_Documentation//EDM_
Definition_v5.2.8_102017.pdf (visited on 06/27/2019).
[144] Europeana Foundation. The Web Portal. 2008. url: http://www.europeana.
eu/portal/en (visited on 06/27/2019).
[145] Alun Evans, Marco Romeo, Arash Bahrehmand, Javi Agenjo, and Josep Blat.
“3D graphics on the web: A survey”. In: Computers & Graphics 41 (2014),
pp. 43–61.
[146] Naser Al-Falahy and Omar Y Alani. “Technologies for 5G Networks: Chal-
lenges and Opportunities”. In: IT Professional 19.1 (Jan. 2017), pp. 12–20.
issn: 1520-9202. doi: 10.1109/MITP.2017.9.
[147] Banafsheh M Farahani, Gelareh Abooali, and Badaruddin Mohamed. “George
Town World Heritage Site: What We Have and What We Sell?” In: Asian
Culture and History 4.2 (2012), p. 81.
[148] Felerminoali. Felerminoali PHP 5 expert system Github Repository. url:
https : / / github . com / felerminoali / ExpertSystemPHP (visited on
06/27/2019).
[149] Achille Felicetti and Matteo Lorenzini. “Metadata and Tools for Integration
and Preservation of Cultural Heritage 3D Information”. In: Geoinformatics
FCE CTU 6 (2011), pp. 118–124.
[150] Dieter Fensel. “Ontologies”. In: Ontologies. Springer, 2001, pp. 11–18.

300 REFERENCES
[151] Jon Ferraiolo, Fujisawa Jun, and Dean Jackson. Scalable Vector Graphics
(SVG) 1.0 Specification. iuniverse, 2000.
[152] Ian Fette and Alexey Melnikov. The WebSocket Protocol. RFC 6455. RFC
Editor, 2011. url: https://www.rfc-editor.org/rfc/rfc6455.txt.
[153] A. Fevgas, N. Fraggogiannis, P. Tsompanopoulou, and P. Bozanis. “The iMuse
Virtual Museum: towards a cultural education platform”. In: IISA 2014,
The 5th International Conference on Information, Intelligence, Systems and
Applications. July 2014, pp. 171–175. doi: 10.1109/IISA.2014.6878817.
[154] J. Flotynski, J. Dalkowski, and K. Walczak. “Building multi-platform 3D virtual
museum exhibitions with Flex-VR”. In: 2012 18th International Conference
on Virtual Systems and Multimedia. Sept. 2012, pp. 391–398. doi: 10.1109/
VSMM.2012.6365950.
[155] Ben Frain. Responsive Web Design With HTML5 and CSS3. Packt Publishing
Ltd, 2012.
[156] Fenella G France. “Best practice and standards in environmental preservation
for cultural heritage institutions: goals, knowledge, gaps”. In: Advances in
Paper Conservation Research 16 (2009).
[157] Sebastian Friston, Carmen Fan, Jozef Doboš, Timothy Scully, and Anthony
Steed. “3DRepo4Unity: Dynamic Loading of Version Controlled 3D Assets
into the Unity Game Engine”. In: Proceedings of the 22Nd International
Conference on 3D Web Technology. Web3D ’17. Brisbane, Queensland,
Australia: ACM, 2017, 15:1–15:9. isbn: 978-1-4503-4955-0. doi: 10.1145/
3055624.3075941. url: http://doi.acm.org/10.1145/3055624.3075941.
[158] Marco Gaiani, Marcello Balzani, and Federico Uccelli. “Reshaping the
Coliseum in Rome: An Integrated Data Capture and Modeling Method at
Heritage Sites”. In: Computer Graphics Forum 19.3 (2000), pp. 369–378. doi:
10.1111/1467-8659.00429. eprint: https://onlinelibrary.wiley.com/
doi/pdf/10.1111/1467-8659.00429. url: https://onlinelibrary.wiley.
com/doi/abs/10.1111/1467-8659.00429.
[159] Fabien Gandon and A Th Schreiber. “RDF 1.1 XML Syntax”. In: W3C
recommendation (2014).
REFERENCES 301
[160] Michael Garland and Paul S Heckbert. “Surface Simplification Using Quadric
Error Metrics”. In: Proceedings of the 24th annual conference on Computer
graphics and interactive techniques. ACM Press/Addison-Wesley Publishing
Co. 1997, pp. 209–216.
[161] Michael Garland and Paul S. Heckbert. “Simplifying Surfaces with Color and
Texture Using Quadric Error Metrics”. In: Proceedings of the Conference
on Visualization ’98. VIS ’98. Research Triangle Park, North Carolina, USA:
IEEE Computer Society Press, 1998, pp. 263–269. isbn: 1-58113-106-2. url:
http://dl.acm.org/citation.cfm?id=288216.288280.
[162] O Georgoula and P Patias. “Visualization Tools Using FlashPix Image Format”.
In: Proceedings of the International Archives of Photogrammetry, Remote
Sensing and Spatial Information Sciences 34.PART 5 (2003), p. 2003.
[163] Gesellschaft mbH. krpano Panorama Viewer. 2008. url: https://krpano.
com/ (visited on 06/27/2019).
[164] Kate Giles, Anthony Masinton, and Geoff Arnott. “Visualising the Guild
Chapel, Stratford-Upon-Avon: Digital Models as Research Tools in Buildings
Archaeology”. In: Internet Archaeology 32 (2012).
[165] GlavSoft LLC. TightVNC - remote desktop application. 2001. url: https:
//www.tightvnc.com/ (visited on 06/27/2019).
[166] Enrico Gobbetti, Fabio Marton, Marcos Balsa Rodriguez, Fabio Ganovelli, and
Marco Di Benedetto. “Adaptive Quad Patches: An Adaptive Regular Structure
for Web Distribution and Adaptive Rendering of 3D Models”. In: Proceedings
of the 17th International Conference on 3D Web Technology. Web3D ’12.
Los Angeles, California: ACM, 2012, pp. 9–16. isbn: 978-1-4503-1432-9. doi:
10.1145/2338714.2338716. url: http://doi.acm.org/10.1145/2338714.
2338716.
[167] Bianca Gockel, Holger Graf, Alfonsina Pagano, Sofia Pescarin, and Joakim
Eriksson. “VMUXE”. In: Design, User Experience, and Usability. Design
Philosophy, Methods, and Tools. Ed. by Aaron Marcus. Berlin, Heidelberg:
Springer Berlin Heidelberg, 2013, pp. 262–272. isbn: 978-3-642-39229-0.
[168] Asunción Gómez-Pérez, Mariano Fernández-López, and Oscar Corcho. Onto-
logical Engineering: with examples from the areas of Knowledge Manage-
ment, e-Commerce and the Semantic Web. Springer Science & Business
Media, 2006.
302 REFERENCES
[169] Simon Goodall, P Lewis, Kirk Martinez, P Sinclair, M Addis, C Lahanier,
and J Stevenson. “Knowledge-based exploration of multimedia museum
collections”. In: European Workshop on the Integration of Knowledge,
Semantics and Digital Media Technology (EWIMT). Event Dates: November
25-26, 2004. 2004. url: https://eprints.soton.ac.uk/260899/.
[170] Google. Google Poly. 2017. url: https://poly.google.com/ (visited on
06/27/2019).
[171] Google. O3D. url: https : / / code . google . com / p / o3d/ (visited on
06/27/2019).
[172] Google. YouTube. 2005. url: https : / / www . youtube . com/ (visited on
06/27/2019).
[173] Craig Gotsman, Stefan Gumhold, and Leif Kobbelt. “Simplification and
Compression of 3D Meshes”. In: Tutorials on Multiresolution in Geometric
Modelling. Ed. by Armin Iske, Ewald Quak, and Michael S. Floater. Berlin,
Heidelberg: Springer, 2002, pp. 319–361. isbn: 978-3-662-04388-2. doi:
10.1007/978-3-662-04388-2_12. url: https://doi.org/10.1007/978-3-
662-04388-2_12.
[174] Norman A Graf et al. 3DPDF: Open Source Solutions for Incorporating 3D
Information in PDF Files. Tech. rep. SLAC National Accelerator Lab., Menlo
Park, CA (United States), 2012.
[175] Almerindo Graziano, Stefano Russo, Vincenzo Vecchio, and Paul Foster.
“Metadata models for QoS-aware information management systems”. In:
Proceedings of the 14th international conference on Software engineering
and knowledge engineering. ACM. 2002, pp. 103–106.
[176] Jason Gregory. Game engine architecture. AK Peters/CRC Press, 2014.
[177] Sigurd Trolle Gronemann. “Introducing iPads in Danish natural science
museum settings: A youthful user perspective”. In: NODEM 2013: Beyond
Control–The Collaborative Museum and its Challenges. 2013.
[178] W3C HTML Working Group et al. HTML 5.0. 2010.
[179] P Grussenmeyer, T Landes, E Alby, and L Carozza. “High Resolution 3D
Recording and Modelling of the Bronze Age Cave Les Fraux in Périgord
(France)”. In: International archives of photogrammetry, remote sensing and
spatial information sciences 38.5 (2010), pp. 262–267.
REFERENCES 303
[180] Alberto Guarnieri, Francesco Pirotti, and Antonio Vettore. “Cultural heritage
interactive 3D models on the web: An approach using open source and free
software”. In: Journal of Cultural Heritage 11.3 (2010), pp. 350–353.
[181] Jinjiang Guo, Vincent Vidal, Irene Cheng, Anup Basu, Atilla Baskurt, and
Guillaume Lavoue. “Subjective and Objective Visual Quality Assessment of
Textured 3D Meshes”. In: ACM Transactions on Applied Perception (TAP)
14.2 (2016), p. 11.
[182] Seung Ryong Han, Toshihiko Yamasaki, and Kiyoharu Aizawa. “Time-Varying
Mesh Compression Using an Extended Block Matching Algorithm”. In: IEEE
Transactions on Circuits and Systems for Video Technology 17.11 (2007),
pp. 1506–1518.
[183] Shak Hanish. “Christians, Yazidis, and Mandaeans in Iraq: A survival issue”.
In: Digest of Middle East Studies 18.1 (2009), pp. 1–16.
[184] Phil Harvey. “ExifTool: Read, write and edit meta information”. In: Software
package (2013). url: https://sno.phy.queensu.ca/~phil/exiftool/.
[185] Hossein Hassani. “Research Methods in Computer Science: The Challenges
and Issues”. In: CoRR abs/1703.04080 (2017). arXiv: 1703.04080. url: http:
//arxiv.org/abs/1703.04080.
[186] Roya Hassanian-esfahani and Mohammad-javad Kargar. “Information Quality
Assessment and the Web3D”. In: International Conference on Web Search 1
(2015).
[187] Susan Hazan and Sorin Hermon. “On Defining the Virtual Museum: A V-
MUST Research Project”. In: ICOM Internation Council of Museums. ICOM
Internation Council of Museums, 2014.
[188] Ilmari Heikkinen. File metadata extraction tool and Ruby library - Github.
2007. url: https://github.com/kig/metadata (visited on 06/27/2019).
[189] Ivan Herman, Ben Adida, Manu Sporny, and Mark Birbeck. “RDFa 1.1
Primer”. In: W3C recommendation (2013).
[190] Roland Hess. The essential Blender: guide to 3D creation with the open
source suite Blender. No Starch Press, 2007.
[191] Pascal Hitzler, Markus Krötzsch, Bijan Parsia, Peter F Patel-Schneider,
and Sebastian Rudolph. “OWL 2 web ontology language primer”. In: W3C
recommendation 27.1 (2009), p. 123.
304 REFERENCES
[192] Hugues Hoppe. “Progressive meshes. ACM Computer Graphics Proc”. In:
Annual Conference Series,(Siggraph’96), pp99-108. 1996.
[193] B. D. Hoyos. “Hannibal: What Kind of Genius?” In: Greece and Rome 30.2
(1983), pp. 171–180. doi: 10.1017/S0017383500027121.
[194] Yonghao Hu, Zhaohui Chen, Xiaojun Liu, Fei Huang, and Jinyuan Jia.
“WebTorrent Based Fine-grained P2P Transmission of Large-scale WebVR
Indoor Scenes”. In: Proceedings of the 22Nd International Conference on
3D Web Technology. Web3D ’17. Brisbane, Queensland, Australia: ACM,
2017, 7:1–7:8. isbn: 978-1-4503-4955-0. doi: 10.1145/3055624.3075944. url:
http://doi.acm.org/10.1145/3055624.3075944.
[195] Chun Ying Huang, Kuan Ta Chen, De Yu Chen, Hwai Jung Hsu, and Cheng
Hsin Hsu. “GamingAnywhere: The First Open Source Cloud Gaming System”.
In: ACM Transactions on Multimedia Computing, Communications, and
Applications (TOMM) 10.1s (Jan. 2014), 10:1–10:25. issn: 1551-6857. doi:
10.1145/2537855. url: http://doi.acm.org/10.1145/2537855.
[196] Chun-Ying Huang, Cheng-Hsin Hsu, Yu-Chun Chang, and Kuan-Ta Chen.
“GamingAnywhere: An Open Cloud Gaming System”. In: Proceedings of the
4th ACM multimedia systems conference. MMSys ’13. Oslo, Norway: ACM,
2013, pp. 36–47. isbn: 978-1-4503-1894-5. doi: 10.1145/2483977.2483981.
url: http://doi.acm.org/10.1145/2483977.2483981.
[197] John F Hughes, Andries Van Dam, James D Foley, Morgan McGuire, Steven K
Feiner, David F Sklar, and Kurt Akeley. Computer Graphics: Principles and
Practice. Pearson Education, 2014.
[198] Greg Humphreys, Matthew Eldridge, Ian Buck, Gordan Stoll, Matthew
Everett, and Pat Hanrahan. “WireGL: A Scalable Graphics System for
Clusters”. In: Proceedings of the 28th Annual Conference on Computer
Graphics and Interactive Techniques. SIGGRAPH ’01. New York, NY, USA:
ACM, 2001, pp. 129–140. isbn: 1-58113-374-X. doi: 10.1145/383259.383272.
url: http://doi.acm.org/10.1145/383259.383272.
[199] Mike Hurwicz. “Web Virtual Reality and 3D in VRML or XML”. In: Web
Developer’s Journal (2000).
[200] Jesús Ibáñez and Carlos Delgado-Mata. “Lessons From Research on Inter-
action With Virtual Environments”. In: Journal of Network and Computer
Applications 34.1 (2011), pp. 268–281.
REFERENCES 305
[201] ICOM. CIDOC Conceptual Reference Model (CRM). 2006. url: http://www.
cidoc-crm.org/ (visited on 06/27/2019).
[202] ICOM. ICOM Museum Definition. 2018. url: http://icom.museum/en/
activities / standards - guidelines / museum - definition/ (visited on
06/27/2019).
[203] Muhammad Idris, Norsimaa Mustaffa, and Syed Yusoff. “Preservation of
Intangible Cultural Heritage Using Advance Digital Technology: Issues and
Challenges”. In: Harmonia: Journal Of Arts Research And Education 16.1
(2016), pp. 1–13. issn: 2541-2426. doi: 10.15294/harmonia.v16i1.6353.
[204] International Telecommunication Union. Definition of Quality of Experience
(QoE) - TU-T FG IPTV. 2007. url: https://www.itu.int/md/T05-FG.IPTV-
IL-0050/en (visited on 06/27/2019).
[205] V. Isler, B. Wilson, and R. Bajcsy. “Building a 3D Virtual Museum of Native
American Baskets”. In: 3D Data Processing, Visualization, and Transmission,
Third International Symposium on. June 2006, pp. 954–961. doi: 10.1109/
3DPVT.2006.38.
[206] ISO ISO. “15836: 2009-Information and Documentation-the Dublin Core
Metadata Element Set”. In: International Standards Organisation (2009).
[207] Jacek Jankowski. “A Taskonomy of 3D Web Use”. In: Proceedings of the 16th
International Conference on 3D Web Technology. Web3D ’11. Paris, France:
ACM, 2011, pp. 93–100. isbn: 978-1-4503-0774-1. doi: 10.1145/2010425.
2010443. url: http://doi.acm.org/10.1145/2010425.2010443.
[208] Jacek Jankowski and Stefan Decker. “2lip: Filling the gap between the current
and the three-dimensional web”. In: Proceedings of the 14th International
Conference on 3D Web Technology. ACM. 2009, pp. 181–190.
[209] Carlos A Jara, Francisco A Candelas, Fernando Torres, Christophe Salzmann,
Denis Gillet, Francisco Esquembre, and Sebastián Dormido. “Synchronous
Collaboration Between Auto-Generated WebGL Applications and 3D Virtual
Laboratories Created With Easy Java Simulations”. In: IFAC Proceedings
Volumes 45.11 (2012), pp. 160–165.
[210] Yang Jianping and Zhang Jie. “Towards HTML 5 and Interactive 3D Graphics”.
In: Educational and Information Technology (ICEIT), 2010 International
Conference on. Vol. 1. IEEE. 2010, pp. V1–522.
306 REFERENCES
[211] Timo Jokela, Netta Iivari, Juha Matero, and Minna Karukka. “The Standard
of User-Centered Design and the Standard Definition of Usability: Analyzing
ISO 13407 Against ISO 9241-11”. In: Proceedings of the Latin American
conference on Human-computer interaction. ACM. 2003, pp. 53–60.
[212] Katherine Jones-Garmil. The wired museum: Emerging technology and
changing paradigms. Amer Alliance of Museums Press, 1997.
[213] Yvonne Jung, Johannes Behr, and Holger Graf. “X3DOM as Carrier of the
Virtual Heritage”. In: International Workshop 3D-ARCH. Vol. 4. 2011, p. 2011.
[214] Jaime Kaminski, Karina Rodriguez-Echavarria, David B Arnold, Gianpaolo
Palma, Roberto Scopigno, Marc Proesmans, and James Stevenson. “Insourc-
ing, Outsourcing and Crowdsourcing 3D Collection Formation: Perspectives
for Cultural Heritage Sites”. In: VAST. 2012, pp. 81–88.
[215] Kostas Kapetanakis, Spyros Panagiotakis, Athanasios G Malamos, and Markos
Zampoglou. “Adaptive Video Streaming on Top of Web3D: A Bridging
Technology Between X3DOM and MPEG-DASH”. In: Telecommunications
and Multimedia (TEMU), 2014 International Conference on. IEEE. 2014,
pp. 226–231.
[216] Kataspace. kataspace - An interactive, web-based, multi-user, 3D application,
based on KataJS and Sirikata. 2010. url: https://github.com/sirikata/
kataspace (visited on 06/27/2019).
[217] Meggin Kearney and Jonathan Garbee. Optimize Performance Under Varying
Network Conditions. 2016. url: https://developers.google.com/web/
tools / chrome - devtools / network / network - conditions (visited on
06/27/2019).
[218] Sebastian Kelle and Raquel M Crespo Garcıéa. “Usability and accessibility in
Web 3D”. In: Workshop on usability evaluation of social software (UESS07),
held in conjunction with IFIP TC 13 Conference INTERACT. 2007.
[219] Ali Safari Khatouni, Marco Mellia, Marco Ajmone Marsan, Stefan Alfredsson,
Jonas Karlsson, Anna Brunström, Özgü Alay, Andra Lutu, Cise Midoglu, and
Vincenzo Mancuso. “Speedtest-Like Measurements in 3G/4G Networks: The
MONROE Experience”. In: 2017 29th International Teletraffic Congress (ITC
29) 1 (2017), pp. 169–177.

REFERENCES 307
[220] Khronos Group. Khronos glTF Webinar. 2017. url: https://www.khronos.
org/assets/uploads/developers/library/2017-glTF-webinar/glTF-
Webinar_Feb17.pdf (visited on 06/27/2019).
[221] Khronos Group. WebGL - OpenGL ES 2.0 for the Web. 2010. url: https:
//www.khronos.org/webgl/ (visited on 06/27/2019).
[222] Chairi Kiourt, Anestis Koutsoudis, Fotis Arnaoutoglou, Georgia Petsa, Stella
Markantonatou, and George Pavlidis. “A dynamic web-based 3D virtual
museum framework based on open data”. In: Digital Heritage, 2015. Vol. 2.
IEEE. 2015, pp. 647–650.
[223] Chairi Kiourt, Anestis Koutsoudis, and George Pavlidis. “DynaMus: A fully
dynamic 3D virtual museum framework”. In: Journal of Cultural Heritage 22
(2016), pp. 984–991.
[224] Felix Klein, Kristian Sons, Stefan John, Dmitri Rubinstein, Philipp Slusallek,
and Sergiy Byelozyorov. “Xflow: Declarative Data Processing for the Web”.
In: Proceedings of the 17th International Conference on 3D Web Technology.
Web3D ’12. Los Angeles, California: ACM, 2012, pp. 37–45. isbn: 978-1-4503-
1432-9. doi: 10.1145/2338714.2338719. url: http://doi.acm.org/10.
1145/2338714.2338719.
[225] James T Klosowski, Peter D. Kirchner, Julia Valuyeva, Greg Abram, Christo-
pher J Morris, Robert H Wolfe, and Thomas Jackman. “Deep view: high-
resolution reality”. In: IEEE Computer Graphics and Applications 22.3 (2002),
pp. 12–15.
[226] David Koller, Bernard Frischer, and Greg Humphreys. “Research Challenges
for Digital Archives of 3D Cultural Heritage Models”. In: Journal on Com-
puting and Cultural Heritage (JOCCH) 2.3 (Jan. 2010), 7:1–7:17. issn: 1556-
4673. doi: 10.1145/1658346.1658347. url: http://doi.acm.org/10.1145/
1658346.1658347.
[227] David Koller and Marc Levoy. “Protecting 3D Graphics Content”. In: Commu-
nications of the ACM 48.6 (2005), pp. 74–80.
[228] David Koller, Michael Turitzin, Marc Levoy, Marco Tarini, Giuseppe Croccia,
Paolo Cignoni, and Roberto Scopigno. “Protected Interactive 3D Graphics via
Remote Rendering”. In: ACM Transactions on Graphics (TOG) 23.3 (2004),
pp. 695–703. issn: 0730-0301. doi: 10.1145/1015706.1015782. url: http:
//doi.acm.org/10.1145/1015706.1015782.
308 REFERENCES
[229] Stanislav Dimchev Kostadinov and Tzvetomir Ivanov Vassilev. “Fast and
Lightweight Solution to Visualising 3D Content on the Web”. In: International
Journal on Information Technologies & Security 5.4 (2013), pp. 19–26.
[230] Stanislav Dimchev Kostadinov and Tzvetomir Ivanov Vassilev. “Mobile Virtual
3D Model of a Medieval Town”. In: International Journal on Information
Technologies & Security 5.4 (2013), pp. 13–18.
[231] Galena Kostoska, Marcos Baez, Florian Daniel, and Fabio Casati. “Virtual,
Remote Participation in Museum Visits by Older Adults: A Feasibility Study”.
In: 8th International Workshop on Personalized Access to Cultural Heritage
(PATCH 2015), ACM IUI 2015. 2015, pp. 1–4.
[232] Kyriakos Kritikos, Barbara Pernici, Pierluigi Plebani, Cinzia Cappiello, Marco
Comuzzi, Salima Benrernou, Ivona Brandic, Attila Kertész, Michael Parkin,
and Manuel Carro. “A Survey on Service Quality Description”. In: ACM
Computing Surveys (CSUR) 46.1 (July 2013), 1:1–1:58. issn: 0360-0300. doi:
10.1145/2522968.2522969. url: http://doi.acm.org/10.1145/2522968.
2522969.
[233] J Kunze and T Baker. “The Dublin Core Metadata Element Set: RFC 5013”.
In: California: IETF (2007).
[234] Heri Kurniawan, Agus Salim, Heru Suhartanto, and Zainal A Hasibuan. “E-
cultural heritage and natural history framework: an integrated approach to
digital preservation”. In: International Conference on Telecommunication
Technology and Applications (IACSIT). 2011, pp. 177–182.
[235] Strahinja Kustudic. Firefox Extended Statusbar. 2014. url: https://github.
com/kustodian/extended-statusbar (visited on 06/27/2019).
[236] Yong Moo Kwon, Jie Eun Hwang, Tae Sung Lee, Min Jeong Lee, Jai Kyung
Suhl, and Sae Woon Ryu. “Toward the Synchronized Experiences between
Real and Virtual Museum”. In: APAN 2003 Conference in Fukuoka. 2003.
[237] EU-LAC Foundation. The European Union – Latin America and Caribbean
Foundation (EU-LAC Foundation VM. 2016. url: https://eu-lac.org/map/
(visited on 06/27/2019).
[238] Carl Lagoze, Herbert Van de Sompel, Pete Johnston, Michael Nelson, Robert
Sanderson, and Simeon Warner. “ORE User Guide - Primer”. In: Open
Archives Initiative, Tech. Rep (2008).
REFERENCES 309
[239] Suzanne Lai. Countries with the fastest internet in the world 2018. Sept.
2018. url: https://www.atlasandboots.com/remote-jobs/countries-
with-the-fastest-internet-in-the-world/ (visited on 06/27/2019).
[240] Fabrizio Lamberti, Claudio Zunino, Andrea Sanna, Antonino Fiume, and
Marco Maniezzo. “An Accelerated Remote Graphics Architecture for PDAS”.
In: Proceedings of the Eighth International Conference on 3D Web Technol-
ogy. Web3D ’03. Saint Malo, France: ACM, 2003, 55–ff. isbn: 1-58113-644-7.
doi: 10.1145/636593.636602. url: http://doi.acm.org/10.1145/636593.
636602.
[241] Guillaume Lavoué, Laurent Chevalier, and Florent Dupont. “Streaming Com-
pressed 3D Data on the Web Using JavaScript and WebGL”. In: Proceedings
of the 18th International Conference on 3D Web Technology. Web3D ’13.
San Sebastian, Spain: ACM, 2013, pp. 19–27. isbn: 978-1-4503-2133-4. doi:
10.1145/2466533.2466539. url: http://doi.acm.org/10.1145/2466533.
2466539.
[242] Guillaume Lavoué and Rafał Mantiuk. “Quality assessment in computer
graphics”. In: Visual Signal Quality Assessment. Springer, 2015, pp. 243–286.
[243] Patrick Le Callet, Sebastian Möller, Andrew Perkis, et al. “Qualinet white
paper on definitions of quality of experience”. In: European Network on
Quality of Experience in Multimedia Systems and Services (COST Action IC
1003) 3 (2012).
[244] Stefan Lederer, Christopher Müller, and Christian Timmerer. “Dynamic adap-
tive streaming over HTTP dataset”. In: Proceedings of the 3rd Multimedia
Systems Conference. ACM. 2012, pp. 89–94.
[245] Stefan Lemme, Jan Sutter, Christian Schlinkmann, and Philipp Slusallek.
“The Basic Building Blocks of Declarative 3D on the Web”. In: Proceedings
of the 21st International Conference on Web3D Technology. Web3D ’16.
Anaheim, California: ACM, 2016, pp. 17–25. isbn: 978-1-4503-4428-9. doi:
10.1145/2945292.2945303. url: http://doi.acm.org/10.1145/2945292.
2945303.
[246] Jerome Edward Lengyel. “Compression of Time-Dependent Geometry”. In:
Proceedings of the 1999 symposium on Interactive 3D graphics. ACM. 1999,
pp. 89–95.
310 REFERENCES
[247] Fotis Liarokapis, Stella Sylaiou, Anirban Basu, Nicholaos Mourkoussis,
Martin White, and Paul F Lister. “An Interactive Visualisation Interface
for Virtual Museums”. In: VAST. 2004, pp. 47–56.
[248] Daniel Limberger, Willy Scheibel, Stefan Lemme, and Jürgen Döllner. “Dy-
namic 2.5D Treemaps Using Declarative 3D on the Web”. In: Proceedings
of the 21st International Conference on Web3D Technology. Web3D ’16.
Anaheim, California: ACM, 2016, pp. 33–36. isbn: 978-1-4503-4428-9. doi:
10.1145/2945292.2945313. url: http://doi.acm.org/10.1145/2945292.
2945313.
[249] Fred Limp, Angelia Payne, Katie Simon, Snow Winters, and Jackson Cothren.
“Developing a 3-D Digital Heritage Ecosystem: From Object to Representation
and the Role of a Virtual Museum in the 21st Century”. In: Internet
Archaeology 30 (2011).
[250] Max Limper, Stefan Wagner, Christian Stein, Yvonne Jung, and André Stork.
“Fast Delivery of 3D Web Content: A Case Study”. In: Proceedings of the
18th International Conference on 3D Web Technology. Web3D ’13. San
Sebastian, Spain: ACM, 2013, pp. 11–17. isbn: 978-1-4503-2133-4. doi: 10.
1145/2466533.2466536. url: http://doi.acm.org/10.1145/2466533.
2466536.
[251] Linden Lab. Second Life. 2003. url: http://secondlife.com/ (visited on
06/27/2019).
[252] Gerard Llorach, Javi Agenjo, Alun Evans, and Josep Blat. “Web-based data
visualization of an MMO virtual regatta using a virtual globe”. In: Proceedings
of the 20th International Conference on 3D Web Technology. ACM. 2015,
pp. 97–100.
[253] David P Luebke. “A developer’s survey of polygonal simplification algorithms”.
In: IEEE Computer Graphics and Applications 21.3 (2001), pp. 24–35.
[254] Greg Lukosek. Learning C# by Developing Games with Unity 5. x. Packt
Publishing Ltd, 2016.
[255] Sharon Macdonald. A companion to museum studies. Vol. 39. John Wiley &
Sons, 2011.

REFERENCES 311
[256] I Scott MacKenzie and Colin Ware. “Lag As a Determinant of Human
Performance in Interactive Systems”. In: Proceedings of the INTERACT’93
and CHI’93 conference on Human factors in computing systems. CHI ’93.
Amsterdam, The Netherlands: ACM, 1993, pp. 488–493. isbn: 0-89791-575-5.
doi: 10.1145/169059.169431. url: http://doi.acm.org/10.1145/169059.
169431.
[257] Jacob B Madsen and Claus B Madsen. “Handheld Visual Representation
of a Castle Chapel Ruin”. In: Journal on Computing and Cultural Heritage
(JOCCH) 9.1 (Nov. 2016), 6:1–6:18. issn: 1556-4673. doi: 10.1145/2822899.
url: http://doi.acm.org/10.1145/2822899.
[258] Adrien Maglo, Ian Grimstead, and Céline Hudelot. “POMAR: Compression
of progressive oriented meshes accessible randomly”. In: Computers &
Graphics 37.6 (2013). Shape Modeling International (SMI) Conference 2013,
pp. 743–752. issn: 0097-8493. doi: https://doi.org/10.1016/j.cag.2013.
05.005. url: http://www.sciencedirect.com/science/article/pii/
S0097849313000794.
[259] Adrien Maglo, Guillaume Lavoué, Florent Dupont, and Céline Hudelot. “3D
Mesh Compression: Survey, Comparisons, and Emerging Trends”. In: ACM
Comput. Surv. 47.3 (Feb. 2015), 44:1–44:41. issn: 0360-0300. doi: 10.1145/
2693443. url: http://doi.acm.org/10.1145/2693443.
[260] Anna Maria Manferdini and Fabio Remondino. “Reality-Based 3D Model-
ing, Segmentation and Web-Based Visualization”. In: Euro-Mediterranean
Conference. Springer. 2010, pp. 110–124.
[261] Frank Manola, Eric Miller, David Beckett, and Ivan Herman. “RDF
Primer—Turtle Version”. In: W3C recommendation (2007).
[262] Chris Marrin. “WebGL Specification”. In: Khronos WebGL Working Group
(2011).
[263] Fabio Marton, Marcos Balsa Rodriguez, Fabio Bettio, Marco Agus, Alberto
Jaspe Villanueva, and Enrico Gobbetti. “IsoCam: Interactive Visual Explo-
ration of Massive Cultural Heritage Models on Large Projection Setups”.
In: Journal on Computing and Cultural Heritage (JOCCH) 7.2 (June 2014),
p. 12. issn: 1556-4673. doi: 10.1145/2611519. url: http://doi.acm.org/10.
1145/2611519.

312 REFERENCES
[264] Marija Mavar-Haramija, Alberto Prats-Galino, Clara Berenguer Escuder, Juan
A. Juanes Méndez, and Anna Puigdelıévoll-Sánchez. “3D PDF Technology
Combined with JavaScript Functions enables the Creation and Visualization
of Interactive 3D Presentations”. In: Proceedings of the First International
Conference on Technological Ecosystem for Enhancing Multiculturality.
TEEM ’13. Salamanca, Spain: ACM, 2013, pp. 67–72. isbn: 978-1-4503-2345-
1. doi: 10.1145/2536536.2536548. url: http://doi.acm.org/10.1145/
2536536.2536548.
[265] John McCaffery, Alan Miller, and Colin Allison. “Extending the Use of Virtual
Worlds as an Educational Platform-Network Island: An Advanced Learning
Environment for Teaching Internet Routing Algorithms”. In: CSEDU (1). 2011,
pp. 279–284.
[266] John McCaffery, Alan Miller, Sarah Kennedy, Tom Dawson, Colin Allison,
Anna Vermehren, Carolyn Lefley, and Keir Strickland. “Exploring Heritage
Through Time and Space Supporting Community Reflection on the Highland
Clearances”. In: Digital Heritage International Congress (DigitalHeritage),
2013. Vol. 1. IEEE. 2013, pp. 371–378.
[267] W. Caleb McDaniel. Python scripts for interacting with Omeka API via Rest,
YAML and CSV. 2013. url: https://github.com/wcaleb/omekadd (visited
on 06/27/2019).
[268] Kenton McHenry and Peter Bajcsy. “An Overview of 3D Data Content, File
Formats and Viewers”. In: National Center for Supercomputing Applications
1205 (2008), p. 22.
[269] Gordon McKenna and Efthymia Patsatzi. SPECTRUM: The UK museum
documentation standard. Museum Documentation Association, 2007.
[270] Jamie McKenzie. “Building a virtual museum community”. In: Museums and
the Web. Conference. 1997, pp. 77–86.
[271] Nils Michaelis, Yvonne Jung, and Johannes Behr. “Virtual heritage to go”. In:
Proceedings of the 17th International Conference on 3D Web Technology.
ACM. 2012, pp. 113–116.
[272] Alistair Miles and Sean Bechhofer. “SKOS Simple Knowledge Organization
System Reference”. In: W3C recommendation 18 (2009), W3C.
REFERENCES 313
[273] Brian Miller, William Conway, Richard P Reading, Chris Wemmer, David
Wildt, Devra Kleiman, Steven Monfort, Alan Rabinowitz, Beth Armstrong, and
Michael Hutchins. “Evaluating the Conservation Mission of Zoos, Aquariums,
Botanical Gardens, and Natural History Museums”. In: Conservation Biology
18.1 (2004), pp. 86–93. doi: 10.1111/j.1523-1739.2004.00181.x. eprint:
https://onlinelibrary.wiley.com/doi/pdf/10.1111/j.1523-1739.
2004.00181.x. url: https://onlinelibrary.wiley.com/doi/abs/10.
1111/j.1523-1739.2004.00181.x.
[274] Frederic P. Miller, Agnes F. Vandome, and John McBrewster. Lua (Program-
ming Language). Alpha Press, 2009. isbn: 9786130256982.
[275] Bradley Mitchell. Learn Exactly How Fast a Wi-Fi Network Can Move. 2018.
url: https://www.lifewire.com/how-fast-is-a-wifi-network-816543
(visited on 06/27/2019).
[276] Martin Mittring. “Finding next gen: CryEngine 2”. In: SIGGRAPH Courses.
2007.
[277] A. K. Moorthy, K. Seshadrinathan, R. Soundararajan, and A. C. Bovik.
“Wireless Video Quality Assessment: A Study of Subjective Scores and
Objective Algorithms”. In: IEEE Transactions on Circuits and Systems for
Video Technology 20.4 (Apr. 2010), pp. 587–599. issn: 1051-8215. doi: 10.
1109/TCSVT.2010.2041829.
[278] Julien Moreau-Mathis. Babylon. js Essentials. Packt Publishing Ltd, 2016.
[279] Laurence Moroney. Introducing Microsoft Silverlight 3. 3rd. Redmond, WA,
USA: Microsoft press, 2009. isbn: 9780735625730.
[280] Mozilla. WebVR. 2014. url: https://webvr.info/ (visited on 06/27/2019).
[281] Kelly L Murdock. 3ds Max 2009 bible. Vol. 560. John Wiley & Sons, 2008.
[282] James AH Murray, Henry Bradley, William A Craigie, and Charles T Onions.
The Oxford english dictionary. Vol. 1. Clarendon Press Oxford, 1933.
[283] National History Museum. The Natural History Museum of London Sketchfab
Repository. 2016. url: https://sketchfab.com/NHM_Imaging (visited on
06/27/2019).
[284] National Information Standards Organization. ANSI/NISO Z39.85-2012 The
Dublin Core Metadata Element Set. 2012. url: https://www.niso.org/
publications/ansiniso-z3985-2012-dublin-core-metadata-element-
set (visited on 06/27/2019).
314 REFERENCES
[285] National Library of New Zealand. Metadata Extraction Tool - Github. 2003.
url: https://github.com/DIA-NZ/Metadata-Extraction-Tool (visited on
06/27/2019).
[286] I. Nave, H. David, A. Shani, Y. Tzruya, A. Laikari, P. Eisert, and P. Fechteler.
“Games@large graphics streaming architecture”. In: 2008 IEEE International
Symposium on Consumer Electronics. Apr. 2008, pp. 1–4. doi: 10.1109/ISCE.
2008.4559473.
[287] Rovshen Nazarov and John Galletly. “Native Browser Support for 3D Render-
ing and Physics Using WebGL, HTML5 and Javascript”. In: BCI (Local) 1036
(2013), p. 21.
[288] Steven Neale, Winyu Chinthammit, Christopher Lueg, and Paddy Nixon.
“Facilitating Learning Through Hands-on Engagement With Virtual Museum
Artefacts”. In: Proceedings of the 28th International BCS Human Computer
Interaction Conference on HCI 2014 - Sand, Sea and Sky - Holiday HCI.
BCS-HCI ’14. Southport, UK: BCS, 2014, pp. 222–227. doi: 10.14236/ewic/
hci2014.27. url: https://doi.org/10.14236/ewic/hci2014.27.
[289] Srushtika Neelakantam and Tanay Pant. “Introduction to A-Frame”. In:
Learning Web-based Virtual Reality. Springer, 2017, pp. 17–38.
[290] Anna Neovesky and Julius Peinelt. “A Virtual Tour to the Inscriptions of the
UNESCO World Heritage Site St. Michael in Hildesheim”. In: Proceedings of
the Conference on Electronic Visualisation and the Arts. EVA ’15. London,
United Kingdom: BCS Learning & Development Ltd., 2015, pp. 285–290.
doi: 10.14236/ewic/eva2015.31. url: https://doi.org/10.14236/ewic/
eva2015.31.
[291] Jakob Nielsen. Designing Web Usability: The Practice of Simplicity. New
Riders Publishing, 1999.
[292] Y. Noimark and D. Cohen-Or. “Streaming scenes to MPEG-4 video-enabled
devices”. In: IEEE Computer Graphics and Applications 23.1 (Jan. 2003),
pp. 58–64. issn: 0272-1716. doi: 10.1109/MCG.2003.1159614.
[293] Julia Noordegraaf, Angela Bartholomew, Alexandra Eveleigh, et al. “Modeling
Crowdsourcing for Cultural Heritage”. In: Museums and the Web. 2014,
pp. 25–37.
[294] Don Norman. The Design of Everyday Things: Revised and Expanded Edition.
Constellation, 2013.
REFERENCES 315
[295] Oak3D. Oak3D. 2013. url: http://www.effecthub.com/t/oak3d (visited on
06/27/2019).
[296] Marianne Odlyha. “Introduction to the preservation of cultural heritage”. In:
Journal of Thermal Analysis and Calorimetry 104.2 (May 2011), pp. 399–403.
issn: 1572-8943. doi: 10.1007/s10973-011-1421-0. url: https://doi.org/
10.1007/s10973-011-1421-0.
[297] Johan Oomen and Lora Aroyo. “Crowdsourcing in the Cultural Heritage
Domain: Opportunities and Challenges”. In: Proceedings of the 5th Interna-
tional Conference on Communities and Technologies. C&T ’11. Brisbane,
Australia: ACM, 2011, pp. 138–149. isbn: 978-1-4503-0824-3. doi: 10.1145/
2103354.2103373. url: http://doi.acm.org/10.1145/2103354.2103373.
[298] Open Simulator. The Open Simulator Project. 2007. url: http : / /
opensimulator.org/wiki/Main_Page (visited on 06/27/2019).
[299] Open Simulator. What is the hypergrid? 2019. url: http://opensimulator.
org/wiki/Hypergrid (visited on 06/27/2019).
[300] Open Virtual Worlds. The Open Virtual Worlds Group - University of St
Andrews Sketchfab Repository. 2016. url: https : / / sketchfab . com /
openvirtualworlds (visited on 06/27/2019).
[301] Open Wonderland Foundation. Open Wonderland. 2010. url: http : / /
openwonderland.org/ (visited on 06/27/2019).
[302] Sixto Ortiz Jr. “Is 3D Finally Ready for the Web?” In: Computer 43.1 (2010).
[303] Armando Padilla. Beginning Zend Framework. Apress, 2009.
[304] R. Pajarola and J. Rossignac. “Compressed progressive meshes”. In: IEEE
Transactions on Visualization and Computer Graphics 6.1 (Jan. 2000), pp. 79–
93. issn: 1077-2626. doi: 10.1109/2945.841122.
[305] Todd Palamar. Mastering Autodesk Maya 2016: Autodesk Official Press. John
Wiley & Sons, 2015.
[306] Yixin Pan, Irene Cheng, and A. Basu. “Quality Metric for Approximating
Subjective Evaluation of 3D Objects”. In: IEEE Transactions on Multimedia
7.2 (Apr. 2005), pp. 269–279. issn: 1520-9210. doi: 10.1109/TMM.2005.
843364.

316 REFERENCES
[307] Paolini Paolo, Barbieri Thimoty, Loiudice Paolo, Alonzo Francesca, Zanti
Marco, and Gaia Giuliano. “Visiting a Museum Together: How to Share a
Visit to a Virtual World”. In: Journal of the American Society for Information
Science 51.1 (2000), pp. 33–38.
[308] George Papagiannakis, Efstratios Geronikolakis, Maria Pateraki, Victor M
López-Menchero, Michael Tsioumas, Stella Sylaiou, Fotis Liarokapis, Athina
Grammatikopoulou, Kosmas Dimitropoulos, Nikolaos Grammalidis, et al.
“Mixed Reality, Gamified Presence, and Storytelling for Virtual Museums”.
In: Encyclopedia of Computer Graphics and Games (2018), pp. 1–13.
[309] Tony Parisi. glTF and the WebGL Art Pipeline March 2015. 2015. url:
https://www.slideshare.net/auradeluxe/gltf-and-the-webgl-art-
pipeline-march-2015 (visited on 06/27/2019).
[310] Tony Parisi. Programming 3D Applications with HTML5 and WebGL: 3D
Animation and Visualization for Web Pages. " O’Reilly Media, Inc.", 2014.
[311] Petros Patias, Yiorgos Chrysanthou, Stella Sylaiou, Charalampos Georgiades,
Despina Michael-Grigoriou, and S Stylianidis. “The Development of an E-
Museum for Contemporary Arts”. In: Proceedings of the 14th International
Conference on Virtual Systems and Multimedia. 2008.
[312] Peter Paulis. “3D Webpages”. In: Študentská vedecká konferencia, FMFI UK,
Bratislava (2010), pp. 316–327.
[313] Pieter Pauwels and Danilo Di Mascio. “Interpreting Metadata and Ontologies
of Virtual Heritage Artefacts”. In: International Journal of Heritage in the
Digital Era 3.3 (2014), pp. 531–555. doi: 10.1260/2047-4970.3.3.531.
eprint: https://doi.org/10.1260/2047- 4970.3.3.531. url: https:
//doi.org/10.1260/2047-4970.3.3.531.
[314] George Pavlidis, Anestis Koutsoudis, Fotis Arnaoutoglou, Vassilios Tsioukas,
and Christodoulos Chamzas. “Methods for 3D digitization of cultural her-
itage”. In: Journal of cultural heritage 8.1 (2007), pp. 93–98.
[315] Angelia Payne, Keenan Cole, Katie Simon, Christopher Goodmaster, and
Fredrick Limp. “Designing the Next Generation Virtual Museum: Making
3D Artifacts Available for Viewing and Download”. In: Making History
Interactive: Proceedings of the 37th Annual International Conference on
Computer Applications and Quantitative Methods in Archaeology (CAA).
Vol. 3. 2009.

REFERENCES 317
[316] Laura Pecchioli, Mirco Pucci, Fawzi Mohamed, and Barbara Mazzei. “Brows-
ing in the Virtual Museum of the Sarcophagi in the Basilica of St. Silvestro
at the Catacombs of Priscilla in Rome”. In: Virtual Systems and Multimedia
(VSMM), 2012 18th International Conference on. IEEE. 2012, pp. 413–420.
[317] Indika Perera, Colin Allison, J Ross Nicoll, and Thomas Sturgeon. “Towards
successful 3D virtual learning-a case study on teaching human computer
interaction”. In: Internet Technology and Secured Transactions, 2009. ICITST
2009. International Conference for. IEEE. 2009, pp. 1–6.
[318] Jorge Pérez, Marcelo Arenas, and Claudio Gutierrez. “Semantics and Com-
plexity of SPARQL”. In: ACM Transactions on Database Systems (TODS) 34.3
(2009), p. 16.
[319] Sofia Pescarin. “Virtual Museums: from the Italian experience to a transna-
tional network”. In: (2013). url: http://www.v-must.net/sites/default/
files/EAC7_20_Pescarin_20130226.pdf (visited on 06/27/2019).
[320] Sofia Pescarin, Selma Rizvic, and Dino Selimovic. “V-MUST.NET - The virtual
museum transnational network”. In: V-MUST.NET. V-MUST.NET, 2011. url:
http://www.v-must.net/sites/default/files/SEEDI2011_pescarin-
rizvic-selimovic-NCD21047.pdf (visited on 06/27/2019).
[321] Marc Petit. “Requirement Templates for Distributed 3D Graphics”. In:
Proceedings of the 21st International Conference on Web3D Technology.
Web3D ’16. Anaheim, California: ACM, 2016, pp. 61–68. isbn: 978-1-4503-
4428-9. doi: 10.1145/2945292.2945301. url: http://doi.acm.org/10.
1145/2945292.2945301.
[322] Panagiotis Petridis, Ian Dunwell, Fotis Liarokapis, George Constantinou,
Sylvester Arnab, Sara de Freitas, and Maurice Hendrix. “The Herbert Virtual
Museum”. In: JECE 2013 (Jan. 2013), 16:16–16:16. issn: 2090-0147. doi:
10.1155/2013/487970. url: http://dx.doi.org/10.1155/2013/487970.
[323] Benjamin Petry and Jochen Huber. “Towards effective interaction with
omnidirectional videos using immersive virtual reality headsets”. In: Proceed-
ings of the 6th Augmented Human International Conference. ACM. 2015,
pp. 217–218.
[324] Laura Pierucci. “The quality of experience perspective toward 5G tech-
nology”. In: IEEE Wireless Communications 22.4 (2015), pp. 10–16. issn:
1536-1284. doi: 10.1109/MWC.2015.7224722.

318 REFERENCES
[325] Mark Pilgrim. HTML5: Up and Running: Dive into the Future of Web
Development. " O’Reilly Media, Inc.", 2010.
[326] Cedric Pinson. OSG.JS WebGL Framework. 2011. url: http://osgjs.org/
(visited on 06/27/2019).
[327] Piriform. CCleaner tool. 2003. url: https://www.piriform.com/ccleaner
(visited on 06/27/2019).
[328] Cecilia Pisa, Fabiana Zeppa, and Gabriele Fangi. “Spherical Photogrammetry
for Cultural Heritage&Mdash;San Galgano Abbey and the Roman Theater,
Sabratha”. In: Journal on Computing and Cultural Heritage (JOCCH) 4.3
(Dec. 2011), 9:1–9:15. issn: 1556-4673. doi: 10.1145/2069276.2069278. url:
http://doi.acm.org/10.1145/2069276.2069278.
[329] Federico Ponchio. The Nexus Framework. 2015. url: http://vcg.isti.cnr.
it/nexus/ (visited on 06/27/2019).
[330] Federico Ponchio and Matteo Dellepiane. “Fast Decompression for Web-based
View-dependent 3D Rendering”. In: Proceedings of the 20th International
Conference on 3D Web Technology. Web3D ’15. Heraklion, Crete, Greece:
ACM, 2015, pp. 199–207. isbn: 978-1-4503-3647-5. doi: 10.1145/2775292.
2775308. url: http://doi.acm.org/10.1145/2775292.2775308.
[331] Marco Potenziani, Marco Callieri, Matteo Dellepiane, Massimiliano Corsini,
Federico Ponchio, and Roberto Scopigno. “3DHOP: 3D Heritage Online
Presenter”. In: Computers & Graphics 52 (2015), pp. 129–141. issn: 0097-
8493.
[332] Marco Potenziani, M Corsini, M Callieri, M Di Benedetto, F Ponchio, M
Dellepiane, and R Scopigno. “An Advanced Solution for Publishing 3D
Content on the Web”. In: Museums and the Web. 2013.
[333] Peter Quax, Bjorn Geuns, Tom Jehaes, Wim Lamotte, and Gert Vansichem.
“On the applicability of remote rendering of networked virtual environments
on mobile devices”. In: Systems and Networks Communications, 2006.
ICSNC’06. International Conference on. IEEE. 2006, pp. 16–16.
[334] Jean-Charles Quillet, Gwenola Thomas, Xavier Granier, Pascal Guitton, and
Jean-Eudes Marvie. “Using Expressive Rendering for Remote Visualization of
Large City Models”. In: Proceedings of the Eleventh International Conference
on 3D Web Technology. Web3D ’06. Columbia, Maryland: ACM, 2006, pp. 27–

REFERENCES 319
35. isbn: 1-59593-336-0. doi: 10.1145/1122591.1122595. url: http://doi.
acm.org/10.1145/1122591.1122595.
[335] Sascha Räsch, Maximilian Herz, Johannes Behr, and Arjan Kuijper. “Efficient
Compression for Server-side G-buffer Streaming in Web Applications”. In:
Proceedings of the 22nd International Conference on 3D Web Technology.
Web3D ’17. Brisbane, Queensland, Australia: ACM, 2017, 16:1–16:7. isbn:
978-1-4503-4955-0. doi: 10.1145/3055624.3075952. url: http://doi.acm.
org/10.1145/3055624.3075952.
[336] REALiX. Comprehensive Hardware Analysis, Monitoring and Reporting for
Windows and DOS. 1995. url: https : / / www . hwinfo . com/ (visited on
06/27/2019).
[337] Rec, ITUT. “P. 910: Subjective video quality assessment methods for multi-
media applications”. In: International Telecommunication Union, Geneva 2
(2008).
[338] Fabio Remondino. “Heritage Recording and 3D Modeling With Photogram-
metry and 3D Scanning”. In: Remote Sensing 3.6 (2011), pp. 1104–1138.
[339] Bernice E Rogowitz and Holly E Rushmeier. “Are image quality metrics
adequate to evaluate the quality of geometric objects?” In: Human Vision
and Electronic Imaging VI. Vol. 4299. International Society for Optics and
Photonics. 2001, pp. 340–349.
[340] José Ignacio Rojas-Sola, Miguel Castro-Garcıéa, and Marıéa del Pilar
Carranza-Canadas. “Content management system incorporated in a virtual
museum hosting”. In: Journal of Cultural Heritage 12.1 (2011), pp. 74–81.
[341] Azriel Rosenfeld. “Image Analysis and Computer Vision: 1998”. In: Computer
vision and image understanding 74.1 (1999), pp. 36–95.
[342] Henriette Roued-Cunliffe and Andrea Copeland. Participatory Heritage. Facet
Publishing, 2017.
[343] Roundme Limited. Roundme Main Website. 2014. url: https://roundme.
com/ (visited on 06/27/2019).
[344] I Rubino. “iPads for museums: Serving visitors and professional communities
[J/OL]”. In: (2011).
320 REFERENCES
[345] Irene Rubino, Claudia Barberis, Jetmir Xhembulla, and Giovanni Malnati.
“Integrating a location-based mobile game in the museum visit: Evaluating
visitors’ behaviour and learning”. In: Journal on Computing and Cultural
Heritage (JOCCH) 8.3 (May 2015), p. 15. issn: 1556-4673. doi: 10.1145/
2724723. url: http://doi.acm.org/10.1145/2724723.
[346] Stuart J Russell and Peter Norvig. Artificial Intelligence: A Modern Approach.
Malaysia; Pearson Education Limited, 2016.
[347] Bernhard Ruthensteiner and MARTIN HEß. “Embedding 3D models of
biological specimens in PDF publications”. In: Microscopy research and
technique 71.11 (2008), pp. 778–786.
[348] Bob Ryan, Robert William Scapens, and Michael Theobald. Research Method
and Methodology in Finance and Accounting. Thomson London, 2002.
[349] Michael Rymaszewski, Wagner James Au, Mark Wallace, Catherine Winters,
Cory Ondrejka, and Benjamin Batstone-Cunningham. Second Life: The
Official Guide. John Wiley & Sons, 2007.
[350] Chad F Salisbury, Steven D Farr, and Jason A Moore. “Web-based simulation
visualization using Java3D”. In: Simulation Conference Proceedings, 1999
Winter. Vol. 2. IEEE. 1999, pp. 1425–1429.
[351] Jairo R Sánchez, David Oyarzun, and Rubén Dıéaz. “Study of 3D web tech-
nologies for industrial applications”. In: Proceedings of the 17th International
Conference on 3D Web Technology. ACM. 2012, pp. 184–184.
[352] Maikon Cismoski dos Santos, Hélio Pedrini, and André Luiz Battaiola. “An
Architecture for Rendering Web 3D Virtual Environments on Computers
With Limited Graphic Processing Power”. In: Proceedings of the XV Brazilian
Symposium on Multimedia and the Web. ACM. 2009, p. 30.
[353] Pedro Santos, Sebastian Pena Serna, André Stork, and Dieter Fellner. “The
Potential of 3D Internet in the Cultural Heritage Domain”. In: 3D Research
Challenges in Cultural Heritage. Springer, 2014, pp. 1–17.
[354] Mark Saunders, Philip Lewis, and Adrian Thornhill. Research methods for
business students. Pearson education, 2009.
[355] MNK Saunders and PC Tosey. “The layers of research design”. In: Rapport
Winter (2013), pp. 58–59.
REFERENCES 321
[356] Werner Schweibenz. “The Virtual Museum: New Perspectives For Museums
to Present Objects and Information Using the Internet as a Knowledge Base
and Communication System.” In: ISI 34 (1998), pp. 185–200.
[357] Roberto Scopigno, Marco Callieri, Paolo Cignoni, Massimiliano Corsini,
Matteo Dellepiane, Federico Ponchio, and Guido Ranzuglia. “3D Models
for Cultural Heritage: Beyond Plain Visualization”. In: Computer 44.07 (July
2011), pp. 48–55. issn: 0018-9162. doi: 10.1109/MC.2011.196.
[358] Roberto Scopigno, Marco Callieri, Matteo Dellepiane, Federico Ponchio, and
Marco Potenziani. “Delivering and Using 3D Models on the Web: Are We
Ready?” In: Virtual Archaeology Review 8.17 (2017), pp. 1–9.
[359] Timothy Scully, Jozef Doboš, Timo Sturm, and Yvonne Jung. “3Drepo.io:
Building the Next Generation Web3D Repository with AngularJS and X3DOM”.
In: Proceedings of the 20th International Conference on 3D Web Technology.
Web3D ’15. Heraklion, Crete, Greece: ACM, 2015, pp. 235–243. isbn: 978-1-
4503-3647-5. doi: 10.1145/2775292.2775312. url: http://doi.acm.org/10.
1145/2775292.2775312.
[360] Timothy Scully, Sebastian Friston, Carmen Fan, Jozef Doboš, and Anthony
Steed. “glTF Streaming from 3D Repo to X3DOM”. In: Proceedings of the
21st International Conference on Web3D Technology. Web3D ’16. Anaheim,
California: ACM, 2016, pp. 7–15. isbn: 978-1-4503-4428-9. doi: 10.1145/
2945292.2945297. url: http://doi.acm.org/10.1145/2945292.2945297.
[361] Semantic Organization. Semantic CSS Framework. 2013. url: https://
semantic-ui.com/ (visited on 06/27/2019).
[362] Luıés Sequeira and Leonel Morgado. “Virtual Archaeology in Second Life
and OpenSimulator”. In: Journal of Virtual Worlds Research (2012).
[363] K. Seshadrinathan, R. Soundararajan, A. C. Bovik, and L. K. Cormack.
“Study of Subjective and Objective Quality Assessment of Video”. In: IEEE
Transactions on Image Processing 19.6 (June 2010), pp. 1427–1441. issn:
1057-7149. doi: 10.1109/TIP.2010.2042111.
[364] Michael Seufert, Sebastian Egger, Martin Slanina, Thomas Zinner, Tobias
Hobfeld, and Phuoc Tran-Gia. “A survey on quality of experience of HTTP
adaptive streaming”. In: IEEE Communications Surveys & Tutorials 17.1
(2015), pp. 469–492.

322 REFERENCES
[365] Shapeways. Shapeways - 3d printing on demand. 2007. url: https://www.
shapeways.com/ (visited on 06/27/2019).
[366] Mary Shaw. “What makes good research in software engineering?” In:
International Journal on Software Tools for Technology Transfer 4.1 (2002),
pp. 1–7.
[367] Shu Shi and Cheng-Hsin Hsu. “A Survey of Interactive Remote Rendering
Systems”. In: ACM Computing Surveys (CSUR) 47.4 (May 2015), 57:1–57:29.
issn: 0360-0300. doi: 10.1145/2719921. url: http://doi.acm.org/10.1145/
2719921.
[368] ShiVa Technologies SAS. Shiva Game engine. 2007. url: http://www.shiva-
engine.com/ (visited on 06/27/2019).
[369] Leslie F Sikos. “A Novel Ontology for 3D Semantics: Ontology-Based 3D
Model Indexing and Content-Based Video Retrieval Applied to the Medical
Domain”. In: International Journal of Metadata, Semantics and Ontologies
12.1 (2017), pp. 59–70.
[370] Roger Silverstone. “Museums and the media: A theoretical and method-
ological exploration”. In: Museum Management and Curatorship 7.3 (1988),
pp. 231–241.
[371] P. Simoens, P. Praet, B. Vankeirsbilck, J. De Wachter, L. Deboosere, F. De
Turck, B. Dhoedt, and P. Demeester. “Design and implementation of a
hybrid remote display protocol to optimize multimedia experience on thin
client devices”. In: 2008 Australasian Telecommunication Networks and
Applications Conference. IEEE. Dec. 2008, pp. 391–396. doi: 10.1109/ATNAC.
2008.4783356.
[372] Simscale. Simscale - Simulation software reinvented for the web. 2013. url:
https://www.simscale.com/ (visited on 06/27/2019).
[373] Dimitrios Skarlatos and Stavroula Kiparissi. “Comparison of laser scanning,
photogrammetry and SFM-MVS pipeline applied in structures and artificial
surfaces”. In: ISPRS annals of the photogrammetry, remote sensing and
spatial information sciences 3 (2012), pp. 299–304.
[374] Sketchfab. Main Website. 2011. url: https://sketchfab.com/ (visited on
06/27/2019).
REFERENCES 323
[375] Sketchfab. Sketchfab Documentation - Improving Viewer Performance. 2014.
url: https://help.sketchfab.com/hc/en- us/articles/201766675-
Performance-Troubleshooting (visited on 06/27/2019).
[376] Sketchfab. Sketchfab Documentation - Interface and Options. 2015. url:
https : / / help . sketchfab . com / hc / en - us / articles / 202509036 -
Interface-and-Options (visited on 06/27/2019).
[377] Sketchfab. Sketchfab Documentation - Materials and Textures. 2015. url:
https : / / help . sketchfab . com / hc / en - us / articles / 202600873 -
Materials-and-Textures (visited on 06/27/2019).
[378] A. Skodras, C. Christopoulos, and T. Ebrahimi. “The JPEG 2000 still image
compression standard”. In: IEEE Signal Processing Magazine 18.5 (Sept.
2001), pp. 36–58. issn: 1053-5888. doi: 10.1109/79.952804.
[379] Smithsonian Institution. Digitization of Smithsonian Collections Media Fact
Sheet. Sept. 2018. url: https://www.si.edu/newsdesk/factsheets/
digitization-smithsonian-collections (visited on 06/27/2019).
[380] Smithsonian Institution. Smithsonian Collections. Aug. 2016. url: https:
//www.si.edu/newsdesk/factsheets/smithsonian-collections (visited
on 06/27/2019).
[381] Smithsonian Institution. Smithsonian Museum X 3D. 2011. url: https://3d.
si.edu/ (visited on 06/27/2019).
[382] Iraj Sodagar. “The MPEG-DASH Standard for Multimedia Streaming Over
the Internet”. In: IEEE MultiMedia 4 (2011), pp. 62–67.
[383] Kristian Sons, Felix Klein, Dmitri Rubinstein, Sergiy Byelozyorov, and Philipp
Slusallek. “XML3D: Interactive 3D Graphics for the Web”. In: Proceedings of
the 15th International Conference on Web 3D Technology. Web3D ’10. Los
Angeles, California: ACM, 2010, pp. 175–184. isbn: 978-1-4503-0209-8. doi:
10.1145/1836049.1836076. url: http://doi.acm.org/10.1145/1836049.
1836076.
[384] Damien Sorel. Photo Sphere Viewer - A JavaScript library to display Photo
Sphere panoramas. 2010. url: https://photo-sphere-viewer.js.org/
(visited on 06/27/2019).
324 REFERENCES
[385] Federico Spini, Enrico Marino, Michele D’Antimi, Edoardo Carra, and Alberto
Paoluzzi. “Web 3D Indoor Authoring and VR Exploration via Texture Baking
Service”. In: Proceedings of the 21st International Conference on Web3D
Technology. Web3D ’16. Anaheim, California: ACM, 2016, pp. 151–154. isbn:
978-1-4503-4428-9. doi: 10.1145/2945292.2945309. url: http://doi.acm.
org/10.1145/2945292.2945309.
[386] Manu Sporny, Dave Longley, Gregg Kellogg, Markus Lanthaler, and Niklas
Lindström. “JSON-LD 1.0”. In: W3C Recommendation 16 (2014), p. 41.
[387] Andreas Stamoulias, Athanasios G Malamos, Markos Zampoglou, and Don
Brutzman. “Enhancing X3DOM declarative 3D with rigid body physics
support”. In: Proceedings of the 19th International ACM Conference on
3D Web Technologies. ACM. 2014, pp. 99–107.
[388] EK Stathopoulou, A Georgopoulos, G Panagiotopoulos, and D Kaliampakos.
“crowdsourcing lost cultural heritage”. In: ISPRS Annals of Photogrammetry,
Remote Sensing & Spatial Information Sciences 2 (2015).
[389] Statista. Global mobile data traffic from 2017 to 2022 (in exabytes per month).
2019. url: https : / / www . statista . com / statistics / 271405 / global -
mobile-data-traffic-forecast/ (visited on 06/27/2019).
[390] Statista. Mobile internet traffic as percentage of total web traffic in February
2019, by region. 2019. url: https://www.statista.com/statistics/
306528 / share - of - mobile - internet - traffic - in - global - regions/
(visited on 06/27/2019).
[391] Internet World Stats. Internet Penetration in Africa - March 31, 2019. 2019.
url: https : / / www . internetworldstats . com / stats1 . htm (visited on
06/27/2019).
[392] Thomas Sturgeon, Colin Allison, and Alan Miller. “802.11 Wireless Exper-
iments in a Virtual World”. In: ACM SIGCSE Bulletin 41.3 (July 2009),
pp. 85–89. issn: 0097-8418. doi: 10.1145/1595496.1562908. url: http:
//doi.acm.org/10.1145/1595496.1562908.
[393] Sylaiou Styliani, Liarokapis Fotis, Kotsakis Kostas, and Patias Petros. “Virtual
museums, a survey and some issues for consideration”. In: Journal of cultural
Heritage 10.4 (2009), pp. 520–528. issn: 1296-2074. doi: https://doi.org/
10.1016/j.culher.2009.03.003.
REFERENCES 325
[394] S Sylaiou, F Liarokapis, L Sechidis, P Patias, and O Georgoula. “Virtual
museums: First results of a survey on methods and tools”. In: Proceedings of
the CIPA and the ISPRS Conference, Torino, Italy. Citeseer. 2005, pp. 1138–
1143.
[395] Stella Sylaiou, Katerina Mania, Athanasis Karoulis, and Martin White.
“Exploring the relationship between presence and enjoyment in a virtual
museum”. In: International journal of human-computer studies 68.5 (2010),
pp. 243–253.
[396] Styliani Sylaiou, M. Economou, A. Karoulis, and M. White. “The Evaluation
of ARCO: A Lesson in Curatorial Competence and Intuition with New
Technology”. In: Comput. Entertain. 6.2 (July 2008), 23:1–23:18. issn: 1544-
3574. doi: 10.1145/1371216.1371226. url: http://doi.acm.org/10.1145/
1371216.1371226.
[397] Elizabeth Tait, Richard Laing, Andy Grinnall, Simon Burnett, and John Isaacs.
“(Re) presenting heritage: Laser scanning and 3D visualisations for cultural
resilience and community engagement”. In: Journal of information science
42.3 (2016), pp. 420–433.
[398] Juan Vicente Talens-Noguera and Hantao Liu. “Studying the Perceived Quality
Variation over Time for Video Quality Assessment”. In: Proceedings of the 1st
International Workshop on Perception Inspired Video Processing. PIVP ’14.
Orlando, Florida, USA: ACM, 2014, pp. 35–36. isbn: 978-1-4503-3125-8. doi:
10.1145/2662996.2663013. url: http://doi.acm.org/10.1145/2662996.
2663013.
[399] David Taubman and Michael Marcellin. JPEG2000 Image Compression
Fundamentals, Standards and Practice: Image Compression Fundamentals,
Standards and Practice. Vol. 642. Springer Science & Business Media, 2012.
[400] TechPowerUp. TechPowerUp GPU-Z. 2004. url: https://www.techpowerup.
com/gpuz/ (visited on 06/27/2019).
[401] Stone Temple. Mobile vs Desktop Traffic in 2019. Apr. 2019. url: https:
//www.stonetemple.com/mobile-vs-desktop-usage-study/ (visited on
06/27/2019).
[402] Nicolas Tizon, Christina Moreno, Mihai Cernea, and Marius Preda. “MPEG-
4-based Adaptive Remote Rendering for Video Games”. In: Proceedings of
the 16th International Conference on 3D Web Technology. Web3D ’11. Paris,

326 REFERENCES
France: ACM, 2011, pp. 45–50. isbn: 978-1-4503-0774-1. doi: 10.1145/
2010425.2010433. url: http://doi.acm.org/10.1145/2010425.2010433.
[403] Costa Touma and Craig Gotsman. Triangle mesh compression. US Patent
6,167,159. Dec. 2000.
[404] Dennis Tsichritzis, Simon J Gibbs, et al. “Virtual Museums and Virtual
Realities”. In: ICHIM. Citeseer. 1991, pp. 17–25.
[405] Nestor Tsirliganis, George Pavlidis, Anestis Koutsoudis, Despina Pa-
padopoulou, Apostolos Tsompanopoulos, Konstantinos Stavroglou, Zachare-
nia Loukou, and Christodoulos Chamzas. “Archiving Cultural Objects in the
21st Century”. In: Journal of Cultural Heritage 5.4 (2004), pp. 379–384.
[406] UNESCO. Tangible Cultural Heritage. 2017. url: http : / / www . unesco .
org/new/en/cairo/culture/tangible-cultural-heritage/ (visited on
06/27/2019).
[407] UNESCO. United Nations Educational, Scientific and Cultural Organisation
(UNESCO) - Natural Heritage. 2019. url: http://uis.unesco.org/en/
glossary-term/natural-heritage (visited on 06/27/2019).
[408] Unity Technologies. Memory Measurement - Unity Profiler Tool. 2005. url:
http://docs.unity3d.com/Manual/ProfilerMemory.html (visited on
06/27/2019).
[409] Unity Technologies. The Unity Documentation. 2005. url: http://docs.
unity3d.com/Manual/index.html (visited on 06/27/2019).
[410] Unity Technologies. Unity 3D game engine. 2005. url: https://unity3d.
com/ (visited on 06/27/2019).
[411] Unity Technologies. Unity Documentation - Caching. 2005. url: http://docs.
unity3d.com/ScriptReference/Caching.html (visited on 06/27/2019).
[412] Unity Technologies. Unity Documentation - Optimizing Graphics Performance.
2005. url: http://docs.unity3d.com/Manual/OptimizingGraphicsPerformance.
html (visited on 06/27/2019).
[413] Unity Technologies. Unity Documentation - The Unity Profiler. 2005. url:
http : / / docs . unity3d . com / Manual / Profiler . html (visited on
06/27/2019).
[414] Unity Technologies. Unity Web Player Roadmap. 2015. url: http://blogs.
unity3d . com / 2015 / 10 / 08 / unity - web - player - roadmap/ (visited on
06/27/2019).
REFERENCES 327
[415] Unity Technologies. Unity3D Documentation - Level of Detail (LOD) versions
2018 and onwards. 2018. url: https : / / docs . unity3d . com / Manual /
LevelOfDetail.html (visited on 06/27/2019).
[416] Richard J Urban. “A Second Life for Your Museum: 3D Multi-User Virtual
Environments and Museums”. In: Museums and the Web (2007).
[417] US Secretary of Defense. Virtual World Framework (VWF). 2011. url: https:
//github.com/virtual-world-framework/vwf (visited on 06/27/2019).
[418] Domenico Visintini, Anna Spangher, and Barbara Fico. “The VRML model of
Victoria Square in Gorizia (Italy) from laser scanning and photogrammetric
3D surveys”. In: Proceedings of the twelfth international conference on 3D
web technology. ACM. 2007, pp. 165–168.
[419] Vassilios Vlahakis, M Ioannidis, John Karigiannis, Manolis Tsotros, Michael
Gounaris, Didier Stricker, Tim Gleue, Patrick Daehne, and Luıés Almeida.
“Archeoguide: an augmented reality guide for archaeological sites”. In: IEEE
Computer Graphics and Applications 22.5 (2002), pp. 52–60. issn: 0272-1716.
doi: 10.1109/MCG.2002.1028726.
[420] Haitao Wang, Xiaoyu Chen, Nicholas Polys, and Peter Sforza. “A Web3D
Forest Geo-visualization and User Interface Evaluation”. In: Proceedings
of the 22Nd International Conference on 3D Web Technology. Web3D ’17.
Brisbane, Queensland, Australia: ACM, 2017, 9:1–9:9. isbn: 978-1-4503-4955-
0. doi: 10.1145/3055624.3075956. url: http://doi.acm.org/10.1145/
3055624.3075956.
[421] Lu Wang, Jian Wei Guo, Cheng Lei Yang, Hai Seng Zhao, and Xiang Xu Meng.
“O3D-Based Game Learning Environments for Cultural Heritage Online
Education”. In: International Conference on Technologies for E-Learning and
Digital Entertainment. Springer. 2010, pp. 417–428.
[422] Rui Wang and Xuelei Qian. OpenSceneGraph 3.0: Beginner’s guide. Packt
Publishing Ltd, 2010.
[423] Wei Wang and Jinyuan Jia. “An Incremental SMLAOI Algorithm for Progres-
sive Downloading Large Scale WebVR Scenes”. In: Proceedings of the 14th
International Conference on 3D Web Technology. Web3D ’09. Darmstadt,
Germany: ACM, 2009, pp. 55–60. isbn: 978-1-60558-432-4. doi: 10.1145/
1559764.1559773. url: http://doi.acm.org/10.1145/1559764.1559773.
328 REFERENCES
[424] Z. Wang and A. C. Bovik. “Mean squared error: Love it or leave it? A new
look at Signal Fidelity Measures”. In: IEEE Signal Processing Magazine 26.1
(Jan. 2009), pp. 98–117. issn: 1053-5888. doi: 10.1109/MSP.2008.930649.
[425] Benjamin Watson, Alinda Friedman, and Aaron McGaffey. “Measuring and
predicting visual fidelity”. In: Proceedings of the 28th annual conference on
Computer graphics and interactive techniques. ACM. 2001, pp. 213–220.
[426] Web3D Consortium, ed. ACM Web3D International Conference. ACM. url:
http://www.web3d.org/.
[427] M. White, N. Mourkoussis, J. Darcy, P. Petridis, F. Liarokapis, P. Lister, K.
Walczak, R. Wojciechowski, W. Cellary, J. Chmielewski, M. Stawniak, W. Wiza,
M. Patel, J. Stevenson, J. Manley, F. Giorgini, P. Sayd, and F. Gaspard. “ARCO-
an architecture for digitization, management and presentation of virtual
exhibitions”. In: Proceedings Computer Graphics International. June 2004,
pp. 622–625. doi: 10.1109/CGI.2004.1309277.
[428] Rafal Wojciechowski, Krzysztof Walczak, Martin White, and Wojciech Cellary.
“Building Virtual and Augmented Reality Museum Exhibitions”. In: Proceed-
ings of the Ninth International Conference on 3D Web Technology. Web3D
’04. Monterey, California: ACM, 2004, pp. 135–144. isbn: 1-58113-845-8.
doi: 10.1145/985040.985060. url: http://doi.acm.org/10.1145/985040.
985060.
[429] World Wide Web Consortium. “Data Catalog Vocabulary (DCAT)”. In: (2014).
[430] World Wide Web Consortium. WebRTC - Web Real-Time Communications.
2011. url: https://webrtc.org/ (visited on 06/27/2019).
[431] World Wide Web Consortium. WebXR. 2018. url: https://www.w3.org/TR/
webxr/ (visited on 06/27/2019).
[432] Liyuan Xing, Junyong You, Touradj Ebrahimi, and Andrew Perkis. “Estimating
Quality of Experience on Stereoscopic Images”. In: Intelligent Signal Process-
ing and Communication Systems (ISPACS), 2010 International Symposium
on. IEEE, 2010, pp. 1–4.
[433] Liyuan Xing, Junyong You, Touradj Ebrahimi, and Andrew Perkis. “Estimating
Quality of Experience on Stereoscopic Images”. In: 2010 International
Symposium on Intelligent Signal Processing and Communication Systems.
Dec. 2010, pp. 1–4. doi: 10.1109/ISPACS.2010.5704599.

REFERENCES 329
[434] Zhao Xu, Yang Zhang, and Xiayan Xu. “3D visualization for building informa-
tion models based upon IFC and WebGL integration”. In: Multimedia Tools
and applications 75.24 (2016), pp. 17421–17441.
[435] Ilmi Yoon and Ulrich Neumann. “Web-Based Remote Rendering with IBRAC
(Image-Based Rendering Acceleration and Compression)”. In: Computer
Graphics Forum 19.3 (2000), pp. 321–330. doi: 10.1111/1467-8659.00424.
eprint: https://onlinelibrary.wiley.com/doi/pdf/10.1111/1467-8659.
00424. url: https://onlinelibrary.wiley.com/doi/abs/10.1111/1467-
8659.00424.
[436] S. e. Yoon and P. Lindstrom. “Random-Accessible Compressed Triangle
Meshes”. In: IEEE Transactions on Visualization and Computer Graphics
13.6 (Nov. 2007), pp. 1536–1543. issn: 1077-2626. doi: 10.1109/TVCG.2007.
70585.
[437] So-Yeon Yoon, James Laffey, and Hyunjoo Oh. “Understanding usability and
user experience of web-based 3D graphics technology”. In: Intl. Journal of
Human–Computer Interaction 24.3 (2008), pp. 288–306.
[438] Sarah Younan and Cathy Treadaway. “Digital 3D Models of Heritage Artefacts:
Towards a Digital Dream Space”. In: Digital Applications in Archaeology and
Cultural Heritage 2.4 (2015), pp. 240–247. issn: 2212-0548. doi: https://
doi.org/10.1016/j.daach.2015.11.001. url: http://www.sciencedirect.
com/science/article/pii/S2212054815300035.
[439] Alon Zakai. “Emscripten: An LLVM-to-JavaScript Compiler”. In: Proceedings
of the ACM International Conference Companion on Object Oriented Pro-
gramming Systems Languages and Applications Companion. OOPSLA ’11.
Portland, Oregon, USA: ACM, 2011, pp. 301–312. isbn: 978-1-4503-0942-
4. doi: 10.1145/2048147.2048224. url: http://doi.acm.org/10.1145/
2048147.2048224.
[440] Markos Zampoglou, Kostas Kapetanakis, Andreas Stamoulias, Athanasios G
Malamos, and Spyros Panagiotakis. “Adaptive streaming of complex Web
3D scenes based on the MPEG-DASH standard”. In: Multimedia Tools and
Applications 77.1 (Jan. 2018), pp. 125–148. issn: 1573-7721. doi: 10.1007/
s11042-016-4255-8. url: https://doi.org/10.1007/s11042-016-4255-8.
[441] Jiri Zara. “Virtual Reality and Cultural Heritage on the Web”. In: Proceedings
of the7th International Conference on Computer Graphics and Artificial
Intelligence. 2004.
330 REFERENCES
[442] JianPing Zhang and YuHui Yang. “Design and Implementation of Virtual
Museum based on Web3D”. In: Transactions on Edutainment III. Ed. by
Zhigeng Pan, Adrian David Cheok, Wolfgang Müller, and Maiga Chang. Berlin,
Heidelberg: Springer Berlin Heidelberg, 2009, pp. 154–165. isbn: 978-3-642-
11245-4. doi: 10.1007/978-3-642-11245-4_14. url: https://doi.org/10.
1007/978-3-642-11245-4_14.
[443] Qian Zhang, Wenwu Zhu, and Ya-Qin Zhang. “End-to-end QoS for video
delivery over wireless Internet”. In: Proceedings of the IEEE 93.1 (2005),
pp. 123–134.
[444] Y. Zhang, Y. Wang, F. Liu, Z. Liu, Y. Li, D. Yang, and Z. Chen. “Subjective
Panoramic Video Quality Assessment Database for Coding Applications”. In:
IEEE Transactions on Broadcasting 64.2 (June 2018), pp. 461–473. issn:
0018-9316. doi: 10.1109/TBC.2018.2811627.
[445] Zhi-Jin Zhong. “Third-Person Perceptions and Online Games: A Comparison
of Perceived Antisocial and Prosocial Game Effects”. In: Journal of Computer-
Mediated Communication 14.2 (2009), pp. 286–306.
[446] Gabe Zichermann and Christopher Cunningham. Gamification by Design:
Implementing Game Mechanics in Web and Mobile Apps. " O’Reilly Media,
Inc.", 2011.
[447] Michael Zollhöfer, Christian Siegl, Mark Vetter, Boris Dreyer, Marc Stam-
minger, Serdar Aybek, and Frank Bauer. “Low-Cost Real-Time 3D Recon-
struction of Large-Scale Excavation Sites”. In: Journal on Computing and
Cultural Heritage (JOCCH) 9.1 (Nov. 2016), p. 2. issn: 1556-4673. doi: 10.
1145/2770877. url: http://doi.acm.org/10.1145/2770877.
[448] Mikolas Zuza. Photogrammetry – 3D scanning with just your phone cam-
era. Mar. 2018. url: https : / / www . si . edu / newsdesk / factsheets /
digitization-smithsonian-collections (visited on 06/27/2019).
Index
360 video, see Videosphere19
3D Markup Language for the Web, 271
3D Mesh Compression, 64–68
3D Scanning, 6
3D Web, 17, 38–46
CSS3 3D, 270
Dublin Core Metadata Standard, 172–
176
Europeana Data Model, 176–177
Fidelity Perception, 142
FlashPix, 66
Frame Rate, 117
Frame Time, 117
Hannibal, 191–242
HTML5, 270
Java OpenGL, 271
Java3D, 271
JPEG2000, 66
metadata, 202–203
metadata , 20–21
MPEG-4, 63
MPEG-7, 63
MPEG-DASH, 63
Multi-User Virtual World, 17
Museum, 9–11
O3D, 271
Oak3D, 272
Omeka, 183–186, 226
Ontology, 74–76, 171–186
Open Wonderland, 18
OpenSim, 18
OpenSim Hypergrid, 17
Panorama, see Photosphere 19
PDF3D, 272
Photogrammetry, 6
Photosphere, 19, 178
Progressive Mesh Compression, 65
QoE, see Quality of Experience 57
QoS, see Quality of Service 53
Quality of Experience, 57–61, 139–165
Quality of Service , 53–57, 115–127,
131–139
Remote Rendering, 68–74
Second Life, 18
Unity3D, 273
Unreal Engine, 273
Videosphere, 19, 179
ViMQO, see Virtual Museum Quality of
Service Ontology 181
Virtual Museum, 12–16, 53
331
332 INDEX
Virtual Museum Quality of Service On-
tology, 181–183
Visual Latency Perception, 140
VRML, 267–268
Web Graphics Library, 269–270
Web-Based Virtual Museum , 16, 46–53
Web-Based Virtual World, 18, 44–46,
113–127, 274
Web3D, see 3D Web
WebGL, see Web Graphics Library 18
WebRTC Protocol, 18, 67
WebSockets Protocol, 18
Xflow, 268
XML3D, 268