Adaption, interdependence and competition - Merit Tutors
280
Save My Exams! – The Home of Revision For more awesome GCSE and A level resources, visit us at www.savemyexams.co.uk Page 1 Adaption, interdependence and competition Question Paper 1 Level GCSE (9-1) Subject Biology Exam Board AQA Topic 4.7 Ecology Sub-Topic Adaption, interdependence, and competition Difficulty Level Bronze Level Booklet Question Paper1 Time Allowed: 59 minutes Score: /58 Percentage: /100
-
Upload
khangminh22 -
Category
Documents
-
view
0 -
download
0
Transcript of Adaption, interdependence and competition - Merit Tutors

Save My Exams! – The Home of Revision
For more awesome GCSE and A level resources, visit us at www.savemyexams.co.uk
Page 1
Adaption, interdependence and competition
Question Paper 1
Level GCSE (9-1) Subject Biology
Exam Board AQA Topic 4.7 Ecology
Sub-Topic Adaption, interdependence, and competition Difficulty Level Bronze Level Booklet Question Paper1
Time Allowed: 59 minutes
Score: /58
Percentage: /100

Save My Exams! – The Home of Revision
For more awesome GCSE and A level resources, visit us at www.savemyexams.co.uk
Page 2
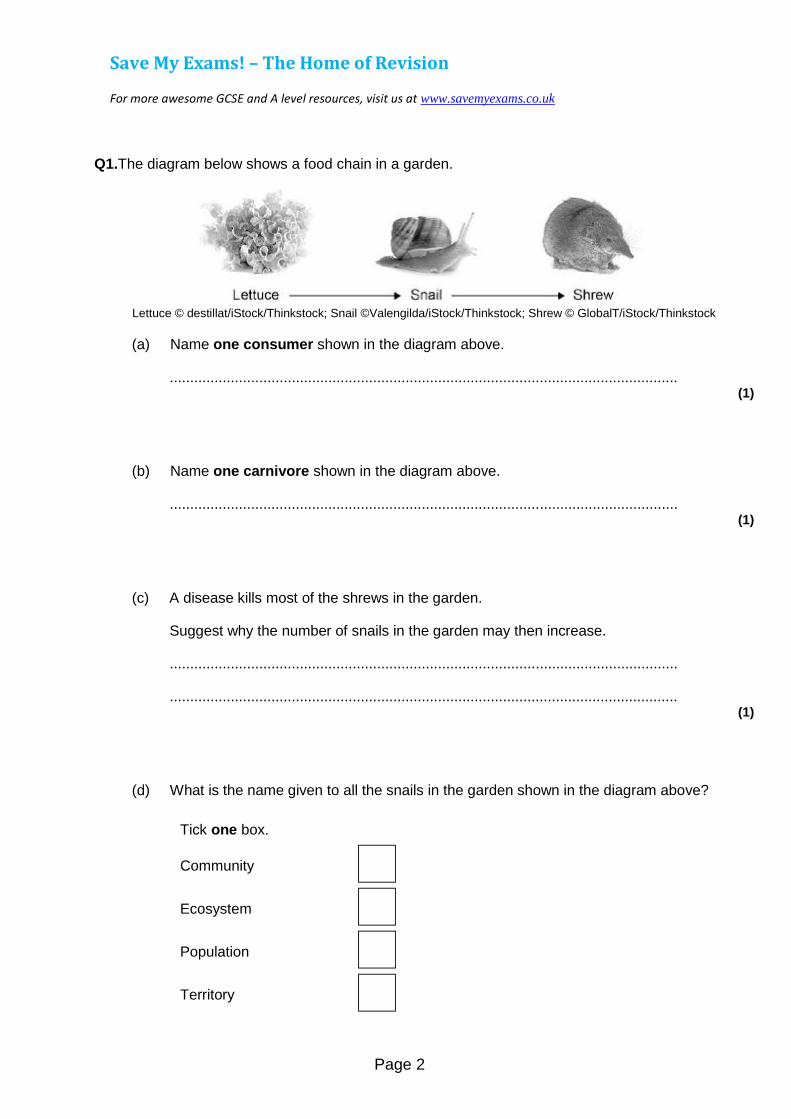
Q1.The diagram below shows a food chain in a garden.
Lettuce © destillat/iStock/Thinkstock; Snail ©Valengilda/iStock/Thinkstock; Shrew © GlobalT/iStock/Thinkstock
(a) Name one consumer shown in the diagram above.
............................................................................................................................. (1)
(b) Name one carnivore shown in the diagram above.
............................................................................................................................. (1)
(c) A disease kills most of the shrews in the garden.
Suggest why the number of snails in the garden may then increase.
.............................................................................................................................
............................................................................................................................. (1)
(d) What is the name given to all the snails in the garden shown in the diagram above?
Tick one box.
Community
Ecosystem
Population
Territory

Save My Exams! – The Home of Revision
For more awesome GCSE and A level resources, visit us at www.savemyexams.co.uk
Page 3
(1)
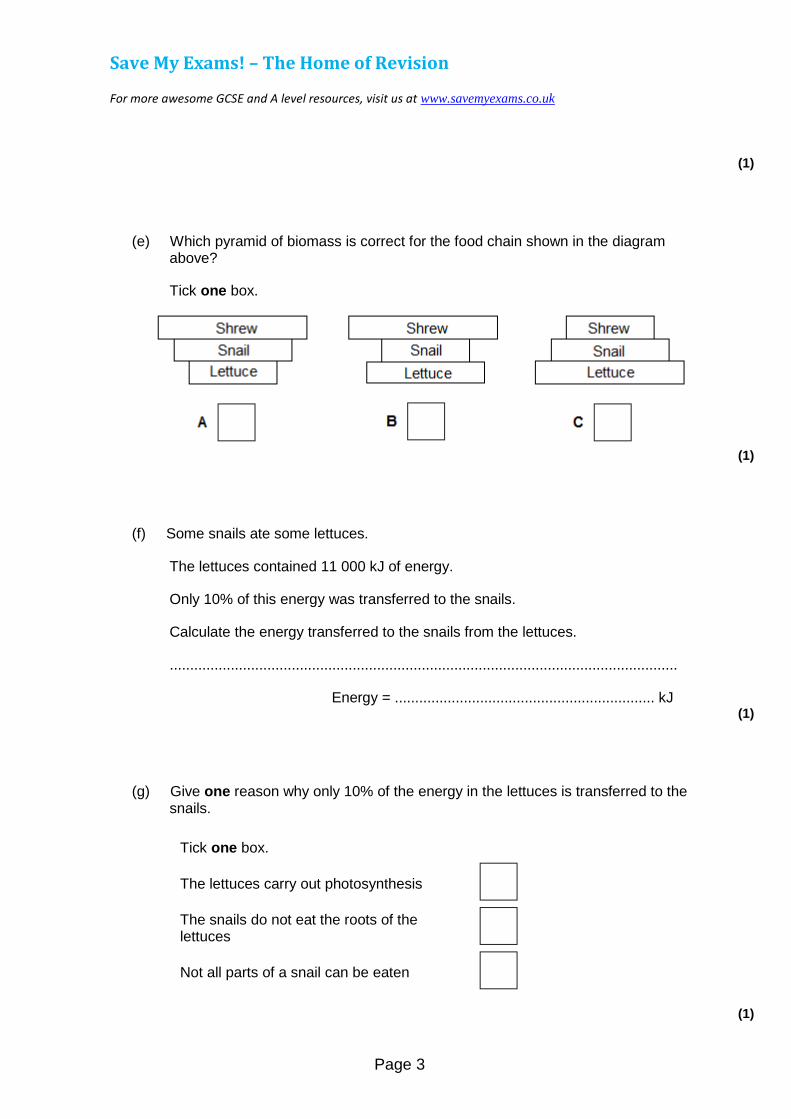
(e) Which pyramid of biomass is correct for the food chain shown in the diagram above?
Tick one box.
(1)
(f) Some snails ate some lettuces.
The lettuces contained 11 000 kJ of energy.
Only 10% of this energy was transferred to the snails.
Calculate the energy transferred to the snails from the lettuces.
.............................................................................................................................
Energy = ................................................................ kJ (1)
(g) Give one reason why only 10% of the energy in the lettuces is transferred to the snails.
Tick one box.
The lettuces carry out photosynthesis
The snails do not eat the roots of the lettuces
Not all parts of a snail can be eaten
(1)

Save My Exams! – The Home of Revision
For more awesome GCSE and A level resources, visit us at www.savemyexams.co.uk
Page 4
(h) Abiotic factors can affect the food chain.
Wind direction is one abiotic factor.
Name one other abiotic factor.
............................................................................................................................. (1)
(Total 8 marks)
Q2. Plants are adapted for survival in many different ways.
Use information from the drawings to answer each question.
(a) This plant lives in ponds. The leaves of the plant float on the surface of the water.
Save My Exams! – The Home of Revision
For more awesome GCSE and A level resources, visit us at www.savemyexams.co.uk
Page 5
The leaf of this plant is adapted for floating on water.
Suggest how.
........................................................................................................................
........................................................................................................................ (1)
(b) This plant lives in areas where a lot of snow falls.
The triangular shape helps the tree to survive in snowy conditions.
Suggest how.
........................................................................................................................
........................................................................................................................ (1)
(c) This plant has sharp thorns on the stem.

Save My Exams! – The Home of Revision
For more awesome GCSE and A level resources, visit us at www.savemyexams.co.uk
Page 6
Thorns help this plant survive.
Suggest how.
........................................................................................................................
........................................................................................................................ (1)
(d) This plant lives in very dry areas.
The swollen leaves help this plant to survive in very dry places.
Suggest how.
........................................................................................................................
........................................................................................................................ (1)
(Total 4 marks)
Q3. Many animals and plants are adapted to stop other organisms eating them.

Save My Exams! – The Home of Revision
For more awesome GCSE and A level resources, visit us at www.savemyexams.co.uk
Page 7
(a) The photograph shows part of a plant stem.
By Forest & Kim Starr [CC BY 3.0], via Wikimedia Commons
Suggest how this plant is adapted to stop animals eating it.
Adaptation
........................................................................................................................
Describe how the adaptation helps to stop animals eating the plant.
........................................................................................................................
........................................................................................................................ (2)
(b) The photograph shows an insect on a plant twig.

Save My Exams! – The Home of Revision
For more awesome GCSE and A level resources, visit us at www.savemyexams.co.uk
Page 8
By Fir0002 [CC BY-SA 3.0], via Wikimedia Commons
Suggest how this insect is adapted to stop animals eating it.
Adaptation
........................................................................................................................
Describe how the adaptation helps to stop animals eating the insect.
........................................................................................................................
........................................................................................................................ (2)
(c) The photograph shows some insects.
These insects are bright red.

Save My Exams! – The Home of Revision
For more awesome GCSE and A level resources, visit us at www.savemyexams.co.uk
Page 9
By Greg Hume (Greg5030) [CC BY 3.0], via Wikimedia Commons
Suggest how these insects are adapted to stop animals eating them.
Adaptation
........................................................................................................................
Describe how the adaptation helps to stop animals eating the insect.
........................................................................................................................
........................................................................................................................ (2)
(Total 6 marks)

Save My Exams! – The Home of Revision
For more awesome GCSE and A level resources, visit us at www.savemyexams.co.uk
Page 10
Q4. In a woodland, bluebells grow well every year.
Bluebells growing well in woodland
Mick Garratt [CC-BY-SA-2.0], via Wikimedia Commons
Each year the dead flowers and leaves of the bluebells and leaves from the trees fall onto the ground. The bluebells do not run out of mineral ions.
Explain why the bluebells do not run out of mineral ions.
The words in the box may help you.
roots dead leaves mineral ions
microorganisms decay
.................................................................................................................................
.................................................................................................................................
.................................................................................................................................
.................................................................................................................................
.................................................................................................................................
................................................................................................................................. (3)
(Total 3 marks)

Save My Exams! – The Home of Revision
For more awesome GCSE and A level resources, visit us at www.savemyexams.co.uk
Page 11
Q5. The photograph shows some features of a waterbuck.
Waterbuck live in areas of tall, brown grass.
By Nevit Dilmen (Own work) [CC-BY-SA-3.0], via Wikimedia Commons
Choose labels from the photograph to answer these questions. You should choose a label once only.
(a) Which feature helps to camouflage the waterbuck in the grass?
........................................................................................................................ (1)
(b) Which feature helps the waterbuck to detect predators?
........................................................................................................................ (1)
(c) Which feature helps the waterbuck to fight predators?
........................................................................................................................ (1)

Save My Exams! – The Home of Revision
For more awesome GCSE and A level resources, visit us at www.savemyexams.co.uk
Page 12
(d) Which feature helps a baby waterbuck to follow a parent through the long grass?
........................................................................................................................ (1)
(Total 4 marks)

Save My Exams! – The Home of Revision
For more awesome GCSE and A level resources, visit us at www.savemyexams.co.uk
Page 13
Q6.The drawing shows a jerboa. Jerboas live in sandy deserts.
Jerboas sleep in underground holes during the hot day and come out during the cold night.
The jerboa’s main food is small insects which run across the surface of the sand.
For each question write the correct letter in the box.
Which structure, A, B, C, D, E or F:
(a) helps to insulate the jerboa
(1)
(b) helps the jerboa to detect insects on a dark night
(1)
(c) helps the jerboa to hop quickly to catch an insect

Save My Exams! – The Home of Revision
For more awesome GCSE and A level resources, visit us at www.savemyexams.co.uk
Page 14
(1)
(d) helps the jerboa to keep its balance when hopping
(1)
(e) helps the jerboa to know the width of its underground hole in the dark?
(1)
(Total 5 marks)

Save My Exams! – The Home of Revision
For more awesome GCSE and A level resources, visit us at www.savemyexams.co.uk
Page 15
Q7.Many organisms are adapted to avoid being eaten.
(a) The photograph shows a gecko on a leafy branch.
© Thomas Marent/ardea.com
The gecko is adapted to avoid being eaten by predators.
Explain how.
........................................................................................................................
........................................................................................................................
........................................................................................................................
........................................................................................................................ (2)
(b) Ants can give a painful bite.
The photograph shows a type of ant living on acacia trees.
Acacia trees have thorns on their branches.
Branch of acacia tree.

Save My Exams! – The Home of Revision
For more awesome GCSE and A level resources, visit us at www.savemyexams.co.uk
Page 16
By Ryan Somma, cropped by Fama Clamosa,20 January 2010 (UTC) [CC-BY-SA-2.0], via Wikimedia Commons
(i) Predators are less likely to eat ants living on acacia trees than ants living on the ground.
Suggest why.
...............................................................................................................
............................................................................................................... (1)
(ii) Giraffes eat the leaves of acacia trees.
Giraffes do not eat the leaves of acacia trees that have ants living on them.
Suggest why.
...............................................................................................................
............................................................................................................... (1)
(c) The photographs show a wasp and a hoverfly.
The wasp and the hoverfly both have black and yellow stripes.
WaspHoverfly

Save My Exams! – The Home of Revision
For more awesome GCSE and A level resources, visit us at www.savemyexams.co.uk
Page 17
© Alexandr Pakhnyushchyy/iStock© Richard Majlinder/iStock
Wasps have stings, but hoverflies do not.
The stripes on the hoverfly help the hoverfly to avoid being eaten by predators.
Explain why.
........................................................................................................................
........................................................................................................................
........................................................................................................................
........................................................................................................................ (2)
(Total 6 marks)
Save My Exams! – The Home of Revision
For more awesome GCSE and A level resources, visit us at www.savemyexams.co.uk
Page 18
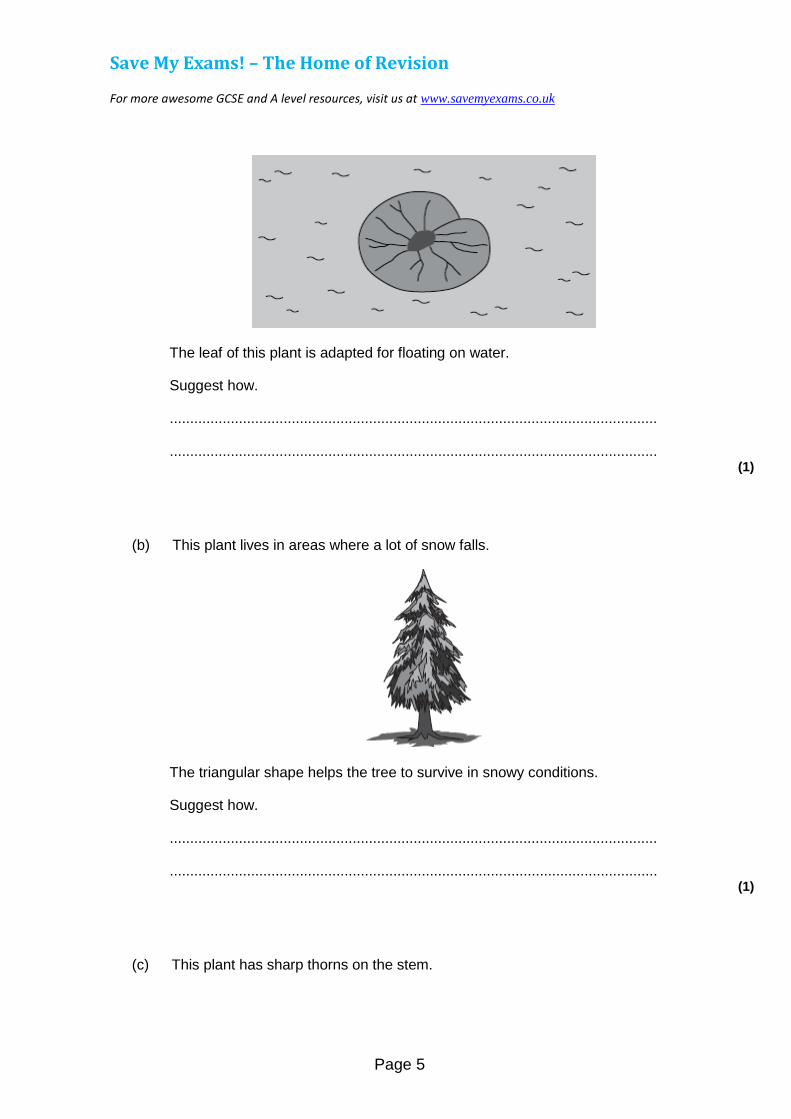
Q8.The picture shows a basilisk lizard. Some of the adaptations of the lizard are labelled.
Basilisk lizards are often found resting on branches of trees that grow next to water. Basilisk lizards can run across the surface of the water.
(a) Draw one line from each adaptation of the lizard to the advantage of the adaptation.
Adaptation Advantage
For camouflage on
branches of trees
Toes on the back feet are webbed
Helps the lizard to
balance when running
Long tail
Warning colours to
deter predators
Brown skin
Increases surface
area in contact with the water
(3)
(b) Suggest one advantage to the basilisk lizard of being able to run across the surface of the water.
........................................................................................................................
........................................................................................................................

Save My Exams! – The Home of Revision
For more awesome GCSE and A level resources, visit us at www.savemyexams.co.uk
Page 19
(1)
(c) Animals, such as lizards, compete with each other.
Give two factors that animals compete for.
Tick ( ) two boxes.
Oxygen
Food
Territory
Light (2)
(Total 6 marks)

Save My Exams! – The Home of Revision
For more awesome GCSE and A level resources, visit us at www.savemyexams.co.uk
Page 20
Q9.Animals and plants are adapted in different ways in order to survive.
(a) Plants may have to compete with other plants.
(i) Name two things for which plants compete.
1 ............................................................................................................
2 ............................................................................................................ (2)
(ii) The drawing shows a creosote bush.
This bush lives in a desert.
The creosote bush produces a poison that kills the roots of other plants.
How does this poison help the creosote bush to survive in the desert?
...............................................................................................................
............................................................................................................... (1)
(b) The photograph shows an insect called a katydid.

Save My Exams! – The Home of Revision
For more awesome GCSE and A level resources, visit us at www.savemyexams.co.uk
Page 21
By Ltshears (Own work) [Public domain], via Wikimedia Commons
The katydid is preyed on by birds.
How does the appearance of the katydid help it to survive?
........................................................................................................................
........................................................................................................................
........................................................................................................................
........................................................................................................................ (1)
(Total 4 marks)

Save My Exams! – The Home of Revision
For more awesome GCSE and A level resources, visit us at www.savemyexams.co.uk
Page 22
Q10.(a) Which term describes organisms that can tolerate very hot or very cold places?
Draw a ring around the correct answer.
an environmental
species an extremophile
species an indicator
species
(1)
(b) Figure 1 shows photographs of an Adelie penguin and a chinstrap penguin. Adelie penguins and chinstrap penguins live in the Antarctic at temperatures below 0 °C.
Adelie penguins spend most of their time on the ice around the Antarctic. Chinstrap penguins live mainly in the sea around the ice. Since 1965 the number of Adelie penguins has decreased by 6 million.
Figure 2 shows changes to the ice around the Antarctic over the past 50 years.

Save My Exams! – The Home of Revision
For more awesome GCSE and A level resources, visit us at www.savemyexams.co.uk
Page 23
(i) Use information from Figure 2 to explain why the number of Adelie penguins has decreased since 1965.
...............................................................................................................
...............................................................................................................
...............................................................................................................
...............................................................................................................
...............................................................................................................
............................................................................................................... (2)
(ii) Suggest what has happened to the number of chinstrap penguins since 1965.
Draw a ring around your answer. increase / decrease
Give a reason for your answer.
...............................................................................................................
............................................................................................................... (1)
(c) The number of penguins can be used to monitor changes in temperature of the environment.
Temperature readings could also be taken using a thermometer.
What is the advantage of using penguins, instead of a thermometer, to monitor changes in temperature of the environment?

Save My Exams! – The Home of Revision
For more awesome GCSE and A level resources, visit us at www.savemyexams.co.uk
Page 24
Tick ( ) one box.
Living organisms show long-term changes.
Thermometers cannot measure temperatures below 0 °C.
Thermometers do not give accurate readings.
(1)
(Total 5 marks)

Save My Exams! – The Home of Revision
For more awesome GCSE and A level resources, visit us at www.savemyexams.co.uk
Page 25
Q11.Some students investigated the distribution of dandelion plants in a grassy field. The grassy field was between two areas of woodland.
Figure 1 shows two students recording how many dandelion plants there are in a 1 metre x 1 metre quadrat.
Figure 1
© Science Photo Library
Figure 2 shows a section across the area studied and Figure 3 shows a bar chart of the students’ results.
Figure 2
Distance in m
Figure 3

Save My Exams! – The Home of Revision
For more awesome GCSE and A level resources, visit us at www.savemyexams.co.uk
Page 26
Distance in m
(a) How did the students use the quadrat and the 30-metre tape measure to get the results in Figure 3?
Use information from Figure 1.
........................................................................................................................
........................................................................................................................
........................................................................................................................
........................................................................................................................
........................................................................................................................
........................................................................................................................ (3)
(b) (i) Suggest one reason why the students found no dandelion plants under the trees.
...............................................................................................................
............................................................................................................... (1)
(ii) Suggest one reason why the students found no dandelion plants at 16 metres.
...............................................................................................................
............................................................................................................... (1)

Save My Exams! – The Home of Revision
For more awesome GCSE and A level resources, visit us at www.savemyexams.co.uk
Page 27
(c) The teacher suggested that it was not possible to make a valid conclusion from these results.
Describe how the students could improve the investigation so that they could make a valid conclusion.
........................................................................................................................
........................................................................................................................
........................................................................................................................
........................................................................................................................ (2)
(Total 7 marks)

Save My Exams! – The Home of Revision
For more awesome GCSE and A level resources, visit us at www.savemyexams.co.uk
Page 1
Adaptations, interdependence and competition
Question Paper 1
Level GCSE (9-1)
Subject Biology
Exam Board AQA
Topic 4.7 EcologySub-Topic Adaptations, independence and competition
Difficulty Level Silver Level
Booklet Question Paper 1
Time Allowed: 55 minutes
Score: /55
Percentage: /100

Save My Exams! – The Home of Revision
For more awesome GCSE and A level resources, visit us at www.savemyexams.co.uk
Page 2
Q1.A grassy field on a farm measured 120 metres by 80 metres.
A student wanted to estimate the number of buttercup plants growing in the field.
The student found an area where buttercup plants were growing and placed a 1 m × 1 m quadrat in one position in that area.
Figure 1 shows the buttercup plants in the quadrat.
The student said, 'This result shows that there are 115 200 buttercup plants in the field.'
(a) (i) How did the student calculate that there were 115 200 buttercup plants in the field?
...............................................................................................................
...............................................................................................................
...............................................................................................................
............................................................................................................... (2)
(ii) The student’s estimate of the number of buttercup plants in the field isprobably not accurate. This is because the buttercup plants are notdistributed evenly.
How would you improve the student’s method to give a more accurateestimate?
...............................................................................................................
...............................................................................................................
...............................................................................................................

Save My Exams! – The Home of Revision
For more awesome GCSE and A level resources, visit us at www.savemyexams.co.uk
Page 3
............................................................................................................... (2)
(b) Sunlight is one environmental factor that might affect the distribution of the buttercup plants.
(i) Give three other environmental factors that might affect the distribution
of the buttercup plants.
1...............................................................................................................
2...............................................................................................................
3............................................................................................................... (3)
(ii) Explain how the amount of sunlight could affect the distribution of the buttercup plants.
(3)
(c) Figure 2 is a map showing the position of the farm and a river which flows through it.
Every year, the farmer puts fertiliser containing mineral ions on some of his fields.When there is a lot of rain, some of the fertiliser is washed into the river.
(i) When fertiliser goes into the river, the concentration of oxygen dissolved in the water decreases.

Save My Exams! – The Home of Revision
For more awesome GCSE and A level resources, visit us at www.savemyexams.co.uk
Page 4
Explain why the concentration of oxygen decreases.
...............................................................................................................
...............................................................................................................
...............................................................................................................
...............................................................................................................
...............................................................................................................
...............................................................................................................
...............................................................................................................
...............................................................................................................
...............................................................................................................
............................................................................................................... (5)
(ii) There is a city 4 km downstream from the farm.
Apart from fertiliser, give one other form of pollution that might go into the river as it flows through the city.
............................................................................................................... (1)
(d) Three sites, A, B and C, are shown in Figure 2.
Scientists took many samples of river water from these sites.
The scientists found larvae of three types of insect in the water: mayfly, stonefly and caddisfly. For each type of insect the scientists found several different species.
The scientists counted the number of different species of the larvae of each of the three types of insect.
Figure 3 shows the scientists’ results.

Save My Exams! – The Home of Revision
For more awesome GCSE and A level resources, visit us at www.savemyexams.co.uk
Page 5
(i) How many more species of mayfly were there at Site B than at Site A?
........................................ (1)
(ii) Suggest what caused this increase in the number of species of mayfly.
...............................................................................................................
............................................................................................................... (1)
(iii) The scientists stated that the number of species of stonefly was the best indicator of the amount of oxygen dissolved in the water.
Use information from Figure 3 to suggest why. (1)
(Total 19 marks)

Save My Exams! – The Home of Revision
For more awesome GCSE and A level resources, visit us at www.savemyexams.co.uk
Page 6
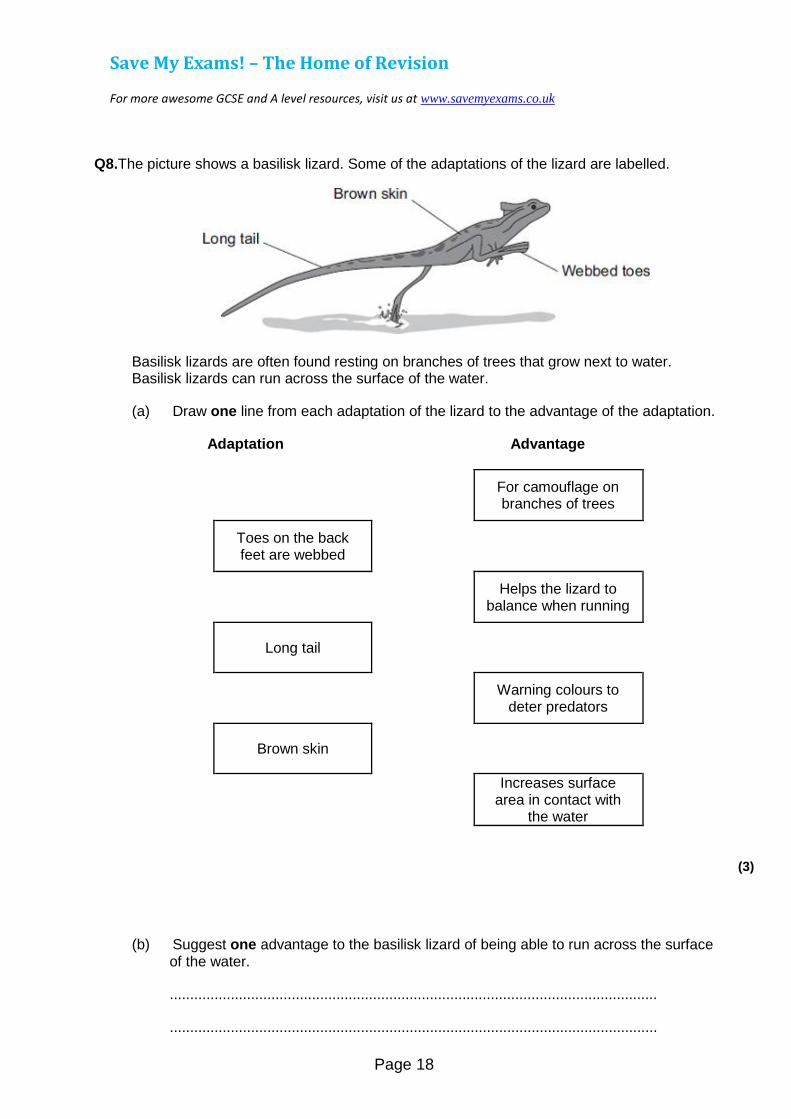
Q2.The diagram below shows a single-celled alga which lives in fresh water.
(a) Which part of the cell labelled above:
(i) traps light for photosynthesis
............................................................................................................... (1)
(ii) is made of cellulose?
............................................................................................................... (1)
(b) In the freshwater environment water enters the algal cell.
(i) What is the name of the process by which water moves into cells?
............................................................................................................... (1)
(ii) Give the reason why the algal cell does not burst.
...............................................................................................................
...............................................................................................................
Save My Exams! – The Home of Revision
For more awesome GCSE and A level resources, visit us at www.savemyexams.co.uk
Page 7
(1)
(c) (i) The alga can photosynthesise.
Complete the word equation for photosynthesis.
water + .............................. ............................... + oxygen (2)
(ii) The flagellum helps the cell to move through water. Scientists think that the flagellum and the light-sensitive spot work together to increase photosynthesis.
Suggest how this might happen.
...............................................................................................................
...............................................................................................................
...............................................................................................................
............................................................................................................... (2)
(d) Multicellular organisms often have complex structures, such as lungs, for gas exchange.
Explain why single-celled organisms, like algae, do not need complex structures for gas exchange.
........................................................................................................................
........................................................................................................................
........................................................................................................................
........................................................................................................................
........................................................................................................................
........................................................................................................................ (3)
(Total 11 marks)

Save My Exams! – The Home of Revision
For more awesome GCSE and A level resources, visit us at www.savemyexams.co.uk
Page 8
Q3.Lichens can be used as air pollution indicators.
The graph below shows the number of lichen species found growing on walls and trees at increasing distances from a city centre.
Distance from city centre in km
(a) (i) How many species of lichen are found on walls 2 km from the city centre?
............................................................................................................... (1)
(ii) Describe the patterns in the data.
...............................................................................................................
...............................................................................................................
...............................................................................................................

Save My Exams! – The Home of Revision
For more awesome GCSE and A level resources, visit us at www.savemyexams.co.uk
Page 9
...............................................................................................................
...............................................................................................................
............................................................................................................... (3)
(b) The table below shows the concentration of sulfur dioxide (SO2) in the air at different distances from the same city centre.
Distance from city centre in
km SO2 concentration in g per m3
0 200
3 160
8 110
13 85
18 65
Suggest how the data in the table could explain the patterns in the graph above.
........................................................................................................................
........................................................................................................................
........................................................................................................................
........................................................................................................................ (2)
(c) Nitrogen oxides are also air pollutants.
The main source of nitrogen oxide pollution comes from road vehicles.
Different lichen species vary in their tolerance of the levels of nitrogen oxides in the air.
Some lichens can only grow in very clean air where there are low levels of nitrogen oxides. They are nitrogen-sensitive.
Some lichens grow very well in high levels of nitrogen oxides. They are

Save My Exams! – The Home of Revision
For more awesome GCSE and A level resources, visit us at www.savemyexams.co.uk
Page 10
nitrogen-loving.
The table below shows one lichen species which is nitrogen-sensitive and one lichen species which is nitrogen-loving.
Nitrogen-sensitiv
e Nitrogen-loving
Usnea
Xanthoria
Usnea © epantha/iStock/Thinkstock; Xanthoria By Zakwitnij!pl Ejdzej + Iric (CC BY-SA.2.0) via wikicommons
(i) Describe how you would investigate the distribution of the two lichens at different distances into a wood from a main road.
...............................................................................................................
...............................................................................................................
...............................................................................................................
...............................................................................................................
...............................................................................................................
...............................................................................................................
............................................................................................................... (3)
(ii) Predict the results from the experiment you described in your answer to part (c)(i). Explain why you made this prediction.
...............................................................................................................
...............................................................................................................
...............................................................................................................
...............................................................................................................

Save My Exams! – The Home of Revision
For more awesome GCSE and A level resources, visit us at www.savemyexams.co.uk
Page 11
...............................................................................................................
...............................................................................................................
...............................................................................................................
............................................................................................................... (3)
(Total 12 marks)

Save My Exams! – The Home of Revision
For more awesome GCSE and A level resources, visit us at www.savemyexams.co.uk
Page 12
Q4.Organisms compete with each other.
(a) Figure 1 shows two types of seaweed which live in similar seashore habitats.
Most of the time the two seaweeds are covered with water.
Bladder wrack has bladders filled with air.
Bladder wrack grows more quickly than saw wrack. Suggest an explanation why.
........................................................................................................................
........................................................................................................................
........................................................................................................................
........................................................................................................................
........................................................................................................................
........................................................................................................................
........................................................................................................................ (3)
(b) Figure 2 shows an angler fish.

Save My Exams! – The Home of Revision
For more awesome GCSE and A level resources, visit us at www.savemyexams.co.uk
Page 13
© Dante Fenolio/Science Photo Library
Angler fish live at depths of over 1000 m.
In clear water, sunlight does not usually reach more than 100 m deep. Many angler fish have a transparent ‘lure’ containing a high concentration of bioluminescent bacteria. Bioluminescent bacteria produce light.
Suggest an advantage to the angler fish of having a lure containing bioluminescent bacteria.
........................................................................................................................
........................................................................................................................
........................................................................................................................
........................................................................................................................
........................................................................................................................ (2)
(Total 5 marks)

Save My Exams! – The Home of Revision
For more awesome GCSE and A level resources, visit us at www.savemyexams.co.uk
Page 14
Q5.The photograph shows a fossil of a prehistoric bird called Archaeopteryx.
By Ghedoghedo (own work) [CC-BY-SA-3.0 (http://creativecommons.org/licenses/BY-SA-3.0) or GFDL
(http://www.gnu.org/copyleft/fdl.html)], via Wikimedia Commons; By Steenbergs from Ripon, United Kingdom (Small Fishing Boat In North Sea) [CC-BY-2.0 (http://creativecommons.org/licenses/by/2.0)], via Wikimedia Commons.
(a) Describe three ways fossils can be made.
........................................................................................................................
........................................................................................................................
........................................................................................................................
........................................................................................................................
........................................................................................................................
........................................................................................................................ (3)
(b) The drawing shows what an Archaeopteryx might have looked like when it was
alive.
Scientists think that Archaeopteryx was a predator.

Save My Exams! – The Home of Revision
For more awesome GCSE and A level resources, visit us at www.savemyexams.co.uk
Page 15
(i) Look at the drawing.
Write down three adaptations that might have helped Archaeopteryx to catch
prey.
How would each adaptation have helped Archaeopteryx to catch prey?
Adaptation 1 ..........................................................................................
How it helps ..........................................................................................
...............................................................................................................
Adaptation 2 ..........................................................................................
How it helps ..........................................................................................
...............................................................................................................
Adaptation 3 ..........................................................................................
How it helps ..........................................................................................
............................................................................................................... (3)
(ii) Archaeopteryx is now extinct.
Give two reasons why animals may become extinct.
1 .............................................................................................................
................................................................................................................

Save My Exams! – The Home of Revision
For more awesome GCSE and A level resources, visit us at www.savemyexams.co.uk
Page 16
2 .............................................................................................................
................................................................................................................ (2)
(Total 8 marks)

Save My Exams! – The Home of Revision
For more awesome GCSE and A level resources, visit us at www.savemyexams.co.uk
Page 1
Adaption, interdependence and
competition
Question Paper 2
Level GCSE (9-1)
Subject Biology
Exam Board AQA
Topic 4.7 Ecology
Sub-Topic Adaption, interpedndence, and competition
Difficulty Level Gold Level
Booklet Question Paper 2
Time Allowed: 56 minutes
Score: /56
Percentage: /100

Save My Exams! – The Home of Revision
For more awesome GCSE and A level resources, visit us at www.savemyexams.co.uk
Page 2
Q1. This is a diagram of a belt transect showing the major types of plants growing on the bottom of a lake.
(a) Suggest, and explain, two reasons why a much smaller population of Nitella plants is found amongst the Potamogeton plants than further down in the lake.
1. ................................................................................................................................
....................................................................................................................................
....................................................................................................................................
....................................................................................................................................
2. ................................................................................................................................
....................................................................................................................................
....................................................................................................................................
.................................................................................................................................... (4)
(b) Describe how you would use the belt transect technique to measure the abundance and distribution of plants which live on the bottom of a shallow lake.
....................................................................................................................................
....................................................................................................................................
....................................................................................................................................
....................................................................................................................................
....................................................................................................................................
.................................................................................................................................... (3)

Save My Exams! – The Home of Revision
For more awesome GCSE and A level resources, visit us at www.savemyexams.co.uk
Page 3
(Total 7 marks
Q2. Read the passage.
Glutton up a gum tree Along the banks of the Cygnet River on Kangaroo Island, the branches of the dying gum
trees stretch out like accusing fingers. They have no leaves. Birds search in vain for nectar-bearing flowers.
The scene, repeated mile upon mile, is an ecological nightmare. But, for once, the culprit is not human. Instead, it is one of the most appealing mammals on the planet – the koala. If the trees are to survive and provide a food source for the wildlife such as koalas that depend on them, more than 2000 koalas must die. If they are not removed the island’s entire koala population will vanish.
Illegal killing has already started. Worried about soil erosion on the island, some farmers have gone for their guns. Why not catch 2000 koalas and take them to the mainland? “Almost impossible,” says farmer Andrew Kelly. “Four rangers tried to catch some and in two days they got just six, and these fought, bit and scratched like fury.”
The diagram shows the flow of energy through a koala. The numbers show units of energy.

Save My Exams! – The Home of Revision
For more awesome GCSE and A level resources, visit us at www.savemyexams.co.uk
Page 4
(i) Calculate the percentage of the food intake which is converted into new tissues for growth. Show your working.
.................... % (2)
(ii) Give three different ways in which the koala uses the energy released in respiration.
1 ..................................................................................................................................
.....................................................................................................................................
2 ..................................................................................................................................
.....................................................................................................................................
3 ..................................................................................................................................
..................................................................................................................................... (3)
(Total 5 marks)

Save My Exams! – The Home of Revision
For more awesome GCSE and A level resources, visit us at www.savemyexams.co.uk
Page 5
Q3. Plant plankton are aquatic microscopic organisms that photosynthesise. The graph shows the numbers of plant plankton in the North Sea at different times of the year.
Use the data and your knowledge of photosynthesis and growth to explain:
(a) why numbers of plant plankton were low in winter but increased rapidly during the spring,
.....................................................................................................................................
.....................................................................................................................................
.....................................................................................................................................
.....................................................................................................................................
.....................................................................................................................................
..................................................................................................................................... (3)
(b) the reduction in numbers of plant plankton in the early summer.
.....................................................................................................................................
.....................................................................................................................................
.....................................................................................................................................
..................................................................................................................................... (1)
(Total 4 marks)

Save My Exams! – The Home of Revision
For more awesome GCSE and A level resources, visit us at www.savemyexams.co.uk
Page 6
Q4.Professor John Lawton researches into the problem of controlling the spread of bracken. Bracken is a fern which threatens upland farms, partly because it poses a health risk to people and animals.
Professor Lawton is waiting for government permission to release the Conservular caterpillar which feeds on the bracken.
The Secretary of State has to decide whether the Conservular caterpillar can be released.
The article printed below describes some of the problems faced by the Secretary of State.
David the caterpillar to bracken’s Goliath
Yorkshire farmer Maurice Cottrill has just forked out £500 to have a helicopter hover over his land and spew out gallons of chemicals aimed at destroying one of the most pervasive and dangerous weeds known to man – bracken. In a little box in a laboratory near Ascot, Berkshire, lies a tiny caterpillar which could have done the job for nothing.
Whether or not that caterpillar and thousand of its chums will ever be let loose on the massive carpet of bracken that is sweeping over Britain at the rate of 53 square kilometres a year has to be decided by the Secretary of State for the Environment.
Weed control through the release of imported insects has never been tried in Britain before. If the Secretary of State permits the experiment, the caterpillar is in for the feast of its life, because five years of painstaking research have proved that bracken is its only food. However, is that the full story? Will the beast stop there, or will it go on, wreaking unforeseen devastation. Can scientists predict what will happen when imported insects are released into the wild?
Bracken is poisonous – more than 20 000 sheep and 1 000 cattle suffer poisoning each year. Its spores are carcinogenic, posing a threat to hill walkers. Bracken costs a depressing £4m a year to control while rendering useless grazing land valued at £5m annually. “Bracken is one factor which is leading to hill farming becoming uneconomic”, says the director of the Ramblers Association. “We are worried about that because, the more uneconomic hill farms become, the more prospect there is of the forestry industry taking over.”
The National Farmers Union are concerned about the consequences of the caterpillar getting out of control. What if it started consuming garden ferns? What if it loved potatoes? On the other hand, the caterpillar might help to preserve important uplands where wildlife flourishes when bracken is kept at bay. However, the experiment takes the scientists into unknown territory.
World-wide, 94 species of weeds have been controlled by biological releases

Save My Exams! – The Home of Revision
For more awesome GCSE and A level resources, visit us at www.savemyexams.co.uk
Page 7
involving 215 types of animal in 50 countries. Professor Lawson says that approximately one-third have achieved effective control and the remainder have failed.
Upland farms are artificial ecosystems, created and maintained mainly for the rearing of sheep and cattle. These farms are being threatened by the spread of bracken. Up to now the only treatment for bracken has been to use herbicides.
Use the article to explain, as fully as you can, what advice you would give the Secretary of State.
Explain the arguments for and against that lead to your decision.
You will not receive marks for simply copying extracts from the article. (Total 8 marks)

Save My Exams! – The Home of Revision
For more awesome GCSE and A level resources, visit us at www.savemyexams.co.uk
Page 8
Q5.Squirrels live in woodland.
Table 1 shows:
• the total area of England, Scotland and Wales
• the area of different types of woodland in these countries.
Table 1
Country Total area of country in
thousands of km2
Area of woodland in thousands of km2
Coniferous woodland
Broadleaf woodland
Total
England 130 3.6 7.8 11.4
Scotland 79 10.4 3.0 13.4
Wales 21 1.9 0.9 2.8
(a) Look at the data for the three countries. Estimate which country has the greatest proportion of its area suitable as a habitat for squirrels.
Support your answer with relevant figures.
........................................................................................................................
........................................................................................................................
........................................................................................................................
........................................................................................................................
........................................................................................................................
........................................................................................................................ (2)
(b) The maps show the distribution of grey squirrels and red squirrels in England, Scotland and Wales.

Save My Exams! – The Home of Revision
For more awesome GCSE and A level resources, visit us at www.savemyexams.co.uk
Page 9
Image under Crown Copyright and courtesy of Pepper & Patterson, 2001. Contains public sector information licensed under the Open Government Licence v1.0
Scientists suggested that the distribution of grey squirrels and red squirrels is linked to the type of trees in woodlands.
(i) The information for England and Scotland supports this suggestion.
How?
........................................................................................................................
........................................................................................................................ (1)
(ii) Give one piece of evidence that contradicts this suggestion.
........................................................................................................................
........................................................................................................................ (1)

Save My Exams! – The Home of Revision
For more awesome GCSE and A level resources, visit us at www.savemyexams.co.uk
Page 10
(c) Red squirrels are native to the UK. Grey squirrels were introduced to the UK from the USA over 100 years ago.
Table 2 gives information about the two types of squirrel.
Table 2
Grey squirrel Red squirrel
Population in UK 2.5 million 140 000
Main food types Seeds, nuts, tree bark, birds' eggs, young birds
Cones from coniferous trees, nuts, tree bark, berries
Health Can become immune to
parapox virus Cannot become immune to
parapox virus
Reproduction Up to 9 young, twice a year Up to 6 young, twice a year
Survival rate of young in mixed populations
41 % 14 %
Length of life 2 – 4 years Up to 7 years
In most parts of the UK the population of grey squirrels is increasing, but the population of red squirrels is decreasing.
Suggest why.
Use information from Table 2.
........................................................................................................................
........................................................................................................................
........................................................................................................................
........................................................................................................................
........................................................................................................................
........................................................................................................................
........................................................................................................................
........................................................................................................................ (3)
(Total 7 marks)

Save My Exams! – The Home of Revision
For more awesome GCSE and A level resources, visit us at www.savemyexams.co.uk
Page 11
Q6.
The drawings and text for this question are based on an article from The Independent newspaper.
Some of Britain’s rarest wild flowers are likely to make a come-back thanks to an EC set-aside regime in which 15 per cent of arable land has been taken out of production.
As a result of this set-aside, shepherd’s needle, pheasant’s eye, corn gromwell, corn cockle, spreading hedge parsley and corn mouse tail are now thriving once again. They were once common in and around cereal fields and were even regarded as weeds, but were swept to near extinction by the intensification of agriculture after the Second World War. Their small, pale flowers are hardly seen. These plants cannot compete in fields where modern cereal crops are cultivated. Nor, however, do they flourish in semi-natural or wild habitats where nature is left to its own devices. They need farmland which is lightly tilled and cut once a year.
Dr Nick Sotherton, lowland research manager with the Game Conservancy Council, says

Save My Exams! – The Home of Revision
For more awesome GCSE and A level resources, visit us at www.savemyexams.co.uk
Page 12
that these species will flourish under the new rotational set-aside regime, in which farmers are compensated for taking land out of production in an attempt to end crop surpluses.
EC agriculture ministers are meeting to decide how much land should be used for rotational set-aside – in which a field is taken out of production for just one year before being replanted – and how much should be set-aside permanently. The ultimate set-aside is a wood, and Britain is seeking a forestry option.
The Game Conservancy Council says that the rotational scheme can benefit ground nesting birds as well as rare flowers that will not be helped by longer-term set-aside. But Richard Knight of the Wildlife Advisory Group, says “Non-rotational is better because it gives flora and fauna a chance to get well established”.
“Intensification of agriculture” has led to the creation of artificial ecosystems.
(a) Explain how the creation of artificial ecosystems may have led to the near-extinction of the plants seen in the picture above.
.....................................................................................................................................
.....................................................................................................................................
.....................................................................................................................................
.....................................................................................................................................
.....................................................................................................................................
..................................................................................................................................... (4)
(b) What would you recommend to ministers meeting to decide a policy involving rotational set-aside and permanent set-aside? Explain the reasons for your answer.
.....................................................................................................................................
.....................................................................................................................................
.....................................................................................................................................
.....................................................................................................................................
..................................................................................................................................... (4)

Save My Exams! – The Home of Revision
For more awesome GCSE and A level resources, visit us at www.savemyexams.co.uk
Page 13
(Total 8 marks)
Q7. The drawings show two different species of butterfly.
• Both species can be eaten by most birds.
• Amauris has a foul taste which birds do not like, so birds have learned not to prey on it.
• Hypolimnas does not have a foul taste but most birds do not prey on it.
(a) Suggest why most birds do not prey on Hypolimnas.
.....................................................................................................................................
.....................................................................................................................................
.....................................................................................................................................
..................................................................................................................................... (2)
(b) Suggest an explanation, in terms of natural selection, for the markings on the wings of Hypolimnas.
.....................................................................................................................................
.....................................................................................................................................
.....................................................................................................................................
.....................................................................................................................................
.....................................................................................................................................
.....................................................................................................................................

Save My Exams! – The Home of Revision
For more awesome GCSE and A level resources, visit us at www.savemyexams.co.uk
Page 14
.....................................................................................................................................
..................................................................................................................................... (3)
(Total 5 marks)

Save My Exams! – The Home of Revision
For more awesome GCSE and A level resources, visit us at www.savemyexams.co.uk
Page 15
Q8. The diagram shows the desert plant, Fredolia.
Describe and explain three adaptations of Fredolia, which you can see in the diagram, that help it to survive in dry conditions.
1 .............................................................................................................................................
................................................................................................................................................
2 .............................................................................................................................................
................................................................................................................................................
3 .............................................................................................................................................
................................................................................................................................................
(Total 3 marks)
Save My Exams! – The Home of Revision
For more awesome GCSE and A level resources, visit us at www.savemyexams.co.uk
Page 16
Q9. (a) Explain, as fully as you can, how natural selection leads to evolution.
.....................................................................................................................................
.....................................................................................................................................
.....................................................................................................................................
.....................................................................................................................................
.....................................................................................................................................
.....................................................................................................................................
.....................................................................................................................................
..................................................................................................................................... (3)
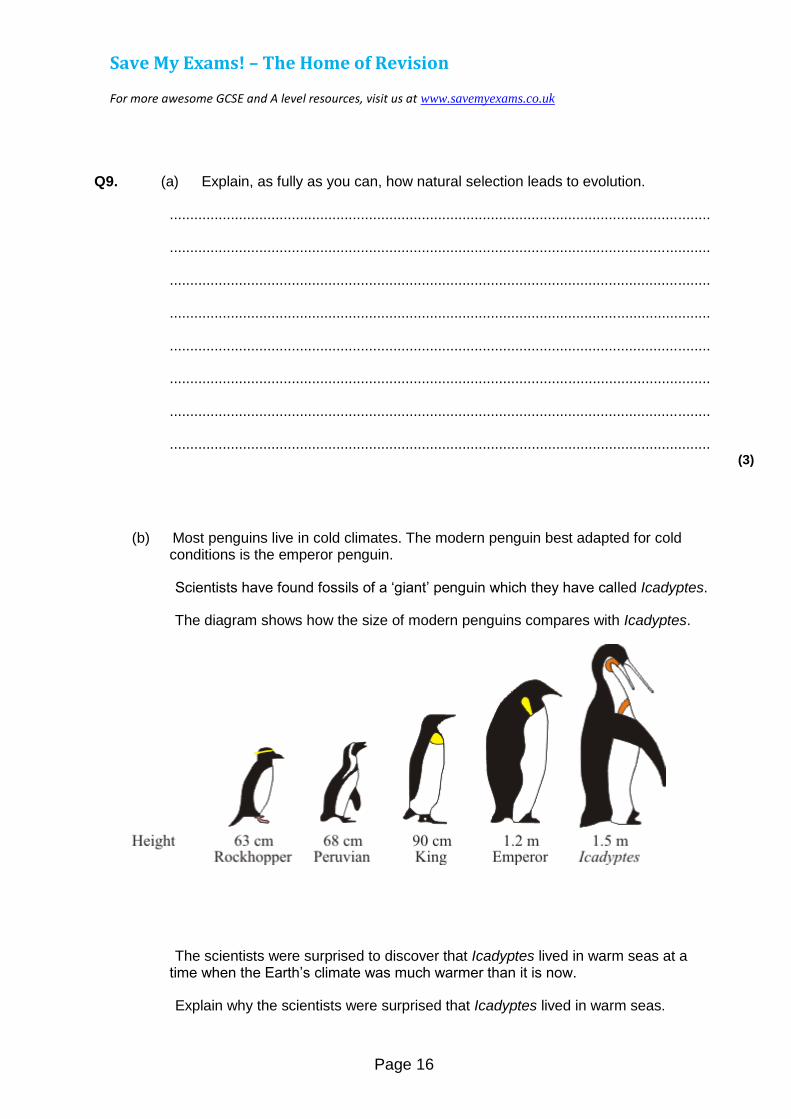
(b) Most penguins live in cold climates. The modern penguin best adapted for cold conditions is the emperor penguin.
Scientists have found fossils of a ‘giant’ penguin which they have called Icadyptes.
The diagram shows how the size of modern penguins compares with Icadyptes.
The scientists were surprised to discover that Icadyptes lived in warm seas at a time when the Earth’s climate was much warmer than it is now.
Explain why the scientists were surprised that Icadyptes lived in warm seas.

Save My Exams! – The Home of Revision
For more awesome GCSE and A level resources, visit us at www.savemyexams.co.uk
Page 17
.....................................................................................................................................
.....................................................................................................................................
.....................................................................................................................................
.....................................................................................................................................
.....................................................................................................................................
.....................................................................................................................................
..................................................................................................................................... (2)
(Total 5 marks)

Save My Exams! – The Home of Revision
For more awesome GCSE and A level resources, visit us at www.savemyexams.co.uk
Page 18
Q10. The photograph shows a sand gazelle.
The sand gazelle lives in the Arabian Desert where temperatures often reach 45 °C.
(a) The sand gazelle feeds only at dawn and at dusk. At other times it stays in the shade.
Suggest how this helps the animal to conserve water.
....................................................................................................................................
....................................................................................................................................
....................................................................................................................................
.................................................................................................................................... (2)
(b) During the dry season, the sand gazelle’s liver and heart shrink in size. This reduces the amount of oxygen that the body needs.
Suggest how needing less oxygen helps the animal to conserve water.
....................................................................................................................................
....................................................................................................................................
....................................................................................................................................

Save My Exams! – The Home of Revision
For more awesome GCSE and A level resources, visit us at www.savemyexams.co.uk
Page 19
.................................................................................................................................... (2)
(Total 4 marks)

Save My Exams! – The Home of Revision
For more awesome GCSE and A level resources, visit us at www.savemyexams.co.uk
Page 1
Organisation of an ecosystem
Question Paper 1
Level GCSE (9-1)
Subject Biology
Exam Board AQA
Topic 4.7 Ecology
Sub-Topic Organisation of an ecosystem Difficulty Level Bronze Level
Booklet Question Paper 1
Time Allowed: 57 minutes
Score: /56
Percentage: /100
Save My Exams! – The Home of Revision
For more awesome GCSE and A level resources, visit us at www.savemyexams.co.uk
Page 2
Q1.The diagram below shows a food chain in a garden.
Lettuce © destillat/iStock/Thinkstock; Snail ©Valengilda/iStock/Thinkstock; Shrew © GlobalT/iStock/Thinkstock
(a) Name one consumer shown in the diagram above.
............................................................................................................................. (1)
(b) Name one carnivore shown in the diagram above.
............................................................................................................................. (1)
(c) A disease kills most of the shrews in the garden.
Suggest why the number of snails in the garden may then increase.
.............................................................................................................................
............................................................................................................................. (1)
(d) What is the name given to all the snails in the garden shown in the diagram above?
Tick one box.
Community
Ecosystem
Population
Territory
Save My Exams! – The Home of Revision
For more awesome GCSE and A level resources, visit us at www.savemyexams.co.uk
Page 3
(1)
(e) Which pyramid of biomass is correct for the food chain shown in the diagram above?
Tick one box.
(1)
(f) Some snails ate some lettuces.
The lettuces contained 11 000 kJ of energy.
Only 10% of this energy was transferred to the snails.
Calculate the energy transferred to the snails from the lettuces.
.............................................................................................................................
Energy = ................................................................ kJ (1)
(g) Give one reason why only 10% of the energy in the lettuces is transferred to the snails.
Tick one box.
The lettuces carry out photosynthesis
The snails do not eat the roots of the lettuces
Not all parts of a snail can be eaten
(1)

Save My Exams! – The Home of Revision
For more awesome GCSE and A level resources, visit us at www.savemyexams.co.uk
Page 4
(h) Abiotic factors can affect the food chain.
Wind direction is one abiotic factor.
Name one other abiotic factor.
............................................................................................................................. (1)
(Total 8 marks)

Save My Exams! – The Home of Revision
For more awesome GCSE and A level resources, visit us at www.savemyexams.co.uk
Page 5
Q2.The mould Penicillium can be grown in a fermenter. Penicillium produces the antibiotic penicillin.
The graph shows changes that occurred in a fermenter during the production of penicillin.
Time in hours
(a) During which time period was penicillin produced most quickly?
Draw a ring around one answer.
0 – 20 hours 40 – 60 hours 80 – 100 hours
(1)
(b) (i) Describe how the concentration of glucose in the fermenter changes between 0 and 30 hours.
...............................................................................................................
...............................................................................................................
...............................................................................................................
...............................................................................................................

Save My Exams! – The Home of Revision
For more awesome GCSE and A level resources, visit us at www.savemyexams.co.uk
Page 6
(2)
(ii) How does the change in the concentration of oxygen in the fermenter compare with the change in concentration of glucose between 0 and 30 hours?
Tick ( ) two boxes.
The oxygen concentration changes after the glucose concentration.
The oxygen concentration changes before the glucose concentration.
The oxygen concentration changes less than the glucose concentration.
The oxygen concentration changes more than the glucose concentration.
(2)
(iii) What is the name of the process that uses glucose?
Draw a ring around one answer.
distillation filtration respiration
(1) (Total 6 marks)

Save My Exams! – The Home of Revision
For more awesome GCSE and A level resources, visit us at www.savemyexams.co.uk
Page 7
Q3.The diagram shows one type of biogas generator.
(a) With this type of biogas generator, the concentration of solids that are fed into the reactor must be kept very low.
Suggest one reason for this.
Tick ( ) one box.
A higher concentration contains too little oxygen.
A higher concentration would be difficult to stir.
A higher concentration contains too much carbon dioxide. (1)
(b) The pie chart shows the percentages of the different gases found in the biogas.

Save My Exams! – The Home of Revision
For more awesome GCSE and A level resources, visit us at www.savemyexams.co.uk
Page 8
Gas X is the main fuel gas found in the biogas.
(i) What is the name of gas X?
Draw a ring around one answer.
methane nitrogen oxygen
(1)
(ii) What is the percentage of gas X in the biogas?
Show clearly how you work out your answer.
...............................................................................................................
...............................................................................................................
Percentage of gas X = ........................................ (2)
(c) If the biogas generator is not airtight, the biogas contains a much higher percentage of carbon dioxide.
Draw a ring around one answer in each part of this question.
aerobic respiration.
(i) The air that leaks in will increase the rate of anaerobic respiration.

Save My Exams! – The Home of Revision
For more awesome GCSE and A level resources, visit us at www.savemyexams.co.uk
Page 9
fermentation.
(1)
ammonia.
(ii) The process in part (c)(i) occurs because the air contains nitrogen.
oxygen.
(1)
(Total 6 marks)

Save My Exams! – The Home of Revision
For more awesome GCSE and A level resources, visit us at www.savemyexams.co.uk
Page 10
Q4.Some students wanted to find the number of thistle plants growing on a lawn. The students placed 10 quadrats at different positions on the lawn. Each quadrat measured 1 metre × 1 metre. The students counted the number of thistle plants in each quadrat.
(a) Which method should the students use to decide where to place the 10 quadrats?
Tick ( ) one box.
Place the quadrats as evenly as possible around the lawn.
Place 5 quadrats in areas with many thistle plants and 5 quadrats in areas with only a few thistle plants.
Place all the quadrats randomly on the lawn.
(1)
(b) The diagram shows the lawn with the positions of the thistle plants and the students’ 10 quadrats.
(i) Complete the table to show:
• how many thistle plants the students found in each of the first four quadrats

Save My Exams! – The Home of Revision
For more awesome GCSE and A level resources, visit us at www.savemyexams.co.uk
Page 11
• the total number of thistle plants found in all 10 quadrats.
Quadrat number
Number of thistle plants in each
quadrat
1
2
3
4
5 1
6 3
7 0
8 0
9 2
10 1
Total
(2)
(ii) Calculate the mean number of thistle plants in one quadrat.
...............................................................................................................
Mean = ...................................................................... (1)
(iii) The lawn measured 12 metres long and 10 metres wide.
Use your answer from part (b)(ii) to estimate the number of thistle plants on the lawn.
...............................................................................................................
...............................................................................................................

Save My Exams! – The Home of Revision
For more awesome GCSE and A level resources, visit us at www.savemyexams.co.uk
Page 12
Estimated number of thistle plants = .............................. (2)
(c) How could the students make their estimate more accurate?
........................................................................................................................
........................................................................................................................ (1)
(Total 7 marks)

Save My Exams! – The Home of Revision
For more awesome GCSE and A level resources, visit us at www.savemyexams.co.uk
Page 13
Q5.Gardeners often collect fallen leaves in autumn and place them on compost heaps.
(a) Over the next year the leaves decay.
Which living things cause decay?
........................................................................................................................ (1)
(b) The leaves decay more quickly in summer than in winter.
Give one reason why.
........................................................................................................................
........................................................................................................................ (1)
(c) The compost heap has holes in its sides to let gases enter.
Which gas is needed for decay?
Tick ( ) one box.
Carbon dioxide
Nitrogen

Save My Exams! – The Home of Revision
For more awesome GCSE and A level resources, visit us at www.savemyexams.co.uk
Page 14
Oxygen (1)
(Total 3 marks)

Save My Exams! – The Home of Revision
For more awesome GCSE and A level resources, visit us at www.savemyexams.co.uk
Page 15
Q6.Some students set up biogas generators to find out which type of animal manure produced the most biogas.
The diagram shows the apparatus they used.
The students: Step 1: Put some cow manure into the plastic bottle Step 2: Filled the bottle with distilled water Step 3: Attached a balloon over the top of the bottle Step 4: Put the bottle in a warm room for 10 days Step 5: Measured the diameter of the balloon on day 10 Step 6: Repeated steps 1 to 5 using each type of animal manure.
The students’ results are shown in the table.
Type of animal manure
Diameter of balloon on day 10
in cm
Cow 29
Horse 26
Sheep 34
Pig 32
(a) What is the main gas found in biogas?
........................................................................................................................ (1)
(b) The students concluded that sheep manure is the best type of manure to use in a biogas generator.
A teacher told the students that the design of their investigation meant that their

Save My Exams! – The Home of Revision
For more awesome GCSE and A level resources, visit us at www.savemyexams.co.uk
Page 16
conclusion might not be correct.
Suggest two reasons why.
1......................................................................................................................
........................................................................................................................
2......................................................................................................................
........................................................................................................................ (2)
(c) Another student suggested that adding potato to the manure would increase the amount of biogas produced.
Why would adding potato increase the amount of biogas produced?
Tick ( ) one box.
The potato contains a lot of carbohydrate.
The potato contains a lot of protein.
The potato contains a lot of water.
(1)
(Total 4 marks)

Save My Exams! – The Home of Revision
For more awesome GCSE and A level resources, visit us at www.savemyexams.co.uk
Page 17
Q7.Some students investigated the distribution of dandelion plants in a grassy field. The grassy field was between two areas of woodland.
Figure 1 shows two students recording how many dandelion plants there are in a 1 metre x 1 metre quadrat.
Figure 1
© Science Photo Library
Figure 2 shows a section across the area studied and Figure 3 shows a bar chart of the students’ results.
Figure 2
Distance in m
Figure 3

Save My Exams! – The Home of Revision
For more awesome GCSE and A level resources, visit us at www.savemyexams.co.uk
Page 18
Distance in m
(a) How did the students use the quadrat and the 30-metre tape measure to get the results in Figure 3?
Use information from Figure 1.
........................................................................................................................
........................................................................................................................
........................................................................................................................
........................................................................................................................
........................................................................................................................
........................................................................................................................ (3)
(b) (i) Suggest one reason why the students found no dandelion plants under the trees.
...............................................................................................................
............................................................................................................... (1)
(ii) Suggest one reason why the students found no dandelion plants at 16 metres.
...............................................................................................................
............................................................................................................... (1)

Save My Exams! – The Home of Revision
For more awesome GCSE and A level resources, visit us at www.savemyexams.co.uk
Page 19
(c) The teacher suggested that it was not possible to make a valid conclusion from these results.
Describe how the students could improve the investigation so that they could make a valid conclusion.
........................................................................................................................
........................................................................................................................
........................................................................................................................
........................................................................................................................ (2)
(Total 7 marks)

Save My Exams! – The Home of Revision
For more awesome GCSE and A level resources, visit us at www.savemyexams.co.uk
Page 20
Q8.A student was asked to estimate how many clover plants there are in the school field.
The image below shows the equipment used.
This is the method used.
1. Throw a quadrat over your shoulder.
2. Count the number of clover plants inside the quadrat.
3. Repeat step 1 and step 2 four more times.
4. Estimate the number of clover plants in the whole field.
(a) What is the tape in the image above used for in this investigation?
.............................................................................................................................
............................................................................................................................. (1)
(b) The teacher told the student that throwing the quadrat over his shoulder was not random.
The method could be improved to make sure the quadrats were placed randomly.
Suggest one change the student could make to ensure the quadrats were placed randomly.
.............................................................................................................................
............................................................................................................................. (1)
(c) How could the student improve the investigation so that a valid estimate can be

Save My Exams! – The Home of Revision
For more awesome GCSE and A level resources, visit us at www.savemyexams.co.uk
Page 21
made?
Tick two boxes.
Weigh the clover plants
Compare their results with another student’s results
Count the leaves of the clover plants
Place more quadrats
Place the quadrats in a line across the field
(2)
(d) The table below shows the student’s results.
Quadrat number
Number of clover plants
counted
1 11
2 8
3 11
4 9
5 1
Total 40
The area of the school field was 500 m2.
The quadrat used in the table above had an area of 0.25 m2.
Calculate the estimated number of clover plants in the school field.
.............................................................................................................................
.............................................................................................................................
Save My Exams! – The Home of Revision
For more awesome GCSE and A level resources, visit us at www.savemyexams.co.uk
Page 22
.............................................................................................................................
Estimated number of clover plants = ................................. (3)
(e) What was the mode for the results in the table above?
Tick one box.
1
8
11
40
(1)
(f) Suggest which quadrat could have been placed under the shade of a large tree.
Give one reason for your answer.
Quadrat number ....................................
Reason ...............................................................................................................
............................................................................................................................. (1)
(Total 9 marks)
s

Save My Exams! – The Home of Revision
For more awesome GCSE and A level resources, visit us at www.savemyexams.co.uk
Page 23
Q9.A gardener investigates if turning over the waste in a compost heap makes the waste decay more quickly.
The gardener: • makes two separate heaps of garden waste, heap A and heap B
• turns over the material in heap A every 2 weeks
• does not turn over the material in heap B
• estimates the amount of decay in the two heaps after 6 months.
The diagram shows the two heaps of garden waste at the beginning of the investigation.
(a) Suggest two factors, other than time, the gardener should control to make the investigation fair.
1......................................................................................................................
........................................................................................................................
2......................................................................................................................
........................................................................................................................ (2)
(b) Name one type of living thing that causes decay.
........................................................................................................................ (1)
(c) The gardener’s results are shown in the table.
Compost heap Estimated amount of decay
A A lot
B Very little

Save My Exams! – The Home of Revision
For more awesome GCSE and A level resources, visit us at www.savemyexams.co.uk
Page 24
(i) Why does turning over the material in heap A make the material decay more quickly?
...............................................................................................................
............................................................................................................... (1)
(ii) The gardener puts decayed material around his plants to help them grow.
Suggest why the plants in a woodland grow well each year without material from compost heaps being added.
...............................................................................................................
...............................................................................................................
...............................................................................................................
............................................................................................................... (2)
(Total 6 marks)

Save My Exams! – The Home of Revision
For more awesome GCSE and A level resources, visit us at www.savemyexams.co.uk
Page 1
Organisation of an ecosystem
Question Paper 1
Level GCSE (9-1)
Subject Biology
Exam Board AQA
Topic 4.7 Ecology
Sub-Topic Organisation of a an ecosystem
Difficulty Level Silver Level
Booklet Question Paper 1
Time Allowed: 55 minutes
Score: /57
Percentage: /100

Save My Exams! – The Home of Revision
For more awesome GCSE and A level resources, visit us at www.savemyexams.co.uk
Page 2
Q1.A gardener wants to add compost to the soil to increase his yield of strawberries.
The gardener wants to make his own compost.
(a) An airtight compost heap causes anaerobic decay.
Explain why the gardener might be against producing compost using this method.
.............................................................................................................................
.............................................................................................................................
.............................................................................................................................
............................................................................................................................. (2)
(b) The gardener finds this research on the Internet:
‘A carbon to nitrogen ratio of 25:1 will produce fertile compost.’
Look at the table below.
Type of material to compost
Mass of carbon in
sample in g
Mass of nitrogen
in sample in g Carbon:nitrogen ratio
Chicken manure
8.75 1.25 7:1
Horse manure 10.00 0.50 20:1
Peat moss 9.80 0.20 X
Determine the ratio X in the table above.
.............................................................................................................................
Ratio ................................ (1)
(c) Which type of material in the table above would be best for the gardener to use to
make his compost?
Justify your answer.
.............................................................................................................................

Save My Exams! – The Home of Revision
For more awesome GCSE and A level resources, visit us at www.savemyexams.co.uk
Page 3
............................................................................................................................. (1)
(d) Some of the leaves from the gardener’s strawberry plant die.
The dead leaves fall off the strawberry plant onto the ground.
The carbon in the dead leaves is recycled through the carbon cycle.
Explain how the carbon is recycled into the growth of new leaves.
.............................................................................................................................
.............................................................................................................................
.............................................................................................................................
.............................................................................................................................
.............................................................................................................................
.............................................................................................................................
.............................................................................................................................
.............................................................................................................................
.............................................................................................................................
............................................................................................................................. (6)
(e) The diagram below shows two strawberries.
• Both strawberries were picked from the same strawberry plant.
• Both strawberries were picked 3 days ago.
• The strawberries were stored in different conditions.
Strawberry A Strawberry B

Save My Exams! – The Home of Revision
For more awesome GCSE and A level resources, visit us at www.savemyexams.co.uk
Page 4
A © sarahdoow/iStock/Thinkstock, B © Mariusz Vlack/iStock/Thinkstock
Give three possible reasons that may have caused strawberry A to decay.
1 ..........................................................................................................................
.............................................................................................................................
2 ..........................................................................................................................
.............................................................................................................................
3 ..........................................................................................................................
............................................................................................................................. (3)
(Total 13 marks)

Save My Exams! – The Home of Revision
For more awesome GCSE and A level resources, visit us at www.savemyexams.co.uk
Page 5
Q2.This question is about carbon.
The graph shows the mass of carbon added to and removed from the atmosphere each year.
(a) Name process X.
........................................................................................................................ (1)
(b) (i) Calculate the mass of carbon added to the atmosphere by respiration per year.
Answer = .......................................... billion tonnes (1)
(ii) Some scientists are concerned that the mass of carbon in the atmosphere is changing.
How does the data in the graph support this idea?
...............................................................................................................
............................................................................................................... (1)
(Total 3 marks)

Save My Exams! – The Home of Revision
For more awesome GCSE and A level resources, visit us at www.savemyexams.co.uk
Page 6
Q3.A grassy field on a farm measured 120 metres by 80 metres.
A student wanted to estimate the number of buttercup plants growing in the field.
The student found an area where buttercup plants were growing and placed a 1 m × 1 m quadrat in one position in that area.
Figure 1 shows the buttercup plants in the quadrat.
The student said, 'This result shows that there are 115 200 buttercup plants in the field.'
(a) (i) How did the student calculate that there were 115 200 buttercup plants in the field?
...............................................................................................................
...............................................................................................................
...............................................................................................................
............................................................................................................... (2)
(ii) The student’s estimate of the number of buttercup plants in the field is probably not accurate. This is because the buttercup plants are not distributed evenly.
How would you improve the student’s method to give a more accurate estimate?
...............................................................................................................
...............................................................................................................
...............................................................................................................

Save My Exams! – The Home of Revision
For more awesome GCSE and A level resources, visit us at www.savemyexams.co.uk
Page 7
............................................................................................................... (2)
(b) Sunlight is one environmental factor that might affect the distribution of the buttercup plants.
(i) Give three other environmental factors that might affect the distribution
of the buttercup plants.
1...............................................................................................................
2...............................................................................................................
3............................................................................................................... (3)
(ii) Explain how the amount of sunlight could affect the distribution of the buttercup plants.
(3)
(c) Figure 2 is a map showing the position of the farm and a river which flows through it.
Every year, the farmer puts fertiliser containing mineral ions on some of his fields.When there is a lot of rain, some of the fertiliser is washed into the river.
(i) When fertiliser goes into the river, the concentration of oxygen dissolved in the water decreases.

Save My Exams! – The Home of Revision
For more awesome GCSE and A level resources, visit us at www.savemyexams.co.uk
Page 8
Explain why the concentration of oxygen decreases.
...............................................................................................................
...............................................................................................................
...............................................................................................................
...............................................................................................................
...............................................................................................................
...............................................................................................................
...............................................................................................................
...............................................................................................................
...............................................................................................................
............................................................................................................... (5)
(ii) There is a city 4 km downstream from the farm.
Apart from fertiliser, give one other form of pollution that might go into the river as it flows through the city.
............................................................................................................... (1)
(d) Three sites, A, B and C, are shown in Figure 2.
Scientists took many samples of river water from these sites.
The scientists found larvae of three types of insect in the water: mayfly, stonefly and caddisfly. For each type of insect the scientists found several different species.
The scientists counted the number of different species of the larvae of each of the three types of insect.
Figure 3 shows the scientists’ results.

Save My Exams! – The Home of Revision
For more awesome GCSE and A level resources, visit us at www.savemyexams.co.uk
Page 9
(i) How many more species of mayfly were there at Site B than at Site A?
........................................ (1)
(ii) Suggest what caused this increase in the number of species of mayfly.
...............................................................................................................
............................................................................................................... (1)
(iii) The scientists stated that the number of species of stonefly was the best indicator of the amount of oxygen dissolved in the water.
Use information from Figure 3 to suggest why. (1)
(Total 19 marks)

Save My Exams! – The Home of Revision
For more awesome GCSE and A level resources, visit us at www.savemyexams.co.uk
Page 10
Q4.A student plans an investigation using mould.
(a) Mould spores are hazardous.
Give one safety precaution the student should take when doing this investigation.
........................................................................................................................
........................................................................................................................ (1)
(b) A student made the following hypothesis about the growth of mould:
‘The higher the temperature, the faster the growth of mould’.
The student planned to measure the amount of mould growing on bread.
The student used the following materials and equipment:
• slices of bread
• sealable plastic bags
• a knife
• a chopping board
• mould spores.
Describe how the materials and equipment could be used to test the hypothesis.
........................................................................................................................
........................................................................................................................
........................................................................................................................
........................................................................................................................
........................................................................................................................
........................................................................................................................
........................................................................................................................
........................................................................................................................ (4)
(c) Give one variable the student should control in the investigation.

Save My Exams! – The Home of Revision
For more awesome GCSE and A level resources, visit us at www.savemyexams.co.uk
Page 11
........................................................................................................................ (1)
(d) Another student did a similar investigation.
The diagram below shows the results.
Determine the rate of mould growth at 42 °C between day 2 and day 7.
........................................................................................................................
........................................................................................................................
Rate of mould growth = .............................. units per day (2)
(e) The growth of mould shows decomposition of the bread.
Give a conclusion about decomposition from the results in the diagram above.
........................................................................................................................
........................................................................................................................ (1)
(Total 9 marks)

Save My Exams! – The Home of Revision
For more awesome GCSE and A level resources, visit us at www.savemyexams.co.uk
Page 12
Q5.Figures 1 and 2 show battery chickens and free-range chickens.
Figure 1
Battery chickens
Figure 2 Free-range chickens
Battery chickens are kept in cages indoors. Free-range chickens can walk around outside.
(a) Give one way in which food production might be more efficient from battery
chickens than from free-range chickens. Give a reason for your answer.
........................................................................................................................
........................................................................................................................
........................................................................................................................
........................................................................................................................
........................................................................................................................ (2)
(b) Some farms use waste from chickens to produce biogas in an anaerobic digester.
Microorganisms in the digester break down the waste by anaerobic respiration.
(i) What does anaerobic mean?
...............................................................................................................
...............................................................................................................

Save My Exams! – The Home of Revision
For more awesome GCSE and A level resources, visit us at www.savemyexams.co.uk
Page 13
(1)
(ii) One product of anaerobic respiration is methane.
Name two other products of anaerobic respiration.
1...............................................................................................................
2............................................................................................................... (2)
(c) The best temperature for anaerobic digesters is about 35 °C.
Explain why the volume of biogas produced would be less at higher temperatures.
........................................................................................................................
........................................................................................................................
........................................................................................................................
........................................................................................................................ (2)
(d) Figure 3 shows other types of waste that can be used in an anaerobic digester to produce biogas.
Figure 3

Save My Exams! – The Home of Revision
For more awesome GCSE and A level resources, visit us at www.savemyexams.co.uk
Page 14
Type of waste
(i) What is the volume of biogas produced by a tonne of grass cuttings?
.............................. m3
(1)
(ii) Biogas is 60% methane.
Calculate the volume of methane gas produced per tonne of grass cuttings.
.............................. m3
(1)
(e) Why should biogas not be allowed to escape into the atmosphere?
........................................................................................................................
........................................................................................................................
........................................................................................................................
........................................................................................................................ (2)

Save My Exams! – The Home of Revision
For more awesome GCSE and A level resources, visit us at www.savemyexams.co.uk
Page 15
(Total 11 marks)

Save My Exams! – The Home of Revision
For more awesome GCSE and A level resources, visit us at www.savemyexams.co.uk
Page 1
Oraganisation of an ecosystem
Question Paper 1
Level GCSE (9-1)
Subject Biology
Exam Board AQA
Topic 4.7 Ecology
Sub-Topic Organisation of an ecosystem
Difficulty Level Gold Level
Booklet Question Paper 1
Time Allowed: 59 minutes
Score: /59
Percentage: /100

Save My Exams! – The Home of Revision
For more awesome GCSE and A level resources, visit us at www.savemyexams.co.uk
Page 2
Q1.Human activities affect the environment.
(a) Deforestation results in an increase in carbon dioxide levels in the atmosphere.
Give two reasons why.
........................................................................................................................
........................................................................................................................
........................................................................................................................
........................................................................................................................ (2)
(b) In this question you will be assessed on using good English, organising information clearly and using specialist terms where appropriate.
A dairy farmer washes out his cow shed each day. The waste water contains urine and faeces. The waste water overflows into a stream by mistake.
The waste water will have an effect on the plants and invertebrates living in the stream.
Explain why.
........................................................................................................................
........................................................................................................................
........................................................................................................................
........................................................................................................................
........................................................................................................................
........................................................................................................................
........................................................................................................................
........................................................................................................................
........................................................................................................................
........................................................................................................................
........................................................................................................................
........................................................................................................................
........................................................................................................................

Save My Exams! – The Home of Revision
For more awesome GCSE and A level resources, visit us at www.savemyexams.co.uk
Page 3
........................................................................................................................
........................................................................................................................
........................................................................................................................
........................................................................................................................
........................................................................................................................
........................................................................................................................
........................................................................................................................
........................................................................................................................
........................................................................................................................ (6)
(Total 8 marks)

Save My Exams! – The Home of Revision
For more awesome GCSE and A level resources, visit us at www.savemyexams.co.uk
Page 4
Q2. Some scientists set up a biogas generator.
The table shows how the rate of biogas production and the composition of the biogas changed over the first 30 days.
Time in days Rate of biogas
production in cm3 per hour
Composition of the biogas
Percentage of methane
Percentage of carbon dioxide
1 110 27 56
5 90 20 78
10 50 30 68
15 170 68 30
20 115 72 26
25 110 71 27
30 105 70 28
(a) (i) Name the process that produces the methane in biogas.
............................................................................................................... (1)
(ii) For the first 10 days, the gas released from the generator contained a high concentration of carbon dioxide. This was because there was air in the generator when it was first set up.
Explain why the presence of air results in a high concentration of carbon dioxide in the biogas.
...............................................................................................................
...............................................................................................................
...............................................................................................................
...............................................................................................................
...............................................................................................................
...............................................................................................................
...............................................................................................................

Save My Exams! – The Home of Revision
For more awesome GCSE and A level resources, visit us at www.savemyexams.co.uk
Page 5
...............................................................................................................
............................................................................................................... (3)
(b) The scientists concluded that it would not be profitable to collect biogas from the generator until after about 20 days.
Use the data to explain why.
........................................................................................................................
........................................................................................................................ (1)
(c) The rate of biogas production slowed down towards the end of the investigation.
Suggest one reason why.
........................................................................................................................
........................................................................................................................ (1)
(Total 6 marks)

Save My Exams! – The Home of Revision
For more awesome GCSE and A level resources, visit us at www.savemyexams.co.uk
Page 6
Q3. The diagram shows the annual energy flow through 1 m2 of a habitat.
The unit, in each case, is kJ per m2 per year.
(a) Calculate the percentage of the energy absorbed by the grass from sunlight that is transferred to the frog.
Show clearly how you work out your answer.
........................................................................................................................
........................................................................................................................
Answer ....................................................... % (2)
(b) All of the energy the grass absorbs from the sun is eventually lost to the surroundings.
In what form is this energy lost?
........................................................................................................................ (1)

Save My Exams! – The Home of Revision
For more awesome GCSE and A level resources, visit us at www.savemyexams.co.uk
Page 7
(c) Food chains are usually not more than five organisms long.
Explain why.
To gain full marks you must use data from the diagram.
........................................................................................................................
........................................................................................................................
........................................................................................................................
........................................................................................................................ (2)
(d) In this habitat microorganisms help to recycle materials.
Explain how.
........................................................................................................................
........................................................................................................................
........................................................................................................................
........................................................................................................................
........................................................................................................................
........................................................................................................................ (3)
(Total 8 marks)
Grass by By Catarina Carvalho from Lisboa, Portugal (Flickr) [CC-BY-2.0], via Wikimedia Commons. Grasshopper by I, Daniel Schwen [GFDL, CC-BY-SA-3.0], via Wikimedia Commons. Frog by Brian Gratwicke (Pickerel Frog) [CC-BY-2.0], via Wikimedia Commons. Heron by Glen Fergus (Own work, Otago Peninsula, New Zealand) [CC-BY-SA-2.5], via Wikimedia Commons.

Save My Exams! – The Home of Revision
For more awesome GCSE and A level resources, visit us at www.savemyexams.co.uk
Page 8
Q4.The photographs show four different species of bird.
Great tit Blue tit
© JensGade/iStock © Marcobarone/iStock
Coal tit Long-tailed tit
© MikeLane45/iStock © Andrew Howe/iStock
The table gives information about the four species of bird in winter.
Bird species Mean body mass in
grams
Mean energy needed in kJ per
day
Mean percentage of day spent
feeding
Great tit 21 84.2 75
Blue tit 12 62.4 81
Coal tit 9 49.5 88
Lond-tailed tit 7 42.0 92
(a) (i) Calculate the energy needed per day per gram of body mass for the blue tit.
...............................................................................................................
...............................................................................................................
...............................................................................................................
Answer = ......................... kJ per day per gram of body mass (2)

Save My Exams! – The Home of Revision
For more awesome GCSE and A level resources, visit us at www.savemyexams.co.uk
Page 9
(ii) Describe the trend for energy needed per day per gram of body mass for the four species of bird.
...............................................................................................................
...............................................................................................................
............................................................................................................... (1)
(iii) Suggest an explanation for the trend you have described in part (a)(ii).
...............................................................................................................
...............................................................................................................
...............................................................................................................
............................................................................................................... (2)
(b) Describe and explain the trend shown by the data for the time spent feeding in winter for the birds.
........................................................................................................................
........................................................................................................................
........................................................................................................................
........................................................................................................................ (2)
(Total 7 marks)

Save My Exams! – The Home of Revision
For more awesome GCSE and A level resources, visit us at www.savemyexams.co.uk
Page 10
Q5.Some students studied bluebell plants growing in two different habitats.
Habitat A was a sunny field next to woodland. Habitat B was a shady, moist woodland.
A bluebell plant can have several flowers on one flower stalk. The students counted the number of flowers on each of 40 bluebell flower stalks growing in each habitat. The bar charts show the results.
Habitat A: Sunny field next to woodland
Number of flowers per stalk
Habitat B: Shady, moist woodland
Number of flowers per stalk
(a) The students wanted to collect valid data. Describe how the students should have sampled the bluebell plants at each habitat to collect valid data.
........................................................................................................................
........................................................................................................................
........................................................................................................................
........................................................................................................................
........................................................................................................................ (2)

Save My Exams! – The Home of Revision
For more awesome GCSE and A level resources, visit us at www.savemyexams.co.uk
Page 11
(b) (i) The students used the bar charts to find the mode for the number of flowers per stalk in the two habitats.
The mode for the number of flowers per stalk in habitat A was 11.
What was the mode for the number of flowers per stalk in habitat B?
Mode = .................................................. (1)
(ii) The students suggested the following hypothesis:
‘The difference in the modes is due to the plants receiving different amounts of sunlight.’
Suggest why.
...............................................................................................................
...............................................................................................................
...............................................................................................................
............................................................................................................... (2)
(iii) Suggest how the students could test their hypothesis for the two habitats.
...............................................................................................................
...............................................................................................................
...............................................................................................................
............................................................................................................... (2)
(c) Suggest how receiving more sunlight could result in the plants producing more flowers per stalk.
........................................................................................................................
........................................................................................................................

Save My Exams! – The Home of Revision
For more awesome GCSE and A level resources, visit us at www.savemyexams.co.uk
Page 12
........................................................................................................................
........................................................................................................................ (2)
(Total 9 marks)

Save My Exams! – The Home of Revision
For more awesome GCSE and A level resources, visit us at www.savemyexams.co.uk
Page 13
Q6.At the seashore, the tide comes in and goes out twice each day.
Some students investigated whether two different species of seaweed could live only at certain positions on a rocky shore. Seaweeds are plant-like organisms that make their food by photosynthesis.
Figure 1 shows the two species of seaweed that the students investigated.
Figure 1
Bladder wrack Sea lettuce
Holdfast
(fixes seaweed to the rock)
(a) The students:
1 placed a 50-metre tape measure on the rocks at right angles to the sea
2 placed a quadrat next to the tape measure
3 recorded whether each species was present or not.
The students repeated steps 2 and 3 every metre down the shore.
Figure 2 shows a section of the seashore and the students’ results.
Figure 2
Section of the seashore

Save My Exams! – The Home of Revision
For more awesome GCSE and A level resources, visit us at www.savemyexams.co.uk
Page 14
metres
Students’ results
metres
(i) The students placed the quadrat at regular intervals along a transect line rather than placing the quadrat at random positions anywhere on the rocky shore.
Explain why.
...............................................................................................................
...............................................................................................................
...............................................................................................................
............................................................................................................... (2)
(ii) How could the students have improved their investigation to ensure that they produced valid data?
...............................................................................................................

Save My Exams! – The Home of Revision
For more awesome GCSE and A level resources, visit us at www.savemyexams.co.uk
Page 15
...............................................................................................................
...............................................................................................................
............................................................................................................... (2)
(iii) Figure 2 is repeated here to help you answer this question.
Figure 2
Section of the seashore
metres
Students’ results
metres
The students concluded that bladder wrack is better adapted than sea lettuce to survive in dry conditions.
What is the evidence for this conclusion?
Use information from Figure 2.
...............................................................................................................

Save My Exams! – The Home of Revision
For more awesome GCSE and A level resources, visit us at www.savemyexams.co.uk
Page 16
...............................................................................................................
...............................................................................................................
............................................................................................................... (2)
(b) The bladder wrack has many air bladders. The air bladders help the bladder wrack to float upwards when the sea covers it.
Suggest how this helps the bladder wrack to survive.
........................................................................................................................
........................................................................................................................
........................................................................................................................
........................................................................................................................ (2)
(Total 8 marks)

Save My Exams! – The Home of Revision
For more awesome GCSE and A level resources, visit us at www.savemyexams.co.uk
Page 17
Q7.The image below shows a model biogas generator.
Students used the model biogas generator to investigate which type of food waste produces the greatest yield of biogas.
Gas collects in the balloon. The gas is then released through the valve and is burned at the Bunsen burner.
The students:
• put 500 g of potato peelings in the plastic bottle with some water and sealed the apparatus
• released the gas from the balloon after day two and timed how long the gas burned for
• released the gas that had collected in the balloon from day two to day four and timed how long the gas burned for
• repeated the investigation using 500 g of cooked rice, then 500 g of cabbage leaves and then 500 g of cooked pasta.
(a) Table 1 shows the students’ results.
Table 1

Save My Exams! – The Home of Revision
For more awesome GCSE and A level resources, visit us at www.savemyexams.co.uk
Page 18
Type of food waste
Length of time the gas burned in seconds
After day two From day two
to day four
Potato peelings 0 175
Cooked rice 0 100
Cabbage leaves 0 150
Cooked pasta 0 160
(i) Suggest why the gas collected in the balloon and released after day two did not burn.
...............................................................................................................
...............................................................................................................
...............................................................................................................
...............................................................................................................
............................................................................................................... (3)
(ii) Suggest why potato peelings produced the most biogas.
...............................................................................................................
............................................................................................................... (1)
(b) Scientists investigated the production of biogas from different types of animal manure.
Table 2 shows the scientists’ results.
Table 2

Save My Exams! – The Home of Revision
For more awesome GCSE and A level resources, visit us at www.savemyexams.co.uk
Page 19
Type of mannure
Volume of biogas produced
in m3
per kg of manure
Methane in the biogas
as % of total volume
Cow 0.34 65
Pig 0.58 68
Hen 0.62 60
Horse 0.30 66
Sheep 0.61 67
(i) Calculate the volume of methane produced from 1 kg of cow manure.
...............................................................................................................
...............................................................................................................
Volume of methane = .................... m3
(2)
(ii) One scientist concluded that it would be better to use sheep manure in a biogas generator than to use cow manure.
What is the evidence for this conclusion?
Use information from Table 2 in your answer.
...............................................................................................................
...............................................................................................................
...............................................................................................................
...............................................................................................................
...............................................................................................................
............................................................................................................... (2)
(Total 8 marks)

Save My Exams! – The Home of Revision
For more awesome GCSE and A level resources, visit us at www.savemyexams.co.uk
Page 20
Q8.On a rocky shore, when the tide goes in and out, organisms are exposed to the air for different amounts of time.
(a) On hot, windy days when the tide is out the concentration of the salt solution in rock pools may become very high.
What term is used to describe organisms that can survive in severe conditions such as very high concentrations of salt solution?
................................................................................................................................. (1)
(b) Periwinkles are types of snail. Students surveyed the different types of periwinkle living on a rocky shore.
The diagram shows the results of the students’ survey. The highest position that the sea water reaches on the shore is called the high tide level. Each bar represents the range of habitats for each type of periwinkle.
(i) Which two types of periwinkle are likely to compete with each other to the greatest extent?
............................................................................................................... (1)
(ii) Explain your answer to part (b)(i).
...............................................................................................................
............................................................................................................... (1)
(iii) The small periwinkle can survive much nearer to the high tide level than the

Save My Exams! – The Home of Revision
For more awesome GCSE and A level resources, visit us at www.savemyexams.co.uk
Page 21
flat periwinkle.
Suggest two reasons why the flat periwinkle cannot survive near to the high tide level.
1.............................................................................................................
...............................................................................................................
...............................................................................................................
2.............................................................................................................
...............................................................................................................
............................................................................................................... (2)
(Total 5 marks)

Save My Exams! – The Home of Revision
For more awesome GCSE and A level resources, visit us at www.savemyexams.co.uk
Page 1
Biodiversity + effect humans on ecosystems
Question Paper 1
Level GCSE (9-1)
Subject Biology
Exam Board AQA
Topic 4.7 Ecology
Sub-Topic Biodiversity + effect humans on ecosystem Difficulty Level Bronze Level
Booklet Question Paper 1
Time Allowed: 55 minutes
Score: /54
Percentage: /100

Save My Exams! – The Home of Revision
For more awesome GCSE and A level resources, visit us at www.savemyexams.co.uk
Page 2
Q1.The graph below shows the area of forest lost in Madagascar from 2009 to 2012.
(a) The area of forest lost each year in Madagascar increased between 2009 and 2012.
Determine the total area of forest lost from the start of 2009 to the end of 2012.
.............................................................................................................................
.............................................................................................................................
Total area of forest lost = ...................... thousand hectares (1)
(b) What are the possible reasons for the change in the area of forest lost per year between 2009 and 2012?
Tick two boxes.
The local people stop growing rice
Fewer new houses are needed for the population

Save My Exams! – The Home of Revision
For more awesome GCSE and A level resources, visit us at www.savemyexams.co.uk
Page 3
The local people decided to farm cattle
More trees have been planted
A company starts growing plants for biofuels
(2)
(c) More forest was lost in 2012 than in 2009.
Use words from the box to complete the sentences.
carbon dioxide excretion nitrogen
oxygen photosynthesis respiration
The increase in the area of forest lost has caused an increase in the gas ...........................................
The increase of this gas has been caused because less of the gas is being absorbed by plants for the process of ........................................... .
(2)
(d) Deforestation can have negative effects on our ecosystems.
What are the negative effects of deforestation?
Tick two boxes.
Animals and birds migrate because there is less food
More habitats are destroyed
There is less acid rain
There is more biodiversity
The global temperature decreases
(2)
Save My Exams! – The Home of Revision
For more awesome GCSE and A level resources, visit us at www.savemyexams.co.uk
Page 4
(e) Scientists try to reduce the negative effects of human activity on our ecosystems.
One way is to protect rare habitats.
Give one other way of reducing the negative effects of human activity on our ecosystems.
.............................................................................................................................
............................................................................................................................. (1)
(Total 8 marks)

Save My Exams! – The Home of Revision
For more awesome GCSE and A level resources, visit us at www.savemyexams.co.uk
Page 5
Q2. The photograph shows an area where a tropical forest is being cleared.
(a) Complete the sentences.
People could use timber from the forest for .................................................................... .
The cleared land can be used for ..................................................................................... .
Clearing forests increases the concentration of ............................................................... in the atmosphere.
This increase causes global .................................................................. . (4)
(b) Clearing forests causes some species to become extinct.
(i) What is meant by extinct?

Save My Exams! – The Home of Revision
For more awesome GCSE and A level resources, visit us at www.savemyexams.co.uk
Page 6
...........................................................................................................................
........................................................................................................................... (1)
(ii) It is important to prevent species from becoming extinct.
Give one reason why.
...........................................................................................................................
........................................................................................................................... (1)
(Total 6 marks)

Save My Exams! – The Home of Revision
For more awesome GCSE and A level resources, visit us at www.savemyexams.co.uk
Page 7
Q3. In many parts of the world, forests are being chopped down (deforestation) so that the land can be used to grow food crops. In other parts, trees are planted to produce new forests.
The graph shows how the area of forest in each of the continents is changing each year.
(a) (i) What area of forest is being lost in Africa each year?
Area = ............................................. thousand km2
(1)
(ii) Use Steps 1, 2 and 3 to calculate the total change to the area of forest each year.
Step 1 Calculate the total area of trees chopped down.
...............................................................................................................
Total area chopped down = .................... thousand km2
Step 2 Calculate the total area of trees planted.
...............................................................................................................
Total area planted = .................... thousand km2
Step 3 Use your answers from Steps 1 and 2 to calculate the total change in the area of forest.
...............................................................................................................

Save My Exams! – The Home of Revision
For more awesome GCSE and A level resources, visit us at www.savemyexams.co.uk
Page 8
Total change in area of forest .................... thousand km2
(3)
(b) Draw a ring around the correct answer to complete each sentence.
plants only.
(i) Large scale deforestation reduces the number of species of animals only.
both animals and plants.
(1)
lichens.
(ii) The remains of the trees are broken down into carbon dioxide by microorganisms.
plants.
(1)
carbon dioxide.
(iii) The gas released into the atmosphere when trees are burned is methane.
oxygen.
(1) (Total 7 marks)

Save My Exams! – The Home of Revision
For more awesome GCSE and A level resources, visit us at www.savemyexams.co.uk
Page 9
Q4. Soay sheep live wild on an island off the north coast of Scotland. No people live on the island.
By Owen Jones = Jonesor [CC-BY-SA-2.5], via Wikimedia Commons
Over the last 25 years, the average height and mass of the wild Soay sheep have decreased.
The scientists think that climate change might have affected the size of the sheep.
(a) More Soay sheep are now able to survive winter than 25 years ago.
What change in the climate may have helped more Soay sheep to survive winters?
........................................................................................................................
........................................................................................................................ (1)
(b) Complete the sentences.
(i) Soay sheep show variation in size because of differences in their
............................................................................ (1)
(ii) The change in the size of the Soay sheep over 25 years can be explained by Darwin’s
theory of ............................................................ (1)
(Total 3 marks)

Save My Exams! – The Home of Revision
For more awesome GCSE and A level resources, visit us at www.savemyexams.co.uk
Page 10
Q5. The photographs show some ways in which humans affect the environment.
(a) Coal-burning power stations give off smoke. The smoke contains many different gases.
By Norbert Kaiser (English: own work.) [CC-BY-SA-3.0], via Wikimedia Commons
Draw a ring around the correct answer to complete each sentence.
carbon dioxide.
(i) The gas which causes global warming is oxygen.
sulfur dioxide.
(1)
methane.
(ii) The gas which causes acid rain is oxygen.

Save My Exams! – The Home of Revision
For more awesome GCSE and A level resources, visit us at www.savemyexams.co.uk
Page 11
sulfur dioxide.
(1)
(b) The photograph shows a quarry.
By Thomas Bjørkan (Own work) [CC-BY-SA-3.0], via Wikimedia Commons
Draw a ring around the correct answer to complete each sentence.
releases methane into the atmosphere.
(i) Quarrying increases biodiversity.
reduces land available for animals and plants.
(1)
metals.
(ii) Quarrying can be reduced by recycling paper.
plastic
(1)

Save My Exams! – The Home of Revision
For more awesome GCSE and A level resources, visit us at www.savemyexams.co.uk
Page 12
(c) The photograph shows a farmer spraying fruit trees.
Photograph supplied by Hemera/Thinkstock
Chemicals in the spray kill insects on the trees.
Draw a ring around the correct answer to complete each sentence.
fertiliser.
(i) The spray contains herbicide.
pesticide.
(1)
kill other animals.
(ii) The chemical in the spray might also kill plants.
increase biodiversity.
(1) (Total 6 marks)

Save My Exams! – The Home of Revision
For more awesome GCSE and A level resources, visit us at www.savemyexams.co.uk
Page 13
Q6.The human population is increasing and more household waste is being produced.
(a) Give one way in which an increase in household waste affects our environment.
........................................................................................................................
........................................................................................................................ (1)
(b) The release of sulfur dioxide affects our environment.
The graph shows how the mass of sulfur dioxide released in the UK has changed from 2001 to 2011.
(i) Describe the pattern shown in the graph.
...............................................................................................................
...............................................................................................................
...............................................................................................................
...............................................................................................................

Save My Exams! – The Home of Revision
For more awesome GCSE and A level resources, visit us at www.savemyexams.co.uk
Page 14
(2)
(ii) In 2001, 1400 thousand tonnes of sulfur dioxide were released.
By which year had the amount of sulfur dioxide released reduced to half of this amount?
...............................................................................................................
...............................................................................................................
...............................................................................................................
Year = ........................................ (2)
(iii) Give one problem caused when sulfur dioxide gas is in the air.
...............................................................................................................
............................................................................................................... (1)
(c) Carbon dioxide is another gas that affects the environment.
Which two of the following help to reduce the levels of carbon dioxide in the atmosphere by storing carbon dioxide?
Tick ( ) two boxes.
Animals respiring
Carbon dioxide being absorbed in oceans and lakes
Photosynthesis by trees
The production of biogas
(2) (Total 8 marks)

Save My Exams! – The Home of Revision
For more awesome GCSE and A level resources, visit us at www.savemyexams.co.uk
Page 15
Q7. Large-scale deforestation is taking place in Brazil.
The pie chart shows the causes of deforestation in Brazil.
(a) Calculate the percentage of forest that has been destroyed for cattle ranches.
Show clearly how you work out your answer.
........................................................................................................................
........................................................................................................................
Percentage = .................................................. (2)
(b) Cattle give off large amounts of methane into the atmosphere.
The methane causes the Earth’s temperature to increase.
Give two effects of the temperature increase on the environment.
1 .....................................................................................................................
........................................................................................................................
2 .....................................................................................................................
........................................................................................................................ (2)
(Total 4 marks)

Save My Exams! – The Home of Revision
For more awesome GCSE and A level resources, visit us at www.savemyexams.co.uk
Page 16
Q8.Human activities affect the environment.
(a) List A gives four human activities.
List B gives the effect of the activities on the environment.
Draw one line from each human activity in List A to its effect on the environment in List B.
List A
Human activity
List B Effect on the environment
Adds methane to the atmosphere
Digging a new quarry
Pollutes hedges around fields
Spraying pesticides on crops
Reduces the land available for
wild animals
Growing rice
Produces lots of litter
Driving cars that release sulfur
dioxide
Produces acid rain
(4)
(b) Human activities are increasing global warming .
Give two effects of global warming on the environment.
1......................................................................................................................
........................................................................................................................
2......................................................................................................................
........................................................................................................................ (2)
(Total 6 marks)

Save My Exams! – The Home of Revision
For more awesome GCSE and A level resources, visit us at www.savemyexams.co.uk
Page 17
Q9.Scientists have produced many different types of GM (genetically modified) food crops.
(a) Use words from the box to complete the sentence about genetic engineering.
clones chromosomes embryos genes
GM crops are produced by cutting ........................................... out of the
........................................... of one plant and inserting them into the cells of a crop plant.
(2)
(b) Read the information about GM food crops.
• Herbicide-resistant GM crops produce higher yields.
• Scientists are uncertain about how eating GM food affects our health.
• Insect-resistant GM crops reduce the total use of pesticides.
• GM crops might breed naturally with wild plants.
• Seeds for a GM crop can only be bought from one manufacturer.
• The numbers of bees will fall in areas where GM crops are grown.
Use this information to answer these questions.
(i) Give two reasons why some farmers are in favour of growing GM crops.
1 ............................................................................................................
...............................................................................................................
2 ............................................................................................................
............................................................................................................... (2)
(ii) Give two reasons why many people are against the growing of GM crops.
1 ............................................................................................................
...............................................................................................................
2 ............................................................................................................

Save My Exams! – The Home of Revision
For more awesome GCSE and A level resources, visit us at www.savemyexams.co.uk
Page 18
............................................................................................................... (2)
(Total 6 marks)

Save My Exams! – The Home of Revision
For more awesome GCSE and A level resources, visit us at www.savemyexams.co.uk
Page 1
Biodiversity + effect humans on ecosystems
Question Paper 1
Level GCSE (9-1)
Subject Biology
Exam Board AQA
Topic 4.7 Ecology
Sub-Topic Biodiversity +Effect Humans on EcosystemsDifficulty Level Silver Level
Booklet Question Paper 1
Time Allowed: 49 minutes
Score: /47
Percentage: /100

Save My Exams! – The Home of Revision
For more awesome GCSE and A level resources, visit us at www.savemyexams.co.uk
Page 2
Q1.A gardener wants to add compost to the soil to increase his yield of strawberries.
The gardener wants to make his own compost.
(a) An airtight compost heap causes anaerobic decay.
Explain why the gardener might be against producing compost using this method.
.............................................................................................................................
.............................................................................................................................
.............................................................................................................................
............................................................................................................................. (2)
(b) The gardener finds this research on the Internet:
‘A carbon to nitrogen ratio of 25:1 will produce fertile compost.’
Look at the table below.
Type of material to compost
Mass of carbon in
sample in g
Mass of nitrogen
in sample in g Carbon:nitrogen ratio
Chicken manure
8.75 1.25 7:1
Horse manure 10.00 0.50 20:1
Peat moss 9.80 0.20 X
Determine the ratio X in the table above.
.............................................................................................................................
Ratio ................................ (1)
(c) Which type of material in the table above would be best for the gardener to use to make his compost?
Justify your answer.

Save My Exams! – The Home of Revision
For more awesome GCSE and A level resources, visit us at www.savemyexams.co.uk
Page 3
.............................................................................................................................
............................................................................................................................. (1)
(d) Some of the leaves from the gardener’s strawberry plant die.
The dead leaves fall off the strawberry plant onto the ground.
The carbon in the dead leaves is recycled through the carbon cycle.
Explain how the carbon is recycled into the growth of new leaves.
.............................................................................................................................
.............................................................................................................................
.............................................................................................................................
.............................................................................................................................
.............................................................................................................................
.............................................................................................................................
.............................................................................................................................
.............................................................................................................................
.............................................................................................................................
............................................................................................................................. (6)
(e) The diagram below shows two strawberries.
• Both strawberries were picked from the same strawberry plant.
• Both strawberries were picked 3 days ago.
• The strawberries were stored in different conditions.
Strawberry A Strawberry B

Save My Exams! – The Home of Revision
For more awesome GCSE and A level resources, visit us at www.savemyexams.co.uk
Page 4
A © sarahdoow/iStock/Thinkstock, B © Mariusz Vlack/iStock/Thinkstock
Give three possible reasons that may have caused strawberry A to decay.
1 ..........................................................................................................................
.............................................................................................................................
2 ..........................................................................................................................
.............................................................................................................................
3 ..........................................................................................................................
............................................................................................................................. (3)
(Total 13 marks)
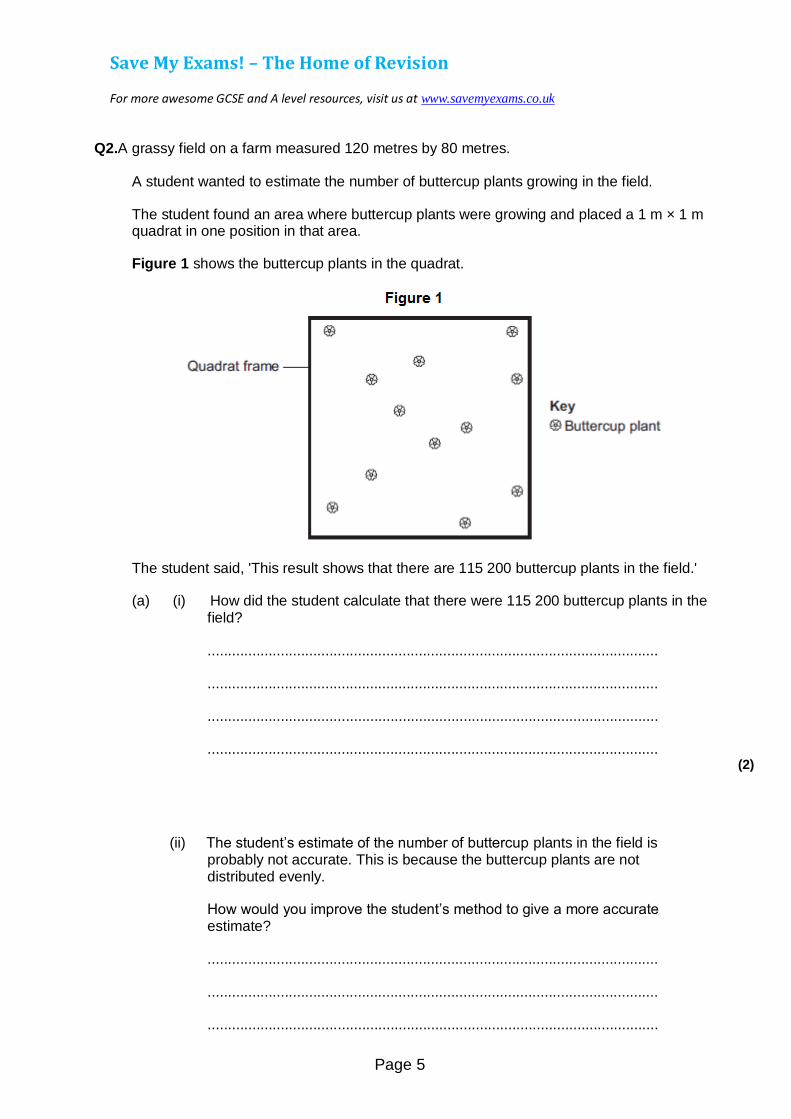
Save My Exams! – The Home of Revision
For more awesome GCSE and A level resources, visit us at www.savemyexams.co.uk
Page 5
Q2.A grassy field on a farm measured 120 metres by 80 metres.
A student wanted to estimate the number of buttercup plants growing in the field.
The student found an area where buttercup plants were growing and placed a 1 m × 1 m quadrat in one position in that area.
Figure 1 shows the buttercup plants in the quadrat.
The student said, 'This result shows that there are 115 200 buttercup plants in the field.'
(a) (i) How did the student calculate that there were 115 200 buttercup plants in the field?
...............................................................................................................
...............................................................................................................
...............................................................................................................
............................................................................................................... (2)
(ii) The student’s estimate of the number of buttercup plants in the field is probably not accurate. This is because the buttercup plants are not distributed evenly.
How would you improve the student’s method to give a more accurate estimate?
...............................................................................................................
...............................................................................................................
...............................................................................................................

Save My Exams! – The Home of Revision
For more awesome GCSE and A level resources, visit us at www.savemyexams.co.uk
Page 6
............................................................................................................... (2)
(b) Sunlight is one environmental factor that might affect the distribution of the buttercup plants.
(i) Give three other environmental factors that might affect the distribution
of the buttercup plants.
1...............................................................................................................
2...............................................................................................................
3............................................................................................................... (3)
(ii) Explain how the amount of sunlight could affect the distribution of the buttercup plants.
(3)
(c) Figure 2 is a map showing the position of the farm and a river which flows through it.
Every year, the farmer puts fertiliser containing mineral ions on some of his fields.When there is a lot of rain, some of the fertiliser is washed into the river.
(i) When fertiliser goes into the river, the concentration of oxygen dissolved in the water decreases.

Save My Exams! – The Home of Revision
For more awesome GCSE and A level resources, visit us at www.savemyexams.co.uk
Page 7
Explain why the concentration of oxygen decreases.
...............................................................................................................
...............................................................................................................
...............................................................................................................
...............................................................................................................
...............................................................................................................
...............................................................................................................
...............................................................................................................
...............................................................................................................
...............................................................................................................
............................................................................................................... (5)
(ii) There is a city 4 km downstream from the farm.
Apart from fertiliser, give one other form of pollution that might go into the river as it flows through the city.
............................................................................................................... (1)
(d) Three sites, A, B and C, are shown in Figure 2.
Scientists took many samples of river water from these sites.
The scientists found larvae of three types of insect in the water: mayfly, stonefly and caddisfly. For each type of insect the scientists found several different species.
The scientists counted the number of different species of the larvae of each of the three types of insect.
Figure 3 shows the scientists’ results.

Save My Exams! – The Home of Revision
For more awesome GCSE and A level resources, visit us at www.savemyexams.co.uk
Page 8
(i) How many more species of mayfly were there at Site B than at Site A?
........................................ (1)
(ii) Suggest what caused this increase in the number of species of mayfly.
...............................................................................................................
............................................................................................................... (1)
(iii) The scientists stated that the number of species of stonefly was the best indicator of the amount of oxygen dissolved in the water.
Use information from Figure 3 to suggest why. (1)
(Total 19 marks)

Save My Exams! – The Home of Revision
For more awesome GCSE and A level resources, visit us at www.savemyexams.co.uk
Page 9
Q3.In many areas of the world the mass of household waste produced each year is increasing.
(a) Give two reasons why the mass of household waste is increasing each year.
1......................................................................................................................
........................................................................................................................
2......................................................................................................................
........................................................................................................................ (2)
(b) The table below shows how the mass of household waste in the UK has changed from 2004 to 2012.
Year
Total mass of household waste in
thousands of tonnes (including total
household recycling)
Total mass of household recycling
in thousands of tonnes
Percentage of household waste
recycled
2004 25 658 5785 22.5
2006 25 775 7976 30.9
2008 24 334 9398 38.6
2010 23 454 9733
2012 22 643 9782 43.2
(i) Calculate the percentage of household waste recycled in 2010.
...............................................................................................................
...............................................................................................................
...............................................................................................................
...............................................................................................................
......................... % (2)
(ii) The UK government has been encouraging a ‘zero waste economy’.

Save My Exams! – The Home of Revision
For more awesome GCSE and A level resources, visit us at www.savemyexams.co.uk
Page 10
In a ‘zero waste economy’, we reduce, reuse and recycle as much waste as possible.
A newspaper concluded that: ‘The government’s ‘zero waste economy’ has been successful.’
Use information from the table to describe the reasons for and against the newspaper’s conclusion.
...............................................................................................................
...............................................................................................................
...............................................................................................................
...............................................................................................................
...............................................................................................................
...............................................................................................................
...............................................................................................................
............................................................................................................... (4)
(c) (i) Some waste releases carbon dioxide and methane into the atmosphere. An increase in carbon dioxide and methane contributes to global warming.
Global warming can cause sea levels to rise.
Describe two other possible effects of global warming on our environment.
1.............................................................................................................
...............................................................................................................
2.............................................................................................................
............................................................................................................... (2)
(ii) Storing the carbon dioxide helps to prevent more global warming. Carbon dioxide can be stored (sequestered) in trees when they photosynthesise.
Give one different way in which carbon dioxide is sequestered in our
environment.

Save My Exams! – The Home of Revision
For more awesome GCSE and A level resources, visit us at www.savemyexams.co.uk
Page 11
...............................................................................................................
............................................................................................................... (1)
(Total 11 marks)

Save My Exams! – The Home of Revision
For more awesome GCSE and A level resources, visit us at www.savemyexams.co.uk
Page 12
Q4.Human activities have many effects on our ecosystem.
The graph shows the volume of peat compost and peat-free compost used in gardening from 1999 to 2009.
(a) Describe the trends shown in the graph.
........................................................................................................................
........................................................................................................................
........................................................................................................................
........................................................................................................................
........................................................................................................................ (2)
(b) What effect does the destruction of peat bogs have on the gases in the atmosphere?
........................................................................................................................
........................................................................................................................ (1)
(c) Deforestation is also damaging ecosystems.

Save My Exams! – The Home of Revision
For more awesome GCSE and A level resources, visit us at www.savemyexams.co.uk
Page 13
Describe one effect of deforestation on ecosystems. (1)
(Total 4 marks)

Save My Exams! – The Home of Revision
For more awesome GCSE and A level resources, visit us at www.savemyexams.co.uk
Page 1
Biodiversity + effect humans on ecosystems
Question Paper 1
Level GCSE (9-1)
Subject Biology
Exam Board AQA
Topic 4.7 Ecology
Sub-Topic Biodiversity + effect humans on ecosystems
Difficulty Level Gold Level
Booklet Question Paper 1
Time Allowed: 59 minutes
Score: /59
Percentage: /100

Save My Exams! – The Home of Revision
For more awesome GCSE and A level resources, visit us at www.savemyexams.co.uk
Page 2
Q1.The diagram shows a fermenter. This fermenter is used for growing the fungus Fusarium.
Fusarium is used to make mycoprotein.
(a) Bubbles of air enter the fermenter at A.
Give two functions of the air bubbles.
1......................................................................................................................
........................................................................................................................
2......................................................................................................................
....................................................................................................................... (2)
(b) Why is glucose added to the fermenter?
........................................................................................................................

Save My Exams! – The Home of Revision
For more awesome GCSE and A level resources, visit us at www.savemyexams.co.uk
Page 3
........................................................................................................................ (1)
(c) The fermenter is prevented from overheating by the cold water flowing in through the heat exchanger coils at C.
Name the process that causes the fermenter to heat up.
........................................................................................................................ (1)
(d) It is important to prevent microorganisms other than Fusarium growing in the fermenter.
(i) Why is this important?
...............................................................................................................
............................................................................................................... (1)
(ii) Suggest one way in which contamination of the fermenter by microorganisms could be prevented.
...............................................................................................................
............................................................................................................... (1)
(e) Human cells cannot make some of the amino acids which we need. We must obtain these amino acids from our diet.
The table shows the amounts of four of these amino acids present in mycoprotein, in beef and in wheat.
Name of
amino acid
Amount of amino acid per 100 g in mg
Daily amount needed by a 70 kg human
in mg Mycoprotein Beef Wheat

Save My Exams! – The Home of Revision
For more awesome GCSE and A level resources, visit us at www.savemyexams.co.uk
Page 4
Lysine 910 1600 300 840
Methionine 230 500 220 910
Phenylalanine 540 760 680 980
Threonine 610 840 370 490
A diet book states that mycoprotein is the best source of amino acids for the human diet.
Evaluate this statement.
Remember to include a conclusion in your evaluation.
........................................................................................................................
........................................................................................................................
........................................................................................................................
........................................................................................................................
........................................................................................................................
........................................................................................................................
........................................................................................................................
........................................................................................................................
........................................................................................................................
........................................................................................................................ (4)
(Total 10 marks)

Save My Exams! – The Home of Revision
For more awesome GCSE and A level resources, visit us at www.savemyexams.co.uk
Page 5
Q2. In tropical areas of the world, forests are being cut down at the rate of 150 hectares every minute of every day.
(a) Give two reasons why forests in tropical areas are being cut down at a high rate.
1 ..................................................................................................................................
.....................................................................................................................................
2 ..................................................................................................................................
..................................................................................................................................... (2)
(b) Explain how this deforestation is affecting the composition of the atmosphere.
.....................................................................................................................................
.....................................................................................................................................
.....................................................................................................................................
.....................................................................................................................................
.....................................................................................................................................
..................................................................................................................................... (5)
(Total 7 marks)

Save My Exams! – The Home of Revision
For more awesome GCSE and A level resources, visit us at www.savemyexams.co.uk
Page 6
Q3.Professor John Lawton researches into the problem of controlling the spread of bracken. Bracken is a fern which threatens upland farms, partly because it poses a health risk to people and animals.
Professor Lawton is waiting for government permission to release the Conservular caterpillar which feeds on the bracken.
The Secretary of State has to decide whether the Conservular caterpillar can be released.
The article printed below describes some of the problems faced by the Secretary of State.
David the caterpillar to bracken’s Goliath
Yorkshire farmer Maurice Cottrill has just forked out £500 to have a helicopter hover over his land and spew out gallons of chemicals aimed at destroying one of the most pervasive and dangerous weeds known to man – bracken. In a little box in a laboratory near Ascot, Berkshire, lies a tiny caterpillar which could have done the job for nothing.
Whether or not that caterpillar and thousand of its chums will ever be let loose on the massive carpet of bracken that is sweeping over Britain at the rate of 53 square kilometres a year has to be decided by the Secretary of State for the Environment.
Weed control through the release of imported insects has never been tried in Britain before. If the Secretary of State permits the experiment, the caterpillar is in for the feast of its life, because five years of painstaking research have proved that bracken is its only food. However, is that the full story? Will the beast stop there, or will it go on, wreaking unforeseen devastation. Can scientists predict what will happen when imported insects are released into the wild?
Bracken is poisonous – more than 20 000 sheep and 1 000 cattle suffer poisoning each year. Its spores are carcinogenic, posing a threat to hill walkers. Bracken costs a depressing £4m a year to control while rendering useless grazing land valued at £5m annually. “Bracken is one factor which is leading to hill farming becoming uneconomic”, says the director of the Ramblers Association. “We are worried about that because, the more uneconomic hill farms become, the more prospect there is of the forestry industry taking over.”
The National Farmers Union are concerned about the consequences of the caterpillar getting out of control. What if it started consuming garden ferns? What if it loved potatoes? On the other hand, the caterpillar might help to preserve important uplands where wildlife flourishes when bracken is kept at bay. However, the experiment takes the scientists into unknown territory.
World-wide, 94 species of weeds have been controlled by biological releases

Save My Exams! – The Home of Revision
For more awesome GCSE and A level resources, visit us at www.savemyexams.co.uk
Page 7
involving 215 types of animal in 50 countries. Professor Lawson says that approximately one-third have achieved effective control and the remainder have failed.
Upland farms are artificial ecosystems, created and maintained mainly for the rearing of sheep and cattle. These farms are being threatened by the spread of bracken. Up to now the only treatment for bracken has been to use herbicides.
Use the article to explain, as fully as you can, what advice you would give the Secretary of State.
Explain the arguments for and against that lead to your decision.
You will not receive marks for simply copying extracts from the article. (Total 8 marks)

Save My Exams! – The Home of Revision
For more awesome GCSE and A level resources, visit us at www.savemyexams.co.uk
Page 8
Q4. Large areas of rain forest are being cleared and burnt in many parts of the world. The cleared land will often produce crops for only a few years.
(a) Explain why rain forests are being burnt to provide land for crops in many parts of the world.
....................................................................................................................................
....................................................................................................................................
....................................................................................................................................
.................................................................................................................................... (2)
(b) Explain why such cleared land will often produce crops for only a few years.
....................................................................................................................................
....................................................................................................................................
....................................................................................................................................
.................................................................................................................................... (2)
(c) Explain the effects that large-scale burning of forests may have on the Earth’s atmosphere in the short and in the long term.
....................................................................................................................................
....................................................................................................................................
....................................................................................................................................
....................................................................................................................................
....................................................................................................................................
....................................................................................................................................
....................................................................................................................................
....................................................................................................................................
....................................................................................................................................

Save My Exams! – The Home of Revision
For more awesome GCSE and A level resources, visit us at www.savemyexams.co.uk
Page 9
.................................................................................................................................... (4)
(Total 8 marks)

Save My Exams! – The Home of Revision
For more awesome GCSE and A level resources, visit us at www.savemyexams.co.uk
Page 10
Q5. In this country most tomatoes are grown in greenhouses.
(a) Suggest one way in which a grower could increase the yield of tomatoes from plants growing in his greenhouse.
.....................................................................................................................................
..................................................................................................................................... (1)
(b) Large supermarkets often import tomatoes from overseas.
(i) Suggest two reasons why a supermarket might decide to import tomatoes rather than buy them from British growers.
1 ........................................................................................................................
...........................................................................................................................
2 ........................................................................................................................
........................................................................................................................... (2)
(ii) Importing tomatoes may be more damaging to the environment than selling tomatoes grown in this country.
Explain why.

Save My Exams! – The Home of Revision
For more awesome GCSE and A level resources, visit us at www.savemyexams.co.uk
Page 11
...........................................................................................................................
...........................................................................................................................
...........................................................................................................................
........................................................................................................................... (2)
(Total 5 marks)

Save My Exams! – The Home of Revision
For more awesome GCSE and A level resources, visit us at www.savemyexams.co.uk
Page 12
Q6. In South Asia, forests are being cleared to grow palm oil trees. The palm oil is mainly used to produce fuel for motor vehicles.
The graph shows the production of palm oil in one South Asian country.
(a) Calculate the mean increase in palm oil production per year for the five year period 2000 to 2005.
Show clearly how you work out your answer.
........................................................................................................................
........................................................................................................................
Mean increase = .............................. millions of tonnes per year (2)
(b) Clearing forests and replacing the forests with palm oil trees to produce fuel for motor vehicles will affect the composition of the atmosphere.
Explain how.
........................................................................................................................
........................................................................................................................

Save My Exams! – The Home of Revision
For more awesome GCSE and A level resources, visit us at www.savemyexams.co.uk
Page 13
........................................................................................................................
........................................................................................................................
........................................................................................................................
........................................................................................................................
........................................................................................................................
........................................................................................................................
........................................................................................................................
........................................................................................................................
........................................................................................................................
........................................................................................................................
........................................................................................................................
........................................................................................................................ (5)
(Total 7 marks)

Save My Exams! – The Home of Revision
For more awesome GCSE and A level resources, visit us at www.savemyexams.co.uk
Page 14
Q7. Scientists have discovered that curry spices affect sheep and cattle. Curry spices can reduce the amount of methane that grazing animals give off.
‘Bad’ bacteria in the animal’s stomach produce methane. About 12% of the animal’s food is changed into methane.
The curry spice coriander works like an antibiotic. Adding coriander to animal food reduces methane production by about 40%.
(a) (i) Why does adding coriander to an animal’s food reduce methane production?
...............................................................................................................
............................................................................................................... (1)
(ii) Explain one advantage to a farmer of adding coriander to the animal’s food.
...............................................................................................................
...............................................................................................................
...............................................................................................................
............................................................................................................... (2)
(b) Farm animals give off large amounts of methane.
Explain the effects of adding large amounts of methane to the atmosphere.
........................................................................................................................
........................................................................................................................
........................................................................................................................
........................................................................................................................
........................................................................................................................
........................................................................................................................ (3)
(Total 6 marks)

Save My Exams! – The Home of Revision
For more awesome GCSE and A level resources, visit us at www.savemyexams.co.uk
Page 15
Q8.Human activities affect the environment.
(a) Deforestation results in an increase in carbon dioxide levels in the atmosphere.
Give two reasons why.
........................................................................................................................
........................................................................................................................
........................................................................................................................
........................................................................................................................ (2)
(b) In this question you will be assessed on using good English, organising information clearly and using specialist terms where appropriate.
A dairy farmer washes out his cow shed each day. The waste water contains urine and faeces. The waste water overflows into a stream by mistake.
The waste water will have an effect on the plants and invertebrates living in the stream.
Explain why.
........................................................................................................................
........................................................................................................................
........................................................................................................................
........................................................................................................................
........................................................................................................................
........................................................................................................................
........................................................................................................................
........................................................................................................................
........................................................................................................................
........................................................................................................................
........................................................................................................................
........................................................................................................................

Save My Exams! – The Home of Revision
For more awesome GCSE and A level resources, visit us at www.savemyexams.co.uk
Page 16
........................................................................................................................
........................................................................................................................
........................................................................................................................
........................................................................................................................
........................................................................................................................
........................................................................................................................
........................................................................................................................
........................................................................................................................
........................................................................................................................
........................................................................................................................ (6)
(Total 8 marks)

Save My Exams! – The Home of Revision
For more awesome GCSE and A level resources, visit us at www.savemyexams.co.uk
Page 1
Trophic level in an ecosystem
Question Paper 1
Level GCSE (9-1)
Subject Biology
Exam Board AQA
Topic 4.7 Ecology
Sub-Topic Trophic levels an ecosystem Difficulty Level Bronze Level
Booklet Question Paper 1
Time Allowed: 52 minutes
Score: /51
Percentage: /100

Save My Exams! – The Home of Revision
For more awesome GCSE and A level resources, visit us at www.savemyexams.co.uk
Page 2
Q1.The diagram below shows a food chain in a garden.
Lettuce © destillat/iStock/Thinkstock; Snail ©Valengilda/iStock/Thinkstock; Shrew © GlobalT/iStock/Thinkstock
(a) Name one consumer shown in the diagram above.
............................................................................................................................. (1)
(b) Name one carnivore shown in the diagram above.
............................................................................................................................. (1)
(c) A disease kills most of the shrews in the garden.
Suggest why the number of snails in the garden may then increase.
.............................................................................................................................
............................................................................................................................. (1)
(d) What is the name given to all the snails in the garden shown in the diagram above?
Tick one box.
Community
Ecosystem
Population
Territory

Save My Exams! – The Home of Revision
For more awesome GCSE and A level resources, visit us at www.savemyexams.co.uk
Page 3
(1)
(e) Which pyramid of biomass is correct for the food chain shown in the diagram above?
Tick one box.
(1)
(f) Some snails ate some lettuces.
The lettuces contained 11 000 kJ of energy.
Only 10% of this energy was transferred to the snails.
Calculate the energy transferred to the snails from the lettuces.
.............................................................................................................................
Energy = ................................................................ kJ (1)
(g) Give one reason why only 10% of the energy in the lettuces is transferred to the snails.
Tick one box.
The lettuces carry out photosynthesis
The snails do not eat the roots of the lettuces
Not all parts of a snail can be eaten
(1)

Save My Exams! – The Home of Revision
For more awesome GCSE and A level resources, visit us at www.savemyexams.co.uk
Page 4
(h) Abiotic factors can affect the food chain.
Wind direction is one abiotic factor.
Name one other abiotic factor.
............................................................................................................................. (1)
(Total 8 marks)

Save My Exams! – The Home of Revision
For more awesome GCSE and A level resources, visit us at www.savemyexams.co.uk
Page 5
Q2. This is a simple food chain.
Lettuce plant → Slug → Frog → Heron
The diagram shows a pyramid of biomass for this food chain.
(a) Write the names of the organisms in the food chain on the correct lines next to the pyramid of biomass.
(1)
(b) (i) The slug obtains its energy from the lettuce plant. What is the source of energy for the lettuce plant?
........................................................................................................................... (1)
(ii) What is the function of chlorophyll in a lettuce plant?
........................................................................................................................... (1)
(iii) The slugs ate some lettuce plants which contained 1620 kJ of energy. Only 10 per cent of this energy is used by the slugs for growth. Use the formula to calculate how much energy can be used by the slugs for growth. Show clearly how you work out your final answer.
Amount of energy =

Save My Exams! – The Home of Revision
For more awesome GCSE and A level resources, visit us at www.savemyexams.co.uk
Page 6
...........................................................................................................................
...........................................................................................................................
...........................................................................................................................
Amount of energy = ................................................... kJ (2)
(Total 5 marks)

Save My Exams! – The Home of Revision
For more awesome GCSE and A level resources, visit us at www.savemyexams.co.uk
Page 7
Q3. (a) The diagrams show three pyramids of biomass.
(i) Which pyramid would be the most efficient in providing food for humans?
Tick ( ) one box.
(1)
(ii) Give one reason for your choice.
...........................................................................................................................
........................................................................................................................... (1)
(b) Pigs may be kept indoors or outdoors.
Pigs kept indoors Pigs kept outdoors

Save My Exams! – The Home of Revision
For more awesome GCSE and A level resources, visit us at www.savemyexams.co.uk
Page 8
The pie charts show what happens to the energy in the food eaten by pigs kept indoors and pigs kept outdoors.
Pigs kept indoors Pigs kept outdoors
(i) Farmers make more profit from keeping pigs indoors than from keeping pigs outdoors.
Use information from the pie charts to explain why.
...........................................................................................................................
...........................................................................................................................
...........................................................................................................................
........................................................................................................................... (2)
(ii) Meat from pigs kept outdoors may cost more than meat from pigs kept indoors.

Save My Exams! – The Home of Revision
For more awesome GCSE and A level resources, visit us at www.savemyexams.co.uk
Page 9
Some people prefer to buy meat from animals that have been kept outdoors.
Suggest one reason why.
...........................................................................................................................
........................................................................................................................... (1)
(Total 5 marks)

Save My Exams! – The Home of Revision
For more awesome GCSE and A level resources, visit us at www.savemyexams.co.uk
Page 10
Q4. The picture shows a food chain.
(a) Which diagram shows a pyramid of biomass for the food chain in the picture?
Tick ( ) one box.
(1)
(b) The plants at the start of the food chain absorb energy.
Where does this energy come from?
Draw a ring around one answer.
the water the sun minerals

Save My Exams! – The Home of Revision
For more awesome GCSE and A level resources, visit us at www.savemyexams.co.uk
Page 11
(1)
(c) Some energy is lost at each stage of the food chain.
Give two ways in which energy may be lost from the food chain.
1 .....................................................................................................................
........................................................................................................................
2 .....................................................................................................................
........................................................................................................................ (2)
(Total 4 marks)

Save My Exams! – The Home of Revision
For more awesome GCSE and A level resources, visit us at www.savemyexams.co.uk
Page 12
Q5. There are plans for a ‘cattle factory’ to be built in the UK.
Information about the cattle factory and traditional cattle farming in the UK is given below.
Cattle factory by Pirhan [CC BY-SA 2.0], via Flickr. Traditional cattle farming by Mat Fascione[CC-BY-SA-2.0], via Wikimedia Commons
Cattle factory
• There will be over 8 000 cows in three large sheds.
• Each cow will be milked three times a day.
• Each cow will produce about 50 litres of milk every day.
• Waste will be collected and used to produce electricity for 2 000 homes.
• Cows are kept near to each other so disease can spread easily.
Traditional cattle farming
• Most farms have between 5 and 500 cows.
• The cows spend most of the time in fields.
• Cows are milked once or twice a day.
• Each cow produces up to 20 litres of milk a day.
• The waste is used as natural fertiliser for crops.
(a) Use the information to answer the questions.
(i) Give two reasons why some people think the cattle factory is a good idea.
1 ............................................................................................................
...............................................................................................................

Save My Exams! – The Home of Revision
For more awesome GCSE and A level resources, visit us at www.savemyexams.co.uk
Page 13
2 ............................................................................................................
............................................................................................................... (2)
(ii) Give two reasons why some people think traditional farming is better than the cattle factory.
1 ............................................................................................................
...............................................................................................................
2 ............................................................................................................
............................................................................................................... (2)
(b) The diagram shows what happens to 100 kJ of energy in the food eaten by a cow on a traditional farm.
By Dohduhdah (Own work) [Public domain], via Wikimedia Commons
Use your knowledge and the information in the diagram to answer this question.
Compare the transfer of energy from the food eaten by cows in the cattle factory

Save My Exams! – The Home of Revision
For more awesome GCSE and A level resources, visit us at www.savemyexams.co.uk
Page 14
with the energy transferred by cows on a traditional farm.
Use words from the box to complete the table.
more less the same
Energy Amount of energy transferred by cows in a cattle factory compared
with cows on a traditional farm
transferred for growth and milk
transferred in respiration
(2)
(Total 6 marks)

Save My Exams! – The Home of Revision
For more awesome GCSE and A level resources, visit us at www.savemyexams.co.uk
Page 15
Q6. Green plants are found at the start of all food chains.
(a) Complete the sentences.
(i) The source of energy for green plants is radiation from the .............. (1)
(ii) Green plants absorb some of the light energy that reaches them for a
process called ............................................................ (1)
(b) Draw a ring around the correct answer to complete each sentence.
chemical
(i) This process transfers light energy into sound energy.
electrical
(1)
carbon dioxide.
(ii) The process uses the gas oxygen.
water.
(1)
carbohydrates.
(iii) The process produces carbon-containing compounds called minerals.
salts.

Save My Exams! – The Home of Revision
For more awesome GCSE and A level resources, visit us at www.savemyexams.co.uk
Page 16
(1)
(c) The amount of living material (biomass) at each stage in a food chain is less than at the previous stage.
The diagram shows a food chain.
oak tree caterpillar blue-tit hawk
Give two ways in which biomass is lost in this food chain.
Tick ( ) two boxes.
As carbon dioxide from the caterpillar
As food eaten by the hawk
As oxygen from the oak tree
As faeces (droppings) from the blue-tit
(2) (Total 7 marks)

Save My Exams! – The Home of Revision
For more awesome GCSE and A level resources, visit us at www.savemyexams.co.uk
Page 17
Q7.There are two forms of peppered moth, dark and pale. Birds eat the moths when the moths are resting on tree bark.
Pollution in the atmosphere may:
• kill lichens living on tree bark
• make the bark of trees go black.
(a) Draw a ring around the correct answer to complete the sentence.
carbon dioxide.
Lichens are very sensitive to air pollution caused by nitrogen.
sulfur dioxide.
(1)
(b) The photographs show the two forms of peppered moth, on tree bark.
Tree bark covered with lichens Tree bark made black by pollution
© Kim Taylor/Warren Photographic
(i) The dark form of the peppered moth was produced by a change in the genetic material of a pale moth.
Use one word from the box to complete the sentence.
characteristic clone mutation
Save My Exams! – The Home of Revision
For more awesome GCSE and A level resources, visit us at www.savemyexams.co.uk
Page 18
A change in genetic material is called a ...............................................................
(1)
(ii) In the 19th century, pollution made the bark of many trees go black.
Explain why:
• the population of the pale form of the moth in forests decreased
• the population of the dark form of the moth in forests increased.
...............................................................................................................
...............................................................................................................
...............................................................................................................
...............................................................................................................
...............................................................................................................
...............................................................................................................
...............................................................................................................
............................................................................................................... (3)
(c) (i) The larvae (young) of the peppered moths eat the leaves of birch trees.
The diagram shows the food chain:
birch trees → peppered moth larvae → birds
Draw a pyramid of biomass for this food chain.
Label the pyramid.

Save My Exams! – The Home of Revision
For more awesome GCSE and A level resources, visit us at www.savemyexams.co.uk
Page 19
(2)
(ii) Which two reasons explain the shape of the pyramid you drew in part (c)(i)?
Tick ( ) two boxes.
Some material is lost in waste from the birds
The trees are much larger than peppered moth larvae
Peppered moth larvae do not eat all the leaves from the trees
The trees do not use all of the Sun’s energy
(2) (Total 9 marks)

Save My Exams! – The Home of Revision
For more awesome GCSE and A level resources, visit us at www.savemyexams.co.uk
Page 20
Q8. The photographs show four ways of farming.
Growing wheat by Eileen Henderson [CC-BY-SA-2.0], via Wikimedia Commons. Keeping Sheep outside by Andrew Smith [CC-BY-SA-2.0], via Wikimedia Commons. Keeping Pigs outside by David Williams [CC-BY-SA-2.0], via Wikimedia Commons. Keeping Pigs inside supplied by iStockphoto/ Thinkstock.
The bar chart shows the amount of food produced from these four ways of farming.

Save My Exams! – The Home of Revision
For more awesome GCSE and A level resources, visit us at www.savemyexams.co.uk
Page 21
(a) How much extra food can be produced when farmers grow wheat, compared with keeping sheep outside?
Show clearly how you work out your answer.
........................................................................................................................
........................................................................................................................
Answer ........................................ tonnes per hectare per year (2)
(b) Sheep eat grass. For every 1000 g of grass eaten, a sheep increases in mass by only 50 g. The other 950 g is lost.
How is the other 950 g lost?
Tick ( ) two boxes.
As oxygen from photosynthesis
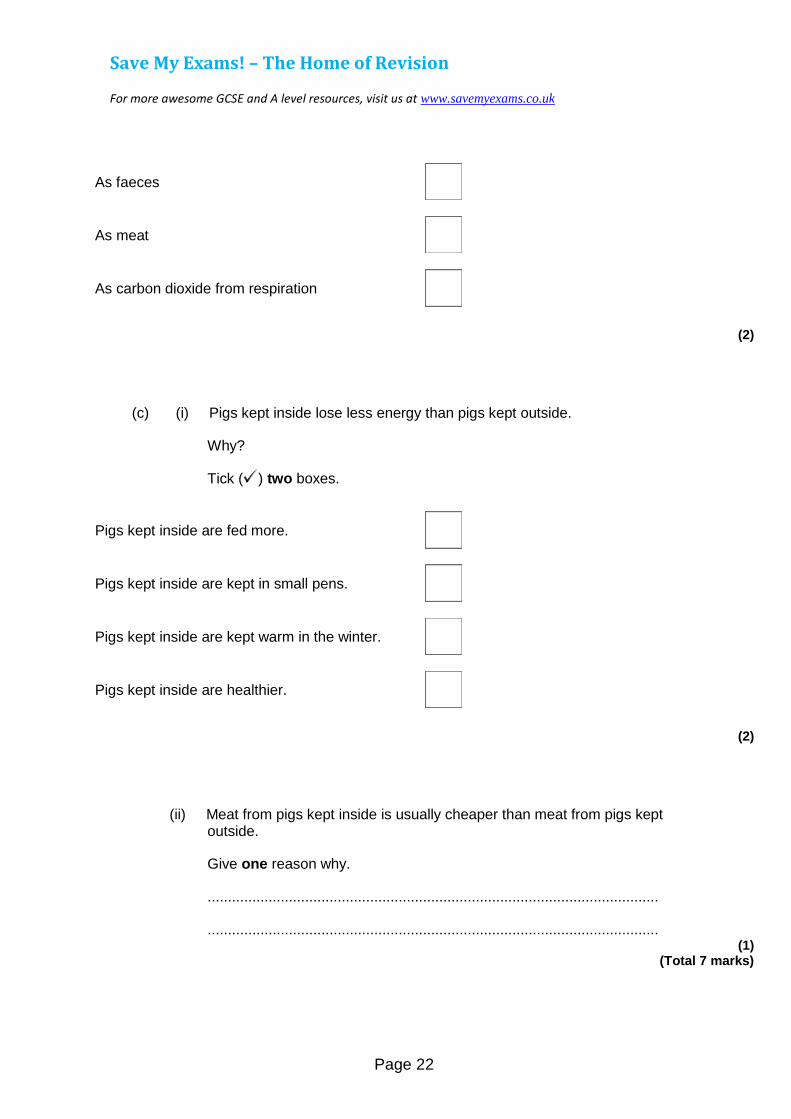
Save My Exams! – The Home of Revision
For more awesome GCSE and A level resources, visit us at www.savemyexams.co.uk
Page 22
As faeces
As meat
As carbon dioxide from respiration
(2)
(c) (i) Pigs kept inside lose less energy than pigs kept outside.
Why?
Tick ( ) two boxes.
Pigs kept inside are fed more.
Pigs kept inside are kept in small pens.
Pigs kept inside are kept warm in the winter.
Pigs kept inside are healthier.
(2)
(ii) Meat from pigs kept inside is usually cheaper than meat from pigs kept outside.
Give one reason why.
...............................................................................................................
............................................................................................................... (1)
(Total 7 marks)

Save My Exams! – The Home of Revision
For more awesome GCSE and A level resources, visit us at www.savemyexams.co.uk
Page 23

Save My Exams! – The Home of Revision
For more awesome GCSE and A level resources, visit us at www.savemyexams.co.uk
Page 1
Trophic levels in an ecosystem
Question Paper 1
Level GCSE (9-1)
Subject Biology
Exam Board AQA
Topic 4.7 Ecology
Sub-Topic Trophic levels in an ecosystem
Difficulty Level Silver Level
Booklet Question Paper 1
Time Allowed: 59 minutes
Score: /59
Percentage: /100

Save My Exams! – The Home of Revision
For more awesome GCSE and A level resources, visit us at www.savemyexams.co.uk
Page 2
Q1.Food chains show the flow of energy through the organisms in a habitat.
(a) The diagram below shows a food chain.
grass sheep human
The biomass in each stage of the food chain changes as food passes along the food chain.
Draw a pyramid of biomass for this food chain.
Label the pyramid.
(2)
(b) The table below shows three food chains, A, B and C.
Food chain
A plants sheep human
B plants grasshoppers frogs trout human
C plants human
(i) In which food chain, A, B or C, will the greatest proportion of biomass and
energy of the plants be passed to humans? (1)
(ii) Give reasons why the food chain that you chose in part (b)(i) passes on the
greatest proportion of biomass and energy to humans.
...............................................................................................................
...............................................................................................................
...............................................................................................................
...............................................................................................................

Save My Exams! – The Home of Revision
For more awesome GCSE and A level resources, visit us at www.savemyexams.co.uk
Page 3
...............................................................................................................
............................................................................................................... (3)
(Total 6 marks)

Save My Exams! – The Home of Revision
For more awesome GCSE and A level resources, visit us at www.savemyexams.co.uk
Page 4
Q2. A group of students investigated a food chain in a garden.
The table shows the estimates of the population and biomass of some of the organisms the students found.
Organism Number in the garden
Mean mass of each one
in g
Biomass of population
in g
Hedgehog 1 200 200
Slug 600 2 1200
Lettuce 20 300
(a) (i) Calculate the biomass of the lettuce population.
Show clearly how you work out your answer.
...............................................................................................................
...............................................................................................................
...............................................................................................................
Biomass = ........................................................... g (2)
(ii) Use your answer to part (a)(i) to complete the pyramid of biomass.
Show the biomass of the lettuces in the garden.
(2)
(b) Hedgehogs eat slugs.

Save My Exams! – The Home of Revision
For more awesome GCSE and A level resources, visit us at www.savemyexams.co.uk
Page 5
The biomass of the hedgehog population is much less than the biomass of the slug population.
Explain why as fully as you can.
........................................................................................................................
........................................................................................................................
........................................................................................................................
........................................................................................................................
........................................................................................................................
........................................................................................................................
........................................................................................................................ (3)
(Total 7 marks)

Save My Exams! – The Home of Revision
For more awesome GCSE and A level resources, visit us at www.savemyexams.co.uk
Page 6
Q3.There are many ways to increase the efficiency of food production.
(a) The table shows the energy available to humans from two different food chains.
Food chain Energy transferred to humans
in kJ per hectare of crop
Wheat → humans 900 000
Wheat → pigs → humans 90 000
(i) Compare the amount of energy the two food chains transfer to humans.
...............................................................................................................
............................................................................................................... (1)
(ii) Give one reason for the difference in the amount of energy the two food
chains transfer to humans.
...............................................................................................................
............................................................................................................... (1)
(b) In this question you will be assessed on using good English, organising information clearly and using specialist terms where appropriate.
Give methods used in the factory farming of animals. Explain the advantages and disadvantages of these methods.
........................................................................................................................
........................................................................................................................
........................................................................................................................
........................................................................................................................
........................................................................................................................
........................................................................................................................
........................................................................................................................
........................................................................................................................

Save My Exams! – The Home of Revision
For more awesome GCSE and A level resources, visit us at www.savemyexams.co.uk
Page 7
........................................................................................................................
........................................................................................................................
........................................................................................................................
........................................................................................................................
........................................................................................................................
........................................................................................................................
........................................................................................................................
........................................................................................................................ (6)
(Total 8 marks)

Save My Exams! – The Home of Revision
For more awesome GCSE and A level resources, visit us at www.savemyexams.co.uk
Page 8
Q4.Students investigated a food chain in a garden.
The students found 650 aphids feeding on one bean plant. Five ladybirds were feeding on the aphids.
Photograph supplied by Hemera/Thinkstock
(a) (i) Draw a pyramid of biomass for this food chain. Label the pyramid.
(2)
(ii) The biomass in the five ladybirds is less than the biomass in the bean plant.
Give two reasons why.
...............................................................................................................
...............................................................................................................
...............................................................................................................
...............................................................................................................
...............................................................................................................
............................................................................................................... (2)
(b) The carbon in dead bean plants is returned to the atmosphere via the carbon cycle.
Describe this part of the carbon cycle.

Save My Exams! – The Home of Revision
For more awesome GCSE and A level resources, visit us at www.savemyexams.co.uk
Page 9
...............................................................................................................
...............................................................................................................
...............................................................................................................
...............................................................................................................
...............................................................................................................
...............................................................................................................
...............................................................................................................
...............................................................................................................
............................................................................................................... (4)
(Total 8 marks)

Save My Exams! – The Home of Revision
For more awesome GCSE and A level resources, visit us at www.savemyexams.co.uk
Page 10
Q5.Plankton live in the sea.Animal plankton eat plant plankton.
Graph 1 shows how the populations of the plankton change through the year in the
seas around the UK.
Graph 1
Month
(a) Basking sharks eat animal plankton. Basking sharks grow up to 8 metres long.
Look at the diagram and Graph 1.
Which is the correct shape for the pyramid of biomass to show the relationship between plant plankton, animal plankton and basking sharks, in June?
Tick ( ) one box.

Save My Exams! – The Home of Revision
For more awesome GCSE and A level resources, visit us at www.savemyexams.co.uk
Page 11
(1)
Graph 1 is repeated here to help you answer the following questions.
Month
Graph 2 shows changes in some of the conditions in the upper layers of the sea around the UK.

Save My Exams! – The Home of Revision
For more awesome GCSE and A level resources, visit us at www.savemyexams.co.uk
Page 12
Month
(b) The population of plant plankton increases between February and April.
Suggest one reason for the increase.
Explain your answer.
........................................................................................................................
........................................................................................................................
........................................................................................................................
........................................................................................................................
(2)
(c) The population of animal plankton changes between April and July.
Suggest explanations for the changes.
........................................................................................................................
........................................................................................................................
........................................................................................................................

Save My Exams! – The Home of Revision
For more awesome GCSE and A level resources, visit us at www.savemyexams.co.uk
Page 13
........................................................................................................................
........................................................................................................................ (2)
(d) The concentration of mineral ions changes between February and December.
Suggest explanations for the changes.
........................................................................................................................
........................................................................................................................
........................................................................................................................
........................................................................................................................
........................................................................................................................
........................................................................................................................
........................................................................................................................ (3)
(Total 8 marks)

Save My Exams! – The Home of Revision
For more awesome GCSE and A level resources, visit us at www.savemyexams.co.uk
Page 14
Q6.Scientists investigated a food chain in a wheat field immediately after the wheat had been
harvested.
Red kites are birds of prey.
(a) The food chain for the wheat field is:
Wheat grains Field mice Red kites
What is the source of energy for the food chain?
........................................................................................................................ (1)
(b) The table shows the data the scientists collected.
Organism Estimated
number in the field
Biomass of one organism in kg
Total biomass for field in kg
Fallen wheat grains 40 000 0.0006 24.0
Red kites 2 1.0 ..........
Field mice 200 0.04 ..........
(i) Complete the table by calculating the total biomass of red kites and of field mice.
Write your answers in the table. (2)
(ii) Use data from your completed table to draw a pyramid of biomass for the food chain shown in the table.

Save My Exams! – The Home of Revision
For more awesome GCSE and A level resources, visit us at www.savemyexams.co.uk
Page 15
You should label each layer of your pyramid.
Total biomass for field in kg (3)
(c) The total biomass of the red kites is less than the total biomass of the field mice.
Give two reasons why.
........................................................................................................................
........................................................................................................................
........................................................................................................................
........................................................................................................................ (2)
(d) The scientists could not find the exact number of organisms in the wheat field.
Suggest two reasons why.
........................................................................................................................
........................................................................................................................
........................................................................................................................
........................................................................................................................ (2)
(Total 10 marks)

Save My Exams! – The Home of Revision
For more awesome GCSE and A level resources, visit us at www.savemyexams.co.uk
Page 16
Q7.The photographs show a food chain from a seashore. The photographs are not to the same
scale.
Seaweed Limpet Crab Gull
© Getty Images/ © Paul Williamson/iStock/ © twobluedogs/iStock/ © Gabriela Insuratelu/
Thinkstock Thinkstock Thinkstock iStock
Students estimated the population and biomass of each of the organisms on part of a seashore.
The table shows the students’ results.
Organism Population Mean mass of one organism in grams
Biomass of population in grams
Seaweed 50 4000 200 000
Limpet 1200 30 36 000
Crab 100 90 9 000
Gull 2 900
(a) (i) Use the data in the table to calculate the biomass of the gull population.
...............................................................................................................
...............................................................................................................
Biomass = ................................... g
(1)
(ii) Draw a pyramid of biomass for this food chain.
Label the pyramid.

Save My Exams! – The Home of Revision
For more awesome GCSE and A level resources, visit us at www.savemyexams.co.uk
Page 17
(2)
(b) The biomass of the crab population is much less than the biomass of the limpet population.
Suggest two reasons why.
1........................................................................................................................
..........................................................................................................................
2........................................................................................................................
.......................................................................................................................... (2)
(Total 5 marks)

Save My Exams! – The Home of Revision
For more awesome GCSE and A level resources, visit us at www.savemyexams.co.uk
Page 18
Q8.A group of students investigated populations in a food chain in a garden.
The table shows the estimates of the number and biomass of some of the organisms the students found.
Organism Number in the
garden
Mean mass of each one in grams
Biomass of population in grams
Hedgehog 1 200 200
Slug 600 2 1200
Lettuce 60 100
(a) (i) Calculate the biomass of the lettuce population.
Show clearly how you work out your answer.
...............................................................................................................
...............................................................................................................
Biomass = ................................................... grams (2)
(ii) Use your answer to part (a)(i) to complete the pyramid of biomass.
Show the biomass of the lettuce population in the garden.
Biomass of population in grams (2)
(b) The energy in the hedgehog population is much less than the energy in the slug

Save My Exams! – The Home of Revision
For more awesome GCSE and A level resources, visit us at www.savemyexams.co.uk
Page 19
population.
Explain why as fully as you can.
........................................................................................................................
........................................................................................................................
........................................................................................................................
........................................................................................................................
........................................................................................................................
........................................................................................................................
........................................................................................................................
........................................................................................................................ (3)
(Total 7 marks)

Save My Exams! – The Home of Revision
For more awesome GCSE and A level resources, visit us at www.savemyexams.co.uk
Page 1
Trophic levels in an ecosystem
Question Paper 1
Level GCSE (9-1)
Subject Biology
Exam Board AQA
Topic 4.7 Ecology
Sub-Topic Trophic levels in an ecosystem Difficulty Level Gold Level
Booklet Question Paper 1
Time Allowed: 59 minutes
Score: /59
Percentage: /100

Save My Exams! – The Home of Revision
For more awesome GCSE and A level resources, visit us at www.savemyexams.co.uk
Page 2
Q1. The diagram below shows a food web for a wood.
(a) The diagrams below show a pyramid of the numbers and a pyramid of the biomass for 0.1 hectare of this wood.
(i) Name one organism from the level labelled X.
........................................................................................................................... (1)
(ii) Explain, as fully as you can, why the level labelled Y is such a different width in the two pyramids.

Save My Exams! – The Home of Revision
For more awesome GCSE and A level resources, visit us at www.savemyexams.co.uk
Page 3
...........................................................................................................................
...........................................................................................................................
...........................................................................................................................
........................................................................................................................... (3)
(b) Explain, as fully as you can, what eventually happens to energy from the sun which is captured by the plants in the wood.
.....................................................................................................................................
.....................................................................................................................................
.....................................................................................................................................
.....................................................................................................................................
.....................................................................................................................................
.....................................................................................................................................
.....................................................................................................................................
.....................................................................................................................................
.....................................................................................................................................
.....................................................................................................................................
.....................................................................................................................................
.....................................................................................................................................
.....................................................................................................................................
.....................................................................................................................................
..................................................................................................................................... (10)
(Total 14 marks)

Save My Exams! – The Home of Revision
For more awesome GCSE and A level resources, visit us at www.savemyexams.co.uk
Page 4
Q2. The diagram below shows a food web for some of the organisms which live in a pond.
(a) (i) Name one secondary consumer in this food web.
........................................................................................................................... (1)
(ii) The algae are small green plants.
Give three conditions needed by green plants to produce sugars.
1 ........................................................................................................................
2 ........................................................................................................................
3 ........................................................................................................................ (3)
(b) This is a pyramid of biomass for the organisms in the aquarium.

Save My Exams! – The Home of Revision
For more awesome GCSE and A level resources, visit us at www.savemyexams.co.uk
Page 5
Some of the biomass of the producers is not transferred to the tertiary consumers.
Explain, as fully as you can, what happens to this biomass. (6)
(Total 10 marks)
Q3. The diagram below shows a food web for some of the organisms which live in a pond.
You may need to use information from the food web to help you to answer the following questions.
(a) The algae photosynthesise. Complete the equation for photosynthesis.
carbon dioxide
+ + light energy sugar +
(2)

Save My Exams! – The Home of Revision
For more awesome GCSE and A level resources, visit us at www.savemyexams.co.uk
Page 6
(b) Only a small percentage of the Sun’s energy captured by the algae is eventually incorporated into the body tissues of the stickleback. Explain, as fully as you can, what happens to the rest of the energy captured by the algae.
....................................................................................................................................
....................................................................................................................................
....................................................................................................................................
....................................................................................................................................
....................................................................................................................................
....................................................................................................................................
....................................................................................................................................
....................................................................................................................................
....................................................................................................................................
....................................................................................................................................
....................................................................................................................................
....................................................................................................................................
....................................................................................................................................
....................................................................................................................................
....................................................................................................................................
.................................................................................................................................... (8)
(Total 10 marks)
##
The diagram shows the flow of energy through a forest. The figures are in kilojoules of energy per square metre per year.

Save My Exams! – The Home of Revision
For more awesome GCSE and A level resources, visit us at www.savemyexams.co.uk
Page 7
(a) What percentage of the energy in the trees is passed on as food for the carnivores? Show clearly how you work out your final answer.
......................................................................................................................................
......................................................................................................................................
................................... per cent (2)
(b) Give three reasons why so little of the energy in the trees is passed on to the carnivores.
1 ...................................................................................................................................
......................................................................................................................................
2 ...................................................................................................................................
......................................................................................................................................
3 ...................................................................................................................................
...................................................................................................................................... (3)
(Total 5 marks)
Q5. The diagram shows the annual flow of energy through a habitat.
The figures are in kJ m–2.

Save My Exams! – The Home of Revision
For more awesome GCSE and A level resources, visit us at www.savemyexams.co.uk
Page 8
(a) (i) Calculate the percentage of the energy in sunlight that was transferred into energy in the green plants.
Show clearly how you work out your answer.
...............................................................................................................
...............................................................................................................
...............................................................................................................
...............................................................................................................
Answer = ........................................ % (2)
(ii) Suggest reasons why the percentage energy transfer you calculated in part (a)(i) was so low.
...............................................................................................................
...............................................................................................................
...............................................................................................................
............................................................................................................... (2)
(b) Compare the amount of energy transferred to the insect-eating birds with the amount transferred to the predatory birds.
Suggest explanations for the difference in the amount of energy transferred to the two types of bird.
........................................................................................................................
........................................................................................................................
........................................................................................................................
........................................................................................................................

Save My Exams! – The Home of Revision
For more awesome GCSE and A level resources, visit us at www.savemyexams.co.uk
Page 9
........................................................................................................................
........................................................................................................................
........................................................................................................................
........................................................................................................................ (3)
(Total 7 marks)
Q6. The table shows energy transfers in a large insect and a small mammal.
Both animals feed mainly on grass.
Energy transfer Amount of energy in kJ.
Large insect Small mammal
Eaten as grass 4.00 25.00
Absorbed into body 1.60 12.50
Leaves body as faeces 2.40 12.50
Production of new tissue 0.64 0.25
Transferred by respiration 0.96 12.25
(a) What percentage of the energy in food is transferred into new tissue in the large insect?
Show clearly how you work out your answer.
........................................................................................................................
........................................................................................................................
........................................................................................................................
Answer = ............................................................ (2)

Save My Exams! – The Home of Revision
For more awesome GCSE and A level resources, visit us at www.savemyexams.co.uk
Page 10
(b) The proportion of energy in the food transferred into new tissue is much greater in the large insect than in the small mammal.
Explain why as fully as you can.
You should include references to the data in your answer.
........................................................................................................................
........................................................................................................................
........................................................................................................................
........................................................................................................................
........................................................................................................................
........................................................................................................................
........................................................................................................................
........................................................................................................................ (3)
(Total 5 marks)
Q7. The diagram shows the annual energy flow through 1 m2 of a habitat.
The unit, in each case, is kJ per m2 per year.

Save My Exams! – The Home of Revision
For more awesome GCSE and A level resources, visit us at www.savemyexams.co.uk
Page 11
(a) Calculate the percentage of the energy absorbed by the grass from sunlight that is transferred to the frog.
Show clearly how you work out your answer.
........................................................................................................................
........................................................................................................................
Answer ....................................................... % (2)
(b) All of the energy the grass absorbs from the sun is eventually lost to the surroundings.
In what form is this energy lost?
........................................................................................................................ (1)
(c) Food chains are usually not more than five organisms long.
Explain why.

Save My Exams! – The Home of Revision
For more awesome GCSE and A level resources, visit us at www.savemyexams.co.uk
Page 12
To gain full marks you must use data from the diagram.
........................................................................................................................
........................................................................................................................
........................................................................................................................
........................................................................................................................ (2)
(d) In this habitat microorganisms help to recycle materials.
Explain how.
........................................................................................................................
........................................................................................................................
........................................................................................................................
........................................................................................................................
........................................................................................................................
........................................................................................................................ (3)
(Total 8 marks)
Grass by By Catarina Carvalho from Lisboa, Portugal (Flickr) [CC-BY-2.0], via Wikimedia Commons. Grasshopper by I, Daniel Schwen [GFDL, CC-BY-SA-3.0], via Wikimedia Commons. Frog by Brian Gratwicke (Pickerel Frog) [CC-BY-2.0], via Wikimedia Commons. Heron by Glen Fergus (Own work, Otago Peninsula, New Zealand) [CC-BY-SA-2.5], via Wikimedia Commons.

Save My Exams! – The Home of Revision
For more awesome GCSE and A level resources, visit us at www.savemyexams.co.uk
Page 1
Food Production
Question Paper 1
Level GCSE (9-1)
Subject Biology
Exam Board AQA
Topic 4.7 Ecology
Sub-Topic Food Production Difficulty Level Bronze Level
Booklet Question Paper 1
Time Allowed: 49 minutes
Score: /49
Percentage: /100

Save My Exams! – The Home of Revision
For more awesome GCSE and A level resources, visit us at www.savemyexams.co.uk
Page 2
Q1. (a) The diagrams show three pyramids of biomass.
(i) Which pyramid would be the most efficient in providing food for humans?
Tick ( ) one box.
(1)
(ii) Give one reason for your choice.
...........................................................................................................................
........................................................................................................................... (1)
(b) Pigs may be kept indoors or outdoors.
Pigs kept indoors Pigs kept outdoors

Save My Exams! – The Home of Revision
For more awesome GCSE and A level resources, visit us at www.savemyexams.co.uk
Page 3
The pie charts show what happens to the energy in the food eaten by pigs kept indoors and pigs kept outdoors.
Pigs kept indoors Pigs kept outdoors
(i) Farmers make more profit from keeping pigs indoors than from keeping pigs outdoors.
Use information from the pie charts to explain why.
...........................................................................................................................
...........................................................................................................................
...........................................................................................................................
........................................................................................................................... (2)
(ii) Meat from pigs kept outdoors may cost more than meat from pigs kept indoors.

Save My Exams! – The Home of Revision
For more awesome GCSE and A level resources, visit us at www.savemyexams.co.uk
Page 4
Some people prefer to buy meat from animals that have been kept outdoors.
Suggest one reason why.
...........................................................................................................................
........................................................................................................................... (1)
(Total 5 marks)

Save My Exams! – The Home of Revision
For more awesome GCSE and A level resources, visit us at www.savemyexams.co.uk
Page 5
Q2. The diagram shows what happens to the energy in the food that a calf eats.
(a) Calculate the % energy lost as urine and faeces (X). Show clearly how you work out your answer.
....................................................................................................................................
....................................................................................................................................
Energy lost as urine and faeces ...................................... % (2)
(b) The energy in the food eaten by the calf in one day is 6 megajoules.
Calculate the amount of this energy that would be used for growth. Show clearly how you work out your answer.
....................................................................................................................................
....................................................................................................................................
Energy used for growth ...................................... megajoules. (2)
(c) Which process in the body transforms energy in food into heat?
.................................................................................................................................... (1)

Save My Exams! – The Home of Revision
For more awesome GCSE and A level resources, visit us at www.savemyexams.co.uk
Page 6
(d) The pictures show two methods of raising calves indoors.
Method 2 is now banned.
(i) Calves raised indoors grow faster than calves raised outdoors.
Suggest one reason why.
..........................................................................................................................
.......................................................................................................................... (1)
(ii) Method 2 was banned after public campaigns.
Suggest one reason why people campaigned against this method of rearing calves.
..........................................................................................................................
.......................................................................................................................... (1)
(Total 7 marks)

Save My Exams! – The Home of Revision
For more awesome GCSE and A level resources, visit us at www.savemyexams.co.uk
Page 7
Q3. To produce cheap meat, animals must be grown (reared) efficiently. When pigs are reared intensively they are kept indoors. Their surroundings are closely monitored to make sure they have even ventilation and the correct temperature. The risk of infection is high but is reduced by feeding them antibiotics and removing their faeces. The pigs live in cages and cannot move around much.
(a) Explain why farmers control the temperature.
.....................................................................................................................................
.....................................................................................................................................
..................................................................................................................................... (2)
(b) Explain why farmers want to stop the pigs moving about.
.....................................................................................................................................
.....................................................................................................................................
..................................................................................................................................... (2)
(c) Give two arguments against rearing pigs indoors instead of rearing them outdoors.

Save My Exams! – The Home of Revision
For more awesome GCSE and A level resources, visit us at www.savemyexams.co.uk
Page 8
1 ..................................................................................................................................
2 .................................................................................................................................. (2)
(Total 6 marks)

Save My Exams! – The Home of Revision
For more awesome GCSE and A level resources, visit us at www.savemyexams.co.uk
Page 9
Q4. The table gives information about the growth of different types of organism. The figures were obtained during the period of fastest growth for each organism.
Organism Time taken to double in mass
Bacteria 40 minutes
Yeasts 2 hours
Fusarium 4 hours
Algae 5 hours
Soybeans 1 week
Cattle 8 weeks
(a) (i) Which type of organism grows the fastest? ...................................................... (1)
(ii) How many times faster than cattle do soybeans double in mass?
........................................................................................................................... (1)
(iii) Fusarium grows at its fastest rate in a fermenter. Some scientists put one tonne of Fusarium into a fermenter.
Use data from the table to calculate how much Fusarium there would be in the fermenter after 8 hours.
Draw a ring around one answer.
2 tonnes 4 tonnes 8 tonnes (1)
(b) Fusarium is used to make mycoprotein.
Read the information about substances found in mycoprotein.
• Protein – can be used for making cells, enzymes and antibodies.

Save My Exams! – The Home of Revision
For more awesome GCSE and A level resources, visit us at www.savemyexams.co.uk
Page 10
• Fats – are rich in energy but large amounts in the diet can cause circulatory problems.
• Dietary fibre – helps to reduce the risk of colon cancer.
The table compares the composition of mycoprotein and beef.
Substance Percentage of dry mass
Mycoprotein Beef
Protein 47.2 68.3
Fat 13.5 30.1
Dietary fibre 19.2 0.0
Use the information above to answer the questions.
(i) Give two reasons why it would be better to eat mycoprotein instead of beef.
1 ........................................................................................................................
...........................................................................................................................
2 ........................................................................................................................
........................................................................................................................... (2)
(ii) Give one reason why it would be better to eat beef instead of mycoprotein.
...........................................................................................................................
........................................................................................................................... (1)
(Total 6 marks)

Save My Exams! – The Home of Revision
For more awesome GCSE and A level resources, visit us at www.savemyexams.co.uk
Page 11
Q5. Mycoprotein is produced from the fungus Fusarium. Mycoprotein is sometimes used instead of meat in foods for vegetarians.
(a) The table shows the amounts of some substances in mycoprotein and in chicken.
Substance Mass in grams per 100 grams
Mycoprotein Chicken
Protein 11.8 22.0
Dietary fibre 4.8 0.0
Fat 3.5 6.2
Carbohydrate 2.0 0.0
Cholesterol 0.0 0.1
(i) Draw a ring around the correct answers to complete the sentence.
Eating mycoprotein instead of chicken helps to lower the risk of heart disease because
fat
mycoprotein contains no carbohydrate
and
cholesterol
dietary fibre.
mycoprotein contains less fat.
carbohydrate.
(2)
(ii) A body-builder ate 4 kilograms of chicken each week to help him build up his muscles.
If he ate mycoprotein instead of chicken, he would need to eat about twice as much to have the same effect.

Save My Exams! – The Home of Revision
For more awesome GCSE and A level resources, visit us at www.savemyexams.co.uk
Page 12
Use information from the table to give one reason why.
...............................................................................................................
............................................................................................................... (1)
(b) Scientists investigated the growth of two species, A and B, of the fungus Fusarium. The scientists grew the fungus on agar jelly in Petri dishes. They measured the diameter of a colony of each fungus every day for 8 days.
The graph shows the results.
(i) Describe how the diameter of the colony of species A changed between day 0 and day 8.
...............................................................................................................
...............................................................................................................

Save My Exams! – The Home of Revision
For more awesome GCSE and A level resources, visit us at www.savemyexams.co.uk
Page 13
...............................................................................................................
............................................................................................................... (2)
(ii) Give one difference between the results for species A and the results for species B.
...............................................................................................................
............................................................................................................... (1)
(c) Both Petri dishes contained the same nutrients. Both Petri dishes were kept at 25 °C.
When Fusarium is grown in an industrial fermenter, other factors also need to be controlled.
Give two of these other factors.
1 ......................................................................................................................
2 ...................................................................................................................... (2)
(Total 8 marks)

Save My Exams! – The Home of Revision
For more awesome GCSE and A level resources, visit us at www.savemyexams.co.uk
Page 14
Q6.The map shows pie charts, A, B, C and D, that give information about fisheries in some of the seas around Europe.
© European Environment Agency
(a) Which pie chart, A, B, C or D, shows the fishery with the largest amount of
overfishing? (1)
(b) It is important to maintain fish stocks high enough for breeding to continue.
Give the reason why.
........................................................................................................................
........................................................................................................................ (1)
(c) Give two ways fish stocks can be conserved.
........................................................................................................................
........................................................................................................................

Save My Exams! – The Home of Revision
For more awesome GCSE and A level resources, visit us at www.savemyexams.co.uk
Page 15
........................................................................................................................
........................................................................................................................ (2)
(Total 4 marks)

Save My Exams! – The Home of Revision
For more awesome GCSE and A level resources, visit us at www.savemyexams.co.uk
Page 16
Q7. The photographs show four ways of farming.
Growing wheat by Eileen Henderson [CC-BY-SA-2.0], via Wikimedia Commons. Keeping Sheep outside by Andrew Smith [CC-BY-SA-2.0], via Wikimedia Commons. Keeping Pigs outside by David Williams [CC-BY-SA-2.0], via Wikimedia Commons. Keeping Pigs inside supplied by iStockphoto/ Thinkstock.
The bar chart shows the amount of food produced from these four ways of farming.

Save My Exams! – The Home of Revision
For more awesome GCSE and A level resources, visit us at www.savemyexams.co.uk
Page 17
(a) How much extra food can be produced when farmers grow wheat, compared with keeping sheep outside?
Show clearly how you work out your answer.
........................................................................................................................
........................................................................................................................
Answer ........................................ tonnes per hectare per year (2)
(b) Sheep eat grass. For every 1000 g of grass eaten, a sheep increases in mass by only 50 g. The other 950 g is lost.
How is the other 950 g lost?
Tick ( ) two boxes.
As oxygen from photosynthesis

Save My Exams! – The Home of Revision
For more awesome GCSE and A level resources, visit us at www.savemyexams.co.uk
Page 18
As faeces
As meat
As carbon dioxide from respiration
(2)
(c) (i) Pigs kept inside lose less energy than pigs kept outside.
Why?
Tick ( ) two boxes.
Pigs kept inside are fed more.
Pigs kept inside are kept in small pens.
Pigs kept inside are kept warm in the winter.
Pigs kept inside are healthier.
(2)
(ii) Meat from pigs kept inside is usually cheaper than meat from pigs kept outside.
Give one reason why.
...............................................................................................................
............................................................................................................... (1)
(Total 7 marks)

Save My Exams! – The Home of Revision
For more awesome GCSE and A level resources, visit us at www.savemyexams.co.uk
Page 19
Q8. There are plans for a ‘cattle factory’ to be built in the UK.
Information about the cattle factory and traditional cattle farming in the UK is given below.
Cattle factory by Pirhan [CC BY-SA 2.0], via Flickr. Traditional cattle farming by Mat Fascione[CC-BY-SA-2.0], via Wikimedia Commons
Cattle factory
• There will be over 8 000 cows in three large sheds.
• Each cow will be milked three times a day.
• Each cow will produce about 50 litres of milk every day.
• Waste will be collected and used to produce electricity for 2 000 homes.
• Cows are kept near to each other so disease can spread easily.
Traditional cattle farming
• Most farms have between 5 and 500 cows.
• The cows spend most of the time in fields.
• Cows are milked once or twice a day.
• Each cow produces up to 20 litres of milk a day.
• The waste is used as natural fertiliser for crops.
(a) Use the information to answer the questions.
(i) Give two reasons why some people think the cattle factory is a good idea.
1 ............................................................................................................

Save My Exams! – The Home of Revision
For more awesome GCSE and A level resources, visit us at www.savemyexams.co.uk
Page 20
...............................................................................................................
2 ............................................................................................................
............................................................................................................... (2)
(ii) Give two reasons why some people think traditional farming is better than the cattle factory.
1 ............................................................................................................
...............................................................................................................
2 ............................................................................................................
............................................................................................................... (2)
(b) The diagram shows what happens to 100 kJ of energy in the food eaten by a cow on a traditional farm.
By Dohduhdah (Own work) [Public domain], via Wikimedia Commons
Use your knowledge and the information in the diagram to answer this question.

Save My Exams! – The Home of Revision
For more awesome GCSE and A level resources, visit us at www.savemyexams.co.uk
Page 21
Compare the transfer of energy from the food eaten by cows in the cattle factory with the energy transferred by cows on a traditional farm.
Use words from the box to complete the table.
more less the same
Energy Amount of energy transferred by cows in a cattle factory compared
with cows on a traditional farm
transferred for growth and milk
transferred in respiration
(2)
(Total 6 marks)

Save My Exams! – The Home of Revision
For more awesome GCSE and A level resources, visit us at www.savemyexams.co.uk
Page 1
Food Production
Question Paper 1
Time Allowed: 54 minutes
Score: /54
Percentage: /100
Level GCSE (9-1)
Subject Biology
Exam Board AQA
Topic 4.7 Ecology
Sub-Topic Food Production
Difficulty Level Silver Level
Booklet Question Paper 1

Save My Exams! – The Home of Revision
For more awesome GCSE and A level resources, visit us at www.savemyexams.co.uk
Page 2
Q1.Figures 1 and 2 show battery chickens and free-range chickens.
Figure 1
Battery chickens
Figure 2 Free-range chickens
Battery chickens are kept in cages indoors. Free-range chickens can walk around outside.
(a) Give one way in which food production might be more efficient from battery
chickens than from free-range chickens. Give a reason for your answer.
........................................................................................................................
........................................................................................................................
........................................................................................................................
........................................................................................................................
........................................................................................................................ (2)
(b) Some farms use waste from chickens to produce biogas in an anaerobic digester.
Microorganisms in the digester break down the waste by anaerobic respiration.
(i) What does anaerobic mean?
...............................................................................................................

Save My Exams! – The Home of Revision
For more awesome GCSE and A level resources, visit us at www.savemyexams.co.uk
Page 3
............................................................................................................... (1)
(ii) One product of anaerobic respiration is methane.
Name two other products of anaerobic respiration.
1...............................................................................................................
2............................................................................................................... (2)
(c) The best temperature for anaerobic digesters is about 35 °C.
Explain why the volume of biogas produced would be less at higher temperatures.
........................................................................................................................
........................................................................................................................
........................................................................................................................
........................................................................................................................ (2)
(d) Figure 3 shows other types of waste that can be used in an anaerobic digester to
produce biogas.
Figure 3

Save My Exams! – The Home of Revision
For more awesome GCSE and A level resources, visit us at www.savemyexams.co.uk
Page 4
Type of waste
(i) What is the volume of biogas produced by a tonne of grass cuttings?
.............................. m3
(1)
(ii) Biogas is 60% methane.
Calculate the volume of methane gas produced per tonne of grass cuttings.
.............................. m3
(1)
(e) Why should biogas not be allowed to escape into the atmosphere?
........................................................................................................................
........................................................................................................................
........................................................................................................................
........................................................................................................................

Save My Exams! – The Home of Revision
For more awesome GCSE and A level resources, visit us at www.savemyexams.co.uk
Page 5
(2) (Total 11 marks)
Q2. Tomatoes are grown in greenhouses in the UK and outdoors in the UK and the
Canary Islands.
The chart shows in which months these tomatoes can be bought in shops in the UK.
The Canary Islands are about 3000 km from the UK.
Some people prefer to buy tomatoes grown in the UK.
What are the advantages and disadvantages of buying tomatoes grown in the UK, instead of buying tomatoes grown in the Canary Islands?
Advantages of buying tomatoes grown in the UK
........................................................................................................................
........................................................................................................................
........................................................................................................................
........................................................................................................................
Disadvantages of buying tomatoes grown in the UK
........................................................................................................................
........................................................................................................................
........................................................................................................................
........................................................................................................................ (Total 3 marks)

Save My Exams! – The Home of Revision
For more awesome GCSE and A level resources, visit us at www.savemyexams.co.uk
Page 6
Q3.There are many ways to increase the efficiency of food production.
(a) The table shows the energy available to humans from two different food chains.
Food chain Energy transferred to humans
in kJ per hectare of crop
Wheat → humans 900 000
Wheat → pigs → humans 90 000
(i) Compare the amount of energy the two food chains transfer to humans.
...............................................................................................................
............................................................................................................... (1)
(ii) Give one reason for the difference in the amount of energy the two food
chains transfer to humans.
...............................................................................................................
............................................................................................................... (1)
(b) In this question you will be assessed on using good English, organising information clearly and using specialist terms where appropriate.
Give methods used in the factory farming of animals. Explain the advantages and disadvantages of these methods.
........................................................................................................................
........................................................................................................................
........................................................................................................................
........................................................................................................................
........................................................................................................................
........................................................................................................................
........................................................................................................................

Save My Exams! – The Home of Revision
For more awesome GCSE and A level resources, visit us at www.savemyexams.co.uk
Page 7
........................................................................................................................
........................................................................................................................
........................................................................................................................
........................................................................................................................
........................................................................................................................
........................................................................................................................
........................................................................................................................
........................................................................................................................
........................................................................................................................ (6)
(Total 8 marks)

Save My Exams! – The Home of Revision
For more awesome GCSE and A level resources, visit us at www.savemyexams.co.uk
Page 8
Q4.The world population is increasing and the need for food is increasing.
Mycoprotein is a high-protein food made in fermenters using the organism Fusarium.
The process takes only a few weeks to produce a large amount of food.
(a) (i) What type of organism is Fusarium?
Draw a ring around the correct answer.
bacterium fungus virus
The diagram below shows a fermenter used in mycoprotein production.
(1)
(ii) Fusarium makes mycoprotein. Fusarium respires aerobically.
Suggest which gas is added to the fermenter at point A.
............................................................................................................... (1)
(iii) Another substance is added to the fermenter at point B. This substance is
used in aerobic respiration.
Name this substance.
............................................................................................................... (1)

Save My Exams! – The Home of Revision
For more awesome GCSE and A level resources, visit us at www.savemyexams.co.uk
Page 9
(b) People need to eat protein to grow and to be healthy.
Some people think that it would be an advantage to get more food from mycoprotein and less from farming animals.
Suggest two possible advantages of getting more food from mycoprotein.
1......................................................................................................................
........................................................................................................................
2......................................................................................................................
........................................................................................................................ (2)
(Total 5 marks)

Save My Exams! – The Home of Revision
For more awesome GCSE and A level resources, visit us at www.savemyexams.co.uk
Page 10
Q5.The number of fish in the oceans is decreasing.
The table below shows information about the mass of fish caught by UK fishermen between 2002 and 2010.
Year
Mass of fish caught by UK fishermen from
ALL SOURCES in thousands of tonnes
Mass of fish caught by UK fishermen from
SUSTAINABLE SOURCES
in thousands of tonnes
Percentage of fish caught from
sustainable sources
2002 690.0 427.8 62.0
2004 655.0 396.6 60.5
2006 619.0 386.0 62.4
2008 589.0 436.1 74.0
2010 611.5 465.0
(a) (i) Calculate the percentage of fish caught from sustainable sources in 2010.
...............................................................................................................
...............................................................................................................
...............................................................................................................
......................... % (2)
(ii) Describe the pattern in the table above for the mass of fish caught from all sources.
Suggest reasons for this pattern.
...............................................................................................................
...............................................................................................................
...............................................................................................................
...............................................................................................................
...............................................................................................................

Save My Exams! – The Home of Revision
For more awesome GCSE and A level resources, visit us at www.savemyexams.co.uk
Page 11
...............................................................................................................
...............................................................................................................
...............................................................................................................
...............................................................................................................
............................................................................................................... (4)
(iii) Suggest why the percentage of fish caught from sustainable sources is increasing.
...............................................................................................................
............................................................................................................... (1)
(b) Give two methods of maintaining fish stocks at a sustainable level.
1 .....................................................................................................................
2 ..................................................................................................................... (2)
(c) The image below shows a fish farm.
© debsthelio/iStock/Thinkstock

Save My Exams! – The Home of Revision
For more awesome GCSE and A level resources, visit us at www.savemyexams.co.uk
Page 12
In a fish farm, large numbers of fish are grown in cages in the sea.
Why do fish in the cages grow faster than fish of the same species that are free in the sea? You should refer to energy in your answer.
........................................................................................................................
........................................................................................................................
........................................................................................................................
........................................................................................................................
........................................................................................................................
........................................................................................................................
........................................................................................................................
........................................................................................................................
........................................................................................................................
........................................................................................................................ (4)
(Total 13 marks)

Save My Exams! – The Home of Revision
For more awesome GCSE and A level resources, visit us at www.savemyexams.co.uk
Page 13
Q6.Herring are a type of fish found in the North Sea. Herring are caught using nets which are
pulled by large boats.
The photographs show a fishing boat and some herring.
By Atle Grimsby from Utsira, Norway (Herring Catch at Utsira) [CC-BY-2.0 (http://creativecommons.org/licenses/by/2.0)], via Wikimedia Commons.
The herring population in the North Sea has changed a lot in recent years.
The graph shows the estimated biomass of herring in the North Sea between 1965 and 2010.

Save My Exams! – The Home of Revision
For more awesome GCSE and A level resources, visit us at www.savemyexams.co.uk
Page 14
Year
(a) Suggest why the biomass can only be estimated.
Tick ( ) one box.
Scientists are not properly trained.
There are too many different types of fish in the sea.
It is impossible to weigh all the herring in the sea.
(1)
(b) (i) Describe the pattern shown in the graph from 1978 to 1983.

Save My Exams! – The Home of Revision
For more awesome GCSE and A level resources, visit us at www.savemyexams.co.uk
Page 15
...............................................................................................................
............................................................................................................... (1)
(ii) Suggest a reason for the pattern you have described in part (b) (i).
...............................................................................................................
............................................................................................................... (1)
(c) In 1996 the Government brought in strict rules to help to conserve fish stocks.
(i) State two rules that would help to conserve fish stocks.
1 ............................................................................................................
...............................................................................................................
2 ............................................................................................................
............................................................................................................... (2)
(ii) Were the Government’s rules effective?
Use data from the graph to support your answer.
...............................................................................................................
...............................................................................................................
...............................................................................................................
............................................................................................................... (2)
(iii) Why should fish stocks be kept above a certain minimum level?
...............................................................................................................
...............................................................................................................

Save My Exams! – The Home of Revision
For more awesome GCSE and A level resources, visit us at www.savemyexams.co.uk
Page 16
(1)
(iv) The Government did not introduce rules about the amount of herring caught until 1977.
This was in response to a dramatic decrease in herring stocks.
What was the percentage decrease in herring stocks between 1965 and 1977?
...............................................................................................................
...............................................................................................................
Percentage decrease = ............................... (2)
(d) Herring migrate to feed and spawn (lay eggs).
The eggs normally take about 3 weeks to hatch at 12 °C.
If the temperature of the water is higher the eggs will hatch more quickly.
But, if the temperature of the water is above 19 °C, the eggs will die.
Other fish, such as cod, feed on herring.
Suggest how climate change could affect North Sea fish.
........................................................................................................................
........................................................................................................................
........................................................................................................................
........................................................................................................................
........................................................................................................................
........................................................................................................................
........................................................................................................................
........................................................................................................................
........................................................................................................................ (4)
(Total 14 marks)

Save My Exams! – The Home of Revision
For more awesome GCSE and A level resources, visit us at www.savemyexams.co.uk
Page 17

Save My Exams! – The Home of Revision
For more awesome GCSE and A level resources, visit us at www.savemyexams.co.uk
Page 1
Food Production
Question Paper 1
Level GCSE (9-1)
Subject Biology
Exam Board AQA
Topic 4.7 Ecology
Sub-Topic Food production Difficulty Level Gold Level
Booklet Question Paper 1
Time Allowed: 57 minutes
Score: /56
Percentage: /100

Save My Exams! – The Home of Revision
For more awesome GCSE and A level resources, visit us at www.savemyexams.co.uk
Page 2
Q1. (a) The diagram shows what happens to each 1000 kJ of light energy absorbed by plants growing in a meadow.
Use the information from the diagram to calculate:
(i) how much energy was transferred to herbivores;
............................ kJ (1)

Save My Exams! – The Home of Revision
For more awesome GCSE and A level resources, visit us at www.savemyexams.co.uk
Page 3
(ii) the percentage of the energy absorbed during photosynthesis that was eventually transferred to carnivores. Show your working.
............................ % (2)
(b) The table gives the energy output from some agricultural food chains.
FOOD CHAIN ENERGY AVAILABLE TO HUMANS FROM FOOD CHAIN
(kJ PER HECTARE OF CROP)
cereal crop humans 800 000
cereal crop pigs humans 90 000
cereal crop cattle humans 30 000
Explain why the food chain cereal crop humans gives far more energy than the other two food chains.
....................................................................................................................................
....................................................................................................................................
....................................................................................................................................
....................................................................................................................................
....................................................................................................................................
....................................................................................................................................
....................................................................................................................................
.................................................................................................................................... (3)

Save My Exams! – The Home of Revision
For more awesome GCSE and A level resources, visit us at www.savemyexams.co.uk
Page 4
(c) The amounts of energy available to humans from the food chaincereal crop pigs
humanscan be increased by changing the conditions in which the pigs are kept.
Give two changes in conditions which would increase the amount of energy available. In each case explain why changing the condition would increase the available energy.
Change of condition 1 ..............................................................................................
Explanation ...............................................................................................................
....................................................................................................................................
....................................................................................................................................
Change of condition 2 ..............................................................................................
Explanation ...............................................................................................................
....................................................................................................................................
.................................................................................................................................... (4)
(Total 10 marks)

Save My Exams! – The Home of Revision
For more awesome GCSE and A level resources, visit us at www.savemyexams.co.uk
Page 5
Q2. Battery Pigs!
Some countries have battery pigs! Large numbers of pigs are kept indoors and have limited living space which restricts their movement. The temperature of their environment is carefully controlled.
This is a way of producing food efficiently.
These pigs have their movement restricted. Explain why.
...............................................................................................................................................
...............................................................................................................................................
...............................................................................................................................................
............................................................................................................................................... (Total 2 marks)

Save My Exams! – The Home of Revision
For more awesome GCSE and A level resources, visit us at www.savemyexams.co.uk
Page 6
Q3. The diagram shows a fermenter. This fermenter is used for growing the fungus Fusarium which is used to make mycoprotein.
(a) Bubbles of air enter the fermenter at A.
Give two functions of the air bubbles.
1 .................................................................................................................................
....................................................................................................................................
2 .................................................................................................................................
.................................................................................................................................... (2)
Save My Exams! – The Home of Revision
For more awesome GCSE and A level resources, visit us at www.savemyexams.co.uk
Page 7
(b) Glucose is added to the fermenter at B.
Explain why glucose is added.
....................................................................................................................................
.................................................................................................................................... (1)
(c) The fermenter is prevented from overheating by the cold water flowing in through the heat exchanger coils at C.
Explain what causes the fermenter to heat up.
....................................................................................................................................
.................................................................................................................................... (1)
(d) It is important to prevent microorganisms other than Fusarium from growing in the fermenter.
(i) Why is this important?
..........................................................................................................................
.......................................................................................................................... (1)
(ii) Suggest two ways in which contamination of the fermenter by microorganisms could be prevented.
1 .................................................................................................................................
....................................................................................................................................
2 .................................................................................................................................
.............................................................................................................................

Save My Exams! – The Home of Revision
For more awesome GCSE and A level resources, visit us at www.savemyexams.co.uk
Page 8
....... (2)
(e) Human cells cannot make some of the amino acids which we need. We must obtain these amino acids from our diet.
The table shows the amounts of four of these amino acids present in mycoprotein, in beef and in wheat.
Name of amino acid
Amount of amino acid per 100 g in mg
Daily amount needed by a 70
kg human in mg Mycoprotein Beef Wheat
Lysine 910 1600 300 840
Methionine 230 500 220 910
Phenylalanine 540 760 680 980
Threonine 610 840 370 490
A diet book states that mycoprotein is the best source of amino acids for the human diet.
Evaluate this statement.
Remember to include a conclusion in your evaluation.
....................................................................................................................................
....................................................................................................................................
....................................................................................................................................
....................................................................................................................................
....................................................................................................................................
....................................................................................................................................
....................................................................................................................................
.................................................................................................................................... (4)

Save My Exams! – The Home of Revision
For more awesome GCSE and A level resources, visit us at www.savemyexams.co.uk
Page 9
(Total 11 marks)
Q4.
The drawings and text for this question are based on an article from The Independent newspaper.
Some of Britain’s rarest wild flowers are likely to make a come-back thanks to an EC set-aside regime in which 15 per cent of arable land has been taken out of production.
As a result of this set-aside, shepherd’s needle, pheasant’s eye, corn gromwell, corn cockle, spreading hedge parsley and corn mouse tail are now thriving once again. They were once common in and around cereal fields and were even regarded as weeds, but were swept to near extinction by the intensification of agriculture after the Second World War. Their small, pale flowers are hardly seen. These plants cannot compete in fields where modern cereal crops are cultivated. Nor, however, do they flourish in semi-natural or wild habitats where nature is left to its own devices. They need farmland which is

Save My Exams! – The Home of Revision
For more awesome GCSE and A level resources, visit us at www.savemyexams.co.uk
Page 10
lightly tilled and cut once a year.
Dr Nick Sotherton, lowland research manager with the Game Conservancy Council, says that these species will flourish under the new rotational set-aside regime, in which farmers are compensated for taking land out of production in an attempt to end crop surpluses.
EC agriculture ministers are meeting to decide how much land should be used for rotational set-aside – in which a field is taken out of production for just one year before being replanted – and how much should be set-aside permanently. The ultimate set-aside is a wood, and Britain is seeking a forestry option.
The Game Conservancy Council says that the rotational scheme can benefit ground nesting birds as well as rare flowers that will not be helped by longer-term set-aside. But Richard Knight of the Wildlife Advisory Group, says “Non-rotational is better because it gives flora and fauna a chance to get well established”.
“Intensification of agriculture” has led to the creation of artificial ecosystems.
(a) Explain how the creation of artificial ecosystems may have led to the near-extinction of the plants seen in the picture above.
.....................................................................................................................................
.....................................................................................................................................
.....................................................................................................................................
.....................................................................................................................................
.....................................................................................................................................
..................................................................................................................................... (4)
(b) What would you recommend to ministers meeting to decide a policy involving rotational set-aside and permanent set-aside? Explain the reasons for your answer.
.....................................................................................................................................

Save My Exams! – The Home of Revision
For more awesome GCSE and A level resources, visit us at www.savemyexams.co.uk
Page 11
.....................................................................................................................................
.....................................................................................................................................
.....................................................................................................................................
..................................................................................................................................... (4)
(Total 8 marks)
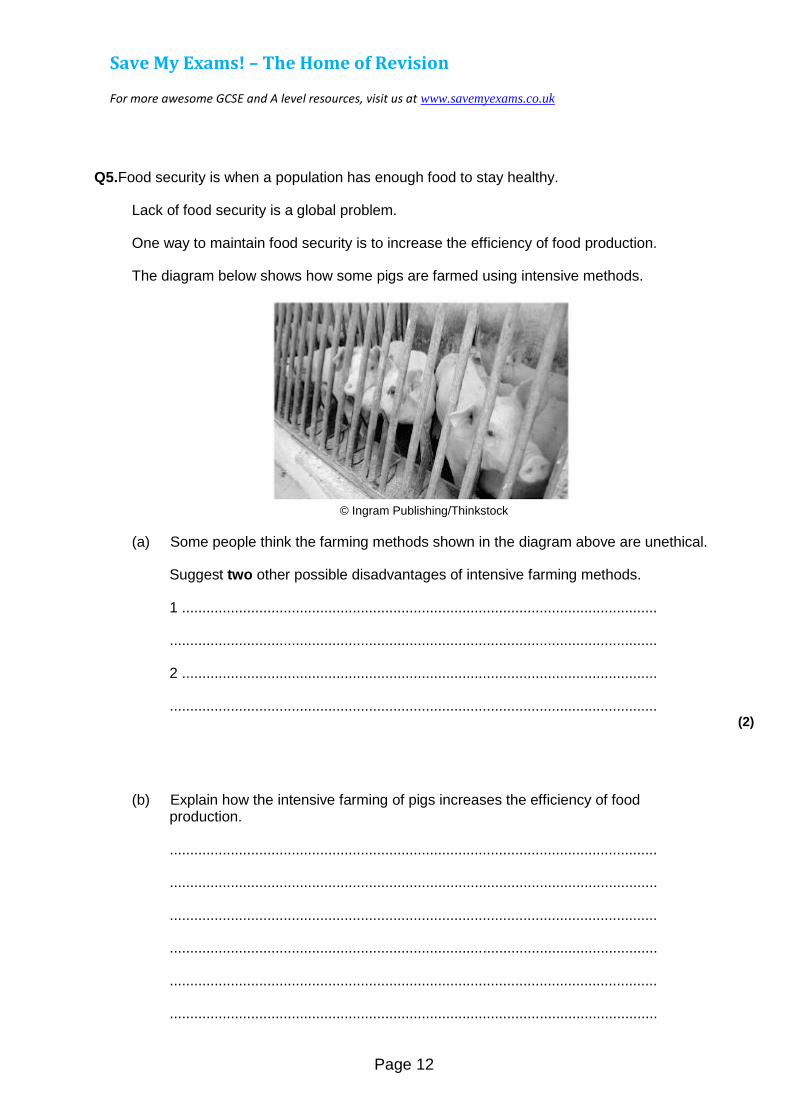
Save My Exams! – The Home of Revision
For more awesome GCSE and A level resources, visit us at www.savemyexams.co.uk
Page 12
Q5.Food security is when a population has enough food to stay healthy.
Lack of food security is a global problem.
One way to maintain food security is to increase the efficiency of food production.
The diagram below shows how some pigs are farmed using intensive methods.
© Ingram Publishing/Thinkstock
(a) Some people think the farming methods shown in the diagram above are unethical.
Suggest two other possible disadvantages of intensive farming methods.
1 .....................................................................................................................
........................................................................................................................
2 .....................................................................................................................
........................................................................................................................ (2)
(b) Explain how the intensive farming of pigs increases the efficiency of food production.
........................................................................................................................
........................................................................................................................
........................................................................................................................
........................................................................................................................
........................................................................................................................
........................................................................................................................

Save My Exams! – The Home of Revision
For more awesome GCSE and A level resources, visit us at www.savemyexams.co.uk
Page 13
........................................................................................................................
........................................................................................................................
........................................................................................................................
........................................................................................................................ (4)
(c) A newspaper reported that:
‘Food security is a serious problem in remote communities in Canada. This is because Aboriginal communities are eating fewer traditional foods.’
One traditional food eaten by Aboriginal communities in Canada is seal.
Look at the table below
Year Number of seals
caught in thousands
2004 362
2005 316
2006 348
2007 224
2008 215
2009 91
2010 67
Calculate the percentage (%) decrease in the number of seals caught from 2004 to 2010.
........................................................................................................................
........................................................................................................................
Decrease in seals = ............................................. % (2)
(d) The conclusion in the newspaper might not be correct.

Save My Exams! – The Home of Revision
For more awesome GCSE and A level resources, visit us at www.savemyexams.co.uk
Page 14
Suggest two reasons why.
1 .....................................................................................................................
........................................................................................................................
2 .....................................................................................................................
........................................................................................................................ (2)
(Total 10 marks)
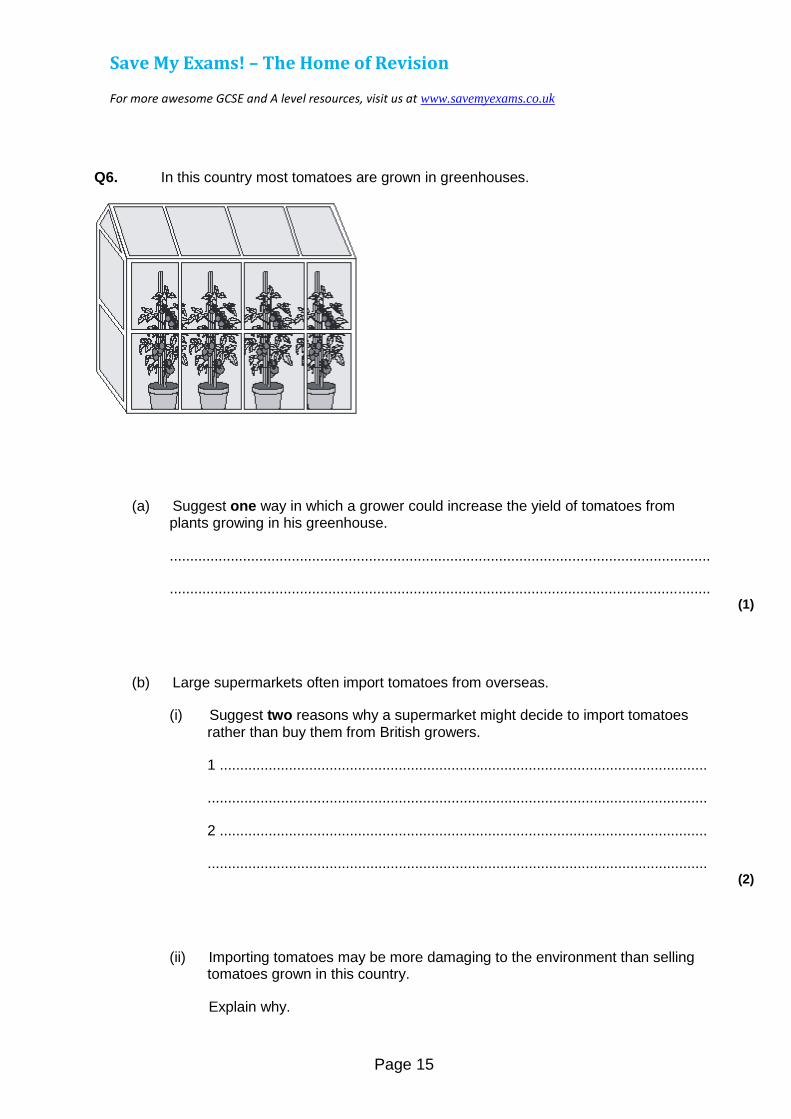
Save My Exams! – The Home of Revision
For more awesome GCSE and A level resources, visit us at www.savemyexams.co.uk
Page 15
Q6. In this country most tomatoes are grown in greenhouses.
(a) Suggest one way in which a grower could increase the yield of tomatoes from plants growing in his greenhouse.
.....................................................................................................................................
..................................................................................................................................... (1)
(b) Large supermarkets often import tomatoes from overseas.
(i) Suggest two reasons why a supermarket might decide to import tomatoes rather than buy them from British growers.
1 ........................................................................................................................
...........................................................................................................................
2 ........................................................................................................................
........................................................................................................................... (2)
(ii) Importing tomatoes may be more damaging to the environment than selling tomatoes grown in this country.
Explain why.

Save My Exams! – The Home of Revision
For more awesome GCSE and A level resources, visit us at www.savemyexams.co.uk
Page 16
...........................................................................................................................
...........................................................................................................................
...........................................................................................................................
........................................................................................................................... (2)
(Total 5 marks)

Save My Exams! – The Home of Revision
For more awesome GCSE and A level resources, visit us at www.savemyexams.co.uk
Page 17
Q7.The diagram shows a fermenter. This fermenter is used for growing the fungus Fusarium.
Fusarium is used to make mycoprotein.
(a) Bubbles of air enter the fermenter at A.
Give two functions of the air bubbles.
1......................................................................................................................
........................................................................................................................
2......................................................................................................................
....................................................................................................................... (2)
(b) Why is glucose added to the fermenter?
........................................................................................................................

Save My Exams! – The Home of Revision
For more awesome GCSE and A level resources, visit us at www.savemyexams.co.uk
Page 18
........................................................................................................................ (1)
(c) The fermenter is prevented from overheating by the cold water flowing in through the heat exchanger coils at C.
Name the process that causes the fermenter to heat up.
........................................................................................................................ (1)
(d) It is important to prevent microorganisms other than Fusarium growing in the fermenter.
(i) Why is this important?
...............................................................................................................
............................................................................................................... (1)
(ii) Suggest one way in which contamination of the fermenter by microorganisms could be prevented.
...............................................................................................................
............................................................................................................... (1)
(e) Human cells cannot make some of the amino acids which we need. We must obtain these amino acids from our diet.
The table shows the amounts of four of these amino acids present in mycoprotein, in beef and in wheat.
Name of
amino acid
Amount of amino acid per 100 g in mg
Daily amount needed by a 70 kg human
in mg Mycoprotein Beef Wheat

Save My Exams! – The Home of Revision
For more awesome GCSE and A level resources, visit us at www.savemyexams.co.uk
Page 19
Lysine 910 1600 300 840
Methionine 230 500 220 910
Phenylalanine 540 760 680 980
Threonine 610 840 370 490
A diet book states that mycoprotein is the best source of amino acids for the human diet.
Evaluate this statement.
Remember to include a conclusion in your evaluation.
........................................................................................................................
........................................................................................................................
........................................................................................................................
........................................................................................................................
........................................................................................................................
........................................................................................................................
........................................................................................................................
........................................................................................................................
........................................................................................................................
........................................................................................................................ (4)
(Total 10 marks)