Acute and delayed response to resistance exercise leading or ...
10
Acute and delayed response to resistance exercise leading or not leading to muscle failure Fernando Pareja-Blanco 1 , David Rodr ıguez-Rosell 1 , Luis S anchez-Medina 2 , Juan Ribas-Serna 3 , Covadonga L opez-L opez 4 , Ricardo Mora-Custodio 1 , Juan Manuel Y a~ nez-Garc ıa 1 and Juan Jos e Gonz alez-Badillo 1 1 Physical Performance & Sports Research Center, Pablo de Olavide University, Seville, 2 Studies, Research & Sports Medicine Center, Government of Navarre, Pamplona, 3 Medical Physiology and Biophysics Department, University of Seville, Seville, and 4 Andalusian Center of Sports Medicine, Seville, Spain Summary Correspondence Fernando Pareja-Blanco, Facultad del Deporte, Universidad Pablo de Olavide, Ctra. de Utrera, km 1, 41013 Seville, Spain E-mail: [email protected] Accepted for publication Received 11 September 2015; accepted 4 January 2016 Key words heart rate complexity; heart rate variability; hormonal response; neuromuscular fatigue; strength training; velocity-based resistance training This study compared the time course of recovery following two resistance exer- cise protocols differing in the number of repetitions per set with regard to the maximum possible (to failure) number. Ten men performed three sets of 6 versus 12 repetitions with their 70% 1RM (3 9 6 [12] versus 3 9 12 [12]) in the bench press (BP) and squat (SQ) exercises. Mechanical [CMJ height, velocity against the 1 m s 1 load (V 1 -load)], biochemical [testosterone, cortisol, growth hormone, prolactin, insulin-like growth factor-1, creatine kinase (CK)] and heart rate variability (HRV) and complexity (HRC) were assessed pre-, postexercise (Post) and at 6, 24 and 48 h-Post. Compared with 3 9 6 [12], the 3 9 12 [12] protocol resulted in significantly: higher repetition velocity loss within each set (BP: 65% versus 26%; SQ: 44% versus 20%); reduced V 1 -load until 24 h-Post (BP) and 6 h-Post (SQ); decreased CMJ height up to 48 h-Post; greater increases in cortisol (Post), prolactin (Post, 48 h-Post) and CK (48 h-Post); and reductions in HRV and HRC at Post. This study shows that the mechanical, neuroendocrine and autonomic cardiovascular response is markedly different when manipulating the number of repetitions per set. Halving the number of repetitions in relation to the maximum number that can be completed serves to minimize fatigue and speed up recovery following resistance training. Introduction Manipulation of the acute resistance exercise variables (i.e. load, number of sets and repetitions, exercise type and order, rest duration and movement velocity) configures the exercise stimulus and determines the magnitude and type of the phys- iological responses and adaptations consequent to resistance training (RT) (Spiering et al., 2008). One of the key physio- logical systems in tissue remodelling is the neuroendocrine system (Crewther et al., 2005; Ratamess et al., 2005). Exercise protocols using moderate to high loads (10RM), high vol- ume (3 sets of 10 repetitions per exercise), short inter-set rests (1 min) and stressing a large muscle mass tend to pro- duce the highest elevations in hormones such as testosterone, growth hormone (GH) and cortisol (Kraemer et al., 1990, 1991). Muscle damage induced by such protocols is thought to play a role in muscle hypertrophy (Schoenfeld, 2010). Thus, the greater magnitude and duration of the hormonal response and muscle damage associated with RT to failure would result in an increased muscle hypertrophy (Ahtiainen et al., 2003). In contrast, other studies seem to indicate that exercising to failure may not be a critical stimulus for strength gains to occur (Folland et al., 2002; Izquierdo et al., 2006; Izquierdo-Gabarren et al., 2010; Sampson & Groeller, 2015). It has been shown that the mechanical stress and metabolic stress clearly differ when manipulating the actual number of repetitions performed in each training set in relation to the maximum, to failure, number that can be completed (S anchez-Medina & Gonz alez-Badillo, 2011). However, to our knowledge, the neuroendocrine response to RT protocols dif- fering in the number of repetitions, i.e. going to muscle fail- ure versus ending each set several repetitions short of failure, has not yet been addressed. In addition, it has been suggested that training to failure may require longer recovery times (S anchez-Medina & Gonz alez-Badillo, 2011; Gorostiaga et al., 2012, 2014), which is an important factor for most competi- tive athletes, as an excessive fatigue resulting from RT might interfere with the development of other physical, technical or tactical components (Draganidis et al., 2013). Heart rate variability (HRV), analysed using linear time and frequency domain measures (Akselrod et al., 1981), has been used to study the responses of the physiological control system to physical activity (Heffernan et al., 2007, 2008; Clin Physiol Funct Imaging (2016) doi: 10.1111/cpf.12348 1 © 2016 Scandinavian Society of Clinical Physiology and Nuclear Medicine. Published by John Wiley & Sons Ltd
-
Upload
khangminh22 -
Category
Documents
-
view
1 -
download
0
Transcript of Acute and delayed response to resistance exercise leading or ...

Acute and delayed response to resistance exercise leadingor not leading to muscle failureFernando Pareja-Blanco1, David Rodr�ıguez-Rosell1, Luis S�anchez-Medina2, Juan Ribas-Serna3, CovadongaL�opez-L�opez4, Ricardo Mora-Custodio1, Juan Manuel Y�a~nez-Garc�ıa1 and Juan Jos�e Gonz�alez-Badillo1
1Physical Performance & Sports Research Center, Pablo de Olavide University, Seville, 2Studies, Research & Sports Medicine Center, Government of Navarre,
Pamplona, 3Medical Physiology and Biophysics Department, University of Seville, Seville, and 4Andalusian Center of Sports Medicine, Seville, Spain
Summary
CorrespondenceFernando Pareja-Blanco, Facultad del Deporte,
Universidad Pablo de Olavide, Ctra. de Utrera,
km 1, 41013 Seville, Spain
E-mail: [email protected]
Accepted for publicationReceived 11 September 2015;
accepted 4 January 2016
Key wordsheart rate complexity; heart rate variability;
hormonal response; neuromuscular fatigue; strength
training; velocity-based resistance training
This study compared the time course of recovery following two resistance exer-cise protocols differing in the number of repetitions per set with regard to themaximum possible (to failure) number. Ten men performed three sets of 6 versus12 repetitions with their 70% 1RM (3 9 6 [12] versus 3 9 12 [12]) in thebench press (BP) and squat (SQ) exercises. Mechanical [CMJ height, velocityagainst the 1 m s�1 load (V1-load)], biochemical [testosterone, cortisol, growthhormone, prolactin, insulin-like growth factor-1, creatine kinase (CK)] and heartrate variability (HRV) and complexity (HRC) were assessed pre-, postexercise(Post) and at 6, 24 and 48 h-Post. Compared with 3 9 6 [12], the 3 9 12 [12]protocol resulted in significantly: higher repetition velocity loss within each set(BP: 65% versus 26%; SQ: 44% versus 20%); reduced V1-load until 24 h-Post(BP) and 6 h-Post (SQ); decreased CMJ height up to 48 h-Post; greater increasesin cortisol (Post), prolactin (Post, 48 h-Post) and CK (48 h-Post); and reductionsin HRV and HRC at Post. This study shows that the mechanical, neuroendocrineand autonomic cardiovascular response is markedly different when manipulatingthe number of repetitions per set. Halving the number of repetitions in relationto the maximum number that can be completed serves to minimize fatigue andspeed up recovery following resistance training.
Introduction
Manipulation of the acute resistance exercise variables (i.e.
load, number of sets and repetitions, exercise type and order,
rest duration and movement velocity) configures the exercise
stimulus and determines the magnitude and type of the phys-
iological responses and adaptations consequent to resistance
training (RT) (Spiering et al., 2008). One of the key physio-
logical systems in tissue remodelling is the neuroendocrine
system (Crewther et al., 2005; Ratamess et al., 2005). Exercise
protocols using moderate to high loads (10RM), high vol-
ume (3 sets of 10 repetitions per exercise), short inter-set
rests (1 min) and stressing a large muscle mass tend to pro-
duce the highest elevations in hormones such as testosterone,
growth hormone (GH) and cortisol (Kraemer et al., 1990,
1991). Muscle damage induced by such protocols is thought
to play a role in muscle hypertrophy (Schoenfeld, 2010).
Thus, the greater magnitude and duration of the hormonal
response and muscle damage associated with RT to failure
would result in an increased muscle hypertrophy (Ahtiainen
et al., 2003). In contrast, other studies seem to indicate that
exercising to failure may not be a critical stimulus for
strength gains to occur (Folland et al., 2002; Izquierdo et al.,
2006; Izquierdo-Gabarren et al., 2010; Sampson & Groeller,
2015).
It has been shown that the mechanical stress and metabolic
stress clearly differ when manipulating the actual number of
repetitions performed in each training set in relation to the
maximum, to failure, number that can be completed
(S�anchez-Medina & Gonz�alez-Badillo, 2011). However, to our
knowledge, the neuroendocrine response to RT protocols dif-
fering in the number of repetitions, i.e. going to muscle fail-
ure versus ending each set several repetitions short of failure,
has not yet been addressed. In addition, it has been suggested
that training to failure may require longer recovery times
(S�anchez-Medina & Gonz�alez-Badillo, 2011; Gorostiaga et al.,
2012, 2014), which is an important factor for most competi-
tive athletes, as an excessive fatigue resulting from RT might
interfere with the development of other physical, technical or
tactical components (Draganidis et al., 2013).
Heart rate variability (HRV), analysed using linear time
and frequency domain measures (Akselrod et al., 1981), has
been used to study the responses of the physiological control
system to physical activity (Heffernan et al., 2007, 2008;
Clin Physiol Funct Imaging (2016) doi: 10.1111/cpf.12348
1© 2016 Scandinavian Society of Clinical Physiology and Nuclear Medicine. Published by John Wiley & Sons Ltd
Iglesias-Soler et al., 2015; Kingsley et al., 2014). As physiolog-
ical control mechanisms under healthy conditions exhibit
complex dynamics (Costa et al., 2002), a loss of information
regarding cardiac autonomic fluctuations might happen if
only linear methods are used. Methods derived from the the-
ory of non-linear dynamics, such as multiscale entropy, may
provide complementary information about the structure of
physiological output signals (Costa et al., 2002). Complexity
relates to the irregularity of a dynamic process, which can be
estimated by assessing the uncertainty of patterns reoccurring
within a time event series (Lipsitz, 1995). Recent studies
have compared the effect of training with two different rela-
tive loads on cardiac autonomic modulation (Lima et al.,
2011; De Souza et al., 2013). A decreased HRV following RT
was observed, without significant differences between the
loads used. To our knowledge, no study has analysed the
effect of two different resistance exercise protocols (REP)
leading or not leading to muscle failure using the same rela-
tive load (percentage of one-repetition maximum, %1RM) on
HRV and heart rate complexity (HRC). It seems worthy of
attention to further explore this issue, given the likely greater
accuracy of methods derived from the theory of non-linear
dynamics.
The disturbance in homeostasis induced by exercise requires
coordinated adjustments in the neuroendocrine and autonomic
nervous systems (Borresen & Lambert, 2008). The hypothala-
mus plays a key role in the integration and control of these
systems (Kuipers, 1996). As greater mechanical stress and
metabolic stress have been observed as the number of repeti-
tions in an exercise set approaches failure (S�anchez-Medina &
Gonz�alez-Badillo, 2011), a greater hormonal and cardiac auto-
nomic response would be expected when RT is performed to
muscle failure. Therefore, the aim of this study was to analyse
the time course of recovery following two different REP in
terms of the level of effort required: maximal (to failure) ver-
sus half-maximal number of repetitions per set in the funda-
mental RT exercises of bench press (BP) and full squat (SQ).
Several assessment time points up to 48 h postexercise were
established to evaluate the mechanical, biochemical and auto-
nomic cardiovascular response to an acute REP in an attempt
to advance in our understanding of the overall recovery status
following RT.
Methods
Participants
Ten men (age 23�6 � 3�7 years, height 1�75 � 0�03 m,
body mass 75�0 � 8�7 kg) volunteered to participate in this
study. Subjects were physically active sports science students
with a RT experience ranging from 2 to 4 years (1–3 sessions
per week). 1RM strength was 108�3 � 15�0 kg for the SQ
and 87�6 � 20�5 kg for the BP exercise. After being informed
about the purpose, testing procedures and potential risks of
the investigation, subjects gave their written consent to partic-
ipate. No physical limitations, health problems or muscu-
loskeletal injuries were found after a medical examination.
None of the subjects was taking drugs, medications or dietary
supplements known to influence physical performance. The
study was approved by the Research Ethics Committee of
Pablo de Olavide University and was conducted in accordance
with the Declaration of Helsinki.
Study design
Following familiarization and initial strength assessment, sub-
jects undertook two randomized REP performed 14 days apart
in separate trials. The same relative load (70% 1RM), number
of exercise sets (3) and inter-set rest duration (5 min) were
used in both REP. The protocols only differed in the actual
number of repetitions (R) performed in each set (S) in rela-
tion to the maximum possible number of repetitions (P)
(S 9 R [P]: 3 9 12 [12] versus 3 9 6 [12]); i.e. the first
protocol demanded a maximal effort (to failure, equivalent to
3 9 12RM), whereas in the second one, only half the maxi-
mum number of repetitions were performed in each set.
To compare the mechanical, biochemical and HRV
response, as well as the time course of recovery following the
two REP analysed, subjects underwent a battery of measure-
ments at different time points: preexercise (Pre), postexercise
(Post), 6 h-Post, 24 h-Post and 48 h-Post (Fig. 1a). We chose
to study recovery up to 48 h following each REP because this
is a temporal segment usually employed as maximal separation
between training sessions, or between a training session and
competition in many sports disciplines. Vertical countermove-
ment jump (CMJ) height and the individual load (kg) that
elicits a ~1�00 m s�1 (V1-load) barbell mean propulsive veloc-
ity (from here on, velocity) were assessed at Pre, Post, 6 h-
Post, 24 h-Post and 48 h-Post. These mechanical measure-
ments have been described in previous research (S�anchez-
Medina & Gonz�alez-Badillo, 2011; Pareja-Blanco et al., 2014).
The V1-load was chosen because it is a sufficiently high veloc-
ity, which is attained against medium loads (~47% 1RM in BP
and ~60% 1RM in SQ) (Gonz�alez-Badillo & S�anchez-Medina,
2010; S�anchez-Medina & Gonz�alez-Badillo, 2011; Pallar�es
et al., 2014; Pareja-Blanco et al., 2014), and it allows a good
expression of the effect of fatigue on velocity, besides being
relatively easy to move and quick to determine as part of the
warm-up (S�anchez-Medina & Gonz�alez-Badillo, 2011). Blood
sampling for the determination of testosterone, cortisol, GH,
prolactin (PRL), insulin-like growth factor-1 (IGF-1) and cre-
atine kinase (CK) concentrations was performed at Pre, Post
and 48 h-Post. HRV measurements are described later in
detail.
Participants abstained from any strenuous physical activity
for at least 4 days before each trial. The two REP were per-
formed at the same time of day for each subject and under
similar environmental conditions (20–22°C and 55–65%humidity). Subjects underwent four familiarization sessions
2 weeks before the start of the first trial. These sessions were
© 2016 Scandinavian Society of Clinical Physiology and Nuclear Medicine. Published by John Wiley & Sons Ltd
Recovery following resistance exercise leading or not leading to failure, F. Pareja-Blanco et al.2
supervised by researchers, and attention was paid to proper
exercise lifting technique and instruction on testing proce-
dures. An initial strength assessment was performed 1 week
before the first trial.
Procedures
Initial strength assessment
A Smith machine with no counterweight mechanism (Mul-
tipower Fitness Line, Peroga, Murcia, Spain) was used for all
testing and exercise sessions. Individual load–velocity relation-
ships and 1RM strength were determined using a progressive
isoinertial loading test in the BP and SQ exercises, in that order.
From the load–velocity relationship, the individual load corre-
sponding to 70% 1RM was determined for each subject and
exercise. The velocity corresponding to this load was
0�63 � 0�03 m s�1 for BP and 0�82 � 0�04 m s�1 for SQ,
which agrees with previous research (Gonz�alez-Badillo &
S�anchez-Medina, 2010; S�anchez-Medina & Gonz�alez-Badillo,
2011; Pallar�es et al., 2014; Pareja-Blanco et al., 2014). The BP
was performed imposing a momentary pause (~1�5 s) at the
chest between the eccentric and concentric actions to minimize
the contribution of the rebound effect and allow for more
reproducible, consistent measurements (Pallar�es et al., 2014).
The SQ was performed starting from the upright position with
the knees and hips fully extended. Each subject descended in a
continuous motion until the top of the thighs got below the
horizontal plane, then immediately reversed motion and
ascended back to the upright position. Subjects were required to
always execute the concentric phase of either BP or SQ in an
explosive manner, at maximal intended velocity. This execution
technique for the BP and SQ was exactly reproduced on the two
REP under study. Repetitions were recorded with a linear veloc-
ity transducer (T-Force System, Ergotech, Murcia, Spain). Relia-
bility of this system has been reported elsewhere (S�anchez-
Medina & Gonz�alez-Badillo, 2011). All reported repetition
velocities in this study correspond to the mean concentric veloc-
ity of the propulsive phase (S�anchez-Medina et al., 2010).
Acute resistance exercise protocols
Both REP were performed in the morning (10 AM) and were
comprised of the BP followed by the SQ, with a 10-min rest
between exercises. This order was chosen to avoid the fact that
the higher metabolic stress associated with the SQ exercise
(greater amount of muscle mass involved) compared with the
BP (S�anchez-Medina & Gonz�alez-Badillo, 2011) could nega-
tively influence performance in the latter exercise. Subjects
warmed up for the BP by performing 3 min of upper-body
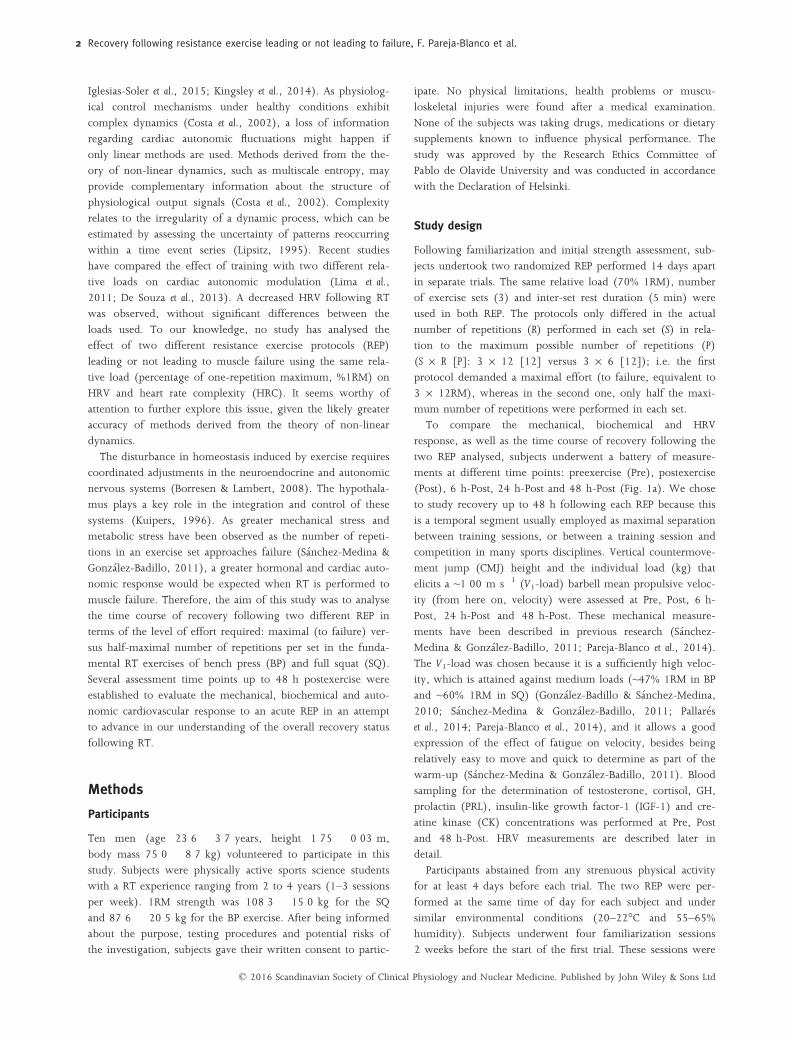
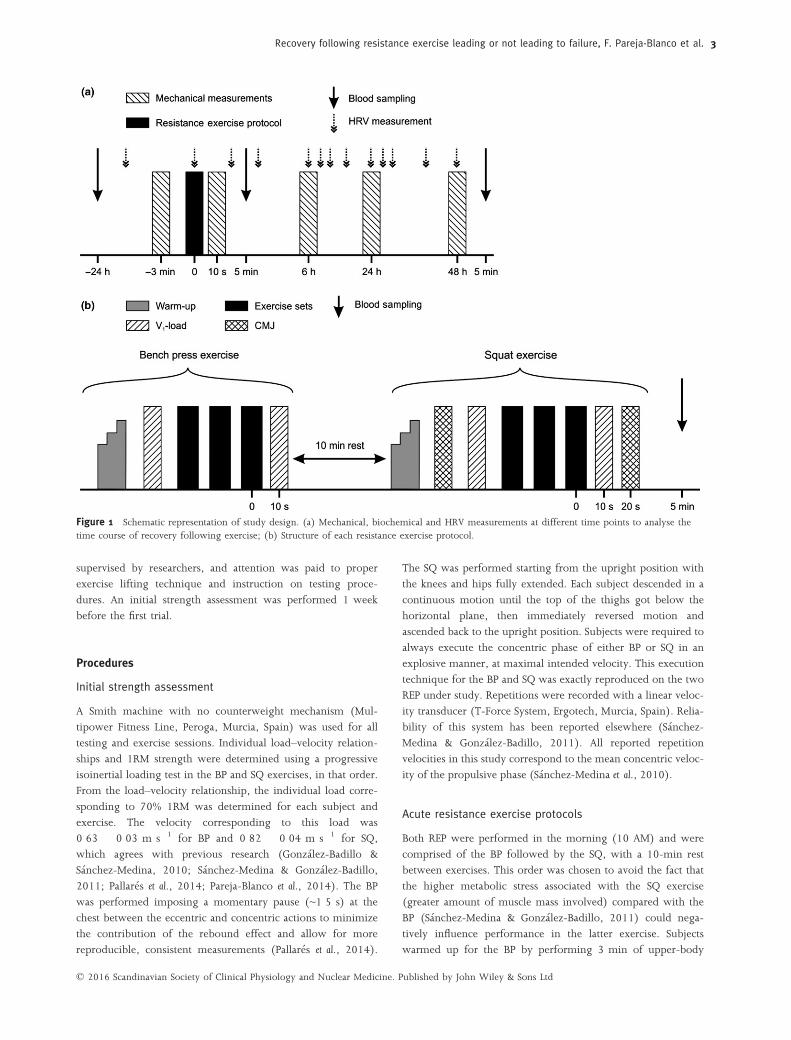
Figure 1 Schematic representation of study design. (a) Mechanical, biochemical and HRV measurements at different time points to analyse thetime course of recovery following exercise; (b) Structure of each resistance exercise protocol.
© 2016 Scandinavian Society of Clinical Physiology and Nuclear Medicine. Published by John Wiley & Sons Ltd
Recovery following resistance exercise leading or not leading to failure, F. Pareja-Blanco et al. 3

joint mobilization exercises and two sets of eight repetitions
with a 20 kg barbell. The warm-up for the SQ consisted of: (i)
5 min of jogging at a self-selected easy pace, (ii) two 30-m
running accelerations, (iii) two sets of 10 squats with no exter-
nal load (own body weight) and (iv) five CMJ with increasing
intensity. Then, three maximal CMJ, separated by 20-s rests,
were performed and the mean jump height (cm) taken as the
preexercise reference value. CMJ height was determined using
an infrared timing system (Optojump, Microgate, Bolzano,
Italy). In both BP and SQ, the determination of the V1-load fol-
lowed. For this purpose, three sets of six down to three repeti-
tions (2-min inter-set rests) with increasing loads up to each
subject’s V1-load were performed. The mean velocity of the
three maximal intended repetitions with the V1-load in each
exercise was registered as the preexercise reference value for
this variable, determined to a precision of �0�03 m s�1.
Finally, load was progressively increased (in 2–3 sets of 3 repe-
titions each) up to 70% 1RM. The three sets of the correspond-
ing REP were performed next. Immediately after completing
the last repetition of the third set (load was changed in 10–15 s
with the help of trained spotters), subjects performed three rep-
etitions again with the V1-load. Furthermore, after the SQ exer-
cise, another three maximal CMJ, separated by 20-s rests, were
performed (Fig. 1b). The V1-load and CMJ mean values were
taken as the immediate postexercise measures. Strong verbal
encouragement and velocity feedback in every repetition was
provided throughout all exercise sets.
At 4 PM in the evening (6 h-Post), and at 10AM the follow-
ing 2 days (24 h-Post and 48 h-Post), the V1-load and CMJ
measurements were repeated, exactly as described above, to
assess the state of neuromuscular recovery following each REP.
Mechanical measurements of fatigue
Three different methods were used to quantify the extent of
neuromuscular fatigue induced by each REP (S�anchez-Medina
& Gonz�alez-Badillo, 2011). The first method analysed the
decline in repetition velocity during the three consecutive
exercise sets and was calculated as the percentage loss in mean
propulsive velocity from the fastest to the slowest repetition
of each set and averaged over the three sets. The second
method examined the pre-post exercise change in velocity
attained against the V1-load. The third method analysed the
change in CMJ height pre-post exercise.
Blood collection and analysis
Blood sampling took place 24 h before (Pre), 5 min after
completion of the corresponding REP (Post), and 48 h-Post.
Subjects rested seated for 30 min before the first blood collec-
tion. Samples were drawn from an antecubital forearm vein
using a 20-gauge needle connected to vacutainers�. The Pre
(baseline) samples were drawn at the same time of day
(�15 min) that the REP (10 AM) to minimize the bias in
hormonal values due to the circadian rhythm. Whole blood
was centrifuged at 2045 g (4°C) for 15 min and the resultant
serum was then removed and stored at �20°C. Samples were
assayed in duplicate, thawed only once, and decoded only
after the analyses were completed (i.e. blinded analysis proce-
dure). Concentrations of total testosterone, cortisol, GH, PRL
and CK were measured using electrochemiluminescence
immunoassays on the Elecsys 2010 autoanalyser (Roche Diag-
nostics, Indianapolis, IN, USA). IGF-1 was measured by
chemiluminescent immunometric assay on the Immulite 2000
System (Siemens, Los Angeles, CA, USA). For testosterone,
cortisol, GH, PRL, IGF-1 and CK, assay sensitivities were
0�087 nmol l�1, 8�5 nmol l�1, 0�03 lg l�1, 20 lg l�1,
0�047 lg l�1 and 45 IU l�1; with an intra-assay coefficient of
variation of 2�0%, 1�7%, 2�3%, 2�9%, 1�3% and 1�8% respec-
tively. Concentrations are reported uncorrected for plasma vol-
ume changes because it has been previously demonstrated that
receptors in target tissues are exposed to serum hormonal
levels (Rubin et al., 2005).
Analysis of the R-R interval time series
Measurement of consecutive R-R intervals was used as represen-
tative of the autonomic nervous system output. R-R intervals
were collected using a HR recorder (Firstbeat Bodyguard, First-
beat Technologies Ltd., Jyv€askyl€a, Finland). This device attaches
directly to cleaned skin with two-lead Ag/AgC1 electrodes and
starts recording data automatically. Subjects wore the recorder
uninterruptedly from 24 h before to 48 h post-exercise. Noise
and ectopic heart beats were identified and automatically elimi-
nated by the acquisition software. Data were also inspected
visually for possible artefacts. Analysis algorithms for all vari-
ables analysed were implemented in Matlab 7.11 R2010b(The
MathWorks Inc., Natick, MA, USA).
For the time domain analysis, the natural logarithm of the
root mean square of successive differences in R-R intervals
(LnrMSSD) was calculated (Karavirta et al., 2013; Plews et al.,
2013). HR complexity was measured using the complex index
(CI) (Costa et al., 2008; Karavirta et al., 2013) computed by
summing Sample Entropy (SampEn) values for scales 1–5(CI1–5). The time series extended to 3 days, from 24 h pre-
to 48 h postexercise. Each time series was divided into tem-
poral segments of 3�103 data points, and once we coarse-
grained them up to scale 5, the shortest time series had 600
points. These temporal segments were as follows: (1) during
sleep, the night before the REP (when HR was at its lowest);
(2a) during the REP (from the highest measured HR back-
wards), (2b) immediately postexercise, (2c) in the recovery
phase after the REP; (3a) at 6 h-Post, during the V1-load and
CMJ assessments, (3b) immediately postassessment, (3c) in
the recovery phase after the 6 h-Post assessment; (4) during
sleep, the night after the REP; (5a) at 24 h-Post, during the
V1-load and CMJ assessments, (5b) immediately postassess-
ment, (5c) in the recovery phase after the 24 h-Post assess-
ment; (6) during sleep, two nights after the REP; and (7) at
48 h-Post, during the V1-load and CMJ assessments.
© 2016 Scandinavian Society of Clinical Physiology and Nuclear Medicine. Published by John Wiley & Sons Ltd
Recovery following resistance exercise leading or not leading to failure, F. Pareja-Blanco et al.4

Statistical analyses
Values are reported as mean � standard deviation (SD). Statis-
tical significance was established at P<0�05. Homogeneity of
variance across groups was verified using the Levene’s test. The
distribution of each variable was examined with the Shapiro–Wilk normality test. A factorial ANOVA with repeated mea-
sures with Bonferroni adjustment was used to examine the
effects of the two REP across time on mechanical, biochemical
and autonomic cardiovascular responses. Statistical analyses
were performed using SPSS version 18.0 (SPSS Inc., Chicago,
IL, USA).
Results
All variables were normally distributed and homoscedasticity
across exercise protocols was verified. No significant differ-
ences between 3 9 12 [12] and 3 9 6 [12] were found at
Pre for any of the variables analysed. As an outlier was
observed for baseline CK concentration, this value was omitted
in the biochemical analysis.
Descriptive characteristics of the resistance exercise
protocols
In the 3 9 6 [12] protocol, subjects were able to complete all
repetitions with the assigned load, whereas during 3 9 12
[12], most of the subjects could not complete the 12 repeti-
tions due to fatigue (Table 1). Thus, the number of repeti-
tions decreased for 3 9 12 [12] as sets progressed: 1st set:
11�7 � 0�7, 2nd set: 11�5 � 0�7, 3rd set: 10�5 � 2�0 repeti-
tions for SQ; 1st set: 11�6 � 0�7, 2nd set: 10�4 � 1�6, 3rdset: 9�5 � 2�1 repetitions for BP.
Mechanical measurements of fatigue
Velocity loss within a set was significantly higher for 3 9 12
[12] compared with 3 9 6 [12] for both exercises (Table 1).
Velocity against the V1-load was significantly reduced for
3 9 12 [12] versus 3 9 6 [12] up to 24 h-Post (BP) and
6 h-Post (SQ) (Fig. 2). The 3 9 12 [12] protocol resulted in
significantly lower jump performance than 3 9 6 [12] up to
48 h-Post (Fig. 3).
Biochemical response
Pre concentrations were within the normal range for physi-
cally active young men. Cortisol was higher for 3 9 12 [12]
versus 3 9 6 [12] at Post (P<0�01, Fig. 4a), but no difference
was found between protocols at 48 h-Post. Cortisol levels
were significantly lower (P<0�05) at 48 h-Post compared with
Pre for both REP. PRL concentration was higher for 3 9 12
[12] versus 3 9 6 [12] at Post (P<0�01, Fig. 4b). Higher CKlevels were observed for 3 9 12 [12] compared with 3 9 6
[12] at 48 h-Post (P<0�01, Fig. 4c), whereas no difference
between protocols was found at Post. Higher IGF-1 levels
were observed at Post for 3 9 6 [12] compared with 3 9 12
[12] (P<0�05, Fig. 4e). No differences in hormone levels
were observed between protocols for GH and testosterone
(Fig. 4d,f).
Analysis of the R-R interval time series
As some data were lost due to problems with the HR record-
ing device, only HRV data from seven subjects were analysed.
The behaviour of resting HR did not show any significant dif-
ference between REP for any of the variables analysed.
3 9 12 [12] resulted in lower values (P<0�01–0�05) for
LnrMSSD, SampEn and CI1–5 at immediately Post (2b) than
3 9 6 [12] (Fig. 5). 3 9 12 [12] also resulted in lower
LnrMSSD at 6 h-Post (3a) (P<0�05). Significant differences
(P<0�05) between REP were observed for LnrMSSD at 48 h-
Post (7).
Discussion
The main finding of the present study was that the extent of
fatigue incurred during RT (going to failure versus ending
several repetitions before failure in each exercise set) had a
differential effect on the neuromuscular, autonomic cardiovas-
cular and hormonal response to exercise and the subsequent
recovery. Compared with 3 9 6 [12], the 3 9 12 [12] pro-
tocol resulted in a significantly higher velocity loss in both the
SQ (44% versus 20%) and BP (65% versus 26%) exercises. In
addition, 3 9 12 [12] resulted in greater muscle damage
(CK) and an increased hormonal response (cortisol and PRL).
The 3 9 12 [12] protocol was also associated with a greater
decrease in HRV and HRC, and higher neuromuscular fatigue
(CMJ height loss and impaired performance against the V1-
load in BP and SQ). Interestingly, CMJ height did not return
to preexercise values at 48 h-Post following 3 9 12 [12],
whereas for 3 9 6 [12], initial CMJ performance was already
recovered at 6 h-Post (Fig. 3). This reduction in the ability to
rapidly apply force with the lower limbs up to 48 h following
resistance exercise to failure might negatively interfere with
the development of other components of physical fitness such
as aerobic endurance in sports characterized by concurrent
training (Izquierdo-Gabarren et al., 2010; Garc�ıa-Pallar�es &
Izquierdo, 2011).
It is interesting to note that, even with the ample inter-set
rests used (5 min), the number of performed repetitions
decreased throughout sets in the 3 9 12 [12] protocol; i.e.
neuromuscular fatigue from previous sets prevented subjects
from performing all scheduled repetitions in subsequent sets
and forced them to unintentionally reduce repetition velocity.
Despite the greater training density and time under tension
experienced, which might favour hypertrophic adaptations,
training using this type of exhaustive protocols, where the last
repetitions of each set are performed at very slow velocities,
may considerably increase the amount of time needed for
© 2016 Scandinavian Society of Clinical Physiology and Nuclear Medicine. Published by John Wiley & Sons Ltd
Recovery following resistance exercise leading or not leading to failure, F. Pareja-Blanco et al. 5

recovery, as previously suggested (S�anchez-Medina &
Gonz�alez-Badillo, 2011). Inadequate or insufficient recovery
after training could result in fatigue or underperformance
(Chen et al., 2011). It has been reported that performing repe-
titions to failure causes a marked disruption in the muscle
energy balance and a considerable depletion of muscle puri-
nes, whereas performing a half-maximal number of repeti-
tions per set allows the maintenance of cellular homeostasis
(Gorostiaga et al., 2012, 2014). These findings may explain
the incomplete recovery observed in the hours following the
3 9 12 [12] protocol, as the replenishment of the muscle
adenine nucleotide pool is a time-consuming process that may
take up to several days to complete (Stathis et al., 1999). It
thus seems reasonable to think that in the hours following a
REP such as 3 9 12 [12], a person’s physiological environ-
ment would not be in optimal conditions to assimilate more
training or improve neuromuscular performance. These results
are even more compelling if we consider that only two
Table 1 Descriptive characteristics of each resistance exercise protocol.
Squat Bench press
3 3 6 [12] 3 3 12 [12] P-value 3 3 6 [12] 3 3 12 [12] P-value
Repetitions per set 6�0 � 0�0 11�2 � 0�9 <0�001 6�0 � 0�0 10�5 � 1�3 <0�001Fastest-V (m s�1) 0�85 � 0�03 0�84 � 0�03 0�47 0�65 � 0�03 0�63 � 0�05 0�21Slowest-V (m s�1) 0�63 � 0�07 0�38 � 0�07 <0�001 0�44 � 0�05 0�15 � 0�05 <0�001Mean-V (m s�1) 0�75 � 0�04 0�63 � 0�07 <0�001 0�55 � 0�03 0�42 � 0�04 <0�001MeanLoss-V (%) 20�3 � 6�1 43�8 � 6�7 <0�001 26�4 � 6�7 65�0 � 5�7 <0�001MaxLoss-V (%) 25�9 � 8�5 54�7 � 7�4 <0�001 33�4 � 7�5 76�5 � 7�3 <0�001
Fastest-V, highest velocity measured in the three sets; Slowest-V, lowest velocity measured in the three sets; Mean-V, mean velocity of all repeti-tions during the three sets; MeanLoss-V, mean percentage loss in velocity from the fastest to the slowest repetition over the three sets; MaxLoss-V,maximum percentage loss in velocity from the fastest to the slowest repetition over the three sets.Data are mean � SD, n = 10.Velocities correspond to the mean concentric propulsive velocity of each repetition.P-value indicates the magnitude of the significance between the two resistance exercise protocols, 3 9 6 [12] versus 3 9 12 [12].
Figure 2 Comparison of the changes in the velocity attained againstthe V1-load between the two REP at the different time points for (a)Bench Press; and (b) Squat exercises. Changes are expressed as per-centage of the initial, preexercise, baseline values. Statistically signifi-cant differences between REP (3 9 6 [12] versus 3 9 12 [12]) at thecorresponding time point: †P<0�05, †††P<0�001. Statistically significantdifferences with Pre at the corresponding time point: **P<0�01,***P<0�001.
Figure 3 Comparison of the absolute changes in CMJ heightbetween the two REP at the different time points. Statistically signifi-cant differences between REP (3 9 6 [12] versus 3 9 12 [12]) at thecorresponding time point: †P<0�05, ††P<0�01. Statistically significantdifferences with Pre at the corresponding time point: **P<0�01,***P<0�001.
© 2016 Scandinavian Society of Clinical Physiology and Nuclear Medicine. Published by John Wiley & Sons Ltd
Recovery following resistance exercise leading or not leading to failure, F. Pareja-Blanco et al.6
exercises (BP and SQ) were performed in each REP, whereas
typical RT sessions are usually more demanding and consist of
at least 5–8 exercises. Research analysing the time course of
recovery following different organization schemes for a RT
training session (number and order of the exercises) is war-
ranted.
It has been reported that mechanical tension, metabolic
and hormonal stress as well as muscle damage mediate
hypertrophic adaptations (Schoenfeld, 2010). Thus, the
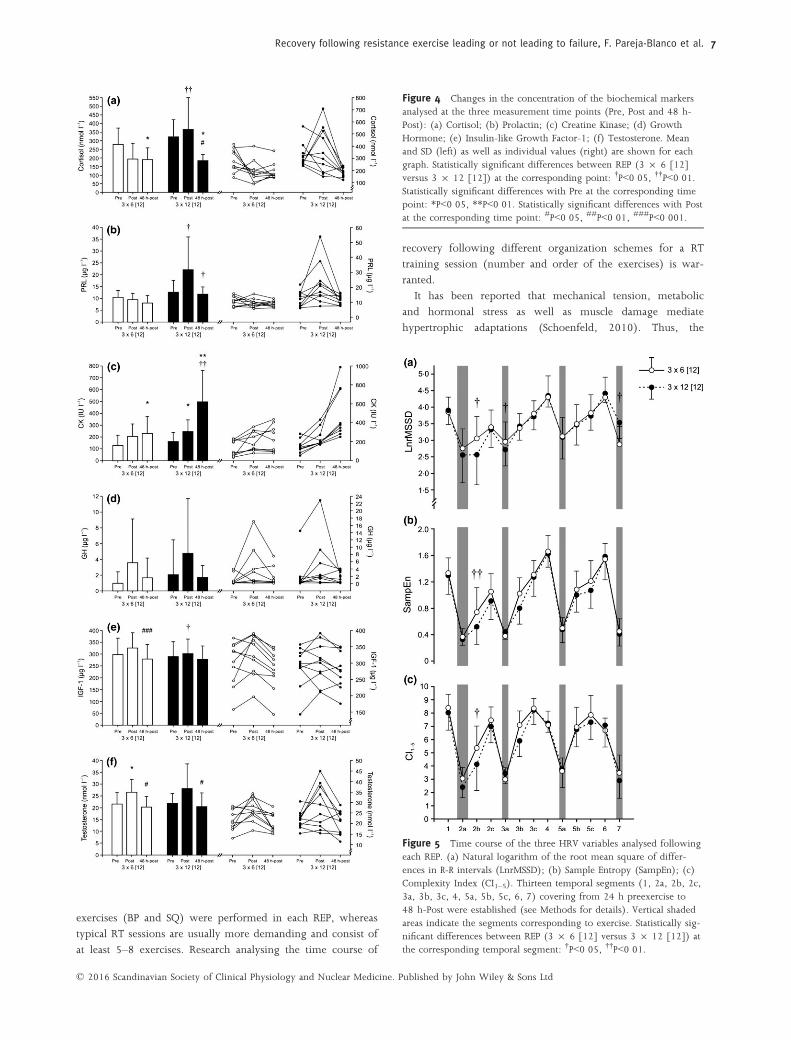
Figure 5 Time course of the three HRV variables analysed followingeach REP. (a) Natural logarithm of the root mean square of differ-ences in R-R intervals (LnrMSSD); (b) Sample Entropy (SampEn); (c)Complexity Index (CI1–5). Thirteen temporal segments (1, 2a, 2b, 2c,3a, 3b, 3c, 4, 5a, 5b, 5c, 6, 7) covering from 24 h preexercise to48 h-Post were established (see Methods for details). Vertical shadedareas indicate the segments corresponding to exercise. Statistically sig-nificant differences between REP (3 9 6 [12] versus 3 9 12 [12]) atthe corresponding temporal segment: †P<0�05, ††P<0�01.
Figure 4 Changes in the concentration of the biochemical markersanalysed at the three measurement time points (Pre, Post and 48 h-Post): (a) Cortisol; (b) Prolactin; (c) Creatine Kinase; (d) GrowthHormone; (e) Insulin-like Growth Factor-1; (f) Testosterone. Meanand SD (left) as well as individual values (right) are shown for eachgraph. Statistically significant differences between REP (3 9 6 [12]versus 3 9 12 [12]) at the corresponding point: †P<0�05, ††P<0�01.Statistically significant differences with Pre at the corresponding timepoint: *P<0�05, **P<0�01. Statistically significant differences with Postat the corresponding time point: #P<0�05, ##P<0�01, ###P<0�001.
© 2016 Scandinavian Society of Clinical Physiology and Nuclear Medicine. Published by John Wiley & Sons Ltd
Recovery following resistance exercise leading or not leading to failure, F. Pareja-Blanco et al. 7
higher muscle damage and hormonal response observed for
the 3 9 12 [12] REP might lead to greater hypertrophy. The
biochemical mechanisms responsible for the observed
increases in blood hormonal concentrations are yet not fully
understood and are beyond the scope of the current study.
However, the high levels of blood lactate and H+ with the
consequent pH decrease, together with the significant deple-
tion in phosphocreatine stores and total adenine nucleotide
pool reported during RT to failure (S�anchez-Medina &
Gonz�alez-Badillo, 2011; Gorostiaga et al., 2012), might
explain the greater stress-related hormonal response (PRL and
cortisol) observed for 3 9 12 [12]. In this regard, a higher
cortisol response has been observed following RT protocols
that included forced repetitions to increase total training vol-
ume (Ahtiainen et al., 2003). The greater cortisol and CK
concentrations following 3 9 12 [12] are in agreement with
previous studies that reported a significant correlation
between cortisol and CK levels (Boone et al., 1990; Kraemer
et al., 1993). Although absolute values of IGF-1 remained
basically unaltered for both REP in the present study, 3 9 6
[12] resulted in greater IGF-1 concentration at Post than
3 9 12 [12], a finding that is difficult to explain. On the
other hand, testosterone showed a trend to increase (24–29%) at Post following both protocols, similar to that
reported in other studies that performed repetitions to failure
(Hakkinen & Pakarinen, 1993; Ratamess et al., 2005). Despite
some research evidence that the magnitude of the testos-
terone response depends on the stress of the RT session
(Hakkinen & Pakarinen, 1993), our results suggest that both
REP, 3 9 6 [12] and 3 9 12 [12], might have reached the
threshold needed to elicit elevations in testosterone of similar
magnitude. In addition, both REP increased GH at Post, with
a tendency for 3 9 12 [12] to result in greater levels of this
hormone. It is known that exercise that imposes great
demands on glycolysis, thus resulting in marked increases in
H+ concentration, may be the primary physiological stimulus
for GH release (Gordon et al., 1994).
There is a growing body of literature aiming to analyse the
acute effects of RT on HRC (Heffernan et al., 2007, 2008;
Iglesias-Soler et al., 2015; Kingsley & Figueroa, 2014). These
studies have used only the SampEn variable to analyse the
HRC, an algorithm that quantifies the degree of irregularity
on the shortest timescale, but fails to quantify it on longer
timescales (Costa et al., 2006). In the present study, in addi-
tion to SampEn, we analysed the CI1–5 using the multiscale
entropy method to quantify the magnitude of irregularity over
a broader range of timescales. Both 3 9 12 [12] and 3 9 6
[12] protocols resulted in acute decreases in HRV and HRC
following exercise (Fig. 5). However, 3 9 12 [12] showed
higher reductions in HRV and HRC than 3 9 6 [12], which
seems to correspond with the greater level of neuromuscular
and hormonal stress induced by 3 9 12 [12]. De Souza et al.
(2013) compared the effects of three sets of 10RM, and three
sets of 10 repetitions at 60% of 10RM on 24 h cardiovascular
response in adult women. Root mean square of standard devi-
ation (rMSSD) decreased (P≤0�05) after both protocols, with-
out significant differences between protocols. However, De
Souza et al. (2013) compared exercise protocols of equal vol-
ume while manipulating loading, whereas in the present
study, loading magnitude (%1RM) was the same for both
protocols, but exercise volume changed. Loss of HRC has been
associated with inflammation (Rassias et al., 2005). Inflamma-
tion is a symptom of the mechanical stress affecting muscle
structures. As 3 9 12 [12] induced an impairment in
mechanical performance (velocity against the V1-load and CMJ
height losses) and was associated with greater physiological
stress (higher CK, cortisol and PRL postexercise levels), this
could have influenced the more pronounced decrease in HRV
and HRC observed following this REP in the present study.
As a limitation of this study, we must acknowledge that the
link between the concomitant in vivo changes of endogenous
anabolic hormones and tissue growth has not been specifically
determined, and thus increased concentrations of circulating
anabolic hormones may not reflect anabolism at the tissue
level. Other factors such as hormonal clearance rates, hormone
degradation, receptor binding protein activation and regula-
tion should also be examined in detail to gain a better insight
into the effects of the degree of fatigue incurred during each
resistance exercise set.
In conclusion, the present study provides novel findings
about the mechanical, biochemical and autonomic cardiovas-
cular response to two REP only differing in the number of
performed repetitions per set with regard to the maximum
possible (to failure) number that can be completed. Our
results seem to indicate that RT to failure induces greater
mechanical fatigue (assessed by the impairment in neuromus-
cular performance throughout the postexercise recovery per-
iod), greater autonomic cardiovascular stress (higher
reductions in HRV and HRC) and an increased hormonal
response and muscle damage. The performance impairment
observed in CMJ height up to 48 h postexercise following
the 3 9 12 [12] protocol may indicate that the ‘explosive-
ness’ or ability to rapidly develop force with the lower limbs
may be considerably compromised up to 48 h following
resistance exercise to failure. As a practical application for the
strength and conditioning coach, the CMJ test could be
implemented as an easy, cheap and quick method to assess
the state of neuromuscular recovery, something which has
already been suggested (Gorostiaga et al., 2010). Further-
more, both REP induced very different repetition velocity
losses in the SQ (44% versus 20%) and BP (65% versus
26%) exercises for 3 9 12 [12] versus 3 9 6 [12] respec-
tively. Monitoring repetition velocity and setting a certain
percentage velocity loss limit (e.g. 20%, 25% or 30%) to
stop an exercise set is another practical measure that can be
implemented to avoid performing unnecessarily slow and
fatiguing repetitions that may not be contributing to the
desired training effect. This rational alternative to traditional
RT can be used to better monitor and individualize the train-
ing load, and it can be accomplished by means of the ever-
© 2016 Scandinavian Society of Clinical Physiology and Nuclear Medicine. Published by John Wiley & Sons Ltd
Recovery following resistance exercise leading or not leading to failure, F. Pareja-Blanco et al.8
increasing number of commercially available linear position
or velocity transducers and accelerometers. Taken together,
the findings of the present study might provide useful infor-
mation for implementing a comprehensive RT programme in
many sports where the performance goal is not merely
focused on maximizing muscle hypertrophy or improving
maximal strength, but rather it is necessary to develop speci-
fic neuromuscular adaptations while trying to avoid excessive
fatigue that could interfere with the development of other
components of physical fitness or negatively affect the techni-
cal, tactical or recovery aspects of training.
Acknowledgments
This study was funded by the Spanish Ministry of Science and
Innovation (National R&D&I Plan 2008–2011; grant referenceDEP2011-29501). The funders had no role in study design,
data collection and analysis, decision to publish or preparation
of the manuscript.
Conflict of interest
The authors declare no conflicts of interest.
References
Ahtiainen JP, Pakarinen A, Kraemer WJ, et al.Acute hormonal and neuromuscular
responses and recovery to forced vs maxi-mum repetitions multiple resistance exer-
cises. Int J Sports Med (2003); 24: 410–418.Akselrod S, Gordon D, Ubel FA, et al. Power
spectrum analysis of heart rate fluctuation: aquantitative probe of beat-to-beat cardiovas-
cular control. Science (1981); 213: 220–222.Boone JB, Lambert CP, Flynn MG, et al. Resis-
tance exercise effects on plasma cortisol,testosterone and creatine kinase activity in
anabolic-androgenic steroid users. Int J SportsMed (1990); 11: 293–297.
Borresen J, Lambert MI. Autonomic control ofheart rate during and after exercise: measure-
ments and implications for monitoring train-ing status. Sports Med (2008); 38: 633–646.
Chen JL, Yeh DP, Lee JP, et al. Parasympa-thetic nervous activity mirrors recovery sta-
tus in weightlifting performance aftertraining. J Strength Cond Res (2011); 25:
1546–1552.Costa M, Goldberger AL, Peng CK. Multiscaleentropy analysis of complex physiologic
time series. Phys Rev Lett (2002); 89:068102.
Costa MD, Cygankiewicz I, Zareba W, et al.Multiscale complexity analysis of heart rate
dynamics in heart failure: preliminary find-ings from the MUSIC study. Comput Cardiol
(2006); 33: 101–103.Costa M, Ghiran I, Peng CK, et al. Complex
dynamics of human red blood cell flicker-ing: alterations with in vivo aging. Phys Rev
E Stat Nonlin Soft Matter Phys (2008); 78:020901.
Crewther B, Cronin J, Keogh J. Possible stim-uli for strength and power adaptation: acute
mechanical responses. Sports Med (2005); 35:967–989.
De Souza JC, Tibana RA, Cavaglieri CR, et al.Resistance exercise leading to failure versus
not to failure: effects on cardiovascular con-trol. BMC Cardiovasc Disord (2013); 13: 105.
Draganidis D, Chatzinikolaou A, Jamurtas AZ,et al. The time-frame of acute resistance
exercise effects on football skill perfor-mance: the impact of exercise intensity. J
Sports Sci (2013); 31: 714–722.Folland JP, Irish CS, Roberts JC, et al. Fatigue
is not a necessary stimulus for strengthgains during resistance training. Br J Sports
Med (2002); 36: 370–373; discussion 374.Garc�ıa-Pallar�es J, Izquierdo M. Strategies to
optimize concurrent training of strengthand aerobic fitness for rowing and canoe-
ing. Sports Med (2011); 41: 329–343.Gonz�alez-Badillo JJ, S�anchez-Medina L. Move-
ment velocity as a measure of loadingintensity in resistance training. Int J Sports
Med (2010); 31: 347–352.Gordon SE, Kraemer WJ, Vos NH, et al. Effect
of acid-base balance on the growth hor-mone response to acute high-intensity cycle
exercise. J Appl Physiol (1994); 76: 821–829.Gorostiaga EM, Asi�ain X, Izquierdo M, et al.
Vertical jump performance and blood
ammonia and lactate levels during typicaltraining sessions in elite 400-m runners. J
Strength Cond Res (2010); 24: 1138–1149.Gorostiaga EM, Navarro-Am�ezqueta I, Calbet
JA, et al. Energy metabolism during repeatedsets of leg press exercise leading to failure
or not. PLoS One (2012); 7: e40621.Gorostiaga EM, Navarro-Am�ezqueta I, Calbet
JA, et al. Blood ammonia and lactate asmarkers of muscle metabolites during leg
press exercise. J Strength Cond Res (2014); 28:2775–2785.
Hakkinen K, Pakarinen A. Acute hormonalresponses to two different fatiguing heavy-
resistance protocols in male athletes. J ApplPhysiol (1993); 74: 882–887.
Heffernan KS, Fahs CA, Shinsako KK, et al.Heart rate recovery and heart rate complex-
ity following resistance exercise trainingand detraining in young men. Am J Physiol
Heart Circ Physiol (2007); 293: H3180–H3186.
Heffernan KS, Sosnoff JJ, Jae SY, et al. Acuteresistance exercise reduces heart rate com-
plexity and increases QTc interval. Int J SportsMed (2008); 29: 289–293.
Iglesias-Soler E, Boullosa DA, Carballeira E,et al. Effect of set configuration on hemody-
namics and cardiac autonomic modulationafter high-intensity squat exercise. Clin Phys-
iol Funct Imaging (2015); 35: 250–257.Izquierdo M, Ib�a~nez J, Gonz�alez-Badillo JJ,
et al. Differential effects of strength trainingleading to failure versus not to failure on
hormonal responses, strength, and musclepower gains. J Appl Physiol (2006); 100:
1647–1656.Izquierdo-Gabarren M, Gonz�alez de Txabarri
Exposito R, Garc�ıa-Pallar�es J, et al. Concur-rent endurance and strength training not to
failure optimizes performance gains. Med SciSports Exerc (2010); 42: 1191–1199.
Karavirta L, Costa MD, Goldberger AL, et al.Heart rate dynamics after combined
strength and endurance training in middle-
aged women: heterogeneity of responses.PLoS One (2013); 8: e72664.
Kingsley JD, Figueroa A. Acute and trainingeffects of resistance exercise on heart rate
variability. Clin Physiol Funct Imaging (2014);doi: 10.1111/cpf.12223. [Epub ahead of
print].Kingsley JD, Hochgesang S, Brewer A, et al.
Autonomic modulation in resistance-trainedindividuals after acute resistance exercise. Int
J Sports Med (2014); 35: 851–856.Kraemer WJ, Marchitelli L, Gordon SE, et al.
Hormonal and growth factor responses toheavy resistance exercise protocols. J Appl
Physiol (1990); 69: 1442–1450.Kraemer WJ, Gordon SE, Fleck SJ, et al.
Endogenous anabolic hormonal and growthfactor responses to heavy resistance exercise
in males and females. Int J Sports Med (1991);12: 228–235.
Kraemer WJ, Dziados JE, Marchitelli LJ, et al.Effects of different heavy-resistance exercise
© 2016 Scandinavian Society of Clinical Physiology and Nuclear Medicine. Published by John Wiley & Sons Ltd
Recovery following resistance exercise leading or not leading to failure, F. Pareja-Blanco et al. 9
protocols on plasma beta-endorphin concen-
trations. J Appl Physiol (1993); 74: 450–459.Kuipers H. How much is too much? Perfor-
mance aspects of overtraining. Res Q ExercSport (1996); 67: S65–S69.
Lima AH, Forjaz CL, Silva GQ, et al. Acuteeffect of resistance exercise intensity in car-
diac autonomic modulation after exercise.Arq Bras Cardiol (2011); 96: 498–503.
Lipsitz LA. Age-related changes in the “com-plexity” of cardiovascular dynamics: a
potential marker of vulnerability to disease.Chaos (1995); 5: 102–109.
Pallar�es JG, S�anchez-Medina L, P�erez CE, et al.Imposing a pause between the eccentric and
concentric phases increases the reliability ofisoinertial strength assessments. J Sports Sci
(2014); 32: 1165–1175.Pareja-Blanco F, Rodr�ıguez-Rosell D, S�anchez-
Medina L, et al. Effect of movement velocityduring resistance training on neuromuscular
performance. Int J Sports Med (2014); 35:916–924.
Plews DJ, Laursen PB, Kilding AE, et al.
Evaluating training adaptation with heart-rate measures: a methodological compar-
ison. Int J Sports Physiol Perform (2013); 8:688–691.
Rassias AJ, Holzberger PT, Givan AL, et al.Decreased physiologic variability as a gener-
alized response to human endotoxemia. CritCare Med (2005); 33: 512–519.
Ratamess NA, Kraemer WJ, Volek JS, et al.Androgen receptor content following heavy
resistance exercise in men. J Steroid BiochemMol Biol (2005); 93: 35–42.
Rubin MR, Kraemer WJ, Maresh CM, et al.High-affinity growth hormone binding pro-
tein and acute heavy resistance exercise.Med Sci Sports Exerc (2005); 37: 395–403.
Sampson JA, Groeller H. Is repetition failurecritical for the development of muscle
hypertrophy and strength? Scand J Med SciSports 2015. doi: 10.1111/sms.12445 [Epub
ahead of print].
S�anchez-Medina L, Gonz�alez-Badillo JJ.
Velocity loss as an indicator of neuromus-cular fatigue during resistance training.
Med Sci Sports Exerc (2011); 43: 1725–1734.
S�anchez-Medina L, P�erez CE, Gonz�alez-BadilloJJ. Importance of the propulsive phase in
strength assessment. Int J Sports Med (2010);31: 123–129.
Schoenfeld BJ. The mechanisms of musclehypertrophy and their application to resis-
tance training. J Strength Cond Res (2010);24: 2857–2872.
Spiering BA, Kraemer WJ, Anderson JM, et al.Resistance exercise biology: manipulation of
resistance exercise programme variablesdetermines the responses of cellular and
molecular signalling pathways. Sports Med(2008); 38: 527–540.
Stathis CG, Zhao S, Carey MF, et al. Purineloss after repeated sprint bouts in humans. J
Appl Physiol (1999); 87: 2037–2042.
© 2016 Scandinavian Society of Clinical Physiology and Nuclear Medicine. Published by John Wiley & Sons Ltd
Recovery following resistance exercise leading or not leading to failure, F. Pareja-Blanco et al.10