Acquisition of Agility's Global Integrated Logistics business ...
29
1 | DSV Panalpina – Q1 2021 results Acquisition of Agility's Global Integrated Logistics business and DSV Panalpina Q1 2021 results Conference call 27 April 2021 11:00 AM CEST
-
Upload
khangminh22 -
Category
Documents
-
view
4 -
download
0
Transcript of Acquisition of Agility's Global Integrated Logistics business ...

1 | DSV Panalpina – Q1 2021 results
Acquisition of Agility's Global Integrated Logistics business and DSV Panalpina Q1 2021 resultsConference call 27 April 202111:00 AM CEST
Forward-looking statementsThis presentation contains forward-looking statements that reflect DSV Panalpina A/S’s (“DSV”) current expectations and views of future events. Some of these forward-
looking statements can be identified by terms and phrases such as “estimate,” “expect,” “target,” “plan,” “project,” “will” and similar expressions. These forward-looking
statements include statements relating to: the expected characteristics of the combined company; expected financial results and characteristics of the combined company;
expected timing of the launch and closing of the proposed transaction and satisfaction of conditions precedent, including regulatory conditions; and the expected benefits of
the proposed transaction, including related synergies. These forward-looking statements are subject to a number of risks and uncertainties, many of which are beyond our
control, which could cause actual results to differ materially from such statements. These forward-looking statements are based on our beliefs, assumptions and
expectations of future performance, taking into account the information currently available to us. These statements are only predictions based upon our current expectations
and projections about future events. Risks and uncertainties include: the ability of DSV to integrate Agility’s Global Integrated Logistics business (“GIL”) into DSV’s
operations; the performance of the global economy; the capacity for growth in internet and technology usage; the consolidation and convergence of the industry, its
suppliers and its customers; the effect of changes in governmental regulations; disruption from the proposed transaction making it more difficult to maintain relationships
with customers, employees or suppliers; and the impact on the combined company (after giving effect to the proposed transaction with Agility Public Warehousing Company
KSCP (“Agility”) of any of the foregoing risks or forward-looking statements, as well as other risk factors listed from time to time in DSV’s and Agility’s public disclosures.
The forward-looking statements should be read in conjunction with the other cautionary statements that are included elsewhere, including the risk factors included in any
public disclosures of DSV or Agility. Any forward-looking statements made in this announcement are qualified in their entirety by these cautionary statements, and there can
be no assurance that the actual results or developments anticipated by us will be realised or, even if substantially realised, that they will have the expected consequences
to, or effects on, us or our business or operations. Except as required by law, we undertake no obligation to publicly update or revise any forward-looking statements,
whether as a result of new information, future events or otherwise.

3 | DSV Panalpina – Q1 2021 results
Agenda
1 The acquisition
of GIL
5 Outlook for
2021 raised
2 Highlights
6 Q&A
3 Business
segments 4 Financial
review

4 | DSV Panalpina – Q1 2021 results
49% 33% 18%
An excellent strategic match
• Adding significant volumes to Air & Sea.
• Creating a stronger and more global player in Solutions.
• Adding volumes to Road in EMEA.
• Similar asset-light business model and corporate culture with focus on
customer service, entrepreneurship and corporate responsibility.
Consolidate infrastructure
• Leverage on DSV’s scalable systems and IT infrastructure.
• Consolidation of operations, administration and logistics facilities.
Attractive financial business case
• Transaction to be EPS accretive (diluted and adjusted) in year 2 after
closing.
• Aspiration to lift operating margin of the combined entity towards DSV’s
existing levels within the respective business areas.
Strategic rationaleAcquisition of Agility's Global Integrated Logistics business (GIL)
Strengthening our geographical footprint
Attractive exposure to Air & Sea business
11%10%79%
EMEA APAC Americas
Air & Sea Road Contract Logistics
GIL will add USD 4.0 billion annual revenue*
*Numbers based on FY2020

5 | DSV Panalpina – Q1 2021 results
Transaction overviewCarve-out of GIL from Agility
Purchase price
and financing
Conditionality
Other
considerations
• 100% share deal.
• DSV will issue 19,304,348 new shares in exchange of GIL, representing approx. 8% of outstanding shares post-transaction.
• The share issue will be according to existing authorisation given to the DSV Panalpina Board of Directors.
• Based on the DSV share closing price of DKK 1,299.5 on 26 April 2021. Equity value: approx. USD 4.1 billion (DKK 25.1
billion), Enterprise Value: approx. USD 4.2 billion (DKK 26.0 billion).
• Transaction multiples: 0.94x EV/LTM sales and 23.2x EV/LTM adj. EBIT.
• The transaction is subject to regulatory approvals and approval by Agility’s shareholders (simple majority required).
• Completion of the transaction is expected in the third quarter of 2021.
• After completion of the transaction, DSV has agreed to nominate an Agility designee to DSV’s Board of Directors.
6 | DSV Panalpina – Q1 2021 results
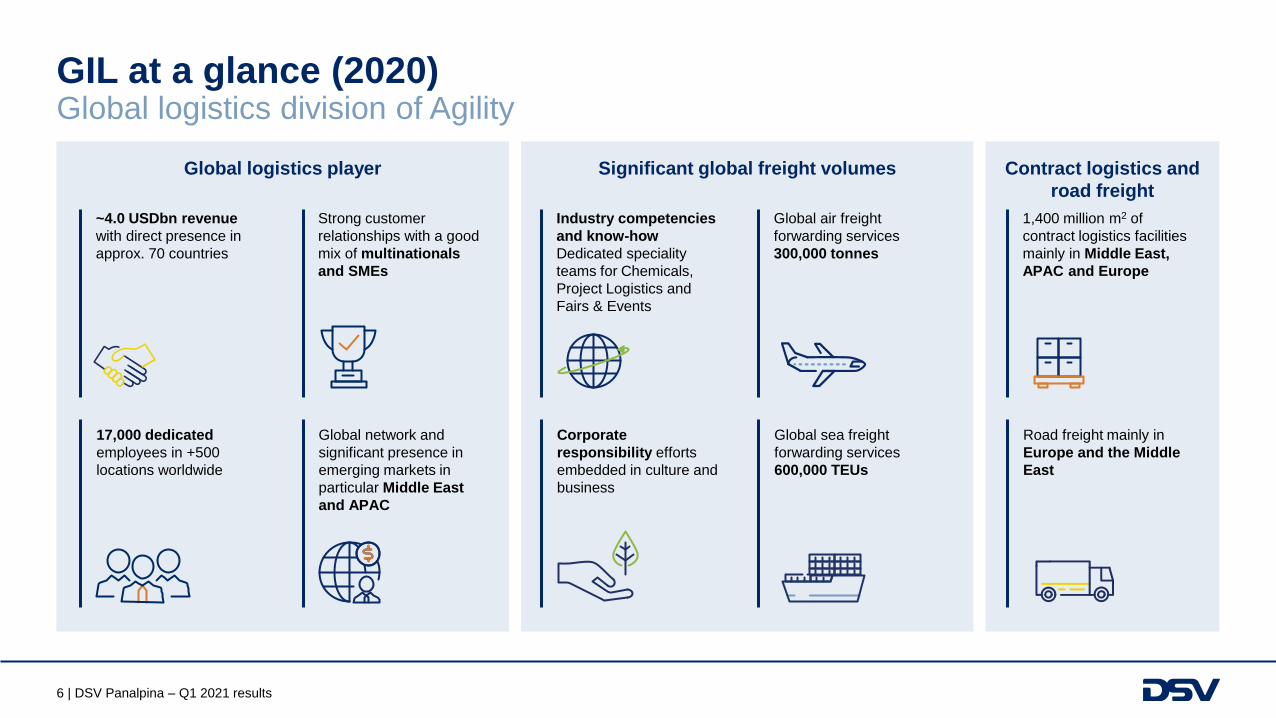
GIL at a glance (2020)Global logistics division of Agility
Global logistics player
Global network and
significant presence in
emerging markets in
particular Middle East
and APAC
Contract logistics and
road freight
Significant global freight volumes
~4.0 USDbn revenue
with direct presence in
approx. 70 countries
Strong customer
relationships with a good
mix of multinationals
and SMEs
Industry competencies
and know-how
Dedicated speciality
teams for Chemicals,
Project Logistics and
Fairs & Events
Global air freight
forwarding services
300,000 tonnes
1,400 million m2 of
contract logistics facilities
mainly in Middle East,
APAC and Europe
17,000 dedicated
employees in +500
locations worldwide
Corporate
responsibility efforts
embedded in culture and
business
Global sea freight
forwarding services
600,000 TEUs
Road freight mainly in
Europe and the Middle
East

7 | DSV Panalpina – Q1 2021 results
32.4
25.4
21.7
19.4
18.5
17.7
15.1
11.3
11.0
10.1
9.2
7.7
7.4
7.4
6.6
5.8
5.2
5.1
4.9
4.8
4.7
4.7
4.0
DHL Logistics (DE)
Kuehne + Nagel (CH)
Combined DSV Panalpina + Agility GIL
DB Schenker (DE)
Nippon Express (JP)
DSV Panalpina (DK)
C. H. Robinson (US)
XPO Logistics (US)
UPS (US)
Expeditors (US)
J. B. Hunt (US)
Dachser (DE)
Sinotrans (CN)
CEVA Logistics (CH)
Bolloré (FR)
SNCF Geodis (FR)
Kintetsu (JP)
Kerry Logistics (HK)
Gefco (FR)
Samsung SDS (KR)
NYK Group (JP)
Rhenus & Co. (DE)
Agility GIL (KW)
Source: Journal of Commerce, DSV estimates
The estimated market share of
the top 20 third-party logistics
providers
30 - 40%
The estimated market share
of DSV Panalpina + GIL
4 - 5%
1
2
4
3
5
6
7
8
9
10
11
12
13
14
15
16
17
18
19
20
21
Creating a global top-three playerThird-party logistics providers by 2020 revenue in USD billion

8 | DSV Panalpina – Q1 2021 results
Uniting the global networksDSV Panalpina and GIL
600,000
1,400,000
17,000
DKK 26.0 bn
USD 4.0 bn
300,000
GIL
57,000
DKK 116.0 bn
USD 17.7 bn
1,300,000
2,200,000
6,000,000
DSV Panalpina
DKK 2.6 bn
USD 0.4 bn
DKK 30.4 bn
USD 4.7 bn
SEA FREIGHT (TEU)
AIR FREIGHT (tonnes)
ANNUAL REVENUE
ROAD FREIGHT (revenue)
LOGISTICS CENTRES (m2)
EMPLOYEES
Note
Numbers based on FY2020, USD / DKK = 6.534 (average 2020).
Illustrative purposes only.

9 | DSV Panalpina – Q1 2021 results
DSV Panalpina and GIL combined (based on 2020 revenue)Adding scale and expanding the global network
GILDSV Panalpina Combined (pro forma)
21%
19%60%
18%
33%
49%
21%
21%58%
Geography
EMEA AMERICAS
APAC
38%
24%
26%
12%
38%
41%
10%
11%
38%
27%
23%
12%
Divisions
Air Sea
Road Contract Logistics
Note
Based on FY2020 revenue. Geographic and business segment splits are estimated.
Illustrative purposes only. USD / DKK = 6.534 (average 2020).

10 | DSV Panalpina – Q1 2021 results
DSV Panalpina and GIL (2020 pro forma combined)Adding approx. 23% to DSV Panalpina’s annual revenue
~142,000DKKm
~10,350DKKm(7.3% EBIT margin)
~74,000FTEs
GILDSV Panalpina
EBITRevenue Employees
9,500 DKKm
(8.2% EBIT margin)
850 DKKm
(3.2% EBIT margin)
116,000 DKKm 26,000 DKKm 57,000 (FTEs) 17,000 (FTEs)
Note
EBIT is before special items/non-recurring items for both DSV Panalpina and GIL based on FY2020
For illustrative purposes only. USD / DKK = 6.534 (average 2020).

11 | DSV Panalpina – Q1 2021 results
Key takeawaysCreating an industry leader in logistics
Creating a new top-
three player in freight
forwarding with a
significantly
strengthened market
position in Air & Sea
GIL has strong
presence in APAC and
Middle East, which is a
strong complement to
DSV’s network
Consolidation of
operations,
administration and
logistics facilities
Highly experienced
integration teams
Leverage on DSV’s
scalable systems and
IT infrastructure
Target of EPS
accretion* in year 2
after closing of the
transaction.
Aspiration to lift
operating margins to
DSV’s levels within the
respective business
areas
*) diluted and adjusted
Q1 2021 RESULTS DSV PANALPINA A/S

13 | DSV Panalpina – Q1 2021 results
1,566
3,067
Q1-20 Q1-21
6,684
7,785
Q1-20 Q1-21
Highlights Q1 2021
*) Growth rates are in constant currencies.
Gross profit (DKKm)
+21.3%* +106.3%*
EBIT before special items (DKKm)
• Strong growth driven by all three divisions.
• New DKK 4,000 million share buyback programme initiated.
• 2021 EBIT guidance upgraded to DKK 11,250 - 12,000 million (previously DKK 10,500 – 11,500 million).
• Capital markets day postponed due to GIL acquisition.
19.0
33.7
Q1-20 Q1-21
EPS for the last 12 months**
+77.4%
**) Diluted adjusted earnings per share of DKK 1 for the last 12 months.

14 | DSV Panalpina – Q1 2021 results
29.2%
45.3% 46.3%44.0%
50.0%
Q1-20 Q2-20 Q3-20 Q4-20 Q1-21
Air & Sea Q1 2021
Operating margin Conversion ratio
6.8%
11.0% 11.1%
9.0%
10.4%
Q1-20 Q2-20 Q3-20 Q4-20 Q1-21
Management commentary
• Significant EBIT growth driven
by growth in gross profit and
full-year impact of synergies
and cost savings.
• Conversion ratio at record high
50.0% for the quarter, driven by
improved productivity and the
extraordinary market conditions.
• All regions contributed to the
strong performance.
• Asia export remains strong,
Europe export is lacking.
(DKKm) Q1 2021 Q1 2020 Growth*
Gross profit 2,026 1,722 23.8%
Gross profit 2,762 2,153 35.6%
Total gross profit 4,788 3,875 30.4%
EBIT 2,393 1,130 126.0%
*) Growth rates are in constant currencies.
15 | DSV Panalpina – Q1 2021 results
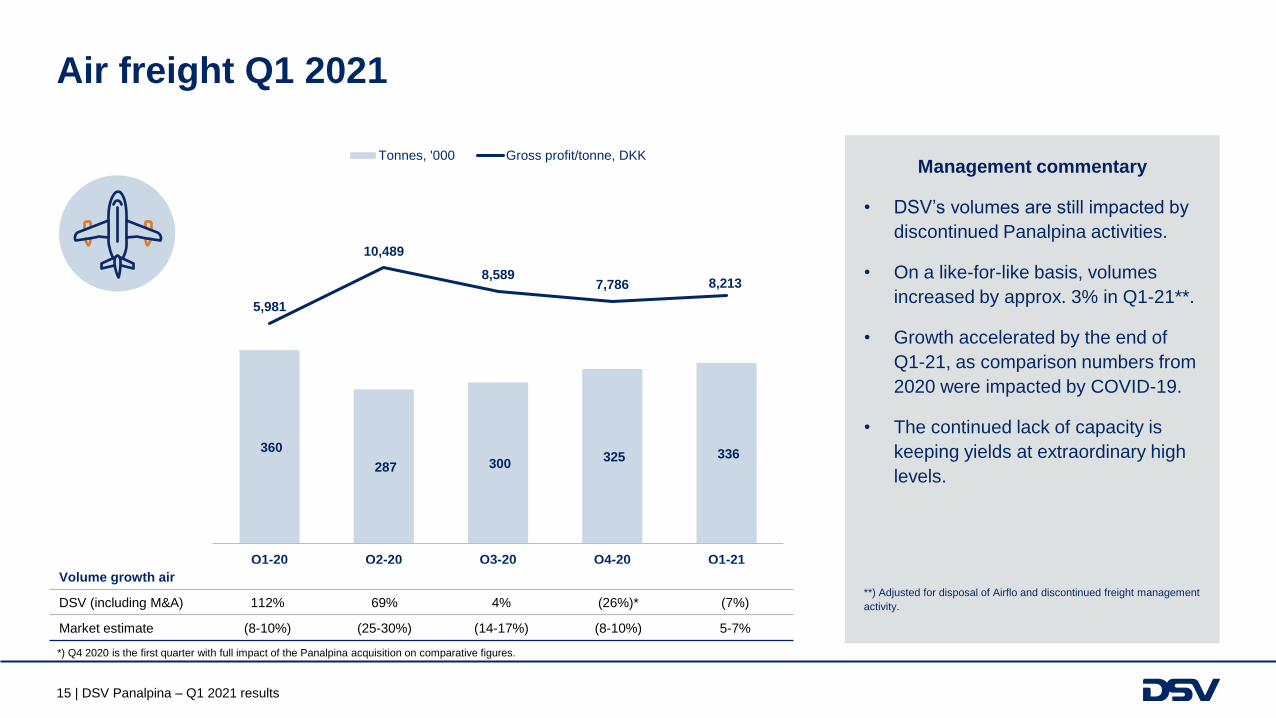
360
287 300 325 336
5,981
10,489
8,5897,786 8,213
0
100
200
300
400
500
600
Q1-20 Q2-20 Q3-20 Q4-20 Q1-21
Tonnes, '000 Gross profit/tonne, DKK
Air freight Q1 2021
Management commentary
• DSV’s volumes are still impacted by
discontinued Panalpina activities.
• On a like-for-like basis, volumes
increased by approx. 3% in Q1-21**.
• Growth accelerated by the end of
Q1-21, as comparison numbers from
2020 were impacted by COVID-19.
• The continued lack of capacity is
keeping yields at extraordinary high
levels.
**) Adjusted for disposal of Airflo and discontinued freight management
activity.
*) Q4 2020 is the first quarter with full impact of the Panalpina acquisition on comparative figures.
Volume growth air
DSV (including M&A) 112% 69% 4% (26%)* (7%)
Market estimate (8-10%) (25-30%) (14-17%) (8-10%) 5-7%

16 | DSV Panalpina – Q1 2021 results
576512
568 549581
2,991
3,2183,036
2,804
3,487
-
500
1,000
1,500
2,000
2,500
3,000
3,500
4,000
0
Q1-20 Q2-20 Q3-20 Q4-20 Q1-21
TEUs, '000 Gross profit/TEU, DKK
Sea freight Q1 2021
Volume growth sea
DSV (including M&A) 60% 31% 9% (14%)* 1%
Market estimate (5-7%) (15-20%) (0-3%) 3-5% 5-7%
Management commentary
• DSV’s volume performance was
closing in on the market in Q1-21.
• Growth was mainly driven by Asia
export, both on Trans-Pacific and
Asia-Europe trade lanes.
• Significant yield improvement in
Q1-21 after temporary pressure in
Q4-20.
• Capacity and equipment situation
remains very tight, and recent events
in the Suez Canal have contributed
to the difficult market situation.
*) Q4 2020 is the first quarter with full impact of the Panalpina acquisition on comparative figures.

17 | DSV Panalpina – Q1 2021 results
19.4%
20.5%
21.1%
19.9%
20.6%
Q1-20 Q2-20 Q3-20 Q4-20 Q1-21
3.3%
3.8%
6.0%
5.3%5.0%
Q1-20 Q2-20 Q3-20 Q4-20 Q1-21
16.9%
18.4%
28.3%26.5%
24.3%
Q1-20 Q2-20 Q3-20 Q4-20 Q1-21
Road Q1 2021
Gross margin Conversion ratio Operating margin
Management commentary
• EBIT growth of 56.8% driven by
solid gross profit growth and
cost discipline.
• Accelerating growth by the end
of Q1-21 as the activity in
March 2020 declined due to
lock-downs.
• Domestic and B2C volumes
continue the strong
momentum.
• Negative Brexit impact on UK
volumes in Q1, but situation has
improved in March and April.
(DKKm) Q1 2021 Q1 2020 Growth*
Revenue 8,056 7,921 3.0%
Gross profit 1,657 1,535 9.2%
EBIT 403 259 56.8%
*) Growth rates are in constant currencies.

18 | DSV Panalpina – Q1 2021 results
(DKKm) Q1 2021 Q1 2020 Growth*
Revenue 3,609 3,441 9.0%
Gross profit 1,348 1,256 11.2%
EBIT 263 159 69.7%
4.6%
7.2%
9.2%10.1%
7.3%
Q1-20 Q2-20 Q3-20 Q4-20 Q1-21
12.7%
18.4%
23.8%
29.8%
19.5%
Q1-20 Q2-20 Q3-20 Q4-20 Q1-21
36.5%
39.0% 38.8%
33.8%
37.4%
Q1-20 Q2-20 Q3-20 Q4-20 Q1-21
Solutions Q1 2021
Management commentary
• EBIT growth driven by solid
gross profit growth and cost
discipline.
• Q1-21 is first quarter with
impact from Prime Cargo
(approx. 4% revenue
contribution).
• E-commerce activities continue
to deliver highest growth rates.
*) Growth rates are in constant currencies.
Gross margin Conversion ratio Operating margin

19 | DSV Panalpina – Q1 2021 results
P&L Q1 2021
(DKKm) Q1 2021 Q1 2020 Growth*
Headlines
Revenue 33,616 27,309 28.4%
Gross profit 7,785 6,684 21.3%
EBIT before special items 3,067 1,566 106.3%
Profit for the period 2,329 331
P&L items
Cost base (staff, other ext., depreciations) 4,718 5,118
Special items, costs - 511
Financial items, FX adjustments (158) 407
Financial items, other 179 190
KPIs
Gross margin (%) 23.2 24.5
Operating margin (%) 9.1 5.7
Conversion ratio (%) 39.4 23.4
Effective tax rate (%) 23.5 27.7
Employees 57,642 58,788
Management commentary
• Strong organic growth in gross
profit for the quarter.
• Full-year impact from synergies and
COVID-19 cost savings – all
savings are fully phased in from
Q1-21.
• Impact from temporary cost savings
on travelling etc.
• Financial items impacted by
positive non-cash FX adjustments
on intra-group loans.
*) Growth rates are in constant currencies.
20 | DSV Panalpina – Q1 2021 results
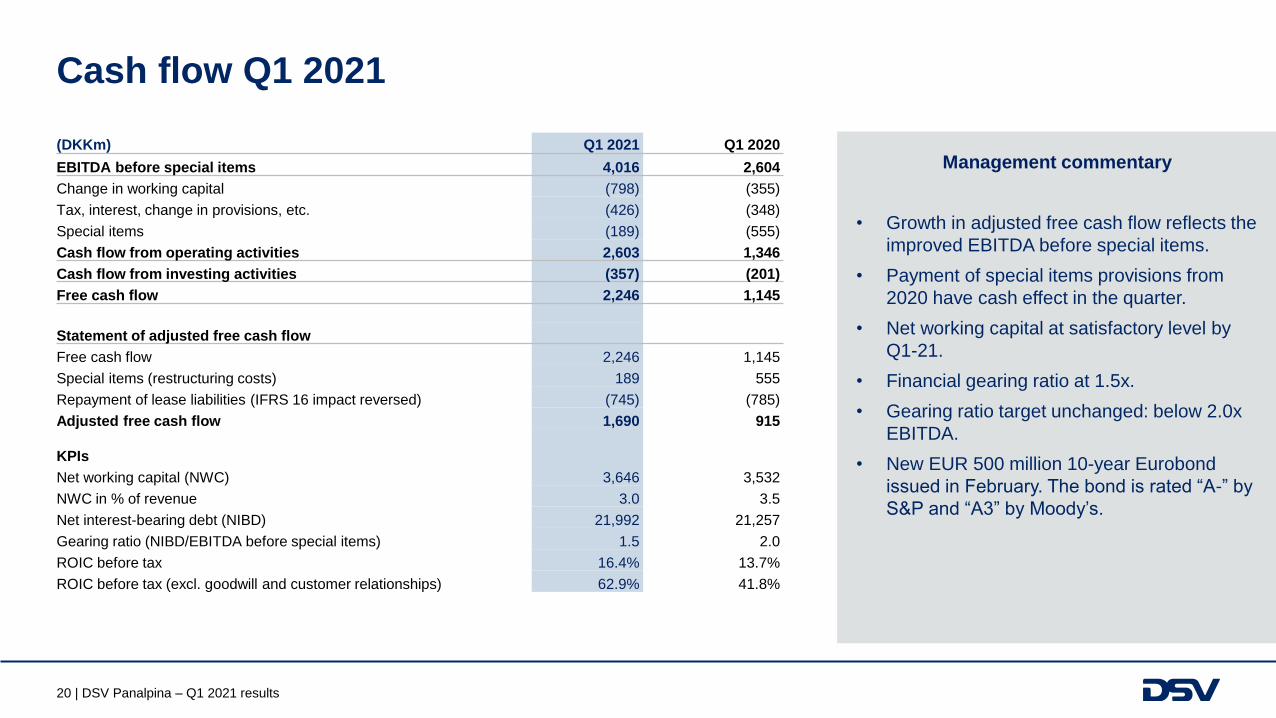
Management commentary
• Growth in adjusted free cash flow reflects the
improved EBITDA before special items.
• Payment of special items provisions from
2020 have cash effect in the quarter.
• Net working capital at satisfactory level by
Q1-21.
• Financial gearing ratio at 1.5x.
• Gearing ratio target unchanged: below 2.0x
EBITDA.
• New EUR 500 million 10-year Eurobond
issued in February. The bond is rated “A-” by
S&P and “A3” by Moody’s.
(DKKm) Q1 2021 Q1 2020
EBITDA before special items 4,016 2,604
Change in working capital (798) (355)
Tax, interest, change in provisions, etc. (426) (348)
Special items (189) (555)
Cash flow from operating activities 2,603 1,346
Cash flow from investing activities (357) (201)
Free cash flow 2,246 1,145
Statement of adjusted free cash flow
Free cash flow 2,246 1,145
Special items (restructuring costs) 189 555
Repayment of lease liabilities (IFRS 16 impact reversed) (745) (785)
Adjusted free cash flow 1,690 915
KPIs
Net working capital (NWC) 3,646 3,532
NWC in % of revenue 3.0 3.5
Net interest-bearing debt (NIBD) 21,992 21,257
Gearing ratio (NIBD/EBITDA before special items) 1.5 2.0
ROIC before tax 16.4% 13.7%
ROIC before tax (excl. goodwill and customer relationships) 62.9% 41.8%
Cash flow Q1 2021

21 | DSV Panalpina – Q1 2021 results
Share buyback and dividend
Announced allocations to shareholders 2021 (DKKm) Q1-21 Q2-21 Q3-21 Q4-21 Total 2021
Dividend (DKK 4.00 per share) 920 - - - 920
Share buyback – rest of 2020 programme 4,815 1,185 - - 6,000
Share buyback – 4.0 billion – cash flow partly in Q3 - 2,700 1,300 - 4,000
Total announced allocations in 2021 5,735 3,885 1,300 - 10,920
• Dividend for 2020 paid in Q1-21: DKK 4.00 per share (2019: DKK 2.50).
• 4.5 million shares bought back in Q1-21 at an average price of DKK 1,072.9.
• New share buyback programme of DKK 4.0 billion running until 28 July 2021.
• Share capital reduction of 6.0 million shares as of 15 April 2021 (cancellation of own shares).

22 | DSV Panalpina – Q1 2021 results
Outlook for 2021 raised Main assumptions
(DKKm) Updated outlook 2021 Previous outlook 2021 Actual 2020
EBIT before special items 11,250-12,000 10,500-11,500 9,520
Effective tax rate 23.0% 23.0% 24.3%
Main assumptions
• Continued recovery of the global economy after the COVID-19 crisis, Global GDP growth around 5%.
• Growth rates in the transport markets in line with the underlying economic growth.
• Tight transport capacity and high rates will continue most of 2021, but we expect yields will decline compared to Q1-21.
• Our ambition is to gain market share in all three divisions.
• Remaining full-year impact of integration synergies and cost savings of approx. DKK 1,200 million in 2021.
• Currency exchange rates will remain at current level.
Excluding impact from the GIL transaction. Update to be provided upon closing

23 | DSV Panalpina – Q1 2021 results
Next stepsExpected timeline
27 April 2021
Announcement
of agreement
Q3-2021
Expected closing
Integration starts
Filing to relevant
authorities
Shareholder
meeting Agility
H1-2021 interim
financial report
DSV Panalpina
(29 July 2021)
Agility
(13 August)
Regulatory
approvals
obtained and
conditions
fulfilled

24 | DSV Panalpina – Q1 2021 results
To attend the teleconference, please dial one of the following phonenumbers:
Danish participants
+ 45 78 72 32 50
International participants
+44 (0) 333 300 9266
US participants
+1 833 526 8384
To ask questions press "0" and then "1"

25 | DSV Panalpina – Q1 2021 results
Appendix

26 | DSV Panalpina – Q1 2021 results
Quarterly P&L detailsDSV Panalpina Group
(DKKm) Q1 2019 Q2 2019 Q3 2019 Q4 2019 FY 2019 Q1 2020 Q2 2020 Q3 2020 Q4 2020 FY 2020 Q1 2021
Revenue 19,979 20,079 24,521 30,122 94,701 27,309 28,782 28,125 31,716 115,932 33,616
Direct costs 14,865 14,794 18,250 23,038 70,947 20,625 21,396 20,873 24,504 87,398 25,831
Gross profit 5,114 5,285 6,271 7,084 23,754 6,684 7,386 7,252 7,212 28,534 7,785
Other external expenses 656 642 817 1,018 3,133 867 795 831 798 3,291 849
Staff costs 2,195 2,202 2,727 3,205 10,329 3,213 2,925 2,708 2,838 11,684 2,920
EBITDA before special items 2,263 2,441 2,727 2,861 10,292 2,604 3,666 3,713 3,576 13,559 4,016
Depreciation of right-of-use assets 632 626 680 796 2,734 798 777 723 692 2,990 752
Amortisation and depreciation of owned
assets 177 184 262 281 904 240 276 265 268 1,049 197
EBIT before special items 1,454 1,631 1,785 1,784 6,654 1,566 2,613 2,725 2,616 9,520 3,067
Special Items, net costs - 19 172 609 800 511 515 453 685 2,164 -
Financial income 22 25 85 (1) 131 65 91 58 40 254 208
Financial expenses - lease liabilities 89 91 96 107 383 114 95 109 116 434 119
Financial expenses 106 83 102 315 606 548 218 427 356 1,549 110
Profit before tax 1,281 1,463 1,500 752 4,996 458 1,876 1,794 1,499 5,627 3,046
Tax on profit for the period 318 314 351 307 1,290 127 486 457 299 1,369 717
Profit for the period 963 1,149 1,149 445 3,706 331 1,390 1,337 1,200 4,258 2,329
Gross margin, % 25.6 26.3 25.6 23.5 25.1 24.5 25.7 25.8 22.7 24.6 23.2
Operating margin, % 7.3 8.1 7.3 5.9 7.0 5.7 9.1 9.7 8.2 8.2 9.1
Conversion ratio, % 28.4 30.9 28.5 25.2 28.0 23.4 35.4 37.6 36.3 33.4 39.4
Effective tax rate, % 24.8 21.5 23.4 40.8 25.8 27.7 25.9 25.5 19.9 24.3 23.5
Blue-collar costs (included in direct costs) 1,218 1,231 1,313 1,537 5,299 1,411 1,132 1,282 1,449 5,274 1,405
Number of full-time employees 47,281 47,552 61,799 61,216 61,216 58,788 53,399 56,090 56,621 56,621 57,642

27 | DSV Panalpina – Q1 2021 results
Quarterly P&L detailsAir & Sea
(DKKm) Q1 2019 Q2 2019 Q3 2019 Q4 2019 FY 2019 Q1 2020 Q2 2020 Q3 2020 Q4 2020 FY 2020 Q1 2021
Divisional revenue 9,411 9,682 13,981 18,077 51,151 16,674 19,144 17,910 19,961 73,689 22,924
Direct costs 6,987 7,153 10,538 13,956 38,634 12,799 14,481 13,607 15,893 56,780 18,136
Gross profit 2,424 2,529 3,443 4,121 12,517 3,875 4,663 4,303 4,068 16,909 4,788
Other external expenses 386 424 594 863 2,267 797 736 692 645 2,870 753
Staff costs 943 935 1,442 1,773 5,093 1,679 1,530 1,394 1,445 6,048 1,445
EBITDA before special items 1,095 1,170 1,407 1,485 5,157 1,399 2,397 2,217 1,978 7,991 2,590
Depreciation of right-of-use assets 82 61 127 214 484 211 190 151 127 679 136
Amortisation and depreciation of owned
assets 15 16 60 76 167 58 95 72 61 286 61
EBIT before special items 998 1,093 1,220 1,195 4,506 1,130 2,112 1,994 1,790 7,026 2,393
Gross margin, % 25.8 26.1 24.6 22.8 24.5 23.2 24.4 24.0 20,4 22.9 20.9
Operating margin, % 10.6 11.3 8.7 6.6 8.8 6.8 11.0 11.1 9.0 9.5 10.4
Conversion ratio, % 41.2 43.2 35.4 29.0 36.0 29.2 45.3 46.3 44.0 41.6 50.0
Number of full-time employees 12,072 12,103 22,824 21,516 21,516 20,610 18,723 18,067 18,008 18,008 17,999
Air
Revenue, DKKm 4,598 4,564 7,352 10,620 27,134 9,530 12,057 10,296 12,873 44,756 12,975
Gross profit, DKKm 1,230 1,224 1,827 2,313 6,594 2,153 3,015 2,578 2,529 10,275 2,762
Air freight, tonnes 170,103 170,301 288,793 442,069 1,071,266 359,975 287,452 300,147 324,831 1,272,405 336,307
GP/tonne, DKK 7,231 7,187 6,326 5,226 6,155 5,981 10,489 8,589 7,786 8,075 8,213
Sea
Revenue, DKKm 4,813 5,118 6,629 7,457 24,017 7,144 7,087 7,614 7,088 28,933 9.949
Gross profit, DKKm 1,194 1,305 1,616 1,808 5,923 1,722 1,648 1,725 1,539 6,634 2,026
TEUs 359,925 391,333 520,048 635,820 1,907,126 575,814 512,138 568,130 548,820 2,204,902 581,019
GP/TEU, DKK 3,317 3,335 3,107 2,846 3,106 2,991 3,218 3,036 2,804 3,009 3,487

28 | DSV Panalpina – Q1 2021 results
Quarterly P&L detailsRoad
(DKKm) Q1 2019 Q2 2019 Q3 2019 Q4 2019 FY 2019 Q1 2020 Q2 2020 Q3 2020 Q4 2020 FY 2020 Q1 2021
Divisional revenue 8,102 7,833 7,698 7,988 31,621 7,921 6,987 7,521 7,966 30,395 8,056
Direct costs 6,541 6,298 6,170 6,456 25,465 6,386 5,556 5,936 6,379 24,257 6,399
Gross profit 1,561 1,535 1,528 1,532 6,156 1,535 1,431 1,585 1,587 6,138 1,657
Other external expenses 300 232 261 267 1,060 287 242 251 241 1,021 258
Staff costs 719 725 679 741 2,864 757 686 650 706 2,799 742
EBITDA before special items 542 578 588 524 2,232 491 503 684 640 2,318 657
Depreciation of right-of-use assets 218 213 212 219 862 206 209 211 202 828 236
Amortisation and depreciation of owned
assets 26 27 33 33 119 26 31 25 18 100 18
EBIT before special items 298 338 343 272 1,251 259 263 448 420 1,390 403
Gross margin, % 19.3 19.6 19.8 19.2 19.5 19.4 20.5 21.1 19.9 20.2 20.6
Operating margin, % 3.7 4.3 4.5 3.4 4.0 3.3 3.8 6.0 5.3 4.6 5.0
Conversion ratio, % 19.1 22.0 22.4 17.8 20.3 16.9 18.4 28.3 26.5 22.6 24.3
Number of full-time employees 13,181 13,134 13,493 13,644 13,644 15,200 13,408 14,090 14,003 14,003 14,222
Solutions
Divisional revenue 3,049 3,147 3,465 4,729 14,390 3,441 3,256 3,388 4,523 14,608 3,609
Direct costs 1,923 1,961 2,209 3,328 9,421 2,185 1,985 2,075 2,994 9,239 2,261
Gross profit 1,126 1,186 1,256 1,401 4,969 1,256 1,271 1,313 1,529 5,369 1,348
Other external expenses 264 254 278 292 1,088 289 244 255 301 1,089 281
Staff costs 306 304 341 355 1,306 385 365 344 355 1,449 377
EBITDA before special items 556 628 637 754 2,575 582 662 714 873 2,831 690
Depreciation of right-of-use assets 314 335 329 348 1,326 364 361 342 355 1,422 369
Amortisation and depreciation of owned
assets 49 52 69 66 236 59 67 60 62 248 58
EBIT before special items 193 241 239 340 1,013 159 234 312 456 1,161 263
Gross margin, % 36.9 37.7 36.2 29.6 34.5 36.5 39.0 38.8 33.8 36.8 37.4
Operating margin, % 6.3 7.7 6.9 7.2 7.0 4.6 7.2 9.2 10.1 7.9 7.3
Conversion ratio, % 17.1 20.3 19.0 24.3 20.4 12.7 18.4 23.8 29.8 21.6 19.5
Number of full-time employees 19,862 20,146 22,521 22,777 22,777 20,079 18,428 21,039 21,478 21,478 22,188

29 | DSV Panalpina – Q1 2021 results
Investor contact information
Share information
Investor Relations contacts
DSV Panalpina A/S is listed on the Copenhagen stock exchange under the
symbol ‘DSV’.
For further company information, please visit: www.dsv.com
DSV Panalpina A/S
Hovedgaden 630, 2640 Hedehusene, Denmark [email protected]
Flemming Ole Nielsen +45 4320 3392 [email protected]
Mads Kristian Hofmeister +45 4320 3388 [email protected]
Financial calendar 2021
26 May 2021 Capital Markets Day 2021, CANCELLED
29 Jul. 2021 Interim Financial Report, Second Quarter 2021
26 Oct. 2021 Interim Financial Report, Third Quarter 2021