Acetate and butyrate as substrates for hydrogen production through photo-fermentation: Process...
10
Acetate and butyrate as substrates for hydrogen production through photo-fermentation: Process optimization and combined performance evaluation 5 S. Srikanth, S. Venkata Mohan*, M. Prathima Devi, Dinakar Peri, P.N. Sarma Bioengineering and Environmental Centre, Indian Institute of Chemical Technology, Tarnaka, Hyderabad, AP 500 007, India article info Article history: Received 11 July 2008 Received in revised form 22 May 2009 Accepted 22 May 2009 Available online 21 June 2009 Keywords: Data enveloping analysis (DEA) Anaerobic fermentation Soluble acid metabolites Wastewater treatment Mixed photosynthetic culture abstract Organic acids viz., acetate and butyrate were evaluated as primary substrates for the production of biohydrogen (H 2 ) through photo-fermentation process using mixed culture at mesophilic temperature (34 C). Experiments were performed by varying parameters like operating pH, presence/absence of initiator substrate (glucose) and vitamin solution, type of nitrogen source (mono sodium salt of glutamic acid and amino glutamic acid) and gas (nitrogen/argon) used to create anaerobic microenvironment. Experimental data showed the feasibility of H 2 production along with substrate degradation utilizing organic acids as metabolic substrate but was found to be dependent on the process parameters evaluated. Maximum specific H 2 production and substrate degradation were observed with acetic acid [3.51 mol/Kg COD R -day; 1.22 Kg COD R /m 3 -day (92.96%)] compared to butyric acid [3.33 mol/ Kg COD R -day; 1.19 Kg COD R /m 3 -day (88%)]. Higher H 2 yield was observed under acidophilic microenvironment in the presence of glucose (co-substrate), mono sodium salt of glutamic acid (nitrogen source) and vitamins. Argon induced microenvironment was observed to be effective compared to nitrogen induced microenvironment. Combined process efficiency viz., H 2 production and substrate degradation was evaluated employing data enveloping analysis (DEA) methodology based on the relative efficiency. Integration of dark fermen- tation with photo-fermentation appears to be an economically viable route for sustainable biohydrogen production if wastewater is used as substrate. ª 2009 International Association for Hydrogen Energy. Published by Elsevier Ltd. All rights reserved. 1. Introduction In recent times, the ever increasing usage of hydrocarbon fuels is resulting in the emission of greenhouse gases and other pollutants in alarming proportions leading to global warming and various health disorders, pushing mankind to the brink of extinction. Furthermore, the supply of hydro- carbon resources in the world is limited, while the demand for hydrocarbon fuels is increasing. Worldwide search is on for an alternate fuel which can replace the fossil fuels and mitigate all their harmful effects. In this context, hydrogen (H 2 ) is generating a lot of interest due to its clean, non-polluting and eco-friendly nature thus being considered as an alternative fuel [1–4]. At present, H 2 is produced mainly from fossil fuels, biomass and water. Most of these methods mainly use fossil fuels as energy source, which are considered to be energy intensive and not always environmental friendly [5–9]. Bio- logical production of H 2 is one of the feasible and alternative 5 Oral presentation No. O41; International Workshop on Biohydrogen Technologies (IWBT2008). * Corresponding author. Tel./fax: þ91 40 27163159. E-mail addresses: [email protected], [email protected] (S. Venkata Mohan). Available at www.sciencedirect.com journal homepage: www.elsevier.com/locate/he 0360-3199/$ – see front matter ª 2009 International Association for Hydrogen Energy. Published by Elsevier Ltd. All rights reserved. doi:10.1016/j.ijhydene.2009.05.095 international journal of hydrogen energy 34 (2009) 7513–7522
Transcript of Acetate and butyrate as substrates for hydrogen production through photo-fermentation: Process...

i n t e r n a t i o n a l j o u r n a l o f h y d r o g e n e n e r g y 3 4 ( 2 0 0 9 ) 7 5 1 3 – 7 5 2 2
Avai lab le a t www.sc iencedi rec t .com
j ourna l homepage : www.e lsev ier . com/ loca te /he
Acetate and butyrate as substrates for hydrogen productionthrough photo-fermentation: Process optimizationand combined performance evaluation5
S. Srikanth, S. Venkata Mohan*, M. Prathima Devi, Dinakar Peri, P.N. Sarma
Bioengineering and Environmental Centre, Indian Institute of Chemical Technology, Tarnaka, Hyderabad, AP 500 007, India
a r t i c l e i n f o
Article history:
Received 11 July 2008
Received in revised form
22 May 2009
Accepted 22 May 2009
Available online 21 June 2009
Keywords:
Data enveloping analysis (DEA)
Anaerobic fermentation
Soluble acid metabolites
Wastewater treatment
Mixed photosynthetic culture
5 Oral presentation No. O41; International* Corresponding author. Tel./fax: þ91 40 271
E-mail addresses: [email protected]/$ – see front matter ª 2009 Interndoi:10.1016/j.ijhydene.2009.05.095
a b s t r a c t
Organic acids viz., acetate and butyrate were evaluated as primary substrates for the
production of biohydrogen (H2) through photo-fermentation process using mixed culture at
mesophilic temperature (34 �C). Experiments were performed by varying parameters like
operating pH, presence/absence of initiator substrate (glucose) and vitamin solution, type
of nitrogen source (mono sodium salt of glutamic acid and amino glutamic acid) and gas
(nitrogen/argon) used to create anaerobic microenvironment. Experimental data showed
the feasibility of H2 production along with substrate degradation utilizing organic acids as
metabolic substrate but was found to be dependent on the process parameters evaluated.
Maximum specific H2 production and substrate degradation were observed with acetic acid
[3.51 mol/Kg CODR-day; 1.22 Kg CODR/m3-day (92.96%)] compared to butyric acid [3.33 mol/
Kg CODR-day; 1.19 Kg CODR/m3-day (88%)]. Higher H2 yield was observed under acidophilic
microenvironment in the presence of glucose (co-substrate), mono sodium salt of glutamic
acid (nitrogen source) and vitamins. Argon induced microenvironment was observed to be
effective compared to nitrogen induced microenvironment. Combined process efficiency
viz., H2 production and substrate degradation was evaluated employing data enveloping
analysis (DEA) methodology based on the relative efficiency. Integration of dark fermen-
tation with photo-fermentation appears to be an economically viable route for sustainable
biohydrogen production if wastewater is used as substrate.
ª 2009 International Association for Hydrogen Energy. Published by Elsevier Ltd. All rights
reserved.
1. Introduction alternate fuel which can replace the fossil fuels and mitigate
In recent times, the ever increasing usage of hydrocarbon
fuels is resulting in the emission of greenhouse gases and
other pollutants in alarming proportions leading to global
warming and various health disorders, pushing mankind to
the brink of extinction. Furthermore, the supply of hydro-
carbon resources in the world is limited, while the demand for
hydrocarbon fuels is increasing. Worldwide search is on for an
Workshop on Biohydroge63159., [email protected] (S.ational Association for H
all their harmful effects. In this context, hydrogen (H2) is
generating a lot of interest due to its clean, non-polluting and
eco-friendly nature thus being considered as an alternative
fuel [1–4]. At present, H2 is produced mainly from fossil fuels,
biomass and water. Most of these methods mainly use fossil
fuels as energy source, which are considered to be energy
intensive and not always environmental friendly [5–9]. Bio-
logical production of H2 is one of the feasible and alternative
n Technologies (IWBT2008).
Venkata Mohan).ydrogen Energy. Published by Elsevier Ltd. All rights reserved.
i n t e r n a t i o n a l j o u r n a l o f h y d r o g e n e n e r g y 3 4 ( 2 0 0 9 ) 7 5 1 3 – 7 5 2 27514
methods being pursued extensively by the research fraternity
recently. Biological H2 production processes can be broadly
classified as biophotolysis of water using algae and cyano-
bacteria, photodecomposition of organic compounds by
photosynthetic bacteria and fermentative H2 production from
organic compounds [2,3,10–16]. These processes mostly occur
at ambient temperatures and pressures, which are less energy
intensive, more environment friendly and further opening
new avenues for the utilization of renewable energy sources
which are inexhaustible [2,5,8–10].
A practical, efficient and economically feasible process of H2
generation are extremely critical [4,11]. Various strategies in
this direction were reported earlier [1–3]. H2 production through
light-dependent (photo-biological) or independent (dark)
fermentative conversions of organic substrates is of great
importance due to its dual function of substrate reduction and
H2 production [2,4,11]. The generation of H2 by fermentation is
accompanied by the formation of organic acids as metabolic
products but these microbes are not capable of breaking the
acids [1,15]. Generation and accumulation of these soluble acid
metabolites causes a sharp drop in the system pH and inhibit
the process of H2 production. Persistent acidophilic conditions
resulted in suppression of methanogenic process and account
for only 15% of the energy conversion from the organic source
in the form of H2 [10]. Usage of unutilized carbon sources in
wastewater for additional H2 production will sustain practical
applicability of the process. Further, soluble metabolites can be
utilized by photosynthetic bacteria to produce additional H2 or
CH4 through photo-fermentation [2–4,11]. Photo-fermentation
is the process of fermentative conversion of organic substrate
manifested by a diverse group of photosynthetic bacteria
through a series of biochemical reactions similar to anaerobic
fermentation. Photo-fermentation only proceeds in the pres-
ence of light unlike dark fermentation. Photosynthetic bacteria
can produce H2 by consuming organic acids which are abun-
dant in the effluents generated from acidogenic H2 fermenta-
tion processes [11,17–19]. Moreover, the economics related to
phototrophic H2 production are limited by poor H2 production
rate of photosynthetic bacteria due to slow growth rate and
inefficient utilization of light energy [2,3]. Improving produc-
tion rate by integrating dark and photo-fermentation could aid
in the development of sustainable H2 production process.
Combination of dark and photo-fermentation appears to be an
ideal route leading to near highest theoritically possible yield
[12,13]. The main scope of this communication is to evaluate
the feasibility of utilizing volatile fatty acids generated from
dark fermentation as primary substrate for subsequent H2
production through photo-fermentation. In this direction an
attempt was made to evaluate organic acids viz., acetate and
butyrate as primary substrates for H2 production using
enriched photosynthetic mixed culture.
2. Material and methods
A series of thirty-two batch experiments each with acetate
and butyrate were designed and performed at mesophilic
temperature (34 �C) employing adapted mixed photosynthetic
culture by varying parameters like operating pH (7/6), pres-
ence/absence of initiator substrate (glucose), vitamin solution,
variable nitrogen source [mono sodium salt of glutamic acid
(MSG) and amino glutamic acid (AG)] and gas (Nitrogen/Argon)
used to create anaerobic microenvironment.
2.1. Substrate composition
Acetic acid (HAc) and butyric acid (HBu) were the two volatile
fatty acids considered in this study for evaluating photo-bio-
logical H2 production. Experiments were performed both in the
presence and absence of carbon source (glucose, 1 g/l) to
enumerate the role of metabolic initiator/co-substrate. AG
(8 mM) and MSG (8 mM) were the two nitrogen sources used in
the feed composition. All experimental studies wereperformed
in the presence of trace elements (mg/l; NH4Cl –0.5, KH2PO4–
0.25, K2HPO4–0.25, MgCl2$6H2O –0.3, FeCl3–0.025, NiSO4 –0.016,
CoCl2 –0.025, ZnCl2 –0.0115, CuCl2 –0.0105, CaCl2 –0.005 and
MnCl2 –0.015) supplemented at 50 ml/l. Feed composition
in the presence and absence of vitamins (mg/l; thiamine
mononitrate – 10.0; riboflavine – 10.0; nicotinic acid – 25.0;
niacinamide – 75.0; pyridoxine hydrochloride – 3.0; calcium
pantothenate – 50.0; folic acid – 1.5; vitamin B12 – 0.015;
vitamin C – 150.0 mg; biotin – 0.260) (2.5 ml/l) was studied.
Various feed compositions used are described in Table 1.
2.2. Mixed culture
The parent photosynthetic culture used as inoculum in the
experiments was acquired from a lake at Saroor Nagar in Hy-
derabad, India [4]. Culture was sampled from a depth of 2–3 feet
of the water bodies. Prior to usage, the inoculum was enriched
with the combination of dairy and domestic wastewater (1:1)
supplementedwith vitamin solution (2.5 ml/l) in the presence of
fluorescent light (4 Klux) at 34 �C for 48 h. As the culture was
collected from lake with diverse characteristics and enriched
with wastewater, there might be possible presence of anaerobic
mixed consortia along with the predominant photosynthetic
mixed consortia [4].
2.3. Experimental design
A series of thirty-two batch experiments were performed with
each of the two organic acids (HAc/HBu) as metabolic
substrates in the presence or absence of glucose and vitamins,
variation in the type of nitrogen source and the gas used to
create anaerobic microenvironment to evaluate the photo-
biological H2 production (Table 1). The experimental varia-
tions were studied for each acid in a series of 250 ml conical
flasks (with a total working volume of 160 ml). A 20 ml of
previously developed mixed photosynthetic culture (24 h;
Saroor Nagar lake) was inoculated into the flask under aseptic
anaerobic conditions [4]. Subsequently 150 ml of feed (with
a final concentration of COD 5900� 100 mg/l) was loaded and
the reaction mixture was adjusted to the desired pH (6/7)
using concentrated orthophosphoric acid and/or 3 N NaOH
solutions. The flasks were then sparged with argon or nitrogen
for a period of 30 s to remove dissolved oxygen and to create
an oxygen free microenvironment prior to closing with rubber
septum (butyl rubber). All the flasks were placed in a temper-
ature controlled shaking incubator (100 rpm) in the presence
of a fluorescent light (4 Klux), at 34 �C.
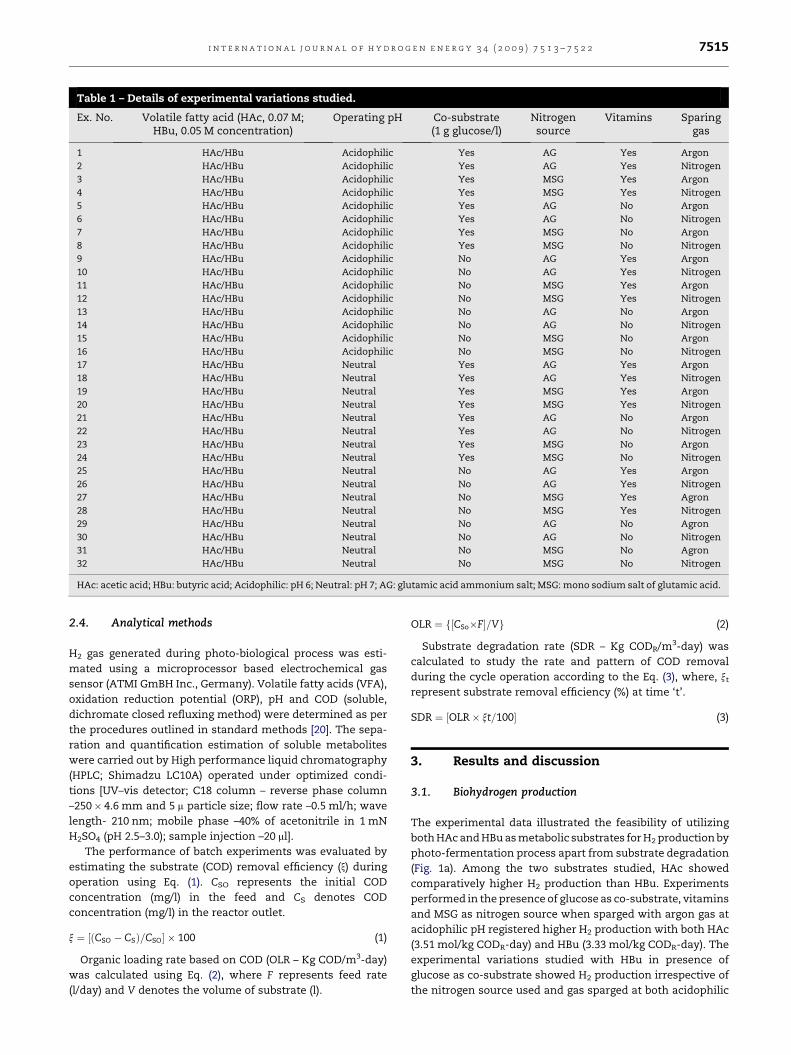
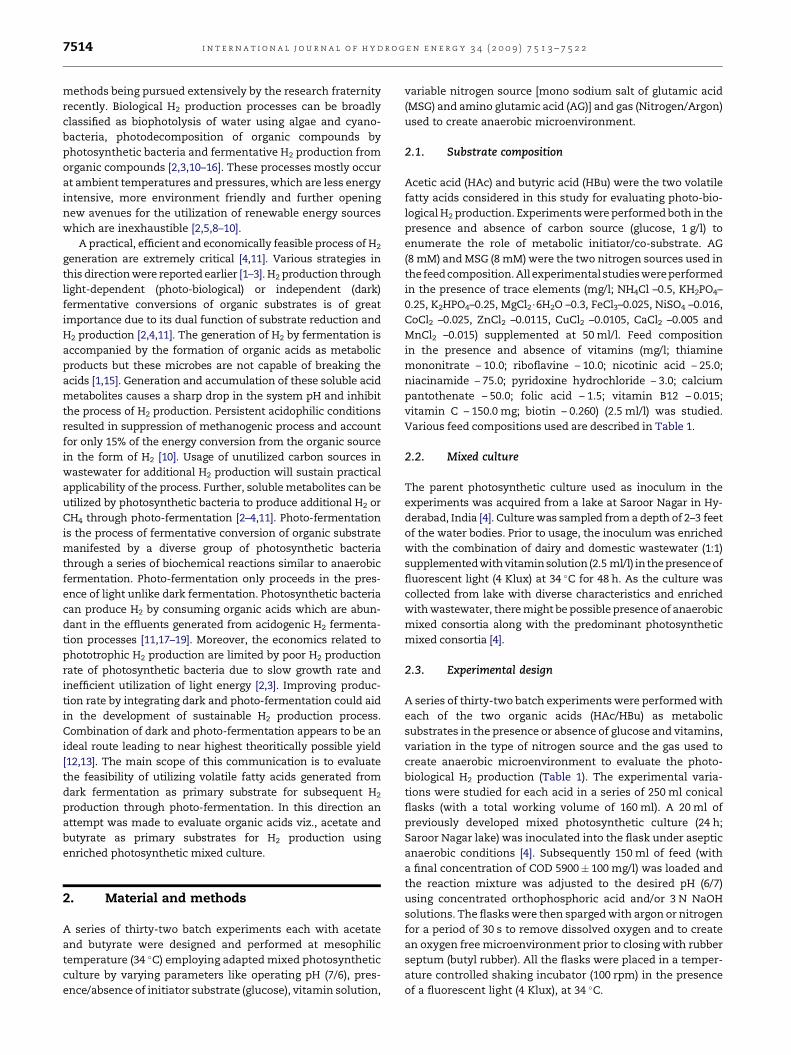
Table 1 – Details of experimental variations studied.
Ex. No. Volatile fatty acid (HAc, 0.07 M;HBu, 0.05 M concentration)
Operating pH Co-substrate(1 g glucose/l)
Nitrogensource
Vitamins Sparinggas
1 HAc/HBu Acidophilic Yes AG Yes Argon
2 HAc/HBu Acidophilic Yes AG Yes Nitrogen
3 HAc/HBu Acidophilic Yes MSG Yes Argon
4 HAc/HBu Acidophilic Yes MSG Yes Nitrogen
5 HAc/HBu Acidophilic Yes AG No Argon
6 HAc/HBu Acidophilic Yes AG No Nitrogen
7 HAc/HBu Acidophilic Yes MSG No Argon
8 HAc/HBu Acidophilic Yes MSG No Nitrogen
9 HAc/HBu Acidophilic No AG Yes Argon
10 HAc/HBu Acidophilic No AG Yes Nitrogen
11 HAc/HBu Acidophilic No MSG Yes Argon
12 HAc/HBu Acidophilic No MSG Yes Nitrogen
13 HAc/HBu Acidophilic No AG No Argon
14 HAc/HBu Acidophilic No AG No Nitrogen
15 HAc/HBu Acidophilic No MSG No Argon
16 HAc/HBu Acidophilic No MSG No Nitrogen
17 HAc/HBu Neutral Yes AG Yes Argon
18 HAc/HBu Neutral Yes AG Yes Nitrogen
19 HAc/HBu Neutral Yes MSG Yes Argon
20 HAc/HBu Neutral Yes MSG Yes Nitrogen
21 HAc/HBu Neutral Yes AG No Argon
22 HAc/HBu Neutral Yes AG No Nitrogen
23 HAc/HBu Neutral Yes MSG No Argon
24 HAc/HBu Neutral Yes MSG No Nitrogen
25 HAc/HBu Neutral No AG Yes Argon
26 HAc/HBu Neutral No AG Yes Nitrogen
27 HAc/HBu Neutral No MSG Yes Agron
28 HAc/HBu Neutral No MSG Yes Nitrogen
29 HAc/HBu Neutral No AG No Agron
30 HAc/HBu Neutral No AG No Nitrogen
31 HAc/HBu Neutral No MSG No Agron
32 HAc/HBu Neutral No MSG No Nitrogen
HAc: acetic acid; HBu: butyric acid; Acidophilic: pH 6; Neutral: pH 7; AG: glutamic acid ammonium salt; MSG: mono sodium salt of glutamic acid.
i n t e r n a t i o n a l j o u r n a l o f h y d r o g e n e n e r g y 3 4 ( 2 0 0 9 ) 7 5 1 3 – 7 5 2 2 7515
2.4. Analytical methods
H2 gas generated during photo-biological process was esti-
mated using a microprocessor based electrochemical gas
sensor (ATMI GmBH Inc., Germany). Volatile fatty acids (VFA),
oxidation reduction potential (ORP), pH and COD (soluble,
dichromate closed refluxing method) were determined as per
the procedures outlined in standard methods [20]. The sepa-
ration and quantification estimation of soluble metabolites
were carried out by High performance liquid chromatography
(HPLC; Shimadzu LC10A) operated under optimized condi-
tions [UV–vis detector; C18 column – reverse phase column
–250� 4.6 mm and 5 m particle size; flow rate –0.5 ml/h; wave
length- 210 nm; mobile phase –40% of acetonitrile in 1 mN
H2SO4 (pH 2.5–3.0); sample injection –20 ml].
The performance of batch experiments was evaluated by
estimating the substrate (COD) removal efficiency (x) during
operation using Eq. (1). CSO represents the initial COD
concentration (mg/l) in the feed and CS denotes COD
concentration (mg/l) in the reactor outlet.
x ¼ ½ðCSO � CSÞ=CSO� � 100 (1)
Organic loading rate based on COD (OLR – Kg COD/m3-day)
was calculated using Eq. (2), where F represents feed rate
(l/day) and V denotes the volume of substrate (l).
OLR ¼ f½CSo�F�=Vg (2)
Substrate degradation rate (SDR – Kg CODR/m3-day) was
calculated to study the rate and pattern of COD removal
during the cycle operation according to the Eq. (3), where, xt
represent substrate removal efficiency (%) at time ‘t’.
SDR ¼ ½OLR� xt=100� (3)
3. Results and discussion
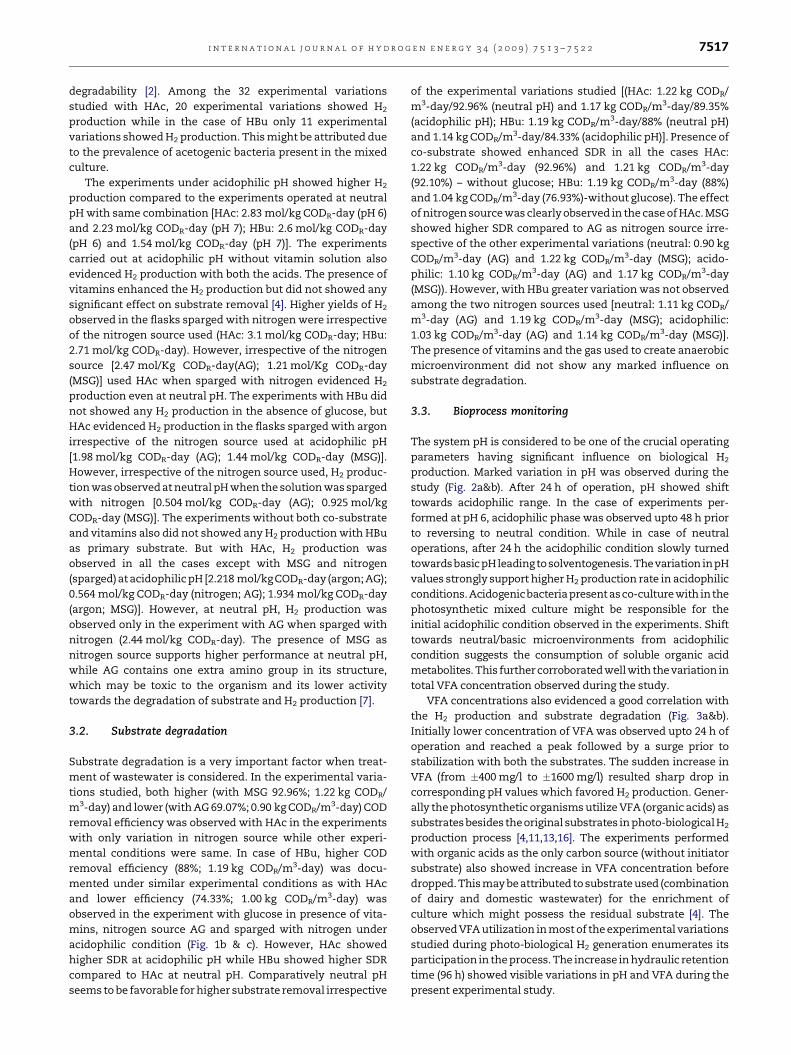
3.1. Biohydrogen production
The experimental data illustrated the feasibility of utilizing
both HAc and HBu as metabolic substrates for H2 production by
photo-fermentation process apart from substrate degradation
(Fig. 1a). Among the two substrates studied, HAc showed
comparatively higher H2 production than HBu. Experiments
performed in the presence of glucose as co-substrate, vitamins
and MSG as nitrogen source when sparged with argon gas at
acidophilic pH registered higher H2 production with both HAc
(3.51 mol/kg CODR-day) and HBu (3.33 mol/kg CODR-day). The
experimental variations studied with HBu in presence of
glucose as co-substrate showed H2 production irrespective of
the nitrogen source used and gas sparged at both acidophilic

0.0
0.5
1.0
1.5
2.0
2.5
3.0
3.5
4.0
3231302928272625242322212019181716151413121110987654321Experiment Number
Sp
ecific H
2 p
ro
du
ctio
n (m
ol/kg
C
OD
R-d
ay)
Acetic acid Butyric acid
0
10
20
30
40
50
60
70
80
90
100
312927252321191715131197531
CO
D rem
oval efficien
cy (%
)
Experiment Number
Acetic acid Butyric acid
0.00
0.20
0.40
0.60
0.80
1.00
1.20
1.40
3231302928272625242322212019181716151413121110987654321Experiment Number
SD
R (kg
C
OD
R/m
3-d
ay)
Acetic acid Butyric acid
a
b
c
Fig. 1 – (a) Specific H2 production; (b) COD removal efficiency; (c) Substrate degradation rate (SDR) with the function of
experimental variations studied.
i n t e r n a t i o n a l j o u r n a l o f h y d r o g e n e n e r g y 3 4 ( 2 0 0 9 ) 7 5 1 3 – 7 5 2 27516
and neutral microenvironment. However, in the absence of
vitamins, acidophilic microenvironment showed lower H2
production. On the contrary, HAc as metabolic substrate
showed higher H2 production irrespective of the presence or
absence of glucose (co-substrate), vitamins, nitrogen source
used and gas sparged at both acidophilic and neutral micro-
environment. HAc evidenced good H2 yield among the two
acids studied which is due to its simple structure and easy
i n t e r n a t i o n a l j o u r n a l o f h y d r o g e n e n e r g y 3 4 ( 2 0 0 9 ) 7 5 1 3 – 7 5 2 2 7517
degradability [2]. Among the 32 experimental variations
studied with HAc, 20 experimental variations showed H2
production while in the case of HBu only 11 experimental
variations showed H2 production. This might be attributed due
to the prevalence of acetogenic bacteria present in the mixed
culture.
The experiments under acidophilic pH showed higher H2
production compared to the experiments operated at neutral
pH with same combination [HAc: 2.83 mol/kg CODR-day (pH 6)
and 2.23 mol/kg CODR-day (pH 7); HBu: 2.6 mol/kg CODR-day
(pH 6) and 1.54 mol/kg CODR-day (pH 7)]. The experiments
carried out at acidophilic pH without vitamin solution also
evidenced H2 production with both the acids. The presence of
vitamins enhanced the H2 production but did not showed any
significant effect on substrate removal [4]. Higher yields of H2
observed in the flasks sparged with nitrogen were irrespective
of the nitrogen source used (HAc: 3.1 mol/kg CODR-day; HBu:
2.71 mol/kg CODR-day). However, irrespective of the nitrogen
source [2.47 mol/Kg CODR-day(AG); 1.21 mol/Kg CODR-day
(MSG)] used HAc when sparged with nitrogen evidenced H2
production even at neutral pH. The experiments with HBu did
not showed any H2 production in the absence of glucose, but
HAc evidenced H2 production in the flasks sparged with argon
irrespective of the nitrogen source used at acidophilic pH
[1.98 mol/kg CODR-day (AG); 1.44 mol/kg CODR-day (MSG)].
However, irrespective of the nitrogen source used, H2 produc-
tion was observed at neutral pH when the solution was sparged
with nitrogen [0.504 mol/kg CODR-day (AG); 0.925 mol/kg
CODR-day (MSG)]. The experiments without both co-substrate
and vitamins also did not showed any H2 production with HBu
as primary substrate. But with HAc, H2 production was
observed in all the cases except with MSG and nitrogen
(sparged)at acidophilic pH [2.218 mol/kgCODR-day (argon; AG);
0.564 mol/kg CODR-day (nitrogen; AG); 1.934 mol/kg CODR-day
(argon; MSG)]. However, at neutral pH, H2 production was
observed only in the experiment with AG when sparged with
nitrogen (2.44 mol/kg CODR-day). The presence of MSG as
nitrogen source supports higher performance at neutral pH,
while AG contains one extra amino group in its structure,
which may be toxic to the organism and its lower activity
towards the degradation of substrate and H2 production [7].
3.2. Substrate degradation
Substrate degradation is a very important factor when treat-
ment of wastewater is considered. In the experimental varia-
tions studied, both higher (with MSG 92.96%; 1.22 kg CODR/
m3-day) and lower (with AG 69.07%; 0.90 kg CODR/m3-day) COD
removal efficiency was observed with HAc in the experiments
with only variation in nitrogen source while other experi-
mental conditions were same. In case of HBu, higher COD
removal efficiency (88%; 1.19 kg CODR/m3-day) was docu-
mented under similar experimental conditions as with HAc
and lower efficiency (74.33%; 1.00 kg CODR/m3-day) was
observed in the experiment with glucose in presence of vita-
mins, nitrogen source AG and sparged with nitrogen under
acidophilic condition (Fig. 1b & c). However, HAc showed
higher SDR at acidophilic pH while HBu showed higher SDR
compared to HAc at neutral pH. Comparatively neutral pH
seems to be favorable for higher substrate removal irrespective
of the experimental variations studied [(HAc: 1.22 kg CODR/
m3-day/92.96% (neutral pH) and 1.17 kg CODR/m3-day/89.35%
(acidophilic pH); HBu: 1.19 kg CODR/m3-day/88% (neutral pH)
and 1.14 kg CODR/m3-day/84.33% (acidophilic pH)]. Presence of
co-substrate showed enhanced SDR in all the cases HAc:
1.22 kg CODR/m3-day (92.96%) and 1.21 kg CODR/m3-day
(92.10%) – without glucose; HBu: 1.19 kg CODR/m3-day (88%)
and 1.04 kg CODR/m3-day (76.93%)-without glucose). The effect
of nitrogen source was clearly observed in the case of HAc. MSG
showed higher SDR compared to AG as nitrogen source irre-
spective of the other experimental variations (neutral: 0.90 kg
CODR/m3-day (AG) and 1.22 kg CODR/m3-day (MSG); acido-
philic: 1.10 kg CODR/m3-day (AG) and 1.17 kg CODR/m3-day
(MSG)). However, with HBu greater variation was not observed
among the two nitrogen sources used [neutral: 1.11 kg CODR/
m3-day (AG) and 1.19 kg CODR/m3-day (MSG); acidophilic:
1.03 kg CODR/m3-day (AG) and 1.14 kg CODR/m3-day (MSG)].
The presence of vitamins and the gas used to create anaerobic
microenvironment did not show any marked influence on
substrate degradation.
3.3. Bioprocess monitoring
The system pH is considered to be one of the crucial operating
parameters having significant influence on biological H2
production. Marked variation in pH was observed during the
study (Fig. 2a&b). After 24 h of operation, pH showed shift
towards acidophilic range. In the case of experiments per-
formed at pH 6, acidophilic phase was observed upto 48 h prior
to reversing to neutral condition. While in case of neutral
operations, after 24 h the acidophilic condition slowly turned
towardsbasic pHleading tosolventogenesis.Thevariation inpH
values strongly support higher H2 production rate in acidophilic
conditions.Acidogenicbacteriapresent asco-culture with inthe
photosynthetic mixed culture might be responsible for the
initial acidophilic condition observed in the experiments. Shift
towards neutral/basic microenvironments from acidophilic
condition suggests the consumption of soluble organic acid
metabolites. This further corroborated well with the variation in
total VFA concentration observed during the study.
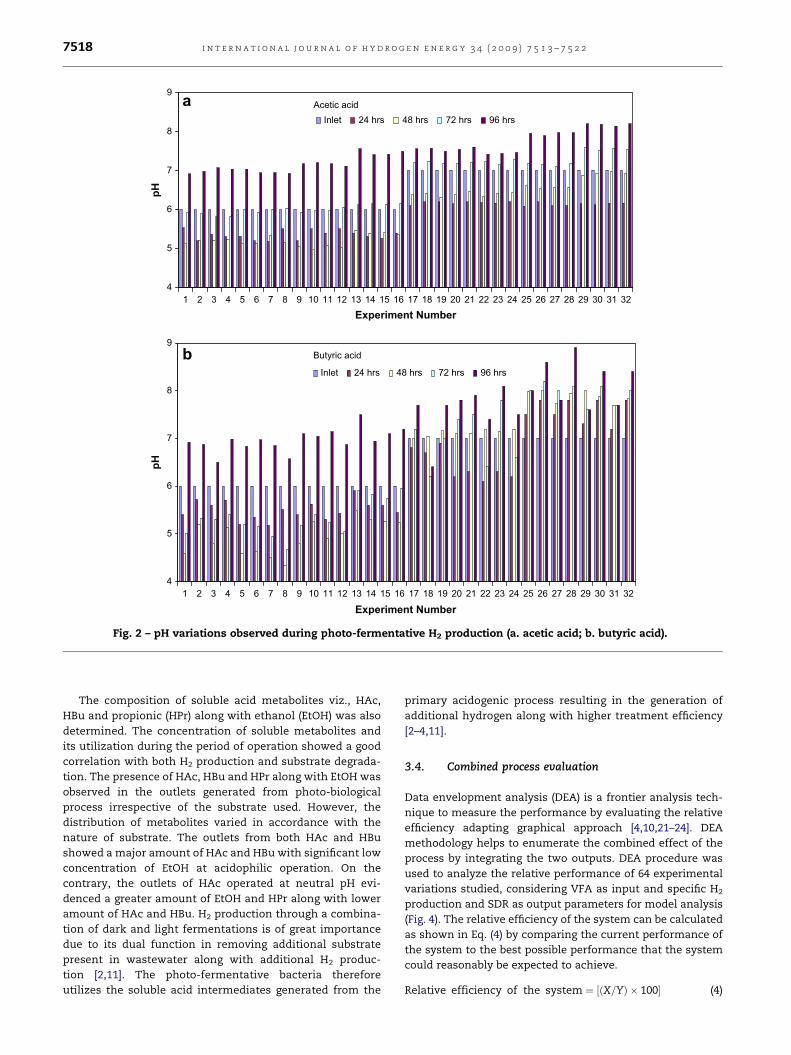
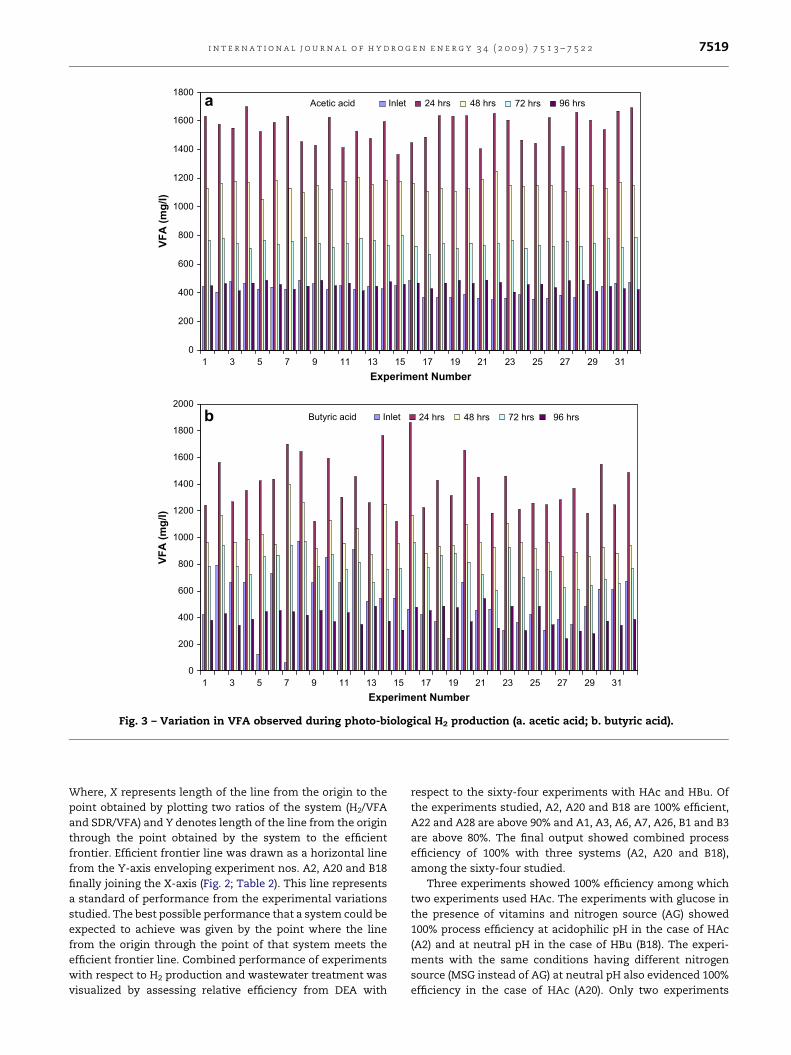
VFA concentrations also evidenced a good correlation with
the H2 production and substrate degradation (Fig. 3a&b).
Initially lower concentration of VFA was observed upto 24 h of
operation and reached a peak followed by a surge prior to
stabilization with both the substrates. The sudden increase in
VFA (from �400 mg/l to �1600 mg/l) resulted sharp drop in
corresponding pH values which favored H2 production. Gener-
ally the photosynthetic organisms utilize VFA (organic acids) as
substrates besides theoriginal substrates in photo-biological H2
production process [4,11,13,16]. The experiments performed
with organic acids as the only carbon source (without initiator
substrate) also showed increase in VFA concentration before
dropped. This may be attributed to substrate used (combination
of dairy and domestic wastewater) for the enrichment of
culture which might possess the residual substrate [4]. The
observed VFA utilization in most of the experimental variations
studied during photo-biological H2 generation enumerates its
participation in the process. The increase in hydraulic retention
time (96 h) showed visible variations in pH and VFA during the
present experimental study.
4
5
6
7
8
9
3231302928272625242322212019181716151413121110987654321
Experiment Number
pH
Inlet 24 hrs 48 hrs 72 hrs 96 hrsAcetic acid
4
5
6
7
8
9
3231302928272625242322212019181716151413121110987654321
Experiment Number
pH
Inlet 24 hrs 48 hrs 72 hrs 96 hrs
Butyric acid
a
b
Fig. 2 – pH variations observed during photo-fermentative H2 production (a. acetic acid; b. butyric acid).
i n t e r n a t i o n a l j o u r n a l o f h y d r o g e n e n e r g y 3 4 ( 2 0 0 9 ) 7 5 1 3 – 7 5 2 27518
The composition of soluble acid metabolites viz., HAc,
HBu and propionic (HPr) along with ethanol (EtOH) was also
determined. The concentration of soluble metabolites and
its utilization during the period of operation showed a good
correlation with both H2 production and substrate degrada-
tion. The presence of HAc, HBu and HPr along with EtOH was
observed in the outlets generated from photo-biological
process irrespective of the substrate used. However, the
distribution of metabolites varied in accordance with the
nature of substrate. The outlets from both HAc and HBu
showed a major amount of HAc and HBu with significant low
concentration of EtOH at acidophilic operation. On the
contrary, the outlets of HAc operated at neutral pH evi-
denced a greater amount of EtOH and HPr along with lower
amount of HAc and HBu. H2 production through a combina-
tion of dark and light fermentations is of great importance
due to its dual function in removing additional substrate
present in wastewater along with additional H2 produc-
tion [2,11]. The photo-fermentative bacteria therefore
utilizes the soluble acid intermediates generated from the
primary acidogenic process resulting in the generation of
additional hydrogen along with higher treatment efficiency
[2–4,11].
3.4. Combined process evaluation
Data envelopment analysis (DEA) is a frontier analysis tech-
nique to measure the performance by evaluating the relative
efficiency adapting graphical approach [4,10,21–24]. DEA
methodology helps to enumerate the combined effect of the
process by integrating the two outputs. DEA procedure was
used to analyze the relative performance of 64 experimental
variations studied, considering VFA as input and specific H2
production and SDR as output parameters for model analysis
(Fig. 4). The relative efficiency of the system can be calculated
as shown in Eq. (4) by comparing the current performance of
the system to the best possible performance that the system
could reasonably be expected to achieve.
Relative efficiency of the system ¼ ½ðX=YÞ � 100� (4)
0
200
400
600
800
1000
1200
1400
1600
1800
312927252321191715131197531Experiment Number
VF
A (m
g/l)
Inlet 24 hrs 48 hrs 72 hrs 96 hrsAcetic acid
0
200
400
600
800
1000
1200
1400
1600
1800
2000
312927252321191715131197531Experiment Number
VF
A (m
g/l)
Inlet 24 hrs 48 hrs 72 hrs 96 hrsButyric acid
a
b
Fig. 3 – Variation in VFA observed during photo-biological H2 production (a. acetic acid; b. butyric acid).
i n t e r n a t i o n a l j o u r n a l o f h y d r o g e n e n e r g y 3 4 ( 2 0 0 9 ) 7 5 1 3 – 7 5 2 2 7519
Where, X represents length of the line from the origin to the
point obtained by plotting two ratios of the system (H2/VFA
and SDR/VFA) and Y denotes length of the line from the origin
through the point obtained by the system to the efficient
frontier. Efficient frontier line was drawn as a horizontal line
from the Y-axis enveloping experiment nos. A2, A20 and B18
finally joining the X-axis (Fig. 2; Table 2). This line represents
a standard of performance from the experimental variations
studied. The best possible performance that a system could be
expected to achieve was given by the point where the line
from the origin through the point of that system meets the
efficient frontier line. Combined performance of experiments
with respect to H2 production and wastewater treatment was
visualized by assessing relative efficiency from DEA with
respect to the sixty-four experiments with HAc and HBu. Of
the experiments studied, A2, A20 and B18 are 100% efficient,
A22 and A28 are above 90% and A1, A3, A6, A7, A26, B1 and B3
are above 80%. The final output showed combined process
efficiency of 100% with three systems (A2, A20 and B18),
among the sixty-four studied.
Three experiments showed 100% efficiency among which
two experiments used HAc. The experiments with glucose in
the presence of vitamins and nitrogen source (AG) showed
100% process efficiency at acidophilic pH in the case of HAc
(A2) and at neutral pH in the case of HBu (B18). The experi-
ments with the same conditions having different nitrogen
source (MSG instead of AG) at neutral pH also evidenced 100%
efficiency in the case of HAc (A20). Only two experiments

0.000
0.010
0.020
0.030
0.040
0.00350.00300.00250.0020SDR/VFA
H2/V
FA
B2
A3B1
B7
B4A4
A9
B3A1 A22A6
B8A8
A18
B20A24
B6
A30A7
A2
A20
B18
A13
A26
B17
A14B5
A28A5
A15
A11
Fig. 4 – Data enveloping analysis (DEA) profile.
i n t e r n a t i o n a l j o u r n a l o f h y d r o g e n e n e r g y 3 4 ( 2 0 0 9 ) 7 5 1 3 – 7 5 2 27520
showed process efficiency between 90 and 100% among the
sixty-four studied with HAc. The experiments performed with
glucose, nitrogen source (AG) and sparged with nitrogen gas in
absence of vitamins at neutral pH depicted combined process
Table 2 – Relative and combined process efficiency (H2
production and wastewater treatment) of theexperiments variation studied based on DEAmethodology.
Experiment number Relative efficiency (%)
A1 82.76
A2 100
A3 88.57
A4 57.34
A5 69.33
A6 82.43
A7 82.76
A8 75.94
A9 54.05
A11 71.12
A13 72.41
A14 54.90
A15 78.32
A18 74.67
A20 100
A22 93.19
A24 68.96
A26 86.79
A28 92.72
A30 79.31
B1 89.28
B2 64.52
B3 86.62
B4 49.65
B5 65.33
B6 62.24
B7 50.67
B8 69.39
B17 51.85
B18 100
B20 51.72
A: acetic acid; B: butyric acid.
efficiency of 93.19% while the one without glucose in the
presence of vitamins, nitrogen source (MSG), sparged with
nitrogen at neutral pH evidenced an efficiency of 92.72%.
Among the sixty-four experiments performed seven systems
showed a relative efficiency in the range of 80–90%, among
which five experiments are with HAc. The experiments in
presence of glucose and vitamins at acidophilic pH sparged
with argon showed efficiency of about 80–90% irrespective of
the nitrogen source and substrate used [82.76% (AG); 88.57%
(MSG) HBu: 89.28% (AG); 86.62% (MSG)]. The experiment per-
formed without glucose in the presence of vitamins, nitrogen
source AG and sparged with nitrogen at neutral pH also evi-
denced an efficiency of 86.79%. The experiment without
vitamins but in presence of glucose and nitrogen source MSG
and sparged with argon at acidophilic conditions evidenced
an efficiency of 82.76% while experiments with the same
conditions except nitrogen source (AG) and sparging (nitrogen
instead) evidenced a process efficiency of 82.43%.
Experimental data documented the feasibility of utilizing
organic acids as primary substrates in the process of photo-
biological H2 production. H2 production can be improved by
integrating dark fermentation process with photo-fermenta-
tion process [11]. Photosynthetic culture is generally capable
of producing H2 by utilizing organic acids generated from
acidogenic H2 fermentation (dark) process [4,11,14,17,18].
Photosynthetic bacteria can use small chain organic acids as
electron donors for the production of H2 at the expense of light
energy and have an advantage over the acidogenic bacteria in
terms of high theoretical conversion [4,7,11,16].
Butyrate: C4H8O2þ 6H2O / 10H2þ 4CO2 (5)
Acetate: C2H4O2þ 2H2O / 4H2þ 2CO2 (6)
In addition to H2 production, photo-biological process also
showed substrate degradation and combined process effi-
ciency which was important when wastewater is used as
substrate. This study indicates the integration feasibility of
dark fermentative process with photo-biological H2 production

i n t e r n a t i o n a l j o u r n a l o f h y d r o g e n e n e r g y 3 4 ( 2 0 0 9 ) 7 5 1 3 – 7 5 2 2 7521
resulting in higher H2 production as well as substrate removal.
However, the performance was found to depend on the nature
of organic acid used as substrate, co-substrate, presence of
vitamins, nitrogen source and nature of gas used for creating
anaerobic microenvironment. Combined process efficiency
studies performed with DEA method depicted 12 experi-
mental sets which were in the relative efficiency range of
80–100% among the 64 experimental sets studied (Table 2).
Evidently most of these experimental sets used acetate as
carbon source indicating its positive role on overall process
performance. Glucose as initiator substrate (co-substrate)
showed marked influence on H2 production as well as on
substrate degradation. Almost all the systems in the range of
80–100% efficiency were observed to be associated with
glucose supplementation suggesting the influence of initiator
substrate. Dark fermentative effluents with higher residual
carbon source along with HAc as major component of soluble
metabolites reported to generate higher H2 production in
subsequent photo-biological process [11]. Presence of nitrogen
in effluents showed marked influence on H2 production.
Although the nitrogenase reaction is a highly energy-
consuming process [25] heterocystous N2 fixing cyanobacteria
have an unique ability to sustain H2 production with simple
nutritional requirements [26]. The overall energy-consuming
reaction as explained by Miyake et al., [27] is as follows
N2þ 8Hþ þ 8e� þ 16ATP / 2NH3þH2þ 16ADPþ 16Pi. (7)
The ability of N2 fixation by photo-heterotrophic bacteria or
cyanobacteria is catalyzed by the nitrogenase enzyme which
also catalyses the evolution of H2, particularly in the absence
of N2. This supports the poor H2 production observed in the
presence of N2 compared to the argon in the study. However
for combined process efficiency, presence of nitrogen showed
positive influence. Nitrogen source is also one of the essential
factors for the effective growth of organisms and substrate
utilization [7]. Among the two nitrogen sources used MSG
showed higher H2 production compared to AG irrespective of
the organic acid used as substrate. However, combined
process efficiency evidenced higher performance with AG as
nitrogen source both with HAc and HBu at acidophilic and
neutral pH respectively. MSG as nitrogen source evidenced
higher performance with HAc at neutral pH. Major variation in
the case of combined process efficiency was not observed with
the type of gas used to create anaerobic microenvironment
and the nitrogen source used. Presence of glucose as co-
substrate along with vitamins, AG as nitrogen source and
nitrogen sparging supported higher combined process effi-
ciency with respect to H2 production and substrate removal at
both acidophilic and neutral pH.
4. Conclusions
The experimental data documented H2 production utilizing
acetate and butyrate as primary metabolic substrate along
with wastewater treatment through photo-fermentation
process using mixed culture. Relatively higher H2 yields were
observed with acetic acid compared to butyric acid.
Acidophilic microenvironment seems to be favorable for
higher H2 production. Presence of carbon source as co-
substrate and vitamins also showed positive influence on H2
production. Mono sodium salt of glutamic acid (MSG) evi-
denced higher H2 production compared to the amino glutamic
acid (AG) as nitrogen source. Argon induced anaerobic
microenvironment showed higher H2 production compared to
corresponding nitrogen induced microenvironment. The
presence of co-substrate also showed positive influence on
substrate removal in all the cases however, vitamins presence
and nature of the gas used for creating anaerobic microenvi-
ronment did not show any marked influence on the substrate
degradation. Data enveloping analysis (DEA) was successfully
applied to assess the combined process efficiency with respect
to H2 production and wastewater treatment. Presence of
carbon source as initiator along with vitamins, amino gluta-
mic acid as nitrogen source and sparging with nitrogen
showed higher combined process efficiency at both the
acidophilic and neutral pH. Combination of dark and photo-
fermentation appears to be an ideal route which might lead to
the economic viability of biohydrogen production process
when wastewater is used as substrate.
Acknowledgments
Authors wish to express their deep sense of gratitude to Dr J.S.
Yadav, Director, Indian Institute of Chemical Technology for
his encouragement and support. SS duly acknowledges
Council of Scientific and Industrial Research (CSIR) for
providing Senior Research Fellowship.
r e f e r e n c e s
[1] Levin DB, Lawrence PL, Love M. Biohydrogen production:prospects and limitations to practical application. Int JHydrogen Energy 2004;29(2):173–85.
[2] Venkata Mohan S. Fermentative hydrogen production withsimultaneous wastewater treatment: influence ofpretreatment and system operating conditions. J Sci Ind Res2008;67(11):950–61.
[3] Venkata Mohan S. Harnessing of biohydrogen fromwastewater treatment using mixed fermentative consortia:process evaluation towards optimization. Int J HydrogenEnergy 2009;34(17):7460–74.
[4] Venkata Mohan S, Srikanth S, Dinakar P, Sarma PN.Photobiological hydrogen production by the adopted mixedculture: data enveloping analysis. Int J Hydrogen Energy2008;33(2):559–69.
[5] Fascetti E, D’addario E, Todin O, Robertiello A. Photosynthetichydrogen evolution with volatile organic acids derived fromthe fermentation of source selected municipal solid wastes.Int J Hydrogen Energy 1998;23(9):753–60.
[6] Oh Y, Seol E, Kim MSM, Park S. Photoproduction of hydrogenfrom acetate by a chemoheterotrophic bacteriumRhodopseudomonas palustris P4. Int J Hydrogen Energy 2004;29(11):1115–21.
[7] Barbosa MJ, Jorge MSR, Tramper J, Wijffels RH. Acetate asa carbon source for hydrogen production by photosyntheticbacteria. J Biotechnol 2001;85:25–33.

i n t e r n a t i o n a l j o u r n a l o f h y d r o g e n e n e r g y 3 4 ( 2 0 0 9 ) 7 5 1 3 – 7 5 2 27522
[8] Venkata Mohan S, Mohanakrishna G, Raghuvulu SV,Sarma PN. Enhancing biohydrogen production fromchemical wastewater treatment in anaerobic sequencingbatch biofilm reactor (AnSBBR) by bioaugmenting withselectively enriched kanamycin resistant anaerobic mixedconsortia. Int J Hydrogen Energy 2007;32:3284–92.
[9] Venkata Mohan S, Vijaya Bhaskar Y, Sarma PN. Biohydrogenproduction from chemical wastewater treatment in biofilmconfigured reactor operated in periodic discontinuous batchmode by selectively enriched anaerobic mixed consortia.Wat Res 2007;41:2652–64.
[10] Venkata Mohan S, Lalit Babu V, Sarma PN. Effect of variouspretreatment methods on anaerobic mixed microflora toenhance biohydrogen production utilizing dairy wastewateras substrate. Bioresour Technol 2008;99:59–67.
[11] Srikanth S, Venkata Mohan S, Prathima Devi M, LeninBabu M, Sarma PN. Effluents with soluble metabolitesgenerated from acidogenic and methanogenic processes assubstrate for additional hydrogen production through photo-biological process. Int J Hydrogen Energy 2009;34:1771–9.
[12] Kim MS, Baek JS, Yun YS, Sang JS, Park S, Kim SC. Hydrogenproduction from Chlamydomonas reinhardtii biomass usinga two-step conversion process: anaerobic conversion andphotosynthetic fermentation. Int J Hydrogen Energy 2006;31:812–6.
[13] Hillmer P, Gest H. H2 metabolism in the photosyntheticbacterium Rhodopseudomonas capsulate: H2 production bygrowing culture. J Bacteriol 1977:209–22.
[14] Ike A, Toda N, Tsuji N, Hirata K, Miyamoto K. Hydrogenphotoproduction from CO2-fixing microalgal biomass:application of halotolerant photosynthetic bacteria.J Ferment Bioeng 1997b;84(6):606–9.
[15] Melis A, Melnicki MR. Integrated biological hydrogenproduction. Int J Hydrogen Energy 2006;31:1563–73.
[16] Shi X, Yu H. Continuous production of hydrogen from mixedvolatile fatty acids with Rhodopseudomonas capsulate. Int JHydrogen Energy 2006;31:1641–7.
[17] Kim JS, Ito K, Takahashi H. The relationship betweennitrogenase activity and hydrogen evolution in
Rhodopseudomonas palustris. Agric Biol Chem 1980;44(4):827–33.
[18] Sasaki K. Hydrogen and 5-aminolevulinic acid production byphotosynthetic bacteria. In: Zaborsky OR, editor.Biohydrogen. London: Plenum Press; 1998. p. 133–42.
[19] Zhu H, Suzuki T, Tsygankov AA, Asada Y, Miyake J. Hydrogenproduction from tofu wastewater by Rhodobacter sphaeroidesimmobilized in agar gels. Int J Hydrogen Energy 1999;24:305–10.
[20] APHA. Standard methods for the examination of water andwastewater. 20th, American Public Health Association.Washington, DC: American Water Works Association, WaterPollution Control Federation; 1998.
[21] Charnes A, Cooper WW, Lewin AY, Seiford LM, editors. Dataenvelopment analysis. Theory, methodology andapplications. Boston: Kluwer; 1994.
[22] Ram Mohan S. Benchmarking evaluation of public researchinstitutes using data envelopment analysis. J Sci Ind Res2005;64:403–10.
[23] Venkata Mohan S, Veer Raghuvulu S, Mohanakrishna G,Srikanth S, Sarma PN. Optimization and evaluation offermentative hydrogen production and wastewatertreatment processes using data enveloping analysis (DEA)and Taguchi design of experimental (DOE) methodology. Int JHydrogen Energy 2008;34:216–26.
[24] Venkata Mohan S, Mohanakrishna G, Kannaiah Goud R,Sarma PN. Acidogenic fermentation of vegetable basedmarket waste to harness biohydrogen with simultaneousstabilization. Biores Technol 2009;100:3061–8.
[25] Burris RH. Nitrogenases. J Biol Chem 1991;266:9339–42.[26] Masukawa H, Mochimaru M, Sakurai H. Disruption of the
uptake hydrogenase gene, but not the bidirectionalhydrogenase gene, leads to enhanced photobiologicalhydrogen production by the nitrogen-fixing cyanobacteriumAnabaena sp. PCC7120. Appl Microbiol Biotechnol 2002;58:618–24.
[27] Miyake J, Mao XY, Kawamura S. Photoproduction ofhydrogen from glucose by a co-culture of a photosyntheticbacterium and Clostridium butyricum. J Ferment Technol 1984;62(6):531–5.