ACCOUNTABILITY AND RESPONSIBILITY The Influence ...
255
ACCOUNTABILITY AND RESPONSIBILITY The Influence ofOrganisation Design on Management Accounting
-
Upload
khangminh22 -
Category
Documents
-
view
0 -
download
0
Transcript of ACCOUNTABILITY AND RESPONSIBILITY The Influence ...

ACCOUNTABILITY AND RESPONSIBILITY
The Influence ofOrganisation Design onManagement Accounting

CIP-DATA KONINKLIJKE BIBLIOTHEEK, DEN HAAG
Roberts, Henri Johan Eduard
Accountability and responsibility : the influenceof organisation design on management accounting / HenriJohan Eduard Roberts. - Maastricht: Universitaire PersMaastricht. - 111.Thesis Maastricht. - With ref. - With summary in Dutch.ISBN 90-5278-082-XSubject headings: management accounting / organisationtheory / sociotechnical systems design.
Produktie: Corien Gijsbers
Druk: Datawyse I Universitaire Pers Maastricht

ACCOUNTABILITY AND RESPONSIBILITY
The Influence of Organisation Design onManagement Accounting
PROEFSCHRIFT
ter verkrijging van de graad van doctoraan de Rijksuniversiteit Limburg te Maastricht,
op gezag van de Rector Magnificus, Prof. mr. M.J. Cohen,volgens het besluit van het College van Dekanen,
in het openbaar te verdedigenop woensdag, 9 juni 1993 om 14.00 uur
door
Henri Johan Eduard Roberts
UPMUNIVERSITAIRE PERS MAASTRICHT

Promotor:
Prof. dr. J.F. den Hertog
Beoordelingscommissie:
Prof. dr. W.F.J. Buijink (voorzitter)Prof. dr. J.M. PenningsProf. dr. J.H.R. van de PoelProf. dr. H. SchreuderProf. dr. L.U. de SitterProf. dr. J.A.M. Theeuwes (TU Eindhoven)

TaWecfConfenfs
Table of Contents
Acknowledgements vii
Chapter 1 - The Research Problem. 1Introduction 1The Changes in Competitive Demands 2Why There is a Problem 4What Sort of Management Accounting is Needed 6The Research Problem 7The Approaches Involved 9Structural Studies 10Processual Studies 12Accounting Change Studies 15
Chapter 2 - The Knowledge Enterprise 20Characterisation of the Research Question 20Developing the Research Question 21A Representation of Choices 25Research Philosophy Employed 26The Research Design 30
Chapter 3 - Sociotechnical Systems Design 35Introduction 36The General Idea 36The Embodiment of Sociotechnical Systems Design 40The Dutch Elaboration 44
Modern Sociotechnical Systems Design 44A Design Toolkit 47A Change Management Approach 53
Chapter 4 - Case Van Nelle Tobacco/Rotterdam Plant 57Introduction 57Case Van Nelle Tobacco/Rotterdam plant 58
The Introduction Phase (1984-1986) 58The Analysis Phase (1986-April 1987) 63The Learning Phase (April 1987 - May 1988) 70The Control and Information Structures 72Control and Information Supply Details 76The Relationship with the Management Accounting Systemof Douwe Egberts 91
Ta We o/ Contents
Chapter 5 - Case Zilverstad Silversmithing 95Situational Background 95The Change Trajectory 100The Organisational Redesign 106
Production Structure 106Control Structure I l lManagement Accounting System 113
Results of the Redesign 123Projects Underway 124
Chapter 6 - Case St. Antonius Vesselheads 126Situational Background 126Categorisation of Bottlenecks 129
Modelling the Primary Process 129Indicating Bottlenecks 131Relating Bottlenecks to Organisation Structure 132
Designing the Organisation Structure 134Designing the Management Accounting System 144A First Assessment 153Appendix 156
Chapter 7- Case Analysis and Cross-Case Comparison 158Grounded Analysis of Van Nelle Tobacco/Rotterdam Plant 159Grounded Analysis of Zilverstad Silversmithing 173Comparison of Van Nelle and Zilverstad 184Grounded Analysis of St. Antonius Vesselheads 188Comparison of Van Nelle, Zilverstad and St. Antonius 198
Chapter 8 - Conclusions and Discussion 205Organisation Design and Management Accounting Design -Equal Logics 206Simple Organisations Make Simple Administrations 211Accounting and Learning Organisations 218Help for Practice 225Limitations of the Study 226Suggestions for Further Research 227
References 229
Authors Index 241
Nederlandse samenvatting - Summary in Dutch 243
Curriculum Vitae 246
VI

Acknowledgements
The preparation, executing and writing of a research study looks like a one-person af-fair, as only one name is mentioned on the cover. Nothing is farther from the truth. Itis a multi-person event, involving many people in various roles.
First of all, my friends of the Technology, Work and Organisation (TAO) team at theMaastricht Economic Research institute on Innovation and Technology (MERIT): Frisoden Hertog, who was as much a guide as a friend when confronted with the frequentquestions of "how now?" The good atmosphere he created within the team was hap-pily continued by my colleagues Jan Cobbenhagen and Ed van Sluijs, with whom Ihad research-related as well as many research-unrelated discussions. Moreover, thesecretarial staff that supported the team were really the people that maintained thegood working atmosphere on a day-to-day basis: Corien Gijsbers and Lori Mees werealways there to help (see the high-quality outline of this study) and we also had a lotof fun. Also, they provided the necessary corrections to my usage of the English lan-guage and turned it into something that could be understood by persons other thanmyself.
Having a good team of friends at your side in itself will not produce a research studyif there is not an equally encouraging research topic. It was the many people I met'out there' that gave life and contour to what I was trying to find out. Therefore, Iwould like to thank Rik van Sonsbeek and Toine Domensino of Van Nelle To-bacco/Rotterdam for their very clear and insightful accounts; it was their explana-tions that provided the insight that further guided my research activities. Further-more, I would like to thank Messrs. Arne and Arie Pluut, and Klaas Teeuwen of Zil-verstad BV for their unrestrained help and cooperation in showing me how to turn asmall company into a frontrunning business. Last but not least, I would like to thankRaymond Cordewener and Cor Jansen of St. Antonius for the many hours they spentexplaining things to me and the kilos of information on how to redesign and managea high-tech business in a competitive European market. Having met them and lis-tened to them helped create much of my research excitement and convinced me of thequalities of Dutch managers.
Next, there are the many people that made things possible. First of all, the consultantsof KOERS Consultancy BV, Mieke van den Oetelaar and Frank Verschuur. They pro-vided access to the above-mentioned companies and added a lot of refreshing per-spectives and insights acquired from their long consultancy experiences to mine.
The Technology, Work and Organisation programme committee provided the fund-ing and institutional framework for this study. The joint efforts of the participatingDutch ministries of Education & Sciences, of Economic Affairs, and of Social Affairs &Employment have created a unique research programme that is now beginning toreap its first benefits.
vu

I would like to thank my colleagues of the University of Limburg and, especially, theaccounting section of the Business Department for their tolerance with me and withmy preoccupation with topics that were often very unrelated to their own ways ofthinking and research.
I would like to thank The Staal Stichting 1966 for their support in funding the publi-cation of this study.
In conclusion, I thank my wife Ellen Krijnen. Without her presence and support, thisstudy would not have been completed and I would not have become the happy per-son I am right now.
Hanno Roberts
Madrid, March 1993
viii

1The Research Problem
C/iapfer 2 dea/s u>if/i f/ie researc/i prob/em, its tacfcgrownd, and ifs f/ieoreh'ca/ posi-tioning. T/ie or^ani'safiona/ design mode/ under/y/ng mawa^emenf accounting /iasc/ianged. Organ/'safion design is moping away /rom Tay/orisfic /uncfiona/ group-ing, specia/ised fasfcs and is malting a distinction between fhin/cing and doing. Theorganisation design t/iat is gradua//y appearing is that o/ /ïow-orienfed organisa-tions with //at strwctwres and using a team approach and integrated fasfcs. Man-agement accounting is a/so required to accommodate this new organisation designand must reconvert ifse// according/y. /f is argued that studying this rematching isbest accomp/ished by /ie/rf study research o/ transition situations in practice. The/ocus o/ this study is directed at the comparison o/ previous and present organisa-tion designs as we// as the concurrent change in the management accounting sys-tems designs, /t is concerned with the /o//owing questions: Js there a particu/ar re-design /ogic in management accounting systems and what is ifs connection withthe redesign /ogic o/ the organisation? And does redesign inpo/z>e the adaptation,renovating or indention o/ traditiona/ management accounting instruments? Theresearch prob/em is positioned in organisationa/ research in accounting. Thisstudy contains both a structure/ and a processua/ perspective on action, and its/eve/ o/ ana/ysis is the organisation.
Introduction'
Since the early 1980s, competition between firms has changed. Authors like Porter(1980, 1985) tended to follow an intensified reflection on the competitive postureand ambitions of firms. His framework for competitive strategy did not onlydistinguish between cost, focus and differentiation strategies, but also pointed outthe competitive forces of consumers, suppliers, new entrants, substitute productsand existing organisations within the industry. Suddenly, firms seemed to realisethat they were living in a world in which they were surrounded by competitiveadvantages and disadvantages. They had to line up their affairs and decide wherethey competitively stood, and what action to take to improve or to defend theirposition.

Chapter 1
The upsurge in attention for Japanese management practices amplified the feeling,especially in the U.S., that established management tools and routines were lag-ging behind and had to catch up. The Japanese produced better and cheaper auto-mobiles, microelectronics and audio equipment; they even wiped out the rest ofthe world in cameras and motorbikes. And they were successful wherever andwhenever they started to compete! Customers massively wanted high-qualityproducts that were made to their personal demands and immediately available. Itled to the 'discovery' of the new competitive parameters of quality, flexibility andinnovativeness (Bolwijn, 1988; Bolwijn and Kumpe, 1987, 1990; Roberts, 1990),almost at the same time that firms began to realise that competition was bothglobal and could be coming from such forces as suppliers and product substitutes.Companies now had to adopt a far more comprehensive business approach aswell, including all 'new' competitive forces and parameters.
The Changes in Competitive Demands
With competitive awareness growing fast and industries beginning to lag, the ten-dency arises to copy successful competitors, i.e., asking questions as to how theJapanese run their organisations. Many studies of management were initiated,usually relating to one of the competitive parameters of quality, flexibility, timeli-ness or innovativeness. The high performance on quality of Japanese companiesplayed an important role in their first competitive successes. The concept of statis-tical in-process quality control formed the basis for a systematic approach in organ-ising for quality performance. Such methods as quality circles, a high level of in-dustrial and process engineering, various forms of on-line feedback in manufac-turing and stepwise product improvement were found to be of importance.
Customisation was considered a part of product quality, usually expressed as 'fit-ness for use': The customer decides whether the product fits his needs. Tying itsdesign as much as possible to these needs will make him a prospective customerfor a long time. Product quality thus defined, resulted in a crystallisation of mar-kets, and with it came an opportunity to execute a focus or differentiation strategy.Customisation introduced a large product variation and, consequently, a largenumber of small production batches. To combine both a large product variety andeconomies of scale, advanced manufacturing technologies such as Flexible Manu-facturing Systems (FMS) and Computer Integrated Manufacturing (CIM) providedhelp. These highly automated and computerised systems enabled firms to design,engineer, plan, manufacture and deliver products with a high level of customisa-tion. The large number of product/customer specifications are stored by the com-puter, which can, for example, use this information at any time to control manu-facturing operations. Also, switching operations from one product to another isdone automatically by the computer, rendering a much more flexible organisationin terms of production capabilities and customer demands.
With quality properly taken care of, the process control of Japanese companies wassophisticated enough to use it as a tool. A tool for another goal: the timeliness oftheir processes. Competing on time indicates the use of a time consumption re-source model throughout the value chain of the organisation, including bothsuppliers and customers (Stalk, 1988). Using it, first of all means excluding the

77ie Researc/i Profr/em
time wastes within the value chain. As these wastes are eliminated, a start can bemade with reducing actual time consumption; standardising operations on a timebasis. This model is fully represented in the Just-In-Time (JIT) philosophy: a(production) control system based on the customer 'pulling' the product out of thecompany instead of having the product 'pushed' to him from inventory, thus re-versing the idea of upstream and downstream product flows (Boons and Roberts,1990). Inventories in JIT systems are considered a waste of resources, because theyslow down the flow (rest time) and add no value to the product (value adding isconsidered equivalent to operating time). As a result, throughput time, capacityutilisation and volume turnover will increase, generating profits (and losses)faster.
Hand in hand with an increase in timeliness goes an increase in product flexibil-ity. If one is able to rapidly develop, manufacture and market products, the prod-uct follow-up can be considerably increased. As soon as product Mark-I is mar-keted, it can be evaluated on its customer satisfaction and profit potential. This in-formation is input for redesigning a Mark-II, tying it again closer to customer satis-faction. In this respect, computer-aided technologies not only increase the rate ofproduct turnover but also improve pre-market testing, using Computer-AidedTesting/Design. Innovations can therefore be developed quicker, with the marketplace less serving as a final evaluation of its success ('economies of speed'; Bertsch,1989).
The above developments in quality, timeliness, flexibility and innovativenesshave also radical consequences for the design of the organisation and the man-agement of the human resources. However, these implications are not alwaysrecognised. Many organisations continue on the same footing, introducing newapproaches and technologies to an organisation based on a Tayloristic design. ThisTayloristic organisation design has all the characteristics of a machine bureaucracy(Mintzberg, 1979). It maintains:
1) a sharp distinction between staff and line functions, coinciding with a distinc-tion between thinking and doing;
2) a functional classification, grouping sort to sort, its application including R&D;3) a strong hierarchy; and4) an extreme splitting up of tasks.
The accounting response to this Tayloristic model is the consideration of labour asbeing a cost. For example, accounting can very well handle line functions, that is,the doing part of doing and thinking: direct labour costs. The thinking part of do-ing and thinking disappears into diffuse overhead categories which, until recentlywith the emergence of Activity-Based Costing, could be made managerable onlywith considerable difficulty.
Nevertheless, more and more firms come to the conclusion that the new competi-tive parameters only flourish in a certain type of organisation. This other organi-sation design is a far cry from the Tayloristic mode of organisation. Its characteris-tics are:
1) bringing staff and line (thinking and doing) back together;

C/iapter ï
2) a flow-oriented production;3) a flat organisation structure;4) integrated tasks, up to the level of maintaining a team approach, including
R&D.
In this organisation model, labour is conceived of as an asset rather than a cost.Labour stands for human resources providing the very competences of the organi-sation. Accounting, however, has not been able yet to comply with this new typeof organisation model. Moreover, the accounting representation of intellectual as-sets (R&D and all other sorts of expertise) as well as Human Resource accountingnever did get off the ground, and is as yet not included in regular accounting re-porting.
Recent studies by Adler (1986, 1988), Adler and Helleloid (1987) and Jaikumar(1986) corroborate the characteristics of this new model. For example, in his studiesof the implementation of flexible automation, Adler notes that human resourcemanagement issues were the major stumbling blocks for successful implementa-tion (1988, p. 48). Jaikumar, in his study of the highly different productivities offlexible manufacturing systems in Japanese and U.S. firms, relates this lowproductivity in U.S. firms to the lack of accompanying changes in the organ-isational model. Especially the management of 'intellectual capital' instead ofequipment, and the focus on decentralised and multi-skill, multi-disciplinaryteam work are major features of this new organisation model.
Why There is a Problem
It was Robert S. Kaplan who cued the reflections on the management accountingdiscipline and what it still has to offer to firms facing the competitive world de-scribed above. In the book Re/ez>ance Lost: 77ie R/se and Fa// o/ Management Ac-counting (Johnson and Kaplan, 1987), he questioned whether management ac-counting was as useful as it was in early 1900, when it was developed. Using his-toric analysis, he showed that most of the present-day accounting instruments andconcepts were products of the then prevailing business situation: A world charac-terised by price competition with low-tech factories turning out large volumes ofstandardised products. Production economies of scale ruled the accounting con-cepts. Large volumes meant low costs and therefore improved price competition.
To get these large volumes, highly centralised and functionally specialised organi-sations were established in order to promote maximum efficiency. Frederick Tay-lor's 'scientific managemenf methods were used to split up processes as much aspossible and divide labour into specialised functions providing further economiesof scale. When processes could not be split up any further - i.e., when one singletask content was assigned - operating standards were set. Originally, these stan-dards were set to provide information for planning the work flow, but soon theywere used to control costs, comparing standards with actuals and interveningwhen variances got 'out of control'. The first (standard) cost system was born. Also,as a consequence of the maximal division of labour, a massive and bureaucraticorganisation structure was required. Each further process desaggregation was com-plemented with an additional control level.

The Research Prob/em
The different units and divisions had to be controlled on their performance, bothin terms of volume and in profit. At the same time, control based on one-dimen-sional cost standards such as material or labour, proved insufficient to capture themultiple number of activities contained in a single division. A problem whicharose because a multi-activity division was run as a mere sum of various single-activity departments, measured by operational efficiencies such as costs per unit,operating ratios and inventory turnover (Johnson and Kaplan, 1987). To coor-dinate internal resource flows (materials, labour, equipment) budget systems werecreated. With the introduction of budgets, the concept of responsibility centres wasimplicitly introduced also. By means of the budget, the various managers of thesingle-activity departments could be grouped into a coherent multi-activity operat-ing unit, aligning departmental goals with overall goals.
Furthermore, in order to grow, these multi-activity firms had to rely on outsidecapital. It resulted in an increased emphasis on management of capital resources asshareholders wanted a (high) return on their investment. Consequently, this ledto an internal emphasis on capital returns as well, for example by employing Re-turn-On-Investment (ROD performance controls. Also, to increase further econo-mies of scale, firms started to vertically integrate with suppliers and buyers in thebusiness column. Usually, a large firm had no extensive knowledge of the specificsof the wholesale or raw materials business, so decision making, control and coor-dination had to be brought to the places where expertise was located. With thehelp of the tools of budgets and financial performance controls, such delegationcould be adequately handled.
The large hierarchic organisations which existed around the 1920s and 1930s werethus managed and controlled by information on their respective efficiency andconsequent profitable return on capital investment. The measurement systemsput up to do this were largely constructed by engineers having a keen eye for themanufacturing processes of the organisation. This stage of managerial controlKaplan calls the era of cost
It was followed by an era of cost accounting, in which financial reporting for capi-tal market requirements gained additional influence. In this era, financial account-ing procedures took the lead in structuring internal financial management. Thiswas because more elaborate cost management systems could not pass the cost-ben-efit test: They were too expensive given the lack of cost-efficient information-pro-cessing technology. The present availability of information technology, however,has witnessed an increase in more elaborate cost management techniques, e.g., theJapanese techniques of value engineering, cost tables and functional analysis(Tanaka, 1989; Yoshikawa, Innes and Mitchell, 1989, 1990). With the dominance offinancial accounting procedures came also a switch in disciplinary focus, sinceauditors and financial accountants were more inclined to use economic methodsto attach activities to products, rather than engineering methods (Johnson andKaplan, 1987).

What Sort of Management Accounting is Needed
Traditional views on how to structure and control organisations operating in aradically changed competitive environment are presently only challenged in prac-tice. For instance, textbooks gave, and still give, an implicit view of organisationsin functional terms (Emmanuel, Otley and Merchant, 1990; Horngren and Foster,1987): A representation of organisations which is still based on the historic notionof a maximal division of labour, grouping similar functions together in de-partments: lathes with lathes, tooling with tooling and material handling withmaterial handling. But also engineers in the Engineering department, marketeersin the Marketing department and accountants in the Finance & Accounting de-partment. Sometimes, grouping appears under a business unit or product divisionlabel but at lower level, the functional distinctions appear again.
However, with the change of the competitive arena, organisational conditions aremore and more found to diverge from conventional notions implied in textbooktechniques and instruments. Inter-disciplinary development teams that follow theproduct's full life cycle, integrated tasks, Just-In-Time production, team-based job-shops - all changes that come in from practice and challenge longstanding views.For example, textbooks as yet do not discuss how to build an information systembased on time consumed, or how to install flow performance measures instead ofresource consumption measures, or manage production based on product at-tributes. Nor do textbooks discuss controlling for organisational learning or howto structure organisations on the basis of a minima/ division of labour, usingmulti- or inter-disciplinary teams. Input from practice will have to supply adapta-tions, improvements and perhaps even innovations of conventional textbookrepresentations and solutions.
Traditionally, accounting instruments and the internal bookkeeping system fromwhich it gets its information input are one-dimensional. It registers financialtransactions. Transactions regarding quality, flexibility or timeliness cannot be cap-tured in this one dimension if translated to financial terms. As a result of thistranslation, many explanatory variables useful for managerial decision making arelost in the translation process. The only one variable that conventional accountingsystems recognise as causing variations in cost behaviour is volume. That is thehistorical upbringing of management accounting systems; more or less input ofproducts, capital, materials or human effort means lower or higher costs^. Parallelsystems are usually needed in order to make translation to the financial accountspossible. For example, improved customer service will be measured by a reductionof the number of complaints. This, in turn, will probably result in lower warrantycosts, thus creating a whole world of inferences, assumptions and estimationswhich allows for heuristics, rules-of-thumb and personal information systems.
Moreover, one-dimensional financial logic will sometimes work contrary to im-proved decision-making and management of the business. For example, usingcapital budgeting methods as Discounted Cash Flow (DCF) to allocate funds to pro-jects, is mainly based on expected cash returns and outlays. Or, as Hayes andGarvin (1982, p. 77-78) put it:
77ie Researc/i Problem
"... Less obvious benefits from increased worker skills and capabilities, new products, and adifferent cost structure are harder to document in advance and so do not fit neatly into a pre-sent-value analysis. In fact, to counteract this bias against modernisation, some companies areexperimenting with a "sunset law" for capital equipment, under which a piece of equipment isautomatically replaced at the end of a predetermined period unless a special review processdecides otherwise."
The heuristic of using a "sunset law" is apparently felt necessary to prevent finan-cial logic of dominating decision making. In itself, it says that financial informa-tion does not capture the complexities of practical decision making. Kaplan (1986a,p. 174) exemplifies the same argument in his notion that
"... the existing financial accounting systems signal short-term increases in accounting profitswhile firms decrease their economic wealth by foregoing investments in their long-term in-formation and productive capital."
He goes on to point out to what he feels is the way back to more relevant man-agement accounting:
"... Effective managerial accounting systems must reflect the value-creating activities of com-panies: in operations, in marketing and sales, and in product and process development. In par-ticular, they cannot be developed and maintained in isolation from the organisation and tech-nology of a company's manufacturing processes. If substantial changes arc taking place in man-ufacturing processes, the management accounting systems must also change if they are to pro-vide relevant information for managerial decisions and control." (p. 174)
In other words, improve the representation of organisational reality and practicein the accounting system. However, how much adherence to this plea is justified,it is a continuation of the historic trend Kaplan himself signalled, called 'man-agement by the numbers' (1987, p. 126). It does not make accounting more organi-sational, it just makes organisations more accountable; the underlying processesare still reduced, this time to befter numbers (Ezzamel, Hoskin and Macve, 1990).
A more substantial approach would be to intervene directly into the processes thatcause the accounting numbers instead of improving the numbers game. Account-ing, and especially cost accounting, can still play a role but this time with a strictawareness of the one-dimensional financial expression of activities. Supplement-ing it with nonfinancial operational information can continue to support the roleof accounting in business management.
The Research Problem
The type of management accounting that is to link up better with the 'new' organ-isation facing the 'new' forms of competition has not yet fully arisen from practice.Several research studies have, however, started to indicate what would be the out-line of such a management accounting system (Berliner and Brimson, 1988;Capettini and Clancy, 1987). Equally important, it became clear in the process ofthese studies, that as yet very little field research had been done regarding'common practice': What methods and instruments are used and how do they re-late to company and business characteristics? (Theunisse, Kerremans, Dyck andVan Overloop, 1988; Bennett, Hendricks, Keys and Rudnicki, 1987; Howell, Brown,
C/iapfer 1
Soucy and Seed III, 1987; Boons and Roozen, 1992). Alternatively, little was knownas to how to position existing practices: What could be conceived as 'worst' or 'bestpractice'. Only recently, as management accounting field research is receivingincreasing attention in publications, a few 'best-practice' studies emerge. However,most of these studies are relating to relatively limited subject areas as, for example,the accounting implications of JIT production systems, or the allocation ofcorporate overheads (McNair, Mosconi and Norris, 1988; Johnson and Loewe,1987; Harrison, Holloway and Patell, 1990).
Typically, these studies point at the diminishing relevance of the logic inherent inthe use of 'economies of scale' (costs decrease as output increases). Economies ofscale are the fundamental concept between the two main cost typologies we know:direct versus indirect costs, and fixed versus variable costs. Direct and indirect costsrelate to the cost causality criterion; directly attributable or indirectly attributable tothe production process presumes that the process is a given, a ceferis paribus con-dition. If the process itself changes, as is the case with advanced manufacturingtechnology, causality should be reexamined on its characteristics. Other processrepresentations, other causality concepts or other cost typologies can be the result.Similarly, the fixed versus variable distinction relates cost behaviour to a firm'soutput; if costs do not proportionally vary with output, they are (semi) fixed. Here,output is again considered as being tied to economies of scale, i.e., volume is theonly given variable put forward by the economic model. Whenever 'economies ofscope' (costs decrease as variety increases) exist, management accounting proce-dures are having difficulties as they are dominated by an 'economies of scale'model of the organisation.
Other organisational models as implicitly introduced by advanced manufacturingtechnology ('the knowledge household'; Jaikumar, 1986), Just-In-Time production('the time-coupled household'; Stalk, 1988) or global competition ('the networkorganisation'; Miles and Snow, 1986) disrupt with the economies of scale conceptin management accounting. In other words, the (economic) mass productionmodel of the organisation underlying present management accounting is movingaway from business reality: The various logics of business and accounting seem tobe in discord. Re-establishing a more contingent relationship between competitivecontext, organisation management and the design of the management accountingsystem is the research goal of this study.
In more operational terms, this rematching is best observed in transition situa-tions in practice, where organisations change their internal accounting system.Motivations and design respectively should reflect the transfer in logic; i.e., theformer and present factual use of management accounting systems as they are re-designed for contemporary competitive circumstances. The comparison of bothsituations should show us how the switch in market demands is met and, espe-cially, how this switch influences the design logic of the management accountingsystem, thus leading to the following research questions:
1) Is there a certain redesign logic to be noticed in management accounting sys-tems?
2) Is there a connection with the logic inherent in the design of the organisation?
T/ie Research Prob/em
3) Are traditional management accounting instruments adapted, renovated or re-placed by totally new instruments?
Before starting to answer these research questions, two preceding conditionsshould be made clear. First of all, answering these questions implies a plea for acertain type of management accounting research: The use of empirical field re-search, working upward from field observations towards more general conceptualand theoretical frameworks. Consequently, this includes methodologies and re-search designs which suit such field research approaches, uplifting field observa-tions to analytical and theoretical knowledge. Generally, these methodologies andresearch designs are already familiar from disciplines such as organisation theory,sociology and psychology. It then becomes a matter of creative application to havethem fit the management accounting research agenda. In Chapter 2, methodologi-cal issues will be discussed further.
Second, we need a theory for framing and putting into perspective the resultsfrom accounting field research. Not only as a map of the territory in terms of theresearch questions and methodologies used, but also theory to develop the re-search findings in terms of its wider interpretations. For example, in this particu-lar study, the wider frame of reference is accounting's organisational context, i.e.,its underlying organisation design model. It is tried to link up with preceding or-ganisation design research in explaining the findings and indicating further direc-tions for research.
In the next sections, the territorial map of accounting research is sketched, in-cluding its inherent type of research methodology. It is concluded by discussing thedirection and type of research the management accounting discipline is headingtowards.
The Approaches Involved
The approaches involved fall under the heading of organisational research in ac-counting. Obviously, these theories are imported from organisation theory andcan be typified along two dimensions: the level of analysis and the perspective onaction (Dent, 1986). The first implicitly points at the definition of what an organ-isation is: Is it based on interacting individuals joined in coordinated efforts to ad-vance their rational or irrational self-interests (micro-level analysis), or is an or-ganisation part of a wider, environmental context with various countervailingforces determining its structure and behaviour (macro-level analysis)? Especiallyuseful for accounting research in this respect, is the built-in notion of aggregation.Organisational processes take place at various levels in the organisation: mea-surement, reporting on and acting in these processes tend to follow the aggregateaccountability structure - building from limited towards organisation encompass-ing responsibilities. Accounting information explicitly parallels this pyramid.Therefore, changes in responsibility or, in general, organisation structures suppos-edly should be reflected in the aggregated accounting information supply. How-ever, what is lacking is a meso-level in the analysis. Groups in management andproduction, whether they are full organisational functions such as the Marketingdepartment or team-based modes of organisation (Mintzberg's adhocracies, 1990),
7
seem to fall in between. They are either reduced to a straightforward aggregation ofindividual behaviours or to a watered-down version of 'little full organisationswithin the organisation'. As a result, dynamics present at meso-level run the riskof being overlooked.
The other dimension is formed by the perspective on action. It pertains mainly tohow one thinks people behave; programmed by a thorough analysis of prefer-ences, goals, alternatives and available means, or heuristically, basing themselveson highly individual perceptions, experiences and beliefs (Van de Poel, 1986). Animportant consequence of this split is the type of research which can be related toit: rational behaviour is far more easy to transform to formal models than irra-tional behaviour. Once one has the input from practice to build a formal model,there will be no need to return; rationality is reconstructed and a start can be madewith optimising it from behind a desk ('arm's length data'). On the contrary, a lessrational perspective is far more difficult to put down into models. The dynamic,ever-changing nature of it necessitates constant study, using both concepts andmeanings supplied by the researched subject ('immersion in the field'). This is notto say that irrationality is quite the opposite of rational behaviour; instead, as Dentstates, irrationality can be conceived as fluid rationality, transiting continuously asit is influenced by experiences, beliefs and negotiations.
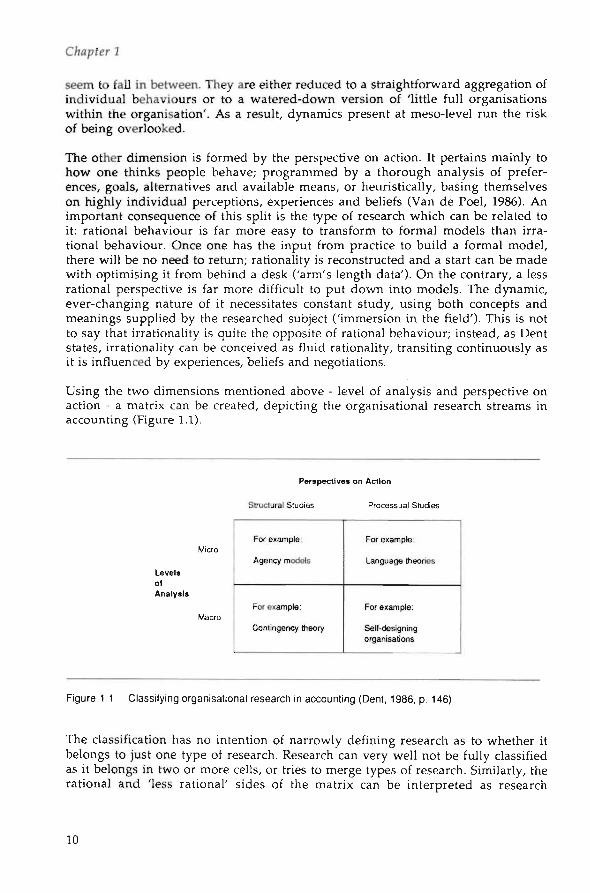
Using the two dimensions mentioned above - level of analysis and perspective onaction - a matrix can be created, depicting the organisational research streams inaccounting (Figure 1.1).
Perspectives on Action
Structural Studies Processual Studies
LevelsofAnalysis
Micro
Macro
For example
Agency models
For example:
Contingency theory
For example:
Language theories
For example:
Sell-designingorganisations
Figure 1.1 Classifying organisational research in accounting (Dent, 1986, p. 146)
The classification has no intention of narrowly defining research as to whether itbelongs to just one type of research. Research can very well not be fully classifiedas it belongs in two or more cells, or tries to merge types of research. Similarly, therational and 'less rational' sides of the matrix can be interpreted as research
10

T/ie Researc/i Prob/cm
streams dominated either by studying organisational structures or organisationalprocesses.
Structural Studies
Structural studies look at organisations as instruments for goal attainment. Organ-isations are considered static and stable, consisting of formal attributes which canbe observed, modelled and predicted. As a consequence, structural studies look ataccounting as an objective toolbox, performing technical analyses on organisa-tional attributes and supplying inputs for control and planning of the organisa-tional entity. For example, structural studies address questions like: What are thedifferences in organisations' planning and control systems, and: How do they sys-tematically relate to contextual variables as technology or strategic posture? Theytry to develop contingency theories presuming to find a 'fit' between organisa-tional effectiveness and variables such as strategy, structure and systems (Porter,1980; Mintzberg, 1979; Ginzberg, 1980). If such a fit could be found, it wouldprescribe the most effective constitution of an organisation as it simply has to getin gear with the various contextual variables.
Contingency theory in accounting draws on the first appearances of contingencytheory in general, which were concerned with organisational structures (Lawrenceand Lorsch, 1969). The accounting version employs the line of argument thatdifferent structural configurations, as a result of contextual factors, lead to differentaccounting systems (Bruns and Waterhouse, 1975; Gordon and Miller, 1976;Gordon and Narayanan, 1984). More recent studies also investigated the role ofstrategy and control as explanatory variables as they are found to take the sameimportance as structure (Govindarajan and Gupta, 1985; Govindarajan and Fisher,1990; Flamholtz, 1983; Flamholtz, Das and Tsui, 1985).
Contingency theory, however promising, has not resulted in conclusive empiricalevidence; conclusions are fragmented because they relate only to narrowly definedrelationships and relationships itself are found to be weak. Also, it is criticisedfrom a behaviouralistic point of view; managerial or human discretion can medi-ate the relationship between external and internal factors. Human interventioncan stop, slow down or affect any action or information implied by a contingencyrelationship. The concept of contingent 'fit' between two or more factors thereforerules out other than mechanistic and objectively modelled behaviour (Van deVen and Drazin, 1985). Moreover, organisation participants can truly exercise theirdiscretion to promote the fit between structural and accounting arrangements. Theintervening effect of discretion therefore can halt, promote or even reversecausality between contingency variables: What causes what becomes unclear. Inother words, increased organisational effectiveness may not be the ou/come ofappropriate choices of external factors and internal arrangements but, instead, aprecondition to choose certain internal configurations.
Another consequence of discretionary behaviour is that it clearly shows that onlyformal properties of the organisation are included. As patterns of behaviour canonly be impartially captured by formal models of structures and information, be-
l l

C/iapfer 2
haviouralistic contingencies that do not have a formal representation are left outand implicitly considered nonexistent (Ford and Schellenberg, 1982).
Furthermore, most of the studies are focused at departmental level, which makesit hard to generalise results to organisational level. This argument is amplifiedwhen considering the need to specify relevant facets of the accounting system atvarious organisational levels: What is crucial at operational level may be of littleimportance at strategic level. Aggregating or disaggregating research findings cantherefore not only be hampered by a lack of consistency across organisational lev-els, but also by a lack of equal level weight of researched factors.
Finally, although contingency studies may result in a clear understanding of howaccounting and information systems designs are matched with external factors(Galbraith, 1977), it does not add to know-how on their instatement. Contingencystudies may identify and classify accounting systems, but they do not help tounderstand how (matched) designs grow and what arguments are used in theirevolution; a processual outlook has to complement its explanation (Dent, 1986).
In this particular study, it is tried to combine both the formal and the behavioralcontingencies in researching organisation design and management accounting sys-tems design. The main tool in this respect is the organisational design methodused in all three researched cases, the Dutch elaboration of SocioTechnical SystemsDesign (STSD). It is this approach that provides an integrated design approach,meaning that it is consistent across all organisation levels, and starts off its designwith the external competitive circumstances of the organisation (see Chapter 3 fora discussion of STSD).
Processual Studies
In contrast, processual studies view organisations as dynamic clusters of mean-ings, symbols and rituals. Goals and instruments are constantly open to changeand (re)negotiation, and organisational participants each contribute a fluent partin this mixture of meanings and rituals. In other words, cognitive processes lie atthe heart of this stream of study. They are the basis for routine and nonroutinebehaviour and as such bring about stability and security to participants. The(non)learning organisation can either use it for reducing complexity to propor-tions it can handle or for barricading itself against change. Consensus on meaningsand beliefs is needed before even to start talking about changes in organisationsand accounting systems. Again as a consequence, accounting is thus far moreviewed as an organisational language, providing categories for interpretationrather than an objective toolbox, and conveying meaning and common percep-tions of what is going on. It follows that an accounting systems design - which de-cides what to measure, to report and to appraise - is a prime language medium andtherefore crucial to the management and unity of the organisation. Accounting'srole is thus considered to be more concerned with analyses of processes and inter-actions between people, than with the formal-analytic attributes of the organisa-tion as, for example, leader/subordinate or principal/agent relationships.
12

77ie Researc/i Prob/em
Processual studies on the organising of accounting (behaviour) have a strong focuson the execution of actions and on system properties. In particular, they look atmanagerial relationships and what specifically constitutes those behavioural rela-tionships. For example, a large part of processual studies are concerned with con-trol: how it is actually exercised, what dynamics certain control types bring aboutand how control links up with accounting systems (Hofstede, 1968; Jönsson, 1982;Birnberg, Turopolec and Young, 1983). Precisely the 'how' and 'what' questionsasked make processual studies important inputs for improvement of accountingmodels of the firm. How things are expected to be done and how it actually turnedout are in fact implicit variance analyses, extending the (learned on the job)repertoire of accounting mechanisms and classification typologies.
Management ControlThe processual study of management control is twofold. It relates to the technicaldesign of controls as we// as how they are used in getting a desired response frompeople. In other words, both the system and the actor are to be controlled (VanAken, 1978). Accounting controls in this respect have to compete with many otherforms of control, e.g., action or personnel controls (Merchant, 1985). The formalaccounting system underlying accounting controls is thus just one of manysystems in an organisation; the formal information provided by it can easily bedistorted by social and political processes.
Three general streams of processual studies can be distinguished:
1) one stream observing the actuation of various controls;2) a stream concerned with the control of the resource allocation process; and3) a stream focusing on the role of accounting in processes of organisational
change (Dent, 1990).
The actuation type of studies are generally the strongest in their behaviouralisticoutlook and involve accounting in a contest for control between organisationmembers (Argyris, 1952; Hopwood, 1974). Studies of the control of resource al-location processes, the second stream, objects to the rational and analytical imagethose processes have. These studies point out the highly political game-playinginvolved, with the various players taking different roles as the quest for fundsevolves over time (Wildavsky, 1975; Jönsson, 1982). Not surprisingly, the ac-counting instrument most prominent in the control of the resource allocationprocess is that of budgeting. It is the most organisational of all accounting instru-ments: Budgeting draws on both the organisation chart as well as the chart of ac-counts in its inputs, thus making it the main instrument for responsibility ac-counting. The budget is formally defined as "... a quantitative expression of man-agement objectives and a means of monitoring progress towards achievement ofthose objectives" (Polimeni, Fabozzi and Adelberg, 1991, p. 375). For accountants,budgeting is usually coupled to standard costing, which is to indicate the costs perunit instead of the total costs. Standard costs as well as budgets therefore providefinancial benchmarks which are periodically determined as to carry overnormative behaviour to the operational levels of the organisation. Setting normsin itself is a highly complex process, because it has to take into account both theconsistency with the strategic plan as the characteristics of the operational pro-cesses which are to attain these norms. The non-analytic aspects are topping this
13

C/iapfer 2
since people can disagree with a norm and its implicated behaviour, or fail to un-dertake desired actions, for example when they lack direction, motivation or abili-ties. 'Good' control systems design therefore rests upon a two-tire approach: theanalytical norm setting and the behavioural consequences.
To have actual behaviour coincide with what was expected/planned, behaviouralproblems can either be avoided, or they can be tackled by employing more thanone type of control. Avoidance, in turn, can be counteracted by automation(machines do not behave unpredictably), by centralisation (less people involvedmeans less disturbance), by risk sharing (putting a premium on desired behaviour)and by elimination (detaching from the activities to be controlled or, in otherwords, create control-free areas).
When it is chosen not to avoid the control problems, a composite control type canbe created spanning all areas in which behaviour can manifest itself. The ingredi-ents of the mix may be threefold: results, action and personnel controls. Resultscontrols are typically based on accountability in a cybernetic fashion; they build onhistorical measurement, feedback and rewarding planned behaviour. They impli-cate defining the dimensions along which results will be measured (e.g., quality,timeliness), set performance standards, measure objectively along those dimen-sions, and provide clear-cut and understandable (negative) rewards. This is thecontrol type most common in accounting, i.e., in budgeting and standard costing.Action controls are less mechanistic as they work on the constituting parts of ex-pected behaviour - its actions. They come in three subtypes. First, a preventiveform, making certain actions difficult or impossible to execute ('behavioural con-straints'), for example by means of passwords or identification cards. Second, anobservant form, monitoring one's activities and correcting them ('pre-action re-view'), for example by using formal expenditure approvals or direct supervision.And, third, an action-accountability form consisting of indicating the limits of ac-ceptable actions, check the actions executed and punish deviations as, for example,in the forms of work rules and codes of conduct. Finally, the type of personnelcontrols spans the social end of manifested behaviour. It is either based on indi-vidual self-control, or social control by the group that people want to belong to orvirtually belong to. Instruments are basically of a Human Resource Managementkind: selection and placement of people, training programmes, team building orcreating a distinct work culture (Merchant, 1985; Emmanuel ef a/., 1990).
The above control types and their subsequent accounting instrumentation are allbased on the underlying assumption of stability. Production processes are fullyknown in their operations, decisions taken have well-anticipated consequencesand people behave in a predictable and correctable manner. In other words, organ-isational activities are programmable and causality is known. Therefore, pro-grammable activities can be expressed in predictive models that are universallyapplicable. In contrast, reality is unprogrammable, but still are accounting, controland organisational concepts and techniques declared to be of suitable use. Usually,an unprogrammable reality is stylised in terms of increased uncertainty andgeneric reactions to it (Den Hertog and Roberts, 1990). Accounting techniques thustry to incorporate uncertainty in their modelling by introducing variousprobabilistic techniques, scaling decision maker's risk preferences or adding riskmark-ups to their calculations. Consistently, however, it is based on program-
14

77ie Reseorc/i Prob/em
mable causation principles (Dermer and Lucas, 1986); decision makers are believedto continue to act rationally in optimising their goal function, weighingalternatives which can be easily delineated and picked from the empiric.
Similarly, organisations are conceived as well-bounded and manipulable entitiesemploying means that can be neatly grouped and coupled to ends. As a result, or-ganisations are believed to react in general to uncertainty by adopting appropriatestrategies of concentration and diversification. Concentration can take the form ofhorizontal or vertical integration and ensures a dominant market position.Economies of scale, market power and other economic aspects of synergy are theresults. Diversification spreads the organisation across many relatively unrelatedactivities and, thus, reduces the dependence on a single product, market or indus-try. Both strategies reduce the possible impact of unprogrammable events outsidethe firm. The consequence, however, is that the organisation becomes bigger andbigger and that the initial functional structure can no longer cope with the increas-ing amount of complex internal transactions. Divisions or business units are cre-ated, reorganising the firm into several smaller-sized organisations each tied to aspecific product market combination. With this organisational desaggregation, asimplification of the coordination of activities and a coupling of various degrees ofuncertainty to the units is obtained (Ezzamel ef a/., 1990). Subsequently, each unittranslates its external environment into the design of its organisation and,accordingly, into its accounting system design (i.e., the contingency approach). Insummary, the processual study of management control relates to the organisationdesign model used. In other words, an organisation design logic underlies themanagement accounting system design, indicating that the design focus of thisstudy has some preceding research to build on: the processes and systems ofmanagerial control.
Accounting Change Studies
Research on adaptations of accounting systems to organisational structures isscarce. As organisations change in their intertwined structures and processes, thematching accounting design has to react. In this respect, the word 'accounting in-novation' is sometimes used to indicate the way in which the reaction will unfold:Will it take the form of adapting traditional accounting systems and techniques tospecific elements in the new environment? Will it complement accounting in-struments with instruments from other areas? Will it result in another choice ofthe accounting system configuration or will take the form of virtually innovatingaccounting techniques and methods?
Thus far, two lines of thought can be distinguished: One, directed at the mere prac-tical and instrumental role of accounting in change processes, and the second, tak-ing a far more functional perspective addressing accounting as a technical toolboxfor the improvement of the effectiveness and efficiency of the changing organisa-tion.
The instrumental role of accounting in bringing about organisational reform is ei-ther occupied with it being a 'language' in the change trajectory or creating condi-tions of possibility for reform (Dent, 1990; Hopwood, 1987). As stated earlier,
15

I
accounting creates a financial 'reality' on top of organisational processes and actualpractice. In doing so, it sifts out elements of that practice, groups, labels, aggregatesand, finally, uses them as inputs for decision making, control and planning. Thisrework process has the aura of being objective and neutral, a craft practised bywell-trained professionals. Nevertheless, sieving practice like this imposes a strict-ly normative view on organisational reality. Only the events that have strict anddirect economic visibility (i.e., can be expressed in costs and benefits, investments,resource consumption, etc.) pass through the accounting loophole. Once passed,they are supplied to decision makers based on what is needed for making 'good'decisions or exercising 'good' control, all in line with what is considered 'besf cost-ing practice: A conception alternatively based on how an organisation is supposedto function. If organisations themselves are changing, wilful or not, the 'neutral'concepts underlying management accounting are affected.
There is expectedly another conceptional model in play of how the organisation issupposed to function. For example, lateral and flow-organised firms are still sup-plemented with accounting information aggregated on the basis of centralised,vertical conceptions of the organisation; information flowing bottom-up to the de-cision maker at the top of the pyramid and decisions flowing back top-down(Hopwood, 1985). It thus highlights aspects of organisational processes which areno longer particularly relevant as the organisation design has changed. As a result,outmodelled accounting systems direct management attention to the aspects thathave «o* changed, which can be an ever-diminishing basis as organisationschange even faster. Loss of process control itself may be an indicator as to whetherthe accounting practices employed by that particular firm are still relevant.Hopwood (1987) has depicted this line of argument as follows:
Market Change
Accounting Mediation
Change in (Production)»» Policies
Organisational Information SystemChange ^ ^ Change
• Accounting Change
IFigure 1.2 Accounting both as change agent and changed subject (Hopwood, 1987, p. 222)
As accounting changes, it provides another regime of economic visibility and cal-culation to management (Hopwood, 1985, 1990; Theeuwes, 1988a, 1988b). Leaning
16

The Reseorc/i Prob/em
on this 'new' framework of representation, managerial decisions can createadditional changes in organisational processes and policies requiring accounting tomake subsequent changes as well, thus making the circle round again. Conditionsfor the possibility of change are therefore themselves a product of 'accounting(not) in motion'. What makes accounting 'move' in the first place does not alwayshave to be stated in terms of design, structure or processes. Strategies, externalshocks or industrial life cycles can all very well be the first cue for change (see thecase studies in Chapters 4, 5 and 6). What is most important, however, is the ideathat accounting is embedded in and configured with an array of very diverseorganisational functions and events. Or, as Hopwood (1985, p. 232) puts it:
"... When seen in such terms, accounting is involved with much more than directly facilitatingmanagerial action. It is concerned with making visible and thereby governable the detailedwork processes of an organisation. It provides for both aggregating and disaggregating organi-sational actions and outcomes - a powerful tool in the hands of organisational managers. It isinvolved with the establishment of a language of organisational motive, with rendering intothe domain of the economic important aspects of the physical and task reality of the organi-sation. And it is quite centrally involved in the construction of operational concepts of account-ability, responsibility, and even performance which play a significant role in the creation ofa manageable organisational regime."
Adversely, the functional perspective of accounting change builds on its technicalinstrumentation and improvement of organisational management. Its capacity forrepresentation of organisational processes is only limitedly questioned. Organisa-tional economy, efficiency and effectiveness are seen as goals in themselves, inde-pendent from accounting representations. Accounting change here is identical torestoring user relevance in a technical sense. Better calculations imply better deci-sions, better decisions cause higher efficiency and effectiveness which, finally, re-sult in 'more economic' organisations and market transactions.
The most prominent of this type of technical accounting innovators is Robert Ka-plan of Harvard Business School. Not only has he started the discussion on ac-counting relevance, but he also takes an active part in innovating the toolboxhimself. Johnson and Kaplan (1987) see two main areas where reassessment ismost needed - cost management and performance measurement. According toKaplan, 'good' cost management will always have to meet two objectives: facilitateprocess control and compute product costs. In his view, process control informa-tion ideally requires a financial process control system for each individual process,resulting in a number of separate cost control systems.
Product cost systems have yet other design requisites. As a process control systemshould employ a minimum of cost allocations relating to the controllability crite-rion (i.e., a manager is only responsible for the cost he can virtually control),product cost systems on the contrary do require representing the full resourcesconsumed by the product, Kaplan states. Compared to financial accounting re-quirements with its neat periodic reporting cycle, process control systems willhave to follow the cycles of the process - be it hourly, daily, weekly or monthly.The same goes for product costing: a reporting cycle is needed which follows thelife cycle of the product as it progressively and digressively consumes resources. Asa result, the objectivity of the information involved varies. Process control sys-tems will involve a minimum of cost allocations, rendering better measurabilityand objectivity than conventional product cost systems.
17
Furthermore, management accounting system users vary largely in their informa-tion demands. Process control systems prominently address production managers,plant staff and operation supervisors while product cost information is of primeimportance to marketing and product managers or business unit management, asthey have to decide on the product mix depending on the relative product prof-itability. Therefore, many cost systems are needed instead of just one systemmainly orientated towards external reporting, each tied to their own purpose(Johnson and Kaplan, 1987; Kaplan, 1988).
Performance measurement is another toolbox reassessment problem. The timeframe of financial accounting requirements obstructs insight into organisationalperformance, e.g., profit incurrence. According to Kaplan, matching revenues withcosts for discrete quarterly periods will lead to a large proportion of prior and pre-sent expenditures being included in period cost, while at the same time, the bene-fits of these expenditures will be mainly realised in future periods. This point isaggravated by the increasing importance of a firm's intangible assets, such as hu-man expertise, work experience, customer and personnel loyalty and productionknow-how. They are essential to the earning capacity of the firm but are not in-cluded in performance reports. Kaplan therefore points out the need to developnonfinancial indicators for measuring manufacturing performance, and capturingthe essence of quality, productivity and new product performance. Especially thecase of new technology makes the development of nonfinancial measures evenmore urgent (Kaplan, 1983, 1984b, 1986b).
Both notions of accounting from a functional and a behaviouralistic perspectiveare seldom integrated. Only the research of Jönsson (1987, 1988, 1990) can benamed. It ties the functionalistic problems signalised by Kaplan to the specific or-ganisational setting. In his research, shop floor employees are asked to developtheir own local information system for process control, building on their expertiseof production processes. Gradually learning from the local problems encountered,links are made with the centralised accounting system and units upstream anddownstream of the product flow. The elements of decentralisation of responsibil-ity and trust, organisational learning and the emergence of local information sys-tems build on a large number of operating statistics. As a result, the bottom-up de-sign point of view engenders a strongly participative management accounting sys-tem.
To innovate management accounting requires a return to the organisational set-ting. Conceptualisations nor theoretical models alone will suffice for adapting in-ternal accounting systems to the new organisation model. It requires going outinto practice - observing, learning and understanding the rationales behind theconstruction of systems as they are continuously shaped by their users. Each caseadds a little to understanding how accounting and organisational life are matched.With each case, insights grow and with that, the possibility of theory building andpractical help. Or, as Dent puts it (1986, pp. 163-164):
"... These interpretations of accounting in action may indeed be subjective. As argued before,they are best seen as stories, but they are illuminating stories opening up alternative appreci-ations of accounting practice. They portray accounting as it is played out in a dynamic world ofdrama and vitality. In comparison ... the issues uncovered here are both more subtle and more
18

TTie Researc/i Problem
immediate. Qualitative methods of processual analysis are as yet, perhaps, underdeveloped.But gradually in the organisation literature in general, and the accounting literature in par-ticular, experience of qualitative research is being acquired, and new understandings are emer-gent."
Notes
1 This research study was made possible by the department of Accounting of the Faculty ofEconomics and Business Administration of the University of Limburg, Maastricht, The Netherlands,which 1 would like to thank for their longstanding cooperation and support. Funding of this studywas generously provided by the Dutch programme on Technology, Work and Organisation (TAO) - amulti-year, multi-disciplinary research and diffusion effort sponsored by the ministries of EconomicAffairs, Social Affairs, and Education and Sciences - of which it was part of the accounting researchline.
2 The input-output modelling of the firm has tried to enlarge the number of independentvariables by pointing out various other activity drivers. Notable in this respect is the work ofStaubus (1971, 1990). However, German cost theory seems to have made better progress in bringingthese models closer to reality as the works of Gutenberg (1951) and Heinen (1983) show. See alsoSchoenfeld (1990) for an English introduction to their works.
19

2The Knowledge Enterprise
77ns chapfer discusses /;ow f/ii's study ei>o/z;ed and /IOW f/ie researc/i design andmef/iodo/ogies were used, /t is argued that any researc/i endeavour can be con-ceited o/ as a fcnow/edge enterprise, especia/fy w/ien jf exp/ores unknown re-search territories trying to dez>e/op new fcnow/edge. T/ie researc/i question wasdez>e/oped a/ter a pi'/ot study. The /oca/ point is t/ie re/ationship between changesin t/ie structure/ organisationa/ design and tne resu/ting changes in f/ie manage-ment accounting design. Tnis inyo/ues /oofcing at two di'scip/i'nes in an iteratingapproacn: Organisation Theory and Management Accounting, /t is tried to bringt/iese two togetner in bofn research approach and research design by using a bridg-ing strategy and a creative application o/ grounded theory insights and procedures.Since no existing body o/ /iterature and research was aaai/ab/e, and because an-swering this research question is conceited to be best researched by /ie/rf study, theresearch design is o/ mixed origin. The design is /egifimated by arguments /rompo/icy research ^Mayc/irzaW and combines the case study approach o/ Yin with thegrounded theory procedures o/ Strauss and Corbin /or its ana/ysis.
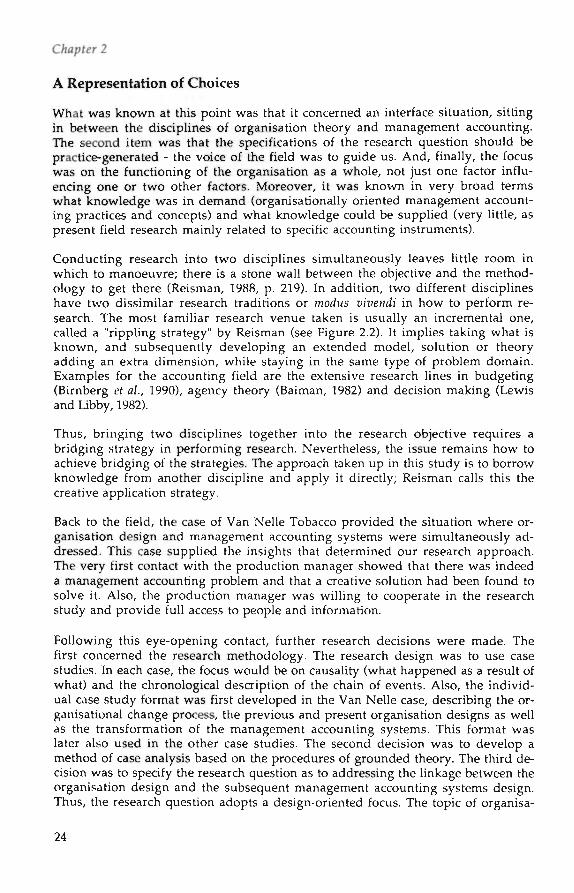
Characterisation of the Research Question
In general, almost every research project forms part of a knowledge enterprise. Aresearch endeavour is a reaction to preceding work and further extends it. In un-dertaking this endeavour, the researcher hopes that others will follow suit andthat his work will be greeted by responses from other researchers. In this way eachresearch project forms part of a larger knowledge enterprise. A knowledge enter-prise is the accumulation of interrelated research activities by which a specificbody of knowledge is built up, maintained, used and adapted. Roethlisberger(1977) sketches the knowledge enterprise in organizational sciences as a cyclicalprocess, going back and forth between clinical practice, and the generation of scien-tific knowledge (see Figure 2.1).
The researcher himself decides upon which enterprise he wishes to contribute to.He also chooses his position within the knowledge enterprise - he chooses his

77ie Know/edge Enterprise
own track. This can be a relatively safe track, deriving hypotheses from a well-es-tablished and ripe theory which can be tested with well-defined and accepted in-struments. However, his choice of a certain track can also include the building of anew theory, based on observations and experiences from practice. In that case, lit-tle is established prior to the start of the research. Thus, theory and methodologydo not provide a firm anchoring point. Even the research question can be veryvague. Moreover, when progressing with the research, it can become clear that theresearch question is incorrect and requires a restatement. This choice was at thebasis of this study.
Analytical(scientific)Knowledge
ClinicalKnowledge
Skill
CharacteristicStatements(theories) Methods Products
GeneralPropositions
Empirical iPropositions
Elementary ,Concepts
ConceptualSchemes
Knowledgeof acquaintance
Creative and InductiveLeap of Imagination
1i Operational Definitions,
Rigorous Measurement
1
, Definition of Conceptsand Variables. Element-ary Measurement ,
Observation andInterviewingClassification
Practice and Reflection
Deductive Systems
Statements of the form:X vanes with V under
, given conditions
Statements of the form:X vanes with V
Descriptive Cases andSyndromsTaxonomies
HowToDo-lt Statementsand Aphorisms
i
THE PHENOMENA
Figure 2.1 The knowledge enterprise (Roethlisberger, 1977, p. 393). The upward arrows indicate thedevelopment of knowledge, the downward arrows the practice of knowledge
Developing the Research Question
Kaplan and Johnson signalled the problem of inadequate management accountinganswers to the problems of the present competitive environment. However, theydid not supply any new theory, possible solutions or clear suggestions for researchefforts. The initial intention of this study was to focus on the advanced manufac-turing technology that allegedly caused many of the management accountingproblems. The expectations were that organisations employing flexible manufac-turing systems would encounter managerial accounting problems and, conse-quently, would find creative solutions to deal with them. This was the goal of theresearch study that had been formally approved. Its research question was asvague as the expectation of fresh solutions from practice: Is Kaplan's problemrecognised in practice and how are management accounting systems subsequentlychanged? With this research question, a conscious choice was made to start a new
21

Chapter 2
knowledge enterprise, one that could hardly build upon any previous work. Inother words, there was a knowledge gap.
The project began with a pilot study whose function was (1) to become acquaintedwith the field, (2) to fine-tune the research question and (3) to provide the basis fora choice of methodology for the main research study. Entering the field, therefore,with an open mind and with few preselected views for consideration was regardedas the best route. Additionally, it was felt that no research question could be for-mulated without some notion of what was going on in practice. "Field reconnais-sance" provides this feel for the matter while at the same time acquiring the vo-cabulary used in the field.
According to preceding research, the most dominant sector in applying new man-ufacturing technology were the electrotechnical, metal and metal-processing in-dustries (Kaplan, 1985; Howell ef a/., 1987; Innes and Mitchell, 1988; Theunisse efa/., 1988). It is to those industries that our attention was turned (see Table 2.1 for asummarised overview).
Table 2.1 Summary outline of companies involved in the pilot study
(Company names have been disguised tor confidentiality reasons.)
Company
PersonInterviewed
MainProductUne
TypeolTechnologyEmployed
HerA
GeneralManager
SheetIron
CAD/CAPP
AarB
ProductionManager
Agri-culturalMachinery
CAD/CMC
HalC
Controller
BakeryMachinery
CNC
MelO
ChielEngineer
Electro-lechnicalAppliances
CAD/CNC
KingE
GeneralManager
Machinerylor theBuildingIndustry
CNC
BOF
ProductionEngineer
Machinerylor theBottlingIndustry
CAM
AirG
ProductionManager
Aircondi-tioningEquipment
CAD/CAE
VerpH
ProductionManager
PackagingMachinery
CAD
Stell
ChielEngineer
CentralHeatingEquip-ment
CAD/CAM
AntonJ
ProductionManager
SheetIron
RuitK
GeneralManager
CanneryMachinery
CAD • Computer Akted DesignCAPP • Computer Aided Production Planning
CAE - Computer Aided EngineeringCNC » Computer Numerical Controlled
CAM - Computer Aided Manufacturing
The results of the pilot study were not at all what was expected. Virtually all firmsreported not having any management accounting troubles in implementing orusing their new manufacturing technologies. Conventional accounting tech-niques were used (standard costing, pay-back, budgeting) and standard operationalprocedures were not altered. The only two items mentioned were relatively re-mote from accounting - they concerned 'organisational troubles' in implementingadvanced technology and problems with getting the necessary information for in-vestment decision making. When asked about the precise nature of these'organisational troubles', most answers fell into the following categories:
- more difficult production planning;- fitting in with existing equipment;- production layout and;- training problems of operators.
22

77ie Knoiü/cdge Enterprise
Training programmes were expensive and, once completed, the scarce number ofoperators tended to leave for better-paying positions at other plants and firms.
To follow up on these unexpected results, three additional interviews were con-ducted. All interviewees were employees of the largest electronics company inThe Netherlands and an acclaimed frontrunning technological company. Inter-views were held at two separate facilities. Typically, both plants made extensiveuse of CNC and CAD technologies and experimented with an elementary form ofCAM. Also, both plants had a wide variety of nonstandard products and wereforced to face outside competition in their own internal order bidding.
However, the additional interviews confirmed the original findings: The firmsfaced unexpected problems in acquiring the necessary financial information forinvestment appraisal, and problems with fitting in technological innovations inthe existing organisation. At this particular point, it was clear that the technologi-cal angle to the organisational context / management accounting relationship wasinconsistent. The pure organisational aspects seemed to be more important.Therefore, the research study was faced with a serious choice: Continue on thechosen track, which would result in a considerable shift in research target and de-sign, or preserve the goal of researching accounting change, but taking a differentangle this time? Continuation implied tracing the reasons why the research ques-tion was not acknowledged. In itself, this required switching over to a differentknowledge enterprise with less accounting and more technology diffusion aspects.Accounting would only be involved as a distant characteristic of production man-agement. Nevertheless, following this route was a less uncertain research activitysince the research question could be related to an existing body of literature ontechnology diffusion, and contacts with research sites were already present. Also,the first exploratory research phase could be maintained and no rerouting wouldbe necessary.
The alternative involved re-examining the initial research question and startingall over*. However, arguments supporting this choice were far more challenging,relating to the earlier choice of an accounting knowledge enterprise. As a result ofthe pilot study, attention was drawn to the role of organisation measures. As or-ganisation measures are the reflection of a larger organisation design framework,organisation design was selected as angle of analysis'*.
The next step was to look for a field situation where both organisation design andmanagement accounting systems were involved, i.e., an organisation renewalcase, and where the same questions could be asked as in the pilot study: Is there amanagement accounting problem if the organisation finds an alternative to theclassical model of mass production, and which creative solutions to these prob-lems are conceived? Such a case was found in the Van Nelle Tobacco/Rotterdamplant. It was found through the help of a consulting company that specialises inorganisation renewal: KOERS consultancy. The first case by the consulting or-ganisation was on full target, and constituted a sort of voyage of discovery, map-ping the new territory and providing many insights, illustrations and data mate-rial.
23
A Representation of Choices
What was known at this point was that it concerned an interface situation, sittingin between the disciplines of organisation theory and management accounting.The second item was that the specifications of the research question should bepractice-generated - the voice of the field was to guide us. And, finally, the focuswas on the functioning of the organisation as a whole, not just one factor influ-encing one or two other factors. Moreover, it was known in very broad termswhat knowledge was in demand (organisationally oriented management account-ing practices and concepts) and what knowledge could be supplied (very little, aspresent field research mainly related to specific accounting instruments).
Conducting research into two disciplines simultaneously leaves little room inwhich to manoeuvre; there is a stone wall between the objective and the method-ology to get there (Reisman, 1988, p. 219). In addition, two different disciplineshave two dissimilar research traditions or modus »ii>end/ in how to perform re-search. The most familiar research venue taken is usually an incremental one,called a "rippling strategy" by Reisman (see Figure 2.2). It implies taking what isknown, and subsequently developing an extended model, solution or theoryadding an extra dimension, while staying in the same type of problem domain.Examples for the accounting field are the extensive research lines in budgeting(Birnberg ef a/., 1990), agency theory (Baiman, 1982) and decision making (Lewisand Libby, 1982).
Thus, bringing two disciplines together into the research objective requires abridging strategy in performing research. Nevertheless, the issue remains how toachieve bridging of the strategies. The approach taken up in this study is to borrowknowledge from another discipline and apply it directly; Reisman calls this thecreative application strategy.
Back to the field, the case of Van Nelle Tobacco provided the situation where or-ganisation design and management accounting systems were simultaneously ad-dressed. This case supplied the insights that determined our research approach.The very first contact with the production manager showed that there was indeeda management accounting problem and that a creative solution had been found tosolve it. Also, the production manager was willing to cooperate in the researchstudy and provide full access to people and information.
Following this eye-opening contact, further research decisions were made. Thefirst concerned the research methodology. The research design was to use casestudies. In each case, the focus would be on causality (what happened as a result ofwhat) and the chronological description of the chain of events. Also, the individ-ual case study format was first developed in the Van Nelle case, describing the or-ganisational change process, the previous and present organisation designs as wellas the transformation of the management accounting systems. This format waslater also used in the other case studies. The second decision was to develop amethod of case analysis based on the procedures of grounded theory. The third de-cision was to specify the research question as to addressing the linkage between theorganisation design and the subsequent management accounting systems design.Thus, the research question adopts a design-oriented focus. The topic of organisa-
24

T/te Enterprise
tion design was further exemplified by the use of SocioTechnical Systems Design(in this book referred to as STSD), an integral design approach based on systemstheory and providing a large number of design instruments and practices. Thespecifics of STSD will be further discussed in Chapter 3. Finally, it was decided toreplicate the analysis in two other cases, giving specification and detail to the con-tent of the initial findings and building up the first elements of a theory regardingthe integral design of organisations and management accounting systems.
Rippling strategy Bridging strategy Creative application strategy
- Domain of problem characteristics
Figure 2.2 Research strategies in the management sciences (Reisman, 1988, pp. 216-218)
With the help of the consulting organisation, two more case studies were foundwhere an identical process of organisational and accounting renewal had takenplace, and where the managements were willing to fully cooperate in the researchstudy.
In terms of the research study, organisation design as performed by STSD had theadvantage that it was well specified, handing over ample concepts and labels toclearly map the context of the management accounting system of each case. More-over, STSD does not address the matter of management accounting design in it-self, indicating that the focal point of this study was relatively untouched by STSDconcepts and open for research. The latter point related to our earlier knowledgeentrepreneurial choice for trying something new and unconventional, away fromthe little steps forward and rippling research strategies that are commonly found.
An identical choice, away from the rippling strategy, is represented by our set-upof the research design. The initial field study of Van Nelle instigated our use of'grounded theory' as the creative application used in bridging the organisation andaccounting disciplines. The research design will be discussed in more detail below.
Research Philosophy Employed
Researching the linkage of the organisation design with MAS design embraces adesign-oriented view. Implicit in this type of research is the question of how the
25

Owpfer 2
study results can be used to improve these designs. A full definition of design-ori-ented research is not available but it can be depicted by its assumptions (Den Her-tog and Van Assen, 1988). First of all, design-oriented research is prescriptive inthe end - it must provide a knowledge base for better designs, not in terms of gen-eral tools but rather in terms of better insights underlying better choices. Second,as the name indicates, it is directed at the design process, including diagnosis, in-tervention and effect phases of the process. Design orientation means an integralfocus on the design ami implementation trajectory, and it is not limited to (mono-disciplinary) parts of the design process. Third, design-oriented research is scien-tific but not in terms of rigourous statistical and experimental modes of research(Argyris, 1980). It is concerned with knowledge acquisition about well-conceptu-ated interventions in human systems (Morgan, 1983; Van Maanen, 1983) andobtaining 'stronger answers from weaker methods'. Fourth, it is directed at the or-ganisation as a whole. This "Gestalt" approach states that organisations are not ac-cumulations of parts but rather comprehensive entities, adding up to more thanthe summed energy of its constituting parts. From this, it follows that design-ori-ented research is multi-disciplinary. Finally, design-oriented research occupies it-self with prevention. Conceivable consequences are considered in advance andnot corrected afterwards when they appear. However, these five functional de-mands of design-oriented research do not provide the instruments for conductingdesign-oriented research. These instruments were found in a combination of casestudy research and grounded theory procedures while the legitimation for per-forming design-oriented research was found in policy research.
Policy research is defined as "... the process of conducting research on, or analysisof, a fundamental social problem in order to provide policy makers with prag-matic, action-oriented recommendations for alleviating the problem" (Majchrzak,1979, p. 12). Here, 'fundamental' means that it addresses broadly defined researchquestions that have multiple facets and a variety of consequences for large groupsof people. In terms of the research problem, policy research would viewmanagement accounting as having a 'coping problem': Managers in practicecannot financially counter the changes in the competitive environment. Hence,their policies break adrift and organisations start to wander in terms of loss of fi-nancial process control.
Clearly, according to Majchrzak, policy research is highly contextual in that it in-teracts with or is responsive to the study user. In an iterative manner, problemdefinition and interim results are confronted and discussed on the basis of thestudy user's conceptualisation of the subject. The intimate tie with the user resultsin a constant interchange between information and the concept(s) wherein the in-formation can be framed. As no concept is available, new concepts or approachescan be generated or, at least, the limitations of available concepts become moreclearly delineated. Furthermore, interaction with the user of the policy optionsimplies that policy research is an inductive, empirically based approach. Evenmore so, it is grounded in practice with a large role for empirical, daily-life events.
In this aspect, it rolls over to the 'grounded theory' approach of Glaser and Strauss(1967). A 'grounded theory' approach inductively builds on the observation of thephenomenon studied:
26

77ie Know/edge Enterprise
"... it is discovered, developed, and provisionally verified through systematic data col-lection and analysis of data pertaining to that phenomenon. Therefore, data collection,analysis, and theory stand in reciprocal relationship with each other. One does not be-gin with a theory, then prove it. Rather, one begins with an area of study and what isrelevant to that area is allowed to emerge" (Strauss and Corbin, 1990, p. 23).
The use of 'grounded theory' in this study is inspired by the type of knowledge en-terprise. This research study is attempting to formulate the initial theoretical in-sights where no theory has yet become available. It does this by relying on field ob-servations and case studies. This material has to be analysed and compared in asystematical way in order to provide valid conclusions. Grounded theory providesthe systematic procedures and well-developed framework of analysis to performthese analyses.
The basic assumption of 'grounded theory' is that discoveries and the develop-ment of new theory in the social sciences, as in the natural sciences, are the resultof observations:
"Grounded theorists share their [natural scientists'] conviction that the usual canons of"good science" should be retained, but require redefinition in order to fit the realities ofqualitative research, and the complexities of social phenomena that we seek to under-stand." (Strauss and Corbin, 1991, p. 249)
Observations are viewed as the raw material 'filling in' new concepts and develop-ing new theory ('obtaining conceptual density'). Relationships between conceptsand phenomena grow from iterating between theorising and observation. Gradu-ally, insights are 'dense' enough as to provide a cohesive theory about a phe-nomenon. Such theory should meet the criteria of fit, understanding, generalityand control. In other words, it should provide a comprehensible representation ofreality and contain enough abstraction to be applicable to a variety of situations.Also, the theory should lead to an increased grip on the phenomenon - it shouldspell out the conditions for controlled actions towards the phenomenon.
In the previous pages, we gave a description of 'our' knowledge enterprise; whatwe wanted to add and why. It involves the building of a theory, followed by mak-ing observations, filling the concepts with observations and continuing to ob-serve. In this way, dense concepts filled with data emerge. That is inductive re-search - theory based on observations - and that is also grounded theory.
However, we also use replication logic in order to test the theory that was built up,i.e., we ask ourselves the question: do we find the same thing in the second andthird cases as we did in the first case? Moreover, when we find more than we didin the first case, we adjust our theory and, consequently, perform deductive re-search. Nevertheless, this study is positivist research because it sticks to the empir-ical cycle of observing to bufW a theory and then observing to fesf a theory. Thisstudy places strong emphasis on the building up of a theory, because (to date) theresimply is no theory available.
'Grounded theory' follows a clearly systematic research methodology. It starts byformulating the research question. The research question marks out the phe-nomenon one wants to investigate. It is, however, not formulated stringently
27
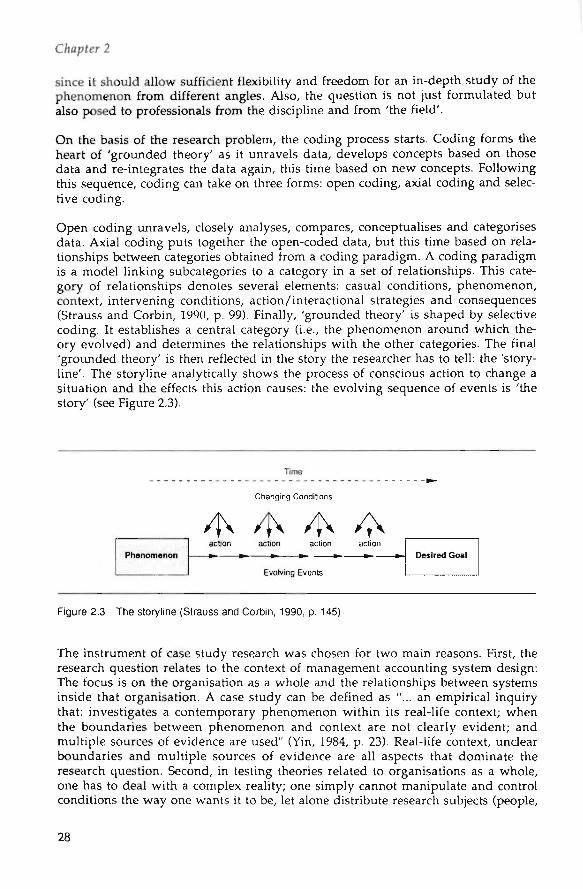
C/zapfer 2
since it should allow sufficient flexibility and freedom for an in-depth study of thephenomenon from different angles. Also, the question is not just formulated butalso posed to professionals from the discipline and from 'the field'.
On the basis of the research problem, the coding process starts. Coding forms theheart of 'grounded theor/ as it unravels data, develops concepts based on thosedata and re-integrates the data again, this time based on new concepts. Followingthis sequence, coding can take on three forms: open coding, axial coding and selec-tive coding.
Open coding unravels, closely analyses, compares, conceptualises and categorisesdata. Axial coding puts together the open-coded data, but this time based on rela-tionships between categories obtained from a coding paradigm. A coding paradigmis a model linking subcategories to a category in a set of relationships. This cate-gory of relationships denotes several elements: casual conditions, phenomenon,context, intervening conditions, action/interactional strategies and consequences(Strauss and Corbin, 1990, p. 99). Finally, 'grounded theory' is shaped by selectivecoding. It establishes a central category (i.e., the phenomenon around which the-ory evolved) and determines the relationships with the other categories. The final'grounded theory' is then reflected in the story the researcher has to tell: the 'story-line'. The storyline analytically shows the process of conscious action to change asituation and the effects this action causes: the evolving sequence of events is 'thestory' (see Figure 2.3).
Time
Changing Conditions
action action action
Evolving Events
actionrwsired Goal
Figure 2.3 The storyline (Strauss and Corbin, 1990, p. 145)
The instrument of case study research was chosen for two main reasons. First, theresearch question relates to the context of management accounting system design:The focus is on the organisation as a whole and the relationships between systemsinside that organisation. A case study can be defined as "... an empirical inquirythat: investigates a contemporary phenomenon within its real-life context; whenthe boundaries between phenomenon and context are not clearly evident; andmultiple sources of evidence are used" (Yin, 1984, p. 23). Real-life context, unclearboundaries and multiple sources of evidence are all aspects that dominate theresearch question. Second, in testing theories related to organisations as a whole,one has to deal with a complex reality; one simply cannot manipulate and controlconditions the way one wants it to be, let alone distribute research subjects (people,
28

T/ie Know/edge Enterprise
groups, organisations) at random across conditions. Therefore, one must look forresearch approaches that are as close to this ideal approach as possible.
Multiple case studies implicitly represent a replication logic in their design. Eachcase study provides additional insight into the phenomena studied, and, whenanalysing the various insights, a pattern or classification may arise. Where no the-ory is yet in existence, as is the case in this study, the convergent observationsfrom each case study will provide a preliminary formulation of theoretical propo-sitions. In other words, theory formulation is 'grounded' in empirical observation.The box 'Develop Theory' (see Figure 2.4) can thus be replaced by 'General Re-search Question'. Only after an initial multiple case study is completed, an attemptcan be made to focus on 'grounded' theoretical propositions.
DESIGN SINGLE-CASE DATA COLLECTION AND ANALYSIS CROSS-CASE ANALYSIS
DevelopTheory
' relate studyto previoustheory
' aim forexplanation
SelectCases
Design DataCollectionProtocol
" define "process"operationally
' define "processoutcomes" (notjust ultimateeffects)
' use formal datacollectiontechniques
• interviews' observations" documents
Conduct 2ndCase Study
• interviews' observations' documents
ConductRemainingCase Studies
"etc.
WriteIndividualCase Report
: * pattern matchi 'policy; implications
WriteIndividualCase Report
: * pattern match: • policy: implications; * replication
WriteIndividualCase Reports
Draw Cross-Case Conclusions
Modify Theory
Develop Policy Implications
Write Cross-Case Report
•etc.
Figure 2.4 Case Study Research Design (Yin, 1984, p. 51)
Therefore, our research design is based upon two methods that each serve a dou-ble purpose: Case study research for the larger setup and replication of the studyfindings, and grounded theory for the development of theory on the basis of dataand its procedures for analysing the individual case studies and making cross-casecomparisons. The case studies serve the purpose of mapping the territory, i.e., per-forming exploratory research, while grounded theory procedures were used forlifting the observations up to a more conceptual level. In terms of the knowledgeenterprise, it was tried to go from observed phenomena to analytical knowledge(the left side of Figure 2.5).
29

Chapfer 2
Analytical(scientific)Knowledge
ClinicalKnowledge
Skill
CharacteristicStatements(theories)
i
GeneralPropositions
Empirical -Propositions
Elementary ,Concepts
ConceptualSchemes
Knowledgeof acquaintance
Methods
Creative and InductiveLeap of Imagination
Operational Definitions.Rigorous Measurement
Definition of Conceptsand Variables, Element-ary Measurement ,
Observation andInterviewingClassification
Practice and Reflection
THE PHENOMENA
Products
Deductive Systems
Statements of the form:Xvaries with /undergiven conditions
Statements of the form:X varies with V
Descriptive Cases andSyndromsTaxonomies
How-To-Do-lt Statementsand Aphorisms
I 1 = Domain of Exploratory Case Study Research
Figure 2.5 The Knowledge Enterprise (Roethlisberger, 1977, p. 393). The upward arrows indicatethe development of knowledge, the downward arrows the practice of knowledge.
Case study research as proposed by Yin plays its role in the categories of skill (i.e.,the application of techniques and methods) and in the category of clinical knowl-edge (Roethlisberger, 1977). Grounded theory procedures picks up in this stage andlifts the observations to the first stage of elementary concepts by way of its codingsteps - by starting to make inferences on it and embedding findings in existingknowledge as they are found, defined and measured in other studies (see Chapter8).
Thus, our knowledge enterprise is an enterprise both in terms of getting from A toB and in terms of the first attempts to develop missing knowledge concerning thelinks between organisation design and management accounting systems design.
The Research Design
The research design consisted of three phases. The first phase relates to the previ-ously discussed exploratory study in which the research question was developed.The second phase relates to the first case study and establishes the individual for-mat of analysis. The last phase relates to the data collection in two other case stud-ies and the comparative analysis of the findings.
30

77ie Knou>/edge Enterprise
The first phase - the exploratory study - consisted of interviews with mainly pro-duction managers, some general managers, and one controller. The high percent-age of technical people interviewed was based on a clue provided by Kaplan, whostated that advanced technology was exposing the bulk of the management ac-counting problems. Therefore, technical people were supposed to be the first 'earlywarning indicators'.
Similarly, the companies interviewed were in industries where, according to theliterature, the first advanced manufacturing technologies should be adopted, i.e.,the metal-processing, machinery, and electrotechnical industries. Companies hadbeen selected using the standard industry codes of the above three industries. Fur-thermore, only firms exceeding 100 employees were approached. This was done asan arbitrary measure of sufficient company size to sustain advanced manufactur-ing technology investments. Twenty-two companies were approached by mail andtelephone, eleven of which agreed to be interviewed. The interviews themselveswere conducted on a partially open format. The agenda was to introduce the goalof the research study and then ask questions regarding alterations made in man-agement accounting procedures and calculations, changes made in the decisiontrajectory regarding capital investments, and other consequences of technologicalchanges that were not included in the interview.
Phase two was dominated by the Van Nelle Tobacco/Rotterdam plant case study.As a result of the previous exploratory study, a field situation was looked for inwhich both the organisation design and management accounting design werechanged. With the help of the KOERS consultancy company, the Van Nelle to-bacco plant was approached. This organisation had just completed a full reorgani-sation of its entire structure as well as its processes through KOERS assistance. Theplant management agreed to cooperate and provided access to management andinternal documentation.
The data material was acquired in three different modes. First, by extensive inter-views of key personnel such as the plant manager, who was the main force behindthe plant reorganisation, and the manager of production planning, who, togetherwith the plant manager, conceived and managed the control and information sys-tem reorganisation. The interviews were between three to five hours in durationand involved several site visits. The interviews focused on explaining the manychanges in organisation and accounting design, their motivation and lines of ar-gument, the effects the changes had and what was to be expected in the near futureregarding accounting design. Second, data analysis involved access to all projectdocumentation and internal reports of the plant organisation. This informationallowed for a chronological support of the interview data and supplied many ex-amples of events and reporting formats. Third, data was acquired from KOERS.This proved to be very valuable because it provided an involved outsider's view.This type of data consisted of material from the consultant's archives as well asoral descriptions, putting into perspective the many data elements.
All interviews were tape-recorded and transcribed verbatim. Documentation andreports were placed into chronological order to describe the chain of events. Theanalysis of the data was performed in two steps. First, a comprehensive case de-scription regarding both organisation redesign and accounting redesign was writ-
31

C/iapfer 2
ten and submitted for verification to plant management. After verification andthe integration of a second round of comments, the case description was approvedby plant management. Second, the approved case description provided the inputfor a grounded theory procedure analysis, using the three coding steps as describedabove.
The format of the case description is twofold. The first part is directed towards theorganisational context and chronologically describes the causes and effects thatpreceded the management accounting redesign. This chronological description iscategorised into a description of the organisation and its products and markets, thepreceding organisation design, the change process events and the resulting re-designed organisation and work processes. Where possible, interview statementshave been inserted to illustrate how events were realised and perceived, giving amore comprehensive flavour of the differing company cultures. The manage-ment accounting part of the case description is based on the reports used in the re-designed information and control systems. This was done for reasons of systemoverview as well as the positioning and use of various managerial accountingpractices and instruments. In this part, the various instruments and reports areindividually represented and discussed, both regarding their composition andtheir use. No attempt is made to relate these descriptions to insights gatheredfrom other research or literature.
The last phase involved the data collection from two other organisations thatcompleted a similar full reorganisation of both the organisation design and theirmanagement accounting design, based on identical reorganisation principles andapproaches. These two organisations were also selected with the help of theKOERS consultancy company, which had also been involved in the two changeprojects. Data collection from these organisations, called Zilverstad and St.Antonius, a silversmithing firm and a producer of vesselheads, respectively,followed an identical method as was used in the case of Van Nelle. Once the or-ganisations agreed to cooperate, extensive interviews were held with key person-nel and extensive documentation was handed over. Again, all interviews weretape-recorded and transcribed in full. The comprehensive case descriptions werethen fed back and complementary information was supplied by additionalinterviews and internal documents. Also, the individual consultants involved ineach case study provided a great deal of additional information. The final casedescriptions were then approved, and constitute the input for the next step ofgrounded analysis.
The comparative analysis of cases was based upon the individual grounded theoryanalysis of each case. In particular, comparison of the open coding and axial codingdiagrams of each case was helpful in this respect; open coding was helpful for itsreclassification of raw case material into more abstract categories that could becompared in a horizontal fashion with other such open-coded categories. Axialcoding was especially helpful in that it provided a so-called axial pattern per casethat could be compared. An axial pattern is a sequential pattern of characteristicswith the characteristic being related to an open-coding category. In short, an axialpattern represents the main line of thought in a case study. Comparison of thesepatterns indicated the differences in motivation and choices made in the threecases in an identical situation of organisational redesign - the contextual motiva-
32
TTie Know/edge Enterprise
tions for different management accounting system designs become clear, i.e., causeand effect on design level can be identified. The axial pattern also provided themain input to build up the storyline, which is the descriptive representation ofthe main line of argument.
Notes
3 Although events here may give the impression that they were evaluated on a strictly rationalbasis, there was considerable disappointment on the part of the investigator. The results of the pilotstudy became available after one year of hard work and preparation. As these results were totallyunexpected, it was felt that this year had been nothing more than a total waste of time. For the nextfew months, little hope remained for continuation of the research project. Fortunately, becomingacquainted with his future wife did provide some unacademic incentives to proceed with theresearch effort. Thank you, Ellen.
"* The implementation of the TAO research programme provided the necessary vehicle foraltering the accent of the research questions - from technology to organisation design (Van Sluijs efa/., 1991). This research programme endeavoured to build up a knowledge base for the integrated(re)design of organisations. To be more specific, the aim was to conduct research into the consequencesof changes in the primary and innovation processes of firms for a number of disciplines - industrialrelations, personnel management and management accounting. With the emergence of this largerresearch framework redirection of the research question was not too cumbersome a burden.
33


3SocioTechnical Systems Design
77iis chapter eAfp/ains f/ie concepts, mef/iods and foo/fci't o/ organ isaf iona/(redesign as advocated by f/je Dutch elaboration o/ Socio Technical Systems DesignCSTSD).
g are yi'ewed as architectures o/ re/afionsnips between infernal subsys-tems. TTJIS arcnifectwre i's designed as to minimise disturbance by providing su//i-cienf opportunities /or control o/ disturbances proportional to fne probabilities 0/disturbances. T«e equilibrium between awji/abfe contro/ options and required con-trol options determines bot/i e//iciency and e//ectiveness.
short nisforical ouerfiew /lands ooer tne /irst insig/its into organisation design,h placed a strong empnasis on /ob design. Tne Dutc/i elaboration as proposed
by f/ze a>orfc o/ De Sitter greatly extends it wit/i replacing /uncfional concentrationby trans/ormational integration.
In transformational integration, an organisation is considered as being made up o/a control and a per/ormance /unction: control relating to tne se/ection o/ relationsto be per/ormed, and per/ormance relating to t/ie rea/isation 0/ t/iese selected rela-tions. Subseauent/y, a production and a control structure are distinguished w/iichare based on seven essential structural design parameters: (Ï,) /unctional concentra-tion, (2) per/ormance di//erentiation, (3) per/ormance specialisation, (4) separationo/ per/ormance and control /unctions, (5.) control specialisation, C6) control di//er-entiation, and C7j division o/ control /unctions. Parallelising and segmenting tneproduct /low constitute tne degrees 0/ /reedom /or contro/ structure design, w/iic/iis based on se/ecting, al/ocating and coup/ing contro/ cyc/es at all /et>els 0/ t/ie or-ganisation. Tne design foo/fcif contains botn design sequence rules as we// as ac/iange management approach. Organisafiona/ c/iange is thus considered both aprogrammable CAiigft/y normative) design and a process greatly in//uenced by hu-man behaviour.

Introduction
As a consequence of the unexpected results from a preceding pilot study into thechange effects of advanced manufacturing technology on management account-ing, the focus of the study was shifted. Although a more thorough exploration ofwhy no change effects were initially found would also provide an interestingstudy, it would signify stepping down from the topic of management accountingchange and its cause(s). However, the preceding pilot study made one thing clearand that is the importance of organisation structures and processes. It is on thispoint we proceeded with the study.
Competitive pressure necessitates change, and one of the roads open to copingwith change is to redesign the organisation. As organisation structures change, in-ternal processes change with it, resulting in a whole new set of dealing with prob-lems and approaching the market place. Furthermore, that organisation design in-fluences management accounting is a commonly held opinion, but scarcely re-searched when it comes to determining what exactly are those influences.
A venue was found in an inspiring development called Modern SocioTechnicalSystems Design (STSD). STSD represents a deliberate design logic which issystematically repeated and addresses the accounting structure as well. Because thelogic surrounding the accounting system is identical, firms using STSD provide agood opportunity for performing research into the relationship of managementaccounting to its context. Moreover, its focus on the design of whole (accounting)systems instead of single elements or practices prevents limited explanations.
To take the STSD option, a well-structured and instrumented path is required. In-terventions in structures and processes place demands on both the content of theredesign and the changeover process. Instrumenting it in just a technical sensefalls short of the behavioural aspects which can easily overrun whatever effectiveand beneficial redesign one had in mind. STSD is basically a systems approach,paying attention to the interacting subsystems of the organisation. Its subsequentredesign toolkit as well as its change management approach relate to managementaccounting in their effects on existing information and control structures. But inorder to properly assess the latter, Modern Sociotechnical Systems Design has to bediscussed in more detail first.
The General Idea
The main point is that STSD is a structural approach to organising. Specifically, itis an open systems approach to organisations, considering that the organisationconsists of a number of aspect systems and subsystems. The difference between thetwo is that subsystems relate to a collection of elements from the overall system,while aspect systems relate to a collection of relations between system elementsfrom the overall system (Den Hertog, 1991). Accounting, for instance, is an aspectsystem, as well as Finance, Logistics and Personnel. When a number of relations(such as accounting, personnel and finance) are coupled to a number of elements(such as the job shops 1 to 6, the shipping department and the order-taking
36

Systems Design
department), one can speak of an integral approach. To prevent partial analysisand design, the parts as well as the relations should be integrally approached,visualising Modern STSD as the 'theor/ of the architecture of relationships.
What 'Modern' STSD adds to traditional STSD consists of the following: a consis-tent concept of overall structure design going beyond working in task groups andthe relatively narrow world of job design and work structuring, and a supportingdesign toolkit and change management trajectory specifically targeted at imple-menting Modern STSD. Both 'extensions' offer a theoretical link between theQuality of Work paradigm usually associated with classical STSD, and called theQuality of Organisation. Roughly speaking, the latter extends sociotechnical designprinciples to areas of the organisation other than the pure production function.More specifically, it adds design elements for obtaining flexibility, control, produc-tivity and innovativeness (Groep Sociotechniek, 1987). Thus, 'Modern' STSDencompasses significantly more than just working in task groups and maintaininggood working ('human') relationships.
Modern STSD is foremost directed at structures, it focuses on the architecture ofconnections between parts. An integral design configures relationships as well asparts - it addresses connectivity and content at the same time.
A more exemplifying discussion of what integral design is and does, can probablybe best arranged by comparing it with the more traditional integral design pro-posed by Frederick W. Taylor. His design rests on the concept of functional concen-tration, which is repeated in every system relationship as well as in the content ofevery subsystem. Taylor's design approach rationalises the organisation into a di-vision of executive tasks on the one hand and controlling and regulative tasks onthe other, concentrating operational and managerial tasks in separated and spe-cialised departments (De Sitter, 1982). Bureaucratic support was organised alongthe same line of functional concentration: the grouping of identical capacities insupporting departments. However, functional concentration also results in sepa-rating and concentrating control and performance functions. In other words, oper-ations become specialised, and so do management and control. They are allocatedto different specialised support departments such as finance and accounting, pro-duction planning and scheduling and inventory control. Management and controlare thus dispersed and allocated to various hierarchical organisational levels andaspect systems, i.e., disciplines.
However, as functional concentration connects all parts of the organisation to allorders (every order passes all or several functions) things will only be relativelysimple as orders are more or less identical in content and only require various ca-pacities to be attributed: that is, when it comprehends standardised mass produc-tion characteristics. The problem arises when orders acquire different characteris-tics. The order size varies per planning period from large to small batches and theorder content becomes less standardised and varies largely in content as well. In afunctionally concentrated structure, this will lead to a (very) high variety of orderseach having to pass all parts of the organisation. In other words, an enormouscrisscrossing of orders throughout the organisation will arise. This enormous va-riety creates an equally complex control problem.
37

Cftapfer 3
In order to solve this control problem one can follow two paths: allocate ordersover different capacities or allocate capacities over different order flows. In the firstoption, one continues on the track of functional concentration, meaning the cre-ation of specialised departments for order coordination and tracking (i.e., expedit-ing), accumulation of large stocks and increases in delivery times, followed by anextensive use of large computer systems for production planning, which are in-stalled at the Computer Support department, and establishing special coordinatingunits, task forces or matrix organisations.
Or, in the second option, one can shift the focus of integration: Changeover toflow-oriented production and integrate on the basis of transformational concentra-tion. Therefore, integrative design is structural design (see Figure 3.1). A flow pro-duction is structured by differentiation of basic functions such as 'support','prepare' and 'make', identical to Tayloristic differentiation, but then they aretransformationally concentrated instead of functionally concentrated. The sameholds for control: No specialisation in process or flow aspects by different aspectsystems such as monodisciplinary departments including accounting, personnel,production planning, but differentiation towards the basic control domains, i.e.,the subprocess in the flow one is working on and responsible for. The basic valueassessment underlying both integral design approaches is its belief in human ca-pabilities. Taylor implicitly holds the belief that human capacities are limited,while STSD holds the belief that humans have almost unlimited capacities, whichsubsequently can be addressed by the organisation design surrounding them; seethe STSD-based research on human resources management and industrial rela-tions wherein this value issue is pronounced more explicitly (Dankbaar and DenHertog, 1990; Van Sluijs, Van Assen and Den Hertog, 1991; Buitelaar, Dankbaarand Van Klaveren, 1991).
Functional Concentration:all parts connected to all orders
Transformational Concentration:some parts connected to some orders
Support j
QÖ§D
Ö _Support
§§0 _
Focus of Integration:Operations
Focus of Integration:Order Flow
Figure 3.1 Integral design: functional concentration vs transformational concentration
38

Soc/oTec/mica/ Systems Design
The above example indicates a two-way reduction of variety: External and inter-nal. External variety is determined by the number of flows or operational trajecto-ries required. On the other hand, internal variety is determined by the number ofdepartments and work stations. To indicate the variety reduction accomplished bytransformational concentration, consider the following calculations (De Sitter andDen Hertog, 1990). For external variety reduction, the functional organisationmode is structured by four flows which require 15 operational trajectories (24-1 =15). However, the transformational organisation mode requires only 6 trajectories([22-1 = 3] + [22 - 1 = 3] = 6), therefore reducing external variety by 9 trajectories or60% (9 + 15 = 60%). A similar type of calculation can be made for the reduction ofinternal variety - in the functional organisation mode, four kinds of operationsyield 24 possible sequences (4 1=4*3*2*1= 24). Each sequence can be producedby 256 different routings (4* = 256); the total internal variety in operational trajec-tories thus amounts to 6144 possible routings (24 * 256). The transformational or-ganisation mode, however, leads to 384 possible routings per flow (4 ! * 2* = 384),amounting to a total reduction of internal variety by 5760 routings or 93%. The oc-currence of external variety is mainly based on demand variation, i.e., changes inproduct mix and product volume demand.
This leads us to the method of integrative design, or how to structure flow-ori-ented production without losing control. Modern STSD has several well-elabo-rated design principles and strategies (i.e., the change management trajectory)which can all be reduced to one basic principle: that of Requisite Variety, alsoknown as Ashby's Law (1952). It is the design criterion of systems controllability,and reads:
(opportunities for process variation)
(variation required)
It constitutes a ratio, coupling structural answers to variety (the nominator) to thelatitude needed to cope with that variety within that particular structure (the de-nominator). A qualitative balance is obtained if the ratio equals 1. That is, if thereis as much structural latitude provided as needed. If there is provided more thanneeded (the ratio is >1), this surplus can be considered anticipating future variety.For instance, regarding the Quality of Work, i.e., at the micro-level, the ratio canbe understood as a ratio of control capacity built into a task versus control capacityrequired. Or, in normal language, if the opportunities to solve problems are equalto what is needed to solve problems.
Furthermore, in order to improve organisational effectiveness one directs atten-tion to the opportunities for process variation (nominator): How much effective-ness is permitted by the structure? An increase in effectiveness is an effect of struc-tural measures, i.e., redesign. Alternatively, to improve efficiency, the variationrequired (denominator) is reduced. For instance, to continue the Quality of Workexample, the required control capacity of a particular task is reduced if the numberof recurring problems encountered in that task is also reduced. If the number ofunusual, nonrecurring problems increases, so does the required control capacity.The employee needs more instruments to solve the unusual problems he encoun-ters. Efficiency therefore increases when all the nonroutine variety is matched by
39

C/zapfer 3
problem-solving instruments. In terms of the above equation: if the ratio is 1, anorganisation is both effective and efficient. An organisation is ineffective whenthe choice options for process variation are less than required (the nominator <the denominator). On the other hand, an organisation is inefficient, but indeed ef-fective, when the structure provides ample problem-solving opportunities butthere is relatively little need for it (the nominator > the denominator).
A somewhat similar basic principle can be found in the work of Galbraith (1977).Together with Ashby, he follows the idea first proposed by Simon (1947) thatorganisations are to be conceived as information-processing institutions or sys-tems run by humans who are plagued by a bounded rationality which does not al-low them to make optimal decisions. Since then, complexity and uncertainty indecision making have generated a stream of research, contingently relating uncer-tainty and complexity to decision making (Thompson, 1967) and organisationaldesign (Galbraith, 1973, 1977). Galbraith states that there is a balance betweeninformation-processing requirements and information-processing capacities. Thedifference between the two, if any, is caused by uncertainty as it necessitates greateramounts of information to be processed between decision makers. Organisationalhierarchy then provides an adequate method to control for certain tasks. Uncer-tain tasks then require implementing a more organic and less hierarchic form oforganising, thus relating the information-processing perspective to organisationaldesign.
Tf thp information-processing equation is not balanced, two design strategies can beoperationalised for dealing with uncertainty: Reducing processing requirementsthrough the creation of slack resources (e.g., excess capacity) and self-containedtasks (the job design predecessor of autonomous work groups), or enlarging theprocessing capacity through sophisticated information systems and improving lat-eral relations. However, Galbraith is one of the few researchers that depart thefunctional concentration point of view because he suggests lateral linkages or self-contained tasks as design-oriented solutions.
The Embodiment of Sociotechnical Systems Design
The crucial experiment which marked the first light of Modern STSD lies in thestudy of Trist and Bamforth (1951) of the work organisation in the Elsecar coalmine in South Yorkshire in the United Kingdom (Van Eijnatten, 1991). Due to theshort coal front in the Haighmoore seam, the new mechanised way of winningcoal, called the 'long wall method', could not be used. Alternatively, Reg Baker,the Area General Manager of the area in which that particular coal front wasfound, developed what he called the all-in method. This work organisationconsisted of so-called 'composite work groups': eight miners forming a smallgroup which was responsible for a full cycle of coal extraction. At that time, it de-viated largely from the generally held opinion that there was one best way of or-ganising, which was determined by a combination of Taylor's scientific manage-ment concept and Weber's concept of bureaucratic organisation (Trist, 1981, c/ VanEijnatten, 1991). Equally significant were two other characteristics involved: thegreat reluctance of management to communicate Trist and Bamforth's findings,
40

SocioTec/inicfl/ Systems Design
and the fact that the new work organisation form was developed independentlyfrom managerial directives or other higher set orders. Later in the development ofsociotechnical systems design, the elements of management steering only in avery general mode (i.e., autonomy means almost full decentralisation of decisionmaking) and of the diffusion and learning by others of sociotechnical findings andconcepts established two main characteristics of 'Modern' sociotechnical design.Meanwhile, the field experiments (known as 'the Bolsover case'; Van Eijnatten,1991, p. 10) with the new work organisation proved highly successful: From othermines in North-West Durham it was reported that output was 25% higher, pro-duction costs were lower and absenteeism was reduced by 50%, all compared to thetraditional mode of work organisation (i.e., Tayloristic and functionally concen-trated jobs).
Typically, the development of 'composite work groups' was constituted primarilyto solve a problem: the mining of coal in such a fashion that the new 'long wallmethod' was retained. However, what was still lacking was a theoretical base oftheir findings. This is not surprising, as the contents of 'composite' versus'traditional' work organisation were primarily described and explained. How to getfrom 'traditional' to 'composite' was not discussed, which essentially means thatthe expert proposes the new solution and convinces management and employeesto apply the proposed solution (Den Hertog, 1992). A theoretical foundation of'composite work groups' was therefore only implicitly present at first. Individualresearchers, however, were influenced by the then emerging research stream ofsystems thinking resulting in the application of the holistic and open system viewof organisations together with the concept of self-regulation. The holistic and opensystem view allowed them to consider both the whole coal-mining situation andthe influence of the hostile and unpredictable environment in the coal mines.Self-regulation is particularly effective in this environment and all-round minersare required for that or, in other words, provide the 'requisite variety' as to theproblems associated with environmental uncertainty (Van Eijnatten, 1991). Also,the application of the open system view to the production organisations led to thedistinction of a 'sociotechnical system' consisting of a social and a technicalcomponent. Both components are independent in so far as they 'obey' the laws ofnatural science and the 'laws' of social sciences. They depend on each other be-cause they need each other in fulfilling the production function of the firm, i.e.,they are connected by heterogeneity. Typically, the economic aspect is not viewedas a separate system but only as a means of measuring the effectiveness of the en-tire sociotechnical system (Emery, 1972 c/ Van Eijnatten, 1991).
Following the action research carried out in the British mines, empirical researchon sociotechnical systems transferred to Norway as the Norwegian programme onIndustrial Democracy (ID) was started up in 1962. Sociotechnical systems designwould fit perfectly in this programme for its self-regulation design and decen-tralised decision making. Part of the Norwegian programme consisted of a num-ber of exemplary projects, featuring the autonomous workgroup as the main de-sign ingredient, in a wire-drawing mill, a paper pulp factory, an electrical appli-ances plant and a fertiliser plant respectively (Emery and Thorsrud, 1969, 1976;Bolweg, 1976). As projects followed one another in time, a transfer of lessonslearned was possible and, as it showed, badly needed.
41

Owpter 3
The first project was carried out at the wire-drawing mill of Christiana Spigerverkin Oslo in 1964. Group work was introduced by the British-Norwegian researchteam, but the reward system and the non-involvement of local managers and millemployees posed serious difficulties to the control of the change process. After ayear, the project was cancelled. A second project was started in February 1965 at thechemical pulp department of the Hunsfos paper mill in Kristiansand. This time,management and unions were extensively consulted and the change process wasbetter controlled by phasing the project and having representative project groupsinstalled for each phase. More importantly, the project really won impact at themoment the research team withdraw and management committed itself stronglyto the new organisation mode. However, early 1967 the project came to an almostcomplete standstill as industry conditions worsened and managerial prioritiesshifted accordingly. A third project was started in December 1965 at N0BO's metalware plant near Trondheim, this time directed at the introduction of autonomousworkgroups at the product line level. All earlier insights regarding change andproject management were applied. This project was turned into the show case ofthe ID programme and drew widespread international attention. Furthermore, asa new plant was built later, the sociotechnical production organisation was main-tained. The fourth and final exemplary project was initiated in 1967 in a conjunc-tive approach wherein an old fertiliser plant was reorganised and a new fertiliserplant of Norsk Hydro in Porsgrun was designed. As in the other projects, it intro-duced group work supported by a training programme and a reward system basedon group work. Both plants were fully organised in sociotechnical terms and be-came very successful (Van Eijnatten, 1991).
The Norwegian programme was of great significance as it provided many so-ciotechnical tools and shaped the change management approach of classical so-ciotechnical systems design (Bolweg, 1976). Two main lessons were learned. First,the overruling importance of participation and, second, as a consequence, theswitch-over from confenf to process in sociotechnical design (i.e., the expertapproach versus the facilitator approach).
Participation proved to be the only route which made the autonomous groupstructure last. Participation took the form of self-design which is basically shapedby an educational workshop in which concepts and tools are handed over to man-agers, shop stewards and employees together. This is followed by small designteams which redesign independent parts of the organisation - design teams are,again, of a mixed composition. Design teams are then brought together again for adiscussion round of the various designs. Subsequently, in a plenary presentation,all revised designs are coupled and a first planning of the reorganisation is made.In the late seventies, a more general redesign approach was generated. It made useof a so-called search con/erence bringing together a broad selection of people (25 to35) of various functions and levels from the organisation who develop possibleand desirable scenarios for the organisation. In fact, it contains a strategic orienta-tion on the environment of the organisation and the organisation's possibilitiesand limitations in that environment. Furthermore, a search conference fulfils thesubsequent role of bringing people together in a learning situation and taking ad-vantage of the future structure of cooperation.
42

SocioTec/inicfl/ Systems Design
At first, change management was dominated by an expert approach. As it was thepioneering phase of sociotechnical systems design, it was believed that an expertmodel would guarantee the largest diffusion of sociotechnical ideas. Expertswould, one believed, convince several firms to agree with sociotechnical experi-ments in their organisations and with the results they would yield, researcherscould further prove that STSD really lived up to expectations. Information trans-fer in the literature, conferences, etc., would then lead to further diffusion. Also,the expert approach reflected the technical model of change at that time; after es-tablishing the goals of the organisation, further specifications were derived andvarious alternatives weighed. The one alternative chosen then would be imple-mented and that is all there is to it. This linear, stepwise mode of operation canstill be found back in the sociotechnical project management tool called the nine-step plan, which will be discussed below. However, the expert approach did notlead to the expected diffusion of ideas despite the success and international atten-tion for the Norwegian experiments. Researchers and the parties involved in theID programme therefore drew the conclusion that participation is not a mere con-dition for lasting change but the main substantial element of the change approach.It reduced the role of technical expertise radically. Expertise from now on was lim-ited to the educational workshops and to the possible need for additional expertiseexplicitly expressed in the later stages of self-design (Den Hertog, 1992).
The sociotechnical tools that resulted from the British and Norwegian experi-ments led to (1) an improved change project management as implied in the nine-step design method, (2) a disturbance diagnostic tool called the 'variance controlmatrix', and (3) a series of job design principles for joint optimisation of the socialand technical systems at individual and group level.
The nine-step method constitutes a classic sequence of action steps, familiar sincethe time Simon proposed it. It was applied to STS change projects by Emery andTrist (1978). Because of its linear logic, it is still used in many models for informa-tion system design (Van Reeken, 1990). What is interesting about the nine-stepmethod, however, is that it implies a sort of project organisation, each projectgroup tied to one or various steps in the method.
The variance control matrix is based on the concept of 'disturbance control' ofHerbst (1959). It maps disturbances as to the locations where they are signalled andto where they are caused, which can be at two very different places in the or-ganisation. Signal and cause then are brought together: At the location where thesignal occurs, the cause should be controlled. Typically, its basic idea is to constructsystem boundaries around those places where signal and disturbance collectivelyappear. In this respect, the variance control matrix is a sort of process analysis.
The nine-step method then was wrapped around the variance control matrix: Byusing the matrix the process was analysed, and its subsequent redesign outcomesare then brought into a project organisation as constituted by the nine-stepmethod (Engelstad, 1972).
Finally, the Norwegian experiments resulted in the formulation of structuralpropositions for joint optimisation. These principles distinguish between indi-vidual and group level. At group level, it is more explicitly attempted to couple
43

work groups to overall organisation design, because it addresses larger issues suchas communication and information, and requirements for personnel policy(Emery and Thorsrud, 1976).
The further diffusion of sociotechnical ideas and experiences to Sweden and theUnited States marked the start of various other experiments which are well doc-umented and still have an significant impact on production organisation design(Whitsett and York, 1983; Agurén, Bredbacka, Hansson, Ihregren and Karlsson,1984; Lawler, 1986; Auer and Rigeler, 1990). In the US, the sociotechnical idea wasfirst renamed 'Quality of Working Life' (QWL) and later Tiigh-Performance WorkSystems' (Vaill, 1982; Buchanan, 1987; Taylor, 1990; Moch and Bartunek, 1990). Asthese changes in labels already indicate, the diffusion of sociotechnical ideas andtheir application in a field situation thus evolve with the accents placed over timeon certain elements of organisational effectiveness. Or, as Safizadeh (1991, p. 63)puts it "... But because the past solutions have reflected the environmentalimperatives of the time in which they were proposed, their applications to amodern setting is problematic". The present accentuation of organisationalflexibility and innovativeness do indeed add an extension to the originalsociotechnical ideas as developed in the U.K. and Scandinavia in the 60s and 70s.The use of the adjective Modern to reflect the Dutch further elaboration of So-cioTechnical Systems Design with an extensive design toolkit and a change man-agement approach is no coincidence in this respect.
The Dutch Elaboration
Modern Sociotechnical Systems Design
As The Netherlands also had its share of classical sociotechnical experiments inthe 60s and 70s (Van Beinum, 1963; Den Hertog and Wester, 1979; Allegro and DeVries, 1979), De Sitter was the first to critically review the original paradigms ofclassical STSD. The main points of his criticism include (Van Eijnatten, 1991):imprecise definitions of concepts, inadequate attention for the system-environment relationship, the overly emphasis on reducing the social system to apsychological entity, the incorrect system-theoretical distinction between socialand technical subsystems instead of defining them as aspect systems and, finally,the inadequate separation of the analytical model (explaining existing productionarchitecture) from the design model (shaping a renewed architecture). The nextparagraphs on the Dutch elaboration of STSD are deeply rooted in the work of DeSitter (1989a, 1989b; Groep Sociotechniek, 1987; De Sitter and Den Hertog, 1990).
De Sitter's critique initiated the design of a new theoretical framework, which de-scribes STSD as 'The study of the manner in which structural parameters of or-ganisation as a function of the division of work and technical instrumentation ofa production system in a given environment, shape opportunities for the produc-tion of internal and external functions, and the application of this knowledge inthis respect to the design of production systems" (De Sitter, 1989c, p. 13). Technicalinstrumentation here literally means technical equipment. The division of workindicates the separation, grouping, allocation and coupling of executive and
44

SocioTecnnica/ Systems
regulative functions. Internal and external functions relate to system functions:Internal functions are, for example, procurement, manufacturing and sales, andexternal functions are transactions with respect to various markets such as theconsumers market, the suppliers market, the governmental 'marker* and the capi-tal market. As a shortcut for understanding, a function can be considered a trans-formation, translating an input into an output. However, this definition particu-larly stresses the interdependence between technical instrumentation and the di-vision of work. The balance model implicit in this conceptualisation is workedout via the Law of Requisite Variety earlier mentioned. It focuses on the premiseof 'requisite variety', stating that turbulence imputed by the variability of the envi-ronment can only be compensated for by a proportional capacity to control (VanEijnatten, 1991).
Modern STSD, however, explicitly tackles the problem of the functional require-ments in which modern production organisations must excel. The productionconcepts of today still build on the characteristics of the Tayloristic-bureaucraticconcept of the organisation dating back more than 100 years ago. At that time, itsorganisational concept was based on integral thinking, relating structure to the di-vision of labour. Since then, efforts have been directed at improving parts of thesystem (e.g., personnel, production, accounting) taking for granted the initial inte-gral setup of the organisation. However, problems can be solved no longer with-out addressing the structural background of the strains between production sys-tems and their socio-economic environments. All other answers not addressingthis structural background will have the characteristic of providing 'more of thesame'. What is therefore needed is a science of integral structural design: i.e., STSDbecomes the architectural science of organisational structures (De Sitter, 1989c).The Modern sociotechnical point of view can thus be summarised:
"Production is embedded in a network of socioeconomic exchange between production systemsand their respective environments. The external structure of a production system can be definedas the configuration of interactive relations with its environment. The internal structuredescribes the architecture of relations between the parts or elements of a system. ... It consistsof a set of functionally differentiated relationships and their interactive outcomes. Outcomeswith an external function are defined as outputs. Outcomes with an internal function areusually conceived as 'emergent' properties or 'condition changes' in the internal structure, suchas changes in inventories, wear & tear, changes in skill and knowledge, and changes in (orreinforcement of) current industrial relations as a function of learning processes. The multitudeof functionally differentiated external and internal processes of exchange requires continuousadaptation and coordinating under ever-changing conditions.
The internal structure or architecture of a production system fosters or restricts the oppor-tunities for effective and efficient control of the required coordination between functionallydifferentiated processes, which may interfere with each other and may impede each other'snormative completion. The core of sociotechnical inquiry is therefore the analysis andidentification of the external and internal structural parameters which together determine asystem's disturbance probability and sensitivity with respect to a balanced production ofinternal and external functions in time." (translated from De Sitter, 1989b, p. 12)
Since STSD is being considered as the architectural science of organisational struc-tures, attention must be paid to the following four design elements:
45

C/wpfer 3
- identification of disturbance criteria (i.e., what type of turbulence turns out tobe a structural problem), which are called the 'functional requirements' of thesystems to be (re)designed;
- identification of structural locations and sources of disturbance;- identification of structural parameters related to the probabilities of disturbance
and disturbance sensitivity, i.e., on what element(s) of design does turbulencereflect and what are the chances that this turbulence highly disrupts the overallorganisation?;
- a study and formulation of structural design principles, indicating how to de-sign aspect systems on the basis of insight into their dynamic interdependencieswith respect to the basic requirement of balanced production of internal andexternal functions in time (De Sitter, 1989, p. 12).
From a design point of view, it thus became necessary to make a fundamental dis-tinction between aspect systems, regardless of their function. Consequently, twobasic functions in every purposeful, and therefore selective processes can be dis-tinguished: control and performance. Control here means the se/ecfion of rela-tions to be performed and performance relates to the reai/safion of selected rela-tions.
This distinction is followed by a subsequent distinction regarding design mef/iod-o/ogy. It addresses the structure of three basic aspect systems (De Sitter and DenHertog, 1990, p. 14):
- the Production structure, which addresses the grouping and coupling of perfor-mance functions;
- the Control structure, which addresses the allocation and coupling of controlfunctions; and
- the Information structure, which is derived from the production and controlstructure and which addresses mainly design questions regarding technicalmatters such as sensing, coding, retrieval and transfer of control data. Basically,the information structure is nothing more than a technical elaboration of thetwo main production and the control structures.
As structural design implies changes in structural parameters, these parameters re-fer to the two basic structural aspect systems, i.e., the production and the controlstructures. These parameters have been well known for a long time as they repre-sent the primary architectural characteristics of any structure. Designing andchanging existing designs therefore always address one or more of the followingparameters:
1. Functional concentration, which can take two extreme forms: all transforma-tion coupled to all subsystems (concentration), or each transformation coupledto its own corresponding subsystem (deconcentration in parallel flows). Thisparameter usually sets the pace for all other structural parameters as itdetermines the freedom of (design) choice for all remaining parameters.
2. Performance differentiation, which refers to the separation of the prepare,support and make functions into specialised subsystems.
46

SocioTecnni'ca/ Systems Design
3. Performance specialisation, referring to classical Taylorism as it splits up aperformance function into a maximum number of subfunctions, which thenare allocated to separate subsystems.
4. Separation of performance and control functions, which allocates a perfor-mance and a corresponding control function to different subsystems, i.e., anemployee overseeing a group of similar lathes.
5. Control specialisation, which allocates the control of functional aspects toseparated aspect systems, i.e., quality, maintenance, logistics, personnel, etc.
6. Control differentiation, which splits up control domains into separate controllevels such as strategic, structural and operational levels.
7. Division of control functions, refers to the allocation of various functions fromthe control cycle (e.g., perceiving, judging, action selection) to separatesubsystems (De Sitter and Den Hertog, 1990, p. 15).
The concept of structural parameters can be considered the link between a'modern' sociotechnical paradigm as sketched above and its elaboration into atoolkit for (re)design. The latter is not only an extension of 'modern' STSD, butalso an important body of knowledge representing design principles, design strate-gies and design sequence rules. It instruments STSD with a view of how to im-plement it, thus adding largely to the significance of sociotechnical design in dailypractice. In other words, it supplements the explanatory function of how an archi-tecture of structure determines the system's internal and external functions with adesign function of how to obtain desired relations between internal and externalfunctions. This design toolkit is discussed below.
A Design Toolkit
The design toolkit of Modern STSD consists of three main instruments in a hier-archy of decreasing abstraction: There are design principles, design strategies anddesign sequence rules. The design principles have the most general significance asthey address the complexity of the systems. Systems' complexity is considered afunction of, respectively, the number of system elements, the number of their ex-ternal and internal relations and their variability in time (i.e., is a steady-state con-dition applicable?).
In Modern STSD terminology, an increase in complexity is related to an increaseof disturbance probability and disturbance sensitivity. Seen from the structuralpoint of view, disturbance probability is a function of the seven parameters men-tioned above. The more separation and differentiation between control and per-forming functions, the more interfaces and, accordingly, the higher the probabilityof interferences: i.e., the probability that functions may interfere with each other.Thus, disturbance probabilities define the degree of requisite variety. On the otherhand, disturbance sensitivity refers to the available options to reduce disturbancesat the level of subsystems. If available options to absorb disturbances are less thanrequired at their location of occurrence, the probability of disturbance transfer in-creases (see Figure 3.2).
47
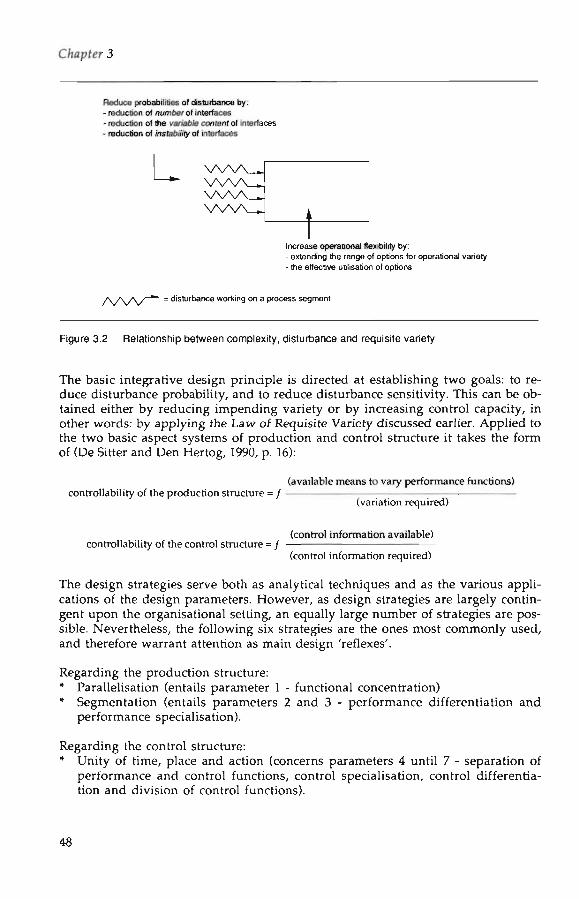
C/iapfer 3
Reduce probabilities of disturbance by:- reduction ol number of interfaces- reduction of the variable conrenf of interfaces• reduction of vulabihry of interfaces
L vwv.
Increase operational flexibility by:- extending the range of options for operational variety- the effective utilisation of options
= disturbance working on a process segment
Figure 3.2 Relationship between complexity, disturbance and requisite variety
The basic integrative design principle is directed at establishing two goals: to re-duce disturbance probability, and to reduce disturbance sensitivity. This can be ob-tained either by reducing impending variety or by increasing control capacity, inother words: by applying the Law of Requisite Variety discussed earlier. Applied tothe two basic aspect systems of production and control structure it takes the formof (De Sitter and Den Hertog, 1990, p. 16):
(available means to vary performance functions)controllability of the production structure = ƒ
controllability of the control structure = ƒ
(variation required)
(control information available)
(control information required)
The design strategies serve both as analytical techniques and as the various appli-cations of the design parameters. However, as design strategies are largely contin-gent upon the organisational setting, an equally large number of strategies are pos-sible. Nevertheless, the following six strategies are the ones most commonly used,and therefore warrant attention as main design 'reflexes'.
Regarding the production structure:* Parallelisation (entails parameter 1 - functional concentration)* Segmentation (entails parameters 2 and 3 - performance differentiation and
performance specialisation).
Regarding the control structure:* Unity of time, place and action (concerns parameters 4 until 7 - separation of
performance and control functions, control specialisation, control differentia-tion and division of control functions).
48

SocioTec/inica/ Systems Design
* Bottom-up allocation of feedback loops (concerns parameter 4 - separation ofperformance and control functions).
* Uncouple feedback loops in time (concerns parameter 6 - control differentia-tion).
* Built-in feedback loops in every task (concerns all seven parameters).
The production structure design strategies can be considered design for /fexibi/ify.They are directed at the available means to vary the production process, while thecontrol structure relates to the ufi/isaf/on of those means.
The point of parallelisation is proven earlier where a process flow was deconcen-trated (parameter 1) into two parallel flows, inherently reducing complexity by60%. Segmentation builds on parallelisation in its reduction of interfaces in theinput-output chain. Interfaces are 'amplifiers' of internal variation sources. For in-stance, in the earlier example complexity was further reduced by 93%. Parallelisa-tion is directed at reducing external variety as caused by demand variation such aschanges in volume demand and product mix. Alternatively, internal variety ascountered by segmentation is caused by the number of performance operations,i.e., their subsequent number of necessary interfaces (see Figure 3.3). Segments arecreated by clustering performance operations that have maximal interdependencein their execution. In general, segments should contain operations that eithershow direct interdependence regarding sequence and balancing the flow ofmaterial or are dealing with quality, or form a cluster with joint input and outputchannels.
Parallelisation
—E"
—g-
Segmentation
r• H• H
»•»>»».
ZlZl
Figure 3.3 Simplifying by parallelisation and segmentation (separating order flows and, subse-quently, separating process parts in the order flows; Van Amelsvoort, 1992)
Segmentation of performing functions are a first step towards a correspondingsegmentation of support and preparatory functions, which thus form a fluent nextstep to the phase of control structure design. Parallelisation and segmentation re-sult in less internal and external variety and use few interfaces which already im-
49

ply an exponential decrease in required control. Therefore, most control problemsare implicitly solved by the design of the production structure; what is left to de-sign, builds on the concept of the control cycle or, as it is sometimes called, thefeedback loop. This is the reason why the design of the production structure has tobe taken care of first, i.e., the sequence rule discussed below. In other words,'required control' is the linking factor between production and control structuredesign.
A control cycle consists of four interrelated functions: (1) sensing, i.e., perceptionof process states, (2) judging, i.e., evaluation per aspect, (3) judging again but nowon an integrated basis of evaluated aspects, and (4) action selection, i.e., the choiceof a controlling activity. The control cycle is independent of the control level. Forinstance, at the operational level operations are controlled on the basis of givennorms. The structural level generates those norms on the basis of production, andcontrol models on the basis of given organisational goals and, finally, the strategiclevel evaluates these goals given the environmental or market conditions. Con-trol cycles therefore control variation at all levels of aggregation (micro, meso andmacro). Control structure design is now directed at configuring the allocation, se-lection and coupling of control cycles in the production structure designed first(see Figure 3.4).
The design principle of unity in time, place and action relates to the availability ofeffective control information. The time between the two phases of occurrence &perception and perception & action upon a disturbance should be as short as possi-ble. What links these two is the place of occurrence. Therefore, separation of thetwo phases and, thus, the control design principle of unity in time, place and ac-tion should be prevented. Implicitly, this design principle hands over criteriawhich determine what information is e//ect/pe information: information shouldbe re/i'flb/e (correspondence between facts and perceptions), acfwa/ (time-span be-tween occurrence and control action), comp/efe (simultaneous measurement ofcurrent conditions) and re/eranf (affects probability of information distortion andsevers learning processes involved in the mental modelling of processes). Each ofthese criteria can be related to the above-mentioned structural parameters. For in-stance, completeness relates to control specialisation (parameter 5) as it pertains toall aspect systems involved. Also, relevance relates to separation of performingand control functions and division of control functions (parameters 6 and 7) be-cause it refers to the allocation of these functions to separate elements, i.e., indi-viduals or machines. Separation of control information can thus block the transferof learning 'on the job'.
Bottom-up allocation of control cycles is in itself an application of the structuralparameter of control differentiation. In general, everything in an organisation canbe controlled top down. However, by starting to allocate bottom up, a differentia-tion is made towards what control cycle is most appropriate at what control level.This is done by means of stepwise elimination. At micro-level (e.g., individualwork stations) a first round of control cycle allocation is made. From the total setof control cycles, these control cycles are then eliminated and a step-up is made tothe next control level. Consequently, at the meso-level, the next round of controlcycles is allocated and eliminated from the total control set. This procedure is re-peated up to the top level, where the last and most strategically oriented control
50

Soc/oTec/inica/ Systems Design
cycles are allocated. For reasons of simplicity regarding the procedure, the micro-level is operationalised to start at the level of segments or whole-task groups. De-termination of the control range at segment level then works two ways: upward tothe organisation's top level and downward into the group. Micro-level for the lat-ter is the individual work station. Typically, in a structural architecture withoutparallelisation and segmentation there would be few starting points for allocatingcontrol cycles, since micro or meso-levels in the organisation are hard to distin-guish.
CouplingJudgement ^_ Choice of action
Percep ion
Process
Allocation and Selection
Figure 3.4 Selecting, allocating and coupling of control cycles and the control cycle concept(KOERS, 1989)
The design strategy of uncoupling feedback loops (control cycles) in time relates tothe moment when external control transforms into internal control. Segmentshave various interfaces. Each segment's internal control cycle is coupled using ahigher level external control cycle, which usually matches the existence of an in-terface. Typically, each segment's internal control would be substantially reduced ifall preparatory and support functions were received at the same time. Therefore,instead of physically buffering those functions, it is the lead-time which definestheir reception. This shows a strong similarity with Just-In-Time production sys-tems, which primarily structure their processes on the basis of time consumption.Most significant here is the use of Kanban cards, which are control signals to thepreceding segment that an input is required by the signalling segment. In otherwords, a kanban is a concrete depiction of control cycle coupling, i.e., an externalcontrol cycle transforming into an internal control cycle if the kanban is receivedand acted upon. The general idea supporting this design strategy is somewhat sim-ilar to stepwise elimination in allocating control cycles. It builds on a hierarchy ofcontrol levels (strategic, structural and operational) each having their control do-main, which are separated by input or output interfaces, thus resulting in localcontrol, interlocal and global controls. It therefore follows that the structural pa-rameter of control differentiation is involved (parameter 6).
The last control design strategy, building in feedback loops in every task, is perhapsthe most 'traditional' as it relates to the 'grandfather' of STSD: job design. It con-
51
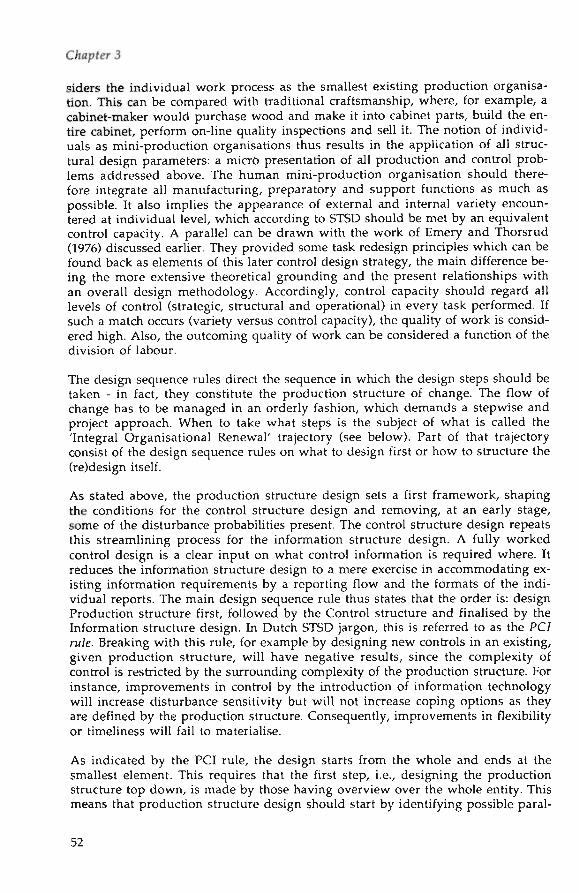
siders the individual work process as the smallest existing production organisa-tion. This can be compared with traditional craftsmanship, where, for example, acabinet-maker would purchase wood and make it into cabinet parts, build the en-tire cabinet, perform on-line quality inspections and sell it. The notion of individ-uals as mini-production organisations thus results in the application of all struc-tural design parameters: a micro presentation of all production and control prob-lems addressed above. The human mini-production organisation should there-fore integrate all manufacturing, preparatory and support functions as much aspossible. It also implies the appearance of external and internal variety encoun-tered at individual level, which according to STSD should be met by an equivalentcontrol capacity. A parallel can be drawn with the work of Emery and Thorsrud(1976) discussed earlier. They provided some task redesign principles which can befound back as elements of this later control design strategy, the main difference be-ing the more extensive theoretical grounding and the present relationships withan overall design methodology. Accordingly, control capacity should regard alllevels of control (strategic, structural and operational) in every task performed. Ifsuch a match occurs (variety versus control capacity), the quality of work is consid-ered high. Also, the outcoming quality of work can be considered a function of thedivision of labour.
The design sequence rules direct the sequence in which the design steps should betaken - in fact, they constitute the production structure of change. The flow ofchange has to be managed in an orderly fashion, which demands a stepwise andproject approach. When to take what steps is the subject of what is called the'Integral Organisational Renewal' trajectory (see below). Part of that trajectoryconsist of the design sequence rules on what to design first or how to structure the(re)design itself.
As stated above, the production structure design sets a first framework, shapingthe conditions for the control structure design and removing, at an early stage,some of the disturbance probabilities present. The control structure design repeatsthis streamlining process for the information structure design. A fully workedcontrol design is a clear input on what control information is required where. Itreduces the information structure design to a mere exercise in accommodating ex-isting information requirements by a reporting flow and the formats of the indi-vidual reports. The main design sequence rule thus states that the order is: designProduction structure first, followed by the Control structure and finalised by theInformation structure design. In Dutch STSD jargon, this is referred to as the PC/ru/e. Breaking with this rule, for example by designing new controls in an existing,given production structure, will have negative results, since the complexity ofcontrol is restricted by the surrounding complexity of the production structure. Forinstance, improvements in control by the introduction of information technologywill increase disturbance sensitivity but will not increase coping options as theyare defined by the production structure. Consequently, improvements in flexibilityor timeliness will fail to materialise.
As indicated by the PCI rule, the design starts from the whole and ends at thesmallest element. This requires that the first step, i.e., designing the productionstructure top down, is made by those having overview over the whole entity. Thismeans that production structure design should start by identifying possible paral-
52

SocioTec/inicfl/ Systems Design
lel flows and proceed by creating segments at the meso-level. Finally, task groupscan be constructed at the micro-level. Alternatively, as follows from the stepwiseelimination procedure for control cycle allocation, the control structure is de-signed bottom up. This bottom-up sequence starts upward from the (parallelisedand segmented) production flow, which consequently allows for a modular archi-tecture of control and a flexible stepwise implementation of a (newly or re-designed) control structure. The modularity involved thus provides options forlimited (i.e., modular) improvements or changes as conditions so require. Thismay be the case in, for example, the introduction of production cell technology orFlexible Manufacturing Systems. These segregated interventions can have clearadvantages in introducing changes slowly to the organisation and allowing peopleto gain experience and become familiar with various innovations. Again, all of itmade possible by a flow-oriented organisation mode.
A Change Management Approach
The change management approach proposed by Modern STSD builds on thechange experiences gained in Scandinavia and Dutch experiences with job designexperiments that ran in the same time period (Den Hertog, 1978).
A number of lessons were learned from these projects and later incorporated intothe change management trajectory. First, STSD should start at least at firm or plantlevel. Starting (re)design at lower organisational levels ignores the basic overallstructures in which, for example, job shops have to operate. At lower organisa-tional levels, the conditions for (re)design are already established and limit the de-grees of freedom left for actual design. Second, involvement of employees in theredesign decision making was an essential condition for success. Employees heremeans everyone employed: all workers and all staff and management. However,participation per se is no guarantee for success (Den Hertog and Wester, 1979; DenHertog and Wielinga, 1992). Design expertise is also needed in order to achieve aneffective redesign. Both approaches try to control the change process in somemanner but seemed to be incompatible. A simple question resulted: If bothapproaches are simultaneously required, how can we find a solution? An answerwas found by combining the expert approach with the participative approach intoa self-design approach: by making people design experts. This led to the introduc-tion of change as an educational programme, which implies that organisationmembers have to be trained how to redesign their organisation themselves. Theresulting change management approach was named Integral OrganisationalRenewal (IOR) and was established after various tryouts in several (re)design pro-jects (De Sitter, 1981; Van Assen and Den Hertog, 1984).
Metaphorically speaking, the expert approach leans towards the engineer-ing/machine metaphor, while the participative approach is rooted in the democ-racy metaphor (Morgan, 1986). Both metaphors were opposed to each other intheir view on the change process. Fortunately, reconciliation was offered by inte-grating the two in a third metaphor, which is also endorsed by Modern STSD: theorganisation as an educational system (Den Hertog and De Sitter, 1989).
53

Chapter 3
An IOR trajectory takes approximately two to four years; the exact duration is de-termined by the active involvement of all the employees which can lead to either'fast' or 'slow' change. Nonetheless, it can definitely not be regarded as yet another'quick fix' method to solve organisational problems. Also, as in the design toolbox,the IOR trajectory can be divided into six phases (Den Hertog and De Sitter, 1989;De Sitter and Den Hertog 1990). The first three phases are concerned with settingthe mind for change and indicating the broad directions of a future organisation.The latter three phases are the actual design phases, including training, projectmanagement and the use of the design toolkit as introduced above (see Figure 3.5).
Awareness of need for change can be restated as 'without pain, no cure'. First, theorganisation has to build up the feeling that "we can't go on like this": Low-expo-sure, low-risk experiments at the outskirts of the organisation have postponedfundamental choices and the firm has to (re)develop a sense of direction. Keyitems at this very early phase are top management leadership and ample resources(time, money). Top management here has to take the lead and must clearly knowwhich problems are to be solved and what the outcome should be (Berg, 1986;Pasmore, 1988).
The Strategic Orientation Round formalises this feeling of discontent into a morespecific analysis which serves several goals:
1) creating insight into the organisation's interrelations as a whole, thus pre-cluding partial or monofunctional views to dominate;
2) providing a list of external demands to be met and an overview of the dis-crepancies and bottlenecks between present and future performance, based onclassic strengths-weaknesses and opportunities-threats analysis (SWOT); and,most importantly,
3) carrying out the analysis itself by a group of people representing the organisa-tion as a whole.
Usually, this group contains about twenty people from all functional areas, whichcan constitute a first base for renewal. Sometimes, a strategic analysis had alreadybeen carried out, leading to believe that this step can be skipped. However, it oftenturns out that the earlier analysis was performed by a small elite (staff) group. Re-peating it, but now in a more representative group, usually benefits the quality ofthe analysis and the company-wide involvement.
Following the SOR, which sets the goals of the change effort, two further routesare taken, based on the question of what problems are structural and what prob-lems are nonstructural. The division between structural and nonstructural prob-lems also gives rise to the distinction between renewal and improvement activi-ties. All activities that do not require fundamental changes in structure and can betaken care of immediately are considered improvements. Even so, they s/iou/d betaken care of immediately, as it is a strong signal to the organisation that things aretaken seriously and management is committed to change. The structural problemsare matched with the external performance requirements drafted earlier, and thusa priority listing emerges.
54
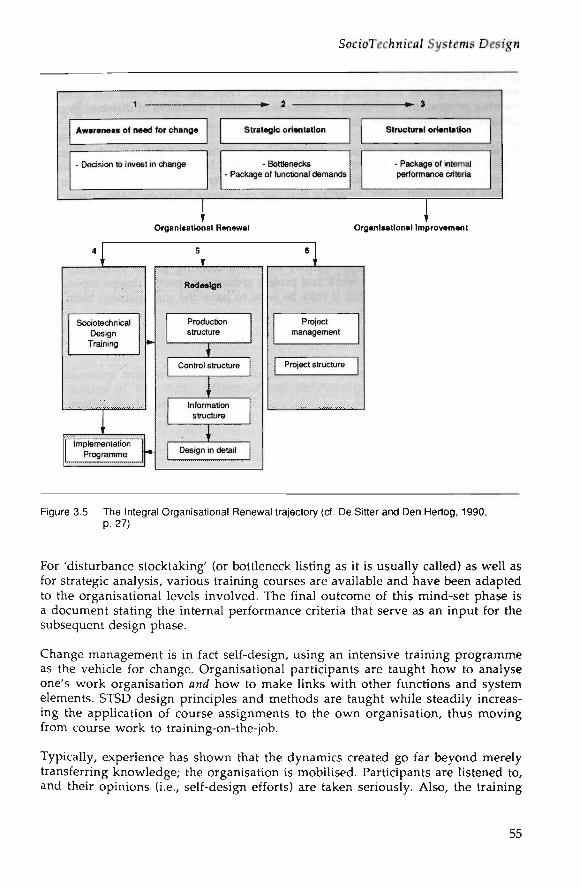
SocioTec/inicfl/ Systems Design
- • - 2
Awareness of need for change
- Decision to invest in change
Strategic orientation
- Bottlenecks- Package of functional demands
Structural orientation
- Package ol internalperformance criteria
Organisational Renewal Organisational Improvement
SociotechnicalDesign
Training
ImplementationProgramme
Redesign
Productionstructure
Control structure
Informationstructure
Design in detail
Projectmanagement
Project structure
Figure 3.5 The Integral Organisational Renewal trajectory (cf. De Sitter and Den Hertog, 1990,p. 27)
For 'disturbance stocktaking' (or bottleneck listing as it is usually called) as well asfor strategic analysis, various training courses are available and have been adaptedto the organisational levels involved. The final outcome of this mind-set phase isa document stating the internal performance criteria that serve as an input for thesubsequent design phase.
Change management is in fact self-design, using an intensive training programmeas the vehicle for change. Organisational participants are taught how to analyseone's work organisation and how to make links with other functions and systemelements. STSD design principles and methods are taught while steadily increas-ing the application of course assignments to the own organisation, thus movingfrom course work to training-on-the-job.
Typically, experience has shown that the dynamics created go far beyond merelytransferring knowledge; the organisation is mobilised. Participants are listened to,and their opinions (i.e., self-design efforts) are taken seriously. Also, the training
55

Chapter 3
programme breaks through functional barriers as people speak the same languageand work together for a long period of time. Thus, the one-to-one link betweentraining programme and design process is essential - members of different organi-sational levels are to take over redesign.
Parallelisation, segmentation and internal structuring of segments are redesigntopics for various work groups at all organisational level, following the top-down,bottom-up sequence rule for production and control structure design. The se-quence is noncompulsory, meaning that one can iterate between macro, meso andmicro-levels to find the most fitting solution to the specific design problem. At thestart of the actual design, there is just one group, designing the basic structure(parallelisation). As they are followed up by various other design groups, the needfor coordinating and matching of the subdesigns implies project control. Conven-tional project management techniques suffice: a steering group to monitor thewhole process, and various work and project groups for specific design topics. Ex-perience here has shown that it may be wise to have the management team andthe steering group coincide.
56
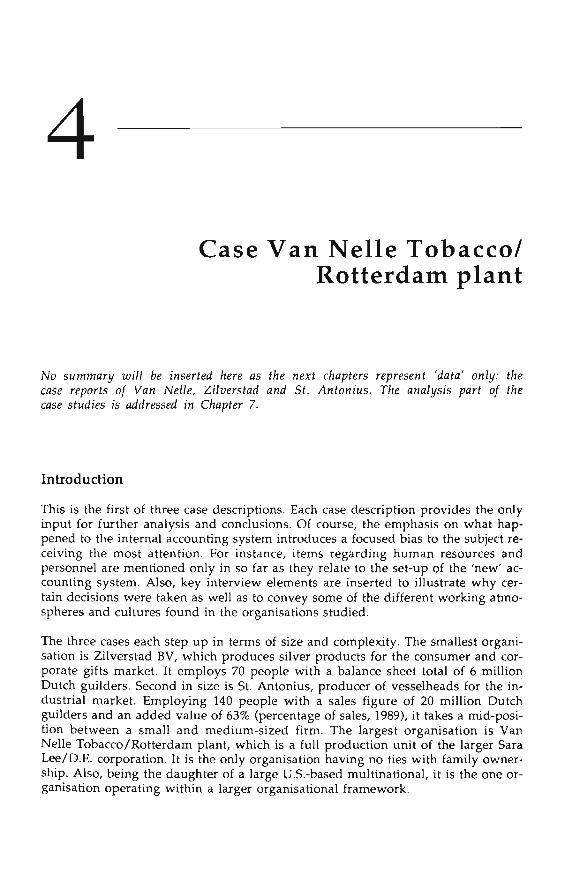
4Case Van Nelle Tobacco/
Rotterdam plant
No summary u>i7/ be inserted toere as Me next diopters represent 'data' on/y: fnecose reports o/ Van Ne//e, Zi7i>erstad and St. Antoni'ws. T/ie ana/ysis part o/ fnecase studies is addressed in Chapter 7.
Introduction
This is the first of three case descriptions. Each case description provides the onlyinput for further analysis and conclusions. Of course, the emphasis on what hap-pened to the internal accounting system introduces a focused bias to the subject re-ceiving the most attention. For instance, items regarding human resources andpersonnel are mentioned only in so far as they relate to the set-up of the 'new' ac-counting system. Also, key interview elements are inserted to illustrate why cer-tain decisions were taken as well as to convey some of the different working atmo-spheres and cultures found in the organisations studied.
The three cases each step up in terms of size and complexity. The smallest organi-sation is Zilverstad BV, which produces silver products for the consumer and cor-porate gifts market. It employs 70 people with a balance sheet total of 6 millionDutch guilders. Second in size is St. Antonius, producer of vesselheads for the in-dustrial market. Employing 140 people with a sales figure of 20 million Dutchguilders and an added value of 63% (percentage of sales, 1989), it takes a mid-posi-tion between a small and medium-sized firm. The largest organisation is VanNelle Tobacco/Rotterdam plant, which is a full production unit of the larger SaraLee/D.E. corporation. It is the only organisation having no ties with family owner-ship. Also, being the daughter of a large U.S.-based multinational, it is the one or-ganisation operating within a larger organisational framework.

C/iapfer 4
The cases are presented in chronology of report completion as this follows thebuild-up of our own insights of what was going on: Van Nelle first, followed byZilverstad and, finally, St. Antonius. After the full case reports were drafted andformally approved by company management, no further changes were made inthe descriptions. Case reports thus represent frozen moments in time, whichmeans that, in some cases, there is an 'open end' at some of the (sub)story lines.
Case Van Nelle Tobacco/Rotterdam plant
When writing this first case history, the following approach was used: First, a de-scription of the actual organisational change is given. It is shown how this organi-sational change furthers the changed control system and, consequently, how theredesigned control system resulted in an adaptation of the management account-ing system. The case description follows events chronologically with most of theattention being paid to the last stage of the organisational renewal process - the re-design of the management accounting systems (MAS).
The Introduction Phase (1984-1986)
The Van Nelle organisation consists of five divisions headed by a holding com-pany: VNIEM, Food Services, the Sweets division, Kennedy and De Erven de We-duwe J. Van Nelle (hereafter called De Erven). The VNIEM division is in charge ofthe sales in Belgium, the Food Services division services vending machine sales(mainly coffee), and the Sweets division contains the consumer brands Droste,Venz and Tonnema (candy and chocolate). In addition, the Kennedy divisiontakes care of the tobacco sales in the United States.
Table 4.1 Core Financial Figures of Van Nelle Holding (Source: consolidated annual report,1988)
Core Figures Van Nelle Holding N V
in 1.000 Guilders
Net turnover
Operating income
E.B.I.T.
Idem in % of net turnover
1988
513.000
36.398
19.959
3.9%
Idem in % ol net assets end of the year 16 2%
Investment in fixed assets
Depreciation
Cash flow
Number of employees perend of the book year
41.368
20.698
40,657
1.520
1987
495,929
34,797
15.240
3.1%
16.1%
34,435
16.774
32.014
1.404
1986
626,654
29.360
10.433
1.7%
12%
15,621
17,051
27.484
1.297
The De Erven division is the focus of the case study. This division accommodatesthe five product lines of coffee, tea, tobacco, rice and desserts. The Rotterdam to-
58

Case Van Nef/e/RoHerdam P/anf
bacco plant is the part of the organisation where the further case description willfocus on (see Figure 4.1).
The Rotterdam plant produces hand-rolling tobacco in two versions, classified topouch volume weights of 40 and 50 gram. Subsequently, each weight type can beturned into a large number of packaging variances according to the wishes of thecustomer. The packaging standard is a poly pouch wrapped in an extra plastic foilfor conserving purposes. Thus, product differentiation consists of either the pack-aging (most of the variance) or the amount of tobacco that goes into the pouch.
Another important aspect of the Rotterdam plant is the building in which it is lo-cated. It was constructed in 1929 by Brinkman and Van der Vlugt, representing thearchitectural stream of New Construction in The Netherlands. A significant fea-ture of the building is the abundant use of glass panels in walls and roofs. As a re-sult of its architectural value, it is virtually impossible to make changes to thebuilding, i.e., change its layout. Consequently, the number of production efficiencymeasures open to use, including limiting the costs of energy, are restricted.
Van NelleHolding
VNIEM FoodServices De En/en Sweet
ProductsKennedy
SalesBelgium
Vendingmachines
CoffeeTea
* • TobaccoRiceDesserts
DrostVenzTonnema
TobaccoU.S.A.
Figure 4.1 Organisation chart of Van Nelle in 1984 (Source: project documentation)
As a result of the lagging operating performance of Van Nelle Holding B.V. in1984, then still a daughter company of the American firm Standard Brands, an or-ganisational survey was held. From the survey, it appeared that the existing organ-isation was ill-adapted to the demands of a changing environment: it was inflexi-ble, pigeon-holed, self-contained and it had high product costs. It was concludedthat a strategic reorientation of the company was necessary. In addition, theAmerican mother company stated the wish to desinvest, which led, in January1985, to a management buy-out and independence for Van Nelle.
(plant manager) "... where the immediate cause resulted from that independence, in whichyou start to think, eh, like - how do we deal with it being an independent company? After thebuy-out, you're left with skewed equity positions, your market position is going to play a rolelike - yes, how can we survive in the coming period, how do we become a company which can gopublic later on? That all played, of course, on the strong need to survive as a new and indepen-dent company. And to do so, to survive, you say like - well, a market-oriented organisation isneeded, flexible and efficient. And how do you go about that, then? Initially by cutting out the
59
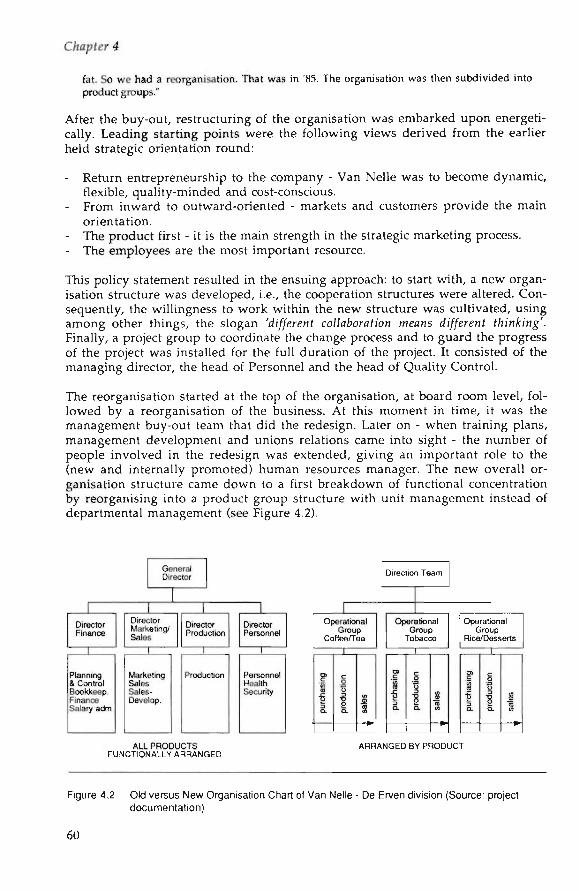
fat. So we had a reorganisation. That was in '85. The organisation was then subdivided intoproduct groups."
After the buy-out, restructuring of the organisation was embarked upon energeti-cally. Leading starting points were the following views derived from the earlierheld strategic orientation round:
- Return entrepreneurship to the company - Van Nelle was to become dynamic,flexible, quality-minded and cost-conscious.
- From inward to outward-oriented - markets and customers provide the mainorientation.
- The product first - it is the main strength in the strategic marketing process.- The employees are the most important resource.
This policy statement resulted in the ensuing approach: to start with, a new organ-isation structure was developed, i.e., the cooperation structures were altered. Con-sequently, the willingness to work within the new structure was cultivated, usingamong other things, the slogan 'di//erenf coZ/aborafion means di//eren( f/iinfcing'.Finally, a project group to coordinate the change process and to guard the progressof the project was installed for the full duration of the project. It consisted of themanaging director, the head of Personnel and the head of Quality Control.
The reorganisation started at the top of the organisation, at board room level, fol-lowed by a reorganisation of the business. At this moment in time, it was themanagement buy-out team that did the redesign. Later on - when training plans,management development and unions relations came into sight - the number ofpeople involved in the redesign was extended, giving an important role to the(new and internally promoted) human resources manager. The new overall or-ganisation structure came down to a first breakdown of functional concentrationby reorganising into a product group structure with unit management instead ofdepartmental management (see Figure 4.2).
GeneralDirector
1 1 1 1DirectorFinanoe
1
Planning& ControlBookkeepFinanceSalary adm
DirectorMarketing/Sales
i
MarketingSalesSales-Develop
DirectorProduction
1
Production
DirectorPersonnel
1
PersonnelHealthSecunty
ALL PRODUCTSFUNCTIONALLY ARRANGED
_LOperational
GroupColfee/Tea
Direction Team
OperationalGroup
Tobacco
OperationalGroup
Rice/ Desserts
ARRANGED BY PRODUCT
Figure 4.2 Old versus New Organisation Chart of Van Nelle - De Erven division (Source: project
documentation)
60
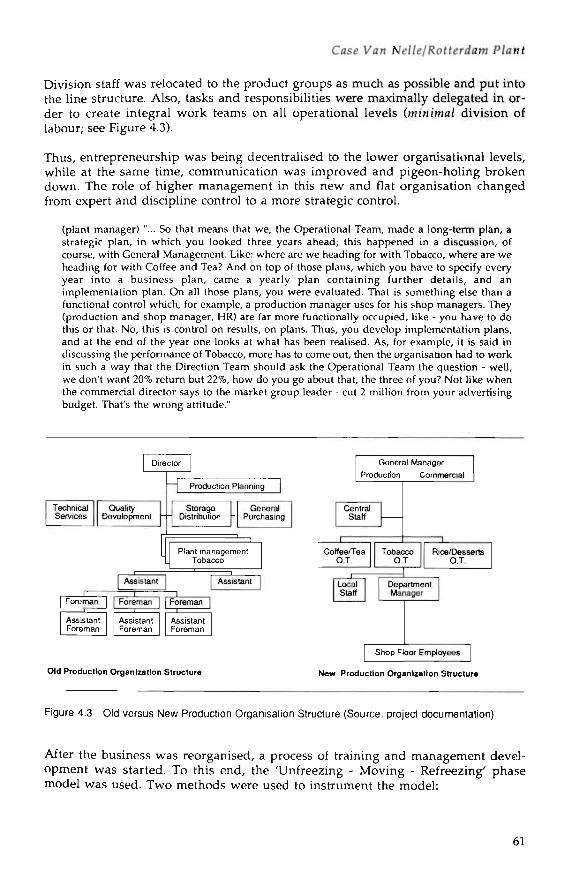
Case Van Ne/Ze/Rofferdom P/anf
Division staff was relocated to the product groups as much as possible and put intothe line structure. Also, tasks and responsibilities were maximally delegated in or-der to create integral work teams on all operational levels (minima/ division oflabour; see Figure 4.3).
Thus, entrepreneurship was being decentralised to the lower organisational levels,while at the same time, communication was improved and pigeon-holing brokendown. The role of higher management in this new and flat organisation changedfrom expert and discipline control to a more strategic control.
(plant manager) "... So that means that we, the Operational Team, made a long-term plan, astrategic plan, in which you looked three years ahead; this happened in a discussion, ofcourse, with General Management. Like: where are we heading for with Tobacco, where are weheading for with Coffee and Tea? And on top of those plans, which you have to specify everyyear into a business plan, came a yearly plan containing further details, and animplementation plan. On all those plans, you were evaluated. That is something else than afunctional control which, for example, a production manager uses for his shop managers. They(production and shop manager, HR) are far more functionally occupied, like - you have to dothis or that. No, this is control on results, on plans. Thus, you develop implementation plans,and at the end of the year one looks at what has been realised. As, for example, it is said indiscussing the performance of Tobacco, more has to come out, then the organisation had to workin such a way that the Direction Team should ask the Operational Team the question - well,we don't want 20% return but 22%, how do you go about that, the three of you? Not like whenthe commercial director says to the market group leader - cut 2 million from your advertisingbudget. That's the wrong attitude."
Director
| Production Planning
TechnicalServices
Quality"Development
General Manager
Production Commercial
StorageDistribution -
GeneralPurchasing
CentralStaff
Coffee/TeaO.T
TobaccoO.T.
Rice/DessertsOT
LocalStaff
DepartmentManager
Old Production Organization Structure
Shop Floor Employees
New Production Organization Structure
Figure 4.3 Old versus New Production Organisation Structure (Source: project documentation)
After the business was reorganised, a process of training and management devel-opment was started. To this end, the 'Unfreezing - Moving - Refreezing' phasemodel was used. Two methods were used to instrument the model:
61

C/iapfer 4
1) Training programmes, with a goal of 'pointing noses'. The training pro-grammes provided an instrument for change as well as establishing unity incommunication and terminology.
2) A management development plan directed at strengthening and training ex-isting management. Part of this plan was that the works council representativeswere much more involved and listened to than before. Moreover, it led tobringing in young and new management, as management that could notchange was internally transferred. Setting up this plan was helped by the strongpresence of a new human resource manager.
The training programmes were organised by an external consultancy company,KOERS B.V., which also supplied the consultancy and process facilitating activitiesfor the latter change phases. The courses were tailored to the specifics of VanNelle's strategic reorientation, emphasising the differentiation between thevarious organisational levels (see Table 4.2 for a specification of the trainingprogrammes).
(plant manager) "...Well, then there is that new organisation with operational teams, andyou're asking yourself - how do we get this organisation functioning ? It always starts withthose .. A lot of people are transferred to new positions. I myself became plant manager, newmarket group leaders entered; a market group leader was quite a new thing for Van Nelle. Sothen you have to start working on the awareness process of those people. General Managementitself - how do they control such a thing as an Operational Team? Operational Team - howdoes it function, what is your control input, how are you being evaluated, what are yourresponsibilities? The development of thinking patterns and your own role in that neworganisation. And all that, we accomplished, here, mainly by training programmes."
OperationalTeam
MiddleManagement
Start
Number ofParticipants
9
65
13
Duration
6 x 2 days
5 x 2 days
6 x 2 days
Subjects
Process InnovationsProducts/TechnicsCooperationLeadership Styles
Leadership StylesIndividual SkillsWorking with Groups
Cooperation O.T. - Staff
Table 4.2 Training Programme Outline (Source: project documentation)
After concluding the training haul, the training programmes were evaluated inmid '86 during an executive meeting with OT, staff and middle management.Among other things, it appeared that the willingness to change had indeed im-
62

Case Van Nd/e/Rofferdawi
proved but the 'old' pigeon-holing and inward-bound behaviour was still lyingdormant. The explicit personnel policy of mutating the employees who were un-willing or unwanting to change, resulted after three years (1988) in the fact that30% of middle management either held other positions within the company, orhad left the company.
During this period of reorganisation and getting the new overall organisation towork, the unions were explicitly involved. The new top management team muchimproved relations with the unions and the company's central works council,both at top and middle management levels. This improved relation kept on last-ing during the time when 150 employees were to find another job, partly as a de-mand of the financers of the buy-out to structurally cut cost. Together with theunions, a social plan was constructed to the benefit of the employees, involvingthe help of an outplacement office in finding other work.
The Analysis Phase (1986-April 1987)
When the awareness process, the learning of new skills and the uniformity of theinternal language on the basis of system theory were completed, a further start wasmade by filling in the new overall organisation structure (the mowing p/iase). Achoice was made to separate the organisation in a production and a nonproduc-tion part. For the production part, the first matter of importance was the remain-ing explication of the production structure. Criteria were the earlier formulatedstrategic goals of quality improvement, better process control and product cost re-duction. Attention would especially be paid to the critical, problem-solving andcustomer-oriented actions of the nonproduction employees.
At this moment in time, several motivational instruments were tried out to'wake up' the organisation. Not all of these instruments were equally functional tothis goal. The instruments encompassed a programme especially designed for theenhancement of so-called Quality of Actions and its influence on the performanceof the organisation. Several other activities for the entire personnel were used inaddition to this campaign, such as the publication of a Quality Indicator, the pre-sentation of a monthly Quality Award and the declaration of 1987 as The Year ofQuality. Evaluation of the quality programme in a workshop-type mode by theemployees showed it was considered afterwards as a major contribution to theprocess of learning how to cooperate and of cultural change, despite the fact thatpeople saw it more as learning techniques, and the activity itself petered out.However, this signified the first occasion were the entire personnel was addressed.
This first campaign was followed up in 1988 by a more comprehensive pro-gramme under the name of /4cfua/. It was directed at the three topics of presence &approachability, customer orientation and performance orientation. Executivemeetings were periodically held in order to obtain commitment and unity inmind-set (poinfing noses). Supporting this campaign was the awarding of indi-vidual and theme group prizes.
Restructuring the production structure was also based on the earlier mentionedgoals of quality improvement, better process control and product cost reduction.To attain those goals, an improvement of effectiveness and an increase in effi-
63

ciency and flexibility were regarded as means. In reality, this meant an integral ap-proach to the respective qualities of organisation, work and working life by whichthe change process should reach the shop floor.
(plant manager) "...Well, that is how it has been sold within the organisation from the starton: the goal is product cost reduction. And to get to a better control. Control of your organisationbut also control of your product quality and then, finally, from your control because only whenyou control your quality you can start improving on it. So that as a goal. We said - well, ameans to reach that goal, for example, product cost reduction, that is to improve on yourefficiency. Thus, the means to attain all that is working on all three because when you use anintegral approach of those three qualities, it will lead to, and that is what 1 also explainelsewhere in the organisation, to cost reduction. If you're working with a fixed number ofpeople and you take care of the effectiveness - more people think about the who and why ofthings; how do I explain then the effects it can have on efficiency? A well-informed groupacting fast, flexibility of course, and that's how I make clear that we're returning, at the end,to our goal using this approach. Well, and that's how it's been told in the organisation."
Consequently, for the redesign of the production structure a stepwise action planwas made by which an integral approach of the three Qs could be attained. Basi-cally, redesign was accomplished in three general phases, starting out from an en-compassing training programme in redesign instruments and concepts. It wasthen followed by an analysis of the organisation (see also Figure 4.4 below) andconcluded by the final redesign.
THE CHANGE PROCESS
1. Wish tor Improvement - The Why
2. Assigning the Design Requirements
3. Analysis of the Present Situation
4. Analysis ot the Control Needs
5. Designing the Organization Structure
6. Taking the Design Decision
7. Making of the Execution Plan per Task Group
8. Implementation
9. Try-out Period
10. Evaluation *~ improvement
Figure 4.4 Redesign Action Plan (Source: project documentation)
The improvement of the quality of work at De Erven's aimed at the working con-ditions as well as the contents and the execution of the various jobs. Workingconditions were approached by means of a S.T.A.P. analysis. This SocioTechnicalAnalysis of Production organisations has a twofold target: the first is to incite a dis-cussion on possible improvements in the working organisation, and the second istrying to raise the point of strengths and weaknesses in the job fulfilments of thepersons concerned. It thus provides data on the formal as well as the informal
64

Case Van Ne//e/RoHerdam P/anf
working organisation in a structured manner. Main points in this S.T.A.P. infor-mation supply round were (see also Figure 4.5):
- job extensiveness and regulating capacity within the job- available slack- working interfaces- participation- information- working conditions
S.T.A.P. steps
Preparation
Introduction
Consumption
Elaboration
1st Feedback
-tAnalysis
Presentation + Rapporting= 2nd feedback
Action Plan
Management
Group
Individual
Change Possibilities
Management + Group
Change Direction
Figure 4.5 S.T.A.P. Plan (Source: project documentation)
A part of S.T.A.P. was to provide budgets for the improvement of working condi-tions.
(plant manager) "... And the STAP analysis, that is a SocioTechnical Analysis of Productionorganisations. It was carried out by Philips, once, so we could draw from their experience - howdo you do such things? And then, here, internal, as a random test, we interviewed a lot ofpeople; how they thought about their jobs, the job content. In short, the quality of work but
65

C/iapfer 4 ,:
also the working conditions. And then we said to ourselves - there are quite a few remarks onthe working conditions which were experienced as being not very good or less pleasant. Thenwe said to ourselves - we have to show that we're being serious about the responsibilities andthat we actually are. willing to do something. So this is what we do - we tackle the workingconditions, anticipating what they will have to do later on. Namely, those task groups, uh..those departments will be transformed into task groups with their own budget responsibility."
The budgets were handed over to the departments to manage; they could spendthem at their own good will. As a result, the employees put confidence in the pro-ject and were motivated while in the same stretch, some of the most troublesomeexperienced working conditions were tackled. The S.T.A.P. budgets consist ofyearly amounts per employee and are still part of the (annual) task group budgets.
(head Production Planning)"... Improvement of working conditions, STAP is 375 guilders peryear per person, standard for each task group. That is an item with which they can do as theyplease. The Variant group, for example, had airconditioning installed in the coffee roombecause in Summer it got very hot and sticky in there. I mean, top-executive boardrooms heredon't even have airconditioning, but that group has, so everybody is looking rather surprisedat it, and says: How can that be? Even the Board doesn't have that but you can do whateveryou want with it, as long as it improves working conditions."
The approach of the quality of work aimed at integrating internal relations on onecommon denominator and linking up with the earlier training programmes onmanagement (leadership styles) and communication.
Finally, quality of the organisation was attained by a transition towards a flat or-ganisation structure and an overall reduction of all ranks and positions leaving alimited number of functions. Therefore, the clarity and visibility created withinthe organisation made fast communication possible. Restructuring the quality ofworking life was being completed by stressing clear mutual relations.
As first site for the production structure changeover, the Rotterdam tobacco plantwas selected. Main reasons were the relative absence of manufacturing distur-bances at Tobacco Rotterdam, and the sheer size of the plant, which was supposedto make effects clearly visible. When successful, other product groups such as riceand desserts would follow suit in restructuring.
What the production redesign was actually going to look like was being estab-lished by the project group IKZ Tobacco (IKZ stands for Integral Quality Manage-ment, "Integrale Kwaliteitszorg" in Dutch). Eight staff members of Van Nelle,among them the production manager of Tobacco and the Head of Quality Control,and two advisors of KOERS participated in this project group. External counsellinghad been "... limited to a minimum and concentrated on passing on concepts andinstruments, and structuring the design process itself" (IKZ report). This IKZreport also provided the main building stone for financial support of the banks forthis round of organisational changes.
In the training programme itself, the integral approach to organisational changeand how to work in and with a task group structure were explicated (see Figure 4.6for an overview of KOERS' participation in the change trajectory). KOERS was in-vited to participate in the redesign process after the favourable experiences withtheir training programmes.
66

Case Van Ne//e/Rofferdflm
The above-mentioned project group was deliberately composed of people whowere supposed to implement the redesign later on. The working method of thisgroup is explicitly integral in approach, i.e., the production organisation has beenwell devised, "... starting as much as possible from functional requirements, thisway of assessing what is desirable and possible from within the existing situation"(IKZ report).
(production manager) "... Well, and what is written here (the IKZ report) is, of course, adescription of how to structure your organisation, and an explanation of what items you haveto be aware of and why, such as defining your system boundaries. And yes, the largest part ofthis report consists of the analyses we made to obtain a clear insight into the process and to beable to rearrange it. Look: assortment analysis, packaging analysis; all part of it, of course."
The contents of the report cover the points two to five of Figure 4.4:
- assigning the design requirements- analysis of the present situation- analysis of the control needs- designing the organisational structure.
Design requirements contained four main demands:
1) double the number of product variants in the future;2) no new small-batch product variants in tobacco preproduction in the near fu-
ture;3) an increase in (new) small-batch packaging variants at the lowest possible costs,
together with an efficiency improvement and a volume increase of bothstandard packagings and of a number of selected variants; and
4) an optimal tobacco quality.
EXTERNAL:
INTERNAL:
Phase 1
UNFREEZING
Phase 2
MOVING
Phase 3
REFREEZING
Do It Yourself(D.I.Y.)
External Hel
Training ' Coaching < Consulting
Absorbing Increasing D.I.Y.
Figure 4.6 Participation of KOERS BV. in the Change Process (Source: project documentation)
67

C/wpter 4
Not only the design requirements were taken into account but also the results ofthe S.T.A.P. analysis (part of the qua/ify o/ uwfa'ng /i/e track) and the generalstrategic starting points of Van Nelle. Quality of working life was mainly used interms of improvement of working conditions, employed by management to indi-cate that it was taking participation and employee involvement seriously^. Theanalysis of the present situation (the existing production process) aimed both at lo-cating the dominant process flows and the particular operations which were driv-ing performance - where is value being added. It resulted in Production beingmodelled in terms of homogeneous and differentiable process elements. Theanalysis of the control requirement came next. It focused on establishing the neces-sary control and support activities regarding technology (maintenance), productquality (standards, inspection) and process information. Typically, it consisted ofinstalling control capacity into the tasks of the Technical Service and ProductionPlanning departments, within the task groups themselves and, finally, in settingup the future personnel structure (i.e., institutionalising control capacity).
The IKZ report, which was handed to the Board of Directors in April 1987, rec-ommended to rearrange the tobacco factory according to a task group structure (seeFigure 4.7).
Tobacco Making 1 Tobacco Making 2
Volume
Variants
Special is Is
Tobacco Preproduction (serial) Packaging (parallel)
• • - « • -
Figure 4.7 Task group Structure Van Nelle Tobacco Production (Source: project documentation)
The approval of this recommendation in May 1987 marked the end of the projectgroup IKZ Tobacco and the beginning of the detailed execution of the plan in andby 'the line'.
intermezzo
What are the characteristics of a task group at Van Nelle's Rotterdam plant?
A task group is the smallest organisational unit and is comprised of between 4 and 20 persons.Criteria concerning the size of the group are: large enough to draw on personal skills, toproduce complete product parts and to attain set goals. The group is small enough to makegroup decisions and to have a clear sight on decisions taken and goals attained.The fast o/ a fasJt group consists of carrying out a clearly recognisable set of activities, whichas such constitute complete or relatively independent process elements within the overall
68

Case Van NeZ/e/Rofferdam P/anf
production process. Activities comprise not only production activities but also preparing(making ready of materials), regulating {carrying on and off materials), controlling (scrap)and supporting activities (cleaning). Criteria for bounding a process element are: existence ofmany internal interfaces inside and few external interfaces outside the process element, adistinguishable contribution of the process element to the end product, a clearly visible andmeasurable performance of the process element and the presence of a possible natural pausefollowing the process element.The task group is responsib/e /or performance, with the task group leader being responsible forthe functioning of the task group as a team. He is not a boss coordinating work, but acoordinator of made and kept agreements. His own tasks are in the field of information supply,working conditions and long-term planning.The remuneration sfrucfwre is attuned to working in task groups - group achievements - and isclear to everybody. Differences in remuneration are possible if clear and acceptable to thegroup, and remuneration should encourage learning capacity.In this case, therefore, the functions have been divided into five categories, each with its ownjob content and separated into executing and controlling activities (see Table 4.3); jobs arecumulative, which means that within the task group a member can '/«am his u>ay' towards amore encompassing and higher paid function category.
Table 4.3 Function Structure and Classification (Source: project documentation)
Function
OperatingSpecialist A
OperatingSpecialist
MachineOperator A
MachineOperator
GeneralProductionEmployee
Executive
1 2 3 4 5 6 7 6
X X X X X X X X
Supporting and Control!
Technical
123 4 56
X X - • X -
Logistics
- - - x
ng Activities
Quality
1 2 3 4
X X X X
X X X X
X X X X
X X X X
• X X -
Maintenance
1 2 3 4
X X X X
X X X -
X X • •
X - - •
x - - -
Innovative
1 23
X X X
X X X
X X -
X • -
x •> task element in that specific functional level and for that specific activity category
Gmfro/ caporiry within a group links up with multi-skill competence and ranges from prioritysetting in production planning and delivery to dealing with complaints and the distribution ofwork orders. Conditions for such flexibility are the presence of an adapted layout and anatmosphere of cooperation.E/fecfróeness of working in task groups is guaranteed by a fixed number of employees per group,common goals and tasks, and the fact that the group itself can indeed attain these goals.E/jft'riency is guaranteed by more people actually thinking about how to carry out productionactivities - it is no longer a matter for higher management only - which improves yields andworking methods and reduces waste/scrap (product quality).Flexibility is increased by the mere existence of a well-informed group acting fast on matterslike sickness/leave, market fluctuations and technical malfunctions.
69

The Learning Phase (April 1987 - May 1988)
After it had been decided to start working in task groups, five task group leaderswere appointed. With them and the production manager, an implementationplan for each 'task group to be' was composed.
(production manager) "... The next phase is when you say - well, if the Board approves, it'salso Okay with us, then you get the green light to change the organisation, and the first thingyou do is appoint persons who are going to be responsible for a task group. So we first appointedtask group leaders, task groups only existed on paper at that time, and we told them - you'reresponsible. As a departmental manager you say what needs to be done, but task group leaders -they do no longer say what has to be done but they have to take care of the functioning of thetask group as a whole, and that all the control means are built in right there and in such a waythat people themselves can take care of the work being done. That's, of course, a completelydifferent point of view of how to deal with your men as a manager."
Each implementation plan used the same systematic approach: first, a descriptionof the task group in terms of goals, task areas and system boundaries (the processelement). Next, the personnel capacity by way of a training flowchart indicatingwhich number of employees (quantitative) are on what functional level(qualitative), accompanied by a training time-ladder which served as a basis for thetask groups training plan to scale up the learning capacity of the group (see Figure4.8). Part of it was also a listing of present function levels and task elements.
FLOW DIAGRAM TRAINING TOBACCO MAKING 1
Operating Specialist A
Operating Specialist Vacuum U - » Operating Specialist RVI
Machine Operator A
Machine Operator
General production Employee
Training timein months
36
24
12
Figure 4.8 Training Flow Diagram (Source: project documentation)
It served as the basis for the function classification to be made - the number offunctions was reduced accordingly from 40 to 5. The target was to reach the sameamount of function levels for each task group. The task element contents of each
70
Case Van Nef/e/Rotferdam
function level differ per task group, but the insight into and clarity of personneland remuneration structure increased considerably.
Finally, each implementation plan contained a listing of the desired support fromother departments, for example, Production Planning or Personnel, specifically de-scribing goal, sort and format of the support. The implementation plan for eachtask group essentially stated what a task group would have to look like in terms ofactivities. A detailed description of control capacity per task group was not for-mally made but instead emerged on the way.
(production manager) "... Because we said - we will select the organisation, we will select thestructure, we'll go for it and then we will, together with the task groups themselves,gradually define their wishes. And that's what we developed, slowly but surely, whilehaving started already. But none of this is mentioned in reports and so on. It is ingrained bynow, in the regular reports we draw up at Production Planning."
A preparation period was installed before starting to work with task groups. Dur-ing this period, all task groups became budget centres, future task group leaderstook courses in budgeting and time management, and the surrounding depart-ments and disciplines were being informed on the forthcoming changes. Fur-thermore, the financial reports and the overall production budget were convertedto the task group structure. A start was being made with the priority items on thewis/ied support lists of each task group.
(production manager) "... Already beforehand, you're assigning people to their task groups.Task group leaders are presenting themselves more and more as such in their regular workinstead of being the department manager. Of course, you don't change your organisation fromone day on to another; you're doing so during the preceding normal daily routine of things,because the good things, you start with 'm right away."
The official date for the whole operation to start was set on September 1, 1988. Onthat date, everything, both in formal-administrative and in operative terms, hadto start at once. The significance of that date was mainly contained in the signal itsent to the other departments - from that date on things had to be done differently.
(production manager) "... Because if you say already at the beginning of the year - September1st, is when we'll start working in task groups, then it will start officially; the accountingdepartment will know the new financial system has to operate from that day on. So, inreality, that date is, of course, a date on which nothing much changes for Production itself."
The time between September 1, 1988 and January 1,1989, was considered a trial pe-riod. Specifically, its goal was to get used to the new situation within and outsidethe task group and to detect and resolve any problems brought about by the newsituation.
A major rupture in the change process was the takeover in May 1989 by DouweEgberts (D.E.), a daughter company of the American Sara Lee corporation. DouweEgberts is about three times the size of Van Nelle in terms of sales, personnel andbalance sheet total. Culturally significant, however, is that Douwe Egberts was thelifelong competitor of Van Nelle on the markets of coffee and rolling tobacco. Typ-ically, the Dutch market shares for coffee and rolling tobacco of the two mergedcompanies now reach between 60% and 70%.
71

IKZ report
1966
IntroductionPhase
Awareness
1987
AnalysisPhase
Redesign
Management
Project Group
1988
L e a rP h <
Specification
n i n gs e
Prepa-
' " TrialTask Group Leaders
Employees
1969
Development
Figure 4.9 Time path change trajectory (Source: project documentation)
As a result of the merger, almost all change projects were frozen and, later on,some were suspended. For Tobacco, the merger signified the end of the opera-tional group structure. It was merged with the Tobacco division of Douwe Egbertsand three new companies were created under the heading of a new Tobacco divi-sion, named Douwe Egberts - Van Nelle. This daughter company accommodatesboth the Tobacco division's headquarters as well as the former tobacco productionsites of Van Nelle and D.E., called Tobacco and Production company respectively,thus not changing much in the actual day-to-day operation of the plants.
Instead of by an Operational Team, Tobacco is now headed by five functional direc-tors each with a functional portfolio - Production, Commerce, Purchasing, Finance& Administration and Personnel & Organisation.
For the specific operation of the Rotterdam Tobacco plant, the merger resulted inanother change in reporting flow: the production manager reports disciplinary tothe Production Director of the division. All other upward information supply wasto be organised according to company rule of Sara Lee, the D.E. mother company.The task group structure as well as the locally developed information formatswere left alone as a consequence of the positive experiences with working in taskgroups (see further on in this chapter). At the same time, it was decided that forthe next three years (until 1992) no structural changes were to be made in the Rot-terdam or Meppel tobacco plants.
The Control and Information Structures
After the overall organisation structure had been changed top down, the controland information structures were changed simultaneously and coherently. Thecontrol structure is specifically tied to autonomous work or task groups. Basic con-trol principle, which is repeated at every control level, is that what con be con-trolled locally, s/iou/d be controlled locally. Typically, this explicitly implies thedelegation of control upward as well, which is contrary to conventional reasoning
72

Case Van Ne/fe/Rotferdam P/anf
that focuses on a maximum of delegation downwards. Basically, it comes down toa replication of the task group design to a /ii'g/ier level in the organisation. For ex-ample, this meant that the staff-line relationships and the factory-business unit re-lationships are refocused on what expertise and control decisions are needed atline/factory level. Concretely, it resulted in an integration of staff functions in theline at both business unit and plant levels. Furthermore, the Operational Team(business unit management) pulled back from plant affairs and obtained controlregarding the coordination of the various business functions, which were previ-ously handled bilaterally at plant level between the various departmental man-agers. The difference between functional business unit management and Opera-tional Team management became very clear when Douwe Egberts reinstituted theformer functional system, thus stopping the application of the task group principleat business unit level.
The control domain of each task group is linked to the five function levels presentwithin each task group. Each function consists of several task elements with itscontents stepping up from task elements with an operating content to task ele-ments with a more supporting and controlling content. When all five functionsare represented in one task group, the task group is considered to possess the high-est possible control domain. In other words, it can perform all functions and istherefore called 'autonomous', 'complete' or 'whole', depending on the jargon theorganisation prefers.
At a higher aggregation level, control of the task groups themselves takes place us-ing three reports (see Figure 4.10):
1) the labour productivity report;2) the machine efficiency report; and3) the period report.
The production report underlies and is the main information carrier for thesethree reports. The period report is a concise report per task group in which the ac-tual labour productivity, machine efficiency and occupancy rate are contrasted re-spectively to the norm productivity, the budgeted machine efficiency and the bud-geted occupancy rate. The norms originate from the yearly capacity and occupancycalculation. The task group budgets are also derived from the yearly productionbudget. Both production budget and capacity and occupancy calculation make upthe performance standards with which the actual performance is measured andcompared. Typically, production budget and the task group budgets are the onlyreports in which financial figures appear.
In the 'old' situation, the period report did not exist and the two reports on taskgroup level were only available in a primitive format to the Personnel and Tech-nical Services departments. Production control was administrated only by theoverall production budget and the basic production report. Other control instru-ments did not have an administrative representation nor were paralleled in theinformation flow by some sort of reporting mechanism.
Two more differences were the reporting frequency and the feedback to shop flooremployees. In the old system, reporting took place monthly. In the new system, it
73

C/iapfer 4
takes place weekly and it can be organised, if the wish or need should arise, on adaily basis. Every week, the labour productivity and machine efficiency reports arealso sent by Production Planning to the task group leaders. The machine efficiencyreport is split out a second time into individual machinery. The efficiency per ma-chine compared to its norm efficiency is weekly reported in a diagram, which isalso stuck to the bulletin board of the task group for the employees to see how theyperformed the week before.
capacity ^ occupancy N productivitycalculation X calculation , calculation
_j production| budget
production management
task group i—
period report
labourproductivity
report
task group
individual employee
machineefficiency
report
productionreport
Figure 4.10 Reporting System Van Nelle Tobacco (Source: constructed using internaldocumentation)
(head Production Planning) "... well needed within the task group, to distinguish what kind ofwork quality has been done. An operator controls the machine and so he can affect theefficiency all right. So that's why we're saying - we look at it per individual machine. That'sfeedback from Production Planning of the information they write down on the productionreport."
The various reports (the task group information supply) were developed in thefollowing order: first the budget and capacity calculation were adapted and stan-dardised to task group operations. Next, the machine efficiency report was per-fected - rebuilt to individual machine and different machine stoppage categories -after which the adaptation of the labour productivity report was started. Finally,the period report was developed in order to follow task group performance on anoverall basis of norm productivity. Thus, the information supply progressed evo-lutionary and simultaneously top down from the (financial) production budgetand bottom up from the production report, all in close cooperation with the taskgroups. The main directive in this evolutionary growth was the goal of adequatecost control, using the operational control parameters of man and machine hours.
74

Case Van Ne/te/RoHerdam P/anf
An integrated report in which all relevant plant information was brought togetherin one format did not exist. However, there was/is a monthly Management In-formation System (MIS ) report compounded by the Planning & Control (P&C)staff department and intended for all line managers and the Executive Board. TheMIS report presents a monthly actual versus budgeted summary and cumula-tively over the year of core figures specified to market group (see Figure 4.11).
The role of the central Planning & Control staff department regarding the Rotter-dam tobacco plant is one of financial information processor and controller ofsubmitted financial reports going from department manager to division andhigher up. Special studies or other products of the P&C expertise are not in greatdemand by Tobacco. The development, for example, of the residing reporting sys-tem is largely done by a local team, consisting of the production manager, the headof Production Planning and the task group leaders.
M.I.S. Tobacco
I Summary Performance1. Profit Tobacco (actual/budgeted)2. Analysis Contribution Margin Tobacco (mutation to plan)3. Inventory (actual/budgeted and average in days)4. Estimated Year Profit (actual/estimated, past year, budgeted estimate)5 B.O.I, until present halfyear (actual/budgeted)
II. Marketing/Sales1. Turnover in tons (actual/budgeted, actual/budgeted/past year)2. Market share (month, cumulatively and past year)3. Contribution Margin and M A P E important brands (cumulatively • month)4 Promotion Price/Special Discounts (actual month, actual/budgeted, estimate)5 Advertising and Sales Promotion (actual/budgeted)
III Production1 Production costs Tobacco (actual/budgeted month and cumulatively)2 Production in tons (aduat'proportionally budgeted)3. Productivity (actual/norm monthly and cumulatively)4. Sick leave (absent, sick, lent)5. Efficiency performance raw material (actual/norm monthly and cumulatively)E. Standard vs Actual Usage Packaging materials (standard/actual/norm)7 Maintenance Machines (actual/budgeted)8 Utilization rate and efficiency Performance Packaging machines (actual/norm month and cumulatively)
Figure 4.11 Contents MIS report (Source: abstracted from internal report)
Other reports or feedback instruments are mere technical or registrative by nature.For instance, the reports on behalf of the e-hallmark (a guaranteed and govern-ment controlled norm for the filling of packages), the waste reports and the regis-tration of temporary employees. As for systematic structure, these reports are notaltered after the organisational change otherwise than for automating their pro-cessing.
An extra use of the task group system was found in the field of product develop-ment and concurrent development cost control. The design of the packaging taskgroups is such that it allows a product to be 'passed on' when it progresses in its
75

Cnapfer 4
product life cycle. For instance, when a new product is still in its experimentalstage, it is manufactured in the specialists group. All labour-intensive packagingand rarely manufactured articles are concentrated in the specialists group, whichmakes it the most experienced group. They are used to small batches (test series)and complicated packaging requirements and also are able to carry over their expe-riences with the new product to subsequent task groups. In fact, it is a sort of'process prototyping'. Once familiarised with the technical machine and othermanufacturing conditions, the man hour costs and machine hours costs can be es-tablished and, consequently, a reasonably appropriate production cost estimate be-comes feasible. When the product is a success and larger batches have to be manu-factured, the variants group can take over. The variants group is positioned in be-tween the specialists group and the volume group in terms of volume, productvariety and changeovers. Production in the variants group indicates further fo-cussing of productivity and efficiency standards and a consequent increase in costcontrol. Eventually the volume group can take over production when the productis in its maturity phase.
(head Production Planning) "... If we wished to introduce a new product in our assortment, itfirst will be produced in the specialists group in an experimental stage, usually small series,nil-series. After some time, we know what the machine adjustments are, we know how thematerial behaves, the final orders for packaging materials are placed. If it's a hit, thedecision is taken - we put it in our assortment as an inventory product, manufacturing it by thevariants group. If it becomes an A-brand and it's put in as a main brand article, the volumegroup can start producing it."
The combination of task group configuration and product life cycle can result inan accurate product management with accompanying accuracy in cost control. Ithas to be noted, however, that tobacco is a mature product in a mature or even de-caying market, which intrinsically makes it a product for an expanded and spunout control system.
Control and Information Supply Details
Successively discussed in the next five sections are the construction of the produc-tion budget and the respective control reports. A comparison with the former in-formation supply system will be made wherever possible, accentuating differencesand growth towards the present system. Finally, the relationship with the(functional) Management Accounting System of Douwe Egberts will be discussed.
The Capacity and Occupancy Ca/cu/afion and f/ie Producf/on BudgetThe start of the budgeting process is the capacity calculation for the next fiscal year,July to July. The capacity is calculated per task group but is, for the most part, iden-tical for each calculation. Fixed start data are:1. general starting points;2. volume to be produced.
/fern 2 indicates the maximal staffing capacity. Changes in, for example, shift, vaca-tion periods, unpaid leave, etc., are being entered here in the calculation. In theformer situation those figures were input from Production Assistance, at present itis Production Planning, /fern 2 is input from the market groups, in the newmerger situation it probably will be the product managers who are the source. This
76

Case Van Nd/e/Rofrerdam P/anf
is also the only data item which comes from outside Production, all other infor-mation is coming from Production Planning.
Besides the identical data for each task group, there are also data which onlychange in the long run - they are connected to the machines and packaging linespresent in the task group (see Figure 4.12):
3. number of machines/packaging lines in the task group;4. standard required manpower;5. attainable efficiency;6. maintenance routine machines;7. weight packaging unit/number of revolutions of the machine/number of
packages per hour/machine output per hour;8. specific task group information.
CAPACTTY CALCULATION Task Group 4: VARIANTS GROUP [3] Machines: 4 Packaging lines for poly pouch 40/50 grams
111 General Starting Points-Number of workdays per yearBusiness hours/days in 2 shiftsAvailable hours per year
Paid hours per man per yearEffective hours per man per year
[3] Task group-specific information:
Start/revving inCoffee breakLunch breakChanging shiftsCleaning/rewing out
Available machining time per day
14
[5Standard required occupancyAttainable efficiency
hourshourshours
hourshours
Poly 50/40 grams
hourshourahourahourahoura
hours
persons%
Number of over-[6] Maintenance Type: hauls m
major haul 3000major duration 80minor haul 750minor duration 46
Loss available machining time/5 yearNet uptime per year:
5 years:
6
141070 hours3562 hours
|?l Volume to be DroducedPoly pouch 50 gramsPoly pouch 40 gramsPoly 40gr WD
Total
Poly 40 grams WD
hourshourahoura&"*»houra
houra
persons%
[7] We*ght of packaging unitRevolutions of packaging machineNumber of packagmgsMachine output per hourDay capacity at attainable eft.
Year capacity packaging line at packaging weight in tons per year:
SAI FS VFRSUS CAPACITY
Machining schedule :
Required machine hours hours Man hours : Required r
PFRSÖNNR OCCUPANCY AND I ABOUR PRODUCTIVITY
PRODUCTIONMachine-bound occupancyNot machine-bound
Control/inventoryExtra trainingTask group leader
Total production personnel
Labour productivity
Standard Required
tontonton
ton
Poly Poly Poly50 y . 40 pj 4Oo/. WD
gramsrev/minp/hour
nacNne-bound personnel:
Figure 4.12 Capacity / Occupancy / Productivity Calculation (Source: regular internal report)
77

C/iapfer 4
/fern 3 concerns the physical production capacity - (des)investments and layoutchanges are visible in this item. The standard required manpower (item 4) is theminimally required number of machine operators in the task group. It is related toboth working methods and the mechanisation or automation of operationswithin the task group; every year it is established following discussions with theappropriate task group leader. Attainable efficiency (item 5) is the average per-centual efficiency standard across all machines present in the task group, which istied to the long-run average machine occupancy. This percentage is also estab-lished in close cooperation with the task group leaders and the production man-ager, /tern 6, the machine maintenance routine, is a calculation to arrive at the to-tal available net production uptime, using a deduction for major maintenance.The maintenance frequency is set by the head of the Technical Services depart-ment and is tied to the production hour volume, /tern 7 applies to the technical re-lationships regarding the product weight and the machine output. If productweight is changed (for the existing machines only the aspect of weight counts) ortechnical improvements are installed in the machine (e.g., computerisation) theeffects on machining schedule, man hours/labour force and labour productivitycan be calculated by using the machine output. Finally, specific task group infor-mation (/tem 5.) comprises the allowed stoppage time of the machines. Part of thisare the set-up and changeover time, cleaning and minor maintenance. The taskgroup leader provides the information needed for the calculation of this item.
Due to the fact that the last two mentioned activities are performed within thetask group, it results in a decrease in work for the Technical Services department.This extra work for the task group is performed without subsequent extension ofperformance standards for the task group.
(production manager) "... When starting the new organisation, the Technical Services de-partment of Tobacco decided to do the machine maintenance. The occupancy rate standardwhich was then set for technical service operations remained much too tight to handle all thetechnical work. However, because we were starting with this project (the task group structure,HR) at which we said; maintenance belongs in task groups, I've never expanded the TechnicalServices department compared to its original manpower capacity. Coffee did expand, theynow have a Technical Services department of about 13 or 14 men, and we're still on 8. What wedid is put in a lot of maintenance tasks, failure maintenance, changeover and so on, which isperformed by the machine specialists, but what we didn't do was build in the required time inthe operating standards of the capacity calculations. Therefore, the results you're now gettingyou can see for yourself; you do not have cost increases in the task groups although they'redoing the maintenance, but you've a reduction of separable maintenance costs, on a yearlybasis."
Using the items under 7. one can subsequently calculate the ratio day capacity af e/-/iciency norm (see Figure 4.12). This is the multiplication of the specific task groupratio auai/ab/e machining fime times machine output per hour times affainab/ee//iriency. The final capacity ratio year capacity at packaging weight in tons per yearis then calculated from the multiplication of this day capacity at e/fiaency normwith number o/ work days per year. This year's capacity ratio is then contrastedwith the volume to be produced (item 2) from which the machining schedu/e(average machine occupancy over the year) follows. With the help from the ma-chining schedu/e one can next calculate the required machine hours for that pro-duction volume: machining schedu/e times number o/ zi>orfc days per year timesauai/ab/e machining per day. From the required machining hours follow, via
78
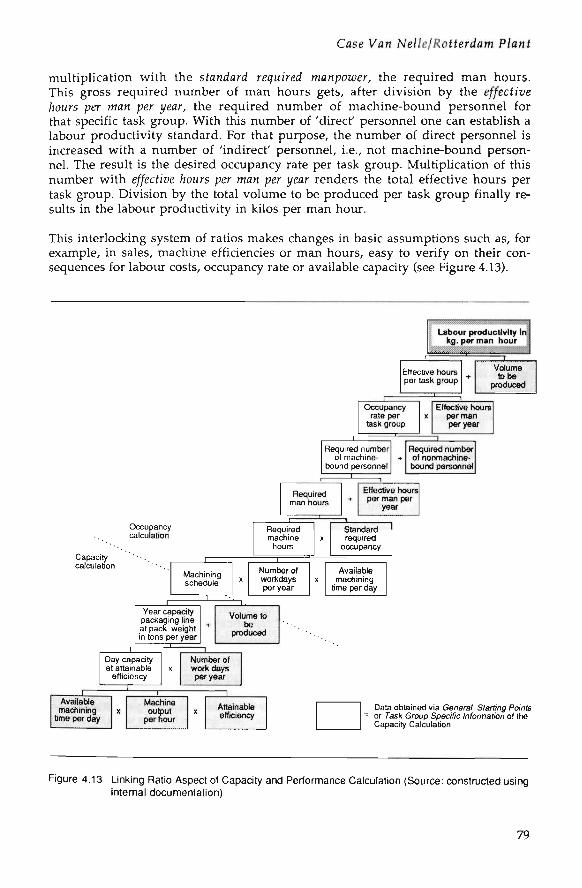
Case Van Ne//e/Rofferdam P/anf
multiplication with the sfandarrf reauired manpower, the required man hours.This gross required number of man hours gets, after division by the e//ecfii>e/jours per man per year, the required number of machine-bound personnel forthat specific task group. With this number of 'direct" personnel one can establish alabour productivity standard. For that purpose, the number of direct personnel isincreased with a number of 'indirect' personnel, i.e., not machine-bound person-nel. The result is the desired occupancy rate per task group. Multiplication of thisnumber with ef/ecf/ye /lours per man per year renders the total effective hours pertask group. Division by the total volume to be produced per task group finally re-sults in the labour productivity in kilos per man hour.
This interlocking system of ratios makes changes in basic assumptions such as, forexample, in sales, machine efficiencies or man hours, easy to verify on their con-sequences for labour costs, occupancy rate or available capacity (see Figure 4.13).
Labour productivity In'kg. per man hour
Effective hoursper task group
Volumeto be
produced
Occupancyrate per
task group
Effective hoursper manper year
Required numberof machine-
bound personnel
~i
Required number:of nonmachine-bound personnel
Requiredman hours
Effective hoursper man per
year
Occupancycalculation
Capacitycalculation
Requiredmachine
hours
Standardrequired
occupancy
Machiningschedule
Number ofworkdaysper year
Availablemachining
time per day
Year capacitypackaging lineat pack, weightin tons per year
Volume tobe
produced
Day capacityat attainable
efficiency
Number ofworkdaysper year
Availablemachining
time per day
Machineoutput
per hourAttainableefficiency
Data obtained via Genera/ Starting Pantsor Tas* Group £^isc//ic /nformat/on of theCapacity Calculation
Figure 4.13 Linking Ratio Aspect of Capacity and Performance Calculation (Source: constructed usinginternal documentation)
79
Chapter 4
(head Production Planning) "... the capacity calculation is also a little spreadsheet-like. Ifthere is a question such as - 40 tons extra production, what are the consequences for youroccupancy rate? - then you simply alter your sales figure and you look at the bottom - has it gotconsequences for my occupancy? Well, in this case it stayed the same. Thus, you can simply givean answer as: it can be done, we have the slack."
The relation between capacity and occupancy calculation and the production bud-get of Tobacco is linked by the labour costs and the norm occupancy. Labour costsare split up into /abour costs, restitution sicJt pay and exferwa/ /abour costs(temporary employees). The item of restitution sick pay is a benefit from the(Dutch) National Health Service Fund to the company for every sick employee; itis legally determined that employers make regular contributions to the Fund foreach person employed. At the moment, the amount for restitution si'cA: pay sub-stantially diverges from the amount for externa/ /abowr costs. It can be analysedper task group as to why these labour cost variances have developed. For instance,a comparison with the above-mentioned average number o/ vacant positions pos-sibly indicates a structural occupancy problem in the task group, with possible con-sequences for the production budget or for total labour cost behaviour (see Figure4.14).
The budget per task group is identically structured as the overall production bud-get. It falls entirely under the responsibility and controllability of the task groupleader. An exception to the rule, the item depreciation rtflrfl"u;are for the computersystem in inventory control of Tobacco, is included in the task group budget. Thisis the only 'over-his-head' the task group leader will find on his budget.
The task group budgets contain a large number of items not related to productionvolume (direct fixed manufacturing costs). Contrary to traditional accounting prac-tice, these costs are allocated and considered controllable by the task group leader.Costs that are indeed uncontrollable by the task groups but still fluctuate with pro-duction volume (e.g., printing costs of tax revenue tobacco stickers, additives, con-tracted-out production) stay out of the task groups and are booked in the produc-tion budget of Tobacco under the item various production costs.
For Production Management and Production Planning a similar budget format ex-ists as for the task groups. The difference with the other (task group) budgets can befound in the presence of training costs, PC depreciation expense, business associa-tion contributions, software expense and the allocated overhead for the Manage-ment Information System. In terms of cost classification, it indicates that, in dailyroutine, the partition between direct and indirect costs coincides with the bound-ary line between task groups and management.
(production manager) "... But in fact I've only got the costs of Production Planning plus whattranscends Tobacco. I definitely see those figures but I don't want them put on my costsummaries. In my controlling I've got nothing to do with them because you get it all allocatedwith some sort of allocation criterion, so that is not interesting enough for me to see. What weactually did do, that was the effect of course, was that we made almost all costs direct. I'vegot hardly any indirect costs - we haven't got an inspection service, no department for processcontrol, no Technical Services department so large that cleaning is part of their job, because Imade all those sort of costs direct."
80

Case Van P/anf
Production budget 19xx
1989 Plan
Acfua/ Restitution Exlsma/restitution at labours/cfc pay 6 5% sick costs
TOBACCO MAKING 1labour costs
. sick pay
TOBACCO MAKING 2labour costs
. sick pay
VOLUME GROUP. labour costs. sick pay
VARIANTS GROUPlabour costssick pay
SPECIALISTS GROUPlabour costssick pay
TOTAL TOBACCO
External labour costs
1988 Estimate
Xcfua/ Restitution Extema/resnfulran at /aboors/cfcpay 6.5% sick costs
Tobacco Tobacco Volume Variants Specialists TotalOccupancy Making 1 Making 2Required at 6.5% sick 35 47 38 21 17 158Actual 32 4&£ 3&5 215 21 1615Vacancies average 3 .1,5 .0,5 -2.5 4 -5,5
Tobacco Tobacco Volume Variants Specialists TotalExternal labour cost* MahingJ. Making 2
Sick payVacancies
Total
Figure 4.14 Production Budget Tobacco - part on External Labour costs (Source: regular internalreport)
The comparison between the present and the former structure can be made di-rectly for the production budget of Tobacco. In the former structure, reports weremade for the departments and organised in functional cost categories. In the newsituation, task groups replace the departmental level and institute a new reportingdenominator. Typically, it meant that the items direct /abour costs, maintenanceand yan'ous production costs were split up into their task group components andbrought under task group responsibility (see Figure 4.15). Additionally, regardingmajor maintenance, the present production budget assigned machines and packag-ing lines to task groups. Within the task group, a further split could then be madeinto direct cost categories such as spendaWe nours and mafer/fl/ and the costs o/third parties (i.e., the Technical Services department).
(head Production Planning) "... And the budget as it was before, was about the same, but ofcourse not split up. Look, you see Management, Production Planning, direct labour costs - bam!And that's what you don't see in here (new budget set-up, HR). And here you see Maintenance
81

Cfcapfer 4
Machines & Inventory - well, that's all transferred to the task group. Various production costs- look at that amount! Well, we've been able to split up things nicely. So now you can controlmuch better; you can see where costs are heading - in which task group are they, where arethey? So this is the budget that the task group leader is responsible for. In this format, themonthly summaries are being reported - they (task group leaders, HR) can get it simply fromthe Bookkeeping department. And those costs, they'll find them all back and the sum issimply divided by twelve and entered. Then you get the budget they've spent, what thevariance is and what the cumulative variance is. Well, that's how they can follow things."
BUDGET 1987 - PRODUCTION TOBACCO
(old «Ituallon)
In guilders
Management/production PlanningD/recr labour cossMaintenance machines/iwemory -. Roflerrfam
Msppe/Maitenance general Meppel. Building and terrains. P/pes and /nsta/ZadonsEnergy supply MeppelVarious producf/on costs —Technical Service Tobacco. Rotterdam. Meppel
Included in maintenance:. Technical Service Rotterdam
Technical Service Meppel
Occupancy par 30 November
Management/Production PlanningTobacco p/anfTechnical Service RotterdamTechnical Service Meppel
Maintenance machlnes/lnventory/general/Meppel
Technical Service Tobacco RotterdamMaten alsAssistance C.T.S.Technical Service Tobacco MeppelMaterialsRounding off calculated hourly wages
BUDGET 1989 - PRODUCTION TOBACCO
(new situation)
In guilder*
Management/production Planning7asfc groups. Tobacco Ma/ung (. Tobacco Mak/ns 2. Vo/ume group. Vanants group^Spedafetes groupMaintenance machinesMaintenance general MeppelEnergy supply MeppelTechnical Services Tobacco:. RotterdamMeppel
Included in maintenance:. Technical Service Rotterdam. Technical Service Meppel
Occupancy per 30 November
Management/Production PlanningTas* groups:. Tobacco A^aMng I. Tobacco Wafang 2. Vo/ume group. Variants group. Speda/tsts groupTotal task groupsTechnical Service RotterdamTechnical Service Meppel
Figure 4.15 Old versus New Production Budget Van Nelle Tobacco (Source: regular internal reports)
Concerning the other formal changes in the management accounting system,there is the shift in budget centres and booking categories. Budget centres such as
82

Case Van Ne//e/Rofferdflm P/onf
tobacco preprodwcf/on, fobacco pacfcaging Roffcrrfflm and packaging Meppe/ arechanged over in the five task groups.
The booking category, direct /abowr cosfs, formerly contained a large number ofbudget items, as a result of which it was unclear what costs (fluctuations) origi-nated from what place in the organisation. Presently, the entry flow is sort ofturned around: from task group upwards it is being aggregated to production bud-get, which reflects the production organisation, and, finally, to cost category.
Furthermore, the capacity and occupancy calculation in the preceding situationdiffered from the new situation in three aspects:
1. the set-up or format of the calculation itself;2. lack of explicit premises before starting to calculate; and3. the goal for which it was used.
Formerly, the calculation was started from a sales estimate for the next three years,which was followed by balancing sales with capacity and arriving at an averagemachine occupancy rate (the present machining schedule). Not present were thestandard setting items of e/jfectiue /lours per man per year and, via the allowedstoppage time of the machines (speci/ic fast group in/ormaf/on), the standard ofnet ayflf/flb/e macto/ning rime per day. This relatively primitive approach led toinaccuracies in establishing the net available capacity.
With the former sales versus capacity comparison, it was also impossible to calcu-late the required labour need. The 'old' capacity calculation was mainly directed atearly signalling of plant and manpower capacity problems - if capacity was not inaccordance with estimated sales volume, actions had to be taken. The present goalof the calculation is, first, directed at setting the labour productivity norm per taskgroup (i.e., a performance standard) and, second, at establishing the required per-sonnel occupancy by function level (i.e., managing the human resources withinthe task group).
The main goal of the triplet capacity, occupancy and producfi'p/fy ca/cu/af/on andthe production budget, is cost control and, subsequently, signalling deviationsfrom standard. Instruments to do so are, firstly, the task group budget and, sec-ondly, the labour productivity and machine efficiency reports. In the productionbudget labour costs are of prime importance (80% to 90% of direct costs are labourcosts) - both budget reports serve as signalling device.
(production manager) "... We're steering, of course, on budget performance, and labourproductivity - that's only to be able to explicitly define influences you notice in your labourcosts. Let's say, you find a large deviation in the combination of labour cos/s and exferna/lafcour costs. Then you will want to know where it stems from: Is it because the people no longerwork so hard or in contrast, are they working harder? Or does it stem from the lagging of yourmachine efficiency, technical causes? And so you want to find explanations for deviations inyour costs, go further in developing your reporting system."
The role of task groups in controlling costs is covered, for a large part, by both re-ports. Change proposals both from the task groups and management are primarily
83

C/iapfer 4
aimed at operational improvements that have quick and noticeable effects on thebudget performance of a specific task group.
(production manager) "... For example, a machining schedule for the vacation period. In theold days you were stuck with two shifts, but we said - we'll abandon the time principle a bitand look at the planning target; it has to be attained, and how you're going to manage - that'ssomething for the task group itself. So, what does a group do? They have people start at halfpast ten in the morning, or at six; that's how they save on temporary employees. Thoseoptimisations turn up again in your labour productivity."
More generally, working in task groups has become a (organisational) means in it-self for generating cost improvement proposals that are already being tried out ontheir practical feasibility.
(production manager)"... Well, and the improvements you finally hope to get, are often ratherradical; you could hardly obtain such proposals in the situation in which we were previouslyorganised, just in departments. And now, in task groups, you have people who live very close totheir product assortment. Who live very close to their budgets; because someone on the shopfloor just speaks with the task group leader and he is being made familiar with his costs, andwhat kind of effects it has and so on. But now you have task groups and the commitment of thepeople is much larger, anticipating proposals made by management much easier. On the otherhand, they themselves come up with that sort of ideas and that's where you'll find yourincrease in labour productivity because they simply spend fewer hours. They start thinkingabout it all, and all within the normal routine of discussing how things are going."
77te PeriodThe period report is a summary report, destinated for the task group leaders andthe production manager of Tobacco. In it, the actual and the norm productivityand efficiencies are presented, which apply to both the task group and the whole ofTobacco. For the aggregate of Tobacco, actual man hour consumption is specifiedand a primitive product quality classification is added (see Figure 4.16).
The preproduction task groups (Tobacco Making 1 and Tobacco Making 2) do notcontain an entry on efficiency and utilisation rate, which is due to the continuousprocess of tobacco making; it reduces the use for individual machine efficiencies.Matching machine efficiencies with utilisation rates (relation between machineuptime and available machining time) has another information value. It indicatesthe spread of production volume across the available packaging machines in thetask group. A high machine efficiency and at the same time a low utilisation rateindicates that a 'good' machine is relatively 'under-operated'.
(head Production Planning) "... It often happened that, for example, a machine had anefficiency percentage of 90% while it had an utilisation rate of 20%. Another machine with anefficiency rate of 60% has a utilisation rate of 80%. So it implicates that they've been using amachine which was not technically Okay for almost a whole week, and a machine which wastechnically all right, got utilised only very little. Well, those are simple analyses you can getlike this (snaps his fingers) from the period report."
The utilisation rate itself does not add much extra information: A cumulativelylow utilisation rate implies a machine overcapacity in that particular task group.As such, it supplies the same sort of (des)investment information as does thecomparison sales versus capacity in the former capacity calculation.
84

Case Van Ne/Ze/Rofferdam P/anf
•• TOBACCO MAKING 1 "Production Hours worked
kg
" TOBACCO MAKING 2 "Production Hours worked
Kg
" VOLUME GROUP "Production Hours worked
kg
"VARIANTS GHOUP "Production Hours worked
Kg
" SPECIALISTS GROUP "Production Hours worked
kg
" TOTAL TOBACCO "Production Hours worked
Kg
PERIODIC REPORT
Hours temp empl
Hours lemp empl
Hours temp. empl.
Hours temp. empl.
Hours temp. empl.
Hours temp empl
Machine efficiencyBudgeted
Volume group 94Variants group 86Specialists M21 70
M20 86
Hours reportNormal hours
Total Tobacco :
Quality
Destroyed tobaccoTobacco on hold
Actual Cumulatively95.5 94.983,9 82,573,3 77,7
Worked normal hours
Kg
Productivitykg/man-hour
Productivitykg/man-hour
Productivitykg/man-hour
Productivitykg/man-hour
Productivitykg/man-hour
Productivitykg/man hour
Normkg/man-hour
Normkg/man-hour
Norm Efficiency Utilization ratekg/man-hour % %
Norm Efficiency Utilisation ralekg/man-hour % %
Norm Efficiency Utilisation ratekg/man hour % M 20 % M 20
% M 21 % M 21
Budgeted FY 90kg/man-hour
Utilisation rateBudgeted Actual Cumulatively
91
5813
bxl/a hours
78.3 79,732,1 34,2
9,6 9,4
Hours temporary employees Hours sick Sick %
Figure 4.16 Period Report (Source: regular internal report)
(head Production Planning) "... Your utilisation rate can be low, you're allowed to know(laughs) that such and such machine has only been utilised for 25%. It just implicates thatyou're having an overcapacity on machines. Nothing much is being done with thatinformation. Each year we run into it - that we're having an overcapacity - but on the otherhand, we say to ourselves, it works quite nicely. Yes, and if you got that alternative, if youhave five machines standing there with an average machining schedule of two on a yearlybasis, then you've got double."
The part at the bottom of the period report, which differentiates into destroyed fo-fcacco and tobacco on /70/d, indicates quality costs: Tobacco returned from the mar-ket and internally rejected tobacco. Tobacco is 'on hold' if it is awaiting the deci-sion whether it should be destroyed or reworked (i.e., re-blended).
T/ie Mac/line E//iciency ReportThis report covers one of the two main control parameters in the production oftobacco: the machine hours. With the collective use of efficiency standards and avariance analysis, a detailed control on machine hour capacity is carried out. Re-porting is therefore organised according to machine (number) and not to taskgroup. However, as it is known in which task group or plant (Rotterdam or Mep-pel) a specific machine is localised, a task group responsibility is easily uncovered.
85

C/iapfer 4
The Meppel plant (the volume task group) is where mass production with veryfew changeovers takes place, accompanied by high occupancy rates and machineefficiencies.
On the lowest aggregation level - the individual machine - actual production vol-ume is matched with the maximum production volume possible in the availablemachining time of the machine, resulting in the machine efficiency percentage.This efficiency percentage is subsequently matched with the attainable efficiencynorm from the capacity calculation, thus indicating slack in the standard settingand not in the virtual performance.
Machine number
(in hours)Available machining time
Machining bmeMaintenanceTesbng bme
11
h - -XX
XX
XX
Technical disturbances in hours
Weighing machineSealing machineTransport chainTape-apparatusBanding machineBundel machine
Organizational disturbances iChange-overPackaging materialMiscellaneousNot accounted for
Production x 1000(in pouches)
Minor stoppage(in hours)
Efficiency %Norm efficiency %
Utilization rate %
Empty weighing boxes %
XX
XX
XX
n hours
XX
XX
XX
XX
XX
XX
14
XX
XX
XX
XX
XX
XX
XX
XX
XX
XX
XX
XX
Efficiency Report Tobacco Production
ROTTERDAM
15
XX
XX
XX
XX
XX
XX
XX
XX
XX
XX
XX
16
74,33
XX
XX
XX
XX
XX
XX
XX
XX
XX
XX
86
XX
19
XX
XX
XX
XX
XX
XX
XX
XX
XX
XX
XX
XX
XX
20
_ ^
XX
XX
XX
XX
XX
XX
XX
XX
XX
XX
XX
XX
80
XX
21
67,25
XX
XX
XX
XX
XX
XX
• X
X
X
X
<
X
X
X
X
XX
XX
70
XX
XX
M l
XX
XX
XX
XX
XX
XX
XX
X
X
X
X
>
x x
x x
;
XX
XX
XX
XX
XX
MEPPEL
M2
XX
XX
XX
XX
XX
XX
XX
XX
XX
XX
XX
XX
XX
XX
XX
XX
XX
M3
75
XX
XX
XX
XX
XX
XX
XX
XX
XX
XX
XX
XX
XX
XX
XX
94
XX
XX
M4
XX
XX
XX
XX
XX
XX
XX
XX
X
X
X
X
>X
X
X
X
•
XX
XX
XX
XX
XX
M5
- - HXX
XX
XX
XX
XX
XX
XX
XX
XX
XX
XX
XX
XX
XX
XX
XX
XX
XX
Figure 4.17 Machine Efficiency Report
To be able to analyse large variances and deviations on what caused them, actualmachining time is led past two main stoppage categories in which possible processfailures can be registered. Those categories are called fec/inica/ disturbances and or-gam'sflfiOMfl/ disturbances. Technical disturbances are subdivided into categories ofmere technical failures each related to a specific machine part. Except for the effi-ciency report, technical failures are also written down in the madnne /ogboofc.
86

Case Van Ne//e/Ro»erdam P/anf
The Technical Services department can have a look in this logbook every majoroverhaul and see what the failure track record of the machine is. Organisationaldisturbances are not being caused by the machine, but are machine-related, ex-plaining for organisational causes of machine setup and changeover downtime.The category of minor stoppage time is a residual category which remains after thecompletion of all other hourly variance analyses and contains only stoppage timesless than five minutes.
The efficiency report (see Figure 4.17) can be read as follows: At the top is the yearlyconstant apai/aWe mac/iining t/'me, including lunch and coffee breaks, and origi-nating from the capacity calculation. Next, the actual machining time whichcomes from the machine clock card and is handed in with the production report.From the division of both figures results the machine utilisation rate at the bot-tom end of the report.
From the actual production volume on the report, an effective machining timecan be derived: production + number of machine rotations (from the capacity cal-culation) + 60 minutes. Effective machining time indicates how many machinehours are allowed to be consumed by this amount of production volume, and re-sembles the standard-allowed-actual comparison in management accounting text-books. This effective machining time is deducted from the machining time on theclock card (actual machine hours for actual production volume) after which avariance results. The calculation of the effective machining time (machine hoursallowed) is not represented in the report - this small calculation is made at Produc-tion Planning. This machine time variance is accounted for in the efficiency reportin technical and organisational disturbance causes, as well as in empty weighingboxes. An empty weighing box originates when the packaging machine makes arotation during changeover but does not package a product. What is left after thisfiltering of variances are the minor stoppage times.
Obviously, the efficiency report is strongly oriented towards (time) variance analy-sis. It is being used as a first-round machine disturbance analysis (vertically: whatfailure caused the most problems in this individual machine?) or machine partdisturbance analysis (horizontally: for example, which machines are having prob-lems with their sealing module?). This can trigger the Technical Services depart-ment to take action long before the formal machine overhaul cycle.
A second-round disturbance analysis employs the items misce//aneous and not ac-counted /or in the category organisational disturbances. Just because these itemscollect every other disturbance that cannot be allocated to other causes, the pres-ence of large numbers in these two items indicates something is going on.
(head Production Planning) "... an item misce/Zaneous and an item «o( arcounfed /or. So if we atProduction Planning see things like - that isn't Okay, is not in correspondence with the clockcard, then, well, if it's fifteen minutes or so, it is not worth the trouble to find out about it. Ifthey are large ... yes, then we follow up. Miscellaneous, if you can't get rid of them under anyother item for some reason. If they don't want to write it down or no personnel is around, there'sno tobacco, somebody else made a mistake and caused a machine stoppage - well, those thingscan all happen. And for technical, the same thing."
87

C7rapfer4
The predecessor of the efficiency report also had an efficiency calculation albeit notso detailed in its construction; it simply read auai/ab/e mac/iining f/me + acfua/mac/nning h/ne. Moreover, the former efficiency report did not use categoriessuch as fedimca/ and organisahona/ dfsfurbances and minor stoppage time, whichare categories that only make sense when using effective machining time (i.e., al-lowable machine hours).
77ie Labour Producfioi'fy ReportThe labour productivity report represents the second main control parameterwithin Tobacco production: man hour consumption. As the machine efficiencyreport is directed at increasing production efficiency by improving and controllingtechnological resources, so is the labour productivity report providing feedback onlabour consumption. Labour productivity is once again reported per task group,and itemised by article number and its subsequent production quantity. A compar-ative summary containing all other task group labour productivities is only pro-vided at the aggregate level of the period report.
The report itself is divided into columns for article number, article description,weight of the product, use of the sleeve-machine, production quantity and thenumber of man-minutes spent (see Figure 4.18).
Artidenumber
*"*2
..»4
... .g
06117
06202
06206
06304
06308
06320
26326
Description
Training
Pouring (sorting out)
M20 sleeving. KLM/CADI
DSSHAG 1A 48x100
DSSPEC.AUT. 12x10@50
Onband. SQ KLM
DSH.ZW.AUT.6x10@50
DS Onband. HZ KLM 20@5
WELPH..ZW. 12x10@50
DSH.ZW. 1 5 X 1 0 @ 4 0
LABOUR
Weight
1000
50
100
50
50
50
50
50
40
PRODUCTIVITY REPORT
Specialists
Sleeving
N
N
N
N
N
N
N
Y
group
Totalproduction
0
xxxx
xxxx
xxxx
xxxx
xxxx
xxxx
xxxx
xxxx
xxxx
Total man-minutes
xxxx
xxxx
xxxx
xxxx
xxxx
xxxx
xxxx
xxxx
xxxx
xxxx
Normproductivity
0
xx kg/man hour
xx kg/man hour
xx kg/man hour
xx kg/ man hour
xx kg/man hour
xx kg/man hour
xx kg/man hour
xx kg/man hour
xx kg/man hour
Productivity
0
xx kg/man hour
xx kg/man hour
xx kg/man hour
xx kg/man hour
xx kg/man hour
xx kg/man hour
xx kg/man hour
xx kg/man hour
xx kg/man hour
Figure 4.18 Labour Productivity Report (Source: regular internal report)
The article description column also contains other human resource activities,such as training - the article number then uses a specific different code. An articlenumber is not the same thing as a customer order; an order is being assembled inthe Distribution Centre from the various batches coming out of the factory (thesmallest denominator of finished product is a carton containing a standardamount of pouches).
Following the batch description, a weight indication is given because the capacitycalculation and the physical machine production are constructed according to
88
Case Van Nd/e/Rofferdam P/ant
weight, and an additional entry is made in case the sleeve-machine is used. Asleeve-machine wraps a plastic sleeve around the tobacco pouch and is a highlydisturbance-sensitive part in the production process (takes time to repair and,thus, can reduce labour productivity and machine efficiency). For the use of thismachine, separate lower standards apply. Moreover, its deployment for a specificbatch already provides a first explanation for possible unfavourable productivityvariances. Actual productivity can subsequently be matched with norm productiv-ity per article number.
(head Production Planning) "...In this manner, the task group leader can see: today I producednumber 02627, which is SQ without revenue band. I produced 12,000 pouches, they spent 1,000man hours, results in a productivity of 9 kilograms per man hour, as opposed to a norm of 9.1 -Okay, I'm below the norm. He can see discrepancies, he starts asking and gets answers like -yes, we had to work with three temporary employees, it took much longer. Well, all thosethings he can simply extract from the report. And that he can do on a weekly basis, on aperiodic basis. Also, holiday periods - how is my productivity behaving, with manytemporary personnel, many vacation workers ? Are we doing as we hoped for, how does itdevelop cumulatively? Well, that sort of information, that was never available before."
The norm productivity per article number serves as a means of control for the taskgroup leader, although it is different from the labour productivity calculated in thecapacity calculation. The latter is an indiscriminate productivity measure andserves to monitor aggregate labour costs. Summation of the fofa/ production col-umn and dividing it by the number of task group members, results in a taskgroup-specific productivity figure which is comparable with the one from the taskgroup's capacity calculation, i.e., it is turned into a performance indicator at taskgroup level.
(head Production Planning)"... Then you don't specify by article number and they can see - am Ion the norm which is also in the capacity calculation, this total norm? And he knows - if I'mabove this, I'm probably having favourable labour costs variances. Do I stay behindcumulatively, then in time I'll have problems with my labour costs. That's always been theproblem with budgets and budget control; as it is, for example, for those task group leaders.They've got a budget and await the year, those labour costs - it won't go wrong that easy. Youdon't go over your budget, only at the end of the year you go over your budget. And if you're notused to handling budgets then you have to learn. If you're over your budget al..ready after twomonths, you'll have to work damn hard to correct it for the end of the year."
In comparison with the past, the labour productivity budget on article level is al-most entirely new. It originated out of discontent with the allocation of labourcosts to products. The allocation criterion used was based on a norm productivitydating from a time-study that was conducted many years ago; it was applied to allproduct variants and task groups regardless of whether or not they required visiblymore or less labour-intensive packaging. To straighten this out, the specialistsgroup, with the largest variation in products, started registering labour time by ar-ticle number.
(head Production Planning) "...Well, the specialists group, that is, of course, handwork,always has been a difficult factor, such as - What are exactly the costs of a bag-in-box? Bags-in-boxes are cardboard boxes, 200 gram packaging, which require a lot of operations. Thatarticle was introduced at one point in time and it has never been looked at, like: Can weproduce this as low cost as we think? Aren't the manufacturing costs higher than the revenues?Why has that never been checked? Because our cost structure simply is like: I've got a taskgroup, the specialists group for example, or I have the tobacco factory or hand packaging. And
89

a norm productivity on the basis of time-studies applies. And, shall we say -15.1 kilos per manhour is spent on bag-in-box for labour costs. So in the product cost calculation you have a portionfor manufacturing costs, labour costs -15.1 kilograms per man hour, 1 man hour costs 37 guilders,just fantasising, so if I sell 15.1 kilograms I spent 37 guilders labour costs for producing thatamount. But is that really true? That's what we wanted to know once and for all; how much dowe really deviate from that norm we apply in our product cost? For bag-in-box we were afraidit would be too much. Well, that guess came out right. And for other hand packagings weactually allocate too many labour costs. That is the reason why we needed to know ratherbadly, especially in the specialists group on article level, what precisely is spent on man hoursper article. Well, and that is what you will find back again in the labour productivity re-port."
Later on, this time registration on article level was expanded to the other packag-ing task groups and it became a commonly used labour productivity report. How-ever, the update of the product cost standards has not yet been formalised; a revi-sion of labour cost absorption, therefore, remains to be done.
(head Production Planning) "... Next, in terms of calculations, it now is looked at on asomewhat higher abstraction level. Still, say per task group, we produce poly pouch 50 gramas the capacity calculation indicates. In that period, they've produced that much, spent thatmuch on labour costs, so it is allocated to products proportionally to sales. And that isobviously incorrect, of course, because you don not know how it all relates. The allocation key isnow according to sales and not according to man hours spent. But we have installed the optionsto allocate more precisely."
T/je Production ReportThe present production report has replaced the former machine report in whichonly machine stoppage was accounted for. The production report is the data carrierfor both the labour productivity and machine efficiency reports. Together with theproduction report, the so-called clock card is handed in: a tabular round card di-vided into 24 hours on which it is recorded at what time and for what period themachine has been working. Clock card and production report are in fact a doublingof information: what is registered as a stoppage on the clock card has to be specifiedin the production report. For that purpose, a number of abbreviations are used(e.g., lunch break - LP, cleaning - SM). It also indicates what caused a stoppage bystating the relevant main machine group in the production line where the stop-page occurred (for example; bundling machine - BM, sealing machine - SM). Theabbreviated note in the production report has to be accompanied by a full note inthe machine logbook, intended for the Technical Services department. If the ma-chine is still working when a disturbance occurs, it is not recorded on the clockcard and only the production report will have to give the disturbance signal. Theproduction report contains the following items:
1. task group and shift number (each shift fills in its own production report);2. article numbers manufactured;3. names of persons who operated the machine (including the one who fills in
the report);4. time account (per 5 minutes); and5. machine number and date.
Similar to the machine efficiency report, the production report is directed at indi-cating disturbances in the manufacturing process; the visibility of the notes andthe layout of the report (time-ladders, everything on one page) show at a single
90
Case Van Nd/e/Rofferdam P/anf
glance what has been going on. There is little text and uncomplicated filling in,which simplifies shop floor use.
The division into two control parameters (man hours and machine hours) takesplace as early as in this first information acquisition round, which is at shop floorlevel. Processing, aggregation and availability in other types of information for-mats and reports are realised on task group (leader) level. The summary report fi-nally reaches the highest production control level and contains the most aggre-gated operational information.
The Relationship with the Management Accounting System of Douwe Egberts
The takeover by Douwe Egberts had an impact on several aspects of the organisa-tional redesign. First, an extra round of meetings and reports was needed - VanNelle's new organisational set-up had to be explained and clarified to the DE man-agement. For the structural and process changes that had already been imple-mented or started, it meant a sort of midterm economic evaluation. Positive yieldsthus far would, of course, signify a continuation decision of the project(s). We willcome back to this subject later.
Secondly, it meant a change in the internal information system. Since Douwe Eg-berts (hereafter D.E.) is a subsidiary of the U.S.-based Sara Lee corporation, a corpo-rate uniform information system was implemented, i.e., internal reports werestandardised according to U.S. accounting practices. Therefore, the local informa-tion system of Van Nelle Tobacco Rotterdam with its own reporting formats hadto change over to 'company rule'. Company rule resulted in reporting formats thatare structured by resource categories and organised according to managementfunctions. Additionally, reports are linked to a planning cycle based on progressingaverage performance figures.
The 'company rule' production budget implemented onto the task group situationuses the three conventional accounting resource categories (direct labour, directmanufacturing and fixed overhead). However, since the production budget of To-bacco Rotterdam is closely knit with the standard-setting capacity and occupancycalculations used for article/batch level production control, the request to draw upa departmental resource category-based production budget becomes an activitywith little relevance to management and control of the manufacturing process it-self.
Therefore, the steady-state type of information that Sara Lee/D.E. requires differslargely from the flow or process information that the information system of To-bacco Rotterdam supplies, and which is tightly linked to local production perfor-mance control.
The resulting linkage problems are being 'solved' by halting the vertical informa-tion flow to and from Tobacco at the system boundary of Tobacco. The productionmanager fills in the required corporate forms and maintains the task group(horizontal) reporting system for local production management and control.
91

(production manager)"... Of course you get a terrible confusion of tongues and other difficultiesby all this. But that's what we try to keep out as much as possible, since what we're saying is:reports we need for D.E., those corporate requirements, do not enter the factory. So they stayout of my organisation, the translation or the switch we make at Production Planning or I'll doit myself. We keep our own reporting system within the organisation so that we can continueworking with them, and nothing is allowed to change that."
Obviously, budget control is familiar to D.E. However, they use budgets differentlycompared to Tobacco Rotterdam. The budget D.E. formulates is a volume budgetbased on steady-state resource information (this many people and this many ma-chines makes so much capacity). In contrast, the task group budget of Tobacco Rot-terdam informs the task group leader in detail on the production process, sup-ported by the other two reports with their built-in variance analyses.
(head of Production Planning) "... We have got an AOP, Annual Operating Plan, which is ayear plan, a budget. It states - Tobacco Preproduction: 130 men, Tobacco Packaging: 80 men,Process Engineering: 7 men, and a short outline of what they're doing. If you're budgeting likewe do, you can hardly do head counts because what do you've to say at that time? You alsocontrol production by using temporary employees, so how to budget? It depends on your sales. Ifyou've got a really busy period because sales go up, you hire more temporary employees. Sothat becomes problematic in your reporting."
The existence of two information systems at the same time results in linkage prob-lems in control: The vertical and uniform system of Sara Lee is directed at thefunctional control of business units, a system level higher than plant level pro-duction control and in distinctive contrast with the local control principle of bothtask groups and operational teams. The plant's own information system is directedat the lowest system level (the shop floor) and has less to do with determininghow many financial resources (budget) are tied down in what parts of the organi-sation; it provides process control. Linkage problems become clear on this locallevel when performance is evaluated by means of vertical capacity information.
(head Production Planning) "...We've put up a nice system; how we budget this, how we budgetat all, how we determine our occupancy, how we calculate our capacities. And at D.E. they'redoing that very simply. They don't budget labour costs but they're budgeting they're needing130 men. We are controlling costs very explicitly. Because you budget, of course, your occupancy,but we're immediately linking labour costs and restitution sicJt pay and external /abour costs toit. And with that application you have to control and stay on your budget, or stay below it."
Returning to the first item, the evaluation /(re)legitimisation of the change, a cal-culation was made based upon a comparison of the production budgets of '88 and'89, both years in which task groups were already implemented and operating. Thefirst estimate for '89 ('outlook 0') is an extrapolation of the '88 plan, which resultedin a savings of 16.5% on the total production budget. Corrected for volume and as-sortment changes, a final production budget saving resulted of approximately 5%for a period of nine months operating in a task group structure.
When measured using the new reporting system, considerably favourable labourproductivities and labour cost results are found. As a result of these first andrough calculations of the economic profitability of the organisational redesign, athree-year freeze on interventions from D.E. management was installed for To-bacco Rotterdam.
92

Case Van M?//e/Rorferdflm P/anf
(head Production Planning) "...Well, the first hit we scored was by the increase in labourproductivity: in '86-'87 and the first six months of '88, it was stable at 20 kilos per man hour.Since the reports and working in task groups, it rose to 21.5 kilos per man hour. This was, ofcourse, because you are producing with more efficient production schedules, so you can arrangethings better, organise better, control better. On the other hand, because you produce more withless people, quite simple. [...] Well, the savings on labour costs, that is the rise in labourproductivity; the first half year we had saved 350,000 guilders alone on labour costs, veryconcrete, from cost reports, in comparison with the year before. This is not something Iconcluded myself this way, it is worked out in cooperation with Planning & Control, whomanage and control the figures."
The main problems of this financial evaluation was that for certain cost and ex-pense categories no historical references were available (the task groups had beenoperating for just eighteen months by then). Furthermore, it was unclear if certaineffects were caused by the task group structure (no unequivocal causality) and, fi-nally, specific industry/company characteristics eliminated some cost/benefit cate-gories from the comparative calculations.
(head of Production Planning) "... We are now one year, one and a half year in operation intask groups and some costs you simply cannot measure yet because you haven't any historicreference material. We have, for example, savings on material losses but if they really /iai>ereduced, it is not yet known. You can sec a decrease all right, but I do not dare to attribute thatto task groups. You can, of course, think the other way around, saying - people get bettermotivated concerning their products and their work and sooner signal things taht are wrong.So, it could implicate very well an increase. I...1 Then they talked about raw materialinventories, that it could decrease since you're organising your production flow better, but apartfrom the fact that we are tied to seasonal purchases, you are always stuck with a 10 monthinventory. And you do not bring that down by working more efficiently in your organisation.And manufacturing inventories are not being determined by cycle time but rather by standingtime: before the tobacco can be packaged it has to stand for 24 hours, and also in preproduction.The total cycle time is thus, for 50%, already fixed by standing time which by all meansintroduces a low yield."
Also, a cost-benefit comparison this selective does not take into account qualita-tive improvements such as increased flexibility or market orientation, which weregoals from the very beginning of the organisational change as well as goals whichfocus on the whole of the organisation.
(head Production Planning) "... Market-oriented thinking must always be directed by theMarketing department or the market group and they of course have to be able to anticipate.And that has also been the most important conclusion of Berenschot (major Dutch managementconsulting group, HR) in 1987, they did the logistics study, that a definite improvementappeared in the production organisation regarding flexibility."
For cost savings, a sort of opportunity cost argument applies because cost savingsare mediated by less direct interventions, such as not hiring additional personnelfor the Technical Services department since minor repairs and maintenance aredone by the task group itself. The organisational decision to keep minor mainte-nance in the task group creates a cost alternative. However, listing and comparingboth cost alternatives is possible in this specific situation, even if it is not sup-ported by financial figures enhancing decision making.
Evaluating the whole change project be/ore/jand using a cost-benefit or capital-budgeting approach, has not been discussed at Van Nelle Tobacco Rotterdam. Typ-
93

C f e a p f e M . -.•• .,;.., .
ically, the organisational and strategie arguments at that time were of such impor-tance and magnitude that financial considerations were not raised nor was the ne-cessity of such a preemptive evaluation felt.
(production manager) "... Well, if you want to decrease product costs, and that is what theexplicit goal eventually is, then, yes, you think at that time - you cannot yet point outprecisely beforehand what the effects will be on product costs. But this is a vision which hasup untill now never, at least for me, been firmly proven. I'm thoroughly convinced of its success.Now I see it proving itself, but I didn't know that when I started with the whole thing. Butthen again, how much do you believe, when you get on with this all (= change project, HR),that it will have consequences for your product cost. And that conviction has to be there. Withthe ones who champion the project but also with top-management of course. That's all there18."
(head Production Planning) "... But okay, it is a global cost-benefit estimate. That has alsobeen the reproach from Planning & Control; that no proper analysis was made before so as toestablish what the accompanying costs are and what the yield is going to be. Well, that is, ofcourse, a little bit difficult when talking about organisational changes because it most of thetime represents a philosophy such as "I'm convinced that it will lower my manufacturingcosts", and that it will most certainly pay itself back in the long run, although it is hard tosubstantiate that. Most certainly because it is such an abstract affair. But now you havecarried it through, so now you can start looking at it in financial terms."
Note
° Although quality of working life usually assumes an industrial relations connotation, VanNelle used it in a mixed sense: It is strongly related to labour and work conditions being the result ofimproved industrial relations (i.e., between employers and unions).
94
5Case Zilverstad Silversmithing
Situational Background
Zilverstad is a small-sized company which was founded in 1875 as one of themany silversmithing shops in Schoonhoven, a city dedicated to this one industrysince medieval times. Its name, which translates as "Silver City", dates back to1953. Prior to that, the family name was used, as still is customary for all other sil-versmithing shops in Schoonhoven. After the Second World War and, morespecifically, during the seventies, severe competition from firms in the Far andMiddle East resulted in a dramatic reduction in the local silver industrial activity.During the eighties, however, this trend was stopped by emphasising quality overlow-cost production. And, as Zilverstad is the name-bearer of Schoonhoven's sil-versmithing tradition, this was reflected in the economic prosperity of Zilverstad.The upturn in events was amplified by a reinstatement of the traditional silverguild, St. Eloy, together with its quality standard, the St. Eloy Guild Mark. Togetherwith the usual silver hallmark, it guarantees Schoonhoven craftsmanship andZilverstad design.
Zilverstad is a family-owned and run company. The present two family members,brothers Arne J.P. Pluut (commercial executive) and Arie Pluut (production execu-tive and engineer), have taken over the company from their father. Collectively,they constitute the Board of Management. The family ownership was reflected bythe internal culture. People work their whole life for the firm, which, therefore,has little personnel turnover. Also, people are relatively well paid and receive ashare of the profit. Labour conditions are good, mediated by the small communitySchoonhoven, resulting in few labour and payment differences in the various lo-cal silver companies. Managerial control and decision making was of an enlight-ened autocratic type. The two brothers frequently consulted and discussed with keypersonnel on important decisions, but they were clearly the ones who actuallymade the decisions. No formal works council or some identical functional body isin place. The vision of the two brothers on labour affairs and human resources hasalways been based on a strong perception of social responsibility and 'taking care ofyour people'.

C/iaprer 5
The organisation is largely structured according to the product market (combi-nation) with two functional departments, i.e., Procurement and Administration(see Figure 5.1).
Board of Management
I I I I I IExport Souvenir Retail Vice-president Procurement Administration
Corporate gifts + Corporate gifts +Premiums Holland Premiums Belgium
Figure 5.1 Former organisation chart (Source: internal brochure)
The craftsmanship tradition of Zilverstad can still be found in the three mainproduct market combinations: premiums and corporate gifts, jewellery and sou-venirs. The jewellery and souvenir lines are also exported; approximately 25% ofsales are designated for export to 26 countries. The premium and corporate giftsmarkets are the fastest growing and most dynamic market, characterised by a largevariety of design-to-order and customised products and a constant pressure forproduct rejuvenation and line development. Product quality, delivery time andtechnical capabilities are the main competitive parameters in this market. Thejewellery and souvenir markets are in a more difficult position. The constantlydecreasing number of jewellers, competition from alternative luxury articles (e.g.,audio equipment and exotic holidays) and the hard monetary position of theDutch guilder put a constant squeeze on sales. Again, quality and delivery time areimportant here, supplemented by the factors of a large product range and high-service level.
The common denominator of all the markets served is that they are characterisedby high-quality, customised and small-batch production with short delivery times.The product mix consists of a large variety of different products, ranging from rela-tively inexpensive, easy to manufacture souvenir spoons to full silver, tradition-ally crafted candlesticks.
Two-thirds of the annual sales are from in-house production with the last one-third coming from wholesale activities. For the manufactured products, Zilverstadhas all the required production facilities available. They range from tool shops andproduct development to the final finishing stage. The technology-in-use is depen-dent on the various craftsmanship domains, i.e., forging, casting, stamping, enam-elling, engraving and electrogalvanizing, with the latter requiring the most tech-nically advanced and complicated machinery. Most of the other crafts are inher-ently low-tech and high-skill manufacturing functions. Further manufacturing re-lationships exist with a fully owned enamelling job shop (since 1986), subcontrac-tors in India and the Far East for low-cost, semi-finished products, and indepen-
96

Case
dent manufacturers in England, Germany and Italy for additional product speciali-ties.
Zilverstad employs 70 people, has a Return On Investment (ROI) and an inven-tory turnover of about 18% and 5.5 respectively. Its balance sheet amounts to a to-tal of 5.7 mln. Dutch guilders (all figures from 1990).
Initially, Zilverstad was specialised in just one manufacturing operation, i.e.,stamping. In the 1970s, a limited number of standard products were made in largebatches, mostly souvenir spoons, cheap nickel-plated ashtrays and cigar boxes.
(Commercial executive) "But our products were being copied in the Far East. Which meant itwas over and out for us. We couldn't compete against this. We had to find a way to survive, itwas as simple as that. We had to find alternative products and markets. We more and morestarted to manufacture products according to customer specification: high-quality productswhich allowed us not to compete on price alone. There is now, except for a basic assortment, al-most no product left from our assortment of fifteen years ago."
From the 1980s onward, Zilverstad experienced an explosive growth. The numberof employees doubled while the sales figures almost tripled. Also, various produc-tion techniques were acquired and used in manufacturing, for example casting andforging.
The success of the company necessitated a change as the company went from a pi-oneer phase to an organisation phase, increasing product diversity and productioncapabilities at the same time.
(Production executive) "... Orders came into the factory and, at some time, came out again butwhat happened in between we didn't know. In the factory everything was milling about, andthere were bottlenecks in manufacturing. This was mainly caused by our own occupation withspecial customer orders, and therefore, with new and unknown products with all the qualityand planning problems that went with it. "
(Commercial executive) "We got delivery time problems in the years '85 -'87, also due to thefact that sales increased very fast. Our continuous need for a sufficient number of adequatelytrained personnel couldn't be kept up. The organisation didn't fit the fast growth.Furthermore, the market was changing rapidly and increasingly kept asking for shorterdelivery times and higher product quality. It really became necessary to control quality in allphases of production. This is how, at the end of the eighties, the need arose to improve thestructure of the company."
Traditionally, the production executive and the production manager acted as ex-pediters once the customer telephoned to assure delivery time. Furthermore, theneed for trained personnel continues to be important, focussing mainly on thejobs of toolmaker and stampmaker, which are highly qualified people and at thesame time bottlenecks in the diversified product turnout. The added value ofthese people is located in the need to be creative in a different way; silversmithsare creative experts in certain operations, but tool and stampmakers are the cre-ative architects of those operations. Appearance of this type of personnel shortageenforced thinking on personnel policy for the very first time. This bottleneck wasapproached in two ways: First, by starting internal training for tool and stamp-makers and, second, by acquiring a computer system that could engrave stampsfrom an engravings database thus taking some routine work away.
97

Complexity in production and a large variety of different products were to blame.Raw materials differ from silver or gold to brass, bronze and pewter, with havingsolid, enamelled or plated final products turned out. Additionally, each materialhas its own production process with many product-dependent individual manu-facturing operations. For instance, galvanising is a complex operation and requires(knowledge of) the use of chemicals. Also, there are assembled products whichcombine two or more different production processes for each assembled part.Apart from all this, sales are highly seasonal with the largest volume being sold inthe last three months of the year, i.e., Christmas and season gifts. To counter com-plexity and variety and to respond to quality-customised competition, high-gradeproduct design and manufacturing technologies would possibly provide some an-swers. Unfortunately, the large product variety with its subsequent large numberof machine changeovers make automation and even mechanisation of produc-tion a troublesome affair. In order for automation, and technological innovationsin general, to succeed, it was felt that the organisation first had to be made fit forsuch changes. Only then can technological interventions be successful.
To the extent that the organisation was felt to be in need of direction, a businessplan was made in 1986 by the commercial executive. Typically, the business planfocused mainly on the commercial aspects, as the Sales function was somewhatleaking away in terms of managerial control. Written in terms of the market, itdealt with, for example, product range, commercial targets, market developmentsand operational improvements in the sales department. In contrast, theProduction function was thinking in terms of product types, e.g., spoons, businessgifts, jewellery, etc. The business plan clearly indicated the need for intensifiedquality control in all production stages. It did not give any information yet as tohow this could be achieved. The previous combined effect of both was that 'as longas the factory is fully occupied and sales sells it all, things are alright'. The businessplan signalled both a reversal in thinking (from the market inward to the organi-sation) and an awareness that insights into the present situations, and informa-tion in general, is important to the firm. It was not the first managerial effort to-wards planning and what things were expected to look like. This business plan,however, was much more thorough and detailed. And, more importantly, it wasdiscussed with all staff members to ensure a shared agreement on targets, etc.
The business plan, however, did not prove to be satisfactory because of its limitedfocus, and the shopping for additional help was continued. This help was found inthe form of the Dutch Contact Group for Employers in the Metal Industry (CWMin Dutch), of which Zilverstad was a member. The CWM offers various low-costservices to its members, including training courses and several types of businessadvice and consulting. By October 1988, the CWM introduced Zilverstad to the ex-ecutive course on SocioTechnical Systems Design (STSD) for small and medium-sized companies. This course was taught collaboratively by the CWM and theDutch Foundation for Quality of Work and Organisation (abbreviated into NKWOin Dutch); they later involved also a consultancy company, practising what theypreached, called KOERS. The brothers Pluut and the head of administrationreturned with the impression that this could be what they were looking for andasked their key people to go and see what they thought of it. In February 1989, theproduction manager and two other production staff members completed a middle
98

Case Zi
management course on STSD, and everyone came out very enthusiastically aboutthe integral redesign ideas presented.
(Head of Administration) "... In fact, we have been looking for some time for the most suitableorganisation format. For instance, we've been thinking about organising production to ordersize; large, medium and small orders. However, it proved no solution to our problems. In fact,we were confronted with the problem that Zilverstad both has products and productionprocesses which are very specific and require specific solutions. To get a more comprehensiveview on things, the two Board members and myself took the CWM executive course on Qualityand Flexibility. Discussions with CWM employees and people of KOERS consultancy have ledus later on in starting to think about flow-oriented manufacturing and homogeneous taskgroups. And since the reorganisation we had in mind had to be done integrally, three otheremployees subsequently took the middle management CWM course on Partaking in Renewal.After that, a start was made with the more specific filling in of the reorganisation."
The educational trajectory thus started with the two board members and the headof administration, followed by key people. The courses explained what system de-sign was, how it was done and what the best way was to depict and describe organi-sational processes. At this moment in time (June 1989), a consultant of KOERS wasintroduced. Her main role was that of process facilitator, not of an expert, as sheserved to keep the project within the tracks set out.
A group of six people was again trained by this consultant, repeating the main de-sign principles. This group consisted of the initial course participants: head of ad-ministration, production manager, two production staff members (the galvanisingforeman and the foreman in charge of jewellery articles) plus the job scheduler,and the board secretary, also being export and import manager; i.e., four from theproduction department and two from nonproduction. The job of the design groupwas to do the general redesign. The highest rank present at all the design workgroup meetings was the head of administration. This was done deliberately sinceone of the goals of the new organisation was to bridge hierarchical distances andhave the lower echelons get used to and acquire more responsibilities.
The project structure maintained a linking-pin model, with a steering group con-sisting of the brothers Pluut, the external consultant and the production manager(who had over 20 years of experience in the company) and the head of administra-tion. The job of the steering group was to monitor progress and to make decisions.Actual redesign was in the hands of the design work group, as the Pluut brothersheld the view that their main job was to just make the decision, nothing more.The installation of this design work group marked the formal start of the organisa-tional change trajectory (August 1989).
Two different types of work groups followed up the general design of the designwork group: A sales work group and various detailed design work groups. Thesales work group, consisting of the commercial executive, market groups' salesmanagers and, to maintain the link with production, the job scheduler and theproduction executive, started mid 1990. Their job was to asses the commercial po-sition of the firm by means of a SWOT analysis and propose measures to bridgethe gap between desired and expected performance. Almost naturally, this flowedover into a strategic orientation round (SOR) as prescribed by STSD (September-December 1990), the preliminary work of the SOR already being done by the busi-ness plan made earlier.
99

C/rapfer 5
Typically, the SOR was not initiated at the start of the reorganisation process butfl/fer the redesign decisions were made: i.e., not performed by the design workgroup before their general redesign of the organisation structure, but by the saleswork group, accepting the new production structure as a given condition. Thisshift in sequence was primarily motivated by the condition of the internal organi-sation. First, a flexible production organisation was considered a neccessary condi-tion before entering the market full-fledged with new strategies and commercialapproaches. Second, since Sales proved itself in the sales growth of the 80s, it wasnot considered in urgent need of structural renewal. The SOR brought forwardthat a decision had to be made on what Zilverstad would look like in the 90s.Strategy was discussed in terms of market capacity, production and sales capabili-ties, and product range. Two strategic directions were considered: continue thepresent flexible organisation with its large and varied product range, or changetowards an organisation with a clear image, having a relatively limited productrange and market coverage. As for the implications for the organisation, it is notcertain whether a flexible organisation can be supported in the long run, mainlyfor its cost consequences and the high organisational demands on Production.More important is the expectation that this option will cause the gap between theseveral market segments to grow since a focused strategy per segment will beneeded, reflecting itself in a segmented sales organisation. The brand and companyimage strategy does not include this expectation, and seems to be preferred.However, this strategic discussion still continues as more and more informationon Zilverstad's markets and organisational capabilities becomes available.
The second type of project group following up the design work group are the vari-ous production work groups. They zoomed in on the general design of their pro-duction segment and made a detailed design, paying special attention to interfaces(i.e., work flow boundaries). Typically, it involved all the members working inthat specific production segment. Figure 5.8 shows such a detailed design made bythe employees. These detailed design work groups were headed by the design workgroup participant under whose responsibility the specific part of the organisationfell. Meanwhile, the design work group was maintained for feedback and cohesionin the various detailed designs.
Therefore, the project structure unfolded simultaneously with the various re-design activities, their sequence and responsibilities coinciding: The redesign workgroup came up with the general design, then the upstream part (coupling jobscheduling and production) was designed in detail, followed by the downstreampart (coupling finished product and shipping). The end of the detailed design wasmarked by the completion of the control structure and information structure inDecember 1990. Halfway the detailed design, the sales work group was started upand an SOR was initiated.
The Change Trajectory
July 1989, the two board members, supported by the consultant, made a company-wide presentation. It was outlined to all organisation members gathered, what thereasons for the change were, what was going to happen, and what generally wouldbe their future role in the upcoming change process, explicitly stating their partici-
100

Case
pation and involvement. In this one big event, which was unequalled in the fir-m's history as well as in the fact that the board directed itself to all personnel, theupcoming change was openly laid out and discussed by the two brothers Pluut,showing their own commitment to the changeover.
Starting points
Design
Extending organisation model
Implementation
Organisational hierarchy
Figure 5.2 Phasing of redesign trajectory (Source: project documentation)
The change trajectory started formally with the installation of the design workgroup and the concise rehearsal of the STSD design principles by the consultant(August 1989). As an immediate result, a phased approach to the change processwas prepared, linking up with the project structure (see Figure 5.2). For example,phase 3 is where the above-mentioned detailed design work groups came in.Remarkably, the phased approach and the project structure related only toProduction. Sales started up its own track later on.
Table 5.1 Full tasks per redesign phase (Source: project documentation)
Phase!
Phase 2
Phase 3
Phase 4
Formulating design specificationsBottleneck listing
Look lor parallel llows in the productionLink flows to the pre-production and past-production trajectories asmuch as possibleDelermine in outlines al operational and control activitiesMatch production and control structure with design spedlcations. plusmake a choice (the Board enters the Irajedory)Present new organisation structure to the entire oompany
Determine in detail operational and control activities of groupsAjnitsDetermine (possfole) layout changesDetermine (possfete) changes in technical equipmentList changes in information supply & demandList the need for trainingMake an implementation plan
Formulate group goalsSystematic problem solvingSüuational leadetshpIntroduce work counsellingTrainingConflict management & team bakingPerformance appraisal
Executed by:design work group
Executed by:workgroups underthe design workgroup
The four-step approach consisted of the following main phases (see Table 5.1 for amore specific outline):
101

- formulating design specifications & categorising organisational bottlenecks(phase 1);
- actual design (phase 2);- elaborating the organisation model (phase 3);- implementing it, using an implementation plan (phase 4).
The design work group started off with listing bottlenecks or what was felt to be abottleneck ('points of attention' and 'points of annoyance'; September 1989) andwith formulating the design requirements (October 1989). In other words, it wasstating the framework and boundary conditions for the upcoming design (seeFigure 5.3).
(Head of Administration) "... That listing showed the way for the detailed final proposals.Those proposals have, to a certain extent, brought about a culture shock: Many things whichwere taken for granted, were suddenly discussed or abandoned."
The functional requirements are preceded by a short statement of General Com-pany Goals, a sort of mission statement, which was unprecedented because it wasthe first time goals were explicitly stated and ratified. The functional requirementsfocus on structure, structure allowing for product quality, quality of work andfunctional integration. Furthermore, the explicit attention for the cost structure ofeach product market group is important: It states cost-structural targets si-multaneously with the targets for delivery time and reliability and product quality,i.e., cost structure and performance are considered to be two sides of the same coin.Cost structure targets are, thus, norms for the overall accounting system to be de-signed, i.e., norms to be attained by means o/ rather than within the accountingsystem.
Bottlenecks were listed according to their system level and to whether or not theyhad a structural cause (September 1989). System level refers to the six subsystemsmaking up the primary process at organisation system level; sales, preparation,production, storage, shipping and procurement. These six subsystems return inphase 2, where a process model of the existing organisation is made in order to es-tablish interfaces and information flows between subsystems, employing theSADT/IDEF technique (see Figure 5.4). It forms the basis for the latter control andinformation structure design.
Nonstructural bottlenecks are then prioritised and serve as inputs for quick im-provement actions. Structural bottlenecks are inputs for the subsequent redesignof the production structure. Apart from a structural/nonstructural and subsystemlevel listing, two other classifications were used: A strategy category, relating tobottlenecks which could only be solved by a change in policy or in managerial dis-cretion. For most items, this classification coincided with a zero systems level, i.e.,it was concerned with the organisation as a whole. Examples are the productionorder backlog on Zilverstad's own standard products compared to the immediateproduction of customer orders (system level 0 plus policy category), the recruit-ment of personnel in the absence of selection criteria and consultation with theforemen involved (system level 0 plus policy category), and the lack of time andattention for product development and product assortment (system levels 1 and 2,plus policy category).
102

Case
G«mral Company Goals
• Sales spread across the various market segments (approx):gift articles (export)souvenirsretail tradepremium/business gifts market
Market opportunities:30% growth, mainly export own products10% stable, on approx. 1 mln.15% growth possible45% growth possible
* In order to operate successfully on the various markets, a wholly owned production of sufficient size per technology(foundry, presses), is needed This means a size which can sustain a good market position per technology
. Priority in choosing to make or buy is . pr<,fj, maximisation is more important than sales growth.determined by: • |n building up the order position targets are:- higher added value; a) a well-utilized production capacity;- own product as image; b) high-running wholesale articles;• short delivery time possibilities. c) supplementing sates with premium/business gift articles
Functional requirements lor the executing and control structure
• A structure that allows for the implementation of Total Quality Management.* A structure in which a high quality of work is realised.* A structure in which the qualities of all personnel are optimally realised, allowing people to develop involvement and/or
motivation• A structure that allows for the integration of wholesale and production activities-* A structure in which the sales activities have to be integrated wilh the strategically set production capabilities and are not
autonomously directed at wholesale.* A structure in which the procurement activities can have a clearly delineated position* A structure that, supported by the administrative department and computerisation, is controllable for the Board.• A structure that allows for a clear and effective consultation structure.* A structure that allows for good planning.* A structure that improves communication between departments.* A structure thai prevents pigeon-noting.• A structure that develops team spirit instead of creating 'little bosses' everywhere.* A structure that allows for standards/norms in general.
Delivery time: FactoryCustomer
Delivery reliability:
Quality A/B/C/:
Cost s,tnjcty,re.'AcquisitionWholesale/materialsProcessing costsMargin
Retail
048 hours
± 2 4 hours
A
196714
_ö_100%
Souvenirs
6 weeks7 weeks
± 1 week
B/C
42548
_23_100%
Business/premium
6 weeks6 weeks
i 1 week
A/B
114430
J5_100%
Gifts/export
2 weeksSweeks
i 1 week
A
44430
_22_100%
Figure 5.3 Functional requirements for organisational redesign (Source: project documentation)
Bottleneck listing was most visibly used for starting up improvement projects,such as improving specific working conditions that have been annoying peoplefor a long time, e.g., bad ventilation in the foundry as a result of plants growing onthe roof of the shop. It involved considerable outlays on equipment such as hoodswith extractor fans and flexible clenching arms. The production employees wereinvited to go to the trade fair and buy the equipment themselves. Apart fromshowing involvement and broadening the support base for the changeover, a ben-eficial effect was the improvement of communication. The various departmentscame into much closer contact than before, because they had to work together out-side the daily routine.
103

Chapter 5
budget market into samples
packaging standards
orders
Inputs
11 colour lists
12 tools
13 planning schedule
14 sample requests
15 raw materials
16 semi-finished products
17 returned product
from
2
2
2
1
6
6
external
Control information
C1 general job regulations
C2 quality requirements product
C3 machine capacities
C4 environmental standards
C5 info on technical disruptions
C6 reporting regulations
from
3
external
3
external
1.2.3
2
Production3 Outputs
O1 product (waste)
02 colour lists + info
O3 scrap
O4 accidents
O5 tools
O6 info material usage
from
1.4,5
2.5
external
2
2
Resources
R1
R2
R3
R4
machines
people
space
knowledge
Figure 5.4 Model of primary process plus a SADT/IOEF subsystem exemplification (Source: projectdocumentation)
By the end of 1990, a project structure was installed, the primary process wascharted, analysed in terms of bottlenecks, and provided with functional require-ments for the upcoming redesign, and the Board could be offered a general design.Meanwhile, some alternatives were considered on how to redesign production,for instance a structure according to batch size or according to manufacturing
104

Case
complexity, but none of these were found to be satisfactory. The main difficulty inchoosing the best alternative was the delineation of tasks, because one of the goalswas to improve interaction between the Sales department, which knows the sig-nals from the marketplace best, and the Production department. In the final designoffered to the Board, this point resulted in placing the warehouse under the re-sponsibility of the Sales department.
Presentation global design;Implementation plan;Start -up detailed design groups
Company-wide presentation;Project structure installed
Executivecourse
MiddleManagementcourse
Entryexternalconsultant
OctB8
Phased approach;Functional requirements;Process modelling;Improvement labour
conditions
Feb. June Jury'89 «9 39
Sept'89
Mid-termfeedbackby detailed designgroups
StrategicOrientationRound
Company-widepresentation ondetailed design
Casestudyentry
Jan.•90
Apr. June•90 ^
Jan.•91
Sept•91
1989
Phase 0 Phase 1
1990
Phase 2
1991
Phase 3 Phase 4
Steeringgroup
Production design group
Detailed design groups
Sales design group
Figure 5.5 Timepath, main events and project structure of organisational change
In January 1990, the general design was presented to the Board and approved. Itmarked the start of the detailed design work groups and extensive participation ofall personnel. The design immediately resulted in an actual reform consisting of aprimitive task group structure and flow-oriented production. The rest of the year1990 was used to further refine this general design. Mid-term feedback implied thevarious work groups commenting on the assumptions and starting points em-ployed by the overall design work group, thus providing a larger framework and a'warming-up' on the design task. The linking-pin project structure was turnedinto reality as work groups were headed by the representative of that particularproduction part, who was also a member of the overall design work group. In fact,task groups turned out to become design work groups, thus bringing the changeprocess 'into the line'. Design focus at this stage was on the upstream and down-stream parts of the production process and on how linkages between parts could beestablished. This also included the first adaptations to the available control sys-tems of, for example, inventory, order processing and registration. External assis-
105

C/iapfer 5
tance was provided here by consultants of the CWM, since Zilverstad was able tomake use of their services at a reduced rate because of its membership. Typically,assistance was seldom called in; the state of affairs was regularly reported to theconsultant from KOERS. Personnel acquired skills and knowledge at a high speed,doing things they had never done before: Providing feedback, making presenta-tions, having meetings, and informing and relating to each other on how their de-sign developed.
At the end of 1990, a detailed production design was ready and an implementationplan formulated. At the traditional New Year's reception in January 1991, the fulldesign was festively introduced to all company personnel. Reactions of personnelwere reserved, not negative nor resistant. Especially some of the jobs that had to bedone in the task group were felt to be unpleasant, as they involved loss of status.For example, quality control is now done by the group itself, and it was somethingof a culture shock the first time a product was refused and returned to the respon-sible worker for additional treatment. In addition, nobody wanted to do the pack-aging as it was considered an inferior type of work. In other words, it took sometime to get used to the full implications of autonomous work groups (in the firstexample, it was the woman that used to do the packaging who refused the productand returned it).
The Organisational Redesign
Production Structure
By January 1991, the final production structure was selected and ready for imple-mentation. Based on the IDEF/SADT systems analysis, four autonomous taskgroups were formed. Three of them occupy themselves with manufacturing (blue,white and yellow), and one with the warehousing activities (green). The IDEF dia-grams resulted in a general design which was handed over to the various workgroups for detail and linkage (see Figure 5.6).
In fact, the warehouse group can be considered an 'inventory management group',since its task is to balance the wholesale and Zilverstad standard product invento-ries with demand. Its tasks include sorting, repackaging and order processing forwholesale products. The main reason for creating this group was, as it was experi-enced over time, that the wholesale and own standard products were overrun bythe specialised customer orders. For example, the habit developed to manufacturestandard products only when production slackened and there was time left, i.e.,standard products filled the gaps in the production schedule. As a consequence,Zilverstad's own standard products were not available and often had an orderbacklog. In other words, Zilverstad was undercutting its own sales performance.
(Head of Administration) "... We deliver both on order and from stock. Then, it showed thatcustomer orders always got priority over inventory orders. Because one order was for ourselvesand the other just for inventory, it was never urgent. And you know, if things are not urgent,they don't get done. So if they have few customer orders, sales performance could drop. But if,in contrast, they produce on inventory when times are slow, that part of sales will be added totheir performance since inventory and sales are the same thing. To them, it doesn't matterwhether they deliver to the warehouse or to the customer: the internal transfer price values
106

Case Zi7versfa<i
their sales turnover. So that's also a reason why you could say that they can influence sales;not directly, but indirectly all right."
sales/drawing/design
tools
job scheduling/planning/procurement
procurementwholesale/productdevelopment
blue
\\
\
white
green
-
warehousestoringinventory
shipping
Figure 5.6 Global production structure design (Source: project documentation)
The warehouse group is separated from the factory and is placed directly under theSales department. Presently, the warehouse group is treated in the productionschedule as another customer, equalling both inventory and customer orders. Theequal role of wholesale versus own products can also be derived from Figure 5.7:There are two inputs to the inventory function (the triangle in the picture) andthe Sales responsibility domain embeds that of production.
cusTOMER
Administration J Management
J
I— o
ProcurementWholesale
WHITEstoring planningincoming inspection calculationjob scheduling tooling
shipping
BLUEstoring planningincoming inspection calculationjob scheduling tooling
shipping
YELLOWstoring planningincoming inspection calculationjob scheduling tooling
shipping
GREEN
CUSTOMER
Figure 5.7 Production structure redesign (Source: project documentation)
107

C h a p t e r 5 ï>? i j ; ; ; ,
The detailed design of the production structure maintained the larger frameworkof the general design (see Figure 5.7). Comparison with the former productionstructure is impossible, as no production layout or process chart previously ex-isted.
The 'WTn'fe' group is made up of 14 people and manufactures so-called singleproducts, i.e., products made out of one piece, and batch products, e.g., spoons andcommemorative medals and coins. The 'B/ue' group consists of 26 people andgenerally manufactures composite products in small batches, e.g., teacup holdersand rattles for babies. The 'Yef/ow' group (see Figure 5.8) contains 8 people and alsomanufactures composite products in precious metal, in even smaller batches, e.g.,silver miniatures, brooches and hallmark-quality decorative ware. This is thegroup where the fully experienced silversmiths are predominantly situated.
Several production typologies at the same time are available. From top to bottom,the order is in decreasing batch size: The W/iife group manufactures the largestbatches, mainly spoons, while the Ye//ow group manufactures the smallestbatches, mainly jewellery. Next, the B/ue groups has also input of semifinishedproducts purchased in the Far East. The Yei/ow group is a full product manufac-turing group and therefore has a somewhat different expertise buildup as well as adifferent way of working, including the craftmanships culture that accompanies it.Nevertheless, each production group is autonomous in terms of jobs: Planning,quality control and tooling are performed by the group (see Figure 5.8).
The detailed design is depicted for the Ye/Zou; group in Figure 5.8. It shows the op-erations contained within each task group, as well as its input and outputs.
Raw materialsOrdersSemifinished productsModelsTools
1Jobscheduling/Inspection
Castingmouldsproduction
Spraying/quanting -up/embedding
-*-j Casting L-».Machining,Polishing.Grinding etc.
Yellow Group(composite complex products from precious metal)
CleaningPaintingPackaging
Figure 5.8 Internal organisation structure ot a production task group (Source: project documentation)
Each group is headed by a group leader. Although circulating group leadership isintended, it is not as yet effectuated because there is not enough knowhow avail-able in each group. Other than high quality and maximum employment of indi-vidual qualities, no explicit rotation target was mentioned in the preceding func-tional requirements. This was done deliberately, because its limitations were clearin advance. Some people do not want to rotate and view such demands as being
108

Case
threatening, while others simply do not have the capacities or qualifications.Changes in the work included shared responsibility for tasks and the availabilityfor various tasks. Group responsibility was the main argument used in the infe-rior packaging job example above - have all group members do packaging jobs.Availability, of course, is restricted to tasks requiring a short learning period onthe job, learned from colleagues.
(Production executive) "Of course it is true that some difficult operations can only be performedby a few people who really know their business. It's hard to get other people to do this. Youneed time to enable all the people in a group to perform all sorts of operations. That's a nextstep in the process on which we're working right now. We're starting with training, jobclassification and all that sort of thing. Again, it's an example of taking up things we're ableto handle. The process will never stop, you have to be inventive constantly."
Consequently, the task group structure resulted in a different responsibility struc-ture in Production, replacing the functional foreman by flow-based units (seeFigure 5.9).
Production executive
Job scheduling1—
Production manager—i
Procurement
I I IForeman Foreman Foreman
Stamping
Assembly
Silvercasting
I 1 IForeman Foreman Foreman Foreman Foreman
Assemblyspecialties
Pewtercasting
Galvanizing
Polishing
Enamelling
Shipping Warehouse
Tool shop» Drawing
Figure 5.9 Former production organisation chart (Source: project documentation)
And the present chart of the responsibility structure:
Production executive
IProduction manager
Job Scheduling & Planning& Calculation & Procurement
ITool shop
Group leader Group leader Group leaderBlue Yellow White
Figure 5.10 Present production organisation chart (Source: project documentation). The 'productionmanager' function is considered temporary and will eventually disappear.
109

C/iaprer 5 .?
The drawing function is renamed 'design' and is coupled to Sales and brought up-stream. Basically, because Sales generates the sample requests, Design has to drawand Production has to manufacture. Samples are important to convince the cus-tomer of the quality and appearance of the product and get him to confirm the or-der. The designer is located next to the job scheduler (which is a production stafffunction) in order to enforce preliminary planning and communication by prox-imity.
The task of higher management is to keep all groups together and have them actas one. For example, it is set up in such a way that a group which is low on ordersassists another group. The 'assistance hours' are being registered and 'sold' to thedemanding group using an internal transfer tariff.
(Production executive) "Changing the organisation brought numerous other changes with it.The first one was the grouping of people. It meant a significant change for people. Previously,they worked on a manufacturing operation and now, they're working on a product. Work wassomething they did on their own in the past, and now they have to work together and inmutual agreement. This has to grow over time. For example, at the start there was clearlyvisible resistance to having meetings. People were saying to one another: "Do we have to goand sit around the table again; it'll cost me ages, all this blabbering." But by now, it hasbecome clear to everyone what the use is of having regular meetings; one is able to say one'spiece, people listen to you and problems get solved. Employees have far more responsibility inthis group structure and it seems that they can handle it very well. A second important thing isthat planning and job scheduling are made much easier and more precise. It improves yourinsight into the organisation and into the throughput of orders. You dare to look ahead, so tospeak. Which was far more difficult in the earlier situation. A third point is that it is easierto deliberate on problematic matters. It improves with groups getting smaller. Solutions docome up quicker from a group. And because people are directly involved, they come up withworkable solutions."
The overall organisation structure underwent a subsequent redesign. The formerproduct market structure was replaced by a structure according to business func-tion (see Figure 5.11), framing a combination of product market and task group ty-pology.
Sales
Board of Management
1
Administration
— Corporate gifts
— Export
— Retail
— Green Group
— Procurement
Production
— Salary Adm.
— Invoicing
— Financial Adm
— Company Adm
- Design &
Product Development
1Personnel
— Calculation &
Planning
— Job Scheduling &
Procurement
— Tool shop
— White Group
Blue Group
— Yellow Group
Figure 5.11 Present organisation chart (Source: project documentation)
110

Case Zi
Control Structure
The control structure design can be seen as resting on two mutually supportingtracks, i.e., meetings and agendas. Both meetings and agendas form parallel linksbetween the elements in the production structure (see Table 5.2). The primaryprocess is supplemented with a combination of agenda-setting reporting formsand concurrent meetings in which this information is discussed. Three meetingsannex forms support the business process:
- the sales meeting with the sales order ticket;- the procurement meeting accompanied by the purchase order form, and- the post-calculation meeting using the calculation ticket for agenda setting.
(Head of Administration) "... Well, you see, we make a difference between standard ordersand special orders. And a special order always goes with a calculation ticket. If we make aproduct we've never made before or very rarely make, the group involved has to calculate it,meaning that they have to register the quantitative data. How many kilos of material do Iuse, how many hours does it take me, this department, that department and that operationtake that much time, etcetera. Those data then go to Job Scheduling, which makes a propercalculation, tariffs get attached to it. As you have a new product, you have a new calculation.And consequently, it is put into a spreadsheet to have it available as a price when the productturns up again sometime in the future. Or if you manufacture it just once, it ended at thatspecial order calculation; no further use is made of it."
Two other combinations of meetings and reports which are less related to theprimary process are the product development meeting with its subsequent productdevelopment proposals, and the after-sales meeting which has filled orders as in-put.
Table 5.2 Control structure design (Source: project documentation)
SalesMeeting
ProcurementMeeting
Post-CalculationMeeting
ProductDevelopmentMeeting
Function
Balance customerdemand withmanufacturingsupply
Coordinatepurchasingorders
Enlargeinsight intomanufacturingprocess
Productmixmanagement
Goal
To acceptsalesproposals
To purchaseeffectivelyand efficiently
Minimal costs+ 'pure'manufactunngdata
Input
Salesproposals
Purchase
proposals
Calculationtickets
Productdevelopmentproposal
Output
Realisable (Ft)+ nonrealisable(non-R)proposals
Purchase
orders
Tested +correctednorms
Mixextensionor pruning
Agenda
Select,prioritizeand decideon R, non-RandR?
Selectcombine anddelivery timecoordination
To evaluatedecisions,correct yea/noand how m uch
To evaluateproposals:prune, take inor don't
Frequency
Weekly
Weekly
Monthly
Quarterly
Participants
Sales reps4 all groupleaders
Group member+ memberProcurementdepartment
Management+ group reps
Group reps.Management,people fromSales and Design
Originally, it was meant to conduct the after-sales meeting as a separate meeting,but it turned out to be more effective to have it coincide with the sales meeting,which is more related to the primary process (Figure 5.12). The main reason wasthat improvement proposals go across functional boundaries. Since people fromboth Sales and from Production groups are present in the sales meeting, it could be
111

coupled and simplified. The sales meeting was first created for internal communi-cation between the four groups, but linking Sales to Production proved to be diffi-cult:
(Commercial executive) "The only difficulty was to link up Sales with the factory. Of course,the thing we would have liked to do was to couple the sales representatives to each separatemanufacturing group. But that's impossible, since a sales person can't just say to a customerwhen he is asked a question about products of a different manufacturing group: "I'm sorry,that's not my area of responsibility, you have to talk to my colleague about that." So we thinkit is necessary that the entire sales department knows about the complete product range.Meaning they would have to be knowledgeable about all products! An additional disadvan-tage is that the communication between Sales and the factory becomes less direct. We try tocircumvent this by having sales meetings: people from Sales are present at this meeting withthe Production groups. The weekly issue of orders is discussed there. As a result, a betterunderstanding of each other's capabilities and impossibilities exists between the Salesdepartment and the factory."
CusTOMER
Sales Meeting
Salsa Order
White
Blue
Procurement Meeting- ^Purchase Order
Wholesale
Yellow
Green
Warehouse Group
= groups involved in sales - - - - « • = groups involved in procurement
Figure 5.12 Controlling the order flow; linking Sales and Procurement to Production (Source: projectdocumentation)
The goal of the after-sales meeting is to obtain insight into the customer's experi-ence with the product so as to optimise and continue customer relationship.Management is also present at this meeting. The problems and improvementproposals that result from this meeting have somewhat the same function as thepost-calculation meeting, which, however, is oriented more towards the businessprocess, towards continuously improving organisational performance by solvingincidental and structural market-oriented problems.
112

Case Zi/uerstad Si
A longer-term-oriented meeting, which requests the presence of board members,is the one concerned with product development and post-calculation (see Figure5.13). Aptly referred to as the product development meeting and post-calculationmeeting, they can be considered as a sort of control mechanism of both productmix composition and manufacturing costs. The product development meeting isheld quarterly and discusses the various development proposals which are putforward on the product development ticket. If the product is technically andcommercially feasible, it is supplied with a product specification and taken into theassortment.
The post-calculation meeting has the objective to enlarge insights into the manu-facturing process. Management and group representatives discuss on a bimonthlybasis the actual consumption of resources and the standards against which they areset. Calculation tickets are explicitly used to match standards with actuals and tocome up with variances which are then used as input for discussion in the meet-ings. Discussing standards often implies discussing their own knowledge on howproducts are manufactured, i.e., results are improvement proposals based on costefficiency. An alternative benefit which is targeted is the supply of up-to-date fi-nancial data for order bidding. Monthly discussion within the production groupsof these calculation tickets is considered ideal but is at the moment of study not yetrealised.
(Head of Administration) "... In the production groups, discussion takes place at managementlevel. Which has to do with this being just a test year (= 1991); it is the first year we startedwith all this. We used the first couple of months to clean up the figures and to correct thingswhich were not all right so that we can now work with the numbers. The next step is to havethe figures discussed with the group leaders. And the step following that is indeed to discussthem within the group, but there are still some differences between people. Production peopleare even less used to dealing with figures than sales people. And that is not without signifi-cance. It has also something to do with education. The people in Production usually have voca-tional training only, or didn't even finish it. So you have to introduce things very slowly, oth-erwise people get jumpy or frightened."
After six months it was evaluated how the various new forms were experiencedin daily practice. It turned out, according to the task groups, that no significantchanges were needed. The layout of certain forms was changed, an additional formfor warehousing was added and the job ticket used for scheduling and productionoperations was considered for integrating both commercial and technical productinformation. The specific comments and critiques received indicated, however,that the forms were used and understood in a production system by people notused to administration and documentation: It was something for the bosses tohandle and they would know. Now, people speak up in detail.
Management Accounting SystemThe financial control system or management accounting system was put up inconcordance with the information system, and therefore used the meetings andagendas as well. This regards all the meetings where group representatives arepresent, especially the post-calculation meeting since cost information is one ofthe primary inputs to this meeting (see Table 5.2). Although started as an outline,the accounting system gradually developed as the detailed task group design wasimplemented. It still is not finished nor is it expected to be ever finished; con-tinuous improvement involves internal control systems as well.
113

Chapter 5
cusTOMER
Management
Design
White
Post-calculation Meeting
Calculation ticket
Product Development Meeting
•I M--H
Blue
Yellow
Green
Warehouse Group
= groups involved in production cost calculation - « - = groups involved in product development
Figure 5.13 Controlling the order flow - linking Design and Administration to Production(Source: project documentation)
Compared to the previous internal accounting system, the present system is anupgrade as well as an extension of existing elements (see Figure 5.14). The top-layer of general ledger, and yearly and monthly budget is upgraded to the taskgroup structure: Budgets, standards and tariffs are formulated on a task group de-nominator. The bottom-layer underwent a similar upgrading, rephrasing certainitems in terms of task groups.
The mid-layer or group level in Figure 5.14 is where the main redesign effort is lo-cated. Previously, budgets where desaggregated only to functional departments aswell as just to labour costs. Similarly, Sales was addressed as one diffuse depart-ment. The redesign therefore involved reconverting lump departmental budgetsinto desaggregated task group budgets, extending the budget content well over thelabour cost item: Budgets are presently some sort of group Profit & Loss state-ments, including detailed standards. As a result, budgets now serve also as plan-ning devices in addition to their traditional control roles. The sequence of re-design followed that of the overall organisation design: Sales task group budgetswere installed first, followed by those of Production. The linkage by an internaltransfer price between the two was introduced last.
The overall management accounting system is a standard cost system based onbudgeted standards and variance analysis. Standards for sales, inventory, trans-ferred work and direct costs are set in the yearly master budget. Monthly reports atthe organisational and task group levels match these budgeted standards with ac-tuals. The net result is reported per group, both in financial numbers and percent-
114

Case Zi/pcrsfad Si
ages. It is also reported in a Direct Costing (DC) type format; a choice explicitlymade to steer organisational behaviour towards margin optimisation rather thansales optimisation or net result optimisation (i.e., instigating a drive towards sheervolume or insightless cost cutting). The gross margin functions as a more stablebehaviour modifier, because it takes account of the profit of an order relative to itssales price and its cost.
Calculator^ '
GeneralLedger
Year Budget
1 1 AllocatedOverhead (using costpool method)
i
Stand.srds
Condensed Balance Statement +Condensed Profit & Loss Statement
Production group budgets
( White ) ( Blue ) (Yellow )
^ Internal transfer price
Sales group budgets
(Corporate gifts ) ( Export)( Retail) ( G r e e n )
Sales report
1
FINANCIAL REPORT (MIS)
Company Level
Group Level
Group Level
Company Level
Figure 5.14 The Management Accounting System design (Source: constructed and approved,using regular internal documentation)
The root of the management accounting system is the yearly master budget. It setsthe standards for both performance and costs, which makes it the building stonefor the variance analyses used in steering at group level. Therefore, considerableattention is paid to constructing this control norm. Inputs for the budget construc-tion are various calculatory data (e.g., depreciation and finance expenses, produc-tive time) and the allocated costs using a cost pool table. Interesting in this respectis the role of the four production task groups as main cost objects: The task groupis the central element in the financial control and information system.Manufacturing cost pools, which are organised by function in the process (e.g.,stamping, casting or galvanising), are transferred into task group cost pools by thepreceding production structure design; in other words, a functional organisationstructure is replaced by a flow-based structure.
The general ledger feeds both the master budget and the group budgets; the pro-duction group budgets via the labour and material accounts, and the sales group
115

C/iapfer 5
budgets via labour, sales and administrative accounts. The use of task groups re-sulted specifically in the insertion of a group layer in the internal accounting sys-tem; it is 'sandwiched' between a top layer of precalculatory, ex ante standardisedinformation and a bottom layer of ex posf aggregated information. The top andbottom layer represents the company-wide information with a strong accent ontraditional balance sheet and profit & loss accounting information. In between, thecontrol of results and the direct steering of processes is effectuated by a group-ori-ented reporting system.
The internal transfer pricing system linking up Production with Sales groups is aresult of the flexibility design requirement. It fulfils three purposes: First, it mea-sures output within the order flow so as to evaluate the manufacturing part of theprocess. Second, it provides production groups with standards for make-or-buy de-cisions that they have to make on whether or not to subcontract certain opera-tions. Finally, the transfer prices are used as minimum costs in order bidding.Since Sales has to exist on the gross margin between factory sales price and fullsales price, the transfer price hands them over a bottom-line figure on which theycan break even. Sales does not use hourly rates themselves, they have to covermargin to make up their budgeted costs.
Management information is considered to be information at the organisationlevel spanning the full entity of the organisation. It makes use of balance sheet ac-counts which appear on reports at company level. The lower level budgets are tocapture the manufacturing process in financial terminology, i.e., a vocabulary anddisciplinary switchover within STSD.
The Head of Administration is the personified link between company level in-formation and group level information, a distinction which is paralleled by thedistinction between financial and management accounting information.
(Head of Administration) "On the basis of this budget (i.e., yearly master budget) the groupbudgets are constructed. And they are matched monthly with the costs and sales turnover ofthat particular month. So this is directed at management and group members, both actually, tohave them communicate more with one another. It's an instrument really. The groups usuallytell management they've had a really busy year and management for example says : 'it doesn'tshow from the figures'. It's usually an instrument to start discussing things since my experienceis that financial information like this doesn't get used very often. You can beat about the busha lot if you lack financial proof."
The cost pool table is used to obtain the tariffs used in order bidding and internaltransfer pricing. Tariffs are applicable to both Production and Sales and are there-fore called 'integral'. They are calculated based on labour cost per minute per taskgroup. As customary when using the cost pool method, tariffs can be consideredstandard product cost elements. In fact, the use of the cost pool method matches abudget-controlled production since they are both standard cost system instru-ments.
Compared to earlier management accounting procedures, present use of the costpool table reflects the task group build-up of the organisation instead of a split-upin functional departments. For instance, it resulted partly in allocating the tool-shop and drawing department costs as part of sales overhead to be allocated to the
116

Case Zi'/persfad Si/uersmit/nng
various sales groups. With Sales being both directly responsible and accountablefor customised orders, they absorb the cost of over-customisation (which results inexcessive unique tooling and drawing).
Two other advantages over the existing method show. First, the calculation of tar-iffs for setting standard product costs is explicitly tied to product movements be-tween parts of the organisation. As each manufacturing task group has two tariffs,one internal for manufacturing and one for sales, it becomes possible to budget permanufacturing task group: The tariffs allowing for establishing the turnover of anindividual task group. Therefore, individual task group output is always valuated,whether it is going via sales to the customer or to another task group for final op-erations. In other words, the performance of each process e/emenf (i.e., taskgroups) is available, not just the lump sum performance of the full process, result-ing in better opportunities for process control and improvements.
(Head of Administration) "Well, the internal settlement of hours I already mentioned: It istaken into the group budget times the internal tariff. To give an example, in the Blue Group wemake the assembled products, for example a baby rattle. But a rattle is stamped by the WhiteGroup: A rattle consists of two parts, both are being stamped, two cups which are soldered to-gether. The product in a sense is made by the Blue Group, but the operation of stamping the twocups is performed by the White Group, so you have a sort of subcontracting. The White Groupstamps and if they have to stamp something for the Blue Group, the internal transfer price isreally turnover of White. And that's being taken care of in the sales of the group budget."
Second, sales performance of production groups can be more adequately judged assales volumes are stated per task group (Figure 5.17). In other words, productionoutput is also individualised in terms of what has been sold, tying production di-rectly to the outside market. Therefore, market fluctuations and customer prefer-ences are almost immediately felt by Production, setting their mind more to whathappens outside the company.
The group budget is the most essential element in the financial control systemsince it is used by the group leaders to steer their operations (Figure 5.15). In thismonthly group budget report, all cost items are included, not just those itemswhich are assumed to be of relevance or discretionary to the group leader.
(Production executive) "Each group has its own budget. They're a kind of small companieswithin the company. And people run it like it is their own company. As a group, people say:We are responsible for our orders and that group has to take care of itself."
The key item on the budget report is gross margin. The two constituting parts ofgross margin, sales and direct costs, are relatively controllable for the group lead-ers. Direct costs (mainly materials), contracted work and inventory mutation aredirectly influenced by work efficiency decisions regarding in-group job schedulingand contracting out some operations. Sales can only be indirectly influenced, ei-ther by balancing output by switching between manufacturing on order to manu-facturing on stock and by manufacturing high-quality samples for the sales groups.
(Head of Administration) "For sales turnover, the group leader is depending on Sales.However, that's only relative. Previously, our philosophy was: Production cannot help it ifthey don't have anything to do. Because Sales is responsible for selling. But if you think a lit-tle bit longer about that, it becomes fairly relative. For instance, the Yellow Group performedvery badly last year, not good at all. And in the beginning of the year, we received a large re-
117

C/iapfer 5
quest for pendants. But it needed a sales sample to make it a full order. And because the Yellowgroup made a really nice sample, the order was awarded. So indirectly they can influencetheir sales turnover by tuning themselves to Sales, by empathising with what product acustomer wants. Usually when Sales came up with a sample request, the reaction was - NotSales again, they have to have one item of everything, that's troublesome. Samples aretroublesome. But if you explain that you can only get orders if you make sharp quotes ... Andwhen do you make sharp quotes? By adding a sample, or make a good blueprint. People nolonger buy automatically. You have to show them something, convince them."
BUDGET OUTLINE 1991 /PERIOD XWHITE GROUP
• 1,000 Guilders
SalesSales PackagingInventory MutationInternal DeliveryA) SALES
P E R I O D C U M U L A T I V EYear budget % Actual Budget +/- Actual Budget +/-
Direct CostsContracted WorkInventory MutationB) DIRECT COSTS
C) GROSS MARGIN
Labour CostsHours LentD) LABOUR COSTS GROUP
E) FIXED FACTORY OVERHEAD
Additional Materials *Overhaul & Maintenance MachinesManufacturing Cost PoolsF) MANUFACTURING COSTS
G) INVENTORY COSTS
H) ADMINISTRAT & PURCHASING
D) to H) GROUP COSTS
F) NET RESULT
Inventory Position Group:
Materials xxx
ƒ % ƒ••.. ƒ / . . . . / . . . .
Figure 5.15 MAS design key item: the production group budget (Source: regular internal report)
The fixed costs, or group costs as they are called, are more long term. For example,group labour costs are fixed costs at group level. Suggestions for investments inequipment and machinery used in that group are reflected in this budget item. Allother fixed costs are fixed at plant level and allocated using various indirect costpool tariffs. Thus, budget build-up represents both discretionary annex controllablecosts at group level and group performance in a direct costing format.
118

Case
Budgeted figures are matched with actuals, indicating variances per reported ac-count both periodically and cumulatively (see Figure 5.15). Discussing variances isthe explicit goal of the Post-calculation meeting taking place between and withingroups. As indicated earlier, these meetings are structured around the CalculationTicket which states the allowed and actual order costs in terms of materials, manu-facturing time, scrap and waste.
The internal transfer price is a sort of 'factory sales price' bringing the order fromProduction to Sales and at the same time indicating a turnover performance perproduction group. The margin between the 'factory sales price' and the final salesprice is indicative of the sales groups to steer their performance. The structure ofthe product cost almost runs parallel with the group structure: Manufacturingcosts of an order can be easily traced to individual task group, including internalsubcontracting, thus providing the means for cost control and performance mea-surement at order level.
(Head of Administration) "We start with the material cost which we then add up with theproduction hours used, we call the result the factory sales price. That's really the internaltransfer price, groups have to be able to exist on that internal transfer price, they have to beable to manufacture within that cost. The next step is the gross sales price. And the differencebetween gross sales price and internal transfer price, that's the margin for Sales and that'swhat Sales has to live from."
For long-range planning the present instruments are the monthly sales and finan-cial reports (Figures 5.16 and 5.17). They compare actuals with cumulatives as wellas with periodic figures (last month and last year), both in percentages and innumbers. These reports are constructed at the company level and contain aggre-gate group performances.
(Head of Administration) "These (i.e., production and sales group budgets) are four respec-tively three periodic reports, and the monthly performances have to be in concordance, have tomatch the financial report. It would be rather strange if all groups would perform positively,and financially we would lose money; the connection would be lost. So it is done deliberately tocontrol the coherence in performance. In fact, this control is established outside the formalbook of accounts. But what is most important is that the end-of-the-year results are expectedto be in line with the constituting results of the groups."
The sales report finalises overall group performance by presenting informationbased on the four production group formats but now solely indicating items suchas sales, order backlog and various standards (budget, percentual, temporal; Figure5.17).
Furthermore, in the sales report three article groups are mentioned separately: thearticle groups 2 and 3, silver-plated articles and packaging. Article groups 2 and 3and the silver-plated articles are products made in the Blue Group, which is boththe largest and, technologically, the most complex group. Separation of the threearticles is done for two reasons: First, it is a historical demand from Sales to havethem reported separately: Secondly, group 2 and 3 articles are fully manufacturedwhile the plated articles are purchased as semifinished products elsewhere, withZilverstad having only to perform the plating and finishing operations. Packagingis usually included in the product line and therefore the production group statis-tic, but for reporting reasons mentioned separately in the sales report.
119

C/wpfer 5
COMPANY FINANCIAL REPORT
INVESTMENTS Buildings Machinery Automobiles Factory fittings Office fittings Total
This month:Until this month:ACCOUNTS RECEIVABLE
End this monthIdem last monthidem last yearACCOUNTS PAYABLE
End this monthidem last monthidem last yearLIQUIDITY
This yearLast yearINVENTORY
> 90 days
> 90 days
60-90 days
60-90 days
30-60 days
30-60 days
until this month until last month
WHITE BLUE YELLOW
0-30 days
0-30 days
GREEN
Total
Total
Last month
TOTAL
per group:+ plated & jewellery:+ packaging:value 1-1-91 ƒ....
Variance this monthidem last monthVariance +/•
ƒ....
Inventory Level (% of Sales budget): Norm: until August .... %until December .... %this month .... %
DIRECT COSTS WHITE BLUE YELLOW SUB FACTORY GREEN TOTALSales this month:Direct costs this month:
Sales cumulative:Direct costs cumulative:
% this month:% cumulative:
Budget:
RESULTS until this month until last month Last month
This yearLast year
Figure 5.16 Company financial report (Source: regular internal report)
The budget for a sales group is somewhat different in set-up than for the manufac-turing groups (see Figure 5.18). It has an identical IX format and is reported ac-cording to product market combination: for corporate gifts, retail and export. Asales group largely coincides with a certain product market combination.Additional is the itemisation of gross margins per sales representative in eachgroup as well as the inventory position which has become the responsibility ofSales (bottom-half of Figure 5.18). Sales groups also provide the basis for long-range product mix and business planning, being the organisational unit most fa-miliar with the specific product market combination.
120

Case Zi
COMPANY SALES REPORT
SALESWhite GroupArticle groups 2 + 3Plated articlesBlue GroupYellow GroupGreen GroupYEAR BUDGET TOTAL
THIS MONTHWhite GroupArticles groups 2 + 3Plated articlesBlue GroupYellow GroupSubtotal Factory
Green Group
TOTAL
CUMULATIVEWhite GroupArticle groups 2 + 3Plated articlesBlue GroupYellow GroupSubtotal Factory
Green Group
TOTAL
YEAR BUDGET 1991
_ _ ' • . - . - • • • • - * •
/TTSALES BUDGET INDICES LAST YEAR INDICES
« H _ _ ^ ^
/ . . . .
ƒ. . . .
SALES BUDGET INDICES LAST YEAR INDICES
/ • * * *
ORDERS IN HAND End of this month End last month Month last yearWHITE GROUPBLUE GROUPPLATED ARTICLESBLUE SUBTOTALPACKAGINGYELLOW GROUPWHOLESALETOTAL
ORDERS RECEIVEDWHITE GROUPBLUE GROUPPLATED ARTICLESBLUE SUBTOTALPACKAGINGYELLOW GROUPWHOLESALETOTAL
/ . . . .
End of this month End last month Month last year
— —
^ ^ ^ w ^ ~ _ _ -
ƒ....
Figure 5.17 Company sales report (Source: regular internal report)
Additional operational information is reported stand-alone and in nonfinancialterms. It comprises such items as sick leave, delivery reliability and internal fail-ure costs measured by the number of reversed sales bookings. In fact, all these
121

stand-alone reports can be considered as quality cost information with quality tiedrespectively to the quality of working life and the quality of the organisation. Thelatter is more narrowly defined in terms of Just-In-Time performance, e.g., deliv-ery reliability is measured by comparing the deviations in weeks (to the presentand last year's figures) of the number of orders either delivered too late, on timeand too early.
BUDGET OUTLINE 1991/PERIODXCORPORATE GIFTS
Sales Representative #1Sales Representative #2Sales Representative #3A)SALES
Direct CostsB) GROSS MARGIN
C) LABOUR COSTS SALES
D) FIXED SALES OVERHEAD
E) OVERHEAD GROUP
F) PAYED ON CREDIT
G) ADMINISTRAT & PURCHASINGC) to G) SALES COSTS
F) NET RESULT
Gross Profit Margins ' 1.000 Guilders
Representative #1Representative »2Representative *3Total
Gross Profit Margins in %Representative *1Representative #2Representative #3Total
INVENTORY POSITION:
White GroupBlue GroupYellow GroupGreen group
TOTAL
P E R I O D C U M U L A T I V EYear budget % Actual Budget +/- Actual Budget +/-
ƒ
- - ƒ
ƒ
. ƒ ....% ƒ ƒ ƒ ƒ / ƒ
ACTUAL NORM +/- ACTUAL NORM +/-
ƒ ƒ ƒ ƒ ƒ ƒ ƒ
....% ....% .... % ....% .... % ....% .... %
Total Corporate Girts/ Inventory ^ . Percentage of SalesInventory Total Sales Ratio Corporate Gifts Actual Norm +/-
/ * % * %
Figure 5.18 Sales group budget (Source: regular internal report)
The internal failure costs in terms of reversed sales booking were analysed onwhat caused the failure. Eight categories are used to this extent: product quality,inventory mistakes, administrative mistakes, sales mistakes, invoices on samples
122

Case Zi/z>erstad Si/uersmif/iing
and consignments-on-approval, service, factory mistakes, and miscellaneous.Norms to this nonfinancial information are not yet introduced nor will be becauseit is felt that a straight count of complaints is sufficient to steer on.
Quality is traditionally defined in terms of craftsmanship and materials used.Quality perceptions of customers, however, stand in sharp contrast with thiscraftsmanship's definition, which is the reason why an extensive use is made ofsamples and consignments-on-approval: To set product quality norms almost on aper customer order basis.
Results of the Redesign
As Sociotechnical redesign inherently links improving efficiency to the frame-work of a (more) effective and reshaped organisation, results are first and mostclearly noticed at the efficiency level.
(Production executive) "There have been many results up until now. Of course, one cannotexpress a number of things in hard figures, for example the involvement of people, theirattitudes. Still, I think that is the most important change, which results afterwards infigures."
Cost control and cost traceability have increased considerably. There is increasedinsight into product cost build-up and the causal factors driving costs, as the MASdesign matches the organisational processes more closely. The relative simplicityof the design and the full participation of group members in designing it are mu-tually dependent factors. Responsibility in designing it seems to make it easier tohave the responsibility accounted for.
In terms of hard numbers, Zilverstad improved its sales by 15% in 1989, while atthe same time experiencing a reduction in personnel of 5% (natural turnover).Inventory turnover in 1989 was 4.7 and 5.5 in 1990, with a norm of 4.0 for the in-dustry. Absenteeism (sick leave) dropped to 6%, which is below the Dutch averageof 9.1% (1989). Furthermore, the number of complaints on product qualitydropped considerably. Another indicator of quality is the number of orders deliv-ered on time. In 1988, operating in the former organisation mode, delivery relia-bility was 40% (three out of five orders went wrong somewhere somehow). In 1989it increased to 60% while in 1990, it increased even more and is now reaching 85%.This percentage relates to the busiest time of the year, i.e., the fourth quarter,which is the gifts season. A by-product of the improved delivery reliability was areduction in orders that were delivered in different batch sizes; most orders arenow being delivered in one single batch, thus saving extra shipping costs.
(Commercial executive) "It results in customers staying customers more easily. We get many re-peat orders. So all the energy you put into customer acquisition you direct at getting new cus-tomers instead of replacing them. Price adaptations are hardly necessary since the organisa-tion has improved and we are able to supply much better quality, service and delivery timesfor the same price. Our competitive position has markedly improved, also internationally.All segments have done well. The sales department has less internal problems to solve and,thus, can concentrate far more on its commercial activities. Of course, we've just been operatingthis way for nearly a year so the effects are still young.
123

C/tapfer 5
(Production executive) "Of course not everything can be accounted for by the organisationalchange. There are many other factors, for example the dollar exchange rate, the economic cli-mate. Or one Saddam Hussein spoiling everything. You can be perfectly organised but if youdon't get any orders ... On the other hand, it is also true that you can't get any orders if youdon't have a well-organised company. It's a bit a question of which came first, the chicken orthe egg."
No additional investments in assets were involved, apart from a one-time-onlyoutlay for equipment to improve working conditions.
(Head of Administration) "Yes, and for the rest: working conditions - we've spent a bit more onthe costs for working conditions than we had the last couple of years. But those costs don't getany lower because for people to perform well they need a good PC, a good terminal, chair,etcetera. And that's of course a very natural thing because these are really legitimatedemands and they speak up far more easily when they take the initiative to purchase orreplace something. But again, that's all right in itself but nevertheless it does lead to higherorganisation costs."
A more structural increase in cost level is initiated, however, regarding personneland human resources. The accentuation of gTOup initiatives and the decentralisa-tion of problem solving has made people aware of both their abilities and capaci-ties and, consequently, of the value they represent for the organisation.
(Head of Administration) "Well, I think personnel costs tend to increase. Putting moredemands on people or on groups is coupled to an overall performance target. By the end of theyear, they know whether they've attained their group performance or not. And you try to steerit in that manner, which has consequences for your personnel policy. If you ask a bit more effortfrom your people, and if they perform accordingly, they'll demand more regarding salaryconditions and payment. Also, people become more important for the organisation because ifpeople drop out, if you end up with fewer people, and certain key personnel in a group drop out,it can be quite harmful. So people, if they perform well, do become aware that they havegained importance for the company. But that has to do with the subject of personnel policy inthe organisation. That's what we have picked up lately, putting up a job classification systemand keeping appraisal interviews."
Projects Underway
At the time of study (September 1991) two main projects were put up and partlyimplemented: one regarding a job classification system and another regarding asales information system. Both systems are the consequence of an increased effec-tiveness of the organisation: the accentuated role of human resources (e.g. localproblem solving and multi-skilled personnel) requires proper management ofjobs, rewards and personnel development (e.g., career planning, training). Also,enabling people to solve problems and structure their work themselves meansthey have to be supplied with the information necessary to do so. Informationwhich crosses functional boundaries as do task groups: The sales information sys-tem therefore links Sales to Production and vice versa. Apart from it being neces-sitated by the redesign itself, putting up a sales information system was also a con-sequence of the Strategic Orientation Round (SOR): One of the outcomes was theawareness that very little information was available on the results of marketingand promotion efforts, sales performance and market conditions.
124

Case Zi
(Head of Administration) "Well, our main bottleneck lay within the company. We were gladthat we had the time to look outward for once since before we had no time at all. As a mannerof speaking, of course, because Sales still passed on the signals what the market needed, theycome up with proposals. Yes, we've always been a bit in a pioneer phase in which you lookmore at your internal problems than really at the possibilities in the market. You react to mar-ket signals, which of course makes you flexible."
The job classification system is adopted from the industries employers' organisa-tion CWM. It distinguishes a number of ranks which are distributed across taskgroups and additional departments. Rank position is assessed using a score cardfor seven job elements constituting each job (education/skill, composition, organ-isational damage risk, interaction frequency, working conditions, nature of super-vision and range of supervision); a high score indicates a high job class. Linked tojob class are payment, secondary conditions such as study grants and study leave,and a development track for individual career management. On the other hand, ifpeople did not want to go along with the general trend towards multi-skill andavailability for various tasks, they would 'freeze' at their present job class levelwith all resulting payment consequences. Human resource management is em-bedded in a general social mentality and policy which is not officially formalisedor written down. The family business character of the company is the main feederof that mentality: The Pluut brothers maintain, however, more an executive thanowner/employer role, which has led to a professionalisation of Zilverstad's socialpolicy. For instance, at the very start of the reorganisation process it was decidedthat no one was to be fired, in fact it was one of the design requirements of theproduction structure.
The sales information system is in its operation a marketing system indicatingwhich customers are the most profitable ones and which products are high-run-ners. Specifically, it is a database system providing the raw data for order-biddinginformation, customer profitability and the dye database used in production (it isimportant for Production to know whether a specific order will require the manu-facturing of a new, customised dye, or if an existing dye can be used). However, asProduction is fed by customer orders it establishes a link between Sales andProduction based on sales information paralleling the order flow through the fac-tory. And again, it provides a concrete basis for discussion between the two busi-ness functions; a market preference for a certain type of product leads directly tomore work for the task group manufacturing those products. In other words, flow-oriented production has its equivalent in Sales, stated, however, in terms of prod-uct type. This 'pre- and past-production trajectory' is fed by the sales informationsystem which links up with the sales orders used for production planning and jobscheduling.
(Head of Administration) "In fact, it comes down to registering all sales actions in the sales in-formation system, including everything that influences the customers' purchasing behaviour.And to take advantage by calculating and finding out which product offers are successful andwhich are typically not. You try to gain insight into how to bid for orders at a particular cus-tomer; which products score and which don't. All that has to be incorporated into some sort ofsales information system, which the sales groups can use in their daily operations."
125

6Case St. Antonius Vesselheads
Situational Background
St. Antonius Vesselheads, Maasbracht, is the manufacturer of heads and speciallyformed parts for pressure vessels and pipelines. They are the subcontractor to Offi-cial Equipment Manufacturers (OEMs) in the petrochemical, energy, storage andfood industries. The company's specialties are formed heads and cones for pres-sure vessels, manhole covers, expansion joints, reducers and bends for pipelines.Expansion joints and reducers are sold to the machine industry using installationcompanies as the intermediating channel. Of its production, 70% is being exportedwith the main markets being Belgium, Germany, France, the United Kingdom,and Scandinavia. All products are made to order, according to customer specifica-tion. The average order size is three products.
Since most products have to meet high-quality requirements - consider, for exam-ple, orders from the nuclear, off-shore and satellite industries - quality control andquality assurance are of prime importance (tolerances of 0-2 millimetres on diame-ters of 5 meters are quite usual). The large export volume further complicatesquality management since St. Antonius has to comply with various constructiondesign codes and regulations. This implies a quality assurance system that is ableto handle and confro/ many quality standards and national regulations. The qual-ity assurance system is based on ISO 9002/9004 and BS 5750 norms. The input vari-ety is also heavily influenced by the high number of various materials used: 70%of St. Antonius' products are made of nonferro, duplex or stainless steel materials.Again, this poses specific demands on production methods such as the choice ofthe appropriate welding technique.
St. Antonius is a small-sized company employing 140 people with a net sales in1989 of 20 million Dutch guilders and an added value of 63% (1989, in percentagesof net turnover). Added value is defined as labour cost turnover plus profit, ex-cluding materials. Its EBIT in percentages of equity is about 36% (1989). From the140 employees, 97 are working in production. Seventy-six people are direct per-sonnel, which leaves an direct/indirect personnel ratio of almost one to one (76 :

Case Sf. AnfoniMS Vesse//»eads
64). St. Antonius' cost structure is mediated by the tariff system it uses: All over-head is allocated to subdepartmental work centres and their subsequent tariffs.This does not show up as separate cost figures to be assigned (see paragraph onmanagement accounting system for a more detailed discussion). Reworking thefigures results in a general, nonmanufacturing overhead of 7.6% of total plannedcosts.
St. Antonius is a family-owned and family-run company wherein engineerJacques J.A. Houben took control of the company from his father in 1986. Previ-ously, the culture of the company was one that was highly informal and wheremany things were improvised. The working method was based on individualcraftsmanship and personal relationships, with the owner-president performing acentral role in the social network. At present, this culture is being replaced with amore business-like one: the new culture disseminating top-down into the organi-sation. The change in control indicated a shift in management as well as in operat-ing style since the need for change became more and more imminent: A clearbusiness strategy was lacking, and ad /IOC decision making and inadequate orderplanning caused many problems. Furthermore, its OEM market increasinglystrengthened their demands for quality, timeliness and delivery reliability.
As a reaction, it was felt that 'more organisation' was needed. To start with,Houben jr. began to hire additional personnel who were to form a new and pro-fessional management team. This involved hiring a central planner for the Pro-duction department, a quality assurance engineer, and a financial controller whowas also to establish a personnel policy. Included in this team was the productionmanager who was previously involved with introducing CAD/CAM to the firm,and the controller. These two later went on to become the STSD programmechampions. The new management team consisted of relatively young people intheir mid-thirties. Together with Houben jr., they were to take care of the day-to-day business and the development of company policies and standpoints on severalareas of interest. This was not an easy job as a hotchpotch of affairs were allscreaming for attention and, as a result, they had no idea where to begin.
Contact was made with the Dutch institute on Quality of Work and Organisation(NKWO), with the Dutch contact group for Employers in the Metal industry(CWM) functioning as an intermediary. The NKWO introduced SocioTechnicalSystems Design ideas to the management team and middle management in twoseparate courses. The middle management course, called Partaking in Renewal,ran for nearly one year, from September 1988 until October 1989, and was joined byall middle management. Afterwards, it was concluded that this course came tooearly. It would have been more accommodating had it been scheduled offer the de-sign phase. People were now becoming anxious to start, although the strategic linehad not yet been established. The timing was unsuccessful here because the in-formation of the CWM was unclear and the management team of St. Antoniushad no idea how big this change would be. It was only afterwards that they becameaware that this was a full-scale reorganisation.
The second course was directed at the management team and was called Qualityand Flexibility for Small and Medium-sized Enterprises, also by NKWO. As a re-sult of these two courses, SocioTechnical Systems Design (STSD) was adopted as a
127
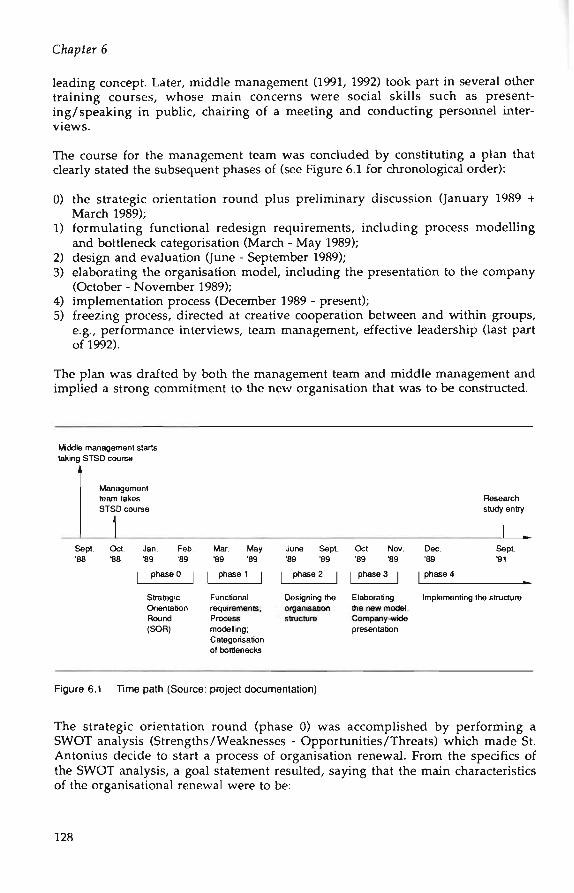
Chapter 6
leading concept. Later, middle management (1991, 1992) took part in several othertraining courses, whose main concerns were social skills such as present-ing/speaking in public, chairing of a meeting and conducting personnel inter-views.
The course for the management team was concluded by constituting a plan thatclearly stated the subsequent phases of (see Figure 6.1 for chronological order):
0) the strategic orientation round plus preliminary discussion (January 1989 +March 1989);
1) formulating functional redesign requirements, including process modellingand bottleneck categorisation (March - May 1989);
2) design and evaluation (June - September 1989);3) elaborating the organisation model, including the presentation to the company
(October - November 1989);4) implementation process (December 1989 - present);5) freezing process, directed at creative cooperation between and within groups,
e.g., performance interviews, team management, effective leadership (last partof 1992).
The plan was drafted by both the management team and middle management andimplied a strong commitment to the new organisation that was to be constructed.
Middle management startstaking STSD course
Managementteam takesSTSD course
Researchstudy entry
Sept. Oct•88
Jan. Feb•89 '89
1 phase 0
StrategicOrientationRound(SOR)
Mar. May•89 '89
phase 1 1
Functionalrequirements.Processmodelling;Categorisationof bottlenecks
June Sept.•89 «9
| phase 2 |
Designing theorganisationstructure
Oct. Nov.'89 '89
| phases |
Elaboratingthe new model;Company-widepresentation
Dec. Sept.•89 91
1 phase 4
Implementing the structure
Figure 6.1 Time path (Source: project documentation)
The strategic orientation round (phase 0) was accomplished by performing aSWOT analysis (Strengths/Weaknesses - Opportunities/Threats) which made St.Antonius decide to start a process of organisation renewal. From the specifics ofthe SWOT analysis, a goal statement resulted, saying that the main characteristicsof the organisational renewal were to be:
128

Case Sf. .rtnfonius Vesse//ieads
- the formation of whole-task groups;- to bring control to the shop floor;
to actually con fro/ the organisation instead of 'fixing things';- communication and information;
'knowing by measuring'.
Other aspects, such as quality, efficiency, environmental care, administrative or-ganisation & management information systems, flexibility and innovation, wereto be considered in each of the above organisational renewal characteristics.
Categorisation of Bottlenecks
After following the strategic orientation came the listing and categorisation of ex-isting bottlenecks. Context for categorisation was the planned redesign of the or-ganisation, i.e., to specifically locate where improvements and structural renewalwere needed. The bottleneck categorisation report was the main point of referencein setting up the final organisation design. It was structured into three parts:
1. formulating a model which represents the primary process of St. Antonius;2. indicating bottlenecks within the modelled primary process;3. indicating the correspondence between bottlenecks and the present organisa-
tional structure.
The categorisation report was drawn up by a work group (Work Group Design orWGD) composed of employees from each department in the primary process(production, planning, marketing, quality control & engineering, general man-agement) and one external consultant. The interdisciplinary character of the workgroup was deliberately put up in order to obtain input from as many experiencedpeople as possible (see Figure 6.7).
The role of the consultant was restricted to that of facilitator in the change process.In the categorisation phase, his role consisted mainly of knowledge transfer on themodelling method as well as in supplying help in analysing the results of themethod. His support was provided only when explicitly requested by the workgroup.
Modelling the Primary Process
The process model consisted of ten different submodels. Together they constitutedthe selling, preparing and manufacturing of vessel heads. Each submodel coin-cided with recognisable and 'old' existing departments (see Figure 6.2 for the pro-cess split-up).
The process analysis was based on a system-theoretical view of the organisationand consisted of classifying activities into four categories: inputs, outputs, re-sources and control information. This is called the IDEF methodology and its tar-get is to model the function of a set of operations and the objects and informationwhich pass through these operations?. Inside each category it was then indicated asto w/iere the inputs and control information came from, or where the outputs
129

6.3).. Also, the resources for that particular process part were indicated (see Figure
Sales
Proajremort 1i Producten
I f Plarong
Jcb 1Sdwdumo L
1 1•>
1LI*\ lV
Ouality 1Engneering |
OuaMy 11 Control |
Shipping
^ —
MaterialsManagement
Figure 6.2 Production process modelling (Source: project documentation)
Inputs
11 Purchasing orders,reservations, invoices,bills of lading
12 Requests, quotations
13 Nonconformity reports
14 Additional materials
IS Engineering orders
Sales, productionPlanning, Production
Sales, ProductionPlanning. Production.Outside
Production Planning
Outside
Control Inlormalion
C1 Inventory info
C2 Market nlo
C3 Technological into
C4 Procedures
C5 Inlo lists
Source
Production Planning
Outside
Outside
Production Planning
Central Plan
Procurement
Resources
Ri Telecommunication equipment
R2 Computer
R3 Archives
R4 People
Outputs
O1 Purchasing orders.invoices, certificates
0 2 Requests, quotations
O3 Nonconformity reports
O4 Additional materials
O5 Engineering into
O6 Inventory ksls
Source
Production.Administration,Outside
Sales.Outside
ProductionPlanning,Outside
Production,Quality Control
Sales
ProductionPlanning
Figure 6.3 Example of the IDEF technique for the Procurement department (Source: projectdocumentation)
130

Case Sf. Anfoniws Vessei/ieads
At a lower system level, this analysis resulted in clarifying not only control infor-mation bottlenecks but also operational constraints. Consequently, the relation-ship between activities and information became clear and improvements fellmore or less into place by the depiction of this relationship. Consider, for instance,the press operation. Previously, the operation was completely controlled by thepress operator, resulting in a clear planning but unreliable quality. Together withthe press operators, the operation then was made transparent by working accord-ing to a new plan: Planning no longer took place on the basis of an operation, butrather a combination of operation plus the required dye (see Figure 6.4), resultingin a new planning based on effective time consumption. In addition, the new pro-cedure made clear what precise craftmanship is required, which is subsequentlynormalised according to ISO 9002.
Previously
crafteman
control info:job sheet
InputPressOperation output
resource: stamps
craftman decides on:press techniquechoic8 ol stamppress pressuretime of in-process heating
Present
O PressOperation
next job shop:blueprintcustomerweightuse of product
ChL P
Figure 6.4 System-theoretical relationship between activities and information (Source: projectdocumentation)
Indicating Bottlenecks
The main assumption was that bottlenecks can only be detected when the primaryprocess is considered in its entirety. Consequently, the full process, from the initialorder to shipment, was analysed according to the present bottlenecks. Once the bot-tlenecks were identified, they were separated into two categories: those havingstructural cause and those having nonstructural cause. This type of listing showedat what system level the bottlenecks occur and how much priority is given to re-solving it. As a result, it became clear that 80% of the bottlenecks had a structural
131

C/iapfer 6
cause and 20% did not; therefore, the latter could be resolved with relative easeand on a short-term basis.
It took somewhere between three and six months to rectify those 20% of bottle-necks that did not require structural rearrangements. The top four nonbottlenecktopics were assigned to a 'problem owner', who acted as chairman of a task force. Itwas up to him to take further action, including setting the time limit in which theproblem should be resolved.
The remaining 80% was regrouped into general problem categories and analysedaccording to their respective structural implications. From the process modelling,it had already been made clear that the primary process was spread out across amultitude of departments: Closer scrutiny showed that each individual productorder required the interference of approximately 15 separate departments.
This complexity was further aggravated by the crisscrossing of information flowsbetween departments as well as within the departments themselves. This resultedin the side-effect that insight and understanding of one another's activities werelacking (compartmentalisation or 'pigeon-holing'). Consequently, the output ofany one department was out of touch with the input needed by the next depart-ment. This created an atmosphere of irritability and reduced the incentive toteam-up in much needed problem solving. The final result was a reduction offlexibility in the organisation, reflected by the need for 'fixing things', and impro-vised and unplanned expediting actions accompanied by relatively high costs.Moreover, the fact that each order/product is relatively unique, places additionalemphasis on the importance of the (crisscrossing) information flow. Therefore, itbecame apparent that all activities, whether in terms of material or information,were interdependent within the product flow (see Figure 6.5). Thus, improve-ments had to be based on this flow interdependence, i.e., redesign should be basedon flow-oriented production.
Relating Bottlenecks to Organisation Structure
Resolving these structural bottlenecks demanded a flow-oriented organisation de-sign that met the following requirements:
1. F/exibi/ify: The mixture of high quality and reliable delivery, at low cost, from awide and customised product assortment required a very flexible organisationto adequately handle individual customer orders. The organisational design ac-commodating this requirement had to address all functions within the primaryprocess.
2. Confro/ o/ Qua/i'fy, De/ipery Time and Costs: Not only had the upstream activi-ties such as procurement, planning, and materials management to be managedon their interdependence but they also had to tune into downstream activitiesin the order flow. This required short-circuited control cycles, bringing controllevels as close to the process as possible. In other words, establishing the leastpossible amount of separation between activities in the production process.
3. Qua/ify o/ Wording Li/e: Accomplishment of the above-mentioned require-ments only becomes possible when the commitment and subsequent participa-tion of all personnel is high. From this point of view, an organisation having
132

Case S/. y4n(onius Vesse//ieads
little departmentalisation is preferred. Simply speaking, this requires a job de-sign with little functional specialisation and a high availability of employeesfor different tasks.
Production manager
- Foreman
Figure 6.5 Product flow interdependency (Source: project documentation)
The overall conclusion of the categorisation phase was that the organisationshould be restructured according to order flow. Initially, redesign of only the up-stream functions was considered to do the job. After the bottleneck analysis, how-ever, it became apparent that this would not be possible without redesigning theproduction function, and therefore the entire organisation. The close interdepen-dences of the various functions precluded a partial reorganisation, it was all ornothing. This led to adding the formation of whole-task groups to the strategicgoal statement.
133

Chapter 6
Designing the Organisation Structure
Input for the design phase consisted of the results obtained from the bottleneckcategorisation and the Strategic Orientation Round. The management team beganthis project chain by formulating the plan by which the design had to be accom-plished (see Figure 6.6). Furthermore, since the Work group Design was comprisedalmost entirely from the management team, with the exception of Houben jr. andthe Quality Assurance manager who had just entered the organisation, no formaltop-down approval mechanism was deemed necessary.
PhaM 1: Formulating Dosign Specifications
* Formulating design specifications and limiting conditions* Not too much detail* Complete list: attention lex all aspects regarding:
- flexibility/controllability- product quality- quality of working life- quality of work relations
* Take into consideration the outcomes of the SOR and the bottleneckcategorisation
Phaw 2: Designing
* Look for parallel flows in manufacturing* Link flows in production preparation and production support as much
as possible to these parallel flows* Develop several alternative production structure designs* Develop several alternative control designs* Match production structure and control structure alternatives with the
design specifications plus make a choice* Presentation of the new organisation by the management team to the
entire company
Phas* 3: Working Out th« New Organisation Model
* Determine all operational and control activities of all groups and divisions* Establish the factory and office lay-out* Establish the adaptations to the technical resources* Categorise the adaptations to the information supply* Categorise the need for training* Put up a training schedule and a construction schedule: plot all activities
on a network plan
Phase 4: Implementation
* Using the implementation plan, possible activities are:• systematic problem solving during implementation- take up work counselling- team building & conflict management- situations I leadership- formulating group goals- performance appraisal- project planning & project control
Throughput time:2 weeks
Executed by:Management team
Throughput time:3 months
Executed by:Project work group
Figure 6.6 Redesign project targets (Source: project documentation)
The management team came up with the following functional requirements onthe new organisational design in nonpriority order:
1. Controllable throughput times per order flow;
134

Case St. i4nfonius
2. Delivery reliability of less than five workdays, meaning that the spread of theactual delivery date should not deviate by more (or less) than five days fromthe agreed date;
3. Produce at the highest possible and necessary product quality levels;4. Zero defects, both in attaining customer satisfaction and in the internal manu-
facturing process, where the rule is 'everything 100% the first time';5. The product flow has to be clearly arranged and, therefore, must be able to be
planned both in its upstream and in its various manufacturing and qualityphases;
6. Overtime has to be minimised;7. A flexible frame of mind for market demands, especially towards product cus-
tomisation requests;8. Self-contained group task descriptions moving responsibilities to the lowest
level of the organisation;9. Production task groups should consist of no more than twenty people (this was
a figure obtained from practical experiences and as such taught in the earlierSTSD course).
Formulating design specifications took approximately four weeks. The design re-quirements themselves were subjected to such limitations as compliance with theresults of the bottleneck categorisation and the SOR. They should not be too de-tailed but remain as complete as possible in terms of flexibility and control, prod-uct quality and quality of both working life and internal labour relationships.
In phase 2, the Work group Design took over and started the actual design of theorganisation structure. This work group consisted of six persons, representing alldepartments involved in the transition process, and was expected to attain the fol-lowing targets in approximately three months:
* Look for parallel flows within manufacturing;* Couple upstream flows as well as production support, as much as possible, to
the parallel flows found in manufacturing;* Develop several production structure alternatives to choose from;* Develop several control structure alternatives to choose from;* Test the production and control structure alternatives using the previously
stated design requirements and make a choice;* Present the new organisation design to all those involved, i.e., the entire com-
pany. The actual presentation is conducted by the management team.
The project planning took longer than expected: about seven months. The addi-tional time was required because it was only realised midway into phase 2, whendesigning the upstream activities, that the entire production process had to be re-designed as well.
The aim of having various alternatives made available stemmed from the wish tohave a choice, i.e., not to be confronted with just one alternative which inevitablyis labelled as the 'best'. Also, the presentation of the new organisation design bythe management team displayed the commitment of the top to this new design.Since the management team almost equals the Work group Design, no ownershipconflicts would arise.
135

C/iapfer 6
In phase 3, redesign was first actuated in the P/afe Mafena/ Supp/y (PMS) groupand then moved downstream to the Formed Heads group and the Finishing andS/iipping (F&S) group (see Figure 6.8 for a layout of the production structure). Im-plementation (phase 4) was started by the main production group (Formed Heads),followed by its upstream supplier P/ate Material Supp/y and its downstream con-sumer Finishing and Shipping. Once the main production flow was reorganised,the two remaining production groups followed suit (Hot £>• Co/d Pressed Productsand Assemb/ed Products).
The project management itself was split up into four separate work groups witheach work group having its own project responsibility (see Figures 6.6 and 6.7). Inboth the work groups for the office and plant design, a majority of 'owner-employ-ee' groups participated. For example, in the 'Work group Office', two members ofthe overall 'Work group Design' were involved, complemented by six others thathad been appointed by the office personnel. The 'Work group Plant' consisted offive people: One from the overall Work group Design, two permanent membersand two rotating members. The rotating members also acted as the chairman andsecretary of the work group, with both functions rotating with the production sub-department which was next in line to be restructured.
/ Orderprocessing
TechnicaJsupport
Generalsupport
H«ads/\Prassins
fesjifi.order quotationorder registrationorder acceptanceInvoice system
calculationmaterial reservationcertification man.remnant materialscustomer materials
restrictions
CTA documentation,library, order files &administration
CTA meetings,communication
testsregulation code
maintenance
Figure 6.7 Linking pin structure of redesign work groups (Source: project documentation)
The central factor in designing the organisation structure was the linkage betweenProduction and upstream/downstream activities. Clearly arranged productionflows were considered the basis for the further design of preparatory and control-
136
Case Sf. /Infoniws Vesse//ieads
ling activities such as engineering, job scheduling, etc. Thus, the main redesignproject was the improvement of the upstream trajectory, restructuring the in-formation flow to and from the Production function. This was the project thattriggered the conclusion that all of production had to be redesigned or there wouldnever be an improved information flow.
Structural rearrangements in this information flow were twofold: First, the for-mer job scheduler was assigned new tasks and his function was renamed Produc-tion Engineer. Second, the tasks of the Quality Engineer were also restructured andthe Quality Engineers were integrated with sales personnel into one new depart-ment called Commercial Technical Activities (CTA). Quality Engineers were pre-viously organised per construction design code category, much the same as thesales people were organised according to country. Five QEs are employed with oneperson fully responsible for giving advice to customers and the internal organisa-tion. Production Engineers and Quality Engineers fulfil identical roles: They con-trol the flow of production information as they possess the pertinent knowledgeconcerning product and production details. Similarly, their tasks require handlingof an extensive and diverse information set.
The Quality Engineer is the person in the organisation who is most knowledge-able about the full production process. More specifically, he is knowledgeableabout the production operations that are most critical to the product quality. Hecombines this knowledge with that of the various construction design codes andregulations required by each country being exported to. In turn, insight into thecontents of the construction design codes requires a vast knowledge of the proper-ties of all kinds of metals and press operations.
The main reason for the integration of Sales with QE was the role that technicalinformation played in closing a sale. Essential technical information no longerbounces back and forth between two different departments but it is now concen-trated into one department (see Figure 6.8). The CTA department is organised ac-cording to product-market combination instead of geographical area, and containsthree CTA units. It required, however, that the QEs be retrained as they had to befamiliar with all construction design codes applicable to their CTA unit. Neverthe-less, each QE has retained his building code specialisation with which he backs uphis colleagues. As a result of this coupling of expert information in one single de-partment, the information flow in the upstream trajectory was considerably sim-plified: Order processing time, from the moment of sales agreement to the actualproduction stage, decreased from 11 to 3 days.
Restructuring the information flow equally involved reviving the administrativeand reporting aspects of the 'new' information. This point is elaborated upon inthe paragraph dedicated to Management Accounting Systems design.
The upstream information flow restructuring was complemented by an im-provement in the customer ordering process. For example, to couple both the or-der and production flows, St. Antonius put together an order catalogue whichhelped the customer to define more exactly his product demands and establish thecorrect product specifications.
137

Chaprer 6
(Head of Central Planning) "Manufacturing a product is not much of a problem as long as thereis adequate information. This starts already at the point where a quotation is drawn up. Pre-viously, once an order was accepted, it went back and forth between production planning andsales, which led to delays. The order stayed too long at production planning. There was a mis-fit between time needed for scheduling and time needed for manufacturing. In the near future,there will only be techno-commercial employees. Delivery time has to be reduced by this fromseven to eight weeks to three or four weeks."
Previous Departmental Organisation Structure
SALES OE
NL/D
B
F
GB
Other
Admin.
Standard
Job*
Ouallty-regulatedprocatMS
Other
J0B
ScHE0ULIH0
MATeRiAI.
MANAO.
PROcu
EMENT
PfiODUCT1ON
OuAi .1T¥
CONTflOI
S : |H -1• ';!
P '•!I ::M ^:Q 3
Present Group Organisation Structure
CTAFORMED HEADS
HOT » COLDPRESSED PRODUCTS
ASSEMS LEOPRODUCTS
t«11SHIM0
3H|l>PIHa
Figure 6.8 Restructuring the preproduction departments from functional concentration to flowconcentration in a general design (Source: project documentation)
The original layout already indicates the crisscrossing of production flows. Manu-facturing operations can be characterised by complex production flows, little con-trollability of order throughput times and the inspection of quality instead of themanufacturing of quality. Furthermore, in the previous situation a functional
138

Case Sf. .Anfonius Vesse//ieads
structure dominated. Manufacturing was organised according to similarity in op-erations, i.e., machines performing identical operations were grouped together.
In the new production structure, manufacturing is organised according to produc-tion flow. As many operations as possible are integrated into distinct process partswithin the flow, i.e., there is little interdependence between the groups them-selves, apart from the flow itself. It allowed the placing of scheduling and control-ling activities into the groups, which then became 'autonomous' or 'composite'.As can be seen in Figures 6.8 and 6.9, manufacturing is split into three productiongroups: Formed Heads, Hof & Co/d Pressed Products and Assemb/ed Products.These are also considered to be the three main production flows, because theseproduct types dominate the manufacturing process. The P/afe Mafen'a/ Supp/ygroup contains the former upstream operations such as cutting and certifying aswell as the purchasing function. Its output has just one single denominator: metaldiscs. The output of the subsequent production groups has an equally simple out-put denominator, whether its output is delivered further downstream or sidewaysas semifinished product to parallel groups.
•OLD' PRODUCTION LAYOUT
S"s
— » • Heads Production
• •Hot Press Shop
M t + •Welding
-| 11 •"
Machinincshop
— ^Assembly
»•
«IIf(A i=
If
•NEW PRODUCTION LAYOUT
PLATEMATERIALSUPPLY
InspectionCertifyingCuttingWeldingDnllingPackeling
DiscsFORMED HEADS
PrepressedHeads
Discs
Discs
Small and LargeHeads; Segments
Segments
HOT AND COLDPRESSED PRODUCTS Pressed Heads
and Segments
Segments
PRODUCTSCones; Constructed
and Welded AssembledHeads and Cones
FINISHINGAND
SHIPPING
PicklingPainting
InspectionFinishing
Size inspectionShipping
Figure 6.9 Production structure design (Source: company documentation)
139
In the new situation, the number of foremen can be limited to three: one for everyproduction group. Also, the physical layout has been rearranged and adapted tothe new production organisation structure.
To control and account for sideway movements, each group or division is split upinto work centres. Work centre costs are assigned to the order passing through. Foradministration and clarification reasons, job sheet category codes coincide withwork centre codes, thus planning the divisions the product passes. To indicatewhat the turnover relationships between divisions are, the turnover can be estab-lished per job sheet category. Work centre tariffs take over the role of transferprices in financially mapping the flow (see paragraph on management accountingsystem for a discussion on the tariffs used).
The above-captioned production structure was not designed as being the only al-ternative available. In fact, three design options for restructuring production werediscussed. When put to the test by the design requirements, the most satisfactoryalternative emerged. The fact that this alternative also required the smallestamount of additional investments settled the matter (see Table 6.1 for argumenta-tion used).
The next step was to design the control structure, i.e., the control tasks of depart-ments and groups. Leading principles for this design phase were threefold:
- Bring as many control tasks as low in the organisation as possible, i.e., to theproduction groups;
- Couple preparatory and supporting activities to production groups as much aspossible;
- Integrate related activities in the production and preproduction functions asmuch as possible.
For each department, its controlling activities were similarly modelled as in thepreceding bottleneck categorisation phase: input, output, resources and control in-formation. However, added to the process model were three other items: A fur-ther differentiation of resources into a technical and a human subcategory, astatement of operational requirements based on the specific technology for thatpart of the process, and a category called improwmenfs/renra;a/s. This last controlcategory indicates the learning capacity requirements related to the various pro-duction groups. Examples are the new job sheet, called fabrication plan, which isdesigned by the employees of each division; the close involvement of divisionemployees in designing several new machine manuals; and the full participationin deciding on the measurement criteria for performance measurement of eachdivision.
A full-fledged control structure design as prescribed by STSD theory was not pre-sent, keeping in mind that the reorganisation was triggered as the only means ofimproving upstream activities was meant to be tackled. Much of the control de-sign can therefore be considered to be included in improvements of the informa-tion flow and the administrative organisation. Consequently, these improve-ments made several structural rearrangements necessary, which, in turn, fitted inwith the general organisation change. The main control redesigns, however, relate
140

Case Sf. An/om'us Vesse/toeads
to normalisation and standard setting, for example, by means of quality systems,administrative organisation, performance measurement.
Table 6.1 Evaluation of design alternatives (Source: project documentation)
DesignRequirements
Control ofthroughput time
Control ofproduct quality
Volumeflexibility
Control capacitybuilt into a task(Quality ofWorking Life)
Availability ofemployees fordifferent jobs(Executivetasks)
Alternative 1
Difficult: during manufacturingmany interdependent localproduct flows.Transport (unction thereforedifficult to put on.
-
No full products within groups.
-
Low, because of largeinterdependent flows
No complete tasks: no fulloverview of product flow.
-
Good.More possibilities than informer organisation.
+
Alternative 2
All single hedges mostly dealt with within thegroup.Supply of prepressed by "HEDGES" to"PRESSED PRODUCTS"
Supply of segments by both "HEDGES" and"CONES/COMPOSITE PRODUCTS"
Transport function can be fulh/ decentralizedto the separate groups
• •
Full products within groups.
• •
Reasonable, less lor Staining because ofexcentric position.
+
Production tasks reasonably complete,Full product, incl. Staining, in one group.OC and Finishing in one separate group.
• •
Good: theoretically also available forStaining, but in practice not realisablebecause of differences in know-howand skills.
•
Alternative 3
idem alt. 2, although Staining/Painting is the focus
"PLATES" and "FINISHING/SHIPPING" have own transport.Other groups are dependent on this.
idem alt. 2, although less completebecause of separating out Staining.
+
High, better because of centralposition of Staining.
• +
Production tasks reasonablycomplete. Full product, excl.Staining, in one group.Staining. OC and Finishing mone separate group
Good.More possibilities than in formerorganisation
The STS redesign led to the following new (responsibility) organisation chart,where you can find at the bottom level, the five production groups and the threesales groups, and a simple, flat management structure (Figure 6.10). It shows theoverall importance of quality as the quality standards of ISO 9004 are fully appliedto the organisation, resulting in a matrix organisation. ISO 9002 is concerned withproduct quality and is the main function of Quality Engineering (CTA depart-ment), while ISO 9004 is concerned with the norms for a quality organisation. ISO9004 is anchored in the organisation by establishing a management team levelQuality Assurance department and by overlaying a quality control and engineer-ing matrix over the organisation. Almost all of the ISO 9004 norms are realised bythe STSD reorganisation, showing that the ISO 9004 concept, saying that goodproduct quality is assured by a quality-organised company, is identical to the STSDconcept of Quality of the Organisation.
141

ManagingDirector (MD) '
Finance &Personnel'
r
QualityAMuranca *
CIA Administration
Central Planning'
TechnicalServices dpt.
Planning
Schooling &Training
H_Commercial Technical Activities (CTA) '
CommercialTechnicalUnits
Advisor Administration(CTAA)
Section Sales
S«ctton Quality Engineering Big account»
Section ProjectJ L
PlateDivision
Formed HeadDivision
Hot & Cold PressedProducts Division
AssembledProductsDivision
Finishing &Shipping Drvision
Calibration Technician
Section QC
Section Shipping
I I = Quality-related departments f — ] = QA activities as required by ISO 9002/9004
* - member of the Management Team
Figure 6.10 Present overall organisation structure of St. Antonius (Source: quality manual)
The following is an explanation of the new organisation chart: The Central Plan-ning department in the new chart is responsible and takes care of overall produc-tion planning, automation and computerisation, R&D, and overall productionmanagement. The manager of Central Planning is also in charge of the STSDchange programme and its subsequent organisation policies and projects. Techni-cal Services is a combination of inventory control & management, and technicalmaintenance and support for the plant. Inventory management requires close at-tention because some customers supply their own materials which, depending onsize/weight, delivery time and type of material, are difficult to handle and planfor. Schooling & Training relates to both additional retraining and continuous ed-ucation for employees as they acquire new tasks and responsibilities under the STSdesign, and to the apprentice job shop for junior employees. The special section ofbig accounts in CTA refers to projects requiring exceptional attention and regula-tion such as orders from the nuclear and space industries.
142

Case Sf. /4n(onius
With the redesign completed, it was now time to start preparing for the final im-plementation. Before that, however, the outcomes of the design phase were madeclear to all employees by means of a role play in one of the production halls. To-gether with the employees it was enacted how the previous structure of the organ-isation made operations very difficult and how the new structure would changeall this. Such a role play was repeated once more during the elaboration of the de-sign (phase 3) to show what progress was made and what still had to be done.
The redesign work group finished its job by suggesting a series of steps for the im-plementation together with a proposal for the accompanying change managementapproach (see Table 6.2). As can be seen, it makes use of the already existent projectmanagement structure with the various work groups now involved in imple-mentation issues.
Table 6.2 Implementation approach of the redesign proposal (Source: project documentation)
Task:
Setting up a stepwiseimplementation plantor both office andplant, including a time path
(1) Establishing the personneloccupancy for both the office and plant(2) Formulating training needsand setting up a training plan
Setting up a communicationplan
(1) Setting up the ideal office layout(2) idem for the plant
(1) Setting up new technical officeequipment descriptions(2) idem for the plant
Checking of information needs andsetting up an information plan
Setting up job descriptions anda job classification
Step t
Step 2
Step 3
Step 4
Step5
Step 6
Step 7
Under Ihs responsibility of:
Overall design work group
Management team
Overall design work group
Office work group
Plant work group
Office work group
Plant work group
Office and Plant work groups
Management team
The implementation was completed almost entirely on the basis of the proposedschedule. The involvement of the management team in steps 2 and 7 was basedon a function classification project that was already running during the start-up ofthe redesign. This plan was abandoned later because the unions were opposed toit.
143

C/iapfer 6
The Work group Interlocal (Figure 6.7) disappeared from the above-captioned im-plementation plan. It proved unnecessary as the other work groups had alreadycoordinated their plans in the Work group Design long before the Work group In-terlocal became operational.
Designing the Management Accounting System
Development of the MAS design was a result of the general construction of acompany-wide information system. This information system had two main start-ing points. First, it should generate the information necessary to steer the whole ofthe organisation: The general manager has to be provided quickly with informa-tion on the financial position of the firm, planning staff has to know real-time on-line where in the process a product was located, and the Quality Assurance de-partment has to know where something went wrong. Second, the people on theshop floor had to be provided with proper information that would enable them tooptimally manufacture products allowing them to influence financial position,planning and quality. Taken together, it requires a local information system thatalso serves the organisation on a higher level of aggregation.
To start with, it was decided to look at what information the job schedulers (thelatter Production Engineers) really needed in order to determine the correct pro-duction method. Next, all tolerances in the entire process were normalised, usingthe strictest building code available. Surprisingly, this norm uniformity very qui-etly resulted in a reduction of the number of failures caused by deviations in mea-surements. Finally, one looked at the information needed by the Quality Engi-neers to determine the correct production process, welding method and heattreatment. It was from these three elements that the content format of a quotationwas derived^.
The difference between the information needed by the PEs and the QEs is in thelevel of operations considered: The QE looks only at the process and the phases theproduct must complete, while the PE looks at the resources and instrumentsneeded for each individual process phase. The PE, therefore, is the person whotries to come up with new work methods and, consequently, has closer contactwith the shop floor.
Typically, these changes in information supply in the upstream quotation and or-der acceptance phases have turned out to be big improvements. Solid improve-ments have been generated in: Internal failure reduction; upstream orderthroughput time; delivery reliability; and, last but not least, the customers' percep-tion of how the product is being manufactured. This, in turn, shows him or herwhat expertise ('value') is being offered for his money. Therefore, as a result of theearlier improvements in the upstream information flow, many elements of theaccounting design were already present.
The general MAS design (or Management Information System as it is called at St.Antonius) is still in its construction phase. The main problem in developing anencompassing Management Information System (MIS) is that aggregation fromparts to the whole is troublesome. This is due to the technological complexities
144

Case St. Anfoniws Vesse/Zzeads
involved. For example, each production group is compelled by its specific produc-tion technology to use its own unit of measurement. This can either be square me-tres, weight, diameter or thickness. Thus, transfers between production groupswould also imply a transfer in the most basic information denominator. However,this problem was solved by creating uwfc centre unite: an alternative and uniformdenominator which can be either hours, square metres, kilos or parts, relative tothe production group involved.
Consequently, work centre units are used to calculate the production cost tariffsper production division. For this purpose, production groups were renamed divi-sions, each containing several work centres (i.e., having identical operational ac-tivities) which each has its own tariffs. Production tariffs are needed for determin-ing manufacturing costs, product cost and, ultimately, the sales price (see Figure6.12 for product cost information to be obtained from the accounting informationsystem). Variance analysis is performed only on the basis of production hours, andnot on a tariff or financial basis. However, the resulting utilisation rates are easilytransformed into a financial numerator by multiplying the variance by the workcentre tariff, thus obtaining a production volume variance.
It is this combination of work centres and tariffs that makes up the backbone of theMAS: They have an evaluative role regarding order performance (the job costingaspect) and a control role regarding the financial control of organisational perfor-mance (i.e., accountable work centre recovering costs). The textbook theory of tariffusage is their standard costing role for inventory valuation, especially regardingWork-In-Process (WIP). However, WIP is considered most significant for itsthroughput and delivery time indication, and far less significant for its balancesheet itemisation. Considering the intensive use of tariffs for this wide range of(financial) decisions, setting the tariffs is an important normalisation of financialbehaviour, equal to the preceding normalisation of (product and organisation)quality, information flow and work processes.
Production tariffs are constructed using the cost pool method, i.e., a total cost esti-mate for the various work centres and subsequently divided by the estimated workcentre units, explicitly taking into account mutual services rendered in the workcentre cost estimate?. This results in the man hour rate and the machine hour rateadding up to one single average rate per work centre and per division. This rate iscalled a tariff. Technical Services, CTA and the Board, which are considered to begeneral overhead, are separate divisions each having an hourly rate. Productiondivisions also have indirect costs, but these are accounted for at the divisionallevel and are included in the divisional tariff.
Because of the cost structure at St. Antonius (few general overheads, itemised fullproduction costs are termed as work centre tariffs), the control of singular over-heads has little management attention. Its cost system is one typical of that of ajobber, having a great deal of tariffs available for operations, and work centres pro-ducing to recover costs and obtaining a sufficient capacity occupation. Neverthe-less, it is leaving its preoccupation with 'capacity selling' to offer a full productionservice by its focus on product quality, timeliness and flexible production on order.
145

There are four different types of tariffs: (1) fiscal; (2) commercial; (3) business-ad-ministrative; and (4) sales. The commercial tariff is the tariff developed first, lead-ing to the fiscal and business-administrative tariffs and, finally, to the sales tariff.The commercial tariff is related to the break-even capacity level when full avail-able production hours, and their subsequent cost, are to be recovered by sales, i.e.,it is based on the necessary sales turnover of the company. This break-even capac-ity level is the denominator for establishing the commercial tariff. With this tariff,the jobbing character of the cost system is most clearly shown.
The business-administrative tariff underpins the sales tariff. It explicitly includesmachine depreciation based on replacement/ current value, creating an accountingreservoir for both a technologically up-to-date machine park and the underab-sorbed work centre man and machine hours.
Finally, the sales tariff is set by both the market and internal influences. If themarket accepts the height of an individual production division tariff as beingequivalent to the market price for a specific (number of) operations, then there isno need for subcontracting the work. If it does not accept these tariff levels as priceequivalents, (parts of) orders should be subcontracted because St. Antonius cannotoperate under its own production cost. The sales tariff equals the business-admin-istrative tariff, with two exceptions: First, on the occasion that it has not beenplanned for the machines to have a 100% occupancy; and, second, on those occa-sions when similar machines in separate divisions have different rates because ofdifferences in division overhead. In both cases, it is accepted that the sales tariff islower than the business-administrative tariff. Furthermore, the sales tariff re-quires authorisation and approval by the management team as it is the tariff usedin day-to-day practice, i.e., for weekly WIP reporting. WIP valuation using thecommercial tariff is performed during each monthly accounting period. The otherthree tariffs are used for WIP valuations at the year's end.
The importance of WIP is also shown in the regular reporting flow. It relates di-rectly to its role as a throughput indicator. Typically, WIP can be broken down intothe individual order level for detailed analysis (see Figures 6.14 and 6.17).
The administrative organisation of St. Antonius focuses primarily on(the controlof) the upstream order information flow between CTA and Production (see Figure6.11). In the flow, the central position of the Quality Engineer and the ProductionEngineer is prominent. Also, the flow chart mirrors the production structure andthe control structure in one diagram (task groups and Production Engineers). Theadministrative organisation 10 chart provides a map of the available financial in-formation - where it is located/registered and what its original target of collectingis. This can be used, for example, to answer the question of whether or not a spe-cific type of information can be used for a decision-making situation although ithad not been originally designed for this.
For managerial purposes, the administration is considered to be able to providecost information on the various product costs. The product cost itself is importantbecause it is used as a basis for sales price setting, i.e., a cost-plus system is used (seeFigure 6.12).
146

Case Sf. i4nton/«s
CTA
quotations
CENTRAL PLANNING
Controlinfo, fromcomputer
^
Contro
info, frc
compuIPlanning
I Guidelines (procedures)
ordersquotationanalysis
CTA (Sales)
Guidelines (construction design codes/procedures)
procedure |
OPOualily
Engineer
CTA (QE)
PRODUCTION
testing
Plates
job sheet
F 8 S
Customer
ORF = Order Registration FormOP = Quality PlanFIP = Fabrication Inspection PlanTOS i Technical Order SpecKicationWPS = Work Process Schedule—^fr- = Cross-lunctional into Itow
Figure 6.11 Administrative organisation of the upstream order flow (Source: project documentation)
147

C/iapteró
Product cost build-up reflects the job order cost system: It is relatively detailed onmaterial costs and shipping costs because of the size of the products and the provi-sion of materials by the customer. The balance between tariff and market pricecosts is reflected by the item subcontracted worfc.
As mentioned above, once production process (QE) and production process meth-ods (PE) are integrated into one singular planning step, production cost standardsare set at the same time because the work flow in the fabrication plan and workcentre tariffs overlap: i.e., as soon as a product type is identified in its required op-erations, a product cost can be indicated to Sales (CTA) for further order negotia-tions.
Cost of malarial*:including material:- cost o( sheet metal material- returned scrap part of materialexcluding material:- returned scrap part of material- material part for transport and liability insurances
Production costsSubcontracted work:
- painting, machining, grinding etc.- testing costs
Shipping costs:- picking up sheet metal- bringing the product
Net product costStorage costsFinance costsProfit
Gross sales priceCommissionsRebates
Net sales price
Figure 6.12 Product cost build-up and subsequent cost information requirements (Source: companydocumentation)
In order to construct a Management Information System, it was decided to build itbottom up, i.e., from the individual groups upwards. As in determining the tariffstructure, the five production groups and the department of Commercial andTechnical Activities (CTA) were renamed 'divisions'.
Each division had to develop its own performance measurements: After establish-ing what control tasks were involved, it was determined what the activity outputof each division was (this was relatively easy because of the preceding STS design).For all divisions, the resulting list was split into four categories, relating tothroughput time, quality, output volume and costs (these four items reappear onthe various reports discussed later on). Further, it was specified what exactly was tobe measured and what would be the priority order of this reduced number ofitems. Simultaneously, the performance range and the performance target wereestablished. This performance modelling provides each division with a group per-
148

Case St. .Antonius Vesse//iea<is
formance standard that they developed themselves and apply to their group deci-sions. Throughput time is especially considered to be of prime importance becauseit is thought to be the best indicator of production process disturbances.
Typically, the MIS will have to accommodate the performance information fromall divisions, with a strong accent on financial information. When this 'new' MISbecomes available, the aim is to have:
1) an information model representing the production process of the firm;2) a linkage method for the chain of customer-CTA-Production, in such a fashion
that the information flow starts at the customer rather than the CTA depart-ment (as already depicted in the administrative flow chart); and
3) a visual method for communication between the primary process level and or-ganisational management.
A clear MAS design cannot yet be depicted. Nevertheless, the present reportingstructure can be used as an indicator of such a management accounting design (seeFigure 6.13).
individua order level
company level
ORDER fLI
'LANNINGSTS
»•
WIP REPORT
Weekly
per Debtor
i
Weeks to date
overall WIP. Backlog
Basis lor tuturegroup budgeting
PERIOD REPORT
Performance
Marginper order
Overall margin(amount»/,,)per customer
Country Salesman
1
Volume
Orders received/Quality ol Ordersreceived
Sales volume/Quality olSales volume
Volume on file/Quality ol Volumeon file
EX POSr ORDER CALCULATION
Planned vs Actual Variances
Changeover lime(hours)
Cycle time(minutes)
Order throughput time(days)
Cost(amounstandar
s;%toI/actual)
Figure 6.13 Management Accounting System design
149

Chapter 6
The two main parameters for managerial control are order flow and (production)bottlenecks. Order flow is managed and controlled by the information on Work-In-Process while production bottlenecks are indicated in the period report. The expos f order calculation provides information on both order flow and productionbottlenecks, disaggregate to order and individual operation (see discussion of in-dividual reports).
From the order administration (see WIP report, Figure 6.14) one should be able tofollow exactly what division retains the main responsibility for each order and towhat other divisions the order must be passed on next. As a result, a listing can bemade as to what the product turnover per division is. Given the future insightinto the specifics of product turnover per division, the intention is to use this in-formation as a basis for group level planning and budgeting. That is, a budgetedresult at the order level (sales according to invoice amount, minus actual productcost), a flexible budget variance per division and a static budget variance per costcategory.
The weekly WIP report is based on production orders, and gives an insight intothe WIP and the order backlog, both factors being indicative of throughput time.To explain: The WIP report is both aggregate and disaggregate. Disaggregate to in-dividual customer (debtor) as to what the order status is, and aggregate as to whatthe total WIP volume and order backlog are per week. For the aggregate WIP posi-tion, the WIP (excluding materials) column is indicative, while for order backlogthe balance (excluding materials) column is indicative. The material componentof WIP is mentioned separately, because some customers provide their own mate-rials and because it is indicative of the added value (defined as labour costturnover) of the job on hand. Thus, it gives insight into the largest direct costscomponent of throughput time and order backlog. The category absent matena/s isfurther relevant to throughput time as it indicates a production slowdown on theparticular order because materials are not delivered, i.e., a sort of production orderon hold.
The next report is the period report. It is split into a volume part and a perfor-mance part (see Figures 6.15 and 6.16). The volume part provides insight intothroughput volume, categorised by product size and the order portfolio. The fi-nancial position related to volume is indicated by the subcategory Sa/es, represent-ing Sales turnover, main cost categories, overall planned costs, as well as theplanned gross margin percentage. All other subcategories are concerned with orderposition in time: Completed until now, today, waiting, and in process. In otherwords, every time element of the product flow - whether upstream or down-stream - is reported on.
The performance part of the period report is less aggregate (Figure 6.16). Instead ofa technical grouping according to product diameter, it groups according to cus-tomer order position and relative (planned) profitability. Both volume and per-formance reports can be further split up into subcategories, providing informationon, for example, monthly order volume or high-margin customers (see the ap-pendix for examples of this split-up).
150

Case St. Anfoni'us Vesse//iea<is
Work-ln-Prooess Report (current production orders)
Orderno. Volumeplan remain.
Specification LSTW-C
ABSMAT period
balance WIP4 mat. - mat. • mat.
12345.11
3456.22
etc.
SmitfiiJones Pic.Smith*Jones Pic.
etc.
LST W-C - Last Work CentrePE - Production EngineerABS MAT . Absent Material
34*15 0(22.)h 31 312 X X]X OE
FOB Rotterdam E 921105
etc.
xx.xxx.n xx,xxx.xx xx,xxx.XX
xx.xxx.xx xx.xxx.xx
etc. elc.
IC = Incoming ControlEC . End ConlrolSITE » Materials status: Materials received
(Open-Closed) • Incl/Excl materials (IE/E)
+ mat. - Including material- mat. - Excluding material
Work-In-Process report (weekly totals to date)
Week
< « « week;
week:
10
11
Works ble days
to date
5.0
CompletedMat. absentRemaining
+ material
XXX,XXX,XX
xx.xxx.xxxxx.xx
- material
XXX,XXX. XX
xx.xxx.xxxxx.xx
- material
XX.XXX.XX
XXX,XXX,XX
+ material
xx.xxx.xx
XXX,XXX.XX
CompletedMat. absent
, Remaining
week: 12 4.0CompletedMat. absentRemaining
XXX,XXX.XX
xx.xxx.xxxxx.xx
XXX,XXX.XX
xx.xxx.xxxxx.xx
xxx.xxx.xxxx.xxx.xx
xxx.xx
XXX .XXX.XX
xx.xxx.xxxxx.xx
xx.xxx.xx
XXX,XXX.XX
xx.xxx.xx
xx.xxx.xx
xxx.xxx.xx
xx.xxx.xx
elc.
Company totals:
etc.
CompletedMat. absentRemaining
etc.
xxx.xxx.xxxx.xxx.xx
xxx.xx
elc.
XXX .XXX.XX
xx.xxx.xxxxx.xx
XXX.XXX XX
etc.
xx.xxx.xx
xxx.xxx.xx
xxx.xxx.xx
etc.
xx.xxx.xx
xxx.xxx.xx
Figure 6.14 The Work-In-Process report (Source: regular company report)
The usefulness of the period report (especially the performance part) is furtherenhanced by having a regular ex post calculation per individual order two weeksafter the period report, pinpointing the variances from plan (Figure 6.17).
The ex post order calculation provides detailed information on planned cycletime, manufacturing costs, changeover time, and order throughput time versustheir various actuals (see Figure 6.17). In addition, it provides detailed informationabout the ex posf gross margin per order and about how this difference occurred,up to and including the individual operation.
151

C/iapfer 6
Period Repon (volume)
time periodnumber ol workdays
Reception * of orders* of products
average*Total
Gross WagesMaterials
average wage;
Sates * of orders# of products
average f
Gross TotalWages
Materialsaverage wages
CostsGross margin in %
throughput average
Completed * of orders* of products
average #
TotalWages
Materialsaverage wages
On file * of orders« of products
TotalWages
Materialsaverage wages
Ready * of orders* of products
lo date TotalWages
Materials
WIP 0 of orders# of products
to date TotalWages
Materials
numberof orders
XX
number ofproducts
XX
diameter0-800
1
2
3
xx.xxx
xx.xxxxx.xxx
X.XXX
600-1200
123
etc.
1200-3000
123
3000-6000
123
6000-
15000
123
totalamount
xx.xxxxx.xxxXX.XXX
X.XXX
1
Figure 6.15 The period report regarding volume (Source: regular company report)
Period Report (performance per order)
Ordernumber
12345.12
.13
.14
23456.22
.23
etc
Customer
SmilhSJones Pic
SmithiJones Pic
Smith&Jones Pic
Roberts Pic
Roberts Pic
•IC.
Specification
1 KB 1234.0IM2.0(12.0)h 12.0
etc.
etc
Total
2 H D 1902.0 •-.-(3.0)h 13 0
etc.
Total
etc
Credit-
Price note
xx.xxx.xx
XX.XXX.XX
xx.xxx.xx
xx.xxx.xx
xx.xxx.xx
xx.xxx.xx
etc.
Costs
X.XXX.XX
X.XXX.XX
X.XXX.XX
X.XXX.XX
X.XKX.XX
X.XXX.XX
etc.
Margin vs
xx.xxx.xx
XX.XXX.XX
xx.xxx.xx
xx.xxx.xx
xx.xxx.xx
xx.xxx.xx
etc.
Costs
• xx%
- xx%
+ xx%
• xx%
- xx%
• xx%
etc
Figure 6.16 The period report regarding performance (Source: regular company report)
152

Case St. y4ntonius Vesse//ieads
£< Post Calculation Report
Oruemo: 12345.11Customer: Smilh & Jones PicCompletion date: 23/11 <92Order active: 19 days
Oper. Description Cho(h)
10 Input control20 engraving ordemo.
6001 welding6002 pressing6004 pickling9400 inl./ext. transfer9500 output control
Throughput 6 days
Cho(h) = Changeover In hoursProd(tl) = Production in hoursOper. • Operation number
SpecificationNumber: lMaterial: R 1
Planning
Prod(h) Costs
16.00
16.00
34'15.0(22^31
.4401
Plandale ChcKh)
921023921024
0.450.80
921028921029
1.25
- Actual -
Prod(h)
0.500.301.006.50
ex
Costs
22 0031.50456 50
510.00
Accounted amount exd. material a creditAmount own transport
Amount subcontracted transport
Pickling/Date Annealing/ Subcontractedready X-ray work
921023921024921030921101921109 210.00921111921111
210.00 0.0
Percentage over accounted amount +
95000110.X
0 00
Performance %
230.00«45%
24%
Explication ol example (all numbers are lictional):
PRODUCTION THROUGHPUT the difference between the planned stan date and the planned end date-> 29 Oct. 92 • 23 Oct. TO - 6 days
ORDER THROUGHPUT throughput days plus the difference between planned and actual date reedy- > 6 days • 13 days (2S.10.S2 11/11/92) . 19 days
PERFORMANCE calculated as actual costs plus special operations plus supplies less accounted amountIn absolute numbers: (510 + 210 + 0) - 950 - 230In percentage over production costs: (230 * 510)' 100% - + 45%in percentage over sales phce: (230 * 950)' 100% - + 24%
Figure 6.17 The ex pos/ calculation (Source: regular company report)
The operations of pickling, annealing and X-raying are mentioned separately be-cause they are per unit operations instead of hourly process operations. The ac-counted amount is in fact the planned sales price. The two percentages calculatedtherefore refer to performance on the basis of production costs (45%) and on thebasis of sales price (24%). The tariffs obtained from the cost pool method are usedto calculate the actual cost per order; they function as a sort of standard unit priceof input. Actual unit prices of operations input are not used in the cost poolmethod for setting tariffs.
Together with the period report on performance, the ex post report allows for con-trol of time and financial resource consumption, as well as technical bottlenecks.
A First Assessment
In general, the insights into the connections between all phases in the process flowhave increased. Typically, it has led to a strong incentive for Quality Assurance,and the use of norms and standards for all activities in general.
The cost-benefit analysis made by the head of Central Planning, occupied with theSTSD project as well as being the production manager, showed the following as-sessment of the change venture:
153

Costs
Takes up a lot of energy and man hours;Forming task groups requires investments in:- additional tools and supplies to have task groups function without outside
interference;- training and coaching of top and middle management;- appliances to generate information (St. Antonius spent 150,000 guilders on a
laser printer and hardware and software to generate blueprints in the wayproduction groups would have provided them);
Introducing work counselling takes up manufacturing labour hours (in St. An-tonius' case 4,800 hours a year, which amounted to 480,000 guilders);Reorganising the production layout is costly. For relocation of machinery, St.Antonius set aside 12 million guilders for a duration of three years. However,relocation offered the opportunity to direct their attention towards workingconditions;Employees view the changes as a burden; at the beginning of the change processabsenteeism dropped from 10% to 7.5%, this was later followed by an increaseto 20%, which lasted for almost two months. It has now returned to 8%;The actual design of the new organisation and subsequent training took about8,000 man hours, 6,000 hours of which were accomplished by the employeesduring their personal time. The final costs to the firm amounted to 200,000guilders.
* Increased pressure on people to attend courses and training programmes;* Stress at various organisational levels; all managerial levels have to start
thinking from the process upwards, forgetting about their disciplinary focusand training;
* Insecurity in many people as to what the reorganisation will hold in store forthem.
Benefits
More has become known by simply measuring things: More attention is paid tomaterial knowledge, and throughput times can (now) be measured;Labour productivity has increased, to the extent that, despite the work coun-selling, 2% more output is produced (2% equals 295,000 guilders, consideringthat the work counselling costs of 480,000 guilders have already been made upfor);Shorter throughput times:- throughput time of the preparatory production stage (the office trajectory)
decreased from 11 to 3 working days;- full throughput time decreased from a 45-day average to a 24-day average.
This led to an average decrease in WIP of 440,000 guilders;- a decrease in sheet metal inventory holdings from 1400 tons to 400 tons is
mainly due to an improved insight into throughput time and the subse-quent arrangements with suppliers;
154
Case St. y4wtoni«s Vesse/heads
- an increase in order position by 66% first led to an increase in throughputtime of all products from 9 to 16 weeks. However, after a selective marketapproach introducing various market segments, it has again been reducedwith 5 to 10 weeks, depending upon the specific market segment;
Qualitative improvement in the documentation supplied to the customer;Costs are more traceable;Better information is available to the customer concerning the progress of theirorder;The amount of repair down-time hours in production has decreased from 5%to 2%;The amount of actual hours worked has increased as a result of group initia-tives. For example, a shift in lunch and coffee break schedules at the press oper-ations, where bottlenecks are prevalent, led to an annual capacity increase of233 production hours (200,000 guilders).
Starting up an innovative, self-renewing organisation;An increase in knowledge of production, materials and construction codes as aresult of recording procedures and norms. This saves a lot of planning andscheduling time;Task groups, with their internal job rotation systems, are less vulnerable to ab-senteeism. For example, during the 20% absenteeism period, production con-tinued without disruption;The lines of communication have shortened and are less dependent upon thecorridors of power;People have become more open;Everything is turned upside down. Many taboos have been broken and it is ev-ident that many things can be done much better; craftsmanship is limited to'real' craftsmanship.
' IDEF is the abbreviation of Integrated DEFinition method and is the activity diagrammingpart of the commercial software package SADT (Structured Analysis and Design Technique). IDEFhas IDEF 0, IDEF 1 and IDEF 2 type models working deeper into the dynamic modelling for systemssimulation. Although mainly known to information system designers, IDEF can be used for any func-tion and information analysis of a complex subject (e.g., van Koetsveld, 1984; Moravec and Yoemans,1992).
" Presently (Summer 1992), Central Planning is working on a method to establish the productionprocess and, thus, product cost, only once.
* The cost pool method, being of German origin, is not known to Anglo-Saxon accounting.However, it is widely used in Europe and part of the traditional body of knowledge of European ac-counting. See for a more detailed discussion A.N.A.M. Boons, H.J.E. Roberts and F.A. Roozen,Contrasting Activity-Based Costing with the German/Dutch Cost Pool method, in: Management/Iccounfmg Research, vol. 3, no. 2, 1992, pp. 97-117.
Typically, Administrative Organisation (AO) is a separate subdiscipline in accountancy inThe Netherlands, related to administrative control and information supply. The presence of an AOsystem is required by external auditors to allow for an unqualified opinion on the annual report. Inother countries, it is unknown as a separate discipline and considered part of Accounting InformationSystems (AIS) or Information Systems in general.
155

Chapter 6
Appendix
Examples of the period report subcategories on volume and performance
Period Report (Orders received)
Time period:xx/xx/92 - xx/xx/92 ArticleOrders received code
AA
AB
CD
DE
FG
Total:
Productvolume
XX
X
XX
XX
X
XXX
diameter0 -800
X
XX
X
XX
aoo-1200
XX
X
X
XX
XX
1200-3000
XX
X
XX
3000-6000
x
X
X
x
X
6000-15000
XX
X
XX
XX
Total financialamount
xx.xxx.xxX.XXX.XX
xx.xxx.xx
xx.xxx.xx
xxx.xxx.xx
Period Report (Quality ol orders received)
Time period:xx/xx/92 - xx/xx/92Quality orders Levelrecerved code
NO code total6.69 3
9 5
Total:
Productvolume
XX
X
XX
XX
X
XXX
diameter0-SOO
XX
X
XX
800-1200
XX
X
X
XX
XX
1200-3000
X
XX
3000-6000
X
X
X
X
X
6000-15000
XX
x
XX
XX
Total financialamount
xx.xxx.xxX, XXX. XX
xx.xxx.xxxx.xxx.xx
xxx.xxx.xx
Period Report (Sales volume)
Time period:xx/xx/92 - xx/xx/92 ArticleSales volume code
AA
AB
CD
DE
FG
Total:
Productvolume
X
XX
XX
X
XXX
diameter0-800
XX
X
XX
800-1200
XX
X
X
XX
XX
1200-3000
XX
X
XX
3000-6000
X
X
X
X
6000-15000
XX
X
XX
XX
Total financialamount
xx.xxx.xxx.xxx.xx
xx.xxx.xxxx.xxx.xx
xxx.xxx.xx
Period Report (Quality of sales volume)
Time period:xx/xx/92 - xx/xx/92Quality of sales Levelvolume code
9.4
9.5
Total:
Productvolume
XX
X
XX
XX
X
diameter0-800
XX
X
XX
800-1200
XX
X
X
XX
XX
1200-3000
x
XX
3000-6000
x
X
X
X
X
600015000
XX
X
XX
X
XX
Total financialamount
XX.XXX.XX
X.XXX.XX
XX,XXX. XX
xx.xxx.xxX.XXX. XX
XXX.XXX.XX
Period Report (Quality ol volume on file)
Time period:xx/xx/92 • xx/xx/92Quality volume Levelon file code
NO code total
QP total 1.5F IP total 5.2
8.393
FP totalTotal:
Productvolume
XX
X
XX
XX
X
XXX
diameier0-8O0
XX
X
XX
XX
800-1200
XX
X
X
XX
XX
XX
1200-3000
X
XX
3000-6000
X
X
X
XX
6000-15000
XX
XX
XX
Total financialamount
xx.xxx.xx
Figure 6.18 Period report - volume subcategories (Source: regular company report)
156

Case Sf. Awfonius Vesse/fteads
Period Report (performance per customer - customer-aligned)
Customernumber Customer
Productvolume Sales
Aligned according to Sales (numbers are fictional)
t
2
3
4
5
etc.
Smith&Jones Pic
Roberts Pic
LIO Industries
DeFe constructions
Metallo Pic
etc.
5
12
9
2
7etc
Aligned according to Product Volume (numbers I
1
2
3
4
5
etc.
Roberts Pic
LIO Industries
Metallo Pic
SmithSJones Pic
DeFe constructions
etc
12
9
75
2
22,897.12
21.450.00
14,35580
12.250 90
9.350.00
etc.
ire fictional)
21.450 00
14.355 80
9.350.00
22,897 12
12.250.90
etc.
Credit note Costs
21.338.00
16.480 00
15.870.85
11.150.00
4,468 95
etc
16.480.00
15.870.85
4.468.95
21.338.00
11,150.00
etc.
Margin
1,556,12
4.970.00
-1.515.05
1.100.90
4.881 05
etc
4,970 00
-1,515 05
4.381.05
1.55912
1.100 90
etc.
vs Costs
7.3%
3015%
-9.5%
9 8 %
109 22%
etc.
30 15%
-9.5%109.22%
7.3%
9.8%
etc
Period Report (performance per customer -
Ranking CustomerProductvolume
Aligned according to performance % tor sales >
1
2
etc.
Roberts Pic
Smilh&Jones Pic
etc
12
5
etc
Aligned according lo perlormance % for sales <
1
2
3etc.
Metallo Pic
DeFe constructions
LIO Industries
etc
72
9
performance-aligned)
Sales Credit note
15.000
21,450 00
22,897 12
etc
15.000
9,350.00
12,250.90
14,355.80
etc.
Costs
16.480.00
21.338.00
etc.
4,468.95
11,150.00
15.870.85
etc.
Margin
4,97000
1.559.12
etc
4.881.05
1.100 90
-1.515.05
etc
vs Costs
30.15%
7.3%
etc
109.22%
9.8%
- 9 5%
etc.
Period Report {performance per country)
Country
Belgium
Germany
France
Sweden
Netherlands
Productvolume
XXX
XX
' XX
XX
Total:
Sales
x.xxx.xxx.xx
XXX.XXX.XX
XXX.XXX.XX
XXX. XXX-XX
x.xxx.xxx.xx
Credit note Cosls
x.xxx.xxx.xx
XXX,XXX.XX
xx.xxx.xx
XX,XXX.XX
x.xxx.xxx.xx
Margin vs
XX,XXX,XX
xx.xxx.xx
xx.xxx.xx
xx.xxx.xx
xxx.xxx.xx
Costs
xx.xx%
XX.XX%
xx.xx%
xxxx%
xx.xx%
Period Report (perlormance per salesman)
Salesman CodeProductvolume Sales Margin vs Costs
Total:
XXX.XXX XX
xxx.xxx.xx
XXX .XXX.XX
xxx.xxx.xx
XXXJtXXXX
x.xxx.xxx.xx
xxx.xxx.xx
xxx.xxx.xx
XXX.XXX.XX
xxx.xxx.xx
XJCXJCXX XX
x.xxx.xxx.xx >% over order amount
xx.xxx.xx
xx.xxx.xx
xx.xxx.xx
xx.xx%
xx.xx%
xx.xx%
xx.xx%
xx.xx%
XXJ(X%
xx.xx%
Figure 6.19 Period report - perlormance subcategories (Source: regular company report)
157

7Case Analysis and Cross-Case
Comparison
/n f/iis c/iapfer, f/ie three case studies are ana/ysed based o« grounded t/ieory pro-cedures as advocated by Strauss and Corbin. To exp/ai'n t/ie wor)tmg o/ t/iese pro-cedures, the /irst case awa/ysis o/ Van Ne//e /s used as aw examp/e, detai7/ng the/ines o/ argument and t/ie speci/ics o/ eacn procedure/ step. Cases are ana/ysed in-difidua//y. /4/ter eac/i case ana/ysis, t/ie aj:/a/ pattern (i.e., t/ie causa/ pattern o/events and re/ated characteristics.) and t/ie story/ine (i.e., f/ie summary /ine o/ ar-gument.) respectire/y are compared, /f is conc/uded t/iat organisati'ona/ /earningp/ays a mayor ro/e in tne change processes o/ organisation design and managementaccounting design. Key /actor in setting up organisationa/ /earning is the STSD-based change management approach used. The strategic choice o/ a human re-source-based vision o/ the organisation, /low-oriented production and simp/e ac-counting systems worfc together to maintain organisationa/ /earning and institutea process o/ continuous improvement.
The three case studies are analysed using the procedures of grounded theory(Strauss and Corbin, 1991). Grounded theory procedures are based on a datagrouping and regrouping system called a coding process. It distinguishes threetypes of coding in a specific order: Open coding, axial coding and selective coding.Open coding is the first data-grouping step, by putting field observations into datacategories. Next, these data categories are regrouped accordingly by using anotheraxis, i.e., a core category overlapping all previous open-coded categories. This iscalled axial coding. The final coding step is selecting the phenomenon present inthe core category which, consequently, is also present in all open-coded categoriesbut did not 'shine through': This last stage is called selective coding. When thecoding procedure is concluded, field observations are categorised and reduced insuch a fashion that they tell the story of what happened during the period of ob-servation. This 'storyline' is a causal narrative providing insight into the evolvingnature of events. To put it another way, the storyline explains why and howthings took shape.

Case /Ina/ysis and Cross-Case Comparison
In the following chapter, coding procedures are used in the three separate casestudies as described above. Input for open coding are, therefore, the full case de-scriptions, allowing the reader to trace back any inferences or analysis steps. Thecoding procedure is repeated for both the case studies and the cross-case analysis.The resulting cross-case storyline thus provides the basis for more formal, topic-constrained conclusions.
Each case study was described in chronological order, beginning with the felt needfor change and how it was further articulated, to the situation where a preliminaryassessment of completed changes is undertaken. Therefore, all open coding fol-lows this initial chronological grouping of data. Furthermore, the three cases arespecifically selected on the redesign of bof/z their organisation and their manage-ment accounting system. In contrast, many situations are available where onlyone of the two is subject to change. For example, where only the management ac-counting design is changed but the organisation structure remains the same.Therefore, the selection of cases having consonance between the two designchanges implies that lessons from cases where there was dissonance between thetwo designs (i.e., only one design was changed) are not considered. In other words,the selection of research sites influences the outcome of the conclusions. Second,and maybe this has to do with the consonance characteristic, these cases follow thenormative prescriptions of STSD theory relatively closely. Weaknesses in STSDare consequently ignored due to their absence in the acquired data. A critical analy-sis of STSD in itself is therefore impossible, if based solely upon the research evi-dence presented here. For this reason, it is important to repeat the research ques-tion and ensure that it focuses on the influence of organisational redesign onmanagement accounting systems design and not on the comparison or evaluationof STSD.
Grounded Analysis of Van Nelle Tobacco/Rotterdam Plant
Van Nelle Tobacco/Rotterdam plant (hereafter referred to as Van Nelle) main-tains an exceptional position in the case study range. First of all, because it wasused as the basis for the very first case: It functioned as a reference point for furtherobservations. This project was started without any previous expectations as noprior cases or literature were available. To date, it is the case that boasts the largestamount of observations and data gathered. It also meant that the relative impor-tance of open interviews was the greatest in all three case studies. As can be ex-pected, this shows in itself both size and structure of the case description. In short,the full force of insecurity and uncertainty in doing grounded research was felt inthis first case study.
This 'first case position' is maintained in the grounded theory approach as seen be-low. Per coding step in the Van Nelle case, each individual step is briefly explainedin terms of the procedural techniques involved. This allows for an understandingof the outcome as well as the analysis procedure. The other reason for its excep-tional position was its situational background. It is the only case regarding an or-ganisation that became part of a larger functionally structured organisation, whichis also of non-European origin. The other two cases concern fully independent or-ganisations of Dutch origin. Therefore, the case description combines two major
159

'externalities': It contains a takeover situation inclusive of all merging of activitiesand processes, and it contains national and managerial cultural factors. However,discussion of either of the two externalities is not attempted because both the re-search question and research design were not framed to do so.
Open CodingThe chronology of the case description equals the sequences in the time path of thechange trajectory. Each sequence is described in a separate paragraph of the case de-scription, leading to, for example, the distinction into: The Introduction Phase(1984-1986), The Analysis Phase (1986-April 1987) and The Learning Phase (April1987-May 1988). Although neatly grouped as observations, they seem to be main-tained at too abstract a level, because open coding requires that:
"During open coding the data are broken down into discrete parts, closely examined, comparedfor similarities and differences, and questions are asked about the phenomena as reflected inthe data. By breaking down and conceptualizing we mean taking apart an observation, a sen-tence, a paragraph, and giving each discrete incident, idea, or event, a name, something thatstands for or represents a phenomenon." (Strauss and Corbin, 1991, pp. 62/63)
Therefore, the paragraphs are broken down into discrete incidents and listed to-gether with the phenomenon and the incidents they represent (see Table 7.1). Theanalytical effort here is to find and couple phenomena to the incidents, as the casedescriptions are incidence listings in themselves.
Table 7.1 Coupling phenomena to incidents in the case description of Van Nelle
Paragraph In c a t * description Incidents Phenomena
The Introduction Phase
The Analysis Phase
The Learning Phase
lagging operating performance
management buy-out
restructuring policy statement
product group organisation structure
management development plan
relocation of personnel
all-level training programmesquality campaign
follow-up campaign
redesign action plan
STAP analysis
revision of job/rank classification
IKZ report on task aroup structureappointment of task group leaders
per task group implementation plans
adapting budget structure
task group training programmes
surrounding deptartments informed
task groups functioning
takeover
functional recentralisaties of org structure
company-rule reporting system
freeze of change projects
R'dam plant continues task group structure
performance sag
change of control
change assessment
change full organisation structure
Human Resource Management
building involvement
job design
structural redesign statement
change structure
fitting the design
use
change of control
fitting the mother
legitimation
160

Case 4na/ysis and Cross-Case Comparison
The phenomena found after listing the incidents now provide an input to theconceptualisation phase. Again, this means regrouping and reducing case observa-tions to an even more abstract level. Or, as Strauss and Corbin (1991, p. 65) put it:
"Once we have identified particular phenomena in data, we can begin to group our conceptsaround them. This is done to reduce the number of units with which we have to work. The pro-cess of grouping concepts that seem to pertain to the same phenomena is called categorizing.The phenomenon represented by a category is given a conceptual name, however, this nameshould be more abstract than that given to the concepts grouped under it."
Naming categories is an important step since it indicates the first move towardsconceptualising raw data/observations. The advice given here by Strauss andCorbin is twofold: Be aware of using concepts from your own disciplinary back-ground or theoretical literature as they bear commonly held meanings and associ-ations with them and, second, name categories by phrases or words used by infor-mants themselves, the so-called in iróo codes. In other words, go back to yourtranscribed interviews and look for catch words/phrases that brought on aner/ebnis. In the case of Van Nelle, the following categories resulted:
Table 7.2 Open-coding categories and their dimensional profile the case description of Van Nelle
Phanomana
performance sag
change of control
change assessment
change lull organisation structure
Human Resource Management
building involvement
job design
structural redesign statement
change structure
fitting the design
use
change of control
fitting the mother
legitimation
Category
Reasons for change
'Pointing noses'
Operational design interventions
Experiences
Property and Dimensional Range
* organisational orientation:inward-looking - outward-looking
* organisational status:independent - dependent
' vision on the future: explicit - implicit* organisation structure change:
integral - partial' job classification: full - limited• personnel policy: explicit - implicit" decision-making on resources:
centralised - decentralised
* functional redesign requirments.extensive - limited
' project management:participatory - non-participatory
' PCI-design: full - limited
' organisational status:independent - dependent
" timeperiod in use: long - short* number of changes made afterwards:
extensive - limited* quantitative costs: high - low' qualitative costs: high - low' quantitatvebenefits: high - low' qualitative benefits: high - low
The final step in open coding is developing the categories, i.e., you blow up theone-dimensional concept by its characteristics. This is accomplished by distin-guishing properties and dimensions. Properties are the characteristics of a concep-tual category, while dimensions locate a property along a continuum, for example,
161

C/iapfer 7
an organisation has an inward- or outward-looking focus of orientation with in-ward-/outward-looking being a characteristic for the concept of change motiva-tion. As a result, each conceptual category acquires several general properties witheach property varying over a dimensional continuum; this is called a dimensionalprofile. A dimensional profile thus depicts the specific characteristics of a phe-nomenon under a given set of conditions (Strauss and Corbin, 1991, p. 70). Inother words, it is a listing of the variables (the category) and their operationalisa-tion (property and dimensional range).
The importance of this step is that properties and dimensions are the basis forbuilding relationships between various categories, i.e., the causal order of eventscan be rebuilt in abstract terms. For example, the property and dimensions of in-ward/outward focus of orientation of the category Reasons /or c/iange can be usedto link up with the property of functional redesign requirements of the Opera-fiona/ design interuenf/ons category. The focus of orientation property could thenbe linked to a redesign requirement that opposes it, such as the requirement todouble the number of product variants in the future.
Open coding applied to Van Nelle thus far has fractured the observations, re-grouped them into conceptual categories and provided the categories with distinc-tive properties. At this point, the chronology of the case description is still presentin the listing of categories. This is due to both the case write-up and to the well-structured approach enforced by the normative content of STSD.
The redesign of the MAS and its underlying logic are considered sufficiently im-portant to be treated separately, i.e., to analyse it in a separate coding procedure.The subsequent two case studies maintained this separate analysis. There are threereasons for doing so. First, the research question was formulated in terms of theinfluence of organisational change on MAS change. In other words, the MAS isthe main subject and organisational change in the context. Concretely, organisa-tional change is expected to provide the change factors for MAS redesign; i.e., theresearch question focuses mainly on the 'then' part of the 'if-then' in the contin-gency relationship.
Second, organisational cues transpose to MAS cues, which can be phrased in a to-tally different manner. This is due to the different terminology and disciplinaryfocus. For example, managerial control is considered a problem in organisationtheory and explored accordingly, while in accounting it is considered a solution.This leads to more elaborate control techniques. These standpoints are reflected inapproach and language, necessitating a translation effort to keep the meaning of acue as identical as possible in both disciplines.
Third, the organisational change is dominated by STSD theory. Subsequently, theresulting MAS design can be expected to bear upon STSD characteristics and con-stitute something like a sociotechnical accounting system. Stating the properties ofsuch a system for both theory building and future empirical tests is considered avaluable side product of this research. Moreover, it would provide STSD researchwith an extension into the financial discipline, one that has been needed for sometime.
162

Case y4«fliysis and Cross-Case Comparison
Open Coding - M/4S DesignAs in the above, case paragraphs are regrouped to their encompassing phenom-ena, which, in turn, are categorised into more conceptual terms. The resulting di-mensional profiles are relatively elaborate, for the same reasons as mentionedabove (study focus, disciplinary translation and first sketch of an STSD accountingsystem). The two tables allow tracing back a specific property to the element in thecase description. Properties of all three cases form the basis for a broad outline ofwhat a STSD accounting system would comprise, i.e., can be reformulated astestable propositions for the next research step.
Table 7.3 Open-coding categories of the MAS design of Van Nelle
Paragraph In c a » description Phenomena Category
control and information structure
control and information supply details:
- the capadty/occupancy calculation
and production budget
- the period report
- the machine efficiency report
• the labour productivity report
- the production report
the relationship with the
Management Accounting System
ol Douwe Egberts/Sara Lee
task group structure
extension of existing MAS
Management Information System
reporting sequence
sodotechnical reporting system
use ol the MAS
organisation redesign
information supply
change chronology
MAS design
information parameters
Table 7.4 Open-coding properties of the MAS design of Van Nelle
Category Property and Dimensional Range
Organisation redesign
Information supply
Change chronology
MAS design
information parameters
• decision making on resources: centralised - decentralised" control build-up: by authority • by function level' information system: aggregated - desaggregaled
' information system: aggregated - desaggregaled' operational control information: aggregated - detailed* performance measurement to standards: extensive - limited
• budgets standard developed: end of project - start of project" operational control reports developed:
after budget standards - before budget standards* periodic report developed:
alter operational control reports - before operational control reports' variance reporting: end of project - Stan of project
* reporting frequency: high - low' goal of MAS: cost control - production planning' cost system: job order costing - process costing• Imk with productivity calculation: lul • limited' link with sensitivity analysis: lull - limited• amount of controllable oost items: large • small' amount of direct cost items: large - small' performance denominator financial - nonfeianbal
' information basis: product line - capacity• amount of information parameters: large - small* user level of generated information: same level - higher level* origin of parameters: local - nonlocal
163

C/iapfer 7
In the open-coding procedure regarding the MAS design, no use is made of the in-termediary category of incidents. Events that have been inputs to the MAS designmainly took place before the actual design of the system itself. In other words,open coding here entails more of a description of a result rather than a descriptionof the dynamic stream of incidents that lead up to that result.
Aria/ CodingAs open coding relates to fracturing data, axial coding refers to putting those databack together albeit in a different manner. The difference is in what you do withthe categories: In open coding, they are further specified in terms of properties andtheir dimensions. In axial coding, categories are specified in terms of subcategoriesand, most important, what connects the two (the axis). As Strauss and Corbin state:
"In axial coding our focus is on specifying a category in terms of the conditions that give rise toit; the context (the specific set of properties) in which it is embedded; the action/interactionalstrategies by which it is handled, managed, carried out; and the consequences of those strate-gies. These specifying features of a category give it precision, thus we refer to them as subcate-gories. In essence, they too are categories, but because we relate them to a category in some formof relationships, we add the prefix sub. (1991, p. 97)"
Every category, whether it is a subcategory or not, still has properties, so they donot disappear from sight in axial coding. Instead, they will reappear in the selec-tive coding phase. The link or axis in relating between categories and subcategoriesis called a coding paradigm. It constitutes a set of relationships that are modelledin terms of:
A. causal conditions —> B. phenomenon —> C. context —> D. intervening condi-tions —> E. action/interaction strategies —> F. consequences
The following will briefly explain what is meant by the various terms (1991, pp.100-107): Causa/ conditions refer to the incidents that lead to the occurrence of aphenomenon. For example, the incident of the management buy-out at VanNelle's led to the phenomenon of control change. A p/ienomenon is the centralevent that is handled by the action set. For example, the control change phe-nomenon was handled by restructuring the organisation and its processes. Conrexthas two meanings: First, it represents the dimensional profile (property plus di-mensional range) related to a phenomenon. Second, it is more literally the contextwherein actions are taken as a means to respond to a phenomenon. For example,the context of control change is reflected both by the property of an inward-lookingfocus of the organisation, as well as the American mother company of StandardBrands, which was unwilling to start up an organisational change process, /nter-wni'ng conditions differ from causal conditions and context as they relate to thegeneral conditions bearing upon action strategies. Such general conditions can beof an historic, economic and technological status, or cultural nature. For example,the intervening conditions related to control change at Van Nelle was of historicaleconomic status because Van Nelle was one of the few Dutch rolling-tobacco pro-ducers. Acrion/iwferacfion sfrafegies are responses to a phenomenon. Ac-tion/interaction strategies themselves have four properties: They are processual,i.e., they can be studied in terms of sequences over time; they are purposeful, i.e.,actions are undertaken for some reason; failed action is as important as actions ac-
164
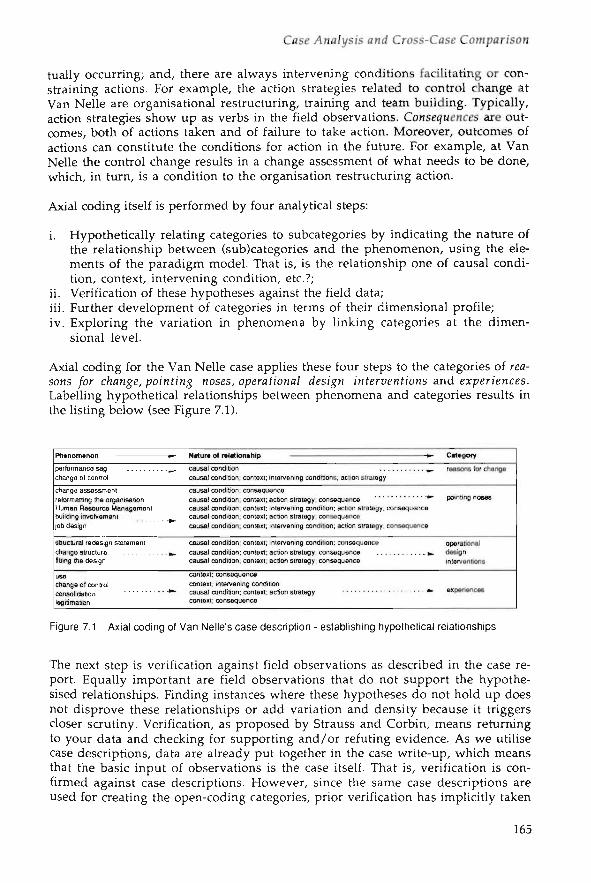
Case -AMÜ/I/S/S and Cross-Cose Comparison
tually occurring; and, there are always intervening conditions facilitating or con-straining actions. For example, the action strategies related to control change atVan Nelle are organisational restructuring, training and team building. Typically,action strategies show up as verbs in the field observations. Consequences are out-comes, both of actions taken and of failure to take action. Moreover, outcomes ofactions can constitute the conditions for action in the future. For example, at VanNelle the control change results in a change assessment of what needs to be done,which, in turn, is a condition to the organisation restructuring action.
Axial coding itself is performed by four analytical steps:
i. Hypothetically relating categories to subcategories by indicating the nature ofthe relationship between (sub)categories and the phenomenon, using the ele-ments of the paradigm model. That is, is the relationship one of causal condi-tion, context, intervening condition, etc.?;
ii. Verification of these hypotheses against the field data;iii. Further development of categories in terms of their dimensional profile;iv. Exploring the variation in phenomena by linking categories at the dimen-
sional level.
Axial coding for the Van Nelle case applies these four steps to the categories of rea-sons /or c/iflnge, pointing noses, operah'ona/ design iwterpenf/ons and experiences.Labelling hypothetical relationships between phenomena and categories results inthe listing below (see Figure 7.1).
Natura of relation «hip Category
performance sagchange of control
causal conditioncausal condition; context; intervening conditions; action strategy
. ^ - reasons for change
change assessmentreformatting the organisationHuman Resource Managementbulking involvementjob design
causal condition; consequencecausal condition; contextcausal condition; contextcausal condition; contexlcausal condition; context
:; action strategy; consequenceintervening condition; action strategy; consequenceaction strategy; consequenceintervening condition; action strategy; consequence
•*- pointing noses
structural redesign statement
change structurefitting the design
causal condition; conte:causal condition; comex'causal condition; con lex
intervening condition; consequenceaction strategy; consequenceaction strategy; consequence
operationaldesigninterventions
usechange of controlconsolidationlegitimation
context; consequencecontext: intervening conditioncausal condition; context; action strategycontext; consequence
• *. experiences
Figure 7.1 Axial coding of Van Nelle's case description - establishing hypothetical relationships
The next step is verification against field observations as described in the case re-port. Equally important are field observations that do not support the hypothe-sised relationships. Finding instances where these hypotheses do not hold up doesnot disprove these relationships or add variation and density because it triggerscloser scrutiny. Verification, as proposed by Strauss and Corbin, means returningto your data and checking for supporting and/or refuting evidence. As we utilisecase descriptions, data are already put together in the case write-up, which meansthat the basic input of observations is the case itself. That is, verification is con-firmed against case descriptions. However, since the same case descriptions areused for creating the open-coding categories, prior verification has implicitly taken
165

Cnapfer 7
place. Therefore, the verification step is of little importance when using case de-scriptions as a data vehicle.
Furthermore, several observations regarding the nature of the relationships can bedrawn. The most important of these is the relevance of causal condition and con-text, appearing 11 times on 14 phenomena, followed by action/interaction strategy,appearing 8 times on 14 phenomena. The first, tentative impression is that STSDdesign is strongly related to environmental factors. If we combine this idea withthe relatively small number of appearances of the intervening conditions rela-tionship, it seems that environmental factors are tied to STSD in discrete steps, i.e.,sequential design and environmental input are combined factors. On a theoreticallevel, this is corroborated by STSD theory stating that a sequential design approachshould be used, initiated by a strategic orientation round. Theoretical presumptionis that strategic considerations are passed on along the line of increasingly specificdesign steps, and the above relationships seem to support this empirically.
Another line of thought connected to the intervening conditions relationship isthat this label seems to indicate a boundary role in between action cycles. At VanNelle's, two main ruptures coincide with the first and last intervening condition,each related to a change in managerial control and economic status. Within thiscycle, there is another cycle related to a specific choice in approaching organisa-tional behaviour, i.e., people are considered the main resource of the organisationand therefore the anchor point for managerial action.
The above-mentioned two analyses clearly show the iteration between observa-tions and concepts, or in other words, between inductive and deductive thinking.This back and forth movement is one of the essential characteristics of groundedtheory. Both the environmental importance and the cycle/metaphor concept areprovisional and carry over to the next step in axial coding as well as to the nexttwo case studies where they can be further supported, discarded or varied.
The third step is further development of categories in terms of their dimensionalprofile (property plus dimensional range). This step aims at improving specificityand developing conceptual density. Regarding the grounded analysis of the firstcase, this step is limited in its significance. Instead, it has considerable importancefor cross-case comparison, when the properties of each case can be placed next toeach other and conceptual specificity and variation can be more elaborately dis-cussed. In other words, when performing grounded analysis on a series of casestudies, this specific axial coding step has increasing significance from the secondcase onward.
The last axial coding step is linking categories at the dimensional level in order toexplore variation in phenomena. Strauss and Corbin note that:
"But, it is here in axial coding that the process of linkage actually begins. While we do ouranalysis, we note patterns in our data in terms of dimensional locations of events, incidents per-taining to the property of a phenomenon (1991, p. 110)."
In the Van Nelle case, the idea of an event cycle or pattern is reflected by its prop-erties. The main pattern is on the control change, which constitutes the link be-tween the categories Reasons /or c/iange and Experiences. The other cycle falls in
166

Case /4na/ysis a«rf Cross-Case Comparison
between those categories, linking the categories Pointing noses and Operafiona/design inferyenfions. Moreover, a third cycle can be distinguished within the Ex-periences category where the action strategy of consolidation is employed follow-ing the takeover of Van Nelle. This relationship is embedded by a preceding in-tervening condition and a successive consequence.
At the dimensional level, the patterns are supported by the properties of organisa-tional status: At the start of the event cycle (management buy-out), the organisa-tion is independent and at the end of the pattern (takeover) it becomes dependent.Linkage of the categories Pointing noses and Operational design interventions issupported by the dimensions of an explicit vision to the future and decentraliseddecision making on resources. The first one establishes the framework for furtherelaboration of that vision, which is a human resources type of vision, and the sec-ond elaborates the decentralised decision making into an Operafiona/ design in-tervention category. In other words, each one of the properties of the Operationa/design intervention category are elements of the STSD change management ap-proach called Integral Organisational Renewal (IOR). Thus, properties becomeidentical to instruments as a result of this approach. The two properties of projectmanagement and PCI design are theoretically restricted to take the dimensionalpositions of 'participatory' and 'ƒ«//'. The property of functional redesign require-ments is left open by the STSD theory; organisations are able to take any positionin this dimension. Under this category, it may be possible to obtain the first inputof the reasons responsible for unsuccess/u/ STSD efforts, since organisations donot keep to the normative advice of the STSD toolkit and only partially redesigntheir organisation.
The above-named patterns and properties are the basis for replication in the fol-lowing two case studies. They can either add support and variation to these pat-terns or they can refute them. They are able to replace them with different patternswhich, in turn, need to be revised against observations from the other case studies.
Coding - MAS Design(An identical axial coding procedure is followed)The relationships between phenomena and categories are established in terms ofthe coding paradigm, and the subseqent analytical axial coding steps are applied.Hypothetical relationships can be depicted as in Figure 7.2.
Phenomena » • Nature of relationship • - Category
causal condition; conlexl; intervening condition; _ . . .task group structure . » ^ i o n strategy: consequence "" ^ « s a l i o n des*n
extension of existing MAS »•• causal condition; action strategy: consequence »» Information supply
Management Information System
reporting sequence *> causal condition; action strategy: consequence »» Change chronology
scciotechnical reporting system »» causal condition; context: action strategy: consequence •»• MAS design
use of the MAS » • causal condition; context; consequence »» Information parameters
Figure 7.2 Axial coding of Van Nelle's MAS design
167

Cnapfer 7
Verification against field data is again of limited relevance because of the use ofcase descriptions as an intermediary data vehicle. However, a number of observa-tions can be made. First of all, the combined appearance of causal condition andconsequence at each category level indicates that this part of the design is a cumu-lative activity, moving from one phase to the next as completion is reached.
It is also interesting that this part of the design is determined by (the interveningcondition of) the task group structure phenomenon; it relies strongly upon thefurther action strategies in the categories of information supply and MAS designitself. In other words, the task group structure, i.e., organisation redesign, consti-tutes the environment constraining and setting further MAS design activities.
The category of organisation design and the category of Pointing noses share anidentical property in decision making on resources. When going back to the casedescription, it can be seen that the different coding elements result in being cate-gorised in one identical category, although these elements do not have an indenti-cal underlying phenomenon. More specifically, these phenomena are related tothe incidents of the STAP analysis and to the bottom-up control design in the taskgroup structure. However, it is important to note that both categories have some-thing in common, i.e., all elements of the coding paradigm. This triggers the ideathat those two categories (pointing noses and organisation design) are linking cat-egories between the context part and the accounting part of the case study; theyeach cover a full coding paradigm and share an identical property.
Considering this idea of linkage, Table 7.4 shows that the information systemproperty carries over to the next category which is that of information supply. Inthis category, the information system property is further exemplified by propertiessuch as detail of control information and extensive performance measurement tostandard; an extensive amount of control detail as well as extensive performancemeasures do not bear up well with an aggregated information system. Moreover,these subsequent properties (control detail and extensive measures), in turn, linkup with the properties of the MAS goal (cost control), reporting frequency (high),amount of controllable and direct cost items (both large) and performance denom-inator (nonfinancial), all in the MAS design category. However, since the MASgoal property is preceded first by the centralised versus decentralised decision-making property and then by the information system property, the distinction cen-tralisation versus decentralised seems to play an important role. This challengesthe textbook idea that management accounting systems can be considered systemsin themselves, which can have their own design argumentation. Instead, man-agement accounting systems appear to be directly related to organisation designlogic.
In the category of information parameters, the property of user /eue/ o/ ginformation relates to the in/brmafion system property in the previous categories.This relationship stems from the STSD balance equation between required controlinformation and control information available, i.e., the control design in the taskgroup structure as proposed by the law of requisite variety. The property of origino/ parameter (local/nonlocal) is similarly related; control information is generatedthere where it is needed for control decisions in terms of best fitting the decision.Typically, these decisions are local (i.e., decentralised) and, according to the case
168
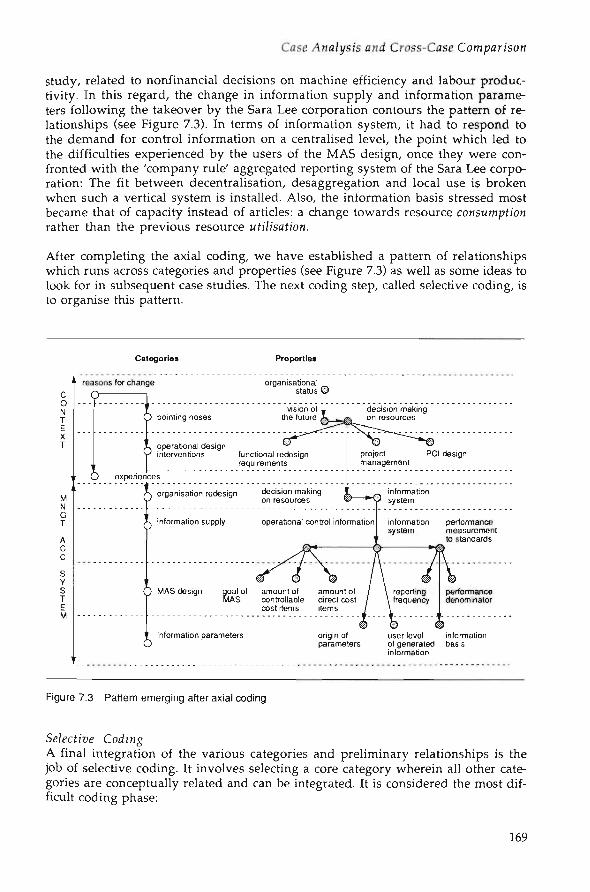
Case /Analysis and Cross-Case Comparison
study, related to nonfinancial decisions on machine efficiency and labour produc-tivity. In this regard, the change in information supply and information parame-ters following the takeover by the Sara Lee corporation contours the pattern of re-lationships (see Figure 7.3). In terms of information system, it had to respond tothe demand for control information on a centralised level, the point which led tothe difficulties experienced by the users of the MAS design, once they were con-fronted with the 'company rule' aggregated reporting system of the Sara Lee corpo-ration: The fit between decentralisation, desaggregation and local use is brokenwhen such a vertical system is installed. Also, the information basis stressed mostbecame that of capacity instead of articles: a change towards resource consumptionrather than the previous resource
After completing the axial coding, we have established a pattern of relationshipswhich runs across categories and properties (see Figure 7.3) as well as some ideas tolook for in subsequent case studies. The next coding step, called selective coding, isto organise this pattern.
Categories Properties
reasons for change
Oorganisational
status
pointing nosesvision of
the futuredecision makingon resources
operational designinterventions functional redesign
requirementsprojectmanagement
PCI design
O experiences
organisation redesign decision makingon resources
informationsystem
As information supply operational control information information performancesystem measurement
to standards
Q MAS design goal ofMAS
amount of amount ofcontrollable direct costcost items items
reportingfrequency
performancedenominator
0information parameters
Oorigin of user level informationparameters of generated basis
information
Figure 7.3 Pattern emerging after axial coding
Se/ecr/ue CodingA final integration of the various categories and preliminary relationships is thejob of selective coding. It involves selecting a core category wherein all other cate-gories are conceptually related and can be integrated. It is considered the most dif-ficult coding phase:
169

Chapter 7
"In axial coding you developed the basis for selective coding. You now havecategories worked out in terms of their salient properties, dimensions, andassociated paradigmatic relationships between major categories along thelines of their properties and dimensions. Furthermore, you have probablybegun to formulate some conception of what your research is all about. Afterall, people have been asking you for some months: What is it that you arestudying, and what are your findings? Surely, some conclusion has formedin your mind, if not on paper. The question is: How do you take that whichis in a rough form, and hopefully in your diagrams and memos, and system-atically develop it into a picture of reality that is conceptual, comprehensible,and above all, grounded?" (Strauss and Corbin, 1991, p. 117)
Again, there is a series of steps to guide this process. There are five and they arenot seqwenfia/ as much as iferaf/ue in their guidance. Also, a strong similaritywith the axial coding process is present. The selective coding procedure involves:
* Explicating the storyline, which is a conceptualisation of the descriptive narra-tive about the central phenomenon (i.e., the core category) of the study;
* Relating subsidiary categories around the core category by means of the codingparadigm;
* Relating categories at the dimensional level;* Validating those relationships against data;* Filling in categories that may require further refinement and/or development
(.i.Strauss and Corbin, 1991, p. 118).
The difference between a storyline and a case description is that the first is an ana-lytical conceptualisation while the latter is merely a description of events, not us-ing conceptual relationships but chronological event relationships: a story, ratherthan a storyline. The central part of the storyline is the core category: The one cate-gory or central phenomenon around which all other categories can be integrated.Choosing a core category is one of the most difficult things to achieve; one can ei-ther select an existing category that is abstract enough to encompass all concepts inthe story, or one can select such a category by means of asking: What phenomenais repeated in all your data? What is the essential message in your research? Inother words, developing the core category asks one to stand above the materialand pinpoint the key subject. Ideally, if the previous coding steps are performedwell, the core category presents itself almost naturally.
The storyline for Van Nelle revolves around the phenomenon ofc/iange, which can be metaphorically labelled as the resurrection of the organisa-tion. The firm went from a sleepy, inward-looking subsidiary organisation with afunctional structure, to an active, market-oriented independent organisation witha highly decentralised, product group structure. Resurrection was accomplishedthrough STSD insights and tools, and was consolidated by the changed informa-tion and control systems. The organisational change phenomenon was put in per-spective by the takeover of a firm with an identical functional and centralised or-ganisation structure as the one Van Nelle previously had. The resurrected organi-sation left the most robust parts untouched - the production, control and informa-tion structures at plant level. In short, this is the storyline at Van Nelle.
170

Case i4na/ysi's and Cross-Case Comparison
Next, the core category is further identified by explicating its properties. Once thecore category acquires its own dimensional profile, it can be used to relate theother categories to it, thereby making them subsidiary categories (Strauss andCorbin, 1991, p. 123). In the case of Van Nelle, the core category selected was organ-isationa/ /earning. The organisation learns how to become more open to its mar-kets and changes itself accordingly. The learning process explicitly follows a routeof structural changes, resurrecting the new organisation from the old one. Theproperties of this learning process can be tied to the three event cycles in thechange process:
1) The control change between management buy-out and takeover within this cy-cle;
2) The change realisation, based on STSD; whereafter3) The consolidated change trajectory is legitimised by its new 'school masters',
i.e., those who set the new learning targets and try to stimulate learning to-wards them.
Properties of the organisational learning core category are, therefore, highly identi-cal to properties of categories already found. Using Figure 7.3 to indicate thoseproperties, the first event cycle of the organisational control change contains themain property organisafiona/ sfafws, the second event cycle of the change realisa-tion contains the properties vision on fne /ufwre and decision ma/ring on re-sources, and the third event cycle that of the legitimation of the change, containsthe properties costs and bene/ifs.
Organisational learning, in terms of MAS design, also relates to the properties ofinformation system, operationa/ contro/ in/brmation and per/ormance measure-ment to standards apart from decision making on resources. The main reason isthe boundary role of these categories: They link up with the organisational contextand translate these organisational concepts into accounting instruments and con-cepts. For example, a decentralised organisation translates into allocating all opera-tional controls to the lowest possible organisational level. This requires a decen-tralised information system encompassing all operational control informationand, subsequently, the provision of a great number of operational targets andstandards. In other words, a detailed system of standards, both financial and non-financial, will intervene in the construction of the management accounting sys-tem, as exemplified in the intervening condition relationship between the taskgroup structure phenomenon and the Organisation design category (Figure 7.2).
We now have the core category of organisational learning, with the properties oforganisational status (independent/dependent), decision making on resources(centralised/decentralised), information system (aggregated/desaggregated), opera-tional control information (aggregated/detailed), performance measurement tostandards (extensive/limited) and qualitative and quantitative cost (high/low) andbenefits (high/low). Subsidiary categories are linked to the core category by meansof the event cycle concept and the property pattern developed earlier (see Figure7.4).
171

C/iapfer 7
Categories
reasons for change
Proportie*
i pointing noses
/ operational designi interventions
functional redesignrequirements
experiences
decision matongon resources
project PCI designmanagement
organisation redesign
information supp/y
Q MAS design
o-Ó
event cycle
information parameters
information performancemeasuremenlto standards
goal of amount ofMAS controllable
cost items
origin ofparameters
user level informationof generated basisinformation
Figure 7.4 Subsidiary categories and properties of the organisational learning core category
To further explicate the linkage between core and subsidiary categories, the termsof the coding paradigm are again used. According to the property pattern, sub-sidiary categories are: Reasons /or c/ionge, Pointing noses, Organisafion redesign,Jn/brmation swpp/y and Experiences. The nature of the relationships between sub-sidiary and core category is depicted in Figure 7.5. Causal condition and conse-quence relationships mark the presence of an events cycle while the presence of anintervening conditions relationship indicates that there are restrictions or bound-aries on the choice of subsequent action strategies. The presence of a causal condi-tion relationship to all subsidiary categories stresses the purposeful coherence inmanagerial action; resurrecting the organisation was a matter of policy decisions,not one of trial and error or good luck.
Category
Reasons for change
Pointing noses
Organisation redesign
Information supply
Experiences
• » Nature of relationship •>
" " Causal conditions, context; intervening conditions
" " Causal conditions; action strategy . . .
» . Action strategy ' ' ^
•"- Action strategy;consequence . . . - ^
" " Causal conditions; consequence " '
Core category
Organisational learning
Figure 7.5 Relating subsidiary categories to the core category
172

Case .Ana/ysis and Cross-Case Comparison
The tentative theory that can now be developed, and the one that is to be repli-cated, specified and varied in subsequent cases, looks like this: In the conditionthat a firm wishes to survive as an independent organisation and finds itself notable to do so, it starts an organisational change process. When envisaging a changeeffort, based on its human resources and organisation design, it decides to create alearning organisation. Learning is initiated by pointing noses in terms of decen-tralising the decision making on resources. Subsequently, the organisation struc-ture is redesigned using STSD-based interventions. The management accountingsystem, as part of the STSD intervention, has been redesigned to fit in the learningorganisation context, by incorporating the same decentralisation decision makingon resources as well as to redesign information supply. Typically, the informationsupply is redesigned to provide desaggregation information for detailed opera-tional control and extensive performance measurements to standards. The experi-ences of having created a learning organisation in operation come forward distinc-tively when confronted with the loss of decentralised decision making. These ex-periences are consolidated into the management accounting system which is a sta-ble entity, untouched by subsequent contextual changes in organisational statusand decision making on resources.
Grounded Analysis of Zilverstad Silversmithing
The case of Zilverstad Silversmithing (hereafter referred to as Zilverstad) will becoded and analysed according to the procedures as described above. Since the VanNelle case also provided an introduction to the content of the grounded theorytechniques, further explanation of the procedures will be dismissed: Analysis con-tains the results and discussion of the results.
Open CodingAs in the Van Nelle case study, the case description is chronological; the time pathand the sequence of events (Figure 5.5) therefore link up with the incidents under-lying the phenomena. To further enhance tracing of the data grouping, the para-graphs in the case description relating to the various incidents are also mentioned.
In naming the open-coded categories, the use of jargon and standard accountingterminology has been avoided where possible, resulting in an almost conversa-tional use of terms. It was unintended, however, to use verbs as a means of nam-ing the categories; the change process seems to be best analysed in terms of dy-namic expression. Unfortunately, no use could be made of in mi» codes as nonewere readily available from the interview transcriptions.
Properties are termed by using expressions or words obtained from the case studyand the transcribed interviews. Again, where possible, it is refrained from usingjargon or standard terminology from the accounting and organisation disciplines.
173
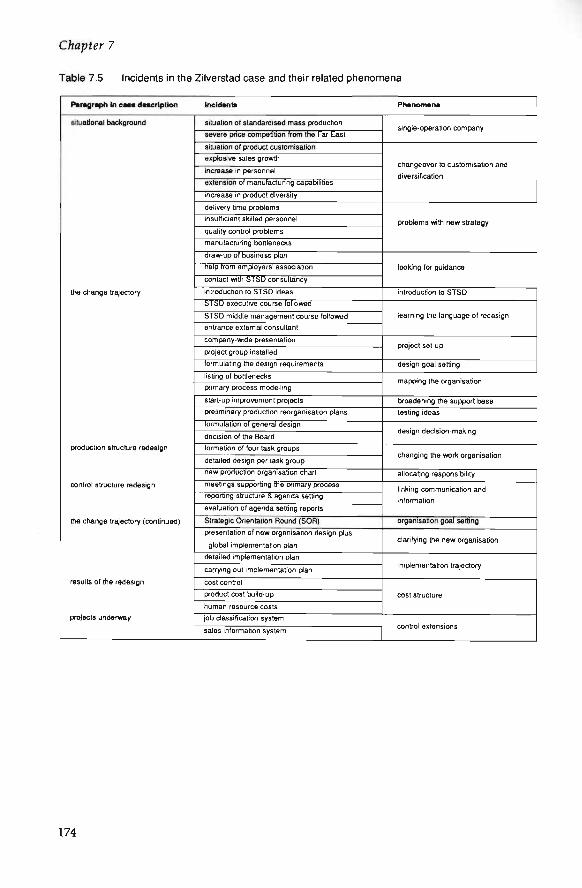
Table 7.5 Incidents in the Zilverstad case and their related phenomena
Paragraph In case description Incidents
situational background
the change trajectory
production structure redesign
control structure redesign
the change trajectory (continued)
results ol the redesign
projects underway
situation of standardised mass production
severe pnee competition from the Far Eastsituation ol product customisationexplosive sales growth
increase in personnel
extension ot manufacturing capabilities
increase in product diversitydelivery time problems
insufficient skilled personnel
quality control problems
manufacturing bottlenecks
draw-up of business planhelp From employers' association
contact with STSL) consultancy
introduction to STSD ideas
5I5U executive course followedSTSD middle management course lollowedentrance external consultant
company-wide presentation
project group installed
formulating the design requirements
listing of bottlenecksprimary process modelling
start-up improvement projects
preliminary production reorganisation plans
formulation ol general designdecision of the Board
lormation ol four task groups
detailed design per task group
new production organisation chart
meetings supporting the primary processreporting structure & agenda settingevaluation of agenda setting reports
Strategic Orientation Round (SOR)
presentation of new organisation design plus
global implementation plan
detailed implementation plan
carrying out implementation plan
cost controlproduct cost build-up
human resource costs
job classification system
sales information system
Phenomena
single-operation company
changeover to customisation anddiversification
problems with new strategy
looking for guidance
introduction to STSD
learning the language of redesign
project set-up
design goal setting
mapping the organisation
broadening the support base
testing ideas
design decision-making
changing the work organisation
allocating responsibility
linking communication andinformation
organisation goal setting
clarifying the new organisation
implementation trajectory
cost structure
control extensions
174

Case ^na/ysis and Cross-Case Comparison
Table 7.6 Open-coding categories and dimensional profile of Zilverstad
Phenomena Category Property end Dlmanslonal Rang*
single-operation company
changeover lo customisationand diversification
problems with new strategy
looking for guidance
introduction to STSD
learning the language o! redesign
project setup
design goal setting
mapping the organisation
broadening the support base
testing ideas
design decision making
changing the work organisation
allocating responsibility
linking communication andinformation
organisation goal setting
clarity ing the new organisation
implementation trajectory
cost structure
control extensions
mo ving-up the organisation
trying lo come lo grips
establishing an organisation view
initiating change
clearing the organisation
structural interventions
selecting a direction
settling in
evaluating
* implicit strategic competitive position:price strategy - focus strategy
* implicit production strategy:full-line producer - single-line producer
* technological competences:extensive - limited
* human resource qualifications:scarcely available - plenty available
'control systems:limitöcfly present • extensively present
' planning systems:limiledly present - extensively present
* organisation solulion wanted:comprehensive solution - partial solution
' network memberships: extensive - limited' type of assistance,
training courses - expert opinion* concepts introduced:
change instruments • change targets
* functional redesign requirements:extensive- limited
* project management:participatory - non-participatory
' analysis of the organisation:extensive - limited
' gaining credbiBty;by actual improvements - by rhetoric
' selecting the production si rue I urein outline - in detail
* PCI-design: full - partial' sequence of production design:
work organisation first - responsibility first* meetings & forms:
highly interactive - liltie interactive
* strategy /redesign sequence:redesign first - strategy first
' communicating expectations:lo everyone - lo a selected group
* change implementation: planned - not planned' cost structure: transparent non transparent
* human resource costsstructurally increased - structurally decreased
* quantitative costs: high • low* qualitative costs: high - low* quantitative benefits: high - low* qualitative benefits: high • low
Open Coding - M/4S DesignSeparate discussion of this portion of the redesign process is warranted by the re-search question, stating that the management accounting system is expected to beinfluenced by changes in its organisational context. The discussion will maintain asimilar format as in the case of Van Nelle: A depiction in logic diagrams of thephenomena found in Zilverstad's MAS, followed up by the open-coding proce-dures.
175

A description of the MAS of Zilverstad can be found in a single paragraph of thecase study. From this description, a listing of phenomena is compiled, followed byregrouping into more abstract categories and then separating these into propertiesand their dimensional ranges (see Table 7.7).
Table 7.7 Open coding of Zilverstad's MAS design
Paragraph Incaw description Phenomena Category Property and Dimensional Rang*
ManagementAccountingSystem
use ol meetings & forms
sequence of redesign
previous internal accounting system
reporting format
task group central element
management information
cost system
use of cost pool method
tariff system
production/sales budgets
sales report
financial report
nonlinancial operational information
Control structure
Change chronology
Information supply
MAS design
• communicating performance:between groups in group
' budgets established:production first - sales first
" transfer pricing system:after budgets - before budgets
" relative new redesign:extension - new design
• steered on: gross margin - volume* central element:
task group - functional depart ment* management information:
aggregated • desaggregated
* cost system:job order costing - process costing
* use of cost pool method:process control - overhead allocation
* tariff system: extensive - limited' use of budgeting: extensive - Smiled* use of budgets: cost control - planning• overall performance measurement:
control coherence - steer organisation* nonfinandal information:
stand-alone - integrated
The category control structure is an example of an identical cue that is phrased dif-ferently in accounting than in organisation theory: The use of meetings and formsin the organisational open coding is focused on interaction of departments whilein the accounting open coding, use of meetings and forms focuses more specifi-cally on communicating performance information, i.e., interaction is specified interms of performance information exchange. The subsequent discussion and pos-sible action follow-up is, again, a matter of the organisational context and cannotbe considered part of an accounting structural design but of the processes attunedto it.
/4;ria/ CodingAs categories and their characteristics are now available, linkage and causation canbe analysed. Using the coding paradigm to find an axis/denominator for this link-age, we obtain an axial coding typification of the organisational redesign (Figure7.6) and of the management accounting systems design (Figure 7.7).
176
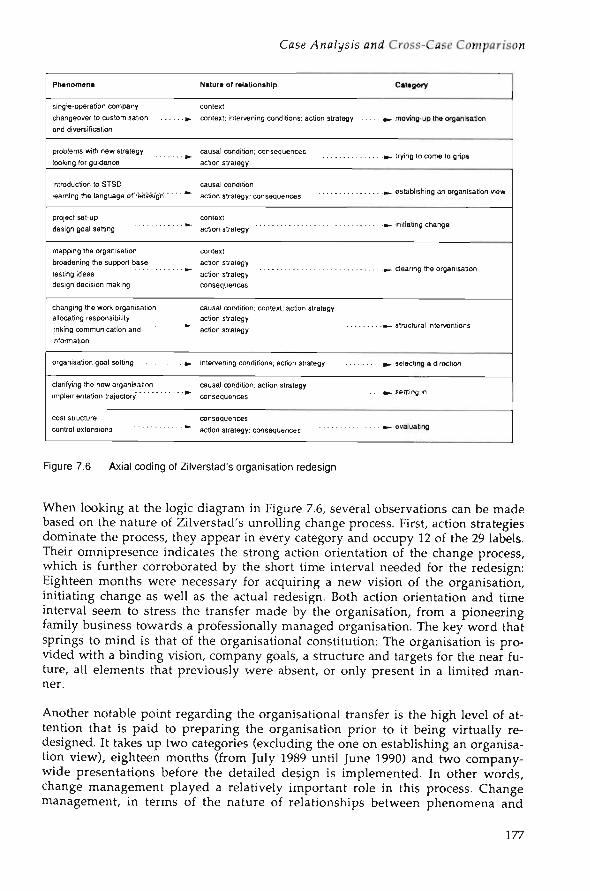
Case Ana/ysis and Cross-Case Comparison
Phenomena
single-operation companychangeover to customisation ».and diversification
problems with new strategylooking lor guidance
introduction to STSOlearning the language of redesign * "
project set-updesign goal setting
mapping the organisationbroadening the support basetesting ideas *~design decision making
changing the work organisationallocating responsibilitylinking communication and *"information
organisation goal setting «-
clarifying the new organisationimplementation trajectory
cost structurecontrol extensions - . . - * -
Natura of relationship
contextcontext; intervening conditions: action strategy
causal condition; consequencesaction strategy
causal conditionaction strategy: consequences
contextaction strategy
contextaction strategyaction strategyconsequences
causal condition: context; action strategyaction strategyaction strategy
intervening conditions; action strategy
causal condition; action strategy
consequences
consequencesaction strategy; consequences
Category
a» moving-up the organisation
a»- trying to come to grips
. ^ establishing an organisation view
-fc. initiating change
^ . clearing the organisation
»- structural interventions
a»- selecting a direction
•»• settling in
« - evaluating
Figure 7.6 Axial coding of Zilverstad's organisation redesign
When looking at the logic diagram in Figure 7.6, several observations can be madebased on the nature of Zilverstad's unrolling change process. First, action strategiesdominate the process, they appear in every category and occupy 12 of the 29 labels.Their omnipresence indicates the strong action orientation of the change process,which is further corroborated by the short time interval needed for the redesign:Eighteen months were necessary for acquiring a new vision of the organisation,initiating change as well as the actual redesign. Both action orientation and timeinterval seem to stress the transfer made by the organisation, from a pioneeringfamily business towards a professionally managed organisation. The key word thatsprings to mind is that of the organisational constitution: The organisation is pro-vided with a binding vision, company goals, a structure and targets for the near fu-ture, all elements that previously were absent, or only present in a limited man-ner.
Another notable point regarding the organisational transfer is the high level of at-tention that is paid to preparing the organisation prior to it being virtually re-designed. It takes up two categories (excluding the one on establishing an organisa-tion view), eighteen months (from July 1989 until June 1990) and two company-wide presentations before the detailed design is implemented. In other words,change management played a relatively important role in this process. Changemanagement, in terms of the nature of relationships between phenomena and
177

Chapter 7
categories, is indicated by the presence of the 'context' label. At the start of thepreparation categories initiating c/jange and C/ean'ng f/ie organisation, a 'context'label appears, indicating the amount of attention paid to preparing the mind forthe next step. In turn, it leads (again) to the idea of event cycles, each cycle being aphase in the transfer process.
Second, the event cycle concept can be further exemplified by the appearance of the'intervening conditions' label, each intervening condition marking the beginningand end of a cycle. Typically, the main event cycle of Zilverstad coincides with itstransfer to the organisation stage. For instance, the phenomenon 'changeover tocustomisation and diversification' marked the beginning of a change in organisa-tional processes, which was concluded by restructuring the organisation and start-ing up a new (and more explicit) selection of a future direction ('organisation goalsetting' phenomenon). This can be considered as 'the big event'.
Several related event cycles that fit into 'the big event' can be subsequently distin-guished: A cycle related to the awareness that something has to be changed, tyingthe categories Trying to come to grips and Esfab/ishing an organisation D/CIÜ to-gether, in terms of 'causal conditions' and 'consequences'. A second subcycle re-lated to preparing the organisation for change, as previously discussed, groupingtogether the categories initiating cnange and C/earing f/ie organisation by means ofthe 'context' and 'consequences' labels. A third subcycle related to structural inter-ventions, including the MAS design, overlying the categories Structural interven-tions, Contro/ structure, Cnange c/irono/ogy, information supp/y and A4Y4S De-sign. This cycle also includes all the axial coding categories of the MAS design (seeFigure 7.7), that will be discussed below. The fourth and final subcycle relates tothe ex post condition of the transferred organisation (categories Sett/ing in andEua/uafi'ng). It contains a relatively large number of 'consequences' labels and isinitiated by a 'causal condition' label. It is, however, termed a subcycle and not a*big event cycle' since the time interval allowed in the case description does not al-low assessing if another 'big event cycle' has been initiated.
The 'intervening conditions' label at the end of the 'big cycle' marks a renewedstrategic discussion. This time, however, it is more explicitly structured and for-malised and departs from an improved starting position. The outcome of thisstrategic discussion can very well mean moving away from the diversification andcustomisation strategy (see case description). If this is the case, a subsequent 'bigevent cycle' inevitably begins, and follows the organisation stage in a step-functionmanner, i.e., building on to the newly acquired organisational capabilities.
Ana/ Coding - M/4S DesignSimilar to the organisation design, the MAS design of Zilverstad shows a strongpresence of 'action strategies' in each category. This is also reflected in the MASdesign, where one can see the considerable effort put into transferring the organi-sation from one stage to another. Moreover, the 'context' labels are repeatedly tiedto the first phenomenon in each category, thereby embedding the 'action strategies'in each category. It suggests that the actions were preceded by setting the context ina planned effort, i.e., the important role of change management was maintainedin the MAS redesign.
178
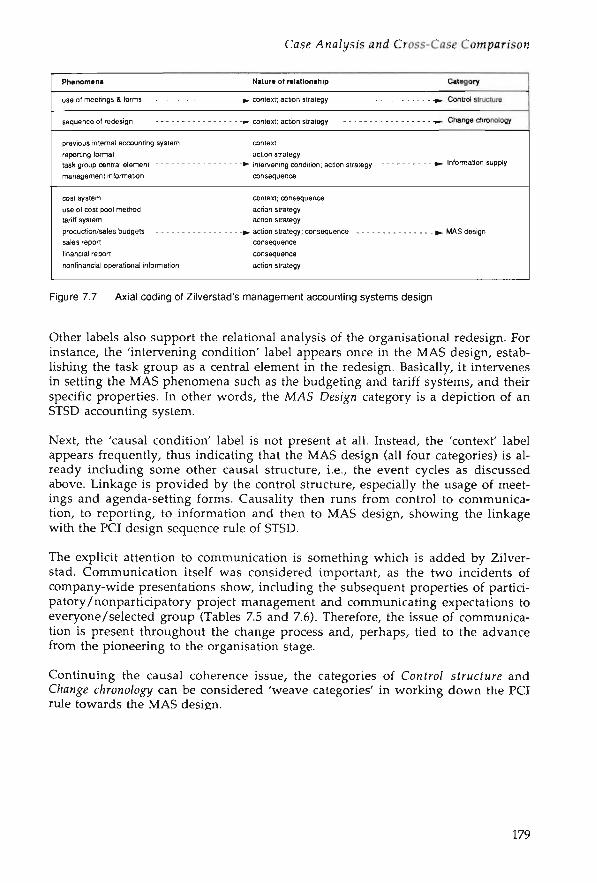
Case .Analysis and Cross-Case Comparison
Phenomena
use of meetings & forms
sequence of redesign
previous internal accounting system
reporting format
task group ceniral element
management information
cost system
use of oost pool method
tariff system
product ion/sales budgets
sales report
financial report
non financial operational information
Natura of relationship
. 1» context; action strategy - . . - .
-^ - context; action strategy
context
action strategy
•*• intervening condition; action strategy
consequence
context; consequence
action strategy
action strategy
»» action strategy; consequence
consequence
consequence
action strategy
Category
•»»• Control structure
• » - Change chronology
. « » Information supply
1». MAS design
Figure 7.7 Axial coding of Zilverstad's management accounting systems design
Other labels also support the relational analysis of the organisational redesign. Forinstance, the 'intervening condition' label appears once in the MAS design, estab-lishing the task group as a central element in the redesign. Basically, it intervenesin setting the MAS phenomena such as the budgeting and tariff systems, and theirspecific properties. In other words, the M/4S Design category is a depiction of anSTSD accounting system.
Next, the 'causal condition' label is not present at all. Instead, the 'context' labelappears frequently, thus indicating that the MAS design (all four categories) is al-ready including some other causal structure, i.e., the event cycles as discussedabove. Linkage is provided by the control structure, especially the usage of meet-ings and agenda-setting forms. Causality then runs from control to communica-tion, to reporting, to information and then to MAS design, showing the linkagewith the PCI design sequence rule of STSD.
The explicit attention to communication is something which is added by Zilver-stad. Communication itself was considered important, as the two incidents ofcompany-wide presentations show, including the subsequent properties of partici-patory/nonparticipatory project management and communicating expectations toeveryone/selected group (Tables 7.5 and 7.6). Therefore, the issue of communica-tion is present throughout the change process and, perhaps, tied to the advancefrom the pioneering to the organisation stage.
Continuing the causal coherence issue, the categories of Confro/ sfrucfure andChange c/irono/ogy can be considered 'weave categories' in working down the PCIrule towards the MAS design.
179

Properties Categories
implicitcompetitivestrategy
implicitproductionstrategy
planningsystems
"control. systems
meetings &agendas
strategic/redesignO sequence
communicatingexpectations
projectmanagement
gaining© credibility
PCI design
coststructure
humanresource
communicatingperformance
budgetsestablished
Movlng-up the organisation
Trying to come to grips
Establishingan organisation view
Initiating change
Clearing the organisation
Structural interventions
Selecting a direction
Settling in
Evaluating
Control structure
Change chronology
Information supply
MAS design
Figure 7.8 Axial pattern of Zilverstad
How this weaving is accomplished can be discussed by linking categories at thedimensional level, i.e., exploring the variation in phenomena, the last step in per-forming axial coding. The axial pattern that can be determined as a result of thisprocess is linked by the dimensions of properties and not so much by the proper-ties themselves. For instance, linkage between organisational context and MASdesign is achieved by the properties of meetings and agendas (organisation design
180

Case v4na/ysi's and Cross-Case Comparison
context) and communicating performance (MAS). Although they have differentnames, their dimensional profile is identical: In an organisational context, it isdimensionalised in terms of /n'g/i and /ift/e interaction while in an MAS context,it is dimensionalised as between groups and in group, both exemplifying the link-age that is accomplished by the meetings and agendas. Categories also link up, be-cause Structure/ interventions also contains the property TCI design'. The C in PCIdesign stands for control structure design. This is the starting category of the MASdesign.
The order in the axial pattern is established by the previous axial coding of the na-ture of relationships between phenomena and categories and their 'properties'. Forinstance, consider the first top nodes in the axial pattern. 'Implicit competitivestrategy' as well as 'implicit production strategy' are part of the changeover to thecustomisation and diversification phenomenon. It is related to Moi>ing-up f/re or-ganisation by means of establishing a context for the upcoming events, while atthe same time providing an intervening condition, in order to set the tone for thereorganisation. In turn, the reorganisation brings events that are themselves ac-tion strategies, albeit implicit ones since the decision to changeover was not wellthought-out. Consequently, the problems of the changeover were with 'human re-source qualifications', and the 'control and planning systems' with which the or-ganisation was Trying to come to grips. These problems directly caused (event cy-cle) the condition where a comprehensive 'organisation solution' was sought, re-sulting in an action to look for a certain 'type of assistance'. Consequently, this re-sulted in 'introducing concepts' that explicitly Esfab/isn an organisation zn'ew.
From the above example (coding paradigm categories in bold and open-coding cat-egories in italic), you can already see that an axial pattern almost naturally rollsover into an abstract narrative of what happened. This narrative constitutes thestoryline, i.e., the heart of selective coding.
Se/ecfiue CodingAgain, the storyline revolves around the central phenomenon of organisationa/cnange, which can be, in the case of Zilverstad, metaphorically labelled as the con-stitution of the organisation. The firm went from a single-operation family busi-ness to a multi- operation, multi-product business with a focus on customisedquality products. During this changeover, the firm professionalised its manage-ment as well as its organisational control by means of STSD instruments and theexplicit human resource-based view on organisations that STSD endorses, andthat neatly fitted together with the social responsibility felt by the owners. Once theorganisation was constituted, it was used as a flexible and active entity for deliber-ate strategic management.
Since the central phenomenon is organisational change, the core category, onceagain selected, was that of organisationa/ /earning. Zilverstad learned quite liter-ally how to lift itself up from a pioneering stage to an organisation stage. In thecourse of learning instruments and techniques, they also learned how to applythose instruments and work together, i.e., they learned a mode of behaviour pre-viously unknown. Both structures, for which they learned how to build them, andthe newly acquired behaviour, which was obtained by virtually building thesestructures, came together in an organisation now able to move as an entity.
181

The first type of learning is single-loop learning (Argyris, 1977): It relates to theproblems that were created by the implicit strategic choice of diversification andcustomisation (category Trying to come to grips) and the STSD instruments andviews applied to resolving this problem. The 'concepts introduced' (final propertyin the Esfab/is/nng an organisation uien; category) marked the end of that single-loop learning process and also of the first event of the subcycle. The second-looplearning process started shortly thereafter when the project management structurewas initiated, getting people to work together. The project gained credibility andpeople rapidly became accustomed to the trust that was placed in them. It was atthis stage, for example, that the case describes that the consultant was not involvedand was only told at regular occasions what the state of affairs was. These twoproperties ('project management' and 'gaining credibility') also coincide with thesecond event subcycle. Subsequent participation in structural interventions (thethird event subcycle) further increased the learning capacity. Notably, the detailedstructural designs made by the organisation members were conceived in less thanone year.
Moreover, the strong emphasis on communication (work groups, the central roleof the meetings and agendas, company-wide presentations) indicated that consid-erable energy was generated and directed towards having people talk to one an-other and teach each other to work together (many action strategies). These newlylearned capacities resulted in "... people do acquire an awareness they have gainedimportance for the company ...", thus leading to an increase of human resourcecosts (see case description) as well as the importance of a job classification systemin Zilverstad's case (the final event subcycle).
The organisation, now perceived as one where people work together, has 'learned'on its way up. Its capacities, at present, involve behavioural routines that were notavailable at the onset of the change process. The next steps for the organisation,such as resetting its strategic course, are only possible once the organisation's struc-tural and behavioural changes have taken place. In other words, deliberate strategyfollowed structure.
In terms of the MAS design, organisational learning is present in the decentralisa-tion of financial control towards task groups ('central element' property). Account-ing instruments are either directed at working together ('overall performancemeasurement' property) or providing the financial information for local control(properties of 'use of cost pool method' and 'use of budgets'). As local control is amatter of jobs and tasks, it is no surprise that the upgraded cost system has becomea job order cost system, possessing characteristics such as products made to cus-tomer specification (samples!); direct material requisitions and direct labour costscarry the job (silver and skilled silversmiths); individual jobs identifiable in theproduction flow (STSD) and sales and administrative expenses are allocated to ar-rive at total cost (gross margin for Sales 'to live on'). Local cost control, clear pro-cesses and a simple cost system result in a highly transparent cost structure, builtby people who learned how to create and think in terms of structures and now usethese same structures to repeat the learning process, although this time, they con-centrated on what behaviour is most profitable for their group. For example, thisis achieved by paying full attention to sample requests from Sales or by manufac-turing inventory orders in the same planning priority as the customer orders.
182
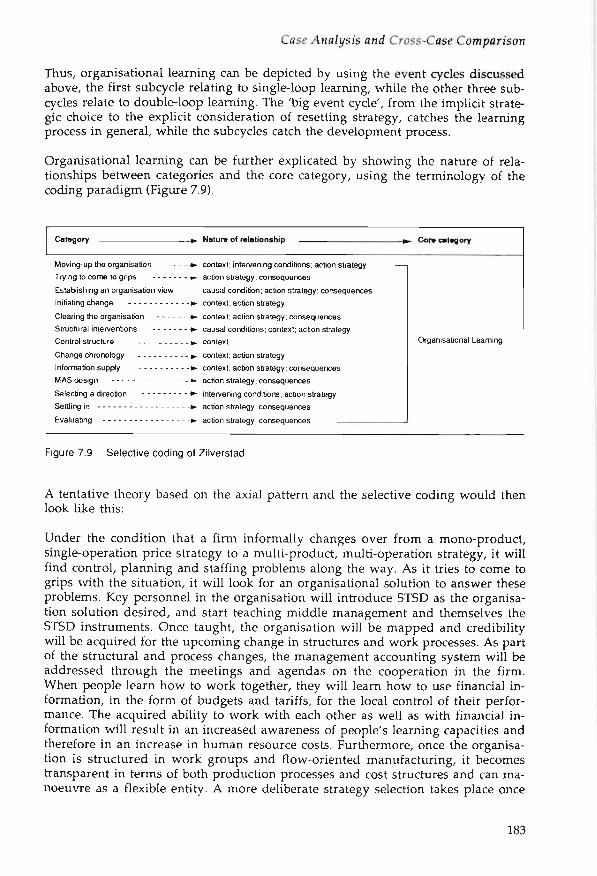
Case /Ina/ysis and Cross-Cose Comparison
Thus, organisational learning can be depicted by using the event cycles discussedabove, the first subcycle relating to single-loop learning, while the other three sub-cycles relate to double-loop learning. The 'big event cycle', from the implicit strate-gic choice to the explicit consideration of resetting strategy, catches the learningprocess in general, while the subcycles catch the development process.
Organisational learning can be further explicated by showing the nature of rela-tionships between categories and the core category, using the terminology of thecoding paradigm (Figure 7.9).
f>t»gnry »- N«tnr» «f f^l^tf P<?h4 p »
Moving-up the organisation #» context: intervening conditions; action strategy — ,
Trying to come to grips *
Establishing an organisation view
Initiating change . _ - . . . _i
Clearing the organisation -i
Structural interventions - - i
Control structure i
Information supply - •
MAS design •
•- action strategy; consequences
causal condition; action strategy: consequences
»• context: action strategy
*• context; action strategy; consequences
*- causal conditions; context: action strategy
». context
». context; action strategy
»- context; action strategy; consequences
«- action strategy; consequences
Selecting a direction • • intervening conditions; action strategy
Settling in i
Evaluating - i
*• action strategy; consequences
» Core category
Organisational Learning
Figure 7.9 Selective coding of Zilverstad
A tentative theory based on the axial pattern and the selective coding would thenlook like this:
Under the condition that a firm informally changes over from a mono-product,single-operation price strategy to a multi-product, multi-operation strategy, it willfind control, planning and staffing problems along the way. As it tries to come togrips with the situation, it will look for an organisational solution to answer theseproblems. Key personnel in the organisation will introduce STSD as the organisa-tion solution desired, and start teaching middle management and themselves theSTSD instruments. Once taught, the organisation will be mapped and credibilitywill be acquired for the upcoming change in structures and work processes. As partof the structural and process changes, the management accounting system will beaddressed through the meetings and agendas on the cooperation in the firm.When people learn how to work together, they will learn how to use financial in-formation, in the form of budgets and tariffs, for the local control of their perfor-mance. The acquired ability to work with each other as well as with financial in-formation will result in an increased awareness of people's learning capacities andtherefore in an increase in human resource costs. Furthermore, once the organisa-tion is structured in work groups and flow-oriented manufacturing, it becomestransparent in terms of both production processes and cost structures and can ma-noeuvre as a flexible entity. A more deliberate strategy selection takes place once
183

management and employees learn how to go about their work and understand thelink between their work and the performance of the organisation.
Comparison of Van Nelle and Zilverstad
Comparison is based on matching both selective coding theories of Van Nelle andZilverstad and their respective axial patterns, and tries to further develop matchedcategories in terms of their dimensional profile.
In general, both cases center on organisational change and organisational learning.Both change processes were initiated by a change in organisational status: VanNelle became independent and Zilverstad departed from its long-term existence asa family business, metaphorically described as 'resurrection' and 'constitution' ofthe organisation. External market considerations seem to be less important: Thetobacco market did not function as a change incentive to Van Nelle, although inZilverstad's case, a market cue was indeed available: Price competition was nolonger a viable strategy and was replaced with diversification.
Organisational status as a cue is followed up by the presence of a social vision onthe part of top management. Van Nelle's new manager had a clear idea as to whatimage the firm must portray, key element being the human resources of the or-ganisation. Zilverstad works somewhat the other way around: People were alreadythe key element because of its longstanding family tradition, but their ideas regard-ing the outcome of the organisational change were less solid. The resulting learn-ing organisations were, therefore, either consciously built upon the idea that peo-ple are the key asset (Van Nelle) or relatively less consciously generated as abyproduct of the longstanding family tradition (Zilverstad).
The central element in the change process is the change management approach. Inboth cases, change management introduced a number of important elements thatguided all subsequent design efforts: participation, decentralised decision making,and local control.
The linking-pin project structure, controlled by a steering group and explicit func-tional design requirements, and the autonomy of work groups to take their owndesign decisions, resulted in credible designs and involved employees. Also, thehigh involvement in the design activity taught people how to cooperate, usingone single STSD language. Further, decentralisation was made operational interms of task groups and local information supply and control.
The newly acquired attribute of knowing how to work together in the design workgroups transfers to how to work together in task groups. A capacity to learn fromone another is also acquired. This is a side-effect of the concrete design skills. This'working together' aspect of the change management approach constitutes the ba-sis for double-loop learning: When people experience how other people work andcooperate, they reflect and question their own behavioural routines and how theypertain to this confrontation, that is, if permitted and encouraged by the context,i.e., the organisational design. Double-loop learning is just that: being able to take a
184
Case /4na/ys!S anti Cross-Case Comparison
double look at the situation by questioning the relevance of operating norms(Morgan, 1986, p. 88).
Both cases can be viewed in terms of cascading event cycles. The largest cycle de-picts the primary motivation for change: The shock of the management buy-outfor Van Nelle and organisational problem solving for Zilverstad. The event cycleswithin the main cycle can be considered learning loops. The first of these minorcycles is related to training: Employees follow courses where they are taught thedesign techniques and instruments of STSD, i.e., single-loop learning. Next, a startis made with a project management structure, preparing functional redesign re-quirements and a general organisation redesign. This first activity forms the basisfor subsequent double-loop learning cycles. This becomes especially apparent inthe case of Zilverstad: Working together in the design activity makes people awareof and allows them to question the mental picture of their work and the sur-rounding organisation. In the further development of the project, mutual interac-tion increases as management shows that they are serious about decentralised de-cision making and local control, either by improvement projects (Zilverstad) orSTAP budgets (Van Nelle).
Double-loop learning is even more present in the considerable use of standards inthe respective accounting systems. Standards can be considered implicit norms onhow to perform although it just measures and controls performance output andnot activity. When the organisation structure is decentralised and local control be-comes the major element in the design, standard setting is completed by thegroups. Thus, performance and performance standards are brought very closelytogether. So when the work of a group changes (i.e., you change the activities andtasks of an autonomous work group) the standards also change. In other words,challenging the job content is challenging the standards, which is a major aspect ofdouble-loop learning. In terms of standard costs and standard cost systems, thenormative standard aspect is more important than the financial cost aspect. Finan-cial standards only differ at this stage in their provision of an alternative weighingfactor in decision making, i.e., is the proposed action financially beneficial as well?When such financial weighing is lacking, other weighing factors such as deliverytime (Zilverstad) or machine occupancy (Van Nelle) can take over because thesefactors are considered as being of strategic (Zilverstad) or control importance (VanNelle). The main assumption, however, is that standards are used to direct be-haviour to improve operations and processes, not to assure accomplishment of settargets and reward or punish accordingly by higher management.
Costs are standardised on the basis of job orders that are grouped into one singleorganisation unit, the task group. Job costs are, therefore, well matched and lo-cated, which in turn leads to a transparent cost behaviour where actions and costscan be traced simultaneously. Indirect costs are either made direct, once their un-derlying activity is revealed and allocated to a task group, or occur only at thecompany level, where they are highly distinguishable and can be allocated by somearbitrary measure open for managerial discretion.
Connectivity/coherence and timely feedback are also used in combination withstandard setting and subsequent variance analysis. The reporting systems of bothVan Nelle and Zilverstad are internally connected, aggregating detailed task group
185

C/iap/er 7
information to Production or company level. In the aggregation process, a systemsjump in control level is explicitly made: Aggregated information addresses thecompany/plant as a whole and supplies input for full product line decision mak-ing. Aggregated and desaggregated information is also reported in different fre-quences: The more frequent, detailed and operational the information is, the lessfinancial it is stated. The management accounting systems of van Nelle and Zil-verstad, therefore, are strongly focused on operational control and local decisionmaking.
Local control is further enabled by three issues that became clear in the Zilverstadcase: the role of strategy, the role of communication and the use of the cost poolmethod. Zilverstad's climb in organisational status more or less replaces VanNelle's fluctuation in economic status, within the larger context of the change pro-cess. The process was motivated by strategic arguments, although these differed inboth cases. Van Nelle's larger goal was to get the organisation on the move, makeit more open and flexible, therefore taking an organisational strategy point ofview. Zilverstad's angle was also to set the organisation in motion, but its primarygoal was to survive in the market place by solving all the organisational problems,i.e., its organisational strategy was linked to an implicit competitive strategy of dif-ferentiation and diversification. In Zilverstad's case, this strategy component be-comes more evident as it relates to a full organisation instead of a plant organisa-tion.
The follow-up to the structural redesign in both cases shows a causal chain: a moreflexible production process, designed from autonomous modules leading to -> amore transparent organisation leading to -> better traceable costs and better organ-isational control which, finally, leads to --> improved input for strategic decisionmaking. Again, Van Nelle is confronted with its economic status, the major policymaker is once again a very large multi-national: Sara Lee has its own strategicagenda and maintains only the plant level controls and flexibilities. On the otherhand, Zilverstad uses its increased control and flexibility to reopen its strategic dis-cussion - this time, in a more deliberate and conscious manner - and builds fur-ther upon its newly acquired capabilities.
To conclude, the interfaces of the strategy-structure-strategy chain are mediated bythe economic or organisational status of the firm. For the resulting MAS design,the mediated strategy-structure relationship is important as well; what is strategi-cally relevant reappears in the MAS structure. As far as strategy and organisationalstatus means challenging set standards, in terms of costs and control informationsupply structures, the MAS design is an instrument to start up or improve double-loop learning.
As a result of the Zilverstad case, the role of communication has been added to thelist of differentiating factors. Communication is located at the boundary of the con-trol structure and the administrative (financial and nonfinancial) informationstructure. What is meant by communication is the explicit use of meetings andagenda-setting forms to relate information to control decision making, i.e., struc-turally bringing supply and demand together. When comparing this to Van Nelle,the role of meetings is limited to internal task group meetings and discussions be-
186

Case y4«a/ysis and Cross-Case Comparison
tween production manager and task group coordinators. Moreover, instead of aseparate line of forms, the formal reports from the MAS are used.
The background of these differences can be either the different systems level (plantversus full organisation) and/or the type of production process (bulk versus cus-tomised). The production process of tobacco has a singular input and then isrouted to one of three task groups (serial + parallel flows). In contrast, Zilverstad'sproduction process maintains several inputs to the task groups and several out-puts to inventory and customer (only parallel flows), requiring more coordinatingeffort between the task groups themselves, and between groups and other parts ofthe organisation. A more structured coordination, by way of meetings and agen-das, then seems highly plausible.
Maybe a third basis for this difference is the attention Zilverstad pays to peopleworking as a unity. Working together and coordinating and communicating it bymeans of a formalised meeting system furthers coherence in actions and opera-tional behaviour. Again, a reference can be made to double-loop learning: Normsand standards such as how to handle sales orders, product development and pro-duction costs are exchanged and discussed. This is partly necessitated by theamount of customised products, and partly by the control and planning problemsexperienced before the STSD redesign, i.e., the importance of coherent and orches-trated action was well understood.
The final item added by Zilverstad is the use of the cost pool method. The costpool method is primarily used to set tariffs, i.e., standard costs for operations: It isthe pure accounting, calculative version of standard setting. Tariffs are used inproduct cost build-up, transfer pricing between groups as well as a minimal finan-cial limit for make-or-buy decisions. The cost pool method at Van Nelle is used toallocate company level overhead across parts of the organisation, indicating thatthe cost pool method requires at least an outline of the full organisation in its cal-culative format. In both cases, cost allocation is performed by centralised staff, hav-ing this outline of the organisation chart.
The use of the cost pool method itself is a further detailing of standard setting. Ithands over standards on individual operations, instead of handing over (budget)standards for the task group as a whole. Furthermore, tariff standards are less be-haviour-restrictive than budgets since they are set less frequently (usually yearly)and relate to bookkeeping categories. These categories are inherently homoge-neous to input, grouping identical costs together, and not to consumption (i.e.,grouping costs on the basis of activities performed in the product flow). Therefore,tariffs relate to what is going in the organisation and what is going out of the or-ganisation but not to what is done in between. In contrast, budgets are relativelybetter behavioural instruments as their unit of application relates to the task or ac-tivity of a section of the organisation and not to input/output registration. There-fore, the use of the cost pool method provides additional standards at the opera-tional level. These standards have less behavioural and learning impact than thebudget standards have.
The existence of a previous accounting system in some detail (Zilverstad) seems toadd to the number of financial building stones required in the accounting system.
187

Chapter 7
For instance, Van Nelle was only provided with an elementary budget for Produc-tion and a number of general overhead expenses to absorb: the consequent re-design of the MAS seems to extend the previous budget type of control. New ele-ments were added only in nonfinancial denominators. Similarly, Zilverstad's ac-counting redesign extends the elements already present to include the new organi-sational format (e.g., cost pool method allocation, budgets). 'New' accounting,therefore, are extensions of the existing elements. New, nevertheless, is the differ-ent use of the system and its explicit embedment in a larger reporting, communi-cating and information structure: Accounting is part of an encompassing man-agement control design.
Grounded Analysis of St. Antonius Vesselheads
Table 7.8 Coupling phenomena to incidents in the case description of St. Antonius
Paragraph In case description
Stuational background
Categorisation ol bottlenecks
Modelling the primary process
Indicating bottlenecks
Relating bottlenecks to org. structure
Designing the organisation structure
A first assessment
Incidents
new president
new management team
dear strategy lacking
ad hoc decision making
inadequate order planning
increasing market pressure
much to do, where to start
contact with STSD
courses followed
STSO leading concept
change plan constituted
SOR
categorisation bottlenecks
Work Group Design installed
entrance external consultant
modelling the primary process
indicating bottleneck causes
relating bottlenecks to org structure
only upstream redesign impossible
project planning
project management
no formal approval mechanism
various alternatives available
redesign chronology
Production Engineers installed
Quality Engineers merged with Sales
improving ordering process
formation of five production groups
modelling controlling activities
normalisation and standard setting
new organisation chart
implementation plan
cost-benefit analysis
Phenomena
change of control
organisation problems
looking for guidance
STSD establishes itself
overall change phases
change goals
redesign reference point
pinpointing change locations
full reorganisation
change management
design choice
information flow linkages
production redesign
control redesign
implementation trajectory
evaluation
188

Case /4na/ysis and Cross-Case Comparison
The case of St. Antonius Vesselheads (hereafter referred to as St. Antonius) is thecase last described in the chronology of all three cases; it is the most recent one andit benefits from experiences gained in the previous two cases, both in terms of de-scription and analysis.
Table 7.9 Open coding of St. Antonius' case description
Ptwnonwna
change of controlorganisation problems
looking for guidance
STSD establishes itself
overall change phases
change goals
redesign reference point
pinpointing change locations
full reorganisation
change management
design choice
information flow linkages
production redesign
control redesign
implementation trajectory
evaluation
Category
Need for change
Adoption of STSD
Planning theredesign contents
Targeting the redesignapplication points
Organising for
Hie new design
Inducing
cooperative behaviour
Structural
interventions
Settling in
Property and Dimensional Rang*
' top management: newly installed - long seated
* type ol change wanted: organisation wide - partial
• STSD acquaintance:
via network membership - via individual contact
* type of assistance: training courses - expert opinion
' redesign planning: phased * all at once
* redesign reference points:
bottleneck locused - indiscriminate
* change goals formulated:
strategy-dependent - nonstrategy-dependent
' planning performed by:
management team - functional department
' analysis of the organisation: extensive - limited
' redesign applied:
to entire organisation • to part of organisation
• functional redesign requirements: specific - global
* project management: participatory - nonparticipalory
' linkage redesign to project planning:extensive - limited
* design and implementation chronology:
dillerent chronology - identical chronology
* role of technical information: important • unimportant
' internal upstream information linkage:
by identical roles - by liaison officer
* external upstream information linkage:
by standardising customer buying behaviour - by
extending order taking procedures
• sequence ol production design:
work organisation first - responsibilities first
' control design chronology:
normalisation first - allocation of control activities first
• control basis: norms • direct supervision
* role of quality control: dominant - subordinate
' linkage with redesign and project planning:
extensive - limited
• communicaiion to organisation:
repeatedly - one lime only
' cost structure: transparent - diffuse
' quantitative cosls: high - low
' qualitative cosls: high - low
' quantitative benefits: high - low
" qualitative benelils high - low
189

er 7
Open CodingSimilar to the previous cases, the case description is chronological. Incidents andunderlying phenomena are, therefore, listed as they unfolded over certain time.Moreover, incidents and phenomena can be traced back to the case description asthe matching paragraphs are also stated.
In labelling phenomena, terminology and words from the case description areused where possible. Next, phenomena are coded into categories, again using ter-minology and descriptions from the case study in order to avoid preliminary ana-lytical interpretations. Both categories and dimensional profiles are closely statedto the text, although they try to obtain a higher conceptual content of terminology.
Open Coding - MAS DesignThe phenomena in the management accounting system of St. Antonius are cou-pled to conceptual categories in Table 7.10. For these categories, the use of account-ing jargon could not be avoided, particularly with the term ya/uafing acfiaifieshaving a balance sheet connotation. Valuation in this case is used as a synonymfor providing a financial dimension to processes, i.e., for translating one concep-tual map (production activity) into another (cost behaviour).
Table 7.10 Open coding of the MAS design of St. Antonius
Paragraph Ino t M description
Designing the
AccountingSystem
Phenomena
result ol preceding company into system
financial organisation level info
shop ROOT level info
work centre units created
production cost tariffs
four types of tariffs
cost pool method
variance analysis
cost structure
Job order cost system
WIP throughput Indicator
administrative organisation
product cost
bottom-up built MIS
roles of MIS
management control parameters
WIP report
Period report
Er pos f calculation report
Category
Goals of the MAS
Valuatlng activities
Cost control
Information supply
MAS design
Property and Dimenelona) Range
* position of MAS in information structure:
technical mfo first - financial info first
* MAS information flows:
accommodating horizontal & vertical flow •
accommodating one How only
* goal of MAS: production control - cost control
* valuation basis:
work centres • responsibility centres
* valuation denominator:
work centre units - product units
' activities cos ted:
by tariffs - by percentual rates
* tariffs set:
by cost pool method • by managerial discretion
* cost control:
on nonflnanciaJ basis - on financial basis
* cost structure:
few indirect costs - many indirect costs
' WorK-ln-Process used as:
throughput indicator - balance sheet Item
* role of administrative organisation:
* MIS: method for communication - method for control
' MIS structure: built bottom-up - built top-down
* management control:
flow-oriented - department-oriented
* level of operational control Information:
Individual order level • task group level
* performance denominator: time • money
* variance analysis on order level:separate report - pan of other reports
190
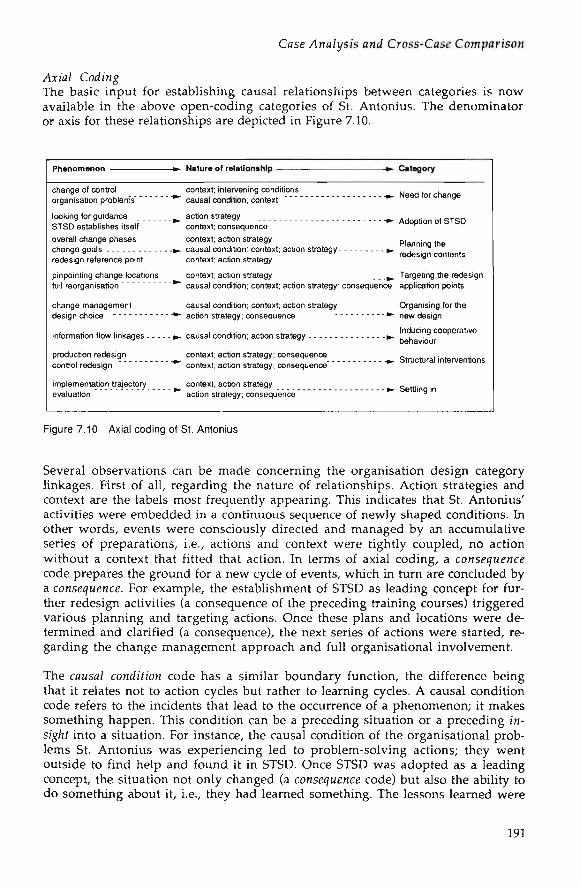
Case j4na/ysis and Cross-Case Comparison
CodingThe basic input for establishing causal relationships between categories is nowavailable in the above open-coding categories of St. Antonius. The denominatoror axis for these relationships are depicted in Figure 7.10.
Phenomenon »• Nature ol relationship •• Category
change of control context; intervening conditionsorganisation problems" * " causal condition; context * " ' ° " " *
looking for guidance action strategy Adootion of STSDSTSD establishes itself context; consequence «oopoon 01 o i au
overall change phases context; action strategy p. . ^change goals . » . causal condition: context; action strategy !?redesign reference point context: action strategy
pinpointing change locations context; action strategy ^ . Targeting the redesignfull reorganisation * " causal condition; context; action strategy; consequence application points
change management causal condition; context; action strategy Organising for thedesign choice — —•"• action strategy, consequence • * new design
. , , , , . , 1 _•• • ._ Inducing cooperativeinformation flow inkages ». causa condition; action strategy ^- ,_ L
" • ""»» ^ behaviour
production redesign context; acton strategy; consequence structural interventionscontrol redesign context; acton strategy; consequence
implementation trajectory context; action strategy _ .evaluation * " action strategy; consequence *" **™'"B ' "
Figure 7.10 Axial coding of St. Antonius
Several observations can be made concerning the organisation design categorylinkages. First of all, regarding the nature of relationships. Action strategies andcontext are the labels most frequently appearing. This indicates that St. Antonius'activities were embedded in a continuous sequence of newly shaped conditions. Inother words, events were consciously directed and managed by an accumulativeseries of preparations, i.e., actions and context were tightly coupled, no actionwithout a context that fitted that action. In terms of axial coding, a consequencecode prepares the ground for a new cycle of events, which in turn are concluded bya consequence. For example, the establishment of STSD as leading concept for fur-ther redesign activities (a consequence of the preceding training courses) triggeredvarious planning and targeting actions. Once these plans and locations were de-termined and clarified (a consequence), the next series of actions were started, re-garding the change management approach and full organisational involvement.
The cawsa/ condition code has a similar boundary function, the difference beingthat it relates not to action cycles but rather to learning cycles. A causal conditioncode refers to the incidents that lead to the occurrence of a phenomenon; it makessomething happen. This condition can be a preceding situation or a preceding in-sig/if into a situation. For instance, the causal condition of the organisational prob-lems St. Antonius was experiencing led to problem-solving actions; they wentoutside to find help and found it in STSD. Once STSD was adopted as a leadingconcept, the situation not only changed (a consequence code) but also the ability todo something about it, i.e., they had learned something. The lessons learned were
191

subsequently put down in the change goals, following the insights from a SWOTanalysis and STSD (a causa/ condition code). Subsequent learning took place as aresult of the extensive bottleneck analysis of the organisation and leading to therecognition that the full organisation needed to be redesigned, again indicated by acausa/ condition code. In short, learning cycles are indicated by a causa/ conditioncode and can extend across action cycles, indicated by context and action strategycodes.
A final observation that can be made, based upon the open-coding diagram, is thatconsiderable effort is put into the preceding design phases: Four categories betweenthe Adoption o/ STSD category and the Structure/ interventions category (i.e., thevirtual design) indicate the importance placed by St. Antonius on the redesignpreparations. Specifically, added by St. Antonius was the Inducing cooperative be-nauiour category which is concerned with establishing the information linkagesprevious to the structural redesign. Moreover, implementing the information de-sign first, indicates that the production process and production structure are of ahighly information dependent nature, up to the point that information controlsthe production. Consequently, the role of information design seems to be moti-vated by quality control and its exclusive attention for technical and normalisedinformation (see axial pattern where this point is elaborated further). In short, St.Antonius' elaborate redesign preparations is related, presumably, to the presenceof quality assurance normation. Comparison with the other case studies can give amore conclusive insight.
Phenomenon Nature of relationship • - • • - Category
result of preceding company information systemfinancial organisation level information . . . «shop-floor level information
work cenlre units createdproduction cost tariffsfour types of tariffs - - - - - - - - - - - - - a j
cost pool method
varianceanalysis
cost structure - - - - - - - . - - - . - . . . . ajjob order cost system
WIP throughput indicatoradministrative organisationproduct costbottom-up build MIS * *roles of MIS
management control parametersW1P reportPeriod report - - - - - - . . . . . . . . . j
Ex post calculation report
context; intervening conditioncausal condition; context; action strategy . . a». Goals of the MAScausal condition; context; action strategy
action strategycausal condition; context; intervening conditionaction strategy •*" Valuating activitiesaction strategy
action strategyintervening condition ^ " Co^ controlcontext
action strategycausal condition; context; action strategyconsequencecausal condition; context; action strategycausa] condition
causal conditionconsequenceconsequence " •*• MAS designconsequence
" • Information supply
Figure 7.11 Axial coding of the MAS design of St. Antonius
/4xi'a/ Coding - M/1S DesignObserving the axial coding of the management accounting system of St. Antonius,in the first place, shows an almost identical frequency in the codes of context (7),action strategy (9) and causa/ condition (7). As in the axial coding of the organisa-tional redesign, context and action strategy are related in terms of action cycles;
192

Case /Ina/ysis and Cross-Case Comparison
what happened and in what order. For example, design of the accounting system isrestricted by the preceding design of the company information system, which isboth a context and intervening condition. Context because it has to reflect a two-tier MAS: One for company-wide managerial purposes and one for local, opera-tional purposes; and intervening condition, because it sets the goal for embeddingthe accounting part of the redesign trajectory in the overall organisation. Linkingthe two is achieved by creating work centre units, an action strategy mirroring theorganisation structure (work centres, divisions) in the accounting map of the or-ganisation (production cost tariffs). Basically, production tariffs were already famil-iar to St. Antonius but in the primitive form of specific labour and machine hourrates. Now, they include overheads and are more comprehensive, hence calledtariffs instead of rates. Actions following the local purposes tier are the use of var-ious nonfinancial variance analyses and the controlling reporting system itself. Ata global company level, the distinction of several types of tariffs, each matchingthe company's capacity outlook (fiscal, break-even, replacement, and marketvalue), as well as the role of WIP as a main throughput indicator, indicates howaggregate management information is supplied.
Causal conditions translate as restrictions on further design actions: Aggregate or-ganisation level information as well as local information are required to be sup-plied, based on the preceding organisation design which matches a strong decen-tralisation with a flexible organisation. Use of work centre units, tariffs (local) andWIP as a throughput indicator (global) are the basic design follow ups. Moreover,causal conditions signal a step-up from the preceding actions: What was learned isused as input for the following action. For instance, building the MIS (an organisa-tion level phenomenon) is done bottom-up. Thus, it was basing itself both on theprevious positive experiences with employees designing their own task group inthe project structure, and on the administrative organisation which was based onlooking for the information Quality and Production Engineers actually needed fortheir work (i.e., endorsing a local perspective): Those lessons learned from the pre-ceding design activities (the intervening condition code at the start of the MAS de-sign).
Furthermore, the consequences codes in the diagram are located predominantly atthe end of the design track. The reporting system and the production cost informa-tion supply are truly the final outcomes of preceding actions, also indicated by theabsence of context and action strategy codes. Again, the importance of extensivepreparations, also noted in the axial coding of the organisation design, is domi-nant: Preliminary and preparatory categories take up much of the event space -three out of five categories, /nternening conditions codes have a historical flavourin that they relate to preceding events and circumstances. First of all, in the condi-tion of the information system, where the accounting design has to fit in and, sec-ond, in the conditions where familiarity already exists with production rates as ba-sis for the latter production tariffs and with a cost structure favouring direct overindirect costs. Both made good basic conditions for the subsequent creation of de-tailed and local cost information.
Linking categories at the dimensional level again indicates the relevance totheoverall and preceding information structure. The information structure itself is areflection of several specific items: The redesign of the entire organisation, focus-
193

Chapter 7
ing on information linkages between departments and the importance of one typeof information (technical). Information is used in the organisation design as amethod of reinforcing the flow orientation of production, i.e., departments are re-quired to cooperate with information supply because the technical process necessi-tates it. The accounting consequences are operationalised by the use of work centreunits, detailed production cost tariffs, reporting at individual order and operationlevels, variance analyses both in reports and as a separate ex posf calculation re-port, a high level of nonfinancial information and a throughput indicator whichis function nonspecific. In general, it can be questioned as to whether one can stillspeak of a management accounting system design because the financial/cost itemsare merely translations from operational and time dimensions of the global andlocal information demanded. Rephrasing linkages between categories and theirproperties, the axial pattern can be established as in Figure 7.12.
Categories Properties
Need for change top management
Planning theredesign contents change goals formulated
Targeting the redesignapplication points
analysis of ,the organisation
Organising tor thenew design
linkage redesignto project planning
projectmanagement
role of technicalinformation
Inducing cooperative behaviour
Structural interventions sequence ofproduction design' control desig
chronologyrole of controlquality basis.control
Settling in linkage with project& redesign planning
communication toorganisation
position of MASin information structureGoals of the MAS MAS information
flows
valuationdenominator
role of WIP usageadministrativeorganisation
level of operationalcontrol information
managementcontrol
MAS design
Figure 7.12 Axial pattern of St. Antonius
194

Case .Ana/ysis and Cross-Case Comparison
Linkage between organisation design and MAS design is performed by the cate-gories /ndwcing cooperafiue be/iay/our and Goa/s o/ f/ie M/4S. More specifically,the upstream information linkage between the Production and Sales functions ofSt. Antonius and the role of technical informationprovide the basic match. Thelatter property, however, links up indirectly as it is tied to the dimensional profileof the MAS property 'position of MAS in information structure' (technical infofirst versus financial info first). The reasons for the overall importance of techni-cal information can be traced back to the 'change goals formulated' property in theP/annmg f/ie redesign contents category. Change goals are dimensionalised as de-pendent on strategy, with the strategic goals of St. Antonius being related to highquality and short and controllable throughput times. More specifically, this isstated as 'communication & information' and 'knowing by measuring'. In otherwords, St. Antonius strategic goals are highly nonfinancial and, therefore, arethought of as being nonfinantially transferred and operationalised in the redesignprocess.
Based on the above axial pattern, the nature of relationship between the variousevents can be stated as follows: The change in top management, as a result ofHouben Jr. taking over control of the organisation and installing a professionalmanagement team, formed the organisational context for solving the organisa-tional problems that St. Antonius experienced. Consequently, they took action bylooking for guidance in their network of contacts. They came upon STSD, whichassisted by training them in organisational redesign. Having adopted STSD as aleading concept, the management team formulated change goals and analysed theorganisation as to locate the application points of their redesign effort. They dis-covered that redesigning only a part of the organisation was impossible and, as aresult, the redesign content, redesign planning and project organisation was ap-plied and communicated to the full organisation. A start was made with the up-stream functions in the flow and, more specifically, with the integration of thetechnical information flow across the departments. The work organisation under-lying the technical information demand was, in the first place, redesigned by nor-malising control standards and information requirements. This was much helpedby the importance of quality control expressed in the change goals.
The management accounting system was preceded by the demand for technical in-formation, both in the horizontal information flow to local users and to the verti-cal flow to managerial users. The structure of the information supply was builtfrom the local users upwards, communicating to management rather than con-trolling actions by higher management. Linkage between the two flows was de-signed and visualised in the administrative organisation chart and in separate re-porting on variances in time consumption and individual order performance.Cost control and managerial control were equally based on the work centres in theproduction flow. The accounting system, being primarily directed at productioncontrol, translated operations into financial values by creating work centres, hav-ing individual production cost tariffs.
Se/ecti'ue CodingAs with the two other case studies, the storyline of St. Antonius has revolvedaround organisafiona/ c/iange, metaphorically expressed as the professionalisationof the organisation. The firm changed itself from a problem-ridden job shop or-
195

•f'
C/iapfer 7 • - . • • . . -
ganisation into a quality-standardised, flexible subcontractor. Professionalisation isaccomplished by a decentralised organisation structure, flow-oriented productionand improved organisational control and information systems. STSD played a keyrole in attaining this status, and is still playing it in the ongoing improvements ofinformation, managerial and work procedures.
Once again, the core category selected is that of orgUMisafiona/ /earning. St. Anto-nius learned how to change itself in full and, along the way, they have gained con-siderable insight into its own production operations, information flow and how tocontrol the two. In other words, St. Antonius has learned to learn by questioningthe relevance of operating norms or, in the many cases where there were nonorms, ask itself what norms they think are relevant, thus questioning both theoperational process and the larger strategic framework containing this process. Theconsiderable effort of St. Antonius in normalising information (and work proce-dures, as the two are intrinsically tied) clearly shows that the question of 'what isrelevant to what' has been asked many times.
Characteristics of the St. Antonius learning process can be gathered from the axialpattern. Learning began with the start of events, i.e., the changeover in managerialcontrol by Houben Jr. and the newly engaged management team. Single-looplearning took place by attending the STSD courses, where the change skills andmethods were literally learned. Single-loop learning is defined as "the ability todetect and correct error in relation to a given set of operating norms" (Morgan,1986, p. 88), hence, the strong normative content of STSD.
The first big lesson learned is that partial reorganisation, by linking up the up-stream and production information flow, was not possible. Information was sodeeply grounded in operational processes, that to engineer the information at thesame time, meant to engineer the processes. This insight created not only a newaction towards a reorganisation in full, but also made everyone aware that infor-mation was the crucial concept in the entire reorganisation; it was linked to everypart of the production flow. It formed the first double-loop learning basis as it putthe topic of what was relevant into the spotlight. Double-loop learning is definedas "being able to take 'a double look' at the situation by questioning the relevanceof operating norms" (Morgan, 1986, p. 88). The lesson was immediately put intopractice by linking redesign content, phases and planning to the linking-pin pro-ject organisation, thus interweaving the information knowledge of various em-ployees with the required information and production redesign targets.
The second double-loop learning step was built from the first: The importance ofinformation was structured into the jobs of Quality and Production Engineers,who have identical roles although at different levels (production processes andproduction methods respectively). Work procedures and information require-ments were brought together in one individual, who, as a result, was able to setthe specific control norm for subsequent operations on an order: Information andcontrol brought together at one place, tightly coupled to production activities.Quality control considerations played an important role here as well. A highproduct and process quality was and is an explicit organisation goal, requiring thatattention for normalisation and standardisation according to ISO was part of theredesign effort. The thorough analysis of the organisation preceding the design
1%

Case /4na/ysis and Cross-Case Comparison
turned out to be usable for both; the process insights also made redesign as well asnormalisation possible. In short, the second double-loop learning experience wasthat quality control information was an extension of the tight coupled informa-tion flow and production activities, up to the point that it set the control structuredesign by its elaborate supply of measurement standards.
The third double-loop learning experience carries over to the management ac-counting system design as it takes up the points of quality-normalised and nonfi-nancial information for organisational control. The goal of the MAS is productioncontrol which, as stated above, is mainly performed in nonfinancial terms. Con-trol information is tied to quality standards as well as to production flow. Mea-surement of standard and variance analysis are, therefore, common ground. Thelearning part of the design, however, is located in the horizontal and vertical pro-vision of information: Horizontal in terms of nonfinancial standards runningparallel with order progress (i.e., WIP as throughput indicator) and vertical interms of communicating the current state of affairs to higher management. Con-trol actions are to be taken at the level where the information is generated andwhere the information system is built, and not by higher management. Unless, ofcourse, it requires an action regarding the full organisation such as setting up a jobclassification system. The lessons learned by the preceding tight linkage betweeninformation and operations are reflected in the reporting structure. Detailed oper-ational information, variances to standard, desaggregate to the order level and aseparate report for checking on performance standards are the four items indica-tive for learning. Especially the check on the performance by the ex posf calcula-tion report is an evaluation device seldom encountered.
Category t>- Nature ol relationship
Need for change a» Causal condition; context; intervening condition
Adoption ol STSD »- Context; action strategy
Planning the redesign contents »- Context: action strategy
Targeting the redesign application points - - » - Causal condition; action strategy
Organising lor the new design • • Causal condition; action strategy
Inducing cooperative behaviour » - Causal condition: action strategy
Structural interventions a» Action strategy: consequence
Settling in - — . . . . — .»» Action strategy; consequence
Goals ol the MAS a» Causal condition; context; intervening condition
Valuating activities »• Context; action strategy
Cost control -a» Action strategy
Information supply - - - - - — — -a» Causal condition; context; action strategy; consequence
MAS design -a» Action strategy: consequence
-a> Cora category
OrganisationalLearning
Figure 7.13 Selective coding of St. Antonius
197

In explicating the linkage between core and subsidiairy categories, the codingparadigm is used for establishing the nature of the linkages. As can be derivedfrom the diagram, learning can be tied to the appearance of the causa/ conditioncode. Interweaving of lessons learned with the next learning cycle is located in thethree categories of Targeting t/ie redesign app/ication points, Organising /or tneneiü design and Inducing cooperative be/iap/our. The link of these lessons withthe MAS design is located in the categories Goa/s o/ the My4S and /n/ormati'onsupp/y, where the position and relationship of the MAS with the organisationalcontext is explicated.
Next, a tentative theory regarding the reorganisation of St. Antonius would lookas follows: On the condition that the top management of a firm determines thatthe organisation needs to be redesigned in order to solve the organisational prob-lems it encounters, it can adopt STSD as leading redesign concept. Redesign is ac-complished by employing STSD methodology. As a lesson of the targeting of re-design efforts, it is learned that partial redesign is impossible. Consequently, theorganisation will extend the redesign effort as well as establish a close linkage be-tween redesign content and planning, and project organisation. Redesign will fo-cus on relating departments to each other, on the basis of the concurrent informa-tion flow. Since these information flows are technical in nature and are managedby creating identical information processing jobs in separate departments, controlis based on the normalisation and passing of information to other function down-stream in the work flow. Structural redesign is then performed by restructuringthe work organisation, by first paying attention to the normalised control informa-tion. The management accounting system links up with the newly acquired in-sight into the horizontal and technical information flows of divisions and workcentres, and is primarily directed at production control. Work centre financial per-formance is valuated by production cost tariffs and controlled on a variance basis.Financial information supply has a causal relation with the importance of theproduct flow and consequently reported on at the order level. The managementaccounting systems design resulted into a transparent cost structure, communicat-ing performance to management and employees.
Comparison of Van Nelle, Zilverstad and St. Antonius
Comparison of the three case studies is based on the open-coding dimensionalprofile, axial patterns and the conclusions of the previous one-to-one comparisonof Van Nelle and Zilverstad.
First, we compare at the open-coding level. All three cases revolve around organi-sational change and organisational learning. However, the need for change andthe objective for entering the change process are different: Van Nelle wanted toresurrect the sleepy organisation and change it into a market-oriented flexiblefirm; Zilverstad wanted to constitute an organisation leaving the family businesspioneering phase it had been in for a long time; and St. Antonius wanted to pro-fessionalise its current management and organisational control in order to becomea quality-certified subcontractor. As different as their motivations may be, theroutes they took were largely identical, following closely the STSD change man-agement approach called Integral Organisational Renewal. Its elements of aware-
198

Case /4na/ysis and Cross-Case Comparison
ness for a need to change, strategic and structural orientation, training courses,structural redesign, project management and implementation can all be distin-guished in each individual case (Table 7.11).
The first and last phases of each individual trajectory can be readily distinguished.Less clear are the phases preceding the interventions. Here, organisational differ-ences become notable, depending on their economic or organisational status. Forexample, Zilverstad performed its strategic orientation in the structural redesignphase because of its wish to 'get organised' before setting its course. St. Antoniusfocused primarily on the information flow because it was here that they felt thelargest contribution would be gained. In short, organisational differences can befound in the sequence or accentuation of elements along the change path, not inmissing elements.
Table 7.11 Comparing change trajectories to STSD norm
Van Nelle
Reasons for change
Pointing noses
Operational design interventions
Experiences
Zilverstad
Moving-up the organisation
Trying to come to grips i-
Establishing an organisation view
Initiating change
Clearing the organisation
Structural interventions \
Selecting a direction
Settling in
Evaluating
St. Anlonius
Need for change
Adoption of STSD
Planning redesign contents
Targeting redesign applications
Organising (or the new design
Inducing cooperative behaviour
Structural interventions
Settling in
STSD
Awareness of need forchange
Strategic orientation
Structural orientation
Training courses
Project management
Structural redesign
Implementation
The open coding of all three management accounting systems design are lesscomparable to what STSD prescribes, simply because the subject is not covered bySTSD. From the axial patterns, it shows that accounting design hangs somewherein between the control structure design and the information structure design: Aprecise location in the STSD theoretical sequence cannot be given. For example, atVan Nelle, the internal accounting system is a financial extension of the informa-tion structure (i.e., the reports), at Zilverstad the accounting system is a natural ex-ponent of the meeting & agenda communication structure, and at St. Antonius,control and information are not easily separated because of their interweavingwith production and quality control, and, before, the management accounting sys-tem. As a result, accounting submerges in the integral redesign process: Its infor-mation function integrating with the performance information and its calculativefunction integrating with the operational control. Furthermore, a clearly distin-guishable change chronology as to when information design stopped and account-ing design started is hard to give. The only chronology possible is, what report fol-lowed in what order in the redesign; in other words, it is an implementationchronology and not so much a design chronology.
To compare at axial coding level, we use the three axial patterns. When looking atthe linkage between the organisational context and the management accountingsystems design, we can see that there are eight properties performing this role: At
199

Chapter 7
Van Nelle, there exists decenfra/ised decision maiting on resources and a desag-gregated information system; at Zilverstad there are the /ii'gh/y interactive meet-ings 6" /orms and the communication o/ per/ormance between groups; and at St.Antonius, there are the properties of the important ro/e o/ tec/imca/ in/ormation,f/je interna/ upstream information /initage by idenfica/ ro/es, fne position o/ t/ieM/4S in t/ie in/ormation structure and the accommodating o/ /lorizonta/ and rer-fica/ in/ormation /lows in f ie MAS. To put into key words, we can identify thelinkage to be made by the issue of decentralisation at Van Nelle, of communica-tion by Zilverstad, and of information at St. Antonius. Each case then elaboratesupon this issue and explores it as an organisation-specific MAS design. However,elaboration is always directed at control, be it managerial or local. In Van Nelle'scase, cost control is explicitly addressed at the local task group level; in Zilverstad'scase the control structure is designed around communication and cost control; andin St. Antonius' case, production control is addressed by tying information flowstogether.
Furthermore, linkage is established by the collaborating event and learning cyclesin each case. Events are strongly mitigated by the use of both the Integral Organisa-tional Renewal change management approach and the Production, Control andInformation structure design rule of the STSD toolkit. Therefore, events are al-ready prescribed in their causal order and attention is automatically drawn to-wards deviations from this order. Learning cycles, however, are less clearly deter-mined. They are distinguished and discussed in terms of single and double-looplearning, with single-loop learning relating to "the ability to detect and correct er-ror in relation to a given set of operating norms" and double-loop learning relat-ing to "the ability to take a 'double look' at the situation by questioning the rele-vance of operating norms" (Morgan, 1986, p. 88).
Obviously, single-loop learning is tied to the training courses that each organisa-tion puts its members through. The results fall into the 'how to' category. Onceorganisations are practising these lessons, double-loop learning begins. However,there seem to be two general double-loop learning bases in the case studies. Thefirst basis is the one initiated by having a full overview of either the organisationor the problem situation, and the second basis is the one initiated by having peo-ple work together and get involved. For instance, the analysis of the organisationby means of process modelling and bottleneck categorisation provided St. Anto-nius with an overview that resulted in the insight that partial redesign would beimpossible. Similarly, the many problems of Zilverstad were open to survey and,consequently, solutions obtained once the organisation was properly mapped.
Project and work groups and employee involvement are perhaps the strongestcarriers of double-loop learning. The role of project management, bottom-up andtop-down design and performance standards setting, are all contributing propertiesto double-loop learning, because they discuss and reflect upon (existing) norms.Learning is mainly based on the last type of characteristics of the design of theMAS. Performance and cost standards are set by the task groups. The conditionsfor participative, bottom-up MAS design are provided by the preceding controland information systems because of the attention they pay to local control and ex-tensive information desaggregation. The overall flow-oriented production designprevents information and control conditions to be contained in functional de-
200

Case y4na/ysis and Cross-Case Comparison
partments and compartmentalised interests, i.e., performing together becomes anecessity through design.
When verifying the previous one-to-one comparison of Van Nelle and Zilver-stad, we see that Zilverstad added the issues of strategy, communication and, forthe MAS design, the cost pool method for standard setting to the issues of decen-tralisation & desaggregation and event cycles, brought forward by the Van Nellecase. St. Antonius contains the items of decentralisation and desaggregation aswell, although the reporting system desaggregates to the order level and not totask group level. However, the budgeting system to be implemented will probablybe responsible for adding this level to the reporting system. St. Antonius also con-tains the issues of strategy and communication, but in a different fashion. Strategyis operationalised by the quality goal and the subsequent use of a large number ofnonfinancial and technical norms. In other words, the quality strategy is imple-mented by transferring ISO 9002 and 9004 norms to the management process.Communication in the implementation stage has been similarly taken up bycompany-wide presentations but it is not addressed in a structural sense, for ex-ample, by a strict use of meetings and agendas. Instead, communication is consid-ered to be integrated in the information and control structure.
The cost pool method is extensively used by St. Antonius as it is the basis for set-ting production cost tariffs. Tariffs are financial standards for operational controland for product costing (i.e., a basis for outsourcing as well as a criterion for orderacceptation). St. Antonius thus adds the use of the tariff to the use of the cost poolmethod as being an important property of the MAS design. Specifically, what St.Antonius adds is the control of the information flow. Information is as critical aresource for operational activities as are inputs such as materials, money and ma-chinery. To control this resource, St. Antonius adopted and implemented both aquality normalisation, and structured information by job design and administra-tive organisation. In comparison, the information flow at Van Nelle is literallycontrolled by the production manager, either asking divisional F&A to format in-formation in the way he can use it or by making the translation from 'companyrule' production budget to internal reporting system himself. At Zilverstad, the in-formation flow is controlled by the agenda-setting forms, which were designed bythe design work group. Therefore, St. Antonius' accent is to structure informationcontrol explicitly, using the methods of a formal job and administrative design.
If we continue to use the coding procedures, we can state the open coding for thecross-case analysis as in Table 7.12. Categories follow STSD prescriptions in termsof the IOR trajectory and the PCI design sequence rule.
The MAS design reflects in its properties the basic principles of STSD: decentralisa-tion of responsibility, control and group accountability. Management AccountingSystems design is closely tied in with the structural interventions and the simpli-fication as set by STSD. The properties of the MAS design reflect this simplifica-tion. For instance, none of the organisations has expressed the need for 'new' or'advanced' accounting instruments. Traditional textbook instruments such asbudgets and variance analyses are found to be adequate. Their use, however, is farmore different in a communicative sense, as it is directed at the need for controlinformation at operational level.
201
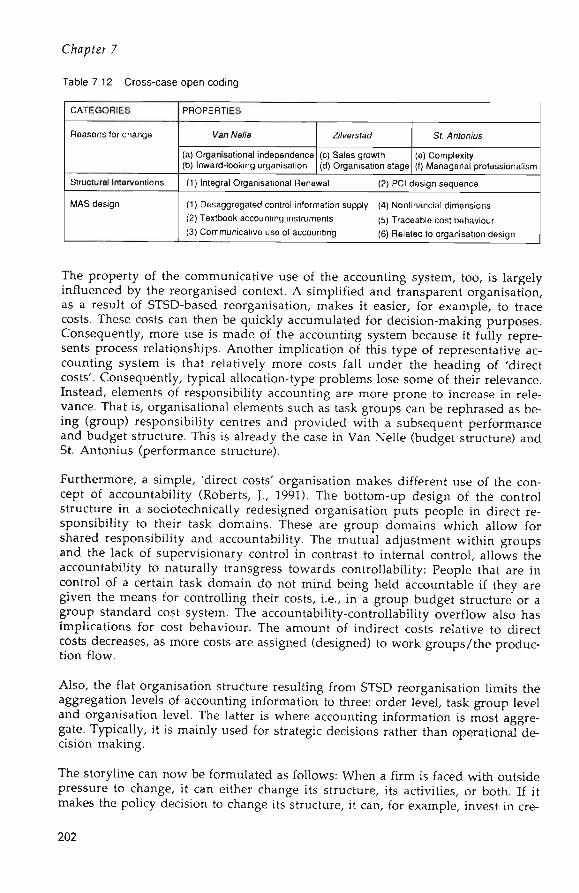
Chapter 7
Table 7.12 Cross-case open coding
CATEGORIES
Reasons for change
Structural interventions
MAS design
PROPERTIES
Van A/etfe
(a) Organisational independence(b) Inward-looking organisation
27/yersted
(c) Sales growth(d) Organisation stage
Sf. /nton/us
(e) Complexity(1) Managerial professionalism
(1) Integral Organisational Renewal (2) PCI design sequence
(1) Desaggregated control information supply (4) Nonfinancial dimensions
(2) Textbook accounting instruments (5) Traceable cost behaviour
(3) Communicative use of accounting (6) Related to organisation design
The property of the communicative use of the accounting system, too, is largelyinfluenced by the reorganised context. A simplified and transparent organisation,as a result of STSD-based reorganisation, makes it easier, for example, to tracecosts. These costs can then be quickly accumulated for decision-making purposes.Consequently, more use is made of the accounting system because it fully repre-sents process relationships. Another implication of this type of representative ac-counting system is that relatively more costs fall under the heading of 'directcosts'. Consequently, typical allocation-type problems lose some of their relevance.Instead, elements of responsibility accounting are more prone to increase in rele-vance. That is, organisational elements such as task groups can be rephrased as be-ing (group) responsibility centres and provided with a subsequent performanceand budget structure. This is already the case in Van Nelle (budget structure) andSt. Antonius (performance structure).
Furthermore, a simple, 'direct costs' organisation makes different use of the con-cept of accountability (Roberts, J., 1991). The bottom-up design of the controlstructure in a sociotechnically redesigned organisation puts people in direct re-sponsibility to their task domains. These are group domains which allow forshared responsibility and accountability. The mutual adjustment within groupsand the lack of supervisionary control in contrast to internal control, allows theaccountability to naturally transgress towards controllability: People that are incontrol of a certain task domain do not mind being held accountable if they aregiven the means for controlling their costs, i.e., in a group budget structure or agroup standard cost system. The accountability-controllability overflow also hasimplications for cost behaviour. The amount of indirect costs relative to directcosts decreases, as more costs are assigned (designed) to work groups /the produc-tion flow.
Also, the flat organisation structure resulting from STSD reorganisation limits theaggregation levels of accounting information to three: order level, task group leveland organisation level. The latter is where accounting information is most aggre-gate. Typically, it is mainly used for strategic decisions rather than operational de-cision making.
The storyline can now be formulated as follows: When a firm is faced with outsidepressure to change, it can either change its structure, its activities, or both. If itmakes the policy decision to change its structure, it can, for example, invest in cre-
202

Case Ana/ysis and Cross-Case Comparison
ating self-contained tasks (Galbraith, 1974). On the other hand, if the firm makesthe policy decision to change its activities it can, for example, improve its account-ing systems by introducing Activity-Based Costing (Cooper and Kaplan, 1991) oralign organisational behaviour by implementing management techniques such asTotal Quality Control (Martin, Schelb, Synder and Sparling, 1992).
There is a third policy option, which is to do both: change the structure of the or-ganisation while changing its activities at the same time. Modern STSD providesthe tools and system-theoretical view to accomplish this redesign. Once re-designed, the organisation is structured according to flow rather than operation.This, in turn, leads to simplified processes and simple structures which are flexibleand can be better controlled. This combination results in a transparent organisa-tion for a// organisation members. 'Transparent' here means that it is visible toeveryone what the results are of (group) actions undertaken and managerial policydecisions made.
Using the story as a guideline, the categories can be rearranged to provide an ana-lytical version of the story. This is to identify the pattern which gives the theoryspecificity. Applying this step to the research study results in the following (as canalso be read in the storyline):
Under the conditions that a firm (a) wants to change; (b) decides to change by in-tegrally changing the organisation structure and its processes; (c) instrumentsthis decision by using modern STSD, what happens is that the firm; (1) adopts aflow-oriented production; (2) simplifies its processes; (3) flattens its organisationstructure; and (4) adopts an STSD-based accounting system.
The meaning of the latter is explained by the six properties in Table 7.12, and canbe summarised as being a simple administration. On the other hand, a statementabout what happens under alternative conditions can>»of be made, due to the re-search design which only selected STSD cases in which both organisation designand management accounting design were collectively altered.
The next step is to group the cross-reference categories along the dimensionalranges of their properties. The main reason is that data should not only relate tothe conceptual level, but also to the lower levels of properties and dimensions. Inother words, the pattern should also hold for less conceptual levels. Applying thisto the study results in a grouping of data as shown in Figure 7.14.
The final phase in generating a 'grounded theory' is validating one's theoryagainst the data. It requires the theory to be laid out in memo format, either graph-ically or narratively, allowing one to make statements based upon relationshipsand thus validate these statements with data. This validating is already considereddone: The memos are the diagrams and storylines of each case study, validated bythe case reports they have been drawn from, and supplemented with a cross-casestoryline and dimensional diagram. The layout of the theory (i.e., the syntaxis ofthe storyline) is identical in every case report and is described and documented inthe above cross-case coding and dimensionalisation.
203

Reasons for Changs
StructuralInterventions
MASetosIgn
Van NeH»
(a) Organisational independence
tow high
(b) Inward-looking organisation
low high
(1) Integral Organisational Renewal
limited full
ZHwirarad
(c) Sales growth
low high
(d) Organisation stage
pioneer organisation
St. Anfon/u*
(e) Complexity
low high
(f) Managerial professionalism
low high
(2) PCI design sequence
limited full
(1) Desaggregated control information supply (4) Nonfinancial dimensions
limited full
(2) Textbook accounting instruments
low high
(3) Communicative use of account™
low high
limited full
(S) Traceable cost behaviour
low high
(6) Related to organisation design
limited full
Figure 7.14 Cross-case dimensional grounding ol the storyline
204

8Conclusions and Discussion
The conclusions pertain to the area of organisational change and the linkages be-tween organisation design and management accounting systems design. To date,research has been limited to either organisational change and its structural andbehavioural aspects, or the relationship of organisational design/management ac-counting systems with external and internal factors. This study attempts to exploretwo disciplines: organisation and accounting, in their design interface, with par-ticular attention paid to the context of their mutual design. Research is inductiveand based on such case evidence as project documentation, interview data and ex-pert opinions. Analysis is performed by the coding procedures and techniquesproposed by 'grounded theory', a sociological research methodology.
We found grounded theory particularly useful for our research study becausegrounded procedures provided stringent logic for reducing data and comparingcase studies. Subsequently, data reduction was supported by using case descrip-tions, in other words, information was aligned in a chronological order of inci-dents, and aided by the strict order in which STSD interventions are to be con-structed. The comparison of case studies benefited most from using the axial pat-terns and storylines. These two coding steps proved very effective in bringing ar-guments to the surface. Grounded procedures provide little help to enable exactcomparison of these different patterns and result in deductions. It is at this pointwhere discussions amongst colleagues and other researchers proved most useful.
Furthermore, the systematic build-up of the coding procedures opened the linesbetween the case elements and the larger conceptual categories. Consequently, theresulting conclusions and storylines are strictly linked to the case elements that aregrounding them (i.e., internal validity is high). For example, in the Zilverstadcase, the important role of communication can be retraced to the case descriptionwhere the control structure redesign gives cause to linking up communicationand information into a control mechanism.
The use of grounded theory itself is new in the accounting research field. Somegrounded studies of innovation management, strategy decision making and or-

ganisational change are available (Burgelman, 1983; Johnson, 1981; Turner, 1983),but these do not provide adequate direction on how to perform such a study in thearea of accounting. As a result, the grounded analysis in this study is virtuallypreliminary in its methods and, therefore, open to improvements and adaptationin the field of accounting research. Such precise requisites being the rich amountof normative practices and concepts, its setting of a calculative regime and itsomnipresence in every part of organisation life.
The case analysis and cross-case comparison resulted in a causal chronology for or-ganisational and management accounting system to change. This causal chronol-ogy is detailed as to what properties are entailed and what makes the conditionsconducive to the occurrence of these properties. Both are described by way of a dia-gram (see Table 7.12) and by way of conceptual narrative. Conclusions, therefore,are based upon the properties brought forward as well as the overall connection ofproperties.
The general outline ('storyline') of the cross-case comparison and the resulting'grounded theory' is as follows:
When a firm enters an organisational change process guided by SocioTechnicalSystems Design (STSD), it reorganises the full organisation according to productflow. Accordingly, control capacities are brought close to the primary processand staff functions are equally and closely allocated to the primary process. Thisleads to simplified processes and simple organisation structures, characterisedby a task group work flow, flat organisation structures with decentralised con-trol. Process and structure are flexible in their ability to cope with differing or-der sizes and contents and capable of improved control due to the decentralisedmode of operation.
The control and information systems in these cases studies were supported byan STSD-based management accounting system that supplied desaggregated in-formation for local control and decision making, utilised conventional ac-counting instruments and strongly related to the overall organisation design.Such a system places heavy accents upon the nonfinancial dimensions of in-formation and control, and is primarily used to permit organisation elementsthe ability to communicate with one another. The cost behaviour in an STSD-based accounting system is related to the increased transparency of the organisa-tion and, therefore, results in additional cost categories that are more direct andeasier to trace back to their originating element.
Conclusion 1: Organisation Design and Management Accounting Design -Equal Logics
The properties included in the management accounting system design are all re-lated to STSD, particularly the IOR trajectory and the PCI design sequence rule.These two instruments indicate the sequence in which the confenf of the change isto be implemented, i.e., the steps that should be made to obtain a redesigned or-ganisation. Typically, it is the point of sequential order that creates the context forthe MAS design, zooming in from strategy to overall organisation structure to
206

Conc/usiOMS and Discussion
control structure. The top-down sequence eliminates several structural factors andsubsequently, eradicates the need to be addressed by the accounting design. Thesestructural factors relate to the design of the control structure, allocating control towhere activities take place, i.e., the task groups. Control information is, therefore,(designed to be) used locally and not translated into an aggregate number for morecentralised control.
Management accounting is only limitedly involved in structural design. Wheremanagement accounting design indeed is involved, it is usually addressed interms of normative information: What qualities should it possess (consistency,verifiability, etc.) and to what characteristics of decision making should it comply?Therefore, management accounting design is most explored in the area of infor-mation properties (Chenhall and Morris, 1986: Daft and Lengel, 1986; Hergert andMorris, 1989). Information properties that border on the design issue are, forexample, timeliness, scope and media richness (Chenhall and Morris, 1986; Daftand Lengel, 1986). These factors relate to the structural characteristics of theorganisation, because they cross organisational boundaries.
In an STSD-based accounting design, these structural characteristics are addressedby the specifics of the control cycle design; i.e., the design principles of unity intime, place and action to provide effective control information (see also Chapter3). T/me/y in/ormafion (i.e., reporting is frequent or speedy) is guaranteed becausethe control cycle can be found at the same location where the tasks are executed,i.e., in the task groups.
The scope of information relates to the use of external, nonfinancial and future-oriented (e.g., probabilistic) information. In all three case studies, we witness sub-stantial usage of nonfinancial information. However, the external informationpresent in the three case studies does not take the form of information on, for ex-ample, GNP or demographic factors but is related to the market performance ofthe organisation as a whole.
Again, future-oriented information is provided by the STSD-based accounting sys-tem. The transparency of processes allows for performing sensitivity analyses onproduction decisions. For example, in the Van Nelle case, the capacity calculationin the MAS design is also used to verify whether future demands on productionsuch as for seasonal product promotion campaigns, can be adequately handled interms of available man and machine capacities.
Media ric/wess relates to the structural characteristics (the media) that can processric/j information. Structural here means related to the organisational design as fa-cilitator or blockade of information supply. Ri'c/i m/ormafiow is defined as: Theability of information to overcome different frames of reference or clarify ambigu-ous issues and, therefore, create understanding within a time interval (Daft andLengel, 1986, p. 560). According to Daft and Lengel, these structural characteristicsamount to seven, each one being found in the production and control structuredesigns of STSD. The structural characteristics are: group meetings, integrators, di-rect contact, planning, special reports, formal information systems and rules andregulations. They run on a continuum from rich (group meetings) to poor (rulesand regulations).
207

C/iap/er 8
In all three cases, group meetings are omnipresent. Zilverstad, in particular, hasmade group meetings its key control and accounting instrument. They tied theformal accounting information system to it by discussing each accounting reportin a meeting specifically designed for this purpose. An example of this is the post-calculation meeting where discussion concerning the various calculation tickets ofthe three task groups are conducted together with Administration, Managementand group leaders.
s can be distinguished in the cases of St. Antonius and Van Nelle; inte-grators representing "... the assignment of an organisational position to a bound-ary spanning activity within the organisation" (Daft and Lengel, 1986, p. 561). AtSt. Antonius, integrators take the role of quality and production engineers, linkingproduction processes and production methods between the Commercial &Technical Activities (CTA) department and Production. At Van Nelle, the integra-tor role is performed by the Production Planning department which translate theplant level and task group reports into the Annual Operating Plan specificationsthat are required by the company rule reporting system. Also, they are the ones re-sponsible for the processing of production performance information, i.e., machineefficiency, and for the task groups, providing them with control charts and graphs.
Direcf confacf is an inherently structural medium for information in any taskgroup and,therefore, present in each individual case study. P/anning is equally in-herent in task groups as it functions as a control/performance measurement stan-dard in the control cycles allocated to the various task groups. The role of planningis most prominent in the case of St. Antonius, where production control is exten-sively planned in terms of quality assurance, throughput time and bottleneck util-isation. Of equal importance is the large amount of quality control specifications asset out in the quality manuals of St. Antonius. These are examples of ru/es andregw/afions. Formal information systems provide the various accounting report-ing systems for all three case studies. An example of a special report can be foundin the way Zilverstad makes use of irregular reporting on delivery reliability oforders.
In short, the structural arrangements preceding the management accounting sys-tem design simplify the contents of the accounting design. Information character-istics brought into the structural organisation design result in the removal of cer-tain elements from the management accounting system. What remains for the ac-counting design is a well-constrained organisational context, where the precedingdesign steps are to be completed by means of a concrete reporting structure.
Although it sounds as if only purely administrative considerations are involved,it is nevertheless necessary, according to the study, for such a reporting system tomatch calculative practices to the behavioural routines established in the controldesign. For example, the budgeting systems of Van Nelle and Zilverstad are group-budgeting systems, compelling the task groups, as a whole, to be accountable fortheir production activities. They must cooperate in attaining the budget standardsthat they themselves set, i.e., as a group they are the only ones that can control thecost items in the budget. Furthermore, at St. Antonius, the press operations - aproduction bottleneck determining reported throughput time - can be planned insuch a manner that dye changeover time is minimal, providing the press operator
208

Conclusions and Discussion
receives the required information from the production engineer. If there exists alack of cooperation, the reported throughput time will not go according to planand bottleneck utilisation will decrease, i.e., cost efficiency decreases.
The above-mentioned integration of organisation design, including informationproperties handled by the management accounting systems, was first signalled inthe work of Galbraith (1973). He views the organisation as an information pro-cessing system, balancing the amount of information needed with the amount ofinformation available. The amount of information required is a result of:
1) the diversity of outputs (e.g., products, services, clients);2) the amount of different input resources utilised (e.g., departments, machine
centres); and3) the difficulty in the level of required performance (e.g., quality tolerance lim-
its).
If the balance is disrupted, uncertainty is created. To resolve this uncertainty, sev-eral organisational design interventions can be undertaken such as: creating slack,investing in vertical information systems, establishing lateral relationships andcreating self-contained tasks. Major strengths, according to Galbraith, are that in-formation is considered a central factor in organisation design and a repertoire oforganisational design responses are available for rectifying organisational prob-lems.
In contrast to the various options Galbraith suggests to increase the effectivenessof an information, this study does not see these options as separate and distin-guishable alternatives. Instead, there is a sequence of measures, each one follow-ing as a logical consequence from previous design choices. For example, an organi-sation can start by creating slack, rolling over to establishing self-contained units,which in turn, rolls over to establishing lateral relationship and is finalised by in-stalling a vertical information system to maintain coherence between units. EachGalbraith type design option is then used, as a consequence of a previous designchoice. Moreover, there is no general priority in this sequence. An organisationcan start from either design option, but once a design choice is made, several otherdesign choices will logically follow. Therefore, what is presented by Galbraith as arepertoire of individual instruments to choose from is in fact the start of a processof redesign: Once one instrument is employed, a sequence of choices is started. Thechoice open to organisations thus is not related to individual design instruments,but between sequences of choices. In other words, if an organisation starts by in-stalling vertical information systems, a sequence is chosen. If it starts by creatingslack, another sequence is chosen.
Many elements of Galbraith's model can be traced back to the case studies. For ex-ample, the amount of information due to output diversity is most visible in theZilverstad case. When Zilverstad switched from being a low-cost single-productproducer to being a producer of various high-quality products, it created an identi-cal diversity. Simultaneously, Zilverstad retained a distinct number of productionjob shops (see the former production organisation chart, Figure 5.9), which, inturn, utilised a number of input resources. Furthermore, the difficulty of the levelof required performance is clearly evident in the St. Antonius case. The ISO
209

9002/9004 quality assurance and certification demand considerable tolerance limitsof its products and processes.
The design strategies proposed by Galbraith are all included in the STSD inter-ventions, with the exception of slack resources. The basic starting point is the cre-ation of self-contained tasks that are central to STSD, followed by the creation ofnew lateral relationships. This final design strategy is most prominent in anSTSD-based accounting system, because it moves the level of decision making tothe point where the information is positioned, i.e., the shop floor/task grouplevel. Galbraith sums up several means to create lateral relationships: liaisonpositions, task forces, dual reporting and matrix organisation. Liaison positionscan be distinguished in the Van Nelle and St. Antonius cases as these positions co-incide with the integrator roles of the Production Planning department and thequality and production engineers respectively. Dual reporting is present in themeeting structure of Zilverstad, and the task group meetings in each case study.The most obvious matrix organisation can be found at St. Antonius, where qualitycontrol and quality assurance are covered by the Production and Commercial de-partments (see Figure 6.10).
The creation of vertical information systems is the final step in the STSD process.Lateral relationships, together with the horizontal exchange of information, areprimary design considerations. Once these are installed, a vertical information sys-tem is set up to provide top management with organisation level information. Inall three cases, we can see that the task group level reporting is encompassed by aperiod report that provides financially aggregated information to the organisationlevel management. It is also at this point that we recognise the choice by STSD forone type of design sequence. STSD commences from self-contained tasks, in-stalling a flow-oriented organisation placing an emphasis on lateral relationships.Slack resources are explicitly 'designed out', as in Just-In-Time systems, becausethey are not needed in organisations where control and execution are brought to-gether in one location. The coordinative effort remaining is in maintainingoverview on the primary process and ensuring that it stays within the controlboundaries. For this purpose, a vertical information system is imperative.However, such a vertical system appears totally different than it did on the occas-sion where it was deemed necessary to start the design process by installing a verti-cal information system. In other words, the sequence included in STS design logicresults in a different content of the design, even though all Galbraith-type ele-ments are equally present.
Where Jönsson is concerned, the vertical and centralised accounting systems havebeen replaced by a more participative management accounting design, whichemerged from the focal position of task groups in the organisation design. This isrepresented in all three cases by:
1) the central position of task groups in the accounting reports;2) the provision of detailed nonfinancial control information; and3) the extensive use of performance indicators that surpass functional depart-
ments (e.g., WIP at St. Antonius, gross margin at Zilverstad, and the simulta-neous use of machine efficiency and utilisation rates as found in the period re-port at Van Nelle).
210

Conc/usions and Discussion
In conclusion, all organisation design elements are removed from the manage-ment accounting system design. Consequently, the resulting accounting system isreduced to completing the information supply as set out by the control structuredesign. Therefore, if the control structure design emphasises decentralisation, localautonomy and participation, the management accounting system has to reflectthese properties: The organisation design according to STSD defines 1:1 the man-agement accounting design elements. The design sequence preceding the man-agement accounting design is crucial to the content of the accounting design.
Conclusion 2: Simple Organisations Make Simple Administrations
The STSD-based focus on decentralisation promotes the design and use of anequally decentralised management accounting system. Previous research hasstressed the point that a prerequisite for successful decentralisation and group au-tonomy is the redesign of information and control systems (Gordon and Miller,1976; Den Hertog, 1978). The other way around, the message is equally true:Information and control systems do not improve if the organisation structures donot allow them to be redesigned. The organisation design is not a given conditionfor redesign efforts, but influences the content of the accounting (re)design, as pre-viously discussed regarding the implementation of vertical information systems.
What, then, would such a decentralised and participative management accountingsystem look like? This question should be interpreted in a much larger context, asthe accounting system is just one element from a larger control package (see Table8.1).
Typically, such a control package consists of the management information system(MIS), the accounting information system (AIS), the organisation design and othercontrol arrangements (Otley, 1980). Inside this comprehensive control package,control mechanisms can complement or substitute each other (Khandwalla, 1973;Mak, 1989).
The notion of an overall control package itself is fully present in the various casestudies. For example, in the case of St. Antonius, the administrative organisation(the AIS), the organisation design (task groups), the management information sys-tem (the reporting system) and the job classification (other control arrangements)are all part of the control package. The other two cases have control packages thatare balanced differently. For example, at Van Nelle the package consists of organi-sation design (task groups), information system (the reporting system) and thefeedback of production charts by Production Planning to the task groups (othercontrol arrangements).
The different control packages of the three cases are the result of different designchoices that had been previously made. These design choices relate to strategicchoices, market conditions and specific organisational circumstances. For example,the strategy of Van Nelle was to make the organisation more open to market sig-nals and to create an internal dynamic. Subsequent design choices were: to reducethe number of organisation levels, install an Operational Team as business unitmanagement, and begin with task groups. Similarly, the strategy of Zilverstad was
211

C/iapfer 5
to create a coherent organisation that could operate as a flexible unit. The tradi-tional ties with the city, the family atmosphere of the organisation and the crafts-manship products influenced design choices; behavioural controls and cross-func-tional cooperation in meetings and task groups were natural extensions.
Table 8.1 Outline of case study characteristics
Van Nail* Tobacco - RoMardam Zllvaretad Silvaramlthlng St. Antonlua Vaasalhaada
7/peor pert of large US multinational small family-owned business
cl rang*
Orpamsafion
Organisation teve/s
ManagementyJccountinjjSystem
OuQxifeonfrDte
BeftcvfourconfrDte
medium A large batchproduction of rolling tobacco
few competitors: matureproduct; stable market
decentralised to BusinessUnits and production taskgroups
within plant: 2; within BU: 3
task group budgets; accountinginfo desaggregated to articlelevel
budgeted vs actual labour costsper task group; machine uptime
informal, with ProductionPlanning and in the task groups
craftmanship products in small &medium batch production; wholei
many competitors; customisedproducts; international market
decentralised to product/marketcombinations inherent in salesand production task groups
3
task group budgets: accountinginfo desaggregated to order level
budgeted vs actual gross marginper task group
extensive meeting structure withconcurrent agenda-setting forms
4ccemo/
system
labour productivity; machineefficiency; budget targets
production control(efficiency)
order gross margin; budgetedresults per task group
production control(order conformance)
medium-sized family-owned business
unit and small batch production ofvessel heads
few competitors; quality-certified products;subcontractor to OEMs: international market
Decentralised to product/marketcombinations and production task groups
planned cost based on work centres;accounting info desaggregaled toorder & customer level; stronginfluence from quality certification
planned vs actual gross margin per order;accordance to constructioncodes; Work- In- Process
©jr posf calculations; many standardsand normalised processes
order gross margin as % ofplanned costs
production control (qualityand timeliness conformance)
The common denominators, however, of all control packages are flexibility andprocess control. Autonomous task groups are provided in all three occasions withfull responsibility, control and information over their tasks. Equally, the three or-ganisations studied live close to the primary process and are able to correct orreroute it when the need arises. The case of St. Antonius is the most notable ex-ample of this common denominator. The administrative organisation, the many(quality-certified) norms in Production and the reporting on individual order andcustomers have led to considerable control of the primary process. Consequently,St. Antonius can operate flexibly on the quality-regulated original equipmentmanufacturer (OEM) market and, alternatively, can select its market approach be-cause it has extensive information concerning ordering behaviour and customerprofitability.
One major question of this study is to determine where organisation design andmanagement design interface. To answer this question regarding the managementaccounting design, six elements are necessary to make up an STSD-based account-ing system. Some of these elements overlap with the findings from alternate em-
212

Conc/usions and Discussion
pirical research, mainly located in contingency studies of management accounting,and discussed accordingly.
The first element is that of textbook accounting instruments. The instrumentsused are:
- budgets (Van Nelle, Zilverstad);- variance analysis, mostly related to variances to budget or plan (Van Nelle,
Zilverstad and St. Antonius);- the cost pool method of cost allocation and its concurrent tariffs per cost pool
(Zilverstad, St. Antonius);- standard costing/job order costing (Van Nelle, Zilverstad, St. Antonius).
All instruments are highly conventional in their calculative format. However,what is special is that they are used in a different way than had been originally in-tended. Each instrument relates to a norm - whether it is a budget norm, a tariffnorm or a job cost standard - and it is the norm that is used. It is used in two ways:First, for local control by the responsible unit and, second, for involving the re-sponsible unit. Feedback and judgement are traditional uses of standards.However, when feedback is used for local control of that process, it steers be-haviour to activities; it instruments local control by providing task groups withtechniques for measuring, judging and taking action. Traditionally, evaluating fi-nancial performance was the origin of these techniques, lining up the expectedcost and profit contributions of each individual organisation element. In the casestudies, this is turned 180 degrees and used for signalling to what degree the activi-ties are controlled, for those that are in control.
The second different use of standards relates to involving the task group in settingthe standard. They themselves set standards within a broader frame of general per-formance indicators. Therefore, they have to indicate what activities in their ac-countability area are crucial, measurable and controllable in relation to these per-formance indicators. In other words, the focus is again on the activities and not onconformity to financial expectations.
The difference with the conventional use of standards, therefore, is the heavy ac-cent on activities rather than financial conformity. In other words, the norms areused to steer behaviour directly towards the process instead of steering behaviourto its (indirect) financial representation.
An identical approach has been adopted by Japanese management accounting. Italso employs conventional instruments but uses a similar orientation to process,steering behaviour to continuously improving activities and processes. Financialstandards take a similar role as reference points for actions onto the process, andnot for aligning financial performance (Hiromoto, 1988; Makido, 1989).
The second element of an STSD-based management accounting system is thecommunicative use of accounting information. It follows from the behaviouraluse made of textbook accounting instruments, directing task groups to focus onthe processes and activities in their accountability area. Communicative use thenrefers to the lateral exchange of activity information between task groups and, ver-
213
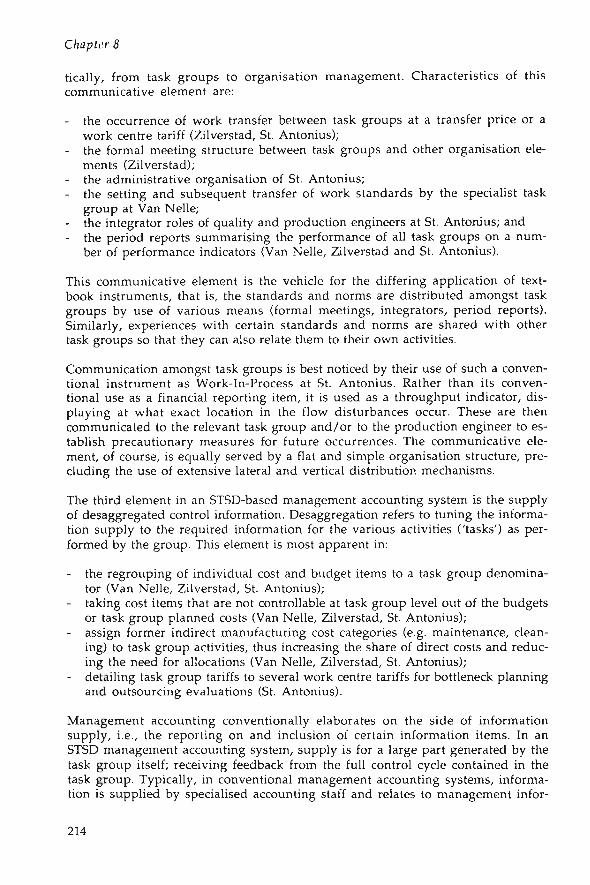
tically, from task groups to organisation management. Characteristics of thiscommunicative element are:
- the occurrence of work transfer between task groups at a transfer price or awork centre tariff (Zilverstad, St. Antonius);
- the formal meeting structure between task groups and other organisation ele-ments (Zilverstad);
- the administrative organisation of St. Antonius;- the setting and subsequent transfer of work standards by the specialist task
group at Van Nelle;- the integrator roles of quality and production engineers at St. Antonius; and- the period reports summarising the performance of all task groups on a num-
ber of performance indicators (Van Nelle, Zilverstad and St. Antonius).
This communicative element is the vehicle for the differing application of text-book instruments, that is, the standards and norms are distributed amongst taskgroups by use of various means (formal meetings, integrators, period reports).Similarly, experiences with certain standards and norms are shared with othertask groups so that they can also relate them to their own activities.
Communication amongst task groups is best noticed by their use of such a conven-tional instrument as Work-In-Process at St. Antonius. Rather than its conven-tional use as a financial reporting item, it is used as a throughput indicator, dis-playing at what exact location in the flow disturbances occur. These are thencommunicated to the relevant task group and/or to the production engineer to es-tablish precautionary measures for future occurrences. The communicative ele-ment, of course, is equally served by a flat and simple organisation structure, pre-cluding the use of extensive lateral and vertical distribution mechanisms.
The third element in an STSD-based management accounting system is the supplyof desaggregated control information. Desaggregation refers to tuning the informa-tion supply to the required information for the various activities ('tasks') as per-formed by the group. This element is most apparent in:
- the regrouping of individual cost and budget items to a task group denomina-tor (Van Nelle, Zilverstad, St. Antonius);
- taking cost items that are not controllable at task group level out of the budgetsor task group planned costs (Van Nelle, Zilverstad, St. Antonius);
- assign former indirect manufacturing cost categories (e.g. maintenance, clean-ing) to task group activities, thus increasing the share of direct costs and reduc-ing the need for allocations (Van Nelle, Zilverstad, St. Antonius);
- detailing task group tariffs to several work centre tariffs for bottleneck planningand outsourcing evaluations (St. Antonius).
Management accounting conventionally elaborates on the side of informationsupply, i.e., the reporting on and inclusion of certain information items. In anSTSD management accounting system, supply is for a large part generated by thetask group itself; receiving feedback from the full control cycle contained in thetask group. Typically, in conventional management accounting systems, informa-tion is supplied by specialised accounting staff and relates to management infor-
214

Conclusions and Discussion
mation regarding the financial performance of the full organisation, i.e., it is ag-gregate information. In other words, the full control cycle is assumed to be locatedat the organisation level and not at task group level. Desaggregate control infor-mation is not covered by the management accounting system, but set aside andmaintained in a nonaccounting system such as a production planning system or awork scheduling database. In contrast, this type of desaggregated control informa-tion is an important aspect of an STSD-based accounting system.
Some similarity exists with the use of critical success factors in management ac-counting designs (Bossert and Van Nimwegen, 1991). These are broadly definedcontrol criteria that apply to the primary process as a whole (e.g., product innova-tiveness or distribution channels). Usually, these factors are desaggregated top-down, i.e., derived from the organisation control level, and broken down intomore specific performance targets for lower levels of control. Equally, control in-formation supply follows this performance breakdown up to the level where per-formance norms and control standards are unified - at the task group level.
The fourth element in an STSD-based management accounting system is the in-clusion of nonfinancial information. It relates closely to the supply of desaggre-gated control information as discussed above. This type of information is usuallyexcluded from formal management accounting systems. Control at the organisa-tion level is predominantly financial control. At the task group level, however,financial information plays an equal role aside from technical and quality- andtime-based information. The importance of nonfinancial information is illus-trated by the following:
- the machine efficiency report of Van Nelle, the standalone delivery reliabilityreports of Zilverstad, and the WIP volume report of St. Antonius;
- the construction codes and regulations, and the quality assurance maintainedby St. Antonius;
- the capacity and occupancy calculation of Van Nelle;- the product development meeting of Zilverstad;- the changeover time, cycle time and throughput time of the ex post order calcu-
lation report of St. Antonius.
The equal status of nonfinancial information can be attributed to the role nonfi-nancial parameters play in performance measurement and process control. Eachcase study has strategic objectives stating their goals as being ones of flexibility,quality improvement and timeliness. Cost efficiency or cost reductions are equallyvalued goals, i.e., they do not stand out as the first and only goal. To acquire goalsof flexibility, quality and timeliness, a well-controlled primary process is first re-quired, allowing the possibility to adapt to the rate of change strategy or environ-ment deemed necessary. It is in this element that Kaplan's question of lost rele-vance of management accounting can be most clearly signalled (1983, 1984a, 1984b).His statement that the concepts and techniques of management accounting aredeveloped in and for a sellers market situation of low-priced mass production ofstandard products, attacks the use of financial and pure efficiency-directed perfor-mance parameters. A changed market situation (buyers market), the appearance ofsimultaneous competitive factors (price, quality, innovativeness, timeliness;Bolwijn, 1988) and the internationalisation of market places requires that firms
215

monitor and steer a greater array of performance parameters. For a large extent,those parameters are nonfinancial.
The few field research studies available support this extensive use of nonfinancialinformation and performance parameters (Johnson and Kaplan, 1987; Bennett efa/., 1987; Howell ef a/., 1987; Innes and Mitchell, 1988). Moreover, they also pointout that well-controlled processes are the primary condition for allowing strategicmobility, i.e., to change strategies and tactics on short notice as competitivesituation or strategic policy require.
The fifth element in an STSD-based management accounting system is that all ac-counting elements are related to the organisation design: The organisation designis not a given condition but rather an active tool for management accounting de-sign. Examples of this design interdependence include:
- the coinciding of the various budget levels with the control levels (Van Nelle,Zilverstad);
- the coinciding of agenda-setting reporting forms with the interfaces betweentask groups and other organisation elements (Zilverstad);
- the triple coinciding of cost pools with accountability areas with organisationsegments (Zilverstad, St. Antonius);
- tariffs representing work flow in the product cost structure instead of indirectcost allocation (Zilverstad, St. Antonius);
- task groups processing various batch sizes within one article group, allowingfor sensitivity analyses of total volume flowing through the specific task group(Van Nelle) and sensitivity analyses of batch sizes within the article group mix(Zilverstad).
Control is the intermediary between organisation design and management ac-counting design. Organisation design sets the possibilities for control, while theneed for control is defined by the activities performed. Therefore, the control de-sign becomes the linkage between the two. The control structure is further set bythe control possibilities on the one side, and by the need for control on the otherside. Control possibilities are the result of a larger organisation design (the produc-tion structure, in STSD terminology), while the need for control is the result of ac-tivities performed (i.e., the 'tasks' of each task group; see Figure 8.1).
Controlling by designing, as proposed by STSD, leaves fewer activities ('tasks') thatshould be controlled on a conventional basis. The role of accounting in this per-spective is extensive. Because the control and information needs reduce as a resultof the organisation design (fewer tasks need to be controlled), more people willstart to use management accounting information within their unit/task group,i.e., the number of users increases. Each task group uses controls (the above-dis-cussed textbook standard instruments) and, therefore, management accounting iswidespread; everyone is tinkering with it in order to have it fit its control needs.
However, it means that the role of accountancy is diverging: Supporting opera-tional managers in improving their local control and information needs ('puttingaccounting in the line') versus supporting top management by providing strategicinformation for their strategic control and decision making (a continued staff
216

Conclusions and Discussion
role). Probably, the latter is more attractive to the present accounting professionalsbecause this type of information and control support remains close to the tradi-tional financial knowledge base of accounting. Either way, the accountant is re-quired to possess additional expertise in the areas of: organisation design, produc-tion processes and information technology and on strategy decision making andanalysis.
Task A »
Management
\ /
TaskB •
\ /
TaskC TaskD
\ /
Task E
\
Task F - product flow
= division of labour
/ *N = coordinating by designing a' ' structure
= coordinating by controllingactivities, results and goalcongruence
Figure 8.1 Structural design and control (cf. Kunst, Olie, Romme and Soeters, 1991)
The final and sixth element of an STSD-based management accounting system isthe traceability of costs. In fact, traceable cost behaviour results from the fiveabove-captioned elements. Traceable cost behaviour can be found in:
- the tariffs making up the product cost that are representations of the productflow across task groups and work centres instead of mere cost accounting alloca-tions (Zilverstad, St. Antonius);
- the machine efficiencies and labour productivities per task group in the periodreport, which can be traced back to individual machines and orders (VanNelle);
- the gross margin fluctuations per task group that can be traced by means of thepost-calculation meeting (Zilverstad);
- the time performance variances in the ex posf report that can be traced back tothe individual work centres involved in each production order (St. Antonius);
- the small amount of allocated costs in production and sales group budgets (VanNelle, Zilverstad);
- the reporting on order and article levels (Van Nelle, Zilverstad, St. Antonius).
The tracing of costs is clearly connected with the transparency of the organisation,the latter being translated by STSD as a simple organisation. Traceability and sim-plicity result from design interventions that go beyond accounting practices andmethods. It is evident that they cannot be addressed by accounting alone. They rp-quire help from additional disciplines such as organisation theory, production
217
Cfcapfer S
management and management science. How to achieve traceability and simplicitycan be found in the examples of STSD cases and the STSD theory in Chapters 3-6.
To date, field research has paid considerable attention to the concept of traceability,especially in relation to the accounting 'innovation' of Activity-Based Costing(Innes and Mitchell, 1990; Cooper and Kaplan, 1991; Boons, Roberts and Roozen,1991). This technique groups costs into cost pools, according to their activityconsumption instead of their resource consumption, i.e., the relationship with theproduction process replaces the traditional functional grouping of costs andresponsibility cost pools. Cost are then tied to the process by using 'cost driver',causal factors that relate product/order flow to cost flow. Costs can now be tracedby utilising these cost drivers, which can either be volume-oriented (as in conven-tional accounting practice), batch-sustaining activities (e.g., number ofchangeovers), product-sustaining activities (e.g., number of engineering changeorders) and plant-sustaining activities (e.g., security). Therefore, cost drivers aretraceability factors, opening up the production process for cost management, aptlyreferred to as Activity-Based Management.
Only recently has there been growing awareness that the alignment of activities,i.e., organisation design, is of prime importance for cost management (Womack,Jones and Roos, 1991). In other words, it is simpler to intervene directly into theprocess first, than to complete a more accurate accounting picture of this processand then intervene.
An STSD-based accounting system is made up of conventional textbook instru-ments that are used for decentralised control and lateral communication. Its rela-tive simplicity closely follows the simplified organisation structure and the pro-cesses performed within that structure. Traceability of costs to responsible and ac-countable organisational units, having full control over the tasks contained inthat unit, are an example of this close scrutiny. Its simplicity in instruments anddesign enhances its use by organisation members, thus adding to the decentralisedperspective of a flexible organisation. In other words, an STSD-based accountingsystem clearly chooses for an operational, in-the-line function. Usa^e and ro/ehere are closely connected: When the accounting function is integrated with theaccountability structure, as determined by the organisation design, little doubt canbe casted on its relevance.
Conclusion 3: Accounting and Learning Organisations
In this section, we will discuss what role management accounting can play in pro-moting organisations to learn, and use the work of Morgan to exemplify thisrelationship.
The main body of knowledge of management accounting systems was developedin a time period when a standardised mass production, price competition andfragmented markets dominated (Johnson and Kaplan, 1987). The bureaucratic typeof organisation provided the context for accounting instruments to be developedand perfected.
218

Conclusions and Discussion
Bureaucracies still dominate in management accounting thinking. Some of theprinciples of bureaucratic management such as centralisation, unity of commandand efficiency maximisation are strongly present in management accounting.Cenfra/i'safion is very prominent in various accounting concepts. For example, in-formation should be consistent in order to have it aggregate up and down the lineof command, calculative instruments focus on the organisation as a macro entity,and performance and control are tied to the organisational hierarchy. Unity o/command states that there is one decision maker who should be supplied with allthe required information, has the required perspective over goals and possible ac-tions, makes the decision and feeds it back for execution. E//iciency is very promi-nent in management accounting, stating that a maximal use of resource should bemade to have maximal returns on these invested resources. Concepts such as effi-ciency, yield and volume variances signal deviations form maximal returns,while break-even analyses, absorption and direct costing, and capacity calculationsindicate the most efficient use of market conditions and internal cost structures.Moreover, the idea of one rational and efficient method of organising permeatedinto systems such as budgeting, Management By Objectives and cost allocation sys-tems.
The organisational context of management accounting thus was one of rationaland technically controllable set of problems with identically mechanistical solu-tions. In other words, the dominant metaphor of organisation was that of a ma-chine. Limitations of this type of organisation are the lack of flexibility in adaptingto changing circumstances, attitudes and outlooks that are limited to the specificarea of responsibility, the use of the machine for personal purposes and the de-humanising effects on employees (Morgan, 1986, p. 35).
In all three cases studied, we can see that the reasons for the firms to change arerather similar to the above limitations. Van Nelle wanted to create an open andmarket-oriented organisation, changing attitudes and mentalities; Zilverstad wasespecially interested in creating a flexibile organisation that could not only handlebut also initiate change; and St. Antonius was motivated by flexibility as well, be-ing able to manage its ever increasing quality, timeliness technological marketpressures. With the STSD-based changes they set the wheels in motion to transferto another organisational metaphor, that of the organisation as a brain.
Morgan (1986) typifies such organisations as being holographically designed, usingfour interrelated principles: Redundancy of functions, requisite variety, minimalcritical specification and learning to learn (see Figure 8.2). These four principlesreturn in the management accounting design, with the principles of minimalcritical specification and learning-to-learn being most clearly observable.
Requisite variety is a focal principle in STSD. Requisite variety indicates that anydesign should contain the critical parameters of the environment it has to dealwith: It can then organise itself, and effectively and efficiently handle environ-mental demands. On a more generic level, such as the set of values maintained bythe organisation, the principle of requisite variety applies as well. An open, activeand rapidly changing environment identically requires an attitude from organisa-tional participants that is equally open-minded, proactive and willing to handlethe ambiguities presented to them.
219
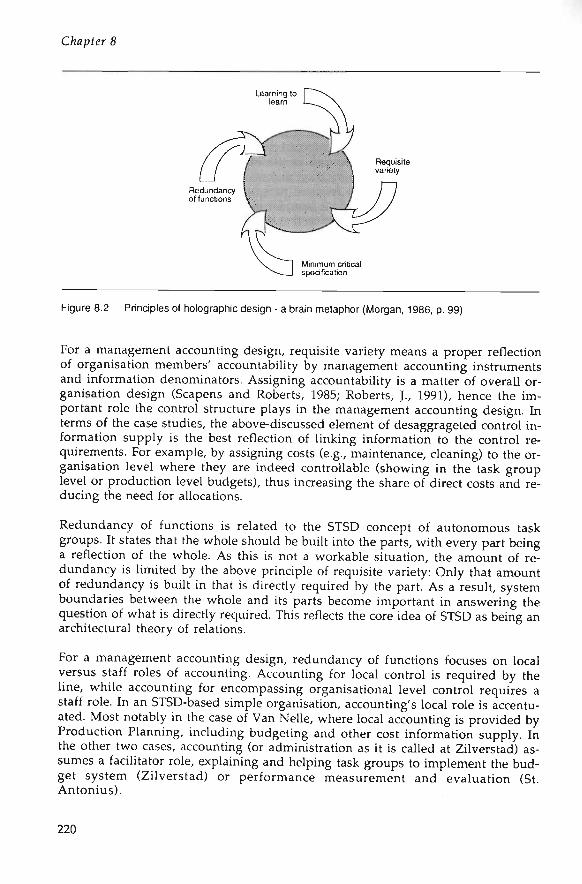
C/iapfer
Learning toteam
Minimum criticalspecification
Figure 8.2 Principles of holographic design - a brain metaphor (Morgan, 1986, p. 99)
For a management accounting design, requisite variety means a proper reflectionof organisation members' accountability by management accounting instrumentsand information denominators. Assigning accountability is a matter of overall or-ganisation design (Scapens and Roberts, 1985; Roberts, J., 1991), hence the im-portant role the control structure plays in the management accounting design. Interms of the case studies, the above-discussed element of desaggrageted control in-formation supply is the best reflection of linking information to the control re-quirements. For example, by assigning costs (e.g., maintenance, cleaning) to the or-ganisation level where they are indeed controllable (showing in the task grouplevel or production level budgets), thus increasing the share of direct costs and re-ducing the need for allocations.
Redundancy of functions is related to the STSD concept of autonomous taskgroups. It states that the whole should be built into the parts, with every part beinga reflection of the whole. As this is not a workable situation, the amount of re-dundancy is limited by the above principle of requisite variety: Only that amountof redundancy is built in that is directly required by the part. As a result, systemboundaries between the whole and its parts become important in answering thequestion of what is directly required. This reflects the core idea of STSD as being anarchitectural theory of relations.
For a management accounting design, redundancy of functions focuses on localversus staff roles of accounting. Accounting for local control is required by theline, while accounting for encompassing organisational level control requires astaff role. In an STSD-based simple organisation, accounting's local role is accentu-ated. Most notably in the case of Van Nelle, where local accounting is provided byProduction Planning, including budgeting and other cost information supply. Inthe other two cases, accounting (or administration as it is called at Zilverstad) as-sumes a facilitator role, explaining and helping task groups to implement the bud-get system (Zilverstad) or performance measurement and evaluation (St.Antonius).
220

Conc/wsions and Discussion
The characteristics of minimal critical specification and learning to learn are thetwo that are most closely related to the learning contents of a STSD-based account-ing system ('accounting for a brain')- They are the principles that realise learningcapacity and give it coherent direction (Morgan, 1986). Minimal critical specifica-tion is the reverse of trying to define and arrange activities as precisely as possible:Only a minimum is specified. The principle focuses on enabling or facilitatingconditions in which activities can take place, i.e., are to be self-organised. In thethree case studies, we saw this element return in how the overall design workgroup (minimally) steered the various other design work groups and, conversely,how the overall design work group was (minimally) steered by the owner-presi-dent (Zilverstad, St. Antonius). Also, the human resource type of vision held byall management in the case studies made them place trust in their people to or-ganise themselves. Once the design was completed, minimal critical specificationwas maintained in setting the control standards: Performance requirements wereformulated in broad terms and further filled in by the groups. In a sense, the use oftextbook accounting techniques and reporting procedures is also prone to minimalcritical specification: Task groups can organise the use of accounting techniquesthemselves.
An explanation of what happens when minimal becomes maximal can be foundin the Van Nelle case. The incorporation of the plant into the accounting and re-porting system of Sara Lee/Douwe Egberts enforces corporate beliefs and modelsupon an organisation holding entirely different beliefs: System boundaries ("... thelimits placed on action ..." according to Morgan) and interdependencies were onceagain redefined. The plant was permitted to maintain its full STSD organisation,but had, when interfacing at its plant's system boundaries, to comply to 'companyrule'. In terms of Morgan, the brain metaphor was replaced by the machinemetaphor and the control system was replaced, concurrently (Kunst andSchreuder, 1991).
An alternative aspect of minimal critical specification is their implication concern-ing the distribution of power and control in the organisation. Autonomous workgroups organising and controlling themselves usually indicate a power shift fromstaff expertise (e.g., accountants) to line functions. Lack of support from the upperechelons can then seriously block the distribution of information necessary for or-ganisational learning to occur.
The learning to learn principle relates to single-loop and double-loop learning (seeFigure 8.3). Single-loop learning relates to applying given knowledge onto a pro-cess, while double-loop learning refers to the process of learning to learn - ques-tioning the appropriateness of what is being done.
Learning requires information for it to occur, i.e., for evaluation of the process athand. This information, in turn, is acquired, processed and distributed by man-agement accounting systems. For example, information regarding performance isacquired in terms of process outcomes, processed as to form budgets, costs and per-formance indicators and distributed to the ones needing that information for con-trol, planning and decision-making purposes.
221

Chapter
Queslioning
single-loop /-— , .learning (Evaluation
(judgement)
double-looplearning
Choice ol acton
Process
Figure 8.3 Single and double-loop control cycle
In other words, a management accounting system is in principle a learn system,used by decision makers to learn about the process they are accountable for. And,as in accounting, norms are used to evaluate and judge whether the process is inor out of control, control cycle elements such as measurement, evaluation andjudgement usually being rephrased into information processing terms. However,an identical cycle is used for learning as well as for control.
A control cycle is depicted in Figure 8.3. It shows a situation in which there are sta-ble norms. In conventional accounting practice, it is assumed that this is the nor-mal situation. For example, for a cost centre to attain a budget norm, the managerresponsible evaluates the results or the activities of the centre, judges them by thebudget norm and takes action, if necessary. Evaluations can be performed by vari-ance analyses to budget as set out in company procedures. If variances are signifi-cantly 'out of control' inquiries into the causes are started.
accounting domain
••-Product flow
Figure 8.4 The accounting role in the control cycle concept
222

Conc/usions anrf Discussion
It is in the evaluation and judgement parts that the role of accounting is tradition-ally located, albeit evaluation is usually called reporting. Judgement and subse-quent control have led to a significant body of accounting research in the area ofaccounting information processing (Birnbergg ef a/., 1983; Birnberg and Sadhu,1986). For example, by presenting financial evaluations in several reportingformats, accounting can shift the accentuation in evaluations, and consequently,manipulate judgements on the activities performed (Van de Poel, 1986, 1988).
The three cases studies correspond with Morgan's brain metaphor in their use ofthe four 'holographic design' principles of redundancy of functions, requisite vari-ety, minimal critical specification and learning to learn. Still, the management ac-counting system, which maintains an inherent mechanical metaphor, serves as avehicle to promote and enhance learning. The link between the two metaphors isthe control cycle concept. The conditions for this linkage come from the case stud-ies. They are related to:
1) the allocation of control, assigning learning to different levels in the organisa-tion;
2) interaction and participation promoting local control, simplification and strongmonitoring;
3) the excessive use of standards as a means to set a process of questioning andimprovement in motion.
Control cycles are allocated at various levels of the organisation. When activitiescannot be executed at one level, because of, for example, interdependencies, theyraise to the next executive level, where these interdependencies are part of the re-sponsibility and accountability. The final control cycle then spans the whole of theorganisation and, consequently, leaves only the execution of activities ('tasks') thatspan the entire organisation, for example, a full reorganisation decision as takenby Van Nelle's top management.
Furthermore, one of the essential points is that control cycles need to be closedwithin the boundaries of one (sub)system. In other words, distributing informa-tion to a control cycle where it remains unclear as to what the relationship is be-tween evaluation and action, blocks learning. For example, supplying task groupleaders with order throughput information does not make sense, unless it is speci-fied to the job shop in their accountability area. This involves redesign: Closingthe control cycles (re)establishes the cause-and-effect relationship with the process.
As a result, control cycle (re)design necessitates reflection on what norms, evalua-tions, judgements and actions are relevant and are to be applied. This question isposed at every level a control cycle is allocated: At shop floor level, where ma-chine efficiency is the norm, and machine downtime is classified into a number ofcategories to judge what action is appropriate (Van Nelle); and at organisationlevel, where quality conformance, throughput time and profitability are of equalimportance, and WIP and actual costs are reported per work centre per order (St.Antonius). The information provided by the management accounting system inthese cases represents the full cause-and-effect relationships of processes, and al-lows solving problems (single-loop learning) as well as improving existing situa-tions (double-loop learning).
223

C/iapfer
In the three STSD-based accounting systems, performance monitoring is madepart of the overall change process: Organisation members are asked to design theirown performance measurement system, maintaining a highly participative focus.Moreover, the resulting performance systems require considerable interaction be-tween task groups because they are related to each other in the flow. Interactioncan be characterised as providing the distribution and sharing of information nec-essary for learning to occur.
The cross-functional cooperation, which is sought in order to keep the various au-tonomous task groups together, is explicitly addressed by the MAS design, for ex-ample, in the period reports of Van Nelle and St. Antonius, and the meetings &agendas as set up by Zilverstad. St. Antonius even integrated structural coopera-tion arrangements (the CTA department and the liaison roles of the Quality andProduction Engineers) with its MAS design, by monitoring quality and through-put performance as the results of these cross-functional interdependencies.
Self-appraisal does not stop at having the organisation members participate in theperformance and accountability design. The resulting performance measurementsystem is owned by the designers, i.e., the task groups. Because task groups are alsothe control loci - responsibility, accountability and controllability are aligned at oneorganisational level - local autonomy and ownership coincide: Performance mon-itoring therefore is deprived of its top-down connotation and rebuilt to what canbe literally called self-appraisal. Therefore, the learning process rests upon interac-tion and participation in the design. Accordingly, the resultant design is owned bythe designers and made up of relatively simple accounting elements such as bud-gets and variances.
The final learning feature is the excessive use of standards, which can be observedin all three cases. Standards are norms for activities as well as reflections of the(cognitive map of the) cause-and-effect relationships in that activity. If activitieschange or are discussed regularly (i.e., task groups redesigning their work and dis-cussing their performance), the underlying cause-and-effect relationships are regu-larly questioned. Consequently, norms are subject to continuous change. The au-tonomy task groups have in setting their own norms, then make it possible to ob-tain new insights into cause-and-effect relationships and to translate them directlyinto improved standards. In other words, a learning cycle effect arises because theprovided accounting information leads continuously to looking for solutions andimprovements. In turn, these show up again in the provided accounting informa-tion and serve a subsequent cycle.
In accounting terms, the use of conventional standard budgeting/costing tech-niques is of considerable relevance. However, the use and the accentuation of thetechnique are quite different from textbook treatments. Standards are not dilutedversions of a top-down performance target, but bottom-up specifications of strate-gic goals. Standards do not serve so much a restrictive control purpose but, in-stead, a feedback and improvement purpose. Added to this, is the accent on thestandard part instead of the cost part in standard costing: Nonfinancially expressedstandards are deemed as important as financially expressed standards.
224

Conc/wsi'ons and Discussion
Help for Practice
The above conclusions and discussions can be related to help for practice on twomain topics:
- How to obtain cost insights that are relevant to the organisation;- How to control and at the same time improve decentralised organisations.
From the case studies, we can observe that the shop floor defines what is relevantcost information: information that can be used to control processes. It resulted insimple systems of accounting and control. At organisation level, these simple sys-tems where encountered with an equally simple control system, that of au-tonomous task groups that self appraise their control design. The key to thesesimple systems is to change the organisation design. Simplify the organisation de-sign from bottom to top, starting from the production process upward. The in-struments used to do this were discussed in Chapter 3 (design toolkit, changemanagement approach, etc). It will result in a totally different organisation, as canbe seen in the case studies.
However, it is not an easy managerial fix. What is crucial is the commitment tothe primary resource of the organisation - people. Human resources need to betaken serious as the primary element of the organisation. People will direct them-selves, as long as they are provided with the trust, goals, structures and instru-ments that will enable them to do so. Human resources are the main input forproviding the requisite variety that a dynamic environment demands from an or-ganisation. Trying to control this variety demands a management control systemthat indeed is critically specified at a minimum - critically here meaning what fol-lows from the human resources vision employed.
The case studies indicate that we can control systems better, by controlling peopleless. Task groups are fully able to take responsibility and self-control their work.Their cumulative efforts at production system level make that little direct inter-ference is needed. The criterion for leaving systems alone is whether they keepwithin their system boundaries, set by higher management in terms of organisa-tion design and general performance targets. However, an important condition isthat task groups are provided with the management accounting instruments tocontrol themselves p/us that they are provided with the information that tellsthem they indeed keep their system within the control and performance bound-aries. Without such instruments and information, self-control is an empty word.
Of course, interdependence still exists, requiring interaction and hierarchic coor-dination. Equally, the need for vertical information system will not disappear, buttheir content will relate much more to controlling the coherence of local processesthan to ensuring execution of set directives. Maintaining coherence will then be amere matter of strategic choice and external conditions, as long as the organisationis carefully designed in terms of its internal system boundaries, including havingthe required management accounting instruments and information, what is re-quired then being determined bottom up.
225

C/iapfer 5
Improvement relates to the possibilities for organisational learning as provided bytask groups and decentralised organisation design. Self-control within systemboundaries, whether they be task groups or business units, promotes questioningexisting norms and procedures thus engaging in improvement management,somewhat similar to the Japanese approach of 'Kaizen'. The job of higher man-agement is to assure that proposed improvements can be handled within theboundaries of each system.
Limitations of the Study
Research findings are constrained by several data-oriented factors. First of all, caseswere selected as to best STSD practice, they are heterogeneous to core concept andto a successful event history (McPhee, 1990). Insights thus have a replicative na-ture, extending a grounded analysis base with subsequent factors from follow-upcases. In the design of this study, we consciously looked for the condition of con-sonant change between the organisation design and the management accountingsystems design. Alternatively, a dissonant match was neglected, i.e., a research de-sign in which only one design changed, or no design changed at all (see Figure 8.5).
Management Accounting Design
changed unchanged
changed
Organisationdesign
unchanged
Thisstudy
Figure 8.5 Researching the alternatives: dissonances organisation design and managementaccounting design
It is plausible that equally interesting evidence would have resulted. Conse-quently, research emphasis then would have shifted, for example, to the questionwhy (STSD) organisational redesign change failed to take the managementaccounting design along. This type of 'dissonant match' research design can befound in the work of Den Hertog (1978) on task groups and vertical informationsystems, where a comparison was made between a simultaneous change and anonsimultaneous change of the two design options.
Second, case descriptions were performed by 'robbing the window' at one limitedperiod of time. In other words, evidence was gathered by taking a snapshot ofevents based on documents and extensive interviews with representative man-agers available at that time period. An action research type of data gathering, over
226

CoHc/usions and Discussion
a longer period of time, would probably have resulted in a closer look at the be-havioural elements of the systems researched (attitudes, perceptions, changes invalue and beliefs systems). For a first exploration, however, it was considered suf-ficient to rob the window because it was the first time this window was looked at.
The grounded theory coding procedures used for data reduction and analysis weredirectly applied from the textbook, i.e., without reference to other studies makinguse of these procedures. This may have resulted in procedural flaws that couldhave been avoided. However, the limited number of studies analysed by means ofgrounded theory available in management accounting were either conducted inhighly dissimilar research areas or were designed to perform in one disciplineonly. A similar research study simultaneously addressing two disciplines(organisation theory and accountancy) as well as lacking any conceptual or empiri-cal guidance was not available.
Furthermore, some of the dimensional profiles in grounded coding lack speci-ficity. They run on a continuum of high versus low, which is an arbitrary scale.Given the presumption that properties resulting from the coding procedures canfunction as independent variables for statistical testing, operationalisation interms of statistical modelling is limited. The few research studies attempting suchmodelling either focus on a limited number of variables or many variables in onesingle research site (Schuring, 1991). However, what is replicated in this study isnot so much a number of factors or variables but a pattern of reasoning and action,i.e., an analytical replication in which contextual conditions are implicit in theanalysis.
Suggestions for Further Research
Directions for future research can be considered opposites of the above-discussedlimitations and therefore move in two directions: Improve the methodologicalaspects, and improve the results of the study.
Methodological aspects relate to site selection, and data gathering and analysis.Regarding site selection, it would involve STSD cases where the management ac-counting design was «of taken along, in order to compare two contrasting clustersof evidence and replicate the study in a more ethnographic research design.Equally, the coding procedures could be improved and made more suitable to fur-ther studies involving management accounting systems. Essentially, these type ofstudies are basically unfamiliar to the management accounting discipline.Studying processes and establishing reasoning and action patterns that can be help-ful to practice as well as to subsequent theory building, opens up many interdisci-plinary research venues. At present, process studies in the accounting field aremainly located in auditing and auditing decision-making research (Hayes, 1989;Vaassen, 1992). Perhaps, the use of protocols in this area is a methodological ex-ample of how to model action & reasoning patterns and how they perform in cer-tain contexts (i.e., judgement and belief environments). Other fields - where pro-cess studies have been familiar for some time and led to a body of process researchmethodologies - are the fields of strategic decision making, innovation manage-ment and organisational change (Van de Ven, 1992; Van de Ven and Poole, 1990;
227

Burgelman, 1983; Glide, Huber, Miller, Doty and Sutcliffe 1990; Barr, Stimpert andHuff, 1992). All make extensive use of case study research designs and haveintroduced several methodological approaches that can be useful to processresearch in management accounting. Particularly, the introduction of quantitativeresearch methods to subportions of a case study seems worthwhile to consider foraccounting research designs because of the many linkages between calculativepractices and managerial discretion (McClintock, Brannon and Moody, 1979).
Finally, the research findings can be further developed and implemented in prac-tice. Similarly, as in strategic/innovation management and in organisational de-velopment research, the results of the study should lead to improved policy deci-sions. Results stated in terms of reasoning and action patterns are then preferredto listings of correlated variables since they provide a map rather than cues. Themove towards practice further implies additional verification and adaptation tovarious other real-life contexts. Consultants and researchers in this type of design-oriented research perform equal roles: Applied sciences have to be applied to ad-vance science.
228

References
Adler, P. and D.U. Helleloid, Effective Implementation of Integrated CAD/CAM: A model,ƒ£££ 7>ansflcf/OMS on £ngi'«eenng Management, vol. EM-34, no. 2, May 1987, pp 101-107. "
Adler, P., New Technologies, New Skills, Ca/i/ornia Management Review, vol. 29, no 1,1986pp. 9-28.
Agurén, S., C. Bredbacka, R. Hansson, K. Ihregren and K.G. Karlsson, Vo/w Xa/mar revis-ited: Ten years o/ ejrpen'ence, Stockholm: Trykert Balder, 1984.
Allegro, J.T. and E. de Vries, Project 'Humanization and Participation' in Centraal Beheer,in: A. Alioth, J. Blake, M Butteriss, M. Elden, O. Oortsman and R. van der Vlist(eds.), Wor/ring on Me Qua/ify o/ Worfci'n? Li/e: Det>e/opmeMfs ;n Europe, Boston- Niihoff1979, pp. 223-237. '
Argyris, C , The /mpacf o/ Budgets on Peop/e, Ithaca NY: The Controllership Foundation, 1952.
Argyris, C , Organizational Learning and Management Information Systems, Accounting, Or-ganizations and Society, vol. 2, 1977, pp. 113-123.
Argyris, C , Inner Contradictions of Rigorous Research, New York: Academic Press, 1980.
Armstrong, P., Changing Management Control Strategies: The role of competition between ac-countancy and other organisational professions, Accounting, Organizations and Societyvol. 10, no. 2, 1985, pp. 129-148.
Ashby, W.R., Design/or a Brain, London: Chapman and Hall, 1956.
Auer, P. and C. Riegler, Post-Tay/orism: The enterprise as a p/ace o/ /earning organizationa/c/iange. A compre/iensrée study on worfc organization changes and its context at Vo/tw, Stock-holm/Berlin: The Swedish Work Environment Fund/Wissenschaftszentrum für Sozial-forschung, 1990.
Baiman, S., Agency Research in Managerial Accounting: A survey, /ourna/ of Accounting Litera-ture, vol. 1, Spring 1982, pp. 154-213.
Barr, P.S., J.L. Stimpert and A.S. Huff, Cognitive Change, Strategic Action, and Organiza-tional Renewal, Strategic Management /ourna/, vol. 13, 1992, pp. 15-36.
Bennett, R.E., J.A. Hendricks, D.E. Keys and E.J. Rudnicki, Cost Accounting /or Factory Au-tomation, Montvale: National Association of Accountants, 1987.
Berg, P.O., Techno-culture: the symbolic framing of technology in a Volvo plant, Scandinavian/ourna/ o/ Management Studies, vol. 1, no. 4, 1985, pp. 237-255.
Berliner, C. and J. Brimson (eds), Cost Management in Today's Advanced Manu/acfuring Envi-ronments.- 77ie CAM-/ Conceptua/ Design, Boston: Harvard Business School Press, 1988.
Bertsch, H.B., Quality Management as a Strategic Learning Process, in: A.N.A.M. Boons enH.B. Bertsch (eds.), Organisatie e//ec/jfiteif en Management Accounting in industrie/e on-dernemingen met geavanceerde produfctietechno/ogie [Organisational Effectiveness andManagement Accounting in industrial organisations using advanced production technol-ogy], rapport 8914/ACC/O, Rotterdam: Erasmus Universiteit - Centrum voor Bedrijfs-economisch Onderzoek, 1989, pp. 11-20.

Re/erences
Birnberg, J.G. and K.K. Sadhu, The Contribution of Psychological and Cognitive Research toManagerial Accounting, in: M. Bromwich and A.G. Hopwood (eds.), Resaarc/i & CurrentIssues in Ma/iageme«f i4ccouMfiMg, London: Pitman, 1986, pp. 116-142.
Birnberg, J.G., L. Turopolec and S.M. Young, The Organizational Context of Accounting,tefg, Organizations and Society, no. 2/3, vol. 8,1983, pp. 111-129.
Birnberg, J.G., M.D. Shields and S.M. Young, The Case for Multiple Methods in EmpiricalManagement Accounting Research (With an Illustration from Budget Setting), /owrna/ o/Management /Accounting Researc/i, vol. 2, Fall 1990, pp. 33-66.
Bolweg, J.F., Job Design and Industrial Democracy: The Case of Norway. Leiden: Nijhoff,1976.
Bolwijn, P.T., Confinuitóf en Vernieuwing win Produfcfiebedri/uen [Continuity and Renewal inProduction Organisations], inaugural speech, Enschede: Technische Universiteit Twente,1988.
Bolwijn, P.T. and S. Brinkman, Japanese Manufacturing: strategy and practice, Long RangeP/anning, vol. 20, no. 1, 1987, pp. 25-34.
Bolwijn, P.T. and T. Kumpe, Manufacturing in the 1990s - Productivity, Flexibility and Inno-vation, Long Range P/anning, vol. 23, no. 4, 1990, pp. 44-57.
Boons, A.N.A.M. and H.J.E. Roberts, Cost Accounting in een JTT-omgeving, in: W.M. du Pon,J. Dijksma and CD. Knoops (eds.), /M/l itronie/t 3990, Groningen: Wolters-Noordhoff,pp. 467-482.
Boons, A.N.A.M, H.J.E. Roberts and F.A. Roozen, /tó/Dify-Based Costing: Strategisc/i costmanagement roor vernieuwende bedri/ven, Deventer: Kluwer Bedrijfswetenschappen, 1991.
Boons, A.N.A.M. and F.A. Roozen, Symptoms of Dysfunctional Cost Information Systems:Some preliminary empirical evidence from the Netherlands, paper presented at the Eu-ropean Accounting Association Conference, Madrid, 1992.
Bossert, J. and H. van Nimwegen, Ontwerpvariabelen voor Interne Berichtgevingssystemen(Design Variables for Management Accounting Systems), in: L. Traas and E. de With(eds.), Handboeit Management Accounting, pp. E1100 /16, 1991.
Bromwich, M., The Case for Strategic Management Accounting: The role of accounting infor-mation for strategy in competitive markets, Accounting, Organizations and Society, vol.15, no. 1/2, 1990, pp. 27-46.
Bruns, W.J. and J.H. Waterhouse, Budgetary Control and Organization Structure, /ourna/ o/Accounting Researc/i, vol. 13, 1975, pp. 177-203.
Buchanan, D.A., Job Enrichment is Dead: Long live high performance work design, Personne/Management, May 1987, pp. 40-43.
Buitelaar, W.L., B. Dankbaar and M. van Klaveren, Integrale Organisatievemieuwing en Ar-beidsverhoudingen (Integral Organisational Renewal and Industrial Relations), Apel-doorn/Maastricht/Amsterdam: TAO position paper, 1990.
Burgelman, R.A., A Process Model of Internal Corporate Venturing in the Diversified MajorFirm, Administrative Science Quarter/y, vol. 28, 1983, pp. 223-244.
Capettini, R. and D.K. Clancy, Cost Accounting, Robotics, and t/ie New Manu/acturing Envi-ronment, Sarasota: American Accounting Association, 1987.
230

References
Chenhall, R.H. and D. Morris, The Impact of Structure, Environment and Interdependenceon the Perceived Usefulness of Management Accounting Systems, TTie Accounting Re-wew, vol. 61, no. 1, 1986, pp. 16-35.
Child, J., Information Technology, Organization and the Response to Strategic Challenges,Ca/i/ornw Management Review, vol. 30, no. 1, Fall 1987, pp. 33-50.
Cooper, R. and R.S. Kaplan, The Deszpn o/ Cost Manupemenf Si/stems, Enelewood Cliffs:Prentice-Hall, 1991.
Daft, R.L. and R.H. Lengel, Organizational Information Requirements, Media Richness andStructural Design, Management Science, vol. 32, no. 5, May 1986, pp. 554-571.
Dankbaar, B. and J.F. den Hertog, Labour Process Analysis and Sociotechnical Design:Living Apart Together?, Tedino/ogy, Work and Emp/oyment, vol. 5, no. 2, 1990, pp. 122-134.
De Sitter, L.U., Sociotechniek, Mens en Onderneming, vol. 28, no. 2,1974, pp. 65-83.
De Sitter, L.U., Op Weg naar Nieuwe Fabriefcen en Kantoren [Setting Out /or New P/ants and O/-/j'ces/, Deventer: Kluwer, 1981.
De Sitter, L.U., /ntegra/e Produfcfienernieuwing: Socia/e en economische achtergronden nan hetTAO-programma [Integral Production Renewal: Social and economic backgrounds of theTAO programme], Maastricht: MERIT, 1989a.
De Sitter, L.U., Modern Sociotechnica/ Systems Design, Maastricht/Den Bosch: MERIT/Koers,1989b.
De Sitter, L.U. and J.F. den Hertog, Simple Organisations, Complex Jobs: The Dutch So-ciotechnical Approach, Maastricht: MERIT Research Memorandum 90-012,1990.
Den Hertog, J.F., The Role of Information and Control Systems in the Process of Organiza-tional Renewal: Roadblock or Roadbridge?, /tecoMntinp, Organizations and Society, vol. 3,no. 1, 1978, pp. 29-45.
Den Hertog, J.F., /nteruentiestrafegieén in Organisaties.- CursusboeJt [Organisational InterventionStrategies: course reader], Heerlen: Open University, 1992.
Den Hertog, J.F. and H.J.E. Roberts, Learning Strategies for Management Accounting in Un-programmable Contexts, Accounting, Management and /n/ormation TechnoWy, vol. 2, no.3, 1992, pp. 165-182. «* '
Den Hertog, J.F. and P. Schroder, Social Research for Technological Change: Lessons fromnational programmes in Europe and North America, Maastricht: MERIT ResearchMemorandum 89-028, 1989.
Den Hertog, J.F. and L.U. de Sitter, Integrated Organisational Design: A structural andstrategic framework, Maastricht: MERIT/University of Limburg, 1989.
Den Hertog, J.F., E. van Sluijs, B. van Diepen, and A. van Assen, Innovatie en personeels-beleid: de beheersing van de kennishuishouding [Innovation and Personnel Policy: man-agement of the knowledge enterprise], Bedn)/situnde, vol. 63, no. 2,1991, pp. 158-167.
Den Hertog, J.F. and Ph. Wester, Organizational Renewal in Engineering Works: A compar-ative process analysis, in: C.L. Cooper and E. Mumford (eds.), The Qua/ity o/ WortongLi/e: The European experiment, London: Associated Business Press, 1979.
231

Re/eren ces
Den Hertog, J.F. and C. Wielinga, Control Systems in Dissonance: The computer as aninkblot, /tecoHMfmg, Organizations and Society, vol. 17, no. 2,1992, pp. 103-127.
Dent, J.F., Organizational Research in Accounting: Perspectives, issues and a commentary, in:M. Bromwich and A.G. Hopwood (eds.), Researcn & Current /ssues in Management Ac-counting, London: Pitman Publishing, 1986, pp. 147-178.
Dent, J.F., presentation held at the European Accounting Association's Doctoral Colloquium,Budapest, 1990.
Dermer, J.D. en R.G. Lucas, The Illusion of Managerial Control, Accounting, Organizationsand Society, vol. 11, no. 6, 1986, pp. 471-482.
Eisenhardt, K.M., Building Theories from Case Study Research, Academy o/ Management Re-view, vol. 14, no. 4, 1989, pp. 532-550.
Eisenhardt, K.M., Better Stories and Better Constructs: The case for rigor and comparativelogic, Academy o/ Management Rei>iea>, vol. 16, no. 3, 1991, pp. 620-627.
Emery, F.E., Characteristics of Socio-Technical Systems, in: L.E. Davis and J.C. Taylor, De-sign o//ofcs, Harmondsworth: Penguin Books, 1972, pp. 177-198.
Emery, F.E. and E. Thorsrud, Form and Content o/ /ndustria/ Democracy: Some Experiments /romNorway and ofner European Countries, Assen: Van Gorcum, 1969.
Emery, F.E. and E. Thorsrud, Democracy at Wort; Tne Report o/ tne Norwegian /ndustria/Democracy Program, Leiden: Martinus Nijhoff, 1976.
Emery, F.E. and E.L. Trist, Analytical Model for Sociotechnical Systems, in: W.A. Pasmoreand J.J. Sherwood (eds.), Sociotecnnica/ Systems; A sourcebooJt, La Jolla: University Asso-ciates, 1978, pp. 120-131.
Emmanuel, C.R., D.T. Otley and K.A. Merchant, Accounting /or Management Confro/, Lon-don: Chapman and Hall, 2nd ed, 1990.
Engelstad, P.H., Socio-technical approach to problems of process control, in: L.E. Davis andJ.C. Taylor (eds.), Design o//obs, Harmondsworth: Penguin, 1972, pp. 328-356.
Ezzamel, M., K. Hoskin and R. Macve, Managing it All by Numbers: A review of Johnson &Kaplan's "Relevance Lost", Accounting and Business Researcn, vol. 20, no. 78, 1990, DD.153-166. ^
Ezzamel, M., The Impact of Environmental Uncertainty, Managerial Autonomy and Size onBudget Characteristics, Management Accounting Researcn, vol. 1, no. 3, 1990, pp. 181-
Flamholtz, E.G., Accounting, Budgeting and Control Systems in their Organizational Context:Theoretical and Empirical Perspectives, Accounting, Organizations and Society, no. 2 /3 ,vol. 8, 1983, pp. 153-169.
Flamholtz, E.G., T.K. Das and A.S. Tsui, Toward an Integrative Framework of Organiza-tional Control, Accounting, Organizations and Society, no. 1, vol. 10,1985, pp. 35-50.
Ford, J.D. and D.A. Schellenberg, Conceptual Linkages in Organizational Performance,Academy o/ Management Reniew, vol. 7, 1982, pp. 49-58.
Galbraith, J., Designing Comp/ex Organisations, London: Addison-Wesley, 1974.
232

Re/erences
Galbraith, J., Organization Design, Reading: Addison-Wesley, 1977.
Ginzberg, M.J., An Organizational Contingencies View of Accounting and Information Sys-tems Implementation, Accounting, Organizations and Society, vol. 5,1980, pp. 369-382.
Glaser, B. and A. Strauss, 77ie Discovery o/ Grounded Theory: Strategies o/ qua/itafive research,London: Wiedenfeld and Nicholson, 1967.
Glick, W.H., G.P. Huber, C.C. Miller, D.H. Doty and K.M. Sutcliffe, Studying Changes inOrganizational Design and Effectiveness: Retrospective Event Histories and PeriodicAssessments, Organization Science, vol. 1, no. 3,1990, pp. 293-312.
Gold, B., CAM Sets New Rules for Production, Harvard Business Review, vol. 60, no. 6, Nov.-Dec. 1982, pp. 88-94.
Goldhar, J.D. and M. Jelinek, Plan for Economies of Scope, Harvard Business Review, vol. 61,no. 6, Nov.-Dec. 1983, pp. 141-148.
Gordon, L.A. and D. Miller, A Contingency Framework for the Design of Accounting Infor-mation Systems, Accounting, Organizations and Society, vol. 1,1976, pp. 59-70.
Gordon, L.A. and V.K. Narayanan, Management Accounting Systems, Perceived Environ-mental Uncertainty and Organization Structure: An Empirical Investigation, Accounting,Organizations and Society, no. 1, vol. 9,1984, pp. 33-48.
Govindarajan, V. and A.K. Gupta, Linking Control Systems to Business Unit Strategy: Im-pact on performance, Accounting, Organizations and Society, no. 1, vol. 10,1985, pp. 51-66.
Govindarajan, V. and J. Fisher, Strategy, Control Systems and Resource Sharing: Effects onbusiness performance, Academy o/Management /ourna/, no. 2, vol. 33,1990, pp. 259-285.
Groep Sociotechniek, Het F/exibe/e Bedrj//: integrate aanpafc van /ler/frifiteif, beheersbaarheid,fawa/ifeit van de arbeid en produ/tfie-automatisering [The Flexibele Organisation: integralapproach of flexibility, control, quality of work and production automation], Deventer:Kluwer Bedrijfswetenschappen, 1987.
Gutenberg, E., Grund/agen der Betriebswirtscha/ïs/ehre, Band /: Die ProduJtiion, 1st. ed. Berlin:Springer Verlag, 1951.
Hammer, M., Reengineering Work Don't Automate, Obliterate, Harvard Business Review, vol.90, no. 4, July-August 1990, pp. 104-112.
Harrison, J.M., C.A. Holloway and J.M. Patell, Measuring Delivery Performance: A CaseStudy from the Semiconductor Industry, in: R.S. Kaplan (ed.), Measures /or Manu/acturingExce//ence, Boston: Harvard Business School Press, pp. 309-351.
Hayes, R.H. en D.A. Garvin, Managing as if Tomorrow Mattered, Harvard Business Reviea;,May-June 1982, pp. 71-79.
Hayes, R.H. and R. Jaikumar, Manufacturing's Crisis: New technologies, obsolete organiza-tions, Harvard Business Review, vol. 66, no. 5, Sept.-Oct. 1988, pp. 77-85.
Hayes, R.H., S.C. Wheelright and K.B. Clark, Dynamic Manu/acturing: Creating the /earningorganization, New York: The Free Press, 1988.
233

Re/erewces
Hayes, R.S., 77ie l/ti/isation o/ Accounting /n/ormafion by /«fernaflona/ Banfc Loan Oncers inLoan Decisions: A Verba/ Protoco/-Based Expert System Stimu/afi'on, Ph.D. Dissertation,London: London School of Economics and Political Science, 1989.
Heinen, E., Befriebswirtscha/if/iche Kosfen/ehre; Kosfentheorie wnd Kosfenenfsc/iei'dungen, 6th. rev.ed, Wiesbaden: Gabler Verlag, 1983.
Herbst, P.G., Task Structure and Work Relations, London: Tavistock Document 528,1959.
Hiromoto, T., Another hidden edge - Japanese management accounting. Haruard BusinessKewew, vol. 66, pp. 22-26, 1988.
Hofstede, G.H., 77ie Game o/ Budge/ Confro/, Assen: Van Gorcum, 1967.
Hopwood, A.G., Accounting and Human Beftaw'our, Englewood Cliffs: Prentice-Hall, 1974.
Hopwood, A.G., Towards an Organizational Perspective for the Study of Accounting and In-formation Systems, i4ccounting, Organizations and Society, vol. 3, no. 1,1978, pp. 3-13.
Hopwood, A.G., On Trying to Study Accounting in the Contexts in which it Operates, Ac-counting, Organizations and Society, vol. 8, no. 2/3,1983, pp. 287-305.
Hopwood, A.G., The Growth of "Worrying" about Management Accounting, in: K.B. Clark,R.H. Hayes and C. Lorenz (eds.), 77ie Uneasy A//iance: Managing the Productivity-Tec/i-no/ogy Di/emma, Boston: Harvard Business School Press, 1985, pp. 227-235.
Hopwood, A.G., Management Accounting and Organisational Action: An introduction, in: M.Bromwich and A.G. Hopwood (eds.), Research and Current /ssues in Management Account-ing, London: Pitman, 1986, pp. 9-30.
Hopwood, A.G., The Archaeology of Accounting Systems, Accounting, Organizations and Soci-ety, vol. 12, no. 3, 1987, pp. 207-234.
Hopwood, A.G., Accounting and Organisation Change, Accounting, Auditing & Accounfabi/ity/ourna/, vol. 3, no. 1, 1990, pp. 7-17.
Horngren, C.T. and G. Foster, Cost Accounting: A managerial emphasis, Englewood Cliffs:Prentice-Hall, 1991.
Howell, R.A., J.D. Brown, S. Soucy and A.H. Seed III, Management Accounting in the NewManu/acturing Environment: Current Cost Management Practice in Automated (Advanced)Manufacturing Environments, Montvale: National Association of Accountants, 1987.
Innes, J. and F. Mitchell, Change in Management Accounting: Some case study evidence fromthe electronics sector, Workshop on Cost Management and Product Cost Analysis inAdvanced Manufacturing Environments, Brussels: European Institute for AdvancedStudies in Management (EIASM), 1988.
Jaikumar, R., Postindustrial Manufacturing, Harvard Business Review, vol. 64, no. 6, Nov.-Dec.1986, pp. 69-76.
Jensen, M.C. and W.H. Meckling, Theory of the firm: Managerial behavior, agency costs andownership structure, /ourna/ o/ Financial Economics, no. 3, Oct. 1976, pp. 305-360.
Johnson, G., The Application of Grounded Theoy to a Study of Corporate Growth, workingpaper no. 212, Birmingham: University of Aston Management Centre, 1989.
234

Re/erences
Johnson, H.T. and A.D. Loewe, How Weyerhauser manages corporate overhead costs, Man-agement /iccouniing, August 1987, pp. 20-26.
Johnson, H.T. and R.S. Kaplan, Re/erojnce Los/: 77ze R/se and Fa// o/ Management Accounting,Boston: Harvard Business School Press, 1987.
Jönsson, S., Budgetary Behavior in Local Government - A case study over three years, Ac-counting, Organizations ana" Society, vol. 7, 1982, pp. 287-304.
Jönsson, S., Limits of Information Technology for Facilitating Organizational Learning, in:j.M. Pennings and A. Buitendam (eds.), New Tec/ino/ogies as Ogani'zationa/ /nnowjtion:77ie dei;e/opment and di/fusion o/ micro-e/ectronics, Cambridge: Ballinger, 1987, pp. 217-234.
Jönsson, S. and A. Grönlund, Life with a Sub-Contractor: New technology and managementaccounting, Accounting, Organizations ana* Society, vol. 13, no. 5, 1988, pp. 512-532.
Jönsson, S. and A. Grönlund, Managing for Cost Improvement in Automated Production, in:R.S. Kaplan (ed.), Measures /or Manufacturing Exce//ence, Boston: Harvard BusinessSchool Press, 1990, pp. 163-191.
Kaplan, R.S., Measuring Manufacturing Performance: A new challenge for managerial ac-counting research, Tne Accounting Reineu», vol. 58, no. 4,1983, pp. 686-705.
Kaplan, R.S., The Evolution of Management Accounting, The Accounting Review, vol. 59, no.3, 1984a, pp. 690-718.
Kaplan, R.S., Yesterday's Accounting Undermines Production, Harwjrd Business Rewiea;, July-August 1984b, pp. 95-101.
Kaplan, R.S., Accounting Lag: The obsolescence of cost accounting systems, in: K.B. Clark,R.H. Hayes and C. Lorenz (eds.), Tne Uneasy Affiance: Managing fne Productivity-Tech-no/ogy Di/emma, Boston: Harvard Business School Press, 1985, pp. 195-226.
Kaplan, R.S., The Role for Empirical Research in Management Accounting, Accounting, Orga-nizations and Society, vol. 11, no. 4/5, 1986a, pp. 429-452.
Kaplan, R.S., Must CIM be Justified by Faith Alone?, Harvard Business Review, March-April1986b, pp. 87-95.
Kaplan, R.S., One Cost System Isn't Enough, Harvard Business R<wa>, Jan.-Feb. 1988, pp. 61-66.
Khandwalla, P.N., Viable and Effective Organizational Design of Frim, Academy o/ Manage-ment /ourna/, vol. 16, 1973, pp. 481-495.
Kirk, J. and M.L. Miller, Re/iflbiZ/fy and Va/idity in Qua/itative Research, Sage University PaperSeries on Qualitative Research Methods, vol. 1, Beverly Hills: Sage Publications, 1986.
KOERS, Principles of Integrative Organizational Design, Den Bosch: KOERS Consultants,1989.
Kunst, P.E.J. and H. Schreuder, Opening Up the Concept of Control, working paper 91-06,Brussels: European Institute for Advanced Studies in Management, 1991.
Kunst, P.E.J., R.L. Olie, A.G.L. Romme and J.L. Soeters, Organisatie, deel 1, Leiden: SMD,1991.
235

Re/erences
Lawler III, E.E., Hi'gft /nüofoemenf Mana^emenf.' Partidpfltiue sfrafegi'es /or improving organiza-tional performance, San Francisco: Jossey-Bass, 1986.
Lawrence, P.R. and J.W. Lorsch, Orgar/izöf/on and Environment: Managing Di^ferentiahon andIntegration, Homewood: Irwin, 1969.
Libby, R. and B.L. Lewis, Human Information Processing Research and Accounting: Thestate of the art in 1982, /4ccounti>ip, Organizations and Society, vol. 7, no. 3, 1982, pp231-285.
Madden, D., Empirical Research in Management Accounting: An unlimited potential forprogress, Management Accounting News & Views, vol. 8, no. 2,1990, pp. 5-7.
Majchrzak, A., Mefnods /or Po/icy Research, Applied Social Research Methods Series, vol. 3,Beverly Hills: Sage Publications, 1984.
Makido, T., Recent Trends in Japan's Cost Management Practices, in: Y. Monden and M.Sakurai (eds.), /apanese Management Accounting: A Wor/d C/ass Approach to Pro/if Man-agement, Cambridge: Productivity Press, 1989, pp. 3-14.
Martin, J.R., W.K. Schelb, R.S. Synder and J.S. Sparling, Comparing U.S. and JapaneseCompanies: Implications for Management Accounting, /ourna/ o/Cost Management, vol.6, no. 1, 1992, pp. 6-15.
McClintock, C C , D. Brannon and S.M. Moody, Applying the Logic of Sample Surveys toQualitative Case Studies: The Case Cluster Method, Administrative Science Quarter/y,vol. 24, 1979, pp. 612-629.
McNair, C.J., W. Mosconi and T. Norris, Meeting the Techno/ogy Ow/fenge: Cost Accounting ina //T Environment, Montvale: National Association of Accountants, 1988.
McPhee, R.D., Alternate Approaches to Integrating Longitudinal Case Studies, OrganizationScience, vol. 1, no. 4, 1990, 393-405.
Merchant, K.A., Contro/ in Business Organizations, Cambridge: Ballinger, 1985.
Merchant, K.A. and R. Simons, Research and Control in Complex Organisations: An over-view, /ourna/ o/Accounting Literature, 1986, pp. 465-476.
Merchant, K.A., Rewarding Resu/ts: E/jfectit>e/y motivating pro/it center managers, Boston: Har-vard Business School Press, 1989.
Miles, M. and A.M. Huberman, Qua/itative Data Ana/ysis, Beverly Hills: Sage Publications1984. *
Miles, R.E. and C.C. Snow, Organizations: New Concepts for New Forms, Ca/i/ornia Man-agement Review, vol. 28, no. 3, 1986, pp. 62-73.
Mintzberg, H., An Emerging Strategy of "Direct" Research, Administrative Science QuarJer/y,vol. 24, Dec. 1979, pp. 582-589.
Mintzberg, H., The Structuring o/ Organizations, Englewood Cliffs: Prentice Hall, 1979.
Mintzberg, H., The Effective Organization: Forces and forms, S/oan Management Review, vol32, no. 2, 1990, pp. 54-67.
Moch, M.K. and J.M. Bartunek, Creating A/temative Rea/ities at Worfc The Qua/ity o/ WorJt Li/eExperiment o/FoodCom, New York: Harper & Row, 1990.
236
Re/erences
Monden, Y. and K. Ham ad a, Target Costing and Kaizen Costing in Japanese AutomobileCompanies, Journa/ o/ Management Accounting Research, vol. 3, Fall 1991, pp. 16-34.
Morgan, G., /mages o/ Organization, Beverly Hills: Sage Publications, 1986.
Nachmias, D. and C. Nachmias, Research Methods in the Socia/ Sciences, New York: St. Mart-in's, 1976.
Nadler, D.A., Concepts for the Management of Organization Change, in: M.L. Tushman, C.O'Reilly and D.A. Nadler (eds.), The Management of Organizations, New York: Harper &Row, 1987, pp. 490-504.
Otley, D.T., The Contingency Theory of Management Accounting: Achievement and Progno-sis, Accounting, Organizaf/ons and Society, vol. 5,1980, pp. 413-428.
Pasmore, W.A., Designing E/fective Organizations: The soriofechnica/ systems perspective, NewYork: Wiley, 1988.
Polimeni, R.S., F.J. Fabozzi and A.H. Adelberg, Cost Accounting: Concepts and app/ications /ormanageria/ decision mafang, New York: McGraw-Hill, 3rd ed., 1991.
Porter, M.E., Competitive Advantage: creating and sustaining superior performance, New York:The Free Press, 1985.
Porter, M.E., Competitive Strategy: techniques /or ana/yzing industries and competitors, NewYork: Free Press, 1980.
Ratnatunga, J., R. Pike and G.J. Hooley, The Application of Management Accounting Tech-niques to Marketing, Accounting and Business Review, vol. 18, no. 72,1988, pp. 363-370.
Reisman, A., On Alternative Strategies for Doing Research in the Management and Social Sci-ences, 7EEE Transactions on Engineering Management, vol. 35, no. 4,1988, pp. 215-220.
Roberts, H.J.E., New Production Technology and Management Accounting, in: A.N.A.M.Boons en H.B. Bertsch (eds.), Organisatie e fecfiw'/«'f en Management Accounting in indus-trie/e ondernemingen met geavanceerde produfctietechno/ogie [Organisational Effectivenessand Management Accounting in industrial organisations using advanced productiontechnology], rapport 8914/ACC/O, Rotterdam: Erasmus Universiteit - Centrum voorBedrijfseconomisch Onderzoek, 1989a, pp. 21-56.
Roberts, H.J.E., Organizafiona/ Change and Management Accounting Systems: A case study, Con-ference on Accounting in its Organizational and Social Contexts, Brussels: European In-stitute for Advanced Studies in Management (EIASM), 1989b.
Roberts, H.J.E., Management Accounting en Innovatie [Management Accounting and Innova-tion], in: J.F. den Hertog en F.M. van Eijnatten (eds.), Management van Techno/ogischeVernieuwing [Management of Technological Renewal], Assen: Van Gorcum, 1990, pp.154-177.
Roberts, J., The Possibilities of Accountability, Accounting, Organizations and Society, vol. 16,no. 4, 1991, pp. 355-368.
Roberts, J. and R. Scapens, Accounting Systems and Systems of Accountability: Under-standing Accounting Practices in their Organisational Contexts, Accounting, Organiza-tions and Society, vol. 10, no. 4, 1985, pp. 443-456.
Saf izadeh, M.H., The Case of Workgroups in Manufacturing Operations, Ca/i/brnia Manage-ment Review, vol. 33, no. 4, Summer 1991, pp. 61-82.
237

Re/erences
Scapens, R.W., Closing the gap between Theory and Practice, Management Accounting (UK),Jan. 1983, pp. 34-36. . ....
Scapens, R.W., Research into Management Accounting Practice, Management Accounting(Lf/O, Dec. 1988, pp. 26-28.
Schoenfeld, H.M.W., The Development of Cost Theory in Germany: A Historical Survey,Management Accounting Research, vol. 1, no. 4,1990, pp. 265-280.
Schonberger, R.J., Frugal Manufacturing, Hareard Business Rewew, vol. 65, no. 5, Sept.-Oct.1987, pp. 95-100.
Schuring, R.W., Produktie-organisatie met autonome groepen: De combinatie van maatrege-len brengt het gewenste strategische resultaat (Production Organisation using Autono-mous Groups: The combination of measures brings the desired strategic result, paperpresented at the NOBO-onderzoeksdag 1991.
Simon, H.A., Adminisfrafiue Behaw'or, New York: Macmillan, 1947.
Stalk, G., Time - The next source of competitive advantage, Harvard Business Reuiezt;, July-Au-gust 1988, pp 41-51.
Staubus, G.J., Activity Costing and /nput-Oufpuf Accounting, Homewood: Irwin, 1971.
Staubus, G.J., Activity Costing: Twenty years on, Management Accounting Research, vol. 1, no.4, 1990, pp. 249-264.
Strauss, A. and J. Corbin, Basics o/ Qua/itatiue Research: Grounded theory procedures and tech-niques, Newbury Park: Sage, 1990.
Takeuchi, H. and I. Nonaka, The New New Product Development Game, Harvard BusinessReuiew, vol. 64, no. 1, Jan.-Feb. 1986, pp. 137-146.
Tanaka, M., Cost Planning and Control Systems in the Design Phase of a New Product, in: Y.Monden and M. Sakurai (eds.), /apanese Management Accounting: A Wor/d C/ass Approachto Pro/it Management, Cambridge: Productivity Press, 1989, pp. 49-72.
Taylor, J.C., Two decades o/ Socio-technica/ Systems in North-America, Los Angeles: University ofSouthern California /Institute of Safety and Systems Mangement, paper presented at the1990 National Academy of Management Meeting, San Francisco, August 1990.
Theeuwes, J.A.M., Bedrijfskundige Heroriëntatie van de Bedrijfseconomie [A Managerial Re-orientation of Business Administration], Bedn//s/tunde, jrg. 60, no. 1,1988a, pp. 39-49.
Theeuwes, J.A.M., Logistiek Management en Budgettering [Logistics Management and Bud-geting], Bedn;/sfcunde, jrg. 60, no. 1,1988b, pp. 31-38.
Theunisse, H., M. Kerremans, D. Dyck and C. van Overloop, Impact of Automation onCost Accounting; Some evidence from empirical research in Belgium, Workshop on CostManagement and Product Cost Analysis in Advanced Manufacturing Environments,Brussels: European Institute for Advanced Studies in Management (EIASM), 1988.
Thompson, J.D., Organizations in Action, New York: MacGraw-Hill, 1967.
Trist, E.L., The Evolution of Socio-Technical Systems: A conceptual framework and an actionresearch program, in: A.H. van de Ven and W.F. Joyce (eds.), Perspectives on Organiza-tion Design and Behavior, New York: Wiley, 1981, pp. 19-75.
238

Re/eren ces
Trist, E.L. and K.W. Bamforth, Some Social and Psychological Consequences of the LongwallMethod of Coal-getting, Human Re/ahoMS, vol. 4, no. 1,1951, pp. 3-38.
Turner, B.A., The Use of Grounded Theory for the Qualitative Analysis of OrganizationalBehaviour, Jourmj/ o/ Manflgeme«< Sf«dies, vol. 20, no. 3, 1983, pp. 333-348.
Vaassen, E.H.J., i4«ditor's Decision Processes in Awdif Planning, Stage Materiality and RiskJudgments, Maastricht: University Press Maastricht, forthcoming.
Vaill, P.B., The Purposing of High-Performing Systems, Organizational Dynamics, Autumn1982, pp. 23-39.
Van Aken, J.E., On f/ie Confro/ o/ Complex /ndusfria/ Organizations, Leiden: Martinus Niihoff,1978.
Van Amelsfoort, P., Het Vergroten van de Bestuurbaarheid van Produktie-Organisaties(Enlarging the Managerial Control of Production Organisations), Oss: ST-Groep, 1992.
Van Assen, A. and J.F. den Hertog, From Job Rotation to Organisation Design, in: P.J.D.Drenth, H. Thierry, P.], Willems and Ch. de Wolff (eds.), Handbook o/ Worfc and Organi-sation Psydio/ogy, London: Wiley, 1984.
Van Assen, A., Tec/ino/ogie en Personee/sbe/eid: De draad i>an Ariadne in he/ fecnnisc/i labyrint[Technology and Personnel Policy: Ariadne's thread in the technological labyrint], inau-gural speech, Nijmegen: Catholic University, 1990.
Van Beinum, H.J.J., Veldexperimentele ervaringen in een bedrijfssituatie (Field experimentalexperiences in a business context], in: M. Mulder (red.), Mensen, Groepen, Organisaties[Peop/e, Groups, Organisations./, Assen: Van Gorcum, 1963.
Van de Poel, J.H.R., /udgmenf and Contro/: /ndi'im/un/ and Organizational Aspects o/ Perfor-mance Evaluation, Groningen: Wolters-Noordhoff, 1986.
Van de Poel, J.H.R., Als de tekenen bedriegen ... (If the evidence is nothing to go by ...), Inau-gural speech, Groningen: Wolters-Noordhoff, 1988.
Van de Ven, A.H., Suggestions for Studying Strategy Process: A Research Note, StrategicManagement /ourna/, vol. 13, 1992, pp. 169-188.
Van de Ven, A.H. and R. Drazin, The Concept of Fit in Contingency Theory, in: L.L. Cum-mings and B.M. Staw, Researc/i in Organizational Benaw'or, vol. 7, London: JAI Press,1985, pp. 333-365.
Van de Ven, A.H. and M.S. Poole, Methods for Studying Innovation Development in theMinnesota Innovation Research Program, Organization Science, vol. 1, no. 3, 1990, pp.313-335.
Van Eijnatten, F.M., From Autonomous Work Groups to Democratic Dailogue and IntegralOrganizational Renewal: 40 Years of Development and Expansion of the SocioTechnicalSystems Design Paradigm, Maastricht: MERIT, University of Limburg, Research Memo-randum 91-015.
Van Maanen, J., The Fact of Fiction in Organizational Ethnography, in: J. van Maanen (ed.),Qua/ifafrye Methodology, Beverly Hills: Sage, 1983.
Van Reeken, A.J., Naar een andere aanpak in de systemering [Towards another approach insystemisation], in: J.F. den Hertog en F.M. van Eijnatten (eds.), Management pan Techno-
239

References
togisc/ie Vern/euwi'ng [Management of Technological Renewal], Assen: van Gorcum, 1991,pp. 129-153.
Van Sluijs, E., A. van Assen and J.F. den Hertog, Personnel Management and Organization-al Change: A Sociotechnical Perspective, European Work and Or?anizflf/o«a/ Psydto/ogisf,vol. 1, no. 1, 1991, pp. 27-51.
Van Terwisga, H.B. and E. van Sluijs, Op/riden voor de toeitomsf: onderdee/ van bedrij/sbe/eid/Educating/or the Future: Part o/Company Po/icy/, Stichting Toekomstbeeld der Techniek;50, Alphen aan den Rijn: Samsom, 1990.
Whitsett, D.A. and L. Yorks, Looking Back at Topeka: General Foods and the Quality-of-Work-Life experiment, Ca/i/ornw Management Review, vol. 25, no. 4, Summer 1983, pp.93-109.
Wildavsky, A., Budgeting: /4 Comparative Theory of Budgetary Processes, Boston: Little andBrown, 1975.
Wildavsky, A., The ,4rt and Cra/ï of Po/icy /\na/ysis, London: The Macmillan Press, 1979.
Womack, J.P., D.T. Jones and D. Roos, The Machine that Changed the Wor/d: The Story o/LeanProduction, New York: Harper Collins, 1990.
Yin, R.K., The Case Study Crisis: Some Answers, Administrative Science Quarter/y, vol. 26, no.1, 1981, pp. 58-65.
Yin, R.K., Cose Study Research: Design and Methods, Applied Social Research Methods Series,vol. 5, Beverly Hills: Sage Publications, 1984.
Yoshikawa, T., J. Innes and F. Mitchell, Cost Management through Functional Analysis,/ourna/ o/ Cost Management, vol. 3, no. 1,1989, pp. 14-19.
Yoshikawa, T., J. Innes and F. Mitchell, Cost tables: A Foundation of Japanese Cost Man-agement, /ourna/ o/ Cost Management, vol. 4, no. 3,1990, pp. 30-36.
240

Authors Index
Adler and Helleloid; 4Adler; 4Agurén, Bredbacka, Hansson, Ihregren and
Karlsson; 44Allegro and De Vries; 44Argyris; 13; 26; 182Ashby; 39; 40Auer and Rigeler; 44Baiman; 24Barr, Stimpert and Huff; 228Bennett, Hendricks, Keys and Rudnicki; 7;
216Berg; 54Berliner and Brimson; 7Bertsch; 3Bimberg and Sadhu; 223Bimberg, Turopolec and Young; 13; 24; 223Bol weg; 41; 42Bolwijn and Kumpe; 2Bolwijn; 2; 215Boons and Roberts; 3Boons and Roozen; 8Boons, Roberts and Roozen; 218Bossert and Van Nimwegen; 215Bruns and Waterhouse; 11Buchanan; 44Buitelaar, Dankbaar and Van Klaveren; 38Burgelman; 206; 228Capettini and Clancy; 7Chenhall and Morris; 207Cooper and Kaplan; 203; 218Daft and Lengel; 207; 208Dankbaar and Den Hertog; 38De Sitter and Den Hertog; 39; 44; 46; 47;
48; 54; 55De Sitter; 45; 37; 44; 45; 46; 53Den Hertog and De Sitter; 53; 54Den Hertog and Roberts; 14Den Hertog and Van Assen; 26Den Hertog and Wester; 44; 53Den Hertog and Wielinga; 53Den Hertog; 36; 41; 43; 53; 211; 226Dent; 9; 10; 12; 13; 15; 18Dermer and Lucas; 15Emery and Thorsrud; 41; 44; 52Emery and Trist; 43Emery; 41Emmanuel, Otley and Merchant; 6; 14Engelstad; 43Ezzamel, Hoskin and Macve; 7; 15Flamholtz, Das and Tsui; 11Flamholtz; 11
Ford and Schellenberg; 12Galbraith; 12; 40; 203; 209; 210Ginzberg; 11Glaser and Strauss; 26Glick, Huber, Miller, Doty and Sutcliffe;
228Gordon and Miller; 11; 211Gordon and Narayanan; 11Govindarajan and Fisher; 11Govindarajan and Gupta; 11Groep Sociotechniek; 37; 44Gutenberg; 19Harrison, Holloway and Patell; 8Hayes and Garvin; 6Hayes; 227Heinen; 19Herbst; 43Hergert and Morris; 207Hiromoto; 213Hofstede; 13Hopwood; 13; 15; 16; 17Homgren and Foster; 6Howell, Brown, Soucy and Seed III; 7; 22;
216Innes and Mitchell; 22; 216; 218Jaikumar; 4; 8Johnson and Kaplan; 4; 5; 17; 18; 216; 218Johnson and Loewe; 8Johnson; 206Jönsson; 13; 18; 210Kaplan; 5; 7; 18; 22; 215Khandwalla; 211KOERS; 51Kunst and Schreuder; 221Kunst, Olie, Romme and Soeters; 217Lawler; 44Lawrence and Lorsch; 11Libby and Lewis; 24Majchrzak; 26Makido; 213Martin, Schelb, Synder and Sparling; 203McClintock, Brannon and Moody; 228McNair, Mosconi and Norris; 8McPhee; 226Merchant; 13; 14Miles and Snow; 8Mintzberg; 3; 9; 11Moch and Bartunek; 44Morgan; 26; 53; 185; 196; 200; 219; 220;
221Otley; 211Pasmore; 54
241

Awf/iors index
Polimeni, Fabozzi and Adelberg; 13Porter; 1; 11Reisman; 24; 25Roberts, J.; 202; 220Roberts, J. and Scapens; 220Roberts; 2Roethlisberger; 30Safizadeh; 44Schoenfeld; 19Schuring; 227Simon; 40Stalk; 2; 8Staubus; 19Strauss and Corbin; 27; 28; 158; 160; 161;
162; 164; 166; 170; 171Tanaka; 5Taylor; 44Theeuwes; 16Theunisse, Kerremans, Dyck and Van
Overloop; 7; 22Thompson; 40Trist; 40Turner; 206Vaassen; 227Vaill; 44Van Aken; 13Van Amelsvoort; 49Van Assen and Den Hertog; 53Van Beinum; 44Van de Poel; 10; 223Van de Ven and Drazin; 11Van de Ven and Poole; 228Van de Ven; 228Van Eijnatten; 40; 41; 42; 44; 45Van Maanen; 26Van Reeken; 43Van Sluijs, Van Assen and Den Hertog; 38Whitsett and York; 44Wildavsky; 13Womack, Jones and Roos; 218Yin; 28; 29; 30Yoshikawa, Innes and Mitchell; 5
242
Nederlandse samenvatting- Summary in Dutch
Dit proefschrift behandelt de samenhang tussen (veranderingen in) het organi-satie-ontwerp en (de daarmee gepaard gaande veranderingen in) het managementaccounting-systeem. De achterliggende gedachtengang is dat het functionele orga-nisatiemodel waarop de management accounting is gebaseerd, niet tegemoet komtaan de markteisen van flexibiliteit, kwaliteit, tijdigheid en innovativiteit. Als al-ternatief voor dit functionele model wordt het stroomsgerichte organisatiemodelvan De Sitter gehanteerd, het zogeheten Moderne Sociotechniek, dat een sterkenadruk legt op de order-/werkstroom die de diverse organisatiefuncties verbindt.Vervolgens is bekeken hoe dit andere organisatiemodel van invloed is op hetmanagement accounting-systeemontwerp c.q. welke wijzigingen zich voordedenin het eerdere, functioneel georiënteerde management accounting-systeemont-werp. Geconcludeerd werd: (1) dat een groot aantal van de problemen die voor-heen door de management accounting-functie werden beantwoordt, nu beant-woord worden door het verbeterde organisatieontwerp waarbij het managementaccounting-systeemontwerp sterk complementair functioneert; van groot belangbleek hier vooral de volgorde van de diverse ontwerpstappen; (2) dat de elemen-ten waaruit een stroomsgericht management accounting-systeemontwerp bestaat(het 'alternatieve' ontwerp), worden gekenmerkt door hun relatieve eenvoud enconventionele tekstboekkarakter; zowel gebruik en rol van deze elementen zijnduidelijk gebaseerd op de beheersings- en verantwoordelijkheidsstructuur dieingebracht is door het organisatieontwerp; (3) dat een stroomsgericht managementaccounting-systeemontwerp het ontstaan van een lerende organisatie aanmoedigt,waarbij dit leren slaat op continue verbetering van produktieactiviteiten enprocesbeheersing met behulp van decentralisatie van beheersing en verantwoor-delijkheden, participatie en normering van activiteiten.
In hoofdstuk 1 wordt de probleemstelling gedefinieerd en gepositioneerd: achter-grond van de probleemstelling en de plaats van de probleemstelling binnen hetbestaande veld van organisatieonderzoek in management accounting. Er wordtaandacht besteed aan de opkomst van additionele concurrentiefactoren zoals flexi-biliteit, kwaliteit en tijdigheid en de claim dat deze nieuwe concurrentiefactoreneen verlies aan relevantie van bestaande management accounting-concepten en-methoden inhoudt. Vervolgens wordt aangegeven wat de theoretische karakter-istieken van een competitief meer relevant management accounting zoudenmoeten zijn, hierbij gebruik wordt gemaakt van de laatste, van toepassing zijndetheoretische en empirische inzichten. Besloten wordt met de opmerking dat eenmogelijke verbetering van de bestaande management accounting-systemen, eenandersoortig onderzoek vereist - praktijkgericht en gebaseerd op veldonderzoek.
Hoofdstuk 2 neemt de draad op bij het andersoortig onderzoek dat vereist is enwerkt dit uit in termen van het gehanteerde onderzoeksontwerp en de gehan-teerde methodologie. Het onderzoeksontwerp is gebaseerd op een combinatie vangevalsstudies en 'grounded theory'-analyseprocedures. Dit omwille van de feitendat het onderzoek gebaseerd is op veldonderzoek en -observatie en op het grens-vlak ligt van organisatietheorie en management accounting terwijl er geen sprakeis van een uitgebreide theoretische en empirische basis voor onderzoek met dit
243

soort kenmerken. Drie gevalsstudies worden beschreven van drie Nederlandsebedrijven (Van Nelle Tabak/Rotterdam, Zilverstad zilversmeden en St. Antoniusmetaalconstructies) die alle hun bedrijfsstructuur en -voering radicaal hebbenveranderd in een stroomsgewijs ontwerp. De grounded theory-analyseprocedures,ontwikkeld vanuit sociologisch veldonderzoek en sterk gestructureerd in hunanalyseproces, zijn vervolgens toegepast, daarbij een aantal gebruikelijkebezwaren met betrekking tot gevalsstudies omzeilend. In hoofdstuk 7 wordt dewerking van deze procedures expliciet en uitvoerig aangetoond aan de hand vande analyse van de Van Nelle Tabak/ Rotterdam case.
In hoofdstuk 3 worden beknopt de basisgedachtengang alsmede de concepten enmethoden van stroomsgewijze produktie volgens de Moderne Sociotechniek be-sproken. Dit hoofdstuk is volledig gebaseerd op het werk van De Sitter. Centraalin de Modern Sociotechniek staat de analyse van relaties tussen interne subsyste-men waarbij een onderscheid wordt gemaakt naar produktie-, besturings- en be-heersingsstructuur. Voorts staat de order-/werksstroom binnen de organisatievoorop in de integratie van de diverse bedrijfsfuncties, hetgeen leidt tot een sterkdecentraal en multifunctioneel ingerichte organisatie. De benadering als zodanigis een Nederlandse voortzetting van eerdere, en beperktere, sociotechnische ex-perimenten elders in Europa, en vereist een integrale verandering van zowel alleorganisatieprocessen als de bijbehorende organisatiestructuur.
De hoofdstukken 4 tot en met 6 bevatten de drie genoemde gevalsstudies. Dezestudies zijn verricht in de volgorde waarin ze opgenomen zijn. Tevens is elkegevalsstudie in chronologische volgorde van gebeurtenissen beschreven. Degevalsstudie van Van Nelle Tabak/Rotterdam omvat het herontwerp van de or-ganisatie in de periode kort na de verzelfstandiging door een management 'buy-out' en vóór de overname door Sare Lee/Douwe Egberts. Het betreft hier vooraleen organisatieverandering geïnitieerd door de wil als zelfstandig bedrijf te over-leven ('wederopstanding' van de organisatie). De gevalsstudie van Zilverstad be-treft een klein tot middelgroot familiebedrijf dat in een sterk competitieve markthet eigen organisatievermogen als concurrentiefactor ontwikkelt ('oprichting'van de organisatie). St. Antonius ten slotte is eveneens een middelgroot familie-bedrijf dat op een Europese markt tegemoet moet komen aan hoge eisen met be-trekking tot kwaliteit en levertijd, waartoe de bestaande procesbeheersing enbedrijfsvoering sterk geprofessionaliseerd dient te worden ('professionalisering'van de organisatie).
Hoofdstuk 7 bevat de uitgebreide analyse van deze drie gevalsstudies. De gehan-teerde grounded theory-analyseprocedures leggen daarbij een dwingende en gron-dige analysevolgorde op; de beschikbare gegevens worden binnen een netwerkvan gerelateerde gebeurtenissen gebracht (een 'axiaal patroon') door middel vaneen iteratief proces van classificatie, rangschikking en betekenisgeving. De groun-ded theory-analyse per geval worden vervolgens vergeleken waarna er een aantalomvattende conclusies getrokken worden. De grounded theory-analysemethodeals zodanig is nooit eerder binnen accounting-veldonderzoek toegepast.
Het slothoofdstuk 8 bevat de conclusies en hun bespreking, hulp voor de praktijk,de beperkingen van de studie en de suggesties voor vervolgonderzoek. Een drietalconclusies worden getrokken: Ten eerste, de concepten en algemene gedachten-
244

Summary in Dufc/i
gang van Moderne Sociotechniek zijn overdraagbaar naar management account-ing-systeemontwerp. Zij resulteren in een complementaire aansluiting waarbijhet resulterende management accounting-systeemontwerp, vanwege de gehan-teerde volgorde van veranderingsstappen, een sterk vereenvoudigde on-dersteunende functie heeft - iedereen beheerst en beoefent management account-ing.Ten tweede, de karakteristieken van een sociotechnisch management accounting-systeemontwerp, waar dus een ander organisatiemodel dan het functionalistischeaan ten grondslag ligt, luiden: (1) accounting-methodieken en -technieken zijnvan een conventionele tekstboekaard; (2) het ontwerp is gericht op de gedrags-aspecten van accounting informatie, d.w.z. signaleren van verbeteringsmogelijk-heden in de procesbeheersing binnen en tussen taakgroepen; (3) het voorzietvoornamelijk in gedesaggregeerde informatie op lokaal taakgroepniveau, d.w.z.het informatiesysteem is sterk 'bottom-up' ontworpen; (4) het ontwerp maakt in-tensief gebruik van niet-financiële informatie die enerzijds relateert aan het sterklokale karakter van het ontwerp (zie 3. hierboven) en anderzijds aan het belangvan concurrentiefactoren die niet-financieel van aard zijn, zoals kwaliteit, lever-tijd en flexibiliteit; (5) het management accounting-systeemontwerp is een inte-graal deel van het organisatieontwerp, met andere woorden het organisatieont-werp is géén gegeven ontwerpconditie, maar een actief bestanddeel van het mana-gement accounting-systeemontwerp; en (6) het organisatieontwerp leidt tot eentransparente organisatie waarbinnen kostengedragingen eenvoudig en snel zijnna te speuren, d.w.z. 'traceability' staat voorop.Ten derde, de hantering van Moderne Sociotechnische concepten als het onder-liggende organisatiemodel stimuleert het ontstaan van een lerende organisatie.Het management accounting-systeemontwerp speelt hierin een duidelijke roldoor middel van de karakteristieken van 'minimale kritische specificatie' (pres-tatiemaatstaven zijn richtinggevend geformuleerd) en 'leren te leren' (de normvan een beheersingsregelkring wordt continu ter discussie gesteld door de taak-groepen). Het is vooral het regelkringconcept dat het management accounting-aandeel in de lerende organisatie betreft: Regelkringen worden 'bottom-up', zon-der uitzondering, op elk organisatieniveau gealloceerd; op lokaal niveau wordt deregelkring gehanteerd om procesbeheersing te vereenvoudigen en onderlingesamenwerking in normbepaling en procesbewaking aan te moedigen; en de nor-men in regelkringen worden vooral gehanteerd als verbeteringsinstrument.
245

Curriculum Vitae
Henri Johan Eduard (Hanno) Roberts werd op 8 november 1959 geboren te Preto-ria, Zuid-Afrika. In 1979 slaagde hij voor het eindexamen Atheneum, waarna hijeconomie ging studeren aan de Erasmusuniversiteit Rotterdam. Na het behalenvan zijn kandidaatsexamen in 1983 studeerde hij vervolgens bedrijfskunde aan detoenmalige Interfaculteit Bedrijfskunde te Delft. In 1986 behaalde hij zijn docto-raaldiploma Bedrijfskunde aan de Faculteit Bedrijfskunde van de Erasmusuniver-siteit Rotterdam, waarna hij als Wetenschappelijk Assistent in dienst trad van desectie Berichtgeving en Accountancy van de Rijksuniversiteit Limburg. Na vierjaar werd hij als Toegevoegd Onderzoeker verbonden aan zowel de sectie Bericht-geving en Accountancy als het Technologie, Arbeid en Organisatie (TAO) pro-gramma, ondergebracht in het Maastricht Economie Research institute on Innova-tion and Technology (MERIT). Van 1991 tot 1992 was hij aan beide groepen ver-bonden als Universitair Docent.Binnen het TAO-programma is hij verantwoordelijk voor de onderzoeklijn Man-agement Accounting. Zijn onderzoekbelangstelling ligt op het grensgebied van deManagement Accounting en de Organisatietheorie, en betreft met name de relatietussen organisatie-/accountingsysteemontwerp en organisatiegedrag.Vanaf 1992 is hij als Visiting Professor verbonden aan de Universidad Carlos III deMadrid, Spanje.
Henri Johan Eduard (Hanno) Roberts was born on November 8th, 1959, in Preto-ria, South-Africa. In 1983, he obtained his Bachelors degree in Economics andBusiness Administration from the Erasmus University of Rotterdam, after whichhe graduated in 1986 from the Rotterdam School of Management with a Master'sdegree in Business Administration. From 1986 onwards, he worked consecutivelyas a research assistant, research fellow and assistant professor at both the Depart-ment of Accounting and the Maastricht Research institute on Innovation andTechnology (MERIT) of the University of Limburg, The Netherlands. At MERIThe participates in the Technology, Work and Organisation programme in whichhe is responsible for the Accounting research line. His research interests arelocated at the interface of Management Accounting and Organisation Theory, andfocus mainly on the relationship between Organisation Design/Management Ac-counting Design and Organisational Behaviour. As of 1992, Hanno has been aVisiting Professor at the Universidad Carlos III de Madrid, Spain.
246

Accountability and Responsibility
extension of competition with elements such as quality,timeliness, flexibility and innovativeness, together withthe effects of the business cycle, resulted in structuralchanges inside the organisational model underlyingmanagement accounting. Management accounting hasto re-establish the links between organisationalmanagement and the design of the internal accountingsystem.
This study looks at the role that the design of theorganisation plays in the redesigning of themanagement accounting system. It describes how threefirms completely reorganised their organisation. Thenew design is highly decentralised and flow-oriented,placing responsibilities as low in the organisation aspossible.Concurrently, the management accounting system wasredesigned, and local responsibilities were matchedwith the new accountabilities that arose.It was found that the resulting management accountingsystem was one of a conventional, textbook nature.However, accounting instruments were distinctivelyapplied, turning their focus towards the behaviouralimplications and actively encouraging organisationallearning and continuous improvement efforts.The case study descriptions were analysed by use ofgrounded theory procedures, a methodology that hasnever before been applied to managerial accountingresearch.
Universitaire Pers Maastricl;ISBN 90 5278 082 x