
Accessory Portfolio Planning Model at Axis Communications
167
Accessory Portfolio Planning Model at Axis Communications Gustav Nyström & Rasmus Wellander Andreas Norrman – Supervisor, LTH Jan Olhager – Examiner, LTH Sara Jacobsson – Supervisor, Axis Communications Ulrika Magnusson – Supervisor, Axis Communications Erik Mårtensson – Supervisor, Axis Communications Robert Lindroth – Assisting Supervisor, Axis Communications
-
Upload
khangminh22 -
Category
Documents
-
view
2 -
download
0
Transcript of Accessory Portfolio Planning Model at Axis Communications

Accessory Portfolio Planning Model at
Axis Communications Gustav Nyström & Rasmus Wellander
Andreas Norrman – Supervisor, LTH
Jan Olhager – Examiner, LTH
Sara Jacobsson – Supervisor, Axis Communications
Ulrika Magnusson – Supervisor, Axis Communications
Erik Mårtensson – Supervisor, Axis Communications
Robert Lindroth – Assisting Supervisor, Axis Communications

I
Acknowledgements
This thesis is the final examination before our Master of Science degree in Industrial Engineering
and Management. The thesis has been written for the division of Engineering Logistics, part of
the Faculty of Engineering at Lund University, and conducted at Axis Communications.
We want to thank Axis and our supervisors who have helped us with practicalities and insights
throughout the process:
Erik Mårtensson
Sara Jacobsson
Ulrika Magnusson
Robert Lindroth
We are also grateful to everyone at Axis who have agreed to meet with us to share their
knowledge and expertise.
We would like to thank the companies and interviewees for taking part in our case
study – Thule Group, Husqvarna Group, Sony Mobile and Alfa Laval.
Finally, we want to express our gratitude to our supervisor at the division of Engineering
Logistics, Andreas Norrman. His help and crisp, constructive criticism throughout the project has
made us work harder and think deeper. His feedback has helped the report to gain credibility and
depth, resulting in higher quality research.
Lund 2016
Gustav Nyström & Rasmus Wellander

II
Abstract
Background
Axis Communications is a Lund based company which specializes in network cameras. In
addition to the cameras, the company has a wide range of accessories that ensure their customers
receive complete solutions. While the company has had significant successes by investing
heavily in R&D, increased competition from low-cost competitors is now placing higher
demands on cost-efficiency.
Problem
The high introduction rate of new cameras and solutions have resulted in an ever-expanding
portfolio of accessories. As the number has grown they are starting to cause problems in the
company’s operations. For example, the increased complexity is making it more difficult to
balance supply and demand. Further, it is a challenge due to the administrative complexities it
introduces. By making more informed decisions early in the development process, it is believed
the inflow of new accessories can be more controlled.
Purpose
To design a practically viable decision support model that enables more informed decisions with
regards to accessory development at Axis Communications.
Method
The study has used a constructive research approach. The construct is a decision support model
for Axis to use when developing accessories. The study started with a literature review to gain
insight into the current body of knowledge. A multiple case study was used to contribute with
empirical data on how companies work with the selection of projects in practice. Interviews and
workshops at Axis were then conducted to see what construct would fit the company and product
context. The final model was constructed and tested with key stakeholders at the company to
ensure its validity.
Theory
In the literature review we have looked at areas which are deemed important for the problem at
hand. Product portfolio management is a broad field and a literature review by Jugend & da Silva
(2014) was used for the initial structure. To further structure the selection and development
process, Michael Cooper’s work around the Stage-Gate process has been used. By combining the
stage-gate perspective with portfolio management an input-output framework was developed.
This framework has then been the basis to which we have formulated 26 theoretical propositions.

III
Empirical research
Axis’ camera development was used as a test case, this enabled fine tuning of the case study
protocol ahead of the main cases. The companies which participated were Sony Mobile, Thule
Group, Husqvarna Group and Alfa Laval. Companies were chosen to ensure a wide perspective
on the contextual aspects of life cycle length, company size, profitability and technology
sophistication. The study contributed with ways of practically working with selection of projects
and methods of maintaining data integrity.
Analysis
Many of the theoretical propositions were supported by the case study findings. Several
empirical propositions were also developed and evaluated for generalizability. Theory and
empirics were then combined to form a generic decision support model which companies can use
to improve development decisions. It starts with choosing criteria that are aligned with company
strategy and goals of the product portfolio. These criteria then dictate the input deliverables and
decision makers needed to make the decision. After the decision, a formal decision and goal
setting for the ensuing work should be performed. Finally, a post-launch review should be
conducted to follow-up on deliverables and decisions made at the decision point. This to ensure a
learning process.
The construct
It was decided that the focus of the model would be accessories developed within camera
projects. Criteria and methods were developed in order to reach the strategic goals of increasing
structure, priority and data integrity of accessories. Nine suggestions were proposed to Axis.
They were fitted into four different points of the current camera development structure. In short,
they serve to increase early awareness of accessories within camera projects. This through
requesting that certain deliverables are presented before an accessory is released for
development. We also suggest the decision to order tooling receives more focus as it results in
the most significant investment for an accessory. Finally, a post launch review is suggested in
order to follow-up on assumptions made at the decision point. This way the process will receive
continuous feedback and learning. As a result, Axis will be able to make more informed
decisions regarding accessories and thus increase control over their product portfolio.
Keywords: Decision support model, Accessories, Product development, Stage-gate process,
Portfolio management

IV
Sammanfattning
Bakgrund
Axis Communications är ett lundabaserat företag som är marknadsledande inom
nätverksvideokameror. Utöver deras kameror har de även tillbehör för att tillgodose kunders
behov av helhetslösningar. Företaget har rönt stora framgångar tack vare deras satsningar på
forskning & utveckling. På senare år har dock konkurrensen ökat från lågkostnadstillverkare
vilket ställt högre krav på kostnadseffektivitet.
Problem
Den höga introduktionstakten av nya kameror har lett till en stadigt ökande tillbehörsportfölj. I
takt med antalet nya tillbehör har även komplexiteten ökat vilket har börjat skapa problem i
företagets verksamhet. Ett exempel är svårigheten att balansera tillgång och efterfrågan när
antalet säljartiklar blir allt fler. Den administrativa bördan blir även den en utmaning i och med
detta. Genom att ta mer informerade beslut tidigt i utvecklingsprocessen tros det vara möjligt att
kontrollera inflödet av nya tillbehör.
Syfte
Att utforma en praktiskt gångbar beslutsmodell som stödjer mer informerade beslut vid
utveckling av tillbehör på Axis Communications.
Metod
Studien är baserad på en constructive approach som använts för att utveckla en beslutsmodell för
Axis tillbehörsutveckling. Studien började med en genomgång av relevant litteratur och följdes
sedan av en multipel fallstudie för att bidra med empirisk data till modellen. Slutligen anpassades
denna modell till Axis specifika kontext och utvärderades av nyckelpersoner på företaget för att
säkerställa modellen.
Teori
Portfolio management har studerats med utgångspunkt i ett ramverk av Jugend & da Silva
(2014). Detta ramverk har givit en initial struktur som sedan utvecklades med hjälp av Michael
Coopers teori kring Stage-Gate processer. Detta för att ge mer inblick till urval-och
utvecklingsbeslut samt för att ge kunskap om hur företag bör strukturera sina utvecklingsbeslut.
Genom att kombinera Stage-Gate processen med portfolio management så togs ett ramverk fram.
Detta ramverk har sedan konkretiserats och med hjälp av ytterligare litteratur formulerades 26
teoretiska påståenden.
V
Empiri
Fallstudien började med Axis kameradivision för att säkerställa vårt case study protocol innan
studien fortsatte. Sedan intervjuades Sony Mobile, Thule Group, Husqvarna Group och Alfa
Laval utöver Axis. Företagen valdes för att få en bredd gällande kontextuella aspekter såsom
längd på produktlivscykel, företagsstorlek, lönsamhet och teknologinivå. I intervjuerna
diskuterades hur företagen arbetade med produkturvalsbeslut, detta med utgångspunkt i vårt
teoretiska ramverk. Studien bidrog med insikter i hur företag arbetar med dessa beslut samt gav
nya förslag till en förbättrad teoretisk modell.
Analys
Flera teoretiska påståenden kunde verifieras genom fallstudien och ytterligare empiriska
påståenden utvecklades. Teori och empiri användes sedan för att utforma en generisk
beslutsmodell som företag kan använda för att ta bättre utvecklingsbeslut. Det börjar med att
välja urvalskriterier som är i linje med företagets strategi och målen med produktportföljen.
Dessa bestämmer sedan vilken information som behövs och vilka beslutsfattare som bör ta
beslutet. Efter ett formellt beslut tagits bör nya mål sättas för projektets framtid. Slutligen bör en
uppföljning göras genom ett formellt möte för att jämföra de antaganden och beslut som tagits
vid beslutspunkten, detta för att införa kontinuerlig inlärning i processen.
Konstruktion av beslutsmodell
Fokus för modellen blev tillbehör utformade inom kameraprojekt. Här togs kriterier och metoder
fram för att nå de strategiska målsättningarna att öka struktur, prioritet och säkerställa
datakvalitet för tillbehör. Nio förslag gavs till Axis och de introducerades på fyra olika platser i
den nuvarande utvecklingsprocessen. I korthet syftar de till att synliggöra tillbehör tidigare
genom att efterfråga särskilda leverabler innan ett tillbehör får godkänt för att utvecklas. Beslutet
att beställa verktyg föreslår vi lyfts fram och tydliggörs då det är det utgör den enskilt största
investeringen. Slutligen föreslås ett uppföljningsmöte för att ge en återblick på projektet och ge
kontinuerlig feedback och inlärning till processen. Med dessa förslag kommer Axis kunna ta
bättre beslut gällande sin tillbehörsportfölj och på så sätt kontrollera den på ett bättre sätt.

VI
Contents
1 Introduction ....................................................................................................................................... 1
1.1 Theoretical background .................................................................................................................. 1
1.1.1 Product Portfolio Management.............................................................................................. 1
1.1.2 Periodic Portfolio Reviews .................................................................................................... 1
1.1.3 Product Development and Idea-to-Launch Systems ............................................................. 2
1.1.4 Decision making and decision support .................................................................................. 2
1.1.5 Contextual factors.................................................................................................................. 3
1.2 Axis Communications ..................................................................................................................... 3
1.2.1 Axis’ Products ....................................................................................................................... 3
1.2.2 Axis’ Product Accessories ..................................................................................................... 4
1.3 Problem formulation ....................................................................................................................... 5
1.3.1 Parallel processes for complementary and essential accessories ........................................... 5
1.3.2 Need for a decision support model ........................................................................................ 6
1.3.3 System of study ..................................................................................................................... 6
1.4 Purpose ........................................................................................................................................... 7
1.5 Research questions ......................................................................................................................... 7
1.6 Focus & delimitations ..................................................................................................................... 7
1.7 Structure of the report ..................................................................................................................... 8
2 Theoretical Framework .................................................................................................................... 9
2.1 Portfolio management ................................................................................................................... 10
2.1.1 Strategy ................................................................................................................................ 11
2.1.2 Organization ........................................................................................................................ 13
2.1.3 Methods ............................................................................................................................... 14
2.1.4 Impact of portfolio management ......................................................................................... 18
2.2 New Product Development ........................................................................................................... 18
2.2.1 Characteristics of Successful Product Development ........................................................... 19
2.2.2 Functions Involved in NPD ................................................................................................. 19
2.2.3 Stage-Gate perspective of NPD ........................................................................................... 20
2.3 Decision point ............................................................................................................................... 23
2.3.1 Input .................................................................................................................................... 24
2.3.2 Decision ............................................................................................................................... 25
2.3.3 Output .................................................................................................................................. 26
2.3.4 Contextual Aspects .............................................................................................................. 26
2.4 Synthesis ....................................................................................................................................... 27
2.4.1 Input .................................................................................................................................... 27
2.4.2 Decision ............................................................................................................................... 28
2.4.3 Output .................................................................................................................................. 29
2.4.4 Contextual Aspects .............................................................................................................. 30
2.4.5 Areas of investigation .......................................................................................................... 30
3 Methodology ..................................................................................................................................... 31
3.1 Overall Approach ......................................................................................................................... 31
3.2 Research Approach ....................................................................................................................... 32
3.3 Research Question ........................................................................................................................ 33
3.4 Research Method .......................................................................................................................... 33

VII
3.4.1 Development of Theory ....................................................................................................... 34
3.4.2 Case Study Method ............................................................................................................. 36
3.4.3 Combine and construct model ............................................................................................. 43
3.4.4 Test and validate at Axis ..................................................................................................... 44
3.4.5 Compare theory and examine generalizability .................................................................... 44
3.5 Reliability and validity .................................................................................................................. 44
3.5.1 Construct validity ................................................................................................................ 45
3.5.2 Internal validity ................................................................................................................... 45
3.5.3 External validity .................................................................................................................. 45
3.5.4 Reliability ............................................................................................................................ 45
3.5.5 Validity & reliability as operationalized in the study .......................................................... 46
4 Empirical Study ............................................................................................................................... 47
4.1 Case 1 – Axis Camera Division .................................................................................................... 47
4.1.1 About Axis Communications .............................................................................................. 47
4.1.2 Industry and Products .......................................................................................................... 47
4.1.3 Product Management at Axis .............................................................................................. 47
4.1.4 Product Management Decision Point .................................................................................. 47
4.1.5 Contextual Aspects .............................................................................................................. 50
4.1.6 Summary ............................................................................................................................. 51
4.2 Case 2 – Sony Mobile ................................................................................................................... 52
4.2.1 About Sony Mobile ............................................................................................................. 52
4.2.2 Industry and Products .......................................................................................................... 52
4.2.3 Product Management at Sony .............................................................................................. 52
4.2.4 Product Management Decision Point .................................................................................. 53
4.2.5 Contextual Aspects .............................................................................................................. 55
4.2.6 Summary ............................................................................................................................. 56
4.3 Case 3 – Alfa Laval ....................................................................................................................... 57
4.3.1 About Alfa Laval ................................................................................................................. 57
4.3.2 Industry and Products .......................................................................................................... 57
4.3.3 Product Development at Alfa Laval .................................................................................... 57
4.3.4 Product Development Decision Point ................................................................................. 57
4.3.5 Contextual Aspects .............................................................................................................. 59
4.3.6 Summary ............................................................................................................................. 61
4.4 Case 4 – Husqvarna Group .......................................................................................................... 62
4.4.1 About Husqvarna Group ..................................................................................................... 62
4.4.2 Industry and Products .......................................................................................................... 62
4.4.3 Product Development at Husqvarna Group ......................................................................... 62
4.4.4 Product Development Decision Point ................................................................................. 62
4.4.5 Contextual Aspects .............................................................................................................. 66
4.4.6 Summary ............................................................................................................................. 67
4.5 Case 5 – Thule Group ................................................................................................................... 68
4.5.1 About Thule Group ............................................................................................................. 68
4.5.2 Industry and Products .......................................................................................................... 68
4.5.3 Product Development at Thule Group ................................................................................. 68
4.5.4 Product Development Decision Point ................................................................................. 69
4.5.5 Contextual Aspects .............................................................................................................. 71
4.5.6 Summary ............................................................................................................................. 73
5 Analysis & Findings ........................................................................................................................ 74

VIII
5.1 Axis Camera Division ................................................................................................................... 74
5.1.1 Comparison to theory .......................................................................................................... 74
5.1.2 Complements to theory ....................................................................................................... 78
5.1.3 Contextual Explanation ....................................................................................................... 78
5.2 Sony ............................................................................................................................................... 79
5.2.1 Comparison to theory .......................................................................................................... 79
5.2.2 Complements to theory ....................................................................................................... 82
5.2.3 Contextual Explanation ....................................................................................................... 83
5.3 Alfa Laval ...................................................................................................................................... 83
5.3.1 Comparison to theory .......................................................................................................... 83
5.3.2 Complements to theory ....................................................................................................... 87
5.3.3 Contextual Explanation ....................................................................................................... 87
5.4 Husqvarna ..................................................................................................................................... 88
5.4.1 Comparison to theory .......................................................................................................... 88
5.4.2 Complements to theory ....................................................................................................... 91
5.4.3 Contextual Explanation ....................................................................................................... 92
5.5 Thule Group .................................................................................................................................. 92
5.5.1 Comparison to theory .......................................................................................................... 92
5.5.2 Complements to theory ....................................................................................................... 96
5.5.3 Contextual Explanation ....................................................................................................... 97
6 Cross Case Analysis ......................................................................................................................... 98
6.1 Comparisons to theory .................................................................................................................. 98
6.1.1 Input .................................................................................................................................... 98
6.1.2 Decision ............................................................................................................................. 100
6.1.3 Output ................................................................................................................................ 103
6.2 Complements to theory ............................................................................................................... 104
6.2.1 Input .................................................................................................................................. 104
6.2.2 Decision ............................................................................................................................. 106
6.2.3 Output ................................................................................................................................ 109
7 Modified decision model ............................................................................................................... 110
7.1 Model Description ...................................................................................................................... 110
7.1.1 Goals & Criteria ................................................................................................................ 110
7.1.2 Input .................................................................................................................................. 111
7.1.3 Decision Makers ................................................................................................................ 111
7.1.4 Output ................................................................................................................................ 112
7.1.5 Feedback loop.................................................................................................................... 112
8 Construction of Decision Support Model at Axis ....................................................................... 113
8.1 Current processes at Axis ........................................................................................................... 113
8.1.1 General process ................................................................................................................. 113
8.1.2 Accessories in camera projects .......................................................................................... 114
8.1.3 Accessory projects ............................................................................................................. 115
8.2 Interviews .................................................................................................................................... 116
8.2.1 Accessory purpose ............................................................................................................. 116
8.2.2 Problem description ........................................................................................................... 116
8.3 Focus group – Workshop 1 ......................................................................................................... 118
8.3.1 Strategy and Purpose of Accessories ................................................................................. 118
8.3.2 Discussion and Prioritization of Problem Areas................................................................ 118

IX
8.3.3 Possible Criteria ................................................................................................................ 119
8.3.4 Contextual Aspects & Implementation Challenges ........................................................... 119
8.3.5 Choice of Criteria .............................................................................................................. 120
8.4 Construction of Model ................................................................................................................ 121
8.4.1 Strategic goals ................................................................................................................... 121
8.4.2 Criteria ............................................................................................................................... 121
8.4.3 Input .................................................................................................................................. 122
8.4.4 Decision makers ................................................................................................................ 123
8.4.5 Output ................................................................................................................................ 123
8.4.6 Feedback loop.................................................................................................................... 123
8.5 Model in Current Structure ......................................................................................................... 123
8.6 Validation at Axis........................................................................................................................ 125
8.6.1 Evaluation of model .......................................................................................................... 125
8.6.2 Validation summary .......................................................................................................... 127
9 Conclusion & Contribution .......................................................................................................... 128
9.1 Conclusion .................................................................................................................................. 128
9.2 Contributions .............................................................................................................................. 131
9.3 Limitations .................................................................................................................................. 132
9.4 Future research........................................................................................................................... 132
9.4.1 Principal company ............................................................................................................. 132
9.4.2 Academic Literature .......................................................................................................... 133
Bibliography ............................................................................................................................................ 134
Appendix I: Case study protocol ........................................................................................................... 143
Appendix II: Interview guide, interviews at Axis ................................................................................ 152
Appendix III: Interviews conducted at Axis ......................................................................................... 153
Appendix IV: Workshop 1, Product Management .............................................................................. 155
Appendix V: Workshop 2, test and validation at Axis ........................................................................ 156

1
1 Introduction
This chapter introduces the report, presenting basic theory and Axis as a company. It will then
motivate and lead up to the problem formulation and purpose of this study.
1.1 Theoretical background
All companies who develop and sell products face decisions about which products to include in
their portfolio. More products drive both costs and revenues and it is seldom clear which level of
variety is optimal and which products to develop or phase out. This chapter will introduce theory
concerning these decisions.
1.1.1 Product Portfolio Management
Deciding which New Product Development (NPD) projects to undertake is an important part of
portfolio decision making. Product portfolio management (PPM) is one important toolset that
can help companies connect company strategy with the product portfolio (Cooper, et al., 1999;
Kaiser, et al., 2015).
Cooper et al (1999) describe the purposes of portfolio management in four points:
Strategic choices. Deciding which markets, products and technologies the company
should pursue.
Resource allocation. Deciding where the limited R&D and marketing resources should be
deployed.
Project selection. Deciding which of the many potential development projects should be
chosen.
Balance. Deciding how the company should balance the number of projects to their
resources and capabilities.
There is a lot of literature on how to conduct PPM and NPD projects for companies main
products (Cooper, 2011; Cooper, 2014; Ulrich & Eppinger, 2012; van Oorschot, et al., 2010;
Krishnan & Ulrich, 2001; Martinsuo & Poskela, 2011). However, accessories have had less
focus in this field of research.
1.1.2 Periodic Portfolio Reviews
Periodic portfolio reviews are a commonly used tool within PPM. It can be explained as a point
in time where the current product portfolio is reviewed together with planned products. These
reviews are necessary since the market and technology dynamics of strategic planning need to be
captured during shorter periods of time (Jugend & da Silva, 2014). According to Patterson
(2005), how often the portfolio reviews are conducted depends on the company and the life
cycles of its products. Cosner et al. (2007) suggest that companies in innovative environments
need to do this more often. Often, PPM is undertaken together with a Stage-Gate process (van
Oorschot, et al., 2010; Chao, et al., 2014; Cooper, 2008) and if used successfully this leads to

2
better portfolio planning. The criteria used in the Stage-Gate process are suited for conducting
these portfolio reviews, the difference being that periodic reviews are comparing a set of projects
and are not evaluating each project individually.
1.1.3 Product Development and Idea-to-Launch Systems
Product development (PD) has been defined as the transformation of a market opportunity into a
product available for sale (Ulrich & Eppinger, 2012; Krishnan & Ulrich, 2001; Wheelwright &
Clark, 1992). It is a critical activity and a source of competitive advantage for many firms in
today’s business environment (Brown & Eisenhardt, 1995; Krishnan & Ulrich, 2001;
Balachandra & Friar, 1997; Wheelwright & Clark, 1992). At the same time, it is one of the
riskiest endeavors that a company can undertake as a majority of new product development
projects fail to deliver commercially (Page, 1991; Cooper, 2011).
To mitigate and control this risk many companies apply a structured idea-to-launch system. An
example is the Stage-Gate process proposed by Cooper (1990). He proposes a development
project should consist of stages and gates. In this process, stages and gates serve to structure the
product development project and increase its chance of success. Each gate sorts out projects that
do not fulfill the necessary criteria to proceed to the next stage. The main objective of this setup
is to focus the company’s resources on projects which are in line with the overall strategy and the
portfolio.
1.1.4 Decision making and decision support
Herbert Simon pioneered the field of decision making with his seminal work about the decision
making process (Simon, 1948). In his later work, Simon (1960) introduced the four steps of this
process named intelligence, design, choice and implementation. As seen in Figure 1, the
intelligence step consists of collecting data that helps identify and understand the problem. The
design step consists of generating solutions or courses of action. The choice step of actually
selecting one of these alternatives and finally, the implementation step of testing the chosen
solution.
Figure 1 – Decision making process, adapted from Simon (1948)
Laudon & Laudon (2014) further distinguish between structured, unstructured and semi
structured decisions. Unstructured decisions are where the decision maker must provide their
own judgment, evaluation and insight where there is no agreed upon way of making the

3
decisions. Structured decisions, on the other hand, are repetitive and routine and can be treated
using a standardized way of solving them each time. Many decisions are however semi-
structured, meaning that they contain elements from both.
Finally, Simon (1948) argues that the main limitation of human decision making is our limited
capability to take in and process all information required to make the best decision. This is why
there is a need for using decision support models and systems to help the decision making.
1.1.5 Contextual factors
As a company decides on how to filter its development opportunities and manage its current
products they need to take internal and external factors into account. While there is not much
written on the topic, a few contextual aspects have been found relevant to discuss.
Company size. Jugend & da Silva (2014) stress the organizational dimension and
information sharing in their framework for portfolio management. The larger the
organization, the more difficult it is to achieve functional integration (Kaiser, et al., 2015)
and inclusive decision making (Cooper, 2004).
Company profitability. Companies that apply formal criteria to all projects will
financially outperform their competition (Cooper, et al., 1999; Cooper, 2011).
Product life cycle. Patterson (2005) states that the product life cycle decides the
frequency of portfolio reviews. Cosner et al. (2007) suggest that companies in innovative
environments need to do this more often.
Technology sophistication. As Ettlie & Elsenbach (2007) found, incremental innovation
and less sophisticated technology development is more favored by a standard Stage-Gate
system.
1.2 Axis Communications
Axis Communications is a non-manufacturing company selling network solutions, mainly within
surveillance. It was founded in 1984 and invented the world’s first network video camera in
1996. It has since been a world market leader within network video and surveillance. The
company takes pride in research and development (R&D) and invests 15% of company turnover
in new products and solutions. These products are manufactured mainly by electronic
manufacturing services (EMS’s) and other suppliers. Axis only have final assembly for select
products, which is done at their configuration and logistics centers (CLCs). Historically the
company has been able to drive both growth and profitability, much because of successes within
R&D. Lately however, increased competition has come from low-cost firms in Asia.
1.2.1 Axis’ Products
Axis has a wide range of products for surveillance and security applications. Their main product
is network surveillance cameras but they also have related products such as video encoders.
Recently they have started to sell a new range of security applications within physical access

4
control stations. Their camera range can be divided into four product families – fixed box
cameras, fixed dome cameras, thermal cameras and pan-tilt-zoom cameras as seen in Figure 2.
Figure 2 - Axis range of cameras. Fixed box (A), fixed dome (B), thermal camera (C), pan-tilt-
zoom (D)
1.2.2 Axis’ Product Accessories
To increase the usability and range of application of their cameras, Axis are developing product
accessories. Some examples of these accessories are mounts, housings, lights and different
cables as seen in Figure 3. The purpose of the accessories is to allow for customization for
applications and to satisfy different customer needs. Mounts are an especially important
accessory group in this regard since they enable their cameras to be used in a variety of settings.
Figure 3 - Axis range of camera accessories. From left to right: camera mount, dome housing,
lighting and cable
While some accessories carry their own costs, there are many which exist to support camera
sales. In recent time, the accessory product portfolio has seen double-digit sales growth.
However, this growth has not necessarily meant more units sold of a select range of best sellers.
Rather through an expansion in product variety and the portfolio as seen in Figure 4. In the last
year, the company has tried to discontinue more accessories which explains the increased gap.
There has not however, been any large effort put into stemming the inflow of new accessories.
Product Managers and other employees believe there is lots of potential on this side of accessory
portfolio decisions as well. Ideally, increased revenue would not have to be driven by an inflated
portfolio but rather by increased sales of existing products.

5
Figure 4 – Development of number of accessories and their revenue (index 100 = 2012)
1.3 Problem formulation
The process of developing accessories follows the regular development process for cameras at
Axis to various degrees. When a new camera is developed, the camera team is responsible for the
essential accessories for that particular camera. Essential accessories are defined by the Product
Manager for that specific camera. They are accessories deemed to be needed for the camera to be
sold. In addition to these essential accessories, there are complementary accessories developed to
existing cameras. These need to be properly motivated before they can be released for
development and are then developed by a designated team.
1.3.1 Parallel processes for complementary and essential accessories
Essential accessories are rarely ran through a decision gate before released into development, as
depicted in Figure 5. This means that an accessory can be deemed essential by a Product
Manager, even though a nearly identical accessory already exists for another camera. A
consequence of this is that too many new accessories are developed as there is little
synchronization and alignment of the accessory portfolio (Mårtensson, 2016).
80
100
120
140
160
180
200
220
240
Q 1 Q 2 Q 3 Q 4 Q 1 Q 2 Q 3 Q 4 Q 1 Q 2 Q 3 Q 4 Q 1 Q 2 Q 3 Q 4 Q 1
2 0 1 2 2 0 1 3 2 0 1 4 2 0 1 5 2 0 1 6
Number of Accessories Accessory revenue

6
Figure 5 - Description of accessory development at Axis
1.3.2 Need for a decision support model
There is a need for a decision support model that helps to decide what accessories should be
developed based on projected sales and other relevant criteria. This decision support model
should align the separate processes for complementary and essential accessories. Complementary
and essential accessories should be more equally evaluated. This will greatly improve and
harmonize the accessory portfolio and make sure that Axis develops the right accessories and
spend their resources in a better way. To do this, the right information of the right quality needs
to be available. This way, Axis can make more informed decisions.
1.3.3 System of study
The studied system can be seen in Figure 6. The point of interest is the decision point where a
product is allowed to proceed into development. It is contained within the areas of NPD,
portfolio management and contextual aspects. The decision is taken early on in the product
development process and is the “point of no return”, as a majority of resources are consumed
after this point. Allowing the right product to pass this decision point is therefore critical for a
successful product portfolio.

7
Figure 6 – The studied system
1.4 Purpose
To design a practically viable decision support model that enables more informed decisions with
regards to accessory development at Axis Communications.
1.5 Research questions
RQ1 What does the decision point look like according to theory?
RQ2 What does the decision point look like in practice?
RQ3 How can these findings be implemented in the context of Axis’ accessories?
1.6 Focus & delimitations
The study has looked at the decision point where the decision is made if a project should be
allocated R&D resources and proceed to development. If a Stage-Gate process is not specifically
used, the corresponding decision point has been identified and studied.
The empirical focus has been on this decision point through a multiple case study. The main
interest has been how companies base their decision on input and then create an output, or
decision, based on set decision criteria.

8
The second phase of the empirical study was conducted at Axis with the focus on applying the
proposed model. People involved in day to day work with accessories and the decision making
were involved in this stage. This part of the study was focused on accessories and did not cover
other products such as spare parts.
When conducting interviews at Axis it became apparent that the focus for the final construct
should be on accessories developed in camera projects, named essential accessories in Figure 5.
This since these accessories accounted for majority of the problems found.
The result of the study was to provide a decision model which could fit into Axis current
structure for camera projects, the implementation will be left to Axis to conduct.
1.7 Structure of the report
The report is structured into seven main parts following the introduction.
Theoretical framework where a foundation for the project is provided. It looks into research
areas which have been judged relevant for the research questions at hand.
Methodology where the working process of the project is described and motivated.
Empirical study describes the data collection at the case companies.
Analysis and Findings where the empirical data is analyzed through single and cross-case
analysis. The outcome of this analysis is then used to improve the theoretical decision model.
Modified Decision Model describes a generic decision support model based on the theoretical
framework and empirical study.
Construction of decision support model deals with the adaption of the model to Axis
Accessories. Data collection in form of interviews and workshops are described followed by
analyses of how the model should be modified to fit Axis’ operations better. The chapter also
contains a verification step of the model at Axis.
Conclusion and Contribution examines how the final model relates to the theoretical
propositions. It also examines how generalizable the empirical findings are and how the study
has contributed to the body of knowledge.

9
2 Theoretical Framework
The theoretical framework is divided into three sections which are described, including
interdependencies, in Figure 7. The framework is based on a number of key articles that provide
its structure. The decision point, the unit of analysis, was used as a starting point and areas
deemed important to explain and understand this point are examined. The theoretical findings
are finally summarized in a conceptual model, consisting of a number of theoretical
propositions.
Figure 7 describes the theoretical framework. The area of portfolio management is important to
lay the groundwork for portfolio decision making. To structure the product development process
a stage gate framework is used. The findings from these two fields is then used to describe the
decision point which is the point of interest. Theory has been used to describe it using the
components input, decision and output. Contextual aspects found to affect the decision making
are also included. Finally, our view of the decision point will be condensed into 26 theoretical
propositions.
Figure 7 - Structure of the theoretical chapter including connections and interdependencies

10
2.1 Portfolio management
Portfolio management is a term referred to in several different contexts. It has been used when
assessing financial products, customers, suppliers, projects and products. We examine the
general thinking of portfolio management with a focus on product portfolios and implications on
R&D.
Portfolio management is not a new idea. Researchers and consultancies have been investigating
and selling the concept as business-unit matrices for some time, the BCG-matrix being a famous
example (Mikkola, 2001). The primary focus is on strategic aspects and resource allocation
among business units (Cooper, et al., 1999).
Cooper et al (1999) describe the purposes of portfolio management in four points:
Strategic choices. Deciding which markets, products and technologies the company
should pursue.
Resource allocation. Deciding where the limited resources within R&D and marketing
should be deployed.
Project selection. Deciding which of the many potential development projects should be
chosen.
Balance. Deciding how the company should balance the number of projects to their
resources and capabilities.
To structure the area of research, Jugend & da Silva (2014) have developed a framework based
on a literature review which is depicted in Figure 8. The dimensions suggested as the most
impactful in the field are strategy, organization and methods with two or three sub-categories.
This chapter is based on their framework.

11
Figure 8 - Product portfolio framework, adopted from Jugend & da Silva (2014, p. 20)
2.1.1 Strategy
There is much focus on the connection to strategy within the field of portfolio management.
Jugend & da Silva (2014) discuss how companies focus on individual projects and products,
missing the bigger picture and the company strategy. Additionally, functional objectives are
deciding which projects are proposed and approved, which leads to a lacking holistic view.
Cooper et al. (1999) explain how portfolio management is one important route by which senior
management can execute company strategy in terms of prioritization of products, markets and
technologies. Product development decisions drive what type of business the company should
rely on in the upcoming years. Kaiser et al. (2015) argue that the main purpose of portfolio
management is aligning the product portfolio with strategic goals of the company.
2.1.1.1 Strategic Planning
Strategic planning deals with long term aspects of portfolio management. Medium and long term
decisions are usually integrated into this phase. Planning of platform shifts and more radical
innovations are usually included as well (Jugend & da Silva, 2014). Jugend & da Silva (2014)
suggest that an innovation strategy can be an alternative connector between strategy and product
planning, bridging the gap and guiding decision making.
Cosner et al. (2007) suggest integrated roadmaps, starting with strategy, should drive the
planning of products. The integrated roadmap consists of four sub-parts which intersect to
connect company strategy with the products.
Strategic Roadmap consists of the long-range objectives of senior management.
12
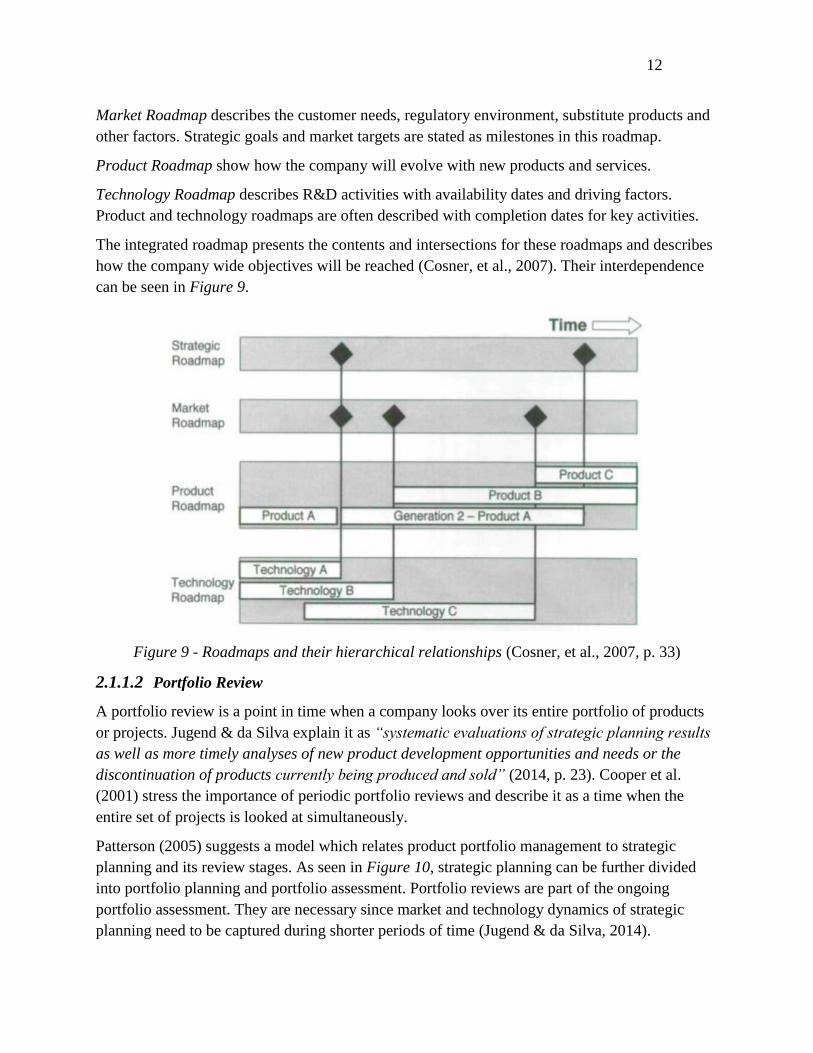
Market Roadmap describes the customer needs, regulatory environment, substitute products and
other factors. Strategic goals and market targets are stated as milestones in this roadmap.
Product Roadmap show how the company will evolve with new products and services.
Technology Roadmap describes R&D activities with availability dates and driving factors.
Product and technology roadmaps are often described with completion dates for key activities.
The integrated roadmap presents the contents and intersections for these roadmaps and describes
how the company wide objectives will be reached (Cosner, et al., 2007). Their interdependence
can be seen in Figure 9.
Figure 9 - Roadmaps and their hierarchical relationships (Cosner, et al., 2007, p. 33)
2.1.1.2 Portfolio Review
A portfolio review is a point in time when a company looks over its entire portfolio of products
or projects. Jugend & da Silva explain it as “systematic evaluations of strategic planning results
as well as more timely analyses of new product development opportunities and needs or the
discontinuation of products currently being produced and sold” (2014, p. 23). Cooper et al.
(2001) stress the importance of periodic portfolio reviews and describe it as a time when the
entire set of projects is looked at simultaneously.
Patterson (2005) suggests a model which relates product portfolio management to strategic
planning and its review stages. As seen in Figure 10, strategic planning can be further divided
into portfolio planning and portfolio assessment. Portfolio reviews are part of the ongoing
portfolio assessment. They are necessary since market and technology dynamics of strategic
planning need to be captured during shorter periods of time (Jugend & da Silva, 2014).

13
According to Patterson (2005), portfolio review frequency depends on the company and product
life cycle. Cosner et al. (2007) suggest that companies in innovative environments need to do this
more often, for example every 2 months.
Figure 10 - PPM and its review activities, adopted from Patterson (2005)
2.1.2 Organization
Organizational aspects are important when making analyses and recommendations to specific
companies (Jugend & da Silva, 2014). An aspect of importance is the ability of the organization
to provide the necessary information. Decision making and portfolio management can only be as
good as the information it is based on (Kaiser, et al., 2015).
2.1.2.1 Integration
Functional integration and cross functional teams are, according to Jugend & da Silva (2014),
some of the most important aspects of portfolio management. They emphasize, in line with
Kaiser et al. (2015), the importance in terms of information sharing and common decision
making. In a well-functioning portfolio management practice, knowledge is used from more than
the function directly involved. The need for information from functions is based on the criteria
used in the decision making. The organizational integration must be good enough to support such
information sharing in an efficient way. This to get the most out of portfolio management
(Kaiser, et al., 2015).

14
2.1.2.2 Organizational structure
Kaiser et al. (2015) describe implementation of portfolio management and argue that it should, in
project based organizations, shape the entire organizational structure. They believe that the
structure of the organization should be aligned with portfolio management goals to enable
greater success for the company by increased informational flow. A structure is considered
aligned with portfolio management goals when “it warrants the timely and efficient delivery of
high-quality information required by portfolio management” (Kaiser, et al., 2015, p. 135).
Studies have indicated that matrix organizations and cross functional teams are the most suitable
for implementation of portfolio management (Jugend & da Silva, 2014). This is contributed to
the information and knowledge sharing enabled by these structures. When employees from
different functions are involved in the same projects and day-to-day work, it is natural that
communication increases.
2.1.2.3 Leadership
For successful implementation it is important to have the organization’s leadership on board. It is
a critical success factor in portfolio management as well (Cooper, et al., 1999). Kaiser et al.
(2015) argue that portfolio management leadership must stimulate different functions to work
together. McNally et al. (2009) and Cooper et al. (2004) believe a more democratic leadership
style, delegation of day-to-day activities and inclusive decision making, increase the
performance of portfolio management. McNally et al. (2009) suggest the reason is increased
communication and information sharing which occurs in organizations with democratic
leadership.
2.1.3 Methods
Methods and tools of portfolio management can be divided into different categories. Depending
on the company’s need and strategy, combinations of these methods should be used in product
management decisions.
2.1.3.1 Financial methods
The most commonly used methods for evaluating products and projects are financially based.
They are also the most dominant in cases where companies use several methods (Cooper, et al.,
2001; Cooper, 2011). Categories of financial models have been proposed by Cooper et al.
(1999):
Financial models and financial indices. Examples being net present value, internal rate of
return and pay back methods.
Probabilistic financial models. Include advanced models as Monte Carlo simulations,
simulations with a stochastic feature, or a simple decision tree.

15
Options pricing theory. Treats each project like an option on a future investment. An
early investment is viewed as buying an option on further investments in the future,
enabling use of option pricing models.
Jugend & da Silva (2014) suggest these methods present a quantitative value that make projects
easy to analyze, compare and prioritize. The authors do however warn that some companies rely
too heavily on the financial measures. There is a risk of misjudging the possible return on riskier
projects, leading to selection of safe projects and limiting innovation. There is a heavy reliance
on the numbers going into the models, which can limit strategic aspects of development
decisions. However, as a complement to other methods, financial metrics are suitable for
analyzing the return on resources going in to a project or product (Cooper, et al., 1999; Jugend &
da Silva, 2014).
2.1.3.2 Scoring, ranking and checklists
Some popular methods, which compare projects or products in a quantitative way without being
financial measures fall within the category of scoring, ranking and checklists. Relative
comparisons look at a given set of products and then rank them. A downside of this method is
that it has to be remade entirely if a new product is added to the set (Lin & Hsieh, 2003). An
alternative idea is to use a set system of scoring or ranking which can be used for one product at
a time. It is not dependent on other products in the set which is more time efficient. It is however
disregarding the interdependencies among products (Jugend & da Silva, 2014). An example of a
simple scoring spreadsheet with weighted criteria is presented in Table 1.
.

16
Table 1 - Example of weighted criteria model (rating of product from 1-10)
Product A Product B
Market risk
(Weight 0,4)
7 out of 10
7*0,4 = 2,8
5 out of 10
5*0,4 = 2
Market potential
(Weight 0,3)
8 out of 10
8*0,3 = 3,2
9 out of 10
9*0,3 = 2,7
Project cost
(Weight 0,3)
4 out of 10
4*0,3 = 1,2
3 out of 10
3*0,3 = 0,9
Total 2,8 + 3,2 + 1,2 = 7,2 2 + 2,7 + 0,9 = 5,6
Bitman and Sharif (2008) suggest that most ranking methods consist of perspective and criteria.
Perspective relates to the company objectives of the portfolio, for example customer satisfaction.
These are then broken down into criteria as a measure of the perspective. The criteria could then
be given weights that are added up by using an analytical hierarchy process (AHP) or a balanced
scorecard (Jugend & da Silva, 2014).
When using checklists as criteria, projects are evaluated based on a number of yes/no questions.
The project often has to answer yes to all questions before continuing into next stage. When
implemented, checklists are often used as a complement to other methods (Cooper, 2011).
2.1.3.3 Visualization tools
To get a visual view of the product portfolio and product introductions some companies use
maps, graphs or diagrams (Jugend & da Silva, 2014). Mikkola (2001) points to the use of
product matrices for positioning in various dimensions, examples are the BCG-matrix, the GE-
matrix and product roadmaps. Matrices’ have been criticized for the simplifications of a two
dimensional model and the difficulty of measuring proposed dimensions. Mikkola (2001)
proposes matrices are a strong tool when aligning company strategy to long term goals and day-
to-day R&D decisions. She continues to argue that competitive advantage and benefits to
customer are the two most important dimensions when analyzing potential projects.
A product roadmap, seen in Figure 11, is a visual tool used to map out products and technologies
to be developed over time. It can be used to allocate resources and plan deadlines for example
(Jugend & da Silva, 2014).

17
Figure 11 - Example of a product roadmap, adapted from Cosner et al. (2007, p. 33)
To add an additional dimension to a two dimensional graph or matrix, some companies use
bubble diagrams where the size of a bubble and the color can add information, seen in Figure 12.
Figure 12 - Typical risk-reward bubble diagram (Cooper, et al., 2001, p. 369)
2.1.3.4 Business strategy models
Cooper et al. (1999) mention business strategy models in addition to the methods from the
portfolio management framework. This category of models has a direct link to the strategy of the
business. The business units are divided into categories, or “buckets”, which are given a set
budget based on strategic prioritizations. The prioritization within these categories is based on a
Time
Product A
Product B
Generation 2, Product A
Product C
Product D

18
different method, the most common being financial measures. An example of strategic buckets is
depicted in Table 2.
Table 2 - Example of a strategic bucket plan, adapted from Cooper et al. (2001, p. 368)
Product Line A
Target budget SEK 3.4 M
Product Line B
Target budget SEK 2.8 M
Product Line C
Target budget SEK 10.4 M
Product A (SEK 1.2 M) Product C (SEK 0.6 M) Product F (SEK 4.6 M)
Product B (SEK 2.2 M) Product D (SEK 1.4 M) Product G (SEK 2.4 M)
Product E (SEK 0.8 M) Product H (SEK 3.4 M)
To achieve the best results, the tool should align the portfolio with company strategy (Jugend &
da Silva, 2014). Cooper et al (2001), suggest that the combination of strategic models with any
other method gives the most beneficial results for companies.
2.1.4 Impact of portfolio management
Portfolio management is said to optimize overall benefits of a product portfolio in terms of
operational and strategic goals. It is a critical factor of success in new product development
(Cooper, et al., 1999; Jugend & da Silva, 2014; Kaiser, et al., 2015). A vital part of the practice is
to control the inflow of new products into the portfolio. This to match the company’s goals with
the resources available and get the most out of development efforts (Cooper, et al., 2001).
Companies who succeed in the field of portfolio management, in terms of fitting management
and being rated as high quality by management, get numerous advantages (Cooper, et al., 1999):
Higher economic value for the firm’s development projects.
Higher degree of strategic alignment. Development projects match company strategy and
spending mirrors strategic priorities.
Higher degree of project balance.
The number of projects match the resources available.
Another purpose discussed by Tolonen, et al. (2015) is the possibility to manage the portfolio to
create a healthy in-and-out-flow of products. Portfolio management can be a key tool to limit the
portfolio size and keep it from expanding to unwanted levels (Tolonen, et al., 2015).
2.2 New Product Development
Product development has been defined as the transformation of a market opportunity into a
product available for sale (Krishnan & Ulrich, 2001; Wheelwright & Clark, 1992). The wide
scope of this process means it encompasses several company functions – research &
development, marketing and operations to name a few. New Product Development (NPD) is
critical for many companies to sustain competitive advantage (Brown & Eisenhardt, 1995;
Krishnan & Ulrich, 2001; Balachandra & Friar, 1997; Wheelwright & Clark, 1992). At the same
19
time, it is one of the riskiest endeavors that a company can undertake as many NPD projects fail
commercially (Page, 1991; Cooper, 2011).
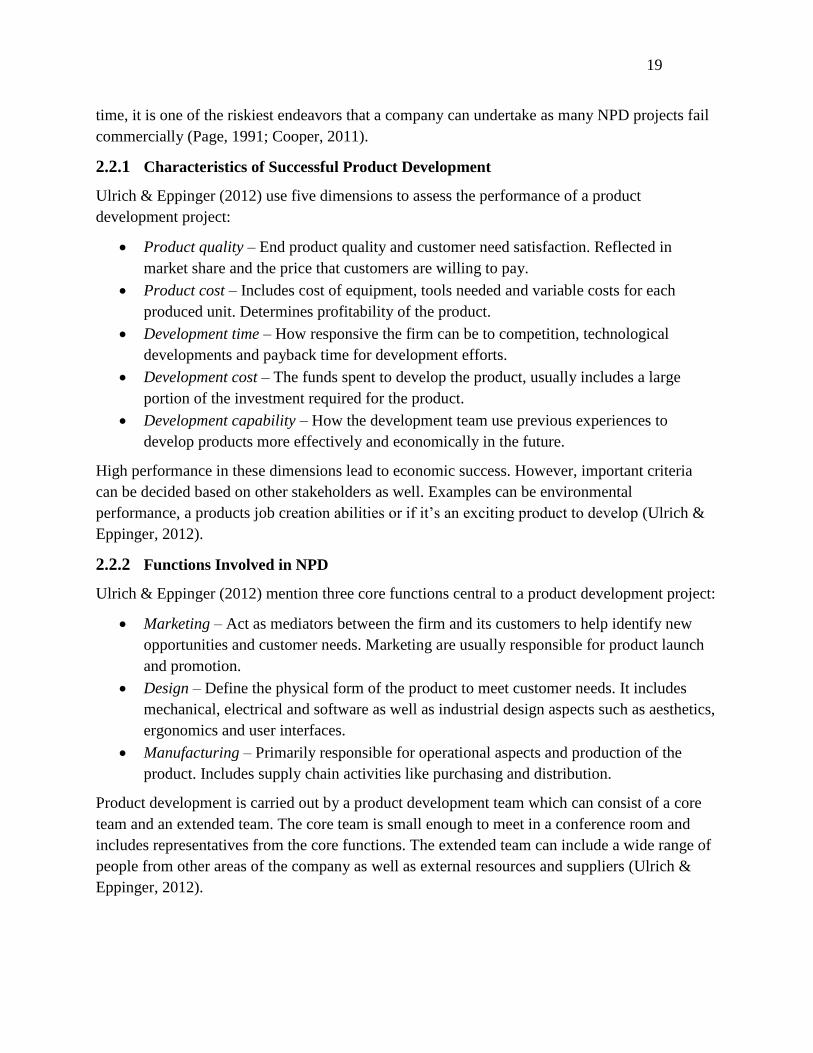
2.2.1 Characteristics of Successful Product Development
Ulrich & Eppinger (2012) use five dimensions to assess the performance of a product
development project:
Product quality – End product quality and customer need satisfaction. Reflected in
market share and the price that customers are willing to pay.
Product cost – Includes cost of equipment, tools needed and variable costs for each
produced unit. Determines profitability of the product.
Development time – How responsive the firm can be to competition, technological
developments and payback time for development efforts.
Development cost – The funds spent to develop the product, usually includes a large
portion of the investment required for the product.
Development capability – How the development team use previous experiences to
develop products more effectively and economically in the future.
High performance in these dimensions lead to economic success. However, important criteria
can be decided based on other stakeholders as well. Examples can be environmental
performance, a products job creation abilities or if it’s an exciting product to develop (Ulrich &
Eppinger, 2012).
2.2.2 Functions Involved in NPD
Ulrich & Eppinger (2012) mention three core functions central to a product development project:
Marketing – Act as mediators between the firm and its customers to help identify new
opportunities and customer needs. Marketing are usually responsible for product launch
and promotion.
Design – Define the physical form of the product to meet customer needs. It includes
mechanical, electrical and software as well as industrial design aspects such as aesthetics,
ergonomics and user interfaces.
Manufacturing – Primarily responsible for operational aspects and production of the
product. Includes supply chain activities like purchasing and distribution.
Product development is carried out by a product development team which can consist of a core
team and an extended team. The core team is small enough to meet in a conference room and
includes representatives from the core functions. The extended team can include a wide range of
people from other areas of the company as well as external resources and suppliers (Ulrich &
Eppinger, 2012).

20
2.2.3 Stage-Gate perspective of NPD
One way of managing NPD process difficulties is to implement an idea-to-launch system. The
purpose of such a system is to structure the innovation process and connect development stages
of products to portfolio management. One such idea-to-launch system, the Stage-Gate process,
has been designed by Cooper (1990). It is a perspective widely used for managing the product
innovation process in portfolio management (van Oorschot, et al., 2010; Chao, et al., 2014;
Cooper, 2008). The Stage-Gate process as seen in Figure 13 consists of a series of guiding stages
and gates.
Figure 13 - Stage-Gate process, adopted from Cooper (2011).
The idea is to have several stations where a project has to motivate its existence. The purpose is
to limit the number of bad development projects. Project Managers have to argue for a project to
executives at each gate, called a go/kill decision (Cooper, 2011).
2.2.3.1 Stages
The stages are where the actual work is carried out. To progress to the next gate, a set of
activities need to be completed. In addition to the actual development, there are activities to
gather information used as a basis for decision making at the subsequent gate, see Figure 14.
Figure 14 - Description of the sub-parts of the Stage-Gate process, adopted from Cooper (2008).

21
Each stage is more expensive than the next explaining why the information gathered is critical to
manage project risk. The stages build on continuous, cross-functional cooperation since no single
department owns the stage (Cooper, 2008).
2.2.3.2 Gates
The gates are check points of the process where a decision is made to proceed or kill projects.
Each gate consists of deliverables, criteria and outputs. Deliverables are what the project team
should bring to the gate, decided at the previous gate. Criteria can be in the categories of must-
meet, which decides whether the project should be allowed to continue, and should-meet where
the project is prioritized against other projects. Output consists of the decision whether to
continue or kill the project. If the project continues, the output should state the deliverables at the
next gate and a deadline for completion (Cooper, 2008).
The criteria most commonly used in the gates have strong parallels to portfolio management.
Cooper (1999) divides them into seven categories similar to the methods proposed in the
portfolio management framework in chapter 2.1:
Financial models and financial indices.
Probabilistic financial models.
Options pricing theory, treats each project like purchasing an option on a future
investment.
Strategic approaches.
Scoring models and checklists, often qualitative measures.
Analytical hierarchy approaches.
Behavioral approaches, tools designed to reach a consensus among managers which is
useful when only qualitative information is available.
Mapping approaches or bubble diagrams.
Jugend & da Silva (2014) point to the importance of having criteria and methods which are easy
to understand for people involved in the project. This to ensure the selected measurements are
driving the operations in the desired direction. Additionally, information required for the
decision must be collected correctly. Jugend & da Silva (2014) suggest highly complex
mathematical methods are often not used due to their complexity. They also have unclear
connection between input in terms of workload and improved decision making for the project.
Criteria used in a selection process should be aligned with information collection. Kaiser et al.
(2015) describe how choice of criteria decide what information is required for the decision. The
information need has to be aligned with the organizational structure. It includes aspects such as
systems, processes and organizational units which can create, process and deliver the necessary
information to the decision point.

22
2.2.3.3 Modifications
The Stage-Gate perspective of product development and its connection to portfolio management
is a strong motive for practical use. There are however limitations with a standardized system.
The Stage-Gate process can provide a solid base for a company wanting to implement a way of
working with portfolio management in NPD. There is criticism to the concept regarding the
linearity, rigidness and limitations in innovative projects (Cooper, 2014). Propositions regarding
modifications have been suggested by researchers to improve the process based on company
specific context.
Ettlie & Elsenbach (2007) have investigated the difference in practice between breakthrough-
and incremental innovation in terms of Stage-Gate modifications. They found that incremental
product development projects are well served by a standard system. When dealing with radical
new technology however, a version modified for the specific company could improve project
efficiency without negative trade-offs.
A large variation in project types while using a “one size fits all” thinking like the Stage-Gate
perspective is not optimal. It risks leading to too little time is spent on the high-value and too
much on the low-value projects. To increase the efficiency of the development there should be a
project specific customization. If done right, companies are able to reduce wasteful activities
without reductions in decision making quality (Cooper, 2008).
To adapt to new business threats from competition and internal development of the organization,
companies have to adapt how they work. Concerning the Stage-Gate perspective several
improvements to the original idea has been proposed:
Use of fuzzy numbers as a means to quantify qualitative data. Lin and Hsieh (2003) suggest the
lack of complete information at the beginning of projects, which reduces the usefulness of
quantitative models, can be mitigated by using fuzzy numbers. Fuzzy numbers can be seen as a
set of possible numbers with various weights which can incorporate risk and uncertainty in a
more sophisticated way than regular numbers. The idea is to use decision makers’ confidence in
their view, as a weight for their impact on the final decision with the purpose of improving total
decision certainty.
Digital decision support systems. To keep track of data and simplify mathematical decision
models, some authors suggest use of digital decision support systems (Lin & Hsieh, 2003;
Cooper, 2014; Cooper, 2008). They can vary from advanced mathematical modelling to simple
AHP software which weighs decision makers’ opinions of criteria.
Increase level of flexibility in project start. As a way to improve the dynamics of complex
projects, van Oorschot et al. (2010) argue that companies should increase investment in the
beginning of projects to improve the dynamics of project execution. They suggest a project
ramp-up focus in the beginning will increase the product success rate when there is a large
degree of built in uncertainty.
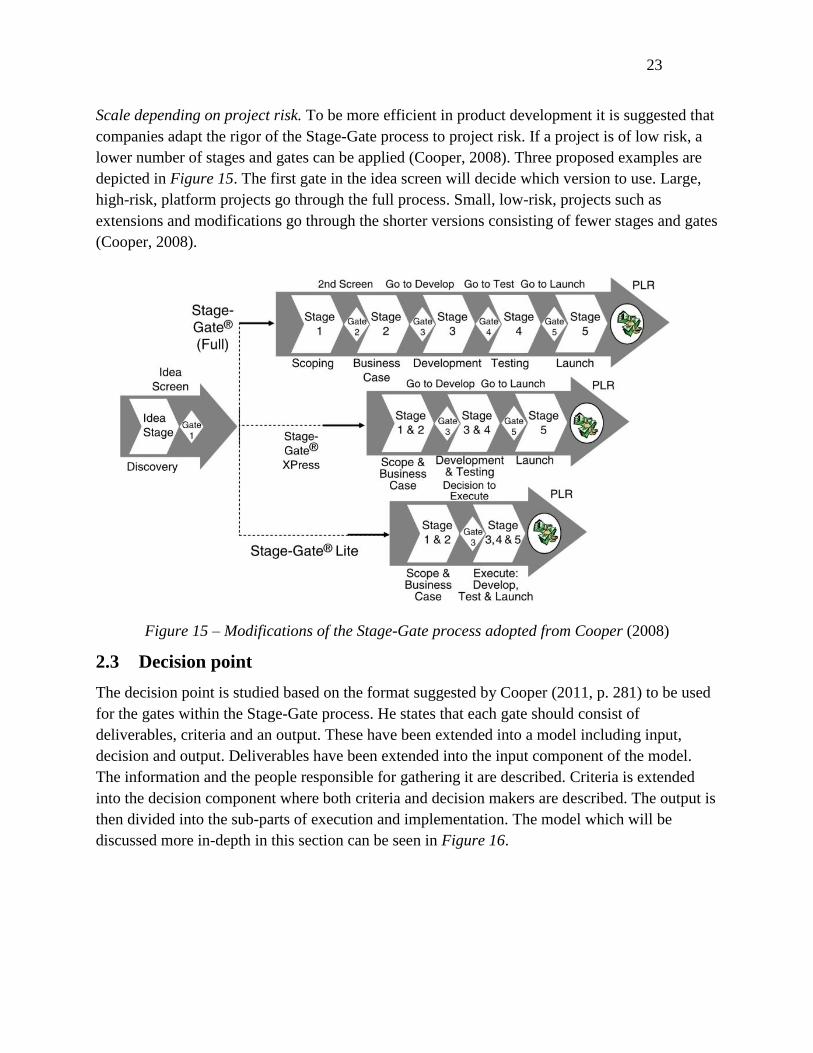
23
Scale depending on project risk. To be more efficient in product development it is suggested that
companies adapt the rigor of the Stage-Gate process to project risk. If a project is of low risk, a
lower number of stages and gates can be applied (Cooper, 2008). Three proposed examples are
depicted in Figure 15. The first gate in the idea screen will decide which version to use. Large,
high-risk, platform projects go through the full process. Small, low-risk, projects such as
extensions and modifications go through the shorter versions consisting of fewer stages and gates
(Cooper, 2008).
Figure 15 – Modifications of the Stage-Gate process adopted from Cooper (2008)
2.3 Decision point
The decision point is studied based on the format suggested by Cooper (2011, p. 281) to be used
for the gates within the Stage-Gate process. He states that each gate should consist of
deliverables, criteria and an output. These have been extended into a model including input,
decision and output. Deliverables have been extended into the input component of the model.
The information and the people responsible for gathering it are described. Criteria is extended
into the decision component where both criteria and decision makers are described. The output is
then divided into the sub-parts of execution and implementation. The model which will be
discussed more in-depth in this section can be seen in Figure 16.

24
Figure 16 - Conceptual model of the decision point before NPD
2.3.1 Input
Kaiser et al. (2015) describe how choice of criteria decides the type of information required in
the decision. The implication of increased sophistication of decision criteria is increased
information need. In line with portfolio management, the information gathering needs to be
supported by the organization. This includes systems and processes which can create, process
and deliver the necessary information.
Cooper et al (1999) discuss how the project team must gather and structure information before
each gate. The team should distill the information into deliverables used by decision makers in
their go/kill decision for the project. The gathering is described in its steps in Figure 17.
Figure 17 - Information gathering for each gate (Cooper, 2008, p. 214)
A problem proposed by Chao et al. (2014) is misalignment between Project Managers collecting
information and the decision makers at the gates. The Project Managers could have an incentive
to give misleading or incomplete information if their project risks being killed. Decision makers
on the other hand try to optimize the portfolio in its entirety and must have complete information
to do so. Chao et al. (2014) suggest that the risk is greatest at the beginning of the development

25
process when information is most uncertain. The proposed solution for this information
asymmetry is to employ a high level of tolerance for failures to decrease the incentive to hide
uncomfortable information.
The focus on killing bad projects early in the process, when the information available is at the
lowest point, has been criticized as it risks killing good ones as well. This has been investigated
by van Oorschot et al. (2010) who found that projects characterized by information uncertainty
risk this destiny. An underestimation of workload in the beginning of the project, in combination
with the Stage-Gate philosophy of low initial investment, can lead to a poor start. This can carry
over through the stages and risk leading to an undeserved kill decision.
2.3.2 Decision
The use of formal methods and criteria can be argued for in numerous ways. It is a way of
combining different aspects of a decision, such as technology, risk, market and economic return
(Jugend & da Silva, 2014). Cooper et al. (2001) argue that one of the most important aspects of
the formal criteria is to put discipline into the process and provide a consistent way of dealing
with decisions. Using the same criteria enables comparison of project and products. A study of
205 companies implementing the practice suggest those who use formal, explicit, clearly defined
methods applied on all projects perform the best (Cooper, 2011).
An important aspect in the choice of decision criteria is the impact they have on the ultimate goal
of the portfolio. Some of the common KPIs found by Cooper et al. (1999) are strategic
alignment, total portfolio value and portfolio balance. The authors discuss this issue and suggest
managers need to align choices of criteria with the KPIs of the entire portfolio to reach long term
success.
To conduct successful portfolio management, it has been proposed that several levels of criteria
should be introduced. The suggestion is to start at the strategic level for the allocation of
resources in different buckets. Other criteria is then used to choose projects and distribute
resources within each bucket. (Kaiser, et al., 2015)
To make the correct decision it is of great importance that the right people have the right
information. Kaiser et al. (2015) discuss how alignment of an organization’s structure and the
decision criteria can help in both aspects. They propose portfolio management and its objectives
should decide both how information is gathered and who makes the decisions. Decision makers
need to be at a sufficiently high hierarchical level, aligned with the criteria and goals of the
portfolio.
Decisions regarding portfolio management and product development need to be well structured
and thought out. This formality includes who is involved in the decision making. Chao et al.
(2014) discuss how the most common decision makers are executives at a strategic level who
come in and evaluate projects.

26
Seifert et al. (2016) use numerical optimization of a company’s resources and profit to motivate
how it is positive for a company to implement joint management of products. Their research
indicates that decision making on a high hierarchical level is profitable for the company.
2.3.3 Output
In line with having a formal process and criteria when selecting projects and products,
researchers propose formality in decision output (Cooper, 2008; Chao, et al., 2014). The main
takeaway is to limit the company to binary go/kill decisions and eliminate the grey scale in
between.
It can be tempting to let projects live in the grey area in hope of a more advantageous market
situation or technical breakthrough later on. However, Cooper (2008) argues strongly on
importance of having gates with teeth, meaning that a kill decision really needs to be
implemented. He argues for a binary choice of go or kill together with a solid follow-up. This
means the project needs to be killed if that is decided.
On the same note, resources must be given to the projects which are considered good enough to
carry on to the next stage. Cooper et al. (2008) discuss how a common mistake is not having
made a clear decision and not mirroring the decision in resource allocation. They argue that the
combination of gates with teeth and resource allocation to the selected projects will focus
resources on the most advantageous projects.
2.3.4 Contextual Aspects
The decision point is influenced by a range of aspects depending on the company context. While
there is not much written on the topic, a few contextual aspects have been found relevant to
discuss.
Company size. Jugend & da Silva (2014) stress the organization dimension in their framework
for portfolio management. It is critical in achieving the needed level of information sharing. It is
assumed that company size has an effect on this since the larger the organization, the more
difficult it is to achieve functional integration (Kaiser, et al., 2015) and inclusive decision
making (Cooper, 2004).
Company profitability. Companies that apply formal criteria to all projects will outperform their
competition financially (Cooper, et al., 1999; Cooper, 2011). It is therefore assumed that
profitable companies contribute their success, at least in part, to having formal criteria and an
overall formality in product decisions.
Product life cycle. Patterson (2005) states that the product life cycle decides the frequency of
portfolio reviews. Cosner et al. (2007) suggest companies in innovative environments need to do
this more often. Portfolio reviews deal with the portfolio as a whole, but product life cycle also
has an effect on the frequency of decision making for individual projects.

27
Technology sophistication. As Ettlie & Elsenbach (2007) found, incremental innovation and less
sophisticated technology development is more favored by a standard Stage-Gate system than
radical new technology is. Therefore, technology sophistication of the company’s products has
an impact on the decision point as well.
2.4 Synthesis
Several components have been identified as important when attempting to make difficult
decisions regarding product projects. The most important can be seen in Figure 18 which
summarizes our view of the decision point into a conceptual model. The components of this
model are input, decision, output and contextual aspects that affect the other components. We
will now present theoretical propositions that describe each component.
Figure 18 – Decision point description
2.4.1 Input
Input into the decision is divided into required information, data integrity and responsibilities
surrounding data collection.
2.4.1.1 Information requirement
1. The information needed for the decision is determined by the choice of criteria, where
increased sophistication of criteria increases the information need. (Kaiser, et al.,
2015)
2. Information and knowledge from different departments are needed for successful
portfolio management decisions (Jugend & da Silva, 2014; Kaiser, et al., 2015)
3. Functional integration and cross functional teams are enablers of this information
gathering (Jugend & da Silva, 2014; Kaiser, et al., 2015)

28
2.4.1.2 Data integrity
Data integrity refers to maintenance and assurance of data accuracy and consistency. That is, to
make sure the data used for the decision is trustworthy.
4. Misaligned incentives can cause misleading or incomplete information to be gathered.
This risk is greatest at the beginning of the process when information is the most
uncertain (Chao, et al., 2014)
5. Decisions made can only be as good as the information they are based on. Therefore,
maintaining data integrity is critical (Kaiser, et al., 2015; Cooper, 2011)
6. The risk of ending the wrong project is greatest in the beginning and is especially
apparent for projects characterized by poor information and low early investment (van
Oorschot, et al., 2010)
7. Many key factors are complex to quantify into financial numbers which can lead to
unreliable results if relying solely on that criteria (Ulrich & Eppinger, 2012)
2.4.1.3 Responsibilities
8. It should be the responsibility of all functions to deliver reliable information to the
portfolio management decisions (Kaiser, et al., 2015).
9. Organizational integration must be good enough to support information sharing; cross
functional teams are one way of achieving this (Jugend & da Silva, 2014). The
information sharing will then be spontaneous with increased quality (Kaiser, et al.,
2015)
10. Management support for cross functional integration is vital to increase the rate of
information sharing (Kaiser, et al., 2015)
11. A Project Manager should be responsible for collecting information on a project and
argue for its survival in gate meetings (Cooper, 2011)
12. Marketing, design and manufacturing should be continuously involved in providing
information to NPD-projects (Ulrich & Eppinger, 2012)
2.4.2 Decision
The decision can be divided into the criteria which is used to judge it and the decision makers
involved in the decision.
2.4.2.1 Criteria
13. The use of formal criteria is important to structure decision making and enable
comparison of projects (Cooper, 2011)
14. Companies that use formal, explicit criteria and apply them to all projects outperform
the companies who do not (Cooper, et al., 1999; Cooper, 2011)
15. Criteria should be chosen and aligned based on the goals of the product portfolio and
company strategy (Cooper, et al., 1999; Kaiser, et al., 2015; Ulrich & Eppinger, 2012)

29
16. Financial based criteria are the most commonly used and enable comparison between
projects. However, relying too much on financial criteria can misjudge riskier projects
and thereby limit innovation. Therefore they should be used as a complement to other
criteria (Jugend & da Silva, 2014; Cooper, et al., 1999)
17. The most successful combination of portfolio methods is using strategic criteria to
sort out the strong candidates, then additional methods to distribute resources among
the chosen ones (Cooper, et al., 1999)
Examples of additional methods to use are
a. scoring/ranking/checklists (Jugend & da Silva, 2014; Lin & Hsieh, 2003; Bitman
& Sharif, 2008; Cooper, et al., 1999),
b. visualization tools (Mikkola, 2001; Jugend & da Silva, 2014; Cooper, 2011)
c. business strategy models (Cooper, et al., 1999; Jugend & da Silva, 2014)
18. The criteria used need to be understood by the people that are using them (Jugend &
da Silva, 2014; Cooper, 2011)
19. Integrated roadmaps can be a viable tool to connect the company strategy and
portfolio planning to new product development (Cosner, et al., 2007)
2.4.2.2 Decision makers
20. Having formally appointed decision makers is vital for the process (Cooper, 2011;
Jugend & da Silva, 2014)
21. To ensure strategic alignment of the product decisions, the decision makers should be
of a corresponding seniority (Kaiser, et al., 2015; Seifert, et al., 2016)
2.4.2.3 Variations
22. Financial importance of a project, and the resources needed, should determine the
length and extensiveness of the decision making process (Cooper, 2008)
2.4.3 Output
The output from the decision is divided into execution of the decision itself and the following
implementation in operational terms.
2.4.3.1 Execution
23. Defining a clear and formal output of the decision is important. It should include a
clear decision and a plan for the continued work (Cooper, 2008; Chao, et al., 2014)
24. The decision should be clearly defined as a go or kill decision without a grey scale in
between (Cooper, 2008; Chao, et al., 2014)
2.4.3.2 Implementation
25. The decision should be reflected in future resource allocation – a project that
continues should receive its suggested resources while one that is killed should stop
receiving resources (Cooper, 2008; Chao, et al., 2014)

30
26. If a project gets a go- decision, goals and criteria should be set up to be achieved until
the next gate (Cooper, 2008)
2.4.4 Contextual Aspects
The contextual aspects suggested by theory, further explained in 2.3.4 Contextual Aspects are:
Company size
Company profitability
Product life cycle
Technology sophistication
The study will investigate these contextual aspects and how they can be related to the theoretical
propositions.
2.4.5 Areas of investigation
To investigate these theoretical propositions and their use in the cases, Table 3 is developed as a
summary. It includes the components and subcomponents of the theoretical model which will
enable comparison within the cases and between the cases.
Table 3 – Areas of investigation for case study
Input Decision Output Contextual Aspects
Information
requirement
Criteria Execution Strategy, Market and
Company
Data integrity Decision makers Implementation
Product & technology
Responsibilities Variations

31
3 Methodology
This chapter describes how the study has been conducted. Starting with the overall approach,
then describing the details of our method and how data was collected and analyzed. To
conclude, the measures taken to ensure reliability and validity will be described.
3.1 Overall Approach
When choosing method it is important to not be influenced by tradition (Persson, 1982). The
field of logistics typically relies on an analytical view of the world (Mentzer & Kahn, 1995).
This assumes that all phenomena can be broken down into smaller parts which can then be
solved independently (Arbnor & Bjarke, 2009). We believe that our research area requires us to
understand a real world setting which a case study method enables us to do (Yin, 2009). It
enables both physical and human elements within an organization to be addressed (Voss, et al.,
2002). As described by Jugend & da Silva (2014), portfolio management requires an
understanding of company strategy and organization. We believe that this understanding is
important to answer the research questions and therefore the case study method was deemed the
best fit.
We have adopted the systems view for this study. To find a suitable decision support model for
Axis it was important to understand the system as a whole. This to find patterns, behaviors and
properties (Arbnor & Bjarke, 2009) that can explain why certain companies make decisions the
way they do. The connection between case study methodology and the systems view is clear in
literature (Gammelgaard, 2004).
Figure 19 describe the decision point and the system parts. This point is included within a
product development process which in turn is a part of portfolio management, affected by
contextual factors.
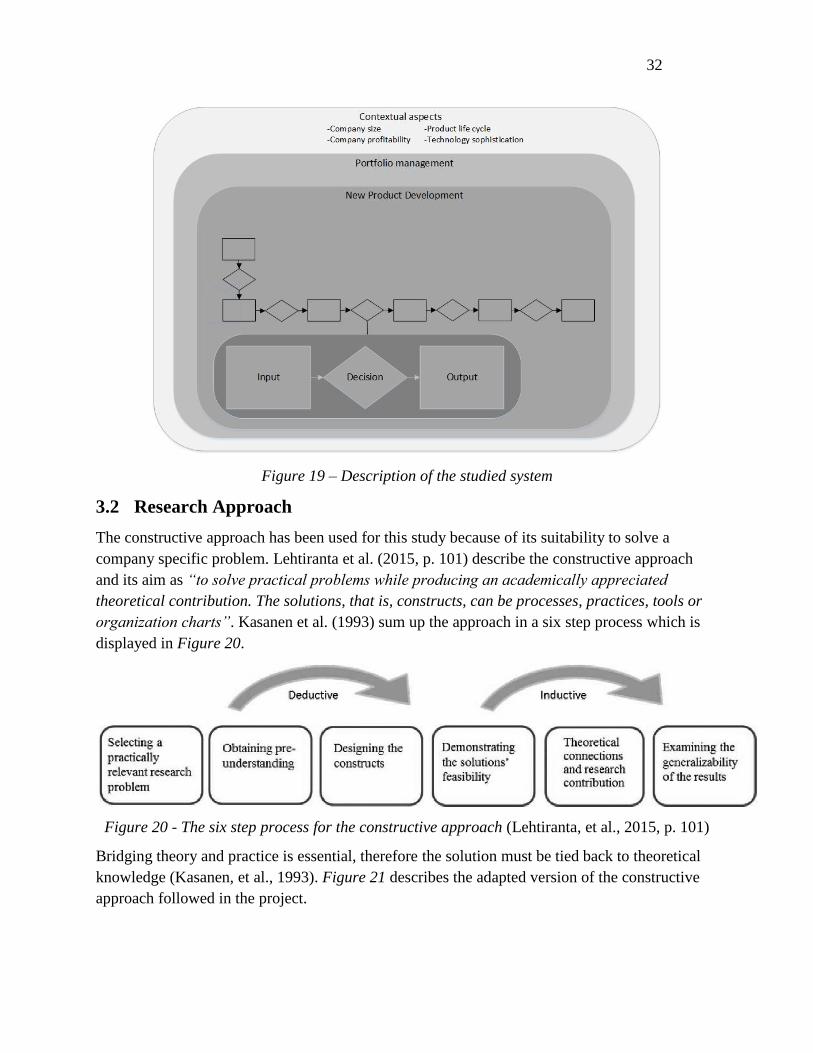
32
Figure 19 – Description of the studied system
3.2 Research Approach
The constructive approach has been used for this study because of its suitability to solve a
company specific problem. Lehtiranta et al. (2015, p. 101) describe the constructive approach
and its aim as “to solve practical problems while producing an academically appreciated
theoretical contribution. The solutions, that is, constructs, can be processes, practices, tools or
organization charts”. Kasanen et al. (1993) sum up the approach in a six step process which is
displayed in Figure 20.
Figure 20 - The six step process for the constructive approach (Lehtiranta, et al., 2015, p. 101)
Bridging theory and practice is essential, therefore the solution must be tied back to theoretical
knowledge (Kasanen, et al., 1993). Figure 21 describes the adapted version of the constructive
approach followed in the project.

33
Figure 21 - Project specific research procedure
It was important to lay a foundation in the field of portfolio management. It was done through a
literature review and a multiple case study. Limited generalizability when having only one case
(Voss, et al., 2002) was the reason for using multiple. The literature review and multiple case
study will be described further.
After the foundation had been laid, it was possible to draw conclusions by comparing the
theoretical and empirical findings through pattern matching and cross-case analysis. This helped
to construct a generic, first version of a decision model. This model was then modified to fit into
Axis’ context through findings from interviews and a workshop with company stakeholders.
After constructing this modified version of the model, it was tested in a second workshop to see
how well it fulfilled its purpose.
3.3 Research Question
The master thesis has strived to answer three research questions:
RQ1 What does the decision point look like according to theory?
RQ2 What does the decision point look like in practice?
RQ3 How can these findings be implemented in the context of Axis’ accessories?
They were formulated to describe the decision point both from a theoretical and empirical point
of view. The third research question strives to answer how a decision support model should be
designed to fit at Axis and specifically to their accessories.
3.4 Research Method
As mentioned the research has been guided by the case study method and constructive approach
as described in Figure 21. Now, each step will be described more in detail.

34
3.4.1 Development of Theory
To gain a better understanding of concepts and previous research, the study should start with a
review of literature (Rugg & Petre, 2007; Rowley & Slack, 2004; Yin, 2009). The goal is to
identify where there is a solid base of literature and theory and where there are gaps to be filled
by empery.
A 5 step approach is proposed by Rowley and Slack (2004) to structure a literature review. The
steps were used and adjusted to fit the project, seen in Figure 22. While most of the process
followed these steps, the review was iterated as additional theory was found, in line with what
Brewerton & Millward (2001) suggests.
Figure 22 - Literature review method
Scanning documents
Articles were gathered through a variant of the citation pearl growing search strategy. We began
with a few articles and then pursued new articles through the key terms used in these articles
(Rowley & Slack, 2004). Key terms were used to find articles which could provide the basis for
the search strategy. A description of key terms can be seen in the chapter Structuring the
literature review.
This way it was possible to gather a large set of interesting articles while structuring and building
a framework. The articles found were published in a similar set of journals. Some notable
authors on the subject had written books which were a valuable addition. These journals and
books can be seen in Table 4.

35
Table 4 - Table of scientific journals and books used in the study
Making notes
During the reading and processing phase, articles were distilled into summaries. Key themes and
messages were noted together with the source to enable citations.
Structuring the literature review
The search strategy made it possible to sketch a preliminary structure for the literary review at an
early stage. The structure was rough at first and continuously refined as our understanding of the
subject grew. Key terms describing the articles and their corresponding authors are described in
Table 5.
Thesis Section Journal or Book
Theoretical framework R&D Management
Journal of Product Innovation Management
Research Technology Management
International Journal of Project Management
Management Science
Journal of Product Innovation Management
Books
o Winning at New Products (Cooper, 2011)
o Product Design and Development (Ulrich & Eppinger,
2012)
Methodology Qualitative Data Analysis – A Methods Sourcebook (Miles, et
al., 2014)
Case Study Research - Design and Methods (Yin, 2009)
Research Methodologies in Supply Chain Management
(Seuring et al., 2005)
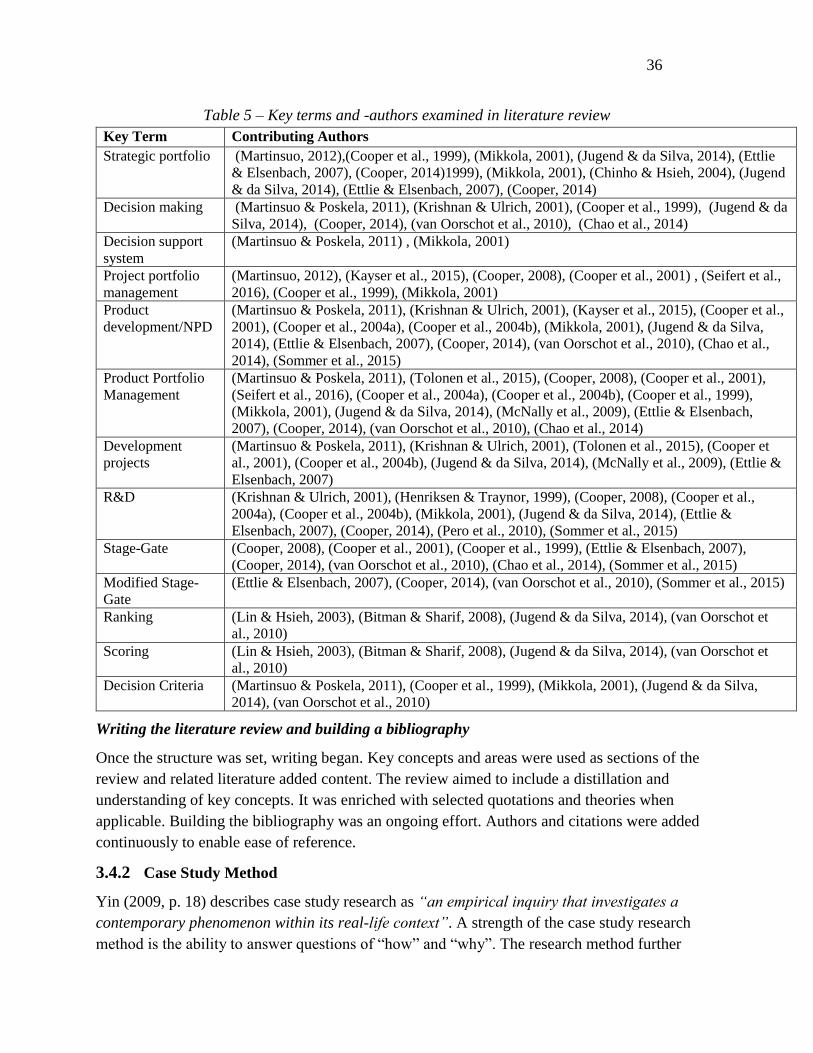
36
Table 5 – Key terms and -authors examined in literature review
Key Term Contributing Authors
Strategic portfolio (Martinsuo, 2012),(Cooper et al., 1999), (Mikkola, 2001), (Jugend & da Silva, 2014), (Ettlie
& Elsenbach, 2007), (Cooper, 2014)1999), (Mikkola, 2001), (Chinho & Hsieh, 2004), (Jugend
& da Silva, 2014), (Ettlie & Elsenbach, 2007), (Cooper, 2014)
Decision making (Martinsuo & Poskela, 2011), (Krishnan & Ulrich, 2001), (Cooper et al., 1999), (Jugend & da
Silva, 2014), (Cooper, 2014), (van Oorschot et al., 2010), (Chao et al., 2014)
Decision support
system
(Martinsuo & Poskela, 2011) , (Mikkola, 2001)
Project portfolio
management
(Martinsuo, 2012), (Kayser et al., 2015), (Cooper, 2008), (Cooper et al., 2001) , (Seifert et al.,
2016), (Cooper et al., 1999), (Mikkola, 2001)
Product
development/NPD
(Martinsuo & Poskela, 2011), (Krishnan & Ulrich, 2001), (Kayser et al., 2015), (Cooper et al.,
2001), (Cooper et al., 2004a), (Cooper et al., 2004b), (Mikkola, 2001), (Jugend & da Silva,
2014), (Ettlie & Elsenbach, 2007), (Cooper, 2014), (van Oorschot et al., 2010), (Chao et al.,
2014), (Sommer et al., 2015)
Product Portfolio
Management
(Martinsuo & Poskela, 2011), (Tolonen et al., 2015), (Cooper, 2008), (Cooper et al., 2001),
(Seifert et al., 2016), (Cooper et al., 2004a), (Cooper et al., 2004b), (Cooper et al., 1999),
(Mikkola, 2001), (Jugend & da Silva, 2014), (McNally et al., 2009), (Ettlie & Elsenbach,
2007), (Cooper, 2014), (van Oorschot et al., 2010), (Chao et al., 2014)
Development
projects
(Martinsuo & Poskela, 2011), (Krishnan & Ulrich, 2001), (Tolonen et al., 2015), (Cooper et
al., 2001), (Cooper et al., 2004b), (Jugend & da Silva, 2014), (McNally et al., 2009), (Ettlie &
Elsenbach, 2007)
R&D (Krishnan & Ulrich, 2001), (Henriksen & Traynor, 1999), (Cooper, 2008), (Cooper et al.,
2004a), (Cooper et al., 2004b), (Mikkola, 2001), (Jugend & da Silva, 2014), (Ettlie &
Elsenbach, 2007), (Cooper, 2014), (Pero et al., 2010), (Sommer et al., 2015)
Stage-Gate (Cooper, 2008), (Cooper et al., 2001), (Cooper et al., 1999), (Ettlie & Elsenbach, 2007),
(Cooper, 2014), (van Oorschot et al., 2010), (Chao et al., 2014), (Sommer et al., 2015)
Modified Stage-
Gate
(Ettlie & Elsenbach, 2007), (Cooper, 2014), (van Oorschot et al., 2010), (Sommer et al., 2015)
Ranking (Lin & Hsieh, 2003), (Bitman & Sharif, 2008), (Jugend & da Silva, 2014), (van Oorschot et
al., 2010)
Scoring (Lin & Hsieh, 2003), (Bitman & Sharif, 2008), (Jugend & da Silva, 2014), (van Oorschot et
al., 2010)
Decision Criteria (Martinsuo & Poskela, 2011), (Cooper et al., 1999), (Mikkola, 2001), (Jugend & da Silva,
2014), (van Oorschot et al., 2010)
Writing the literature review and building a bibliography
Once the structure was set, writing began. Key concepts and areas were used as sections of the
review and related literature added content. The review aimed to include a distillation and
understanding of key concepts. It was enriched with selected quotations and theories when
applicable. Building the bibliography was an ongoing effort. Authors and citations were added
continuously to enable ease of reference.
3.4.2 Case Study Method
Yin (2009, p. 18) describes case study research as “an empirical inquiry that investigates a
contemporary phenomenon within its real-life context”. A strength of the case study research
method is the ability to answer questions of “how” and “why”. The research method further

37
provides flexible data collection which help investigating supply chains and managerial issues
therein (Seuring, 2005). Stuart et al. (2002) argue for the use of case studies in operations
management for comparing companies in different contexts. They describe how it can provide a
way for the researcher to make valid observations and contributions to the body of knowledge.
The multiple case study served to answer RQ2. It also helped to prepare for answering RQ3 by
providing context to practical application.
A process map of the case study method, described in Figure 23, has been proposed by Yin
(2009). This process guided the research within the case study and will be described in detail in
the ensuing pages. Yin (2009) stresses the importance of utilizing a feedback loop which can be
seen as a dotted line in Figure 23. It lets important findings in later steps reiterate the earlier
ones. In our study, this was ensured through using Axis as a case and thereby testing and
modifying the data collection protocol before the other cases began.
Figure 23 - Case study method, adopted from Yin (2009)
3.4.2.1 Unit of analysis
The choice of single or multiple case study depends on degree of depth versus generalizability
the researcher wants to achieve (Voss, et al., 2002). We chose multiple cases, both for the
generalizability it provides and since it would give a wider input into the construct for Axis.

38
Before starting the case study, the research question and unit of analysis must be identified. The
unit of analysis is “the case” and can be a person, company, group of people, decision or event
(Yin, 2009).
The cases studied were meant to provide valuable insights into how companies work with the
selection of development projects. Specifically, selection before a product concept is allocated
R&D resources as seen in Figure 24. Even though some companies did not have the same Stage-
Gate process they did have a decision before a concept goes into development.
Figure 24 – Positioning of the unit of analysis
The unit of analysis is the decision point itself, including decision criteria, responsible
stakeholders and relevant contextual aspects. A conceptual model of the unit of analysis is seen
in Figure 25.
Figure 25 - Unit of analysis in new product development

39
3.4.2.2 Selection of Cases
The companies used in the case study were selected based on a few core criteria. Given these
criteria, the authors and our supervisors at Axis contacted relevant companies.
1. Access. The company and relevant interviewees were interested in participating. There
was data available about the companies’ operations and characteristics. Also, the
ambition was to have access to personnel in a senior product management role, or
similar. This in order to secure high quality data when using only few respondents.
2. Internal R&D. The company had internal R&D and took development decisions in-
house.
3. Sells their own developed products. In line with the internal R&D criteria, companies
which were only trading products were not considered.
4. Use decision criteria before R&D. The companies used decision criteria to choose which
products to develop. There was a point before development where the decision was
made.
In addition to these core criteria, additional dimensions were considered that would serve to give
a variety of companies to compare.
5. Variation in contextual aspects. To get a broad view, cases representing variations in the
contextual aspects were used. These were discussed in the theoretical chapter and were
used in the case study to explain patterns and differences between the cases. The
contextual aspects were:
o Company size
o Operating margin
o Technology character
o Length of product life cycle
The companies which fulfilled core criteria are listed in Table 6, including interviewees and
industry. To provide further credibility to the study, Axis was used as a test case. This to provide
credibility to the study and ensure the quality of the data collection protocol (Yin, 2009).
Table 6 – Companies participating in the multiple case study, PM – Product Manager
Company name Industry Interviewee(s) Criteria Fulfilled
Axis (Camera
R&D)
Electronics -Kent Fransson, PM
-Andres Vigren, PM
-Petra Bennermark, PM
1,2,3,4,5
Thule Consumer Goods Eric Norling – PM Director 1,2,3,4,5

40
Sony Electronics P-O Bergkvist – Former purchaser
Sony
Sara Wall-Sörensen – Former PM
at Sony
1,2,3,4,5
Husqvarna Construction and
Gardening
Anna Annvik – Director PM 1,2,3,4,5
Alfa Laval Process industry Anna-Maja Eriksson - PM 1,2,3,4,5
The relative characteristics of the case companies are described in Figure 26. As seen there is a
significant variation in the relevant aspects.
Figure 26 – Case company characteristics. Ax=Axis, AL=Alfa Laval, Hq=Husqvarna, So=Sony,
Th=Thule
3.4.2.3 Design data collection protocol
Parallel to case selection, a protocol for data collection should be developed. Stuart et al. (2002)
describe the protocol as a way of providing focus for the study. It can help the researcher to stay
on target and keep information gathering as efficient as possible. Yin (2009) proposes the
protocol should consist of:
An overview of the case study project including objectives and theoretical
framework
Data collection plan

41
Case study questions
A guide for the case study report
A data collection protocol was developed and can be found in Appendix I: Case study protocol.
As mentioned it was tested with Axis as one of the cases. This way it was possible to modify and
improve the protocol for the ensuing cases.
3.4.2.4 Data collection
A strength of the case study is the flexibility of data collection methods. Ways of collecting data
include interviews, historic data, business data and observations. Some of the strengths and
weaknesses of these methods are presented in Table 7.
Table 7 - Strengths and weaknesses of data collection methods (Yin, 2009; Hancock &
Algozzine, 2006).
Method Strengths Weaknesses
Interviews and focus
groups
Targeted – Focus on case topic
Contextual – Covers case context
Depending on interviewees’ memory,
biases and knowledge
Questions decide answers’ quality
Documentation and
archival records
Exact and quantitative
Can be reviewed continuously
Not created for case study
Broad coverage
Can be difficult to access
Can reflect bias of authors or bias due to
retrievability
Observations Contextual
Reality – covers events in real time
Insightful into interpersonal behavior and
motives
Time consuming
Observation can affect behavior
Broad coverage need team observers
The data collection in the case study consisted mainly of interviews, with support from public
and internal documentation when available. Before each interview, external documentation was
gathered to get an initial view of the case company. The interviews were held with people
deemed relevant for the unit of analysis. These were often senior people within product
management which ensured they had the right knowledge and experience. Due to the limited
time for the thesis, it was not possible to conduct more interviews within each case. It would
have been preferable but it was prioritized to have more cases with less depth than fewer cases
with more depth.
Each interview was 1.5 hours. They were all conducted in person except for the interview at
Husqvarna and one at Sony, which were done through Skype. A semi-structured interview
protocol was used in line with Yin (2009). It allowed for comparison between cases but to still

42
dig deeper into interesting topics (Ellram, 1996). During the interviews we had separated tasks.
One was leading the interview while the other took notes. Each interview was recorded to allow
us to revisit and ensure the correct data was collected.
After each interview we reviewed the notes and summarized the interview into write-ups to make
sure the right data was collected. This way, higher quality data was available for analysis later, in
line with what Miles et al. (2014) recommend. When possible, we requested internal
documentation from the interviewees to ensure construct validity (Yin, 2009). Once the case
description had been finished, it was sent out to the interviewees for fact checking. This helped
ensure reliability (Yin, 2009).
3.4.2.5 Data analysis
Yin (2009) describes analysis as the most difficult and least developed aspect of case study
research. Many novice researchers gather data before they know what to use it for. Yin does not
go into detail on case analysis which is why Miles, et al. (2014) was used to complement.
We used the theoretical proposition strategy recommended by Yin (2009). Time limitations
made it less suitable to use rival explanation or case description strategies. The mainly
qualitative nature of the collected data and the authors’ inexperience also limited using the
combined qualitative and quantitative strategy. The theoretical propositions guided the data
analysis which is another motivation for using the theoretical proposition strategy (Yin, 2009).
An alternate strategy would have been to examine rival explanations but this was deemed
difficult due to our limited experience within the field.
The propositions consisted of a theoretical model based on the developed framework. This model
and its components was used to create the initial coding for the multiple case study. In line with
Miles, et al. (2014), coding was further refined and rearranged as the case study progressed
which enabled a structured single case and cross-case analysis of the data.
As proposed by Miles, et al. (2014), it underwent the following steps during the analysis phase:
First cycle coding. The write-ups and selected documentation from each case was processed and
coded using descriptive coding to structure the data. First cycle coding was done using
theoretical propositions based on literature.
Second cycle coding. The coding was further systematized into pattern codes which were applied
to each case. The cases were summarized using matrix displays, as seen in Table 8. These were
inspired by conceptually clustered matrices described by Miles, et al. (2014, p. 173). This way,
case data was easy to overview which enabled structured analysis and conclusions to be drawn.
Theory and empirics were compared through pattern matching which helped test internal validity
of the case findings (Yin, 2009).
Explanation building. Throughout this process, initial theoretical propositions were developed
together with new propositions and assertions as new insights were gathered. This is in line with

43
the explanation building technique suggested by Yin (2009) while formalization was reached by
Miles, et al.’s (2014) assertion and proposition development.
Cross-case synthesis. Finally, each case was compared in a cross-case analysis using the matrix
displays. Cases were combined into a full meta-matrix to enable a systematic comparison of all
cases. Thus, the “stacking comparable cases”-approach, suggested by Miles, et al (2014) was
used. That is, first within-case analyses were conducted to draw conclusions from each case.
Later, the cross-case analysis helped find broader patterns common between the cases.
Table 8 – Conceptually clustered matrix display used for individual case analysis
Input Decision Output Contextual Aspects
Information
requirement
Criteria Execution Strategy, Market
and Company
Data integrity Decision makers Implementation
Product &
technology
Responsibilities Variations
3.4.3 Combine and construct model
After the case study was conducted, the construction and application at Axis began. It was
conducted in line with the constructive approach as described earlier by Kasanen, et al (1993),
seen in Figure 27.
Figure 27 – Description of the steps of constructing a model at Axis
At first, interviews were held with employees at Axis to get an understanding of the problem.
The interviews were held one by one for 1 hour which gave a cross-functional view of the
problem and context specific factors affecting accessory decisions. The interview guide can be
found in Appendix II: Interview guide, interviews at Axis and the interviewees in Appendix III:
Interviews conducted at Axis. The interviews were semi-structured to allow to go in depth when

44
interesting topics surfaced. These interviews gathered suggestions for how the problems could be
solved through more informed decision making.
Workshop 1 was then held with two important stakeholders at Axis, Product Managers for
accessories and for the largest product line at Axis. The purpose was in part to validate the
findings from the interviews and prioritize them. The other purpose was to understand how to
design a practically functioning solution in their specific context.
After this, the model construction continued where the previous input was synthesized into what
we thought would be a functioning model. It was an iterative process where we discussed the
model together with our supervisor at product management to make sure it was aligned with
Axis needs and possible to implement.
3.4.4 Test and validate at Axis
Validation at Axis was done through a workshop with employees suggested to use the model,
described as workshop 2 in Figure 27. Several of the employees took part in development of the
model. The primary objective of the session was to agree on implementation. A description of
the workshop is found in Appendix V: Workshop 2, test and validation at Axis.
The tools suggested for use in decision making were presented in the form of a Power Point
presentation. Motivation of the extra time it takes to use the model had to be made. Most of the
model was already known to the participants as informal presentation with feedback had been
held. The participants were allowed to grade each suggestion. Discussions regarding possible
improvements and implementation were then held based on the feedback.
Some minor changes on the model and responsibilities for implementation were agreed on in the
workshop.
3.4.5 Compare theory and examine generalizability
Kasanen et al. (1993) recommends the final construct should be applicable in other instances as
well. Therefore, a discussion about the final model and its applicability was conducted towards
the end. Generalizability of single propositions were conducted and discussed in the cross case
analysis and general model construction.
3.5 Reliability and validity
There have been doubts whether case study can be used to gather reliable research data. The
researcher must ask if stated evidence is relevant (validity) and correct (reliability) (Seuring,
2005). Yin (2009) describe how the researchers should follow a rigorous methodological path to
secure credible insights. He divides the problem into construct validity, internal validity, external
validity, and reliability.

45
3.5.1 Construct validity
Many critics of case study research are pointing to subjectivity of judgments. Stuart et al. (2002)
describe the issue as the researcher’s ability to choose measures that reflect the phenomena. This
study has used multiple sources of evidence, developed a research protocol and drafted the report
by key informants in line with what Yin (2009) suggests.
3.5.2 Internal validity
Internal validity criteria are valid for explanatory studies, when the researcher wants to determine
if event x leads to event y. If the researcher has missed a factor z which has a significant effect
on y, internal validity has failed (Yin, 2009). The underlying factors need to be determined
through interviews (Yin, 2009). Internal validity was ensured through the use of pattern
matching and explanation building, as described in chapter 3.4.2.5 Data analysis.
3.5.3 External validity
External reliability asks whether the findings of the case study are generalizable to other
contexts. Yin (2009) suggest this as a major explanation why case studies are not more widely
used. He explains that findings from a case study should lead to generalizable results, suitable in
similar contexts. This was one of the reasons for choosing a multiple case study.
3.5.4 Reliability
Reliability is about ensuring that evidence is correct. A new researcher should be able to do the
same case study with the same results. Documentation of each step of the process must therefore
be secured (Yin, 2009). This has been ensured through including our case study protocol, see
Appendix I: Case study protocol, and keeping a case study database. In addition, information
gathered in the case study interviews was fact checked by interviewees.

46
3.5.5 Validity & reliability as operationalized in the study
To ensure validity and reliability, measures have been taken throughout the study. The measures,
together with the corresponding tactics on how they were ensured are seen in Table 9.
Table 9 – Validity and reliability tactics of the study
Tactic Description Applied in
Construct
Validity
Triangulation Multiple sources of evidence for
vital data
Data collection
Establish chain of evidence Plan data collection based on
research questions
Data collection
Draft report reviewed by key
informants
Supervisors at Axis and LTH
read report
Composition
Internal
Validity
Pattern Matching Evidence from study is
compared to theoretical
framework
Data analysis
Explanation building Create understanding by
analyzing links between factors
found
Data analysis
External
Validity
Replication logic Cross case analysis to motivate
recommendations
Research design
Reliability Case study protocol Planning of case study prior to
execution
Data collection
Summary sent to interviewee Interviewee reads and approves
case description
Data collection
Case study database All interview notes and open
sources are saved
Data collection

47
4 Empirical Study
The empirical study describes each company, then develops the unit of analysis specificities for
the cases. The information found is used in the single case and cross case analyses chapters.
4.1 Case 1 – Axis Camera Division
Axis camera division is used as a case to gain further insight into the company and get new input
into the problem at hand. This case will only look at camera projects, not accessories.
4.1.1 About Axis Communications
Axis is a Lund based company with high levels of growth and profit in the last few decades. It
was recently sold to Canon but is planned to continue being a separate entity. Axis has three core
values – Act as One, Think Big and Always Open. These describe the culture of the company
which is characterized by openness and cooperation (Axis Communications, 2016).
4.1.2 Industry and Products
Axis develops and sells network cameras and related products. They have a high focus on R&D
which has served the company well, enabling high growth and profitability.
4.1.3 Product Management at Axis
The information in this chapters based on three individual interviews with Product Managers at
Axis Communications:
Kent Fransson – Global Product Manager, Axis PTZ cameras (Fransson, 2016)
Andres Vigren – Global Product Manager, Axis fixed box cameras (Vigren, 2016)
Petra Bennermark – Global Product Manager, Axis fixed dome cameras (Bennermark,
2016)
They each have 8-15 years of experience in the Product Manager role at Axis.
Product management is responsible for Axis products from inception to end of life. Each Product
Manager is responsible for one of eight product groups, four of which are cameras, the others are
related to encoders or accessories.
4.1.4 Product Management Decision Point
The company’s product development process, seen in Figure 28, resembles a Stage-Gate
process. The interest point, matching the unit of analysis, is the start gate between startup and
planning. At this meeting, the decision is made whether the project should be allowed to
continue or not. However, from interviews it seemed that this decision was in reality passed
earlier in the process as almost all projects pass this start gate. Therefore, the unit of analysis was
found to be the roadmap meeting, held once every 6 months.
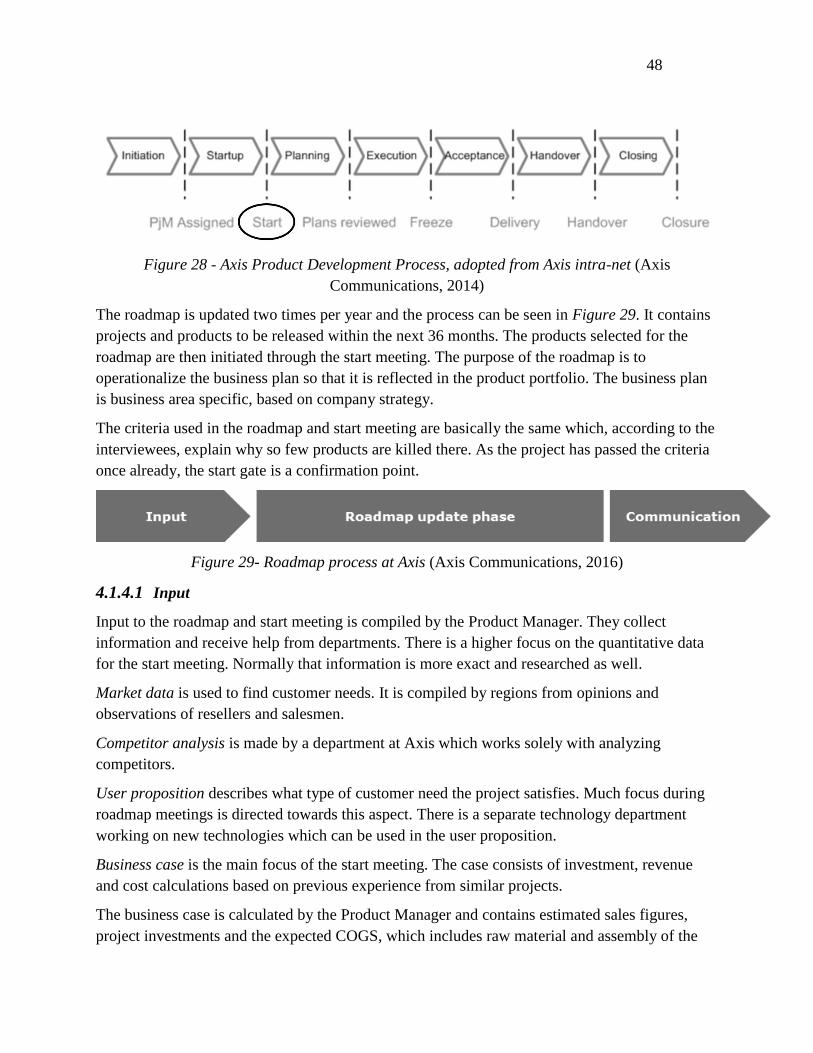
48
Figure 28 - Axis Product Development Process, adopted from Axis intra-net (Axis
Communications, 2014)
The roadmap is updated two times per year and the process can be seen in Figure 29. It contains
projects and products to be released within the next 36 months. The products selected for the
roadmap are then initiated through the start meeting. The purpose of the roadmap is to
operationalize the business plan so that it is reflected in the product portfolio. The business plan
is business area specific, based on company strategy.
The criteria used in the roadmap and start meeting are basically the same which, according to the
interviewees, explain why so few products are killed there. As the project has passed the criteria
once already, the start gate is a confirmation point.
Figure 29- Roadmap process at Axis (Axis Communications, 2016)
4.1.4.1 Input
Input to the roadmap and start meeting is compiled by the Product Manager. They collect
information and receive help from departments. There is a higher focus on the quantitative data
for the start meeting. Normally that information is more exact and researched as well.
Market data is used to find customer needs. It is compiled by regions from opinions and
observations of resellers and salesmen.
Competitor analysis is made by a department at Axis which works solely with analyzing
competitors.
User proposition describes what type of customer need the project satisfies. Much focus during
roadmap meetings is directed towards this aspect. There is a separate technology department
working on new technologies which can be used in the user proposition.
Business case is the main focus of the start meeting. The case consists of investment, revenue
and cost calculations based on previous experience from similar projects.
The business case is calculated by the Product Manager and contains estimated sales figures,
project investments and the expected COGS, which includes raw material and assembly of the

49
product. Axis includes a flat rate percentage to cover customs, freight and warranty which is
used to some extent but not in all business cases. The business case boils down to an estimated
payback time.
There is no clear follow-up of decisions or input information. None of the Product Managers
follow-up on estimations and their accuracy. It is motivated by the development project’s small
size and that most of them are profitable eventually.
The input is gathered into a shortened presentation at the roadmap meeting while the full version
is presented at the start meeting for each project.
4.1.4.2 Decision
The Product Manager and Project Manager present project input, thus starting a discussion about
the project. During the roadmap meeting there are representatives from many different areas of
Axis:
Operations
Test
Core technology – responsible for Axis product platforms
R&D – both engineering manager and director of R&D
Product management – Product Manager and the director of product management is
present
Project Manager
CTO
Criteria used to evaluate the projects consist of formal and informal criteria.
Formal criteria used are payback time and project length. Payback time should be less than 6
months for a camera project. Longer payback can be accepted with further motivation.
Development projects can be questioned if they are expected to be very long since the risk
increases with longer projects.
Informal criteria play an important part in decision making. Strategic balance is measured in
terms of different project types. They are classified as protect, expand or innovate. Protect-
projects replace “old” products needing an update. Expand-projects improve current products to
capture new market share. Innovate-projects are often based on new technologies for Axis. The
roadmap requires balance between project types in line with company goals. Lastly, the user
proposition is weighed in to give a full picture.
The roadmap decision making consists of two meetings. The initial roadmap is presented during
the first meeting and receives feedback. After this, the Product Manager adjusts the roadmap
based on feedback and presents the final version at the second meeting. The decision makers
decide if the projects should pass or not. Most often this decision is unanimous. If there are
conflicting opinions, the CTO has the final say.

50
4.1.4.3 Output
The main purpose and output of the roadmap meeting is a three-year plan of upcoming products,
including resource need. The Product Manager is responsible for implementation together with
the engineering manager.
The roadmap is updated each six months. The Product Manager must then be able to explain
changes relative to the previous plan. If a project has been killed it must be motivated as the
roadmap is a plan which should be implemented.
At the start meeting the possible outputs are:
Go – The project is ready for development. Seen as a handshake between departments to
start the project and commit resources.
Wait – Something is missing. The Project Manager must add more information or make
the project clearer in order for it to go through to development. It will be presented again
at the next start meeting.
Kill – The project is killed and no more resources are committed.
4.1.4.4 Satisfaction
The Project Managers are happy with the current process. They like having a roadmap deciding
the upcoming work and resource use and a start meeting to confirm the decision. The
interviewees could not find any major weaknesses but saw many positives in the process:
Freedom – Axis is seen as a company with few processes which enables innovation and
personal responsibility.
Time to market – With fewer gates and hurdles a project can go to the market faster than
a more extensive process would allow.
Transparency – A clear roadmap makes it is clear to everyone what has been decided.
Communication to customers and functions within the company gets better and enables
feedback from them.
Cross functionality – As the process involves several functions gathering information, it
increases the level of integration and communication.
Low complexity – It is easy for everyone involved to understand.
A future challenge mentioned by the interviewees is competing with new low cost entrants to the
market. The general answer is to be more creative and innovative.
4.1.5 Contextual Aspects
Axis is a company with several years of 15-20% growth and profit margins around 10%. The
organization has grown quickly which can explain the lack of standardized ways of working.
Axis has a high focus on innovation and aims to be the technology leader within their industry.
Some important aspects for the future are investments in new technology and innovation while
increasing the presence in high growth markets and increasing organizational efficiency (Axis

51
Communications, 2016). Technology leadership and innovation has enabled a premium price on
products. This can be an explanation for the freedom in the development process. The culture at
Axis plays a part as it is characterized by openness and cross functional integration. The
development process and decisions are also meant to be driven by these values.
The product life cycle in the industry is relatively short, around three years. Combined with the
technology leadership strategy this increases time to market importance.
4.1.6 Summary
Axis has a focus on innovation rather than structure. Table 10 shows how formal criteria is
limited to payback and project length. Both of these have no strict limit but are rather guidelines.
The Product Managers have a lot of power over the process, this because of Axis technology
leadership strategy which requires rapid decision making and autonomy.
Table 10 – Summary of Axis Camera Division
Input Decision Output Contextual
Aspects
Information
requirement
-Market data
-Competitor analysis
-User proposition
-Business case (includes
flat rate for freight &
customs costs)
Formal criteria
-Pay back (~6 months)
-Project length
Informal criteria
-Strategic balance
-User proposition
Execution
-Go/Wait/Kill
Strategy, Market
and Company
-Technology leader
-Time to market
critical
-High growth &
profitability
-Company culture
Data integrity
-No feedback loop
Decision makers
- Heads of: Operations, Test,
Core Technology, R&D,
Product Management
- CTO
Implementation
-Resources
allocated
Product &
technology
-High Tech
-Relatively short
life cycles
-High focus on
R&D
Responsibilities
-Product Manager gathers
data
-Other functions gather
information
Variations
-Same for all projects
52
4.2 Case 2 – Sony Mobile
Sony Mobile does currently not have much activity in Lund even though it was the place of the
head quarter for a long time. This case focuses on the previous operations, having interviewed
with former employees to gain insights.
4.2.1 About Sony Mobile
Sony Ericsson started as a joint-venture to manufacture and sell mobile communications
technology. In February 2012, Sony bought out Ericsson and integrated the company as the
subsidiary Sony Mobile (Sony, 2013).
Sony Mobile has had financial difficulties for a long time and is still struggling to show a
positive result. Global headquarters for Sony Mobile was earlier placed in Lund. After
integration with Sony, the headquarters moved to Tokyo, leading to down-sizing in Lund.
Sony’s vision is to inspire and fulfill the curiosity of its customers through innovation and
technology (Sony, 2016).
4.2.2 Industry and Products
Sony Mobile develops mobile phones and mobile tablets under the name Xperia. Accessories to
Sony’s main products are referred to as Companion Products and had much of its development in
Lund before it was moved to Tokyo. (Sony Mobile, 2016a).
Companion Products at Sony Mobile consisted of four main product groups:
Smartwear – technically advanced smart watches and smart bands
Extensions – enhanced experience products for mobile phones
Wireless – wireless speakers and head phones
Fundamentals – cables, screen protectors and other basic accessories
4.2.3 Product Management at Sony
The information in this case was based, unless otherwise stated, on interviews with former Sony
employees:
Sara Wall Sörensen – Head of Global Product Management, Companion Products
(Sörensen, 2016)
Per-Olof Bergkvist – Head of Manufacturing & Sourcing, Companion Products
(Bergkvist, 2016)
Both have over 14 years of experience at Sony/Sony Ericsson within different roles before
moving on to new roles at other companies. They worked at Sony until 6 months ago which was
considered recent enough to obtain quality information. Since their most recent positions have
been within Companion Products, that is where the focus will be for this case.

53
4.2.4 Product Management Decision Point
Sony Mobile developed its four product categories with combinations of in-house and
outsourced development. Smartwear used mostly in-house development due to the technical
complexity of the product. Fundamentals were often contracted out to partners for both
development and manufacturing. Extensions and Wireless used combinations of these two. All
development projects went through the same decision making process however.
The decision making process for Companion Products had a toll gate called toll gate define, the
last one before projects received R&D resources. Before reaching this gate, projects were
approved at a monthly portfolio meeting where the portfolio as a whole was examined and
product proposals were evaluated. Approved proposals underwent further information gathering
before reaching toll gate define. This tollgate is the one matching our unit of analysis, seen in
Figure 30.
Figure 30 – Process description at Sony mobile
4.2.4.1 Input
The input to this tollgate consisted of:
User proposition and positioning described the user need and how it would be fulfilled by this
product. It also described positioning relative to competition and current product portfolio.
Examples of information provided to position products were price, sales channels, promotion and
product characteristics.
Business case was a detailed calculation of product financials. On a product level it contained
estimated price and direct costs/COGS. On project level it contained costs for investments and
development resources. An estimated sales figure was calculated based on market data. This data
was used to calculate gross margin of the product and return on investment (ROI). The business
case used a flat rate for overhead costs to estimate the life cycle cost of the product. These
included costs for freight, customs, logistics, warranty and royalties.
The business case had two versions. A base case with the most realistic assumptions and a more
uncertain stretch case which required new sales channels or additional marketing.

54
Technical specification described technical requirements like battery life, weight or size, and
technology performance requirements like screen resolution. These had to match the user
proposition.
Development & manufacturing partners contained a presentation of manufacturing and
development partners required to realize the product.
Product management and product planning were responsible for providing user proposition,
business case and technical specification. The project, mainly manufacturing & sourcing,
provided estimated COGS and description of partners.
The company used independent reports to complement in-house estimates of market size and
sales. After the product launch, figures and learning points were discussed in a separate tollgate.
The feedback was used to improve estimates and the process for future projects.
4.2.4.2 Decision
At the decision meeting a number of functions were involved. The person with profit-and-loss
(P&L) responsibility for the project always had the final say in decision making. The decision
makers present at the meeting were:
Decision owner – P&L responsible. Often a business unit manager
Head of Product Management – Present but not a decision maker
Head of Product Planning
Head of Development
Head of Sourcing
Head of Supply
Head of Customer Service
Head of Business Control
The decisions were made in the same way regardless if the project required internal or external
development. An important discussion at the meeting was how realistic technology and costs
were. If adjustments had to be made, the value proposition could change. Thus leading to further
adjustment of other aspects.
The most important criteria which decided the project’s future was product margins and
positioning. The business case provided product margins, taking the entire product life time into
consideration for a holistic picture.
The positioning aspect of the decision was a vital part of company strategy. Products need to
complement each other to form a complete portfolio. The short product life cycles of the industry
required a high replacement rate to keep up with customer demand. Product Managers had the
responsibility to provide this positioning information to the meeting.
Information regarding margins and positioning was discussed and the final decision was made.
The aspects did not have a set weighting but varied between projects. It varied based on project

55
specific aspects and the decision makers’ previous experience from similar situations. There
were target margin requirements for each category but they could be overruled by strategic
aspects.
4.2.4.3 Output
There were two possible decisions in the meeting:
Pass – the project went to development, an order and product specification went to R&D. The
project leader, appointed before, received resources to drive the project forward. To follow-up on
the progress of the project, 4-5 tollgate meetings were held before the project was over. Criteria
in these meetings were the same but with updated information.
No Pass – the project was not good enough at the moment. In some instances, the project and
idea was killed off entirely and the Project Manager got another assignment. However, most
common was that it came back in a different shape and later on.
4.2.4.4 Satisfaction
Positive aspects brought up in the interviews about the process were:
Very clear and structured
A learning process which developed as flaws were found
A good way to involve executives into product development decisions
Good at removing bad projects early on as they were challenged
There were also improvement points brought up where the process was not optimal. For
example, many Companion Products had overestimated sales if new sales channels needed to be
introduced. There were also doubts regarding the necessity of full cost analysis as it was very
time consuming with limited accuracy. One important improvement area was that the tollgate
structure, while clear and structured, was not always followed. Some projects were prioritized
differently and would receive a less rigorous treatment than others. There were often problems
with these products which is why it was later changed.
4.2.5 Contextual Aspects
The strategy of Sony was previously focused on innovation. Recently however, profitability has
received higher priority through a restructuring program for 2014-2018 (Sony, 2015). Sony
Mobile’s strategy has been to focus on volatility management through securing profits and
limiting capital investments (Sony, 2015). It has shown results and the division has reduced its
losses from -14% (2014) to -5% (2015) while experiencing sales losses of 15% (Sony, 2016).
The market is one of intense competition in terms of cost and commoditization which has been
hard on Sony Mobile (Sony, 2015).
R&D spend within Sony Mobile is classified but Sony as a whole spent 6% of total revenue on
R&D 2014 (Bloomberg, 2014). Smart wear products were considered strategically important for

56
Sony as a whole and therefore received high priority and focus from the parent company in
Japan.
In recent years the mobile phone market has experienced shorter life cycles for its products. A
phone and its accessories can be sold for around 9 months before a new model needs to be
released to the market. Development of a new product took around a year and related Companion
Products needed to be synchronized with that time frame.
4.2.6 Summary
Sony use a strict process with high cost focus. The company is ambitious in their information
gathering and employ senior decision makers, as seen in Table 11. Industry aspects like intense
competition and short life cycles puts high pressure on the company’s processes. Sony handles
this pressure by using a strict business case and follow-up after product release.
Table 11 – Summary of Sony Mobile
Input Decision Output Contextual
Aspects
Information
requirement
-User proposition &
positioning
-Business case (including
logistics & lifecycle costs)
-Technical specification
-Partner specification
Formal criteria
-Product margin
-Product positioning
-Technical assumptions
Execution
-Pass/No Pass
Strategy, Market
and Company
-Profitability focus
-Intense
competition
Data integrity
-Feedback loop 6-12
months after launch
-Independent market
reports
Decision makers
-Director business unit
-Heads of Product
Management, Product
Planning, R&D, Sourcing,
Supply, Customer Service,
Business Control
Implementation
-Resources
allocated or
withdrawn
-Steer group
takes over
Product &
technology
-Short life cycle
-Strategic
importance of
Companion
Products
-High focus on
R&D
Responsibilities
-Product Manager gathers
data
-Other functions supply
information
Variations
-Small projects used
simplified version

57
4.3 Case 3 – Alfa Laval
The case at Alfa Laval is focusing on R&D in Lund. The interview is with an employee within
heat transfer, resulting in a higher focus within that area.
4.3.1 About Alfa Laval
Alfa Laval is a Swedish company founded in 1883. It is listed on the Stockholm stock exchange
and its largest owner is Tetra Laval with 26% of votes (Alfa Laval, 2015).
4.3.2 Industry and Products
Alfa Laval is divided into the three segments of heat transfer, fluid handling and separation. It is
one of the largest companies in each of the segments with 30, 30 and 10 percent world market
shares respectively.
4.3.3 Product Development at Alfa Laval
Information in this chapter is based on open sources when cited and otherwise from an interview
with:
Anna-Maja Eriksson –Product Manager for small and medium GPHE (Gasketed Plate
Heat Exchangers).
Anna-Maja has worked at several positions during her 14 years at Alfa Laval. She has been at
her current position for the last 9 months having previously worked as a Project Manager for 9
years.
4.3.4 Product Development Decision Point
Alfa Laval has two kinds of development projects. First, New Product Development (NPD),
development of an entirely new product. Second, Existing Product Development (EPD),
expanding or further developing an existing product. NPD projects are normally longer and more
complex but the decisions process is the same for both types.
The process’ most important gate before product development is a business plan, updated every
six months. This is done at a product board meeting, gate 2 in Figure 31. In this forum it is
decided whether a development project receives resources. As this gate only occurs every six
months, some projects start the next stage before being approved.
Figure 31 – Alfa Laval’s development process

58
4.3.4.1 Input
Product management has the responsibility for input to the product board meeting. Product
Managers collect information and the business unit’s product management director present the
material.
Business case in form of the Cost-Benefit-Analysis (CBA) is the foundation of decision making.
The format is formalized and the same for every project. Input data on the cost side of this model
includes COGS, investment, project cost, contingencies and cannibalization on other products.
The revenue side consists of predicted sales volume, price of the product, after sales revenue and
potential up sales of other products. The data is collected using similar products, input from
functions and previous experiences.
Project specification includes all products and accessories in the project.
User proposition explains what value the product creates for customers. It is formulated by the
Product Manager and is the product vision. If there are questions on a technical level,
information is collected from relevant functions.
Technology forum suggest technological advances for the future. They do not have the power to
bring suggestions into real development projects. Product Managers use these as a foundations
for proposed projects.
The data is presented using an excel template for the CBA which is the same for all projects. In
addition to the CBA, a presentation is made which takes strategic factors into account in the form
of strategic fit and strategic technology factors.
To improve assumptions, the process itself and data integrity, projects are evaluated at a meeting
after product launch. The purpose of the evaluation is to identify learning opportunities for future
projects.
4.3.4.2 Decision
The decision makers involved in product board meetings are of high seniority within the
company. There are normally 4-5 people from the company’s directorate and the business unit
manager. The director of product management presents the proposed projects.
In the decision making the company use a number of criteria:
Time to million – time for the project to make 1 M EUR
Time to two-times-investment – how long it takes to make two times the investment. This
metric is used mostly on small projects
Net cash flow – essentially an analysis of the project’s NPV
Strategic aspects – an informal criteria evaluated by the decision makers
The outcome of financial criteria is simulated in terms of uncertainty. Sales volume is altered to
look at the risk involved in the project’s assumptions. Most attention among the decision makers

59
is often put on financial criteria. The seniority of the decision makers ensures that strategic
aspects are considered for a more balanced project evaluation.
4.3.4.3 Output
The output from product board meetings is a product development plan for the upcoming 3-5
years. Possible outcomes of the meeting for a single project are:
Go – The project gets a spot in the plan and resources to start the project, including a
Project Manager to drive the project forward.
Kill – The project is killed and receives no further resources.
Most projects go through the gate with a Go-decision as the Product Managers have a good
understanding of what is expected from a project.
When a project receives resources and starts it is evaluated by a project board. It is responsible
for keeping projects on time and making decisions regarding sales start and project end. The
Product Manager is the project owner and the board is the same for all of a Product Manager’s
projects. It consists of representatives from the functions:
Operations
R&D
Sourcing
Marketing and sales
4.3.4.4 Satisfaction
An important purpose of the process is to bring up the product decisions on a directorate level as
R&D is considered of high strategic importance. The six month check points are keeping up the
tempo of the organization as all managers will have to present progress for their part of the
organization.
The interviewee believes the process is structured and works well. Everyone knows what should
be included in new product proposals. A potentially negative aspect of the structured process and
focus on financial aspects is the difficulty to take on risky projects with potentially high rewards.
The current process favors safe projects which might affect innovative, new technologies. An
additional problem is that the weighting of criteria is not entirely clear to the Product Managers
as decisions are made on a higher level.
4.3.5 Contextual Aspects
Alfa Laval has been a profitable business for a long time, having had an operating margin
between 15-20% during the last five years while keeping up an average growth of 10%. The long
term goal of the organization is to grow by 8% which is to be accomplished by a combination of
organic growth and acquisitions. (Alfa Laval, 2015)
60
The company strategy is to keep focusing on its three key technologies. Some attributes
identified as key drivers of customer value are energy efficiency and quality. R&D and
acquisitions are mentioned as the important tools to increase that value, adding new product lines
and complementing existing lines. (Alfa Laval, 2015)
To reach profitability goals Alfa Laval have identified three strategic focus areas (Alfa Laval,
2015).
Decisions regarding make or buy are reviewed continuously to maintain an optimal
production set up.
Central stocks of inventory are kept to lower tied-up capital.
A limit to the scope of customer offering, no solutions outside of a process line are
delivered to ensure profitability and limit risk.
The company has a high level of investment in R&D compared to the competition in the
industry, approximately 2,5% of revenue. The company sees this as a way of ensuring a market
leading position. It aims to have the newest, most efficient products in the industry. The R&D
organization is divided along the industry segments as there is a great difference between the
technologies (Alfa Laval, 2016a).
Alfa Laval sells industrial products with a long life cycle. Most contracts for large systems
include a pledge to sell spare parts for up to 60 years. The company therefore undertakes long
term costs every time they introduce a new product with new spare parts.
Most products sold by the company are available for more than 10 years before end-of-life. An
average development project span over one year. If the project is a new iteration of an existing
product it usually goes faster.

61
4.3.6 Summary
Alfa Laval has a very structured process in general. It has inclusion of senior personnel in the
decision making as seen in Table 12. The company uses an input template which standardizes the
information requirement. In addition, it employs strict go/kill decisions to further structure the
process.
Table 12 – Summary of Alfa Laval
Input Decision Output Contextual
Aspects
Information
requirement
-Business case (CBA)
-Project specification
-User proposition
-Technology forum
Formal criteria
-Financial performance
-Project risk
-Strategic aspects
Execution
-Go/Kill
Strategy, Market
and Company
-Profitability &
R&D focus
-Mature market
-High growth &
high profitability
Data integrity
-Feedback loop 6-12
months after launch
-Sensitivity analysis
Decision makers
-Director business unit
-Members of the directorate
Implementation
-Resources
allocated or
withdrawn
-Steer group
takes over
Product
-Long life cycles
-Mature technology
Responsibilities
-Product Manager gathers
data
-Other functions supply
information
Variations
-All use same version

62
4.4 Case 4 – Husqvarna Group
The case at Husqvarna Group is focusing on the biggest company within the group, Husqvarna.
The interviewees position within handheld electric products mean that is where much focus is
put.
4.4.1 About Husqvarna Group
Husqvarna Group is a Swedish company founded in 1689. The company’s largest owners are
both investment firms, Investor with 32,7% of votes and Lundbergs AB with 24,9%.
4.4.2 Industry and Products
Husqvarna group is a market leader in Europe within gardening and watering products. It is a
world leader within diamond tools and cutting equipment for the construction and stone
industries. (Husqvarna Group, 2016a). The group consist of several brands, divided into
Husqvarna, Gardena, Construction and Consumer brands (Husqvarna Group, 2016b).
4.4.3 Product Development at Husqvarna Group
Information in this chapter is based on open sources when cited and otherwise information from
an interview with:
Anna Annvik – Director Product Management, Handheld Electric at Husqvarna (Annvik,
2016)
Anna has worked as a director of global product management (DPM) within Husqvarna group
for nine years with previous consulting experience at Accenture. She is responsible for handheld
electric which contains all handheld electric gardening. Product Managers within this product
line report to her.
4.4.4 Product Development Decision Point
The Husqvarna division use a process where two gates are of interest for decision making ahead
of NPD, described in Figure 32. Projects with a budget over 2 M SEK are subject to the process.
Smaller projects can be brought directly to R&D by DPMs.
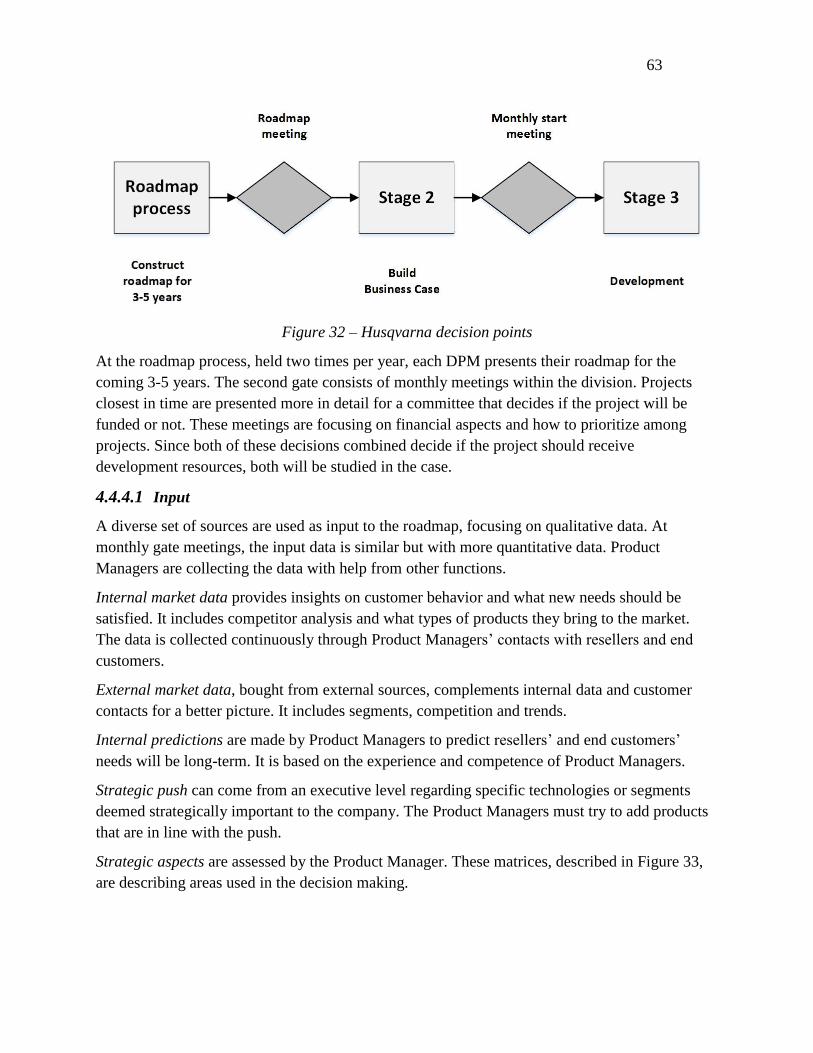
63
Figure 32 – Husqvarna decision points
At the roadmap process, held two times per year, each DPM presents their roadmap for the
coming 3-5 years. The second gate consists of monthly meetings within the division. Projects
closest in time are presented more in detail for a committee that decides if the project will be
funded or not. These meetings are focusing on financial aspects and how to prioritize among
projects. Since both of these decisions combined decide if the project should receive
development resources, both will be studied in the case.
4.4.4.1 Input
A diverse set of sources are used as input to the roadmap, focusing on qualitative data. At
monthly gate meetings, the input data is similar but with more quantitative data. Product
Managers are collecting the data with help from other functions.
Internal market data provides insights on customer behavior and what new needs should be
satisfied. It includes competitor analysis and what types of products they bring to the market.
The data is collected continuously through Product Managers’ contacts with resellers and end
customers.
External market data, bought from external sources, complements internal data and customer
contacts for a better picture. It includes segments, competition and trends.
Internal predictions are made by Product Managers to predict resellers’ and end customers’
needs will be long-term. It is based on the experience and competence of Product Managers.
Strategic push can come from an executive level regarding specific technologies or segments
deemed strategically important to the company. The Product Managers must try to add products
that are in line with the push.
Strategic aspects are assessed by the Product Manager. These matrices, described in Figure 33,
are describing areas used in the decision making.

64
Figure 33 – Strategic matrices used as decision input
The DPM generally has a basket of projects which are candidates for development. The roadmap
is constructed from current projects and 5-10 new projects deemed to deserve priority and fit
within the R&D capacity available.
The gate meeting has a strict power point template for information collection. The purpose of
this formality is to ensure comparability of projects and a fair judgment.
Husqvarna have a follow-up 6-12 months after product launch. The purpose is to improve data
integrity and ensure continuous process improvement.
4.4.4.2 Decision
As the handheld electrical products is an immature market with growth potential, there is more
emphasis on market growth potential in the roadmap decision making. There is no business case
made ahead of the roadmap meeting. Instead, the focus is put on high level business potential.
Some factors given focus based on the Product Manager’s strategic assessments are:
Strategic potential – the project’s overall strategic fit and return on investment
Innovation potential – the project’s level of innovation and probability of success
65
Product potential – the product’s future revenue and profitability growth
Market potential – the market’s expected growth and profitability
These factors are described at a general level at the roadmap meeting and then in more detail in
the business case. Each area is visualized in matrices which describe the project potential for
each aspect to enable project overview, see Figure 33.
The DPMs are responsible for collecting information to the roadmap meetings. They are
presenting their proposed new products and a decision is made. Participants in the meetings are:
DPMs at various business areas
Controller to keep track of budget
Head of DPMs who has final say in decisions
Representatives from
o Brand & marketing
o Sales
o Sourcing
o Manufacturing
Decision making is made in one meeting where the initial roadmap can be modified. The goal is
to have a final roadmap when the meeting is done.
As the products in the roadmap are going into R&D they are subject to the monthly meeting
which screens all development projects. The people responsible for that gate are in the
directorate of the company division and thus on a higher hierarchical level than decision makers
at the roadmap meeting. At these meetings, the head of DPMs are responsible for presenting the
business case for their development projects.
At monthly gate meetings, where priorities are set among the division’s roadmaps, focus is put
on the formal business case. The criteria with top priority in these meetings are:
Pay-back time
Total project cost
These criteria are focused on the entire portfolio and projects are chosen to reach a good total
value for the company. Qualitative factors described above are given different weight depending
on the characteristics of the product line. For young product lines such as handheld electric,
innovation, product and market potential receives a greater focus than in other more mature
product lines.
4.4.4.3 Output
The output from the roadmap meeting is a roadmap including the products to be developed in the
upcoming years. It includes loose specifications on the product itself, the target market and time
plan. Projects usually go through the roadmap process without large changes as the DPMs have a
feel for preferred projects. Sometimes a project gets a no at that meeting. In those cases the

66
project is put on hold. The same project can be brought up in later roadmaps if additional
information is found or the market situation has changed.
When a roadmap has been set, projects receive a number and manager. Preparations for the
project are made, including a specification and business case for the monthly meeting.
The most common outcome of the monthly meeting is a go decision, where the project continues
as planned. If that is not the case, usually because of a lack of resources, some projects will have
to be delayed. It is rare that projects are killed off entirely at this gate.
4.4.4.4 Satisfaction
A positive aspect of the current process is the clarity of what information is required. It is also
clearly defined who the decision makers are. The interviewee believes the main purpose of the
process is to give the division’s directorate better insight and operational power over future
products.
The interviewee mentions some problems. She believes it can be difficult for the decision makers
at the monthly meetings to make decisions as they do not have insight into product roadmaps.
The high number of projects going into that meeting has the effect that financial factors gets the
most weight, which is not always optimal.
4.4.5 Contextual Aspects
Husqvarna Group has experienced an average of 2% growth in the last ten years. Operating
margins has been around 5% in the last years and the biggest focus of the company’s 2020
strategy is to increase these. It is done by focusing the company’s product mix to the most
attractive segments. At the same time they try to keep the cost of goods sold down. The strategy
mentions how important it is for the company to be a product and technology leader. (Husqvarna
Group, 2016c)
Generally, there is a high variety products offered by Husqvarna Group as it operates in various
industries with several brands. A common theme in most of the company’s industries is the high
seasonality, which provides challenges to the company (Husqvarna Group, 2016a).
Husqvarna is structured into the four different segments Husqvarna, Gardena, Construction and
Consumer brands. Each segment has its own organization and product development. There is a
group CTO with the task to organize a more efficient global R&D capacity spanning all brands
(Husqvarna Group, 2016c; Husqvarna Group, 2016d). Total spend on R&D within the company
is currently around 3% of turnover (Husqvarna Group, 2015).
Husqvarna, and the handheld electrical devices in particular, has a life cycle of around seven
years. It is a relatively new segment of products which started selling five years ago. They are
currently starting work on the second generation. The development projects usually span over
two years.

67
4.4.6 Summary
Husqvarna is operating in several industries and markets with different characteristics. The
company use a relatively formal process. To handle the differences between decisions they
utilize strategic criteria with flexible weighting.
Table 13 describes how the company works with these decisions. Ambitious data gathering and
senior decision makers to ensure informed decisions are made.
Table 13 – Summary of Husqvarna
Input Decision Output Contextual
Aspects
Information
requirement
-Internal & External
market data
-Internal predictions
-Strategic push
-Strategic aspects
Criteria
-Strategic / Innovation /
Product / Market potential
-Payback time
-Total project cost
Execution
Roadmap
meeting
-Go/kill/hold
Monthly meeting
-Go/hold
Strategy, Market
and Company
-Profitability &
R&D focus
-Seasonal market
Data integrity
-Feedback loop 6-12
months after release
-External data to
complement
Decision makers
Roadmap meeting
-Head of DPM
-DPM of all business areas
-Controller
-Representatives from
Marketing, Sales, Sourcing &
Manufacturing
Monthly meeting
-Directorate of company
division
Implementation
-Resources
allocated or
project is paused
Product
-Medium life cycle
-Electric a young
segment
Responsibilities
-Product Manager gathers
data
-Other functions supply
information
Variations
-Projects over 2M SEK go
through process

68
4.5 Case 5 – Thule Group
The case at Thule Group is not focused on a particular part of the company. The smaller size of
the company and the seniority of the interviewee enable a holistic view of the company.
4.5.1 About Thule Group
Thule Group is a Swedish company founded in 1942. The company turnover is 5,3 billion SEK
and it is traded on the Stockholm stock exchange after going through an IPO in 2014. The
company currently has no owner with more than 10% of the votes.
4.5.2 Industry and Products
Thule Group consists of several brands where Thule stands for 65% of total sales. The company
focuses on premium products for an active lifestyle. (Thule Group, 2015)
The company consists of two business areas, divided into business units (Thule Group, 2016a):
Outdoor & Bags includes:
o Sports and Cargo Carriers (60% of sales) – The largest business unit, includes car
roof mounts and other carriers
o Bags for Electric Devices (15% of sales) – Bags for cameras, tablets and other
electric devices
o Other Outdoor and Bags (16% of sales) – Some examples of products are hiking
bags and strollers
Specialty (9% of sales) – Includes work gear, mainly tool boxes and work wear
The largest markets for the company are Europe and America, standing for 54% and 38%
respectively (Thule Group, 2015).
4.5.3 Product Development at Thule Group
The information gathered for this case was obtained, unless otherwise cited, from an interview
with:
Eric Norling – Director Product Management Outdoor & Bags Europe and Rest of World
(Norling, 2016).
Eric has been working at Thule Group for four years and has previous experience from Procter &
Gamble and PepsiCo. He started as a Product Manager for the business unit Sports & Cargo and
is now responsible for the overall business area, having Product Managers for the other business
units reporting to him.
Thule Group relies heavily on their products for success and the company puts an undisclosed
but considerable amount of resources into R&D. It has become especially apparent since 2014 as
focus and brand recognition is a bigger part of company strategy.

69
4.5.4 Product Development Decision Point
Thule Group employs a Stage-Gate process called Thule Process System for their product
development, seen in Figure 34.
Figure 34 – Thule Process System, product development process at Thule Group.
Thule continuously tests and develops products throughout the process as product quality is
critical for the brand. There is no clear distinction when a product goes into development as
internal resources are involved throughout the process. The project is evaluated using the same
criteria at each gate but estimation quality is expected to be higher later on in the project.
At gate C the decision is made if external investments should be made in tooling and external
development. That it is best match to the unit of analysis. However, according to the interviewee,
gate B is the point where more projects are questioned and killed. As the gates are so similar they
are both studied in the case.
4.5.4.1 Input
The input to the gates consists of several parts:
Market & user input consists of impressions from customer interactions and industry specific
exhibitions, where Product Managers participate. It is used to assess market trends and customer
needs to motivate the business case. The market input is not available from third parties which is
a difference compared to other consumer goods industries.
Business case consists of estimated sales volumes, product sales price and COGS which is used
to calculate gross margins for the product. In COGS, a detailed calculation is made including
direct material, labor and material overhead to account for scrap, freight and handling costs. The
business case also considers the overall project cost in terms of tooling and development
resources needed. Finally, the market potential is evaluated in terms of expected growth. Sales
and cost estimates are used to perform an NPV-analysis of the project to determine financial
attractiveness.
Project schedule consists of the estimated time line for the project which includes different
tooling, certification and development resources needed.

70
Project risk tries to capture risks which affect the attractiveness of the project. These can be
related to a delayed product launch or uncertain estimations. A number of scenarios where price
and volume change illustrate the estimations’ impact on profitability.
Technical specification captures the customer need and converts it to a technical specification. It
includes size, weight and load requirements of the product. It also considers blue prints,
prototypes and supporting material for products in the project.
The Project Manager is responsible for gathering input and gets help from functions in finding
data. Decision makers questioning data at all gates help ensure data integrity. Gate E is a follow-
up and evaluation meeting which takes place a year after product launch. The initial input at gate
B is compared to the actual results showing estimation accuracy and helps create feedback for
future projects.
4.5.4.2 Decision
Thule Group uses a number of criteria for evaluation before and during decision meetings.
Technical solution & product quality evaluates the product on quality of its technical aspects and
how well it solves customer needs. Technical aspects receive special attention to maintain
product quality, both at gates B and C. Feasibility of the technical solution is judged through
estimated costs using the current design for example. Environmental performance is evaluated in
that the engineers must show they have considered eco-design and environmental footprint.
Financial attractiveness is determined through the business case and reliability of the
estimations. Top line revenue growth and gross margins are in focus. Projects with lower than
target gross margins can be accepted under special circumstances. These can be strategic aspects
such as covering up for lost sales or completing the product portfolio.
Project schedule & cost examines how realistic the schedule is and how critical the milestones
are for project success. The project cost considers investments in tooling, development as well as
resources available.
The criteria weight is not set but financial attractiveness and project schedule & cost have high
priority, especially at gate C. At gate B, the technical solution is prioritized as it decides the
product concept. Strategic aspects of the project are not evaluated by criteria but is judged by the
decision makers.
Decision meetings are scheduled at set times every second week. Projects that have reached a
gate book a presentation slot. Material is sent out two days before to make the decision meeting
efficient and enable decision makers to send questions ahead of the meeting. Decision makers
are the business area management team:
Business area president – CEO of Thule Group
SVP Finance – CFO of Thule Group
Director Product Management

71
VP Sales
VP Marketing
VP Product Development
VP Supply Chain
Director Operations
Director Sustainability
Each participant cast a vote to pass or not to pass the project with the CEO having the final say.
Projects reaching these gate meetings are often approved as they have been questioned ahead of
the meeting. If severe problems are found they are held back before the meeting. Less critical
questions related to the pre-read are dealt with during the meeting.
4.5.4.3 Output
The output from the gate can be of two types:
Go - the project is allowed to proceed to the next stage and the required resources are approved.
Go with restriction - additional information is needed which means the project has to revisit the
gate or work to eliminate uncertainties before proceeding with the project. This decision can
mean criteria have been fulfilled and the project is approved but the budget situation requires a
project pause. If timing is not critical, the product can be postponed at a low cost.
Projects are rarely killed at the gate meeting but instead in between. Most common is that
information has surfaced that severely affects the business case or other input variables. This
relies upon senior directors being informed of projects’ status continually.
4.5.4.4 Satisfaction
Overall, the interviewee is satisfied with the decision making process. Its success lies in
sufficient structure to support decision making while not limiting efficiency through excessive
formality. Scheduled gate meetings and senior decision makers ensure information spread
throughout the company through executives, which is positive.
4.5.5 Contextual Aspects
Thule Group has had a strong development recently after some turbulent years. In its recent
report it had a growth of 17% and an operating margin of 16%.
Thule Group has R&D and production internally, facilitated over nine different production
plants. The company sees itself as a premium brand and uses product development to strengthen
that position. Product development is always attractive as long as it is within the company’s
competence and strategic direction to provide “branded consumer goods that enable active
lives” (Thule Group, 2016b).

72
The product life cycle varies a lot between business areas. Normally it is 4-5 years while some
rare cases can be as high as 15. Development projects are typically 18-24 months but can be
shortened to 12 months for smaller projects.
Products generally have a high level of mechanical development. According to the interviewee
the decision making process is tailored for these projects and would not suit high tech
development projects as well.
Thule Group considers itself pragmatic in its view on business processes. They prioritize fast
decision making over rigorous planning. They rather be 70% sure with quick decision making
than 100% sure with the risk of losing the window of opportunity.
The company has had a relatively high level of product variety. To focus its activities and get a
clearer brand, the divisions of snow chains and towing & trailer have been divested (Thule
Group, 2015; Thule Group, 2016a). These transactions have been to focus the company’s
strategic direction.

73
4.5.6 Summary
Thule Group has the ambition to be pragmatic. In the information gathering they use internal
sources to save time. It is said that it is better to be nearly correct fast than completely right later
on. Table 14 describe a high involvement of senior management. The company has a high focus
on R&D which is considered to drive company performance.
Table 14 – Summary of Thule Group
Input Decision Output Contextual
Aspects
Information
requirement
-Market & user input
-Business case (includes
freight, scrap & handling
costs)
-Project schedule
-Project risk
-Technical specification
Criteria
-Technical solution & product
quality
-Financial attractiveness
-Project schedule & cost
Execution
-Go/go with
restriction
-Kill decisions
executed between
gates
Strategy, Market
and Company
-Product quality
focus
-Mature market
-Pragmatic view on
business processes
-High growth &
profitability
Data integrity
-Feedback loop 12 months
after product launch
-Sanity checks from function
heads
Decision makers
-CEO
-Directors of: Product
Management, Business area,
Sales, Marketing, Finance,
Sustainability, Operations &
Supply Chain
Implementation
-Resources
allocated or
project awaits
budget
Product
-Medium/long life
cycle (4/15 years)
-High product variety
-High focus on R&D
Responsibilities
-Project Manager gathers data
-Other functions supply
information
Variations
-Project cost > 100 000 SEK
go through process

74
5 Analysis & Findings
The cases presented in the previous chapter will here be analyzed based on the theoretical
propositions through pattern matching. In addition, new propositions based on the empirical
study will be made. In the analysis each case is compared to theory and a rating is made whether
the case supports (+), contradicts (-) or is neutral (0) to the theoretical propositions.
5.1 Axis Camera Division
Axis uses a relatively unstructured approach when selecting development projects. The
company’s outspoken prioritization of creativity and freedom of thinking makes a clear mark on
the process. The company’s financial success has enabled it to invest heavily in R&D which so
far has paid off in high growth and profit margins.
5.1.1 Comparison to theory
Axis’ unstructured approach lead to a low theoretical alignment in aspects of formality. In other
areas they are more in line with theory.
5.1.1.1 Input
As seen in Table 15 Axis’ camera division supports propositions regarding information
requirement and responsibilities. In the area of data integrity however, there is a lower level of
alignment to theory. This can be explained partly by the fact that follow-up of information is low
at the company.
Table 15 – Comparison to input theory at Axis Camera Division
Area Proposition Rating
Information
requirement
1 – Criteria sophistication drive information need 0
2 – Cross functional information gathering +
3 – Cross functional teams and integration +
Data integrity
4 – Misaligned incentives lead to poor data integrity 0
5 – Data integrity is critical for good decision making 0
6 – Risk of ending wrong project is greatest at start +
7 – Key factors hard to financially quantify 0
Responsibilities
8 – Functions are responsible to deliver information +
9 – Organizational integration support information sharing +
10 – Management support drive information sharing +
11 – Project Managers should collect information +
12 – Marketing, design, manufacturing provide info +

75
Information requirement
Axis gathers a wide range of information to the decision making, examples being competitor
analysis and customer needs. Most is not collected to serve the formal criteria of payback time
and project length, but rather to help the Product Manager choose new projects. The information
comes from different functions. Interviewees argue that the entire decision process is a tool for
connecting personnel across functions, improving the level of integration.
Data integrity
The importance of data integrity at Axis is not apparent as estimations are not followed up after
the project goes live. Product Managers have great power in deciding which projects to put
forward. They are constructing the business case and there could be instances where goals or
incentives are at risk of misalignment. No evidence has been found but it can follow due to the
lack of data integrity. In regard to the informal criteria there is more effort put into information
collection as people are working solely on analyzing competition and customer needs.
As formal financial criteria are not alone in the decision making, quantifying key figures can’t be
viewed as a great issue to the process. There is room to make decisions on project specific or
strategic factors if needed. It can be argued that there is a risk of ending quality projects
prematurely as Product Managers are responsible for bringing projects to the meeting. That is the
single greatest screening of projects and also where the least amount of information is available.
Responsibilities
Even though the Product Manager performs the data collection, the engineering manager is
responsible for information on R&D costs. There are people working full time with information
collection on competition and technical development. This supports the proposition that
functions should be responsible for delivering reliable information. The main purpose of the
decision process as described by interviewees is to increase functional integration and
communication. Management support is apparent which is seen in that the CTO is involved in
these decisions. The Product Managers are responsible for the information gathering at early
stages but it is the Project Manager’s responsibility when assigned. This supports the proposition
that the Project Manager should gather the information. Marketing, design and manufacturing are
all vital information providers through the entire decision making process. These functions also
have people represented in the decision meeting as the Product Manager can be seen as a
representative for marketing and sales.
5.1.1.2 Decision
The decision aspect at Axis gives a low rate of support to theory in the two areas of criteria and
variations, as seen in Table 16. There is a low use of formal criteria which explains the lack of
alignment. However, in the area of decision makers the case supports theory to a high degree.

76
Table 16 – Comparison to decision theory at Axis Camera Division
Area Proposition Rating
Criteria
13 – Formal criteria important for structure 0
14 – Formal criteria drive company performance -
15 – Strategic goals should drive criteria +
16 – Financial criteria is good as a complement +
17 – Strategic criteria should sort out candidates 0
17a – Use of scoring/ranking/checklists 0
17b – Use of visualization tools 0
17c – Use of business strategy models 0
18 – Criteria should be understood by organization 0
19 – Roadmaps can connect to company strategy +
Decision makers 20 – Use of formal decision makers +
21 – Decision makers at strategic level +
Variations 22 – Project importance should decide thoroughness 0
Criteria
The case at Axis does not support that formal criteria is a requirement for comparing projects.
Axis does so in a more informal setting, relying on the collective gut feeling of its Product
Managers and people at the roadmap meeting. This disproves the proposition that formal criteria
is necessary to drive company performance as Axis has been very successful despite, or perhaps
thanks to, its lack of formal criteria. Furthermore, the overall strategic goals of Axis and the
goals of each respective portfolio is reflected in the way Axis chooses its projects. Although this
is reflected in the informal criteria rather than the formal, financially based criteria. The formal
criteria function as a complement to the informal, strategic criteria. Important projects can be
prioritized despite their lack of financial performance if they are seen as important for
maintaining Axis technology leadership role. However, these informal, strategic criteria are not
the main drivers of sorting out projects initially which is why that proposition is not fully
supported.
Axis uses almost no suggested methods such as scoring, visualization or business strategy
models in selection of comparison of development projects. Selection is done by Product
Managers in the presentation at the roadmap meeting. This can then be questioned and projects
be changed. It is not done in a structured way with standardized methods but is rather through an
open discussion at the roadmap meeting. Since the criteria are informal it does not support the

77
proposition that the criteria must be understood by the organization. It is up to each of the
Product Managers to interpret what is important to present in the roadmap meeting to gain
acceptance for their projects. Product roadmap use is implemented at Axis to a large extent. The
purpose is to include company strategy into the selection of development projects.
Decision makers
Axis uses a formalized decision process where it is clear who should be represented at the
decision meeting. It provides a sense of transparency to the organization which is important
according to interviewees. The decision makers are at a high hierarchical level at the company,
with the CTO highest ranked. It gives the decisions a higher strategic connection even though the
formal criteria are not necessarily of strategic nature.
Variations
Axis does not have a formalized way of prioritizing the most important projects to give them a
more thorough decision process. The process and criteria differ among the Product Managers and
projects. Therefore, it might be a tendency towards more important projects receiving more
resources before the decision is made. This hasn’t been confirmed through the empirical study
however.
5.1.1.3 Output
Table 17 shows that Axis gives a relatively low level of support to the output aspect of theory.
The company supports one proposition while contradicting another. This is mainly due to the
lack of formality and employing a binary go/kill decision.
Table 17 – Comparison to output theory at Axis Camera Division
Area Proposition Rating
Execution 23 – A clear, formal output based on decision is vital 0
24 – The decision should be a clear go/kill -
Implementation 25 – Resource allocation should reflect decision +
26 – Goals for next gate should be set if go-decision 0
Execution
The formal output from the roadmap is a collective decision to let the project start. The fact that
few projects are killed but rather postponed proves that Axis does not follow a binary go/kill
decision.
Implementation
In the few instances where there is a clear kill decision the project is stripped of its resources. As
a decision is made to start product development, the project is receiving the resources requested.

78
Other than the project plan, the time frame for the project, there are no formal criteria set up for
the upcoming gates of the project.
5.1.2 Complements to theory
The Axis case gives interesting complements to theory regarding the use of less formal criteria
and the roadmap as a tool for cross functional communication.
5.1.2.1 Decision
Axis does not put much focus on formal criteria. The interviews argued that the company wants
to free up the employees and thereby enable more innovation. Product Managers are very free in
their role and can argue for new projects where they see potential. It seems to be a conscious
choice by management to have this loose process.
Use of less formalized criteria enables a more innovative organization.
5.1.2.2 Output
The use of a roadmap is an important part of product development and product planning at Axis.
However, it is an important tool not only for decision support. The Product Managers are
pushing for the idea of using it to communicate decisions and plans to the company to provide
transparency and company alignment. Some important functions using this tool are sales and
others with customer contact.
A roadmap can provide valuable cross functional communication after a development
decision has been made
5.1.3 Contextual Explanation
Axis has long been a very successful and profitable company. Innovation and technology
leadership have been important factors enabling success in an industry with short product life
cycles. It is not surprising that the heavy focus on innovation is holding back the company from
introducing more formal criteria. It is not clear that a more formal process with the same criteria
would necessarily help the company. It can be argued that their current approach is successful
when looking at the company and its performance as a whole.
Many theoretical propositions which Axis does not fulfill are due to the lack of formality. It can
be argued that the innovation weight in company strategy cause this prioritization. The company
is therefore in line with some of the propositions regarding strategic alignment indirectly. The
lack of criteria and connection to company strategy is arguably fulfilled by the hierarchical level
of decision makers, indirectly taking strategic aspects into account.
While Axis matches fewer of the propositions regarding formality, they match more concerning
cross functional integration and cooperation. The company culture, which is characterized by
openness and cooperation, can be seen as an enabler. The theoretical framework states this is an
important part of the decision making and it is clear that Axis fulfills these propositions.

79
5.2 Sony
Sony is the case that is most aligned with theory regarding formality of the decision point.
Several deliverables are required and the product projects are scrutinized in detail.
5.2.1 Comparison to theory
Sony has a high level of formality in its processes. It provides much of the alignment with the
theoretical framework. The company is less in line with theory in aspects of information sharing
and cross functionality.
5.2.1.1 Input
Table 18 shows a relatively high level of support for theoretical propositions from the Sony case.
The exceptions are primarily related to cross functional information sharing and integration.
Table 18 – Comparison of input theory at Sony
Area Proposition Rating
Information
requirement
1 – Criteria sophistication drive information need +
2 – Cross functional information gathering +
3 – Cross functional teams and integration 0
Data integrity
4 – Misaligned incentives lead to poor data integrity +
5 – Data integrity is critical for good decision making +
6 – Risk of ending wrong project is greatest at start 0
7 – Key factors hard to financially quantify +
Responsibilities
8 – Functions are responsible to deliver information 0
9 – Organizational integration support information sharing 0
10 – Management support drive information sharing 0
11 – Project Managers should collect information +
12 – Marketing, design, manufacturing provide info +
Information requirement
Information requirements are to large extents set by the criteria used at the gate meeting. The
thoroughness of criteria in the detailed business case decides the information required. Short
development life cycles meant a project could be killed only based on demand or cost
estimations, which could change rapidly. This required sufficient quality from the information
gathering from functions. Mainly, product and Project Managers were responsible for gathering
information by contacting departments and functions.

80
Data integrity
Alignment of incentives was an issue at times. There could be directives from corporate
headquarters that a certain project should be allowed to pass through the toll gate even if
information gathered by product management suggested otherwise. Other than these issues, Sony
was successful and adamant about ensuring data integrity. It is shown in that each project was
followed up after release to evaluate initial estimations. This was further enforced by the fact that
a financial controller was present at the tollgate meeting to verify and question data validity.
No sufficient evidence was found to support that Sony was at risk of ending projects based on
insufficient information at early gates. It was however clear that, although the business case and
project financials were the most important, strategic factors could overrule financial data. Sony
had projects that were accepted despite lack of solid financial data due to a strategic technology
push. It also had projects which were killed when other factors were considered to affect
credibility of the calculations.
Responsibilities
Information gathering and sharing was found to be largely attributed to the project and Product
Managers. No sufficient evidence was found of information sharing happening due to cross-
functional integration or by enablement of top management. Involved functions would however
provide information upon request from the project or Product Manager which supports these
propositions.
5.2.1.2 Decision
The Sony case supports theoretical propositions concerning the decision to a varying extent, as
seen in Table 19. The company supports most of the propositions concerning formality. The two
contradicting aspects are also connected to formality, not allowing for any variations.
Table 19 – Comparison to decision theory at Sony
Area Proposition Rating
Criteria
13 – Formal criteria important for structure +
14 – Formal criteria drive company performance -
15 – Strategic goals should drive criteria +
16 – Financial criteria is good as a complement 0
17 – Strategic criteria should sort out candidates +
17a – Use of scoring/ranking/checklists 0
17b – Use of visualization tools +
17c – Use of business strategy models 0
18 – Criteria could be understood by organization 0

81
19 – Roadmaps can connect to company strategy +
Decision makers 20 – Use of formal decision makers +
21 – Decision makers at strategic level +
Variations 22 – Project importance should decide thoroughness -
Criteria
Sony Mobile relied on formal criteria to structure the decision making and compare projects. At
the same time, they struggled to deliver financially during a long period of time. It shows that
formal criteria do not necessarily drive company performance. There is certainly a more complex
relationship that drives company performance but the Sony case showed an exception to this
proposition.
They let strategic goals drive criteria by allowing riskier projects, with more uncertain business
cases, to proceed if they were of strategic importance to the portfolio. It was clear that most of
the time however, financial criteria were relied upon heavily. Strategic criteria were used to sort
out candidates during the portfolio meetings which occurred before the start meeting of any
project.
No evidence was found for use of scoring or business strategy models. Visualization tools were
only used to minor extent during the portfolio meeting. That is why the proposition regarding
visualization tools was not fully supported. Criteria was not always understood by stakeholders
as they could differ depending on involvement and pushes from top management. Roadmaps
were used to connect the portfolio with company strategy. This was done in the portfolio
meetings before the first tollgate of the project.
Decision Makers
Formal decision makers were used at the gate meetings. These were senior managers of the
functions involved. This ensured involvement of decision makers at a strategic level.
Variations
Sony had a differentiated way of working with different projects which decided the thoroughness
of the decision making. According to an interviewee this led to more problems than it simplified
the process. Less important projects that were allowed to pass through faster often led to the
most problems later on. This led to a change where all projects needed a thorough business case
to be approved.
5.2.1.3 Output
There is a high level of variety in support of output propositions, as seen in Table 20. There is a
formal output which drives resource allocation. However, the decision is not a binary go/kill and
no goals are set for the next gate.
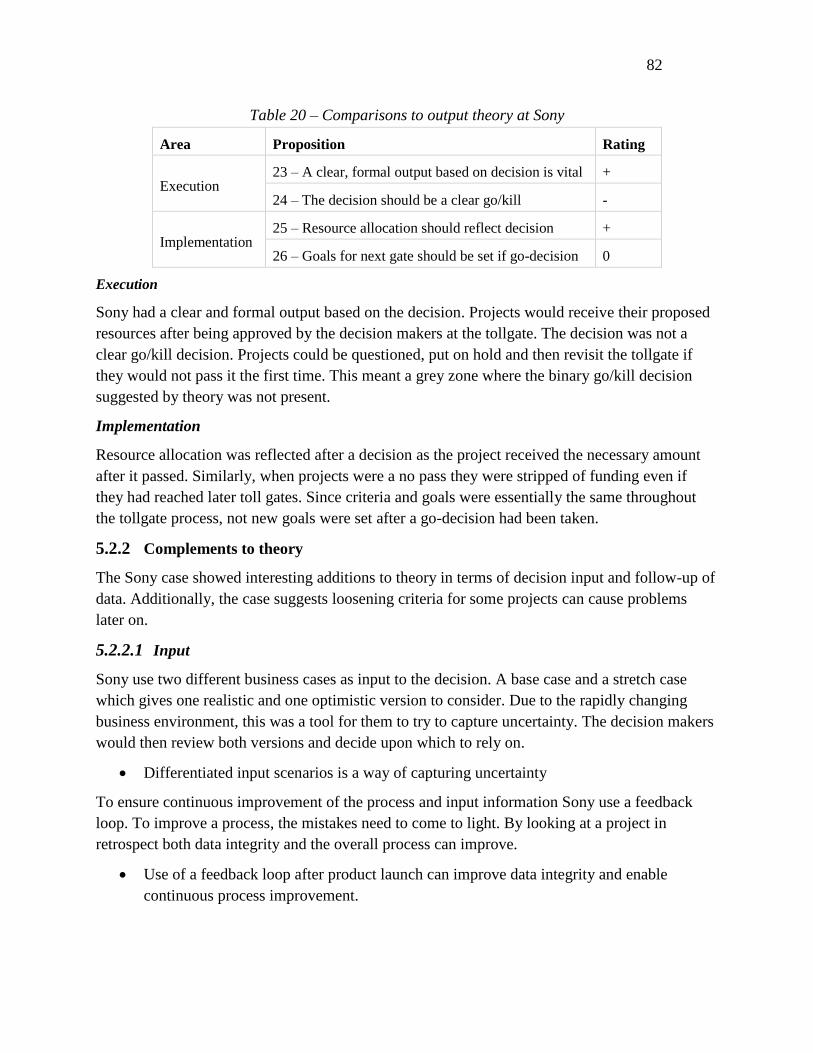
82
Table 20 – Comparisons to output theory at Sony
Area Proposition Rating
Execution 23 – A clear, formal output based on decision is vital +
24 – The decision should be a clear go/kill -
Implementation 25 – Resource allocation should reflect decision +
26 – Goals for next gate should be set if go-decision 0
Execution
Sony had a clear and formal output based on the decision. Projects would receive their proposed
resources after being approved by the decision makers at the tollgate. The decision was not a
clear go/kill decision. Projects could be questioned, put on hold and then revisit the tollgate if
they would not pass it the first time. This meant a grey zone where the binary go/kill decision
suggested by theory was not present.
Implementation
Resource allocation was reflected after a decision as the project received the necessary amount
after it passed. Similarly, when projects were a no pass they were stripped of funding even if
they had reached later toll gates. Since criteria and goals were essentially the same throughout
the tollgate process, not new goals were set after a go-decision had been taken.
5.2.2 Complements to theory
The Sony case showed interesting additions to theory in terms of decision input and follow-up of
data. Additionally, the case suggests loosening criteria for some projects can cause problems
later on.
5.2.2.1 Input
Sony use two different business cases as input to the decision. A base case and a stretch case
which gives one realistic and one optimistic version to consider. Due to the rapidly changing
business environment, this was a tool for them to try to capture uncertainty. The decision makers
would then review both versions and decide upon which to rely on.
Differentiated input scenarios is a way of capturing uncertainty
To ensure continuous improvement of the process and input information Sony use a feedback
loop. To improve a process, the mistakes need to come to light. By looking at a project in
retrospect both data integrity and the overall process can improve.
Use of a feedback loop after product launch can improve data integrity and enable
continuous process improvement.

83
5.2.2.2 Decision
Theory suggests that rigidness of criteria can be adjusted depending on the financial importance
and risk of the project. At Sony Mobile, this was found to be difficult to apply in practice as
projects with looser criteria would be problematic later, when the product was released. These
problems were traced back to the business case which is why data integrity needs to be ensured
for all projects.
Loose criteria for low risk projects can lead to issues later on. Therefore, data integrity
must be ensured also for these projects
5.2.3 Contextual Explanation
Sony operate in an extremely competitive industry which has been increasingly commoditized,
with smaller margins as a consequence. It has a great impact on how they work with product
development. The company calculates the cost structure of a new product for the entire life cycle
to control costs. The process and decision input is heavily formalized and all assumptions are
evaluated as a project is closed. Strictness and thoroughness of the data collection is drawing a
lot of resources. The company has deemed it to be important anyway, as a development project
decide what costs a product drives through its entire life time. Company size could be a factor in
strictness of data collection. As poor data has a bigger impact in a larger company it can be
argued to be a better investment there.
The proposition of process formality and its relation to company performance should not be
considered a direct correlation. It is probable that the industry characteristics and competition are
stronger drivers of performance than decision process formality.
The short life cycles of the industry mean there is a lot of pressure on the R&D aspect of the
company which can further explain the formality of the process. They were forced to keep a
steady product introduction rate, while maintaining a competitive product portfolio. This put
pressure on the decision making process to deliver. Having an external owner who wants to
control the process further explains the uniformity of development projects and their formal set
up.
5.3 Alfa Laval
Alfa Laval has a relatively formal process for product development decisions. The company
strategy mentions both cost control and resource focus which requires restrictions. At the same
time R&D is given a high focus, shown by the involvement from senior managers. Formal
processes at the company can be seen as a way for the directorate to have control of R&D.
5.3.1 Comparison to theory
The support for theoretical proposition is high at Alfa Laval. Formality and theoretical alignment
is most apparent in information gathering up until the decision making. The support for decision
and output dimensions is not as strong.

84
5.3.1.1 Input
The Alfa Laval case gives a high level of support for input propositions, as seen in Table 21. The
less supported propositions are primarily related to spontaneous information sharing and
functional integration. An explanation is that the responsibility for information gathering is
concentrated to the Product Manager.
Table 21 – Comparison to input theory at Alfa Laval
Area Proposition Rating
Information
requirement
1 – Criteria sophistication drive information need +
2 – Cross functional information gathering +
3 – Cross functional teams and integration 0
Data integrity
4 – Misaligned incentives lead to poor data integrity 0
5 – Data integrity is critical for good decision making +
6 – Risk of ending wrong project is greatest at start +
7 – Key factors hard to financially quantify +
Responsibilities
8 – Functions are responsible to deliver information 0
9 – Organizational integration support information sharing 0
10 – Management support drive information sharing +
11 – Project Managers should collect information +
12 – Marketing, design, manufacturing provide info +
Information Requirement
Alfa Laval has a high sophistication level regarding criteria. This is partly because the decision
meetings are held every 6 months with very senior decision makers. The sophistication is shown
in the detailed input data calculated in the form of the thorough cost-benefit-analysis (CBA).
Several functions are involved in collecting this data and the related documents. It is especially
apparent when projects have been initiated from the technology forum, requiring information
from more sources. However, cross functional teams were not found to be the enablers of this
information gathering. Rather, Product Managers gathered the information when needed.
Data integrity
There were no signs of misaligned incentives leading to manipulated data. Instead, data integrity
was a critical part of Alfa Laval’s decision process. It is seen in follow-up meetings after product
release and use of sophisticated sensitivity analyses within each CBA. The importance of
financial criteria favors safer projects which affect innovative and risky projects. These were

85
often based on more uncertain information at the early project stages. This can be a problem
since the early project financials might not reflect the full potential of a project.
Responsibilities
At Alfa Laval it is not the responsibility of each function to deliver information. Instead it was up
to the Product Managers early on and Project Managers at later stages. Other functions would
then provide information upon request. Management support for the decision process was clear
in that the directorate was directly involved in decisions. It is likely to affect the information
sharing in a positive way.
5.3.1.2 Decision
Alfa Laval has a high focus on their formal business case in its decision making. Strategic
aspects of the decision are primarily inserted through involvement of senior decision makers. As
seen in Table 22, many of the propositions with no support can be explained by the financial
focus.
Table 22 – Comparison to decision theory at Alfa Laval
Area Proposition Rating
Criteria
13 – Formal criteria important for structure +
14 – Formal criteria drive company performance +
15 – Strategic goals should drive criteria 0
16 – Financial criteria is good as a complement +
17 – Strategic criteria should sort out candidates 0
17a – Use of scoring/ranking/checklists 0
17b – Use of visualization tools 0
17c – Use of business strategy models 0
18 – Criteria should be understood by organization 0
19 – Roadmaps can connect to company strategy +
Decision makers 20 – Use of formal decision makers +
21 – Decision makers at strategic level +
Variations 22 – Project importance should decide
thoroughness
0
Criteria
The importance of formal criteria was supported by the Alfa Laval case, demanding strict criteria
for a project to be approved. The strong company performance has been apparent for Alfa Laval
throughout the years, even though they are competing in a mature market. We believe this can be

86
somewhat related to the use of strict criteria. It ensures that every project started will yield
positive financial results. The strategic goals are not reflected in the use of criteria but through
the strategic level of the decision makers.
Alfa Laval relies heavily on financial criteria which could affect riskier, more innovative projects
negatively. There is no evidence that strategic criteria were used first to sort out candidates.
Neither were any of the qualitative methods of scoring, visualization tools or business strategy
models used.
The criteria are not fully comprehended by the people involved. One example is that the
interviewee was unsure on how decisions were made, especially what weight criteria had in
decisions. The decision meeting can be seen as a roadmap as it gathers current and future
projects to be evaluated as a whole. Together with the strategic decision makers it enables a
connection between portfolios and the overall company strategy.
Decision makers
Formal decision makers were appointed and were at a strategic level, as most of them were from
the company directorate.
Variations
No sufficient evidence supports that Alfa Laval had different levels of sophistication for the
decision making depending on project importance. Since only a handful development projects
are conducted each year, they can be thorough in each decision.
5.3.1.3 Output
There is high support for output propositions, as seen in Table 23. There is a formal output which
drives resource allocation and Alfa Laval is the only case that supports a binary go/kill decision.
Table 23 – Comparison to output theory at Alfa Laval
Area Proposition Rating
Execution 23 – A clear, formal output based on decision is vital +
24 – The decision should be a clear go/kill +
Implementation 25 – Resource allocation should reflect decision +
26 – Goals for next gate should be set if go-decision 0
Execution
The output from the decision was clear in that formalized ways of proceeding afterwards were
implemented. Alfa Laval also support a binary go/kill decision which shows they are formal and
strict in their output.

87
Implementation
Resource allocation largely followed the decisions made to approve or kill a project. There were
no new goals set in relation to the criteria however. The same criteria were used at the
subsequent gates.
5.3.2 Complements to theory
There are several complements to theory proposed, based on the Alfa Laval case. There is no
major change from theory but rather variations of existing theoretical concepts.
5.3.2.1 Input
Alfa Laval demands that all products ina development project are listed in the project proposal. It
is mentioned that additional products or modifications are rather put in new projects in the future.
It is interpreted that the company wants to keep projects from swelling and taking more time and
resources than necessary.
All planned products in a project should be part of the input to the decision meeting.
To assess the risks involved in business case assumptions, Alfa Laval include a scenario analysis.
They use the base scenario which is the projection and adds two cases where the sales differ 10-
20% up and down. The scenarios give decision makers an idea of how sensitive the project is to
market changes and poor projections.
Scenario analysis can be used as a way of assessing the risks involved with sales
projections.
Alfa Laval use an evaluation meeting at the end of each project. This way they can find possible
weak points of the project and improve going forward. Improvements can be found in both data
integrity and the working process.
Use of a feedback loop after product launch can improve data integrity and enable
continuous process improvement.
5.3.2.2 Decision
Alfa Laval employ financial criteria similar to pay back time but counting to gross profit
reaching one million EUR or twice the investment. This can be seen as a simple way of ensuring
that the introduction of the new product is able to cover the hidden costs outside of the direct cost
and investments.
Time-to-million and time-to-two-times-investment can ensure that a project covers all
hidden costs it drives.
5.3.3 Contextual Explanation
Alfa Laval has a long experience of being one of the industry leaders in a relatively mature and
competitive market. R&D is a priority but is controlled rather tightly to ensure efficiency.

88
Critique is expressed that the result of the financial control and risk avoidance to keep up
margins might actually result in lower innovation. However, in a mature industry it might be
motivated to stay within the core business when the company already has large market shares.
Product focus and control of market are key aspects of company strategy which include a limit to
the level of customization the company provides to its customers. The product life cycle is long.
Since the company often undertakes the liability of providing spare parts for a long time after a
sale, it is important not to widen the number of sales units. This liability might also be a strong
reason behind the restrictive approach towards uncertain and innovative projects.
5.4 Husqvarna
Husqvarna and its diverse product portfolio is divided into several companies and markets. The
company has tried to centralize and reduce cost in recent years which has put focus on formality.
As a way of being flexible to market characteristics the company puts high emphasis on strategic
aspects and flexible criteria weight.
5.4.1 Comparison to theory
Husqvarna has a high variety in degree of theoretical alignment. The company is following
propositions closely at the decision point. However, in input and output there is a significantly
lower level of alignment.
5.4.1.1 Input
In the input phase there is a low level of theoretical support from the Husqvarna case, as seen in
Table 24. The input to the decision has a relatively high focus on qualitative strategic aspects.
These are collected by the Product Manager with little input from other functions.
Table 24 – Complements to input theory at Husqvarna
Area Proposition Rating
Information
requirement
1 – Criteria sophistication drive information need 0
2 – Cross functional information gathering +
3 – Cross functional teams and integration 0
Data integrity
4 – Misaligned incentives lead to poor data integrity 0
5 – Data integrity is critical for good decision making +
6 – Risk of ending wrong project is greatest at start 0
7 – Key factors hard to financially quantify +
Responsibilities
8 – Functions are responsible to deliver information 0
9 – Organizational integration support information sharing 0
10 – Management support drive information sharing 0

89
11 – Project Managers should collect information 0
12 – Marketing, design, manufacturing provide info +
Information requirement
Husqvarna has introduced sophistication to its criteria other than the business case and financial
measures. They use matrices to visualize strategic aspects ahead of roadmap and start meetings.
However, those tools do not drive a significant amount of new data collection. It is mostly a way
of putting the Product Manager’s existing knowledge to print. Cross functionality and integration
are important for data collection as help is needed for some data collection, primarily for the
business case input. The data is not reliant on the cross functional teams but rather on the Product
Manager being able to contact the right people with the right information.
Data integrity
There is no empirical evidence that a misalignment of incentives lead to poor data integrity.
There is however a high level of power over information at the hands of the Product Manager. It
seems there is potential for conflicting interests but no incentives have been found which would
drive the conflict. Husqvarna employs a feedback loop through their follow-up meetings which
ensures data integrity and shows that they value this aspect.
Risk factors of ending the wrong projects can be found in the beginning. An important filter of
projects is the Product Manager’s decisions regarding which project to bring to the roadmap
meeting. However, this is a potential issue rather than something verified by empirical evidence.
Visualization of strategic factors could clarify the Product Manager’s thinking on relevant factors
which could otherwise go unnoticed. This measure acknowledges that financial criteria cannot
catch all significant aspects.
Responsibilities
The collection of information is centralized to the Product Manager until the project gets a go in
the start meeting. Therefore, it is dependent on that person reaching out to the organization for
information collection. This instead of spontaneous information sharing through management
support or a functional responsibility to deliver the information. However, when the information
is needed it will be gathered from relevant functions such as manufacturing, design and
marketing.
5.4.1.2 Decision
The decision aspects at Husqvarna give a high level of support to theory, as seen in Table 25.
The aspect where the case contradicts theory relates to the hierarchical level of decision makers
since they are inconsistent in that regard.

90
Table 25 – Comparison to decision theory at Husqvarna
Area Proposition Rating
Criteria
13 – Formal criteria important for structure +
14 – Formal criteria drive company performance +
15 – Strategic goals should drive criteria +
16 – Financial criteria is good as a complement +
17 – Strategic criteria should sort out candidates +
17a – Use of scoring/ranking/checklists 0
17b – Use of visualization tools +
17c – Use of business strategy models 0
18 – Criteria should be understood by organization 0
19 – Roadmaps can connect to company strategy +
Decision makers 20 – Use of formal decision makers +
21 – Decision makers at strategic level -
Variations 22 – Project importance should decide
thoroughness
0
Criteria
The formality of the process at Husqvarna is used to achieve a similar structure for all projects. It
is important to the company to control the alignment of products. It seems criteria are based on
strategic goals, especially if looking at the matrices focusing on strategic aspects. In addition, it
is possible to include strategic priorities for different product lines. Handheld electronic products
receive higher weight on growth and innovation than traditional lawn mowers do for example.
Since there is a focus on the strategic aspects in the roadmap meeting and financial aspects in the
monthly meeting, one can say that strategic aspects are the primary criteria. A contradiction to
this is that decision makers are at a higher hierarchical level at the monthly meeting with
financial focus. However, the order of the meetings is deemed to be a primary factor since the
strategic factors are prioritized first. The matrices used for the strategic purpose are judged to be
visualization tools of strategic criteria rather than business strategy models, as defined in theory.
Decision makers
The fact that Husqvarna employs clear and formal decision makers in their process is one of the
positive aspects brought up in the interview. However, contrary to theory the company use
senior, strategic decision makers at the monthly start meeting where financial factors are in
focus. When strategic aspects are discussed at the roadmap meeting, decision makers there are at
a lower hierarchical level.

91
Variations
The company use the same process for all projects. The factor that change between projects is
the weight of criteria, instead of the thoroughness of the process itself.
5.4.1.3 Output
There is variations in support for the output propositions, as seen in Table 26. There is a formal
output which drives resource allocation. However, the decision is not a binary go/kill and no
goals are set for the next gate.
Table 26 – Comparison to output theory at Husqvarna
Area Proposition Rating
Execution 23 – A clear, formal output based on decision is vital +
24 – The decision should be a clear go/kill -
Implementation 25 – Resource allocation should reflect decision +
26 – Goals for next gate should be set if go-decision 0
Execution
The output from a roadmap meeting is clear for all projects receiving a go decision. They get a
place in the roadmap which means a dedicated Project Manager and a start date for development.
At the start meeting the project gets necessary resources if it receives a go decision. The
decisions are not only go or kill, there is a grey scale as projects not passing the gate can be
reintroduced later on.
Implementation
The resources are deemed to be allocated according to the decision meeting, even though
projects which were killed sometimes are reworked to get a second chance. When projects are
passed at a gate there are no project specific criteria decided for the next gate as they are constant
for all gates.
5.4.2 Complements to theory
Husqvarna offers two complements to theory. The company generally has a relatively high
alignment to theory which explains the low number.
5.4.2.1 Input
Husqvarna uses follow-up meetings at the end of each project. The purpose of the meeting is to
learn from aspects of the project which went particularly well or badly.
Use of a feedback loop after product launch can improve data integrity and enable
continuous process improvement.
92
5.4.2.2 Decision
Husqvarna use flexible criteria to fit a specific business area’s strategic goals. Even though the
tools and criteria are basically the same for all projects, the weighting can be fundamentally
different. This is a way of combining the formality of uniform criteria while still enabling for
strategic customization.
Flexible criteria weight at different business units allow for customization of decision
making based on unit specific strategic goals.
5.4.3 Contextual Explanation
Husqvarna has a company-wide ambition to be a technology leader in the fields it operates. In
combination with the new strategic initiative to increase margins of the products there is a risk of
conflicting interests. The fact that high company executives go in to judge ongoing projects on
primarily financial aspects could be a consequence of this conflict. The Product Managers have
the ambition to be technology leaders. This might not be in line with the more financial motives
of the executives making the decisions at the monthly meetings. Another explanation for this
misalignment of decisions is the recent centralization of the organization. This is, according to
the interviewee, something that affects product development decisions. The product management
function was kept decentralized but can be overruled by decision makers on group level. This
divide further strengthens the theoretical proposition to keep decision makers on a strategic level
since they will have the final say in the end.
The fact that Husqvarna use a differentiated weighting of the decision criteria could be explained
by the variations in industries the company operates in. They have realized that a common
decision making cannot serve the purpose of all markets and products. The decision making must
be different for immature, growing markets as opposed to the mature markets where Husqvarna
mainly operates. This is also explained by the varying product life cycles that their products
have. The products that the interviewee is responsible for have a shorter life cycle than their
combustion driven lawn mowers. This is captured in the flexible criteria weight as well.
5.5 Thule Group
Thule Group has had dramatic changes during the last years with its IPO to the Stockholm stock
market and a redirection of its business. Product development has had a strong impact on these
changes as the company has gone into new markets and needed products to fit. Strong focus on
brand and quality has meant investments in new products have received much time and
resources. The interviewee stress that it is hard to build up a quality brand but easy to erase it.
5.5.1 Comparison to theory
Thule Group follow the basic ideas of theory. The company’s ambition to be pragmatic in
decisions does however limit formality and theoretical alignment in some aspects.

93
5.5.1.1 Input
Thule Group has a low level of theoretical alignment in areas of information sharing and cross
functional integration, as seen in Table 27. Their dependence on senior management to share
information is the strongest explanation for this. In the other areas there is strong support for
theoretical propositions.
Table 27 – Comparison to input theory at Thule Group
Area Proposition Rating
Information
requirement
1 – Criteria sophistication drive information need +
2 – Cross functional information gathering +
3 – Cross functional teams and integration 0
Data integrity
4 – Misaligned incentives lead to poor data integrity 0
5 – Data integrity is critical for good decision making +
6 – Risk of ending wrong project is greatest at start 0
7 – Key factors hard to financially quantify +
Responsibilities
8 – Functions are responsible to deliver information +
9 – Organizational integration support information sharing -
10 – Management support drive information sharing 0
11 – Project Managers should collect information +
12 – Marketing, design, manufacturing provide info +
Information requirement
Information collected follows a given structure, a template for presentation. The information
need is thus driven by the criteria set up from the start. That information is collected by a Project
Manager who reaches out to the departments. Later the information is sanity checked by each
department head and the cross functional decision meeting. It is regarded as a cross functional
information gathering. However, the information gathering is not dependent on cross functional
teams, other than the decision meeting itself.
Data integrity
There is no evidence to suggest misaligned incentives lead to poor data integrity at Thule Group.
There are control functions in place to sanity check the information. The functional directors are
reviewing data before all checkpoints and follow-up the entire project at the end. Those measures
show their focus on data integrity as a means of maximizing decision quality.
There is no evidence suggesting that good projects are killed early in their development. Instead,
there is strong focus on design and concept at those stages. If a project is killed, it is often due to

94
technical reasons. The process at Thule Group has a high focus on financial criteria. However,
those factors can be overruled by qualitative, strategic factors. It is mentioned that some projects
are started to fill a gap in the market or to update an existing product, if it is important to not lose
market share or reputation.
Responsibilities
Information is collected from a wide range of functions including manufacturing, marketing and
design. They also have these managers involved throughout the process. The Project Manager
has the responsibility to collect information going in to the decision meeting with help from
other functions. It is therefore deemed to be a functional responsibility in practice. However, as it
is a centralized collection process controlled from the Project Manager it is not necessary to have
organizational integration to get the information. There is a clear support from management to
share information. However, it is not done necessarily through cross functional integration.
Rather, it is the managers’ responsibility to spread the information to their respective function.
5.5.1.2 Decision
Thule Group offers a relatively high level of support for theoretical propositions regarding the
decision aspect, as seen in Table 28. The formality of the process is primarily related to a focus
on financial aspects. Strategic aspects are brought in to the decision in the form of decision
makers at the directorate level.
Table 28 – Comparison to decision theory at Thule Group
Area Proposition Rating
Criteria
13 – Formal criteria important for structure +
14 – Formal criteria drive company performance +
15 – Strategic goals should drive criteria 0
16 – Financial criteria is good as a complement +
17 – Strategic criteria should sort out candidates +
17a – Use of scoring/ranking/checklists 0
17b – Use of visualization tools 0
17c – Use of business strategy models 0
18 – Criteria could be understood by organization 0
19 – Roadmaps can connect to company strategy 0
Decision makers 20 – Use of formal decision makers +
21 – Decision makers at strategic level +
Variations 22 – Project importance should decide thoroughness 0

95
Criteria
The formal criteria and presentation tools Thule Group uses are mentioned to be very important
for the structure of the development process. It appears that criteria are of great help to the
company. It has enabled the quick transition to new markets and the new focus in the last few
years. This suggests that formal criteria drives company performance.
There is no apparent connection between company strategy of a focused product portfolio and
the formal criteria other than their gross margin goal. However, it seems there are informal
criteria steering the selection of projects in a strategic direction. The company has focused its
portfolio strategically through informal talks in between gates and strategic decision makers.
Although they don’t utilize strategic criteria, the effect on decisions is the same.
As a tool for the Product Managers to keep track of planned product introductions and
development projects, a 3-5-year plan is used. The essence of it is similar to a roadmap, but
without the purpose of aligning the portfolio to strategy. Rather it helps resource planning,
although strategic alignment might be a positive effect.
Decision makers
Thule Group’s use of a set meeting every other week with the same decision makers each time
clearly signals formal decision making. The decision makers are on a high strategic level at the
company, including CEO and heads of functions.
Variations
Other than very small projects, which do not go through the formal process, all projects go
through the same process. No room is thus given for a general customization of the process.
5.5.1.3 Output
There is varied support for the output propositions, as seen in Table 29. The company utilizes a
formal output to drive resource allocation. However, the decision is not a binary go/kill and no
new goals are set for the next gate in the process.
Table 29 – Comparison to output theory at Thule Group
Area Proposition Rating
Execution 23 – A clear, formal output based on decision is vital +
24 – The decision should be a clear go/kill -
Implementation 25 – Resource allocation should reflect decision +
26 – Goals for next gate should be set if go-decision 0
Execution
The delay option is the most common reason for not letting the project through. Even though this
option sounds indecisive it is accompanied with directions for the project. It could be a pause

96
decision with a new start date or directives for what has to be accomplished by the project to
pass. It is not a binary go/kill decision, nor are there any project specific criteria decided for the
next gate. The criteria are the same for every gate but with updated information.
Implementation
Thule Group uses a clear output from its decision point which is reflected in resource allocation.
A go decision means that the project will go on as planned. In the rare cases the project is killed,
it will no longer receive resources. As the criteria are the same for all gates there are no new
goals accompanying a go-decision.
5.5.2 Complements to theory
Thule Group offers several additional propositions. Many of the propositions are related to the
high level of involvement from senior management. The company focuses on pragmatism and
efficient decision making which affects the process.
5.5.2.1 Input
Thule uses a system where function heads are able to do sanity checks of assumptions ahead of
decision meetings. This enable them to find mistakes early on in the process when information is
uncertain and thus ensure data integrity.
Sanity checks from relevant functions can increase data integrity in early assumptions.
Thule uses a continuous development and iteration of product concepts from early stages. They
involve development resources to start prototyping during the first stages of the development
process. Physical prototypes are tested and used as an input to each gate. As the prototypes grow
in sophistication, so does the quality of their estimations and the certainty of a product’s success.
Early physical prototypes as input help to ensure data integrity and product quality.
To ensure continuous learning in the process, Thule use a follow-up meeting in each project.
Typical points of discussion are how well the work went and the accuracy of early assumptions.
As the company relies heavily on internal data and assumptions for the business case, this
feedback loop is particularly important.
Use of a feedback loop after product launch can improve data integrity and enable
continuous process improvement.
5.5.2.2 Decision
Thule Group use a decision system where there are set slots for gate decisions every other
Friday. The slot is booked for all relevant executives to have a fast development process and still
make decisions on a strategic level.
Use of set slots for decision making can speed up decisions and thus make a more
efficient process.
97
The company utilizes informal strategic criteria which are not outspoken. The presence of senior
personnel at the gate meeting combined with thorough communication ahead of the meeting can
align portfolio and strategy.
Strategic alignment can be achieved through project involvement of personnel at a
strategic level instead of formal strategic criteria.
Thule Group uses scenario analysis in the business case to assess risk. In the analysis sales
volume and price are adjusted up and down to show how they affect project profitability.
Scenario analysis can be used as a way of assessing the risks involved with sales and
price projections.
5.5.2.3 Output
Thule has an approach of rarely killing projects at the decision gates. They are questioned
continually, if severe problems arise, projects are killed leading up to the gates. This approach of
continuous questioning enables them not to spend unnecessary meeting time on these projects.
Questioning and killing projects continually enables more efficient meetings.
5.5.3 Contextual Explanation
Thule has experienced high growth and profitability during the last few years. A significant part
of the development can be attributed to product development. The company’s focus on its core
products has increased by divesting business units and more investment in R&D. The focus on
product development is shown by the seniority of decision makers who are highly involved in
the projects. The strategic involvement can explain the low use of strategy criteria. It is
assumedly included by these decision makers anyway.
Thule Group prides itself in being a pragmatic company with a flat company structure. The
ambitions for R&D is to have a fast process not hindered by too much formality. In combination
with the high involvement from senior executives it can explain why the process works well
without formal kill decisions. The questioning of projects, which comes naturally within the
organization, sorts out poor projects even before the gate is reached. The pragmatism and small
company size are likely to be strong enablers of this practice. It could also explain why
information sharing does not happen through cross functional teams. Rather, it is achieved
through gate meetings where top management will spread information to the rest of the
organization.

98
6 Cross Case Analysis
The structure of the cross case analysis is to first discuss the theoretical propositions.
Propositions discussed in the previous chapter, both theoretical and empirical, make up the
basis for the following discussion. Through pattern matching we will compare similarities and
differences between empirics and theory and how contextual aspects might explain this. After
this, the empirical propositions will be discussed from a cross-case point of view to examine
generalizability of the findings.
6.1 Comparisons to theory
The pattern matching is done on an aggregate level to find general patterns that could support or
disprove the theoretical propositions. The propositions which received support from a majority
of cases, three or more, were highlighted in dark grey. The propositions that were disproved by
one or more cases were highlighted in white. Those that were proved, disproved or both were
highlighted in light grey.
6.1.1 Input
As seen in Table 30, there are many propositions with a high level of support from the cases,
marked in dark grey. In addition, several aspects get support from only some of the cases and
thus warrant further discussion.
Table 30 – Cross Case analysis of input propositions
Category Proposition Axis Sony Alfa
Laval
Husqv
arna
Thule Total
Information
requirement
1 – Criteria sophistication drive
information need
0 + + 0 + 3+
2 – Cross functional information
gathering
+ + + + + 5+
3 – Cross functional teams and
integration
+ 0 0 0 0 +
Data integrity
4 – Misaligned incentives lead
to poor data integrity
0 + 0 0 0 +
5 – Data integrity is critical for
good decision making
0 + + + + 4+
6 – Risk of ending wrong
project is greatest at start
+ 0 + 0 0 2+
7 – Key factors hard to
financially quantify
0 + + + + 4+

99
Responsibilities
8 – Functions are responsible to
deliver information
+ 0 0 0 + 2+
9 – Organizational integration
support information sharing
+ 0 0 0 - 0
10 – Management support drive
information sharing
+ 0 + 0 0 2+
11 – Project Managers should
collect information
0 + + 0 + 3+
12 – Marketing, design,
manufacturing provide info
+ + + + + 5+
6.1.1.1 Supported propositions
Six out of twelve propositions related to decision input were supported by the case studies. The
most supported were the propositions on the need to support cross functional information
gathering and the difficulty to financially quantify certain data. It was supported that criteria
sophistication drives information need, which is something to consider when designing criteria.
The need to ensure data integrity was supported in all but one case which shows that companies
see the importance of this in their decision making. Several case companies had one person
responsible for gathering the information which proves this to be viable in practice. It explains
why information from other functions is often provided upon request, rather than that the
functions themselves being responsible for delivering it.
6.1.1.2 Unsupported or disproved propositions
Some of the unclear propositions relate to cross functional integration as an enabler for
information sharing. The lack of support can be seen in that companies have people responsible
for information gathering. Theory suggests that a cross functional project team should be
appointed early on for the project. However, most case companies have this in place first after
the studied decision point, explaining the lack of support for these propositions. It was also
difficult to find support for propositions 4 and 6 which relate to the risk of misaligned incentives
and premature ending of quality projects. Since these are highly complex propositions to study,
the format with interview case studies did not allow for sufficient depth to prove or disprove
them.
6.1.1.3 Contextual aspects
Propositions related to information sharing and organizational integration did not receive as
strong empirical evidence. There is however one interesting observation to make. It seems
companies have either high information sharing between functions, or a designated gatherer of

100
information in the form of a Project Manager. The exception is Husqvarna, which instead use
Product Managers for the information gathering.
The company size, see Figure 35, is possibly an explanation why companies are giving functions
responsibility of information sharing. It is reasonable to assume it is easier to accomplish in
smaller companies like Thule Group and Axis which is suggested by the findings. The
companies use different ways of ensuring the information sharing. At Thule it is dependent on
upper management whereas Axis entrusts the responsibility throughout the organization. This
difference could be explained by the involvement of directorate level employees, which is higher
at Thule.
Figure 35 – Size of case companies
6.1.2 Decision
A majority of the decision propositions receive support from the case studies, as seen in Table
31. There are also several propositions which are unsupported, but not disproved, by a majority
of cases. In addition, there are some which need further discussion since there is conflicting or
contradictory evidence.

101
Table 31 – Cross Case analysis of decision propositions
Category Proposition Axis Sony Alfa
Laval
Husqv
arna
Thule Total
Criteria
13 – Formal criteria important for
structure
0 + + + + 4+
14 – Formal criteria drive company
performance
- - + 0 + 0
15 – Strategic goals should drive criteria + + 0 + 0 3+
16 – Financial criteria is good as a
complement
+ 0 + + + 4+
17 – Strategic criteria should sort out
candidates
0 + 0 + + 3+
17a – Use of scoring/ranking/checklists 0 0 0 0 0 0
17b – Use of visualization tools 0 0 0 + 0 +
17c – Use of business strategy models 0 0 0 0 0 0
18 – Criteria should be understood by
organization
0 0 0 0 0 0
19 – Roadmaps can connect to company
strategy
+ + + + 0 4+
Decision
makers
20 – Use of formal decision makers + + + + + 5+
21 – Decision makers at strategic level + + + - + 3+
Variations 22 – Project importance should decide
thoroughness
0 - 0 0 0 -
6.1.2.1 Supported propositions
It was clear that all cases supported use of formal decision makers as a vital part. The use of
roadmaps to connect company strategy together with formal criteria to structure decision making
were also supported by nearly all cases. Financial criteria was present in all cases and theory
stated that overly relying on these criteria could misjudge riskier projects, which was observed as
a risk in many cases. To balance this, more strategic considerations were present in several cases.
It was used as a complement to the financial criteria in the form of informal criteria or in the
sorting process. Many companies used roadmaps to select projects and ensure their strategic fit
within the portfolio.

102
6.1.2.2 Unsupported or disproved propositions
Proposition 14 regarding formal criteria driving company performance was difficult to verify.
Both due to the limited scope of the case study and conflicting evidence where Axis had low
formality of criteria but high company performance and Sony Mobile had the opposite. Matching
thoroughness to project importance was not used to any extent. The Sony case rather proved the
challenges of such an approach. It could be explained by a lack of focus on data integrity which
is not in line with what theory suggests. The different methods suggested by theory to score and
compare projects were not found to be used to any extent in practice. The authors do not believe
these are less relevant but rather that financial criteria and comparisons are relied upon instead,
perhaps due to tradition.
6.1.2.3 Contextual aspects
The proposition suggesting that formal criteria drives company performance receives conflicting
evidence from the case study, as seen in Figure 36.
Figure 36 – Criteria formality compared against operating margin at case companies
The Alfa Laval and Thule cases suggest it is a positive aspect that contributes to the success of
the companies. The Axis case instead suggests that too much formality will limit innovation and
thus company performance. There is probably truth to that, which suggests it is important to
consider the company’s general attitude towards formality. The Sony case, containing one of the
most formal processes, and their recent difficulties suggests formality is bad for performance. It
is however difficult to attribute those difficulties only to product decisions. Their industry in
general has had a trend where increased commoditization put pressure on margins. The
contradiction of the case at Sony regarding the proposition can thus be partly disregarded.

103
The proposition of strategic goals driving criteria did not receive support from the Alfa Laval
and Thule cases. This can be explained by the seniority of the involved decision makers. Since
they are present, it is assumed they consider strategic goals when making their decisions. This
explains why they were not using clearly defined strategic criteria to the same extent.
Roadmaps were another way to connect company strategy with the decision making. Thule was
the only case that did not use roadmaps to the same extent, this is assumed to be due to the size
of the company. They are smaller and all of the directorate, including the CEO, are present for
the decisions which enables them to connect company strategy with the decision making.
The use of visualization tools is present only at Husqvarna. A possible explanation is the large
variation in products and markets in which the company operates. These differences mean the
decision makers need a more diverse and flexible input. In addition, the visualization’s
qualitative nature enables Product Managers to base input on market and industry characteristics.
6.1.3 Output
As seen in Table 32 the cases provide almost identical evidence in propositions related to the
output. There are propositions with strong support and one which is contradicted by nearly all
cases.
Table 32 – Cross case analysis of output propositions
Category Proposition Axis Sony Alfa
Laval
Husqv
arna
Thule Total
Execution
23 – A clear, formal output based on
decision is vital
0 + + + + 4+
24 – The decision should be a clear go/kill - - + - - 3-
Follow-
up
25 – Resource allocation should reflect
decision
+ + + + + 5+
26 – Goals for next gate should be set if go-
decision
0 0 0 0 0 0
6.1.3.1 Supported propositions
There is strong support showing that the decision should be reflected in future resource
allocation in all cases. The credibility of this finding can be discussed since it, according to us, is
strongly tied to the proposition to have a binary go/kill decision. If several outcomes are
possible, including a greyscale in between go/kill, the decision will be reflected in the resource
allocation as there is always the alternative to put the decision on hold. The formal output with a
plan included also received support from almost all cases.

104
6.1.3.2 Unsupported or disproved propositions
The proposition to have a binary go/kill decision was least fulfilled in practice. All case
companies except Alfa Laval employed at least one option to pause or hold and return to the
decision point in the future. Some used this alternative of passing projects to await funding while
others used it to give projects a new chance. Theory suggests this is the wrong approach since it
will waste resources that could have been used for other, higher quality projects. Hence it was
interesting to observe how few cases fulfilled this proposition. No evidence was found to support
the proposition that new goals and criteria was set for the next gate if the project would be
approved. This should be a reasonable approach but not one that is used in practice based on
these findings. It is possibly due to the additional work needed to decide on new goals that most
cases were found to use the same criteria throughout.
6.1.3.3 Contextual aspects
There are no major differences in the level of evidence concerning output propositions. Alfa
Laval is the only company that employs a binary go/kill decision. This could be explained by the
size of the company in combination with high senior management involvement. If the decision
makers want to decide the fate of the project it is likely easier when there are only two clear
options.
6.2 Complements to theory
There are several complements to theory found in the case study. They are found in all three
components of the decision point. Their generalizability and dependence on contextual factors
are further discussed below.
6.2.1 Input
A set of differentiated inputs or scenarios are very similar approaches which are both intended to
examine the sensitivity of assumptions. Sony, Alfa Laval and Thule all use it which suggests it to
be a value creator in the decision making. Sony is the most ambitious and creates entirely
different scenarios, Thule and Alfa Laval use simple variations in price or volume as an
automatic part of the input template. The practice in its simplest form should be a simple
measure to increase the awareness of the assumptions made and their impact. The diversity of the
companies, as seen in Figure 37, that use scenario analysis suggests there to be no specific
contextual aspect is necessary for it to work.

105
Figure 37 – Sony, Alfa Laval and Thule’s contextual positioning
27. Differentiated input is a way of capturing uncertainty &
28. Scenario analysis can be used as a way of assessing the risks involved with sales
projections
To ensure that time and resource plans are held in a project – Thule, Alfa Laval and Sony
demand all products which are part of a project should be mentioned in the decision meeting.
This can be seen as a way of minimizing unnecessary swelling of a project. It can avoid poor use
of resources as the new products are not compared in terms of alternative resource use. Similarly
to scenario analysis there is a diversity in the companies supporting the proposition. This would
indicate it is a practice which is relatively independent of contextual factors.
29. All planned products in a project should be part of the input to the decision meeting
Thule has expressed importance of sanity checks of relevant assumptions. It is also the company
which can be said to have the most ambitious preparations ahead of the meetings. In combination
with the most senior decision makers this could explain why it works at Thule Group. It is likely
that other companies have informal sanity checks of the information. However, a risk of not
having formalized the practice could be that results, rather than the underlying assumptions, are
examined. That could lead to poor assumptions slipping through. The high involvement of senior
personnel is likely to be a strong enabler of this practice.
30. Sanity checks from relevant functions can increase data integrity in early assumptions
Thule Group has a high focus on product quality in R&D. This has led to a process where
development and testing is done continuously using physical prototypes. A strong enabler of this
practice is the focus on mechanical engineering. It is likely that this practice is harder to

106
implement with more complex, high tech products since more planning might be needed ahead
of development. As seen in Figure 38, Thule is a stand-out in this aspect which would make for
low generalizability of the proposition.
31. Early physical prototypes help ensure data integrity and product quality
Figure 38 – Technology characteristics of case companies
All companies in the case study with the exception of Axis use a feedback loop of some sort. The
main purpose is to ensure a continuously improved process and data integrity. Most of the
decision making in the companies is relying on some sort of assumptions. The uncertain nature
of assumptions makes it especially important to assess their quality. Having a formal assessment
point in each project should be an easy way of improving data integrity and decision making.
Four of the companies in the study employ a similar setup to ensure feedback. The logical
reasoning and diversity of the companies suggest there is a high level of generalizability to the
proposition.
32. Use of a feedback loop after product launch can improve data integrity and enable
continuous process improvement
6.2.2 Decision
It seems that Axis is the company primarily valuing a looser process. There are tendencies at
Thule for a pragmatic and loose process, but they still have a more formalized and ambitious
data collection and follow-up. There are indications that the larger companies use more
formalized processes, as seen in Figure 39, which could be motivated by the distance to senior
decision makers. A closer distance could mean less need for formality.
33. Use of less formalized criteria enables a more innovative organization
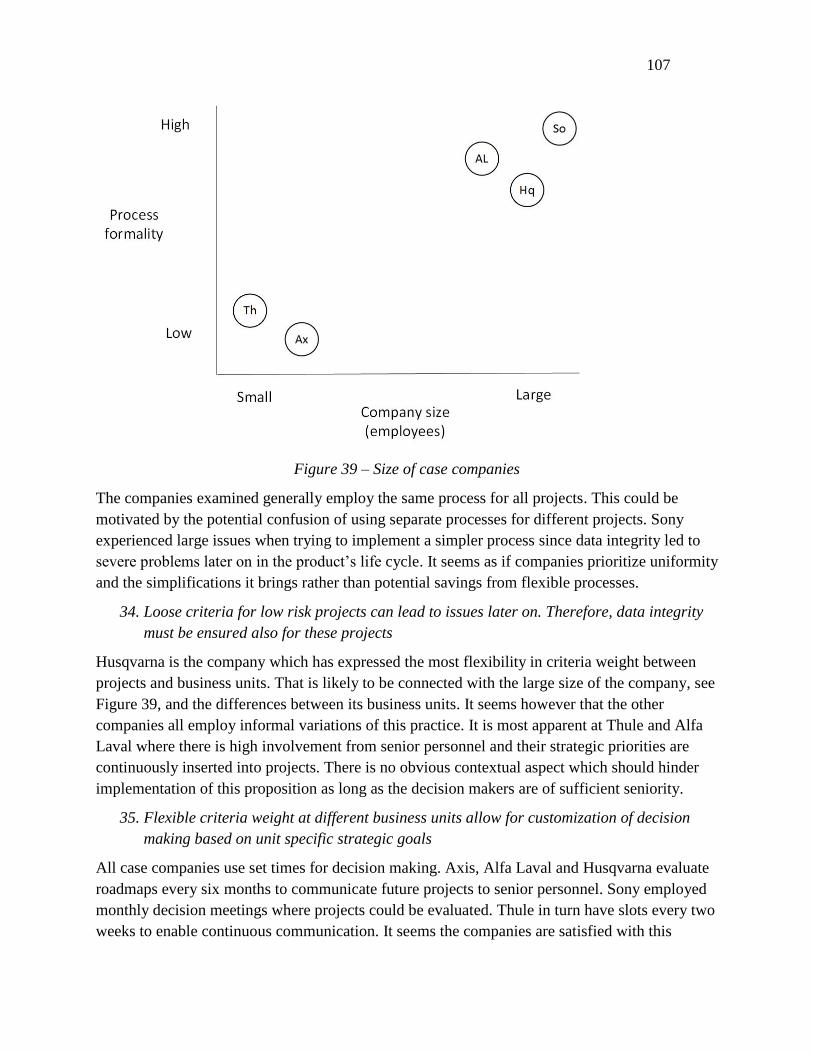
107
Figure 39 – Size of case companies
The companies examined generally employ the same process for all projects. This could be
motivated by the potential confusion of using separate processes for different projects. Sony
experienced large issues when trying to implement a simpler process since data integrity led to
severe problems later on in the product’s life cycle. It seems as if companies prioritize uniformity
and the simplifications it brings rather than potential savings from flexible processes.
34. Loose criteria for low risk projects can lead to issues later on. Therefore, data integrity
must be ensured also for these projects
Husqvarna is the company which has expressed the most flexibility in criteria weight between
projects and business units. That is likely to be connected with the large size of the company, see
Figure 39, and the differences between its business units. It seems however that the other
companies all employ informal variations of this practice. It is most apparent at Thule and Alfa
Laval where there is high involvement from senior personnel and their strategic priorities are
continuously inserted into projects. There is no obvious contextual aspect which should hinder
implementation of this proposition as long as the decision makers are of sufficient seniority.
35. Flexible criteria weight at different business units allow for customization of decision
making based on unit specific strategic goals
All case companies use set times for decision making. Axis, Alfa Laval and Husqvarna evaluate
roadmaps every six months to communicate future projects to senior personnel. Sony employed
monthly decision meetings where projects could be evaluated. Thule in turn have slots every two
weeks to enable continuous communication. It seems the companies are satisfied with this

108
structure and the quick decision making it enables. It is assumed that the frequency of these
meetings should match the length of the product life cycle. As seen in Figure 40, it is fulfilled for
Alfa Laval and Sony which have corresponding decision frequencies for the length of their
product life cycles. Husqvarna and Axis are less aligned with the same decision frequency as
Alfa Laval but shorter life cycles. Thule has the highest decision frequency paired with a long
product life cycle, this might be explained with their relatively small company size. Overall,
using set slots for decision making is used in all cases which ensures a high level of
generalizability for this proposition.
36. Use of set slots for decision making can speed up decisions and thus make a more
efficient process
Figure 40 – Length of product life cycle and frequency of decision meetings
Formal strategic criteria with corresponding input seems to be implemented only at Husqvarna.
There are however several companies using informal strategic criteria. Thule and Alfa Laval
both use their high involvement of strategic decision makers to ensure strategic alignment of new
products. Sony are considering strategic aspects although they do not have decision makers at the
highest seniority level. Companies are thus employing either set strategic criteria or decision
makers at a strategic hierarchical level.
37. Strategic alignment can be achieved through project involvement of personnel at a
strategic level instead of formal strategic criteria
The increased margin for error Alfa Laval gets when using a higher goal for breakeven should
not be a problem to implement at any other company even though it is not found anywhere else.

109
It appears to be a clever way of ensuring that each project is be able to cover the indirect costs
resulting from the project that are not accounted for after the development stage. These criteria
are strongly connected to limiting the number of projects, something which is a vital part in Alfa
Laval’s strategy.
38. Time-to-million and time-to-two-times-investment can ensure that a project covers the
hidden costs it drives
6.2.3 Output
There are several companies that use roadmaps. However, Axis is the only company which has
implemented roadmaps to communicate the decision making to the company. In other cases such
as Sony, Husqvarna and Alfa Laval, the roadmap seems to primarily be a tool for the Product
Managers to plan resource use. There seems to be no apparent reason for the roadmap not to be
displayed to the rest of the company which suggests it could be implemented with gains in
communication at a small cost.
39. A roadmap can provide valuable cross functional communication after a development
decision has been made
Only Alfa Laval is using strict go/kill decisions while the other companies include a grey area in
between. It could be a good addition to include a formal option to increase flexibility without
losing structure. Thule’s option of giving projects a go or hold decision with restrictions could be
an addition to a structured grey area. As almost all companies employ some sort of grey area, it
should be a good idea to formalize the option, regardless of contextual aspects.
40. A formal hold decision option can increase the binary go/kill decision’s flexibility and
reduce the number of poor kill decisions due to bad timing
Thule’s high involvement of strategic decision makers, high frequency of decision meetings and
structured preparations ahead of meetings enables it to function well without many kill decisions.
The option of questioning projects continuously seems like a good option. However, it is
probably dependent on the structure and involvement at Thule. In the structure of the other
companies in the case study it might not be possible to implement this practice without changing
other aspects as well. In addition, there is a risk that the informality of the decision is not
providing enough transparency in a larger organization.
41. Questioning and killing projects continuously enables more efficient resource use

110
7 Modified decision model
A modified decision model will now be presented based on the empirical findings. Its
components will be described and how they fit together. The propositions found to be the most
relevant, based on theory and the cross case analysis, will be included in this modified decision
model. This can be used to structure the decision making ahead of product development.
Based on theoretical propositions and the analysis of empirical evidence a modified version of
the decision model, including propositions, is constructed. Some of the propositions are difficult
to confirm or contradict on the basis of five case studies as discussed in the analysis. The
propositions which are represented in the model are those which have the most theoretical and
empirical evidence. Empirical propositions with proven generalizability have also been
introduced into the model.
7.1 Model Description
The model, presented in Figure 41, has its starting point in company strategy which should drive
the criteria to use. The criteria in turn decides decision makers and input needed for the decision.
Output is then decided by the decision makers.
Figure 41– Updated decision model based on theoretical and empirical findings
7.1.1 Goals & Criteria
The overall goal of portfolio management is to connect the product portfolio and company
strategy. Therefore, choosing criteria that are aligned with company strategy is important

111
according to theory (Cooper, et al., 1999; Kaiser, et al., 2015; Ulrich & Eppinger, 2012). It has
been supported by the case studies that either use specific, strategic criteria, or use senior
decision makers that are able to make decisions in line with company strategy. Using roadmaps
is another way of connecting the company strategy together with these decisions (Cosner, et al.,
2007).
Formal criteria are important to structure the decision making and enable comparison of projects
(Cooper, 2011). Further, financial criteria is commonly used but should be used as a complement
to other criteria (Jugend & da Silva, 2014; Cooper, et al., 1999) since the data is complex to
quantify (Ulrich & Eppinger, 2012). The ideal combination is to use strategic criteria to sort out
strong candidates and then using additional criteria to distribute resources between projects
(Cooper, et al., 1999). Scoring/ranking/checklists (Jugend & da Silva, 2014; Lin & Hsieh, 2003;
Bitman & Sharif, 2008; Cooper, et al., 1999), visualization tools (Mikkola, 2001; Jugend & da
Silva, 2014; Cooper, 2011) and business strategy models (Cooper, et al., 1999; Jugend & da
Silva, 2014) are examples of additional criteria to use. Empirical evidence has proved that
visualization tools can be a flexible way to compare projects, for example by using matrices.
Empirical findings suggest that flexible criteria weights can be used as a way to tailor decision
making for different business units where some units require differently weighted criteria.
Ensuring that a project covers the hidden costs it drives after development can be done by use of
criteria such as time-to-million and time-to-two-times-investment. These can also help to reduce
the number of small projects.
7.1.2 Input
The information need is decided by the criteria, a higher number of criteria and higher
sophistication increases the information need (Kaiser, et al., 2015). This information comes from
different departments which is why collaboration is needed to gather it (Jugend & da Silva, 2014;
Kaiser, et al., 2015). The case studies and theory show this can be ensured by an appointed
information gatherer (Cooper, 2011), then departments should provide this information upon
request (Ulrich & Eppinger, 2012). It can also be fulfilled by a high level of functional
integration (Jugend & da Silva, 2014; Kaiser, et al., 2015). In this case, information sharing can
increase and be more spontaneous.
The case studies further show the importance that all relevant products, including accessories,
are specified in the project proposal. This to ensure that the project will be evaluated correctly
and finished in time.
7.1.3 Decision Makers
Having formal decision makers is important for the process (Cooper, 2011; Jugend & da Silva,
2014), the strategic alignment of the decisions is also dependent on the seniority of the decision
makers (Kaiser, et al., 2015; Seifert, et al., 2016). Regarding the decision meetings, empirical

112
findings show that the use of set time slots where senior decision makers are gathered can be
used to speed up the decision process.
7.1.4 Output
Having a clear and formal output from the decision is important, this should include a plan for
the continuation of the project (Cooper, 2008; Chao, et al., 2014). Emperical findings have
proved it difficult to employ a binary go/kill decision, hence a formal hold alternative can be
used to increase formality but still allow flexibility. Resources should then be allocated
depending on the outcome of the decision (Cooper, 2008; Chao, et al., 2014). This means that a
go-decision leads to that the project receives its allocated resources and a kill-decision strips the
project of its resources. A formal hold alternative can be used if the project needs to be paused
due to budget reasons. New goals to be reached by the next gate should be agreed upon when a
project receives a go-decision (Cooper, 2008).
When the decision has been made, the roadmap is updated. Empirical evidence shows that this
roadmap can then be used to communicate new products with the rest of the company.
7.1.5 Feedback loop
Data integrity is another critical aspect since the decisions made can only be as good as the
information they are based on (Kaiser, et al., 2015; Cooper, 2011). This can be ensured through a
feedback loop where initial estimates are compared to the actual results 6-12 months after the
product has been launched. Several cases prove this to be an effective way to implement learning
elements into the process to ensure improved data integrity. Scenario analysis and varying input
variables is another way of assessing uncertainties in the estimations which is used in practice.

113
8 Construction of Decision Support Model at Axis
The chapter will describe the data collection at Axis based on interviews with different functions
and a workshop with Product Managers. The data from the interviews and the workshop will
then be used to construct an Axis-specific model. Finally, the proposed model is tested with
relevant stakeholders at the company.
The focus of the chapter is on the R&D process rather than the roadmap process. The reason for
this decision is to enable an implementation. The Product Managers will be the recipients of the
recommendation and since the R&D process is the one they control; it is where our focus will be.
8.1 Current processes at Axis
The data collection on Axis’ current processes is conducted through formal and informal
interviews with employees. That information was complemented with data from the company
intranet and discussions with company supervisors.
8.1.1 General process
Axis currently develops accessories through two different channels, essential accessories within
camera projects and complementary accessories in separate projects. Accessories which are part
of a camera project are developed by the camera team. Product Managers for the camera lines
are the owners of these projects and decide which accessories are needed. There is a separate
channel for accessories which are developed independently. The two accessory Product
Managers are project owners and decide which projects to initiate. Accessories within these
projects are evaluated and scrutinized to a larger extent than those within camera projects.
Axis conducts an ongoing roadmap process which results in a roadmap that is updated every six
months. The purpose of the roadmap is to plan resources and communicate R&D efforts to the
company. When a product has made it into the roadmap it is given an initiation date, when the
project starts. The decision for cameras is made at project level and does not dig into each
specific accessory included within the project. The focus is on the “main product” of the project
which for camera projects is the new camera.
Figure 42 describes the process structure for R&D projects at Axis. There are seven stages, each
followed by a tollgate. Each project is evaluated as one unit when decisions are made at
important gates, similar to the roadmap process.

114
Figure 42 – Project process at Axis
There is a steering group that controls the tollgates within the R&D process. Members of the
steering group normally include an Engineering Manager, Product Manager, Operations
representative and a project sponsor, appointed by the CTO. The relevant tollgates, where the
decision model can be applied, are Start, Plans reviewed and Freeze. After the Freeze tollgate,
the design is set and industrialization starts.
At the Start meeting, the project presents the following deliverables:
Business case – A financial assessment of the project, focuses on payback time
o COGS
o Retail Price
o Project cost and investments
o Expected sales volume
Time plan – A schedule for the primary product’s tollgates
Resource need – How many and what type of resources are needed
At the Plans reviewed meeting there is a large focus on planning the upcoming project. The
purpose of the meeting is to approve a time plan, Product Requirement Specification (PRS) and
evaluate risks involved in the project. If changes have been made to the deliverables from the
start meeting, they are brought up here.
At the Freeze meeting, the final design is set and no more changes are allowed. Now, the focus
will be on securing the quality of deliverables and industrialization. When frozen, tools are
ordered for production of the process.
8.1.2 Accessories in camera projects
As mentioned, project related decisions are focused on the primary product of the project. For
camera projects, this results in a low focus on accessories. The significantly higher complexity of
developing a camera leads to higher resource use. The budget impact of introducing an
additional accessory is therefore limited. However, at an aggregate level, the development of
accessories can consume a lot of the project’s development resources. For some up to 30%
(Lundqvist, 2016), although the average is lower.
The focus on the cameras adds difficulties in other aspects as well. The accessories are usually
only mentioned in the form of a list at the start meeting. If changes are made to that list it should

115
be brought up to the steering group. However, interviews suggest that this is not always the case.
Project schedules are normally not taking accessories into account which can lead to shortage of
resources and delays. Figure 43 describes what deliverables related to accessories is currently
required in the camera projects.
Figure 43 – Description of accessory data required in the camera projects
8.1.3 Accessory projects
In accessory projects the focus on accessories is forced to be higher. The project goes through
the same stages and tollgates as a camera project. The primary product of such a project is the
accessory and as such it receives all of the focus.
The process and decision makers are the same in an accessory project as the general process
model. Figure 44 describes the deliverables required for an accessory to go through the tollgates.
Figure 44 – Description of accessory data required in the accessory projects

116
8.2 Interviews
The purpose of the interviews was to get a cross-functional view on accessories. A number of
functions contributed with their view on accessories, see Appendix III: Interviews conducted at
Axis for a full description of the interviews. The focus in the interviews came to be on
accessories developed within the camera projects as they were found to contribute to the majority
of the problems.
8.2.1 Accessory purpose
The interviewees had a consistent view on the purpose of accessories. They all mentioned all or
several of the following reasons:
Ensure complete solutions. Axis as a market leader are expected to deliver full solutions
and act as a single point of contact for their customers. Accessories help tailor the
cameras to each application and thereby expand their range of use.
Ensure quality of the entire solution. By developing accessories themselves, Axis can
ensure a high quality and fit with their cameras.
Make additional money. Accessories developed by Axis can be upsold together with the
cameras. These bear their own costs and contribute to company profit.
8.2.2 Problem description
The range of problems mentioned in the interviews were wide spread. To structure them, they
were divided into categories. Table 33 describes the problems mentioned and the categories they
belong to. It also marks out which function(s) mentioning them.

117
Table 33 – Summary of problem descriptions from interviews
Category Problem In
du
stri
al L
ead
Pro
du
ct M
anag
er
Su
pp
ly A
cces
sori
es
EM
Acc
esso
ries
Pro
ject
Man
ager
Mec
han
ical
En
gin
eer
Dem
and
Pla
nn
ing
Sal
es
Data integrity
Data quality X X X
Uncertain gross margins due to
promotions X
No sanity check until ramp up X
Unclear market need X X X X
Stock keeping
High stock levels X
High MOQ requirements X
Prognosis difficulties X X
Project planning Optimistic/no time tables X X X X X
No technical specification X X
Follow-up No R&D resource tracking X
No data feedback loop X X X X X
Number of
products
Too many products X X X X X X
Low product kill rate X X
Low priority Low priority X X X X X X
Product owners Different project owners X
Poor overview of products X X
8.2.2.1 Data integrity
Data integrity is related to the quality of the information that current development decisions are
based on. The interviewees which bring up these aspects are primarily those with insight into the
deliverables. Product Managers, together with the Project Manager, are responsible for providing
these deliverables to the decision makers. It seems the information which is currently used is
uncertain. This leads to decisions based on gut feeling in many situations. Industrial Lead is the
function responsible for communication between R&D and operations They state that this
uncertain information leads to problems in the product industrialization stage.
8.2.2.2 Stock keeping
The large number of accessories in Axis’ system is causing difficulties for several functions.
Demand Planning are experiencing trouble with projecting the often volatile sales. The
interviewee from supply experiences that the combination of high minimum order quantities
(MOQs) and uncertain projections leads to high stock levels.

118
8.2.2.3 Project planning
The planning of accessory development within camera projects is considered a problem by
several interviewees. Generally, they believe the projects would be more efficient if resource
planning was done more thoroughly for accessories. The interviewees directly involved in
camera projects, the Project Manager and Mechanical Engineer, press the need for a technical
specification of the accessories. This is always done for the cameras but more seldom for the
accessories.
8.2.2.4 Number of products
All functions who deal with day-to-day activities consider the high number of accessories a
problem. Two functions mention the low product kill rate as a strong contributor. The result is a
general increase in the complexity related to operations and administration.
8.2.2.5 Low priority
The low priority of accessories in camera projects is thought to cause problem by most functions.
It has a strong connection to many of the other problems brought up in the interviews. By many,
it is mentioned as a root cause for most other problems.
8.2.2.6 Product owners
The engineering manager, who coordinates R&D resources, mentions the different project
owners as a problem cause for accessories. The setup where all Product Managers are able to
develop accessories leads to poor portfolio overview. This in turn leads to unnecessary
development of accessories and a lack of holistic thinking.
8.3 Focus group – Workshop 1
In addition to the interviews, a focus group was held together with two Product Managers at Axis
with the purpose to assess and prioritize input from the interviews. Another purpose was to gain
more insight into the future users of the model and also what barriers might exist to implement
such a model. The results will be presented below, for a more detailed description, see Appendix
IV: Workshop 1, Product Management.
8.3.1 Strategy and Purpose of Accessories
At first, the purpose of the accessory portfolio was established. It was agreed that the strategic
goal of product accessories is to ensure complete, high quality, solutions to the customer. This is
in line with Axis market leader strategy which focuses on complete solutions.
8.3.2 Discussion and Prioritization of Problem Areas
The problem areas encountered in the initial interviews were:
Stock keeping
Number of products

119
Product owners
Data integrity
Project planning
Low priority
From these, it was agreed that stock keeping and number of products were problem areas that are
difficult to affect in the short term. Rather, these could be affected in the long term through the
use of a more formalized way of working with accessories. Difficulties regarding different
product owners were considered a deeper rooted problem. It was thought to be difficult to
address without significant, organizational changes. Therefore – data integrity, project planning
and low priority were seen as the problem areas which should be prioritized initially.
8.3.3 Possible Criteria
Based on these problem areas, we started discussing possible criteria that could address them.
Two types of criteria were discussed, checklists and stricter financial criteria. Checklists could be
used to formalize the decision making by ensuring that certain input is collected before the
accessories proceed to development. Stricter financial criteria could be used to compare different
accessories against each other and also to ensure the financial viability of each accessory.
Additionally, having a separate freeze meeting for accessories was discussed to increase focus.
8.3.4 Contextual Aspects & Implementation Challenges
During these discussions, a few contextual aspects regarding accessories were encountered that
would affect the design of our model. It was clear that there is a resistance to having too much
formality in the process. This was encountered during the case study at Axis and was even more
prominent when discussing accessories. The current structure gives the Product Managers few or
no requirements for how they develop accessories within camera projects. One of the participants
said the less “paperwork”, the better. This suggests that introducing too strict demands will only
ensure the model will not be used at all.
There is currently no decision point where accessories are evaluated and approved within the
camera projects. The format used for their cameras is integrated in the roadmap decision. This is
not a viable alternative for accessories due to the amount of new introductions and low financial
priority of each accessory. Therefore, a new decision point needs to be introduced and integrated
within the camera projects to function properly.
Other contextual aspects such as company size and operating margin are considered to affect
cameras and accessories in the same way. Therefore, the company wide figures are used. The life
cycle follows the life cycle of the camera and since it is short, the decision making needs to be
swift to cope with this fact. Regarding technology, a majority of accessories developed at Axis
involve more mechanical elements and less technological elements than their cameras, the
technological sophistication is therefore lower. This mapping can be seen in Figure 45 and
Figure 46.

120
Figure 45 – Axis wide contextual aspects
Figure 46 – Accessory specific contextual aspects
8.3.5 Choice of Criteria
The strategic purpose of accessories, as an enabler of complete solutions, can usually only be
fulfilled if the accessories are developed in time to be released with the cameras. The problems
related to project planning and low priority of accessories are in conflict with this purpose and
needs to be addressed. The same goes for data integrity, if this is not ensured accessories will
have the wrong prognosis which affect the availability to the customer.
At the same time, the contextual aspects need to be considered. These suggest that the criteria
cannot be too arduous to conform to or else the old way of working will prevail. Introducing too
much formality and criteria is therefore seen as the most prominent risk to be considered.
Theory suggests that relying too much on financial criteria will limit innovation (Jugend & da
Silva, 2014; Cooper, et al., 1999). Therefore, a combination of strategic and financial criteria
should be used.
At the freeze meeting, there will be no new criteria. It will be the same setup as currently
employed for cameras and accessories but at a separate accessory meeting.

121
8.4 Construction of Model
Through discussions with the Product Managers, who are the recipients of the model, the focus is
decided to be on accessories within camera projects. Accessory projects are already evaluated
and contribute to a minority of the new accessories. An important aspect of this model is
therefore to align these two channels.
8.4.1 Strategic goals
Through the interviews and discussions in workshop 1, a number of strategic goals for
accessories were established:
Increase the priority level of accessories
Increase data integrity to reach better decisions
Structure resource planning of accessory development
8.4.2 Criteria
To satisfy the strategic goals, criteria were decided upon in order for an accessory to pass into
development. The criteria are of three different kinds:
Checklist
o Classification
o Early Product Motivation (EPM)
o Product investigation
o Time plan
o Technical specification
Business case
Investment/benefit matrix
The checklist will increase priority level for accessories by forcing the project to consider them
earlier. The time plan ensures the project inputs each accessory into the project plan which
makes the resource use more efficient. The classification is assessing product criticality for
essential accessories. If the accessory is absolutely necessary for the camera to be sold, it is
critical. If the accessory is not expected to drive camera sales at all it is classified non-critical.
There is also a semi-critical option which is introduced to ensure not all accessories are classified
as critical.
EPM motivates the development of a new accessory. This is required for the cameras today and
the accessories should be no different. The product investigation forces the project to examine
what types of current accessories the company already has. This because it is more efficient to
remodel an existing one than to start from scratch. It should also be examined what other
cameras a new accessory could be compatible with. Finally, a technical specification should be
required. It specifies what requirements the product should live up to when it is developed. It is
done for cameras and some accessories and is requested from people working in the projects.

122
The business case is a sanity check of how profitable the accessory will be. It focuses on what
attachment rate, percentage of cameras are sold with the accessory, is needed for a pay back of
one year. There is no required attachment rate, the purpose is rather to make a quick assessment
of how financially viable the product is. Another purpose is to have numbers to compare with
after the accessory has been released, this feedback loop will be described later on. The model is
made as simple as possible to make it user friendly and easy to implement.
The investment/benefit matrix is a way for the project to communicate a cost-benefit analysis of
the accessory. The dimensions of customer value and investment level together with the
classification of the product are used for this qualitative assessment. An example of the matrix is
seen in Figure 47.
Figure 47 – Investment/benefit Matrix as a suggested deliverable
8.4.3 Input
To assess the criteria, certain information is required, as described in Table 34. The sources
describe where the information can be found at Axis. Input with previous experience are criteria
which can be assessed by the project itself.
Table 34 – Input to criteria, including sources
Sources Input deliverable Criteria
Qualitative - previous
experiences
Level of criticality Classification
Qualitative - previous
experiences
Purpose of the product Early Product Motivation
(EPM)
Current product portfolio
Product Managers
Applicable cameras and
products
Product Investigation

123
Qualitative - previous
experiences
Plan for development and toll
gates
Time plan
Previous projects
Product Manager for accessories
COGS
Investment & resource use
Retail price
Sales volume of camera
Business case
Previous projects
Qualitative - previous
experiences
Investment & resource use
Customer value
Strategic product matrix
8.4.4 Decision makers
To ensure a strategic level of the decision making a certain seniority is necessary. At Axis, the
steering group is deemed an appropriate forum for the decisions. It includes Engineering
Manager, Product Manager and representatives from Operations and CTO.
8.4.5 Output
The output of the decisions regarding accessories should have three formal options when in
camera projects:
Go – The product is developed according to plan
Kill – The product is not deemed attractive enough and will not be developed
Go to new project – The product will be developed but within another project. This can
be applied to accessories that are developed for more than one camera.
8.4.6 Feedback loop
To ensure continuous learning and improve data integrity, it is proposed that a post-launch
review is introduced to the current process. Twelve months after a product launch the original
deliverables should be revisited with key stakeholders. Suggested participants are the Project
Manager as well as Product Managers for accessories and the camera. By doing this, the quality
of information and decisions is believed to increase over time. It is proposed that this should be
done for the entire project, including the camera, since it is not done today at all.
8.5 Model in Current Structure
To implement the model at Axis it is important to consider where in the current process the
proposed actions will fit in. Through discussions with the main parties involved, primarily
Product Managers and Project Managers, a structure has been developed. Figure 48 describes in
which stage each aspect will be taken into account.

124
Figure 48 – Implementation plan at Axis
At the start meeting of the project, a list of accessories with classification and EPM is required. It
is preliminary and serves as a measure to raise early accessory awareness in the project. The
plans reviewed meeting for cameras is where accessories are examined more in depth. Here the
deliverables are a time plan, business case, product investigation and strategic product value
matrix. At this point the project should know which accessories are needed for the camera.
In addition to the criteria based decisions there will be a freeze meeting for each separate
accessory. The aspects of the meeting will be the same as for a camera, mainly to have a formal
point where no further changes are allowed so that tooling can be ordered. Today, there is only a
freeze meeting scheduled for the camera and nothing for accessories. To increase the efficiency
of these meetings, only the Project Manager and Product Managers for the camera and
accessories need to be present.
Finally, there will be a post launch review meeting for the entire project. This will take place 12
months after product launch to revisit the project and enable a continuous learning.
The suggested model is not consistent with the unit of analysis as described ahead of the case
study. However, to fit in with Axis current structure and process it is necessary to spread the
suggestions over several decision points. The post launch review can be argued to be out of
scope. Based on case studies it was deemed important enough to be suggested anyway. The same
goes for the dedicated freeze meeting which takes place after a product has been developed. The
meeting is important to avoid unnecessary tooling costs based on the interviews at Axis.

125
8.6 Validation at Axis
A workshop was held with the people affected by the suggested new way of working. The
purpose was to validate the model and promote the suggestions to gain support for
implementation. A description of the workshop and the attendees is seen in Appendix V:
Workshop 2, test and validation at Axis.
8.6.1 Evaluation of model
After a presentation and ensuing questions regarding the model components, the attendees gave
their feedback on two dimensions:
Value creation, evaluate how the component will help make better decisions or create
value for the process in other ways.
Resource use, evaluate how complicated and time consuming the component is to realize
for each accessory.
These dimensions were chosen to handle the aversion to formality that was encountered in the
interviews and workshop. For the model to be used, it was important that the users perceived it to
create more value than the resources it consumed.
Figure 49 describes the average scores for each component. The darker fields in the matrix
indicate favorable areas, they create more value than the resources they consume.
Figure 49 – Evaluation of suggestions in workshop 2

126
8.6.1.1 Evaluation of suggestions
Classification of accessories with regards to their criticality for camera sales is a simple measure.
The workshop attendees believe the data is already available and can easily be presented. They
also believe this will improve decision making since it will increase focus on accessories early
on.
Early Product Motivation (EPM) is believed to create value but at a relatively high price in
resource use. The attendees did however accept the suggestion after we clarified that technical
aspects will be part of the technical specification. An EPM describing the purpose of the
accessory, expected COGS and release date was deemed simple and effective in the beginning.
Product Investigation was judged a vital deliverable which is shown in the high value creation.
The attendees agreed there is a lot of potential of introducing wider portfolio perspective early on
in the accessory development.
Timeline for accessories is already supposed to be a part of the deliverables but is rarely present.
The participants agreed it is creating value but see it as a relatively time consuming task. The
Project Manager present saw the most value in the suggestion. When agreeing on that the Project
Manager should be responsible for creating it, everyone voted for implementation.
Technical specification was agreed to be the most resource consuming of the suggested
deliverables. At the same time, it is deemed essential since other deliverables such as timeline
and product investigation are dependent on it. It was agreed to be the Product Manager’s
responsibility to request it and the Project Manager’s responsibility to supply it. Since the project
and Product Managers attending the workshop were pushing for implementation and saw great
value in it, this suggestion was agreed upon.
Investment/benefit matrix received moderate but positive reviews. It was seen as a low
investment in resources that could provide some value. The attendees were questioning the value
of doing one for each accessory and considered it to be of more value if all of the project’s
accessories would be in the same matrix. Then, comparisons and discussions about the relative
value of each accessory would be possible. This was agreed to be a valuable tool after making
this change.
Business Case was the suggestion which received the lowest grading in terms of value creation
versus resource use. Attendees did not see a great value since the project is currently evaluated
through a business case already, but only for the project as a whole. When discussions continued
it was concluded the data needed would be available “for free” when other deliverables were
gathered. The conclusion was that the business case should be used as well, since it would add
no additional work and enable more transparency for the project financials.
Dedicated freeze meeting was seen as a good value creator without too much resource use
needed. Skepticism was directed against adding another meeting to the process. It was agreed
that physical meetings would be required only when deviating from the agreed deliverables at the
127
plans reviewed meeting. Introducing a formal point is important to ensure an informed decision
before ordering tooling since these comprise the bulk of an accessory’s costs.
Post launch review received a varied response. Some Product Managers did not see much value
as they look at old projects before starting a new, similar one. It was discussed that it could be
valuable to the people involved in the project, engineers and Project Manager. Although it is an
additional meeting to the Product Manager’s schedules it was considered relevant. The
formalization is important to ensure a learning organization.
8.6.2 Validation summary
Axis’ general aversion against too much formality was present during the workshop. The
suggested model was however well received overall. Also, the discussions were more focused on
implementation issues than on questioning the model components. A majority of them were
agreed upon and a meeting with the R&D directors was booked to initiate an implementation of
the changes into Axis current process.

128
9 Conclusion & Contribution
This chapter will present a summary of findings from this study. Conclusions based on purpose
and research questions will be presented. Contributions to the body of knowledge are
summarized. Finally, limitations of the study and suggestions for further research are discussed.
9.1 Conclusion
The steps of the study and its methods have been designed to fulfill the master thesis’ purpose:
“To design a practically viable decision support model that enables more informed decisions
with regards to accessory development at Axis Communications.”
To make informed decisions is a vital part of any company’s operations. In the context of
development decisions and their inherent uncertainties it is particularly important and difficult.
Theory suggests processes and formality to structure decisions and enable comparison.
Formalized decision criteria, data collection and decision makers are widely mentioned as
success factors.
The case study companies and their practice introduced additional ideas and concepts. There was
a higher focus on practicality and pragmatism since theoretical concepts need to fit with the
company’s operations. In addition to new ideas, the multiple case study made it possible to
enhance credibility of the suggestions to Axis. Although the focus was on a general decision
point rather than accessories specifically, it provided examples where theoretical concepts were
used in practice.
The study then shifted focus to Axis and its two separate flows of accessories, camera and
accessory projects. The large differences in formality quickly focused the study on accessories
within camera projects. They have a very limited focus on accessories which enabled a higher
improvement potential. The aim of the final suggestion was to enhance its practical viability by
integrating it within their current process. In interviews with important stakeholders it was clear
that it would not be possible to remake the camera process for the sake of accessories. This
limitation made it important to fit the suggestions into the current structure and process at Axis in
order to gain acceptance.
Research questions have been answered continuously through the report and are summarized
below.
RQ1 – “What does the decision point look like according to theory?”
A conceptual model of the decision point was developed based on findings within the areas of
portfolio management and the Stage-Gate perspective on NPD. This resulted in a model (Figure
50), consisting of the components input, decision and output. Theoretical propositions were
developed to describe each component.

129
Figure 50 – Theoretical framework used in the study
Input consists of the information required to make the decision, the quality of that information
and the people responsible for gathering it. Theory stresses the need for high quality information
to make the right decisions. This information collection requires functional integration and
collaboration across departments.
Decision describes the criteria used to evaluate projects and the decision makers involved. The
criteria range from financial criteria to other qualitative and strategic criteria. In literature, the
use of formal criteria is essential for company performance. While financial criteria remain the
most commonly used, aligning and introducing strategic aspects is essential. Decision makers
should be formally appointed and be on a corresponding seniority level as the decisions they
make.
Output describes the outcome from the decision. Firstly, in terms of its execution which we have
defined as making the decision to let the project through the gate or not. Secondly, in terms of
implementation which we have defined as the continuation of the project. Theory stresses the
need for a formal output where a project either receives a go or kill decision. This output should
be reflected in the future resource allocation and goals for the project’s next gate, if it receives a
go decision.
Contextual aspects were introduced to the model to help explain similarities and differences that
later would be found in the case study. Company size and profitability, product life cycle and
technology sophistication were found to be relevant aspects.
RQ2 – “What does the decision point look like in practice?”
Findings from the case study were used to confirm or disprove the theoretical propositions. In
addition to this, new propositions were developed based on empirical findings. Combining the

130
theoretical propositions supported in practice with empirical propositions that had high
generalizability resulted in the model described in Figure 51.
Figure 51 – Conceptual model of the decision point after the multiple case study
Important components that were added to the theoretical model were goals, criteria and feedback
loop. The updated model describes the preferred order for how to design the decision point.
Starting with the strategic goals of the product, these should decide what criteria to use to reach
these goals. The criteria then decide required input and what decision makers are needed to make
the decision. Following the decision, a formal output and new goals are set for the next gate.
When the product is released, a post-launch review is held which compares the initial input
deliverables to the actual outcome. This way, the decisions will become better over time since
learnings from previous projects will be formally introduced into the decision point.
RQ3 – “How can these findings be implemented in the context of Axis’
accessories?”
Interviews with various functions were held to gain an understanding of current processes as well
as the purpose and current challenges with accessories. A workshop with Product Managers used
these findings as well as the empirical and theoretical results to distil the most important aspects.
Focus of the workshop was on the overall goals and which criteria should be used in order to
reach them. We then came up with suggestions that would fit into Axis’ context and current
operations. Since much emphasis was put on solutions which would be possible to implement, all
suggestions would have to work in Axis’ context. Through continuous discussions with our

131
stakeholders, the recommendations were anchored in the organization. Figure 52 describes how
the final recommendations are placed within the current process for camera projects.
Figure 52 – Suggestions for Axis and their place in current structure
There are three main recommendations:
Introduction of accessory specific deliverables at the start and project review meetings.
Formalize the freeze meeting for all accessories before ordering tools.
Introduce a post launch review of projects to enable a learning process.
These recommendations were tested with important stakeholders at a separate workshop. They
evaluated and discussed how they would work in practice and how their day-to-day work would
be affected. The overall assessment was positive and the recommendations were accepted.
9.2 Contributions
To examine contributions to the body of knowledge we have compared our findings to existing
theory. This chapter discusses the report’s contributions on a high level and does not go down to
proposition level. That discussion concerning generalizability can be found in the Cross Case
Analysis.
This research has been focused on providing a viable model for making more informed decisions
within accessory development. The empirical research was not focused on accessories but on
general product development. It did however add interesting ideas that were tested for their
generalizability and added to the model. The importance of having a feedback loop in the
decision making process was stressed in all cases to enable a learning process. Several
researchers stress data integrity as an important aspect in decision making (Cooper, 2011; Kaiser,

132
et al., 2015; Jugend & da Silva, 2014; Chao, et al., 2014; van Oorschot, et al., 2010). Our
findings suggest that a feedback loop is a good way to operationalize the data integrity aspect.
The generic decision model and how to decide on criteria to use at a company have been
conceptualized in the study. It contributes to theory by suggesting a way to decide criteria, input
and decision makers by starting with the strategic goals of the company. These aspects have been
examined separately by several authors (Cooper, 2011; Ettlie & Elsenbach, 2007; Jugend & da
Silva, 2014; Cosner, et al., 2007; Patterson, 2005).Our model suggest a way to operationalize the
practices. The combination of theory and practice adds a dimension of credibility to the model.
By introducing the model in Axis’ accessory development it was necessary to include goals for
Axis at large and accessories. The fact that accessories are not the primary product mean they
have to adjust to the cameras. This study has started to look into some of the aspects to consider
in decision making for accessories, a field with limited previous research.
9.3 Limitations
As time is limited in a master thesis, simplifications and delimitations have to be made. This
leads to limitations in the results, some of which are presented here.
The time limitation in the study made it necessary to choose and contact companies early for the
multiple case study. The ambition of interviewing senior personnel made this even more
important. The short time frame limited the possibility to choose companies based on contextual
aspects, as they were chosen before the theoretical framework had been fully developed.
The study and its unit of analysis had a rather large scope. As companies work differently it was
not always evident what aspect should be analyzed. It is possible that the answer would have
been different if a different person would have been interviewed. We tried to handle this by
interviewing senior personnel. However, more time and more interviewees would probably have
given deeper and more accurate insights.
As the model was adapted to Axis’ operations, company stakeholders stressed the importance of
fitting it into the current processes. By limiting solutions to their current context, the probability
of implementation was increased at the cost of a more innovative, ground breaking solution.
Some ideas which could have been introduced with a freer approach are discussed in future
research.
9.4 Future research
Future research is divided into recommendations for Axis, the principal company, and academic
literature.
9.4.1 Principal company
Recommendations for Axis’ handling of accessories are based on our findings from the company
study. There were aspects which did not fit into the scope or within the company’s camera

133
project structure. As mentioned, the focus on implementation meant there were
recommendations which were not considered in the initial adaptation. These suggestions can be
seen as interesting next steps to follow the initial recommendations.
Introduce a portfolio planner for accessories to enable a better overview of projects and
product development.
Develop all accessories in their own projects to increase focus on these products.
Resources should then be allocated from camera projects to these projects.
Examine the possibility to modularize accessories to limit the need for new products and
increase supply chain efficiency.
Portfolio analysis, this to challenge current preconceptions on what accessories create the
most value for the end customer. A more detailed cost/revenue analysis would be
rewarding here.
Involve full life cycle aspects into product decisions. Now, much focus is early in the
product life cycle when making decisions. Expanding that view into considering the full
life cycle, including operational challenges and end-of-life considerations, would likely
be beneficial
9.4.2 Academic Literature
The academic research has been focused on generic solutions to decision making. Some ideas to
further develop the body of knowledge are suggested:
Further examine how development decisions should be made for accessories that support
a company’s main product.
Further study what contextual aspects are most relevant when designing a decision model
for product development. We believe our study only scratched the surface.
Study how companies should work with projects including multiple products in a stage-
gate setup.
Examine how to consider supply chain aspects in product development. What is the
potential for improvements and cost savings if the entire life cycle is considered?

134
Bibliography
Alfa Laval, 2015. Annual Report 2014, Tumba: s.n.
Alfa Laval, 2016a. Research and Development. [Online]
Available at: www.alfalaval.com/investors/alfa-laval-brief/research-and-development
[Accessed 15 3 2016].
Annvik, A., 2016. Director Product Management, Handheld Electric [Interview] (15 March
2016).
Arbnor, I. & Bjarke, B., 2009. Methodology for Creating Business Knowledge. 3rd ed. London:
SAGE Publications, Ltd.
Axis Communications, 2014. Product development processes. [Online]
Available at: galaxis.axis.com
[Accessed 10 March 2016].
Axis Communications, 2016. Axis Core Values. [Online]
Available at: galaxis.axis.com
[Accessed 5 April 2016].
Axis Communications, 2016. Bokslutskommuniké 2015, Lund: s.n.
Axis Communications, 2016. Product & Solution Planning - The Roadmap Process. [Online]
Available at: galaxis.axis.com
[Accessed 10 March 2016].
Balachandra, R. & Friar, J., 1997. Factors for Success in R&D Projects and New Product
Innovation: A Contextual Framework. IEE Transactions on Engineering Management,
44(3), pp. 276-287.
Baxter, P. & Jack, S., 2008. Qualitative Case Study Methodology: Study Design and
Implementation for Novice Researchers. The Qualitative Report, 13(4), pp. 544-559.
Bennermark, P., 2016. Global Product Manager, Fixed Dome Cameras [Interview] (14 March
2016).
Bergkvist, P.-O., 2016. Head of Manufacturing & Sourcing, Companion products [Interview]
(17 March 2016).
Bertrand, W. & Fransoo, J., 2002. Modelling and simulation: Operations management research
methodologies using quantitative modeling. International Journal of Operations &
Production Management, 22(2), pp. 241-264.
Bitman, W. R. & Sharif, N., 2008. A conceptual framework for ranking R&D projects. IEEE
Transactions on Engineering management, 55(2), pp. 267-278.

135
Blackhurst, J., Wu, T. & O'Grady, P., 2005. PCDM: a decision support modeling methodology
for supply chain, product and process design decisions. Journal of Operations
Management, 23(3), pp. 325-343.
Bloomberg, 2014. Sony Bets It Can Find the Next Big Thing - The company’s skunkworks is
engaged in dozens of projects. [Online]
Available at: http://www.bloomberg.com/news/articles/2014-07-03/sony-r-and-d-lab-
hunts-for-next-tech-megahit
[Accessed 15 March 2016].
Brewerton, P. & Millward, L., 2001. Organizational Research Methods - A Guide for Students
and Researchers. London: SAGE Publications, Ltd.
Brown, S. L. & Eisenhardt, K. M., 1995. Product development: Past research, present findings,
and future directions.. Academy of Management Review, 20 (2), pp. 343-378.
Chao, R. O., Lichtendahl Jr, K. C. & Gruchka-Cockayne, Y., 2014. Incentives in the stage-gate
process. Production and Operations Manegement, 23(8), pp. 1286-1298.
Cooper, R., Edgett, S. & Kleinschmidt, 2001. Portfolio management for ner product
development: results of an industry practices study. R&D Management, 21(4), pp. 361-
380.
Cooper, R. G., 1990. Stage-Gate Systems: A New Tool for Managing New Products. Business
Horizons, 33(3), pp. 44-54.
Cooper, R. G., 2004. New Products: What Separates the Winners from the Losers. In: K. Kahn,
ed. The PDMA Handbook of New Product Development. New York: John Wiley & Sons,
pp. 3-28.
Cooper, R. G., 2008. Perspective: The Stage-Gates Idea-to-Launch Process—Update, What’s
New, and NexGen Systems. Journal of Product Innovation Management, 25(3), pp. 213-
232.
Cooper, R. G., 2011. Winning at New Products: Accelerating the Process from Idea to Launch.
4th edition ed. MA: Perseus Books.
Cooper, R. G., 2014. What's next? After stage-gate. Research-Technology Management, 57(1),
pp. 20-31.
Cooper, R. G., Edgett, S. J. & Kleinschmidt, E. J., 1999. New product portfolio management:
practices and performance. Journal of Product Innovation Management, Volume 16, pp.
333-351.
Cosner, R. R. et al., 2007. Integrating roadmapping into technical planning. Research
Technology Management, 50(6), pp. 31-48.

136
Coughlan, P. & Coghlan, D., 2002. Action research for operations management. International
Journal of Operations & Production Management, 22(2), pp. 220-240.
Ellram, L. M., 1996. The use of case study method in logistics research. Journal of Business
Logistics, 17(2), pp. 93-138.
Ettlie, J. E. & Elsenbach, J. M., 2007. Modified stage-gate regimes in new product development.
The Journal of Product Innovation Management, Volume 24, pp. 20-33.
Fisher, M., 1997. What is the right supply chain for your product?. Harvard Business Review,
Volume 75, pp. 105-117.
Fisher, M. M., Ramdas, K. & Ulrich, K., 1999. Component sharing in the management of
product variety: a study of automotive braking system. Management Science, 45(3), pp.
297-315.
Fransson, K., 2016. Global Product Manager, PTZ Cameras [Interview] (26 February 2016).
Gammelgaard, B., 2004. Schools in logistics research? A methodological framefork for analysis
of the dicipline. International Journal of Physical Distribution & Logistics Management,
34(6), pp. 479-491.
Garcia, R. & Calantone, R., 2002. A critical look at the technological innovation typology and
innovativeness terminology: a literature review. ournal of product innovation
management, 19(2), pp. 110-132.
Gasson, S., 2009. Employing A Grounded Theory Approach For MIS Research. In: B. L. M. W.
S. S. M. W. Y.K. Dwivedi, ed. Handbook of Research on Contemporary Theoretical
Models in Information Systems. s.l.:IGI Publishing, Hershey PA, pp. 34-56.
Gsm Arena, 2015. Sony is giving its mobile division a year to turn profitable or face a split.
[Online]
Available at:
http://www.gsmarena.com/sony_is_giving_its_mobile_division_a_year_to_turn_profitabl
e_or_else_it_faces_an_uncertain_future-news-14382.php
[Accessed 16 March 2016].
Hancock, D. R. & Algozzine, B., 2006. Doing Case Study Research: A Practical Guide for
Beginning Researchers. New York: Teachers College Press.
Hieber, R., 2002. Supply Chain Management: A Collaborative Performance Measurement
Approach. 1st edition ed. Zurich: VDF Hochschulverlag AG.
Huiskonen, J., 2001. Maintenance spare parts logistics: Special characteristics and strategic
choices. International Journal of Production Economics, 71(1-3), pp. 125-133.
Husqvarna Group, 2015. Annual Report 2014, Stockholm: s.n.

137
Husqvarna Group, 2016a. Company Overview. [Online]
Available at: www.husqvarnagroup.com/en/ir/company-overview
[Accessed 15 03 2016].
Husqvarna Group, 2016b. Year-end report 2015, Stockholm: s.n.
Husqvarna Group, 2016c. Strategy 2020. [Online]
Available at: www.husqvarnagroup.com/en/strat2020
[Accessed 15 3 2016].
Husqvarna Group, 2016d. Organization. [Online]
Available at: www.husqvarnagroup.com/en/about/organization
[Accessed 15 5 2016].
Jugend, D. & da Silva, S. L., 2014. Product-portfolio management: a framework based on
methods, organization and strategy. Concurrent Engineering: Research, 22(1), pp. 17-28.
Kaiser, M. G., Arbi, F. E. & Ahleman, F., 2015. Successful project portfolio management
beyond project selection techniques: understanding the role of structural alignment.
International journal of Project Management, Volume 33, pp. 126-139.
Kasanen, E., Lukka, K. & Siitonen, A., 1993. The constructive approach in management
accounting research. Journal of Management Accounting Research,, 5(Fall), pp. 243-264.
Kennedy, W. J., Patterson, W. J. & Fredendall, L. D., 2002. An overview of recent literature on
spare parts inventories. International Journal of Production Economics, 76(2), pp. 201-
215.
Kotzab, H., 2005. The Role and Importance of Survey Research in the Field of Supply Chain
Management. In: M. Müller & G. Reiner, eds. Research Methodologies in Supply Chain
Management. s.l.:Physica-Verlag, pp. 125-137.
Koulikoff-Souviron, M. & Harrison, A., 2005. Using Case Study Methods in Researching
Supply Chains. In: H. Kotzab, S. Seuring, M. Müller & G. Reiner, eds. Research
Methodologies in Supply Chain Management. Heidelberg: Physica-Verlag, pp. 267-282.
Krishnan, V. & Ulrich, K. T., 2001. Product Development Decisions: A Review of the
Literature. Management Science, 47(1), pp. 1-21.
Laudon, K. C. & Laudon, J. P., 2014. Chapter 12 - Enhancing Decision Making. In: S. Wall, ed.
Management Information Systems - Managing the Digital Firm. Thirteenth edition,
International edition ed. Harlow: Pearson Education, pp. 482-514.
Lee, H. L. & Sasser, M. M., 1995. Product universality and design for supply chain. Production
Planning & Control, 6(3), pp. 270-277.
Lehtiranta, L., Junnonen, J.-M., Kärnä, S. & Pekuri, L., 2015. The Constructive Research
Approach: Problem Solving for Complex Problems. In: B. Pasian, ed. Designs, Methods

138
and Practices for Research of Project Management. Aldershot: Gower Publishing, pp.
95-107.
Lin, C. & Hsieh, P.-J., 2003. A fuzzy decision support system for strategic portfolio
management. Decision Support Systems, Volume 38, pp. 383-398.
Lundqvist, J., 2016. Senior Project Manager, Fixed Dome Cameras [Interview] (12 April 2016).
Martinsuo, M. & Poskela, J., 2011. Use of Evaluation Criteria and Innovation Performance in the
Front End of Innovation. Journal of Product Innovation Management, Volume 28, p.
896–914.
McGrath, J. E., 1982. Dilemmatics, The Study of Research Choices and Dilemmas, in: Judgment
Calls in Research. 1 ed. Beverly Hills: Sage Publications.
McNally, R. C., Durmusoglu, S. S., Calantone, R. J. & Harmancioglu, N., 2009. Exploring new
product portfolio management decisions: The role of managers' dispositional traits.
Industrial Marketing Management, Volume 38, pp. 127-143.
Mentzer, J. & Kahn, K., 1995. A framework of logistics research. Journal of Business Logistics,
6(1), pp. 231-250.
Mikkola, J. H., 2001. Portfolio management of R&D projects: implications for innovation
management. Technovation, Volume 21, pp. 423-435.
Miles, M. B., Hubermann, M. A. & Saldaña, J., 2014. Quantitative Data Alanysis - A Methods
Sourcebook. 3rd ed. London: SAGE Publications.
Mitroff, I. I., Betz, F., Pondy, L. R. & Sagasti, F., 1974. On Managing Science in the Systems
Age: Two Schemas for the Study of Science as a Whole Systems Phenomenon.
Interfaces, 4(3), pp. 46-58.
Muller, M., 2005. Action Research in Supply Chain Management – An Introduction. In: H.
Kotzab, S. Seuring, G. Reiner & M. Muller, eds. Research Methodologies in Supply
Chain Management. Heidelberg: Physica-Verlag, pp. 349-364.
Mårtensson, E., 2016. Product Manager Accessories, Axis Communications [Interview] (21
January 2016).
Norling, E., 2016. Director Product Management, Outdoor & Bags and Product Manager Sports
& Cargo for all markets except Americas [Interview] (31 March 2016).
Näslund, D., 2002. Logistics needs qualitative research - especially action research. International
Journal of Physical Distribution & Logistics Management, 32(5), pp. 321-338.
Ojala, L. & Hilmola, O., 2003. Case study research in logistic. Turku: Turku school of
economics and business administration.

139
Oyegoke, A., 2011. The constructive research approach in project management research.
International Journal of Managing Projects in Business, 4(4), pp. 573 - 595.
Page, A. L., 1991. PDMA new product development survey: performance and best practices.
Chicago, PDMA Conference.
Patterson, M., 2005. New product portfolio planning and management. In: K. B. Kahn, ed. The
PDMA Handbook of New Product Development. 2nd Edition ed. Hoboken(NJ): John
Wiley & sons, pp. 46-58.
Pero, M., Abdelkafi, N., Sianesi, A. & Blecker, T., 2010. A framework for the alignment of new
product development and supply chains. Supply Chain Management: An International
Journal, 15(2), pp. 115-128.
Persson, G., 1982. Materialadministrativ metod - Några synpunkter. Journel of Materials
Administration/Business Logistics, 8(3), pp. 72-96.
Petersen, K. J., Handfield, R. B. & Ragatz, G. L., 2005. Supplier integration into new product
development: coordinating product, process and supply chain design. Journal of
Operations Management, 23(3-4), pp. 371-388.
Pil, F. K. & Holweg, M., 2004. Linking product variety to order-fulfillment strategies. Interfaces,
34(5), pp. 394-403.
Randall, T. & Ulrich, K., 2001. Product variety, supply chain structure and firm performance:
analysis of the US bicycle industry. Management Science, 47(12), pp. 1588-1604.
Rowley, J. & Slack, F., 2004. Conducting a literature review. Management Research News,
27(6), pp. 31-39.
Rugg, G. & Petre, M., 2007. A Gentle Guide to Research Methods. Berkshire: McGraw-Hill.
Salvador, F., Forza, C. & Rungtusanatham, M., 2002. Modularity, product variety, production
volume, and component sourcing: theorizing beyond generic prescriptions. Journal of
Operations Management, 20(5), pp. 549-575.
Saunders, M., Lewis, P. & Thornhill, A., 2015. Research Methods for Business Students. 7th
edition ed. s.l.:Pearson.
Schilling, M. A. & Steensma, K. H., 2001. The use of modular organizational forms: an industry-
level analysis. Academy of Management Journal, 44(6), pp. 1149-1168.
Seifert, R. W., Tancrez, J.-S. & Bicer, I., 2016. Dynamic product portfolio management with life
cycle considerations. International journal of Production Economics, 171(1), pp. 71-83.
Seuring, S., 2005. Case Study Research in Supply Chains – An Outline and Three Examples. In:
H. Kotzab, S. Seuring, M. Müller & G. Reiner, eds. Research Methodologies in Supply
Chain Management. New York: Physica-Verlag, pp. 236-314.

140
Seuring, S., Muller, . M., Reiner, . G. & Kotzab, H., 2005. Is There a Right Research Design for
Your Supply Chain Study?. In: S. Seuring, M. Muller, G. Reiner & H. Kotzab, eds.
Research Methodologies in Supply Chain Management. Heidelberg: Physica-Verlag, pp.
1-12.
Simon, H. A., 1948. Administrative Behavior, a Study of Decision-Making Processes in
Administrative Organization. 1st edition ed. New York: The Macmillan Co.
Simon, H. A., 1960. The New Science of Management Decision. 1st edition ed. New York:
Harper & Row.
Sommer, A. F., Hedegaard, C., Dukovska-Popovska, I. & Steger-Jensen, K., 2015. Improved
product development performande through agile/stage-gate hybrids. Research-
Technology Management, 58(1), pp. 34-44.
Sony Mobile, 2016a. Sony Mobile - Products. [Online]
Available at: http://www.sonymobile.com/gb/products/phones/
[Accessed 14 March 2016].
Sony Mobile, 2016b. Sony Mobile - Products, Accessories. [Online]
Available at: http://www.sonymobile.com/gb/products/accessories/
[Accessed 14 March 2016].
Sony, 2013. Annual Report 2013. [Online]
Available at: http://www.sony.net/SonyInfo/IR/library/ar/2013/special/index.html
[Accessed 14 March 2016].
Sony, 2015. Sony Mid-Term Corporate Strategy for FY2015 – FY2017. [Online]
Available at:
http://www.sony.net/SonyInfo/IR/calendar/presen/strategy/strategy2015/pdf/pressE.pdf
[Accessed 14 March 2016].
Sony, 2016. Q3 FY2015 Consolidated Financial Results. [Online]
Available at: http://www.sony.net/SonyInfo/IR/library/fr/15q3_sonypre.pdf
[Accessed 14 March 2016].
Sony, 2016. Sony Global - About Sony. [Online]
Available at: http://www.sony.net/SonyInfo/
[Accessed 14 March 2016].
Stokes, D. & Bergin, R., 2006. Methodology or "methodolatry"? An evaluation of focus groups
and depth interviews. Qualitative Market Research: An International Journal, 9(1), pp.
26-37.
Stuart, I. et al., 2002. Effective case research in operations management: a process perspective.
Journal of Operations Management, Volume 20, p. 419–433.

141
Susan Hart, E. J. H. N. T. & Commandeur, H. R., 2003. Industrial Companies’ Evaluation
Criteria in New Product Development Gates. Journal of Product Innovation
Management, Volume 20, pp. 22-36.
Susan L. Golicic, D. F. D. T. M. M., 2005. A Balanced Approach to Research in Supply Chain
Management. In: S. A. A. S. M. W. Kotzab Herbert, ed. Research Methodologies in
Supply Chain Management. Heidelberg: Physica-Verlag, pp. 15-29.
Sörensen, S. W., 2016. Head of Global Product Management, Companion Products [Interview]
(16 March 2016).
Thule Group, 2015. Annual Report 2014, Malmö: s.n.
Thule Group, 2016a. Year-end-Report 2015, Malmö: s.n.
Thule Group, 2016b. Strategy. [Online]
Available at: http://www.thulegroup.com/en/strategy
[Accessed 16 03 2016].
Tolonen, A., Shahmarichatghieh, M., Harkonen, J. & Haapasalo, H., 2015. Product portfolio
management – Targets and key performance indicators for product portfolio renewal over
life cycle. 179(B), pp. 468-477.
Ulrich, K., 1995. The role of product architecture in the manufacturing firm. Research Policy,
24(3), pp. 419-440.
Ulrich, K. & Eppinger, S., 2012. Product Design and Development. 5 ed. Massachusetts:
McGraw-Hill Higher Education.
Ulrich, K. T. & Eppinger, S. D., 2012. Product Design and Development. Fifth edition,
International Edition ed. New York: McGraw-Hill.
van Oorschot, K., Sengupta, K., Akkermans, H. & van Wassenhove, L., 2010. Get fat fast:
Surviving stage-gate in NPD. Journal of Innovation Management, Volume 27, pp. 828-
839.
Veryzer, R. W., 1998. Discontinuous Innovation and the New Product Development Process.
Journal of Product Innovation Management, 15(4), pp. 304-321.
Wheelwright, S. C. & Clark, K. B., 1992. Creating plans to focus product development. Harvard
Business Review, 70(2), pp. 70-82.
Wheelwright, S. & Clark, K., 1992. Creating plans to focus product development. Harvard
Business Review, March-April.pp. 70-82.
Vigren, A., 2016. Global Product Manager, Fixed Box Cameras [Interview] (4 March 2016).
Woodruff, R., 2003. Alternative paths to marketing knowledge. Qualitative methods doctoral
seminar: University of Tennessee.

142
Voss, C., Tsikriktsis, N. & Frohlich, M., 2002. Case research in operations management.
International Journal of Operations & Production Management, 22(2), pp. 195-219.
Yin, R. K., 2009. Case Study Research - Design and Methods. 4th ed. London: SAGE
Publications Inc.
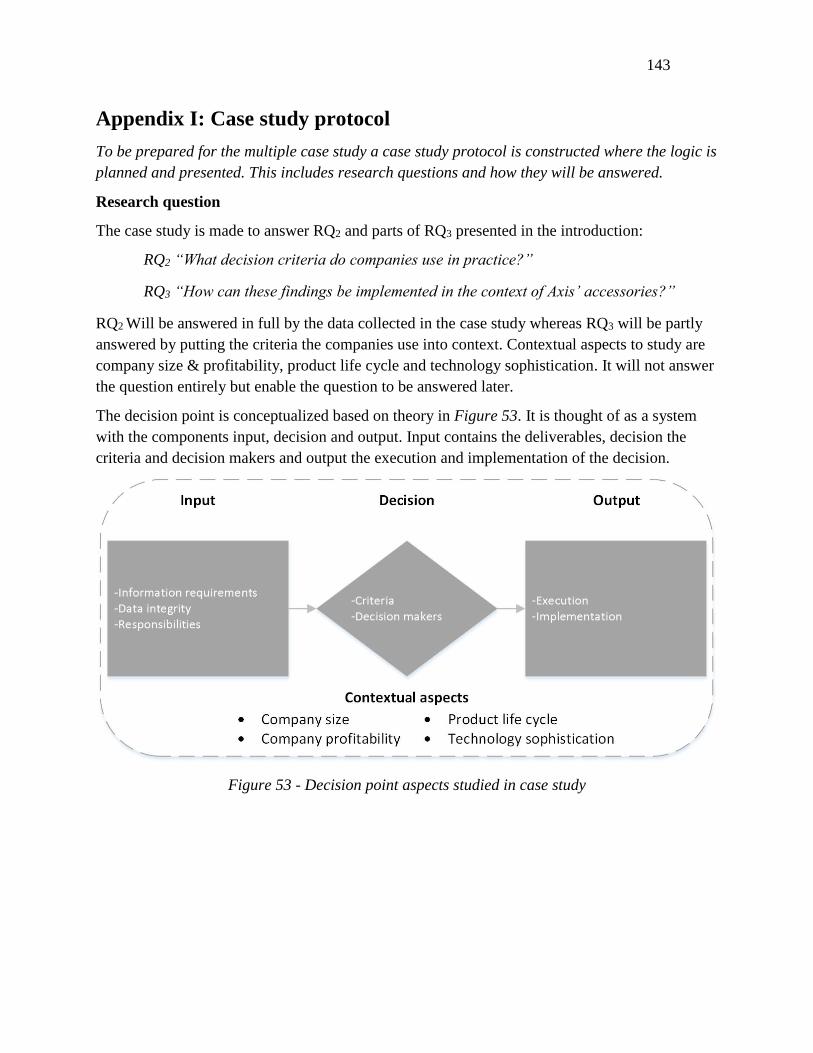
143
Appendix I: Case study protocol
To be prepared for the multiple case study a case study protocol is constructed where the logic is
planned and presented. This includes research questions and how they will be answered.
Research question
The case study is made to answer RQ2 and parts of RQ3 presented in the introduction:
RQ2 “What decision criteria do companies use in practice?”
RQ3 “How can these findings be implemented in the context of Axis’ accessories?”
RQ2 Will be answered in full by the data collected in the case study whereas RQ3 will be partly
answered by putting the criteria the companies use into context. Contextual aspects to study are
company size & profitability, product life cycle and technology sophistication. It will not answer
the question entirely but enable the question to be answered later.
The decision point is conceptualized based on theory in Figure 53. It is thought of as a system
with the components input, decision and output. Input contains the deliverables, decision the
criteria and decision makers and output the execution and implementation of the decision.
Figure 53 - Decision point aspects studied in case study

144
Credibility
As a means to ensure validity and reliability in the case study measures will be taken, described
in Table 35. The tactics are based on 3.5 Reliability and validity.
Table 35 - Credibility tactics used in the case study:
Tactic Description Applied in
Construct
Validity
Triangulation Multiple sources of evidence for
vital data
Data collection
Establish chain of evidence Plan data collection based on
research questions
Data collection
Draft report reviewed by key
informants
Supervisors at Axis and LTH read
report
Composition
Internal
Validity
Pattern Matching Evidence from study is compared to
theoretical framework
Data analysis
Explanation building Create understanding by analyzing
links between factors found
Data analysis
External
Validity
Replication logic Cross case analysis to motivate
recommendations
Research design
Reliability Case study protocol Planning of case study prior to
execution
Data collection
Summary sent to interviewee Interviewee reads and approves case
description
Data collection
Case study database All interview notes and open
sources are saved
Data collection
Data collection
The data will be collected through research and interviews based on a four step approach:
1. Research through open sources prior to interview(s)
2. Interview(s) conducted based on interview protocol
3. Additional research conducted to complement interview
4. Interviewee review and comment on case description to ensure reliability
Case selection
The companies used in the case study were selected based on a few core criteria. Given these
criteria, the authors and employees at Axis contacted relevant companies.

145
1. Access. The company and relevant interviewees were interested in participating. There
was data available about the companies’ operations and characteristics.
2. Internal R&D. The company had internal R&D and took development decisions in-
house.
3. Sells their own developed products. In line with the internal R&D criteria, companies
which were only trading products were not considered.
4. Use decision criteria before R&D. The companies used decision criteria to choose which
products to develop. There was a point before development where the decision was
made.
In addition to these core criteria, additional dimensions were considered that would serve to give
a variety of companies to compare.
5. Variation in contextual aspects. To get a broad view, cases representing variations in the
contextual aspects were used. These were discussed in the theoretical chapter and were
used in the case study to explain patterns and differences between the cases. The
contextual aspects were:
o Company size
o Operating margin
o Technology character
o Length of product life cycle
6. Customized criteria. It should be tested if companies work differently with different
kinds of products and what those differences are based on.
The companies which fulfilled core criteria are listed in Table 36, including interviewees
and industry. To provide further credibility to the study, Axis was used as a test case. This to
provide credibility to the study and ensure the quality of the data collection protocol (Yin,
2009).
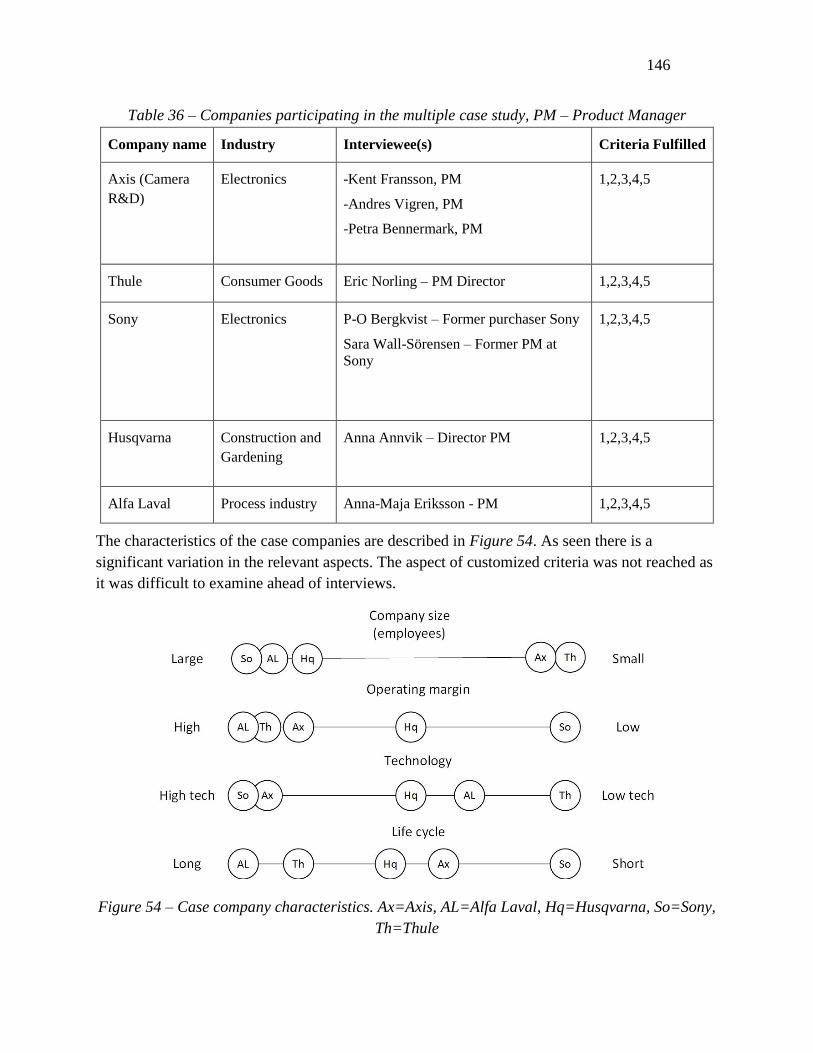
146
Table 36 – Companies participating in the multiple case study, PM – Product Manager
Company name Industry Interviewee(s) Criteria Fulfilled
Axis (Camera
R&D)
Electronics -Kent Fransson, PM
-Andres Vigren, PM
-Petra Bennermark, PM
1,2,3,4,5
Thule Consumer Goods Eric Norling – PM Director 1,2,3,4,5
Sony Electronics P-O Bergkvist – Former purchaser Sony
Sara Wall-Sörensen – Former PM at
Sony
1,2,3,4,5
Husqvarna Construction and
Gardening
Anna Annvik – Director PM 1,2,3,4,5
Alfa Laval Process industry Anna-Maja Eriksson - PM 1,2,3,4,5
The characteristics of the case companies are described in Figure 54. As seen there is a
significant variation in the relevant aspects. The aspect of customized criteria was not reached as
it was difficult to examine ahead of interviews.
Figure 54 – Case company characteristics. Ax=Axis, AL=Alfa Laval, Hq=Husqvarna, So=Sony,
Th=Thule

147
Expected findings
The motivation of the study is to examine the decision point ahead of product development. To
put the findings into context, information regarding the contextual aspects was gathered to map
and compare them against each other.
Outline of case study report
Presentation of the company and people involved in the study
Identification of the decision point within the specific case
Description of how they work with the decision point - based on framework
o Input
Information required – what deliverables do they gather?
Data integrity – how is data quality ensured?
Responsibilities – who gathers the information?
o Decision point
Criteria – what criteria are used to evaluate the project?
Decision makers – who evaluates the project?
Variations – Are project treated differently?
o Output
Execution – what decisions are available?
Implementation – what are the next steps after the decision?
o Satisfaction
What is the degree of satisfaction with current way of working?
Description of contextual aspects and how they are impacting how the company works
with the decision point
Summary of the above in the format seen in Table 37.
Table 37 – Conceptually clustered matrix display used for individual case analysis
Input Decision Output Contextual Aspects
Information
requirement
Criteria Execution Strategy, Market and
Company
Data integrity Decision makers Implementation
Product & technology
Responsibilities Variations

148
Interview guide
The interviews start with a contextual introduction of the company to get a background for the
following questions. A first version of the interview guide was written based on theory. That
version was tested on the Axis case and further developed before being used in the other cases.
The interview is semi structured and held based on the structure:
First question, let the interviewee speak freely
o Complimentary questions if not covered
Each interview is recorded to enable verification and replay parts of the interview when doing
the write-up. One of the authors is responsible for interviewing and the other is responsible for
taking notes.
Contextual aspects, if not answered before interview
Company background
o Turnover, number of employees
o Company profitability
o Strategic goals/priorities
o R&D spending
Product characteristics
o Product life cycle
o Technology sophistication
Organization
o Structure of company
o NPD’s place in structure
o People responsible for NPD decision
o Level of priority
Decision point aspects
General questions
1. How do you decide which products to develop
2. Describe the decision making process before a product is going into development
a. If possible using a process map drawn or based on company guideline
3. What are the typical steps
4. Are they always the same or vary between products
a. What determines the variation
b. Do you distinguish between important/not important products
5. Who is responsible for the decision point
(Show the theoretical decision point in a Stage-Gate system to make them understand that we are
looking for the decision point ahead of NPD)

149
Input
6. What information is required
a. How long does it take to gather
b. Is it always the same information
7. How do you ensure data integrity
a. How reliable is the information gathered
b. Do you follow-up on the information after launch
8. Responsibilities
a. Where does it come from
b. Who is gathering it
c. Is it always the same people
d. Other variations
9. Can we see an example of input deliverables to a typical decision meeting
The decision
10. Who are the decision makers
a. Who is involved
b. Roles in the company
c. Who makes the decision
d. Who has final say if there are different opinions
11. Explain the decision making and what it is based on
a. What are the decisions based on
b. Is it always the same criteria
c. Is there a clear structure to the decision making
12. What types of criteria is used
a. One or several
b. Weight of each criteria
c. Are there tools to help in the decision making
d. Do everyone understand why the criteria are used
e. What is the motivation behind them
Output
13. What are possible outcomes from the decisions
a. Are there several
14. What happens for each outcome
a. Is there a structure to what comes next in each outcome
15. Who is responsible to implement the decision
a. Role
b. Always the same person
c. Variations

150
Satisfaction
16. What is the main purpose of the decision structure
a. Why was it implemented
b. What are the goals
17. How do you rate your process
a. What is good
b. What could be improved
c. Does it serve its purpose
d. Are the goals reached
e. Does everyone understand the structure
18. Is it aligned with the rest of the company’s operations
a. Strategic goals
b. Other goals
c. Have you had to make concessions in the decision making due to other goals
19. What would you change
a. Improvement opportunities
b. What are the weaknesses
20. Do you see any trade-offs that you have to make when designing:
a. The process as a whole
b. The decision point itself

151
Research Timeline
Activity Time Period Description
Research Initiation 18 Jan – 29 Jan Pre-study to define scope of the study
Develop RQs 25 Jan – 29 Jan
Develop methodology 25 Jan – 19 Feb Reviewing methodology literature and setting up
constructive approach and multiple case study
method
Literature review 25 Jan – 12 Feb Reviewing portfolio management and the Stage-Gate
perspective
Synthesis of literature 12 Feb – 26 Feb Reviewing literature findings and constructing
theoretical framework
Find and contact case companies 15 Feb – 26 Feb Contacting relevant persons at
Develop interview guide 22 Feb – 4 Mar Develop interview guide for case study
Seminar with supervisor 2 Mar
Conduct case study interviews Axis (26 Feb, 4 Mar, 14 Mar)
Husqvarna (15 Mar)
Sony Mobile (16 Mar, 17 Mar)
Alfa Laval (16 Mar)
Thule (31 Mar)
Interviews focused on the companies’ development
decision point
Documentation of interview
study
26 Feb – 25 Mar Case descriptions, single case analysis
Constructing modified decision
model
28 Mar – 8 April Cross-case analysis, pattern matching and new
version of model
Develop interview guide 4 April For interviews at Axis
Interviews at Axis Cathérine Welander & Mattias
Forsmark (6 April)
Erik Mårtensson (6 April)
Calvin Lee (8 April)
Åsa Strömblad (8 April)
Janne Lundqvist (12 April)
Larissa Eng (14 April)
Lena Kastor & Tobias Gard (14 April)
Markus Lai (25 April)
Discuss purpose, challenges and solutions of
accessories at Axis
Workshop 1 15 April Discuss interview findings and accessory specific
decision model
Constructing accessory specific
decision model
11 April – 2 May Developing the final construct
Workshop 2 29 April Demonstrating and testing final construct

152
Appendix II: Interview guide, interviews at Axis
Introduction
1. How do you come in contact with product accessories in your daily work
Problems with accessories
2. What is the main purpose of the product accessories in your opinion
3. What problems do you see with product accessories in your daily work
a. What do you hear from colleagues from different departments
b. Are these problems linked to accessories developed within camera projects or
those developed within their own projects
Which can be affected in the development stage
4. Based on these problems, which do you believe can be affected in the development stage
Criteria needed in decision
5. Would it be possible to sort out certain accessories in the development stage
a. What criteria would then be needed
6. Are there risks present with applying stricter criteria to product accessories
a. What risks would that be
Information need
7. What information would be needed for the suggested criteria
a. Is this information available
b. Is it credible
Other questions
8. Do you think change takes a long time in your organization
9. How are new ways of working acknowledged by the employees
10. What format do you think the powerpoint should be in
a. Powerpoint/Excel
11. Is there anyone else we should speak to

153
Appendix III: Interviews conducted at Axis
Table 38 – Summary of interviews conducted at Axis
Function Problems Possible Criteria Information need
Cathérine
Welander &
Mattias
Forsmark
Industrial Lead
Accessories
2016-04-06
-Too many
-Data integrity
-Low product kill rate
-Unclear market need
-No data feedback loop
-Low priority
-Market need
-Need for NEW product?
-Rigid business case
-Multiple use
-Market analysis
-Current portfolio
-Historical data
Erik
Mårtensson
Product
Manager,
Accessories
2016-04-06
-No data feedback loop
-No sanity check until ramp
up
-Data integrity
-Uncertain margins due to
promotions
-Low priority
-Margins
-Need for NEW product?
-Multiple use
-Pricing data
-Current portfolio
Calvin Lee
Purchaser
Supply
Accessories
2016-04-08
-Too many
-Low product kill rate
-Partly high stock levels
-High MOQ requirements
-Prognosis difficulties
-Optimistic time tables
-Market need
-Need for NEW product?
-Rigid business case
-Up sales potential
-Multiple use
-% of total camera
sale
-Current portfolio
Åsa
Strömblad
Engineering
Manager,
Accessories
2016-04-08
-Too many
-No data feedback loop
-Optimistic/no time tables
-Different project owners
-Poor overview
-Low priority
-Need for NEW product?
-Multiple use
-Project schedule
-Attachment rate
-Rigid business case
-Current portfolio
-Historical data
-Old projects
-Accessory
selection tool
Janne
Lundqvist
Project
Manager
-No data feedback loop
-No business case
-Optimistic/no time tables
-Project schedule
-Rigid business case
-Technical specification
-Current portfolio
-Historical data
-Old projects

154
2016-04-12 -Low priority
-No technical specification
-Data integrity
-No R&D resource tracking
-Portfolio analysis -R&D resource use
Larissa Eng
Mechanical
Engineer
2016-04-14
-Low priority
-Optimistic/no time tables
-No technical specification
-Unclear market need
-Project schedule
-Rigid business case
-Technical specification
-Historical data
-Old projects
-Market analysis
Lena Kastor
& Tobias
Gard
Demand
Planner
2016-04-14
-Too many
-No data feedback loop
-No business case
-Low priority
-Optimistic time tables
-Unclear market need
-Prognosis difficulties
-Project schedule
-Rigid business case
-Need for NEW product?
-Multiple use
-Attachment rate
-Market need
-Sanity check of business
case
-Market analysis
-Historical data
-Old projects
-Current portfolio
-Attachment rate
Markus Lai
Technical
Sales
2016-04-25
-Too many
-Unclear market need
-Low priority
-Poor overview
-Need for NEW product?
-Multiple use
-Market need
-Rigid business case
-Current portfolio
-Market analysis
-Accessory
selection tool

155
Appendix IV: Workshop 1, Product Management
Information Participants
Workshop 1 – discuss problem areas and
accessory specific decision model
2015-04-15
Erik Mårtensson (Product Manager Accessories)
Petra Bennermark (Product Manager Fixed Dome
Cameras)
This workshop was held in addition to the initial interviews to gain acceptance and explore news
way of working, together with the main stakeholders of the decision model.
Participants
The Product Managers are the main stakeholders in these decisions. The Product Manager for
accessories was the supervisor for this thesis and well informed about the need for the study and
its progress. The Product Manager for fixed dome cameras is in charge of the product line that
contributes the most to the creation of new accessories. She was therefore an important
stakeholder to get on board and involved to increase the model’s chance of success.
Workshop Format
In line with our generic decision model, the strategic goals of Axis and its product accessories
were discussed and established first. Then the problems encountered in the individual interviews
were discussed. This to gain acceptance for a new way of working and also determine which
problem areas were the most important. Based on these problems and strategic goals, new
criteria were generated to best solve these issues.
Criteria
Criteria of two types were discussed, checklists and financial criteria. Checklists meant to ensure
certain information should be gathered before the decision meeting. This included detailed
project schedules, a business case, searching for current accessories that can solve the same
problem etc. In addition to these, stricter financial criteria were also discussed. It was deemed
important to introduce financial thinking into the camera project’s accessory development, which
is currently not done.

156
Appendix V: Workshop 2, test and validation at Axis
Information Participants
Workshop 2 – Demonstrate and evaluate
accessory decision support model
2015-04-29
Erik Mårtensson (Product Manager, Accessories)
Petra Bennermark (Product Manager, Fixed Dome
Cameras)
Kent Fransson (Product Manager, PTZ Cameras
Andres Vigren (Product Manager, Fixed Box
Cameras)
Janne Lundqvist (Senior Project Manager, Fixed
Dome Cameras)
Sara Jacobsson (Demand Manager, Demand
Planning)
This workshop was held to evaluate our proposed model for accessory development.
Participants
Our main stakeholders who determine if the model will be used or not are the camera Product
Managers. Therefore, we invited the ones responsible for the product lines responsible for the
most accessories – fixed dome, PTZ and fixed box cameras. The Product Manager for fixed box
cameras was however briefed individually due to scheduling issues. A senior Project Manager
was invited to contribute with a more direct involvement in the development process. In addition,
our supervisors were invited to contribute with their view from an operations and accessory
specific standpoint.
Workshop Format
First we presented our suggestions and allowed time for questions to ensure that everyone
understood the deliverables of the model. After this, we handed out summaries describing each
deliverable together with an evaluation form. The participants were asked to rate each of the 9
deliverables along the dimensions of value and effort. This was important to counter the risk of
the model being perceived as too formal and not value adding. After the results were gathered,
each deliverable was discussed based on the individual and aggregated results from the
evaluation. This enabled a valuable discussion around each deliverable and clarified any
misunderstandings that might have occurred.

157
Evaluation form
The evaluation form in Table 39 is used to ensure a balance between resources spent to gather
each deliverable and the value it will contribute. Each attendee will have their subjective opinion
but is asked to keep a holistic view when grading. This means that even if you are not
responsible for gathering the deliverable, don’t put a low value for resource use but see to the
resources for the project in its entirety.
1 = Low resource use/value creation
2 = Medium-low resource use/value creation
3 = Medium-high resource use/value creation
4 = High resource use/value creation
Table 39 – Evaluation table
Deliverable Resource use Value creation
1 2 3 4 1 2 3 4
1. Classification
2. Early Product Motivation
3. Product Investigation
4. Timeline for Accessories
5. Business Case
6. Investment/Benefit-matrix
7. Technical Specification
8. Dedicated Freeze Meeting
9. Post Launch Review