AAL Middleware Infrastructure for Green Bed Activity Monitoring
16
Hindawi Publishing Corporation Journal of Sensors Volume 2013, Article ID 510126, 15 pages http://dx.doi.org/10.1155/2013/510126 Research Article AAL Middleware Infrastructure for Green Bed Activity Monitoring Filippo Palumbo, 1,2 Paolo Barsocchi, 1 Francesco Furfari, 1 and Erina Ferro 1 1 ISTI-CNR, Pisa Research Area, Via G.Moruzzi 1, 56124 Pisa, Italy 2 Computer Science Department, University of Pisa, Largo B. Pontecorvo 3, 56127 Pisa, Italy Correspondence should be addressed to Paolo Barsocchi; [email protected] Received 8 February 2013; Revised 19 June 2013; Accepted 20 June 2013 Academic Editor: Ignacio Matias Copyright © 2013 Filippo Palumbo et al. is is an open access article distributed under the Creative Commons Attribution License, which permits unrestricted use, distribution, and reproduction in any medium, provided the original work is properly cited. is paper describes a service-oriented middleware platform for ambient assisted living and its use in two different bed activity services: bedsore prevention and sleeping monitoring. A detailed description of the middleware platform, its elements and interfaces, as well as a service that is able to classify some typical user’s positions in the bed is presented. Wireless sensor networks are supposed to be widely deployed in indoor settings and on people’s bodies in tomorrow’s pervasive computing environments. e key idea of this work is to leverage their presence by collecting the received signal strength measured among fixed general- purpose wireless sensor devices, deployed in the environment, and wearable ones. e RSS measurements are used to classify a set of user’s positions in the bed, monitoring the activities of the user, and thus supporting the bedsores and the sleep monitoring issues. Moreover, the proposed services are able to decrease the energy consumption by exploiting the context information coming from the proposed middleware. 1. Introduction e last few years have seen research development in the field of ambient assisted living (AAL), which can be defined as concepts, products, and services supporting a healthy and independent life of elderly citizens with intelligent systems that assist them in carrying out their daily activities. AAL encompasses a wide range of applications ranging from tele- monitoring of vital parameters for patients with chronic dis- eases to scenarios involving home automation and domotics, the recognition of adverse events such as a fall causing a fracture, or specific assistance systems for people with hearing or vision deficits. ese researches were focused on network infrastructures, distributed soſtware architectures as well as context information models to support pervasive computing applications in smart environments. e AAL environments leveraging smart devices have the ability to support user’s daily life activities through efficient context evaluation systems that support activities for different users’ requirements. At the same time, application adaptation for these activities is also required in response to changes from the environment. In this regard, the interconnections among components sharing the same context are also rele- vant. A crucial role in this scenario is played by the mid- dleware infrastructure as it provides the central connection point that is shared by all the components according to the needed information exchanges. A middleware infrastructure provides a set of basic services for the development of an AAL and vital signs monitoring applications. Activity recognition is an important issue for healthcare since sufficient information about patients is vital for an effective care. Monitoring the activities of patients enables hospital staffs to provide specialized care. For example, in a pervasive hospital, a nurse can use a mobile activity monitor to provide immediate care for patients in need of assistance or in risky situations [1]. Also in home environment, due to decline in both physical and mental abilities, some elderly are oſten unable to make the desirable bodily movements in the bed and repositioning that are critical for blood circulation and relieving of prolonged pressure over the body. For these
Transcript of AAL Middleware Infrastructure for Green Bed Activity Monitoring

Hindawi Publishing CorporationJournal of SensorsVolume 2013, Article ID 510126, 15 pageshttp://dx.doi.org/10.1155/2013/510126
Research ArticleAAL Middleware Infrastructure for Green BedActivity Monitoring
Filippo Palumbo,1,2 Paolo Barsocchi,1 Francesco Furfari,1 and Erina Ferro1
1 ISTI-CNR, Pisa Research Area, Via G.Moruzzi 1, 56124 Pisa, Italy2 Computer Science Department, University of Pisa, Largo B. Pontecorvo 3, 56127 Pisa, Italy
Correspondence should be addressed to Paolo Barsocchi; [email protected]
Received 8 February 2013; Revised 19 June 2013; Accepted 20 June 2013
Academic Editor: Ignacio Matias
Copyright © 2013 Filippo Palumbo et al. This is an open access article distributed under the Creative Commons AttributionLicense, which permits unrestricted use, distribution, and reproduction in any medium, provided the original work is properlycited.
This paper describes a service-oriented middleware platform for ambient assisted living and its use in two different bed activityservices: bedsore prevention and sleeping monitoring. A detailed description of the middleware platform, its elements andinterfaces, as well as a service that is able to classify some typical user’s positions in the bed is presented. Wireless sensor networksare supposed to be widely deployed in indoor settings and on people’s bodies in tomorrow’s pervasive computing environments.The key idea of this work is to leverage their presence by collecting the received signal strength measured among fixed general-purpose wireless sensor devices, deployed in the environment, and wearable ones. The RSS measurements are used to classify aset of user’s positions in the bed, monitoring the activities of the user, and thus supporting the bedsores and the sleep monitoringissues. Moreover, the proposed services are able to decrease the energy consumption by exploiting the context information comingfrom the proposed middleware.
1. Introduction
The last few years have seen research development in the fieldof ambient assisted living (AAL), which can be defined asconcepts, products, and services supporting a healthy andindependent life of elderly citizens with intelligent systemsthat assist them in carrying out their daily activities. AALencompasses a wide range of applications ranging from tele-monitoring of vital parameters for patients with chronic dis-eases to scenarios involving home automation and domotics,the recognition of adverse events such as a fall causing afracture, or specific assistance systems for peoplewith hearingor vision deficits. These researches were focused on networkinfrastructures, distributed software architectures as well ascontext information models to support pervasive computingapplications in smart environments.
TheAAL environments leveraging smart devices have theability to support user’s daily life activities through efficientcontext evaluation systems that support activities for differentusers’ requirements. At the same time, application adaptation
for these activities is also required in response to changesfrom the environment. In this regard, the interconnectionsamong components sharing the same context are also rele-vant. A crucial role in this scenario is played by the mid-dleware infrastructure as it provides the central connectionpoint that is shared by all the components according to theneeded information exchanges. A middleware infrastructureprovides a set of basic services for the development of anAALand vital signs monitoring applications.
Activity recognition is an important issue for healthcaresince sufficient information about patients is vital for aneffective care. Monitoring the activities of patients enableshospital staffs to provide specialized care. For example, in apervasive hospital, a nurse can use a mobile activity monitorto provide immediate care for patients in need of assistanceor in risky situations [1]. Also in home environment, due todecline in both physical andmental abilities, some elderly areoften unable to make the desirable bodily movements in thebed and repositioning that are critical for blood circulationand relieving of prolonged pressure over the body. For these

2 Journal of Sensors
reasons, continuous observation of the patients, through abed position detection service, is necessary in order to preventthe above-mentioned adverse effects. Moreover, monitoringthe body movements during the sleep is important to recog-nize sleeping disorders for diagnosis and prompt treatmentof disease. A bed position detection service can also providedetailed sleeping profiles that depict periods of restlessnessand interruptions such as bed exits and entries due tovisiting the bathroom.This information helps find trends thatcorrelate to certain diseases. Moreover, it enables monitoringeffectiveness of treatments to sleep-related diseases. In orderto monitor context and behaviour of subjects in the bed, theauthors in [2] propose the use of pressure sensing system.In fact, the pressure evidences can assist in determining theelderly persons position. However, this solution is based onspecific hardware and does not exploit the pervasive smartenvironment around the elderly person. Instead, in this workwe verified that the presence of a generic and not specificwireless devices (such as light, switch, and mains poweroutlet sensors) can be exploited to infer the elderly position.Usually, the elderly persons are monitored with wearablesensor devices that communicate through a wireless sensornetwork (WSN) themedical data (such as pressure, heartbeat,etc.) to a server. In this work instead, we propose a distributedinfrastructure where data can travel through shared busesand can be used by different components in order to infercritical situations. The key point of the proposed system isthe availability of mechanisms, tools, and methodologies forthe rapid prototyping of AAL applications built on top of itwithout knowledge about the network infrastructure or thecommunication protocols needed to communicate with theWSN.
We leverage the received signal strength (RSS) measuredbetween the wearable sensors and the WSN to infer thepatients position in the bed. Since the RSS does not requirea special or a sophisticated hardware and it has become astandard feature inmost of the wireless devices, the proposedtechnique is simple and minimally invasive. A wide varietyof techniques and algorithms are found in the literatureto classify measurements for posture and movement recog-nition. Most of them are based on traces collected usingaccelerometers and gyroscopes. Techniques range from feed-forward backpropagation neural networks [3] to discretewavelet transforms [4], classification techniques [5–7], andhidden Markov models [8]. In this work support vectormachine (SVM) classification techniques were implementedto recognize user’s positions in the bed due to their success inmany classification problems [5–7].
Our purpose is not to present a finely tuned and well-engineered algorithm, but to increase the performance interms of energy consumption with respect to the state of theart. Moreover, in this work we will show that by exploitingthe context information coming from the context bus ofthe proposed middleware platform, we are able to furtherdecrease the overall energy consumption of the WSN.
The paper is organized as follows. Section 2 describesthe reasons that led us to investigate this issue. Section 3presents the middleware architecture and the bed positiondetection service. The SVM method used to classify the bed
positions is also briefly described. Results are reported andcommented on in Section 4, and concluding remarks aredrawn in Section 5.
2. Motivations
The use of a middleware infrastructure able to provide datafrom any kind of sensor installed at the assisted person’s homeis essential for AAL applications where context informationcan be shared among different services. The objective of thiswork is to provide a middleware infrastructure for the rapidprototyping of applications of ambient intelligence (AMI) forhealthcare and AAL, with a certain degree of dependability.In particular, we propose a bed position detection servicethat is the input for other two important services, namely,bedsores prevention and sleep monitoring services. Theseservices together are called bed activity monitoring (BAM)services.
The key point of the proposed work is the optimization,in terms of energy consumption, of the resources used by theservices to infer useful information about the health, safety,and well-being of the assisted person. To do this, the use ofcontext information coming from sensors and informationabout the activities of the user coming from dedicatedactivity recognition services becomes crucial to reduce theenergy consumption of the overall WSN deployed in theenvironment. The proposed BAM services use a wearabledevice to monitor the sleeping activity of the user. Increasingthe battery life of thismobile devicemeans reducing the effortfor recharging and maintenance of the device by the user,making him feel less in need of care.
2.1. AAL Middleware. Making software a commodity bydeveloping an industry of reusable components was set as agoal in the early days of software engineering. Evolving accessto information and to computing resources into a utility, likeelectric power or telecommunications, is also a big target inthe current ICT research fields. While significant progresshas been made towards these goals, their achievement stillremains a long-term challenge. As stated in [9], the comput-ing facilities of large enterprises are evolving into an utility.This is true for AAL system especially when integrated withHealthcare Information Systems (HIS), which should becomefar more portable from one site to another in order to limitdevelopment and maintenance costs. On the way to meetingthis challenge, designers and developers of distributed soft-ware applications are confronted with more concrete prob-lems in their day-to-day practice. Reusing legacy software,developing mediation systems, component-based architec-tures, or implementing client adaptation through proxies aresituations where applications use intermediate software thatresides on top of the operating systems, and communicationprotocols to perform the following functions: hiding distri-bution (i.e., the fact that an application is usually made up ofmany interconnected parts running in distributed locations),hiding heterogeneity (i.e., various hardware components,operating systems and communication protocols that areused by the different parts of an application), providing uni-form and standard high-level interfaces (so that applications

Journal of Sensors 3
can easily interoperate and be reused, ported, and composed),supplying a set of common services to perform variousgeneral-purpose functions, in order to avoid duplicatingefforts and to facilitate collaboration between applications.This intermediate software layer have come to be knownunder the generic name of middleware. Using middlewarehas many benefits, most of which derive from abstraction:hiding low-level details, providing language and platformindependence, reusing expertise and possibly code, easingapplication evolution. As a consequence, the applicationdevelopment cost is reduced, while quality (sincemost effortsmay be devoted to application-specific problems), portabilityand interoperability are increased [10].
In this work, we propose a middleware that, despite itsgeneral-purpose nature, is well suited to the AAL context.Since the inner context-aware nature of AAL applications,the presence of a pervasive solution that provides any kindof information about the interaction between the user andthe surrounding environment became a key aspect for theireffectiveness.
2.2. Bed Activity Monitoring Services
2.2.1. Bed Position Detection Service. Continuous observa-tions of the assisted person through a bed position detectionservice is necessary in order to prevent bedsores or tomonitorhis sleeping behaviour. This service is the core service forBAM services providing inputs for further analysis by otherAAL services. The proposed component-based architecturelets developers use services in a modular way. Future serviceswill be able to use the data produced by the bed positiondetection service without rewriting a new ad hoc component.The configurable parameters for this service are the observa-tion time and the sampling frequency. By means of these twoparameters, a more efficient use of the WSN deployed in theenvironment is possible.
2.2.2. Bedsores Prevention Service. Nursing home requires acaregiver that ideally observes the elderly around the clockto prevent bedsores. The caregivers have to provide a highdegree of surveillance and attendance to the elderly all thetime. Moreover, the knowledge and personality of caregiversaffect the quality of nursing care. Lack of timely care andinsufficient preventive measures taken by human caregiversleads to unfortunate consequences to be suffered by theelderly and also indirectly affects their family members. Thiscan lead to further escalation in the alreadymounting health-care costs for the government and degradation of qualityof life (QoL) for the elderly. The bedsores can be mainlycaused due to unrelieved or constantly applied pressure overbony and bedsore-prone areas of the body. Bedsores areregarded as one of the serious diseases and take a longtime to completely heal [11]. Figure 1 shows the areas of thebody most vulnerable to bedsores: heels, hips, buttocks, andshoulders. In addition to the pain and embarrassment thataccompanies bedsores, patients are at risk for developing avariety of medical complications such as sepsis, an infectionof the blood from bacteria entering the body from a bedsore.The most widely accepted ways of preventing bedsores is to
Backof
the head
ShoulderElbow
ButtocksHeel
EarShoulder
ElbowHip
ThighLeg
Heel
ElbowRib cage
ThighKnees
Toes
Figure 1: Diagram showing the areas of the body at risk of pressuresores when lying down.
actively turn the patients who have limited mobility on aregular basis (every 2 h) to avoid unrelieved pressure fromforming on the body. Usually the caregivers use a turningsheet to keep track of the patient’s position, recording thelast position, the elapsed time, and the next position (turningplan).
In this work, we propose a service able to automaticallyassess the bedsore risk, able to help the caregiver to decidethe care program and, thus, control that the actual patient’sposition matches with the turning plan, and increase thequality of nursing care. This is the scope of this servicethat wants to support the pressure ulcer prevention by (i)monitoring the patient’s self-movements and adapting thecaregivers interventions and (ii) decreasing the burden ofthe caregiver to prevent the bedsore. In fact, by knowing theposture of the subject, potential bedsore risks of the subjectcan be inferred and timely reminders can be sent to care-givers.
2.2.3. Sleep Monitoring Service. The sleep plays an importantrole in quality of life and is an important factor in stayinghealthy. Having inadequate and irregular sleeping patternshas a serious impact on our health and can lead to manyserious diseases like cardiovascular disease, obesity, depres-sion, and diabetes [12]. People can feel fatigued and cannotconcentrate during the day if they do not sleep for a sufficientamount of time. This may be caused by interrupted sleep,such as having frequent periods of restlessness during sleep.Moreover, in many cases, particular body positions shouldbemaintained or avoided (i.e., patients with obstructive sleepapnea should avoid sleeping supine [13]).
Sleepmonitoring service is essential to recognize sleepingdisorders for diagnosis and prompt treatment of disease. In

4 Journal of Sensors
fact, it can provide healthcare providers with quantitativedata about irregularity in sleeping periods and durations.Moreover, it can also provide detailed sleeping profilesthat depict periods of restlessness and interruptions helpingto find trends that correlate to certain diseases. Finally,it enables monitoring effectiveness of treatments to sleep-related diseases. Many studies (such as [14]) are focused onfinding correlations between body positions during sleep andvarious breathing problems (e.g., sleep apnea). Therefore,a bed position detection service that provides informationabout body positions during sleep helps such type of studies.
3. The Proposed Solution
The goal of our work is to infer the elderly position in thebed, without using an ad hoc or sophisticated hardware. Infact, we suppose that the elderly/patient wear any wirelesssensor device able to transmit (hereafter also called mobile),and that the environment is equipped with fixed wirelessdevices (hereafter also called anchors) installed transparentlyat home in general-purpose devices such as lights, mainspower outlets, or light switches. Indeed, recent advances insensor technology have enabled the development and deploy-ment of wearable systems for patients’ remote monitoring.We envision that in the near future wearable sensor willbe placed directly on the woven in order to increase theacceptability of the patient. In [15], the authors describethe key enabling technologies to monitor the patients usingacceptable wearable sensors such as flexible wireless sensorand e-textile technology.
In this work, we propose a bed position detection servicethat, leveraging the RSS measured between the mobile andthe anchors, infers the patient’s bed position.The informationabout the position while the patient is in bed would allowus to support caregivers in the prevention of bedsoresand monitoring of patient’s sleeping behaviour. Indeed, theproposed services would be able to alert the caregivers if theposition of the patient keeps fixed for a long time, to tailoringthe interventions to the patient’s current needs (bedsoresprevention service) or to recognize sleeping disorders as earlyas possible for diagnosis and prompt treatment of disease(sleep monitoring service).
In the following, we will describe the proposed mid-dleware architecture, the proposed bed position detectionservice (that, as already highlighted in Section 2, is the mainbuilding block of any bed activity monitoring services), and,finally, the practical usage of the overall system.
3.1. Middleware Architecture. The sensors, the services, andthe components integrated in the system will use a softwareinfrastructure, which is based on amiddleware that hides het-erogeneity and distribution of the computational resourcesin the environment. The proposed middleware solution usesa Java/OSGi platform as the reference platform for thedevelopment.However, the integration of such components isdemanding, especially if we consider that the system is com-posed of different services written in different languages andit may need to be accessible by a number of remote healthcarecenters whichmay use different protocols.The fragmentation
middleware API layer
communication layer
AAL service
Middleware
RESTfulPublish/subscribeMiddleware
Service bus
Context bus
“Component”
“Component”
“Component”
Figure 2: The proposed middleware architecture.
in this sector is still high, but there are initiatives working tobuild converging solutions. Service interoperability is a keypoint to build an ecosystem of applications that helps thegrowth of an ambient assisted living (AAL) consumermarket.In this regards, several European projects have intenselyworked on the definition and standardization of a commonplatform for AAL, on top of which to develop intelligentsoftware applications for the end users. Our objective is todesign and develop a system compliant to the results of themost promising research projects in this field [16]. Withinthe proposed AAL ecosystem, an AAL space is intendedto be the physical environment—such as the home of anassisted person—in which independent living services areprovided to people that need any sort of assistance. In such avirtual ecosystem, hardware as well as software componentscan “live” while being able to share their capabilities. Inthis space, the proposed platform facilitates the sharing oftwo types of capabilities: service (description, discovery,and control of components) and context (data based onshared models). Therefore, connecting components to theplatform is equivalent to using the brokerage mechanism ofthe middleware in these two areas for interacting with othercomponents in the system. Such connectors together with theapplication logic behind the connected component are calledaltogether “AAL services.’’
3.1.1. Middleware Layers. The concrete middleware architec-ture is made up of two layers: a core middleware API layerand a communication layer that includes a publish/subscribeconnector and a RESTful connector (Figure 2). A genericservice built upon themiddleware can discoverwhich sensorsare present in the environment and other services togetherwith their functionalities using methods from the middle-ware API layer. The underlying layer fulfils these requestsexploiting the connectors available. In the communicationlayer, anMQTT [17] and aRESTful [18] connector are present.

Journal of Sensors 5
By means of these connectors, the middleware realizes apublish/subscribe and a method description and invocationmechanism transparently to the services that use them.
3.1.2. The Buses. Two buses form the heart of the proposedmiddleware: a context bus and a service bus. All communi-cations between applications can happen in a round-aboutway via one of them, even if physically, the applicationsare located on the same hardware node. Each of the buseshandles a specific type of message/request and is realizedby different kinds of topics. The aim of the middlewareis to provide a publish/subscribe mechanism for accessingthe context information about the physical environmentand physiological data. This information will be exposedas different topics: topics for discovery and description ofdevices and services that form the service bus and topics forpublishing and retrieving data from devices and services thatform the context bus.
3.1.3.TheAnnounceMechanism. Themiddleware is in chargeof presenting the available sensors and services in the systemimplementing an announce mechanism on the service bus.A generic resource (i.e., a sensors exporter or a service) usesthis mechanism to notify its subscribed system componentsthe presence andmodification of the exported resources.Thisprocess of announcing and exchanging available content isefficiently implemented using a particular message on therelative topic in the service bus. The message is a descriptorfile containing an id, a description, a type (i.e., exporter orservice), a set of resources (i.e., sensors or components), anda set of methods. Once a resource has been announced onthe service bus, a generic service can search for it filteringthe descriptor fields and use it. A generic service can alsosubscribe to future available resources or particular kindof them by means of filters. When the required resourcebecomes available, the subscribers will be notified with thecorresponding descriptor. In the same way when a resource ismodified or becomes unavailable, the subscribed services willbe notified with the new descriptor in case of modificationor null value in case of unavailability. The topic used forannouncement and discovery of devices and services, the so-called service bus, has this format:
<<location>>\serviceBus\<<serviceID>>,
where location identifies the room in the assisted person’sapartment, serviceBus is the keyword to identify the topic asa service bus topic, and serviceID is the unique identifier ofthe service. The message of this topic is a JavaScript ObjectNotation (JSON) [19] descriptor file. JSON is a lightweight-text-based open standard for client/server data exchange, andan opportunity in the Internet ofThings (IoT) [20] ecosystemarises from the choice of JSON: connected sensor nodescan use standard Internet protocols with lightweight webservices based on REST/HTTP. In the case of sensors withlow-resource hardware, the exporter, generally installed ina gateway node with higher hardware specifications, is incharge of translating small data packets from sensor motesinto JSON descriptors.
3.1.4. The Context Bus. The middleware takes care of dis-patching information about the state of the resources amongservices by means of a context bus. Any service that wants tomake his data available (sensors readings and events or dataanalysis results) can use the middleware API to publish it.Any service interested inmonitoring these data can subscribeto the relative context bus topics indicated in the descriptorusing the middleware API. The topic used for gathering datafrom devices and service, the so-called context bus, has thisformat:
<<location>>\contextBus\<<serviceID>>\
<<subtreefield>>,
where location identifies the room, contextBus is the keywordto identify the topic as a context bus topic, serviceID is theunique identifier of the service, and the subtreefield identifiesall the resources of that service that can be monitored. Foreach resource there will be a dedicated context bus subtopic.The message of these topics is a string value.
3.1.5. Overall System Architecture. Figure 3 shows the pro-posed system architecture where a particular kind of AALservices, called exporters, provides data from a generic WSNto other services in the environment. Different exporterscan be present to let services interact with different WSNtechnologies (i.e., ZigBee, Bluetooth, andKNX).The exporteracts like a gateway for the WSN. It announces on the servicebus the presence of a new device installed and publishesevents and sensed data on the context bus. It can be alsoconfigured using the API described in its descriptor file.Another important service of the proposed system is thesimple activity recognition service. It is in charge of publishsimple activity information like “is sleeping,” “is cooking,”and “is bathing” based on the context data gathered from thecontext bus. In the proposed scenario, data from a presencepressure detection sensor, a passive infrared sensor (PIR),and a light sensor are used to infer the activity “is sleeping.”The core components of the proposed system are the bedactivity monitoring (BAM) services including a bed positiondetection, a bedsores prevention, and a sleep monitoringservice. These services gather RSS sensors data and activitydata from the context bus in order to monitor context andbehaviour of subjects on the bed.Thebed activities events andalerts will be published, and a remote interoperability servicecan transmit and visualize them to remote relatives, telecarecenters, and hospitals.
3.2. Bed Position Detection Service
3.2.1. Devices. In order to retrieve environmental data andinfer simple activities, we test our system by using wirelesssensors provided by different manufacturers. The bed occu-pancy sensor is produced by Tunstall [21] and consists of abed pressure pad, which is placed underneath the mattress ofthe user.The sensor raises events when the user is in or out thebed transmitting on the dedicated European 869MHz socialalarm frequency. The same frequency is used by Tunstall’s

6 Journal of Sensors
MiddlewareSensors
exporters
Middleware
Telecarecenter Tools
Hospital Continua(IHE)
RemoterelativesTools
InternetRemote
interoperability
DBWSN
Middleware
Bed positiondetection
Middleware
Bedsoresprevention
Middleware
Sleepmonitoring
Middleware
Simple activityrecognition
Middleware
OtherAAL services
Bed activity monitoring services
Context busService bus
Figure 3: The proposed system architecture.
ba
cd
Figure 4: The sensors used in the test system: (a) bed occupancysensor, (b) light sensor, (c) PIR, and (d) IRIS transceivers.
wireless PIR detectors delivering motion detection. The sen-sors are connected to a gateway that collects the events raised.A middleware instance is installed on the gateway nodeto announce sensor descriptors on the service bus and theevents on the context bus. Also an illuminance sensor whichcontains a light sensor that detects the level of light in a roomhas been used.The sensor, called ZLum, is a wireless productproduced by Cleode [22] that sends its alarms on ZigBeenetwork. It is compliantwith ZigBee Pro 2007 stack. AZigBeegateway has been used and integrated in the middleware. Inorder to investigate how the RSS measured between wirelessdevices can be used to infer the elderly position in the bed, wetest our system by using a WSN composed of Crossbow IRIStransceivers [23] operating at 2.4GHz (ISM band) accordingto the IEEE 802.15.4 protocol [24]. The sensors include anAtmel ATmega1281 microcontroller, 128 KiB flash memory tostore the executable code, 512 KiB serial (slow) flash memoryto store data, and 8KiB RAM. The transceiver is powered bytwo AA batteries and draws 8mA in active mode plus 17mAin continuous Tx mode at max power (3 dBm) and 20mA inRxmode.The antenna is a 1/4wavemonopole. Figure 4 showsthe sensors used in the test system.
S2 S1
S3
Figure 5: Setup environment: three fixed sensors 𝑆1, 𝑆2, and 𝑆
3are
placed on the environment. 𝑆1is placed on the nightstand, 𝑆
2is
placed on the dresser, and 𝑆3is placed on the wardrobe. The user
wears a mobile sensor placed on the breast.
3.2.2. Setup and Integration. The environment chosen to testthe proposed solution is a typically bedroom with wardrobe,nightstands, and a dresser. Three fixed sensors are placedon the environment as highlighted in Figure 5; two sensorswere placed at about 55 cm height (𝑆
1and 𝑆2), while the last
one (namely 𝑆3) was placed on the dresser at about 85 cm
height. The users wear a mobile sensor that was placed onthe breast. The bed positions we take into account in thiswork are summarized in Table 1. We conducted a series ofexperiments (fifty) that consist of cyclical repeat in all thebed positions.The user’s positions are held at least 10 seconds,and the fifty repetitions were performed in different days toverify the experiment repeatability. The sampling frequencyshould be chosen considering on one hand the computingconstraints and networking overhead, which are both directlyresponsible for power consumption in the sensors, and on theother hand RSS waveform reconstruction accuracy. In thiswork, we evaluate the accuracy of the bed position detectionservice collecting the RSS measures for an observation periodof 2 seconds and with a sampling frequency of 1, 2, 4 and

Journal of Sensors 7
Table 1: Schematic representation of the considered positions.
Prone—position 1 Left lateral—position 2 Supine—position 3 Right lateral—position 4
Lie on their bellieswith head turned tothe side
Sleep on left side withboth arms down
Lie on their backswith arms up or down
Sleep on right side withboth arms down
{
"id":"crossbowIris",
"type":"exporter",
"description":"The exporter for Crossbow
Iris sensors",
"resources":
[
{"deviceId":"Anchor1", "freq":"1"},{"deviceId":"Anchor2", "freq":"1"},{"deviceId":"Anchor3", "freq":"1"}.{"deviceId":"Body1", "freq":"1"}
],"getSamplingFrequency":
{
"type":"method",
"description":"GET method responsible
for obtaining the sampling frequency
of the transceivers",
"returns":"number",
"params":""
},"setSamplingFrequency":
{
"type":"method",
"description":"SET method responsible
for obtaining the sampling frequency
of the transceivers",
"returns":"boolean",
"params":{"deviceId":{"type":"number"},"freq":{"type":"number"}}
},⋅ ⋅ ⋅
}
Pseudocode 1: The crossbow exporter JSON descriptor file.
8Hz. The time between two consecutive observations is aparameter that is set to zero in order to generate the user’sposition every observation period. The Crossbow sensorshave been integrated in the system through an OSGi bundle
(the exporter) that wraps the procedures of the embeddedoperating system installed on the transceivers. Pseudocode 1shows a snippet of the message published on the service busonce the exporter is started. The descriptor file of the bedposition detection service will present similar methods to getand set the observation period and the sample frequency.
3.2.3. The Proposed Method. In order to infer the user’sposition, we used the well-known SVM classificationmethod[25, 26]. In our case, each bedside position produced threetraces (one for each receiver, 𝑆
1, 𝑆2, and 𝑆
3); each triple-trace
is an object to be classified.These triple-traces were identifiedby up to four features, as described in the next section. Thespecific features extracted from the RSS traces were chosenusing Weka, a collection of tools for data preprocessing,classification, clustering and more [27]. Weka was also usedto evaluate the performance of the SVM algorithm [25, 26].A one-against-one approach was used to tackle themulticlassclassification problem. The classification is made by a max-wins voting strategy. This method constructs a classifier thatis trained for every pair of classes (in our case a class wasassociated to a specific position). After that, for a given testsequence, each classifier assigns one vote, and the object isassigned to the class with the highest number of votes. Forboth classification methods, classification performance wascomputed by using a 10-fold cross-validation technique; thatis, an object set (a triplet of traces, for each position) wasrandomly subdivided into 10 equal-sized partitions: 9 of themwere used as the training dataset and the last one was usedas the testing dataset. The same procedure was repeated 10times, until each partition was used for testing. In this way,each object was used exactly once for testing.
3.3. Practical Usage. In order to clarify the overall function-alities of the proposed system, a simple usage scenario will beshown (Figure 7). After an installation phase, any device ableto communicate its state present at home will be available onthe service bus and will publish sensed data on the contextbus. We want to monitor the sleeping behaviours and criticalsituations when the assisted person is in bed. For this reason,

8 Journal of Sensors
Alarm trigger Alarm
Bedsores prevention service
0 1 2 3 4 5 6Time
0 1 2 3 4 5 6Time
· · ·
· · ·
Turning plan
P1
P2
P3
P4
tp(t)
e(t)
P1
P2
P3
P4
Bed position service
bp(t) +− if e(t) > 0
Posit
iontp(t)
Posit
iontp(t)
Figure 6: The bedsores detection service reasoning. If the actual position 𝑏𝑝(𝑡) of the patient does not match with the turning plan position𝑡𝑝(𝑡), an alarm is raised.
the simple activity recognition service will be listening to thesensed data coming from the PIR, the bedpresence pressuredetection sensor, and from the light sensors. When theassisted person goes to sleep, first the PIR indicates thatthere is a movement in the bedroom, then the bedpresencewill communicate that there is somebody in the bed, andthen the light sensor will publish data about the change ofilluminance level in the room. Collecting these context data,the simple activity detection service infers that the person isgoing to sleep and will publish the “isSleeping” activity eventon the context bus. The bed activity monitoring services arelistening for this event because they are subscribers for thattopic. Depending on the type of BAM service selected bythe caregiver, once the event is received, the chosen servicewill configure the bed position detection service in termsof observation period and sampling frequency in order tooptimize the resources utilization. Then, it will start the bedposition detection service and begin to collect bed positionevents. For each patient, the proposed systemmust be trained,collecting the RSS traces in each position. After the trainingphase, the bedsores prevention service will publish alarmsif a critical bedsore situation is detected. Since the patientsneed to be moved every two hours in order to prevent therisk of bedsores, we propose a service able to control that theactual position of the patient matches with the turning plan.Therefore, the service will publish alarms if the position of thepatient (detected by our system) and the turning plan doesnot match (Figure 6).
If the sleeping monitoring service is running, it willreport the collected bed positions timeline.The bed positionstimeline will be accessible via the RESTful API describedin the relative descriptor file on the service bus. Once
the assisted person wake up, the simple activity recognitionservice will publish the event “isAwake” to the context busand the services listening for this event will stop theiractivities. Figure 7 shows the activity diagram for the bedsoresprevention service. In our experimental setup, the wirelesssensor devices were close to each other (in the same room);this deployment ensured a negligible packet loss. Indeed,during our measurement campaign we did not observe anypacket loss.
4. Results and Discussions
In this section, the results of the bed position detectionservice are presented. In particular, we evaluated the perfor-mance of the proposed method in terms of accuracy, energyconsumption, and responsiveness.
4.1. Preliminary RSS Traces Analysis. Figure 8 presents anexample of typical RSS 40-minute registrations for the bedpositions. The variations between RSS traces relevant todifferent user’s position are clearly apparent. In particular, theRSS values when 𝑆
3is used for the left and right lateral posi-
tions are quite similar, as well as the prone and supine posi-tions for 𝑆
2. For this reason, exploiting more sensors and/or
more RSS features, the classification performance shouldincrease. In the following, we will describe the extracted RSSfeatures showing also the achieved performance.
4.2. Feature Extraction. The first step of the classificationprocedure was to identify a limited number of features thatact as the “fingerprint” of a trace. An initial large set of

Journal of Sensors 9
User WSN exporters Simple activity monitoring Bed position detection Bedsores prevention
Go to bed
Reasoning
Configure crossbow exporter
Reasoning
Start
Configure bed positiondetection service
Start
Reasoning
Publish alarm
Gather bed positionsevents
Gather RSS data
Gather “isSleeping”event
Publish RSS values
Publish bed positions events
event
Publish pressure, PIR,and light events
Gather pressure, PIR,and light events
(Bedsore alarm)
Publish “isSleeping”
Figure 7: The activity diagram of the bedsores prevention usage scenario.
possible features was defined, fromwhich the best performerswere chosen using the feature selection tools provided byWeka. In the set of possible features, we considered bothtime-independent and time-series-based statistics. As far astime-independent statistics are concerned, the ones involvingonly one transceiver (either 𝑆
1, 𝑆2, or 𝑆3) were mean value
𝜇, standard deviation 𝜎, skewness, and kurtosis. The oneinvolving two transceivers (chosen among 𝑆
1, 𝑆2, and 𝑆
3) was
the cross-correlation 𝜌. As far as time-series-based statisticsare concerned, we considered the level crossing rate (LCR)at four different thresholds, firstly computed on each devicesseparately, and secondly on the difference of the devices’RSS measurements. The LCR is a statistical parameter thatquantifies how often the signal crosses a given threshold inthe positive-going direction. The four thresholds consideredin this work were LCR1 at 𝜇 − 0.5𝜎, LCR2 at 𝜇 + 0.5𝜎, LCR3at 𝜇−𝜎, and LCR4 at 𝜇+𝜎, since they are the most used LCRthresholds used in the literature [6, 7, 24]. A features’ short listwas selected from the initial large set data in order to optimizeclassification performance. If two of the three transceivers areused, the list of features includes two mean values among𝜇1, 𝜇2, or 𝜇
3and two standard deviations among 𝜎
1, 𝜎2, or
𝜎3. If only one sensor is used, the feature list includes the
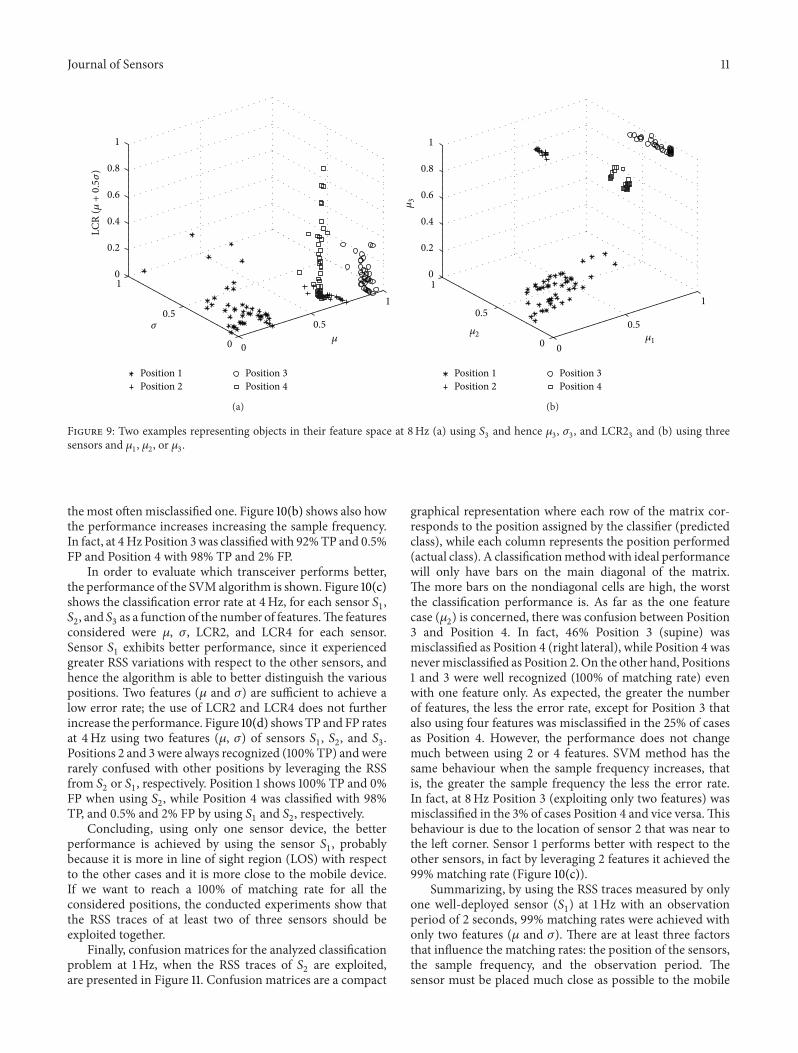
mean value 𝜇, the standard deviation 𝜎, LCR2, and LCR4.An example of how some features are distributed, changingthe number of exploited sensors is shown in Figure 9. Asshown in Figure 9(a), exploiting only one sensor and henceLCR2, 𝜇, and 𝜎, Positions 1 and 3 are well separated fromPositions 2 and 4, which means that Positions 1 and 3 can bewell recognized, whereas Positions 2 and 4 are more difficultto identify and may be confused to each other. Instead, whenwe chose to exploit all the three sensors and 𝜇
1, 𝜇2, and
𝜇3, Figure 9(b) shows that all the positions can be easily
recognized since the features are well distributed.
4.3. Experimental Results. Performance of the proposed sys-tem is measured in terms of error rate or, equivalently, ofmatching rate (i.e., its complementary) and in terms of truepositive rate (TPR) and false positive rate (FPR) measuresdefined as follows:
TPR = TPTP + FN
, FPR = FPFP + TN
, (1)

10 Journal of Sensors
0 4 8 12 16 20 24 28 32 36 400
5
10
15
20
25
30
Time (minutes)
RSS
(a)
0 4 8 12 16 20 24 28 32 36 4010
15
20
25
30
35
40
Time (minutes)
RSS
(b)
0 4 8 12 16 20 24 28 32 36 400
5
10
15
20
25
30
35
40
Time (minutes)
RSS
(c)
Figure 8: Samples of RSS traces of the five different bed positions estimated from sensors (a) 𝑆1, (b) 𝑆
2, and (c) 𝑆
3.
where true positive (TP) test result is the one that detects thecondition when the condition is present, a false negative (FN)is defined as a negative result on a test when the conditionis present, a false positive (FP) test result is the one thatdetects the condition when the condition is absent, and a truenegative (TN) test result is the one that does not detect thecondition when the condition is actually absent.
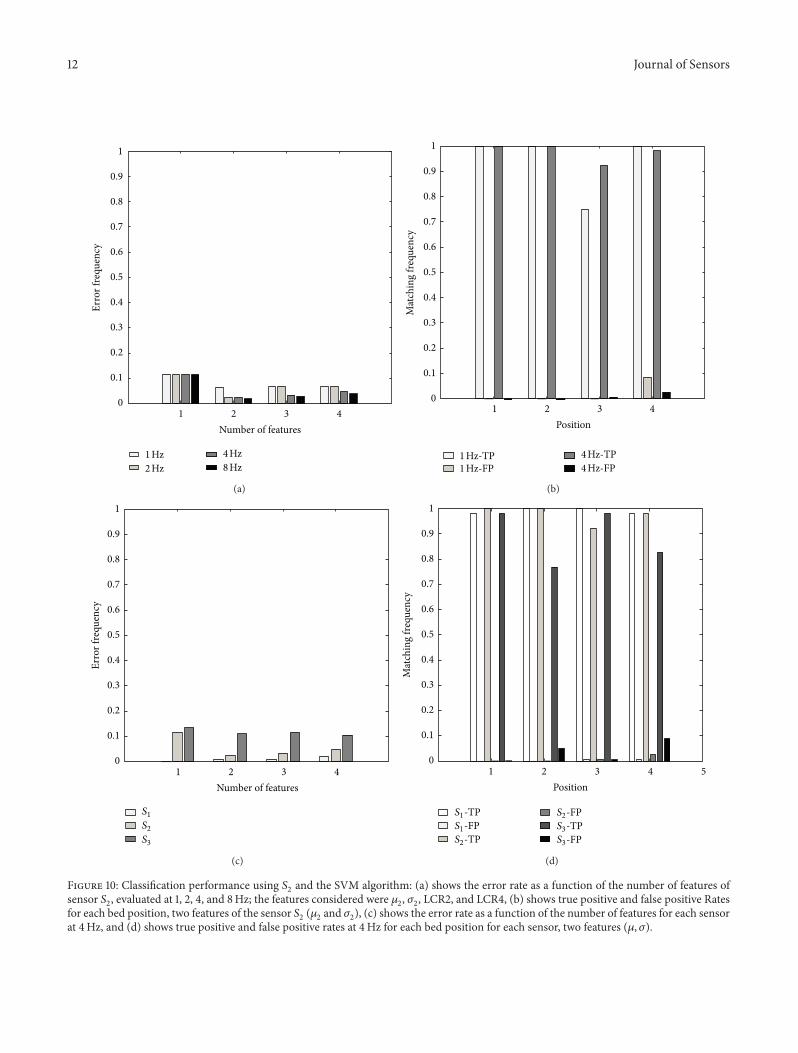
Figure 10(a) shows the error rate using only sensor 𝑆2as
a function of the number of features, when the sampling ratewas 1, 2, 4, or 8Hz.We chose the sensor 𝑆
2since it did not get
neither the best nor worst performances. Firstly, one featurewas considered (𝜇
2) achieving about 88% of matching rate at
1Hz.Thematching rate increaseswith the number of features,as expected. In fact, when using two features (𝜇
2, 𝜎2), 94%
matching rates were achieved. In this case, the use of LCR2and LCR4 does not significantly improve the performance.
Moreover, increasing the sample frequency, the performancein terms of error rate shown in Figure 10(a) increases.
Figure 10(b) shows the TP and the FP rates, consideringsensor 𝑆
2and only two features (𝜇
2and 𝜎2). Positions 1 and 2
exhibited 100% TP and 0% FP, while Position 3 was classifiedwith 75% TP and 0% FP and Position 4 was classified with100% TP and 8% FP, when the sample frequency of 1Hz waschosen. Position 4 (right lateral) presented the highest valueof FP, which means that it was the most often misclassifiedone. In fact, as we will see later Position 3 and Position 4 aremisclassified; that is, Position 4 is classified as 3 and vice versa.Moreover, Position 1 (prone) and Position 2 (left lateral) hadthe highest values of TP and the lowest value of FP, makingthem the most correctly recognized movements. When theSVM algorithm was used, Positions 1, 2, and 4 were themost correctly recognized movements, while Position 3 was
Journal of Sensors 11
0
0.5
1
0
0.5
10
0.2
0.4
0.6
0.8
1
𝜇
𝜎
Position 1Position 2
Position 3Position 4
LCR
(𝜇+0.5𝜎
)
(a)
0
0.5
1
0
0.5
10
0.2
0.4
0.6
0.8
1
Position 1Position 2
Position 3Position 4
𝜇3
𝜇2 𝜇1
(b)
Figure 9: Two examples representing objects in their feature space at 8Hz (a) using 𝑆3and hence 𝜇
3, 𝜎3, and LCR2
3and (b) using three
sensors and 𝜇1, 𝜇2, or 𝜇3.
the most oftenmisclassified one. Figure 10(b) shows also howthe performance increases increasing the sample frequency.In fact, at 4Hz Position 3was classifiedwith 92%TP and 0.5%FP and Position 4 with 98% TP and 2% FP.
In order to evaluate which transceiver performs better,the performance of the SVM algorithm is shown. Figure 10(c)shows the classification error rate at 4Hz, for each sensor 𝑆
1,
𝑆2, and 𝑆
3as a function of the number of features.The features
considered were 𝜇, 𝜎, LCR2, and LCR4 for each sensor.Sensor 𝑆
1exhibits better performance, since it experienced
greater RSS variations with respect to the other sensors, andhence the algorithm is able to better distinguish the variouspositions. Two features (𝜇 and 𝜎) are sufficient to achieve alow error rate; the use of LCR2 and LCR4 does not furtherincrease the performance. Figure 10(d) shows TP and FP ratesat 4Hz using two features (𝜇, 𝜎) of sensors 𝑆
1, 𝑆2, and 𝑆
3.
Positions 2 and 3 were always recognized (100%TP) andwererarely confused with other positions by leveraging the RSSfrom 𝑆
2or 𝑆1, respectively. Position 1 shows 100% TP and 0%
FP when using 𝑆2, while Position 4 was classified with 98%
TP, and 0.5% and 2% FP by using 𝑆1and 𝑆2, respectively.
Concluding, using only one sensor device, the betterperformance is achieved by using the sensor 𝑆
1, probably
because it is more in line of sight region (LOS) with respectto the other cases and it is more close to the mobile device.If we want to reach a 100% of matching rate for all theconsidered positions, the conducted experiments show thatthe RSS traces of at least two of three sensors should beexploited together.
Finally, confusion matrices for the analyzed classificationproblem at 1Hz, when the RSS traces of 𝑆
2are exploited,
are presented in Figure 11. Confusion matrices are a compact
graphical representation where each row of the matrix cor-responds to the position assigned by the classifier (predictedclass), while each column represents the position performed(actual class). A classificationmethodwith ideal performancewill only have bars on the main diagonal of the matrix.The more bars on the nondiagonal cells are high, the worstthe classification performance is. As far as the one featurecase (𝜇
2) is concerned, there was confusion between Position
3 and Position 4. In fact, 46% Position 3 (supine) wasmisclassified as Position 4 (right lateral), while Position 4 wasnevermisclassified as Position 2.On the other hand, Positions1 and 3 were well recognized (100% of matching rate) evenwith one feature only. As expected, the greater the numberof features, the less the error rate, except for Position 3 thatalso using four features was misclassified in the 25% of casesas Position 4. However, the performance does not changemuch between using 2 or 4 features. SVM method has thesame behaviour when the sample frequency increases, thatis, the greater the sample frequency the less the error rate.In fact, at 8Hz Position 3 (exploiting only two features) wasmisclassified in the 3% of cases Position 4 and vice versa.Thisbehaviour is due to the location of sensor 2 that was near tothe left corner. Sensor 1 performs better with respect to theother sensors, in fact by leveraging 2 features it achieved the99% matching rate (Figure 10(c)).
Summarizing, by using the RSS traces measured by onlyone well-deployed sensor (𝑆
1) at 1Hz with an observation
period of 2 seconds, 99% matching rates were achieved withonly two features (𝜇 and 𝜎). There are at least three factorsthat influence the matching rates: the position of the sensors,the sample frequency, and the observation period. Thesensor must be placed much close as possible to the mobile
12 Journal of Sensors
1 2 3 40
0.1
0.2
0.3
0.4
0.5
0.6
0.7
0.8
0.9
1
Number of features
Erro
r fre
quen
cy
1 Hz2 Hz
4 Hz8 Hz
(a)
1 2 3 40
0.1
0.2
0.3
0.4
0.5
0.6
0.7
0.8
0.9
1
PositionM
atch
ing
frequ
ency
1 Hz-TP1 Hz-FP
4 Hz-TP4 Hz-FP
(b)
Number of features1 2 3 4
0
0.1
0.2
0.3
0.4
0.5
0.6
0.7
0.8
0.9
1
Erro
r fre
quen
cy
S2
S1
S3
(c)
1 2 3 4 50
0.1
0.2
0.3
0.4
0.5
0.6
0.7
0.8
0.9
1
Position
Mat
chin
g fre
quen
cy
S1-TP
S2-TPS1-FP
S2-FP
S3-FPS3-TP
(d)
Figure 10: Classification performance using 𝑆2and the SVM algorithm: (a) shows the error rate as a function of the number of features of
sensor 𝑆2, evaluated at 1, 2, 4, and 8Hz; the features considered were 𝜇
2, 𝜎2, LCR2, and LCR4, (b) shows true positive and false positive Rates
for each bed position, two features of the sensor 𝑆2(𝜇2and 𝜎
2), (c) shows the error rate as a function of the number of features for each sensor
at 4Hz, and (d) shows true positive and false positive rates at 4Hz for each bed position for each sensor, two features (𝜇, 𝜎).

Journal of Sensors 13
1 2 3 41
23
4
00.20.40.60.8
1
Predicted
1 feature
Actual 1 2 3 41
23
4
00.20.40.60.8
1
Predicted
2 features
Actual
Freq
uenc
yFr
eque
ncy
Freq
uenc
y
Freq
uenc
y
Freq
uenc
y
Freq
uenc
y1 2 3 4
12
34
00.20.40.60.8
1
Predicted
3 features
Actual
Freq
uenc
y
1 2 3 41
23
4
00.20.40.60.8
1
Predicted
4 features
Actual
PredictedActual
PredictedActual
PredictedActual
PredictedActual
Freq
uenc
y
1 2 3 41
23
4
00.20.40.60.8
1
1 Hz 2 Hz 4 Hz 8 Hz
1 2 3 41
23
4
00.20.40.60.8
1
1 2 3 41
23
4
00.20.40.60.8
1
1 2 3 41
23
4
00.20.40.60.8
1
0 0.1 0.2 0.3 0.4 0.5 0.6 0.7 0.8 0.9 1
Figure 11: Confusion matrices for the bed positions. The two axes on the base of each graph represent the actual position class and the classpredicted by the algorithm, respectively.The performance achieved by leveraging 𝑆
2is given as a function of the features number (𝜇, 𝜎, LCR2,
and LCR4) at 1Hz, and sample frequency (1, 2, 4, and 8Hz) when only two features (𝜇 and 𝜎) are selected.The smaller the bars outside of themain diagonal, the better the performance.
(more in LOS) in order to have a stable signal over time.Lower value of sampling frequency and observation periodimplies a lower value of energy consumption and a servicemore responsive but with a degradation of the accuracy. Inthe next section, we will analyse the best communicationarchitecture in terms of mobile lifetime, and we will showhow decreasing the observation period fixes both the energyconsumption and the accuracy performance.
4.4. Energy Consumption. As already discussed in Section 2,energy efficiency is recognised as a paramount property ofany mobile device, in particular forWSNs. Consequently, theproposed BAM services must be designed to minimize thepower consumption, especially if the services run for longperiods. There are two different approaches to measure theRSS between mobile and anchors. In the first, the mobilereceives the beacon emitted from each anchor, it computesthe corresponding RSS, and it publishes these values to thecontext bus, while in the second approach the anchors receivethe broadcast beacons emitted from the mobile, and latereach anchor transmits the measured RSS to the contextbus. As already discussed in Section 3.2.1, the transceiverdraws 17mAand 20mA in transmitting and receivingmodes,respectively. An analysis of the energy consumption of thetwo different approaches is reported in Figure 12. In fact,Figure 12 shows the lifetime of the mobile as a function ofthe sampling rate of the wireless channel, assuming that thesensor is a micaZ mote [23] equipped with an IEEE 802.15.4radio subsystem and a battery of 2000mAh. We can notethat when mobile node transmit, using 1Hz sampling rate
1 2 4 8Frequency (Hz)
Mob
ile li
fetim
e (da
ys)
Mobile transmitAnchors transmit
100
101
102
103
104
Figure 12: Mobile sensor lifetime considering a battery of2000mAh.
triplicates, the battery life compared to a 8Hz sampling rate.It is worth to note also that if the mobile device is deployedon a network where other applications exist, the system canexploits the communications required by the applications

14 Journal of Sensors
1 2 30
0.01
0.02
0.03
0.04
0.05
0.06
0.07
0.08
0.09
0.1
Number of used sensors
Erro
r fre
quen
cy
1 s2 s
0.25 s0.5 s
(a)
1 2 3 40
0.1
0.2
0.3
0.4
0.5
0.6
0.7
0.8
0.9
1
Position
Mat
chin
g fre
quen
cy
2 s-TP 0.25 s-TP0.25 s-FP2 s-FP
(b)
Figure 13: Classification performance exploiting two features (𝜇 and 𝜎) and fixing the number of the emitted beacon (hence fixing the energyconsumption) to 2: (a) shows the error rate as a function of the number of used sensors, evaluated fixing the observation period to 2, 1, 0.5,and 0.25 seconds; (b) shows true positive and false positive rates for each bed position, two used sensors (𝑆
1and 𝑆
2).
themselves to sample the channel, thus reducing the actualnumber of beacons sent by the mobile node. An importantimprovement to the energy consumption reduction is givenalso by the use of the context awareness provided by theproposed overall system. Thanks to the context informationshared between the services installed on the middleware,it is possible to infer simple activity of the user. In ourscenario, the continuous monitoring of the bed activity isuseless if nobody is sleeping. For this reason a simple activityrecognition service is present. In this way, the WSN is usedonly when needed, especially the mobile nodes. Since themobile sensor consumes more energy receiving the beaconsinstead of transmitting, the approach that allows to decreasethe energy consumption is the second one, where the mobileemits the beacons and the anchors measure the RSS values(Figure 12). Indeed, when the anchors transmit, the mobilemust receive a number of packets equal to the number ofanchors deployed in the environment (thatmeans consumingenergy in receiving mode proportionally to the numberof anchors) and later transmit a packet that contain themeasured RSS values to the bed position detection service.While when the mobile transmits the beacon, the tasks of theanchors are receive the beacon, measure the RSS, and sendthis value to the bed position detection service. Furthermore,since the mobile only has to send a beacon periodically, it canremain in idle mode between any two consecutive beacons(which means that, between any two beacons, it can turn offthe radio and the processing subsystems).
4.5. Observation Period. In this section, we want to analyse,fixing the energy consumption (i.e., number of emittedbeacons), the accuracy performance of the proposed SVMmethod decreasing the observation period. This parameterneed to be as lower as possible for real-time services while it
could be higher otherwise. Figure 13 shows the performanceachieved by the proposed SVMmethod, fixing the number ofemitted beacons to 2, that corresponds to a mobile lifetime ofabout 3000 days. As depicted in Figure 13(a), increasing thenumber of exploited sensors, the error rate decreases. Whiledecreasing the observation period from 2 to 0.25 seconds, theerror rate increases from 2.5% to 6.3% when only the sensor𝑆2is used. However, the error rate decreases to less than 1%
when three sensors are used for any value of observationperiod. Finally, Figure 13(b) shows the TP and FP rates usingtwo features (𝜇, 𝜎) of sensors 𝑆
1and 𝑆
2with an observation
period of 2 and 0.25 seconds.This figure further highlight thatthere was confusion between Position 3 and Position 4. Infact, 7% Position 4 (right lateral) wasmisclassified as Position3 (supine), when the observation period was fixed to 0.25seconds. On the other hand, Positions 1, 2, and 3 were wellrecognized (100% of matching rate).
5. Conclusions
In this work, a service-orientedmiddleware platform forAALfor green bed activity monitoring has been presented. Thekey idea of this work is to leverage the presence of a WSNby collecting the RSSmeasured among fixed general-purposewireless devices, deployed in the environment, and awearableone.The RSS measurements are used to classify a set of user’spositions in the bed, monitoring the activities of the user, andthus supporting the bedsores and the sleepmonitoring issues.
In particular, measurements showed that it is possible touse low-cost transceivers to classify the patient’s positions.Good classification performance can be achieved by usingonly the received signal strength measurements relevant toa wearable and a fixed sensor. In fact, by using the RSS tracesmeasured by only one sensor (𝑆
1) at 8Hz with an observation

Journal of Sensors 15
period of 2 seconds, 100% matching rates were achievedeven with only one feature (𝜇). These results are similarto those showed in [7], but when the energy consumptionis taken into account the proposed solution increases theperformance with respect to the state of the art. In fact,measurements showed that it is possible to achieve 100%matching rate at 1Hz, increasing the mobile lifetime of about85% with respect to [7]. Instead, when the requirement ofresponsiveness increases (i.e., observation period equal to0.25 seconds), the bed position detection service needs toexploit the RSS traces measured by at least two sensors. Ouranalysis suggests that, in the near future, the electrical socketsin the environment can be also exploited from bed activitymonitoring services. In particular, in our experiments twosensors near to the bed on the night table and one sensoron the dresser are able to provide the user’s positions in thebed.The LOS condition guarantees the 100% ofmatching ratewhen the fixed nodes are placed close to the user (as on thenight table).
Conflict of Interests
The authors do not have any conflict of interests with theWeka program exploited in this paper to evaluate the perfor-mances of the proposed system.
Acknowledgments
This work was supported in part by part by the EuropeanCommission in the framework of the universAALFP7project(Contract no. 247950) and GiraffPlus FP7 project (Contractno. 288173).
References
[1] M. Tentori and J. Favela, “Activity-aware computing for health-care,” IEEE Pervasive Computing, vol. 7, no. 2, pp. 51–57, 2008.
[2] A. A. P. Wai, K. Yuan-Wei, F. S. Fook, M. Jayachandran, J.Biswas, and J.-J. Cabibihan, “Sleeping patterns observation forbedsores and bed-side falls prevention,” in Proceedings of the31st Annual International Conference of the IEEE Engineeringin Medicine and Biology Society: Engineering the Future ofBiomedicine (EMBC ’09), pp. 6087–6090, September 2009.
[3] J. Baek, G. Lee, W. Park, and B.-J. Yun, “Accelerometer signalprocessing for user activity detection,” Knowledge-Based Intel-ligent Information and Engineering Systems, Springer, vol. 3215,pp. 573–580, 2004.
[4] A.M.Adami,M. Pavel, T. L.Hayes, andC.M. Singer, “Detectionof movement in bed using unobtrusive load cell sensors,” IEEETransactions on Information Technology in Biomedicine, vol. 14,no. 2, pp. 481–490, 2010.
[5] H.-Y. Lau, K.-Y. Tong, andH. Zhu, “Support vector machine forclassification of walking conditions using miniature kinematicsensors,” Medical and Biological Engineering and Computing,vol. 46, no. 6, pp. 563–573, 2008.
[6] A. R. Guraliuc, P. Barsocchi, F. Potorti, and P. Nepa, “Limbmovements classification using wearable wireless transceivers,”IEEE Transactions on Information Technology in Biomedicine,vol. 15, no. 3, pp. 474–480, 2011.
[7] P. Barsocchi, “Position recognition to support bedsores pre-vention,” IEEE Transactions on Information Technology in Bio-medicine, vol. 99, p. 1, 2012.
[8] M. Quwaider and S. Biswas, “Body posture identification usinghidden markov model with a wearable sensor network,” in Pro-ceedings of the ICST 3rd International Conference on Body AreaNetworks (BodyNets ’08), pp. 19:1–19:8, 2008.
[9] P. A. Bernstein, “Middleware: a model for distributed systemservices,” Communications of the ACM, vol. 39, no. 2, pp. 86–98,20131996.
[10] S. Krakowiak, Middleware Architecture with Patterns andFrameworks, INRIA, Rhone-Alpes, France, 2007.
[11] E. Parry and T. Strickett, “The pressure is on—everyone,everywhere, everyday,” in Workshop on ARATA, pp. 589–592,June 2004.
[12] “National sleep foundation,” http://www.sleepfoundation.org/.[13] A. Oksenberg and D. S. Silverberg, “The effect of body posture
on sleep-related breathing disorders: facts and therapeuticimplications,” Sleep Medicine Reviews, vol. 2, no. 3, pp. 139–162,1998.
[14] E. Hoque, R. F. Dickerson, and J. A. Stankovic, “Monitoringbody positions and movements during sleep using wisps,” inWireless Health 2010, pp. 44–53, ACM, New York, NY, USA,2010.
[15] S. Patel, H. Park, P. Bonato, L. Chan, and M. Rodgers, “Areview of wearable sensors and systems with application in re-habilitation,” Journal of NeuroEngineering and Rehabilitation,vol. 9, p. 21, 2012.
[16] M.-R. Tazari, F. Furfari, A. Fides-Valero et al., “The universaalreference model for aal,” in Handbook of Ambient AssistedLiving: Technology For Healthcare, Rehabilitation and Well-Being, vol. 11 of Ambient Intelligence and Smart Environments,pp. 610–625, IOS Press, 2012.
[17] U. Hunkeler, H. L. Truong, and A. Stanford-Clark, “MQTT-S- A publish/subscribe protocol for wireless sensor networks,” inProceedings of the 3rd IEEE/Create-Net International Conferenceon Communication System Software and Middleware (COM-SWARE ’08), pp. 791–798, January 2008.
[18] R. T. Fielding andR.N. Taylor, “Principled design of themodernweb architecture,” ACM Transactions on Internet Technology,vol. 2, no. 2, pp. 115–150, 2002.
[19] “Javascript object notation,” http://www.json.org/.[20] L. Atzori, A. Iera, and G. Morabito, “The internet of things: a
survey,”Computer Networks, vol. 54, no. 15, pp. 2787–2805, 2010.[21] “Tunstall healthcare,” http://www.tunstall.co.uk/.[22] “Cleode embedded systems,” http://www.cleode.fr/.[23] “Crossbow technology inc,” http://www.xbow.com/.[24] F. Potortı, A. Corucci, P. Nepa, F. Furfari, P. Barsocchi, and A.
Buffi, “Accuracy limits of in-room localisation using RSSI,” inProceedings of IEEE International Symposium on Antennas andPropagation (APSURSI ’09), pp. 1–4, June 2009.
[25] C. Cortes and V. Vapnik, “Support-vector networks,” MachineLearning, vol. 20, no. 3, pp. 273–297, 1995.
[26] S. R. Gunn, “Support vector machines for classification andregression,” Tech. Rep. 256459, Faculty of Engineering, Scienceand Mathematics School of Electronics and Computer Science,May 1998.
[27] M. Hall, E. Frank, G. Holmes, B. Pfahringer, P. Reutemann,and I. H. Witten, “The weka data mining software: an update,”SIGKDD Explorations Newsletter, vol. 11, no. 1, pp. 10–18, 2009.

Submit your manuscripts athttp://www.hindawi.com
VLSI Design
Hindawi Publishing Corporationhttp://www.hindawi.com Volume 2014
International Journal of
RotatingMachinery
Hindawi Publishing Corporationhttp://www.hindawi.com Volume 2014
Hindawi Publishing Corporation http://www.hindawi.com
Journal ofEngineeringVolume 2014
Hindawi Publishing Corporationhttp://www.hindawi.com Volume 2014
Shock and Vibration
Hindawi Publishing Corporationhttp://www.hindawi.com Volume 2014
Mechanical Engineering
Advances in
Hindawi Publishing Corporationhttp://www.hindawi.com Volume 2014
Civil EngineeringAdvances in
Acoustics and VibrationAdvances in
Hindawi Publishing Corporationhttp://www.hindawi.com Volume 2014
Hindawi Publishing Corporationhttp://www.hindawi.com Volume 2014
Electrical and Computer Engineering
Journal of
Hindawi Publishing Corporationhttp://www.hindawi.com Volume 2014
Distributed Sensor Networks
International Journal of
The Scientific World JournalHindawi Publishing Corporation http://www.hindawi.com Volume 2014
SensorsJournal of
Hindawi Publishing Corporationhttp://www.hindawi.com Volume 2014
Modelling & Simulation in EngineeringHindawi Publishing Corporation http://www.hindawi.com Volume 2014
Hindawi Publishing Corporationhttp://www.hindawi.com Volume 2014
Active and Passive Electronic Components
Hindawi Publishing Corporationhttp://www.hindawi.com Volume 2014
Chemical EngineeringInternational Journal of
Control Scienceand Engineering
Journal of
Hindawi Publishing Corporationhttp://www.hindawi.com Volume 2014
Antennas andPropagation
International Journal of
Hindawi Publishing Corporationhttp://www.hindawi.com Volume 2014
Hindawi Publishing Corporationhttp://www.hindawi.com Volume 2014
Navigation and Observation
International Journal of
Advances inOptoElectronics
Hindawi Publishing Corporation http://www.hindawi.com
Volume 2014
RoboticsJournal of
Hindawi Publishing Corporationhttp://www.hindawi.com Volume 2014