
A Web-based and Grid-enabled dChip version for the analysis of large sets of gene expression data
15
BioMed Central Page 1 of 15 (page number not for citation purposes) BMC Bioinformatics Open Access Software A Web-based and Grid-enabled dChip version for the analysis of large sets of gene expression data Luca Corradi*, Marco Fato, Ivan Porro, Silvia Scaglione and Livia Torterolo Address: Computer Science, Systems, and Communication Department, University of Genova, Viale Causa 12, 16100 Genova, Italy Email: Luca Corradi* - [email protected]; Marco Fato - [email protected]; Ivan Porro - [email protected]; Silvia Scaglione - [email protected]; Livia Torterolo - [email protected] * Corresponding author Abstract Background: Microarray techniques are one of the main methods used to investigate thousands of gene expression profiles for enlightening complex biological processes responsible for serious diseases, with a great scientific impact and a wide application area. Several standalone applications had been developed in order to analyze microarray data. Two of the most known free analysis software packages are the R-based Bioconductor and dChip. The part of dChip software concerning the calculation and the analysis of gene expression has been modified to permit its execution on both cluster environments (supercomputers) and Grid infrastructures (distributed computing). This work is not aimed at replacing existing tools, but it provides researchers with a method to analyze large datasets without any hardware or software constraints. Results: An application able to perform the computation and the analysis of gene expression on large datasets has been developed using algorithms provided by dChip. Different tests have been carried out in order to validate the results and to compare the performances obtained on different infrastructures. Validation tests have been performed using a small dataset related to the comparison of HUVEC (Human Umbilical Vein Endothelial Cells) and Fibroblasts, derived from same donors, treated with IFN-α. Moreover performance tests have been executed just to compare performances on different environments using a large dataset including about 1000 samples related to Breast Cancer patients. Conclusion: A Grid-enabled software application for the analysis of large Microarray datasets has been proposed. DChip software has been ported on Linux platform and modified, using appropriate parallelization strategies, to permit its execution on both cluster environments and Grid infrastructures. The added value provided by the use of Grid technologies is the possibility to exploit both computational and data Grid infrastructures to analyze large datasets of distributed data. The software has been validated and performances on cluster and Grid environments have been compared obtaining quite good scalability results. Published: 13 November 2008 BMC Bioinformatics 2008, 9:480 doi:10.1186/1471-2105-9-480 Received: 6 June 2008 Accepted: 13 November 2008 This article is available from: http://www.biomedcentral.com/1471-2105/9/480 © 2008 Corradi et al; licensee BioMed Central Ltd. This is an Open Access article distributed under the terms of the Creative Commons Attribution License (http://creativecommons.org/licenses/by/2.0 ), which permits unrestricted use, distribution, and reproduction in any medium, provided the original work is properly cited.
-
Upload
independent -
Category
Documents
-
view
0 -
download
0
Transcript of A Web-based and Grid-enabled dChip version for the analysis of large sets of gene expression data

BioMed CentralBMC Bioinformatics
ss
Open AcceSoftwareA Web-based and Grid-enabled dChip version for the analysis of large sets of gene expression dataLuca Corradi*, Marco Fato, Ivan Porro, Silvia Scaglione and Livia TorteroloAddress: Computer Science, Systems, and Communication Department, University of Genova, Viale Causa 12, 16100 Genova, Italy
Email: Luca Corradi* - [email protected]; Marco Fato - [email protected]; Ivan Porro - [email protected]; Silvia Scaglione - [email protected]; Livia Torterolo - [email protected]
* Corresponding author
AbstractBackground: Microarray techniques are one of the main methods used to investigate thousandsof gene expression profiles for enlightening complex biological processes responsible for seriousdiseases, with a great scientific impact and a wide application area. Several standalone applicationshad been developed in order to analyze microarray data. Two of the most known free analysissoftware packages are the R-based Bioconductor and dChip. The part of dChip softwareconcerning the calculation and the analysis of gene expression has been modified to permit itsexecution on both cluster environments (supercomputers) and Grid infrastructures (distributedcomputing).
This work is not aimed at replacing existing tools, but it provides researchers with a method toanalyze large datasets without any hardware or software constraints.
Results: An application able to perform the computation and the analysis of gene expression onlarge datasets has been developed using algorithms provided by dChip. Different tests have beencarried out in order to validate the results and to compare the performances obtained on differentinfrastructures. Validation tests have been performed using a small dataset related to thecomparison of HUVEC (Human Umbilical Vein Endothelial Cells) and Fibroblasts, derived fromsame donors, treated with IFN-α.
Moreover performance tests have been executed just to compare performances on differentenvironments using a large dataset including about 1000 samples related to Breast Cancer patients.
Conclusion: A Grid-enabled software application for the analysis of large Microarray datasets hasbeen proposed. DChip software has been ported on Linux platform and modified, usingappropriate parallelization strategies, to permit its execution on both cluster environments andGrid infrastructures. The added value provided by the use of Grid technologies is the possibility toexploit both computational and data Grid infrastructures to analyze large datasets of distributeddata. The software has been validated and performances on cluster and Grid environments havebeen compared obtaining quite good scalability results.
Published: 13 November 2008
BMC Bioinformatics 2008, 9:480 doi:10.1186/1471-2105-9-480
Received: 6 June 2008Accepted: 13 November 2008
This article is available from: http://www.biomedcentral.com/1471-2105/9/480
© 2008 Corradi et al; licensee BioMed Central Ltd. This is an Open Access article distributed under the terms of the Creative Commons Attribution License (http://creativecommons.org/licenses/by/2.0), which permits unrestricted use, distribution, and reproduction in any medium, provided the original work is properly cited.
Page 1 of 15(page number not for citation purposes)

BMC Bioinformatics 2008, 9:480 http://www.biomedcentral.com/1471-2105/9/480
BackgroundDuring the last years, genomics and proteomics havedeeply changed the scientific approach to the study of themolecular basis of cells and tissues behaviors both inphysiological and pathological conditions, giving a newcomprehensive view to the research community.
As the interest on these fields has been more and moreincreasing, innovative and more suitable technologieshave been developed. At present, one of the most promis-ing and reactive fields is certainly the microarray technol-ogy, which has had, so far, a great scientific impact and awide application area. In fact, several types of micorarrayshave been developed and proposed, each focused on aspecific type of analysis, from genetic screening to pro-teomics and from biological research to diagnostics.
Through the comparison of genomic profiles it is possibleto study gene expression differences among cross-corre-lated conditions, thus understanding their meaning.Thanks to the microarray technology a large number ofgenes may be investigated at the same time to find whichare differentially expressed on a certain cell type. Quanti-tative researchers have proposed a variety of methods forhandling probe-level data from Affymetrix® oligonucle-otide arrays. Such methods employ different proceduresfor adjusting background fluorescence, normalizing data,incorporating information from "mismatch" probes, andsummarizing probe sets.
Even if microarrays are a powerful instrument, studies onthese data are often conditioned by technological limits,thus decreasing their capabilities. The most relevant limi-tation concerns the analysis of large datasets. In fact thiskind of analysis requires long computational times ratherthan the availability of specific hardware. A huge availa-bility of memory and computational power is required foranalyzing microarrays and often researchers cannot suc-ceed in performing their studies because of the impossi-bility to access suitable resources.
Several tools and algorithms had been developed in orderto analyze microarray data, all of them consisting in stan-dalone applications. Two of the most known free analysissoftware packages are the R-based Bioconductor anddChip [1,2].
This work is not aimed at replacing those systems, but itprovides researchers with a new method to analyze largedatasets without any hardware or software constraints, bysimply using a common web browser. To reach this aim,dChip software has been modified by using appropriateparallelization strategies, to permit its execution on bothcluster environments and Grid infrastructures, exploitingexisting computational and storage capabilities. Since
dChip is a wide application containing a large number offunctionalities, this work is related to the computationand the analysis of gene expression.
ImplementationThe goal of this work is focused on the design and devel-opment of a tool for the analysis of gene expression to beincluded in a more general Grid-enabled software applica-tion for the analysis of microarray data. As an added value,the use of Grid technologies makes it possible to exploitboth computational and data Grid infrastructures to ana-lyze large datasets of distributed data.
DChip, an existing analysis tool for Microarray experi-ments, was originally a free and open source Windowsapplication. Starting from the original source code (dChip2005 version), several versions of the software have beenimplemented, in order to fit different kinds of resources[see Additional file 1]:
• standalone Linux version
• parallel cluster implementation
• parallel Grid implementation
The execution is supported on 64 bit computers too.
With regard to the user interface, as a first release, theapplication was implemented in a command line versionto permit the execution on remote computing elements.Two input files are used: the first one contains specificoptions for the execution; the second one contains the listof the microarray files used for the analysis. As a secondstep, in order to simplify the use of above mentioneddChip versions, the executables have been integratedwithin a biomedical portal [3,4] which provides a simplegraphical user interface to run the application. Such a por-tal integration allows unpractised users to store theirexperimental data on a complex storage system and accessdistributed data and services in a transparent way. Further-more users can easily run the application from any com-puter or location with only Internet connection, withoutloosing time in installation and maintenance procedures.Moreover, users can use the software through a simpleweb interface and launch their analyses taking advantageof the possibility to orchestrate different portal services ina workflow strategy. Thanks to the ease of the web inter-face, users are not required to know technical dChipdetails.
The new software version has been designed to be modu-lar, i.e. the original software has been divided into severalindependent modules, each performing a different part ofthe analysis. This approach has allowed to improve (i)
Page 2 of 15(page number not for citation purposes)
BMC Bioinformatics 2008, 9:480 http://www.biomedcentral.com/1471-2105/9/480
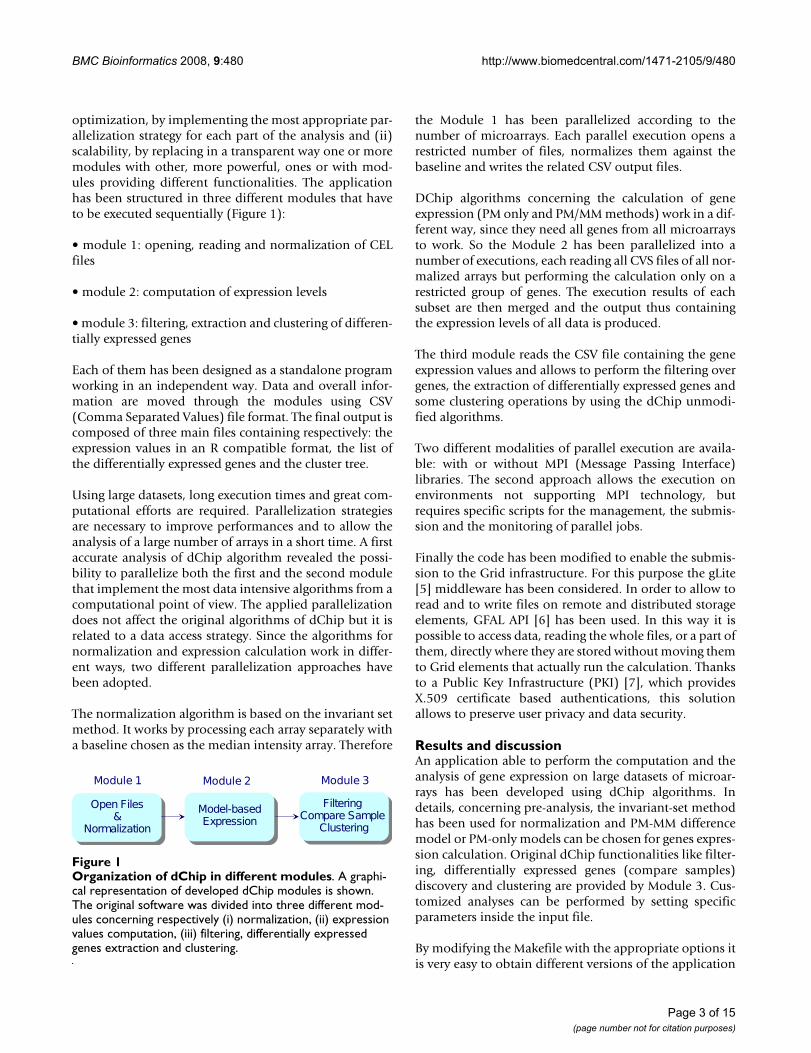
optimization, by implementing the most appropriate par-allelization strategy for each part of the analysis and (ii)scalability, by replacing in a transparent way one or moremodules with other, more powerful, ones or with mod-ules providing different functionalities. The applicationhas been structured in three different modules that haveto be executed sequentially (Figure 1):
• module 1: opening, reading and normalization of CELfiles
• module 2: computation of expression levels
• module 3: filtering, extraction and clustering of differen-tially expressed genes
Each of them has been designed as a standalone programworking in an independent way. Data and overall infor-mation are moved through the modules using CSV(Comma Separated Values) file format. The final output iscomposed of three main files containing respectively: theexpression values in an R compatible format, the list ofthe differentially expressed genes and the cluster tree.
Using large datasets, long execution times and great com-putational efforts are required. Parallelization strategiesare necessary to improve performances and to allow theanalysis of a large number of arrays in a short time. A firstaccurate analysis of dChip algorithm revealed the possi-bility to parallelize both the first and the second modulethat implement the most data intensive algorithms from acomputational point of view. The applied parallelizationdoes not affect the original algorithms of dChip but it isrelated to a data access strategy. Since the algorithms fornormalization and expression calculation work in differ-ent ways, two different parallelization approaches havebeen adopted.
The normalization algorithm is based on the invariant setmethod. It works by processing each array separately witha baseline chosen as the median intensity array. Therefore
the Module 1 has been parallelized according to thenumber of microarrays. Each parallel execution opens arestricted number of files, normalizes them against thebaseline and writes the related CSV output files.
DChip algorithms concerning the calculation of geneexpression (PM only and PM/MM methods) work in a dif-ferent way, since they need all genes from all microarraysto work. So the Module 2 has been parallelized into anumber of executions, each reading all CVS files of all nor-malized arrays but performing the calculation only on arestricted group of genes. The execution results of eachsubset are then merged and the output thus containingthe expression levels of all data is produced.
The third module reads the CSV file containing the geneexpression values and allows to perform the filtering overgenes, the extraction of differentially expressed genes andsome clustering operations by using the dChip unmodi-fied algorithms.
Two different modalities of parallel execution are availa-ble: with or without MPI (Message Passing Interface)libraries. The second approach allows the execution onenvironments not supporting MPI technology, butrequires specific scripts for the management, the submis-sion and the monitoring of parallel jobs.
Finally the code has been modified to enable the submis-sion to the Grid infrastructure. For this purpose the gLite[5] middleware has been considered. In order to allow toread and to write files on remote and distributed storageelements, GFAL API [6] has been used. In this way it ispossible to access data, reading the whole files, or a part ofthem, directly where they are stored without moving themto Grid elements that actually run the calculation. Thanksto a Public Key Infrastructure (PKI) [7], which providesX.509 certificate based authentications, this solutionallows to preserve user privacy and data security.
Results and discussionAn application able to perform the computation and theanalysis of gene expression on large datasets of microar-rays has been developed using dChip algorithms. Indetails, concerning pre-analysis, the invariant-set methodhas been used for normalization and PM-MM differencemodel or PM-only models can be chosen for genes expres-sion calculation. Original dChip functionalities like filter-ing, differentially expressed genes (compare samples)discovery and clustering are provided by Module 3. Cus-tomized analyses can be performed by setting specificparameters inside the input file.
By modifying the Makefile with the appropriate options itis very easy to obtain different versions of the application
Organization of dChip in different modulesFigure 1Organization of dChip in different modules. A graphi-cal representation of developed dChip modules is shown. The original software was divided into three different mod-ules concerning respectively (i) normalization, (ii) expression values computation, (iii) filtering, differentially expressed genes extraction and clustering.
Page 3 of 15(page number not for citation purposes)
BMC Bioinformatics 2008, 9:480 http://www.biomedcentral.com/1471-2105/9/480
depending on the kind of infrastructure chosen for theanalysis: standalone Linux, MPI or Grid-enabled versions.
Starting from the developed application different testshave been performed in order to validate results and com-pare performances obtained on different infrastructures.To this goal, tests have been divided into two different cat-egories:
• Validation Tests
• Performance Tests
Validation TestsIn order to validate the results obtained with the devel-oped software, a small dataset coming from a publishedstudy [8] has been used for the analysis. The consideredcase study concerns the comparison of results obtainedfrom separated analyses of HUVEC (Human UmbilicalVein Endothelial Cells) and Fibroblasts, derived fromsame donors, treated with Interferon-α (INF-α), to thepurpose of identifying interferon's effects on transcrip-tome of endothelial cells.
The dataset is divided in two parts with the following fea-tures:
• ChipType: Affimetrix GeneChip HU-133A
• Origin: HUVEC, Human Umbilical Vein EndothelialCells
• Genes: 22283
• Dataset dimension: 103 MB
• Number of microrarrays: 10
• ChipType: Affimetrix GeneChip HU-133A
• Origin: FB, Human Umbilical Fibroblasts
• Genes: 22283
• Dataset dimension: 54.3 MB
• Number of microrarrays: 5
The datasets are both composed by baseline and experi-ment arrays (respectively untreated and treated with INF-α) and for each of them the following steps, according tothe original analysis, have been performed:
• Normalization: Invariant-set method
• Model-based expression: PM Only model [9,10]
• Extraction of differentially expressed genes: fold changewith threshold 2.
As a first test, microarrays have been analyzed using bothoriginal and modified versions of dChip (standaloneLinux version, parallel and grid-enabled). The sameoptions have been set in all tests in order to compare finalresults.
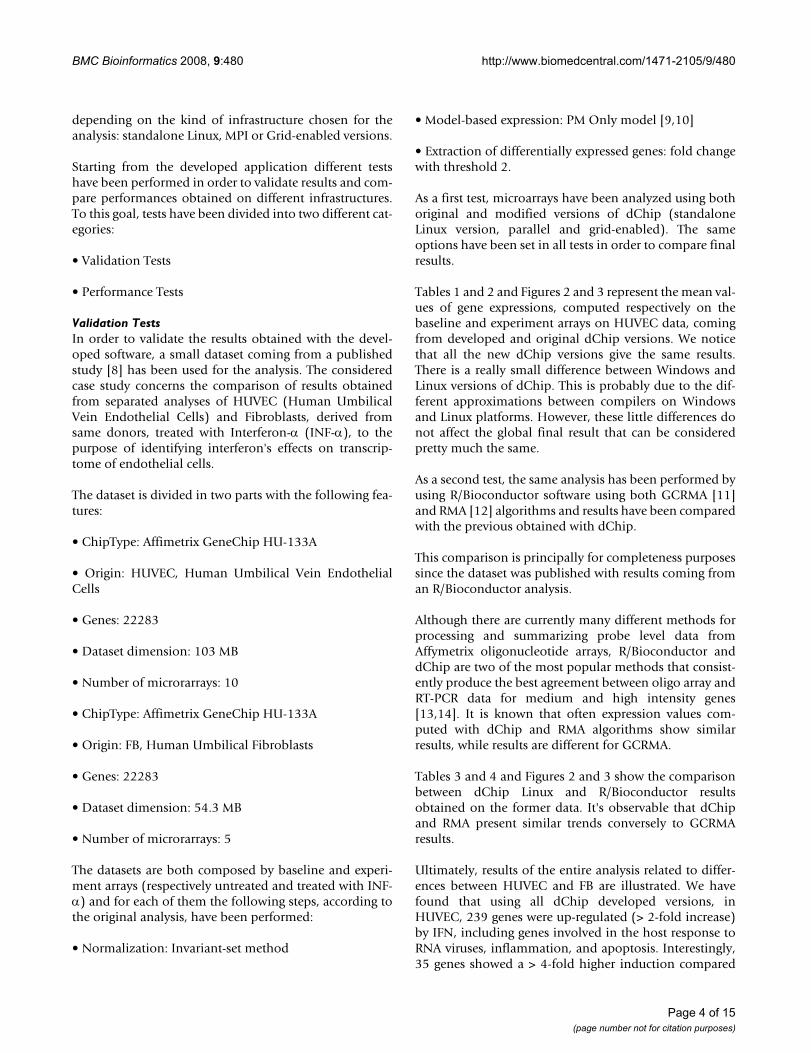
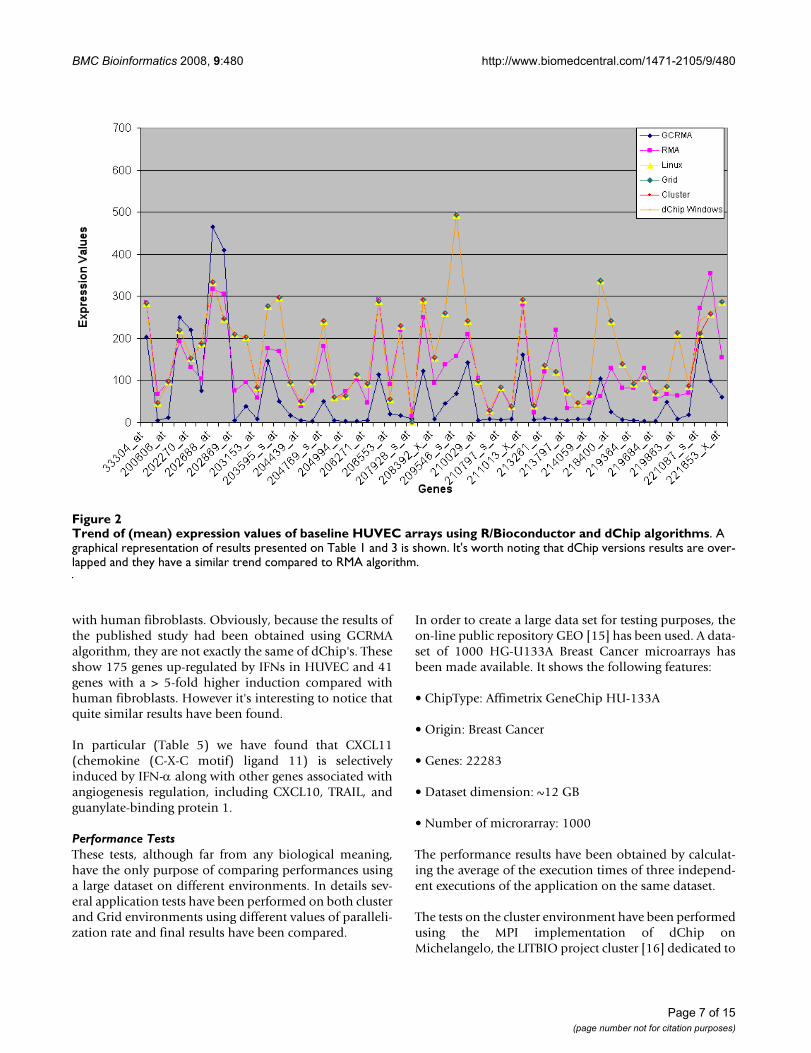
Tables 1 and 2 and Figures 2 and 3 represent the mean val-ues of gene expressions, computed respectively on thebaseline and experiment arrays on HUVEC data, comingfrom developed and original dChip versions. We noticethat all the new dChip versions give the same results.There is a really small difference between Windows andLinux versions of dChip. This is probably due to the dif-ferent approximations between compilers on Windowsand Linux platforms. However, these little differences donot affect the global final result that can be consideredpretty much the same.
As a second test, the same analysis has been performed byusing R/Bioconductor software using both GCRMA [11]and RMA [12] algorithms and results have been comparedwith the previous obtained with dChip.
This comparison is principally for completeness purposessince the dataset was published with results coming froman R/Bioconductor analysis.
Although there are currently many different methods forprocessing and summarizing probe level data fromAffymetrix oligonucleotide arrays, R/Bioconductor anddChip are two of the most popular methods that consist-ently produce the best agreement between oligo array andRT-PCR data for medium and high intensity genes[13,14]. It is known that often expression values com-puted with dChip and RMA algorithms show similarresults, while results are different for GCRMA.
Tables 3 and 4 and Figures 2 and 3 show the comparisonbetween dChip Linux and R/Bioconductor resultsobtained on the former data. It's observable that dChipand RMA present similar trends conversely to GCRMAresults.
Ultimately, results of the entire analysis related to differ-ences between HUVEC and FB are illustrated. We havefound that using all dChip developed versions, inHUVEC, 239 genes were up-regulated (> 2-fold increase)by IFN, including genes involved in the host response toRNA viruses, inflammation, and apoptosis. Interestingly,35 genes showed a > 4-fold higher induction compared
Page 4 of 15(page number not for citation purposes)
BMC Bioinformatics 2008, 9:480 http://www.biomedcentral.com/1471-2105/9/480
Page 5 of 15(page number not for citation purposes)
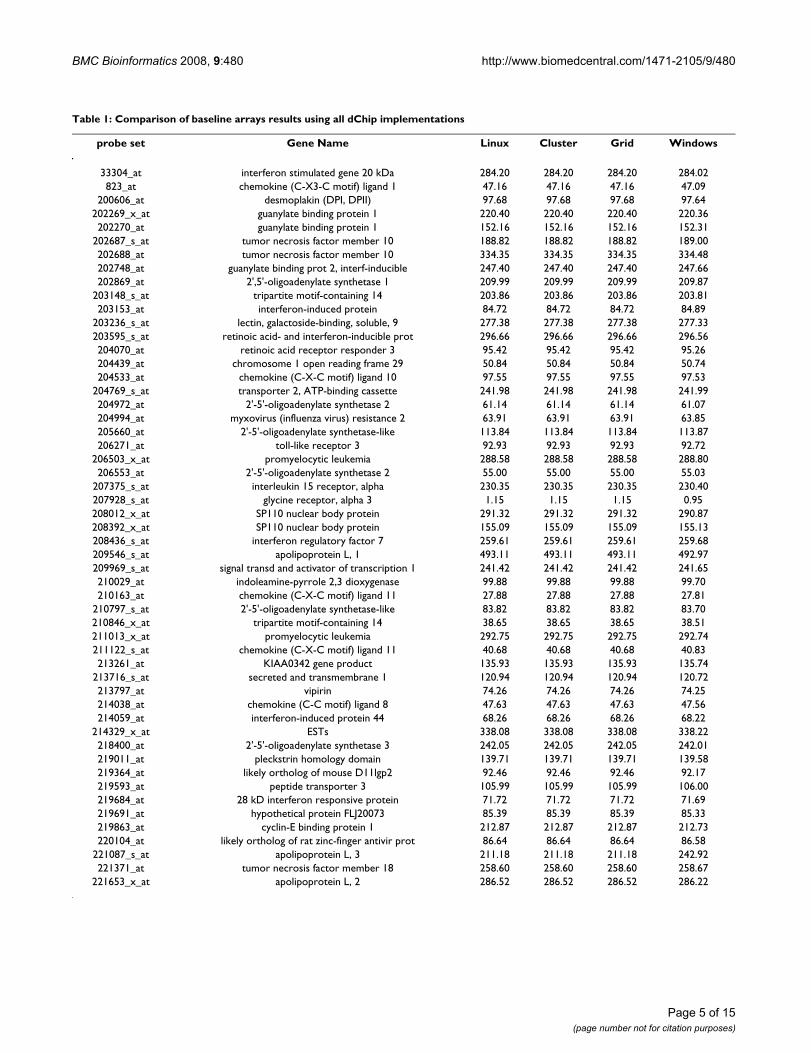
Table 1: Comparison of baseline arrays results using all dChip implementations
probe set Gene Name Linux Cluster Grid Windows
33304_at interferon stimulated gene 20 kDa 284.20 284.20 284.20 284.02823_at chemokine (C-X3-C motif) ligand 1 47.16 47.16 47.16 47.09
200606_at desmoplakin (DPI, DPII) 97.68 97.68 97.68 97.64202269_x_at guanylate binding protein 1 220.40 220.40 220.40 220.36202270_at guanylate binding protein 1 152.16 152.16 152.16 152.31
202687_s_at tumor necrosis factor member 10 188.82 188.82 188.82 189.00202688_at tumor necrosis factor member 10 334.35 334.35 334.35 334.48202748_at guanylate binding prot 2, interf-inducible 247.40 247.40 247.40 247.66202869_at 2',5'-oligoadenylate synthetase 1 209.99 209.99 209.99 209.87
203148_s_at tripartite motif-containing 14 203.86 203.86 203.86 203.81203153_at interferon-induced protein 84.72 84.72 84.72 84.89
203236_s_at lectin, galactoside-binding, soluble, 9 277.38 277.38 277.38 277.33203595_s_at retinoic acid- and interferon-inducible prot 296.66 296.66 296.66 296.56204070_at retinoic acid receptor responder 3 95.42 95.42 95.42 95.26204439_at chromosome 1 open reading frame 29 50.84 50.84 50.84 50.74204533_at chemokine (C-X-C motif) ligand 10 97.55 97.55 97.55 97.53
204769_s_at transporter 2, ATP-binding cassette 241.98 241.98 241.98 241.99204972_at 2'-5'-oligoadenylate synthetase 2 61.14 61.14 61.14 61.07204994_at myxovirus (influenza virus) resistance 2 63.91 63.91 63.91 63.85205660_at 2'-5'-oligoadenylate synthetase-like 113.84 113.84 113.84 113.87206271_at toll-like receptor 3 92.93 92.93 92.93 92.72
206503_x_at promyelocytic leukemia 288.58 288.58 288.58 288.80206553_at 2'-5'-oligoadenylate synthetase 2 55.00 55.00 55.00 55.03
207375_s_at interleukin 15 receptor, alpha 230.35 230.35 230.35 230.40207928_s_at glycine receptor, alpha 3 1.15 1.15 1.15 0.95208012_x_at SP110 nuclear body protein 291.32 291.32 291.32 290.87208392_x_at SP110 nuclear body protein 155.09 155.09 155.09 155.13208436_s_at interferon regulatory factor 7 259.61 259.61 259.61 259.68209546_s_at apolipoprotein L, 1 493.11 493.11 493.11 492.97209969_s_at signal transd and activator of transcription 1 241.42 241.42 241.42 241.65210029_at indoleamine-pyrrole 2,3 dioxygenase 99.88 99.88 99.88 99.70210163_at chemokine (C-X-C motif) ligand 11 27.88 27.88 27.88 27.81
210797_s_at 2'-5'-oligoadenylate synthetase-like 83.82 83.82 83.82 83.70210846_x_at tripartite motif-containing 14 38.65 38.65 38.65 38.51211013_x_at promyelocytic leukemia 292.75 292.75 292.75 292.74211122_s_at chemokine (C-X-C motif) ligand 11 40.68 40.68 40.68 40.83213261_at KIAA0342 gene product 135.93 135.93 135.93 135.74
213716_s_at secreted and transmembrane 1 120.94 120.94 120.94 120.72213797_at vipirin 74.26 74.26 74.26 74.25214038_at chemokine (C-C motif) ligand 8 47.63 47.63 47.63 47.56214059_at interferon-induced protein 44 68.26 68.26 68.26 68.22
214329_x_at ESTs 338.08 338.08 338.08 338.22218400_at 2'-5'-oligoadenylate synthetase 3 242.05 242.05 242.05 242.01219011_at pleckstrin homology domain 139.71 139.71 139.71 139.58219364_at likely ortholog of mouse D11lgp2 92.46 92.46 92.46 92.17219593_at peptide transporter 3 105.99 105.99 105.99 106.00219684_at 28 kD interferon responsive protein 71.72 71.72 71.72 71.69219691_at hypothetical protein FLJ20073 85.39 85.39 85.39 85.33219863_at cyclin-E binding protein 1 212.87 212.87 212.87 212.73220104_at likely ortholog of rat zinc-finger antivir prot 86.64 86.64 86.64 86.58
221087_s_at apolipoprotein L, 3 211.18 211.18 211.18 242.92221371_at tumor necrosis factor member 18 258.60 258.60 258.60 258.67
221653_x_at apolipoprotein L, 2 286.52 286.52 286.52 286.22

BMC Bioinformatics 2008, 9:480 http://www.biomedcentral.com/1471-2105/9/480
Page 6 of 15(page number not for citation purposes)
Table 2: Comparison of experiment arrays results using all dChip implementations
probe set Gene Name Linux Cluster Grid Windows
33304_at interferon stimulated gene 20 kDa 2244.54 2244.54 2244.54 2246.75823_at chemokine (C-X3-C motif) ligand 1 303.39 303.39 303.39 303.30
200606_at desmoplakin (DPI, DPII) 459.07 459.07 459.07 459.40202269_x_at guanylate binding protein 1 3651.44 3651.44 3651.44 3654.06202270_at guanylate binding protein 1 2282.05 2282.05 2282.05 2283.43
202687_s_at tumor necrosis factor member 10 2133.03 2133.03 2133.03 2131.72202688_at tumor necrosis factor member 10 3309.36 3309.36 3309.36 3311.57202748_at guanylate binding prot 2, interf-inducible 1007.71 1007.71 1007.71 1007.97202869_at 2',5'-oligoadenylate synthetase 1 3112.07 3112.07 3112.07 3112.08
203148_s_at tripartite motif-containing 14 1774.94 1774.94 1774.94 1773.47203153_at interferon-induced protein 6863.81 6863.81 6863.81 6853.83
203236_s_at lectin, galactoside-binding, soluble, 9 1540.56 1540.56 1540.56 1540.34203595_s_at retinoic acid- and interfer-inducible prot 2144.76 2144.76 2144.76 2144.24204070_at retinoic acid receptor responder 3 314.03 314.03 314.03 314.49204439_at chromosome 1 open reading frame 29 1982.76 1982.76 1982.76 1980.53204533_at chemokine (C-X-C motif) ligand 10 3018.77 3018.77 3018.77 3015.67
204769_s_at transporter 2, ATP-binding cassette 971.37 971.37 971.37 973.42204972_at 2'-5'-oligoadenylate synthetase 2 2173.07 2173.07 2173.07 2172.05204994_at myxovirus (influenza virus) resistance 2 2312.15 2312.15 2312.15 2312.96205660_at 2'-5'-oligoadenylate synthetase-like 2793.93 2793.93 2793.93 2792.91206271_at toll-like receptor 3 905.37 905.37 905.37 905.16
206503_x_at promyelocytic leukemia 910.07 910.07 910.07 909.93206553_at 2'-5'-oligoadenylate synthetase 2 873.65 873.65 873.65 873.49
207375_s_at interleukin 15 receptor, alpha 1114.76 1114.76 1114.76 1114.91207928_s_at glycine receptor, alpha 3 2.37 2.37 2.37 2.65208012_x_at SP110 nuclear body protein 2436.07 2436.07 2436.07 2435.94208392_x_at SP110 nuclear body protein 842.89 842.89 842.89 842.75208436_s_at interferon regulatory factor 7 3397.64 3397.64 3397.64 3397.97209546_s_at apolipoprotein L, 1 2170.99 2170.99 2170.99 2170.16209969_s_at signal transd and activator of transcription 1 1642.44 1642.44 1642.44 1642.01210029_at indoleamine-pyrrole 2,3 dioxygenase 814.88 814.88 814.88 814.71210163_at chemokine (C-X-C motif) ligand 11 2400.30 2400.30 2400.30 2400.22
210797_s_at 2'-5'-oligoadenylate synthetase-like 2210.17 2210.17 2210.17 2210.97210846_x_at tripartite motif-containing 14 139.55 139.55 139.55 139.69211013_x_at promyelocytic leukemia 891.32 891.32 891.32 892.07211122_s_at chemokine (C-X-C motif) ligand 11 2835.46 2835.46 2835.46 2829.05213261_at KIAA0342 gene product 598.16 598.16 598.16 598.27
213716_s_at secreted and transmembrane 1 1844.02 1844.02 1844.02 1846.77213797_at vipirin 4883.14 4883.14 4883.14 4882.36214038_at chemokine (C-C motif) ligand 8 209.79 209.79 209.79 209.81214059_at interferon-induced protein 44 417.94 417.94 417.94 418.01
214329_x_at ESTs 2344.63 2344.63 2344.63 2348.62218400_at 2'-5'-oligoadenylate synthetase 3 1695.06 1695.06 1695.06 1694.47219011_at pleckstrin homology domain 462.15 462.15 462.15 462.03219364_at likely ortholog of mouse D11lgp2 828.68 828.68 828.68 830.36219593_at peptide transporter 3 1005.54 1005.54 1005.54 1006.65219684_at 28 kD interferon responsive protein 792.34 792.34 792.34 793.37219691_at hypothetical protein FLJ20073 1068.37 1068.37 1068.37 1068.61219863_at cyclin-E binding protein 1 2329.30 2329.30 2329.30 2332.30220104_at likely ortholog of rat zinc-finger antivir prot 547.91 547.91 547.91 548.08
221087_s_at apolipoprotein L, 3 1547.18 1547.18 1547.18 1570.80221371_at tumor necrosis factor member 18 821.30 821.30 821.30 820.92
221653_x_at apolipoprotein L, 2 1495.00 1495.00 1495.00 1496.70
BMC Bioinformatics 2008, 9:480 http://www.biomedcentral.com/1471-2105/9/480
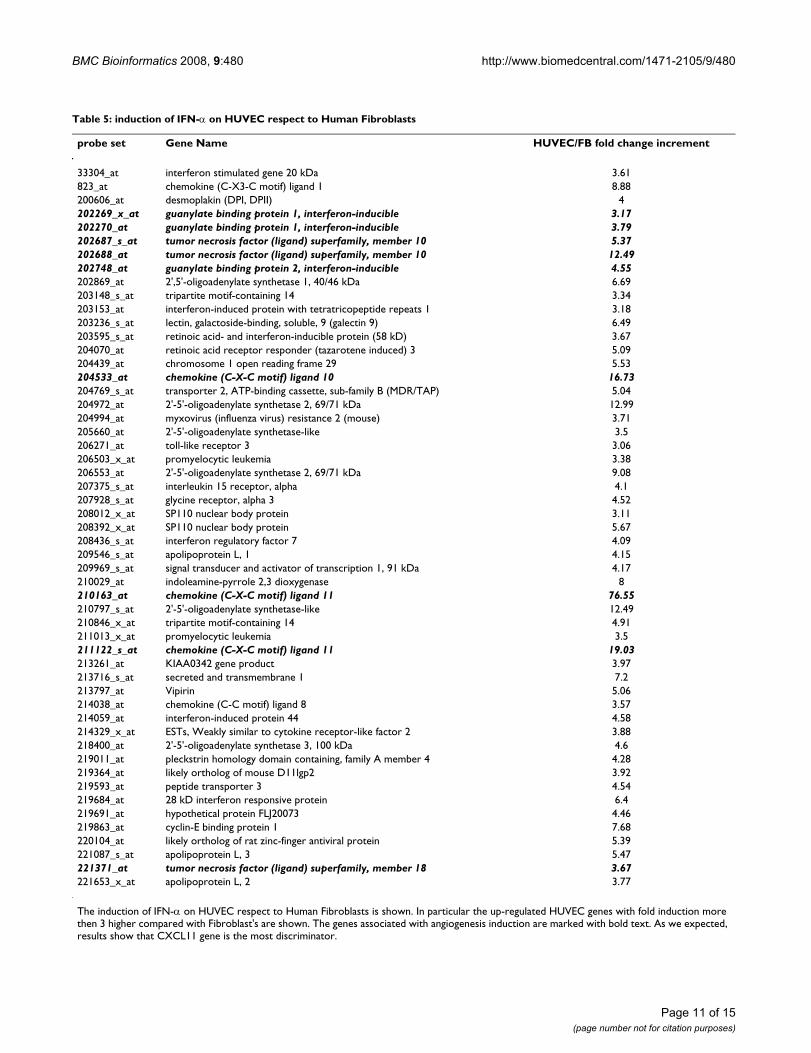
with human fibroblasts. Obviously, because the results ofthe published study had been obtained using GCRMAalgorithm, they are not exactly the same of dChip's. Theseshow 175 genes up-regulated by IFNs in HUVEC and 41genes with a > 5-fold higher induction compared withhuman fibroblasts. However it's interesting to notice thatquite similar results have been found.
In particular (Table 5) we have found that CXCL11(chemokine (C-X-C motif) ligand 11) is selectivelyinduced by IFN-α along with other genes associated withangiogenesis regulation, including CXCL10, TRAIL, andguanylate-binding protein 1.
Performance TestsThese tests, although far from any biological meaning,have the only purpose of comparing performances usinga large dataset on different environments. In details sev-eral application tests have been performed on both clusterand Grid environments using different values of paralleli-zation rate and final results have been compared.
In order to create a large data set for testing purposes, theon-line public repository GEO [15] has been used. A data-set of 1000 HG-U133A Breast Cancer microarrays hasbeen made available. It shows the following features:
• ChipType: Affimetrix GeneChip HU-133A
• Origin: Breast Cancer
• Genes: 22283
• Dataset dimension: ~12 GB
• Number of microrarray: 1000
The performance results have been obtained by calculat-ing the average of the execution times of three independ-ent executions of the application on the same dataset.
The tests on the cluster environment have been performedusing the MPI implementation of dChip onMichelangelo, the LITBIO project cluster [16] dedicated to
Trend of (mean) expression values of baseline HUVEC arrays using R/Bioconductor and dChip algorithmsFigure 2Trend of (mean) expression values of baseline HUVEC arrays using R/Bioconductor and dChip algorithms. A graphical representation of results presented on Table 1 and 3 is shown. It's worth noting that dChip versions results are over-lapped and they have a similar trend compared to RMA algorithm.
Page 7 of 15(page number not for citation purposes)

BMC Bioinformatics 2008, 9:480 http://www.biomedcentral.com/1471-2105/9/480
bioinformatics applications requiring great computa-tional efforts.
Grid tests have been performed using the gLite middle-ware on the BIOMED Virtual Organization [17] of theEGEE (Enabling Grids for E-sciencE) infrastructure [18].In this case data had been previously uploaded on severalremote and distributed storage elements and have beenanalyzed submitting more parallel jobs through oppor-tune strategies.
Concerning Grid tests, a not-MPI parallel implementationhas been used, because MPI jobs are unstable on the gLitemiddleware, at the present time. More parallel jobs can besubmitted and monitored using ad hoc scripts.
Two kinds of test have been carried out: (i) scalability onthe number of parallel jobs, (ii) scalability on the numberof microarrays.
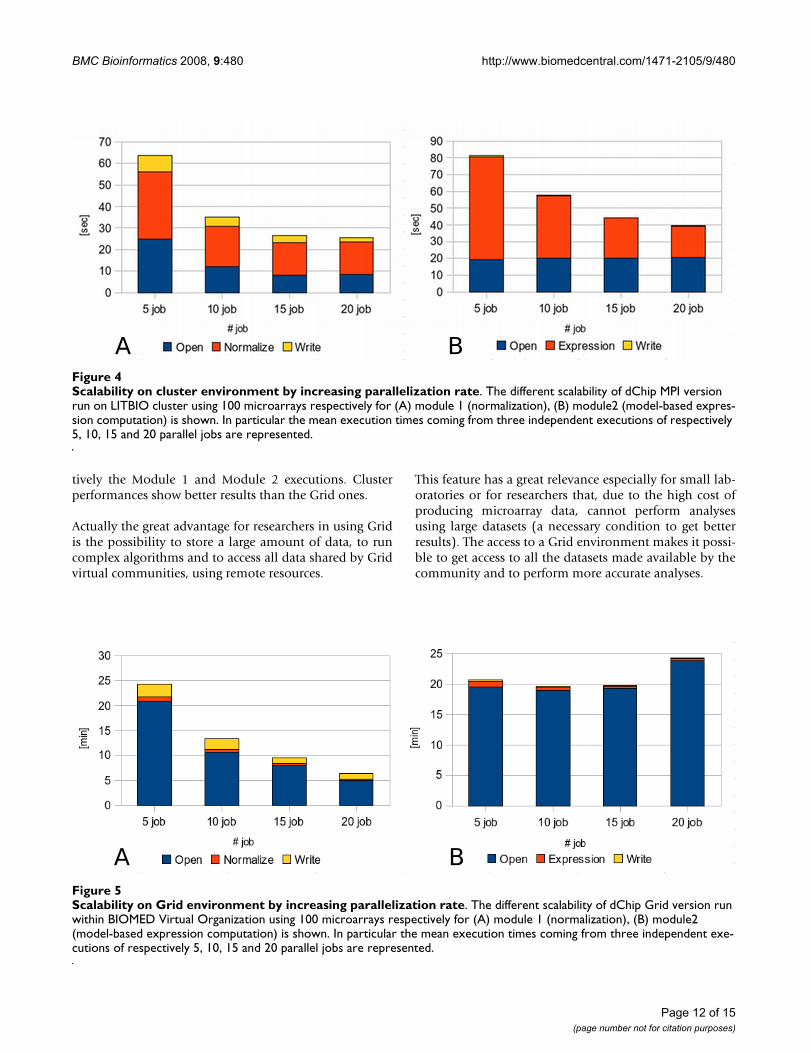
As a first test, a subset of 100 microarrays has been ana-lyzed to compare the performances of the two parallelmodules in changing the parallelization rate, both oncluster and grid implementation. In detail, four tests have
been run using respectively 5, 10, 15 and 20 parallel jobs.By comparing results, we can observe that Module 1 has abetter scalability (Figures 4A and 5A) due to the differentparallelization strategy adopted. In fact, while in the firstmodule there is a reduction in time for all the three execu-tion steps (file opening, normalization and output writ-ing), in the Module 2 (Figures 4B and 5B) we have areduction only for gene expression calculation whereasfile opening and output writing remain constant. Throughthe comparison of cluster and Grid executions we cannotice that this trend is approximately the same in bothconditions. Eventually, the speedup ratio (S(N) = T(1)/T(N), where T(1) is the execution time on a single proces-sor and T(N) the execution time on N processors), hasbeen calculated for the cluster tests with the purpose toestimate the parallelization efficiency. As shown in Table6, it is worth noting that for 100 microarrays the paralleli-zation has a quite good result up to 15 parallel jobs.
As a second test, the whole 1000 microarrays dataset hasbeen analyzed on the Grid, by running the parallel dChipversion using 10 parallel jobs, in order to investigate thetrend of performances according to the dataset dimen-sions. In Figure 6 we can see the results concerning respec-
Trend of (mean) expression values of experiment HUVEC arrays using R/Bioconductor and dChip algorithmsFigure 3Trend of (mean) expression values of experiment HUVEC arrays using R/Bioconductor and dChip algorithms. A graphical representation of results presented on Table 2 and 4 is shown. It's worth noting that all dChip versions results are overlapped and they have a similar trend compared to RMA algorithm.
Page 8 of 15(page number not for citation purposes)

BMC Bioinformatics 2008, 9:480 http://www.biomedcentral.com/1471-2105/9/480
Page 9 of 15(page number not for citation purposes)
Table 3: Comparison of baseline arrays results using R/Bioconductor and dChip implementation
probe set Gene Name GCRMA RMA dChip Linux
33304_at interferon stimulated gene 20 kDa 203.01 284.72 284.20823_at chemokine (C-X3-C motif) ligand 1 4.93 66.60 47.16
200606_at desmoplakin (DPI, DPII) 12.38 97.36 97.68202269_x_at guanylate binding protein 1 250.15 192.46 220.40202270_at guanylate binding protein 1 220.16 131.76 152.16
202687_s_at tumor necrosis factor member 10 75.06 104.00 188.82202688_at tumor necrosis factor member 10 464.46 316.93 334.35202748_at guanylate binding protein 2, interferon-inducible 409.70 305.82 247.40202869_at 2',5'-oligoadenylate synthetase 1 5.81 75.13 209.99
203148_s_at tripartite motif-containing 14 38.57 96.29 203.86203153_at interferon-induced protein 7.75 58.02 84.72
203236_s_at lectin, galactoside-binding, soluble, 9 146.27 176.17 277.38203595_s_at retinoic acid- and interferon-inducible protein 50.34 169.34 296.66204070_at retinoic acid receptor responder 3 16.93 90.63 95.42204439_at chromosome 1 open reading frame 29 5.06 39.15 50.84204533_at chemokine (C-X-C motif) ligand 10 4.16 76.22 97.55
204769_s_at transporter 2, ATP-binding cassette 50.42 180.53 241.98204972_at 2'-5'-oligoadenylate synthetase 2 4.97 56.39 61.14204994_at myxovirus (influenza virus) resistance 2 3.85 74.62 63.91205660_at 2'-5'-oligoadenylate synthetase-like 3.64 101.76 113.84206271_at toll-like receptor 3 5.82 46.99 92.93
206503_x_at promyelocytic leukemia 114.42 292.54 288.58206553_at 2'-5'-oligoadenylate synthetase 2 19.89 90.71 55.00
207375_s_at interleukin 15 receptor, alpha 17.48 219.39 230.35207928_s_at glycine receptor, alpha 3 8.48 14.27 1.15208012_x_at SP110 nuclear body protein 122.80 250.06 291.32208392_x_at SP110 nuclear body protein 8.20 94.29 155.09208436_s_at interferon regulatory factor 7 45.15 138.04 259.61209546_s_at apolipoprotein L, 1 69.01 158.61 493.11209969_s_at signal transducer and activator of transcription 1 142.29 210.42 241.42210029_at indoleamine-pyrrole 2,3 dioxygenase 5.07 105.59 99.88210163_at chemokine (C-X-C motif) ligand 11 7.94 22.10 27.88
210797_s_at 2'-5'-oligoadenylate synthetase-like 6.44 80.66 83.82210846_x_at tripartite motif-containing 14 9.07 34.13 38.65211013_x_at promyelocytic leukemia 161.42 279.82 292.75211122_s_at chemokine (C-X-C motif) ligand 11 7.12 23.88 40.68213261_at KIAA0342 gene product 10.03 120.40 135.93
213716_s_at secreted and transmembrane 1 8.37 220.23 120.94213797_at vipirin 4.70 33.70 74.26214038_at chemokine (C-C motif) ligand 8 8.16 39.84 47.63214059_at interferon-induced protein 44 7.65 46.42 68.26
214329_x_at ESTs 104.51 62.56 338.08218400_at 2'-5'-oligoadenylate synthetase 3 25.02 128.86 242.05219011_at pleckstrin homology domain 5.92 81.93 139.71219364_at likely ortholog of mouse D11lgp2 4.44 81.92 92.46219593_at peptide transporter 3 3.52 129.28 105.99219684_at 28 kD interferon responsive protein 3.66 55.44 71.72219691_at hypothetical protein FLJ20073 48.86 66.73 85.39219863_at cyclin-E binding protein 1 8.03 64.18 212.87220104_at likely ortholog of rat zinc-finger antiviral protein 18.28 70.07 86.64
221087_s_at apolipoprotein L, 3 204.63 272.26 211.18221371_at tumor necrosis factor member 18 98.32 354.34 258.60
221653_x_at apolipoprotein L, 2 60.81 153.69 286.52

BMC Bioinformatics 2008, 9:480 http://www.biomedcentral.com/1471-2105/9/480
Page 10 of 15(page number not for citation purposes)
Table 4: Comparison of experiment arrays results using R/Bioconductor and dChip implementation
probe set Gene Name GCRMA RMA dChip Linux
33304_at interferon stimulated gene 20 kDa 3196.51 2268.74 2244.54823_at chemokine (C-X3-C motif) ligand 1 94.32 199.31 303.39
200606_at desmoplakin (DPI, DPII) 346.10 472.57 459.07202269_x_at guanylate binding protein 1 9812.82 4339.89 3651.44202270_at guanylate binding protein 1 6437.35 2278.30 2282.05
202687_s_at tumor necrosis factor member 10 2156.88 1550.21 2133.03202688_at tumor necrosis factor member 10 7854.88 3398.70 3309.36202748_at guanylate binding protein 2, interferon-inducible 2345.96 1250.53 1007.71202869_at 2',5'-oligoadenylate synthetase 1 3531.07 2325.40 3112.07
203148_s_at tripartite motif-containing 14 2521.04 1435.02 1774.94203153_at interferon-induced protein 15412.19 8556.41 6863.81
203236_s_at lectin, galactoside-binding, soluble, 9 1711.84 847.55 1540.56203595_s_at retinoic acid- and interferon-inducible protein 2012.55 2181.61 2144.76204070_at retinoic acid receptor responder 3 211.37 292.39 314.03204439_at chromosome 1 open reading frame 29 3293.52 2515.21 1982.76204533_at chemokine (C-X-C motif) ligand 10 3827.84 3009.14 3018.77
204769_s_at transporter 2, ATP-binding cassette 351.22 608.05 971.37204972_at 2'-5'-oligoadenylate synthetase 2 2566.06 1918.87 2173.07204994_at myxovirus (influenza virus) resistance 2 1879.30 1864.21 2312.15205660_at 2'-5'-oligoadenylate synthetase-like 2757.19 3007.87 2793.93206271_at toll-like receptor 3 572.08 560.92 905.37
206503_x_at promyelocytic leukemia 737.59 913.65 910.07206553_at 2'-5'-oligoadenylate synthetase 2 315.50 323.83 873.65
207375_s_at interleukin 15 receptor, alpha 438.00 1020.22 1114.76207928_s_at glycine receptor, alpha 3 8.43 14.61 2.37208012_x_at SP110 nuclear body protein 4220.13 2720.23 2436.07208392_x_at SP110 nuclear body protein 347.25 510.43 842.89208436_s_at interferon regulatory factor 7 2270.19 2097.07 3397.64209546_s_at apolipoprotein L, 1 1379.27 915.53 2170.99209969_s_at signal transducer and activator of transcription 1 3157.23 2027.40 1642.44210029_at indoleamine-pyrrole 2,3 dioxygenase 833.17 1133.97 814.88210163_at chemokine (C-X-C motif) ligand 11 4702.03 2094.38 2400.30
210797_s_at 2'-5'-oligoadenylate synthetase-like 3022.68 2622.26 2210.17210846_x_at tripartite motif-containing 14 20.39 70.48 139.55211013_x_at promyelocytic leukemia 952.73 861.97 891.32211122_s_at chemokine (C-X-C motif) ligand 11 6782.66 2521.40 2835.46213261_at KIAA0342 gene product 184.92 481.56 598.16
213716_s_at secreted and transmembrane 1 924.99 1132.93 1844.02213797_at vipirin 9384.39 4037.25 4883.14214038_at chemokine (C-C motif) ligand 8 131.65 153.26 209.79214059_at interferon-induced protein 44 460.99 417.83 417.94
214329_x_at ESTs 1651.68 566.67 2344.63218400_at 2'-5'-oligoadenylate synthetase 3 1914.27 2042.07 1695.06219011_at pleckstrin homology domain 33.03 216.27 462.15219364_at likely ortholog of mouse D11lgp2 23.39 211.10 828.68219593_at peptide transporter 3 678.07 754.28 1005.54219684_at 28 kD interferon responsive protein 678.29 651.96 792.34219691_at hypothetical protein FLJ20073 1761.43 914.96 1068.37219863_at cyclin-E binding protein 1 2191.56 1844.42 2329.30220104_at likely ortholog of rat zinc-finger antiviral protein 500.61 427.62 547.91
221087_s_at apolipoprotein L, 3 1873.08 1325.73 1547.18221371_at tumor necrosis factor member 18 787.94 1269.50 821.30
221653_x_at apolipoprotein L, 2 520.21 609.52 1495.00
BMC Bioinformatics 2008, 9:480 http://www.biomedcentral.com/1471-2105/9/480
Page 11 of 15(page number not for citation purposes)
Table 5: induction of IFN-α on HUVEC respect to Human Fibroblasts
probe set Gene Name HUVEC/FB fold change increment
33304_at interferon stimulated gene 20 kDa 3.61823_at chemokine (C-X3-C motif) ligand 1 8.88200606_at desmoplakin (DPI, DPII) 4202269_x_at guanylate binding protein 1, interferon-inducible 3.17202270_at guanylate binding protein 1, interferon-inducible 3.79202687_s_at tumor necrosis factor (ligand) superfamily, member 10 5.37202688_at tumor necrosis factor (ligand) superfamily, member 10 12.49202748_at guanylate binding protein 2, interferon-inducible 4.55202869_at 2',5'-oligoadenylate synthetase 1, 40/46 kDa 6.69203148_s_at tripartite motif-containing 14 3.34203153_at interferon-induced protein with tetratricopeptide repeats 1 3.18203236_s_at lectin, galactoside-binding, soluble, 9 (galectin 9) 6.49203595_s_at retinoic acid- and interferon-inducible protein (58 kD) 3.67204070_at retinoic acid receptor responder (tazarotene induced) 3 5.09204439_at chromosome 1 open reading frame 29 5.53204533_at chemokine (C-X-C motif) ligand 10 16.73204769_s_at transporter 2, ATP-binding cassette, sub-family B (MDR/TAP) 5.04204972_at 2'-5'-oligoadenylate synthetase 2, 69/71 kDa 12.99204994_at myxovirus (influenza virus) resistance 2 (mouse) 3.71205660_at 2'-5'-oligoadenylate synthetase-like 3.5206271_at toll-like receptor 3 3.06206503_x_at promyelocytic leukemia 3.38206553_at 2'-5'-oligoadenylate synthetase 2, 69/71 kDa 9.08207375_s_at interleukin 15 receptor, alpha 4.1207928_s_at glycine receptor, alpha 3 4.52208012_x_at SP110 nuclear body protein 3.11208392_x_at SP110 nuclear body protein 5.67208436_s_at interferon regulatory factor 7 4.09209546_s_at apolipoprotein L, 1 4.15209969_s_at signal transducer and activator of transcription 1, 91 kDa 4.17210029_at indoleamine-pyrrole 2,3 dioxygenase 8210163_at chemokine (C-X-C motif) ligand 11 76.55210797_s_at 2'-5'-oligoadenylate synthetase-like 12.49210846_x_at tripartite motif-containing 14 4.91211013_x_at promyelocytic leukemia 3.5211122_s_at chemokine (C-X-C motif) ligand 11 19.03213261_at KIAA0342 gene product 3.97213716_s_at secreted and transmembrane 1 7.2213797_at Vipirin 5.06214038_at chemokine (C-C motif) ligand 8 3.57214059_at interferon-induced protein 44 4.58214329_x_at ESTs, Weakly similar to cytokine receptor-like factor 2 3.88218400_at 2'-5'-oligoadenylate synthetase 3, 100 kDa 4.6219011_at pleckstrin homology domain containing, family A member 4 4.28219364_at likely ortholog of mouse D11lgp2 3.92219593_at peptide transporter 3 4.54219684_at 28 kD interferon responsive protein 6.4219691_at hypothetical protein FLJ20073 4.46219863_at cyclin-E binding protein 1 7.68220104_at likely ortholog of rat zinc-finger antiviral protein 5.39221087_s_at apolipoprotein L, 3 5.47221371_at tumor necrosis factor (ligand) superfamily, member 18 3.67221653_x_at apolipoprotein L, 2 3.77
The induction of IFN-α on HUVEC respect to Human Fibroblasts is shown. In particular the up-regulated HUVEC genes with fold induction more then 3 higher compared with Fibroblast's are shown. The genes associated with angiogenesis induction are marked with bold text. As we expected, results show that CXCL11 gene is the most discriminator.
BMC Bioinformatics 2008, 9:480 http://www.biomedcentral.com/1471-2105/9/480
tively the Module 1 and Module 2 executions. Clusterperformances show better results than the Grid ones.
Actually the great advantage for researchers in using Gridis the possibility to store a large amount of data, to runcomplex algorithms and to access all data shared by Gridvirtual communities, using remote resources.
This feature has a great relevance especially for small lab-oratories or for researchers that, due to the high cost ofproducing microarray data, cannot perform analysesusing large datasets (a necessary condition to get betterresults). The access to a Grid environment makes it possi-ble to get access to all the datasets made available by thecommunity and to perform more accurate analyses.
Scalability on cluster environment by increasing parallelization rateFigure 4Scalability on cluster environment by increasing parallelization rate. The different scalability of dChip MPI version run on LITBIO cluster using 100 microarrays respectively for (A) module 1 (normalization), (B) module2 (model-based expres-sion computation) is shown. In particular the mean execution times coming from three independent executions of respectively 5, 10, 15 and 20 parallel jobs are represented.
Scalability on Grid environment by increasing parallelization rateFigure 5Scalability on Grid environment by increasing parallelization rate. The different scalability of dChip Grid version run within BIOMED Virtual Organization using 100 microarrays respectively for (A) module 1 (normalization), (B) module2 (model-based expression computation) is shown. In particular the mean execution times coming from three independent exe-cutions of respectively 5, 10, 15 and 20 parallel jobs are represented.
Page 12 of 15(page number not for citation purposes)

BMC Bioinformatics 2008, 9:480 http://www.biomedcentral.com/1471-2105/9/480
As previously said, the Grid provides several advantagesrelated to security aspects as well. Using the Grid certifi-cate-based authentication data are safe from possibleattacks to privacy and security.
Finally, the integration of this application into a Grid-ena-bled portal provides a simple graphical user interface torun the application. In this way, researchers do not needany particular hardware or software installed locally butonly a web connection to the portal.
Actually, besides the cost of producing data, another rele-vant issue concerns the analysis of large datasets usingstandalone applications running on local hardware. Theuse of such applications implies the existence powerfulcomputers available locally, and, often, this is not possi-ble, even in large laboratories. The previously explained
analysis related to 1000 microarrays is an example ofexperiment that could not be performed using standaloneapplications, even on the most recent powerful comput-ers.
Our solution resolves this problem and provides userswith a web-based service able to launch more analyses ina parallel way, easily monitoring the status of executionsdirectly from the portal.
ConclusionA scalable way to analyze large microarray datasets hasbeen presented. To do that, we have ported existing toolsto High Performance and Grid Computing environments.dChip software has been ported on Linux platforms andmodified, by using appropriate parallelization strategies,to permit its execution on both cluster environments and
Table 6: Mean execution times and speedup ratio analysing 100 microarrays on cluster environment
1 job 5 job 10 job 15 job 20 job
Module 1 285 sec 63.80 sec 35.20 sec 26.40 sec 25.65 secModule 2 344 sec 81.60 sec 58.00 sec 44.47 sec 39.55 secModule 1+2 629 sec 145.40 sec 93.20 sec 70.87 sec 65.20 sec
speedup ratio module 1 4.47 8.09 10.79 11.11speedup ratio module 2 4.22 5.93 7.74 8.69speedup ratio module 1+2 4.33 6.75 8.88 9.65
The table shows the mean execution times coming from three different execution of dChip MPI version run on LITBIO cluster using respectively 1, 5, 10, 15, 20 parallel jobs to compute the expression values of 100 microarrays. To estimate the parallelization efficiency, the speedup ratio (S(N) = T(1)/T(N), where T(1) is the execution time on a single processor and T(N) the execution time on N processors) was calculated.
Scalability on Grid environment by increasing microarrays' numberFigure 6Scalability on Grid environment by increasing microarrays' number. The different scalability on microarray's number of dChip Grid version run within BIOMED Virtual Organization using 10 parallel jobs respectively for (A) module 1 (normaliza-tion), (B) module2 (model-based expression computation) is shown. In particular the mean execution times coming from three independent executions to analyse respectively 50, 100, 500 and 1000 microarrays are represented.
Page 13 of 15(page number not for citation purposes)
BMC Bioinformatics 2008, 9:480 http://www.biomedcentral.com/1471-2105/9/480
Grid infrastructures. The added value provided by the useof Grid technologies is the possibility of exploiting bothcomputational and data Grids infrastructures to analyzelarge datasets of distributed data. The software has beensuccessfully validated through the comparison with theoriginal standalone Windows version of dChip. Perform-ance tests were performed in order to investigate theimprovements on performances related to the adoptedstrategies for parallelization. Moreover these tests havebeen used to compare cluster and Grid performances too.As result we found that parallelization gives quite goodresults in terms of execution times, especially for the firstmodule. Furthermore we found that Grid executions havelonger execution times rather than cluster ones. But it isworth noting that the relevance related to the use of Gridcomputing for the presented application is principallyfocused on the opportunity of sharing data. This is donethrough different research groups and exploiting distrib-uted computational resources rather than on the improve-ment of performances.
Availability and requirements• Project name: grid-dChip
• Project home page: http://www.bio.dist.unige.it/download/public/bioSoft/dChip/download_form
A web-portal version of the software is accessible withinthe LITBIO portal.
• Operating system(s): Linux
• Programming language: C++
• Other requirements: MPICH2 library (cluster version)
• License: GNU GPL
AbbreviationsGFAL: Grid File Access Library; API: Application ProgramInterface; INF: Interferon; HUVEC: Human UmbilicalVein Endothelial Cells; FB: Human Fibroblasts
Authors' contributionsLC developed the code, participated in the software designand tests definition, ran validation and performance testsand helped to draft the manuscript, MF helped to draft themanuscript, IP participated in the software design, helpedto define the performance tests and to draft the manu-script, SS helped to define the validation tests and to draftthe manuscript, LT participated in the Grid-design of thesoftware, helped to define the performance tests and todraft the manuscript. All authors read and approved thefinal manuscript.
Additional material
AcknowledgementsThis work is developed within the Italian FIRB project LITBIO (Laboratory for Interdisciplinary Technologies in BlOinformatics).
Thanks are due to Ulrich Pfeffer and his Bioinformatics group at the Advanced Biotechnology Centre of Genoa, Italy for their collaboration and for provision of microarray data as well as of their expertise.
Thanks are due to Cheng Li for his collaboration and for provision of the dChip source code.
References1. Li C, Wong WH: DNA-Chip Analyzer (dChip). In The analysis of
gene expression data: methods and software Edited by: Parmigiani G,Garrett ES, Irizarry R, Zeger SL. Springer, New York; 2003:120-141.
2. Gentleman RC, Carey VJ, Bates DJ, Bolstad BM, Dettling M, Dudoit S,Ellis B, Gautier L, Ge Y, Gentry J, Hornik K, Hothorn T, Huber W,lacus S, Irizarry R, Leisch F, Li C, Maechler M, Rossini AJ, Sawitzki G,Smith C, Smyth GK, Tierney L, Yang YH, Zhang J: Bioconductor:Open software development for computational biology andbioinformatics. Genome Biol 2004, 5(10):R80.
3. Porro I, Torterolo L, Corradi L, Fato M, Papadimitropoulos A, Scagl-ione S, Schenone A, Viti F: A Grid-based solution for manage-ment and analysis of microarrays in distributedexperiments. BMC Bioinformatics 8(Suppl 1):S7. 2007 Mar 8
4. Beltrame F, Papadimitropoulos A, Porro I, Scaglione S, Schenone A,Torterolo L, Viti F: GEMMA – A Grid environment for micro-array management and analysis in bone marrow stem cellsexperiments. Future Generation Computer Systems 2007,23(3):382-390.
5. gLite middleware [http://glite.web.cern.ch/glite]6. GFAL [http://grid-deployment.web.cern.ch/grid-deployment/gis/
GFAL/GFALindex.html]7. Tuecke S, Welch V, Engert D, Pearlman L, Thompson M: Internet
X.509 public key infrastructure (PKI) proxy certificate pro-file. IETF RFC 2004:3820.
8. Pfeffer U, Ferrari N, Dell'Eva R, Indraccolo S, Morini M, Noonan DM,Albini A: Molecular mechanisms of action of angiopreventiveanti-oxidants on endothelial cells: Microarray gene expres-sion analyses. Mutation Research -Fundamental and Molecular Mecha-nisms of Mutagenesis 2005, 591(1–2):198-211.
9. Li C, Wong WH: Model-based analysis of oligonucleotidearrays: expression index computation and outlier detection.Proc Natl Acad Sci USA 2001, 98:31-36.
10. Li C, Wong WH: Model-based analysis of oligonucleotidearrays: model validation, design issues and standard errorapplication. Genome Biology 2001, 2(8):1-0032.
11. Wu Z, Irizarry RA, Gentleman R, Murillo FM, Spencer F: A ModelBased Background Adjustment for Oligonucleotide Expres-sion Arrays. Working Papers, Department of Biostatistics, JohnsHopkins University; 2004.
12. Irizarry RA, Hobbs B, Collin F, Beazer-Barclay YD, Antonellis KJ,Scherf U, Speed TP: Exploration, normalization, and summa-ries of high density oligonucleotide array probe level data.Biostatistics 2003, 4:249-264.
13. Qin LX, Beyer RP, Hudson FN, Linford NJ, Morris DE, Kerr KF: Eval-uation of methods for oligonucleotide array data via quanti-tative real-time PCR. BMC Bioinformatics 2006, 7:23.
14. Millenaar FF, Okyere J, May ST, van Zanten M, Voesenek LA, PeetersAJ: How to decide? Different methods of calculating gene
Additional file 1Source code. The archive contains the source code of modified dChip.Click here for file[http://www.biomedcentral.com/content/supplementary/1471-2105-9-480-S1.gz]
Page 14 of 15(page number not for citation purposes)

BMC Bioinformatics 2008, 9:480 http://www.biomedcentral.com/1471-2105/9/480
Publish with BioMed Central and every scientist can read your work free of charge
"BioMed Central will be the most significant development for disseminating the results of biomedical research in our lifetime."
Sir Paul Nurse, Cancer Research UK
Your research papers will be:
available free of charge to the entire biomedical community
peer reviewed and published immediately upon acceptance
cited in PubMed and archived on PubMed Central
yours — you keep the copyright
Submit your manuscript here:http://www.biomedcentral.com/info/publishing_adv.asp
BioMedcentral
expression from short oligonucleotide array data will givedifferent results. BMC Bioinformatics 2006, 7:137.
15. Expression Omnibus (GEO) [http://www.ncbi.nlm.nih.gov/geo]16. LITBIO – Laboratory for Interdisciplinary Technologies in
BIOinformatics FIRB Project [http://www.litbio.org]17. BIOMED [http://cic.gridops.org/index.php?sec
tion=home&page=volist&vo=6]18. EGEE Project [http://public.eu-egee.org/intro/]
Page 15 of 15(page number not for citation purposes)