A wave-driven jet over a rocky shoal
13
A wave‐driven jet over a rocky shoal Ryan P. Mulligan, 1,2 Alex E. Hay, 1 and Anthony J. Bowen 1 Received 21 December 2009; revised 25 May 2010; accepted 8 July 2010; published 16 October 2010. [1] Field observations and model simulations are presented of flow generated by waves breaking over a shoal at the entrance to a shallow bay. The shoal is composed of a series of steep and narrow bedrock ridges with depths of 2–8 m at the ridge crests. Observations from instruments on the shoal indicated peak significant wave heights during a storm event were 2.4–4.0 m across the observation sites; this spatial variability is due to wave breaking over the ridges. The 2‐D depth‐averaged hydrodynamic model Delft3D, coupled to the wave model SWAN, was used to simulate the waves and wave‐driven flow over the shoal and throughout the entire bay with a nested fine grid (5 m resolution) to resolve the shoal bathymetry. The model predicts a well‐defined jet behind the shoal, with mean axial speeds of 0.4–0.7 m/s. The observations indicate maximum speeds behind the shoal of 0.3–0.4 m/s, exceeding the maximum tidal current speed by more than a factor of 4, that are consistent in timing and direction with the model predictions. The model overpredicts wave breaking over the steep slopes and as a result the current speeds are overestimated. Citation: Mulligan, R. P., A. E. Hay, and A. J. Bowen (2010), A wave‐driven jet over a rocky shoal, J. Geophys. Res., 115, C10038, doi:10.1029/2009JC006027. 1. Introduction [2] The term “jet” is often used to describe the narrow dis- charge of a fluid into a large body of the same fluid that is driven by momentum [Fischer et al., 1979]. Wave breaking in the coastal ocean is a mechanism for the transfer of wave momentum to the mean flow through the radiation stress gra- dients [Longuet‐Higgins and Stewart, 1964] and when waves break over a submerged shoal, the resulting wave‐driven flows behind the shoal have a jet‐like shape in the horizontal. Con- sidering the extent of shoals and bathymetric irregularities along rocky coasts such as the coast of Nova Scotia, currents driven by wave breaking over these features are likely to be an important part of coastal circulation during storms. [3] Refraction and breaking of waves over submerged shoals have been studied previously using physical models [Vincent and Briggs, 1989; Chawla et al., 1998] and numer- ical models [Panchang et al., 1990; Chen et al., 2000; Yoon et al., 2004]. These studies have examined transformation of the wave field over circular and elliptical shoals, and the models were validated using laboratory measurements of the waves. Both Chen et al. [2000] and Yoon et al. [2004] used numerical models to compute radiation stress gra- dients, identified a current behind the shoal, and noted the improvement to wave predictions when the currents were included. These studies have also reported strong sensitivity in the ability to model wave breaking over steep slopes. Liu and Losada [2002] compared the breaking formulations of both Battjes and Janssen [1978] and Thornton and Guza [1983] to the experimental results of Chawla et al. [1998] for wave propagation over a circular shoal. They reported good agreement for the significant wave height between observations and model results seaward of, and refracted behind, the shoal, but found major disparities on the top of the shoal. No studies have thus far shown observations or predictions of the currents behind a shoal in the field. [4] Cross‐shore flows over submerged breakwaters have also been investigated. Johnson et al. [2005] compared numerical model results to wave basin experiments for low‐ crested submerged breakwaters with qualitative good agree- ment, and found that currents were directed onshore over the breakwater and offshore through the breakwater gaps. Johnson [2006] compared the Battjes and Janssen [1978] wave breaking model (hereinafter referred to as BJ78) with labo- ratory measurements of waves over a submerged breakwater, and predicted excessive energy loss due to breaking over the breakwater crest. It was suggested that energy dissipation over the breakwater was overestimated due to an incipient breaking criterion that is not appropriate for steep slopes, which caused wave breaking to begin in deeper water in the model. Baldock et al. [1998] also indicated that the BJ78 model does not describe wave transformation on steep slopes well. [5] Wave‐driven currents have also been studied in coral reef environments. Wave‐driven flows over reefs and through lagoons have a major influence on flushing [Hearn, 1999], and are critical in determining community distributions and production rates in coral reef ecosystems. Wave breaking over the reef face creates the radiation stress gradients that induce cross‐reef currents over the reef‐tops [Gourlay and Colleter, 2005], setup inside lagoons [ Callaghan et al. , 2006] and outflows through deeper channels [ Kraines et al., 1998]. Strong correlations were observed between mea- 1 Department of Oceanography, Dalhousie University, Halifax, Nova Scotia, Canada. 2 Now at Department of Geological Sciences and the Institute for Coastal Science and Policy, East Carolina University, Greenville, North Carolina, USA. Copyright 2010 by the American Geophysical Union. 0148‐0227/10/2009JC006027 JOURNAL OF GEOPHYSICAL RESEARCH, VOL. 115, C10038, doi:10.1029/2009JC006027, 2010 C10038 1 of 13
Transcript of A wave-driven jet over a rocky shoal

A wave‐driven jet over a rocky shoal
Ryan P. Mulligan,1,2 Alex E. Hay,1 and Anthony J. Bowen1
Received 21 December 2009; revised 25 May 2010; accepted 8 July 2010; published 16 October 2010.
[1] Field observations and model simulations are presented of flow generated by wavesbreaking over a shoal at the entrance to a shallow bay. The shoal is composed of a seriesof steep and narrow bedrock ridges with depths of 2–8 m at the ridge crests. Observationsfrom instruments on the shoal indicated peak significant wave heights during a stormevent were 2.4–4.0 m across the observation sites; this spatial variability is due to wavebreaking over the ridges. The 2‐D depth‐averaged hydrodynamic model Delft3D, coupledto the wave model SWAN, was used to simulate the waves and wave‐driven flow overthe shoal and throughout the entire bay with a nested fine grid (5 m resolution) to resolve theshoal bathymetry. The model predicts a well‐defined jet behind the shoal, with mean axialspeeds of 0.4–0.7 m/s. The observations indicate maximum speeds behind the shoal of0.3–0.4 m/s, exceeding the maximum tidal current speed by more than a factor of 4, that areconsistent in timing and direction with the model predictions. The model overpredicts wavebreaking over the steep slopes and as a result the current speeds are overestimated.
Citation: Mulligan, R. P., A. E. Hay, and A. J. Bowen (2010), A wave‐driven jet over a rocky shoal, J. Geophys. Res., 115,C10038, doi:10.1029/2009JC006027.
1. Introduction
[2] The term “jet” is often used to describe the narrow dis-charge of a fluid into a large body of the same fluid that isdriven by momentum [Fischer et al., 1979]. Wave breaking inthe coastal ocean is a mechanism for the transfer of wavemomentum to the mean flow through the radiation stress gra-dients [Longuet‐Higgins and Stewart, 1964] and when wavesbreak over a submerged shoal, the resultingwave‐driven flowsbehind the shoal have a jet‐like shape in the horizontal. Con-sidering the extent of shoals and bathymetric irregularitiesalong rocky coasts such as the coast of Nova Scotia, currentsdriven by wave breaking over these features are likely to be animportant part of coastal circulation during storms.[3] Refraction and breaking of waves over submerged
shoals have been studied previously using physical models[Vincent and Briggs, 1989; Chawla et al., 1998] and numer-ical models [Panchang et al., 1990; Chen et al., 2000; Yoonet al., 2004]. These studies have examined transformationof the wave field over circular and elliptical shoals, and themodels were validated using laboratory measurements ofthe waves. Both Chen et al. [2000] and Yoon et al. [2004]used numerical models to compute radiation stress gra-dients, identified a current behind the shoal, and noted theimprovement to wave predictions when the currents wereincluded. These studies have also reported strong sensitivityin the ability to model wave breaking over steep slopes. Liu
and Losada [2002] compared the breaking formulations ofboth Battjes and Janssen [1978] and Thornton and Guza[1983] to the experimental results of Chawla et al. [1998]for wave propagation over a circular shoal. They reportedgood agreement for the significant wave height betweenobservations and model results seaward of, and refractedbehind, the shoal, but found major disparities on the top ofthe shoal. No studies have thus far shown observations orpredictions of the currents behind a shoal in the field.[4] Cross‐shore flows over submerged breakwaters have
also been investigated. Johnson et al. [2005] comparednumerical model results to wave basin experiments for low‐crested submerged breakwaters with qualitative good agree-ment, and found that currents were directed onshore over thebreakwater and offshore through the breakwater gaps. Johnson[2006] compared the Battjes and Janssen [1978] wavebreaking model (hereinafter referred to as BJ78) with labo-ratory measurements of waves over a submerged breakwater,and predicted excessive energy loss due to breaking over thebreakwater crest. It was suggested that energy dissipation overthe breakwater was overestimated due to an incipient breakingcriterion that is not appropriate for steep slopes, which causedwave breaking to begin in deeper water in the model. Baldocket al. [1998] also indicated that the BJ78 model does notdescribe wave transformation on steep slopes well.[5] Wave‐driven currents have also been studied in coral
reef environments.Wave‐driven flows over reefs and throughlagoons have a major influence on flushing [Hearn, 1999],and are critical in determining community distributions andproduction rates in coral reef ecosystems. Wave breakingover the reef face creates the radiation stress gradients thatinduce cross‐reef currents over the reef‐tops [Gourlay andColleter, 2005], setup inside lagoons [Callaghan et al.,2006] and outflows through deeper channels [Kraines etal., 1998]. Strong correlations were observed between mea-
1Department of Oceanography, Dalhousie University, Halifax, NovaScotia, Canada.
2Now at Department of Geological Sciences and the Institute forCoastal Science and Policy, East Carolina University, Greenville, NorthCarolina, USA.
Copyright 2010 by the American Geophysical Union.0148‐0227/10/2009JC006027
JOURNAL OF GEOPHYSICAL RESEARCH, VOL. 115, C10038, doi:10.1029/2009JC006027, 2010
C10038 1 of 13
sured wave height and cross‐reef current velocity [Symondset al., 1995], and analytical model results [Symonds et al.,1995; Gourlay and Colleter, 2005] demonstrated thedependence of the currents and lagoon setup on reef geometryand wave forcing. In a review of previous research on flowsover coral reefsMonismith [2007] noted that, unlike the casefor beaches, measurements of waves and currents on reefs arerelatively limited.[6] In this paper, field observations and model simulations
of a jet forced by the waves breaking over a rocky shoal arepresented. We use the standard formulations included in theSWAN model, including the BJ78 wave breaking formula-tion, and compare waves and currents. The field experimentand storm event are described in section 2, wave and currentobservations are presented in section 3, the numerical models(SWAN and Delft3D) and simulation results are discussedin section 4 and conclusions are drawn in section 5.
2. Field Experiment
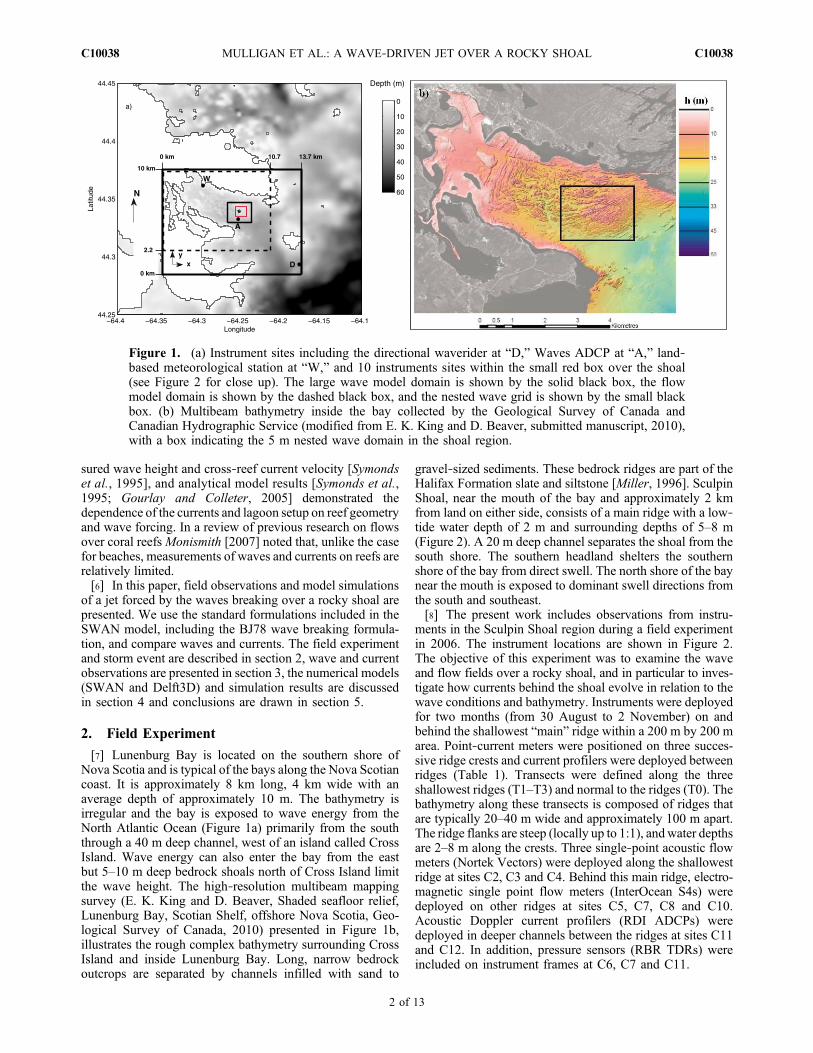
[7] Lunenburg Bay is located on the southern shore ofNova Scotia and is typical of the bays along the Nova Scotiancoast. It is approximately 8 km long, 4 km wide with anaverage depth of approximately 10 m. The bathymetry isirregular and the bay is exposed to wave energy from theNorth Atlantic Ocean (Figure 1a) primarily from the souththrough a 40 m deep channel, west of an island called CrossIsland. Wave energy can also enter the bay from the eastbut 5–10 m deep bedrock shoals north of Cross Island limitthe wave height. The high‐resolution multibeam mappingsurvey (E. K. King and D. Beaver, Shaded seafloor relief,Lunenburg Bay, Scotian Shelf, offshore Nova Scotia, Geo-logical Survey of Canada, 2010) presented in Figure 1b,illustrates the rough complex bathymetry surrounding CrossIsland and inside Lunenburg Bay. Long, narrow bedrockoutcrops are separated by channels infilled with sand to
gravel‐sized sediments. These bedrock ridges are part of theHalifax Formation slate and siltstone [Miller, 1996]. SculpinShoal, near the mouth of the bay and approximately 2 kmfrom land on either side, consists of a main ridge with a low‐tide water depth of 2 m and surrounding depths of 5–8 m(Figure 2). A 20 m deep channel separates the shoal from thesouth shore. The southern headland shelters the southernshore of the bay from direct swell. The north shore of the baynear the mouth is exposed to dominant swell directions fromthe south and southeast.[8] The present work includes observations from instru-
ments in the Sculpin Shoal region during a field experimentin 2006. The instrument locations are shown in Figure 2.The objective of this experiment was to examine the waveand flow fields over a rocky shoal, and in particular to inves-tigate how currents behind the shoal evolve in relation to thewave conditions and bathymetry. Instruments were deployedfor two months (from 30 August to 2 November) on andbehind the shallowest “main” ridge within a 200 m by 200 marea. Point‐current meters were positioned on three succes-sive ridge crests and current profilers were deployed betweenridges (Table 1). Transects were defined along the threeshallowest ridges (T1–T3) and normal to the ridges (T0). Thebathymetry along these transects is composed of ridges thatare typically 20–40 m wide and approximately 100 m apart.The ridge flanks are steep (locally up to 1:1), andwater depthsare 2–8 m along the crests. Three single‐point acoustic flowmeters (Nortek Vectors) were deployed along the shallowestridge at sites C2, C3 and C4. Behind this main ridge, electro-magnetic single point flow meters (InterOcean S4s) weredeployed on other ridges at sites C5, C7, C8 and C10.Acoustic Doppler current profilers (RDI ADCPs) weredeployed in deeper channels between the ridges at sites C11and C12. In addition, pressure sensors (RBR TDRs) wereincluded on instrument frames at C6, C7 and C11.
Figure 1. (a) Instrument sites including the directional waverider at “D,” Waves ADCP at “A,” land‐based meteorological station at “W,” and 10 instruments sites within the small red box over the shoal(see Figure 2 for close up). The large wave model domain is shown by the solid black box, the flowmodel domain is shown by the dashed black box, and the nested wave grid is shown by the small blackbox. (b) Multibeam bathymetry inside the bay collected by the Geological Survey of Canada andCanadian Hydrographic Service (modified from E. K. King and D. Beaver, submitted manuscript, 2010),with a box indicating the 5 m nested wave domain in the shoal region.
MULLIGAN ET AL.: A WAVE‐DRIVEN JET OVER A ROCKY SHOAL C10038C10038
2 of 13

[9] The highest waves during the field experiment werefrom a large‐scale midlatitude storm on 29 October 2006(YD 302). Satellite observations from Environment Canada(www.weatheroffice.gc.ca/satellite) indicated that the stormwas 3000 km in scale, with cloud bands on the eastern armof the low‐pressure center that extended from Florida toNova Scotia. Significant wave heights in the Gulf of Maine(buoy 44024) reached 9.9 m at the peak of the storm. Thedirectional waverider buoy outside Lunenburg Bay (site D)recorded amaximum significant wave height of 5.5 m, shownin Figure 3. A rapid reduction in wave height occurred atYD 302.3, coincident with a change in wave direction fromsoutheast to southwest (from 160° to 200°) causing thesouthern headland to shelter the bay from direct swell. Thisoccurred at the same time as the rapid shift in wind direction(Figure 3d) associated with the passage of the storm centernorthwest of Lunenburg Bay. Damage to the instrumentframes on the main ridge (C2, C3, C4) occurred during thestorm event. All three aluminum frames were bent as a resultof inadequate lead ballasting, as the wave forces pushedthe frames over and down the rocky slope. However, the
Figure 2. Bathymetry of the shoal in model coordinates. Long and narrow shallow areas (shown in yellowand red) are the bedrock ridges that form Sculpin Shoal. Instruments sites (C) and transect locations (T) areshown.
Table 1. Instruments in Lunenburg Bay During the MidlatitudeStorm on 29–30 October 2006
Site Instruments Waves/Currents h (m)
D DataWell directional waverider buoy w 30.0A RDI Waves ADCP (1200 kHz) w+c 19.0C2 Nortek Vector w+c 5.7C3 Nortek Vector w+c 3.0C4 Nortek Vector w+c 3.9C5 InterOcean S4 c 9.1C6 InterOcean S4, RBR TDR w+c 6.2C7 InterOcean S4, RBR TDR w+c 4.2C8 InterOcean S4 c 9.4C10 InterOcean S4 c 8.8C11 RDI Waves ADCP (1200 kHz) w+c 9.2C12 RDI ADCP (600 kHz), RBR TDR w+c 13.7
Figure 3. Bulk wave statistics measured by the directionalwaverider (site D): (a) significant wave height; (b) peak andmean wave period; (c) peak wave direction; (d) wind speedand vectors at site W (see locations on Figure 1).
MULLIGAN ET AL.: A WAVE‐DRIVEN JET OVER A ROCKY SHOAL C10038C10038
3 of 13

instruments themselves were not damaged and useful pres-sure data were recovered.[10] The wave breaking parameter is herein defined as:
� ¼ Hs
h; ð1Þ
where h is the water depth, reached 0.7–0.9 at C3 on YD 302.Other field studies have shown that g = 0.33 at the onset ofbreaking and g = 0.6 at maximum breaking intensity[Ruessink et al., 1998], and g decreases into the surf zonewith continued breaking [Thornton andGuza, 1983] reachingvalues of 0.2–0.5 over flat beach terraces [Raubenheimeret al., 1996] and coral reef flats [Hearn, 1999] until all wavesare broken. The foreslope of the shoal was very steep (1:10over 100 m horizontal distance, and locally 1:1). The steep-nesses are comparable to typical coral reef faces (for whichHearn [1999] suggested high values for g of 0.8 on thesteep faces) and to steep beaches with shorebreaks (for whichRaubenheimer et al. [1996] indicated values for g can be upto 1.2).
3. Observations Over the Shoal
3.1. Waves
[11] Waves were measured at seven locations in the shoalarea and the observations indicated large differences in waveheight O(1 m) over the short distances O(100 m) between
instrument sites. The significant wave height (Hs) was deter-mined from pressure data using:
Hs ¼ 4
ffiffiffiffiffiffiffiffiffiffiffiffiffiffiffiffiffiffiffiffiffiffiZ fN
0S��df
s; ð2Þ
where Shh is the sea surface elevation spectral density, f isthe wave frequency and fN is the Nyquist frequency for eachinstrument. Shh was determined from the pressure observa-tions at the instrument depth, and transformation of thebottom pressure spectral densities to the surface using linearwave theory. The Waves ADCPs at sites C11 and A mea-sured bottom pressure, velocity and acoustic range to the seasurface. The observations were used to estimate the surfaceelevation spectra and thus the significant wave height. Thewave direction was determined from the directional spectra,obtained from the measurements of pressure and velocity.[12] Time series of significant wave height are shown in
Figure 4 (model results discussed in section 4). The wavefield evolution can be attributed to several wave transfor-mation processes including wave shoaling, breaking andrefraction. Along the main ridge (T1), Hs reached 3.9 m atC2, 3.1 m at C3 and 3.4 m at C4 at YD 302.2. Smaller waveheights were observed 80 m behind the shoal at C11 whereHs was 2.4 m at YD 302.2. The spectra, shown in Figure 5,indicate that the differences in wave energy between thesites was at the peak frequency. These observations are
Figure 4. Observed (filled circle) and simulated (open circle) significant wave height in the shoal area atthe seven wave instrument sites. (top left) The site locations and the 8 m depth contour. (top right)Observed (plus) and simulated (open square) mean wave direction at C11.
MULLIGAN ET AL.: A WAVE‐DRIVEN JET OVER A ROCKY SHOAL C10038C10038
4 of 13

similar to studies within the surf zone along a beach [Elgaret al., 1997], where spectral observations indicate both non-linear energy transfer and significant inferred breaking‐induced dissipation. The observed spectra indicate strongevidence of energy transfer through nonlinear interaction,with harmonics at multiples of the peak frequency. Theenergy peak at the first harmonic was greatest at the mainridge sites (T1), weaker behind the shoal on the secondridge (T2) and not evident farther behind the shoal at C12.The decay with distance of the first harmonic is evidence ofnonlinear energy transfer back toward the primary frequencyas the waves propagated into deeper water, or refraction ofthe original wave train around the shoal.
3.2. Currents
[13] Currents were observed at nine of the ten sites listedin Table 1. Seven point current instruments recorded veloc-ities near the seabed on the ridge crests and two ADCPsmeasured current profiles between ridges (C11,C12) alongtransect T0. In addition, the ADCP at site A (part of theLunenburg Bay coastal observatory [Mulligan et al., 2008])was in operation, located 700 m south of the shoal.[14] Tidal currents (ut, vt) were estimated using harmonic
analysis of the complex current We:
We ¼ uobs þ ivobs ð3Þ
ut; vtð Þ ¼ R Weð Þ;= Weð Þð Þ
using T‐TIDE [Pawlowicz et al., 2002] with 29 constituentsto determine We. The residual currents (u, v) were deter-mined from the difference between the observations (uobs,vobs) and tidal currents. Figure 6 shows the observed hori-zontal velocity components at near‐surface bins from threeADCPs and the tidal currents estimated by harmonic analysis.Prior to the storm (YD 298–300) calm conditions existed inthe bay, with light winds (<2 m/s) and small waves (<0.3 m).During this period, currents were less than 0.1 m/s and werewell described by the tidal analysis (Figure 6). Strong cur-rents up to 0.4 m/s behind the shoal began flowing into thebay (−u, +v) on YD 302 (Figures 6 and 7). Strong currentswere also measured at site A, south of the shoal near thedeep channel. These currents were directed out of the bay(+u, −v) and the peak outflow occurred approximately 3 h afterthe peak inflow behind the shoal.[15] On YD 302 the currents behind the shoal became
much stronger than the prior flow conditions (see Figure 7),where the current magnitude is given as juj ¼ ffiffiffiffiffiffiffiffiffiffiffiffiffiffiffi
u2 þ v2p
. Thecurrent speed increased in correlation with the difference insignificant wave height between C2 on the main ridge andC11 behind it. Currents rapidly subsided as the wave heightdifference across the shoal decreased, indicating a rapidresponse of the current to variations in wave forcing. Verticalprofiles of the horizontal currents are shown in Figure 8,before and after the peak velocity. The currents at C11 werestrongest in the upper 5 m of the water column, and at C12were strongest in the upper 10 m. The strong vertical shear at
Figure 5. Evolution of observed surface elevation spectral density, Shh, in the shoal region. The 1, 2, and7 m2/Hz spectral density contours are shown. (top left) The site locations and the 8 m depth contour.
MULLIGAN ET AL.: A WAVE‐DRIVEN JET OVER A ROCKY SHOAL C10038C10038
5 of 13

these depths indicate that the current was restricted to thedepth of the local ridges upstream of each instrument site.[16] The observations at C11 and C12 shown in Figures 6,
7, and 8 indicate that a 0.3–0.4 m/s current occurred behindthe breaking zone. Point‐current meters were located 200 mbehind the main ridge at C8 and C10 in 9 m water depthalong transect T3. The ADCP at C12 was located halfwaybetween these sites in the x‐direction, and was 40 m closerto the main ridge (Figure 2). Based on the profiles at C12,which indicate that the currents were depth‐uniform in theupper 10 m, the observations at C8 and C10 are represen-tative of the depth‐averaged flow over the ridge. Time seriesof the currents at these three sites indicate that the peak cur-rent magnitude occurred at each instrument site at a differentangle and at a different time. The peak current occurred firstat C8 (YD 302.17), directed to the northwest (−u, +v). Onehour later (YD 302.21) the peak current occurred at C12,directed to the north. Another hour later (YD 302.25), a verysimilar signal was recorded at C10 directed slightly northeast.[17] Point‐current meters were also located at C5 and C7
along transect T2. At the peak of the event the current was0.1 m/s at C5 (9 m depth) and 0.2 m/s at C7 (4 m depth).These currents were relatively weak compared to the othersites, but at C7 were well correlated with the significantwave height. This indicates that the flow was narrow in thehorizontal, and much weaker near the edges than along its
axis. Wave forces moved all acoustic current meters thatwere on the main ridge (C2, C3 and C4) before the peak inwave conditions. Before the instruments moved, the observa-tions at C2 and C4 indicated northward flow over the shoal(+v): at the shallower site (C4) a rapidly increasing meancurrent of 0.2 m/s was observed while at the deeper site (C2)a weaker flow <0.1 m/s was recorded.
4. Model Simulations
[18] For the case of vertically‐averaged flow (u, v) in thehorizontal (x, y) plane over depth h, the momentum equa-tions with wave forcing included are:
@u
@tþ u
@u
@xþ v
@u
@y� fcv ¼ �g
@�
@xþ AH
@2u
@x2þ @2u
@y2
� �
þ �ax�h
� �bx�h
� Fx
�h; ð4Þ
@v
@tþ u
@v
@xþ v
@v
@yþ fcu ¼ �g
@�
@yþ AH
@2v
@x2þ @2v
@y2
� �
þ �ay�h
� �by�h
� Fy
�h; ð5Þ
Figure 6. Observed currents and predicted tidal currents at ADCPs. (top) Observed significant waveheight on the shoal (C2) and behind it (C11). (bottom) Observed (thick black line) near‐surface (4 mdepth) horizontal velocity components (uobs, vobs) and tidal (thin gray line) velocity components (ut, vt)predicted from harmonic analysis at three ADCPs: 80 m north of the shoal at C11, 160 m north of theshoal at C12, and 700 m south of the shoal at A. The vertical line indicates the time when g first reached0.4 at site C3.
MULLIGAN ET AL.: A WAVE‐DRIVEN JET OVER A ROCKY SHOAL C10038C10038
6 of 13

where g is gravitational acceleration, r is fluid density, t istime and fc is the Coriolis parameter. The relatively smallsize of Lunenburg Bay leads to negligible Coriolis force inthe barotropic circulation.[19] The depth‐averaged continuity equation is:
@�
@tþ @ huð Þ
@xþ @ hvð Þ
@y¼ 0: ð6Þ
The forcing terms, on the right‐hand side of equations (4)and (5) include the pressure gradient due to changes inwater level h, eddy friction parameterized by a horizontaleddy viscosity coefficient AH, atmospheric wind stress (ta),bottom friction (tb), and wave‐induced radiation stressgradients (F). Wave momentum flux is described by thegradients in radiation stress:
Fx;Fy
� � ¼ � @Sxx@x
þ @Sxy@y
;@Syx@x
þ @Syy@y
� �; ð7Þ
where S is the radiation stress tensor [Longuet‐Higgins andStewart, 1962].[20] Two numerical models were used to simulate waves
and circulation. The wave model is SWAN (SimulatingWAves Nearshore) developed by Booij et al. [1999] at DelftUniversity of Technology and the flow model is Delft3D[Lesser et al., 2004] developed by WL Delft Hydraulics(now Deltares) in the Netherlands. The numerical codes are
coupled within the Delft3D (D3D) hydrodynamic modelingpackage, and compute waves and currents (with interactionbetween both) on specified time scales. SWAN is a spectralwave model that is widely used to simulate wave conditionsin coastal areas. It incorporates physics for wave processes indeep and shallow water, including wave propagation,refraction due to currents and depth, wave generation bywind, dissipation (whitecapping, bottom friction, depth‐induced wave breaking), and nonlinear wave‐wave interac-tions (see Booij et al. [1999] for a complete description). Theenergy dissipation rate for wave‐breaking is expressed bythe Battjes and Janssen [1978] model.[21] The flow model is a finite difference scheme that
numerically solves the horizontal momentum equations. D3Daccounts for the effects of waves on currents by (1) includingradiation stress gradients [Longuet‐Higgins and Stewart,1964] in the flow momentum equations; (2) enhancing thebed shear stress due to waves [Fredsoe, 1984]; (3) inducingturbulence and vertical mixing [Lesser et al., 2004]; and(4) accounting for Stokes drift using a generalized Lagrangianmean approach [Groeneweg and Battjes, 2003] (see Lesseret al. [2004] for a complete description). Elias et al. [2000]described validation of the model in depth‐averaged mode,for an alongshore uniform coast in the Netherlands. Theyobtained generally good agreement with measurements andwere able to simulate wave‐driven longshore and rip cur-rents associated with bar bathymetry, although they notedthat the current magnitude was over‐predicted especiallywhen water levels were high.
Figure 7. Vertical structure of residual current speed |u| behind the shoal: (a) significant wave heightobservations on the shoal (C2) and behind it (C11), and current speed at 2 min intervals at (b) C11and (c) C12.
MULLIGAN ET AL.: A WAVE‐DRIVEN JET OVER A ROCKY SHOAL C10038C10038
7 of 13
[22] The D3D model was setup in 2‐D (depth‐averaged)mode with three regular grids to simulate waves and currentsthroughout the bay and to resolve the complex bathymetry inthe shoal region. The large wave grid with 20 m resolution(Figure 1) covered an area of 13.7 km in the east‐west (x)direction and 10.4 km in the north‐south (y) direction and
extended well beyond the bay to Cross Island. Within thisgrid, a 5 m nested wave grid was developed for the shoalregion over a domain of 3.0 km in x and 2.0 km in y. Theflow grid covered an area of 10.7 km in the east‐west (x)direction and 8.2 km in the north‐south (y) at 10 m resolution,and was constructed inside the larger wave model domain(Figure 1) to allow waves to adjust within the wave domainbefore reaching the flow domain (avoiding unrealisticallystrong wave‐driven currents due to breaking near theboundary).[23] The wave model was configured with frequencies in
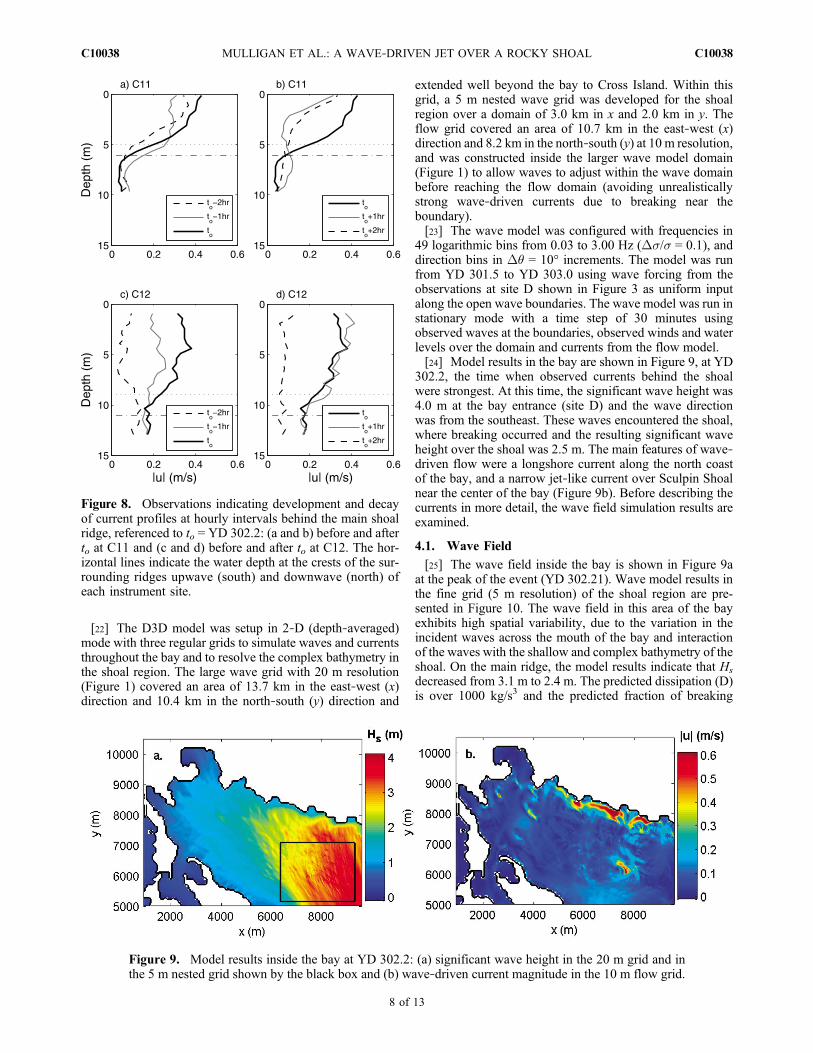
49 logarithmic bins from 0.03 to 3.00 Hz (Ds/s = 0.1), anddirection bins in D� = 10° increments. The model was runfrom YD 301.5 to YD 303.0 using wave forcing from theobservations at site D shown in Figure 3 as uniform inputalong the open wave boundaries. The wave model was run instationary mode with a time step of 30 minutes usingobserved waves at the boundaries, observed winds and waterlevels over the domain and currents from the flow model.[24] Model results in the bay are shown in Figure 9, at YD
302.2, the time when observed currents behind the shoalwere strongest. At this time, the significant wave height was4.0 m at the bay entrance (site D) and the wave directionwas from the southeast. These waves encountered the shoal,where breaking occurred and the resulting significant waveheight over the shoal was 2.5 m. The main features of wave‐driven flow were a longshore current along the north coastof the bay, and a narrow jet‐like current over Sculpin Shoalnear the center of the bay (Figure 9b). Before describing thecurrents in more detail, the wave field simulation results areexamined.
4.1. Wave Field
[25] The wave field inside the bay is shown in Figure 9aat the peak of the event (YD 302.21). Wave model results inthe fine grid (5 m resolution) of the shoal region are pre-sented in Figure 10. The wave field in this area of the bayexhibits high spatial variability, due to the variation in theincident waves across the mouth of the bay and interactionof the waves with the shallow and complex bathymetry of theshoal. On the main ridge, the model results indicate that Hs
decreased from 3.1 m to 2.4 m. The predicted dissipation (D)is over 1000 kg/s3 and the predicted fraction of breaking
Figure 9. Model results inside the bay at YD 302.2: (a) significant wave height in the 20 m grid and inthe 5 m nested grid shown by the black box and (b) wave‐driven current magnitude in the 10 m flow grid.
Figure 8. Observations indicating development and decayof current profiles at hourly intervals behind the main shoalridge, referenced to to = YD 302.2: (a and b) before and afterto at C11 and (c and d) before and after to at C12. The hor-izontal lines indicate the water depth at the crests of the sur-rounding ridges upwave (south) and downwave (north) ofeach instrument site.
MULLIGAN ET AL.: A WAVE‐DRIVEN JET OVER A ROCKY SHOAL C10038C10038
8 of 13

waves (Qb) is over 10% on several ridges. This is also shownalong transect T0 in Figure 11, indicating that the decreasedwave heights and strong dissipation are closely related tothe shallow ridges where wave breaking occurs (predictedQb
is 100% on the main ridge).[26] The significant wave heights from the coarse (20 m)
and fine (5 m) grids are shown along transect T0 in Figure 11for the wave conditions on YD 302.21. The water depths overthe narrow rocky ridges are better resolved in the fine grid,and the reduction in wave height across the shoal occurs overa smaller distance indicating that the surf zone width isdetermined by the shallowest ridge. Results from a 1‐Dmodel (5 m resolution) are also presented, to remove theeffect of refraction around the shoal. Both 1‐D and 2‐Dmodels simulated wave breaking over the main ridge, with aregion of lower wave height behind it. The total predicteddissipation on the main ridge was 1181 kg/m3 on YD 302.21.The wave model simulates the total dissipation by computingthe sum of three wave dissipation processes namely wavebreaking, bottom friction and whitecapping. The predicteddissipation due to breaking was 1170 kg/m3, which accounts
for over 99% of the total with the remaining contributions3 orders of magnitude smaller (bottom friction = 8 kg/m3;whitecapping = 3 kg/m3). Therefore wave breaking was thedominant dissipative process over the shoal.[27] At 80–160 m behind the main ridge along transect T0,
the 1‐D and 2‐D models yield very different results. The 2‐Dmodel is in better agreement with observations, indicatingsignificant wave heights 0.5–0.8 m greater than in the wavebreaking zone. The 2‐dimensional process of refraction aroundthe shoal becomes important over this length scale, and the2‐D model predicts an increase in directional spreading from20o on the south side of the main ridge to 40o on the northside. Since refraction cannot be simulated with a 1‐D model,the 1‐D model predicted decreasing wave height with dis-tance except where shoaling occurred over other ridges.[28] Time series of the significant wave height predicted
using the 2‐D model are shown in Figure 4 together with theobservations. At the peak of the storm, the data and modelpredictions are in agreement indicating that the lowest waveheights occur at the shallowest point on the shoal (C3, C4)and downwave of this point (C6, C11). The observations
Figure 10. Model results in the shoal region at YD 302.2: (a) significant wave height with 8 m depthcontour and instrument locations (cross); (b) wave‐driven current magnitude and vectors; (c) energy dis-sipation rate; and (d) fraction of breaking waves (1% and 10% contours).
MULLIGAN ET AL.: A WAVE‐DRIVEN JET OVER A ROCKY SHOAL C10038C10038
9 of 13

show that higher wave heights occur at surrounding sites indeeper water both on the shoulder of the main ridge (C2)and behind it (C7). Model results at these sites are 0.1–0.8 m(up to 20%) less than the observations, suggesting over-prediction of dissipation due to breaking on the shoal crest (C2)and possible effects of refraction around the shoal (C7).[29] Following the peak of the storm, the significant wave
height rapidly decreased to less than 2 m in the shoal region,and therefore the intensity of wave breaking decreased. Thisoccurred at YD 302.3, at the time when the wave directionoutside the bay exceeded 180o and the bay was sheltered bythe southern headland. The model wave heights during thispost‐peak time period were significantly less than observa-tions, and could possibly be improved by using spatiallyvarying wave boundary conditions along the southern modelboundary.
4.2. Radiation Stress Gradients
[30] When oriented in the direction of wave propagation,and upon substitution of linear wave theory, the radiationstress tensor is:
S ¼ ESxx 00 Syy
� �¼ E
2kh
sinh 2khþ 1
20
0kh
sinh 2kh
0B@
1CA; ð8Þ
[Longuet‐Higgins and Stewart, 1962] where k is the wavenumber and h is the water depth. S is proportional to thewave energy E
E ¼ 1
2�g
H
2
� �2
; ð9Þ
where H is the wave height, r is the water density and g isgravitational acceleration. For the change in wave heightfrom 3.1 to 2.4 m over a distance of 30 m across the mainridge shown in Figure 11, combining equation (8) withequation (7) gives Fx = 400 N/m2 and Fy = 100 N/m2.[31] The model results are shown along transect T0 in
Figure 12, at YD 302.21 when wave propagation is in the(−x, +y) direction. The main ridge is the location where theradiation stress gradients are the highest and reach Fy =260 N/m2 and Fx = −120 N/m2, in general agreement withthe simple case using equation (8) but accounting for the2‐D wave field. The steep bathymetry causes strong fluc-tuations in radiation stress over short distances, resulting in thecomplex wave and current fields (Figure 10). Wave breakingdoes not need to occur for radiation stress gradients to gen-erate currents. In this case the observations indicate strongcorrelation between spatial variability in wave height andcurrent speed and the wave model predicts strong dissipationover the shoal, together suggesting that wave breakinginduces the mean flow behind the shoal. The model predic-tion for bed shear stress due to combined waves and currentswas a maximum of 10 N/m2. Since this is an order of mag-
Figure 11. Comparison between the water depth, predictedsignificant wave height, and wave energy dissipation on the20 and 5 m wave model grids along transect T0 at YD302.21. Dashed lines indicate results from a 1‐D modelalong T0 with 5 m resolution. Observed significant waveheight at sites C3, C11, C6, and C12 are shown. Wave prop-agation is from left to right.
Figure 12. Bathymetry, predicted radiation stress gradientcomponents, and current velocity components along transectT0 at YD 302.21.
MULLIGAN ET AL.: A WAVE‐DRIVEN JET OVER A ROCKY SHOAL C10038C10038
10 of 13

nitude smaller than the radiation stress gradients, it suggeststhat the radiation stress dominates forcing over the shoal.
4.3. Jet Development
[32] Time series of simulated and observed current mag-nitude at the instrument sites are compared in Figure 13,confirming that it was both transient in time and 100–200 min horizontal width. Since the currents behind the shoal weredepth‐uniform over the ridges (section 3.2), the currentsobserved at near‐bed sensors on the ridges should be rep-resentative of the depth‐averaged flow, and the 2‐D modelresults are comparable to the observations at sites C5, C7,C8 and C10. The model predicted the strongest mean cur-rent (0.7 m/s) at site C3. At other sites behind the shoal, thepredicted currents became slightly weaker as the jet spreadhorizontally. At 160–200 m behind the main ridge (C8, C12and C10) the predicted jet speed was 0.3–0.5 m/s and thepeak currents at each site occurred at different times asthe jet direction shifted from northwestward to northward.The jet was O(100 m) in horizontal width and changeddirection from northwestward to northward over a period ofonly a few hours. Weaker currents at C5, due to the narrowwidth of the jet, are also suggested by the model. The timeseries (Figure 13) illustrate the important transient aspectsof the jet, and the current magnitude was generally wellcorrelated with the largest waves on the main ridge at siteC3 (Figure 4). The wave‐driven currents became immedi-
ately evident at YD 301.81 and had the strongest magnitudeat several sites from YD 302.00 to 302.30. Dissipation ofthe current was abrupt after YD 303.0. The current mag-nitude was over‐predicted by about 0.3–0.4 m/s at C11 andC7, perhaps due to the over‐prediction of wave breaking onthe shoal crest (see section 4.1), but the overall results werein reasonable agreement with observations and indicate thesmall spatial scale and transient variability of the jet.[33] The predicted and observed circulation patterns over
the shoal, presented in Figure 14, indicate that the width ofthe jet is controlled by the width of the breaking zone on themain ridge of the shoal. The axis of maximum velocitystreamed from the shallowest point of the main ridge nearC3 and over site C11. The wave‐driven flow was approxi-mately 200 m wide, and currents away from the axis of thejet (e.g., C5) were weaker than near the axis. The jet had themost well defined shape with strongest horizontal shearfrom YD 302.1 to 302.3. In response to a combination ofchanging wave direction and interaction with the opposingoutflow, the flow direction changed from northwestward tonorthward at YD 302.17 and therefore passed over sites C8,C12 and C10 at different times. The timing of the opposingoutflow is indicated in Figure 14 by the current vectors atsite A, south of the shoal near the deep channel. Thissoutheastward outflow at site A attained its maximummagnitude of 0.25 m/s 3 h after maximum jet inflow at YD302.29. The wave‐driven flow out of the bay at this site also
Figure 13. Comparison between observed residual current speed (depth‐averaged at C11, C12; near bedat other sites) and simulated depth‐averaged wave‐driven current speed (at C3 a maximum of 0.7 m/s isreached). The subplots are arranged according to field location (see Figure 2) with north at top and west atleft. Vertical lines indicate the times shown in Figure 14.
MULLIGAN ET AL.: A WAVE‐DRIVEN JET OVER A ROCKY SHOAL C10038C10038
11 of 13

occurred after the peak in significant wave height foranother event described by Mulligan et al. [2008].
5. Summary and Conclusions
[34] We measured wave heights and currents in thevicinity of a bedrock shoal in Lunenburg Bay, NS, during astorm event. Significant wave heights were 2.4–4.0 m withspatial variability due to wave breaking over the main ridge.The SWAN wave model, coupled to the 2‐D depth‐averagedhydrodynamic model Delft3D, was used to simulate thewaves with coarse resolution (20 m) and fine resolution (5 m)grids and wave‐driven currents in the bay with 10 m reso-lution. The fine wave grid was considerably better than thecoarse wave grid at resolving the bathymetric ridges andresulting wave heights, dissipation rates and radiation stressgradients. The Battjes and Janssen [1978] wave‐breakingformulation was used, and the modeled significant waveheights on the main ridge of the shoal were up to 20% lowerthan the observations suggesting that wave breaking began
in deeper water in the model, in agreement with others[Baldock et al., 1998; Johnson, 2006].[35] The observations indicate maximum currents behind
the shoal were 0.3–0.4 m/s at peak wave height during thestorm, a factor of 4 greater than the strongest currentsobserved in the absence of wave forcing. Consistent with theobservations, the model predicts strong wave‐forced currentsover the shoal. However, the maximum predicted axialspeeds are 0.4–0.7 m/s, a factor of 1.3–1.8 greater than theobserved maximum. The overprediction of wave energydissipation by the wave model led to overprediction of thewave‐driven current magnitude by the flow model, but thedirection and timing of the current were in agreement withthe observations. The model results suggest that the jet has atypical length of 500–600 m, typical width 100–200 m andthe axis of maximum velocity occurs at the shallowest pointon the main ridge. The jet lasts for the duration of time thatwave forcing was strong and the width and speed of thecurrent are determined by the geometry of the shoal ridgesand wave forcing. The current was immediately responsive
Figure 14. Current vectors in the shoal region at 3 h intervals. Residual current observations are shownin red, from bottom current meters (filled circle) and depth‐averaged ADCP observations (filled square);depth‐averaged model predictions are shown in blue, subsampled at 3 times the grid size. The 8 m meandepth contour is shown and the inset shows site A, located 700 m south at y = 5270.
MULLIGAN ET AL.: A WAVE‐DRIVEN JET OVER A ROCKY SHOAL C10038C10038
12 of 13

to transient changes in wave forcing and the flow directionchanged over time, in response to a combination of changingwave direction and interaction with the wave‐driven flowout of the bay (forced mainly by the longshore current alongthe north shore).[36] Current profile observations at two sites indicate that
the flow occupied the available water column above thedepth of the local ridges immediately upstream of theseinstrument sites. Weaker flow was observed in the channelsbetween the shoal ridges. Therefore a 3‐Dmodeling approachwould be of interest and would be important for predictionof near‐bottom currents and further understanding the bathy-metric control of the near‐bed flow.
[37] Acknowledgments. Thanks to the dedicated field crew for alltheir efforts deploying and recovering the instruments numerous timeson the shallow rocky shoal. This includes Doug Schillinger and WalterJudge for instrument setup; divers John Lindley, Steph Kirchhoff, AdamComeau, and Julia Mullarney; and captain Bryan Schofield. We thankPeter Smith and Will Perrie at the Bedford Institute of Oceanography forcooperation and sharing of directional waverider and ADCP data and DarrylBeaver and Edward King of the Geological Survey of Canada for the multi-beam bathymetry data. We also thank anonymous reviewers for helpful com-ments and suggestions. Use of the model is gratefully acknowledged, as partof the Delft3D Community Model Development Project sponsored byWL|Delft Hydraulics and the U.S. Office of Naval Research. This study wasfunded by the Canadian Foundation for Climate and Atmospheric Sciencesand the Natural Sciences and Engineering Research Council of Canada.
ReferencesBaldock, T., P. Holmes, S. Bunker, and P. V. Weert (1998), Cross‐shorehydrodynamics within an unsaturated surf zone, Coastal Eng., 34,173–196.
Battjes, J., and J. Janssen (1978), Energy loss and set‐up due to breaking ofrandom waves, in Proc. Intl. Conf. on Coastal Eng. 1978, pp. 569–587,ASCE, Hamburg, Germany.
Booij, N., R. Ris, and L. Holthuijsen (1999), A third‐generation wavemodel for coastal regions: 1.Model description and validation, J. Geophys.Res., 104(C4), 7649–7666, doi:10.1029/98JC02622.
Callaghan, D., P. Nielsen, N. Cartwright, M. Gourlay, and T. Baldock(2006), Atoll lagoon flushing forced bywaves,Coastal Eng., 53, 691–704.
Chawla, A., H. Ozkan‐Haller, and J. Kirby (1998), Spectral model for wavetransformation and breaking over irregular bathymetry, J. Waterw. PortCoastal Ocean Eng., 124(4), 189–198.
Chen, Q., J. Kirby, R. Dalrymple, A. Kennedy, and A. Chawla (2000),Boussinesq modeling of wave transformation, breaking and runup: II.Two horizontal dimensions, J. Waterw. Port Coastal Ocean Eng., 126(1),48–56.
Elgar, S., R. Guza, B. Raubenheimer, T. Herbers, and E. Gallagher (1997),Spectral evolution of shoaling and breaking waves on a barred beach,J. Geophys. Res., 102(C7), 15,797–15,805, doi:10.1029/97JC01010.
Elias, E., D. Walstra, J. Roelvink, M. Stive, and M. Klein (2000), Hydro-dynamic validation of Delft3D with field measurements at Egmond, inProc. Intl. Conf. on Coastal Eng. 2000, pp. 2714–2727, ASCE, Sydney,Australia.
Fischer, H., E. List, H. Koh, J. Imberger, and N. Brooks (1979), Mixing inInland and Coastal Waters, Academic, New York.
Fredsoe, J. (1984), Turbulent boundary layer in wave‐current interaction,J. Hydraul. Eng., 110, 1103–1120.
Gourlay, M., and G. Colleter (2005), Wave‐generated flow on coral reefs—An analysis for two‐dimensional horizontal reef‐tops with steep faces,Coastal Eng., 52, 353–387.
Groeneweg, J., and J. Battjes (2003), Three‐dimensional wave effects on asteady current, J. Fluid Mech., 478, 325–343.
Hearn, C. (1999), Wave‐breaking hydrodynamics within coral reef systemsand the effect of changing relative sea level, J. Geophys. Res., 104(C12),30,007–30,019, doi:10.1029/1999JC900262.
Johnson, H. (2006), Wave modelling in the vicinity of submerged break-waters, Coastal Eng., 53, 39–48.
Johnson, H., T. Karambas, I. Avgeris, B. Zanuttigh, D. Gonzalez‐Marco,and I. Caceres (2005), Modelling of waves and currents around sub-merged breakwaters, Coastal Eng., 52, 949–969.
Kraines, S., T. Yanagi, M. Isobe, and H. Komiyama (1998), Wind‐wavedriven circulation on the coral reef at Bora Bay, Miyako Island, CoralReefs, 17, 133–143.
Lesser, G., J. Roelvink, J. van Kester, and G. Stelling (2004), Developmentand validation of a three‐dimensional morphological model, CoastalEng., 51, 883–915.
Liu, P. L.‐F., and I. Losada (2002), Wave propagation modelling in coastalengineering, J. Hydraul. Res., 40(3), 229–240.
Longuet‐Higgins, M., and R. Stewart (1962), Radiation stress and masstransport in gravity waves, with application to ‘surf beats’, J. FluidMech., 9, 193–217.
Longuet‐Higgins, M., and R. Stewart (1964), Radiation stresses in waterwaves; a physical discussion, with applications, Deep Sea Res., 11,529–562.
Miller, R. (1996), Environmental seabed conditions of the Lunenburgmarine park, GSC Open File Rep., 3257.
Monismith, S. G. (2007), Hydrodynamics of coral reefs, Annu. Rev. FluidMech., 39, 37–55.
Mulligan, R., A. Hay, and A. Bowen (2008), Wave‐driven circulation in acoastal bay during the landfall of a hurricane, J. Geophys. Res., 113,C05026, doi:10.1029/2007JC004500.
Panchang, V., B. Pearce, and M. Briggs (1990), Numerical simulation ofirregular wave propagation over shoal, J. Waterw. Port Coastal OceanEng., 116(3), 324–340.
Pawlowicz, R., B. Beardsley, and S. Lentz (2002), Classical tidal harmonicanalysis including error estimates in MATLAB using T‐TIDE, Comput.Geosci., 28(8), 929–937.
Raubenheimer, B., R. Guza, and S. Elgar (1996), Wave transformationacross the inner surf zone, J. Geophys. Res., 101(C11), 25,589–25,597,doi:10.1029/96JC02433.
Ruessink, B., K. Houwman, and P. Hoekstra (1998), The systematic con-tribution of transporting mechanisms to the cross‐shore sediment trans-port in water depths of 3 to 9 m, Mar. Geol., 152, 295–324.
Symonds, G., K. Black, and I. Young (1995), Wave‐driven flow over shal-low reefs, J. Geophys. Res., 100(C2), 2639–2648, doi:10.1029/94JC02736.
Thornton, E., and R. Guza (1983), Transformation of wave height distri-bution, J. Geophys. Res., 88(C10), 5925–5938, doi:10.1029/JC088iC10p05925.
Vincent, C., and M. Briggs (1989), Refraction‐diffraction of irregularwaves over a mound, J. Waterw. Port Coastal Ocean Eng., 115(2),269–284.
Yoon, S., Y.‐S. Cho, and C. Lee (2004), Effects of breaking‐induced cur-rents on refraction‐diffraction of irregular waves over submerged shoal,Ocean Eng., 31, 633–651.
A. J. Bowen and A. E. Hay, Department of Oceanography, DalhousieUniversity, Halifax, NS B3H 4J1, Canada.R. P. Mulligan, Department of Geological Sciences and the Institute for
Coastal Science and Policy, East Carolina University, 391 Flanagan Bldg.,Greenville, NC 27858, USA. ([email protected])
MULLIGAN ET AL.: A WAVE‐DRIVEN JET OVER A ROCKY SHOAL C10038C10038
13 of 13


![Jet [Novela] Biblioteca](https://static.fdokumen.com/doc/165x107/6321c71564690856e108db2b/jet-novela-biblioteca.jpg)