A test of the Theory of Planned Behaviour - the cross section of the students' entrepreneurial...
199
200
-
Upload
uni-miskolc -
Category
Documents
-
view
1 -
download
0
Transcript of A test of the Theory of Planned Behaviour - the cross section of the students' entrepreneurial...
200
1
Foreword...................................................................................................3
EDIT BÁNYAI – KATALIN DUDÁSThe role of teachers and parents in the decision-makingprocess of secondary-school students regarding theirhigher education choices.........................................................................5
TAMÁS CSORDÁSThe new role of consumer meanings and legitimacyin building marketing value...................................................................27
SZILVESZTER FARKAS – ANDREA S. GUBIKA test of the Theory of Planned Behaviour – the cross sectionof the students’ entrepreneurial attitude in Hungary.............................49
VIKTÓRIA GERDESICS – ÁKOS ANDRÁS NAGY –VALÉRIA PAVLUSKA – KRISZTIÁN SZÛCS – MÁRIA TÖRÕCSIKDiffusion of renewable energy innovations – innovation-acceptance behaviour of the Hungarian society.....................................65
BALÁZS HEIDRICH – RICHÁRD KÁSA – WESLEY SHUWelcome to the machine. How web-based technologiesaffect team collaboration?......................................................................82
ILDIKÓ MAROSITrust and innovation in Hungarian SMEs............................................117
Contents
ECONOMISTS'
FORUM
ECONOMISTS'
FORUM
2
PÉTER NÉMETH – ÁKOS ANDRÁS NAGY – KRISZTIÁN SZÛCS –MÁRIA TÖRÕCSIKVirtual life of men. Gender differences inInternet using habits and attitudes......................................................134
TEKLA S. SZÉPEight methods for decomposing the aggregate energyintensity with special regard to the industrial sector...........................149
OANA STÃNCULESCUEvaluating Romania’s regional competitivenessusing Analytic Hierarchy Process........................................................171
ERZSÉBET TERÉZ VARGAComparison of the equity effect of progressiveincome and consumption taxation......................................................184
Guidelines for authors..........................................................................197
3
The Economist’s Forum / Közgazdász Fórum has the privilege topub lish some of the best papers presented at the 1st edition of theInternational Conference in Economics and Business Management –ICEBM 2013, held on 23rd of November 2013 in Cluj-Napoca.
Academics and researchers from various fields (accounting, econom-ics, finance, marketing and management) came together at the Babeº-Bolyai University Faculty of Economics and Business Administration toshare their innovative ideas, strategies and research results regardingcurrent economic problems, both at macro and micro levels.
The conference was organized by the Department of Economics andBusiness Administration in Hungarian Language, Faculty of Economicsand Business Administration, Babeº-Bolyai University (also co-publisherof the Economist’s Forum) in partnership with the TransylvanianMuseum Society – Department for Law, Economics and Social Sciencesand the Pro Oeconomica Association.
During the conference an important number of papers werepresented: four in the plenary session and 61 in the four thematicsessions. Before admitting the presentation of the papers to theconference, the members of the scientific committee had carefullyreviewed the abstracts sent in by the authors. During the conference,section moderators, discussants and participants had contributed withtheir comments, questions and suggestions to the improvement of thepapers. Full papers went through a process of review and only thoserecommended by the reviewers have been accepted for publication.
I would like to express my gratitude to all those who contributed tothe selection and review of the papers, as well as to the success of theconference:
Scientific committeeJózsef Berács, Krisztina Demeter, Mihály Görög and János Száz
(Corvinus University of Budapest, Hungary), István Bessenyei, János
Foreword
4
Fojtik and Gyula Horváth (University of Pécs, Hungary), Lajos Bokros(Central European University, Budapest, Hungary / Babeº-BolyaiUniversity, Cluj-Napoca, Romania) Balázs Heidrich (Budapest BusinessSchool, Hungary), Bálint Zsolt Nagy, Ágnes Nagy and István Pete(Babeº-Bolyai University, Cluj-Napoca, Romania), József Poór (SzentIstván University, Gödöllõ, Hungary), István Szintay (University ofMiskolc, Hungary) and Mária Vincze, (Transylvanian Museum Society /Babeº-Bolyai University, Cluj-Napoca, Romania).
ReviewersMónika Anetta Alt, József Berács, Krisztina Demeter, Balázs
Heidrich, Szilveszter Fekete, János Fojtik, Lehel-Zoltán Györfy, KingaKerekes, Imola Kovács, Judit Molnár, Tünde Petra Petru, József Poór,Zsuzsa Sãplãcan, Levente Szász, Imre Székely, János Szlávik, IstvánTakács, Klára Tóthné Szita, Ibolya Török and Mária Vincze.
Conference organizing committeeCoordination, contact: Kinga Kerekes, Gyöngyvér Kovács and
Melinda Szodorai.Accounting and finance section: Szilveszter Fekete, Imola Kovács,
Annamária Benyovszki, Ildikó Réka Cardoº and Jácint-Attila Juhász.Economics section: Judit Molnár, Imre Székely, Mihai Avornicului
and Ildikó Kovács.Management section: Levente Szász, Lehel-Zoltán Györfy and Tünde
Petra Petru.Marketing section: Mónika Anetta Alt, Zsuzsa Sãplãcan and László
Seer.
The present issue of Economist’s Forum contains ten English-language papers out of the 65 presented at the ICEBM 2013. Furtherpapers, written in both English and Hungarian, will be published in theforthcoming issues from 2014. In this way, the Economist’s Forum wouldlike to contribute to the dissemination of the outstanding scientificresults achieved by the researchers participating at the conference.
Kinga KerekesEditor-in-chief
5
1 PhD, associate professor, University of Pécs, Faculty of Business andEconomics, Department of Business and Management, e-mail: [email protected].
2 PhD, senior lecturer, University of Pécs, Faculty of Business and Economics,Department of Business and Management, e-mail: [email protected].
The role of teachers and parentsin the decision-making process
of secondary-school students regardingtheir higher education choices
EDIT BÁNYAI1 – KATALIN DUDÁS2
Today universities face major challenges in respect of applicationprocesses, and so it is an increasingly difficult problem for them to attractstudents to institutions due to the ongoing changes in Higher Education (HE)itself and in government policy. The purpose of this study is to analyse whatwe might term the ‘coaching and counselling’ activities of two significantgroups of people who are only indirectly concerned: parents and teachers. Ourresults are based on in-depth interviews conducted with parents and teachersof pupils in their 11th and 12th forms, with two special focus groups amongfirst-year students at the Faculty of Business and Economics of the Universityof Pécs, and on a questionnaire completed by 603 pupils from the samesecondary school years. Our results suggest that parents have a moderateinfluence on students’ decisions, although financial factors are becomingincreasingly important for them, sometimes making it necessary to overridethe preferences or decisions of their children. The most important function ofteachers in the HE decisionmaking process is to provide their pupils with allrelevant information concerning HE. Clearly, if they are to attract students,universities need to understand the motives of parents and the role of teachersin the process.
Keywords: higher education marketing, enrolment, bachelor programme,marketing communication, empirical research, student (consumer) behaviour.
JEL code: M31.
IntroductionThis study does not deal with conceptual and definitive questions,
since other authors (Kuráth 2004, 2007a; Sáfrány 2005, 2006) discuss the
6 Edit Bányai – Katalin Dudás
development, the target groups and marketing assets of ‘EnrolmentMarketing’.
Both the importance and timeliness of enrolment marketing aresupported by several arguments. Drastic regulatory restructuring in theHungarian HE market, increasing competition, the continuing declinein applicant numbers and significant changes in the labour market areall factors which make the marketing strategy of HE institutionsincreasingly important - and especially the planning of their enrolmentstrategy.
Broadly speaking, the target groups for enrolment marketing are:students in general, the actual applicants, teachers, parents, the jobmarket and society. Unusually, with HE, the buyer and the consumerare rarely the same person. The students are the actual consumers(Harker et al. 2001, Conard and Conard 2001, Shash et al. 1999, Corbitt1998, Browne et al. 1998, Joseph and Joseph 1997), whilst the parents,the job market and society can be regarded as the buyers. All have somedegree of interest in the decision-making process and, clearly, in thevast majority of cases, the consumers (the students) make the finaldecision. However, the buyers exercise indirect influence and so, asfinance providers, play an indirect role in the effects of HE. In thisstudy, however, we focus on the role played by the actual consumersand by their teachers and parents in the decision-making process inFurther Education (FE).
To take a more narrow focus, the target groups can be viewed fromdifferent angles (internal – external, education level of their membershipand the level targeted, residence, age, type of secondary school, familybackground, etc). For the purposes of this study, our questionnaire wasdrawn up targeting the Bachelor programme, namely 17 to 19 years oldsecondary school pupils. These are on the border between Generations Yand Z; or, rather, they belong mainly to Generation Z. The age-range ofthis group means that its members are either on the threshold of theirmajority or have just reached it. In consequence, most need somesupport in respect of one of the most important decisions of their life. Itfollows that their parents and teachers, as the main influencers and
7
stakeholders, must also be taken into consideration during the planningof any enrolment marketing activity.
Research objective and methodologyThe conducted exploratory research consists of the following main
parts. Firstly we focused on secondary research with the aim to revealthe main changes and challenges due to the new education policy andthe features of the target segment, the Z generation. Furthermore weinvestigated the characteristics of the HE from the perspective of servicemarketing. On the basis of the secondary research we conducted aprimary research. The main aims were to explore the factorsinfluencing secondary school pupils in their decisions regardingFurther Education and to identify the main stages and actors of theprocess (their choice of location, type of institution, faculty etc.).
Our primary research uses four methods: ten in-depth interviewswere undertaken with secondary school teachers (form-masters andcareer masters) and a further ten with the parents of students in the 11th
and 12th forms. In addition, two focus groups (using psychodrama) wereorganised with 1st year Bachelor students at the Faculty of Business andEconomics, University of Pécs. The objective of these interviews andpsychodrama groups was to discover main decision habits, to gaininsights into the decision-making process as well as into parents’,teachers’ and students’ different initiatives. Based on the result of thesequalitative methods, an online questionnaire was compiled in order toreveal secondary school students’ opinions, information gathering habitsand decision-making process in connection with HE. A questionnairewas administered to 603 secondary school pupils in the 11th and 12th
forms. This was handled in part on a face-to-face basis and partly via theCAWI (Computer-Assisted Web Interviewing) method. The results for the‘indirectly concerned’ segment will be shown in this study. Our goal is toinvestigate whether the role of the parents and teachers and theirinformation gathering and supporting habits in connection with HEreally reflect the above mentioned information asymmetry and highperceived risk.
The role of teachers and parents in...
8
Theoretical basisSpecifics of Generations Y and ZAccording to ‘youth research’, it is clear that defining groups of
young people is difficult, since the age limits of different groups can beestablished biological, sociological and legal criteria which do notnecessarily coincide.
As a result, Generation Y is defined in a variety of ways by differentauthors. Some researchers limit this Generation to people born between1980 and 1997 (Johnson and Hanson 2006), others to those bornbetween 1980 and 2000 (Cheung et al. 2008), while a third groupconsider the period between 1982 and 1995 (Tari 2010). The last view isthe most generally accepted, although, for the purpose of our study, theactual bracket used is not important.
The members of Generation Y typically do not accept traditionalvalues; they have positive attitudes and are sometimes idealists. Theyare open to novelty, and the internet seems to have encouraged a kind ofpractical attitude among them. This is also typical of their attitude inthe world of work, where they handle change flexibly.
Generation Y are active users of Facebook, the most popular onlinesocial community page in Hungary. Some 24% communicate onlinewith their friends rather than offline (Ipsos 2012a). The internet’seffects on their work, concentration and focus are first seen here. Thisgeneration are able to divide their attention and so they are able tosimultaneously play with numerous TV channels whilst chatting withtheir friends, listening to music and using the internet. However, thisdivided attention does not mean that their connections are superficial.As this generation grew up with technological development, itsmembers mostly regard the internet as a highly valid source ofinformation, even if, unfortunately, it does not necessarily mean areliable base of knowledge (Tari 2010, ITHAKA 2011).
In Hungary, according to Ipsos research, it is worthwhile using thesocial media to reach Generation Y since 74% have already ‘clicked’ onan advertisement placed on a social community’s pages (Ipsos 2012b).Another trend, online word-of-mouth, builds on personal influencewhen, first of all, some opinion leader is persuaded to disseminate the
Edit Bányai – Katalin Dudás
9
received information, with the result that the advertisement spreadslike wildfire among the community’s members.
Generation Z is made up of children born in the period between themid-1990s to date. They have grown up in a completely digitalizedworld and are commonly believed to have acquired this name from theEnglish word “zapper” (wikipedia.com) which, inter alia, means‘remote control’. They are also referred to as the ‘Internet Generation’ or‘digital natives’ (Schmidt and Hawkins 2008). This generation has beenused to everything being mobile and digitalised and their attention canfocus on several things at the same time; they solve their problemsflexibly and, we might say, in a mobile way. They spend much time infront of the computer; 65% of them use the internet daily or severaltimes a day. There are, however, significant differences between urbanand rural youth. Whilst 75% of young people from Budapest use theinternet daily, the same can be said only about half of those in smallersettlements (Ipsos F&F 2011). The internet has become an inseparablepart of life for the young; they entertain, gather information, makefriends and relax here (MRSZ 2010, Kósa and László 2011). Accordingto the research data provided by the National Media andCommunication Authority on the technical and communicationequipment owned by 13-17 year-olds and their families, 91% of thesehouseholds have wired or mobile internet connection, about 98% ofyoung people have their own mobile phone and 43% have internetaccess.
There is a relatively wide gap between Generations Y and Z since thelatter has grown up in a more dynamic and constantly changingenvironment. To understand their behaviour it is very important torecognise their dominant characteristics as summarised by Törõcsik(2011. 214): “… the age of uncertainty was left behind for them.” Theyare the first truly global generation. They are the smallest generation andthis will have an effect on their position in the labour market in that thecompetition will be less strong for them than for today’s entrants.However, they now consider daily life situations as stressful (Tari 2012,Törõcsik 2011) and this is in spite of the research results of Törõcsik(2011), who made the interesting observation that the members of the
The role of teachers and parents in...
10
young generations live better and more well-balanced lives than theaverage Hungarian. It is, therefore, not surprising that, among thelifestyle groups in the 16-24 years old bracket, the “experienceconsumers” are the most significant group (33%), followed by the “socialcentre” (30%), the “fast-modern” group (15%) and, lastly, the “emerginggroup” (13%) (Törõcsik 2011).
Generation Z members are more independent and more individualthan those of Generation Y, thanks to their mobile gadgets and to theirmore active presence in the virtual communities. Their independenceis associated with their near-total self-sufficiency, and this presumablyis also the case with the Further Education (FE) decision-makingprocess. There remains the question of the extent to which thisgeneration is receptive to the messages from HE institutes or the media.
According to the research by Törõcsik (2011), the most importantfactors in the decisions of the group of “experience consumers”regarding HE institutions are: the atmosphere of the institution, studyprogrammes, entertainment opportunities and a modern infrastructure.Other important factors are their friends’ choices and the admissionrequirements. They prefer short-term goals, and evaluate HE as aservice process in terms of its tangible features and immediate results.The “social centre” and “emerging” groups are more conscious and takeprice, convenience, availability and prospective salary intoconsideration as they make their HE-related decisions.
Career decisions have always been very significant and high-riskdecisions, and the considerations generated by today’s frequent socialand economic changes obviously do not make this decision-makingprocess any easier; neither do they help in forming a clear view of thefuture or long-term planning.
Sources of information for the ‘concerned’ and the ‘indirectlyconcerned’Realignment is slowly taking place in terms of the ways in which
secondary school-leavers spend their free time, that is, by favouring theinternet at the expense of TV. However, in respect of the credibility ofinformation sources, personal contacts are the main ones as the
Edit Bányai – Katalin Dudás
11
information provided by parents and teachers is trustworthy andsupposedly acceptable by the young (Kósa and László 2011). Accordingto the results of a separate research project (investigating the orientationchannels of 10 400 new entrants and 16 500 experienced employees)those born after 1992 prefer to obtain information in an informal wayfrom their own network of connections. More concretely, members ofGenerations Y and Z prefer university job fairs, mailing lists, companypresentations and their teachers’ opinion supporting their job decisions(AonHewitt 2012).
Generation Z are usually children of Generation X or olderGeneration Y, but there are also some younger baby boomers (55+)among the parents. Parental values are obviously reflected in the worldof the young. Although in different ways, a significant number ofparents must fight to retain their given living standard or even forsubsistence. Often they are unaware of their own aim in life, or theymay have to struggle to maintain their position in the labour market.(They might indeed be jobless). Although they seem self-confident, theydo not necessarily set a good example for their child. Parents’ technicalknow-how and use of the internet varies widely, but, generally, they donot share a common language with their children. This is importantsince the young can best be approached via the internet and socialmedia. Young people need far more information than their parents didin their day and ways of information search and processing used by theyoung appear as a response to the challenges of our performance-oriented world. The majority of parents feel powerless, and professionalteachers find it difficult to relate to this generation (Tari 2012).
The younger generations of our era are confronted withincreasingly difficult career choices. The reality is that, whilst this agegroup becomes consumers early, their responsible and independentadult life is postponed. The difficulties associated with embarking onone’s working life are supported by data such as those provided by theCentral Statistical Office (KSH in Hungarian) according to which, inMay-July 2012, the number of unemployed was 459 000, equal to a10.5% unemployment rate. Of the total number of unemployed, 18%belong to the 15-24 age bracket, which features rather weakly in the
The role of teachers and parents in...
12
labour market. This group’s unemployment rate of 28.1% is 3.1percentage points higher than that of the previous year. The averagelength of unemployment was 17.8 months (KSH 2012).
One of the most interesting secondary sources for our research werethe results of European Youth Research’s (EIKKA) national youth surveyshowing the connections between Hungarian secondary schools andHE, as well as its problems (Jancsák and Polgár 2010). This investi-gation shows that students’ strongest motivation for further studies is toavoid unemployment and to build a career (which is supposed to gohand in hand with a high level of social awareness). Parentalqualifications are not an influencing factor according to the study, butthe role of parents and friends as control factors in making choices forfurther studies seems to be strong.
The relationship between secondary and higher education hasbecome extremely complicated because of the Bologna process.Students have to evaluate a good deal of information – a process inwhich neither parents nor teachers can seriously help. “Adults(teachers and parents alike) orientating-helping-supporting the youngbefore further studies are characterised by a great lack of informationabout the world of Higher Education (the inner world of eachinstitution, the content and outcome of programmes)” (Jancsák andPolgár 2010. 32). According to the teachers participating in the survey,parents and students have distorted pictures of HE programmes as aresult of the inaccurate and incomplete information circulating in thecommunication channels.
Approach to HE from the perspective of services marketingA special approach to HE marketing which follows the general
principles of services marketing appeared first in the 1990s (Shnaks etal. 1993), clearly acknowledging that, within the services sector, HE is aservice having numerous special characteristics (Liu 1998). It might,therefore, be useful to review those characteristics which may help usto understand the complexity of the decision-making process and thedifference between specific Enrolment Marketing and general ServicesMarketing.
Edit Bányai – Katalin Dudás
13
HE as a service is characterised by a two-sided risk relating toperformance. The supplier institution and the user alike enter theprocess with a significant, perceived risk. The risk perceived by the userregarding performance is one of the most crucial factors influencing thedecision. The outcome of the service is knowledge itself, but in the formof a graduate who has acquired adequate professional knowledge. Thiscannot be known at the time of decision-making since it is anexperience-based product (Zeithaml 1981). At the same time, theprocess is an essential part of a service product which might last a longtime – even a number of years. Parameters determining the perceptionof quality may well change during the process and may overwrite therequirements of output quality, even if only temporarily. Aspects whichare important before and after entering HE differ. Short-term andlong-term interests seem to mingle. There are short-term goals prior toentry, such as the hope of being accepted in ‘a good place’, andlong-term goals, such as earning a marketable diploma. In some cases,short-term goals do not even exist for supporting parents and teachers.
Certainly everyone involved is aware of the fact that this is along-term investment – or at least a decision – and the decision-makerhas to set his own expectations regarding the future labour market.They obviously collect information about the current state of affairs, butperceive (or could perceive) the trends, the changes concerning thepopularity of different professions. Accordingly, getting to know thecomplex product directly is not possible, and so decision-makers try toreduce the perceived risk by exploiting all the information sourcesavailable before their decision. They study welcoming messages in themedia (at some stages actively looking for them), seek information frompeople they know and from current students, and visit universities ontheir open days. Current students, whose perception of quality islimited and who must be heavily influenced by a good deal ofsubjectivity, seem to be an important information source.
The information asymmetry between institutions of highereducation and students comes partly from the above features (Bay andDaniel 2001). Earlier evaluation of the quality of HE is nearlyimpossible and it is obvious that the prospective student does not have
The role of teachers and parents in...
14
the same view of the future as the institutions. It is clear that theexpectations of students and applicants are based on inadequateinformation.
The next influencing factor is that students do not pay, or pay onlypartially, for their education: they are state-funded or financed by theirparents. Students pay for their own tuition fees in very few cases.Certainly, students do pay for their education in terms of time, energyand effort invested during the years spent in HE or in terms of theincome lost by not working in a job of some sort, although HE is often away of avoiding unemployment (Mészáros 2012).
These factors make the decision-making process and collectingobjective information difficult both for students and for theirsupporters, i.e. their parents and teachers. The situation has nowbecome even more complicated by the uncertainty generated by thechanges implemented in HE in 2011, by the ongoing economic crisisand by the unpredictable steps of the government.
Primary research resultsMotivation for Further Education (FE)In the psychodrama focus groups of first year university students,
two groups of motives are visible and both have a strong relationshipwith the respective family backgrounds. On the one hand, studentscame to university since this was a family tradition: their parents havedegrees, and continuing the tradition is somehow expected of them (“Iwas born into these expectations”). On the other hand, the familybackground can produce a totally contrary reaction: students want torise above their parents’ level of education and they also feel theirability to realise this ambition (“I day-dreamed; there were no highlyeducated people in my family).
According to the in-depth interviews with parents, it is clear that allthe parents interviewed, irrespective of their education level andfinancial situation, think a degree is important, useful and essential tofinding a job and to prosperity. Several of them said that, today, a degreeis worth the same as the so-called School Leaving Certificate (from asecondary school) of their own youth. Among our respondents there is a
Edit Bányai – Katalin Dudás

15
family consensus in connection with the role and importance of FurtherEducation.
The HE decision-making process from the perspectives ofparents and teachersAccording to the in-depth interviews with parents, it is totally clear
for the majority of our respondents that FE was already in their mindduring elementary school years (and even during kindergarten).Similarly, the teachers questioned highlighted two groups from amongtheir school-leaver pupils:
• Pupils with a good family background (at least secondary schooleducated parents and a supportive home atmosphere), good abilitiesand good school achievements know very early (in the 9th year) thatthey will go into Higher Education.
• Students with a disadvantaged family background (poorlyeducated parents and modest financial circumstances), poor abilitiesand no more than medium school achievements scarcely make adecision and, if they make it, it is at the last minute.
According to the observations of parents and teachers, a pupil’sacademic path is generally decided in the second half of the 10th form,when students choose their optional courses. Their specific path ordiscipline is refined, that is to say, the particular faculty and universityare chosen in the 12th form, often just before the application deadline. Inthese cases, the logical sequence of first choosing the institution andthen deciding on the faculty simply cannot be seen and often thesedecisions are made in the same time.
The results of the questionnaire completed by pupils in their 11th
and 12th forms support and refine the views of the teachers and parentsquestioned. From the results, three clusters emerge based on theanswers to questions on the time dimension of the HE decision-makingprocess:
• 33% can be classed among the group of “conscious students”.They are those who had already decided on FE during their elementaryschool years and chose the area of their future specialisation in their10th year (together with their optional courses), although their decisionsconcerning the specific faculty and institution were taken in their 10th
The role of teachers and parents in...
16
or 11th form, earlier than the parents had suggested.• 58.5% of respondents are “average decision-makers”, who make
decisions about everything rather late: about FE in their 9th or 10th year,about the discipline in the 10th or 11th year, and about the institutionand the faculty in their 11th or 12th year.
• 8.5% of the pupils interviewed can be described as the “impulsivegroup”. The members of this group postpone their decision about FEeven longer – in their 11th or 12th year, and about the specialisation,faculty and institution at the very last minute.
Aided by the questionnaire, we also have answers to the question ofwhether, after choosing the discipline, pupils make their decisionsabout faculty or institution earlier. Our results show that the “consciousstudents” and the “average decision makers” decide earlier about thefaculty than about the institution. This process is reversed in the case ofthe “impulsive group”.
If we compare the results of the in-depth interviews with parents,with teachers and the questionnaires filled in by secondary schoolpupils, we can affirm the following:
• In the case of the in-depth interviews with parents, earlydecisions seemed to be typical. This matches the questionnaire’s clusterof “conscious students” (33%). Hence, whilst in-depth interviews withparents show the conscious attitude as general, questionnaire researchset this phenomenon right. The result of the difference may be found inthat parents from conscious families were more willing to answer.According to the teachers’ responses, the ratio of the “consciousstudents” is higher (even 70-80%) in the good and best performingsecondary schools. In the lower quality schools their ratio is about10-40 %.
• Based on the estimation of teachers, the proportion of the“average decision-makers” is 40-50 %.
• According to the teachers interviewed, pupils from adisadvantaged family background and/or with limited abilities (thosewho decide at the last moment), could be identified with the “impulsivegroup” cluster. The teachers estimated their ratio around 30-50%.
We would also like to draw attention to a further important issue.
Edit Bányai – Katalin Dudás
17
Shaping the decision-making process is significantly influenced by thechanges in the regulation of Hungarian HE in recent years. As one of therespondents (she is a career master) indicated, the time of decision forFE has changed significantly over the last few years. Whilst, previously,students “were much surer, and many were already sure at thebeginning of the 12th year” where they would go; nowadays, she thinksthat 50% is the current ratio of those students who decide only at thevery last minute. “We feel this uncertainty also with parents. This wasthe first year when parents also visited me at my open hours and asked”.Financial viability has become a very important point and so studentsand parents postpone the decision due to the changeable nature of theregulations. Hence, parental uncertainty and their desire to wait isanother factor in postponing the decision. The results show that thechanges in the regulations of HE and financial viability enhance theperceived risk of HE decision.
The role of teachers in Further Education decisionsIn the opinion of parents, students interested in FE are very
independent; they do not allow anyone to influence them. Parents mayhave the greatest influence, but the informants also mentioned the roleof University Open Days, presentations in schools by form-masters andolder friends (already studying in HE institutions). It seems that parentsdo not credit teachers with much real influence.
Our responding teachers also consider students independent, andso they target them (not parents) with communication about career andFE. In general they do not give particular advice, but they ask the rightquestions (students can think them over with their parents). Careermasters evaluate the form-masters’ role as more important than theparents’, especially if they have a direct and good relationship withtheir pupils. Therefore, by their own admission, secondary schoolteachers do not influence pupils and do not take part in their decision ina direct way, but they explain the important factors and their opinion ofthe decision. Our responding teachers underlined that they have toemphasise rather the long-term factors, since the short-term entrancerequirements and the students’ preferences matter most.
The role of teachers and parents in...
18
Our questionnaire revealed that pupils consider the influencingfactor of teachers as less than ‘moderately important’. They graded it at2.72 on a 5-point scale. In this respect, there is no significant differencebetween the three clusters and so teachers have an informationprovider role rather than direct influence. Obviously, the fullest rangeof information should be available and for the pupils it is obvious thattheir teachers are well informed about all of the aspects related to HE. Itis very important what and how much information teachers provide,since this will naturally influence their students’ decisions. It seemed tobe an interesting opportunity to examine what communicationactivities secondary schools organise to help students with their careerorientation. According to the in-depth interviews with teachers, thereare 3 stages:
• In secondary schools thinking about FE begins in the 10th form,when students have to choose their optional course of study. Thisperiod is important since the chosen course technically determines theFE discipline for the majority of students. Therefore, in this period theyare given detailed information about the situation in the differentdisciplines of Higher Education, especially concerning admissionrequirements and admission scores. This information makes it easierfor pupils to narrow their possibilities and compare their abilities withthe requirements.
• The next important stage is the 11th form, when schools areinformed about the required admission scores and more specificquestions emerge, such as the method of calculating scores.
• The 3rd stage of the information process is at the beginning of the12th year, when faculties and institutions ‘market’ themselves. InJanuary, when the admission web pages are opened, pupils are taughthow to use them.
Secondary schools provide information about HE for pupils andparents in different ways:
• during the so-called ‘form-master’ classes• by career masters (who have open hours)• during the so-called ‘parents’ meetings’• by organizing the so-called ‘career days’
Edit Bányai – Katalin Dudás

19
• by purchasing the annual admission information book• through publicity posters and brochures provided by the HE
institutions• through enrolment presentations delivered by HE institutions• by inviting alumni students• through the social media, e.g. Facebook etc.All in all, the role of secondary school teachers, especially
form-masters and career masters, can be evaluated as significant.Although neither pupils nor parents associate teachers with influencingfactors, their information-providing function is unquestionable sinceproviding appropriate information is a key issue in an HE institution’senrolment marketing activity.
The in-depth interviews with teachers reveal that they plan to bewell-informed in connection with FE and that they use severalinformation sources for this purpose (see Table 1).
The role of parents in HE decisionsEvery research method shows that parents have a moderately
important role in a student’s HE decision-making process. Parentsthemselves also have the same opinion: students are independent; theydo not allow anyone to interfere in their FE decisions and, if they do,then the parents’ words are the most accepted. Nevertheless, theparents interviewed stated that, literally, they had not interfered. Mostof them declared that they had really not wanted to influence theirchildren and would not like to press something on them: “We supportanything he would like to do; only he must like it”. In an ideal case,parents only strengthen them, ask questions, draw attention to pitfalls,listen, answer and help if necessary. In the opinion of the majority of theparents, with all these roles, they do have a significant effect on theirchildren’s decisions.
Serious discussion within the family about Further Educationbegins in the 10th year. In general, only close family members take partin this: the student, the parents and older brothers and sisters. Thisbuying centre will generally discuss a number of topics: the student’sabilities, talent and fields of interest, which disciplines and faculties are
The role of teachers and parents in...

20
worth considering, what the family budget allows and how theregulation of HE is developing.
From the in-depth interviews with teachers, four groups of parentsemerge:
• One segment of parents is not interested in FE; they do not collectinformation, do not participate in the meetings organized by thesecondary schools or HE institutions. Generally, these parents do notpossess any higher degree, and/or their child has no chance to beadmitted to HE based on his ability and talent.
• Parents of ‘very conscious’ students, who possess a clear vision,also gather less information since they trust their children, leave theinformation gathering to them and accept their decisions. Theseparents, for instance, may not attend open days activities or parents’meetings in HE institutions.
• The majority of parents gather information primarily from thesecondary school (about admission score calculations, about thedifference between the levels of final examinations, and about thefinancial circumstances of Further Education); they do not interfere intheir children’s choice of institution and faculty, being mostlyinterested in financial questions.
• Parents (in general degree holders) who play a major role in theirchildren’s FE decision-making. There are two main motivations: on theone hand, they are the parents of ‘uncertain’ students with weakerschool achievements, and they help more actively, by taking part in allthe events; on the other hand, these parents want to orient theirchildren towards a particular faculty or institution.
The results of the questionnaire shows that 64.5% of respondingstudents made their FE decision with their parents, and that only 35%decided alone. According to their replies, parents were rated at 3.5,friends at 3.06 and teachers at 2.72 on the 5-point scale. These datashow the importance of these groups in influencing decisions in thisfield. If the three main groups (parents, teachers, and friends) are takeninto account, we can conclude that the students evaluated their parents’influence as the most important.
Edit Bányai – Katalin Dudás

21
Parents’ and students’ perspectives in FE decisionsParents, teachers and students were also asked about the parents’
opinions of disciplines and institutions. According to the parents’common opinion, the financial situation of the family influences thedecision on Further Education and only the extent of this effect varies.Four parents (out of ten) declared that financial factors were verycrucial; that is, the family in no way could afford to pay tuition feesand/or choose an institution in a remote location. These limitations apriori exclude certain faculties (for instance Business and Economics).In the case of the other six responding parents, financial factors areimportant, but they are able and willing to make sacrifices for theirchildren’s future.
To determine the crucial factors influencing the HE decision, theparents were given a list of 22 items and asked to choose the 5 mostimportant. The answers showed the factors below to be the mostimportant (with frequency of mention in brackets):
• Prospective job opportunities (8)• The reputation of the institution (6)• Ability to study (i.e, which subject one is good at) (4)• Entry difficulties (i.e. minimum points level) (4)• Tuition fees (4)• Job opportunities in the institution’s location, in addition to
studies (4).Our responding teachers were asked to compare the factors listed
by the pupils with those of the parents. In their opinion there are pointsof conflict between the generations, such as:
• Parents typically try to persuade students to choose the local HEinstitution, although students would prefer to move and beindependent.
• For parents, the market value of the diploma and the potentialcareer opportunities seem more important than to the students.
• Students, unlike parents, accord more importance to student lifeand the entertainment opportunities in an institution.
In the questionnaire, the secondary school pupils were also askedabout the factors that are important to their parents in connection with
The role of teachers and parents in...
22
their FE decision and the responses about their parents views can beinteresting:
• It seems that parents evaluate prospective job opportunities as themost important factor, which favours faculties of Business andEconomics.
• The parents’ point of view differs significantly from the students’belief in two respects. Six of the ten parents interviewed evaluate the“good reputation of the HE institution” as very important althoughstudents rarely thought of it (11th place). The other four parents thinkthat “job opportunities in the institution’s town in addition to studies”is an important aspect to consider, but this factor ranks only 15th on thestudents’ list.
The information sources of students, parents and teachersStudents, parents and teachers use different channels and methods
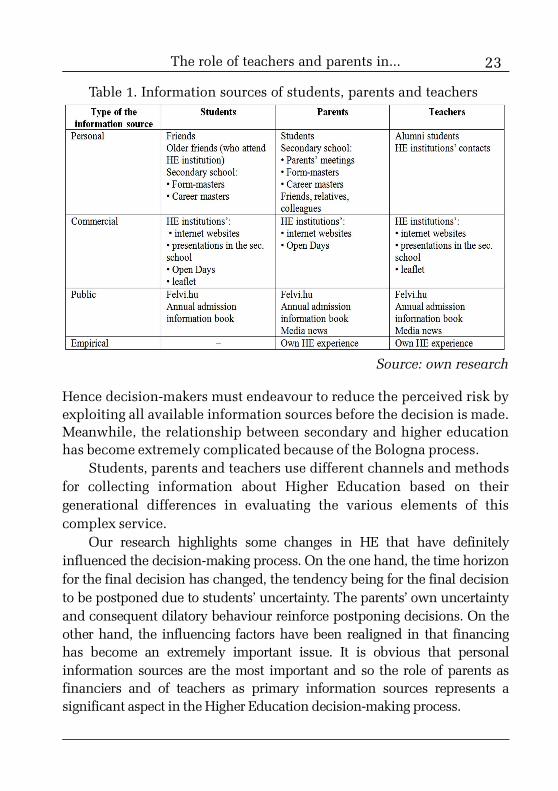
for collecting information about HE based on their generationaldifferences. The results of our survey show that teachers are required tobe well-informed and that parents also make efforts to gather essentialinformation in their desire to help their children make the greatdecision. Table 1 shows the main information sources of students,parents and secondary school teachers.
The parents and teachers interviewed were also asked aboutreliable information sources. Above all, they consider independentpeople most reliable. For parents these are their own child, their child’solder friends (who attend an HE institution), teachers, the form master,relatives and friends, while for teachers, the present and formerstudents of a HE institution.
ConclusionsThe HE decision-making process is multipersonal and multi -
dimensional. A decision about an intangible and scarcely assessableservice and that involves a long-term commitment has to be made in anunstable environment based on restricted information. HigherEducation is characterised as a two-sided risky process. There is aninformation asymmetry between the institutions of HE and students,and so getting to know the complex product directly is not possible.
Edit Bányai – Katalin Dudás
23
Hence decision-makers must endeavour to reduce the perceived risk byexploiting all available information sources before the decision is made.Meanwhile, the relationship between secondary and higher educationhas become extremely complicated because of the Bologna process.
Students, parents and teachers use different channels and methodsfor collecting information about Higher Education based on theirgenerational differences in evaluating the various elements of thiscomplex service.
Our research highlights some changes in HE that have definitelyinfluenced the decision-making process. On the one hand, the time horizonfor the final decision has changed, the tendency being for the final decisionto be postponed due to students’ uncertainty. The parents’ own uncertaintyand consequent dilatory behaviour reinforce postponing decisions. On theother hand, the influencing factors have been realigned in that financinghas become an extremely important issue. It is obvious that personalinformation sources are the most important and so the role of parents asfinanciers and of teachers as primary information sources represents asignificant aspect in the Higher Education decision-making process.
The role of teachers and parents in...
Table 1. Information sources of students, parents and teachers
Source: own research
24
ReferencesAonHewitt (2012). Munkáltatói Márka Kutatás, http://www.aon-
hewitt.hu/sajtoszoba/letoltheto_anyagok, downloaded at 10.05.2013.Bay, D. and Daniel, H. (2001). The Student is Not the Customer - An
Alternative Perspective. Journal of Marketing for Higher EducationalInstitutions, 11(1), 1-19.
Browne, B. A., Kaldenberg, D. O., Browne, W. G. and Brown, D. J.,(1998). Students as Customer: Factors Affecting Satisfaction andAssessments of Institutional Quality. Journal of Marketing for HigherEducational Institutions, 8(3), 1-14.
Cheung, L., Harker, D. and Harker, M. (2008). The state of the art ofadvertising from the consumers’ perspective: a Generational approach.Marketing Review, 8(2), 125-146.
Conard, M. and Conard, M. (2001). Factors that predict AcademicReputation don’t always predict Desire to Attend. Journal of Marketingfor Higher Educational Institutions, 11(4), 1-18.
Corbitt, B. (1998). Managing Quality by Action Research –Improving Quality Service Delivery in Higher Education as a MarketingStrategy. Journal of Marketing for Higher Educational Institutions, 8(3),45-62.
Harker, D., Slade, P. and Harker, M. (2001). Exploring the Process of’School Leavers’ and ’Mature Students’ in University Choice. Journal ofMarketing for Higher Educational Institutions, 11(2), 1-20.
Jancsák, Cs. and Polgár, Zs. (2010). Középiskolások továbbtanulásimotivációi és jövõ orientációi. Ifjúság és társadalom, 2010/õsz, 27-34,http://www.uisz.hu/archivum/uisz_28_jancsak_polgar.pdf, downloadedat 25.04.2013.
Johnson, L. and Hanson, C. (2006). Mind Your X’s and Y’s: Satisfyingthe 10 Cravings of a New Generation of Consumers. New York: Free Pass.
Liu, S. (1998). Integrating Marketing on an Institutional Level.Journal of Marketing for Higher Educational Institutions, 8(4), 17-28.
Ipsos (2012a). Trendi netrandi. http://www.ipsos.hu/site/trendi-netrandi/, downloaded at 12.10.2012.
Ipsos (2012b). Nyitott ajtókat döngetnek a marketingesek.http://www.ipsos.hu/site/nyitott-ajt-kat-d-ngetnek-a-marketingesek/,downloaded at 12.10.2012.
Edit Bányai – Katalin Dudás
25
Ipsos F&F (2011). Fókuszban a fiatal felnõttek. http://www.ipsos.hu/site/f-f-f-kuszban-a-fiatal-feln-ttek/, downloaded at 03.08.2012.
ITHAKA (2011). EU Kids Online II A magyarországi kutatáseredményei. A gyerekek internethasználatának jellegzetességei. http://www2.lse.ac.uk/media@lse/research/EUKidsOnline/EU%20Kids%20II%20%282009-11%29/National%20reports/Hungarian%20report.pdf,downloaded at 10.04.2013.
Joseph, M. and Joseph, B., (1997). Employers’ Perception of ServiceQuality in Higher Education. Journal of Marketing for HigherEducational Institutions, 8(2). 1-13.
Kósa, É. and László, M. (2011). Együtt-egyedül, www.gyermek-mento.hu/.../2011/.../K_L_Plenaris, downloaded at 10.04.2013.
KSH (2012). A KSH legfrissebb adataiból. Gyorstájékoztató 2012.augusztus 12. http://www.ksh.hu/docs/hun/xftp/gyor/mun/mun21207.pdf, downloaded at 10.04.2013.
Kuráth, G. (2004). A versenyképesség növelésének lehetõségei afelsõoktatásban – regionális vonzáskörzetek és beiskolázási marketing.In Glück, R. and Gyimesi, G. (eds): Pécsi TudományegyetemKözgazdaságtudományi Kara Regionális Politika és Gazdaságtan DoktoriIskola, Évkönyv 2004-2005 II. kötet. Pécs: Pécsi TudományegyetemKözgazdaságtudományi Kara, pp. 224-232.
Kuráth, G. (2007a). A beiskolázási marketing szerepe a hazaifelsõoktatási intézmények vonzerõfejlesztésében. Doktori értekezés. Pécs:Pécsi Tudományegyetem.
Mészáros, T. (2012). Gondolatok a magyar felsõoktatásról szólóvitákhoz. In Felsõoktatás-finanszírozás. Nemzetközi tendenciák és ahazai helyzet. Budapest: Aula, pp. 255-292.
MRSZ (2010). Öt órát töltenek naponta a fiatalok számítógép és tévéelõtt, http://www.mrsz.hu/news-age.php?oid=T62a8f80049258210c19b6deaf1f3f93;cmssessid=Tb2b868d194b8188733ed0dad24f9ed03edf4227df9b3071461af51ee2f427b3, downloaded at 04.08.2013.
Sáfrány, Zs. (2005). Motivációk a 17-18 éves korosztálypályaválasztási döntéseiben. In Kuráth, G. (ed): II. FelsõoktatásiMarketing Konferencia konferenciakötet. Pécs: Pécsi Tudományegyetem,pp. 72-82.
The role of teachers and parents in...
26
Sáfrány, Zs. (2006). Alapozni a középiskolás években kell – hatékonykommunikációs stratégia a célcsoportban. http://www.safrany-zsuzsanna.hu/download/fnyk_szs_2006.pdf, downloaded at11.10.2012.
Schmidt, L., P and Hawkins (2008). Children of the tech revolution.http://www.smh.com.au/news/parenting/children-of-the-tech-revo-lution/2008/07/15/1215887601694.html, downloaded at 10.04.2013.
Shanks, M., Walker, M. and Hayes, T. J. (1993). UniversityExperience Expectations: A Marketing Orientation Applied to HigherEducation. In: 1993 Symposium of Higher Education. Chicago IL:American Marketing Association.
Shash, A., Zeis, C., Regassa, H. and Ahmadian, A. (1999). ExpectedService Quality as perceived by Potential Customer of an EducationalInstitution. Journal of Marketing for Higher Educational Institutions,9(3), 49-72.
Tari, A. (2010). Y generáció. Budapest: Jaffa Kiadó.Tari, A. (2012). Z generáció – Hogyan érthetünk szót a mai kama-
szokkal? Nõk Lapja Psziché, downloaded at 10.04.2013.Törõcsik, M. (2011). Fogyasztói magatartás: Insight, trendek,
vásárlók. Budapest: Akadémia Kiadó.Zeithaml, V. A. (1981). How Consumer Evaluation Processes Differ
Between Goods and Services. In Donelly, J. H. and George, W. R. (eds):Marketing of Services. Chicago IL: American Marketing Association,pp.186-190.
Edit Bányai – Katalin Dudás
27
1 Assistant research fellow, Corvinus University of Budapest, Institute ofMarketing and Media, e-mail: [email protected].
The new role of consumer meaningsand legitimacy in building
marketing valueTAMÁS CSORDÁS1
Starting from the current official definition of marketing, in ourconceptual paper we present an overview of the literature of consumer valuein marketing in connection with the topical process of co-created value whichincludes firms as much as their consumers and third-party digital audiences,thus widening the pool of stakeholders present in the value creating process.Based on the service-dominant logic of marketing and the value buildupmodel, we argue that, ultimately, it is consumers’ meaning creation processesthat drive what can be referred to as the process of consumer advocacy, thusbecoming one focal point of postmodern marketing theory and leading to areal relationship based on interactive communications where earned mediaare as important elements of marketing communications as paid advertising.Following this we introduce the concept, process and role of brand legitimacyand its expressions within various social groups (brand communities,subcultures and neo-tribes) as well as its impact on marketing science.
Keywords: marketing value, consumer meanings, consumerparticipation, brand legitimacy, earned media, value buildup, consumertribes, postmodern marketing.
JEL codes: M31, M37.
IntroductionThere is growing evidence that marketing science as well as
practice is undergoing a paradigm shift. For nearly 20 years, between1985 and 2004, the American Marketing Association’s (AMA) officialdefinition of marketing had remained unchanged, despite the three-yearreview cycles while, since then, it has already been significantly alteredtwice (Gundlach and Wilkie 2009), leading more and more to anexternally-focused interpretation of marketing logic through the
28
growing emphasis on stakeholders, relationships or communications(see e.g. Vargo and Lusch 2004; Merz et al. 2009). At the same time, thenotion of postmodern marketing enters into mainstream scientificdiscourse (Brown 1993, 2006; Dholakia 2009). Hence, according to theofficial definition of the AMA, marketing “is the activity, set ofinstitutions, and processes for creating, communicating, delivering, andexchanging offerings that have value for customers, clients, partners,and society at large” (AMA 2007).
The notion of value entered the definition of marketing in 2004,while the current definition adopted in (and kept since) 2007introduces, even beyond the organizations and its stakeholders, societyat large as a beneficiary of the marketing activity. Another novelty isthat value creation is no longer considered a direct task of anorganization’s marketing activity. Instead, value creation is carried outindirectly through promises and offerings by the organization as awhole and achieved through interactions between the organization andits other stakeholders. Overall, this brings about a conceptual extensionof marketing that takes into account the complex environment in whichcompanies exist in the new millennium, characterized by a growingnumber of the aforementioned stakeholders as well as of their marketconnections, an exponential growth of available marketing data(referred to as “big data”) and a growing variety of communicationchannels (Forsyth 2004).
The growing influence of company-stakeholder interactions, aswell as the sharp increase of the number of stakeholders, foreshadowsan appreciation of the organizational role of communications.Moreover, “brands do not exist in a void. Regardless whether or not acompany participates online, consumers are constantly talking onlineabout companies and services” (Johnston 2011. 84). Thecommunication space can thus be defined as an „aggressivelyinteractive” (Rust et al. 2010. 96), “many-to-many” environment whereeach participant can take the role of the information source and thuswhere the organization is but one of many information sources,concerning even their own product or brand messages. This is why, in a
Tamás Csordás
29
postmodern, consumer-centric marketing view, the consumer is anintegral part of the value creation system (Prahalad and Ramaswamy2002) and marketing communications cannot merely imply solelytransmitting a marketing message, but rather should be considered apartnership where meanings are created outside of the organization, ina communication space shared by the organization and its stakeholders.Marketing communications, by using user- and consumer-generatedcontent in this perspective become a tool for differentiation through amerely marketing-based value proposition going beyond the coreproduct benefits.
However, in the postmodern space, the notions of production andconsumption intertwine: consumers themselves participate in themarketing activity, marketing becomes a value carrier as much asproduction itself, and production becomes a consumer of consumers’expected value (Firat and Venkatesh 1995). In this context, production isno longer a linear and delimited process nor can consumers beconsidered end-users at the end of the value chain (Mitev and Horváth2008). Similarly, the concepts of product and service are blurred. On amarket of consumer goods filled with products with practicallymatching attributes (Shugan 2004), a manufacturer ought to prevailthrough the de-commoditization (Sassatelli 2007) of its products andthereby constitute added value to consumers (and, in addition, apply aprice premium) (Mahajan and Wind 2002). According to this perception,consumer relations and highly personalized communications to narrowand well-defined target groups appear as a core element of a company’smarketing activity (Rust et al. 2010). Following this logic, the productitself can still remain generic although marketing communications are toestablish and maintain unique, personal value perceptions andmeanings related to the extended product.
Consumer value in marketingThe concept of value in the business literature can be traced back to
three main approaches (Khalifa 2004): (1) shareholder value (e.g. Black etal. 1998), (2) stakeholder value (e.g. Peyrefitte 2012) and (3) consumer
The new role of consumer meanings and legitimacy in...
30
value. Understanding the consumer side of value creation can help tocontribute to elaborating services- and value-focused business strategies(Woodruff 1997), to increasing perceived consumer value and thereby toconsumer loyalty. The driving force behind a company’s businessperformance lies in the quality of its consumer relations (Grönroos 2000)or consumer loyalty (Reichheld et al. 2000). Thus, marketing researchoften focuses on the third category, that of consumer value.
Defining consumer value in marketing is difficult, for it is a complex,multidimensional and, to a large extent, subjective concept (Payne andHolt 2001) used by researchers in various contexts and research fields.These sources, however, offer a number of key features that can help indelimiting it. A first common characteristic is the dynamic and temporalnature of consumer value (Jaworski and Kohli 1993). Sources onconsumer value also largely agree on the fact that value stems fromconsumers’ perception and experience (Helm and Jones 2010; Merz et al.2009) and is not the mere result of a company’s intended effort. Thus,“the value of a product is not what the producer puts in, but what theconsumer gets out” (Doyle 1989. 78). Consumers’ perception of value istherefore equally influenced by the consumption and marketenvironment (e.g. number of substitutes, marketing communications).
Khalifa (2004) identifies three groups of value models in theliterature: (1) value components models, (2) benefits/costs ratio modelsand (3) means-ends models. He argues that value as a marketing conceptcan be identified through the combined consideration of these threeviews. In the following, we present a brief overview of the three models.
Value components models distinguish between various buildingblocks and functions of consumer value. Kaufman (1998) defines threevalue components: (1) exchange value or “worth”, (2) utility value or“need”, and (3) esteem value or “want”. Based on previous reviews onthe concept of value (e.g. Khalifa 2004; Rowley 2008), one can state thatthe literature often confuses the narrower with the broader concepts ofconsumer value.
Based on Kaufman’s (1998) categories, exchange value (“worth”), amicroeconomic concept, can be considered the narrowest interpretation
Tamás Csordás
31
of the concept. Similarly, Green and Jenkins (2011. 119) define „value”(interestingly, in opposition to „worth”) as no other than measurable andquantifiable exchange value, based on “agreed upon standards andmeasurements”. In other words, exchange value can be considered ameasurement of the preference of a consumer toward one or anotherproduct or service of similar attributes in a supply and demand context,and can give indications as to the social and other contexts of theintended use of the given product or service by the user (Kaufman 1998).In contrast, a consumer “need” is intended to describe physicalcharacteristics of a product or service (Kaufman 1998) and thereby aconsumer performance triggered by that product or service. Lastly, theesteem value of a product or service is the sum of those attributes thatlead consumers to buy them for the mere desire of ownership (Kaufman1998) and which it is impossible to put a price on (Hyde 1983 in Greenand Jenkins 2011. 119). Esteem value is therefore largely personal andthus variable. In this way, unveiling and understanding consumermeanings becomes particularly important in assessing esteem value asthis category can be described as the colloquial concept of “addedvalue”. In this perspective, the added value of a product or service is an“emotional investment” (Green and Jenkins 2011. 119) in theconsumption of culturally embedded products.
Building upon the disconfirmation model (Oliver and Bearden1985), Kano’s model of customer perception (Kano et al. 1984 in Khalifa2004. 648) distinguishes various functional components within theconcept of value. The model examines two dimensions: the presence ofcharacteristics and the level of customer satisfaction. Along these twodimensions, three major product attributes can be distinguished(Khalifa 2004): (1) dissatisfiers, (2) satisfiers and (3) delighters.Dissatisfiers are elementary, implicitly expected requirements thatevery product within a category should satisfy to even be marketable:their existence does not lead to any additional satisfaction, but theirabsence leads to customer dissatisfaction. Satisfiers are comparable toperformance indicators. They are expected and expressed consumerneeds. These are one-dimensional product attributes, most often
The new role of consumer meanings and legitimacy in...
32
associated with the product’s or service’s performance. Delighters areunexpected, often innovative features which, when met, triggersurprise and additional satisfaction from the consumer.
One can observe from the description of delighters that valuecomponents models merely represent a static state and therefore areless applicable to the entire product and consumer life cycles: they donot take into consideration the temporality and dynamics of the latter(e.g. during the life cycle of a product a delighter can first become asatisfier then even a dissatisfier on the market).
One equally has to take into consideration the subjectivity andemotional characteristic of value. As Schneider and Bowen (1999)argue, most consumers range from moderately satisfied to moderatelydissatisfied. This implies that consumer loyalty is a rather ambivalentconstruct (Khalifa 2004) and various momentary value magnifiers (e.g.sales promotion tools) or destroyers (e.g. poor customer service) caneasily dissuade consumers from their original purchase intentions(Keiningham et al. 2011). At the same time, the presence of delightersand, in some cases, the absence of dissatisfiers can predict even moreintense consumer reactions. While moderate (dis)satisfaction is mainlydue to product performance (i.e. satisfiers), in these extreme casesabove average emotional charges like delight or “awesomeness” (Haque2009), or outrage (Schneider and Bowen 1999) will prevail. These inturn would then explain consumer behaviours like brand evangelism(Scarpi 2010) or anti-branding (Krishnamurthy and Kucuk 2009).
Benefits/costs ratio or utilitarian models trace back perceivedcustomer value to the difference between customers’ perceived benefitsand customers’ perceived costs (Day 1990; Horovitz 2000), where thevalue of a product or service is what a consumer is willing to pay for(Porter 1998). However, it can be noted that with their purchasedecision of a product or service customers not only make a pecuniaryeffort but also a sacrifice (i.e. opportunity cost) by diverting resourcesfrom other possible uses and investing time and effort into purchasingand consuming the given good or service (Kotler and Keller 2012).Huber et al. (2001) identify the following cost factors: time costs, search
Tamás Csordás

33
costs, learning costs, emotional costs, cognitive and physical effort, aswell as financial, social and psychological risks. The higher theexchange value or the associated costs of a product or service, the lowerits perceived benefit will be for the customer (Khalifa 2004). Thecompany can improve, extend or expand the perceived benefit(Horovitz 2000) by improving the performance of certain productattributes (e.g. by pointing out a product’s unique selling propositionsduring marketing communications), extending the product to anintegral solution (Vargo and Lusch 2004; Helm and Jones 2010) (e.g. byoffering software as a service [SaaS] instead of software alone) and byexpanding the act of consumption to an experience. In this sense,products consist of a core value and additional, added value elements(Grönroos 2000). The latter, however, can also be negative: the incorrecthandling by the company of its support activities (e.g. poor distributionsystem) can negatively impact on the perceived value by the customer.
Means-ends models are based on the premise that products andservices are purchased with the ultimate intention to satisfy a givenneed or goal. These models are prevalent in consumer behaviorliterature. Value surveys developed by social psychologists (e.g.Rokeach 1973) explore consumers’ cultural, social and personal beliefsand convictions. These psychological and symbolic values can berelated to consumer culture through the acts of consumption, purchaseor communication. Moreover, symbolic values represent a category ofvalues that includes all consumer perceptions beyond the merefunctional attributes of a product.
End values or terminal values include personal and social values,while means values or instrumental values can be divided into moraland competence values. Moral values have an interpersonal focus anddefine expected behavioral patterns for the individual whilecompetence values are intrapersonal and pertain to individuals’self-actualization (Rokeach, 1973).
Gallié (2009) identifies two main components of value: utility valueand existential value. The first assesses the extent to which customers’functional expectations are met. Existential or symbolic values can be
The new role of consumer meanings and legitimacy in...
34
further divided from social, hedonic and ethical value components(Gallié 2009) to personal (affective/emotional) and external – social, i.e.linking value (Cova and Cova 2002) components. Symbolic valuescontribute to consumers’ self-expression and social success and therebydetermine the consumer experience derived from the consumption of agiven product or service.
In a social psychological approach, consumers might manifest adirect or indirect relation to their acts of consumption needs other thana product’s or service’s functional attributes. Conversely, one canconsider consumption as a socially embedded phenomenon, whereconsumption itself contributes to the expression of consumers’ valuesystems. In a means-end logic, consumption brings about desirable orundesirable outcomes that manifest themselves either directly, at themoment of consumption, or indirectly, over time, through otherconsumers’ behaviors. In this respect, the notion of value extendsbeyond the scope of the company and that of the perceived and actualproduct attributes. In this regard, individuals are first and foremosthuman beings with psychological and social needs and only thenconsumers (Fournier and Lee 2009). This explains why it is emotionalfactors stemming from experiences related to the act of consumptionand not the product attributes that will lead to the aforementionedextreme states of delight and outrage.
Woodruff (1997. 142) defines customer value as “a customer’sperceived preference for and evaluation of those product attributes,attribute performances, and consequences arising from use thatfacilitate (or block) achieving the customer’s goals and purposes in usesituations”. According to this definition, value stems from a subjectiveconsumer perception, consequence of the consumption of a product orservice. It is positive when the product or service goes beyond itssimple functional properties and is instrumental in solving the originalproblem or need it was consumed for in the first place, and negative if itfails to achieve this function. Value is a dynamic process: each use of orencounter with the product shapes its evaluation thereof by theconsumer. By including a context (i.e. goals and purposes) to the act of
Tamás Csordás
35
consumption, the definition explains why perceived value is relativeand why certain product attributes are more important to a given circleof consumers than to others. In short, one can state that perceived valueis subjective, relative, context-driven and interactive.
In contrast to the purely economic viewpoint, where consumers areconsidered to pursue a value- and utility-maximizing behaviour,whereas companies seek to increase the gap between the productioncosts and the actual exchange value (value exchange model), the notionof value-in-use is increasingly present in the literature on consumervalue (Payne and Holt 2001; Porter 1998). According to it, consumervalue stems from the use rather than the exchange of a product. Themore complex a service is, the more attributes consumers need toevaluate – and the less price weighs as a decision criterion, even less inthe case of technologically saturated products with rapid obsolescence,or of expensive, high-involvement products with high social risks ofpurchase. According to Mahajan and Wind (2002), consumers’pre-purchase information need is surprisingly low, mainly due to theabundance of available information and their limited capacity ofinformation processing (Johnson 2012), which leaves emotions andproduct promises as a major decision factor. Unless the phenomenon ofcognitive dissonance arises (i.e. the product does meet consumerexpectations), objective product attributes thus become of secondaryimportance.
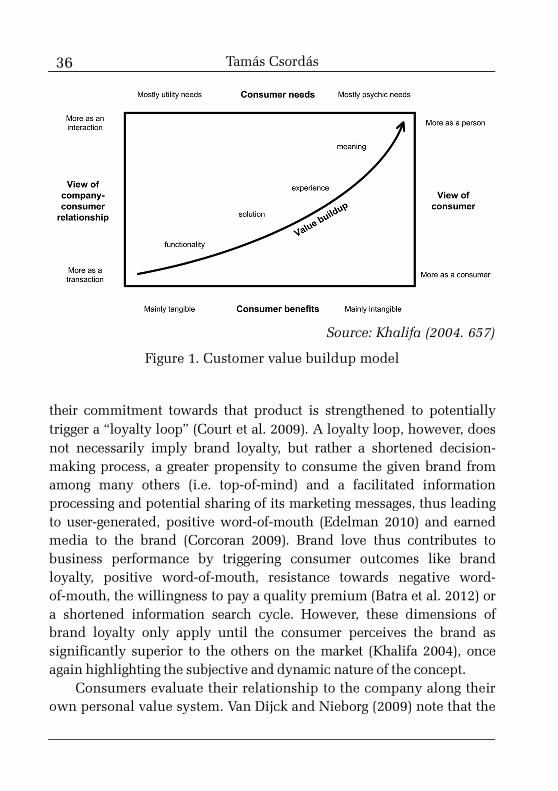
Developing the concept of value-in-use, Khalifa (2004) highlightsthe importance of psychic value. In his integrative model, hedistinguishes four main categories that determine consumers’perception of value: (1) consumer needs, (2) consumer benefits, (3) thenature of the relationship between the supplier and the consumer, and(4) the perceived treatment or view of the consumer by the supplier(Figure 1). The model places a product’s functionality (and thus utilityvalue) on the lowest level of total consumer value.
Beyond the perceived value of product attributes, the perceivedadded value appears as a direct antecedent of brand love in Batra et al.’s(2012) model: in case a consumer is satisfied with a consumed product,
The new role of consumer meanings and legitimacy in...
36
their commitment towards that product is strengthened to potentiallytrigger a “loyalty loop” (Court et al. 2009). A loyalty loop, however, doesnot necessarily imply brand loyalty, but rather a shortened decision-making process, a greater propensity to consume the given brand fromamong many others (i.e. top-of-mind) and a facilitated informationprocessing and potential sharing of its marketing messages, thus leadingto user-generated, positive word-of-mouth (Edelman 2010) and earnedmedia to the brand (Corcoran 2009). Brand love thus contributes tobusiness performance by triggering consumer outcomes like brandloyalty, positive word-of-mouth, resistance towards negative word-of-mouth, the willingness to pay a quality premium (Batra et al. 2012) ora shortened information search cycle. However, these dimensions ofbrand loyalty only apply until the consumer perceives the brand assignificantly superior to the others on the market (Khalifa 2004), onceagain highlighting the subjective and dynamic nature of the concept.
Consumers evaluate their relationship to the company along theirown personal value system. Van Dijck and Nieborg (2009) note that the
Tamás Csordás
Source: Khalifa (2004. 657)
Figure 1. Customer value buildup model
37
majority of consumers do not aim to actively participate in thisrelationship, do not require higher order interactions from brands theylike and keenly settle for an “I don’t call them, and they don’t call me”type of relationship (Barnes 1997. 771), which they can equally judge asa suitable (smooth, useful, etc.) kind of company-consumerrelationship. Based on the above, a company should distinguishbetween relational clients, who deem important and require an activerelationship with the company, and transactional clients, who do notput emphasis on the affective dimensions of their relationship with thebrand. The value buildup model thus contributes to a betterunderstanding of the different perception of value between low- andhigh-involvement products. While consumers with a high involvementare prone to process larger amounts of cognitive information(Greenwald and Leavitt 1984), low involvement consumers can becharacterized by a total lack of interest (Fagerstrøm and Ghinea 2010).While a low involvement consumer can be characterized as atransactional client, potential users of high-involvement products havemore (implicit or explicit) expectations, going beyond their functionalneeds.
Another significance of the value buildup model is that it forms adirect hierarchical link between functionality, solution, experience andmeanings within the process of consumer value generation. Thus,functionality can be related to generic product attributes (Levitt 1983)and to meeting consumers’ rational needs, solution comes back to whatcan be referred to as a consumer-centric view of business (Vargo andLusch 2004), experience is the extension of perceived benefits beyondthe mere product or service itself, while meanings imply meetingconsumers’ most abstract social or psychic needs.
According to Khalifa (2004. 658), meaning “magnifies the worth ofthe experience”, referring to the fact that meanings are those elements ofthe act of consumption that affect long-term memory and through whichfrom a one-time experience consumption becomes an ideological andphilosophical act that supports an individual’s views, values (in asocial-psychological sense) and self-realization. There is empirical
The new role of consumer meanings and legitimacy in...
38
evidence that, in the case of relational clients and real company-consumer relationships, marketing communications throughexperiences do effectively contribute to building brand equity (Fransenand van Rompay 2011). In this context, therefore, business performancelargely relies upon consumers’ perception of value rather than actualproduct attributes and performance. In other words, market competitionis increasingly based on subjective consumer experiences (Helm andJones 2010). It is equally the presence of the emotional factor that allowsthe company to convert its value propositions into relevant consumermeanings, through its marketing communications activities, in a broadsense.
Manifestations of consumer value in marketingcommunications: Meanings and social embeddednessMarketing communications represent a growing scene of the
company-customer interactions. One of its main tasks is to convey toconsumers positive meanings about the brand. From an economic pointof view, the growing importance of meanings within the concept ofadded value is a natural consequence of a welfare society (Potts et al.2008). From a sociological perspective, consumption itself is a sociallyand culturally embedded activity, and consumer creativity (e.g. thecreative use of tools) is a constituting element thereof (Becker 1982;Bourdieu 1993). User-generated content, such as user brand mentionsand narratives of consumption, is also part of consumer creativity. Thisis ubiquitous in the new media and constitutes the defining element ofvirtual communities and, incidentally, the ultimate channel for theexpression of shared consumer meanings.
As in the case of consumer value, the notion of meanings ismultidimensional, allowing a variety of interpretations in the variousfields of research (Finne and Grönroos 2009). Meanings as a marketingconcept manifest themselves through consumers interpreting their actsof consumption, a process during which symbols, experiences andmeanings are created. In this context, interpreters (consumers) gain afar more important role than the sender of a marketing message (the
Tamás Csordás
39
brand) can plan ahead. Research shows that consumers can interpretbrand messages in a far wider scope and in far more different ways thanthe brand owner has originally intended (Schouten and McAlexander1995; Kozinets 2001; Muñiz and O’Guinn 2001).
As mentioned above, consumer value can be interpreted as adynamic process (value buildup). The sum of a consumer’s pastexperience with the brand constitutes one temporal dimension ofconsumer value and makes up the current meaning thereof for them.Past experiences can be of a commercial origin (e.g. experiences at thepoint of purchase, during product use, advertising messages, etc.) andcan equally originate from any other source with loose ties to the brand:personal conversations (word-of-mouth), browsing, etc. However,brand meaning does have another temporal dimension, namely that ofexperiences not yet lived, of which the most important are brandexpectations. As brand messages can most often be associated with apromise of future consumer satisfaction (Berry 2000; Grönroos 2009),marketing can only succeed in constituting value through meanings if itcan avoid any “communication gaps” (Parasuraman et al. 1985), i.e. ifthe implied or explicit promises are not at odds with actual productattributes and individual product experiences (Mahajan and Wind2002). The future dimension of brand meanings also includes externalelements that are not directly related to the brand itself (e.g. the effect ofthe economic crisis on consumption patterns and brand choice).
The temporal dimension is particularly important in marketingcommunications, as consumers’ past experiences are of a cumulativenature (Helm and Jones 2010). It follows that a company’s responsecannot be but incremental in nature, i.e. it ought to have a long term,strategic focus.
One can also distinguish between internal and external dimensionsof brand meanings. External dimensions comprise all the effects of the(cultural, economic, etc.) environment on consumers. The externalenvironment also includes competitors’ marketing communicationsmessages. Internal dimensions reflect consumers’ individual situationsregarding their social, emotional, motivational, etc. states.
The new role of consumer meanings and legitimacy in...
40
It is important to note that it is the consumer who, along with thecontext and time dimensions, makes up their own understanding andmeaning of a brand’s communications that they subsequently do or donot embrace. Green and Jenkins (2011. 114, 117) emphasize that, in aconsumer-to-consumer information flow, the context itself can modifythe objective content and (intended) meaning of a message. In this case,the recipient interprets not only the message itself but also the (implicitor explicit) meaning attached to it by its source (referred to as “grassrootintermediary” by the authors).
One also has to note the potential negative impact of thephenomenon on marketing communications. Marketing messages, asproducts of popular consumer culture, are prone to be hijacked andturned against the company by an empowered audience (Green andJenkins 2011; Krishnamurthy and Kucuk 2009).
Based on its personal and relative nature, value-based emotionalpositioning also involves necessarily restricted targeting, but at leastwell-defined target groups might have a notably differing interpretationof a same message (Mahajan and Wind 2002; Kates 2004), whilemessages similar in content but configured in different ways are frameddifferently by target groups (Yi and Baumgartner 2009). Virtualcommunities build around specific needs and activities and thesubsequent internal consistencies thus offer the possibility of a naturalsegmentation along consumer needs, habits and even lifestyles (vanDijck 2006).
Brand communities are self-organized groups of consumers of acommercial brand. Muñiz and O’Guinn (2001) note that a strong brandcommunity can contribute to socially embedding a brand by affirmingconsumer loyalty, commitment, and even the phenomenon of brandevangelism. However, relatively few brands (those referred to aslovebrands or lovemarks) are fit for generating active and widespreadbrand communities. Moreover, it can be stated that a large majority ofconsumers are not self-conscious members of brand communities(Kates 2004) and that their relationships to brands are embedded withintheir daily lives and routines. People nonetheless are still members of
Tamás Csordás
41
various communities referred to as neo-tribes, where common lifestyleand shared experiences are the basis for closer or looser socialconnections (Cova and Cova 2002).
Marketing’s value creation within groups organized around sharedexperiences, lifestyle and rites can best be characterized and evaluatedthrough its level of legitimacy (Kates 2004; Muñiz and O’Guinn 2001).In this respect, marketing activity is necessarily built aroundcommunity participation, as the product, service or brand it serves ispositioned as a tool, a channel for members to succeed within theirrespective communities (e.g. through community experiences offeredby the product [Schouten and McAlexander, 1995]), thus accepting thata given community of consumers gain some level of control on shapingthe brand’s social and cultural meanings (i.e. consumer empowerment).In this approach, brand equity is the result of a company-consumerco-creation, where in return of a certain degree of openness from theorganization’s side, customers become voluntary advocates of itsproducts or services (Urban 2004).
Marketing activity can thus join a community’s everyday lifethrough contributing to its self-determination with the ultimate goal toreach a level where the community accepts a product or brand as alegitimate information carrier of the community’s own values,resulting,in the long term, in what can be referred to as “institutionalisomorphism” (Handelman and Arnold 1999). Such communities, eventhough not related directly to brands, represent a special andwell-delimited circle of consumers who can thus contribute todeveloping a brand’s products by using them in a way adapted to theirown needs, even by modifying or recycling them (user-led innovation).
The process of legitimation is a bottom-up, consumer-generatedprocess that manifests itself at the top of the before-mentionedvalue-buildup model, through personal meanings merging into acollective sphere. A brand’s legitimacy is complete on a community levelwhen it admittedly fits the community’s greater relationship and valuechains (Cova and Cova 2002), effectively contributes to building andperpetuating its ethos (Kates 2004) and its messages are accepted by the
The new role of consumer meanings and legitimacy in...
42
community as socially accurate (Handelman and Arnold 1999).According to several authors (e.g. Andsager et al. 2006; Paek et al. 2011),in these cases perceived similarity plays a greater role in the reception ofa marketing message than perceived expertise. As legitimacy is a sociallyembedded process, in the case of a relatively large community, a brandowner may have little control over the dynamics of brand meanings andconsequently of brand equity, which might, in extreme cases, lead to aforced repositioning or adaptation to the actual market situation.
ConclusionDespite the extraordinary growth in quantity and in importance of
user-generated content, companies still remain hesitant to venture intothis unproven environment. Their concerns stem from a fear ofintruding into a “consumer” environment, a lack of understanding ofvirtual community members and their behaviour, as well as a lack ofcontrol over the context in which their messages are exhibited(Krishnamurthy and Dou 2008). Regardless whether or not theyparticipate, brands are inherently present in the discussions ofconsumers in virtual communities. In a postmodern space,de-commoditized brands are bound to communicate through affectivecomponents and to offer user experiences that go beyond merefunctionality. By understanding how consumers live their encounterswith the brand through monitoring expressed meanings, companies cannot only direct more relevant messages to their target groups but alsoidentify positive experiences and shared consumer meanings inconnection with the brand, which can offer them new grounds fortargeting and positioning activities through organically integrating thebrand into the community by relying on the social values and beliefsthereof, offering community members an additional channel ofself-expression.
In this context of interactive communications and co-createdmeanings, marketing communications face a new challenge, i.e. that ofbecoming an activity providing media content and management,through which new stakeholders and target groups come into the
Tamás Csordás
43
picture. Not only must a company perform in its core business throughcreating value in order to delight its marketing target groups, but it alsoneeds to take into consideration a new pool of stakeholders, namely itsaudiences or media target groups. Stakeholders, in addition toconsuming the company’s products and messages, ought to bemotivated to participate in the co-creation of a brand’s equity.
AcknowledgementsThis research was supported by a grant of the 7th Framework
Programme (FP7) of the European Commission as part of the Cre8tv.euresearch project.
ReferencesAMA (2007). Definition of Marketing. American Marketing
Association, http://www.marketingpower.com/AboutAMA/Pages/DefinitionofMarketing.aspx, downloaded at 12,01.2013.
Andsager, J. L., Bemker, V., Choi, H-L. and Torwel, V. (2006).Perceived Similarity of Exemplar Traits and Behavior: Effects onMessage Evaluation. Communication Research, 33, 3-18.
Barnes, J. G. (1997). Closeness, strength, and satisfaction:Examining the nature of relationships between providers of financialservices and their retail customers. Psychology & Marketing, 14(8)765-790.
Batra, R., Ahuvia, A. and Bagozzi, R. (2012). Brand Love. Journal ofMarketing, 76(2), 1-16.
Becker, H (1982). Art Worlds. Berkeley, CA: University of CaliforniaPress.
Berry, L. L. (2000). Cultivating Service Brand Equity. Journal of TheAcademy Of Marketing Science, 28(1), 128.
Black, A., Wright, P. and Bachman, J. E. (1998). In Search ofShareholder Value. London: Pitman.
Bourdieu, P (1993). The Field of Cultural Production: Essays on Artand Literature. Cambridge: Polity Press.
Brown, S. (1993). Postmodern Marketing? European Journal ofMarketing, 27(4), 19.
The new role of consumer meanings and legitimacy in...
44
Brown, S. (2006). Recycling Postmodern Marketing. MarketingReview, 6(3), 211-230.
Corcoran, S. (2009). Defining owned, earned, and paid media.Forrester Research – Sean Corcoran's Blog, http://blogs.forrester.com/interactive_marketing/2009/12/defining-earned-owned-and-paid-media.html, downloaded at05.01.2012.
Court, D., Elzinga, D., Mulder, S. and Vetvik, O. (2009). Theconsumer decision journey. Mckinsey Quarterly, 3, 96-107.
Day, G. (1990). Market-driven strategy: Processes for creating value.New York: The Free Press.
Dholakia, N. (2009). Marketing theory: Breaking the siege ofincrementalism. Journal of Marketing Management, 25(7/8), 825-829.
Doyle, P. (1989). Bulding successful brands: the strategic objectives.Journal of Marketing Management, 5(1), 77-95.
Edelman, D. C. (2010). Branding in The Digital Age. HarvardBusiness Review, 88 (12), 62-69.
Fagerstrøm, A. and Ghinea, G. (2010). Web 2.0’s Marketing Impacton Low-Involement Consumers. Journal of Interactive Advertising,10(2), 67-72.
Finne, Å. and Grönroos, C. (2009). Rethinking marketingcommunication: From integrated marketing communication torelationship communication. Journal of Marketing Communications,15(2/3), 179-195.
Firat, A.F. and Venkatesh, A. (1995). Liberatory Postmodernism andthe Reenchantment of Consumption. Journal of Consumer Rsearch,22(3) 239267.
Forsyth, K. (2004). Content management: A prerequisite tomarketing and sales effectiveness. International Journal of MedicalMarketing, 4(3), 228-234.
Fournier, S. and Lee, L. (2009). Getting brand communities right.Harvard Business Review, 87(4) 105–111.
Fransen, M.L. and Van Rompay, T. J. L. (2011). Living brands:Consumer reactions toward online experience-based marketing
Tamás Csordás
45
communication. In Okazaki, S. (ed.). Advances in Advertising Research,Vol. II. Wiesbaden: Gabler.
Green, J. and Jenkins, H. (2011). Spreadable Media - HowAudiences Create Value and Meaning in a Networked Economy. InNightingale, V. (ed.). The Handbook of Media Audiences. Malden, MA:Wiley-Blackwell, 109-146.
Greenwald, A. G. and Leavitt, C. (1984). Audience involvement inadvertising: Four levels. The Journal of Consumer Research, 11(1),581–592.
Grönroos, C. (2000). Service Management and Marketing: aCustomer Relationship Management Approach. Chichester: John Wiley.
Grönroos, C. (2009). Marketing as promise management: regainingcustomer management for marketing. Journal of Business & IndustrialMarketing, 24(5/6), 351-359.
Gundlach, G.T. and Wilkie, W.L. (2009). The American MarketingAssociation’s New Definition of Marketing: Perspective andCommentary on the 2007 Revision. Journal of Public Policy & Marketing,28(2) 259-264.
Handelman, J. M. and Arnold, S. J. (1999). The Role of MarketingActions with a Social Dimension: Appeals to the InstitutionalEnvironment. Journal of Marketing, 63(3), 33-48.
Haque, U. (2009). The Awesomeness Manifesto. Harvard BusinessReview Blog Network, 16.09.2009. http://blogs.hbr.org/haque/2009/09/is_your_business_innovative_or.html, downloaded at 24.02.2013.
Helm, C. and Jones, R. (2010). Extending the value chain - Aconceptual framework for managing the governance of co-created brandequity. Journal of Brand Management, 17(8) 579-589.
Horovitz, J. (2000). The seven secrets of service strategy. Harlow,UK: Financial Times/Prentice Hall.
Jaworski, B. J. and Kohli, A. K. (1993). Market Orientation:Antecedents and Consequences, Journal of Marketing, 57(3), 53-70.
Johnson, C. A. (2012): The Information Diet. Sebastopol, CA:O'Reilly Media.
Johnston, R. (2011). Social Media Strategy: Follow the 6 P's forsuccessful outreach. Alaska Business Monthly, 27(12), 83-85.
The new role of consumer meanings and legitimacy in...
46
Kates, S. M. (2004). The Dynamics of Brand Legitimacy: AnInterpretive Study in the Gay Men's Community. Journal of ConsumerResearch, 31(2), 455-464.
Kaufman, J. J. (1998). Value Management: Creating CompetitiveAdvantage. Menlo Park, CA: Crisp Publications.
Keiningham, T. L., Aksoy, L., Buoye, A. and Cooil, B. (2011).Customer Loyalty isn't Enough. Grow Your Share of Wallet. HarvardBusiness Review, 89(10), 29-31.
Khalifa, A. (2004). Customer Value: a review of recent literature andan integrative configuration. Management Decision, 42(5), 645-666.
Kotler, P. and Keller, K. L. (2012). Marketing Management, 14th ed.Boston, MA: Prentice Hall.
Kozinets, R. V. (2001). Utopian Enterprise: Articulating theMeanings of Star Trek's Culture of Consumption. Journal Of ConsumerResearch, 28(1), 67-88.
Krishnamurthy, S. and Dou, W. (2008). Note From Special IssueEditors: Advertising with User-Generated Content: A Framework andResearch Agenda. Journal of Interactive Advertising, 8(2), 1-7.
Krishnamurthy, S. and Kucuk, U. (2009). Anti-branding on theinternet. Journal of Business Research, 62, 1119-1126.
Levitt, T. (1983). The Marketing Imagination. New York, NY: TheFree Press.
Mahajan, V. and Wind, Y. (2002). Got Emotional ProductPositioning?. Marketing Management, 11(3), 36-41.
Merz, M. A., Yi, H., and Vargo, S. L. (2009). The evolving brandlogic: A service-dominant logic perspective. Journal of the Academy ofMarketing Science, 37(3), 328–344.
Mitev, A. Z. and Horváth, D. (2008). A posztmodern marketingrózsaszirmai. Vezetéstudomány, 39(9), 4-18.
Muñiz, A. M. Jr., O’Guinn, T. C. (2001). Brand Community. Journalof Consumer Research, 27(4), 412-432.
Oliver, R. L. and Bearden, W. O. (1985). Disconfirmation Processesand Consumer Evaluations in Product Usage. Journal of BusinessResearch, 13(3), 235-246.
Paek, H-J., Hove, T., Jeong, H. J. and Kim, M. (2011). Peer or expert?
Tamás Csordás
47
The persuasive impact of youtube public service announcementproducers. International Journal of Advertising, 30(1), 161-188.
Parasuraman, A., Zeithaml, V. A. and Berry, L. L. (1985). Aconceptual model of service quality and its implications for furtherresearch. Journal of Marketing, 49(4) 41-50.
Payne, A. and Holt, S. (2001). Diagnosing Customer Value:Integrating the Value Process and Relationship Marketing. BritishJournal of Management, 12(2), 159.
Peyrefitte, J. (2012). The Relationship Between StakeholderCommunication in Mission Statements and Shareholder Value. Journalof Leadership, Accountability and Ethics, 9(3), 28-40.
Porter, M. E. (1998). Competitive Advantage: Creating andSustaining Superior Performance. New York: Free Press.
Potts, J., Hartley, J., Banks, J., Burgess, J., Cobcroft, R., Cunningham,S., and Montgomery, L. (2008). Consumer co-creation and situatedcreativity. Industry and Innovation, 15(5) 459–474.
Prahalad, C. K. and Ramaswamy, V. (2002). The co-creationconnection. Strategy and Business, 27, 50–61.
Reichheld, F. F., Markey, R. G. Jr. and Hopton, C. (2000). The loyaltyeffect: the relationship between loyalty and profits. European BusinessJournal, 12(3), 134-139.
Rokeach, M. (1973). The Nature of Human Values. New York: TheFree Press.
Rowley, J. (2008). Understanding digital content marketing. JournalOf Marketing Management, 24(5/6), 517-540.
Rust, R. T., Moorman, C. and Bhalla, G. (2010). RethinkingMarketing. Harvard Business Review, 88(1/2), 94-101.
Sassatelli, R. (2007). Consumer culture: History, theory and politics.London: Sage.
Scarpi, D. (2010). Does Size Matter? An Examination of Small andLarge Web-Based Brand Communities. Journal of Interactive Marketing,24(1) 14–21.
Schneider, B. and Bowen, D. E. (1999). Understanding CustomerDelight and Outrage. Sloan Management Review, 41(1), 35-45.
The new role of consumer meanings and legitimacy in...
48
Schouten, J. W. and McAlexander, J. H. (1995). Subcultures ofConsumption: An Ethnography of the New Bikers. Journal of ConsumerResearch, 22(1), 43-61.
Shugan, S. M. (2004). Finance, Operations, and Marketing Conflictsin Service Firms - an invited commentary on "Evolving to a NewDominant Logic for Marketing", The Journal of Marketing, 68(1), 24-26.
Urban, G. L. (2004). The Emerging Era of Customer Advocacy. MITSloan Management Review, 45(2), 77-82.
van Dijck, J. and Nieborg, D. (2009). Wikinomics and itsdiscontents: a critical analysis of Web 2.0 business manifestos. NewMedia & Society, 11(5) 855-874.
van Dijck, J. (2006). The network society. 2nd edition. London: Sage.Vargo, S. L. and Lusch, R. F. (2004). Evolving to a new dominant
logic for marketing. Journal of Marketing, 68(1), 1–17.Woodruff, R. B. (1997). Customer value: the next source for
competitive advantage. Journal of the Academy of Marketing Science,25(2), 139-153.
Yi, S. and Baumgartner, H. (2009). Regulatory focus and messageframing: A test of three accounts. Motivation and Emotion, 33(4)435-443.
Tamás Csordás
49
1 The paper was prepared within the framework of OTKA project no. K109839.2 PhD, associate professor, Budapest Business School, e-mail:
[email protected] PhD, associate professor, University of Miskolc, e-mail: [email protected] http://guesssurvey.org.
A test of the Theory of Planned Behaviour– the cross section of the students’entrepreneurial attitude in Hungary1
SZILVESZTER FARKAS2 – ANDREA S. GUBIK3
A country’s economic performance highly depends on successfulentrepreneurship. Conducting research into entrepreneurial behaviour andthe processes of becoming an entrepreneur as well as developing tools of howto enhance this activity are of essential importance. The tasks of theresearchers dealing with this issue would seem to be very simple if only theabundant available literature and the applied theories on behaviour weretaken into account. However, there are many issues regarding the conceptualand methodological approach, which have not been dealt with so far. Thepresent study tests Ajzen Theory of Planned Behaviour within the frameworkof the GUESSS research project and its database. The study attempts toprovide a very detailed description of entrepreneurial intentions by usingMultinomial Logistic Regression (SPSS).
Keywords: entrepreneurship, attitude, entrepreneurial intention, Theoryof Planned Behaviour.
JEL codes: C31, C38, I25.
IntroductionThe international research project GUESSS (Global University
Entrepreneurial Spirit Students’ Survey)4 investigates entrepreneurialintentions and activities of students. The first aim of this survey is toprovide a deep insight into the process of starting up a business. Inaddition, this survey helps explore the processes and factors that maybe crucial in the development of the students’ positive attitude inundertaking business activities. Moreover, it provides an internationalplatform for comparison of career intentions of students who study at
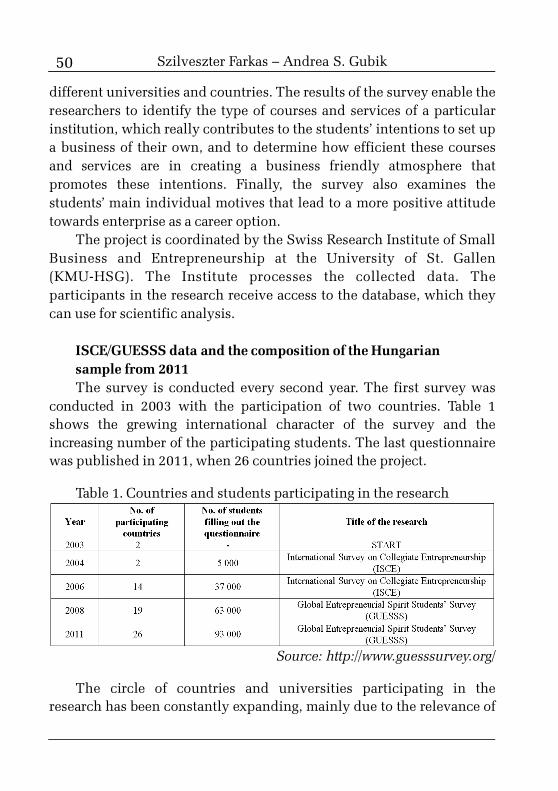
50
different universities and countries. The results of the survey enable theresearchers to identify the type of courses and services of a particularinstitution, which really contributes to the students’ intentions to set upa business of their own, and to determine how efficient these coursesand services are in creating a business friendly atmosphere thatpromotes these intentions. Finally, the survey also examines thestudents’ main individual motives that lead to a more positive attitudetowards enterprise as a career option.
The project is coordinated by the Swiss Research Institute of SmallBusiness and Entrepreneurship at the University of St. Gallen(KMU-HSG). The Institute processes the collected data. Theparticipants in the research receive access to the database, which theycan use for scientific analysis.
ISCE/GUESSS data and the composition of the Hungariansample from 2011The survey is conducted every second year. The first survey was
conducted in 2003 with the participation of two countries. Table 1shows the grewing international character of the survey and theincreasing number of the participating students. The last questionnairewas published in 2011, when 26 countries joined the project.
Table 1. Countries and students participating in the research
Source: http://www.guesssurvey.org/
The circle of countries and universities participating in theresearch has been constantly expanding, mainly due to the relevance of
Szilveszter Farkas – Andrea S. Gubik
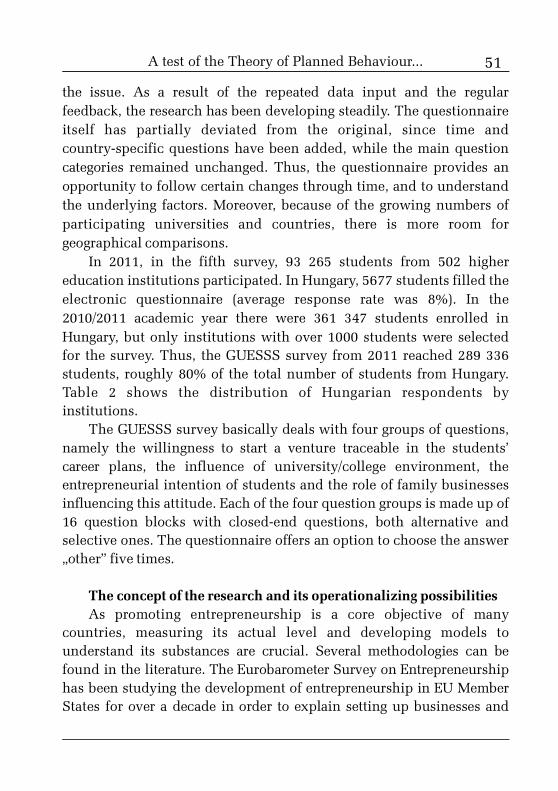
51
the issue. As a result of the repeated data input and the regularfeedback, the research has been developing steadily. The questionnaireitself has partially deviated from the original, since time andcountry-specific questions have been added, while the main questioncategories remained unchanged. Thus, the questionnaire provides anopportunity to follow certain changes through time, and to understandthe underlying factors. Moreover, because of the growing numbers ofparticipating universities and countries, there is more room forgeographical comparisons.
In 2011, in the fifth survey, 93 265 students from 502 highereducation institutions participated. In Hungary, 5677 students filled theelectronic questionnaire (average response rate was 8%). In the2010/2011 academic year there were 361 347 students enrolled inHungary, but only institutions with over 1000 students were selectedfor the survey. Thus, the GUESSS survey from 2011 reached 289 336students, roughly 80% of the total number of students from Hungary.Table 2 shows the distribution of Hungarian respondents byinstitutions.
The GUESSS survey basically deals with four groups of questions,namely the willingness to start a venture traceable in the students’career plans, the influence of university/college environment, theentrepreneurial intention of students and the role of family businessesinfluencing this attitude. Each of the four question groups is made up of16 question blocks with closed-end questions, both alternative andselective ones. The questionnaire offers an option to choose the answer„other” five times.
The concept of the research and its operationalizing possibilitiesAs promoting entrepreneurship is a core objective of many
countries, measuring its actual level and developing models tounderstand its substances are crucial. Several methodologies can befound in the literature. The Eurobarometer Survey on Entrepreneurshiphas been studying the development of entrepreneurship in EU MemberStates for over a decade in order to explain setting up businesses and
A test of the Theory of Planned Behaviour...
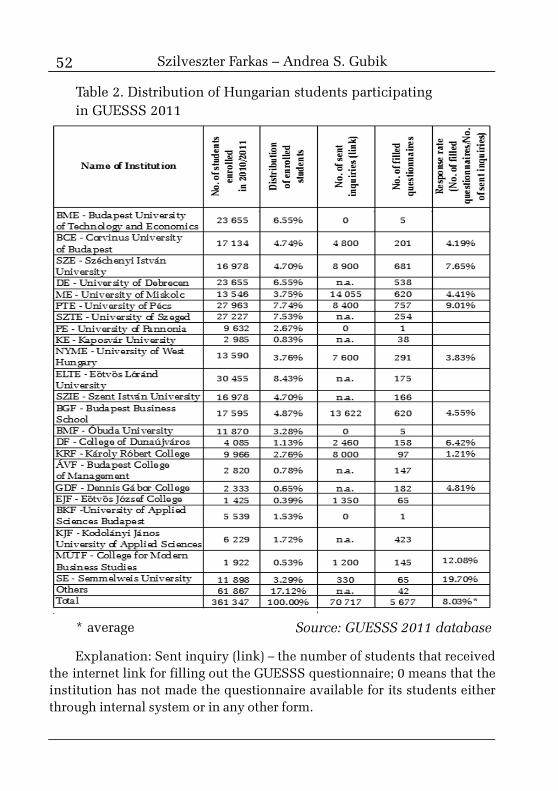
52
Table 2. Distribution of Hungarian students participatingin GUESSS 2011
* average Source: GUESSS 2011 database
Explanation: Sent inquiry (link) – the number of students that receivedthe internet link for filling out the GUESSS questionnaire; 0 means that theinstitution has not made the questionnaire available for its students eitherthrough internal system or in any other form.
Szilveszter Farkas – Andrea S. Gubik
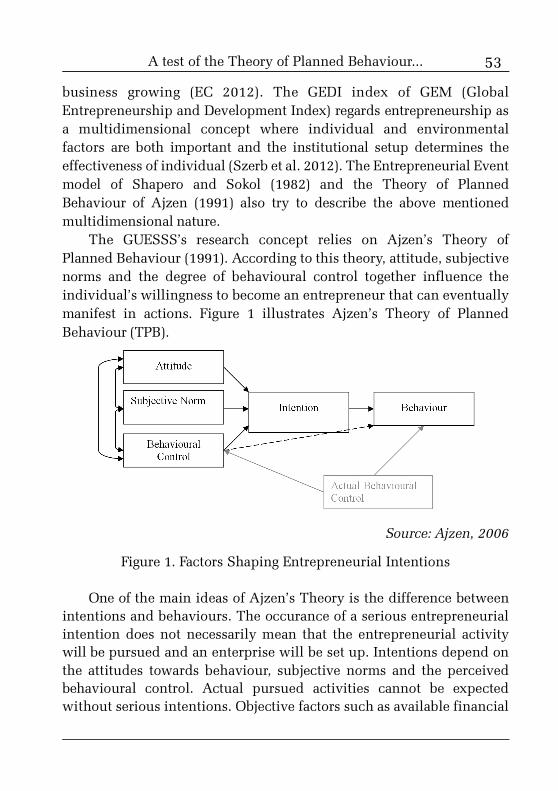
53
business growing (EC 2012). The GEDI index of GEM (GlobalEntrepreneurship and Development Index) regards entrepreneurship asa multidimensional concept where individual and environmentalfactors are both important and the institutional setup determines theeffectiveness of individual (Szerb et al. 2012). The Entrepreneurial Eventmodel of Shapero and Sokol (1982) and the Theory of PlannedBehaviour of Ajzen (1991) also try to describe the above mentionedmultidimensional nature.
The GUESSS’s research concept relies on Ajzen’s Theory ofPlanned Behaviour (1991). According to this theory, attitude, subjectivenorms and the degree of behavioural control together influence theindividual’s willingness to become an entrepreneur that can eventuallymanifest in actions. Figure 1 illustrates Ajzen’s Theory of PlannedBehaviour (TPB).
Source: Ajzen, 2006
Figure 1. Factors Shaping Entrepreneurial Intentions
One of the main ideas of Ajzen’s Theory is the difference betweenintentions and behaviours. The occurance of a serious entrepreneurialintention does not necessarily mean that the entrepreneurial activitywill be pursued and an enterprise will be set up. Intentions depend onthe attitudes towards behaviour, subjective norms and the perceivedbehavioural control. Actual pursued activities cannot be expectedwithout serious intentions. Objective factors such as available financial
A test of the Theory of Planned Behaviour...
54
resources and opened-up opportunities (money, time, etc.) that arerequired for carrying out intentions also influence business activities.This factor is termed as actual control in the revised Ajzen’s Theorymodel (Ajzen 2006).
According to this model, there is a direct positive relationshipbetween the entrepreneurial attitude and the willingness to start up abusiness. The more favourable a person’s attitude towardentrepreneurship, the stronger the intention to run an enterprise. Asupporting social environment is also nourishing for entrepreneurshipintentions. Thus, the more positively the individual’s environment isreacting to his entrepreneurial intention, the more likely he will showwillingness to start up his own business.
The third factor – perceived control over events – also directlyinfluences the individual’s intention to start up an enterprise, and canhave a significant effect on the behaviour as well. The impact of theperceived behavioural control on intentions and actions is twofold.Firstly, the more an individual feels that he is in control of hissurroundings, the more likely he is in favour of starting up his ownventure. Secondly, self-efficacy also has a positive effect onentrepreneurial spirit. The more the person feels that he has acquiredthe appropriate skills and knowledge to start up an enterprise, the morelikely he thinks his own business can be launched.
The factors influencing willingness are interlinked as well. Thetwofold nature of the perceived behavioural control consisting ofsusceptibility to control and self-efficacy are also positively related. Thelatter can be interpreted as an individual who feels he has the requiredskills and experience and thinks that he is in control of the events.
On the basis of this survey, the factors of Ajzen’s model, as well asthe most important factors influencing them can be analysed. Whenoperationalizing these concepts, this study heavily relied on the relatedliterature. The questionnaire in this study also contains questionsapplied by conventional research methods. However, as in the case ofmost research studies aiming at measuring qualitative factors, it isinevitable to deal with the issue of validity, whether the variables
Szilveszter Farkas – Andrea S. Gubik
55
original planned to be measured are really measured. Then, methods formeasuring the factors of the model described in the related literature areinvestigated. Finally, the practical implementation of the method usedin this study is explained.
Entrepreneurial IntentionKrueger (1993) tried to clarify the concept entrepreneurial intention
by applying simple closed questions (yes/no), such as „Do you thinkyou will ever start a business?” Autio et al. (2001) made attempts tomeasure the probability of time span, notably the respondents’intentions to start a business at the time of filling in the questionnaire orfive years after filling the questionnaire in. Ajzen (2002b) underlinesthat all items aimed to measure an intention has to measure exactly thesame things, that is, the questions have to present a strong internalcorrelation (to realize internal consistency). He himself measured theintention on a 7-grade differential scale, but Likert-scale is also anaccepted method for measuring entrepreneurial intentions.
GUESSS questionnaire measures intentions in several ways. Oneof them is similar to Autio’s solution, but the question regardingentrepreneurial intentions is more strongly related to the respondents’studies when formulated in the following way: „Which career path doyou intend to pursue right after completion of your studies, andwhich career path 5 years after completion of studies?” (respondentscomplete a table). Another similar question is „Please indicate ifand how seriously you have been thinking about founding an owncompany.”
AttitudesAccording to Ajzen, any standard attitude scale is suitable for
measuring attitudes (2002). In his methodological article he givesseveral examples of semantic differential scales, and he mentions theuse of Likert and Thurstone scales as well. There is a possibility tomeasure attitudes both in a direct and indirect way. Directmeasurement refers to the judgement of a person’s actions as a whole.Indirect measurement tries to determine how much an individualbelieves in the happening of a certain event, and how important he
A test of the Theory of Planned Behaviour...
56
believes the event will happen. The aim of the questions is to determinewhy the respondents think in this or that way. Since the factors lyingbehind a certain attitude are ambivalent in many cases, Ajzen (2002)highlights that internal consistency does not necessarily prevail inthese cases.
According to the common practice of testing (e.g. Autio et al. 2001,Krueger et al. 2000), this study conceptualised attitude as theacceptance of entrepreneurship as a career goal. However, contrary tocommon practices, this study measured the effects of four variablesinstead of one. For the measurement of attitudes, respondents evaluatedthe following four statements on a 7-grade Likert scale:
• Being an entrepreneur implies more advantages thandisadvantages to me.
• A career as entrepreneur is attractive for me.• If I had the opportunity and resources, I would become an
entrepreneur.• Being an entrepreneur would entail great satisfactions for me.
Subjective NormsFor the measurement of subjective norms, literature describes
several approaches. Kolvereid (1996) applied 3 items, and used them tofind out what the groups (immediate family, friends, other people withimportant influence), which are of determining importance to therespondent, think a potential entrepreneurial activity. Krueger et.al.(2000) also used this approach, but they weighted the responsesaccording to how much the respondent relied on the opinion of aparticular group. Autio et al. (2001) investigated an additional aspect,namely, how much the respondents felt their university environmentinspiring.
The GUESSS questionnaire gives the possibility for testing all thethree approaches. In case of question 10 (If you would pursue a careeras an entrepreneur, how would people in your environment reactto/judge that decision?) the respondents had to judge if the reaction oftheir environment would be negative or positive, and to what extent.The respondents had to evaluate the opinion of parents/family
Szilveszter Farkas – Andrea S. Gubik
57
members, friends/fellow students, and other people they consider to beimportant. Question 11 (Please indicate how much you care about theopinion of the following persons.) shows how important for therespondent the opinion of a given group is. The supporting universityatmosphere becomes clear from question 2.6 in the questionnaire. In allof the above-mentioned three questions students had to give theiranswers on a 7-grade Likert scale.
Perceived Behavioural ControlMost surveys measure perceived behavioural control by using a
varying number of questions answered on a Likert scale. Autio et al.(2001) formulated 4 statements (I am confident that I would succeed if Istarted my own firm; It would be easy for me to start my own firm; Tostart my own firm would probably be the best way for me to takeadvantage of my education, I have the skills and capabilities required tosucceed as an entrepreneur) that students had to evaluate on a 5-gradescale. According to Ajzen (2002), the perceived behavioural control hasto measure both the person’s susceptibility for external control, and hisself-efficacy, and the internal consistency of these items has to be takeninto account.
This study measured the perceived behavioural control by usingtwo variables in line with Ajzen’s (2002) suggestions. Question 12 in thequestionnaire is suitable for measuring controllability, and question 13is applicable for measuring self-efficacy. In both cases, the respondentshad to evaluate the statements and the significance of each factor on a7-grade Likert scale.
Question 12 (Please indicate your level of agreement with thefollowing statements) contains nine statements that can be helpful inassessing how much the respondents feel they can control and managethe events around them, and how much they feel influenced by othersin making their own decisions, etc. Factor analysis was used to describethe nine variables of controllability in terms of a smaller collection ofvariables. Principal component method was applied to create 3 factors(KMO=0.745, 65.834%):
A test of the Theory of Planned Behaviour...

58
Offensiveness• When I make plans, I am almost certain to make them work.• I can pretty much determine what will happen in my life.• I am usually able to protect my personal interests.Defensiveness• I feel like what happens in my life is mostly determined by
powerful people.• My life is chiefly controlled by powerful others.• In order to make my plans work, I make sure that they fit in with
the desires of people who have power over me.Passiveness• When I get what I want, it is usually because I am lucky.• I have often found that what is going to happen will happen.• It is not always wise for me to plan too far ahead because many
things turn out to be a matter of good or bad fortune.Question 13 measured self-efficacy with the help of the following
question: Please indicate your degree of certainty in performing thefollowing roles / tasks. In this question respondents had to evaluate 12factors, out of which 11 measured the students’ sensitivity to risk,innovative behaviour, and how consistent they were when making theirdecisions. The variables were grouped into 3 factors (KMO=0.745,65.834%):
Risk Tolerance• Reduce risk and uncertainty• Take calculated risks• Perform financial analysis• Make decisions under uncertainty and riskInnovativeness• Start my own firm• Lead my own firm to success• Develop new products and services• Generate new ideasConsistency• Take responsibility for my ideas and decisions
Szilveszter Farkas – Andrea S. Gubik
59
• Establish and achieve goals and objectives• Manage my time by setting goals
TPB test with Multinomial Logistic RegressionIn most cases, the theory’s descriptive power is assessed by the
analysis of correlation coefficients, and by using multi-variableregression models. Autio et al. (2001) for instance tested this modelwith the participation of 3445 Finnish, Swedish and Americanstudents. Gird and Bagraim (2008) investigated the model on 247South-African, Carr and Sequeira and 308 American students.
Krueger had tested entrepreneurial intention models in his studies.In 1993 he used the data of 126, in 2000 of 97 students, and applied avery similar method in both cases. However, in 1993 he measuredentrepreneurial intention with a dichotomous variable, while in 2000he used continuous variables. As a first step, he analysed the strength ofcorrelation between each pair of factors by using linear correlationcoefficients, and in the case of dichotomous variables, biserialcorrelations. After this, he calculated the whole impact of the analysedindependent variables on entrepreneurial intention using a pathanalysis. He did the same thing in 1993 despite the fact that he useddichotomous variables for the measurement of intention.
Zellweger et al. (2011), Szerb and Márkus (2007) and Gubik (2013)applied multinomial logistic regression. The advantage of this methodis that it can be reliably used in case of low level measurement variableswith non-normal distributions.
There are several examples of SEM (Structural Equation Modelling)models, which aim at the most accurate description of causalrelationships between variables. This type of analysis can be found inthe Kolveleid (1996), Plant and Ren (2010) studies.
Throughout the GUESSS survey analysis, we tested Ajzen’s Theoryof Planned Behaviour by multinomial logistic regression and structuralequation modelling. This study presents the results of the regressionmodel, using a low-level measurement variable for the expression of thedegree of entrepreneurial intentions. Despite of its low interpretability,
A test of the Theory of Planned Behaviour...
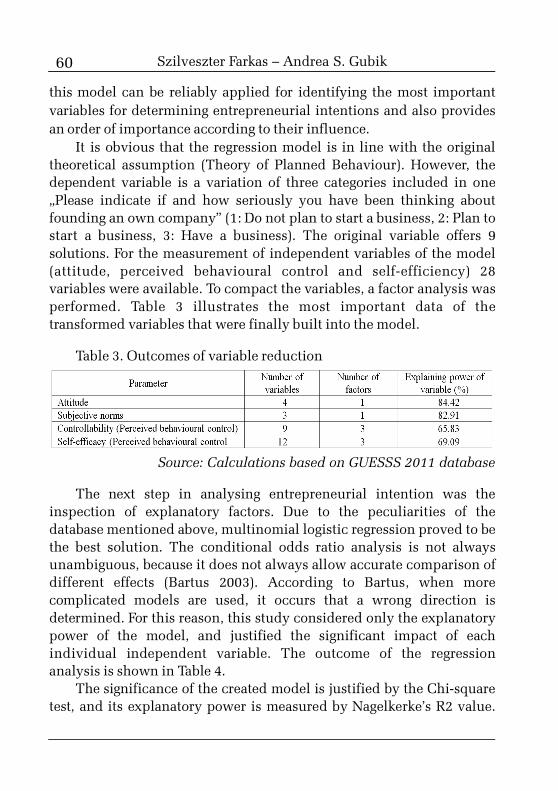
60
this model can be reliably applied for identifying the most importantvariables for determining entrepreneurial intentions and also providesan order of importance according to their influence.
It is obvious that the regression model is in line with the originaltheoretical assumption (Theory of Planned Behaviour). However, thedependent variable is a variation of three categories included in one„Please indicate if and how seriously you have been thinking aboutfounding an own company” (1: Do not plan to start a business, 2: Plan tostart a business, 3: Have a business). The original variable offers 9solutions. For the measurement of independent variables of the model(attitude, perceived behavioural control and self-efficiency) 28variables were available. To compact the variables, a factor analysis wasperformed. Table 3 illustrates the most important data of thetransformed variables that were finally built into the model.
Table 3. Outcomes of variable reduction
Source: Calculations based on GUESSS 2011 database
The next step in analysing entrepreneurial intention was theinspection of explanatory factors. Due to the peculiarities of thedatabase mentioned above, multinomial logistic regression proved to bethe best solution. The conditional odds ratio analysis is not alwaysunambiguous, because it does not always allow accurate comparison ofdifferent effects (Bartus 2003). According to Bartus, when morecomplicated models are used, it occurs that a wrong direction isdetermined. For this reason, this study considered only the explanatorypower of the model, and justified the significant impact of eachindividual independent variable. The outcome of the regressionanalysis is shown in Table 4.
The significance of the created model is justified by the Chi-squaretest, and its explanatory power is measured by Nagelkerke’s R2 value.
Szilveszter Farkas – Andrea S. Gubik

61
The study applied the Wald statistics to check the significance of eachindividual independent variable, and the conditional odds ratios showthe partial effect of each variable.
Table 4. The effect of endogenous variables of entrepreneurialintentions
Nagelkerke’s R2=0.47Source: Calculations based on GUESSS 2011 database
The findings of this study show that the most important andsignificant factors of entrepreneurial intentions are attitudes andself-efficacy. The relationship has a positive direction in both cases,notably, the more positive the students’ attitude and the more theybelieve they possess the necessary skills, the more likely they willshow interest in starting up a business. The two variables applied forthe measurement of controllability in the study are in a negativerelationship with entrepreneurial intentions. This means that themore a person feels that he is capable of controlling his future, themore likely he will become an entrepreneur. The conducted analysesjustified the assumptions that attitudes and perceived behavioural
A test of the Theory of Planned Behaviour...
62
controls play a significant role in the development of entrepreneurialintentions. However, the role the subjective norms play in thisprocess could not be confirmed.
ConclusionsFostering entrepreneurship has become a priority for economic
policy makers. It is of essential importance to identify the factors thatshape the students’ entrepreneurial intentions. It has also becomecrucial to analyse the areas that considerably contribute to developingthese intentions.
Ajzen’s Theory of Planned Behaviour provides a detaileddescription of entrepreneurial intentions, which is relevant in theHungarian context as well. The findings of this study clearly illustratethat the more positive attitude the students express in terms of starting abusiness of their own, and the more they believe that they possess theskills and competencies necessary for implementing this, the morestimulating intentions they have to do so. The controllability of theevents is of determining importance as well. The more students feel thatthey are capable of influencing their future, the more likely theybecome entrepreneurs.
Education, training and a supportive atmosphere can considerablycontribute to shifting these factors in a positive direction. Students’openness towards entrepreneurship will increase if they receiveappropriate knowledge and higher education institutions offer morepractice-oriented programmes.
ReferencesAjzen, I. (1991). The Theory of Planned Behavior. Organizational
Behavior and Human Decision Processes, 50(2), 179-211.Ajzen, I. (2002). Perceived Behavioral Control, Self-Efficacy, Locus
of Control, and the Theory of Planned Behavior. Journal of AppliedSocial Psychology, 32( 4), 665–683.
Ajzen, I. (2002b). Constructing a TpB Questionnaire: Conceptualand Methodological Considerations. http://www.uni-bielefeld.de/ikg/zick/ajzen%20construction%20a%20tpb%20questionnaire.pdf, down-
Szilveszter Farkas – Andrea S. Gubik
63
loaded at 04.10.2013.Ajzen, I. (2006). Constructing a Theory of Planned Behavior
Questionnaire - Brief Description of the Theory of Planned Behavior.http://people.umass.edu/aizen/pdf/tpb.measurement.pdf, downloadedat 04.10.2013.
Autio, E., Keeley, R. H., Klofsten, M., Parker, G. C. and Hay, M.(2001). Entrepreneurial Intent among Students in Scandinavia and inthe USA. Enterprise and Innovation Management Studies, 2(2), 145-160.
Bartus, T. (2003). Interpretation of Logistic Regression Outcomes,Statistical Review, 81(4), 328-347.
Carr, J. C. and Sequeira, J. M. (2007). Prior family business exposureas intergenerational influence and entrepreneurial intent: A Theory ofPlanned Behavior approach. Journal of Business Research, 60(10),1090–1098.
EC (2012). Flash Eurobarometer 354. Entrepreneurship in the EUand Beyond. European Commission, Directorate-General for Enterpriseand Industry.
Gird, A. and Bagraim, J. J. (2008). The theory of planned behaviouras predictor of entrepreneurial intent amongst final-year universitystudents. South African Journal of Psychology, 38(4), 711-724.
Gubik, S. A. (2013). Model of the Hungarian students’ businessstart-up intention influencing factors – Extending of Ajzen’s Theory ofPlanned Behavior. Vezetéstudomány, 44, 18-30.
Kolvereid, L. (1996). Prediction of Employment Status ChoiceIntentions. Entrepreneurs. Entrepreneurship: Theory and Practice, 1994 Fall.
Krueger, N., Reilly, M. D. and Carsrud, A. L. (2000). CompetingModels of Entrepreneurial Intentions. Journal of Business Venturing, 15,411–432.
Krueger, N. F. (1993). The impact of prior entrepreneurial exposureon perceptions of new venture feasibility and desirability.Entrepreneurship Theory and Practice, 5, 5–21.
Plant, R. and Ren, J. (2010). A comparative study of motivation andEntrepreneurial intentionality: chinese and american perspectives.Journal of Developmental Entrepreneurship, 15(2), 187–204.
Shapero, A. and Sokol, L. (1982). The social dimensions of
A test of the Theory of Planned Behaviour...

64
entrepreneurship. In Kent, C.A., Sexton, D. L. and Vesper, K. H. (eds):Encyclopedia of entrepreneurship. New Jersey: Prentice-Hall, pp. 72-90.
Szerb, L., Aidis, R. and Ács, Z. J. (2012). The comparison of theGlobal Entrepreneurship Monitor and the Global Entrepreneurship andDevelopment Index methodologies: The case of Hungary.http://www.gemconsortium.org/assets/uploads/1337684852GEM_GEDI_Hungary_2006-2010_Report.pdf, downloaded at 04.10.2013.
Szerb, L. and Márkus, G. (2007). The effects of higher educationenvironment on the choice of an enterpreneurial carreer. Internationalcomparative study. Közgazdasági Szemle, LIV(március), 248-273.
Zellweger, T., Sieger, P. and Halter, F. (2011). Should I stay or shouldI go? Career choice intentions of students with family businessbackground. Journal of Business Venturing, 26(5), 521–536.
Szilveszter Farkas – Andrea S. Gubik
65
1 The paper presents partial results of the research SROP-4.2.2.A-11/1/KONV-2012-0058, Modeling the effects of the energy-production, utilization andwaste management technologies to the competitiveness of the cities and regions.
2 PhD student, University of Pécs, Faculty of Business and Economics, e-mail:[email protected].
3 PhD, assistent lecturer, University of Pécs, Faculty of Business and Economics,e-mail: [email protected].
4 PhD, associate professor, University of Pécs, Faculty of Business andEconomics, e-mail: [email protected].
5 PhD, senior lecturer, University of Pécs, Faculty of Business and Economics,e-mail: [email protected].
6 PhD, professor, University of Pécs, Faculty of Business and Economics, e-mail:[email protected].
Diffusion of renewable energy innovations– innovation-acceptance behaviour
of the Hungarian society1
VIKTÓRIA GERDESICS2 – ÁKOS ANDRÁS NAGY3 – VALÉRIA PAVLUSKA4
– KRISZTIÁN SZÛCS5 – MÁRIA TÖRÕCSIK6
Nowadays, innovation and its diffusion represent a crucial phenomenonof economic practice and economic theories. The increase of the proportion ofrenewable energy consumption is an essential task of the governmentsworldwide; however, it has been quickly acknowledged that, in the diffusion ofsuch innovations, social acceptance could mean a serious obstacle. The paperinvestigates the innovation-acceptance behaviour of the Hungarian society. Itfocuses on the following aspects: the moment when consumers adoptalternative energy resources, the motivations they base their decisions on and,moreover, the communicational processes and segments that characterize theacceptance procedure, especially regarding the role of information. Accordingto research results it can be concluded that Hungarian society adoptsinnovations similarly to the presented theoretical background, appreciate thefinancial advantages of an ecologically sustainable energy source and can beinfluenced by a prior trial. The third result of the paper is the identification ofthree clusters that can provide a good basis for a communication strategy.
Keywords: renewable energy, innovation acceptance, diffusion of inno-vation, alternative energy consumption, social acceptance, consumer behaviour.
JEL code: M30.
66
IntroductionPeople of the 21st century meet such worldwide problems as air
pollution, scarcity of water supply and effects of fossil energy sourceson our everyday lives. In line with these, one can also mentionrenewable energy sources, their usage being able not only to help outbudget but to protect the Earth for future generations as well. Increasingthe share of renewable energy is high on the policy agenda of thegovernments worldwide. However, it was quickly acknowledged thatthere is one factor that can potentially be a powerful barrier to thediffusion of such innovations: their social acceptance. The paperpresents one slice of a bigger research carried out in the frames ofSROP-4.2.2.A-11/1/ KONV-2012-0058, Modeling the effects of theenergy-production, utilization and waste management technologies tothe competitiveness of the cities and regions. The aim of the research isto study the social acceptance of the ecologically sustainabletechnologies in Hungary, primarily the residential energy consumption.For reaching this aim, designed on literature base, a personalinterviewing was carried out. The present study reveals the innovationacceptance behaviour of the Hungarians as a part of the overallresearch. It focuses on the diffusion of ecologically sustainable energytechnology innovations in society, namely the moment when theconsumers adopt the new energy sources, the motivations they basetheir decision on and the communication processes that characterizethe social acceptance of such an innovation, especially regarding therole of information.
Literature reviewNowadays, innovation is a crucial phenomenon of economic
practice and economic theories, on the turn of the 20th and 21st century.Its concept was introduced in the theory of economics by the Austrianeconomist Schumpeter (1980) in the 1930’s as “the process born in acreative idea” and he was followed by a series of definitions. Accordingto Vágási (2001) by synthesizing the different definitions innovationmeans new knowledge, ideas, methods, procedures, organizations, new
Gerdesics et al.
67
strategies, markets, new products or services and their establishment atany field supposed to be associated with some economic and societaldevelopment. When an innovation aims to win a market it is not onlynecessary to investigate the company side (as it is neither done in thisstudy) but the company’s innovativeness and its ability to accept aswell. Several researchers and thus several fields of research deal withinnovation diffusion and almost all of them are based on the theory ofthe “father” of innovation diffusion, Everett M. Rogers researching thetopic since the early 1960’s. Researchers of the diffusion defined byRogers (2003) study the process by which the innovation iscommunicated through certain channels over time among the membersof a social system. According to Rogers four main elements in thediffusion of innovations are: innovation, communication channels,time and the given social system. The typical process of the newproduct diffusion can be displayed as an S-curve that shows thecumulated percentage of the adopters of the innovation within thepopulation concerned against time. Based on this it can be concludedthat the percent of the new product adopters is low at the beginning, itgradually grows until the possible maximum where its steepness showsthe proportion of acceptance and its maximum shows the marketpotential. Thus, while at the beginning of the diffusion relatively fewpeople became users, the number of people joining started rising after awhile and later it diminished again. Accordingly, people can be dividedin groups based on the time of innovation adoption. According toRogers’ research on American consumers from 1962, five consumertypes can be differentiated: innovators (2.5%), early adopters (13.5%),early majority (34%), late majority (34%) and laggards (16%). Thistheory of Rogers is studied in our research as well.
Ecologically sustainable energy sources being different than thetraditional, years-long familiar ones are also innovations. Increasing theproportion of renewable energy consumption is an essential task of thegovernments worldwide; however, it has been quickly acknowledgedthat in the diffusion of such innovations their social acceptance couldmean a serious obstacle. According to Wüstenhagen et al. (2007)
Diffusion of renewable energy innovations
68
Carlman was the first scholar defining the problem of social acceptancein her study on the acceptance of wind power in 1984 in which shesuggested that there were several constraints for social acceptance.There are several features of renewable energy innovations that bringnew aspects to the topic of social acceptance. Their implication inhouses is specifically an investment decision of the individual, inwhich the energy conversion is carried out near to the customer(“backyard”) and means short-term expenditure but long-term return atthe same time. Wüstenhagen et al. (2007) intending to contribute to theclarity of the term’s understanding distinguished three dimensions ofsocial acceptance, namely socio-political acceptance, communityacceptance and market acceptance that could be studied evenindependently in some cases. Based on the three dimensions detailedabove, Sovacool and Ratan (2012) defined the conditional framework,the factors influencing acceptance. At the level of socio-politicalacceptance there is a need of strong institutional capacity, politicalcommitment and favourable legal and regulatory frameworks. In case ofmarket acceptance competitive costs, adequate informationmechanisms and access to financing are needed. Furthermore,community acceptance depends on the presence of prolific use,participatory project siting and recognition of externalities. Besides, theacceptance of an innovation can also be influenced by somepsychological factors. Wejnert (2002) specified characteristics of theinnovation, innovators and environment, while Huijts et al. (2012)developed their model specifically regarding alternative energyconsumption by defining three types of motives for the individual.Depending on whether the acceptance of energy innovation ismotivated by gain, normative or hedonic goals, individuals (1) canevaluate costs, risks and benefits, (2) can perform an evaluation basedon moral aspects thus weighing whether the new technology has morepositive or negative effects on the environment and society, and (3) canmake a decision based on their positive or negative feelings such assatisfaction, happiness, fear or anger. In addition to these knowledgeand experience, trust and fairness have an essential role. The study of
Gerdesics et al.
69
McMichael and Shipworth (2013) is focusing on the diffusion ofenergy-efficiency innovations in households in the UK. Authors builtupon Rogers’ network theory and also investigate the significance ofsocial capital. Supposing that the desired information is in connectionwith energy-saving innovations, the individual would ask someone, forinstance, and would receive technological knowledge, experience or anargument as an answer. This practically means mobilizing the socialcapital, thus the authors are striving to understand theinformation-seeking within the communication channels regardingenergy-saving opportunities through the theory of social capital. Theresearch shown in the paper is based on the presumption that the abovemechanisms are true for the Hungarian innovation acceptancebehaviour as well, and the listed factors affect the willingness to applyan alternative energy source also in case of the investigated sample.
MethodologyPaper-based face-to-face interviews were carried out with a sample
of 2000 people that is representative for gender, age, settlement type andhighest level of education criteria, considering the Hungarianpopulation as the base population. The questionnaire used in theface-to-face interviews is not processed entirely in the present study; weinvestigate only the elements regarding the basic consumer behaviourreactions on innovations and changes: acceptance of innovations andalternative energy sources in the society and behavioural elementsregarding the information source. The analysis was done by using SPSSand Microsoft Excel software.
The sample consists of 52.2% of women and 47.8% of men. Themajority of the respondents possesses secondary school degree (41.4%);besides, there is a higher proportion of respondents with vocationalschool qualification (27.5%) than those with college (14.2%) oruniversity (4.5%) degree and primary school qualification (9.6%).57.4% of the respondents live in a house. Regarding the age groups,24.8% of the respondents belong to the group of 18-29, 18.6% to 30-39,21.7% to 40-49, 16.9% to 50-59 and 18.1% to the group over 60 years.
Diffusion of renewable energy innovations
70
41.6% of the respondents are married, 33.9% live with a partner andchild while 21.9% only with a partner.
Results and discussionAs the overall aim of our research is to help the enhancement of
using sustainable energy sources by studying current attitude of theHungarian society regarding innovation acceptance, more fields of thistopic are presented in this chapter. Based on Rogers’ (2003) theory oneinvestigates the groups included in the sample in terms of time ofadoption of an energy resource, motivations of innovation acceptanceand segments that can be identified in connection with the credibilityand source of the information, and at the same time regardingcommunication target groups which can be identified for enhancementof renewable energy consumption.
Time dimension of innovation adoptionAs mentioned in the previous chapter, people can be divided into
five categories based on their attitude towards using an innovation. AsRogers defined (2003) these are the groups of innovators (2.5%), earlyadopters (13.5%), early majority (34%), late majority (34%) and laggards(16%), acting along different behavioural features. Initiated by thistheory, we intended to see whether there are any groups in the samplebased on the time dimension of using an innovation. Using Rogers’adopter groups and their behavioural features we set five statements foreach category and tried to identify these groups in the sample of ourstudy:
• innovators: “I am really open to new things, I begin to use them asone of the firsts”;
• early adopters: “I buy them when they are still new, I like gettingfamiliar with innovations myself and then give advice about them toothers”;
• early majority: “I am open to new things but after others alreadyuse them”;
• late majority: “I am curious about new things but I wait until theirprice gets lower”;
Gerdesics et al.
71
• laggards: “I do not buy innovations, I do not want to be the tester”.The respondents were asked to choose the statement most
suitable for them in connection with a new product or methodemerging on the market. The results were also evaluated incomparison with Rogers’ results used as a reference point. Accordingto the results, 6% of the respondents belong to the innovator categorybeing two times larger than the basic category in Rogers’ theory(2.5%). It can be concluded that the participants at the survey aremore open to innovations and like to use new things more than itcould be presumed based on the secondary data. The category ofearly adopters is theoretically 13.5%, but its size is a lot smaller inour sample as only 8% stated they buy innovations when they arestill brand-new as they like getting familiar with them themselvesand give advices to others. Two segments being practically theinitiators of the innovations are altogether smaller than they shouldbe according to the theory; however, compared to Rogers there is ahigher proportion of those – according to their statement – who reallyintroduce innovations to the society. The group named early adoptersis larger in our research with 4% than the one presented by Rogerswhile late majority represents itself in almost the same proportion.However, the category called laggards is smaller with 3.5% as insteadof 16% it is only 12.5%. All in all, according to the results, Rogers’adopter categories can be identified in our study on the innovationadoption of the Hungarian society as well. However, a slight shift canbe realized towards the ones more open to innovations. Identifyingwhen people start to use an innovation can be an essential base forstudying further behavioural elements with the overall aim ofenhancing usage of sustainable energy sources.
Motivations of innovation adoptionThe respondents were asked to evaluate on a five-point Likert scale
the importance of the listed aspects (1 – not important at all, 5 – veryimportant) in case of deciding to use an alternative energy source or not:to save money with it; not to be entirely unknown to me; to have the
Diffusion of renewable energy innovations
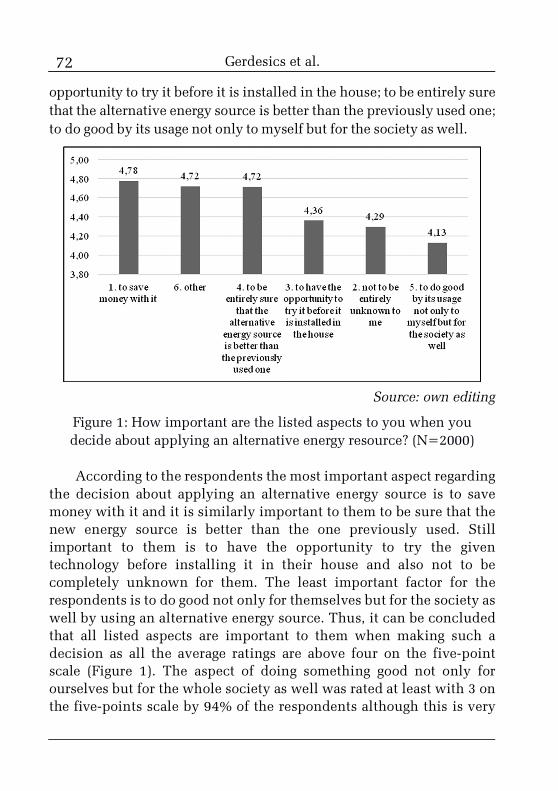
72
opportunity to try it before it is installed in the house; to be entirely surethat the alternative energy source is better than the previously used one;to do good by its usage not only to myself but for the society as well.
Source: own editing
Figure 1: How important are the listed aspects to you when youdecide about applying an alternative energy resource? (N=2000)
According to the respondents the most important aspect regardingthe decision about applying an alternative energy source is to savemoney with it and it is similarly important to them to be sure that thenew energy source is better than the one previously used. Stillimportant to them is to have the opportunity to try the giventechnology before installing it in their house and also not to becompletely unknown for them. The least important factor for therespondents is to do good not only for themselves but for the society aswell by using an alternative energy source. Thus, it can be concludedthat all listed aspects are important to them when making such adecision as all the average ratings are above four on the five-pointscale (Figure 1). The aspect of doing something good not only forourselves but for the whole society as well was rated at least with 3 onthe five-points scale by 94% of the respondents although this is very
Gerdesics et al.
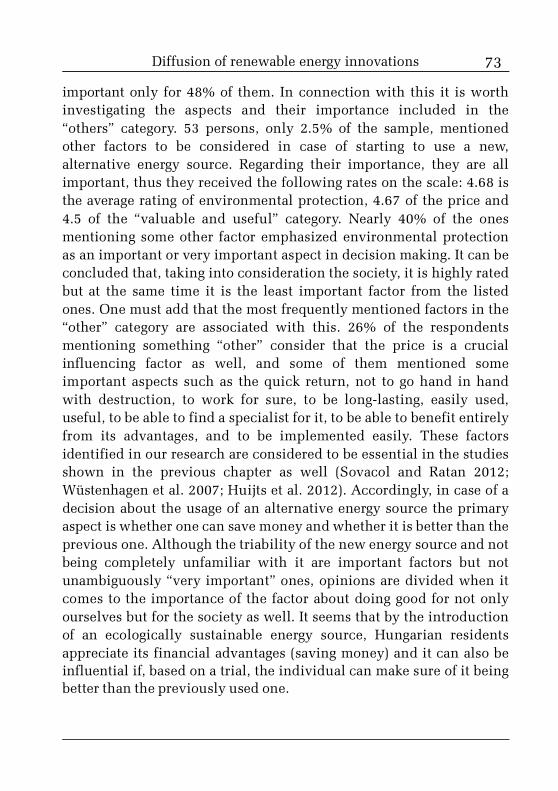
73
important only for 48% of them. In connection with this it is worthinvestigating the aspects and their importance included in the“others” category. 53 persons, only 2.5% of the sample, mentionedother factors to be considered in case of starting to use a new,alternative energy source. Regarding their importance, they are allimportant, thus they received the following rates on the scale: 4.68 isthe average rating of environmental protection, 4.67 of the price and4.5 of the “valuable and useful” category. Nearly 40% of the onesmentioning some other factor emphasized environmental protectionas an important or very important aspect in decision making. It can beconcluded that, taking into consideration the society, it is highly ratedbut at the same time it is the least important factor from the listedones. One must add that the most frequently mentioned factors in the“other” category are associated with this. 26% of the respondentsmentioning something “other” consider that the price is a crucialinfluencing factor as well, and some of them mentioned someimportant aspects such as the quick return, not to go hand in handwith destruction, to work for sure, to be long-lasting, easily used,useful, to be able to find a specialist for it, to be able to benefit entirelyfrom its advantages, and to be implemented easily. These factorsidentified in our research are considered to be essential in the studiesshown in the previous chapter as well (Sovacol and Ratan 2012;Wüstenhagen et al. 2007; Huijts et al. 2012). Accordingly, in case of adecision about the usage of an alternative energy source the primaryaspect is whether one can save money and whether it is better than theprevious one. Although the triability of the new energy source and notbeing completely unfamiliar with it are important factors but notunambiguously “very important” ones, opinions are divided when itcomes to the importance of the factor about doing good for not onlyourselves but for the society as well. It seems that by the introductionof an ecologically sustainable energy source, Hungarian residentsappreciate its financial advantages (saving money) and it can also beinfluential if, based on a trial, the individual can make sure of it beingbetter than the previously used one.
Diffusion of renewable energy innovations
74
Groups formed by source and credibility of informationBeing well-informed and the information base itself occur in the
literature as quiet essential factors in enhancing the introduction orusage of an alternative energy source. The possibility of formingclusters in the sample, according to the source of information and thecredibility of the received information, serving as a base for targeting incase of a communication strategy was investigated in the research.According to the results the respondents can be divided in three groupsby K-means cluster analysis: “the ones involved” (44%), “the onestrusting experts” (33%) and “the ones collecting information from a fewsources” (23%) (Figure 2). In what follows, the characteristics of thechapters are presented. There is a significant difference (p<0,05)between the clusters in case of every feature.
Source: own editing
Figure 2. Groups formed by source and credibility of information
The ones involvedThe group of the ones involved is almost the most balanced
segment. They consider any information possibly important thus theywould like to know about everything; they mostly believe theinformation from their own experiences or the one they get from
Gerdesics et al.
75
someone personally about an alternative energy source. Things read inprofessional journals are convincing for them as well and they also payattention to the information gathered from the TV or everyday papers.
They collect information from their family or people they knowabout an energy innovation as they do in case of other topics as well andthey usually ask the same people with this aim. This segment isinterested in the professional opinion of experts but they primarilycollect information from people living close to them. Accordingly, theycan be characterized by a high involvement when they want to get toknow a new technology as these people try to find as much trustworthyinformation as they can; they thoroughly deal with the problem as theyare not only interested in outside but in also direct information.
This is the most populous cluster as 880 respondents (44%) belongto the group of the involved ones out of the 2000-member sample.Although this is not the group where the largest number of women ispresent but there are more involved women (55%) than men (45%) –this can come from the specialty of the topic or even from thestereotypic traits characterizing the genders. Their majority belongs tothe age group of 40-49 (24.7%) or to the young age group of 18-29(23.1%); all in all more than 43% of them feels to be part of themiddle-aged generation, while 42% marked the young generation forthis answer. 45% possesses college or university diploma although thehighest percentage of primary school qualification is also here (24.7%).They mostly consider the financial situation of their household to bemoderate, 46% can buy the basic things but do not have money forothers while 42% can afford some extra expenditures next to the basicones but cannot save any money (N=1917). Compared to other groupsthey are the closest ones to the environment.
Equally to the ones trusting experts, 63% of the involved ones areopen to modernization of their homes to reduce energy costs; 23% (twopercentage points more than the ones trusting experts) have alreadycarried out some kind of modernization, 40% have planned but havenot done anything and 37% have not thought about this. The latter twocategories were also asked to express their reasons. The majority of thegroup (56%) is restrained from modernization with the aim of reducing
Diffusion of renewable energy innovations

76
energy costs because any change would lead to high expenditure,therefore they can be called to be price sensitive. 13% marked theoption of not interested in the topic at all as an answer and quite a fewof them answered not to have enough information or professional helpin implementation. It seems that they are aware of the fact (more than90%) that return on this investment would appear in long-term.
The ones trusting expertsThe ones trusting experts are primarily convinced by their own
experiences and by the information gathered from professional journalsabout an alternative energy source. Tools of mass media are slightlyeffective in their case as they do not appreciate information comingfrom the TV or everyday papers. When they collect information about anew technology, they rarely do this on their own and neither is typicalthat they would ask the same people every time. They are much moreinterested in expert opinions and perhaps the ones living in their closeenvironment, family or people they know.
This is the second most populous cluster, 660 persons (33%) belongto it, out of the 2000-membered sample. This is the only segment wherethe proportion of men (55%) is averting the number of women (45%) thatis supposed to be in connection with the fact that men are usually morefamiliar with the world of technology than most of the women. 27% ofthem are young (18-29 years old), 22% belong to the age group of 40-49,18% to 50-59 while nearly 47% feel to be middle-aged and 43% to beyoung. More than 70% (71.4%) possess secondary or vocational schoolqualification. They evaluate their household finances to be a bit betterthan the category of the involved ones, 47% can buy the basic things andcan also afford some extra expenditures but cannot save money, while41% cannot spend money on things above the basic level. In this groupthere are more members who cannot even buy the basic things (7%) thanin the previous group. After the involved ones, this group feels to beclosest to the environment. 7.1% of all the answers (N=1991) belong tothe group of trusting experts from those who rated this question with tenon the ten-point scale. Out of 1990 answers only 4.5% of the onestrusting experts felt to be environmental friendly and protecting theenvironment, which result is less than the involved ones by 3 percentage
Gerdesics et al.
77
points although still higher than the one of the third group.63% of the ones trusting experts are open to the modernization of
their home to reduce energy costs, similarly to the involved ones, but 2percentage points less claimed to have already carried out something.37% chose the answer “have not thought about this”. The ones whohave been already thinking about it but have not carried out anything orthe ones who have not been thinking about this topic, also gave theirreasons. The costs were the most frequently marked reason for notcarrying out any modernization although this is by three percentagepoints less (54%) than the ones’ involved. It can be observed that moremembers from this group do not live in their own apartment and morementioned (10%) not to possess enough information about theopportunities. Similarly to the involved ones 13% marked that they arenot interested at all in the topic. Thus, this group can also beprice-sensitive besides the fact that that they can be influenced by asatisfying amount and quality information coming from experts orfound in professional journals.
The ones collecting information from a few sourcesThe segment of the ones collecting information from a few sources
is the smallest one as it consists of 460 persons (23%). They mostly donot make an effort to get information about innovations, about a newtechnology or about an alternative energy source. The most convincinginformation is coming from their own experiences or personal contactsbut they consider things on TV moderately trustworthy as well. Theyare not persuaded by the information in professional journals oreveryday papers thus they are not susceptible to print media. Whencollecting information they ask someone, however, not experts butthose who they contact anyway, their family members and people theyknow (similarly to the involved ones but more than the ones trustingexperts). They contact more the same people than the ones trustingexperts as this latter category considers the professional opinionimportant thus supposedly they ask experts about the given problem.
This is the most feminine group (58%) and this group includes thelowest proportion of men (42%). This could come from a presumptionthat women are less interested in new technologies thus they make less
Diffusion of renewable energy innovations
78
effort to gain information, however, this can be denied as in the group ofinvolved people trying to find as much information as possible 55% arewomen. This is the group with the highest proportion of people above60 years (23.7%) and at the same time 25% of the cluster rangesbetween 18 and 29 years. 40.6% feel to be young and 37.4% considerthey belong to the middle-age generation. There are far less people witha diploma (12%) and while in the group trusting experts there is aproportion of 71% possessing at least secondary degree, in this categoryonly 50% have secondary degree.
While the previous two clusters – although marking a moderatelevel regarding the financial situation of the household – chose thestronger, better financial level categories, this group of the onescollecting information from few sources rated themselves to possess ahigher financial status by 14 percentage points less. 50% can buy thebasic things but nothing else and 36% can afford some additionalexpenditures as well but cannot save money. They feel to be far awayfrom the environment and they are the last to think to be environmentalfriendly or environmentalist.
Here is the highest percentage of those who are not interested inenergy-cost-reducing modernization (57%) and the lowest proportion ofthose who have been thinking about modernization but have not doneanything (30%) or have already done something (14%). Therespondents of the first and second category gave a reason for that aswell. The respondents from this cluster also mentioned more than theinvolved ones that they do not have enough information (7%); 12% donot live in their own apartment thus do not want to spend money onmodernization and here is the largest group of those who are notinterested in the topic at all (23%). Accordingly, they are the leastinquiring group which can be in connection with their financial statusor even with their qualification. Perhaps this is the segment that couldbe reached most difficultly, they are by all means price-sensitive as thecost of a modernization means an obstacle for them; moreover, they arethe most disinterested group of all the three.
Gerdesics et al.
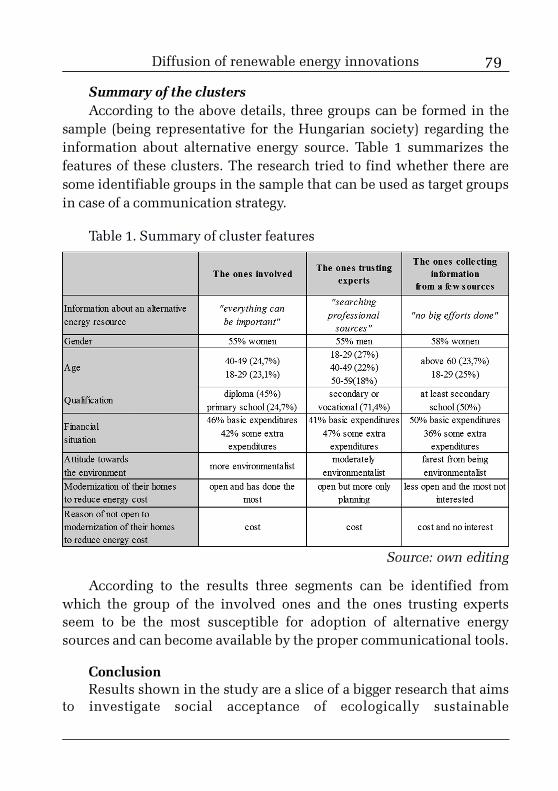
79
Summary of the clustersAccording to the above details, three groups can be formed in the
sample (being representative for the Hungarian society) regarding theinformation about alternative energy source. Table 1 summarizes thefeatures of these clusters. The research tried to find whether there aresome identifiable groups in the sample that can be used as target groupsin case of a communication strategy.
Table 1. Summary of cluster features
Source: own editing
According to the results three segments can be identified fromwhich the group of the involved ones and the ones trusting expertsseem to be the most susceptible for adoption of alternative energysources and can become available by the proper communicational tools.
ConclusionResults shown in the study are a slice of a bigger research that aims
to investigate social acceptance of ecologically sustainable
Diffusion of renewable energy innovations
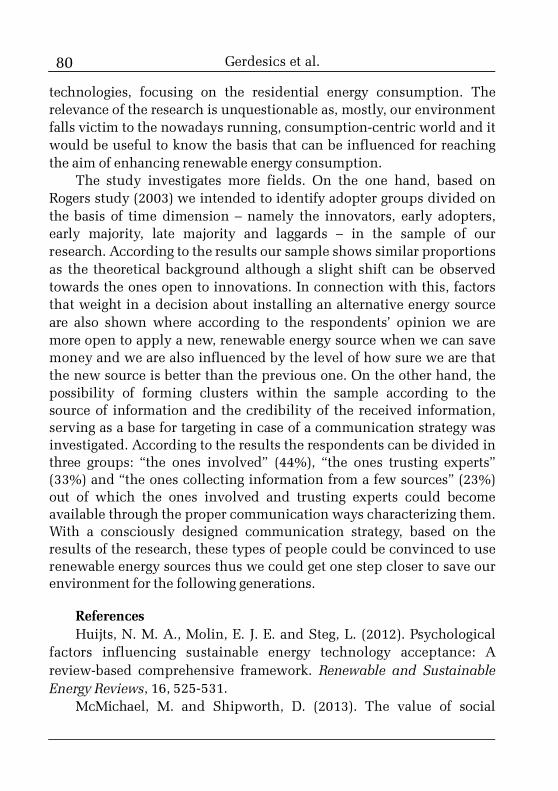
80
technologies, focusing on the residential energy consumption. Therelevance of the research is unquestionable as, mostly, our environmentfalls victim to the nowadays running, consumption-centric world and itwould be useful to know the basis that can be influenced for reachingthe aim of enhancing renewable energy consumption.
The study investigates more fields. On the one hand, based onRogers study (2003) we intended to identify adopter groups divided onthe basis of time dimension – namely the innovators, early adopters,early majority, late majority and laggards – in the sample of ourresearch. According to the results our sample shows similar proportionsas the theoretical background although a slight shift can be observedtowards the ones open to innovations. In connection with this, factorsthat weight in a decision about installing an alternative energy sourceare also shown where according to the respondents’ opinion we aremore open to apply a new, renewable energy source when we can savemoney and we are also influenced by the level of how sure we are thatthe new source is better than the previous one. On the other hand, thepossibility of forming clusters within the sample according to thesource of information and the credibility of the received information,serving as a base for targeting in case of a communication strategy wasinvestigated. According to the results the respondents can be divided inthree groups: “the ones involved” (44%), “the ones trusting experts”(33%) and “the ones collecting information from a few sources” (23%)out of which the ones involved and trusting experts could becomeavailable through the proper communication ways characterizing them.With a consciously designed communication strategy, based on theresults of the research, these types of people could be convinced to userenewable energy sources thus we could get one step closer to save ourenvironment for the following generations.
ReferencesHuijts, N. M. A., Molin, E. J. E. and Steg, L. (2012). Psychological
factors influencing sustainable energy technology acceptance: Areview-based comprehensive framework. Renewable and SustainableEnergy Reviews, 16, 525-531.
McMichael, M. and Shipworth, D. (2013). The value of social
Gerdesics et al.
81
networks in the diffusion of energy-efficiency innovations in UKhouseholds. Energy Policy, 53, 159-168.
Rogers, E. M. (2003). Diffusion of Innovations. 5th ed. New York:The Free Press.
Schumpeter, J. A. (1980). A gazdasági fejlõdés elmélete. Budapest:Közgazdasági és Jogi Könyvkiadó.
Sovacool, K. B. and Ratan, P. L. (2012). Conceptualizing theacceptance of wind and solar electricity. Renewable and SustainableEnergy Reviews, 16, 5268-5279.
Vágási, M. (2001). Újtermék-marketing. Budapest: NemzetiTankönyvkiadó.
Wejnert, B. (2002). Integrating models of diffusion of innovations: aconceptual framework. Annual Review of Sociology, 28, 297-326.
Wüstenhagen, R., Wolsink, M. and Bürer M. J. (2007). Socialacceptance of renewable energy innovation: A introduction to theconcept. Energy Policy, 35, 2683-2691.
Diffusion of renewable energy innovations
82
1 PhD, associate professor, Budapest Business School, e-mail:[email protected].
2 PhD, research fellow, Budapest Business School, e-mail:[email protected].
3 PhD, associate professor, National Central University, Taiwan, e-mail:[email protected].
Welcome to the machineHow web-based technologies affect
team collaboration?BALÁZS HEIDRICH1 – RICHÁRD KÁSA2 – WESLEY SHU3
No matter how large an organization might be, it cannot achieve fast orsignificant development on its own. Collaboration has become a fundamentalelement: collaboration with customers, with suppliers and internal andexternal stakeholders. This phenomenon fades the boundaries of companiesaway, giving soil to a higher level of cooperation, as the advent of the Internethas made information readily available in a press of a button. With the absenceof information disparity organizations thrive to continue to innovate in order tosustain its corporate competencies. Traditionally, innovation has always beenmade within a small-dedicated group within an organization. More recently,some of major corporations have discovered that innovation is theresponsibility of the entire organization and the best ideas are most likely tocome from the collaboration of people of diverse background, culture,experience, and age. Unlikely to the traditional face-to-face collaborations,modern meetings can take a virtual form that participants are completelyseparated from physical location and time zones. Social ties are not anymoreestablished only at the canteen’s coffee table but through computer assistedcommunication systems. Recent studies on global collaboration areconcentrated mostly under the domain of Group Decision Support System(GDSS) on communication efficiencies, problem solving, and decision-making.
In this paper the results of an experiment on how inter-departmentalcommunication can proceed to render higher decision quality, productivityand satisfaction is demonstrated. 175 team members of 45 student teams haveworked in technologically and demographically diverse groups. The factorvariables were the task/technology fit, productivity, decision quality,satisfaction and key competencies. It has been proven that modern web-2
83
based social technologies called wikis may facilitate such collaborations andmassive knowledge share.
Keywords: diverse teams, decision-making, GDSS, task/technology fit,wiki collaboration technologies.
JEL codes: M12, I29, O39, C92.
IntroductionCreated by Ward Cunningham in 1995, wikis are web-based
hypertext applications intended for collaborative writing. In addition towriting and viewing their own pages in real time, people who use a wikican see pages others have published and hyper-textually link to themwithout having to wait for an editor to assemble the various componentsdeveloped individually on multiple PCs. Second, during the writingprocess, content can be displayed immediately to other team members,who can immediately add their own contributions and see others’revisions without having to wait for an editor to assemble the variouselements from people working on other PCs (Lin et al. 2012).
Wikis can facilitate knowledge management by formattingcollaboration. As McAfee argued, “The technologists of Enterprise 2.0(e.g., wikis) are trying hard not to impose on users any preconceivednotions about how work should proceed or how output should becategorized or structured. Instead, they’re building tools that let theseaspects of knowledge work emerge” (McAfee 2006). Tacit knowledge isunstructured, subjective, abstract, and without a fixed format. Wikis haveevolved as a tool capable of matching these various characteristics (Lin etal. 2012).
Literature reviewRecent trends in Web2 and Wiki technologiesWeb 2.0 technologies enable remarkable interactivity and create
many new collaboration models such as Wikipedia or InnoCentive. Whatencourages us is not only its popularity but its idiosyncrasy; simple andparallel editing, version control, and real-time updates (Trkman andTrkman 2009). Bean and Hott (2005) pointed out “bottleneck effect”where updates are delayed through centrally managed entry. Instead of
Welcome to the machine
84
being served as a control centre, wiki serves as a platform and centralrepository. This makes asynchronous cooperation and cross-time zoneoperations possible, and conflicts can be solved in an asynchronous andlocation independent setting.
First, in a typical corporate hierarchy, opinions from higher rankedofficers may be valued more. Wiki provides an equal opportunity thatallows all opinions to be heard. It also permits efficiency. As Bean andHott (2005) commented, rather than the back-and-forth exchanges ofe-mail attachments or discussion boards, wiki allows direct exchanges ofopinions centrally and stored permanently.
Second, unlike blogs or micro-blogs available today, wiki allowsbi-directional communication, which makes it a dynamic process thatclosely resembles the real life communication exchange. Mattison (2003)pointed out that compared to blogs where articles are written mainly byindividuals, wiki is a groupware where authors have a chance to seeothers’ writings and offer their own thought. Most wiki provide forumswhere authors can discuss and resolve conflicting opinions before theyare posted.
Lastly, the entire methodology is built on trust, which means allentries are assumed to be genuine and correct and filters are establishedonly when necessary. The assumed trust and the way wiki encouragescontinuous enhancement of facts, in turns harness the power of diverseindividuals to create collaborative works globally (Shu and Cheng 2012).
In the past 20 years, many organizations have begun to understandthe importance of companywide knowledge management as a key tocompetitiveness and productivity (Stratford and Davenport 2008). A wikiis a readily available and convenient tool for knowledge management andcollaboration. Many organizations such as Motorola use wiki as aninternal knowledge management system (Chu and Kennedy 2011; Shuand Yu-Hao 2012). IBM has also used wiki to manage and obtain productknowledge and insights through its component broker (Hasan and Ptaff2006). Organizations need to focus on their own organization learning tosustain growth in order to compete favourably in the global market(Argyris 1997). Wikis have been successful in helping companies
Balázs Heidrich – Richárd Kása – Wesley Shu
85
converge scattered information into a streamlined and easily accessibleknowledge base (Hasan and Ptaff 2006). Wikis enable people to workcollaboratively in the creation and storage of knowledge (Wagner andBolloju 2005), the accumulation of knowledge, which allows innovatorsto absorb and use of knowledge to generate innovation (Cohen andLevinthal 1990), and the organizational body of thoughts which can becollected. These are important for studying the organizational learningand knowledge creation (Lam 2004).
The different perspectives of understanding diversityin work-groupsThe increasing dilemma in organizations is the growing presence
and need to manage diversity in work-groups: namely how can theunavoidable symptom of different faces of diversity turned to a potentialbenefit? Traditional management techniques had used the assumption ofa much more homogenous work-force. And for quite a long period of timethe techniques seemed to work well-enough. However with theinternationalization of markets, the radically changing motivation andattitude of the work-force, and the equity legislation in many countries,those techniques do not seem to be valid anymore for today’sorganizations.
As Maznevski (1994) argues, any group of people can be described byits diversity. Two basic types of diversity sources can be identified:
Role diversity, which includes occupation, organizational position,specialized knowledge and skills, and family role. Diversity along thisdimension seems easy to understand even in the everyday practice of acompany. Moreover, in business settings role type of diversity is oftenconsciously created in decision-making teams. These explicit roles andthe behaviours, attitudes and norms associated with them are publiclyrecognized.
In spite the public relevance of role diversity, inherent diversity is lessobvious and visible. This dimension includes age, gender, nationality,cultural values, personality and information processing anddecision-making style. By being less explicit, the impact andconsequences of inherent diversity are also more challenging to
Welcome to the machine
86
understand. Interestingly gender seemed to become a role-related sourceof diversity recently. Research has demonstrated that women and menbring different perspectives, better ideas to a group thus generatingdifferent solution possibilities and better performance (Dyson et al. 1976;Hoffman and Maier 1961; Ruhe 1978). Culturally diverse groups alsogenerate more ideas of higher quality in brainstorming processes (Adler1990; McLeod and Lobe 1992). Mobilizing the energy and synergy ofpeople from various cultures working as a team can lead to more creativeapproaches to the problems and challenges faced by corporate teams(Marquadt and Horvath 2001). The summary of task-related effectivenessof diverse teams is demonstrated on Table 1.
Another perspective of diversity takes the individuals culturalbackground as the main source of classification. Adler (1990) focuses onthe cultural background of the individuals in the construction of teams.In homogeneous groups all members share the same cultural background.Therefore members of homogeneous groups generally perceive, interpret,and evaluate the world in a very similar way. Homogeneous nature of theteam can be perceived by professional and national culture and otherinherent diversity characteristics. When all but one member of a certaingroup share the same diversity characteristics then token groups aretaking over. Managing token groups can be a real challenge even if theleader of the team is the one culturally/professionally etc. differentmember, which is often the case in business reality. This situationrequires a high level of leadership and cultural and managerialintelligence, where authority and power are in contrast with the majorityof the members. In bicultural groups, two or more members representeach of two distinct diversity characteristics. This bicultural situationhappens very often in the case of mergers and acquisitions (M&A), whenexperts and managers from two companies try to integrate the cultures ofthe two merging organizations or in product development teams withengineers and marketing people on board. Such bicultural interactionsraise the most cultural conflicts. Following the diversity framework ofAdler (1990), in multicultural groups, three or more culturally orotherwise diverse backgrounds are represented. The latter is the type,which is mostly referred to as diverse group in this study.
Balázs Heidrich – Richárd Kása – Wesley Shu
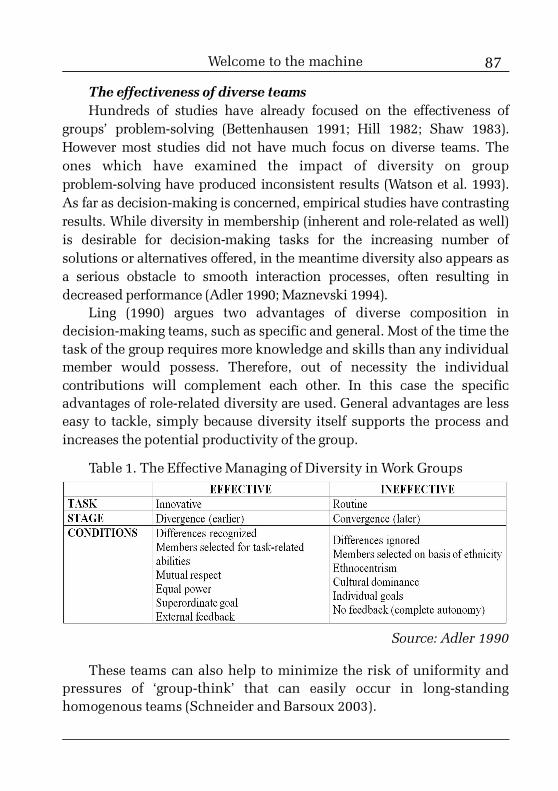
87
The effectiveness of diverse teamsHundreds of studies have already focused on the effectiveness of
groups’ problem-solving (Bettenhausen 1991; Hill 1982; Shaw 1983).However most studies did not have much focus on diverse teams. Theones which have examined the impact of diversity on groupproblem-solving have produced inconsistent results (Watson et al. 1993).As far as decision-making is concerned, empirical studies have contrastingresults. While diversity in membership (inherent and role-related as well)is desirable for decision-making tasks for the increasing number ofsolutions or alternatives offered, in the meantime diversity also appears asa serious obstacle to smooth interaction processes, often resulting indecreased performance (Adler 1990; Maznevski 1994).
Ling (1990) argues two advantages of diverse composition indecision-making teams, such as specific and general. Most of the time thetask of the group requires more knowledge and skills than any individualmember would possess. Therefore, out of necessity the individualcontributions will complement each other. In this case the specificadvantages of role-related diversity are used. General advantages are lesseasy to tackle, simply because diversity itself supports the process andincreases the potential productivity of the group.
Table 1. The Effective Managing of Diversity in Work Groups
Source: Adler 1990
These teams can also help to minimize the risk of uniformity andpressures of ‘group-think’ that can easily occur in long-standinghomogenous teams (Schneider and Barsoux 2003).
Welcome to the machine
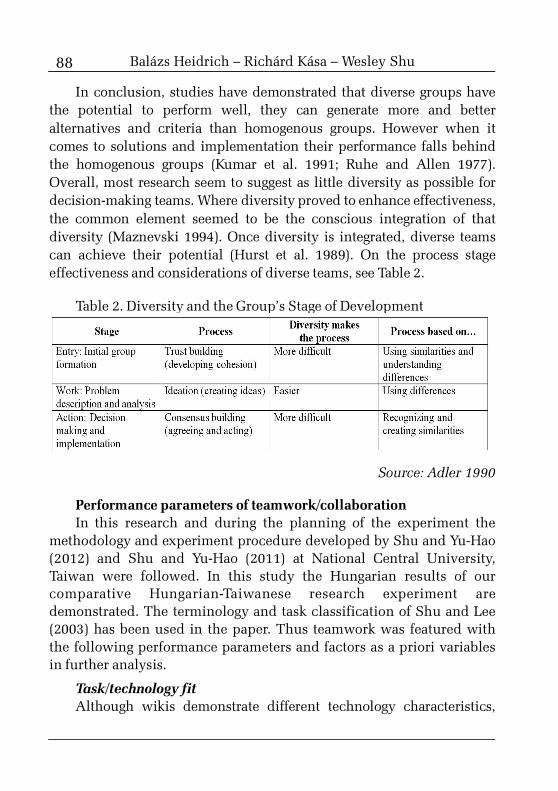
88
In conclusion, studies have demonstrated that diverse groups havethe potential to perform well, they can generate more and betteralternatives and criteria than homogenous groups. However when itcomes to solutions and implementation their performance falls behindthe homogenous groups (Kumar et al. 1991; Ruhe and Allen 1977).Overall, most research seem to suggest as little diversity as possible fordecision-making teams. Where diversity proved to enhance effectiveness,the common element seemed to be the conscious integration of thatdiversity (Maznevski 1994). Once diversity is integrated, diverse teamscan achieve their potential (Hurst et al. 1989). On the process stageeffectiveness and considerations of diverse teams, see Table 2.
Table 2. Diversity and the Group’s Stage of Development
Source: Adler 1990
Performance parameters of teamwork/collaborationIn this research and during the planning of the experiment the
methodology and experiment procedure developed by Shu and Yu-Hao(2012) and Shu and Yu-Hao (2011) at National Central University,Taiwan were followed. In this study the Hungarian results of ourcomparative Hungarian-Taiwanese research experiment aredemonstrated. The terminology and task classification of Shu and Lee(2003) has been used in the paper. Thus teamwork was featured withthe following performance parameters and factors as a priori variablesin further analysis.
Task/technology fitAlthough wikis demonstrate different technology characteristics,
Balázs Heidrich – Richárd Kása – Wesley Shu
89
which may be proven to be superior in terms of productivity, decisionquality, and satisfaction in collaboration, they may not be superior in alltypes of tasks. Goodhue (1998) has demonstrated that differenttechnologies may fit into different task categories.
According to (McGrath 1984), collaborative tasks can be divided intotwo classifications: intellective tasks and preference tasks; the former isthe task to solve a problem that has an anticipated outcome. The latter isa task that an outcome is uncertain. The final agreement must rely onteam members’ values and beliefs. Zigurs and Buckland (1998) believeteam members will, under different task classifications and collaborativetechnologies, collaborate differently and cause difference in task fit. Thenature of the preference task makes us to infer that it is more likely toincite discussion within the group, different opinion exchange, andalternative interpretation on the task, which makes the need for soundcollaborative platform more prominent.
In Goodhue (1998) task/technology fit (TTF) model, the usefulness oftools in performing a task is highly correlated with how well the taskcollocates with the tools functionality. The main thrust of TTF theory isthat any science and technology must collocate in unison with the needsof mission before any measurable performance is possible. For example,collaboration between team members under a collaborative supportsystem can solve problems more efficiently because it is not subjected totime and geographical constraints (Dennis et al. 1999; Jessup andValacich 1993; Klein and Dologite 2000).
We believe TTF is appropriate for our study. First, wiki andtraditional collaboration differs in synchronization. It is our goal to findout which technology mode fits better on tasks requiring extensiveasynchronous collaboration.
Second, TTF differs from the utilization models such as UTAUT(Venkatesh et al. 2003) in that it is a direct measurement of performance.As Goodhue stated, “Utilization of a poor system (i.e., one with low TTF)will not improve performance, and poor systems may be utilized“extensively due to social factors, habit, ignorance, availability, etc., evenwhen utilization is voluntary.” When the technology use is not voluntary,then it is treated as a contaminant in a utilization model, which makes
Welcome to the machine
90
the model less credible as measure performance (Goodhue andThompson 1995).
According to Goodhue (1998) as Shu and Yu-Hao (2012) refersTechnology/Task Fit (TTF) is related to the usefulness of tools used inperforming a task which is highly correlated with how well the taskcollocates with the tools’ functionally. The main trust of TTF model isthat any science and technology must collocate in unison with the needsof mission before any measurable performance is possible. Goodhue isthe first scholar to conceive the Task/Technology Fit Theory (TTF), whichstated that the degree of task/technology fit determines how helpful aninformation technology is to a user while performing tasks. Goodhuepointed out that an information technology is said to have a good fitwhenever it is able to reduce operating costs, provide easier userexperience, and better performance outcome (Goodhue 1988). In otherwords, a user must believe that the information system is useful and ableto provide considerable benefits to his/her assigned task (Greenstein1998). Collaboration between team members under a collaborativesupport system that can solve problems without time and geographicalconstrain would be more efficient and favourable (Dennis et al. 1999;Katz and Shapiro 1994; Klein and Dologite 2000).
ProductivityIn mathematical terms, productivity can be calculated as the ratio
between inputs and outputs (Belanger et al. 2001). Yet not all aspects ofinput and output are measurable (Brynjolfsson and Yang 1996). Outputssuch as quality of life, fun, and convenience are nearly impossible toquantify or measure directly.
Consequently, the respondents’ beliefs about the effectiveness ofusing wikis or not using wikis in the performance of tasks and theirperceived productivity should be measured. Thus, previous researchesthat have shown strong links between self-judgments and the quality ofperformance were strongly relied upon (Kauffman and Weill 1989; Kelley1994). Productivity will be measured in two ways. The first is aquestionnaire based on Shu and Chuang (2012). The second is anobjective measurement, which will count the number of generated ideas.
Balázs Heidrich – Richárd Kása – Wesley Shu
91
Decision QualityMuch of the studies on group decision quality came from the study
of Group Support Systems (GSS). Benbasat and Lim (1993) quantitativelyintegrated the results of several experimental studies on GSS usage andfound that it has a positive effect on decision quality. Their founding wasfurther supported by Nunamaker et al. (1996) that in laboratory studiesthat group using GSS produce higher quality ideas than those usingstandard meeting techniques.
Quality is often used to measure the final results in collaborativeresearch. It refers to team members’ own feelings towards the teamoutput during the decision-making process (Chen 2003). It can also beequate to members’ own evaluation of the final decision outcomes(Chizmar and Zak 1983). Decision quality will be measured by aquestionnaire based on Shu and Yu-Hao's study (2012).
SatisfactionSatisfaction may be defined as an application's ability to meet the
expectation of the users. It is by far a subjective term that varies withone’s perceptions and attitudes toward its eventual benefits andoutcomes. Past studies have indicated that satisfaction is closelymoderated by the aspect of an application's ease of use or the precision ofthe user-machine interface (Adam Mahmood et al. 1999). Satisfactionoften used to measure the effectiveness of a collaborative process orresult (Church and Gandal 1992, 1993).
Past researches also suggested that care must be taken whenformulating satisfaction metrics, because measurement of satisfactionand quality are similar, but in practice, high degree of satisfaction may ormay not necessarily equates to high quality (Jonscher 1983). Satisfactionwill be measured by a questionnaire based on Shu and Yu-Hao's study(2012).
Key capabilitiesIn this sense some typical capabilities and competencies of team
members were measured regarding to teamwork and collaboration withother team members as suggested in literature (Lin et al. 2012; Shu andCheng 2012; Shu and Lee 2003; Shu and Yu-Hao 2012). The ability of
Welcome to the machine
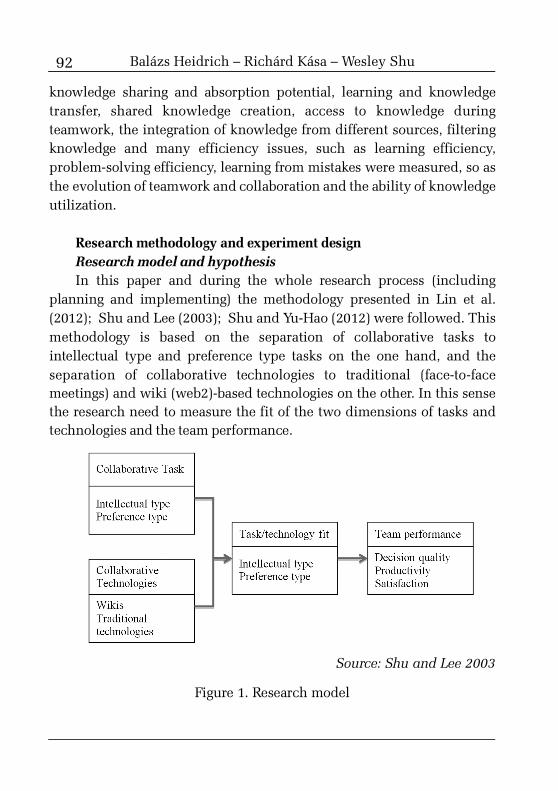
92
knowledge sharing and absorption potential, learning and knowledgetransfer, shared knowledge creation, access to knowledge duringteamwork, the integration of knowledge from different sources, filteringknowledge and many efficiency issues, such as learning efficiency,problem-solving efficiency, learning from mistakes were measured, so asthe evolution of teamwork and collaboration and the ability of knowledgeutilization.
Research methodology and experiment designResearch model and hypothesisIn this paper and during the whole research process (including
planning and implementing) the methodology presented in Lin et al.(2012); Shu and Lee (2003); Shu and Yu-Hao (2012) were followed. Thismethodology is based on the separation of collaborative tasks tointellectual type and preference type tasks on the one hand, and theseparation of collaborative technologies to traditional (face-to-facemeetings) and wiki (web2)-based technologies on the other. In this sensethe research need to measure the fit of the two dimensions of tasks andtechnologies and the team performance.
Source: Shu and Lee 2003
Figure 1. Research model
Balázs Heidrich – Richárd Kása – Wesley Shu
93
Goodhue and Thompson (1995) in their task/technology fit (TTF)model argued that the usefulness of tools in performing a task is highlycorrelated with how well the task collocates with the tools’ functionality.The main thrust of TTF theory is that any science and technology mustcollocate with the needs of the mission before measurable performance ispossible. In other words, potential users must be thoroughly convincedthat a technology is capable of assisting them in completing their missionbefore it is adopted (Greenstein 1998). For example, collaborationbetween team members under a collaborative support system that cansolve problems with no time and geographical constraints would be themost efficient (Banker and Kemerer 1989; Katz and Shapiro 1994).
Zigurs and Buckland (1998) have shown that groups adopting agroup support system are more motivated to express their ideas thangroups that do not. This is probably because the group members canavoid the possibility of face-to-face confrontation, which might lead tocoercion and embarrassment. Additionally, systems that support parallelediting and allow multiple participants to instantly share and expresstheir opinions, ideas, and information could be far more efficient thanconventional systems in which editing and expression are sequential(Berndt 1992).
Based on these arguments, we proposed the following hypotheses:Hypothesis 1: In the context of inter-group collaboration, wiki offers a
better task/technology fit than conventional processor.Hypothesis 1a: In the context of inter-group intellective tasking, wiki
offers a better task/technology fit than conventional processor.Hypothesis 1b: In the context of inter-group preference tasking, wiki
offers a better task/technology fit than conventional processor.Christensen and Jorgenson (1969) argued that the amount of
information a member of a team can contribute is an important indicatorof the quality of the group collaboration. Christensen and Greene (1976)further defined productivity as the quantity of output data that acollaborative team can produce. Grover et al. ( 1998) used perceivedproductivity as the dependent variable in their study of IT diffusion,primarily because previous studies of IT and productivity yielded
Welcome to the machine
94
ambiguous results, largely due to measurement issues. In our model,neither the inputs nor the outputs in either the intellective or thepreference task are measurable. Thus, we defined productivity, in thecontext of inter-group collaboration, as the perceived adequacy of theacquired and assimilated information for completion of the task at hand.Based on the above argument, we argued the following hypotheses:
Hypothesis 2: The better the task/technology fit, the better a team’sproductivity.
Hypothesis 2a: The better the task/technology fit, the better a team’sproductivity in intellective tasks.
Hypothesis 2b: The better the task/technology fit, the better a team’sproductivity in preference tasks.
Decision quality is often used as a metric to measure the results ofcollaborative studies. Fan et al. (2004) argued that decision-makingquality is a good measure of group communication performance. Salas etal. (1992) agreed with Fan et al. that output quality is an importantindicator of performance. Quality is defined as team members’ feelingsabout the team’s output during the decision-making process (Chen 2003),has also been used to measure the final results of collaborative research.Quality can also refer to members’ evaluation of the outcomes of the finalgroup decision (Chizmar and Zak 1983).
Hypothesis 3: The better the task/technology fit, the better the qualityof the team’s decision.
Hypothesis 3a: The better the task/technology fit, the better thequality of the team’s decision in intellective tasks.
Hypothesis 3b: The better the task/technology fit, the better thequality of the team’s decision in preference tasks.
Satisfaction, defined as the manifestation of good feelings that theteam members experience during the course of collaboration, is oftenused in studies of collaboration to measure the success of a process oroutcome (Church and Gandal 1992, 1993). It is often associated withgroup members’ positive evaluation of their collaborative efforts.According to the above literature, the following hypotheses can bedefined:
Balázs Heidrich – Richárd Kása – Wesley Shu
95
Hypothesis 4: The better the task/technology fit, the greater the groupsatisfaction.
Hypothesis 4a: The better the task/technology fit, the greater thegroup satisfaction in intellective tasks.
Hypothesis 4b: The better the task/technology fit, the greater thegroup satisfaction in preference tasks.
The research experiment also focuses on the performanceimprovement due to wiki usage during the procedure. It is our intentionto prove, that experimental groups have greater improvement in allcollaboration performance factors than control groups – and this is alsoinfluenced by their previous attitudes to teamwork and wikis.
Hypothesis 5a: If a team member’s attitude to teamwork is positive,they will reach higher improvement in all performance parameters due towiki usage during the experiment and vice versa than those, who did notuse wikis.
Hypothesis 5b: If a team member’s attitude to wiki usage is positive,they will reach higher improvement in all performance parameters due towiki usage during the experiment and vice versa than those, who did notuse wikis.
Experimental design and procedureThe research was implemented at Budapest Business School,
Faculty of Finance and Accountancy among part-time master studentsof finance and accounting specialization. A demographic survey wascarried out among participants before the experiment procedure todetect their attitudes and habits of teamwork and wiki usage. The usagefrequency of wiki platforms (social sites, cloud computing devices,on-line collaboration tools) by each participant was measured in theirwork and dichotomous variables were defined to classify them whetherthey are wiki users or not. Teamwork habits were also measured: howoften and how many times participants work in teams, anddichotomous variables were defined to classify them whether they areteam workers or not.
Having these results made it possible to form teams of four, withspecial regard to their demographic features – as detailed in the sampleallocation and distribution part of this paper. Having all the teams formed
Welcome to the machine
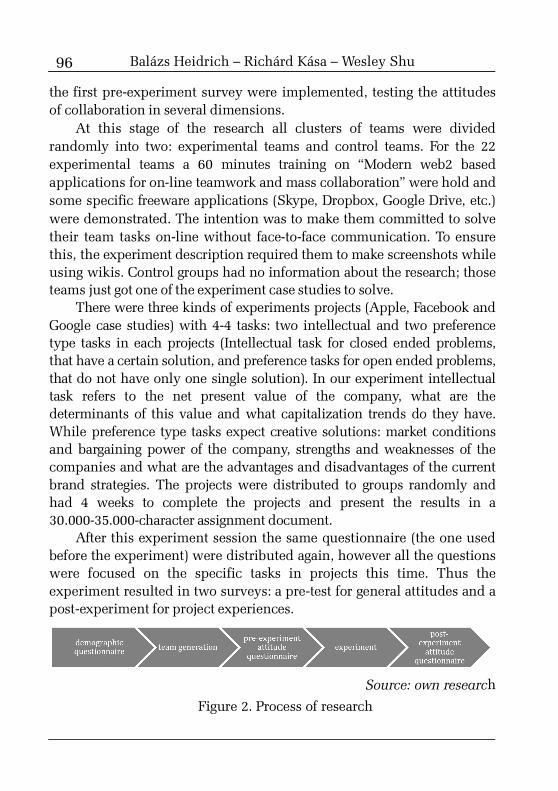
96
the first pre-experiment survey were implemented, testing the attitudesof collaboration in several dimensions.
At this stage of the research all clusters of teams were dividedrandomly into two: experimental teams and control teams. For the 22experimental teams a 60 minutes training on “Modern web2 basedapplications for on-line teamwork and mass collaboration” were hold andsome specific freeware applications (Skype, Dropbox, Google Drive, etc.)were demonstrated. The intention was to make them committed to solvetheir team tasks on-line without face-to-face communication. To ensurethis, the experiment description required them to make screenshots whileusing wikis. Control groups had no information about the research; thoseteams just got one of the experiment case studies to solve.
There were three kinds of experiments projects (Apple, Facebook andGoogle case studies) with 4-4 tasks: two intellectual and two preferencetype tasks in each projects (Intellectual task for closed ended problems,that have a certain solution, and preference tasks for open ended problems,that do not have only one single solution). In our experiment intellectualtask refers to the net present value of the company, what are thedeterminants of this value and what capitalization trends do they have.While preference type tasks expect creative solutions: market conditionsand bargaining power of the company, strengths and weaknesses of thecompanies and what are the advantages and disadvantages of the currentbrand strategies. The projects were distributed to groups randomly andhad 4 weeks to complete the projects and present the results in a30.000-35.000-character assignment document.
After this experiment session the same questionnaire (the one usedbefore the experiment) were distributed again, however all the questionswere focused on the specific tasks in projects this time. Thus theexperiment resulted in two surveys: a pre-test for general attitudes and apost-experiment for project experiences.
Source: own research
Figure 2. Process of research
Balázs Heidrich – Richárd Kása – Wesley Shu
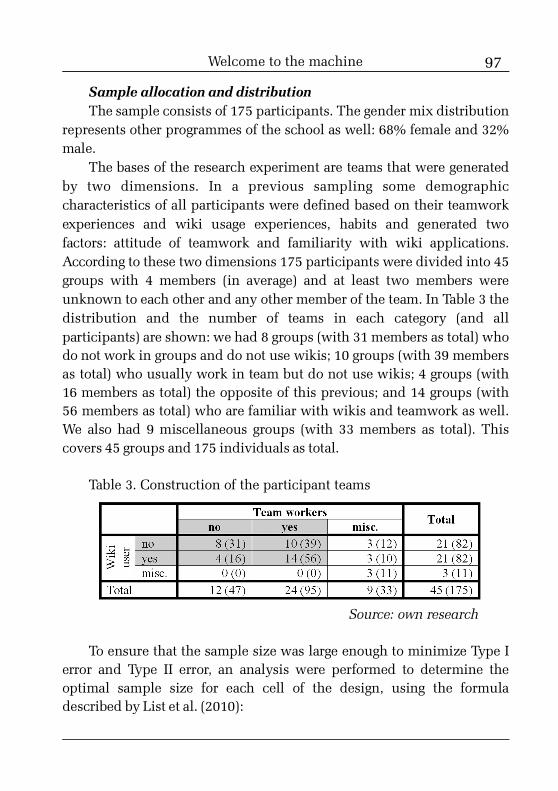
97
Sample allocation and distributionThe sample consists of 175 participants. The gender mix distribution
represents other programmes of the school as well: 68% female and 32%male.
The bases of the research experiment are teams that were generatedby two dimensions. In a previous sampling some demographiccharacteristics of all participants were defined based on their teamworkexperiences and wiki usage experiences, habits and generated twofactors: attitude of teamwork and familiarity with wiki applications.According to these two dimensions 175 participants were divided into 45groups with 4 members (in average) and at least two members wereunknown to each other and any other member of the team. In Table 3 thedistribution and the number of teams in each category (and allparticipants) are shown: we had 8 groups (with 31 members as total) whodo not work in groups and do not use wikis; 10 groups (with 39 membersas total) who usually work in team but do not use wikis; 4 groups (with16 members as total) the opposite of this previous; and 14 groups (with56 members as total) who are familiar with wikis and teamwork as well.We also had 9 miscellaneous groups (with 33 members as total). Thiscovers 45 groups and 175 individuals as total.
Table 3. Construction of the participant teams
Source: own research
To ensure that the sample size was large enough to minimize Type Ierror and Type II error, an analysis were performed to determine theoptimal sample size for each cell of the design, using the formuladescribed by List et al. (2010):
Welcome to the machine
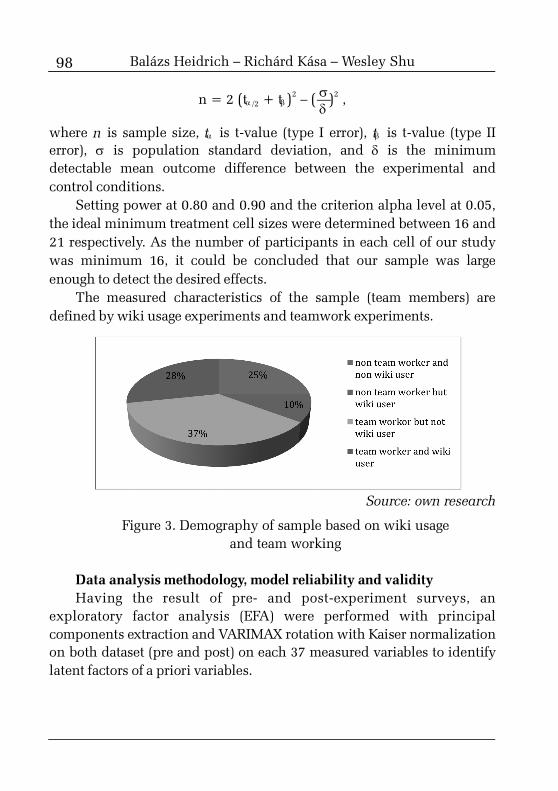
98
n = 2 (t� /2 + t�)2 – ( )2 ,
where n is sample size, t� is t-value (type I error), t� is t-value (type IIerror), � is population standard deviation, and � is the minimumdetectable mean outcome difference between the experimental andcontrol conditions.
Setting power at 0.80 and 0.90 and the criterion alpha level at 0.05,the ideal minimum treatment cell sizes were determined between 16 and21 respectively. As the number of participants in each cell of our studywas minimum 16, it could be concluded that our sample was largeenough to detect the desired effects.
The measured characteristics of the sample (team members) aredefined by wiki usage experiments and teamwork experiments.
Source: own research
Figure 3. Demography of sample based on wiki usageand team working
Data analysis methodology, model reliability and validityHaving the result of pre- and post-experiment surveys, an
exploratory factor analysis (EFA) were performed with principalcomponents extraction and VARIMAX rotation with Kaiser normalizationon both dataset (pre and post) on each 37 measured variables to identifylatent factors of a priori variables.
�
�
Balázs Heidrich – Richárd Kása – Wesley Shu

99
Table 4. Rotated component matrices of EFA
Source: own research
As the 5-5 latent variables were expressed [task/technology fit (FIT),productivity (PRO), decision quality (DQ), satisfaction (SAT) and keycompetences (KEY)] out of the 37-37 measured variables a confirmatoryfactor analysis (CFA) was performed to test the fit of the clausal models(pre and post) as Jöreskog (1969) suggests.
In order to get the best fit of the model, numerous iterations wereperformed and the results of the last are demonstrated here, which wasthe most significant and showed the best fit.
All required tests were performed as well which are necessary for theinterpretation of the results, with special regard to reliability analysis[Cronbach’s � for internal consistency of the scales, Kaiser-Meyer-Olkintest (KMO), Bartlett’s spherical test, and we measured the total varianceexpressed (TVE) by the factors], convergent validity [range of factorloadings, composite reliability (CR) and average variance expressed(AVE) by the factors], discriminant validity [correlation of the scales,
Welcome to the machine
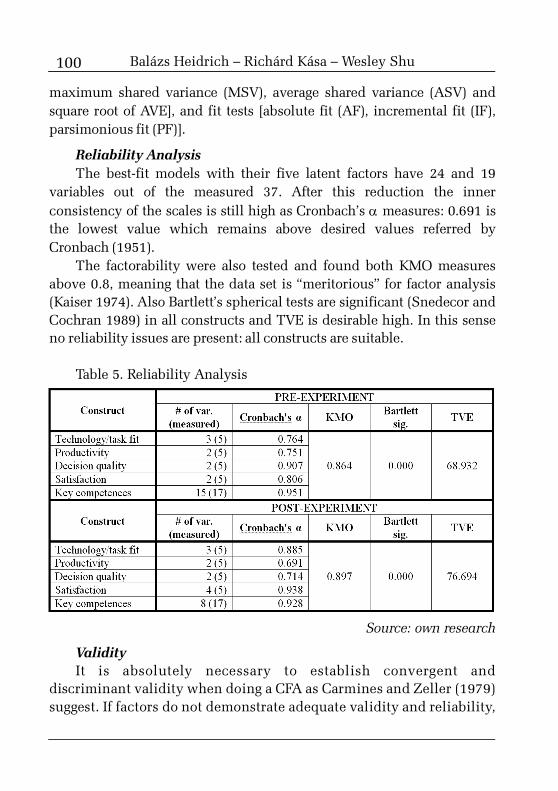
100
maximum shared variance (MSV), average shared variance (ASV) andsquare root of AVE], and fit tests [absolute fit (AF), incremental fit (IF),parsimonious fit (PF)].
Reliability AnalysisThe best-fit models with their five latent factors have 24 and 19
variables out of the measured 37. After this reduction the innerconsistency of the scales is still high as Cronbach’s � measures: 0.691 isthe lowest value which remains above desired values referred byCronbach (1951).
The factorability were also tested and found both KMO measuresabove 0.8, meaning that the data set is “meritorious” for factor analysis(Kaiser 1974). Also Bartlett’s spherical tests are significant (Snedecor andCochran 1989) in all constructs and TVE is desirable high. In this senseno reliability issues are present: all constructs are suitable.
Table 5. Reliability Analysis
Source: own research
ValidityIt is absolutely necessary to establish convergent and
discriminant validity when doing a CFA as Carmines and Zeller (1979)suggest. If factors do not demonstrate adequate validity and reliability,
Balázs Heidrich – Richárd Kása – Wesley Shu
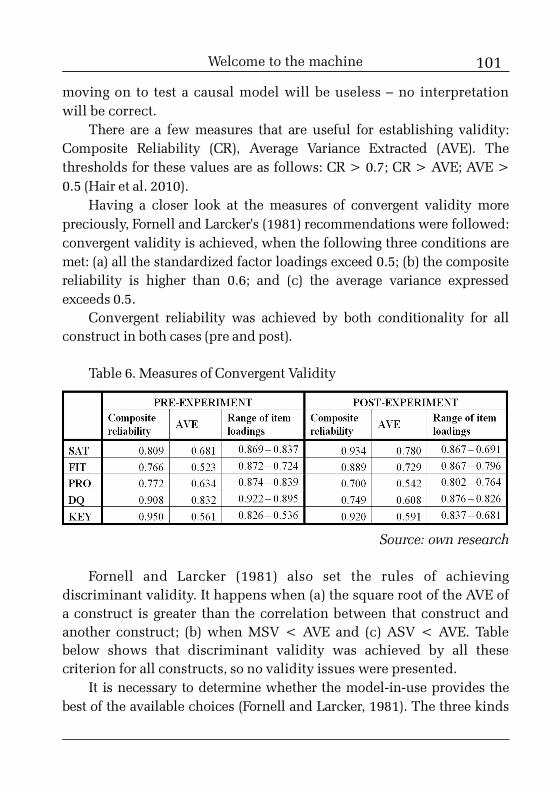
101
moving on to test a causal model will be useless – no interpretationwill be correct.
There are a few measures that are useful for establishing validity:Composite Reliability (CR), Average Variance Extracted (AVE). Thethresholds for these values are as follows: CR > 0.7; CR > AVE; AVE >0.5 (Hair et al. 2010).
Having a closer look at the measures of convergent validity morepreciously, Fornell and Larcker's (1981) recommendations were followed:convergent validity is achieved, when the following three conditions aremet: (a) all the standardized factor loadings exceed 0.5; (b) the compositereliability is higher than 0.6; and (c) the average variance expressedexceeds 0.5.
Convergent reliability was achieved by both conditionality for allconstruct in both cases (pre and post).
Table 6. Measures of Convergent Validity
Source: own research
Fornell and Larcker (1981) also set the rules of achievingdiscriminant validity. It happens when (a) the square root of the AVE ofa construct is greater than the correlation between that construct andanother construct; (b) when MSV < AVE and (c) ASV < AVE. Tablebelow shows that discriminant validity was achieved by all thesecriterion for all constructs, so no validity issues were presented.
It is necessary to determine whether the model-in-use provides thebest of the available choices (Fornell and Larcker, 1981). The three kinds
Welcome to the machine
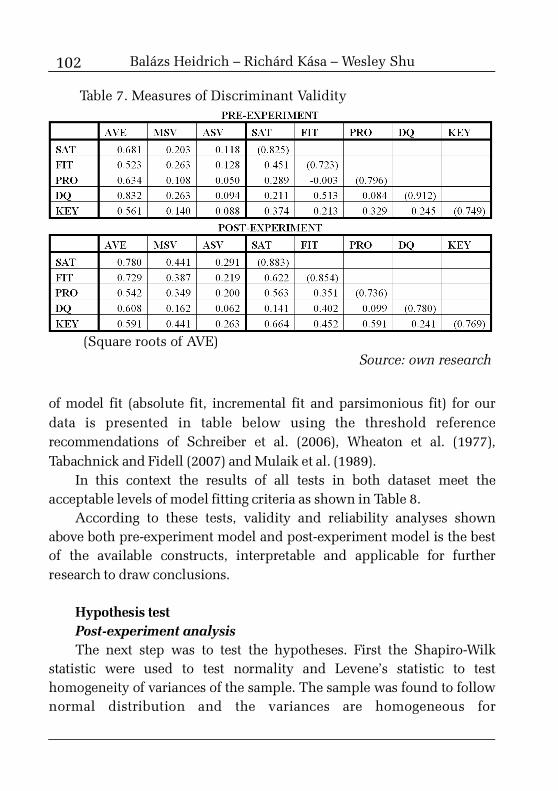
102
of model fit (absolute fit, incremental fit and parsimonious fit) for ourdata is presented in table below using the threshold referencerecommendations of Schreiber et al. (2006), Wheaton et al. (1977),Tabachnick and Fidell (2007) and Mulaik et al. (1989).
In this context the results of all tests in both dataset meet theacceptable levels of model fitting criteria as shown in Table 8.
According to these tests, validity and reliability analyses shownabove both pre-experiment model and post-experiment model is the bestof the available constructs, interpretable and applicable for furtherresearch to draw conclusions.
Hypothesis testPost-experiment analysisThe next step was to test the hypotheses. First the Shapiro-Wilk
statistic were used to test normality and Levene’s statistic to testhomogeneity of variances of the sample. The sample was found to follownormal distribution and the variances are homogeneous for
Table 7. Measures of Discriminant Validity
(Square roots of AVE)Source: own research
Balázs Heidrich – Richárd Kása – Wesley Shu
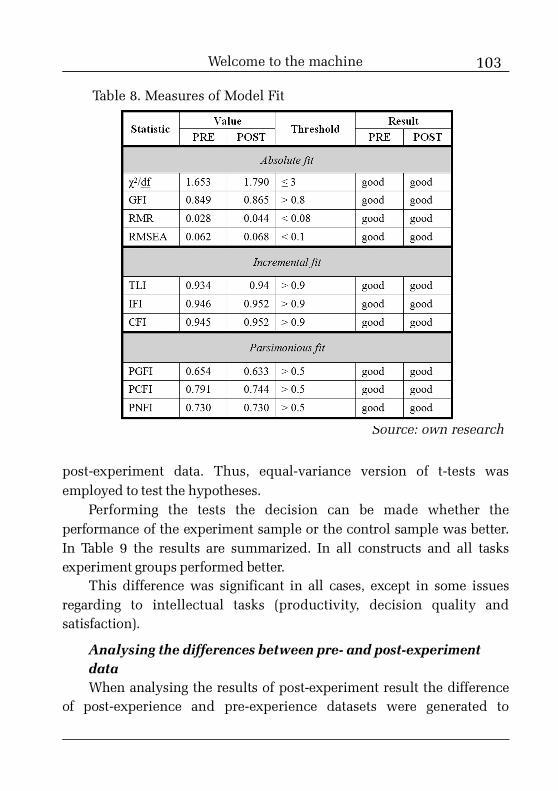
Table 8. Measures of Model Fit
Source: own research
103
post-experiment data. Thus, equal-variance version of t-tests wasemployed to test the hypotheses.
Performing the tests the decision can be made whether theperformance of the experiment sample or the control sample was better.In Table 9 the results are summarized. In all constructs and all tasksexperiment groups performed better.
This difference was significant in all cases, except in some issuesregarding to intellectual tasks (productivity, decision quality andsatisfaction).
Analysing the differences between pre- and post-experimentdataWhen analysing the results of post-experiment result the difference
of post-experience and pre-experience datasets were generated to
Welcome to the machine
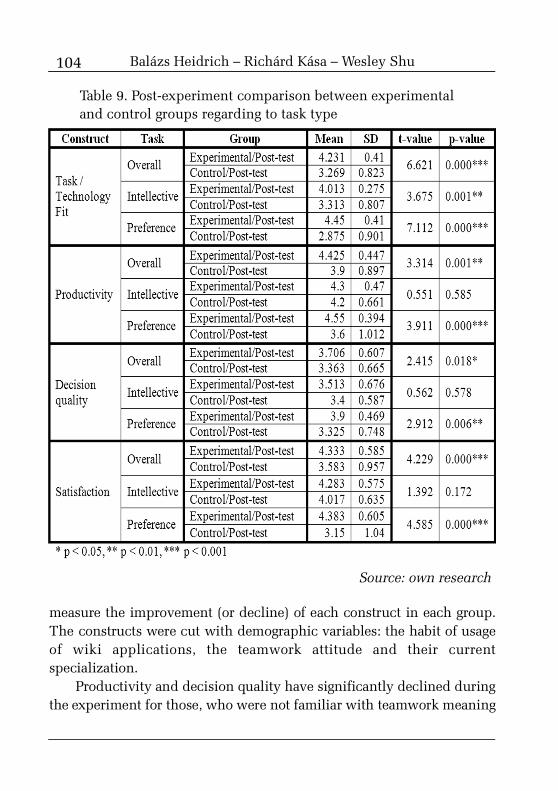
104
measure the improvement (or decline) of each construct in each group.The constructs were cut with demographic variables: the habit of usageof wiki applications, the teamwork attitude and their currentspecialization.
Productivity and decision quality have significantly declined duringthe experiment for those, who were not familiar with teamwork meaning
Table 9. Post-experiment comparison between experimentaland control groups regarding to task type
Source: own research
Balázs Heidrich – Richárd Kása – Wesley Shu
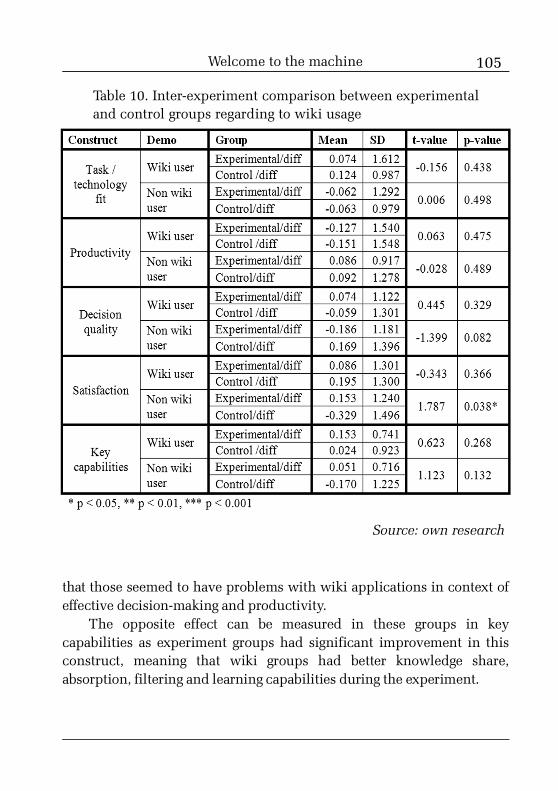
105
that those seemed to have problems with wiki applications in context ofeffective decision-making and productivity.
The opposite effect can be measured in these groups in keycapabilities as experiment groups had significant improvement in thisconstruct, meaning that wiki groups had better knowledge share,absorption, filtering and learning capabilities during the experiment.
Table 10. Inter-experiment comparison between experimentaland control groups regarding to wiki usage
Source: own research
Welcome to the machine
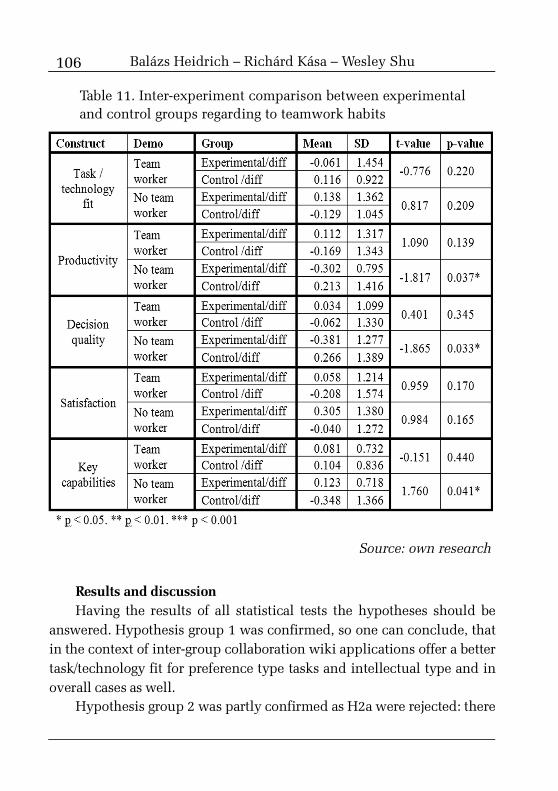
106
Results and discussionHaving the results of all statistical tests the hypotheses should be
answered. Hypothesis group 1 was confirmed, so one can conclude, thatin the context of inter-group collaboration wiki applications offer a bettertask/technology fit for preference type tasks and intellectual type and inoverall cases as well.
Hypothesis group 2 was partly confirmed as H2a were rejected: there
Table 11. Inter-experiment comparison between experimentaland control groups regarding to teamwork habits
Source: own research
Balázs Heidrich – Richárd Kása – Wesley Shu
107
were no significant evidence found that team productivity is higher inwiki user groups in solving intellective tasks. However the connection insolving preference type tasks and in overall cases could be significantlyconfirmed.
The same was the case in context of team’s decision making: H3ahypothesis were rejected, however the fact that wiki user groups reachedbetter decision quality through the experiment in preference type tasksand in overall cases could be significantly confirmed.
Similar conclusions could be drawn in hypothesis group 4, as H4a isrejected: the better the task/technology fit the greater the groupsatisfaction in preference type tasks and in overall cases – but notsignificantly better in intellectual type tasks.
Therefore in case of H2a, H3a and H4a it can be argued that inaccordance to the reviewed literature (Adler 1990; McLeod and Lobe1992; Marquadt and Horvath 2001) diversity only provides betterperformance when it is integrated into the process. Thus wikis provide agood framework of collaboration for more divergent tasks (i.e. preferencetasks in this study), whereas in case of more routine and procedure basedtasks (i.e. intellective tasks) performance has not increased significantly.
Hypothesis group 5 have many cases after the split of all theperformance indicator variables by wiki dichotomous and teamworkdichotomous demographic variables. Due to this splitting very fewsignificant differences were found in post/pre experiment differences byexperimental and control groups. However it can be argued that non-wikiusers who did not use wiki applications before the experiment and nowwere forced to use them had significantly greater satisfaction with theteamwork than those in control groups.
The opposite was found regarding to decision quality and teamwork:those who did not work in team before have significant decline indecision quality during the experiment due to the wiki usage than thosewho were in control groups (and was not asked to use wikis during theexperiment). However these groups of non-team workers havesignificantly higher improvement in key capabilities of teamwork thanthose in control group. This means, that non-team workers can improve
Welcome to the machine
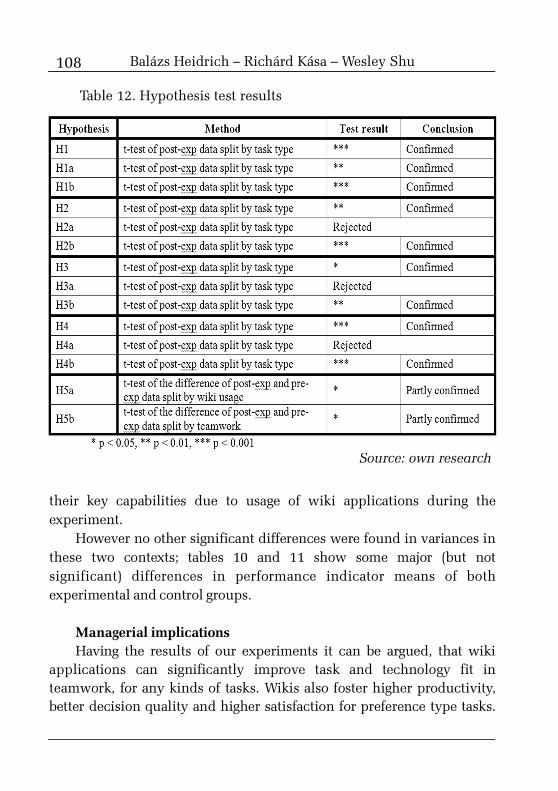
108
their key capabilities due to usage of wiki applications during theexperiment.
However no other significant differences were found in variances inthese two contexts; tables 10 and 11 show some major (but notsignificant) differences in performance indicator means of bothexperimental and control groups.
Managerial implicationsHaving the results of our experiments it can be argued, that wiki
applications can significantly improve task and technology fit inteamwork, for any kinds of tasks. Wikis also foster higher productivity,better decision quality and higher satisfaction for preference type tasks.
Table 12. Hypothesis test results
Source: own research
Balázs Heidrich – Richárd Kása – Wesley Shu
109
In contrast wiki applications are not very useful for intellectual typetasks: collaborative tasks which have an anticipated outcome and analready known process to use for problems solving are not the field to usewikis, more traditional methods would apply. Therefore theseapplications appear to be very useful for preference type task; but cannotreplace face-to-face problem solving methods, when the details ofcommunication and implementation become vital. This argument is infull accordance with the literature reviewed (Adler 1990; Maznevski1994).
Another factor hindering the productivity of teamwork, whenmembers have no positive attitudes to use wiki applications and are notkeen on teamwork.
Limitations and further research directionsHowever all major recommendations in literature for sample size and
distributions were considered, for experimental procedure (test andcontrol groups) and latent variables construction (reliability andconvergent and discriminant validity and model fit) and for applicablehypothesis test methods, there are still some basic limitations to thisresearch. Firstly the sampling limitations: the sample of this experimentwas part-time higher education business students with financial andaccounting specialization, which is an undeniable constraint. Thesampling procedures are needed to be extended.
Secondly a systematic problem occurs: it seems complicated toensure that experimental groups do use wiki applications during theexperiments whereas control groups are supposed not to do so.
Further plans are focused to eliminate these limitations and fine-tunethe whole experiment procedure. A longitudinal analysis seems a viableoption to carry out in a years time resolving the limitations of theprocedure and sample and providing an opportunity for both for adynamic and intercultural (ie. Taiwanese and Hungarian) comparativestudy.
ReferencesAdam Mahmood, M., Burn, J. M., Gemoets, L. A. and Jacquez, C.
(2000). Variables affecting information technology end-user satisfaction:
Welcome to the machine
110
A meta-analysis of the empirical literature. International Journal ofHuman-Computer Studies, 52(4), 751–771.
Adler, N. J. (1990). International Dimensions of OrganizationalBehavior (2nd ed.). Boston: PWS-KENT Pub. Co.
Argyris, C. (1997). Learning and teaching: A theory of actionperspective. Journal of Management Education, 21(1), 9–26.
Banker, R. D. and Kemerer, C. F. (1989). Scale economies in newsoftware development. IEEE Transactions on Software Engineering, 15(9),1199–1205.
Bean, L. A. and Hott, D. D. (2005). Wiki: A speedy new tool tomanage projects. Journal of Corporate Accounting & Finance, 16(5), 3–8.
Belanger, F., Collins, R. W. and Cheney, P. H. (2001). Technologyrequirements and work group communication for telecommuters.Information Systems Research, 12(2), 155-176.
Benbasat, I. and Lim, L. (1993). The effects of group task, context,and technology variables on the usefulness of group support systems: AMeta-Analysis. Small Group Research, 24, 30–46.
Berndt, T. J. (1992). Child Development. New York: Holt, Rinehartand Winston.
Bettenhausen, K. L. (1991). Five years of group research: What havewe learned and what needs to be addressed. Journal of Management, 17,345–381.
Brynjolfsson, E. and Yang, S. (1996). Information technology andproductivity: A review of the literature. Advances in Computers, 43,179–214.
Carmines, E. G. and Zeller, R. A. (1979). Reliability and ValidityAssessment. Beverly Hills, CA: Sage Publications.
Chen, T. (2003). Globalization of E-commerce: Environment andpolicy of taiwan. Communications of the Association for InformationSystems, 12(1), 326–353.
Chizmar, J. F. and Zak, T. A. (1983). Modeling multiple outputs ineducational production functions. American Economic Review, 73(2),18–22.
Christensen, L. R., and Greene, W. H. (1976). Economies of scale in
Balázs Heidrich – Richárd Kása – Wesley Shu
111
U.S. electric power generation. Journal of Political Economy, 84(4),655–676.
Christensen, L. R., and Jorgenson, D. (1969). The Measurement of USReal Capital Input, 1927-1967. Rewiev of Income and Wealth, 15,293–320.
Chu, S. K. W. and Kennedy, D. M. (2011). Using online collaborativetools for groups to co-construct knowledge. Online Information Review,35(4), 581–597.
Church, J. and Gandal, N. (1992). Network effects, softwareprovision, and standardization. Journal of Industrial Economics, 40(1),85–103.
Church, J. and Gandal, N. (1993). Complementary networkexternalities and technological adoption. International Journal ofIndustrial Organization, 11(2), 239–260.
Cohen, W. M. and Levinthal, D. A. (1990). Absorptive capacity: Anew pespective on learning and innovation. Administrative ScienceQuarterly, 35, 128–152.
Cronbach, L. J. (1951). Coefficient alpha and the internal structure oftests. Psychometrika, 16(3), 297–334.
Dennis, A. R., Hayes, G. S. and Robert, M. D. J. (1999). Businessprocess modeling with group support systems. Journal of ManagementInformation Systems, 15(4), 115–142.
Dyson, J. W., Godwin, P. H. B. and Hazlewood, L. A. (1976). Groupcomposition, leadership orientation, and decisional outcomes. SmallGroup Behavior, 7, 114–128.
Fan, Z. P., Hu, G. F. and Xiao, S. H. (2004). A method for multipleattribute decision-making with the fuzzy preference relation onalternatives. Computers & Industrial Engineering, 46(2), 321–327.
Fornell, C. and Larcker, D. F. (1981). Evaluating structural equationmodels with unobservable variables and measurement error. Journal ofMarketing Research, 18(1), 39–50.
Goodhue, D. L. (1988). IS Attitudes: Toward Theoretical andDefinition Clarity. Information Systems, Winter, 6–15.
Goodhue, D. L. (1998). Development and Measurement Validity of a
Welcome to the machine
112
Task-Technology Fit Instrument for User Evaluations of InformationSystems. Decision Sciences, 29(1), 105–139.
Goodhue, D. L. and Thompson, R. L. (1995). Task-technology fit andindividual performance. MIS Quarterly, 19(2), 213–236.
Greenstein, S. (1998). The economic contribution of informationtechnology: Value indicators in international perspective. Paris:Organization for Economic and Cooperative Development.
Grover, V., Teng, J., Segars, A. H. and Fiedler, K. (1998). The influenceof information technology diffusion and business process change onperceived productivity: The IS executive’s perspective. Information &Management, 34(3), 141–159.
Hair, J., Black, W., Babin, B. and Anderson, R. (2010). Multivariatedata analysis (7th ed.). Upper Saddle River, NJ: Prentice-Hall.
Hasan, H. and Ptaff, C. C. (2006). The wiki: An environment torevolutionise employees’ interaction with corporate knowledge. InProceedings of OZCHI06, the CHISIG Annual Conference onHuman-Computer Interaction, pp. 377–380.
Hill, G. W. (1982). Group versus individual performance. Are N+1heads better than one? Psychology Bulletin, 91, 517–539.
Hoffman, L. R. and Maier, N. R. (1961). Quality and acceptance ofproblem solutions by members of culturally homogenous andheterogeneous groups. Journal of Abnormal Psychology, 62, 401–407.
Hurst, D. K., Rush, J. C. and White, R. E. (1989). Top managementteams and organizational renewal. Strategic Management Journal,10(Special Issue), 87–105.
Jessup, L. and Valacich, J. (1993). Group support systems: A newfrontier. New York: MacMillan.
Jonscher, C. (1983). Information resources and economic productivityInformation resources and economic productivity. Cambridge, MA:Massachusets Institute of Technology, Center for Information SystemsResearch, Sloan School of Management.
Jöreskog, K. G. (1969). A general approach to confirmatory factoranalysis. Psychometrika, 34, 183–202.
Kaiser, J. F. (1974). Using the I0 - sinh Window Function. IEEE
Balázs Heidrich – Richárd Kása – Wesley Shu
113
Transactions on Circuits and Systems - Fundamental Theory andApplications, April, 123–126.
Katz, M. L. and Shapiro, C. (1994). Systems competition and networkeffects. Journal of Economic Perspectives, 8(2), 93–115.
Kauffman, R. and Weill, P. (1989). An evaluative framework forresearch on the performance effects of information technologyinvestment. In Proceedings of the Tenth International Conference onInformation Systems, pp. 377–388.
Kelley, M. R. (1994). Productivity and information technology: Theelusive connection. Management Science, 40(11), 1406–1425.
Klein, E. E. and Dologite, D. G. (2000). The role of computer supporttools and gender composition in innovative information system ideageneration by small groups. Computers in Human Behavior, 16(2),111–139.
Kumar, K., Subramanian, R. and Nonis, S. A. (1991). Culturaldiversity’s impact on group processes and performance: Comparingculturally homogenous and culturally diverse work groups engaged inproblem solving tasks. In Southern Management Association Proceedings,Atlanta.
Lam, A. (2004). Organizational Innovation. In J. Fagerberg, D. C.Mowery, and R. R. Nelson (Eds.), The Oxford Handbook of Innovation.Oxford: Oxford University Press.
Lin, C., Yu-Hao, C. and Shu, W. (2012). The Effectiveness of Wikis’Knowledge Sharing on Decision Quality, Productivity, and Satisfaction.In J. G. Cegarra (Ed.), Proceedings of the 13th European Conference onKnowledge Management. Cartagena: Universidad Politécnica deCartagena, p. 209.
Ling, S. C. (1990). The effects of group cultural composition andcultural attitudes on performance. London, ON: The University ofWestern Ontario.
List, J. A., Sadoff, S. and Wagner, M. (2010). So You Want to Run anExperiment, Now what? Some Simple Rules of Thumb for OptimalExperimental Design. Experimental Economics, 14(4), 439-457.
Marquadt, M. J. and Horvath, L. (2001). Global Teams: How Top
Welcome to the machine
114
Multinationals Span Boundaries and Cultures with High-speed Teamwork.Palo Alto, CA: Davies-Black.
Mattison, D. (2003). Quickiwiki, swiki, twiki, zwiki, and the plonewars: Wiki as PIM and collaborative content tool. Searcher: The Magazinefor Database Professionals, 11(4), 32–48.
Maznevski, M. L. (1994). Understanding Our Differences:Performance in Decision-making Groups with Diverse Members. HumanRelations, 47, 531–552.
McAfee, A. P. (2006). Enterprise 2.0: The Dawn of EmergentCollaboration. MIT Sloan Management Review, 47(3), 21.
McGrath, J. E. (1984). Groups: Interaction and performance.Englewood Cliffs, NJ: Prentice-Hall.
McLeod, P. L. and Lobe, S. A. (1992). The effects of ethnic diversityon idea generation in small groups. In Academy of Management AnnualMeeting Best Papers Proceedings, pp. 227–231.
Mulaik, S. A., James, L. R., Van Alstine, J., Bennett, N., Lind, S. andStilwell, C. D. (1989). Evaluation of goodness-of-fit indices for structuralequation models. Psychological Bulletin, 105(3), 430-445.
Nunamaker Jr, J. F., Briggs, R. O., Mittleman, D. D., Vogel, D. R. andBalthazard, P. A. (1996). Lessons from a dozen years of group supportsystems research: A discussion of lab and field findings. Journal ofManagement Information Systems, 163–207.
Ruhe, J. A. (1978). Effect of leader sex and leader behaviour on groupproblem-solving. In Proceedings of the American Institute for DecisionSciences, Northeast Division, pp. 123–127.
Ruhe, J. A. and Allen, W. R. (1977). Differences and similaritiesbetween black and white leaders. In Proceedings of the American Institutefor Decision Sciences, Northeast Division, pp. 30–35.
Salas, E., Dickinson, T. L., Converse, S. A. and Tannenbaum, S. I.(1992). Toward an understanding of team performance and training. InSwezey, R. W., Salas, E. (eds.) Teams: Their Training and Performance,Westport, CT: Ablex Publishing, pp. 3–29.
Schneider, S. C. and Barsoux, J. L. (2003). Managing Across Cultures(2nd ed.). Englewood Cliffs, NJ: Prentice-Hall, Inc.
Balázs Heidrich – Richárd Kása – Wesley Shu
115
Schreiber, J. B., Stage, F. K., King, J., Nora, A. and Barlow, E. A.(2006). Modeling and Confirmatory Factor Analysis Results: A Review.The Journal of Educational Research, 99(6), 323–338.
Shaw, M. E. (1983). Group dynamics: The psychology of small goupbehavior. New York: McGraw-Hill.
Shu, W. and Cheng, C. Y. (2012). How to improve consumer attitudestoward using credit cards online: An experimental study. ElectronicCommerce Research and Applications, 11(4), 335–345.
Shu, W. and Lee, S. (2003). Beyond Productivity - Productivity andthe Three Types of Efficiency of Information Technology Industry.Information and Software Technology, 45(8), 513–524.
Shu, W. and Yu-Hao, C. (2011). The Behavior of Wiki Users. SocialBehavior and Personality (SSCI), 39(6), 851–864.
Shu, W. and Yu-Hao, C. (2012). Wikis as an effective group writingtool: A study in Taiwan. Online Information Review, 36(1), 89.
Snedecor, G. W. and Cochran, W. G. (1989). Statistical Methods (8thed.). Ames: Iowa State University Press.
Stratford, J. and Davenport, J. (2008). Unit knowledge management.Intelligent Computer Mathematics, 1, 382–397.
Tabachnick, B. G. and Fidell, L. S. (2007). Using multivariate statistics(5th ed.). Boston, MA: Allyn and Bacon.
Trkman, M. and Trkman, P. (2009). A wiki as intranet: A criticalanalysis using the delone and McLean model. Online Information Review,33(6), 1087–1102.
Venkatesh, V., Morris, M. G., Gordon, B. D. and Davis, F. D. (2003).User acceptance of information technology: Toward a unified view. MISQuarterly, 27(3), 425–478.
Wagner, C. and Bolloju, N. (2005). Supporting knowledgemanagement in organizations with conversational technologies:Discussion forums, weblogs, and wikis. Journal of DatabaseManagement, 16(2).
Watson, W. E., Kumar, K. and Michaelson, L. K. (1993). CulturalDiversity’s Impact on Interaction Process and Performance: ComparingHomogenous and Diverse Task Groups. Academy of Management Journal,36, 590–602.
Welcome to the machine

116
Wheaton, B., Muthen, B., Alwin, D. F. and Summers, G. F. (1977).Assessing reliability and stability in panel models. SociologicalMethodology, 8, 84–136.
Zigurs, I. and Buckland, B. K. (1998). A theory of task/technology fitand group support systems effectiveness. MIS Quarterly, 22(3), 313–334.
Balázs Heidrich – Richárd Kása – Wesley Shu
117
Hungary is not favourably ranked in the various competitiveness andinnovation lists. If enterprises want to develop, they do not only needfinancial capital (among other factors), but also a high level of innovativeactivity and cooperative social capital. The basis of cooperation is trust; at thesame time, Hungary is an individualistic society with a closed mindset wherepeople follow their own aims and goals. Owing to the “knowledge is power”and “zero-sum game” way of thinking, even if enterprises develop, they do iton their own and trust usually stays within the organizational framework.
The aim of this paper is to look into the relation of trust and innovation. Iendeavor to explore the way trust influences innovative activities, thecooperation of business actors as well as economic performance along the way.In the first part of the paper, after a short overview of the relevant literature, anattempt will be made at exploring the influence of trust on innovation in theworking practices of Hungarian SMEs. In the second part of the study,preliminary research data are presented in order to verify the hypotheses thatarose on the basis of the literature as well as to identify further factorscontributing to the understanding of the phenomenon of innovation and itsrelation with trust.
Based on my researches, I found a medium-strength positive correlationbetween trust and innovative pursuits. The reason for the relation’s strength isthat innovation is not only affected by trust but by other factors as well, likecustomer and supplier relations or network-type cooperation within thecluster, corporate tax, the problem of risk capital etc.
Keywords: cooperation, innovation, social capital, SMEs, trust.JEL code: M10.
IntroductionIn line with international researches and literature data trust has a
strong influence on the economic actors’ innovative tendencies and their
1 PhD, assistant professor, Óbuda University, Keleti Faculty of Business andManagement, e-mail: [email protected].
Trust and innovationin Hungarian SMEs
ILDIKÓ MAROSI1
118
willingness thereof. Based on the Global Innovation Index scores for2012, Hungary was placed 31st in the world rankings, which is a quitegood rank. However, turning our attention to the most up-to-date figureswe can discover that, e.g., on innovation linkages, Hungary ranked only53rd (Cornell University et al. 2013). Its 88th position on the state of clusterdevelopment is yet another indicator to show that the Hungarianeconomy is in urgent need of change in its economic and social practices,namely its reluctance to facilitate collaboration.
Accordingly, two of the major drivers of the competitiveness ofcompanies and industries are trust and innovation (Kiss 2013). SinceHungary does not rank among the top-performing countries, it is ofutmost importance that innovation, especially among SMEs, is fosteredand developed.
The aim of this paper is to look into the relation of trust andinnovation. I endeavor to explore the way trust influences innovativeactivities, the cooperation of business actors, as well as economicperformance along the way.
In the first part of the paper after a short overview of the relevantliterature, an attempt will be made at exploring the influence of trust oninnovation in the working practices of Hungarian SMEs.
In the second part of the study, preliminary data of a research on thevery topic is presented in order to verify the hypotheses that arose on thebasis of the literature on the topic, as well as to identify further factorscontributing to the understanding of the phenomenon of innovation andits relation with trust.
Literature reviewInnovationAccording to the Frascati manual, innovation is “turning an idea into
an either freshly marketed or updated product, into a new or updatedprocess to be used in the industry or commerce or into a new viewpointfor a social service” (OECD 1993). Out of the various innovation typesfound in the professional literature, we wish to emphasize openinnovation. The point of the open innovation business model is thateither occasionally or regularly, the company uses outside knowledge in
Ildikó Marosi
119
the initial or perhaps in all phases of the innovation. (Csath 2010). Owingto open innovation, the enterprise is able to enter a new market quickerand it is easier for it to find new technology and get access to new ideas(Mortara et al. 2009). Open innovation builds on social capital andrequires the enterprise to remain open towards its own environment.
Trust as Social Capital FacilitatorThe literature dealing with social capital – with its numerous
definitions – has a history of approximately 100 years, beginning with the1916 definition of Hanifan. Social capital appears in knowledge transferand the ability of the economy to form adaptation techniques (Kun 2008).Social capital is mostly measured with general trust. Fukuyama (1997)also traces a country’s prosperity and competitiveness to a singleprevailing cultural factor, namely the level of trust in the given society.Fukuyama (1995) argues that in lack of trust, partnership at any level cancome about only when partners make, enforce and apply precise rulesand regulations covering all details. If all else fails, then by legal means orother coercive measures. Evidence of insisting on rules, at times evenoverregulation resulting, e.g., in a huge body of written and audio-recordsis common at both micro- and macro-levels, for the sharing ofinformation as well as cooperation call for trust.
The relationships based on trust and cooperation represents asignificant social resource (Kopp and Martos 2011). No matter whethersocial capital is examined from an anthropological, sociological oreconomic perspective, trust will appear as an important factor in allthose approaches. According to Putnam (2000) and Szabó (2011), socialcapital has both direct and indirect influences on economicperformance. Directly, e.g., due to trust, transaction costs as well as thecost of monitoring or that of enforcing contracts go down in just thesame way as the costs of deception or crime. Its indirect influence canbe felt by means of the interaction between human and social resources,through political channels and the link between social capital andinvestment. As a result, actors take more risks and make moreinvestments in physical and human capital. The researches of Takács etal. (2012) among agricultural enterprises verified that cooperation doesreduce transaction costs owing to better agricultural machinery
Trust and innovation in Hungarian SMEs
120
capacity utilization. As a result, farmers are beginning to realize thenecessity of cooperation.
Based on the way social capital is linked to economic performance,the factors of social capital can be divided into two large groups, namelythe factors of social coexistence and those of trust and reciprocity (Kovács2009) and they are all determined by cultural embeddedness. A lack ofbonds of trust and reciprocity between actors of the economy will lead tolow-quality relationships or no relationship at all, and as a consequence,social capital will be wasted. In fact, we are not living in the age of lonewolves. No matter whether financial, technological or human capital isconsidered, cooperation and interaction are essential. Rather thanreadiness for partnership, however, distrust will feed a negative andinward-looking attitude.
Research at organizational level as well as macro studies reviewed bySimon and Tóth (2010), reveal three measures used for trust indexes.First, it is predictability, i.e., a need for rule-driven behaviour. The secondone is expectations implying uncertainty.
Finally, the third one is identified as goodwill, an intention or effortto make progress towards positive goals. A fall in trust may affectmicro-level businesses as well. In order to set up and operate a business itis crucial to cooperate and exhibit an intention to meet the others’ needs,and it is trust that lays the foundations of this attitude (Tóth-Bordásnéand Bencsik 2012). In the Lövey and Nadkarni (2007) model, a successfulorganization is the same as an effective and healthy organization. A lackof trust means failing to fulfill customer or co-worker demand forharmony, which will lead to unsound, inefficient and unsuccessfuloperation; nor can innovation be promoted in an atmosphere of distrustand, as a result, in over-controlled and rigidly hierarchical organizationswhere the motivation for creating and communicating new ideas will beset back (Tóth 2009).
National culture contributes a great deal to economic performance inmeasurable ways (Moon and Choi 2001). In their survey Tóth and hisco-workers (2009) examine the system of values in Hungary, takingInglehart’s (1997) findings based on a large body of research into values,as a point of reference. They have found that:
Ildikó Marosi
121
• Hungary is near the closed-mindedness pole, which is notconnected to the state of economic development or the structure ofsociety.
• in the traditional – religious vs. secular – rational scale, preferenceis given to the secular – rational way of thinking.
• in terms of the value system, self-actualization turns out to be lesscharacteristic, while distrust is prevalent in large measure in thepopulation.
In addition, according to the typical Hungarian mindset, success inbusiness transactions equals to being on the receiving end of zero-sumgames. This mindset cannot promote the idea of achieving economicsurplus through mutual benefits or that of succeeding through fair playand cooperation, without either party losing the game at the same time(Tóth 2009). In individualistic societies, such as Hungary, the bases ofindividual labour are individual needs and motivations, actors strive toachieve their individually best position (Lazányi 2012). Accordingly,trust is not a relevant economical phenomenon. Undoubtedly, thisattitude continues to negatively affect the country’s position through aninability to articulate shared interests and wasted opportunities tocollaborate resulting in failed attempts to be in competition or gain acompetitive advantage.
When analyzing OECD reports on Hungary, innovation seems to bethe other main hurdle in the way of the economy's prosperity. The mainweaknesses of the Hungarian innovation system are, first of all, alow-level innovative activity combined with a similarly low-level patentactivity. In addition, R&D&I is not regionally balanced, there are notenough innovative SMEs, mobility and collaboration are scarce andhuman resources for R&D&I are insufficient, mainly as far as science andengineering graduates are concerned. The INNOTARS survey (conductedfrom May 2009 to January 2011 by a team led by professor MagdolnaCsath) that was aimed at exploring and evaluating all those factors whichinfluence small- and medium-sized enterprises, their innovative activityalso verified the OECD findings (Csath 2011).
Trust and reciprocity are crucial for innovation. Varga (2012. 19)defines the higher synergy produced by higher social capital as the
Trust and innovation in Hungarian SMEs
122
re-vitality of the effect of social capital, which makes change,development and modernization simple. In addition, he sets up “veryclose direct proportion” between economic revitalization and innovation.
All in all, actors in a relationship of trust are interdependent. Trustforms the basis not only for building exchange relationships but also forworking around uncertainty and risks. The key to organizational trust isthat leaders are capable of building trust in a certain organization,irrespective of the field of operation, workforce or form of business,which brings organizational trust dividends, i.e. an increased value,faster growth, more innovation, more effective cooperation, stablepartnerships and stronger loyalty.
According to my previous research of 2008-2009 called “TertiaryKnowledge Management, Internal and External Cooperation Features,”conducted among 486 enterprises, there is remarkably little cooperationor even willingness to cooperate between enterprises and tertiaryinstitutions; this is true regardless of the size of the organization. Wherethere was established relationship, it was mostly dominated byshort-term entrepreneurial interests, although the knowledge effect of theuniversities should be an important factor (Tóth-Bordásné 2011).
Borbás (2007) conducted another research in the North-Hungarianregion, finding that half of the sample from that local region had noturnover, which meant they had no effective economic connectionseither. The companies in question mostly cooperated with companiesfrom the capital in product development (34.8%), while 27% of themcooperated with others in putting their products on the market.
Vadasi (2009) also conducted a research in one of the local regions inNorth-Hungary and found that most business relations are kept together bybusiness savvy and tactics. Entrepreneurs are more willing to slow downthe development of their own companies than to take a risk and shareknowledge or cooperate with a partner who is not worthy of their trust.
Vadasi (2009) claims that enterprises keep their information andcooperation within the frames of micro-networks. Relationship betweendevelopment institutions, incubator houses, chambers, clusters and localenterprises is scarce, and entrepreneurs clearly mistrust the public sectorand official regulations (Borbás 2007, Vadasi 2009).
Ildikó Marosi
123
Interpreting cooperation at organizational level, I used my aboveresearch to examine company expectations towards employees.Employers primarily expect their workforce to be frank and fair, while theability to work in a group ranked fifth, ethical norms ranked sixth andhelping colleagues ranked eighth. I revealed that employers receive moreobedience and flexibility from new entrants, but they expect morecreativity than what they get. Participation in team-work is an everydaypractice within companies.
Borbás (2007) and Vadasi (2008) pointed out in their researches thatthe enterprises they interviewed would like to find loyal workforcewhich is able to bear heavier workload, while they are reluctant to spendon further training or R&D.
In the research described in this paper, the two main influencingfactors, namely trust and innovation are addressed together. I was aimingat not only verifying the research results of many others on the topic, butbroaden the state of understanding factors influencing economic growthby searching for a connection between trust and innovation. The purposeof the paper is to provide yet another proof for the fact that:
H1: The level of innovation cooperation among SMEs is low.H2: There are co-worker innovative activities within companies, but
firms refuse to spend money on it.H3: Internal cooperation and trust increase innovative capabilities of
companies.
Methodology and participants in the researchPresent data are an outcome of a broad explorative questionnaire
addressing five main topics: changes after Hungary’s joining to the EU,innovation activity of enterprises, R&D activity of enterprises, questionsabout market competition and background information aboutenterprises. It has been forwarded to 1800 enterprises altogether, whichwere asked to use a channel of their choice to return their answers bypost, fax, e-mail or in person. The selection of enterprises was carried outusing the method of stratified sampling, the stratifying criteria beingregion, operation field and workforce. Out of the incomingquestionnaires, 814 were found suitable for further examination.
Trust and innovation in Hungarian SMEs
124
The questionnaire consisted of 32 questions, 19 closed-format and13 open-format questions. Most of the closed-format (multiple-choice)questions were yes/no or dichotomous closed-format questions (nominalscales). The 13 open-format (unstructured) questions served the purposeof providing details of the enterprises as well as the respondents’opinions.
The statistical analysis of the questionnaires was done with the SPSS17.00 program. After preparing (checking and repairing) for an analysisthe data obtained from our quantitative survey a decision had to be madeas to how to treat missing data. As we did not consider using the methodof replacing the missing data with averages, we opted to omit the unitswith missing data. Therefore, we indicated the number of answers foreach part of the analysis, for the sake of clarity.
We started our analysis using the method of simple descriptivestatistics (arithmetic mean, frequency), which also formed the basis offurther analyses. Bearing in mind that most of the survey questionsincluded nominal scales, as a rule we calculated frequencies andarithmetic means. To examine a correlation between two qualitativevariables, we applied a cross-tabulation analysis to show thecombined frequency distribution of variants of the criteria at issue andPearson’s �² statistics was used to measure statistical significance ofthe correlation of two variables. The analysis was carried out at a 5%empirical significance level (95% of reliability), which is a generallyaccepted practice in economic analyses. It was most interesting todiscover an intensity of connections in the proved correlations. In ourresearch, the intensity of associative connections was measured withCramer’s V coefficient, which is generally applied and which can be inthe range [0-1].
Results and discussionSample specificationsAs regards workforce, the details of the 746 enterprises are obtained
from the questionnaires. Based on the criteria defined by the EU, asignificant number of the enterprises included in the sample (42.6%)qualify as micro-enterprises, one third (32.7%) as small enterprises and
Ildikó Marosi
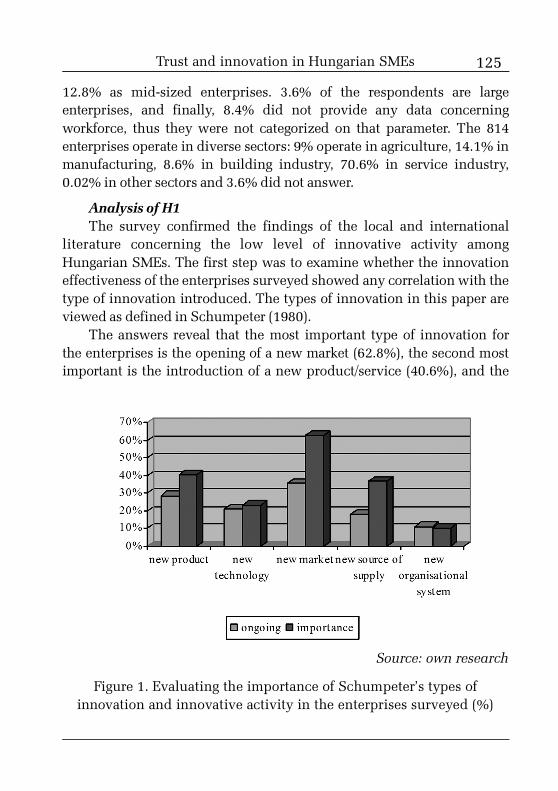
125
12.8% as mid-sized enterprises. 3.6% of the respondents are largeenterprises, and finally, 8.4% did not provide any data concerningworkforce, thus they were not categorized on that parameter. The 814enterprises operate in diverse sectors: 9% operate in agriculture, 14.1% inmanufacturing, 8.6% in building industry, 70.6% in service industry,0.02% in other sectors and 3.6% did not answer.
Analysis of H1The survey confirmed the findings of the local and international
literature concerning the low level of innovative activity amongHungarian SMEs. The first step was to examine whether the innovationeffectiveness of the enterprises surveyed showed any correlation with thetype of innovation introduced. The types of innovation in this paper areviewed as defined in Schumpeter (1980).
The answers reveal that the most important type of innovation forthe enterprises is the opening of a new market (62.8%), the second mostimportant is the introduction of a new product/service (40.6%), and the
Source: own research
Figure 1. Evaluating the importance of Schumpeter’s types ofinnovation and innovative activity in the enterprises surveyed (%)
Trust and innovation in Hungarian SMEs
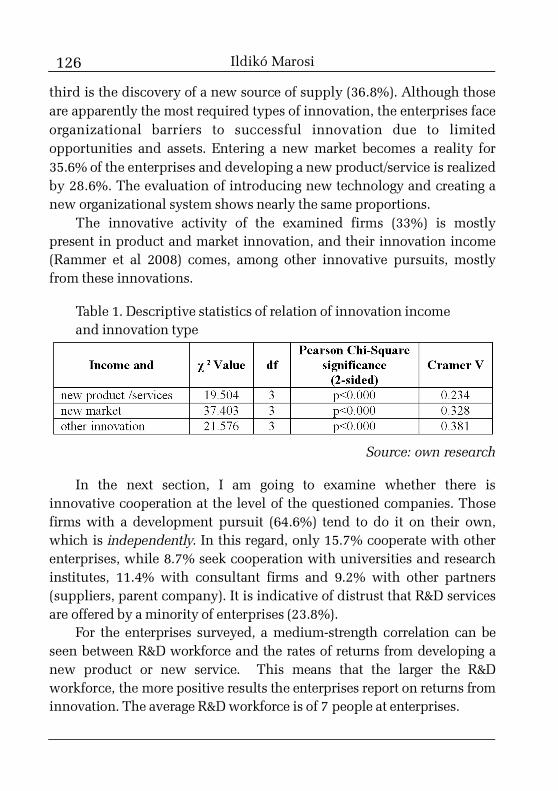
126
third is the discovery of a new source of supply (36.8%). Although thoseare apparently the most required types of innovation, the enterprises faceorganizational barriers to successful innovation due to limitedopportunities and assets. Entering a new market becomes a reality for35.6% of the enterprises and developing a new product/service is realizedby 28.6%. The evaluation of introducing new technology and creating anew organizational system shows nearly the same proportions.
The innovative activity of the examined firms (33%) is mostlypresent in product and market innovation, and their innovation income(Rammer et al 2008) comes, among other innovative pursuits, mostlyfrom these innovations.
Table 1. Descriptive statistics of relation of innovation incomeand innovation type
Source: own research
In the next section, I am going to examine whether there isinnovative cooperation at the level of the questioned companies. Thosefirms with a development pursuit (64.6%) tend to do it on their own,which is independently. In this regard, only 15.7% cooperate with otherenterprises, while 8.7% seek cooperation with universities and researchinstitutes, 11.4% with consultant firms and 9.2% with other partners(suppliers, parent company). It is indicative of distrust that R&D servicesare offered by a minority of enterprises (23.8%).
For the enterprises surveyed, a medium-strength correlation can beseen between R&D workforce and the rates of returns from developing anew product or new service. This means that the larger the R&Dworkforce, the more positive results the enterprises report on returns frominnovation. The average R&D workforce is of 7 people at enterprises.
Ildikó Marosi
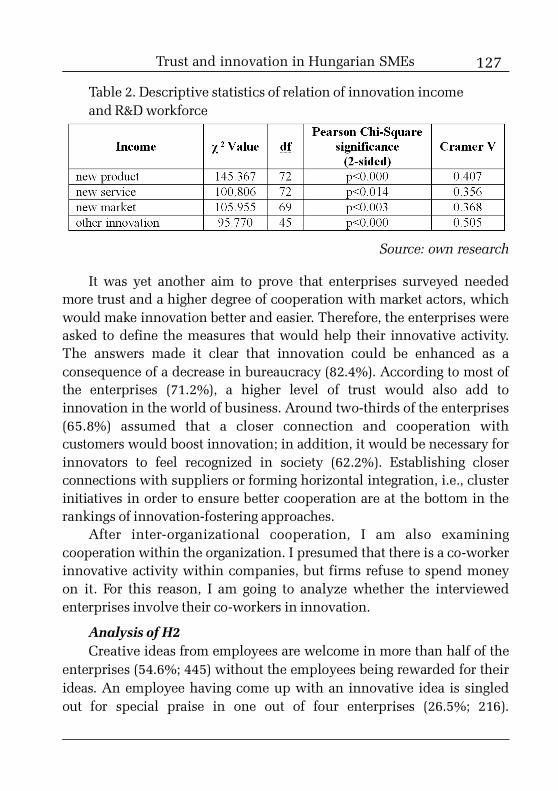
127
Table 2. Descriptive statistics of relation of innovation incomeand R&D workforce
Source: own research
It was yet another aim to prove that enterprises surveyed neededmore trust and a higher degree of cooperation with market actors, whichwould make innovation better and easier. Therefore, the enterprises wereasked to define the measures that would help their innovative activity.The answers made it clear that innovation could be enhanced as aconsequence of a decrease in bureaucracy (82.4%). According to most ofthe enterprises (71.2%), a higher level of trust would also add toinnovation in the world of business. Around two-thirds of the enterprises(65.8%) assumed that a closer connection and cooperation withcustomers would boost innovation; in addition, it would be necessary forinnovators to feel recognized in society (62.2%). Establishing closerconnections with suppliers or forming horizontal integration, i.e., clusterinitiatives in order to ensure better cooperation are at the bottom in therankings of innovation-fostering approaches.
After inter-organizational cooperation, I am also examiningcooperation within the organization. I presumed that there is a co-workerinnovative activity within companies, but firms refuse to spend moneyon it. For this reason, I am going to analyze whether the interviewedenterprises involve their co-workers in innovation.
Analysis of H2Creative ideas from employees are welcome in more than half of the
enterprises (54.6%; 445) without the employees being rewarded for theirideas. An employee having come up with an innovative idea is singledout for special praise in one out of four enterprises (26.5%; 216).
Trust and innovation in Hungarian SMEs
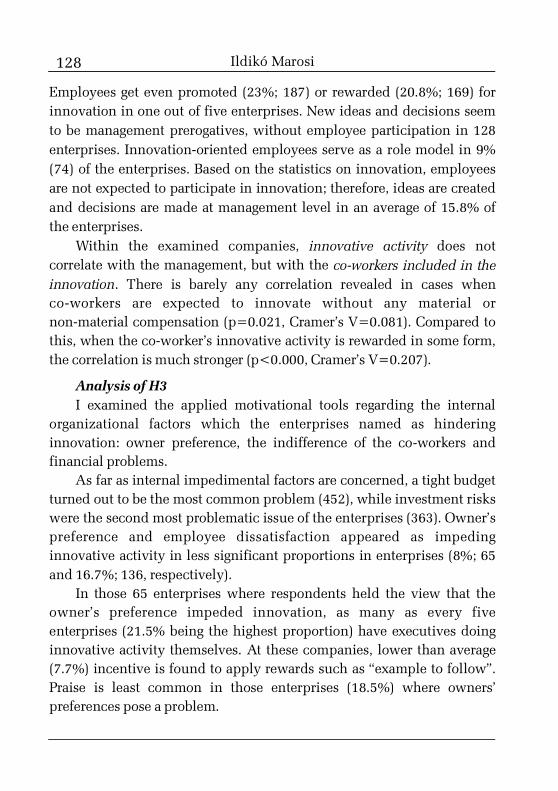
128
Employees get even promoted (23%; 187) or rewarded (20.8%; 169) forinnovation in one out of five enterprises. New ideas and decisions seemto be management prerogatives, without employee participation in 128enterprises. Innovation-oriented employees serve as a role model in 9%(74) of the enterprises. Based on the statistics on innovation, employeesare not expected to participate in innovation; therefore, ideas are createdand decisions are made at management level in an average of 15.8% ofthe enterprises.
Within the examined companies, innovative activity does notcorrelate with the management, but with the co-workers included in theinnovation. There is barely any correlation revealed in cases whenco-workers are expected to innovate without any material ornon-material compensation (p=0.021, Cramer’s V=0.081). Compared tothis, when the co-worker’s innovative activity is rewarded in some form,the correlation is much stronger (p<0.000, Cramer’s V=0.207).
Analysis of H3I examined the applied motivational tools regarding the internal
organizational factors which the enterprises named as hinderinginnovation: owner preference, the indifference of the co-workers andfinancial problems.
As far as internal impedimental factors are concerned, a tight budgetturned out to be the most common problem (452), while investment riskswere the second most problematic issue of the enterprises (363). Owner’spreference and employee dissatisfaction appeared as impedinginnovative activity in less significant proportions in enterprises (8%; 65and 16.7%; 136, respectively).
In those 65 enterprises where respondents held the view that theowner’s preference impeded innovation, as many as every fiveenterprises (21.5% being the highest proportion) have executives doinginnovative activity themselves. At these companies, lower than average(7.7%) incentive is found to apply rewards such as “example to follow”.Praise is least common in those enterprises (18.5%) where owners’preferences pose a problem.
Ildikó Marosi
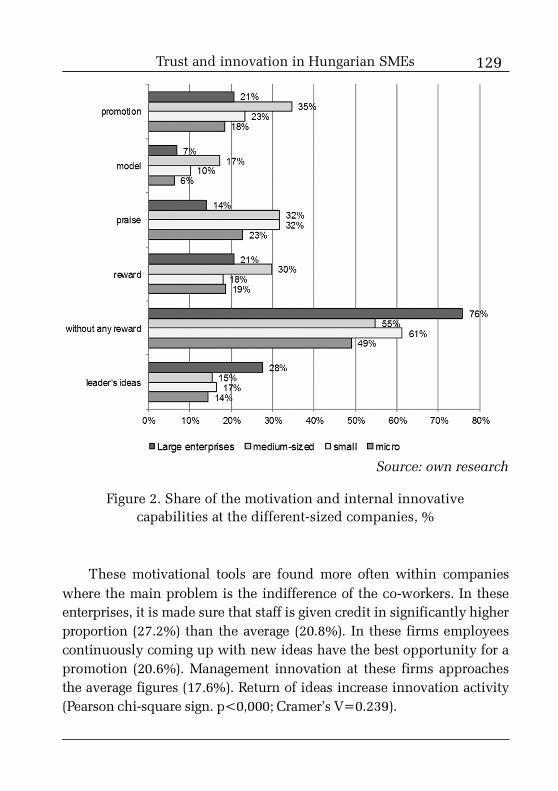
129
These motivational tools are found more often within companieswhere the main problem is the indifference of the co-workers. In theseenterprises, it is made sure that staff is given credit in significantly higherproportion (27.2%) than the average (20.8%). In these firms employeescontinuously coming up with new ideas have the best opportunity for apromotion (20.6%). Management innovation at these firms approachesthe average figures (17.6%). Return of ideas increase innovation activity(Pearson chi-square sign. p<0,000; Cramer’s V=0.239).
Source: own research
Figure 2. Share of the motivation and internal innovativecapabilities at the different-sized companies, %
Trust and innovation in Hungarian SMEs
130
ConclusionsTrust, one of the pillars of social capital, permeates our everyday life
to a degree that its presence or absence has become the focus of myresearch. The aim of this paper is to prove from a theoretical andpractical point of view that trust and cooperation positively correlatewith the innovative activity of enterprises.
I conducted a secondary research in the relevant literature and foundthat Hungary is characterized by low innovative activity and equally lowsocial capital. My primary research confirmed this claim. I could alsoverify that the few existing innovative enterprises pursuit all suchactivities on their own: they refuse to open to or cooperate with others.The innovation normally derived from cooperation is also low, and it ischaracterized and dominated by corruption, bureaucracy, power anddecision-making distances etc. – factors which are the subject of anotheressay (Marosi 2013). Although the results show that co-workers seem toparticipate in such activities, the enterprise itself mostly fails to give“due” compensation for their effort. The general opinion seems to be thatsuch contribution from the employer is the expected norm, and if this istrue, we cannot speak about real trust within the organization.
My researches verified a medium-strength positive correlationbetween trust and innovative pursuits. The strength of the relation canbe explained by the fact that innovation is not only affected by trust, butby other factors as well like customer and supplier relationship,network-type cooperation within the cluster, corporate tax, the problemof risk capital etc.; these factors also mark the continuation and newdirections of the research.
ReferencesBorbás, L. (2007). A KKV-k versenyképességének empirikus
vizsgálata az Észak-magyarországi régióban. In Gulyás, L. (ed.) Régiók aKárpát-medencén innen és túl. Baja: EJF, pp. 104.
Covey, S. M. R. and Merill, R. R. (2011). A bizalom sebessége. Arejtett tényezõ, ami mindent megváltoztat. Budapest: HVG Kiadó.
Fukuyama, F. (1997). Bizalom. Budapest: Európa Kiadó.Csath M. (ed.) (2011). Az innovációt segítõ és hátráltató tényezõk
Ildikó Marosi
131
vizsgálata a hazai KKV-k körében. Research final study. Székesfehérvár:Kodolányi János University College of Applied Sciences.
Csath M. (2010). Versenyképesség-menedzsment. Budapest:Nemzeti Tankönyvkiadó.
GII (2013). Global Innovation Index 2013 Edition.http://www.globalinnovationindex.org/content.aspx?page=GII-Home,downloaded at 12.10.2013.
IMD (2013). World Competitiveness Yearbook 2013.http://www.imd.org/wcc/wcy-world-competitiveness-yearbook,downloaded at 12.10.2013.
Kiss, J. (2013). Az innováció hatása a vállalati teljesítményre ésversenyképességre. http://edok.lib.uni-corvinus.hu/476/, downloaded at18.02.2013.
Kopp, M. and Martos, T. (2011). A magyarországi gazdaságinövekedés és a társadalmi jóllét, életminõség viszonya. Budapest:Hungarian Psychophysiological and Healthpsychological Association.http://www.nefbudapest.org/index.php?article=1057&langcode=hu,downloaded at 12.10.2013.
Kovács, T. (2009). A kísérleti gazdaságtan szerepe a társadalmi tõkevizsgálatában. Periodica Oeconomica, 2(May), 185-192.
Lazányi, K. (2012). A társas támogatás szerepe egy individualistatársadalomban. A Virtuális Intézet Közép-Európa KutatásáraKözleményei. 4(2), 51-58.
Lövey I. and Nadkarni, M. S. (2007). Az örömteli szervezet: Vállalatiegészségrõl, betegségekrõl és gyógymódokról vezetõknek éstanácsadóknak. Budapest: HVG Zrt. Kiadó.
Marosi, I. (2013). Innovation Goals and Practices among HungarianSmall and Medium Enterprises. Budapest, In FIKUSZ Symposium forYoung Researchers Proceedings. Budapest: Óbuda University, pp. 7-19.
Moon, H. C. and Choi, E. K. (2001). Cultural Impact on NationalCompetitiveness. Journal of International and Area Studies. 8(2), 21-36.
Mortara, L., Napp, J. J., Slacik, I. and Minshall, T. (2009). How toImplement Open Innovation. Lessons from Studying Large MultinationalCompanies. University of Cambridge, Centre for Technology
Trust and innovation in Hungarian SMEs
132
Management, Institute for Manufacturing. http://www-cikc.eng.cam.ac.uk/wp-content/docs/COIN.pdf, downloaded at 12.10.2013.
OECD (2009). OECD Innovációpolitikai országtanulmányok:Magyarország. Budapest: Nemzeti Kutatási és Technológiai Hivatal.
OECD (1993). Frascati Manual. Proposed Standard Practice forSurveys of Research and Experimental Development. Paris: Organisationfor Economic Co-operation and Development.
Putnam, R. D. (2000). Bowling Alone: The Collapse and Revival ofAmerican Community. New York: Simon and Schuster.
Rammer, C., Czarnitzki, D. and Spielkamp, A. (2008). InnovationSuccess of Non-R&D-Performers. Substituiting Technology byManagement in SMEs. ZEW Discussion Papers, 08-092,ftp:/ftp.zew.de/pub/zew-docs/dp/dp0892.pdf, downloaded at31.08.2010.
Schumpeter, J. A. (1980). A gazdasági fejlõdés elmélete. Budapest:Közgazdasági és Jogi Kiadó.
Simon, J. and Tóth, Zs. (2010). A bizalom alakulása a gazdasági éspénzügyi világválság alatt. Dél-Kelet Európa. South-East EuropeInternational Relations Quarterly, 1(3), 1-8.
Szabó, A. (2011). Társadalmi tõke. University of Debrecen, Facultyof Economics and Business Administration, http://www.doktori.econ.unideb.hu/download/pdf/kutatasiforum/2011jun/Szabo_Andrea.pdf, downloaded at 12.10.2013.
Takács, I., Takácsné György, K. and Baranyai, Zs. (2013). The Role ofTrust in Cooperation Between Farmers – the Outcomes of a Survey inBékés Country. Applied Studies in Agribusiness and Commerce, 6(5),103-114.
Tóth, I. Gy. (2009). A társadalmi kohézió elemei: bizalom,normakövetés, igazságosság és felelõsségérzet – lennének. In Agazdasági felemelkedés társadalmi-kulturális feltételei. Research finalstudy. Budapest: TÁRKI. http://www.tarsadalomkutatas.hu/kkk.php?TPUBL-A-921/publikaciok/tpubl_a_921.pdf, downloaded at12.10.2013.
Tóth, I. Gy. (2009). Bizalomhiány, normazavarok, igazságtalanság-
Ildikó Marosi
133
érzet és paternalizmus a magyar társadalom érték-szerkezetében. In Agazdasági felemelkedés társadalmi-kulturális feltételei. Research finalstudy. Budapest: TÁRKI. http://www.tarsadalomkutatas.hu/kkk.php?TPUBL-A-921/publikaciok/tpubl_a_921.pdf, downloaded at12.10.2013.
Tóth-Bordásné Marosi, I. and Bencsik, A. (2012). Szervezetimagatartás avagy a bizalom ereje. Jegyzet. Gyõr: Universitas-GyõrNonprofit Kft.
Tóth-Bordásné Marosi, I. (2011). Felsõoktatási tudásmenedzsment,avagy külsõ-belsõ együttmûködési sajátosságok. PhD thesis, SzéchenyiIstván University, Doctoral School of Regional and Economic Sciences,http://rgdi.sze.hu/files/Ertekezesek,%20tezisek/Marosi%20Ildiko%20PhD%20ertekezes%202011%20februar.pdf, downloaded at 12.10.2013.
Vadasi, A. (2008). Hálózat és bizalom. A bizalom szerepe avállalkozói hálózatok kialakulásában, mûködésében. PhD thesis.University of Pécs, Faculty of Business and Economics, Doctoral Schoolof Regional Policy and Regional Economics, http://www.rphd.ktk.pte.hu/files/tiny_mce/File/Vedes/Vadasi_Aida_disszertacio.pdf,downloaded at 12.10.2013.
Varga, J. (2012). A társadalmi tõke és az evolucionizmus szerepe ahazai vállalkozások innovációs folyamataiban: a nyitott innováció,http://www.szvt.hu/userfiles/file/Harsanyi%20Istvan%20dij/Harsanyi_Istvan_dij_2012/Varga%20J%C3%A1nos%20-%20osszefoglalo.pdf,downloaded at 12.10.2013.
Trust and innovation in Hungarian SMEs
134
1 This article is the result of a research project supported bySROP-4.2.2.A-11/1/KONV-2012-0058, Modelling the effects of the energyproduction, utilization and waste management technologies to the competitivenessof cities and regions.
2 PhD student, University of Pécs, Faculty of Business and Economics, e-mail:[email protected].
3 PhD, assistant lecturer, University of Pécs, Faculty of Business andEconomics,e-mail: [email protected].
4 PhD, senior lecturer, University of Pécs, Faculty of Business and Economics,e-mail: [email protected].
5 PhD, professor, University of Pécs, Faculty of Business and Economics, e-mail:
Virtual life of men. Gender differencesin Internet using habits and attitudes1
PÉTER NÉMETH2 – ÁKOS ANDRÁS NAGY3 – KRISZTIÁN SZÛCS4 –MÁRIA TÖRÕCSIK5
Recent surveys show that men and women behave differently in theireveryday life, especially during shopping, free time or even housework. Thepresent article aims to present the gender differences in habits, behaviour andattitudes regarding internet usage. We conducted a survey with a sample of2000 respondents which expressed their attitudes towards internet usage andonline behaviour. The sample consists of 956 men and 1044 women. It isimportant and interesting to observe the gender differences related to theaforementioned topics as it allows us to draw further conclusions concerningthe online behaviour of different segments. We analyzed the dissimilarities inhabits (e.g. regularity, length, activities etc.) and attitudes of men and women inthe sample towards internet usage. We focused on men’s virtual life, and this iswhy we also aimed to analyze the generational differences among male internetusers. Furthermore, by using a multivariate analysis, we identified groups ofmen based on their virtual habits and behaviour. We found that, in general, menare more interested in IT than women, while women are usually moreconcerned about internet security. Men use internet with a higher participationrate and also more frequently. Men have a higher participation rate when itcomes to online activities. On the other hand, women perform more socialactivities on the internet with a higher participation rate than men. As we
135
expected, these results show that the difference between the internet usagehabits of men and women exists.
Keywords: internet using, virtual life, gender differences, groups of men.JEL code: M31.
Introduction and objectives“Men and women are different” – it is a common sentence applicable
to almost everything in everyday life. If we think about internet usage, wecan say that men have extensively been associated with technology whilewomen have often been depicted as somewhat passive users (Gad 2012).In our study we present a short review of gender differences concerninginternet usage and internet connected attitudes, such as internet access,mobile internet access, the proportion of smartphone owners, thefrequency of internet usage and internet usage attitudes. Moreover, inorder to see the different types of internet user men we established acluster analysis and identified different groups of male respondents.
At the beginning of our comparable study – in the literature review –we mostly discuss topics in connection with internet usage and onlineshopping. Thus, we can see the differences between the researchpresented in this study and other researches on this topic. At the end ofthe article we compare our results with other researches presented in theliterature review.
Literature reviewGender differences have been of interest to advertisers and marketers
for decades. Alreck and Settle (2002) examined online, catalogue andstore shopping behaviour of men and women. The result of their studyindicated with substantial clarity that women do hold markedly morepositive and less negative attitudes toward the shopping experience.Women have a more favourable view toward shopping and they moreoften use a value to optimise the shopping strategy than men do.According to the study of Alreck and Settle women hold a much morepositive image of store and catalogue shopping than men. Moreover, theyfound that women’s attitude towards internet shopping wereapproximately the same as men’s perspective.
Virtual life of men
136
Van Slyke et al. (2002) demonstrated in their study that women viewWeb-based shopping less favourable than men. They offer a few steps fororganizations to improve women’s perceptions concerning Web-basedshopping. In their opinion, Web merchants may consider using atechnology in order to increase the sense of community by creating asocial forum for their customers. Van Slyke et al. found that women enjoythe social aspect of shopping, so merchants should consider establishingchat rooms and building communities.
Roogers and Harris (2003) examined the attitudes towardse-commerce among different gender internet users. Their findingsrevealed that the women from their sample were less emotionallysatisfied with e-shopping than men, because they were sceptical of thisvenue and did not find it as convenient as males. Men respondentsreported greater trust in internet shopping and perceived the internet as amore convenient shopping outlet than women did. The authors alsofound that men had more positive attitudes toward internet shopping ingeneral. As Roogers and Harris expected, emotion, trust and conveniencepredicted women's negative and men's positive attitudes towards theinternet, emotion and trust predicted the frequency with which malesand females made online purchases during a month. In a nutshell, theirresearch showed that emotion, trust and convenience are three criticaldeterminants of women’s and men's shopping attitudes and behaviour.
Yang and Lester (2005) researched the gender differences ine-commerce. They compared the predictors of online shopping for menand women by using a sample of 365 college students. For men, the onlypredictor of purchasing products online was the number of hours theyspent online. For women, the predictors of making purchases onlineincluded anxiety about using computers and attitudes towards money, inaddition to the number of hours spent online.
Alreck et al. (n.a.) prepared a comparable analysis concerning menand women’s attitudes towards online and store shopping. According totheir results perhaps the most noteworthy difference between men's andwomen's ratings were for the statement “Online shopping is more boringand less fun than store shopping.” Women's enjoyment of store shopping
Németh et al.
137
is obvious as they highly rated the online shopping problem statement.Women were also more concerned than their male counterparts about thetime and effort required to find what they want online. It seems to be thatfor women store shopping is more fun but online shopping is easier. Bycontrast, men appear to feel that online shopping is an effective way toavoid the hassle of store shopping.
Alreck et al. established a generational comparable analysis. Theyanalyzed three groups: seniors, younger respondents and juniors. Theyfound that the senior group of respondents was more concerned than thejunior group about the problems regarding information security and thedifficulty and complexity of online shopping. While the younger groupwas least concerned about the sale of mailing lists, that and the creditcard information security were the two top concerns for all three agegroups.
Based on the above mentioned literature review we can see that thereare differences regarding gender issues in internet using habits,especially when it comes to online shopping habits and attitudes. Withour complex questionnaire one of our aims was to highlight thedifferences about the time spent on the internet, the frequency of internetusage, online activities and also about internet using attitudes. Thus,based on these attitudes, different groups of men will be identified inorder to see different behavioural patterns concerning men’s internetusage.
Research methodsIn our research, we examined 2000 respondents in Hungary with a
face-to-face questionnaire. This questionnaire is a part of a complexresearch at the University of Pécs Faculty of Business and Economics.This research project was supported by SROP-4.2.2.A-11/1/KONV-2012-0058, Modelling the effects of the energy production,utilization and waste management technologies to the competitiveness ofcities and regions.
The sample represented the Hungarian population by the followingdemographic characteristics: gender, age, education, region and theresidence’s type of settlement. We presented a univariate analysis: first,
Virtual life of men
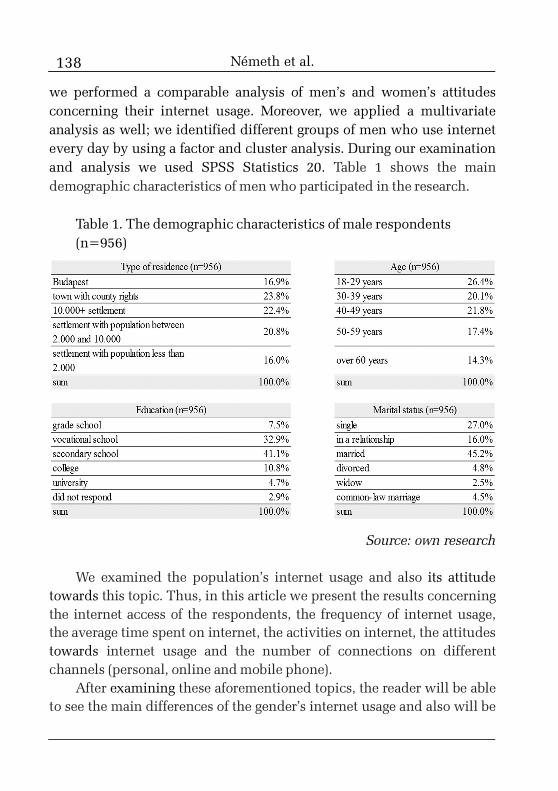
138
we performed a comparable analysis of men’s and women’s attitudesconcerning their internet usage. Moreover, we applied a multivariateanalysis as well; we identified different groups of men who use internetevery day by using a factor and cluster analysis. During our examinationand analysis we used SPSS Statistics 20. Table 1 shows the maindemographic characteristics of men who participated in the research.
Table 1. The demographic characteristics of male respondents(n=956)
Source: own research
We examined the population’s internet usage and also its attitudetowards this topic. Thus, in this article we present the results concerningthe internet access of the respondents, the frequency of internet usage,the average time spent on internet, the activities on internet, the attitudestowards internet usage and the number of connections on differentchannels (personal, online and mobile phone).
After examining these aforementioned topics, the reader will be ableto see the main differences of the gender’s internet usage and also will be
Németh et al.
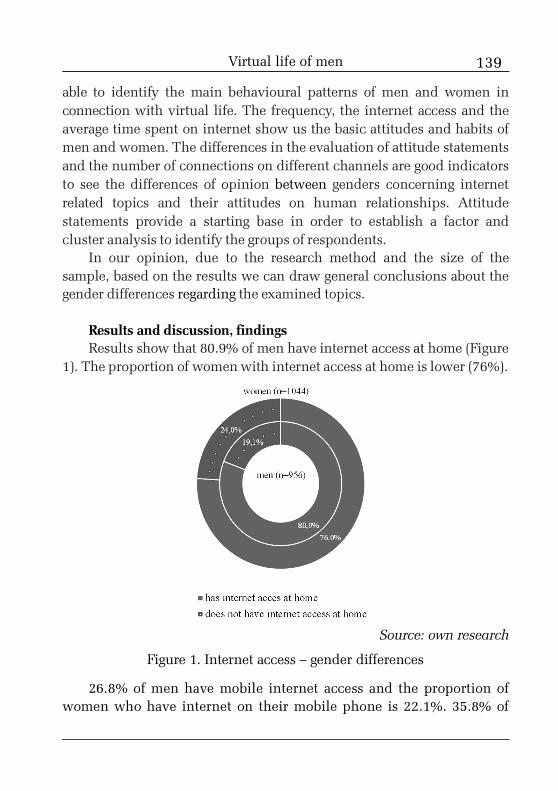
139
able to identify the main behavioural patterns of men and women inconnection with virtual life. The frequency, the internet access and theaverage time spent on internet show us the basic attitudes and habits ofmen and women. The differences in the evaluation of attitude statementsand the number of connections on different channels are good indicatorsto see the differences of opinion between genders concerning internetrelated topics and their attitudes on human relationships. Attitudestatements provide a starting base in order to establish a factor andcluster analysis to identify the groups of respondents.
In our opinion, due to the research method and the size of thesample, based on the results we can draw general conclusions about thegender differences regarding the examined topics.
Results and discussion, findingsResults show that 80.9% of men have internet access at home (Figure
1). The proportion of women with internet access at home is lower (76%).
Source: own research
Figure 1. Internet access – gender differences
26.8% of men have mobile internet access and the proportion ofwomen who have internet on their mobile phone is 22.1%. 35.8% of
Virtual life of men
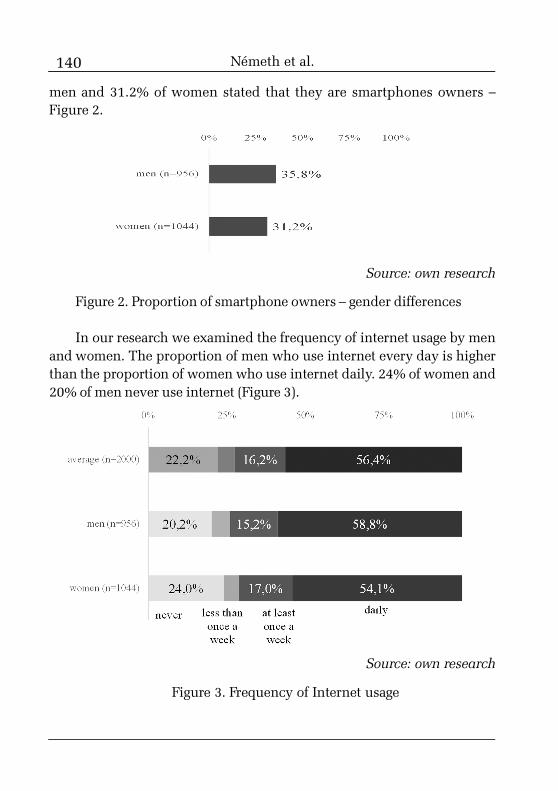
140
men and 31.2% of women stated that they are smartphones owners –Figure 2.
Source: own research
Figure 2. Proportion of smartphone owners – gender differences
In our research we examined the frequency of internet usage by menand women. The proportion of men who use internet every day is higherthan the proportion of women who use internet daily. 24% of women and20% of men never use internet (Figure 3).
Source: own research
Figure 3. Frequency of Internet usage
Németh et al.
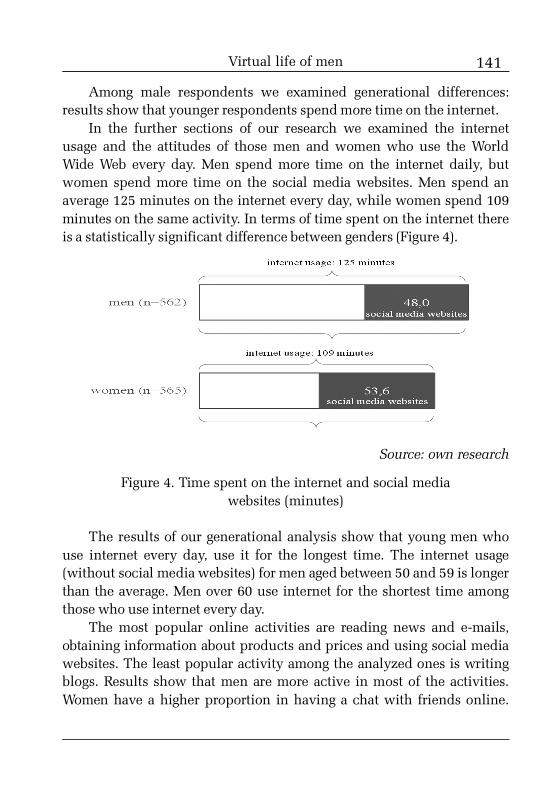
141
Among male respondents we examined generational differences:results show that younger respondents spend more time on the internet.
In the further sections of our research we examined the internetusage and the attitudes of those men and women who use the WorldWide Web every day. Men spend more time on the internet daily, butwomen spend more time on the social media websites. Men spend anaverage 125 minutes on the internet every day, while women spend 109minutes on the same activity. In terms of time spent on the internet thereis a statistically significant difference between genders (Figure 4).
Source: own research
Figure 4. Time spent on the internet and social mediawebsites (minutes)
The results of our generational analysis show that young men whouse internet every day, use it for the longest time. The internet usage(without social media websites) for men aged between 50 and 59 is longerthan the average. Men over 60 use internet for the shortest time amongthose who use internet every day.
The most popular online activities are reading news and e-mails,obtaining information about products and prices and using social mediawebsites. The least popular activity among the analyzed ones is writingblogs. Results show that men are more active in most of the activities.Women have a higher proportion in having a chat with friends online.
Virtual life of men
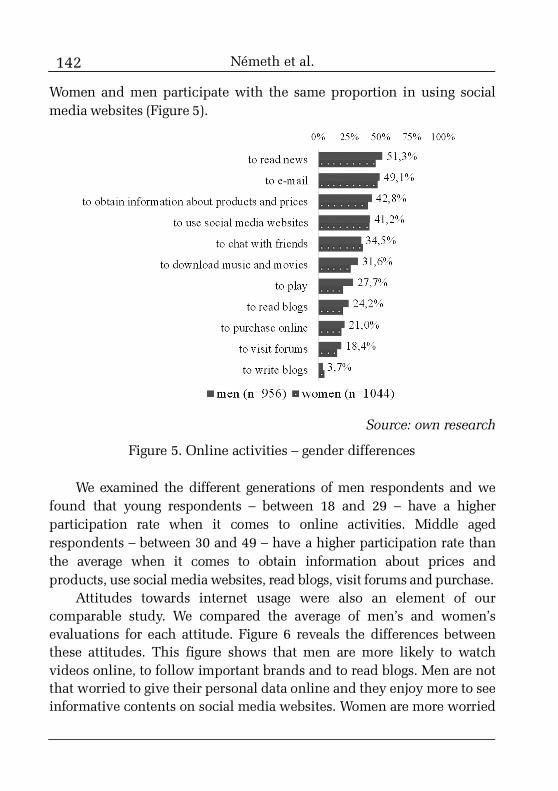
142
Women and men participate with the same proportion in using socialmedia websites (Figure 5).
Source: own research
Figure 5. Online activities – gender differences
We examined the different generations of men respondents and wefound that young respondents – between 18 and 29 – have a higherparticipation rate when it comes to online activities. Middle agedrespondents – between 30 and 49 – have a higher participation rate thanthe average when it comes to obtain information about prices andproducts, use social media websites, read blogs, visit forums and purchase.
Attitudes towards internet usage were also an element of ourcomparable study. We compared the average of men’s and women’sevaluations for each attitude. Figure 6 reveals the differences betweenthese attitudes. This figure shows that men are more likely to watchvideos online, to follow important brands and to read blogs. Men are notthat worried to give their personal data online and they enjoy more to seeinformative contents on social media websites. Women are more worried
Németh et al.
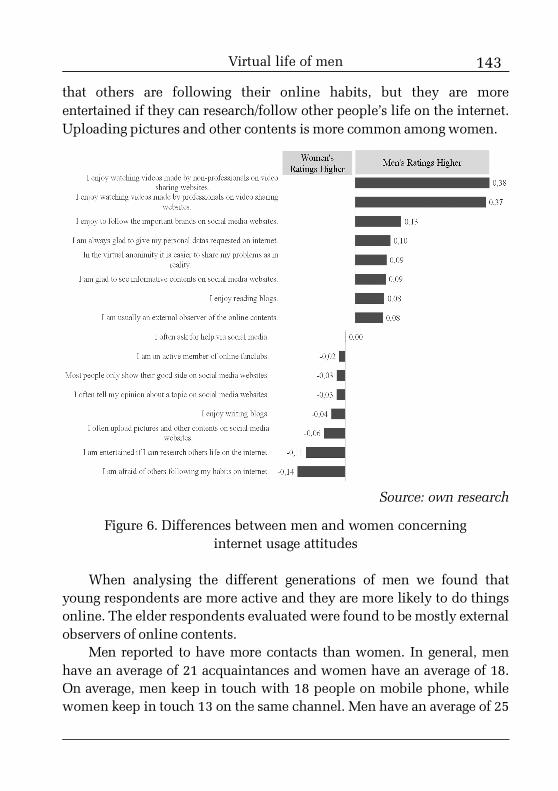
143
that others are following their online habits, but they are moreentertained if they can research/follow other people’s life on the internet.Uploading pictures and other contents is more common among women.
Source: own research
Figure 6. Differences between men and women concerninginternet usage attitudes
When analysing the different generations of men we found thatyoung respondents are more active and they are more likely to do thingsonline. The elder respondents evaluated were found to be mostly externalobservers of online contents.
Men reported to have more contacts than women. In general, menhave an average of 21 acquaintances and women have an average of 18.On average, men keep in touch with 18 people on mobile phone, whilewomen keep in touch 13 on the same channel. Men have an average of 25
Virtual life of men
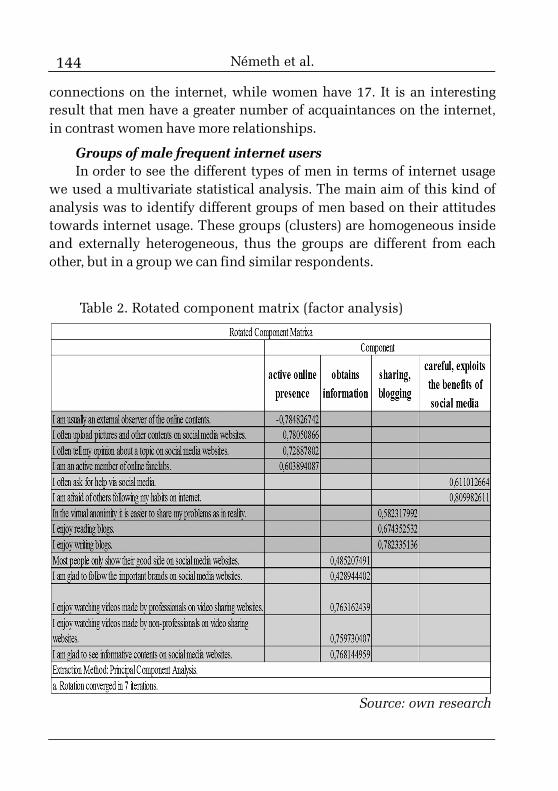
144
connections on the internet, while women have 17. It is an interestingresult that men have a greater number of acquaintances on the internet,in contrast women have more relationships.
Groups of male frequent internet usersIn order to see the different types of men in terms of internet usage
we used a multivariate statistical analysis. The main aim of this kind ofanalysis was to identify different groups of men based on their attitudestowards internet usage. These groups (clusters) are homogeneous insideand externally heterogeneous, thus the groups are different from eachother, but in a group we can find similar respondents.
Németh et al.
Table 2. Rotated component matrix (factor analysis)
Source: own research

145
As a first step we established a factor analysis. This analysis helps usto reduce the attitudes into factors without having a massive informationloss. The Kaiser-Meyer-Olkin Measure was 0.879 which means that theattitudes involved in the factor analysis are appropriate for the analysis.The rotated component matrix (Table 2) is the result of the factoranalysis. We involved 14 attitudes into our analysis and it resulted in 4factors. These factors are the following: active online presence, obtainsinformation, sharing-blogging and careful, who exploits the benefits ofsocial media. The names of these factors depend on their meanings, sothe attitudes explain the factors.
The cluster analysis is the second step of our multivariate analysis.The essence of this method is to identify different groups of respondentsbased on these factors. We used k-means cluster analysis and weidentified four different groups of men who use internet every day. Figure7. emphasizes the connection between the factors and clusters(respondents’ groups).
Source: own research
Figure 7. The relationship between clusters and factors
Based on the demographic differences of the clusters and theconnection between factors and clusters we provide a short introductionof the groups of men:
Virtual life of men
146
1. Sharing youth: in this group the proportion of younger members –between 18 and 39 – is higher than the average. The proportion ofrespondents from Budapest and with an education of secondary school isalso higher than the average. They assessed the sharing-blogging, andcarefully exploiting the social media factors over the average.
2. Information seeker, online active youth: in this group the proportionof 18-39 years old respondents is higher than the average. They mostlylive in smaller settlements and have a lower education. They are mostlyactive online and obtain information on the World Wide Web.
3. Non-interested: the members of this group are mostly over 40, theylive in smaller settlements and have a lower education. They are notinterested in any of the factors.
4. Information seeker seniors: among these respondents theproportion of men over 40 is higher than the average. Also, people wholive at least in a middle-sized settlement and who are high educated aremore likely to be the member of this group. They highly rated the factorcalled “obtains information”.
ConclusionsThe results of our research show that men are more open when it
comes to internet and things which are in connection with the WorldWide Web. On the other hand, women are more focused on internetsecurity issues. Women’s enjoyment of store shopping is higher whilemen’s enjoyment is higher in case of online shopping. Men use internetmore frequently than women, and they enjoy it more. Men developonline activities more than women; while women are more sociallyactive (e.g. having a chat with friends).
According to these results we conclude that women are moreemotional when it comes to internet usage. We drew this conclusion aswe found that for them internet usage is rather connected with socialactivities. Van Slyke et al. (2002) arrived to the same conclusion duringtheir research. For men internet usage is rather an entertaining activity:men like to watch videos online and they participate in most of theexamined online activities with a higher participation rate than womendo. The results of this study justify our presuppositions that men and
Németh et al.
147
women are different in terms of internet usage, and while women havea “social” role, men have more like a “player” role in their onlinepresence.
These results can be helpful for decision makers. As Van Slyke et al.(2002) demonstrated: due to the fact that women are more socially open,Web merchants may consider using a technology to increase the sense ofcommunity by creating a social forum for their customers. Roogers andHarris (2003) found that women are more sceptical and they do not findthis venue as convenient as men do. In our research, we reached theconclusions that these statements are correct: women are more afraid thatothers are following their habits on the internet; furthermore, men areless reluctant to give personal data online. Also, we found that menagreed with a higher rate that they can find many informative contents onthe internet. Alreck et al. (n.a.) discovered in their research that men findonline shopping more effective and they can find online what they wanteasier than women do. In parallel, in our research we found that menhave a higher participation rate in case of online shopping.
An idea and plan for further research that can be a new perspective isto study the group of all men – not just those men groups who useinternet every day – by approaching internet connected things andattitudes. Also, another interesting topic is to identify the groups ofwomen frequent internet users and compare them to the groups of men.
ReferencesAlreck, P., and Settle, R. B. (2002). Gender effects on Internet,
catalogue and store shopping. Journal of Database Marketing, 9(2),150–162.
Alreck, P., L., DiBartolo, G. R., Diriker, M. F. and Settle, R. B. (n.d.):Images of Online and Store Shopping by Men and Women, Young andOld. Marketing Educators Research Group, http://beacon.salisbury.edu/MERG/Image.pdf, downloaded at 26.10.2013.
Gad, K. A. (2012). The Impact of Demographics and TechnologyReadiness on Egyptians’ Attitude towards E-Shopping. In: InternationalConference on Transport, Environment & Medical Sciences (ICTEMS'2012)August 25-26, 2012 Kuala Lumpur (Malaysia).
Virtual life of men

148
Roogers, S. and Harris, M. A. (2003). Gender and E-Commerce: AnExploratory Study. Journal of Advertising Research, 43(3), 322-329.
Van Slyke, C., Comunale, C. L., Belanger, F. (2002). GenderDifferences in Perceptions of Web-based Shopping. Communications ofthe ACM, 45(8), 82-86.
Yang, B. and Lester, D. (2005). Gender differences in e-commerce.Applied Economics, 37, 2077–2089.
Németh et al.
149
1 The article presents the results of a research carried out as part of the TÁMOP4.2.1.B-10/2/KONV-2010-0001 project in the framework of the New HungarianDevelopment Plan. The realization of this project is supported by the EuropeanUnion, co-financed by the European Social Fund.
2 PhD, assistant lecturer, University of Miskolc, Faculty of Economics, Institute ofWorld and Regional Economics, e-mail: [email protected].
Eight methods for decomposing theaggregate energy intensity with special regard to the industrial sector1
TEKLA S. SZÉP2
The energy intensity of East-Central Europe strongly improved in the lasttwo decades and it has two main reasons. The first one is that after the change ofregime the heavy industry collapsed, and there was a shift from agriculturetowards the service sector. The second is the technological development of theeconomy, which increased the energy efficiency of the economic sectors. Thesubject of this paper is to give a comprehensive analysis and decompose boththe energy intensity of the industrial sector and the aggregate energy intensity ofthe economy in East-Central Europe (Czech Republic, Slovakia, Slovenia,Poland and Hungary) between 1990 and 2010. We study how the aggregateenergy intensity is influenced by the structural and the intensity effects.
Keywords: energy consumption, energy intensity, East-Central Europe,change of regime, industry sector.
JEL classification codes: P28, Q43.
IntroductionThere are serious differences in the size of the energy intensity of
economic sectors. The energy intensity of an economy is affected by twofactors. On one hand it is affected by the role of the given economic sector(such as the value added in percentage of GDP) and on the other hand byits energy intensity.
Our analysis can be divided into two main parts. In the first part weaim to examine these two factors, we analyze the transformation processof the East-Central European region after the change of regime, with
150 Tekla S. Szép
special regard to the shifts among the economic sectors and the changesof the sectoral energy intensity. In our database we used the final energyconsumption of economic structures (primary, secondary, tertiarysectors, 1000 toe) and the value added of these sectors (constant 2000US$; % of GDP). “Final energy consumption covers energy supplied tothe final consumer for all energy uses. It is calculated as the sum of finalenergy consumption of all sectors. These are disaggregated to coverindustry, transport, households, services and agriculture.” (IEA, 2005)The examined countries and time spans: Hungary (1990-2010), Poland(1993-2010), Czech Republic (1990-2010), Slovakia (1993-2010) andSlovenia (1990-2010). We used the Eurostat and the Worldbank database,which enable the results to be comparable.
In the second part we examine the changes of the industry sector,because in the last two decades the improvements of the energy intensityin the economy stemmed from the development of energy efficiency of theindustry sector. For our analysis we also use the final energy consumption(Mtoe) and the added value (constant 2000 €) of the industrial subsectors(chemical industry; primary metals; non metallic minerals; woodindustry; paper, pulp and printing industry; food industry; textile andleather industry; machinery; transport equipment; other industries;mining; construction). We apply the Odyssee database and the division ofthe industry sector is based on the UN ISIC (International StandardIndustrial Classification of All Economic Activities).
We use the following abbreviations: Dtot means the changes of theaggregate energy intensity (energy intensity of the primary, secondaryand tertiary sectors), Dint is the intensity effect and Dstr is the structuraleffect.
Theoretical backgroundThe effects of economic activities on energy intensity have become a
central research topic of the energy and environmental economy after thefirst oil price shock (Boyd and Roop 2004.). The Index DecompositionAnalysis (IDA) is a widespread method: it is used for the analysis ofenergy consumption and emission both in the energy and environmentaleconomy; furthermore in the last years it appeared as a toolbar of human
151Eight methods for decomposing the aggregate energy...
resource economy (Achao and Schaeffer 2009) and it gives new additivesfor the examination of income inequalities. It can be easily interpretedand nowadays it is a frequently used tool for the decision-makers (Ang1995, 2000; Hoekstra et al. 2003; Zhao et al. 2010; Liu and Ang 2003;Unander 2007).
Table 1 contains relevant publications regarding this reviewedtopic, which includes not only methodology surveys, but empiricalresults as well. It is somewhat odd – with some exceptions – that theyuse only one method and they do not aim to compare their results withothers. The analyzed area is quite wide: Achao and Schaeffer (2009) tryto explain Brazil’s income inequalities, Mairet and Decellas (2009)decompose the energy intensity of the French service sector and Ang(2005) studies the emission in the Canadian industry sector. Theexamined number of subsectors fluctuates heavily: the minimum is 3,the maximum is 28 in the reviewed publications, but Ang (2000)mentioned as well that an analysis ranging between 2 and 400subsectors is not rare.
The index decomposition method has many similar characteristicswith the shift-share analysis which is presented by Nemes Nagy (1995).The latter is an additive approach; the former one can be additive andmultiplicative as well. The target of both analyses is the decomposition ofan aggregate data into components. While the shift-share analysis can bemainly observed in the regional studies, the index decompositionanalysis is the result of increasing energy interests caused by the 1973 oilcrisis. At this time the general target of the governments was to restrainenergy consumption and enhance energy efficiency. The first step was todetermine factors which have influence on the energy consumption andto work out the exact methodology, with special regard to the indexdecomposition analysis.
The essential of the IDA is that it can explain the changes of anindicator at sectoral level, and another advantage is the low data request(Hoekstra 2003). The starting point is the final intensity in the economicstructure (aggregate energy intensity) which is essentially affected by twofactors: changes in energy intensity of economic sectors (intensity effect)
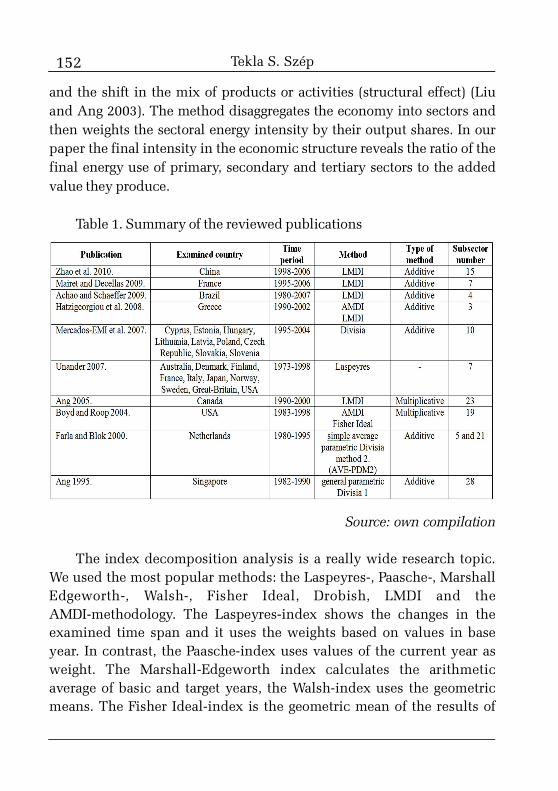
152
and the shift in the mix of products or activities (structural effect) (Liuand Ang 2003). The method disaggregates the economy into sectors andthen weights the sectoral energy intensity by their output shares. In ourpaper the final intensity in the economic structure reveals the ratio of thefinal energy use of primary, secondary and tertiary sectors to the addedvalue they produce.
Table 1. Summary of the reviewed publications
Source: own compilation
The index decomposition analysis is a really wide research topic.We used the most popular methods: the Laspeyres-, Paasche-, MarshallEdgeworth-, Walsh-, Fisher Ideal, Drobish, LMDI and theAMDI-methodology. The Laspeyres-index shows the changes in theexamined time span and it uses the weights based on values in baseyear. In contrast, the Paasche-index uses values of the current year asweight. The Marshall-Edgeworth index calculates the arithmeticaverage of basic and target years, the Walsh-index uses the geometricmeans. The Fisher Ideal-index is the geometric mean of the results of
Tekla S. Szép
153
the Laspeyres and Paasche methods, while the Drobish-index argues fortheir arithmetic average (Liu and Ang 2003). According to Boyd andRoop (2004), the perfect index decomposition method is the Fisher Idealindex, because it is fit for all of the strict requirements and the value ofresidual term is one of them. Both the AMDI and LMDI are integralindex numbers and they have many advantages such as “pathindependency, ability to handle zero values and consistency inaggregation” (Zhao et al. 2010. 1382).
Let V be an energy-related aggregate. We assume that it is affectedby n variables, x1, x2,… xn. The aggregate can be divided into i subsector,where the changes happen (the structural and the intensity changes).The connection among the subsectors can be described as following:
V = �Vi = x1,ix2,i…xn,i
By using the multiplicative method we decompose the relativechanges (Ang 2005. 867):
Dtot = =Dx1Dx2…Dxn
where:
V0 = �Vi = x1,ix2,i…xn,i VT = �Vi = x1,ix2,i…xn,i
By using the additive method we decompose the absolute changes:
�Vtot = VT – V0 = �Vx1 + �Vx2 + … + �Vxn
where:
V0 = �Vi = x1,ix2,i…xn,i VT = �Vi = x1,ix2,i…xn,i
Hereafter we present the methodology of index decompositionanalysis with the Laspeyres-index. We chose this one, because this isthe most frequently used method (Ang 2000, Mairet and Decellas 2009),and the methodology is easily realized.
i
i
VT
V0
i
0 0 0 T T T
i i
0 0 0 T T T
Eight methods for decomposing the aggregate energy...
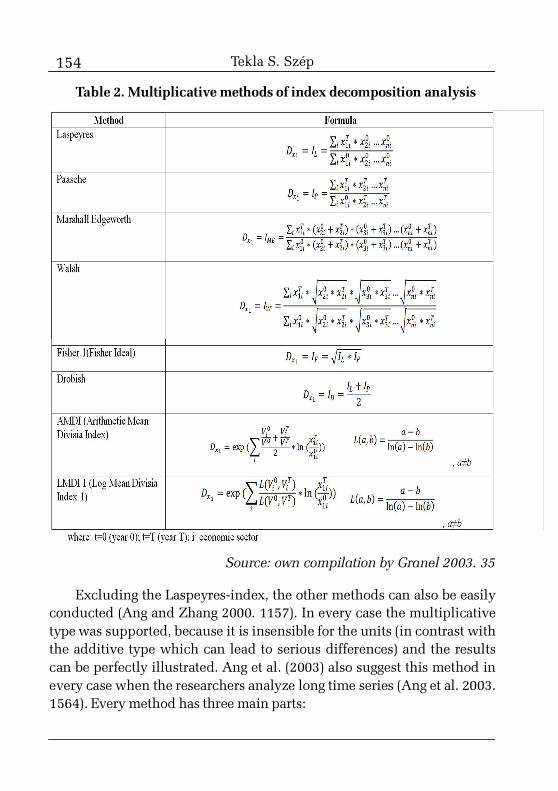
154
Table 2. Multiplicative methods of index decomposition analysis
Source: own compilation by Granel 2003. 35
Excluding the Laspeyres-index, the other methods can also be easilyconducted (Ang and Zhang 2000. 1157). In every case the multiplicativetype was supported, because it is insensible for the units (in contrast withthe additive type which can lead to serious differences) and the resultscan be perfectly illustrated. Ang et al. (2003) also suggest this method inevery case when the researchers analyze long time series (Ang et al. 2003.1564). Every method has three main parts:
Tekla S. Szép
155
Dtot = Dint * Dstr * Dres =
where: Et: total energy consumption; Ei,t: energy consumption of sector i;Yt: GDP; Yi,t: GDP of sector i; Si,t: share of sector (=Yi,t/Yt); It: energyintensity of the economy, (=Et/Yt); Ii,t: energy intensity of sector i (=Ei,t/Yi,t).
The first part shows (Dtot) the changes of energy intensity in theeconomy within two years.
Dstr =
The next two indicators (Dstr, Dint) are the difference of final intensityin the economic structure belonging to the year 0 and year t. Thedifference between them is the factor that is unchanged (base year) in thecounter. The Dstr leaves the energy intensity of subsectors unchanged so itshows the structural effect, which means the size of the effect in the finalintensity (in the economic structure) caused by the shift in the economicstructure (from agriculture and industry sector towards the servicesector).
Dint =
The Dint leaves the share of subsectors unchanged and it presents theeffect of energy intensity changes (intensity effect), which reveals howthe changes of the subsectors’ energy intensity affect the final intensity inthe economic structure. The closer Dstr,Dint are to the value 1, the less theeffect is. The equation includes a residual term for every method, whichshows all the effects that are not explained by the model. The value of theresidual term is ideal if it is close to 1 (in multiplicative method).
ResultsBy change of economic structure we mean the changes of the share of
the primary, secondary and tertiary sectors. As a starting point weexamine the changes of the share within the economic sectors withregard to its value added (% of GDP). Similar processes can be observedin the examined region. The share of agriculture and industry sectorsdeclined in comparison with the development of the service sector. “The
ItI0
�iSi,0Ii,T�iSi,0Ii,0
�iSi,TIi,0�iSi,0Ii,0
Eight methods for decomposing the aggregate energy...
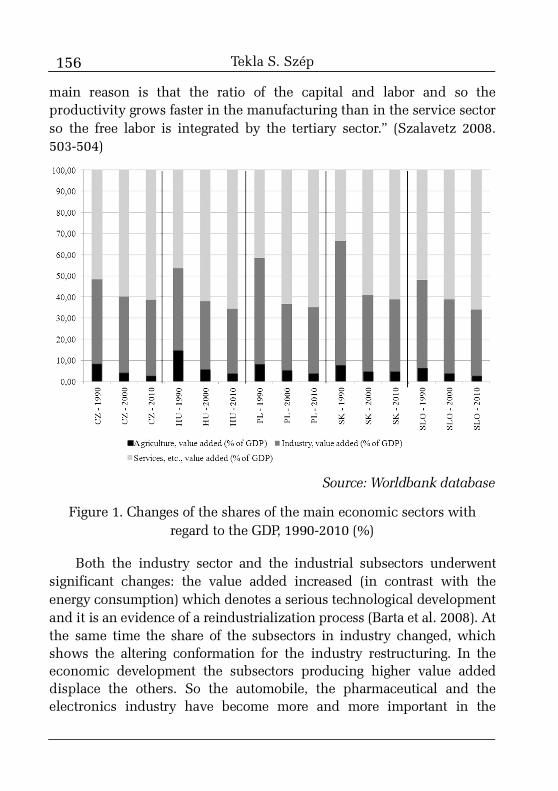
156
main reason is that the ratio of the capital and labor and so theproductivity grows faster in the manufacturing than in the service sectorso the free labor is integrated by the tertiary sector.” (Szalavetz 2008.503-504)
Source: Worldbank database
Figure 1. Changes of the shares of the main economic sectors withregard to the GDP, 1990-2010 (%)
Both the industry sector and the industrial subsectors underwentsignificant changes: the value added increased (in contrast with theenergy consumption) which denotes a serious technological developmentand it is an evidence of a reindustrialization process (Barta et al. 2008). Atthe same time the share of the subsectors in industry changed, whichshows the altering conformation for the industry restructuring. In theeconomic development the subsectors producing higher value addeddisplace the others. So the automobile, the pharmaceutical and theelectronics industry have become more and more important in the
Tekla S. Szép
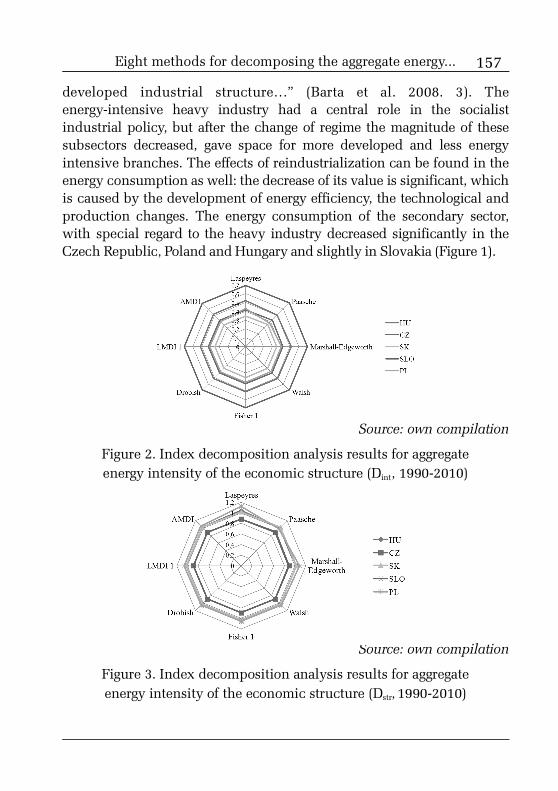
157
developed industrial structure…” (Barta et al. 2008. 3). Theenergy-intensive heavy industry had a central role in the socialistindustrial policy, but after the change of regime the magnitude of thesesubsectors decreased, gave space for more developed and less energyintensive branches. The effects of reindustrialization can be found in theenergy consumption as well: the decrease of its value is significant, whichis caused by the development of energy efficiency, the technological andproduction changes. The energy consumption of the secondary sector,with special regard to the heavy industry decreased significantly in theCzech Republic, Poland and Hungary and slightly in Slovakia (Figure 1).
Source: own compilation
Figure 2. Index decomposition analysis results for aggregateenergy intensity of the economic structure (Dint, 1990-2010)
Source: own compilation
Figure 3. Index decomposition analysis results for aggregateenergy intensity of the economic structure (Dstr, 1990-2010)
Eight methods for decomposing the aggregate energy...
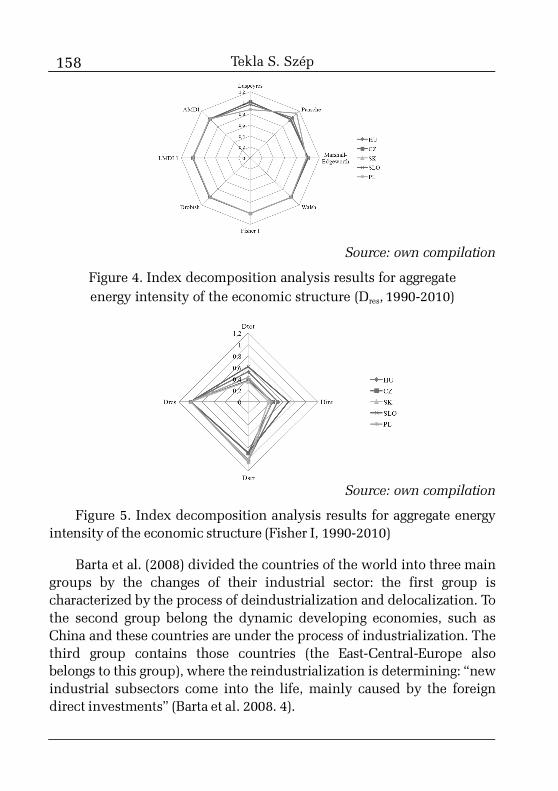
158
Source: own compilation
Figure 4. Index decomposition analysis results for aggregateenergy intensity of the economic structure (Dres, 1990-2010)
Source: own compilation
Figure 5. Index decomposition analysis results for aggregate energyintensity of the economic structure (Fisher I, 1990-2010)
Barta et al. (2008) divided the countries of the world into three maingroups by the changes of their industrial sector: the first group ischaracterized by the process of deindustrialization and delocalization. Tothe second group belong the dynamic developing economies, such asChina and these countries are under the process of industrialization. Thethird group contains those countries (the East-Central-Europe alsobelongs to this group), where the reindustrialization is determining: “newindustrial subsectors come into the life, mainly caused by the foreigndirect investments” (Barta et al. 2008. 4).
Tekla S. Szép
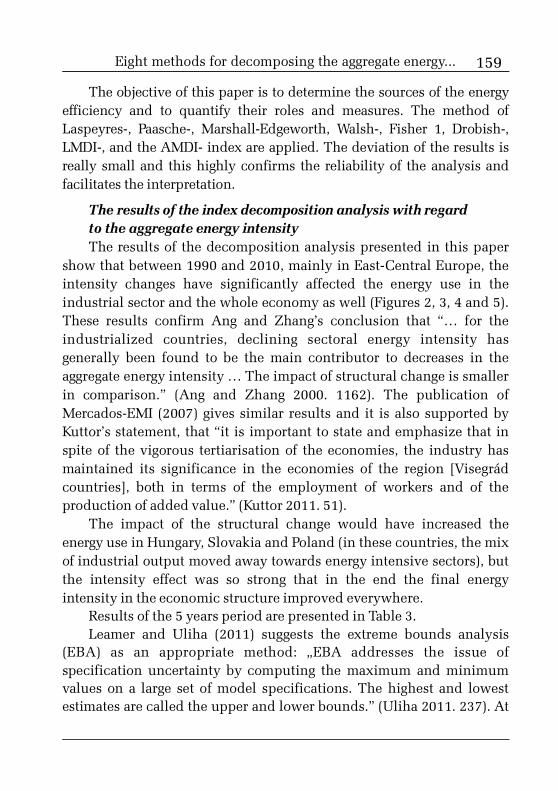
159
The objective of this paper is to determine the sources of the energyefficiency and to quantify their roles and measures. The method ofLaspeyres-, Paasche-, Marshall-Edgeworth, Walsh-, Fisher 1, Drobish-,LMDI-, and the AMDI- index are applied. The deviation of the results isreally small and this highly confirms the reliability of the analysis andfacilitates the interpretation.
The results of the index decomposition analysis with regardto the aggregate energy intensityThe results of the decomposition analysis presented in this paper
show that between 1990 and 2010, mainly in East-Central Europe, theintensity changes have significantly affected the energy use in theindustrial sector and the whole economy as well (Figures 2, 3, 4 and 5).These results confirm Ang and Zhang’s conclusion that “… for theindustrialized countries, declining sectoral energy intensity hasgenerally been found to be the main contributor to decreases in theaggregate energy intensity … The impact of structural change is smallerin comparison.” (Ang and Zhang 2000. 1162). The publication ofMercados-EMI (2007) gives similar results and it is also supported byKuttor’s statement, that “it is important to state and emphasize that inspite of the vigorous tertiarisation of the economies, the industry hasmaintained its significance in the economies of the region [Visegrádcountries], both in terms of the employment of workers and of theproduction of added value.” (Kuttor 2011. 51).
The impact of the structural change would have increased theenergy use in Hungary, Slovakia and Poland (in these countries, the mixof industrial output moved away towards energy intensive sectors), butthe intensity effect was so strong that in the end the final energyintensity in the economic structure improved everywhere.
Results of the 5 years period are presented in Table 3.Leamer and Uliha (2011) suggests the extreme bounds analysis
(EBA) as an appropriate method: „EBA addresses the issue ofspecification uncertainty by computing the maximum and minimumvalues on a large set of model specifications. The highest and lowestestimates are called the upper and lower bounds.” (Uliha 2011. 237). At
Eight methods for decomposing the aggregate energy...
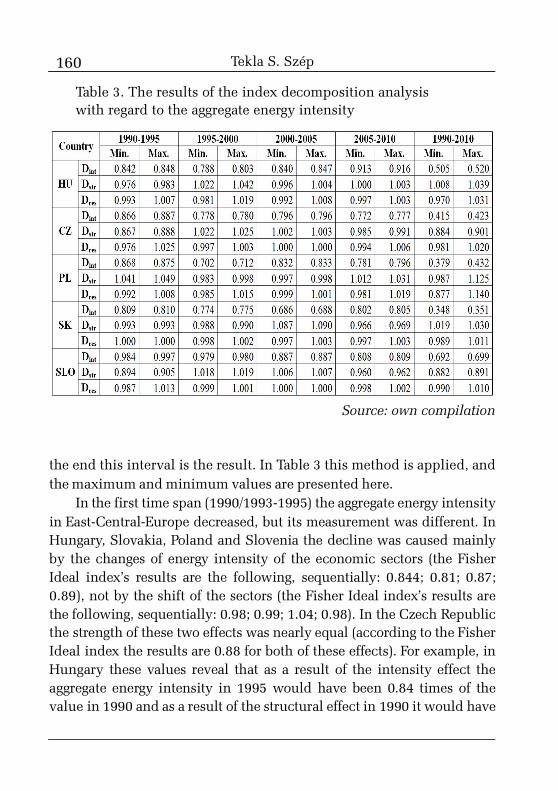
160
the end this interval is the result. In Table 3 this method is applied, andthe maximum and minimum values are presented here.
In the first time span (1990/1993-1995) the aggregate energy intensityin East-Central-Europe decreased, but its measurement was different. InHungary, Slovakia, Poland and Slovenia the decline was caused mainlyby the changes of energy intensity of the economic sectors (the FisherIdeal index’s results are the following, sequentially: 0.844; 0.81; 0.87;0.89), not by the shift of the sectors (the Fisher Ideal index’s results arethe following, sequentially: 0.98; 0.99; 1.04; 0.98). In the Czech Republicthe strength of these two effects was nearly equal (according to the FisherIdeal index the results are 0.88 for both of these effects). For example, inHungary these values reveal that as a result of the intensity effect theaggregate energy intensity in 1995 would have been 0.84 times of thevalue in 1990 and as a result of the structural effect in 1990 it would have
Table 3. The results of the index decomposition analysiswith regard to the aggregate energy intensity
Source: own compilation
Tekla S. Szép
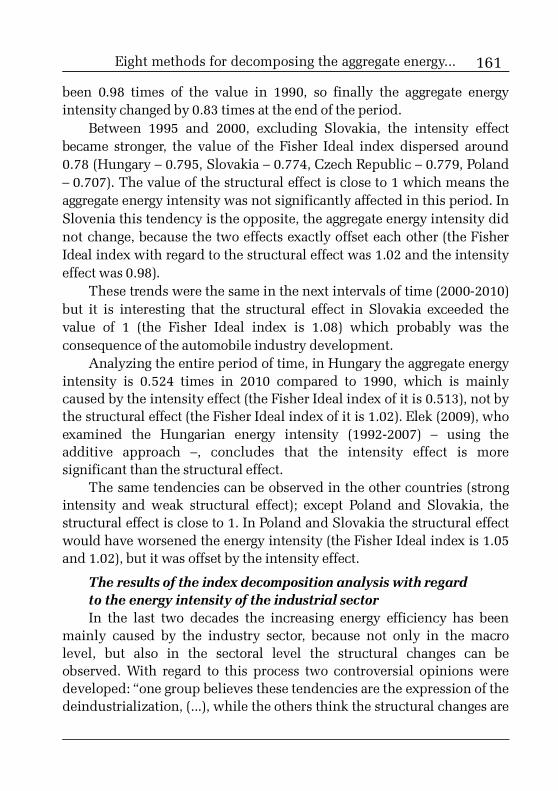
161
been 0.98 times of the value in 1990, so finally the aggregate energyintensity changed by 0.83 times at the end of the period.
Between 1995 and 2000, excluding Slovakia, the intensity effectbecame stronger, the value of the Fisher Ideal index dispersed around0.78 (Hungary – 0.795, Slovakia – 0.774, Czech Republic – 0.779, Poland– 0.707). The value of the structural effect is close to 1 which means theaggregate energy intensity was not significantly affected in this period. InSlovenia this tendency is the opposite, the aggregate energy intensity didnot change, because the two effects exactly offset each other (the FisherIdeal index with regard to the structural effect was 1.02 and the intensityeffect was 0.98).
These trends were the same in the next intervals of time (2000-2010)but it is interesting that the structural effect in Slovakia exceeded thevalue of 1 (the Fisher Ideal index is 1.08) which probably was theconsequence of the automobile industry development.
Analyzing the entire period of time, in Hungary the aggregate energyintensity is 0.524 times in 2010 compared to 1990, which is mainlycaused by the intensity effect (the Fisher Ideal index of it is 0.513), not bythe structural effect (the Fisher Ideal index of it is 1.02). Elek (2009), whoexamined the Hungarian energy intensity (1992-2007) – using theadditive approach –, concludes that the intensity effect is moresignificant than the structural effect.
The same tendencies can be observed in the other countries (strongintensity and weak structural effect); except Poland and Slovakia, thestructural effect is close to 1. In Poland and Slovakia the structural effectwould have worsened the energy intensity (the Fisher Ideal index is 1.05and 1.02), but it was offset by the intensity effect.
The results of the index decomposition analysis with regardto the energy intensity of the industrial sectorIn the last two decades the increasing energy efficiency has been
mainly caused by the industry sector, because not only in the macrolevel, but also in the sectoral level the structural changes can beobserved. With regard to this process two controversial opinions weredeveloped: “one group believes these tendencies are the expression of thedeindustrialization, (...), while the others think the structural changes are
Eight methods for decomposing the aggregate energy...
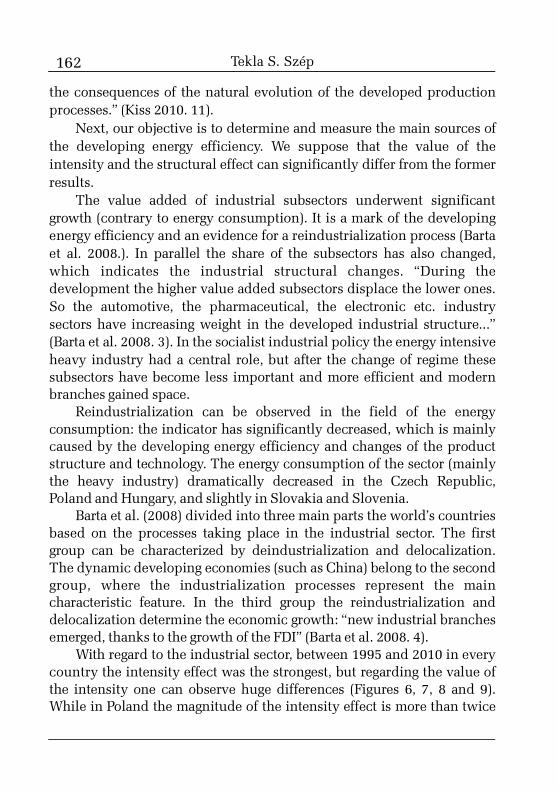
162
the consequences of the natural evolution of the developed productionprocesses.” (Kiss 2010. 11).
Next, our objective is to determine and measure the main sources ofthe developing energy efficiency. We suppose that the value of theintensity and the structural effect can significantly differ from the formerresults.
The value added of industrial subsectors underwent significantgrowth (contrary to energy consumption). It is a mark of the developingenergy efficiency and an evidence for a reindustrialization process (Bartaet al. 2008.). In parallel the share of the subsectors has also changed,which indicates the industrial structural changes. “During thedevelopment the higher value added subsectors displace the lower ones.So the automotive, the pharmaceutical, the electronic etc. industrysectors have increasing weight in the developed industrial structure...”(Barta et al. 2008. 3). In the socialist industrial policy the energy intensiveheavy industry had a central role, but after the change of regime thesesubsectors have become less important and more efficient and modernbranches gained space.
Reindustrialization can be observed in the field of the energyconsumption: the indicator has significantly decreased, which is mainlycaused by the developing energy efficiency and changes of the productstructure and technology. The energy consumption of the sector (mainlythe heavy industry) dramatically decreased in the Czech Republic,Poland and Hungary, and slightly in Slovakia and Slovenia.
Barta et al. (2008) divided into three main parts the world’s countriesbased on the processes taking place in the industrial sector. The firstgroup can be characterized by deindustrialization and delocalization.The dynamic developing economies (such as China) belong to the secondgroup, where the industrialization processes represent the maincharacteristic feature. In the third group the reindustrialization anddelocalization determine the economic growth: “new industrial branchesemerged, thanks to the growth of the FDI” (Barta et al. 2008. 4).
With regard to the industrial sector, between 1995 and 2010 in everycountry the intensity effect was the strongest, but regarding the value ofthe intensity one can observe huge differences (Figures 6, 7, 8 and 9).While in Poland the magnitude of the intensity effect is more than twice
Tekla S. Szép
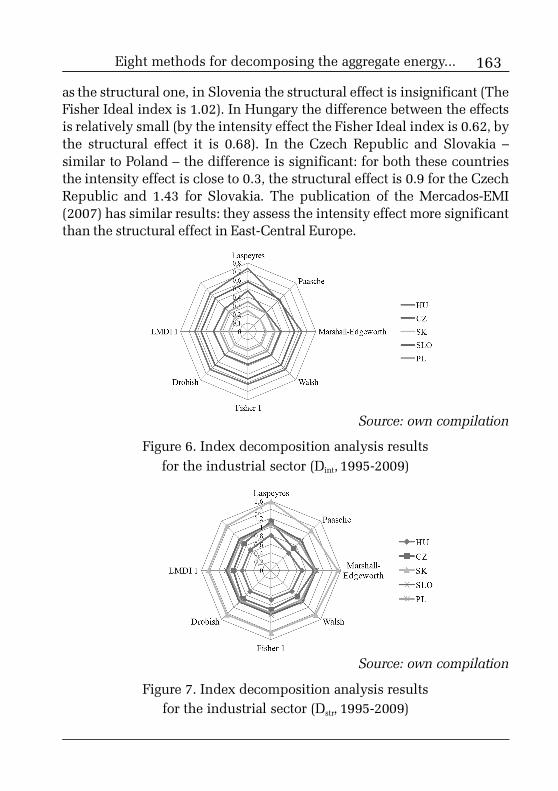
163
as the structural one, in Slovenia the structural effect is insignificant (TheFisher Ideal index is 1.02). In Hungary the difference between the effectsis relatively small (by the intensity effect the Fisher Ideal index is 0.62, bythe structural effect it is 0.68). In the Czech Republic and Slovakia –similar to Poland – the difference is significant: for both these countriesthe intensity effect is close to 0.3, the structural effect is 0.9 for the CzechRepublic and 1.43 for Slovakia. The publication of the Mercados-EMI(2007) has similar results: they assess the intensity effect more significantthan the structural effect in East-Central Europe.
Source: own compilation
Figure 6. Index decomposition analysis resultsfor the industrial sector (Dint, 1995-2009)
Source: own compilation
Figure 7. Index decomposition analysis resultsfor the industrial sector (Dstr, 1995-2009)
Eight methods for decomposing the aggregate energy...
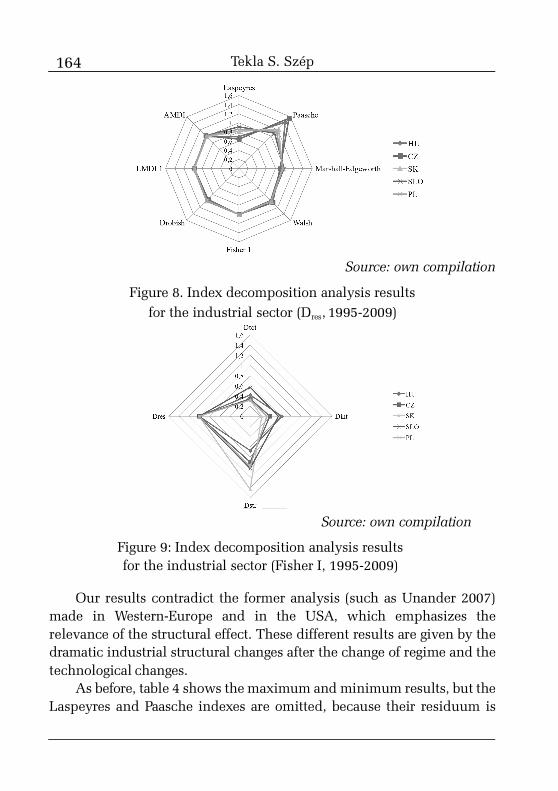
164
Source: own compilation
Figure 8. Index decomposition analysis resultsfor the industrial sector (Dres, 1995-2009)
Source: own compilation
Figure 9: Index decomposition analysis resultsfor the industrial sector (Fisher I, 1995-2009)
Our results contradict the former analysis (such as Unander 2007)made in Western-Europe and in the USA, which emphasizes therelevance of the structural effect. These different results are given by thedramatic industrial structural changes after the change of regime and thetechnological changes.
As before, table 4 shows the maximum and minimum results, but theLaspeyres and Paasche indexes are omitted, because their residuum is
Tekla S. Szép
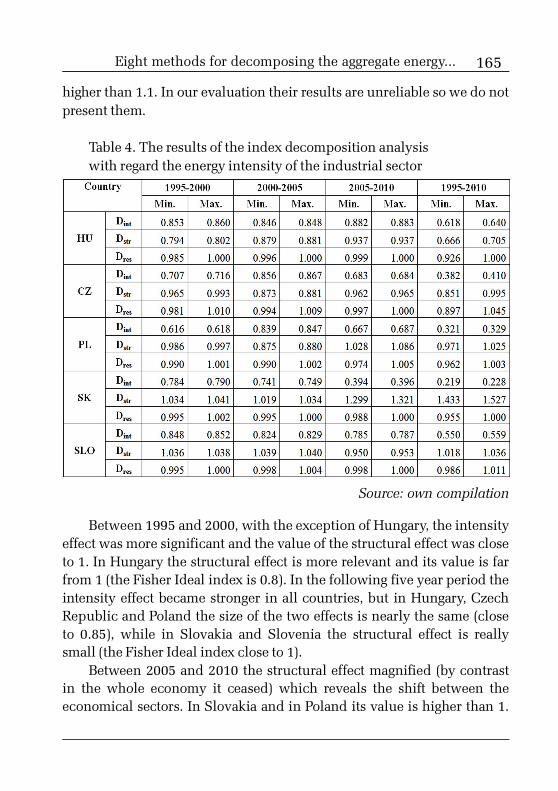
165
higher than 1.1. In our evaluation their results are unreliable so we do notpresent them.
Table 4. The results of the index decomposition analysiswith regard the energy intensity of the industrial sector
Source: own compilation
Between 1995 and 2000, with the exception of Hungary, the intensityeffect was more significant and the value of the structural effect was closeto 1. In Hungary the structural effect is more relevant and its value is farfrom 1 (the Fisher Ideal index is 0.8). In the following five year period theintensity effect became stronger in all countries, but in Hungary, CzechRepublic and Poland the size of the two effects is nearly the same (closeto 0.85), while in Slovakia and Slovenia the structural effect is reallysmall (the Fisher Ideal index close to 1).
Between 2005 and 2010 the structural effect magnified (by contrastin the whole economy it ceased) which reveals the shift between theeconomical sectors. In Slovakia and in Poland its value is higher than 1.
Eight methods for decomposing the aggregate energy...
166
In the Czech Republic, Hungary and Slovenia the intensity effect isstronger, but the structural effect is also present.
Our conclusions are similar to the analysis of the Odyssee project(2009) which concluded that both the structural and intensity effectsinfluenced the development of the energy intensity in the industrialsector. Taylor et al. (2010) examined the member states of the IEA. Heconcluded that more than half of the energy intensity development in theindustrial sector is given by the structural effect.
ConclusionsThe main difference between the neoclassical and energy economy is
the different opinion regarding the role of energy in the economicdevelopment. According to the former one the energy is just anintermediary input among other production factors (land, capital andworkers), which determines directly or indirectly the economicdevelopment. For the energy economists (Cleveland C. J., Herring H. andStern D. I.) the energy significantly affects the income and the economydepends on the changes in energy consumption. The relationshipbetween economic development and energy use was a core topic formany centuries.
In this paper we study how the aggregate energy intensity isinfluenced by the shift in the mix of products or activities (structuraleffect) and the changes in energy intensity of economic sectors (intensityeffect). The starting hypothesis was that both these effects weresignificant. We carried out the examination with the indexdecomposition analysis and we used eight methods. Significantdifferences between the results did not appear, therefore the size of theresidual term was treatable.
In East-Central Europe the aggregate energy intensity includes theprimary, secondary and tertiary sectors which underwent significantdevelopment in the last two decades. It is mainly caused firstly by theintensity effect and secondly by the structural effect. By using the 8methods of the Index Decomposition Analysis we divided the changes ofthe aggregate energy intensity into their components. We quantified theintensity and the structural effect for the whole time span (1990-2010)
Tekla S. Szép
167
and for a 5 year-period as well. In our analysis, between 1990 and 1995,the intensity effect was more significant than the structural one in allcountries, except Slovakia.
In the second section we examined the industrial sector, because thedevelopment of the aggregate energy intensity mainly stems from thesecondary sector and it is also interesting whether the processes are thesame in the whole economy and at sectoral level. There was only onesituation in the industrial sector (Hungary, 1995-2000) when thestructural effect was more significant, so generally the processes in thesecondary sectors are similar to the processes within the whole economy.So, we drafted the following conclusions:
1. In East-Central Europe (Czech Republic, Poland, Hungary,Slovakia, Slovenia) between 1990 and 2009 the intensity effectcontributed more to the improvement of final intensity in the economicstructure than the structural effect.
2. The magnitude of structural effect is smaller than the intensityeffect from the energy intensity perspective.
3. The development of the energy intensity in the industrial sector ofthe Czech Republic, Slovakia, Hungary and Poland is mainly caused bythe intensity and structural effect, but the intensity effect is moresignificant.
4. In Slovenia the development of the energy intensity in theindustrial sector is mainly caused by the intensity effect, the structuraleffect is insignificant.
5. The processes developing the aggregate energy intensity of aneconomy can be different at the level of the economy and the sectors.
ReferencesAchao, C. and Schaeffer, R. (2009). Decomposition analysis of the
variations in residential electricity consumption in Brazil for the1980-2007 period: Measuring the activity, intensity and structure effect.Energy Policy, 37, 5208-5220.
Ang, B. W. (1995). Multilevel decomposition of industrial energyconsumption. Energy Economics, 17, 39-51.
Ang, B. W. and Zhang, F. Q. (2000). A survey of index decomposi-
Eight methods for decomposing the aggregate energy...
168
tion analysis in energy and environmental studies. Energy, 25,1149-1176.
Ang, B. W., Liu, F. L. and Chew, E. P. (2003). Perfect decompositiontechniques in energy and environmental analysis, Energy Policy,31,1561-1566.
Ang, B. W., Liu, F. L. and Chung, H. (2004). A generalized Fisherindex approach to energy decomposition analysis. Energy Economics,26, 757-763.
Ang, B. W. (2005). The LMDI approach to decomposition analysis: apractical guide. Energy Policy, 33, 867-871.
Barta, Gy., Czirfusz, M. and Kukely, Gy. (2008). Újraiparosodás anagyvilágban és Magyarországon. Tér és Társadalom, 22(4), 1-20.
Boyd G. A., Roop J. M. (2004). A note on the Fisher Ideal Indexdecomposition for structural change in energy intensity. The EnergyJournal, 25(1), 87-101.
Elek L. (2009). Energiahatékonysági politikák és intézkedésekMagyarországon. Budapest: Energiaközpont Kht.
Eurostat Database http://epp.eurostat.ec.europa.eu/portal/page/portal/statistics/search_database, downloaded at 10.09.2010.
Farla, J. C. M. and Blok, K. (2001). The quality of energy intensityindicators for international comparison in the iron and steel industry.Energy Policy, 29, 523-543.
Farla, J. C. M. and Blok, K. (2000). Energy efficiency and structuralchange in the Netherlands, 1980-1995 Journal of Industrial Ecology,4(1), 93-117.
Granel, F. (2003). A comparative analysis of index decompositionmethods National University of Singapore. http://scholarbank.nus.edu.sg/handle /10635/14229, downloaded at 10.09.2010.
Hatzigeorgiou, E., Polatidis, H. and Haralambopoulos D. (2008).CO2 emissions in Greece for 1990-2002: A decomposition analysis andcomparison of results using the Arithmetic Mean Divisia Index andLogarithmic Mean Divisia Index techniques. Energy, 33. 492-499.
Hoekstra, R., Jeoren, J. C. and van der Bergh, J. M. (2003).Comparing structural and index decomposition analysis. EnergyEconomics, 25, 39-64.
Tekla S. Szép
169
IEA (2005). Energy Statistics Manual. http://www.iea.org/publications/freepublications/publication/statistics_manual.pdf,downloaded at 10.09.2010.
Kiss, É. (2010). Területi szerkezetváltás a magyar iparban 1989 után.Budapest-Pécs: Dialóg-Campus.
Kuttor, D. (2011). Spatial effects of industrial restructuring in theVisegrád countries. Theory Methodology Practice, 7(1), 51-57.
Liu, F. L. and Ang,B. W. (2003). Eight methods for decomposing theaggregate energy-intensity of industry. Applied Energy, 76, 15-23.
Ma, H., Oxley, L. and Gibson, J. (2010). China’s energy economy: asurvey of the literature. Energy Systems, 34, 105-132.
Mairet, N., Decellas, F. (2009). Determinants of energy demand inthe French service sector: A decomposition analysis, Energy Policy 37,2734-2744.
Mercados – Energy Markets International, Regionális Energia-gazdasági Kutatóközpont and E-Bridge (2007). Study on the impact of the2004 enlargement of the European Union in the area of energy.http://rekk.uni-corvinus.hu/index-en.html, downloaded at 04.05.2012.
Nemes Nagy, J. (2005). Regionális elemzési módszerek. RegionálisTudományi Tanulmányok. Budapest: MTA-ELTE Regionális TudományiKutatócsoport, ELTE Regionális Földrajzi Tanszék.
Szalavetz, A. (2003). Technológiafejlõdés, specializáció,komplementaritás, szerkezetátalakulás. MTA Világgazdasági Kutató-intézet Mûhelytanulmányok, 44, 18 p. http://www.vki.hu/mt/mh-44.pdfdownloaded at 20.09.2010.
Taylor, L. (1993). Fuel poverty: from cold homes to affordablewarmth. Energy Policy, 21, 1071-1072.
Taylor, P. G., d’Ortigue, O. L., Francoeur, M. and Trudeau, N. (2010).Final energy use in IEA countries: The role of energy efficiency, EnergyPolicy, 38, 6463-6474.
Uliha, G. (2011). Az ökonometria aktuális helyzete – Vita a Journalof Economic Perspectives hasábjain. Köz-Gazdaság, 2, 237-247.
Unander, F. (2007). Decomposition of manufacturing energy-use inIEA countries. How do recent developments compare with historicallong-term trends? Applied Energy, 84, 771-780.
Eight methods for decomposing the aggregate energy...

170
Worldbank Database http://data.worldbank.org/, downloaded at15.09.2010.
Zhao, X., Ma, C. and Hong, D. (2010). Why did China’s energyintensity increase during 1998-2006: decomposition and policyanalysis. Energy Policy, 38, 1379-1388.
Tekla S. Szép
171
1 PhD student, Babeº-Bolyai University, Faculty of Economics and BusinessAdministration, e-mail: [email protected]
Evaluating Romania’s regionalcompetitiveness using
Analytic Hierarchy ProcessOANA STÃNCULESCU1
In recent years, the evaluation of regional competitiveness aroused theinterest of academics as well as policymakers. In the specialized literature manydefinitions for the concept of regional competitiveness and also severalevaluation methods of the level of regional competitiveness can be found. Fromour point of view, regional competitiveness is regarded as a matter of decision,in which all factors of influence, seen as criteria, should be analyzed in order toidentify the best method to improve the regional competitiveness level. In ourpaper we applied the Analytic Hierarchy Process (AHP) method, a multi-criteriadecision-making method by which we can evaluate the competitiveness of theRomanian regions using quantitative data and define the position of theseregions in the national ranking.
Keywords: regional competitiveness, analytic hierarchy process, factors,pair wise comparison.
JEL codes: C61, P25, P48, R11, R58.
IntroductionThere are many ways in which regional competitiveness can be
assessed either by analyzing a single factor, or a set of factors, usingtheoretical models of competitiveness (Lengyel 2003, Ecorys Group 2003)or by creating composite indices (Snieska and Bruneckiene 2009).
In this paper, regional competitiveness is seen as a decision-makingprocess where determinants are the criteria of the process. Based on thisapproach, the competitiveness of the Romanian regions (except for theBucharest-Ilfov region) will be evaluated through a multi-criteria analysismethod, namely the Analytic Hierarchy Process (AHP).
The purpose of the paper is to rank the Romanian regions taking into
172
account a set of criteria in the form of measurable indicators. This methodcan be used to examine the influence factors of regional competitivenessand to provide directions to improve the regional competitiveness level.
Literature reviewAs a concept, regional competitiveness is not very sharply defined
and there is no universally accepted definition in the literature. As aphenomenon, regional competitiveness is strongly exploited in theregional development strategies; authors such as Porter, Storper, Camagniand Krugman admit that the regions play a key role in terms ofstimulating economic growth and competitiveness (Bosma et al. 2011).
In order to assess regional competitiveness, we must first understandits meaning. The literature is not devoid of economists’ interventionstackling the regional dimension of competitiveness; for example, MichaelPorter tried to define regional competitiveness by connecting it with theregional living standard. He believes that productivity is the mostsuitable definition of regional competitiveness, as it depends on the valueof goods and services and the efficiency with which they are produced(Porter 2002).
According to Storper, one of the meanings of regionalcompetitiveness is „the ability of an economy to attract and maintainfirms with stable or rising market shares in an activity while maintainingor increasing standards of living for those who participate in it” (Storper1997. 20).
Lengyel (2003) groups the different approaches of competitivenessinto two categories:
1. „Ex-post competitiveness” or „revealed competitiveness” aimed atmeasurable results of the economy, represented by indicators such as theGDP growth rate, productivity, trade balance and export market shares;
2. „Ex-ante competitiveness” focuses on sources of competitiveadvantages of firms, rather than on a set of indicators of economicperformance, an approach that aims primarly business conditions, seenas inputs. Briefly, this approach offers a number of arguments which maybe useful for assessing regional competitiveness: knowledge base, skilledlabour, infrastructure etc.
Oana Stãnculescu
173
Other studies address this issue in terms of increasing the level ofliving standards and reducing the differences between revenues. In mostof these studies, regional competitiveness is correlated with high levels ofemployment.
The most common method for assessing regional competitiveness,widely accepted in the European Union, is based on the calculation ofper capita GDP, considered to be the indicator that best describes thedevelopment of the regions, respective its level of competitiveness. Thisindicator is representative for the measurement of the generated revenuevolume per capita in a region, offering a high degree of comparability.According to Lengyel, the measurement of regional competitiveness canbe achieved through three economic categories. The correlation betweenthese categories is the following (Lengyel 2003):
Regional income � Labour productivity x Employment rate
Lengyel (2003) treats regional competitiveness as the growthgenerated by high labour productivity (measurable indicator:GDP/employment) in the region, a higher employment rate (measurableindicator: employment rate) and the degree of economic openness of theregion (meaurable indicators: the values of imports and exports). He alsobuilt a pyramid model that classifies the factors influencing the quality oflife and living standard and hence the regional competitiveness on threelevels, as follows (Lengyel 2003):
1. Basic factors: consisting of measurable indicators ofcompetitiveness: labour productivity, employment and the economicopenness of the region.
2. Growth factors: influencing the first category, are being used toimprove the competitiveness of a territory: R&D, SMEs, FDI,infrastructure and human capital, institutions and social capital;
3. Success factors: which build up over time; their influence is visibleonly after long periods of time: economic structure, innovation, regionalaccessibility, qualified labour, social structure, regional identity.
In our opinion, GDP/capita could also be considered a basic factor.Experts of the Ecorys Group assessed regional competitiveness by
taking into account a number of factors and grouping them in an
Evaluating Romania’s regional competitiveness...
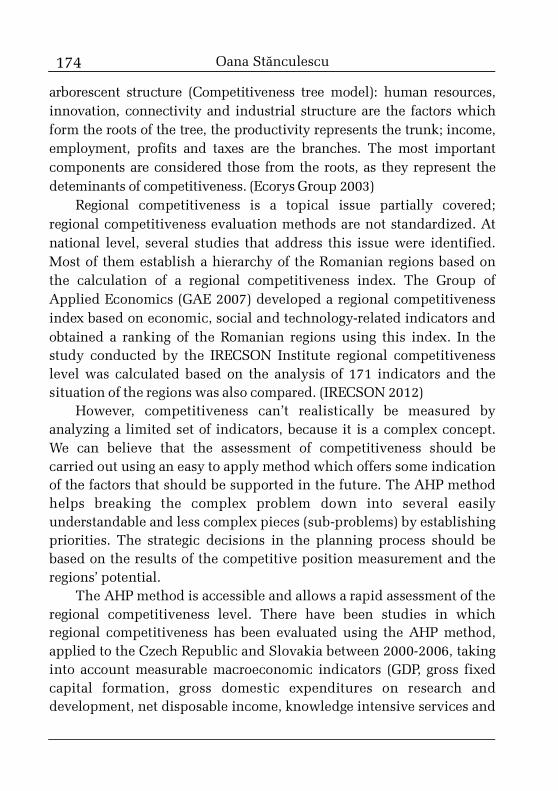
174
arborescent structure (Competitiveness tree model): human resources,innovation, connectivity and industrial structure are the factors whichform the roots of the tree, the productivity represents the trunk; income,employment, profits and taxes are the branches. The most importantcomponents are considered those from the roots, as they represent thedeteminants of competitiveness. (Ecorys Group 2003)
Regional competitiveness is a topical issue partially covered;regional competitiveness evaluation methods are not standardized. Atnational level, several studies that address this issue were identified.Most of them establish a hierarchy of the Romanian regions based onthe calculation of a regional competitiveness index. The Group ofApplied Economics (GAE 2007) developed a regional competitivenessindex based on economic, social and technology-related indicators andobtained a ranking of the Romanian regions using this index. In thestudy conducted by the IRECSON Institute regional competitivenesslevel was calculated based on the analysis of 171 indicators and thesituation of the regions was also compared. (IRECSON 2012)
However, competitiveness can’t realistically be measured byanalyzing a limited set of indicators, because it is a complex concept.We can believe that the assessment of competitiveness should becarried out using an easy to apply method which offers some indicationof the factors that should be supported in the future. The AHP methodhelps breaking the complex problem down into several easilyunderstandable and less complex pieces (sub-problems) by establishingpriorities. The strategic decisions in the planning process should bebased on the results of the competitive position measurement and theregions’ potential.
The AHP method is accessible and allows a rapid assessment of theregional competitiveness level. There have been studies in whichregional competitiveness has been evaluated using the AHP method,applied to the Czech Republic and Slovakia between 2000-2006, takinginto account measurable macroeconomic indicators (GDP, gross fixedcapital formation, gross domestic expenditures on research anddevelopment, net disposable income, knowledge intensive services and
Oana Stãnculescu
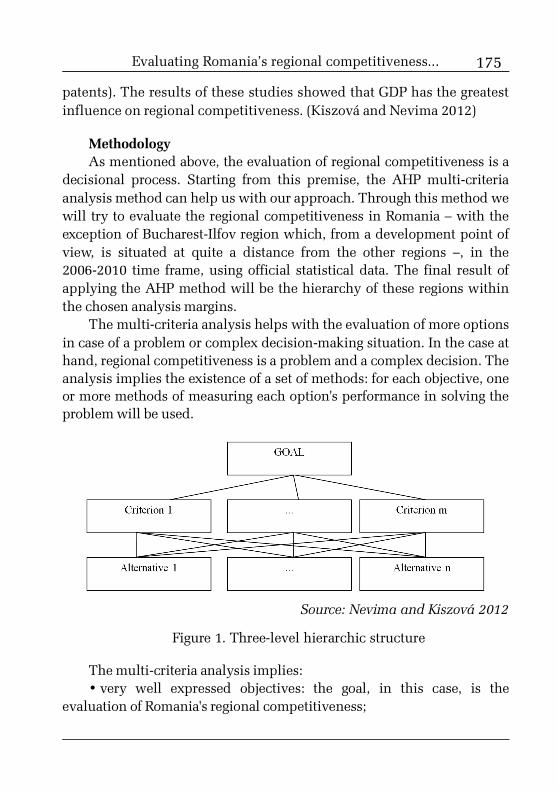
175
patents). The results of these studies showed that GDP has the greatestinfluence on regional competitiveness. (Kiszová and Nevima 2012)
MethodologyAs mentioned above, the evaluation of regional competitiveness is a
decisional process. Starting from this premise, the AHP multi-criteriaanalysis method can help us with our approach. Through this method wewill try to evaluate the regional competitiveness in Romania – with theexception of Bucharest-Ilfov region which, from a development point ofview, is situated at quite a distance from the other regions –, in the2006-2010 time frame, using official statistical data. The final result ofapplying the AHP method will be the hierarchy of these regions withinthe chosen analysis margins.
The multi-criteria analysis helps with the evaluation of more optionsin case of a problem or complex decision-making situation. In the case athand, regional competitiveness is a problem and a complex decision. Theanalysis implies the existence of a set of methods: for each objective, oneor more methods of measuring each option's performance in solving theproblem will be used.
Source: Nevima and Kiszová 2012
Figure 1. Three-level hierarchic structure
The multi-criteria analysis implies:• very well expressed objectives: the goal, in this case, is the
evaluation of Romania's regional competitiveness;
Evaluating Romania’s regional competitiveness...
176
• each criteria must be assigned a certain weight/value based on itsimportance: in this case, the criteria will be the indicators which we willbe using for comparing the regions;
• each alternative must be evaluated/noted according to each criteria(the extent to which each alternative leads to achieving the goals of thepublic policies): in this case, the alternatives are the regions;
• for each alternative the sum of all the given grades is computed, thealternatives being ranked based on each result.
Thus, in our case, the hierarchical structure levels will look likeFigure 2.
Source: own research
Figure 2. Regional competitiveness –Three-level hierarchic structure
The method's criteria (the indicators which are at the base of theevaluation) were selected by taking into consideration the influence thateach of them has on the region's competitiveness, representing thatcategory of base factors described in the literature review. They aremeasurable indicators, offering a high degree of comparability. Of course,the research can be extended by using other indicators, such as: businessenvironment structure, research and development activities,infrastructure, FDI, etc. However, the paper at hand is confined to thebase indicators of regional competitiveness, unanimously accepted in thespecialized literature: GDP per capita, labour productivity(GDP/employment), net exports/GDP and monthly net income.
Oana Stãnculescu
177
As already mentioned, GDP/capita is one of the most representativeindicators of regional competitiveness. It measures the economic activitygenerated by the production of new goods and services in a certainregion. This indicator was chosen because it reflects the living standardof a region’s inhabitants. The source of these data is the National Instituteof Statistics (NIS).
Labour productivity (GDP/employment) is an indicator agreed uponby the majority of specialists from this field, considering it to be at theessence of regional competitiveness. This indicator measures howeffective is the use of human capital in obtaining the regional GDP, aswell as how competitive a certain region is in comparison with the othersby evaluating the contribution of its human capital to the regional GDP.The data has been provided by the National Institute of Statistics.
Net exports represents the difference between the total value ofexports and imports at regional level. In the comparative analysis, theabsolute value of the net exports is less relevant, because it shows theexcess of demand in the region regardless to the size of the regionaleconomy. That is why we consider it is necessary to report net exports tothe regional GDP (net exports/GDP). The value of a region’s exports isdependent on the size of the economy of that region, and a high level ofexports represents a high level of competitiveness.
Monthly net income represents the difference between the grossincome and the income tax, contributions for health and social insuranceand any taxes on other income generating assets, setting the effectivepurchasing power of a regions population.
The AHP method (Analytical Hierarchy Process) is a methodpracticed in order to solve a complex decisional problem which impliesthe comparison of attributes or variants. Generally speaking, the methoddeveloped by Saaty (1982) allows the deciders to represent theinteraction of multiple factors, attributes, characteristics or variants. TheAHP method is based on building a series of “pair comparison” matriceswhich compare all the criteria between each other. Saaty elaborated ascale for the Intensity of Importance with 9 points which properly reflectthe priorities of the comparison between the two elements (Table 1).
Evaluating Romania’s regional competitiveness...
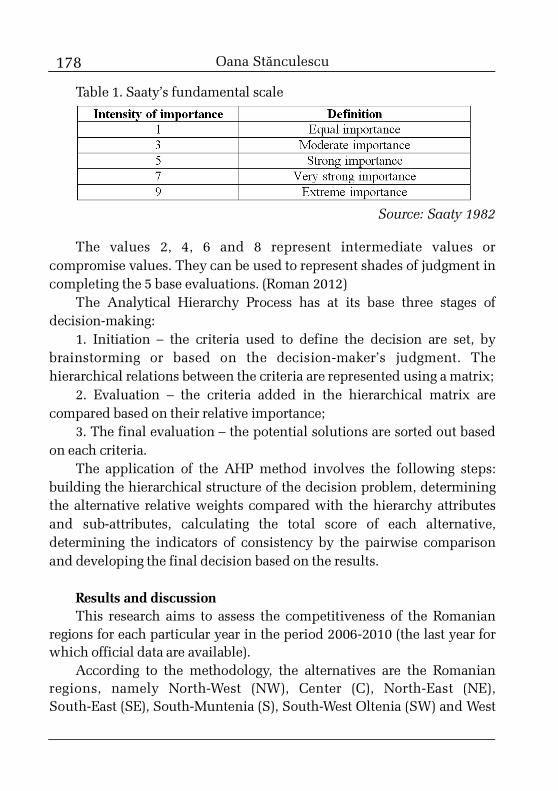
178
Table 1. Saaty’s fundamental scale
Source: Saaty 1982
The values 2, 4, 6 and 8 represent intermediate values orcompromise values. They can be used to represent shades of judgment incompleting the 5 base evaluations. (Roman 2012)
The Analytical Hierarchy Process has at its base three stages ofdecision-making:
1. Initiation – the criteria used to define the decision are set, bybrainstorming or based on the decision-maker’s judgment. Thehierarchical relations between the criteria are represented using a matrix;
2. Evaluation – the criteria added in the hierarchical matrix arecompared based on their relative importance;
3. The final evaluation – the potential solutions are sorted out basedon each criteria.
The application of the AHP method involves the following steps:building the hierarchical structure of the decision problem, determiningthe alternative relative weights compared with the hierarchy attributesand sub-attributes, calculating the total score of each alternative,determining the indicators of consistency by the pairwise comparisonand developing the final decision based on the results.
Results and discussionThis research aims to assess the competitiveness of the Romanian
regions for each particular year in the period 2006-2010 (the last year forwhich official data are available).
According to the methodology, the alternatives are the Romanianregions, namely North-West (NW), Center (C), North-East (NE),South-East (SE), South-Muntenia (S), South-West Oltenia (SW) and West
Oana Stãnculescu
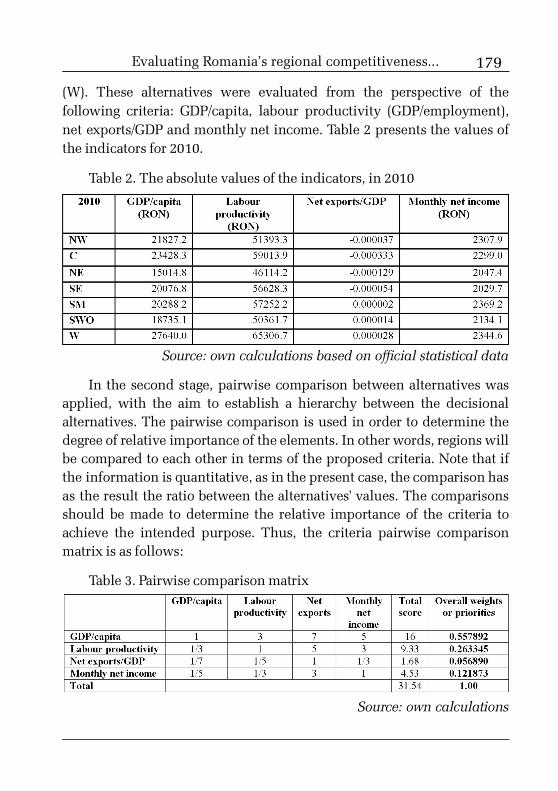
179
(W). These alternatives were evaluated from the perspective of thefollowing criteria: GDP/capita, labour productivity (GDP/employment),net exports/GDP and monthly net income. Table 2 presents the values ofthe indicators for 2010.
Table 2. The absolute values of the indicators, in 2010
Source: own calculations based on official statistical data
In the second stage, pairwise comparison between alternatives wasapplied, with the aim to establish a hierarchy between the decisionalalternatives. The pairwise comparison is used in order to determine thedegree of relative importance of the elements. In other words, regions willbe compared to each other in terms of the proposed criteria. Note that ifthe information is quantitative, as in the present case, the comparison hasas the result the ratio between the alternatives' values. The comparisonsshould be made to determine the relative importance of the criteria toachieve the intended purpose. Thus, the criteria pairwise comparisonmatrix is as follows:
Table 3. Pairwise comparison matrix
Source: own calculations
Evaluating Romania’s regional competitiveness...
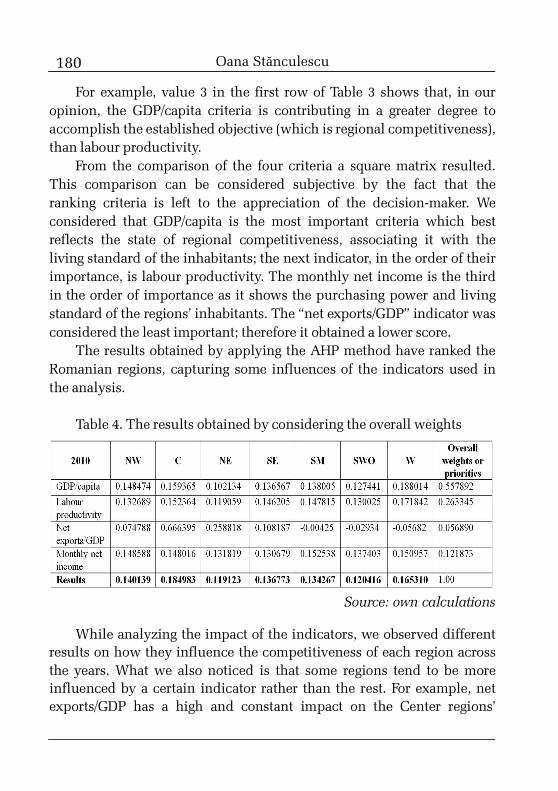
180
For example, value 3 in the first row of Table 3 shows that, in ouropinion, the GDP/capita criteria is contributing in a greater degree toaccomplish the established objective (which is regional competitiveness),than labour productivity.
From the comparison of the four criteria a square matrix resulted.This comparison can be considered subjective by the fact that theranking criteria is left to the appreciation of the decision-maker. Weconsidered that GDP/capita is the most important criteria which bestreflects the state of regional competitiveness, associating it with theliving standard of the inhabitants; the next indicator, in the order of theirimportance, is labour productivity. The monthly net income is the thirdin the order of importance as it shows the purchasing power and livingstandard of the regions’ inhabitants. The “net exports/GDP” indicator wasconsidered the least important; therefore it obtained a lower score.
The results obtained by applying the AHP method have ranked theRomanian regions, capturing some influences of the indicators used inthe analysis.
Table 4. The results obtained by considering the overall weights
Source: own calculations
While analyzing the impact of the indicators, we observed differentresults on how they influence the competitiveness of each region acrossthe years. What we also noticed is that some regions tend to be moreinfluenced by a certain indicator rather than the rest. For example, netexports/GDP has a high and constant impact on the Center regions’
Oana Stãnculescu
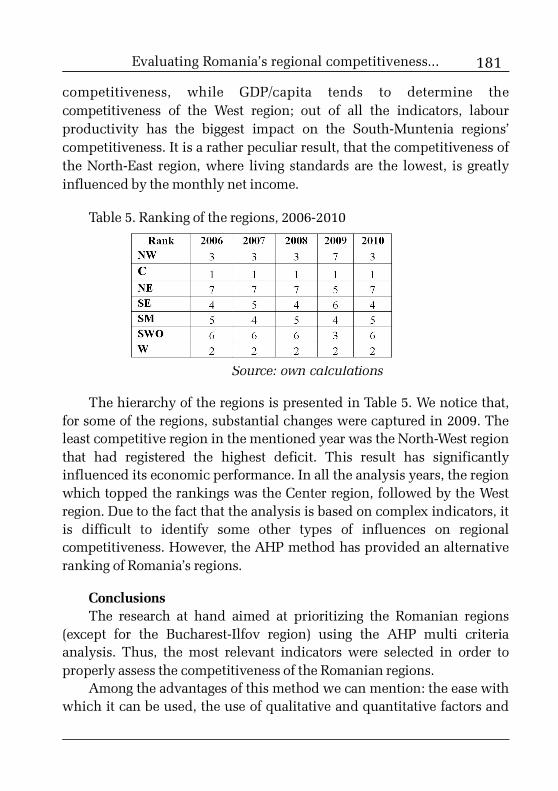
181
competitiveness, while GDP/capita tends to determine thecompetitiveness of the West region; out of all the indicators, labourproductivity has the biggest impact on the South-Muntenia regions’competitiveness. It is a rather peculiar result, that the competitiveness ofthe North-East region, where living standards are the lowest, is greatlyinfluenced by the monthly net income.
Table 5. Ranking of the regions, 2006-2010
Source: own calculations
The hierarchy of the regions is presented in Table 5. We notice that,for some of the regions, substantial changes were captured in 2009. Theleast competitive region in the mentioned year was the North-West regionthat had registered the highest deficit. This result has significantlyinfluenced its economic performance. In all the analysis years, the regionwhich topped the rankings was the Center region, followed by the Westregion. Due to the fact that the analysis is based on complex indicators, itis difficult to identify some other types of influences on regionalcompetitiveness. However, the AHP method has provided an alternativeranking of Romania’s regions.
ConclusionsThe research at hand aimed at prioritizing the Romanian regions
(except for the Bucharest-Ilfov region) using the AHP multi criteriaanalysis. Thus, the most relevant indicators were selected in order toproperly assess the competitiveness of the Romanian regions.
Among the advantages of this method we can mention: the ease withwhich it can be used, the use of qualitative and quantitative factors and
Evaluating Romania’s regional competitiveness...
182
that different hierarchies can be performed according to the complexityof the problem. The method gives the freedom of choosing the mostappropriate criteria with the purpose of making a good decision. Thestudy is intended to the local governments, in order to assess regionalcompetitiveness and compare their policies with those of other regions;the business community, to achieve investments plans, and toacademics, who can use it to better understand and analyze how regionscompete in the market.
Like any other method, the AHP has also some limitations. It isimportant to note that this method involves a high degree of subjectivismespecially in the stage of establishing the weight of each indicator.
In the future, we will try to prove the applicability of the method byapplying at industry level (as alternatives) in one specific region andchoosing specific indicators (such as the turnover, number of employees,labour productivity etc.) in order to identify the most competitiveindustry in the regional economy.
ReferencesBosma, N., Stam, E. and Schutiens, V. (2011). Creative destruction
and regional productivity growth: evidence from the Dutchmanufacturing and services industries. Small Business Economics, 36,401-418.
Ecorys Group (2003). A study on the factors of regionalcompetitiveness. A draft final report for the European Commission.http://ec.europa.eu/ regional_policy/sources/docgener/studies/pdf/3cr/competitiveness.pdf, downloaded at 16.10.2013.
Filip, F. G. (2007). Sisteme suport pentru decizii. Ediþia a II-a,revãzutã ºi adãugitã. Bucureºti: Editura Tehnicã.
GAE (2007). Manual de evaluare a competitivitãþii regionale.http://www.adrmuntenia.ro/documente/manual-de-evaluare-a-competi-tivitatii-regionale.pdf, downloaded at 15.10.2013.
IRECSON (2012). Competitivitatea la nivelul regiunilor de dezvoltare- 2011: http://www.roinno.ro/pdf/Competitivitate2011.pdf, downloadedat 17.10.2013.
Kiszová, Z. and Nevima, J. (2012). Evaluation of regionalcompetitiveness in case of the Czech and Slovak Republic using analytic
Oana Stãnculescu
183
hierarchy process. http://www.wseas.us/e-library/conferences/2012/Zlin/EPRI/EPRI-44.pdf , downloaded at 18.10.2013
Lengyel, I. (2003). Economic Growth and Competitiveness ofHungarian Region. In Reinventing Regions in the Global EconomyRegional Studies Association Conference, 12-15th April, Pisa, Italy.http://www2.eco.u-szeged.hu/region_gazdfejl_szcs/pdf/Economic_growth_and_competitiveness_of_Hungarian_regions.pdf, downloaded at20.10.2013.
Porter, M. E. (2002). Regional Foundations of Competitiveness. Issuesfor Wales-Conference. http://www.isc.hbs.edu/Wales%20Reg%20Comp%2004-02-02%20CK.pdf, downloaded at 10.10.2013.
Roman, M. (2012). Analiza multi-criterialã – Manual.http://www.fonduri-ue.ro/res/filepicker_users/cd25a597fd-62/Documente_Suport/Studii/0_Studii_Instrumente_Structurale/Pag.3_ACB/19_Analiza_Multicriteriala.pdf, downloaded at 18.10.2013.
Saaty, T. (1982). Decision-making for Leaders. California: Wadsworth.Snieška, V. and Bruneckienë, J. (2009). Measurement of Lithuanian
Regions by Regional Competitiveness Index. Engineering Economics,1(61), 45-57.
Storper, M. (1997). The Regional World: Territorial Development in aGlobal Economy. New York: The Guilford Press.
Evaluating Romania’s regional competitiveness...
184
1 PhD candidate, assistant lecturer, Corvinus University of Budapest, Departmentof Finance, e-mail: [email protected].
Comparison of the equity effectof progressive income andconsumption taxation
ERZSÉBET TERÉZ VARGA1
The paper compares the progressive income tax with the progressiveconsumption tax from the aspect of equity. The progressive taxation of personalconsumption is possible since Irving and Herbert Fisher published theirconception in 1942. The comparison of linear taxes is prevailing while theanalysis of various progressive tax types is not typical in the economicliterature. The paper defines an equivalence conception for the progressive caseto create an opportunity for contrasting. The social inequality is measured bythe Gini coefficient in a two-period model with four types of consumers whoearn different amounts of income, smooth their consumption and are levied bytwo-bracket progressive tax systems. According to the results of the model theinequality depends on the composition of the population and the rate of wages;both progressive income tax and consumption tax can lead to a more equitabledistribution in adequate circumstances.
Keywords: progressive taxation, expenditure tax, social inequality,equivalent tax, Gini coefficient.
JEL codes: H23, H24.
IntroductionThe fundamental reason for the application of progressive taxation is
the principle of equity: while progressive taxation unambiguouslyworsens the efficiency of the economy more than linear taxation does, itis still widely adopted in the world for the sake of social justice (Stiglitz2000). The tax base of progressive taxation is income earned everywherein the world. While the opportunity of progressive taxation of personalconsumption has existed since 1942 only India and Ceylon have tried tointroduce it.
The paper discusses the progressive income based tax with the
185
progressive consumption based tax from the aspect of equity to decide ifprogressive consumption taxation is worth using for improving theequity of tax policy.
For determining a more equitable tax base a well-defined measure isneeded. While the concept of deadweight loss is a plausible asset ofmeasuring the efficiency there is not any obvious measure of justice.While a tax which has less excess burden is more efficient the principlesof equal sacrifice or horizontal and vertical equity do not offer acceptableinstruments in answering the question: which tax system is moreequitable? The Gini coefficient presents an opportunity to compare theeffect that different tax systems have on reducing the distribution of thegoods.
Social inequality is an evergreen problem which stands in the focusof governmental policy. The (re)distribution is one of the three functions(beside allocation and stabilization) of the modern state according toMusgrave. (Balogh 2007)
The ground for comparison means another problem: there are manyopportunities to compare tax systems with linear tax rates but what kindof progressive taxes are comparable? I define an equivalence conceptionfor progressive tax rates which harmonizes with the linear tax case.Following this I construct a model in which I can measure thedistributional effect of different taxes using the Gini coefficient. Finally Isum up the results. The purpose of this methodology is to find the mostefficient manner of reducing inequality in different circumstances.
Literature review: the opportunity of progressive consumptiontaxation and its advantagesThe progressive taxation of income is widely applied in the world, so
its reasonableness is not questionable. The discovery of the personalprogressive consumption tax is an outcome of an age-long controversyabout the best tax base. From the income versus consumption debate hereI mention only the consumption side because this leads us to thepracticability of the so called expenditure tax.
It is likely to have started with Thomas Hobbes in the 17th centurywhen he asked in his Leviathan: “For what reason is there that he which
Comparison of the equity effect of progressive income...
186
laboureth much and, sparing the fruits of his labour, consumeth littleshould be more charged than he that, living idly, getteth little and spendethall he gets; seeing the one hath no more protection from theCommonwealth than the other?” (Hobbes 1651, Ch. XXX. 17th paragraph).
After 200 years John Stuart Mill (1875) returned to consumptiontaxation on the ground of another consideration, namely dealing with theproblem of double taxation of savings in the case of income basedsystems. If all income (both from labour and capital) is levied on incometax we tax the saved part of the income twice while the consumed part islevied only once. This different handling discriminates negatively futureconsumption against present consumption.
Later came Alfred Marshall and Arthur Cecil Pigou who wereadvocates of consumption taxation but they recognized its degressiveeffect. The result of this effect is namely the fact that a poorer taxpayerspends a greater part of his income on consumption than a richer oneconsequently they suggested a second role for consumption taxes afterincome taxation. (Musgrave 1996, Kaldor 1955)
In the middle of the last century Fisher and Fisher (1942) and laterKaldor (1955) constructed practicable plans for a personal (direct)progressive consumption based tax, namely the expenditure tax. Theexpenditure tax has two main elements: its tax base and its tax rate. Thetax base is the personal annual consumption which first seems verycomplex and untreatable.
Controlling a detailed shopping list on every taxpayer at the end ofthe year would be a real disaster for tax authorities. This task becomes allat once simple if we use the definition of saving: saving of a given periodis the part of the income of this period which is not consumed in thesame period. Mathematically:
Si = Yi – Ci (1)
where: Si is the savings in period i,Yi is the income in period i andCi is the consumption in period i.
After rearranging equation (1) we get a new definition of consump-tion: namely it is the non saved part of the income. Mathematically:
Erzsébet Teréz Varga
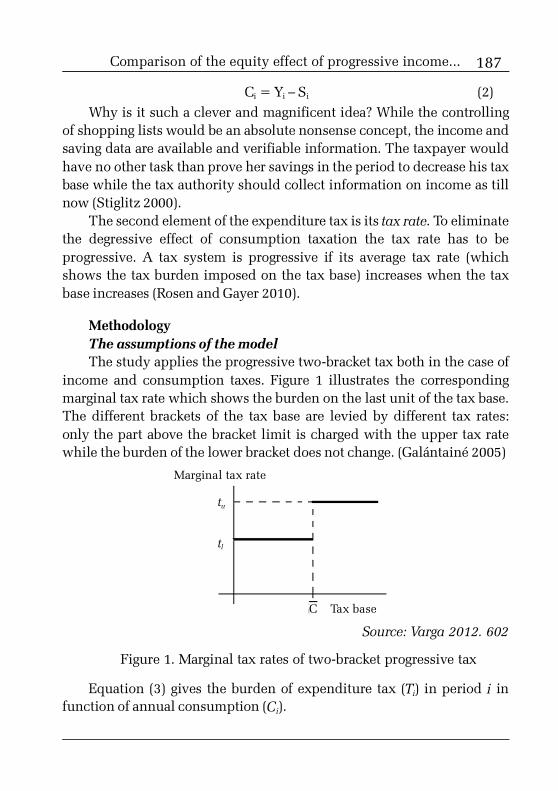
187
Ci = Yi – Si (2)Why is it such a clever and magnificent idea? While the controlling
of shopping lists would be an absolute nonsense concept, the income andsaving data are available and verifiable information. The taxpayer wouldhave no other task than prove her savings in the period to decrease his taxbase while the tax authority should collect information on income as tillnow (Stiglitz 2000).
The second element of the expenditure tax is its tax rate. To eliminatethe degressive effect of consumption taxation the tax rate has to beprogressive. A tax system is progressive if its average tax rate (whichshows the tax burden imposed on the tax base) increases when the taxbase increases (Rosen and Gayer 2010).
MethodologyThe assumptions of the modelThe study applies the progressive two-bracket tax both in the case of
income and consumption taxes. Figure 1 illustrates the correspondingmarginal tax rate which shows the burden on the last unit of the tax base.The different brackets of the tax base are levied by different tax rates:only the part above the bracket limit is charged with the upper tax ratewhile the burden of the lower bracket does not change. (Galántainé 2005)
Source: Varga 2012. 602
Figure 1. Marginal tax rates of two-bracket progressive tax
Equation (3) gives the burden of expenditure tax (Ti) in period i infunction of annual consumption (Ci).
Marginal tax rate
C Tax base
tu
tl
Comparison of the equity effect of progressive income...
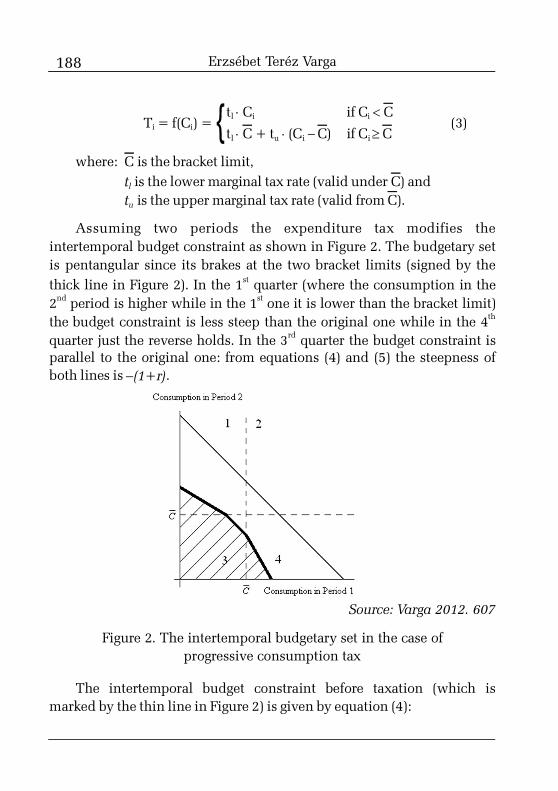
188
tl Ci if Ci CTi = f(Ci) = (3) tl C + tu (Ci – C) if Ci � C
where: C is the bracket limit,tl is the lower marginal tax rate (valid under C) andtu is the upper marginal tax rate (valid from C).
Assuming two periods the expenditure tax modifies theintertemporal budget constraint as shown in Figure 2. The budgetary setis pentangular since its brakes at the two bracket limits (signed by thethick line in Figure 2). In the 1st quarter (where the consumption in the2nd period is higher while in the 1st one it is lower than the bracket limit)the budget constraint is less steep than the original one while in the 4th
quarter just the reverse holds. In the 3rd quarter the budget constraint isparallel to the original one: from equations (4) and (5) the steepness ofboth lines is –(1+r).
Source: Varga 2012. 607
Figure 2. The intertemporal budgetary set in the case ofprogressive consumption tax
The intertemporal budget constraint before taxation (which ismarked by the thin line in Figure 2) is given by equation (4):
Erzsébet Teréz Varga
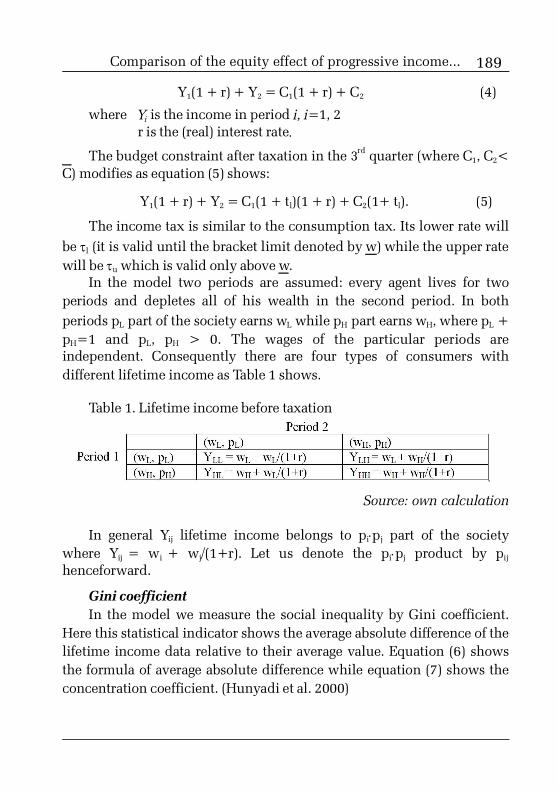
189
Y1(1 + r) + Y2 = C1(1 + r) + C2 (4)
where Yi is the income in period i, i=1, 2r is the (real) interest rate.
The budget constraint after taxation in the 3rd quarter (where C1, C2<C) modifies as equation (5) shows:
Y1(1 + r) + Y2 = C1(1 + tl)(1 + r) + C2(1+ tl). (5)
The income tax is similar to the consumption tax. Its lower rate willbe �l (it is valid until the bracket limit denoted by w) while the upper ratewill be �u which is valid only above w.
In the model two periods are assumed: every agent lives for twoperiods and depletes all of his wealth in the second period. In bothperiods pL part of the society earns wL while pH part earns wH, where pL +pH=1 and pL, pH > 0. The wages of the particular periods areindependent. Consequently there are four types of consumers withdifferent lifetime income as Table 1 shows.
Table 1. Lifetime income before taxation
Source: own calculation
In general Yij lifetime income belongs to pipj part of the societywhere Yij = wi + wj/(1+r). Let us denote the pipj product by pij
henceforward.
Gini coefficientIn the model we measure the social inequality by Gini coefficient.
Here this statistical indicator shows the average absolute difference of thelifetime income data relative to their average value. Equation (6) showsthe formula of average absolute difference while equation (7) shows theconcentration coefficient. (Hunyadi et al. 2000)
Comparison of the equity effect of progressive income...
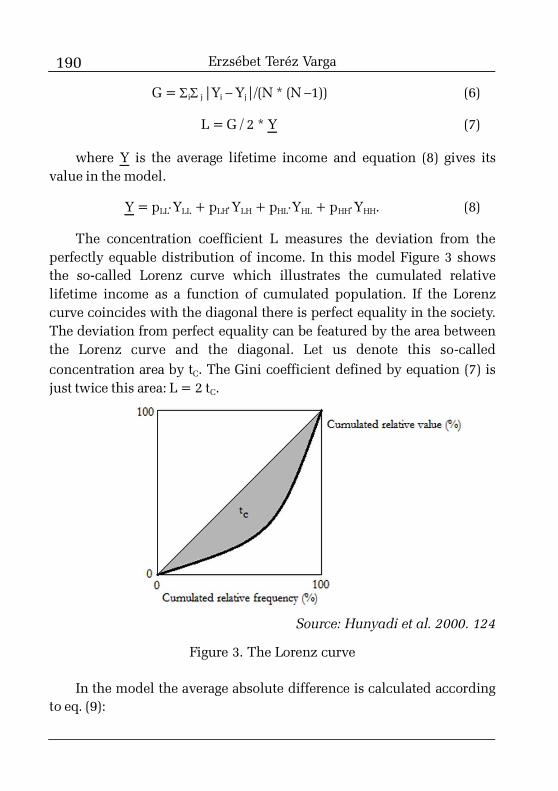
190
G = �i� j |Yi – Yj|/(N * (N –1)) (6)
L = G / 2 * Y (7)
where Y is the average lifetime income and equation (8) gives itsvalue in the model.
Y = pLLYLL + pLHYLH + pHLYHL + pHHYHH. (8)
The concentration coefficient L measures the deviation from theperfectly equable distribution of income. In this model Figure 3 showsthe so-called Lorenz curve which illustrates the cumulated relativelifetime income as a function of cumulated population. If the Lorenzcurve coincides with the diagonal there is perfect equality in the society.The deviation from perfect equality can be featured by the area betweenthe Lorenz curve and the diagonal. Let us denote this so-calledconcentration area by tC. The Gini coefficient defined by equation (7) isjust twice this area: L = 2 tC.
Source: Hunyadi et al. 2000. 124
Figure 3. The Lorenz curve
In the model the average absolute difference is calculated accordingto eq. (9):
Erzsébet Teréz Varga
191
G = pLLpLH|YLL–YLH| + pLLpHL|YLL–YHL| + pLLpHH|YLL–YHH| + (9) +pLHpHL|YLH–YHL| + pLHpHH|YLH–YHH| + pHLpHH|YHL–YHH|.
Now assume that the government introduces a progressive incometax. The income tax modifies the lifetime income denoted by Y�
ij as eq.(10)–(13) shows assuming the following relations: wL < w< wH.
Y� LL = wL (1 – �l) + wL (1 – �l) /(1+r) (10)
Y� LH = wL (1 – �l) + [wH (1 – �u) + w (�u – � )] /(1+r) (11)
Y�HL = wH (1 – �u) + w (�u – �l) + wL (1 – �l) /(1+r) (12)
Y�HH = wH (1 – �u) + w (�u – �l) + [wH (1 – �u) + w (�u – �l)] /(1+r) (13)
The Gini coefficient is calculated similarly as without taxation. Nowwe only have to change the pre-tax lifetime income variables (Yij) to taxedvariables (Y� ij). Let us denote the Gini coefficient after income taxation byL� .
Taxation reduces the differences in disposable income so the aftertaxLorenz curve will be closer to the diagonal than the pre-tax curve was.Consequently the concentration area (let us denote it by t�C) and from itthe concentration coefficient (the amount of L� ) will be smaller than theoriginal one (tC and L respectively). The smaller Gini coefficient meansmore equable distribution.
Equivalent taxesNow let us calculate the effect of progressive consumption. For a
comparable result we have to use adequate rates. Comparison of lineartax systems is by far simpler, consequently its literature is also extensive.The most usual approach of equivalence is the equal tax revenue of thestate (sometimes including the riskiness of it as well) or the equal utilityachieved by consumers (Bonds and Myles 2007, Hashimzade and Myles2006).
These equivalence concepts cannot be applied in the case ofprogressive taxation because they would not be unambiguous. Threeelements determine a two-bracket progressive tax: its lower tax rate, itsupper tax rate and its bracket limit. If we used the principle of equal tax
Comparison of the equity effect of progressive income...
192
revenue for determining equivalent tax systems we would get oneequation for three variables which problem generates an infinite quantityof solutions and this would result in different measures of inequality andalso Gini coefficients.
Now I introduce an unusual equivalence concept for the case ofprogressive tax rates. Henceforward I regard two tax systems asequivalent if the same part of the earned income is consumable. It meansthat if someone’s gross wage is yi the consumable part of it will be xi inboth tax systems. This requires the following relation between incomeand consumption tax rates and bracket limits (Varga 2012):
tj = �j /(1 – �j), j � (l, u) (14)
C = w(1 – �l). (15)
This equivalent concept meets the following requirement as well:“any two sets of taxes that generate the same changes in relative priceshave equivalent incidence effects” (Rosen and Grayer 2010. 320).Assuming only one period the budgetary constraints in the case ofprogressive income and consumption taxation are the same so theireffects on relative prices are identical as well. Regarding more periods thebudget lines are not the same but they are parallel accepting theassumption of consumption smoothing (see later) so they generate thesame changes in relative prices (Varga 2012).
The Gini coefficient regarding the consumption taxFor the calculation of Gini coefficients in the case of consumption
taxation (let us denote its value by Lt) the lifetime income data aremodified (reduced) by the discounted value of the consumption tax. Forcalculating the consumption tax burden we need information on theconsumption decision of the consumers. Let us assume that when thedecision makers maximize their lifetime utility they choose a smoothconsumption path: an agent consumes the same amount in both periodsof his life regarding his net lifetime income.
This assumption is really factual, accepted and proved by manyeconomists. It works according to the Life Cycle/Permanent Income Hypo-thesis (Modigliani and Brumberg 1954, Friedman 1957) and even corres-
Erzsébet Teréz Varga
193
ponds to the buffer-stock behaviour (Carroll 1996) or the habit persistenceapproach by Deaton (1987). Actually all of them support the concept ofconsumption smoothing. Consequently in the model the consumptiondecision of a person are determined by equations (16) and (17):
Cij = Yij(1 + r)/[(2 + r)(1 + tl)] if (16) Yij(1 + r)/[(2 + r)(1 + tl)] � C
Cij = [Yij + C(2 + r)(tu – tl)/(1 + r)](1 + r)/[(2 + r) (1 + tu)] if (17) Yij(1 + r)/[(2 + r)(1 + tl)] � C
where Cij is the one-period consumption of a taxpayer who has Yij lifetimeincome.
After calculating consumption in the two periods the consumptiontax is determined by equation (3).
Results and discussionsThe calibration of the modelThe lower and upper income tax rates are calibrated respectively
with 20 and 40 per cent. The lower and upper consumption tax ratescome from eq. (14) and their values are 25 and 67 per cent.
The bracket limit of the income tax (w) is the simple (not weighted)arithmetic average of the low and high wage: w= (wL + wH)/2.
The income is standardized assuming wL equals to 1. I investigatedtwo cases of high wage. In the first version high wage (wH) is 2 while inthe second version its value is 10.
I calculated the impact of the different tax systems on the Ginicoefficient by different distribution of population. I calculated theconcentration coefficients as a function of the value of pL (the rate of the“poorer” people of the society in a given period) both for income andconsumption taxes.
Thereafter I determined the difference of the Gini coefficients of in-come and consumption taxes (let’s denote it by �L) as equation (18) shows.
�L = L� – Lt (18)
The sign of �L reflects which tax reduces social inequality more.
Comparison of the equity effect of progressive income...

194
When income tax is more efficient in reducing inequality then L� is lowerthan Lt so �L is negative and vice versa (when consumption tax is moreefficient �L is positive).
The results of the modelAccording to my calculations �L can be both positive and negative. It
depends on the composition of the population and the difference of thelower and higher wages as Figure 4 depicts.
The income tax reduces inequality more than the consumption taxwhen the rate of people with higher income is less.
When the higher wage is more times bigger than the lower wage theconsumption tax performs better in a wider interval of possible societystructures.
When the high wage is 10 times the low wage the consumption tax ismore effective if the rate of poorer is not greater than 70 per cent whereasif the high wage is only twice the low wage the consumption tax has amore favourable impact until the rate of poorer is around 55 per cent.
In both cases the consumption tax works better in a broader interval.
Source: own figure
Figure 4. The difference of the Gini coefficients as a functionof the rate of the poorer part of the society
Erzsébet Teréz Varga
195
ConclusionsEquity is a main argument in the debate over the ideal tax base. I
investigated the reduction in inequality implied by different taxesmeasured by the Gini coefficient. According to my model theeffectiveness of reducing inequality depends on the own features of agiven society: the composition of the population and the rate of wages.
The higher the rate of poorer persons the better the equalizing effectof the income tax and the higher the difference between wages the betterthe consumption tax. It means that the effect on inequality is favourablebut not as high as the problems of the introduction of a progressiveconsumption tax. Certainly if other aspects prefer the consumption taxthe effect on inequality can contribute to a favourable assessment as well.
Necessarily the assumptions of the model limited its adaptability. Iassumed two periods, only two income categories and they were certainand known in advance. Taking account of the riskiness of the incomepath would deliver further solutions to the problem.
ReferencesBalogh, L. (2007). Államháztartás – Adórendszer. In Bánfi, T. (ed.):
Pénzügytan. Budapest: Tanszék Kft.Bond, S. and Myles, G. D. (2007). Income and Consumption Taxation:
An Equivalence Result. http://people.exeter.ac.uk/gdmyles/papers/pdfs/IncConEq.pdf, downloaded at 10.06.2013.
Carroll, C. D. (1996). Buffer-Stock Saving and the LifeCycle/Permanent Income Hypothesis. NBER Working Paper.http://www.nber.org/papers/w5788.pdf, downloaded at 08.05.2013.
Cullis, J. and Jones, Ph. (2003). Közpénzügyek és közösségi döntések.Budapest: Aula.
Deaton, A. (1987). Life-cycle models of consumption: is the evidenceconsistent with theory. In Advances in Econometrics. Fifth WorldCongress, vol. 2, pp. 121-148, Cambridge and New York: CambridgeUniversity Press.
Fisher, I. and Fisher, H. N. (1942). Constructive Income Taxation: AProposal for Reform. New York and London: Harper & Bros.
Friedman, M. (1957). A Theory of the Consumption Function.Princeton: Princeton University Press.
Comparison of the equity effect of progressive income...
196
Galántainé, M. Zs. (2005). Adó(rendszer)tan. EU-konform magyaradók. Budapest: Aula.
Hashimzade, N. and Myles, G. D. (2006). Inequality and the Choice ofthe Personal Tax Base. http://people.exeter.ac.uk/gdmyles/papers/pdfs/ExpInEq.pdf, downloaded at 28.05.2013.
Hobbes, T. (1651). Leviathan or the Matter, Forme and Power of aCommonwealth Ecclasiasticall and Civil. London: Printed for AndrewCrooke.
Hunyadi, L., Mundruczó, Gy. and Vita, L. (2000). Statisztika.Budapest: Aula.
Kaldor, N. (1955). An Expenditure Tax. London: George Allen andUnwin.
Mill, J. S. (1875). A nemzetgazdaságtan alapelvei, s ezeknémelyikének a társadalom-bölcsészetre való alkalmazása. 4. és 5. kötet.Budapest: Légrády testvérek.
Modigliani, F. and Brumberg, R. (1954). Utility Analysis and theConsumption Function: An Interpretation of Cross-Section Data. In Abel,A.: Collected Papers of Franco Modigliani. Cambridge: MIT Press.
Musgrave, R. A. (1996). Public Finance and FinanzwissenschaftTraditions Compared. Finanzarhiv, 53, 145-193.
Rosen, H. S. and Gayer, T. (2010). Public Finance. Singapore:McGraw-Hill.
Stiglitz, J. E. (2000). A kormányzati szektor gazdaságtana. Budapest:KJK-KERSZÖV.
Varga, E. (2012). A jövedelem és fogyasztás alapú sávosanprogresszív adóztatás összevetése. In Tavaszi szél konferenciakötet,Budapest: Doktoranduszok Országos Szövetsége.
Erzsébet Teréz Varga
197
Economists' Forum (in Hungarian: Közgazdász Fórum) is a bimonthlyscientific journal of economic profile edited by the Hungarian Economists'Society of Romania and the Department of Economics and BusinessAdministration in Hungarian Language of Babeº-Bolyai University(Faculty of Economics and Business Administration). Its reference numberis ISSN 1582-1986. The journal has six editions a year, five of them inHun garian and one in English.
The Economists' Forum has been recognised by the RomanianCouncil of Scientific Research (CNCSIS). Starting from volume XII, no.92 (December 2009) the issues of the Economists' Forum are indexed inthe ProQuest and EBSCO international databases.
Economists' Forum invites papers presenting the conclusions oftheoretical or applied economic research, scientific debates, or bookreviews. The articles can be written in Hungarian or English. Thearticles should be submitted to one of the following e-mail addresses:[email protected], [email protected].
The text should be between 8 and 20 printed pages, numbered, A4format, characters Times New Roman 12, single spacing. The first pagemust contain the title of the article, the author's name, their completescientific title and affiliation, professional address and e-mail, followedby an abstract of 5-10 lines, that should present the main results of thearticle. The abstract will be followed by 5-7 keywords and one or moreJEL classification code(s). If the article is in Hungarian, authors arerequired to submit an English abstract with title and keywords as well.
In the text reference quotes will appear between brackets, with thename and the publication date, e.g.: (Gyeroffy 1997), for two authors(Black and Scholes 1973). In case of three or more authors, only the firstwill be mentioned, under the form (Barberis et al. 1998). If tworefe rences have the same author and year of publication, they will bedifferentiated through letters (Fanra 1965a). These letters will alsoappear in the bibliography.
Guidelines for authors

198
At the end of the article the references will be presented as follows:• periodicals: the list of the authors including the first name initial,
the year of publication, the title of the article, the name of the periodicalin italics without abbreviations, the number of the volume and thenumber of pages;
• books: the list of authors including the first name initial and theyear of publication, the title of the book in italics without abbreviations,the place of publication and the publishing house.