A Sustainable Approach to Financial Turnaround of a Mature ...
344
A Sustainable Approach to Financial Turnaround of a Mature Business within the UK Steel Industry Andrew Leslie Hill Doctor of Philosophy Newcastle University Business School 6 th January 2017
-
Upload
khangminh22 -
Category
Documents
-
view
3 -
download
0
Transcript of A Sustainable Approach to Financial Turnaround of a Mature ...

A Sustainable Approach to Financial Turnaround of a
Mature Business within the UK Steel Industry
Andrew Leslie Hill
Doctor of Philosophy
Newcastle University Business School
6th January 2017

i
ABSTRACT
The UK steel industry is an example of a mature industry that has failed to cope with the
harsh realities of changing market dynamics. Since nationalisation its response has been
predicated upon cost and asset retrenchment. However, this alone has failed to address
decline in sales and poor financial returns. Consequently, the UKs market share within
home and global markets has been eroded and will continue as such unless it can address
its ability to differentiate the product it offers.
This thesis has considered the cause(s) of organisational failure and the development of
an appropriate turnaround strategy. As an Action Researcher this has involved
understanding how change introduced in the work place was accepted within the social
context of that environment. Fieldwork undertaken within Corus Tubes Energy (CTE),
considered by the Researcher to be representative of the UK steel industry, included both
primary and secondary methods of data capture and analysis. For example, interviews,
observation, narrative and content analysis, followed by periods of reflection as theories
were constructed and tested. Investigative studies concluded that for CTE to compete
effectively it had to differentiate itself as a high-tech, low-cost competitor by addressing
internal issues and improving productivity by 52%.
The turnaround strategy developed by the Researcher was premised on a mutually
supportive operational and HRM strategy. Lean Manufacturing (LM) was adopted as a
mechanism to reform workshop practices, address operational efficiency, reduce
conversion cost, extend capability and thereby address competitive position. Whilst
simultaneously, outdated HRM practices were reconstituted to support the introduction
and the ability to sustain a radical transformation in operational and strategic practices.
The ‘adopt and adapt’ approach employed has achieved this and resulted in a sustained
turnaround moving a loss-making trajectory to profit-making. The turnaround has
demonstrated the viability of the business and safe-guarded jobs.
The unique contribution to theory has been the development of the Sustainability
Framework and the use of LM as a concept to be used to facilitate turnaround. Supportive
contributions include: the extension the NEPA model through the development of a
process that supports strategic change at management level within the UK steel industry;
and a closed loop methodology that engaged shop floor operators in continuous
improvement.


ii
Acknowledgement
I would firstly, like to thank Tim Bird and Dr Colin Heron for their encouragement and
advice that provided me with the inspiration to take on this research project. In addition,
I would like to thank my two supervisors Prof Chris Hicks and Dr Tom McGovern for
their patience, advice, encouragement and personal support. Without this support I
believe this research would have lost direction and focus and may never have reached this
stage.
Special thanks to Harry Nicholson, Gary Turner, Colin Bestford and Michael Kay who
have spent hours listening to my hypotheses and acting as sounding boards to my thoughts
and planned activities.
I would like to thank all the individuals within the organisation past and present who have
taken the time to offer me support and advice throughout this project. Furthermore, to
those who have enthusiastically adopted my ideas in practice and have openly discussed
their views on practices introduced. This has allowed me to truly understand the
perception of change within the social context of the work place and refine practices to
develop and support a sustained culture of continuous improvement. A process that has
enabled the Researcher deliver a successful turnaround and help safeguard jobs.
Special thanks to my sister Wendy Hill for proof reading my two final drafts and having
the patience to address ‘Andy-esque’ grammar errors for which I am truly grateful.
Equally, a special thanks to my mother, Iris Hill, my siblings Mark and Julie, and the
extended families who have helped me keep my feet on the ground
Finally, to my wife Karen and son James who have had the patience to put up with my
long hours in work and study and support me throughout what has been a time-consuming
but rewarding experience.


i
Table of Contents
ABSTRACT ...................................................................................................................... i
Acknowledgement ............................................................................................................ ii
List of Figures ................................................................................................................. vii
Chapter One: Introduction ................................................................................................ 1
1.0 Problem overview .................................................................................................. 1
1.1 Background ............................................................................................................ 1
1.2 Aims ...................................................................................................................... 4
1.3 Research questions ................................................................................................ 5
1.4 Contribution to knowledge ................................................................................. 11
1.5 Thesis structure – main chapters ......................................................................... 14
Chapter Two: Steel ......................................................................................................... 16
2.0 Introduction ......................................................................................................... 16
2.1 The evolution of steel: from mediocrity to indispensability................................ 17
2.2 The dynamics of world steel production ............................................................. 19
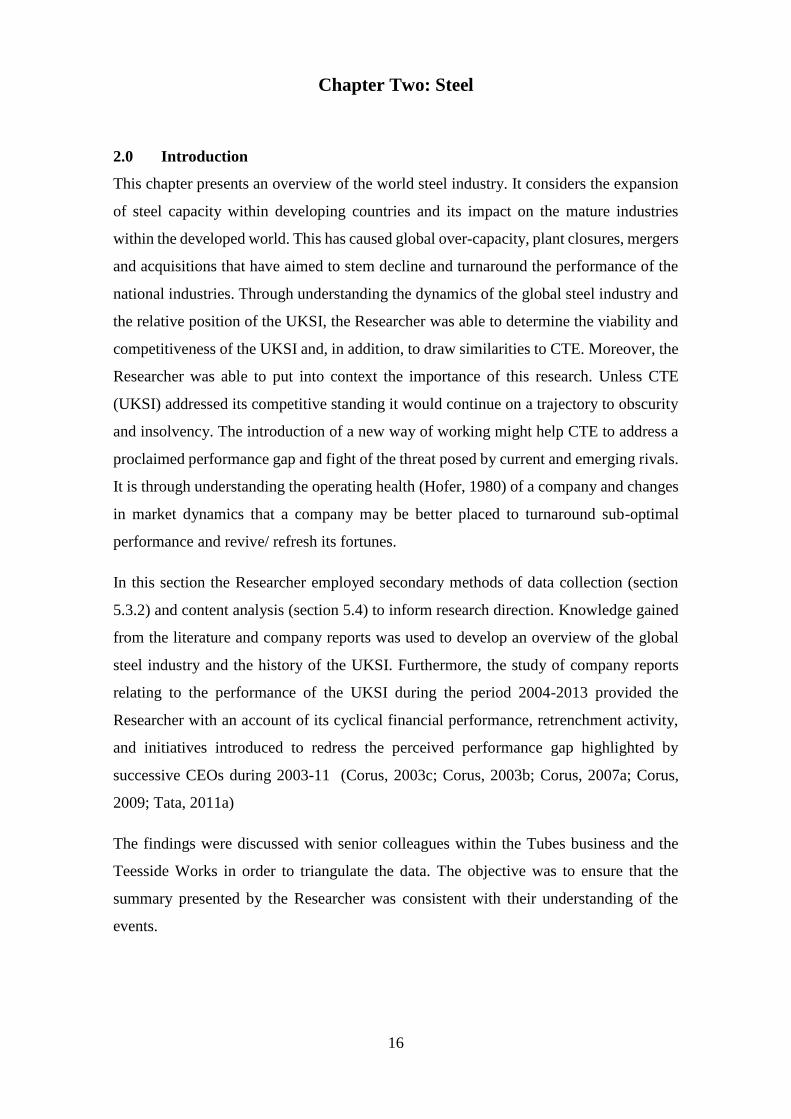
2.3 The UK Steel history relative to changes in world dynamics ............................. 23
2.4 Corus Tubes Energy ............................................................................................ 29
Chapter Three. An approach to implementing and sustaining a process centric
manufacturing strategy ................................................................................................... 32
3.0 Introduction ......................................................................................................... 32
3.1 The need for change ............................................................................................ 33
3.2 Lean manufacturing – from humble beginnings ................................................. 34
3.2.1 Scientific Management .................................................................................... 36
3.2.2 From Scientific Management to Mass Production. ......................................... 37

ii
3.3 What is Lean Manufacturing ................................................................................ 39
3.4 Implementing Lean Manufacturing .................................................................... 40
3.4.1 The basic building blocks of Lean manufacturing ................................................ 44
3.4.2 The basis for a successful transformation to LM ............................................. 48
3.5 The role of HRM .................................................................................................... 51
3.5.1 Selection, Recruitment, Learning and Development ....................................... 53
3.5.2 Motivation ........................................................................................................ 55
3.5.3 Hoshin Kanri .................................................................................................... 58
3.6 Summary .............................................................................................................. 60
Chapter Four: The evolution of the sustainability framework ....................................... 64
4.1 Introduction ......................................................................................................... 64
4.2 The development of the Sustainability Framework ............................................. 65
4.2.1 Manufacturing strategy .................................................................................... 66
4.2.2 HRM strategy ................................................................................................... 75
4.2.3 The scale of the challenge ................................................................................ 78
4.2.4 The Sustainability Framework ......................................................................... 81
4.2.5 Summary .......................................................................................................... 82
4.3 The Sustainability Framework applied. ............................................................... 82
Chapter Five. Research Design ...................................................................................... 86
5.1 Introduction ......................................................................................................... 86
5.2 Research design ................................................................................................... 86
5.2.1. Research Philosophy ........................................................................................ 87
5.2.2. Research approach ........................................................................................... 89
5.2.3. Research strategy ............................................................................................. 89

iii
5.3 Data collection ..................................................................................................... 93
5.3.1. Primary methods of data collection ................................................................. 94
5.3.2. Secondary methods of data collection ........................................................... 104
5.4 Data Analysis ..................................................................................................... 106
5.5 Summary ............................................................................................................ 114
Chapter Six: The launch phase of CTE’s transformation ............................................. 115
6.1 Introduction ....................................................................................................... 115
6.2 Identifying the ‘how’; the findings of the business diagnostic. ......................... 117
6.2.1 Productivity Needs Analysis (PNA) .............................................................. 118
6.2.2 Manufacturing and Training Needs analysis (MNA and TNA). ................... 119
6.2.3 Workforce Development ................................................................................ 120
6.3 Basic concepts introduced to support a new way of working. .......................... 121
6.3.1 Change Agent philosophy .............................................................................. 121
6.3.2 Lean tools applied: Launch phase (year one) ................................................ 122
6.3.3 Other key tools and techniques ...................................................................... 129
6.3.4 Project governance ......................................................................................... 130
6.4 Human Resource Management Strategy ........................................................... 131
6.4.1 Recruitment and Training .............................................................................. 132
6.4.2 Training and Development ............................................................................ 132
6.4.3 Reward System .............................................................................................. 133
6.4.4 Communication ............................................................................................. 134
6.5 Benchmarking Japan - The Right Direction ...................................................... 136
6.5.1 Common themes uncovered. .......................................................................... 136
6.5.2 Two important lessons. .................................................................................. 138

iv
6.5.3 Synopsis of the visit ....................................................................................... 138
6.6 Sustaining the new way of working .................................................................. 139
6.6.1 Compliance auditing ...................................................................................... 139
6.6.2 Simplified Kaizen system .............................................................................. 140
6.6.3 Visual management within the factory .......................................................... 142
6.6.4 Workforce development phase 2 ................................................................... 144
6.6.5 Problem solving interventions ....................................................................... 144
6.6.6 Hoshin Kanri .................................................................................................. 145
6.6.7 Team Member appraisal process ................................................................... 149
6.7 Summary ............................................................................................................ 150
Chapter Seven: Research in action ............................................................................... 152
7.1 Introduction ....................................................................................................... 152
7.2. An agreed approach ............................................................................................... 152
7.2.1 The development of the main themes .................................................................. 152
7.2.2 The conceptual framework .................................................................................. 154
7.3 Research philosophy ............................................................................................... 158
7.4 Action Research ................................................................................................. 159
7.5 Data gathering......................................................................................................... 166
7.6 Data Analysis ..................................................................................................... 185
7.6.1 Categorisation ................................................................................................ 185
7.6.2 Unitising data ................................................................................................. 186
7.6.3 Recognising relationships. ............................................................................. 188
7.6.4 Developing and testing hypotheses ................................................................ 196
7.7 Summary ............................................................................................................ 198

v
Chapter Eight: Results .................................................................................................. 200
8.1 Introduction ....................................................................................................... 200
8.2 The benefit of a HRM strategy .......................................................................... 200
8.3 The benefits of the approach to CTE ................................................................. 212
8.4 Summary ............................................................................................................ 223
Chapter Nine: Discussion ............................................................................................. 224
9.1 Introduction ....................................................................................................... 224
9.2 The application of LM within CTE ................................................................... 226
9.2.1 Construct, Action plan, Action taking, and Evaluation. ................................ 232
9.3 Are LM tools and techniques transferable? ....................................................... 238
9.4 Summary ............................................................................................................ 243
Chapter Ten: Conclusions ............................................................................................ 246
10.0 Introduction. ...................................................................................................... 246
10.1 Reviewing the research intent............................................................................ 246
10.2 The impact of the lessons learned and applied. ................................................. 249
10.3 Recommendations for future research. .............................................................. 254
10.4 Reflecting on the research strategy adopted ...................................................... 255
10.5 Personal reflections............................................................................................ 257
APPENDIX A: Improvement plan and charters. ......................................................... 259
APPENDIX B: The NEPA 123 Methodology .............................................................. 267
APPENDIX C: The Productivity, Manufacturing and Training Needs Analysis ........ 268
APPENDIX D: Examples of Questions ....................................................................... 272
Continuous Improvement questions ............................................................................. 272
Refresher training questionnaire and survey results ..................................................... 273

vi
APPENDIX E: Finishing Mill Development ............................................................... 277
APPENDIX F: Single Minute Exchange of Dies (SMED) .......................................... 280
APPENDIX G: Refresher training 2009 ...................................................................... 281
APPENDIX H: Example of the 6 step HK process employed by CTE ....................... 282
APPENDIX I: The Availability Challenge .................................................................. 283
APPENDIX J: The appraisal process ........................................................................... 286
APPENDIX K: Diary and Database extracts ............................................................... 292
Bibliography ................................................................................................................. 297

vii
List of Figures
Chapter One:
Figure 1.1 The model used by the Researcher to depict the framework
used in the introduction of a sustainable business transfromation…………………. 12
Chapter Two:
Figure 2.1 Crude steel production: China’s growth relative to the main
steel producers……………………………………………………………………... 19
Figure 2.2 The structure of Corus Group in 2003……………………………. 30
Chapter Three:
Figure 3.1 Chronological events that have contributed to the evolution of TPS. 34
Figure 3.2 Classes of sustainability……………………………………………. 42
Figure 3.3 The temple of continuous improvement…………………………… 44
Figure 3.4 Waste, non-value and value added activities………………………. 46
Figure 3.5 The strategic cascade process termed ‘the Z-ing process’…………. 59
Chapter Four:
Figure 4.1 The development of the manufacturing strategy……………………74
Figure 4.2 The development of the HRM strategy……………………………..78
Figure 4.3 The development of CTE’s vision…………………………………..79
Figure 4.4 The development of the governance criteria………………………..80
Figure 4.5 P.D.C.A. iterative cycle…………………………………………….80
Figure 4.6 The Sustainability Framework……………………………………..81
Chapter Five:
Figure 5.1 The research process onion………………………………………… 87
Figure 5.2 The cyclical nature of AR………………………………………… 91
Figure 5.3 The general empirical method employed in AR projects………… 92
Figure 5.4 An example of an ABCD summary………………………………. 101
Figure 5.5 Typology of participant observation researcher roles……………. 102
Figure 5.6 The main themes identified at the outset of this research programme. 108
Figure 5.7 An example of an index card used for labelling files…………….. 109
Figure 5.8 An example of an extract from an interview summary…………… 110

viii
Chapter Six:
Figure 6.1 The main themes identified at the outset of this research programme. 115
Figure 6.2 Years 1 to 3, the implementation phase……………………………. 115
Figure 6.3 The sustainability and maturity phase……………………………… 116
Figure 6.4 Examples of 5S practices adopted within CTE……………………. 124
Figure 6.5 An example of a standard operation sheet used by CTE………….. 126
Figure 6.6 An example process map used by the Researcher………………… 128
Figure 6.7 An example of a typical communication board within the H42….. 134
Figure 6.8 Spider diagrams of audited areas…………………………………. 140
Figure 6.9 Front and reverse side of a kaizen card useb by CTE……………. 141
Figure 6.10 An extract from a presentation made to CTE……………………. 142
Figure 6.11 Examples of visual management deployed within CTE………… 143
Figure 6.12 Strategy deployment cascade process…………………………… 146
Figure 6.13 Extracts from the Time Out For Business booklets……………… 148
Chapter Seven:
Figure 7.1 The main themes identified at the outset of this research programme. 153
Figure 7.2 An example of a method employed to visualise data captured……… 154
Figure 7.3 Iteration identifying the main themes to be pursued………………… 154
Figure 7.4 Years 1 to 3, the implementation phase……………………………. 156
Figure 7.5 The sustainability and maturity phase……………………………… 157
Figure 7.6 An example of an interview question set…………………………... 168
Figure 7.7 An example of a follow-up interview question set………………… 169
Figure 7.8 Extract from an interview summary re difference between TCP
and the H42………………………………………………………………………. 171
Figure 7.9 Extract from an interview transcript re difference between TCP
and the H42………………………………………………………………………… .172
Figure 7.10 Examples of questions extracted from a questionnaire……………. 175
Figure 7.11 Examples of a questionnaire where the participant picked
from options available…………………………………………………………….. 176
Figure 7.12 Exampe of a method of data gathering employed by the Researcher. 176

ix
Figure 7.13 An example of a 5M (Ishikawa) diagram employed by the
Researcher………………………………………………………………………… 177
Figure 7.14 An example of a copy of an observation made by the Researcher.. 179
Figure 7.15 Trends in cycle time reduction relative to changes in tip
cutting depth on miller……………………………………………………………. 180
Figure 7.16 Edge miller cycle time…………………………………………….. 181
Figure 7.17 Example of a diary note recorded by the Researcher……………… 182
Figure 7.18 An example of a summary form…………………………………… 186
Figure 7.19 An example of an extract from an interview summary……………. 187
Figure 7.20 Trend in press line performance…………………………………… 189
Figure 7.21 Historic trends in the number of interventions and Kaizen raised… 190
Figure 7.22 Application versus evidence……………………………………….. 192
Figure 7.23 Support versus evidence…………………………………………… 192
Chapter Eight:
Figure 8.1 Trend in the number of intervention run at CTE………………….. 205
Figure 8.2 Trend in Kaizen raised by employees…………………………….. 206
Figure 8.3 Trend in the total number of ideas generated…………………….. 206
Figure 8.4 Product throughput rate on press line…………………………….. 212
Figure 8.5 Mill availability measured on the press line……………………….212
Figure 8.6 Average number of good pps exiting the Finishing mill…………. 213
Figure 8.7 The approach to changeover and set up improvement…………….215
Figure 8.8 Process map illustrating pipe/hr/process for 610mm x 29.7mm
in 2008……………………………………………………………………………..218
Figure 8.9 An example of an annual implementation plan……………………219
Figure 8.10 Process map illustrating pipe/hr/process for 457mm x 28.6mm
in 2015……………………………………………………………………………..219
Figure 8.11 Profitability performance against annual plan for CTE……………220
Chapter Nine:
Figure 9.1 Creating a virtuos circle……………………………………………225
Figure 9.2 The framework adopted by CTE to achieve a sustanable

x
transformation………………………………………………………………… 230
Figure 9.3 Moving from a reactive to a proactive approach……………… 234
Figure 9.4 The interdependent role of LM within the overall
manufacturing strategy………………………………………………………. 236
Figure 9.5 The vital role of HRM………………………………………. 237
Appendix:
Figure A1 An example of a generic three year plan……………………… 260
Figure A2 Percentage gain or contribution aligned to a particular activity.. 261
Figure A3 An example of an annual implementation plan………………. 262
Figure A4 An example of a project charter employed at CTE…………… 263
Figure A5 An example of a project charter employed at CTE…………… 264
Figure A6 Charter for a welding activity………………………………… 265
Figure A7 An example of an Ishikawa diagram………………………… 265
Figure A8 An example of a 3C chart used by the Researcher…………… 266
Figure B1 The structured 123 process flow of the NEPA methodology… 267
Figure C1 The output of the NEPA/ CTE initial evaluation……………… 268
Figure C2 The result of the NEPA/ CTE MNA part 1…………………… 269
Figure C3 The result of the NEPA/ CTE MNA part 2…………………… 270
Figure C4 The result of the NEPA/ CTE TNA ……..……………………. 271
Figure E1 Pipe inspection and rectification layout…..…………………… 277
Figure E2 Modified process for product inspection and x-ray clearance… 278
Figure I1 Reactive incoherent approach………………………………… 284
Figure I2 Focused and structured approach…………………………… 284
Figure I3 Engineering pin diagram…………………………………… 285
Figure J1 Job related skills…………………………………………… 287
Figure J2 Team working…………………………………………….. 288
Figure J3 Commitment………………………………………………. 289
Figure J4 Flexibility………………………………………………… 290
Figure J5 Time Out For Business booklet assessment sheet………… 291
Figure K1 An example of a Researcher diary note…………………… 292
xi
Figure K2 An example of a diary entry plus feedback post meeting…. 293
Figure K3 Examples of the database content…………………………… 296
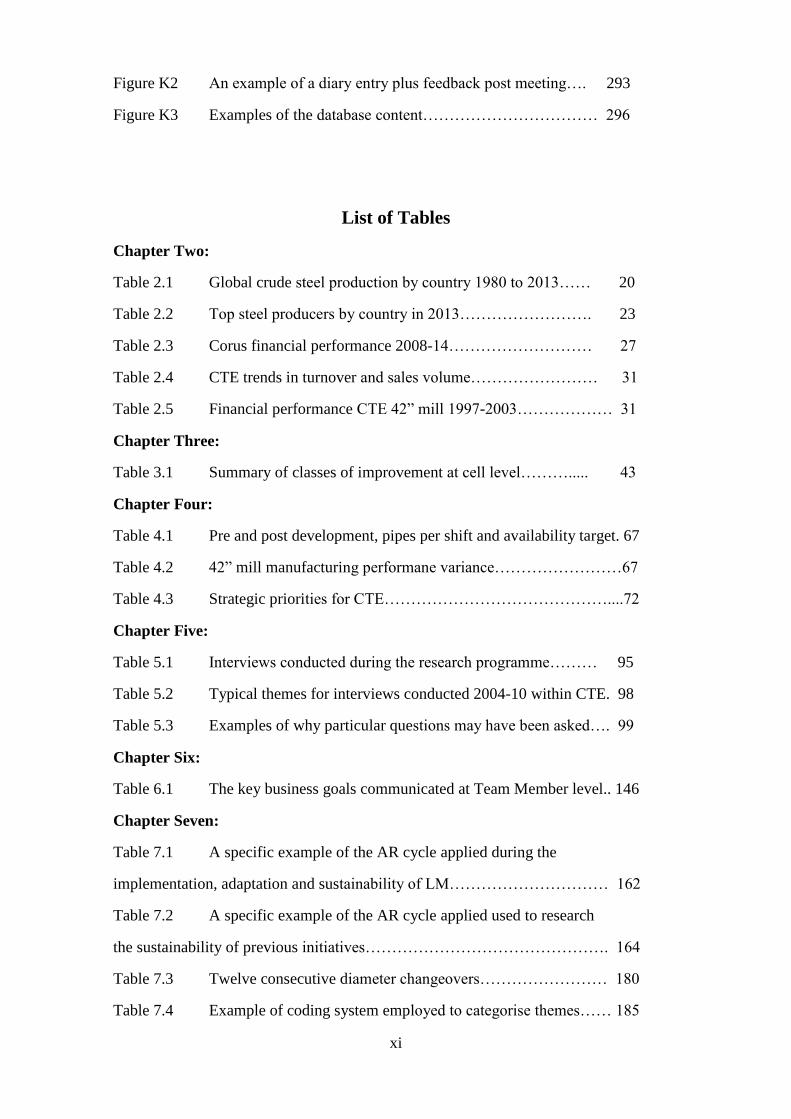
List of Tables
Chapter Two:
Table 2.1 Global crude steel production by country 1980 to 2013…… 20
Table 2.2 Top steel producers by country in 2013……………………. 23
Table 2.3 Corus financial performance 2008-14……………………… 27
Table 2.4 CTE trends in turnover and sales volume…………………… 31
Table 2.5 Financial performance CTE 42” mill 1997-2003……………… 31
Chapter Three:
Table 3.1 Summary of classes of improvement at cell level………..... 43
Chapter Four:
Table 4.1 Pre and post development, pipes per shift and availability target. 67
Table 4.2 42” mill manufacturing performane variance……………………67
Table 4.3 Strategic priorities for CTE……………………………………....72
Chapter Five:
Table 5.1 Interviews conducted during the research programme……… 95
Table 5.2 Typical themes for interviews conducted 2004-10 within CTE. 98
Table 5.3 Examples of why particular questions may have been asked…. 99
Chapter Six:
Table 6.1 The key business goals communicated at Team Member level.. 146
Chapter Seven:
Table 7.1 A specific example of the AR cycle applied during the
implementation, adaptation and sustainability of LM………………………… 162
Table 7.2 A specific example of the AR cycle applied used to research
the sustainability of previous initiatives………………………………………. 164
Table 7.3 Twelve consecutive diameter changeovers…………………… 180
Table 7.4 Example of coding system employed to categorise themes…… 185

xii
Table 7.5 Manufacturing performance variance…………………………. 191
Table 7.6 Strategic priorities for CTE……………………………………. 192
Table 7.7 An example of an extended matrix employed to demonstrate
features associated with the introduction of LM techniques in the FM………. 193
Table 7.8 An example of an extended matrix employed to demonstrate
features associated with the introduction of LM techniques in the F&W lines.. 194
Table 7.9 An examle of an extended matrix viz-a-vizprevious initiatives. 195
Chapter Eight:
Table 8.1 The main concerns raised bt TMs as issues they perceived
would prevent the transition and sustainability of LM………………………. 201
Table 8.2 An extended matrix employed to demonstrate features
associated with the introduction of LM techniques within CTE……………. 208
Table 8.3 Twelve consecutive diameter changeovers………………… 215
Table 8.4 SoW and availability variances for H42……………………… 217
Table 8.5 Sales volume 2003-15………………………………………… 221
Appendix:
Table F1 Standard changeover times for H42 press line……………….. 280

1
Chapter One: Introduction
1.0 Problem overview
The cause(s) of organisational failure and the ability to turnaround an under-performing
asset has generated significant interest within the research literature (Mellahi and
Wilkinson, 2004; Hedberg et al., 1976; Slatter and Lovett, 1984; Weitzel and Jonsson,
1989; Quinn and Cameron, 1983; Khandwalla, 1992; Bibeault, 1982; Pearce II and
Robbins, 1993; Balgobin and Pandit, 2001; Sheppard and Chowdhury, 2005; Hofer,
1980; Schendel and Patton, 1976; Arogyaswamy et al., 1995; Pearce II and Robbins,
2008; Barker III and Mone, 1994; Wild, 2010). The regeneration of the business position
may require a lone strategy or a hybrid of a combined approach. However, it is proffered
that in the case of a mature business in decline, it is common to adopt efficiency
improvement strategies (Slatter and Lovett, 1984; O'Neill, 1986; Khandwalla, 1992;
Robbins and Pearce II, 1992; Bowman and Singh, 1993). Consequently, for a mature
industrial business efficiency orientated improvements have become the prevailing
managerial concern (Zammuto and Cameron, 1985; Bateman, 2001; Bateman and David,
2002; Cushnaghan, 2003; Herron and Braiden, 2006; Herron and Hicks, 2008).
The UK steel industry (UKSI) is an example of a mature business in decline (section 2.3).
In conjunction with the Cardiff Business School (CBS) the UKSI (Corus) sought to
introduce Lean practices to address its performance gap (Hines and Taylor, 2000). Corus
launched a Restoring Success Programme (RSP) in 2003/04 based on Lean principles
(Corus, 2003b). Notwithstanding the support of CBS, and the fact that much has been
written of Lean practices and its implementation (chapter 3) - the practices were not
sustained (section 2.3); consequently, despite such support and the abundance of
literature, the lessons were not being learnt.
1.1 Background
In 2012 UK manufacturing industry employed around 2.6 million people and accounted
for 10% of £139 billion of national economic output. Manufacturing’s share of total UK
economic output has been in steady decline for many decades from more than 30% in the
early 1970s to 10% in 2012 (ONS, 2014).

2
Steel is an essential and strategic industry, the hallmark of a developed country and of
national greatness (Walker, 1906). Every G20 nation has a domestic steel industry
(Verstappen, 2009). The UKSI has a strategic role in underpinning the UK manufacturing
sector (Commons, 2003) and providing employment opportunities.
The UKSI was nationalised in 1967 to form the British Steel Corporation (BSC). It
employed 250,000 people and has since continually rationalised its portfolio. In the three
decades after nationalisation the number of full-time employees reduced by 88% to
31,000 with overall capacity reduced by 44% to 15mmt pa (Beauman, 1996). In 2013,
employment had fallen to approximately 21,000 and output had reduced to 12mmt (WSA,
2014).
Previous research has documented the closure of under-performing businesses, as
opposed to successful turn-around (Evans, 1983). The literature on the steel industry has
considered the declining performance of the UKSI and focused upon retrenchment
(Vaizey, 1974; Ovenden, 1978; Dudley, 1979; ISTC, 1980; Upham, 1980; Sadler, 1984;
Blyton, 1992; Beauman, 1996; Lenway et al., 1996; Pandit, 1998; Baojun, 1999; Prouvost
and Wagner-Ferrari, 1999; Kipping et al., 2001; Balcerek, 2002; Sadler, 2004; Jha et al.,
2006).
Successive CEOs of the Corus Group: Moffat, Pedder, Varin, Adams and Koehler had
argued that one of the greatest challenges facing the Corus Group was to address the
significant performance gap between the company and its competitors (Corus, 2000b;
Corus, 2000a; Corus, 2003c; Corus, 2003b; Corus, 2003a; Corus, 2005; Corus, 2007a;
Corus, 2009; Tata, 2011e). The RSP launched in 2003 was based on implementing Lean
Manufacturing (LM) (Corus, 2003b; Corus, 2003a). However, as with numerous other
initiatives introduced within BSC/ Corus it was not sustained (CTE, 2005c; CTE, 2010a)
(section 4.2.2). Investigations conducted by the Researcher (CTE, 2008a; CTE, 2008h)
indicated that within many of the sites visited, the RSP programme as with other
initiatives, had stalled. Moreover, these initiatives failed to address the repeated calls of
successive CEOs to address the growing performance gap reflected by the deteriorating
financial performances (Corus, 2000b; Corus, 2003c; Corus, 2003b; Corus, 2007a; Corus,
2009; Corus, 2011).
LM has been extolled by numerous authors as a superior way of working and as the 21st
Century manufacturing paradigm (Ohno, 1988; Womack et al., 1991; Womack and Jones,
2003; Liker, 2004). Lean has been employed successfully by the automotive industry,

3
particularly Japanese car manufacturers to achieve a competitive advantage through
reducing cost and innovative thinking in the delivery of improved efficiencies. However,
there is limited research on the implementation of Lean in the UKSI. The reasons for the
dearth of literature may include: that successful applications have yet to be published or
attempts to implement LM have not been sustained and were therefore not successful.
There is a body of literature that has proffered various roadmaps and approaches to adopt
in the application and sustainability of LM (Hines and Rich, 1997; Taylor et al., 2001;
Bateman and David, 2002; Hines et al., 2004; Herron and Braiden, 2006; Herron and
Hicks, 2008). These differ in their approach, starting point and support required to
implement a particular approach. Whilst each, in the Researcher’s opinion offer value,
they do not fully address the issue of Lean sustainability; particularly when the likelihood
is that a business in decline may be confronted with numerous competing pressures. The
literature advocated that there was a propensity for new business initiatives such as Lean
to fail if not implemented correctly (Umble et al., 2003; Achanga et al., 2006). The
propensity increased when compounded with issues such as: a lack of leadership; an
inability to engage with the key stakeholders; a superficial understanding of the initiative
or technique to be introduced; its goals, and many others (Barker, 1996; Holland and
Light, 1999; Coronado and Antony, 2002; Hargreaves, 2007).
The HRM literature (reviewed in section 3.5) extols the importance of transformational
practices such as: leadership, motivation, communication, training and development, as
common themes to engage employees; practices that if incorporated within the business
strategy, have increased the probability of success of a business transformation.
Therefore, the reason this research is important is that:
1. it seeks to understand why the UKSI has failed to sustain key initiatives and use the
lessons learnt to reverse this situation. Learning that highlights that LM must be seen
and managed strategically not just operationally;
2. it identifies the importance of a mutually supportive operational and HRM strategy;
the latter serving to create a culture that engages employees and is conducive to
continuous improvement. This is opposed to a culture where Lean may be perceived
as an imposition and something that must be tolerated in the short-term;
3. it addresses a gap that currently exists in the literature. The literature is replete with
information pertaining to turnaround strategies, recommending efficiency orientated
strategies as pertinent for mature business. Furthermore, there exists extensive

4
literature on how to implement LM within a business. However, there is a gap in the
literature proffering the use of LM as a turnaround strategy to be employed by a
mature business in decline. In addition, a gap exists in the literature indicating /
demonstrating how LM could be implemented and sustained within an environment
such as the UKSI. Corus did work with Cardiff Business School to introduce Lean
practices as part of the RSP (section 2.3) (Hines and Taylor, 2000). However, there is
no evidence to corroborate the sustained approach within Corus or that the stated
performance gap was addressed;
4. the author's contribution to new learning in this field addresses this possible gap by
using direct experience from turning around the business of Corus Tubes Energy
(CTE). Ten years after the introduction of the recovery plan (turnaround strategy) and
practices associated with LM within CTE, the practices were still evident.
Furthermore, the financial performance of CTE has been transformed (section 8.3).
CTE performance and history was considered to be representative of the UKSI
(sections 2.3 and 2.4), which makes the findings of this research generalisable to the
wider steel industry.
1.2 Aims
This research attempts to build on the plethora of valued work associated with:
organisational failure; turnaround strategies; LM and HRM policies that engage
employees. It seeks to highlight how the Researcher has achieved a sustainable
transformation in work shop practices and financial performance within CTE. This was
important because CTE and the UKSI were described as a mature business in decline
(sections 2.4 and 2.3 resp.). Such companies are characterised by under-utilised assets
and ineffective management (Bibeault, 1982). In this situation management inertia will
increase the level of external challenges (Kuznets, 1940); the consequence is that further
decline as opposed to growth ensues and the trajectory to dissolution beckons.
The principal aim of this research was to examine the course(s) of action that would be
deemed appropriate to counter this predicament. To understand how Lean techniques and
philosophies could be employed and sustained as a key component of a turnaround
strategy in the UKSI. The motivation for this thesis was derived from the firm belief that
for the UKSI to remain viable it must continuously improve its operational efficiency
through the application of Lean principles. World class companies employing Lean
techniques pay particular attention to value creation within the overall supply chain

5
(Bateman, 2001). It was the Researcher’s opinion that without radical change to strategic
and operational practices, the future of the UKSI would continue on a path of
retrenchment and decline.
1.3 Research questions
This thesis explored how LM could be implemented and sustained within the UKSI. The
research addressed the following questions:
1. How can the principles of LM be successfully applied in an established organisation
with hierarchical management structures, adversarial industrial relations and
established demarcations? In addition, is it possible to develop an effective model for
breaking down traditional working practices and cultures in order to achieve the
required transformation?
2. How can HRM policies and practices support the introduction of Lean principles in a
'Brownfield' operation? In particular, what is the most appropriate HRM strategy for
overcoming resistance to change and engaging with key stakeholders (the shop floor
team members, management and the union) to support new ways of working?
3. Are Lean tools and techniques transferable within a heterogeneous working
environment? For example, are the techniques limited to particular contexts, such as
high volume manufacturing, or can they be applied in a low volume, engineer-to-
order traditional industry?
The research questions (RQs) were constructed as a result of the hypotheses developed
by the Researcher. The hypotheses (listed below) were informed following the analysis
of interviews (sections 5.3.1, 7.2 and 7.5), business reports (sections 5.3.2, 7.2 and 7.6),
fieldwork (sections 5.2.3 and 7.4), and deduced from literature (chapter 3).
- In 2003 CTE was considered not viable as a stand-alone business. To be deemed
worthy of saving CTE had to develop a recovery programme that addressed its
competitive standing/ prevailing performance gap;
- LM can be used to improve the competitiveness and therefore viability of a business;
- downstream throughput could be improved if upstream quality was improved.
Upstream quality could be improved by adherence to established best practice;
- the introduction of LM techniques would improve the efficiency of the process;

6
- Team Members (TMs) would only adopt new techniques if it could be shown to add
value to the user;
- an optimum cycle time will not be achieved unless the employee is motivated
sufficiently to comply with the agreed standard operating practice; furthermore,
- an employee will not be motivated to achieve the optimum cycle time unless there is
a positive or negative impact associated with his/ her behaviour;
- the internal issues within CTE (operational culture) had generated an inertia that had
impeded the introduction of previous initiatives;
- unless the internal issues associated with the above causal attributes were addressed
then the ability to sustain the new approach would as with other initiatives, falter;
- the ability for CTE to introduce and sustain a new way of working was proportional
to its ability to transform its HRM policies”;
- HRM policies such as training, communication, and leadership behaviour has a vital
role in the engagement of TMs and their desire to support change;
- the absence of post-training activities and engagement was proportional to the
knowledge retained of LM by TMs and the dwindling support for the programme;
- training in workforce development would act as an enabler to a new way of working.
Moreover, if employees are not engaged in the process the initiative could stumble;
- support in the post-launch phase was critical to the implementation and sustainability
of new techniques;
- there is a direct relationship between post-implementation strategic management of
change and sustainability;
- the absence of a clear vision and a structured approach (to change) will increase the
likelihood of failure;
- a contemporary HRM strategy was critical to the sustainability of LM (within CTE).
The Researcher was able to conclude from the hypotheses listed above that the overriding
hypothesis in support of this research was that:
Lean could be employed as a manufacturing paradigm to achieve a turnaround
within a mature business in decline if strategically managed and implemented with a
mutually supportive HRM strategy.
In order to answer the RQs the following actions were required:
- to critically review the literature and identify theories in support of the introduction
and sustainability of Lean practices;

7
- to adopt a participative approach based on Action Research (Lewin, 1946). This
provided the Researcher with an opportunity to evaluate the change programme
within the social context of the work environment. The very act of involvement may
provide an insight into the (mis)behaviour of individuals during the transformation
process. An insight that may provide learning and the development of themes to be
pursued;
- the development of a framework that enabled the Researcher to prioritise and
coordinate actions throughout this extensive longitudinal study.
The following provides an overview of the research methodology adopted and informed
by the RQ.
Establishing the direction: To aid the research intent the Researcher needed to generate
an understanding as to why CTE was confronted with the crisis situation in 2003 (section
2.4). Furthermore, what actions could be implemented to deliver a sustained turnaround
in performance. Consequently, the research method adopted to explore the ‘as is’
condition within CTE in 2003/04 involved the primary data gathering method of
interviewing (examples p94, 166, and 167) and secondary techniques (p103) involving
the review of company reports and minutes of meetings. The subsequent analysis of the
data (section 5.4, p105) informed the initial direction of the research. For example,
follow-up interviews, benchmarking and recommended literature reviews. The output
supported the development of the research questions (p5) and contributed to the
advancement of the subsequent interventions (sections 6.2, 6.3, 6.4; pages 115, 119, 129
resp.) employed by the Researcher during the implementation phase (figure 7.4, p154) of
this project.
Research question 1: Research relative to the success of previous initiatives launched
within CTE had shown that all previous initiatives had failed (section 4.2.2, p73).
Consequently, if the Researcher was to succeed with the planned transformation to LM,
it was important to manage the change process and address perceived barriers to engender
stakeholder support. Leadership, culture and engagement were some of the primary issues
cited by employees as barriers to change (section 4.2.2, table 8.1). To comprehend the
true nature or root cause of the internal issues and perceived negative culture, the
Researcher needed to explore within the social context of the workplace, the subjective
meaning behind actions that motivated an employee to behave in a certain manner. The

8
findings could be used to interpret the meaning rather than the measurement of a social
phenomenon. Thus, the ontological and epistemological stance employed was that of
subjectivism and interpretivism (p86). This approach was selected because the study
involved understanding TM perception of, and attitude to change over an extended period
of time (p162). In addition, the iterative approach of Action Research (section 5.2.3, p88)
was chosen because it provided a methodology that allowed the Researcher to learn from
his experience whilst simultaneously evaluating the organisation and stakeholder views
by trying to change them.
Due to the extended period of time required to implement Lean and demonstrate
sustainability a multi-method approach to data collection was required. The primary
(inductive) approach involved interviews and observations (sections 5.3 and 7.5). Data
gathered pre-, during and post-interventions were assessed to determine how practices
and possibly behaviour (culture) had changed over time. The approach would allow the
Researcher to evaluate and compare what was being observed with what was being said
(Argyris 1995). The research methodology supported the Researcher’s ability to immerse
himself within the change process and acquire knowledge as a consequence of the three-
step heuristic process – experience, understanding and judgement. An example of the AR
cycle employed in support of RQ1 is provided in Table 7.1 (p160).
In order to strengthen and validate the initial themes established and informed from the
analysis of interviews, secondary forms of data analysis (company reports and literature
reviews) were required. The approach helped validate conclusions and supported the
development of new insights or themes to consider as the next wave of countermeasures
to consider and potentially, test (section 5.2). An approach that complemented the AR
cycle.
Research in to LM, and support from the NEPA team (section 4.2.1) resulted in a series
of interventions launched to train all CTE employees in Lean principles and the
application of basic Lean techniques (section 3.4, 6.2 and 6.3). To validate that the change
to workshop practices and employee support for this new way of working (subjective
assessment) had a positive impact on manufacturing metrics, the change had to be
quantified (objective assessment). Consequently, trials were conducted and repeated in
order to demonstrate positive or negative impacts associated with the interventions made
on the mill performance. Mill-based trials were conducted and evaluated to assess not just
improvements but also repeatability (sustainability). Similarly, company reports (over
time) could be used to highlight trends. Examples of objective data gathering are given
in section 7.5 (pp178-179).

9
Content analysis was used as the primary method of data analysis to assess interview
narratives, observation summaries, company reports and literature reviews (sections 5.4
and 7.6, pages 105 and 183 resp.). Feedback obtained could be analysed and interpreted
to explain statements made, actions observed and establish patterns. These could be and
were triangulated with quantifiable data in the form of trials and audited company reports
that articulated key business metrics. This approach, where applicable, was used to
demonstrate a (sustained) change in measured performance (see chapter 8) as a
consequence of an intervention made. Consequently, the Researcher was then able to
establish and demonstrate relationships (for example, p194).
Research question 2: A ‘them and us’ culture and the lack of Team Member (TM)
engagement was cited as why previous initiatives had failed (CTE, 2005c). Unless
addressed this might act as an impediment to sustaining the new approach (p75 and p151).
Literature reviews (section 3.6, p49) were considered as an essential form of data
gathering in order to generate insights and counter inertia. The literature review revealed
that the key objective of any contemporary HRM (transformational) strategy is to
maximise the capabilities of employees in the successful execution of business strategy
(Alvares 1997). The Researcher reflected that if TMs were considered as part of the
problem then they must also be considered as part of the solution. Having identified this
as a primary issue affecting sustainability, and as a consequence of insights generated
from literature reviews (section 3.5) and benchmarking (section 4.2.1), the Researcher
launched a series of HRM interventions (section 6.4, p129) simultaneous with the launch
of LM. The objective was to research and identify the supportive HRM enablers
(interventions) required to facilitate a culture conducive to the new way of working such
that over time the new practices would become the norm and be sustained. Interventions
that would subsequently need to be assessed using primary and secondary forms of data
gathering (section 5.3.1) in order to determine the impact on employee behaviour/
engagement.
Consistent with RQ1, the Researcher needed to explore and understand the acceptance or
resistance to change. For example, did the HR policy introduced support a particular
initiative to achieve desired outcome? Did it act as a catalyst for change? Or did it fail?
Consequently, the philosophical stance of subjectivism and interpretivism supported the
AR strategy and AR cycle. This in turn was complemented by the multi-method approach
of inductive and deductive data gathering over a seven-year period. Observations (p101
and 177) were considered by the Researcher to be an essential technique to be employed

10
in support of the evaluation of TM attitude during training, Master-Classes, and on-the-
job activities. Interviews (p94 and 164) provided accounts of the meanings behind
employee behaviour; an account that could be subsequently juxtaposed with observed
practices. Questionnaires (p98, 173 and 174) provided an anonymous gauge of a
participant’s perception of concepts introduced. Using content analysis as the primary
form of data analysis, the Researcher was able to determine trends in acceptance/ rejection
based on repeated comments and summaries from observations. Fieldwork in the form of
AR provided an occasion to engage with TMs in their environment. The frequent
immersion helped break-down barriers and develop trust; an approach that yielded tacit
agreement or permission to make changes. The Researcher was able to use such
opportunities to relate and comprehend TM perception of key issues and why they had
felt or did feel ‘not included’.
Feedback analysed from the various forms of primary data gathering allowed themes to
be revised. For example, the iterative AR process resulted in the development of a second
wave of enabling interventions in support of sustainability (section 6.6, p137). An
example of the AR cycle linked to RQ2 is given in section 7.4 (Table 7.2, p161).
Objective data were recorded in the form of training hours, of interventions attended, of
Kaizens generated (for example, figure 7.2.1, p188). In addition, the completion of Time
Out For Business booklets (figure 6.1.3, p146) could be used to assess TM commitment
to the new way of working. Similarly, relationships between training and support
provided could be compared with knowledge retention and application of new techniques
within the work area (pp191-193). Finally, the noted changes in workshop practices could
be triangulated with objective data in the form of business manufacturing metrics. This
would allow relationships to be drawn between the changes in working practices with
quantifiable manufacturing data (chapter 8). The approach taken or interventions made
could then be tested in other areas of the mill. This provided opportunities to exhaust
alternatives and or demonstrate consistency.
In summary, RQ1 asked how LM could be implemented within CTE whereas RQ2 sought
to explore the HRM policies deemed critical to sustaining such a new approach. The
design of this study needed to comprehend the reason why previous initiatives had failed
and to determine how the failing(s) could be overcome in order to implement a sustainable
transformation. Consequently, the design of the study in support of the RQs 1 and 2 had
to consider the subjective meaning of employee behaviour in order to unlock resistance
and bring about the necessary change. Subsequently, the themes developed would have

11
to be tested and proven to demonstrate a benefit associated linked to the intervention
made. Hence, the research methodology summarised above and detailed in chapter 5 and
7 were germane to RQ1 and RQ2.
Research question 3: sought to explore the transfer-ability of techniques within CTE
(and ultimately Tata Steel UK). The Researcher sought to benchmark (p70 and 182) the
changes to workshop practices, operator behaviour and quantifiable performance within
one area of the H42 with another area. For example, why had the approach adopted been
successful in the Finishing Mill (FM) but a similar approach had failed in the Forming
and Welding lines (Section 7.6.3)? What was the difference between the success noted in
the FM and that associated with previous initiative pre 2003 (sections 4.2.2 and 7.6.3)?
How did the sustainability noted with CTE compare with the Restoring Success
Programme applied within TSUK (section 7.6.4)? And how did the approach employed
within successful Japanese companies compare with that at CTE (section 6.5).
The inductive analysis of data allowed the Researcher to generate insights and contrast
the differences between successful and less successful areas. This helped validate or
disprove a theory; a theory that could be subsequently tested (as per the approach
described above in RQ1 and 2). Practices that had yielded a benefit could be repeated in
‘untouched’ areas. The impact could be evaluated in a novel area to determine if the
technique had been: a) beneficial, and b) transferable. The approach reflected the iterative
approach described above in RQ1 and 2.
The general approach to the Research methodologies outlined above is provided in more
detail in chapter five, whereas the specific actions associated with the research
methodology as applied during this study are captured in chapter seven.
1.4 Contribution to knowledge
The RQs depict the main areas of investigation which were considered important for this
research. Figure 1.1 is proffered by the Researcher as a concise model or framework that
links the key research areas in support of a sustainable turnaround. Research informed
by: the initial scoping exercise undertaken within CTE incorporating interviews and the
analysis of company reports (section 8.2); benchmarking (section 4.2.1.); and refined as
a consequence of the Action Research strategy employed to test and refine learning

12
(section 5.2 and 8.4). Furthermore, deduced from academic literature on related best
practices (chapter 3).
Figure 1.1 outlines the structured approach adopted throughout the implementation of
change within CTE. A brief description of the value and the areas of research linked to
(1) to (5) is provided below:
(1) it is headed by a clear and concise vision of what the business sought to achieve in
the future and what it needed to do in order to achieve this goal. Failing organisations
need to examine the cause(s) of their decline and determine appropriate strategies to
address the performance gap. The absence of a clear vision on what to implement may
cause failure (Achanga et al., 2006). Consequently, the three areas of research to be
explored by the Researcher in order to develop a realistic recovery plan and a vision
of the future state included: the causes of organisational failure, the competitive
environment in which it operates, and the appropriate turnaround strategy.
Arogyaswamy et al. (1995) proffered that a lack of a clear direction may result in the
loss of stakeholder support in the delivery of the transformation;

13
(2) to maintain stakeholder support the model highlights the imperative for a structured
and focused approach in the delivery of the transformation. Two primary areas of
research included: the mechanisms under-pining the successful implementation and
sustainability of a major change programme, and the value drivers such as;
engagement, service levels, and ethical policies etc., and key performance indicators
that constitute success within the business being transformed;
(3) in the case of a mature business seeking to address its competitive position it is
important the company understands the extent of the performance gap. The proposed
manufacturing strategy (3) should only be finalised following a review of the
company’s competitive standing within its operating environment. This may validate
the extent of the performance gap and the actions required. Failure to do so may result
in faulty or inappropriate action (Weitzel and Jonsson, 1989). Four areas of research
conducted by the Researcher included: a review of the external operating environment
(industrial context and sector served); benchmarking (internal, functional, generic and
competitive benchmarking) in order to analyse the situation in which the business
functioned (Camp, 1989; Camp, 1993) and the development of best practices (Pyzdek,
2003); a review of LM and the benefit it offers the user; and the support mechanisms
required that may facilitate the successful implementation of Lean;
(4) it was proffered that a properly defined HRM strategy can influence the human capital
pool and elicit the desired employee behaviour (Harter et al., 2002). The Researcher’s
hypothesis was that the adoption of a contemporary HRM strategy (4) would
maximise the capability of employees in the successful execution of the business
strategy as described by Alvares (1997) and Wright et al. (2005). Consequently, five
areas of research to be explored within the available literature and insights generated
to be subsequently applied to CTE included: a review of internal issues within the
business that may have acted as an impediment to change; an evaluation of
contemporary HRM transformational policies; research into resource based views
which espouse employees as the key components associated with value creation
(Barney, 1991); employee motivational forces, and research into policy engagement
processes that can align employee behaviour with business objectives (Akao, 1991;
Cowley and Domb, 1997);
(5) the process of Action Research (AR) is iterative, a cyclical process of ‘construction,
planning action, taking action, and evaluating action’ (Coghlan and Brannick, 2010).
Deming (2000) proffered the ‘Plan, Do, Check, Act’ cycle (5) which is associated
with a continuous improvement. This philosophy mirrors the iterative nature of this

14
research. The cyclical process of AR (section 5.2), ensures that the adopted practices
are refined through vigorous reviews and reflections, and adapted to suit the operation
or process in question as exemplified in chapter 7. The benefit and strength derived
from the AR (section 5.2) was in the employment of experience gained, in reflecting
upon learning and the generation of new insights in support of the business
transformation and the establishment of supportive HRM policies. The above cyclical
approach (described in sections 5.2.3 and 7.4) was employed at a macro level when
looking at the transformation in ‘general’ as a whole, or at a micro level when
introducing change at a particular ‘specific’ level.
1.5 Thesis structure – main chapters
Chapter two provides a summary of the world steel industry and the history of the UKSI
since nationalisation in 1967. An overview is presented of the challenges confronting the
mature steel makers of the EU(27), the USA and Japan. It highlights the ascendency of
China as a super power in steel making that has transformed the face of global steel
capacity and demand. The chapter reflects on the relative demise of the UKSI and the
challenges it faces if it is to remain viable. It concludes by introducing CTE as the case
study. CTE was used because it was deemed by the Researcher to be representative of a
mature industry in decline (section 2.4) typical of the UKSI, (section 2.3).
Chapter three reviews the principles of LM as employed within the automotive sector.
The chapter emphasises the evolutionary process of improved manufacturing stratagems
that depict a process of adaptation. The focus was on the introduction of basic Lean tools
and techniques with the objective of eliminating waste and improving operational
efficiency. Furthermore, the Researcher considered HRM practices prescribed as
supportive strategies to assist a business transformation. These concepts and
methodologies were evaluated to determine if these could be replicated within the steel
industry to achieve a successful turnaround. Lean production was initially developed by
Toyota (Womack et al., 1991) which became an exemplar that the rest of the world has
followed. Japanese quality and production systems, which are considered the best in the
world have exposed the frailties of accepted western manufacturing practices
(Schonberger, 1982) .
Chapter four introduces the Sustainability framework (SF) proffered by the Researcher
as the key contribution to knowledge. The SF houses in one place the main themes

15
employed to: a) answer the research question; and b) provided a model that resulted in
the successful implementation and sustainability of a new way of working. Section 4.3
introduces how the Researcher validated the applicability of the SF.
Chapter five reviews the research approach and method/s adopted (Action Research,
enabling research in action rather than research about action): predominantly qualitative
methods in the form of real time assessments, surveys and interviews that were used to
generate data and help in the development of concepts and constructs.
Chapter six outlines the intervention made by or assessed by the Researcher in order to
turnaround the performance of CTE. Chapter seven reflects the approach adopted by the
Researcher, the method of data gathering and analysis in support of answering the
research questions, the hypotheses, and the objectives of this thesis.
Within the chapter key lessons were learned that contributed to the Researcher’s
comprehension of interventions made that resulted in a successful business
transformation. Learning that could support a theory of generalisability associated with
this research that in turn may a) assist the UKSI address the performance gap in across its
various sites, and b) contribute to the various bodies of literature.
Chapter eight describes the impact of the intervention outlined in chapter 6 and the
process of adaptation reviewed in chapter 7. Chapter 9 discusses the impact the research
had on CTE relative to the study undertaken and the interventions introduced. Chapter 10
concludes the thesis by reflecting on the research intent, lessons learnt and a personal
reflection of this study.

16
Chapter Two: Steel
2.0 Introduction
This chapter presents an overview of the world steel industry. It considers the expansion
of steel capacity within developing countries and its impact on the mature industries
within the developed world. This has caused global over-capacity, plant closures, mergers
and acquisitions that have aimed to stem decline and turnaround the performance of the
national industries. Through understanding the dynamics of the global steel industry and
the relative position of the UKSI, the Researcher was able to determine the viability and
competitiveness of the UKSI and, in addition, to draw similarities to CTE. Moreover, the
Researcher was able to put into context the importance of this research. Unless CTE
(UKSI) addressed its competitive standing it would continue on a trajectory to obscurity
and insolvency. The introduction of a new way of working might help CTE to address a
proclaimed performance gap and fight of the threat posed by current and emerging rivals.
It is through understanding the operating health (Hofer, 1980) of a company and changes
in market dynamics that a company may be better placed to turnaround sub-optimal
performance and revive/ refresh its fortunes.
In this section the Researcher employed secondary methods of data collection (section
5.3.2) and content analysis (section 5.4) to inform research direction. Knowledge gained
from the literature and company reports was used to develop an overview of the global
steel industry and the history of the UKSI. Furthermore, the study of company reports
relating to the performance of the UKSI during the period 2004-2013 provided the
Researcher with an account of its cyclical financial performance, retrenchment activity,
and initiatives introduced to redress the perceived performance gap highlighted by
successive CEOs during 2003-11 (Corus, 2003c; Corus, 2003b; Corus, 2007a; Corus,
2009; Tata, 2011a)
The findings were discussed with senior colleagues within the Tubes business and the
Teesside Works in order to triangulate the data. The objective was to ensure that the
summary presented by the Researcher was consistent with their understanding of the
events.

17
2.1 The evolution of steel: from mediocrity to indispensability
The introduction of the Bessemer and Siemens process circa 1860 enabled impurities to
be removed from iron, yielding ‘steel’ which became a mass production industry (Vaizey,
1974). The increase in demand was driven by the strength and versatility of steel. Steel is
one of the most commonly used materials in the world (Verstappen, 2009). With
widespread uses in buildings, automobiles, rail, ships, machines and many other
applications, an indigenous steel industry is deemed critical to the overall economic
development of a country, an indicator of economic progress (Verstappen, 2009; Miller,
2012), and was perceived as the mark of a developed country and of national industrial
greatness (Walker, 1906).
Global crude steel production (CSP) increased from 28 million metric tonnes (mmt) in
1900 to an annual capacity in excess of 1,550 mmt by 2013 (WSA, 2014). The growth in
demand was driven by the needs of both developed and developing countries whilst
simultaneously underpinned by the emergence of new entrants. The introduction of
innovative technology and operating practices helped modernise processes and improve
operational efficiency (Hufbauer and Goodrich, 2001; WSA, 2008). However, continuous
improvement in manufacturing delivered increased productivity at the expense of
employee numbers. Consequently, between 1980 and 2006 there was a 75% increase in
steel output (WSA, 2014) combined with a 57% reduction in employees (WSA, 2008).
In 2012, the global steel industry employed in excess of two million direct employees
(WSA, 2012a). This would suggest a reduction of two million employees over thirty
years.
The increased demand and production capacity in the last forty years was founded on the
needs of the developing countries. In the early 1980’s the continued growth in demand
and capacity was driven by South-Korea, Mexico and Taiwan (Sadler, 1984). More
recently Brazil, Russia, India and China (BRIC) have contributed to the escalation in
global steel demand and capacity (WSA, 2013). This escalation has been matched by the
simultaneous growth of the steel industry within the developing country itself. For
example, China is now the largest consumer and producer of steel with an annual capacity
>750mmt (WSA, 2013). Contrastingly, the UK based element of Tata Steel Europe
(TSE), would have been ranked eighteenth with an annual output of 12mmt.
The ascendancy of the Chinese steel industry (section 2.2) has resulted in China acquiring
a dominant position within the global steel industry; an ascendancy that has created a shift

18
in world steel dynamics and contributed to persistent overcapacity in a cyclical industry
(Hufbauer and Goodrich, 2001). Between 1970 and 2012, overcapacity was equivalent to
more than 20-percent of production (Hufbauer and Goodrich, 2001; WSA, 2012b; Cheng,
2013), and between 2008 -12 approximated 350 million tonnes per annum (Miller, 2012;
WSA, 2012b).
Trends continued to show cycles of growth and decline in market demand juxtaposed
with increased productivity and capacity (Economist, 1993; Abbott et al., 1999; Jha et
al., 2006; Miller, 2012; Walters, 2012; WSA, 2012b; Cheng, 2013; Commission, 2013;
OECD, 2013). During periods of economic growth and buoyant market conditions it is
possible for steel manufacturers to generate positive margins (Lacroix, 2013). However,
during global recessions or periods when demand has declined the reverse occurs. This
generates a downward pressure on price as competition for sales intensifies. Steel sales
and profitability are intrinsically linked to global economic activity. Banerji et al. (2012)
identified four globally synchronised recessions that had in turn adversely impacted the
global steel industry: in 1973/75; 1980-82; 2000-01; and 2008, the latter still impacting
the EU in 2013. These abnormal events resulted in a significant decline in economic
activity and tended to last for greater than a few months.
The effect of overcapacity and fluctuating demand, which has been amplified during
downturns, has made steel making a competitive global industry. The older, nationalised
and labour intensive integrated sites commonly found in developed countries were
heavily subsidised and inefficient (Balcerek, 2002). This contributed to poor capacity
utilisation and higher fixed costs. Fixed costs included interest payments on corporate
debt and ‘legacy costs’ of pensions, health and severance benefits promised to current
and retired workers (Hufbauer and Goodrich, 2001). In the 1990’s the advent of mini-mill
technology compounded the problem of the integrated sites by offering a competitive,
portable and efficient alternative (Economist, 1993). Mini-mills offer a low cost
alternative due to lower manning, reduced capital outlay, and cheaper feedstock. The
older integrated sites in the developed countries were financially disadvantaged due to:
higher fixed costs; aging assets; a self-induced inertia; alternative modern production
methods, more efficient emergent players and a market burdened with over-capacity (Jha
et al., 2006). This combination frustrated the ability of the developed countries to compete
favourably and reduced profit margins to insufficient levels in the USA and the EU
(Lacroix, 2013).

19
2.2 The dynamics of world steel production
Figure 2.1 depicts the ascendance of China as the major force in world CSP relative to
the principal players of 1980. In 1980 global CSP totalled 716 mmt (Table 2.1) and the
top three steel producers were: the USSR (148 mmt), Japan (111 mmt) and the USA (101
mmt). These accounted for 50% of global CSP. Chinese output in 1980 accounted for 5%
(37mmt) of total world production. However, in 2013 Chinese CSP had increased by
21.05 times to 779mmt, equivalent to 49.24% of global CSP (WSA, 2014). Since 2000,
China has been the major steel producer in the world (WSA, 2014). Furthermore, due to
its rapid economic development and demand for steel, it was also the major contributor
to growth in global steel consumption. (Jha et al., 2006).
Figure 2.1: Crude Steel Production: China’s growth relative to main steel producers,
(WSA, 2013; WSA, 2014).
The emergence of the Chinese steel industry and China’s demand for steel has had a
critical and important impact on world markets (Jha et al., 2006). The impact was
pronounced in the period 1998-2008 when China’s steel trade balance shifted from that
of a net importer to a net exporter of steel (Zheng et al., 2008). This was a period when
the Chinese industry was characterised by a high investment in steel infrastructure, low
efficiency and poor utilisation of production processes (Fang et al., 2007). However, since
2007 Chinese CSP increased from 490 mmt in 2007 to 779 mmt in 2013; a 59% increase
in output over 6 years (WSA, 2014).
Table 2.1 illustrates the volume of CSP by country 1980-2008 where China’s dominance
can be compared with other major industrial economies. In comparison to China’s
growth, the change in CSP of the established industries such as Japan, Germany, France
and the UK output increased by a multiple of 1.00, 0.98, 0.70 and 1.09 respectively. This

20
suggests relative stability and a maturity of capacity within these developed and
established industries.
Table 2.1: Global crude steel production by country 1980 to 2013. (WSA, 2013; WSA,
2014).
Japanese CSP was static with the same output in 2013 as in 1980. It averaged 110mmt pa
and accounted for approximately 9% of global CSP. Japan is a net exporter of steel and
employs a complex distribution system, tightly controlled by trading houses as a
defensive strategy to restrict steel imports (Jha et al., 2006).
The developed countries have struggled to compete in the low-cost commodity sector
now dominated by the Chinese steel makers. The perpetual cycle of ‘boom or bust’ linked
to economic activity and the emergence of new players necessitated the restructuring of
the steel industry within the developed countries. A restructuring that has spawned
numerous cost cutting activities, particularly in the USA and the EU (Prouvost and
Wagner-Ferrari, 1999; Jha et al., 2006).
In America, a study of 130 US steel makers indicated that the older, larger and less
profitable firms were dependent on government protection (Lenway et al., 1996). Trade
barriers in the form of government subsidies, import quotas and tariffs, were employed
as a common defence strategy to shield the American steel industry from foreign
competition (Jha et al., 2006). However, the influx of cheap imports combined with
inefficient operations and the volatile nature of the US Steel industry still resulted in
closures and consolidations (Robertson, 2008). The study concluded that subsidies
1980 1985 1990 1995 2000 2005 2007 2008 2009 2010 2011 2012 2013Shift between
1980 & 2013
% of total world
production 2008
% of total world
production 2009
% of total world
production 2013
Australia 8 7 7 8 7 8 8 8 5 7 6 5 5 0.63 0.60 0.40 0.32
Brazil 15 20 21 25 28 32 34 34 27 33 35 35 34 2.27 2.56 2.18 2.15
China 37 47 66 95 127 356 490 512 577 639 702 717 779 21.05 38.49 43.41 49.24
France 23 19 19 18 21 19 19 18 13 15 16 16 16 0.70 1.35 1.05 1.01
Germany 44 40 38 32 16 45 49 46 33 44 44 43 43 0.98 3.23 2.67 2.72
India 10 12 13 22 27 46 53 55 64 69 73 78 81 8.10 4.14 5.17 5.12
Italy 26 24 25 28 27 29 32 30 20 26 29 27 24 0.92 2.26 1.62 1.52
Japan 111 105 110 102 106 112 120 119 87 110 108 107 111 1.00 8.95 7.03 7.02
UK 11 16 18 18 15 13 14 14 10 10 9 10 12 1.09 1.05 0.81 0.76
USA 101 80 90 95 102 95 98 92 58 80 86 89 87 0.86 6.92 4.67 5.50
Former USSR & CIS 148 155 154 79 98 113 124 114 98 109 113 112 109 0.74 8.57 7.92 6.89
Total M East 1 3 4 8 11 15 16 17 18 20 23 25 26 26.00 1.28 1.46 1.64
Total N America 125 103 111 123 135 128 133 124 83 112 119 122 119 0.95 9.32 6.71 7.52
Total Europe (27) 208 199 192 191 193 196 210 199 139 173 178 169 166 0.80 14.96 11.24 10.49
World Total 716 719 770 752 848 1147 1351 1330 1237 1433 1537 1545 1582 2.21
Source: World steel association 2014
Share increased Share deteriorated
Crude steel production by country/ million metric tonnes (mmt)

21
protected poor performance and reduced the incentive to innovate. It is the action of
innovation that serves to re-stimulate demand (Fels, 1952). Without product or process
innovation, decline may ensue leading to further retrenchment and ultimately the death
of the industry (Boulding, 1950). This may account for the decline in American CSP from
101mmt in 1980 to 87mmt in 2013.
Total Europe (27) CSP has decreased by a factor of 0.80; from 208mmt in 1980 to
166mmt in 2013. In 1980, EU (27) CSP accounted for approximately 29% of world CSP
(See table 2.1). However, in 2013, EU (27) steel output accounted for a 10.5% share of
world CSP; a reduction of 68.3% of its share of CSP over thirty-three years.
The innovative practices and changing face of the world steel industry left the EU steel
industry in a state of turmoil (Blyton, 1992). An ever deepening crisis was compounded
by: capacity cutbacks; EEC imposed production quotas introduced in 1975 (Sadler,
1984); persistent over capacity; the emergence of low cost players; and technological
advances (Hufbauer and Goodrich, 2001; Jha et al., 2006; Miller, 2012; Cheng, 2013;
OECD, 2013). This contributed to a downward pressure on price, falling profits (Lacroix,
2013) and mounting losses compounded during global recessions (Tata, 2011e). The
consequence was the closure, privatisation or consolidation of the previously heavily
subsidised nationalised industries in Italy, France, Spain, Belgium and the UK (Balcerek,
2002). The response was a series of national and trans-national mergers and acquisitions
that have typified the steel industry in the EU (Stundza, 2000). For example Usinor
merged with Cockerill Sambre; Thyssen with Krupp; BSC with Koninjilike Hoogovens
to form Corus; and Aceralia with Arbed (Prouvost and Wagner-Ferrari, 1999). Mittal
acquired Aceralia, Arbed and Usinor in 2006 (Parliament, 2007). Most recently Corus
(the Anglo-Dutch JV), was acquired by Tata in 2007 as part of its global strategy
(Bremner and Lakshman, 2007). The primary objective was to reduce cost and maximise
economies of scale.
The contraction in EU (27) output in the last decade could be attributed to a downturn in
economic activity (Banerji et al., 2012) and global over-capacity exacerbated by China’s
ascendancy. European exports to China and India had initially offset the decline in
demand in the home market (Parliament, 2007). However, the growth of the Chinese and
Indian steel industries reduced the demand for imported steel. It is noteworthy that China
and India were amongst the few countries to post increases in production and demand
post the economic crisis of 2008 (Cheng, 2013; Lacroix, 2013). Thus, to remain viable

22
the EU steel industry must address its cost base on commodity type products and
maximise opportunities by offering more specialised steel (Baojun, 1999; Cheng, 2013);
for example, in the automotive and white goods sector.
The Former USSR which includes (CIS, Estonia, Latvia and Lithuania) experienced a
marked decline in output from 148mmt in 1980 to a low of 74mmt in 1998. However,
steel capacity subsequently gradually increased and reached 109mmt in 2013.
The Middle East showed the greatest shift in capacity albeit not volume. Steel capacity
increased by a multiple of 26 from 1mmt in 1980 to 26mmt in 2013. Whilst the Middle
East had a low starting point of 1mmt in 1980, its annual output exceeded the UKSI in
2013. Indian CSP increased by a multiple of 8.1, to 81mmt over the same period.
In summary, the demand for steel has continued to increase in the developing countries
However, this has been matched by the simultaneous growth of an indigenous modern
steel infrastructure. The EU and the American steel industries have failed to keep pace
resulting in widespread losses in the previous thirty years and intense restructuring
(Blyton, 1992; Abbott et al., 1999; D'Costa, 1999; Prouvost and Wagner-Ferrari, 1999;
EU-Report, 2008; Tata, 2014a).
The demand for steel in China and India provided growth opportunities in CSP throughout
the world. This provided the developed countries with an avenue to exploit, offsetting
maturing home markets. However, this opportunity diminished as China and India
developed their indigenous steel industries. Consequently, the mature industries in the
developed countries continued to face growing competition from the developing countries
(EU-Report, 2008; Tata, 2011a; Cheng, 2013; Lacroix, 2013; Tata, 2014a).
Since its peak in 1995, the recent history of the UKSI has been one of perpetual decline
and contraction as it has continued to size itself to the available market. In 1967 the newly
formed BSC had a CSP of 26mmt ranking it third in the table of top world steel producers
by country. In 2013 the UK steel capacity had reduced to 12mmt ranking the UKSI
eighteenth behind China, Japan, the former Soviet Union, and the USA (WSA, 2014).
Table 2.2 indicates the relative position of UK steel output in 2008 compared with the top
four producers by country.
23
Rank Country Annual production
(million metric tonnes)
% of world steel
production
1st China 779 49.24
2nd Japan 111 7.02
3rd CIS 109 6.89
4th United States 87 5.5
5th India 81 5.12
18th United Kingdom 12 0.76
Table 2.2: Top steel producers by country in 2013 (WSA, 2014).
The following section provides a brief review of the evolution of the UKSI.
2.3 The UK Steel history relative to changes in world dynamics
The UKSI was nationalised in 1967 uniting the fourteen leading privately owned UK steel
makers to form the British Steel Corporation, (BSC). A major force within UK
manufacturing, BSC was the third largest steel maker in the world, employed 250,000
people and had a CSP of 26mmt (Upham, 1980; Beauman, 1996). However, Blyton
(1992) argued that the post-war UKSI had fallen behind that of the other major industrial
nations such as Japan, the United States and West Germany due to its higher costs, lower
productivity and poor technological developments. This technological neglect of the
British industry was evident to the Labour government which nationalised the industry in
1967 and launched an aspirational strategy to revive the industry and regain its position
as a major world steel maker (Dudley, 1979).
A sum of £3 billion of state money was committed as part of Lord Beswick’s ten year
plan, to modernise BSC and develop a potential CSP capacity of 36-38 mmt by 1980
(Upham, 1980). The industry was converted from a plethora of satellite sites to five
modern, fully integrated sites at Port Talbot, Llanwern, Teesside, Scunthorpe and
Ravenscraig (Dudley, 1979). BSC retrenched by closing the labour intensive open hearth
plants in favour of the Basic Oxygen process (Upham, 1980). Steel making facilities at
Hartlepool, Consett and Corby were closed (Sadler, 1984). Yet in spite of more than £3
billion of public money going into BSC, the losses still accumulated (Thatcher, 1995,
p307).

24
Internal issues and poor manufacturing performance meant that BSC was badly placed to
meet the changes and challenges presented by the deterioration in the economic
conditions during the period 1973 to 1980 (Beauman, 1996). Trade barriers previously
imposed by governments had an adverse effect on BSC’s ability to compete. They
restricted BSC’s ability to export to the US, its biggest market and offered little protection
from the influx of cheaper EU imports (Upham, 1980). Consequently, Beswick’s
ambitious plan was replaced in 1979 by the ‘slimline plan’. However, restrictive practices,
demands for excessive wage increases that were not matched by higher productivity could
no longer be tolerated (Thatcher, 1995, p307). The continued decline in demand
necessitated a reduction of 5 million tonnes of surplus (UK steel) capacity over and above
the announcements of the closure of iron and steel making at Corby and Shotton
(Thatcher, 1995, p307). Further restructuring was to occur in the aftermath of the national
strike in 1980. Ian MacGrgeor, Chairman BSC, introduced a ‘survival plan’ subsuming
the ‘slimline plan’. This was an attempt to reduce annual output to 15mmt, align capacity
to demand, and stem the financial losses (Blyton, 1992).
Upham (1980) suggested that BSC’s initial lack of appropriate investment and restrictive
practices enabled new entrants to make inroads into its traditional sectors. Dissatisfied
customers were able and did turn to the cost competitive and reliable products offered by
foreign imports. The main customer base had started to erode in the late seventies and
into the eighties with the demise of British shipbuilding; automobile production (British
Leyland), and coal production. The resurgence of the UK based automotive industry was
declared as a key component of the UKSI’s strategy (Tata, 2014b).
To combat efficiency issues a ‘Total Quality Production’ philosophy was introduced in
the mid-eighties. BSC sought to plagiarise features of Japanese industrial structure and
methods with the aim of achieving similar efficiencies (Beauman, 1996).
In 1988 BSC was acclaimed to be one of the world’s most efficient steel producers,
having achieved probably the biggest turnaround in UK history recording pre-tax profits
in 1989 of £733m (Pandit, 1998). This improvement may have been a direct consequence
of the TQP philosophy introduced, a result of the retrenchment activities which may have
stemmed the heavy losses, or equally plausible was that it was coincident with an upturn
in demand. “The upturn was associated most likely with an upturn in demand because
TQP did not come to anything” (General Manager, Corus Pipe Mills; Aug 2005).

25
In 1988 the British Steel Act was introduced leading to the privatisation of BSC. A period
when the Conservative Government sought to privatise a number of nationalised
companies considered fundamental to the elected government’s economic approach and
mandate (Thatcher, 1995, p405). The objective was to privatise a number of public sector
holdings including, British Telecom, British Airways, British Shipbuilders, British
Leyland, British Gas (offshore), and as many as possible of Britain’s airports. The
assumption was that privately owned businesses had greater customer focus and were
more efficient (EIU, 1996).
The British Steel industry was privatised in 1988 and a decade later merged with
Koninklijke Hoogovens to form Corus (Sadler, 2004). In 2003, Corus was considered
Europe’s second largest steel producer with annual revenues of £12 Billion and crude
steel production of c18.2 mmt per annum (Corus, 2010). Corus employed 42,000 people
across major sites in the UK, Netherlands, Germany, France and Belgium (Corus1, 2000-
2007 ).
In 2003, A Pedder resigned as the third CEO of Corus following the unsuccessful attempt
to acquire CSN of Brazil and improve Corus’ long-term viability through growth,
economies of scale and access to cheap iron ore. At this time, Corus was once again in a
precarious position having yet to make a profit from its UK operations since the merger
of 1999. Furthermore, it was in the midst of another global recession (Banerji et al., 2012).
Corus was incurring significant losses brought about by the progressive decline in UK
manufacturing and the market downturn (Corus, 2003c). Moreover, there existed a
significant performance gap between Corus and its rivals (Corus, 2003a). UK
manufacturing was a significant consumer of steel. However, UK manufacturers had been
investing and moving production outside of the UK. As such, the UK steel industry could
not expect to recover all of its customer base. In 2003, Corus was facing liquidation as
ordinary shares plummeted to a record low.
Decades of poor strategic investment culminated in poor operational efficiency and poor
availability that had adversely impacted quality and delivery performance (Beauman,
1996; Tata, 2011e). The deterioration in performance between 1990 to 2003 can be
attributed to a variety of issues: failed strategies; economic crisis in the Far East; the
continued strength of Sterling (Corus, 2000b; Corus, 2003c); and more efficient new
entrants highlighting an increasing performance gap that had eroded market share which

26
was exacerbated by weak demand (Corus, 2000b; Corus, 2003b; Corus, 2003a; Tata,
2011a).
The UKSI was beset by internal issues: it remained heavily unionised (CTE, 2004d) and
enamoured with legacy agreements that underpinned established operations and
hierarchical management structures. On the larger integrated sites adversarial industrial
relations and demarcations were still evident. “The relationship was like stepping back
in time. Each believed the other was out to get something for nothing. One side did not
trust the other. That was how Teesside and Scunthorpe were. I have to say I think Port
Talbot were worse” (Senior HR Manager at Corus CC&I, July 2009). The combination
of these may have generated an inherent inertia and impeded the ability to introduce
strategic change in the form of new initiatives.
Consequently, Corus continued to face fierce competition (Tata, 2011a; Tata, 2014a). The
growth of steel industries within the rapidly developing economies of the BRIC countries
combined with severe economic cycles, had a significant and adverse impact on UK
exports and therefore the UKSI (Stundza, 2000; OECD, 2013). Corus remained
vulnerable to lower cost competitors due to the performance gap between itself and its
rivals (Corus, 2003a; Corus, 2003b; Corus, 2007a; Corus, 2008a; Tata, 2011a). For Corus
to survive it had to address the size of the prevailing performance gap (Corus, 2008a).
The turnaround strategy which was launched in 2003 included: a major change in the top
team; a reduction of steel making facilities; and the launch of a three-year Restoring
Success Programme (RSP) (Parliament, 2007; Varin, 2007); a combination of
retrenchment and recovery. The aim was to close the competitive gap by improving the
operational performance (Corus, 2003b). An initiative that was premised on a continuous
improvement philosophy founded on Lean principles as used in the automotive industry
(Corus, 2003a; Corus, 2005).
Following the introduction of the RSP Corus achieved a turnaround recording three
consecutive profitable years of £627m, £720m and £449m in 2004 to 06 respectively.
(Corus1, 2000-2007 ). In 2007, the Corus Group was acquired by the Indian conglomerate
Tata (Corus, 2007b). The enlarged group employed 80,000 people with a capacity of
26.6mmt (WSA, 2009). Corus (formerly BSC), now a subsidiary of Tata Steel,
subsequently renamed Tata Steel Europe (TSE), remains the only significant producer of
primary steel located in the UK (Datamonitor, 2008).

27
Tata sought to restructure the UKSI through: the closure of a number of unprofitable
downstream operations; the shared ownership of the Teesside Cast Products (TCP); the
restructuring of Scunthorpe through Project Ark, and the significant investments in
Ijmuiden and Port Talbot (Tata, 2011a; Tata, 2014a). However, in spite of acclaimed
progress prior to 2008/09, Corus found itself once again in a precarious position (Corus,
2008b) due to: a) its weak competitive position and demand; and b) the global economic
recession (Banerji et al., 2012). Steel demand and prices plummeted. The consequence
for the UKSI was a 50% drop in order intake. UK steel output reduced by 40%
necessitating the alignment and retrenchment of upstream operations with downstream
demand (Corus, 2009).
In 2008 the Corus group (now TSE) was again confronted with an unprecedented decline
in demand for steel (Corus, 2008a). The survival strategy (now familiar within BSC/
Corus) was one of retrenchment via divestment of non-viable/ non-strategic assets,
mothballing of unprofitable units and offices, reduced headcount and the imperative to
recover via the delivery of efficiency improvement programmes (Corus, 2009). Table 2.3
illustrates the financial performance of Corus UK (now Tata UK) following the recession
of 2008/09.
*In Feb 2011 Tata sold TCP to the Indonesian company SSI (Tata, 2011c).
Table 2.3: Corus financial performance 2008-14 (source Company report 2008/09 to
2013/14).
To avoid confusion the Researcher will continue to use Corus when referring to Tata UK
(the Tata owned element of the UKSI).

28
The following sections describe some of the actions and initiatives introduced by Corus
to stem the decline in financial performance. The data were gathered from company
reports and CEO communications during the period 2010 to 2014 inclusive:
Feb 2011 TCP was sold to SSI (Tata, 2011c);
May 2011 a new plan to reshape the Scunthorpe division (path to profit) and save
£400m pa was announced (Tata, 2011d);
Nov 2011 a rigorous cost reduction programme called ‘step up and save’ was
introduced across the Corus Group (Tata, 2011b);
in Oct 2014, Corus entered an exclusivity agreement with the Klesch Group (KG) to
explore the potential sale of the Scunthorpe site and its related businesses (Tata,
2014b);
in addition, Corus introduced a number of initiatives such as: operational reliability,
operational excellence (Lean practices), supply chain transformation; the selling
machine; and iterations of step up and save in order to improve efficiency and reduce
fixed costs;
in Oct 2014, Corus announced its vision – to focus primarily on its strip products
business. This is where it believes it has the best platform for a sustainable future with
a common customer base, operational flexibility and shared best ways of working
(Tata, 2014b).
The area of interest to the Researcher and this study was the impact that the RSP had on
operational performance following its introduction in 2004. This initiative preceded the
global recession but had been intended to ensure that following the recession of 2003,
Corus was better positioned to cope with such a downturn. However, in spite of the efforts
of numerous actions such as those described above, Corus’ financial performance
remained a concern (table 2.3). The Researcher hypothesised that some of the practices
introduced had not delivered the expected benefits or that without them, the losses may
have been worse. Moreover, Corus may have sought to adopt a general and consistent
approach to the adoption of the RSP across a heterogeneous environment. However, the
RSP might not have been adapted consistent with the individual needs of the targeted
operation nor solicited the required support. Consequently, the RSP was either not
sustained or did not address the performance gap.

29
A shadow of its former self, Corus remains a major employer in the UK but worryingly
a hostage to the cyclical nature of this sector. For Corus to survive it must address the size
of the prevailing performance gap (Corus, 2008a; Tata, 2011b; Tata, 2013) and complete
a corporate restructuring within the Tata owned UKSI. The objective serving to
rationalise operations and supply chains, and modernise some of the older, less efficient
operations with a view to returning Corus UK (TSE) to profitability. To compete
effectively Corus had to invest in its processes whilst simultaneously optimising the
operational performance to improve efficiency and reliability (Tata, 2011e).
It is possible that by understanding the root cause(s) of failure a company can implement
actions to remedy the business. This assumes that consistent with Hofer’s view, the
business is still worthy of being saved (Hofer, 1980). The vision of Corus (Tata) UK was
announced in 2014 as a company that was to be focused primarily on its strip products
business (Tata, 2014b). It was stated that this would provide it with a platform for a
sustainable business. However, if Corus is to generate the expected margins required to
support this strategy, then it should also consider the extent of the prevailing performance
gap; one of the causes of the previous deterioration in performance that may have
contributed to further retrenchment.
Section 2.4 introduces Corus Tubes Energy (CTE) considered by the Researcher to typify
a mature business in decline, representative of the UKSI. CTE was a stagnant and
strategically disadvantaged asset typified by an under-investment in process and people
capabilities. A business struggling to compete effectively in the sector served that had
experienced a visible deterioration in sales and profitability (tables 2.4 & 2.5). CTE’s
moment of truth occurred when it was charged in 2004 to address its variable financial
performance and therefore viability, within three years or face closure. CTE is introduced
as the case study used by the Researcher to introduce LM and explore how this paradigm
was sustained when all previous major initiative had failed (section 4.2.2).
2.4 Corus Tubes Energy
CTE was one of four market focused sub-business units within Corus Tubes, a business
unit that was aligned to the Commercial, Construction and Industry (CC&I) division; one
of the four main divisions that composed the Corus Group (figure 2.2, source: CTE visitor
presentation).

30
Figure 2.2: The structure of the Corus Group in 2003.
CTE had an annual turnover of £100m and employed approximately 500 people in the
manufacture of large diameter carbon steel pipe for the oil and gas industry (CTE, 2004c).
There was an established core of 250 employees that was supported by approximately
300 temporary workers that helped counter variability in mill loading. CTE comprises a
42” pipe mill (H42) and an 84” pipe mill with production capacities of 300kt and 25kt
respectively (CTE, 2003-05). As a net exporter, CTE supplies a bespoke, unique,
‘engineer-to-order’ (Rudberg and Wikner, 2004) product to a fluctuating global market.
(CTE and H42 are used interchangeably throughout the thesis; H42 is the mill in which
the principles were introduced and is the main manufacturing unit within CTE.
The H42 mill was commissioned in 1993 providing a world class, competitive pipe
making facility with advanced capability and low operating costs, (CTE, 1989; CTE,
1991; CTE, 1995). 70% of H42 feedstock was sourced from third party plate mills, the
balance from Corus’ plate mills at Scunthorpe and Dalzell (CTE, 1995). H42 had to
generate the expected financial returns of £20m EBIT and >12% return on net assets,
using feedstock from external sources (CTE, 1989).
Data were gathered from Company reports and analysed by the Researcher to generate an
understanding of CTE’s historic turnover, sales volume, manufacturing and financial
performance. The Researcher was able to demonstrate (table 2.4) that CTE had a sales
growth rate of <10%. CTE typified a mature business in decline (Slatter and Lovett, 1984)
and was confronted with organisational failure as its financial performance had become
untenable (table 2.5).
Strip MLE
Division
Automotive
SBU
Strip UK
Division
Executive Committee
Corus Group
Tubes Business
Building &
Distribution
Division
Commercial ,
Construction,
and Industry
Division
Energy SBU
SAW Mills
Cold Form
SBU
Structural &
Conveyance
SBU
H42

31
Table 2.4: CTE trends in Turnover and Sales Volume (Source CTE Company reports
1996 to 2003).
Table 2.5: Financial performance CTE 42” Mill 1997-2003 (Corus-Reports, 1997-2003).
Table 2.5, shows a variable financial performance; in only two of the previous six years
up to 2003 was CTE able to achieve a return on net operating assets. Furthermore, gains
made in 2001/02 were insufficient to offset losses made in the other years or to justify the
viability of the operation (CTE, 2008f). In 2003, having failed to secure the requisite
financial returns (table 2.5), the performance of the business was declared unacceptable
and faced closure (CTE, 2008f).
In addressing the issues confronting CTE, it is the Researcher’s belief that the lessons
learned could be used to address similar performance issues within the UKSI.
The next chapter considers process centric options promulgating Lean Manufacturing
(LM) as a world class manufacturing paradigm to pursue. Research into best practice
techniques that would allow the Researcher to generate insights in support of the research
aims and questions (section 1.2 and 1.3).
Actual £ B/(W) £ RONOA
P/(L) Plan %
1997/98 (2036) 860 -
1998/99 ( 952) (1725) -
2000 (3328) (2743) -
2001 4389 2059 11.6
2002 1181 (2106) 8.6
2003 (4998) (4738)

32
Chapter Three. An approach to implementing and sustaining a
process centric manufacturing strategy
3.0 Introduction
The principal aim of this thesis was to develop an approach to improving the
competitiveness and therefore viability of CTE. CTE was shown to be suffering from an
extended deterioration in financial performance reflective of a mature company in decline
(section 2.4). The hypotheses associated with this study were listed in section 1.3. These
included: if CTE could develop a recovery plan that addressed the performance gap then
it would be deemed worthy of saving. Furthermore, Lean Manufacturing (LM) could be
employed to improve a) the efficiency of the business, and b) its competitiveness and
therefore viability. However, and following the initial scoping exercise associated with
this thesis (section 5.4 and 4.2.2), additional hypotheses included: internal issues within
CTE had generated a barrier that had impeded previous initiatives which unless addressed
would hamper the required transformation to new way of working. Furthermore, the
ability to sustain Lean Manufacturing is proportional to CTE’s ability to transform HRM
policies.
In order to answer the research questions and address the hypotheses (section 1.3), the
Researcher sought to critically review the literature and identify theories in support of the
introduction and sustainability of Lean practices. Consequently, insights and themes
deduced from the literature could be considered in conjunction with the research aims.
Moreover, they could be applied (chapter 6) and tested (chapter 7) in order to provide
evidence in support of the research questions. The methodology associated with the
research design and the approach to data collection and analysis is outlined in general in
chapter 5 and more specifically in chapter 7.
There is significant literature on Lean including: the setting of quality goals in
multifunctional processes (Juran, 1992); secrets of Japanese manufacturing success
(Schonberger, 1982); continuous improvement and the importance of employee
involvement (Imai, 1986; Lillrank and Kano, 1989; Lillrank, 1995; Imai, 1997; Rother,
2010); understanding the TPS (Ohno, 1988; Liker, 2004); Lean tools and techniques
(Dennis, 2002; Bicheno, 2004); the importance of developing culture (Liker and Meier,
2006; Liker and Hoseus, 2008). Achanga et al. (2006) and Hargreaves (2007) proffered
that a superficial understanding of Japanese concepts introduced in the West has often

33
resulted in failure. To avoid such a fate, the Researcher sought to investigate how LM
came to prominence (section 3.2). Thus, the starting point was to discern the core
principles associated with LM. Furthermore, to determine if LM could be adopted within
the UKSI as a mechanism to modernise aged practices, stem decline, and turnaround its
competitiveness by addressing the perceived performance gap (sections 2.3 and 2.4).
Section 3.2 emphasises the evolution of improved manufacturing strategies. Good
practices employed by one sector, company or country that could be adopted, enhanced
and adapted to meet the specific needs of another. Section 3.3 introduces LM as a
derivative of mass production. Section 3.4 considers how LM can be transplanted within
western cultures as part of a change in manufacturing practices.
Section 3.5 considers the importance of a contemporary human resource management
(HRM) strategy as vital and supportive of any manufacturing policy. HR practices that
can have a positive impact on the success and sustainability of any change programme
(Barney, 1991; Lado and Wilson, 1994; Huselid, 1995; Youndt et al., 1996; Alvares,
1997; Wright et al., 2005; Birdi et al., 2008).
3.1 The need for change
The requirement for change and the appropriate strategy will differ according to: the
operational and financial performance of the business (Bibeault, 1982; Maritan and
Brush, 2003); the stage of the business within its life cycle (Slatter and Lovett, 1984); and
the cause of the decline and the lack of competitiveness (Arogyaswamy et al., 1995).
However, successful turnarounds of mature businesses are shown to be heavily weighted
towards efficiency improvements (Slatter and Lovett, 1984; O'Neill, 1986; Khandwalla,
1992; Robbins and Pearce II, 1992; Bowman and Singh, 1993). Efficiency is about ‘How
little waste we are producing’ and ‘Are we doing things right?’ whereas effectiveness is
about, ‘Are we doing the right thing?’ and ‘What should we be doing?’
Efficiency orientated improvements have become the prevailing managerial concern
(Zammuto and Cameron, 1985; Bateman, 2001; Bateman and David, 2002; Cushnaghan,
2003; Herron and Braiden, 2006; Herron and Hicks, 2008). However, the turnaround
literature does not prescribe the operational practices to adopt or how it should be
implemented in support of a sustainable transformation. The Toyota Production System
(Ohno, 1988) renamed Lean Manufacturing (LM) in the West, evolved into a concept that
has become widely regarded as offering superior workshop practices (Womack et al.,

34
1991). This has led many companies to embark on process improvement programmes
through the introduction of Lean (Bateman and David, 2002).
Whilst the concept of LM has grown in importance since the mid-seventies (Ohno, 1988),
the associated tools and techniques are refinements of previous best practices. LM has its
origins in the work of the early innovators in the field of mass production (MP) for
instance, Gutenberg (Woods, 2005), Smith & Babbage (West, 1999; Chandra, 2004),
Whitney (Sawyer, 1954), Ford (Duguay et al., 1997) and Deming (section 4.2).
Figure 3.1 provides an overview of the key chronological events that have contributed to
the evolution of LM as interpreted by the Researcher.
Figure 3.1: Chronological events that have contributed to the evolution of TPS (derived
from Researcher’s review of the associated literature).
The following section reviews some of the key developments. The Researcher believed
that by ‘going back in time’ to evaluate the evolution of Lean practices, he would obtain
a better appreciation of the fundamental concepts. This in turn might help eradicate some
of the complexity associated with Lean (section 3.3).
3.2 Lean manufacturing – from humble beginnings
The earliest form of mass production (MP) occurred circa 1430 when Gutenberg’s
innovative printing press was employed to print books and papers at a fraction of the cost,
Gutenberg c1430
Smith; Babbage:
1770 –1820
Whitney, De Gribeauval:
1810 -1850
Whitworth c1850
Taylor, Gannt,
Gilbreth 1910 –1930
Ford: 1910
Toyoda, Ohno,
Shingo 1950 – current
Earliest form of standardisation
Division of Labour
Interchangeability
Mechanisation
Scientific Management
Moving assembly line
Toyota Production System
Lean Manufacturing
Total Quality Management Deming, Juran
1940 –1980
35
making it affordable to a wider population (Woods, 2005). This stimulated demand and
the ‘growth’ of printed media.
The subsequent 18th Century industrial revolution was characterised by: the division of
labour, interchangeable parts and mechanisation (Duguay et al., 1997).
Division of labour
Smith (1776) demonstrated using his famous pin factory experiment, that through the
division of labour costs could be reduced and productivity improved (Chandra, 2004).
Output efficiency was increased whilst manufacturing cost was reduced (West, 1999).
Three advantages have been associated with the division of labour (Chandra, 2004):
1. the increase in skills and dexterity of semi-skilled workers. Through learning by doing
a single task (as opposed to the whole), workers may discover easier ways to
accomplish the required task; reducing overall cycle and increasing output per day;
2. by focusing on one task only there would be no distractions by having to reacquaint
oneself with a new task; and
3. the invention of machinery reduced labour content. Machinery provided the user with
an increased output and possibly quality, thereby reducing dependence on manual
labour.
Babbage (1832) developed the work of Smith (1776) by dividing work into sub-processes
that required varying degrees of skill to completed the sub-task (West, 1999). This
differentiation of skills culminated in the establishment of variable rates of pay with
higher skills demanding higher pay (Stigler, 1991). The redefinition of skill requirements
reduced the dependence on the skill of the craftsmen, lowered wage bills and increased
rates of output.
Making products more affordable can increase demand (Schumpeter, 1934; Nelson and
Winter, 1982). In 1810, Eli Whitney’s work on the development of interchangeable parts
manufactured by semi-skilled labour (Sawyer, 1954), resulted in a revolutionary step in
the manufacture of goods (Woodbury, 1960). This resulted in a standard design for guns
that could be made from interchangeable parts. Parts machined in compliance with

36
specified tolerances were considered identical and could be readily interchanged to make
the final assembly. This reduced the requirement for remedial work pre-assembly (Ford,
2005).
The advent of mechanisation or ‘basic machining tools’ allowed semi-skilled workers to
produce parts to a greater degree of accuracy and uniformity in a fraction of the time and
cost of the traditional method (Sawyer, 1954; Woodbury, 1960; Musson, 1993).
The above developments heralded the onset of MP. This made products more affordable
to a larger population that in turn created a growth in demand. MP became the harbinger
of time and motion studies. Advanced by pioneers such as Taylor and Gilbreth
(Thompson, 1914) they extended specialisation beyond manual labour and effort to that
of mental labour. This formed the basis of Scientific Management (Taylor, 1911), the
separation of planning from execution.
3.2.1 Scientific Management
Taylor (1911) published his principles of Scientific Management (SM), defined by
Sheldon (1925, p131) as:
“that form of management in which the object and method of any activity has been
determined, not by the opinion of any one individual but by the scientific analysis of all
available facts and the determination of standards”.
Taylor’s predecessors had sought to de-skill and standardise tasks, whereas Taylor
focused on the systematic organisation of work to identify the one best way (Duguay et
al., 1997).
SM required management to gather all the knowledge, techniques and systems possessed
by the workmen and codify this knowledge into a series of rules, laws and formulae
(Taylor, 1911). SM included:
- the scientific development of a standard procedure for each element of a man’s work;
- the scientific selection and training of the worker in the procedure developed; and
- the appropriate division of work between management and workman to ensure each
is responsible for the element they are best suited.

37
Gilbreth and Gilbreth (1917) introduced micromotion techniques (ergonomics) with the
objective of reducing fatigue to achieve the best from the man and machine combination
(Schroyer, 1975). The new methodology recorded in the form of a written document that
captured the standardised mode of operation or the ‘one best way’ to accomplish the task
and facilitate training (Thompson, 1914).
The work of Taylor and Gilbreth was an important step in the evolution of modern
manufacturing practices (Nelson, 1974). However, SM remains one of the most
controversial management theories of all time (Witzel, 2005). To its supporters, it brought
professionalism based on knowledge and scientific principles that galvanised American
industry to bring about huge gains in productivity. To its detractors, SM represented
everything that was bad about the capitalist system; deskilling, dehumanising, and the
death of craft production (Witzel, 2005). In Stalin’s Russia it became what the detractors
in the West always feared, a tool for driving workers harder rather than a means for
rewarding efficiency gains. Yet, the key principles e.g. time and motion study, personnel
selection and standard times are pervasive (Freeman, 1996).
The following section considers how MP built on the work of SM.
3.2.2 From Scientific Management to Mass Production.
Ford refined the work of his predecessors to achieve greater output efficiency (Raff and
Summers, 1987) which significantly reduced the cost of, and time to build vehicles (Wren
and Greenwood, 1998). Ford made automobiles affordable (Greissel, 2003) and in doing
so; ‘put the world on wheels’ (Krafcik, 1988).
Ford’s foremost contribution was the invention of the moving assembly line (Wren and
Greenwood, 1998). This heralded a new era of MP (Womack et al., 1991) characterised
by large production runs, push scheduling, high levels of automation and worker
specialisation (Duguay et al., 1997).
However, as the automotive industry matured the competitive advantage held by the
Americans was gradually eroded (Womack et al., 1991). Emerging players offered
cheaper and superior alternatives to the choices offered by Ford; alternatives that
emphasised the frailties of MP (Cusumano, 1988; Krafcik, 1988).

38
Toyota refined the principles of MP by providing customers with what they wanted when
they wanted it (Sugimori et al., 1977); an approach that evolved into the Toyota
Production System (TPS) (Liker and Meier, 2006).
The philosophy and key values of the TPS for example: waste elimination; quality
control; line balancing; standardisation; 5S; employee engagement; and customer focus,
have become synonymous with the Toyota culture of continuous improvement (Sugimori
et al., 1977; Ohno, 1988; Womack and Jones, 2003; Liker and Meier, 2006) and reflect a
company committed to learning. However, the main change introduced by the TPS was
the way employees were allowed to think and operate within their work environment
(Womack and Jones, 2003). Practices and insights considered by the Researcher as
fundamental to providing a simple structure and approach to support the transformation.
The Researcher hypothesised that training in the basic Lean techniques would act as an
enabler to the new way of working (section 1.3). Moreover, contemporary HRM policies
would play a vital role in the engagement of employees and their desire to support change.
Themes that were to be included within the evolving Sustainability Framework (section
4.2.2).
The TPS gained recognition in the West following the oil crisis of 1973 and subsequent
world-wide recession (Ohno, 1988). Toyota was one of the few companies which was
able to sustain greater earnings during this period, an achievement that made other
manufacturers sit up and take note (Imai, 1986; Ohno, 1988; Shah and Ward, 2003;
Womack and Jones, 2003; Liker and Meier, 2006). Consequently, the TPS is the standard
manufacturing mode of the 21st century (Shah and Ward, 2007); a view that is well
accepted amongst academics and practitioners alike, for example (Krafcik, 1988;
MacDuffie, 1995; Shah and Ward, 2003; Wood et al., 2004). For ease of reference the
TPS will be referred to as Lean Manufacturing (LM).
A complementary approach to LM is Six Sigma which also incorporates the work of many
early quality pioneers (Pyzdek, 2003). Six Sigma demands a rigorous, highly effective
implementation of proven quality principles and techniques to deliver virtually error free
performances. Six Sigma employs the DMAIC (define, measure, analyse, improve, and
control) improvement model, draws on similar practices to LM, but focuses on statistical
tools and measurement.
There exists a plethora of literature available that provides information on the latest
manufacturing techniques. The best known are: LM, Six Sigma and the Balanced

39
Scorecard (Bhuiyan and Baghel, 2005). More recently hybrid methodologies have been
developed for example Lean Six Sigma and Leagile (Naylor et al., 1999; Mason-Jones et
al., 2000; Krishnamurthy and Yauch, 2007). However, in this study the Researcher has
focused on LM as the paradigm to be incorporated within CTE’s manufacturing strategy
(section 4.2.1).
3.3 What is Lean Manufacturing
Typing the words ‘Lean Manufacturing’ into the search box of ‘Google’ produces over
9,000,000 results (May 2015). ‘Lean Manufacturing tools and techniques’ returned over
650,000 whilst ‘Lean Manufacturing tools and techniques in the process industry with a
focus on steel’ returned 188,000 results. LM is equally well documented in numerous
books, for example (Schonberger, 1982; Monden, 1983; Shingo, 1985; Ohno, 1988;
Womack et al., 1991; Dennis, 2002; Womack and Jones, 2003; Bicheno, 2004; Liker,
2004), and many more.
The fundamental essence of LM is a continuous improvement (CI) philosophy; an
approach that reflects the spirit of a particular way of working. When applied
successfully: it will increase the probability of success and reduce the likelihood of failure
(Deming, 2000); forms part of a Kaizen mind-set which is inextricably linked to
maintaining and improving standards (Imai, 1986); unleashes employee experience and
creativity to improve both product and processes (Schroeder and Robinson, 1991); and
sustains a culture of sustained improvements targeting the elimination of waste in all
systems and processes of an organisation (Ohno, 1988).
Continuous rather than one-time improvement can be achieved through a greater
integration of workers and suppliers into the production system (Cusumano, 1988). The
importance of integrated approaches linking diverse manufacturing practices is well cited.
For example, 'world class manufacturing’ as a synthesis of just-in time (JIT), total quality
management (TQM), employee involvement, preventative maintenance practices
(Schonberger, 1982; Schonberger, 1986), computer integrated manufacturing (Gunn,
1987), strategic management (Akao, 1991; Cowley and Domb, 1997) and many others.
By 1970 and coincident with the oil crisis of 1973, Toyota had successfully positioned its
cars as high quality and fuel efficient (Walton, 1990). Toyota advanced a flexible build
approach that offered greater product variety than MP. Toyota provided increasingly

40
discerning consumers a choice: a selection of models, colours and finishes that
distinguished Toyota’s offering from its competitors.
The definition of LM has evolved to become more expansive over time. It is multi-faceted
and is not easy for managers to fully describe, define or comprehend its true nature (Shah
and Ward, 2007). It is often ambiguous in terms of meanings, what it can offer and what
the exact benefits to the production process are. It is therefore not uncommon when
applying LM that managers often focus on a single visible aspect of the process whilst
missing the invisible, highly interdependent links within the system as a whole. By way
of example, just-in-time (JIT), is one of the four main concepts of Lean (Monden, 1983).
To maintain JIT production at the Toyota plant, a Kanban system (Ohno, 1988) was
employed as a means to pull material from an upstream station and manage product flow.
In describing and measuring JIT, Sugimori et al. (1977) focused on the critical factors
namely Kanban, production smoothing, and set-up time reduction. Later definitions
incorporated these elements but also included quality improvement and employee
involvement (Hall, 1987; MacLachlin, 1997) and customer focus (Flynn et al., 1995a;
Flynn et al., 1995b). Rehder (1989) stated that the integrated and overlapping practices
were mutually supportive. Consequently, the success of LM does not emanate from
break-through ideas, or the success of an individual element, but the convergence of many
new and existing approaches (Flynn et al., 1995a).
However, the difficulty with any change process is that companies may recognise the
need for change and comprehend what needs to be achieved but have great difficulty in
understanding or deciding where to start and what to do (Barker, 1996; Hargreaves,
2007). Bartezzaghi (1999) asserted that companies cannot readily imitate the successful
LM models used by other companies. Indeed, many companies have embarked on this
journey but have failed to implement the various tools and techniques successfully
(Achanga et al., 2006). Toyota took more than forty years of relentless effort to fully
implement and refine Lean practices (Womack et al., 1991; Dennis, 2002). Therefore, it
should come as no surprise that Lean is not a ‘silver bullet’ or quick solution.
3.4 Implementing Lean Manufacturing
The absence of a clear vision, an agreed framework on what to implement, or knowledge
of the primary tools and techniques to introduce Lean will result in failure (Achanga et
al., 2006; Hargreaves, 2007). A lack of direction causes companies to flounder during the

41
change process, enthusiasm is lost and the programme falters. Confusion engenders
conflicts of interest from those who oppose change; which without the support of the key
stakeholders increases the likelihood of failure (Barker, 1996; Holland and Light, 1999;
Coronado and Antony, 2002; Umble et al., 2003). The outcome is that the initiative is de-
based to sloganeering (Schroeder and Robinson, 1991). The hypothesis was that the lack
of vision, direction, and post-launch strategic management would increase the likelihood
of failure (section 1.3).
DeMeyer et al. (1989) reasoned that a set of pre-conditions and supporting structure must
exist before the subsequent techniques or initiatives can be developed. They proposed a
‘sand cone’ model. If the foundations are weakened the entire programme would collapse.
Hines and Taylor (2000) provided a roadmap that identifies the various stages of Lean
implementation. For example: understanding waste; setting the direction; understanding
the big picture; detailed mapping; getting the supplier and customer involved; checking
the plan fits the direction; and ensuring buy-in. The roadmap commences by suggesting
that the reader should first determine if Lean is likely to be appropriate. Affirmation
results in the need to understand the customer needs and the internal value stream. This
identifies opportunities to eliminate waste or non-value adding activities. Core business
processes such as: order fulfilment, sales acquisition; product life cycle management,
plant and equipment management, HR development; and policy deployment should be
evaluated to allow the establishment of aspirational targets and critical success factors.
Finally, process maps disseminate tasks into sub-tasks to make visible opportunities for
improved practices. The goal is to reduce wasteful activities (cost) and improve efficiency
by adding value throughout the customer value stream. The main sections are
underpinned by a supportive structure and (guidance) information for a company to
consider.
However, the roadmap proffered by Hines and Taylor (2000) does not articulate, address
or evaluate: the starting point for a company; the need for LM; the key tools and
techniques to be employed; the priority order of application; or the training requirements.
Furthermore, it does not consider the extent of existing knowledge of Lean techniques or
internal issues that might act as an impediment to change. Factors that may be deemed
pivotal when examining: a) a particular industry; b) the issue or challenges faced; c) the
company’s commitment to implementing LM tools and techniques; and d) the strategic
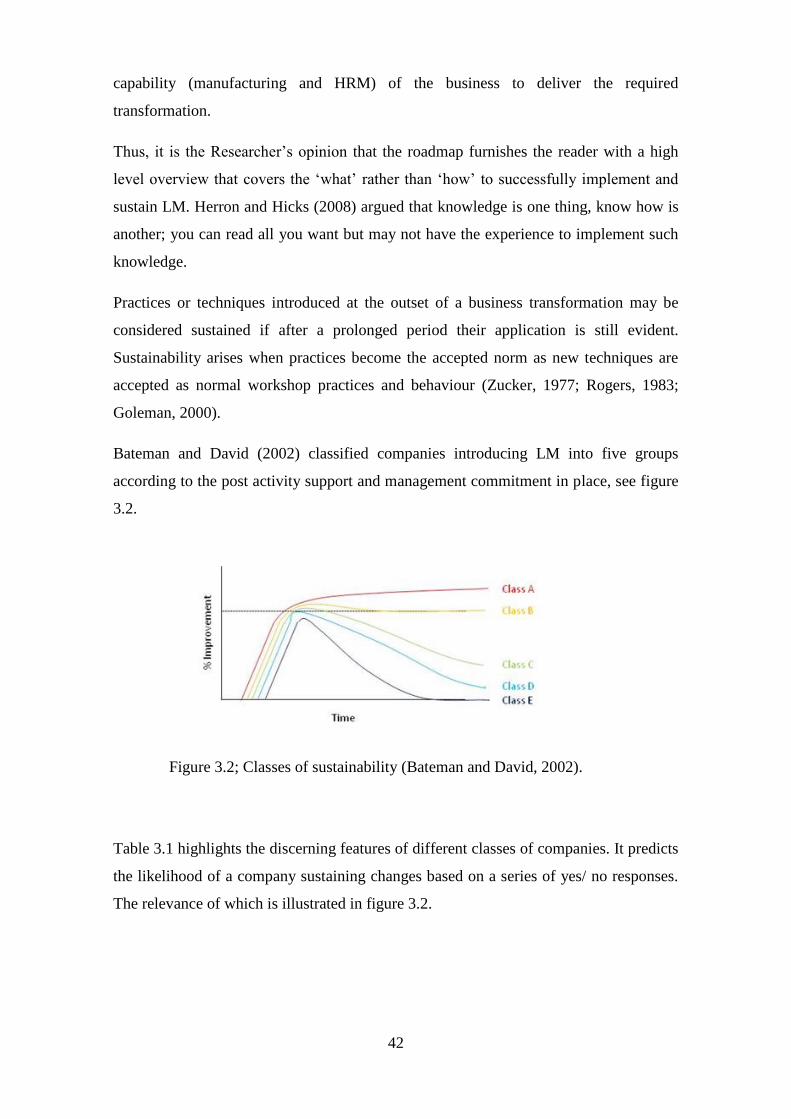
42
capability (manufacturing and HRM) of the business to deliver the required
transformation.
Thus, it is the Researcher’s opinion that the roadmap furnishes the reader with a high
level overview that covers the ‘what’ rather than ‘how’ to successfully implement and
sustain LM. Herron and Hicks (2008) argued that knowledge is one thing, know how is
another; you can read all you want but may not have the experience to implement such
knowledge.
Practices or techniques introduced at the outset of a business transformation may be
considered sustained if after a prolonged period their application is still evident.
Sustainability arises when practices become the accepted norm as new techniques are
accepted as normal workshop practices and behaviour (Zucker, 1977; Rogers, 1983;
Goleman, 2000).
Bateman and David (2002) classified companies introducing LM into five groups
according to the post activity support and management commitment in place, see figure
3.2.
Figure 3.2; Classes of sustainability (Bateman and David, 2002).
Table 3.1 highlights the discerning features of different classes of companies. It predicts
the likelihood of a company sustaining changes based on a series of yes/ no responses.
The relevance of which is illustrated in figure 3.2.

43
Table 3.1: Summary of classes of improvement at cell level (Bateman and David,
2002).
Companies that fail to close out all the agreed actions, or fail to roll out learning into other
parts of the business are most likely to forfeit improvement opportunities (Bateman,
2001). Class A companies continue to drive the improvement activities and secure
benefits by adopting them as a new way of working. Class E companies lack support
resulting in deterioration in performance and a return to the original state prior to the
commencement of the activity.
Bhuiyan and Baghel (2005) identified that CI can occur through evolutionary
improvement or through radical change, but it takes time for the benefits to be determined.
Companies must establish a strong foundation of key tools and techniques to allow LM
to flourish (Bateman and David, 2002). Bateman and David (2002) proffered a Society
of Motor Manufactures and Traders (SMMT) temple (figure 3.3) that complemented the
work of Hines and Rich (1997); Hines and Taylor (2000). It portrayed the basic building
blocks underpinning LM and a continuous improvement philosophy. The model
emphasises 5S as fundamental for any CI programme bolstering the secondary techniques
which include: 7 wastes, standard operations and visual management.
Class of
Activity
Improvement during
workshop
Maintain new
method of
working
Close out
action
Apply/ extend
tools to new areas
Class A Yes Yes Yes Yes
Class B Yes Yes Yes No
Class C Yes Yes No No
Class D Yes No Yes No
Class E Yes No No No

44
Figure 3.3: The temple of continuous improvement illustrating the basic building blocks
of LM (Bateman and David, 2002).
The following section provides a synopsis of the above basic building blocks;
fundamental techniques that were subsequently included within the interventions
launched by the Researcher (section 6.3.2).
3.4.1 The basic building blocks of Lean manufacturing
5S
The establishment of a robust, stable, safe, and orderly work place. 5S is based upon a
philosophy of “everything in its place and a place for everything” (Bicheno, 2004). 5S
acts as an enabler of waste identification and elimination, improves visual management
and standardised work; the combination of which enables continuous improvement in
performance.
However, its strength is that it nurtures a safe and well-organised area helping to reduce
operator fatigue through improved ergonomic practices whilst simultaneously liberating
valuable floor space (Dennis, 2002). 5S exposes deviation from a pre-determined
standard that would otherwise not be seen (Liker and Hoseus, 2008).
LM focused on trouble free manufacturing through the elimination of waste, defect free
work, and line efficiency. Ohno (1988, p41) stated that; “Insufficient standardisation and
rationalisation creates waste (muda), inconsistency (mura), and unreasonableness (muri)
in work procedures and work hours that eventually lead to the production of defective
products.” The TPS addressed this by focusing on the elimination of all forms of waste
and established standardised routines for the most effective way to complete a task.

45
7 Wastes
Eliminating the seven forms of waste (over-production, waiting, unnecessary transport,
over-processing, excess inventory, unnecessary movement, defects) completely is the
starting point of Lean thinking (Womack and Jones, 2003) and can improve operating
efficiency by a large margin (Ohno, 1988). Waste (muda) is endemic and may go
unnoticed for decades (Bicheno, 2004), thus teams must consciously learn to recognise it
and seek to reduce it. By eliminating waste a company can eliminate unnecessary costs
within the process for example, reduction in high value stock and improved process
efficiency via reduced operational cycle times. The result is the creation of greater wealth
within the company (Womack and Jones, 2003).
Ohno (1988) argued that true efficiency can only be achieved when all waste is
eliminated. Ohno (1988, p19) defined waste as; “anything that adds cost but does not add
value”. Furthermore “only work that is needed is real work everything else can be
regarded as waste.” Ohno (1988, p19). The following equation expresses that view
(Ohno, 1988)
Present capacity = work + waste
(total time taken) = (added value time + wasted activity time)
In this formula work reflects value added (VA) activities which is typically measured in
minutes and seconds. Waste includes non-value added (NVA) activities, again measured
in minutes and seconds. NVA may be necessary, but does not add value to the end
product. It should be regarded as waste and all efforts made to change operating
conditions to eliminate or reduce the extent of this form of waste. Reducing NVA to a
minimum and eliminating all forms of waste, the overall cycle time can be reduced see
figure 3.4 (Ohno, 1988).

46
Figure 3.4: Waste, non-value and value added activities. (Illustrated by the researcher to
depict Ohno’s (1988) view).
Through the total elimination of waste a company can un-mask manufacturing issues and
create a visibility that allows employees to identify and eliminate causes of adverse
manufacturing problems. Employee behaviour changes to one of addressing issues such
as poor quality, breakdowns, long changeover and set up times rather than accepting
waste and poor efficiency (Sugimori et al., 1977).
Visual Management
The third building block associated with CI is visual management (Bateman and David,
2002), a system that allows simple and effective communication of goals to each
department and covers all levels. Good visual management acts as an enabler to area
control. It is a communication device that indicates at a glance how work should be done
and whether it is deviating from that standard (Liker, 2004). Visual management means
more pictures and fewer words (Dennis, 2002). In its simplest form it provides a clear
understanding of the current situation; for example, a graph depicting schedule adherence
of a machine or process, or current quality issues complete with remedial actions.
Integrated with 5S and standard work, it is a ‘litmus test’ for Lean (Bicheno, 2004). At a
higher level it may be used to promulgate the strategy of the business and the deliverable
objectives of each function (Akao, 1991). The objective is that the information helps drive
behaviour to support/ remedy the situation and achieve business goals; a method of

47
communicating that informs and engages operators of the main business drivers (Bicheno,
2004; Liker, 2004; Liker and Hoseus, 2008; Mann, 2012).
Standard Work
5S, the seven wastes and visual management form the foundation of CI (Bateman and
David, 2002). Techniques that are fundamental to LM (Bateman and David, 2002).
Standardisation is also a pre-requisite to effective Lean and supply chain management.
Standardisation (the one best way) has been the pursuit of numerous pioneers (section
3.2) and should be captured in a simple written procedure complete with pictures, quality
standard and TAKT (cycle) time (Bicheno, 2004).
Standard operations (SO) have three key purposes:
- they highlight the most effective way to do the job;
- they help eliminate variability; and
- they prevent improvements made from ‘slipping backwards’ and thus allows the
company to ‘hold the gains’ (Juran, 1992).
A deviation from standard implies that something unusual is happening and should be
addressed promptly. SO should be written by operators, not experts (unlike Scientific
Management where managers capture the one best way (Taylor, 1911)) , and maintained
at the workplace. Unlike SM, Toyota believed that SO provides a basis for empowering
workers and generating innovation within the working environment as teams aim to
develop a cycle time driven by the pace of customer demand (Liker, 2004). If work is not
standardised and is therefore different each time, there is no basis for evaluation. This
implies that there is no reference point from which to compare or to improve (Liker and
Meier, 2006). Consequently, SOs form an essential element of LM and CI.
The North East Productivity Alliance (NEPA) best practice dissemination programme
augmented the Society of Motor Manufacturers and Traders (SMMT) model by
introducing a ‘needs analysis’ matrix (Herron and Braiden, 2006). This process
established a starting point and identified the priority techniques to be applied. Latterly,
the value of change agents was proferred as a further enhancement to aid knowledge
transfer and support sustainability (Herron and Braiden, 2006; Herron and Hicks, 2008).

48
3.4.2 The basis for a successful transformation to LM
A successful company cannot simply imitate and implement a best practice (Bartezzaghi,
1999). It must seek a continuous process of interpretation and abstraction, followed by
selection, assimilation and operational translation. This is because production models are
specific to individual companies and evolve over time, even if they are based on the same
paradigm. The relevant change to Lean is not something that a business can be without
one day and have the next. Similarly, Lean is not something you set out to introduce but
more akin to something that you become. An evolution based on persistence and
adherence to the basic philosophy that underpins LM. LM has been shown to be an
evolutionary journey (Gill, 2009), a process that builds one technique on top of the
preceding technique (DeMeyer et al., 1989; Lucey et al., 2004). It is the on-going efforts
of everyone in the organisation that improves the probability of sustained change (Kanter,
1999). In the past, Western companies were quick to associate the success of Japanese
practices with Japanese culture (Cusumano, 1988; Lillrank, 1995). However, numerous
authors have dispelled this view and have demonstrated that greater productivity has been
achieved by non-Japanese and Japanese transplant companies in the US and Europe
(Cusumano, 1988; Krafcik, 1988; Womack and Jones, 2003).
The inability of Western companies to sustain Japanese practices has been attributed to a
superficial understanding of the phenomenon (Lillrank, 1995). Companies may copy (low
abstraction) good practices employed in another company or country but overlook the
philosophy or organisational values that support the good practice. To overcome this
deficiency the concept of the Master Class was developed (Bateman, 2001; Bateman and
David, 2002). Master Classes provide a methodology for a company to extract ‘know
how’ from Master Engineers. This process was based upon abstraction and transfer of
knowledge as described by the Lillrank model (Lillrank, 1995). In this model the high
level of abstraction is founded upon an intelligent learning process. This enables the
adopted technique to be applied and re-created to fit local conditions.
In the North East of England the first step of the NEPA approach involved the abstraction
of Lean expertise from Japanese Car plants such as Nissan to engineers within UK
(Nissan) car plants and regional government agencies such as, Industry Forum (IF)
(Herron and Hicks, 2008). The second step was to abstract the knowledge from Nissan/
IF and transfer it to master engineers within NEPA. This process directly involved the
work-force. It demanded high levels of participation during the knowledge transfer
process (Bessant et al., 1994).

49
Master Classes are highly prescriptive and commence with a prognosis of the problem
(Bateman and David, 2002). This is followed by a series of workshops to implement
required actions, and iterative assessments of progress. Each stage follows a structured
application of agreed tools and techniques to support knowledge transfer and help deliver
a real and sustainable improvement (Bateman and David, 2002; Herron and Braiden,
2006).
The quandary on where or how to embark on the journey may be resolved through the aid
of a Productivity Needs Analysis (PNA) (Herron and Braiden, 2006). The PNA could be
used to assess the manufacturing issues confronting the business. These are juxtaposed in
a matrix with the principle Lean tools and techniques considered appropriate to resolve
these issues. A scoring system is employed which establishes priority areas to address.
The process is conducted jointly by trained engineers and the host company. The agreed
priorities outline the recommended starting point (Herron and Braiden, 2006).
Herron and Hicks (2008) identified that it was important to develop change agents in
order to achieve sustainability after the departure of the ‘hired’ experts. These change
agents, employed by the host company, are trained throughout the Master Class activities
(Bateman, 2001; Herron and Hicks, 2008).
It has been argued that the attainment of LM is one of the most influential paradigm shifts
in manufacturing (Caffyn, 1999). Consequently, in order to succeed, a company needs to
understand the scope of the change and be committed to its introduction. Hines et al.
(2004) stated that a period of five years is not an unrealistic time frame to achieve a ‘Lean
leap’ and deliver the desired organisational change. Companies seeking to become Lean
within a short time-frame have tended to ignore the thirty years of iterative adaptation (or
trial and error) conducted by Toyota, (Lewis, 2000). Toyota’s philosophy is based upon
continuous improvement and a learning culture (Sugimori et al., 1977; Womack and
Jones, 2003; Liker, 2004). Toyota’s success emanated from a commitment to a way of
working, a way of looking at the business purpose, of looking at the process, of looking
at people, and a way forward in learning to learn as an organisation (Liker and Meier,
2006); a shift in management attitude towards employee involvement.
The chosen direction, degree of success or sustainability of any strategic change is
proportional to the orientation of an enabling context within the organisation (Krafcik,
1988). To assist this, a company has to develop mutually supportive manufacturing and
human resource management (HRM) policies (Youndt et al., 1996; Guest, 1997; Wood,

50
1999; Guest et al., 2003; Bowen and Ostroff, 2004; Wright et al., 2005; Birdi et al., 2008).
The probability of success could be increased if the company can generate sustained
involvement across functions, develop a learning environment and incorporate the new
values as part of corporate culture (Barney, 1991; Ulrich and Lake, 1991; Teece et al.,
1997; Senge, 2006). The importance of the workforce and how it is managed as a
competitive force is articulated by numerous authors (MacDuffie, 1995; Youndt et al.,
1996; Garratt, 2000; Wright et al., 2001; Senge, 2006; Liker and Hoseus, 2008). The
TPS set out to continuously enhance the workers’ skills and to gain the benefit of their
knowledge and experience as well as their brawn (Womack et al., 1991).
Any set-back will have a significant adverse impact unless there is strong leadership and
a commitment to improve (Achanga et al., 2006). Failure creates doubt and scepticism
that the cost of implementation is greater than the potential benefits (Achanga et al.,
2006). Kanter (1999) contended that too often management announces a plan, launches
the plan and then simply hopes that employees will make it happen. By agreeing the
vision and establishing joint goals, employees are likely to buy into the new programme
and become engaged (Lucey et al., 2004); the higher the level of employee engagement,
the greater the chance of success and sustainability. This would appear to be at the core
of Toyota’s approach.
Caffyn (1999) stated that any attempt to introduce and sustain a programme of major
change like LM, must be strategically managed and matched with a commensurate long-
term support structure.
Novick (1981) and Staw et al. (1981) warned that in periods of decline and crisis
situations (such as CTE), decision makers will revert to what worked well previously and
thus institute well-learned past routines. For example, cash saving initiatives or headcount
reductions to remove slack resources. These may have proved successful in previous
initiatives. However, such actions with the benefit of hindsight may prove faulty
(Hedberg et al., 1976). CTE (UKSI) had failed to address an existing performance gap
(section 2.3). This form of rigidity is proffered as the consequence of an entrenched mind-
set supported by the theory of cognitive inertia that leads to failure (Nystrom and
Starbuck, 1984). It is therefore difficult to change management’s perception and tendency
to adhere to past orientations that have previously worked well (Miller, 1994).
Given that CTE was faced with a crisis situation (section 2.4) and that only about 30% of
declining organisations achieve turnaround (Barker III and Patterson, 1996), the
51
Researcher had to review the ability of CTE in dealing with external threats (Mone et al.,
1998). Such a turnaround requires a concerted organisational effort to redress a decline
in performance (Khandwalla, 1992).
Failure to respond to a series of both internal and external factors resulted in the eventual
demise of Dunlop which was acquired by BTR in 1985 (McGovern, 2007). The case study
of the demise of Dunlop could read as an epitaph for a number of ailing British industries
from ship building to car making, from steel industry to white goods. Consequently, the
interpretation and reaction of management to the perceived changes in the external
environment is heavily dependent on the culture and capability of that organisation
(Lorange and Nelson, 1987).
The Researcher conducted a series of literature reviews (data gathering) studying
contemporary HRM policies in order to gain insights and develop themes that would
support the implementation and sustainability of a new way of working. The hypothesis
developed was that a contemporary HRM strategy was critical to the sustainability of LM
within CTE (section 1.3). A properly designed and deployed HRM strategy can influence
the human capital pool and elicit desired employee behaviours (Harter et al., 2002).
3.5 The role of HRM
The output of the review indicated that HRM practices such as: selection; training and
development; job security; involvement; communication; and team working seek to
develop an outcome linked to improved skills and ability, effort and motivation, and
flexibility (Guest, 1997). The outcome is the development of distinct capabilities leading
to superior performance that is a source of inherent competitive advantage (Barney, 1991;
Pfeffer, 1995); an advantage that is valuable and rare because it is difficult to replicate or
imitate (Barney, 1991; Wright and McMahan, 1992; Lado and Wilson, 1994; Connor
and Prahalad, 1996; Ferris et al., 1998; Bowen and Ostroff, 2004).
Consequently, the literature review revealed that the primary objective of a HRM strategy
is to maximise the capability of employees in the successful execution of business
strategies (Alvares, 1997; Huselid and Becker, 1997; Wright et al., 2001). Youndt et al.
(1996) stated that whilst studies support the existence of a best practice approach to HRM,
there remained notable differences as to what constitutes ‘best’ practice.

52
There are three business strategies that can be coupled with supportive HRM policies.
The cost leadership strategy focuses on reducing costs associated with manufacturing.
The strategy may result in reduced or lower input costs that translate into superior returns
(Porter, 1985). Companies pursuing cost strategies seek to increase customer value by
reducing cost incurred in the process of manufacture or by increasing value of benefits to
customer (Youndt et al., 1996). A HR strategy may focus on de-skilling jobs or roles of
individuals, by reducing the headcount required to undertake tasks and by operating in a
command and control culture. As work becomes routine, a point is reached where labour
becomes a commodity. Expensive training is not necessary and the utility of the
individual, diminishes (Cascio, 1991). This approach runs counter to a philosophy based
on a commitment to investment in developing individual capabilities.
Quality strategies, focus on continually improving the manufacturing process to increase
product reliability and customer satisfaction (Garvin, 1993). Quality management
theorists (Juran, 1992; Deming, 2000) have argued that ‘quality is free’ and that skill
acquisition and development is core to a quality centric strategy and sustainability of
initiatives (Crosby, 1979; Youndt et al., 1996; Deming, 2000). In this approach
individuals own the process and have discretionary responsibility for planning, trouble
shooting, problem solving and CI (Kern and Schumann, 1990; Snell and Dean, 1994).
The supporting HR strategy must focus on the enhancement of human capital via the
development, engagement and up-skilling of the individual.
Flexibility strategies – whilst there are many types of flexibility, an example of this
approach is where companies seek to outdistance those firms already achieving a low cost
and high quality market position (Upton, 1995) by improving their agility, adaptability
and responsiveness to market demands. In this scenario flexibility is expressed as the
ability to scale production up or down quickly. This is achieved by increasing or reducing
employee headcount / activity levels in an attempt to increase/ decrease output, and or
delivery performance (lead time) (Youndt et al., 1996). In another scenario, this may be
perceived as the ability to quickly expand the scope of product offerings (volume and
mix) by producing small lots and accommodating non-standard orders (DeMeyer et al.,
1989; Leong et al., 1990). Thus in this case, flexibility builds on the quality strategy in
order to adapt and respond quickly to changes in the environment (Youndt et al., 1996).
Consequently, flexible work demands a conceptual grasp of the production process and
accompanying analytical skills to identify the root cause of the problem (DeMeyer et al.,
1989; Leong et al., 1990; MacDuffie, 1995). Improved organisational performance in this

53
type of flexible operation is achieved from a combination of LM and supportive HR
practices (Shah and Ward, 2003).
Each strategy addresses competitive challenges facing the business. The common theme
is that the successful delivery of HRM practices will have a positive influence on
operational performance (Becker et al., 1997). A mutually supportive manufacturing and
HRM strategy can lead to improved turnover and profitability (Guthrie, 2001) and
improved economic performance (Huselid, 1995; MacDuffie, 1995). The proponents of
the resource based view (RBV) (Barney, 1991) associate people as intrinsically linked to
the value creation process and as the ultimate source of competitive advantage (Ulrich
and Lake, 1991). Many firms support the enhancement of the skill base of individuals
(Pfeffer, 1995) and the development of a learning organisation (Harvey and Denton,
1999; Senge, 2006). Consequently, the ability of the firm to manage its intellectual capital
is a key determinant of organisational performance (Prahalad, 1983; Pfeffer, 1994;
Youndt et al., 1996; Becker et al., 1997; Guest, 1997). Moreover, the development of
human capital has evolved to become a fundamental strategic issue (Hamel and Prahalad,
1994; Teece et al., 1997); insights deduced from the literature that underpinned the
research aims and question 2.
This enabled the Researcher to conclude that the starting point for any HRM strategy is
recruitment, selection and training (Guest, 1997); an approach that ensures the
appropriate skills and abilities.
3.5.1 Selection, Recruitment, Learning and Development
The development of human capital through commitment based practices reflects a
learning organisation that is focused on improving performance (Arthur, 1994;
MacDuffie, 1995; Youndt et al., 1996). Commitment based HR Practices (Pfeffer, 1994;
Collins and Smith, 2006), are typified by a combination of employee selection practices,
extensive training programmes, appraisals, compensation packages, and team building.
The outcome is the upgrading of employee skills, empowered teams (Tsui et al., 1997),
and the development of firm specific knowledge (Arthur, 1994; MacDuffie, 1995). HRM
practices such as: job rotation, job enrichment and de-layering (Wall et al., 2004) allows
responsibility for line performance to be delegated to more junior employees within the
team. Multi-functional teams that are able to identify and remedy problems within the
area as part of its day-to-day duties (Ahlstrom and Karlsson, 2000). In developing the

54
capability of an employee a firm could increase the versatility and extent of the
contribution an employee can offer (Frese et al., 1996). A versatility that supports greater
flexibility in the way a line can be operated, or improves the ability of an employee to
adapt to and support change, innovate and exhibit behaviours that are conducive to the
firm’s strategic priorities and inherent company values (Hackman and Oldham, 1976;
Barney, 1991; MacDuffie, 1995).
However, the skills associated with flexible production are of little use unless workers are
motivated to contribute mental as well as physical effort (MacDuffie, 1995); motivation
that is typically affected by reward systems and job security (Huselid, 1995).
The stability of a workforce is a variable that could have a significant impact, both
positively and negatively, on the ability of a company to introduce any form of change.
Reducing the number of shifts worked or layoffs may be perceived by those affected as a
violation of their psychological contract with the organisation. The threat of lay-offs
breeds insecurity. This can cause high performing employees to leave the business to
avoid the uncertainties and ambiguities associated with a downsizing environment
(Iverson and Pullman, 2000). This results in a loss of valuable firm specific skills
(Guthrie, 2001), reduced motivation, decreased trust, doubt, lack of support and greater
stress within the work place (Mishra and Spreitzer, 1998; DeMeuse et al., 2004). This
leads to reduced commitment (Brockner, 1992; Applebaum et al., 1999), lower work
place productivity of the surviving employees (Snell et al., 1996) and an adverse effect
on change programmes (Lam and Reshef, 1999).
The threat of layoffs may lead to management by stress (Roth, 2008). In this situation
workers are ‘sweated’ and made to work at a faster pace for fear of being ‘laid-off’
(Graham, 1993; MacDuffie, 1995). Workers pressure each other to perform and to have
an unremitting capacity to work at full intensity (Roth, 2008).
Within the literature alternative views indicated that unlike loss by natural attrition, lay-
offs can actually increase a firm’s flexibility over a transition period from high to low
activity (Cascio and Wynn, 2004). Firms could remove employees whose skills are no
longer required or do not fit. They could be expediently replaced with employees who
have greater potential, greater absorptive and retentive capacity. Zatzick and Iverson
(2006) stated that positive HRM practices throughout lay off periods can help maintain
work force productivity. Continued development of an individual, in spite of potential

55
layoffs reinforces the importance of employees in the workplace (Bowen and Ostroff,
2004); an action that can result in them being more employable if released.
An aligned recruitment, induction and training programme is paramount to the
development of the required capability and competence for which an individual is
employed. Furthermore, it provides a mechanism that enables the company to cascade
expectations and prime values, for example; ethical behaviour; responsibility; customer
first; operational excellence; corporate social responsibility, and many others (MacDuffie,
1995; Youndt et al., 1996; Wright et al., 2005; Birdi et al., 2008). To be successful new
knowledge has to be used repeatedly until it sheds its novelty and becomes a routine part
of the work pattern that is taken for granted by the employee (Zucker, 1977; Rogers,
1983). To achieve this, it is important that a company develops a strong relationship with
the employee at the outset (Hansen, 1999) and establish a fertile knowledge transfer
process (Szulanski and Jensen, 2004). In the absence of this, trust breaks down and the
employee’s support is lost. The importance of commitment based HRM policies is
therefore paramount (Zatzick and Iverson, 2006).
3.5.2 Motivation
Properly implemented incentives are effective mechanisms for enhancing individual
performance (Stajkovic and Luthans, 2003). Work performance can be influenced by the
organisation’s reward system (Rynes and Gerhart, 1999), leadership behaviour (Dulek
and Fielden, 1990; Cranwell-Ward et al., 2002) and communication (Sullivan, 1988;
Mayfield and Mayfield, 2002).
Non-financial incentives include: recognition, positive feedback, employee of the month
schemes and social recognition in terms of praise for work done well. Conceptualised as
illocutionary language (Sullivan, 1988), the leader empathises with the subordinate and
compliments the subordinate on his or her efforts. Nelson (2001) proffered that 90% of
managers felt that informal recognition motivated employees and helped improve
performance.
Financial incentives such as lump sum bonuses are a commonly used payment method
(Sturman and Short, 2000) and are usually paid in recognition of some level of attained
performance (Milkovich and Newman, 1999). Stajkovic and Luthans (2003) stated that

56
money (or wages) was considered to be the primary factor in attracting, motivating and
retaining people and to reinforce employee performance.
Administered correctly both financial and non-financial incentives have a positive effect
on improving business unit outcomes. However, a weak system administered poorly will
have a destructive effect as it may lead to a perceived lack of appropriate reward for effort
(Peterson and Luthans, 2006).
An equally valid form of motivation emanates from inspirational leadership. MacArthur
(2005) stated that leaders are the most influential role models within their organisation.
Their actions, even more than their words, communicate their values, priorities and
expectations to their followers (Cranwell-Ward et al., 2002). Inspirational leadership
builds on a combination of skills, attributes and behaviour. The most important attribute
being respect; a respected leader can motivate a team to new levels of performance and
achieve superior results (Mayfield and Mayfield, 2002; Szulanski and Jensen, 2004;
MacArthur, 2005). However, different leadership styles will create different cultures that
may in turn result in variable behaviours and attitudes among employees (Lewin et al.,
1939). When confidence is lost in the leaders, followers may hesitate to commit their full
energy to the challenges ahead (MacArthur, 2005). Rousseau and Wade-Benzoni (1994)
indicated that employees quickly gain an understanding and acceptance of what is
expected of them, or what they can get away with. The consequence is that in
organisations where practices have been in place a long time, there exists a potential for
entrenched mind-sets.
It is the responsibility of top management i.e. the leaders, to establish a shared vision and
to identify and communicate their goals (Skinner, 2006). A lack of a clear and concise
vision or understanding of what is required is a contributory factor in the failure of
implementation programmes (Holland and Light, 1999).
Together with leadership, communication is a third factor that influences worker
motivation and performance (Levering, 1988; Robbins, 2001). Effective communication
by leaders can result in greater employee loyalty (Mayfield and Mayfield, 2002) and
sustained commitment to the strategies adopted (Reina and Reina, 1999; Goleman, 2000).
Moreover, communication is a powerful catalyst for developing and sustaining trust
between leader and workforce, (Reina and Reina, 1999; Mayfield and Mayfield, 2002).
Communication strategies of companies that successfully implement change incorporate
five key communication principals (Young and Post, 1993; Robbins, 2001):

57
1. managers explain why decisions are made;
2. communication is conducted in a timely manner;
3. important information flows continuously;
4. line supervisors explain the specific implications of environmental and organisational
changes to the work teams; and
5. employee responses to communication can be discussed, questions answered, reasons
for change explained and concerns (possibly) quelled.
Training and guiding leaders in communication skills can help the company to generate
engagement and improved worker performance (Sullivan, 1988), the absence of which
could allow apathy to flourish. Motivational language can bridge the gap between the
leader’s intent and employees’ understanding. This can favourably influence employee
action. Three types of speech were conceptualised by Sullivan (1988):
1. perlocutionary language which provides direction and reduces uncertainty. A form of
direction setting speech occurs when a leader clarifies tasks, goals and rewards to an
employee;
2. illocutionary language occurs when a leader shares his or her views and experience
with a subordinate. This form of speech act occurs when a manager commends a
worker for a job well done or empathises with the difficulties a worker may be
experiencing with a particular task;
3. locutionary speech provides meaning through explanation of why a particular goal
was selected. For example, the leader may explain the challenges that the company is
facing and in so doing, give meaning or logic to the strategic decisions made.
Importantly, motivational language must be congruent with the Leader’s behaviour and
is most beneficial when integrated with a compatible set of leadership traits,
organisational objectives and culture (Mayfield et al., 1998). Where words and behaviour
are incongruent, employees will rely on action in lieu of words (Dulek and Fielden, 1990).
Therefore, deeds must be consistent with what a leader communicates and says; a
powerful combination and motivational tool especially during periods of change
(Mayfield and Mayfield, 2002).

58
However, the actions of the ‘motivated’ teams must be aligned in the chosen direction.
The scope of change should be aligned to the business vision and strategy, whereas the
success will be determined by the effectiveness of the strategic plan. The conversion of a
vision (strategic intent) into actionable steps is a fundamental prerequisite of a successful
strategic plan (Mintzberg, 1994). A strategic plan is used to bridge the gap between the
current state of an organisation and its aspiration or vision of how it wishes to be in the
future (Cowley and Domb, 1997, p9). It should also be noted that in the words of Dwight
E Eisenhower “plans are nothing, planning is everything” (Eisenhower, 1991, pxxi).
Consequently, strategic direction is about setting the high level plan. To be effective it
must be cascaded / deployed down the organisation to managers, team leaders and
individuals who perform the work (Cowley and Domb, 1997). Holland and Light (1999)
contended that the establishment of clear goals, management objectives and commitment
are key enablers to success. Furthermore, improvements will not be maintained if the
company lack’s commitment or employees lose confidence in the approach (Bateman and
David, 2002). Therefore, the Researcher was able to conclude that successful programmes
must serve to inspire and engage those involved. Furthermore, strategy deployment or
Hoshin Kanri ‘the method for setting direction’ (Akao, 1991, pxxi), provides an effective
method for achieving this through the development and cascading of business strategy.
3.5.3 Hoshin Kanri
Sustainability can only be achieved through the development and introduction of a vision
of strategic intent (Ansoff, 1970; Ackoff, 1981; Mintzberg, 1994; Cowley and Domb,
1997) and the committed application and support off stakeholders at all levels (Herron
and Hicks, 2008) as part of the strategic vision. The concept of HK addresses these
concerns through the identification of strategic goals (level 1) or breakthrough ideas
(Juran, 1992) and the implementation of daily management control measures (Level 2)
(Akao, 1991). Hoshin is interpreted as pointing the direction, and Kanri as management
or control (Akao, 1991, pxiii). HK provides a step-by-step planning, implementation, and
review process for managed change and the delivery of core objectives within the
business (Akao, 1991; Cowley and Domb, 1997).
Level 1 strategic goals involve the development and implementation of ‘Breakthrough’
ideas (Juran, 1992); initiatives that should be considered as most important for the future
success of the company (Cowley and Domb, 1997). The ideas should identify actions that
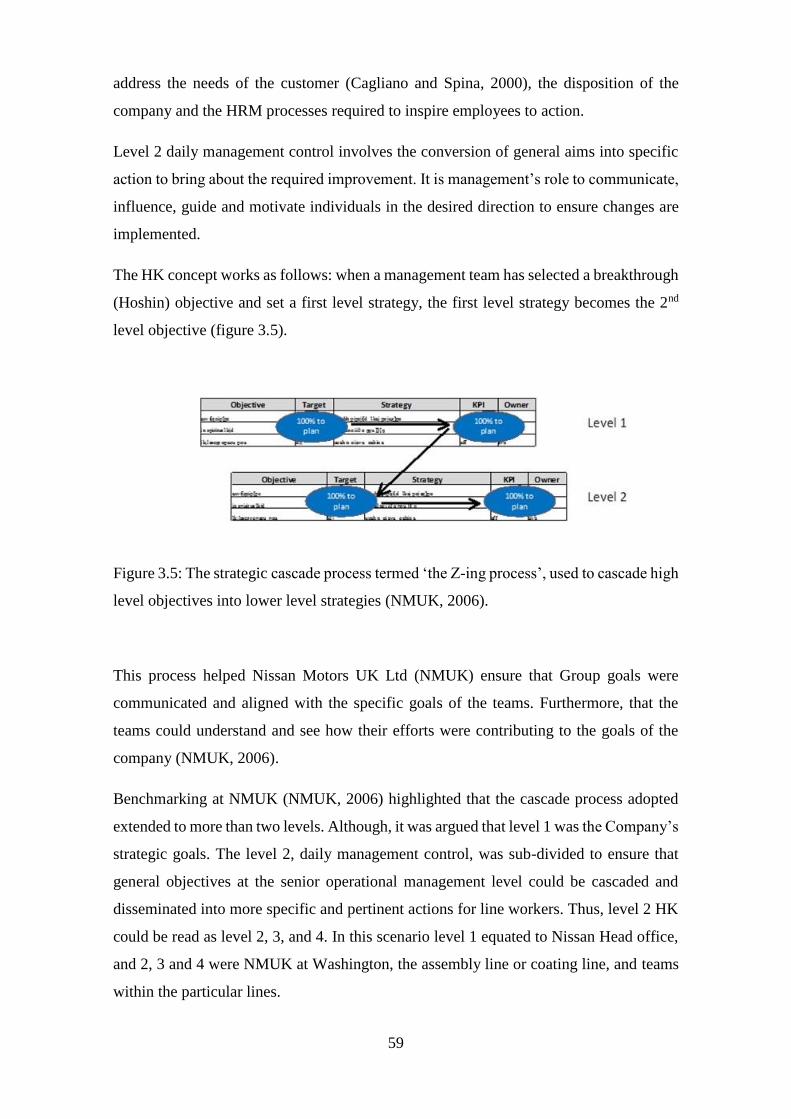
59
address the needs of the customer (Cagliano and Spina, 2000), the disposition of the
company and the HRM processes required to inspire employees to action.
Level 2 daily management control involves the conversion of general aims into specific
action to bring about the required improvement. It is management’s role to communicate,
influence, guide and motivate individuals in the desired direction to ensure changes are
implemented.
The HK concept works as follows: when a management team has selected a breakthrough
(Hoshin) objective and set a first level strategy, the first level strategy becomes the 2nd
level objective (figure 3.5).
Figure 3.5: The strategic cascade process termed ‘the Z-ing process’, used to cascade high
level objectives into lower level strategies (NMUK, 2006).
This process helped Nissan Motors UK Ltd (NMUK) ensure that Group goals were
communicated and aligned with the specific goals of the teams. Furthermore, that the
teams could understand and see how their efforts were contributing to the goals of the
company (NMUK, 2006).
Benchmarking at NMUK (NMUK, 2006) highlighted that the cascade process adopted
extended to more than two levels. Although, it was argued that level 1 was the Company’s
strategic goals. The level 2, daily management control, was sub-divided to ensure that
general objectives at the senior operational management level could be cascaded and
disseminated into more specific and pertinent actions for line workers. Thus, level 2 HK
could be read as level 2, 3, and 4. In this scenario level 1 equated to Nissan Head office,
and 2, 3 and 4 were NMUK at Washington, the assembly line or coating line, and teams
within the particular lines.

60
Consequently, as the level 1 (group goal), cascaded through to level 4 (team goal) the
strategy moved from a general direction to a specific action. Equally, specific actions at
level 4 could be identified that conformed to the level 1 aspiration.
HK involves subordinate management in the development of plans via the cascade
process of two way communication and catchballing (Akao, 1991). Catchballing is the
term used to describe how a sub-action identified as part of a larger action by one function
may be delegated or ‘caught’ as a key action owned by a manager at a different
hierarchical level or owned by a manager operating in a different function. The process
of strategy development should generate a bottom up, sideways and top down
identification and agreement of pertinent strategic actions. The process of catchballing
ensures actions are owned by the relevant individual and function. Consequently, all
actions have an owner. The secondary benefit is that the agreed actions are not only
‘bought into’ but also ensures that the various departments are working towards the same
goal for instance, vertically aligned throughout the functional hierarchy and horizontally
aligned across the various functions. Without which they will have little or no impact on
achieving organisational goals medium to long term, (Cowley and Domb, 1997).
HK allows the senior manager’s to own and identify key objectives, the strategy required
to achieve goals over pre-determined timescales, the assignment of the appropriate level
of responsibility whilst simultaneously encouraging adaptive behaviour (Cowley and
Domb, 1997).
Consequently, the Researcher was able to conclude from research undertaken, that a clear
vision of what is required and the scope of implantation is a fundamental priority at the
outset of any project. It is thus an imperative that the scale and magnitude of work needing
to be delivered is aligned to the strategic objectives. This ensures that everyone is working
towards a common goal and the same objective. The ability to successfully deliver and
sustain any business vision is proportional to the clarity of the challenge ahead and the
ability to engage the work force to pull in the same direction.
3.6 Summary
Japanese companies adopted the TPS as an alternative to MP (Womack et al., 1991).
Krafcik (1988) coined the term ‘Lean’ to describe approaches derived from the TPS. LM,

61
is based on the concept of total waste elimination, cost reduction and continuous
improvement.
Many companies embarking on LM fail to sustain the approach. Common causes of
failure have been attributed to: cognitive inertia; a lack of clear vision; superficial
understanding of the tools and techniques; and the lack of stakeholder support. LM may
only be one key element of a successful business. Companies that adopt any new initiative
may only achieve a short-term advantage, reflective of the market conditions at a specific
point in time. Consequently, the attainment of LM does not automatically imply an
improvement in financial performance or the ability to sustain the new way of working.
Change programmes are prone to failure and sustainability is a common problem. Many
companies recognise the need for change but are uncertain on what it is they intend to
introduce, or do not recognise where to start or what to do.
The user needs to establish a firm base on which to build and determine the approach they
plan to adopt. For the inexperienced practitioners, this may involve the acquisition of
knowledge, a clear starting point, strong leadership and iterative adaptation of adopted
practices. Discrete roadmaps for implementing Lean have been developed: ‘achieving
best practice in your business’ (DTI, 1998); Sustainability (Bateman, 2001); Supply
Chain management (Taylor et al., 2001); Going Lean (Hines and Taylor, 2000); Process
Improvement programmes (Bateman and David, 2002). The ability for a company to
successfully implement LM tools and techniques is dependent upon its understanding of
the principles, values and knowledge of the techniques to be applied.
Bateman and David (2002) outlined the SMMT model that provided the user with a guide
and a generic starting point for the introduction of LM. NEPA’s best practice
dissemination programme enabled starting conditions to be evaluated a specific
techniques to be employed at the outset (Herron and Braiden, 2006). Finally, the value of
change agents to aid knowledge transfer and support sustainability was proferred (Herron
and Braiden, 2006; Herron and Hicks, 2008).
However, findings drawn from previous research (Sugimori et al., 1977; Schonberger,
1986; Krafcik, 1988; Bartezzaghi, 1999; Liker, 2004; Herron and Braiden, 2006; Herron
and Hicks, 2008; Liker and Hoseus, 2008) suggests that Lean should not be implemented
in isolation. It requires a mutually supportive HRM and manufacturing strategy. The
ability to sustain any change programme is dependent upon the following critical success
factors: strong leadership; a clear and compelling vision (Achanga et al., 2006); the

62
realisation of savings (quick wins) and improved financial performance (Ahlstrom,
1998); the formation of a powerful, guiding coalition (Kotter, 1995); and work force
engagement (Ohno, 1988).
Bessant et al. (1994) argued that the capture of tacit knowledge may unlock a neglected
source of organisational innovation. This is a powerful tool that could be used to identify
improvements and sustain them through ownership and buy-in. The effective
management of human resources could become a strategic weapon for achieving unique
and sustainable competitive advantage (Voss et al., 1995). A supportive HRM strategy
may have a positive impact on operational performance (Youndt et al., 1996). HRM
practices include recruitment, selection and training, leadership, and communication.
These can be used to motivate and engage the workforce. Change programmes require a
clear vision of desired achievements.
HK is a methodology for cascading the vision and strategy to provide meaning and set
the direction. This should be supported by an authoritative, guiding coalition that can
implement the strategy and monitor progress against plan. Without the development and
involvement of the work force it is unlikely that the company can nurture the culture
required to sustain the change programme introduced. LM or the philosophy of CI
necessitates the capturing of tacit knowledge as part of a structured programme. A
strategy that if successful is not only hard to introduce but also hard to imitate (Schroeder
and Robinson, 1991) and can form the basis of a competitive advantage.
LM is espoused as a superior way of working (Womack and Jones, 2003) but on its own
will not deliver success. The transplant of Japanese working practices have been shown
to have suffered setbacks during its implementation. LM has been shown to be a
convergence of good practices built one on top of another. Successful companies like
Toyota would appear to have adopted good practices and adapted them to fit their specific
needs.
Section 2.4 identified CTE as a mature business in decline confronted with a crisis
situation. The challenge for the Researcher was to consider how Lean could be introduced
and sustained within CTE (research questions 1 and 2, section 1.3). The inductive
approach resulted in the establishment of the major themes (figure 5.6) and a theoretical
framework (section 7.2) to be pursued at the outset of this study. The output of this
inductive approach directed the literature review undertaken in this chapter. The
deductions gathered from the literature enabled the further development of hypotheses

63
(section 1.3) to be subsequently tested in support of the research aims and questions. This
learning resulted in the development of a sustainability framework (SF) to aid the
successful implementation and sustainability of this new way of working. The next
chapter emphasises the development of the SF; a model that is proffered by the Researcher
as a unique contribution to research.

64
Chapter Four: The evolution of the Sustainability Framework
4.1 Introduction
CTE, described as a mature business in decline (section 2.4), was confronted with a crisis
situation in 2003. The prevailing conditions contributed to an external climate conducive
to an industry shakeout amongst the weaker players (Klepper, 1997); reinforced by the
crisis situation of CTE and the impatience of the parent group.
The Researcher’s hypothesis was, “if CTE could innovate and improve its manufacturing
performance (section 4.2.1 and 4.2.3), it could reduce its conversion cost; by reducing its
conversion cost it could improve its competitiveness”. This would allow CTE to reduce
its selling price, strengthen its position in its niche market and compete more aggressively
in other sectors (section 4.2.1 and table 7.6). A theory that was consistent with the
recommended turnaround strategy articulated in the business literature on turnarounds
(Slatter and Lovett, 1984; O'Neill, 1986; Khandwalla, 1992; Robbins and Pearce II, 1992;
Zammuto and Cameron, 1985; Bateman, 2001; Bateman and David, 2002; Cushnaghan,
2003; Herron and Braiden, 2006;).
The challenge, encapsulated in the research questions (section 1.3) and reflected by the
purpose of this study (section 1.2), was twofold:
1. to implement a new way of working; and
2. to sustain the new way of working.
This section introduces the ‘Sustainability Framework’ (SF) which evolved during the
initial research undertaken during the evaluation of CTE’s predicament (section 5.4).
Insights inferred from interviews (section 4.2) and deduced from associated literature
(chapter 3) were used to develop the SF as a model to aid the successful implementation
and sustainability of a new way of working. The SF was initially developed to aid
discussion with CTE and portray the key themes associated with this project.
The value of the SF is that it housed in one place, all of the primary interconnected
techniques, themes and concepts considered as critical by the Researcher (and associated
areas of study) to address the research question and aims of this study in support of
implementing a significant change programme. The SF demonstrated a means to align
employees in this new way of working and motivate them to deliver continuous

65
improvement and process optimisation. An engagement process considered as essential
in the successful execution of a business transformation (section 3.5).
Section 4.2 describes the primary areas of focus employed in the development of the SF.
Section 4.3 outlines the next steps associated with applying the SF and testing validity.
4.2 The development of the Sustainability Framework
In order to provide support and direction for the themes being developed, it was important
that the Researcher equally developed an understanding of the main issues that impacted
CTE’s perceived viability. The output could be used to develop a foundation on which to
build. Furthermore, the data obtained could be used to envisage the scale of the challenge
confronting CTE with respect to the required manufacturing strategy (sections 4.2.1 and
4.2.3).
To assist this stage of the investigation over fifty meetings were held or attended by the
Researcher at Corby or Hartlepool. The participants included managers and directors of
various functions that comprised: commercial; finance; operations; engineering;
technical; and HR. The various meetings considered the data maintained by CTE which
included functional performances, monthly reports, market intelligence, and
benchmarking activities. To evaluate changes in the operating environment, data gathered
from both primary sources (interviews) and secondary sources (market reports) were
reviewed and analysed (see also section 5.3 and 5.4). Each was considered in greater
detail in the following sub-sections.
Interviews were always face to face and on average lasted less than one hour. A written
record was maintained of each interview and typed up at the end of each day. The
Researcher would ask the interviewee to confirm the transcript reflected what he/ she had
said. Furthermore, they were given the opportunity to modify it should it be necessary.
The transcripts were filed against the category of internal issues with relevant parts,
(sentences, comments) copied and where appropriate filed against individual sub-
categories. For example, previous initiatives, communication, leadership, motivation,
reward mechanism, etc. For further information on interview methodology refer to
section 5.3.1).
Content analysis (Robson, 2002) was the technique employed by the Researcher to assist
with data analysis. Repetitive themes or comments were captured based on the frequency

66
with which they occurred. The technique employed by the Researcher also involved
writing key themes on ‘post-it’ notes and grouping them by attaching them to brown paper
(figure 7.2). This provided a visual method for the Researcher to recognise the prominent
themes and support the analysis of relationship or pattern mapping. The technique also
provided a visual mechanism used to discuss the emerging themes with those previously
interviewed. (Sections 5.4 and 7.6 outline the approach adopted by the Researcher in
greater detail).
The approach allowed the Researcher to generate insights into the development of themes
to introduce (chapter 6) and test (chapter 7) in order to answer the following research
questions (section 1.3):
1. how can the principles of LM be successfully applied in an established organisation
with hierarchical management structures, adversarial industrial relations and
established demarcations? In addition, is it possible to develop an effective model for
breaking down traditional working practices and cultures in order to achieve the
required transformation?
2. how can HRM policies and practices support the introduction of Lean principles in a
'Brownfield' operation? In particular, what is the most appropriate HRM strategy for
overcoming resistance to change and engaging with key stakeholders (the shop floor
team members, management and the union) to support new ways of working?
The starting point was the development of the required manufacturing strategy.
4.2.1 Manufacturing strategy
The company reports were analysed to identify the main causes and to identify common
themes. The justification for the H42 had been low cost manufacturing that would be
achieved by a fifty per cent increase in productivity (table 4.1). Improvements were
measured in terms of the target number of pieces pressed per shift (pps) for two common
pipe wall thicknesses (CTE, 1991). These key metrics were used throughout this project
to measure and monitor manufacturing improvements.

67
Table 4.1: Pre & post development, pipes per shift and availability targets (CTE, 1989).
The data revealed an inability to achieve the stated production and availability targets
(table 4.2). This resulted in adverse variances (table 4.2) due to manufacturing losses,
exposure to liquidated damages for late delivery and a costing model that disadvantaged
H42 tenders (CTE, 2003-05). However, the data also supported the hypothesis that if CTE
could address its manufacturing performance, it was a viable business and therefore,
worthy of saving.
Year Speed of work
Gain/ (Loss) £k
Availability
Gain/ (Loss) £k
Total (manufacturing)
Gain/ (Loss) £k
Overall business
performance Profit/ (Loss) £k
97-98 453 (2,815) (2,362) (2,036)
98-99 614 (2,437) (1,823) (952)
2000 (1,291) (593) (1,884) (3,328)
2001 (1,616) (4,203) (5,819) 4,389
2002 414 (2,019) (1,605) 1,181
2003 (108) (776) (884) (4,998)
Table 4.2: 42” Mill, Manufacturing performance variance (Corus-Reports, 1997-2003).
The previous chapter (section 3.1) indicated that for a mature industrial business (such as
the UKSI) efficiency orientated improvements have become the prevailing managerial
concern (Zammuto and Cameron, 1985; Bateman, 2001; Bateman and David, 2002;
Cushnaghan, 2003; Herron and Braiden, 2006; Herron and Hicks, 2008).
Literature reviews (Sugimori et al., 1977; Schonberger, 1982; Monden, 1983; Shingo,
1985; Imai, 1986; Schonberger, 1986; Ohno, 1988; Lillrank and Kano, 1989; Juran, 1992;
Prasad, 1995; Voss, 1995; Duguay et al., 1997; Katayama and Bennett, 1999; Naylor et
al., 1999; Deming, 2000; Hines and Taylor, 2000; Lewis, 2000; Mason-Jones et al., 2000;
Wall thickness
(mm)
44” mill
Capability (pps)
Developed case
Target (pps)
Availability target
%
15.9 90 135 86.5
25.4 70 105 86.5

68
Pyzdek, 2003; Womack and Jones, 2003; Liker, 2004; Krishnamurthy and Yauch, 2007;
Gill, 2009) afforded many examples of what constitutes best manufacturing practices, for
example LM, 6 Sigma, JIT, Quality improvement TPM, or hybrids such as Leagile. Each
provided a different slant or concept associated with improved efficiency and increased
value for the customer.
The literature review provided the Researcher with a hierarchy of techniques to consider
relative to the predicament faced by CTE. Functional benchmarking within the North East
of England had highlighted LM as the vehicle to be adopted and to assist CTE achieve
world class conversion cost (CTE, 2004e). Following an edict issued by CTE, it was
decided that LM would be used as the preferred manufacturing paradigm to address
operational efficiency (CTE, 2004e) and that the Researcher was to utilise the NEPA team
for assistance, (section 1.1.1 and 6.2). The NEPA team was a government funded agency
that had been established to provide a roadmap for SMEs to pursue as well as disseminate
best practice LM tools and techniques (section 3.4). NEPA offered a structured approach
which emphasised the alignment of workforce development needs with the specific
productivity objectives and business strategy (NEPA, 2004). The PNA offered by NEPA
(section 6.2) provided a method for establishing a starting point and a direction in the
journey associated with LM. CTE had confirmed its lack of knowledge and understanding
of LM best practice tools and techniques, their applicability or associated benefits, (CTE,
2004n; CTE, 2007e). NEPA identified a toolbox of tools and techniques which could
guide CTE in the initial phase of its transformation and would act as building blocks for
subsequent activities. Sections 3.3 and 3.4 provide an overview of LM, its evolution, its
value, and the basic building blocks.
However, prior to running headlong into introducing LM as the paradigm to affect the
required turnaround, the Researcher proffered the importance of validating the strategy
in the context of CTE’s standing within the sector served. The proposed manufacturing
strategy (figure 4.1) could only be finalised following a review of the company’s
competitive standing within its operating environment. This helped validate the extent of
the performance gap and the actions to be considered. Failure to do so may result in faulty
or inappropriate action (Weitzel and Jonsson, 1989). Three areas of research conducted
by the Researcher in order to identify the relevance and size of the performance gap
included: a review of the external operating environment (industrial context and sector
served); benchmarking (internal, functional, generic and competitive benchmarking) in
order to analyse the situation in which the business functioned (Camp, 1989; Camp, 1993)

69
and the development of best practices (Pyzdek, 2003); a review of LM and the benefit it
offers the user (chapter 3).
Industrial context
Information solicited from the Professional Energy Research Group that forecasted and
analysed global energy demand, suggested a growing demand for oil and gas (Douglas-
Westwood, 2003). However, the analysis of interviews conducted by the Researcher
within CTE indicated that the company would struggle to fully exploit this opportunity
due to its high costs (CTE, 2005a). “Market feedback suggests that we are approximately
20% out on price for bids submitted. That is why we are not winning the jobs.”
(Commercial Director CTE, May 2004).
CTE operated in a competitive market that was susceptible to swings in the price of oil
and gas (CTE, 2005a). As long-term demand increased, the price per barrel of oil
escalated. This increased the commercial feasibility of new oil and gas projects. In a
depressed market the reverse occurred and projects were held in abeyance. A condition
that occurred in 2002/03 and again in 2008 (CTE, 2005-2008) which mirrored the
economic downturn that impacted on the global steel industry.
Data derived from commercial intelligence reports (CTE, 2003b; CTE, 2004k) were
reviewed by the Researcher to generate an understanding of CTE’s competitive position
with respect to its rivals. Subsequently, the Researcher interviewed managers within
commercial, technical and operational functions to solicit their views and understanding.
The theme of the interviews was quite specific with questions inductively informed by
following the analysis of the commercial reports. The aim was to establish the
interviewee’s perception of CTE’s competitive strengths and weaknesses compared with
the perceived main rivals. Content analysis (sections 5.4 and 7.6) was the research method
employed to analyse the transcripts in search of repeat variables linking particular
strength/ weakness with a rival or group of rivals. These suggested that the established
and mature pipe mills in Germany, Japan and the UK sought to maintain competitive
advantage through innovative offerings. The strategies employed were product
development (using more exotic and higher grade steel) and process development
(improved operational efficiency). The less technically capable or newer entrants from
Brazil, Russia, India and China (BRIC countries) built on their low cost base and targeted

70
less technically challenging projects. This eroded the market share of the established
players, (CTE, 2002; CTE, 2004l; CTE, 2004m). CTE could be characterised as a small
volume player in a competitive landscape (CTE, 2008b).
The following trends were inferred from the written transcripts obtained during this
process. Existing and new rivals were developing their manufacturing capability and
posed an ominous threat to established players for several reasons:
- new equipment allowed for greater innovation in the design and efficiency of the
process;
- lower overhead/ fixed costs resulted in a more cost competitive offering;
- new builds were situated closer to or were ‘in-country’ of greatest growth sectors;
- capability in terms of ‘know-how’ was developing rapidly. Companies from Brazil
and India were competing in areas not considered possible three to five years
previously; and
- inertia within CTE perpetuated the increasing performance gap.
In support of the above the Researcher conducted a simultaneous evaluation of the market
sectors in which CTE operated.
Market sectors
The monthly business reports between the period 2000 and 2004 were reviewed in order
to gather and evaluate information associated with the sectors served by CTE. Whilst
sufficient information was available to identify historic volumes, it did not sufficiently
cover the main differences between the various sectors served. Consequently, the
Researcher interviewed five managers from the commercial and technical functions. The
objective was to generate an understanding of CTE’s strengths and weaknesses in the
individual sectors. Content analysis (section 5.4) was employed to provide an overview
of the over-riding challenges faced by CTE within each sector (CTE, 2009b). These were:
Category one – Deep water - Pipe specifications were exceptionally demanding owing to
deep water locations and hostile environments. The solution sought to minimise
individual pipe weight (cost) and maximise pipeline pressure capability (extraction
efficiency). Small diameter, thick wall pipe coupled with high strength steel grades were

71
favoured. CTE offered a differentiated product as a direct consequence of technological
advancements, process capability, know-how and a proven track record.
Category two - Shallow water - the product specification was less onerous although still
critical; a sector in which the lowest cost provider appeared to be favoured. However, in
buoyant markets, shorter lead times were paramount, a requirement that enabled CTE to
compete favourably because lead time was more important to the customer than price.
Category three – Large diameter offshore – (product specification as per Cat 2); large
diameter pipe manufacture is steel intensive and the lowest cost producers tended to be
the most successful. CTE feedstock was constrained which resulted in a poor return on
the available steel. This was a strategic disadvantage for CTE, which was rarely
successful in this sector.
Category four – Conductor pipe which was linked to oil-rig activity and drilling,
experienced demand fluctuations between 30 to 50kt pa. The need for flexibility and
storage facilities was more important than price. This enabled CTE to secure orders at
minimum margins. The volume of pipe provided a reasonable base load that was
supported by internal steel and plate making.
Category five – Onshore – the specifications remained onerous, however they were the
least demanding of all the sectors. Usually large diameter and 18m pipe lengths were
preferred for the transmission of oil/ gas over long distances at low pressure. CTE was
weakly positioned in terms of location, cost, pipe dimensions and steel availability; as
such was a minor player in this sector.
Other - Specialised products such as 9% nickel pipe and clad pipe were being developed.
There was a potential for high margins once a supplier was proven, but the volumes
remained low. CTE continued to develop its capability in this sector which was perceived
as a very small, but profitable opportunity, which could add value. However, this was not
a sector that could support an empty mill (CTE, 2009b).
The data gathered was tabulated to depict the perceived strategic priorities affecting CTE
in the market (table 4.3). Data that indicated the need to reduce cost via improved
productivity and lower cost feedstock across all categories.

72
Sector Category
Productivity High
performance feedstock
Lower cost feedstock
Welding development
Tooling support
Formability Testing
capability
Cat 1 1 2 3 1 1 1 1
Cat 2 1 2 1 2 2 2 1
Cat 3 1 2 1 1 1 1 1
Cat 4 1 3 1 3 3 3 3
Cat 5 1 3 1 2 3 2 3
1 = Essential: 2 = Usually required: 3 = Nice to have, but not essential
Table 4.3: Strategic priorities for CTE (CTE, 2009d).
The review of market sectors combined with the industrial context provided a grounded
perspective on environmental dynamics (Mellahi and Wilkinson, 2004). To generate an
insight into the scale of the performance gap between CTE and its rivals, and to identify
best practice concepts to consider, the final element of the external review necessitated
an appreciation of the capability of rivals and manufacturing peers.
Benchmarking
Benchmarking is an important ‘quality’ tool that has enabled an environmental analysis
of the situation in which a business system functions (Akao, 1991). Benchmarking:
increases sensitivity to changes (turbulence) in the external environment; reduces
complacency by shifting corporate mind-sets; and has assisted in the development of best
practices (Pyzdek, 2003). Consequently, functional and competitive benchmarking was
identified as paramount to assessing the scale of the performance gap (CTE, 2004i).
Benchmarking exercises were undertaken by the Researcher, various managers and
functions with:
a. Europipe, Germany and Sumitomo, Japan. These were considered as technically the
best pipe makers in the world with developments and know how comparable to CTE
(CTE, 2007e);
b. Confab, Brazil; Vyksa, Russia and Welspun, India. These were seen as fast growing
and developing manufacturers which had a low cost base and were investing heavily
in their facilities (CTE, 2007e).

73
Visit reports were completed and content analysis was employed by the Researcher to
assess the strengths of other businesses and the opportunities for the Researcher to exploit.
Strategic benchmarking was popularised by Camp (1993) who identified the huge
performance gap that existed between Xerox and its competition. Pyzdek (2003) defined
benchmarking as comparing the performance of the host company with that of best-in-
class companies. Data gathered forms the basis for improvement and allows a company
to evaluate its strategic direction (Cowley and Domb, 1997) and bridge the gap between
internal and external practices (Camp, 1989; Pyzdek, 2003).
Camp (1993) proffered the following four main types of benchmarking:
1. internal; benchmarking conducted within a company to identify replicable best
practices that are not always communicated (Senge, 2006). Managers should be alert
to the concept of the ‘not invented here syndrome’ and be prepared to recognise, adopt
and adapt practices. In a bid to challenge assumptions and look at best practices the
Researcher conducted a series of visits and interviews with colleagues at sister mills
(CTE, 2008h; CTE, 2008i);
2. functional; benchmarking involved looking outside the industry to identify
transferable best practice techniques. The Researcher turned to Nissan UK to observe
LM (CTE, 2004b) and Hoshin Kanri (Akao, 1991);
3. generic; best practices adopted in one area of the parent business can be introduced
throughout all sectors of the business. LM was introduced within Corus in 2003
(Corus, 2003a). However, numerous units failed to sustain the approach (CTE, 2008h).
The Researcher sought to learn from good practices and set-backs;
4. competitive benchmarking; benchmarking is used as a tool to understand rival
companies in terms of manufacturing performance, new products to market and
customer service. The establishment of various performance metrics enables the user
to understand and monitor identified performance gaps. CTE conducted numerous
reciprocal benchmark visits with rivals. The analysis of benchmark reports enabled
the Researcher to generate realistic comparisons of manufacturing capability and
efficiency for example, for pipe diameters >20” (CTE, 2001; CTE, 2002; CTE, 2003b;
CTE, 2004k; CTE, 2004l; CTE, 2004m; CTE, 2004j; CTE, 2005b; CTE, 2007c). Data
supplied to Tubes management resulted in the edict associated with the 52%
improvement in speed of work (section 4.2.3).

74
A summary of benchmark studies conducted by the Researcher and others were reviewed
by the Researcher who used highlighter pens to highlight pertinent comments for further
consideration. These may have been related to: a particular practice being used such as
Lean; the sustainability (or not) of a technique introduced; or the differences in speed of
work compared to rival mills. The assumption made by the Researcher throughout the
benchmarking exercise was that the data obtained provided a true reflection of reality.
The analysis of data reinforced that CTE’s poor competitive position was premised on a
variable manufacturing capability exemplified by the performance gap with benchmarked
competitors. This insight reinforced the need to address the controllable element of CTEs
operations, for instance, its manufacturing performance in order to remove the impediment
to its competitive standing.
The Researcher concluded that the development of an effective manufacturing strategy
had to be founded on an understanding of the scale of the performance gap and the
adoption of best practices techniques relevant to the industry. The manufacturing strategy
supports the development of a credible manufacturing policy that addresses the cause of
concern within the business and can be perceived as appropriate by the stakeholders.
Figure 4.1, depicts the components of the manufacturing strategy that were considered
and proffered by the Researcher as critical activities during the development of the SF.
Figure 4.1: The development of the manufacturing strategy.
The manufacturing strategy was only finalised following a review of the external
environment (above). This supported the evaluation of ‘what’ needed to be done and
ultimately ‘how’ to achieve the required transformation (chapter 6). It forced the user to
at least consider company performance with those deemed best-in-class (benchmarking).

75
With the scale of the external challenge established (section 4.2.3) it had to be balanced
with the necessary approach required to combat perceived internal inertia and the
prevailing culture.
Consequently, to support the external review, the Researcher investigated the internal
issues within CTE; issues that could adversely affect any attempt to transform working
practices. The Researcher had hypothesised that the ability of CTE to sustain the new way
of working was proportional to its ability to transform HRM practices. This contributed
to the development of research question 2 and the subsequent literature review (section
3.5).
4.2.2 HRM strategy
The voluntaristic view (Mone et al., 1998; Mellahi and Wilkinson, 2004) considers
management to be the primary cause of organisational failure. They might not recognise
or react to changing conditions that threaten the viability of the company in which they
operate. However, Duck (1993) proclaimed that those who have lived through failed
initiatives become sceptical and have learned how to survive new initiatives without
changing. This suggests an inertia that could be evident at all levels of the hierarchy.
A contemporary HRM strategy (section 3.5) is argued as paramount in the development
and engagement of employees. The alignment of employee goals articulated as
fundamental in any recovery plan (Beer et al., 1984), and a source of strategic advantage
(Pfeffer, 1995; Youndt et al., 1996). The elements articulated will force the company to
consider the skills required in new and existing employees and the motivational forces
that drive an existing behaviour or new way of working. The subsequent approach should
nurture the required cultural change in support of the transformation.
To comprehend the reasons why CTE had succumbed to the predicament faced in 2003,
the Researcher sought to explore the ‘health’ of the organisation in terms of its existing
culture and CTE’s ability to respond to change. The objective was to assess existing HRM
policies, communication channels, employee engagement, and discuss the success or
otherwise of the initiatives previously introduced within the UKSI (and by default CTE).
The Researcher’s conviction was that in exploring the reasons behind the failed
initiatives, common causes, patterns or relationships (section 5.4) could be identified. The
knowledge acquired could then be compared with earlier research into CTE’s HRM

76
policies. This could help develop appropriate countermeasures; actions that may improve
the likelihood of sustaining a business transformation. Research that underpinned RQ2
(section 1.3).
Over 70% of those interviewed had cited the failure of previous major initiatives. The
resultant analysis suggested that the internal issues (operational culture) had generated an
inertia that had impeded the introduction of initiatives. The hypothesis subsequently
expressed by the Researcher was that unless the internal issues associated with CTE’s
operating practices were addressed, then the probability of a successful transformation to
a new way of working could be compromised. Consequently, if the cause(s) of the internal
issues could be addressed / improved, then the likelihood of introducing/ sustaining a
major transformation could be increased.
The Researcher sought to investigate the success or otherwise of previous initiatives.
Furthermore, to explore the views of employees on what they believed would prevent a
successful transformation. The approach of the Researcher was to interview (section 5.3
explains interview methodology), a broad range of employees that included team
members, craftsmen, middle and senior managers up to director level across various
functions. Specifically, the Researcher interviewed long tenured employees within CTE
who had been exposed to previously unsuccessful initiatives. Their status ranged from
staff to senior management and comprised of initiative owners, facilitators and workshop
attendees from this period.
The questions asked were inferred from the inductive analysis of data gathered in support
of the scoping exercise; for example, figure 5.9. Questions typically explored: What were
the previous initiatives? How were they perceived? What were the causes of success/
failure? However, as the Researcher’s experience and knowledge of the subject matter
increased, for example, as a result of literature reviews and the analysis of data gathered
during the process, subsequent questions were more focused. For example: What training
did you provide/ receive? What are the business objectives? How is key information
communicated? How are your objectives agreed? How is your contribution assessed?
How is the business performing? Examples of question sets are shown in Appendix D.
The approach to data gathering and analysis (sections 5.4, 5.4, 7.5 and 7.6) provided the
Researcher with the opportunity to gain an insight into why previous initiatives had failed.
Furthermore, to juxtapose this with perceived best practice deduced from the literature
review and inferred from benchmarking. Previous initiatives that had succumbed to

77
failure within Corus included: Total Quality Performance; Quality Circles; Quality
Improvement Programmes; the Transformation Map project; Supply Chain initiatives;
and Business Improvement projects (CTE, 2004b; CTE, 2004h).
Research conducted at CTE had identified that the lack of sustainability was linked to the
following conclusions (CTE, 2005c):
- the focus was on the delivery of the training and not on the subsequent application
of the tools and techniques (100%);
- there was no structure to the post-training phase (70%). Established steering groups
were poorly attended or cancelled (70%);
- initiatives lacked a localised vision, objective or implementation plan. In addition
the absence of metrics meant that progress could not be tracked (86%);
- senior management failed to drive or encourage initiatives. Ideas generated were
developed and implemented by individuals in their own time (86%). The absence of
monitoring meant that there were no consequences positive or negative for
delivering objectives associated with the initiative (70%);
- communication was poor; there were no team briefs or workshops that outlined the
business position (100%). The work force were not engaged which reinforced the
view that it was management’s thought for today (86%);
- initiatives that affected a small number of businesses were not communicated to the
remainder (86%);
- some initiatives relied on local management to develop the concepts but then
brought in external managers to implement the programme. This generated
resistance and conflict. When the pilots were finished the concepts were dropped
(30%), (this equated to 100% of senior management interviewed); and
- there was a general consensus amongst those interviewed, that ‘moving metal’ was
the priority above all else (86%).
Most damningly with respect to previous initiatives was the comment (perception or
reality) - “Basically, senior management weren’t interested in whether you did it or not.
There was no direction and no accountability” (Shift Manager, Corus Pipe Mills; Aug
2005).
The Researcher hypothesised that if LM was to be successfully implemented and
sustained, it could only be enabled by a mutually supportive HRM strategy. A HRM

78
strategy that provided a culture conducive to continuous improvement and engaged
employees at all levels. The Researcher used the insights inferred from the initial
interviews (employed to examine ‘as is’ condition and the failure of previous initiatives),
to direct the research into HRM literature (section 3.5). Literature that extolled the virtues
of employee value, leadership, and engagement tools. The concepts studied and perceived
by the Researcher as critical are captured in figure 4.2. The figure depicts the HRM
strategy proffered by the Researcher during the development of the SF. The Researcher
considered each element as enablers to employee involvement and engagement;
fundamental HR policies that had to be considered in a rejuvenated HRM strategy within
CTE in order to implement and sustain the new way of working. Themes which could be
subsequently tested and validated in support of research questions 1 and 2.
Figure 4.2: The development of the HRM strategy
4.2.3 The scale of the challenge
Benchmarking had equipped CTE with a plethora of valued data (CTE, 2004i). This
highlighted that to equal perceived best practice in terms of conversion cost, CTE had to
achieve a 40% improvement in productivity (CTE, 2004e; CTE, 2007e). To match the
world’s best, CTE had to leap-frog the planned improvements deduced from the
benchmarking process. The directive issued by the Corus Tubes Director was that CTE
had to deliver a 52% improvement in conversion cost between 2004 and 2007 (CTE,
2008f). This formed part of the specification for this research project.

79
The vision (figure 4.3) declared incorporated (CTE, 2004e):
- a 52% productivity improvement over the 2003 standard;
- the identification of capital expenditure requirements to support plan;
- an uptime of >83%;
- a HRM programme that supported the introduction of modern manufacturing
practices.
Figure 4.3: The development of CTE’s Vision.
The improved speed of work and availability would deliver an approximate £15m
financial benefit that would help to reduce conversion cost or improve margins (CTE,
2006b). A one percent improvement in either speed or availability was stated as being
equivalent to an annual financial benefit of approximately £250k (CTE, 2011a). The
ability to extend the product offering enabled CTE to maintain an aggressive position in
a key niche and satisfy the future demands of customers in the deep water sector (CTE,
2009b).
Section 3.4 proffered various reasons that contributed to the failure of change
programmes. Companies fighting to survive may focus more on today’s problem and
might not be able to afford the time or resource to plan for tomorrow’s resolution. This
could be attributed to a number of the reasons highlighted in section 3.4, such as: lack of
vision, leadership or commitment; a superficial understanding of what was required; a
lack of knowledge; and a lack of stakeholder support, engagement, buy-in or working
within the constraints imposed by the business viz-a-viz finance and resource. The
analysis of internal issues associated with previous initiatives (section 4.2.2.) revealed the
reasons behind why key stakeholders perceived them to have floundered. The findings
suggested to the Researcher a lack of strategic management of change notable in the post-
launch or implementation phase. Moreover, change management that reflected inertia at
management level and a lack of shop floor (stakeholder) engagement. The hypothesis was

80
that unless the Researcher managed the post-launch phase more effectively, then the
initiative would, as with other initiatives, fail. Consequently, the Researcher identified
two key actions:
1. to develop a governance structure (figure 4.4) that supported and directed the
activities to be launched. The governance structure included a steering group
(called the Omega team, section 6.3.4) who would agree, direct, and oversee
priority actions. Three year general plans would be sub-divided into specific
annual implementation actions that would be assigned clear objectives to pre-
determined owners.
Figure 4.4: The development of the governance criteria.
2. the requirement for an iterative approach consistent with the Action Research
strategy and cycle (section 5.2.3). The Researcher identified themes to be
launched (chapter 6) and subsequently tested (chapter 7) by gathering and
analysing data associated with its acceptance/ rejection. Moreover, ascertained the
applicability of the technique in terms of value it offered and the benefits secured.
Given that within CTE this was about Lean implementation (and not the
Researcher’s objective), Deming, 2000; Plan, Do, Check, and Act cycle (figure
4.5) was incorporated within the SF to depict the required iterative approach.
Figure 4.5: PDCA iterative cycle.

81
4.2.4 The Sustainability Framework
The Researcher determined that in order to demonstrate to CTE the importance of the
independent elements (figures 4.1 to 4.5 inc.), they should be housed in one model termed
the Sustainability Framework (figure 4.6).
Figure 4.6: The Sustainability Framework.
The Model depicted that the value of the SF was that it:
- united stakeholders in a shared vision by providing direction and meaning (Sullivan);
- provided governance and structure via the Omega team in the post launch phase. This
structure was cited as being absent in previous initiatives (section 4.2.2) which may
have contributed to the failure to sustain initiatives;
- highlighted the method for developing a relevant manufacturing strategy. This was
identified by the Researcher as the required hardware. For example, what needed to
be implemented and changed within the process and product capability;
- depicted the importance of a mutually supportive HRM strategy. Cited by the
Researcher as an enabler to developing the required culture conducive to continuous
improvement and to sustaining the approach; and finally
- proffered the importance of a cyclical approach to adopting a practice and using the
experience/ knowledge gain in order to adapt the concept to optimize potential
benefits. This was vital since Gilbreth and Gilbreth (1917) asserted that not all
companies have the same organisational characteristics, or ability to implement the

82
same set of practices. The conclusion insinuated that what worked well in one
company had the potential to fail if applied in the same manner in another.
4.2.5 Summary
Insights inferred from interviews and data extracted from company reports during the
initial scoping exercise (sections 4.2 and 5.4) were used to understand the extent of the
challenges that confronted CTE. Information deduced from literature reviews (chapter 3)
identified a series of good practices to be considered as countermeasures in support of the
theories/ concepts being developed by the Researcher. The concepts were captured in the
SF developed and proffered by the Researcher (section 4.2.4) as a framework to be
employed at the outset of the transformation. Individual concepts that could be and were
evaluated during the implementation of the recovery plan employed to transform working
practices within CTE. Concepts that would force the user (CTE) to consider the relevance
of the practice/ paradigm to be introduced and the enablers to sustain the approach.
Consequently, the SF was developed in support of, and as a consequence of the research
questions articulated in section 1.3: “how to introduce Lean, and what HRM policies are
required to sustain the new way of working?” The mutually supportive manufacturing
and HRM strategy reflecting the basic principles of the Toyota Production System
described by (Sugimori et al., 1977) as: a) the requirement to reduce cost through the total
elimination of waste; and b) to have respect for the employee (human).
The final section identifies how this was used and tested to corroborate its validity.
4.3 The Sustainability Framework applied.
The experience within CTE and the review of previous failings (section 4.2.2) caused the
Researcher to reflect that the tools and techniques were simple to employ albeit difficult
to endure initially. LM could be employed in any business and be used to benefit of the
company if it was supported by an enabling context.
“You cannot just introduce something and hope it happens, you have to work hard to
ensure it makes sense to those involved” (Ops Manager, H20, Sept 2008).
Having developed the SF and proffered it as a model to be employed in support of
research questions 1 and 2 (section 1.3), the claim needed to be validated. Furthermore,
the appropriateness of the individual enablers to aid sustainability, proven. As a

83
consequence of the initial research undertaken and the Researcher’s involvement with the
NEPA team (section 6.2), the Researcher launched a series of interventions (chapter 6).
Chapter 6 details the interventions introduced by the Researcher to a) implement Lean,
and b) to facilitate this new way of working. Interventions that would subsequently be
evaluated in accordance with the research design and methodology described in Chapter
5. For example, in order to understand employee’s perception, acceptance, and or
resistance to change, the Researcher had to comprehend the meaning behind an
individual’s behaviour. Consequently, the Researcher was seeking to interpret subjective
meanings (section 5.2.1) and explore patterns or relationships associated with behaviour.
Action Research (AR) (section 5.2.3) coupled with primary methods of data collection
such as, interviewing and observation (section 5.3), provided a research methodology that
would enable the Researcher develop ‘local theory’ (Rapoport, 1970). Theory or theories
that could be explored through the AR cycle and by more objective assessments such as,
experimentation (objectivity), until patterns / relationships were proven and the theory,
exhausted (sections 5.4 and 7.6).
In 2004, and simultaneous with the launch of the interventions, Corus UK launched its
Restoring Success Programme (section 2.3) to improve productivity across the group.
The objective was to use the principles of LM to close the performance gap with
competitors. Furthermore, and aligned to the associated retrenchment activities, the aim
was to be in a position where the company was able to maximise its profits in busy periods
and at least break even during downturns. A team was established that was headed by an
Executive Committee member to launch and implement LM. Corus employed consultants
to aid the implementation of this new manufacturing concept and worked closely with the
Lean Enterprise Research Centre, Cardiff Business School.
The Manufacturing Directors of each business were charged with implementing LM and
improving manufacturing performance. To support this, extensive training of Lean
coaches and the work force in Lean tools and techniques was available.
This provided the Researcher an opportunity to compare (benchmark) the success or
otherwise, of the launch in sister plants with the approach adopted by the Researcher
(sections 6.2, 6.3 and 6.4) within CTE during the period 2004-08. A period where the
Researcher applied the Action Research (AR) cycle of construct, plan, take action and
reflect (section 5.2.3). The benefit and strength derived from the AR (section 5.2) was in

84
the employment of experience gained, in reflecting upon learning and the generation of
new insights in support of the business transformation.
Throughout the process of data gathering and analysis (Chapter 7), dominant themes were
highlighted and discussed further with colleagues. The conclusions drawn from this
cyclical approach resulted in a refinement of the theory and the introduction of new
interventions to implement (section 6.6) and explore/ test (chapter 7). This resulted in an
effective four stage process (section 9.2.1) that could be employed at a macro level when
looking at the transformation in ‘general’ as a whole, or at a micro level when introducing
change at a particular ‘specific’ level. This approach assisted learning associated with
research questions 1 and 2 as it included the Researcher within the change process
(section 5.2).
The Researcher has reiterated and demonstrated that the introduction of this change
programme was iterative (section 7.3). One size does not and cannot fit all. Therefore, the
cyclical process of AR (sections 5.2 and 7.3), ensured that the adopted practices were
refined through vigorous reviews and reflections, and adapted to suit the operation or
process in question. An iterative data gathering process that included: for example,
interviews, questionnaires, observations, fieldwork and various timed trials (section 7.5).
Monthly company reports depicting manufacturing metrics and trends were used to
corroborate improvements or set-backs. This process entailed a multitude of iterations
over a period in excess of three years (for example see table 7.1); a period considered by
the Researcher as sufficient time to generate a platform considered stable.
For example, in LM employee engagement was identified as vital (section 3.3). The HRM
literature (section 3.5) identified the primary policies to consider that could act as
enablers/ motivators. However, the detail and how these general policies were to be
converted into appropriate action, or the priority order in which they should be
implemented was left to the user to decide. Equally, it was left to the user to determine,
relative to the changes introduced, which HRM policies were most beneficial. For
example, communication was identified as vital to engaging and motivating employees
(section 3.5.2). However, the question remained, how was this engagement converted into
action? And how could that action be measured or rewarded? Why should a temporary
worker support the transformation of a business, if at a point in time in the future they
will be laid-off? Why should a permanent employee, secure in that knowledge, work

85
harder than a temporary employee? Once again, the ingredients were evident in the
literature, however, it resided in the host company to develop the enabling strategy.
The modification and modernisation of the HRM strategy within CTE therefore had to
generate an environment conducive to continuous improvement, supportive of employee
engagement, and fundamental to the new way of working. As an Action Researcher and
complemented by the research design of interpretevism (section 5.2), the Researcher
became part of the change programme and sought to interpret the meaning behind the
(subjective) behaviour of participants. Primary methods of data collection (interviews and
observation (section 5.3) provided accounts of how those involved interacted with,
supported, or rejected change. This could subsequently be corroborated by experiments
and trends uncovered in monthly business reports (secondary methods of data collection).
It was during the iterative and cyclical process of Action Research that the RQs were
analysed and answered. The SF was refined to incorporate the experience gained by the
Researcher through academic studies in this field. Experienced founded: on the
interventions introduced (chapter 6); as a practitioner introducing this significant change
programme within CTE (chapter 7); the analysis of the benefits secured as a result of this
study (sections 8.2 and 8.3); and as an observer who had benchmarked good practices
within various companies within the UK, the Netherlands, Germany and Japan.
The results of the structured approach in terms of employee involvement were
demonstrated in section 8.2, whereas the impact on manufacturing and financial
performance were shown in section 8.3. This allowed the Researcher to conclude the
validity of the SF as a consequence of answering the RQs.
The next chapter outlines the research design and methods employed throughout this
study.
86
Chapter Five. Research Design
5.1 Introduction
This chapter outlines the research design and methods employed by the Researcher to
answer the research questions (RQs) and test the hypotheses outlined in section 1.3. This
study and associated RQs demanded an understanding of the acceptance/ rejection of
change within the workplace. Furthermore, to evaluate the benefits derived as a result of
the changes introduced to work shop practices (Chapter 6). The main data gathering
methods included: interviews; observation benchmarking; and the review of various
company reports, minutes and academic literature. The data collection methods are
described in section 5.3.
Content analysis was employed to reduce data gathered into manageable chunks.
Recurring themes or repeat comments could be used to generate insights into the views
of the participants, of behaviour in the workplace, and the generation of new themes to
consider and test. The espoused views of participants (qualitative data) could be compared
with data accumulated in support of changes to cycle times, speed, and / or availability
(quantitative data). Similarly, training hours or the number of improvement activities
could be used to provide evidence in support enablers such as employee involvement/
engagement. Section 5.4 provides an overview of how the data were reduced and
analysed.
The nature of this study required the planning and implementation of action followed by
periods of reflection and evaluation. Insights from lesson learned could then be used to
restart this cycle. Consequently, the over-riding research strategy was Action Research
(section 5.2.3); a strategy that provided the Researcher with the opportunity to be part of
the change process. The research comprised a seven-year longitudinal evaluation of
business strategy, strategic and operational transformation, process and product
capability, and HRM.
5.2 Research design
The research design is critical to the overall configuration of a research project and the
way in which the study is conducted (Easterby-Smith et al., 1991). The design should
reflect the purpose and reason for the study (Robson, 2002); the RQs; the strategy and

87
tactics adopted (Manstead and Semin, 1988); the evidence gathered and how it is
interpreted in order to answer the research questions (Easterby-Smith et al., 1991); and
the philosophical stance employed in the development of knowledge (Saunders et al.,
2003).
To support the design of research projects (Saunders et al., 2003) proffered a ‘research
process onion’ shown in figure 5.1.
Figure 5.1: The research process onion (Saunders et al., 2003).
The first layer represents the research philosophy adopted. The following depict the
research approach; the choice of research strategy applied to a time horizon and the
methods for data collection and analysis.
5.2.1. Research Philosophy
Research philosophies -or paradigms- refer to the ways in which knowledge is gathered
about the social world (Bowling, 2002).
Ontology is concerned with the nature of reality. The two aspects are: objectivism, which
assumes that social entities exist as a meaningful reality external to those social actors
concerned with their existence; in contrast subjectivism asserts that social phenomena are
created from the perceptions and consequent actions of social actors (Saunders et al.,
2012).
Epistemology concerns what constitutes acceptable knowledge in a field of study.
Research in the natural sciences is associated with the epistemological position known as
positivism. In contrast, interpretivism recognises the differences between people and
objects and recognises the subjective meaning of social action (Bryman and Bell, 2007).
The three main philosophies proffered are:
88
Positivism - the philosophical stance of the natural scientist who considers the world to
exist a priori as a unified and causally ordered system inferred from empirical observation
and a highly structured methodology (Gill and Johnson, 1997). The researcher is
objective, detached and assumes a reality exists. Data gathered can be logically
reconstructed into predictable, generalised law-like hypotheses, applicable and repeatable
in any circumstance (Remenyi et al., 1998).
Interpretivism is associated with the exploration of subjective meanings that motivate
people’s actions in order to understand them or perhaps a reality working behind them
(Remenyi et al., 1998). Interpretive techniques describe, decode, translate the meaning,
but not the frequency of naturally occurring phenomena in the social world (Van Maanen,
1983).
Realism suggests that reality exists independently of our thoughts or beliefs (Robson,
2002). The realist view is that the ‘outcome’ of an ‘action’ follows the ‘mechanism’ of
change, acting in a particular ‘context’. As such realism can provide a model of scientific
experimentation that avoids both positivism and interpretivism (Robson, 2002).
In this study an interpretivist philosophy was employed. The Researcher sought to
interpret his understanding of the acceptance of change within CTE through subjective
experiences. This qualitative approach stresses the subjective aspects of human activity
by focusing on the meaning, rather than the measurement of social phenomenon (Hussey
and Hussey, 1997). The meanings are not just shared beliefs that individuals hold; they
have been jointly created by many individuals (Lauer and Handel, 1983). In social
environments, actions or behaviours are based on the values (meanings) held by that
social group. Consequently, the Researcher can interpret the actions observed to generate
an understanding of why for example, a change in operating practices may, or may not,
have been accepted. The findings can then be used to provide an impetus for subsequent
actions enacted by the Researcher (Bhaskar, 1986). This approach was an imperative due
to the requirement to evaluate the acceptance of tools and techniques introduced as part
of this research programme (questions 1 & 2, section 1.3).
However, it is not uncommon for researchers to utilise each of the research philosophies
to convey a particular point of view or examine a particular theory (Easterby-Smith et al.,
1991) and is prevalent in business/management (Saunders et al., 2003).

89
5.2.2. Research approach
The two main approaches to research are deductive and inductive (Saunders et al., 2003).
The approach adopted should complement the RQs and objectives, and the
epistemological or ontological stance of the researcher. Knowledge is advanced by
deduction or induction (Susman and Evered, 1978).
Deduction is the development of new propositions deduced from previously accepted
laws (Susman and Evered, 1978): a hypothesis (or hypotheses) that must be subjected to
empirical scrutiny (Bryman and Bell, 2007). This approach is sometimes called ‘testing
theory’, and has an affinity with scientific research and positivism (Hussey and Hussey,
1997). This approach employs quantifiable data to test and validate a particular study
(McNiff and Whitehead, 2009). The inductive approach is most suitable when the
research focuses upon events that are taking place (Saunders et al., 2003). The undistorted
observation of association between discrete events or actions are noted (Susman and
Evered, 1978). Lee (1999) concluded that the inductive approach provides the researcher
with the opportunity to observe complex phenomena and understand the dynamics of
behaviour in organisations. With induction, theory is the outcome of the research,
therefore the approach is known as ‘theory building’.
The two approaches should not be seen as mutually exclusive (Saunders et al., 2003).
Throughout this study a combination of both inductive and deductive approaches were
employed. For example, interviews conducted with Corus management at the outset of
this study provided the Researcher with an understanding of the extent of the problem.
This inductive approach resulted in the development of the main categories worthy of
further investigation (figure 5.6). However, the theories introduced based on an inductive
approach (theory building) that could impact on set operational standards for example,
conversion costing or employee bonus systems, would have to be proven (deduced)
empirically before their acceptance and any subsequent change in standards. This
coalescence being used to substantiate or triangulate (Jick, 1979) the findings. Deductions
made from the study of academic literature corroborated or supported the development
of ‘good’ practices employed as enablers to the sustained transformation.
5.2.3. Research strategy
Numerous research strategies are proffered in the research literature (Eden and Huxham,
1996; Robson, 2002; Voss et al., 2002; Saunders et al., 2003; Yin, 2003) including: case

90
studies; surveys; experiments; grounded theory; action research; ethnography; cross
sectional and longitudinal studies; and exploratory, descriptive and explanatory studies.
The very act of change reveals factors that would not be unearthed in a stable environment
(Eden and Huxham, 1996). Whilst grounded theory (Corbin and Strauss, 1990),
ethnography (Willis and Trondman, 2000), case studies (Yin, 2003) and exploratory
studies (Robson, 2002) are all valuable strategies for helping determine: i) what is
happening; ii) seeking new insights; and iii) asking questions within the social world in
which action is occurring. The research strategy employed by the Researcher was Action
Research; a strategy that is concerned with learning about organisations through trying to
change them (Lewin, 1946). Action Research incorporates similar approaches which have
acquired such names as ‘action learning’ (Revans, 1982), ‘action science’ (Argyris et al.,
1985), ‘action inquiry’ (Torbet, 1991) and participatory action research (Whyte, 1991).
Action research
Kurt Lewin was the first person to use Action Research (Coughlan and Coghlan, 2002;
Robson, 2002). The knowledge attained can lead to an unfreezing of the dynamic
equilibrium present in people, groups and organisations (Watkins, 1991). Furthermore,
Action Research (AR) provides a way of empowering participants at the moment of action
(Elden and Levin, 1991). It supports the development of ‘local theory’ and contributes
both to the practical concerns of people in an immediate situation and to the goals of
social science via joint collaboration with a mutually acceptable ethical framework
(Rapoport, 1970). Interdependencies derived from involvement and close collaboration
with practitioners relating to issues of genuine concern provides a richness of insight that
could not be gained in other ways (Reason and Rowan, 1981).
The knowledge gained can be used to develop hypotheses that in turn can be trialled
through experimentation and controlled evaluations. The resultant data could be used to
generate emergent theory that will inform the research intent and challenge historical
assumptions or beliefs (Eden and Huxham, 1996). Thus, AR is concerned with systemic
relationships, learning from what people do and say, and what theories are used and are
usable. Argyris (1995) outlined two modes of learning; single-loop and double-loop. The
former may change the views of an individual. However, double-loop learning is critical
if the group values or culture is to be changed. Single-loop learning, often considered
basic problem solving, seeks to improve the system as it exists. Whereas double-loop
learning is a style of learning that questions the underlying assumptions, values and
beliefs behind what we do (Argyris and Schon, 1991). In double-loop learning every

91
significant action is evaluated in terms of the degree to which it helps the participants
generate valid and useful information, including relevant feelings. Its thorough
application addresses the root cause and solves the problem so that it remains solved,
which contributes to achieving sustainability (Argyris, 1995). Learning generated as a
result of change can be used to restart the learning cycle (Kemmis and Wilkinson, 1998;
Coghlan and Brannick, 2010).
The AR strategy supported theory building in incremental stages (Eden and Huxham,
1996), moving from particular themes to be explored to the adoption of practices within
CTE. The approach developed theory from practice through an iterative and cyclical
process of constructing a theme, planning the required activity, taking action, evaluating,
and learning from the consequence(s) of the change, before planning further action and
repeating the cycle (figure 5.2).
Figure 5.2: The cyclical nature of AR (Coghlan and Brannick, 2010).
The iterative approach of AR resulted in the development of, and refinement of the main
themes to be pursued throughout this study (sections 5.4 and 8.2). Table 7.1 and 7.2 offer
specific examples of the AR cycle applied by the Researcher to evaluate the acceptance
of the interventions listed in chapter 6. The outcome associated with this area of activity
was employed to answer RQs 1 and 2.
The AR cycle involved a number of cycles and during the initial scoping of the study,
culminated in an explicit framework being developed between CTE and the Researcher

92
depicting the agreed course of action (section 7.2). The explicit framework can help
reduce researcher bias and detail purposeful outcomes as a result of the Researcher’s
intervention (Checkland and Holwell, 1998).
Throughout the process the Action Researcher acquires knowledge as a result of a three
step heuristic process – experience, understanding and judgement (Coghlan and Brannick,
2010). This is linked to the experience and cognitive ability of the researcher to explore
and problem solve (see figure 5.3). A role that must balance intellectual diversity and
coherence on one hand, with blending in different personalities and styles on the other
(Pettigrew, 1990).
Figure 5.3: The general empirical method employed in AR projects source (Coghlan and
Brannick, 2010).
In summary, AR was selected as the research strategy in support of the RQs, because it
has an explicit focus on action, in particular promoting change within an organisation
(Marsick and Watkins, 1997).
The challenge when introducing and looking to sustain new working methods was to
understand and explain the reaction of employees to change. AR enabled fieldwork to be
balanced with investigative studies. The fieldwork provided the opportunity for
experience-based learning through observation, practical work and trial and error
experiments. “Inquiry in action can lead to learning by experience” (Torbert, 1972, piv).
This was supported by learning which arose from reading the literature, interviews,
company reports etc. This included a balance of qualitative and quantitative data (see
section 5.3 for data gathering methods). AR makes the research experience public to the

93
people concerned by and interested in the change process (Altrichter et al., 2002). Thus,
the iterative approach of AR provided a methodology that could explore the acceptance /
rejection of LM techniques and HRM policies introduced within the workplace.
Information that could be used in support of answering the RQs in section 1.3.
Furthermore, AR contributes to the development of theory by taking action guided by
theory and evaluating the consequences for the problems that members of an organisation
face (Susman and Evered, 1978).
It is the personal learning derived from the actions implemented throughout the AR cycle
that makes the research unique and authentic (McNiff and Whitehead, 2009).
5.3 Data collection
The collection of data is central to, and a totally indispensable part of real world enquiry;
no data – no project (Robson, 2002). The specifics of data collection are bound by the
various methods of investigation featured earlier. Equally, the data collection techniques
should allow the research question(s) to be answered. Research that focuses upon the
individual learning process and the emotion of participants, employ techniques such as
interviews and observation (Yeo, 2002). Whilst research into learning at the level of the
organisation uses questionnaires and surveys (Yeo, 2002). The objective of this research
was to introduce a sustained change to workshop practices in order to turnaround the
financial performance of the business. This involved understanding the associated
behaviour of participants involved in the transformation. Consequently, the design of this
project lent itself to a ‘soft’ or qualitative approach to data collection (section 5.3.1). Data
were obtained through active involvement in the day-to-day organisational processes; a
combination of interviewing, involvement, engagement and reflection with participants
in the AR process (Coghlan and Brannick, 2010); an iterative, cyclical process of
observation and verification that embodies a longitudinal study (Pettigrew, 1990).
Theory may be supported by secondary sources of data that may include ‘hard’ or
‘quantitative’ data obtained through operational/ business statistics, financial accounts,
company reports, and literature (Coughlan and Coghlan, 2002). The ‘soft’ approach
allowed the Researcher to explore topics and explain findings; a process that supported
learning associated with new techniques. Learning that strengthened or refined an
approach taken such as, the investigation of best practice HRM policies to be used to
motivate and sustain such a transformation associated with questions 1, 2, & 3 (section

94
1.3). Whereas the ‘hard’ approach helped validate the findings associated with question
1 (section 1.3) by providing empirical data that would be used to validate relationships.
For example, repeat trials that could provide timings (minutes and seconds) to support an
improvement in a cycle time as a result of a change in operating practice. A combination
of methods allows a variety of perspectives to be drawn out, which confirms or refutes
issues (Robson, 2002).
These are discussed in more detail in the following sections.
5.3.1. Primary methods of data collection
The RQs sought to understand how LM could be introduced within the UKSI as an
appropriate turnaround strategy. Furthermore, to discern how resistance to change could
be subjugated and through the adoption of improved HRM practices, how employees
could be motivated to accept, support and sustain change (RQs 1 & 2, section 1.3).
The interaction and acceptance of new practices within the work environment could
provide new learning that underpins or refines theories. The Action Researcher may gain
insights that could not be gleaned in any other way. For example, there are numerous
books on change programmes that reference how change should be managed and enacted.
However, the reality is that until change is introduced it is difficult to predict in what way
those involved will react at that time and in what manner. Would change be accepted or
supported in part, in full, or not at all? What behavioural traits can be interpreted from
participants’ actions within the social context of the work place? Consequently, the
subjective and interpretative nature of this study comprised: interviews; observation; and
discussion. Table 5.1 shows the how these data were collected over time.
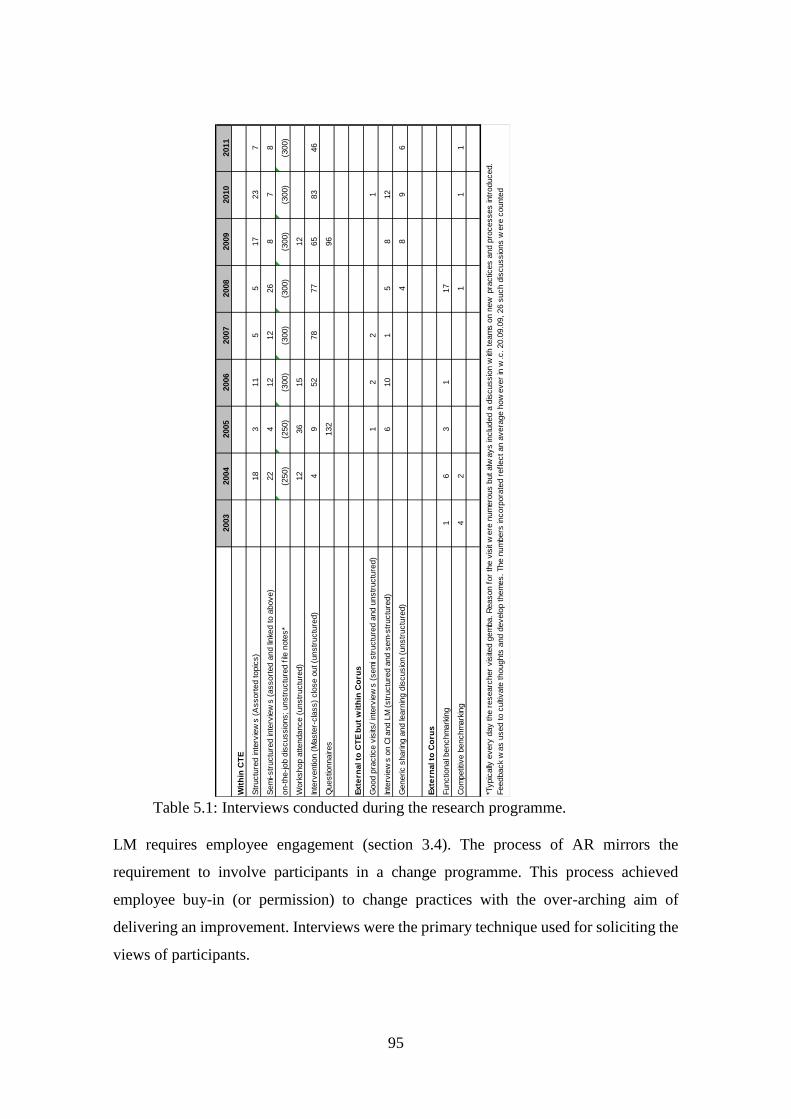
95
Table 5.1: Interviews conducted during the research programme.
LM requires employee engagement (section 3.4). The process of AR mirrors the
requirement to involve participants in a change programme. This process achieved
employee buy-in (or permission) to change practices with the over-arching aim of
delivering an improvement. Interviews were the primary technique used for soliciting the
views of participants.
2003
2004
2005
2006
2007
2008
2009
2010
2011
Wit
hin
CT
E
Str
uctu
red in
terv
iew
s (
Assort
ed topic
s)
18
311
55
17
23
7
Sem
i-str
uctu
red in
terv
iew
s (
assort
ed a
nd li
nke
d to a
bove)
22
412
12
26
87
8
on-t
he-job d
iscussio
ns; unstr
uctu
red f
ile n
ote
s*
(250)
(250)
(300)
(300)
(300)
(300)
(300)
(300)
Work
shop a
ttendance (
unstr
uctu
red)
12
36
15
12
Inte
rventio
n (
Maste
r-cla
ss)
clo
se o
ut (u
nstr
uctu
red)
49
52
78
77
65
83
46
Questio
nnaires
132
96
Exte
rnal to
CT
E b
ut
wit
hin
Co
rus
Good p
ractic
e v
isits
/ in
terv
iew
s (
sem
i str
uctu
red a
nd u
nstr
uctu
red)
12
21
Inte
rvie
ws o
n C
I and L
M (
str
uctu
red a
nd s
em
-str
uctu
red)
610
15
812
Generic s
haring a
nd le
arn
ing d
iscusio
n (
unstr
uctu
red)
48
96
Exte
rnal to
Co
rus
Functio
nal b
enchm
ark
ing
16
31
17
Com
petit
ive b
enchm
ark
ing
42
11
1
*Typic
ally
every
day the r
esearc
her
vis
ited g
em
ba. R
eason f
or
the v
isit
were
num
ero
us b
ut alw
ays in
clu
ded a
dis
cussio
n w
ith team
s o
n n
ew
pra
ctic
es a
nd p
rocesses in
troduced.
Feedback
was u
sed to c
ulti
vate
thoughts
and d
evelo
p them
es. The n
um
bers
incorp
ora
ted r
eflect an a
vera
ge h
ow
ever
in w
.c. 20.0
9.0
9, 26 s
uch d
iscussio
ns w
ere
counte
d

96
Interviews.
An interview is a purposeful discussion between two or more people (Kahn and Cannell,
1957) and provides the researcher with a flexible and adaptable way of finding things out
(Robson, 2002). Interviewees possess knowledge and beliefs linked to their area of work
and the changes taking place. “The main reason for qualitative interviews is to
understand how individuals construct the meaning and significance of their situations
from the complex personal framework of beliefs and values which they have developed
over their (work) lives in order to explain and predict events in their world” (Burgess,
1982, p45). Interviewees were described by (Gilchrist and Williams, 1999) as key
informants who have a rich connection with the research topic. They possess knowledge
that could help the researcher develop an understanding of the respondent’s ‘world’ so
that the researcher might influence it either independently or collaboratively as in the case
of AR (Easterby-Smith et al., 1991). Interviews enable personal contact, which could help
the researcher understand the reasons for the decisions or choices made by the
interviewee. Qualitative interviews can be one-to-one (either face-to-face or telephone
interviews) or one-to-many via focus group interviews (Saunders et al., 2003). A
commonly used typology distinguishes between structured, semi-structured and
unstructured interviews (Easterby-Smith et al., 1991; Robson, 2002; Saunders et al.,
2003).
The majority of interviews undertaken within CTE were semi-structured or unstructured.
The former were often developed following literature reviews or after a period of
reflection following the inductive analysis of data gathered. These were often piloted with
a small population before being amended and applied to a larger group. The unstructured
questions were usually undertaken during an event or activity observed by the Researcher.
The observations were usually planned in accordance with a pre-determined activity and
theme.
To help prepare and set the expectation of those interviewed, participants were informed
of the objective and purpose of the interview prior to it taking place. To avoid undue bias
an active listening stance should be adopted (Sullivan, 1988; Robbins and Hunsaker,
1996). The interview is a data gathering process therefore it is important that the
interviewee is given the opportunity to speak (Robson, 2002). To assist this the interviews
should not be overly structured. The Researcher should aid the process by posing helpful
questions, validating employee expressions through considered conversation, turn taking,
and paraphrasing to ensure mutual understanding (Sullivan, 1988). Probes that repeat the

97
initial question, elaborate on vague statements, or paraphrase comments to help improve
or sharpen-up the interviewee’s response (Easterby-Smith et al., 1991). However, it is
equally important that the researcher does not lead with a probing question. An example
might be “so you would say the LM has had a positive impact on your operation?” Instead
the interviewer should say, “Can you explain what impact if any, that LM has had on your
operation?”
All interviews were conducted by the Researcher but some meetings and workshops were
assisted by a facilitator. The interviews were designed with three purposes. Firstly, to
understand how the individual perceived their role or contribution within the change
programme, secondly, to solicit their views on the existing or evolving initiatives
occurring at the business level (such as bonus system, HRM policies), and finally, to
capture the process that were undertaken as part of each project.
Interviews were transcribed and read back to the interviewee to ensure correct
interpretation recorded, as well as a form of validity checking to comply with ethics
(Gilchrist and Williams, 1999). Group discussions resulted in a summary of the
discussion being made and then checked with a supporting colleague and the facilitator
of the workshop. This ensured that the file note (narrative) reflected an accurate
interpretation of what had been discussed. There was no digital recording of any
interviews (initial concern expressed by the craft population about videoing and taping
resulted in the Researcher abandoning this approach). The main data collected from
interviews related to written transcripts (Silverman, 1993), which were transcribed by
hand, before being typed up on a PC. Furthermore, if participants wished to remain
anonymous, this option was afforded to them.
The intention was to make contact with a wide range of stakeholders across both shifts
and encompass various functions and all levels of employees from team members to
senior directors. The aim was to obtain as far as reasonably practicable, a balanced view.
This process also provided a method for establishing personal contact and developing
trust; barriers that the Researcher needed to bridge if he was to fully comprehend the true
nature behind observed behaviour.
The interview themes evolved throughout the period of study. The themes were derived
inductively as a result of data analysis linked to interviews and observation, and
deductively from literature. For example, the challenge for the Researcher was to turn
around the financial performance of CTE. Intuitively, the Researcher believed a key

98
theme was to gain an appreciation of Management’s perception of CTE’s predicament.
The analysis of the interviews conducted with Senior Management culminated in the
identification of the main themes to explore (figure 5.6). The main themes provided an
inductive framework to be employed during the initial scoping of this study. However,
the subsequent investigation involved literature reviews in addition to primary forms of
data gathering. Consequently, sub-themes (figure 7.3) were developed both deductively
(as a result of insights generated following literature reviews) and inductively, following
an analysis of transcripts and company based data. Data analysis is discussed in section
5.4. Table 5.2 provides a more comprehensive list (although not exhaustive) of themes
pursued.
Table 5.2: Typical themes for interviews conducted 2004-10 within CTE and selected sites.
The questions associated with particular themes were developed as a consequence of the
multi-method approach to data gathering. For example, they were derived following
observations during fieldwork, periods of reflection, and/ or informed by literature.
Interviews generated a more in-depth understanding and perspective on how the key
themes were perceived by the various functions and social groups operating within the
business. For example, why had previous initiatives failed? How did employees perceive
the business, its operating practices and performance? Table 5.3 provides an example of
the rationale for the use of particular questions.
Typical themes covered during interviews
History of H44 and H42
Knowledge of previous initiatives
Training received
Master-class/ intervention structure
Workshop content
Value of intervention; what was done, how was it achieved
Knowledge and use of LM tools and techniques
Hoshin Kanri (strategy deployment)
Personal objectives
Communication process and events
Employee engagement
Availability challenge
HR Practices and policies pre and post Omega

99
Question: Informed by:
What is CTEs strategy and are employees aligned
to it?
Akao (1991), Cowley and Domb (1997), stressed
the vital role of employee engagement in business
transformation.
What LM tools do you believe to be most
beneficial?
Bateman and David (2002) stressed the importance
of four key (LM) basic building blocks.
Do you have any concerns with the intervention
approach (Master-class)? What is the benefit of the
approach?
Bateman and David (2002) espoused the value of
this approach in delivering change linked to LM
and supporting knowledge retention. In addition,
however, fieldwork suggested that the initial
approach was acting as a de-motivator.
What are the benefits or concerns of the
communication process employed by CTE?
Initially, this was an intuitive question asked to
ascertain the process employed by CTE.
Subsequently, the question was repeated following
a review of literature that indicated communication
was a powerful catalyst for engaging teams and
delivering successful transformations (Reina and
Reina, 1999; Mayfield and Mayfield, 2002).
What is your perception of the benefits or failings
associated with the Omega programme?
The question was asked following a review of data
suggesting positive changes in performance. The
Researcher was keen to gauge employee
perception. Linked to this was a view that new
practices can only be sustained if TMs perceive the
new way of working as a norm (Goleman, 2000).
What do you believe are the internal and external
causes of failure?
Mellahi and Wilkinson (2004) articulated that
there are two causes of organisational failure
which are inexorably linked.
Table 5.3: Examples of why particular questions may have been asked.
The reality, however, was that the Researcher was in a unique position with open access
on a daily basis to over 300 employees. AR provided opportunities for the Researcher to
ask numerous unstructured questions linked to changes in practices, employee
comprehension, and observed behaviour. Questions that may have been informed:
intuitively as a result of observation; following the inductive analysis of data gathered; or
as a result of an insight deduced from the literature. Appendix D provides examples of
question sets used by the Researcher.
Questionnaires were also developed as a method for: reaching out to a wider population;
and as a measuring device to gauge a participants’ perception relative to concepts
introduced immediately after their introduction and after a period of time determined by
the Researcher, to reflect on sustainability. The questionnaires were developed by the

100
Researcher, discussed with a colleague and then with CTE prior to its application. The
questionnaires were usually designed to test a particular theme, its use, acceptance and
value within the team(s). For example, to investigate the knowledge retention and
application of the basic Lean techniques proffered by Bateman and David (2002) (section
3.4), questionnaires asked those surveyed to agree/ disagree with a range of statement.
The anonymous responses allowed the Researcher to develop an understanding of the
widespread use (or not) of the tools and techniques used, of the value employees attributed
to a particular technique, and if benefits had been derived/ observed by those involved.
The questionnaires were piloted with the first groups surveyed and modified (if required)
based on the feedback received.
Data obtained were captured in many forms: transcripts; minutes of meetings; annotation
of minutes; in personal log books (diary) and file notes (Appendix K). Data captured in
minutes and presentations were also stored on a company based Lotus Notes computer
database. Personal documents, summaries, interview narratives, and file notes
(handwritten and typed) were maintained in generic files (non-PC) catalogued under the
heading of the primary theme under investigation (for example, figure 5.6). Files
(narratives) were maintained in date order, relevant to subject matter or category heading
(theme or sub-theme), and stored in the site office of the CI Department. Records were
maintained in a row of eight filing cabinets. Each main theme was assigned a drawer(s)
with dividing files used to reflect the sub-themes. An index card at the front of the drawer
was used to keep track of the sub-themes held within each drawer (figure 5.7). The
framework of themes considered was developed using both inductive and deductive
methods described above.
It was recognised that interviews reflect a reality at a point in time and may therefore not
be repeatable (Saunders et al., 2003). In order to establish patterns, the Researcher
involved a wide a range of people from various functions and levels of hierarchy. Patterns
that in turn indicated areas for further exploration. The content of each interview (file
note) was captured in hand written form and summarised using a simple A,B,C,D analysis
(figure 5.4) developed and adopted by the Researcher: What was Achieved? What were
the Benefits? What were the Concerns? What should the Researcher (or team) do Next?
The actions or paraphrased summaries formed a key element of the data reducing
technique and explanation building process (section 5.4) employed by the Researcher to
aid the analysis of copious amounts of data.

101
Figure 5.4: An example of an ABCD summary (linked to figure 5.8).
When combined with field observations, interviews provided a method for bridging the
gap (Flanagan, 1954) between an observation and the recording and interpretation of the
reason behind a particular behaviour or action. The benefit to this project of the adopted

102
approach was the opportunity it provided to explore and address barriers to change in
order to develop a sustained approach.
Primary data were also collected through observation.
Observation.
Observation of individual behaviour or group dynamics provides the basis for inquiry into
underlying assumptions and the effects on the work and life of those involved (Schein,
1995). Observation is a natural and obvious technique to employ to help describe and
analyse what has been witnessed (Robson, 2002). It provides a method for the researcher
to interpret how the recipient (of change) acts and behaves which may differ from what
they might say or state during an interview. AR benefits from directly observable
behaviour and experience-based learning. Observation provides the researcher with an
opportunity to participate in the lives and activities of those being studied.
The various methods of observation are depicted in figure 5.5.
Figure 5.5: Typology of participant observation researcher roles (Gill and Johnson, 1997).
Gill and Johnson (1997) developed four categories of the observer:
1 complete participant – a covert observer and member of a group whose purpose is not
revealed to the team under study. This may raise ethical concerns as the Researcher
may be interpreted as spying on people whose trust has been gained;
2 complete observer – as above the purpose is not revealed. The Researcher seeks to
observe behaviour unobtrusively in a structured manner and is not an active
participant;

103
3 observer as participant (OP) –an overt participant where the purpose of the research
has been communicated to and is understood by the team under study. The Researcher
acts as a spectator, observing events without taking part in the activity itself. This
allows the Researcher to openly capture and record what is happening;
4 participant as observer (PO) – as above the research purpose is known and understood.
The Researcher gains admission and involvement in activities that may otherwise
have ‘been out-of-bounds’. Because the role is clear the researcher is able to ask
questions (unstructured interviews) and gain a greater understanding of activity and
behaviour.
The Researcher was cognisant that as the Senior Manager, his very presence could be
unsettling and cause employees to behave in a guarded manner. Furthermore, he was
conscious of the importance of gaining trust and had pre-determined that all activities
would be as transparent as possible. Consequently, an overt participatory style was
adopted. Participant observation (PO) requires the researcher to enter into the group that
is under observation (Vinten, 1994). In doing so, it provides a method for collecting more
data than would be possible using other methods from outside the organisation. PO also
provides an opportunity for the researcher to step back from the immersion in the activity
and write about what has been observed (Vinten, 1994). An approach that complements
the overt style of AR.
Observation conducted on a frequent basis allows the researcher to build up a better
picture of the activity being undertaken (Vinten, 1994). Observations were normally
planned and formed part of a pre-determined activity. Whilst the associated questions
were initially semi-structured they often evolved (unstructured) as questions relating to
what had been observed were developed.
As a PO and or an OP the mode of data collection and the benefits derived throughout
this research programme are captured in section 7.5. The investigative nature of this
approach resulted in over 250 unstructured, informal interviews per annum (table 5.1).
There were occasions where structured observation was required (Saunders et al., 2003).
This was usually linked to a planned trial being conducted within the process such as a
SMED activity. In this scenario, the Researcher would attend armed with a stop watch
and checklist to record and capture quantifiable data associated with the trial.
Occasionally the Researcher solicited the assistance of various colleagues to observe

104
work place activities. The outcome may have resulted in the generation of similar
conclusions or a noted difference in behaviour; an approach to theoretical sampling that
allowed propositions to be exhausted and thus grounded in reality.
The benefit of this approach was the ability to assess the behaviour of individuals in the
work place, amongst their peers and appraise the effectiveness of their actions, their
acceptance of new practices, obstacles that might hinder an application or improve it,
which might not have been stated during a discussion. The impact of change could be
evaluated and an assessment of subtle nuances or latent issues provided an insight that
might not be gained from literature reviews and or interviews. Importantly, it helped
answer research questions 1 & 2 linked to resistance/ acceptance of change and long-term
sustainability of LM.
This approach supported the interpretivist and subjective nature of the Researcher’s
primary research philosophy.
5.3.2. Secondary methods of data collection
Data that have been collected for some other purpose is known as secondary data
(Saunders et al., 2003). Secondary data provided useful sources of material that were used
by the Researcher to: corroborate findings obtained from observation and interviews; to
help formulate new themes deduced from available (secondary) data; and to assist the
Researcher to compare and put into context research findings. The secondary data utilised
by the Researcher included:
Formal reports – these comprised internally published reports that provided historical
accounts of the mill/ business performance, developments and benchmark activities.
Monthly reports published by and incorporating financial, commercial and HR statistics,
and operational performances, pre-implementation and throughout the transformation
process. In addition, presentations and communication packages that outlined and
justified capital expenditure requirements and business strategies.
These were used prior to and throughout the period of study to generate: a) an
understanding of the predicament the business was confronted with in 2003; b) to help
generate theory; and c) to substantiate progress.

105
Minutes of meetings – were obtained from a plethora of functional meetings. The minutes
provided the Researcher with a source of current and historical data, of reviews, problems
and next steps, of changes in direction or links to the transformation experienced. The
Omega (title given to CTE’s recovery plan section 6.3.4) meetings and minutes provided
the focal point for reviewing performance and agreeing the short and long-term plans and
actions.
The minutes of meetings and formal reports provided a rich source of qualitative
(longitudinal) data that enabled the Researcher to reflect upon and assess the
transformation of operating practices and employee behaviour. Thus, in year seven
previous aspirations were compared with actual performance. It may be possible that
during the analysis of data gathered over this period that relationships between (dependent
and independent) variables could help substantiate theoretical propositions (Yin, 1994).
For example, mill speeds and availability (dependent variables) could be compared year
on year to establish patterns associated with the introduction of Lean practices
(independent variable). Similarly, the training and support provided to employees could
be assessed (section 5.4).
The priority of the Researcher was to research data that enhanced a particular theme or
theoretical proposition being pursued. Themes that may have been developed inductively
following interviews and necessitated either supportive material to help validate a theme,
or required information that might provide examples of perceived best practice. For
example, the Researcher sought to understand the methods associated with, as well as the
importance of, employee engagement, training and strategy deployment in the successful
delivery of Lean. Knowledge gained could be used to refine the approach and develop a
stronger foundation on which to build subsequent techniques. This process was perceived
as critical by the Researcher as he sought to instil confidence within the stakeholder
population, in the approach adopted.
Primary and secondary data were used to help the Researcher establish links between the
concepts introduced and knowledge acquired in support of long-term sustainability and
improvement. For example, a common theme in the HR (section 3.5) and Lean (section
3.4) literatures was the need to engage employees. This was proffered as fundamental;
employees were deemed a valuable resource that could help deliver improved
performance. Internal issues were a significant factor related to organisation failure
(Mellahi and Wilkinson, 2004). Therefore, any attempt to transform an established and

106
accepted way of working should address employees’ receptiveness to change (Pfeffer and
Pfeffer, 1995). Similarly, LM (section 3.4) is premised on the ability to embark on a
journey and engage team members to identify improved practices, eliminate waste, and
achieve continuous improvement. Hoshin Kanri (Akao, 1991) has been considered to be
an effective method for cascading a business strategy and engaging employees at all
levels. Linkages and policies that could be used in support of RQ2 (section 1.3).
Secondary data, such as literature reviews, informed the Researcher of ‘general’ practices
and approaches to consider and adopt. In order to implement these practices it was
necessary to solicit feedback from interested parties to identify possible benefits or
concerns. The analysis led to the further refinement of practices. This was an iterative
process as indicated by the AR cycle (figure 5.2).
5.4 Data Analysis
The previous section identified how data were gathered; an approach that employed a
combination of co-operative and lone processes. Co-operative inquiry involved co-
workers (McNiff and Whitehead, 2009) who had similar concerns and interests as the
Researcher (Reason, 1999). In this scenario all members of the group contribute to, and
form part of the activity that is being researched. The value is that they can assist in the
approach to, and the scrutiny of qualitative data gathered. The analysis of data collected
is important and relates to the researcher’s interpretation and explanation. Whilst the
Researcher had the support of colleagues during periods of the data collection process, it
was the Researcher who analysed and interpreted the data for this thesis.
A problem with this approach is that different researchers analysing the same information
may interpret the findings differently and derive different categories for further study
depending on their research objectives (Dey, 1993).
Distinctions have been developed between quantitative and qualitative data (Dey, 1993).
The analysis of quantitative data, typically based on meanings derived from numbers is
conducted through the use of statistics and number. Qualitative data based on meanings
expressed from words typically involves analysis conducted through the use of
conceptualisation. It is the characterisation or conceptualisation of experiences which
amount to the theory which falls out of AR (Eden and Huxham, 1996). AR is concerned
with systemic relationships, learning from what people do and say, and what theories are
used and are usable. The interpretivist, inductive nature of this research design required

107
an inductive analytical strategy and procedure as the predominant approach to analyse
qualitative data.
A key part of the data gathering process employed to answer RQs 1 and 2 involved
interviewing and observation. Due to the significant volume of written and typed data the
Researcher needed to reduce this into manageable chunks in order to ascertain common
themes and where appropriate, test. In order to help analyse and present suitable data
Saunders et al. (2003) suggest that a common feature would appear to involve the
disaggregation of the mass of qualitative data collected, as it is collected, into meaningful
and related parts or categories. The approach proffered by Saunders et al. (2003) was
employed by the Researcher and involved the following activities:
- categorisation;
- ‘unitising’ data;
- recognising relationships and developing the categories used to facilitate this; and
- developing and testing hypotheses to reach conclusions.
This process offers a systematic and proceduralised process to analysing data collected
as it moves from one level of analysis to another; from general themes to specific areas
of focus as the research progresses. An approach the Researcher believed complemented
the procedure required in the case study to provide frequent and structured accounts of
progress made. A brief summary of each of the phases will now be reviewed, with an
explanation of how they related to the work.
Categorisation provides a method for the management of data. It involves classifying the
data collected into meaningful categories relative to the research topic. For example, in
support of: RQ1 a key intervention was the application of basic Lean tools (section 6.3.2);
and in RQ2 it was to assess the value of HRM policies to aid sustainability (sections 6.4
and 6.6). Accounts provided by participants linked to their acceptance and application of
a particular intervention would be gathered through the use of interviews and observation.
Consequently, all data relative to the intervention or topic being investigated would be
maintained in a common file or category.
The categories provide an emergent structure that allowed data to be organised and
analysed further. For example, the Researcher conducted over 50 interviews in year one
with the Senior Management from within the business. The objective was to ascertain

108
what they perceived as the main issues affecting the business and its plight. Furthermore,
based on their knowledge and experience, what did they consider pertinent and required
to address this predicament. The theories were refined and discussed with research
colleagues to elaborate the initial themes to be considered.
This inductive approach resulted in the establishment of the major themes (figure 5.6)
and a theoretical framework (section 7.2) to be pursued at the outset of this study in order
to address the research problem/ questions; general categories that reflected the crisis
situation pertaining to the case study in 2003. The main themes comprised: the ability to
turnaround the business; external factors affecting competitiveness; internal issues
that have resulted in the crisis point and affect competitiveness; process centric
strategies considered best practice; barriers to change; the rationale as to why previous
initiatives had failed; Leadership; strategy deployment; supportive HRM strategies,
and sustainability.
Figure 5.6: The main themes identified at the outset of this research programme.
Whilst the knowledge gained from early interviews helped develop the main categories
(figure 5.6), data obtained deductively from the subsequent literature reviews and the
inductive analysis of transcripts and company reports allowed the Researcher to discuss,
refine and advance these. This resulted in new sub-themes (sub-categories) being
considered (figure 7.3). Themes that could be used to advance a particular topic. For
example, an approach to aid sustainability, or a method that would engage TMs. The
evolution of the approach employed by the Researcher is discussed in section 7.2.
Unitising data is the process of attaching ‘units’ of data to the appropriately developed
category devised. In the case of this study, units of data comprised: transcripts and
sentences or individual sentences reflecting key topics or comments from company
reports and literature; empirical data in the form of times (minutes and seconds) for trials
undertaken in the mill; scores derived from questionnaires; and many other pertinent
forms of textual data that ‘fitted’ the category. For example, to validate the benefit of
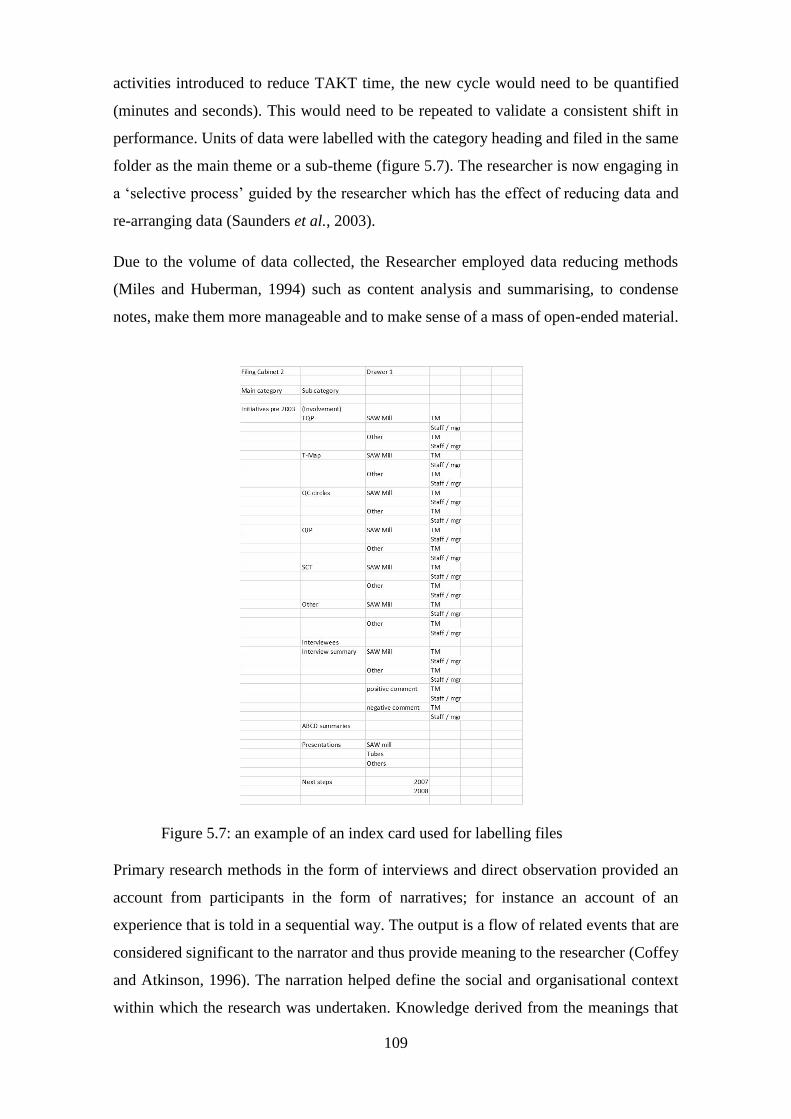
109
activities introduced to reduce TAKT time, the new cycle would need to be quantified
(minutes and seconds). This would need to be repeated to validate a consistent shift in
performance. Units of data were labelled with the category heading and filed in the same
folder as the main theme or a sub-theme (figure 5.7). The researcher is now engaging in
a ‘selective process’ guided by the researcher which has the effect of reducing data and
re-arranging data (Saunders et al., 2003).
Due to the volume of data collected, the Researcher employed data reducing methods
(Miles and Huberman, 1994) such as content analysis and summarising, to condense
notes, make them more manageable and to make sense of a mass of open-ended material.
Figure 5.7: an example of an index card used for labelling files
Primary research methods in the form of interviews and direct observation provided an
account from participants in the form of narratives; for instance an account of an
experience that is told in a sequential way. The output is a flow of related events that are
considered significant to the narrator and thus provide meaning to the researcher (Coffey
and Atkinson, 1996). The narration helped define the social and organisational context
within which the research was undertaken. Knowledge derived from the meanings that

110
make up the individual’s views of reality. The Researcher’s role is to reconstruct those
meanings (Partington, 2000). The content of narratives were employed as a mechanism
to highlight common themes repeated in interview statements or observation summaries.
The main points were emphasized using a highlighter pen for priority consideration and
for future referral. For example: negative comments were highlighted in pink; positive
comments, green; and next steps/ actions in blue. Figure 5.8 shows an extract of a
summary taken from a series of interviews. The narrative was catalogued under the
heading of, ‘involvement in the change process’ a sub-theme of the main theme (figure
7.3) ‘barriers to change’. The narratives were analysed by the Researcher to ascertain and
evaluate potential cause and effect between the interventions made and the reaction of the
participants.
Figure 5.8: An example of an extract from an interview summary.
The approach provided a method of uncovering emerging patterns. Patterns that resulted
in further investigation to validate a theme or enable the Researcher to commence a
process that explored linkages or relationships with other themes or socially constructed
explanations. This would provide the Researcher with an opportunity to draw a
conclusion between a particular intervention and its application based on what had been

111
stated and observed. However, in order to explore the impact of change and answer RQs
1 and 2, the Researcher needed to correlate qualitative data on perception of techniques
introduced with quantifiable data demonstrating a measured shift in performance. This
might allow the Researcher to conclusively demonstrate a relationship between the
intervention made and the impact on CTE. To support the quantification of data gathered,
various graphs and tables were employed to provide a visual representation and show the
trends or values linked to the subject under investigation. Bar (multiple) charts, pie charts,
line graphs, and scatter diagrams were common types of graphs employed during this
study to present frequencies of comments, findings and trends (see section 7.6). Graphs
and tables provide a complementary method to quantify and assist the analysis of
qualitative data (Saunders et al., 2003).
Recognising relationships: The analysis of data continues as the researcher looks for key
themes or relationships within the rearranged data (Miles and Huberman, 1994; Yin,
1994). Recognising relationships and developing categories allows data to be rearranged
following initial rounds of data analysis. This may result in the development of new
categories or the sub-division of existing categories as new insights are generated. The
researcher can compare new statements (or information gathered) with previous
statements. A consequence is that (sub) categories could become part of a matched pair
or triad where a given comment could be linked to several categories. For example, when
exploring the reasons for sub-optimal cycle times, the insights generated could be
attributed to: poor training; inadequate work procedures; design of work station.
Furthermore, these could be linked to employee motivation and employee engagement.
At this point the Researcher was seeking interpret and or demonstrate what he had
predicted; a positive impact on employee motivation/ engagement as a direct consequence
of a particular intervention.
The process leads to a hierarchical approach to categorisation as the research moves from
a general theme to specific areas of exploration in the generation of a well-defined
explanation (Miles and Huberman, 1994). An approach that could allow a predicted
outcome to be tested. For example, the Researcher might predict that: improved
communication would support employee engagement; an engaged employee might be
more receptive to change and the adoption of Lean techniques; the Lean paradigm will
assist business performance; and so on. Hypotheses that were to be tested or confirmed.

112
Developing and testing hypotheses: As apparent relationships between categories emerge
the researcher is able to develop hypotheses in order to test them. In essence, a hypothesis
is a testable proposition (Silverman, 1993). The appearance of an apparent relationship
(and subsequent hypothesis) needs to be tested if a conclusion is to be established
(Saunders et al., 2003).
For example, during the process of qualitative data analysis investigating the cause of
sub-optimal cycle times the Researcher formulated the following hypotheses:
- an optimum cycle time will not be achieved unless the employee is motivated
sufficiently to comply with the agreed standard operating practice; furthermore,
- an employee will not be motivated to achieve the optimum cycle time unless there is
a positive or negative impact associated with his behaviour.
Whilst the relationship is evident in each of the hypotheses. Each hypothesis was used to
test the relationship within it through the data that had been collected or that were to be
collected. A relationship or hypothesis deemed critical by the Researcher in answering
the research questions (section 1.3) linked to the acceptance of, and sustainability in a
new way of working.
Furthermore, it is important to test the hypotheses by seeking alternative examples that
do not conform to the relationship. It is only as a result of this process can the researcher
formulate explanatory theory (Dey, 1993; Miles and Huberman, 1994) and well-grounded
conclusions (Saunders et al., 2003).
To assist this process the Researcher employed two key deductive analysis techniques in
support of the inductive approach described above: explanation building and pattern
mapping (Yin, 1994). These are deductive based analysis techniques considered
applicable to qualitative analysis.
Explanation building (EP) provides an iterative approach to test theoretical propositions.
EP allows the researcher to build an explanation while collecting data and analysing them,
rather than testing a predicted explanation as in the case of pattern matching. The
Researcher believed EP supported the inductive approach employed rather than oppose it
because it allowed key themes (or theoretical propositions) to be explored until a
saturation point was reached.

113
Pattern matching involves predicting a pattern or outcome based on a theoretical
proposition to explain what the expected outcome is likely to be as a result of an action.
Two approaches are employed which could be used to explain the different phenomena
linked to the variables employed (Yin, 1994):
1. a dependent variable (mill speed) will improve as a result of the introduction of an
independent variable (Lean Manufacturing);
2. a number of explanations are proffered to explain a phenomena. Here the variables
are independent of each other. For example, speed of throughput increased due to: a)
an improved HRM strategy, or b) threat of being made redundant. Where one is
proven, the other is discarded.
For example, Tables 7.7, 7.8, and 7.9 provide examples of an extended matrix employed
by the Researcher to demonstrate what interventions had been introduced (or not) within
a particular area associated with the introduction of Lean techniques. Quantifiable
changes in performance (figures 7.15, 7.20, and 7.21) could be used to highlight a positive
of negative change in performance relative to the interventions made within the area under
investigation. The Researcher would repeat the various forms of data gathering associated
with a particular intervention with the same team on different day or month and with
different teams employing the technique. This would be continued until such time that
the findings were conclusive and grounded in reality. The findings could be used to re-
start the cycle or ultimately conclude the investigation pertaining to the particular
intervention; a method that allowed conclusion to be drawn in support of RQ1 and 2. The
Researcher, by comparing the two sets of data was able to develop a relationship. To aid
the study benchmarking other areas in the same mill, sister mills that had deployed the
RSP, or companies where a specific best practice were being investigated. This allowed
the Researcher to uncover differences or similarities in approach. This helped reinforce
conclusions drawn by the Researcher in support of RQs 1 and 2. Moreover, the data
captured and analysed could be used to support transferability of technique(s) helping to
answer RQ3.
Whilst the above approaches of inductive and deductive analysis are subtly different they
provided alternative yet complementary options to consider and employ. The Researcher
was tracking change and testing theoretical propositions over a seven year period thus,
the multi-method approach was useful during periods of reflection.

114
The risk to validity may be considered by the bias that might be introduced by transcripts
paraphrased by the Researcher. However, reviews obtained were validated with other
team members and triangulated where possible with alternative sources of data, for
example: published material, interviews corroborating improvements noted, quantifiable
data supporting cycle times and trends in manufacturing metrics, and company financial
reports.
Thus, the multi-method approach comprised qualitative (subjective) and quantitative
(positivist) data collection and analysis, which assisted the Researcher in substantiating
and validating the outcomes and results obtained. Multiple methods of data collection
should be used in research to validate findings and ensure the any variance reflects that
of the trait observed and not that of the method (Campbell and Fiske, 1959). The
convergence or triangulation of data (Webb et al., 1966) enhances the value of the
findings, and the belief that the results are valid and not a methodological artefact
(Bouchard, 1976). Triangulation is concerned with the combination of methods in the
study of the same phenomenon. Triangulation allows the researcher to improve the
accuracy of his/ her judgement by collecting different types of data which bring greater
bearing on the same phenomenon (Denzin, 1978).
5.5 Summary
The ontological and epistemological philosophies of subjectivism and interpretivism
supported the stance of the Researcher as they were best suited to understanding the
behaviour of individual(s) and groups within the work place and the motivational factors
supporting or acting as barriers to change. The primary research strategy was Action
Research. Secondary data were used to empirically demonstrate initiatives, to generate
new insights and contextualise observations to substantiate themes or conclusions and
exhaust possibilities.
This chapter has outlined the research methodology adopted in the design of this project.
Chapter 7 continues the approach adopted by providing more specific example of data
gathering and analysis employed throughout this study; an approach that was used to
evaluate and test themes developed and implemented in order to answer the RQs. The
next section outlines the interventions made by the Researcher during the transformation
process.


115
Chapter Six: The launch phase of CTE’s transformation
6.1 Introduction
Section 5.4 described the analytical process that culminated in the development of the
main themes pursued as part of this study. For ease of reference the main themes are
replicated in figure 6.1.
Figure 6.1: The main themes identified at the outset of this research programme.
CTE had determined LM as the manufacturing paradigm to be adopted to improve
operational efficiency (section 4.2). However, concern was expressed by CTE that it had
failed to sustain previous initiatives. This concern formed the basis of the research
questions (RQs) 1 and 2 (section 1.3). The ensuing discussion culminated in the
conceptual framework (developed by the Researcher) that guided the key stages of this
research. This is discussed in chapter 7. However, for ease of reference the framework is
repeated as: figure 6.2, the implementation phase; and figure 6.3, the sustainability phase.
Figure 6.2: Years 1 to 3: the implementation phase.
Year 2 (2005/06) Year 3 (2006/07)
Launch recovery plan and communicate vision
Re-engineer finishing mill lay-out
Install Capex plan; Optimise cycle time of new installation(s)
Engage employees at all levels; CI Activities
Master-classes; Interventions, workshops
Suggestions scheme; Kaizen generation
Review Cost of quality
stakeholder support; engagement and involvement Eliminating inertia
Improved communication Overcoming resistance to change
Leadership and alignment of management goals and failing of previous initiatives
HRM Strategy, recruitment, induction, training Post launch support
Recovery plan governance Quick wins
Process efficiency; Process Mapping SMED, Problem solving, Kaizen
Need for advanced T&T?
Management training in LM BIT Level 3 and BIT Level 4
Interviews; feedback sessions, questionnaires Inductive data capture and reflection
Observation Content analysis
Meetings, Business and CI reviews Deductive data capture via experimentation
Assessment of progress v plan Constant PDCA
Feedback from 3rd parties Coding data
Development of key themes
YEAR 1 (2004/05)
Implementation year 1 to 3 inc
Implementation of recovery plan
Learning from involvement and monitoring progress
Launch workshops BIT L2 in Forming, welding, expansion and finishing bays c350 employees
Change Agent appointment (x4), development and support (philosophy)
Turnaround potential and opportunities
Industry l ife cycle stage and tactics
Review performance metrics
Understand process capabilities
Review industrial context
Conduct market sector analysis
Benchmark: Internal, Functional, Generic, &
Competitive
Establish the performance gap
and the scale of the challenge
As
Is' c
on
dit
ion
an
d
asse
ssm
ent
of
chal
len
ge
Rec
ove
ry p
lan
Intr
od
uct
ion
of
key
them
es a
nd
go
od
pra
ctic
es
Them
es t
o p
urs
ue
Business Vision (can the business deliver a viable outcome?)
Recovery plan
Operational strategy - Process improvent: (efficiency & reliability)
..... - Product capability: (Current and extended capability)
Manufacturing improvement plan: (Criteria, Governance & ownership) -
Capital expenditure requirement -
Stakeholder support communication
Workforce development programme: (Paradigm; Training providers; tools &
techniques, Change agents)
HRM (Communication, selection, recruitment and induction process, Terms
and conditions, TM reward system, employee engagement)
Enabling context
Measuring performance and progress
Establishing metrics
Omega team
Interviews
Fieldwork
Business diagnostic & need analysisDat
a C
aptu
re
Providing a platform on which
to build
Achieving 'Buy-in'
Trai
nin
g
Lean Manufacturing: 5S, S Ops, 7 Wastes and visual
management (the basic building blocks)
Dat
a C
aptu
re

116
Figure 6.3: the sustainability and maturity phase.
To support the introduction of LM the Researcher employed the help of the NEPA
engineers (CTE, 2004n). Section 6.2 outlines the intervention recommended by NEPA to
establish the primary ‘needs’ of a novice company as it commences its Lean journey. The
output of the diagnosis facilitated by NEPA, provided CTE with a starting point and the
appropriate tools and techniques to address the foremost areas of concern. This addressed
a concern uncovered during the review of the literature associated with Lean
implementation (section 3.4), that companies do not know where to start and may lack
direction. Section 6.3 continues the NEPA recommended approach by introducing: the
enablers required to aid the knowledge transfer process; and the LM techniques proffered
as the basic building blocks in support of continuous improvement (Bateman and David,
2002; Herron and Hicks, 2008).
During the development of the main themes, CTE had expressed concern about its failure
to sustain previous initiatives (section 4.2.2). The challenge for the Researcher was to
develop a culture and work shop practices conducive to the new way of working in
support of a sustainable transformation. This formed the basis of RQ2 (section 1.3); what
is the most appropriate HRM strategy for overcoming resistance to change and engaging
with key stakeholders? Data deduced from literature (section 3.5) provided the
Researcher with a series of themes to pursue and launch simultaneous to the launch of

117
LM. Section 6.4 describes the HR policies introduced by the Researcher during the launch
stage (year one).
Throughout the first three years, the Researcher investigated the governance of the
implementation phase and the behaviour of individuals relative to their acceptance of the
new techniques. The research methodology was to interpret the subjective meaning
behind the behaviour of employee’s, informed by interviews and observation, and
triangulate this where possible with objective changes in measured performance. The
investigation allowed the Researcher to determine: a) if the interventions had secured the
anticipated benefits; and b) could they be modified in any way to add greater value or
ensure/ enable sustainability.
The output of the Research was compared with information deduced from literature on:
best practices associated with LM implementation (section 3.4); and HRM policies
(section 3.5). Furthermore, the findings were also considered in the light of inferences
made following a two week benchmark visit to Japan (section 6.5).
Consequently, during the sustainability and maturity phase (year 4 to 6, figure 6.3), the
Researcher implemented a second series of major interventions (section 6.6). The
objective was to improve the potential to sustain Lean practices and develop a culture
conducive to continuous improvement.
Throughout this study the role of the Researcher was to facilitate all of the above
interventions and investigate how LM could be adopted and importantly sustained by
CTE within a mature industry such as steel. This formed the basis of this study. The
approach to data gathering and analysis used to evaluate and adapt the above interventions
in support of a generalizable theory (RQ3) is covered in chapters 5 and specifically
chapter 7.
6.2 Identifying the ‘how’; the findings of the business diagnostic.
A combination of functional benchmarking, inquiries into available regional support, and
CTE’s lack of internal expertise associated with LM resulted in the NEPA best practice
dissemination programme being adopted by CTE (CTE, 2003a; CTE, 2004i). The NEPA
programme addressed fundamental concerns commonly cited by companies (NEPA,
2004) that included: where to start; what process should be followed (direction); and what

118
LM tools and techniques should be used to address manufacturing inefficiency.
Information that would help answer RQ1.
The NEPA model adhered to a two-pronged approach:
1. a business diagnostic that established the ‘as is’ condition of the business. The
resultant output was in the form of a diagnostic matrix (appendix C). The matrix cross-
referenced known problems with suitable countermeasures in the form of basic LM
tools and techniques (Herron and Braiden, 2006). Termed a productivity needs
analysis (PNA) it was conducted at the outset of the change programme and was
attended by CTE department heads and NEPA representatives (CTE, 2004g); and
2. a knowledge transfer process in the form of a workforce development programme
(section 6.2.3) and productivity interventions in the form of Master-Classes (section
6.3.2).
A synopsis of the process employed by NEPA and the conclusions drawn is covered next.
Data acquisition in support of this was gathered from observations during meetings, diary
notes, minutes of meetings, and interviews employed by the Researcher to clarify his
understanding of what had been observed or concluded from narratives.
6.2.1 Productivity Needs Analysis (PNA)
Data from the monthly business reports compiled over the previous two years included:
sales volume; turnover; financial metrics, speed, availability; recirculation; overtime and
many more were used as inputs for the PNA (NEPA, 2003). This culminated in the
identification of priority areas for the first year. The focus of attention centred on
manufacturing reliability. This confirmed the initial conclusions drawn from CTE’s
manufacturing performance (section 4.2). A summary of the PNA results are shown
below and were incorporated in the first phase of the recovery programme (CTE, 2004g):
1. process issues: upstream processes and equipment had not been optimised. This
resulted in a high percentage of ‘not right first time (NRFT). For example
approximately 13% x-ray recirculation, 8% returns from final inspection and 100%
of pipes required an average of 30 score marks per pipe to be dressed (source CTE
QC Dashboard March 2004). These had to be remedied during downstream
operations;

119
2. process issues and measures: Data gathered, in the form of CTE monthly business
reports during the FY 2013/14, corroborated high levels of NRFT in downstream
operations which had been countered by unplanned overtime (14.1% versus 5.0%
standard). There was a poor level of labour productivity (man hours/ metre) and
schedule adherence;
3. measures and tools: Labour productivity could be improved through the elimination
of NRFT. Tools such as problem solving, skill control, standard operations (SO), 5S
and SMED were highlighted as potential countermeasures;
4. tools and process: the tools identified could be applied to upstream process to
establish the required standard of workmanship and eliminate root cause of NRFT.
The results of the PNA gave credence to the adoption of the basic tools and techniques of
LM (section 3.4.1). Together with basic problem solving activities, it was claimed by
NEPA that the basic tools of LM, for example, 5S; SO, waste elimination, visual
management and continuous improvement, offered a series of low cost techniques that
would have a positive impact on operational efficiency and on established modes of
operation (NEPA, 2003).
To determine the extent of the knowledge of LM within CTE and therefore the training
required to support the initiative, NEPA undertook a Manufacturing Needs Analysis
(MNA) and a Training Needs Analysis (TNA). The following section considers the
results of this assessment.
6.2.2 Manufacturing and Training Needs analysis (MNA and TNA).
The assessment (appendix C) demonstrated a lack of understanding of the application of
Lean tools and techniques. This was viewed as a potential inhibitor (CTE, 2004n). The
value of LM was reinforced by a NEPA organised trip to NMUK to observe LM in
operation (CTE, 2004i). This visit demonstrated the gulf in operating practices between
NMUK and CTE (CTE, 2004i). The potential value to CTE of the successful application
of basic tools and techniques was highlighted. CTE declared that training in LM was a
fundamental pre-requisite for all employees (CTE, 2004n). The development of a training
programme is considered next.

120
6.2.3 Workforce Development
The second prong of the NEPA model provided the requisite training to address the lack
of knowledge within CTE (CTE, 2004n). It ensured that employees were capable of
speaking the same LM ‘language’. The Researcher assessed the programmes available
and selected an interactive five-day workshop delivered by external trainers. This was
preferred because the workshop was ‘practical’ rather than ‘theoretical’ and afforded the
maximum amount of transferable training (CTE, 2004i). Successful completion
culminated in the individual being awarded an NVQ Level 2 in Business Improvement
Techniques (BIT L2). However, in delivering this the Researcher had to overcome two
major ‘showstoppers’ raised by employee representatives (CTE, 2004d):
a) Lean was perceived by Team Members (TM) as a method for reducing employee
numbers; and
b) TMs interpreted that a failure to achieve the level 2 qualification would result in their
dismissal.
The recovery plan was premised on a progressive movement towards a new
manufacturing paradigm and a subtle shift in future employees’ terms and conditions
(CTE, 2004d). To achieve this, the support of the work force was deemed paramount
(section 4.2.2). Consequently, employees were assured that there would be no enforced
dismissals should someone fail to achieve BIT L2 (CTE, 2004i; CTE, 2004d; CTE,
2010d). However, to underline the dilemma that confronted CTE, the Researcher
communicated the urgency of the crisis situation. This promulgated the need to address
operational efficiency, improve competitiveness, and turnaround the business or face
closure. The disclosure gave meaning to the strategy and communicated the ‘need for
change’. The employees and their representatives gave their full endorsement to the
proposals (CTE, 2004d) and supported the objective that all employees would attend the
relevant training course planned 2004-06 (CTE, 2004n).
To ensure consistency of approach and understanding, training courses were arranged for
all employees regardless of seniority. Management attended the prescribed management
workshops that were held between February and July 2004 (CTE, 2004f). This included
training in kaizen, 7 QC tools, mentoring support, and workforce development. TMs,
Team Leaders and some managers attended the 5-day workshops listed above. A total of
42 workshops were delivered (source researcher file note), which included training in 5S,
product cycle times or TAKT times, the seven wastes, SOs, SMED activities, the need to

121
ask ‘why’ five times, and the value of constant plan, do, check, act cycles. A simple model
cart exercise enabled the attendees to apply techniques and visualise the variety of
‘wastes’ and the importance of standardisation.
To reinforce and demonstrate management commitment the Researcher and a senior
manager attended the start and finish of each workshop. This enabled:
- a visible display of management’s commitment to the process (congruence);
- the ability to stress the value of LM and the recovery plan (meaning);
- an opportunity to solicit how the TMs viewed the training and it’s applicability
(empathising); and
- to address concerns expressed by various employees (section 4.2.2) that “senior
management don’t care about what happens after initiatives are launched”.
6.3 Basic concepts introduced to support a new way of working.
This section continues the NEPA recommended approach by introducing: a) the enablers
required to facilitate the knowledge transfer process; and b) the LM techniques proffered
as the basic building block in support of continuous improvement.
6.3.1 Change Agent philosophy
CTE adopted the approach recommended by NEPA; a knowledge transfer process that
involved four separate Master-Class (MC) activities (Bateman and David, 2002) over a
twelve-month period during which the four Change Agents (CA) and NEPA team would
swap roles as outlined below:
First MC
NEPA helped set up the team, organise and facilitate the MC; The CAs observed and
assisted as required;
Second and third MC
Increasingly the roles were reversed which allowed the CAs to take over more of the
planning and running of the MC whilst the NEPA team monitored, assessed and
provided feedback.
Fourth MC
122
The CAs set up, organised and facilitated the MC; The NEPA team observed and
assisted as required. NEPA provided feedback during and at the end of the
programme;
The medium of MCs were the NEPA recommended approach to problem solving
activities. These were to be (ultimately) facilitated by CAs employed by CTE. MCs were
identified as a primary method for a) knowledge retention, and b) the ability to exploit
the knowledge of the workforce in the application of LM tools and techniques. A MC was
a thirteen week highly structured programme that demanded set routines and teach points
(Bateman and David, 2002). This approach was considered intrinsic to CI and a vital
element of the NEPA knowledge transfer programme (NEPA, 2004).
The above transition was supported by additional training (arranged by the Researcher)
that culminated in the CAs attaining an NVQ level 2, 3 and 4 in Lean BIT. The
appointment and associated training of CAs furnished CTE with the expertise and
capability to facilitate interventions and apply LM techniques in the post-training phase;
critical to knowledge retention within the host company (Herron and Hicks, 2008). This
support was identified as lacking in previous initiatives (section 4.2.2) and provided an
epicentre for the coordination and facilitation of mill based interventions.
The systematic approach of the MC adhered to a standardised methodology and
incorporated practices aimed at engaging and motivating employees in localised
improvement activities using basic LM tools (section 6.3.2).
The following section considers the primary Lean tools and techniques adopted by CTE.
Techniques that were considered the basic building blocks of LM (Bateman and David,
2002).
6.3.2 Lean tools applied: Launch phase (year one)
The basic building blocks of LM were informed by the literature reviews (section 3.4.1)
and guidance from the NEPA team. This section introduces the basic Lean tools and
techniques launched within CTE in year one and its value. The NEPA workforce
development programmes (section 6.2.3) ensured that all employees were trained in these
techniques. Competence was tested and culminated in the award of BIT Level 2.

123
5S
5S was a primary technique covered and practised in all training sessions, and applied in
all the work place activities. Within the first year teams were given time to establish the
required standard which was captured and displayed using photographs on an A3 sheet
(Standard Operation sheet, figure 6.5). Shadow boards were erected to support the
housing and retention of the required tools and spares (figure 6.4); “everything in its place
and a place for everything”. It was anticipated that this would be owned by Team Leaders
and supported by the teams to maintain the required standard and ensure sustainability.
The Researcher hypothesised that support during the post launch phase would be critical
if the new techniques were to be sustained. The Researcher had deduced from literature
associated with change programmes (section 3.4) and inferred from the sustainability of
previous initiatives (section 4.2.2), that the acceptance of change would take time.

124
Therefore, the Researcher ensured the value of the concept was stressed at all workshops,
training sessions, and workplace activities.
Figure 6.4: Examples of 5S practices adopted within CTE.

125
Standard Operation (SOs)
CTE had standard work procedures (SWPs) in place which detailed the full
responsibilities and duties of an employee and the prescribed sequence for completing the
assigned task. Fieldwork suggested that these were weighty tomes that were never used
or read by TMs (file note April 2004). However, NEPA (2003) had argued that SOs
(figure 6.5) were more effective because of their simplicity portraying on one A3 page
the fundamental requirement of the job. It was used as a standard to: assist training of
new employees; reduce variation in quality and productivity; and provide a platform for
further improvement.
The Researcher agreed with CTE that SOs would complement SWPs and would only be
introduced following an improvement activity in the associated work area. Since each
work area would be targeted to improve in the first three years, it was felt that this was a
realistic objective. Any activity undertaken in the mill would not be closed until a new
SO had been completed and TMs trained accordingly. SOs would be owned by Line
Managers and completed with the involvement of TMs.

126
Figure 6.5: An example of a standard operation sheet used by CTE

127
Kaizen
The third important tool in the Lean toolkit was Kaizen - the Japanese term for small
incremental continuous improvements involving everyone (Imai, 1986). Insights deduced
from literature reviews (Imai, 1986; Ohno, 1988), observations during benchmark visits
to NMUK and to Japan (section 6.5), and discussions with the NEPA teams highlighted
the importance of Kaizen. The Researcher reflected that with approximately 400
employees within CTE, this provided a major opportunity to tap into their knowledge,
generate ideas and deliver continuous incremental improvement.
The concept of Kaizen together with waste elimination achieved by engaged employees
captured the essence of the Toyota way (Sugimori et al., 1977). In September 2005, the
Researcher conducted a review of the suggestion scheme employed within CTE. Thirty-
six suggestions had been implemented during the period 1999-2004. The Researcher
interviewed a total of ten managers and TMs. The questions were confined to generating
an understanding of the existing suggestion scheme, asking for example: What did the
interviewee think about the existing scheme? What was their view of the benefit? Did
they believe the system to be beneficial or not (and why)? Was it effective? Were they
aware of it? Did they know how many suggestions had been generated within the last 12
months? If it was stopped, what did they believe the impact would be?
The analysis of the transcripts resulted in the Researcher declaring to CTE that the
suggestion scheme was ineffective, divisive and not conducive to the ethos of CI. The
consequence was that the existing suggestion scheme was replaced with a Kaizen system.
A system that was considered fundamental to continuous improvement as espoused by
NEPA and the literature on LM (Bateman and David, 2002). In support of this, the
Researcher set an expectation within CTE that all employees had to generate Kaizen ideas
as a condition of employment and not for some arbitrary award. This was a key learning
inferred as a result of the benchmark visit to NMUK and Japanese car plants, and deduced
from the literature (Imai, 1986).
Process Mapping
Process mapping did not form part of the original NEPA intervention. However, in order
to provide focus on the appropriate areas of the mill, process mapping was introduced by
the Researcher. The process map (figure 6.6) depicted the standard cycle time (TAKT
time) for each individual process within the H42; a holistic visual representation of the
mill at a macro level. This allowed the user to stand back, evaluate and question the

128
process. The red, amber, green traffic light system advanced by the Researcher,
introduced a visible management system that empowered the user to prioritise areas for
attention. This was founded upon an applied logic, based on fact, in the delivery of a
structured manufacturing improvement plan. The subsequent application of LM
techniques used in the targeting of priority areas (red) enabled individual elements to be
dissected into a micro level for further analysis. Using data and MC activities, the root
cause(s) could be determined and appropriate countermeasures developed.
Figure 6.6: An example process map used by the Researcher.
Fieldwork indicated that teams appeared to function more effectively when assigned
objective tasks linked to an agreed priority, understood what and why the area had been
targeted and had the tools to deliver the ‘how’ to improve the selected area (Diary notes
May to Oct 2004).
7 wastes
A Lean company focuses on the elimination of all forms of waste (Ohno, 1988). NEPA
espoused the value and necessity to reduce waste as a mechanism to eliminate
unnecessary costs within the process for example, reduction in high value stock and
improved process efficiency via reduced operational cycle times. Insights deduced from
the literature reinforced the value of this technique. For example, the elimination of all
forms of waste (seven wastes) can improve operating efficiency by a large margin (Ohno,
1988) and is the starting point of Lean thinking (Womack and Jones, 2003).

129
The Researcher considered the application of the seven wastes as an essential thought
provoker to be included as a mandatory element in all workshop activities. The TMs could
break down each stage of the prioritised task into micro level steps. All non-value added
activities such as one of the seven wastes would be questioned and where possible
remedied.
Line balancing of the area, coupled with the simultaneous (safe) movement of product
were one of the many and most prominent concerns addressed in work place
interventions. A repeat theme noted by the Researcher captured in field notes (Oct 2005)
relating to the first ten interventions conducted within CTE.
6.3.3 Other key tools and techniques
In addition to the above, NEPA stressed the importance of data and genchi genbutsu.
These were subsequently adopted by CTE as part of the recommended techniques to be
included within CTE’s launch of LM (CTE, 2004i).
Prior to 2004 actions agreed were undertaken on a paucity of data and a great deal of
guess work (CTE, 2004n). This was reversed with the insistence at the outset of the
recovery plan that factual data had to be used to support objectives, conclusions and
recommendations associated with any activity.
Genchi genbutsu (to go and see things first hand for yourself) ensured/ forced participants
of any activity to visit the place where the work would be undertaken (Ohno, 1988). An
activity that would enable participants to see first-hand the extent of the issue in question
and make more informed decisions. The problem could be observed, the issues could be
discussed and understood, as well as the potential for, and consequences of any envisaged
change.
The combined and structured approach listed above of prioritised problem solving
coupled with the application of LM tools and techniques provided the starting point for
CTE on its quest to adopt LM.
To facilitate progress the Researcher supported CTE in the introduction of an intervention
to develop a form of governance. A guiding coalition identified as fundamental was
established (sections 3.5 and 4.2.3), to provide direction and support during the
implementation phase.

130
6.3.4 Project governance
Achanga et al. (2006) argued that the introduction of any change programme demanded
strong leadership, a clear vision and activities aligned to delivering the vision. To address
this and provide support for the implementation phase a steering group was established
by the Researcher. The team comprised of full and part time members who were assigned
to develop the plan and to deliver the vision (CTE, 2007e). They also provided a focal
point for decision making, setting direction and providing dedicated ownership post the
launch; fundamental traits shown to be absent in previous initiatives.
The project was named the OMEGA project and coined from the phrase (CTE, 2004n):
Optimise Manufacturing Excellence, provide for business Growth and gain
competitive Advantage.
The steering group comprised of managers from operations, which included (the
Researcher), Engineering, Human Resources and Technical departments. The steering
group was perceived as comprising those most capable of ‘making things happen’ (CTE,
2004e; CTE, 2007e).
The framework shown in figures 6.2 and 6.3 guided the study. However, the three-year
recovery plan developed by the Researcher (Appendix A, figures A1 & A2) pinpointed
the priorities to target and formed the basis of CTE’s recovery programme. A combination
of ambitious actions set against realistic and accepted timescales to support the required
transformation (CTE, 2004e). The plan targeted all aspects of manufacturing
performance, for example quality, cost and delivery, and was subdivided into a detailed
annual plan (Appendix A figure A3). To maintain focus and prevent “project creep”, the
Researcher employed an ‘Omega charter’ to depict the individual objectives, the key
activities, deliverables and timeline of each priority action (Appendix A, figures A4 &
A5). Thus, objectives were assigned to owners equipped with clear targets who in turn
provided feedback at subsequent meetings. The combination of the above would provide
CTE with a structured programme that could be monitored and managed (Appendix A4).
These were key components that supported the implementation phase of the journey, a
key omission in previous initiatives (section 4.2.2).
The steering group was charged to meet twice per month (source Omega steering group
meeting minutes) to support the application phase of the project. Feedback at these
meetings had to be founded on accurate data that reflected the original status of an

131
intervention and the progress made. The fortnightly meetings also provided an avenue for
the Researcher to update CTE with insights generated and progress made relative to this
study.
The next section considers the HR policies introduced by the Researcher. These were
launched concurrent to the launch of LM tools and techniques. The objective was to
develop an approach that engaged employees in support of the business transformation.
6.4 Human Resource Management Strategy
The primary objective of the HRM strategy is to maximise the capability of employees
and motivate them in the successful execution of business strategy (section 3.5). The
inductive analysis of the interviews conducted with CTE at the outset of this study,
highlighted the main themes to be explored (figure 5.6). One of the main themes included
the review of the prevailing HRM policies. Practices that could have contributed to a
disengaged workforce. The Researcher had previously developed a hypothesis drawn
from insights informed by interviews and literature that “the ability for CTE to introduce
and sustain a new way of working was proportional to its ability to transform its HRM
policies”. The revised approach had to be aligned with and supportive of the recovery
plan. Furthermore, it had to cater not for just existing employees but also for new
employees associated with CTE’s flexible mode of operation (CTE, 2004d; CTE, 2008e).
The following sections give prominence to the policies introduced. Policies that were
inferred following the analysis of interview transcripts and deduced from literature
(section 3.5). The policies (themes) portray a logic in the sequence of introduction. For
example, it made sense to start with recruitment and training prior to ongoing
development of skills and the various forms of engagement. However, learning derived
from one technique was used to enhance or support other techniques as they matured and
experience was gained from their application.
Concern had been expressed by CTE during the initial scoping of this study that the
flexible approach to manning, linked to activity, would result in new recruits being
ignorant of the new practices.
“New starters will have not received any training in the new way of working. There is a
danger that when we need to recruit, new starters may not have the ability or desire to
work the way we want them to” (Production Manager CTE, Nov 2004).

132
This had the potential to dilute the effectiveness of LM techniques over time and
potentially impact sustainability. Best practise HRM literature (section 3.5) extolled the
need to cultivate the values and expectation of new recruits at the outset of their
employment.
6.4.1 Recruitment and Training
The analysis conducted by the Researcher of the ‘as is’ state in 2004 resulted in the
following interventions by the Researcher to the existing recruitment policy:
1. the reformation of the blue-collar recruitment policy. A basic skill test was introduced
in which new employees had to attain a minimum level in numeracy and literacy;
2. the induction period was extended from 2 days to 2.5 weeks to aid ‘on and off the job’
training and set expectations of new starters (CTE, 2010c); giving meaning and setting
direction (Sullivan, 1988);
3. the elimination of job specific titles. Individuals were recruited as team members
employed in the manufacture of pipe. Demarcations were removed which enabled
increased flexibility and duties limited only by training and capability;
4. terms and conditions were revised which resulted in the elimination of numerous
grades and legacy agreements that inhibited flexibility (CTE, 2010c). TM grades were
reduced to three with 80% of TMs paid the higher rate of grade 2 to allow job rotation.
The above actions reflected the seriousness of CTE’s new strategy and need to eliminate
aged agreements. The additional cost was absorbed by the increased benefits derived from
the new manufacturing paradigm (CTE, 2004d).
6.4.2 Training and Development
Guest et al. (2003) and Harter et al. (2002) argued that training ensured that employees
were better equipped to adapt to change, innovate and exhibit behaviours that were
conducive to, and focused on the business priorities. It was agreed with CTE that the
upgrading of employee skills on-the-job would occur through job rotation, job
enrichment, and off-the-job training. This supported the goal of producing high quality
products and services in the most cost effective way. Section 6.2.3, outlined the training
programmes introduced whilst section 6.6.4 describes the refresher training.

133
Employees at all levels were encouraged to take on further advanced training which in
some cases involved IOSH and NEBOSH safety training, PCN level inspection courses,
HNC, HND, and degree level courses. Section 3.5 had introduced the benefit as a non-
financial motivator and as a means to improve business performance. Consequently,
training and further training was inferred by the Researcher to: a) advance and broaden
the capability of individuals and by default, the mill; b) be morally correct especially
when linked to the potential of future lay-offs; and c) a prime non-financial motivator.
The training would furnish the business with a platform on which to build. The subsequent
interventions introduced by the Researcher were on how to stimulate and sustain further
improvement. The next section considers the reward system that was modified to act as a
motivational force.
6.4.3 Reward System
The reward systems discussed in section 3.5.2 proved to be effective mechanisms for
enhancing individual performance (Stajkovic and Luthans, 2003). Corus group policy
limited CTE’s ability to use financial methods as a motivator (CTE, 2010c). However,
CTE did have some flexibility in the establishment of locally agreed bonus systems.
These could be used to motivate employees to adopt the required behaviour. In 2004, the
Researcher secured approval to align the weekly press target and bonus payment with the
planned improvements identified in the recovery plan. If the press target was achieved in
the week, the bonus was realised; if the target was not achieved then no bonus was paid.
This occurred following extensive planning and consultation with employees and
employee representatives to secure their acceptance. The main concern expressed by
employee representatives was that “Management will rob us of our bonus by introducing
targets that we can’t achieve. Why should we support this?” (Shop Steward UNITE, Jul
2004).
The need for change had been established and agreed (section 6.2.3). However, the
emotive element of ‘robbing’ someone of their bonus had to be addressed. CTE was
confident of its ability as well as the need, to deliver the improvement in manufacturing
performance; without which the business may not survive. Therefore, it was agreed
between CTE and the employee representatives that both parties would fully support the
improvement plans. However, the production targets could not be raised until a) the
changes to the process and practices had been implemented, and b) the new production

134
rates were proved to be achievable. This was agreed (source: Lump Sum Bonus meeting
minutes, Oct 2006). Once proven and increased, the revised target was used to calculate
the conversion cost as part of the commercial costing model. The targets would not be
reduced subsequently.
To support visual management and target attainment, electronic boards were installed
which depicted the shift output against agreed targets (figure 6.7).
Figure 6.7: An example of typical communication boards posted around the H42
The new method of communicating openly and honestly between the two parties (CTE
and Union) had a positive impact (diary note Oct 2006). However, to be effective
communication must be a two way process that provides information and feedback to
employees; an initiative that once started must be sustained (Lucey et al., 2004).
The next section considers the communication methods introduced by the Researcher.
6.4.4 Communication
Section 4.2.2 revealed that CTE failed to communicate any sensitive or pertinent
information within the business. Section 3.5.2 had stressed the importance of
communication as a motivational force. The Researcher had proffered that CTE’s
recovery plan had to be founded on an open and honest communication process. The
Researcher’s belief deduced from literature reviews (section 3.5) was that in sharing
information employees would develop a sense of belonging and become engaged with

135
the business strategy. The new open policy would provide transparency of what was being
undertaken and what needed to be achieved.
The modes of communication introduced by the Researcher included:
- annual time out for business (TOFB) team briefs owned and facilitated by the senior
management team and departmental heads. These varied from 2 to 4 hours and were
interactive, sharing business performance, challenges and objectives;
- quarterly off-the-job team briefs of circa forty-minute duration run by the senior
production manager. These provided updates on performance and shared key
messages;
- monthly toolbox talks of 15 minutes duration delivered by line supervisors. These
usually covered a brief overview of the performance in the period plus any key
messages;
- ad hoc team talks or ‘brown paper’ exercises that covered pertinent and important
information;
- notice boards that displayed important but not sensitive information;
- gripe session every quarter. 6 employees picked at random from various functions
would over a cup of coffee one hour session, ask the Researcher (Senior Manager)
questions or raise any concerns they wanted; and finally,
- as and when required, documents were attached to TM payslips or sent to home
address.
For consistency, the recovery plan and progress made against key objectives were at the
core of the communication content. Lidz (1973) stated that the consistency of the message
was important and influenced behaviour, particularly when introducing new concepts.
Practices that have been in place for a long time nurture employee expectations.
Employees became accustomed to what was expected of them (Rousseau and Wade-
Benzoni, 1994) and operated accordingly. Therefore, as values or practices changed it
was essential that communication and management behaviour was consistent and
supportive of that change (Mayfield et al., 1998).
The annual launch of CTE’s business strategy aimed to secure TM commitment to
personal objectives that they would own and deliver. The intention of the Researcher was
to engage employees in the change process and heighten the expected contribution of
TMs to deliver the required transformation.

136
In a bid to determine the next steps in the evolution of this process, the Researcher was
presented with an opportunity to undertake a benchmark visit to Japan; to visit the birth-
place of LM.
6.5 Benchmarking Japan - The Right Direction
In 2008 the Researcher joined a North East delegation that was afforded the opportunity
to spend two weeks in Japan. The over-arching aim of the Researcher was to explore and
understand how the principles of LM were applied and sustained within the Japanese
manufacturing sector. Furthermore, to generate insights that may result in the
development of new themes to pursue. Equally important for the Researcher was to gain
an appreciation of Japanese culture, values and drivers as a contextual backdrop to the
Japanese approach to LM. The Researcher sought to use this experience as a means to
explore how LM had evolved and was being deployed within the environment in which
it had originated and to subsequently transplant good practices within CTE. The primary
method of data gathering was observation and interviewing. Furthermore, discussion with
other delegates during periods of reflection on places visited presented an opportunity to
validate findings.
6.5.1 Common themes uncovered.
The visit incorporated a total of twenty events in ten days with an average working day
of fourteen hours. The Researcher visited three car plants: Toyota, Honda and Nissan;
seven suppliers to car plants; one process plant; one steel works; the Sony media centre;
the Toyota museum and exhibition centre; lectures on Japanese economy, total productive
maintenance and total quality manufacturing; a trip on the bullet train, and two receptions
at the Japanese Embassy.
At every plant visited the senior management team provided an overview of the company
values and product manufactured. This was followed by a plant tour in which the
Researcher observed the plant operations and questioned methods employed.
The Researcher collated data from information provided and maintained files notes
relative to his experience and what he had observed. These were subsequently coded and
filed with the main themes (figure 6.1). Content analysis provided the main method for
evaluating data gathered. Following a period of reflection linked to knowledge gained

137
from literature reviews, the identification of repeat themes, and discussion with delegates,
the Researcher concluded the following common themes:
- the company’s goals were clear and were cascaded to all employees;
- 5S, waste elimination and standardised operations was reinforced at every company;
- visual management: stations and lines displayed company goals and had visible
indicators of shift output against plan;
- NRFT: every operator was responsible for the quality of the product they produced.
Poka yoke devices were used in support where practicable;
- Kaizen: all employees were expected to identify areas of improvement;
- engineering support: Prime focus was given to the availability of machinery.
Dedicated teams maintained equipment in line with a strict planned maintenance
programme;
- Kanban: the process utilised a pull system, downstream operations worked in accord
with agreed cycle time and pull from upstream operations;
- team support: in the event of a line stoppage, support from other areas and ranks was
immediate;
- genchi genbutsu: the need to visit gemba and see the problems first hand; and
- schedule adherence was priority; all actions were centred on delivering what had been
promised.
The Researcher reflected that it is easy to associate LM with the Japanese culture;
however, this would be a gross error of judgement. The companies visited demonstrated
a consistent approach in their application of ‘basic’ Lean tools and techniques.
Techniques consistent with those listed in section 6.3.2 and deemed sufficient to deliver
significant gains. To counter the cultural issue, Nissan UK based at Washington, was
considered one of the most efficient and productive car plants in Europe (NEPA, 2004;
Mann, 2012). This was premised on its dedication to LM practices. Therefore, such
practices should not be attributed to culture but to operational strategies and a desire to
continually improve.
The visit to Japan provided the Researcher with two key areas of additional
understanding, namely the critical importance of schedule adherence and of
communication.

138
6.5.2 Two important lessons.
Schedule adherence: Japanese supply chains were devoted to schedule adherence and
the ability to create customer value using employee kaizen systems. Company directors
extolled the virtue of, and pride in delivery performance as a prime requisite. However,
the reality unearthed was that the financial penalties associated with late delivery were
totally unacceptable; something with which CTE could empathise.
The stability in operations was said to be achieved through dedication to basic techniques
such as 5S, waste elimination, and standardised operations; tools that helped maintain
control of the process by reducing variability. Proactive maintenance programmes
improved reliability of equipment and therefore plant availability. The combination
bolstered the unit’s ability to deliver on its promises. Employee Kaizen was expected and
used to improve the process which helped to guarantee the schedule. Kaizen delivered
incremental improvement under-pinning the philosophy of cost reduction (adding value)
in subsequent years.
The second area of learning reinforced the value of communication.
Communication: Various display boards and banners provided a constant reminder of
shift output against target, of annual strategic objectives, and of successful Kaizen; a
medium for communicating goals and celebrating success. This was presented as a
method for setting direction and giving meaning, for sharing learning and for promoting
the success of individual employees and teams.
When asking a Japanese worker: “What was the production target for the day? What did
they still need to achieve? Or what was the strategic improvement target?” In all cases a
full and precise answer to every question was given. Thus, communication played a vital
and motivational role within the process of LM serving to influence human behaviour.
6.5.3 Synopsis of the visit
The visit reinforced the validity and appropriateness of the new working practices
introduced at CTE by the Researcher. It strengthened the Researcher’s resolve to promote
business and individual objectives through an effective HK process denoted in section
6.6.6 and deduced from literature (section 3.5.3). It substantiated the value of the TM
population and the opportunities that could be exploited by engaging individuals, and

139
finally, provided a positive ‘feedback loop’ that the basic tools applied within CTE were
sufficient if applied rigorously.
6.6 Sustaining the new way of working
The introduction of LM and HRM policies (sections 6.3 and 6.4) had provided CTE with
a platform on which to build. Consistent with the Action Research cycle a number of
iterations had been carried out on the interventions employed during the implementation
phase. Sufficient evidence (in the form of interview statements, CI dashboards, company
reports and observations (section 7.5)) suggested that the techniques were still being used
two plus years after the introduction of LM. However, fieldwork which included the
analysis of interview transcripts, observations and the analysis of company meeting
minutes, reports and dashboards, indicated that the application of the interventions
described earlier, were inconsistent. Furthermore, stakeholders although involved, were
not necessarily committed to the new workshop practices. For example, CI was still
perceived to be the responsibility of Change Agents (CA); the application of 5S and use
of SOs was sporadic, and there was an absence of ownership of techniques/ objectives at
TM level.
The analysis of data gathered (section 7.6) by the Researcher during the implementation
phase (first two-three years) identified a number of shortcomings with the interventions
described above. For example, the Master-Class structure was considered to be overly
bureaucratic, employees in some areas were reverting to old habits, the Kaizen system
lacked structure, and Lean practices had to be driven by CAs as opposed to owned locally.
Informed by experience (fieldwork and data analysis) gained in the first two/ three years
of the study, by insights deduced from literature, and from learning inferred from
benchmark visits, the Researcher introduced the following interventions. Interventions
introduced from approximately year three, a period described by the Researcher as the
sustainability phase (figure 6.3).
6.6.1 Compliance auditing
To motivate employees in the use and importance of 5S and standard operations (SO) the
Researcher introduced compliance auditing. The Researcher with the aid of the CAs
developed a checklist of key criteria which resulted in an assessment of the team in each
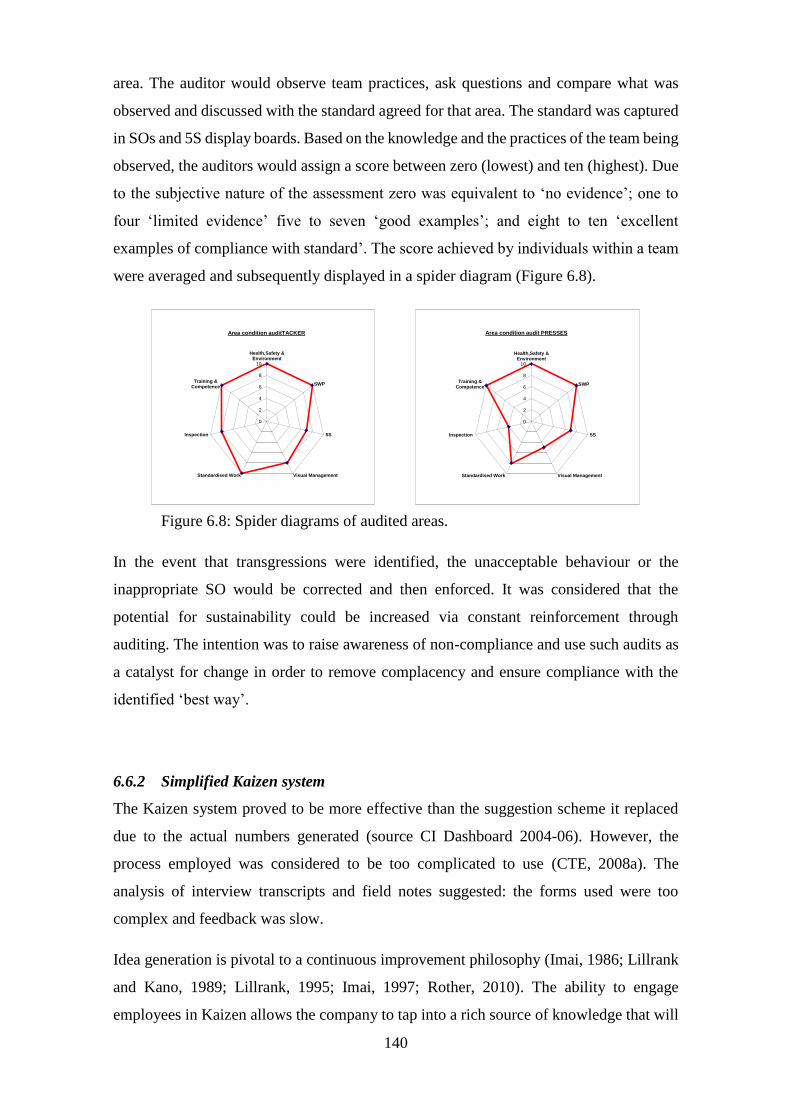
140
area. The auditor would observe team practices, ask questions and compare what was
observed and discussed with the standard agreed for that area. The standard was captured
in SOs and 5S display boards. Based on the knowledge and the practices of the team being
observed, the auditors would assign a score between zero (lowest) and ten (highest). Due
to the subjective nature of the assessment zero was equivalent to ‘no evidence’; one to
four ‘limited evidence’ five to seven ‘good examples’; and eight to ten ‘excellent
examples of compliance with standard’. The score achieved by individuals within a team
were averaged and subsequently displayed in a spider diagram (Figure 6.8).
Figure 6.8: Spider diagrams of audited areas.
In the event that transgressions were identified, the unacceptable behaviour or the
inappropriate SO would be corrected and then enforced. It was considered that the
potential for sustainability could be increased via constant reinforcement through
auditing. The intention was to raise awareness of non-compliance and use such audits as
a catalyst for change in order to remove complacency and ensure compliance with the
identified ‘best way’.
6.6.2 Simplified Kaizen system
The Kaizen system proved to be more effective than the suggestion scheme it replaced
due to the actual numbers generated (source CI Dashboard 2004-06). However, the
process employed was considered to be too complicated to use (CTE, 2008a). The
analysis of interview transcripts and field notes suggested: the forms used were too
complex and feedback was slow.
Idea generation is pivotal to a continuous improvement philosophy (Imai, 1986; Lillrank
and Kano, 1989; Lillrank, 1995; Imai, 1997; Rother, 2010). The ability to engage
employees in Kaizen allows the company to tap into a rich source of knowledge that will
0
2
4
6
8
10
Health,Safety &Environment
SWP
5S
Visual ManagementStandardised Work
Inspection
Training &Competence
Area condition auditTACKER
0
2
4
6
8
10
Health,Safety &Environment
SWP
5S
Visual ManagementStandardised Work
Inspection
Training &Competence
Area condition audit PRESSES

141
add value to the business (diary note, Japanese benchmark visit, section 6.5). NEPA had
previously espoused the value of Kaizen. The Researcher’s intervention involved the
introduction of: a simple card system (figure 6.9) to capture kaizen ideas; and a simplified
structure to enable the process of idea generation (figure 6.10).
Figure 6.9: Front and reverse side of a Kaizen card used by CTE.
The cards were 150mm long x 75mm wide. They were designed to fit in the top pocket
of the overalls worn by employees. They were equally housed in plastic holders at various
point around the mill. The operator completed the Kaizen card by adding basic details
informing the business of what the problem was and what could be done.
The spirit and definition of Kaizen was outlined in all BIT workshops (sections 6.2.3 and
6.6.5) and nurtured through Master-Class and intervention activities, linked to improved
safety, cycle time, or quality).

142
Figure 6.10: an extract from a presentation made to CTE (Sept 2013) showing the kaizen
flow process.
The Kaizen would be submitted to the Line Manager who would conduct an immediate
evaluation and add any further comments or advice. The Kaizen would be forwarded to
the Omega steering committee where it would be accepted or rejected. Only the top ten
would be accepted, the remainder rejected. The employee’s TOFB booklet (section 6.6.5)
would be upgraded accordingly.
6.6.3 Visual management within the factory
Fieldwork conducted within the mill and feedback captured during interviews between
2005-07 indicated a propensity for employees not involved in Lean activities such as
Master-Classes, to consider the recovery plan to have faltered. Numerous authors
(Bateman and David, 2002; Dennis, 2005; Liker and Meier, 2006) had stressed the
importance of visual management as a mechanism for communicating strategy and
providing updates. This concept was reinforced during the Japanese benchmark activity
(section 6.5). To overcome this perception and communicate what had/ was being
achieved; and use what had been done to a) motivate others and b) generate further ideas,
the Researcher launched annual brown-paper events (figure 6.11). This was to be
undertaken in addition to the TOFB workshops (section 6.6.5).

143
Figure 6.11: Examples of visual management deployed within CTE.

144
6.6.4 Workforce development phase 2
During the implementation phase, the analysis of interviews and fieldwork associated
with training and knowledge retention of Lean inferred that knowledge retention was poor
in areas where Lean tools and techniques had not been employed (section 7.6). The lack
of competent practitioners to facilitate Master-Class activities was considered as
fundamental to this failing. However, it also reflected a period when CTE was still
developing the required skills within its CA. To address this the Researcher developed
and introduced a refresher training course with the following objective:
1. to remind attendees of the basic LM tools and techniques, its value and the method of
application. The two and half day refresher-training course in Lean tools (See
appendix G) would be used to reinforce TM understanding and comprehension. This
was to be followed by a range of activities which provided an opportunity to apply
the learning. The main difference between the training completed in 2006 and the
refresher programme was that CTE now had resource available in the form of CAs,
to own and facilitate the subsequent interventions.
6.6.5 Problem solving interventions
Research conducted by the Researcher (interviews and questionnaires) exploring the
effectiveness of the Master-classes approach (section 6.2.3) during 2004 and 2005,
concluded that as employees became increasingly familiar with the process, the
workshops were perceived as overly bureaucratic and time-consuming (CTE, 2006a).
This was in spite of the benefits being derived from adherence to the process.
84% (21 out of 25) of attendees interviewed had expressed that motivation to attend or
facilitate workshops was tainted by the perceived complexity and tedious ritual of teach
points. Without detracting from the spirit of the methodology the Researcher sought to
develop an approach that could be applied consistently. An approach that would eliminate
the extended structure that previously de-motivated participants. The outcome was a
slightly altered approach termed ‘problem solving’ interventions. The agenda deployed
and launched incorporated the following stages:
- charter stating objective and scope (appendix A);
- brainstorming of ideas and actions;
- development of 5M cause and effect (Ishikawa) diagram;
- transfer of data into a 3C action table;

145
- identification and agreement on the top 10 priorities;
- action owners and plans agreed;
- date of next meeting.
To support Lean sustainability the Researcher introduced Hoshin Kanri (HK). HK
(section 3.5.3) was employed to disseminate strategic objectives and engage employees
at all levels. The following sections outline the Researcher’s approach in the evolution of
the HK process and its contribution to sustaining performance; an approach that evolved
as a consequence of the AR cycle (figure 5.2).
6.6.6 Hoshin Kanri
The value of HK was as a tool that sustained and fostered the introduction of a vision of
strategic intent (Ansoff, 1970; Ackoff, 1981; Mintzberg, 1994; Cowley and Domb, 1997).
The approach encouraged the required adaptive behaviour (Cowley and Domb, 1997) and
commitment from participatory stakeholders (Herron and Hicks, 2008). The ability to
successfully deliver and sustain any business vision is proportional to the clarity of the
challenge ahead and the ability to engage the workforce to pull in the same direction
(section 3.5).
HK was introduced within the business by the Researcher in late 2006. Pre 2006 the
annual objective setting and appraisal process within CTE only applied to senior and
middle management grades (CTE, 2010c). Objectives were cascaded to the subordinate
management team with little or no discussion as to the strategic rationale (CTE, 2005c)
or involvement of other functions. Consequently, there was neither vertical nor horizontal
strategic alignment of goals.
Deduced from literature (Akao, 1991; Juran, 1992; Cowley and Domb, 1997) and inferred
from benchmarking visits with NMUK (NMUK 2006) and Japanese plants (section 6.5),
HK offered a structured methodology to cascade or ‘Zedd’ from level 1 group goals to
level 4 and 5 team member objectives to achieve this goal (figure 6.12). A process if
deployed correctly could engage all stakeholders in an aligned approach to delivering the
business objectives.

146
Figure 6.12: Strategy deployment cascade process.
The Researcher adopted a six-step approach (Appendix H) to the development and
deployment of the business strategy; a process that continued to be refined each year. The
adopted approach translated business goals into TM goals in a language they could
comprehend (CTE, 2010c). The level 5 TM objectives were disencumbered and
advertised as: ‘the key three’ and later ‘the four to know’ followed by ‘ACT together’; see
table 6.1.
Year Aim in terms of Number of accidents
Cost reduction
%
Ave No of good Seam / shift
H84
Ave No of pipes Pressed/ shift
H42
Terminology used
2007-08 0 55 105 The key three
2008-09 0 5 57 113 The four to know
2009-10 0 5 57 113 The four to know
2010-11 0 5 57 114 ACT together
Table 6.1: the key business goals communicated at team member level.
The goals targeted safety, cost reduction and speed of work which are expanded upon
below:
Safety - ‘Zero’ reflected the aspiration of the company to achieve zero lost time accidents
in a year;
Objecti Strategy KPI
Objecti Strategy KPI
Objecti Strategy KPI
Level
Level 4/5 Team member
Level
Level
Group
Business
Department

147
Cost Reduction - 5% in 2008-11; represented the aim to reduce cost of operation by 5%.
This was achieved through an improved focus on greater control of consumables, energy
savings etc.; and
Production - “55; 57” represented the average number/ shift of good weld seams that
were passed out of the 84” pipe mill for every shift worked. “105; 113; 114” the average
number of pipes pressed in the H42 for every shift worked.
The cascade process would be deployed during the annual launch of the business
objectives. This would involve an interactive Time Out For Business (TOFB) workshop.
The interactive process would allow TMs to discuss and agree the 5 key objectives that
they would commit to and deliver over the next 12 months. For example, in the first TOFB
session, the commonly agreed TM objectives for ‘zero’ accidents included: adherence to
safe working procedures; the correct use of the immobilisation system; and wearing the
appropriate personal protective equipment for the task identified.
A summary of the TOFB presentation, business objectives, and the TM’s personal
objectives would be captured in a newly developed TOFB booklet (figure 6.13). The
TOFB booklet was developed and introduced by the Researcher and would allow every
operator to capture their personal objectives and record activities they had completed
during the year. The activities would be countersigned by a Line Manager which would
validate TM contribution.

148
Cover page and key TM targets of the time out for business (TOFB) booklet.
Extracts from TOFB depicting challenges, HK process, goals and 5S.
Extracts from TOFB depicting CI, and objective scoping.
Extract from TOFB depicting contribution towards goals and record of achievement.
Figure 6.13: Extracts from the time out for business booklets issued to all TMs.

149
Whilst considered by stakeholders within CTE to have been a successful step forward,
the Researcher was mindful that the completion or not of the book was linked to the
individual’s determination and commitment to support the business. There were no
repercussions if the individual failed to comply; a failure noted with previous initiatives
and covered in section 4.2.2.
The intervention proffered by the Researcher was to introduce a closed-loop appraisal
system in support of the HK process. The appraisal process is introduced in the next
section and was used to assess employee contribution in a more objective manner (CTE,
2009e).
6.6.7 Team Member appraisal process
The HK process provided CTE with an effective means to cascade its strategy and agree
TM objectives. The TOFB booklet allowed TMs to capture and prove their contribution.
The appraisal process would provide an objective method to assess TM performance,
their contribution to the H42 strategic goals, and a means of motivating the desired
behaviour. The TMs would be appraised on job related skills, commitment, flexibility and
team working. An example of the TM appraisal criteria is shown in appendix J.
The Researcher took advantage of a change in UK law that resulted in the existing ‘last
in, first out (LIFO) de-selection process used by CTE, becoming illegal due to age
discrimination (CTE, 2009e). The new appraisal process with additional elements such
as disciplinary record, attendance, and a token point system for service rendered, was
offered as a suitable alternative. Employee representatives considered and accepted the
appraisal process as a fair and objective system. Consequently, the process became a
fundamental constituent of the union approved process to identify employees at risk and
therefore to be ‘laid-off’ during periods of low activity. The Researcher closed the loop
by setting an expectation that an employee’s performance rating coupled with their
demonstrable commitment to business goals would be recognised as superior to those
who did just enough or ‘soldiered’(Taylor, 1911).
The academic literature covered in detail the value of employee engagement, of strategy
deployment coupled with ownership and accountability, as well as the need to motivate,
engage and lead teams in the delivery of business objectives and transformation.

150
Moreover, the successful engagement of employees was proffered as a source of
competitive advantage (section 3.5). In reviewing the literature the Researcher was able
to reflect on the advantages of the above concepts and link them with the benefits and
concerns associated with lay-offs (section 3.5). This was of interest due to the modus
operandi of CTE with respect to temporary contracts. The Researcher comprehended the
value of each of the above concepts and recognised the value of linking these together. A
mechanism that could be used to engage and motivate employees to sustain LM and
commit to business objectives, with the ability to retain the most capable employees
during a lay-off period.
The introduction of each of the above concepts discussed in this section may be deemed
as solving individual problems (single loop learning). However, the iterative and
interwoven process was instigated to enable the required change in culture so that the new
practices became accepted as the norm (double loop learning process).
The next section provides a brief overview of the key activities introduced in this section.
6.7 Summary
In 2003 CTE was identified as a business in decline and facing the threat of closure. This
prompted the development of a recovery plan aimed at stemming the losses and building
a platform to turnaround the business. The underlying philosophy of the plan was the
need to transform the operating practices through the introduction of LM. This chapter
has introduced the major interventions launched at the outset of CTE’s transformation
with the support of NEPA (sections 6.2 and 6.3), and by the Researcher during the launch
phase (section 6.4), and during the sustainability phase (section 6.6).
The interventions implemented by the Researcher during the sustainability phase were
subsequent to research conducted during the implementation phase (years one to three),
and incorporated learning from a benchmark trip to Japanese manufacturing companies
(section 6.5).
A combination of inductive analysis and data deduced from literature culminated in a
series of tools, techniques and concepts to be employed to kick start CTE’s Lean
transformation. For example, what the Researcher did as an implementer of Lean. These
have been introduced and explained in this chapter.

151
The next chapter presents the application of research and research methods that
underpinned the research strategy. For example, what the Researcher did as the
Researcher.


152
Chapter Seven: Research in action
7.1 Introduction
This chapter outlines the approach adopted by the Researcher in the application of the
research methods outlined in chapter 5. Section 7.2 identifies the main themes pursued
and the ‘conceptual framework’ agreed between CTE and the Researcher which guided
this study. Section 7.3 reiterates the research philosophy employed. Section 7.4 describes
the AR cycle used to evaluate the interventions listed in chapter 6. Data gathering and
analysis associated with the research application (and questions) is discussed in sections
7.5 and 7.6.
7.2. An agreed approach
The Action Researcher as an agent of change studies change over a prescribed time
interval (Bouma and Atkinson, 1995). This contributes to the development of theory and
the transfer of new knowledge during the change process (Cunningham, 1995). The
innovative practices introduced in this study were expected to encompass a period of
around seven years to implement. This comprised three years to establish an enabling
platform and an additional three plus years to demonstrate sustainability. Due to the
extended nature of the longitudinal study it was important to: a) identify the main themes
to be investigated; and b) agree a framework to guide the Research.
7.2.1 The development of the main themes
To gain an understanding of the predicament facing CTE the Researcher undertook a
series of exploratory (unstructured) interviews (Oppenheim, 1992). In depth interviews
that are associated with idea collection as opposed to data collection. The output provides
the researcher with the beginnings of a conceptualisation of the problem (Oppenheim,
1992); themes that form the basis for further investigation.
The Researcher conducted 16 unstructured interviews with the Senior Management from
within the business. The objective was to ascertain what they perceived as the main issues
affecting the business and its plight. Furthermore, based on their knowledge and
experience, what did they consider pertinent and required to address this predicament.
The output of the interviews, informed by content analysis, provided a list of general

153
themes to consider (section 5.4 and figure 7.1) and formed the basis for the research aims
and questions (section 1.3).
Figure 7.1: The main themes identified at the outset of this research programme.
The insights generated were used to inform the questions to be asked in a second round
of exploratory interviews. Approximately 30 semi-structured interviews were undertaken
across a broad range of functions and hierarchies. For example, managers within
technical, commercial, engineering and operational functions, and TMs from operational
and engineering disciplines.
The associated questions were more focused in order to develop a greater understanding
of stakeholder perception of specific issues linked to the main themes (figure 7.1). For
example, what did they believe to be the main challenges for CTE? What were the
strengths of the 42” mill? How would they describe the role of leadership within CTE?
What was their view on the success or failure of previous initiatives? What did they
believe would support the introduction of a new initiative?
The Researcher captured key comments on ‘Post-it’ notes and attached them to a sheet of
brown paper (figure 7.2). The main themes (figure 7.1) were used as the category
headings. Repeat comments were grouped below the category heading forming a
selection of sub-themes. The greater the frequency of a comment or topic mentioned
(content analysis), the higher the importance it was given. This resulted in the
development of the ultimate core themes to be pursued (figure 7.3). These were presented
to CTE and designated as of primary interest in the development of a sustainable
transformation.

154
Figure 7.2: An example of method employed to visualise the data captured.
Figure 7.3: Iteration identifying main themes to be pursued.
The output was used to inform the Research questions, develop hypotheses (section 1.3),
and direct the areas for further study. The Action Researcher was now focusing on a topic
of genuine and mutual benefit to the company and the Researcher.
7.2.2 The conceptual framework
The Researcher developed a framework to support the planned research activities against
an indicative timescale. Figure 7.4 reflects activities associated with the establishment of
the recovery plan and the implementation phase, whereas Figure 7.5 illustrates key
actions associated with the development and sustainability of the new mode of operation.

155
It was understood for example: the workforce development programme would take in
excess of two years; capex approval would be spread over five years; and change agent
development over eighteen months etc. Furthermore, it was suggested that the
transformation would take approximately five years, and that sustainability would need
to be demonstrated following the introduction of techniques.
This inductive approach provided a starting point; a series of planned (general) activities
in readiness to launch the change programme. The main interventions were discussed in
chapter 6. The Researcher’s role was to evaluate the acceptance and effectiveness of these
interventions, to determine the impact they had, what refinements were necessary, and
how could the benefits of the new way of working, be sustained.
The combination of literature reviews, company reports (2000-03) and benchmark reports
were used to provide insights and inform the Researcher of actions to start the AR cycle.
This allowed the Researcher to develop as well as validate themes both inductively and
deductively. For example:
- interviews with senior management identified the manufacturing performance as a
major issue to be addressed;
- company reports were used to substantiate the root cause of negative performance;
- benchmarking reports were used to identify the size of the performance gap between
CTE and its rivals; and
- research of literature (chapters 3) provided insights into good practices.

156
Figure 7.4: Years 1 to 3: the implementation phase.
Year
2 (
2005
/06)
Year
3 (
2006
/07)
Lau
nch
rec
ove
ry p
lan
an
d c
om
mu
nic
ate
vis
ion
Re-
engi
nee
r fi
nis
hin
g m
ill
lay-
ou
t
Inst
all
Ca
pex
pla
n; O
pti
mis
e cy
cle
tim
e o
f n
ew i
nst
all
ati
on
(s)
Enga
ge e
mp
loye
es a
t a
ll l
evel
s;C
I A
ctiv
itie
s
Ma
ster
-cla
sses
; In
terv
enti
on
s, w
ork
sho
ps
Sugg
esti
on
s sc
hem
e; K
aiz
en g
ener
ati
on
Rev
iew
Co
st o
f q
ua
lity
sta
keh
old
er s
up
po
rt; e
nga
gem
ent
an
d i
nvo
lvem
ent
Elim
inat
ing
ine
rtia
Imp
rove
d c
om
mu
nic
ati
on
Ove
rco
min
g re
sist
ance
to
ch
ange
Lea
der
ship
an
d a
lign
men
t o
f m
an
age
men
t go
als
and
fai
lin
g o
f p
revi
ou
s in
itia
tive
s
HR
M S
tra
tegy
, rec
ruit
men
t, i
nd
uct
ion
, tra
inin
gP
ost
lau
nch
su
pp
ort
Rec
ove
ry p
lan
go
vern
an
ce
Qu
ick
win
s
Pro
cess
eff
icie
ncy
; Pro
cess
Ma
pp
ing
SMED
, Pro
ble
m s
olv
ing,
Ka
izen
Nee
d f
or
ad
van
ced
T&
T?
Ma
na
gem
ent
tra
inin
g in
LM
BIT
Le
vel 3
an
d B
IT L
eve
l 4
Inte
rvie
ws;
fee
db
ack
ses
sio
ns,
qu
esti
on
na
ires
Ind
uct
ive
dat
a ca
ptu
re a
nd
re
fle
ctio
n
Ob
serv
ati
on
Co
nte
nt
anal
ysis
Mee
tin
gs, B
usi
nes
s a
nd
CI
revi
ews
De
du
ctiv
e d
ata
cap
ture
via
exp
eri
me
nta
tio
n
Ass
essm
ent
of
pro
gres
s v
pla
nC
on
stan
t P
DC
A
Feed
ba
ck f
rom
3rd
pa
rtie
sC
od
ing
dat
a
De
velo
pm
en
t o
f ke
y th
em
es
YEA
R 1
(20
04/0
5)
Imp
lem
en
tati
on
ye
ar 1
to
3 in
c
Imp
lem
en
tati
on
of
reco
very
pla
n
Lea
rnin
g fr
om
in
volv
emen
t a
nd
mo
nit
ori
ng
pro
gres
s
Lau
nch
wo
rksh
op
s B
IT L
2 i
n F
orm
ing,
wel
din
g, e
xpa
nsi
on
an
d f
inis
hin
g b
ays
c3
50
em
plo
yees
Ch
an
ge A
gen
t a
pp
oin
tmen
t (x
4),
dev
elo
pm
ent
an
d s
up
po
rt (
ph
ilo
sop
hy)
Turn
aro
un
d p
ote
nti
al
an
d o
pp
ort
un
itie
s
Ind
ust
ry l
ife
cycl
e st
age
an
d t
act
ics
Rev
iew
per
form
an
ce m
etri
cs
Un
der
sta
nd
pro
cess
ca
pa
bil
itie
s
Rev
iew
in
du
stri
al
con
text
Co
nd
uct
ma
rket
sec
tor
an
aly
sis
Ben
chm
ark
: In
tern
al,
Fu
nct
ion
al,
Gen
eric
, &
Co
mp
etit
ive
Esta
bli
sh t
he
per
form
an
ce g
ap
an
d t
he
sca
le o
f th
e ch
all
enge
As Is' condition and
assessment of challenge
Recovery plan
Introduction of key themes and good
practices
Themes to pursue
Bu
sin
ess
Vis
ion
(ca
n t
he
bu
sin
ess
del
iver
a v
iab
le o
utc
om
e?)
Rec
ove
ry p
lan
Op
era
tio
na
l st
rate
gy -
Pro
cess
im
pro
ven
t: (
effi
cien
cy &
rel
iab
ilit
y)
.....
-
Pro
du
ct c
ap
ab
ilit
y: (
Cu
rren
t a
nd
ext
end
ed c
ap
ab
ilit
y)
Ma
nu
fact
uri
ng
imp
rove
men
t p
lan
: (C
rite
ria
, Go
vern
an
ce &
ow
ner
ship
)
-
Ca
pit
al
exp
end
itu
re r
equ
irem
ent
-
Sta
keh
old
er s
up
po
rt c
om
mu
nic
ati
on
Wo
rkfo
rce
dev
elo
pm
ent
pro
gra
mm
e: (
Pa
rad
igm
; Tra
inin
g p
rovi
der
s; t
oo
ls &
tech
niq
ues
, Ch
an
ge a
gen
ts)
HR
M (
Co
mm
un
ica
tio
n, s
elec
tio
n, r
ecru
itm
ent
an
d i
nd
uct
ion
pro
cess
, Ter
ms
an
d c
on
dit
ion
s, T
M r
ewa
rd s
yste
m, e
mp
loye
e en
gage
men
t)
Enab
lin
g co
nte
xt
Me
asu
rin
g p
erf
orm
ance
an
d p
rogr
ess
Esta
bli
shin
g m
etri
cs
Om
ega
tea
m
Inte
rvie
ws
Fiel
dw
ork
Bu
sin
ess
dia
gno
stic
& n
eed
an
aly
sis
Data Capture
Pro
vid
ing
a p
latf
orm
on
wh
ich
to b
uil
d
Ach
ievi
ng
'Bu
y-in
'
Training
Lea
n M
an
ufa
ctu
rin
g: 5
S, S
Op
s, 7
Wa
stes
an
d v
isu
al
ma
na
gem
ent
(th
e b
asi
c b
uil
din
g b
lock
s)
Data Capture

157
Figure 7.5: The sustainability and maturity phase.
The challenge for the Researcher was clear; he had to transform the business performance
of CTE. This involved introducing and sustaining a new mode of operation – affecting
YEA
R 5
(2
00
8/0
9)
YEA
R 6
(2
00
9/1
0)
YEA
R 7
(2
01
0/1
1)
The
resu
lts
Cle
ar
(an
d a
gree
d)
visi
on
Rec
ove
ry p
lan
(2
nd
mid
ter
m s
tra
tegy
)W
ha
t st
age
of
the
ILC
wa
s C
TE i
n?
Ad
ap
t LM
To
ols
an
d t
ech
niq
ues
co
mm
ensu
rate
wit
h p
roce
ss r
equ
irem
ent
Wh
y d
id C
TE i
gno
re t
he
EWS?
Too
lin
g st
rate
gyA
vail
ab
ilit
y ch
all
enge
Wh
at
wer
e th
e ty
pic
al
turn
aro
un
d s
tra
tegi
es o
pen
to
CTE
?
Ca
pex
Ph
2: r
epla
ce a
ged
eq
uip
men
t &
mo
der
nis
e fl
ow
s/ t
ech
no
logy
Wh
y w
as
CTE
co
nsi
der
ed w
ort
h s
avi
ng?
Ma
ster
-cla
ss w
ork
sho
ps
to o
pti
mis
e Q
CD
Ad
op
t &
Is t
he
via
bil
ity
of
the
bu
sin
ess
an
y b
ette
r n
ow
th
an
in
20
03
?
Ben
chm
ark
'oth
er' C
oru
s B
usi
nes
s u
nit
sA
da
pt
pro
cess
Emp
loye
e en
gage
men
t in
pro
cess
Eva
lua
te s
ucc
ess/
fa
ilu
re o
f a
pp
roa
ch -
is
the
tra
nsf
orm
ati
on
bei
ng
emb
edd
edD
id C
TE a
chie
ve a
tu
rna
rou
nd
in
fin
an
cia
l p
erfo
rma
nce
?
Rev
iew
Ma
rket
co
nd
itio
ns
an
d v
ali
dit
y o
f p
roce
ss c
entr
ic a
pp
roa
chC
ou
ld t
he
imp
rove
men
t b
e a
sso
cia
ted
wit
h i
mp
rove
d m
an
ufa
ctu
rin
g p
erfo
rma
nce
?
Sta
keh
old
er s
up
po
rtB
ench
ma
rk J
AP
AN
ESE
Co
mp
an
ies
Wh
ich
to
ols
an
d t
ech
niq
ues
pro
ved
mo
st b
enef
icia
l?
Ha
s th
e a
pp
roa
ch b
een
su
sta
ined
?
Wh
y h
as
the
ap
pro
ach
bee
n s
ust
ain
ed w
hen
oth
ers
ha
d f
ail
ed?
Rec
ruit
men
t a
nd
Tra
inin
gH
ow
did
CTE
ove
rco
me
imp
edim
ents
ass
oci
ate
d w
ith
th
e 'u
nkn
ow
n' a
nd
ch
an
ge?
Tra
inin
g a
nd
dev
elo
pm
ent
- C
urr
ent
emp
loye
es, n
ew s
tart
sR
efre
sher
tra
inin
g w
ork
sho
ps
Ho
w d
id C
TE s
tra
tegi
call
y m
an
age
th
e ch
an
ge p
roce
ss?
Rew
ard
sys
tem
s, e
ffec
tive
nes
s a
nd
rea
l-ti
me
resu
lts
ori
enta
ted
Wh
at
wa
s th
e m
od
el e
mp
loye
d b
y C
TE t
o a
chie
ve t
hei
r a
spir
ati
on
?
Co
mm
un
ica
tio
n -
Fo
rma
l TO
FB, l
au
nch
, up
da
tes,
pro
gres
s v
pla
n -
EN
GA
GEM
ENT
Ho
w d
id C
TE e
nga
ge t
he
wo
rk f
orc
e?
Stra
tegy
dep
loym
ent/
Ho
shin
Ka
nri
n p
roce
ss (
TM O
bje
ctiv
e se
ttin
g)W
ha
t p
art
did
th
e H
RM
str
ate
gy a
ffo
rd?
TM A
pp
rais
al
pro
cess
dev
elo
pm
ent
Wo
rksh
op
ma
na
gem
ent
&
Ho
w w
as
this
dif
fere
nt
to p
revi
ou
s p
ract
ices
an
d i
n w
ha
t w
ay
did
it
con
trib
ute
?
Flex
ibil
ity
/ a
gili
ty -
ma
rket
res
po
nsi
ven
ess
emp
loye
e ex
pec
tati
on
tra
nsf
orm
ati
on
Co
uld
th
is t
ran
sfo
rma
tio
n b
e a
chie
ved
wit
ho
ut
the
Ca
pex
?
(ma
inta
inin
g a
n e
na
bli
ng
con
text
)W
ha
t h
ad
th
e gr
eate
st i
mp
act
Ma
jor
imp
rove
men
ts (
cap
ex)
or
min
or
imp
rove
men
ts (
kaiz
en)?
Wh
at
wa
s th
e va
lue
of
the
cha
nge
age
nt?
Wh
at
wa
s th
e va
lue
of
the
NEP
A e
ngi
nee
rs?
Did
th
e w
ork
fo
rce
tra
inin
g p
rogr
am
mes
ha
ve a
po
siti
ve i
mp
act
?
Inte
rvie
ws
- st
uct
ure
d, s
emi-
stru
ctu
red
an
d u
nst
ruct
ure
dW
ha
t w
as
the
role
of
bu
sin
ess
lea
der
ship
?
Ben
chm
ark
ing:
Co
rus
an
d N
on
Co
rus
Wh
at
act
ivit
y h
ad
th
e b
igge
st i
mp
act
on
th
e ch
an
ge p
rogr
am
me?
Pa
rtic
ipa
nt
ob
serv
ati
on
- F
ield
wo
rk o
bse
rva
tio
nW
ha
t w
as
the
imp
act
of
the
pro
cess
ch
an
ges
(LM
) o
n m
ark
et o
pp
ort
un
itie
s?
Qu
esti
on
na
ires
Wh
at
wa
s th
e im
pa
ct o
f th
e p
roce
ss c
ha
nge
s (L
M)
on
per
form
an
ce m
etri
cs?
Gro
up
dis
cuss
ion
Wh
at
wer
e th
e se
tba
cks
enco
un
tere
d?
Rev
iew
of
pri
ma
ry a
nd
sec
on
da
ry r
epo
rts
- C
om
pa
ny
acc
ou
nts
, bu
sin
ess
mee
tin
gs, a
cad
emic
lit
era
ture
Ho
w c
an
th
is a
pp
roa
ch b
e su
sta
ined
po
st 2
01
1?
Rev
iew
/ re
flec
tio
n o
f fi
le n
ote
sW
ha
t w
as
the
valu
e/ r
ole
of
the
act
ion
res
earc
her
?
Pre
sen
tati
on
s a
nd
fee
db
ack
ses
sio
ns
wit
h v
ari
ou
s st
ake
ho
lder
sW
ha
t le
sso
ns
ha
ve b
een
lea
rned
th
at
can
be
ap
pli
ed t
o o
ther
are
as
wit
hin
Co
rus?
Tren
ds
in p
erfo
rma
nce
an
d a
ctu
al
mo
nth
ly r
esu
lts
Wh
at
is t
he
new
lea
rnin
g to
co
ntr
ibu
te t
o a
cad
emic
lit
era
ture
?
Exp
erim
enta
tio
n a
nd
res
ult
s (M
ill
ba
sed
tri
als
)
Data Gathering and Evaluation
Did
CTE
ach
ieve
a w
ork
pla
ce t
ran
sfo
rma
tio
n t
hro
ugh
th
e in
tro
du
ctio
n o
f a
pro
cess
cen
tric
inn
ova
tio
n?
YEA
R 4
(2
00
7/0
8)
Sust
ain
ing
an
d M
atu
rin
g ye
ar
4 t
o 7
in
c.
Ad
ap
tati
on
an
d E
volu
tio
n
Manufacturing Strategy
Co
nti
nu
ou
s P
lan
, Do
, Ch
eck
an
d A
ct P
roce
ss
HRM Strategy
Co
nti
nu
ou
s A
ctio
n R
esea
rch
Cyc
le -
Co
nst
ruct
, Pla
n, T
ake
act
ion
an
d E
valu
ate

158
people. The next section describes the ontological and epistemological approach adopted
by the Researcher.
7.3 Research philosophy
CTE’s transformation would be felt by employees at all levels; an impact that would
necessitate changes in the behaviour of employees and their day-to-day activities. A series
of internal issues were proffered by CTE as barriers to change. Consequently, a key
objective of the Researcher was to understand behaviour associated with change.
Furthermore, to understand the values maintained by employees, their approach to work
and their perception of how they in turn are valued by CTE.
The emphasis on employee behaviour would assist the Researcher identify the enablers
required to facilitate and sustain change. The focus was on the ‘meaning’ attributed to a
social phenomenon and not a ‘measurement. Thus the ontological approach adopted by
the Researcher was to consider the subjective aspects of human activity/ behaviour. The
epistemological stance was that of interpretivism. By monitoring and assessing the
actions of individuals throughout the change process, the Researcher could interpret the
actions observed to generate an understanding of why for example, an employee behaved
in a particular manner: why was a change in operating practices such as the use of 5S,
accepted/ resisted? Or why did an individual feel motivated to support a particular course
of action but not another?
An employee could have numerous reasons for behaving in a compliant manner. For
example, he or she may be committed to the approach, fearful for their job, afraid of their
Line Manager, seeking promotion or just did what he/ she was told. Thus, the Researcher
needed to comprehend critical success factors that motivated employees to behave in a
particular and common way.
The approach would necessitate the Researcher immersing himself in the social group
being studied; an approach that could provide him with an understanding of the ‘meaning’
that drives employees to behave in a particular manner. Through immersion within the
workplace the Researcher was seeking to record through observation and the process of
interviewing, what had been seen or discussed. The information subsequently captured in
field notes or written transcripts to be evaluated and through the process of reflexivity
(section 5.4), inductively analysed.

159
The required behavioural change needed to be assessed over a period of time. This
favoured a longitudinal study (Saunders et al., 2003) as opposed to the ‘snapshot’ study
or cross-sectional study. The period of seven years allowed the Researcher to conduct
comparative studies of rivals or local networks that helped to inform him of the best
practices deployed in other sectors. Furthermore, the period of time provided an
opportunity to repeat exercises and take multiple snapshots. Finally, because the study is
over a significant period of time the Researcher used the interval to observe the historical
evolution of ideas and actions, and to note the change in the operating/ financial
performance relative to the outset of the project.
The primary method of data gathering was an inductive approach. This supported the
research philosophy. For example during the exploratory stage the Researcher captured
data in the form of written transcripts. These were evaluated using content analysis;
searching for repeat themes mentioned by numerous/ various informants (interviewees).
The Researcher was inductively building theories to be explored further. However, where
research is conducted in operations management, it is not uncommon to use a multi-
method approach. Consequently, the Researcher was able to triangulate perceived
improvements noted during fieldwork or declared by interviewees with secondary data
gathering sources such as company reports. Furthermore, insights deduced from the
literature on recommended best practices provided the Researcher with themes to
consider, explore and test; for example, communication, leadership, LM, and strategy
deployment. Similarly, in the event that the Researcher had to validate an improvement
in operational practices, such as a reduced cycle time or changeover time (minutes and
seconds), this would have to be empirically proven. Data had to be deduced from repeat
tests that would demonstrate beyond doubt (objectively) that the change had a measurable
impact.
To support the ontological and epistemological approach the strategy adopted by the
Researcher was one of Action Research (AR) (section 5.2.3 and section 7.4).
7.4 Action Research
AR was the strategy employed by the Researcher (section 5.2.3). The AR strategy
supported theory building in incremental stages (Eden and Huxham, 1996), moving from
particular themes to be explored to the adoption of practices within CTE. This section

160
provides two examples (tables 7.1 and 7.2) of the AR cycle applied by the Researcher to
evaluate the acceptance of the interventions listed in section 6.
RQ1 asked how can the tools and techniques associated with LM be successfully
introduced within CTE? Table 7.1 summarises the AR cycle employed during the
introduction and evaluation of the NEPA intervention (section 6.3). Whilst the summary
is given sequentially it should be noted that there was significant overlap within and
between techniques introduced. For example, learning derived from the introduction of a
techniques in year two or three could be used to enhance or reinforce techniques
introduced in year one.
Cycle 1 Cycle 2 Cycle 3
Construct The objective was to evaluate
the impact of the NEPA
intervention (6.3) and the
acceptance of the techniques
introduced. For example, were
they effective, were they being
employed to add value, and
did they need to be adapted?
Cycle 1 typifies the
introduction within CTE of
each of the themes.
Participants had to be pre-
positioned prior to the
technique being launched.
Feedback received from
workplace interviews indicated
that due to the protracted nature
of the work force development
programmes coupled with the
variable introduction of some
techniques, there existed the
potential during the first year,
for some techniques to be
discarded or forgotten.
The challenge was to understand
the relationship between the
value and acceptance of the
adopted technique with the
behaviour of the recipient.
Furthermore, to determine
actions that might enhance the
value of a technique(s) and/ or
improve the likelihood of its
sustainability.
Cycle 2 typifies the approach
adopted post the launch phase.
At this stage the techniques were
no longer novel. This was a
period where the opportunity to
embed techniques and generate
learning / insights was deemed
by the Researcher as critical. It
was a period suggested by those
interviewed (section 4.2.2),
where previous initiatives had
lost their impetus.
Fortnightly updates were
presented to CTE. The
techniques were now embedded
and the individual value
understood. The intent at this
stage (typified by cycle 3), three
plus years into the journey was
to re-visit techniques and ensure:
the value they offered was
optimised; address concerns by
adapting the technique
accordingly relative to insights
generated from fieldwork or via
literature; and linking one
technique with another to further
enhance to combined benefit.
This involved: observing
practices, conducting interviews
(and questionnaires) and
reviewing company reports.
Action
planning
Initial meetings outlined the
original problem and why a
particular theme had been
selected as a potential
countermeasure. The scope
and time frame for each
theoretical proposition was
agreed. For example would
the technique be applied to the
The intent was to validate the
approach, refresh learning where
appropriate and address factors
that may have adversely
impacted the effectiveness or
value of the technique.
The Researcher had to ensure
that evidence supporting good
Inference would be generated
from observation and various
data reducing techniques such as
content analysis whilst a
deductive approach to pattern
matching may be complemented
by various quantitative data.

161
full mill? An individual bay?
Or a particular function? And
over what time frame. The
multi-method approach for
data gathering and the format/
frequency of updates to be
presented by the Researcher
was agreed.
The Researcher was also
charged with searching the
literature to aid knowledge of
a particular theme and its
introduction.
practices was understood and
shared with the ‘not-so-good’
areas. This involved presenting
findings to all employees and
discussing research findings and
conclusions.
CTE meetings were to be used to
discuss feedback and question
aspects linked to optimisation
and sustainability. It was agreed
that the Researcher could utilise
support from various line
managers but it was he that had
to analyse data, discuss and
coordinate priorities via the
Omega team.
In addition, surveys and audits
were conducted by third parties
to review LM techniques and
workshop practices within the
H42. This eradicated any
Research bias by validating
practices employed within the
mill. The Researcher was
charged with conducting
benchmark visits to sister mills
to ascertain the progress made
against the RSP (section 4.3).
Action
taking
The emphasis on cycle 1 was
pre-positioning stakeholders
in readiness for the
introduction of the new theme.
This involved formal meetings
with trade unions and informal
meetings with employees
affected. This ensured
awareness and understanding
of the technique(s) to be
introduced and why.
Moreover, it provided
stakeholders with the
opportunity to ask questions.
A process that was aimed at
engaging them and ultimately
overcoming initial scepticism.
Line managers were identified
as sponsors to own and
support/ guide users in its
application. Informal
presentations and discussion
on- and off-the-job concluded
with written summaries and
field notes which were
captured and filed.
The Researcher utilised team
briefs and work place activities
to evaluate techniques such as
5S, SOs, the use of Kaizen.
Feedback was used to help the
Researcher refine an approach or
identify areas where support
may be required. Further
training was to be given to line
managers. This would ensure
their understanding of a
technique and its value.
This process ensured greater
support for interventions
conducted throughout the mill,
not just in localised areas.
Data were gathered from
company reports to explore
relationship between improved
practice and financial
performance.
Surveys were conducted by
Tubes managers (external to
CTE) and third party
consultants. Qualitative data
were gathered from primary
methods such as interviews,
questionnaires and observation.
Quantitative data were gathered
from company monthly reports.
Benchmarking of sister plants
was undertaken by the
Researcher. This included UK
plants and some Mainland
European (MLE) plants.
The Researcher was now
looking for patterns between the
areas of study that could
corroborate findings and
enhance adopted techniques.
The Researcher was using
learning from one theme to
strengthen other themes such
that the combination of and
benefit derived from the groups
of themes ensured the
accumulative benefit to the
transformation was strengthened
and the potential for
sustainability increased.
Evaluation The approach to data
gathering, reducing, and
analysis is described in section
5.3, 5.4, 7.5 and 7.6.
The key learning was that
during the communication
(launch) sessions and training
workshops, TMs were
engaged. The Researcher
conducted group/ individual
interviews to capture their
views on the changes planned/
introduced.
Diary note: the Researcher
commented that at this stage
the culture within CTE was a
dependent culture. Here
employees required, training,
The fortnightly Omega meetings
provided an opportunity to
feedback and explain progress.
Data gathered were coupled with
experiential learning. This
allowed the Researcher to
analyse progress, reflect on
learning, develop relationships
(pattern match), eliminate or
address false claims and refine
the value of themes considered.
The Researcher provided
monthly updates in the form of
‘explanation building’ to the
Omega team and CTE. This was
supported with data from the CI
dashboard. For example
Four years into the ‘journey’ the
changes in working practices
were now embedded. The
iterative process of learning
from experience and adapting
the techniques to suit the social
context of the work place was
having the aspired
transformation in business
performance. Trends in
manufacturing and financial
metrics were positive (section
8.3). Improvements that were
underpinned and driven by a
new culture of CI.
Encouragingly, third party
surveys reinforced this and
highlighted good practices.

162
support and direction during
the implementation of new
practices.
numbers of activities undertaken
or 5S’/ Kaizen completed.
Company reports capturing the
manufacturing performance and
profitability of the company
allowed the Researcher to
(triangulate) consider if changes
were having a positive impact.
Where it was agreed that the
technique had reached a stage
where CTE were happy (a
sustained approach could be
demonstrated), this cycle was
considered finished. Equally,
insights that may have been
generated during the evaluation
would be fed back into this cycle
for further testing.
The specific learning was that
over the period 1 to 3 years, the
manufacturing reliability and
capability was improving. This
was having a positive influence
on financial trends such as
profitability and RONOA. Initial
hypotheses concerning
employee resistance to change
was unfounded. Furthermore,
where employees were engaged,
they were contributing to further
improvements.
Diary note: at this stage the
culture within CTE was
changing from a dependent to
independent culture. Here
employees were adopting new
techniques because they
believed it was right for them.
Benchmarking at sister mills had
identified that in 90% of the
mills visited, the RSP and the
use of changes agents had been
abandoned.
Within CTE qualitative data
suggesting changes in practices
and behaviour linked to
espoused improvements in
productivity could be
triangulated with qualitative
data obtained from formal
business reports.
The outcome was the ability to
demonstrate (or not) the benefit
of a particular theoretical
proposition, of links to
sustainability, of improved
workshop practices and business
performance.
Diary note: at this stage the
culture within CTE was
changing from an independent to
an interdependent culture. Here
employees were owning,
training others and using peer
pressure to sustain these (new)
techniques because they
believed it was right for the
business.
Specific learning reaffirmed that
employees engaged in the
process who understood what
was being done and why, who
could envisage their role and
how they could contribute,
coupled with a structure that
facilitated this way of working,
helped transfer tacit knowledge
into explicit action.
Table 7.1: A specific example of the AR cycle applied during the implementation,
adaptation and sustainability of LM basic tools and techniques.
In summary, the role of the Researcher during this AR cycle (figures 5.2 and 5.3)
included:
- cycle 1: Pre-position participants, launch the new techniques, support the introduction
and facilitate training;
- cycle 2: generate insights via literature on best practices, evaluate the acceptance of
the techniques, monitor progress, share good practices and adapt techniques based on
lessons leant to improve their effectiveness and potential for sustainability; and
- cycle 3: repeat cycle 2 and compare learning with sister sites.

163
In support of question 2 (section 1.3), the Researcher launched the themes highlighted in
section 6.4. Table 7.2 outlines the AR cycle associated with the approach to identifying a
sustainable transformation within CTE. An approach that sought to engage all
stakeholders employed at CTE.
Cycle 1 Cycle 2 Cycle 3
Construct The inability of CTE to
introduce and sustain change
had been determined as one
of the main sub-themes to be
pursued (section 5.4 and
figure 5.6). Unless resolved,
the planned changes to
working practices would
also fail.
The role of the Researcher
was to evaluate the impact of
his intervention described in
section 6.4.
The Researcher provided an
account of findings to CTE. Main
issues indicated: a lack of employee
engagement; an absence of change
management; and that previous
initiatives lacked ownership post
the launch. The focus would have
appeared to be on the pre-launch
work and training but not the
application! This did not appear to
surprise CTE (diary noted June
2005).
The Researcher was challenged to
review literature on successful
transformation.
The third phase broached the
period 2005 to 2010. The
Researcher was asked to
explore how the approach
adopted within CTE was
different to that applied by
sister-mills during the
introduction of the Restoring
Success Programme of 2004.
Insights that could support
RQ3.
The main data gathering
method would be semi
structured questions and
observation at plant(s)
visited.
Action
planning
The Researcher agreed with
CTE that the starting point
would be to interview
employees who had
experienced major change
initiatives in the last 10 to 15
years.
Data gathering were in the
form of semi structured
interviews, Open-ended
question exploring what the
initiative had been, its’
objective, how it was
launched, who it involved,
what training, support
structures, etc.
Transcripts were analysed
(content analysis) to identify
prominent features
associated with the initiative
that might provide an insight
for further investigation. It
was agreed that any insight
generated as a result of this
approach should be
discussed with CTE.
The Researcher continued with the
original intervention (section 6.4)
whilst simultaneously exploring
good practices prescribed by the
literature. The original intervention
(following agreement with CTE)
should be amended to test the
themes deduced from the literature.
Consequently, it was expected that
throughout ‘cycle two’, parallel
activities would be ongoing: i)
literary reviews and ii) observation
and interviewing associated with
the introduction and evaluation of
concepts introduced.
Concepts introduced were re-visited
and adapted to accommodate new
learning. Findings inferred from
observation or deduced from
quantitative measurements or
literature reviews provided the
Researcher with an opportunity to
modify or adapt practice to have a
greater impact.
The approach adopted was to
contact colleagues within the
North East and arrange
reciprocal visits.
Action
taking
7 long-serving employees
were interviewed. A record
of the interviews was
recorded and typed up at the
end of the day. In addition,
the Researcher maintained a
diary note of how he felt
each interview progressed.
For example, was the
interviewee nervous? Were
Techniques deduced from the
literature as offering value were
discussed with various teams
including management, shop floor
and trade unions.
Feedback (interviews) was used to
adapt approaches to local
environment without diluting the
main emphasis stressed within the
technique. For example, the bonus
17 site visits were conducted
and over 30 semi and
unstructured interviews were
completed. These included
operating units at Teesside,
Scunthorpe, Corby,
Skinningrove, Oosterhaut,
Zwijndrecht and Maastricht.
A summary of the visits was
made within 24 hours. Prior

164
there particular points they
were quite vocal about? etc.
system was modified to make it a
live ‘motivator’ in support of
change. Induction programmes
were modified and extended in
support of indoctrinating new
starters in the new values expected
of CTE employees.
Fieldwork provided the opportunity
to observe and discuss changes
introduced with those affected.
Files notes of observations and
interviews were maintained as part
of the data gathering process. In
addition, the Researcher maintained
a diary reflecting his experience on
how he believed employees were
perceiving changes and what the
‘mood’ was within the group(s)
involved. This was useful since on
some occasions a comment
(negative or positive) might have
been at odds with reality within the
group behaviour.
to leaving the site the
Researcher paraphrased his
findings captured in his own
log book during the visit with
those involved. Thus, the
Researcher was only
recording insights that the
host manager recognised as
being said.
Evaluating The Researcher identified
common themes within the
transcripts of the interviews
by highlighting them with a
highlighter pen. The number
of times a theme was
repeated was tabulated.
Matrix tables (Oppenheim,
1992) (section 7.6) were
used to cross reference the
initiatives discussed with
key repeat features. The
themes with the highest
number of repeats were
identified as worthy of a)
mention and b) further
investigation.
Key learning would suggest
that operatives were not the
barrier to change as initially
proffered. There was a
strong leaning towards the
lack of post-implementation
support in the management
of change and the lack of
leadership during the change
process.
Data were gathered from appx 20
semi-structured and over 250 un-
structured interviews per annum,
and 80 questionnaires (see table 5.1
and section 7.5).
Data reducing techniques (section
5.4) were employed to ensure key
points were identified (section 7.6).
The Researcher could develop a
hypothesis in one month and then
over an extended period test the
same hypothesis with different
people, at a later stage, or even trial
alternative techniques to determine
if the outcome would be the same or
different. This provided an
opportunity to explore and exhaust
themes.
Themes developed were tested by
introducing changes. Observation
and semi-structured interviews
were used to gather feedback.
Content analysis, survey results
used to further adapt findings.
The key learning reinforced the
requirement for a structured
approach to managing change pre
and post implementation.
Furthermore, that the need to
engage the workforce was not only
an imperative but actually served to
motivate teams to want to help the
transformation as opposed to resist
it.
Repeat themes were again
highlighted following an
analysis of the visits. These
were compared (over time)
with findings from earlier
cycles. These included
negative issues serving to
reinforce causes of failure as
well as positive actions that
complemented actions being
introduced.
Table 7.2: A specific example of the AR cycle applied used to research the sustainability
of previous initiatives.

165
Tables 7.1 and 7.2 outlined the AR cycle adopted by the Researcher as an all-
encompassing approach to researching themes associated with research questions 1 and
2 (section 1.3). insights derived from cycle 3 table 7.2 could be used to support RQ3.
Following this the agreed actions associated with the main themes were introduced. For
example: benchmarking the performance gaps between CTE, its rivals and perceived best
practice industries; reviewing literature on barriers to change; launching workforce
training programmes; introducing new communication processes; and undertaking
activities such as 5S and SMED. Actions that multiplied as experience was gained and
the recovery plan evolved.
The combined and cyclical approach provided a method to explore linkages and socially
constructed accounts of events observed or deduced from quantifiable data. For example,
availability of data suggested the need to introduce SMED (Changeover) activities in
order to improve availability. Literature and the knowledge of local experts provided
accounts (narratives) of how this could be achieved. The method of experimentation
involved the establishment of a mill-based activity and of structured observation; the
objective and methodology explained at the outset and appropriate training given. The
timings recorded over successive changeovers confirmed an average for the cycle of
changeovers that could be compared to those undertaken pre the introduction of SMED.
Thus, qualitative narratives could be compared to quantifiable timings.
The comparison enabled the Researcher to substantiate and validate change in
performance, draw conclusions concerning potential relationships, and generate further
theories to be tested. For example, how did cycle times vary pre and post the experiment,
on different shifts and with different teams? If the same technique was applied to a new
team would the same result occur? Will ‘younger teams’ deliver an improvement in time
over that of changeovers conducted by ‘older teams’? If the test was repeated at a different
time of day, or day of the week, would the outcome differ? The exercise would be
repeated several weeks later to evaluate repeatability and sustainability. The averaging of
cycles linked to different teams would provide an output that demonstrated a consistent
shift in performance and would thus be deemed valid. This type of experimentation
(theoretical sampling) would need to be repeated many times over encompassing the
plethora of areas associated with the scope of the investigation.
Secondary data in the form of business reports published by the business’ management
accountant allowed trends in performance to be analysed. The accountants compiled
actual data on a variety of manufacturing metrics such as: pipes produced, stoppages

166
reported, margins achieved, depicting month by month performance. Since the data
utilised was gathered and compiled from established methods and by un-biased
participants this form of data was considered valid.
The Researcher was thus ensuring a particular hypothesis was consistent with the theory
and that witnessed via observation in the social context and data provided by
experimentation. The change in performance could be scrutinised to assess the impact
(and relationships) of the known changes, hard and soft, on the performance of the
business; addressing question 1 (section 1.3). The data gathered and analysed were used
to refine techniques and training, to provide insights for the new themes to be considered
and tested and to deduce conclusions. This iterative process provided an opportunity to
evaluate the techniques and determine if they were generalizable and therefore
transferrable within a heterogeneous environment (question 3, section 1.3).
7.5 Data gathering
The primary forms of data gathering (section 5.4) employed by the Researcher were
interviews and observation. Secondary sources included company reports, minutes of
meetings and literature sources.
Interviews:
The primary purpose of any interview is associated with data collection and the
development of ideas and research hypotheses (Oppenheim, 1992), ideas that may
improve the conceptualisation of the problem being investigated. The approach adopted
by the Researcher followed the recommendations of the literature (Easterby-Smith et al.,
1991; Oppenheim, 1992; Robson, 2002; Saunders et al., 2003). This included: preparing
a list of general topics to explore, consider what is to be explored (measured); explain at
the outset the purpose of the question set; use ask open-ended and closed questions where
appropriate, let the interviewee talk; avoid leading questions; probe to clarify
understanding or follow up on an interesting point, paraphrase; maintain a record of what
was said and agree it with interviewee, and many more.
The benefit of the longitudinal study provided an opportunity for questions asked in year
one to be repeated in year two or three. This could help determine if there had been a shift
in an interviewee’s knowledge, perception or contribution to a technique launched at the
outset. An approach that could help evaluate how a) Lean had been applied and accepted
(RQ1); and how Lean had been sustained (RQ2).

167
In year one, over fifty exploratory interviews were conducted (section 7.2). Questions
were informed by the need to generate an understanding on how employees at CTE
perceived the challenges that confronted CTE and of their understanding and viewpoint
of planned changes.
Primary research methods in the form of interviews and direct observation provided an
account from participants in the form of narratives; for instance an account of an
experience that is told in a sequential way. This could have indicated a flow of related
events or a direct response to a question; a response that might be considered significant
to the narrator and thus provided meaning to the researcher (Coffey and Atkinson, 1996).
The narration helped define the social and organisational context within which the
research was undertaken. Knowledge derived from the meanings that make up the
individuals views of reality. The researcher’s role is to reconstruct those meanings
(Partington, 2000). The output could similarly be used to corroborate what was espoused
by the interviewee and that observed in practice. Similarly, what was observed by the
Researcher could be discussed and validated via such discussions.
The conceptual framework (figures 7.4 and 7.5) allowed the Researcher to plan in
advance the area of the mill and themes to be explored. Themes that would be agreed with
CTE and the Omega team at the monthly progress review meetings.
During the three-year implementation phase, over 250 informal semi-structured and
unstructured interviews were conducted with various team members. These included
managers from the various functions: HR, technical, operational, engineering, and
quality. These were usually senior and middle management levels involved in leading the
change programme and various initiatives. In addition, team members, craftsmen and
team leaders who were heavily involved in implementing or ‘doing’ the work associated
with the new manufacturing paradigm. The interviews typically lasted thirty minutes to
an hour. They incorporated a selection of pre-determined questions adjusted relative to
the person being interviewed and the topic being considered. The semi-structured
interviews introduced flexibility within the question set in a bid to solicit individual
experience or behaviour associated with new practices. The target population involved
those engaged in activities at that time.
During the fieldwork, the Researcher attended over 85% (circa 500, table 5.1) of all
intervention workshops, training sessions, presentations and work place activities in a bid
to discuss and solicit views on what went well, could be improved, or should be suspended
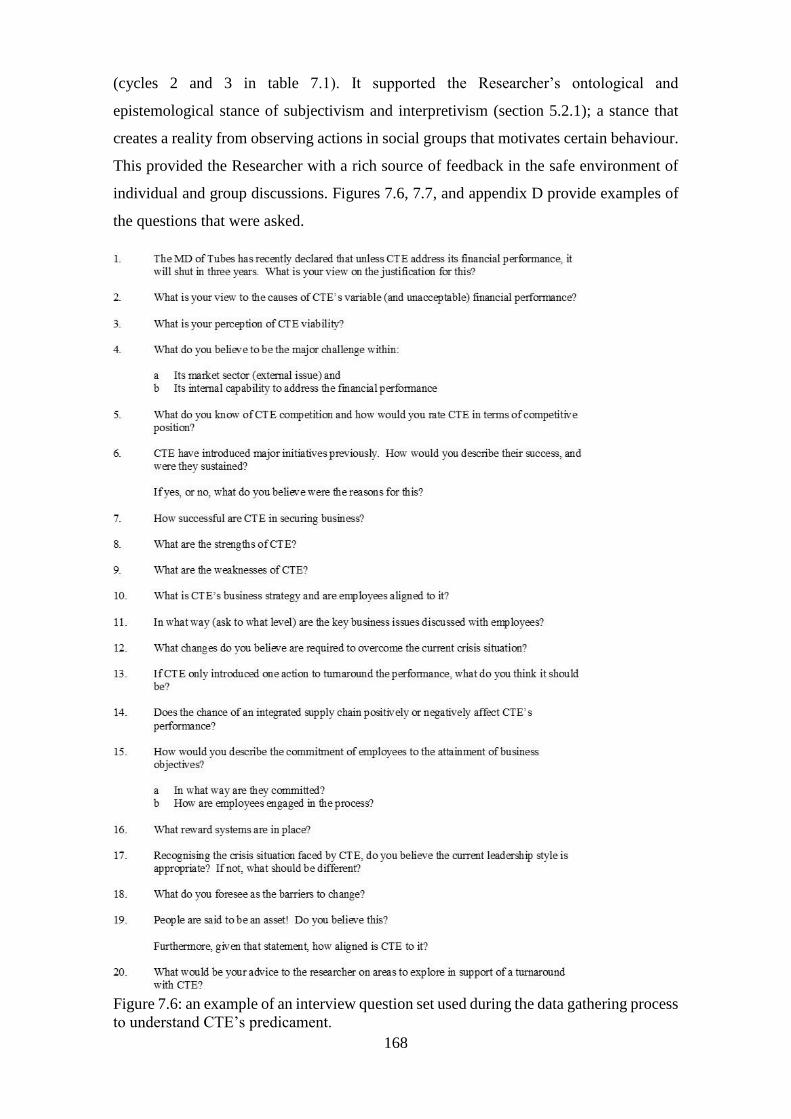
168
(cycles 2 and 3 in table 7.1). It supported the Researcher’s ontological and
epistemological stance of subjectivism and interpretivism (section 5.2.1); a stance that
creates a reality from observing actions in social groups that motivates certain behaviour.
This provided the Researcher with a rich source of feedback in the safe environment of
individual and group discussions. Figures 7.6, 7.7, and appendix D provide examples of
the questions that were asked.
Figure 7.6: an example of an interview question set used during the data gathering process
to understand CTE’s predicament.

169
Figure 7.7: an example of a follow-up interview question set linked to interventions and
sustainability.
The focus of the interview questions were aligned to the RQs and the hypothesis being
tested. For example, during the implementation phase, year one to four of the study the
hypotheses were linked to research questions 1 and 2. The Researcher hypothesised:
- the introduction of LM techniques would improve the efficiency of the process;

170
- downstream throughput could be improved if upstream quality was improved.
Upstream quality could be improved by adherence to established best practice;
- TMs would only adopt new techniques if it could be shown to add value to the user;
- training in workforce development would act as an enabler to a new way of working.
However, if employees are not engaged in the process the initiative could falter;
- support in the post-launch phase was critical to the implementation and sustainability
of new techniques;
- a contemporary HRM strategy was critical to the sustainability of LM;
The Researcher as the Senior Manager on site had unlimited access to employees and was
in a position to access work areas, teams, workshops etc. to gather data on a daily basis.
This level of immersion allowed the Researcher to socially construct the perceptions of
the employees. For example, discuss opinions and beliefs, observe changes in behaviour
or environment, interview (repeat discussion), reflect, and plan/ take the next phase of
action; an approach that supported the Researcher’s ontological perspective of
subjectivism.
Post year four, the Researcher was comparing practices adopted at CTE with sister mills
which had adopted (or not) RSP (CTE, 2008i). The findings would in turn, be compared
with the literature on successful transformations. Furthermore, it could be used to explain
the differences between approaches and the success or failure of the approach in
implementing and sustaining a new way of working. Findings that would support RQ3.
The Researcher also interviewed employees who had previously worked at Teesside steel
works and subsequently at the 42” Mill. The aim was to gather data from employees who
had experienced the introduction of Lean practices at two different sites and who may
then be able to comment of differences. Examples of the interview responses are given in
figures 7.8 and 7.9.

171
Figure 7.8: Extract from an interview (response) summary re difference between TCP and
the H42.

172
INTERVIEW WITH J. BISCOMB, HR MANAGER, HARTLEPOOL SITE (Code: B/mark/TCP/LM-imp’n) INTERVIEW DATE – JULY 2011 Prior to May 2011 J. Biscomb was a Senior HR Manager working for Teesside Cast Products, an iron and steel manufacturing operation employing approx. 5000 people
Q6 Was there an overall vision of what was to be achieved?
I don’t believe there was an overall vision beyond the need to introduce RSP (Lean) or set up a CI Department, and undertake a number of key activities.
Q7 What was the role of the CI team with respect to the business objectives?
CI was seen as something the CI Team undertook to do, probably activities identified by Senior Management and FD’s. It was the responsibility of the CI Department to do the work, leave and go on to the next project. CI Department considered to be quite silo’d. However, I am not certain if there was an overall strategy/vision or if the CI dep’t was aligned to it. The fact that I am not certain suggest there was not one or I would have been involved/ informed
Q8 In what way were CI Silo’d?(follow on question)
They were brought out to do a specific activity and when completed go off to do another activity. It did not appear structured. Equally Team Members were involved in the activity but like the Management had no accountability, thus when the CI Department left, the operation would revert to how it was before. Basically, changes were not sustained
Q9 Were the workforce trained in CI (Lean)?
No, at least not at the outset, two key issues: - 1. Lean was not seen as something that could be delivered and more as a way of reducing numbers and 2. It was difficult to get operators released off their job for any training. Reflecting on an earlier question, I would agree that in not understanding LM or what it really meant. Team Members had no enthusiasm for it. Equally, it was not seen as important by the Managers. When TCP was mothballed, with time on our hands and access to free training, Team Members were trained in lean T&T but this was not subsequently used.
Q10 Did you set Team Member objectives or have a strategy deployment process?
No, we did not set Team Members any objectives and no, we did not have a strategy deployment process. Thus in that sense we were not engaging Team Members in the way it was done at Hartlepool. That probably starts to suggest why H42 have been more successful in their ability to implement and sustain LM.
General Comment TCP was such a large site it was difficult to achieve a consistent approach especially compounded by inconsistencies in attitudes and approaches of various Senior Managers. Lean was not perceived as important especially with so many other ‘more important’ issues needing attention. CI was the responsibility of the CI function which was not either vertically or horizontally integrated. The shift system and cover meant employees could not/would not be released reinforcing Lean T&T as a CI Department role and responsibility. I suppose that if you broke TCP down into its various plants and operations then each would be similar in size to CTE. However CI did not have sufficient impetus to generate change.
Figure 7.9: Extract from an interview transcript reflecting some of the differences
between TCP and the H42.

173
The output from the analysis allowed the Researcher to hypothesise:
- there is a direct relationship between post-implementation strategic management of
change and sustainability;
- the absence of a clear vision and a structured approach (to change) will increase the
likelihood of failure;
- communication and leadership behaviour has a vital role in the engagement of TMs
and their desire to support change;
- LM can be used to improve the competitiveness and therefore viability of a business.
At the outset of the study the themes to be explored may have been quite broad. However,
as the study progressed they became more focused as propositions were being tested and
proven or eliminated. Questions were informed:
a) inductively, as a result of reviewing transcripts of exploratory interviews,
observations, or following discussions with NEPA. Here the Researcher sought to test
the themes launched at the outset of the recovery programme; and
b) deductively, themes deduced by the Researcher following literature reviews were to
be explored to identify a relationship between good practices uncovered in the
literature and what was occurring within the mill.
When developing the question set to be employed, the researcher should consider all the
variables that may result in ‘A’ causing ‘B’ (Oppenheim, 1992). For example, when
considering efficiency improvements did an improved output occur because?
- there was a senior manager observing practices;
- the product being manufactured was easier to make than other products manufactured;
- the techniques introduced were having a positive impact;
- the operators were working harder; or
- there was a novelty bias (Oppenheim, 1992) associated with the introduction of the
new way of working.

174
Equally, to avoid assumptions about the interviewee’s knowledge, understanding and
interpretation associated with the questions asked (Oppenheim, 1992), they were piloted
(where practicable). For example:
- when asking about the perception of a particular technique introduced, it was
important to avoid using leading questions such as, “Can you explain why 5S was a
success”;
- it was important to avoid assumptions, for example, when asking someone to explain
SMED, it cannot be assumed that they had a) been trained in the technique, b) applied
it since any training given, or c) that any improvement in changeover time could be
attributed to SMED;
- the Researcher had to be cognisant of the reality that in asking questions the informant
might want to be seen as more ‘desirable’ or ‘effective’ than his peers in that social
group.
Consequently, having identified the theme to be considered, the question set(s) was
discussed with a co-researcher and piloted with two or three employees before being
refined and used. The pilot helped reduce the likelihood of inappropriate questions as
described by Oppenheim (1992). The interview style and use of probes was discussed in
section 5.4. To validate responses questions were in some circumstances, repeated at a
later date. This usually followed a period of observation and a sufficient lapse of time to
avoid novelty bias.
For example, considering the application of the basic building blocks within the H42 in
year one, the Researcher inquired about the acceptance and use of techniques. Questions
included:
- What training have you received in LM?
- Has the technique been applied in your area?
- What has been the impact of the application?
- Which LM techniques have been employed?
- What support, if any, was available during the implementation?
- Did the change agent or line manager play any part in the intervention?
- How have the changes introduced been captured?

175
In repeat interviews additional questions may have been included for example, the ability
to demonstrate sustainability.
To support data gathering over 200 questionnaires were completed anonymously and
comprised set questions on LM tools and techniques, strategy deployment and work shop
management practices. The questionnaires employed the Likert scale and were developed
in such a way that the recipient would agree (strongly)/ disagree (strongly) with a
particular statement (figure 7.10).
Strongly
disagreeDisagree
Don't
knowAgree
Strongly
agree
Tick the appropriate box
1a 5S is a basic LM tool.
1b 5S is practised by me.
1c 5S is of benefit to my operation.
1d 5S does not add any benefit to my operation.
1e 5S has been sustained since its launch.
7a I have completed my BIT level 2.
7b I have been involved in a Master-Class.
7c The Master-Class achieved its objective.
7dI was involved in a Master-Class and I had not been
trained in LM (BIT level 2).
7e The Master-Class (7d) achieved its objective.
8aI received no information about the Master-Class until
I attended on the first day.
8b I thought the Master-Class 'teach points' were useful
8c I found the Master-Class experience to be boring
8d The facilitator was good at keeping me interested
8e I would like to facilitate a Master-Class
11a I am not aware of of the business objectives
11b I do not have any personal objectives
11cI am able to show my contribution to the business
objectives
11d The Omega plan has been communicated to me
11e I understand my role within the Omega plan
Figure 7.10: An example of questions extracted from a questionnaire.
Alternatively, the respondent could select a choice from a series of option (figure 7.11).
These were often backed up with more structured interviews.

176
Circle one or more responses to each question
Q1
useful ineffective motivating dull
tiring informative interesting relevant
Q2
cancelling them making them shorter having more breaks
making them more interactive changing the presenter
Nothing, I believe it went well
Q3 Master-Classes:
are useful solve problems are interetsing are boring
should be shortened made a difference in my area
The information covered in the Time Out For Business session was:
The Time Out For Business session could be improved by:
Figure 7.11: Example of a questionnaire where the participant picked from options
available.
Data gathering associated with a group activity may have started with a question asking
‘how would we set about improving the integrity of welding? Or what is required to
improve communication? Or what is required to deliver an effective TOFB workshop.
Ideas would be brainstormed and captured on ‘post-it’ notes (figure 7.12).
Figure 7.12: Example of a method of data gathering employed by the Researcher

177
However, to assist the data gathering process, the categorisation of themes and ultimately
development of action(s), the ideas captured on ‘post-it’ notes would be collated by the
Researcher on a 5M chart (figure 7.13).
April 2015
5M Longitudinal Welding
Misalignment
of Weld x 81
MAN MACHINE
METHOD MILIEU
MATERIAL
Wire Travel on Small Dia Pipes
Incorrect Flux FeedMacro Recording x 2
Poor Macro
Assessment x 3
ID Bogie Drive & Wheels
Fine Adjustment reqd for ID T/Rolls x 2
Wires not set up as per seam follower
OD Cross Hair too far away from wires x 2
OD Seam Follower goes off line x 3
ID Wire Alignment x 2Pipe Spiral
Tack Weld Alignment
Unknown if ID or OD Mismatch
No Prep On Tab Plates x 2
Worn Nozzles
Radial Offset x 2
Twisted Skelps
Defect % Not Being Communicated
No Checks to determine
if alignment is full length or just
North End
Lack of Visual Management x 2
Nib Wheel Security x 2
No Checks For Play on Nib Wheel
Difficult to View
Electrodes in Seam on Set Up
Too Many Hand Tacks x 2
Accuracy of Tacks &
Back Runs x 2
Welding on Conveyor not T/Rolls
Not Known if defect is ID or OD
Thickness to Alignment
correlation not understood
Inaccurate entering guide points
Op Check Frequency
Wire Straightness
No Defect ChecklistSOPs Out of Date
Best Practice Not Applied
In House Spec / Customers Spec
Control Limit for Alignment Not Known
Last Seam Follower Point x 2
No Fine Adjustment on Slides
T/Roll Alignment – ID Boom
Angles - East / West
Wire Not Feeding Down at 90° x 3
Lack of Maintenance PMs
Nib Wheel Design x 2
T/Roll Alignment - Weld Head
Wires not central to Flux Boat
Flux Boat Alignment
No Standard for Wire Run Off
ID Boom Off Centre
OD Height Controls x 2
ID Seam position methodology x 2
OD TDC Alignment & Tracking x 2
Difficult setting 12 &
6 O'clock Position on OD & ID
Weld Not TDC / BDC Full length x 3
Inaccurate TDC/BDCPoor Wire Feed
Height Sensor TrippingNo Laser Tracking
No Servo On OD Head
Figure 7.13: an example of a 5M fishbone diagram (Ishikawa diagram) employed by the
Researcher.
The second method of primary data collection included observation.
Observation
Section 5.3.1 described the role of an observer. The Researcher’s mode of data collection
as an observer throughout this research programme included:
a) attendance at meetings, workshops, team briefs, Master Classes, training events, and
interventions; the rationale for this was many and varied. It included the need to set
the scene, to gather feedback, to observe behaviour/ mannerisms within the meeting
itself, to enquire about activities, and to help the generation of next steps;
b) fieldwork - time within the plant (office and mill based) to comprehend issues at the
source (Gemba). This could also enable chance meetings, discussions and
observations. Furthermore, to appraise the interaction and involvement of team
members. On-the-job activities were evaluated to establish the impact and
acceptability of the new techniques. Management meetings, such as daily production
meetings were observed to assess senior management’s engagement and support.
Likewise, trade union meetings were observed to assess representatives’

178
interpretations and feelings towards change. A process that gave meaning to how the
transformations was being received or viewed by key stakeholders; and
c) site visits – to compare and contrast perceived best practices and understand how these
practices had been sustained.
PO allowed the Researcher to record particular details of the event (who attended, what
was being done, where and why it was happening), to probe and then record what was
being said and done at a particular point in time. The Researcher was able to observe
individuals or groups deemed ‘normal’ occupants or attendees in the role or activity under
study. Oppenheim (1992) warned that interviewees may say what they believe you want
to hear. Observation provided an effective method that could be used to corroborate
statements made. Consequently, participants were informed at the outset of the
Researcher’s intention and the need for their support, openness and honesty. This enabled
the Researcher to get to the root of what was going on in a variety of social groups and
sub-cultures. File notes were maintained of each observation (figure 7.14). Observation
helps to improve the validity of what was said by ensuring it is consistent with what is
seen happening (Oppenheim, 1992).

179
Record of Observation Objective: To review the Master-Classes workshop. Date: 10.11.2006
Location: Training Centre re ID SAW Welding
Attendees: ASmith/VDawkins/SFoster/GStevens/PDolan/BCrane/RPlace/MKay
Purpose: To assess how the MC activity was progressing against the previously agreed
objectives, was it on track? What were the benefits or concerns associated with the
approach? Could it be improved?
Positive observations/ Discussion:
Team enthused and getting on well; Good introduction and recap of issues and actions;
Used Data to show improvement made. These included improved/ focused PM
programme; introduction of dedicated craft to machine; appx 24 minor issues resolved;
improvement in non arc time of 30secs (appx 10%).
Demonstrated benefits of 5S and newly introduced shadow boards
Identified actions still to complete
Team confirmed that ALL operators in area had been informed (and involved) in all
aspects of changes. Sops are being updated to reflect changes in practices
Negative observation/ discussion (OFI);
Team believed initial scope had been too aspirational. They had tried to take too much
on. This had resulted in a modification to charter.
Some improvements would necessitate financial resource which team believed would not
be approved (Major change to welding systems cost £1m ?)
Sometimes conflicts of priorities meant they did not get access to machine when they had
planned. (i.e. production wouldn’t hand line to them as agreed on two occasions out of 6)
Team appeared more concerned with the structure of the MC. They commented the teach
points were tedious since they already knew this. They then went on to complain about
the entire MC process, about it being too bureaucratic!!! (felt like an opportunity to moan
about MC); Finished by saying that in some cases MC are ‘too big’ an approach to tackle
smaller issues ALTHOUGH, the PS tools used were effective!!
Next steps:
Promote success i.e. SAW Benefits, structured approach
Discuss capex plan with HN and CTE
Re-visit feedback from previous MC feedback.
Interview previous attendees to ascertain B and C’s of MC approach and what would they
change.
Discuss MC with CAs to solicit their views on MC structure
Present summary at next Omega mtg
Figure 7.14: An example of a copy of an observation maintained by the Researcher.
Occasionally, the Researcher would be observing a trial or series of trials and would go
armed with a stop watch to time a particular event. For example, empirical studies
conducted with various teams on different shifts and day corroborated the improvement

180
in changeover time (table 7.3). Objective data that could be employed demonstrating the
benefit of an intervention made and provide evidence in support of RQs 1 and 2.
Table 7.3: 12 consecutive diameter changeovers.
Other examples of quantitative date gathering methods employed by the Researcher are
shown in figures 7.15 and 7.16.
Figure 7.15: Trends in cycle time reduction relative to changes in tip cutting depth on
miller and amount of metal removed.
150
160
170
180
190
200
210
220
230
8 13 18 23 28
0.6
0.65
0.7

181
Figure 7.16: Edge miller cycle time.
The above typify but do not exhaust the methods of quantitative data gathering employed
by the Researcher in support of gathering data in order to demonstrate a shift in measured
performance.
At the end of the observed task the Researcher discussed the observed activity with the
attendees in order to get their perception of what had taken place. The ensuing discussion
considered as an example: how the activity may have been different to normal modes of
operation, what was good or bad about the activity, suggestions for how the activity could
be improved. This follow-up discussion provided an opportunity to compare what was
being said with what was actually done, and what was the resultant outcome? For
example, was it possible to recognise a change in cycle time or NRFT?
The notes maintained by the Researcher of the observed practice and subsequent
discussion provided a form of qualitative data to be reflected upon and where necessary
iterated. Field (or file) notes that were re-written at the end of each day, as a form of
reflection. Figure 7.17 provides an example of a diary note made during the observation
of a training workshop. Figure 7.14 provided an example of an observation summary.
Feedback, paraphrased in written (and then typed) formats was analysed by the
Researcher who would identify common themes or key points (narrative/ content analysis
section 5.4). The Researcher would reflect upon and where necessary modify and adapt
the techniques employed using the iterative process of AR to optimise and evaluate
theoretical propositions. For example: the development of the Time Out For Business
booklet (figure 6.13); the refinement of SMED activities; the reconstitution of the Master-
Class workshop; and on-the-job trials.

182
In addition, those who had not been directly involved but had observed the event
(secondary observation) could be questioned. This provided the Researcher with varying
perspectives that tempered his experience. Moreover, it helped reduce the likelihood of
observer bias (Hussey and Hussey, 1997), a bias that might be introduced as a result of a
distraction or because the observer only recorded self-fulfilling events. By discussing
observations with primary and secondary participants, and by repeating observations of
the same event, this potential bias could be reduced if not eliminated.
Figure 7.17 Example of a diary note recorded by the Researcher.

183
Key points were copied or cut out and filed with common themes. For example the
comment by TJB, Business Director, was cut and filed against the sub-category
TM/training/ enthusiasm
Finally, the Researcher made a note on his feelings during the event which captured
experiential data. This indicated whether he felt that a particular event had gone well, or
an opportunity had been wasted.
Benchmarking
Benchmarking conducted by the Researcher and the Omega team (CTE, 2004b; CTE,
2004a; CTE, 2007d; CTE, 2007c; CTE, 2008h; CTE, 2008i), for example Nissan Motors
UK and Toyota UK, coupled with workshops attended by NEPA engineers, supported
and reinforced key literature themes. The combined findings enabled the Researcher to
recognise contemporary approaches to overcoming barriers to change. For example, the
need for a clear and compelling vision, a structure, involvement and committed
leadership. Elements (1) and (2) in the SF proffered by the Researcher (figures 1.1 and
4.6). For CTE to succeed it had to demonstrate that the ‘new’ recovery plan to be
introduced was not just another initiative (CTE, 2007e; CTE, 2010d).
Benchmarking (section 4.2.1) provided a greater understanding of competitor capabilities
and strategies (CTE, 2003-05; CTE, 2007e). CTE needed to address the reliability of its
performance as an enabler to improving and reducing conversion costs. Success would
permit CTE to maintain its hold in niche markets and facilitate a more aggressive
approach in new sectors (table 7.6).
Benchmarking allowed the Researcher to:
- appreciate how companies identified by NEPA as best practice, had adopted and
sustained techniques;
- gain insights into how Japanese automotive companies had implemented and
sustained LM practice 30 plus years after its introduction; and
- conduct gap analyses between CTE and its aspired goals.
The consequential themes to be further explored in order to reinforce an approach or
modify a line of inquiry. For example, to determine the effectiveness of the approach to

184
introduce LM adopted within CTE, the Researcher visited other Corus sites that had
introduced LM as part of the RSP (section 2.3). Sites visited included: Corby; Teesside;
Scunthorpe; Oosterhaut; and Zwijnderecht. Internal benchmarking involved interviewing
(semi-structured) operational, HR and CI managers, at various levels of seniority with the
aim of ascertaining the approach to the implementation of the RSP and associated tools
and techniques (LM).
The Researcher arranged interviews with managers and operators from: HR, the CI
department, and operations. Questions were informed from the literature. For example, is
there evidence of the basic LM tools and techniques prescribed by (Bateman and David,
2002) as fundamental in a Lean journey? Was there evidence of an aligned strategy
deployment process necessary to unite and engage stakeholders in a common goal (Akao,
1991)? Questions were informed as a result of the progress made at CTE and hypotheses
developed by the Researcher. Examples of typical questions are shown in figures 7.6 to
7.9 inclusive. These may have been employed at CTE and repeated at sister mills.
Following the office based interviews mill visits were undertaken where it was possible
to asses if the practices stated during the office based interview were apparent within the
work environment and recognised by TMs. Furthermore, the Researcher was able to
interview (unstructured) and discuss RSP or CI activities with team leaders and operators
in the host mill. Summaries of the interviews and observations were captured in hand-
written form in a note-book (section 5.3). At the end of the visit the Researcher discussed
his finding inferred from the interviews and observations with the host manager.
Data were coded in the main category of ‘B/mark’ with sub-categories of site visited, for
example, ‘B/mark/Teesside’. Key points were extracted from the summary and filed
against relevant themes: ‘LM-Corby’ or ‘Comms-Scun’.
The subsequent findings formed a key activity within the perpetual research cycle which
resulted in the generation of new insight, the establishment of a new series of next steps,
or the conclusion to an area of research.

185
7.6 Data Analysis
The section considers the method of data analysis employed by the Researcher.
7.6.1 Categorisation
Data gathered were filed against the appropriate category (for example figure 7.3 and
table 7.4). In most cases the full electronic reports were filed on a PC. However,
summaries of interview transcripts, questionnaires, field notes, mill-based trials,
interventions, and many more were kept in filing cabinets (section 5.4).
Main theme Sub-theme Secondary sub-theme Tertiary sub-theme
PC Strategy
CI Tools
LM-Omega
Benchmarking
Yr1 (2004/05)
- Programme
- Training
- Interventions
- Involvement
- Feedback
- Rivals
- Other
- Japanese b/mark visit
- 5S
-
- BIT l2
- BIT L3
- BIT L4
- No1 miller
- No2 SIID
- No3 FINA
- No4 BSMA
- Comms
- Objectives
- Observation
- Interviews
- Field notes
- Europipe
- JFE
- Confab
- Welspun
- Severstahl
- NMUK
- D.Roll
- Walkers
- Other
-
- Car plants
- Suppliers
- Training
- Observations/ audits
- Interviews
- Workshops
- CI dashboard data
- Summary reports
Table 7.4: Example of coding system employed to categorise themes.
Data gathered were coded by assigning it a primary category and where pertinent a
secondary or tertiary sub-category. This would result in the document (or a section of the
document) being filed with other similar and pertinent information (see section 5.4).

186
The structured approach employed by the Researcher of focusing on a particular activity
at a time and updating CTE and Omega teams monthly resulted in regular summaries
being maintained complete with ‘do next’ actions. This allowed silo activities to be
undertaken without project creep. When an action was exhausted or to be replaced by a
competing or complementary theme the activity would be closed when a summary form
had been completed (figure 7.18). The summary form allowed the Researcher to quickly
remind himself of progress made but also to use as a medium to update CTE on progress
against agreed actions.
SUMMARY
Date: 12/09/09
Subject: Compliance with basic tool and techniques linked to TM Objectives.
Summary: A combination of interviews and observations had shown that in the Finishing Mill, support for the main CI building blocks was evident. Compliance auditing, although only recently started (April 2009) demonstrated very good scores. Numerous
interventions have been run in the area and KPI’s have shown marked improvement. Whilst differences have been recorded between Finishing Mill and Forming & Welding lines, this is subject to an already agreed
course of action.
The challenge to put to the team (Finishing Mill) was in their ability to a) sustain practices and b) improve further.
The following actions that need to be considered are a result of discussion on sustainability: -
1. - Knowledge Retention – implement the ‘Andy & Me’ refresher training course.
2. - Develop post course activities (include JMK and AW to arrange).
3. - Review TOFB sessions and clarity of employee objectives.
- Update the TOFB Booklet to capture a) TM objectives and what they had done. - Consider how deselection process can make ‘commitment’ to objectives more demanding.
N.B. These were discussed and agreed with CTE during August Meeting.
Figure 7.18: An example of a summary form
7.6.2 Unitising data
The unit of measurement employed by the Researcher varied due to the requirements of
the project and method of research. For example:
Interviews:
Where individuals were asked a series of questions or completed a questionnaire, their
responses were captured. The subsequent (content) analysis of data sought to consider
how many times the same response was given. It was possible that when asking a question
of ten participants, either individually or as a group, then a number of them might provide
the same response. Thus, it was expressed as a percentage. The greater the percentage
associated with a response or assigned to a comment, then the greater the priority was
afforded to the topic by the Researcher. Focused attention that might help uncover/

187
explain the meaning attributed to employee behaviour. For example, why were TMs more
receptive to change during this transformation than with previous initiatives?
The unit of data could equally have been an individual sentence. This might have been
linked to a comment made by the interviewee considered by the Researcher to be a
revealing or profound comment. For example, “if you could bottle that enthusiasm
displayed in the workshop – you are on to a winner” or “previous initiatives failed
because we (the workers) were not deemed important enough to be involved!”
Content analysis was a technique employed to emphasise the main points for priority
consideration and for future referral. For example, in this extract from an interview (figure
7.19) comments were highlighted to provide the required emphasis. The narrative was
catalogued under the heading of ‘involvement in the change process’ a sub-theme of the
main theme ‘barriers to change’.
Figure 7.19: An example of an extract from an interview summary.
188
Secondary data:
Secondary data were derived from company reports, benchmark reports and literature.
Here the units of data may have been in the form of sentences and paragraphs. For
example, an account of: why something had been successful/ failed; good practices
observed at other plants; or insights uncovered during literature reviews. These would be
copied, coded and filed against the appropriate category.
In addition to this, a variety of performance metrics (unit of data) were being gathered
and analysed. For example: financial performance (Pounds Sterling, EBIT, EBITDA,
RONOA); mill performance (pipes/ shift, pipes per hour, NRFT); mill availability,
employee overtime (percentages); training (hours); sales volume (tonnes or metres); data
that could be used to explore trends in performance over time. Quantifiable data that could
be used to determine if an intervention made to address employee behaviour or practices
within the mill were having an impact on key business metrics. This form of triangulation
of comparing subjective changes with an objective impact helped to validate conclusions
proffered by the Researcher concerning the success or otherwise of mill-based
intervention (chapter 6). The output being used in turn to answer RQs 1 and 2.
Observation:
Data were captured in two main forms (units of data): 1) written accounts of an
observation, (sentences and paragraphs); 2) trials carried out in the mill to demonstrate
cycle time, downtime and reject rates (minutes and seconds, pipes/ hr and per shift, and
percentages).
The units of data were labelled with the category heading and filed in the same folder as
the main theme or a sub-theme (figure 5.7 and table 7.4).
7.6.3 Recognising relationships.
The Researcher took the data derived from interviews, observations, questionnaires,
company reports, and trials to construct graphs, tables, simple and extended matrices in
order to develop patterns and relationships. Objective data that could be employed by the
Researcher to juxtapose with changes in behaviour or work shop practices (subjective) to
establish if a particular intervention had been: a) sustained; and b) had a measured impact.

189
For example:
Graphs
Line charts, scatter diagrams and bar charts were all useful methods for displaying a shift
in performance or a relationship. For example, figure 7.15 demonstrates a relationship
between the miller cutting depth and a machine cycle time. Using charts such as this to
record machine performance the Researcher could extrapolate data and suggest that there
existed a relationship between the introduction of Lean techniques and an improved
performance. Information that could be used to answer RQ1.
Figure 7.20 provides an example of the trend in manufacturing performance pre- and post
the launch of Lean. The Researcher was able to demonstrate a positive shift in
performance. This allowed a cause and effect relationship to be demonstrated, linking
improvements in performance with a change in workshop practices.
Figure 7.20: Trend in press line performance
Bar charts were also employed to demonstrate changes in performance. For example,
figure 7.21 highlights the historic trend in a) Master-Class (MC) / problem solving
activities (blue line); b) the number of Kaizen raised by employees; and c) the number of
ideas generated as a consequence of an improvement activity.
0
20
40
60
80
100
120
6
8
10
12
14
16
18
20
No
of
pip
es/
ho
ur
(pu
re)
Press line: Historic performance. (Pure speed/hr)
Pure speed/hr
Ave pipes pressed/shift
Linear (Pure speed/hr)

190
Figure 7.21: Historic trends in the number of interventions and Kaizen raised (source, CI
Dashboards).
The analysis of data suggested that the increase in problem-solving interventions could
be related to the number of ideas being generated by employees, independent to, or as a
consequence of the structured intervention. Problem-solving interventions were a forum
for generating ideas via a structured activity. However, they were also a mechanism for
attuning the employee mind-set on what actually constituted a Kaizen. The increase in
Kaizen suggested a change in employee behaviour, an acceptance of the new technique,
and the potential for an improvement in performance.
Figures 7.20 and 7.21 are examples of macro level trends over long periods of time. The
myriad of micro level graphs (for example, figure 7.15) are examples of the numerous
graphs employed during problem-solving workshops to demonstrate a shift in
performance. The micro level improvements was used by the Researcher to demonstrate
a relationship between Lean techniques and improved efficiency of a process or
processes. The historic trend reflected the impact of a myriad of focused improvements;
an improvement that was used by the Researcher to demonstrate the relationship between
isolated activities and an evolving CI culture. Trends that could corroborate Lean was
having an impact. Consequently, the Researcher could then demonstrate that the
interventions made could be used to answer and support RQs 1, 2 and 3. A research
methodology that could allow the Researcher to suggest/ demonstrate that a change in
employee behaviour (subjective) was having a measured impact (objective).
0
50
100
150
200
250
0250500750
10001250150017502000225025002750300032503500
2005 2006 2007 2008 2009 2010 2011 2012 2013 2014
No
of
even
ts
Year
Trend in events 2005 to 2014
No of Kaizen No of ideas raised in interventions No of MC or Intervention

191
Likewise, interviews, questionnaires and the time-line associated with localised
interventions enacted by the Researcher such as: the advent of TOFB, the reformation of
the Kaizen system, and the introduction of the appraisal/ de-selection process, could be
employed to demonstrate an increased momentum and or sustainability of CI throughout
the mill. This in turn could be related to the observed improvement manufacturing trends
(figure 7.20). Findings that supported RQ2.
Tables
Data gathered were also tabulated as a method for demonstrating more complex
relationships. For example, table 7.5 illustrates the relationship between manufacturing
variance and the overall financial performance of the business.
Year Speed of work Gain/ (Loss) £k
Availability Gain/ (Loss) £k
Total (manufacturing) Gain/ (Loss) £k
Overall business
performance Profit/ (Loss) £k
97-98 453 (2,815) (2,362) (2,036)
98-99 614 (2,437) (1,823) (952)
2000 (1,291) (593) (1,884) (3,328)
2001 (1,616) (4,203) (5,819) 4,389
2002 414 (2,019) (1,605) 1,181
2003 (108) (776) (884) (4,998)
Table 7.5: Manufacturing performance variance (Corus-Reports, 1997-2003)
This was used to inform the Researcher of prevailing issues and to substantiate the
requirement to address manufacturing efficiency at the outset of this study. Similarly,
table 7.6 was developed to depict the strategic priorities affecting CTE in the market. The
inference drawn from company reports and from interviews with Commercial, Technical
and Operational functions provided data on the challenges that confronted CTE (CTE,
2009d). These were subsequently prioritised and tabulated by the Researcher (table 7.6).

192
Sector
Category Productivity
High
performance
feedstock
Lower cost
feedstock
Welding
development
Tooling
support Formability
Testing
capability
Cat 1 1 2 3 1 1 1 1
Cat 2 1 2 1 2 2 2 1
Cat 3 1 2 1 1 1 1 1
Cat 4 1 3 1 3 3 3 3
Cat 5 1 3 1 2 3 2 3
1 = Essential: 2 = Usually required: 3 = Nice to have, but not essential
Table 7.6: Strategic priorities for CTE (CTE, 2009d).
Matrices
Data gathered was also represented in a 2x2 matrices. Figures 7.22 and 7.23 typify the
approach adopted by the Researcher to support the development of (evolving)
relationships.
Figure 7.22: Application versus evidence. Figure 7.23: Support versus evidence.
For example, figure 7.22 provided a visual representation of TM’s responses to question
sets that grouped the application of LM techniques with evidence of improvement.
Whereas figure 7.23 linked the support structures in place (CAs) with evidence of
improvement.
Closer analysis revealed that the interviews were undertaken within two disparate areas:
the Finishing mill (FM); and the Forming and Welding lines (F&W). In the FM planned
activities were being implemented. In the F&W lines, training had been completed but

193
activities were not being implemented. The yes/yes reflected the FM, the no/no reflected
the F&W.
It was possible to argue that the positive statements could be attributed to ‘novelty bias’
whereas the negative statements to the fact that no activities of any nature had been
undertaken. This would form the basis for testing the relationship (section 7.6.4). The
Researcher having analysed data gathered from interviews and direct observation, was
able to demonstrate that the CI programme employed in the FM had involved or touched
nearly 100% of TMs. This was substantiated following interviews and fieldwork that
indicated TMs were involved in: workshops that resulted in the development of ideas to
improve the layout and reduce wasteful actions; the re-writing of procedures; and their
involvement in the change process. 77% (20 out of 26) of TMs interviewed could discuss
with clarity the impact that they had within their area. The data captured was subsequently
represented in an extended matrix used to visualise and analyse data (table 7.7). Yes/ no
responses from TMs at each work station were plotted against questions asked.
Trai
ned
in L
M
Invo
lved
in M
C
5S 7 W
aste
s
Std
Ops
Vis
man
agem
ent
Cha
nges
mad
e lin
ked
to L
M
Impr
ove
men
ts m
ade
linke
d to
LM
Ass
iste
d by
CA
Ass
iste
d by
Lin
e
Man
ager
Enth
used
/ en
gage
d
kno
wle
dgab
le a
bout
MC
pro
cess
Abl
e to
dem
ons
trat
e
wha
t th
ey h
ad d
one
Wan
t to
be
invo
lved
BSMA Yes Yes Yes Yes Yes Yes Yes Yes Yes No Yes Yes Yes Yes
X-Ray Yes Yes Yes Yes Yes Yes Yes Yes Yes No Yes No Yes Yes
SIID Yes Yes Yes Yes Yes Yes Yes Yes Yes Yes Yes Yes Yes Yes
BEVL Yes Yes Yes Yes Yes Yes Yes Yes Yes Yes Yes Yes Yes Yes
FLIA Yes Yes Yes Yes Yes No Yes Yes Yes Yes Yes Yes Yes Yes
Researcher's perception of
indvidualSupportive structureApplied
Table 7.7: An example of an extended matrix employed to demonstrate features
associated with the introduction of LM techniques in the FM (July 2008).
Follow-up interviews explored the subjective elements of the activity. For example, how
did the employee perceive the intervention to have gone? What did they like/ dislike about
it? Which tools did they believe to have added value or been ineffective? Did they believe
the intervention to have had a positive/ negative impact on their duties? Would they
volunteer to be involved in another intervention? Data that was now being employed to
answer RQ1 i.e. how Lean was being introduced successfully within the work area.
A method of analysis that enabled the Researcher to illustrate the training and support
provided (or not) to specific areas within the mill. This would be cross-referenced with

194
quantifiable data to assess the benefit / concern as a consequence of the intervention. An
approach that provided a vehicle for establishing relationships.
In order to test a perceived relationship the fieldwork was repeated in the F&W line. Here,
data gathered and analysed from interviews and training records informed the Researcher
that post-training support had been found to be minimal in the first two years (table 7.8).
68% of those interviewed were apathetic to the transformation claiming they had done
little since the initial training and appeared less motivated.
Trai
ned
in L
M
Invo
lved
in M
C
5S 7 W
aste
s
Std
Ops
Vis
man
agem
ent
Cha
nges
mad
e lin
ked
to L
M
Impr
ove
men
ts m
ade
linke
d to
LM
Ass
iste
d by
CA
Ass
iste
d by
Lin
e
Man
ager
Enth
used
/ en
gage
d
kno
wle
dgab
le a
bout
MC
pro
cess
Abl
e to
dem
ons
trat
e
wha
t th
ey h
ad d
one
Wan
t to
be
invo
lved
ID Weld Yes Yes No No No No No No No No No No No Yes
ID Insp Yes Yes Yes Yes No No No No Yes Yes Yes No Yes Yes
OD Weld Yes No No No No No No No No No No No No Yes
OD Insp Yes No No No No No No No No No No No No Yes
Press line Yes Yes No No No No No No No Yes No No No Yes
Tack insp Yes No No No No No No No No No No No No Yes
Expander Yes Yes No No No No No No No Yes No No No Yes
Applied Supportive structure Researcher's perception of
Table 7.8: An example of an extended matrix employed to demonstrate features
associated with the introduction of LM techniques in the F&W lines (July 2008).
The analysis of the data (qualitative and quantitative) suggested that training alone was
not conducive to the application within the work-place. This resulted in the hypothesis
that the absence of post-training activities and engagement was proportional to the
knowledge retained of LM by TMs and the dwindling support for the programme. This
bolstered an earlier hypothesis as to why previous initiatives had failed; the lack of post-
launch support had an adverse impact on the sustainability of initiatives (Table 7.9); a
hypothesis that would then be tested. The iterative cycle allowed the interventions to be
proven and honed. The effectiveness/ ineffectiveness could be validated which in turn
supported RQs 1 and 2 with respect to the Researchers ability to demonstrate how Lean
was introduced to deliver sustained benefits.
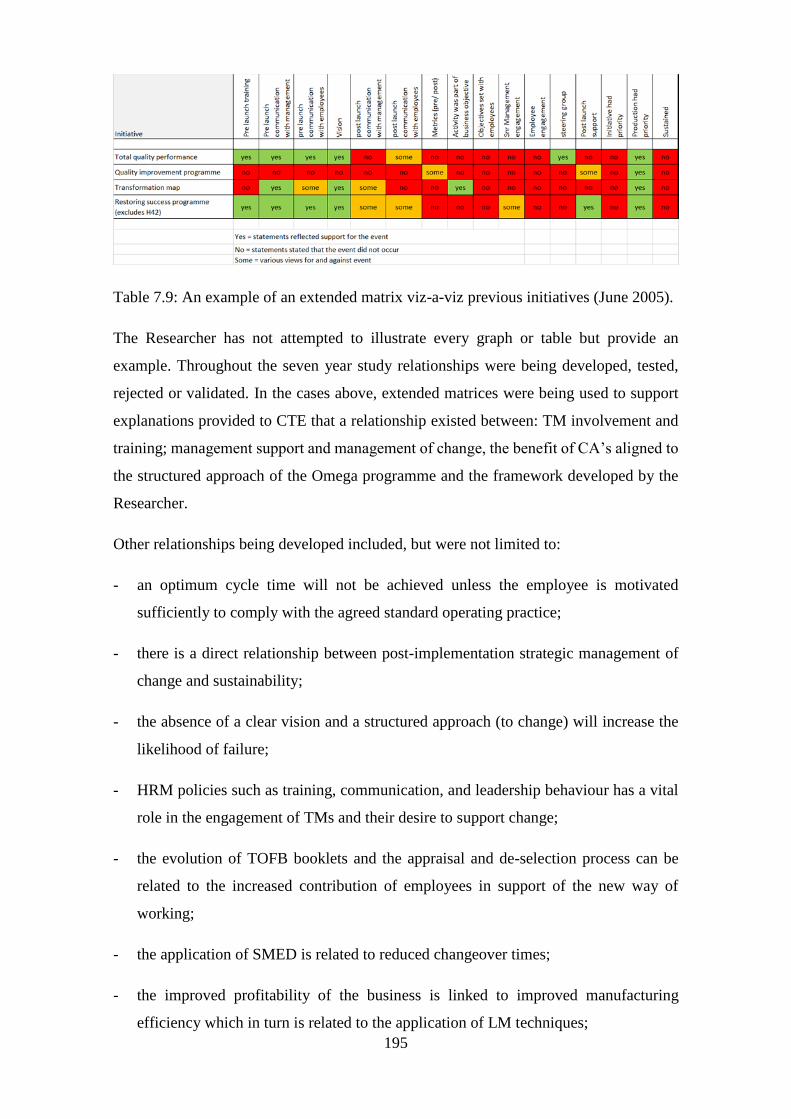
195
Table 7.9: An example of an extended matrix viz-a-viz previous initiatives (June 2005).
The Researcher has not attempted to illustrate every graph or table but provide an
example. Throughout the seven year study relationships were being developed, tested,
rejected or validated. In the cases above, extended matrices were being used to support
explanations provided to CTE that a relationship existed between: TM involvement and
training; management support and management of change, the benefit of CA’s aligned to
the structured approach of the Omega programme and the framework developed by the
Researcher.
Other relationships being developed included, but were not limited to:
- an optimum cycle time will not be achieved unless the employee is motivated
sufficiently to comply with the agreed standard operating practice;
- there is a direct relationship between post-implementation strategic management of
change and sustainability;
- the absence of a clear vision and a structured approach (to change) will increase the
likelihood of failure;
- HRM policies such as training, communication, and leadership behaviour has a vital
role in the engagement of TMs and their desire to support change;
- the evolution of TOFB booklets and the appraisal and de-selection process can be
related to the increased contribution of employees in support of the new way of
working;
- the application of SMED is related to reduced changeover times;
- the improved profitability of the business is linked to improved manufacturing
efficiency which in turn is related to the application of LM techniques;
196
- LM can be used to improve the competitiveness and therefore viability of a business.
Again, these could be used to demonstrate relationships between interventions and the
benefits secured in response to RQs 1 and 2. Furthermore, by applying the successful
techniques to new areas and assessing the effectiveness of the interventions, it was
possible to start drawing relationships that could answer RQ3. The next phase of the
research was to explore and test such hypotheses.
7.6.4 Developing and testing hypotheses
The appearance of an apparent relationship (and subsequent hypothesis) needs to be tested
if a conclusion is to be established (Saunders et al., 2003).
For example, during the process of qualitative data analysis investigating the cause of
sub-optimal cycle times the Researcher formulated the following hypotheses:
- an optimum cycle time will not be achieved unless the employee is motivated
sufficiently to comply with the agreed standard operating practice.
A relationship or hypothesis deemed critical by the Researcher in answering the research
questions (section 1.3). Explanation building (EP) was employed as a technique to
understand why the significant improvements (52% increase in speed of work) were
achieved in the FM over the period 2004 to 2007. Furthermore, to explain the support
structure that had resulted in sustaining LM and delivering the aspired 52% improvement
throughout the full mill by 2012. The conclusion drawn relating to how LM had been
successfully introduced could be used to answer RQ1. Whereas the HRM practices that
had either acted as a catalyst to support LM introduction or contributed to sustainability
supported RQ2
The inductive analysis of data suggested that the failure in the F&W lines (2004-07) could
be linked to the lack of support provided during the post-launch phase (table 7.3). CTE
had insufficient resource to support all areas during the first two years of the
transformation. Tactical decisions had been made that had resulted in the FM being given
priority at the pre-determined expense of the F&W lines (CTE, 2008j).
The Researcher was able to demonstrate a relationship between the introduction and
sustainability of Lean with the structured approach applied to FM post the launch phase

197
(tables 7.7, 7.8, 7.9 and sections 8.2 and 8.3). Informed by interviews and observation,
and deduced by measured changes in TAKT time. Furthermore, that it had been enabled
by the evolving HRM policies; a mutually supportive strategy that had motivated and
engaged employees in the transformation (for example figure 7.21).
For example:
1) the relationship between the success in the FM with the set back in the FW Lines
(tables 7.7 and 7.8);
2) the relationship between the FM and previous initiatives (tables 7.7 and 7.9);
3) the comparison between successes noted at CTE with the failure to sustain RSP at
other Corus sites (CTE, 2008i). The main conclusions were:
- 86% (12 out of 14) had employed alternative methods to the NEPA programme
to introduce LM and to train the CI managers and workforce;
- the delivery of CI activities was found to be inconsistent and quite isolated (93%),
although CI had proved beneficial in the isolated areas applied;
- there was a distinct absence of any coordination between CI activities and the
business strategy (100%);
- 79% of senior managers perceived CI as something the CI department controlled.
An attitude that was equally prevalent with line managers (100%);
- CI (RSP or LM) had not been integrated within the manufacturing values and
policy of the sites (100%). It transpired that CI activities at Teesside had ceased
within two years of its launch (CTE, 2008i) and was employed at Corby as a 5S
exercise (CTE, 2011e);
4) the success of CTE’s approach (in applying Lean techniques) was consistent with the
success noted during the benchmark visit to Japan and NMUK. The Researcher’s
experience in Japan (section 6.5) had culminated in the realisation that persistence in
basic tools and techniques had a powerful impact which combined with strategy
deployment could nurture a culture of continuous improvement;
5) the similarities uncovered following the success of the F&W lines 2008-11 could be
related to the FM 2004-07.
The Researcher was seeking to test theories and exhaust other possibilities that would
demonstrate that the support in the new way of working had a positive influence on the

198
ability to: a) sustain the new mode of operation; and b) engage employees in the adoption
of new practices and in their commitment to the business goals.
Pre 2004 HRM policies had failed to engage TMs in support of business goals (section
4.2.2). Consequently, CTE had failed to tap into a rich source of available tacit
knowledge. The analysis of anonymous surveys expressed the value (as well as change)
in communication policies, training, appraisals, and TM involvement. A change TMs
believed suggested was a prime motivator which underpinned their contribution to the
new way of working. Whilst, it could be suggested that the increased focus may have
contributed to a ‘white coat’ effect, it would be difficult to state that the LM approach had
not been beneficial. Furthermore, that seven years after the launch of the recovery plan,
Lean techniques were very much still evident.
The Researcher was able to support theories with evidence in the form of explanation
building. For example, over six years into the research programme the analysis of
observations in the mill, interviews and a variety of company reports reflected
quantifiable (objective) improvements that suggested that this particular initiative had
been sustained and had a positive impact (chapter 8).
7.7 Summary
The chapter has outlined the research approach employed by the Researcher. It mirrors
the methodology outlined in chapter five. Guided by the framework (section 7.2) the
Researcher sought to understand behaviour associated with change and its acceptance;
furthermore, to use this learning to succeed where previous initiatives within CTE had
failed (section 4.2.2). The AR strategy was selected because it allowed the Researcher to
be subsumed within the operating environment as part of the change process and
supported theory building in incremental stages (section 7.4); a strategy that supported
the ontological and epistemological stance of subjectivism and interpretivism. Section 7.5
outlined the method of data gathering and section 7.6 of data analysis.
The research methodology of understanding the subjective meaning applied by
employees to change and interpreting TM action/ behaviour allowed the Researcher to
refine practices and develop approaches (interventions) that solicited TM support. The
change in workshop practices could then be measured and again through the iterative
process of AR, refined and optimised. Summaries and conclusion taken from interviews
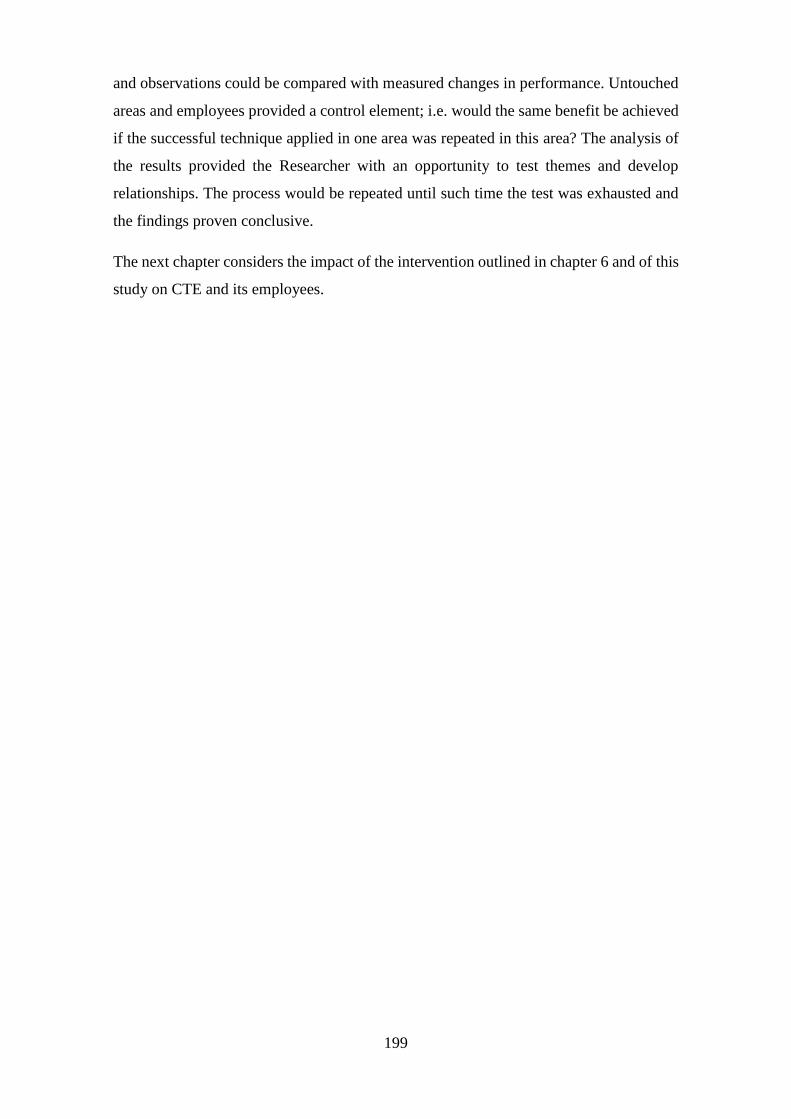
199
and observations could be compared with measured changes in performance. Untouched
areas and employees provided a control element; i.e. would the same benefit be achieved
if the successful technique applied in one area was repeated in this area? The analysis of
the results provided the Researcher with an opportunity to test themes and develop
relationships. The process would be repeated until such time the test was exhausted and
the findings proven conclusive.
The next chapter considers the impact of the intervention outlined in chapter 6 and of this
study on CTE and its employees.

200
Chapter Eight: Results
8.1 Introduction
The analysis of the various reports and transcripts suggested that CTE had a world class
asset but was handicapped by its inability to compete on price. In 2003, CTE was charged
with introducing cost reduction measures in order to retrench and stem the decline or face
closure (CTE, 2008f). Operational efficiency centred on process centric innovation was
proffered by numerous researchers as an appropriate strategy for companies in a mature
market (Slatter and Lovett, 1984; O'Neill, 1986; Khandwalla, 1992; Robbins and Pearce
II, 1992; Bowman and Singh, 1993). Consequently, cost reduction through improved mill
availability, throughput, and capability became a primary theme encapsulated within the
recovery plan (section 4.2.3). Data gathered resulted in CTE declaring the need to
improve productivity by 52% (CTE, 2004e). The problem, however, was that CTE had
failed to sustain any previous initiatives of any significance (section 4.2.2).
“With previous initiatives management had failed to engage the workforce. These were
often theoretical exercises driven by consultants that lacked management buy-in.
Consequently, there was no effort to change existing HR practices in support of this.” (N.
Duffey, HR Manager Sept 2009).
Thus, the challenge for the Researcher was how to introduce and sustain a new way of
working in order to turnaround the performance of CTE. Previous chapters have outlined
what the Researcher did. This chapter considers the impact of this study and of the
interventions made by the Researcher.
Section 8.2 considers the results of the HRM strategy, section 8.3 the results associated
with the manufacturing strategy. Each section starts by reflecting upon the changes
introduced as part of this study. It continues by outlining the results derived as a
consequence of the data gathering and analysis process (sections 7.5 and 7.6) in order to
answer the research questions.
8.2 The benefit of a HRM strategy
The strength of contemporary HRM policies was stated as providing the ability to
influence employee behaviour in the delivery of business goals (section 3.5). Section
4.2.2 outlined the failings associated with previous initiatives.

201
Interviews (section 7.5) conducted by the Researcher with 140 TMs to consider the
question “what is going to stop us (with respect to sustaining LM)?” identified 57
common concerns (Researcher file note, Jul 2005). These were captured and shown in
table 8.1.
Comment Number of times raised
Management are the barriers to change 36
Training and development is limited 83
Poor HR practices (communications, pay) 68
Negative culture in mill 92
Resistance to change (by TMs) 74
TMs not involved or listened to 83
What’s in it for us 62
Lack of resources 48
TM and craft do not work together 46
Lack of investment/ lack of work 28
Table 8.1: The main concerns raised by TMs as issues they perceived would prevent the
transition and sustainability of LM.
The data collected (Chapter 3, sections 4.2 and 7.5) contributed to the hypothesis that to
overcome barriers to change and motivate employees in support of the business
transformation, a new (within CTE) and mutually supportive HRM strategy had to be
introduced (section 1.3). Section 6.4 described the HRM intervention made by the
Researcher. The Researcher’s approach was to adopt and where necessary adapt the best
practices deduced from the literature (section 3.5). From this, develop and coordinate a
‘novel’ phased approach that engaged employees and motivated them at all levels to
support the recovery plan. Furthermore, to develop a closed loop system that motivated
employees to generate a commitment in the delivery of personal objectives in support of
the business goals (sections 3.5 and 6.4).
The basic themes introduced (sections 6.4 and 6.6) which were associated with the HRM
strategy included recruitment, training, development, objective setting, communication,
incentives, and involvement.
CTE’s recruitment policy was overhauled to ensure that when new (temporary)
employees commenced work at CTE they fully understood the business values,

202
production practices, and the expected employee commitment. This ensured that new
starters were clear that in agreeing to work at CTE, they were ‘buying-in’ to key principles
that they had to adopt. The Researcher thus ensured expectations were established by both
employer and employee at the outset.
Training and development was twofold:
1) during recruitment and induction; and
2) for existing employees.
Sections 3.5 and 6.2.3 identified that the primary value was that the training provided the
existing workforce with the requisite knowledge, understanding and expectations of this
new way of working. Supported by leadership, Hoshin Kanri (HK), and engagement
policies, it generated a culture of CI that under-pinned CTE’s transformation. The primary
value was pivotal in that it ensured that the new work methods were understood prior to
being engaged in the mill (source, CTE competency job profiles).
“The change in TM grades took away the constant bickering about what rate I should
book somebody in at……. Moving people around was easier and accepted without
fuss…….. The approach to new starters meant that when they actually went solo they
were up to speed much quicker” (Section Manager CTE, July 2008).
The secondary value was a moral objective. During lay-offs, employees being released
were better trained than when they had started. This could provide an advantage when
seeking new employment.
Simultaneous to this and from the outset of the transformation was the introduction of an
improved communication process. The Researcher recognised the importance of
communication outlined in the literature review (section 3.5.2) as a primary non-financial
motivator (section 4.2.2).
Informed by the inductive analysis of interviews undertaken and deduced from various
literature reviews, the Researcher introduced a total and radical change in CTE’s
management policy, communication strategy, vision and expectations (sections 6.4.4,
6.6.3 & 6.6.6). This approach included regular team briefs and feedback sessions that
engaged employees and made them feel part of the process. Previously absent, the

203
interventions were confirmed by CTE HR teams and employee feedback sessions, as a
major catalyst in helping breakdown adversarial relationships that existed between
management, employees and their representatives (CTE, 2010c). The transparency
behind the rationale for change secured buy-in at all levels.
“The increased levels of engagement were welcomed by TU members and they felt as if
they finally had a voice in the company” (Union Convenor CTE, Mar 2010).
The persistent and consistent approach coupled with changes being observed confirmed
this strategy was to be endured. Employees were informed and therefore aware of the
recovery plan and the reasons behind the decisions made. The adopted strategy
contributed to engaging the work force and making them feel part of the recovery process
as opposed to having it forced upon them. Teams were aware of progress being made,
challenges still to face, and importantly how they contributed.
The financial reward system was transformed to enable and accelerate the desired change
in behaviour. The weekly bonus targets were aligned to improvements in speed of work
which made the bonus system a ‘live’ rather than moribund reward system. The
communication process explained how this would be achieved and moreover
demonstrated that the new targets would be phased in as the teams demonstrated they
could achieve the higher throughput rates. The alignment of targets with improvement
milestones introduced by the Researcher within CTE was novel within Corus (CTE,
2010c; CTE, 2011c).
Employees were expected to generate ideas (Kaizen) as a condition of employment not
for some arbitrary award; ideas that reduced cycle times and contributed to the aspired
reduction in conversion cost. This was engendered via the HK process (section 6.6.6).
This established the expectation that TMs would and could make a difference.
Importantly the HK cascade process converted business objectives into a language team
members could understand and objectives in which they could partake. Thus, employee
goals at all levels were aligned.
The new appraisal process for TMs introduced by the Researcher was unique to CTE (at
TM level within Corus). This closed a loop in the HK process. TMs were informed of the
strategy, assigned objectives which they established and were then recorded in their time
out for business booklet (section 6.6.6). TMs were appraised against their performance
and contribution to business objectives. Employees were assessed on numerous elements
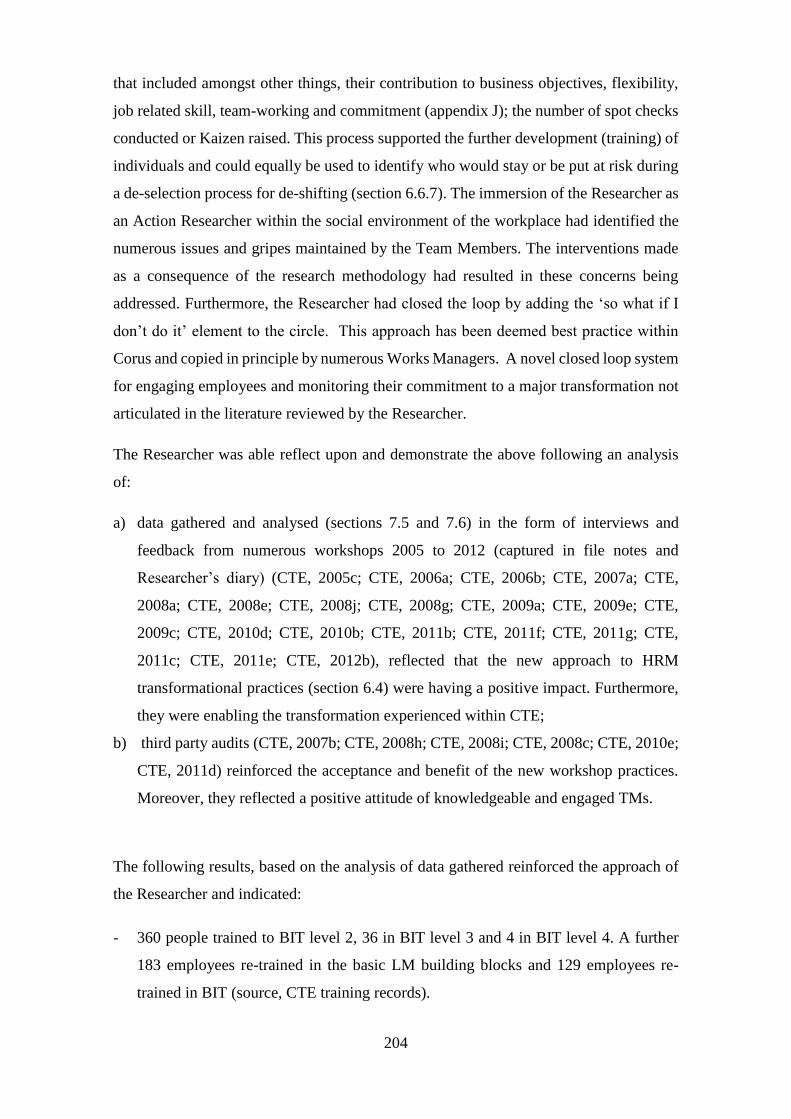
204
that included amongst other things, their contribution to business objectives, flexibility,
job related skill, team-working and commitment (appendix J); the number of spot checks
conducted or Kaizen raised. This process supported the further development (training) of
individuals and could equally be used to identify who would stay or be put at risk during
a de-selection process for de-shifting (section 6.6.7). The immersion of the Researcher as
an Action Researcher within the social environment of the workplace had identified the
numerous issues and gripes maintained by the Team Members. The interventions made
as a consequence of the research methodology had resulted in these concerns being
addressed. Furthermore, the Researcher had closed the loop by adding the ‘so what if I
don’t do it’ element to the circle. This approach has been deemed best practice within
Corus and copied in principle by numerous Works Managers. A novel closed loop system
for engaging employees and monitoring their commitment to a major transformation not
articulated in the literature reviewed by the Researcher.
The Researcher was able reflect upon and demonstrate the above following an analysis
of:
a) data gathered and analysed (sections 7.5 and 7.6) in the form of interviews and
feedback from numerous workshops 2005 to 2012 (captured in file notes and
Researcher’s diary) (CTE, 2005c; CTE, 2006a; CTE, 2006b; CTE, 2007a; CTE,
2008a; CTE, 2008e; CTE, 2008j; CTE, 2008g; CTE, 2009a; CTE, 2009e; CTE,
2009c; CTE, 2010d; CTE, 2010b; CTE, 2011b; CTE, 2011f; CTE, 2011g; CTE,
2011c; CTE, 2011e; CTE, 2012b), reflected that the new approach to HRM
transformational practices (section 6.4) were having a positive impact. Furthermore,
they were enabling the transformation experienced within CTE;
b) third party audits (CTE, 2007b; CTE, 2008h; CTE, 2008i; CTE, 2008c; CTE, 2010e;
CTE, 2011d) reinforced the acceptance and benefit of the new workshop practices.
Moreover, they reflected a positive attitude of knowledgeable and engaged TMs.
The following results, based on the analysis of data gathered reinforced the approach of
the Researcher and indicated:
- 360 people trained to BIT level 2, 36 in BIT level 3 and 4 in BIT level 4. A further
183 employees re-trained in the basic LM building blocks and 129 employees re-
trained in BIT (source, CTE training records).

205
The enthusiasm displayed by the attendees during the BIT level 2 training was
overwhelming (diary note March 2005). This opposed the incipient view held by CTE
that TMs would act as barriers to change. The conviction or earnestness demonstrated
by the TMs gave credence to the polar view that the attendees were actually receptive
to change and keen to utilise the new skills.
“If you could tap that enthusiasm, you are on to a winner.” (Business Director -
Tubes, April 2005).
The Researcher demonstrated (tables 7.7 and 8.2) that the training proved to be a
fundamental enabler which generated support for the new way of working.
Conversely, the lack of training recorded at other sites (CTE, 2008i; CTE, 2008h)
may have accounted for the perceived apathy of TMs to LM techniques.
- 5 NEPA trained CA’s to run Master-Classes and over 30 managers and Team Leaders
trained in problem solving interventions (section 6.4) (source, CI dashboard);
- the volume of interventions, Kaizen, 5S activities, SOs, (source CI dashboard, figures
8.1, 8.2 and 8.3). This provided CTE with the expertise and capability to facilitate
interventions and apply Lean techniques during the application phase. This ability
was stated as missing in previous initiatives (section 4.2.2) and deemed paramount to
aid knowledge transfer/ retention in companies seeking to adopt Lean practices
(Herron and Hicks, 2008);
Figure 8.1 Trend in the number of interventions run at CTE
-40
-20
0
20
40
60
80
100
120
140
No of MC or Intervention
No of MC orIntervention
Linear (No of MCor Intervention)

206
Figure 8.2: Trend in Kaizen raised by employees
Figure 8.3: Trend in the total number of ideas generated.
- LM is indicative of a continuous improvement (CI) philosophy that reflected the spirit
of a particular way of working and formed part of a Kaizen mind-set (section 3.3).
Employee experience and creativity to raise Kaizen and eliminate all forms of waste
was a fundamental goal in a Lean organisation (Ohno, 1988). Figures 8.1, 8.2 and 8.3
depict a positive trend in the sustained use of interventions and kaizen (idea
generation) reflective of the required CI culture;
- the noted improvement in speed of work, availability and NRFT (analysis of monthly
reports and interventions). This could be used to demonstrate a relationship between
the activities undertaken and improvements noted. See also section 8.3;
- the continued profitability (and loading) of the mill post 2006 in spite of volatile
market conditions (monthly reports, section 8.3).
0
100
200
300
400
500
600
700
No of Kaizen
No of Kaizen
Linear (No ofKaizen)
-1000
0
1000
2000
3000
4000
20
05
20
06
20
07
20
08
20
09
20
10
20
11
20
12
20
13
20
14
No of ideas raised per annum
No of ideasraised per annum
Linear ( No ofideas raised perannum)

207
In addition, fieldwork supported the reality that:
- the Lean language was common jargon in the mill (interviews, fieldwork and third
party audits). This supported a) knowledge retention, and b) the acceptance and
therefore sustainability of the new way of working within the mill at TM level (tables
7.7 and 8.2);
- Lean techniques were visibly practised in the mill (fieldwork 2008-2012, figures 6.4,
6.5 and 6.11). In 2012 the Researcher repeated an on-the-job questionnaire during
fieldwork to determine the impact TMs had in their area and what factors they
perceived influenced the change in work shop practices. The data captured were
subsequently represented in an extended matrix used to visualise and analyse data
(table 8.2). Yes/ no responses from TMs at each work station were plotted against
questions asked;

208
Table 8.2: An extended matrix employed to demonstrate features associated with the
introduction of LM techniques within CTE (April 2012).
The benefits across the mill were now evident and tangible (section 8.3). The
Researcher sought to determine what enablers the TMs perceived to have contributed
Trained in LM
Involved in MC
5S
7 Wastes
Std Ops
Vis management
Changes made linked
to LM
Improvements made
linked to LM
Assisted by CA and/or
Line Manager
Enthused/ engaged
knowledgable about
MC/ intervention
process
Able to demonstrate
what they had done
Want to be involved
LM has made a
difference
I am/ have been
involved in the mill
based improvement
I have and do make a
difference
I am proud of what I/
we have achieved
LM has been sustained
I am aware of the
challenges confronting
the business
There are further
improvements that
could be made
The old ways (pre
Lean) were better
Tab
atta
chYe
sYe
sYe
sYe
sYe
sYe
sYe
sYe
sYe
sYe
sSo
me
Yes
Yes
Yes
Yes
Yes
Yes
Yes
Yes
Yes
NO
Pres
s lin
eYe
sYe
sYe
sYe
sYe
sYe
sYe
sYe
sYe
sYe
sYe
sYe
sYe
sYe
sYe
sYe
sYe
sYe
sYe
sYe
sN
O
Tack
insp
ecti
on
Yes
Yes
Yes
Yes
Yes
Yes
Yes
Yes
Yes
Yes
Yes
Yes
Yes
Yes
Yes
Yes
Yes
Yes
Som
eYe
sN
O
ID w
eld
Yes
Yes
Yes
Yes
Yes
Yes
Yes
Yes
Yes
Yes
Yes
Yes
Yes
Yes
Yes
Yes
Yes
Yes
Yes
Yes
NO
ID in
spec
tio
nYe
sYe
sYe
sYe
sYe
sYe
sYe
sYe
sYe
sYe
sYe
sYe
sYe
sYe
sYe
sYe
sYe
sYe
sYe
sYe
sN
O
OD
wel
dYe
sYe
sYe
sYe
sYe
sYe
sYe
sYe
sYe
sYe
sYe
sYe
sYe
sYe
sYe
sYe
sYe
sYe
sYe
sYe
sN
O
OD
insp
ecti
on
Yes
Yes
Yes
Yes
Yes
Yes
Yes
Yes
Yes
Yes
Yes
Yes
Yes
Yes
Yes
Yes
Yes
Yes
Yes
Yes
NO
Expa
nsio
nYe
sYe
sYe
sYe
sYe
sSo
me
Yes
Yes
Yes
Som
eSo
me
Yes
Yes
Yes
Yes
Yes
Yes
Yes
Som
eM
aybe
NO
BSM
AYe
sYe
sYe
sYe
sYe
sYe
sYe
sYe
sSo
me
Yes
Yes
Yes
Yes
Yes
Yes
Yes
Yes
Yes
Yes
Yes
NO
X-R
ayYe
sYe
sYe
sYe
sYe
sYe
sYe
sYe
sSo
me
Yes
Som
eYe
sYe
sYe
sYe
sYe
sYe
sYe
sYe
sM
aybe
NO
SIID
Yes
Yes
Yes
Yes
Yes
Yes
Yes
Yes
Yes
Yes
Yes
Yes
Yes
Yes
Yes
Yes
Yes
Yes
Yes
Yes
NO
BEV
LYe
sYe
sYe
sYe
sYe
sYe
sYe
sYe
sYe
sYe
sSo
me
Yes
Yes
Yes
Yes
Yes
Yes
Yes
Yes
Yes
NO
FLIA
Yes
Yes
Yes
Yes
Yes
Yes
Yes
Yes
Yes
Yes
Yes
Yes
Yes
Yes
Yes
Yes
Yes
Yes
Yes
Yes
NO
Team
Mem
ber'
s pe
rcep
tio
n o
f th
e tr
ansf
orm
atio
n to
Lea
nR
esea
rche
r's
perc
epti
on
of
indv
idua
lSu
ppo
rtiv
e st
ruct
ure
App
lied

209
to the improvement, the extent of the LM techniques practised, and TM involvement.
The output of the survey demonstrated a consistency with the positive engagement
noted in the FM in 2008 (table 7.7), and addressed the shortcoming noted in the F&W
line (table 7.8). Information that served to help answer RQ 1, 2 and 3;
- the continuation of key meetings such as the Omega steering group (monthly
minutes). Visible support and direction from departmental heads. The commitment
and the support of the senior team within a business was shown to be critical to the
success of any change programme (Krafcik, 1988; Mintzberg, 1994; Cranwell-Ward
et al., 2002; Skinner, 2006). The patterns deduced by the Researcher suggested that
the lack of strategic vision linked to CI and the absence of senior management support
could be linked to demotivation of the CAs and poor sustainability of new practices.
Not indistinct from the differences noted between the FM and the Forming lines at
CTE (tables 7.7 and 7.8);
- the annual launch of TOFB and supporting team briefs. Over 65% of TMs questioned,
strongly agreed that the team briefs had helped them understand the issues facing the
business, the reasons why certain actions were undertaken, and the contribution they
could make.
“With this initiative you (the Researcher) have given LM a meaning, a local identity that
has engaged the workforce. The HRM practices (described by the Researcher) have
helped develop a positive culture in support of the transformation. Something all
employees could relate to and apply their skills practically.” (Union Convenor Nov
2011);
- the evolving and growing value of the TOFB booklet (figure 6.13) juxtaposed with
the appraisal/ de-selection process (section 6.6.7 and appendix J);
- feedback from commercial teams that the standard conversion cost (price) was now
comparable at least, with rivals (CTE, 2013);
- third party audits were complimentary about what CTE had achieved and were
informing sister businesses of the good practices;
- new employees were encouraged to adopt the new practices they had been trained in
and perceived this as a norm (interview transcripts).

210
Other indications that helped validate the approach taken included:
- an independent company survey involving 20,000 Tata employees highlighted CTE
to be above average on employee motivation, direction, and culture and climate.
Furthermore, CTE results were the strongest within Corus Tubes. The survey was
repeated in 2015 which demonstrated an improvement in results. CTE scored top in
leadership, direction and accountability. Workshops, post the event attributed this to
the Omega recovery programme and leadership that engaged the teams to contribute
to the business goals highlighted during TOFB sessions;
- from approximately 2011, CTE was hosting at least 6 visits per year from other Corus
businesses to learn from what had been achieved (source, Omega minutes 2001-15).
Insights employed to validate RQ3.
“In my 30 plus years in the steel industry, I have seen nothing better” (COO CTE, Nov
2011); and
- the Researcher had been requested to present at numerous senior forums within Corus
to explain what had been achieved with respect to: turnaround, daily management,
idea generation, strategy deployment, employee engagement, and competitive stance
in a depressed market.
The analysis of data gathered and of the results achieved allowed the Researcher to
conclude that:
The HRM strategy employed by CTE (independent variable) is having a positive
impact of the acceptance and sustainability of a new way of working (independent
variable). The combination is reflected in improved manufacturing and financial
performance (section 8.3).
Furthermore,
That the HRM policies adopted and introduced by the Researcher can be used (were
used) to answer research question 2.

211
“The way you have set out to introduce LM, and what you have achieved is not only
inspirational but is also unique within Corus. Why others have not copied you, God only
knows. One day the business will wake up and see what you have achieved and want to
copy it” (Business Director, Energy & Power, Dec 2012).
“The HRM approach which includes: communication; OGSM (HK); TOFB booklet, are
all excellent examples of how you have engaged the workforce. This is best practice, and
needs to be replicated in other parts of our business” (H Duval, Business Excellence
Director, Nov 2014).
It was by understanding the subjective meanings behind employee behaviour and
introducing remedial actions that the Researcher has managed to transform workshop
practices and succeed where previous initiatives have failed. The Researcher has
attributed and demonstrated this success to the manner in which he had engaged
stakeholders at all levels, and how he had been able to use the knowledge of employees
to extend the capability of H42 in support of this transformation; an approach that had
been perceived by stakeholders to have added value to them. The information gathered
and analysed assisted the development of, and validity of the SF (section 4.3) and was
employed to answer RQ 1 (how Lean could be introduced) and RQ2 (the HRM policies
employed to achieve a sustained approach).
The combination of policies overcame major resistive barriers to change. Demonstrated
by the support shown for the new way of working (figures 8.1, 8.2 and 8.3, table 8.2) and
the reality that ten years after its introduction, Lean techniques were still very much
practised within CTE. LM introduced a new way of working and has delivered significant
benefits (section 8.3). The importance and value of the HRM strategy introduced by the
Researcher was in the ability to influence the required behaviour during the
transformation process and through it nurture a competitive advantage. The improvement
in communication, the revitalisation of the reward system and the introduction of strategy
deployment all helped eliminate complacency and sustain motivation for the required
transformation. The data gathered and analysed supported RQ 2.
The sustainability of the new workshop practices had been enabled by the change in HRM
practices. However, the benefit of this transformation would only be of value if it
addressed the financial performance of CTE. Without this then the viability of the
business would remain questionable.

212
8.3 The benefits of the approach to CTE
This section demonstrates the impact on CTE’s manufacturing and financial performance.
Data were gathered from monthly business reports provided by the Business’
management accountants; an auditable source independent of potential Researcher bias.
Thus, the data were considered valid and supports the rigorous approach to empirically
proving the benefits associated with the change in working practices; patterns that can be
linked together. For example, the effect of SMED activities on mill availability; the
improvement in TAKT times to address bottlenecks as an enabler to improved speeds.
Figures 8.4, 8.5 & 8.6 illustrate the trend in manufacturing performance 2003 to 2015
inclusive, based upon three key production metrics. These were; press line pure speed/
hr; mill availability (uptime); and average number of pipes/ shift (pps) finished.
Figure 8.4: Product throughput rate on press line (Source, CTE annual reports 2003 to
2015).
0
20
40
60
80
100
120
8
10
12
14
16
18
20
22
Av
era
ge/
net
pip
es/
sh
ift
pre
ssed
Pu
re s
peed
/ h
r
Press line - Historic Performance: (Pure speed/ hr)
Pure speed/hr Pipes/shift Linear (Pure speed/hr) Linear (Pipes/shift)

213
Figure 8.5: Mill availability measured on the press line (source, CTE annual reports 2003
to 2015).
Figure 8.6: Average number of good pps exiting the Finishing mill (source, CTE annual
reports 2003 to 2015).
Each of the above graphs show a positive trend and typify the cyclical process of the
business transformation. The analysis of data had shown that the transformation was not
a straight line but a wave of improvement, set-back, reflection and further improvement.
For example, figure 8.4 depicts an initial increase in speed of work (SoW) 2003-05 on
the press line, a loss of impetus 2006/07 before recovering and progressing 2008-12.
2013/14 reflects a significant downturn in mill loading (table 8.5) which distorted the
figures for that particular year. In the first phase (2003-05) the focus addressed agreed
priority issues affecting NRFT such as, weld quality and the tooling strategy. Data
analysed had demonstrated that training had been delivered but interventions were not
50
55
60
65
70
75
80
85
90
95
Perc
en
tag
e a
vail
ab
ilit
y
Historic availability performance
Actual
Standard
Linear (Actual)
40
50
60
70
80
90
100
110
120
130
20
03
20
04
20
05
20
06
20
07
20
08
'
20
08
/09
20
09
/10
20
10
/11
20
11
/12
20
12
/13
20
13
/14
20
14
/15
No
of
pip
es /
sh
ift
Average Number of good pipes passed every shift worked
Av pipes / shift
Linear (Av pipes / shift)

214
utilised in the same manner as in the Finishing mill (FM) (section 7.6.3). Consequently,
it could be shown that impetus was lost. This was compounded by a 50% increase in
activity and an intake of approximately 90 new (temporary) employees (source CTE
monthly reports 2006/07). This was further compounded by a lack of resource to facilitate
Lean practices, which resulted in CTE’s inability to sustain LM practices in the Forming
and Welding (F&W) lines.
The second phase 2007 onwards commenced with the launch of the new interventions
(section 6.6), and a renewed focus on the F&W lines. The F&W line had been deliberately
under-resourced with respect to Lean activities due to the priority focus given to the FM
(CTE, 2008j). A stepped improvement can be noted from 2008-15 which can in turn be
related to an increase in mill based interventions (figure 8.1) and idea generation (figures
8.2 and 8.3). The exception is 2008/09 where CTE took on a demanding project at the
extreme edge of its capability that necessitated slow production rates but yielded positive
margins (CTE, 2013). Furthermore, in 2013/14 CTE experienced a major downturn in
order intake (table 8.5). Regardless of loading, however, the production throughout rates
were still averaged over a twelve month period.
Similarly, whilst the Engineering Department had targeted repeat faults within the two
bays, the resource had been focused on work associated with major capex, especially in
the FM (CTE, 2008d; CTE, 2008j). Consequently, availability was shown to improve
initially (figure 8.5) but decline in 2006 before continuing a trajectory depicting a positive
trend. A major and positive influence on this improvement was the work completed on
press line changeovers (SMED activities).
The press line represented the major cost driver for the 42” mill with an operating cost of
£9,500/ hour (CTE, 2011a). Data gathered and analysed by the Researcher (CTE, 2007f)
(sections 7.5 and 7.6, table 8.3) indicated that Press line changeovers accounted for
approximately 45% of downtime and hampered the flexibility of operations. On average
a diameter changeover would take 5 hours to complete (source CTE press changeover
records). The approach adopted adhered to four distinct stages summarised in figure 8.7
with the standard changeover times outlined in appendix F.

215
Figure 8.7: The approach to changeover and set up improvement (Shingo, 1985).
The benefits were derived from this intervention included:
1. the elimination of repeat faults and standardised operations;
2. the separation of internal and external set up requirements, maximising the
preparatory work to be conducted whilst the press was still operational; and
3. an upgrade to the area through the introduction of a second die cart.
Attention afforded to points 1 and 2 delivered a 30% improvement in the standard
changeover time at 3 hours and 30 minutes (source CTE press changeover reports 2007/
08/ 09). Point 3 was finally completed in August 2011 (delayed due to the capex
requirement). This eliminated the delays incurred due to slow overhead crane operations.
Changeover times were reduced by 70% with empirical data to support changeovers
completed sub 90 minutes with the fastest recorded taking 65 minutes (CTE, 2012b).
Empirical studies conducted with various teams on different shifts and day corroborated
the improvement in changeover time (table 8.3).
Table 8.3: 12 consecutive diameter changeovers.

216
Trials such as timings associated with diameter changeovers were imperative if the
Researcher was to demonstrate to CTE (and all stakeholders) that SMED (LM) had a
positive impact. The theoretical proposition being tested within the mill (section 7.5) was
that SMED as used in the automotive sector could be equally applied to a 50,000t pipe
press to deliver a significant improvement in changeover downtime. The output of the
‘theory testing’ allowed the Researcher to empirically demonstrate a sustained
improvement. This resulted in the introduction of an accepted (by CTE and Trade Union)
reduction in standard changeover times from four hours to a new standard of two hours
in 2011. An approach underpinned by supportive data and the cyclical process of Action
Research (figure 5.2).
In keeping with the phasing of the recovery plan and issues identified during the PNA
(section 6.2), the main benefits were observed in the FM (figure 8.6). Here, following a
slow and steady progression in the period 2003-06, the completion of the initial work
catapulted the performance of the bay. This generated a capability which delivered the
52% SoW aspiration during the period 2007-09. The FM was not only brought into
balance with the forming line but on a shift basis, out-performed the production rates of
the upstream bays. An opportunity realised when CTE increased forming line activity to
fifteen-shift operation in 2009 leaving the FM on ten shifts. This generated a saving in
labour cost of £1m (CTE, 2011a). This was achieved as a direct combination of: improved
shape and weld quality from upstream process; the modifications and new design of the
pipe flow in the FM; and the application of problem solving techniques (sections 6.3 and
6.6). Relationships that could be linked to activities undertaken and benefits observed as
a consequence. Intervention reports captured within the Omega database (Appendix K)
identified the work completed and the benefits secured. This manifested in improved
downstream throughput.
The FM transformation was completed by 2009 and had enabled a 52% speed of work
improvement whereas the F&W lines were only operating at 27% speed improvement.
The launch of a second three year mid-term plan by the Researcher sought to balance this
(CTE, 2008j). The details of the main actions undertaken are covered in section 7.6 and
Appendix I. The aspired 52% speed of work improvement was achieved by 2012.
In 2010/11 and then again in 20011/12, CTE recorded its best ever manufacturing
performance and demonstrated the success of, and the sustainability of LM principles.
Manufacturing standards used for standard costing from 2012/13 were now set at 145 pps

217
(5 years previous the rate was 94pps, one year previous, 121 pps); an availability of >83%
(previously running at <78%) and a yield of 96% (previously 95%) (source, CTE
management reports, CTE HR reports and union meetings).
Table 8.4 reflects the impact that this had on the manufacturing variance; planned versus
actual. Column 4 indicates that throughout the period 2003-07 and 2010-13 there was a
significant adverse variance in manufacturing performance. However, it should be noted
that the latter period was compounded by light loading and periods of inactivity which
had an adverse impact on mean speed and availability for each year (source CTE monthly
business reports). Furthermore, that the standard product of speed and availability
employed in the conversion cost calculation were being raised year on year (column 7
table 8.4).
Table 8.4: SoW and availability variances for H42 (source CTEB annual reports 2003-
2013).
During the period 2004-13 the process based activities were delivering measurable
benefits viz improved efficiency and optimisation of equipment as trended in figures 8.4,
8.5 and 8.6. The assorted work streams helped address competitiveness via capability and
reduced conversion cost. Of note was that a 1% improvement on standard SoW or
availability was equivalent to a financial variance of £250k p.a. (CTE, 2011a). In 2010/11,
CTE achieved its aspiration and delivered the 52% speed of work improvement, an
availability increase by a net 6.5%, and an extended capability realising the vision
espoused in 2004. This reflected a shift in financial performance in 2010/11 by £13m and
£1.625m respectively. This improvement in SoW and availability was worth £15m p.a.
to the H42. Now reflected in the standard costing model for pipe manufacture it assisted
Period Speed of
work
Gain/(loss)
£k
Availability
G/(l) £k
Total
G/(L)
£k
H42
result
G/(L) £k
Planned SoW
improvement %
pipes/ shift in
year (total)
Actual SoW
improvement
implemented
%pps
in year (total)
Availability
standard
%
2003 (108) (776) (884) (4,988) - - 77.5
2004 (200) (496) (696) (4,918) 8 8 77.5
2005 (1,067) (377) (1,444) (2,010) 15 (23) 8 (16) 80
2006 (348) (595) (943) (1,927) 17 (32) 6 (22) 82.5
2007 (898) (1,752) (2,650) 4,655 20 (52) 6 (28) 82.5
2008/09 1,907 (13) 1,894 5,823 5 (33)* 83
2009/10 461 721 1,182 10,554 10 (43) 83.5
2010/11** (1,422) (301) (1,733) 8,486 9 (52) 84
2011/12 (795) (743) (1,538) 6,300 1 (53) 85
2012/13 '(1,587) '(569) (2,156) 13,995 3.5 (56.5) 86

218
CTE in closing the competitive gap between itself and its rivals (CTE, 2008j; CTE,
2011a).
The Researcher was able to demonstrate using the Process map (figure 8.8) a direct
relationship (pattern matching) between problem solving activities and the impact on
cycle times. The impact has been governed (section 4.2.3) by the Omega team’s
establishment of priorities (source, Omega minutes and Appendix A) and coordinated by
the annual implementation plan (figure 8.9). Emergent interventions (allowed for in the
intervention plan) were guided by the ‘red’ (bottleneck) areas depicted in the process map
(figure 8.8). The problem solving intervention was then employed to address the
bottleneck. In 2015, the process map shown in figure 8.10, reflected an improvement in
pps (and cycle times) for an equivalent pipe diameter and thickness as shown in figure
8.8.
Figure 8.8: Process map illustrating pipe/ hr/ process for 610mm x 29.7mm in 2008.

219
Figure 8.9: An example of an annual implementation plan.
Figure 8.10: Process map illustrating pipe/ hr/ process for 457mm x 28.6mm in 2015.
The persistent and iterative approach was reflected in a positive trend in mill speeds.
Figures 8.4, 8.5 and 8.6 portray a positive trend in key manufacturing metrics which is
reinforced by the turnaround in financial performance (figure 8.11).

220
Figure 8.11: Profitability performance against Annual Plan for CTE (Source CTE annual
reports 2003-15).
CTE has not escaped the challenges of the economic downturn of 2008/09 or the impact
that this had on oil and gas exploration. Table 8.5 highlights the impact on the sales
volumes for the period 2003-15. In 2013/14 (FY14), CTE recorded a sales volume of 57kt
(table 8.5), a mill loading of approximately 30% (source CTE annual report March 2014).
Yet, CTE managed to record a virtual break even in that year (figure 8.11). The
improvements achieved within CTE provided an ability to demonstrate that during busy
periods CTE could achieve good profitable returns in excess of 15% RONOA. However,
in quieter periods such as an economic downturn affecting all pipe producers, CTE could
break-even.
-10000
-5000
0
5000
10000
15000
20000
£k
Financial performance
Profit/ loss AP Linear (Profit/ loss)
RONOA
FY08 FY09 FY10 FY11 FY12 FY13 FY14 FY15
Tubes Energy 9% 19% 19% 22% 22% 25% -1% 12%
Actual

221
Table 8.5: Sales volume 2003-15 (source, CTE annual reports).
The financial performance (figure 8.11) demonstrated a successful turnaround as defined
by Schendel and Patton (1976). Following four loss-making years 2003 to 2006 inclusive,
CTE achieved four successive years of profitability. Moreover, the research project had
transformed the business, its associated operating practices, and achieved a positive return
on net operating assets on average of 20% p.a. Something few businesses within the UKSI
have been able to achieve since the economic downturn of 2008/09 (CTE, 2012a).
The Researcher can thus argue and demonstrate conclusively that LM has had a
significant impact that has delivered a cost benefit to the business of £15m p.a. over 8
years (2004-12). In addition, conclude that LM can assist a mature business in decline,
turnaround its financial performance and help ensure its viability. A statement not
supported previously in the literature appertaining to turnaround and the UK steel sector.
It took CTE three years to embed the basic principles of LM and to provide a foundation
for the techniques to flourish. The relentless and persistent application of LM tools and
techniques resulted in CTE achieving a profitable return in excess of 19% RONOA year
on year since 2007. LM delivered an effective method that optimised the process and
generated a climate where continuous improvement and by default change, was expected.
A culture that recognised and accepted that today’s performance would not suffice in
tomorrow’s operating environment. The success derived by CTE through the introduction
of LM as a novel manufacturing paradigm has been illustrated in this section. The
Sales Volume (Kt)
FY2003 119
FY2004 107
FY2005 180
FY2006 178
FY2007 189
FY2008 149
FY2009 80
FY2010 108
FY2011 95
FY2012 188
FY2013 197
FY2014 57
FY2015 87

222
approach adopted to enable the success achieve is encapsulated within the SF (chapter 4)
and employed to answer the RQs 1 and 2.
Thus, the Researcher was able to conclude:
Mill speed (dependent variable) has improved as a direct result of the introduction of
problem solving activities involving the tools and techniques associated with LM
(independent variable).
Similarly,
Mill availability (dependent variable) has improved as a direct result of the introduction
of SMED activities – a technique associated with LM (independent variable).
And finally,
That the SF proffered by the Researcher provides a structured approach that has been
employed to introduce a new way of working within CTE; an approach that can be used
to answer RQ1 and as a model to support the transfer-ability of the approach into other
areas and answer RQ3.
This validated the theoretical proposition stated by the Researcher at the outset of the
study that LM can be employed as a mechanism to transform workshop practices and
turnaround the financial performance (figure 8.11) of a mature business in decline
(section 1.3). The manner in which Lean was introduced and sustained (section 7) allowed
the Researcher to answer RQs 1 and 2. Furthermore, it supported the hypotheses
developed (section 1.3) and corroborated the approach articulated in the SF (chapter 4)
as a method that could be applicable to other parts of the industry (RQ3).
CTE now has an established and secure foundation on which to continue to apply this
iterative approach. A smart company is the one that stays ahead of the competition by
continually improving and refreshing its strategy.

223
‘You can never reach the promised land and possibly never will because the goal
posts will always (and should always) be extended to the next out of reach level as
perfection is sought.’ (Bendell, 2005, p972).
8.4 Summary
This section has demonstrated the impact that the Researcher’s intervention has had on
CTE’s manufacturing and financial performance (section 8.3). The improvement in
productivity were enabled by the introduction of LM. A manufacturing paradigm founded
on the elimination of waste and a culture of CI. Section 8.2 highlights the impact that the
Researcher’s HRM intervention had on the development of a CI culture and sustainability
of the new way of working; a culture that has helped turnaround the performance of CTE.
The next chapter deliberates the research questions and objectives of this thesis; learning
that was applied and used to deliver a sustained approach in the introduction of a new
manufacturing paradigm to aid turnaround.

224
Chapter Nine: Discussion
9.1 Introduction
This section discusses the impact the research has had on CTE relative to the study
undertaken and the interventions introduced by the Researcher in his quest to turnaround
the financial performance of the business and answer the research questions (section 1.3).
CTE’s external operating environment had changed over time (section 4.2.1) which had
resulted in the proliferation of capacity and capability, culminating in an adverse
performance gap, inferred through benchmarking (section 4.2.1), and thus market
erosion. The prevailing conditions contributed to an external climate conducive to an
industry shakeout amongst the weaker players; reinforced by the crisis situation of CTE
and the impatience of the parent group.
CTE was fortunate to be deemed worthy of saving and presented with an opportunity to
turnaround its performance. The Researcher’s hypothesis was, “If CTE could innovate
and improve its manufacturing performance (sections 4.2.1 and 4.2.3), it could reduce its
conversion cost; by reducing its conversion cost it could improve its competitiveness”.
This would allow CTE to reduce its selling price, strengthen its position in its niche
market and compete more aggressively in other sectors (section 4.2.1 and table 7.6).
The scale of the challenge required a £15m improvement in manufacturing performance
(section 4.2.3) equivalent to 75% of CTE’s fixed costs and enabled by a 52%
improvement in standard speed of production. The potential benefit was a realisation of
improved margins and the potential to compete more aggressively in price sensitive
markets. The latter could create greater stability in the loading of the pipe mill, a platform
to build upon, and a potential to reduce activity related losses; again supporting the
potential for increased profitability. A portion of the profit realised could then be re-
invested within the mill in support of further improvements. The theory developed by the
Researcher and presented to CTE was founded on the premise of creating a virtuous circle
(figure 9.1).

225
Figure 9.1: Creating a virtuous circle.
The perpetual application of the CI philosophy (section 3.3) could provide a committed
company with the opportunity to constantly refresh its manufacturing performance and
therefore price competitiveness. However, knowing ‘what’ is required is not the same as
understanding ‘how’ to implement the strategy or ‘how’ to sustain the required
transformation. CTE had unsuccessfully introduced numerous initiatives in previous
years (section 4.2.2).
The internal review of CTE suggested the need for strategic change at management level
and the introduction of contemporary HRM policies. This resulted in a second hypothesis.
Unless the internal issues associated with the above causal attributes were addressed then
the ability to sustain the new approach would as with other initiatives, falter. This was the
basis of RQ2 (section 1.3).
Consequently, the recovery plan developed by the Researcher had to form an integral part
of the overall business strategy (section 4.2.3). Furthermore, unless the leadership team
engaged the workforce in its deployment then it would stumble. This resulted in a third
hypothesis: The introduction of a new manufacturing strategy must be supplemented by
a mutually supportive HRM strategy to nourish and nurture the required change (section
6.4). This could counter the internal issues within the company, create an environment
supportive of planned change, and increase the propensity for success.
The principal goal of the Researcher was to eliminate waste, stabilise performance and
improve the reliability of the operation. CTE had proffered that Lean was to be employed
Hit Targets
Improved Performance
Reduced Costs Increased Profits
More Competitive in
Low Price Markets
Higher, stable
mill loading
Investment
Creating a virtuous circle

226
as the paradigm to address its performance gap. Literature on Lean (sections 3.3 and 3.4)
has identified this concept as a superior way of working.
The use of Lean within Corus was not novel. Corus had used Cardiff University to deploy
LM techniques within the Group. However, the Researcher had visited numerous
operations at Port Talbot, Scunthorpe, Teesside, Ijmuiden and a succession of
downstream operational units where he was unable to uncover any strategically aligned
practices associated with LM (CTE, 2008h; CTE, 2008i).
This resulted in the development of RQ1:
How can the principles of LM be successfully applied in an established operation where
hierarchical management structures, adversarial industrial relations and established
demarcations are still evident, in order to achieve a significant manufacturing
improvement? In addition, is it possible to develop an effective model for breaking down
traditional working practices and cultures in order to achieve the required transformation?
9.2 The application of LM within CTE
LM was prefaced as one of the most complex paradigm shifts to be introduced in modern
manufacturing (section 3.3). For a mature business in decline this could be considered a
high risk strategy which advanced the liability of newness (Stinchcombe, 1965). Here,
managers may favour safer practices perceived as less challenging. A view that would be
supported by the suggestion that attempts to introduce Japanese modes of practice like
LM within western companies had met with variable success (section 3.4). A superficial
understanding of the techniques contributing to the potential for tools and techniques to
be deployed in complete isolation and ignorance of the interconnected supportive
techniques; knowledge is one thing, know-how is another.
There is voluminous literature on Lean (section 3.3) detailing the variety of tools and
techniques that underpin this concept within a business and its extended supply chain.
However, the danger with such a profusion of literature is that it may only prove useful
to those who already have a base knowledge which they seek to extend. For a novice team
it could engender confusion (section 3.3) and appear quite onerous as they are left to
decipher what LM is, could be ascribed to, and the value of what may be, alien tools and
techniques.

227
Roadmaps (Hines and Rich, 1997; DTI, 1998; Hines and Taylor, 2000; Bateman, 2001;
Bateman and David, 2002; Cushnaghan, 2003; Maritan and Brush, 2003; NEPA, 2004;
Herron and Braiden, 2006; Herron and Hicks, 2008) were useful as they provided
information on how to introduce change and LM (section 3.4). The roadmaps offered the
user: a structured approach supported by recommendations for further reading (Hines and
Rich, 1997; Hines and Taylor, 2000); the identification of basic techniques to employ
(Bateman and David, 2002); an approach to knowledge retention via change agents
(Herron and Hicks, 2008); a diagnostic to evaluate the ‘as is’ condition and techniques to
consider (Herron and Braiden, 2006); and models useful in the introduction of change
(Maritan and Brush, 2003). However, each provides the reader with a high level overview
of ‘the what’ to do rather than necessarily, the ‘how’.
It is the Researcher’s opinion based on his experience associated with this study and of
the literature covered, that the content whilst clearly articulated, presents the reader with
a series of ingredients to consider, not the finished article. The available roadmaps did
not convey the spirit of what LM should be and is. They did not portray in detail the
pitfalls and hurdles a company will face on its journey towards introducing LM. In most
cases they lacked a cohesive, formalised and prescriptive structure; a methodology for
the user to establish a starting point; a direction; and an interconnected process that could
be employed within the UKSI. Furthermore, they did not elaborate on how to engage
workers in a business transformation where employees comprise of both permanent and
temporary workers; where the latter could be reduced or increased at any point in time.
The inference from each roadmap suggested that the tools and techniques were equally
applicable to all forms of manufacturing. However, it was also stated that not all
companies can readily imitate what has been achieved elsewhere (Bartezzaghi, 1999).
Thus, the journey taken by any company is unpredictable and indigenous to the company
introducing it. This is likely to be a unique experience and contingent to a period in time.
Consequently, the degree of success or sustainability of any change programme is
proportional to the orientation of an enabling context within the organisation (Krafcik,
1988).
Bhuiyan and Baghel (2005) stated that CI was evolutionary and a convergence of
numerous good practices (section 3.2). This suggested that any benefits derived would
take time and require an iterative process of learning from techniques introduced. This
reinforced the Researcher’s opinion that each roadmap could add value if applied at the

228
appropriate stage and then enhanced by individuals with experience in: a) LM; and b) the
plant under study. The need to obtain stakeholder support was proffered as important in
the successful delivery of a business transformation (section 3.4). Sceptical stakeholders
may lose confidence in the event the programme falters. Consequently, enthusiasm and
support for an initiative could be lost and replaced by short term decisions at the expense
of longer term benefits.
The NEPA best practice model (section 6.2) provided the novice company (CTE) with a
pivotal first step in the journey to LM. NEPA developed a model for the dissemination of
LM that identified an appropriate starting point and implementation plan; the ‘how’ in
the introduction of improved workshop practices and a medium for transferring
knowledge (section 6.3). The NEPA model builds on the high-level structure outlined by
Hines and Taylor (2000), and was supported by the SMMT model that utilised Master
Classes (Bateman and David, 2002). However, whilst the NEPA programme provided a
foundation on which to build, it should also be recognised that the inherent drawback or
shortcomings of this approach as applied to CTE and identified during the research project
included:
- an assumption that the recipient management team were mindful of LM techniques;
- a lack of clarity on how this new knowledge could or should be integrated in and
aligned with the overall business strategy;
- beyond the development of change agents and further training, the programme did not
advocate how to sustain the approach by motivating employees to apply their new-
found knowledge; and
- a limited view on the set-backs a company is likely to experience.
What was incontestable was that: LM does not provide the user with a ‘silver bullet’ but
more a suite of assorted techniques from which to select the most appropriate tool(s). A
company does not introduce ‘Lean’ it is something it eventually becomes through a rigid
adoption and adherence to basic principles.
The introduction of any change programme demands a concerted effort to implement and
sustain the new approach (section 3.4 and chapter 6). However, a company must be
prepared for potential set-backs and learn from experience and emergent issues in a
continuous cycle of reflective learning (section 7.6); akin to the AR cycle. The upshot is

229
that there cannot be one unique and correct method of implementation; LM must be
adapted for purpose and not adopted blindly.
The approach of the Researcher was to comprehend the value of the individual best
practice elements prescribed in the literature (sections 3.4, 3.5, & chapter 5) such as: LM;
basic building blocks; supportive HRM policies; leadership; communication;
engagement; a continuous review process; Action Research; and many more.
The fundamental concepts were represented in a SF developed by the Researcher (chapter
4 and figure 9.2). The SF was initially developed to aid discussion with CTE and portray
the key themes associated with this project. Key themes that were identified at the outset
of the research (section 5.4) and subsumed best practices uncovered in the literature; a
model that could be utilised at the outset of a process centric transformation. The model
was refined to incorporate the experience gained by the Researcher through academic
studies in this field, the framework developed to guide this study (section 7.2), the
interventions introduced (chapter 6), as a practitioner introducing this significant change
programme within CTE (chapter 7), the benefits secured as a result of this study (sections
8.2 and 8.3), and as an observer who had benchmarked good practices within various
companies within the UK, the Netherlands, Germany and Japan. The Researcher’s theory
was that the model housed in one place all of the primary interconnected techniques,
themes and concepts considered as critical by the Researcher (and associated areas of
study) when implementing a significant change programme. The model demonstrated a
means to align employees in this new way of working and motivate them to deliver
continuous improvement and process optimisation. An engagement process considered
as essential in the successful execution of a business transformation (section 3.5).

230
Figure 9.2: The SF adopted by CTE to achieve a sustainable transformation.
The model is headed by a clear and concise vision for example ‘to introduce and sustain
a viable operation at Hartlepool that would help secure the future for its employees’. A
vision that gave direction and meaning (Sullivan, 1988).
In the case of CTE, the vision demanded a major change in established operations and
processes to overcome the performance gap identified and recorded as a 52% speed of
work improvement (section 4.2.3). The vision was underpinned by the Omega
programme (section 6.3.4) which provided governance and structure; a three year plan
identifying priority actions across a range of activities and work streams. The long-term
(three-year) project plan was sub-divided into an annual schedule with primary tasks
assigned clear ownership. The steering group members (governance team) comprised
those who had the authority to agree subsequent priorities. This group was composed of
strong advocates within the stakeholder population who could promote, own and
encourage the need for change.
To provide clarity and direction, each supporting work stream and activity had its own
charter (section 6.3.4 and Appendix A) aligned to priority actions. This furnished the
owner with an agreed objective, scope, a series of activities/ deliverables and
accountability. It also depicted the KPIs necessary to measure the change in performance
and monitor progress. This was paramount in the post-launch phase within CTE as it
helped overcome: a) inertia; and b) failings associated with previous initiatives.
- Benchmarking- Introduce best practice manufacturing- Solicit support- Improve mill availability/ reliability- Improve speed of work- Improve NRFT- Reduce conversion cost- Change Agents
- Selection & Recruitment- Learning and development- Communication process- Motivational factors- Training providers- Strategy deployment- Objective setting process- Employee engagement
VISION- A competitive and viable pipe-making
facility in Hartlepool.- 52% improvement in speed of work
+Manufacturing Strategy HRM Strategy- Mutually supporting strategies- A direction- An ability to overcome previous
failings
Omega Programme
Clear Objectives Ownership Steering Group
- A three year plan- A structured and focused approach- Visible metrics- Accountability

231
The manufacturing strategy was only finalised following a review of the external
environment (section 4.2.1). This supported the evaluation of ‘what’ needed to be done
and ultimately ‘how’ to achieve the required transformation (chapter 6). It forced the user
to at least consider company performance with those deemed best-in-class,
(benchmarking). With the scale of the external challenge established (section 4.2.3) it had
to be balanced with the necessary approach required to combat internal inertia and the
prevailing culture (sections 3.4, 3.5 and chapter 6.0).
A contemporary HRM strategy (section 3.5) is argued as paramount in the development
and engagement of employees. The alignment of employee goals articulated as
fundamental in any recovery plan (Beer et al., 1984), and a source of strategic advantage
(Pfeffer, 1995; Youndt et al., 1996). The elements articulated will force the company to
consider the skills required in new and existing employees and the motivational forces
that drive an existing behaviour or new way of working. The subsequent approach should
nurture the required cultural change in support of the transformation.
In LM employee engagement was identified as vital (section 3.3) and reflected in the data
analysis (section 7.6). A mutually supportive combination of LM and HRM strategies that
was not typified or elaborated in the literature reviewed in support of this thesis. The
HRM literature (section 3.5) identified the primary policies to consider that could act as
enablers/ motivators. However, the detail and how these general policies were to be
converted into appropriate action, or the priority order in which they should be
implemented was left to the user to decide. Equally, it was left to the user to determine,
relative to the changes introduced, which HRM policies were most beneficial. For
example, communication was identified as vital to engaging and motivating employees
(section 3.5.2). However, the question remained, how was this engagement converted into
action? And how could that action be measured or rewarded? Why should a temporary
worker support the transformation of a business, if at a point in time in the future they
will be laid-off? Why should a permanent employee, secure in that knowledge, work
harder than a temporary employee? Once again, the ingredients were evident in the
literature, however, it resided in the host company to develop the enabling strategy.
The modification and modernisation of the HRM strategy within CTE therefore had to
generate an environment conducive to continuous improvement, supportive of employee
engagement, and fundamental to the new way of working. Section 6.4 identified the
intervention by the Researcher to facilitate this new way of working. Section 8.2

232
demonstrated the sustained engagement of TMs in idea generation and associated
problem-solving activities reflecting the acceptance/ support for a new way of working.
Involvement that was shown to have a positive impact on the manufacturing and financial
performance of CTE (section 8.3). Furthermore, unlike previous initiatives (section
4.2.2), Lean was still being practised ten years after its introduction.
The Researcher has reiterated that the introduction of this change programme was
iterative (section 7.3). One size does not and cannot fit all. Therefore, the cyclical process
of AR (sections 5.2 and 8.3) ensured that the adopted practices were refined through
vigorous reviews and reflections, and adapted to suit the operation or process in question.
This process entailed a multitude of iterations over a period in excess of three years (for
example, see table 7.1); a period considered by the Researcher as sufficient time to
generate a platform considered stable.
The benefit and strength derived from the AR (section 5.2) was in the employment of
experience gained, in reflecting upon learning and the generation of new insights in
support of the business transformation. This resulted in an effective four stage process
that could be employed at a macro level when looking at the transformation in ‘general’
as a whole, or at a micro level when introducing change at a particular ‘specific’ level.
The following sub-section typified the cyclical approach employed at a macro level;
offered by the Researcher as consistent with the AR cycle (section 5.2) and with the
successful introduction of LM at CTE (sections 7.4, 8.2 and 8.3). The approach adopted
by the Researcher to validate interventions used to ultimately answer RQs 1, 2 and 3.
9.2.1 Construct, Action plan, Action taking, and Evaluation.
Stage1: Construct
The ‘plan’ stage is vital to the development of a fertile climate (sections 7.1 and 7.2). The
‘plan’ stage involved completing the preparatory work to evaluate areas of concern and
themes to pursue; themes that become tactics to adopt and objectives to deliver in support
of the company’s vision (typified by cycle 1, table 7.1). The themes were informed
following the initial review of the internal and external challenges that confronted the
business (for example, section 4.2.1). With the need for change established the plan to be
communicated outlined the adopted countermeasures (sections 6.2, 6.3, 6.4 and 6.6) to be
implemented over a prescribed period of time. The structure and clarity of the recovery

233
plan engendered confidence in the various stakeholder populations. For example, at
employee level, an acceptance reflected in the support of the training programmes to be
undertaken or changes to practices; at group level the release of capital expenditure in
support of the plan of CTE’s recovery plan.
Stage 2: Action plan
The ‘do’ phase was concerned with the delivery and launch of the recovery plan. This
encompassed communicating the vision to the entire workforce and articulating the main
objectives, milestones and time frame. The aim was to instil confidence in the workforce
that the plan was realistic and could be delivered.
The transparency of what was to be introduced was vital; it ensured that the various
stakeholders recognised:
a) the potential for the plan to deliver the required outcome;
b) the manner in which each element contributed to the overall goal; and
c) the role of employees in the delivery of the plan.
Research suggested that during this phase it is critical that the company portray a united
front and an alignment of objectives throughout the hierarchy. Expectations should be
established which may include commentary that the introduction of the plan is an
evolutionary process; mistakes are likely but the knowledge gained will help the company
during the transformation process.
Knowledge gained from fieldwork, experience, benchmarking, observation and literature
reviews etc. (chapter 7) was used to reflect upon and adapt the process as required without
invoking a total change in direction (typified by cycle 2, tables 7.1 and 7.2).
Stage 3: Action taking
This stage was where the process of trial and error and of conflicts of interest began in
earnest. Where changes in established practices were being challenged and where the time
spent on the design of the recovery plan (or research strategy sections 5.2 and 7.4) and
establishing the method of governance (section 6.3.4), proved advantageous. The mill
was split into zones and the planned pilot activities, process developments and Master-
Classes were undertaken and observed in each zone. Every area was ‘touched’ by the new
way of working (section 7.6). Moreover, early successes were promulgated however

234
small. The visibility of senior management in every training session, activity and success
reinforced the commitment to the new way of working (section 6.2.3).
Pitfalls were expected as the pain of change manifested itself in frustration, errors, cost,
stress and delays; a pain that was not truly reflected in the literature, of how to endure it
or to overcome it. The Researcher asserted that this pain or burden of initial change(s)
would ease with time as success ensued and benefits were observed. The cyclical nature
of the process resulted in the initial pain(s) being soon forgotten, built upon by improved
practices and in most cases replaced with further change and pain. This is where the less
determined may abandon the new way of work as a result of this ‘pain’ in favour of
something more comfortable and familiar. The Company must be persistent in its
conviction if it is to overcome expected set-backs and achieve its long term goals.
The approach promulgated by the Researcher depicted a see-saw (figure 9.3) and
conveyed a key message- to deliver a Lean transformation, a balance has to be achieved.
Too little effort and reactive habits will dominate. However, too much focus on CI may
result in day-to-day issues being left unresolved. Hence, a balance was required.
Figure 9.3: moving from a reactive to a proactive approach.
It was identified during fieldwork that when introducing change, a pain barrier must be
overcome. This pain barrier may be in the form of increased cost, of additional resource,
or stretched goals and increased workload for teams. However, this pain barrier had to be
recognised and countered if CTE was to break away from old reactive habits. The
Researcher’s experience had uncovered that there were always reasons why something
Reactive/
Emergent
Proactive/
Planned
CI
Fire Fighting
Everything is a priority
Poor availability
No focus
Variation
Unplanned
Not my issue
Polarised
Differentiated
Greater availability
Greater productivity
Less fire fighting
Constructive approach
Focused approach
Standardised
Ownership
Work together/ Integrated
Common goals
What has to be done to shift weight?
Pain
Barrier
Old habits/ customs
Bad practices
N.I.Here.
Additional resource
Change
Dialogue etc,etc

235
could not be done, even if it was the correct course of action. The persistence of the
change agent and support of the Company, coupled with the structured approach, helped
the business break through the barriers of uncomfortable change to deliver the new way
of working.
The model shown in figure 9.2 is proffered as an example of ‘how to shift the weight
displayed in figure 9.3 to the left. A model that the Researcher adhered to in this study
and allowed structure to replace anarchy. The focused approach allowed CTE to target
agreed priorities. This did not eliminate the need for dealing with emergent issues or fire-
fighting in the early phase of the transformation. However, over time the planned
improvements helped reduce the emergent issues, allowed greater control within the
processes and delivered improved reliability. Typified by figures 8.4, 8.5 and 8.6.
The final stage in the cycle was the act stage where the experience gained was used in the
development of new themes.
Stage 4: Evaluation
Regular meeting such as the fortnightly Omega meetings (section 6.3.4) were used to
review and reflect on successes and setbacks, on the application of training and of
interventions. In addition, to cogitate on feedback received from stakeholder groups
involved in the process for instance: the NEPA team; management; supervisors; and of
team members. Factual (real time) data, gathered and analysed (sections 7.5 and 7.6) was
used to establish the next phase of priorities, of activities to be implemented and to refine
the approaches undertaken. In the case of CTE this included revisiting training (section
6.6.4) and refresher programmes, the reformation of Master-Classes to interventions
(section 6.6.5), of the approach to fieldwork, of employee involvement, training and
development, and the constant evolution of the strategy deployment process (section
6.6.6).
This allowed for discussion, for opening up themes to scrutiny as well as a process for
soliciting support in planned changes and of engendering confidence in the approach with
key stakeholders.
The ‘act’ phase was literally about introducing new practices and learning from
experience gained (section 7.6). The new knowledge was used to plan the next phase
which restarted the cycle. This was fundamental to the process of AR. The new actions
acted as reinforcing mechanisms; whether that was in process development, availability

236
or workforce training. The iterative process allowed techniques to be enhanced and
increased the probability of success; as one cycle was completed the learning was applied
then re-applied to the new cycle; an evolutionary process and convergence of good
practices (Bhuiyan and Baghel, 2005). Importantly the company must avoid knee-jerk
reactions. Emergent issues should be employed to strengthen the application of new ways
of working, not change direction.
The cyclical nature of business improvement
The introduction of Lean was described as an iterative approach (Bicheno, 2004), that
demanded organisational change at all levels (Caffyn, 1999). This study has demonstrated
and prescribed an iterative approach of adoption and adaptation of a manufacturing
strategy that has been underpinned by a mutually supportive HRM strategy. The
combination has served to help transform the business. Figure 9.4 illustrates the
interdependent nature of this approach.
Figure 9.4: The interdependent role of LM within the overall manufacturing strategy.
The manufacturing strategy was to improve the competitive position of a manufacturing
unit within the UKSI and its viability through the introduction of LM. The primary tactics
sought to stabilise the process by focusing on reliability and availability of plant. Basic
LM tools and techniques such as 5S, standard operations, SMED, TPM, process
mapping, waste elimination and visual management (sections 3.4 and 6.3) were employed
to enable this. Using structured CI activities like ‘needs analysis, master-classes,
interventions, Kaizen and problem solving, the user was able to tap into the tacit
knowledge of key individuals. The output of which was used to identify and allocate the
appropriate resources. Through employee involvement, the host company could nurture

237
innovative ideas and solutions to extend the capability of the company and achieve its
vision; i.e. its manufacturing strategy.
Following eight years of trial and error within CTE, there was in existence a strong
nucleus of LM practitioners and an acceptance of the new way of operating, as the norm;
the outcome of which is highlighted in the sections 8.2 and 8.3.
The Researcher has managed to transform workshop practices and succeed where
previous initiatives have failed. The Researcher has attributed success to the manner in
which he has engaged stakeholders at all levels, and how he has been able to use the
knowledge of employees to extend the capability of H42 in support of this transformation
(sections 4.2.2, 6.4, 6.6 and 8.2). An approach that has engaged employees and been
perceived by stakeholders to have added value to them.
The sustainability has been enabled by a change to existing HRM practices. A change
that has addressed a weakness associated with the application phase (post-training) of a
new way of working. Thus, the vital role of the HRM strategy on a brownfield site resided
within the ability to influence the desired behaviour, to eliminate all forms of
complacency and inertia, and to sustain motivation of the work force (figure 9.5).
Figure 9.5: The vital role of HRM.
Reduce cost
Increase
productivity
Manufacturing
Strategy
Process ‘In control’
5S
S Ops
SMED
TPM
Reduce variability
Focus on availability
Lean
Manufacturing
tools & techniquesTacit
knowledge,
involvement and
engagement
PNA
MNA
TNA
Kaizens
Interventions
Master-classes
Problem solving
Process mapping
Extend
capability
Role of HRM
Influence behaviour
Remove complacency and sustain motivation
Innovation
&
Improvement
Allocation
of resource
Structured
CI
Activities

238
The Researcher ruminated that the new HRM policies allowed CTE to tap into a rich vein
of tacit knowledge in support of the transformation. Furthermore, it was the structured
approach applied by the Researcher that enabled him to use that knowledge and extend
the capability of CTE.
“With this initiative you (the Researcher) have given LM a meaning, a local identity that
has engaged the workforce. The HRM practices (described by the Researcher) has helped
develop a positive culture in support of the transformation. Something all employees
could relate to and apply their skills practically.” (Union Convenor Nov 2011).
“The booklet you have developed is a super tool to create better recognition of OGSM
(HK) and what an individual can contribute. Hopefully this excellent example of best
practice will be used by the rest of Tubes.” (M Banus, Commercial Manager Tubes, Feb
2014).
9.3 Are LM tools and techniques transferable?
Gilbreth and Gilbreth (1917) asserted that not all companies have the same organisational
characteristics, or ability to implement the same set of practices. The conclusion
insinuated that what worked well in one company had the potential to fail if applied in
the same manner in another. The Researcher has reiterated that the LM journey within
CTE has been a journey of adaptation over adoption synonymous with the statement that
each business is unique.
To assist the Researcher’s comprehension of how RSP/ (LM) (section 2.3) had been
deployed and sustained within the UKSI, the Researcher conducted a series of interviews
in 2008 with managers in various businesses within the extended Corus group (CTE,
2008h; CTE, 2008i). Informal meetings were held with managers at Teesside,
Skinningrove, Corby, Scunthorpe, Workington, York, Oosterhaut and Zwijndrecht. The
analysis confirmed that LM tools and techniques although introduced had not been
sustained. Furthermore, they had even failed to gain any impetus beyond the launch phase
(section 7.6.4). In some plants like Teesside and Scunthorpe, LM existed in isolation,
apparent in only small pockets of the plants and operated by dedicated continuous
improvement teams. At Corby LM had taken on a different title, termed Manex with LM
activities restricted to 5S programmes conducted during shutdowns. Within other plants
LM had been discontinued altogether due to competing pressures. In the businesses where

239
LM was introduced but not sustained, 100% of interviewees confirmed a common theme,
the absence of: a) vision; b) an effective support structure; and c) CI targets within senior
management objectives.
This was consistent with findings uncovered within CTE depicting why previous
initiatives had failed (section 4.2.2 and table 7.9) and with the lack of post-launch
structure offered to the F&W lines at CTE (section 7.6 and table 7.8). The interviews had
concluded a greater level of management apathy and a view that CI was the responsibility
of the change agents disparate from main stream operations. The polar condition to that
of CTE and the few who had outlined how they had achieved success in the plant or a
sub-area in which they had worked (section 7.6.3 and table 7.7). It was the aligned
execution of a shared vision that engendered success and shaped the social culture of an
organisation (section 7.6.3). The results of the structured approach in terms of employee
involvement were demonstrated in section 8.2, whereas the impact on manufacturing and
financial performance were shown in section 8.3.
The method for training Change Agents (CA) adopted by the Researcher was based on
the NEPA approach (section 6.3.1). An approach that differed to the approach adopted
by other parts of the Corus group (CTE, 2010b). The Corus approach of training and
integrating CAs within the business displayed in the Researcher’s opinion, a deviation
from good practices articulated by the literature. For example, the knowledge transfer
process and the absence of an ‘aligned business’ governance structure incorporating CI
(or LM). This may have accounted for the perceived lack of confidence or direction
observed in CAs on other sites (CTE, 2008h; CTE, 2008i). This may have been
compounded by a less than enthusiastic senior team and lack of direction. What was clear
was that in most cases the manufacturing programmes reviewed during the above visits
lacked a contemporary HRM policy and aligned leadership. This may well have
contributed to the failure to address cultural issues, motivate stakeholders and instil
confidence in the vision or the ability to introduce and sustain, improved process
efficiency.
Section 3.4 proffered various reasons that contributed to the failure of change
programmes. Companies fighting to survive may focus more on today’s problem and
might not be able to afford the time or resource to plan for tomorrow’s resolution. This
could be attributed to a number of the reasons highlighted in section 3.4, such as: lack of
vision, leadership or commitment; a superficial understanding of what was required; a

240
lack of knowledge; and a lack of stakeholder support, engagement, buy-in or working
within the constraints imposed by the business viz-a-viz finance and resource. Analysis
of internal issues associated with previous initiatives (section 4.2.2) revealed the reasons
behind why key stakeholders perceived them to have floundered. The findings support
the learning deduced from the literature (section 3.4) and implemented by the Researcher
(chapter 6).
What became evident during the interviews conducted by the Researcher was that change
caused unrest and pain (64% of those interviewed). Furthermore, initiatives like LM were
seen as a trade off with other initiatives (75% of those interviewed). Moreover, a lack of
clear vision, knowledge and support often inferred a lack of determination and desire to
want to introduce new initiatives, like LM. The tendency was to revert to what an
individual manager knew and had worked well previously; for example, coaching and
mentoring over learning and development at Teesside (CTE, 2008h).
However, there existed within Corus beyond CTE, examples where LM had prevailed.
For example, Concast at Teesside, the 20” mill at Hartlepool and the Medium Sections at
Scunthorpe. The success often attributed to a lone manager who believed fully in the
benefits that could be derived; someone who had a passion to persevere. This reinforced
a view that TMs were not necessarily the blockers to change.
“You cannot just introduce something and hope it happens, you have to work hard to
ensure it makes sense to those involved” (Ops Manager, H20, Sept 2008).
The experience endured by the Researcher as a result of numerous literature reviews
(Chapter 3), of implementing LM within CTE (chapters 6 and 7) and in benchmarking
and conducting fieldwork with other factories and businesses within the UK, the
Netherlands, Germany and Japan has served to reinforce a pattern. The pattern showing
that the basic tools and techniques of LM as articulated by (Bateman and David, 2002),
introduced at successful plants were not dissimilar. They included the techniques listed
as basic building blocks in section 6.3.2 to be common in all plants. Furthermore, they
stressed the involvement of the local teams in the delivery of a localised ‘better way of
working’, almost as if they had secured permission and therefore acceptance to the
introduction of change. The only subtle difference was the varying degrees of

241
commitment and energy adopted in their application. In the successful companies it was
noted that in all (100%) cases a high degree of support was apparent from senior
management; managers that had the authority and ability to influence change. They
espoused the importance of the techniques, the integrative role it had within their business
strategy and in the development of individuals. Consequently, business and management
objectives were aligned to the delivery of improvement programmes. This ensured that a
supportive structure to facilitate the programmes was in force.
The visit to Japan (section 6.5) reinforced the Researcher’s opinion that persistence and
determination in the application of basic principles would deliver the required workshop
practices. The companies that were visited did not seek to introduce complex
improvements but just aspired to be more professional and aspirational in what they could
achieve with simple tools and techniques (source: diary note, Dec 2008).
The experience within CTE and the review of previous failings caused the Researcher to
reflect that the tools and techniques were simple to employ albeit difficult to endure
initially. LM could be employed in any business and be used to benefit of the company if
it was supported by an enabling context. The larger integrated sites within the UKSI
composed of a small number of manufacturing units akin to CTE. The larger sites would
have to deliver the same approach as CTE to up to ten units if it was to achieve a consistent
approach across the integrated site. Relatively, the issues that confronted CTE for
example: the scale of the equipment; the cost and time associated with the changes; the
resource available, and the local knowledge of LM, were identical. The issues confronting
the UKSI were shown by the Researcher to be typified by CTE (section 7.6). However,
unless there was a support structure in place or a desire to want to implement and sustain
LM practices, it was prone to failure.
The plethora of literature did not prescribe the individual pitfalls that could result in a set-
back. Neither did it provide an adequate roadmap that could take the user through a series
of steps to pursue from a pre-determined start point to a sustained approach. The NEPA
model did provide a starting point and a process that supported knowledge transfer.
However, the NEPA model did not offer a methodology beyond more training, to sustain
the approach and incorporate Lean within the business strategy. The SF developed by the
Researcher (figure 9.2), which builds upon the models available, is proffered by the
Researcher as good practice and if employed can support the introduction of LM; as

242
proven in this project. As the user becomes more experienced in the approach adopted,
then the available literature may help quench the desire for further understanding.
Within the enlarged Corus Group, it was the Researcher’s conviction that no other
business had delivered the turnaround that CTE had implemented. For example, no other
business had delivered a 52% improvement in productivity as a result of LM (section 8.3).
Albeit, there were isolated examples where similar tools and techniques had been
introduced and as a consequence the business had secured a benefit. However, the same
approach adopted and adapted for purpose has the potential to deliver similar benefits.
For example, the successful practices were observed at NMUK and within Japanese
operational units (section 6.5), practices that were successfully transplanted by the
Researcher within CTE and adapted to suit the prevailing culture in the delivery of an
enabling climate. This was underpinned by an enabling HRM strategy.
CTE was recognised locally (within Corus) as best practice for the introduction of LM
(idea generation) and as having demonstrated a significant turnaround not just in business
performance but also in Return on Net Operating Assets (figure 8.11). The turnaround in
performance and profitability of CTE was recognised at executive group level and hailed
as one of the few businesses within Corus making profitable returns during the period
2009-13.
Throughout 2011 to 2015, the number of Managers and Directors from existing Corus
sites visiting CTE has increased. CTE was recognised by the Business Excellence team
and Tata Quality Management Team for its adoption and application of Hoshin Kanri, of
Kaizen (idea generation), daily management and managing by fact. In addition, the
manner in which it had engaged employees to achieve a sustainable approach to CI. The
Researcher hosted five visits to the mill in an eight month period (Sept 2011 to April
2012), as the success of CTE was recognised and established as a good practice site.
Senior managers from sister plants have visited the site to consider how this was achieved.
Managers who, like CTE in 2003, had found themselves facing a crisis situation and were
determined to turnaround their business by adopting and adapting the approach CTE had
taken. Whilst it is outside the scope of this research, similar approaches are now being
introduced in other downstream operations.
The approach adopted by the Researcher was certainly not innovative in the sense that he
had developed a new way of working, or new tools and techniques to employ in the

243
introduction, delivery and sustainability of a change programme. However, what the
Researcher had successfully achieved was the ability to keep the transformation simple;
focus on the basics well; and apply a structured approach with realistic aspirations
(complete with vision, plan and accountability; appendix A). Furthermore, to use HRM
practices that developed, engaged and solicited the support of all employees in a better
way of working; an engagement process founded on a closed loop system (sections 6.6.6
and 6.6.7), unique within the literature covered by the Researcher.
Concepts like LM can improve the reliability of the operation, reduce waste and
importantly reduce cost. Consequently, the tools and techniques are considered valid and
could work in any process if there is in existence a management desire and structure to
implement them. Any company can introduce a CI programme; it is the ability to sustain
the approach that is questionable.
9.4 Summary
The chapter has discussed and answered the research questions highlighted in section 1.3
and shown that LM can be employed during the decline phase of a business life-cycle to
facilitate a turnaround. Furthermore, LM can be used by a business at any stage of the life
cycle in a bid to ‘refresh’ its manufacturing strategy and maintain a programme that
continues to add value (improve competitiveness) within its area of operation.
The process of adoption and adaptation delivered through a structured process is reflected
in the SF described in chapter 4 and shown in figure 9.2. The SF assists in the
development of an appropriate recovery plan and the establishment of the supportive
enablers. The output and structure can help reduce/ eliminate management inertia. It is
management inertia and not the tools and techniques that appeared evident and acted as
the greatest barrier to the change programmes previously introduced within CTE (section
4.2.2).
The thesis has supported the hypotheses generated by the Researcher that:
i) a process centric strategy such as the adoption of LM can be employed to turnaround
the financial performance of a business. Reducing conversion cost assisted CTE in
the development of a price competitive position. This has helped CTE retain its
position in its traditional sector as well as increase its capability to compete
aggressively in new sectors;

244
ii) to overcome management inertia and eliminate the internal causes of organisational
failure, there was a requirement to change the business strategy at strategic
management level through a holistic approach to change management;
iii) to implement and sustain LM and the work-streams associated with the recovery plan,
there was a requirement to introduce a mutually supportive HRM strategy. LM has
delivered the aspired benefits and has been sustained in a business initially weighed
down with aged practices and agreements, and where a hybrid of permanent and
temporary employees existed; and
iv) the SF model developed by the Researcher is applicable to other manufacturing units
within the UKSI.
The approach adopted has helped CTE succeed where it had failed previously (section
4.2.2). The structured approached described above coordinated via the Omega team
(section 6.3.4) provided a vehicle for co-ordinating and prioritising the interwoven yet
distinct set of work streams. The structure sought to balance the various work streams
such as workplace Master-Classes, training and development, and capex programmes in
a bid to complement each other. The application of LM within a business is complex and
must be underpinned and supported by a series of key concepts such as: leadership;
strategy deployment; training; communication; and activities such as: idea generation;
problem solving; and Master-Classes etc, if it is to be sustained.
The workforce training combined with modern HRM policies helped nurture the
development of individuals in a new way of working. Consequently, the implementation
and ability to sustain LM within the social environment of CTE dominated the research
programme.
The sections have highlighted that the techniques adopted had been refined or adapted as
the Researcher reflected on their effectiveness juxtaposed with the Researcher’s growing
experience. The role of the Researcher as an academic, practitioner, observer, action
researcher, client and customer has been paramount to the development and success of
this transformation programme. Each role offered a different perspective in the research
cycle, served to challenge status quo, establish direction, and provided the confidence (or
arrogance) to persist when confronted with set-backs. The role aided the development of
core themes to be pursued (section 5.4), helped to generate new insights, provided a
mechanism for evaluating and reflecting on output(s) (sections 7.5 & 7.6), and established

245
next steps whilst staying true to the core of the journey embarked upon. Figures 8.4, 8.5
and 8.6 portray a positive trend in key manufacturing metrics which is reinforced by the
turnaround in financial performance (table 8.3 and figure 8.11).
Section 8.3 demonstrated that the impact of the new mode of operation was significant.
It enabled a significant improvement in operational efficiency, reliability and capability
that addressed internal issues and turned-around the performance of the business. A
transformation that has allowed CTE to demonstrate the viability of its operation by
securing profitable returns during busy periods and at worse, break-even during quiet
periods.
LM has proved to be a primary enabler which coupled with engaged employees has
delivered a 52% improvement in speed of work and a net 10% improvement in
availability. An improvement that enabled a £15m cost benefit to the business and helped
CTE turnaround its financial performance and competitive position. The change in
operational efficacy supported the Researcher’s hypothesis that LM could be utilised as
a process centric strategy to turnaround a mature business in decline in any sector not just
the automotive or aerospace sectors but heavy industry as well.
The next chapter concludes the thesis by reflecting on the key learning derived from this
longitudinal study.
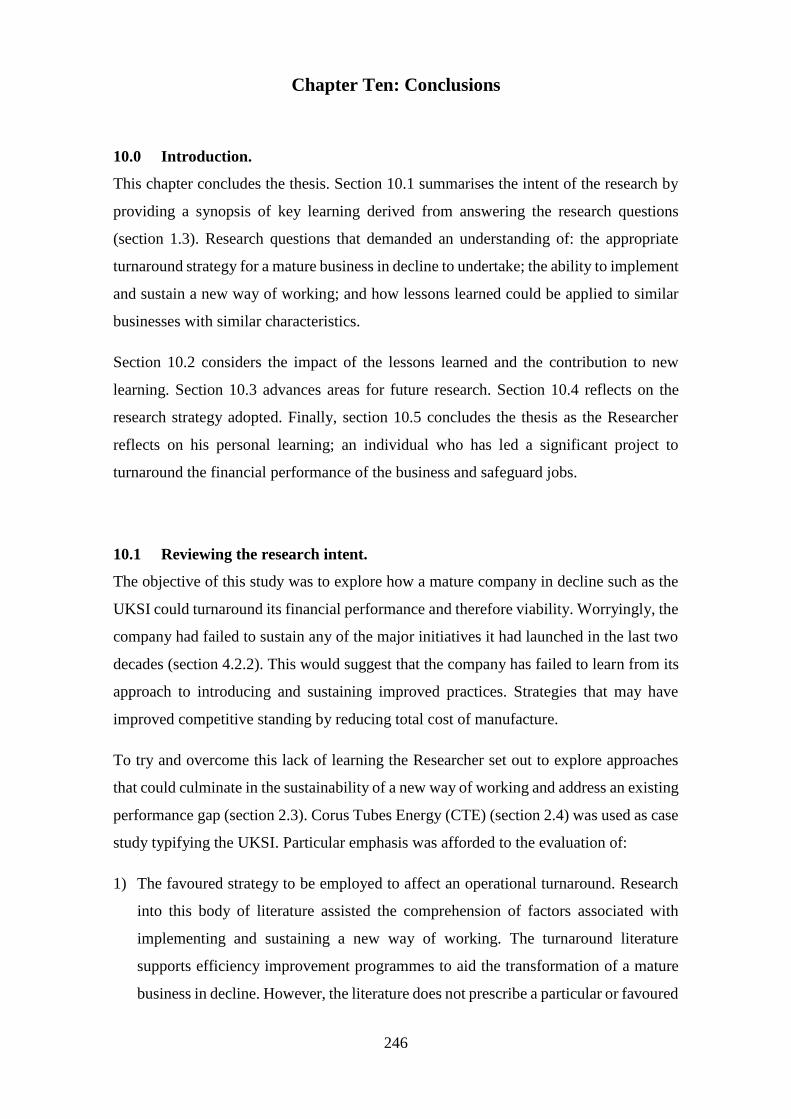
246
Chapter Ten: Conclusions
10.0 Introduction.
This chapter concludes the thesis. Section 10.1 summarises the intent of the research by
providing a synopsis of key learning derived from answering the research questions
(section 1.3). Research questions that demanded an understanding of: the appropriate
turnaround strategy for a mature business in decline to undertake; the ability to implement
and sustain a new way of working; and how lessons learned could be applied to similar
businesses with similar characteristics.
Section 10.2 considers the impact of the lessons learned and the contribution to new
learning. Section 10.3 advances areas for future research. Section 10.4 reflects on the
research strategy adopted. Finally, section 10.5 concludes the thesis as the Researcher
reflects on his personal learning; an individual who has led a significant project to
turnaround the financial performance of the business and safeguard jobs.
10.1 Reviewing the research intent.
The objective of this study was to explore how a mature company in decline such as the
UKSI could turnaround its financial performance and therefore viability. Worryingly, the
company had failed to sustain any of the major initiatives it had launched in the last two
decades (section 4.2.2). This would suggest that the company has failed to learn from its
approach to introducing and sustaining improved practices. Strategies that may have
improved competitive standing by reducing total cost of manufacture.
To try and overcome this lack of learning the Researcher set out to explore approaches
that could culminate in the sustainability of a new way of working and address an existing
performance gap (section 2.3). Corus Tubes Energy (CTE) (section 2.4) was used as case
study typifying the UKSI. Particular emphasis was afforded to the evaluation of:
1) The favoured strategy to be employed to affect an operational turnaround. Research
into this body of literature assisted the comprehension of factors associated with
implementing and sustaining a new way of working. The turnaround literature
supports efficiency improvement programmes to aid the transformation of a mature
business in decline. However, the literature does not prescribe a particular or favoured

247
paradigm to pursue. Lean Manufacturing (LM) was advanced within CTE as the
manufacturing paradigm to adopt (section 4.2.3).
The learning derived from this area of study revealed that many companies which
seek to introduce LM fail. This is attributed to a superficial understanding of LM and
the supporting values. For example, LM was described as multi-faceted, complex and
ambiguous in terms of its meaning (section 3.4). Companies often recognise the need
for change but struggle with where to start and what to do. Supportive roadmaps
offering guidance are available but are perceived by the Researcher to indicate ‘what
to do’ not necessarily ‘how to do it’. Knowledge is one thing, know how is another;
you can read all you want but may lack the expertise or experience to implement such
knowledge (Herron and Hicks, 2008). Consequently, confronted with pressure to
perform, the less determined manager/ business may abandon LM for a less complex
alternative.
The ability to overcome this was the focus of the RQ1 “How can the principles of LM
be successfully applied in an established organisation with hierarchical management
structures, adversarial industrial relations and established demarcations? In addition,
is it possible to develop an effective model for breaking down traditional working
practices and cultures in order to achieve the required transformation?”
LM is a convergence of best practices that have occurred over extended periods.
Companies may copy (low abstraction) good practices from other companies but
overlook the philosophy and organisational values that have supported the practice.
The NEPA dissemination programme elaborated upon earlier roadmaps by furnishing
the user with a method to a) establish a starting point, and b) assist in the knowledge
transfer process. However, the NEPA programme could not offer beyond this, advice
on how LM could be integrated within the business’ strategic objectives. This was left
to the Researcher to resolve in order to generate a culture of continuous improvement
and a sustainable approach that engaged all stakeholders. The Researcher was keen to
understand the basics of LM and how it had evolved. Furthermore, to unpick some of
the complexity that the Researcher believed acted as an impediment to a ‘green’
disciple. Good practices were explored in the literature and also identified as a result
of benchmarking. This helped the investigative nature of this study as the Researcher
started with a small number of key techniques (sections 6.3 and 6.4) which were
subsequently enhanced during the iterative nature of the study (section 6.6 and chapter

248
7). Complementing this area of study, the Researcher explored and evaluated the
differences between successful and unsuccessful transformations. The objective was
to understand the guiding principles that enabled and motivated stakeholders in a new
way of working.
Chapter 5 outlined the research design. The multi-method approach to data gathering
and analysis that assisted in the development of an approach germane to the criteria
established by the client – to turnaround the financial performance of the business.
The Researcher’s declaration was thus, to develop and implement a recovery plan that
would innovate workshop practices. The objective was to reduce cost and improve
competitive standing whilst simultaneously developing an appropriate structure to
create an environment conducive to the new way of working. Chapter 6 outlined the
interventions made and chapter 7 the Researcher’s approach to this study.
The data gathered and analysed suggested that LM should not be introduced in
isolation. LM must constitute a primary element of a company’s manufacturing
strategy and be enabled by a mutually supportive HRM strategy. Consequently, the
recovery programme had to consider both of these elements. An approach that aided
the development of the framework proposed by the Researcher (figures 7.4 and 7.5).
2) The second body of literature augmented the Researcher’s comprehension of the vital
role of contemporary HRM policies. Transformational policies that were
subsequently shared with CTE as a mechanism to engage stakeholders and develop
distinct capabilities in the successful execution (and sustainability) of a superior way
of working. Various good practices were uncovered (section 3.5) which underpinned
RQ2 “How can HRM policies and practices support the introduction of Lean
principles in a 'Brownfield' operation? In particular, what is the most appropriate
HRM strategy for overcoming resistance to change and engaging with key
stakeholders (the shop floor team members, management and the union) to support
new ways of working?”
The main emphasis of this area of study was to investigate and develop learning
associated with an ability to overcome inherent inertia and to succeed where previous
initiatives had failed (section 4.2.2). Thus, the focus was on typical methods used to
engage employees and increase the likelihood of sustaining new practices. However,
the additional challenges included: a) the need to overcome existing terms and

249
condition, accepted custom and practice that had evolved over decades within the
UKSI; and b) how to engage temporary workers in a new way of working given they
faced the ever-present threat of being ‘laid off’.
The learning deduced from the literature and experience gained from the ontological
and epistemological perspective of an Action Researcher, supported knowledge
generation and enabled the development of a number of key themes. Furthermore,
this philosophical perspective also related to how learning (and its acceptance) is
believed to occur. The key themes were advanced in the Sustainability Framework
(SF) developed by the Researcher (chapter 4) and depicted under the heading HRM
strategy. The themes were proven as key enablers in the ability to engage employees
and sustain the new practices. More importantly, they were fundamental in the
approach used to tap into the tacit knowledge of employees and convert tacit
knowledge into explicit action. An approach that culminated in the development of a
closed-loop employee engagement system, unique within Corus and the literature.
The Lillrank (1995) method of knowledge transfer was replicated by the Researcher.
Knowledge gained as a result of academic studies and associated fieldwork was
similarly transferred between: a) co-researchers, b) CTE management, and c)
participants in the change process. This allowed the Researcher to share substantiated
theories and learning. Insights or theoretical propositions that had been opened up to
scrutiny, tested by applying them in the work place, obtained as a result of feedback
and iterated in accordance with the AR cycle (figure 5.2). Finally, this was
triangulated with quantifiable as well as qualitative data. An approach that resulted
in the development of generalisable theories in support of the third RQ: “Are Lean
tools and techniques transferable within a heterogeneous working environment? For
example, are the techniques limited to particular contexts, such as high volume
manufacturing, or can they be applied in a low volume, engineer-to-order traditional
industry?”
10.2 The impact of the lessons learned and applied.
By critically evaluating the main bodies of literature, the Researcher developed a series
of theoretical propositions in support of the scoping exercise (section 5.4 and figures 5.6
and 7.3). This resulted in the development of an action plan (figures 7.4 and 7.5) that
provided structure to the research programme. The theoretical propositions deduced from
the literature were subsequently implemented and tested. This culminated in the

250
establishment of the SF (chapter 4 and section 9.2); a framework that provided a
mechanism to achieve a sustainable business transformation. Furthermore, the vital role
of HRM as a means of sustaining motivation and influencing behaviour was emphasised
(figure 9.5).
The SF incorporated the primary constituents deemed as fundamental in the development
and implementation of the transformation undertaken. The significance of the SF was that
participants were able to debate the value of each component and discuss the relevance
to them, the company and its predicament. It was used to challenge the perception of the
adopted manufacturing strategy relative to benchmarked rivals (or good companies) and
to juxtapose this with the perceived ability of CTE to deliver its long term aspiration. The
framework forced the team to reflect on the enabling structure and the supportive HRM
practices. Activities that may aid an alert ‘mature’ company to avoid decline or constantly
refresh its competitive position.
The SF provided an over-arching structure that proved successful within CTE; the
supporting methodologies were discussed in preceding chapters. The vision depicts the
future state; an aspiration that is developed based on a review of the external environment
and competitive forces juxtaposed with a review of internal capability and ambition. The
manufacturing strategy should comprise actions deemed appropriate to address the gap
between the ‘as is’ condition and the ‘to be’ aspiration. The ability to deliver the
manufacturing strategy is contingent on the support structure in place to lead, manage,
own, and execute the actions necessary to achieve the required goal. In addition, it is
equally contingent on the ability to engage stakeholders in the execution of the plan; a
plan that may be enabled or optimised by contemporary transformational HRM strategies.
Throughout the study the Researcher has emphasised the need to keep things ‘simple and
structured’. The primary learning is that the business strategy should set the direction and
give meaning to what is to be done and why. The manufacturing strategy engendered
confidence that the aspiration was realistic, whilst the HRM strategy enabled the
development of the required culture and motivational forces to support its delivery. The
tools and techniques employed throughout this study provided focus and were viewed as
enablers to the delivery of the end goals and not impediments.
The literature was used to generate learning and comprehension of good practices. The
framework incorporated the main components in one model. The Researcher ‘joined the
dots’ and built upon the NEPA roadmap to demonstrate:

251
a. the manner in which LM can be used as a mechanism achieve turnaround (section
8.3);
b. the vital role of HRM (figures 9.2 and 9.5);
c. a unique closed loop TM engagement process (sections 6.6.6 and 6.6.7); and
d. the benefit of an iterative approach of adoption and adaptation.
The development of the SF and the above points may be considered as the main
contribution to knowledge that the Researcher has provided. The SF emerged as a
conceptual model during the explanation stages of the AR strategy. However, as the study
evolved it became the focal point for the attachment of learning derived as a result of the
research process. Ultimately, the framework was used as a prompt to discuss with
stakeholders internal and external to CTE, the interdependent nature of each of the
components.
The AR methodology was effective in understanding how changes being introduced were
being perceived and or accepted (section 7.4). These changes may be considered hard
changes, such as the introduction of SMED activities, the basic building blocks of LM,
or involvement in Master-Class activities linked to mill improvements; changes that had
a direct impact on the recipient demanding their involvement. The output of which could
be measured by improvement in TAKT time or mill availability etc. Equally changes
could be considered as soft changes. For example, the introduction of improved
communication, training and development, involvement and leadership congruence. The
output of which might have increased an employee’s desire to support an initiative and
was measured by their perception and attitude to change, typically qualitative metrics
inferred from what they said in surveys and interviews or how they acted (observation).
Without the participation of individuals within CTE (and off-site), the Researcher may
not have been able to draw out the tacit knowledge linked to an individual’s views. Tacit
knowledge in terms of idea generation that resulted in the development of more effective
techniques and an optimisation of mill efficiency. This idea generation process was
mostly facilitated by the workshops or activities in which they were involved. The
capacity to study and discuss change through immersing in the social world of the
workplace allowed the Researcher to induce a degree of trust and engage team members
in open dialogue. The importance of AR was that theoretical propositions initially

252
deduced from secondary methods of data gathering could be tested and evaluated
empirically and as a result of observed behaviour, interviews and experience, proven.
The combination of qualitative and quantitative data gathering and analysis helped
validate the framework and the approach adopted during the transformation of workshop
practices to deliver a turnaround in financial performance within CTE. Consequently, the
framework provided a focal point in the structured methodology to implement change.
The approach adopted in this study has contributed to knowledge in a number of ways:
the development of a SF that provided visibility and structure in support of learning
associated with the design and implementation of a process centric strategy;
a methodology for employing the SF that generated discussion and the establishment
of supportive enablers;
to challenge academia in the use of LM as a process centric strategy to expedite a
turnaround of a mature business in decline;
a case study exemplifying the use of LM to turnaround the financial performance of
a business within the UKSI;
the role of HRM as a mutually supportive strategy to engage employees, underpin a
successful transformation and more importantly, achieve sustainability;
the development of a culture within a hybrid of permanent and temporary employees
that engaged employees and was conducive to a culture of continuous improvement;
an objective de-selection process that retains those employees most committed to the
business success;
the development of a closed-loop team member engagement process that is unique
within Corus and the literature covered; and
learning that demonstrated that the successful introduction of LM must be managed
strategically and not just operationally;
As a consequence of this research and the models/ frameworks developed, key learning
can be linked to the subject headings listed below. Learning that could be used to advance
academic studies or industrial transformational practices. These include:
The structured management of change:
the structured approach to the strategic management of change may need further
evaluation if it is to be applied in other areas of the UKSI or similar sectors;

253
the development of a framework that presents the user with a method, starting point
and direction during the introduction of LM techniques complete with a mutually
supportive HRM strategy from initiating point to (strategic) sustainability;
provides teams with tools and techniques to enable a more focused discussion of
problems that may culminate in more effective solutions;
the advantage of a framework that could be applied to other areas of the UKSI.
Organisational failure and turnaround:
the framework provides a central focus on the issues that need to be considered and
accomplished in order to introduce sustainable change;
using the framework developed as mechanism to engage in discussion and advance
LM as a methodology to aid the successful turnaround of a mature business in decline;
the benefit and the advantages derived from the application of basic LM tools and
techniques;
a case study that exemplifies how a mature business has turned around its financial
performance and sustained the approach. The development of a CI culture that was
still refreshing its manufacturing strategy and extending its capability ten years after
its inception;
HRM transformational practices:
understanding the advantages of a mutually supportive HRM strategy, as an enabler,
a method for influencing behaviour, and for sustaining motivation;
the use of non-financial motivators as a method for engaging employees in the
successful execution of business strategy;
the requirement of an iterative process to generate double-loop learning (Argyris and
Schon, 1991) critical to the development of group values and the required culture;
an objective de-selection process that avoids the use of ‘last in first out’ processes or
the acceptance of volunteers for redundancy;
understanding the value of teams, enabling interventions, and the ability to exploit
tacit knowledge;

254
This section has outlined the contribution to knowledge. The next section considers the
areas for future research.
10.3 Recommendations for future research.
This sections considers the recommendations for future research which include:
a) Re-test the framework and methodology adopted.
The case study employed by the Researcher was stated as being a typical representation
of the UKSI. The SF and associated methodology depicting a mutually supportive
manufacturing and HRM strategy delivered in a structured manner was empirically
proven to be successful within CTE. Consequently, CTE averted a crisis situation and
demonstrated its viability by contributing significantly to the financial performance of the
Group. However, it has not been re-tested outside of CTE. Whilst practices are now
starting to be adopted by sister mills, the framework needs to be re-tested and investigated
through each stage in a sister mill to evaluate the approach and demonstrate its
generalizability as declared by this study.
b) Development of a transformation roadmap.
Learning deduced form this research programme could be used to enhance knowledge
and the development of a supportive roadmap in the strategic management of change
using LM to aid turnaround. There is in existence a number of insightful roadmaps that
provide information on the introduction of LM, the establishment of a starting point/
direction, and methodologies for knowledge transfer. Equally, literature exists on the
successful introduction of change and of assorted best practice transformational HRM
policies. However, the Researcher did not uncover any evidence that combined each of
these in one roadmap in order to facilitate the strategic management of change using LM.
Therefore, further research could investigate how this could be formally addressed viz
the development of a roadmap that guides the user in this complementary approach to
strategic (structured) change.
c) Further work to be conducted using the closed-loop engagement process within other
organisations.
LM highlighted the importance of employee input and the ability to motivate them in the
application of their knowledge and skills; this is commensurate with a culture of

255
continuous improvement. The HRM literature extols the value in the development of
‘people’ as a fundamental strategic issue who are intrinsically linked to the value creation
process, and as such are an ultimate source of competitive advantage. The closed-loop
engagement process developed as an output of this research has served to engage
employees in support of the transformation delivered within CTE. The learning derived
from this participatory approach is worthy of further investigation. It should be re-tested
and evaluated within a different environment to enhance learning.
10.4 Reflecting on the research strategy adopted
The objective of this research was to deliver a sustainable transformation in the financial
performance of CTE. Previous initiatives introduced within CTE had neither been
sustained nor delivered the required aspiration (section 4.2.2). Furthermore, theoretical
propositions developed by the Researcher would have to be tested and proven prior to
their acceptance within CTE.
The ‘adopt and adapt’ approach employed throughout this seven year study lent itself to
a multi-method approach. The ‘adopt’ perspective provided a platform to evaluate how
new techniques were deployed and accepted. The review process allowed the Researcher
to ‘adapt’ techniques to: a) reinforce the introduction and use of techniques; b) measure
the observed improvements; and c) achieve sustainability of new practices.
The primary approach involved a subjective/ interpretivist epistemology to help construct
a reality based on observation and the acceptance of techniques introduced. This was
argued as vital in trying to understand why previous initiatives had failed and
subsequently introduce appropriate counter-measures to ensure a sustained approach. To
facilitate this study, the imperative was to engage with employees in the social context of
their work place. AR was argued as being the most effective approach because it has an
explicit focus on action and the promotion of change within an organisation. AR equally
supported the multi-method approach necessary throughout this longitudinal study. It
enabled an ability to introduce change that was developed either inductively from
individual and group discussions, and/ or informed deductively by secondary forms of
data such as literature reviews, company reports and experimental data. Furthermore, AR
in the form of overt participatory observation provided a method which helped summarise
the perceived benefits and concerns associated with the introduction of (change)
techniques.

256
In order to avoid confusion, the Researcher developed theoretical propositions both
inductively (from interviews and observations) and deductively (from literature reviews
and company reports). The nature of the seven-year longitudinal study demanded
improvements be triangulated. Consequently, subjective/ interpretive data gathering and
analysis were vital in constructing relationships between what was said, what was
observed, perceived changes in behaviour, and benefits. Moreover, objective quantifiable
data were required to link these observations/ changes with improvements in
manufacturing and financial performance. Thus, if the Researcher was to claim that the
introduction of a technique such as SMED had been accepted and had a positive impact
on performance, the Researcher had to support this with empirical data such as reduced
downtime (minutes and seconds) to conduct a changeover. Thus, a multi-method
approach was essential to this study.
The AR cycle of construct, plan action, take action, and evaluate fully supported the
iterative approach of adoption and adaption. A cyclical approach that allowed individual
techniques to be exhausted and then enhanced as new complementary learning or new
theoretical propositions were developed.
Ethical practices.
Throughout the research project and involvement with various stakeholders during
interviews or observation, the research intent was communicated. For example, at the
outset of interviews, workshops or mill based interventions the Researcher outlined the
objective of the planned change in practice or action being undertaken. A summary of
transcripts or observations captured was communicated to participants to ensure it: a)
reflected what was said, b) reflected what had been observed, c) it provided participants
with an opportunity to alter (or add) something they did not agree with, and d) it secured
their acceptance or permission to use data gathered. Where practical, all actions
undertaken by the Researcher were overt to ensure stakeholders were aware of the fact
that they were being observed etc. Any queries or concerns raised by any stakeholder
were addressed immediately. This might have involved not video recording a process that
they were involved in, or explaining an activity the Researcher had been associated with
but may not have explained it thoroughly to participants. The Researcher can vouch that
his behaviour was ethical and that as far as he was aware, his intervention with others was
conducted ethically.
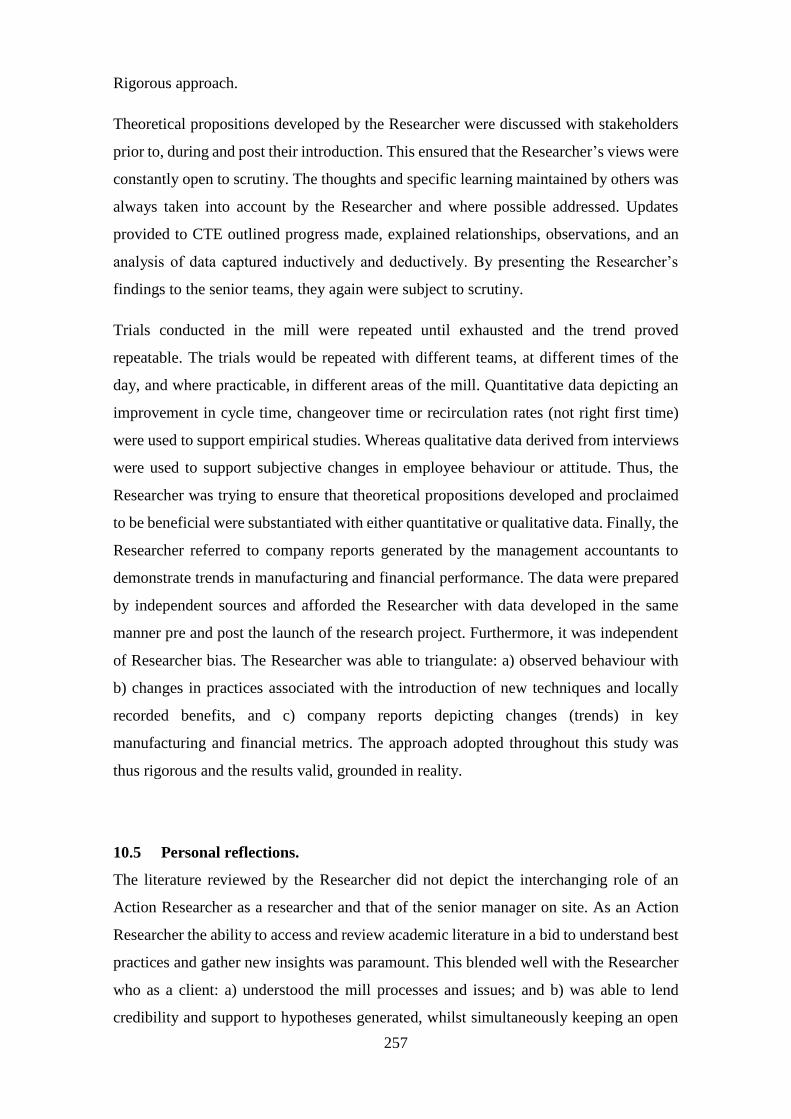
257
Rigorous approach.
Theoretical propositions developed by the Researcher were discussed with stakeholders
prior to, during and post their introduction. This ensured that the Researcher’s views were
constantly open to scrutiny. The thoughts and specific learning maintained by others was
always taken into account by the Researcher and where possible addressed. Updates
provided to CTE outlined progress made, explained relationships, observations, and an
analysis of data captured inductively and deductively. By presenting the Researcher’s
findings to the senior teams, they again were subject to scrutiny.
Trials conducted in the mill were repeated until exhausted and the trend proved
repeatable. The trials would be repeated with different teams, at different times of the
day, and where practicable, in different areas of the mill. Quantitative data depicting an
improvement in cycle time, changeover time or recirculation rates (not right first time)
were used to support empirical studies. Whereas qualitative data derived from interviews
were used to support subjective changes in employee behaviour or attitude. Thus, the
Researcher was trying to ensure that theoretical propositions developed and proclaimed
to be beneficial were substantiated with either quantitative or qualitative data. Finally, the
Researcher referred to company reports generated by the management accountants to
demonstrate trends in manufacturing and financial performance. The data were prepared
by independent sources and afforded the Researcher with data developed in the same
manner pre and post the launch of the research project. Furthermore, it was independent
of Researcher bias. The Researcher was able to triangulate: a) observed behaviour with
b) changes in practices associated with the introduction of new techniques and locally
recorded benefits, and c) company reports depicting changes (trends) in key
manufacturing and financial metrics. The approach adopted throughout this study was
thus rigorous and the results valid, grounded in reality.
10.5 Personal reflections.
The literature reviewed by the Researcher did not depict the interchanging role of an
Action Researcher as a researcher and that of the senior manager on site. As an Action
Researcher the ability to access and review academic literature in a bid to understand best
practices and gather new insights was paramount. This blended well with the Researcher
who as a client: a) understood the mill processes and issues; and b) was able to lend
credibility and support to hypotheses generated, whilst simultaneously keeping an open

258
mind generated via fieldwork and insights gained from relevant literature. The driver
motivating the attendance at so many meetings or conducting interviews and assessments
varied between the schizophrenic roles of the Researcher. The various modes of enquiry
(section 5.3) were clearly necessary and valid for research integrity and rigour. However,
they were equally valid as a driver depicting a senior manager seeking to demonstrate not
only support and commitment for the activities being undertaken, but also a genuine
interest to learn and apply that learning for the betterment of the mill.
Regardless of the driving force, there was however, a mutual and joint objective, to
deliver a change in manufacturing strategy and turnaround the financial performance of
the mill. Furthermore, it should be noted that it was the Researcher who analysed and
interpreted the data associated with this study.
The Researcher concludes by advocating that this seven year journey has provided
intellectual benefit to himself due to the various literature studies and the experience
gained. However, and more importantly, the application of the work associated with this
study has served to innovate and transform the product and process capability of the
business (CTE). This was epitomised by a radical and positive change in manufacturing
metrics and financial viability. Furthermore, ten years after the launch of this study, the
practices are very much still alive within CTE as the team continue year-on-year to refresh
the manufacturing strategy and extend the H42’s capability. A transformation, that unlike
CTE’s historic past, has been sustained.

259
APPENDIX A: Improvement plan and charters.
The approach adopted by the Researcher provided a mechanism to shape the project at a
macro level and a micro level, assign priorities, and monitor progress. The structure
heralded from an over-arching three year mid- term strategy (figure A1). Each group of
activities or work streams, identified as providing an accumulative benefit in terms of:
speed of work; availability; and NRFT (figure A2).
The general approach of the three year macro level plan (vision) was disseminated into
an annual action plan depicting the agreed set of specific activities (figure A3). Each
action and therefore agreed priority was assigned an owner accountable for the successful
delivery which would be captured in agreed annual management objectives. They would
implement the agreed action and provide updates on progress versus plan at the Omega
meetings.
To avoid project creep and provide clarity of objective the Researcher introduced the use
of a project charter (figure A4 and A5 macro level, A6 micro level). The charter acted as
the Terms of Reference (Brown, 2002) and represented the project manager’s contract
with the users and the Omega team.
The charter defined either in general the macro level activities such as the three year plan
covering a group of key activities, or in more detail at micro level covering the specific
details of an individual activity. The charters established the foundation for a systematic
approach to an agreed priority; assigning roles and responsibilities at the outset with
deadlines to be monitored and tracked. The subsequent problem solving approach
employing the typical tools and techniques in each workshop as outlined in section 6.3.2.
Figure A7 depicts the development of causal relationships using the Ishikawa diagram
(or 5M approach) which are translated into priority actions using a 3C and 3W sheet
(figure A8).

260
Figure A1: An example of a generic 3 year plan.
The following figure A2 provides a more specific validation of how and where a
particular initiative will support the improvement programme.

261
Figure A2: Percentage gain or contribution aligned to a particular activity.
Figure A3 reflects an example taken from an annual implementation plan employed by
the Researcher. It identifies the activity, the owner and the timescale. The attachments
shown in the second column could be accessed to provide specific detail.

262
Figure A3: An example of the annual implementation plan.
A1, A2, and A3 supported the structured approach depicted in figure 7.2 and was built on
factual, real time data. The output instilled confidence in the vision and the ability to
deliver. Furthermore, it provided a means for tracking progress and assigning priorities.

263
Figure A4: An example of a project charter employed by CTE.
MA
NU
FA
CT
UR
ING
EX
CE
LL
EN
CE
C
HA
RT
ER
O
ME
GA
OB
JE
CT
IVE
SC
OP
E
TE
AM
ME
MB
ER
S
AC
TIV
ITIE
SD
EL
IVE
RA
BL
ES
CR
ITIC
AL
SU
CC
ES
S F
AC
TO
RS
TIM
ES
CA
LE
•T
o i
mpro
ve
spee
d o
f w
ork
ing f
rom
75 t
o
114 f
inis
hed
pip
es/s
hif
t re
spec
tivel
y.
•F
ocu
s “c
ost
of
qual
ity”
impro
vem
ent
pro
gra
mm
e.
•M
anag
e th
e C
apex
pro
gra
mm
e.
•42”
Pip
e M
ill.
•84”
Pip
e M
ill
Cap
ex.
Ch
am
pio
n/S
pon
sor
–H
arr
y N
ich
ols
on
•A
ndy H
ill
•D
arre
n T
ow
ers
•T
ony B
row
n
•B
ill
Johnso
n
•M
ike
How
ling
•G
ary T
urn
er
•B
ob P
roct
or
•Jo
hn
Jo
yce
•M
ark F
ryer
Ou
tsid
e S
up
port
•O
ne
Nort
h E
ast
Sto
pp
age
An
aly
sis
•Id
enti
fy f
requen
cy a
nd d
ura
tion s
topp
age
cate
gori
es.
•In
itia
lly f
ocu
sing o
n p
ress
lin
e ex
its
blo
cked
.
Yie
ld P
erfo
rman
ce
•Id
enti
fy p
late
ord
erin
g d
imen
sio
nal
rule
s.
•Id
enti
fy y
ield
loss
es o
n s
elec
ted
contr
acts
.
Mil
l S
pee
ds
•D
eter
min
e oper
atin
g s
pee
ds
for
all
mac
hin
es.
•O
rigin
al e
quip
men
t m
anufa
cture
rs’
dat
a.
•A
ctual
tim
ings.
•H
isto
rica
l dat
a via
Tan
dem
.
Cost
of
Qu
ali
ty
•D
eter
min
e to
tal
qual
ity c
ost
s.
•P
reven
tion c
ost
s.
•A
ppra
isal
cost
s.
•F
ailu
re c
ost
s –
inte
rnal
and e
xte
rnal
.
Pu
rch
asi
ng
•Id
enti
fy s
trat
egic
ite
ms.
•D
eter
min
e K
ey P
erfo
rman
ce I
nd
icat
ors
.
•D
evel
op f
eedbac
k r
oute
s –
info
rmal
/non
confo
rman
ce r
eport
s.
Man
agem
ent
Tools
•B
ench
mar
kin
g.
•P
roduct
ion M
odel
ling.
•S
ix S
igm
a/L
ean M
anufa
cturi
ng.
•S
hort
ter
m i
mpro
vem
ents
im
ple
men
ted.
•Im
ple
men
tati
on p
lan.
•S
hort
ter
m.
•L
ong t
erm
.
•R
obust
dat
a ac
quis
itio
n i
n r
eal
tim
e.
•A
chie
vem
ent
of
Cap
ex p
rogra
mm
e.
•O
pti
mis
ed y
ield
per
form
ance
.
•F
ull
y t
rain
ed a
nd c
om
mit
ted w
ork
forc
e.
•S
ust
ained
per
form
ance
.
•A
chie
ve
spee
d o
f w
ork
ing g
oal
s.
•R
emoval
of
pro
duct
ion b
ott
le n
ecks.
•L
eader
ship
and s
upport
.
•C
om
mit
ted r
esourc
e.
•C
apex
in
ves
tmen
ts.
•W
ork
forc
e tr
ainin
g a
nd d
evel
opm
ent.
•S
ust
ained
pro
duct
ion l
oad
ing.
•A
ppro
pri
ate
ince
nti
ves
.
1st
Januar
y 2
004 –
31
stD
ecem
ber
2006

264
Figure A5: An example of a project charter employed by CTE.

265
Figure A6: Charter for Welding activity; a sub-group of the main annual plan.
Figure A7: An example of an Ishikawa diagram (5M Chart) used by the Researcher.
CONTINUOUS IMPROVEMENT CHARTER
OBJECTIVE
SCOPE
TEAM MEMBERS
ACTIVITIES
IMPACTS ON
A = Main impact B= Some impact C = Little or no impact
B
B
A
A
DELIVERABLES
CRITICAL SUCCESS FACTORS
TIMESCALE
To develop a World Class welding facility
capable of achieving >160 pipes/shift,
with repair rate <0.5% and availability
>95%.
ID Welders x 4
OD Welders x 4
Process flow IDW entry to OD inspection incl.
Flux and wire system and refill
A. Smith
- Shift Engineer
- Electrical Craftsman
- Mechanical Craftsman
K. Nicholson/L. Bond
A. Ward
Engineering Team
A. L. Hill
C. S. Bestford
Full Time November – January incl.
November 2010 – November 2013
• Review current issues affecting machine
performance and quality.
• Develop and implement a 3-year plan that
addresses short-term needs and long-term
development.
• Establish SOP’s for current engineering
setup and PM requirements.
• Review training needs of team and
implement development plan to improve
efficiency and effectiveness of team.
• Support case for development and
implementation of 5th welding line.
• Fully commission weld condition
monitoring equipment.
• Identify essential replacement programme
for components supporting effective
operation of ID and OD welders.
Safety
Quality
Production
Environment
• 95% availability of ID and OD’s.
• A World Class proactive planned maintenance
programme.
• A 25% speed of work improvement capability.
• Repair rate of <0.5% combined.
• A fully competent and dedicated welder support
team.
• Availability of machines (access).
• Support from team and available resource.
• Capital requirements/revenue support.
• Senior management support.
Welder
Overhaul
Blue
Sky
Machine
Material Method
Milieu
Acceptance of poor standards,
i.e. empty shadow boards
FLW system reliability and performance
Man
Experience of craftsmen
Non reporting of issue
Experience of operators
Do we have adequate
skilled resource?
Redefine and train
Craftsmen in PM
Flux tank pressure variability
- what is standard?
Grating system used to sieve
flux ineffective (ID and OD)Flux stops major issue
Poor flux recovery efficiency (ID & OD)
– new hose/mouthsSlag hanging up in hoppers
Flux system strengthen all wearing parts
Can recovered flux be filtered off line and
fed back into hoppers?
Wire feed repeat problems
Nozzles have lateral movement (OD)
Introduce team work, craftsmen to learn
to operate welding machines and
therefore understand issues
Weld engineering expertise/experience
(AT/KN/LB)
Redefine and train
Operators in TPM
No ownership of machines
- engineering
- production
- quality
N74 unit repeat faults
- replace with digital
Consider if transformers
need to be on ID carriageHow much equipment
should be on ID carriage?
Excess slogger in weld heads
Gearbox for carriage travel
(improve speed control)
All bogies ID and carriage OD
Need overhauling
Renew/replace ID bogies
Improve tolerance on speed by using same
drive control as edge miller
Welding heads on OD’s excess slogger
Welding heads on ID’s excess slogger
What is latest design (is there a superior act)?
Visit U&S to see new heads/control
Earth system effectiveness
-variability - performance
- design
L&T roll design and locking mechanism
ID pine supports
Carbon fibre ID boom
Get U&S to visit site
Can we get 4 wire ID flow better?
Mount wire feed motors in
a different position
Excessive dust in atmosphere
- normal or due to blowing out at ID inspection?
- during flux top up
Excess flux on carriages and below carriages
- excess dust effects transformer
Poor clean up affects catenary
Cold during winter
Moisture levels
Redevelop area for pipes to cool
Close transformer in AC sealed area
Take away the excuses!
Cu coating level of wires
Quality of flux batches
- breaking down rapidly
- using too high heat inputs
- moisture control
Contamination of prep
Deformity of prep
Correct prep
Crimp Press transitions
Pipes stick on conveyors due to bend
Pipes bend due to heat input
Repeat defects
- globular slag
- gas
- S/W
Excessive defects
- gas vs slag 30 x 1"
- machine vs parameter 22 x 1"
Pre-use inspection of wire and flux
(16"/18") pipe bending during weld
Interpass temperature too hot
OD laser tracking system
ID laser tracking/gimbled head
Set up variation amongst operators
Calibration variability
Machine variability with same set up across all shifts
PM programme – does it address issues?
PM programme – is it on track and being done?
Competence of operators/craftsmen to resolve issues
- deliver requirements
Poor standardisation (craftsmen/operators)
Conveyor drives for feeding pipe in/out to change
Fully commission weld condition
monitoring system
Design ID boom for a 14" pipe
Install 5th welding line
5M : ISSUES AFFECTING WELDING MACHINE PERFORMANCE

266
Figure A8: An example of a 3C Chart (cause, concern and countermeasure) used by the
Researcher.
Concern Cause Countermeasure Who When Status
ID & OD Weld Carriage Hesitations Track Condition Complete survey KN/DS Nov
Mcgill wheel Condition Complete survey KN/DS Nov
Acceptance Level Establish standard KN/VD Dec
Dirty Tracks Include in start up procudure VD/KR Nov
Defects due to Power cable
OverheatingCables Loose Review current fitment method DS Nov
ID Welding Nozzle Issues /Liners
wear rates Material / Size Investigate options /material KN Dec
Obtain 5mm ID specific KN Dec
Check / Inspect nozzle holders VD/DT/GS Nov
Defects due to lack of Knowledge &
TrainingInexperienced Operators Introduction to welding training KN Nov
Defect cause & effect training KN Nov
PLM training VD Nov
Inconsistant Set Ups Non Standard Tools Determine standard & associated
tools & equipment VD/KR/GS Nov
Difficult to adjust flux Height Review options VD/DT Nov
Poor Quality Tack Inspection /Repair Lack of Training / UnderstandingComplete operator training
programmeVD Jan
Tab Plates not Level Acceptance at TKIAComplete operator training
programmeVD Jan
Tab Attach Issues Consider auto tab attach clamping KN Nov
High strength wire trial VD/DF Jan
Tabs pressed down post Tacker Investigate cause KN/GH Nov
Inconsistant Tab Widths Review current method KN/GH Nov
Too slow to react to Defectslack of Communication TKIA / IWIA /
OWIA / Xray / UST
Education /Awareness training
programmeVD Nov
Review current controls
Standardise defect type
Repeat Defects Non Standard Rectification Establish procedures KN/VD Dec
Defects due to Process Deviation Transformer related IssuesReview reactive / proactive
maintenace DS Dec
Repetitive OD Weld Defects Wire Feed Routes Relocate welding heads VD/KR/DS Dec
25% complete 50% complete 75% complete
Title Welding Issues
100% complete

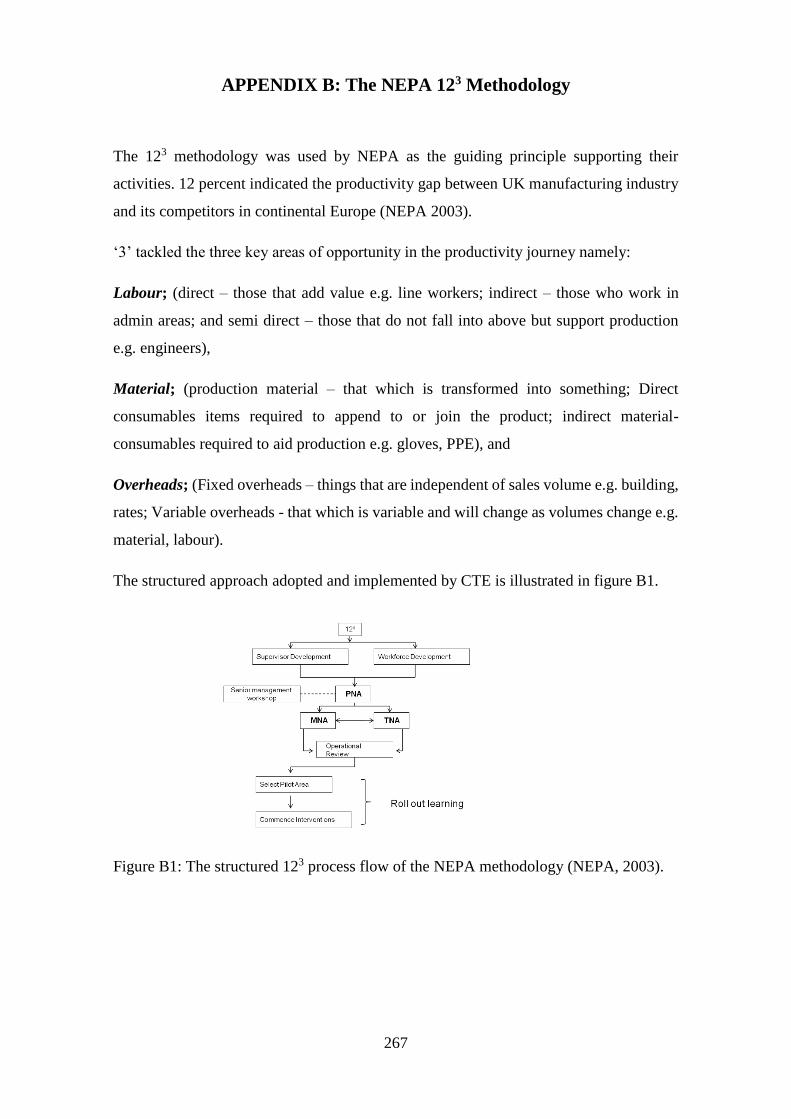
267
APPENDIX B: The NEPA 123 Methodology
The 123 methodology was used by NEPA as the guiding principle supporting their
activities. 12 percent indicated the productivity gap between UK manufacturing industry
and its competitors in continental Europe (NEPA 2003).
‘3’ tackled the three key areas of opportunity in the productivity journey namely:
Labour; (direct – those that add value e.g. line workers; indirect – those who work in
admin areas; and semi direct – those that do not fall into above but support production
e.g. engineers),
Material; (production material – that which is transformed into something; Direct
consumables items required to append to or join the product; indirect material-
consumables required to aid production e.g. gloves, PPE), and
Overheads; (Fixed overheads – things that are independent of sales volume e.g. building,
rates; Variable overheads - that which is variable and will change as volumes change e.g.
material, labour).
The structured approach adopted and implemented by CTE is illustrated in figure B1.
Figure B1: The structured 123 process flow of the NEPA methodology (NEPA, 2003).


268
APPENDIX C: The Productivity, Manufacturing and Training Needs
Analysis
The following tables indicate the results of the PNA, MNA and TNA conducted by the
NEPA team in 2004 as part of the initial evaluation of CTE (section 6.2). The results
when applied to the matrices provided NEPA with a method for determining priority
actions (figure D1). Each tool or technique of the Lean toolbox was considered in terms
of the influence - major, significant or minor, exerted on issues identified. The output
from this formed the basis for initial work.
Figure C1: The output of the NEPA/ CTE initial evaluation.
Figures C2, 3 & 4 illustrate the results of the MNA and TNA assessment.
Current Condition
Commercial
Welding
Inspection
Shipping/logistics
Test
Finishing
Expanding
Pressing
SM
ED
Valu
e s
tream
map
pin
g
FM
EA
Wo
rk m
easu
rem
en
t
PL
M
Pro
ble
m s
olv
ing
JIT
Kaiz
en
Sk
ill
Co
ntr
ol
Sta
nd
ard
Op
era
tio
ns
5S
Recir
c/
rew
ork
Pla
nn
ed
ov
ert
ime
Feed
sto
ck
co
ntr
ol
Kit
op
tim
isati
on
Tu
rno
ver/
pro
fita
bil
ity
Deli
very
on
tim
e
Labour
Absenteeism
Overtime
People Productivity
Material content
Not Right First Time
Stock Turns
Overhead Control
OEE
Value added per operator
Floor space utilisation
Schedule achievement
Major influence = 9
Significant influence = 3
Mionor influence = 1
Process
Measures
Process
IssuesTools

269
Figure C2: The result of the NEPA / CTE MNA part 1.

270
Figure C3: The result of the NEPA / CTE MNA part 2.

271
Figure C4: The result of the NEPA/ CTE TNA.

272
APPENDIX D: Examples of Questions
Continuous Improvement questions
1. How many workplace interventions have you been involved in within the last 12
months?
2. What was your role within the intervention?
3. Was there a clear objective at each intervention?
4. Did you achieve your/the objective?
5. Was the intervention aligned to a personal objective or/and business strategic
objective?
6. Is there a systematic approach to the interventions, if yes please describe?
7. Typically who was involved in the interventions?
8. What, if any, was the benefit of the approach adopted?
9. Do you maintain any of the techniques in your day-to-day work, outside of the
intervention structure?
10. Do you have any concerns linked to the intervention approach? If so what would
you change?
11. What training did you receive pre, during or post the intervention?
12. What tool(s) do you believe to be most beneficial?
13. Has the resultant work been sustained?
If yes – how was this managed?
If no – discuss your thoughts on the reasons why not.
14. In terms of your role: -
- How did you track progress?
- Develop themes based on feedback?
- Engage team members in intervention?
- Engage teams not associated with intervention workshop?
15. Did you encourage and solicit feedback/dialogue with team members NOT directly
involved in workshop, but affected by change? How?
16. In considering the OMEGA plan, how familiar are you with its objective?
17. If you consider current workshop practices, e.g. 5S, Standard Ops, SMED, problem
solving etc., how does this compare with activities pre 2004?
18. Has the OMEGA plan delivered any improvements or is it the same as before?

273
19. What do you believe to be the reasons for: -
- Success
- Failure
Refresher training questionnaire and survey results
Training
1. How long have you been employed at the SAW Mills?
2. Have you attended any previous Business Improvement Courses at SAW mills?
3. If yes, please list courses/ workshops attended.
Knowledge of Lean Manufacturing (LM)
4. Have you heard of the term LM?
5. If yes, what does LM mean to you?
.What are the tools and techniques associated with LM that you aware of? (please list).
6. What skills have you developed (if any) in the SAW Mills as a result of the
implementation of lean tools and techniques?
7. Which of the tools and techniques listed are most useful to you in your day-to-day
role?
8. Are Standard Operation Procedures (SOP’s), available in your area?
9. Can you describe the main purpose of Standard Ops, and what you believe are the
main benefits?
10. Have you been involved in their preparation?
11. Do you believe Standard ops to be useful to you in your role? If yes, why and if
no, why not?
Application
12. Have you been involved in any improvement activities i.e. Masterclasses,
Interventions, CI activity?
14. If yes, briefly list the main ones and your view of the outcome.
15. The main tools and techniques used.

274
Application/ Impact of Lean
16. What are the main benefits you believe SAW Mills have achieved/can achieve
through the introduction of Lean tools and techniques?
17. What are the main drawbacks or barriers associated with Lean?
18. Can you identify the main impact of Lean (if any), on the following:
Speed of Work.
Changeovers.
Availability.
Quality.
Cost reduction.
19. How well do you believe Lean implementation or progress towards our Omega
programme has been communicated?
20. What do you believe could be done to improve this?
21. In your view how well do the following support the introduction of Lean tools and
techniques:
Line Managers (Team Leaders/ Shift Engineers).
Middle Management (Process Managers/ Engineers).
Senior management (MPO, Manufacturing Manager/ Directors).
22. In your opinion what could management do to improve this?
Sustainability
23. In what way do you believe this refresher training course has:
Aided your knowledge of lean tools and techniques.
Your understanding of how the tools can be used effectively.
Helping to achieve sustainability of the benefits of lean manufacturing
within your area.

275
The following provides a summary of the findings
Team members, (TM)
82 TMs completed the questionnaire (78% of TM attendees). Length of service ranged
between 1 to 29 years, with an average service of 19 years, of which 88% had attended
the NVQ Level 2 BIT held at CTE. Interestingly only 51% were familiar with the term
‘Lean’; 26% stating it was about CI; 17% suggested a focus on quality, cost and delivery;
14% - working smarter and 12% waste elimination.
Discussion with TMs highlighted the lack of a real definition of how Lean was interpreted
within CTE. The responses were consistent with the visible tools and techniques
employed in by the TMs in the area of the mill in which they worked.
The most commonly known tools recalled by TMs were 5S; PDCA; kaizen; standard
operations and safety improvements, with each TM recalling on average 2.4 tools per
person.
84% suggested that standard operations were of benefit because they aid training, reduce
variability and highlight the best way to undertake a task. Only 21% of TM population
had been involved in a master-class or intervention. This came as a surprise when
recounted to the Researcher who was expecting a figure approximating 80%. TMs when
asked if they believed their involvement in a master-class would result in a work place
improvement, 66% said yes.
TM considered barriers to implementing LM as: - reluctance to change (33%); time
constraint (13%); employee commitment (10%), inertia (9%); most of which they
believed could be overcome by greater communication (66%) and more training like the
refresher course (34%). Over 90% of responders commented that the refresher course had
aided understanding and knowledge of Lean tools and techniques plus the relevance to
the mill.
Team Leaders (TL)
12 TL completed the course as an attendee. Length of service varied from 1 year to 32
years with an average service of 16 years.

276
100% of TL had attended courses on Lean at both CTE and external courses, yet only
92% were familiar with the term Lean of which waste elimination (42%), and increased
efficiency (38%) were used to define lean.
Each TL was able to recall an average of 5.6 tools used in Lean reflecting the greater level
of training received compared to TM.
84% of TL espoused the benefits of standardised operations as an aid to training, reducing
variability and improving quality.
Only 50% of TL had been involved in or run a master-class or intervention of which 84%
suggested that if they were to run one, they could deliver an improvement.
TL cited fear of change as the main barrier to the introduction of Lean techniques,
suggesting greater communication and involvement as a method to overcome this.
The Researcher attended the close out meeting of every session to engage the attendees
in an open discussion about the merits and pitfalls of LM.
The TLs felt more confident in having to run the subsequent improvement activities
planned.
Each TL was charged on their return with running an agreed set of interventions within
their area. This allowed them to consolidate their learning and extend the evidence of
Lean application throughout the mill; supporting sustainability (Bateman and David,
2002) (section 3.4).


277
APPENDIX E: Finishing Mill Development
The challenge set by the Researcher was to eliminate a key bottleneck associated with the
operations that occurred ‘in series’ (figure E1). Consequently, to eradicate waste through
the introduction of parallel processes and increased operator flexibility.
Figure E1: Pipe inspection and rectification layout (in series).
The mill process caused superficial mechanical damage to the surface of the product that
had to be rectified. The process necessitated a visual inspection of the pipe surface
whereupon observed blemishes are marked using chalk. Blemishes that were
subsequently removed on the second bench (figure E1) using hand held grinding
machines. In the event that one station has a delay then the entire operation stops. The
process employed 6 operators in this area and had a maximum average of approximately
20 pipes per hour.
This required a fundamental change to the employment practices and layout of the
benches. Discussion with various managers and operators in workshops and at gemba,
culminated in an alternative flow being developed and introduced. This is shown in figure
E2.

278
Figure E2: Modified process for product inspection and x-ray clearance (In parallel).
Key differences
- the benches were reduced in length;
- the inspection was combined with rectification. The inspector on seeing a
defect would rectify it;
- the external inspection/ rectification was combined and relocated with the
final inspection undertaken at the very end of the mill (Duplicated work);
- the processes are now in parallel; a production or quality issue will slow one
bench but allow the other to continue;
- an average of 30 pipes per bench was possible;
- employee’s terms and conditions have changed; and
- no job losses.
This same philosophy was applied to the entire process layout within the finishing mill
with the aim of eliminating wasteful practices and modernising the process flow. The
proposed changes took two years to complete due mainly to the requirement of
undertaking work during summer shutdowns. This was a key element of the speed of
work gains achieved in the finishing mill (figure 8.6) and a requisite of the original PNA
evaluation outlined in section 6.2.1.
Throughout the process the operators were fully involved with the changes proposed. The
involvement and engagement of the team members ensured that their knowledge was
accounted for in making the task easier to complete and thus optimising cycle time. A

279
major benefit was the elimination of a myriad of previously unseen wasteful activities.
For example why was the computer distant from their operating controls, why were the
operating controls laid out awkwardly and in the wrong position?


280
APPENDIX F: Single Minute Exchange of Dies (SMED)
Table F1 illustrates the standard times set and agreed between management and unions
for changeovers to the Crimp, U and O.Press; the three presses in sequence that need to
be changed simultaneously when conducting a press line changeover.
C Press
(Mins)
U Press
(Mins)
O Press
(Mins)
Gauge change 30 30 30
Diameter change 120 90 240
Master die change 180 90 480
Table F1: Standard Changeover times for H42 Press line. (Source CTE management and
Union agreement minutes).


281
APPENDIX G: Refresher training 2009
The workshop centred on the book ‘Andy and Me’ (Dennis, 2005). Employees were
tasked with reading five chapters at a time; this enabled techniques to be introduced
commensurate with the basic needs of the industry being examined in the book. The next
stage was to answer a series of basic multiple-choice questions; this served to test their
comprehension of what they had read. The third stage involved an open and interactive
discussion built around specific site related questions. This linked what was read/ learned
with an understanding of relevance to their operating environment. The final stage was to
conduct a teach point, relative to the chapters read and re-enforce what had gone
previously. This was repeated until the book was completed.
The refresher training and particularly the interactive sessions allowed the operators to
visualise and comprehend the relevance to their day-to-day duties. The main emphasis
was given to the importance of standard operations and waste elimination. Critically, this
was not about teaching the employees a host of new techniques but refreshing their
understanding and comprehension of techniques.
The training was immediately followed by an on-the-job application of tools and
techniques owned and facilitated by line management. The focus was centred on saving
14 seconds on a typical product cycle time, reducing NRFT by targeting welding
activities, reduce cost by improving consumable consumption rates, improving
changeovers through SMED activities, eliminating NVA time on presses and welders,
and driving the basic building block - 5S.
This served to ensure that the techniques covered in the refresher course were adopted
and applied immediately whilst the learning was still fresh in the minds of the employees.
It is unlikely that this new action alone would address all the issues however, the iterative
process helps ensure that with each cycle, greater numbers of employees are remembering
and adopting the techniques.


282
APPENDIX H: Example of the 6 step HK process employed by CTE
Step 1: the development of a strategic proposal; for example, improving productivity by
52%.
Step two: the need to balance work load. The productivity improvements were
juxtaposed with annual HS&E plans and other business initiatives. The aim was to ensure
that agreed priorities did not conflict by pulling on the same resource.
Step three: The development of an overall master plan with clear ownership and agreed
timescales. This provided the Omega team the ability to allocate resource according to
the agreed priorities.
Once validated the master plan was split into a three year overall plan subdivided into an
annual action plan. This formed the basis for monthly progress reviews monitored by the
CI steering committee.
Step four: was the establishment of the monthly steering group set up to review progress
against plan, to agree next steps and to prioritise actions. Meetings were held twice per
month. The purpose of the meeting was to ensure progress occurred according to plan.
Step five: was to communicate what was to be done especially at the outset of any
workshop and finally on completion, promulgate what had been achieved, publicising and
celebrating success.
Step six: was to start over again.
Throughout the year priorities may change and emergent issues create a distraction.
However, the 6 step process provided a focus and a structure that ensured for the most
part, the plan was maintained.

283
APPENDIX I: The Availability Challenge
Three years into the recovery plan the reliability of the forming and welding lines was
deemed inconsistent and an impediment to the programme. Consequently the availability
challenge was launched.
The issues to be addressed included:
- insufficient accountability;
- the appointment of senior engineers to own activities and prioritise the work of the
department at an operational level;
- maintain focus on research and development of tooling;
- total review of planned maintenance programme and gradual implementation of TPM;
and
- a review of training and competence of engineering personnel at all levels.
Key objectives going forward for the engineering team to support and deliver in 2008
included:
Deliver mill availability (uptime) >82.5%;
Achieve a pressing capability of >17.5 pieces per hour;
Achieve an average pressing output for every shift worked of >16.4 pieces per hour.
Reactive maintenance was evident as opposed to a proactive, planned approach. Two
senior engineers were given ownership and accountability of the availability challenge.
Their plan was to re-model the engineering team and introduce a structured approach to
asset management through the development of structured work teams.
Figures I1 & I2 illustrate the difference in approach.

284
Figure I1: Reactive incoherent approach.
In the reactive approach the resource is made available on a virtual first come first served
basis. The priority for the engineering department was to maintain availability and as such
in the event of breakdowns resource would be drawn from wherever available regardless
of work ongoing at that time.
Figure I2 shows the developed cased for the engineering team
Figure I2: Focused and structured approach.
The structured approach allowed the engineers to identify and agree resource that would
be assigned to each work-stream. The system was difficult to operate at the outset due to
the legacy of outstanding issues. This structure was initially perceived as a weakening of
the strength available to tackle issues on the shift. However, the dedicated resource

285
ensured 100% attention to planning and completing the work assigned without being
pulled away to fix a mill breakdown. Work could now be prioritised and planned more
effectively without the constant distraction of having teams start work, leave to attend a
breakdown and return some time later to start over. Moreover it was an opportunity to
break out of the constant reactive style of engineering planning.
KPIs were developed to monitor progress and identify trends. Good examples were the
‘pin diagrams’ (figure I3). These outlined the occurrence of stops greater than two hours
or repeat stops.
Figure I3: Engineering pin diagram.
Figure 8.6 showed that by the end of 2008, H42 had achieved a sustained stepped change
in mill availability. The improvement in availability was commensurate with a significant
increase in productivity measured on the press line (figure 8.5). The financial
performance of the mill see table 8.4, supports the fact that for the first time since the
launch of the omega programme in 2003, the H42 was achieving positive variances due
to the overall manufacturing performance.
The availability challenge provided the next major transition in manufacturing
performance.


286
APPENDIX J: The appraisal process
The appraisal process comprises an assessment of:
- Job related skills (figure J1);
- Team working (figure J2);
- Commitment (figure J3); and
- Flexibility (figure J4)
- TOFB Booklet assessment (figure J5)
The assessment is undertaken by the area manager and team leader.
In the event the appraisal form is to be used for de-selection than three additional
components are added, namely: disciplinary record, length of service, and attendance
record. To support consistency across the process HR and senior ops management are
also involved.

287
Figure J1: Job related skills.
As
se
ss
me
nt
AJ
OB
RE
LA
TE
D S
KIL
LS
::
LE
VE
L O
F K
NO
WLE
DG
E A
ND
EXP
ER
TIS
E R
EQ
UIR
ED
TO
CA
RR
Y O
UT J
OB
Em
plo
ye
e N
am
e
:C
OM
PLE
XIT
Y O
F J
OB
SA
P N
um
be
r
PR
OD
UC
TIO
N:
EF
FE
CTIV
EN
ES
S W
ITH
IN B
US
INE
SS
/OP
ER
ATIO
NA
L A
RE
AS
TO
FB
Bo
okle
tA
vailable
__
Not
ava
ilable
although r
equeste
d
__
Pe
n P
ictu
re -
Le
ve
l
of
Sk
ill R
eq
uir
ed
Pe
n P
ictu
re -
Le
ve
l
of
Sk
ill
De
mo
ns
tra
ted
0
S c o r e
1 2
3
4
5
S c o r e
6 7
8
9
1
0
S c o r e
11
1
2 1
3 1
4 1
5
S c o r e
16
1
7 1
8 1
9 2
0
S c o r e
Ma
xim
um
5 p
oin
ts in
ra
ng
eA
dd
itio
na
l 5
po
ints
ma
xim
um
Ad
dit
ion
al 5
po
ints
ma
xim
um
Ad
dit
ion
al 5
po
ints
ma
xim
um
1
Ha
s n
ot a
ch
ieve
d th
e b
as
ic le
ve
l o
f
co
mp
ete
nce
fo
llo
win
g e
xte
nd
ed
pe
rio
d o
f
tra
inin
g r
eq
uir
ed
to
ca
rry o
ut d
utie
s
as
sig
ne
d.
Ha
s n
ot a
tta
ine
d th
e b
as
ic s
kill re
qu
ire
me
nts
of th
eir
jo
b
bu
t w
ith
exte
nd
ed
tra
inin
g w
ill a
ch
ieve
le
ve
l o
f
co
mp
ete
nce
/ach
ieve
d le
ve
l o
f co
mp
ete
nce
in
on
e jo
b.
Ha
s a
ch
ieve
d a
le
ve
l o
f co
mp
ete
nce
in
th
e m
inim
um
nu
mb
er
of co
re s
kills
re
qu
ire
d to
ca
rry o
ut jo
b a
nd
is
co
ns
ide
red
a p
ractitio
ne
r in
1 r
ole
.
Is tra
ine
d a
nd
fu
lly c
om
pe
ten
t in
>3
jo
bs
an
d is
re
gu
larl
y
em
plo
ye
d in
th
em
en
su
rin
g s
kills
are
ma
inta
ine
d.
Is tra
ine
d a
nd
co
mp
ete
nt in
>3
jo
bs
. H
as
ach
ieve
d e
xp
ert
sta
tus
in a
ll 3
OR
is
th
e s
ole
exp
ert
in
1 jo
b. (N
.B R
ea
d e
xp
ert
sta
tus
req
uir
me
nts
)
2
Is lim
ite
d to
a m
inim
um
nu
mb
er
of d
utie
s
wh
ich
are
ca
rrie
d o
ut p
oo
rly a
nd
ne
ed
ing
co
ns
tan
t s
up
erv
isio
n.
Has b
een t
rain
ed in >
3 jobs h
ow
eve
r tr
ain
ing in job
held
has lapsed (
not
been in job >
6 m
onth
).
Ha
s a
ch
ieve
d a
le
ve
l o
f co
mp
ete
nce
in
>3
jo
bs
an
d s
kills
are
still v
alid
Is c
on
sid
ere
d a
pra
ctitio
ne
r in
>3
ro
les
an
d a
n e
xp
ert
in
>1
.is
consid
ere
d p
ractitioner/
expert
in a
ll/m
ost
jobs in t
he a
rea
em
plo
yed
3
Co
mp
ete
nt to
op
era
te in
acco
rda
nce
with
SW
P/S
OP
an
d
pro
du
ce
a q
ua
lity
pro
du
ct s
afe
ly a
nd
re
gu
larl
y w
ith
in c
ycle
tim
e, w
ith
ou
t s
up
po
rt.
4F
am
ilia
r w
ith
mo
st S
WP
/SO
P’s
an
d fu
lly c
on
ve
rsa
nt in
on
e,
he
lpin
g to
am
en
d a
s r
eq
uir
ed
.
5N
one o
f th
e jobs t
rain
ed in h
ave
any r
eal
com
ple
xity
Jo
bs
tra
ine
d in
ha
ve
a lo
w to
me
diu
m le
ve
l o
f
co
mp
lexity.
Is tra
ine
d in
a m
inim
um
of jo
bs
wh
ere
le
ve
l o
f co
mp
lexity is
hig
h a
nd
is
ab
le to
op
era
te th
em
pro
ficie
ntly w
ith
in
req
uir
ed
cycle
tim
e.
De
gre
e o
f d
ifficu
lty in
ro
le is
hig
h (
str
es
sfu
l)?
De
gre
e o
f d
ifficu
lty in
ro
le is
hig
h (
str
es
sfu
l) a
nd
fre
qu
en
tly
au
dite
d b
y e
xte
rna
l b
od
ies
(h
old
po
ints
)
6R
efu
se
s o
r is
un
ab
le to
un
de
rta
ke
tra
inin
g in
mo
re c
om
ple
x jo
b.
Is r
elu
cta
nt to
un
de
rta
ke
tra
inin
g in
mo
re c
om
ple
x jo
b
un
les
s p
us
he
d
Ab
le to
un
de
rta
ke
mo
re c
om
ple
x d
utie
s/r
ole
s a
nd
ha
s
be
en
tra
ine
d in
at le
as
t 1
co
mp
lex r
ole
.
Opera
tes a
com
ple
x job w
here
there
are
few
people
tra
ined
to c
om
ple
te t
ask i.e
<7.
Opera
tes a
com
ple
x job w
here
there
exis
ts a
scarc
ity o
f skill-
set
held
by indiv
idual i.e <
4
7
Job d
oes n
ot
require O
R is u
nable
to
conduct
changeove
rs o
f m
achin
ery
, but
can o
pera
te t
hem
when c
om
ple
ted b
y
oth
ers
.
Has u
ndert
aken t
rain
ing a
nd s
how
n a
n a
bility t
o
com
ple
te s
atisfa
cto
rily
com
ple
x c
hangeove
rs a
nd
requires a
degre
e o
f superv
isio
n
Invo
lve
d in
ch
an
ge
ove
r a
nd
se
t u
p o
f m
ach
ine
to
re
qu
ire
d
sta
nd
ard
re
qu
irin
g n
o s
up
erv
isio
n.
Ha
s a
n a
bility to
co
nd
uct co
mp
lex c
ha
ng
eo
ve
rs/s
et u
ps
with
ou
t
su
pe
rvis
ion
an
d is
vie
we
d a
s a
n e
xp
ert
, fu
lly c
om
pe
ten
t in
th
eir
ab
ility to
co
mp
lete
th
e c
ha
ng
eo
ve
r.
Is a
ble
to a
ct
as t
he lead d
uring c
hangeove
rs a
nd m
achin
e
set
ups a
nd e
nsure
pro
duct
fully c
om
plies w
ith r
equirem
ent
8Is
consid
ere
d a
tra
inee
Job is r
outine o
r auto
mate
d a
nd r
equires n
o p
hysic
al
exert
ion
Job is r
outine,
manual, o
r auto
mate
d a
nd r
equires
min
imal to
occassio
nal burs
ts o
f physic
al exert
ion
Job is m
anually o
rienta
ted a
nd r
equires r
egula
r to
dem
andin
g p
eriods o
f physic
al exert
ion
Job is m
anually o
rienta
ted r
equires c
onsta
ntly d
em
andin
g
periods o
f physic
al exert
ion
9Is
consid
ere
d a
tra
inee
Is a
ble
to
tra
in s
om
eo
ne
els
e in
1 jo
b o
nly
to
th
e
req
uir
ed
le
ve
l o
f co
mp
ete
nce
.
Is a
ble
to
tra
in s
om
eo
ne
els
e in
2 o
r 3
jo
bs
to
th
e r
eq
uir
ed
leve
l o
f co
mp
ete
nce
.
Is a
ble
to
tra
in o
the
rs in
mo
st o
f th
e ta
sks
in
vo
lve
d in
are
a o
f
op
era
tio
n to
re
qu
ire
d le
ve
l o
f co
mp
ete
nce
.
Is a
ble
to
tra
in o
the
rs in
all jo
bs
th
ey th
em
se
lve
s a
re tra
ine
d in
,
to r
eq
uir
ed
le
ve
l o
f co
mp
ete
nce
. T
he
se
jo
bs
in
clu
de
hig
hly
co
mp
lex ta
sks
.
Job r
equires e
xte
nsiv
e t
rain
ing t
o b
e c
onsid
ere
d c
om
pte
nt
to o
pera
te m
achin
e a
nd c
om
pete
ntly p
roble
m s
olv
e h
igh
tech e
quip
ment
(c3 t
o 6
month
)
Is s
ee
n a
s th
e le
ad
in
un
de
rta
kin
g c
om
ple
x ta
sks
.
Pro
fes
sio
na
l q
ua
lifica
tio
ns
are
re
qu
ire
d a
nd
in
div
idu
al h
as
so
me
of th
e e
lem
en
ts r
eq
uir
ed
.
Exce
lle
nt le
ve
l o
f e
xp
ert
ise
in
jo
b a
nd
th
ere
fore
te
nd
s n
ot to
be
mo
ve
d b
y T
ea
m L
ea
de
r/M
an
ag
er.
11
Is in
fle
xib
le.
Takes o
n o
ther
tasks a
nd learn
oth
er
jobs w
hen
asked b
y m
anager
Willingly
takes o
n o
ther
tasks a
nd learn
new
jobs
Regula
rly v
olu
nte
ers
to t
ake o
n e
xtr
a w
ork
and learn
new
jobs
Takes o
n e
xtr
a w
ork
willingly
and m
ostly in o
wn t
ime
12
Ha
s h
ad
in
form
al/fo
rma
l d
iscu
ss
ion
re
jo
b
pe
rfo
rma
nce
an
d h
as
sh
ow
n n
o in
tere
st o
r
inte
nt to
im
pro
ve
.
Ha
s h
ad
in
form
al/fo
rma
l d
iscu
ss
ion
ab
ou
t jo
b –
re
late
d
pe
rfo
rma
nce
bu
t h
as
sh
ow
n p
os
itiv
e s
ign
of
imp
rove
me
nt –
no
dis
cu
ss
ion
.
Pe
rfo
rm jo
b c
om
pe
ten
tly a
nd
is
no
ted
/co
mm
en
de
d
occa
sio
na
lly fo
r a
ll r
ou
nd
pe
rfo
rma
nce
.
Pe
rfo
rm jo
b/d
utie
s w
ell a
nd
is
re
gu
larl
y n
ote
d/c
om
me
nd
ed
fo
r
pe
rfo
rma
nce
.
Pe
rfo
rms
jo
b w
ell a
nd
co
ntin
ue
s to
str
etc
h b
ou
nd
ari
es
–
co
ns
iste
ntly o
pe
ratin
g a
bo
ve
exp
ecta
tio
n. (v
alid
ate
d b
y file
no
te
by s
up
erv
iso
r)
13
Multip
lier
___
x
0.4
6
=
___
___
x
0.4
2
=
_
__
___
x
0.3
9
=
___
___
x
0.4
2
=
_
__
eg
7 t
icke
d ÷
13 i
n t
ota
l x
3 p
oin
ts m
ax
imu
m =
1.6
Asse
sso
r N
am
eS
ign
atu
reD
ate
Ex
pe
rt
sta
tus
in
mo
st
job
s: E
xp
ert
co
re s
kills
; p
rob
lem
so
lvin
g (
5Y
,
PD
CA
), c
om
mu
nic
atio
n, a
bo
ve
ave
rag
e IT
skills
, C
I -
run
a m
ini
pro
ject s
ucce
ss
fully, co
nd
ucte
d H
S&
E a
ud
its
, d
ecis
ion
ma
kin
g
str
on
g.
Pra
cti
tio
ne
r: C
om
pe
ten
t o
pe
ratio
n, g
oo
d u
nd
ers
tan
din
g o
f
ba
sic
skills
an
d a
ble
to
op
era
te jo
b c
om
pe
ten
tly a
nd
alw
ays
with
in a
gre
ed
cycle
tim
e to
sta
nd
ard
re
qu
ire
d. C
arr
ies
ou
t 5
S
du
tie
s w
ith
in a
rea
of re
sp
on
sib
ility. Is
in
vo
lve
d w
ith
tra
inin
g
ne
w s
tart
ers
in
1 r
ole
. A
ble
to
ca
rry o
ut b
as
ic P
LM
. A
ble
to
ide
ntify
im
pro
ve
me
nts
. C
ha
ng
eo
ve
r m
ach
ine
an
d s
et u
p a
s
req
uir
ed
.
Se
mi-
skille
d jo
b r
eq
uir
ing
exte
nd
ed
tra
inin
g o
n s
ite
or
pri
or
to
takin
g o
n r
ole
(e
.g. A
SN
T II in
on
e d
iscip
lin
e).
Ex
pe
rt:
Pra
ctitio
ne
r p
lus
is
active
ly in
vo
lve
d in
de
ve
lop
ing
SW
P/S
OP
's. Is
ab
le to
ch
an
ge
ove
r/s
et u
p c
om
ple
x p
iece
s o
f
eq
uip
me
nt (a
uto
s, p
res
s).
H
as
su
bm
itte
d n
um
ero
us
id
ea
s fo
r
imp
rovin
g H
&S
an
d im
ple
me
nte
d. C
an
tra
in n
ew
sta
rte
r in
1-3
job
s c
om
pe
ten
tly. R
eg
ula
rly a
ch
ievin
g r
es
ults
gre
ate
r th
an
sta
nd
ard
s in
te
rms
of p
rod
uctio
n a
nd
ch
an
ge
ove
rs. Is
in
vo
lve
d in
co
st re
du
ctio
n e
xe
rcis
es
with
in a
rea
.
Se
mi-
skille
d jo
b r
eq
uir
ing
an
exte
nd
ed
pe
rio
d o
f tr
ain
ing
on
site
an
d p
rio
r to
em
plo
ym
en
t, e
.g. A
SN
T II in
mu
lti d
iscip
lin
es
.
Skille
d jo
b, e
g a
pp
ren
tice
sh
ip b
ut w
ith
min
ima
l w
ork
exp
eri
en
ce
Skille
d jo
b, e
.g. a
pp
ren
tice
an
d fu
lly e
xp
eri
en
ce
d in
ca
rryin
g o
ut
du
tie
s to
re
qu
ire
d le
ve
l.
Core
skills
: d
uties t
hat
allow
you t
o c
arr
y o
ut
your
job s
afe
ly a
nd in lin
e w
ith b
usin
ess g
oals
, e.g
. C
I tr
ain
ing,
PC
train
ing,
unders
tandin
g b
asic
specific
ation r
equirem
ents
/tole
rances.
Com
munic
ation c
hannels
, e.g
. re
port
ing
faults/issues/im
pro
vem
ents
. R
A's
.
duties t
hat
allow
you t
o c
arr
y o
ut
your
job s
afe
ly a
nd in lin
e w
ith b
usin
ess g
oals
, e.g
. P
LM
/PM
, apply
BIT
techniq
ue a
t
basic
leve
l, c
an c
onduct
safe
ty,
quality
spot
checks,
pro
ble
m e
valu
ation g
ood,
decis
ion-m
akin
g –
will m
ake s
om
e
decis
ions.
Co
mp
lex
jo
b :
Co
re S
kills
:
Inte
rme
dia
te c
ore
sk
ills
:
No
n-s
kille
d jo
b w
ith
tra
inin
g g
ive
n ‘o
n s
ite
’ to
ca
rry o
ut jo
b.
Jo
b p
erf
orm
an
ce
un
acce
pta
ble
ha
s b
ee
n
form
ally d
iscip
lin
ed
fo
r jo
b p
erf
orm
an
ce
an
d h
as
sh
ow
n n
o r
em
ors
e o
r s
ign
s o
f im
pro
ve
me
nt.
Aw
are
ne
ss
: h
as
ba
sic
aw
are
ne
ss
. K
no
ws
wh
at is
in
vo
lve
d
an
d w
hy it is
do
ne
. H
as
no
re
al d
eta
ile
d k
no
wle
dg
e o
r
pra
ctica
l s
kills
No
n-s
kille
d jo
b w
ith
tra
inin
g g
ive
n ‘o
n s
ite
’ to
ca
rry o
ut jo
b.
Job e
nta
ils n
orm
al le
vel of tr
ain
ing
<1m
onth
10
where
opera
tion r
equires a
n e
xte
nded p
eriod o
f tim
e t
o u
ndert
ake a
n o
nero
us a
nd r
esponsib
le o
pera
tion,
e.g
.
pre
ss/e
xpander/
weld
ers
. H
ere
tra
inin
g is m
ore
than n
orm
al – IT b
ased s
yste
m.
As c
om
ple
xity incre
ases job s
kill
requirem
ents
incre
ase.
Unfa
milia
r w
ith S
WP
s/S
OP
s a
nd c
annot
dem
onstr
ate
com
pliance w
ith t
hem
as
part
of jo
b.
There
fore
unable
to p
roduce
good q
uality
pro
ducts
on t
ime
Is a
ble
to
op
era
te in
acco
rda
nce
with
SW
P/S
OP
an
d
pro
du
ce
a q
ua
lity
pro
du
ct s
afe
ly a
nd
re
gu
larl
y w
ith
in
cycle
tim
e b
ut o
nly
if u
nd
er
su
pe
rvis
ion
an
d w
ith
su
pp
ort
Fa
milia
r a
nd
co
nve
rsa
nt w
ith
all S
WP
/SO
P’s
an
d r
eg
ula
rly
as
sis
ts in
up
da
tin
g a
nd
am
en
din
g >
1.
Ca
lcu
lati
on
: to
tal
nu
mb
er
of
ticks x
(th
e t
ota
l n
um
be
r o
f p
oin
ts
ava
ila
ble
/ t
ota
l n
um
be
r o
f e
lem
en
ts a
va
ila
ble
)
DE
FIN
ITIO
NS
TO
TA
LS
Job r
equires a
dditio
nal tr
ain
ing b
eyond t
he n
orm
al 1
month
but
<3m
onth
s t
o b
e c
om
pete
nt
to o
pera
te
machin
e.
There
are
>3 p
eople
tra
ined in t
his
job
Pa
rt o
f th
e r
ole
pla
ce
d u
po
n th
e in
div
idu
al is
th
e a
nn
ua
l re
vie
w o
f
SO
ps
an
d S
WP
s fo
r th
e a
rea
Pro
fes
sio
na
l q
ua
lifica
tio
ns
are
re
qu
ire
d a
nd
in
div
idu
al h
as
all
qu
alifica
tio
ns
re
qu
ire
d.
Job r
equires a
dditio
nal tr
ain
ing b
eyond t
he n
orm
al 1
month
but
<3m
onth
s t
o b
e c
om
pete
nt
to o
pera
te
machin
e.
There
are
<4 p
eople
tra
ined in t
his
job

288
Figure J2: Team working.
AS
SE
SS
ME
NT
B -
TE
AM
WO
RK
ING
:C
OO
PE
RA
TIV
E W
OR
K D
ON
E B
Y A
/TH
E T
EA
ME
mp
loye
e N
am
e
:W
OR
KIN
G T
OG
ETH
ER
FO
R T
HE
BE
NE
FIT
OF
EA
CH
OTH
ER
/OB
JE
CTIV
ES
AP
Nu
mb
er
TO
FB
Bo
okle
tA
vailable
__
Not
available
although r
equeste
d
__
Pe
n P
ictu
re
-
Le
ve
l o
f
Te
am
wo
rk
ing
De
mo
ns
tra
ted
0
S c o r e
1 2
3
S c o r e
4 5
6
S c o r e
7 8
9
S c o r e
Ma
xim
um
3 p
oin
ts in
ra
ng
eA
dd
itio
na
l 3
po
ints
ma
xim
um
Ad
dit
ion
al 3
po
ints
ma
xim
um
1L
oo
ks
afte
r s
elf o
nly
an
d is
no
t e
ng
ag
ed
with
th
e te
am
or
the
ach
ieve
me
nt o
f te
am
go
als
Is c
on
sid
ere
d a
te
am
pla
ye
r b
ut o
nly
co
ntr
bu
tes
to
se
lecte
d te
am
go
als
, e
.g. p
rod
uctio
n b
ut n
ot 5
S
Ha
s th
e in
tere
st o
f th
e te
am
at h
ea
rt a
nd
co
ntr
ibu
tes
effe
ctivle
y to
all te
am
go
als
an
d te
am
pe
rfo
rma
nce
Is s
ee
n a
s th
e le
ad
in
a te
am
an
d s
tee
rs th
e te
am
in
pu
rsu
it o
f te
am
go
als
an
d te
am
pe
rfo
rma
nce
2D
oes t
heir job o
nly
and w
ill not
assis
t oth
ers
.D
oes job o
nly
and w
ill help
oth
ers
if in
str
ucte
d t
o d
o s
o.
Will re
adily h
elp
oth
ers
within
team
– d
oes n
ot
need
to b
e t
old
.
Sees t
eam
str
uggling a
nd a
ctively
join
s in t
o g
et
thin
gs g
oin
g.
3U
nable
or
unw
illing t
o c
arr
y o
ut
the m
inim
um
role
s e
xpecte
d
of te
am
. N
ot
a t
eam
pla
yer
Able
to c
arr
y o
ut
som
e o
f th
e r
ole
s w
ithin
the t
eam
but
will only
do s
o if in
str
ucte
d,
even if obvio
us t
hat
colleagues a
re s
truggling t
o m
ain
tain
perform
ance.
Can c
arr
y o
ut
most
– a
ll o
f th
e r
ole
s in t
he t
eam
com
ple
tely
with d
em
onstr
ating a
range o
f
com
pete
nce
Able
to c
arr
y o
ut
all r
ole
s in t
eam
and c
om
pete
nty
.
4O
ther
mem
bers
of th
e t
eam
tend t
o ‘carr
y t
hem
’ m
ost
of th
e
tim
e.
Does ‘fa
ir-s
hare
’ in
any t
eam
– c
arr
ies o
thers
.C
ontr
ibute
well a
nd o
ften c
onsid
ere
d a
lead in g
roup
activitie
s –
know
n for
gett
ing t
hin
gs m
ovin
g.
Team
dis
pla
ys h
ighest
sta
ndard
s in t
erm
s o
f 5S
,
quality
and p
roductivity.
An e
xem
pla
r of te
am
work
5R
efu
ses t
o join
in C
I activitie
s,
leavin
g w
ork
/actions t
o o
ther
gro
up m
em
bers
.
Is inte
reste
d in C
I activitie
s b
ut
needs e
ncoura
gem
ent
from
manager,
contr
ibution is p
oor
Will seek o
ut
are
as for
impro
vem
ent
and p
ut
forw
ard
suggestions for
benefit
of te
am
. C
ontr
ibution is
usually g
ood/
accepta
ble
Alw
ays lookin
g t
o im
pro
ve t
eam
perform
ance a
nd
actively
gets
involv
ed w
ith C
I to
ensure
are
a is
perc
eiv
ed a
s t
he b
est
6N
egative a
ttitude in g
roup d
iscussio
ns.
Som
etim
es c
ontr
ibute
s t
o t
eam
activitie
s/d
iscussio
ns
but
needs t
o b
e p
ushed
Contr
ibute
s w
ell in t
eam
activitie
s/d
iscussio
n –
is
constr
uctive.
Leads t
eam
dis
cussio
ns,
is a
motivato
r and u
sually
carr
ies o
thers
(le
ads b
y e
xam
ple
).
7Looks a
fter
self o
nly
(safe
ty).
Has c
onducte
d Z
ero
safe
ty
spot
checks/
audits
Looks a
fter
self b
ut
will only
com
ment
on s
afe
ty issues
if r
isk o
f in
jury
/incid
ent
is h
igh.
Has c
onducte
d 3
or
less
safe
ty
spot
checks o
r audits
Pra
ctices b
roth
er’s k
eeper
som
etim
es/m
ost
tim
es
and u
sually d
ispla
ys a
low
to z
ero
tole
rance o
f
unsafe
pra
ctices.
Has c
onducte
d 4
to 1
0 s
afe
ty s
pot
checks/
audits
Pra
ctices b
roth
er’s k
eeper
consta
ntly in a
rea,
dis
pla
yin
g low
to z
ero
tole
rance o
f unsafe
pra
ctices.
Audits a
rea r
egula
rly in t
erm
s o
f com
pliance w
ith
safe
ty/q
uality
. >
10 s
afe
ty s
pot
checks/
audits.
8F
requently b
ein
g c
onta
cte
d a
bout
poor
sta
ndard
s a
nd q
uality
of w
ork
manship
Occassio
nally (
<0nce p
er
month
) bein
g info
rmed o
f
poor
sta
ndard
s a
nd q
uality
of w
ork
manship
em
anating
from
team
.
Alw
ays w
ork
s h
ard
to m
ain
tain
sta
ndard
s a
nd
conta
in N
RF
T .
Very
infrequently is t
he indiv
dual
info
rmed a
bout
poor
sta
ndard
s o
r w
ork
manship
,
(<once p
er
6 m
onth
)
Actively
auditin
g o
wn t
eam
for
com
pliance r
e H
S&
E,
SW
Ps a
nd q
uality
. A
lways m
ain
tain
s h
ighest
sta
ndard
rare
ly b
roached a
bio
ut
poor
sta
ndard
s (
<1/y
r) a
nd
conta
ins p
oor
work
manship
9A
lways h
as r
easons for
inability t
o c
arr
y o
ut
non-r
outine
tasks
5S
an
d a
ud
its
co
nd
ucte
d h
ow
eve
r a
rea
do
es
no
t re
fle
ct
sta
nd
ard
exp
ecte
d o
f te
am
Appare
nt
willingness t
o h
elp
team
during ‘non-
routine’ w
ork
(audits/inspections).
Are
a is r
eflective o
f
hig
h s
tandard
s s
et
by t
eam
Gets
involv
ed w
ith a
ctivitie
s o
uts
ide o
f norm
al te
am
work
in a
rea,
e.g
. safe
ty m
eetings,
repre
senta
tive in C
I
activitie
s.
10
Refu
ses t
o t
rain
oth
ers
.U
nable
to t
rain
oth
ers
due t
o lim
ited a
bility/k
now
ledge
in o
ther
duties/jobs w
ithin
team
.
Good k
now
ledge/u
nders
tandin
g o
f te
am
duties in
are
as p
re a
nd p
ost
curr
ent
team
and w
ill help
in
these a
reas if in
str
ucte
d/if in
difficulty.
Keen t
o e
xte
nd k
now
ledge (
and t
here
fore
assis
tance)
of oth
er
team
s.
11
Consid
ere
d a
weak T
eam
mem
ber;
usually n
eeds t
o b
e
carr
ied
Consid
ere
d a
good t
o s
trong t
eam
mem
ber
who w
ork
s
well a
s p
art
of a w
ider
team
Consid
ere
d a
str
ong t
o e
xceptional te
am
mem
ber
dis
pla
yin
g a
nd a
ctive c
om
pete
nce in t
he t
eam
role
s
Consid
ere
d a
n e
xceptional te
am
mem
ber,
dis
pla
yin
g a
hig
h d
egre
e o
f com
pete
nce,
is s
een a
s t
he s
enio
r and
unappoin
ted t
eam
leader
12
Sees o
ther
team
s s
truggling a
nd w
ill actively
assis
t
(lim
ited o
nly
by t
rain
ing)
13
14
___
x
0.2
8
=
___
___
x
0.2
8
=
___
___
x
0.2
8
=
___
___
x
0.2
5
=
___
TO
TA
LS
Te
am
:
Te
am
ro
le:
Co
mp
ete
nce
(e
xp
ert
sta
tus):
eg
7 t
icke
d ÷
13 i
n t
ota
l x
3 p
oin
ts m
ax
imu
m =
1.6
Asse
sso
r N
am
eS
ign
atu
re
Da
teEn
thu
sia
sti
c a
nd
hig
hly
co
op
era
tive
. p
ro
mo
tes a
cu
ltu
re
wh
ich
su
pp
orts
te
am
wo
rkin
g p
rin
cip
les
acro
ss o
wn
are
a a
nd
ad
jace
nt
are
as/f
un
cti
on
s.
Imp
lem
en
ts b
est
tea
m w
orkin
g p
rin
cip
les t
o
en
co
ura
ge
bu
sin
ess i
mp
ro
ve
me
nts
Lo
ne
r,
do
es n
ot
co
ntr
ibu
te t
o g
ro
up
acti
vit
ies.
Is a
po
or
me
mb
er o
f th
e t
ea
m
Ave
ra
ge
te
am
me
mb
er.
No
t co
nsid
ere
d a
n
acco
mp
lish
ed
gro
up
wo
rke
r –
is a
ble
to
co
ntr
ibu
te t
o
tea
m b
ut
on
ly w
he
n i
nstr
ucte
d.
Go
od
te
am
me
mb
er.
Wo
rks w
ell
in
a g
ro
up
an
d
co
ntr
ibu
tes w
ell
to
gro
up
acti
vit
ies w
ith
ou
t
pro
mp
tin
g.
De
fin
itio
ns
The a
rea in w
hic
h a
n indiv
idual is
em
plo
yed a
nd c
overe
d b
y h
is t
eam
leader
Inclu
des n
orm
al opera
tional and q
uality
duties in c
om
pliance w
ith S
WP
s/
SO
ps.
Is a
ctively
involv
ed in A
ctions t
o im
pro
ve
HS
E (
audits,
bro
thers
keeper)
, pra
ctices 5
S a
nd c
onta
ins N
RF
T.
Furt
herm
ore
can s
how
exam
ple
s o
f how
they h
ave
contr
ibute
d t
o im
pro
vin
g t
he e
ffectiveness o
f th
e t
eam
Is s
igned o
ff in t
asks r
equired t
o p
erform
e.g
. opera
tional ta
sk,
behavio
ura
l auditin
g,
train
ing a
nd t
hro
ugh d
em
onstr
able
pra
ctices h
as b
een d
eem
ed c
om
pete
nt
to d
o s
o
Ca
lcu
lati
on
: to
tal
nu
mb
er o
f ti
cks x
(th
e t
ota
l n
um
be
r o
f p
oin
ts a
va
ila
ble
/ t
ota
l
nu
mb
er o
f e
lem
en
ts a
va
ila
ble
)

289
Figure J3: Commitment.
AS
SE
SS
ME
NT
C -
CO
MM
ITM
EN
T:
DE
DIC
ATIO
N T
O A
CA
US
E O
R P
RIN
CIP
LE
(TH
E S
TA
TE
OF
BE
ING
CO
MM
ITTE
D)
:R
ELA
TE
D T
O E
MP
LO
YE
ES
CO
MM
ITM
EN
T T
O W
OR
KIN
G T
OW
AR
DS
BU
SIN
ES
S G
OA
LS
AN
D A
DH
ER
EN
CE
TO
CO
RE
VA
LU
ES
Em
plo
ye
e N
am
e
:D
ETE
RM
INA
TIO
N T
O B
E S
UC
CE
SS
FU
L IN
PU
RS
UIT
OF
TH
E D
ELIV
ER
Y O
F B
US
INE
SS
OB
JE
CTIV
ES
SA
P N
um
be
r
TO
FB
Bo
okle
t
Availability
Lim
ite
d i
nte
re
st
in w
orkin
g t
ow
ard
s b
usin
ess g
oa
ls o
r
prin
cip
les.
Co
ntr
ibu
tio
n t
ow
ard
s B
usin
ess g
oa
ls =
po
or.
Sa
fety
att
itu
de
min
ima
l.
0
S c o r e
1 2
3
S c o r e
4 5
6
S c o r e
7 8
9
S c o r e
Ma
xim
um
3 p
oin
ts in
ra
ng
eA
dd
itio
na
l 3
po
ints
ma
xim
um
Ad
dit
ion
al 3
po
ints
ma
xim
um
1N
o k
now
ledge o
r unders
tandin
g o
f safe
ty o
r busin
ess im
pro
vem
ent
pro
gra
mm
es a
nd t
heir p
rogre
ss.
Lim
ited/s
om
e k
now
ledge/u
nders
tandin
g o
f safe
ty a
nd b
usin
ess
impro
vem
ent
pro
gra
mm
es a
nd c
an d
iscuss g
oals
‘w
ith s
om
e p
rom
pting’.
Good k
now
ledge/u
nders
tandin
g o
f safe
ty a
nd b
usin
ess
impro
vem
ent
pro
gra
mm
es a
nd c
onfidently c
om
munic
ate
s k
ey
goals
.
Excellent
know
ledge/u
nders
tandin
g o
f safe
ty a
nd b
usin
ess
impro
vem
ent
pro
gra
mm
es/p
rogre
ss a
nd c
an c
onfidently t
alk
about
key
goals
and t
heir c
ontr
ibution.
2U
nable
to d
iscuss o
r dem
onstr
ate
contr
ibution t
o b
usin
ess g
oals
and s
how
s little inte
rest
Is a
ware
of busin
ess g
oals
and c
an d
iscuss r
ole
in d
elivering o
bje
ctives
Can d
em
onstr
ate
contr
ibution t
o a
chie
vin
g b
usin
ess g
oals
, w
ork
hard
to e
nsure
success.
Will re
adily d
em
onstr
ate
contr
ibution t
o B
usin
ess g
oals
and o
wn
initia
tive t
hat
has e
xceeded e
xpecta
tions.
3H
as r
ais
ed <
2 U
SR
's a
nd K
aiz
ens (
TO
FB
Bookle
t)R
ais
es o
ccasio
nal U
SR
/Kaiz
en im
pro
vem
ent
2 t
o 4
rasie
d.
Tendency for
Kaiz
ens t
o b
e s
tate
ments
of is
sues r
ath
er
than ideas for
impro
vem
ent
Fre
quently g
enera
ting ideas for
impro
vin
g a
rea t
hro
ugh U
SR
/Kaiz
en
syste
m,
5 t
o 9
rais
ed.
Occasio
nally im
ple
ments
im
pro
vem
ent
idea.
Kaiz
ens t
end t
o r
eflect
an o
pport
unity for
impro
vem
ent
Alw
ays lookin
g t
o im
pro
ve t
ask/a
rea a
nd r
egula
rly s
ubm
its
US
R/K
aiz
en –
but
more
im
port
antly w
ill im
ple
ment
idea if w
ithin
their
ability.1
0+
Kaiz
ens r
ais
ed a
nd a
t le
ast
3 im
ple
mente
d b
y s
elf.
4W
ill only
perform
when t
old
to d
o s
o b
y lin
e m
anager.
Has
conducte
d
<
3 5
S's
Will only
undert
ake a
dditio
nal ta
sks w
hen instr
ucte
d b
y lin
e m
anager,
does
carr
y o
ut
som
e t
asks w
ithout
pro
mpting.
Has c
onducte
d 3
to 6
5S
's
Takes o
n a
dditio
nal ta
sks w
ithout
pro
mpting.
Will auto
matically
get
on w
ith a
dditio
nal duties in d
ow
ntim
e,
e.g
. 5S
, P
LM
. C
an
dem
onstr
ate
>10 5
S a
nd w
aste
elim
ination e
xerc
ises iand P
LM
exerc
ises c
om
ple
ted
Takes o
n a
dditio
nal ta
sks w
ithout
pro
mpting,
gett
ing o
n w
ith a
dditio
nal
duties d
uring u
ptim
e a
nd d
ow
ntim
e,
e.g
. 5S
, P
LM
(alw
ays lookin
g t
o
be a
ctive).
Can d
em
onstr
ate
requla
r in
volv
em
ent
in t
ypic
al C
I activitie
s
>20 a
ctivitie
s
5
Not
inte
reste
d in s
elf-d
evelo
pm
ent,
even t
hough t
rain
ing a
vailable
,
resis
ts a
ttendance a
t tr
ain
ing w
ork
shops o
r negative a
ttitude in
pro
ble
m s
olv
ing a
ctivitie
s.
.
Tra
inin
g a
vailable
and d
oes t
ake o
n b
oard
som
e c
lassro
om
shifts
/opport
unitie
s (
1+
jobs)
Keen t
o d
evelo
p o
wn s
kills
and p
ositiv
ely
engages in t
rain
ing
opport
unitie
s,
has s
how
n a
n inte
rest
in s
elf-d
evelo
pm
ent
and w
ants
to t
ake o
n a
dditio
nal re
sponsib
ility/r
un a
ctivity.
Actively
develo
pin
g o
wn s
kills
and s
eeks t
rain
ing o
pport
unitie
s w
hic
h
inclu
de s
elf-d
evelo
pm
ent
and learn
ing n
ew
jobs –
takes o
n a
dditio
nal
responsib
ilitie
s b
eyond t
hat
available
in w
ork
.
6H
as n
ot
com
ple
ted a
ny o
f th
e T
ata
ste
el buildin
g b
locks
Has c
om
ple
ted <
8 o
f th
e T
S b
locks
Has c
om
ple
ted a
ll T
S b
uildin
g b
loacks a
nd a
chie
ved m
anufa
ctu
ring
aw
are
ness c
ert
ific
ate
Dem
onstr
ate
s a
ppplication o
f tr
ain
ing v
ia involv
em
ent
in C
I activitie
s
record
ed in T
OF
B b
ook
7H
as b
een d
iscip
lined r
ela
tive t
o a
ttitude o
f w
ork
/perform
ance a
nd
has s
how
n little e
ffort
to c
hange w
ays.
Has b
een d
iscip
lined r
ela
tive t
o a
work
rela
ted issue in r
ecent
period,
how
ever,
has s
how
n a
willingness/e
agern
ess t
o im
pro
ve.
Has n
ot
been
dis
cip
lined b
ut
does t
he m
inim
um
.
No d
iscip
linary
record
in r
efe
rence p
eriod a
nd is o
ccasio
nally
com
mended for
effort
.N
o d
iscip
linary
record
and is r
egula
rly c
om
mended for
effort
s.
8S
truggle
s t
o d
o a
ny job c
om
pete
ntly d
em
onstr
ating p
oor
com
mitm
ent
to t
he b
usin
ess.
Carr
ies o
ut
norm
al duties c
om
pete
ntly –
but
no m
ore
. C
an d
em
onstr
ate
contr
ibution t
o ‘som
e o
f th
e B
usin
ess g
oals
’.
Seeks a
dvic
e fro
m lin
e
manager
Carr
ies o
ut
norm
al duties c
om
pete
ntly a
nd is a
lways lookin
g t
o
impro
ve job a
nd p
ush t
he b
oundaries.
Com
mitte
d t
o d
elivering a
n
impro
vem
ent
within
team
perform
ance.
(This
must
be v
alidate
d b
y
T L
dr
file
note
)
Carr
ies o
ut
norm
al duties e
nth
usia
stically,
is e
asily m
otivate
d t
o w
ork
,
alw
ays lookin
g t
o im
pro
ve job a
nd p
ush t
he b
oundaries.
Usually/a
lways g
oes t
he e
xtr
a m
ile,
does t
he e
xtr
a p
ipe (
This
must
be
validate
d b
y P
Mgr
file
note
).
9U
sually a
rriv
es o
n job just
in t
ime o
r slightly late
.U
sually p
rom
pt
on s
hift
changeover
Alw
ays o
n job b
efo
re s
tart
of shift/
day a
nd w
ork
s r
ight
up t
o a
nd
over
norm
al finis
hin
g t
imes.
Tim
ekeepin
g is e
xem
pla
ry,
usually first
on job s
tart
ing w
ork
befo
re
norm
al sta
rt t
ime,
pro
mpt
tim
ekeepin
g a
t bre
aks,
sw
ift
‘accura
te’
changeover,
where
applicable
10
Level of com
mitm
ent
to b
usin
ess d
rivers
(O
GS
M)
is b
elo
w
expecta
tion/s
tandard
.
Level of com
mitm
ent
to b
usin
ess d
rivers
(O
GS
M)
bord
ers
expecta
tion a
nd
is s
om
etim
es a
bove.
Level of com
mitm
ent
to b
usin
ess d
rivers
(O
GS
M)
is a
lways in
accord
ance w
ith e
xpecta
tion a
nd s
om
etim
es a
bove.
Level of com
mitm
ent
to b
usin
ess d
rivers
(O
GS
M)
is a
lways h
igher
than e
xpecta
tion.
11
Can d
em
onstr
ate
im
pro
vem
ent/
savin
gs t
hat
the t
eam
they w
ere
involv
ed
with h
ave d
elivere
d.
Can d
em
onstr
ate
im
pro
vem
ent/
savin
gs t
hat
they h
ave p
ers
onally
delivere
d.
Can d
em
onstr
ate
im
pro
vem
ent/
savin
gs t
hat
they h
ave p
ers
onally
delivere
d.T
he im
pro
vem
ents
have d
elivere
d a
t le
ast
3 s
ilver
or
Gold
kaiz
en a
ward
s
12
Is u
sually t
he d
rum
beat
in a
rea.
Is a
lways t
he d
rum
beat
in a
rea a
nd a
n a
ctive p
roble
m s
olv
er.
13
Can b
e r
elied u
pon t
o g
et
on w
ith w
ork
and r
esolv
e p
roble
ms
lookin
g t
o info
rm lin
e m
anager
of w
hat
the issue h
ave b
een a
nd h
ow
they h
ave b
een o
verc
om
e..
Can b
e r
elied u
pon t
o g
et
on w
ith job,
resolv
e p
roble
m a
nd c
oord
inate
activitie
s o
f oth
ers
(usually t
he ‘un-a
ppoin
ted’ Team
Leader)
.
14
Alw
ays lookin
g t
o k
eep b
usy a
nd fin
d w
ork
during q
uie
t tim
es,
Does n
ot
need t
o b
e t
old
Can d
em
onstr
ate
self-s
tart
ing a
bility a
nd b
enefits
to O
GS
M
com
mitm
ents
that
they p
ers
onally h
ave d
elivere
d w
ithout
havin
g t
o b
e
pro
mpte
d
15
16
TO
TA
LS
eg
7 t
icke
d ÷
13 i
n t
ota
l x
3 p
oin
ts m
ax
imu
m =
1.6
Ca
lcu
lati
on
: to
tal
nu
mb
er o
f ti
cks x
(th
e t
ota
l n
um
be
r o
f p
oin
ts a
va
ila
ble
/ t
ota
l
nu
mb
er o
f e
lem
en
ts a
va
ila
ble
)
Co
ntr
ibu
tio
n t
o a
ch
ievin
g g
oa
ls n
ote
d i
n s
om
e a
cti
vit
ies.
Sa
fety
att
itu
de
– l
oo
ks a
fte
r s
elf
.
De
mo
nstr
ate
s a
n e
nth
usia
sti
c i
nte
re
st
in A
LL
wo
rk a
cti
vit
ies a
nd
wo
rks h
ard
to
ach
ieve
bu
sin
ess g
oa
ls.
Sa
fety
att
itu
de
, lo
oks a
fte
r s
elf
, sh
ow
s e
vid
en
ce
of
bro
the
rs
ke
ep
er a
pp
ro
ach
.
De
mo
nstr
ate
s l
ittl
e t
o s
om
e i
nte
re
st
in a
cti
vit
ies t
ha
t a
re
ali
gn
ed
to
ach
ievin
g b
usin
ess g
oa
ls/o
the
rs.
De
mo
nstr
ate
s a
n e
nth
usia
sti
c i
nte
re
st
in m
an
y o
f th
e (
wo
rk)
bu
sin
ess a
cti
vit
ies a
nd
co
ntr
ibu
tes w
ell
to
ach
ievin
g b
usin
ess
go
als
.
Po
sit
ive
sa
fety
att
itu
de
; lo
oks a
fte
r s
elf
, b
ro
the
r’s
ke
ep
er a
nd
re
gu
larly
au
dit
s o
wn
are
a.
Pe
n P
ictu
re
-
Le
ve
l o
f
Co
mm
itm
en
t
De
mo
ns
tra
ted

290
Figure J4: Flexibility.
AS
SE
SS
ME
NT
D -
FL
EX
IBIL
ITY
:
AB
ILIT
Y T
O A
DA
PT T
O C
HA
NG
ING
CIR
CU
MS
TA
NC
ES
.
AD
AP
TA
BIL
ITY
TO
CH
AN
GE
S IN
WO
RK
EN
VIR
ON
ME
NT
Em
plo
ye
e N
am
e
IS A
BLE
TO
BE
FLE
XIB
LE
AS
RE
QU
IRE
DS
AP
Nu
mb
er
TO
FB
Bo
okle
tA
vaila
ble
__
Not
ava
ilable
although r
equeste
d
__
0
S c o r e
1 2
3
S c o r e
4 5
6
S c o r e
7 8
9
S c o r e
Ma
xim
um
3 p
oin
ts in
ra
ng
eA
dd
itio
na
l 3
po
ints
ma
xim
um
Ad
dit
ion
al 3
po
ints
ma
xim
um
1P
oor
response t
o a
ny instr
uctions fro
m s
uperv
isors
/ m
anagers
rela
ting t
o w
ork
pla
ce a
ctivi
ties
Mix
ed r
esponse t
o a
ny instr
uctions fro
m s
uperv
isors
or
managers
rela
ting t
o w
ork
pla
ce a
ctivi
ties
Good r
esponse t
o a
ny instr
uctions fro
m s
uperv
isors
or
managers
realtin
g t
o w
ork
pla
ce a
ctivi
ties.
Usually
relie
d
upon t
o g
et
on w
ith it.
Excelle
nt
response t
o a
ny instr
uctions fro
m s
uperv
isors
or
managers
realtin
g t
o w
ork
pla
ce a
ctivi
ties.
Alw
ays
relie
d u
pon t
o g
et
on w
ith it
2H
as a
poor
att
itude t
o a
nd is r
esis
tant
to c
hange
Can b
e n
egative
and r
elu
cta
nt
to c
hange,
only
help
ing o
r changin
g
after
confronta
tion.
Positiv
e a
bout
change a
nd w
ill e
nth
usia
stically
take o
n
role
s g
iven.
Positiv
e a
bout
change a
nd p
rom
ote
s/
voic
es n
eed for
change t
o im
pro
ve a
rea/p
roductivi
ty.
3A
rgum
enta
tive
and im
pedes c
hange.
Can b
e a
rgum
enta
tive
but
will
change if to
ld b
ut
only
deliv
er
min
imum
requirem
ent
in job.
When g
iven a
new
role
will
deliv
er
in m
ost
cases in lin
e
with r
equirem
ents
/expecta
tions.
Takes o
n a
ny r
ole
enth
usia
stically
and a
lways p
erform
s
at/
above
expecta
tions.
4W
ill n
ot
learn
new
skill
s.
Does n
ot
seek t
o learn
new
skill
s t
o im
pro
ve fle
xib
ility
/will
learn
som
e n
ew
skill
s.
Enjo
ys learn
ing n
ew
skill
s/u
tilis
ing o
wn s
kill
s w
hen
required.
Will
push lin
e m
anager
to learn
new
skill
s.
5W
ill n
ot
work
on o
ther
jobs t
o e
nable
gre
ate
r fle
xib
ility
within
team
.
Does n
ot
have
the c
apabili
ty o
r desire t
o learn
new
jobs.
Has a
n a
bili
ty t
o w
ork
on o
ther
jobs b
ut
is r
estr
icte
d t
o a
few
due t
o
capabili
ty a
nd/
or
negative
att
itude.
Has n
o r
estr
ictions,
can b
e e
mplo
yed o
n m
ost
jobs
follo
win
g t
rain
ing.
Will
happily
work
in o
ther
depart
ments
and m
ills for
the b
enefit
of busin
ess/m
ills.
Has n
o lim
itations d
ue t
o fle
xib
ility
and u
sually
keen t
o
train
oth
ers
in s
om
e s
kill
s.
Has d
em
onstr
ate
d fle
xib
ility
by w
ork
ing in o
ther
depart
ments
and m
ills for
the b
enefit
of th
e b
usin
ess/
mill
s
6W
ill w
ork
on o
ther
‘favo
ure
d’ jo
bs a
nd w
ill n
ot
work
on c
ert
ain
jobs
Will
work
on m
ost
jobs g
iven w
ithin
their c
apabili
ty a
nd d
eve
lop a
leve
l of com
pete
nce/e
xpert
ise in m
ost
jobs.
Will
work
on a
ny job g
iven a
nd d
eve
lops a
leve
l of
com
pete
nce/e
xpert
ise in A
LL jobs.
Will
work
on a
ny job g
iven a
nd v
ery
quic
kly
optim
ise
and r
ais
e t
he p
erform
ance v
ia C
I activi
ties.
7W
hen a
pppoin
ted into
a n
ew
role
, experiences n
um
ero
us d
ela
ys,
pro
ductivi
ty issues.
Able
to a
chie
ve r
equired T
akt
tim
e in n
ew
role
with m
inim
al
superv
isio
n
Able
to a
chie
ve r
equired T
akt
tim
e in n
ew
role
without
superv
isio
n a
nd h
as a
lready im
ple
mente
d c
hanged
pra
ctices/
ideas t
o im
pro
ve t
he c
ycle
tim
e
Has b
een intr
oduced o
n t
o >
3 r
ole
s h
as p
erform
ed
without
superv
ison t
o a
chie
ve T
akt
tim
e a
nd h
as
deliv
ere
d im
pro
vem
ents
in a
ll th
ree d
eliv
ering im
pro
ved
QC
D
8N
eve
r vo
lunte
ers
to t
ake o
n a
diff
ere
nt
role
.If
asked,
takes o
n n
ew
role
will
ingly
Regula
rly/
Alw
ays v
olu
nte
ering t
o t
ake o
n d
iffere
nt
role
/duty
to g
ain
experience a
nd b
enefit
the b
usin
ess.
Able
to p
ush b
oundaries a
nd t
ake o
n r
ole
s o
thers
cannot.
9Is
vocal in
their d
issent
of change t
o w
ork
requests
within
team
.In
flexib
le -
will
not
sw
ap s
hift
. R
efu
ses t
o w
ork
ove
rtim
e o
r unusual
hours
, or
at
short
notice.
Refu
ses t
o w
ork
thro
ugh b
reaks.
Fle
xib
le -
sw
ap s
hift
s a
s/if re
queste
d.
Work
ove
rtim
e in
most
cases a
nd inclu
din
g u
nusual hours
/short
notice.
Will
happily
cove
r bre
aks/a
bsences.
Will
work
ove
r to
com
ple
te a
task.
Fle
xib
le -
no w
ork
tim
e b
oundaries.
Will
work
virtu
ally
any o
vert
ime,
unusual hours
or
at
short
notice.
Will
sto
p b
ack a
nd c
om
ple
te a
task.
Work
s/c
ove
rs b
reaks.
10
Refu
ses t
o b
e invo
lved in a
ny w
ork
pla
ce inte
rventions o
r
impro
vem
ent
activi
ties.
Will
only
join
in w
ork
pla
ce inte
rvention C
I activi
ties if fo
rced.
Will
ingly
join
s in s
om
e w
ork
pla
ce inte
rventions/C
I
activi
ties.
Will
ingly
volu
nte
ers
to b
e inclu
ded in a
ny w
ork
pla
ce
inte
rvention o
r C
I activi
ty.
11
Poor
response t
o n
ew
ideas.
Responds w
ell
to n
ew
ideas/s
uggestions.
Responds p
ositiv
ely
and e
nth
usia
stically
to n
ew
ideas/s
uggestions (
constr
uctive
criticis
m o
nly
).
Responds p
ositiv
ely
and e
nth
usia
stically
to n
ew
ideas/s
uggestions a
nd u
sually
genera
tes im
pro
ved
build
s o
n o
rigin
al id
ea.
12
Will
not
support
change.
(Infle
xib
le)
Show
s s
om
e s
upport
of change.
Giv
es 1
00%
in s
upport
of change.
(Fle
xib
le)
Positiv
ely
support
s c
hange a
nd is a
n u
nappoin
ted
change a
gent.
16
17
___
x
0.2
5
=
___
___
x
0.2
5
=
___
___
x
0.2
5
=
___
eg
7 t
icke
d ÷
13 i
n t
ota
l x
3 p
oin
ts m
ax
imu
m =
1.6
Ass
ess
or
Na
me
Sig
na
ture
Da
te
De
gre
e o
f fl
ex
ibil
ity =
po
or.
TO
TA
LS
Po
siti
ve
ly p
rom
ote
s ch
an
ge
to
su
pp
ort
im
pro
ve
me
nt.
De
gre
e o
f fl
ex
ibil
ity g
oo
d t
o e
xce
lle
nt.
Ca
lcu
lati
on
: to
tal
nu
mb
er
of
ticks
x (
the
to
tal
nu
mb
er
of
po
ints
ava
ila
ble
/ t
ota
l n
um
be
r
of
ele
me
nts
ava
ila
ble
)
Ab
le t
o a
da
pt
to c
ha
ng
e b
ut
fin
ds
the
pro
ce
ss d
iffi
cu
lt.
De
gre
e o
f fl
ex
ibil
ity p
oo
r to
ave
rag
e.
Ab
le t
o a
da
pt
to c
ha
ng
e i
n r
esp
on
se t
o c
ha
ng
ing
De
gre
e o
f fl
ex
ibil
ity a
ve
rag
e t
o g
oo
d.
Pe
n P
ictu
re -
Le
ve
l
of
Fle
xib
ilit
y
De
mo
ns
tra
ted
Ha
s re
al
dif
ficu
lty i
n a
da
pti
ng
to
ch
an
ge
.

291
Figure J5: Time Out for Business (TOFB) Booklet assessment sheet.
TOFB Booklet Assessment Date: / / .
TOFB Received Yes No
Personal objectives listed 0 <5 5
Comment on objectives
Commitment to H&S
No of 5S' completed <3 3-9 >10 >20
Informal spot checks 0 <4 4-10 >10
Summary of safety contribution
Commitment to improving performance
No of Kaizens <2 <4 4-10 >10
No of CI activities 0 <2 <5 >4
Award status Nil Bro Sil Gold
Summary of CI contribution
0% 5% 10%
11% 20% 30%
31% 40% 50%
51% 60% 70%
71% 80% 90%
91% 95% 100%
Assessor Name Assessor signature
Name
Poor
Moderate
Good
Good to very good
Overall commitment to business goals
V Good
Exceptional
Comment

292
APPENDIX K: Diary and Database extracts
Figure K1: An example of the first diary note of research document which summarises
the original informal launch of the CTE manufacturing improvement programme. The
first official OMEGA meeting occurred the following day and the minutes were captured
in the CTE Lotus notes database (figure K3).
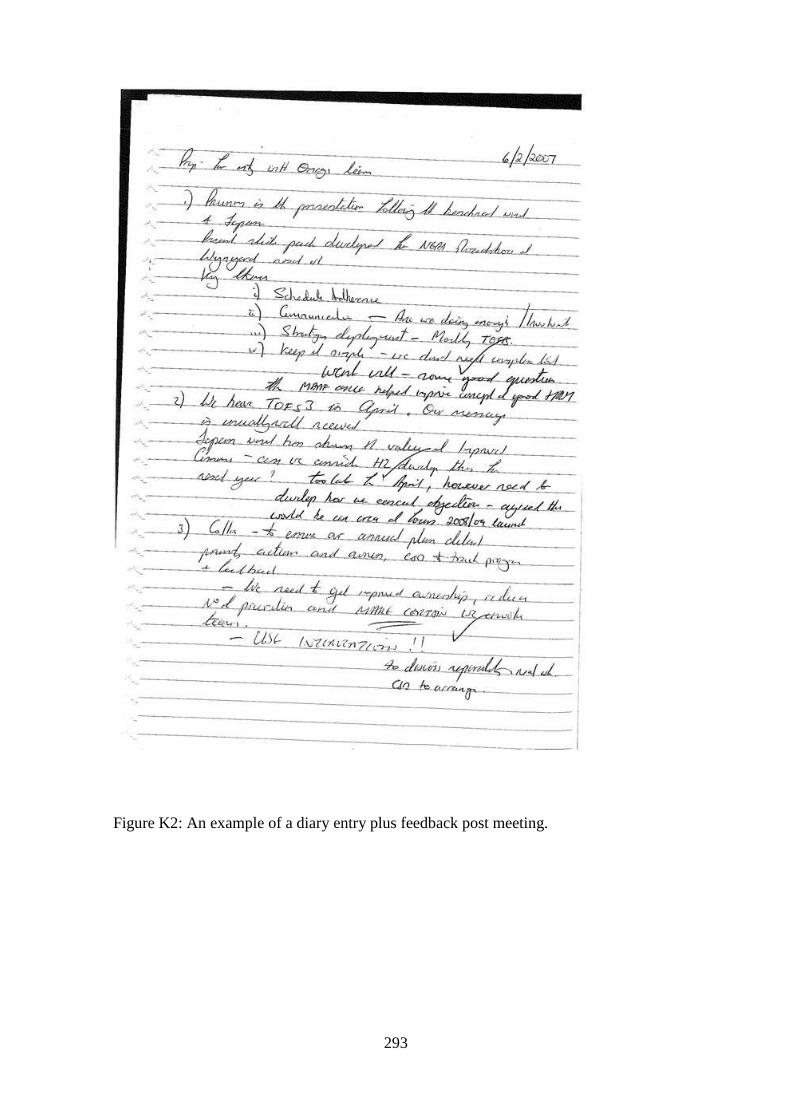
293
Figure K2: An example of a diary entry plus feedback post meeting.

294

295

296
Figure K3: Examples of the database content.


297
Bibliography
Abbott, A.J., Lawler, K.A. and Armistead, C. (1999) 'The UK demand for steel', Applied
Economics, 31, pp. 1299-1302.
Achanga, P., Shebab, E., Roy, R. and Nelder, G. (2006) 'Critical success factors for lean
implementation within SME's', Journal of Manufacturing Technology Management,
17(4), pp. 460-471.
Ackoff, R.L. (1981) Creating the Corporate Future. New York: Wiley.
Ahlstrom, P. (1998) 'Sequences in the implementation of lean production', European
Management Journal, 16(3), pp. 327-334.
Ahlstrom, P. and Karlsson, C. (2000) 'Sequences of manufacturing improvement
initiatives: the case of delayering', International Journal of Operations & Production
Management, 20(11), pp. 1259-1277.
Akao, Y. (1991) 'Hoshin Kanri: Policy Deployment for Successful TQM', in Productivity
Press, pp. xxi-xxxiv.
Altrichter, H., Kemmis, S., McTaggart, R. and Zuber-Skerritt, O. (2002) 'The concept of
Action Research', The Learning Organization, 9(3), pp. 253-268.
Alvares, K.M. (1997) 'The business of human resources', Human Resource Management,
36(1), pp. 9-15.
Ansoff, H.I. (1970) Corporate Strategy. Hammondsworth.
Applebaum, S.H., Everard, A. and Hung, L. (1999) 'Strategic downsizing: Critical
success factors', Management Decision, 37, pp. 535-552.
Argyris, C. (1995) 'Action science and organizational learning', Journal of Managerial
Psychology, 10(6), pp. 20-26.
Argyris, C., Putnam, R. and Smith, D. (1985) Action Science. Josey-Bass, San Francisco,
CA.
Argyris, C. and Schon, D.A. (1991) 'Participatory action research and action science
compared ', In W.F.Whyte (ed), Participatory action research. Sage, London, pp. 85-96.
Arogyaswamy, K., Barker, I.I.I.V.L. and Yasai-Ardekani, M. (1995) 'Firm Turnarounds:
An Intergrative Two-Stage Model', Journal of Management Studies, 32(4), pp. 493-525.
Arthur, J.B. (1994) 'Effects of human resource systems on manufacturing performance
and turnover', Academy of Management Journal, 37(3), pp. 670-687.
Balcerek, T. (2002) 'European steelmakers cheer EU's retaliatory import tariffs',
American Metal Market, 110(60), p. 2.
Banerji, A., Layton, A.P. and Achuthan, L. (2012) 'Dating the 'world business cycle'',
Applied Economics, 44, pp. 2051-2063.
Baojun, A. (1999) 'Steel: sunset enterprises but not sunset industry', American Metal
Market, 107(137), p. 1.
Barker III, V.L. and Patterson, P.W. (1996) 'Top Management Team Tenure and Top
Manager Causal Attributions at Declining Firms Attempting Turnarounds', Group and
Organization Management, 21, pp. 304-336.
Barker, R.C. (1996) 'Value chain development: An account of some implementation
problems', International Journal of Operations & Production Management, 16(10), pp.
23-36.
Barney, J. (1991) 'Firm resources and sustained competitive advantages', Journal of
Management, 17, pp. 99-120.
Bartezzaghi, E. (1999) 'The evolution of production models: is a new paradigm emerging',
International Journal of Operations & Production Management, 19(2), pp. 229-250.
Bateman, N. (2001) Sustainability. a guide to Process Improvement.
Bateman, N. and David, A. (2002) 'Process improvement programmes: a model for
assessing sustainability', International Journal of Operations & Production Management,
22(5), pp. 515-526.

298
Beauman, C. (1996) 'British Steel: a turnaround under public ownership', Business
Strategy Review, 7(3), pp. 16-29.
Becker, B.E., Huselid, M.A., Pickus, P.S. and Spratt, M.F. (1997) 'HR as a source of
shareholder value: Research and recommendations.', Human Resource Management,
36(1), pp. 39-47.
Beer, M., Spector, B., Lawrence, P., Mills, D. and Walton, R. (1984) Managing Human
Assets. NY. Free Press.
Bendell, T. (2005) 'Structuring business process improvement methodologies.', Total
Quality Management, 16(8-9), pp. 969-978.
Bessant, J., Caffyn, S., Gilbert, J., Harding, R. and Webb, S. (1994) 'Rediscovering
continuous improvement', Technovation, 14(1), pp. 17-29.
Bhaskar, R. (1986) Scientific Realism and Human Emancipation. London, Verso.
Bhuiyan, N. and Baghel, A. (2005) 'An overview of continuous improvement: from the
past to the present', Management Decision, 43(5), pp. 761-771.
Bibeault, D.B. (1982) Corporate Turnaround: How Managers Turn Losers Into Winners!
Beard Books.
Bicheno, J. (2004) The New Lean Toolbox, Towards Fast, Flexible Flow. PICSIE Books.
Birdi, K., Clegg, C., Patterson, M., Robinson, A., Stride, C.B., Wall, T.D. and Wood, S.J.
(2008) 'The impact of human resource and operational management practices on company
productivity: A longitudinal study', Personnel Psychology, 61, pp. 467-501.
Blyton, P. (1992) 'Steel: A classic case of industrial relations change in Britain', Journal
of Management Studies, 29(5), pp. 635-650.
Bouchard, T.J., Jr (1976) 'Onobtrusive measures:An inventory of uses', Sociological
Methods and Research, 4, pp. 267-300.
Boulding, K.A. (1950) A Reconstruction of Economics. New York: Wiley.
Bouma, G. and Atkinson, G. (1995) A Handbook of Social Science Research: A
Comprehensive and Practical Guide for Students. Second edn. Oxford, Oxford
University Press.
Bowen, D.E. and Ostroff, C. (2004) 'Understanding HRM-firm performance linkages:
The role of the "strength" of the HRM system', Academy of Management Review, 29(2),
pp. 203-221.
Bowling, A. (2002) Research Methods in health: Investigating Health and Health
Services. Second edn. Buckingham: Open University Press.
Bowman, E.H. and Singh, H. (1993) 'Corporate restructuring: Reconfiguring the firm.',
Strategic Management Journal, 14 (Special issue: Corporate Restructuring, Summer), pp.
5-14.
Bremner, B. and Lakshman, N. (2007) 'Tata Steel bags Corus - But at what price',
Business Week.
Brockner, J. (1992) 'Managing the effects of layoffs on survivors', California
Management Review, 34(2), pp. 9-28.
Brown, M. (2002) Project Management: In a Week. Hodder & Stoughton.
Bryman, B. and Bell, E. (2007) Business Research Methods. 2nd edn. Oxford: Oxford
University Press.
Burgess, R. (1982) Field Research: A Source Book and Field Manual. An extract from
An Intrododuction to Mnagement Research by M. Easterby-Smith, R Thorpe, and A Lowe
1991 p73. London: Routledge.
Caffyn, S. (1999) 'Development of a continuous self - assessment tool', International
Journal of Operations & Production Management, 19(11), pp. 1138-1153.
Cagliano, R. and Spina, G. (2000) 'How improvement programmes of manufacturing are
selected: the role of strategic priorities and past experience ', International Journal of
Operations & Production Management, 20(7), pp. 772-791.

299
Camp, R.C. (1989) Benchmarking: The Search for Industry Best Practices that Lead to
Superior Performance. ASQC Quality Press.
Camp, R.C. (1993) 'A Bible for Benchmarking, by Xerox', Financial Executive, (July/
August), pp. 23-27.
Campbell, D.T. and Fiske, D.W. (1959) 'Convergent and discriminant validation by the
multitrait- multimethod matrix', Psychological Bulletin, 56, pp. 81-105.
Cascio, W.F. (1991) Costing Human Resources: The Financial Impact of Behaviour in
Organizations. Boston: PWS-Kent.
Cascio, W.F. and Wynn, P. (2004) 'Managing a downsizing process', Human Resource
Management, 43, pp. 425-436.
Chandra, R. (2004) 'Adam Smith, Allyn Young, and the Division of Labor', Journal of
Economic Issues, 38(3), pp. 787-805.
Checkland, P. and Holwell, S. (1998) 'Action Research: Its nature and validity', Systemic
Practice and Action Research, 11(1), pp. 9-21.
Cheng, R. (2013) 'Global steel 2013: Maintaining value in volatile economic conditions
- a look at the year ahead', Global Steel 2013. India. Ernst & Young. Available at:
www.ey.com/Globalsteel/globalsteel_report_India_conference.
Coffey, A. and Atkinson, P. (1996) Making Sense of Qualitative Data. Thousand Oaks,
CA, Sage.
Coghlan, D. and Brannick, T. (2010) Doing Action Research In Your Own Organization.
Third edn. SAGE Publication Ltd.
Collins, C.J. and Smith, K.G. (2006) 'Knowledge exchange and combination: The role of
human resource practices in the performance of high-technology firms', Academy of
Management Journal, 49(3), pp. 544-560.
Commission, E. (2013) 'Action plan for a competitive and siustainable industry in
Europe', http://ec.europa.eu/enterprise/sections/metals [Online].
Commons (2003) UK Steel 2003. Ordered by the House of Commons.
Connor, K.R. and Prahalad, C.K. (1996) 'A resource based theory of the firm: Knowledge
versus opportunism', Organization Science, 7, pp. 477-501.
Corbin, J. and Strauss, A. (1990) 'Grounded theory research: Procedures, canons, and
evaluative criteria', Qualitative Sociology, 13(1), pp. 3-21.
Coronado, R.B. and Antony, F. (2002) 'Critical success factors for the successful
implementation of six sigma projects in organisations', The TQM Magazine, 14(2), pp.
92-99.
Corus1 (2000-2007 ) Corus Company reports and Accounts.
Corus-Reports (1997-2003) CTEB Monthly Management Reports.
Corus (2000a) Internal report: Review of the operating performance of Corus 1999: J
Bryant, Chief Executive's Statement.
Corus (2000b) Review of the operating performance of Corus 1999: B.Moffat Chairman's
Statement.
Corus (2003a) Corus CEO Bulletin No1 - Restoring success. P.Varin, CEO Corus.
Corus (2003b) Corus CEO Bulletin No3: Restoring success - Refinancing progress.
P.Varin, CEO Corus.
Corus (2003c) UK Asset review - AGM Statement. B Moffat Chairman Corus.
Corus (2005) Corus CEO Bulletin No3 - Interim Results 2005. P.Varin, CEO Corus
Corus (2007a) Corus CEO Bulletin No1 - New Year message. P.Varin, CEO Corus.
Corus (2007b) Corus CEO Bulletin: Tata steel acquisition complete. P.Varin, CEO
Corus.
Corus (2008a) Corus CEO Bulletin. P.Varin, CEO Corus
Corus (2008b) Corus CEO Bulletin. P.Varin, CEO Corus.
Corus (2009) Fit for the future: An internal Tata Steel Europe communication slide pack.
Presentation by P Dryden, Executive Director CC&I Corus.

300
Corus (2010) 'An on line intorduction to Corus', Corus: An online site introducing the
Corus group Available at: http://www.corusgroup.com.
Corus (2011) 'Direction: The CEO's method for communicating business strategy and
leadership goals. K.Koehler, CEO Tata Steel Europe (formerly Corus)'. April 2011.
Coughlan, P. and Coghlan, D. (2002) 'Action research for operations management',
International Journal of Operations & Production Management, 22(2), pp. 220-240.
Cowley, M. and Domb, E. (1997) 'Beyond Strategic Vision: Effective Corporate Action
with Hoshin Planning', in Butterworth Heinemann, pp. 202-232.
Cranwell-Ward, J., Bacon, A. and Mackie, R. (2002) Inspiring Leadership: Staying Afloat
In Turbulent Times. Thomson.
Crosby, P.B. (1979) Quality Is Free: The Art of Making Certain. New York: New
American Library.
CTE (1989) British Steel Plc Internal Document. Stage 3 Capital Submission:
Development Proposal for New Pipe Mill. Prepared by P.W.Palmer, General Manager
NEPM (Pre Corus).
CTE (1991) Internal Document. British Steel Plc Contract Agreement with Sumiomo
Metal Industries, Japan: Agreement Relating to U.O.E. Pipe Mill. P.W.Palmer, General
Manager NEPM (Pre Corus) Y.Mizuta, General Manager Sumitomo, Japan.
CTE (1995) Internal Report: British Steel Plc Overview of the North East Pipe Mills
P.W.Palmer, General Manager NEPM (Pre Corus).
CTE (2001) Internal CTE report summarising the technical and operational benchmark
exercise conducted between CTE and Osaka Tokushu Kokan (OTK), Japan. Written by
H.Nicholson, Manufacturing Manager, A.L.Hill, Production Manager.
CTE (2002) CTE Internal Report summarising the technical and operational benchmark
exercise conducted between CTE and Confab, Brazil. G.Turner, Works Engineer,
A.L.Hill, Production Manager.
CTE (2003a) CTE Internal Report: Minutes of the initial NEPA kick-off meeting.
Introduction to LM and the best practice dissemination programme. Written by
H.Nicholson, CI Manager.
CTE (2003b) Internal CTE report summarising the technical and operational benchmark
exercise conducted between CTE and Europipe Germany. H.Nicholson CI Manager,
A.L.Hill Manufacturing Manager.
CTE (2003-05) CTE Internal Strategic Reviews: Annual review of business performance
and strategy setting. T.J.Bird, Business Director, A.Townson, Commercial Manager.
CTE (2004a) 'CTE Internal report: Benchmark viit to Day Roll UK, Gateshead to review
how Davy Roll UK had accessed NEPA funding and determine benefits realised. Written
by B.Johnson, Quality Manager & A.L.Hill, Operations Manager'.
CTE (2004b) CTE Internal Report: Best Practice Business Improvement Techniques:
Nissan MUK, Lean Manufacturing.written by H.Nicholson, CI Manager; R.J.Prince,
Business Director.
CTE (2004c) CTE internal report: Minutes of Energy business managent team review of
strategic imperatives.
CTE (2004d) CTE internal report: Minutes of management and employee representative
meeting outlining aims and objective of the Omega programme and implications on work
force. written by D.Tyson, HR Manager.
CTE (2004e) CTE Internal Report: The Omega Way; Presentation and report depicting
the rationale and progress made since the launch of the recovery plan. H.Nicholson, CI
Manager.
CTE (2004f) CTE Internal Report: Training plan for senior managers 25.02.04: this
outlined attendees and course content. D Tyson, HR Manager.

301
CTE (2004g) CTE Internal Report; Meeting minutes of the NEPA/CTE PNA feedback. H
Nicholson, CI Manager.
CTE (2004h) CTEB Internal Report written by T.J.Bird & A.L.Hill: Management meeting
minutes with employee representatives. Progress towards achieving Omega targets.
CTE (2004i) CTEB Internal Report: Management meeting minutes with employee
representatives. Progress towards achieving Omega targets. T.J.Bird & A.L.Hill.
CTE (2004j) Internal CTE report summarising the technical and operational benchmark
exercise conducted between CTE and Europipe, Germany. Written by J. Annal; A.L.Hill;
D.W.M.Brereton; & J.A.Joyce.
CTE (2004k) Internal CTE report summarising the technical and operational benchmark
exercise conducted between CTE and Sumitomo, Japan. Written by H.Nicholson, CI
Manager; W.P.Tait, Technical Manager.
CTE (2004l) Internal CTE report summarising the technical and operational benchmark
exercise conducted between CTE and United Metallurgical Company 'OMK' Russia.
H.Nicholson, CI Manager; A.L.Hill, Manufacturing Manager; W.P.Tait, Technical
Manager; A.Townson, Commercial Manager.
CTE (2004m) Internal CTE report summarising the technical and operational benchmark
exercise conducted between CTE and Welspun, India. Written by T.Murie & R.Codling,
CTE Commercial Managers.
CTE (2004n) Internal Report: The First Omega Review; Six month report presented to
senior management outlining progress on key workstream. H.Nicholson.
CTE (2005a) CTE Annual Report: Sections Incorporating the Industry Overview and
Commercial Summary written by A.Townson, Commercial Manager.
CTE (2005b) CTE Internal Report summarising the technical and operational benchmark
exercise conducted between CTE and Sumitomo, Japan. W.P.Tait, Technical Manager;
T.Murie & R.Codling, Commercial Managers.
CTE (2005c) Interview with colleagues associated with the introduction of manufacturing
improvement techniques 1985 to 2010. C.S.Bestford; S.Dodgson; K.E.Duffy;
C.Fleetham; M.Kay & H.Nicholson, interviewed by A.L.Hill April 2005.
CTE (2005-2008) CTE Annual Reports 05-08: Sections Incorporating the Industry
Overview and Commercial Summary, Written by A.Townson, Commercial Manager
CTE (2006a) CTE Internal Report: Masterclass versus Intervention methodology: A
presentation on the decision to abandon the masterclass approach. H.Nicholson,
A.L.Hill.
CTE (2006b) An interview with A. J Smith, Finance Controll CTE: The financial benefits
of the planned three year improvement programme 2004-07. Interview by A.L.Hill.
CTE (2007a) CTE Internal report. The inability to sustain improvements across the full
mill; a precursor to the availability challenge. J.A.Joyce, Works Engineer; A.L.Hill Ops
Manager.
CTE (2007b) CTE Internal Report: Survey conducted to assess status of implementation
of LM tools and techniques within Tubes. Written by S.Welch and C.SBestford, Tubes CI
Managers.
CTE (2007c) Internal CTE report summarising the technical and operational benchmark
exercise conducted between CTE Sumitomo, Kashima, Japan. T.J.Bird & A.L.Hill.
CTE (2007d) Internal CTE report; Best Practice Training - Walkers Crisps, Peterlee.
N.Duffey, HR Manager.
CTE (2007e) 'The logic and rationale behind the decision making process that resulted in
the OMEGA programme being introduced. Interview with Tim Bird, CTE Director 2004-
2008; CTE Financial Controller 2000-2004. Interviewed by Andrew Hill in support of
thesis'.

302
CTE (2007f) Management/ Union pay round agreement
CTE (2008a) CTE Internal Report: A Review of the Strategy Deployment Cascade
Process following a sample survey of all Corus Tubes UK Team Members, presented to
Corus Tubes Management Team. Written by S.Welch, Tubes CI and Strategy Manager.
CTE (2008b) CTE Internal Report: Minutes of team brief given by management to CTEB
employees. A.Townson, Commercial Manager; A.L.Hill, Ops Manager.
CTE (2008c) CTE Internal Report: Site survey of LM tools and techniques implemented
and assessment of supporting structures. G Griffiths, Independent consultant.
CTE (2008d) CTE Internal Report: The Engineering Availability Challenge, A.Smith,
Elec Engineer; J.Cox, Mech Engineer.
CTE (2008e) CTE Monthly Reports. HR content reflecting BIT training and development
of workforce. N.Duffey, HR Manager.
CTE (2008f) The driving force behind the CI programme and re-setting of manufacturing
standards pre Omega project. Interview with Guy Glover, CT Managing Director 2002-
2008; CTE Director 2000-2002. Interviewed by Andrew Hill in support of thesis'.
CTE (2008g) File note completed by the researcher: the reatined knoledge of LM among
TM's and TLdrs, plus the effectiveness of communication. A.L.Hill.
CTE (2008h) Internal Report completed by the researcher reflecting heterogeneity and
knowledge transfer within Corus UK. A.L.Hill.
CTE (2008i) An internal report completed by the researcher: Summary of discussion with
other Works managers and the implementation of Lean tools and techniques or
alternative manufacturing improvement programmes. A.L.Hill.
CTE (2008j) Strategic summary of CTE's LM journey presented to local management
team by T.J.Bird, CTE Business Director.
CTE (2009a) CTE Internal Report: Strategic Review, R.Ross CTE Business Director
2008-2012.
CTE (2009b) CTE Annual Strategy: Technical and Commercial Review, Objectives and
Strategy. M.J.J.Connelly Technical Manager; A.Townson Commercial Manager
CTE (2009c) CTE Internal Report: Summary report on progress of the second mid term
improvement strategy. Written by C.S.Bestford, CI Manager.
CTE (2009d) CTE Strategic presentation. Launch of strategic objectives in 2009 to mill
employees. M.J.J.Connelly, Technical Manager, A.Townson, Commercial Manager, &
A.L.Hill Operations Manager.
CTE (2009e) Management meeting minutes with employee representatives. Introduction
of the selection process. N.Duffey, HR Manager, AlHill Ops Manager.
CTE (2010a) Interview by A.L.Hill of CTE senior management team (1993) P.W.Palmer
General Manager, H Nicholson Production Manager, G Turner Works Engineer. The
rationale behind the base and developed case for upgrading the pipe mill (H42) and why
the plate mill case failed June 2010.
CTE (2010b) An interview with K.E.Duffy CTE Change Agent, considering the
difference in approach between Corus led change agent training and that delivered by
NEPA. Interviewed by A.L.Hill, Mar 2010.
CTE (2010c) An Interview with N Duffey HR manager CTE: Reflecting on HRM
practices associated with CTE recovery plan.
CTE (2010d) 'The logic and rationale behind the decision making process during and
throughout key stages of the OMEGA programme. Interview with Harry Nicholson, CTE
Omega Project Manager 2003- 2008. Interviewed by Andrew Hill in support of thesis',
2010.
CTE (2010e) Summary of survey conducted to understand importance of primary Lean
tools and techniques employed in CTE. Survey was conducted following time out for
business workshop No2. C.S.Bestford.

303
CTE (2011a) CTE Accounts summary: Information on the cost benefit of a 1%
improvement in speed of work and/ or availability. M.Howling, Management Accountant.
CTE (2011b) CTE Internal Omega report on the welder intervention: A summary of the
improvement activity aimed at reducing non-arc cycle time. C.S.Bestford, CI Manager;
A.Smith, Elec Engineer.
CTE (2011c) CTE Internal Report: Feedback following presentation to Corus ExCo
Group on the implemention of the Flexible model of employment introduced in
Hartlepool July 2011. R.Ross, Business Director 2008-12., Sept 2011.
CTE (2011d) CTE internal report: Summary of feedback provided by the Corus executive
committee following a visit to the 42" Pipe Mill. Summary captured by A.L.Hill.
CTE (2011e) An interview with M Kay CTE Change Agent: The LM practices in place
at other sites following a Tubes based Change Agent two day workshop. Interview by
A.L.Hill.
CTE (2011f) Interviews with CTE employees to understand their knowledge of Lean
manufacturing within CTE and progress made 2008-2011. K. Armstrong; D.Tuck;
D.Brennan; G.Fuller, Aug 2011.
CTE (2011g) Tooling Strategy: A review of tooling strategy 2005-2011 and associated
benefits. Interview with S Deeley Mech Engineer Tooling. Interview by A.L.Hill, Dec
2011.
CTE (2012a) An interview with R Blaauw, Managing Director Tubes: Considering the
strategic possibilities of CTE, Aug 2012.
CTE (2012b) Interviews with J Cox and A Smith: The two senior engineers recount the
benefits and improvements associated with the availability challenge. Interview by
A.L.Hill, January 2012.
CTE (2013) CTE Internal Report: Interview with R.Broughton, Commercial Manager
CTE on the competitive standing of CTE
Cunningham, J.B. (1995) 'Strategic considerations in using action researchfor improving
personnel practices', Public Personnel Management, 24(2), pp. 515-529.
Cushnaghan, J. (2003) 'Workforce development talk-book for nepa: a win-win for
everyone. Foreword by J Cushnaghan CBE, Former MD NMUK Ltd'. 2003.
Cusumano, M.A. (1988) 'Manufacturing innovation: Lessons from the Japanese auto
industry', Sloan Management Review, 30(1), pp. 29-39.
D'Costa, A.P. (1999) The Global Restruturing of the Steel Industry: Innovations,
Installations and Industrial Change. Routledge.
Datamonitor (2008) Steel in the United Kingdom: Industry profile. [Online]. Available
at: www.datamonitor.com.
DeMeuse, K.P., Bergmann, T.J., Vanderheiden, P.A. and Roraff, C.E. (2004) 'New
evidence regarding organizational downsizing and a firm's financial performance: A long
term analysis.', Journal of Managerial Issues, 16, pp. 155-177.
DeMeyer, A., Nakane, J., Miller, J. and Ferdows, K. (1989) 'Flexibility: The next
competitive battle.', Strategic Management Journal, 10, pp. 135-144.
Deming, W.E. (2000) Out Of The Crisis. MIT Press Edition.
Dennis, P. (2002) Lean Production Simplified: A Plain Language Guide to the World's
Most Powerful Production System. Productivity Press.
Dennis, P. (2005) Andy & Me: Crisis and Transformation on the Lean Journey.
Productivity Press.
Denzin, N.K. (1978) The Research Act. 2nd edn. New York, McGraw-Hill.
Dey, I. (1993) Qualitative Data Analysis. Loundon, Routledge.
Douglas-Westwood (2003) Energy business prospects.
DTI (1998) 'Quality, Cost, Delivery. Seven measures for improved competitiveness in
manufacturing industry. ', Department of Trade and Industry.

304
Duck, D. (1993) 'Managing change: The art of balancing', Harvard Business Review, pp.
109-118.
Dudley, G. (1979) 'Pluralism, Policy making and implementation: The evolution of the
British Steel Corporation's development strategy with reference to the activity of the
Shelton action committee', Public Administration, 57(3), pp. 253-270.
Duguay, C.R., Landry, S. and Pasin, F. (1997) 'From mass production to flexible/ agile
production', International Journal of Operations & Production Management, 17(12), pp.
1183-1195.
Dulek, R. and Fielden, J. (1990) Principles of Business Communication.
Easterby-Smith, M., Thorpe, R. and Lowe, A. (1991) Management Research: An
Introduction. SAGE Publications Ltd.
Economist (1993) 'The European steel monster', Economist, the, 326(7801), pp. 65-66.
Eden, C. and Huxham, C. (1996) 'Action research for management research', British
Journal of Management, 7, pp. 75-86.
Eisenhower, D.D. (1991) In Hoshin Kanri: Policy Deployment for Successful TQM.
Akao,Y. Productivity.
EIU, C., profile (1996) 'The Economy', The Economist Intelligence Unit Limited
Elden, M. and Levin, M. (1991) 'Cogenerative learning: Bringing participation into
Action research', In W.F.Whyte (ed), Participatory Action Research. Sage, London, pp.
142-147.
EU-Report (2008) Study on the Competitveness of the European Steel Sector. . [Online].
Available at: http://ec.europe.eu/enterprisesectors/metal-
minerals/files/final_report_steel.
Evans, P. (1983) Accounting for British Steel: A financial analysisof British Steel, 1967-
1980 and who was to blame:RA Bryer, TH Brignall and AR Maunders,. Gower
Publication, Aldershot (1982), (hardback) in Pergamon.
Fang, Y., Cote, R. and Qin, R. (2007) 'Industrial sustainability in China: Practice and
prospects for eco-industrial development', Journal of Environmental Management, 83,
pp. 315-328.
Fels, R. (1952) 'The Theory of Business Cycles', Quarterly Journal of Economics, 66(1),
pp. 25-42.
Ferris, G.R., Arthur, M.M., Berkson, H.M., Kaplan, D.M., Harrel-Cook, G. and Frink,
D.D. (1998) 'Toward a social context theory of the human resource management
organization effectiveness relationship', Human Resource Management Review, 8, pp.
235-264.
Flanagan, J.C. (1954) 'The critical incident technique. An extract taken from p83
Management Research, an introduction by Easterby Smith, M; Thorpe, R; & Lowe, A',
Psychological Bulletin, 1, pp. 327-58.
Flynn, B.B., Sakakibara, S. and Schroeder, R.G. (1995a) 'Relationship between JIT and
TQM: practices and performance.', Academy of Management Journal, 38(5), pp. 1325-
1360.
Flynn, B.B., Schroeder, D. and Sakakibara, S. (1995b) 'The impact of quality
management practices on performance and competitive advantage', Decision Sciences,
26(5), pp. 659-691.
Ford, R.C. (2005) 'The Springfield armory's role in developing interchangeable parts',
Management Decision, 43(2), pp. 265-277.
Freeman, M. (1996) 'Scientific Management: 100 years old; poised for the next century',
SAM Advanced Management Journal, 61(2), pp. 35-41.
Frese, M., Kring, W., Soose, A. and Zempel, J. (1996) 'Personal initiative at work:
Differences between East and west Germany.', Academy of Management Journal, 39, pp.
37-63.

305
Garratt, B. (2000) The Learning Organization: Developing Democracy At Work. Harper
Collins Business.
Garvin, D.A. (1993) 'Manufacturing strategic planning', California Management Review,
35(4), pp. 85-106.
Gilbreth, F.B. and Gilbreth, L.M. (1917) Applied Motion Study. New York.
Gilchrist, V.J. and Williams, R.L. (1999) "Chapter Four Key informant Interviews" in
Crabtree, B.,F and Miller, W.,L., (Eds) "Doing Qualitative Research. Second Edition edn.
Sage Publications, California.
Gill, J. (2009) 'Quality follows quality: add quality to the business and quality will
multiply the profits', The TQM Journal, 21(5), pp. 530-539.
Gill, J. and Johnson, P. (1997) Research Methods for Managers. London, Paul Chapman.
Goleman, D. (2000) 'Leadership that gets results', Harvard Business Review, 78(2), pp.
78-90.
Graham, L. (1993) 'Inside a Japanese transplant: A critical perspective ', Work and
Occupations 20(2), pp. 147-173.
Greissel, M. (2003) '100 years young, The ford motor company changed the way
Americans worked and played. Paint and Varnish company has been a major innovator
in paints for plastics. They both turned 100 this year', Industrial Paint and Powder,
79(11), pp. 12-22.
Guest, D.E. (1997) 'Human resource management and performance: a review and
research agenda ', The International Journal of Human Resource Management, 8(3), pp.
263-276.
Guest, D.E., Michie, J., Conway, N. and Sheehan, M. (2003) 'Human resource
management and corporate performance in the UK.', British Journal of Industrial
Relations, 41(2), pp. 291-314.
Gunn, T.G. (1987) Manufacturing for Competitive Advantage: Becoming a World Class
Manufacturer. . Cambridge,MA: Ballinger.
Guthrie, J. (2001) 'High involvement work practices, turnover and productivity: evidence
from New Zealand', Academy of Management Journal, 44, pp. 180-190.
Hackman, J.R. and Oldham, G.R. (1976) 'Motivation through the design of work: Test of
a theory ', Organizational Behaviour and Human Performance, 16, pp. 250-279.
Hall, R.W. (1987) 'Attaining Manufacturing Excellence: Just in Time, Total Quality,
Total People Involvement. ', The Dow Jones-Irwin/ APICS Series in Production
Management.
Hamel, G. and Prahalad, C.K. (1994) 'Competing for the future', Harvard Business
Review, 72(4), pp. 122-129.
Hansen, M. (1999) 'The search transfer problem: the role of weak ties in sharing
knowledge across organization subunits', Administrative Science Quarterly, 44, pp. 82-
111.
Hargreaves, B. (2007) 'Leaner and Fitter', Professional Engineering
pp. 41-42.
Harter, J.K., Schmidt, F.L. and Hayes, T.I. (2002) 'Business-unit level relationship
between employee satisfaction, employee engagement and business outcomes: A meta
analysis', Journal of Applied Psychology, 87, pp. 268-279.
Harvey, C. and Denton, J. (1999) 'To come of age: The antecedents of organizational
learning', Journal of Management Studies, 36, pp. 897-916.
Hedberg, B.L.T., Nystrom, P.C. and Starbuck, W.H. (1976) 'Camping on Seesaws:
Prescriptions for a Self-Designing Organization', Administrative Science Quarterly,
21(1), pp. 41-65.
306
Herron, C. and Braiden, P.M. (2006) 'A methodology for developing sustainable
quantifiable productivity improvement in manufacturing companies', International
Journal of Production Economics, 104(1), pp. 143-153.
Herron, C. and Hicks, C. (2008) 'The transfer of selected lean manufacturing techniques
from Japanese automotive manufacturing into general manufacturing (UK) through
change agents ', Robotics and Computer-Integrated Manufacturing, 24(4), pp. 524-531.
Hines, P., Holweg, M. and Rich, N. (2004) 'Learning to evolve: A review of contemporary
lean thinking', International Journal of Operations & Production Management, 24(10),
pp. 994-1011.
Hines, P. and Rich, N. (1997) 'The seven value stream mapping tools', International
Journal of Operations & Production Management, 17(1), pp. 46-64.
Hines, P. and Taylor, D. (2000) Going Lean. Centre, L.E.R.
Hofer, C.W. (1980) 'Turnaround strategies', Journal of Business Strategy, 1, pp. 19-31.
Holland, P. and Light, B. (1999) 'A critical success factors model for ERP
implementation', IEEE Software, (May/ June), pp. 30-35.
Hufbauer, G.C. and Goodrich, B. (2001) 'International Economics Policy Briefs. Steel:
Big problems, better solutions', Institute for International Economics, 1(9), pp. 1-20.
Huselid, M.A. (1995) 'The impact of human resource management practices on turnover,
productivity and corporate financial performance.', Academy of Management Journal, 38,
pp. 635-672.
Huselid, M.A. and Becker, B.E. (1997) 'The impact high performance work systems,
implementation effectiveness, and alignment with strategy on shareholder wealth. ',
Academy of Management Proceedings, pp. 144-148.
Hussey, J. and Hussey, R. (1997) Business Research: A Practical Guide for
Undergraduate and Postgraduate Students. MacMillan Press Ltd.
Imai, M. (1986) Kaizen: The Key to Japan's Competitive Success. McGraw Hill.
Imai, M. (1997) Gemba Kaizen: A Commonsense, Low-Cost Approach to Management.
McGraw Hill.
ISTC (1980) New Deal For Steel: How British Steel could cut prices, halt closures, make
profits and grow. An alternative strategy from Britains main stel union, the Iron and Steel
Trades Confederation. Penshurst Press.
Iverson, R.D. and Pullman, J.A. (2000) 'Determinants of voluntary turnover and layoffs
in an environment of repeated downsizing following a merger: An event history analysis',
Journal of Management, 26, pp. 977-1003.
Jha, V., Nedumpara, J. and Endow, T. (2006) 'Dealing with trade distortions in Steel
Industry', United Nations Conference on Trade and Development. pp. 1-140.
Jick, T.D. (1979) 'Mixing Qualitative and Quantitative Methods: Triangulation in Action',
Administrative Science Quarterly, 24(4), pp. 602-611.
Juran, J.M. (1992) 'Juran on Quality by Design: The New Steps for Planning Quality into
Goods and Services', in Free Press, pp. 35-36.
Kahn, R. and Cannell, C. (1957) The Dynamics of Interviewing. New York and
Chichester, Wiley.
Kanter, R. (1999) 'The enduring skills of change leaders', Leader to Leader, 13.
Katayama, H. and Bennett, D. (1999) 'Agility, adaptability and leanness: A comparison
of concepts and a study of practice.', International Journal of Production Economics, 60-
61, pp. 43-51.
Kemmis, S. and Wilkinson, M. (1998) Participatory Action Research and the Study of
Practice. In C Robson, Real World Research, Blackwell Publishers Ltd.
Kern, K. and Schumann, M. (1990) 'The impact of technology on job content and work
organization', Taken from Youndt etal., 1996, HRM, manufacturing strategy, and firm
performance, 39(4), p. 837.
Khandwalla, P.N. (1992) Innovative Corporate Turnarounds. Sage.

307
Kipping, M., Ranieri, R. and Dankers, J. (2001) 'The emergence of new competitor
nations in the European steel industry: Italy and the Netherlands 1945-65', Business
History, 43(1), pp. 69-96.
Klepper, S. (1997) 'Industry Life Cycles', Industrial and Corporate Change, 6(1), pp.
145-181.
Kotter, J.P. (1995) 'Why transformation efforts fail', Harvard Business Review, pp. 29-
67.
Krafcik, J.F. (1988) 'Triumph of the lean production system.', Sloan Management Review,
30(1), pp. 41-52.
Krishnamurthy, R. and Yauch, C. (2007) 'Leagile manufacturing: a proposed corporate
infrastructure.', International Journal of Operations & Production Management, 27(6),
pp. 588-604.
Kuznets, S. (1940) 'Schumpeter's Business Cycles', The American Economic Review,
30(2, part1), pp. 257-271.
Lacroix, Y. (2013) 'Major overcapcity in the global steel industry', Economic Insight, pp.
1-4 [Online]. Available at: http://eulerhermes.com/mediacenter/lists (Accessed:
20.07.14).
Lado, A.A. and Wilson, M.C. (1994) 'Human resource systems ans sustained competitive
advantage: A competency based perspective', Academy of Management Review, 19(4),
pp. 699-727.
Lam, H. and Reshef, Y. (1999) 'Are quality improvements and downsizing compatible:
A human resource perspective', Relations Industrielles, 54, pp. 727-744.
Lauer, R.H. and Handel, W.H. (1983) Social Psychology the Theory and Application of
Symbolic interactionism. Second Edition edn. Prentice-Hall, New Jersey.
Lee, T.W. (1999) Using Qualitative Methods in Organizational Research. London, Sage
Publications.
Lenway, S., Morck, R. and Yeung, B. (1996) 'Rent seeking, protectionism and innovation
in the American Steel Industry', Economic Journal 106(435), pp. 410-421.
Leong, G.K., Snyder, D. and Ward, P.T. (1990) 'Research in the process and content of
manufacturing strategy.', Omega, 18(2), pp. 109-122.
Levering, R. (1988) A Great Place to Work. New York: Avon.
Lewin, k. (1946) 'Action research and minority problems', Journal of Social Issues, 2, pp.
34-46.
Lewin, K., Lippit, R. and White, R. (1939) 'Patterns of aggressive behaviour in
experimentally created social climates. ', Journal of Social Psychology, 10, pp. 271-299.
Lewis, M.A. (2000) 'Lean production and sustainable competitive advantage',
International Journal of Operations & Production Management, 20(8), pp. 959-978.
Lidz, T. (1973) The origin and treatment of schizophrenic disorders. New York,: Basic
Books.
Liker, J.K. (2004) The Toyota Way: 14 Management Principles from the World's Greatest
Manufacturer. McGraw Hill.
Liker, J.K. and Hoseus, M. (2008) Toyota Culture: The Heart and Soul of the Totoya
Way. McGraw-Hill.
Liker, J.K. and Meier, D. (2006) The Toyota Way Fieldbook: A Practical Guide for
Implementing Toyota's 4Ps. McGraw Hill.
Lillrank, P. (1995) 'The transfer of management innovations from Japan', Organizational
Studies, 16(6), pp. 971-989.
Lillrank, P. and Kano, N. (1989) Continuous Improvement: Quality Control Circles In
Japanese Industry. Michagan Papers in Japanese Studies.
Lorange, P. and Nelson, R.T. (1987) 'How to Recognize - and - Avoid Organizational
Decline', Sloan Management Review, 28(3), pp. 41-48.

308
Lucey, J., Bateman, N. and Hines, P. (2004) 'Achieving pace and sustainability in a major
Lean Transition', Management Services, pp. 8-12.
MacArthur, D. (2005) In No substitute for victory: Lessons in strategy and Leadership
from General Douglas MacAthur. Kinni, T.; Kinni, D. USE. Prentice Hall.
MacDuffie, J.P. (1995) 'Human resource bundles and manufacturing performance:
organizational logic and flexible production systems in the world auto industry.',
Industrial and Labour Relations Review, 48(2), pp. 199-221.
MacLachlin, R. (1997) 'Management initiatives and just-in-time manufacturing.', Journal
of Operations Management, 15(4), pp. 271-292.
Mann, T. (2012) Presentation given by T Mann, VP Nissan Europe at Newcastle
University, Mar 2012.
Manstead, A.S.R. and Semin, G.R. (1988) Methodology in Social Psychology: Turning
ideas into action. In C. Robson eds Real World Research 2002. second edn. Blackwell
Publishers Ltd.
Maritan, C.A. and Brush, T.H. (2003) 'Heterogeneity and transferring pratices:
Implementing flow manufacturing in multiple plants', Strategic Management Journal, 24,
pp. 945-959.
Marsick, V.J. and Watkins, K.E. (1997) Case Study Research Methods. In M. Saunders,
P.Lewis & A. Thornhill; Research Methods for Business Students, FT Prentice Hall.
Mason-Jones, R., Naylor, B. and Towill, D.R. (2000) 'Lean, agile or leagile? Matching
your supply chain to the marketplace.', International Journal of Production Research,
38(17), pp. 4061-4070.
Mayfield, J. and Mayfield, M. (2002) 'Leader communication strategies: critical paths to
improving employee commitment', American Business Review, 20, pp. 89-94.
Mayfield, J., Mayfield, M.R. and Kopf, J. (1998) 'The effects of leader motivating
language on subordinate performance and satisfaction', Human Resource Management,
37(3&4), pp. 235-248.
McGovern, T. (2007) 'Why do successful companies fail? A case study of the decline of
Dunlop', Business History, 19(6), pp. 886-907.
McNiff, J. and Whitehead, J. (2009) Doing and Writing Action Research. SAGE
Publications Ltd.
Mellahi, K. and Wilkinson, A. (2004) 'Organizational failure: a critique of recent research
and a proposed integrative framework', International Journal of Management Review,
5/6(1), pp. 21-41.
Miles, M.B. and Huberman, A.M. (1994) Qualitative Data Analysis. 2nd edn. Thousand
Oaks, CA, Sage.
Milkovich, G.T. and Newman, J.M. (1999) Compensation. Boston: Irwin.
Miller, D. (1994) 'What Happens After Success: The Perils of Excellence', Journal of
Management Studies, 31(3), pp. 325-358.
Miller, J.W. (2012) 'Global steel industry faces capacity glut', Wall Street Journal,
http://online.wjs.com/news/articles [Online].
Mintzberg, H. (1994) The Rise and Fall of Strategic Planning. New York: Free Press,
MacMillan.
Mishra, A.K. and Spreitzer, G.M. (1998) 'Explaining how survivors respond to
downsizing: The roles of trust, empowerment, justice and work redesign', Academy of
Management Review, 23, pp. 567-589.
Monden, Y. (1983) Toyota Production System: A Practical Approach to Production
Management. . Industrial Engineers and Management Press, Norcross, GA.
Mone, M.A., McKinley, W. and Barker, V.L. (1998) 'Organizational decline and
innovation: a contingency framework.', Academy of Management Review, 23, pp. 115-
132.

309
Musson, A.E. (1993) 'Jopseph Whitworth and the growth of mass-production
engineering', The South African Journal of Economic History, 8, pp. 181-220.
Naylor, J.B., Naim, M.M. and Berry, D. (1999) 'Leagility: Integrating the lean and agile
manufacturing paradigms in the total supply chain.', International Journal of Production
Economics, 62, pp. 107-118.
Nelson, D. (1974) 'Scientific Management, Systematic Management, and Labor, 1880-
1915', The Business History Review, 48(4), pp. 479-500.
Nelson, R.R. (2001) Please don't just do what I tell you, do what needs to be done: Every
employee's guide to making work more rewarding New York: Hyperion.
Nelson, R.R. and Winter, S.G. (1982) 'The Schumpeterian Tradeoff Revisited', The
American Economic Review, 72(1), pp. 114-132.
NEPA (2003) Productivity Needs Analysis: Method of assessment and input
requirements.
NEPA (2004) An Introduction to NEPA.
NMUK (2006) Nissan Value-Up: NMUK objectives Management Process. Presentation
prepared by K Copeland NESQA Engineer at NMUK
Novick, H.J. (1981) 'How to keep managerial mistakes from turning into organizational
failures', Management Review, pp. 56-61.
Nystrom, P.C. and Starbuck, W.H. (1984) 'To Avoid Organizational Crises, Unlearn',
Organizational Dynamics, Spring 1984, pp. 53-65.
O'Neill, H.M. (1986) 'Turnaround and Recovery: What Strategy do You Need?', Long
Range Planning, 19(1), pp. 80-88.
OECD (2013) 'Overcapacity in the steel industry', OECD Steel Committee. Paris, France,
02.07.13.
Ohno, T. (1988) Toyota Production System: Beyond Large Scale Production.
Productivity Press.
ONS (2014) Labour market statistics. Available at:
http://www.ons.gov.uk/rcl/subnational-labour/regional-labour-market-statistics/august.
Oppenheim (1992) Questionnaire Design, Interviewing and Attitude Measurement.
second edn. Pinter Publishers Ltd.
Ovenden, K. (1978) The Politics of Steel. The MacMillan Press Ltd.
Pandit, N.R. (1998) 'British Steel Corporation: probably the biggest turnaround story in
UK industrial history.', Strategic Change, 7, pp. 65-79.
Parliament (2007) Globilisation in the steel industry. [Online]. Available at:
www.parliament.uk.
Partington, D. (2000) 'Building grounded theories of management action', British Journal
of Management, 11, pp. 91-102.
Peterson, S.J. and Luthans, F. (2006) 'The impact of financial and nonfinancial incentives
on business-unit outcomes over time', Journal of Applied Psychology, 91(1), pp. 156-165.
Pettigrew, A.M. (1990) 'Longitudinal field research on change theory and practice',
Organization Science, 1(3), pp. 267-292.
Pfeffer, J. (1994) Competitive Advantage Through People. Boston, MA: Harvard
Business School Press.
Pfeffer, J. (1995) 'Producing sustainable competitive advantage through the effective
management of people', Academy of Management Executives, 9(1), pp. 55-69.
Pfeffer, J. and Pfeffer, J. (1995) 'Producing sustainable competitive advantage through
the effective management of people', Academy of Management Executive, 9(1), pp. 55-
69.
Porter, M.E. (1985) Competitive Advantage: Creating and Sustaining Superior
Performance. New York. The Free Press.
Prahalad, C.K. (1983) 'Developing strategic capability: An agenda for top management ',
Human Resource Management, 22, pp. 237-254.

310
Prasad, B. (1995) 'JIT quality matrices for strategic planning and implementation',
International Journal of Operations & Production Management, 15(9), pp. 116-142.
Prouvost, S. and Wagner-Ferrari, J. (1999) 'Mergers, acquisitions reshape steel industry',
American Metal Market, 107(177), p. 16a.
Pyzdek, T. (2003) 'The Six Sigma Handbook: A Complete Guide for Green Belts, Black
Belts and Managers at All Levels', in McGraw-Hill, pp. 92-94.
Raff, D.M.G. and Summers, L.H. (1987) 'Did Henry Ford Pay Efficiency Wages?',
Journal of Labour Economics, 5(4, Part 2), pp. pp57-86.
Rapoport, R.N. (1970) 'Three dilemmas of action research', Human Relations, 23(499-
513).
Reason, P. and Rowan, J. (1981) Human Inquiry. A Sourcebook of New Paradigm
Research Wiley. Chichester.
Reason, P.W. (1999) 'Integrating Action and Reflection Through Co-operative Inquiry',
Management Learning, 30(2), p. 207.
Rehder, R.R. (1989) 'Japanese transplants: In search of a balanced and broader
perspective.', Columbia Journal of World Business, 24(4), pp. 17-28.
Reina, D.S. and Reina, M.L. (1999) Trust and Betrayal in the Workplace San Francisco:
Berrett-Koehler.
Remenyi, D., Williams, B., Money, A. and Swartz, E. (1998) Doing Research in Business
and Management: An Introduction to Process and Method. London, Sage.
Revans, R.W. (1982) The Origins and Growth of Action Learning. Chartwell-Bratt,
Bickley, Kent.
Robbins, D.K. and Pearce II, J.A. (1992) 'Turnaround: Retrenchment and Recovery',
Strategic Management Journal, 13(4), pp. 287-309.
Robbins, S.P. (2001) Organizational Behaviour: Concepts, Controversies, Applications.
9th Edition edn. U.S.A.: Prentice Hall.
Robbins, S.P. and Hunsaker, P.I. (1996) Training In Interpersonal Skills: TIPS For
Managing People At Work. 2nd edn. Upper Saddle River, NJ; Prentice-Hall.
Robertson, S. (2008) 'A whole, new ballgame', American Metal Market, 117(7), pp. 42-
43.
Robson, C. (2002) Real World Research. Second edn. Blackwell Publishers Ltd.
Rogers, E. (1983) The Diffusion of Innovation. 3rd edition edn. Free Press: New York.
Roth, R. (2008) 'Lean Manufacturing in the auto industry: kaizening ourselves to death',
pp. 1-11, http://leo.oise.utoronto.ca/~rroth/1953.htm [Online].
Rother, M. (2010) 'Toyota Kata: Managing People for Improvement, adaptiveness and
Superior Results', in McGraw Hill, pp. 37-54.
Rousseau, D.M. and Wade-Benzoni, K.A. (1994) 'Linking strategy and human resource
practices: How employee and customer contracts are created ', Human Resource
Management, 33, pp. 463-490.
Rudberg, M. and Wikner, J. (2004) 'Mass customization in terms of the customer order
decoupling point', Production Planning and Control, 15(4), pp. 445-458.
Rynes, S.L. and Gerhart, B. (1999) Compensation in Organizations: Progress and
Prospects. San Francisco: New Lexington Press.
Sadler, D. (1984) 'Works closure at British Steel and the nature of the state', Political
Geography Quarterly, 3(4), pp. 297-311.
Sadler, D. (2004) 'Cluster evolution, the transformation of old industrial regions and the
steel industry supply chain in North East England', Regional Studies, 38(1), pp. 55-66.
Saunders, M., Lewis, P. and Thornhill, A. (2003) Research Methods for Business
Students. Third edn. FT Prentice Hall.
Saunders, M., Lewis, P. and Thornhill, A. (2012) Research Methods for Business
Students. Sixth edn. Pearson.

311
Sawyer, J.E. (1954) 'The Social Basis of the American System of Manufacturing', The
Journal of Economic Histroy, 14(4), pp. pp361-379.
Schein, E.H. (1995) 'Process consultation, action research and clinical inquiry: are they
the same?', Journal of Managerial Psychology, 10(6), pp. 14-19.
Schendel, D.E. and Patton, G.R. (1976) 'Corporate stagnation and turnaround', Journal of
Economics and Business, 28, pp. 236-241.
Schonberger, R.J. (1982) Japanese Manufacturing Techniques: Nine Hidden Lessons in
Simplicity. Free Press.
Schonberger, R.J. (1986) World Class Manufacturing: The Lessons of Simplicity Applied.
Free Press.
Schroeder, D. and Robinson, A. (1991) 'America's most successful export to Japan:
Continuous improvement programs', Sloan Management Review, 32(3), pp. 67-81.
Schroyer, H.Q. (1975) 'Contributions of the Gilbreths to the development of management
thought', Academy of Management Proceedings, pp. 7-9.
Schumpeter, J. (1934) The Theory of Economic Development. Cambridge: Harvard
University Press. .
Senge, P.M. (2006) 'The Fifth Discipline: The Art and Practice of the Learning
Organisation.', in Random House, pp. 3-16.
Shah, R. and Ward, P.T. (2003) 'Lean manufacturing: context, practice, bundles and
performance.', Journal of Operations Management, 21(2), pp. 129-149.
Shah, R. and Ward, P.T. (2007) 'Defining and developing measures of lean production',
Journal of Operations Management, 25, pp. 785-805.
Sheldon, O. (1925) 'The development of Scientific Management in England', Harvard
Business Review, 3(2), pp. 129-140.
Shingo, S. (1985) A Revolution in Manufacturing: The SMED System. Productivity Press.
Silverman, D. (1993) Interpreting Qualitative Data. London, Sage.
Skinner, W. (2006) 'Manufactruing strategy: The story of its evolution', Journal of
Operations Management, 25, pp. 328-335.
Slatter, S. and Lovett, D. (1984) Corporate Turnaround: Managing Companies in
Distress. Penguin Books.
Smith, A. (1776) An Enquiry into the Nature and Cause of the Wealth of Nations, Reprint
edited by Edwin Cannan, Chicago. The University of Chicago Press 1976.
Snell, S.A. and Dean, J.W., Jr (1994) 'Strategic compensation for integrated
manufacturing: The moderating effects of job and organizational inertia.', Academy of
Management Journal, 37, pp. 1109-1140.
Snell, S.A., Youndt, M.A. and Wright , P.M. (1996) 'Establishing a framework for
research in strategic human resource management: Merging resource theory and
organization learning ', ReIn G Ferris (Ed). Research in personnel and human resource
management 14, pp. 61-90.
Stajkovic, A.D. and Luthans, F. (2003) 'Behavioural management and task performance
in organizations: Conceptual background, meta-analysis, and test of alternative models.',
Personnel Psychology, 56(155-194).
Staw, B., Sandelands, L. and Dutton, J.E. (1981) 'Threat-rigidity cycles in organisational
behaviour: a multi-level analysis.', Administrative Science Quarterly, 26, pp. 501-524.
Stigler, G.J. (1991) 'Charles Babbage (1791+200 = 1991)', Journal of Economic
Literature, 29, pp. 1149-1152.
Stinchcombe, A.L. (1965) 'Social structures and organisations', In K.Mellahi and A.
Wilkinson Organizational Failure; International Journal of Management Reviews.
Stundza, T. (2000) 'New decade, same old story: Friction abounds', Purchasing, 129(6),
p. 48B1.
Sturman, M.C. and Short, J.C. (2000) 'Lump-sum bonus satisfaction:Testing the construct
validity of a new pay satisfaction dimension', Personnel Psychology, 86, pp. 684-696.

312
Sugimori, Y., Kusunoki, K., Cho, F. and Uchikawa, S. (1977) 'Toyota production System
and Kanban system: Materialisation of just-in-time and repsect-for-human system',
International Journal of Production Research, 15(6), pp. 553-564.
Sullivan, J. (1988) 'Three roles of language in motivation theory', Academy of
Management Review, 13, pp. 101-115.
Susman, G.I. and Evered, R.D. (1978) 'An assessment of scientific merits of action
research', Administrative Science Quarterly, 23, pp. 582-603.
Szulanski, G. and Jensen, R.J. (2004) 'Overcoming stickiness: An empirical investigation
of the role of the template in the replication of organizational routines.', Managerial and
Decision Economics, 25, pp. 347-363.
Tata (2011a) 104th Annual report 2010-2011: Growth through sustainability.
Tata (2011b) CEO Bulletin - An introduction to the cost saving programme 'step up and
save', 21.11.2011.
Tata (2011c) CEO Bulletin - Teesside Cast Products, 24.02.2011.
Tata (2011d) CEO Message - Tata Steel announces turnaround plan for the Long Products
business, 20.05.2011.
Tata (2011e) Internal report: Direction; The Tata Steel Europe method for
communicating business strategy and leadership goals. K.Koehler CEO TSE.
Tata (2013) CEO Message: Review of fiscal year 2012-13 23.05.2013.
Tata (2014a) 107th Annual report 2013-2014: Journey towards operational excellence.
Tata (2014b) CEO Message: Long Products and related businesses, 15.10.2014.
Taylor, D., Rich, N. and Brunt, D. (2001) Supply chain management and the UK Metals
Industry
Taylor, F.W. (1911) The Principles of Scientific Management. Harper & Brothers.
Teece, D.J., Pisano, G. and Shuen, A. (1997) 'Dynamic capabilities and strategic
management ', Strategic Management Journal, 18(7), pp. 509-533.
Thatcher, M. (1995) Margaret Thatcher: The autobiography. Harper Press.
Thompson, C.B. (1914) 'The literature of Scientific Management ', The Quarterly Journal
of Economics, 28(3), pp. 506-557.
Torbert, W.R. (1972) '"Learning from experience" in Susman, G.I., and Evered, R.,D.,
An assessment of scientific methods of Action Research', Administrative Science
Quarterly, 23, pp. 582-603.
Torbet, W.R. (1991) The Power of Balance; Transforming Self, Society and Scientific
Inquiry. Sage, Newbury Park, CA.
Tsui, A.S., Pearce, J.I., Porter, I.W. and Tripoli, A.M. (1997) 'Alternative approaches to
employee-organization relationships: Does investment in employees pay off?', Academy
of Management Journal, 40, pp. 1089-1121.
Ulrich, D. and Lake, D. (1991) 'Organizational capability: Creating competitive
advanatge', Academy of Management Executives, 5(1), pp. 77-92.
Umble, E.J., Haft, R.R. and Umble, M.M. (2003) 'Enterprise resource planning:
Implementation procedures and critical success factors', European Journal of
Operational Research, 146, pp. 241-257.
Upham, M. (1980) 'British Steel: retrospect and prospect', Industrial Relations Journal
11(3), pp. 5-21.
Upton, D.M. (1995) 'What really makes factories flexible?', Harvard Business Review,
73(4), pp. 74-84.
Vaizey, J. (1974) The History of British Steel. Weidenfeld & Nicolson.
Van Maanen, J. (1983) Qualitative Methodology. London, Sage.
Varin, P. (2007) 'Leaders', European Business Forum, (31), pp. 54-57.
Verstappen, R. (2009) OECD Steel committee meeting.
Vinten, G. (1994) 'Participant Observation: A Model for Organizational Investigation?',
Journal of Managerial Psychology, 9(2), p. 30.

313
Voss, C. (1995) 'Operations management - from Taylor to Toyota - and beyond?', British
Journal of Management, 6(Special issue), pp. S17-S29.
Voss, C., Blackmon, K., Hanson, P. and Oak, B. (1995) 'The competitiveness of European
manufacturing - A four country study', Business Strategy Review, 6(1), pp. 1-25.
Voss, C., Tsikriktsis, N. and Frohlich, M. (2002) 'Case research in operations
management', International Journal of Operations & Production Management, 22(2), pp.
195-219.
Walker, F. (1906) 'The German steel syndicate', Quarterly Journal of Economics, 20(3),
pp. 353-398.
Wall, T.D., Wood, S.J. and Leach, D.J. (2004) 'Empowerment and performance. In
Cooper CL, Robertson IT (Eds)', International Review of Industrial and organizational
psychology, 19.
Walters, N. (2012) 'Global economic outlook and steel demand trends',
www.worldsteel.org [Online].
Walton, M. (1990) Deming Management At Work. Putnam, New York, NY.
Watkins, K.E. (1991) 'Validity in Action Research', The American Educational Research
Association. Chicago, IL, Apr 91. pp. 1-18.
Webb, E.J., Campbell, D.T., Schwartz, R.D. and Secgrest, L. (1966) Unobtrusive
Measures: Non-reactive Research in the Social Sciences. Chicago, Rand McNally.
Weitzel, W. and Jonsson, E. (1989) 'Decline in Organizations: A Literature Integration
and Extension', Administrative Science Quarterly, 34, pp. 91-109.
West, A. (1999) 'The flute factory: An empirical measurement of the effect of the division
of labor on productivity and production cost', The American Economist, 43(1), pp. 82-87.
Whyte, W. (1991) Participatory Action Research. Sage, London.
Willis, P. and Trondman, M. (2000) 'Manifesto for Ethnography', 1(5),
http://eth.sagepub.com [Online] DOI: 10.1177/14661380022230679.
Witzel, M. (2005) 'Where scientific management went awry', European Business Forum,
21, pp. 89-91.
Womack, J.P. and Jones, D.T. (2003) Lean Thinking: Banish Waste And Create Wealth
In Your Corporation. Free Press.
Womack, J.P., Jones, D.T. and Roos, D. (1991) The Machine That Changed The World:
The Story Of Lean Production. Harper Perennial.
Wood, S. (1999) 'Human resource management and performance', International Journal
of Management Review, 1(4), pp. 367-413.
Wood, S.J., Stride, C.B., Wall, T.D. and Clegg, C.W. (2004) 'Revisiting the use and
effectiveness of modern management practices.', Human Factors and Ergonomics, 14(4),
pp. 413-430.
Woodbury, R.S. (1960) 'The legend of Eli Whitney and interchangeable parts',
Technology and Culture, 1(3), pp. 235-253.
Woods, R.O. (2005) 'First in mass production', Mechanical Engineering, pp. 48-52.
Wren, D.A. and Greenwood, R.G. (1998) 'Business Leaders: A Historical Sketch of
Henry Ford', The Journal of Leadership Studies, 5(3), pp. pp72-79.
Wright, P.M. and McMahan, G. (1992) 'Theoretical perspectives for strategic human
resource management', Journal of Management, 18, pp. 295-320.
Wright, P.W., Dunford, B.B. and Snell, S.A. (2001) 'Human resources and the resource
based view of the firm', Journal of Management, 27, pp. 701-721.
Wright, P.W., Gardner, T.M., Moynihan, L.M. and Allen, M.R. (2005) 'The relationship
between HR practices and firm performance: Examining causal order', Personnel
Psychology, 58, pp. 409-446.
WSA (2008) 'World Steel Association: Fact sheet employment: working in the steel
industry', [Online]. Available at: www.worldsteel.org/ fact sheet.
WSA (2009) World Steel Association: Steel Statistical Yearbook 1984 - 2009.

314
WSA (2012a) 'World Steel Association: Sustainable steel: At the core of a green
economy', [Online]. Available at: www.worldsteel.org.
WSA (2012b) 'World Steel Association: World steel capacity utilisation ratio', [Online].
Available at: www.worldsteel.org/ archives.
WSA (2013) World Steel Association: World steel production archives Available at:
www.worldsteel.org.
WSA (2014) World Steel Association: World Crude steel production 2013. Available at:
www.worldsteel.org.
Yeo, R. (2002) 'Learning within organisations: Linking the theoretical and empirical
perspectives', Journal of workplace learning 14(3), pp. 109-122.
Yin, R.K. (1994) Case Study Research: Design and Methods. 2nd edn. Thousand Oaks,
CA, Sage.
Yin, R.K. (2003) Applications of Case Study Research. Second edn. SAGE Publications.
Youndt, M.A., Snell, S.A., Dean, J.W., Jr and Lepak, D.P. (1996) 'Human resource
management, manufacturing strategy, and firm performance.', Academy of Management
Journal, 39(4), pp. 836-866.
Young, M. and Post, J.E. (1993) 'Managing to communicate.', Organizational Dynamics,
Summer, pp. 31-43.
Zammuto, R.F. and Cameron, K.S. (1985) 'Environmental Decline and Organisational
Response', In L.L. Cummings and B.M.Staw (Eds), Research in Organisational
Behaviour, CT: JAI Press,231-62.
Zatzick, C.D. and Iverson, R.D. (2006) 'High-involvement management and workforce
reduction: Competitive advantage or disadvantage.', Academy of Management Journal,
49(5), pp. 999-1015.
Zheng, J., Bigsten, A. and Hu, A. (2008) 'Can China's Growth be Sustained? A
Productivity Perspective', World Development, 37(4), pp. 874-888.
Zucker, L.G. (1977) 'The role of institutionalization in cultural persistence', American
Sociological Review, 42, pp. 726-743.