A STUDY ONCUSTOMER SATISFACTION FOR MTNLPRODUCTS AND SERVICES
65
CHAPTER 1 INTRODUCTION. When we talk about customer service and/or satisfaction, we talk about creativity. Creativity allows us to handle or diffuse problems at hand or later on in the process of conducting the everyday business. We talk about how, or rather what, does the organization have to do to gain not only the sale but also the loyalty of the customer. We want to know the payoff of the transaction both in the short and long term. We want to know what our customerswant.1 We want to know if our customers are satisfied. Satisfaction,of course, means that what we delivered to a customer met the customer’sapproval. We want to know if customers are delighted and willing to come back, and so on. Fleiss2 and Feldman3 present examples of that delightfulnessin their writings. Fleiss has written about Ben and Jerry’s ice cream andFeldman has discussed excellence in a cab ride.As important as delightfulness is,
-
Upload
grandceremony -
Category
Documents
-
view
1 -
download
0
Transcript of A STUDY ONCUSTOMER SATISFACTION FOR MTNLPRODUCTS AND SERVICES
CHAPTER 1 INTRODUCTION.
When we talk about customer service and/or satisfaction, we
talk about creativity. Creativity allows us to handle or
diffuse problems at hand or later on in the process of
conducting the everyday business. We talk about how,
or rather what, does the organization have to do to gain
not only the sale but also the loyalty of the customer. We
want to know the payoff of the transaction both in the
short and long term. We want to know what our
customerswant.1 We want to know if our customers are
satisfied. Satisfaction,of course, means that what
we delivered to a customer met the customer’sapproval. We
want to know if customers are delighted and willing to
come back, and so on. Fleiss2 and Feldman3 present examples
of that delightfulnessin their writings. Fleiss has written
about Ben and Jerry’s ice cream andFeldman has discussed
excellence in a cab ride.As important as delightfulness is,
some of us minimize it, or even totallydisregard it. At
this point, we fail.
Some of the issues that will guarantee failurein sales,
satisfaction, and loyalty are
:• Employees must adhere to a rigid chain of command•
Employees are closely supervised• Conflict—in whatever form
—is not allowed• Rewards are based on carrot-and-stick
principles• Wrong objectives are measuredHowever, we
increase our chance of success if we allow employees to
take personal responsibility for their actions in the areas
of communication, performance, and customer satisfaction.
How can we sensitize our employeesto these issues?
First
, we must identify how we define the customer. Customer
Service and Satisfaction
Second
, we must understand customer expectation levels concerning
quality.
Third
, we must understand the strategy for customer service
quality,and
fourth
, we must understand the measurement and feedback cycles
of customer satisfaction.The customer is the person or unit
receiving the output of a process onthe system. In fact, it
is worth emphasizing that a customer can be theimmediate,
intermediate, or ultimate customer. Also, a customer may
be a person or persons, or a process or processes.Customer
satisfaction, however, is when the customer is satisfied
with a product/service that meets the customer’s needs,
wants, and expectations.
To further understand customer satisfaction, we must take a
deeper look at the levels of specific satisfaction. We must
also recognize that there arelevels of customer
satisfaction that, in a sense, define the basic
ingredientsof quality.
There are at least three levels of customer expectations
aboutquality:
Level 1
Expectations are very simple and take the form of
assumptions ,must have,or take it for granted
. For example, I expectthe airline to be able to take off,
fly to my destination, and landsafely. I expect to get the
correct blood for my blood transfusion.And I expect the
bank to deposit my money to my accountand to keep a correct
tally for me.
Level 2
Expectations are a step higher than that of level 1 andthey
require some form of
Satisfaction through meeting the requirements
and/or specifications.
For example, I expect to betreated courteously by all
airline personnel. I went to the hospitalexpecting to have
my hernia repaired, to be in some painafter it was done, to
be out on the same day, and to receive a correct bill. And
I went to the bank expecting the bank teller to befriendly,
informative, and helpful with my transactions.
Level 3
Expectations are much higher than for levels 1 and 2.Level
3 requires some kind of
Delightfulness or a service that is so good that it
attracts me to it .
For example, an airline gives passengerstraveling coach
class the same superior food service thatother airlines
provide only for first-class passengers. In fact, Ionce
took a flight where the flight attendants actually
bakedcookies for us right there on the plane. When I went
to the hospital,I expected staff to treat me with respect
and they carefullyexplained things to me. But I was
surprised when they calledme at home the next day to find
out how I was doing. And at myhouse closing, the bank
officer, representing the bank holdingmy mortgage, not only
treated me with respect and answered allmy questions about
my new mortgage, but just before we shook hands to close
the deal, he gave me a housewarming gift.01 459518 Ch01.qxd
7/2/03 8:52 AM Page 2Customer Service and Satisfaction 3The
strategy issue is also a very important element of customer
satisfaction, primarily because it sets the tone for the
appropriate training, behavior, and delivery of the
specific service.
There are four items thatthe strategy for service quality ought
to address:
1.Customer service attributes
The delivery of the service must be timely,accurate, with
concern, and with courtesy. One may ask why are
theseelements important? The answer is that all services
are intangible and are a function of perception. As such,
they depend on interpretation.In addition and perhaps
more importantly, service by definition is perishableand if
left unattended, it can spoil on the organization.The
acronym COMFORT
4 can be used to signify the importance of service.
COMFORT is
caring,
observant,
mindful,
f riendly,
obliging,
responsible, and
tactful.
These characteristics are the most basic attributes of
customer service and without them, there cannot be a true
service of any kind. They all depend on interpersonal
skills, communication,empowerment, knowledge, sensitivity,
understanding, and somekind of external behavior.For
example,
caring :
will show that, indeed, you are interested in what the
customer will have to say. You may spend time with a
customer tofind out the customer’s real needs, wants, and
expectations. It is not unusual to tell a customer that you
may not be able to help, even at the expense of losing the
sale. Furthermore, you may go as far as suggesting the
services of someone else or some other company. You must be
observant :
. In most cases when dealing with service-related items,
observations may contribute more to satisfying the
customer than direct communication. Pay attention to body
language and mannerisms and, if necessary, listen between
the lines. Always try to be a stepahead of the customer.
Anticipate the customer’s action. Actively listen for what
the customer is communicating, but also—and, perhaps, more
importantly—listen for what the customer is
not communicating. You must be
mindfull :
Remember that you and your organization exist to satisfy
the customer. Without the customer’s need, you do not have
a job and the organization does not have a service to
provide. The customer has a choice and, as such, if you or
the organization does not recognize the urgency,
sensitivity, uniqueness, expectations, and influence that
the customer has, you will not be successful in satisfying
the customer .You must be
Friendly :
. Friendliness does not mean being a pest. Offer guidance
and information, and let the customer know you are there to
help. If necessary, provide feedback to to assist the
customer in makinga decision. If you do provide feedback,
be truthful. For example, in are tail clothing store,
someone walks into your store, walks aroundCustomer Service
and Satisfaction up some clothing, and tries it on. As a
salesperson, you may advise the customer about fit and
answer any questions that the customer may have. You must
be
obliging :
Patience is the key word to customer satisfaction.Sometimes
customers do not know what they want. They are makingup
their minds as they go along. You are serving as the
guinea pigfor their decision. As such, accommodating them
may make the difference between a satisfied and
an unsatisfied customer, or the difference between a sale
and a walkout. When obliging the customer, do not hesitate
to educate the customer as well. You must be
Responsible :
You are the expert. The customer is lookingto you to
provide the appropriate information in a clear, concise,
andeasy-to-understand manner. Don’t try to make the sale at
all costs. Thismay backfire. What you are trying to
accomplish is to develop a relationshipwhere your expertise
can indeed help the customer. You must be
tactful :
In any service organization, and in any service delivery,
there are going to be problems between you and the
customer.Do not panic. Tactfulness is the process by which
the conflict may be resolved. Your focus is to satisfy the
customer and, as such, you should try to identify the
problem, analyze it, and then resolve it in the most
expedient way.Being tactful does not mean that you have to
give in to the customer all the time. What it does mean is
that you act in a composed, professional manner and
communicate to the customer in a way that is not
threatening or demeaning. Being tactful means you are
willing to listen and exchange information with the
intention of resolving the conflict.It means you have a way
of presenting the facts and information in a nice and non
intimidating way. It means listening patiently,
thinking before speaking, and listening to what the
customer says withoutinterruptions. Notice that cost is not
an attribute that will make or break service and/or
satisfaction. In service especially, cost is equated with
value. That is not to suggest that high cost is
prerequisite to good service or vice versa. We simply
suggest that one must continue to generate morevalue for
the customer but not give away the house. It is indeed a
verydelicate balance.
2.Approach for service quality improvement
The basic question one must beable to answer is
why bother with service quality? The answer is in a three prong
approach. The first is cost, the second is time to
implement the program, and the third is the
customer service impact. Together, they present a nucleus
for understanding and implementing the system Customer
Service and Satisfaction 5is responsive to both customers
and organization for optimum satisfaction.For example, the
Japanese are working on the notion of sensuouscars.
Basically, the car itself gives you a kind of delight and
surprise justopening the door, hearing the sound, pressing
the accelerator.Everything is being thought through
now
, almost emotionally.
3.Develop feedback systems for customer service quality
The feedback systemone chooses will make or break the
organization. Make sure not to mixthe focus of customer
satisfaction and marketing. They are not thesame. The focus
of customer service and satisfaction is to build
loyalty,and the focus of marketing is to meet the needs of
the customer profitably.Another way of saying it is that
marketing’s function is to generatecustomer value
profitably, whereas the purpose of customer service and
satisfaction is to generate repeatability, recognition, and
overall satisfactionof the transaction.The concern here is
to make sure that a goal exists (a reporting systemfor
measurement is appropriate and useful for the particular
service)and to reach the reward of service quality. The
question then becomes how to develop a system that is
responsive to the customer’sneeds, wants, and expectations.
To answer these concerns, look to thecustomer for answers.
The value of the information must be focused inat least the
following areas:• To know what customers are thinking about
you, your service, andyour competitors• To measure and
improve your performance• To turn your strongest areas into
market differentiators• To turn weaknesses into
developmental opportunities—before someoneelse does• To
develop internal communications tools to let everyone know
howthey are doing• To demonstrate your commitment to
quality and your customersIn essence your measurement for
the feedback must be of two distinctkinds:
1. Customer satisfaction, which is dependent upon the
transaction 2. Service quality, which is dependent upon the
actual relationship4.
Implementation
Perhaps the most important strategy is that of
implementation.As part of the implementation process,
management mustdefine the scope of the service quality as
well as the level of customer service as part of the
organization’s policy. Furthermore, they must alsodefine
the plan of implementation. The plan should include the
timeschedule, task assignment, and reporting cycle.
assets can be grouped into four dimensions: brand awareness
, perceived quality, brandassociations, and brandloyalty. The
sefour dimensionsguide branddevelopment, managementand
measurement.
Brand awareness:
Brand awareness is an often undervalued asset;however,
awareness has been shown to affect perceptions and even
taste. People like the familiar and are prepared to ascribe
all sorts of good attitudes to items that are familiar to
them. The Intel Insidecampaign has dramatically transferred
awareness into perceptions of technologicalsuperiority and
market acceptance.
Perceived quality
Perceived quality is a special type of association,
partly because itinfluences brand associations in
many contexts and partly because it has been
empiricallyshown to affect profitability (as measured by
both ROI and stock return).
Brand associations
Brand association can be anything that connects the customer to
the brand.
Itcan include user imagery, product attributes, use situati
ons, Organizational associations, brand personality and sy
mbols. Much of brand management involves determining whata
ssociations to develop and then creating programs that will
link the associations to the brand.
Brand loyalty
Brand loyalty is at the heart of any brand’s value. The concept
is to strengthenthe size and intensity of each loyalty segment.
A brand with a small but intensely loyalcustomer base can have
significant equity.
Brand Preference
The stage of brand loyalty at which a brand will select a
particular brand but willchoose a competitor’s brand if
the preferred brand is unavailable. See Brand
insistence;Brand recognition.
Customer Satisfaction
If the customer's expectations of product quality, service
quality, and price areexceeded, a firm will achieve high
levels of customer satisfaction and will create
"customer delight." If the customer's expectations are not
met, customer dissatisfaction will result. Andthe lower the
satisfaction level, the more likely the customer is to stop
buying from the firm.
REVIEW OF LITERATURE:
When the employees accomplish something they have
achieved something, recognitionis appreciation for that
achievement. Most managers don't give enough
recognitionbecause they don't get enough.
Lars-Hendrik Roller & Leonard Waverman (2001) in their
study investigated how telecommunications infrastructure
affects Telecom India Daily Deregulation and streamlining
prices in telecommunication industry in Delhi economic
growth. They used evidence from 21 OECD countries over a
20-year period to examine the impacts that
telecommunications developments may have had. They jointly
estimate a micro model for telecommunication investment
with a macro production function. They found evidence of a
significant positive causal link, especially when a
critical mass of telecommunications infrastructure is
present. Interestingly, the critical mass appears to be at
a level of telecommunications infrastructure that is near
universal service.
JERRY A. HAUSMAN his paper deals with how to value the
introduction of new services in telecommunications. Much
public discussion has centered on the evolving
"information superhighway" as well as on the many new
services that may be offered as highcapacity fiber optic
transmission networks are extended into the
telecommunications infrastructure. The Federal
Communications Commission (FCC) has decided to tax long
distance Users to subsidize Internet access to schools and
libraries. The cost is estimated to exceed $2 billion a
year. Numerous cable companies, such as Time Warner, have
announced plans to upgrade their
current coaxial-based networks to combined fiber-coax
networks. This increased transmission capacity will allow
many more channels of entertainment, high-speed access to
information, and new interactive services. How can society
establish the value of these new services and increased
choices? This question has potentially important economic
consequences and equally important public
OBJECTIVES:
To ascertain the Customers preferences of Land line and
Mobile Services.
To ascertain the Customers Satisfaction level for Mobile
services as well as Land lineServices.
To analyze the Customer opinion and satisfaction with
specific reference to MTNL.
To suggest some guidelines to MTNL in order to provide
better focused services.
To determine the status of brand awareness and brand
loyalty in order to conclude about brand equity.
To learn about the brand attributes and their preferences
in MTNL.
SCOPE:
The study is based on the Customer Satisfaction and the
result are made on the basis of the information. The study
suffers from all the limitation of case study method.
HYPOTHESIS:
The number of services are good.
There are more number of users.
Response might be good.
CHAPTER 2 RESEARCH AND MRTHODLOGY
RESEARCH
Research means search for facts in order to find answers to
certain questions or to find solutions to certain problems.
It is often referred to as ‘scientific inquiry’ or
‘scientific investigation’ into a specific problem or
situation. This is because the search for facts should be
made by scientific method rather than by arbitrary method.
The scientific method uses systematic rational approach to
search for facts, whereas, the arbitrary method attempts to
find answers to questions on the basis of imagination and
ones own beliefs and judgments.
William C. Emory in his book ‘Business Research Methods’
defines research as “any organized inquiry designed and
carried out to provide information for solving a problem.”
METHODOLOGY
In simple terms methodology can be defined as, it is used
to give a clear cut idea on what the researcher is carrying
out his or her research. In order to plan in a right point
of time and to advance the research work methodology makes
the right platform to the researcher to mapping out the
research work in relevance to make solid plans.
More over methodology guides the researcher to involve and
to be active in his or her particular field of enquiry.
Most of the situations the aim of the research and the
research topic won’t be same at all time it varies from its
objectives and flow of the research but by adopting a
suitable methodology this can be achieved.
Right from selecting the topic and carrying out till
recommendations research methodology drives the researcher
in the right track. The entire research plan is based on
the concept of right methodology.
More over through methodology the external environment
constitutes the research by giving a depth idea on setting
the right research objective, followed by literature point
of view, based on that chosen analysis through interviews
or questionnaires findings will be obtained and finally
concluded message by this research.
On the other hand from the methodology the internal
environment constitutes by understanding and identifying
the right type of research, strategy, philosophy, time
horizon, approaches, followed by right procedures and
techniques based on his or her research work. In other hand
the research methodology acts as the nerve center because
the entire research is bounded by it and to perform a good
research work, the internal and external environment has to
follow the right methodology process.
RESEARCH METHODOLOGY
Research methodology is a set of various methods to be
followed to find out various information regarding market
strata of different products. Research methodology required
in every industry for acquiring knowledge of their
products.
RESEARCH DESIGN
A research design is purely and simply the frame work or
plan for a study that guides in the collection and analysis
of the data. There are three types of research designs,
they are
Exploratory research design
Descriptive research design
Casual or experimental research design
Since this study attempts to describe the demographic,
economic and psychographic features of the respondents, it
is a descriptive research.
Descriptive research design
Descriptive research is one that concerned with describing
the characteristics of a particular individual, or of a
group. The descriptive study is typically concerned with
determining frequency with which something occurs or how
two variables vary together. Here the problems are defined
and the solutions are provided.
SOURCES OF DATA
There are two types of data namely primary data and
secondary data.
Primary data
Primary data refers to those data that are collected newly
and they are not used earlier. The researcher has to gather
the primary data freshly for the specific study undertaken
by him.
The primary data can be collected by three methods namely
observation method, experimentation method and survey
method. Survey research is the systematic gathering of data
from respondents through questionnaires.
Secondary data
The secondary data refers to those data which were gathered
for some other purpose and are already available in the
firm’s internal records and commercial trade or government
publications.
DATA COLLECTION METHOD
The primary data required for this study is collected
through schedules. This schedule method is also like the
collection of data through questionnaires, with little
difference which lies in the fast that questions are being
filled in by the enumerators according to the replies of
the respondents for the questions.
CHAPTER SCHEME
Chapter 1
It deals with introduction, objectives of the study, scope
of study, limitation and review of literature.
Chapter 2
It deals with research, research methodology, research
design, source of data, data collection method and chapter
scheme
Chapter 3
It deals with company profile
Chapter 4
It includes data analysis through interpretation of various
tables and charts
Chapter 5
It deals with findings, suggestions and conclusion.
CHAPTER NO 3: PROFILE OF MTNL
On October 1, 2000 the Department of Telecom
Operations,Government of India became a corporation and was
christened
Mahanagar Telephone NigamLimited (MTNL)
Today, MTNL is the No. 1 Telecommunications Company
and the largestPublic Sector Undertaking of India
with authorized share capital of $ 3977 million and
networth of $ 14.32 billion. It has a network of over
45 million lines covering 5000 towns withover 35
million telephone connections.With latest digital
switching technology like OCB,EWSD,AXE-10,FETEX,NEC
etc. and widespread transmission network including SDH
system up to 2.5 gbps, DWDM system up to80 gbps,Web
telephony,DIAS,VPN, Broadband and more than
400,000 data customers MTNL continues to serve this
great nation.
Its responsibilities include improvement of the already imp
eccable quality of telecomservices, expansion of telecom
network, introduction of new telecom services in all
villagesand instilling confidence among its customers. MTNL
has managed to shoulder these responsibilities remarkably
and deftly. Today with over 45 million line capacity, 99.9%
of its exchanges digital, nation wide Network management
& surveillance system (NMSS) to control telecom
traffic and over 4,00,000route kms of OFC network,
Bharat Sanchar Nigam Ltd is a name to reckon with in the
worldof connectivity. Along with its vast customer base,
MTNL's financial and asset bases too arevast and strong.
Consider the figures, as they speak volumes on MTNL’s
standing:
The telephone infrastructure alone is worth about Rs.
1,00,000 crore (US $ 22.74 billion)
Turnover of Rs. 31,400 crore ( US $ 7.14 billion)Add to
which, MTNL's nationwide coverage and reach,
comprehensive range of telecomservices and a penchant
for excellence; and you have the ingredients for
restructuring Indiafor a bright future. Today, MTNL is
most trusted Telecom Brand of India
1911
Establishment of Delhi telephones system with
manual exchange
1926
Opening if 1st automatic exchange (Lothian exchange)
1937
Opening of Connaught Place exchange.
1945
First Manual Trunk exchange opened.
1950
Opening of Cantt exchange
1953
Tiz Hazari Exchange (Lothian exchange ceased working)
commissioned.
1955
Secretariat exchange commissioned
1958
Karol Bagh exchange (SXS) commissioned.
1961
Jor Bagh exchange (SXS) commissioned.
1961
Shahadara exchange (SXS) commissioned.
1962
Opening of First STC service to Agra.
1963
Delhi Gate (27) exchange commissioned.
1964
Delhi telephone crosses 50,000 lines.
1966
Opening of exchanges at Nangloi, Narela, Najafgarh,
Bahadurgarh andBallabgarh.
1967
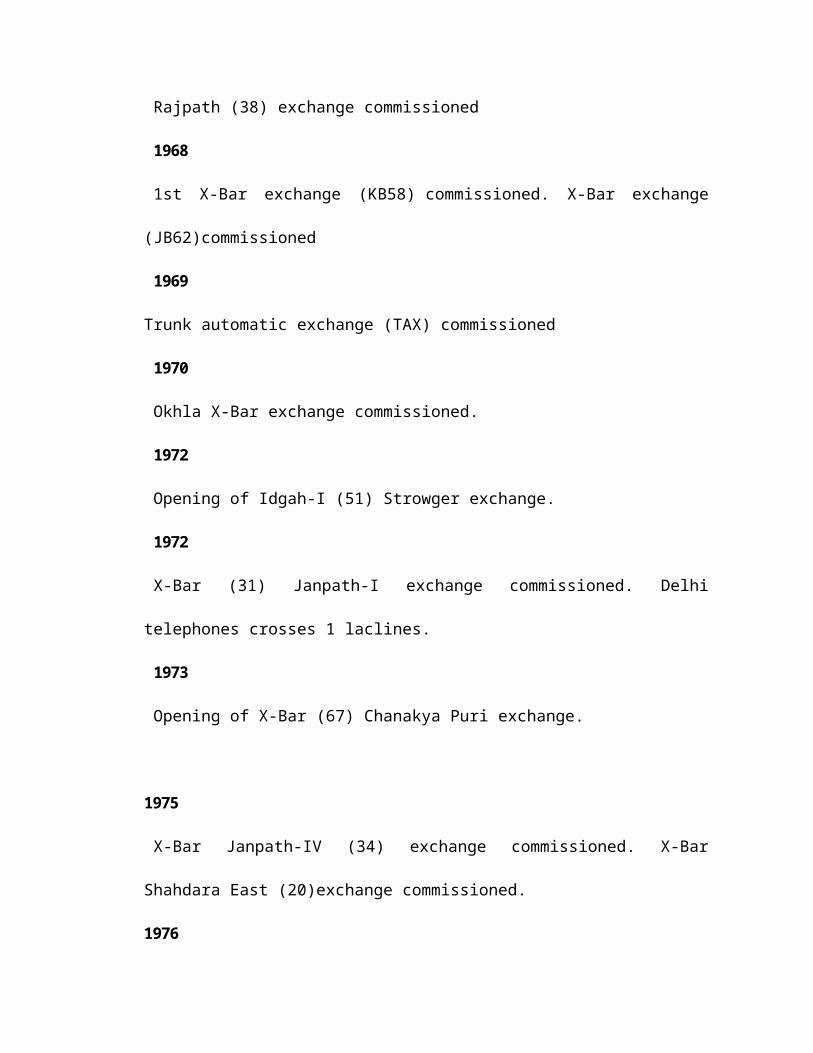
Rajpath (38) exchange commissioned
1968
1st X-Bar exchange (KB58) commissioned. X-Bar exchange
(JB62)commissioned
1969
Trunk automatic exchange (TAX) commissioned
1970
Okhla X-Bar exchange commissioned.
1972
Opening of Idgah-I (51) Strowger exchange.
1972
X-Bar (31) Janpath-I exchange commissioned. Delhi
telephones crosses 1 laclines.
1973
Opening of X-Bar (67) Chanakya Puri exchange.
1975
X-Bar Janpath-IV (34) exchange commissioned. X-Bar
Shahdara East (20)exchange commissioned.
1976
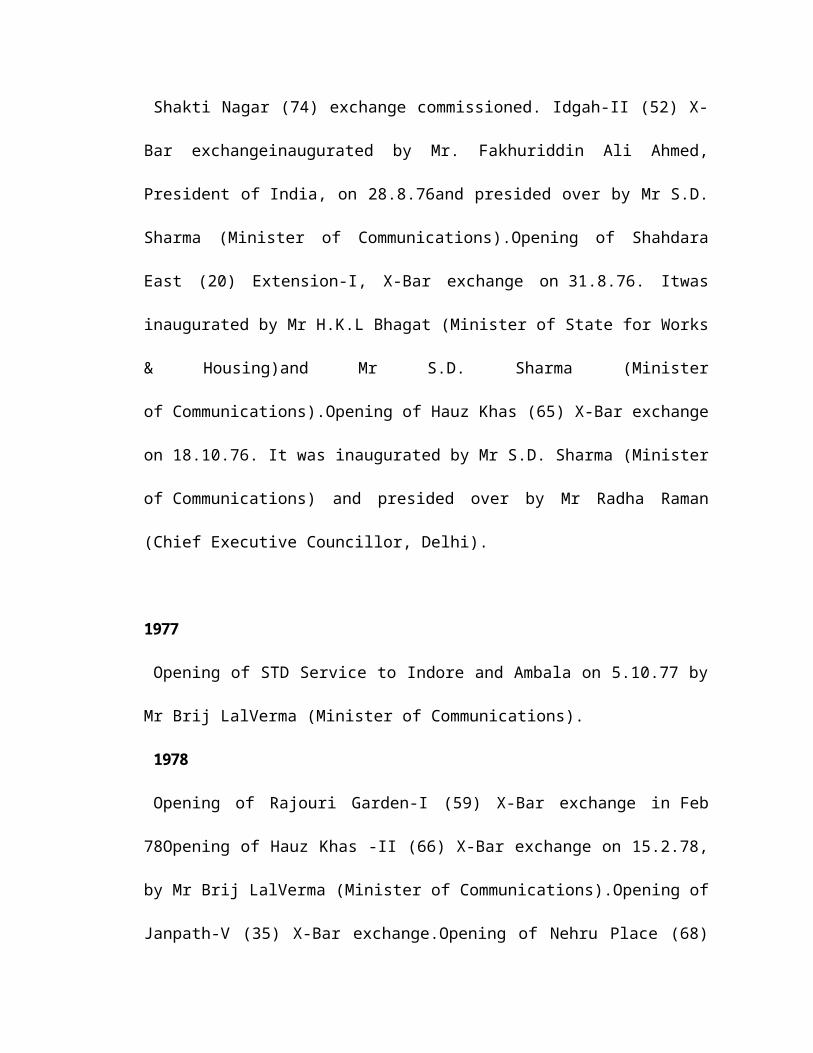
Shakti Nagar (74) exchange commissioned. Idgah-II (52) X-
Bar exchangeinaugurated by Mr. Fakhuriddin Ali Ahmed,
President of India, on 28.8.76and presided over by Mr S.D.
Sharma (Minister of Communications).Opening of Shahdara
East (20) Extension-I, X-Bar exchange on 31.8.76. Itwas
inaugurated by Mr H.K.L Bhagat (Minister of State for Works
& Housing)and Mr S.D. Sharma (Minister
of Communications).Opening of Hauz Khas (65) X-Bar exchange
on 18.10.76. It was inaugurated by Mr S.D. Sharma (Minister
of Communications) and presided over by Mr Radha Raman
(Chief Executive Councillor, Delhi).
1977
Opening of STD Service to Indore and Ambala on 5.10.77 by
Mr Brij LalVerma (Minister of Communications).
1978
Opening of Rajouri Garden-I (59) X-Bar exchange in Feb
78Opening of Hauz Khas -II (66) X-Bar exchange on 15.2.78,
by Mr Brij LalVerma (Minister of Communications).Opening of
Janpath-V (35) X-Bar exchange.Opening of Nehru Place (68)
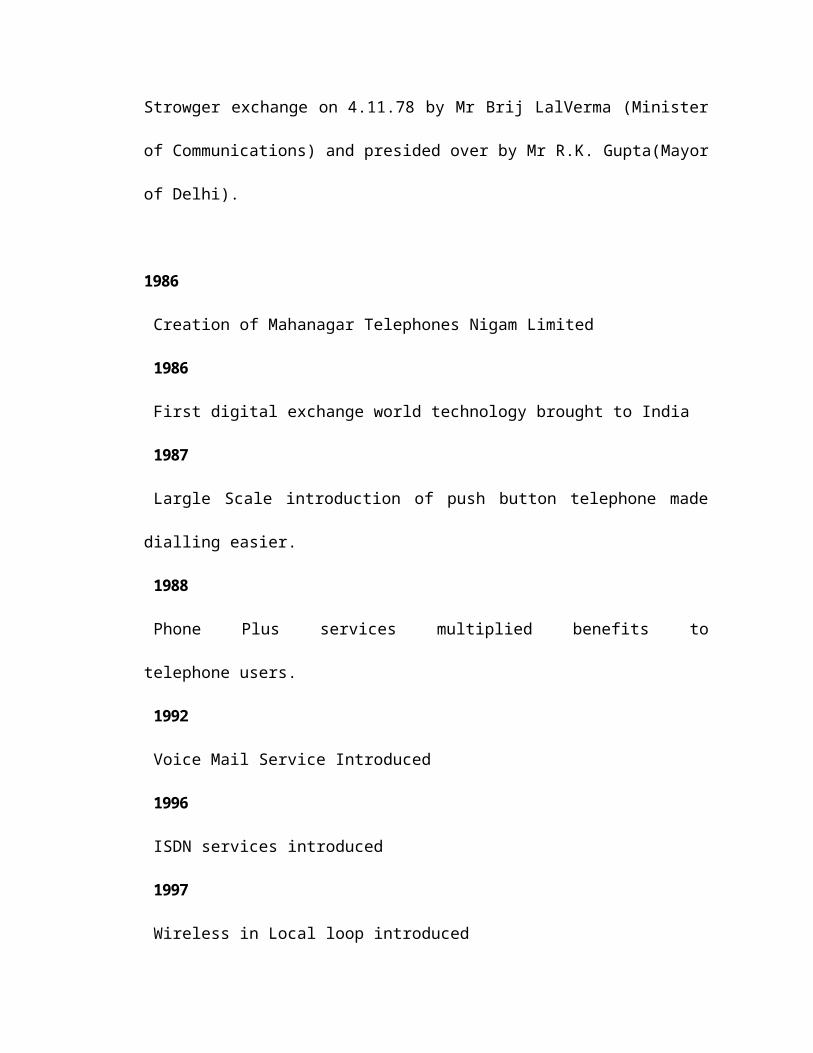
Strowger exchange on 4.11.78 by Mr Brij LalVerma (Minister
of Communications) and presided over by Mr R.K. Gupta(Mayor
of Delhi).
1986
Creation of Mahanagar Telephones Nigam Limited
1986
First digital exchange world technology brought to India
1987
Largle Scale introduction of push button telephone made
dialling easier.
1988
Phone Plus services multiplied benefits to
telephone users.
1992
Voice Mail Service Introduced
1996
ISDN services introduced
1997
Wireless in Local loop introduced
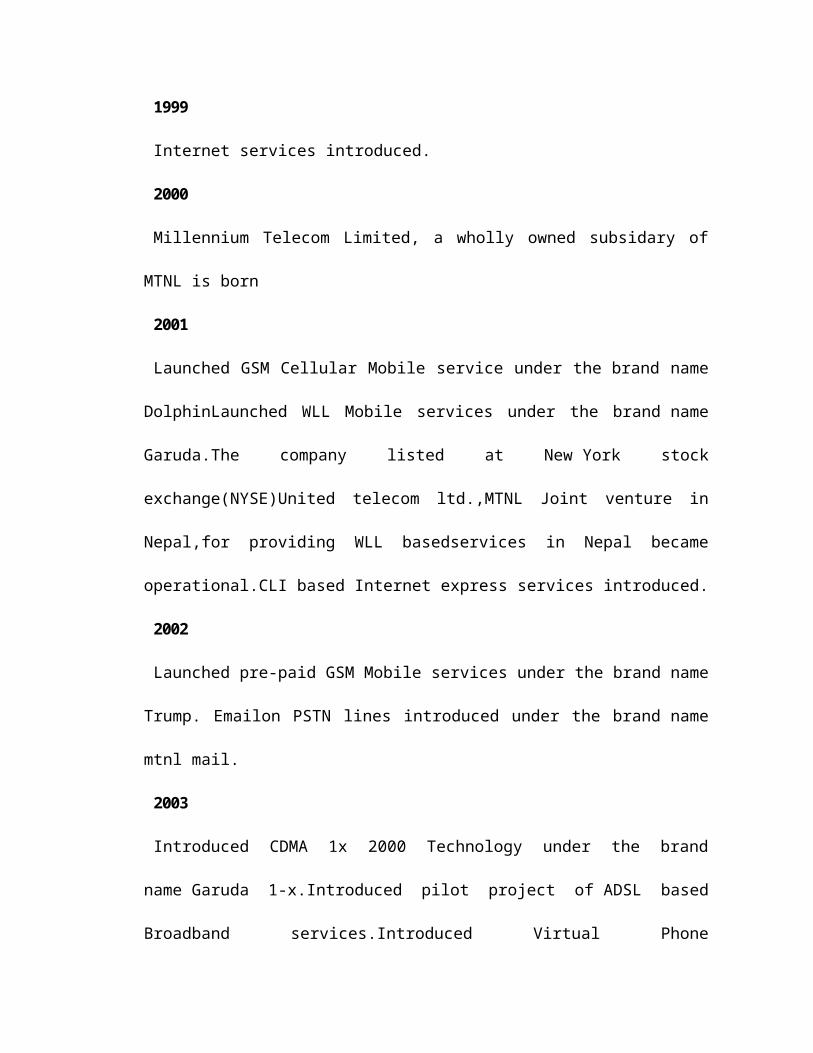
1999
Internet services introduced.
2000
Millennium Telecom Limited, a wholly owned subsidary of
MTNL is born
2001
Launched GSM Cellular Mobile service under the brand name
DolphinLaunched WLL Mobile services under the brand name
Garuda.The company listed at New York stock
exchange(NYSE)United telecom ltd.,MTNL Joint venture in
Nepal,for providing WLL basedservices in Nepal became
operational.CLI based Internet express services introduced.
2002
Launched pre-paid GSM Mobile services under the brand name
Trump. Emailon PSTN lines introduced under the brand name
mtnl mail.
2003
Introduced CDMA 1x 2000 Technology under the brand
name Garuda 1-x.Introduced pilot project of ADSL based
Broadband services.Introduced Virtual Phone
services.Mahanagar Telephone Mauritius Ltd. bagged second
operator license in Mauritius.
2004
Expanded GSM & CDMA capacity by 800,000 lines each (total
1.6 millionlines expanded) STD/ISD rates slashed by
almost 60%. MTNL subsidiaryMTML obtained license to provide
fixed, mobile & ILD services in Mauritius.Launched Wi-Fi &
digital certification services. State of the art training
centre “CETTM” commissioned.
Leading market in GSM customer additions. Launched
broadband servicesunder the brand name “TRI BAND”. Floated
tender for 1 million 3G GSM lines.
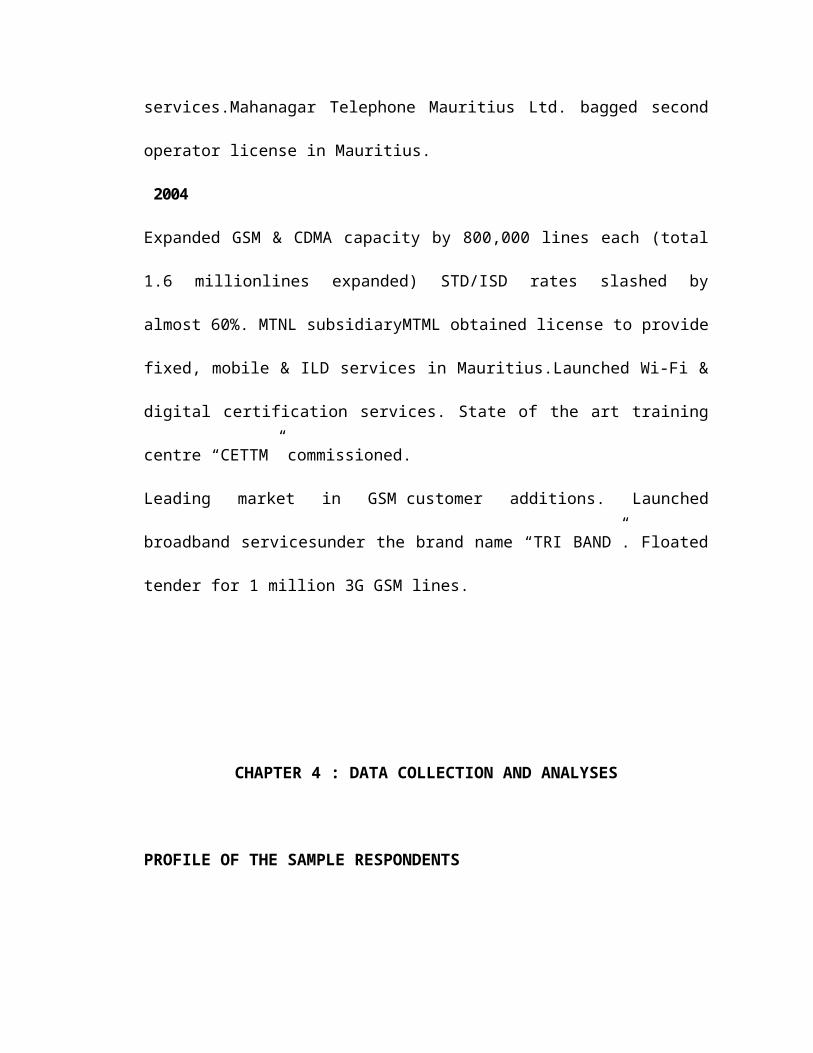
CHAPTER 4 : DATA COLLECTION AND ANALYSES
PROFILE OF THE SAMPLE RESPONDENTS
FREQUENCY PERCENT VALID
PERCENT
CUMM
PERCENT
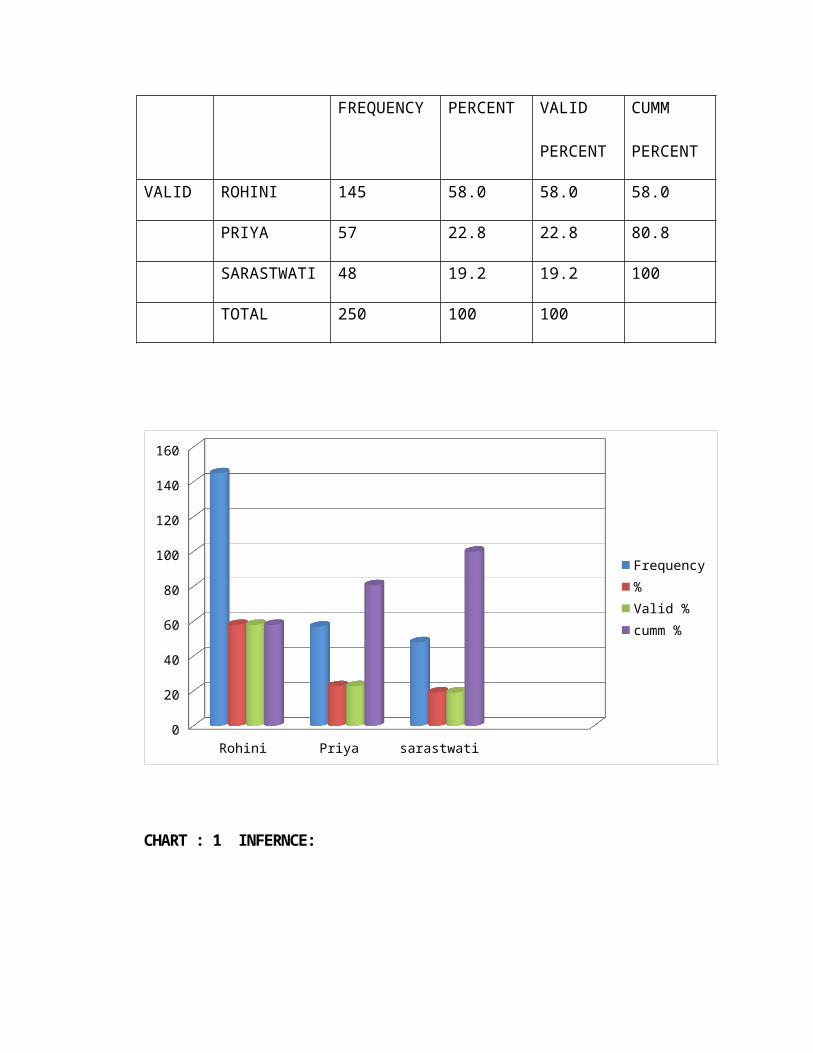
VALID ROHINI 145 58.0 58.0 58.0
PRIYA 57 22.8 22.8 80.8
SARASTWATI 48 19.2 19.2 100
TOTAL 250 100 100
Rohini Priya sarastwati0
20
40
60
80
100
120
140
160
Frequency%Valid %cumm %
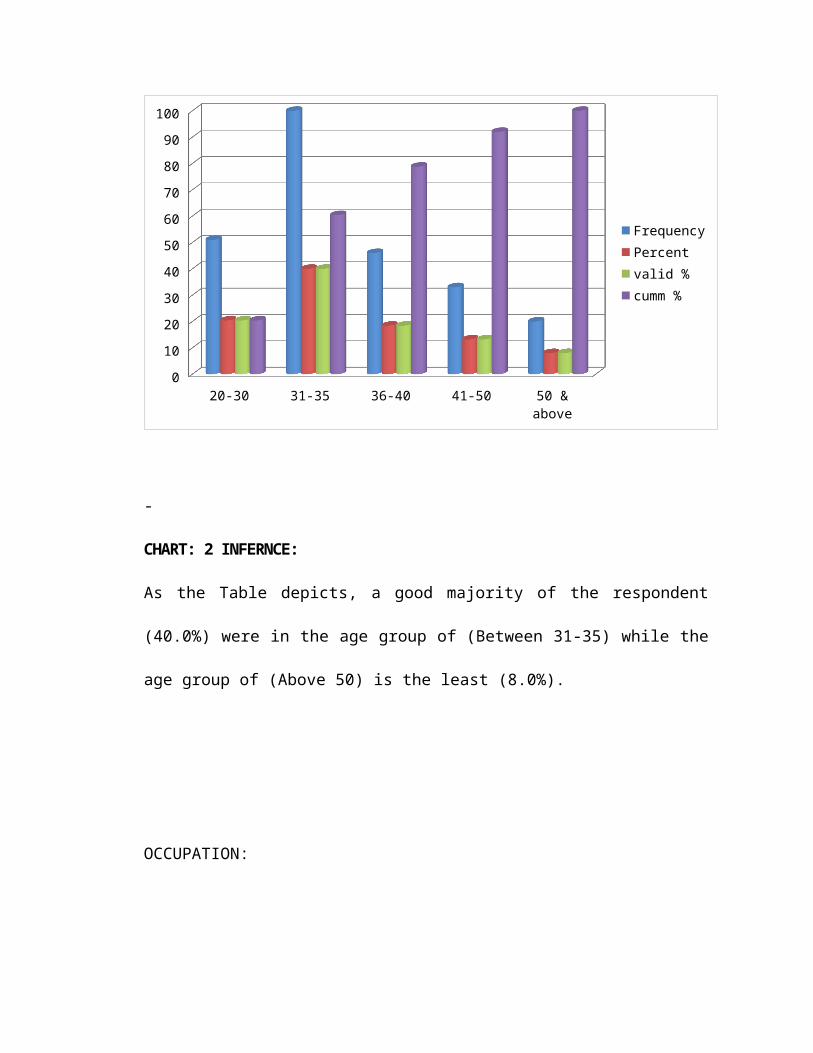
CHART : 1 INFERNCE:
As the Table depicts, a good majority of the
respondent (58%) of consumers belongs toCoimbatore
while Tirupur is the least (0.4%).
AGE
FREQUENCY PERCENT VALID
PERCENT
CUMM
PERCENT
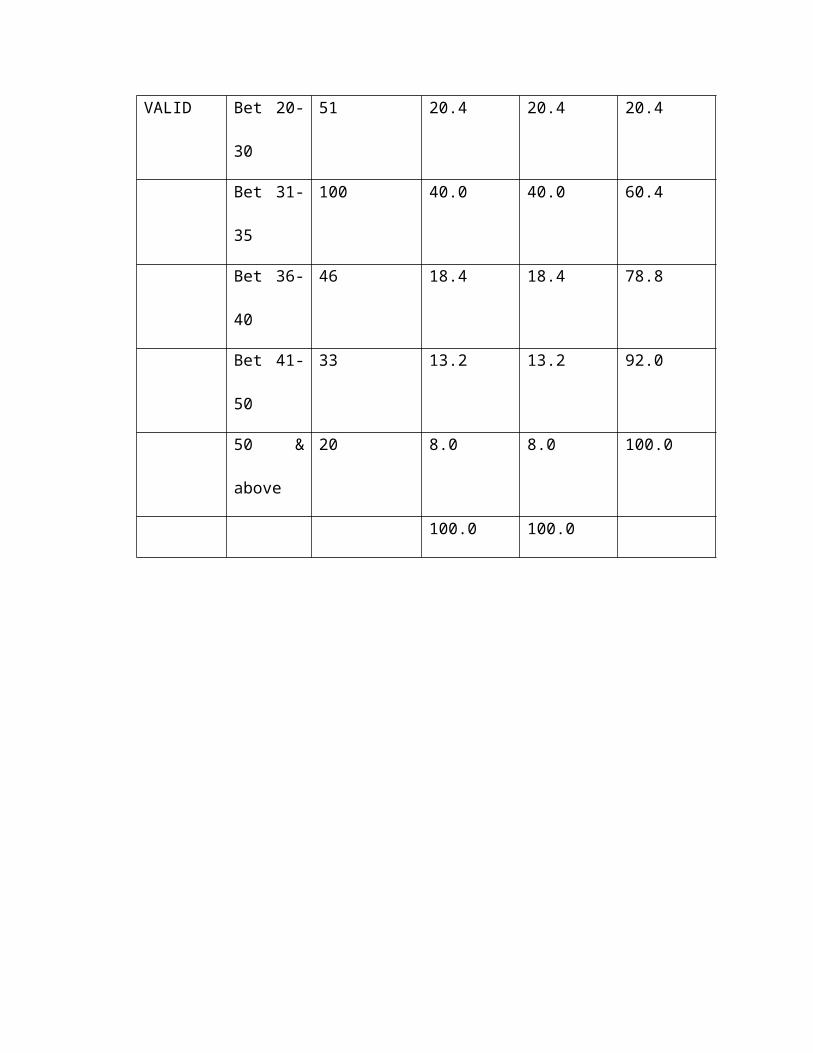
VALID Bet 20-
30
51 20.4 20.4 20.4
Bet 31-
35
100 40.0 40.0 60.4
Bet 36-
40
46 18.4 18.4 78.8
Bet 41-
50
33 13.2 13.2 92.0
50 &
above
20 8.0 8.0 100.0
100.0 100.0
20-30 31-35 36-40 41-50 50 & above
0102030405060708090100
FrequencyPercentvalid %cumm %
-
CHART: 2 INFERNCE:
As the Table depicts, a good majority of the respondent
(40.0%) were in the age group of (Between 31-35) while the
age group of (Above 50) is the least (8.0%).
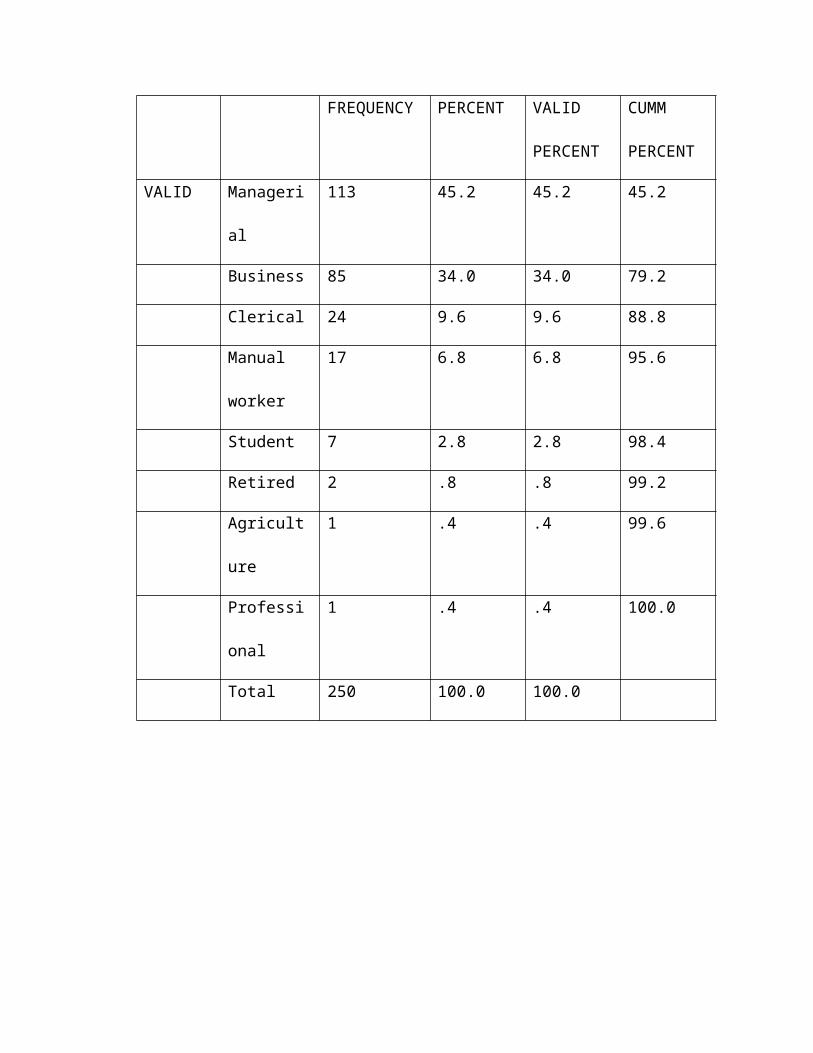
OCCUPATION:
FREQUENCY PERCENT VALID
PERCENT
CUMM
PERCENT
VALID Manageri
al
113 45.2 45.2 45.2
Business 85 34.0 34.0 79.2
Clerical 24 9.6 9.6 88.8
Manual
worker
17 6.8 6.8 95.6
Student 7 2.8 2.8 98.4
Retired 2 .8 .8 99.2
Agricult
ure
1 .4 .4 99.6
Professi
onal
1 .4 .4 100.0
Total 250 100.0 100.0
Managerial
Business
Clerical
Manual worker
Student
Retired
Agriculture
Professional
0
20
40
60
80
100
120
FREQUENCYPERCENTVALID PERCENTCUMM PERCENT
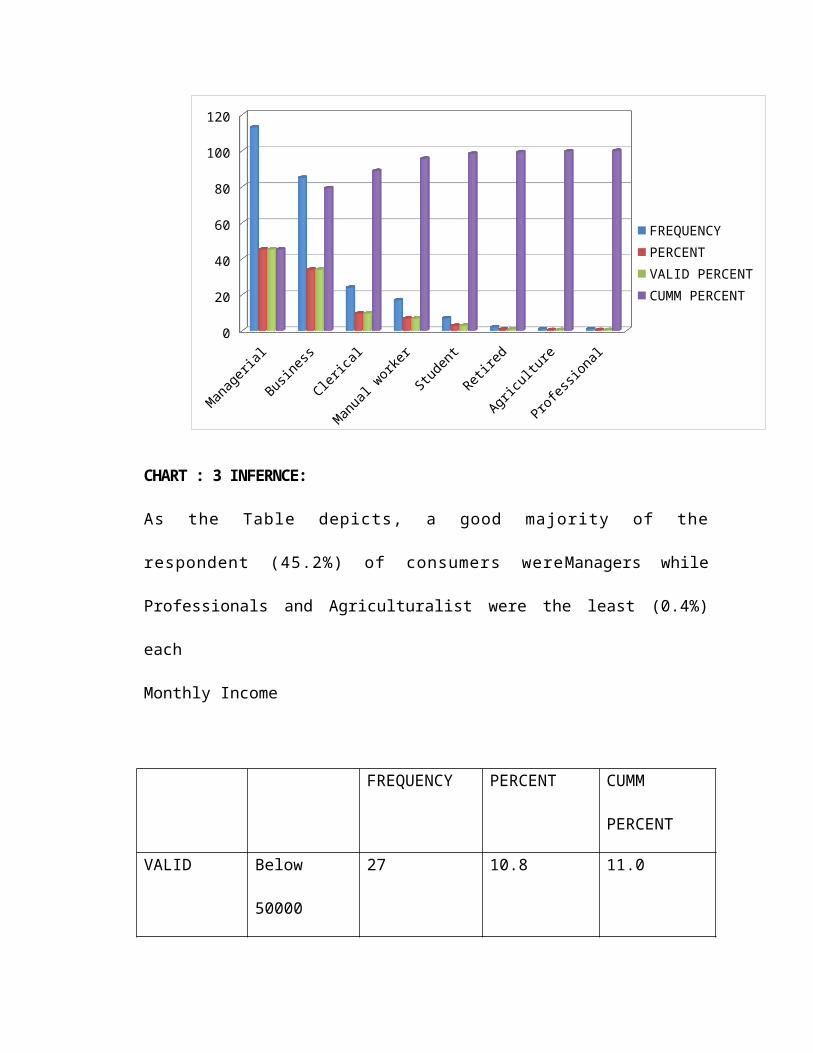
CHART : 3 INFERNCE:
As the Table depicts, a good majority of the
respondent (45.2%) of consumers wereManagers while
Professionals and Agriculturalist were the least (0.4%)
each
Monthly Income
FREQUENCY PERCENT CUMM
PERCENT
VALID Below
50000
27 10.8 11.0
Bet 5000-
10000
132 52.8 64.9
Bet 10000-
15000
62 24.8 90.2
Bet 15000-
25000
11 4.4 94.7
Above
25000
13 5.2 100
Total 245 98.0
System 5 2.0
TOTAL 250 100
5000 5000-10000
10000-15000
Above 25000
Above 25000
0
20
40
60
80
100
120
140
FREQUENCYPERCENTCUMM PERCENT
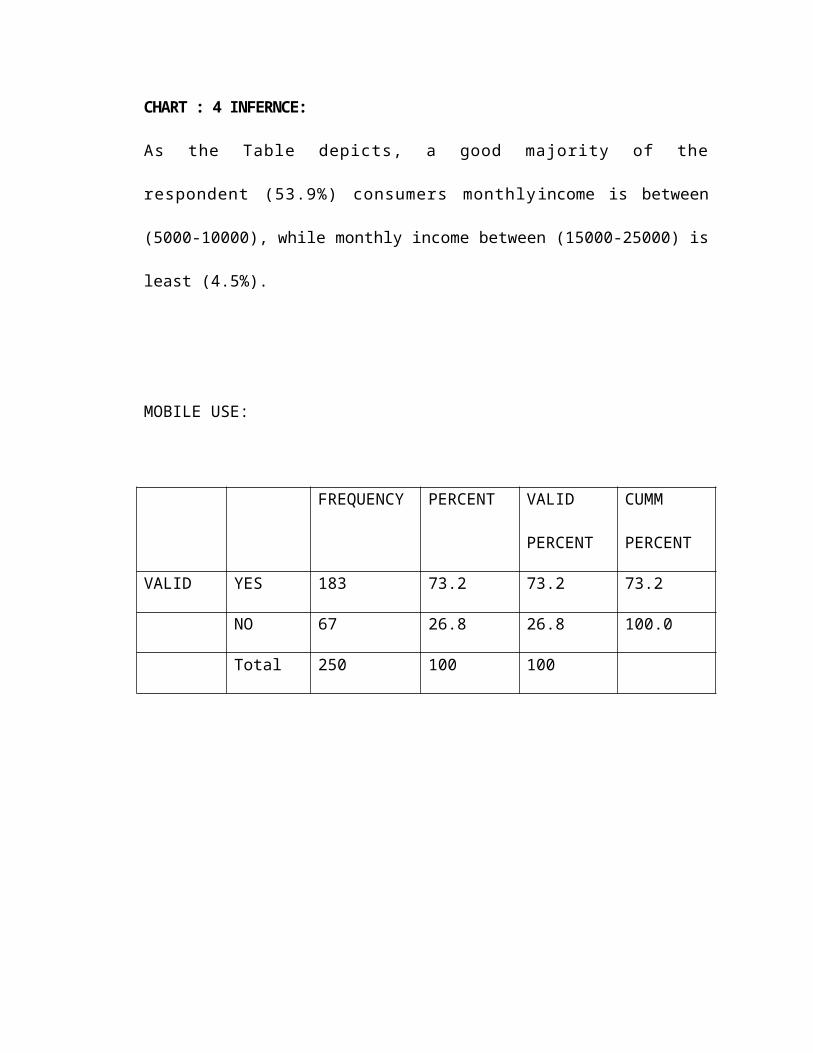
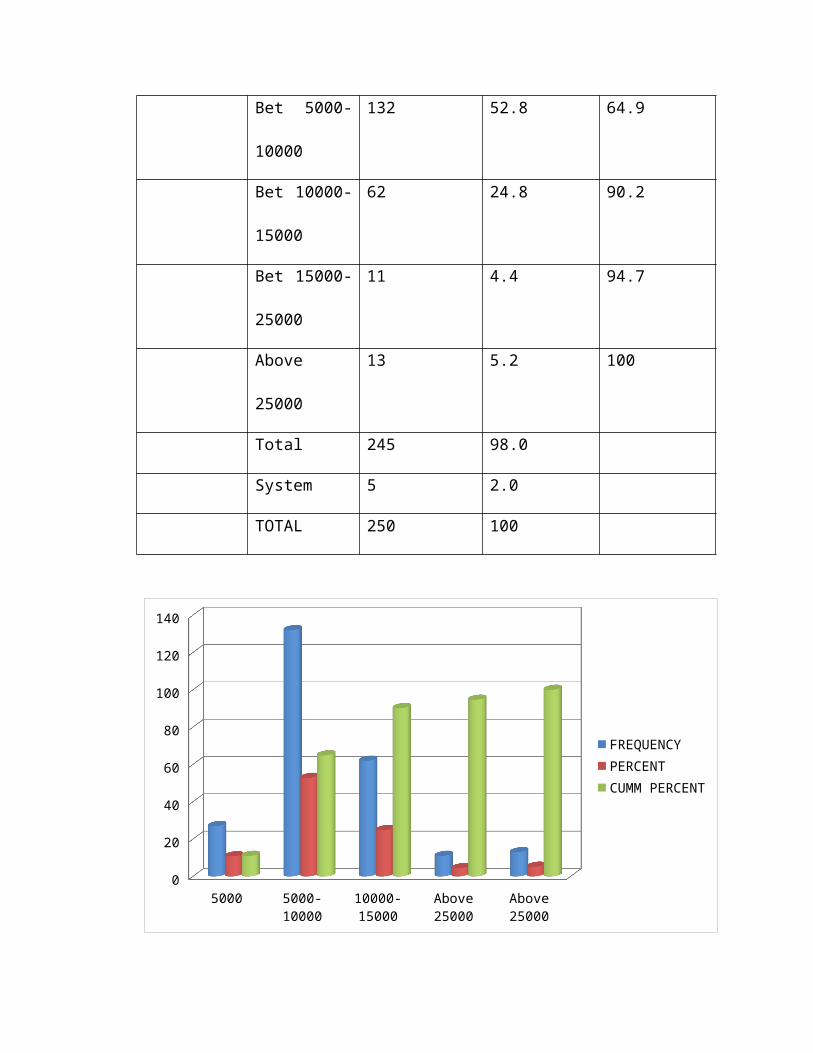
CHART : 4 INFERNCE:
As the Table depicts, a good majority of the
respondent (53.9%) consumers monthlyincome is between
(5000-10000), while monthly income between (15000-25000) is
least (4.5%).
MOBILE USE:
FREQUENCY PERCENT VALID
PERCENT
CUMM
PERCENT
VALID YES 183 73.2 73.2 73.2
NO 67 26.8 26.8 100.0
Total 250 100 100
YES NO0
20
40
60
80
100
120
140
160
180
200
FREQUENCYPERCENTVALID PERCENTCUMM PERCENT
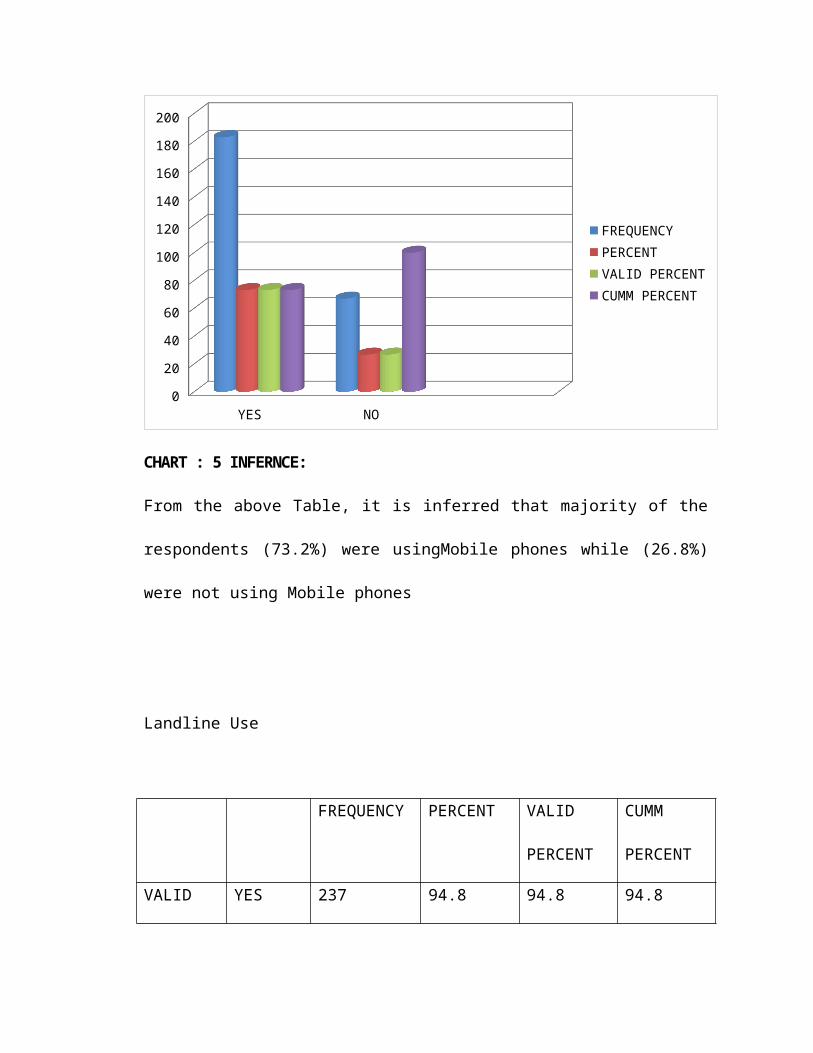
CHART : 5 INFERNCE:
From the above Table, it is inferred that majority of the
respondents (73.2%) were usingMobile phones while (26.8%)
were not using Mobile phones
Landline Use
FREQUENCY PERCENT VALID
PERCENT
CUMM
PERCENT
VALID YES 237 94.8 94.8 94.8
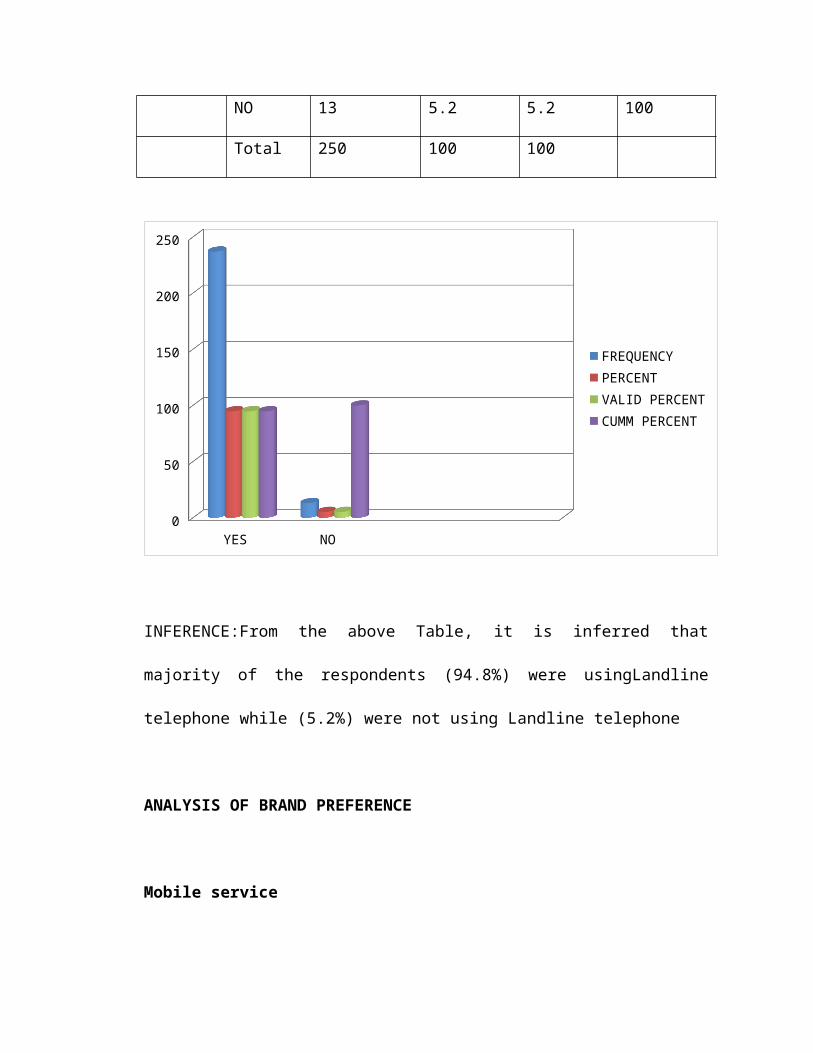
NO 13 5.2 5.2 100
Total 250 100 100
YES NO0
50
100
150
200
250
FREQUENCYPERCENTVALID PERCENTCUMM PERCENT
INFERENCE:From the above Table, it is inferred that
majority of the respondents (94.8%) were usingLandline
telephone while (5.2%) were not using Landline telephone
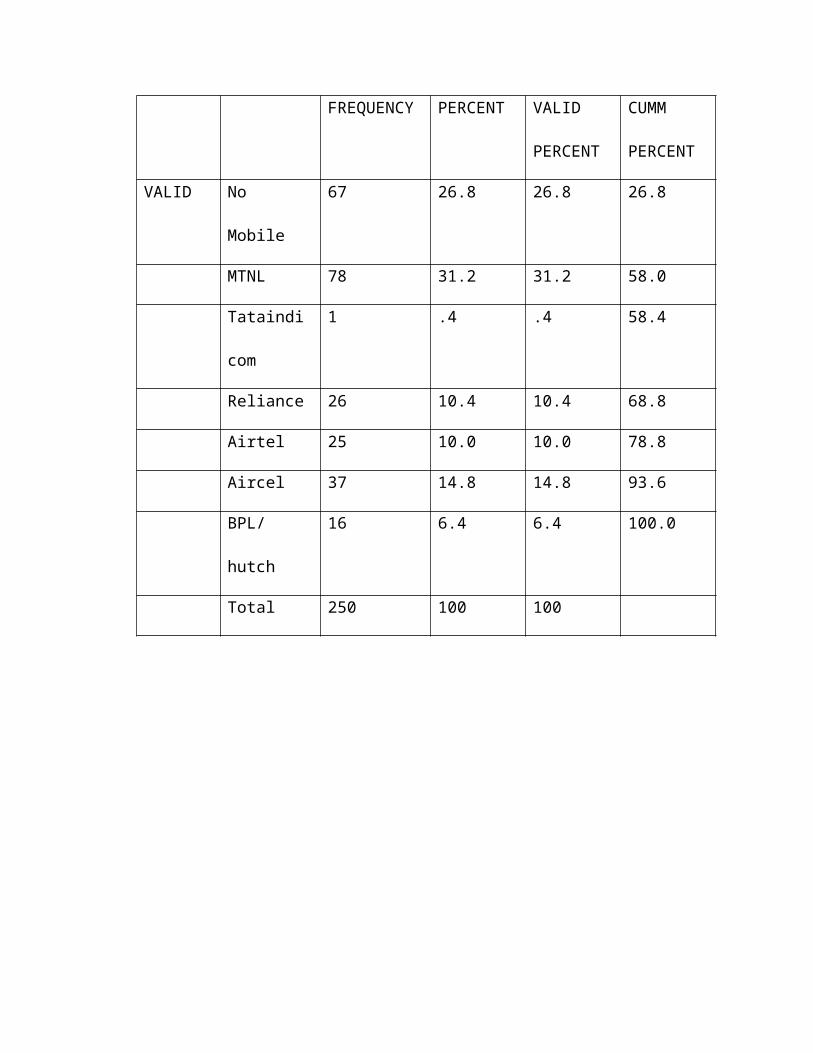
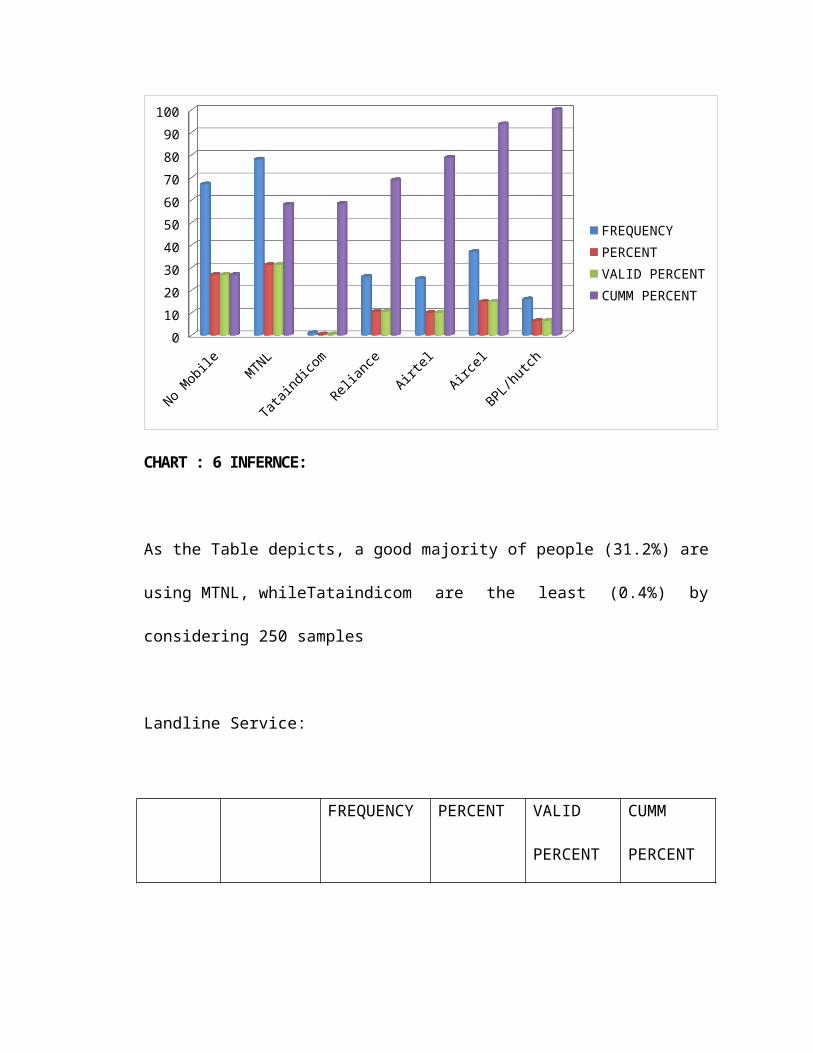
ANALYSIS OF BRAND PREFERENCE
Mobile service
FREQUENCY PERCENT VALID
PERCENT
CUMM
PERCENT
VALID No
Mobile
67 26.8 26.8 26.8
MTNL 78 31.2 31.2 58.0
Tataindi
com
1 .4 .4 58.4
Reliance 26 10.4 10.4 68.8
Airtel 25 10.0 10.0 78.8
Aircel 37 14.8 14.8 93.6
BPL/
hutch
16 6.4 6.4 100.0
Total 250 100 100
No Mobile
MTNL
Tataindicom
Reliance
Airtel
Aircel
BPL/hutch
0102030405060708090100
FREQUENCYPERCENTVALID PERCENTCUMM PERCENT
CHART : 6 INFERNCE:
As the Table depicts, a good majority of people (31.2%) are
using MTNL, whileTataindicom are the least (0.4%) by
considering 250 samples
Landline Service:
FREQUENCY PERCENT VALID
PERCENT
CUMM
PERCENT
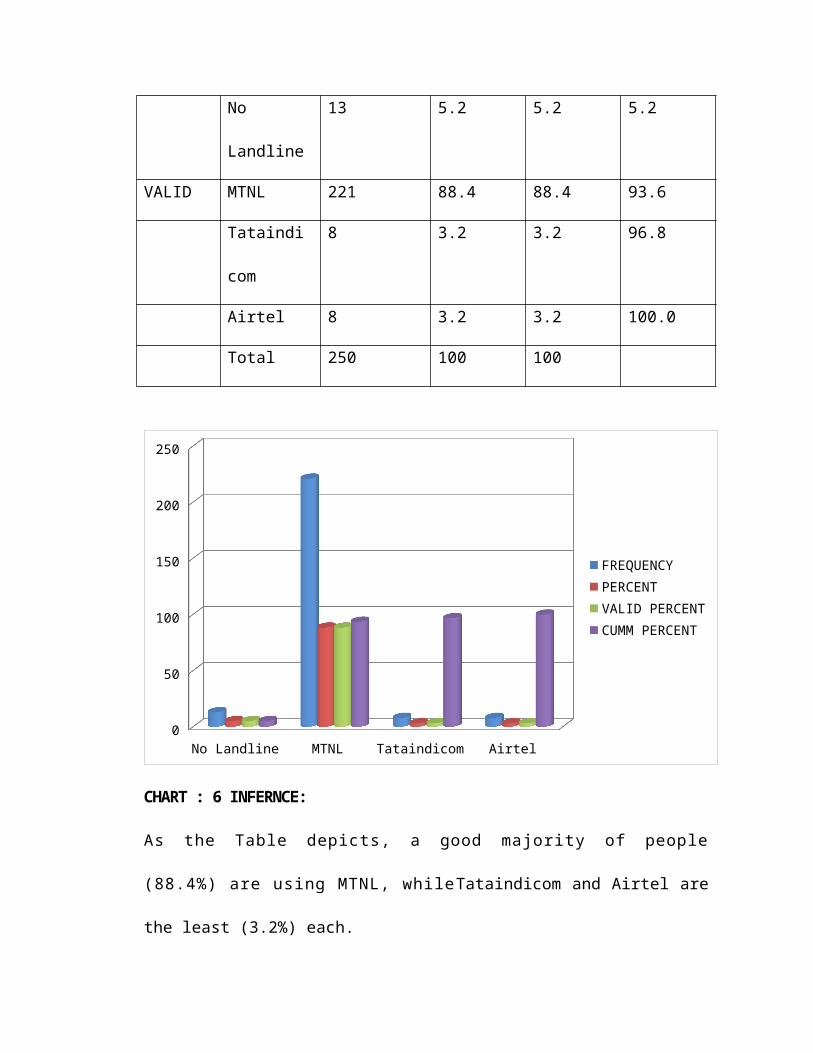
No
Landline
13 5.2 5.2 5.2
VALID MTNL 221 88.4 88.4 93.6
Tataindi
com
8 3.2 3.2 96.8
Airtel 8 3.2 3.2 100.0
Total 250 100 100
No Landline MTNL Tataindicom Airtel0
50
100
150
200
250
FREQUENCYPERCENTVALID PERCENTCUMM PERCENT
CHART : 6 INFERNCE:
As the Table depicts, a good majority of people
(88.4%) are using MTNL, whileTataindicom and Airtel are
the least (3.2%) each.
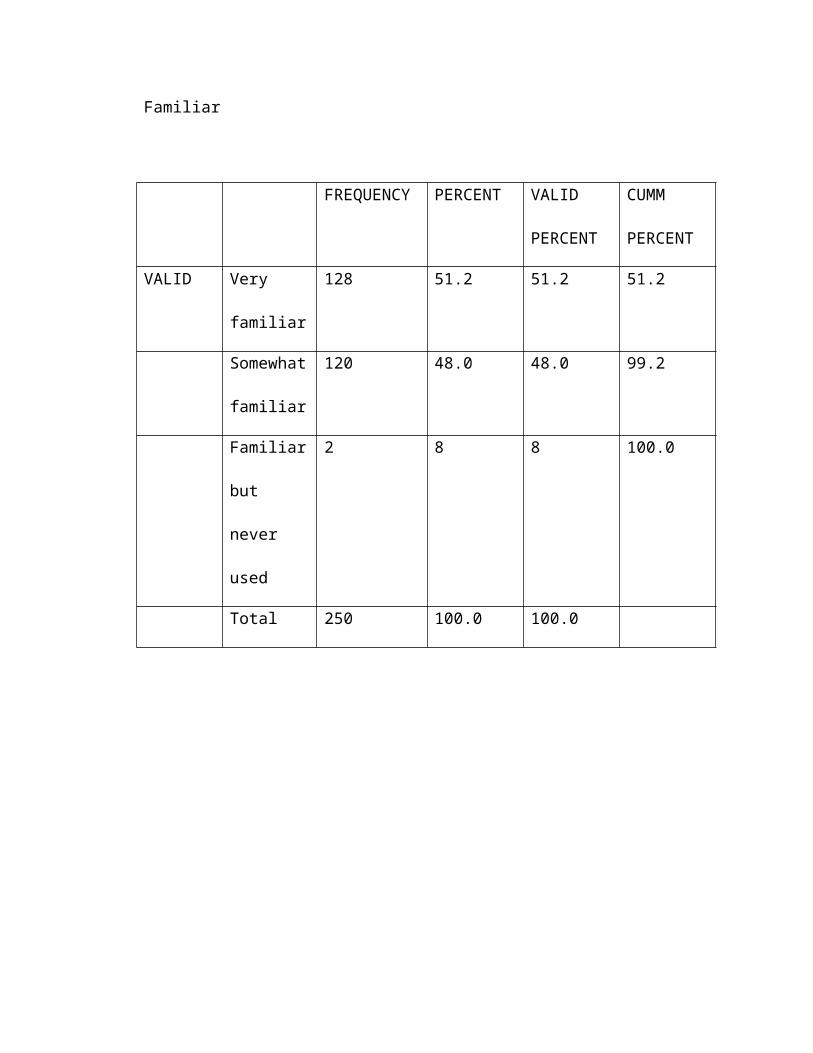
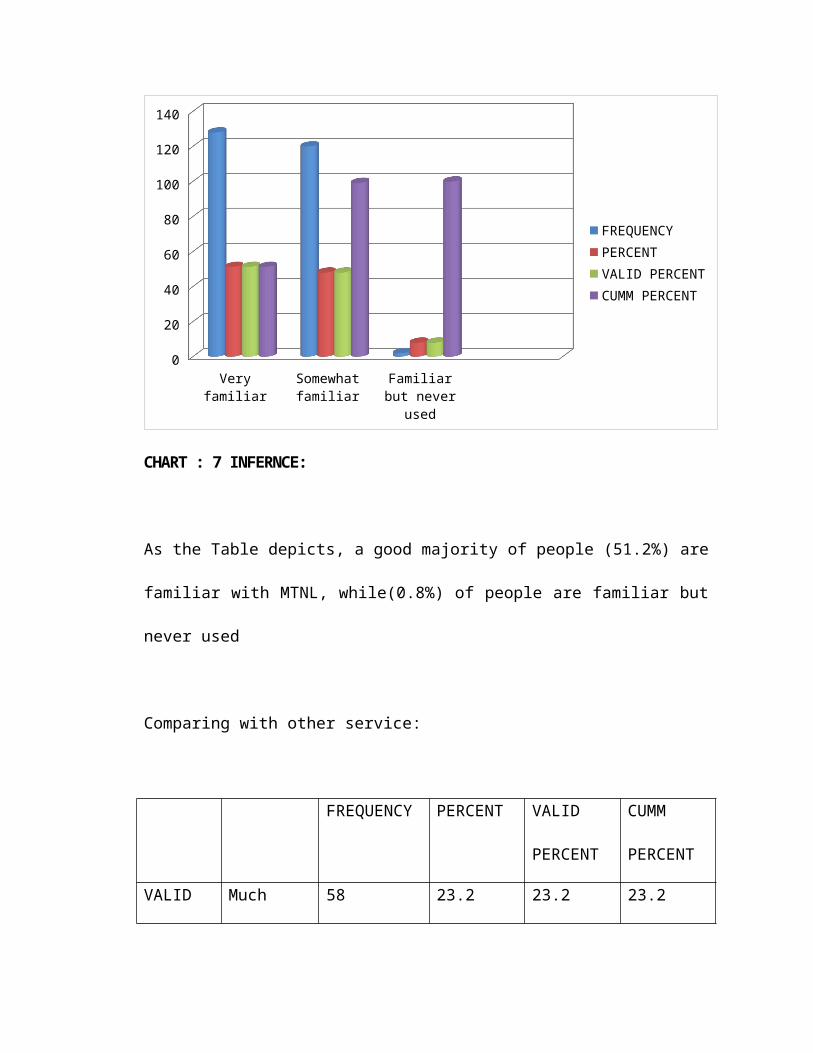
Familiar
FREQUENCY PERCENT VALID
PERCENT
CUMM
PERCENT
VALID Very
familiar
128 51.2 51.2 51.2
Somewhat
familiar
120 48.0 48.0 99.2
Familiar
but
never
used
2 8 8 100.0
Total 250 100.0 100.0
Very familiar
Somewhat familiar
Familiar but never
used
0
20
40
60
80
100
120
140
FREQUENCYPERCENTVALID PERCENTCUMM PERCENT
CHART : 7 INFERNCE:
As the Table depicts, a good majority of people (51.2%) are
familiar with MTNL, while(0.8%) of people are familiar but
never used
Comparing with other service:
FREQUENCY PERCENT VALID
PERCENT
CUMM
PERCENT
VALID Much 58 23.2 23.2 23.2
better
Somewhat
better
99 39.6 39.6 62.8
About
the same
65 26.0 26.0 88.8
Somewhat
worse
27 10.8 10.8 99.6
Don’t
know/nev
er used
1 .4 .4 100.0
Total 250 100.0 100.0
Much better
Somewhat better
About the same
Somewhat worse
Don’t know/never used
0102030405060708090100
FREQUENCYPERCENTVALID PERCENTCUMM PERCENT
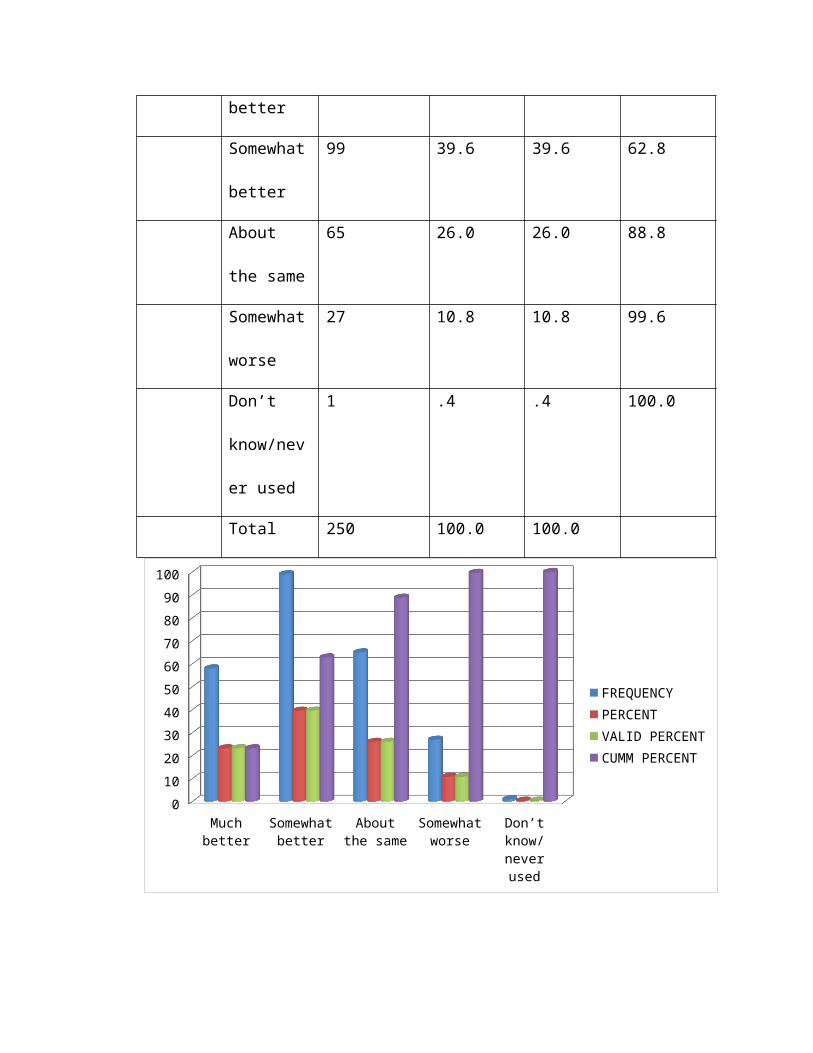
CHART : 8 INFERENCE:
As the Table depicts, majority of respondents (39.6%)
opined MTNL is “Some WhatBetter” when compared to
other services, while the least number of respondents
(0.4%) opined“Don’t know/Never used”
FINDINGS:
Respondents felt that there was no personalized service
to customers.
Due to non-availability of CUG connections to all,
most of the customers surrenderedMTNL and migrated to
Airtel.
Customers perceived that the bills are always inflated.
Due to excessive rules and regulations for
operating 1rupee coin telephones customersare not
willing to buy and they are preferring Airtel and Reliance.
Even after Surrendered the phone before 6months
deposit amount was not yet received but receiving bill.
Customers are expecting more number of free calls.
In Pollachi network is not proper inside the
house so Customers were very muchdissatisfied.
With regards to mobile services options are limited hence
customers were switching over to other service providers.
The extensive time lag between submission of
application and receiving of a telephoneconnection had
made some respondents switch over to other service
providers.
Due to the maturity and easy availability of Mobile
service most of the customers weresurrendered their
landline connection.
Due to limited number of linemen, faults were no
t immediately attended to, hencecustomers were very
much dissatisfied.
Customers were preferring to replace their old
instrument.
It was brought to notice of the researcher that
prepaid SIM cards took up to 10 days for activation.
There is not much awareness among the Customer’s
regarding the facilities which are provided by MTNL,
so effective media campaign is a must to enhance the
awarenesslevel.
Most of the people were not satisfied with the MTNL
Customer Service for both Mobileand Landline.
The respondents felt that the number of payment service
counters was inadequate, hencemore payment counters should
be made available.
Students are not much interested in MTNL Cell one because
of non-availability of SMS facilities.
The respondents felt that The MTNL cell ones
starter pack and recharge cards are in perennial short
supply.
The respondents experienced network problems when they
used roaming to cities.
The respondents suggested that simple value added
such as display of last call rate and balance amount
should be made available by MTNL.
Even though customers were dissatisfied with MTNL due to
Loyalty they are still usingMTNL service (For only
Incoming).
One of the major irritations, as told by the
respondents was that the communicationinstruments
provided by MTNL were of poor quality and hence they had to
face frequent problems with the instruments.
SUGGESTION:
Increase Communication:
It is recommended that the communication between management
and the employees beimproved in the organization. Customer
service is a very important part of organizationand in
order to provide the customer with quality services, it is
necessary to make surethat the employees of the
organization are motivated. This can be achieved
byincreasing the interaction between the management and the
employees. It isrecommended that the top managers visit the
work floor of the organization andpersonally communicate
the employees so that they motivated to perform better.
Decentralization:
It is also recommended that the organization provide the
employees with anopportunity to take part in the decision
making process. All new ideas and thoughtsshould be
welcomes and employees should be encouraged to express
their opinions.This will improve the sense of belongingness of
the employees and they will feel like they play an important
part in the organization. This will also serve the esteem
need mentioned in Maslow’s hierarchy of needs theory.
Utilization of Skills:
Managers should make sure that the each employee is fit for
his or her job. If the skillsof the employees are
underutilized this can result in boredom and
dissatisfaction. Eachemployee must be suited for his or her
job position.
CHAPTER 5 CONCLUSIONS
Time was not sufficient to conduct detailed study.
study had been conducted only in a few areas of Delhi.
For few questions researcher was not able to get proper
response which are as follows:
i.Chances of Switching.
ii.Reason for Switching.
iii.Monthly Income.
iv.Comparative questions
MTNL being a public sector, in order to thrive and excel,
have to understand about theCustomers expectations.They
also have to understand about their competitors and their
nuances in understanding their Customers.Since
Communication industry is a very competitive one it is high
time for MTNL to understandabout their Customers in
Landline as well as Mobile services.
BIBLIOGRAPHY
BooksGupta, C.B (2006). Marketing Research,
Sultan Chand & Sons.1.2.Sharma, J.K (2008): Operations
Research, Macmillan India Ltd.3.Gitomer, Jeffrey
(1998).
Customer Satisfaction is worthless Customer loyalty
is priceless,Jeffrey Gitomer Bard Press.
Questionnaire
is your Age?
a. Between 20-30
b. Between 31-35.
c. Between 36-40.
d. Between 41-50. e. Above 50
2. Which of these best describes your job?
a . Managerial
b . Professionalc.
c . Clericald.Manual Worker
e Student
f .Retired
g .Agriculture
3. Under which category you belong to regarding your
Monthly Income?
a. Below 5000.
b. Between 5000-10000.
c. Between 10000-15000.
d. Between 15000-25000.
e. Above 25000
4. Are you using mobile services?
a . Yes
b . No
And which of the following mobile services you are using
currently?
a . MTNL
b . Tata Indicom.
c . Reliance.
d . Airtel.
e . Aircel.
f . BPL\Hutch.
g . A n y o t h e r p l e a s e m e n t i o n
6. Which of the following Landline Services you are using
currently?
a. MTNL.
b. Tata Indicom.
c. Reliance.
d. Airtel.
e. Any other please mention
7. How familiar are you with MTNL Services?
a.Very familiar (use on regular basis).
b.Some what familiar (use it only some times).
c . F a m i l i a r b u t n e v e r u s e d i t .
d . Never heard of service before
8. How satisfied are you with the Tariff plan of MTNL?
a . Very satisfied
b . Quite satisfied
c Neutral
d . Quite dissatisfied
e . Very dissatisfied
9. How satisfied are you with the network of MTNL?
a . Very satisfied
b . Quite satisfied
c . Neutral
d . Quite dissatisfied
e . Very dissatisfied
10. How satisfied are you with the cost of MTNL?
a . Very satisfied
b . Quite satisfied
c . Neutral
d . Quite dissatisfied
e . Very dissatisfied
11. How satisfied are you with the customer care of MTNL?
a . Very satisfied
b . Quite satisfied
c . Neutral
d . Quite dissatisfied
e . Very dissatisfied
12. How satisfied are you with the additional packages of
MTNL?
a . Very satisfied
b . Quite satisfied
c Neutral
d . Quite dissatisfied
e . Very dissatisfied
13. In thinking about your most recent with others was the
Quality of the MTNL Customer Service you received:
a . Excellent.
b . Good.
c . Average.
d . Poor.
e . Very poor.
14. Compared with others would you say that MTNL is
a . Much better.
b . Some what better.
c . About the same.
d . Some what worse.
e . Don’t know (or) Never used
15. [a]. All things considered over the next 12 months how
likely are you to replace your currentService
a . Certain.
b . High chance.

c . Not sure.
d . Low chance.
e . Never.