Turkish Nursing Students’ Perceptions and Experiences of Bullying Behaviors in Nursing Education
Upload
khangminh22Category
view
0download
0
A STUDY ON PERCEPTIONS AND EXPERIENCES OF
CORRUPTION IN THE PUBLIC SERVICE IN KENYA
NCRC Research Report No. 12
NATIONAL CRIME RESEARCH CENTRE
COPY RIGHT
Copyright© 2018 by National Crime Research Centre
Nairobi; Printed in Kenya
ISBN 978-9966-7493-7-6
Part of this publication may be copied for use in research and education purposes provided that the source is acknowledged. This publication may not be re-produced for other purposes
without prior permission from the National Crime Research Centre
Published by: The Jomo Kenyatta Foundation

iii
iii
TABLE OF CONTENTS COPY RIGHT ------------------------------------------------------------------------------------------- iiLIST OF TABLES --------------------------------------------------------------------------------------viLIST OF FIGURES ------------------------------------------------------------------------------------- xFOREWORD ---------------------------------------------------------------------------------------------xiACKNOWLEDGEMENTS -------------------------------------------------------------------------- xiiOPERATIONAL DEFINITION OF TERMS --------------------------------------------------- xiiiCHAPTER ONE: INTRODUCTION --------------------------------------------------------------- 11.1 Background of the Study -------------------------------------------------------------------------- 11.1.1. Global Perspective ------------------------------------------------------------------------------- 21.1.2 African Perspective ------------------------------------------------------------------------------ 21.1.3 Kenyan Perspective ------------------------------------------------------------------------------ 31.2 Problem Statement --------------------------------------------------------------------------------- 51.3 Objectives of the Study ---------------------------------------------------------------------------- 61.4 Justification of the Study -------------------------------------------------------------------------- 61.5 Assumptions of the Study ------------------------------------------------------------------------- 71.6 Scope of the Study ---------------------------------------------------------------------------------- 71.7 Conceptual Framework of the Study ----------------------------------------------------------- 8CHAPTER TWO: METHODOLOGY OF THE STUDY ------------------------------------- 102.1 Introduction ----------------------------------------------------------------------------------------- 102.2 Research Design ------------------------------------------------------------------------------------ 102.3 Methods and Tools of Data Collection -------------------------------------------------------- 162.3.1 Data Collection Methods ----------------------------------------------------------------------- 162.3.2 Data Collection Tools --------------------------------------------------------------------------- 162.4 Data Collection and Management -------------------------------------------------------------- 162.5 Methods of Data Analysis ------------------------------------------------------------------------ 162.6. Ethical Considerations --------------------------------------------------------------------------- 17CHAPTER THREE: RESULTS AND DISCUSSIONS ---------------------------------------- 183.1 Introduction ----------------------------------------------------------------------------------------- 183.2 Socio-demographic Characteristics of Members of the Public Respondents --------- 183.3 Public Perceptions on Common and Emerging Types of Corruption ------------------ 203.3.1 Understanding of corruption ------------------------------------------------------------------ 203.3.2 Perceptions on existence of corruption in public service institutions ---------------- 213.3.3 Perceptions on existence of corruption in different arms of government ----------- 243.3.4 Institutions where corruption is perceived to be most prevalent ---------------------- 313.3.5 Perceived common and emerging types of corruption ---------------------------------- 353.3.5.1 Perceived common and emerging types of corruption in the Executive Arm of
the National Government -------------------------------------------------------------------- 353.3.5.2 Perceived common and emerging types of corruption in the Executive Arm of
County Government -------------------------------------------------------------------------- 383.3.5.3 Perceived common and emerging types of corruption in the Judiciary ----------- 423.3.5.4 Perceived common and emerging types of corruption in the Senate Assembly -- 463.3.5.5 Perceived common and emerging types of corruption in the National Assembly503.3.5.6 Perceived common and emerging types of corruption in the County Assembly - 543.4 Experiences of Corruption in the Public Service ------------------------------------------- 583.4.1 Corruption in relation to seeking of services from the public service ---------------- 583.4.1.1 Seeking of services from the public service ---------------------------------------------- 583.4.1.2 Corruption-related challenges encountered in seeking public services ------------ 63
iviv
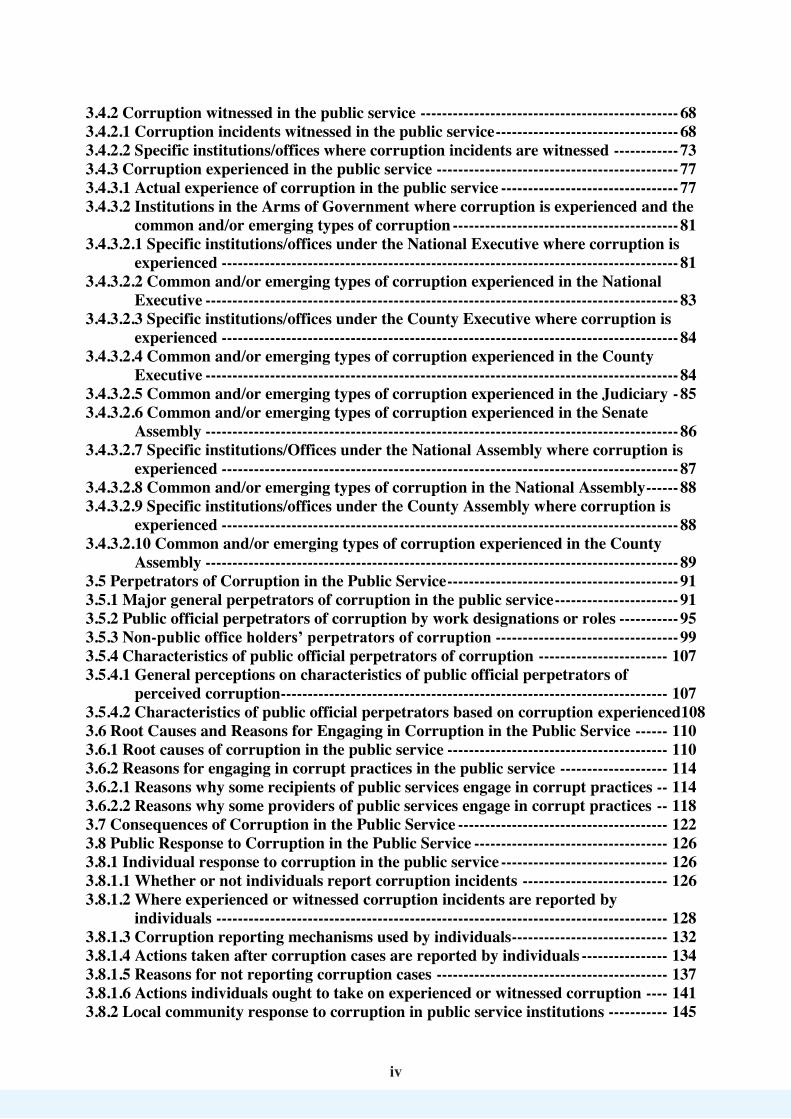
3.4.2 Corruption witnessed in the public service ------------------------------------------------ 683.4.2.1 Corruption incidents witnessed in the public service ---------------------------------- 683.4.2.2 Specific institutions/offices where corruption incidents are witnessed ------------ 733.4.3 Corruption experienced in the public service --------------------------------------------- 773.4.3.1 Actual experience of corruption in the public service --------------------------------- 773.4.3.2 Institutions in the Arms of Government where corruption is experienced and the
common and/or emerging types of corruption ------------------------------------------ 813.4.3.2.1 Specific institutions/offices under the National Executive where corruption is
experienced ------------------------------------------------------------------------------------- 813.4.3.2.2 Common and/or emerging types of corruption experienced in the National
Executive ---------------------------------------------------------------------------------------- 833.4.3.2.3 Specific institutions/offices under the County Executive where corruption is
experienced ------------------------------------------------------------------------------------- 843.4.3.2.4 Common and/or emerging types of corruption experienced in the County
Executive ---------------------------------------------------------------------------------------- 843.4.3.2.5 Common and/or emerging types of corruption experienced in the Judiciary - 853.4.3.2.6 Common and/or emerging types of corruption experienced in the Senate
Assembly ---------------------------------------------------------------------------------------- 863.4.3.2.7 Specific institutions/Offices under the National Assembly where corruption is
experienced ------------------------------------------------------------------------------------- 873.4.3.2.8 Common and/or emerging types of corruption in the National Assembly ------ 883.4.3.2.9 Specific institutions/offices under the County Assembly where corruption is
experienced ------------------------------------------------------------------------------------- 883.4.3.2.10 Common and/or emerging types of corruption experienced in the County
Assembly ---------------------------------------------------------------------------------------- 893.5 Perpetrators of Corruption in the Public Service ------------------------------------------- 913.5.1 Major general perpetrators of corruption in the public service ----------------------- 913.5.2 Public official perpetrators of corruption by work designations or roles ----------- 953.5.3 Non-public office holders’ perpetrators of corruption ---------------------------------- 993.5.4 Characteristics of public official perpetrators of corruption ------------------------ 1073.5.4.1 General perceptions on characteristics of public official perpetrators of
perceived corruption------------------------------------------------------------------------ 1073.5.4.2 Characteristics of public official perpetrators based on corruption experienced1083.6 Root Causes and Reasons for Engaging in Corruption in the Public Service ------ 1103.6.1 Root causes of corruption in the public service ----------------------------------------- 1103.6.2 Reasons for engaging in corrupt practices in the public service -------------------- 1143.6.2.1 Reasons why some recipients of public services engage in corrupt practices -- 1143.6.2.2 Reasons why some providers of public services engage in corrupt practices -- 1183.7 Consequences of Corruption in the Public Service --------------------------------------- 1223.8 Public Response to Corruption in the Public Service ------------------------------------ 1263.8.1 Individual response to corruption in the public service ------------------------------- 1263.8.1.1 Whether or not individuals report corruption incidents --------------------------- 1263.8.1.2 Where experienced or witnessed corruption incidents are reported by
individuals ------------------------------------------------------------------------------------ 1283.8.1.3 Corruption reporting mechanisms used by individuals ----------------------------- 1323.8.1.4 Actions taken after corruption cases are reported by individuals ---------------- 1343.8.1.5 Reasons for not reporting corruption cases ------------------------------------------- 1373.8.1.6 Actions individuals ought to take on experienced or witnessed corruption ---- 1413.8.2 Local community response to corruption in public service institutions ----------- 145
vv
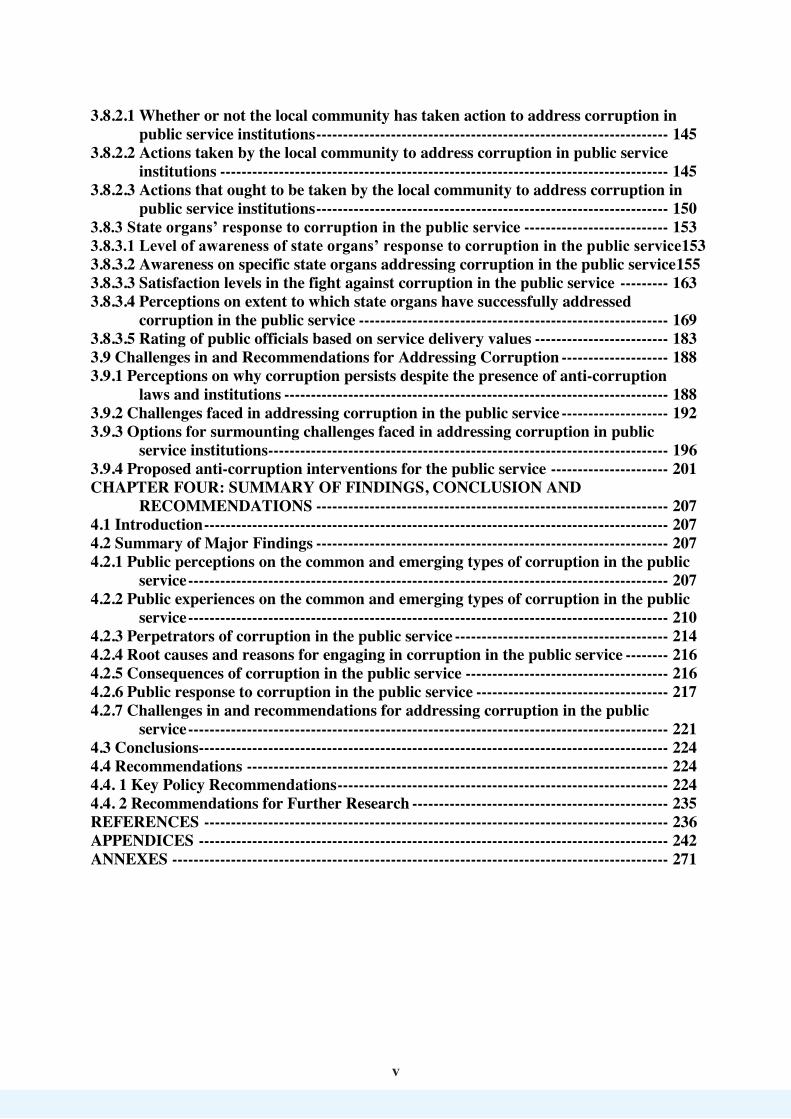
3.8.2.1 Whether or not the local community has taken action to address corruption in public service institutions ------------------------------------------------------------------ 145
3.8.2.2 Actions taken by the local community to address corruption in public service institutions ------------------------------------------------------------------------------------ 145
3.8.2.3 Actions that ought to be taken by the local community to address corruption in public service institutions ------------------------------------------------------------------ 150
3.8.3 State organs’ response to corruption in the public service --------------------------- 1533.8.3.1 Level of awareness of state organs’ response to corruption in the public service1533.8.3.2 Awareness on specific state organs addressing corruption in the public service1553.8.3.3 Satisfaction levels in the fight against corruption in the public service --------- 1633.8.3.4 Perceptions on extent to which state organs have successfully addressed
corruption in the public service ---------------------------------------------------------- 1693.8.3.5 Rating of public officials based on service delivery values ------------------------- 1833.9 Challenges in and Recommendations for Addressing Corruption -------------------- 1883.9.1 Perceptions on why corruption persists despite the presence of anti-corruption
laws and institutions ------------------------------------------------------------------------ 1883.9.2 Challenges faced in addressing corruption in the public service -------------------- 1923.9.3 Options for surmounting challenges faced in addressing corruption in public
service institutions --------------------------------------------------------------------------- 1963.9.4 Proposed anti-corruption interventions for the public service ---------------------- 201CHAPTER FOUR: SUMMARY OF FINDINGS, CONCLUSION AND
RECOMMENDATIONS ------------------------------------------------------------------ 2074.1 Introduction --------------------------------------------------------------------------------------- 2074.2 Summary of Major Findings ------------------------------------------------------------------ 2074.2.1 Public perceptions on the common and emerging types of corruption in the public
service ------------------------------------------------------------------------------------------ 2074.2.2 Public experiences on the common and emerging types of corruption in the public
service ------------------------------------------------------------------------------------------ 2104.2.3 Perpetrators of corruption in the public service ---------------------------------------- 2144.2.4 Root causes and reasons for engaging in corruption in the public service -------- 2164.2.5 Consequences of corruption in the public service -------------------------------------- 2164.2.6 Public response to corruption in the public service ------------------------------------ 2174.2.7 Challenges in and recommendations for addressing corruption in the public
service ------------------------------------------------------------------------------------------ 2214.3 Conclusions ---------------------------------------------------------------------------------------- 2244.4 Recommendations ------------------------------------------------------------------------------- 2244.4. 1 Key Policy Recommendations -------------------------------------------------------------- 2244.4. 2 Recommendations for Further Research ------------------------------------------------ 235REFERENCES --------------------------------------------------------------------------------------- 236APPENDICES ---------------------------------------------------------------------------------------- 242ANNEXES --------------------------------------------------------------------------------------------- 271
vi
vi
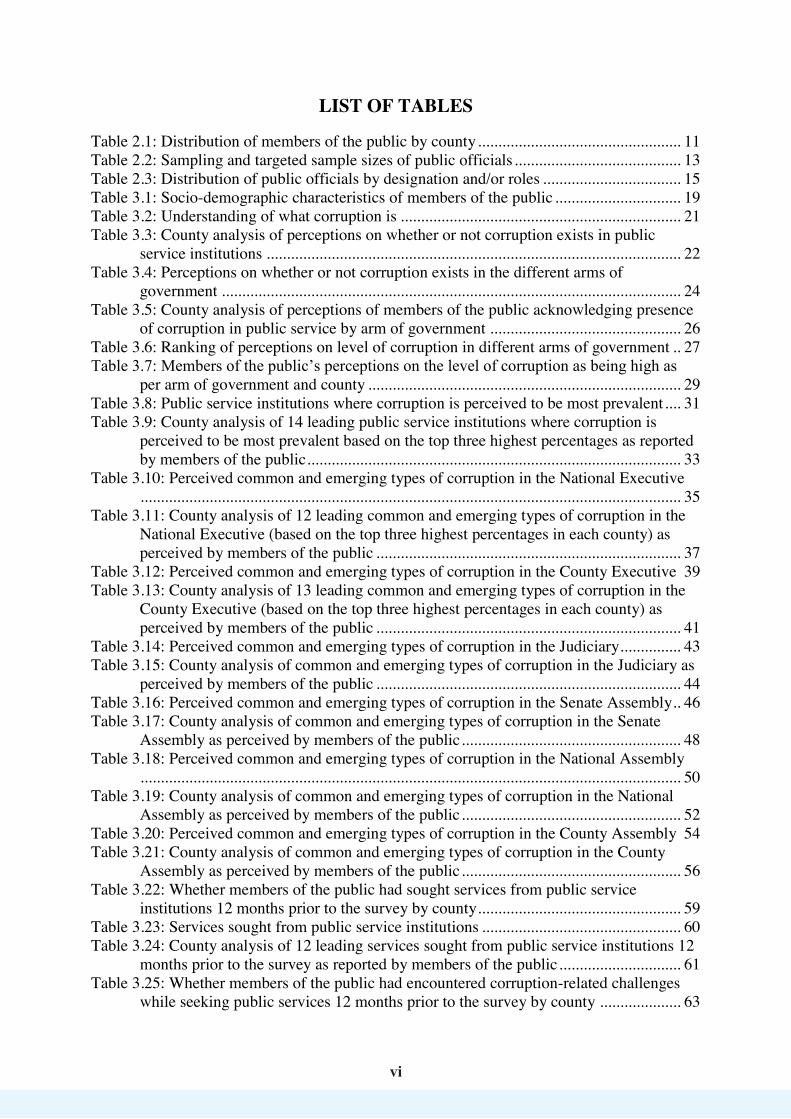
LIST OF TABLES Table 2.1: Distribution of members of the public by county .................................................. 11Table 2.2: Sampling and targeted sample sizes of public officials ......................................... 13Table 2.3: Distribution of public officials by designation and/or roles .................................. 15Table 3.1: Socio-demographic characteristics of members of the public ............................... 19Table 3.2: Understanding of what corruption is ..................................................................... 21Table 3.3: County analysis of perceptions on whether or not corruption exists in public
service institutions ...................................................................................................... 22Table 3.4: Perceptions on whether or not corruption exists in the different arms of
government ................................................................................................................. 24Table 3.5: County analysis of perceptions of members of the public acknowledging presence
of corruption in public service by arm of government ............................................... 26Table 3.6: Ranking of perceptions on level of corruption in different arms of government .. 27Table 3.7: Members of the public’s perceptions on the level of corruption as being high as
per arm of government and county ............................................................................. 29Table 3.8: Public service institutions where corruption is perceived to be most prevalent .... 31Table 3.9: County analysis of 14 leading public service institutions where corruption is
perceived to be most prevalent based on the top three highest percentages as reported by members of the public ............................................................................................ 33
Table 3.10: Perceived common and emerging types of corruption in the National Executive..................................................................................................................................... 35
Table 3.11: County analysis of 12 leading common and emerging types of corruption in the National Executive (based on the top three highest percentages in each county) as perceived by members of the public ........................................................................... 37
Table 3.12: Perceived common and emerging types of corruption in the County Executive 39Table 3.13: County analysis of 13 leading common and emerging types of corruption in the
County Executive (based on the top three highest percentages in each county) as perceived by members of the public ........................................................................... 41
Table 3.14: Perceived common and emerging types of corruption in the Judiciary ............... 43Table 3.15: County analysis of common and emerging types of corruption in the Judiciary as
perceived by members of the public ........................................................................... 44Table 3.16: Perceived common and emerging types of corruption in the Senate Assembly .. 46Table 3.17: County analysis of common and emerging types of corruption in the Senate
Assembly as perceived by members of the public ...................................................... 48Table 3.18: Perceived common and emerging types of corruption in the National Assembly
..................................................................................................................................... 50Table 3.19: County analysis of common and emerging types of corruption in the National
Assembly as perceived by members of the public ...................................................... 52Table 3.20: Perceived common and emerging types of corruption in the County Assembly 54Table 3.21: County analysis of common and emerging types of corruption in the County
Assembly as perceived by members of the public ...................................................... 56Table 3.22: Whether members of the public had sought services from public service
institutions 12 months prior to the survey by county .................................................. 59Table 3.23: Services sought from public service institutions ................................................. 60Table 3.24: County analysis of 12 leading services sought from public service institutions 12
months prior to the survey as reported by members of the public .............................. 61Table 3.25: Whether members of the public had encountered corruption-related challenges
while seeking public services 12 months prior to the survey by county .................... 63
viivii
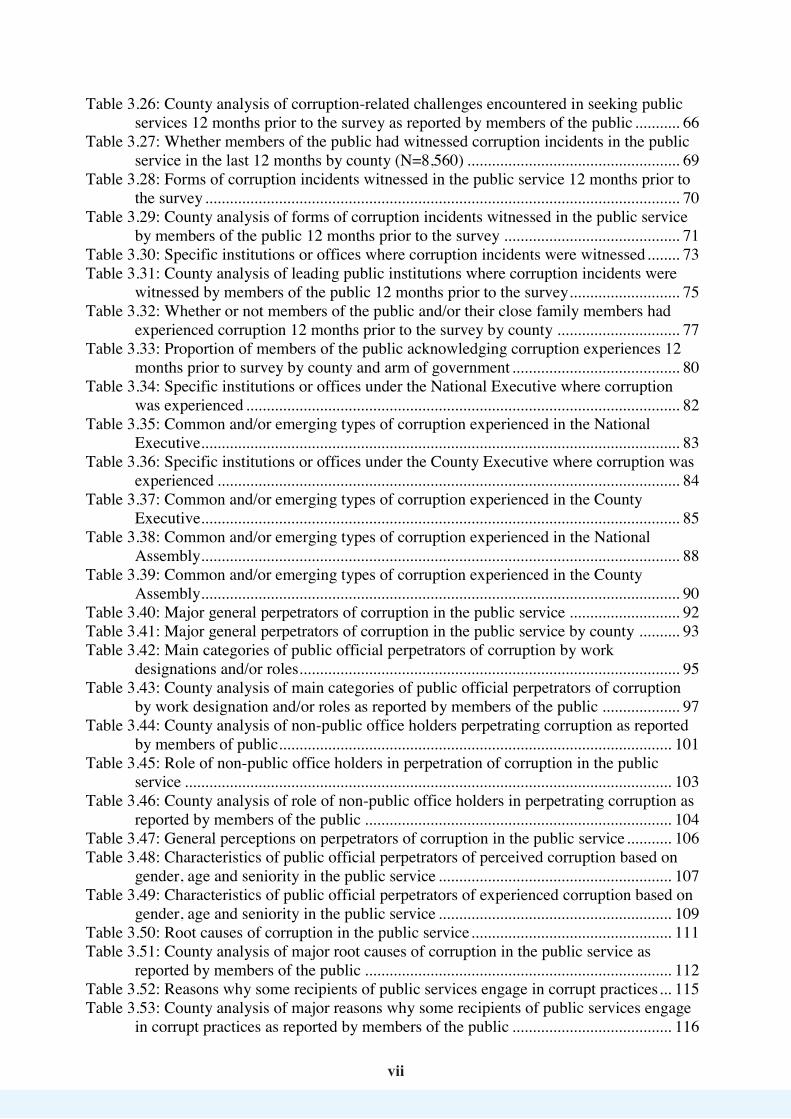
Table 3.26: County analysis of corruption-related challenges encountered in seeking public services 12 months prior to the survey as reported by members of the public ........... 66
Table 3.27: Whether members of the public had witnessed corruption incidents in the public service in the last 12 months by county (N=8,560) .................................................... 69
Table 3.28: Forms of corruption incidents witnessed in the public service 12 months prior to the survey .................................................................................................................... 70
Table 3.29: County analysis of forms of corruption incidents witnessed in the public service by members of the public 12 months prior to the survey ........................................... 71
Table 3.30: Specific institutions or offices where corruption incidents were witnessed ........ 73Table 3.31: County analysis of leading public institutions where corruption incidents were
witnessed by members of the public 12 months prior to the survey ........................... 75Table 3.32: Whether or not members of the public and/or their close family members had
experienced corruption 12 months prior to the survey by county .............................. 77Table 3.33: Proportion of members of the public acknowledging corruption experiences 12
months prior to survey by county and arm of government ......................................... 80Table 3.34: Specific institutions or offices under the National Executive where corruption
was experienced .......................................................................................................... 82Table 3.35: Common and/or emerging types of corruption experienced in the National
Executive..................................................................................................................... 83Table 3.36: Specific institutions or offices under the County Executive where corruption was
experienced ................................................................................................................. 84Table 3.37: Common and/or emerging types of corruption experienced in the County
Executive..................................................................................................................... 85Table 3.38: Common and/or emerging types of corruption experienced in the National
Assembly..................................................................................................................... 88Table 3.39: Common and/or emerging types of corruption experienced in the County
Assembly..................................................................................................................... 90Table 3.40: Major general perpetrators of corruption in the public service ........................... 92Table 3.41: Major general perpetrators of corruption in the public service by county .......... 93Table 3.42: Main categories of public official perpetrators of corruption by work
designations and/or roles............................................................................................. 95Table 3.43: County analysis of main categories of public official perpetrators of corruption
by work designation and/or roles as reported by members of the public ................... 97Table 3.44: County analysis of non-public office holders perpetrating corruption as reported
by members of public................................................................................................ 101Table 3.45: Role of non-public office holders in perpetration of corruption in the public
service ....................................................................................................................... 103Table 3.46: County analysis of role of non-public office holders in perpetrating corruption as
reported by members of the public ........................................................................... 104Table 3.47: General perceptions on perpetrators of corruption in the public service ........... 106Table 3.48: Characteristics of public official perpetrators of perceived corruption based on
gender, age and seniority in the public service ......................................................... 107Table 3.49: Characteristics of public official perpetrators of experienced corruption based on
gender, age and seniority in the public service ......................................................... 109Table 3.50: Root causes of corruption in the public service ................................................. 111Table 3.51: County analysis of major root causes of corruption in the public service as
reported by members of the public ........................................................................... 112Table 3.52: Reasons why some recipients of public services engage in corrupt practices ... 115Table 3.53: County analysis of major reasons why some recipients of public services engage
in corrupt practices as reported by members of the public ....................................... 116

viiiviii
Table 3.54: Reasons why some providers of public services engage in corrupt practices ... 118Table 3.55: County analysis of reasons why some providers of public services engage in
corrupt practices as reported by members of the public ........................................... 120Table 3.56: Consequences of corruption in the public service ............................................. 122Table 3.57: County analysis of major consequences of corruption in the public service
reported by members of the public ........................................................................... 123Table 3.58: County analysis of responses of members of the public on whether or not
experienced or witnessed corruption incidents are reported ..................................... 127Table 3.59: Responses on where experienced or witnessed corruption incidents are reported
................................................................................................................................... 129Table 3.60: County analysis of institutions where experienced or witnessed corruption
incidents are reported as indicated by members of public ........................................ 130Table 3.61: County analysis of mechanisms used for reporting experienced or witnessed
corruption cases as indicated by members of the public........................................... 133Table 3.62: County analysis of actions taken after reporting encountered corruption incidents
as indicated by members of the public ...................................................................... 136Table 3.63: Reasons for not reporting corruption in public service institutions ................... 138Table 3.64: County analysis of the reasons for not reporting corruption in public service
institutions as indicated by members of the public ................................................... 139Table 3.65: Actions individuals who have experienced or witnessed corruption ought to take
to address it ............................................................................................................... 141Table 3.66: County analysis of actions individuals who have experienced or witnessed
corruption ought to take to address it as reported by members of the public ........... 143Table 3.67: County analysis of actions taken by the local community to address corruption in
public service institutions as reported by members of the public ............................. 147Table 3.68: Actions local community ought to take to address corruption in public service
institutions ................................................................................................................. 150Table 3.69: County analysis of actions the local community ought to take to address
corruption in public service institutions .................................................................... 151Table 3.70: County level responses by members of the public on whether they are aware of
measures/initiatives put in place by state organs to address corruption ................... 154Table 3.71: Awareness on specific state organs addressing corruption in the public service
................................................................................................................................... 155Table 3.72: Most popular specific state organs addressing corruption in the public service by
county as reported by members of the public ........................................................... 157Table 3.73: Actual measures/initiatives put in place by state organs to fight corruption in the
public service ............................................................................................................ 159Table 3.74: County analysis of measures/initiatives put in place by state organs to fight
corruption as highlighted by members of the public ................................................ 161Table 3.75: Explanations for general satisfaction levels in the fight against corruption ...... 164Table 3.76: County analysis of general satisfaction levels with measures put in place by state
organs to address corruption in the public service as reported by members of the public......................................................................................................................... 165
Table 3.77: County analysis of explanations for general satisfaction levels of the members of the public with regard to measures put in place by state organs to address corruption in the public service .................................................................................................. 167
Table 3.78: Perceptions on extent to which specific state organs have successful addressed corruption in the public service ................................................................................. 170
Table 3.79: Explanations on extent of success of the Office of the Attorney General in addressing corruption in the public service .............................................................. 171
ixix
Table 3.80: Explanations for responses on extent of success of the Office of the Auditor General in addressing corruption in the public service ............................................. 173
Table 3.81: Explanations on extent of success of the EACC in addressing corruption........ 174Table 3.82: Explanations on extent of success of the ODPP in addressing corruption in the
public service ............................................................................................................ 176Table 3.83: Explanations on extent of success of the Directorate of Criminal Investigations in
addressing corruption in the public service .............................................................. 177Table 3.84: Explanations on extent of success of the Judiciary’s Anti-Corruption Courts in
addressing corruption in the public service .............................................................. 179Table 3.85: Explanations on extent of success of the National Anti-Corruption Campaign
Steering Committee in addressing corruption in the public service ......................... 182Table 3.86: Rating of public officials based on selected service delivery values ................. 184Table 3.87: County analysis of ratings on selected service delivery values as reported by
members of the public ............................................................................................... 186Table 3.88: Reasons why corruption remains unabated despite the presence of anti-corruption
laws and institutions .................................................................................................. 188Table 3.89: County analysis of reasons why corruption remains unabated despite presence of
anti-corruption laws and institutions as reported by members of the public ............ 190Table 3.90: Challenges faced in addressing corruption in public service institutions .......... 192Table 3.91: County analysis of challenges faced in addressing corruption in public service
institutions as highlighted by members of the public ............................................... 194Table 3.92: Proposed options for surmounting challenges faced in addressing corruption in
public service institutions ......................................................................................... 196Table 3.93: County analysis of the proposed options for surmounting challenges faced in
addressing corruption in the public service as reported by members of the public .. 199Table 3.94: Proposed anti-corruption interventions for the public service ........................... 201Table 3.95: County analysis of proposed anti-corruption interventions for the public service
as reported by members of the public ....................................................................... 204
xx
LIST OF FIGURES Figure 1: Conceptual framework on causes and effects of corruption in the public service .... 9Figure 2: Responses on whether or not corruption exists in public service institutions ......... 22Figure 3: Proportion of sample respondents who perceive that corruption exists in the
different arms of government...................................................................................... 25Figure 4: Ranking of arms of government according to how their level of corruption is
perceived to be high .................................................................................................... 28Figure 5: Corruption-related challenges encountered 12 months prior to the survey............. 65Figure 6: Forms of Corruption and Unethical conduct encountered in public offices (Source:
EACC (2018)) ............................................................................................................. 68Figure 7: Sample respondents acknowledging that they and/or their close family members
had experienced corruption 12 months prior to the survey by arm of government .... 79Figure 8: Common and/or emerging types of corruption experienced in the Judiciary ......... 86Figure 9: Common and/or emerging types of corruption experienced in the Senate Assembly
..................................................................................................................................... 87Figure 10: Specific institutions/Offices under the National Assembly where corruption is
experienced ................................................................................................................. 87Figure 11: Specific institutions/Offices under the County Assembly where corruption is
experienced ................................................................................................................. 89Figure 12: Institutions where bribes were paid (Source: EACC (2018))................................ 91Figure 13: Responses on whether or not non-public office holders perpetrate corruption in the
public service .............................................................................................................. 99Figure 14: Categories of non-public office holders perpetrating corruption in the public
service ....................................................................................................................... 100Figure 15: Responses on whether or not experienced or witnessed corruption incidents are
reported ..................................................................................................................... 126Figure 16: Mechanisms used for reporting experienced or witnessed corruption cases....... 132Figure 17: Actions taken after reporting experienced or witnessed corruption incidents .... 135Figure 18: Responses on whether the local community had taken any action to address
corruption in public service institutions .................................................................... 145Figure 19: Actions taken by the local community to address corruption in public service
institutions ................................................................................................................. 146Figure 20: Whether aware of measures/initiatives put in place by state organs to address
corruption in the public service ................................................................................. 153Figure 21: General satisfaction levels with measures put in place by state organs to address
corruption in the public service ................................................................................. 163Figure 22: Explanations on extent of success of the Internal Audit Department/Section in
Ministries in addressing corruption in the public service ......................................... 180Figure 23: Explanations on extent of success of the Internal Corruption Prevention
Committees in addressing corruption in the public service ...................................... 181Figure 24: Institutional frameworks effectiveness (Source: Kichwen (2017)) ..................... 183
xi
xi
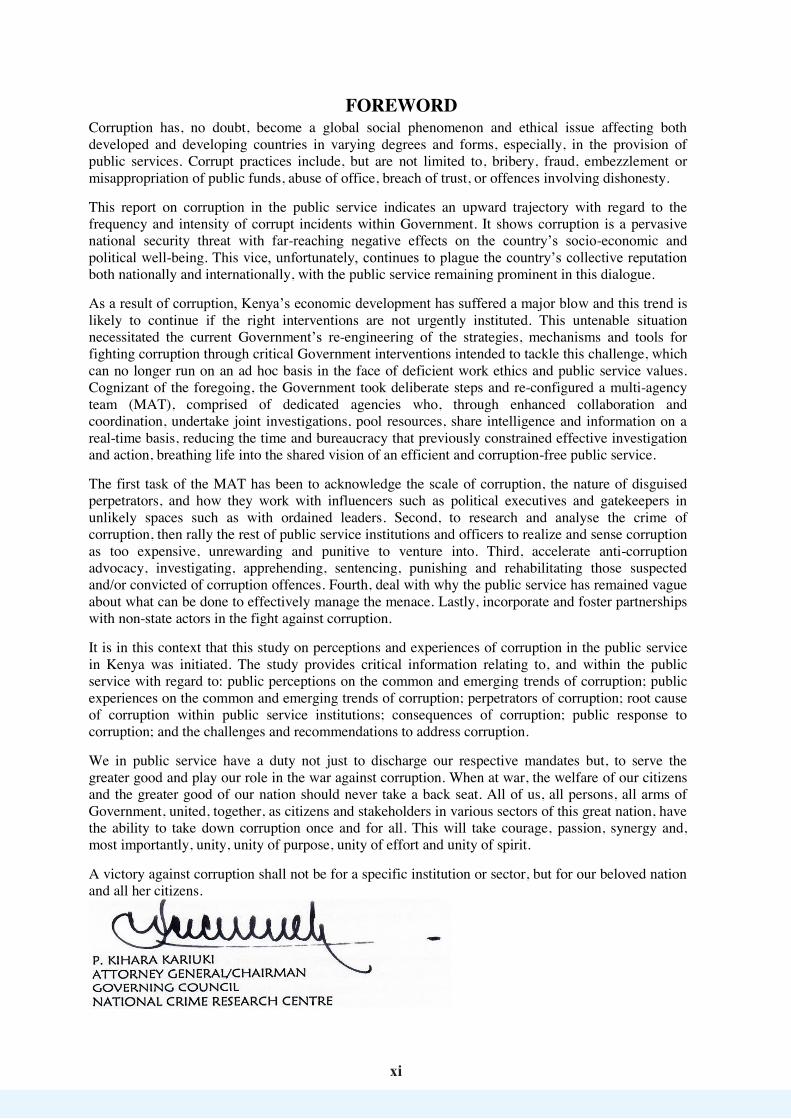
FOREWORD Corruption has, no doubt, become a global social phenomenon and ethical issue affecting both developed and developing countries in varying degrees and forms, especially, in the provision of public services. Corrupt practices include, but are not limited to, bribery, fraud, embezzlement or misappropriation of public funds, abuse of office, breach of trust, or offences involving dishonesty. This report on corruption in the public service indicates an upward trajectory with regard to the frequency and intensity of corrupt incidents within Government. It shows corruption is a pervasive national security threat with far-reaching negative effects on the country’s socio-economic and political well-being. This vice, unfortunately, continues to plague the country’s collective reputation both nationally and internationally, with the public service remaining prominent in this dialogue. As a result of corruption, Kenya’s economic development has suffered a major blow and this trend is likely to continue if the right interventions are not urgently instituted. This untenable situation necessitated the current Government’s re-engineering of the strategies, mechanisms and tools for fighting corruption through critical Government interventions intended to tackle this challenge, which can no longer run on an ad hoc basis in the face of deficient work ethics and public service values. Cognizant of the foregoing, the Government took deliberate steps and re-configured a multi-agency team (MAT), comprised of dedicated agencies who, through enhanced collaboration and coordination, undertake joint investigations, pool resources, share intelligence and information on a real-time basis, reducing the time and bureaucracy that previously constrained effective investigation and action, breathing life into the shared vision of an efficient and corruption-free public service. The first task of the MAT has been to acknowledge the scale of corruption, the nature of disguised perpetrators, and how they work with influencers such as political executives and gatekeepers in unlikely spaces such as with ordained leaders. Second, to research and analyse the crime of corruption, then rally the rest of public service institutions and officers to realize and sense corruption as too expensive, unrewarding and punitive to venture into. Third, accelerate anti-corruption advocacy, investigating, apprehending, sentencing, punishing and rehabilitating those suspected and/or convicted of corruption offences. Fourth, deal with why the public service has remained vague about what can be done to effectively manage the menace. Lastly, incorporate and foster partnerships with non-state actors in the fight against corruption. It is in this context that this study on perceptions and experiences of corruption in the public service in Kenya was initiated. The study provides critical information relating to, and within the public service with regard to: public perceptions on the common and emerging trends of corruption; public experiences on the common and emerging trends of corruption; perpetrators of corruption; root cause of corruption within public service institutions; consequences of corruption; public response to corruption; and the challenges and recommendations to address corruption. We in public service have a duty not just to discharge our respective mandates but, to serve the greater good and play our role in the war against corruption. When at war, the welfare of our citizens and the greater good of our nation should never take a back seat. All of us, all persons, all arms of Government, united, together, as citizens and stakeholders in various sectors of this great nation, have the ability to take down corruption once and for all. This will take courage, passion, synergy and, most importantly, unity, unity of purpose, unity of effort and unity of spirit. A victory against corruption shall not be for a specific institution or sector, but for our beloved nation and all her citizens.
xiixii
ACKNOWLEDGEMENTS This publication is a product of tremendous efforts, contribution and generous support received from individuals, state and non-state agencies in the country. First and foremost, the National Crime Research Centre (NCRC) is indebted to the Government of Kenya for provision of the resources utilized in undertaking the study and the general day-to-day operations towards the realization of the Centre’s core mandate. The success of the study and publication of the report is equally attributed to the overwhelming support received from the full Governing Council under the chairmanship of Hon. Justice (Rtd) Paul Kihara Kariuki with regard to approval of the required funds, and the Research and Development Committee of the Council comprising the Chairperson Dr. Linda Musumba and members -Mr. Benard N. Bwoma, Dr. Florence-Muli Musiime, Dr. Robinson Ocharo, Mr. Noah Sanganyi and Mr. Joseph Boinnet for offering the professional guidance needed throughout the process of the study. Special thanks go to Dr. Linda Musumba who personally supervised the writing of the report. The internal staff and external research resource persons of the Centre played significant roles in ensuring that the report was finalized as per the guidance given by the Governing Council, and to all of them, I say a big thank you. Special acknowledgements go to Mr. Kenneth Bundi Mbaya, Mr. John Ngugi Kariuki and Mr. Steven Nyamai Kimetu who wrote the first draft of the report and Mr. Stephen Masango Muteti who analyzed the data and authored the final report. The Centre also wishes to appreciate Prof. Simiyu Wandibba for his professional peer-review of the report. Last but not least, the Centre acknowledges the immense contribution and support of all members of the public, state and non-state officials and the various groups that willingly participated in the study and accorded the Centre great support and cooperation during the whole process of the study and publication of the final report.
GERARD E. WANDERA DIRECTOR/CEO NATIONAL CRIME RESEARCH CENTRE

xiiixiii
OPERATIONAL DEFINITION OF TERMS Challenges faced in addressing corruption These were the difficulties, hindrances and/or obstacles encountered in the effort to address corruption in the public service. Consequences of corruption This referred to the the negative socio-cultural, economic and political effects of public service corruption. Corruption This referred to “the misuse of public office for private gains”. In Kenya, corruption is an offence under any of the provisions of sections 39 to 44, 46 and 47 of the Economic and Anti-Corruption Act, 2003 and includes bribery, fraud, embezzlement or misappropriation of public funds, abuse of office, breach of trust and an offence involving dishonesty (Economic and Anti-Corruption Act, 2003). Disguised perpetrators These are camouflaged groups and/or categories of individuals who directly or indirectly misuse public offices for private gains and sometimes pursue enticement and bribes through namedropping of appointed, elected and ordained leaders. Perpetrators of corruption This referred to categories of individuals who directly or indirectly misuse public offices for private gains.
Public service The term was used to refer to the three arms of Government namely, the executive (both at the national and county level), legislature (both at the national and county level) and the Judiciary. Public service corruption This referred to the misuse of public office for private gain within the three arms of Government. Response to corruption This referred to actions taken by individuals, local community members and state organs to address corruption committed in the three arms of Government. Root causes of corruption These were the factors contributing to, facilitating or enabling corruption in the three arms of Government. Unexplained wealth accumulation This is the transfer and/or accumulation by public and non-public officials of finances and assets of inexplicable amounts and/or values that far exceed their legitimate source of income.

xivxiv
ABBREVIATIONS AND ACRONYMS
ADB Asian Development Bank ASALs Arid and Semi-Arid Lands CDF Constituency Development Fund CEO Chief Executive officer CCTV Closed Circuit Television DCI Directorate of Criminal Investigations EACC Ethics and Anti-Corruption Commission GDP Gross Domestic Product GHRIS Government Human Resource Information System HELB Higher Education Loans Board ICAC Independent Commission Against Corruption IEBC Independent Electoral and Boundaries Commission IFMIS Integrated Financial Management Information System IPOA Independent Policing Oversight Authority KDF Kenya Defence Forces KFS Kenya Forest Service KI Key Informant KMTC Kenya Medical Training College KNBS Kenya National Bureau of Statistics KNEC Kenya National Examinations Council KPA Kenya Ports Authority KPC Kenya Pipeline Company KPLC Kenya Power and Lighting Company KRA Kenya Revenue Authority KWS Kenya Wildlife Service MCA Member of County Assembly MDAs Ministries, Departments and Agencies MP Member of Parliament MTP Medium Term Plan NACADA National Authority for the Campaign Against Alcohol and Drug Abuse NCIC National Cohesion and Integration Commission NCPB National Cereals and Produce Board NCLR National Council for Law Reporting NCRC National Crime Research Centre NDMA National Disaster Management Authority NGO Non-Governmental Organization NHIF National Hospital Insurance Fund NPS National Police Service NSSF National Social Security Fund NTSA National Transport and Safety Authority NYS National Youth Service OB Occurrence Book

xv
xv
ODPP Office of the Director of Public Prosecutions OECD Organization for Economic Co-operation and Development PSC Public Service Commission PSV Public Service Vehicle SPSS Statistical Package for Social Scientists SRC Salaries and Remuneration Commission TI Transparency International TSC Teachers Service Commission UN United Nations UNDP United Nations Development Programme UNODC United Nations Office on Drugs and Crime
xvi
xvi
EXECUTIVE SUMMARY
Corruption, regarded as a serious and organized economic crime affecting the populace in Kenya, has become an endemic problem and is now regarded as a serious threat to national development. It is a pervasive national security threat with far-reaching negative effects on Kenya’s socio-economic and political well-being and international reputation. Although there are mixed reactions on its magnitude in the country, the negative impact of corruption has been felt both in the public and private sectors of the country’s economy. While corruption prevention is quite noticeably the sphere of national security with immediate and commonplace implications for the public, efforts by previous and current governments taking a number of dimensions to combat public service corruption are perceived to have realized minimal success. Premised on the above background, this study sought to establish the perceptions and experiences of corruption in the public service in Kenya with a view to informing evidence-based policy planning and formulation on the subject. The specific objectives were to: establish the public perceptions on the common and emerging types of corruption; establish the public experiences on the common and emerging types of corruption; identify the different perpetrators of corruption; ascertain the root cause of corruption in public service institutions; appraise the consequences of corruption; assess public response to corruption; and identify the challenges and make appropriate recommendations for addressing corruption. Through probability and non-probability sampling techniques, a sample of 8627 members of the public (out of the targeted 8767 thus representing a 98.4% response rate) and 1795 public officials (out of the targeted 8258 thus representing a 21.7% response rate) was drawn and covered by the study. Key informants who were senior officials were drawn from both state and non-state agencies. Both primary and secondary sources of data and data collection methods were utilized and the Statistical Package for Social Scientists (SPSS) software was used in the analysis of quantitative data. Findings that were reported by at least 1 out of 10 members of the public and/or public official sample respondents were deemed significant for the purpose of policy recommendation. All the results were thematically presented based on the study objectives. Key Findings Public perceptions on types of corruption in the public service According to the findings of the study, corruption in the public service was majorly perceived as: bribery (that is, soliciting for and/or receiving bribes); embezzlement/misuse/ misappropriation of public funds/resources; abuse of power and/or office; dishonesty by public officials; and giving and/or receiving a valuable public resource in exchange for personal favours. A greater proportion (92.6%) of the members of the public compared to public officials (85.0%) perceived that there was corruption in public service institutions in Kenya with more than 63.0% of the members of the public in each of the 47 counties

xviixvii
perceiving that corruption existed in these institutions. Based on the average perceptions of the members of the public and public officials, corruption was perceived to exist in all the arms of government, with the highest to the lowest ranked arm of government being the National Executive, County Executive, County Assembly, Judiciary, National Assembly and the Senate Assembly. According to the findings of the study, the specific public service institutions where corruption was perceived to be most prevalent were the: National Police Service (NPS), particularly the Traffic Police and Police in border areas; County Government; Ministry of Health; Ministry of Lands and Physical Planning; Judiciary/Law Courts; and the Ministry of Interior and Coordination of National Government. Based on the three highest percentages recorded from members of the public in each of the counties on where corruption was most prevalent, the institutions featuring in at least a third of the counties were the National Police Service (in 46 counties), County Government (in 31 counties), Ministry of Interior and Coordination of National Government (in 25 counties) and the Ministry of Health (in 24 counties). Further findings showed that the perceived leading common and emerging types of corruption in the Executive Arm of the National Government were: bribery (soliciting for and/or receiving bribes); flouting procurement; embezzlement/misuse/misappropriation of public funds/resources; and nepotism in service delivery. On the basis of the three highest percentages reported by members of the public in each of the counties, the common and emerging types of corruption featuring in at least a third of the counties were bribery, embezzlement/misuse/misappropriation of public funds/resources and nepotism in service delivery. The major perceived common and emerging types of corruption in the Executive Arm of the County Government reported by at least 1 out of 10 members of the public and/or public officials were found to be: flouting procurement regulations; bribery, that is, soliciting for and/or receiving bribes; embezzlement/misuse/misappropriation of public funds/ bribes; nepotism in service delivery; and corruption in job recruitments. The perceived common and emerging types of corruption reported by members of the public and featuring in at least a third of the counties (based on the three highest percentages reported by members of the public in each of the counties) were: bribery; embezzlement/misuse/misappropriation of public funds/resources; and nepotism in service delivery. The perceived common and emerging type of corruption in the County Assembly were: embezzlement/misuse/misappropriation of public funds/resources; bribery (that is, soliciting for and/or receiving bribes); flouting procurement regulations; nepotism in service delivery; discrimination in service delivery; abuse of office; and passing defective laws. On the basis of the three highest percentages in each of the analyzed counties reported by members of the public, the common and emerging types of corruption featuring in at least a third of the
xviiixviii
counties were embezzlement/misuse/misappropriation of public funds/resources, nepotism in service delivery, bribery and discrimination in service delivery. The findings of the study showed that the major perceived common and emerging types of corruptions in the Judiciary were: bribery (that is, soliciting for and/or receiving bribes); influenced cases/unjust verdicts and delay/dragging of service delivery. County analysis of perceptions of members of the public based on the three highest percentages in each of the counties showed that the common and emerging types of corruption featuring in at least a third of the counties were: bribery; influenced cases/unjust verdicts; delay/dragging of service delivery; and discrimination in service delivery. The common and emerging types of corruption in the National Assembly perceived by at least 1 out of 10 members of the public and/or public officials were: embezzlement/misuse/ misappropriation of public funds/resources; bribery, that is, soliciting for and/or receiving bribes; abuse of office; passing defective; nepotism in service delivery; and discrimination in service delivery. The common and emerging types of corruption featuring in at least a third of the counties (based on the three highest percentages reported by members of the public in each of the counties) were embezzlement/misuse/misappropriation of public funds/resources, bribery, nepotism in service delivery and discrimination in service delivery. The most perceived common and emerging type of corruption in the Senate Assembly were: bribery; embezzlement/misuse/misappropriation of public funds/resources; and abuse of office. Based on the three highest percentages reported by members of the public in each of the analyzed counties, the common and emerging types of corruption featuring in at least a third of the counties were: bribery; embezzlement/misuse/misappropriation of public funds/resources; abuse of office; nepotism in service delivery; and discrimination in service delivery. Public experiences on types of corruption in the public service Corruption in the public service is experienced majorly in the context of seeking services. Nationally, the findings showed that 69.5% of the members of the public and/or their close family members and 64.6% of the public officials and/or their close family members had sought services from the public service. County-specific analysis also showed that more than 50.0% of the members of the public and/or their close family members in 45 out of the 47 counties had sought public services. The most sought services, nationally, were: registration of persons services, hospital/medical-related services, lands-related services, employment/recruitment services, police-related services and bursary services. Based on the three highest percentages recorded from members of the public in each of the counties, the services sought in at least a third of the counties were registration of persons services, hospital/medical-related services, bursary services and employment/recruitment services. According to the findings, nationally, majority of the members of the public (71.3%) and public officials (55.0%) and/or their close family members had, 12 months prior to the

xixxix
study, encountered corruption-related challenges while seeking services from public institutions. County-specific analysis showed that at least 50.0% of the members of the public and/or their close family members in 44 out of 47 counties had encountered these challenges. With regard to the nature of the corruption-related challenges members of the public and public officials and/or their close family members had faced while seeking public services, at least 1 out of 10 members of the public and/or public officials affirmed that they had faced: bribery, that is, soliciting for and/or receiving bribes; delay in delivery of justice and/or services; and poor service delivery. The findings further showed that the corruption-related challenges featuring in at least a third of the 47 counties (based on the three highest percentages recorded from members of the public in each of the counties) were bribery, delay in delivery of justice and/or services, poor service delivery and favoritism and/or intimidation. Nationally, majority of the members of the public (58.6%) and slightly below a half of the public officials (49.3%) confirmed that they and/or their close family members had witnessed corruption incidents in the public service 12 months prior to the survey, the main incident being bribery (soliciting for and/or receiving bribes). In all the counties, at least 2 out of 10 members of the public and/or their close family members had witnessed corruption in the public service. However, 33 out of 47 counties had more than 50.0% of the members of the public and/or their close family members witness corruption incidents with bribery being the most common corruption-related incident. County analysis (based on the three highest percentages in each of the counties) of the corruption incidents witnessed by members of the public 12 months prior to the survey showed that the forms of corruption incidents featuring in at least a third of the counties were bribery, discrimination and/or favoritism and/or nepotism in service delivery, poor service delivery and extortion. The results of the study showed that corruption incidents were witnessed by members of the public and public officials 12 months prior to the survey majorly within the National Police Service, County Government and the National Government Administrative Office. On the basis of the three highest percentages recorded from members of the public in each of the counties, the institutions (where corruption incidents were witnessed) featuring in at least a third of the counties were the National Police Service, National Government Administrative Office and the county government. The findings of this study established that majority of the members of the public and more than a third of the public officials and/or their close family members had experienced acts of corruption in the public service 12 months prior to the survey. In all the counties, at least 2 out of 10 members of the public and/or their close family members had experienced acts of corruption with majority of them having experienced corruption in at least 27 of the 47 counties. With regard to corruption experiences within the specific arms of government during the period 12 months prior to the study, the following was established: majority of the members
xxxx
of the public and public officials and/or their close family members had experienced corruption in the National Executive arm of government; majority of the members of the public and public officials and/or their close family members had experienced acts of corruption in the County Executive arm of government; majority of the members of the public and more than a quarter of the members of the public and/or close members of their families had experienced different acts of corruption in the Judiciary; more than a quarter of members of the public and about half of the public officials and/or their close family members had experienced corruption-related cases in the County Assembly; about a quarter of the public officials and about a tenth of the members of the public and/or their close family members had experienced corruption in the National Assembly; and the least proportion of members of the public and public officials and/or their close family members had experienced corruption in the Senate Assembly. Therefore, in order of ranking of the arms of government from the highest to the lowest, corruption was experienced by members of the public and public officials and/or their close family members from the National Executive arm of government followed by County Executive arm of government, Judiciary, County Assembly, National Assembly and the Senate Assembly. Other findings showed that larger proportions of public officials and/or their close family members than members of the public and/or their close family members had experienced corruption in 5 of the 6 sections of the three broad arms of government. With regard to institutions within the National Executive arm of government where corruption was experienced by members of the public and public officials and/or their close family members during the period 12 months prior to the survey, the most adversely mentioned were the: National Police Service; National Government Administrative Office; National Registration Bureau; and the Ministry of Lands and Physical Planning. Bribery was the most common and/or emerging type of corruption experienced in the National Executive. Findings of the study from at least 1 out of 10 members of the public and/or public officials showed that institutions within the County Executive arm of government where members of the public and public officials and/or their close family members experienced corruption during the period 12 months prior to the survey were the general County Government Executive, followed specifically by the Ministry of Health, the Governor’s Office and the Procurement Department. In order of prominence, the common and emerging type of corruption most experienced in the County Executive were bribery; flouting of procurement regulations, nepotism in service delivery; corruption in job recruitments; and embezzlement/misuse/misappropriation of public funds/resources. Within the Judiciary, the common and/or emerging types of corruption mostly experienced by at least 1 out of 10 members of the public and/or the public officials and/or their close family members during the period 12 months prior to the survey were: bribery; delay/dragging of service delivery; and influenced cases/unjust verdicts. Other findings of this study reported by at least 1 out of 10 members of the public and/or public officials on

xxi
xxi
corruption within the Senate Assembly were that: majority of the public officials and more than a third of the members of the public and/or their close family members had, during the period 12 months prior to the survey, experienced abuse of office; bribery and embezzlement/misuse/misappropriation of public funds/resources. According to the findings, the specific institutions within the National Assembly where corruption was experienced by members of the public and/or the public officials and/or their close family members during the period 12 months prior to the survey were the Constituency Development Fund (CDF) Office and the Member of Parliament’s Office. The most experienced common and emerging types of corruption in the National Assembly were: embezzlement/misuse/misappropriation of public funds/resources; bribery; nepotism in service delivery; actual and/or facilitation of implementation of shoddy/ghost /white elephant projects; abuse of office; and discrimination in service delivery. Within the County Assembly arm of government, corruption was experienced during the period 12 months prior to the survey by majority of the public officials and members of the public and/or their close family members in the Ward-level MCA’s Office. The leading common and/or emerging types of corruption were: abuse of office; embezzlement/misuse/misappropriation of public funds/resources; discrimination in service delivery; nepotism in service delivery; and bribery. Perpetrators of corruption in the public service Results of the study showed that majority of the members of the public and public officials agreed with the statement that corruption in the public service was perpetrated by a public official partnering with another public official. Further, majority of the public officials and members of the public agreed with the statement that corruption in the public service was perpetrated by a public official partnering with a non-public official. Hence corruption in the public service majorly has the involvement of at least two public officials and a non-public official. The findings of the study showed that the perceived major general perpetrators of corruption in the public service singled out by at least 1 out of 10 members of the public and/or public officials, were public servants in general; Police Officers; members of the public; County Government staff; and Chiefs. On the basis of the three highest percentages in each of the counties, the categories of major general perpetrators featuring in at least a third of the counties were Police Officers, public servants, County Government staff and Chiefs. The leading public official perpetrators of corruption in the public service with regard to their work designations and/or roles and in order of prominence (based on the highest percentage reported by either the members of the public or the public officials) were Police Officers, National Government Administrative Officers, procurement staff, Members of County Assembly, Governors and Accountant. The main categories of public official perpetrators featuring in at least a third of the counties (according to the three highest percentages
xxiixxii
recorded from members of the public) were Police Officers, National Government Administrative Officers and Member of County Assembly. According to majority of the public officials and most of the members of the public, corruption in the public service was also perpetrated by non-public office holders with the main ones being business persons, the general public, other professionals and brokers. County data from members of the public based on the three highest percentages in each of the counties showed that the main categories of non-public office holders featuring in at least a third of the counties were business persons, general public, brokers and other professionals. The major roles of the non-public office holders in the perpetration of corruption in the public service were: giving bribes to public officials; colluding (including with drug peddlers) to influence public offices; and canvassing for tenders. The three most prominent responses of the members of the public in each of the counties on the roles of non-public office holders in the perpetration of corruption showed that the roles that were prominent in at least a third of the counties were giving bribes, colluding (including with drug peddlers) to influence public office and canvassing for tenders. With regard to characteristics of public official perpetrators of corruption, the findings showed that public official perpetrators of perceived and experienced corruption were majorly middle aged, that is, 36-50 years old and males who were in the middle to senior cadre level in terms of seniority in the public service, with most of them being in the senior cadre level. Root causes and reasons for engaging in corruption in the public service The major root cause of corruption in the public service was greed, followed by low wages, poverty, poor management and rationalization of corruption. The root causes of corruption featuring in at least a third of the counties (based on the three highest responses recorded from members of the public) were greed, poverty, low wages and poor management. The reasons (in order of prominence) that were identified by at least 1 out of 10 members of the public and/or public officials on why some recipients of public services engage in corrupt practices were: urgency of needed service; greed; culture of impunity; limited alternatives for improved livelihood; and quest for financial freedom. County-specific analysis of responses from members of the public on the basis of the three highest percentages in each of the counties showed that the reasons featuring in at least a third of the counties were urgency of needed service, greed and limited alternatives for improved livelihood. The main reasons why some providers of public services engaged in corrupt practices in the public service were found to be: greed; low wages; poor governance systems in the country; and lack of respect for public offices and other Kenyans. Similarly, based on the three highest percentages recorded from members of the public in each of the counties, the
xxiiixxiii
reasons featuring in at least a third of the counties were greed, low wages and lack of respect for public offices and other Kenyans. Consequences of corruption in the public service The main consequences (in order of prominence) listed by at least 1 out of 10 members of the public and/or public officials were: delayed and/or poor services; underdevelopment; increased levels of poverty; loss of jobs; social inequality; and loss of public resources. County-specific analysis of responses from members of the public on the basis of the three highest percentages in each of the counties showed that the consequences featuring in at least a third of the counties were underdevelopment, increased levels of poverty and delayed and/or poor services. Public response to corruption in the public service The findings of the study showed that majority of the members of the public and public officials and/or their close family members who had either witnessed or experienced corruption did not report the corruption incidents. A similar pattern of non-reporting of corruption incidents was observed in all the counties with majority of the members of the public respondents and/or their close family members who had witnessed or experienced corruption incidents in each of the 47 counties not reporting the incidents. The main reasons on why experienced or witnessed corruption incidents were not report were that: nothing happens even when you report; there is fear of victimization; some people do not know where to report; corruption is almost normal, hence no need for reporting; there is no confidence in corruption reporting; and that there is nowhere to report. Based on the three highest percentages of the responses of memers of the public in each of the counties, the reasons for not reporting that were prominent in at least a third of the counties were: fear of victimization; nothing happens even when you report; some people do not know where to report; no confidence in corruption reporting; nowhere to report; and corruption is almost normal, hence no need for reporting. The findings showed that at least 1 out of 10 members of the public and/or public officials and/or their close family members who had reported the corruption incidents they had witnessed or experienced reported to: the National Government Administrative Office, that is, County Commissioner and line officers; National Police Service; Journalists; and unspecified Senior Management Office. Based on the three highest percentages of responses from members of the public in each of the counties, the institutions where corruption incidents were reported and that featured at least in a third of the counties were the National Government Administrative Office, that is, County Commissioner and line officers, National Police Service, unspecified Senior Management Office and unspecified County Government Office. Nationally, the most popular corruption reporting mechanisms used by individuals were: verbal reporting; Complaints and/or Suggestion Box; Complaints Register and/or Occurrence Book; official letter and anonymous letter. Based on the three highest

xxivxxiv
percentages in each of the counties, the mechanisms featuring prominently in at least a third of the counties were verbal reporting, Complaints and/or Suggestion Box, Complaints Register and/or Occurrence Book, telephone call and official letter. Further, majority of the members of the public and public officials pointed out that no action was taken after reporting corruption incidents they and/or their close family members had experienced or witnessed. Absence of action by the relevant agencies against the reported witnessed or experienced corruption incidents was also mentioned by more than half of the members of the public respondents in 32 out of 47 counties (that is, in 68.1% of the counties). With regard to what actions individuals who have experienced or witnessed corruption ought to take to address it, the most popular actions were: reporting corruption cases to relevant authority; desisting from engaging in corruption; and being uncooperative to corrupt public officials until they stop being corrupt. On the basis of the three highest percentages recorded from members of the public in each county, the actions that ought to be taken by individuals that featured in at least a third of the counties were: reporting corruption to relevant authorities; desisting from engaging in corruption; and being uncooperative to corrupt public officials until they stop being corrupt. On whether or not the local community had taken action to address corruption in public service institutions, majority of the members of the public and most of the public officials argued that it had not. However, according to the few who argued that the local community had taken some actions, the most popular actions were: public demonstrations against corruption; reporting corrupt officers to relevant authorities; anti-corruption civic education; and exposing corrupt practices. Based on the three highest percentages in each of the counties, the actions that featured in at least a third of the counties were: reporting corrupt officers to relevant authorities; public demonstrations against corruption; anti-corruption civic education; exposing corruption practices; and refusing to engage in corruption. Findings of the study indicated that the actions that the local community ought to take to address corruption in public service institutions were: reporting corruption to the relevant authorities; engaging in community sensitizations against corruption; uniting and speaking in one voice against corruption; and community members desisting from giving bribes. The actions that the local community ought to take to address corruption in the public service that featured in at least a third of the counties (based on the three highest percentages of responses of members of the public in each of the counties) were reporting corruption to the relevant authorities, engaging in community sensitizations against corruption and uniting and speaking in one voice against corruption. The results of the study showed that awareness of measures/initiatives put in place by state organs to address corruption in the public service was exceptionally high among public officials (68.9%) compared to members of the public (25.9%). Further, majority of the members of the public in all the counties except in Kirinyaga county were not aware of the measures/initiatives put in place by state organs to address corruption in the public service.
xxvxxv
With regard to awareness on specific state organs addressing corruption in the public service, the most popular state organs were the Ethics and Anti-Corruption Commission and the National Police Service and especially the Directorate of Criminal Investigations. A county-level analysis based on the three highest percentages of responses of members of the public showed that the state organs that were most popular in at least a third of the counties were the Ethics and Anti-Corruption Commission, the National Police Service and especially the Directorate of Criminal Investigations, National Government Administrative Office and the Judiciary. The measures and/or initiatives put in place by state organs to fight corruption in the public service that were listed by at least 1 out of 10 members of the public and/or public officials were: investigation of corruption; civic education/public awareness on corruption; arrest of corrupt officials; management of suggestion boxes; prosecution of corrupt officials; exposing/whistle blowing of corrupt officials; offering of efficient and corruption-free services; and institution-specific/localized anti-corruption measures. Based on the three highest percentages of the responses of the members of the public in each of the 47 counties, the measures and/or initiatives that came out strongly in at least a third of the counties were investigation of corruption, civic education/public awareness on corruption, arrest of corrupt officials, exposing/whistle blowing of corrupt officials and prosecution of corrupt officials. Findings of the study showed that majority of the members of the public and public officials were generally not satisfied with the measures/initiatives put in place by state organs to address corruption in the public service. Overall, most of the sample respondents gave negative explanations to emphasize why they were not satisfied with the measures, with the most prominent explanations being that there was no serious action taken against corruption and that they had no confidence in the anti-corruption system. Further, county-specific analysis showed that majority of the members of the public in at least 40 counties was generally not satisfied with the measures/initiatives. This implied that measures put in place by state organs in addressing corruption in 87.2% of the 47 counties were generally not satisfactory to most of the members of the public. The negative explanations that featured prominently in at least a third of the counties (based on the three highest ercentages of responses of the members of the public in each county) were that: there is no serious action taken against corruption; there is inadequate arrests and/or jailing of perpetrators; and there is no confidence in the anti-corruption system. With regard to the perceptions on the extent to which state organs had successfully addressed corruption in the public service, an overall index, computed as an average of all responses across different state organs, showed that 57.6% of the members of the public and 18.9% of the public officials did not know the extent. However, of the members of the public who could rate the success of the state organs in addressing corruption, most of them reported that all the state organs were not successful at all, with those leading in being unsuccessful being the Judiciary’s Anti-Corruption Courts, followed by the DCI and the EACC. On the other hand, most of the public officials thought that the state organs had

xxvi
xxvi
achieved some marginal level of success and hence rated the organs as majorly successful to a small extent, with the least performing organ being the EACC, followed by Judiciary’s Anti-Corruption Courts and the ODPP. Findings on rating of public officials based on 8 selected service delivery values showed that majority of the members of the public and public officials rated their interaction with public officials as unsatisfactory. Majority of the members of the public rated all the 8 selected service delivery values as unsatisfactory while most of the public officials rated 7 of the 8 values as unsatisfactory. The service delivery values that were rated by the largest proportion of the members of the public as unsatisfactory included honesty and trust, transparency and accountability, prompt service delivery and impartiality. On the other hand, the service delivery values that were rated by the largest proportion of the public officials as unsatisfactory included transparency and accountability, impartiality, honesty and trust and prompt service delivery. Therefore, the top four unsatisfactory service delivery values reported by both the members of the public and public officials were: honesty and trust; transparency and accountability; prompt service delivery; and impartiality. County-specific analysis on rating of selected service delivery values showed that all the 8 values were rated unsatisfactorily by more than 50.0% of the members of the public in at least 39 of the 47counties. Challenges in and recommendations for addressing corruption in the public service The major reasons given by at least 1 out of 10 members of the public and/or public officials on why corruption remained unabated despite the presence of anti-corruption laws and institutions were: inadequate close monitoring of public officials’ ethical conduct, weak legal frameworks and/or compromised and lax law enforcement; culture of impunity, pro-corruption attitude on consequences and rationalization of corruption as part of the public service system; citizens’ ignorance, lack of confidence and their inadequate involvement from the grassroots level in the fight against corruption; and inadequate government leadership commitment to fight corruption, bad governance and corrupt leadership. Based on the three highest percentages of responses from members of the public in each of the counties, the reasons that featured prominently in at least a third of the counties were: inadequate close monitoring of public officials’ ethical conduct, weak legal frameworks and/or compromised and lax law enforcement; culture of impunity, pro-corruption attitude on consequences and rationalization of corruption as part of the public service system; and citizens’ ignorance, lack of confidence and their inadequate involvement from the grassroots level in the fight against corruption. The most prominent challenges faced in addressing corruption in the public service were: engagement of top government officials in corruption, inadequate vetting of senior public officials and political interference in anti-corruption initiatives; lack of commitment by county and national government agencies to fight corruption (including failure to declare it a national disaster) and/or inadequate law enforcement/implementation; fear of victimization, intimidation, threats, assassination and abduction from corruption cartels; culture of
xxviixxvii
impunity, selfishness, dishonesty, pro-corruption attitude on consequences and rationalization of corruption in the public service as normal; bureaucracy and lack of professionalism in the public service, inadequate automation of public services and poor remuneration; and public/citizen ignorance, lack of sensitization and awareness about corruption. Based on the three highest percentages of the challenges reported in each of the counties by members of the public, the challenges that featured prominently at least in a third of the counties were: engagement of top government officials in corruption, inadequate vetting of senior public officials and political interference in anti-corruption initiatives; lack of commitment by county and national government agencies to fight corruption (including failure to declare it a national disaster) and/or inadequate law enforcement/implementation; fear of victimization, intimidation, threats, assassination and abduction from corruption cartels; and culture of impunity, selfishness, dishonesty, pro-corruption attitude on consequences and rationalization of corruption in the public service as normal. The study established six (6) major options for surmounting challenges faced in addressing corruption in public service institutions and these were: strengthening and/or indiscriminately implementing/enforcing anti-corruption laws, including the arrest and dismissal of corrupt officials and recovery of corruptly-acquired assets; undertaking public/citizen sensitization and awareness creation about the different aspects of corruption; reforming and/or professionalizing the public service (for example through proper recruitment and deployment of competent officers, use of technology and automation of services, proper remuneration and merger of institutions with similar/related roles); whole of government commitment in the fight against corruption including non-politicization of anti-corruption iniatiatives; appointment and/or election of leaders of integrity; and enhancing the resourcing and strengthening the operations of the EACC and other anti-corruption institutions up to the devolved units. Based on the three highest percentages of responses of members of the public in each of the counties, the proposed options that featured prominently in at least a third of the counties were: strengthening and/or indiscriminately implementing/enforcing anti-corruption laws (including arrest and dismissal of corrupt officials and recovery of corruptly-acquired assets); undertaking public/citizen sensitization and awareness creation about corruption; whole of government commitment in the fight against corruption including non-politicization of anti-corruption iniatiatives; appointment and/or election of leaders of integrity; and reforming and/or professionalizing the public service (for example, through proper recruitment and deployment of competent officers, use of technology and automation of services, proper remuneration and merger of institutions with similar/related roles). The study found out that the major proposed anti-corruption interventions for the public service were: strengthening and/or implementing/enforcing anti-corruption laws and structures (including wealth declaration policy, auditing mechanisms, arrest and dismissal of corrupt officials, recovery of corruptly-acquired assets, monitoring and evaluation of projects and other new anti-corruption systems/mechanisms); reforming and/or professionalizing the public service (for example through staff training/capacity building,
xxviii
xxviii
service delivery in Huduma Centres, proper recruitment and deployment of competent officers with integrity, use of technology and automation of services, better terms of service and remuneration); and undertaking public/citizen sensitization and awareness creation about the different aspects of corruption. Based on the three highest percentages of responses of members of the public in each of the counties, the proposed interventions that featured prominently in at least a third of the counties were: strengthening and/or implementing/enforcing anti-corruption laws and structures (including wealth declaration policy, auditing mechanisms, arrest and dismissal of corrupt officials, recovery of corruptly-acquired assets, monitoring and evaluation of projects and other new anti-corruption systems/mechanisms) which featured in all the counties; reforming and/or professionalizing the public service (for example through staff training/capacity building, service delivery in Huduma Centres, proper recruitment and deployment of competent officers with integrity, use of technology and automation of services, better terms of service and remuneration); and undertaking public/citizen sensitization and awareness creation about the different aspects of corruption. Key Policy Recommendations 1. There is need for corruption prevention to form a deliberate standing agenda among all
heads of the arms of government and the heads of Ministries, Departments and Agencies (MDAs) especially those responsible for the National Police Service, National Government Administrative Office, National Registration Bureau, Ministry of Lands and Physical Planning, County Government, Ministry of Health, Governor’s Office, Members of Parliament Office, CDF Office, Ward-level Member of County Assembly Office, County Assembly’s Office and the Judiciary as part of raising vigilance against the vice.
2. The Ethics and Anti-Corruption Commission, in partnership with the Central Bank of Kenya, Kenya Bankers Association, Kenya Institute of Bankers and the Kenya Revenue Authority, needs to prioritize disruption of professional enablers of corruption by undertaking regular vetting and impromptu internal and external monetary, unaccounted wealth accumulation and lifestyle audit and trail of all public officials (and especially the middle to senior cadre level male officials aged 36-50 years working as Police Officers, National Government Administrative Officers, procurement staff, Member of County Assembly, Governor and Accountant).
3. The Ethics and Anti-Corruption Commission needs to partner with the National Intelligence Service, Directorate of Criminal Investigations, Central Bank of Kenya, Kenya Bankers Association, Kenya Institute of Bankers, Kenya Revenue Authority and the Registrar of Companies to sanitize records of companies doing business with the government (especially with regard to location of the companies/business entities, their financial transactions and true identities of their directors/owners) and undertake identification, profiling, audit and trailing of wealth accumulation (including by way of wealth declaration), investment/business portfolios and lifestyles of non-public official disguised perpetrators of corruption.
xxixxxix
4. Public service institutions need to prioritize development and/or implementation of innovative service delivery models premised on transparent, quality and timely services anchored in the enhanced utilization of the Huduma Centres’ framework, technology-supported integrated public services through the Huduma Namba platform, e-Citizen platform and cashless payment systems for all public services and especially those most susceptible to corruption.
5. There is need for Parliament to enact and the Kenya Revenue Authority, the Ethics and Anti-Corruption Commission and other relevant state and non-state actors to implement a comprehensive harmonized law covering lifestyle audit, income, tax and wealth declaration (that for example requires all Kenyans to file income sources and amounts, expenditure of income, tax and wealth declaration returns together) in order to tame both public and private sector corruption majorly perpetrated through unexplained wealth accumulation and investments, disguised investments and tax evasion by disguised public and non-public official perpetrators.
6. The national and county legislature to institute stringent and stiff anti-corruption laws to be implemented by the Judiciary and the Executive which will require the burden of proof to be on the defence/accused (rather than the prosecution) and the relative value of the benefits of corruption to be lower than the imposed sanctions which will include the recovery of 100% corruptly-acquired assets and embezzled public funds and/or resources and the barring of all those who fail the leadership and integrity test from holding public office and doing business with any public service institution.
7. The Ethics and Anti-Corruption Commission, in partnership with the Commission on Administrative Justice (Ombudsman), needs to put in place innovative corruption reporting mechanisms such as locating clearly-marked EACC-managed reporting facilities (for example mail boxes and/or toll-free telephone booths and lines) in strategic yet convenient, confidential and security-friendly environments such as public play grounds, Huduma Centres, Post Offices, banking institutions, premises of religious institutions and on the streets for citizens to freely and confidently report corruption incidents.
8. Concerted efforts of the Ethics and Anti-Corruption Commission, Directorate of Criminal Investigations, National Intelligence Service, Office of the Director of Public Prosecutions and the Office of the Auditor General are needed with regard to intelligence sharing on corruption, multi-layered oversight of public service institutional financial transactions and innovative identification, detection, investigation and free-from-influence prosecution mechanisms appropriate for each of the specific most prevalent types of corruption with a special focus on bribery (soliciting for and/or receiving bribes) and embezzlement/misuse/misappropriation of public funds/resources.
9. The Ethics and Anti-Corruption Commission and the National Anti-Corruption Campaign Steering Committee, in partnership with other relevant state and non-state actors (especially faith-based organizations and the mass media), need to prioritize the use of anti-corruption socio-cultural messaging approaches that sensitize and create
xxx
xxx
awareness on different aspects of corruption, leadership and integrity and inculcate (for example through religious and learning institutions) a culture of legitimate hard work, upholding and practicing moral principles (such as kindness, honesty and tolerance and respect for others), patriotism and social justice (such as access, equity, citizens’ rights and participation in public services and/or opportunities).
10. There is need for Parliament and the National Treasury, with the support of development partners, to increase the operational capacity of the Ethics and Anti-Corruption Commission and other anti-corruption institutions up to the devolved units through strengthening of their autonomy and enhanced financial, human and infrastructural resourcing.
11. The Ethics and Anti-Corruption Commission and the National Anti-Corruption Campaign Steering Committee to prioritize putting in place innovative anti-corruption public participation in governance, decision making and access to information strategies through forums such as public open-air outreach and vernacular radio and television programmes which will also boost citizens’ awareness of the efforts state organs have put in place to stamp out corruption.
12. The Ethics and Anti-Corruption Commission to undertake county-specific mapping of public service institutions in all the arms of government where corruption is most prevalent and put in place anti-corruption strategies that seal corruption loopholes specific to the institutions’ mode of service delivery.
13. The Ethics and Anti-Corruption Commission needs to leverage on public trust/confidence on the National Police Service and the National Government Administrative Office especially with regard to reporting of corruption witnessed and/or experienced outside these two institutions, and the three institutions to nurture this trust/confidence.
14. The Government, through all relevant ministries, needs to prioritize fighting corruption through the approach dubbed ‘skills and tool box for youth in technical and vocational training centres’ which has the potential to create employment opportunities and improve livelihoods for the general public and the youth in particular and eventually minimize the drivers of their involvement in public sector corruption.
15. There is need for the Witness Protection Agency, in collaboration with the Ethics and Anti-Corruption Commission, the Office of the Director of Public Prosecutions and the Judiciary to put in place an effective witness protection programme for key corruption cases.
16. The Government needs to undertake performance management reforms premised on proper staff recruitment, deployment and capacity building practices, objective job evaluation, harmonized and improved terms of service across the public service with a special focus on departments in the mainstream Civil Service Ministries with a view of minimizing corruption incidents arising from public staff performance and employment-related factors.
1
1
CHAPTER ONE: INTRODUCTION
1.1 Background of the Study Governments worldwide, in the provision of public services, are more or less confronted with similar ethical challenges, with one of the major ones being that of corruption. The World Bank and Transparency International (TI) define corruption as “the misuse of public office for private gains”. This involves improper and unlawful behavior of public officials (that is, politicians and public servants) whose positions create opportunity for diversion of public resources and especially, abuse of trust, great power and hopes entrusted on them by serving corrupt or selfish interests once they are in power (TI, 2004; Bhargava, 2005). According to Bhargava (2005), corruption is present in all countries of the world and that it is its pervasiveness which varies as evidenced by country scores on the Corruption Perceptions Index published by Transparency International as well as other cross-country governance indicators published by the World Bank Institute (Hamilton and Hammer, 2018). Recent Corruption Perception and Fraud Index surveys indicate that corruption is on the increase in government institutions’ and the private sector mostly in African countries compared to Scandinavian and European Countries. This is so despite the existence of elaborate regimes, legal frameworks and other policies aimed at combating the vice (TI, 2010; 2014; 2015; 2017). Globally, the common denominator on combating corruption is that corruption is a moral, systems, institutional and governance problem that threatens the realization of development agenda of most countries. Researchers argue that existence of clear ethical standards for the public service where public servants are made aware and expected to apply to their work and acceptable boundary of behavior-codes of conduct, clear policies, procedures and legal framework through enactment of appropriate laws and regulations-investigation, discipline and prosecution does reduce corruption. Further, knowledge of rights and obligation of public servants when exposing actual or suspected wrong doing and commitment to reinforce ethical conduct by the political leadership is a key factor in controlling corruption in the public service. The Organization for Economic Co-operation and Development (OECD), a membership intergovernmental economic organization, supports the argument that embracing open and accountable decision making that is open to public scrutiny where the public has the right to know how public institutions apply the power and resources entrusted to them reduces corruption (OECD, 2018). Addressing corruption in the public service for quality services is paramount. The United Nations recommends collective efforts by countries to be carried out through criminalization, law enforcement measures, international co-operation, asset recovery, technical assistance and information exchange between governments, meant to advance international best practices in public service management. Similarly, the UN system, through the Sustainable Development Goals, is one of most recent efforts in engaging countries towards eradication of corruption amongst their public service (UNODC, 2004).
2
2
1.1.1. Global Perspective Corruption has, no doubt, become a global social phenomenon and an ethical problem affecting both the developed and developing countries in varying degrees and forms (Bhargava, 2005; Adebayo, 2014). For instance, societies in countries such as in Australia (Podger, 2002), America (Wallis, 2004), Argentina (Gedan and Alonso, 2018), India (Bhaskar, 2018) and Russia have not been spared by this social vice. However, it has been argued that developing countries are the hardest hit. Societies in countries such as Haiti, Argentina, India (where 40 percent of the population lives below poverty line) and Iraq (for example, Saddam Hussein resorted to corruption in order to prevent the development of civic groups that could oppose his regime) have not been spared by this social vice (GAN Integrity, 2017a; Sumah, 2017). China has also experienced corruption with studies showing that firms involved in Foreign Direct Investment (FDI) are more likely to locate in provinces that do more to prevent corruption (D’Amico, 2015). 1.1.2 African Perspective The African continent is faced with a myriad of challenges, among them corruption. Basically, majority of African countries inherited their governance and public service structure from the colonial governments designed along western models of Scandinavian and European countries; hence they were designed along western models which pose opportunities and threats on ethical conduct. Today, many African countries grapple with the problem of corruption that continues to hinder Government’s efforts to provide welfare to its citizens as a result of diversion of public resources to personal and selfish gains (TI, 2017). For instance, the level of corruption practices in the process of accessing land in peri-urban areas is reportedly enormous in Tanzania (Nuhu and Mpambije, 2017).
The African Union Agenda 2063 (https://au.int/en/agenda2063/overview) and the African Charter on Human and Peoples Rights (https://www.achpr.org/legalinstruments/detail?id=49) recognizes the seriousness of the corruption challenge in the continent’s development initiatives. To this end, the two instruments prioritize corruption control and prevention for efficient services. Whereas the causes of corruption vary from one African country to another, there are similarities including poorly conceived policies and programmes; failing public institutions; high levels of poverty; poor public service remuneration and disparities; income disparities amongst the population; and lack of accountability and transparency mechanisms (Graaf, 2007; Forson, Baah-Ennumh, Buracom, Chen & Peng, 2016). Most African countries are rated low on Transparency International and Mo Ibrahim Good Governance’s Indices. For instance, Transparency International has ranked various African countries on how bad they are doing in the fight against corruption (for instance, Madagascar 90%, Liberia 81%, Zimbabwe 80%, South Africa 79%, Nigeria 78% and Uganda 69%). Botswana is the only African country where 54% of its citizens responded

3
3
that the country was progressing on well with anti-corruption interventions (TI, 2010; 2015; 2017). Significantly, corruption impacts negatively on national security, economic prosperity and international standing. It manifests itself in the form of poor governance, nepotism, racism, bribery, fraud, favouritism and discrimination in the public service, the engine of service delivery to citizens. This has increased the need for official statistical data on the corruption and fraud index for policy formulation and planning (Forson et. al, 2016). The Conference on Global Campaign against Corruption has stepped up effort towards corruption prevention in Africa and other continents through increased accountability, raising public awareness and capacity building to strengthen pillars of integrity and encourage championing of reforms in public sector (Ki-moon, 2018). 1.1.3 Kenyan Perspective Corruption in Kenya has become an endemic problem and is now regarded as a serious cancer in the public sector as well as a security threat in the country. The manace has permeated different sectors of the economy in the country. For instance, it is a major election crime and offence during general elections (NCRC, 2016) and is also a major challenge faced in addressing the crime of kidnap (NCRC, 2017) and borderland-related crimes and security threats in the country (NCRC, 2018). The 2017 Transparency International's Corruption Perceptions Index placed the country on position 143 out of 180 countries with a score of 28 (TI, 2017). Recent reports indicate that Kenya is now ranked one of the most corrupt countries in Africa and that there no marked improvements for the country from the 2017 Global Corruption Perceptions Index (Chepkwony, 2018; TI, 2018). Further research points towards an upward trend of corruption exhibited in the last three years with some governance commentators suggesting that corruption in Kenya stands at 90%. Within this broad context, the recent economic performance has been rated to be well below potential due to a combination of factors including governance-related problems, structural bottlenecks and slow pace of reform, as well as persistent labor unrest (Wike, Simmons, Vice & Bishop, 2016). According to the Kenya National Bureau of Statistics, the country’s gross domestic product (GDP) increased from 5.3% in 2014 to 5.6% in 2015 to 6.0 in 2016, thus demonstrating a growth trajectory in most sectors of the economy driven by the construction sector that grew by 13.6% in 2015 compared to 13.1% in 2014, the financial and insurance sector that grew by 8.7% in 2015 from 8.3% in 2014 and the agricultural sector that reported a 5.6% growth in 2015 compared to the sector’s growth of 3.5% in 2014. This was happening notwithstanding perceived increase in corruption thus implying that higher growth rates would have been realized if corruption was eliminated (KNBS, 2017).
4
4
The main cause of corruption in the country is linked to the breakdown in personal morals, values and other factors which give opportunity for social pressure, and its existence on demand side and supply for services. Scholars have established that, in Kenya, the institutions meant for the regulation of the relationship between citizens and the State have been converted to personal enrichment avenues. A key reason why corruption has persisted in Kenya is because the people who have been entrusted with power have instead abused their position by converting the existing governance structures and system to their favour. The existing governance structures have therefore been deprived of their will and capacity to circumvent corruption (Kempe, 2014). Corruption has slowed down public service delivery and contributed to increased costs of implementing government projects and infrastructure arising from fraud, bribery, misappropriation of public resources and other malpractices. This has culminated into declining income per head, daunting social problems and worrisome state of corrupt governance in the public service. These concerns are reflected in emerging cases of grand corruption scandals, increased poverty indices, unemployment, increased culpability of public servants as evidenced by public audit reports, ‘blame-game’ between the multi- agency institutions set up to coordinate fight against corruption and relatively low performance in basic public services such as health standards/ indicators, education system (EACC, 2013; 2015; 2017). Notably, this obtaining situation appears to have impacted negatively on the realization of the Sustainable Development Goals and Vision 2030 objectives through which Kenya aims to be a middle level income/ industrial country compared to its peers at independence time, the Asian Tigers (GAN Integrity, 2017b; EACC, 2018). Efforts by previous and current governments to combat corruption in the public service have taken a number of dimensions. There has, for example, been legal instruments published by the Government’s National Council for Law Reporting (NCLR) with regard to the relevant enacted laws (such as the Kenya Constitution 2010 (NCLR, 2010), Public Officers Act (NCLR, 2003a), Anti-Corruption and Economic Crimes Act (NCLR, 2003b), Ethics and Anti-corruption Act (2011), Public Finance Management Act (NCLR, 2012a), Leadership and Integrity Act (NCLR, 2012b), the County Government Act (NCLR, 2012c) and the Public Service (Values and Principles) Act (NCLR, 2015)), policy frameworks (such as Internal Work Place Corruption Prevention Policies, Code of Conduct and Ethics and the Human Resource Policies and Procedures Manual, May 2016, developed by the Public Service Commission (PSC, 2016a)) and administrative arrangements (such as the: establishment of corruption prevention multi-sector mechanisms; adoption of Integrated Financial Management Information System (IFMIS); digitization of Land Registries; establishment of Huduma Centres, Government Human Resource Information System (GHRIS), computerization of court systems; introduction and adoption of e-government services on e-citizen platform); introduction of general reforms in the public service; establishment of oversight and watchdog institutions to deal with the vice (for instance the National Anti-corruption Steering Committee which sensitizes and educates the public on the fight against corruption); and strengthening regulatory authorities by creating Anti-
5
5
Corruption Courts within the Judicial system). Articles 10, 110, 232 and 234 of the Kenya Constitution 2010 demand commitment, professionalism, accountability and excellence in public service delivery in promotion of a transformative, dynamic and ethical public service (Cytonn, 2018). Despite the fact that indicators provide a basis for positive economic performance and despite the checks and measures put in place, corruption still persists in the public service with the Ethics and Anti-Corruption Commission (2012) report, ranking from the most to the least corrupt, the Police Department, Ministry of Lands, Government hospitals, local authorities, Registrar of Persons and former Provincial Administration. This implies that the fight against corruption in the public service continues to remain a daunting task that requires major and well-informed policy interventions. Therefore, the challenge of corruption in the realization of the Government’s noble course of providing quality, efficient and effective public services must be addressed at all costs. 1.2 Problem Statement The complexity of corruption in the public service as a crime has confounded both political and professional leadership and brought forth a dilemma. The pronouncement by and seemingly frustrated top political leadership acknowledges corruption as a challenge in the realization of the country’s development agenda towards realization of Kenya’s Vision 2030. The question of corruption in Kenya’s public service continues to elicit mixed reactions. Some quarters argue that the vice is escalating in real terms, while the other quarters argue that the escalation is mainly perceived and not real. For instance, political leadership, financial experts and professional commentators argue that there is both perceived and real runaway corruption and emergence of new patterns of the vice in Kenya’s public service. One is therefore left guessing the real state of corruption in the public service. The need to establish the basis of the mixed reactions can also not be overemphasized. The public service is the engine of development in the country and must therefore function to deliver services effectively and efficiently. However, there is an apparent strong feeling from the public and other stakeholders that serious corruption witnessed in the yester years (such as the Goldenberg Scandal) is creeping back in different forms and extent in the public service as evidenced by the reported incidents. These citizens’ and stakeholders’ concern about corruption in the public service has not been recently verified, especially through studies focused on public experiences of corruption. Moreover, the emerging forms/types of corruption, their prevalence and effects in the public service grossly remain unestablished. Further, some of the pertinent issues that would need to be answered are the the causal factors behind corruption and the main perpetrators of corruption in the public service. There are numerous strategies and efforts - legal, policy, and administrative mechanisms - that have been put in place to fight corruption in the country in general and the public service in particular. Despite these corruption prevention strategies and efforts, incidents of
6
6
corruption continue to be reported in the public service and appear to fuel increasing discontent among various stakeholders. It remains unclear if these strategies and efforts have been adequately audited. One of the most fundamental questions that beg answers therefore is: Are the legal, policies, and administrative frameworks themselves perpetuating corruption or are they deficient in their design or is it their implementation that is wanting? The other pertinent questions that beg answers are: Is the general public fully aware of these corruption prevention initiatives and are they utilizing them to address corruption? What are the successes and/or failures of these corruption prevention initiatives? What is the public perception about the commitment and the effectiveness of public institutions bestowed with the responsibility of addressing corruption in the country in general, and the public service in particular?; how can corruption be addressed in the public service? In addition, what challenges bedevil the fight against corruption in the public service and; how can the challenges be addressed? The study was therefore envisaged, among other things, to examine the opportunities and challenges in the fight against corruption through a survey of public perceptions and experiences on corruption and its methodological elimination approaches in the public service.
1.3 Objectives of the Study
1.3.1 General Objective of the Study The main objective of the study was to establish the perceptions and experiences of corruption in the public service in Kenya with a view to informing policy planning and formulation on the subject. The study was guided by the following specific objectives with regard to the public service.
1. To establish the public perceptions on the common and emerging types of corruption. 2. To establish the public experiences on the common and emerging types of corruption. 3. To identify the different perpetrators of corruption. 4. To ascertain the root cause of corruption. 5. To appraise the consequences of corruption. 6. To assess public response to corruption. 7. To identify the challenges and make appropriate recommendations for addressing
corruption.
1.4 Justification of the Study This study is justified for a number of reasons. First; corruption undermines the realization of Kenya’s socio-economic development agenda through non-delivery, inadequate delivery or shoddy delivery of required public services (and goods by extension). As enshrined in the Constitution, citizens expect delivery of corruption free public services and goods.

7
7
Secondly; the legitimacy and success of political and professional leadership is anchored in a corruption-free public service environment. Corruption also undermines the stability of a political leadership structure. Thirdly; the existence of legal, policy, and administrative frameworks in Kenya appear not to have translated into effective mechanisms in the fight against corruption in the public service. The need for and effective implementation of legal, policy and administrative frameworks for fighting corruption that are informed by research evidence cannot be overemphasized. Fourthly; corruption is a common problem and a serious economic crime that requires effective management through strengthened stakeholder collaboration. This study addresses itself to issues of gaps in agency collaboration and the best approaches to multi-sectoral interventions on combating corruption in the public service. Lastly, scientific studies on public experiences with real corruption in the public service are still limited. Therefore, the information generated from this survey not only informs relevant public policy interventions but also contributes to knowledge on the subject of corruption. 1.5 Assumptions of the Study Corruption in the public service is both sensitive and emotive. Based on this background, the study made the following underlying assumptions that:
1. Members of the public were aware of issues of corruption and will be free and willing to report their own experiences with corruption in the public service and also share other necessary information despite the emotive and sensitive nature of the subject.
2. Some corruption practices in the public service may be covert. It is assumed that researchers will be able to obtain the required information on the same.
3. State agencies and public officials will cooperate with researchers in providing the required information.
4. Institutions charged with prevention and control of corruption are effective. 5. Corruption has negative effects and hinders effective service delivery, economic
development and equilibrium in the social structures. 6. Citizens and non-state actors are supportive of government initiatives in the
eradication of corruption in the public service. 7. There is goodwill from all levels of government in the control of corruption in the
public service. 8. The findings of this study will not be politicized by either side of the political divide.
1.6 Scope of the Study The study was focused on corruption in the public service with regard to the: perceptions on the common and emerging types of corruption; public experiences on the common and emerging types of corruption; perpetrators; root causes; consequences; public response; and the challenges and appropriate recommendations for addressing corruption in the public service.

8
8
The study was conducted in all the forty-seven (47) counties and covered institutions in the Executive, Legislature and Judiciary arms of government at the National and County Government level. Sample respondents were adults drawn from members of the public and officials drawn from the public service institutions. Key informants were also interviewed thus providing voices that were triangulated to inform the survey findings. 1.7 Conceptual Framework of the Study Corruption in the public service is brought about by a combination of several risk factors. The environment in public institutions create opportunities that, when exploited in a negative way, lead to corruption. These risk factors are: unequal distribution of state resources that leads to people feeling excluded; mutating nature of corruption and new forms of corruption; corruption perpetrators hiding their identity; weak enforcement of anticorruption laws; different ideologies of perceived corruption and the reality of corruption; culture of impunity; and unethical upbringing in the society; conflicting data on the levels; weak anticorruption laws that have loopholes; lack of institutional and managerial goodwill to eradicate corruption and low levels of corruption reporting by the victims. All these factors, among others, contribute to corruption in the public service. The results of corruption are frustration of the political leadership on how to govern, slow economic growth that leads to underdevelopment and uneven development, weak deterrence to issues of corruption; and poor service delivery to the public.
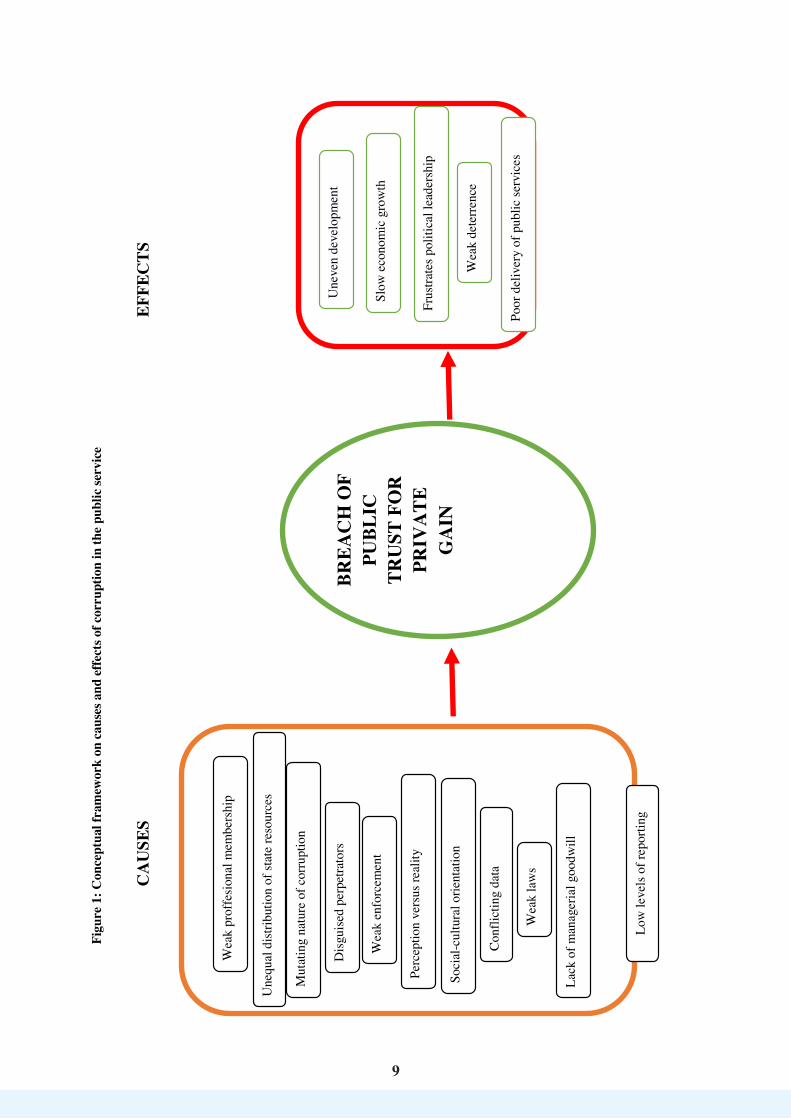
9
9
Figu
re 1
: Con
cept
ual f
ram
ewor
k on
cau
ses a
nd e
ffect
s of c
orru
ptio
n in
the
publ
ic se
rvic
e
CA
USE
SEF
FEC
TS
BREA
CH
OF
PUBL
IC
TRU
ST F
OR
PR
IVA
TE
GA
IN
Wea
k pr
offe
sion
al m
embe
rshi
p
Une
qual
dist
ribut
ion
of st
ate
reso
urce
s
Con
flict
ing
data
Wea
k la
ws
Perc
eptio
n ve
rsus
real
ity
Dis
guis
ed p
erpe
trato
rs
Wea
k en
forc
emen
t
Soci
al-c
ultu
ral o
rient
atio
n
Mut
atin
g na
ture
of c
orru
ptio
n
Poor
del
iver
y of
pub
lic se
rvic
es
Une
ven
deve
lopm
ent
Lack
of m
anag
eria
l goo
dwill
Slow
eco
nom
ic g
row
th
Frus
trate
s pol
itica
l lea
ders
hip
Low
leve
ls o
f rep
ortin
g
Wea
k de
terr
ence
1010
CHAPTER TWO: METHODOLOGY OF THE STUDY
2.1 Introduction This chapter presents the study’s research design, methods and tools of data collection and management, data analysis and ethical considerations. 2.2 Research Design The study employed a mixed methods research design. The design was used because it presented an opportunity to fuse both quantitative and qualitative data on the subject of corruption. A cross-sectional and descriptive survey approach was used to extract and unearth respondents’ perceptions and experiences on corruption in public service institutions in the Executive, Legislature and Judiciary arms of government at the National and County Government levels with regard to the: common and emerging types of corruption; perpetrators; root causes; consequences; public response; and challenges and appropriate recommendations for addressing corruption in the public service. The population for the study consisted of adults (that is, persons aged 18 years and above) drawn from the members of the public and public officials serving in the public service institutions in the forty-seven (47) counties in Kenya. Such adults were assumed to be knowledgeable on corruption issues because of their positions as receivers and/or providers of public services where corruption practices take place. Sample respondents were sampled using both probability and non-probability sampling techniques. Selection of the members of the public sample respondents was multi-stage thus involving a number of steps. All the 47 counties were targeted and selected purposively then 50% of the Constituencies in each of the 47 counties in the country (which have a total of 290 Constituencies) were targeted but only 143 were selected. An arbitrary 30% of the Wards in a selected Constituency (for each of the 143 selected Constituencies) were targeted for selection using simple random sampling and therefore, 233 Wards were selected. This was then followed by targeting an arbitrary 0.1% of the 8,767,954 households in Kenya (as per the 2009 Population Census), that is, 8,767 households. The sample size of households for each of the 233 selected Wards was then calculated based on its population as a percentage of the population hosted by the 8,767 households. The households in the selected Wards were then selected randomly. Each of the 8,767 households was targeted to provide one adult member of the public (who was the household head, spouse or most aged offspring/child of the household) who would become a sample respondent. Efforts were made to select male and female sample respondents in households in equal percentages. Eventually, the study managed to reach 8627 households which produced 4907 male and 3720 female members of the public sample respondents (that is, 98.4% response rate) distributed across the 47 counties as shown in Table 2.1 below.

1111
Table 2.1: Distribution of members of the public by county County Male Female Total Nairobi 508(57.1%) 382(42.9%) 890(10.3% Nakuru 318(55.9%) 251(44.1%) 569(6.6% Meru 202(52.2%) 185(47.8%) 387(4.5% Bungoma 204(64.6%) 112(35.4%) 316(3.7% Mombasa 184(58.6%) 130(41.4%) 314(3.6% Kakamega 158(53.6%) 137(46.4%) 295(3.4% Machakos 198(67.6%) 95(32.4%) 293(3.4% Migori 150(51.0%) 144(49.0%) 294(3.4% Kisii 156(58.6%) 110(41.4%) 266(3.1% Busia 164(63.6%) 94(36.4%) 258(3.0% Kiambu 115(44.2%) 145(55.8%) 260(3.0% Kitui 146(55.7%) 116(44.3%) 262(3.0% Trans Nzoia 95(36.3%) 167(63.7%) 262(3.0% Kajiado 110(45.1%) 134(54.9%) 244(2.8% Kisumu 129(55.6%) 103(44.4%) 232(2.7% Narok 149(67.4%) 72(32.6%) 221(2.6% West Pokot 123(60.6%) 80(39.4%) 203(2.4% Embu 126(63.3%) 73(36.7%) 199(2.3% Murang'a 119(59.5%) 81(40.5%) 200(2.3% Turkana 119(62.3%) 72(37.7%) 191(2.2% Bomet 93(60.8%) 60(39.2%) 153(1.8% Nyamira 95(61.7%) 59(38.3%) 154(1.8% Tharaka Nithi 84(54.5%) 70(45.5%) 154(1.8% Vihiga 75(48.7%) 79(51.3%) 154(1.8% Baringo 66 (48.9%) 69(51.1%) 135(1.6% Siaya 87(68.5%) 40(31.5%) 127(1.5% Elgeyo Marakwet 72(57.6%) 53(42.4%) 125(1.4% Homa Bay 66(58.9%) 46(41.1%) 112(1.3% Kilifi 67(60.4%) 44(39.6%) 111(1.3% Kericho 58(55.2%) 47(44.8%) 105(1.2% Nandi 59(55.1%) 48(44.9%) 107(1.2% Makueni 65(69.1%) 29(30.9%) 94(1.1% Nyeri 38(39.2%) 59(60.8%) 97(1.1% Kwale 46(56.1%) 36(43.9%) 82(1.0% Mandera 57(64.8%) 31(35.2%) 88(1.0% Garissa 50(62.5%) 30(37.5%) 80(0.9% Marsabit 59(72.8%) 22(27.2%) 81(0.9% Uasin Gishu 45(60.0%) 30(40.0%) 75(0.9% Nyandarua 42(60.9%) 27(39.1%) 69(0.8% Tana River 36(51.4%) 34(48.6%) 70(0.8% Kirinyaga 36(58.1%) 26(41.9%) 62(0.7% Laikipia 31(54.4%) 26(45.6%) 57(0.7% Wajir 25(59.5%) 17(40.5%) 42(0.5% Lamu 24(64.9%) 13(35.1%) 37(0.4% Samburu 23(63.9%) 13(36.1%) 36(0.4% Taita Taveta 13(38.2%) 21(61.8%) 34(0.4% Isiolo 22(73.3%) 8(26.7%) 30(0.3% Total 4,907(56.9%) 3,720(43.1%) 8,627(100.0%)

12
12
Using probability (specically, random sampling) and non-probability sampling (specifically, purposive and availability sampling), the study targeted to sample public officials in all the arms of government, who were perceived to have information on the key areas where corruption occurs. These officials were in the categories of core mandate technical officers, Internal Auditor, Accountant, Procurement/Supply Chain Management Officer and Human Resource Management Officer. The sampling and determination of sample sizes for each category of public officials was guided by the tabulation indicated in Table 2.2 below. However, from a target of 8258 public officials, the study only managed to reach 1795 of them (after majority of them shied away from the study, thus representing a 21.7% response rate) as indicated in Table 2.3 below. What can be deduced from this low response rate is that majority of public officials did not participate in the study as expected thus symbolizing their possible concealing of relevant information and participation in unethical conducts within the public sector. This is also an indicator of unwillingness of the public officials in addressing issues of corruption in public institutions.
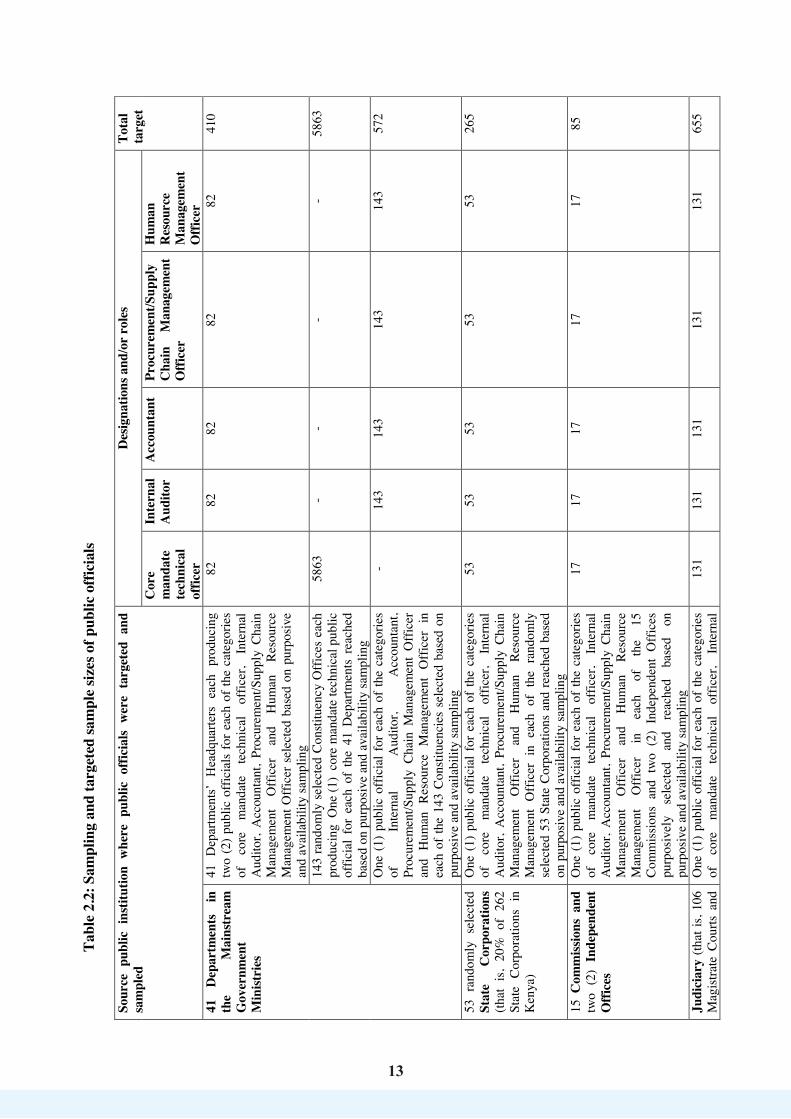
13
13
Tabl
e 2.
2: S
ampl
ing
and
targ
eted
sam
ple
sizes
of p
ublic
off
icia
ls
Sour
ce p
ublic
ins
titut
ion
whe
re p
ublic
offi
cial
s w
ere
targ
eted
and
sa
mpl
ed
Des
igna
tions
and
/or
role
s To
tal
targ
et
Cor
e m
anda
te
tech
nica
l of
ficer
Inte
rnal
A
udito
r A
ccou
ntan
t Pr
ocur
emen
t/Sup
ply
Cha
in
Man
agem
ent
Offi
cer
Hum
an
Res
ourc
e M
anag
emen
t O
ffice
r 41
D
epar
tmen
ts
in
the
Mai
nstr
eam
G
over
nmen
t M
inist
ries
41 D
epar
tmen
ts’ H
eadq
uarte
rs e
ach
prod
ucin
g tw
o (2
) pub
lic o
ffici
als
for e
ach
of th
e ca
tego
ries
of
core
m
anda
te
tech
nica
l of
ficer
, In
tern
al
Aud
itor,
Acc
ount
ant,
Proc
urem
ent/S
uppl
y C
hain
M
anag
emen
t O
ffice
r an
d H
uman
R
esou
rce
Man
agem
ent O
ffice
r sel
ecte
d ba
sed
on p
urpo
sive
and
avai
labi
lity
sam
plin
g
82
82
82
82
82
410
143
rand
omly
sel
ecte
d C
onsti
tuen
cy O
ffice
s ea
ch
prod
ucin
g O
ne (1
) co
re m
anda
te te
chni
cal p
ublic
of
ficia
l fo
r ea
ch o
f th
e 41
Dep
artm
ents
rea
ched
ba
sed
on p
urpo
sive
and
avai
labi
lity
sam
plin
g
5863
-
- -
- 58
63
One
(1)
pub
lic o
ffici
al f
or e
ach
of th
e ca
tego
ries
of
Inte
rnal
A
udito
r, A
ccou
ntan
t, Pr
ocur
emen
t/Sup
ply
Cha
in M
anag
emen
t O
ffice
r an
d H
uman
Res
ourc
e M
anag
emen
t O
ffice
r in
ea
ch o
f th
e 14
3 C
onsti
tuen
cies
sel
ecte
d ba
sed
on
purp
osiv
e an
d av
aila
bilit
y sa
mpl
ing
- 14
3 14
3 14
3 14
3 57
2
53 r
ando
mly
sel
ecte
d St
ate
Cor
pora
tions
(th
at i
s, 20
% o
f 26
2 St
ate
Cor
pora
tions
in
Ken
ya)
One
(1)
pub
lic o
ffici
al f
or e
ach
of th
e ca
tego
ries
of
core
m
anda
te
tech
nica
l of
ficer
, In
tern
al
Aud
itor,
Acc
ount
ant,
Proc
urem
ent/S
uppl
y C
hain
M
anag
emen
t O
ffice
r an
d H
uman
R
esou
rce
Man
agem
ent
Offi
cer
in e
ach
of t
he r
ando
mly
se
lect
ed 5
3 St
ate
Corp
orat
ions
and
reac
hed
base
d on
pur
posiv
e an
d av
aila
bilit
y sa
mpl
ing
53
53
53
53
53
265
15 C
omm
issio
ns a
nd
two
(2)
Inde
pend
ent
Offi
ces
One
(1)
pub
lic o
ffici
al f
or e
ach
of th
e ca
tego
ries
of
core
m
anda
te
tech
nica
l of
ficer
, In
tern
al
Aud
itor,
Acc
ount
ant,
Proc
urem
ent/S
uppl
y C
hain
M
anag
emen
t O
ffice
r an
d H
uman
R
esou
rce
Man
agem
ent
Offi
cer
in
each
of
th
e 15
C
omm
issio
ns a
nd t
wo
(2)
Inde
pend
ent
Offi
ces
purp
osiv
ely
sele
cted
an
d re
ache
d ba
sed
on
purp
osiv
e an
d av
aila
bilit
y sa
mpl
ing
17
17
17
17
17
85
Judi
ciar
y (th
at is
, 106
M
agist
rate
Cou
rts a
nd
One
(1)
pub
lic o
ffici
al f
or e
ach
of th
e ca
tego
ries
of
core
m
anda
te
tech
nica
l of
ficer
, In
tern
al
131
131
131
131
131
655
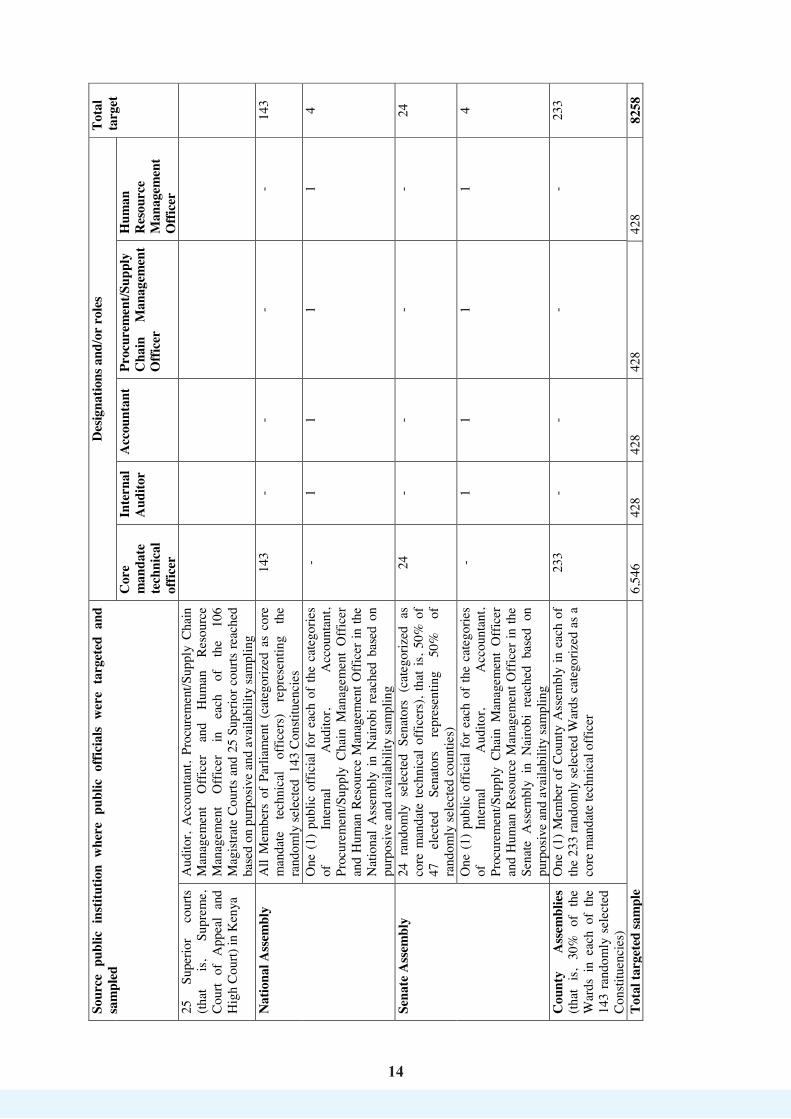
14
14
Sour
ce p
ublic
ins
titut
ion
whe
re p
ublic
offi
cial
s w
ere
targ
eted
and
sa
mpl
ed
Des
igna
tions
and
/or
role
s To
tal
targ
et
Cor
e m
anda
te
tech
nica
l of
ficer
Inte
rnal
A
udito
r A
ccou
ntan
t Pr
ocur
emen
t/Sup
ply
Cha
in
Man
agem
ent
Offi
cer
Hum
an
Res
ourc
e M
anag
emen
t O
ffice
r 25
Su
perio
r co
urts
(that
is,
Su
prem
e,
Cou
rt of
App
eal
and
Hig
h C
ourt)
in K
enya
Aud
itor,
Acc
ount
ant,
Proc
urem
ent/S
uppl
y C
hain
M
anag
emen
t O
ffice
r an
d H
uman
R
esou
rce
Man
agem
ent
Offi
cer
in
each
of
th
e 10
6 M
agist
rate
Cou
rts a
nd 2
5 Su
perio
r cou
rts re
ache
d ba
sed
on p
urpo
sive
and
avai
labi
lity
sam
plin
g N
atio
nal A
ssem
bly
A
ll M
embe
rs o
f Pa
rliam
ent
(cat
egor
ized
as
core
m
anda
te
tech
nica
l of
ficer
s)
repr
esen
ting
the
rand
omly
sele
cted
143
Con
stitu
enci
es
143
- -
- -
143
One
(1)
pub
lic o
ffici
al f
or e
ach
of th
e ca
tego
ries
of
Inte
rnal
A
udito
r, A
ccou
ntan
t, Pr
ocur
emen
t/Sup
ply
Cha
in M
anag
emen
t O
ffice
r an
d H
uman
Res
ourc
e M
anag
emen
t Offi
cer i
n th
e N
atio
nal
Ass
embl
y in
Nai
robi
rea
ched
bas
ed o
n pu
rpos
ive
and
avai
labi
lity
sam
plin
g
- 1
1 1
1 4
Sena
te A
ssem
bly
24
ran
dom
ly s
elec
ted
Sena
tors
(ca
tego
rized
as
core
man
date
tech
nica
l offi
cers
), th
at is
, 50%
of
47
elec
ted
Sena
tors
re
pres
entin
g 50
%
of
rand
omly
sele
cted
cou
ntie
s)
24
- -
- -
24
One
(1)
pub
lic o
ffici
al f
or e
ach
of th
e ca
tego
ries
of
Inte
rnal
A
udito
r, A
ccou
ntan
t, Pr
ocur
emen
t/Sup
ply
Cha
in M
anag
emen
t O
ffic
er
and
Hum
an R
esou
rce
Man
agem
ent O
ffice
r in
the
Sena
te A
ssem
bly
in N
airo
bi r
each
ed b
ased
on
purp
osiv
e an
d av
aila
bilit
y sa
mpl
ing
- 1
1 1
1 4
Cou
nty
Ass
embl
ies
(that
is,
30%
of
the
War
ds i
n ea
ch o
f th
e 14
3 ra
ndom
ly s
elec
ted
Con
stitu
enci
es)
One
(1)
Mem
ber
of C
ount
y A
ssem
bly
in e
ach
of
the
233
rand
omly
sele
cted
War
ds c
ateg
oriz
ed a
s a
core
man
date
tech
nica
l offi
cer
233
- -
- -
233
Tota
l tar
gete
d sa
mpl
e 6,
546
428
428
428
428
8258
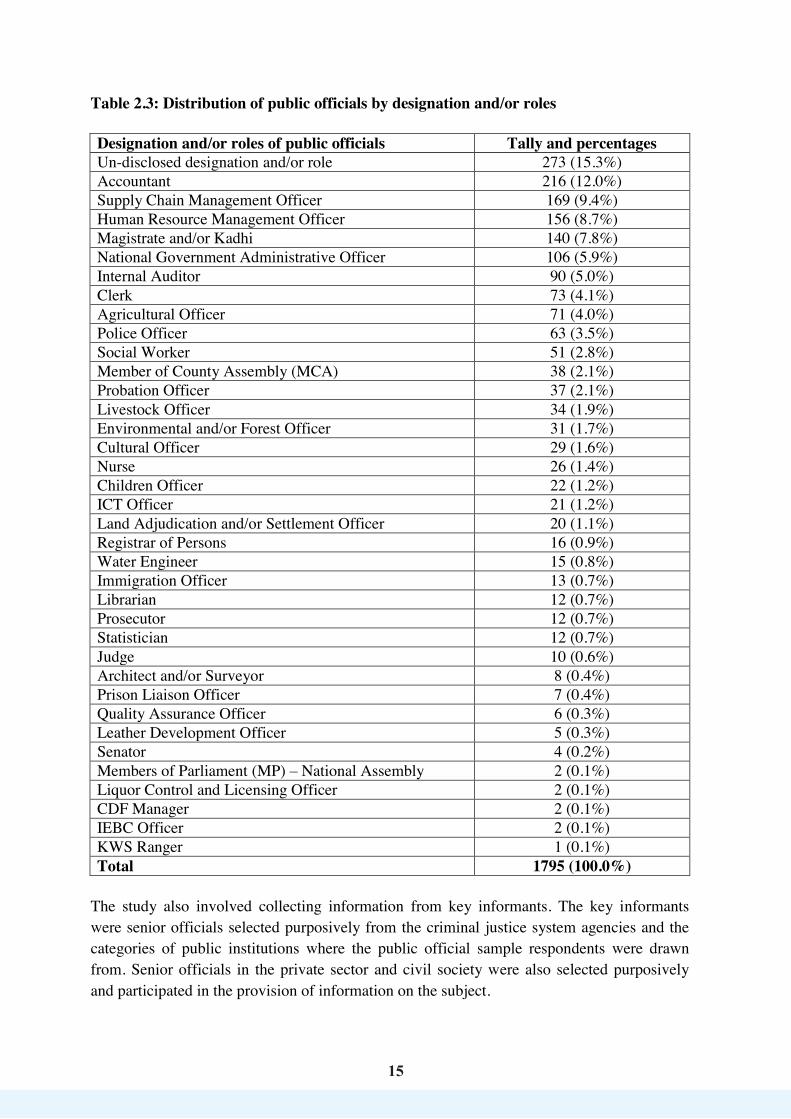
15
15
Table 2.3: Distribution of public officials by designation and/or roles Designation and/or roles of public officials Tally and percentages Un-disclosed designation and/or role 273 (15.3%) Accountant 216 (12.0%) Supply Chain Management Officer 169 (9.4%) Human Resource Management Officer 156 (8.7%) Magistrate and/or Kadhi 140 (7.8%) National Government Administrative Officer 106 (5.9%) Internal Auditor 90 (5.0%) Clerk 73 (4.1%) Agricultural Officer 71 (4.0%) Police Officer 63 (3.5%) Social Worker 51 (2.8%) Member of County Assembly (MCA) 38 (2.1%) Probation Officer 37 (2.1%) Livestock Officer 34 (1.9%) Environmental and/or Forest Officer 31 (1.7%) Cultural Officer 29 (1.6%) Nurse 26 (1.4%) Children Officer 22 (1.2%) ICT Officer 21 (1.2%) Land Adjudication and/or Settlement Officer 20 (1.1%) Registrar of Persons 16 (0.9%) Water Engineer 15 (0.8%) Immigration Officer 13 (0.7%) Librarian 12 (0.7%) Prosecutor 12 (0.7%) Statistician 12 (0.7%) Judge 10 (0.6%) Architect and/or Surveyor 8 (0.4%) Prison Liaison Officer 7 (0.4%) Quality Assurance Officer 6 (0.3%) Leather Development Officer 5 (0.3%) Senator 4 (0.2%) Members of Parliament (MP) – National Assembly 2 (0.1%) Liquor Control and Licensing Officer 2 (0.1%) CDF Manager 2 (0.1%) IEBC Officer 2 (0.1%) KWS Ranger 1 (0.1%) Total 1795 (100.0%)
The study also involved collecting information from key informants. The key informants were senior officials selected purposively from the criminal justice system agencies and the categories of public institutions where the public official sample respondents were drawn from. Senior officials in the private sector and civil society were also selected purposively and participated in the provision of information on the subject.

16
16
2.3 Methods and Tools of Data Collection
2.3.1 Data Collection Methods The study utilized both primary and secondary data collection methods and sources. Primary data was collected from sample respondents and key informants. Secondary data was collected by way of review, collating, recording and analyzing available documents, reports and publications on corruption. 2.3.2 Data Collection Tools The study utilized a closed and open-ended self administered questionnaire (for the public officials who were deemed literate) and interview schedule (used on the members of the public in face to face individual interviews) and a key informant guide, all with relevant questions tailored to respond to the study’s specific objectives. Information was recorded using field notebooks, pens, pencils and erasers. 2.4 Data Collection and Management A pre-test was undertaken prior to the actual data collection for purposes of ensuring the reliability and validity of the questionnaire, interview schedule, key informant guide and the study methodology. The National Crime Research Centre sought for authority and/or cooperation from the relevant institutions and their staff to embark on the study. This enabled NCRC realize the study objectives and fostered participation in the exercise. A team of qualified researchers comprising lead researchers, supervisors and research assistants were trained and thereafter dispatched to the field to conduct the actual data collection using the refined tools. 2.5 Methods of Data Analysis Duly filled questionnaires, interview schedules and key informant guide notes were received at a central data collection point at the National Crime Research Centre. The data was then cleaned, coded and subjected to analysis using the appropriate Statistical Package for Social Scientists (SPSS) software. The quantitative data was analyzed through descriptive statistics and presented in frequencies and percentiles, charts and graphs. Findings that were reported by at least 1 out of 10 members of the public and/or public official sample respondents were deemed significant for the purposes of policy recommendation. The information was then presented thematically as per the research objectives in a hierarchical (that is, from the highest to the lowest), relational (that is, how a set of data relates with another in the study) and networking order (that is, how numerous data sets are linked). Analyzed data was used inform the findings and appropriate key policy recommendations for addressing corruption in the country.

1717
2.6. Ethical Considerations The following ethical considerations were adhered to during the research process.
i. Authority to collect data and cooperation were sought from relevant institutions and individuals before commencement of the exercise.
ii. Consent was sought from each of the respondents before the commencement of data collection.
iii. The language of communication used was appropriate to the respondents’ socio-cultural, economic and political beliefs and aspirations.
iv. There was respect of the respondents’ rights throughout the study. v. Confidentiality of the respondents’ identity and information was safeguarded
throughout the study. vi. During data collection process, respect for diversity in regard to socio-cultural,
economic and political views was upheld. vii. The data collected was treated with the required levels of confidentiality.
viii. Researchers only recorded feedback from the respondents, and avoided subjective interpretation of the views provided.
ix. Adequate orientation and training of research assistants and their supervisors prior to data collection was undertaken to acquaint them with ethical issues of conduct in research.
18
18
CHAPTER THREE: RESULTS AND DISCUSSIONS 3.1 Introduction This chapter first presents the socio-demographic characteristics of the members of the public. The chapter then presents and discusses the findings on corruption in the public service with regard to the: common and emerging types of corruption; perpetrators; root causes; consequences; public response; and challenges and appropriate recommendations for addressing corruption in the public service. 3.2 Socio-demographic Characteristics of Members of the Public Respondents A total of 8,627 members of the public were interviewed comprising 4,907 males (that is, 56.9%) and 3,720 females (that is, 43.1%). These sample respondents were asked about their socio-demographic characteristics specifically with regard to their status in the household, age, marital status, level of education, religion and main occupation. Nearly two-thirds (55.6%) of the members of the public were heads of households. Of these, 80.6% were male headed households while female headed households were 22.6%. Those who were first wife/spouse were 25.5% while those who were either son or daughter were 13.0% with each of the other categories accounting for 1.4% or below. Members of the public who were between 18 and 33 years old were 41.2% whereas those aged between 34 and 49 years were 35.7%. The remaining 23.1% were aged 50 years and above. This is consistent with Kenya’s population which is majorly youthful and hence in the reproductive and productive stages of life. Therefore, by implication, corruption majorly affects the youth. The youth may also be the main perpetrators of corruption during their endeavors to eke a living and fend for their families. Majority (72.7%) of the members of the public were married, 19.2% were single or never married while the rest were widowed, divorced or separated. These findings indicate that majority of the members of the public were in household statuses and therefore had social responsibilities with a likelihood that they sought services in one or more public service institutions. Hence, by implication, corruption has a direct effect on the Kenyan household. When asked about their highest attained level of education, 67.3% of members of the public had either primary (32.7%) or secondary (34.6%) level of education whereas 16.2% had middle level college education. This implied that the level of literacy was fairly high among the members of the public and hence were knowledgeable on the subject of corruption. Christians were 89.4%, Muslims were 9.1% while the rest of the religious categories comprised 1.6% of the members of the public. According to the Cultural Atlas on Kenyan culture, the majority of the country identifies as Christian at 82.1% of the population (www.culturalatlas) and a similar scenario was therefore reflected in this study. The
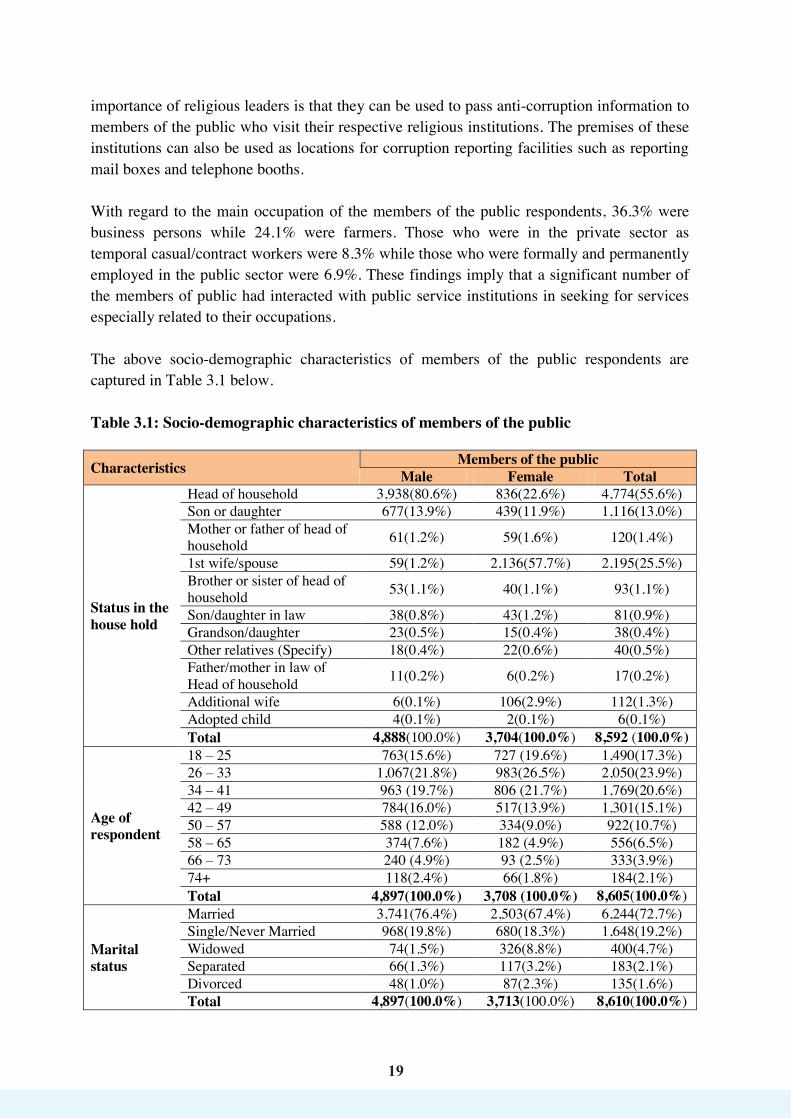
19
19
importance of religious leaders is that they can be used to pass anti-corruption information to members of the public who visit their respective religious institutions. The premises of these institutions can also be used as locations for corruption reporting facilities such as reporting mail boxes and telephone booths. With regard to the main occupation of the members of the public respondents, 36.3% were business persons while 24.1% were farmers. Those who were in the private sector as temporal casual/contract workers were 8.3% while those who were formally and permanently employed in the public sector were 6.9%. These findings imply that a significant number of the members of public had interacted with public service institutions in seeking for services especially related to their occupations. The above socio-demographic characteristics of members of the public respondents are captured in Table 3.1 below. Table 3.1: Socio-demographic characteristics of members of the public
Characteristics Members of the public Male Female Total
Status in the house hold
Head of household 3,938(80.6%) 836(22.6%) 4,774(55.6%) Son or daughter 677(13.9%) 439(11.9%) 1,116(13.0%) Mother or father of head of household 61(1.2%) 59(1.6%) 120(1.4%)
1st wife/spouse 59(1.2%) 2,136(57.7%) 2,195(25.5%) Brother or sister of head of household 53(1.1%) 40(1.1%) 93(1.1%)
Son/daughter in law 38(0.8%) 43(1.2%) 81(0.9%) Grandson/daughter 23(0.5%) 15(0.4%) 38(0.4%) Other relatives (Specify) 18(0.4%) 22(0.6%) 40(0.5%) Father/mother in law of Head of household 11(0.2%) 6(0.2%) 17(0.2%)
Additional wife 6(0.1%) 106(2.9%) 112(1.3%) Adopted child 4(0.1%) 2(0.1%) 6(0.1%) Total 4,888(100.0%) 3,704(100.0%) 8,592 (100.0%)
Age of respondent
18 – 25 763(15.6%) 727 (19.6%) 1,490(17.3%) 26 – 33 1,067(21.8%) 983(26.5%) 2,050(23.9%) 34 – 41 963 (19.7%) 806 (21.7%) 1,769(20.6%) 42 – 49 784(16.0%) 517(13.9%) 1,301(15.1%) 50 – 57 588 (12.0%) 334(9.0%) 922(10.7%) 58 – 65 374(7.6%) 182 (4.9%) 556(6.5%) 66 – 73 240 (4.9%) 93 (2.5%) 333(3.9%) 74+ 118(2.4%) 66(1.8%) 184(2.1%) Total 4,897(100.0%) 3,708 (100.0%) 8,605(100.0%)
Marital status
Married 3,741(76.4%) 2,503(67.4%) 6,244(72.7%) Single/Never Married 968(19.8%) 680(18.3%) 1,648(19.2%) Widowed 74(1.5%) 326(8.8%) 400(4.7%) Separated 66(1.3%) 117(3.2%) 183(2.1%) Divorced 48(1.0%) 87(2.3%) 135(1.6%) Total 4,897(100.0%) 3,713(100.0%) 8,610(100.0%)
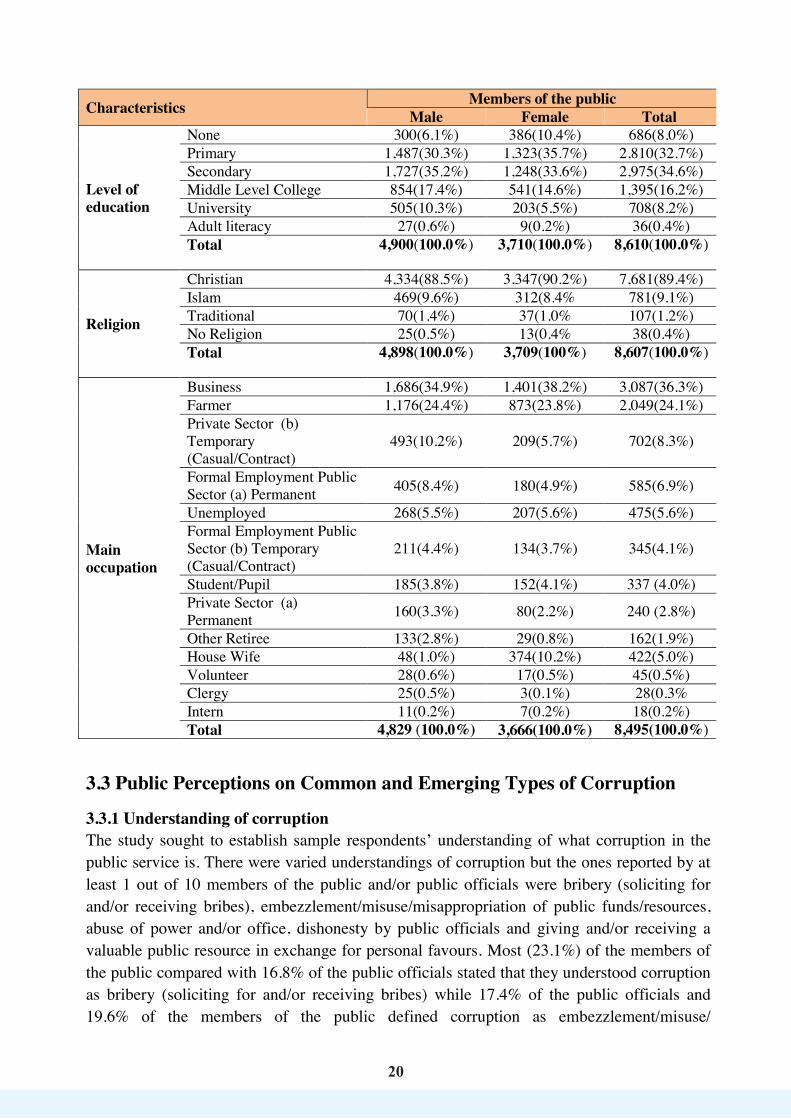
2020
Characteristics Members of the public Male Female Total
Level of education
None 300(6.1%) 386(10.4%) 686(8.0%) Primary 1,487(30.3%) 1,323(35.7%) 2,810(32.7%) Secondary 1,727(35.2%) 1,248(33.6%) 2,975(34.6%) Middle Level College 854(17.4%) 541(14.6%) 1,395(16.2%) University 505(10.3%) 203(5.5%) 708(8.2%) Adult literacy 27(0.6%) 9(0.2%) 36(0.4%) Total 4,900(100.0%) 3,710(100.0%) 8,610(100.0%)
Religion
Christian 4,334(88.5%) 3,347(90.2%) 7,681(89.4%) Islam 469(9.6%) 312(8.4% 781(9.1%) Traditional 70(1.4%) 37(1.0% 107(1.2%) No Religion 25(0.5%) 13(0.4% 38(0.4%) Total 4,898(100.0%) 3,709(100%) 8,607(100.0%)
Main occupation
Business 1,686(34.9%) 1,401(38.2%) 3,087(36.3%) Farmer 1,176(24.4%) 873(23.8%) 2,049(24.1%) Private Sector (b) Temporary (Casual/Contract)
493(10.2%) 209(5.7%) 702(8.3%)
Formal Employment Public Sector (a) Permanent 405(8.4%) 180(4.9%) 585(6.9%)
Unemployed 268(5.5%) 207(5.6%) 475(5.6%) Formal Employment Public Sector (b) Temporary (Casual/Contract)
211(4.4%) 134(3.7%) 345(4.1%)
Student/Pupil 185(3.8%) 152(4.1%) 337 (4.0%) Private Sector (a) Permanent 160(3.3%) 80(2.2%) 240 (2.8%)
Other Retiree 133(2.8%) 29(0.8%) 162(1.9%) House Wife 48(1.0%) 374(10.2%) 422(5.0%) Volunteer 28(0.6%) 17(0.5%) 45(0.5%) Clergy 25(0.5%) 3(0.1%) 28(0.3% Intern 11(0.2%) 7(0.2%) 18(0.2%) Total 4,829 (100.0%) 3,666(100.0%) 8,495(100.0%)
3.3 Public Perceptions on Common and Emerging Types of Corruption
3.3.1 Understanding of corruption The study sought to establish sample respondents’ understanding of what corruption in the public service is. There were varied understandings of corruption but the ones reported by at least 1 out of 10 members of the public and/or public officials were bribery (soliciting for and/or receiving bribes), embezzlement/misuse/misappropriation of public funds/resources, abuse of power and/or office, dishonesty by public officials and giving and/or receiving a valuable public resource in exchange for personal favours. Most (23.1%) of the members of the public compared with 16.8% of the public officials stated that they understood corruption as bribery (soliciting for and/or receiving bribes) while 17.4% of the public officials and 19.6% of the members of the public defined corruption as embezzlement/misuse/

21
21
misappropriation of public funds/resources. Other understandings by both members of the public and public officials of what corruption is are summarized in Table 3.2 below. Table 3.2: Understanding of what corruption is Understanding of what corruption is Members of
the public Public
officials
Bribery (soliciting for and/or receiving bribes) 23.1% 16.8% Embezzlement/misuse/misappropriation of public funds/resources
19.6% 17.4%
Destroying and/or wasting public resources 9.0% 2.8% Illegally taking citizens’ money and/or illegally asking for money in exchange for service delivery
7.7% 8.5%
Abuse of power and/or office 6.3% 14.2% Where one is used directly or indirectly to give money for free service
6.3% 5.3%
Giving and/or receiving a valuable public resource in exchange for personal favours
5.4% 10.6%
Injustice orchestrated by public officials 5.3% 4.6% Influencing for service by offering money 2.9% 6.5% Dishonesty by public officials 2.9% 12.8% Failure to follow and act according to the law 2.9% 3.4% Discrimination and/or favoritism 2.4% 1.2% Lack of transparency and accountability in the public service 2.0% 3.3% Taking advantage of a public service seeker 1.6% 0.8% Act of cheating service seekers 1.3% 1.8% Form of theft in the public service 1.3% 0.6% Anything bad done to government or another person using the influence of a public office
1.2% 0.4%
Use of public office for selfish interests 1.1% 0.8% Tribalism 0.9% 0.4% Non-delivery of service promised by leaders 0.9% - Unequal distribution of resources 0.8% 0.1% Lack of development 0.3% 0.1% Buying a right and/or oppressing people’s rights 0.1% 0.1% Rigging of voters in order to get a political post 0.1% -
The above findings imply that the main form of corruption which is bribery is well understood by most Kenyans. The findings are also a pointer to the changing nature of corruption. 3.3.2 Perceptions on existence of corruption in public service institutions The sample respondents were asked about their perceptions on the existence of corruption in public service institutions in Kenya. As indicated in Figure 2 below, a greater proportion (92.6%) of the members of the public compared to public officials (85.0%) said that there was corruption in public service institutions in Kenya.
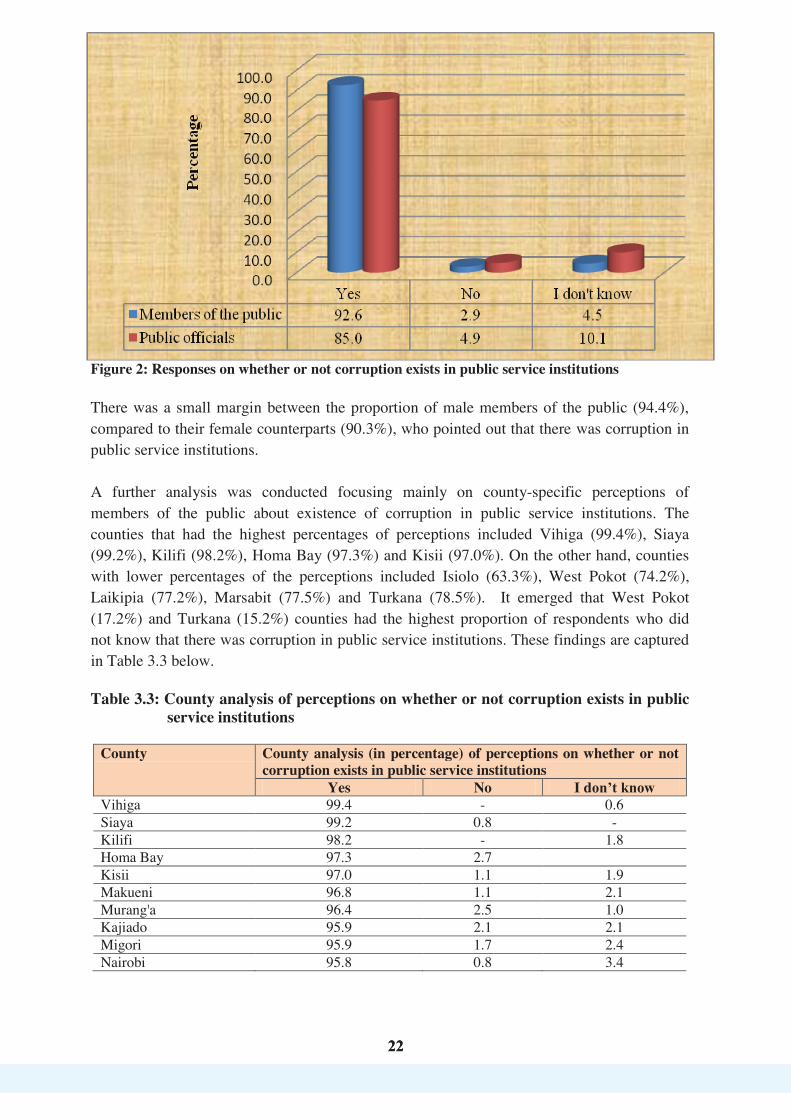
22
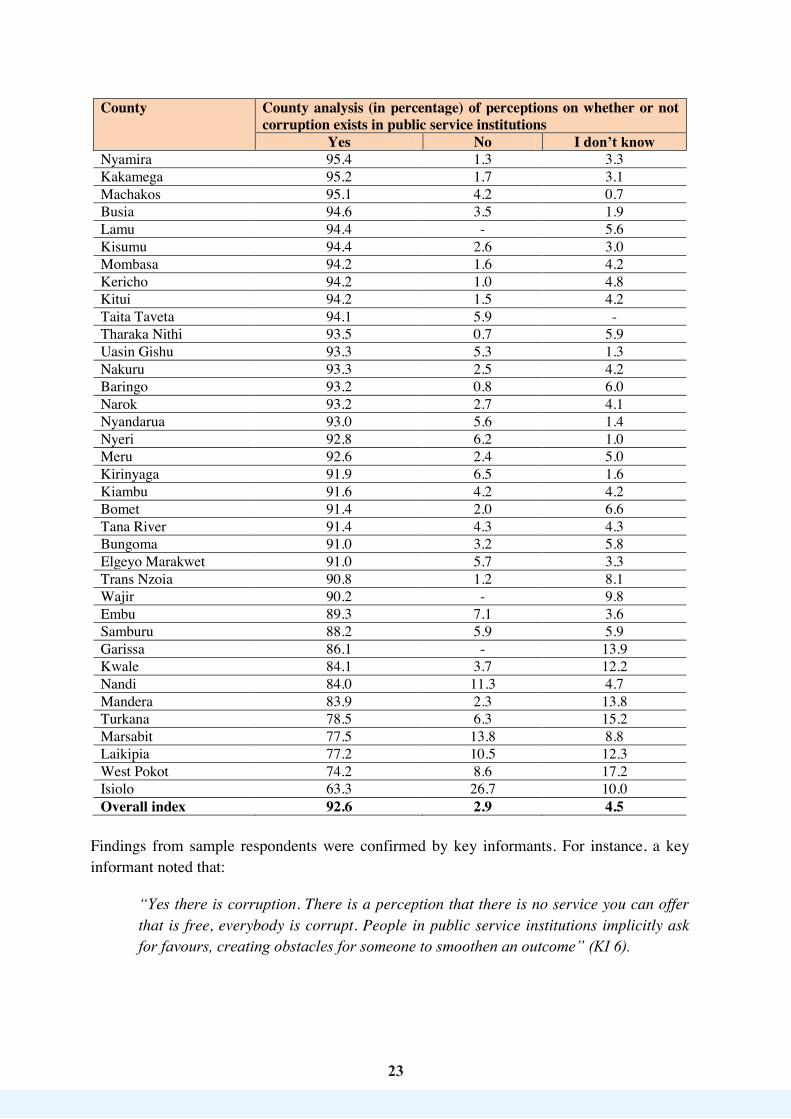
23
23
County County analysis (in percentage) of perceptions on whether or not corruption exists in public service institutions
Yes No I don’t know Nyamira 95.4 1.3 3.3 Kakamega 95.2 1.7 3.1 Machakos 95.1 4.2 0.7 Busia 94.6 3.5 1.9 Lamu 94.4 - 5.6 Kisumu 94.4 2.6 3.0 Mombasa 94.2 1.6 4.2 Kericho 94.2 1.0 4.8 Kitui 94.2 1.5 4.2 Taita Taveta 94.1 5.9 - Tharaka Nithi 93.5 0.7 5.9 Uasin Gishu 93.3 5.3 1.3 Nakuru 93.3 2.5 4.2 Baringo 93.2 0.8 6.0 Narok 93.2 2.7 4.1 Nyandarua 93.0 5.6 1.4 Nyeri 92.8 6.2 1.0 Meru 92.6 2.4 5.0 Kirinyaga 91.9 6.5 1.6 Kiambu 91.6 4.2 4.2 Bomet 91.4 2.0 6.6 Tana River 91.4 4.3 4.3 Bungoma 91.0 3.2 5.8 Elgeyo Marakwet 91.0 5.7 3.3 Trans Nzoia 90.8 1.2 8.1 Wajir 90.2 - 9.8 Embu 89.3 7.1 3.6 Samburu 88.2 5.9 5.9 Garissa 86.1 - 13.9 Kwale 84.1 3.7 12.2 Nandi 84.0 11.3 4.7 Mandera 83.9 2.3 13.8 Turkana 78.5 6.3 15.2 Marsabit 77.5 13.8 8.8 Laikipia 77.2 10.5 12.3 West Pokot 74.2 8.6 17.2 Isiolo 63.3 26.7 10.0 Overall index 92.6 2.9 4.5
Findings from sample respondents were confirmed by key informants. For instance, a key informant noted that:
“Yes there is corruption. There is a perception that there is no service you can offer that is free, everybody is corrupt. People in public service institutions implicitly ask for favours, creating obstacles for someone to smoothen an outcome” (KI 6).

2424
Another key informant observed that:
“There is real corruption, you can’t talk of it sometimes but it is there and a lot of it. For example, in getting employment, advertising tenders, people give out money to benefit in one way or the other” (KI 10).
The above findings are an indictment to public service institutions in all the 47 counties and call for elaborate anti-corruption strategies to change this perception. 3.3.3 Perceptions on existence of corruption in different arms of government Members of the public and public officials were further asked whether there was corruption in specific arms of the government with reference to the National Executive, the County Executive, the National Assembly, the Senate Assembly, the County Assembly and the Judiciary. The findindings showed that majority of the members of the public perceived that there was corruption in all the arms of government (with the executive arm of the National Government recording the highest percentage of 85.7%) except in the Senate Assembly (which recorded the lowest percentage of 28.0%). On the other hand, public officials perceived that there was corruption in all the arms of government (with the executive arm of County Government recording the highest percentage of 87.0% and the Senate Assembly recording the lowest percentage of 50.4%). Table 3.4 below provides more details on the existence of corruption in each of the six (6) sections of the arms of government. Table 3.4: Perceptions on whether or not corruption exists in the different arms of
government
Arm of government Perceptions (in percentage) on whether or not corruption exists in the different arms of government
Members of the public Public officials Male Female Overall %
The executive arm of County Government
Yes 85.6 81.4 83.9 87.0 No 5.0 5.9 5.4 2.4 I don’t know 9.3 12.7 10.8 10.5
The executive arm of National Government
Yes 87.8 82.8 85.7 82.1 No 4.3 5.0 4.6 4.4 I don’t know 7.9 12.3 9.7 13.5
The County Assembly
Yes 72.3 62.3 68.1 78.8 No 9.1 10.4 9.7 2.9 I don’t know 18.6 27.3 22.2 18.3
The Judiciary Yes 66.7 57.3 62.8 79.5 No 9.1 9.8 9.4 4.1 I don’t know 24.2 32.8 27.8 16.4
The National Assembly
Yes 57.7 49.0 53.9 65.5 No 12.1 11.2 11.7 4.5 I don’t know 30.1 39.8 34.4 30.0
The Senate Assembly
Yes 28.6 27.1 28.0 50.4 No 17.2 12.5 15.2 9.2 I don’t know 54.2 60.4 56.9 40.4

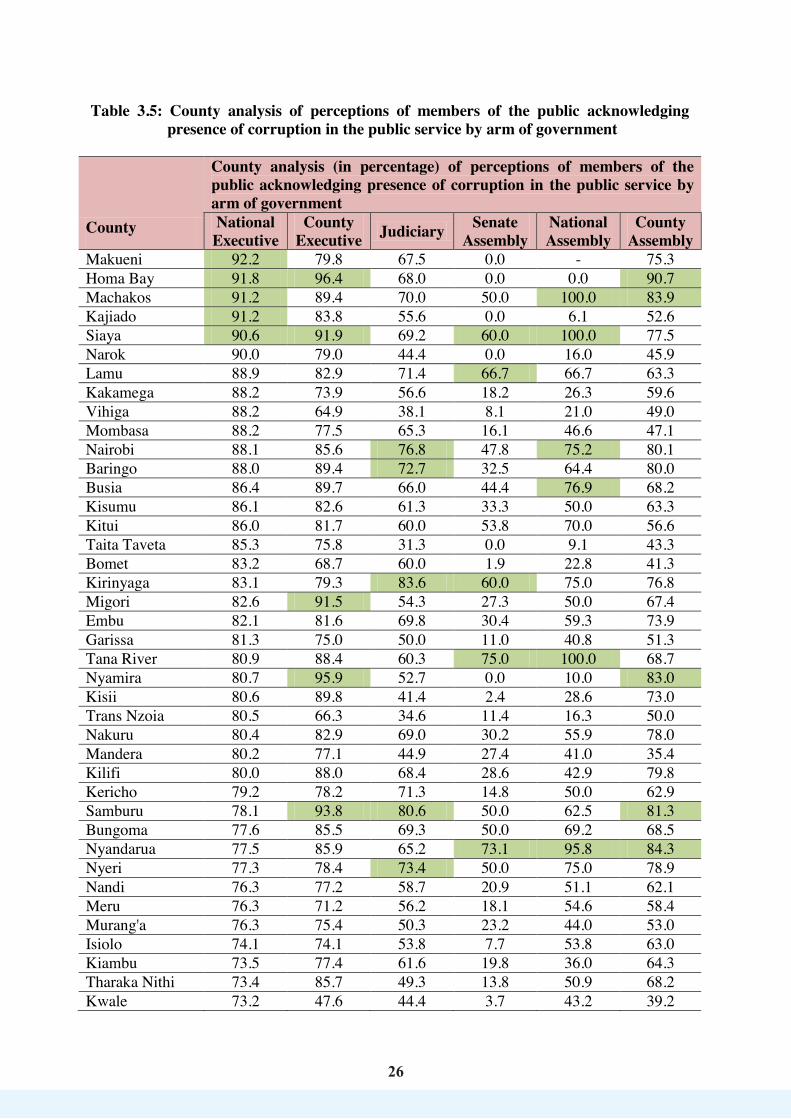
26
26
Table 3.5: County analysis of perceptions of members of the public acknowledging presence of corruption in the public service by arm of government
County
County analysis (in percentage) of perceptions of members of the public acknowledging presence of corruption in the public service by arm of government National Executive
County Executive Judiciary Senate
Assembly National Assembly
County Assembly
Makueni 92.2 79.8 67.5 0.0 - 75.3 Homa Bay 91.8 96.4 68.0 0.0 0.0 90.7 Machakos 91.2 89.4 70.0 50.0 100.0 83.9 Kajiado 91.2 83.8 55.6 0.0 6.1 52.6 Siaya 90.6 91.9 69.2 60.0 100.0 77.5 Narok 90.0 79.0 44.4 0.0 16.0 45.9 Lamu 88.9 82.9 71.4 66.7 66.7 63.3 Kakamega 88.2 73.9 56.6 18.2 26.3 59.6 Vihiga 88.2 64.9 38.1 8.1 21.0 49.0 Mombasa 88.2 77.5 65.3 16.1 46.6 47.1 Nairobi 88.1 85.6 76.8 47.8 75.2 80.1 Baringo 88.0 89.4 72.7 32.5 64.4 80.0 Busia 86.4 89.7 66.0 44.4 76.9 68.2 Kisumu 86.1 82.6 61.3 33.3 50.0 63.3 Kitui 86.0 81.7 60.0 53.8 70.0 56.6 Taita Taveta 85.3 75.8 31.3 0.0 9.1 43.3 Bomet 83.2 68.7 60.0 1.9 22.8 41.3 Kirinyaga 83.1 79.3 83.6 60.0 75.0 76.8 Migori 82.6 91.5 54.3 27.3 50.0 67.4 Embu 82.1 81.6 69.8 30.4 59.3 73.9 Garissa 81.3 75.0 50.0 11.0 40.8 51.3 Tana River 80.9 88.4 60.3 75.0 100.0 68.7 Nyamira 80.7 95.9 52.7 0.0 10.0 83.0 Kisii 80.6 89.8 41.4 2.4 28.6 73.0 Trans Nzoia 80.5 66.3 34.6 11.4 16.3 50.0 Nakuru 80.4 82.9 69.0 30.2 55.9 78.0 Mandera 80.2 77.1 44.9 27.4 41.0 35.4 Kilifi 80.0 88.0 68.4 28.6 42.9 79.8 Kericho 79.2 78.2 71.3 14.8 50.0 62.9 Samburu 78.1 93.8 80.6 50.0 62.5 81.3 Bungoma 77.6 85.5 69.3 50.0 69.2 68.5 Nyandarua 77.5 85.9 65.2 73.1 95.8 84.3 Nyeri 77.3 78.4 73.4 50.0 75.0 78.9 Nandi 76.3 77.2 58.7 20.9 51.1 62.1 Meru 76.3 71.2 56.2 18.1 54.6 58.4 Murang'a 76.3 75.4 50.3 23.2 44.0 53.0 Isiolo 74.1 74.1 53.8 7.7 53.8 63.0 Kiambu 73.5 77.4 61.6 19.8 36.0 64.3 Tharaka Nithi 73.4 85.7 49.3 13.8 50.9 68.2 Kwale 73.2 47.6 44.4 3.7 43.2 39.2
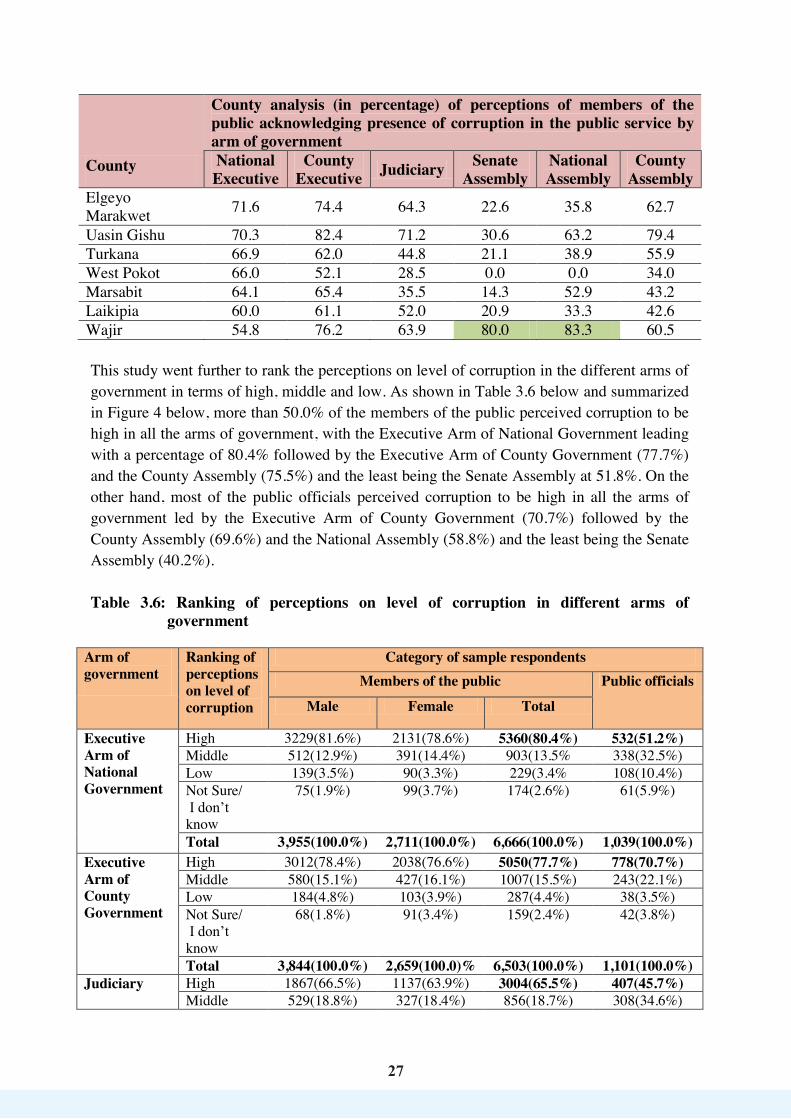
27
27
County
County analysis (in percentage) of perceptions of members of the public acknowledging presence of corruption in the public service by arm of government National Executive
County Executive Judiciary Senate
Assembly National Assembly
County Assembly
Elgeyo Marakwet 71.6 74.4 64.3 22.6 35.8 62.7
Uasin Gishu 70.3 82.4 71.2 30.6 63.2 79.4 Turkana 66.9 62.0 44.8 21.1 38.9 55.9 West Pokot 66.0 52.1 28.5 0.0 0.0 34.0 Marsabit 64.1 65.4 35.5 14.3 52.9 43.2 Laikipia 60.0 61.1 52.0 20.9 33.3 42.6 Wajir 54.8 76.2 63.9 80.0 83.3 60.5 This study went further to rank the perceptions on level of corruption in the different arms of government in terms of high, middle and low. As shown in Table 3.6 below and summarized in Figure 4 below, more than 50.0% of the members of the public perceived corruption to be high in all the arms of government, with the Executive Arm of National Government leading with a percentage of 80.4% followed by the Executive Arm of County Government (77.7%) and the County Assembly (75.5%) and the least being the Senate Assembly at 51.8%. On the other hand, most of the public officials perceived corruption to be high in all the arms of government led by the Executive Arm of County Government (70.7%) followed by the County Assembly (69.6%) and the National Assembly (58.8%) and the least being the Senate Assembly (40.2%). Table 3.6: Ranking of perceptions on level of corruption in different arms of
government
Arm of government
Ranking of perceptions on level of corruption
Category of sample respondents Members of the public Public officials
Male Female Total
Executive Arm of National Government
High 3229(81.6%) 2131(78.6%) 5360(80.4%) 532(51.2%) Middle 512(12.9%) 391(14.4%) 903(13.5% 338(32.5%) Low 139(3.5%) 90(3.3%) 229(3.4% 108(10.4%) Not Sure/ I don’t know
75(1.9%) 99(3.7%) 174(2.6%) 61(5.9%)
Total 3,955(100.0%) 2,711(100.0%) 6,666(100.0%) 1,039(100.0%) Executive Arm of County Government
High 3012(78.4%) 2038(76.6%) 5050(77.7%) 778(70.7%) Middle 580(15.1%) 427(16.1%) 1007(15.5%) 243(22.1%) Low 184(4.8%) 103(3.9%) 287(4.4%) 38(3.5%) Not Sure/ I don’t know
68(1.8%) 91(3.4%) 159(2.4%) 42(3.8%)
Total 3,844(100.0%) 2,659(100.0)% 6,503(100.0%) 1,101(100.0%) Judiciary
High 1867(66.5%) 1137(63.9%) 3004(65.5%) 407(45.7%) Middle 529(18.8%) 327(18.4%) 856(18.7%) 308(34.6%)
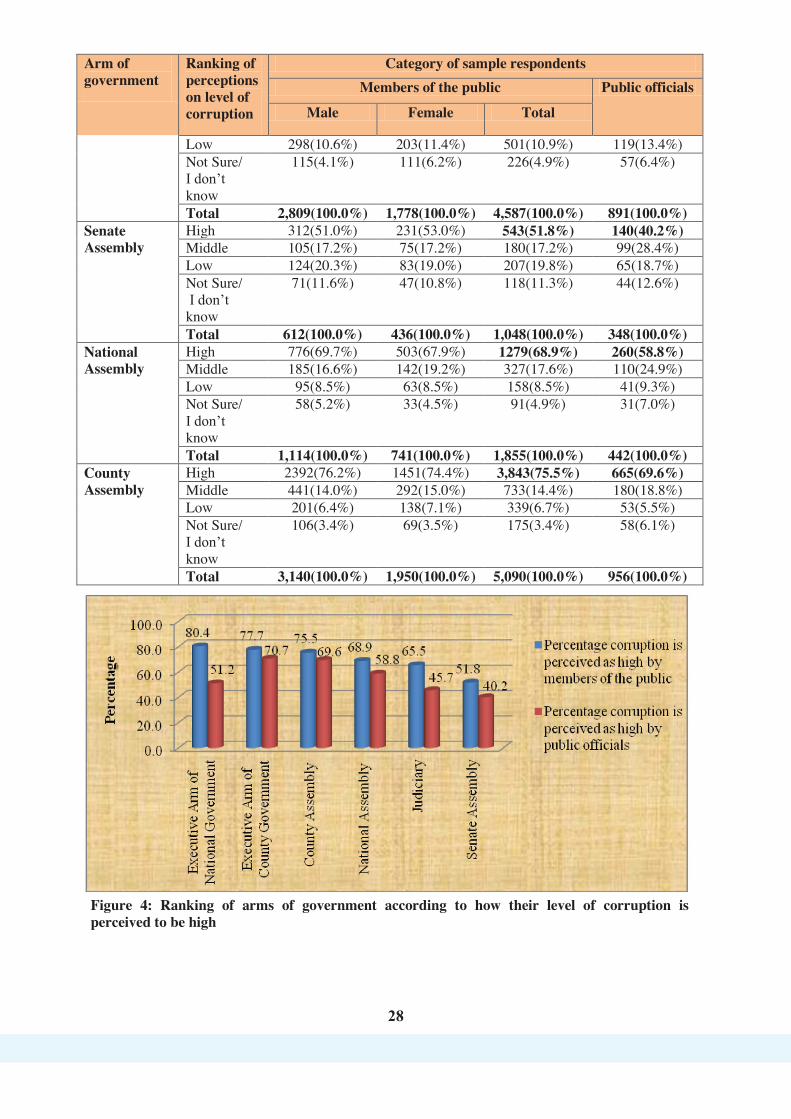

29
29
A further county-specific analysis of perceptions of the members of the public on the level of corruption in the different arms of government was conducted. This analysis was based only on the proportion of the members of the public who perceived that there was high level of corruption. The findings showed that more than 50.0% of the members of the public perceived corruption to be high: in the National Executive in all the 47 counties; in the County Executive in 46 counties; in the County Assembly in 45 counmties; in the Judiciary in 42 counties; in the National Assembly in 32 counties; and in the Senate Assembly in 18 counties. Counties with the highest percentages of perceptions of corruption as high in the National Executive included Vihiga (91.2%), Makueni (87.8%), Kisumu (86.6%), Nairobi (86.3%) and Kakamega (85.5%). With regard to the County Executive, the leading counties included Nyandarua (90.2%), Kisumu (88.2%), Homa Bay (88.0%), Taita Taveta (86.4%) and Tana River (86.2%). County Assembly was reported by the highest percentage of members of the public especially in Homa Bay (94.1%), Taita Taveta (92.3%), Nyandarua (90.0%), Kisii (87.9%) and Makueni (85.0%) counties while the Judiciary recorded the highest percentages especially in Isiolo (84.6%), Wajir (82.6%), Nandi (81.5%), Nyandarua (79.5%) and Kiambu (78.2%) counties. The National Assembly was reported highest especially in the counties of Kisumu (100.0%), Taita Taveta (100.0%), Tana River (100.0%), Lamu (100.0%), Vihiga (92.9%), Kitui (87.5%), Nyeri (83.3%) and Nyandarua (82.6%) while the Senate Assembly recorded the highest reporting especially in Kisumu (100.0%), Siaya (100.0%), Tana River (100.0%), Lamu (100.0%), Vihiga (83.3%), Nyandarua (78.9%), Nyeri (75.0%), Wajir (75.0%), Kiambu (70.0%) and Laikipia (70.0%) counties. The details of these findings are presented in Table 3.7 below. Table 3.7: Members of the public’s perceptions on the level of corruption as being high
as per arm of government and county
County County analysis (in percentage) of members of the public’s perceptions of the level of corruption as being high as per arm of government
Executive Judiciary Legislature National Executive
County Executive
Judiciary Senate Assembly
National Assembly
County Assembly
Vihiga 91.2 84.8 71.4 83.3 92.9 76.4 Makueni 87.8 57.1 67.9 - - 85.0 Kisumu 86.6 88.2 74.0 100.0 100.0 80.0 Nairobi 86.3 79.5 68.2 56.4 75.4 79.2 Kakamega 85.5 75.7 57.8 62.2 69.4 72.0 Mombasa 85.2 71.5 71.8 29.3 60.3 55.4 Nakuru 85.1 78.8 71.5 57.5 66.5 81.5 Kajiado 84.5 78.4 56.0 0.0 26.7 66.4 Machakos 83.8 76.3 72.5 0.0 40.0 78.2 Nyandarua 83.6 90.2 79.5 78.9 82.6 90.0 Siaya 83.6 86.0 71.3 100.0 50.0 81.4 Kitui 83.0 79.9 57.2 57.1 87.5 81.4 Narok 82.4 80.7 53.3 0.0 47.1 66.0 Marsabit 82.4 76.9 54.2 0.0 15.8 42.4

30
30
County County analysis (in percentage) of members of the public’s perceptions of the level of corruption as being high as per arm of government
Executive Judiciary Legislature National Executive
County Executive
Judiciary Senate Assembly
National Assembly
County Assembly
Kisii 82.3 81.2 57.7 50.0 78.6 87.9 Nyeri 81.3 83.1 71.0 75.0 83.3 79.2 Nandi 81.1 76.3 81.5 50.0 77.3 68.3 Baringo 81.1 75.6 62.8 28.6 65.6 75.7 Mandera 80.9 84.6 77.8 66.7 78.8 75.9 Nyamira 80.5 83.1 57.1 0.0 28.6 81.9 Migori 80.2 77.3 62.5 28.6 50.0 71.0 Meru 79.9 69.6 63.3 42.6 69.3 76.9 Homa Bay 79.2 88.0 60.0 - - 94.1 Embu 79.1 82.4 73.5 31.6 40.0 78.6 Garissa 78.8 85.2 58.1 46.2 59.4 72.5 Kiambu 78.4 77.7 78.2 70.0 65.7 81.3 Laikipia 77.1 81.1 69.2 70.0 82.4 68.0 Uasin Gishu 77.1 71.9 60.4 36.4 72.7 64.2 Samburu 76.9 83.3 61.5 40.0 66.7 74.1 Taita Taveta 75.9 86.4 62.5 - 100.0 92.3 Trans Nzoia 74.8 76.5 55.0 17.6 53.8 66.7 Busia 73.6 73.4 65.8 22.2 80.0 71.1 Tana River 72.2 86.2 45.0 100.0 100.0 78.6 Bungoma 71.5 77.0 63.7 66.7 75.8 73.8 Murang’a 70.0 70.1 68.2 44.4 81.3 65.3 Isiolo 70.0 80.0 84.6 0.0 0.0 64.7 Tharaka Nithi 68.3 80.5 63.3 50.0 73.8 73.1 West Pokot 68.3 59.8 50.0 - 67.8 62.5 Bomet 68.0 75.5 50.6 16.7 42.1 48.4 Wajir 66.7 81.3 82.6 75.0 80.0 65.2 Kilifi 65.9 76.1 45.7 0.0 66.7 75.0 Turkana 65.6 61.9 43.6 60.0 28.6 61.6 Kwale 65.5 36.8 66.7 25.0 52.8 56.3 Kirinyaga 65.4 67.3 75.0 58.3 60.0 76.6 Lamu 61.3 67.9 70.8 100.0 100.0 57.9 Kericho 61.3 50.6 42.4 14.3 41.2 45.9 Elgeyo Marakwet 54.5 64.1 63.6 23.8 35.7 59.7 Number of counties where more than 50.0% of the members of the public perceived corruption to be high in each of the arms of government
47 46 42 18 32 45
The finding that corruption is minimal at the Senate Assembly may be attributed to its reduced interactions with members of public in provision of public services compared to other the arms of government.
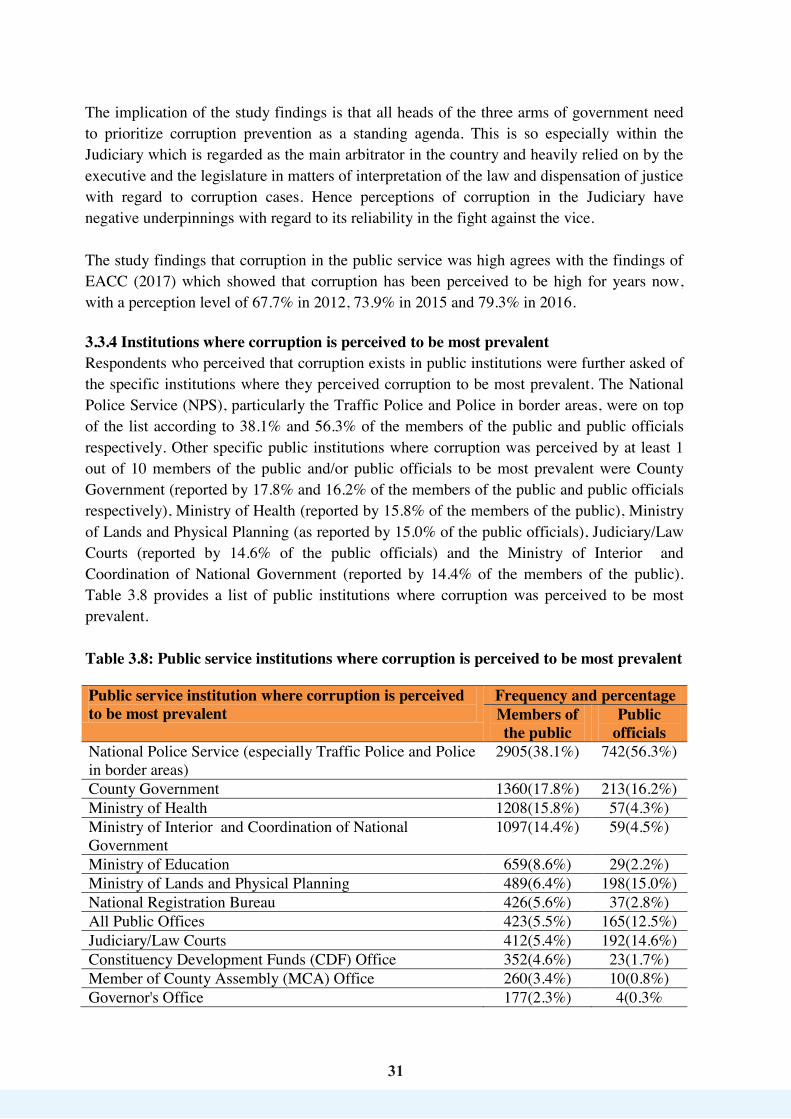
31
31
The implication of the study findings is that all heads of the three arms of government need to prioritize corruption prevention as a standing agenda. This is so especially within the Judiciary which is regarded as the main arbitrator in the country and heavily relied on by the executive and the legislature in matters of interpretation of the law and dispensation of justice with regard to corruption cases. Hence perceptions of corruption in the Judiciary have negative underpinnings with regard to its reliability in the fight against the vice. The study findings that corruption in the public service was high agrees with the findings of EACC (2017) which showed that corruption has been perceived to be high for years now, with a perception level of 67.7% in 2012, 73.9% in 2015 and 79.3% in 2016. 3.3.4 Institutions where corruption is perceived to be most prevalent Respondents who perceived that corruption exists in public institutions were further asked of the specific institutions where they perceived corruption to be most prevalent. The National Police Service (NPS), particularly the Traffic Police and Police in border areas, were on top of the list according to 38.1% and 56.3% of the members of the public and public officials respectively. Other specific public institutions where corruption was perceived by at least 1 out of 10 members of the public and/or public officials to be most prevalent were County Government (reported by 17.8% and 16.2% of the members of the public and public officials respectively), Ministry of Health (reported by 15.8% of the members of the public), Ministry of Lands and Physical Planning (as reported by 15.0% of the public officials), Judiciary/Law Courts (reported by 14.6% of the public officials) and the Ministry of Interior and Coordination of National Government (reported by 14.4% of the members of the public). Table 3.8 provides a list of public institutions where corruption was perceived to be most prevalent. Table 3.8: Public service institutions where corruption is perceived to be most prevalent
Public service institution where corruption is perceived to be most prevalent
Frequency and percentage Members of the public
Public officials
National Police Service (especially Traffic Police and Police in border areas)
2905(38.1%) 742(56.3%)
County Government 1360(17.8%) 213(16.2%) Ministry of Health 1208(15.8%) 57(4.3%) Ministry of Interior and Coordination of National Government
1097(14.4%) 59(4.5%)
Ministry of Education 659(8.6%) 29(2.2%) Ministry of Lands and Physical Planning 489(6.4%) 198(15.0%) National Registration Bureau 426(5.6%) 37(2.8%) All Public Offices 423(5.5%) 165(12.5%) Judiciary/Law Courts 412(5.4%) 192(14.6%) Constituency Development Funds (CDF) Office 352(4.6%) 23(1.7%) Member of County Assembly (MCA) Office 260(3.4%) 10(0.8%) Governor's Office 177(2.3%) 4(0.3%
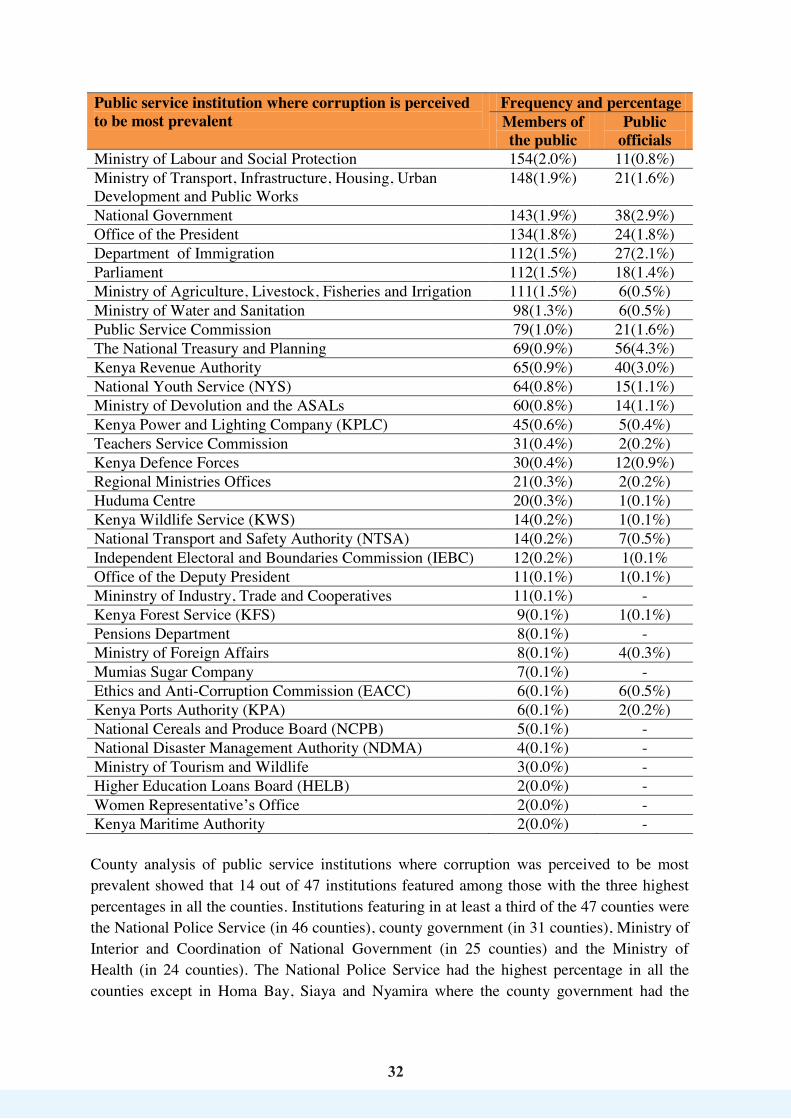
32
32
Public service institution where corruption is perceived to be most prevalent
Frequency and percentage Members of the public
Public officials
Ministry of Labour and Social Protection 154(2.0%) 11(0.8%) Ministry of Transport, Infrastructure, Housing, Urban Development and Public Works
148(1.9%) 21(1.6%)
National Government 143(1.9%) 38(2.9%) Office of the President 134(1.8%) 24(1.8%) Department of Immigration 112(1.5%) 27(2.1%) Parliament 112(1.5%) 18(1.4%) Ministry of Agriculture, Livestock, Fisheries and Irrigation 111(1.5%) 6(0.5%) Ministry of Water and Sanitation 98(1.3%) 6(0.5%) Public Service Commission 79(1.0%) 21(1.6%) The National Treasury and Planning 69(0.9%) 56(4.3%) Kenya Revenue Authority 65(0.9%) 40(3.0%) National Youth Service (NYS) 64(0.8%) 15(1.1%) Ministry of Devolution and the ASALs 60(0.8%) 14(1.1%) Kenya Power and Lighting Company (KPLC) 45(0.6%) 5(0.4%) Teachers Service Commission 31(0.4%) 2(0.2%) Kenya Defence Forces 30(0.4%) 12(0.9%) Regional Ministries Offices 21(0.3%) 2(0.2%) Huduma Centre 20(0.3%) 1(0.1%) Kenya Wildlife Service (KWS) 14(0.2%) 1(0.1%) National Transport and Safety Authority (NTSA) 14(0.2%) 7(0.5%) Independent Electoral and Boundaries Commission (IEBC) 12(0.2%) 1(0.1% Office of the Deputy President 11(0.1%) 1(0.1%) Mininstry of Industry, Trade and Cooperatives 11(0.1%) - Kenya Forest Service (KFS) 9(0.1%) 1(0.1%) Pensions Department 8(0.1%) - Ministry of Foreign Affairs 8(0.1%) 4(0.3%) Mumias Sugar Company 7(0.1%) - Ethics and Anti-Corruption Commission (EACC) 6(0.1%) 6(0.5%) Kenya Ports Authority (KPA) 6(0.1%) 2(0.2%) National Cereals and Produce Board (NCPB) 5(0.1%) - National Disaster Management Authority (NDMA) 4(0.1%) - Ministry of Tourism and Wildlife 3(0.0%) - Higher Education Loans Board (HELB) 2(0.0%) - Women Representative’s Office 2(0.0%) - Kenya Maritime Authority 2(0.0%) - County analysis of public service institutions where corruption was perceived to be most prevalent showed that 14 out of 47 institutions featured among those with the three highest percentages in all the counties. Institutions featuring in at least a third of the 47 counties were the National Police Service (in 46 counties), county government (in 31 counties), Ministry of Interior and Coordination of National Government (in 25 counties) and the Ministry of Health (in 24 counties). The National Police Service had the highest percentage in all the counties except in Homa Bay, Siaya and Nyamira where the county government had the
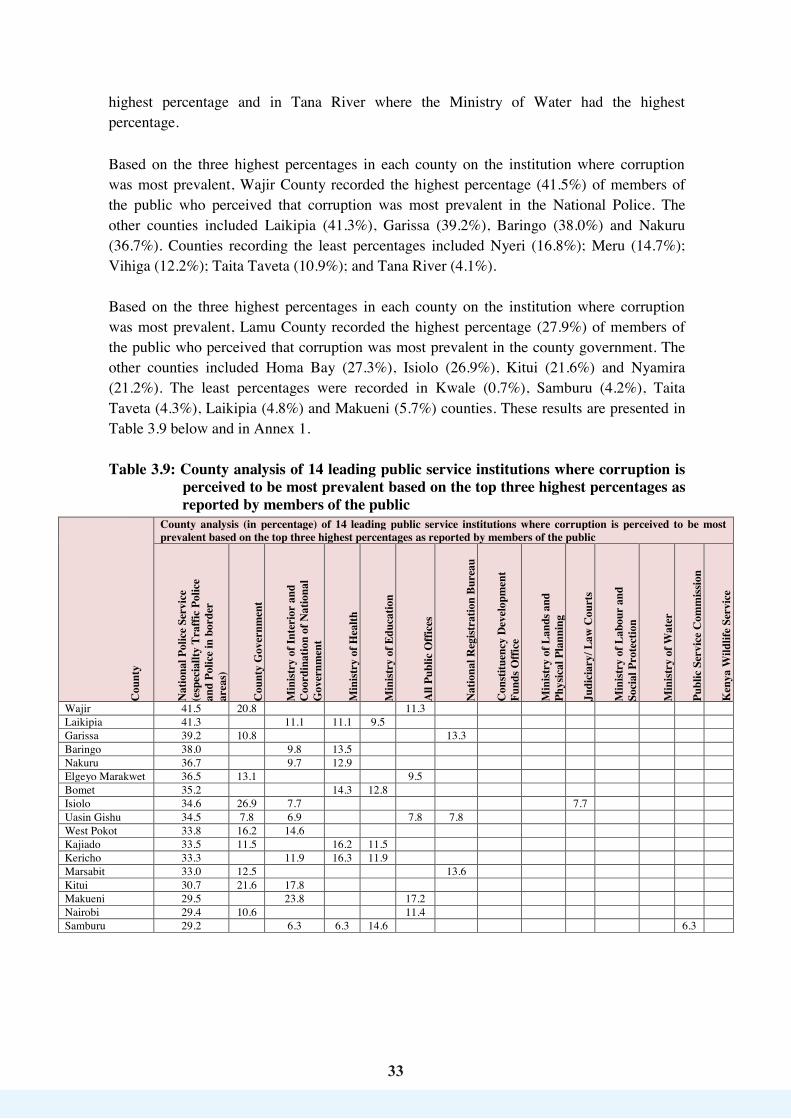
33
33
highest percentage and in Tana River where the Ministry of Water had the highest percentage.
Based on the three highest percentages in each county on the institution where corruption was most prevalent, Wajir County recorded the highest percentage (41.5%) of members of the public who perceived that corruption was most prevalent in the National Police. The other counties included Laikipia (41.3%), Garissa (39.2%), Baringo (38.0%) and Nakuru (36.7%). Counties recording the least percentages included Nyeri (16.8%); Meru (14.7%); Vihiga (12.2%); Taita Taveta (10.9%); and Tana River (4.1%). Based on the three highest percentages in each county on the institution where corruption was most prevalent, Lamu County recorded the highest percentage (27.9%) of members of the public who perceived that corruption was most prevalent in the county government. The other counties included Homa Bay (27.3%), Isiolo (26.9%), Kitui (21.6%) and Nyamira (21.2%). The least percentages were recorded in Kwale (0.7%), Samburu (4.2%), Taita Taveta (4.3%), Laikipia (4.8%) and Makueni (5.7%) counties. These results are presented in Table 3.9 below and in Annex 1. Table 3.9: County analysis of 14 leading public service institutions where corruption is
perceived to be most prevalent based on the top three highest percentages as reported by members of the public
Cou
nty
County analysis (in percentage) of 14 leading public service institutions where corruption is perceived to be most prevalent based on the top three highest percentages as reported by members of the public
Nat
iona
l Pol
ice
Serv
ice
(e
spec
iallt
y Tr
affic
Pol
ice
an
d Po
lice
in b
orde
r
area
s)
Cou
nty
Gov
ernm
ent
Min
istry
of I
nter
ior
and
C
oord
inat
ion
of N
atio
nal
Gov
ernm
ent
Min
istry
of H
ealth
Min
istry
of E
duca
tion
All
Publ
ic O
ffice
s
Nat
iona
l Reg
istra
tion
Bure
au
Con
stitu
ency
Dev
elop
men
t Fu
nds O
ffice
Min
istry
of L
ands
and
Ph
ysic
al P
lann
ing
Judi
ciar
y/ L
aw C
ourt
s
Min
istry
of L
abou
r an
d
Soci
al P
rote
ctio
n
Min
istry
of W
ater
Publ
ic S
ervi
ce C
omm
issio
n
Ken
ya W
ildlif
e Se
rvic
e Wajir 41.5 20.8 11.3 Laikipia 41.3 11.1 11.1 9.5 Garissa 39.2 10.8 13.3 Baringo 38.0 9.8 13.5 Nakuru 36.7 9.7 12.9 Elgeyo Marakwet 36.5 13.1 9.5 Bomet 35.2 14.3 12.8 Isiolo 34.6 26.9 7.7 7.7 Uasin Gishu 34.5 7.8 6.9 7.8 7.8 West Pokot 33.8 16.2 14.6 Kajiado 33.5 11.5 16.2 11.5 Kericho 33.3 11.9 16.3 11.9 Marsabit 33.0 12.5 13.6 Kitui 30.7 21.6 17.8 Makueni 29.5 23.8 17.2 Nairobi 29.4 10.6 11.4 Samburu 29.2 6.3 6.3 14.6 6.3
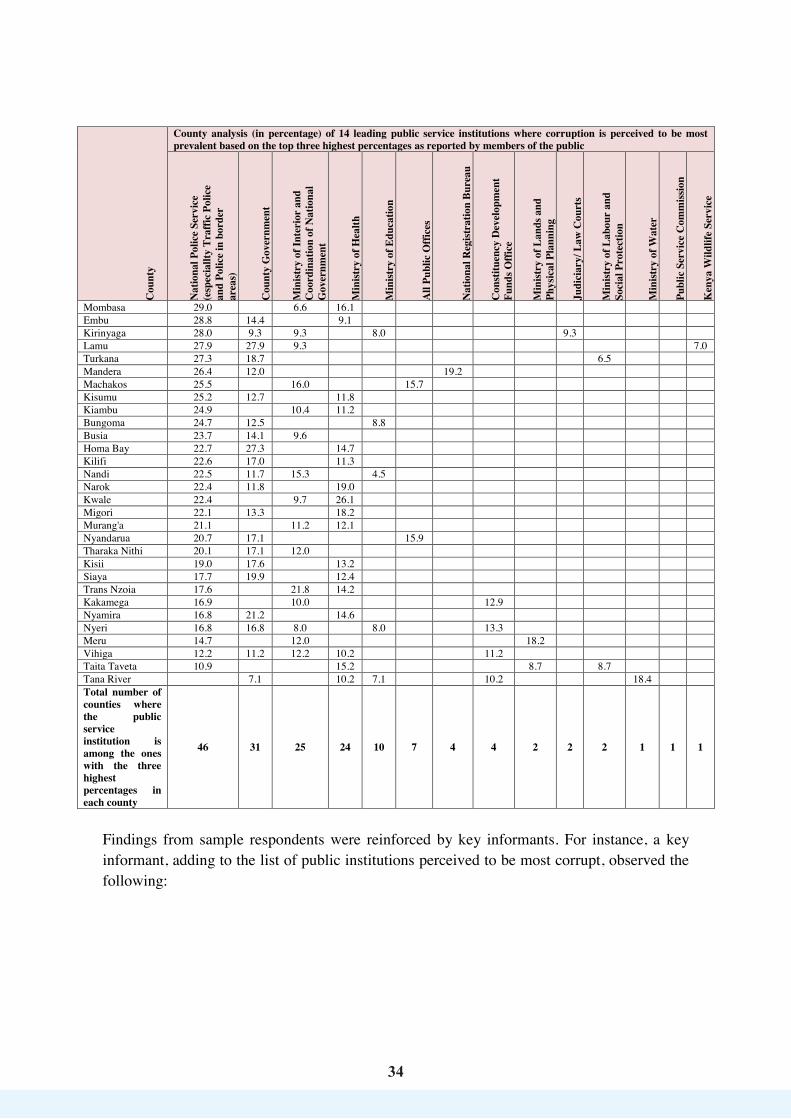
34
34
Cou
nty
County analysis (in percentage) of 14 leading public service institutions where corruption is perceived to be most prevalent based on the top three highest percentages as reported by members of the public
Nat
iona
l Pol
ice
Serv
ice
(e
spec
iallt
y Tr
affic
Pol
ice
an
d Po
lice
in b
orde
r
area
s)
Cou
nty
Gov
ernm
ent
Min
istry
of I
nter
ior
and
C
oord
inat
ion
of N
atio
nal
Gov
ernm
ent
Min
istry
of H
ealth
Min
istry
of E
duca
tion
All
Publ
ic O
ffice
s
Nat
iona
l Reg
istra
tion
Bure
au
Con
stitu
ency
Dev
elop
men
t Fu
nds O
ffice
Min
istry
of L
ands
and
Ph
ysic
al P
lann
ing
Judi
ciar
y/ L
aw C
ourt
s
Min
istry
of L
abou
r an
d
Soci
al P
rote
ctio
n
Min
istry
of W
ater
Publ
ic S
ervi
ce C
omm
issio
n
Ken
ya W
ildlif
e Se
rvic
e
Mombasa 29.0 6.6 16.1 Embu 28.8 14.4 9.1 Kirinyaga 28.0 9.3 9.3 8.0 9.3 Lamu 27.9 27.9 9.3 7.0 Turkana 27.3 18.7 6.5 Mandera 26.4 12.0 19.2 Machakos 25.5 16.0 15.7 Kisumu 25.2 12.7 11.8 Kiambu 24.9 10.4 11.2 Bungoma 24.7 12.5 8.8 Busia 23.7 14.1 9.6 Homa Bay 22.7 27.3 14.7 Kilifi 22.6 17.0 11.3 Nandi 22.5 11.7 15.3 4.5 Narok 22.4 11.8 19.0 Kwale 22.4 9.7 26.1 Migori 22.1 13.3 18.2 Murang'a 21.1 11.2 12.1 Nyandarua 20.7 17.1 15.9 Tharaka Nithi 20.1 17.1 12.0 Kisii 19.0 17.6 13.2 Siaya 17.7 19.9 12.4 Trans Nzoia 17.6 21.8 14.2 Kakamega 16.9 10.0 12.9 Nyamira 16.8 21.2 14.6 Nyeri 16.8 16.8 8.0 8.0 13.3 Meru 14.7 12.0 18.2 Vihiga 12.2 11.2 12.2 10.2 11.2 Taita Taveta 10.9 15.2 8.7 8.7 Tana River 7.1 10.2 7.1 10.2 18.4 Total number of counties where the public service institution is among the ones with the three highest percentages in each county
46 31 25 24 10 7 4 4 2 2 2 1 1 1
Findings from sample respondents were reinforced by key informants. For instance, a key informant, adding to the list of public institutions perceived to be most corrupt, observed the following:

35
35
“Immigration offices, Ministry of lands, KRA- if you want waiver you pay something small, Water ministry – if you have a huge bill you pay something/ bribe so that you can be waived.” (KI 8).
The above findings are in concurrence with the findings of the Ethics and Anti-Corruption Commission which showed that the leading Government Ministries perceived to be most prone to corruption were the Ministry of Interior and Coordination of National Government (45.9%) followed by the Ministry of Health (33.0%), Devolution and Planning (19.3%), Education, Science and Technology (19.2%), Transport and Infrastructure (15.5%), Land, Housing and Urban Development (15.1%) and Finance with 8.3% (EACC, 2017). 3.3.5 Perceived common and emerging types of corruption Members of the public and public officials listed the common and emerging types of corruption in each of the arms of government as discussed below. 3.3.5.1 Perceived common and emerging types of corruption in the Executive Arm of the National Government The leading common and emerging types of corruption in the Executive Arm of the National Government according to at least 1 out of 10 members of the public and/or public officials were: bribery (soliciting for and/or receiving bribes) which was reported by 50.5% and 30.8% of the members of the public and public officials respectively; flouting procurement (reported by 30.9% of the public officials); embezzlement/misuse/misappropriation of public funds/resources (reported by 23.3% and 18.3% of the members of the public and public officials respectively); and nepotism in service delivery (reported by 9.5% of the public officials). The least reported perceived common and emerging types of corruption in the National Executive included smuggling of goods, implementing defective laws and money laundering. These findings are captured in Table 3.10 below. Table 3.10: Perceived common and emerging types of corruption in the National
Executive Perceived common and emerging types of corruption in the National Executive
Members of the public
Public officials
Bribery (soliciting for and/or receiving bribes) 50.5% 30.8% Embezzlement/misuse/misappropriation of public funds/resources
23.3% 18.3%
Tribalism in service delivery 8.6% 6.2% Nepotism in service delivery 7.5% 9.5% Abuse of office 5.6% 7.9% Discrimination in service delivery 5.4% 5.5% Flouting procurement regulations 4.0% 30.9% Fraud and/or forgery 3.2% 3.6% Theft scandals/looting 2.9% 1.4% Extortion 2.5% 1.7% Unequal distribution of public resources 2.2% 2.3%

3636
Perceived common and emerging types of corruption in the National Executive
Members of the public
Public officials
Denial of entitled resources/services 2.1% 0.3% Actual and/or facilitation of implementation of shoddy/ghost /white elephant projects
1.9% 2.9%
Corruption in job recruitments 1.8% 8.8% Facilitation of and/or actual land grabbing 1.2% 1.2% Exaggeration of prices of goods and services 1.0% 2.7% Harassment of service seekers 1.0% 0.2% Laxity 0.9% 0.7% Interference by other arms of government in the discharge of mandate
0.9% 1.4%
Delay/dragging of service delivery 0.7% 0.5% Incompetency in provision of public funds 0.6% 0.9% Unjustified withholding of vital documents 0.3% 0.2% Influenced cases/unjust verdicts 0.3% 0.1% Money laundering 0.2% - Absenteeism in public office 0.2% 0.3% Implementing defective laws 0.2 % - Conflict of interest 0.2% 0.8% Soliciting for sexual favors 0.2% 0.3% Smuggling of goods 0.1% - Cyber/online theft of public resources 0.0% 0.4%
County analysis of perceptions of members of the public on common and emerging types of corruption in the National Executive showed that 12 out of 30 common and emerging types of corruption featured among those with the three highest percentages in each of the 47 counties. The common and emerging types of corruption featuring in at least a third of the counties were bribery (prominent in all the 47 counties), embezzlement/misuse/ misappropriation of public funds/resources (prominent in 39 counties) and nepotism in service delivery (prominent in 16 counties). Based on the three highest percentages in each county on the perceived common and emerging types of corruption in the National Executive, the highest percentage of perceptions of members of the public on bribery was recorded in Wajir (56.8%) followed by Laikipia (56.3%), Mandera (55.0%), Elgeyo Marakwet (54.7%) and Nandi (52.7%). The least percentages were recorded in counties such as Kilifi (21.2%), Homa Bay (22.5%), Kisumu (23.7%), Siaya (24.4%) and Tana River (25.7%). Based on the three highest percentages in each county on the common and emerging types of corruption in the National Executive, the highest percentage of perceptions of members of the public on embezzlement/misuse/misappropriation of public funds/resources was recorded in Makueni (35.4%) followed by Machakos (33.7%), Nyandarua (32.5%), Baringo (29.1%), Nakuru (28.4%) and Kirinyaga (28.4%) counties. The least percentages were recorded in
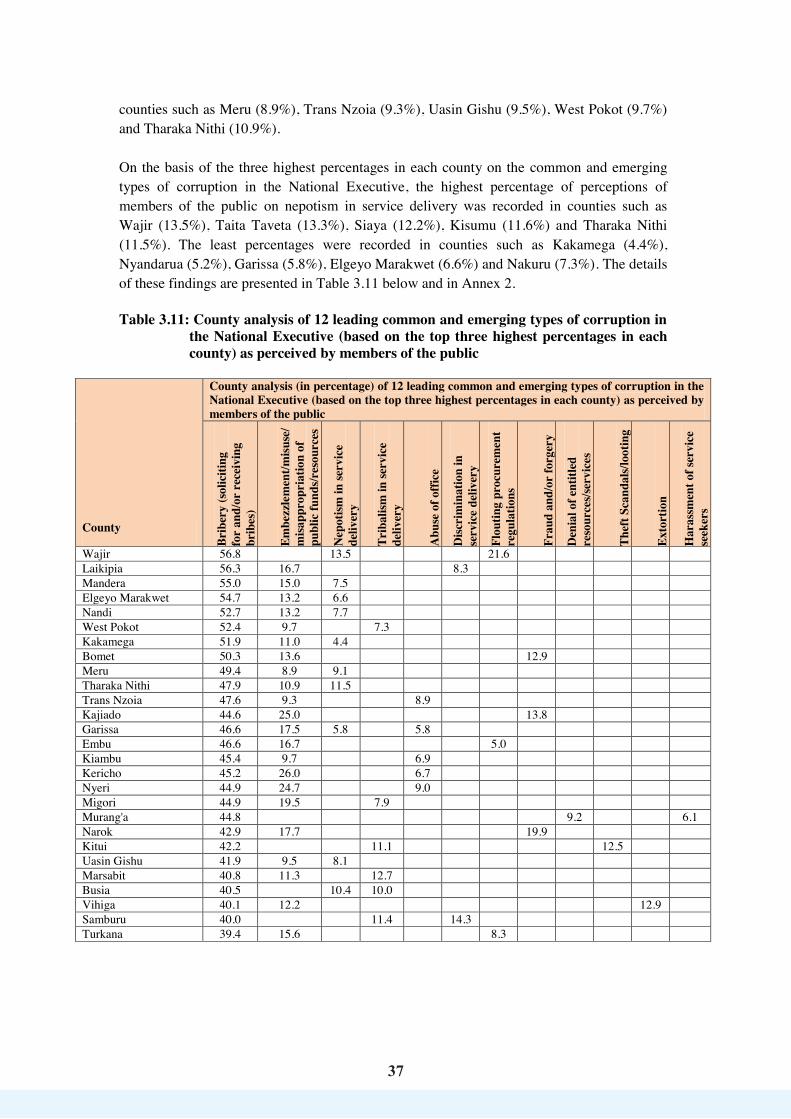
37
37
counties such as Meru (8.9%), Trans Nzoia (9.3%), Uasin Gishu (9.5%), West Pokot (9.7%) and Tharaka Nithi (10.9%). On the basis of the three highest percentages in each county on the common and emerging types of corruption in the National Executive, the highest percentage of perceptions of members of the public on nepotism in service delivery was recorded in counties such as Wajir (13.5%), Taita Taveta (13.3%), Siaya (12.2%), Kisumu (11.6%) and Tharaka Nithi (11.5%). The least percentages were recorded in counties such as Kakamega (4.4%), Nyandarua (5.2%), Garissa (5.8%), Elgeyo Marakwet (6.6%) and Nakuru (7.3%). The details of these findings are presented in Table 3.11 below and in Annex 2. Table 3.11: County analysis of 12 leading common and emerging types of corruption in
the National Executive (based on the top three highest percentages in each county) as perceived by members of the public
County
County analysis (in percentage) of 12 leading common and emerging types of corruption in the National Executive (based on the top three highest percentages in each county) as perceived by members of the public
Brib
ery
(sol
iciti
ng
for
and/
or r
ecei
ving
br
ibes
)
Embe
zzle
men
t/misu
se/
misa
ppro
pria
tion
of
publ
ic fu
nds/r
esou
rces
Nep
otism
in se
rvic
e de
liver
y
Trib
alism
in se
rvic
e de
liver
y
Abu
se o
f offi
ce
Disc
rim
inat
ion
in
serv
ice
deliv
ery
Flou
ting
proc
urem
ent
regu
latio
ns
Frau
d an
d/or
forg
ery
Den
ial o
f ent
itled
re
sour
ces/s
ervi
ces
Thef
t Sca
ndal
s/loo
ting
Exto
rtio
n
Har
assm
ent o
f ser
vice
se
eker
s
Wajir 56.8 13.5 21.6 Laikipia 56.3 16.7 8.3 Mandera 55.0 15.0 7.5 Elgeyo Marakwet 54.7 13.2 6.6 Nandi 52.7 13.2 7.7 West Pokot 52.4 9.7 7.3 Kakamega 51.9 11.0 4.4 Bomet 50.3 13.6 12.9 Meru 49.4 8.9 9.1 Tharaka Nithi 47.9 10.9 11.5 Trans Nzoia 47.6 9.3 8.9 Kajiado 44.6 25.0 13.8 Garissa 46.6 17.5 5.8 5.8 Embu 46.6 16.7 5.0 Kiambu 45.4 9.7 6.9 Kericho 45.2 26.0 6.7 Nyeri 44.9 24.7 9.0 Migori 44.9 19.5 7.9 Murang'a 44.8 9.2 6.1 Narok 42.9 17.7 19.9 Kitui 42.2 11.1 12.5 Uasin Gishu 41.9 9.5 8.1 Marsabit 40.8 11.3 12.7 Busia 40.5 10.4 10.0 Vihiga 40.1 12.2 12.9 Samburu 40.0 11.4 14.3 Turkana 39.4 15.6 8.3
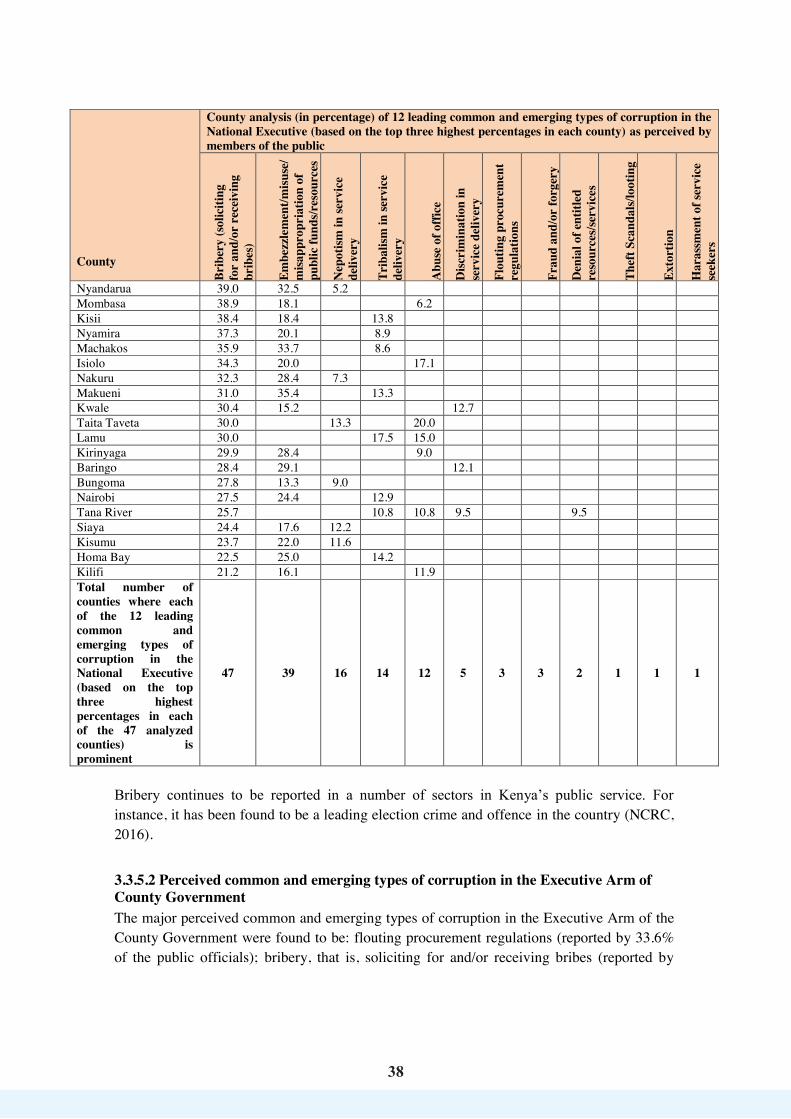
38
38
County
County analysis (in percentage) of 12 leading common and emerging types of corruption in the National Executive (based on the top three highest percentages in each county) as perceived by members of the public
Brib
ery
(sol
iciti
ng
for
and/
or r
ecei
ving
br
ibes
)
Embe
zzle
men
t/misu
se/
misa
ppro
pria
tion
of
publ
ic fu
nds/r
esou
rces
Nep
otism
in se
rvic
e de
liver
y
Trib
alism
in se
rvic
e de
liver
y
Abu
se o
f offi
ce
Disc
rim
inat
ion
in
serv
ice
deliv
ery
Flou
ting
proc
urem
ent
regu
latio
ns
Frau
d an
d/or
forg
ery
Den
ial o
f ent
itled
re
sour
ces/s
ervi
ces
Thef
t Sca
ndal
s/loo
ting
Exto
rtio
n
Har
assm
ent o
f ser
vice
se
eker
s
Nyandarua 39.0 32.5 5.2 Mombasa 38.9 18.1 6.2 Kisii 38.4 18.4 13.8 Nyamira 37.3 20.1 8.9 Machakos 35.9 33.7 8.6 Isiolo 34.3 20.0 17.1 Nakuru 32.3 28.4 7.3 Makueni 31.0 35.4 13.3 Kwale 30.4 15.2 12.7 Taita Taveta 30.0 13.3 20.0 Lamu 30.0 17.5 15.0 Kirinyaga 29.9 28.4 9.0 Baringo 28.4 29.1 12.1 Bungoma 27.8 13.3 9.0 Nairobi 27.5 24.4 12.9 Tana River 25.7 10.8 10.8 9.5 9.5 Siaya 24.4 17.6 12.2 Kisumu 23.7 22.0 11.6 Homa Bay 22.5 25.0 14.2 Kilifi 21.2 16.1 11.9 Total number of counties where each of the 12 leading common and emerging types of corruption in the National Executive (based on the top three highest percentages in each of the 47 analyzed counties) is prominent
47 39 16 14 12 5 3 3 2 1 1 1
Bribery continues to be reported in a number of sectors in Kenya’s public service. For instance, it has been found to be a leading election crime and offence in the country (NCRC, 2016).
3.3.5.2 Perceived common and emerging types of corruption in the Executive Arm of County Government The major perceived common and emerging types of corruption in the Executive Arm of the County Government were found to be: flouting procurement regulations (reported by 33.6% of the public officials); bribery, that is, soliciting for and/or receiving bribes (reported by
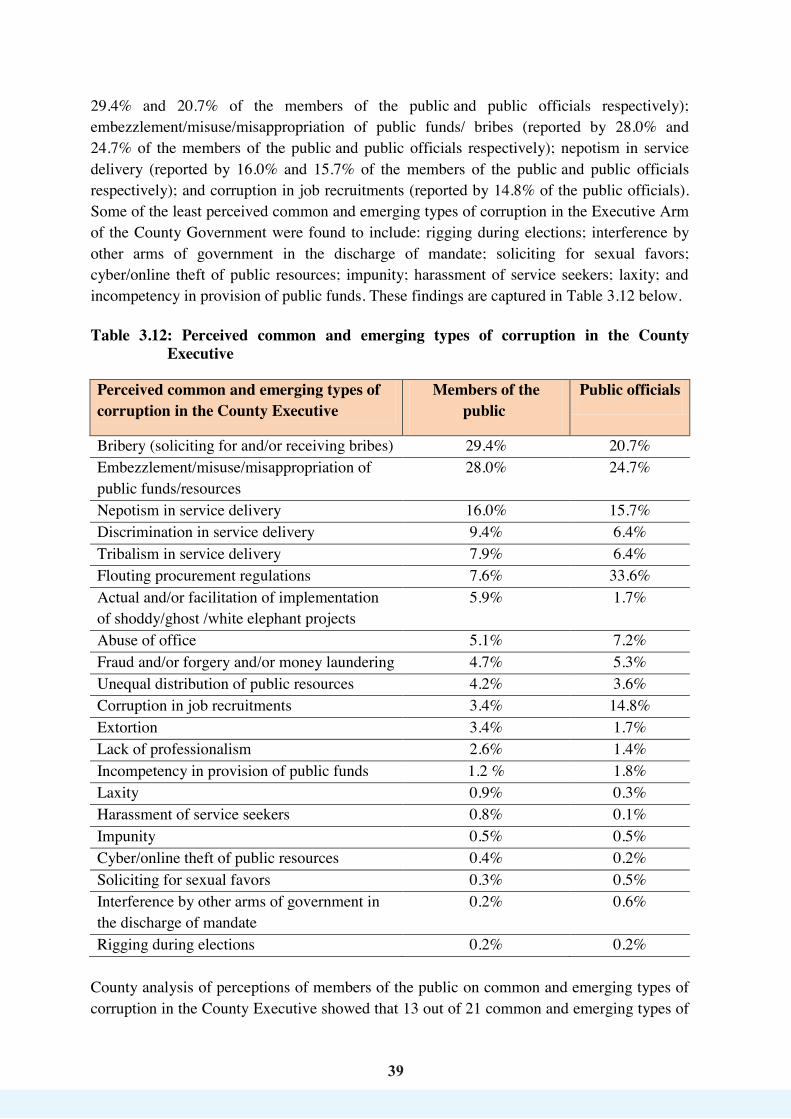
39
39
29.4% and 20.7% of the members of the public and public officials respectively); embezzlement/misuse/misappropriation of public funds/ bribes (reported by 28.0% and 24.7% of the members of the public and public officials respectively); nepotism in service delivery (reported by 16.0% and 15.7% of the members of the public and public officials respectively); and corruption in job recruitments (reported by 14.8% of the public officials). Some of the least perceived common and emerging types of corruption in the Executive Arm of the County Government were found to include: rigging during elections; interference by other arms of government in the discharge of mandate; soliciting for sexual favors; cyber/online theft of public resources; impunity; harassment of service seekers; laxity; and incompetency in provision of public funds. These findings are captured in Table 3.12 below. Table 3.12: Perceived common and emerging types of corruption in the County
Executive Perceived common and emerging types of corruption in the County Executive
Members of the public
Public officials
Bribery (soliciting for and/or receiving bribes) 29.4% 20.7% Embezzlement/misuse/misappropriation of public funds/resources
28.0% 24.7%
Nepotism in service delivery 16.0% 15.7% Discrimination in service delivery 9.4% 6.4% Tribalism in service delivery 7.9% 6.4% Flouting procurement regulations 7.6% 33.6% Actual and/or facilitation of implementation of shoddy/ghost /white elephant projects
5.9% 1.7%
Abuse of office 5.1% 7.2% Fraud and/or forgery and/or money laundering 4.7% 5.3% Unequal distribution of public resources 4.2% 3.6% Corruption in job recruitments 3.4% 14.8% Extortion 3.4% 1.7% Lack of professionalism 2.6% 1.4% Incompetency in provision of public funds 1.2 % 1.8% Laxity 0.9% 0.3% Harassment of service seekers 0.8% 0.1% Impunity 0.5% 0.5% Cyber/online theft of public resources 0.4% 0.2% Soliciting for sexual favors 0.3% 0.5% Interference by other arms of government in the discharge of mandate
0.2% 0.6%
Rigging during elections 0.2% 0.2% County analysis of perceptions of members of the public on common and emerging types of corruption in the County Executive showed that 13 out of 21 common and emerging types of
40
40
corruption featured among those with the three highest percentages in each of the 47 counties. The common and emerging types of corruption featuring in at least a third of the counties were bribery (prominent in 41 counties), embezzlement/misuse/misappropriation of public funds/resources (prominent in 37 counties) and nepotism in service delivery (prominent in 33 counties). Based on the three highest percentages in each county on the perceived common and emerging types of corruption in the County Executive, the highest percentage of perceptions of members of the public on bribery in the County Executive was recorded in Kakamega (37.6%) followed by Kitui (36.5%), Migori (35.6%), Wajir (33.3%) and Machakos (32.6%). The least percentages were recorded in counties such as Nyandarua (6.5%), Kisumu (11.4%), Lamu (12.9%), Kajiado (13.7%) and Kirinyaga (13.8%).
Based on the three highest percentages in each county on the common and emerging types of corruption in the County Executive, the highest percentage of perceptions of members of the public on embezzlement/misuse/misappropriation of public funds/resources was recorded in Nyandarua (57.6%), Kirinyaga (38.5%), Nyeri (37.0%), Laikipia (34.7%) and Nakuru (34.1%) counties. The least percentages were recorded in counties such as Marsabit (8.2%), Trans Nzoia (11.2%), Elgeyo Marakwet (12.9%), Kitui (13.3%) and Tana River (13.8%). On the basis of the three highest percentages in each county on the common and emerging types of corruption in the County Executive, the highest percentage of perceptions of members of the public on nepotism in service delivery was recorded in Wajir (28.9%), Garissa (23.3%), Tharaka Nithi (22.4%), Marsabit (21.9%) and Taita Taveta (21.4%). The least percentages were recorded in counties such as Kakamega (8.1%), Nakuru (8.2%), Machakos (8.9%), Nyeri (9.0%) and Bungoma (9.6%). The details of these findings are presented in Table 3.13 below and in Annex 3.

41
41
Table 3.13: County analysis of 13 leading common and emerging types of corruption in the County Executive (based on the top three highest percentages in each county) as perceived by members of the public
County
County analysis (in percentage) of 13 leading common and emerging types of corruption in the County Executive (based on the top three highest percentages in each county) as perceived by members of the public
Brib
ery
(sol
iciti
ng fo
r
and/
or r
ecei
ving
bri
bes)
Em
bezz
lem
ent/m
isuse
/ m
isapp
ropr
iatio
n of
pu
blic
fund
s/res
ourc
es
Nep
otism
in se
rvic
e
deliv
ery
Disc
rim
inat
ion
in s
ervi
ce d
eliv
ery
Trib
alism
in se
rvic
e
deliv
ery
Abu
se o
f offi
ce
Flou
ting
proc
urem
ent
regu
latio
ns
Act
ual a
nd/o
r fa
cilit
atio
n
of im
plem
enta
tion
of
shod
dy/g
host
/whi
te
elep
hant
pro
ject
s
Frau
d an
d/or
forg
ery
and/
or
mon
ey la
unde
ring
Une
qual
dist
ribu
tion
of
publ
ic r
esou
rces
Cor
rupt
ion
in jo
b
recr
uitm
ents
Exto
rtio
n
Har
assm
ent o
f ser
vice
se
eker
s
Kakamega 37.6 15.1 8.1
Kitui 36.5 13.3 13.0
Migori 35.6 23.7
10.3
Wajir 33.3
28.9
31.1
Machakos 32.6 30.9 8.9
Elgeyo Marakwet 31.0 12.9 12.1
Trans Nzoia 30.7 11.2
13.4
Kericho 28.3 20.7 12.0
Turkana 27.4
17.9
14.2
Kiambu 26.8 20.8
8.2
Nairobi 26.6 28.8
10.2
Uasin Gishu 26.2
16.7
11.9
Mombasa 26.2
16.1 11.4
Makueni 25.5 28.4 13.7
Vihiga 25.0 19.4
13.9
Kisii 24.7 25.5 17.1
Mandera 23.5
11.8
10.6
10.6 11.8
Murang'a 22.6 17.0
9.4
Nandi 22.0 22.0 16.0
Nyeri 22.0 37.0 9.0
Nyamira 20.7 22.8 17.2
Bungoma 20.6 17.4 9.6
Meru 20.5 16.9 14.6
Garissa 20.4
23.3
12.6
Laikipia 20.4 34.7
12.2
Bomet 19.3 17.8 17.0
Samburu 19.0 14.3 16.7
19.0
Kwale 19.0
13.8
10.3
Nakuru 18.1 34.1 8.2
Marsabit 17.8 8.2 21.9
16.4
Embu 16.8 17.8 16.2
Busia 16.8 14.9 14.2
Tharaka Nithi 16.1 21.4 22.4
Siaya 15.4 22.8 15.4

42
42
County
County analysis (in percentage) of 13 leading common and emerging types of corruption in the County Executive (based on the top three highest percentages in each county) as perceived by members of the public
Brib
ery
(sol
iciti
ng fo
r
and/
or r
ecei
ving
bri
bes)
Em
bezz
lem
ent/m
isuse
/ m
isapp
ropr
iatio
n of
pu
blic
fund
s/res
ourc
es
Nep
otism
in se
rvic
e
deliv
ery
Disc
rim
inat
ion
in s
ervi
ce d
eliv
ery
Trib
alism
in se
rvic
e
deliv
ery
Abu
se o
f offi
ce
Flou
ting
proc
urem
ent
regu
latio
ns
Act
ual a
nd/o
r fa
cilit
atio
n
of im
plem
enta
tion
of
shod
dy/g
host
/whi
te
elep
hant
pro
ject
s
Frau
d an
d/or
forg
ery
and/
or
mon
ey la
unde
ring
Une
qual
dist
ribu
tion
of
publ
ic r
esou
rces
Cor
rupt
ion
in jo
b
recr
uitm
ents
Exto
rtio
n
Har
assm
ent o
f ser
vice
se
eker
s
West Pokot 14.1 23.1 17.9
Narok 13.9 18.6
16.9
Kirinyaga 13.8 38.5
12.3
Kajiado 13.7
15.3 13.7
18.4
Lamu 12.9
12.9 6.5 25.8 6.5
12.9 6.5 Kisumu 11.4 22.4 18.6
Nyandarua 6.5 57.6
14.1
Baringo
32.2
11.3 10.4
Homa Bay
27.7 20.0
10.0
Kilifi
18.4 12.3 12.3
16.7 12.3
Taita Taveta
17.9 21.4
10.7
Isiolo
17.9
14.3 21.4 14.3
Tana River
13.8 11.3 13.8 15.0
Total number of counties where each of the 13 leading common and emerging types of corruption in the County Executive (based on the top three highest percentages in each of the 47 analyzed counties) is prominent 41 37 33 12 11 5 4 2 2 1 1 1 1
A key informant confirmed the existence of corruption in the executive arm of the County Government when he said:
“When you hear about the wheelbarrow story (in reference to flouting of procurement regulations and overpricing of purchased wheelbarrows in Bungoma County …(laughs) that tells you that corruption is there, and its being done by politicians themselves, the only issue is that I can’t say its witchhunting or media exposure regarding these individuals. There is something not adding up, ama? (KI 4)”.
3.3.5.3 Perceived common and emerging types of corruption in the Judiciary Nearly three-quarters (71.4%) of the members of the public and 54.2% of the public officials perceived bribery (soliciting for and/or receiving bribes) to be one of the common and
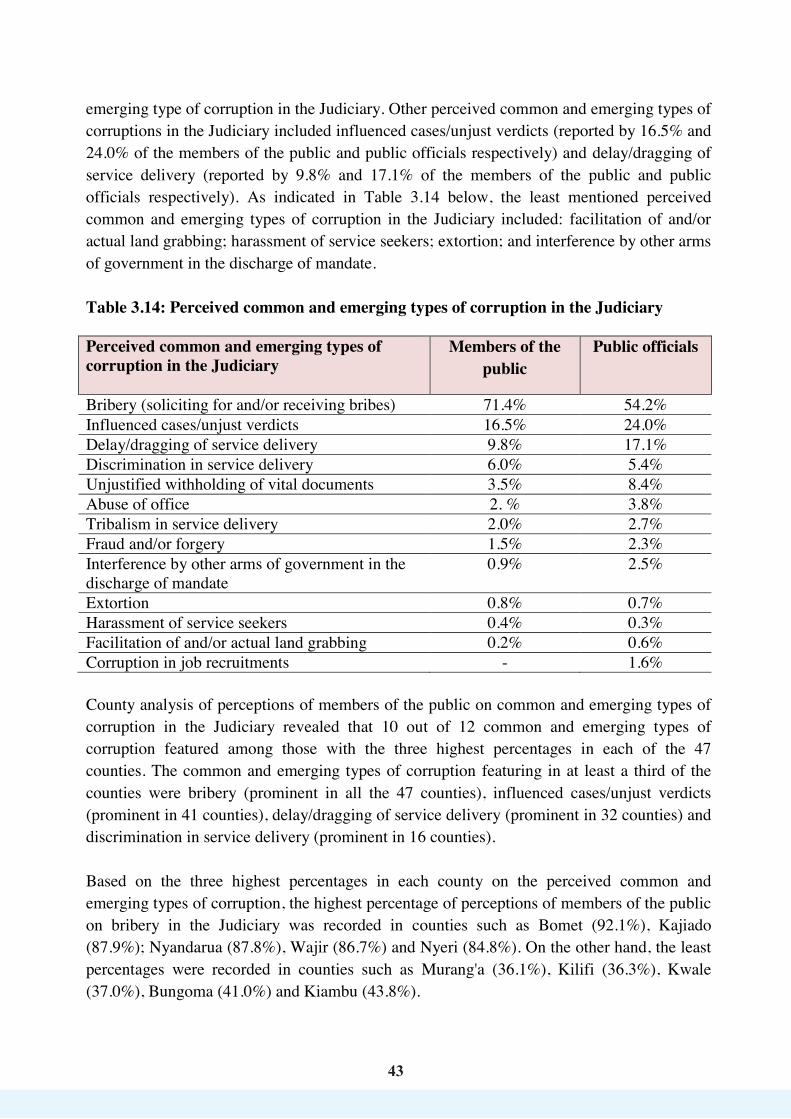
4343
emerging type of corruption in the Judiciary. Other perceived common and emerging types of corruptions in the Judiciary included influenced cases/unjust verdicts (reported by 16.5% and 24.0% of the members of the public and public officials respectively) and delay/dragging of service delivery (reported by 9.8% and 17.1% of the members of the public and public officials respectively). As indicated in Table 3.14 below, the least mentioned perceived common and emerging types of corruption in the Judiciary included: facilitation of and/or actual land grabbing; harassment of service seekers; extortion; and interference by other arms of government in the discharge of mandate. Table 3.14: Perceived common and emerging types of corruption in the Judiciary Perceived common and emerging types of corruption in the Judiciary
Members of the public
Public officials
Bribery (soliciting for and/or receiving bribes) 71.4% 54.2% Influenced cases/unjust verdicts 16.5% 24.0% Delay/dragging of service delivery 9.8% 17.1% Discrimination in service delivery 6.0% 5.4% Unjustified withholding of vital documents 3.5% 8.4% Abuse of office 2. % 3.8% Tribalism in service delivery 2.0% 2.7% Fraud and/or forgery 1.5% 2.3% Interference by other arms of government in the discharge of mandate
0.9% 2.5%
Extortion 0.8% 0.7% Harassment of service seekers 0.4% 0.3% Facilitation of and/or actual land grabbing 0.2% 0.6% Corruption in job recruitments - 1.6% County analysis of perceptions of members of the public on common and emerging types of corruption in the Judiciary revealed that 10 out of 12 common and emerging types of corruption featured among those with the three highest percentages in each of the 47 counties. The common and emerging types of corruption featuring in at least a third of the counties were bribery (prominent in all the 47 counties), influenced cases/unjust verdicts (prominent in 41 counties), delay/dragging of service delivery (prominent in 32 counties) and discrimination in service delivery (prominent in 16 counties). Based on the three highest percentages in each county on the perceived common and emerging types of corruption, the highest percentage of perceptions of members of the public on bribery in the Judiciary was recorded in counties such as Bomet (92.1%), Kajiado (87.9%); Nyandarua (87.8%), Wajir (86.7%) and Nyeri (84.8%). On the other hand, the least percentages were recorded in counties such as Murang'a (36.1%), Kilifi (36.3%), Kwale (37.0%), Bungoma (41.0%) and Kiambu (43.8%).

44
44
Based on the three highest percentages in each county on the common and emerging types of corruption in the Judiciary, the highest percentage of perceptions of members of the public on influenced cases/unjust verdicts was recorded in counties such as Kwale (38.9%), Murang'a (28.9%), Baringo (26.1%), Bungoma (26.1%), Elgeyo Marakwet (22.2%) and Nyamira (22.1%). The least percentages were recorded in counties such as Bomet (1.3%), Wajir (3.3%), Kajiado (3.8%), Narok (5.3%), Makueni (5.3%) and Kitui (5.7%). On the basis of the three highest percentages in each county, perceptions of members of the public on delay/dragging of service delivery as a common and emerging type of corruption in the Judiciary were highest in Kiambu (22.7%), Kilifi (22.5%), Murang'a (21.7%), Tana River (15.9%) and Bungoma (15.4%) counties. The least percentages of the perceptions were recorded in counties such as Bomet (1.3%), Kajiado (3.0%), Wajir (3.3%), Lamu (4.5%) and Kitui (5.1%). Based on the three highest percentages in each county on the common and emerging types of corruption in the Judiciary, the highest percentage of perceptions of members of the public on discrimination in service delivery was recorded in Trans Nzoia (13.5%) followed by Mombasa (11.2%), Samburu (9.5%), Lamu (9.1%) and Makueni (8.8%). Similarly, the least percentages of the perceptions on discrimination in service delivery were recorded in Nyeri (2.5%), Bomet (2.6%), Narok (3.2%), Wajir (3.3%) and Nairobi (4.7%). These results findings are presented in Table 3.15 below. Table 3.15: County analysis of common and emerging types of corruption in the Judiciary as perceived by members of the public
County
County analysis (in percentage) of common and emerging types of corruption in the Judiciary as perceived by members of the public
Brib
ery
(sol
iciti
ng fo
r
and/
or r
ecei
ving
bri
bes)
Influ
ence
d ca
ses/u
njus
t ve
rdic
ts
Del
ay/d
ragg
ing
of se
rvic
e
deliv
ery
Disc
rim
inat
ion
in se
rvic
e
deliv
ery
Unj
ustif
ied
with
hold
ing
of
vita
l doc
umen
ts
Abu
se o
f offi
ce
Frau
d an
d/or
forg
ery
Trib
alism
in se
rvic
e
deliv
ery
Inte
rfer
ence
by
othe
r
arm
s of g
over
nmen
t in
th
e di
scha
rge
of m
anda
te
Faci
litat
ion
of a
nd/o
r
actu
al l
and
grab
bing
Exto
rtio
n
Har
assm
ent o
f ser
vice
se
eker
s
Bomet 92.1 1.3 1.3 2.6 0.0 0.0 2.6 0.0 0.0 0.0 0.0 0.0 Kajiado 87.9 3.8 3.0 1.5 1.5 0.8 1.5 0.0 0.0 0.0 0.0 0.0 Nyandarua 87.8 0.0 6.1 0.0 4.1 2.0 0.0 0.0 0.0 0.0 0.0 0.0 Wajir 86.7 3.3 3.3 3.3 0.0 0.0 0.0 0.0 0.0 3.3 0.0 0.0 Nyeri 84.8 0.0 0.0 2.5 2.5 2.5 1.3 6.3 0.0 0.0 0.0 0.0 Narok 83.2 5.3 2.1 3.2 0.0 2.1 3.2 0.0 1.1 0.0 0.0 0.0 Kericho 81.4 1.4 1.4 1.4 2.9 4.3 7.1 0.0 0.0 0.0 0.0 0.0 Taita Taveta 80.0 20.0 0.0 0.0 0.0 0.0 0.0 0.0 0.0 0.0 0.0 0.0 Kitui 79.7 5.7 5.1 2.5 1.9 0.0 1.9 1.3 0.6 0.0 1.3 0.0 Machakos 79.1 6.3 1.0 6.8 0.5 2.6 1.6 1.6 0.0 0.0 0.0 0.5 Makueni 78.9 5.3 0.0 8.8 0.0 1.8 0.0 3.5 0.0 0.0 0.0 1.8 Kirinyaga 71.4 7.9 6.3 0.0 1.6 6.3 6.3 0.0 0.0 0.0 0.0 0.0 Samburu 71.4 14.3 0.0 9.5 0.0 0.0 4.8 0.0 0.0 0.0 0.0 0.0
44
Based on the three highest percentages in each county on the common and emerging types of corruption in the Judiciary, the highest percentage of perceptions of members of the public on influenced cases/unjust verdicts was recorded in counties such as Kwale (38.9%), Murang'a (28.9%), Baringo (26.1%), Bungoma (26.1%), Elgeyo Marakwet (22.2%) and Nyamira (22.1%). The least percentages were recorded in counties such as Bomet (1.3%), Wajir (3.3%), Kajiado (3.8%), Narok (5.3%), Makueni (5.3%) and Kitui (5.7%). On the basis of the three highest percentages in each county, perceptions of members of the public on delay/dragging of service delivery as a common and emerging type of corruption in the Judiciary were highest in Kiambu (22.7%), Kilifi (22.5%), Murang'a (21.7%), Tana River (15.9%) and Bungoma (15.4%) counties. The least percentages of the perceptions were recorded in counties such as Bomet (1.3%), Kajiado (3.0%), Wajir (3.3%), Lamu (4.5%) and Kitui (5.1%). Based on the three highest percentages in each county on the common and emerging types of corruption in the Judiciary, the highest percentage of perceptions of members of the public on discrimination in service delivery was recorded in Trans Nzoia (13.5%) followed by Mombasa (11.2%), Samburu (9.5%), Lamu (9.1%) and Makueni (8.8%). Similarly, the least percentages of the perceptions on discrimination in service delivery were recorded in Nyeri (2.5%), Bomet (2.6%), Narok (3.2%), Wajir (3.3%) and Nairobi (4.7%). These results findings are presented in Table 3.15 below. Table 3.15: County analysis of common and emerging types of corruption in the Judiciary as perceived by members of the public
County
County analysis (in percentage) of common and emerging types of corruption in the Judiciary as perceived by members of the public
Brib
ery
(sol
iciti
ng fo
r
and/
or r
ecei
ving
bri
bes)
Influ
ence
d ca
ses/u
njus
t ve
rdic
ts
Del
ay/d
ragg
ing
of se
rvic
e
deliv
ery
Disc
rim
inat
ion
in se
rvic
e
deliv
ery
Unj
ustif
ied
with
hold
ing
of
vita
l doc
umen
ts
Abu
se o
f offi
ce
Frau
d an
d/or
forg
ery
Trib
alism
in se
rvic
e
deliv
ery
Inte
rfer
ence
by
othe
r
arm
s of g
over
nmen
t in
th
e di
scha
rge
of m
anda
te
Faci
litat
ion
of a
nd/o
r
actu
al l
and
grab
bing
Exto
rtio
n
Har
assm
ent o
f ser
vice
se
eker
s Bomet 92.1 1.3 1.3 2.6 0.0 0.0 2.6 0.0 0.0 0.0 0.0 0.0 Kajiado 87.9 3.8 3.0 1.5 1.5 0.8 1.5 0.0 0.0 0.0 0.0 0.0 Nyandarua 87.8 0.0 6.1 0.0 4.1 2.0 0.0 0.0 0.0 0.0 0.0 0.0 Wajir 86.7 3.3 3.3 3.3 0.0 0.0 0.0 0.0 0.0 3.3 0.0 0.0 Nyeri 84.8 0.0 0.0 2.5 2.5 2.5 1.3 6.3 0.0 0.0 0.0 0.0 Narok 83.2 5.3 2.1 3.2 0.0 2.1 3.2 0.0 1.1 0.0 0.0 0.0 Kericho 81.4 1.4 1.4 1.4 2.9 4.3 7.1 0.0 0.0 0.0 0.0 0.0 Taita Taveta 80.0 20.0 0.0 0.0 0.0 0.0 0.0 0.0 0.0 0.0 0.0 0.0 Kitui 79.7 5.7 5.1 2.5 1.9 0.0 1.9 1.3 0.6 0.0 1.3 0.0 Machakos 79.1 6.3 1.0 6.8 0.5 2.6 1.6 1.6 0.0 0.0 0.0 0.5 Makueni 78.9 5.3 0.0 8.8 0.0 1.8 0.0 3.5 0.0 0.0 0.0 1.8 Kirinyaga 71.4 7.9 6.3 0.0 1.6 6.3 6.3 0.0 0.0 0.0 0.0 0.0 Samburu 71.4 14.3 0.0 9.5 0.0 0.0 4.8 0.0 0.0 0.0 0.0 0.0

45
45
County
County analysis (in percentage) of common and emerging types of corruption in the Judiciary as perceived by members of the public
Brib
ery
(sol
iciti
ng fo
r
and/
or r
ecei
ving
bri
bes)
Influ
ence
d ca
ses/u
njus
t ve
rdic
ts
Del
ay/d
ragg
ing
of se
rvic
e
deliv
ery
Disc
rim
inat
ion
in se
rvic
e
deliv
ery
Unj
ustif
ied
with
hold
ing
of
vita
l doc
umen
ts
Abu
se o
f offi
ce
Frau
d an
d/or
forg
ery
Trib
alism
in se
rvic
e
deliv
ery
Inte
rfer
ence
by
othe
r
arm
s of g
over
nmen
t in
th
e di
scha
rge
of m
anda
te
Faci
litat
ion
of a
nd/o
r
actu
al l
and
grab
bing
Exto
rtio
n
Har
assm
ent o
f ser
vice
se
eker
s
Marsabit 71.0 19.4 6.5 0.0 0.0 3.2 0.0 0.0 0.0 0.0 0.0 0.0 Isiolo 70.6 17.6 0.0 5.9 0.0 0.0 0.0 5.9 0.0 0.0 0.0 0.0 Tharaka Nithi 70.2 8.5 12.8 4.3 1.1 1.1 0.0 2.1 0.0 0.0 0.0 0.0 Nairobi 68.7 11.8 3.5 4.7 2.0 3.2 0.9 3.5 1.2 0.0 0.3 0.2 Lamu 68.2 0.0 4.5 9.1 0.0 4.5 4.5 0.0 9.1 0.0 0.0 0.0 Embu 67.2 8.8 13.1 0.0 0.0 2.2 0.7 4.4 1.5 0.7 1.5 0.0 Turkana 67.1 12.7 3.8 2.5 2.5 1.3 0.0 5.1 0.0 0.0 1.3 3.8 Nandi 66.1 15.3 1.7 3.4 5.1 0.0 3.4 3.4 0.0 0.0 1.7 0.0 Vihiga 65.1 12.7 9.5 3.2 3.2 4.8 0.0 0.0 0.0 0.0 1.6 0.0 Garissa 64.8 18.5 5.6 5.6 1.9 0.0 0.0 0.0 0.0 0.0 3.7 0.0 Laikipia 63.4 17.1 14.6 0.0 0.0 0.0 0.0 4.9 0.0 0.0 0.0 0.0 Migori 62.8 14.7 7.8 6.2 3.9 0.8 0.8 2.3 0.0 0.8 0.0 0.0 Meru 59.6 13.8 10.2 8.0 3.1 0.4 0.9 0.9 0.4 0.4 2.2 0.0 Homa Bay 59.0 16.9 12.0 1.2 7.2 2.4 1.2 0.0 0.0 0.0 0.0 0.0 West Pokot 57.1 2.9 8.6 2.9 14.3 8.6 5.7 0.0 0.0 0.0 0.0 0.0 Kakamega 57.0 12.3 12.3 3.9 10.1 0.6 2.2 0.6 0.6 0.0 0.6 0.0 Nakuru 56.6 18.8 10.5 9.5 1.7 0.6 0.8 1.0 0.2 0.2 0.0 0.0 Kisii 55.8 17.4 6.5 3.6 10.1 3.6 1.4 0.0 0.0 0.0 1.4 0.0 Siaya 55.6 14.8 7.4 2.5 11.1 1.2 1.2 2.5 2.5 0.0 0.0 1.2 Mandera 53.3 13.3 13.3 6.7 3.3 6.7 0.0 3.3 0.0 0.0 0.0 0.0 Uasin Gishu 53.1 17.2 9.4 3.1 1.6 6.3 6.3 0.0 0.0 0.0 1.6 1.6 Baringo 52.9 26.1 11.8 3.4 2.5 0.8 0.8 1.7 0.0 0.0 0.0 0.0 Elgeyo Marakwet 51.4 22.2 2.8 6.9 2.8 5.6 2.8 2.8 2.8 0.0 0.0 0.0 Kisumu 50.7 20.7 10.7 3.6 5.0 2.1 0.7 2.9 0.7 0.7 2.1 0.0 Tana River 50.0 11.4 15.9 0.0 4.5 11.4 0.0 4.5 0.0 0.0 2.3 0.0 Nyamira 50.0 22.1 7.4 7.4 1.5 0.0 0.0 0.0 2.9 1.5 2.9 4.4 Busia 49.4 21.8 12.1 4.6 1.1 2.3 1.1 1.7 3.4 0.0 0.0 2.3 Mombasa 48.9 18.5 9.9 11.2 6.4 2.1 0.4 0.9 0.9 0.0 0.9 0.0 Trans Nzoia 47.9 7.3 9.4 13.5 2.1 4.2 3.1 6.3 0.0 0.0 4.2 2.1 Kiambu 43.8 21.9 22.7 5.5 2.3 0.8 0.0 0.0 1.6 0.8 0.8 0.0 Bungoma 41.0 26.1 15.4 6.9 4.3 2.1 0.0 0.5 2.7 1.1 0.0 0.0 Kwale 37.0 38.9 13.0 9.3 1.9 0.0 0.0 0.0 0.0 0.0 0.0 0.0 Kilifi 36.3 16.3 22.5 5.0 2.5 5.0 5.0 3.8 0.0 0.0 3.8 0.0 Murang'a 36.1 28.9 21.7 3.6 3.6 1.2 0.0 1.2 1.2 0.0 2.4 0.0 Total number of counties where each of the 10 leading common and emerging types of corruption in the Judiciary (based on the top three highest percentages in each of the 47 analyzed counties) is prominent
47 41 32 16 7 7 5 3 1 1
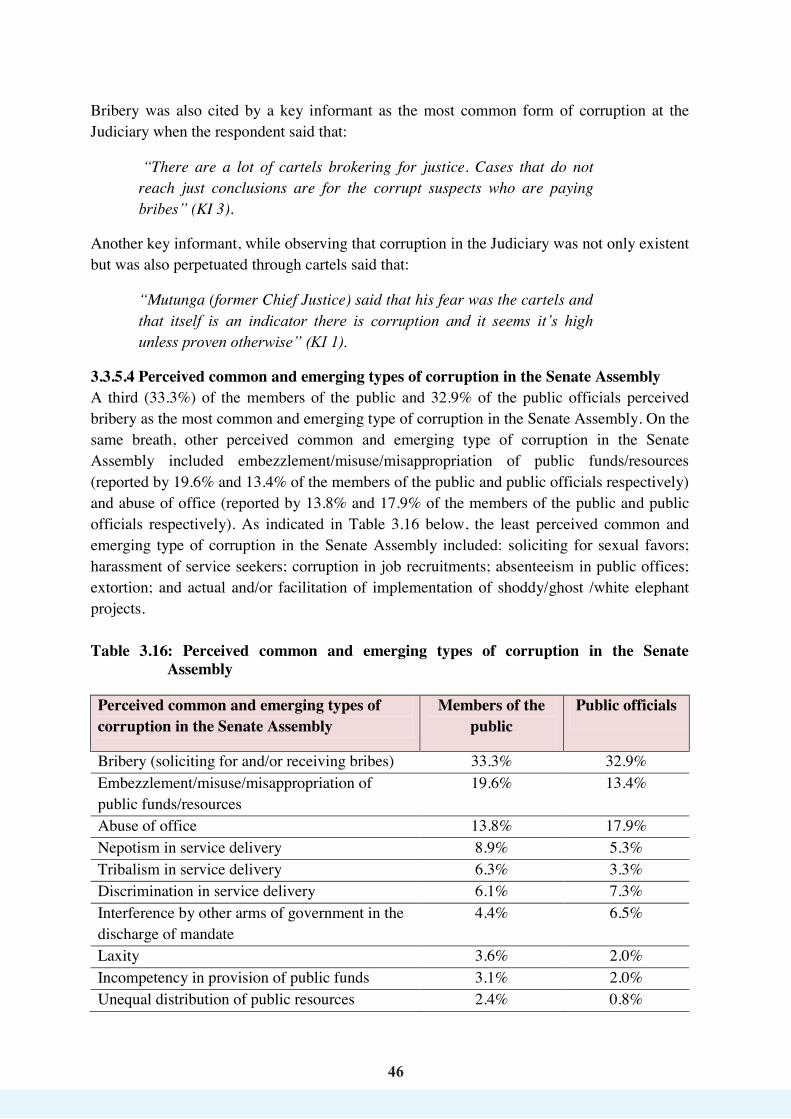
46
46
Bribery was also cited by a key informant as the most common form of corruption at the Judiciary when the respondent said that:
“There are a lot of cartels brokering for justice. Cases that do not reach just conclusions are for the corrupt suspects who are paying bribes” (KI 3).
Another key informant, while observing that corruption in the Judiciary was not only existent but was also perpetuated through cartels said that:
“Mutunga (former Chief Justice) said that his fear was the cartels and that itself is an indicator there is corruption and it seems it’s high unless proven otherwise” (KI 1).
3.3.5.4 Perceived common and emerging types of corruption in the Senate Assembly A third (33.3%) of the members of the public and 32.9% of the public officials perceived bribery as the most common and emerging type of corruption in the Senate Assembly. On the same breath, other perceived common and emerging type of corruption in the Senate Assembly included embezzlement/misuse/misappropriation of public funds/resources (reported by 19.6% and 13.4% of the members of the public and public officials respectively) and abuse of office (reported by 13.8% and 17.9% of the members of the public and public officials respectively). As indicated in Table 3.16 below, the least perceived common and emerging type of corruption in the Senate Assembly included: soliciting for sexual favors; harassment of service seekers; corruption in job recruitments; absenteeism in public offices; extortion; and actual and/or facilitation of implementation of shoddy/ghost /white elephant projects. Table 3.16: Perceived common and emerging types of corruption in the Senate
Assembly Perceived common and emerging types of corruption in the Senate Assembly
Members of the public
Public officials
Bribery (soliciting for and/or receiving bribes) 33.3% 32.9% Embezzlement/misuse/misappropriation of public funds/resources
19.6% 13.4%
Abuse of office 13.8% 17.9% Nepotism in service delivery 8.9% 5.3% Tribalism in service delivery 6.3% 3.3% Discrimination in service delivery 6.1% 7.3% Interference by other arms of government in the discharge of mandate
4.4% 6.5%
Laxity 3.6% 2.0% Incompetency in provision of public funds 3.1% 2.0% Unequal distribution of public resources 2.4% 0.8%
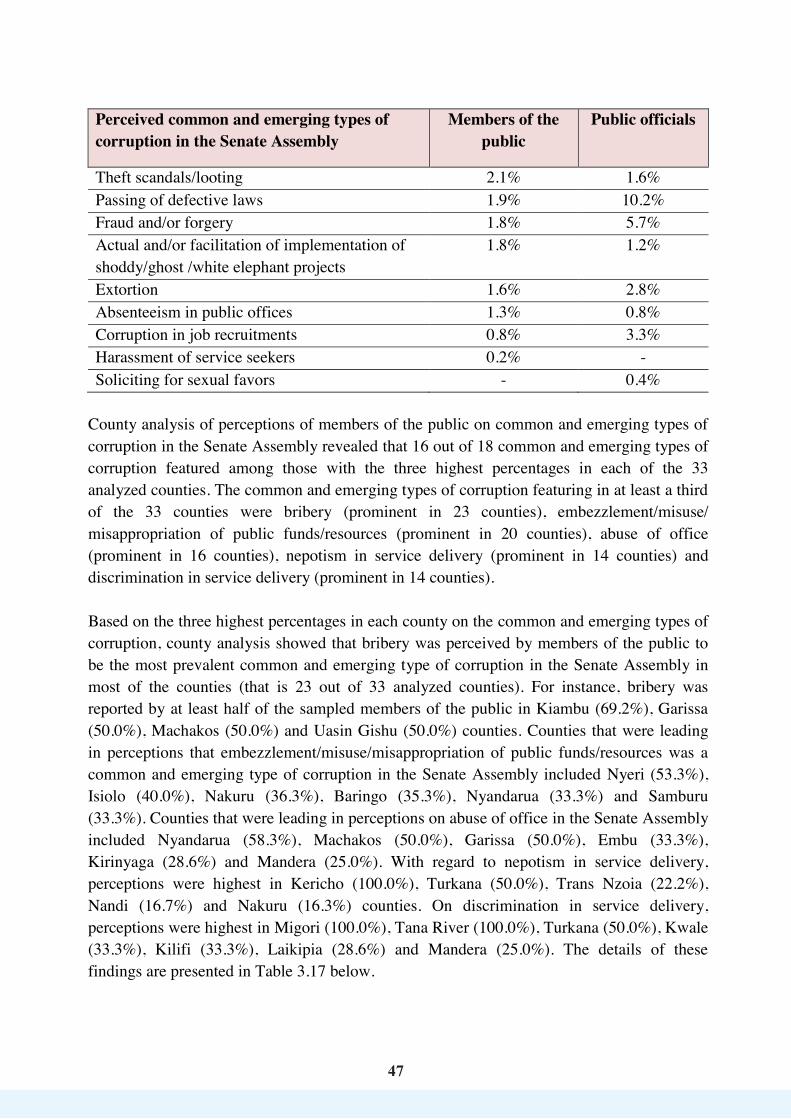
4747
Perceived common and emerging types of corruption in the Senate Assembly
Members of the public
Public officials
Theft scandals/looting 2.1% 1.6% Passing of defective laws 1.9% 10.2% Fraud and/or forgery 1.8% 5.7% Actual and/or facilitation of implementation of shoddy/ghost /white elephant projects
1.8% 1.2%
Extortion 1.6% 2.8% Absenteeism in public offices 1.3% 0.8% Corruption in job recruitments 0.8% 3.3% Harassment of service seekers 0.2% - Soliciting for sexual favors - 0.4%
County analysis of perceptions of members of the public on common and emerging types of corruption in the Senate Assembly revealed that 16 out of 18 common and emerging types of corruption featured among those with the three highest percentages in each of the 33 analyzed counties. The common and emerging types of corruption featuring in at least a third of the 33 counties were bribery (prominent in 23 counties), embezzlement/misuse/ misappropriation of public funds/resources (prominent in 20 counties), abuse of office (prominent in 16 counties), nepotism in service delivery (prominent in 14 counties) and discrimination in service delivery (prominent in 14 counties). Based on the three highest percentages in each county on the common and emerging types of corruption, county analysis showed that bribery was perceived by members of the public to be the most prevalent common and emerging type of corruption in the Senate Assembly in most of the counties (that is 23 out of 33 analyzed counties). For instance, bribery was reported by at least half of the sampled members of the public in Kiambu (69.2%), Garissa (50.0%), Machakos (50.0%) and Uasin Gishu (50.0%) counties. Counties that were leading in perceptions that embezzlement/misuse/misappropriation of public funds/resources was a common and emerging type of corruption in the Senate Assembly included Nyeri (53.3%), Isiolo (40.0%), Nakuru (36.3%), Baringo (35.3%), Nyandarua (33.3%) and Samburu (33.3%). Counties that were leading in perceptions on abuse of office in the Senate Assembly included Nyandarua (58.3%), Machakos (50.0%), Garissa (50.0%), Embu (33.3%), Kirinyaga (28.6%) and Mandera (25.0%). With regard to nepotism in service delivery, perceptions were highest in Kericho (100.0%), Turkana (50.0%), Trans Nzoia (22.2%), Nandi (16.7%) and Nakuru (16.3%) counties. On discrimination in service delivery, perceptions were highest in Migori (100.0%), Tana River (100.0%), Turkana (50.0%), Kwale (33.3%), Kilifi (33.3%), Laikipia (28.6%) and Mandera (25.0%). The details of these findings are presented in Table 3.17 below.

48
48
Tabl
e 3.
17: C
ount
y an
alys
is of
com
mon
and
em
ergi
ng ty
pes o
f cor
rupt
ion
in th
e Se
nate
Ass
embl
y as
per
ceiv
ed b
y m
embe
rs o
f the
pub
lic
Cou
nty
Cou
nty
anal
ysis
(in p
erce
ntag
e) o
f com
mon
and
em
ergi
ng ty
pes o
f cor
rupt
ion
in th
e Se
nate
Ass
embl
y as
per
ceiv
ed b
y m
embe
rs o
f the
pub
lic
Bribery (soliciting for and/or receiving bribes)
Embezzlement/misuse/ misappropriation of public funds/resources
Abuse of office
Nepotism in service delivery
Discrimination in service delivery
Incompetency in provision of public funds
Laxity
Tribalism in service delivery
Unequal distribution of public resources
Interference by other arms of government in the discharge of mandate
Extortion
Corruption in job recruitments
Passing of defective laws
Fraud and/or forgery Actual and/or facilitation of implementation of shoddy/ ghost/white elephant projects
Absenteeism in public offices
Theft scandals/looting
Harassment of service seekers
Kia
mbu
69
.2
7.7
15.4
7.
7 0.
0 0.
0 0.
0 0.
0 0.
0 0.
0 0.
0 0.
0 0.
0 0.
0 0.
0 0.
0 0.
0 0.
0 U
asin
Gis
hu
50.0
16
.7
16.7
0.
0 0.
0 0.
0 0.
0 0.
0 16
.7
0.0
0.0
0.0
0.0
0.0
0.0
0.0
0.0
0.0
Gar
issa
50
.0
0.0
50.0
0.
0 0.
0 0.
0 0.
0 0.
0 0.
0 0.
0 0.
0 0.
0 0.
0 0.
0 0.
0 0.
0 0.
0 0.
0 M
acha
kos
50.0
0.
0 50
.0
0.0
0.0
0.0
0.0
0.0
0.0
0.0
0.0
0.0
0.0
0.0
0.0
0.0
0.0
0.0
Elge
yo M
arak
wet
44
.4
22.2
0.
0 11
.1
11.1
0.
0 0.
0 0.
0 0.
0 0.
0 0.
0 11
.1
0.0
0.0
0.0
0.0
0.0
0.0
Embu
44
.4
0.0
33.3
0.
0 0.
0 0.
0 0.
0 11
.1
0.0
0.0
0.0
0.0
11.1
0.
0 0.
0 0.
0 0.
0 0.
0 M
eru
44.2
9.
3 7.
0 11
.6
2.3
2.3
4.7
9.3
2.3
0.0
2.3
0.0
2.3
2.3
0.0
0.0
0.0
0.0
Bus
ia
42.9
14
.3
0.0
0.0
0.0
14.3
0.
0 0.
0 0.
0 0.
0 28
.6
0.0
0.0
0.0
0.0
0.0
0.0
0.0
Thar
aka
Nith
i 42
.1
21.1
10
.5
10.5
5.
3 0.
0 0.
0 0.
0 5.
3 0.
0 0.
0 0.
0 0.
0 0.
0 5.
3 0.
0 0.
0 0.
0 Is
iolo
40
.0
40.0
20
.0
0.0
0.0
0.0
0.0
0.0
0.0
0.0
0.0
0.0
0.0
0.0
0.0
0.0
0.0
0.0
Nai
robi
36
.5
12.4
11
.7
4.7
4.0
1.1
1.5
8.0
1.5
7.7
1.5
0.4
2.6
0.7
2.6
0.0
3.3
0.0
Kak
ameg
a 33
.3
13.9
5.
6 8.
3 5.
6 8.
3 0.
0 5.
6 5.
6 5.
6 2.
8 0.
0 0.
0 0.
0 0.
0 0.
0 2.
8 2.
8 Tr
ans N
zoia
33
.3
11.1
0.
0 22
.2
11.1
0.
0 0.
0 22
.2
0.0
0.0
0.0
0.0
0.0
0.0
0.0
0.0
0.0
0.0
Kili
fi 33
.3
0.0
0.0
0.0
33.3
0.
0 0.
0 0.
0 33
.3
0.0
0.0
0.0
0.0
0.0
0.0
0.0
0.0
0.0
Kiri
nyag
a 28
.6
28.6
28
.6
7.1
7.1
0.0
0.0
0.0
0.0
0.0
0.0
0.0
0.0
0.0
0.0
0.0
0.0
0.0
Vih
iga
25.0
12
.5
12.5
12
.5
12.5
0.
0 0.
0 0.
0 0.
0 0.
0 0.
0 0.
0 12
.5
12.5
0.
0 0.
0 0.
0 0.
0 N
yeri
20.0
53
.3
6.7
0.0
6.7
0.0
0.0
13.3
0.
0 0.
0 0.
0 0.
0 0.
0 0.
0 0.
0 0.
0 0.
0 0.
0 N
akur
u 18
.8
36.3
3.
8 16
.3
5.0
5.0
2.5
1.3
2.5
1.3
0.0
1.3
0.0
2.5
1.3
2.5
0.0
0.0
Nan
di
16.7
0.
0 16
.7
16.7
0.
0 0.
0 33
.3
0.0
0.0
0.0
0.0
0.0
0.0
0.0
16.7
0.
0 0.
0 0.
0 M
omba
sa
15.9
9.
1 13
.6
13.6
4.
5 2.
3 4.
5 11
.4
2.3
0.0
0.0
0.0
2.3
0.0
2.3
11.4
6.
8 0.
0 La
ikip
ia
14.3
28
.6
0.0
0.0
28.6
14
.3
14.3
0.
0 0.
0 0.
0 0.
0 0.
0 0.
0 0.
0 0.
0 0.
0 0.
0 0.
0 B
ungo
ma
14.3
14
.3
0.0
0.0
14.3
14
.3
0.0
0.0
0.0
7.1
7.1
7.1
7.1
14.3
0.
0 0.
0 0.
0 0.
0 B
arin
go
5.9
35.3
17
.6
0.0
5.9
5.9
5.9
0.0
5.9
0.0
0.0
0.0
0.0
17.6
0.
0 0.
0 0.
0 0.
0

49
49
Cou
nty
Cou
nty
anal
ysis
(in p
erce
ntag
e) o
f com
mon
and
em
ergi
ng ty
pes o
f cor
rupt
ion
in th
e Se
nate
Ass
embl
y as
per
ceiv
ed b
y m
embe
rs o
f the
pub
lic
Bribery (soliciting for and/or receiving bribes)
Embezzlement/misuse/ misappropriation of public funds/resources
Abuse of office
Nepotism in service delivery
Discrimination in service delivery
Incompetency in provision of public funds
Laxity
Tribalism in service delivery
Unequal distribution of public resources
Interference by other arms of government in the discharge of mandate
Extortion
Corruption in job recruitments
Passing of defective laws
Fraud and/or forgery Actual and/or facilitation of implementation of shoddy/ ghost/white elephant projects
Absenteeism in public offices
Theft scandals/looting
Harassment of service seekers
Mur
ang'
a 0.
0 6.
3 18
.8
18.8
6.
3 6.
3 37
.5
0.0
0.0
6.3
0.0
0.0
0.0
0.0
0.0
0.0
0.0
0.0
Ker
icho
0.
0 0.
0 0.
0 10
0.0
0.0
0.0
0.0
0.0
0.0
0.0
0.0
0.0
0.0
0.0
0.0
0.0
0.0
0.0
Kw
ale
0.0
0.0
0.0
0.0
33.3
0.
0 33
.3
0.0
0.0
0.0
0.0
0.0
0.0
0.0
0.0
33.3
0.
0 0.
0 M
ande
ra
0.0
0.0
25.0
0.
0 25
.0
0.0
0.0
0.0
25.0
25
.0
0.0
0.0
0.0
0.0
0.0
0.0
0.0
0.0
Mig
ori
0.0
0.0
0.0
0.0
100.
0 0.
0 0.
0 0.
0 0.
0 0.
0 0.
0 0.
0 0.
0 0.
0 0.
0 0.
0 0.
0 0.
0 Ta
na R
iver
0.
0 0.
0 0.
0 0.
0 10
0.0
0.0
0.0
0.0
0.0
0.0
0.0
0.0
0.0
0.0
0.0
0.0
0.0
0.0
Turk
ana
0.0
0.0
0.0
50.0
50
.0
0.0
0.0
0.0
0.0
0.0
0.0
0.0
0.0
0.0
0.0
0.0
0.0
0.0
Waj
ir 0.
0 0.
0 0.
0 0.
0 0.
0 10
0.0
0.0
0.0
0.0
0.0
0.0
0.0
0.0
0.0
0.0
0.0
0.0
0.0
Nya
ndar
ua
0.0
33.3
58
.3
4.2
0.0
0.0
0.0
0.0
0.0
0.0
0.0
4.2
0.0
0.0
0.0
0.0
0.0
0.0
Sam
buru
0.
0 33
.3
0.0
0.0
0.0
0.0
33.3
0.
0 0.
0 0.
0 33
.3
0.0
0.0
0.0
0.0
0.0
0.0
0.0
Tota
l nu
mbe
r of
co
untie
s w
here
eac
h of
th
e 16
le
adin
g
com
mon
an
d em
ergi
ng
type
s of
co
rrup
tion
in
the
Sena
te
Ass
embl
y (b
ased
on
th
e to
p th
ree
high
est
perc
enta
ges
in e
ach
of t
he 3
3 an
alyz
ed
coun
ties)
is
prom
inen
t
23
20
16
14
14
7 6
5 4
3 3
3 3
3 1
1
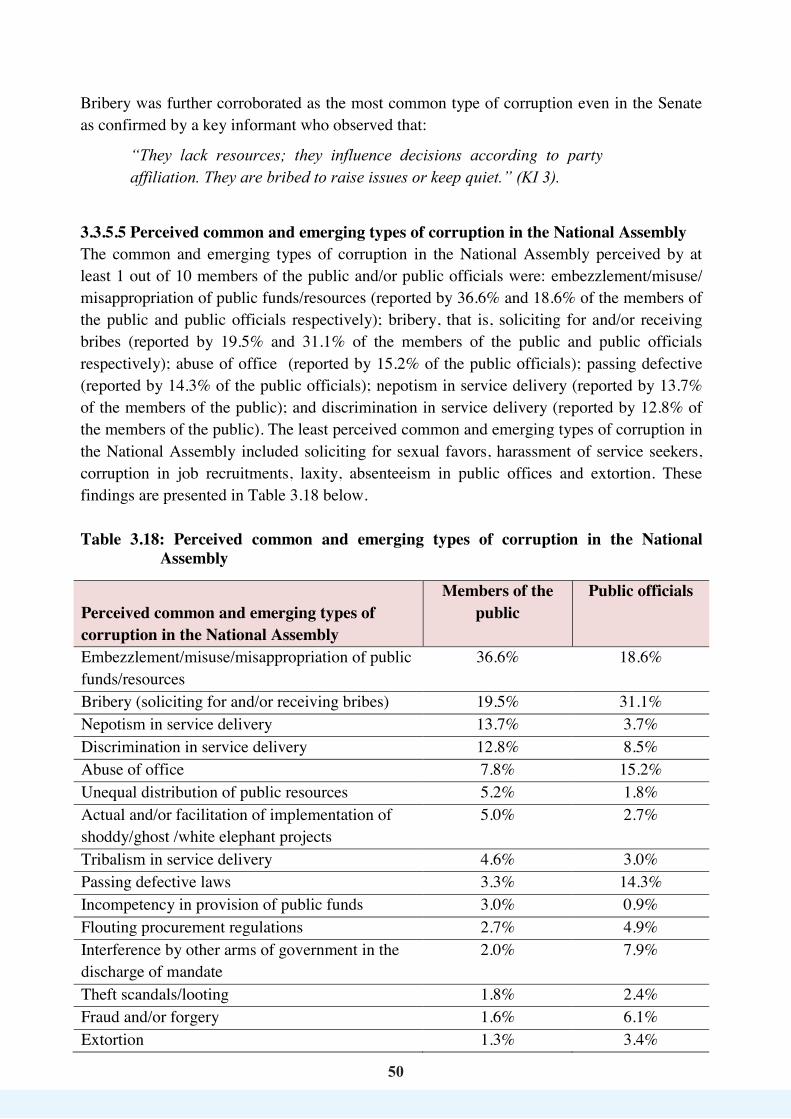
5050
Bribery was further corroborated as the most common type of corruption even in the Senate as confirmed by a key informant who observed that:
“They lack resources; they influence decisions according to party affiliation. They are bribed to raise issues or keep quiet.” (KI 3).
3.3.5.5 Perceived common and emerging types of corruption in the National Assembly The common and emerging types of corruption in the National Assembly perceived by at least 1 out of 10 members of the public and/or public officials were: embezzlement/misuse/ misappropriation of public funds/resources (reported by 36.6% and 18.6% of the members of the public and public officials respectively); bribery, that is, soliciting for and/or receiving bribes (reported by 19.5% and 31.1% of the members of the public and public officials respectively); abuse of office (reported by 15.2% of the public officials); passing defective (reported by 14.3% of the public officials); nepotism in service delivery (reported by 13.7% of the members of the public); and discrimination in service delivery (reported by 12.8% of the members of the public). The least perceived common and emerging types of corruption in the National Assembly included soliciting for sexual favors, harassment of service seekers, corruption in job recruitments, laxity, absenteeism in public offices and extortion. These findings are presented in Table 3.18 below. Table 3.18: Perceived common and emerging types of corruption in the National
Assembly
Perceived common and emerging types of corruption in the National Assembly
Members of the public
Public officials
Embezzlement/misuse/misappropriation of public funds/resources
36.6% 18.6%
Bribery (soliciting for and/or receiving bribes) 19.5% 31.1% Nepotism in service delivery 13.7% 3.7% Discrimination in service delivery 12.8% 8.5% Abuse of office 7.8% 15.2% Unequal distribution of public resources 5.2% 1.8% Actual and/or facilitation of implementation of shoddy/ghost /white elephant projects
5.0% 2.7%
Tribalism in service delivery 4.6% 3.0% Passing defective laws 3.3% 14.3% Incompetency in provision of public funds 3.0% 0.9% Flouting procurement regulations 2.7% 4.9% Interference by other arms of government in the discharge of mandate
2.0% 7.9%
Theft scandals/looting 1.8% 2.4% Fraud and/or forgery 1.6% 6.1% Extortion 1.3% 3.4%
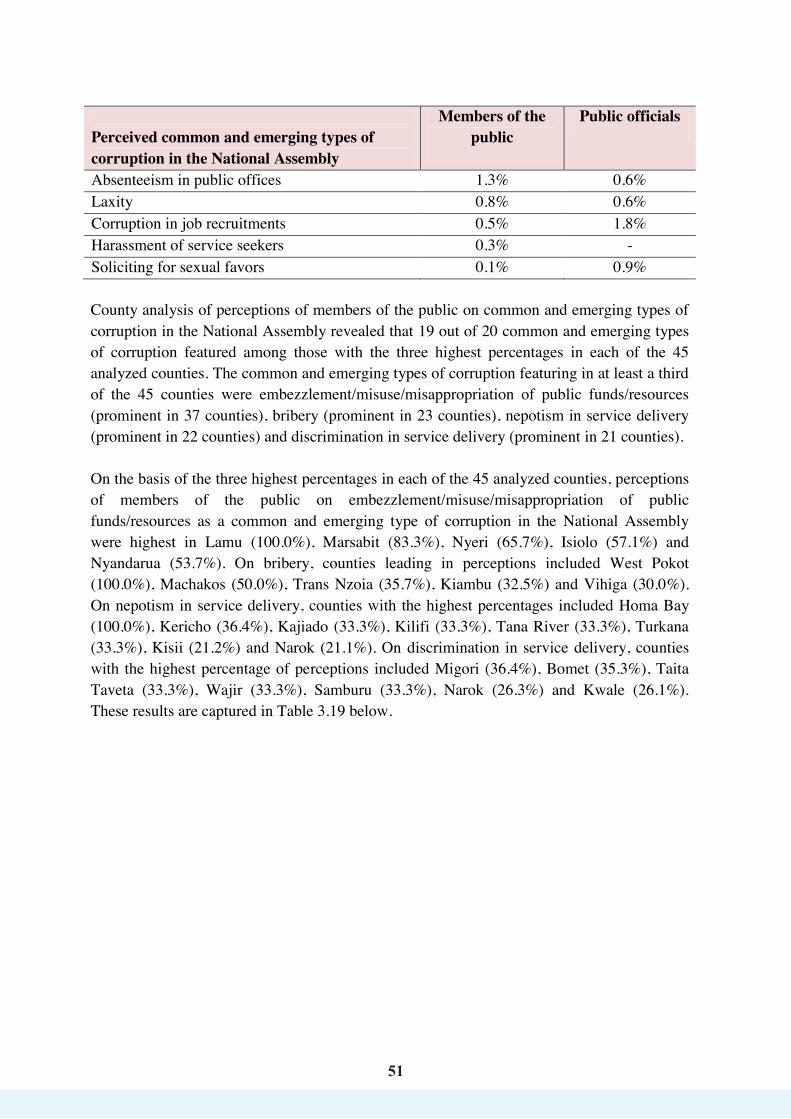
51
51
Perceived common and emerging types of corruption in the National Assembly
Members of the public
Public officials
Absenteeism in public offices 1.3% 0.6% Laxity 0.8% 0.6% Corruption in job recruitments 0.5% 1.8% Harassment of service seekers 0.3% - Soliciting for sexual favors 0.1% 0.9% County analysis of perceptions of members of the public on common and emerging types of corruption in the National Assembly revealed that 19 out of 20 common and emerging types of corruption featured among those with the three highest percentages in each of the 45 analyzed counties. The common and emerging types of corruption featuring in at least a third of the 45 counties were embezzlement/misuse/misappropriation of public funds/resources (prominent in 37 counties), bribery (prominent in 23 counties), nepotism in service delivery (prominent in 22 counties) and discrimination in service delivery (prominent in 21 counties). On the basis of the three highest percentages in each of the 45 analyzed counties, perceptions of members of the public on embezzlement/misuse/misappropriation of public funds/resources as a common and emerging type of corruption in the National Assembly were highest in Lamu (100.0%), Marsabit (83.3%), Nyeri (65.7%), Isiolo (57.1%) and Nyandarua (53.7%). On bribery, counties leading in perceptions included West Pokot (100.0%), Machakos (50.0%), Trans Nzoia (35.7%), Kiambu (32.5%) and Vihiga (30.0%). On nepotism in service delivery, counties with the highest percentages included Homa Bay (100.0%), Kericho (36.4%), Kajiado (33.3%), Kilifi (33.3%), Tana River (33.3%), Turkana (33.3%), Kisii (21.2%) and Narok (21.1%). On discrimination in service delivery, counties with the highest percentage of perceptions included Migori (36.4%), Bomet (35.3%), Taita Taveta (33.3%), Wajir (33.3%), Samburu (33.3%), Narok (26.3%) and Kwale (26.1%). These results are captured in Table 3.19 below.
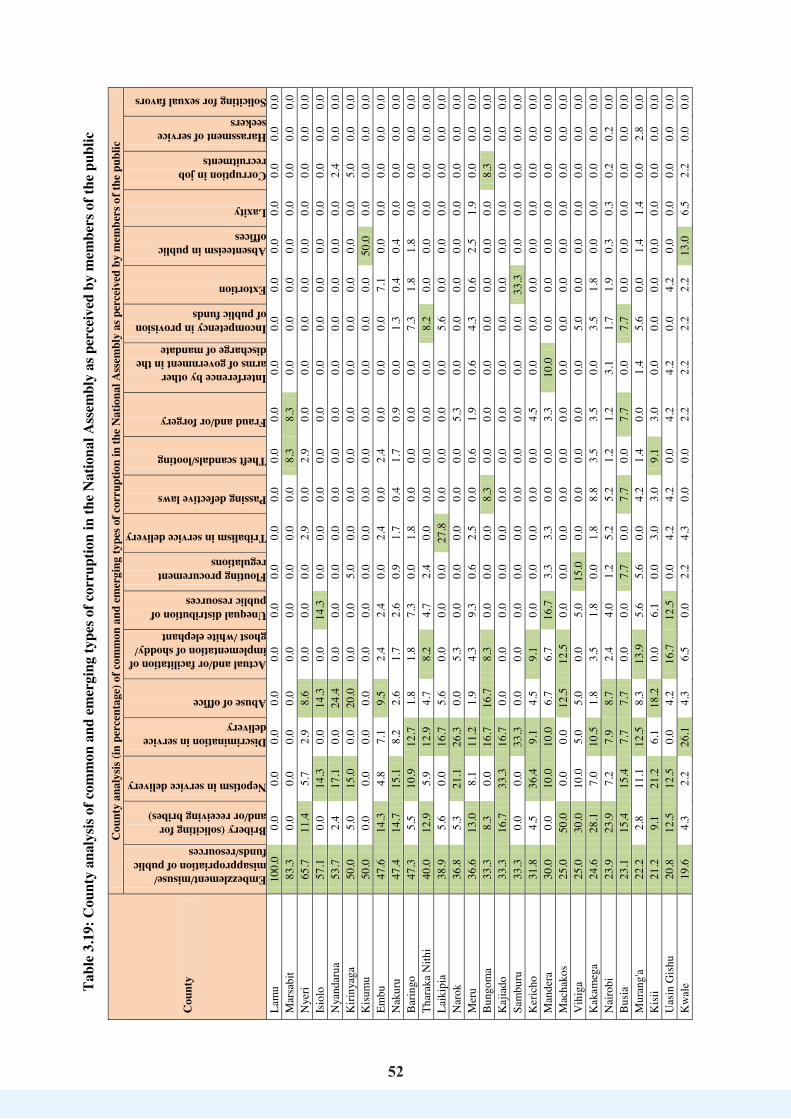
52
52
Tabl
e 3.
19: C
ount
y an
alys
is of
com
mon
and
em
ergi
ng ty
pes o
f cor
rupt
ion
in th
e N
atio
nal A
ssem
bly
as p
erce
ived
by
mem
bers
of t
he p
ublic
Cou
nty
Cou
nty
anal
ysis
(in p
erce
ntag
e) o
f com
mon
and
em
ergi
ng ty
pes o
f cor
rupt
ion
in th
e N
atio
nal A
ssem
bly
as p
erce
ived
by
mem
bers
of t
he p
ublic
Embezzlement/misuse/ misappropriation of public funds/resources
Bribery (soliciting for and/or receiving bribes)
Nepotism in service delivery
Discrimination in service delivery
Abuse of office
Actual and/or facilitation of implementation of shoddy/ ghost /white elephant projects Unequal distribution of public resources
Flouting procurement regulations
Tribalism in service delivery
Passing defective laws
Theft scandals/looting
Fraud and/or forgery
Interference by other arms of government in the discharge of mandate
Incompetency in provision of public funds
Extortion
Absenteeism in public offices
Laxity
Corruption in job recruitments
Harassment of service seekers
Soliciting for sexual favors
Lam
u 10
0.0
0.0
0.0
0.0
0.0
0.0
0.0
0.0
0.0
0.0
0.0
0.0
0.0
0.0
0.0
0.0
0.0
0.0
0.0
0.0
Mar
sabi
t 83
.3
0.0
0.0
0.0
0.0
0.0
0.0
0.0
0.0
0.0
8.3
8.3
0.0
0.0
0.0
0.0
0.0
0.0
0.0
0.0
Nye
ri 65
.7
11.4
5.
7 2.
9 8.
6 0.
0 0.
0 0.
0 2.
9 0.
0 2.
9 0.
0 0.
0 0.
0 0.
0 0.
0 0.
0 0.
0 0.
0 0.
0 Is
iolo
57
.1
0.0
14.3
0.
0 14
.3
0.0
14.3
0.
0 0.
0 0.
0 0.
0 0.
0 0.
0 0.
0 0.
0 0.
0 0.
0 0.
0 0.
0 0.
0 N
yand
arua
53
.7
2.4
17.1
0.
0 24
.4
0.0
0.0
0.0
0.0
0.0
0.0
0.0
0.0
0.0
0.0
0.0
0.0
2.4
0.0
0.0
Kiri
nyag
a 50
.0
5.0
15.0
0.
0 20
.0
0.0
0.0
5.0
0.0
0.0
0.0
0.0
0.0
0.0
0.0
0.0
0.0
5.0
0.0
0.0
Kis
umu
50.0
0.
0 0.
0 0.
0 0.
0 0.
0 0.
0 0.
0 0.
0 0.
0 0.
0 0.
0 0.
0 0.
0 0.
0 50
.0
0.0
0.0
0.0
0.0
Embu
47
.6
14.3
4.
8 7.
1 9.
5 2.
4 2.
4 0.
0 2.
4 0.
0 2.
4 0.
0 0.
0 0.
0 7.
1 0.
0 0.
0 0.
0 0.
0 0.
0 N
akur
u 47
.4
14.7
15
.1
8.2
2.6
1.7
2.6
0.9
1.7
0.4
1.7
0.9
0.0
1.3
0.4
0.4
0.0
0.0
0.0
0.0
Bar
ingo
47
.3
5.5
10.9
12
.7
1.8
1.8
7.3
0.0
1.8
0.0
0.0
0.0
0.0
7.3
1.8
1.8
0.0
0.0
0.0
0.0
Thar
aka
Nith
i 40
.0
12.9
5.
9 12
.9
4.7
8.2
4.7
2.4
0.0
0.0
0.0
0.0
0.0
8.2
0.0
0.0
0.0
0.0
0.0
0.0
Laik
ipia
38
.9
5.6
0.0
16.7
5.
6 0.
0 0.
0 0.
0 27
.8
0.0
0.0
0.0
0.0
5.6
0.0
0.0
0.0
0.0
0.0
0.0
Nar
ok
36.8
5.
3 21
.1
26.3
0.
0 5.
3 0.
0 0.
0 0.
0 0.
0 0.
0 5.
3 0.
0 0.
0 0.
0 0.
0 0.
0 0.
0 0.
0 0.
0 M
eru
36.6
13
.0
8.1
11.2
1.
9 4.
3 9.
3 0.
6 2.
5 0.
0 0.
6 1.
9 0.
6 4.
3 0.
6 2.
5 1.
9 0.
0 0.
0 0.
0 B
ungo
ma
33.3
8.
3 0.
0 16
.7
16.7
8.
3 0.
0 0.
0 0.
0 8.
3 0.
0 0.
0 0.
0 0.
0 0.
0 0.
0 0.
0 8.
3 0.
0 0.
0 K
ajia
do
33.3
16
.7
33.3
16
.7
0.0
0.0
0.0
0.0
0.0
0.0
0.0
0.0
0.0
0.0
0.0
0.0
0.0
0.0
0.0
0.0
Sam
buru
33
.3
0.0
0.0
33.3
0.
0 0.
0 0.
0 0.
0 0.
0 0.
0 0.
0 0.
0 0.
0 0.
0 33
.3
0.0
0.0
0.0
0.0
0.0
Ker
icho
31
.8
4.5
36.4
9.
1 4.
5 9.
1 0.
0 0.
0 0.
0 0.
0 0.
0 4.
5 0.
0 0.
0 0.
0 0.
0 0.
0 0.
0 0.
0 0.
0 M
ande
ra
30.0
0.
0 10
.0
10.0
6.
7 6.
7 16
.7
3.3
3.3
0.0
0.0
3.3
10.0
0.
0 0.
0 0.
0 0.
0 0.
0 0.
0 0.
0 M
acha
kos
25.0
50
.0
0.0
0.0
12.5
12
.5
0.0
0.0
0.0
0.0
0.0
0.0
0.0
0.0
0.0
0.0
0.0
0.0
0.0
0.0
Vih
iga
25.0
30
.0
10.0
5.
0 5.
0 0.
0 5.
0 15
.0
0.0
0.0
0.0
0.0
0.0
5.0
0.0
0.0
0.0
0.0
0.0
0.0
Kak
ameg
a 24
.6
28.1
7.
0 10
.5
1.8
3.5
1.8
0.0
1.8
8.8
3.5
3.5
0.0
3.5
1.8
0.0
0.0
0.0
0.0
0.0
Nai
robi
23
.9
23.9
7.
2 7.
9 8.
7 2.
4 4.
0 1.
2 5.
2 5.
2 1.
2 1.
2 3.
1 1.
7 1.
9 0.
3 0.
3 0.
2 0.
2 0.
0 B
usia
23
.1
15.4
15
.4
7.7
7.7
0.0
0.0
7.7
0.0
7.7
0.0
7.7
0.0
7.7
0.0
0.0
0.0
0.0
0.0
0.0
Mur
ang'
a 22
.2
2.8
11.1
12
.5
8.3
13.9
5.
6 5.
6 0.
0 4.
2 1.
4 0.
0 1.
4 5.
6 0.
0 1.
4 1.
4 0.
0 2.
8 0.
0 K
isii
21.2
9.
1 21
.2
6.1
18.2
0.
0 6.
1 0.
0 3.
0 3.
0 9.
1 3.
0 0.
0 0.
0 0.
0 0.
0 0.
0 0.
0 0.
0 0.
0 U
asin
Gis
hu
20.8
12
.5
12.5
0.
0 4.
2 16
.7
12.5
0.
0 4.
2 4.
2 0.
0 4.
2 4.
2 0.
0 4.
2 0.
0 0.
0 0.
0 0.
0 0.
0 K
wal
e 19
.6
4.3
2.2
26.1
4.
3 6.
5 0.
0 2.
2 4.
3 0.
0 0.
0 2.
2 2.
2 2.
2 2.
2 13
.0
6.5
2.2
0.0
0.0

53
53
Cou
nty
Cou
nty
anal
ysis
(in p
erce
ntag
e) o
f com
mon
and
em
ergi
ng ty
pes o
f cor
rupt
ion
in th
e N
atio
nal A
ssem
bly
as p
erce
ived
by
mem
bers
of t
he p
ublic
Embezzlement/misuse/ misappropriation of public funds/resources
Bribery (soliciting for and/or receiving bribes)
Nepotism in service delivery
Discrimination in service delivery
Abuse of office
Actual and/or facilitation of implementation of shoddy/ ghost /white elephant projects Unequal distribution of public resources
Flouting procurement regulations
Tribalism in service delivery
Passing defective laws
Theft scandals/looting
Fraud and/or forgery
Interference by other arms of government in the discharge of mandate
Incompetency in provision of public funds
Extortion
Absenteeism in public offices
Laxity
Corruption in job recruitments
Harassment of service seekers
Soliciting for sexual favors
Mig
ori
18.2
27
.3
9.1
36.4
0.
0 9.
1 0.
0 0.
0 0.
0 0.
0 0.
0 0.
0 0.
0 0.
0 0.
0 0.
0 0.
0 0.
0 0.
0 0.
0 El
geyo
Mar
akw
et
17.9
17
.9
10.7
3.
6 10
.7
14.3
3.
6 3.
6 3.
6 0.
0 3.
6 0.
0 3.
6 7.
1 0.
0 0.
0 0.
0 0.
0 0.
0 0.
0 B
omet
17
.6
11.8
17
.6
35.3
5.
9 5.
9 0.
0 5.
9 0.
0 0.
0 0.
0 0.
0 0.
0 0.
0 0.
0 0.
0 0.
0 0.
0 0.
0 0.
0 K
itui
16.7
0.
0 0.
0 0.
0 0.
0 0.
0 33
.3
0.0
0.0
33.3
0.
0 0.
0 0.
0 0.
0 0.
0 0.
0 0.
0 0.
0 16
.7
0.0
Gar
issa
16
.0
0.0
16.0
12
.0
0.0
0.0
2.0
18.0
2.
0 14
.0
0.0
0.0
2.0
12.0
0.
0 2.
0 0.
0 0.
0 2.
0 2.
0 Tr
ans N
zoia
14
.3
35.7
7.
1 10
.7
7.1
0.0
0.0
0.0
7.1
3.6
3.6
10.7
0.
0 0.
0 0.
0 0.
0 0.
0 0.
0 0.
0 0.
0 M
omba
sa
12.8
12
.8
19.6
19
.6
6.1
4.5
3.4
2.8
7.8
0.0
2.2
0.0
2.8
0.6
0.0
2.8
0.6
1.1
0.0
0.6
Nan
di
11.5
19
.2
19.2
7.
7 0.
0 7.
7 15
.4
3.8
7.7
0.0
0.0
0.0
0.0
0.0
0.0
0.0
3.8
3.8
0.0
0.0
Kia
mbu
7.
5 32
.5
17.5
2.
5 2.
5 17
.5
0.0
7.5
2.5
2.5
5.0
2.5
0.0
0.0
0.0
0.0
0.0
0.0
0.0
0.0
Hom
a B
ay
0.0
0.0
100.
0 0.
0 0.
0 0.
0 0.
0 0.
0 0.
0 0.
0 0.
0 0.
0 0.
0 0.
0 0.
0 0.
0 0.
0 0.
0 0.
0 0.
0 K
ilifi
0.0
0.0
33.3
0.
0 0.
0 0.
0 33
.3
33.3
0.
0 0.
0 0.
0 0.
0 0.
0 0.
0 0.
0 0.
0 0.
0 0.
0 0.
0 0.
0 N
yam
ira
0.0
25.0
0.
0 0.
0 0.
0 0.
0 0.
0 0.
0 25
.0
0.0
25.0
0.
0 0.
0 0.
0 25
.0
0.0
0.0
0.0
0.0
0.0
Taita
Tav
eta
0.0
0.0
0.0
33.3
0.
0 0.
0 0.
0 0.
0 0.
0 0.
0 0.
0 0.
0 0.
0 0.
0 0.
0 0.
0 66
.7
0.0
0.0
0.0
Tana
Riv
er
0.0
0.0
33.3
0.
0 0.
0 0.
0 0.
0 0.
0 33
.3
0.0
0.0
0.0
0.0
0.0
0.0
0.0
33.3
0.
0 0.
0 0.
0 Tu
rkan
a 0.
0 0.
0 33
.3
0.0
33.3
0.
0 0.
0 0.
0 33
.3
0.0
0.0
0.0
0.0
0.0
0.0
0.0
0.0
0.0
0.0
0.0
Waj
ir 0.
0 0.
0 0.
0 33
.3
0.0
0.0
33.3
0.
0 0.
0 0.
0 0.
0 0.
0 33
.3
0.0
0.0
0.0
0.0
0.0
0.0
0.0
Wes
t Pok
ot
0.0
100.
0 0.
0 0.
0 0.
0 0.
0 0.
0 0.
0 0.
0 0.
0 0.
0 0.
0 0.
0 0.
0 0.
0 0.
0 0.
0 0.
0 0.
0 0.
0 To
tal
num
ber
of
coun
ties
whe
re e
ach
of
the
19
lead
ing
co
mm
on
and
emer
ging
ty
pes
of
corr
uptio
n in
th
e N
atio
nal
Ass
embl
y (b
ased
on
th
e to
p th
ree
high
est
perc
enta
ges
in e
ach
of
the
45
anal
yzed
co
untie
s) is
pro
min
ent
37
23
22
21
12
8 7
5 5
4 3
3 2
2 2
2 2
1 1
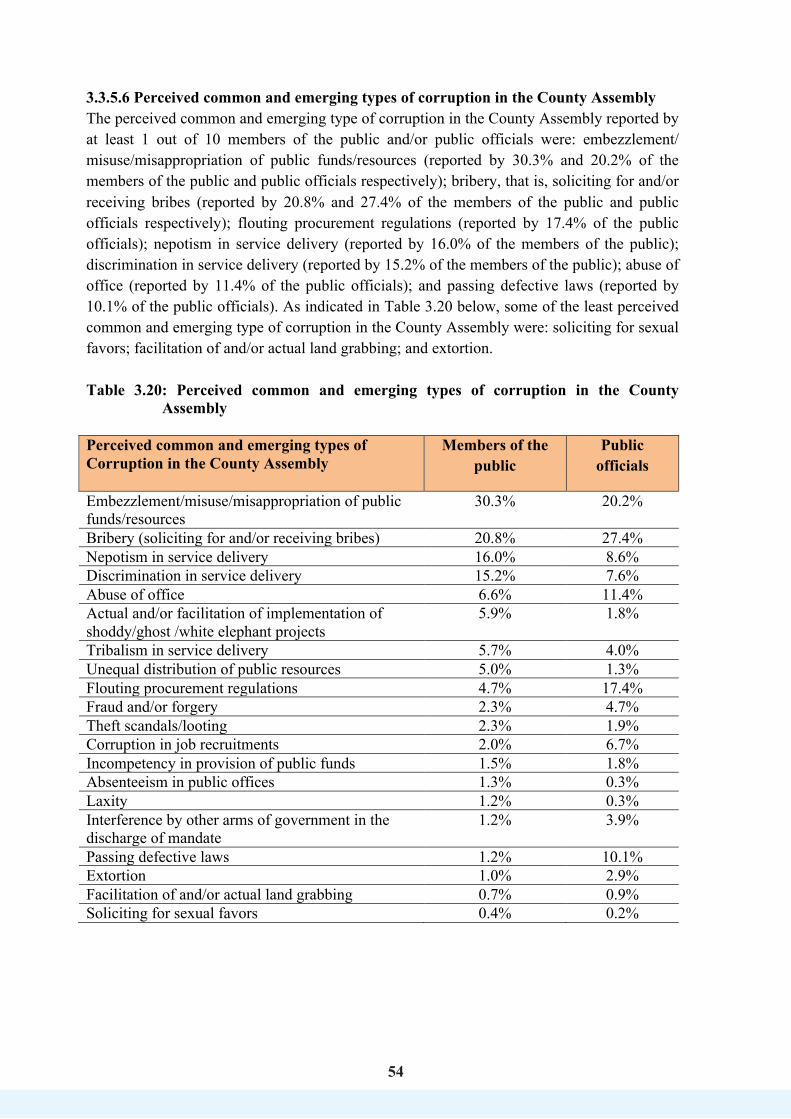
54
54
3.3.5.6 Perceived common and emerging types of corruption in the County Assembly The perceived common and emerging type of corruption in the County Assembly reported by at least 1 out of 10 members of the public and/or public officials were: embezzlement/ misuse/misappropriation of public funds/resources (reported by 30.3% and 20.2% of the members of the public and public officials respectively); bribery, that is, soliciting for and/or receiving bribes (reported by 20.8% and 27.4% of the members of the public and public officials respectively); flouting procurement regulations (reported by 17.4% of the public officials); nepotism in service delivery (reported by 16.0% of the members of the public); discrimination in service delivery (reported by 15.2% of the members of the public); abuse of office (reported by 11.4% of the public officials); and passing defective laws (reported by 10.1% of the public officials). As indicated in Table 3.20 below, some of the least perceived common and emerging type of corruption in the County Assembly were: soliciting for sexual favors; facilitation of and/or actual land grabbing; and extortion. Table 3.20: Perceived common and emerging types of corruption in the County
Assembly Perceived common and emerging types of Corruption in the County Assembly
Members of the public
Public officials
Embezzlement/misuse/misappropriation of public funds/resources
30.3% 20.2%
Bribery (soliciting for and/or receiving bribes) 20.8% 27.4% Nepotism in service delivery 16.0% 8.6% Discrimination in service delivery 15.2% 7.6% Abuse of office 6.6% 11.4% Actual and/or facilitation of implementation of shoddy/ghost /white elephant projects
5.9% 1.8%
Tribalism in service delivery 5.7% 4.0% Unequal distribution of public resources 5.0% 1.3% Flouting procurement regulations 4.7% 17.4% Fraud and/or forgery 2.3% 4.7% Theft scandals/looting 2.3% 1.9% Corruption in job recruitments 2.0% 6.7% Incompetency in provision of public funds 1.5% 1.8% Absenteeism in public offices 1.3% 0.3% Laxity 1.2% 0.3% Interference by other arms of government in the discharge of mandate
1.2% 3.9%
Passing defective laws 1.2% 10.1% Extortion 1.0% 2.9% Facilitation of and/or actual land grabbing 0.7% 0.9% Soliciting for sexual favors 0.4% 0.2%
County analysis of perceptions of members of the public on common and emerging types of corruption in the County Assembly revealed that 13 out of 20 common and emerging types
5555
County analysis of perceptions of members of the public on common and emerging types of corruption in the County Assembly revealed that 13 out of 20 common and emerging types of corruption featured among those with the three highest percentages in each of the 45 analyzed counties. The common and emerging types of corruption featuring in at least a third of the 45 counties were embezzlement/misuse/misappropriation of public funds/resources (prominent in 43 counties), nepotism in service delivery (prominent in 34 counties), bribery (prominent in 30 counties) and discrimination in service delivery (prominent in 28 counties). On the basis of the three highest percentages in each of the 45 analyzed counties, perceptions of members of the public on embezzlement/misuse/misappropriation of public funds/resources as a common and emerging type of corruption in the County Assembly were highest in Nyandarua (45.3%), Samburu (43.5%), Nyeri (40.7%), Nakuru (36.7%) and Baringo (34.2%). On nepotism in service delivery, counties with the highest percentages included West Pokot (32.7%), Homa Bay (30.3%), Turkana (26.7%), Kisii (24.0%) and Kericho (22.7). On bribery, counties leading in perceptions included Machakos (34.2%), Kitui (31.6%), Wajir (29.6%), Makueni (29.3%) and Kakamega (29.2%). On discrimination in service delivery, counties with the highest percentage of perceptions included Kajiado (41.2%), Narok (35.0%), Tana River (29.1%), Bomet (28.2%) and Kwale (25.6%). These findings are highlighted in Table 3.21 below.
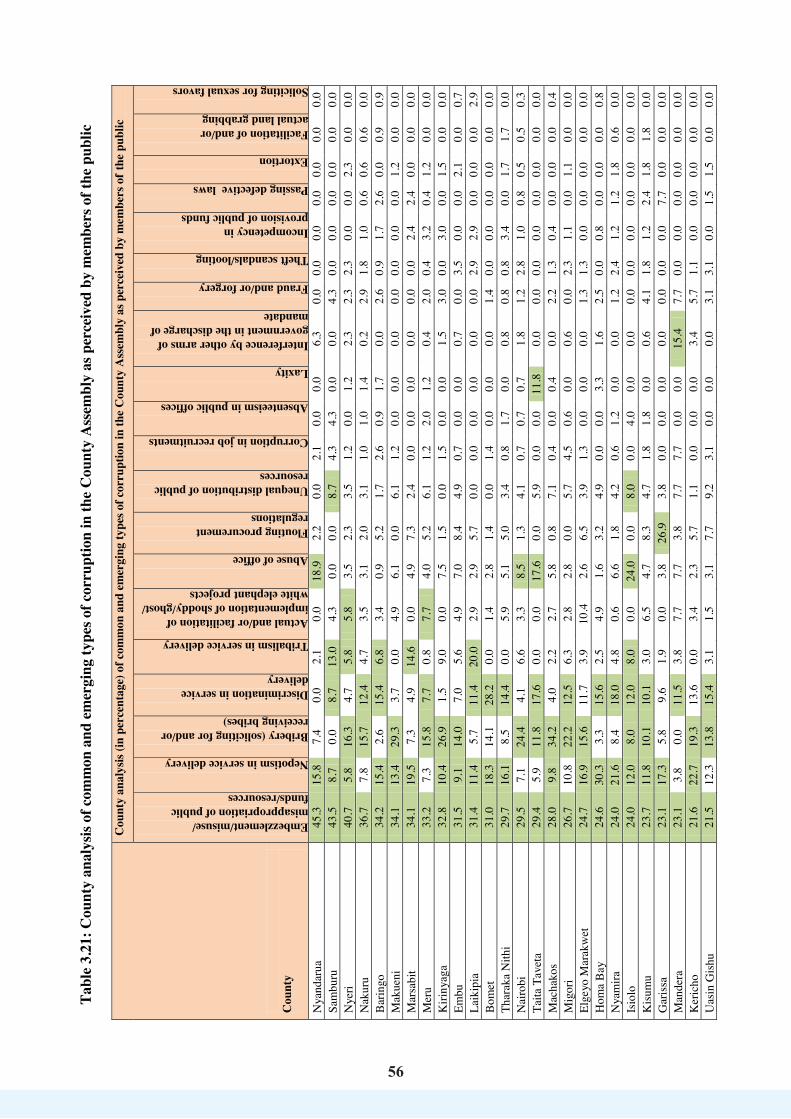
56
56
Tabl
e 3.
21: C
ount
y an
alys
is of
com
mon
and
em
ergi
ng ty
pes o
f cor
rupt
ion
in th
e C
ount
y A
ssem
bly
as p
erce
ived
by
mem
bers
of t
he p
ublic
Cou
nty
Cou
nty
anal
ysis
(in p
erce
ntag
e) o
f com
mon
and
em
ergi
ng ty
pes o
f cor
rupt
ion
in th
e C
ount
y A
ssem
bly
as p
erce
ived
by
mem
bers
of t
he p
ublic
Embezzlement/misuse/ misappropriation of public funds/resources
Nepotism in service delivery
Bribery (soliciting for and/or receiving bribes)
Discrimination in service delivery
Tribalism in service delivery
Actual and/or facilitation of implementation of shoddy/ghost/ white elephant projects
Abuse of office
Flouting procurement regulations
Unequal distribution of public resources
Corruption in job recruitments
Absenteeism in public offices
Laxity
Interference by other arms of government in the discharge of mandate
Fraud and/or forgery
Theft scandals/looting
Incompetency in provision of public funds
Passing defective laws
Extortion
Facilitation of and/or actual land grabbing
Soliciting for sexual favors
Nya
ndar
ua
45.3
15
.8
7.4
0.0
2.1
0.0
18.9
2.
2 0.
0 2.
1 0.
0 0.
0 6.
3 0.
0 0.
0 0.
0 0.
0 0.
0 0.
0 0.
0 Sa
mbu
ru
43.5
8.
7 0.
0 8.
7 13
.0
4.3
0.0
0.0
8.7
4.3
4.3
0.0
0.0
4.3
0.0
0.0
0.0
0.0
0.0
0.0
Nye
ri 40
.7
5.8
16.3
4.
7 5.
8 5.
8 3.
5 2.
3 3.
5 1.
2 0.
0 1.
2 2.
3 2.
3 2.
3 0.
0 0.
0 2.
3 0.
0 0.
0 N
akur
u 36
.7
7.8
15.7
12
.4
4.7
3.5
3.1
2.0
3.1
1.0
1.0
1.4
0.2
2.9
1.8
1.0
0.6
0.6
0.6
0.0
Bar
ingo
34
.2
15.4
2.
6 15
.4
6.8
3.4
0.9
5.2
1.7
2.6
0.9
1.7
0.0
2.6
0.9
1.7
2.6
0.0
0.9
0.9
Mak
ueni
34
.1
13.4
29
.3
3.7
0.0
4.9
6.1
0.0
6.1
1.2
0.0
0.0
0.0
0.0
0.0
0.0
0.0
1.2
0.0
0.0
Mar
sabi
t 34
.1
19.5
7.
3 4.
9 14
.6
0.0
4.9
7.3
2.4
0.0
0.0
0.0
0.0
0.0
0.0
2.4
2.4
0.0
0.0
0.0
Mer
u 33
.2
7.3
15.8
7.
7 0.
8 7.
7 4.
0 5.
2 6.
1 1.
2 2.
0 1.
2 0.
4 2.
0 0.
4 3.
2 0.
4 1.
2 0.
0 0.
0 K
iriny
aga
32.8
10
.4
26.9
1.
5 9.
0 0.
0 7.
5 1.
5 0.
0 1.
5 0.
0 0.
0 1.
5 3.
0 0.
0 3.
0 0.
0 1.
5 0.
0 0.
0 Em
bu
31.5
9.
1 14
.0
7.0
5.6
4.9
7.0
8.4
4.9
0.7
0.0
0.0
0.7
0.0
3.5
0.0
0.0
2.1
0.0
0.7
Laik
ipia
31
.4
11.4
5.
7 11
.4
20.0
2.
9 2.
9 5.
7 0.
0 0.
0 0.
0 0.
0 0.
0 0.
0 2.
9 2.
9 0.
0 0.
0 0.
0 2.
9 B
omet
31
.0
18.3
14
.1
28.2
0.
0 1.
4 2.
8 1.
4 0.
0 1.
4 0.
0 0.
0 0.
0 1.
4 0.
0 0.
0 0.
0 0.
0 0.
0 0.
0 Th
arak
a N
ithi
29.7
16
.1
8.5
14.4
0.
0 5.
9 5.
1 5.
0 3.
4 0.
8 1.
7 0.
0 0.
8 0.
8 0.
8 3.
4 0.
0 1.
7 1.
7 0.
0 N
airo
bi
29.5
7.
1 24
.4
4.1
6.6
3.3
8.5
1.3
4.1
0.7
0.7
0.7
1.8
1.2
2.8
1.0
0.8
0.5
0.5
0.3
Taita
Tav
eta
29.4
5.
9 11
.8
17.6
0.
0 0.
0 17
.6
0.0
5.9
0.0
0.0
11.8
0.
0 0.
0 0.
0 0.
0 0.
0 0.
0 0.
0 0.
0 M
acha
kos
28.0
9.
8 34
.2
4.0
2.2
2.7
5.8
0.8
7.1
0.4
0.0
0.4
0.0
2.2
1.3
0.4
0.0
0.0
0.0
0.4
Mig
ori
26.7
10
.8
22.2
12
.5
6.3
2.8
2.8
0.0
5.7
4.5
0.6
0.0
0.6
0.0
2.3
1.1
0.0
1.1
0.0
0.0
Elge
yo M
arak
wet
24
.7
16.9
15
.6
11.7
3.
9 10
.4
2.6
6.5
3.9
1.3
0.0
0.0
0.0
1.3
1.3
0.0
0.0
0.0
0.0
0.0
Hom
a B
ay
24.6
30
.3
3.3
15.6
2.
5 4.
9 1.
6 3.
2 4.
9 0.
0 0.
0 3.
3 1.
6 2.
5 0.
0 0.
8 0.
0 0.
0 0.
0 0.
8 N
yam
ira
24.0
21
.6
8.4
18.0
4.
8 0.
6 6.
6 1.
8 4.
2 0.
6 1.
2 0.
0 0.
0 1.
2 2.
4 1.
2 1.
2 1.
8 0.
6 0.
0 Is
iolo
24
.0
12.0
8.
0 12
.0
8.0
0.0
24.0
0.
0 8.
0 0.
0 4.
0 0.
0 0.
0 0.
0 0.
0 0.
0 0.
0 0.
0 0.
0 0.
0 K
isum
u 23
.7
11.8
10
.1
10.1
3.
0 6.
5 4.
7 8.
3 4.
7 1.
8 1.
8 0.
0 0.
6 4.
1 1.
8 1.
2 2.
4 1.
8 1.
8 0.
0 G
aris
sa
23.1
17
.3
5.8
9.6
1.9
0.0
3.8
26.9
3.
8 0.
0 0.
0 0.
0 0.
0 0.
0 0.
0 0.
0 7.
7 0.
0 0.
0 0.
0 M
ande
ra
23.1
3.
8 0.
0 11
.5
3.8
7.7
7.7
3.8
7.7
7.7
0.0
0.0
15.4
7.
7 0.
0 0.
0 0.
0 0.
0 0.
0 0.
0 K
eric
ho
21.6
22
.7
19.3
13
.6
0.0
3.4
2.3
5.7
1.1
0.0
0.0
0.0
3.4
5.7
1.1
0.0
0.0
0.0
0.0
0.0
Uas
in G
ishu
21
.5
12.3
13
.8
15.4
3.
1 1.
5 3.
1 7.
7 9.
2 3.
1 0.
0 0.
0 0.
0 3.
1 3.
1 0.
0 1.
5 1.
5 0.
0 0.
0
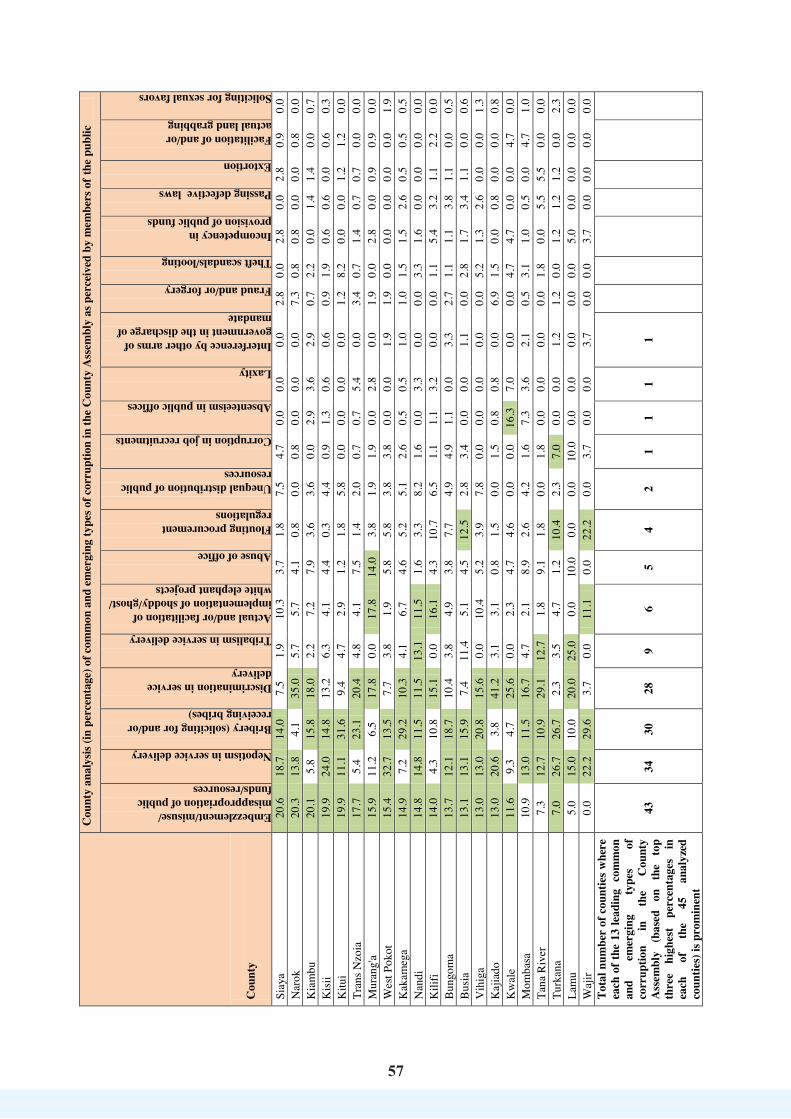
57
57
Cou
nty
Cou
nty
anal
ysis
(in p
erce
ntag
e) o
f com
mon
and
em
ergi
ng ty
pes o
f cor
rupt
ion
in th
e C
ount
y A
ssem
bly
as p
erce
ived
by
mem
bers
of t
he p
ublic
Embezzlement/misuse/ misappropriation of public funds/resources
Nepotism in service delivery
Bribery (soliciting for and/or receiving bribes)
Discrimination in service delivery
Tribalism in service delivery
Actual and/or facilitation of implementation of shoddy/ghost/ white elephant projects
Abuse of office
Flouting procurement regulations
Unequal distribution of public resources
Corruption in job recruitments
Absenteeism in public offices
Laxity
Interference by other arms of government in the discharge of mandate
Fraud and/or forgery
Theft scandals/looting
Incompetency in provision of public funds
Passing defective laws
Extortion
Facilitation of and/or actual land grabbing
Soliciting for sexual favors
Siay
a 20
.6
18.7
14
.0
7.5
1.9
10.3
3.
7 1.
8 7.
5 4.
7 0.
0 0.
0 0.
0 2.
8 0.
0 2.
8 0.
0 2.
8 0.
9 0.
0 N
arok
20
.3
13.8
4.
1 35
.0
5.7
5.7
4.1
0.8
0.0
0.8
0.0
0.0
0.0
7.3
0.8
0.8
0.0
0.0
0.8
0.0
Kia
mbu
20
.1
5.8
15.8
18
.0
2.2
7.2
7.9
3.6
3.6
0.0
2.9
3.6
2.9
0.7
2.2
0.0
1.4
1.4
0.0
0.7
Kis
ii 19
.9
24.0
14
.8
13.2
6.
3 4.
1 4.
4 0.
3 4.
4 0.
9 1.
3 0.
6 0.
6 0.
9 1.
9 0.
6 0.
6 0.
0 0.
6 0.
3 K
itui
19.9
11
.1
31.6
9.
4 4.
7 2.
9 1.
2 1.
8 5.
8 0.
0 0.
0 0.
0 0.
0 1.
2 8.
2 0.
0 0.
0 1.
2 1.
2 0.
0 Tr
ans N
zoia
17
.7
5.4
23.1
20
.4
4.8
4.1
7.5
1.4
2.0
0.7
0.7
5.4
0.0
3.4
0.7
1.4
0.7
0.7
0.0
0.0
Mur
ang'
a 15
.9
11.2
6.
5 17
.8
0.0
17.8
14
.0
3.8
1.9
1.9
0.0
2.8
0.0
1.9
0.0
2.8
0.0
0.9
0.9
0.0
Wes
t Pok
ot
15.4
32
.7
13.5
7.
7 3.
8 1.
9 5.
8 5.
8 3.
8 3.
8 0.
0 0.
0 1.
9 1.
9 0.
0 0.
0 0.
0 0.
0 0.
0 1.
9 K
akam
ega
14.9
7.
2 29
.2
10.3
4.
1 6.
7 4.
6 5.
2 5.
1 2.
6 0.
5 0.
5 1.
0 1.
0 1.
5 1.
5 2.
6 0.
5 0.
5 0.
5 N
andi
14
.8
14.8
11
.5
11.5
13
.1
11.5
1.
6 3.
3 8.
2 1.
6 0.
0 3.
3 0.
0 0.
0 3.
3 1.
6 0.
0 0.
0 0.
0 0.
0 K
ilifi
14.0
4.
3 10
.8
15.1
0.
0 16
.1
4.3
10.7
6.
5 1.
1 1.
1 3.
2 0.
0 0.
0 1.
1 5.
4 3.
2 1.
1 2.
2 0.
0 B
ungo
ma
13.7
12
.1
18.7
10
.4
3.8
4.9
3.8
7.7
4.9
4.9
1.1
0.0
3.3
2.7
1.1
1.1
3.8
1.1
0.0
0.5
Bus
ia
13.1
13
.1
15.9
7.
4 11
.4
5.1
4.5
12.5
2.
8 3.
4 0.
0 0.
0 1.
1 0.
0 2.
8 1.
7 3.
4 1.
1 0.
0 0.
6 V
ihig
a 13
.0
13.0
20
.8
15.6
0.
0 10
.4
5.2
3.9
7.8
0.0
0.0
0.0
0.0
0.0
5.2
1.3
2.6
0.0
0.0
1.3
Kaj
iado
13
.0
20.6
3.
8 41
.2
3.1
3.1
0.8
1.5
0.0
1.5
0.8
0.8
0.0
6.9
1.5
0.0
0.8
0.0
0.0
0.8
Kw
ale
11.6
9.
3 4.
7 25
.6
0.0
2.3
4.7
4.6
0.0
0.0
16.3
7.
0 0.
0 0.
0 4.
7 4.
7 0.
0 0.
0 4.
7 0.
0 M
omba
sa
10.9
13
.0
11.5
16
.7
4.7
2.1
8.9
2.6
4.2
1.6
7.3
3.6
2.1
0.5
3.1
1.0
0.5
0.0
4.7
1.0
Tana
Riv
er
7.3
12.7
10
.9
29.1
12
.7
1.8
9.1
1.8
0.0
1.8
0.0
0.0
0.0
0.0
1.8
0.0
5.5
5.5
0.0
0.0
Turk
ana
7.0
26.7
26
.7
2.3
3.5
4.7
1.2
10.4
2.
3 7.
0 0.
0 0.
0 1.
2 1.
2 0.
0 1.
2 1.
2 1.
2 0.
0 2.
3 La
mu
5.0
15.0
10
.0
20.0
25
.0
0.0
10.0
0.
0 0.
0 10
.0
0.0
0.0
0.0
0.0
0.0
5.0
0.0
0.0
0.0
0.0
Waj
ir 0.
0 22
.2
29.6
3.
7 0.
0 11
.1
0.0
22.2
0.
0 3.
7 0.
0 0.
0 3.
7 0.
0 0.
0 3.
7 0.
0 0.
0 0.
0 0.
0 To
tal n
umbe
r of
cou
ntie
s whe
re
each
of t
he 1
3 le
adin
g c
omm
on
and
emer
ging
ty
pes
of
corr
uptio
n in
th
e C
ount
y A
ssem
bly
(bas
ed
on
the
top
thre
e hi
ghes
t pe
rcen
tage
s in
ea
ch
of
the
45
anal
yzed
co
untie
s) is
pro
min
ent
43
34
30
28
9 6
5 4
2 1
1 1
1
58
58
A key informant observed the following in relation to corruption in the County Assembly:
“All legislators are just the same. Disbursement of money at the County Assembly level by MCAs is very opaque and the system lacks transparency”(KI 8).
In general, the study indicated that corruption is a crime that is perceived to be in all the arms of government. This supports the findings of EACC (2017) report that notes that corruption is widely in all sectors of the Kenyan economy.
The foregoing findings on perceptions of corruption agree with those of TI Global Corruption Barometer 2004 which showed that political parties were perceived to be the most corrupt institutions worldwide followed by parliaments, the Police and the Judiciary (TI, 2004). Political parties in Kenya have their members elected and/or nominated into the legislative arm of government while the winning political party majorly forms and/or shapes the executive arm of the government of the day. Therefore, one of the implications of the findings of this study (which has also been advanced by Transparency International) is that political parties must put in place internal measures to stamp out corruption and increase transparency, through fair candidate selection procedures, running clean election campaigns, rejecting corrupt sources of political funding and disclosing their sources of donations.
3.4 Experiences of Corruption in the Public Service 3.4.1 Corruption in relation to seeking of services from the public service 3.4.1.1 Seeking of services from the public service Corruption in the public service is experienced majorly in the context of seeking services. Therefore, members of the public and public officials were asked whether they, or any close family member, had sought any service from any public service institution. The findings showed that 69.5% of the members of the public and/or their close family members and 64.6% of the public officials and/or their close family members had sought services from the public service. A further analysis indicated that the counties of Nyandarua (92.9%), Kirinyaga (87.3%), Nyeri (85.4%), Kakamega (84.4%) and Vihiga (82.4%) were among the counties with high proportions of members of the public and/or their close family members who had sought services from public service institutions 12 months prior to the survey. As indicated in Table 3.22 below, the counties that had only a handful of the members of the public and/or their close family members seeking such services included Mandera (44.8%) and West Pokot (48.0%).
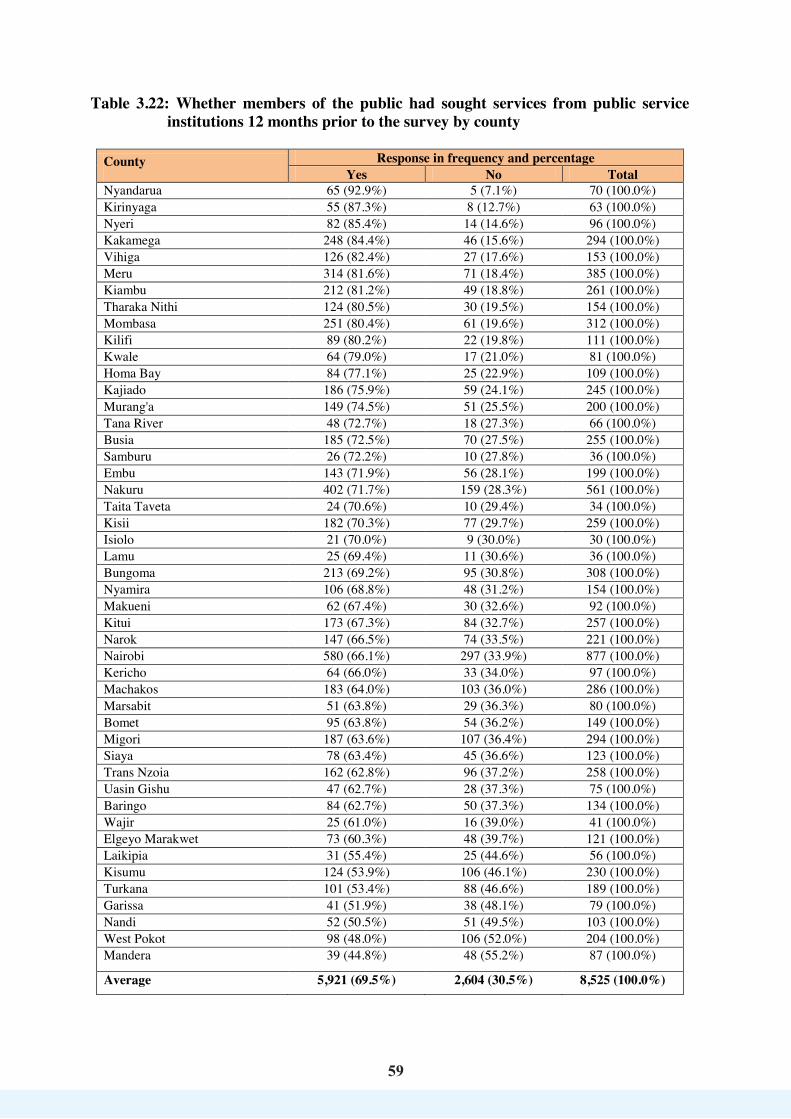
59
59
Table 3.22: Whether members of the public had sought services from public service institutions 12 months prior to the survey by county
County Response in frequency and percentage
Yes No Total Nyandarua 65 (92.9%) 5 (7.1%) 70 (100.0%) Kirinyaga 55 (87.3%) 8 (12.7%) 63 (100.0%) Nyeri 82 (85.4%) 14 (14.6%) 96 (100.0%) Kakamega 248 (84.4%) 46 (15.6%) 294 (100.0%) Vihiga 126 (82.4%) 27 (17.6%) 153 (100.0%) Meru 314 (81.6%) 71 (18.4%) 385 (100.0%) Kiambu 212 (81.2%) 49 (18.8%) 261 (100.0%) Tharaka Nithi 124 (80.5%) 30 (19.5%) 154 (100.0%) Mombasa 251 (80.4%) 61 (19.6%) 312 (100.0%) Kilifi 89 (80.2%) 22 (19.8%) 111 (100.0%) Kwale 64 (79.0%) 17 (21.0%) 81 (100.0%) Homa Bay 84 (77.1%) 25 (22.9%) 109 (100.0%) Kajiado 186 (75.9%) 59 (24.1%) 245 (100.0%) Murang'a 149 (74.5%) 51 (25.5%) 200 (100.0%) Tana River 48 (72.7%) 18 (27.3%) 66 (100.0%) Busia 185 (72.5%) 70 (27.5%) 255 (100.0%) Samburu 26 (72.2%) 10 (27.8%) 36 (100.0%) Embu 143 (71.9%) 56 (28.1%) 199 (100.0%) Nakuru 402 (71.7%) 159 (28.3%) 561 (100.0%) Taita Taveta 24 (70.6%) 10 (29.4%) 34 (100.0%) Kisii 182 (70.3%) 77 (29.7%) 259 (100.0%) Isiolo 21 (70.0%) 9 (30.0%) 30 (100.0%) Lamu 25 (69.4%) 11 (30.6%) 36 (100.0%) Bungoma 213 (69.2%) 95 (30.8%) 308 (100.0%) Nyamira 106 (68.8%) 48 (31.2%) 154 (100.0%) Makueni 62 (67.4%) 30 (32.6%) 92 (100.0%) Kitui 173 (67.3%) 84 (32.7%) 257 (100.0%) Narok 147 (66.5%) 74 (33.5%) 221 (100.0%) Nairobi 580 (66.1%) 297 (33.9%) 877 (100.0%) Kericho 64 (66.0%) 33 (34.0%) 97 (100.0%) Machakos 183 (64.0%) 103 (36.0%) 286 (100.0%) Marsabit 51 (63.8%) 29 (36.3%) 80 (100.0%) Bomet 95 (63.8%) 54 (36.2%) 149 (100.0%) Migori 187 (63.6%) 107 (36.4%) 294 (100.0%) Siaya 78 (63.4%) 45 (36.6%) 123 (100.0%) Trans Nzoia 162 (62.8%) 96 (37.2%) 258 (100.0%) Uasin Gishu 47 (62.7%) 28 (37.3%) 75 (100.0%) Baringo 84 (62.7%) 50 (37.3%) 134 (100.0%) Wajir 25 (61.0%) 16 (39.0%) 41 (100.0%) Elgeyo Marakwet 73 (60.3%) 48 (39.7%) 121 (100.0%) Laikipia 31 (55.4%) 25 (44.6%) 56 (100.0%) Kisumu 124 (53.9%) 106 (46.1%) 230 (100.0%) Turkana 101 (53.4%) 88 (46.6%) 189 (100.0%) Garissa 41 (51.9%) 38 (48.1%) 79 (100.0%) Nandi 52 (50.5%) 51 (49.5%) 103 (100.0%) West Pokot 98 (48.0%) 106 (52.0%) 204 (100.0%) Mandera 39 (44.8%) 48 (55.2%) 87 (100.0%)
Average 5,921 (69.5%) 2,604 (30.5%) 8,525 (100.0%)
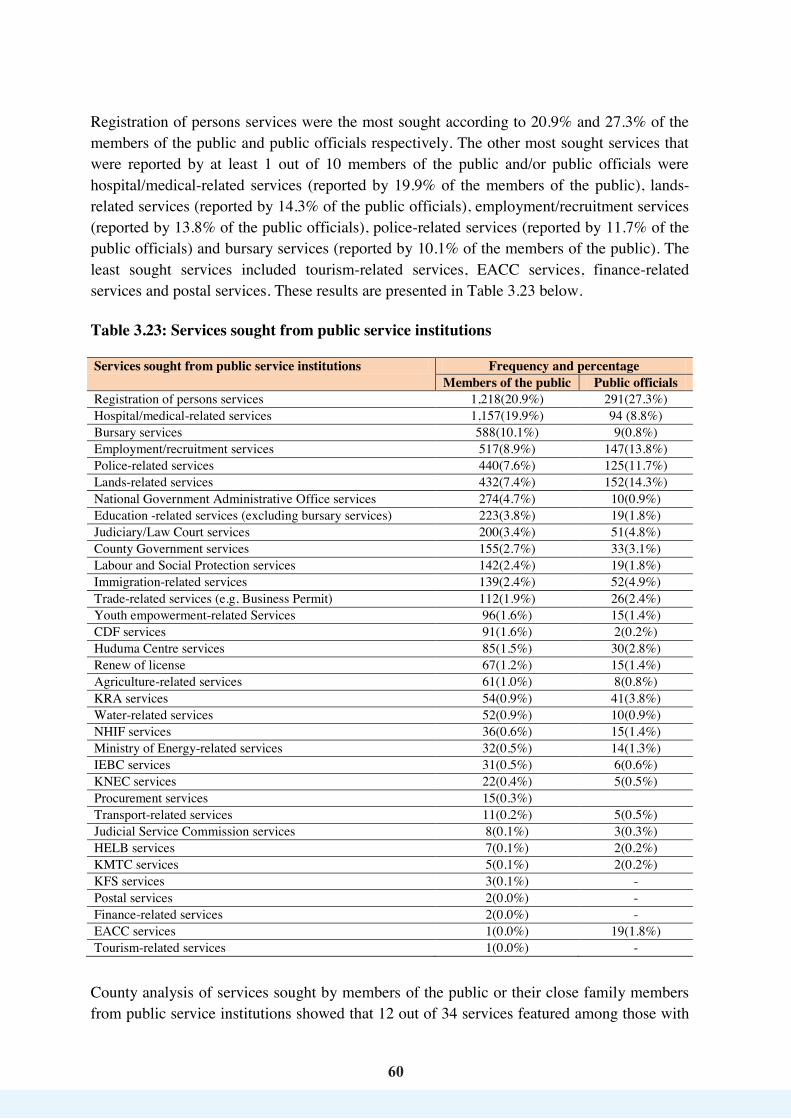
60
60
Registration of persons services were the most sought according to 20.9% and 27.3% of the members of the public and public officials respectively. The other most sought services that were reported by at least 1 out of 10 members of the public and/or public officials were hospital/medical-related services (reported by 19.9% of the members of the public), lands-related services (reported by 14.3% of the public officials), employment/recruitment services (reported by 13.8% of the public officials), police-related services (reported by 11.7% of the public officials) and bursary services (reported by 10.1% of the members of the public). The least sought services included tourism-related services, EACC services, finance-related services and postal services. These results are presented in Table 3.23 below. Table 3.23: Services sought from public service institutions Services sought from public service institutions Frequency and percentage
Members of the public Public officials Registration of persons services 1,218(20.9%) 291(27.3%) Hospital/medical-related services 1,157(19.9%) 94 (8.8%) Bursary services 588(10.1%) 9(0.8%) Employment/recruitment services 517(8.9%) 147(13.8%) Police-related services 440(7.6%) 125(11.7%) Lands-related services 432(7.4%) 152(14.3%) National Government Administrative Office services 274(4.7%) 10(0.9%) Education -related services (excluding bursary services) 223(3.8%) 19(1.8%) Judiciary/Law Court services 200(3.4%) 51(4.8%) County Government services 155(2.7%) 33(3.1%) Labour and Social Protection services 142(2.4%) 19(1.8%) Immigration-related services 139(2.4%) 52(4.9%) Trade-related services (e.g, Business Permit) 112(1.9%) 26(2.4%) Youth empowerment-related Services 96(1.6%) 15(1.4%) CDF services 91(1.6%) 2(0.2%) Huduma Centre services 85(1.5%) 30(2.8%) Renew of license 67(1.2%) 15(1.4%) Agriculture-related services 61(1.0%) 8(0.8%) KRA services 54(0.9%) 41(3.8%) Water-related services 52(0.9%) 10(0.9%) NHIF services 36(0.6%) 15(1.4%) Ministry of Energy-related services 32(0.5%) 14(1.3%) IEBC services 31(0.5%) 6(0.6%) KNEC services 22(0.4%) 5(0.5%) Procurement services 15(0.3%) Transport-related services 11(0.2%) 5(0.5%) Judicial Service Commission services 8(0.1%) 3(0.3%) HELB services 7(0.1%) 2(0.2%) KMTC services 5(0.1%) 2(0.2%) KFS services 3(0.1%) - Postal services 2(0.0%) - Finance-related services 2(0.0%) - EACC services 1(0.0%) 19(1.8%) Tourism-related services 1(0.0%) -
County analysis of services sought by members of the public or their close family members from public service institutions showed that 12 out of 34 services featured among those with
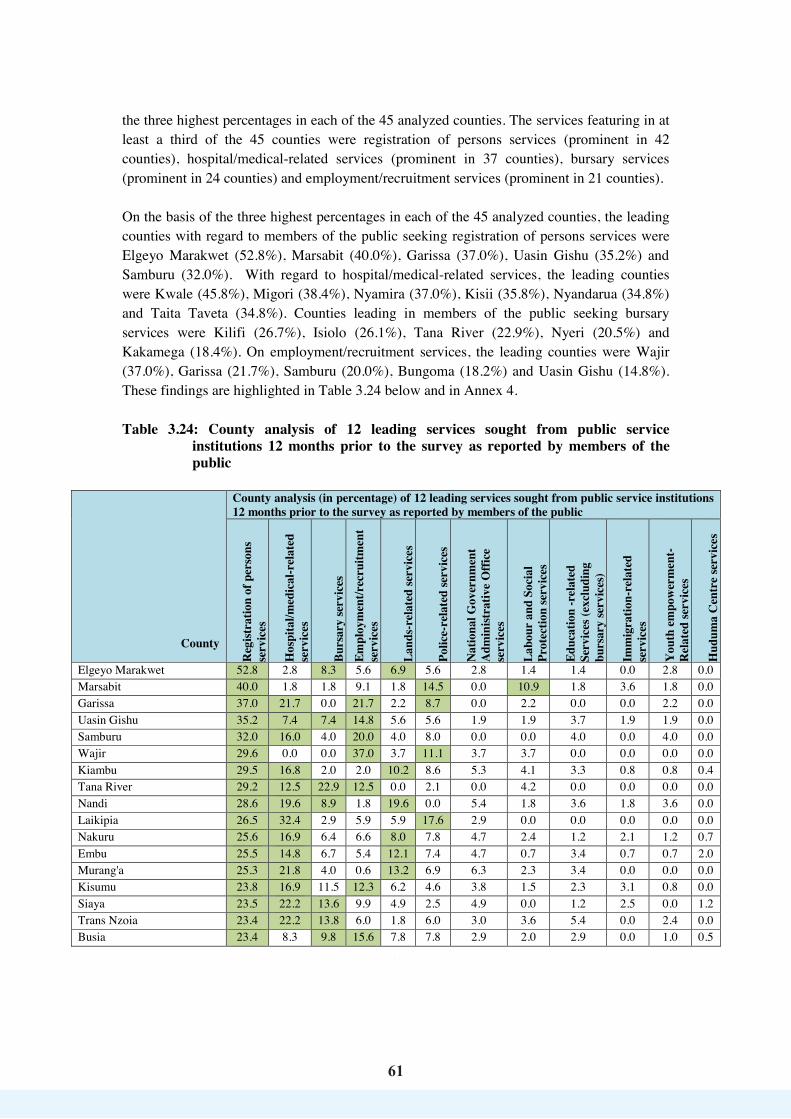
61
61
the three highest percentages in each of the 45 analyzed counties. The services featuring in at least a third of the 45 counties were registration of persons services (prominent in 42 counties), hospital/medical-related services (prominent in 37 counties), bursary services (prominent in 24 counties) and employment/recruitment services (prominent in 21 counties). On the basis of the three highest percentages in each of the 45 analyzed counties, the leading counties with regard to members of the public seeking registration of persons services were Elgeyo Marakwet (52.8%), Marsabit (40.0%), Garissa (37.0%), Uasin Gishu (35.2%) and Samburu (32.0%). With regard to hospital/medical-related services, the leading counties were Kwale (45.8%), Migori (38.4%), Nyamira (37.0%), Kisii (35.8%), Nyandarua (34.8%) and Taita Taveta (34.8%). Counties leading in members of the public seeking bursary services were Kilifi (26.7%), Isiolo (26.1%), Tana River (22.9%), Nyeri (20.5%) and Kakamega (18.4%). On employment/recruitment services, the leading counties were Wajir (37.0%), Garissa (21.7%), Samburu (20.0%), Bungoma (18.2%) and Uasin Gishu (14.8%). These findings are highlighted in Table 3.24 below and in Annex 4. Table 3.24: County analysis of 12 leading services sought from public service
institutions 12 months prior to the survey as reported by members of the public
County
County analysis (in percentage) of 12 leading services sought from public service institutions 12 months prior to the survey as reported by members of the public
Reg
istra
tion
of p
erso
ns
serv
ices
Hos
pita
l/med
ical
-rel
ated
se
rvic
es
Burs
ary
serv
ices
Em
ploy
men
t/rec
ruitm
ent
serv
ices
Land
s-re
late
d se
rvic
es
Polic
e-re
late
d se
rvic
es
Nat
iona
l Gov
ernm
ent
Adm
inist
rativ
e O
ffice
se
rvic
es
Labo
ur a
nd S
ocia
l Pr
otec
tion
serv
ices
Educ
atio
n -r
elat
ed
Serv
ices
(exc
ludi
ng
burs
ary
serv
ices
)
Imm
igra
tion-
rela
ted
se
rvic
es
You
th e
mpo
wer
men
t-
Rel
ated
serv
ices
Hud
uma
Cen
tre
serv
ices
Elgeyo Marakwet 52.8 2.8 8.3 5.6 6.9 5.6 2.8 1.4 1.4 0.0 2.8 0.0 Marsabit 40.0 1.8 1.8 9.1 1.8 14.5 0.0 10.9 1.8 3.6 1.8 0.0 Garissa 37.0 21.7 0.0 21.7 2.2 8.7 0.0 2.2 0.0 0.0 2.2 0.0 Uasin Gishu 35.2 7.4 7.4 14.8 5.6 5.6 1.9 1.9 3.7 1.9 1.9 0.0 Samburu 32.0 16.0 4.0 20.0 4.0 8.0 0.0 0.0 4.0 0.0 4.0 0.0 Wajir 29.6 0.0 0.0 37.0 3.7 11.1 3.7 3.7 0.0 0.0 0.0 0.0 Kiambu 29.5 16.8 2.0 2.0 10.2 8.6 5.3 4.1 3.3 0.8 0.8 0.4 Tana River 29.2 12.5 22.9 12.5 0.0 2.1 0.0 4.2 0.0 0.0 0.0 0.0 Nandi 28.6 19.6 8.9 1.8 19.6 0.0 5.4 1.8 3.6 1.8 3.6 0.0 Laikipia 26.5 32.4 2.9 5.9 5.9 17.6 2.9 0.0 0.0 0.0 0.0 0.0 Nakuru 25.6 16.9 6.4 6.6 8.0 7.8 4.7 2.4 1.2 2.1 1.2 0.7 Embu 25.5 14.8 6.7 5.4 12.1 7.4 4.7 0.7 3.4 0.7 0.7 2.0 Murang'a 25.3 21.8 4.0 0.6 13.2 6.9 6.3 2.3 3.4 0.0 0.0 0.0 Kisumu 23.8 16.9 11.5 12.3 6.2 4.6 3.8 1.5 2.3 3.1 0.8 0.0 Siaya 23.5 22.2 13.6 9.9 4.9 2.5 4.9 0.0 1.2 2.5 0.0 1.2 Trans Nzoia 23.4 22.2 13.8 6.0 1.8 6.0 3.0 3.6 5.4 0.0 2.4 0.0 Busia 23.4 8.3 9.8 15.6 7.8 7.8 2.9 2.0 2.9 0.0 1.0 0.5

62
62
County
County analysis (in percentage) of 12 leading services sought from public service institutions 12 months prior to the survey as reported by members of the public
Reg
istra
tion
of p
erso
ns
serv
ices
Hos
pita
l/med
ical
-rel
ated
se
rvic
es
Burs
ary
serv
ices
Em
ploy
men
t/rec
ruitm
ent
serv
ices
Land
s-re
late
d se
rvic
es
Polic
e-re
late
d se
rvic
es
Nat
iona
l Gov
ernm
ent
Adm
inist
rativ
e O
ffice
se
rvic
es
Labo
ur a
nd S
ocia
l Pr
otec
tion
serv
ices
Educ
atio
n -r
elat
ed
Serv
ices
(exc
ludi
ng
burs
ary
serv
ices
)
Imm
igra
tion-
rela
ted
se
rvic
es
You
th e
mpo
wer
men
t-
Rel
ated
serv
ices
Hud
uma
Cen
tre
serv
ices
Baringo 22.7 22.7 5.7 9.1 5.7 6.8 8.0 1.1 1.1 0.0 3.4 1.1 Bomet 22.2 32.4 3.7 8.3 8.3 3.7 1.9 4.6 4.6 0.0 1.9 0.0 West Pokot 21.2 24.7 4.7 5.9 2.4 4.7 7.1 2.4 10.6 2.4 1.2 0.0 Nairobi 20.8 13.0 5.7 7.7 2.5 7.3 0.8 1.5 5.7 13.5 0.7 2.0 Vihiga 20.8 9.2 15.4 6.2 4.6 3.1 3.1 10.0 5.4 1.5 2.3 2.3 Mombasa 20.4 21.1 10.4 2.9 2.9 6.5 3.6 1.1 1.8 3.2 3.2 5.7 Narok 19.6 27.2 8.9 8.2 3.8 3.8 1.9 1.3 4.4 0.0 2.5 0.0 Machakos 18.5 17.4 5.1 4.1 7.2 10.3 9.2 1.5 2.6 0.0 0.5 2.1 Kwale 18.1 45.8 4.2 6.9 4.2 4.2 5.6 0.0 4.2 2.8 0.0 0.0 Kericho 16.7 19.7 7.6 10.6 4.5 7.6 3.0 1.5 10.6 0.0 0.0 1.5 Kajiado 16.6 31.0 9.1 9.1 5.9 4.8 3.2 0.5 5.3 0.5 0.0 0.0 Meru 16.2 9.0 11.8 4.3 20.2 5.5 7.8 2.0 3.8 0.3 1.4 1.4 Makueni 15.8 21.1 10.5 1.3 2.6 11.8 14.5 1.3 6.6 1.3 2.6 0.0 Homa Bay 14.1 31.8 7.1 5.9 5.9 4.7 4.7 2.4 1.2 1.2 1.2 7.1 Turkana 14.1 31.5 9.8 14.1 1.1 4.3 2.2 2.2 6.5 1.1 1.1 1.1 Kakamega 14.1 4.7 18.4 12.5 8.2 6.7 4.7 1.6 3.5 1.2 2.0 0.8 Bungoma 13.6 7.6 12.7 18.2 5.5 11.9 2.1 3.0 2.5 0.8 2.5 0.8 Nyeri 13.3 21.7 20.5 2.4 12.0 1.2 2.4 0.0 4.8 3.6 2.4 7.2 Mandera 12.5 32.5 7.5 17.5 0.0 7.5 0.0 2.5 2.5 0.0 0.0 0.0 Kilifi 12.2 12.2 26.7 4.4 6.7 7.8 3.3 0.0 3.3 0.0 3.3 0.0 Nyamira 11.1 37.0 9.3 13.9 5.6 2.8 0.9 0.9 3.7 0.0 0.0 1.9 Kirinyaga 10.5 21.1 12.3 1.8 8.8 8.8 5.3 1.8 5.3 0.0 0.0 5.3 Kisii 10.3 35.8 9.8 12.7 3.4 5.9 2.5 2.9 3.9 0.0 3.4 1.5 Nyandarua 10.1 34.8 10.1 2.9 17.4 1.4 5.8 2.9 1.4 0.0 2.9 5.8 Kitui 9.4 7.3 5.7 14.6 5.2 18.8 15.6 1.6 2.1 0.0 0.5 1.0 Tharaka Nithi 8.7 8.7 18.1 7.9 11.0 6.3 4.7 6.3 1.6 0.8 3.1 0.0 Migori 4.9 38.4 11.9 9.2 4.3 5.9 3.8 2.7 3.8 1.6 0.5 1.1 Taita Taveta 4.3 34.8 4.3 0.0 13.0 4.3 13.0 8.7 4.3 0.0 0.0 0.0 Lamu 3.7 3.7 14.8 3.7 3.7 14.8 11.1 0.0 3.7 0.0 22.2 3.7 Isiolo 0.0 26.1 26.1 8.7 0.0 8.7 0.0 0.0 4.3 17.4 0.0 0.0 Total number of counties where each of the 12 leading services sought from public service institutions (based on the top three highest percentages in each of the 45 analyzed counties) is prominent
42 37 24 21 11 9 4 3 2 2 1 1

63
63
3.4.1.2 Corruption-related challenges encountered in seeking public services According to majority (71.3%) of the members of the public and public officials (55.0%), they and/or their close family members had encountered corruption-related challenges while seeking services from public institutions. County-specific analysis showed that at least 50.0% of the members of the public and/or their close family members in 44 out of 47 counties had encountered these challenges. Counties that were on the top included Vihiga (93.0%), Kakamega (90.6%), Makueni (83.1%), Wajir (81.5%) and Tharaka Nithi (81.4%). On the other hand, Nyandarua (43.9%), Bomet (47.3%) and Lamu (50.0%) were some of the counties where the least proportions of members of the public and/or their close family members had encountered corruption-related challenges while seeking services. However, in all these counties, at least 4 out of 10 members of the public had encountered corruption-related challenges while seeking public services. These findings are presented in Table 3.25 below.
Table 3.25: Whether members of the public had encountered corruption-related challenges while seeking public services 12 months prior to the survey by county
County Response in percentage
Yes No Vihiga 93.0 7.0 Kakamega 90.6 9.4 Makueni 83.1 16.9 Wajir 81.5 18.5 Tharaka Nithi 81.4 18.6 Kisii 81.1 18.9 Kitui 80.2 19.8 Homa Bay 80.0 20.0 Bungoma 79.8 20.2 Baringo 78.8 21.2 Mandera 78.6 21.4 Busia 78.2 21.8 Machakos 78.1 21.9 Samburu 77.8 22.2 Isiolo 76.2 23.8 Kilifi 75.8 24.2 Mombasa 74.6 25.4 Migori 74.2 25.8 Siaya 73.9 26.1 Kiambu 73.7 26.3 Meru 73.5 26.5 Trans Nzoia 72.9 27.1 Garissa 71.7 28.3
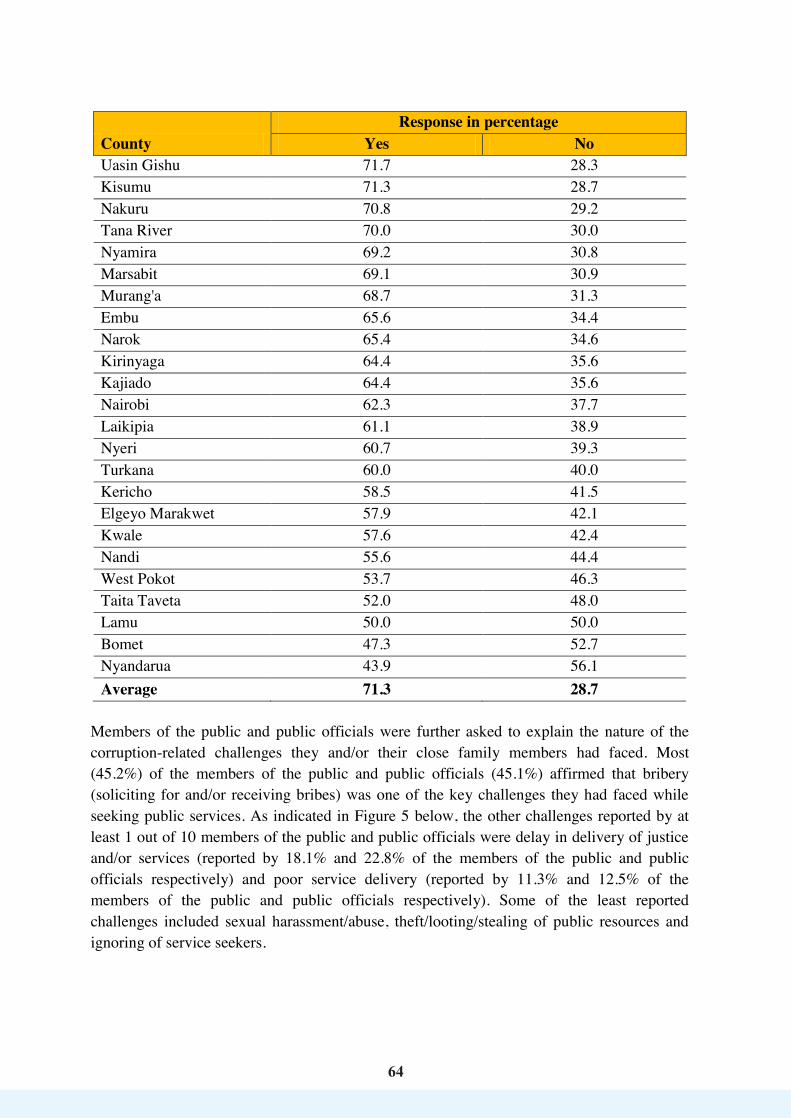
64
64
County Response in percentage
Yes No Uasin Gishu 71.7 28.3 Kisumu 71.3 28.7 Nakuru 70.8 29.2 Tana River 70.0 30.0 Nyamira 69.2 30.8 Marsabit 69.1 30.9 Murang'a 68.7 31.3 Embu 65.6 34.4 Narok 65.4 34.6 Kirinyaga 64.4 35.6 Kajiado 64.4 35.6 Nairobi 62.3 37.7 Laikipia 61.1 38.9 Nyeri 60.7 39.3 Turkana 60.0 40.0 Kericho 58.5 41.5 Elgeyo Marakwet 57.9 42.1 Kwale 57.6 42.4 Nandi 55.6 44.4 West Pokot 53.7 46.3 Taita Taveta 52.0 48.0 Lamu 50.0 50.0 Bomet 47.3 52.7 Nyandarua 43.9 56.1 Average 71.3 28.7
Members of the public and public officials were further asked to explain the nature of the corruption-related challenges they and/or their close family members had faced. Most (45.2%) of the members of the public and public officials (45.1%) affirmed that bribery (soliciting for and/or receiving bribes) was one of the key challenges they had faced while seeking public services. As indicated in Figure 5 below, the other challenges reported by at least 1 out of 10 members of the public and public officials were delay in delivery of justice and/or services (reported by 18.1% and 22.8% of the members of the public and public officials respectively) and poor service delivery (reported by 11.3% and 12.5% of the members of the public and public officials respectively). Some of the least reported challenges included sexual harassment/abuse, theft/looting/stealing of public resources and ignoring of service seekers.
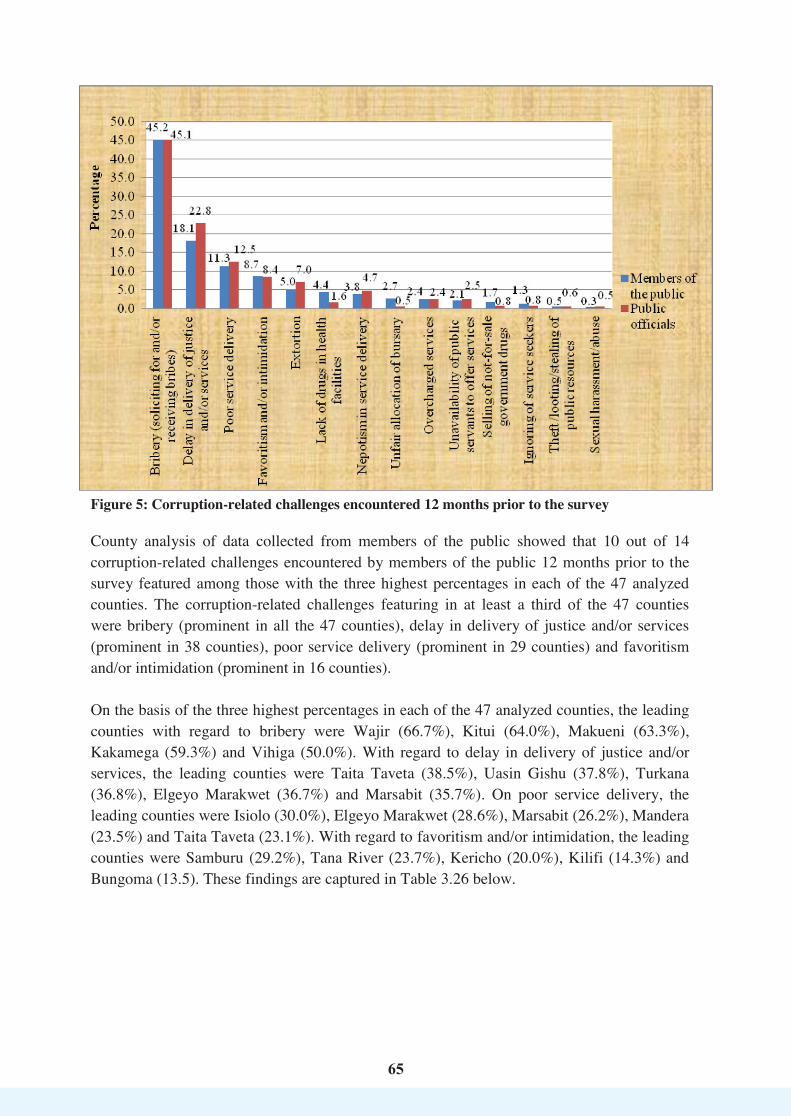
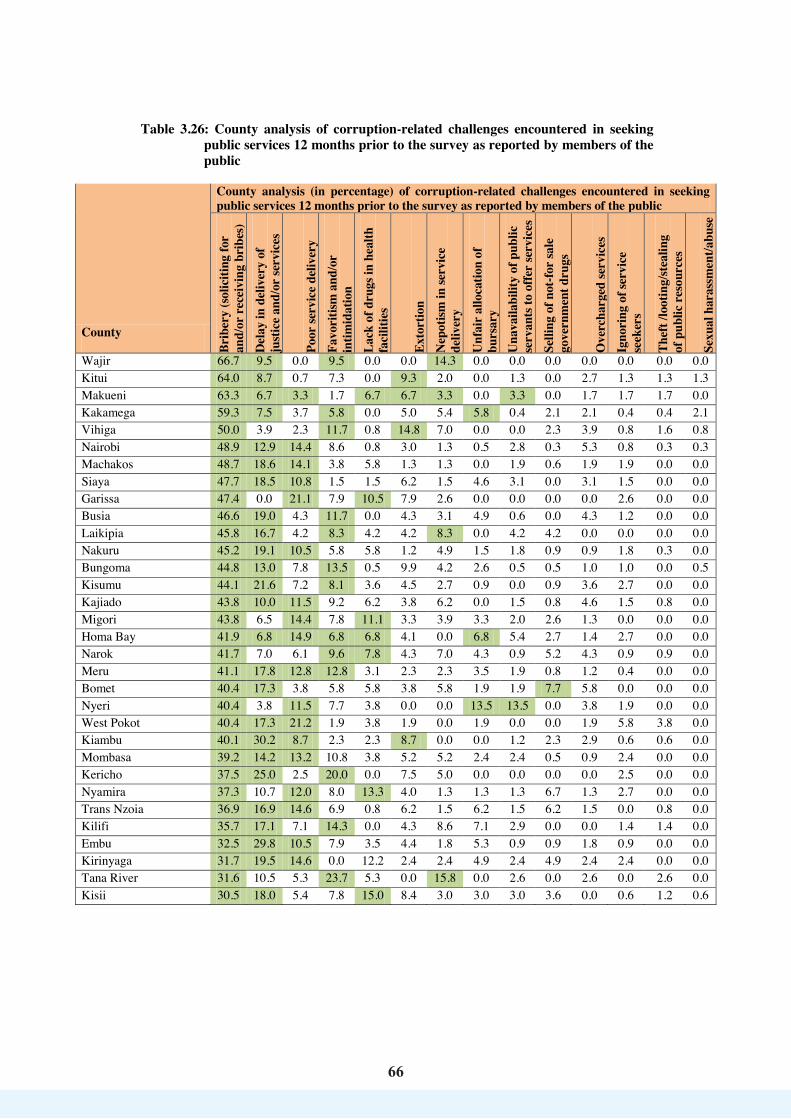
66
66
Table 3.26: County analysis of corruption-related challenges encountered in seeking public services 12 months prior to the survey as reported by members of the public
County
County analysis (in percentage) of corruption-related challenges encountered in seeking public services 12 months prior to the survey as reported by members of the public
Brib
ery
(sol
iciti
ng fo
r an
d/or
rec
eivi
ng b
ribe
s)
Del
ay in
del
iver
y of
ju
stic
e an
d/or
serv
ices
Poor
serv
ice
deliv
ery
Favo
ritis
m a
nd/o
r in
timid
atio
n La
ck o
f dru
gs in
hea
lth
faci
litie
s
Exto
rtio
n N
epot
ism in
serv
ice
deliv
ery
Unf
air
allo
catio
n of
bu
rsar
y U
nava
ilabi
lity
of p
ublic
se
rvan
ts to
offe
r se
rvic
es
Selli
ng o
f not
-for
sale
go
vern
men
t dru
gs
Ove
rcha
rged
serv
ices
Ig
nori
ng o
f ser
vice
se
eker
s
Thef
t /lo
otin
g/st
ealin
g
of p
ublic
res
ourc
es
Sexu
al h
aras
smen
t/abu
se
Wajir 66.7 9.5 0.0 9.5 0.0 0.0 14.3 0.0 0.0 0.0 0.0 0.0 0.0 0.0 Kitui 64.0 8.7 0.7 7.3 0.0 9.3 2.0 0.0 1.3 0.0 2.7 1.3 1.3 1.3 Makueni 63.3 6.7 3.3 1.7 6.7 6.7 3.3 0.0 3.3 0.0 1.7 1.7 1.7 0.0 Kakamega 59.3 7.5 3.7 5.8 0.0 5.0 5.4 5.8 0.4 2.1 2.1 0.4 0.4 2.1 Vihiga 50.0 3.9 2.3 11.7 0.8 14.8 7.0 0.0 0.0 2.3 3.9 0.8 1.6 0.8 Nairobi 48.9 12.9 14.4 8.6 0.8 3.0 1.3 0.5 2.8 0.3 5.3 0.8 0.3 0.3 Machakos 48.7 18.6 14.1 3.8 5.8 1.3 1.3 0.0 1.9 0.6 1.9 1.9 0.0 0.0 Siaya 47.7 18.5 10.8 1.5 1.5 6.2 1.5 4.6 3.1 0.0 3.1 1.5 0.0 0.0 Garissa 47.4 0.0 21.1 7.9 10.5 7.9 2.6 0.0 0.0 0.0 0.0 2.6 0.0 0.0 Busia 46.6 19.0 4.3 11.7 0.0 4.3 3.1 4.9 0.6 0.0 4.3 1.2 0.0 0.0 Laikipia 45.8 16.7 4.2 8.3 4.2 4.2 8.3 0.0 4.2 4.2 0.0 0.0 0.0 0.0 Nakuru 45.2 19.1 10.5 5.8 5.8 1.2 4.9 1.5 1.8 0.9 0.9 1.8 0.3 0.0 Bungoma 44.8 13.0 7.8 13.5 0.5 9.9 4.2 2.6 0.5 0.5 1.0 1.0 0.0 0.5 Kisumu 44.1 21.6 7.2 8.1 3.6 4.5 2.7 0.9 0.0 0.9 3.6 2.7 0.0 0.0 Kajiado 43.8 10.0 11.5 9.2 6.2 3.8 6.2 0.0 1.5 0.8 4.6 1.5 0.8 0.0 Migori 43.8 6.5 14.4 7.8 11.1 3.3 3.9 3.3 2.0 2.6 1.3 0.0 0.0 0.0 Homa Bay 41.9 6.8 14.9 6.8 6.8 4.1 0.0 6.8 5.4 2.7 1.4 2.7 0.0 0.0 Narok 41.7 7.0 6.1 9.6 7.8 4.3 7.0 4.3 0.9 5.2 4.3 0.9 0.9 0.0 Meru 41.1 17.8 12.8 12.8 3.1 2.3 2.3 3.5 1.9 0.8 1.2 0.4 0.0 0.0 Bomet 40.4 17.3 3.8 5.8 5.8 3.8 5.8 1.9 1.9 7.7 5.8 0.0 0.0 0.0 Nyeri 40.4 3.8 11.5 7.7 3.8 0.0 0.0 13.5 13.5 0.0 3.8 1.9 0.0 0.0 West Pokot 40.4 17.3 21.2 1.9 3.8 1.9 0.0 1.9 0.0 0.0 1.9 5.8 3.8 0.0 Kiambu 40.1 30.2 8.7 2.3 2.3 8.7 0.0 0.0 1.2 2.3 2.9 0.6 0.6 0.0 Mombasa 39.2 14.2 13.2 10.8 3.8 5.2 5.2 2.4 2.4 0.5 0.9 2.4 0.0 0.0 Kericho 37.5 25.0 2.5 20.0 0.0 7.5 5.0 0.0 0.0 0.0 0.0 2.5 0.0 0.0 Nyamira 37.3 10.7 12.0 8.0 13.3 4.0 1.3 1.3 1.3 6.7 1.3 2.7 0.0 0.0 Trans Nzoia 36.9 16.9 14.6 6.9 0.8 6.2 1.5 6.2 1.5 6.2 1.5 0.0 0.8 0.0 Kilifi 35.7 17.1 7.1 14.3 0.0 4.3 8.6 7.1 2.9 0.0 0.0 1.4 1.4 0.0 Embu 32.5 29.8 10.5 7.9 3.5 4.4 1.8 5.3 0.9 0.9 1.8 0.9 0.0 0.0 Kirinyaga 31.7 19.5 14.6 0.0 12.2 2.4 2.4 4.9 2.4 4.9 2.4 2.4 0.0 0.0 Tana River 31.6 10.5 5.3 23.7 5.3 0.0 15.8 0.0 2.6 0.0 2.6 0.0 2.6 0.0 Kisii 30.5 18.0 5.4 7.8 15.0 8.4 3.0 3.0 3.0 3.6 0.0 0.6 1.2 0.6
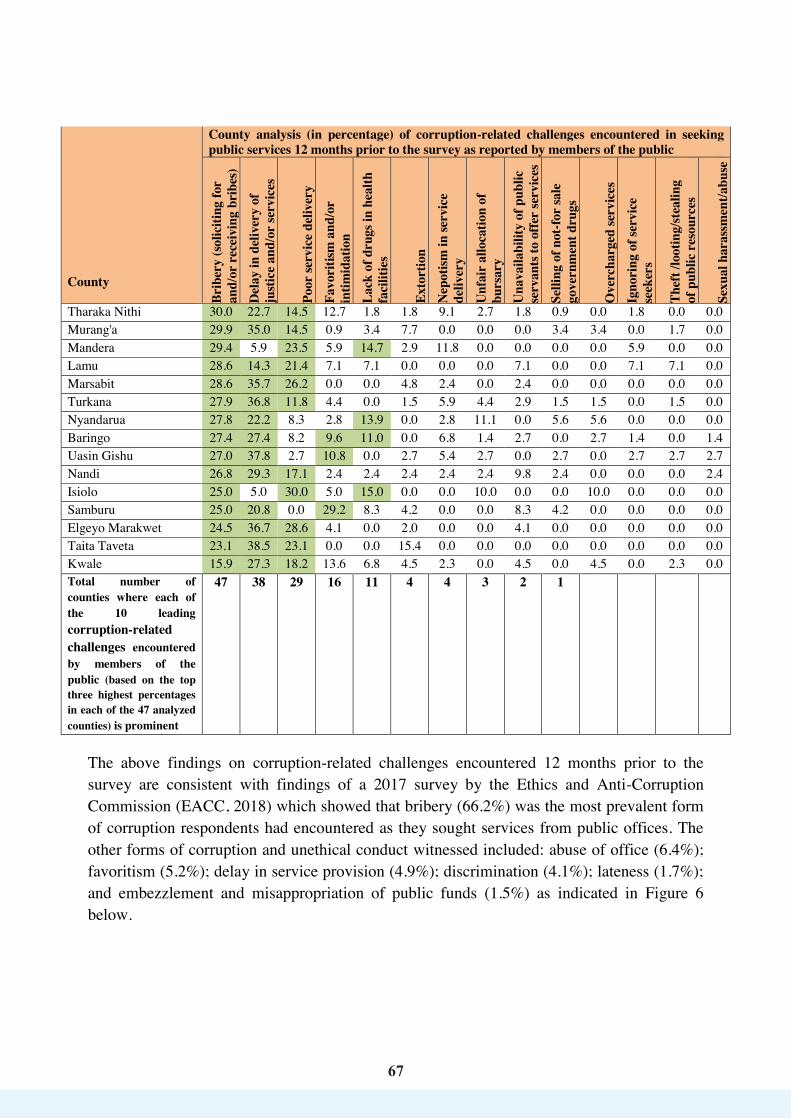
67
67
County
County analysis (in percentage) of corruption-related challenges encountered in seeking public services 12 months prior to the survey as reported by members of the public
Brib
ery
(sol
iciti
ng fo
r an
d/or
rec
eivi
ng b
ribe
s)
Del
ay in
del
iver
y of
ju
stic
e an
d/or
serv
ices
Poor
serv
ice
deliv
ery
Favo
ritis
m a
nd/o
r in
timid
atio
n La
ck o
f dru
gs in
hea
lth
faci
litie
s
Exto
rtio
n N
epot
ism in
serv
ice
deliv
ery
Unf
air
allo
catio
n of
bu
rsar
y U
nava
ilabi
lity
of p
ublic
se
rvan
ts to
offe
r se
rvic
es
Selli
ng o
f not
-for
sale
go
vern
men
t dru
gs
Ove
rcha
rged
serv
ices
Ig
nori
ng o
f ser
vice
se
eker
s
Thef
t /lo
otin
g/st
ealin
g
of p
ublic
res
ourc
es
Sexu
al h
aras
smen
t/abu
se
Tharaka Nithi 30.0 22.7 14.5 12.7 1.8 1.8 9.1 2.7 1.8 0.9 0.0 1.8 0.0 0.0 Murang'a 29.9 35.0 14.5 0.9 3.4 7.7 0.0 0.0 0.0 3.4 3.4 0.0 1.7 0.0 Mandera 29.4 5.9 23.5 5.9 14.7 2.9 11.8 0.0 0.0 0.0 0.0 5.9 0.0 0.0 Lamu 28.6 14.3 21.4 7.1 7.1 0.0 0.0 0.0 7.1 0.0 0.0 7.1 7.1 0.0 Marsabit 28.6 35.7 26.2 0.0 0.0 4.8 2.4 0.0 2.4 0.0 0.0 0.0 0.0 0.0 Turkana 27.9 36.8 11.8 4.4 0.0 1.5 5.9 4.4 2.9 1.5 1.5 0.0 1.5 0.0 Nyandarua 27.8 22.2 8.3 2.8 13.9 0.0 2.8 11.1 0.0 5.6 5.6 0.0 0.0 0.0 Baringo 27.4 27.4 8.2 9.6 11.0 0.0 6.8 1.4 2.7 0.0 2.7 1.4 0.0 1.4 Uasin Gishu 27.0 37.8 2.7 10.8 0.0 2.7 5.4 2.7 0.0 2.7 0.0 2.7 2.7 2.7 Nandi 26.8 29.3 17.1 2.4 2.4 2.4 2.4 2.4 9.8 2.4 0.0 0.0 0.0 2.4 Isiolo 25.0 5.0 30.0 5.0 15.0 0.0 0.0 10.0 0.0 0.0 10.0 0.0 0.0 0.0 Samburu 25.0 20.8 0.0 29.2 8.3 4.2 0.0 0.0 8.3 4.2 0.0 0.0 0.0 0.0 Elgeyo Marakwet 24.5 36.7 28.6 4.1 0.0 2.0 0.0 0.0 4.1 0.0 0.0 0.0 0.0 0.0 Taita Taveta 23.1 38.5 23.1 0.0 0.0 15.4 0.0 0.0 0.0 0.0 0.0 0.0 0.0 0.0 Kwale 15.9 27.3 18.2 13.6 6.8 4.5 2.3 0.0 4.5 0.0 4.5 0.0 2.3 0.0 Total number of counties where each of the 10 leading corruption-related challenges encountered by members of the public (based on the top three highest percentages in each of the 47 analyzed counties) is prominent
47 38 29 16 11 4 4 3 2 1
The above findings on corruption-related challenges encountered 12 months prior to the survey are consistent with findings of a 2017 survey by the Ethics and Anti-Corruption Commission (EACC, 2018) which showed that bribery (66.2%) was the most prevalent form of corruption respondents had encountered as they sought services from public offices. The other forms of corruption and unethical conduct witnessed included: abuse of office (6.4%); favoritism (5.2%); delay in service provision (4.9%); discrimination (4.1%); lateness (1.7%); and embezzlement and misappropriation of public funds (1.5%) as indicated in Figure 6 below.

6868
Figure 6: Forms of Corruption and Unethical conduct encountered in public offices (Source: EACC (2018))
3.4.2 Corruption witnessed in the public service 3.4.2.1 Corruption incidents witnessed in the public service The survey sought to establish corruption incidents witnessed by members of the public and public officials and/or their close family members in the public service in the period 12 months prior to the survey. Nearly three-fifths (58.6%) of the members of the public and about half (49.3%) of the public officials confirmed that they or their close family members had witnessed corruption incidents. Of the 47 counties, 33 counties had more than 50.0% of the members of the public or their close family members witness corruption incidents. The counties where the largest proportions of the members of the public or their close family members had witnessed corruption incidents included Vihiga (83.8%), Siaya (81.0%), Nyandarua (80.3%), Kakamega (79.6%) and Homa Bay (74.8%). As shown in Table 3.27 below, the counties which had significantly smaller proportions of members of the public and/or their close family members who had witnessed corruption in the public service included West Pokot (19.5%), Turkana (30.5%), Mandera (35.3%), Isiolo (36.7%) and Makueni (38.7%). However, in all of these counties, at least 2 out of 10 members of the public and/or their close family members had witnessed corruption in the public service.

6969
Table 3.27: Whether members of the public had witnessed corruption incidents in the public service in the last 12 months by county (N=8,560)
County Response in frequency and percentage Yes No Total
Vihiga 129 (83.8%) 25 (16.2%) 154 (100.0%) Siaya 102 (81.0%) 24 (19.0%) 126 (100.0%) Nyandarua 57 (80.3%) 14 (19.7%) 71 (100.0%) Kakamega 234 (79.6%) 60 (20.4%) 294 (100.0%) Homa Bay 83 (74.8%) 28 (25.2%) 111 (100.0%) Baringo 100 (74.1%) 35 (25.9%) 135 (100.0%) Nakuru 416 (73.9%) 147 (26.1%) 563 (100.0%) Mombasa 231 (73.6%) 83 (26.4%) 314 (100.0%) Kisumu 167 (72.9%) 62 (27.1%) 229 (100.0%) Nyeri 69 (71.9%) 27 (28.1%) 96 (100.0%) Kirinyaga 45 (71.4%) 18 (28.6%) 63 (100.0%) Laikipia 39 (68.4%) 18 (31.6%) 57 (100.0%) Kilifi 74 (66.7%) 37 (33.3%) 111 (100.0%) Tana River 43 (65.2%) 23 (34.8%) 66 (100.0%) Bungoma 202 (64.5%) 111 (35.5%) 313 (100.0%) Busia 164 (62.4%) 99 (37.6%) 263 (100.0%) Kwale 51 (62.2%) 31 (37.8%) 82 (100.0%) Kajiado 149 (61.1%) 95 (38.9%) 244 (100.0%) Nairobi 537 (61.0%) 343 (39.0%) 880 (100.0%) Tharaka Nithi 91 (59.9%) 61 (40.1%) 152 (100.0%) Wajir 25 (59.5%) 17 (40.5%) 42 (100.0%) Embu 116 (58.3%) 83 (41.7%) 199 (100.0%) Kitui 151 (58.1%) 109 (41.9%) 260 (100.0%) Lamu 21 (56.8%) 16 (43.2%) 37 (100.0%) Taita Taveta 18 (56.3%) 14 (43.8%) 32 (100.0%) Meru 217 (56.1%) 170 (43.9%) 387 (100.0%) Kericho 57 (55.9%) 45 (44.1%) 102 (100.0%) Samburu 20 (55.6%) 16 (44.4%) 36 (100.0%) Uasin Gishu 40 (54.1%) 34 (45.9%) 74 (100.0%) Marsabit 42 (53.8%) 36 (46.2%) 78 (100.0%) Machakos 153 (53.7%) 132 (46.3%) 285 (100.0%) Garissa 42 (52.5%) 38 (47.5%) 80 (100.0%) Kisii 134 (51.1%) 128 (48.9%) 262 (100.0%) Migori 145 (49.7%) 147 (50.3%) 292 (100.0%) Kiambu 127 (48.8%) 133 (51.2%) 260 (100.0%) Narok 106 (48.4%) 113 (51.6%) 219 (100.0%) Trans Nzoia 125 (47.7%) 137 (52.3%) 262 (100.0%) Bomet 69 (45.7%) 82 (54.3%) 151 (100.0%) Elgeyo Marakwet 55 (45.1%) 67 (54.9%) 122 (100.0%) Nyamira 68 (44.4%) 85 (55.6%) 153 (100.0%) Murang'a 87 (43.5%) 113 (56.5%) 200 (100.0%) Nandi 42 (40.0%) 63 (60.0%) 105 (100.0%) Makueni 36 (38.7%) 57 (61.3%) 93 (100.0%) Isiolo 11 (36.7%) 19 (63.3%) 30 (100.0%) Mandera 30 (35.3%) 55 (64.7%) 85 (100.0%) Turkana 58 (30.5%) 132 (69.5%) 190 (100.0%) West Pokot 39 (19.5%) 161 (80.5%) 200 (100.0%) Total 5,017 (58.6%) 3,543 (41.4%) 8,560 (100.0%)
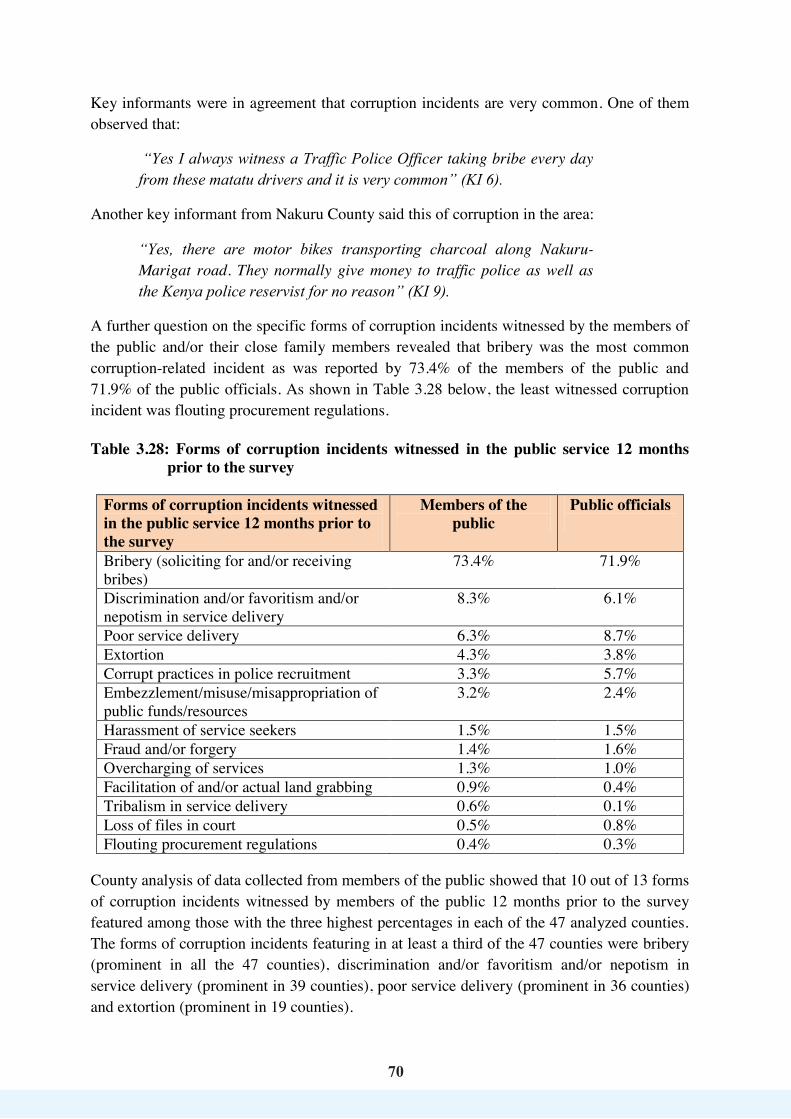
70
70
Key informants were in agreement that corruption incidents are very common. One of them observed that:
“Yes I always witness a Traffic Police Officer taking bribe every day from these matatu drivers and it is very common” (KI 6).
Another key informant from Nakuru County said this of corruption in the area:
“Yes, there are motor bikes transporting charcoal along Nakuru-Marigat road. They normally give money to traffic police as well as the Kenya police reservist for no reason” (KI 9).
A further question on the specific forms of corruption incidents witnessed by the members of the public and/or their close family members revealed that bribery was the most common corruption-related incident as was reported by 73.4% of the members of the public and 71.9% of the public officials. As shown in Table 3.28 below, the least witnessed corruption incident was flouting procurement regulations. Table 3.28: Forms of corruption incidents witnessed in the public service 12 months
prior to the survey
Forms of corruption incidents witnessed in the public service 12 months prior to the survey
Members of the public
Public officials
Bribery (soliciting for and/or receiving bribes)
73.4% 71.9%
Discrimination and/or favoritism and/or nepotism in service delivery
8.3% 6.1%
Poor service delivery 6.3% 8.7% Extortion 4.3% 3.8% Corrupt practices in police recruitment 3.3% 5.7% Embezzlement/misuse/misappropriation of public funds/resources
3.2% 2.4%
Harassment of service seekers 1.5% 1.5% Fraud and/or forgery 1.4% 1.6% Overcharging of services 1.3% 1.0% Facilitation of and/or actual land grabbing 0.9% 0.4% Tribalism in service delivery 0.6% 0.1% Loss of files in court 0.5% 0.8% Flouting procurement regulations 0.4% 0.3%
County analysis of data collected from members of the public showed that 10 out of 13 forms of corruption incidents witnessed by members of the public 12 months prior to the survey featured among those with the three highest percentages in each of the 47 analyzed counties. The forms of corruption incidents featuring in at least a third of the 47 counties were bribery (prominent in all the 47 counties), discrimination and/or favoritism and/or nepotism in service delivery (prominent in 39 counties), poor service delivery (prominent in 36 counties) and extortion (prominent in 19 counties).

71
71
On the basis of the three highest percentages in each of the 47 analyzed counties, the leading counties with regard to bribery included Nairobi (85.8%), Samburu (80.0%), Nyandarua (79.7%), Nandi (77.5%) and Nakuru (76.9%). With regard to discrimination and/or favoritism and/or nepotism in service delivery, the leading counties were Trans Nzoia (19.5%), Tharaka Nithi (17.9%), Tana River (17.1%), Marsabit (16.3%) and Bungoma (14.6%). On poor service delivery, the leading counties were Taita Taveta (36.8%), Tana River (22.0%), Kilifi (17.6%), Lamu (16.7%) and Machakos (16.0%). With regard to extortion, the leading counties were Taita Taveta (15.8%), Trans Nzoia (13.0%), Wajir (11.5%), Vihiga (11.0%) and Makueni (9.4%). These findings are presented in Table 3.29 below. Table 3.29: County analysis of forms of corruption incidents witnessed in the public
service by members of the public 12 months prior to the survey
County
County analysis (in percentage) of forms of corruption incidents witnessed in the public service by members of the public 12 months prior to the survey
Brib
ery
(sol
iciti
ng fo
r an
d/or
re
ceiv
ing
brib
es)
Disc
rim
inat
ion
and/
or
favo
ritis
m a
nd/o
r ne
potis
m
in se
rvic
e de
liver
y
Poor
serv
ice
deliv
ery
Exto
rtio
n Em
bezz
lem
ent/m
isuse
/ m
isapp
ropr
iatio
n of
pub
lic
fund
s/res
ourc
es
Cor
rupt
pra
ctic
es in
pol
ice
recr
uitm
ent
Frau
d an
d/or
forg
ery
Land
gra
bbin
g
Har
assm
ent o
f ser
vice
seek
ers
Ove
rcha
rgin
g of
serv
ices
Trib
alism
in se
rvic
e de
liver
y
Loss
of f
iles i
n co
urt
Flou
ting
proc
urem
ent
regu
latio
ns
Nairobi 85.8 2.8 2.8 1.3 0.8 2.5 0.2 0.9 1.1 1.1 0.2 0.2 0.2 Samburu 80.0 10.0 5.0 5.0 0.0 0.0 0.0 0.0 0.0 0.0 0.0 0.0 0.0 Nyandarua 79.7 3.4 3.4 0.0 6.8 1.7 0.0 1.7 1.7 0.0 0.0 1.7 0.0 Nandi 77.5 10.0 0.0 2.5 5.0 0.0 2.5 0.0 0.0 2.5 0.0 0.0 0.0 Nakuru 76.9 8.0 4.3 1.4 3.2 2.5 0.5 1.4 0.7 0.0 0.7 0.0 0.5 Uasin Gishu 76.3 15.8 5.3 0.0 0.0 2.6 0.0 0.0 0.0 0.0 0.0 0.0 0.0 Laikipia 76.2 7.1 4.8 7.1 2.4 0.0 0.0 0.0 0.0 0.0 2.4 0.0 0.0 Bomet 75.4 7.2 2.9 0.0 2.9 4.3 2.9 0.0 0.0 2.9 0.0 0.0 1.4 Kajiado 75.4 6.3 4.9 2.1 1.4 2.1 1.4 0.0 2.8 1.4 0.0 0.7 0.0 Embu 75.0 4.0 6.5 6.5 2.4 2.4 0.0 0.0 0.0 0.8 0.0 1.6 0.0 Kirinyaga 74.5 8.5 6.4 2.1 0.0 4.3 4.3 0.0 0.0 0.0 0.0 0.0 0.0 Migori 74.0 5.2 4.5 4.5 3.9 3.9 1.3 0.0 0.6 0.6 0.6 0.0 0.0 Kisumu 73.9 5.6 5.6 4.4 3.3 2.8 0.6 0.6 0.0 2.2 0.6 0.6 0.0 Nyamira 73.1 9.0 3.0 3.0 4.5 3.0 0.0 0.0 3.0 1.5 0.0 0.0 0.0 Mombasa 73.0 6.1 4.9 4.1 1.2 2.5 1.6 2.0 2.9 0.8 0.8 0.0 0.0 Isiolo 72.7 0.0 9.1 0.0 0.0 9.1 9.1 0.0 0.0 0.0 0.0 0.0 0.0 Elgeyo Marakwet 72.2 7.4 0.0 1.9 7.4 9.3 0.0 0.0 1.9 0.0 0.0 0.0 0.0 Kericho 72.1 8.2 6.6 4.9 0.0 3.3 1.6 0.0 0.0 1.6 0.0 0.0 1.6 Meru 72.1 9.3 3.6 2.4 3.2 2.0 1.6 1.2 0.0 0.8 1.2 2.4 0.0 Nyeri 71.0 7.2 10.1 0.0 1.4 5.8 0.0 1.4 0.0 0.0 0.0 1.4 0.0 Narok 70.5 13.3 1.9 1.0 1.0 1.0 8.6 1.9 1.0 0.0 0.0 0.0 0.0 Kakamega 70.2 5.7 6.5 4.5 2.9 1.2 0.4 0.8 2.0 2.9 0.4 0.8 0.4

72
72
County
County analysis (in percentage) of forms of corruption incidents witnessed in the public service by members of the public 12 months prior to the survey
Brib
ery
(sol
iciti
ng fo
r an
d/or
re
ceiv
ing
brib
es)
Disc
rim
inat
ion
and/
or
favo
ritis
m a
nd/o
r ne
potis
m
in se
rvic
e de
liver
y
Poor
serv
ice
deliv
ery
Exto
rtio
n Em
bezz
lem
ent/m
isuse
/ m
isapp
ropr
iatio
n of
pub
lic
fund
s/res
ourc
es
Cor
rupt
pra
ctic
es in
pol
ice
recr
uitm
ent
Frau
d an
d/or
forg
ery
Land
gra
bbin
g
Har
assm
ent o
f ser
vice
seek
ers
Ove
rcha
rgin
g of
serv
ices
Trib
alism
in se
rvic
e de
liver
y
Loss
of f
iles i
n co
urt
Flou
ting
proc
urem
ent
regu
latio
ns
Kisii 70.1 4.9 5.6 7.6 4.9 2.8 0.7 0.0 2.1 0.7 0.0 0.7 0.0 Siaya 69.5 1.9 4.8 2.9 6.7 3.8 0.0 1.0 1.0 2.9 1.9 1.0 1.0 Garissa 69.4 11.1 5.6 5.6 0.0 2.8 0.0 0.0 0.0 0.0 0.0 0.0 2.8 Kwale 69.2 11.5 3.8 3.8 3.8 1.9 0.0 3.8 1.9 0.0 0.0 0.0 0.0 Wajir 69.2 11.5 3.8 11.5 0.0 3.8 0.0 0.0 0.0 0.0 0.0 0.0 0.0 Vihiga 69.1 3.7 2.9 11.0 0.7 4.4 1.5 0.7 0.7 2.2 1.5 1.5 0.0 Baringo 68.6 7.8 3.9 2.9 3.9 2.0 2.9 1.0 2.9 1.0 2.0 0.0 0.0 Murang'a 68.1 7.7 14.3 2.2 5.5 0.0 0.0 0.0 0.0 2.2 0.0 0.0 0.0 Kitui 67.9 11.9 0.6 7.7 1.2 3.6 1.8 0.6 1.8 1.8 0.6 0.0 0.0 Homa Bay 65.9 5.9 3.5 2.4 14.1 3.5 1.2 0.0 2.4 0.0 0.0 1.2 0.0 Mandera 65.5 6.9 3.4 6.9 6.9 3.4 3.4 0.0 0.0 0.0 0.0 0.0 0.0 Machakos 63.9 4.2 16.0 0.7 4.2 6.3 1.4 1.4 0.7 0.7 0.0 0.0 0.0 Tharaka Nithi 60.7 17.9 2.7 0.9 3.6 6.3 2.7 0.9 0.9 0.9 1.8 0.0 0.9 Kiambu 57.1 6.4 15.0 7.9 2.1 0.7 2.1 0.0 3.6 1.4 0.7 1.4 0.7 Bungoma 56.3 14.6 6.8 6.8 2.1 5.7 1.0 0.0 2.1 2.1 0.0 1.0 1.0 Makueni 56.3 9.4 9.4 9.4 3.1 3.1 0.0 3.1 0.0 3.1 0.0 0.0 0.0 Busia 55.6 13.0 7.1 7.1 4.1 1.2 1.8 1.8 4.7 1.2 0.6 0.0 1.8 West Pokot 54.1 2.7 5.4 8.1 8.1 8.1 0.0 2.7 10.8 0.0 0.0 0.0 0.0 Marsabit 53.5 16.3 9.3 0.0 4.7 4.7 4.7 0.0 2.3 2.3 0.0 0.0 2.3 Turkana 50.0 7.7 7.7 3.8 9.6 7.7 3.8 0.0 1.9 5.8 1.9 0.0 0.0 Trans Nzoia 46.3 19.5 12.2 13.0 1.6 2.4 2.4 0.0 1.6 0.8 0.0 0.0 0.0 Lamu 44.4 11.1 16.7 0.0 11.1 11.1 0.0 5.6 0.0 0.0 0.0 0.0 0.0 Kilifi 40.5 9.5 17.6 6.8 5.4 6.8 0.0 5.4 2.7 4.1 1.4 0.0 0.0 Tana River 34.1 17.1 22.0 4.9 2.4 4.9 2.4 0.0 0.0 0.0 9.8 0.0 2.4 Taita Taveta 21.1 5.3 36.8 15.8 0.0 5.3 5.3 0.0 0.0 5.3 0.0 0.0 5.3 Total number of counties where each of the 10 leading forms of corruption incidents witnessed by members of the public (based on the top three highest percentages in each of the 47 analyzed counties) is prominent
47 39 36 19 13 12 3 2 1 1
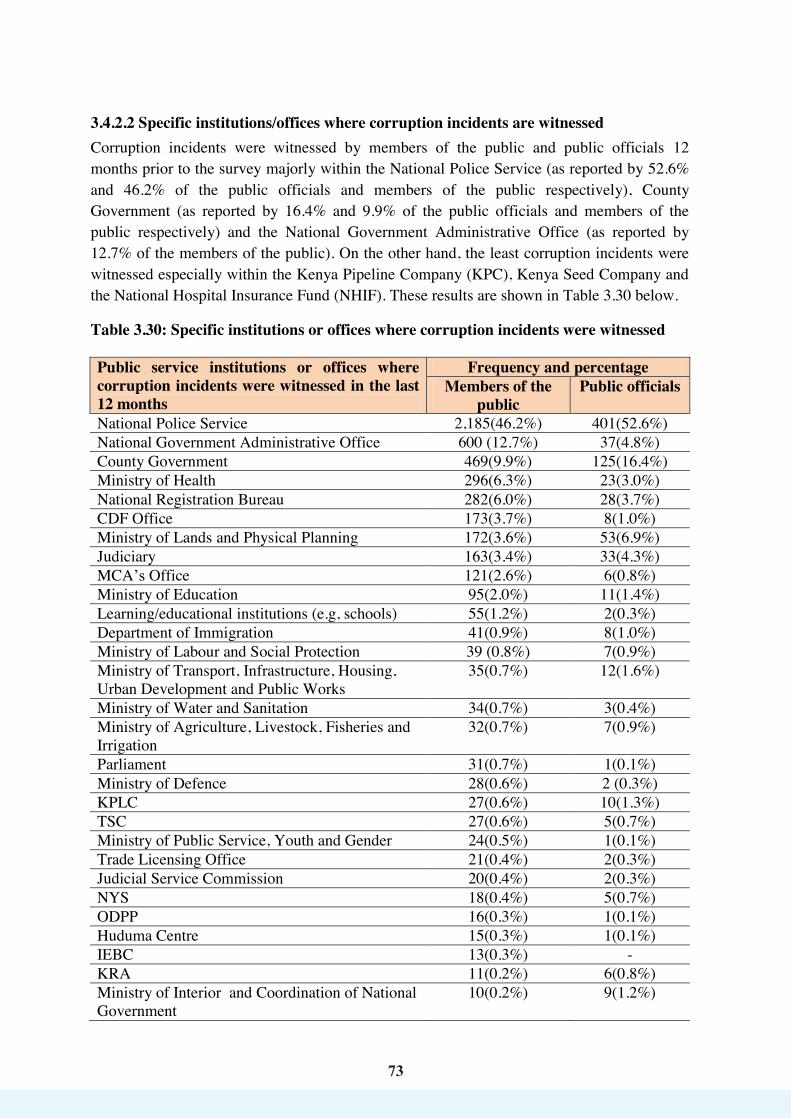
73
73
3.4.2.2 Specific institutions/offices where corruption incidents are witnessed Corruption incidents were witnessed by members of the public and public officials 12 months prior to the survey majorly within the National Police Service (as reported by 52.6% and 46.2% of the public officials and members of the public respectively), County Government (as reported by 16.4% and 9.9% of the public officials and members of the public respectively) and the National Government Administrative Office (as reported by 12.7% of the members of the public). On the other hand, the least corruption incidents were witnessed especially within the Kenya Pipeline Company (KPC), Kenya Seed Company and the National Hospital Insurance Fund (NHIF). These results are shown in Table 3.30 below.
Table 3.30: Specific institutions or offices where corruption incidents were witnessed Public service institutions or offices where corruption incidents were witnessed in the last 12 months
Frequency and percentage Members of the
public Public officials
National Police Service 2,185(46.2%) 401(52.6%) National Government Administrative Office 600 (12.7%) 37(4.8%) County Government 469(9.9%) 125(16.4%) Ministry of Health 296(6.3%) 23(3.0%) National Registration Bureau 282(6.0%) 28(3.7%) CDF Office 173(3.7%) 8(1.0%) Ministry of Lands and Physical Planning 172(3.6%) 53(6.9%) Judiciary 163(3.4%) 33(4.3%) MCA’s Office 121(2.6%) 6(0.8%) Ministry of Education 95(2.0%) 11(1.4%) Learning/educational institutions (e.g, schools) 55(1.2%) 2(0.3%) Department of Immigration 41(0.9%) 8(1.0%) Ministry of Labour and Social Protection 39 (0.8%) 7(0.9%) Ministry of Transport, Infrastructure, Housing, Urban Development and Public Works
35(0.7%) 12(1.6%)
Ministry of Water and Sanitation 34(0.7%) 3(0.4%) Ministry of Agriculture, Livestock, Fisheries and Irrigation
32(0.7%) 7(0.9%)
Parliament 31(0.7%) 1(0.1%) Ministry of Defence 28(0.6%) 2 (0.3%) KPLC 27(0.6%) 10(1.3%) TSC 27(0.6%) 5(0.7%) Ministry of Public Service, Youth and Gender 24(0.5%) 1(0.1%) Trade Licensing Office 21(0.4%) 2(0.3%) Judicial Service Commission 20(0.4%) 2(0.3%) NYS 18(0.4%) 5(0.7%) ODPP 16(0.3%) 1(0.1%) Huduma Centre 15(0.3%) 1(0.1%) IEBC 13(0.3%) - KRA 11(0.2%) 6(0.8%) Ministry of Interior and Coordination of National Government
10(0.2%) 9(1.2%)
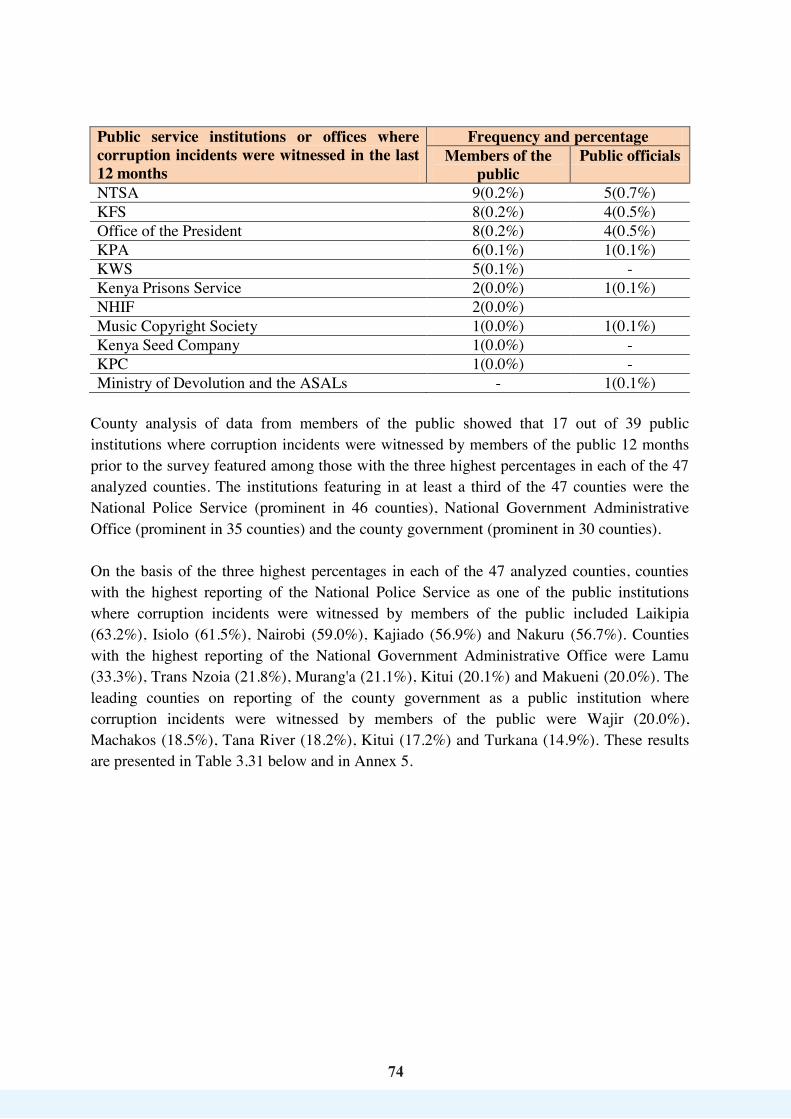
7474
Public service institutions or offices where corruption incidents were witnessed in the last 12 months
Frequency and percentage Members of the
public Public officials
NTSA 9(0.2%) 5(0.7%) KFS 8(0.2%) 4(0.5%) Office of the President 8(0.2%) 4(0.5%) KPA 6(0.1%) 1(0.1%) KWS 5(0.1%) - Kenya Prisons Service 2(0.0%) 1(0.1%) NHIF 2(0.0%) Music Copyright Society 1(0.0%) 1(0.1%) Kenya Seed Company 1(0.0%) - KPC 1(0.0%) - Ministry of Devolution and the ASALs - 1(0.1%)
County analysis of data from members of the public showed that 17 out of 39 public institutions where corruption incidents were witnessed by members of the public 12 months prior to the survey featured among those with the three highest percentages in each of the 47 analyzed counties. The institutions featuring in at least a third of the 47 counties were the National Police Service (prominent in 46 counties), National Government Administrative Office (prominent in 35 counties) and the county government (prominent in 30 counties). On the basis of the three highest percentages in each of the 47 analyzed counties, counties with the highest reporting of the National Police Service as one of the public institutions where corruption incidents were witnessed by members of the public included Laikipia (63.2%), Isiolo (61.5%), Nairobi (59.0%), Kajiado (56.9%) and Nakuru (56.7%). Counties with the highest reporting of the National Government Administrative Office were Lamu (33.3%), Trans Nzoia (21.8%), Murang'a (21.1%), Kitui (20.1%) and Makueni (20.0%). The leading counties on reporting of the county government as a public institution where corruption incidents were witnessed by members of the public were Wajir (20.0%), Machakos (18.5%), Tana River (18.2%), Kitui (17.2%) and Turkana (14.9%). These results are presented in Table 3.31 below and in Annex 5.
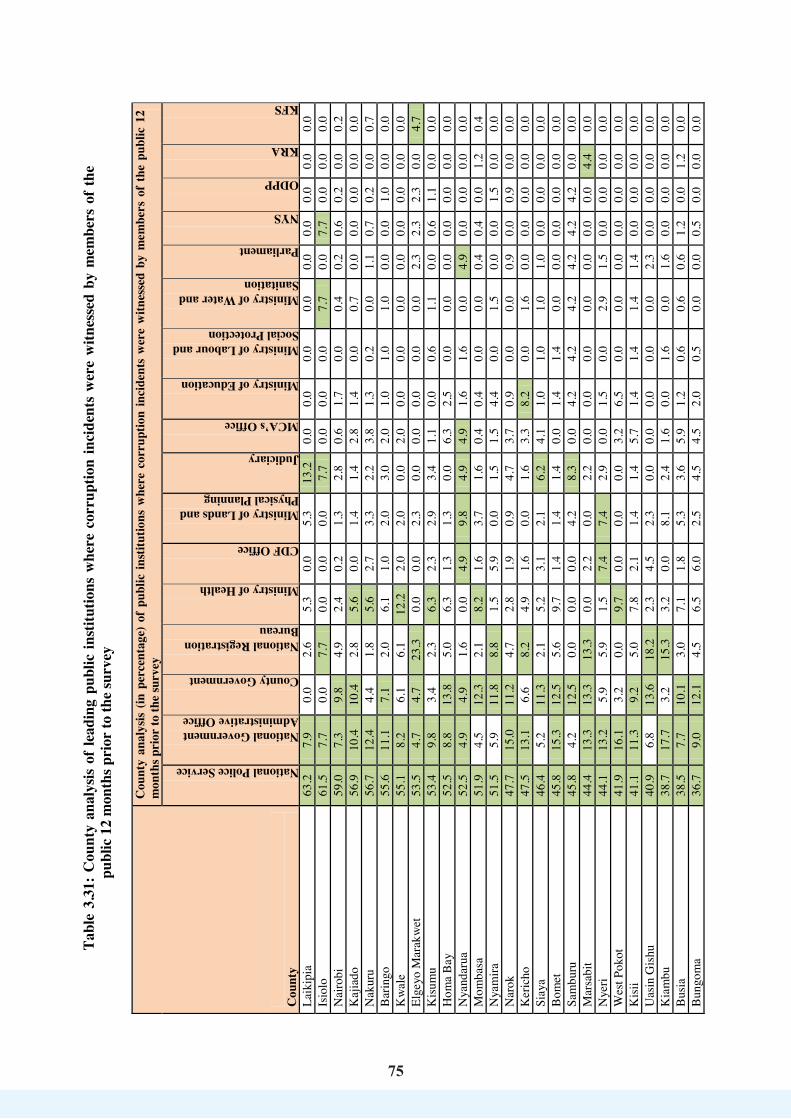
75
75
Tabl
e 3.
31:
Cou
nty
anal
ysis
of le
adin
g pu
blic
inst
itutio
ns w
here
cor
rupt
ion
inci
dent
s w
ere
witn
esse
d by
mem
bers
of
the
publ
ic 1
2 m
onth
s pri
or to
the
surv
ey
Cou
nty
Cou
nty
anal
ysis
(in p
erce
ntag
e) o
f pu
blic
inst
itutio
ns w
here
cor
rupt
ion
inci
dent
s w
ere
witn
esse
d by
mem
bers
of
the
publ
ic 1
2 m
onth
s pri
or to
the
surv
ey
National Police Service
National Government Administrative Office
County Government
National Registration Bureau
Ministry of Health
CDF Office
Ministry of Lands and Physical Planning
Judiciary
MCA’s Office
Ministry of Education
Ministry of Labour and Social Protection
Ministry of Water and Sanitation
Parliament
NYS
ODPP
KRA
KFS
Laik
ipia
63
.2
7.9
0.0
2.6
5.3
0.0
5.3
13.2
0.
0 0.
0 0.
0 0.
0 0.
0 0.
0 0.
0 0.
0 0.
0 Is
iolo
61
.5
7.7
0.0
7.7
0.0
0.0
0.0
7.7
0.0
0.0
0.0
7.7
0.0
7.7
0.0
0.0
0.0
Nai
robi
59
.0
7.3
9.8
4.9
2.4
0.2
1.3
2.8
0.6
1.7
0.0
0.4
0.2
0.6
0.2
0.0
0.2
Kaj
iado
56
.9
10.4
10
.4
2.8
5.6
0.0
1.4
1.4
2.8
1.4
0.0
0.7
0.0
0.0
0.0
0.0
0.0
Nak
uru
56.7
12
.4
4.4
1.8
5.6
2.7
3.3
2.2
3.8
1.3
0.2
0.0
1.1
0.7
0.2
0.0
0.7
Bar
ingo
55
.6
11.1
7.
1 2.
0 6.
1 1.
0 2.
0 3.
0 2.
0 1.
0 1.
0 1.
0 0.
0 0.
0 1.
0 0.
0 0.
0 K
wal
e 55
.1
8.2
6.1
6.1
12.2
2.
0 2.
0 0.
0 2.
0 0.
0 0.
0 0.
0 0.
0 0.
0 0.
0 0.
0 0.
0 El
geyo
Mar
akw
et
53.5
4.
7 4.
7 23
.3
0.0
0.0
2.3
0.0
0.0
0.0
0.0
0.0
2.3
2.3
2.3
0.0
4.7
Kis
umu
53.4
9.
8 3.
4 2.
3 6.
3 2.
3 2.
9 3.
4 1.
1 0.
0 0.
6 1.
1 0.
0 0.
6 1.
1 0.
0 0.
0 H
oma
Bay
52
.5
8.8
13.8
5.
0 6.
3 1.
3 1.
3 0.
0 6.
3 2.
5 0.
0 0.
0 0.
0 0.
0 0.
0 0.
0 0.
0 N
yand
arua
52
.5
4.9
4.9
1.6
0.0
4.9
9.8
4.9
4.9
1.6
1.6
0.0
4.9
0.0
0.0
0.0
0.0
Mom
basa
51
.9
4.5
12.3
2.
1 8.
2 1.
6 3.
7 1.
6 0.
4 0.
4 0.
0 0.
0 0.
4 0.
4 0.
0 1.
2 0.
4 N
yam
ira
51.5
5.
9 11
.8
8.8
1.5
5.9
0.0
1.5
1.5
4.4
0.0
1.5
0.0
0.0
1.5
0.0
0.0
Nar
ok
47.7
15
.0
11.2
4.
7 2.
8 1.
9 0.
9 4.
7 3.
7 0.
9 0.
0 0.
0 0.
9 0.
0 0.
9 0.
0 0.
0 K
eric
ho
47.5
13
.1
6.6
8.2
4.9
1.6
0.0
1.6
3.3
8.2
0.0
1.6
0.0
0.0
0.0
0.0
0.0
Siay
a 46
.4
5.2
11.3
2.
1 5.
2 3.
1 2.
1 6.
2 4.
1 1.
0 1.
0 1.
0 1.
0 0.
0 0.
0 0.
0 0.
0 B
omet
45
.8
15.3
12
.5
5.6
9.7
1.4
1.4
1.4
0.0
1.4
1.4
0.0
0.0
0.0
0.0
0.0
0.0
Sam
buru
45
.8
4.2
12.5
0.
0 0.
0 0.
0 4.
2 8.
3 0.
0 4.
2 4.
2 4.
2 4.
2 4.
2 4.
2 0.
0 0.
0 M
arsa
bit
44.4
13
.3
13.3
13
.3
0.0
2.2
0.0
2.2
0.0
0.0
0.0
0.0
0.0
0.0
0.0
4.4
0.0
Nye
ri 44
.1
13.2
5.
9 5.
9 1.
5 7.
4 7.
4 2.
9 0.
0 1.
5 0.
0 2.
9 1.
5 0.
0 0.
0 0.
0 0.
0 W
est P
okot
41
.9
16.1
3.
2 0.
0 9.
7 0.
0 0.
0 0.
0 3.
2 6.
5 0.
0 0.
0 0.
0 0.
0 0.
0 0.
0 0.
0 K
isii
41.1
11
.3
9.2
5.0
7.8
2.1
1.4
1.4
5.7
1.4
1.4
1.4
1.4
0.0
0.0
0.0
0.0
Uas
in G
ishu
40
.9
6.8
13.6
18
.2
2.3
4.5
2.3
0.0
0.0
0.0
0.0
0.0
2.3
0.0
0.0
0.0
0.0
Kia
mbu
38
.7
17.7
3.
2 15
.3
3.2
0.0
8.1
2.4
1.6
0.0
1.6
0.0
1.6
0.0
0.0
0.0
0.0
Bus
ia
38.5
7.
7 10
.1
3.0
7.1
1.8
5.3
3.6
5.9
1.2
0.6
0.6
0.6
1.2
0.0
1.2
0.0
Bun
gom
a 36
.7
9.0
12.1
4.
5 6.
5 6.
0 2.
5 4.
5 4.
5 2.
0 0.
5 0.
0 0.
0 0.
5 0.
0 0.
0 0.
0
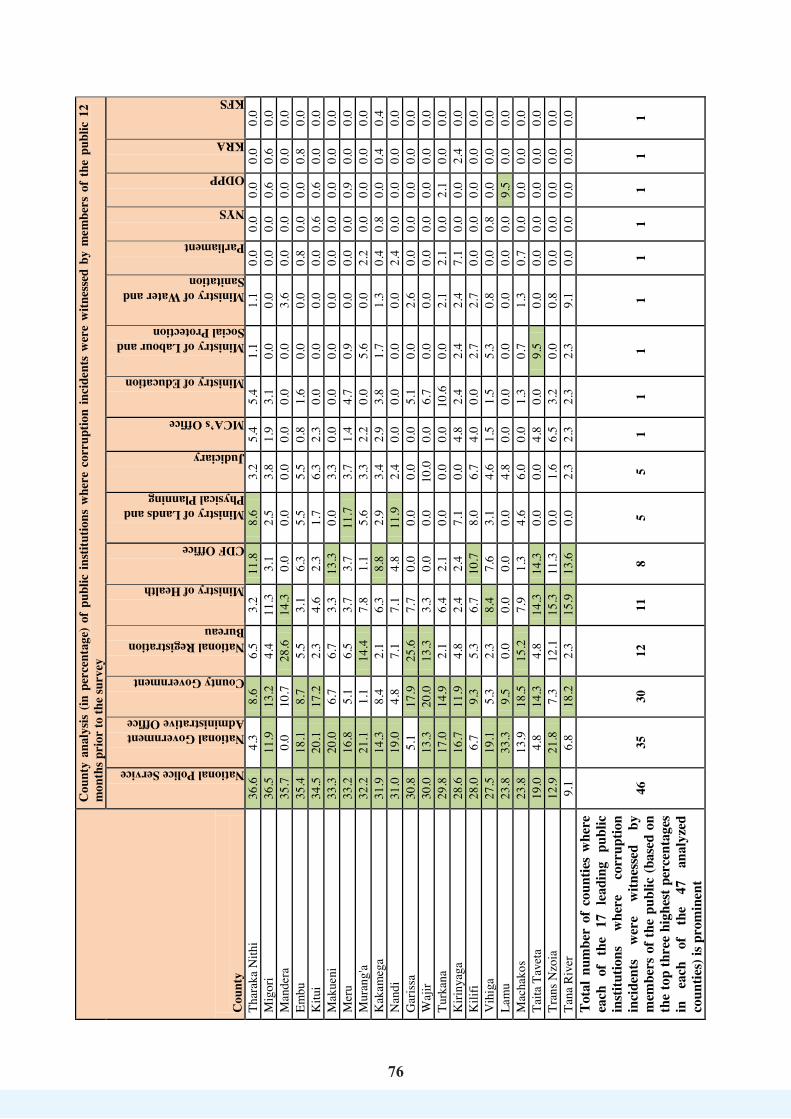
76
76
Cou
nty
Cou
nty
anal
ysis
(in p
erce
ntag
e) o
f pu
blic
inst
itutio
ns w
here
cor
rupt
ion
inci
dent
s w
ere
witn
esse
d by
mem
bers
of
the
publ
ic 1
2 m
onth
s pri
or to
the
surv
ey
National Police Service
National Government Administrative Office
County Government
National Registration Bureau
Ministry of Health
CDF Office
Ministry of Lands and Physical Planning
Judiciary
MCA’s Office
Ministry of Education
Ministry of Labour and Social Protection
Ministry of Water and Sanitation
Parliament
NYS
ODPP
KRA
KFS
Thar
aka
Nith
i 36
.6
4.3
8.6
6.5
3.2
11.8
8.
6 3.
2 5.
4 5.
4 1.
1 1.
1 0.
0 0.
0 0.
0 0.
0 0.
0 M
igor
i 36
.5
11.9
13
.2
4.4
11.3
3.
1 2.
5 3.
8 1.
9 3.
1 0.
0 0.
0 0.
0 0.
0 0.
6 0.
6 0.
0 M
ande
ra
35.7
0.
0 10
.7
28.6
14
.3
0.0
0.0
0.0
0.0
0.0
0.0
3.6
0.0
0.0
0.0
0.0
0.0
Embu
35
.4
18.1
8.
7 5.
5 3.
1 6.
3 5.
5 5.
5 0.
8 1.
6 0.
0 0.
0 0.
8 0.
0 0.
0 0.
8 0.
0 K
itui
34.5
20
.1
17.2
2.
3 4.
6 2.
3 1.
7 6.
3 2.
3 0.
0 0.
0 0.
0 0.
0 0.
6 0.
6 0.
0 0.
0 M
akue
ni
33.3
20
.0
6.7
6.7
3.3
13.3
0.
0 3.
3 0.
0 0.
0 0.
0 0.
0 0.
0 0.
0 0.
0 0.
0 0.
0 M
eru
33.2
16
.8
5.1
6.5
3.7
3.7
11.7
3.
7 1.
4 4.
7 0.
9 0.
0 0.
0 0.
0 0.
9 0.
0 0.
0 M
uran
g'a
32.2
21
.1
1.1
14.4
7.
8 1.
1 5.
6 3.
3 2.
2 0.
0 5.
6 0.
0 2.
2 0.
0 0.
0 0.
0 0.
0 K
akam
ega
31.9
14
.3
8.4
2.1
6.3
8.8
2.9
3.4
2.9
3.8
1.7
1.3
0.4
0.8
0.0
0.4
0.4
Nan
di
31.0
19
.0
4.8
7.1
7.1
4.8
11.9
2.
4 0.
0 0.
0 0.
0 0.
0 2.
4 0.
0 0.
0 0.
0 0.
0 G
aris
sa
30.8
5.
1 17
.9
25.6
7.
7 0.
0 0.
0 0.
0 0.
0 5.
1 0.
0 2.
6 0.
0 0.
0 0.
0 0.
0 0.
0 W
ajir
30.0
13
.3
20.0
13
.3
3.3
0.0
0.0
10.0
0.
0 6.
7 0.
0 0.
0 0.
0 0.
0 0.
0 0.
0 0.
0 Tu
rkan
a 29
.8
17.0
14
.9
2.1
6.4
2.1
0.0
0.0
0.0
10.6
0.
0 2.
1 2.
1 0.
0 2.
1 0.
0 0.
0 K
iriny
aga
28.6
16
.7
11.9
4.
8 2.
4 2.
4 7.
1 0.
0 4.
8 2.
4 2.
4 2.
4 7.
1 0.
0 0.
0 2.
4 0.
0 K
ilifi
28.0
6.
7 9.
3 5.
3 6.
7 10
.7
8.0
6.7
4.0
0.0
2.7
2.7
0.0
0.0
0.0
0.0
0.0
Vih
iga
27.5
19
.1
5.3
2.3
8.4
7.6
3.1
4.6
1.5
1.5
5.3
0.8
0.0
0.8
0.0
0.0
0.0
Lam
u 23
.8
33.3
9.
5 0.
0 0.
0 0.
0 0.
0 4.
8 0.
0 0.
0 0.
0 0.
0 0.
0 0.
0 9.
5 0.
0 0.
0 M
acha
kos
23.8
13
.9
18.5
15
.2
7.9
1.3
4.6
6.0
0.0
1.3
0.7
1.3
0.7
0.0
0.0
0.0
0.0
Taita
Tav
eta
19.0
4.
8 14
.3
4.8
14.3
14
.3
0.0
0.0
4.8
0.0
9.5
0.0
0.0
0.0
0.0
0.0
0.0
Tran
s Nzo
ia
12.9
21
.8
7.3
12.1
15
.3
11.3
0.
0 1.
6 6.
5 3.
2 0.
0 0.
8 0.
0 0.
0 0.
0 0.
0 0.
0 Ta
na R
iver
9.
1 6.
8 18
.2
2.3
15.9
13
.6
0.0
2.3
2.3
2.3
2.3
9.1
0.0
0.0
0.0
0.0
0.0
Tota
l num
ber
of c
ount
ies
whe
re
each
of
the
17 l
eadi
ng p
ublic
in
stitu
tions
w
here
co
rrup
tion
inci
dent
s w
ere
witn
esse
d by
m
embe
rs o
f the
pub
lic (b
ased
on
the
top
thre
e hi
ghes
t per
cent
ages
in
ea
ch
of
the
47
anal
yzed
co
untie
s) is
pro
min
ent
46
35
30
12
11
8 5
5 1
1 1
1 1
1 1
1 1
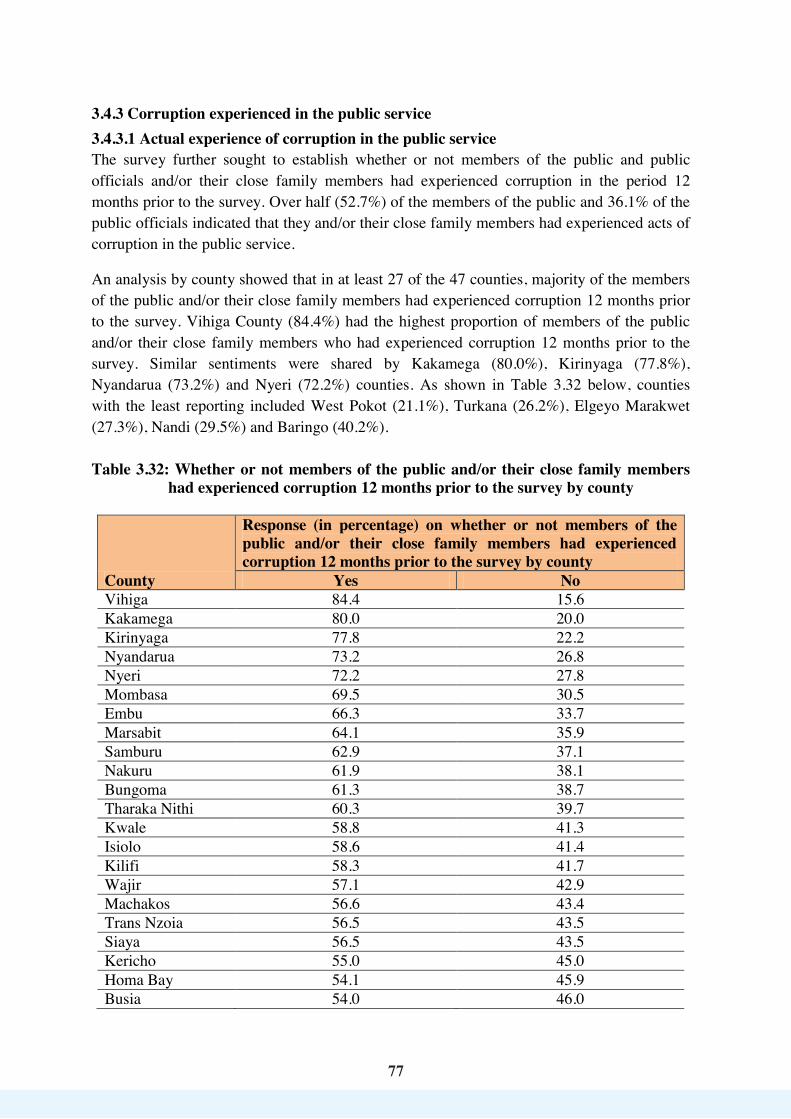
77
77
3.4.3 Corruption experienced in the public service 3.4.3.1 Actual experience of corruption in the public service The survey further sought to establish whether or not members of the public and public officials and/or their close family members had experienced corruption in the period 12 months prior to the survey. Over half (52.7%) of the members of the public and 36.1% of the public officials indicated that they and/or their close family members had experienced acts of corruption in the public service.
An analysis by county showed that in at least 27 of the 47 counties, majority of the members of the public and/or their close family members had experienced corruption 12 months prior to the survey. Vihiga County (84.4%) had the highest proportion of members of the public and/or their close family members who had experienced corruption 12 months prior to the survey. Similar sentiments were shared by Kakamega (80.0%), Kirinyaga (77.8%), Nyandarua (73.2%) and Nyeri (72.2%) counties. As shown in Table 3.32 below, counties with the least reporting included West Pokot (21.1%), Turkana (26.2%), Elgeyo Marakwet (27.3%), Nandi (29.5%) and Baringo (40.2%). Table 3.32: Whether or not members of the public and/or their close family members
had experienced corruption 12 months prior to the survey by county
County
Response (in percentage) on whether or not members of the public and/or their close family members had experienced corruption 12 months prior to the survey by county
Yes No Vihiga 84.4 15.6 Kakamega 80.0 20.0 Kirinyaga 77.8 22.2 Nyandarua 73.2 26.8 Nyeri 72.2 27.8 Mombasa 69.5 30.5 Embu 66.3 33.7 Marsabit 64.1 35.9 Samburu 62.9 37.1 Nakuru 61.9 38.1 Bungoma 61.3 38.7 Tharaka Nithi 60.3 39.7 Kwale 58.8 41.3 Isiolo 58.6 41.4 Kilifi 58.3 41.7 Wajir 57.1 42.9 Machakos 56.6 43.4 Trans Nzoia 56.5 43.5 Siaya 56.5 43.5 Kericho 55.0 45.0 Homa Bay 54.1 45.9 Busia 54.0 46.0

78
78
County
Response (in percentage) on whether or not members of the public and/or their close family members had experienced corruption 12 months prior to the survey by county
Yes No Kajiado 53.9 46.1 Kitui 53.7 46.3 Murang'a 53.1 46.9 Meru 52.9 47.1 Narok 50.9 49.1 Makueni 49.5 50.5 Tana River 49.3 50.7 Kiambu 48.4 51.6 Garissa 46.8 53.2 Mandera 46.5 53.5 Kisumu 46.3 53.7 Migori 45.4 54.6 Bomet 45.3 54.7 Nairobi 43.3 56.7 Nyamira 42.5 57.5 Laikipia 41.8 58.2 Lamu 41.7 58.3 Taita Taveta 41.2 58.8 Uasin Gishu 41.1 58.9 Kisii 40.5 59.5 Baringo 40.2 59.8 Nandi 29.5 70.5 Elgeyo Marakwet 27.3 72.7 Turkana 26.2 73.8 West Pokot 21.1 78.9 Average 52.7 47.3
The above findings on experiences of corruption are consistent with findings from the Kenya National Bureau of Statistics (KNBS). At least 7.0 percent of households in Nairobi City County, 2.0 percent in Trans Nzoia County, 1.9 percent in Kisumu County and 1.9 percent in Homabay County reported corruption/bribery as one of the experienced grievances during the 2015/16 Kenya Integrated Household Budget Survey (KNBS, 2018). A further analysis was conducted with specifics on which arm of government members of the public and public officials and/or their close family members had experienced corruption during the period 12 months prior to the survey. More or less the same proportion of the members of the public and public officials (75.8% and 74.5% respectively) noted that they and/or their close family members had experienced corruption in the National Executive arm of government. Nearly three-fifths (56.1%) of the members of the public and 71.6% of the public officials reported that they and/or their close family members had experienced acts of corruption in the County Executive arm of government while 55.3% members of the public and 28.7% of the members of the public and/or close members of their families had


80
80
leading in corruption experienced in the National Assembly. Counties leading in corruption experienced by members of public and/or their close family members in the County Assembly were Nyandarua (86.5%), Nyeri (79.0%), Kirinyaga (76.7%), Uasin Gishu (75.0%) and Isiolo (71.4%). These findings are presented in Table 3.33 below. Table 3.33: Proportion of members of the public acknowledging corruption experiences
12 months prior to survey by county and arm of government
County
Proportion (in percentage) of members of the public acknowledging that they and/or their close family members had experienced corruption 12 months prior to the survey by county and arm of government National Executive
County Executive Judiciary
Senate Assembly
National Assembly
County Assembly
Elgeyo Marakwet
100.0 75.0 40.0 0.0 0.0 0.0
Nandi 100.0 63.6 0.0 0.0 4.5 0.0 Makueni 95.6 57.1 44.4 - 48.1 16.7 Embu 93.4 58.1 39.6 2.8 21.9 44.7 Machakos 92.7 74.2 52.1 25.0 0.0 46.9 Nyandarua 91.8 98.1 71.2 79.2 77.8 86.5 Mandera 91.7 88.9 30.6 3.7 6.5 20.8 Kwale 91.5 8.5 6.5 0.0 4.5 2.2 Garissa 91.4 76.5 39.4 0.0 46.9 23.3 Taita Taveta 90.9 70.0 25.0 - 7.8 25.0 Bomet 89.2 40.6 13.2 4.5 5.9 13.8 West Pokot 88.9 51.3 27.3 20.0 0.0 31.3 Narok 88.1 46.7 11.9 0.0 16.7 22.2 Kericho 86.0 66.7 44.4 0.0 10.0 51.2 Mombasa 86.0 37.9 27.2 3.6 4.2 13.2 Uasin Gishu 85.7 84.6 55.6 0.0 25.0 75.0 Kajiado 85.0 43.4 10.8 0.0 6.3 16.2 Nyeri 83.6 83.3 74.6 40.5 0.0 79.0 Trans Nzoia 82.6 55.8 17.8 3.6 50.0 38.0 Vihiga 82.6 39.2 19.0 0.0 0.0 12.7 Isiolo 82.4 81.3 41.2 0.0 12.5 71.4 Kiambu 81.7 52.0 17.9 4.1 8.2 13.0 Nairobi 81.5 36.3 27.2 3.2 9.6 10.5 Kakamega 81.3 47.2 28.9 5.3 5.5 20.0 Kirinyaga 80.4 77.8 87.2 57.9 87.5 76.7 Marsabit 78.0 58.1 22.2 0.0 11.4 16.7 Lamu 76.9 44.4 44.4 0.0 - 33.3 Samburu 76.2 81.8 36.8 0.0 0.0 58.8 Kitui 76.1 48.1 16.9 4.5 0.0 16.8 Murang'a 75.3 57.1 12.1 0.0 9.7 1.8 Laikipia 73.9 36.4 26.1 0.0 4.5 9.1 Baringo 69.6 44.7 9.1 2.3 5.7 11.4 Kilifi 69.5 58.9 41.7 0.0 7.1 42.6
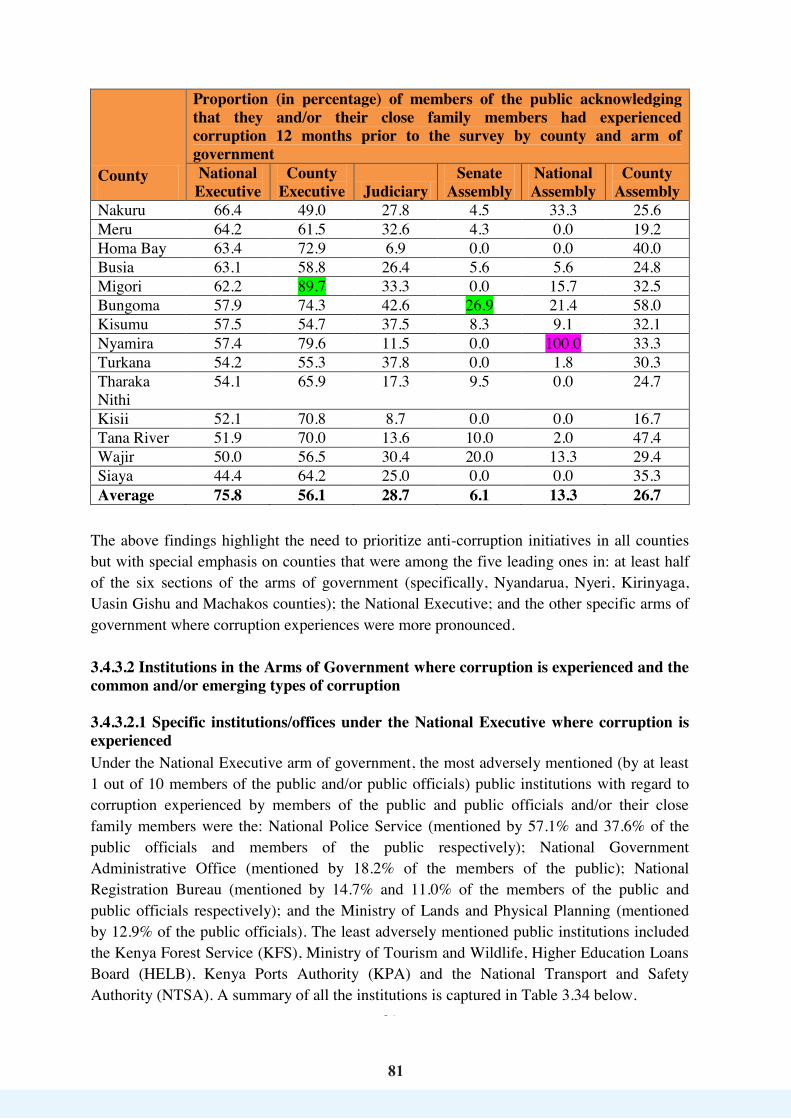
81
81
County
Proportion (in percentage) of members of the public acknowledging that they and/or their close family members had experienced corruption 12 months prior to the survey by county and arm of government National Executive
County Executive Judiciary
Senate Assembly
National Assembly
County Assembly
Nakuru 66.4 49.0 27.8 4.5 33.3 25.6 Meru 64.2 61.5 32.6 4.3 0.0 19.2 Homa Bay 63.4 72.9 6.9 0.0 0.0 40.0 Busia 63.1 58.8 26.4 5.6 5.6 24.8 Migori 62.2 89.7 33.3 0.0 15.7 32.5 Bungoma 57.9 74.3 42.6 26.9 21.4 58.0 Kisumu 57.5 54.7 37.5 8.3 9.1 32.1 Nyamira 57.4 79.6 11.5 0.0 100.0 33.3 Turkana 54.2 55.3 37.8 0.0 1.8 30.3 Tharaka Nithi
54.1 65.9 17.3 9.5 0.0 24.7
Kisii 52.1 70.8 8.7 0.0 0.0 16.7 Tana River 51.9 70.0 13.6 10.0 2.0 47.4 Wajir 50.0 56.5 30.4 20.0 13.3 29.4 Siaya 44.4 64.2 25.0 0.0 0.0 35.3 Average 75.8 56.1 28.7 6.1 13.3 26.7
The above findings highlight the need to prioritize anti-corruption initiatives in all counties but with special emphasis on counties that were among the five leading ones in: at least half of the six sections of the arms of government (specifically, Nyandarua, Nyeri, Kirinyaga, Uasin Gishu and Machakos counties); the National Executive; and the other specific arms of government where corruption experiences were more pronounced. 3.4.3.2 Institutions in the Arms of Government where corruption is experienced and the common and/or emerging types of corruption 3.4.3.2.1 Specific institutions/offices under the National Executive where corruption is experienced Under the National Executive arm of government, the most adversely mentioned (by at least 1 out of 10 members of the public and/or public officials) public institutions with regard to corruption experienced by members of the public and public officials and/or their close family members were the: National Police Service (mentioned by 57.1% and 37.6% of the public officials and members of the public respectively); National Government Administrative Office (mentioned by 18.2% of the members of the public); National Registration Bureau (mentioned by 14.7% and 11.0% of the members of the public and public officials respectively); and the Ministry of Lands and Physical Planning (mentioned by 12.9% of the public officials). The least adversely mentioned public institutions included the Kenya Forest Service (KFS), Ministry of Tourism and Wildlife, Higher Education Loans Board (HELB), Kenya Ports Authority (KPA) and the National Transport and Safety Authority (NTSA). A summary of all the institutions is captured in Table 3.34 below.
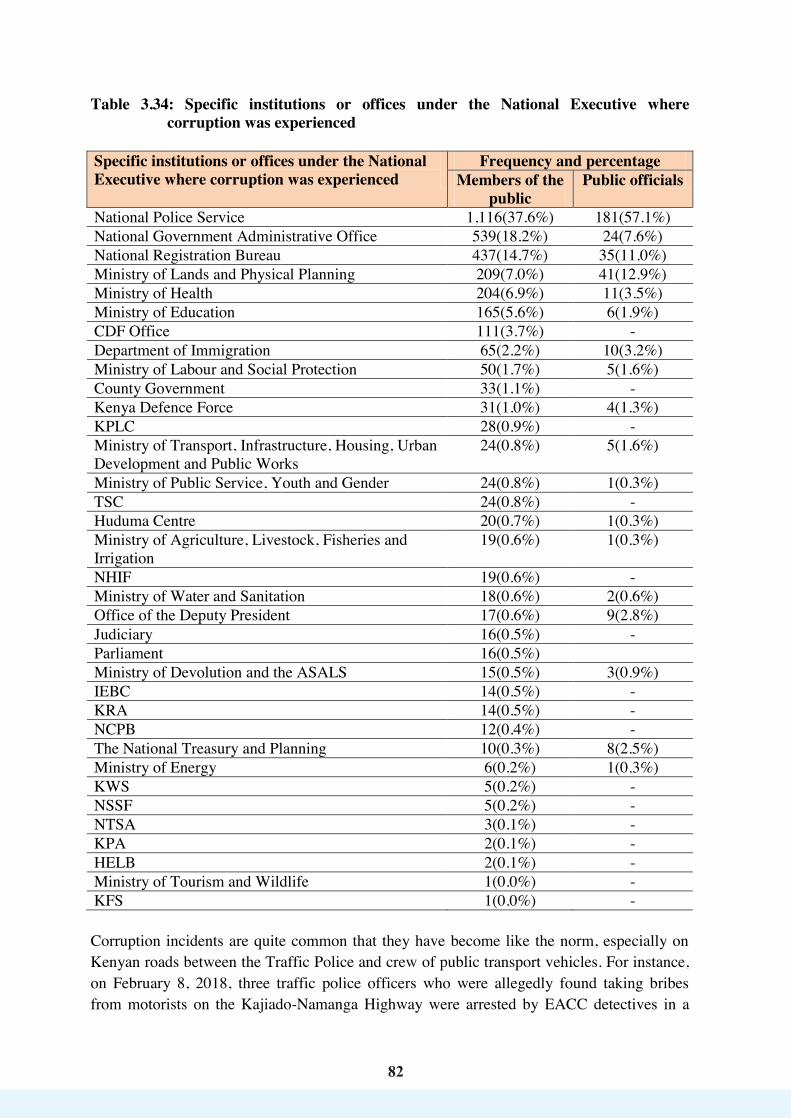
82
82
Table 3.34: Specific institutions or offices under the National Executive where corruption was experienced
Specific institutions or offices under the National Executive where corruption was experienced
Frequency and percentage Members of the
public Public officials
National Police Service 1,116(37.6%) 181(57.1%) National Government Administrative Office 539(18.2%) 24(7.6%) National Registration Bureau 437(14.7%) 35(11.0%) Ministry of Lands and Physical Planning 209(7.0%) 41(12.9%) Ministry of Health 204(6.9%) 11(3.5%) Ministry of Education 165(5.6%) 6(1.9%) CDF Office 111(3.7%) - Department of Immigration 65(2.2%) 10(3.2%) Ministry of Labour and Social Protection 50(1.7%) 5(1.6%) County Government 33(1.1%) - Kenya Defence Force 31(1.0%) 4(1.3%) KPLC 28(0.9%) - Ministry of Transport, Infrastructure, Housing, Urban Development and Public Works
24(0.8%) 5(1.6%)
Ministry of Public Service, Youth and Gender 24(0.8%) 1(0.3%) TSC 24(0.8%) - Huduma Centre 20(0.7%) 1(0.3%) Ministry of Agriculture, Livestock, Fisheries and Irrigation
19(0.6%) 1(0.3%)
NHIF 19(0.6%) - Ministry of Water and Sanitation 18(0.6%) 2(0.6%) Office of the Deputy President 17(0.6%) 9(2.8%) Judiciary 16(0.5%) - Parliament 16(0.5%) Ministry of Devolution and the ASALS 15(0.5%) 3(0.9%) IEBC 14(0.5%) - KRA 14(0.5%) - NCPB 12(0.4%) - The National Treasury and Planning 10(0.3%) 8(2.5%) Ministry of Energy 6(0.2%) 1(0.3%) KWS 5(0.2%) - NSSF 5(0.2%) - NTSA 3(0.1%) - KPA 2(0.1%) - HELB 2(0.1%) - Ministry of Tourism and Wildlife 1(0.0%) - KFS 1(0.0%) - Corruption incidents are quite common that they have become like the norm, especially on Kenyan roads between the Traffic Police and crew of public transport vehicles. For instance, on February 8, 2018, three traffic police officers who were allegedly found taking bribes from motorists on the Kajiado-Namanga Highway were arrested by EACC detectives in a
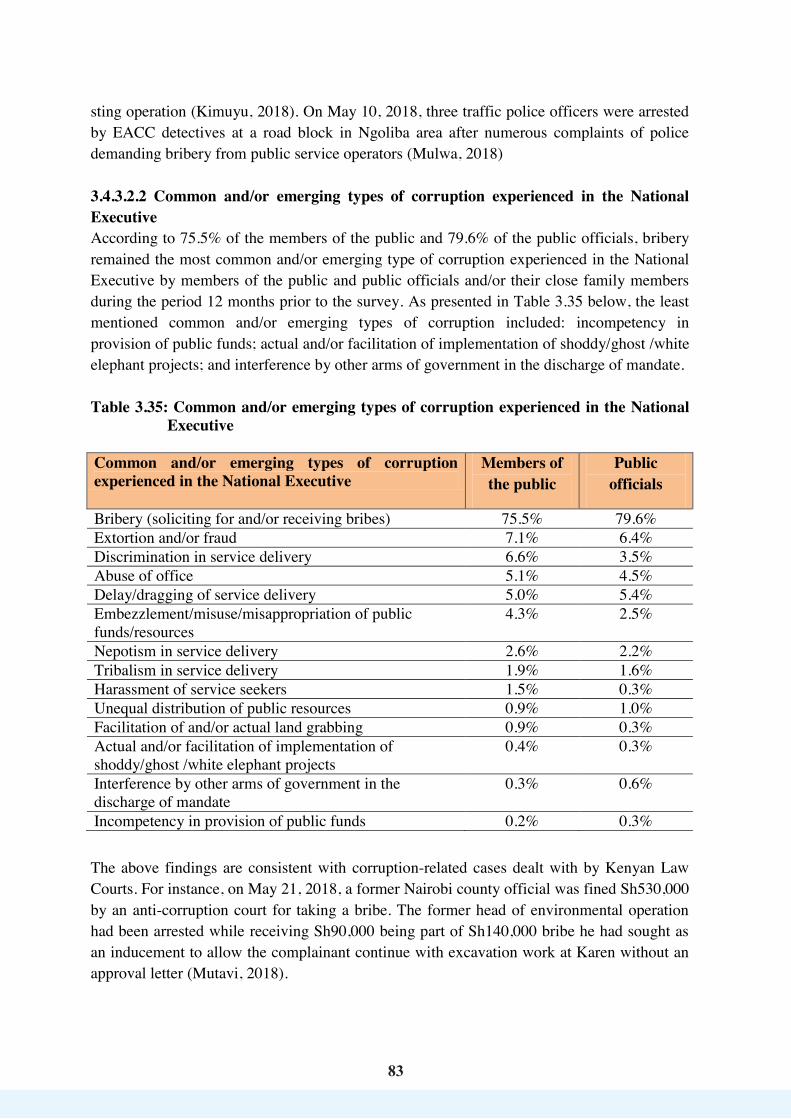
83
83
sting operation (Kimuyu, 2018). On May 10, 2018, three traffic police officers were arrested by EACC detectives at a road block in Ngoliba area after numerous complaints of police demanding bribery from public service operators (Mulwa, 2018) 3.4.3.2.2 Common and/or emerging types of corruption experienced in the National Executive According to 75.5% of the members of the public and 79.6% of the public officials, bribery remained the most common and/or emerging type of corruption experienced in the National Executive by members of the public and public officials and/or their close family members during the period 12 months prior to the survey. As presented in Table 3.35 below, the least mentioned common and/or emerging types of corruption included: incompetency in provision of public funds; actual and/or facilitation of implementation of shoddy/ghost /white elephant projects; and interference by other arms of government in the discharge of mandate. Table 3.35: Common and/or emerging types of corruption experienced in the National
Executive Common and/or emerging types of corruption experienced in the National Executive
Members of the public
Public officials
Bribery (soliciting for and/or receiving bribes) 75.5% 79.6% Extortion and/or fraud 7.1% 6.4% Discrimination in service delivery 6.6% 3.5% Abuse of office 5.1% 4.5% Delay/dragging of service delivery 5.0% 5.4% Embezzlement/misuse/misappropriation of public funds/resources
4.3% 2.5%
Nepotism in service delivery 2.6% 2.2% Tribalism in service delivery 1.9% 1.6% Harassment of service seekers 1.5% 0.3% Unequal distribution of public resources 0.9% 1.0% Facilitation of and/or actual land grabbing 0.9% 0.3% Actual and/or facilitation of implementation of shoddy/ghost /white elephant projects
0.4% 0.3%
Interference by other arms of government in the discharge of mandate
0.3% 0.6%
Incompetency in provision of public funds 0.2% 0.3%
The above findings are consistent with corruption-related cases dealt with by Kenyan Law Courts. For instance, on May 21, 2018, a former Nairobi county official was fined Sh530,000 by an anti-corruption court for taking a bribe. The former head of environmental operation had been arrested while receiving Sh90,000 being part of Sh140,000 bribe he had sought as an inducement to allow the complainant continue with excavation work at Karen without an approval letter (Mutavi, 2018).

84
84
3.4.3.2.3 Specific institutions/offices under the County Executive where corruption is experienced According to 42.4% and 48.4% of the members of the public and public officials respectively, the general County Government Executive was leading in corruption experienced in the County Executive arm of government by members of the public and public officials and/or their close family members during the period 12 months prior to the survey. The general County Government Executive was followed specifically by the Ministry of Health (mentioned by 18.2% of the members of public), the Governor’s Office (mentioned by 17.0% of the members of the public and 9.5% of the public officials) and the Procurement Department (mentioned by 12.4% of the public officials). The least mentioned included the Pensions Department, the Ministry of Public Service, Youth and Gender and the Ministry of Agriculture, Livestock, Fisheries and Irrigation. These results are presented in Table 3.36 below. Table 3.36: Specific institutions or offices under the County Executive where corruption
was experienced Specific institutions or offices under the County Executive where corruption was experienced
Members of the public
Public officials
General County Government Executive 42.4% 48.4% Ministry of Health 18.2% 7.1% Governor’s Office 17.0% 9.5% Ministry of Lands and Physical Planning 5.7% 7.1% County Administration Office (that is, offices of Sub-county and Ward Administrators)
3.6% 1.8%
Procurement Department 2.9% 12.4% Human Resources Department 2.8% 4.2% Ministry of Education 2.7% 1.8% Ministry of Industry, Trade and Cooperatives 2.4% 1.8% Ministry of Water and Sanitation 2.2% 3.2% Ministry of Transport, Infrastructure, Housing, Urban Development and Public Works
1.9% 4.2%
Ministry of Agriculture, Livestock, Fisheries and Irrigation
1.8% 0.7%
County Treasury 1.3% 6.0% Ministry of Public Service, Youth and Gender 1.2% 0.7% Pensions Department 0.5% 1.1% 3.4.3.2.4 Common and/or emerging types of corruption experienced in the County Executive Bribery was the common and emerging type of corruption most experienced in the County Executive by majority (51.0%) of the members of the public and most (41.5%) of the public officials and/or their close family members during the period 12 months prior to the survey. Bribery was followed by flouting of procurement regulations (reported by 14.4% of the public officials), nepotism in service delivery (reported by 11.6% and 10.2% of the public
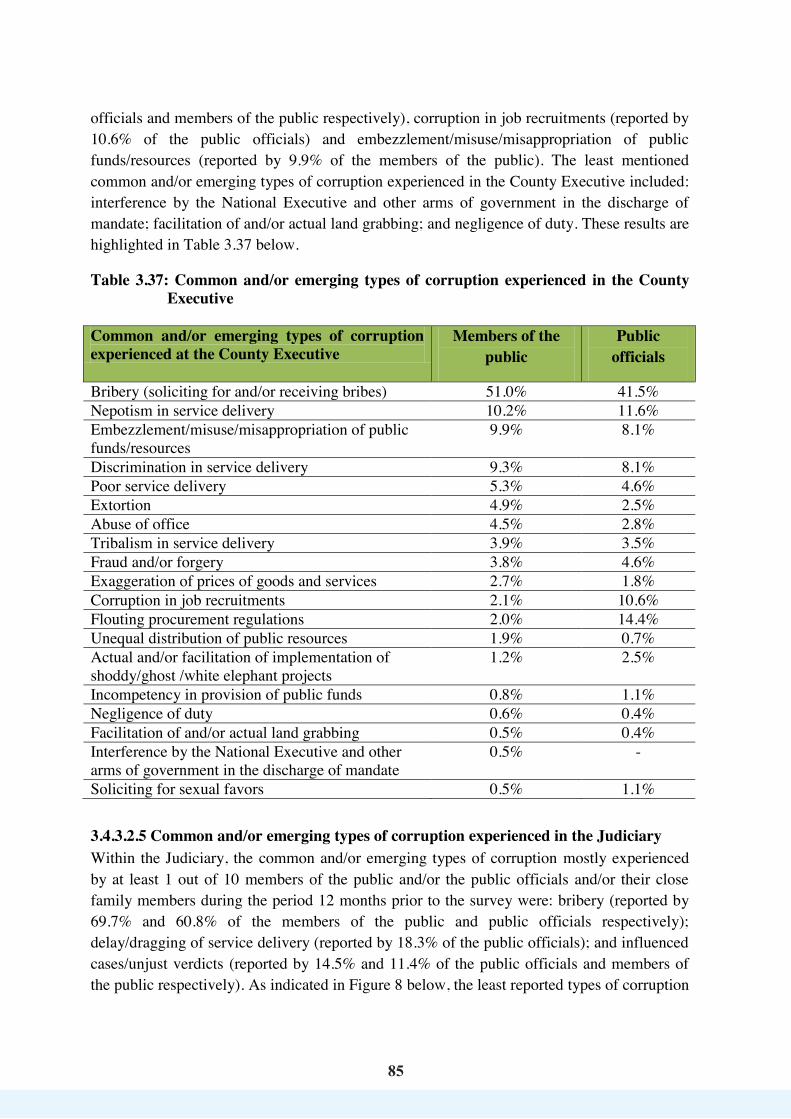
85
85
officials and members of the public respectively), corruption in job recruitments (reported by 10.6% of the public officials) and embezzlement/misuse/misappropriation of public funds/resources (reported by 9.9% of the members of the public). The least mentioned common and/or emerging types of corruption experienced in the County Executive included: interference by the National Executive and other arms of government in the discharge of mandate; facilitation of and/or actual land grabbing; and negligence of duty. These results are highlighted in Table 3.37 below.
Table 3.37: Common and/or emerging types of corruption experienced in the County Executive
Common and/or emerging types of corruption experienced at the County Executive
Members of the public
Public officials
Bribery (soliciting for and/or receiving bribes) 51.0% 41.5% Nepotism in service delivery 10.2% 11.6% Embezzlement/misuse/misappropriation of public funds/resources
9.9% 8.1%
Discrimination in service delivery 9.3% 8.1% Poor service delivery 5.3% 4.6% Extortion 4.9% 2.5% Abuse of office 4.5% 2.8% Tribalism in service delivery 3.9% 3.5% Fraud and/or forgery 3.8% 4.6% Exaggeration of prices of goods and services 2.7% 1.8% Corruption in job recruitments 2.1% 10.6% Flouting procurement regulations 2.0% 14.4% Unequal distribution of public resources 1.9% 0.7% Actual and/or facilitation of implementation of shoddy/ghost /white elephant projects
1.2% 2.5%
Incompetency in provision of public funds 0.8% 1.1% Negligence of duty 0.6% 0.4% Facilitation of and/or actual land grabbing 0.5% 0.4% Interference by the National Executive and other arms of government in the discharge of mandate
0.5% -
Soliciting for sexual favors 0.5% 1.1%
3.4.3.2.5 Common and/or emerging types of corruption experienced in the Judiciary Within the Judiciary, the common and/or emerging types of corruption mostly experienced by at least 1 out of 10 members of the public and/or the public officials and/or their close family members during the period 12 months prior to the survey were: bribery (reported by 69.7% and 60.8% of the members of the public and public officials respectively); delay/dragging of service delivery (reported by 18.3% of the public officials); and influenced cases/unjust verdicts (reported by 14.5% and 11.4% of the public officials and members of the public respectively). As indicated in Figure 8 below, the least reported types of corruption


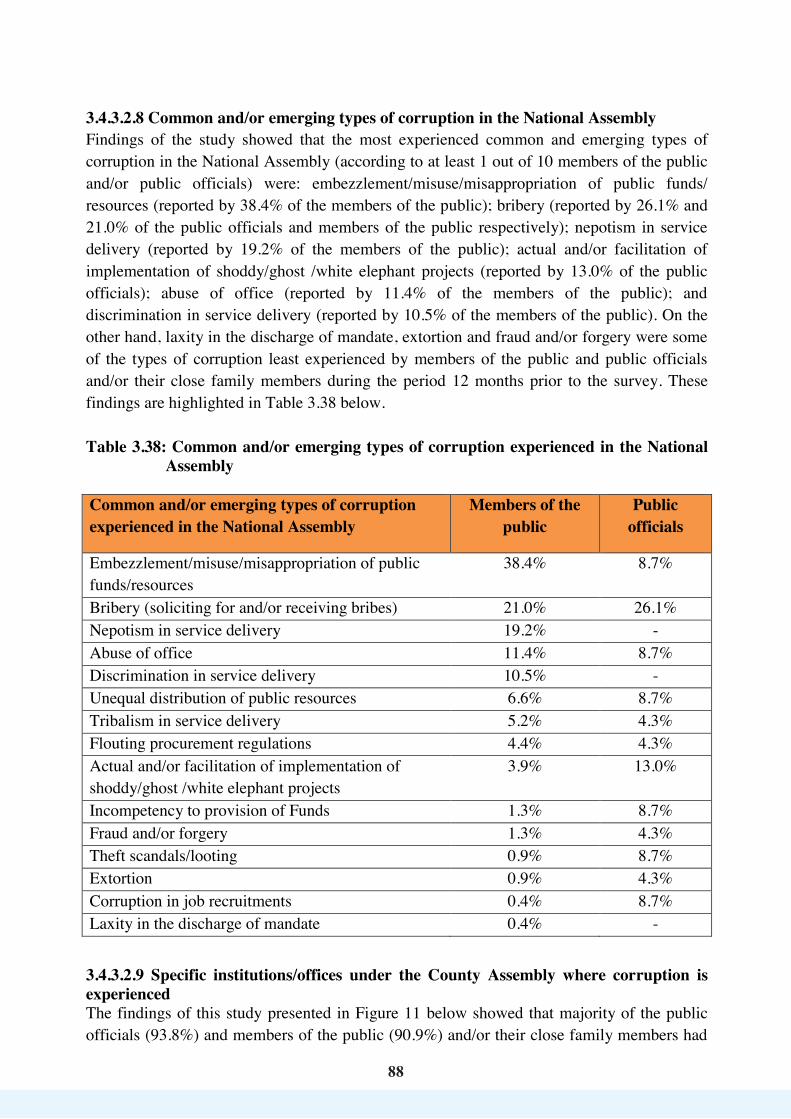
8888
3.4.3.2.8 Common and/or emerging types of corruption in the National Assembly Findings of the study showed that the most experienced common and emerging types of corruption in the National Assembly (according to at least 1 out of 10 members of the public and/or public officials) were: embezzlement/misuse/misappropriation of public funds/ resources (reported by 38.4% of the members of the public); bribery (reported by 26.1% and 21.0% of the public officials and members of the public respectively); nepotism in service delivery (reported by 19.2% of the members of the public); actual and/or facilitation of implementation of shoddy/ghost /white elephant projects (reported by 13.0% of the public officials); abuse of office (reported by 11.4% of the members of the public); and discrimination in service delivery (reported by 10.5% of the members of the public). On the other hand, laxity in the discharge of mandate, extortion and fraud and/or forgery were some of the types of corruption least experienced by members of the public and public officials and/or their close family members during the period 12 months prior to the survey. These findings are highlighted in Table 3.38 below. Table 3.38: Common and/or emerging types of corruption experienced in the National
Assembly Common and/or emerging types of corruption experienced in the National Assembly
Members of the public
Public officials
Embezzlement/misuse/misappropriation of public funds/resources
38.4% 8.7%
Bribery (soliciting for and/or receiving bribes) 21.0% 26.1% Nepotism in service delivery 19.2% - Abuse of office 11.4% 8.7% Discrimination in service delivery 10.5% - Unequal distribution of public resources 6.6% 8.7% Tribalism in service delivery 5.2% 4.3% Flouting procurement regulations 4.4% 4.3% Actual and/or facilitation of implementation of shoddy/ghost /white elephant projects
3.9% 13.0%
Incompetency to provision of Funds 1.3% 8.7% Fraud and/or forgery 1.3% 4.3% Theft scandals/looting 0.9% 8.7% Extortion 0.9% 4.3% Corruption in job recruitments 0.4% 8.7% Laxity in the discharge of mandate 0.4% -
3.4.3.2.9 Specific institutions/offices under the County Assembly where corruption is experienced The findings of this study presented in Figure 11 below showed that majority of the public officials (93.8%) and members of the public (90.9%) and/or their close family members had
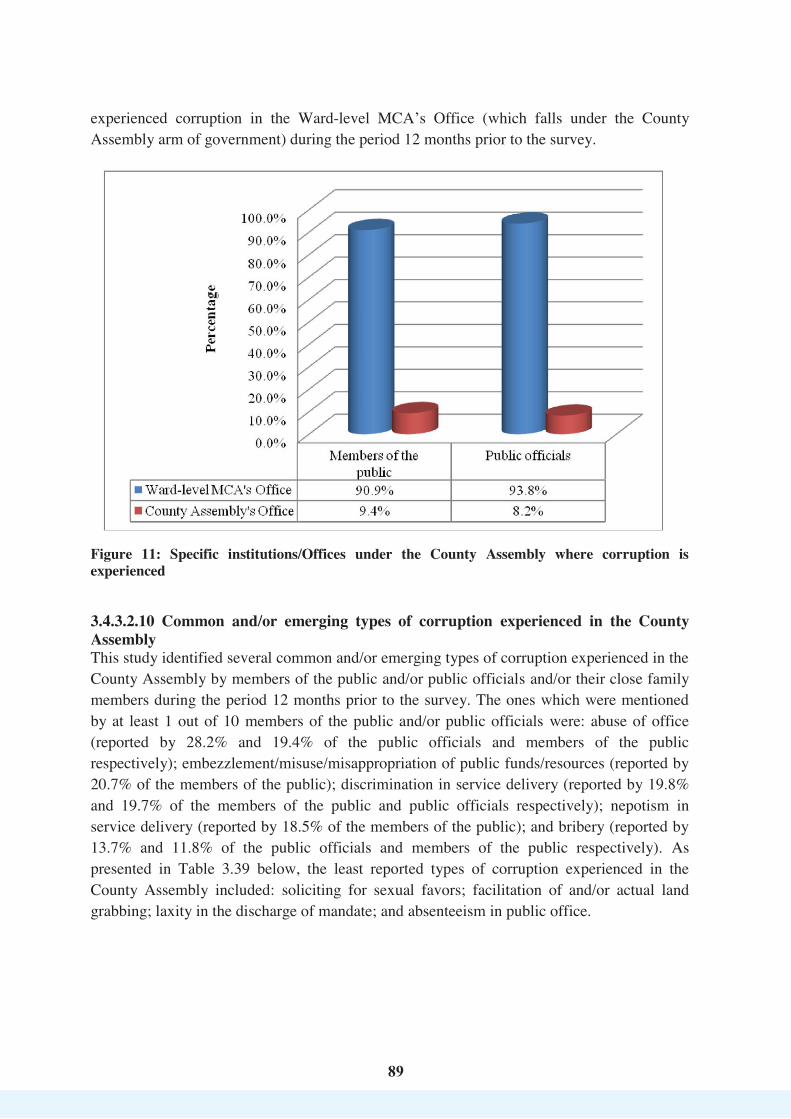

90
90
Table 3.39: Common and/or emerging types of corruption experienced in the County Assembly
Common and/or emerging types of corruption experienced in the County Assembly
Members of the public Public officials
Embezzlement/misuse/misappropriation of public funds/resources
20.7% 9.4%
Discrimination in service delivery 19.8% 19.7% Abuse of office 19.4% 28.2% Nepotism in service delivery 18.5% 9.4% Bribery (soliciting for and/or receiving bribes)
11.8% 13.7%
Extortion 7.0% 4.3% Actual and/or facilitation of implementation of shoddy/ghost /white elephant projects
3.9% 4.3%
Denial of entitled resources 3.8% - Corruption in job recruitments 3.0% 9.4% Shoddy Implementation of Projects 3.0% - Interference by the Executive and Judiciary in the discharge of mandate
2.5% 6.0%
Laxity in the discharge of mandate 1.4% 0.9% Absenteeism in public office 0.9% 2.6% Exaggeration of prices of goods and services
0.8% 5.1%
Facilitation of and/or actual land grabbing
0.3% -
Soliciting for sexual favors 0.1% - The study findings on public institutions where corruption is experienced and the common and/or emerging types of corruption experienced are consisted with findings of EACC (2018) which among others, showed that bribery was paid in public offices especially at Chief’s Office, Regular Police/Police Stations (16.4%), Ministry of Health/County Health Department (13.0%), Registrar of Persons Offices (10.5%), Ministry of Lands (6.1%) and Huduma Centre (5.1%) as shown in Figure 12 below.
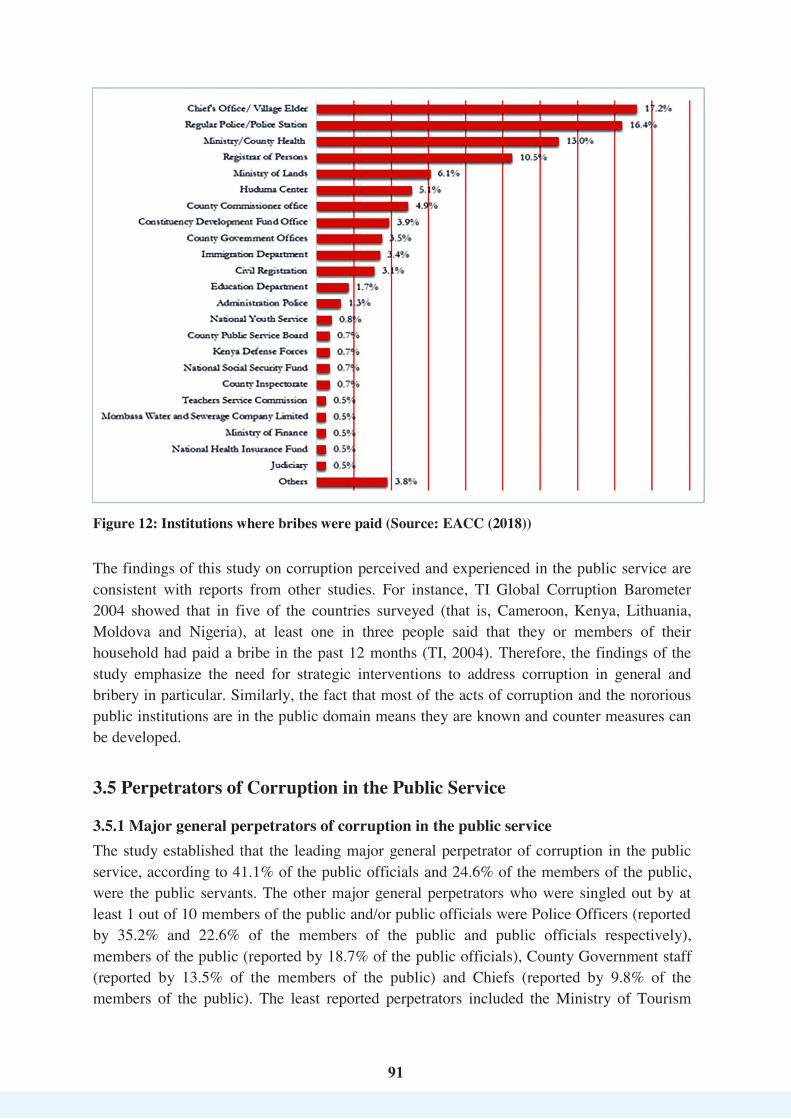
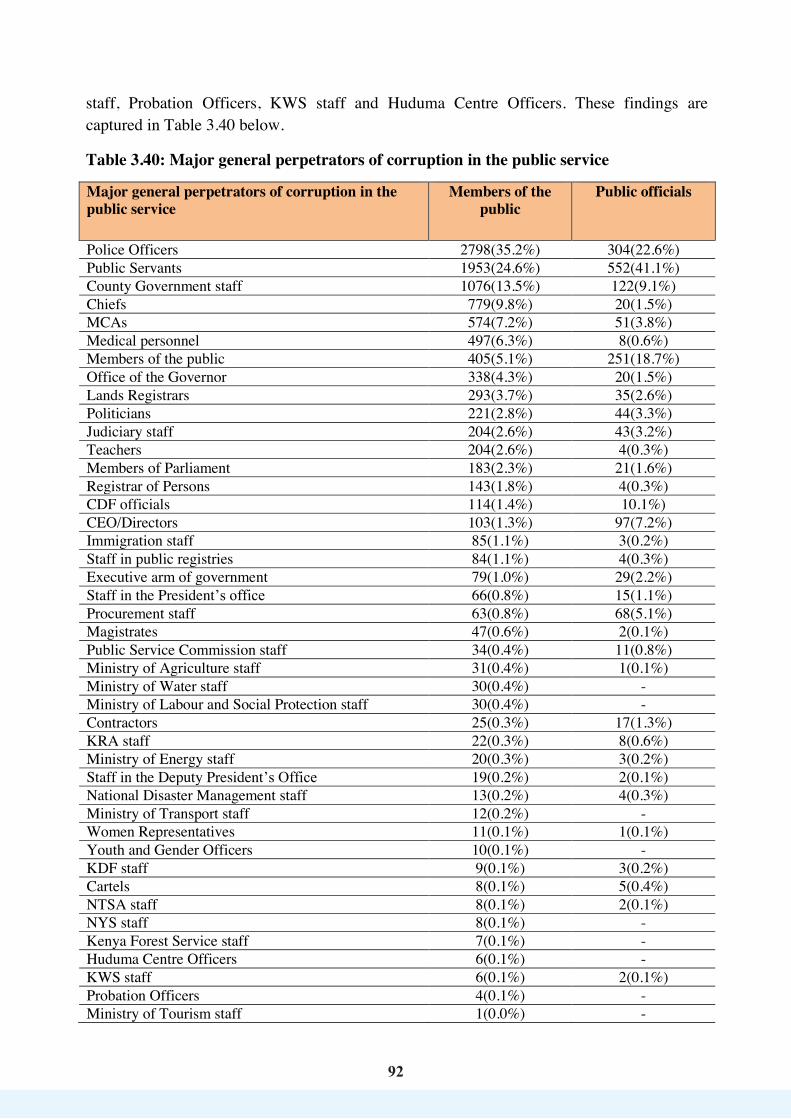
9292
staff, Probation Officers, KWS staff and Huduma Centre Officers. These findings are captured in Table 3.40 below. Table 3.40: Major general perpetrators of corruption in the public service Major general perpetrators of corruption in the public service
Members of the public
Public officials
Police Officers 2798(35.2%) 304(22.6%) Public Servants 1953(24.6%) 552(41.1%) County Government staff 1076(13.5%) 122(9.1%) Chiefs 779(9.8%) 20(1.5%) MCAs 574(7.2%) 51(3.8%) Medical personnel 497(6.3%) 8(0.6%) Members of the public 405(5.1%) 251(18.7%) Office of the Governor 338(4.3%) 20(1.5%) Lands Registrars 293(3.7%) 35(2.6%) Politicians 221(2.8%) 44(3.3%) Judiciary staff 204(2.6%) 43(3.2%) Teachers 204(2.6%) 4(0.3%) Members of Parliament 183(2.3%) 21(1.6%) Registrar of Persons 143(1.8%) 4(0.3%) CDF officials 114(1.4%) 10.1%) CEO/Directors 103(1.3%) 97(7.2%) Immigration staff 85(1.1%) 3(0.2%) Staff in public registries 84(1.1%) 4(0.3%) Executive arm of government 79(1.0%) 29(2.2%) Staff in the President’s office 66(0.8%) 15(1.1%) Procurement staff 63(0.8%) 68(5.1%) Magistrates 47(0.6%) 2(0.1%) Public Service Commission staff 34(0.4%) 11(0.8%) Ministry of Agriculture staff 31(0.4%) 1(0.1%) Ministry of Water staff 30(0.4%) - Ministry of Labour and Social Protection staff 30(0.4%) - Contractors 25(0.3%) 17(1.3%) KRA staff 22(0.3%) 8(0.6%) Ministry of Energy staff 20(0.3%) 3(0.2%) Staff in the Deputy President’s Office 19(0.2%) 2(0.1%) National Disaster Management staff 13(0.2%) 4(0.3%) Ministry of Transport staff 12(0.2%) - Women Representatives 11(0.1%) 1(0.1%) Youth and Gender Officers 10(0.1%) - KDF staff 9(0.1%) 3(0.2%) Cartels 8(0.1%) 5(0.4%) NTSA staff 8(0.1%) 2(0.1%) NYS staff 8(0.1%) - Kenya Forest Service staff 7(0.1%) - Huduma Centre Officers 6(0.1%) - KWS staff 6(0.1%) 2(0.1%) Probation Officers 4(0.1%) - Ministry of Tourism staff 1(0.0%) -
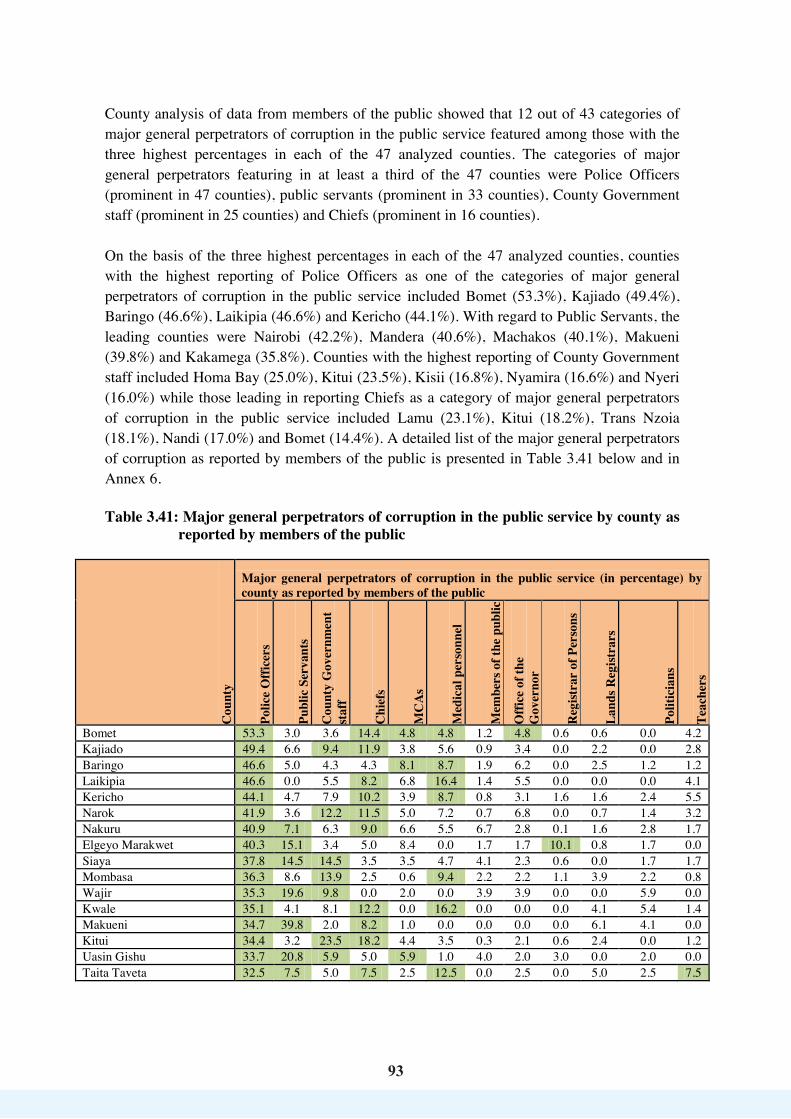
93
93
County analysis of data from members of the public showed that 12 out of 43 categories of major general perpetrators of corruption in the public service featured among those with the three highest percentages in each of the 47 analyzed counties. The categories of major general perpetrators featuring in at least a third of the 47 counties were Police Officers (prominent in 47 counties), public servants (prominent in 33 counties), County Government staff (prominent in 25 counties) and Chiefs (prominent in 16 counties). On the basis of the three highest percentages in each of the 47 analyzed counties, counties with the highest reporting of Police Officers as one of the categories of major general perpetrators of corruption in the public service included Bomet (53.3%), Kajiado (49.4%), Baringo (46.6%), Laikipia (46.6%) and Kericho (44.1%). With regard to Public Servants, the leading counties were Nairobi (42.2%), Mandera (40.6%), Machakos (40.1%), Makueni (39.8%) and Kakamega (35.8%). Counties with the highest reporting of County Government staff included Homa Bay (25.0%), Kitui (23.5%), Kisii (16.8%), Nyamira (16.6%) and Nyeri (16.0%) while those leading in reporting Chiefs as a category of major general perpetrators of corruption in the public service included Lamu (23.1%), Kitui (18.2%), Trans Nzoia (18.1%), Nandi (17.0%) and Bomet (14.4%). A detailed list of the major general perpetrators of corruption as reported by members of the public is presented in Table 3.41 below and in Annex 6. Table 3.41: Major general perpetrators of corruption in the public service by county as
reported by members of the public
Cou
nty
Major general perpetrators of corruption in the public service (in percentage) by county as reported by members of the public
Polic
e O
ffice
rs
Publ
ic S
erva
nts
Cou
nty
Gov
ernm
ent
staf
f
Chi
efs
MC
As
Med
ical
per
sonn
el
Mem
bers
of t
he p
ublic
Offi
ce o
f the
G
over
nor
Reg
istra
r of
Per
sons
Land
s Reg
istra
rs
Polit
icia
ns
Teac
hers
Bomet 53.3 3.0 3.6 14.4 4.8 4.8 1.2 4.8 0.6 0.6 0.0 4.2 Kajiado 49.4 6.6 9.4 11.9 3.8 5.6 0.9 3.4 0.0 2.2 0.0 2.8 Baringo 46.6 5.0 4.3 4.3 8.1 8.7 1.9 6.2 0.0 2.5 1.2 1.2 Laikipia 46.6 0.0 5.5 8.2 6.8 16.4 1.4 5.5 0.0 0.0 0.0 4.1 Kericho 44.1 4.7 7.9 10.2 3.9 8.7 0.8 3.1 1.6 1.6 2.4 5.5 Narok 41.9 3.6 12.2 11.5 5.0 7.2 0.7 6.8 0.0 0.7 1.4 3.2 Nakuru 40.9 7.1 6.3 9.0 6.6 5.5 6.7 2.8 0.1 1.6 2.8 1.7 Elgeyo Marakwet 40.3 15.1 3.4 5.0 8.4 0.0 1.7 1.7 10.1 0.8 1.7 0.0 Siaya 37.8 14.5 14.5 3.5 3.5 4.7 4.1 2.3 0.6 0.0 1.7 1.7 Mombasa 36.3 8.6 13.9 2.5 0.6 9.4 2.2 2.2 1.1 3.9 2.2 0.8 Wajir 35.3 19.6 9.8 0.0 2.0 0.0 3.9 3.9 0.0 0.0 5.9 0.0 Kwale 35.1 4.1 8.1 12.2 0.0 16.2 0.0 0.0 0.0 4.1 5.4 1.4 Makueni 34.7 39.8 2.0 8.2 1.0 0.0 0.0 0.0 0.0 6.1 4.1 0.0 Kitui 34.4 3.2 23.5 18.2 4.4 3.5 0.3 2.1 0.6 2.4 0.0 1.2 Uasin Gishu 33.7 20.8 5.9 5.0 5.9 1.0 4.0 2.0 3.0 0.0 2.0 0.0 Taita Taveta 32.5 7.5 5.0 7.5 2.5 12.5 0.0 2.5 0.0 5.0 2.5 7.5

94
94
Cou
nty
Major general perpetrators of corruption in the public service (in percentage) by county as reported by members of the public
Polic
e O
ffice
rs
Publ
ic S
erva
nts
Cou
nty
Gov
ernm
ent
staf
f
Chi
efs
MC
As
Med
ical
per
sonn
el
Mem
bers
of t
he p
ublic
Offi
ce o
f the
G
over
nor
Reg
istra
r of
Per
sons
Land
s Reg
istra
rs
Polit
icia
ns
Teac
hers
Kisumu 30.3 11.1 13.8 6.0 4.5 3.6 4.2 6.6 2.1 3.0 3.6 0.6 West Pokot 29.6 11.7 11.1 10.5 9.9 1.2 0.6 2.5 2.5 0.0 4.9 6.2 Garissa 29.5 25.4 8.2 3.3 2.5 0.0 13.1 0.0 0.8 0.0 4.1 0.0 Kirinyaga 29.3 10.9 10.9 4.3 7.6 1.1 3.3 8.7 0.0 4.3 2.2 2.2 Homa Bay 28.9 7.9 25.0 5.3 6.6 4.6 2.0 5.3 1.3 2.0 0.7 2.0 Samburu 26.9 21.2 11.5 1.9 1.9 3.8 9.6 1.9 1.9 1.9 5.8 5.8 Trans Nzoia 26.9 5.5 7.4 18.1 8.9 6.6 0.7 1.5 4.4 0.4 0.4 3.7 Kiambu 24.6 3.4 6.8 9.8 9.5 11.0 0.8 3.8 8.0 6.1 1.9 0.8 Machakos 23.9 40.1 11.7 5.8 2.6 1.0 1.9 1.0 0.3 3.2 0.6 0.6 Marsabit 23.6 27.3 4.5 5.5 3.6 2.7 3.6 1.8 10.9 0.9 5.5 0.0 Mandera 22.6 40.6 2.8 2.8 1.9 3.8 10.4 3.8 1.9 0.0 0.0 0.0 Migori 22.6 23.1 11.1 7.9 3.7 10.3 3.2 2.9 0.7 1.5 0.7 1.0 Isiolo 22.5 20.0 15.0 7.5 5.0 2.5 12.5 2.5 0.0 0.0 5.0 0.0 Murang'a 21.2 5.8 11.1 4.8 10.1 9.1 0.0 5.3 3.4 5.3 1.4 1.9 Lamu 20.5 7.7 12.8 23.1 2.6 0.0 2.6 2.6 0.0 0.0 5.1 2.6 Nandi 20.5 12.5 4.5 17.0 6.3 2.7 1.8 0.9 4.5 7.1 2.7 4.5 Kilifi 19.8 12.3 8.6 3.7 6.8 2.5 1.2 9.9 0.6 1.9 8.6 2.5 Nyeri 19.3 21.0 16.0 4.2 8.4 1.7 1.7 3.4 0.8 4.2 3.4 4.2 Nairobi 19.2 42.2 8.9 1.2 0.6 1.0 12.5 1.5 0.2 1.0 1.3 0.5 Meru 18.7 19.4 7.9 7.5 3.6 3.8 2.3 0.8 1.8 10.8 0.5 1.7 Embu 18.5 33.7 5.1 2.5 3.6 4.0 5.4 2.9 3.3 4.0 3.3 0.7 Nyandarua 17.9 15.4 10.6 9.8 8.9 1.6 2.4 6.5 0.8 1.6 9.8 0.0 Bungoma 17.4 23.2 11.4 4.4 4.9 1.9 3.8 6.3 0.5 1.9 1.4 3.8 Turkana 16.6 8.6 12.6 5.7 13.7 2.9 2.3 3.4 0.6 0.6 11.4 4.0 Busia 15.7 24.8 10.4 7.9 7.2 2.2 3.1 3.8 0.3 7.5 1.6 2.8 Vihiga 14.8 14.4 1.9 12.5 7.4 6.0 0.5 2.8 0.5 0.5 1.9 3.7 Kisii 13.9 24.1 16.8 6.1 6.1 7.1 6.6 2.7 0.7 1.5 0.5 2.4 Tharaka Nithi 13.2 14.9 13.6 9.1 13.6 4.5 1.7 0.0 1.7 5.0 0.8 2.5 Kakamega 13.0 35.8 7.6 8.2 5.9 3.9 2.3 1.4 0.0 2.8 0.8 2.3 Nyamira 12.9 30.0 16.6 3.7 11.1 6.5 4.6 5.5 0.9 1.4 0.9 1.4 Tana River 11.1 11.1 7.1 7.1 11.1 4.0 0.0 13.1 0.0 1.0 9.1 1.0 Total number of counties where each of the 12 major general perpetrators of corruption in the public service (based on the top three highest percentages in each of the 47 analyzed counties) is prominent
47 33 25 16 8 8 4 4 2 1 1 1

95
95
The findings from sample respondents were confirmed by some key informants. For instance, one of the key informants observed that:
“There is a lot of corruption in the public service institutions. Some officers in the offices are very corrupt in their dealings and they are encouraged by the people in the public who are non-office holders. For example, when a person is arrested for a crime, they protest for the person not to be arrested thus encouraging corruption.” (KI 5).
Another key informant said the following concerning perpetrators of corruption:
“It’s both in the government and private sector and this is seen cutting across all offices involving huge amounts of money. You see corruption is not only for the small people but also seniors in organizations.” (KI 9).
The above findings indicate that both members of the public and public officials are parties to corruption. The engagement of members of the public in corruption shows dynamicity of corruption, as many people would expect that only public officials engage in public service corruption. It further shows that corruption is a vicious circle and is becoming a complex enterprise proving that public service corruption cannot be a one party crime. Addressing it must therefore involve concerted anti-corruption efforts and/or strategies focused on both public officials and non-public official perpetrators. 3.5.2 Public official perpetrators of corruption by work designations or roles A further question was asked on who the main public official perpetrators of corruption in the public service were with regard to their work designations and/or roles. The top public official perpetrators in order of prominence (based on the highest percentage reported by either the members of the public or the public officials) included Police Officers (31.6%), National Government Administrative Officers (10.7%), procurement staff (9.5%), Members of County Assembly (9.2%), Governors (5.5%) and Accountant (5.3%). As indicated in Table 3.42 below, the least prominent public official perpetrators included Fisheries Officers, KDF Officers and Forest Officers. Table 3.42: Main categories of public official perpetrators of corruption by work
designations and/or roles Main categories of public official perpetrators of corruption by work designations and/or roles
Members of the Public
Public Officials
Police Officer 31.6% 23.1% National Government Administrative Officer 10.7% 3.3% Member of County Assembly 9.2% 8.0% Governor 5.5% 3.8% Pharmacist and/or Nurse 5.2% 0.3%
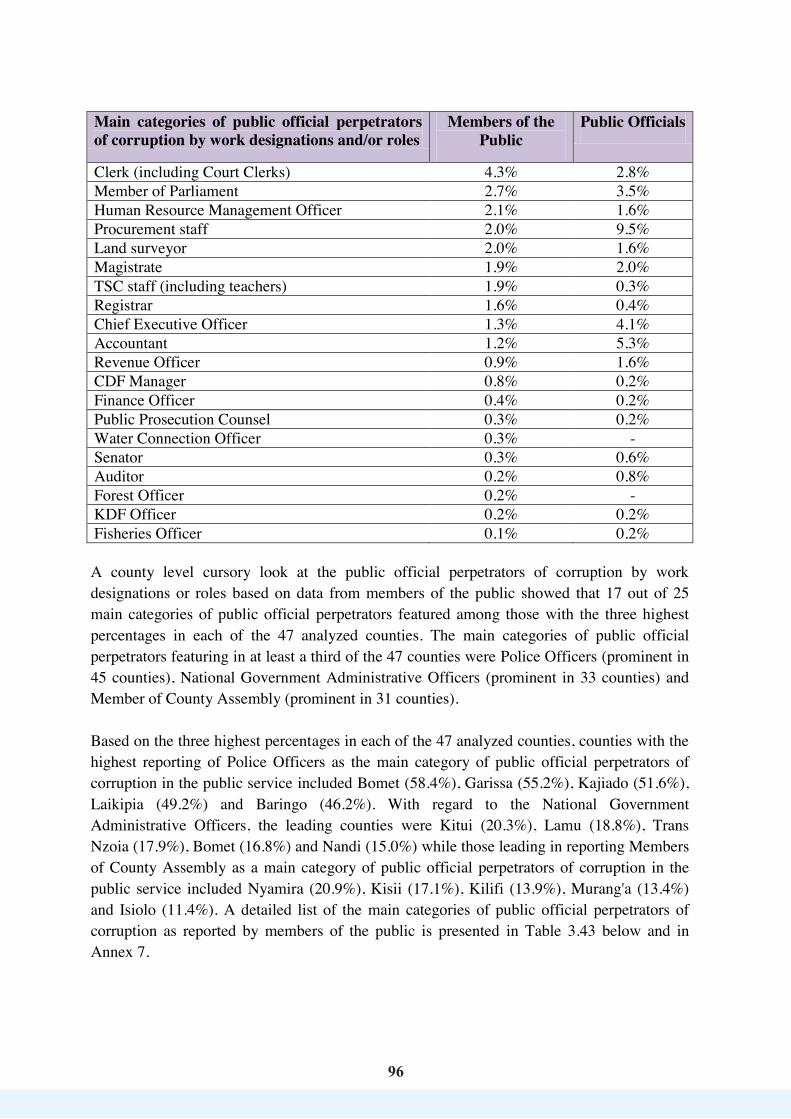
96
96
Main categories of public official perpetrators of corruption by work designations and/or roles
Members of the Public
Public Officials
Clerk (including Court Clerks) 4.3% 2.8% Member of Parliament 2.7% 3.5% Human Resource Management Officer 2.1% 1.6% Procurement staff 2.0% 9.5% Land surveyor 2.0% 1.6% Magistrate 1.9% 2.0% TSC staff (including teachers) 1.9% 0.3% Registrar 1.6% 0.4% Chief Executive Officer 1.3% 4.1% Accountant 1.2% 5.3% Revenue Officer 0.9% 1.6% CDF Manager 0.8% 0.2% Finance Officer 0.4% 0.2% Public Prosecution Counsel 0.3% 0.2% Water Connection Officer 0.3% - Senator 0.3% 0.6% Auditor 0.2% 0.8% Forest Officer 0.2% - KDF Officer 0.2% 0.2% Fisheries Officer 0.1% 0.2% A county level cursory look at the public official perpetrators of corruption by work designations or roles based on data from members of the public showed that 17 out of 25 main categories of public official perpetrators featured among those with the three highest percentages in each of the 47 analyzed counties. The main categories of public official perpetrators featuring in at least a third of the 47 counties were Police Officers (prominent in 45 counties), National Government Administrative Officers (prominent in 33 counties) and Member of County Assembly (prominent in 31 counties). Based on the three highest percentages in each of the 47 analyzed counties, counties with the highest reporting of Police Officers as the main category of public official perpetrators of corruption in the public service included Bomet (58.4%), Garissa (55.2%), Kajiado (51.6%), Laikipia (49.2%) and Baringo (46.2%). With regard to the National Government Administrative Officers, the leading counties were Kitui (20.3%), Lamu (18.8%), Trans Nzoia (17.9%), Bomet (16.8%) and Nandi (15.0%) while those leading in reporting Members of County Assembly as a main category of public official perpetrators of corruption in the public service included Nyamira (20.9%), Kisii (17.1%), Kilifi (13.9%), Murang'a (13.4%) and Isiolo (11.4%). A detailed list of the main categories of public official perpetrators of corruption as reported by members of the public is presented in Table 3.43 below and in Annex 7.

97
97
Tabl
e 3.
43:
Cou
nty
anal
ysis
of m
ain
cate
gori
es o
f pu
blic
offi
cial
per
petr
ator
s of
cor
rupt
ion
by w
ork
desig
natio
n an
d/or
ro
les a
s rep
orte
d by
mem
bers
of t
he p
ublic
Cou
nty
Cou
nty
anal
ysis
(in p
erce
ntag
e) o
f mai
n ca
tego
ries
of p
ublic
offi
cial
per
petr
ator
s of c
orru
ptio
n by
wor
k de
signa
tion
and/
or r
oles
as r
epor
ted
by m
embe
rs o
f the
pub
lic
Police Officer
National Government Administrative Officer
Member of County Assembly
Governor
Pharmacist and/or Nurse
Clerk (including Court Clerks)
Human Resource Management Officer
Registrar
Member of Parliament
Procurement staff
Chief Executive Officer
Accountant
Land surveyor
TSC staff (including teachers)
Finance Officer
Senator
Auditor
Bom
et
58.4
16
.8
5.4
4.0
4.7
0.7
0.0
1.3
0.0
0.0
0.7
0.0
0.0
2.0
0.0
0.0
0.0
Gar
issa
55
.2
1.1
2.3
4.6
0.0
1.1
2.3
8.0
1.1
2.3
3.4
3.4
0.0
0.0
1.1
0.0
0.0
Kaj
iado
51
.6
12.5
4.
5 3.
8 4.
5 0.
0 1.
0 0.
3 0.
3 0.
7 0.
7 0.
3 1.
7 1.
7 0.
0 0.
3 0.
0 La
ikip
ia
49.2
10
.2
1.7
1.7
11.9
0.
0 0.
0 0.
0 1.
7 0.
0 0.
0 0.
0 0.
0 3.
4 0.
0 0.
0 0.
0 B
arin
go
46.2
3.
2 7.
7 5.
1 5.
8 3.
8 0.
0 0.
0 7.
1 4.
5 1.
3 0.
0 1.
3 0.
6 0.
6 0.
0 0.
0 K
eric
ho
44.6
10
.7
9.9
0.8
9.1
0.8
3.3
0.0
1.7
1.7
0.8
1.7
0.8
2.5
0.0
0.0
0.0
Nar
ok
41.3
14
.0
6.1
11.0
7.
2 0.
4 1.
1 0.
8 0.
4 0.
0 0.
4 0.
0 0.
8 3.
0 0.
0 0.
0 0.
0 N
akur
u 39
.8
9.5
9.1
3.5
6.7
3.5
0.6
0.1
2.3
1.1
0.6
0.1
1.4
3.0
0.0
0.1
0.0
Waj
ir 37
.7
3.8
1.9
1.9
0.0
0.0
9.4
1.9
3.8
1.9
3.8
5.7
0.0
1.9
0.0
1.9
1.9
Siay
a 37
.6
7.5
8.1
9.8
4.6
2.3
1.2
1.2
1.7
2.3
1.7
1.7
2.3
1.2
0.6
0.0
0.0
Man
dera
35
.3
5.9
5.9
7.6
2.5
2.5
0.8
14.3
3.
4 0.
0 0.
0 2.
5 4.
2 0.
0 0.
0 2.
5 0.
0 El
geyo
Mar
akw
et
34.2
4.
3 6.
0 0.
0 0.
0 1.
7 0.
0 8.
5 1.
7 4.
3 0.
9 0.
9 0.
0 0.
0 0.
0 0.
0 0.
9 K
itui
31.9
20
.3
5.5
2.3
3.5
0.6
1.6
0.0
1.0
2.3
0.0
0.6
1.3
1.0
0.0
0.0
0.0
Tran
s Nzo
ia
29.0
17
.9
8.9
2.7
5.4
7.6
0.4
3.6
0.4
0.0
0.9
0.4
0.0
2.2
0.0
0.0
0.0
Hom
a B
ay
28.5
6.
9 11
.1
5.6
4.2
1.4
8.3
0.0
0.7
3.5
2.8
0.7
0.7
0.7
0.0
0.0
0.7
Mom
basa
28
.0
2.5
1.6
2.5
6.9
4.4
2.2
0.3
1.6
1.6
0.3
1.3
0.3
0.6
0.3
0.6
0.0
Kis
umu
27.0
8.
4 6.
7 6.
4 4.
9 2.
3 5.
2 2.
0 0.
3 6.
7 0.
6 1.
5 2.
3 0.
6 0.
6 0.
6 0.
0 K
isii
24.5
8.
3 17
.1
8.3
6.0
4.8
1.4
0.5
4.2
0.7
0.0
0.0
0.0
1.8
0.0
0.0
0.0
Wes
t Pok
ot
24.3
9.
3 5.
7 3.
6 1.
4 1.
4 5.
7 1.
4 0.
0 1.
4 5.
7 4.
3 0.
0 2.
9 0.
0 0.
0 0.
0 K
iam
bu
23.6
10
.7
6.2
2.9
10.3
4.
5 0.
0 5.
0 2.
5 0.
8 0.
4 0.
0 2.
5 0.
8 0.
8 0.
8 0.
0 M
igor
i 23
.4
6.9
7.6
5.1
8.4
2.0
1.5
0.5
1.0
0.3
1.3
0.5
1.3
1.3
0.5
0.0
0.0
Nan
di
23.4
15
.0
6.5
2.8
1.9
0.0
0.9
4.7
4.7
5.6
1.9
0.0
4.7
2.8
0.0
0.0
0.0
Sam
buru
23
.3
7.0
7.0
4.7
2.3
0.0
7.0
0.0
4.7
9.3
0.0
0.0
0.0
2.3
0.0
0.0
0.0
Uas
in G
ishu
21
.8
5.0
3.0
1.0
1.0
5.9
5.0
2.0
1.0
2.0
1.0
5.0
1.0
0.0
0.0
1.0
1.0
Mur
ang'
a 20
.1
5.3
13.4
4.
8 8.
1 2.
4 0.
0 1.
4 3.
8 2.
4 0.
5 0.
0 3.
3 0.
5 0.
0 0.
0 0.
0
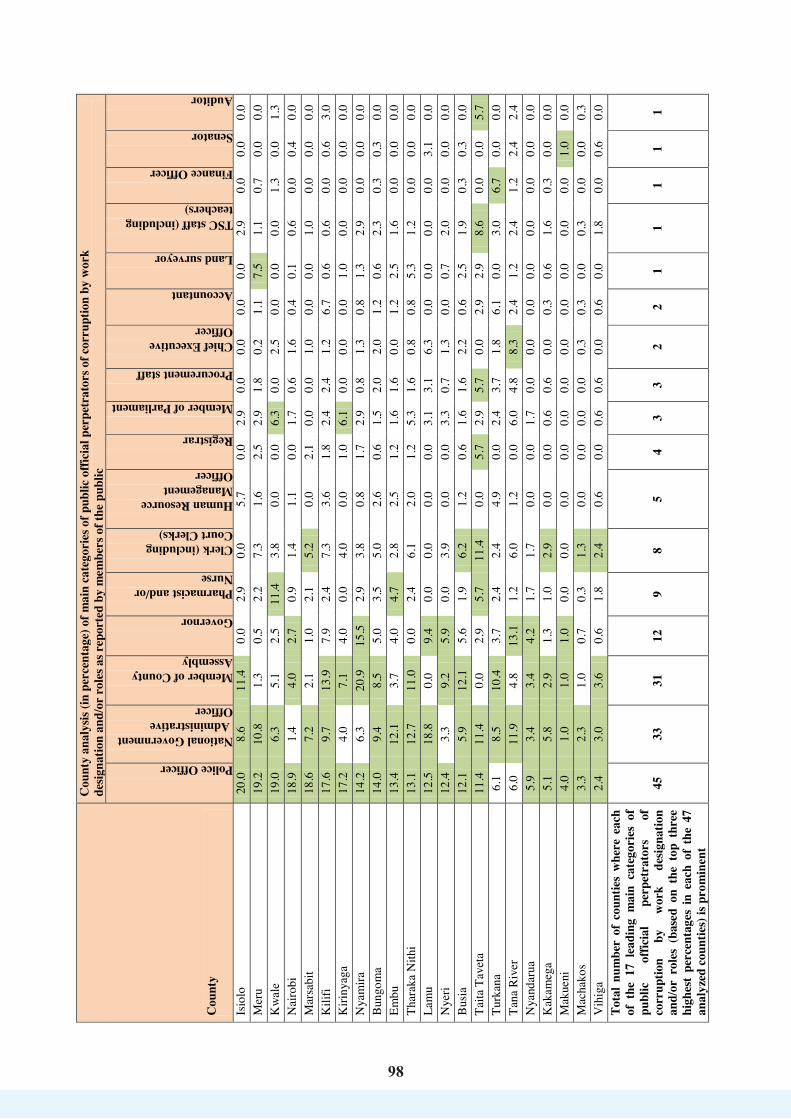
98
98
Cou
nty
Cou
nty
anal
ysis
(in p
erce
ntag
e) o
f mai
n ca
tego
ries
of p
ublic
offi
cial
per
petr
ator
s of c
orru
ptio
n by
wor
k de
signa
tion
and/
or r
oles
as r
epor
ted
by m
embe
rs o
f the
pub
lic
Police Officer
National Government Administrative Officer
Member of County Assembly
Governor
Pharmacist and/or Nurse
Clerk (including Court Clerks)
Human Resource Management Officer
Registrar
Member of Parliament
Procurement staff
Chief Executive Officer
Accountant
Land surveyor
TSC staff (including teachers)
Finance Officer
Senator
Auditor
Isio
lo
20.0
8.
6 11
.4
0.0
2.9
0.0
5.7
0.0
2.9
0.0
0.0
0.0
0.0
2.9
0.0
0.0
0.0
Mer
u 19
.2
10.8
1.
3 0.
5 2.
2 7.
3 1.
6 2.
5 2.
9 1.
8 0.
2 1.
1 7.
5 1.
1 0.
7 0.
0 0.
0 K
wal
e 19
.0
6.3
5.1
2.5
11.4
3.
8 0.
0 0.
0 6.
3 0.
0 2.
5 0.
0 0.
0 0.
0 1.
3 0.
0 1.
3 N
airo
bi
18.9
1.
4 4.
0 2.
7 0.
9 1.
4 1.
1 0.
0 1.
7 0.
6 1.
6 0.
4 0.
1 0.
6 0.
0 0.
4 0.
0 M
arsa
bit
18.6
7.
2 2.
1 1.
0 2.
1 5.
2 0.
0 2.
1 0.
0 0.
0 1.
0 0.
0 0.
0 1.
0 0.
0 0.
0 0.
0 K
ilifi
17.6
9.
7 13
.9
7.9
2.4
7.3
3.6
1.8
2.4
2.4
1.2
6.7
0.6
0.6
0.0
0.6
3.0
Kiri
nyag
a 17
.2
4.0
7.1
4.0
0.0
4.0
0.0
1.0
6.1
0.0
0.0
0.0
1.0
0.0
0.0
0.0
0.0
Nya
mira
14
.2
6.3
20.9
15
.5
2.9
3.8
0.8
1.7
2.9
0.8
1.3
0.8
1.3
2.9
0.0
0.0
0.0
Bun
gom
a 14
.0
9.4
8.5
5.0
3.5
5.0
2.6
0.6
1.5
2.0
2.0
1.2
0.6
2.3
0.3
0.3
0.0
Embu
13
.4
12.1
3.
7 4.
0 4.
7 2.
8 2.
5 1.
2 1.
6 1.
6 0.
0 1.
2 2.
5 1.
6 0.
0 0.
0 0.
0 Th
arak
a N
ithi
13.1
12
.7
11.0
0.
0 2.
4 6.
1 2.
0 1.
2 5.
3 1.
6 0.
8 0.
8 5.
3 1.
2 0.
0 0.
0 0.
0 La
mu
12.5
18
.8
0.0
9.4
0.0
0.0
0.0
0.0
3.1
3.1
6.3
0.0
0.0
0.0
0.0
3.1
0.0
Nye
ri 12
.4
3.3
9.2
5.9
0.0
3.9
0.0
0.0
3.3
0.7
1.3
0.0
0.7
2.0
0.0
0.0
0.0
Bus
ia
12.1
5.
9 12
.1
5.6
1.9
6.2
1.2
0.6
1.6
1.6
2.2
0.6
2.5
1.9
0.3
0.3
0.0
Taita
Tav
eta
11.4
11
.4
0.0
2.9
5.7
11.4
0.
0 5.
7 2.
9 5.
7 0.
0 2.
9 2.
9 8.
6 0.
0 0.
0 5.
7 Tu
rkan
a 6.
1 8.
5 10
.4
3.7
2.4
2.4
4.9
0.0
2.4
3.7
1.8
6.1
0.0
3.0
6.7
0.0
0.0
Tana
Riv
er
6.0
11.9
4.
8 13
.1
1.2
6.0
1.2
0.0
6.0
4.8
8.3
2.4
1.2
2.4
1.2
2.4
2.4
Nya
ndar
ua
5.9
3.4
3.4
4.2
1.7
1.7
0.0
0.0
1.7
0.0
0.0
0.0
0.0
0.0
0.0
0.0
0.0
Kak
ameg
a 5.
1 5.
8 2.
9 1.
3 1.
0 2.
9 0.
0 0.
0 0.
6 0.
6 0.
0 0.
3 0.
6 1.
6 0.
3 0.
0 0.
0 M
akue
ni
4.0
1.0
1.0
1.0
0.0
0.0
0.0
0.0
0.0
0.0
0.0
0.0
0.0
0.0
0.0
1.0
0.0
Mac
hako
s 3.
3 2.
3 1.
0 0.
7 0.
3 1.
3 0.
0 0.
0 0.
0 0.
0 0.
3 0.
3 0.
0 0.
3 0.
0 0.
0 0.
3 V
ihig
a 2.
4 3.
0 3.
6 0.
6 1.
8 2.
4 0.
6 0.
0 0.
6 0.
6 0.
0 0.
6 0.
0 1.
8 0.
0 0.
6 0.
0 To
tal
num
ber
of c
ount
ies
whe
re e
ach
of t
he 1
7 le
adin
g m
ain
cate
gori
es o
f pu
blic
of
ficia
l pe
rpet
rato
rs
of
corr
uptio
n by
w
ork
desig
natio
n an
d/or
rol
es (
base
d on
the
top
thr
ee
high
est
perc
enta
ges
in e
ach
of t
he 4
7 an
alyz
ed c
ount
ies)
is p
rom
inen
t
45
33
31
12
9 8
5 4
3 3
2 2
1 1
1 1
1


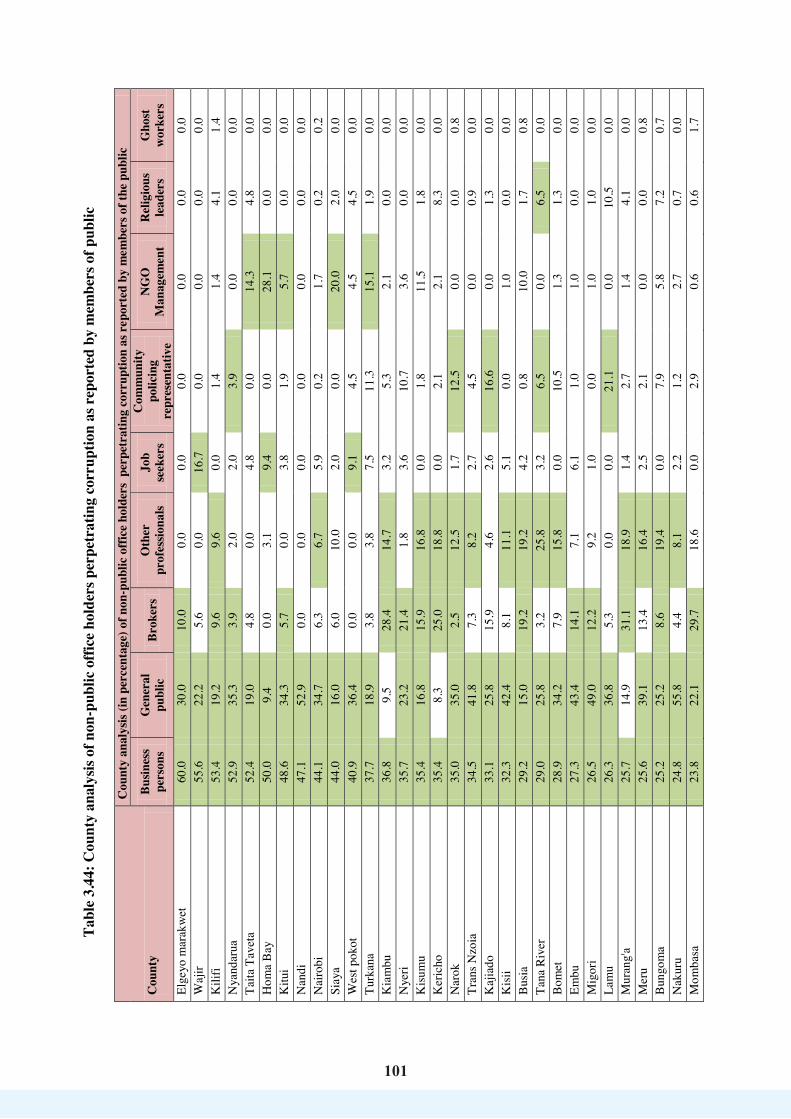
101
101
Tabl
e 3.
44: C
ount
y an
alys
is of
non
-pub
lic o
ffice
hol
ders
per
petr
atin
g co
rrup
tion
as r
epor
ted
by m
embe
rs o
f pub
lic
Cou
nty
Cou
nty
anal
ysis
(in p
erce
ntag
e) o
f non
-pub
lic o
ffice
hol
ders
per
petr
atin
g co
rrup
tion
as r
epor
ted
by m
embe
rs o
f the
pub
lic
Busin
ess
pers
ons
Gen
eral
pu
blic
Br
oker
s O
ther
pr
ofes
siona
ls
Job
seek
ers
Com
mun
ity
polic
ing
repr
esen
tativ
e
NG
O
Man
agem
ent
Rel
igio
us
lead
ers
Gho
st
wor
kers
Elge
yo m
arak
wet
60
.0
30.0
10
.0
0.0
0.0
0.0
0.0
0.0
0.0
Waj
ir 55
.6
22.2
5.
6 0.
0 16
.7
0.0
0.0
0.0
0.0
Kili
fi 53
.4
19.2
9.
6 9.
6 0.
0 1.
4 1.
4 4.
1 1.
4 N
yand
arua
52
.9
35.3
3.
9 2.
0 2.
0 3.
9 0.
0 0.
0 0.
0 Ta
ita T
avet
a 52
.4
19.0
4.
8 0.
0 4.
8 0.
0 14
.3
4.8
0.0
Hom
a B
ay
50.0
9.
4 0.
0 3.
1 9.
4 0.
0 28
.1
0.0
0.0
Kitu
i 48
.6
34.3
5.
7 0.
0 3.
8 1.
9 5.
7 0.
0 0.
0 N
andi
47
.1
52.9
0.
0 0.
0 0.
0 0.
0 0.
0 0.
0 0.
0 N
airo
bi
44.1
34
.7
6.3
6.7
5.9
0.2
1.7
0.2
0.2
Siay
a 44
.0
16.0
6.
0 10
.0
2.0
0.0
20.0
2.
0 0.
0 W
est p
okot
40
.9
36.4
0.
0 0.
0 9.
1 4.
5 4.
5 4.
5 0.
0 Tu
rkan
a 37
.7
18.9
3.
8 3.
8 7.
5 11
.3
15.1
1.
9 0.
0 K
iam
bu
36.8
9.
5 28
.4
14.7
3.
2 5.
3 2.
1 0.
0 0.
0 N
yeri
35.7
23
.2
21.4
1.
8 3.
6 10
.7
3.6
0.0
0.0
Kis
umu
35.4
16
.8
15.9
16
.8
0.0
1.8
11.5
1.
8 0.
0 K
eric
ho
35.4
8.
3 25
.0
18.8
0.
0 2.
1 2.
1 8.
3 0.
0 N
arok
35
.0
35.0
2.
5 12
.5
1.7
12.5
0.
0 0.
0 0.
8 Tr
ans N
zoia
34
.5
41.8
7.
3 8.
2 2.
7 4.
5 0.
0 0.
9 0.
0 K
ajia
do
33.1
25
.8
15.9
4.
6 2.
6 16
.6
0.0
1.3
0.0
Kis
ii 32
.3
42.4
8.
1 11
.1
5.1
0.0
1.0
0.0
0.0
Bus
ia
29.2
15
.0
19.2
19
.2
4.2
0.8
10.0
1.
7 0.
8 Ta
na R
iver
29
.0
25.8
3.
2 25
.8
3.2
6.5
0.0
6.5
0.0
Bom
et
28.9
34
.2
7.9
15.8
0.
0 10
.5
1.3
1.3
0.0
Embu
27
.3
43.4
14
.1
7.1
6.1
1.0
1.0
0.0
0.0
Mig
ori
26.5
49
.0
12.2
9.
2 1.
0 0.
0 1.
0 1.
0 0.
0 La
mu
26.3
36
.8
5.3
0.0
0.0
21.1
0.
0 10
.5
0.0
Mur
ang'
a 25
.7
14.9
31
.1
18.9
1.
4 2.
7 1.
4 4.
1 0.
0 M
eru
25.6
39
.1
13.4
16
.4
2.5
2.1
0.0
0.0
0.8
Bun
gom
a 25
.2
25.2
8.
6 19
.4
0.0
7.9
5.8
7.2
0.7
Nak
uru
24.8
55
.8
4.4
8.1
2.2
1.2
2.7
0.7
0.0
Mom
basa
23
.8
22.1
29
.7
18.6
0.
0 2.
9 0.
6 0.
6 1.
7

102
102
Cou
nty
Cou
nty
anal
ysis
(in p
erce
ntag
e) o
f non
-pub
lic o
ffice
hol
ders
per
petr
atin
g co
rrup
tion
as r
epor
ted
by m
embe
rs o
f the
pub
lic
Busin
ess
pers
ons
Gen
eral
pu
blic
Br
oker
s O
ther
pr
ofes
siona
ls
Job
seek
ers
Com
mun
ity
polic
ing
repr
esen
tativ
e
NG
O
Man
agem
ent
Rel
igio
us
lead
ers
Gho
st
wor
kers
Nya
mira
22
.8
42.1
22
.8
1.8
5.3
0.0
5.3
0.0
0.0
Kiri
nyag
a 20
.8
33.3
18
.8
18.8
2.
1 0.
0 2.
1 4.
2 0.
0 Th
arak
a N
ithi
19.8
45
.1
3.3
12.1
18
.7
0.0
1.1
0.0
0.0
Bar
ingo
18
.5
65.2
5.
4 5.
4 4.
3 0.
0 0.
0 1.
1 0.
0 G
aris
sa
17.8
17
.8
35.6
6.
7 8.
9 8.
9 4.
4 0.
0 0.
0 Is
iolo
17
.6
52.9
23
.5
0.0
0.0
5.9
0.0
0.0
0.0
Kak
ameg
a 17
.4
38.0
13
.2
24.8
5.
8 0.
8 0.
0 0.
0 0.
0 K
wal
e 17
.1
31.4
34
.3
11.4
0.
0 5.
7 0.
0 0.
0 0.
0 U
asin
Gis
hu
16.7
29
.2
25.0
8.
3 4.
2 8.
3 4.
2 4.
2 0.
0 Sa
mbu
ru
15.8
73
.7
0.0
10.5
0.
0 0.
0 0.
0 0.
0 0.
0 M
arsa
bit
14.6
46
.3
17.1
7.
3 9.
8 4.
9 0.
0 0.
0 0.
0 M
ande
ra
14.6
22
.9
56.3
0.
0 2.
1 4.
2 0.
0 0.
0 0.
0 V
ihig
a 13
.5
51.9
9.
6 15
.4
1.9
5.8
0.0
1.9
0.0
Laik
ipia
12
.0
60.0
8.
0 16
.0
0.0
4.0
0.0
0.0
0.0
Mac
hako
s 8.
0 83
.2
2.9
4.4
0.0
0.7
0.0
0.7
0.0
Mak
ueni
1.
9 98
.1
0.0
0.0
0.0
0.0
0.0
0.0
0.0
Tota
l nu
mbe
r of
cou
ntie
s w
here
ea
ch o
f the
8 le
adin
g ca
tego
ries
of
non-
publ
ic
offic
e ho
lder
s pe
rpet
ratin
g co
rrup
tion
(bas
ed o
n th
e to
p th
ree
high
est
perc
enta
ges
in
each
of
th
e 47
an
alyz
ed
coun
ties)
is p
rom
inen
t
47
44
24
22
6 6
6 1

103103
Non-public office holder perpetrators of corruption were also confirmed by some key informants, with one of them observing that:
“Corruption is a two-way activity. You give and take, so both parties in the public service as well as civilians and members of public do play a part”, KI 6.
The survey further sought to establish the role played by non-public office holders in the perpetration of corruption in the public service. The roles identified by at least 1 out of 10 members of the public and/or public officials were: giving bribes to public officials (reported by 55.0% and 44.3% of the members of the public and public officials respectively); colluding (including with drug peddlers) to influence public offices (reported by 22.4% and 18.4% of the public officials and members of the public respectively); and canvassing for tenders (reported by 13.0% of the public officials). On the other hand, the least reported roles of non-public office holders in perpetration of corruption in the public service included intimidation and sabotage. Table 3.45 below captures the detailed findings of the roles of non-public office holders in perpetration of corruption in the public service. Table 3.45: Role of non-public office holders in perpetration of corruption in the public
service Role of non-public office holders in perpetration of corruption Members of the public Public officials
Giving bribes 55.0% 44.3% Colluding (including with drug peddlers) to influence public office
18.4% 22.4%
Canvassing for tenders 6.1% 13.0% Rationalizing corruption 5.1% 9.3% Supplying substandard goods and services 3.8% 4.8% Extortion 3.4% 1.9% Brokerage 3.1% 1.7% Nepotism 1.8% 0.5% Canvasing for jobs 1.5% 1.7% Intimidation 1.2% 0.2% Sabotage 0.7% 0.1%
County-specific analysis of responses of members of the public showed that 9 out of 11 roles played by non-public office holders in perpetration of corruption in the public service featured among those with the three highest percentages in each of the 47 analyzed counties. The roles that were prominent in at least a third of the counties were giving bribes (prominent in all the 47 counties), colluding (including with drug peddlers) to influence public office (prominent in all the 40 counties) and canvassing for tenders (prominent in all the 23 counties).

104
104
On the basis of the three highest percentages in each of the 47 analyzed counties, non-public office holders were reportedly playing a critical role of giving bribes with the highest percentages reported in Wajir (82.4%), Tharaka Nithi (75.0%), Embu (74.7%), Nakuru (73.7%) and Baringo (73.2%) counties. The highest percentages with regard to collusion to influence public office were recorded in Bomet (37.5%), Isiolo (35.3%), Laikipia (31.8%), Elgeyo marakwet (30.0%) and Mandera (29.8%) counties while the highest percentages with regard to canvassing for tenders were observed in Elgeyo marakwet (45.0%), Homa Bay (30.6%), Nandi (29.4%), Lamu (21.1%) and Murang'a (21.0%). A detailed summary of the roles played by non-public office holders in perpetration of corruption in the public service by county is presented in Table 3.46 below. Table 3.46: County analysis of role of non-public office holders in perpetrating
corruption as reported by members of the public
County
County analysis (in percentage) of role of non-public office holders in perpetrating corruption as reported by members of the public
Giv
ing
brib
es
Col
ludi
ng (i
nclu
ding
with
dr
ug p
eddl
ers)
to
influ
ence
pub
lic o
ffice
Can
vass
ing
for
tend
ers
Rat
iona
lizin
g co
rrup
tion
subs
tand
ard
Supp
lyin
g su
bsta
ndar
d go
ods a
nd
serv
ices
Exto
rtio
n
Brok
erag
e
Nep
otism
Can
vasin
g fo
r jo
bs
Intim
idat
ion
Sabo
tage
Wajir 82.4 0.0 5.9 0.0 0.0 5.9 0.0 0.0 5.9 0.0 0.0 Tharaka Nithi 75.0 13.1 2.6 6.6 0.0 0.0 1.3 0.0 1.3 0.0 0.0 Embu 74.7 16.1 3.4 1.1 1.1 1.1 0.0 1.1 0.0 1.1 0.0 Nakuru 73.7 12.8 1.7 2.5 2.8 3.1 0.6 0.8 0.6 1.1 0.3 Baringo 73.2 12.2 2.4 1.2 1.2 3.7 1.2 1.2 3.7 0.0 0.0 Kisii 70.7 9.1 7.1 2.0 1.0 1.0 3.0 0.0 4.0 1.0 1.0 Nyandarua 70.2 3.5 7.0 0.0 8.8 1.8 0.0 8.8 0.0 0.0 0.0 Kitui 69.7 11.2 5.6 9.0 1.1 3.4 0.0 0.0 0.0 0.0 0.0 Nyeri 67.2 6.9 5.2 0.0 5.2 1.7 0.0 8.6 1.7 3.4 0.0 Isiolo 64.7 35.3 0.0 0.0 0.0 0.0 0.0 0.0 0.0 0.0 0.0 Machakos 64.4 25.2 1.5 6.7 0.0 1.5 0.0 0.7 0.0 0.0 0.0 Marsabit 63.9 13.9 2.8 2.8 2.8 5.6 2.8 0.0 5.6 0.0 0.0 Meru 63.9 19.4 2.1 9.9 0.5 0.0 2.6 0.0 0.0 1.0 0.5 Laikipia 63.6 31.8 0.0 0.0 0.0 4.5 0.0 0.0 0.0 0.0 0.0 Samburu 61.1 0.0 5.6 11.1 5.6 11.1 5.6 0.0 0.0 0.0 0.0 Kirinyaga 59.5 2.7 13.5 0.0 10.8 2.7 2.7 5.4 2.7 0.0 0.0 Makueni 59.3 27.1 1.7 8.5 0.0 0.0 1.7 0.0 0.0 1.7 0.0 Mombasa 57.7 17.9 5.4 0.6 0.6 5.4 7.1 1.2 1.2 2.4 0.6 Nyamira 56.5 15.2 6.5 13.0 2.2 0.0 0.0 2.2 4.3 0.0 0.0 West pokot 55.6 3.7 11.1 0.0 7.4 7.4 3.7 11.1 0.0 0.0 0.0 Kwale 54.3 25.7 5.7 0.0 5.7 2.9 2.9 0.0 0.0 0.0 2.9 Migori 54.1 23.5 1.2 2.4 4.7 3.5 9.4 0.0 0.0 0.0 1.2 Nairobi 53.4 23.9 6.4 3.9 3.4 2.1 1.8 0.5 3.4 0.9 0.2 Trans Nzoia 53.2 11.5 4.3 1.4 5.0 7.2 4.3 7.9 2.2 2.9 0.0 Kilifi 48.3 10.0 3.3 10.0 13.3 6.7 1.7 1.7 1.7 0.0 3.3 Kajiado 48.1 17.3 3.8 6.8 16.5 1.5 1.5 0.8 0.8 3.0 0.0

105
105
County
County analysis (in percentage) of role of non-public office holders in perpetrating corruption as reported by members of the public
Giv
ing
brib
es
Col
ludi
ng (i
nclu
ding
with
dr
ug p
eddl
ers)
to
influ
ence
pub
lic o
ffice
Can
vass
ing
for
tend
ers
Rat
iona
lizin
g co
rrup
tion
subs
tand
ard
Supp
lyin
g su
bsta
ndar
d go
ods a
nd
serv
ices
Exto
rtio
n
Brok
erag
e
Nep
otism
Can
vasin
g fo
r jo
bs
Intim
idat
ion
Sabo
tage
Tana River 48.0 8.0 4.0 4.0 16.0 12.0 0.0 0.0 8.0 0.0 0.0 Kisumu 46.9 21.4 7.1 2.0 3.1 6.1 1.0 4.1 4.1 2.0 2.0 Vihiga 46.2 25.6 0.0 23.1 0.0 2.6 2.6 0.0 0.0 0.0 0.0 Narok 44.0 23.0 4.0 12.0 9.0 0.0 1.0 1.0 1.0 4.0 1.0 Kakamega 43.9 17.6 2.6 21.1 1.8 4.4 7.0 0.0 0.9 0.0 0.9 Taita Taveta 42.9 14.3 0.0 4.8 9.5 9.5 4.8 14.3 0.0 0.0 0.0 Mandera 42.6 29.8 19.1 0.0 0.0 0.0 6.4 2.1 0.0 0.0 0.0 Garissa 41.5 17.1 19.5 0.0 2.4 7.3 7.3 2.4 0.0 0.0 2.4 Nandi 41.2 17.6 29.4 0.0 0.0 0.0 5.9 5.9 0.0 0.0 0.0 Kiambu 40.9 25.0 3.4 6.8 1.1 5.7 9.1 3.4 2.3 1.1 1.1 Siaya 40.9 15.9 13.6 6.8 6.8 9.1 0.0 6.8 0.0 0.0 0.0 Kericho 40.8 16.3 4.1 8.2 6.1 4.1 18.4 0.0 0.0 2.0 0.0 Bungoma 38.5 28.7 7.4 8.2 4.1 2.5 4.9 1.6 1.6 0.8 1.6 Busia 37.5 25.0 11.5 5.8 5.8 3.8 3.8 2.9 1.0 1.0 1.9 Lamu 36.8 21.1 21.1 0.0 10.5 0.0 5.3 0.0 0.0 5.3 0.0 Bomet 35.9 37.5 7.8 4.7 4.7 1.6 3.1 1.6 0.0 0.0 3.1 Turkana 35.3 25.5 11.8 2.0 3.9 5.9 2.0 2.0 3.9 5.9 2.0 Homa Bay 33.3 5.6 30.6 0.0 2.8 19.4 5.6 2.8 0.0 0.0 0.0 Uasin gishu 27.3 13.6 18.2 4.5 18.2 0.0 9.1 4.5 0.0 4.5 0.0 Murang'a 22.6 14.5 21.0 4.8 3.2 11.3 11.3 1.6 0.0 1.6 8.1 Elgeyo marakwet 10.0 30.0 45.0 0.0 0.0 0.0 5.0 0.0 5.0 5.0 0.0 Total number of counties where each of the 9 leading roles of non-public office holders in perpetrating corruption (based on the top three highest percentages in each of the 47 analyzed counties) is prominent
47 40 23 12 10 10 5 5 3
The above findings were corroborated by a key informant conversant with the transport
sector in Nairobi County who observed that:
“In Nairobi, there are cartels of public service vehicle (that is, matatu) operators (that is, the owners, drivers, crew/conductors and bus stage controllers) who collect money from among themselves and specifically bribe Traffic Police Officers located in roundabouts (for example the Nyayo House/Kenyatta Avenue, Haile Sellasie/Uhuru Highway, Bunyala Road/Uhuru Highway and Nyayo National Stadium roundabouts) to ensure that the roundabout routes appearing to be dominated by private vehicles are blocked for longer times during traffic snarl ups so that these public service
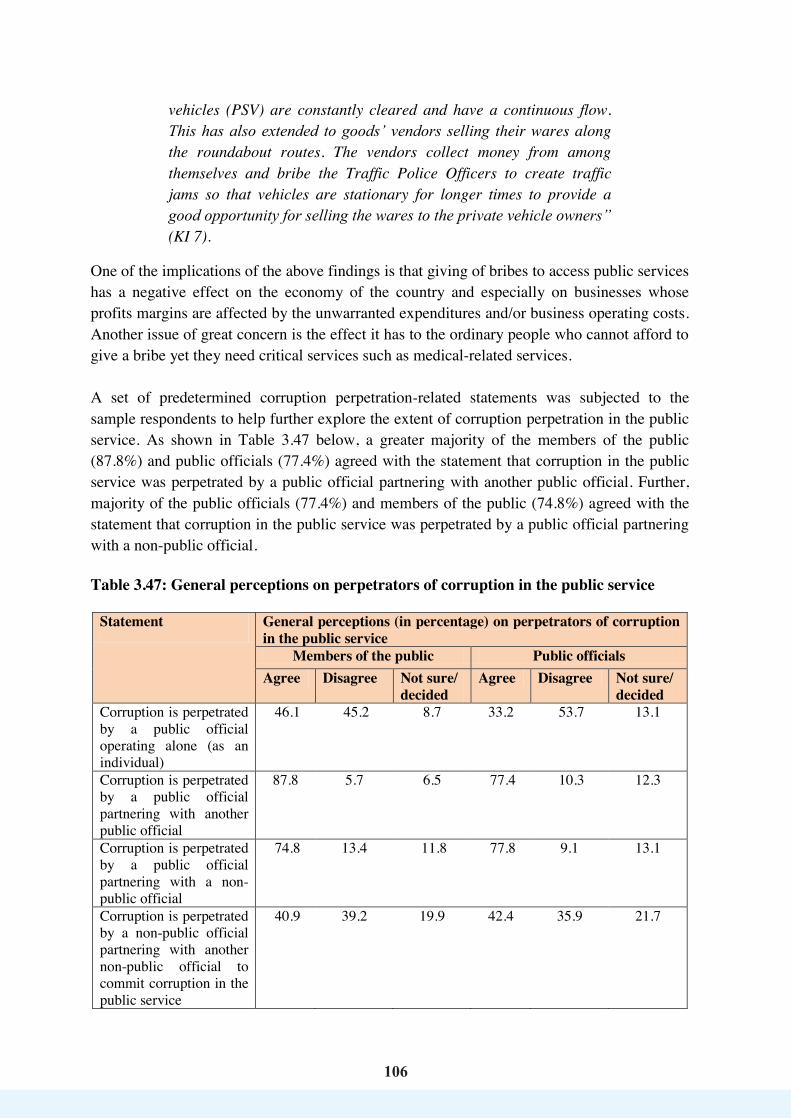
106
106
vehicles (PSV) are constantly cleared and have a continuous flow. This has also extended to goods’ vendors selling their wares along the roundabout routes. The vendors collect money from among themselves and bribe the Traffic Police Officers to create traffic jams so that vehicles are stationary for longer times to provide a good opportunity for selling the wares to the private vehicle owners” (KI 7).
One of the implications of the above findings is that giving of bribes to access public services has a negative effect on the economy of the country and especially on businesses whose profits margins are affected by the unwarranted expenditures and/or business operating costs. Another issue of great concern is the effect it has to the ordinary people who cannot afford to give a bribe yet they need critical services such as medical-related services. A set of predetermined corruption perpetration-related statements was subjected to the sample respondents to help further explore the extent of corruption perpetration in the public service. As shown in Table 3.47 below, a greater majority of the members of the public (87.8%) and public officials (77.4%) agreed with the statement that corruption in the public service was perpetrated by a public official partnering with another public official. Further, majority of the public officials (77.4%) and members of the public (74.8%) agreed with the statement that corruption in the public service was perpetrated by a public official partnering with a non-public official. Table 3.47: General perceptions on perpetrators of corruption in the public service
Statement General perceptions (in percentage) on perpetrators of corruption in the public service
Members of the public Public officials Agree Disagree Not sure/
decided Agree Disagree Not sure/
decided Corruption is perpetrated by a public official operating alone (as an individual)
46.1 45.2 8.7 33.2 53.7 13.1
Corruption is perpetrated by a public official partnering with another public official
87.8 5.7 6.5 77.4 10.3 12.3
Corruption is perpetrated by a public official partnering with a non-public official
74.8 13.4 11.8 77.8 9.1 13.1
Corruption is perpetrated by a non-public official partnering with another non-public official to commit corruption in the public service
40.9 39.2 19.9 42.4 35.9 21.7
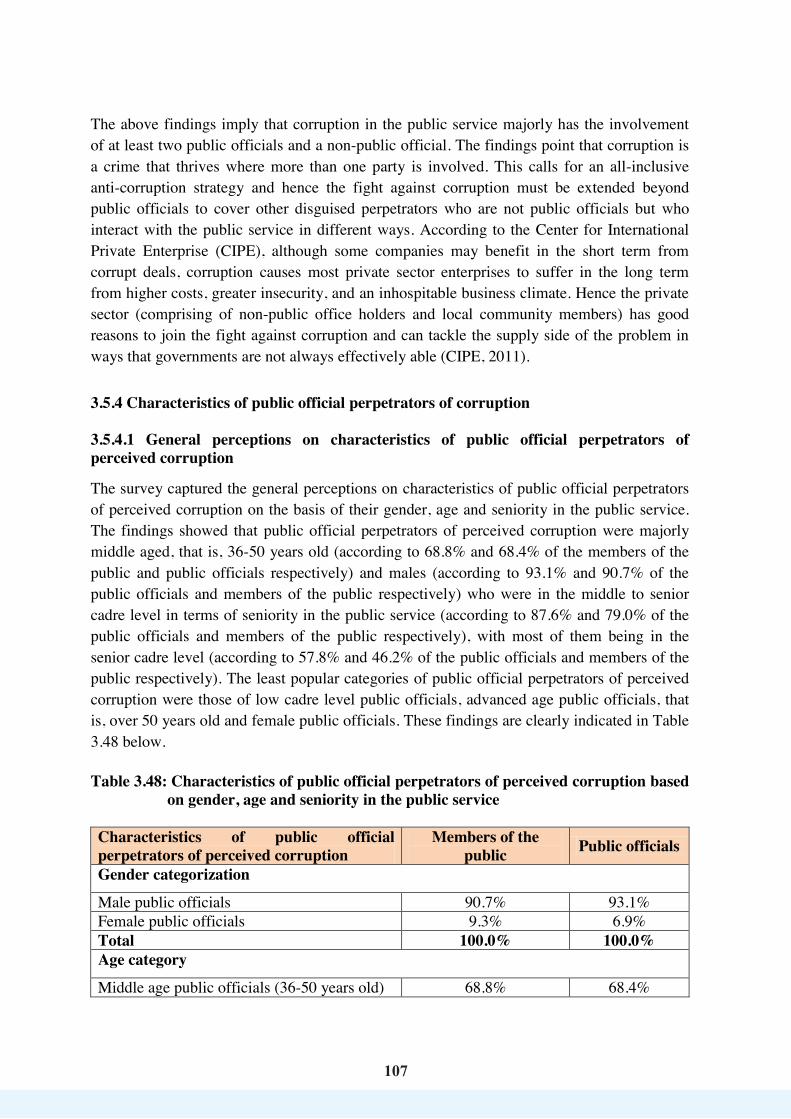
107
107
The above findings imply that corruption in the public service majorly has the involvement of at least two public officials and a non-public official. The findings point that corruption is a crime that thrives where more than one party is involved. This calls for an all-inclusive anti-corruption strategy and hence the fight against corruption must be extended beyond public officials to cover other disguised perpetrators who are not public officials but who interact with the public service in different ways. According to the Center for International Private Enterprise (CIPE), although some companies may benefit in the short term from corrupt deals, corruption causes most private sector enterprises to suffer in the long term from higher costs, greater insecurity, and an inhospitable business climate. Hence the private sector (comprising of non-public office holders and local community members) has good reasons to join the fight against corruption and can tackle the supply side of the problem in ways that governments are not always effectively able (CIPE, 2011).
3.5.4 Characteristics of public official perpetrators of corruption 3.5.4.1 General perceptions on characteristics of public official perpetrators of perceived corruption The survey captured the general perceptions on characteristics of public official perpetrators of perceived corruption on the basis of their gender, age and seniority in the public service. The findings showed that public official perpetrators of perceived corruption were majorly middle aged, that is, 36-50 years old (according to 68.8% and 68.4% of the members of the public and public officials respectively) and males (according to 93.1% and 90.7% of the public officials and members of the public respectively) who were in the middle to senior cadre level in terms of seniority in the public service (according to 87.6% and 79.0% of the public officials and members of the public respectively), with most of them being in the senior cadre level (according to 57.8% and 46.2% of the public officials and members of the public respectively). The least popular categories of public official perpetrators of perceived corruption were those of low cadre level public officials, advanced age public officials, that is, over 50 years old and female public officials. These findings are clearly indicated in Table 3.48 below. Table 3.48: Characteristics of public official perpetrators of perceived corruption based
on gender, age and seniority in the public service Characteristics of public official perpetrators of perceived corruption
Members of the public Public officials
Gender categorization
Male public officials 90.7% 93.1% Female public officials 9.3% 6.9% Total 100.0% 100.0% Age category
Middle age public officials (36-50 years old) 68.8% 68.4%

108
108
Characteristics of public official perpetrators of perceived corruption
Members of the public Public officials
Young public officials (35 years of age and below) 16.2% 21.3%
Advanced age public officials (Over 50 years old) 15.0% 10.3%
Total 100.0% 100.0% Seniority in the public service
Senior cadre public officials 46.2% 57.8% Middle cadre public officials 32.8% 29.8% Low cadre public officials 21.0% 12.4% Total 100.0% 100.0%
Findings from key informant interviews confirmed that male public officials were perceived to be more corrupt than female public officials. For instance, one key informant observed that:
“Oh okay……according to my own opinion, men are mostly mentioned in cases of corruption and especially the working class and this does not matter whether they are senior or junior…mmm. Its cuts across, but it seems from top to bottom and it’s mainly a chain of cartels working together….” (KI 4).
The findings showed that senior officers in the public service were perceived to perpetrate corruption. This implies that the seniors cannot take appropriate action against corruption if they themselves engage in it. This may have a negative effect in the fight against the vice in that junior officers may also engage in acts of corruption upon knowing that their seniors also engage in corruption and are unlikely to take any action against them with the result being escalated levels of corruption in the public service. 3.5.4.2 Characteristics of public official perpetrators based on corruption experienced With regard to the gender, age and seniority in the public service of the public official perpetrators of experienced corruption, the findings were similar to those of perceived corruption. The findings showed that public official perpetrators of experienced corruption were majorly middle aged, that is, 36-50 years old (according to 72.0% and 69.1% of the members of the public and public officials respectively) and males (according to 90.1% and 86.7% of the public officials and members of the public respectively) who were in the middle to senior cadre level in terms of seniority in the public service (according to 80.2% and 75.6% of the public officials and members of the public respectively), with most of them being in the senior cadre level (according to 41.8% of the public officials). The least popular categories of public official perpetrators of experienced corruption were also found to be those of low cadre level public officials, advanced age public officials, that is, over 50 years old and female public officials. The detailed findings are captured in Table 3.49 below.
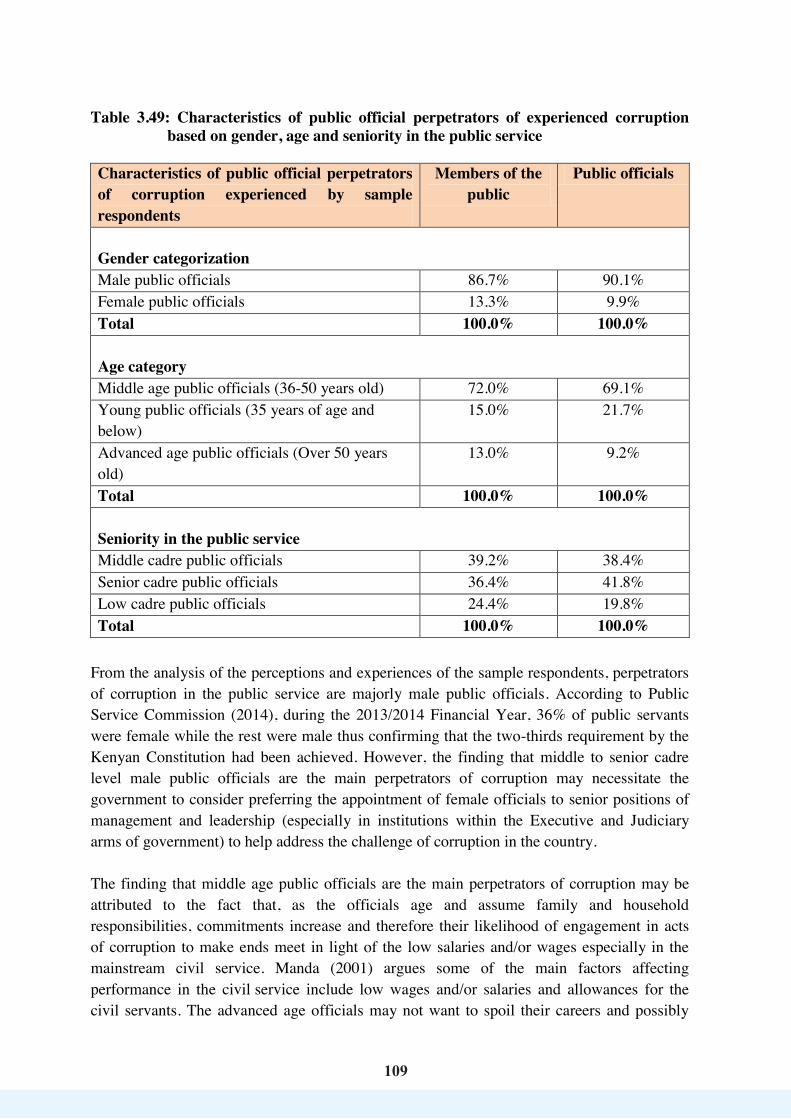
109
109
Table 3.49: Characteristics of public official perpetrators of experienced corruption based on gender, age and seniority in the public service
Characteristics of public official perpetrators of corruption experienced by sample respondents
Members of the public
Public officials
Gender categorization Male public officials 86.7% 90.1% Female public officials 13.3% 9.9% Total 100.0% 100.0% Age category Middle age public officials (36-50 years old) 72.0% 69.1% Young public officials (35 years of age and below)
15.0% 21.7%
Advanced age public officials (Over 50 years old)
13.0% 9.2%
Total 100.0% 100.0% Seniority in the public service Middle cadre public officials 39.2% 38.4% Senior cadre public officials 36.4% 41.8% Low cadre public officials 24.4% 19.8% Total 100.0% 100.0%
From the analysis of the perceptions and experiences of the sample respondents, perpetrators of corruption in the public service are majorly male public officials. According to Public Service Commission (2014), during the 2013/2014 Financial Year, 36% of public servants were female while the rest were male thus confirming that the two-thirds requirement by the Kenyan Constitution had been achieved. However, the finding that middle to senior cadre level male public officials are the main perpetrators of corruption may necessitate the government to consider preferring the appointment of female officials to senior positions of management and leadership (especially in institutions within the Executive and Judiciary arms of government) to help address the challenge of corruption in the country. The finding that middle age public officials are the main perpetrators of corruption may be attributed to the fact that, as the officials age and assume family and household responsibilities, commitments increase and therefore their likelihood of engagement in acts of corruption to make ends meet in light of the low salaries and/or wages especially in the mainstream civil service. Manda (2001) argues some of the main factors affecting performance in the civil service include low wages and/or salaries and allowances for the civil servants. The advanced age officials may not want to spoil their careers and possibly

110
110
their pension entitlements through corruption as they approach their exit on early or normal retirement age of between 55 and 60 years and/or end of contract engagement. The involvement of middle to senior cadre officials in public service corruption could be attributed to their roles in especially financial and human resource decisions and responsibilities which predispose them to likely corruption situations. Those who are weak in integrity values and face economic challenges occasioned by low salaries and/or wages may be lured into corrupt practices. In most public institutions, the low cadre staffs are constantly supervised because they are not in positions of authority and decision making thus minimizing their chances of, for example, engaging in embezzlement of public funds. Therefore, taming corruption acts among the middle to senior cadre officials may require strengthened integrity, transparency and accountability systems (such as regular financial monitoring and wealth declarations) on this category of public officials. Overall, perpetrators of corruption in the public service are majorly male public officials who are of middle age and middle to senior cadre in terms of seniority in the public service. Therefore, efforts to address corruption in the public service need to focus more on male public officials who are middle aged, that is, 36-50 years old and occupying middle to senior cadre level positions in the public service, with a special focus on the senior cadre level officials. 3.6 Root Causes and Reasons for Engaging in Corruption in the Public Service 3.6.1 Root causes of corruption in the public service
The major root cause of corruption in the public service was found to be greed (reported by 54.4% and 38.9% of the members of the public and public officials). Other root causes of corruption reported by at least 1 out of 10 members of the public and/or public officials were: low wages (reported by 39.0% and 12.3% of the public officials and members of the public respectively); poverty (mentioned by 19.0% and 10.2% of the members of the public and public officials respectively); poor management (reported by 15.7% and 9.8% of the public officials and members of the public respectively);

111
111
and rationalization of corruption (reported by 14.0% of the public officials). As indicated in Table 3.50 below, the least reported causes of corruption included technological advancement and/or innovations, high population growth and fear of victimization. Table 3.50: Root causes of corruption in the public service
Root cause of corruption Frequency and Percentage Members of the public Public officials
Greed 4,425(54.4%) 604(38.9%) Poverty 1,548(19.0%) 159(10.2%) Low wages 1,002(12.3%) 605(39.0%) Poor management 793(9.8%) 244(15.7%) Rationalization of corruption 594(7.3%) 217(14.0%) Unemployment 587(7.2%) 79(5.1%) Tribalism and/or nepotism 506(6.2%) 75(4.8%) Scarce resources and/or high cost of living
374(4.6%) 87(5.6%)
Ignorance 306(3.8%) 50(3.2%) Lack of laws 258(3.2%) 77(5.0%) Illiteracy 225(2.8%) 43(2.8%) Unequal resource distribution 149(1.8%) 35(2.3%) Bad politics 116(1.4%) 23(1.5%) Poor service delivery 104(1.3%) 29(1.9%) Discrimination 84(1.0%) 18(1.2%) Bureaucracy 77(0.9%) 38(2.4%) Lack of peace and harmony 49(0.6%) 7(0.5%) Retrogressive beliefs and practices 47(0.6%) 17(1.1%) Fear of victimization 35(0.4%) 7(0.5%) High population growth 11(0.1%) 1(0.1%) Technological advancement and/or innovations
4(0.0%) 2(0.1%)
Members of the public held varied views on the root causes of corruption in the public service in the respective counties. However, on the basis of the three highest percentages of the root causes of corruption in each of the 47 analyzed counties, 8 out of 21 root causes featured prominently. The ones that featured in at least a third of the counties were greed (prominent in 47 counties), poverty (prominent in 40 counties), low wages (prominent in 22 counties) and poor management (prominent in 18 counties).
Based on the three highest percentages in each of the 47 analyzed counties, greed had the highest reporting in Nyandarua (62.8%), Taita Taveta (54.5%), Nyeri (54.1%), Embu (53.7%) and Kitui (52.1%). The highest percentages for poverty as a root cause of corruption in the public service were recorded in Turkana (25.0%), Homa Bay (21.9%), Meru (21.9%), Siaya (21.1%), Lamu (20.5%) and Elgeyo Marakwet (20.2%) counties while those for low wages were recorded in Garissa (18.8%), Mandera (18.2%), Kwale (16.0%), Mombasa (15.1%), Kakamega (15.1%) and Bungoma (14.9%). The highest percentages for poor
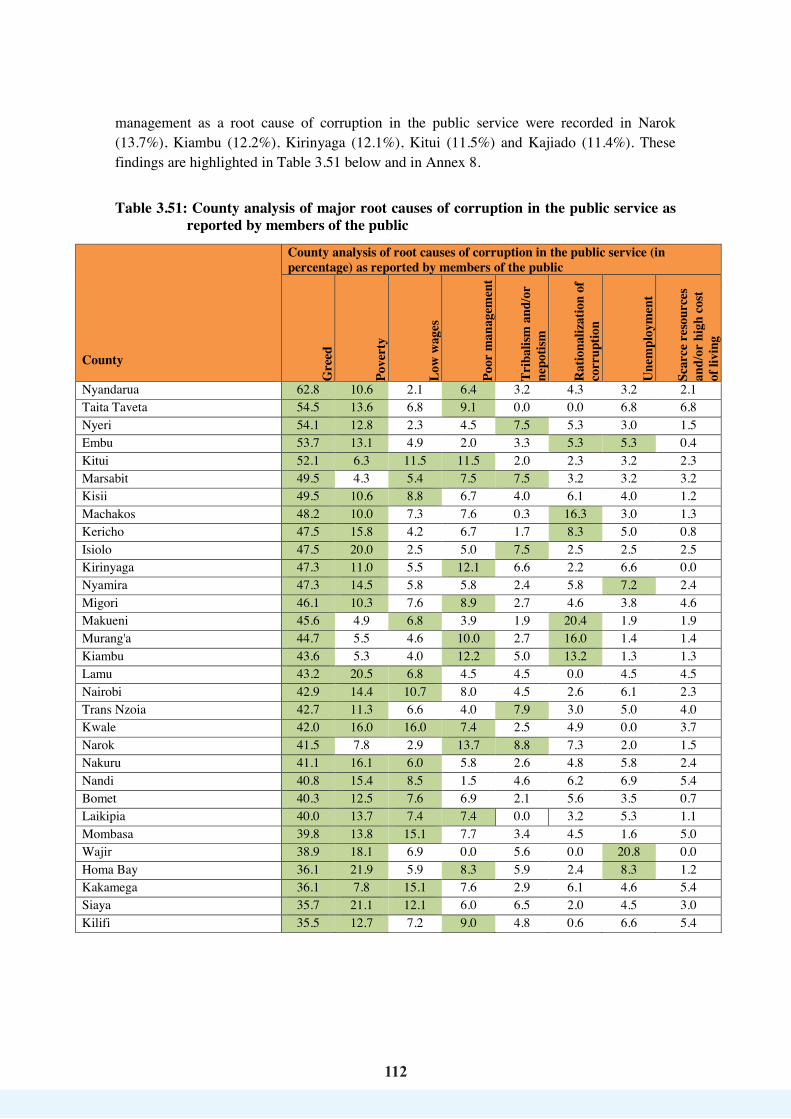
112
112
management as a root cause of corruption in the public service were recorded in Narok (13.7%), Kiambu (12.2%), Kirinyaga (12.1%), Kitui (11.5%) and Kajiado (11.4%). These findings are highlighted in Table 3.51 below and in Annex 8.
Table 3.51: County analysis of major root causes of corruption in the public service as reported by members of the public
County
County analysis of root causes of corruption in the public service (in percentage) as reported by members of the public
Gre
ed
Pove
rty
Low
wag
es
Poor
man
agem
ent
Trib
alism
and
/or
nepo
tism
Rat
iona
lizat
ion
of
corr
uptio
n
Une
mpl
oym
ent
Scar
ce r
esou
rces
an
d/or
hig
h co
st
of li
ving
Nyandarua 62.8 10.6 2.1 6.4 3.2 4.3 3.2 2.1 Taita Taveta 54.5 13.6 6.8 9.1 0.0 0.0 6.8 6.8 Nyeri 54.1 12.8 2.3 4.5 7.5 5.3 3.0 1.5 Embu 53.7 13.1 4.9 2.0 3.3 5.3 5.3 0.4 Kitui 52.1 6.3 11.5 11.5 2.0 2.3 3.2 2.3 Marsabit 49.5 4.3 5.4 7.5 7.5 3.2 3.2 3.2 Kisii 49.5 10.6 8.8 6.7 4.0 6.1 4.0 1.2 Machakos 48.2 10.0 7.3 7.6 0.3 16.3 3.0 1.3 Kericho 47.5 15.8 4.2 6.7 1.7 8.3 5.0 0.8 Isiolo 47.5 20.0 2.5 5.0 7.5 2.5 2.5 2.5 Kirinyaga 47.3 11.0 5.5 12.1 6.6 2.2 6.6 0.0 Nyamira 47.3 14.5 5.8 5.8 2.4 5.8 7.2 2.4 Migori 46.1 10.3 7.6 8.9 2.7 4.6 3.8 4.6 Makueni 45.6 4.9 6.8 3.9 1.9 20.4 1.9 1.9 Murang'a 44.7 5.5 4.6 10.0 2.7 16.0 1.4 1.4 Kiambu 43.6 5.3 4.0 12.2 5.0 13.2 1.3 1.3 Lamu 43.2 20.5 6.8 4.5 4.5 0.0 4.5 4.5 Nairobi 42.9 14.4 10.7 8.0 4.5 2.6 6.1 2.3 Trans Nzoia 42.7 11.3 6.6 4.0 7.9 3.0 5.0 4.0 Kwale 42.0 16.0 16.0 7.4 2.5 4.9 0.0 3.7 Narok 41.5 7.8 2.9 13.7 8.8 7.3 2.0 1.5 Nakuru 41.1 16.1 6.0 5.8 2.6 4.8 5.8 2.4 Nandi 40.8 15.4 8.5 1.5 4.6 6.2 6.9 5.4 Bomet 40.3 12.5 7.6 6.9 2.1 5.6 3.5 0.7 Laikipia 40.0 13.7 7.4 7.4 0.0 3.2 5.3 1.1 Mombasa 39.8 13.8 15.1 7.7 3.4 4.5 1.6 5.0 Wajir 38.9 18.1 6.9 0.0 5.6 0.0 20.8 0.0 Homa Bay 36.1 21.9 5.9 8.3 5.9 2.4 8.3 1.2 Kakamega 36.1 7.8 15.1 7.6 2.9 6.1 4.6 5.4 Siaya 35.7 21.1 12.1 6.0 6.5 2.0 4.5 3.0 Kilifi 35.5 12.7 7.2 9.0 4.8 0.6 6.6 5.4
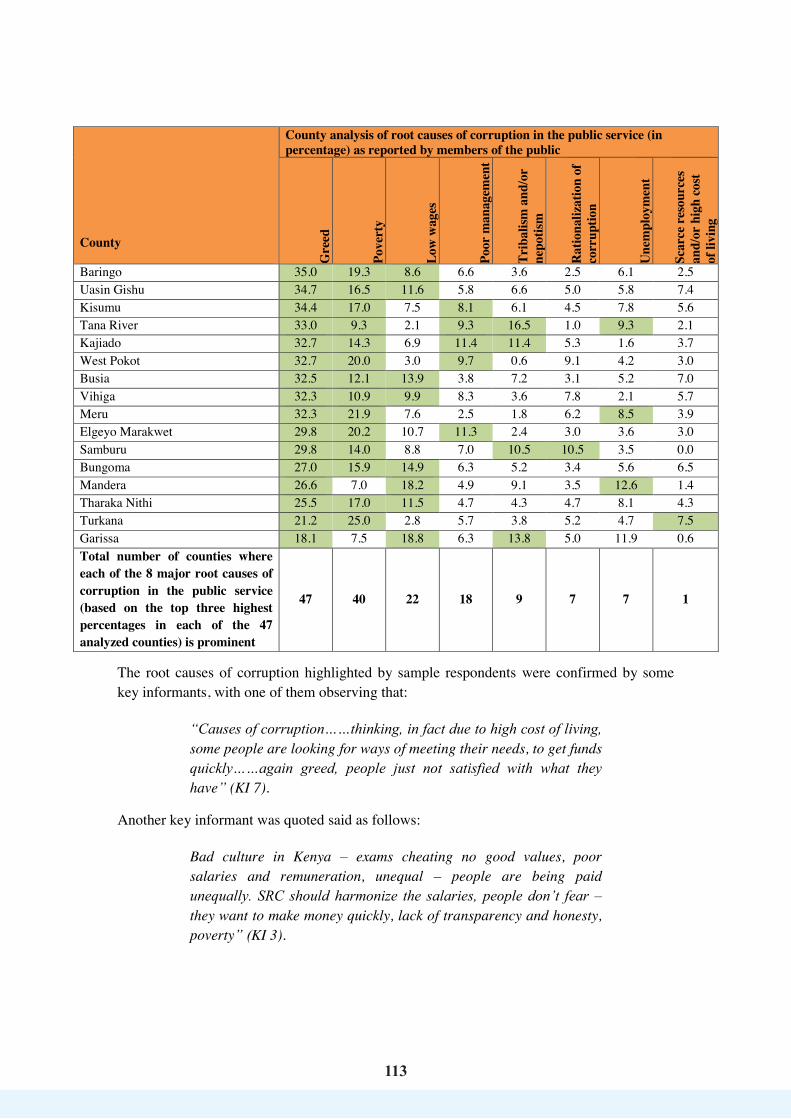
113
113
County
County analysis of root causes of corruption in the public service (in percentage) as reported by members of the public
Gre
ed
Pove
rty
Low
wag
es
Poor
man
agem
ent
Trib
alism
and
/or
nepo
tism
Rat
iona
lizat
ion
of
corr
uptio
n
Une
mpl
oym
ent
Scar
ce r
esou
rces
an
d/or
hig
h co
st
of li
ving
Baringo 35.0 19.3 8.6 6.6 3.6 2.5 6.1 2.5 Uasin Gishu 34.7 16.5 11.6 5.8 6.6 5.0 5.8 7.4 Kisumu 34.4 17.0 7.5 8.1 6.1 4.5 7.8 5.6 Tana River 33.0 9.3 2.1 9.3 16.5 1.0 9.3 2.1 Kajiado 32.7 14.3 6.9 11.4 11.4 5.3 1.6 3.7 West Pokot 32.7 20.0 3.0 9.7 0.6 9.1 4.2 3.0 Busia 32.5 12.1 13.9 3.8 7.2 3.1 5.2 7.0 Vihiga 32.3 10.9 9.9 8.3 3.6 7.8 2.1 5.7 Meru 32.3 21.9 7.6 2.5 1.8 6.2 8.5 3.9 Elgeyo Marakwet 29.8 20.2 10.7 11.3 2.4 3.0 3.6 3.0 Samburu 29.8 14.0 8.8 7.0 10.5 10.5 3.5 0.0 Bungoma 27.0 15.9 14.9 6.3 5.2 3.4 5.6 6.5 Mandera 26.6 7.0 18.2 4.9 9.1 3.5 12.6 1.4 Tharaka Nithi 25.5 17.0 11.5 4.7 4.3 4.7 8.1 4.3 Turkana 21.2 25.0 2.8 5.7 3.8 5.2 4.7 7.5 Garissa 18.1 7.5 18.8 6.3 13.8 5.0 11.9 0.6 Total number of counties where each of the 8 major root causes of corruption in the public service (based on the top three highest percentages in each of the 47 analyzed counties) is prominent
47 40 22 18 9 7 7 1
The root causes of corruption highlighted by sample respondents were confirmed by some key informants, with one of them observing that:
“Causes of corruption……thinking, in fact due to high cost of living, some people are looking for ways of meeting their needs, to get funds quickly……again greed, people just not satisfied with what they have” (KI 7).
Another key informant was quoted said as follows:
Bad culture in Kenya – exams cheating no good values, poor salaries and remuneration, unequal – people are being paid unequally. SRC should harmonize the salaries, people don’t fear – they want to make money quickly, lack of transparency and honesty, poverty” (KI 3).

114114
Greed is a societal moral decadence issue (Akech, 2011). So when the opportunity to exercise one’s discretion, financial and other authority and/or powers presents itself to a morally weak public official who has needs to meet with meager resources, stares at family poverty due to the limited resources (Manda, 2001) and/or has the allures of getting rich faster, the temptation to engage in corrupt practices becomes stronger and real. The implication of this finding is that relevant agencies need to prioritize the use of anti-corruption socio-cultural messaging approaches that sensitize and create awareness on different aspects of corruption, leadership and integrity and inculcate (for example through religious and learning institutions) a culture of legitimate hard work, upholding and practicing moral principles (such as kindness, honesty and tolerance and respect for others), patriotism and social justice (such as access, equity, citizens’ rights and participation in public services and/or opportunities). Some scholars negate the popular notion that corruption is a cultural, and specifically, a moral problem. Rather, they argue that corruption in the Kenyan Government is largely an institutional problem, rather than a cultural issue, attributable to the predominance of arbitrary power, especially in statutory order that grants executive, legislative, and judicial actors broad powers without establishing effective procedural mechanisms to circumscribe their exercise (Akech, 2011). CIPE (2011) asserts that corruption is majorly attributed to institutional failures. The Routine Activity Approach to social change and crime rates advanced by Cohen and Felson (1979) also asserts that most criminal acts happen because of, among others, the absence of capable guardians (such as an effective government crime control machinery) against crime. Therefore, these assertions relate to the study finding that poor management is one of the major root causes of corruption in the public service.
3.6.2 Reasons for engaging in corrupt practices in the public service 3.6.2.1 Reasons why some recipients of public services engage in corrupt practices The reasons (in order of prominence) that were identified by at least 1 out of 10 members of the public and/or public officials on why some recipients of public services engage in corrupt practices were: urgency of needed service (mentioned by 42.7% and 29.7% of the members of the public and public officials respectively); greed (reported by 27.1% and 14.0% of the public officials and members of the public respectively); culture of impunity (reported by 15.1% of the public officials); limited alternatives for improved livelihood (reported by 12.6% of the members of the public); and quest for financial freedom (reported by 9.8% of the public officials). The least reported reasons included lack of openness/transparency, endowment with resources which enable one to compromise public officials and being denied opportunity/voice to raise concerns. These findings are presented in Table 3.52 below.
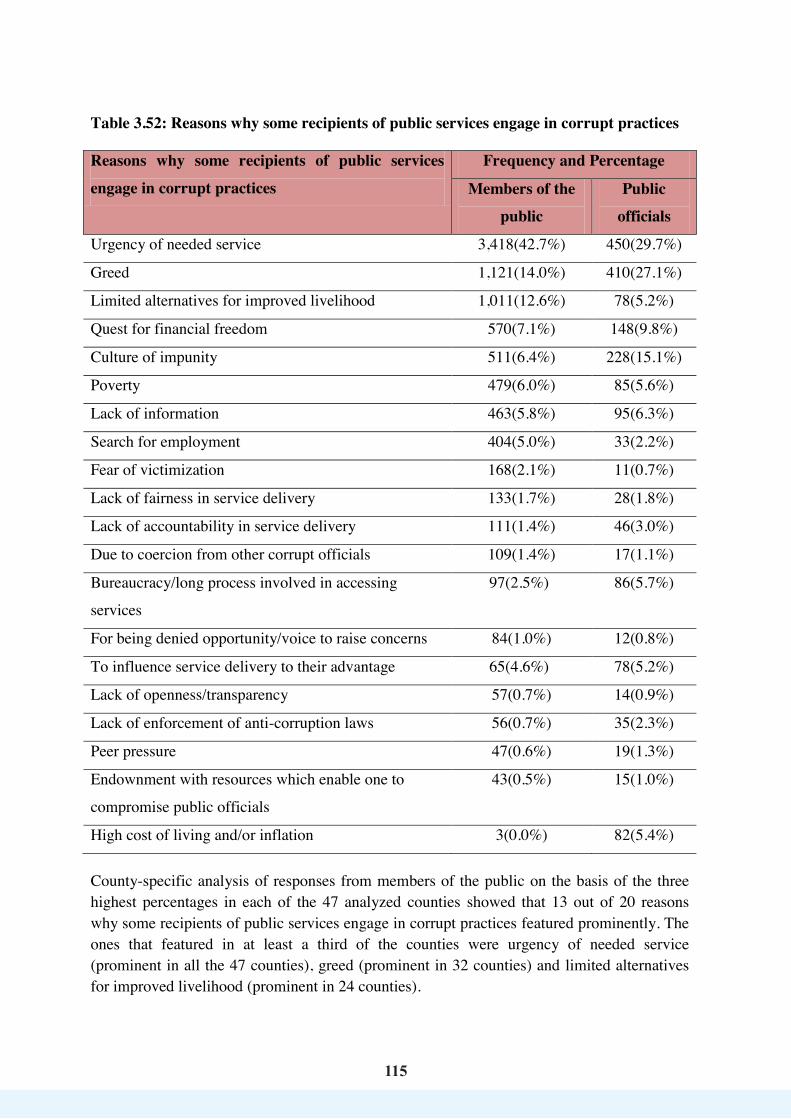
115
115
Table 3.52: Reasons why some recipients of public services engage in corrupt practices Reasons why some recipients of public services
engage in corrupt practices
Frequency and Percentage
Members of the
public
Public
officials
Urgency of needed service 3,418(42.7%) 450(29.7%)
Greed 1,121(14.0%) 410(27.1%)
Limited alternatives for improved livelihood 1,011(12.6%) 78(5.2%)
Quest for financial freedom 570(7.1%) 148(9.8%)
Culture of impunity 511(6.4%) 228(15.1%)
Poverty 479(6.0%) 85(5.6%)
Lack of information 463(5.8%) 95(6.3%)
Search for employment 404(5.0%) 33(2.2%)
Fear of victimization 168(2.1%) 11(0.7%)
Lack of fairness in service delivery 133(1.7%) 28(1.8%)
Lack of accountability in service delivery 111(1.4%) 46(3.0%)
Due to coercion from other corrupt officials 109(1.4%) 17(1.1%)
Bureaucracy/long process involved in accessing
services
1 97(2.5%) 86(5.7%)
For being denied opportunity/voice to raise concerns 84(1.0%) 12(0.8%)
To influence service delivery to their advantage 3 65(4.6%) 78(5.2%)
Lack of openness/transparency 57(0.7%) 14(0.9%)
Lack of enforcement of anti-corruption laws 56(0.7%) 35(2.3%)
Peer pressure 47(0.6%) 19(1.3%)
Endownment with resources which enable one to
compromise public officials
43(0.5%) 15(1.0%)
High cost of living and/or inflation 3(0.0%) 82(5.4%) County-specific analysis of responses from members of the public on the basis of the three highest percentages in each of the 47 analyzed counties showed that 13 out of 20 reasons why some recipients of public services engage in corrupt practices featured prominently. The ones that featured in at least a third of the counties were urgency of needed service (prominent in all the 47 counties), greed (prominent in 32 counties) and limited alternatives for improved livelihood (prominent in 24 counties).
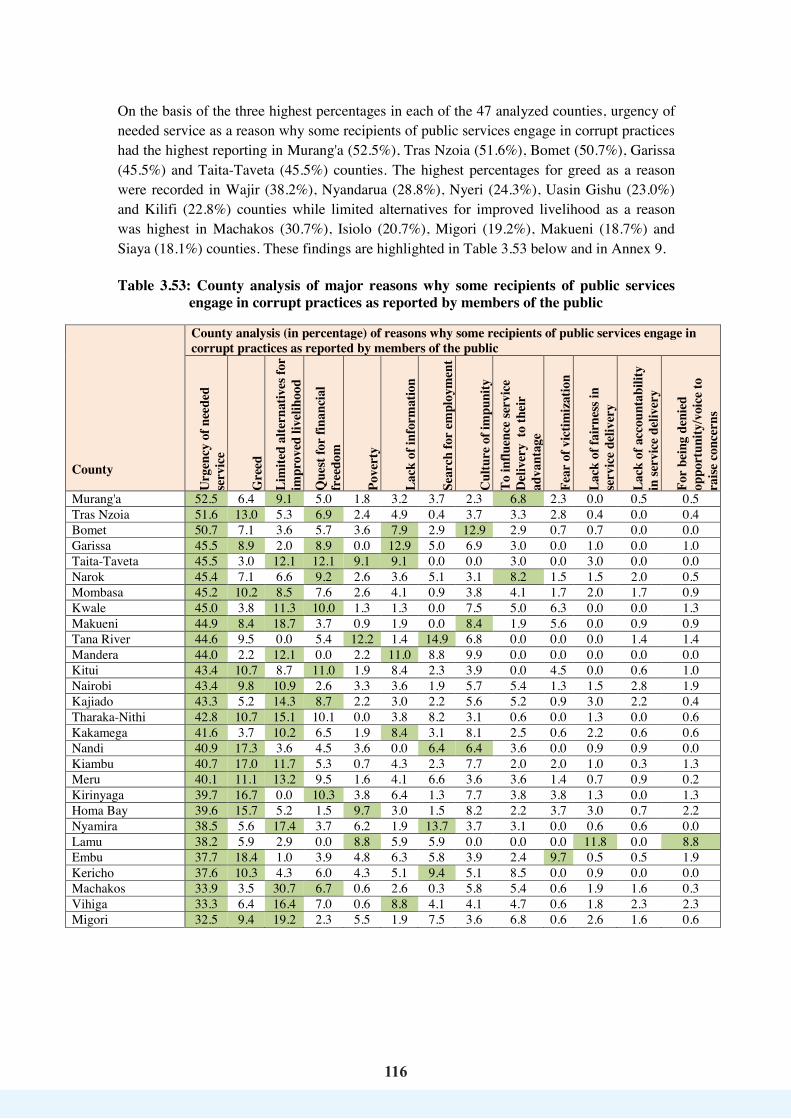
116
116
On the basis of the three highest percentages in each of the 47 analyzed counties, urgency of needed service as a reason why some recipients of public services engage in corrupt practices had the highest reporting in Murang'a (52.5%), Tras Nzoia (51.6%), Bomet (50.7%), Garissa (45.5%) and Taita-Taveta (45.5%) counties. The highest percentages for greed as a reason were recorded in Wajir (38.2%), Nyandarua (28.8%), Nyeri (24.3%), Uasin Gishu (23.0%) and Kilifi (22.8%) counties while limited alternatives for improved livelihood as a reason was highest in Machakos (30.7%), Isiolo (20.7%), Migori (19.2%), Makueni (18.7%) and Siaya (18.1%) counties. These findings are highlighted in Table 3.53 below and in Annex 9. Table 3.53: County analysis of major reasons why some recipients of public services
engage in corrupt practices as reported by members of the public
County
County analysis (in percentage) of reasons why some recipients of public services engage in corrupt practices as reported by members of the public
Urg
ency
of n
eede
d
serv
ice
Gre
ed
Lim
ited
alte
rnat
ives
for
impr
oved
live
lihoo
d
Que
st fo
r fin
anci
al
free
dom
Pove
rty
Lack
of i
nfor
mat
ion
Sear
ch fo
r em
ploy
men
t
Cul
ture
of i
mpu
nity
To
influ
ence
serv
ice
D
eliv
ery
to th
eir
adva
ntag
e
Fear
of v
ictim
izat
ion
Lack
of f
airn
ess i
n
serv
ice
deliv
ery
Lack
of a
ccou
ntab
ility
in
serv
ice
deliv
ery
For
bein
g de
nied
op
port
unity
/voi
ce to
ra
ise c
once
rns
Murang'a 52.5 6.4 9.1 5.0 1.8 3.2 3.7 2.3 6.8 2.3 0.0 0.5 0.5 Tras Nzoia 51.6 13.0 5.3 6.9 2.4 4.9 0.4 3.7 3.3 2.8 0.4 0.0 0.4 Bomet 50.7 7.1 3.6 5.7 3.6 7.9 2.9 12.9 2.9 0.7 0.7 0.0 0.0 Garissa 45.5 8.9 2.0 8.9 0.0 12.9 5.0 6.9 3.0 0.0 1.0 0.0 1.0 Taita-Taveta 45.5 3.0 12.1 12.1 9.1 9.1 0.0 0.0 3.0 0.0 3.0 0.0 0.0 Narok 45.4 7.1 6.6 9.2 2.6 3.6 5.1 3.1 8.2 1.5 1.5 2.0 0.5 Mombasa 45.2 10.2 8.5 7.6 2.6 4.1 0.9 3.8 4.1 1.7 2.0 1.7 0.9 Kwale 45.0 3.8 11.3 10.0 1.3 1.3 0.0 7.5 5.0 6.3 0.0 0.0 1.3 Makueni 44.9 8.4 18.7 3.7 0.9 1.9 0.0 8.4 1.9 5.6 0.0 0.9 0.9 Tana River 44.6 9.5 0.0 5.4 12.2 1.4 14.9 6.8 0.0 0.0 0.0 1.4 1.4 Mandera 44.0 2.2 12.1 0.0 2.2 11.0 8.8 9.9 0.0 0.0 0.0 0.0 0.0 Kitui 43.4 10.7 8.7 11.0 1.9 8.4 2.3 3.9 0.0 4.5 0.0 0.6 1.0 Nairobi 43.4 9.8 10.9 2.6 3.3 3.6 1.9 5.7 5.4 1.3 1.5 2.8 1.9 Kajiado 43.3 5.2 14.3 8.7 2.2 3.0 2.2 5.6 5.2 0.9 3.0 2.2 0.4 Tharaka-Nithi 42.8 10.7 15.1 10.1 0.0 3.8 8.2 3.1 0.6 0.0 1.3 0.0 0.6 Kakamega 41.6 3.7 10.2 6.5 1.9 8.4 3.1 8.1 2.5 0.6 2.2 0.6 0.6 Nandi 40.9 17.3 3.6 4.5 3.6 0.0 6.4 6.4 3.6 0.0 0.9 0.9 0.0 Kiambu 40.7 17.0 11.7 5.3 0.7 4.3 2.3 7.7 2.0 2.0 1.0 0.3 1.3 Meru 40.1 11.1 13.2 9.5 1.6 4.1 6.6 3.6 3.6 1.4 0.7 0.9 0.2 Kirinyaga 39.7 16.7 0.0 10.3 3.8 6.4 1.3 7.7 3.8 3.8 1.3 0.0 1.3 Homa Bay 39.6 15.7 5.2 1.5 9.7 3.0 1.5 8.2 2.2 3.7 3.0 0.7 2.2 Nyamira 38.5 5.6 17.4 3.7 6.2 1.9 13.7 3.7 3.1 0.0 0.6 0.6 0.0 Lamu 38.2 5.9 2.9 0.0 8.8 5.9 5.9 0.0 0.0 0.0 11.8 0.0 8.8 Embu 37.7 18.4 1.0 3.9 4.8 6.3 5.8 3.9 2.4 9.7 0.5 0.5 1.9 Kericho 37.6 10.3 4.3 6.0 4.3 5.1 9.4 5.1 8.5 0.0 0.9 0.0 0.0 Machakos 33.9 3.5 30.7 6.7 0.6 2.6 0.3 5.8 5.4 0.6 1.9 1.6 0.3 Vihiga 33.3 6.4 16.4 7.0 0.6 8.8 4.1 4.1 4.7 0.6 1.8 2.3 2.3 Migori 32.5 9.4 19.2 2.3 5.5 1.9 7.5 3.6 6.8 0.6 2.6 1.6 0.6
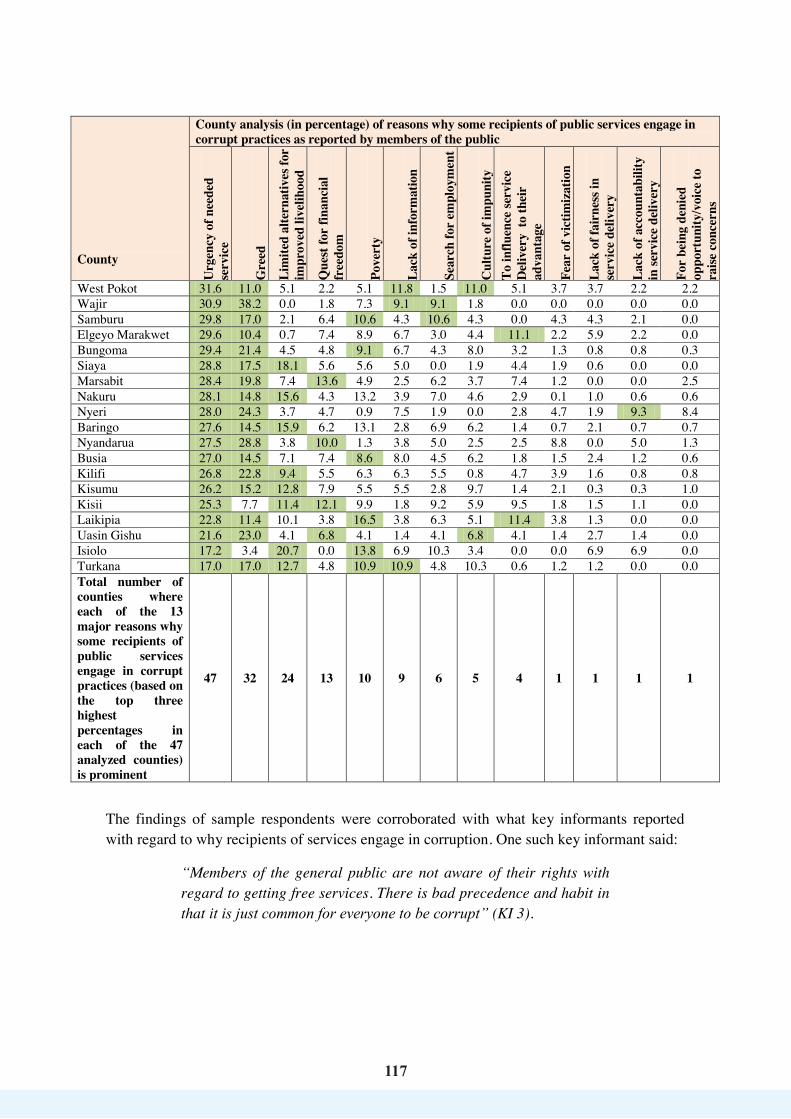
117
117
County
County analysis (in percentage) of reasons why some recipients of public services engage in corrupt practices as reported by members of the public
Urg
ency
of n
eede
d
serv
ice
Gre
ed
Lim
ited
alte
rnat
ives
for
impr
oved
live
lihoo
d
Que
st fo
r fin
anci
al
free
dom
Pove
rty
Lack
of i
nfor
mat
ion
Sear
ch fo
r em
ploy
men
t
Cul
ture
of i
mpu
nity
To
influ
ence
serv
ice
D
eliv
ery
to th
eir
adva
ntag
e
Fear
of v
ictim
izat
ion
Lack
of f
airn
ess i
n
serv
ice
deliv
ery
Lack
of a
ccou
ntab
ility
in
serv
ice
deliv
ery
For
bein
g de
nied
op
port
unity
/voi
ce to
ra
ise c
once
rns
West Pokot 31.6 11.0 5.1 2.2 5.1 11.8 1.5 11.0 5.1 3.7 3.7 2.2 2.2 Wajir 30.9 38.2 0.0 1.8 7.3 9.1 9.1 1.8 0.0 0.0 0.0 0.0 0.0 Samburu 29.8 17.0 2.1 6.4 10.6 4.3 10.6 4.3 0.0 4.3 4.3 2.1 0.0 Elgeyo Marakwet 29.6 10.4 0.7 7.4 8.9 6.7 3.0 4.4 11.1 2.2 5.9 2.2 0.0 Bungoma 29.4 21.4 4.5 4.8 9.1 6.7 4.3 8.0 3.2 1.3 0.8 0.8 0.3 Siaya 28.8 17.5 18.1 5.6 5.6 5.0 0.0 1.9 4.4 1.9 0.6 0.0 0.0 Marsabit 28.4 19.8 7.4 13.6 4.9 2.5 6.2 3.7 7.4 1.2 0.0 0.0 2.5 Nakuru 28.1 14.8 15.6 4.3 13.2 3.9 7.0 4.6 2.9 0.1 1.0 0.6 0.6 Nyeri 28.0 24.3 3.7 4.7 0.9 7.5 1.9 0.0 2.8 4.7 1.9 9.3 8.4 Baringo 27.6 14.5 15.9 6.2 13.1 2.8 6.9 6.2 1.4 0.7 2.1 0.7 0.7 Nyandarua 27.5 28.8 3.8 10.0 1.3 3.8 5.0 2.5 2.5 8.8 0.0 5.0 1.3 Busia 27.0 14.5 7.1 7.4 8.6 8.0 4.5 6.2 1.8 1.5 2.4 1.2 0.6 Kilifi 26.8 22.8 9.4 5.5 6.3 6.3 5.5 0.8 4.7 3.9 1.6 0.8 0.8 Kisumu 26.2 15.2 12.8 7.9 5.5 5.5 2.8 9.7 1.4 2.1 0.3 0.3 1.0 Kisii 25.3 7.7 11.4 12.1 9.9 1.8 9.2 5.9 9.5 1.8 1.5 1.1 0.0 Laikipia 22.8 11.4 10.1 3.8 16.5 3.8 6.3 5.1 11.4 3.8 1.3 0.0 0.0 Uasin Gishu 21.6 23.0 4.1 6.8 4.1 1.4 4.1 6.8 4.1 1.4 2.7 1.4 0.0 Isiolo 17.2 3.4 20.7 0.0 13.8 6.9 10.3 3.4 0.0 0.0 6.9 6.9 0.0 Turkana 17.0 17.0 12.7 4.8 10.9 10.9 4.8 10.3 0.6 1.2 1.2 0.0 0.0 Total number of counties where each of the 13 major reasons why some recipients of public services engage in corrupt practices (based on the top three highest percentages in each of the 47 analyzed counties) is prominent
47 32 24 13 10 9 6 5 4 1 1 1 1
The findings of sample respondents were corroborated with what key informants reported with regard to why recipients of services engage in corruption. One such key informant said:
“Members of the general public are not aware of their rights with regard to getting free services. There is bad precedence and habit in that it is just common for everyone to be corrupt” (KI 3).
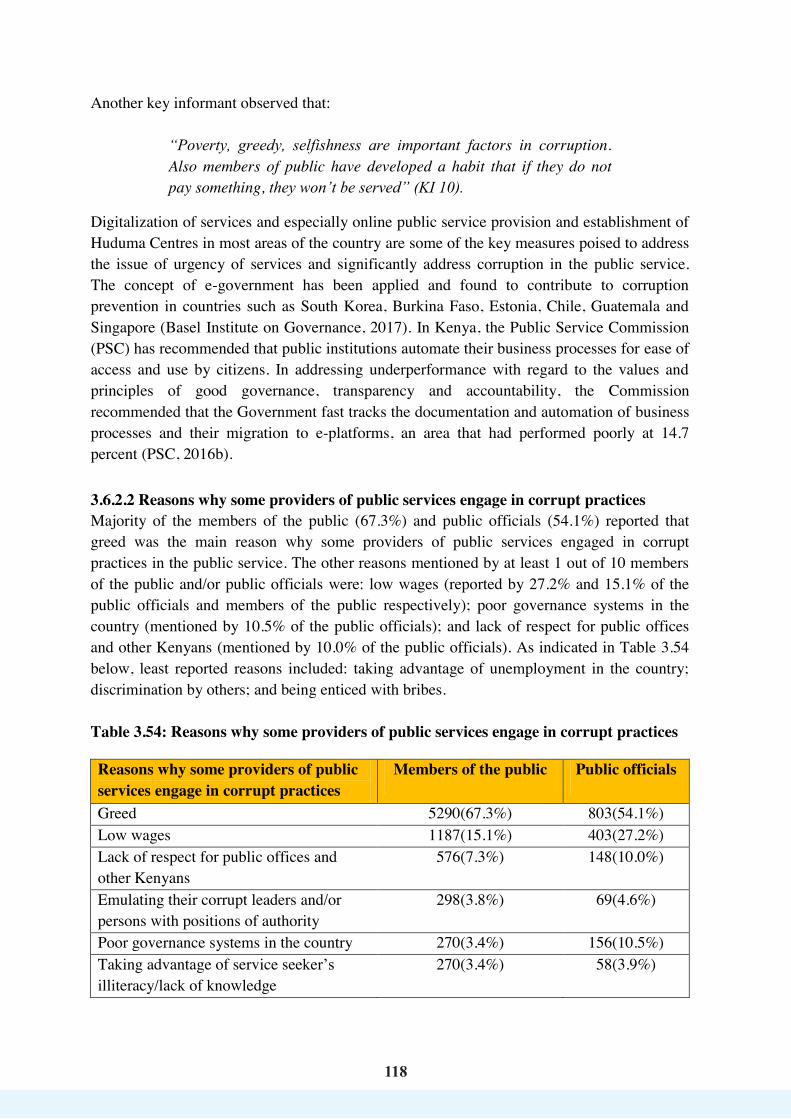
118
118
Another key informant observed that:
“Poverty, greedy, selfishness are important factors in corruption. Also members of public have developed a habit that if they do not pay something, they won’t be served” (KI 10).
Digitalization of services and especially online public service provision and establishment of Huduma Centres in most areas of the country are some of the key measures poised to address the issue of urgency of services and significantly address corruption in the public service. The concept of e-government has been applied and found to contribute to corruption prevention in countries such as South Korea, Burkina Faso, Estonia, Chile, Guatemala and Singapore (Basel Institute on Governance, 2017). In Kenya, the Public Service Commission (PSC) has recommended that public institutions automate their business processes for ease of access and use by citizens. In addressing underperformance with regard to the values and principles of good governance, transparency and accountability, the Commission recommended that the Government fast tracks the documentation and automation of business processes and their migration to e-platforms, an area that had performed poorly at 14.7 percent (PSC, 2016b). 3.6.2.2 Reasons why some providers of public services engage in corrupt practices Majority of the members of the public (67.3%) and public officials (54.1%) reported that greed was the main reason why some providers of public services engaged in corrupt practices in the public service. The other reasons mentioned by at least 1 out of 10 members of the public and/or public officials were: low wages (reported by 27.2% and 15.1% of the public officials and members of the public respectively); poor governance systems in the country (mentioned by 10.5% of the public officials); and lack of respect for public offices and other Kenyans (mentioned by 10.0% of the public officials). As indicated in Table 3.54 below, least reported reasons included: taking advantage of unemployment in the country; discrimination by others; and being enticed with bribes. Table 3.54: Reasons why some providers of public services engage in corrupt practices Reasons why some providers of public services engage in corrupt practices
Members of the public Public officials
Greed 5290(67.3%) 803(54.1%) Low wages 1187(15.1%) 403(27.2%) Lack of respect for public offices and other Kenyans
576(7.3%) 148(10.0%)
Emulating their corrupt leaders and/or persons with positions of authority
298(3.8%) 69(4.6%)
Poor governance systems in the country 270(3.4%) 156(10.5%) Taking advantage of service seeker’s illiteracy/lack of knowledge
270(3.4%) 58(3.9%)
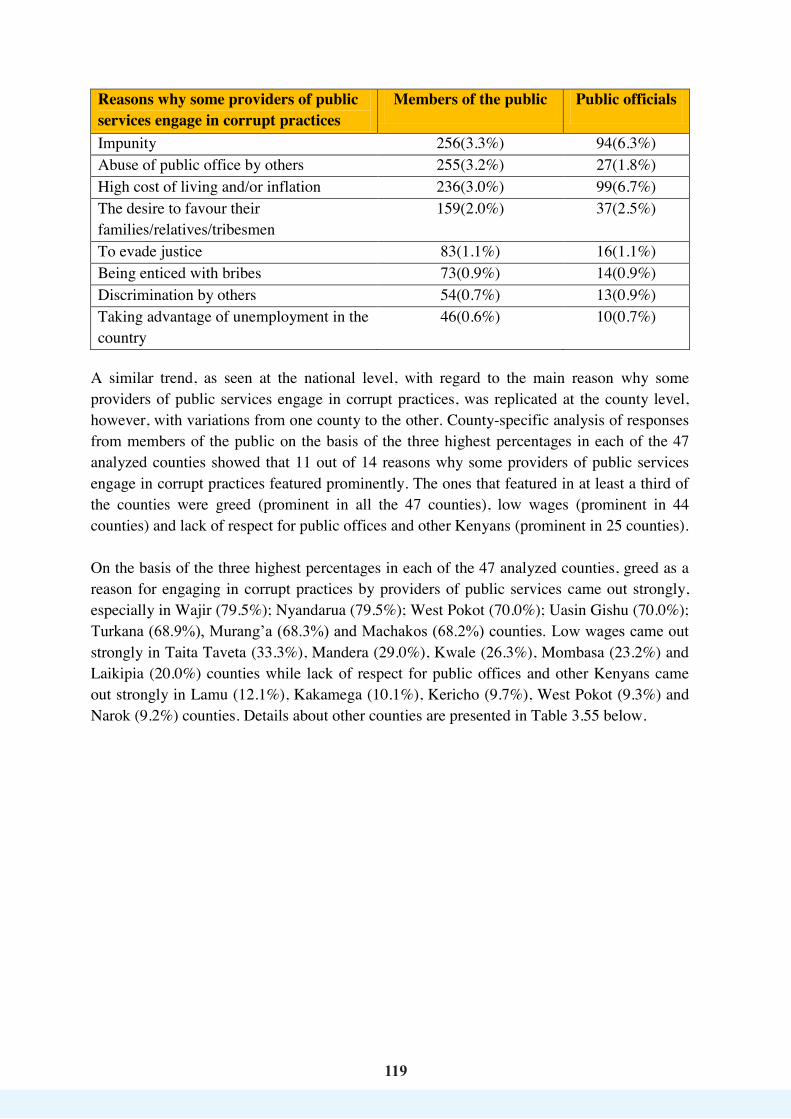
119
119
Reasons why some providers of public services engage in corrupt practices
Members of the public Public officials
Impunity 256(3.3%) 94(6.3%) Abuse of public office by others 255(3.2%) 27(1.8%) High cost of living and/or inflation 236(3.0%) 99(6.7%) The desire to favour their families/relatives/tribesmen
159(2.0%) 37(2.5%)
To evade justice 83(1.1%) 16(1.1%) Being enticed with bribes 73(0.9%) 14(0.9%) Discrimination by others 54(0.7%) 13(0.9%) Taking advantage of unemployment in the country
46(0.6%) 10(0.7%)
A similar trend, as seen at the national level, with regard to the main reason why some providers of public services engage in corrupt practices, was replicated at the county level, however, with variations from one county to the other. County-specific analysis of responses from members of the public on the basis of the three highest percentages in each of the 47 analyzed counties showed that 11 out of 14 reasons why some providers of public services engage in corrupt practices featured prominently. The ones that featured in at least a third of the counties were greed (prominent in all the 47 counties), low wages (prominent in 44 counties) and lack of respect for public offices and other Kenyans (prominent in 25 counties). On the basis of the three highest percentages in each of the 47 analyzed counties, greed as a reason for engaging in corrupt practices by providers of public services came out strongly, especially in Wajir (79.5%); Nyandarua (79.5%); West Pokot (70.0%); Uasin Gishu (70.0%); Turkana (68.9%), Murang’a (68.3%) and Machakos (68.2%) counties. Low wages came out strongly in Taita Taveta (33.3%), Mandera (29.0%), Kwale (26.3%), Mombasa (23.2%) and Laikipia (20.0%) counties while lack of respect for public offices and other Kenyans came out strongly in Lamu (12.1%), Kakamega (10.1%), Kericho (9.7%), West Pokot (9.3%) and Narok (9.2%) counties. Details about other counties are presented in Table 3.55 below.
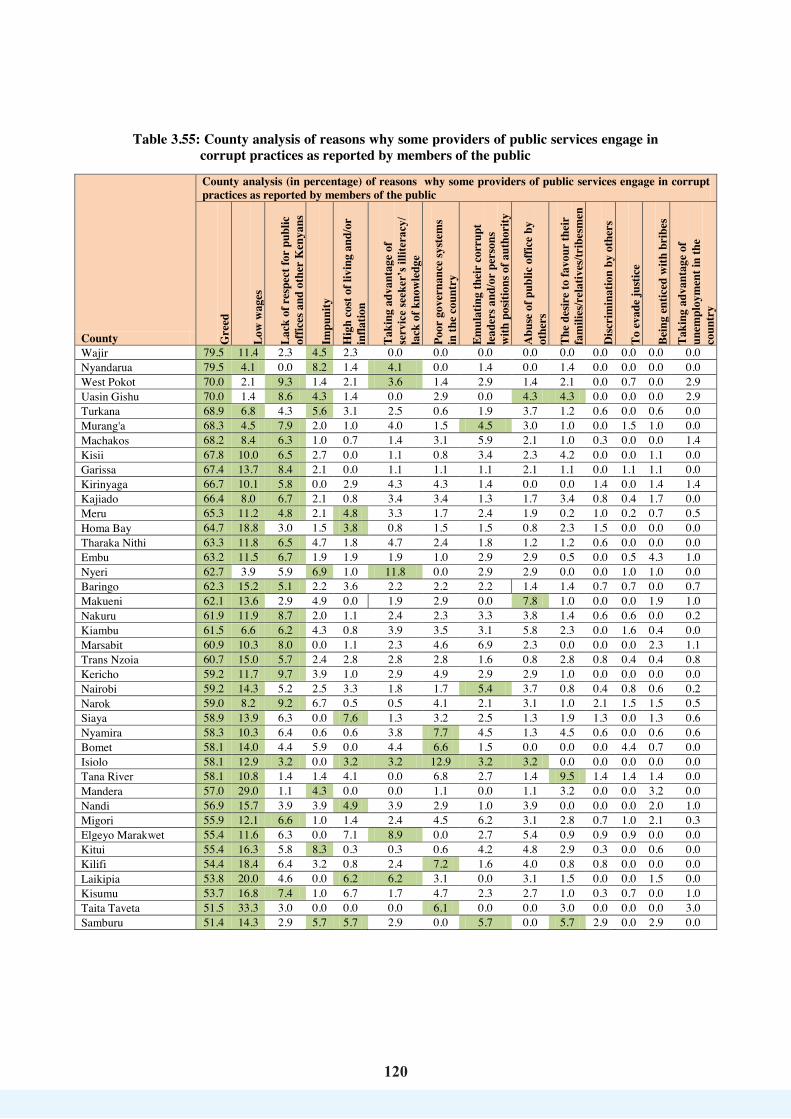
120
120
Table 3.55: County analysis of reasons why some providers of public services engage in corrupt practices as reported by members of the public
County
County analysis (in percentage) of reasons why some providers of public services engage in corrupt practices as reported by members of the public
Gre
ed
Low
wag
es
Lack
of r
espe
ct fo
r pu
blic
of
fices
and
oth
er K
enya
ns
Impu
nity
Hig
h co
st o
f liv
ing
and/
or
infla
tion
Taki
ng a
dvan
tage
of
serv
ice
seek
er’s
illit
erac
y/
lack
of k
now
ledg
e
Poor
gov
erna
nce
syst
ems
in th
e co
untr
y
Emul
atin
g th
eir
corr
upt
lead
ers a
nd/o
r pe
rson
s w
ith p
ositi
ons o
f aut
hori
ty
Abu
se o
f pub
lic o
ffice
by
ot
hers
The
desir
e to
favo
ur th
eir
fam
ilies
/rel
ativ
es/tr
ibes
men
Disc
rim
inat
ion
by o
ther
s
To e
vade
just
ice
Bein
g en
ticed
with
bri
bes
Taki
ng a
dvan
tage
of
unem
ploy
men
t in
the
co
untr
y
Wajir 79.5 11.4 2.3 4.5 2.3 0.0 0.0 0.0 0.0 0.0 0.0 0.0 0.0 0.0 Nyandarua 79.5 4.1 0.0 8.2 1.4 4.1 0.0 1.4 0.0 1.4 0.0 0.0 0.0 0.0 West Pokot 70.0 2.1 9.3 1.4 2.1 3.6 1.4 2.9 1.4 2.1 0.0 0.7 0.0 2.9 Uasin Gishu 70.0 1.4 8.6 4.3 1.4 0.0 2.9 0.0 4.3 4.3 0.0 0.0 0.0 2.9 Turkana 68.9 6.8 4.3 5.6 3.1 2.5 0.6 1.9 3.7 1.2 0.6 0.0 0.6 0.0 Murang'a 68.3 4.5 7.9 2.0 1.0 4.0 1.5 4.5 3.0 1.0 0.0 1.5 1.0 0.0 Machakos 68.2 8.4 6.3 1.0 0.7 1.4 3.1 5.9 2.1 1.0 0.3 0.0 0.0 1.4 Kisii 67.8 10.0 6.5 2.7 0.0 1.1 0.8 3.4 2.3 4.2 0.0 0.0 1.1 0.0 Garissa 67.4 13.7 8.4 2.1 0.0 1.1 1.1 1.1 2.1 1.1 0.0 1.1 1.1 0.0 Kirinyaga 66.7 10.1 5.8 0.0 2.9 4.3 4.3 1.4 0.0 0.0 1.4 0.0 1.4 1.4 Kajiado 66.4 8.0 6.7 2.1 0.8 3.4 3.4 1.3 1.7 3.4 0.8 0.4 1.7 0.0 Meru 65.3 11.2 4.8 2.1 4.8 3.3 1.7 2.4 1.9 0.2 1.0 0.2 0.7 0.5 Homa Bay 64.7 18.8 3.0 1.5 3.8 0.8 1.5 1.5 0.8 2.3 1.5 0.0 0.0 0.0 Tharaka Nithi 63.3 11.8 6.5 4.7 1.8 4.7 2.4 1.8 1.2 1.2 0.6 0.0 0.0 0.0 Embu 63.2 11.5 6.7 1.9 1.9 1.9 1.0 2.9 2.9 0.5 0.0 0.5 4.3 1.0 Nyeri 62.7 3.9 5.9 6.9 1.0 11.8 0.0 2.9 2.9 0.0 0.0 1.0 1.0 0.0 Baringo 62.3 15.2 5.1 2.2 3.6 2.2 2.2 2.2 1.4 1.4 0.7 0.7 0.0 0.7 Makueni 62.1 13.6 2.9 4.9 0.0 1.9 2.9 0.0 7.8 1.0 0.0 0.0 1.9 1.0 Nakuru 61.9 11.9 8.7 2.0 1.1 2.4 2.3 3.3 3.8 1.4 0.6 0.6 0.0 0.2 Kiambu 61.5 6.6 6.2 4.3 0.8 3.9 3.5 3.1 5.8 2.3 0.0 1.6 0.4 0.0 Marsabit 60.9 10.3 8.0 0.0 1.1 2.3 4.6 6.9 2.3 0.0 0.0 0.0 2.3 1.1 Trans Nzoia 60.7 15.0 5.7 2.4 2.8 2.8 2.8 1.6 0.8 2.8 0.8 0.4 0.4 0.8 Kericho 59.2 11.7 9.7 3.9 1.0 2.9 4.9 2.9 2.9 1.0 0.0 0.0 0.0 0.0 Nairobi 59.2 14.3 5.2 2.5 3.3 1.8 1.7 5.4 3.7 0.8 0.4 0.8 0.6 0.2 Narok 59.0 8.2 9.2 6.7 0.5 0.5 4.1 2.1 3.1 1.0 2.1 1.5 1.5 0.5 Siaya 58.9 13.9 6.3 0.0 7.6 1.3 3.2 2.5 1.3 1.9 1.3 0.0 1.3 0.6 Nyamira 58.3 10.3 6.4 0.6 0.6 3.8 7.7 4.5 1.3 4.5 0.6 0.0 0.6 0.6 Bomet 58.1 14.0 4.4 5.9 0.0 4.4 6.6 1.5 0.0 0.0 0.0 4.4 0.7 0.0 Isiolo 58.1 12.9 3.2 0.0 3.2 3.2 12.9 3.2 3.2 0.0 0.0 0.0 0.0 0.0 Tana River 58.1 10.8 1.4 1.4 4.1 0.0 6.8 2.7 1.4 9.5 1.4 1.4 1.4 0.0 Mandera 57.0 29.0 1.1 4.3 0.0 0.0 1.1 0.0 1.1 3.2 0.0 0.0 3.2 0.0 Nandi 56.9 15.7 3.9 3.9 4.9 3.9 2.9 1.0 3.9 0.0 0.0 0.0 2.0 1.0 Migori 55.9 12.1 6.6 1.0 1.4 2.4 4.5 6.2 3.1 2.8 0.7 1.0 2.1 0.3 Elgeyo Marakwet 55.4 11.6 6.3 0.0 7.1 8.9 0.0 2.7 5.4 0.9 0.9 0.9 0.0 0.0 Kitui 55.4 16.3 5.8 8.3 0.3 0.3 0.6 4.2 4.8 2.9 0.3 0.0 0.6 0.0 Kilifi 54.4 18.4 6.4 3.2 0.8 2.4 7.2 1.6 4.0 0.8 0.8 0.0 0.0 0.0 Laikipia 53.8 20.0 4.6 0.0 6.2 6.2 3.1 0.0 3.1 1.5 0.0 0.0 1.5 0.0 Kisumu 53.7 16.8 7.4 1.0 6.7 1.7 4.7 2.3 2.7 1.0 0.3 0.7 0.0 1.0 Taita Taveta 51.5 33.3 3.0 0.0 0.0 0.0 6.1 0.0 0.0 3.0 0.0 0.0 0.0 3.0 Samburu 51.4 14.3 2.9 5.7 5.7 2.9 0.0 5.7 0.0 5.7 2.9 0.0 2.9 0.0
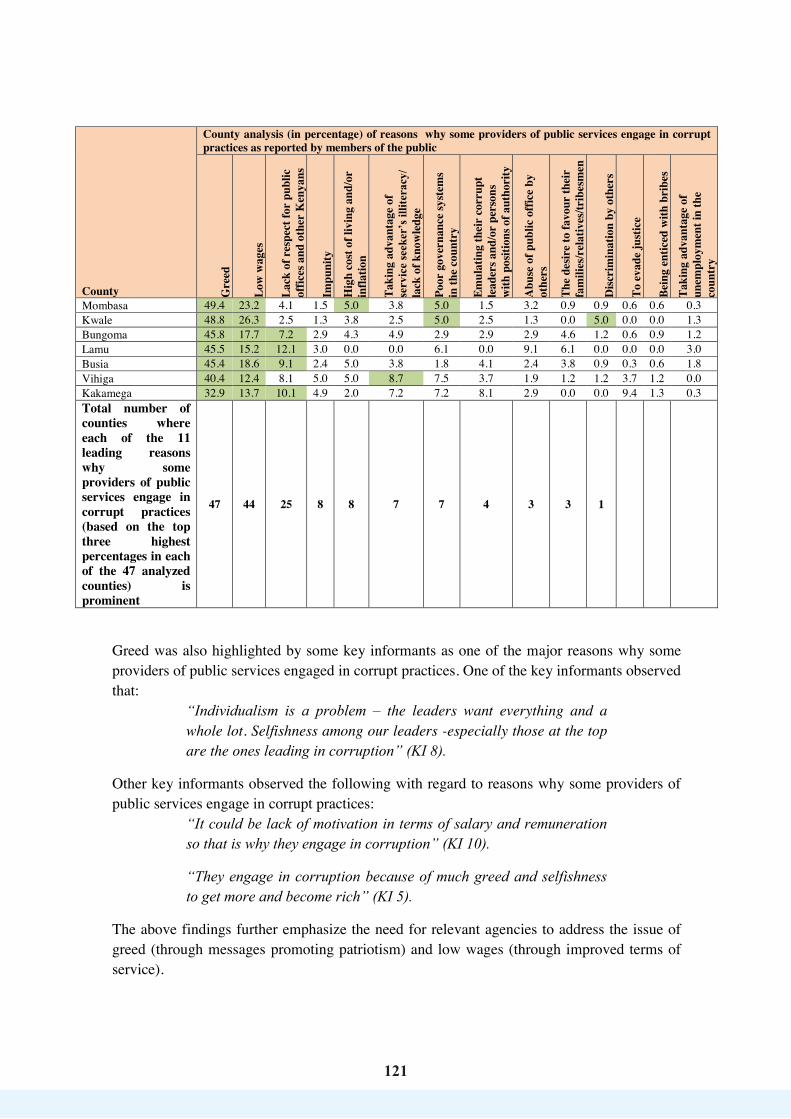
121
121
County
County analysis (in percentage) of reasons why some providers of public services engage in corrupt practices as reported by members of the public
Gre
ed
Low
wag
es
Lack
of r
espe
ct fo
r pu
blic
of
fices
and
oth
er K
enya
ns
Impu
nity
Hig
h co
st o
f liv
ing
and/
or
infla
tion
Taki
ng a
dvan
tage
of
serv
ice
seek
er’s
illit
erac
y/
lack
of k
now
ledg
e
Poor
gov
erna
nce
syst
ems
in th
e co
untr
y
Emul
atin
g th
eir
corr
upt
lead
ers a
nd/o
r pe
rson
s w
ith p
ositi
ons o
f aut
hori
ty
Abu
se o
f pub
lic o
ffice
by
ot
hers
The
desir
e to
favo
ur th
eir
fam
ilies
/rel
ativ
es/tr
ibes
men
Disc
rim
inat
ion
by o
ther
s
To e
vade
just
ice
Bein
g en
ticed
with
bri
bes
Taki
ng a
dvan
tage
of
unem
ploy
men
t in
the
co
untr
y
Mombasa 49.4 23.2 4.1 1.5 5.0 3.8 5.0 1.5 3.2 0.9 0.9 0.6 0.6 0.3 Kwale 48.8 26.3 2.5 1.3 3.8 2.5 5.0 2.5 1.3 0.0 5.0 0.0 0.0 1.3 Bungoma 45.8 17.7 7.2 2.9 4.3 4.9 2.9 2.9 2.9 4.6 1.2 0.6 0.9 1.2 Lamu 45.5 15.2 12.1 3.0 0.0 0.0 6.1 0.0 9.1 6.1 0.0 0.0 0.0 3.0 Busia 45.4 18.6 9.1 2.4 5.0 3.8 1.8 4.1 2.4 3.8 0.9 0.3 0.6 1.8 Vihiga 40.4 12.4 8.1 5.0 5.0 8.7 7.5 3.7 1.9 1.2 1.2 3.7 1.2 0.0 Kakamega 32.9 13.7 10.1 4.9 2.0 7.2 7.2 8.1 2.9 0.0 0.0 9.4 1.3 0.3 Total number of counties where each of the 11 leading reasons why some providers of public services engage in corrupt practices (based on the top three highest percentages in each of the 47 analyzed counties) is prominent
47 44 25 8 8 7 7 4 3 3 1
Greed was also highlighted by some key informants as one of the major reasons why some providers of public services engaged in corrupt practices. One of the key informants observed that:
“Individualism is a problem – the leaders want everything and a whole lot. Selfishness among our leaders -especially those at the top are the ones leading in corruption” (KI 8).
Other key informants observed the following with regard to reasons why some providers of public services engage in corrupt practices:
“It could be lack of motivation in terms of salary and remuneration so that is why they engage in corruption” (KI 10).
“They engage in corruption because of much greed and selfishness to get more and become rich” (KI 5).
The above findings further emphasize the need for relevant agencies to address the issue of greed (through messages promoting patriotism) and low wages (through improved terms of service).

122
122
3.7 Consequences of Corruption in the Public Service A number of major consequences of corruption in the public service were pointed out by the respondents. For instance, the main consequences (in order of prominence) listed by at least 1 out of 10 members of the public and/or public officials were: delayed and/or poor services (mentioned by 39.6% and 18.2% of the public officials and members of the public respectively); underdevelopment (reported by 36.4% and 36.2% of the members of the public and public officials respectively); increased levels of poverty (reported by 29.1% of the members of the public and 12.1% of the public officials); loss of jobs (reported by 12.0% of the members of the public and 11.9% of the public officials); social inequality (mentioned by 11.3% and 10.7% of the public officials and members of the public respectively); and loss of public resources (according to 10.8% of the public officials). These findings are captured in Table 3.56 below. Table 3.56: Consequences of corruption in the public service Consequences of corruption in the public service
Members of the public
Public officials
Underdevelopment 2943(36.4%) 559(36.2%) Increased levels of poverty 2349(29.1%) 187(12.1%) Delayed and/or poor services 1471(18.2%) 611(39.6%) Loss of jobs 968(12.0%) 184(11.9%) Social inequality 865(10.7%) 175(11.3%) Insecurity 522(6.5%) 89(5.8%) High cost of living 514(6.4%) 75(4.9%) Disunity and/or hatred 495(6.1%) 40(2.6%) Injustice 455(5.6%) 109(7.1%) Loss of life 358(4.4%) 28(1.8%) Loss of public resources 297(3.7%) 166(10.8%) Lack of trust in the public office 225(2.8%) 108(7.0%) High levels of illiteracy 195(2.4%) 13(4.8%) Tainted reputation 99(1.2%) 87(5.6%) Political instability 97(1.2%) 16(1.0%) Unwarranted charging of services 96(1.2%) 30(1.9%) Tribalism 95(1.2%) 15(1.0%) Loss of business 94(1.2%) 17(1.1%) Increased rate of crime (including corruption itself)
91(1.1%) 18(1.2%)
Increased levels of immorality and diseases (such as high HIV prevalence)
82(1.0%) 39(2.5%)
Reduced citizen participation in development initiatives
67(4.8%) 56(3.6%)
Increase in road accidents 60(4.7%) 7(4.5%) Misuse of public office 58(4.7%) 30(1.9%) Industrial actions, strikes, demonstrations and protests
51(4.6%) 8(4.5%)
Low wages 23(0.3%) 13(4.8%)

123
123
County-specific analysis of responses from members of the public on the basis of the three highest percentages in each of the 47 analyzed counties showed that out of the 25 consequences of corruption in the public service, 9 of them featured prominently and were therefore major. The ones that featured in at least a third of the counties were underdevelopment (prominent in 46 counties), increased levels of poverty (prominent in 45 counties) and delayed and/or poor services (prominent in 28 counties). On the basis of the three highest percentages in each of the 47 analyzed counties, underdevelopment featured prominently especially in Wajir (40.7%), Machakos (34.9%), Elgeyo Marakwet (33.7%), Nandi (32.6%) and Makueni (31.3%) counties. Increased levels of poverty featured prominently in Turkana (33.9%), Bomet (29.6%), Kajiado (29.5%), Narok (28.9%), Migori (28.9%) and Nyandarua (27.3%) counties while delayed and/or poor services featured prominently in Garissa (23.8%), Murang'a (23.0%), Meru (18.9%), Trans Nzoia (18.9%), Mandera (15.9%), Siaya (15.9%) and Busia (15.8%) counties. The detailed findings on consequences of corruption in the public service by county are presented in Table 3.57 below and in Annex 10. Table 3.57: County analysis of major consequences of corruption in the public service
reported by members of the public
County
County analysis (in percentage) of major consequences of corruption in the public service as reported by members of the public
Und
erde
velo
pmen
t
Incr
ease
d le
vels
of
pov
erty
Del
ayed
and
/or
po
or se
rvic
es
Loss
of j
obs
Soci
al in
equa
lity
Disu
nity
and
/or
ha
tred
Inju
stic
e
Inse
curi
ty
Loss
of l
ife
Wajir 40.7 11.9 10.2 23.7 0.0 3.4 1.7 1.7 0.0 Machakos 34.9 20.8 8.4 7.7 6.0 2.9 2.4 3.6 3.1 Elgeyo Marakwet 33.7 8.4 8.4 7.2 13.3 4.8 4.8 4.2 1.2 Nandi 32.6 17.8 7.0 6.2 10.1 1.6 6.2 3.9 0.0 Makueni 31.3 26.0 4.7 6.0 10.0 3.3 1.3 3.3 3.3 Kiambu 30.8 18.6 14.8 1.2 9.0 6.4 2.9 1.5 2.3 Uasin Gishu 30.6 18.0 7.2 6.3 12.6 1.8 5.4 1.8 0.9 Migori 28.6 28.9 6.8 10.8 4.9 3.5 1.1 3.8 1.1 Mandera 27.8 17.9 15.9 7.3 3.3 4.6 0.0 6.0 0.0 Murang'a 27.3 14.1 23.0 2.7 12.1 1.2 2.7 2.0 3.1 Garissa 27.3 8.4 23.8 9.1 3.5 3.5 2.1 7.7 0.0 Kisii 26.7 26.7 11.6 9.1 9.3 1.5 2.5 2.8 1.3 Kirinyaga 26.5 22.4 8.2 6.1 8.2 11.2 2.0 7.1 2.0 Nyandarua 26.4 27.3 3.6 3.6 5.5 11.8 1.8 2.7 1.8 Nyeri 25.9 22.3 1.4 7.2 2.9 10.1 6.5 4.3 1.4 Vihiga 25.6 14.2 11.4 9.5 9.0 3.8 1.9 3.8 1.9 Siaya 25.5 13.2 15.9 8.6 5.5 4.1 0.9 6.4 2.3 Nairobi 25.3 13.0 12.0 8.4 6.8 3.2 2.1 4.3 2.2 Nyamira 25.2 24.3 8.1 10.8 10.8 5.0 1.8 1.8 1.4
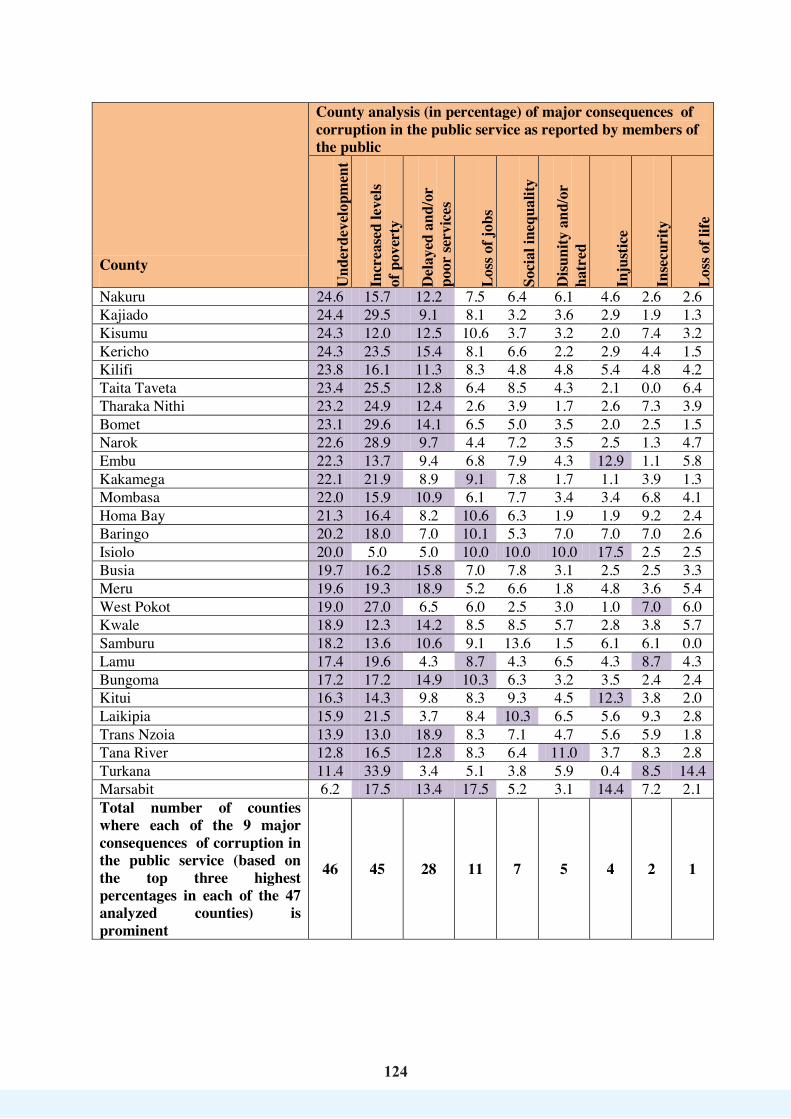
124124
County
County analysis (in percentage) of major consequences of corruption in the public service as reported by members of the public
Und
erde
velo
pmen
t
Incr
ease
d le
vels
of
pov
erty
Del
ayed
and
/or
po
or se
rvic
es
Loss
of j
obs
Soci
al in
equa
lity
Disu
nity
and
/or
ha
tred
Inju
stic
e
Inse
curi
ty
Loss
of l
ife
Nakuru 24.6 15.7 12.2 7.5 6.4 6.1 4.6 2.6 2.6 Kajiado 24.4 29.5 9.1 8.1 3.2 3.6 2.9 1.9 1.3 Kisumu 24.3 12.0 12.5 10.6 3.7 3.2 2.0 7.4 3.2 Kericho 24.3 23.5 15.4 8.1 6.6 2.2 2.9 4.4 1.5 Kilifi 23.8 16.1 11.3 8.3 4.8 4.8 5.4 4.8 4.2 Taita Taveta 23.4 25.5 12.8 6.4 8.5 4.3 2.1 0.0 6.4 Tharaka Nithi 23.2 24.9 12.4 2.6 3.9 1.7 2.6 7.3 3.9 Bomet 23.1 29.6 14.1 6.5 5.0 3.5 2.0 2.5 1.5 Narok 22.6 28.9 9.7 4.4 7.2 3.5 2.5 1.3 4.7 Embu 22.3 13.7 9.4 6.8 7.9 4.3 12.9 1.1 5.8 Kakamega 22.1 21.9 8.9 9.1 7.8 1.7 1.1 3.9 1.3 Mombasa 22.0 15.9 10.9 6.1 7.7 3.4 3.4 6.8 4.1 Homa Bay 21.3 16.4 8.2 10.6 6.3 1.9 1.9 9.2 2.4 Baringo 20.2 18.0 7.0 10.1 5.3 7.0 7.0 7.0 2.6 Isiolo 20.0 5.0 5.0 10.0 10.0 10.0 17.5 2.5 2.5 Busia 19.7 16.2 15.8 7.0 7.8 3.1 2.5 2.5 3.3 Meru 19.6 19.3 18.9 5.2 6.6 1.8 4.8 3.6 5.4 West Pokot 19.0 27.0 6.5 6.0 2.5 3.0 1.0 7.0 6.0 Kwale 18.9 12.3 14.2 8.5 8.5 5.7 2.8 3.8 5.7 Samburu 18.2 13.6 10.6 9.1 13.6 1.5 6.1 6.1 0.0 Lamu 17.4 19.6 4.3 8.7 4.3 6.5 4.3 8.7 4.3 Bungoma 17.2 17.2 14.9 10.3 6.3 3.2 3.5 2.4 2.4 Kitui 16.3 14.3 9.8 8.3 9.3 4.5 12.3 3.8 2.0 Laikipia 15.9 21.5 3.7 8.4 10.3 6.5 5.6 9.3 2.8 Trans Nzoia 13.9 13.0 18.9 8.3 7.1 4.7 5.6 5.9 1.8 Tana River 12.8 16.5 12.8 8.3 6.4 11.0 3.7 8.3 2.8 Turkana 11.4 33.9 3.4 5.1 3.8 5.9 0.4 8.5 14.4 Marsabit 6.2 17.5 13.4 17.5 5.2 3.1 14.4 7.2 2.1 Total number of counties where each of the 9 major consequences of corruption in the public service (based on the top three highest percentages in each of the 47 analyzed counties) is prominent
46 45 28 11 7 5 4 2 1

125125
According to some key informants, corruption leads to socio-economic and political consequences. For instance, one key informant was quoted saying:
“Corruption has socio-economic and political impact. Funds that could be used for development and critical services are lost, including lives. Under-development occurs in roads electricity, poor quality services, disputes, lack of transparency, widening the gap between the poor and rich thus causing a lot of psychological problems. Underdevelopment results after electing people who are economic sabotages. There also arises a big gap between the rich and the poor. Poor services delivery not meeting expectations is another negative consequence” (KI 2).
Other key informants had the following to say about consequences of corruption:
“Corruption results in increased cost of production to bridge the gap that has been created, that’s why kickbacks are evident. We result in substandard goods and services, incomplete projects due to funds not being enough to complete them for instance buildings; the result is poor services due to inadequate infrastructure to support the same”, KI 8.
“There is loss of jobs if you are gotten red handed in corruption. Corruption also leads to poor image and/or tarnishes the name of the Ministry you are working under” (KI 7).
The above findings are consistent with the findings by Transparency International (TI) - Kenya that corruption (for example in politics in the form of electoral fraud) affects the choice of leaders to govern a country and is the most insidious and harmful to the democratic process. One of the grave consequences of political corruption is the loss of lives and property like what was witnessed during the 2007/2008 post-election violence in Kenya (TI-Kenya, 2014). Studies have established that corruption is a complex global problem that undermines democratic institutions, stunts the growth of small businesses, discourages foreign direct investment and generally hampers economic progress. The Economic Theory and empirical evidence both demonstrate that there is a direct causal link between corruption and economic growth. The Economic Model postulates that corruption affects poverty by first impacting economic growth factors, which, in turn, impact poverty levels. Consequences of corruption therefore impact a country’s economy adversely, both at the macro and micro economic levels (Chertwynd, Chetwynd & Spector, 2003). According to Klitgaard (1988) in Nuhu and Mpambije (2017), corruption is increasingly recognized as a preeminent problem in the developing world and that bribery, extortion, fraud, kickbacks, and collusion have resulted in retarded economies, predator elites, and political instability.
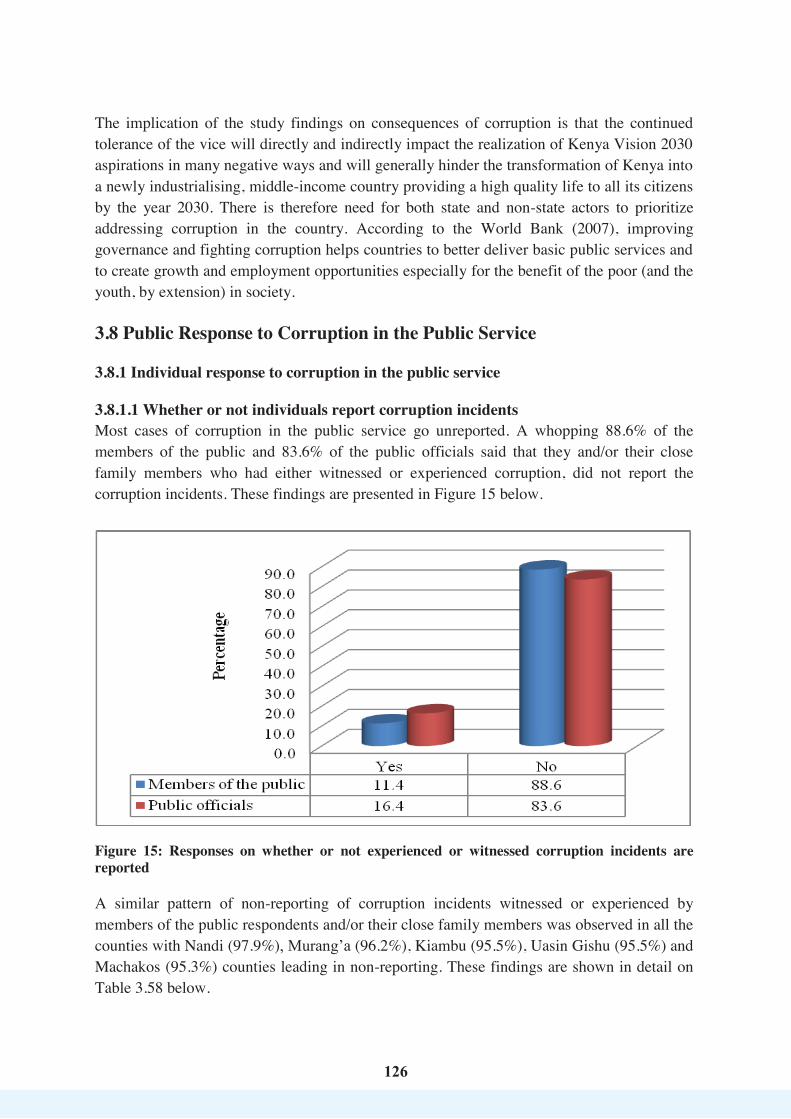
126
126
The implication of the study findings on consequences of corruption is that the continued tolerance of the vice will directly and indirectly impact the realization of Kenya Vision 2030 aspirations in many negative ways and will generally hinder the transformation of Kenya into a newly industrialising, middle-income country providing a high quality life to all its citizens by the year 2030. There is therefore need for both state and non-state actors to prioritize addressing corruption in the country. According to the World Bank (2007), improving governance and fighting corruption helps countries to better deliver basic public services and to create growth and employment opportunities especially for the benefit of the poor (and the youth, by extension) in society. 3.8 Public Response to Corruption in the Public Service 3.8.1 Individual response to corruption in the public service 3.8.1.1 Whether or not individuals report corruption incidents Most cases of corruption in the public service go unreported. A whopping 88.6% of the members of the public and 83.6% of the public officials said that they and/or their close family members who had either witnessed or experienced corruption, did not report the corruption incidents. These findings are presented in Figure 15 below.
Figure 15: Responses on whether or not experienced or witnessed corruption incidents are reported A similar pattern of non-reporting of corruption incidents witnessed or experienced by members of the public respondents and/or their close family members was observed in all the counties with Nandi (97.9%), Murang’a (96.2%), Kiambu (95.5%), Uasin Gishu (95.5%) and Machakos (95.3%) counties leading in non-reporting. These findings are shown in detail on Table 3.58 below.
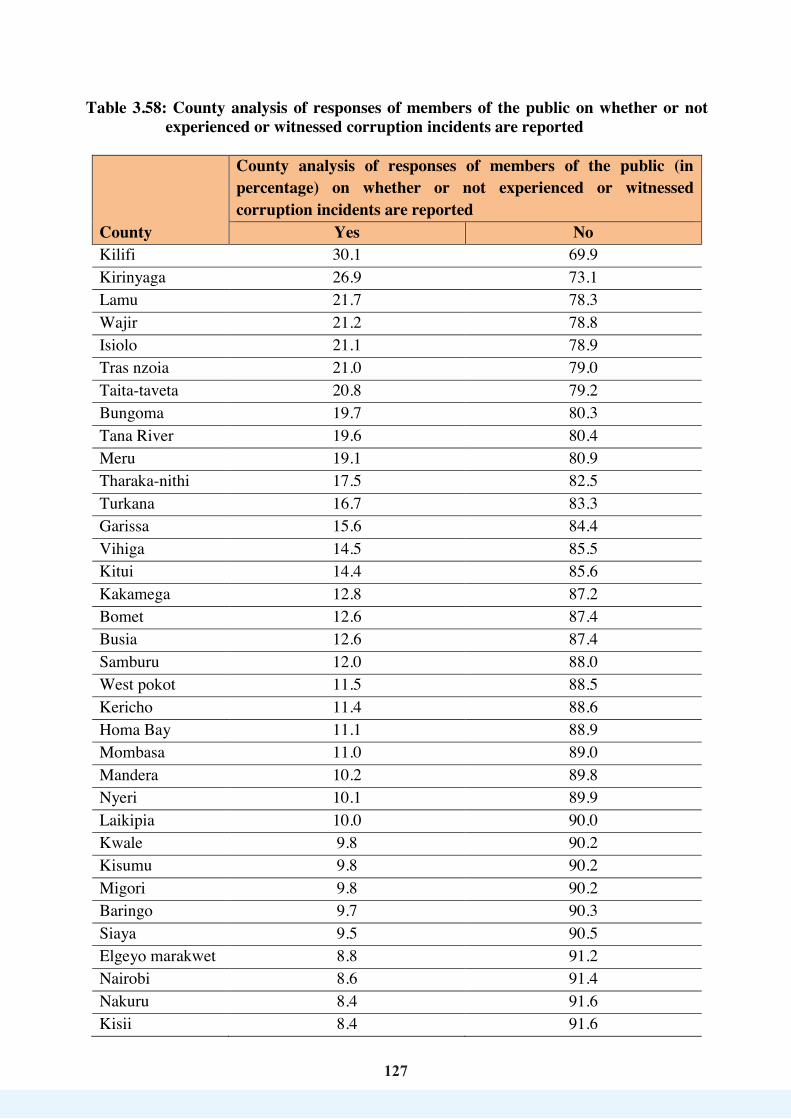
127127
Table 3.58: County analysis of responses of members of the public on whether or not experienced or witnessed corruption incidents are reported
County
County analysis of responses of members of the public (in percentage) on whether or not experienced or witnessed corruption incidents are reported
Yes No Kilifi 30.1 69.9 Kirinyaga 26.9 73.1 Lamu 21.7 78.3 Wajir 21.2 78.8 Isiolo 21.1 78.9 Tras nzoia 21.0 79.0 Taita-taveta 20.8 79.2 Bungoma 19.7 80.3 Tana River 19.6 80.4 Meru 19.1 80.9 Tharaka-nithi 17.5 82.5 Turkana 16.7 83.3 Garissa 15.6 84.4 Vihiga 14.5 85.5 Kitui 14.4 85.6 Kakamega 12.8 87.2 Bomet 12.6 87.4 Busia 12.6 87.4 Samburu 12.0 88.0 West pokot 11.5 88.5 Kericho 11.4 88.6 Homa Bay 11.1 88.9 Mombasa 11.0 89.0 Mandera 10.2 89.8 Nyeri 10.1 89.9 Laikipia 10.0 90.0 Kwale 9.8 90.2 Kisumu 9.8 90.2 Migori 9.8 90.2 Baringo 9.7 90.3 Siaya 9.5 90.5 Elgeyo marakwet 8.8 91.2 Nairobi 8.6 91.4 Nakuru 8.4 91.6 Kisii 8.4 91.6
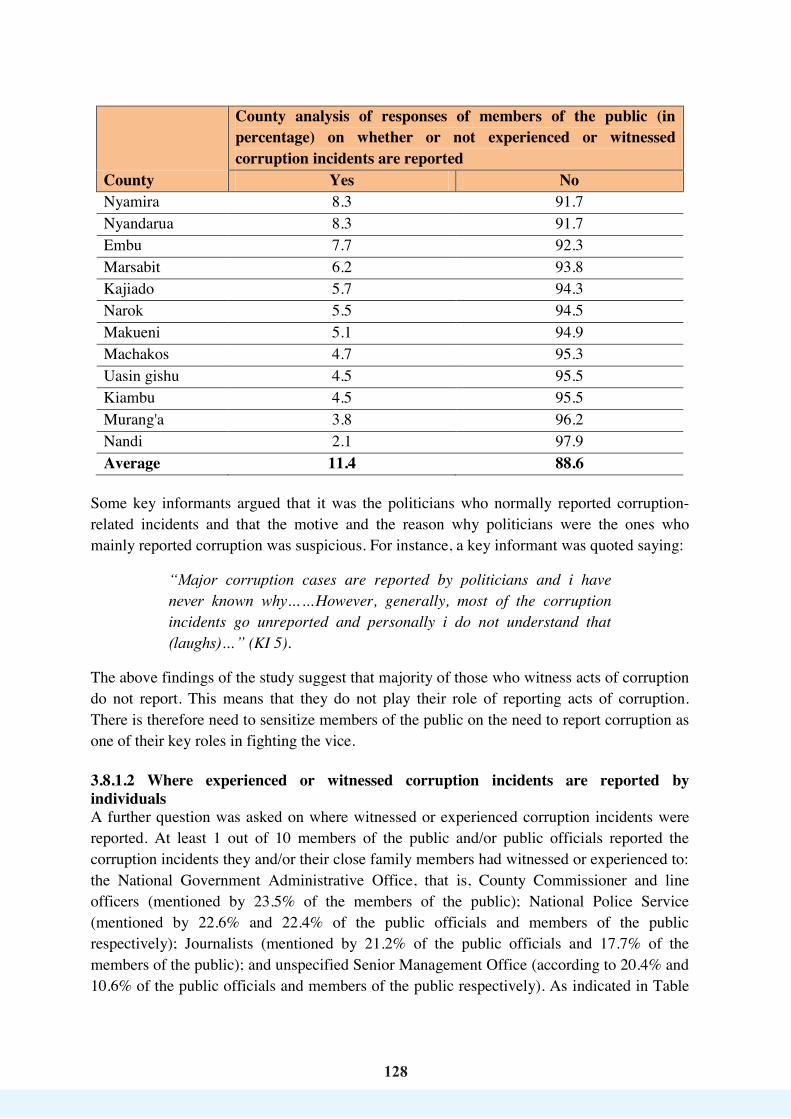
128
128
County
County analysis of responses of members of the public (in percentage) on whether or not experienced or witnessed corruption incidents are reported
Yes No Nyamira 8.3 91.7 Nyandarua 8.3 91.7 Embu 7.7 92.3 Marsabit 6.2 93.8 Kajiado 5.7 94.3 Narok 5.5 94.5 Makueni 5.1 94.9 Machakos 4.7 95.3 Uasin gishu 4.5 95.5 Kiambu 4.5 95.5 Murang'a 3.8 96.2 Nandi 2.1 97.9 Average 11.4 88.6
Some key informants argued that it was the politicians who normally reported corruption-related incidents and that the motive and the reason why politicians were the ones who mainly reported corruption was suspicious. For instance, a key informant was quoted saying:
“Major corruption cases are reported by politicians and i have never known why……However, generally, most of the corruption incidents go unreported and personally i do not understand that (laughs)…” (KI 5).
The above findings of the study suggest that majority of those who witness acts of corruption do not report. This means that they do not play their role of reporting acts of corruption. There is therefore need to sensitize members of the public on the need to report corruption as one of their key roles in fighting the vice. 3.8.1.2 Where experienced or witnessed corruption incidents are reported by individuals A further question was asked on where witnessed or experienced corruption incidents were reported. At least 1 out of 10 members of the public and/or public officials reported the corruption incidents they and/or their close family members had witnessed or experienced to: the National Government Administrative Office, that is, County Commissioner and line officers (mentioned by 23.5% of the members of the public); National Police Service (mentioned by 22.6% and 22.4% of the public officials and members of the public respectively); Journalists (mentioned by 21.2% of the public officials and 17.7% of the members of the public); and unspecified Senior Management Office (according to 20.4% and 10.6% of the public officials and members of the public respectively). As indicated in Table
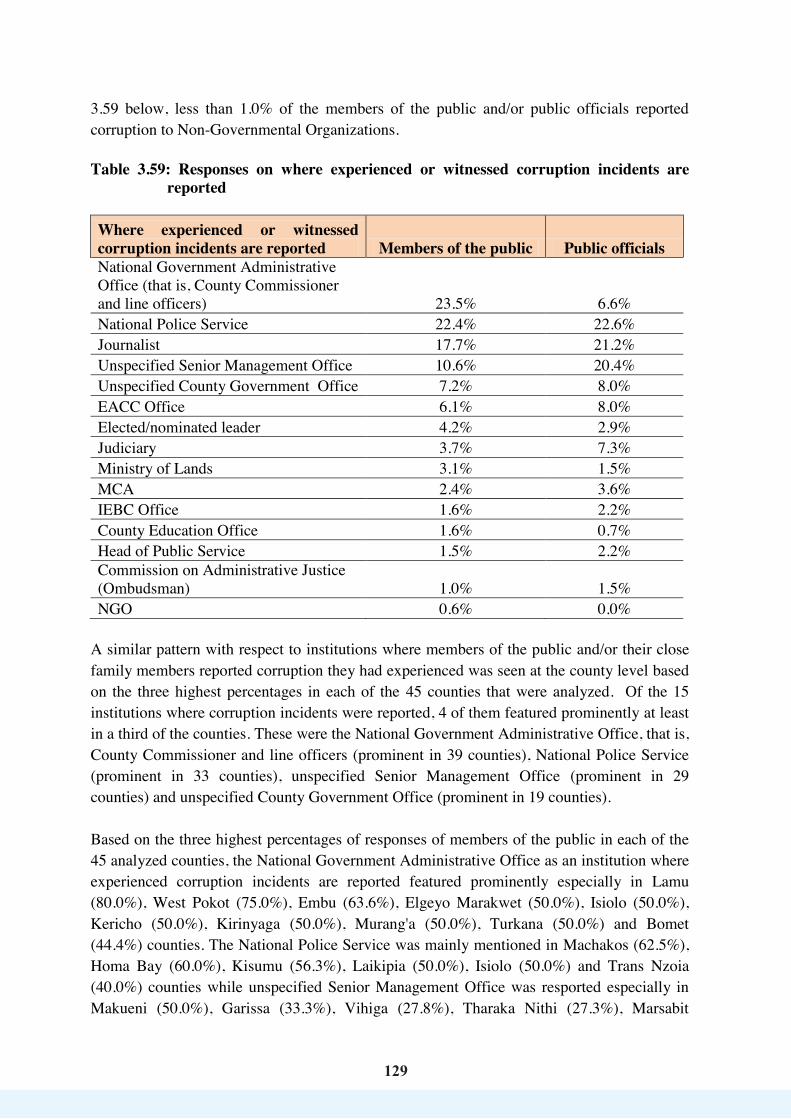
129
129
3.59 below, less than 1.0% of the members of the public and/or public officials reported corruption to Non-Governmental Organizations. Table 3.59: Responses on where experienced or witnessed corruption incidents are
reported Where experienced or witnessed corruption incidents are reported Members of the public Public officials National Government Administrative Office (that is, County Commissioner and line officers) 23.5% 6.6% National Police Service 22.4% 22.6% Journalist 17.7% 21.2% Unspecified Senior Management Office 10.6% 20.4% Unspecified County Government Office 7.2% 8.0% EACC Office 6.1% 8.0% Elected/nominated leader 4.2% 2.9% Judiciary 3.7% 7.3% Ministry of Lands 3.1% 1.5% MCA 2.4% 3.6% IEBC Office 1.6% 2.2% County Education Office 1.6% 0.7% Head of Public Service 1.5% 2.2% Commission on Administrative Justice (Ombudsman) 1.0% 1.5% NGO 0.6% 0.0%
A similar pattern with respect to institutions where members of the public and/or their close family members reported corruption they had experienced was seen at the county level based on the three highest percentages in each of the 45 counties that were analyzed. Of the 15 institutions where corruption incidents were reported, 4 of them featured prominently at least in a third of the counties. These were the National Government Administrative Office, that is, County Commissioner and line officers (prominent in 39 counties), National Police Service (prominent in 33 counties), unspecified Senior Management Office (prominent in 29 counties) and unspecified County Government Office (prominent in 19 counties). Based on the three highest percentages of responses of members of the public in each of the 45 analyzed counties, the National Government Administrative Office as an institution where experienced corruption incidents are reported featured prominently especially in Lamu (80.0%), West Pokot (75.0%), Embu (63.6%), Elgeyo Marakwet (50.0%), Isiolo (50.0%), Kericho (50.0%), Kirinyaga (50.0%), Murang'a (50.0%), Turkana (50.0%) and Bomet (44.4%) counties. The National Police Service was mainly mentioned in Machakos (62.5%), Homa Bay (60.0%), Kisumu (56.3%), Laikipia (50.0%), Isiolo (50.0%) and Trans Nzoia (40.0%) counties while unspecified Senior Management Office was resported especially in Makueni (50.0%), Garissa (33.3%), Vihiga (27.8%), Tharaka Nithi (27.3%), Marsabit

130
130
(25.0%) and Samburu (25.0%) counties. Unspecified County Government Office was prominently reported especially in Kajiado (33.3%), Wajir (33.3%), Busia (31.6%), Nyandarua (25.0%), Mandera (25.0%), Marsabit (25.0%), Kisii (23.1%) and Kitui (21.7%) counties. These findings are captured in Table 3.60 below. Table 3.60: County analysis of institutions where experienced or witnessed corruption
incidents are reported as indicated by members of public
County
County analysis (in percentage) of institutions where experienced or witnessed corruption incidents are reported as indicated by members of the public
Nat
iona
l Gov
ernm
ent
Adm
inist
rativ
e O
ffice
(tha
t is,
C
ount
y C
omm
issio
ner
and
lin
e of
ficer
s)
Nat
iona
l Pol
ice
Serv
ice
Uns
peci
fied
Seni
or
Man
agem
ent O
ffice
Uns
peci
fied
Cou
nty
G
over
nmen
t O
ffice
EAC
C O
ffice
Elec
ted/
nom
inat
ed le
ader
Judi
ciar
y
Jour
nalis
t
MC
A
Min
istry
of L
ands
IEBC
Offi
ce
Cou
nty
Educ
atio
n O
ffice
C
omm
issio
n on
Adm
inist
rativ
e Ju
stic
e (O
mbu
dsm
an)
NG
O
Hea
d of
Pub
lic S
ervi
ce
Lamu 80.0 20.0 0.0 0.0 0.0 0.0 0.0 0.0 0.0 0.0 0.0 0.0 0.0 0.0 0.0 West Pokot 75.0 0.0 0.0 0.0 0.0 0.0 0.0 0.0 0.0 0.0 0.0 25.0 0.0 0.0 0.0 Embu 63.6 0.0 9.1 0.0 9.1 9.1 0.0 9.1 0.0 0.0 0.0 0.0 0.0 0.0 0.0 Elgeyo Marakwet 50.0 0.0 0.0 0.0 0.0 50.0 0.0 0.0 0.0 0.0 0.0 0.0 0.0 0.0 0.0 Isiolo 50.0 50.0 0.0 0.0 0.0 0.0 0.0 0.0 0.0 0.0 0.0 0.0 0.0 0.0 0.0 Kericho 50.0 0.0 0.0 0.0 16.7 0.0 0.0 0.0 16.7 16.7 0.0 0.0 0.0 0.0 0.0 Kirinyaga 50.0 10.0 10.0 10.0 10.0 10.0 0.0 0.0 0.0 0.0 0.0 0.0 0.0 0.0 0.0 Murang'a 50.0 16.7 16.7 16.7 0.0 0.0 0.0 0.0 0.0 0.0 0.0 0.0 0.0 0.0 0.0 Turkana 50.0 20.0 10.0 10.0 0.0 0.0 0.0 0.0 0.0 0.0 10.0 0.0 0.0 0.0 0.0 Bomet 44.4 11.1 11.1 11.1 11.1 0.0 0.0 11.1 0.0 0.0 0.0 0.0 0.0 0.0 0.0 Kiambu 42.9 14.3 14.3 0.0 14.3 14.3 0.0 0.0 0.0 0.0 0.0 0.0 0.0 0.0 0.0 Nyeri 40.0 20.0 20.0 0.0 0.0 0.0 0.0 20.0 0.0 0.0 0.0 0.0 0.0 0.0 0.0 Taita Taveta 40.0 0.0 20.0 0.0 0.0 40.0 0.0 0.0 0.0 0.0 0.0 0.0 0.0 0.0 0.0 Kwale 37.5 0.0 0.0 0.0 25.0 0.0 25.0 0.0 0.0 0.0 0.0 0.0 12.5 0.0 0.0 Garissa 33.3 16.7 33.3 0.0 0.0 16.7 0.0 0.0 0.0 0.0 0.0 0.0 0.0 0.0 0.0 Kajiado 33.3 16.7 16.7 33.3 0.0 0.0 0.0 0.0 0.0 0.0 0.0 0.0 0.0 0.0 0.0 Kakamega 33.3 20.8 20.8 0.0 4.2 4.2 4.2 0.0 8.3 4.2 0.0 0.0 0.0 0.0 0.0 Siaya 33.3 0.0 0.0 0.0 66.7 0.0 0.0 0.0 0.0 0.0 0.0 0.0 0.0 0.0 0.0 Tana River 33.3 22.2 11.1 11.1 11.1 0.0 0.0 0.0 0.0 11.1 0.0 0.0 0.0 0.0 0.0 Wajir 33.3 16.7 0.0 33.3 16.7 0.0 0.0 0.0 0.0 0.0 0.0 0.0 0.0 0.0 0.0 Meru 32.0 30.0 8.0 2.0 6.0 2.0 0.0 16.0 0.0 4.0 0.0 0.0 0.0 0.0 0.0 Kisii 30.8 30.8 0.0 23.1 7.7 0.0 0.0 7.7 0.0 0.0 0.0 0.0 0.0 0.0 0.0 Baringo 30.0 20.0 20.0 0.0 0.0 0.0 10.0 0.0 0.0 0.0 10.0 10.0 0.0 0.0 0.0 Migori 27.8 22.2 5.6 11.1 5.6 5.6 0.0 11.1 5.6 0.0 0.0 0.0 0.0 5.6 0.0 Vihiga 27.8 5.6 27.8 0.0 0.0 16.7 11.1 0.0 11.1 0.0 0.0 0.0 0.0 0.0 0.0 Laikipia 25.0 50.0 0.0 0.0 25.0 0.0 0.0 0.0 0.0 0.0 0.0 0.0 0.0 0.0 0.0 Nyamira 25.0 25.0 12.5 0.0 0.0 0.0 25.0 0.0 0.0 0.0 0.0 12.5 0.0 0.0 0.0 Nyandarua 25.0 0.0 0.0 25.0 0.0 0.0 0.0 0.0 25.0 25.0 0.0 0.0 0.0 0.0 0.0 Nairobi 22.9 33.3 4.2 0.0 18.8 4.2 10.4 6.3 0.0 0.0 0.0 0.0 0.0 0.0 0.0 Tharaka Nithi 22.7 13.6 27.3 13.6 9.1 0.0 4.5 0.0 0.0 4.5 0.0 4.5 0.0 0.0 0.0 Kilifi 22.2 37.0 3.7 7.4 3.7 3.7 7.4 0.0 3.7 0.0 0.0 0.0 7.4 3.7 0.0 Bungoma 21.4 33.3 9.5 4.8 0.0 4.8 0.0 9.5 7.1 0.0 0.0 7.1 2.4 0.0 0.0 Homa Bay 20.0 60.0 0.0 0.0 0.0 0.0 0.0 0.0 0.0 0.0 0.0 0.0 0.0 0.0 20.0

131
131
County
County analysis (in percentage) of institutions where experienced or witnessed corruption incidents are reported as indicated by members of the public
Nat
iona
l Gov
ernm
ent
Adm
inist
rativ
e O
ffice
(tha
t is,
C
ount
y C
omm
issio
ner
and
lin
e of
ficer
s)
Nat
iona
l Pol
ice
Serv
ice
Uns
peci
fied
Seni
or
Man
agem
ent O
ffice
Uns
peci
fied
Cou
nty
G
over
nmen
t O
ffice
EAC
C O
ffice
Elec
ted/
nom
inat
ed le
ader
Judi
ciar
y
Jour
nalis
t
MC
A
Min
istry
of L
ands
IEBC
Offi
ce
Cou
nty
Educ
atio
n O
ffice
C
omm
issio
n on
Adm
inist
rativ
e Ju
stic
e (O
mbu
dsm
an)
NG
O
Hea
d of
Pub
lic S
ervi
ce
Mombasa 20.0 10.0 16.7 13.3 10.0 3.3 6.7 6.7 0.0 0.0 0.0 3.3 6.7 3.3 0.0 Trans Nzoia 20.0 40.0 13.3 0.0 0.0 6.7 6.7 0.0 0.0 0.0 0.0 13.3 0.0 0.0 0.0 Nakuru 17.6 32.4 2.9 11.8 8.8 5.9 0.0 0.0 5.9 11.8 0.0 2.9 0.0 0.0 0.0 Kisumu 12.5 56.3 12.5 0.0 6.3 6.3 6.3 0.0 0.0 0.0 0.0 0.0 0.0 0.0 0.0 Machakos 12.5 62.5 0.0 12.5 0.0 0.0 12.5 0.0 0.0 0.0 0.0 0.0 0.0 0.0 0.0 Busia 10.5 31.6 5.3 31.6 0.0 0.0 5.3 0.0 5.3 5.3 0.0 0.0 5.3 0.0 0.0 Kitui 8.7 30.4 13.0 21.7 4.3 4.3 0.0 0.0 4.3 8.7 4.3 0.0 0.0 0.0 0.0 Makueni 0.0 0.0 50.0 0.0 0.0 0.0 0.0 0.0 0.0 0.0 0.0 0.0 0.0 50.0 0.0 Mandera 0.0 25.0 0.0 25.0 0.0 0.0 0.0 0.0 0.0 0.0 50.0 0.0 0.0 0.0 0.0 Marsabit 0.0 0.0 25.0 25.0 0.0 0.0 0.0 0.0 25.0 0.0 25.0 0.0 0.0 0.0 0.0 Narok 0.0 33.3 16.7 0.0 0.0 0.0 33.3 0.0 0.0 0.0 16.7 0.0 0.0 0.0 0.0 Samburu 0.0 25.0 25.0 0.0 0.0 25.0 0.0 25.0 0.0 0.0 0.0 0.0 0.0 0.0 0.0 Total number of counties where each of the 15 institutions where experienced or witnessed corruption incidents are reported (based on the top three highest percentages in each of the 45 analyzed counties) is prominent
39 33 27 19 13 9 9 8 6 5 5 4 3 1 1
The findings showed that although sample respondents reported to have experienced forms of corruption in the National Government Administrative Office and the National Police Service, some had faith in them and went further to report corruption incidents to these institutions. The proximity and presence of these two institutions to service seekers could be the reason behind many sample respondents reporting to these institutions. The above findings also relate with earlier findings which showed that EACC services were among the least sought services thus confirming that only a few people interacted with the EACC, including on reporting corruption incidents to the institution. Therefore, strategies that will enhance the trust of the members of the public on the Commission and improve reporting of corruption to the organization are paramount.
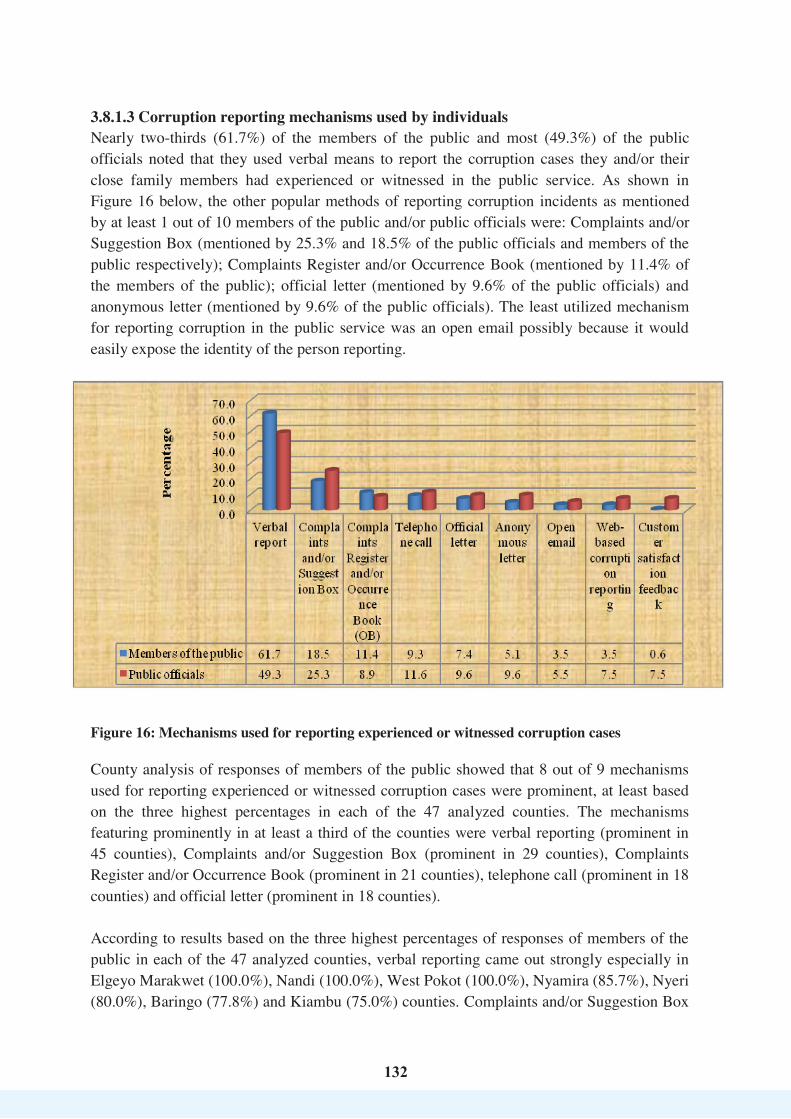
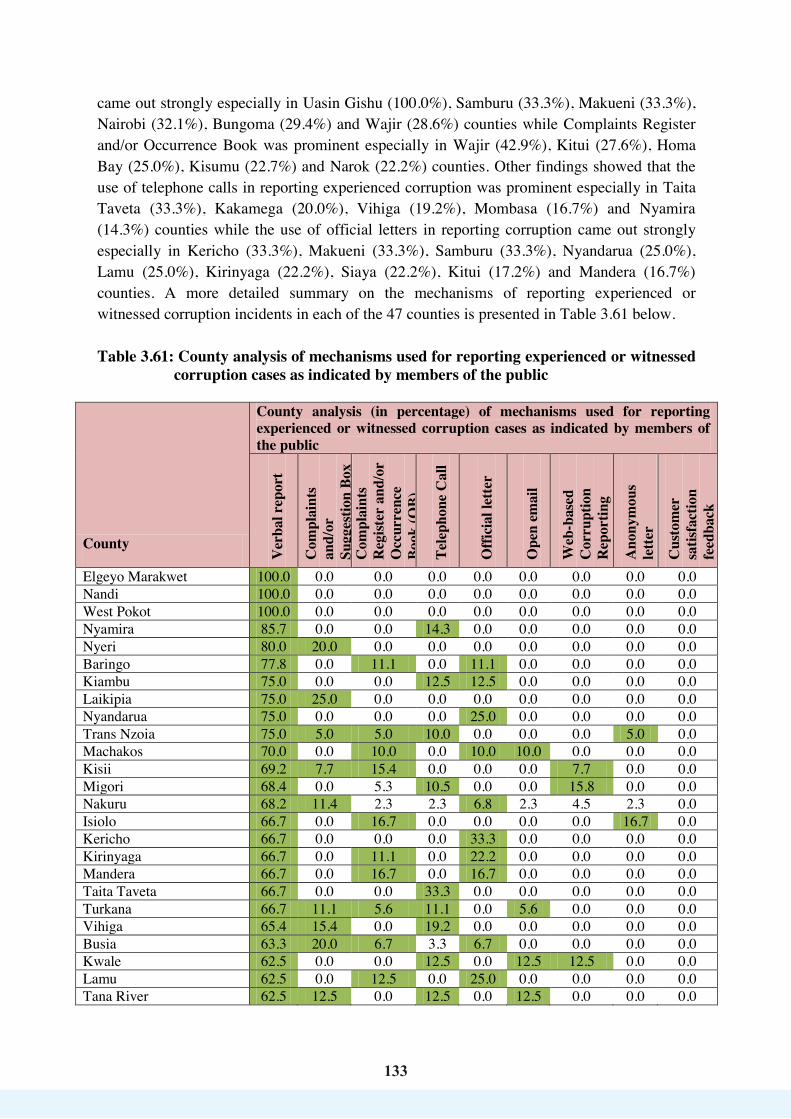
133
133
came out strongly especially in Uasin Gishu (100.0%), Samburu (33.3%), Makueni (33.3%), Nairobi (32.1%), Bungoma (29.4%) and Wajir (28.6%) counties while Complaints Register and/or Occurrence Book was prominent especially in Wajir (42.9%), Kitui (27.6%), Homa Bay (25.0%), Kisumu (22.7%) and Narok (22.2%) counties. Other findings showed that the use of telephone calls in reporting experienced corruption was prominent especially in Taita Taveta (33.3%), Kakamega (20.0%), Vihiga (19.2%), Mombasa (16.7%) and Nyamira (14.3%) counties while the use of official letters in reporting corruption came out strongly especially in Kericho (33.3%), Makueni (33.3%), Samburu (33.3%), Nyandarua (25.0%), Lamu (25.0%), Kirinyaga (22.2%), Siaya (22.2%), Kitui (17.2%) and Mandera (16.7%) counties. A more detailed summary on the mechanisms of reporting experienced or witnessed corruption incidents in each of the 47 counties is presented in Table 3.61 below. Table 3.61: County analysis of mechanisms used for reporting experienced or witnessed
corruption cases as indicated by members of the public
County
County analysis (in percentage) of mechanisms used for reporting experienced or witnessed corruption cases as indicated by members of the public
Ver
bal r
epor
t
Com
plai
nts
and/
or
Sugg
estio
n Bo
x C
ompl
aint
s R
egist
er a
nd/o
r O
ccur
renc
e Bo
ok (O
B)
Tele
phon
e C
all
Offi
cial
lette
r
Ope
n em
ail
Web
-bas
ed
Cor
rupt
ion
Rep
ortin
g
Ano
nym
ous
lette
r
Cus
tom
er
satis
fact
ion
feed
back
Elgeyo Marakwet 100.0 0.0 0.0 0.0 0.0 0.0 0.0 0.0 0.0 Nandi 100.0 0.0 0.0 0.0 0.0 0.0 0.0 0.0 0.0 West Pokot 100.0 0.0 0.0 0.0 0.0 0.0 0.0 0.0 0.0 Nyamira 85.7 0.0 0.0 14.3 0.0 0.0 0.0 0.0 0.0 Nyeri 80.0 20.0 0.0 0.0 0.0 0.0 0.0 0.0 0.0 Baringo 77.8 0.0 11.1 0.0 11.1 0.0 0.0 0.0 0.0 Kiambu 75.0 0.0 0.0 12.5 12.5 0.0 0.0 0.0 0.0 Laikipia 75.0 25.0 0.0 0.0 0.0 0.0 0.0 0.0 0.0 Nyandarua 75.0 0.0 0.0 0.0 25.0 0.0 0.0 0.0 0.0 Trans Nzoia 75.0 5.0 5.0 10.0 0.0 0.0 0.0 5.0 0.0 Machakos 70.0 0.0 10.0 0.0 10.0 10.0 0.0 0.0 0.0 Kisii 69.2 7.7 15.4 0.0 0.0 0.0 7.7 0.0 0.0 Migori 68.4 0.0 5.3 10.5 0.0 0.0 15.8 0.0 0.0 Nakuru 68.2 11.4 2.3 2.3 6.8 2.3 4.5 2.3 0.0 Isiolo 66.7 0.0 16.7 0.0 0.0 0.0 0.0 16.7 0.0 Kericho 66.7 0.0 0.0 0.0 33.3 0.0 0.0 0.0 0.0 Kirinyaga 66.7 0.0 11.1 0.0 22.2 0.0 0.0 0.0 0.0 Mandera 66.7 0.0 16.7 0.0 16.7 0.0 0.0 0.0 0.0 Taita Taveta 66.7 0.0 0.0 33.3 0.0 0.0 0.0 0.0 0.0 Turkana 66.7 11.1 5.6 11.1 0.0 5.6 0.0 0.0 0.0 Vihiga 65.4 15.4 0.0 19.2 0.0 0.0 0.0 0.0 0.0 Busia 63.3 20.0 6.7 3.3 6.7 0.0 0.0 0.0 0.0 Kwale 62.5 0.0 0.0 12.5 0.0 12.5 12.5 0.0 0.0 Lamu 62.5 0.0 12.5 0.0 25.0 0.0 0.0 0.0 0.0 Tana River 62.5 12.5 0.0 12.5 0.0 12.5 0.0 0.0 0.0
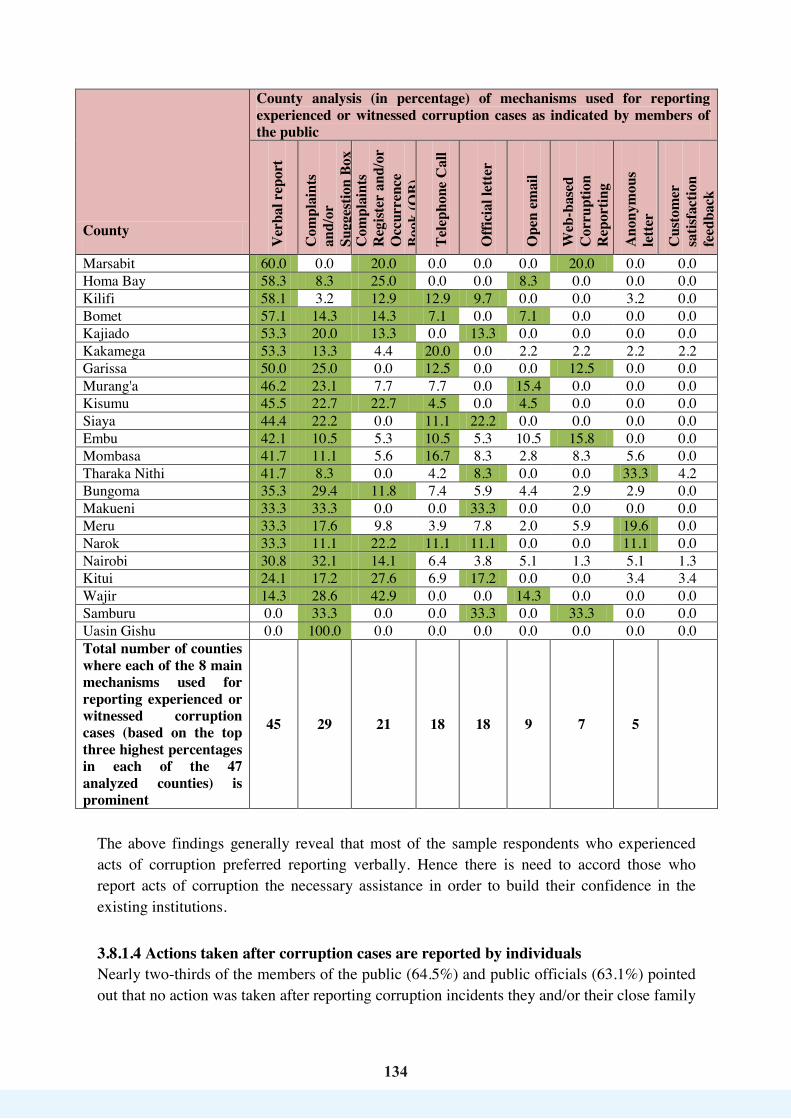
134
134
County
County analysis (in percentage) of mechanisms used for reporting experienced or witnessed corruption cases as indicated by members of the public
Ver
bal r
epor
t
Com
plai
nts
and/
or
Sugg
estio
n Bo
x C
ompl
aint
s R
egist
er a
nd/o
r O
ccur
renc
e Bo
ok (O
B)
Tele
phon
e C
all
Offi
cial
lette
r
Ope
n em
ail
Web
-bas
ed
Cor
rupt
ion
Rep
ortin
g
Ano
nym
ous
lette
r
Cus
tom
er
satis
fact
ion
feed
back
Marsabit 60.0 0.0 20.0 0.0 0.0 0.0 20.0 0.0 0.0 Homa Bay 58.3 8.3 25.0 0.0 0.0 8.3 0.0 0.0 0.0 Kilifi 58.1 3.2 12.9 12.9 9.7 0.0 0.0 3.2 0.0 Bomet 57.1 14.3 14.3 7.1 0.0 7.1 0.0 0.0 0.0 Kajiado 53.3 20.0 13.3 0.0 13.3 0.0 0.0 0.0 0.0 Kakamega 53.3 13.3 4.4 20.0 0.0 2.2 2.2 2.2 2.2 Garissa 50.0 25.0 0.0 12.5 0.0 0.0 12.5 0.0 0.0 Murang'a 46.2 23.1 7.7 7.7 0.0 15.4 0.0 0.0 0.0 Kisumu 45.5 22.7 22.7 4.5 0.0 4.5 0.0 0.0 0.0 Siaya 44.4 22.2 0.0 11.1 22.2 0.0 0.0 0.0 0.0 Embu 42.1 10.5 5.3 10.5 5.3 10.5 15.8 0.0 0.0 Mombasa 41.7 11.1 5.6 16.7 8.3 2.8 8.3 5.6 0.0 Tharaka Nithi 41.7 8.3 0.0 4.2 8.3 0.0 0.0 33.3 4.2 Bungoma 35.3 29.4 11.8 7.4 5.9 4.4 2.9 2.9 0.0 Makueni 33.3 33.3 0.0 0.0 33.3 0.0 0.0 0.0 0.0 Meru 33.3 17.6 9.8 3.9 7.8 2.0 5.9 19.6 0.0 Narok 33.3 11.1 22.2 11.1 11.1 0.0 0.0 11.1 0.0 Nairobi 30.8 32.1 14.1 6.4 3.8 5.1 1.3 5.1 1.3 Kitui 24.1 17.2 27.6 6.9 17.2 0.0 0.0 3.4 3.4 Wajir 14.3 28.6 42.9 0.0 0.0 14.3 0.0 0.0 0.0 Samburu 0.0 33.3 0.0 0.0 33.3 0.0 33.3 0.0 0.0 Uasin Gishu 0.0 100.0 0.0 0.0 0.0 0.0 0.0 0.0 0.0 Total number of counties where each of the 8 main mechanisms used for reporting experienced or witnessed corruption cases (based on the top three highest percentages in each of the 47 analyzed counties) is prominent
45 29 21 18 18 9 7 5
The above findings generally reveal that most of the sample respondents who experienced acts of corruption preferred reporting verbally. Hence there is need to accord those who report acts of corruption the necessary assistance in order to build their confidence in the existing institutions.
3.8.1.4 Actions taken after corruption cases are reported by individuals Nearly two-thirds of the members of the public (64.5%) and public officials (63.1%) pointed out that no action was taken after reporting corruption incidents they and/or their close family
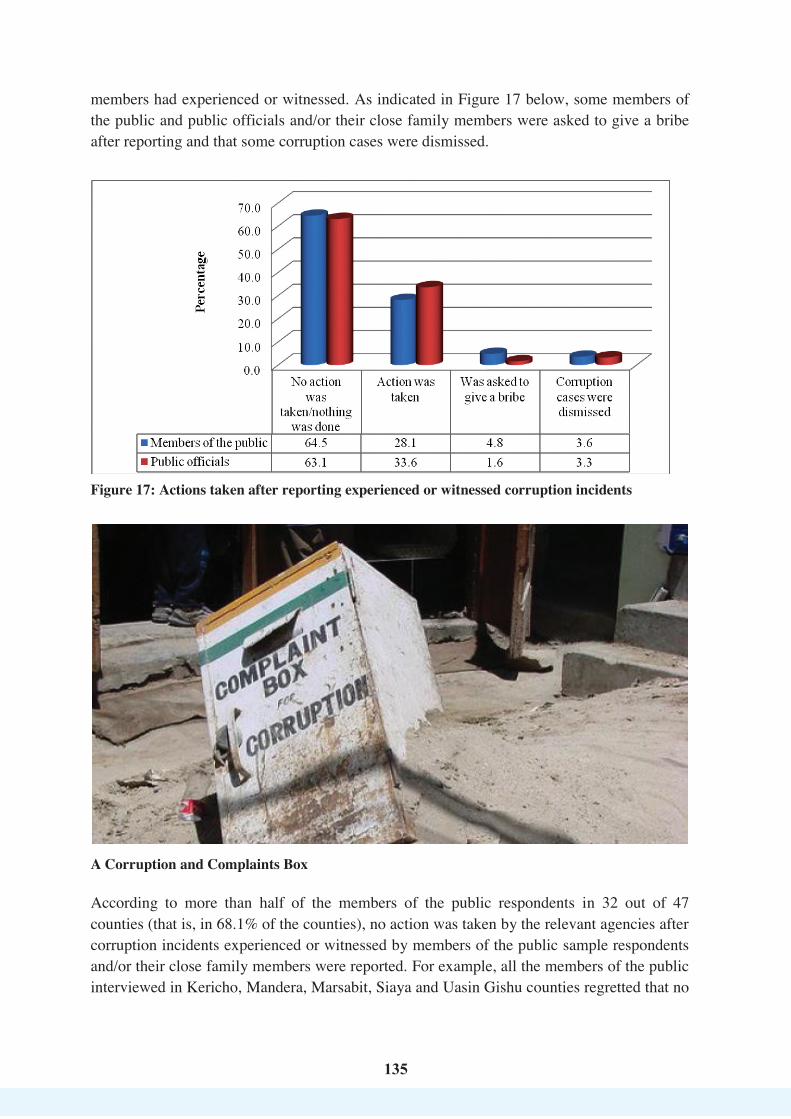

136
136
action was taken after they or their close family members reported corruption incidents. However, action was duly taken after reporting in the counties of Bungoma (30.8%), Narok (28.6%), Nyeri (28.6%), Wajir (28.6%) and Bomet (27.3%). Further, there were cases where those reporting corruption incidents were asked for bribes, especially in Nandi (100.0%), Nyeri (28.6%) and Makueni (20.0%) counties. These findings are presented in Table 3.62 below. Table 3.62: County analysis of actions taken after reporting encountered corruption
incidents as indicated by members of the public
County
County analysis (in percentage) of actions taken after reporting encountered corruption incidents as indicated by members of the public No action was taken/ nothing was done
Action was taken
Was asked to give a bribe Dismissal
Kericho 100.0 0.0 0.0 0.0 Mandera 100.0 0.0 0.0 0.0 Marsabit 100.0 0.0 0.0 0.0 Siaya 100.0 0.0 0.0 0.0 Uasin Gishu 100.0 0.0 0.0 0.0 Nyamira 83.3 16.7 0.0 0.0 Kisii 81.8 18.2 0.0 0.0 Nairobi 80.9 10.6 4.3 4.3 Isiolo 80.0 20.0 0.0 0.0 Kisumu 80.0 15.0 0.0 5.0 Nakuru 78.8 15.2 6.1 0.0 Baringo 75.0 12.5 12.5 0.0 Lamu 75.0 0.0 0.0 25.0 West Pokot 75.0 25.0 0.0 0.0 Bomet 72.7 27.3 0.0 0.0 Kilifi 69.6 26.1 4.3 0.0 Turkana 69.2 23.1 7.7 0.0 Migori 68.8 25.0 6.3 0.0 Busia 68.2 27.3 4.5 0.0 Machakos 66.7 16.7 0.0 16.7 Samburu 66.7 0.0 0.0 33.3 Elgeyo Marakwet 66.7 33.3 0.0 0.0 Garissa 66.7 33.3 0.0 0.0 Kirinyaga 66.7 33.3 0.0 0.0 Murang'a 66.7 33.3 0.0 0.0 Tana River 66.7 33.3 0.0 0.0 Tharaka Nithi 66.7 33.3 0.0 0.0 Bungoma 64.1 30.8 5.1 0.0 Homa Bay 62.5 37.5 0.0 0.0 Meru 61.9 31.0 7.1 0.0 Taita Taveta 60.0 20.0 0.0 20.0 Kakamega 54.5 36.4 4.5 4.5 Embu 50.0 40.0 10.0 0.0

137
137
County
County analysis (in percentage) of actions taken after reporting encountered corruption incidents as indicated by members of the public No action was taken/ nothing was done
Action was taken
Was asked to give a bribe Dismissal
Kajiado 50.0 40.0 10.0 0.0 Kwale 50.0 50.0 0.0 0.0 Laikipia 50.0 50.0 0.0 0.0 Nyandarua 50.0 25.0 0.0 25.0 Kitui 47.4 36.8 5.3 10.5 Mombasa 46.7 43.3 3.3 6.7 Nyeri 42.9 28.6 28.6 0.0 Wajir 42.9 28.6 14.3 14.3 Narok 42.9 28.6 0.0 28.6 Makueni 40.0 0.0 20.0 40.0 Trans Nzoia 35.7 42.9 7.1 14.3 Vihiga 31.6 63.2 5.3 0.0 Kiambu 28.6 57.1 14.3 0.0 Nandi 0.0 0.0 100.0 0.0
The finding that no action is taken upon reporting corruption incidents implies that only a few perpetrators of the vice are sanctioned. Failure by specific institutions to act on reported forms of corruption affects the levels of confidence of the victims and witnesses and works to demoralize the parties willing to report acts of corruption. In addition, this affects data on the magnitude of the corruption problem as the relevant agencies will not be able to collate all corruption-related information to be able to effectively inform the planning, formulation and implementation of anti-corruption policies and programmes. Further, failure to act promptly against the perpetrators encourages their continued engagement in corruption because they are not deterred. 3.8.1.5 Reasons for not reporting corruption cases The main reasons reported by at least 1 out of 10 members of the public and/or public officials on why experienced or witnessed corruption incidents were not reported were that: nothing happens even when you report (reported by 29.5% and 17.0% of the public officials and members of the public respectively); there is fear of victimization (reported by 23.9% and 21.9% of the public officials and members of the public respectively); some people do not know where to report (reported by 15.4% of the members of the public); corruption is almost normal, hence no need for reporting (reported by 13.1% and 11.5% of the public officials and members of the public respectively); there is no confidence in corruption reporting (reported by 12.3% and 10.9% of the public officials and members of the public respectively); and that there is nowhere to report (reported by 11.6% of the members of the public). Some of the least reported reasons why corruption incidents were never reported were that there are no hot lines and/or proper channels for reporting and that people should report the main perpetrators of corruption only. The detailed reasons for non-reporting of corruption incidents are summarized in Table 3.63 below.

138
138
Table 3.63: Reasons for not reporting corruption in public service institutions Reasons why those who have experienced or witnessed corruption did not report
Members of the public Public officials
Fear of victimization 21.9% 23.9% Nothing happens even when you report 17.0% 29.5% Some people do not know where to report 15.4% 7.0% Nowhere to report 11.6% 5.8% Corruption is almost normal, hence no need for reporting
11.5% 13.1%
No confidence in corruption reporting 10.9% 12.3% Fear of arrest 4.6% 2.4% Time constraints 3.8% 9.3% Because of being part of corruption perpetration
3.6% 2.4%
Some people give bribes and still do not get posive results
3.3% 3.0%
People should report the main perpetrators of corruption only
2.4% 1.4%
No hot lines and/or proper channels for reporting
0.5% 1.2%
Analysis by county of the reasons given by members of the public on why those who have experienced or witnessed corruption do not report showed that 9 out of 12 reasons were major, at least based on the three highest percentages of the responses in each of the 47 analyzed counties. Of the 9 major reasons, the ones that were prominent in at least a third of the counties were: fear of victimization (prominent in 43 counties); nothing happens even when you report (prominent in 33 counties); some people do not know where to report (prominent in 32 counties); no confidence in corruption reporting (prominent in 19 counties); nowhere to report (prominent in 18 counties); and corruption is almost normal, hence no need for reporting (prominent in 16 counties). On the basis of the three highest percentages in each of the analyzed counties, fear of victimization was prominently mentioned especially in Nyandarua (41.3%); Mandera (36.0%); Kilifi (35.8%); Nandi (34.4%); and Bungoma (32.8%) counties. The reason that nothing happens even when one reports came out strongly especially in Wajir (36.4%), Tana River (32.5%), Garissa (30.6%), Narok (30.4%) and Lamu (26.3%) counties while the reason that some people do not know where to report was prominent especially in Kiambu (36.8%), Murang'a (32.0%), Nyeri (28.8%), Nandi (25.0%) and Elgeyo Marakwet (23.3%) counties. The prominence of the other three reasons is as follows: no confidence in corruption reporting was especially prominent in Laikipia (25.0%), Nyamira (23.0%), Kwale (18.2%), Kisumu (15.9%), Lamu (15.8%) and Trans Nzoia (15.8%) counties; nowhere to report came out strongly especially in Tana River (25.0%), Marsabitn (24.6%), Migori (24.3%), Kisii (22.7%) and Samburu (17.4%) counties; and the reason that corruption was almost normal, hence no need for reporting was prominent especially in Taita Taveta (25.0%), Kajiado
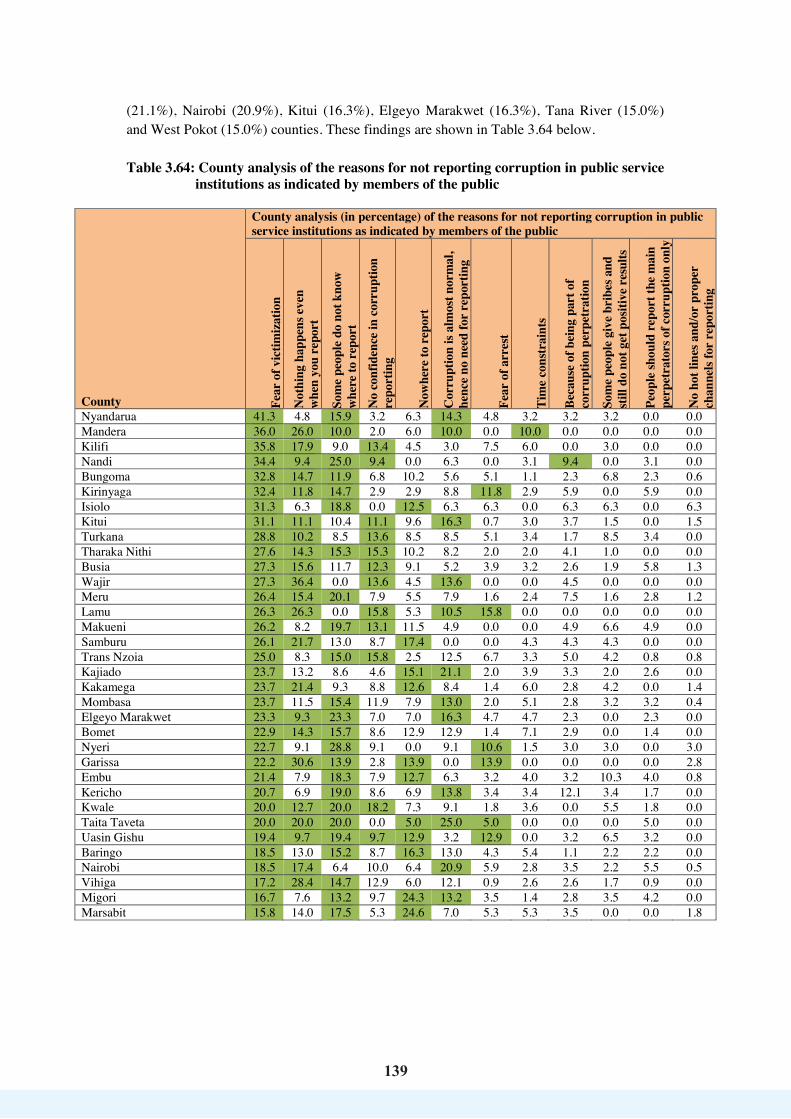
139
139
(21.1%), Nairobi (20.9%), Kitui (16.3%), Elgeyo Marakwet (16.3%), Tana River (15.0%) and West Pokot (15.0%) counties. These findings are shown in Table 3.64 below. Table 3.64: County analysis of the reasons for not reporting corruption in public service
institutions as indicated by members of the public
County
County analysis (in percentage) of the reasons for not reporting corruption in public service institutions as indicated by members of the public
Fear
of v
ictim
izat
ion
Not
hing
hap
pens
eve
n
whe
n yo
u re
port
Som
e pe
ople
do
not k
now
w
here
to r
epor
t N
o co
nfid
ence
in c
orru
ptio
n re
port
ing
Now
here
to r
epor
t
Cor
rupt
ion
is al
mos
t nor
mal
, he
nce
no n
eed
for
repo
rtin
g
Fear
of a
rres
t
Tim
e co
nstr
aint
s
Beca
use
of b
eing
par
t of
corr
uptio
n pe
rpet
ratio
n
Som
e pe
ople
giv
e br
ibes
and
st
ill d
o no
t get
pos
itive
res
ults
Peop
le sh
ould
rep
ort t
he m
ain
perp
etra
tors
of c
orru
ptio
n on
ly
No
hot l
ines
and
/or
prop
er
chan
nels
for
repo
rtin
g
Nyandarua 41.3 4.8 15.9 3.2 6.3 14.3 4.8 3.2 3.2 3.2 0.0 0.0 Mandera 36.0 26.0 10.0 2.0 6.0 10.0 0.0 10.0 0.0 0.0 0.0 0.0 Kilifi 35.8 17.9 9.0 13.4 4.5 3.0 7.5 6.0 0.0 3.0 0.0 0.0 Nandi 34.4 9.4 25.0 9.4 0.0 6.3 0.0 3.1 9.4 0.0 3.1 0.0 Bungoma 32.8 14.7 11.9 6.8 10.2 5.6 5.1 1.1 2.3 6.8 2.3 0.6 Kirinyaga 32.4 11.8 14.7 2.9 2.9 8.8 11.8 2.9 5.9 0.0 5.9 0.0 Isiolo 31.3 6.3 18.8 0.0 12.5 6.3 6.3 0.0 6.3 6.3 0.0 6.3 Kitui 31.1 11.1 10.4 11.1 9.6 16.3 0.7 3.0 3.7 1.5 0.0 1.5 Turkana 28.8 10.2 8.5 13.6 8.5 8.5 5.1 3.4 1.7 8.5 3.4 0.0 Tharaka Nithi 27.6 14.3 15.3 15.3 10.2 8.2 2.0 2.0 4.1 1.0 0.0 0.0 Busia 27.3 15.6 11.7 12.3 9.1 5.2 3.9 3.2 2.6 1.9 5.8 1.3 Wajir 27.3 36.4 0.0 13.6 4.5 13.6 0.0 0.0 4.5 0.0 0.0 0.0 Meru 26.4 15.4 20.1 7.9 5.5 7.9 1.6 2.4 7.5 1.6 2.8 1.2 Lamu 26.3 26.3 0.0 15.8 5.3 10.5 15.8 0.0 0.0 0.0 0.0 0.0 Makueni 26.2 8.2 19.7 13.1 11.5 4.9 0.0 0.0 4.9 6.6 4.9 0.0 Samburu 26.1 21.7 13.0 8.7 17.4 0.0 0.0 4.3 4.3 4.3 0.0 0.0 Trans Nzoia 25.0 8.3 15.0 15.8 2.5 12.5 6.7 3.3 5.0 4.2 0.8 0.8 Kajiado 23.7 13.2 8.6 4.6 15.1 21.1 2.0 3.9 3.3 2.0 2.6 0.0 Kakamega 23.7 21.4 9.3 8.8 12.6 8.4 1.4 6.0 2.8 4.2 0.0 1.4 Mombasa 23.7 11.5 15.4 11.9 7.9 13.0 2.0 5.1 2.8 3.2 3.2 0.4 Elgeyo Marakwet 23.3 9.3 23.3 7.0 7.0 16.3 4.7 4.7 2.3 0.0 2.3 0.0 Bomet 22.9 14.3 15.7 8.6 12.9 12.9 1.4 7.1 2.9 0.0 1.4 0.0 Nyeri 22.7 9.1 28.8 9.1 0.0 9.1 10.6 1.5 3.0 3.0 0.0 3.0 Garissa 22.2 30.6 13.9 2.8 13.9 0.0 13.9 0.0 0.0 0.0 0.0 2.8 Embu 21.4 7.9 18.3 7.9 12.7 6.3 3.2 4.0 3.2 10.3 4.0 0.8 Kericho 20.7 6.9 19.0 8.6 6.9 13.8 3.4 3.4 12.1 3.4 1.7 0.0 Kwale 20.0 12.7 20.0 18.2 7.3 9.1 1.8 3.6 0.0 5.5 1.8 0.0 Taita Taveta 20.0 20.0 20.0 0.0 5.0 25.0 5.0 0.0 0.0 0.0 5.0 0.0 Uasin Gishu 19.4 9.7 19.4 9.7 12.9 3.2 12.9 0.0 3.2 6.5 3.2 0.0 Baringo 18.5 13.0 15.2 8.7 16.3 13.0 4.3 5.4 1.1 2.2 2.2 0.0 Nairobi 18.5 17.4 6.4 10.0 6.4 20.9 5.9 2.8 3.5 2.2 5.5 0.5 Vihiga 17.2 28.4 14.7 12.9 6.0 12.1 0.9 2.6 2.6 1.7 0.9 0.0 Migori 16.7 7.6 13.2 9.7 24.3 13.2 3.5 1.4 2.8 3.5 4.2 0.0 Marsabit 15.8 14.0 17.5 5.3 24.6 7.0 5.3 5.3 3.5 0.0 0.0 1.8

140
140
County
County analysis (in percentage) of the reasons for not reporting corruption in public service institutions as indicated by members of the public
Fear
of v
ictim
izat
ion
Not
hing
hap
pens
eve
n
whe
n yo
u re
port
Som
e pe
ople
do
not k
now
w
here
to r
epor
t N
o co
nfid
ence
in c
orru
ptio
n re
port
ing
Now
here
to r
epor
t
Cor
rupt
ion
is al
mos
t nor
mal
, he
nce
no n
eed
for
repo
rtin
g
Fear
of a
rres
t
Tim
e co
nstr
aint
s
Beca
use
of b
eing
par
t of
corr
uptio
n pe
rpet
ratio
n
Som
e pe
ople
giv
e br
ibes
and
st
ill d
o no
t get
pos
ive
resu
lts
Peop
le sh
ould
rep
ort t
he m
ain
perp
etra
tors
of c
orru
ptio
n on
ly
No
hot l
ines
and
/or
prop
er
chan
nels
for
repo
rtin
g
Nyamira 14.9 14.9 18.9 23.0 10.8 4.1 4.1 2.7 1.4 1.4 2.7 1.4 Machakos 14.5 16.8 6.1 14.5 16.8 10.6 2.8 1.1 10.1 5.6 1.1 0.0 Murang'a 14.4 10.4 32.0 11.2 10.4 6.4 4.0 3.2 3.2 2.4 0.8 1.6 Homa Bay 14.3 20.8 20.8 7.8 6.5 10.4 5.2 3.9 2.6 3.9 3.9 0.0 Nakuru 14.1 23.5 13.4 10.5 14.5 7.7 4.2 5.7 3.3 2.6 0.4 0.0 Kisii 14.0 14.7 21.3 5.3 22.7 8.0 0.7 4.0 2.7 6.0 0.7 0.0 Siaya 13.3 20.4 14.3 15.3 11.2 11.2 7.1 2.0 1.0 1.0 3.1 0.0 Kisumu 12.9 15.9 14.7 15.9 7.6 9.4 9.4 4.1 4.1 5.9 0.0 0.0 Kiambu 11.8 8.1 36.8 5.9 15.4 5.9 5.1 5.1 0.0 2.2 3.7 0.0 Laikipia 11.1 16.7 8.3 25.0 13.9 2.8 19.4 0.0 0.0 0.0 2.8 0.0 Narok 10.4 30.4 13.0 7.0 13.0 7.0 7.0 5.2 3.5 0.9 2.6 0.0 Tana River 10.0 32.5 10.0 7.5 25.0 15.0 0.0 0.0 0.0 0.0 0.0 0.0 West Pokot 10.0 17.5 2.5 15.0 15.0 15.0 17.5 2.5 0.0 2.5 2.5 0.0 Total number of counties where each of the 9 major reasons for not reporting corruption in public service institutions (based on the top three highest percentages in each of the 47 analyzed counties) is prominent
43 33 32 19 18 16 8 1 1
Fear of victimization was corroborated by findings from a key informant who noted that:
“People fear reporting corruption because of victimization. Most don’t report because they fear the consequences. There is also lack of clear procedures on how to report” (KI 10).
Another key informant observed that:
“I think corruption is not reported because people fear commitment to be witnesses in court as this consumes their time and the end result, nothing is done. The reporting process is not well stipulated and the witness is not well protected by the laws, so they fear. Other cases do not have enough evidence to prove if its corruption, for example if I bribe you know……..(laughs)…….. There is no evidence” (KI 9).
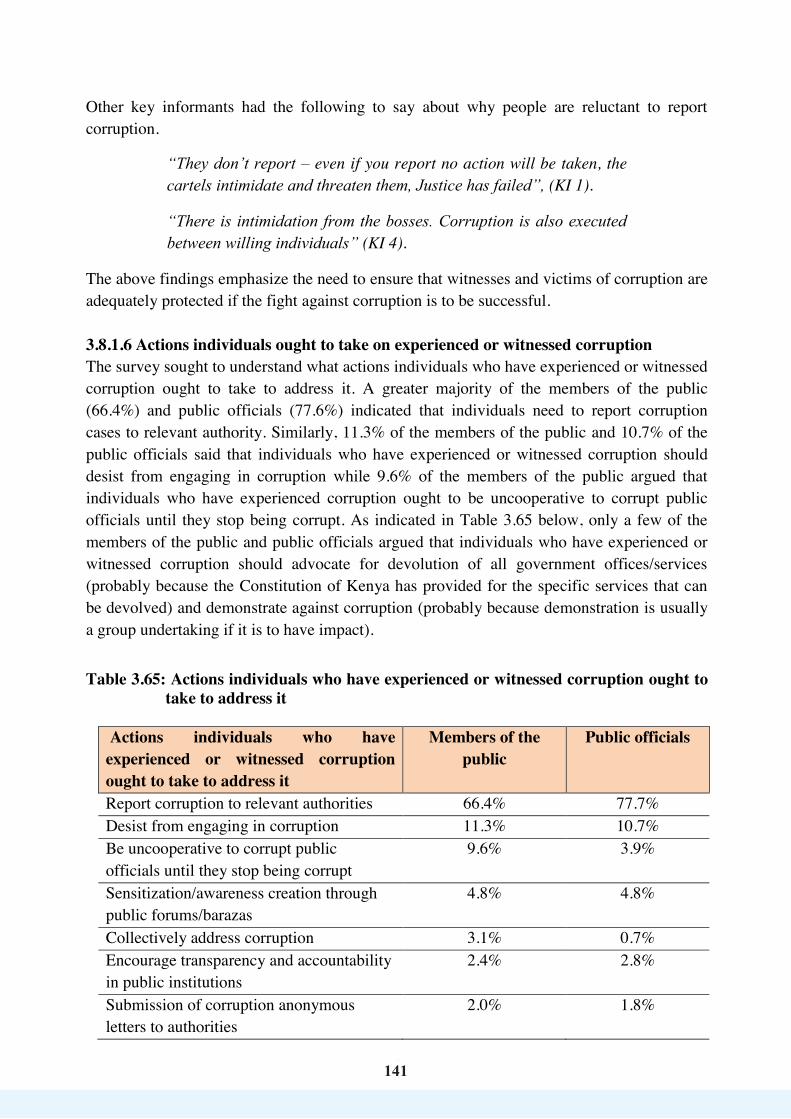
141141
Other key informants had the following to say about why people are reluctant to report corruption.
“They don’t report – even if you report no action will be taken, the cartels intimidate and threaten them, Justice has failed”, (KI 1).
“There is intimidation from the bosses. Corruption is also executed between willing individuals” (KI 4).
The above findings emphasize the need to ensure that witnesses and victims of corruption are adequately protected if the fight against corruption is to be successful. 3.8.1.6 Actions individuals ought to take on experienced or witnessed corruption The survey sought to understand what actions individuals who have experienced or witnessed corruption ought to take to address it. A greater majority of the members of the public (66.4%) and public officials (77.6%) indicated that individuals need to report corruption cases to relevant authority. Similarly, 11.3% of the members of the public and 10.7% of the public officials said that individuals who have experienced or witnessed corruption should desist from engaging in corruption while 9.6% of the members of the public argued that individuals who have experienced corruption ought to be uncooperative to corrupt public officials until they stop being corrupt. As indicated in Table 3.65 below, only a few of the members of the public and public officials argued that individuals who have experienced or witnessed corruption should advocate for devolution of all government offices/services (probably because the Constitution of Kenya has provided for the specific services that can be devolved) and demonstrate against corruption (probably because demonstration is usually a group undertaking if it is to have impact). Table 3.65: Actions individuals who have experienced or witnessed corruption ought to
take to address it
Actions individuals who have experienced or witnessed corruption ought to take to address it
Members of the public
Public officials
Report corruption to relevant authorities 66.4% 77.7% Desist from engaging in corruption 11.3% 10.7% Be uncooperative to corrupt public officials until they stop being corrupt
9.6% 3.9%
Sensitization/awareness creation through public forums/barazas
4.8% 4.8%
Collectively address corruption 3.1% 0.7% Encourage transparency and accountability in public institutions
2.4% 2.8%
Submission of corruption anonymous letters to authorities
2.0% 1.8%
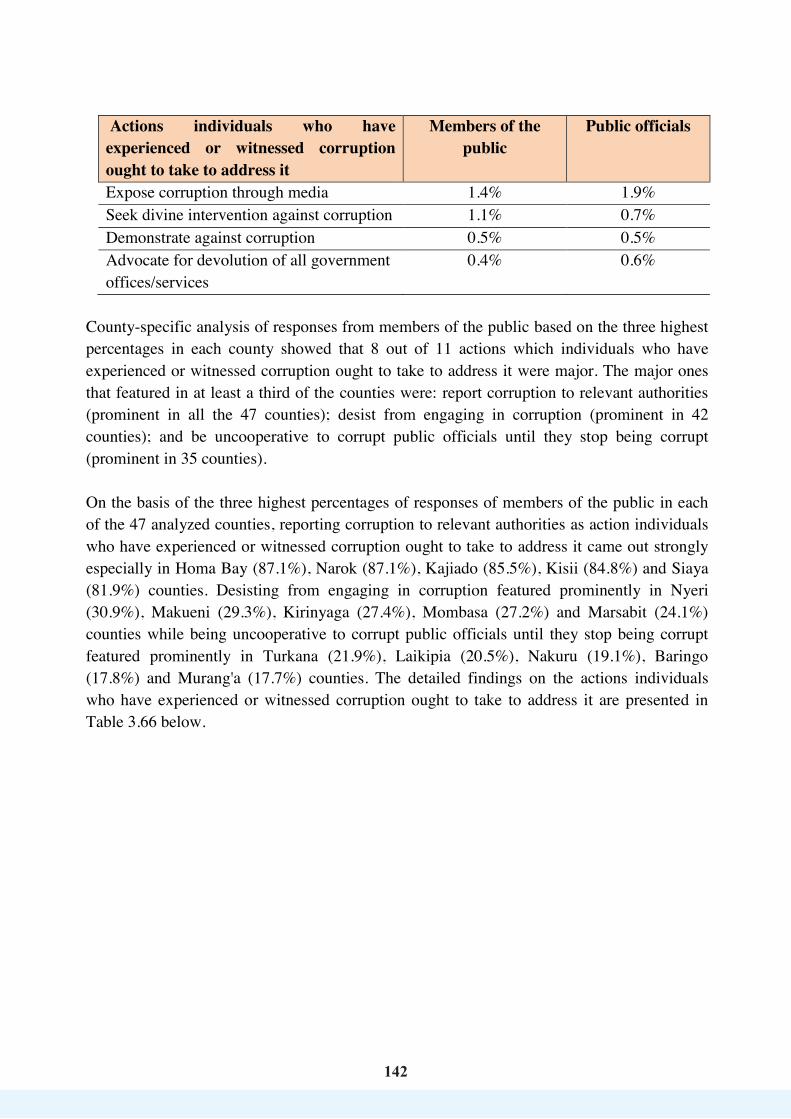
142142
Actions individuals who have experienced or witnessed corruption ought to take to address it
Members of the public
Public officials
Expose corruption through media 1.4% 1.9% Seek divine intervention against corruption 1.1% 0.7% Demonstrate against corruption 0.5% 0.5% Advocate for devolution of all government offices/services
0.4% 0.6%
County-specific analysis of responses from members of the public based on the three highest percentages in each county showed that 8 out of 11 actions which individuals who have experienced or witnessed corruption ought to take to address it were major. The major ones that featured in at least a third of the counties were: report corruption to relevant authorities (prominent in all the 47 counties); desist from engaging in corruption (prominent in 42 counties); and be uncooperative to corrupt public officials until they stop being corrupt (prominent in 35 counties). On the basis of the three highest percentages of responses of members of the public in each of the 47 analyzed counties, reporting corruption to relevant authorities as action individuals who have experienced or witnessed corruption ought to take to address it came out strongly especially in Homa Bay (87.1%), Narok (87.1%), Kajiado (85.5%), Kisii (84.8%) and Siaya (81.9%) counties. Desisting from engaging in corruption featured prominently in Nyeri (30.9%), Makueni (29.3%), Kirinyaga (27.4%), Mombasa (27.2%) and Marsabit (24.1%) counties while being uncooperative to corrupt public officials until they stop being corrupt featured prominently in Turkana (21.9%), Laikipia (20.5%), Nakuru (19.1%), Baringo (17.8%) and Murang'a (17.7%) counties. The detailed findings on the actions individuals who have experienced or witnessed corruption ought to take to address it are presented in Table 3.66 below.
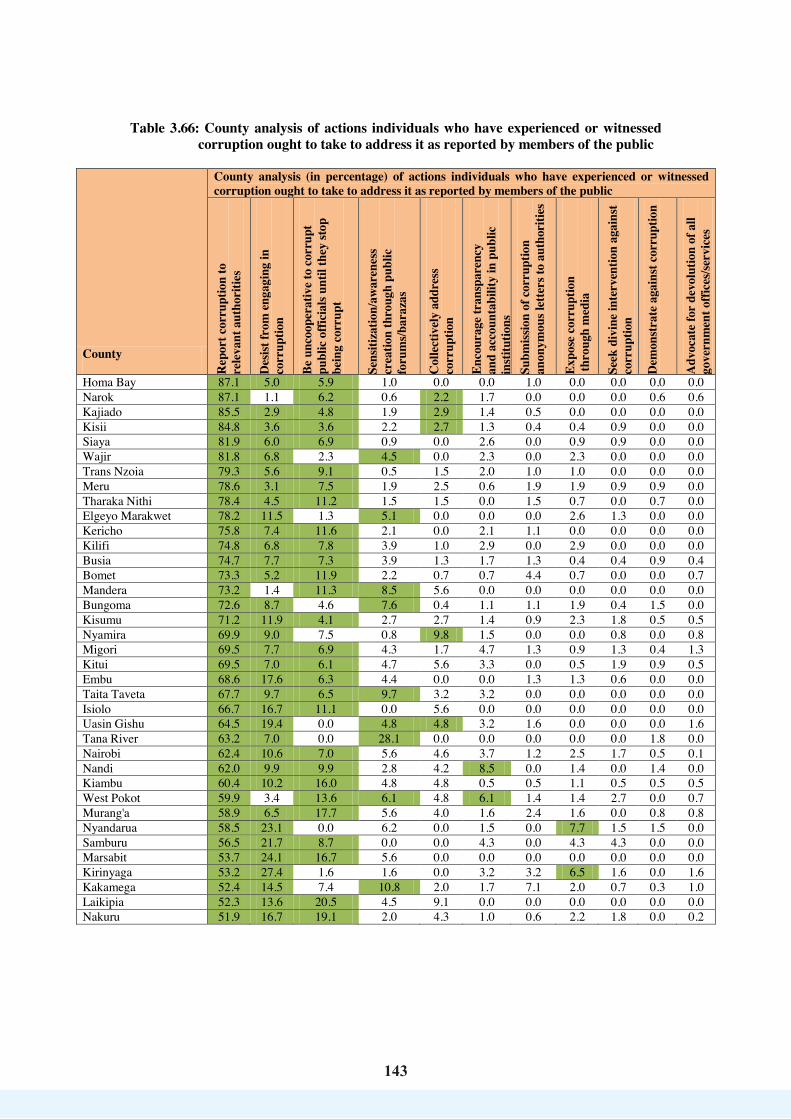
143
143
Table 3.66: County analysis of actions individuals who have experienced or witnessed corruption ought to take to address it as reported by members of the public
County
County analysis (in percentage) of actions individuals who have experienced or witnessed corruption ought to take to address it as reported by members of the public
Rep
ort c
orru
ptio
n to
re
leva
nt a
utho
ritie
s
Des
ist fr
om e
ngag
ing
in
corr
uptio
n
Be u
ncoo
pera
tive
to c
orru
pt
publ
ic o
ffici
als u
ntil
they
stop
be
ing
corr
upt
Sens
itiza
tion/
awar
enes
s cr
eatio
n th
roug
h pu
blic
fo
rum
s/bar
azas
Col
lect
ivel
y ad
dres
s co
rrup
tion
Enco
urag
e tr
ansp
aren
cy
and
acco
unta
bilit
y in
pub
lic
inst
itutio
ns
Subm
issio
n of
cor
rupt
ion
anon
ymou
s let
ters
to a
utho
ritie
s
Expo
se c
orru
ptio
n th
roug
h m
edia
Seek
div
ine
inte
rven
tion
agai
nst
corr
uptio
n
Dem
onst
rate
aga
inst
cor
rupt
ion
Adv
ocat
e fo
r de
volu
tion
of a
ll go
vern
men
t offi
ces/s
ervi
ces
Homa Bay 87.1 5.0 5.9 1.0 0.0 0.0 1.0 0.0 0.0 0.0 0.0 Narok 87.1 1.1 6.2 0.6 2.2 1.7 0.0 0.0 0.0 0.6 0.6 Kajiado 85.5 2.9 4.8 1.9 2.9 1.4 0.5 0.0 0.0 0.0 0.0 Kisii 84.8 3.6 3.6 2.2 2.7 1.3 0.4 0.4 0.9 0.0 0.0 Siaya 81.9 6.0 6.9 0.9 0.0 2.6 0.0 0.9 0.9 0.0 0.0 Wajir 81.8 6.8 2.3 4.5 0.0 2.3 0.0 2.3 0.0 0.0 0.0 Trans Nzoia 79.3 5.6 9.1 0.5 1.5 2.0 1.0 1.0 0.0 0.0 0.0 Meru 78.6 3.1 7.5 1.9 2.5 0.6 1.9 1.9 0.9 0.9 0.0 Tharaka Nithi 78.4 4.5 11.2 1.5 1.5 0.0 1.5 0.7 0.0 0.7 0.0 Elgeyo Marakwet 78.2 11.5 1.3 5.1 0.0 0.0 0.0 2.6 1.3 0.0 0.0 Kericho 75.8 7.4 11.6 2.1 0.0 2.1 1.1 0.0 0.0 0.0 0.0 Kilifi 74.8 6.8 7.8 3.9 1.0 2.9 0.0 2.9 0.0 0.0 0.0 Busia 74.7 7.7 7.3 3.9 1.3 1.7 1.3 0.4 0.4 0.9 0.4 Bomet 73.3 5.2 11.9 2.2 0.7 0.7 4.4 0.7 0.0 0.0 0.7 Mandera 73.2 1.4 11.3 8.5 5.6 0.0 0.0 0.0 0.0 0.0 0.0 Bungoma 72.6 8.7 4.6 7.6 0.4 1.1 1.1 1.9 0.4 1.5 0.0 Kisumu 71.2 11.9 4.1 2.7 2.7 1.4 0.9 2.3 1.8 0.5 0.5 Nyamira 69.9 9.0 7.5 0.8 9.8 1.5 0.0 0.0 0.8 0.0 0.8 Migori 69.5 7.7 6.9 4.3 1.7 4.7 1.3 0.9 1.3 0.4 1.3 Kitui 69.5 7.0 6.1 4.7 5.6 3.3 0.0 0.5 1.9 0.9 0.5 Embu 68.6 17.6 6.3 4.4 0.0 0.0 1.3 1.3 0.6 0.0 0.0 Taita Taveta 67.7 9.7 6.5 9.7 3.2 3.2 0.0 0.0 0.0 0.0 0.0 Isiolo 66.7 16.7 11.1 0.0 5.6 0.0 0.0 0.0 0.0 0.0 0.0 Uasin Gishu 64.5 19.4 0.0 4.8 4.8 3.2 1.6 0.0 0.0 0.0 1.6 Tana River 63.2 7.0 0.0 28.1 0.0 0.0 0.0 0.0 0.0 1.8 0.0 Nairobi 62.4 10.6 7.0 5.6 4.6 3.7 1.2 2.5 1.7 0.5 0.1 Nandi 62.0 9.9 9.9 2.8 4.2 8.5 0.0 1.4 0.0 1.4 0.0 Kiambu 60.4 10.2 16.0 4.8 4.8 0.5 0.5 1.1 0.5 0.5 0.5 West Pokot 59.9 3.4 13.6 6.1 4.8 6.1 1.4 1.4 2.7 0.0 0.7 Murang'a 58.9 6.5 17.7 5.6 4.0 1.6 2.4 1.6 0.0 0.8 0.8 Nyandarua 58.5 23.1 0.0 6.2 0.0 1.5 0.0 7.7 1.5 1.5 0.0 Samburu 56.5 21.7 8.7 0.0 0.0 4.3 0.0 4.3 4.3 0.0 0.0 Marsabit 53.7 24.1 16.7 5.6 0.0 0.0 0.0 0.0 0.0 0.0 0.0 Kirinyaga 53.2 27.4 1.6 1.6 0.0 3.2 3.2 6.5 1.6 0.0 1.6 Kakamega 52.4 14.5 7.4 10.8 2.0 1.7 7.1 2.0 0.7 0.3 1.0 Laikipia 52.3 13.6 20.5 4.5 9.1 0.0 0.0 0.0 0.0 0.0 0.0 Nakuru 51.9 16.7 19.1 2.0 4.3 1.0 0.6 2.2 1.8 0.0 0.2
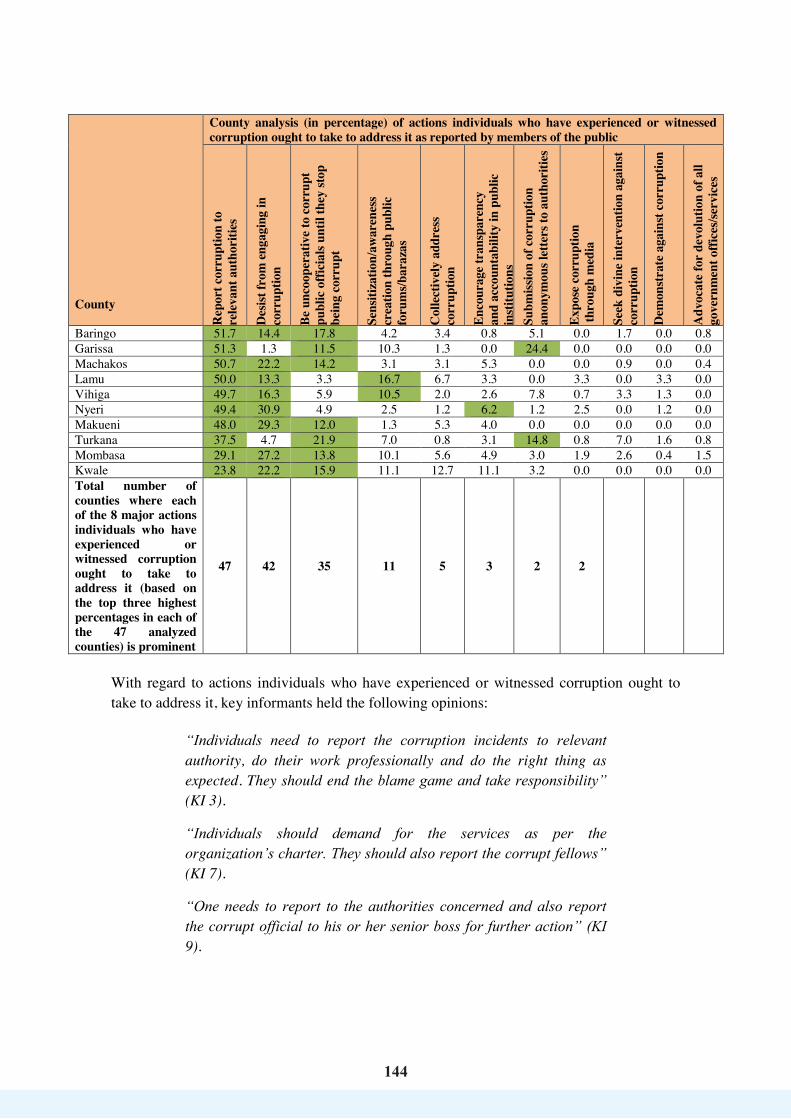
144
144
County
County analysis (in percentage) of actions individuals who have experienced or witnessed corruption ought to take to address it as reported by members of the public
Rep
ort c
orru
ptio
n to
re
leva
nt a
utho
ritie
s
Des
ist fr
om e
ngag
ing
in
corr
uptio
n
Be u
ncoo
pera
tive
to c
orru
pt
publ
ic o
ffici
als u
ntil
they
stop
be
ing
corr
upt
Sens
itiza
tion/
awar
enes
s cr
eatio
n th
roug
h pu
blic
fo
rum
s/bar
azas
Col
lect
ivel
y ad
dres
s co
rrup
tion
Enco
urag
e tr
ansp
aren
cy
and
acco
unta
bilit
y in
pub
lic
inst
itutio
ns
Subm
issio
n of
cor
rupt
ion
anon
ymou
s let
ters
to a
utho
ritie
s
Expo
se c
orru
ptio
n th
roug
h m
edia
Seek
div
ine
inte
rven
tion
agai
nst
corr
uptio
n
Dem
onst
rate
aga
inst
cor
rupt
ion
Adv
ocat
e fo
r de
volu
tion
of a
ll go
vern
men
t offi
ces/s
ervi
ces
Baringo 51.7 14.4 17.8 4.2 3.4 0.8 5.1 0.0 1.7 0.0 0.8 Garissa 51.3 1.3 11.5 10.3 1.3 0.0 24.4 0.0 0.0 0.0 0.0 Machakos 50.7 22.2 14.2 3.1 3.1 5.3 0.0 0.0 0.9 0.0 0.4 Lamu 50.0 13.3 3.3 16.7 6.7 3.3 0.0 3.3 0.0 3.3 0.0 Vihiga 49.7 16.3 5.9 10.5 2.0 2.6 7.8 0.7 3.3 1.3 0.0 Nyeri 49.4 30.9 4.9 2.5 1.2 6.2 1.2 2.5 0.0 1.2 0.0 Makueni 48.0 29.3 12.0 1.3 5.3 4.0 0.0 0.0 0.0 0.0 0.0 Turkana 37.5 4.7 21.9 7.0 0.8 3.1 14.8 0.8 7.0 1.6 0.8 Mombasa 29.1 27.2 13.8 10.1 5.6 4.9 3.0 1.9 2.6 0.4 1.5 Kwale 23.8 22.2 15.9 11.1 12.7 11.1 3.2 0.0 0.0 0.0 0.0 Total number of counties where each of the 8 major actions individuals who have experienced or witnessed corruption ought to take to address it (based on the top three highest percentages in each of the 47 analyzed counties) is prominent
47 42 35 11 5 3 2 2
With regard to actions individuals who have experienced or witnessed corruption ought to take to address it, key informants held the following opinions:
“Individuals need to report the corruption incidents to relevant authority, do their work professionally and do the right thing as expected. They should end the blame game and take responsibility” (KI 3).
“Individuals should demand for the services as per the organization’s charter. They should also report the corrupt fellows” (KI 7).
“One needs to report to the authorities concerned and also report the corrupt official to his or her senior boss for further action” (KI 9).
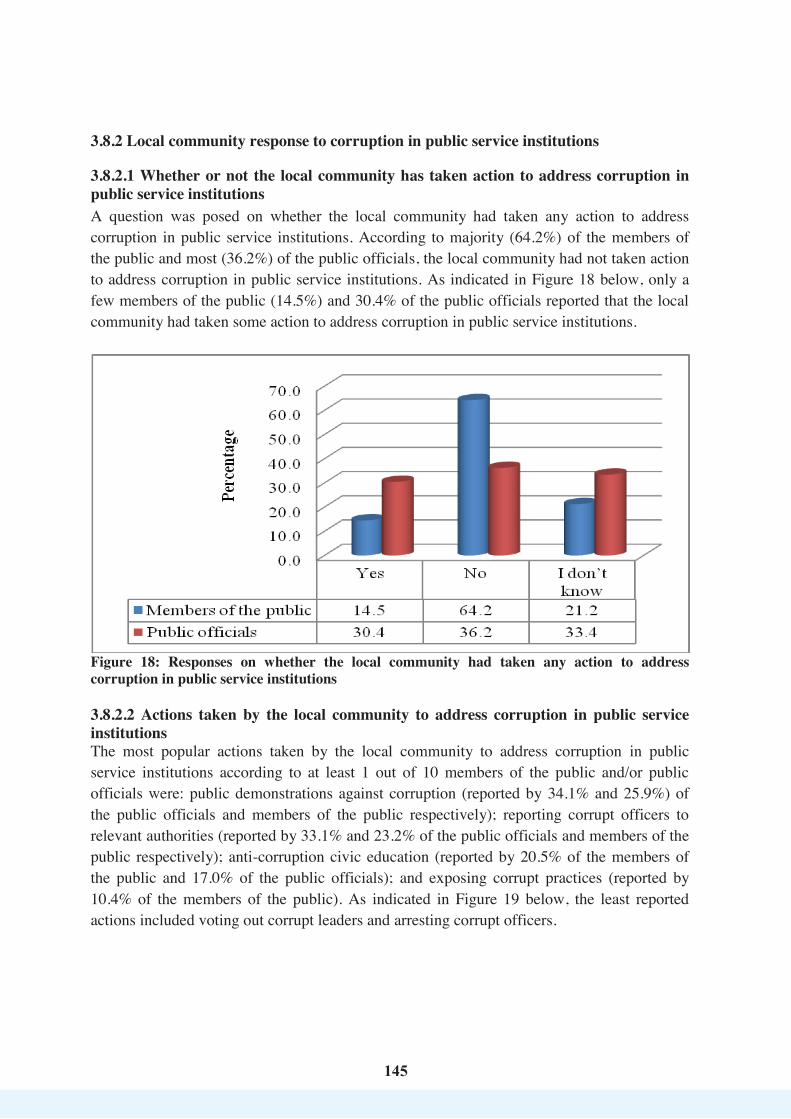
145145
3.8.2 Local community response to corruption in public service institutions 3.8.2.1 Whether or not the local community has taken action to address corruption in public service institutions A question was posed on whether the local community had taken any action to address corruption in public service institutions. According to majority (64.2%) of the members of the public and most (36.2%) of the public officials, the local community had not taken action to address corruption in public service institutions. As indicated in Figure 18 below, only a few members of the public (14.5%) and 30.4% of the public officials reported that the local community had taken some action to address corruption in public service institutions.
Figure 18: Responses on whether the local community had taken any action to address corruption in public service institutions 3.8.2.2 Actions taken by the local community to address corruption in public service institutions The most popular actions taken by the local community to address corruption in public service institutions according to at least 1 out of 10 members of the public and/or public officials were: public demonstrations against corruption (reported by 34.1% and 25.9%) of the public officials and members of the public respectively); reporting corrupt officers to relevant authorities (reported by 33.1% and 23.2% of the public officials and members of the public respectively); anti-corruption civic education (reported by 20.5% of the members of the public and 17.0% of the public officials); and exposing corrupt practices (reported by 10.4% of the members of the public). As indicated in Figure 19 below, the least reported actions included voting out corrupt leaders and arresting corrupt officers.

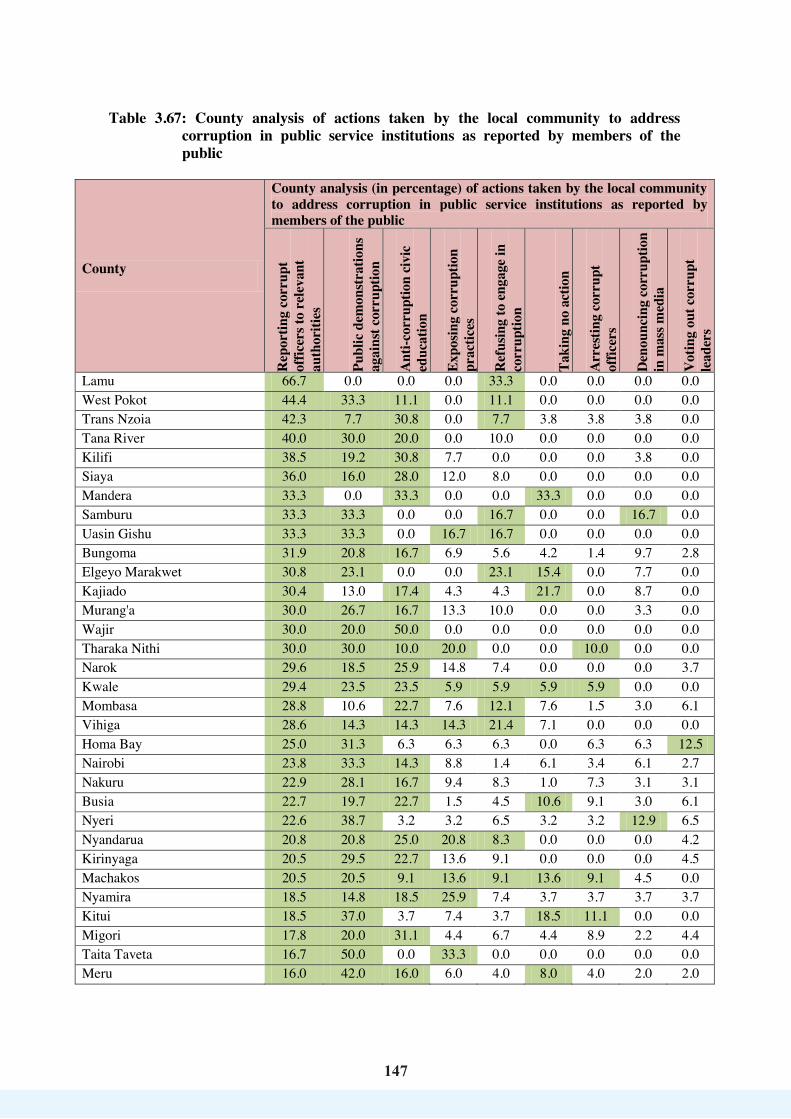
147
147
Table 3.67: County analysis of actions taken by the local community to address corruption in public service institutions as reported by members of the public
County
County analysis (in percentage) of actions taken by the local community to address corruption in public service institutions as reported by members of the public
Rep
ortin
g co
rrup
t of
ficer
s to
rele
vant
au
thor
ities
Publ
ic d
emon
stra
tions
ag
ains
t cor
rupt
ion
Ant
i-cor
rupt
ion
civi
c ed
ucat
ion
Expo
sing
corr
uptio
n pr
actic
es
Ref
usin
g to
eng
age
in
corr
uptio
n
Taki
ng n
o ac
tion
Arr
estin
g co
rrup
t of
ficer
s
Den
ounc
ing
corr
uptio
n
in m
ass m
edia
Vot
ing
out c
orru
pt
lead
ers
Lamu 66.7 0.0 0.0 0.0 33.3 0.0 0.0 0.0 0.0 West Pokot 44.4 33.3 11.1 0.0 11.1 0.0 0.0 0.0 0.0 Trans Nzoia 42.3 7.7 30.8 0.0 7.7 3.8 3.8 3.8 0.0 Tana River 40.0 30.0 20.0 0.0 10.0 0.0 0.0 0.0 0.0 Kilifi 38.5 19.2 30.8 7.7 0.0 0.0 0.0 3.8 0.0 Siaya 36.0 16.0 28.0 12.0 8.0 0.0 0.0 0.0 0.0 Mandera 33.3 0.0 33.3 0.0 0.0 33.3 0.0 0.0 0.0 Samburu 33.3 33.3 0.0 0.0 16.7 0.0 0.0 16.7 0.0 Uasin Gishu 33.3 33.3 0.0 16.7 16.7 0.0 0.0 0.0 0.0 Bungoma 31.9 20.8 16.7 6.9 5.6 4.2 1.4 9.7 2.8 Elgeyo Marakwet 30.8 23.1 0.0 0.0 23.1 15.4 0.0 7.7 0.0 Kajiado 30.4 13.0 17.4 4.3 4.3 21.7 0.0 8.7 0.0 Murang'a 30.0 26.7 16.7 13.3 10.0 0.0 0.0 3.3 0.0 Wajir 30.0 20.0 50.0 0.0 0.0 0.0 0.0 0.0 0.0 Tharaka Nithi 30.0 30.0 10.0 20.0 0.0 0.0 10.0 0.0 0.0 Narok 29.6 18.5 25.9 14.8 7.4 0.0 0.0 0.0 3.7 Kwale 29.4 23.5 23.5 5.9 5.9 5.9 5.9 0.0 0.0 Mombasa 28.8 10.6 22.7 7.6 12.1 7.6 1.5 3.0 6.1 Vihiga 28.6 14.3 14.3 14.3 21.4 7.1 0.0 0.0 0.0 Homa Bay 25.0 31.3 6.3 6.3 6.3 0.0 6.3 6.3 12.5 Nairobi 23.8 33.3 14.3 8.8 1.4 6.1 3.4 6.1 2.7 Nakuru 22.9 28.1 16.7 9.4 8.3 1.0 7.3 3.1 3.1 Busia 22.7 19.7 22.7 1.5 4.5 10.6 9.1 3.0 6.1 Nyeri 22.6 38.7 3.2 3.2 6.5 3.2 3.2 12.9 6.5 Nyandarua 20.8 20.8 25.0 20.8 8.3 0.0 0.0 0.0 4.2 Kirinyaga 20.5 29.5 22.7 13.6 9.1 0.0 0.0 0.0 4.5 Machakos 20.5 20.5 9.1 13.6 9.1 13.6 9.1 4.5 0.0 Nyamira 18.5 14.8 18.5 25.9 7.4 3.7 3.7 3.7 3.7 Kitui 18.5 37.0 3.7 7.4 3.7 18.5 11.1 0.0 0.0 Migori 17.8 20.0 31.1 4.4 6.7 4.4 8.9 2.2 4.4 Taita Taveta 16.7 50.0 0.0 33.3 0.0 0.0 0.0 0.0 0.0 Meru 16.0 42.0 16.0 6.0 4.0 8.0 4.0 2.0 2.0
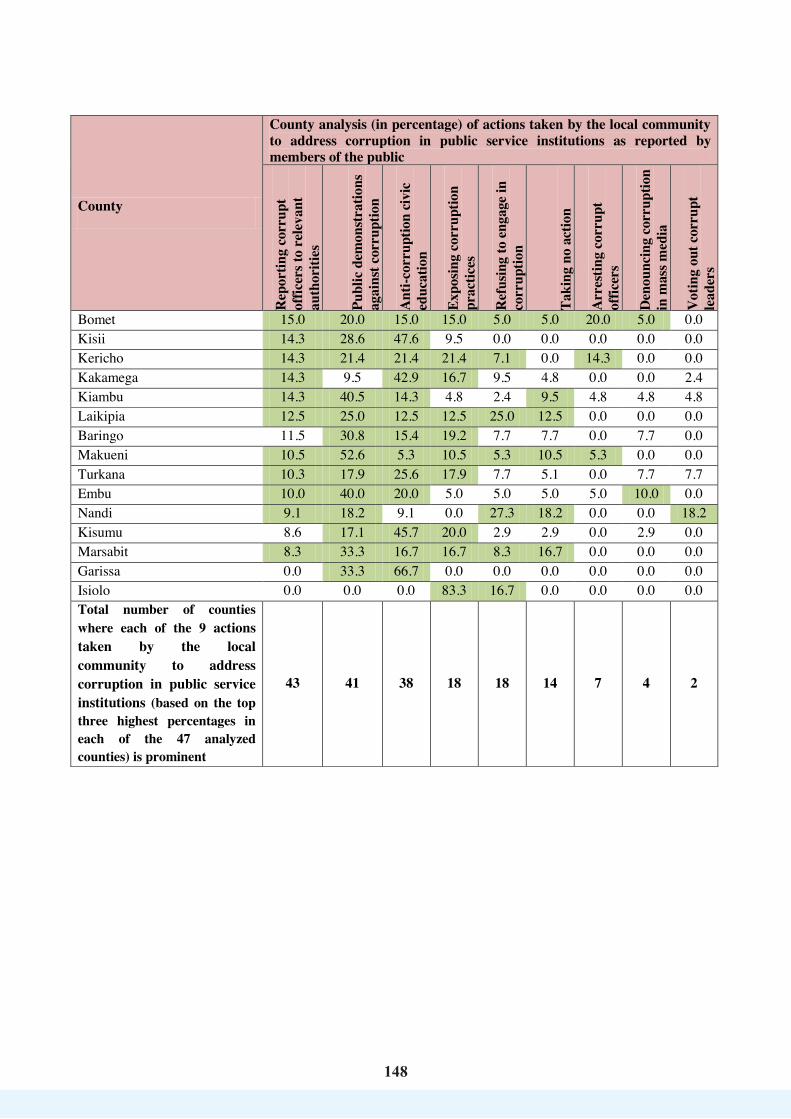
148
148
County
County analysis (in percentage) of actions taken by the local community to address corruption in public service institutions as reported by members of the public
Rep
ortin
g co
rrup
t of
ficer
s to
rele
vant
au
thor
ities
Publ
ic d
emon
stra
tions
ag
ains
t cor
rupt
ion
Ant
i-cor
rupt
ion
civi
c ed
ucat
ion
Expo
sing
corr
uptio
n pr
actic
es
Ref
usin
g to
eng
age
in
corr
uptio
n
Taki
ng n
o ac
tion
Arr
estin
g co
rrup
t of
ficer
s
Den
ounc
ing
corr
uptio
n
in m
ass m
edia
Vot
ing
out c
orru
pt
lead
ers
Bomet 15.0 20.0 15.0 15.0 5.0 5.0 20.0 5.0 0.0 Kisii 14.3 28.6 47.6 9.5 0.0 0.0 0.0 0.0 0.0 Kericho 14.3 21.4 21.4 21.4 7.1 0.0 14.3 0.0 0.0 Kakamega 14.3 9.5 42.9 16.7 9.5 4.8 0.0 0.0 2.4 Kiambu 14.3 40.5 14.3 4.8 2.4 9.5 4.8 4.8 4.8 Laikipia 12.5 25.0 12.5 12.5 25.0 12.5 0.0 0.0 0.0 Baringo 11.5 30.8 15.4 19.2 7.7 7.7 0.0 7.7 0.0 Makueni 10.5 52.6 5.3 10.5 5.3 10.5 5.3 0.0 0.0 Turkana 10.3 17.9 25.6 17.9 7.7 5.1 0.0 7.7 7.7 Embu 10.0 40.0 20.0 5.0 5.0 5.0 5.0 10.0 0.0 Nandi 9.1 18.2 9.1 0.0 27.3 18.2 0.0 0.0 18.2 Kisumu 8.6 17.1 45.7 20.0 2.9 2.9 0.0 2.9 0.0 Marsabit 8.3 33.3 16.7 16.7 8.3 16.7 0.0 0.0 0.0 Garissa 0.0 33.3 66.7 0.0 0.0 0.0 0.0 0.0 0.0 Isiolo 0.0 0.0 0.0 83.3 16.7 0.0 0.0 0.0 0.0 Total number of counties where each of the 9 actions taken by the local community to address corruption in public service institutions (based on the top three highest percentages in each of the 47 analyzed counties) is prominent
43 41 38 18 18 14 7 4 2

149
149
A past demonstration by members of the public against corruption in the public service A key informant in the study observed that some members of the local community were responding against corruption. The informant reported that:
“Community is sharing about corruption so as to create awareness on corruption. Some members try to go a step further and gather evidence for action, disclose some facts on tenders and attempt to stop the culture of encouraging the perpetrators” (KI 5).
Another key informant argued that:
“The local community has done a lot in pointing out corruption during their meetings” (KI 2).
Some community members in some counties are active in anti-corruption programmes. For instance, members of the public in Nakuru County have partnered with the Ethics and Anti-Corruption Commission and the National Police Service in an initiative dubbed “Mulika Hongo” (in English, ‘highlight bribery’) in the county which is aimed at creating awareness among members of the public on corruption-related matters.
Members of the public participating in an anti-corruption activity in Nakuru County
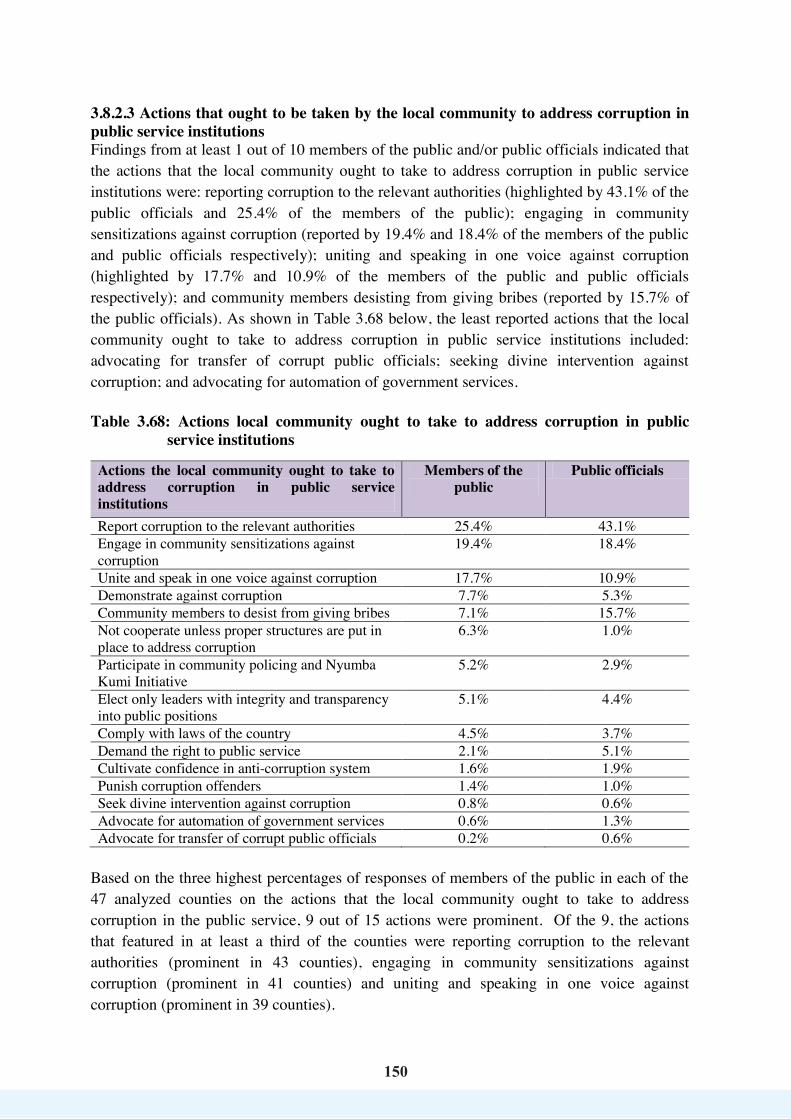
150
150
3.8.2.3 Actions that ought to be taken by the local community to address corruption in public service institutions Findings from at least 1 out of 10 members of the public and/or public officials indicated that the actions that the local community ought to take to address corruption in public service institutions were: reporting corruption to the relevant authorities (highlighted by 43.1% of the public officials and 25.4% of the members of the public); engaging in community sensitizations against corruption (reported by 19.4% and 18.4% of the members of the public and public officials respectively); uniting and speaking in one voice against corruption (highlighted by 17.7% and 10.9% of the members of the public and public officials respectively); and community members desisting from giving bribes (reported by 15.7% of the public officials). As shown in Table 3.68 below, the least reported actions that the local community ought to take to address corruption in public service institutions included: advocating for transfer of corrupt public officials; seeking divine intervention against corruption; and advocating for automation of government services. Table 3.68: Actions local community ought to take to address corruption in public
service institutions Actions the local community ought to take to address corruption in public service institutions
Members of the public
Public officials
Report corruption to the relevant authorities 25.4% 43.1% Engage in community sensitizations against corruption
19.4% 18.4%
Unite and speak in one voice against corruption 17.7% 10.9% Demonstrate against corruption 7.7% 5.3% Community members to desist from giving bribes 7.1% 15.7% Not cooperate unless proper structures are put in place to address corruption
6.3% 1.0%
Participate in community policing and Nyumba Kumi Initiative
5.2% 2.9%
Elect only leaders with integrity and transparency into public positions
5.1% 4.4%
Comply with laws of the country 4.5% 3.7% Demand the right to public service 2.1% 5.1% Cultivate confidence in anti-corruption system 1.6% 1.9% Punish corruption offenders 1.4% 1.0% Seek divine intervention against corruption 0.8% 0.6% Advocate for automation of government services 0.6% 1.3% Advocate for transfer of corrupt public officials 0.2% 0.6%
Based on the three highest percentages of responses of members of the public in each of the 47 analyzed counties on the actions that the local community ought to take to address corruption in the public service, 9 out of 15 actions were prominent. Of the 9, the actions that featured in at least a third of the counties were reporting corruption to the relevant authorities (prominent in 43 counties), engaging in community sensitizations against corruption (prominent in 41 counties) and uniting and speaking in one voice against corruption (prominent in 39 counties).
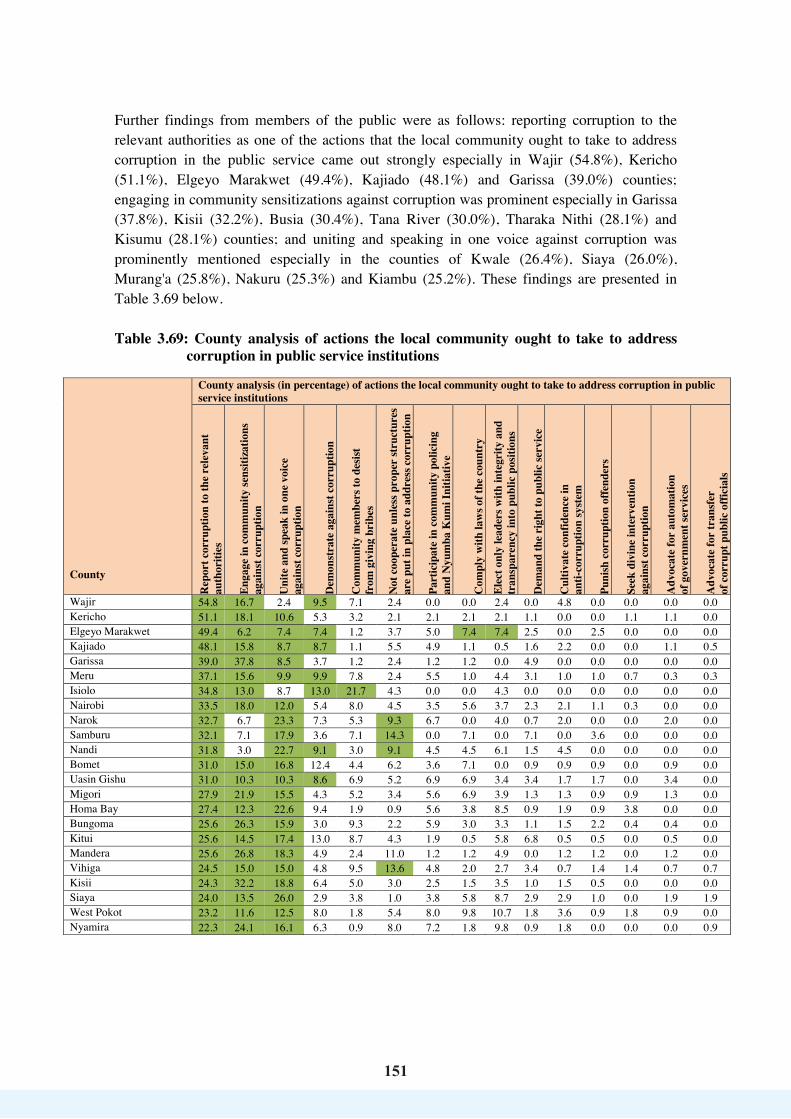
151
151
Further findings from members of the public were as follows: reporting corruption to the relevant authorities as one of the actions that the local community ought to take to address corruption in the public service came out strongly especially in Wajir (54.8%), Kericho (51.1%), Elgeyo Marakwet (49.4%), Kajiado (48.1%) and Garissa (39.0%) counties; engaging in community sensitizations against corruption was prominent especially in Garissa (37.8%), Kisii (32.2%), Busia (30.4%), Tana River (30.0%), Tharaka Nithi (28.1%) and Kisumu (28.1%) counties; and uniting and speaking in one voice against corruption was prominently mentioned especially in the counties of Kwale (26.4%), Siaya (26.0%), Murang'a (25.8%), Nakuru (25.3%) and Kiambu (25.2%). These findings are presented in Table 3.69 below. Table 3.69: County analysis of actions the local community ought to take to address
corruption in public service institutions
County
County analysis (in percentage) of actions the local community ought to take to address corruption in public service institutions
Rep
ort c
orru
ptio
n to
the
rele
vant
au
thor
ities
Enga
ge in
com
mun
ity se
nsiti
zatio
ns
agai
nst c
orru
ptio
n
Uni
te a
nd sp
eak
in o
ne v
oice
ag
ains
t cor
rupt
ion
Dem
onst
rate
aga
inst
cor
rupt
ion
Com
mun
ity m
embe
rs to
des
ist
from
giv
ing
brib
es
Not
coo
pera
te u
nles
s pro
per
stru
ctur
es
are
put i
n pl
ace
to a
ddre
ss c
orru
ptio
n
Part
icip
ate
in c
omm
unity
pol
icin
g
and
Nyu
mba
Kum
i Ini
tiativ
e
Com
ply
with
law
s of t
he c
ount
ry
Elec
t onl
y le
ader
s with
inte
grity
and
tr
ansp
aren
cy in
to p
ublic
pos
ition
s
Dem
and
the
righ
t to
publ
ic se
rvic
e
Cul
tivat
e co
nfid
ence
in
anti-
corr
uptio
n sy
stem
Puni
sh c
orru
ptio
n of
fend
ers
Seek
div
ine
inte
rven
tion
ag
ains
t cor
rupt
ion
Adv
ocat
e fo
r au
tom
atio
n
of g
over
nmen
t ser
vice
s
Adv
ocat
e fo
r tr
ansf
er
of c
orru
pt p
ublic
offi
cial
s
Wajir 54.8 16.7 2.4 9.5 7.1 2.4 0.0 0.0 2.4 0.0 4.8 0.0 0.0 0.0 0.0 Kericho 51.1 18.1 10.6 5.3 3.2 2.1 2.1 2.1 2.1 1.1 0.0 0.0 1.1 1.1 0.0 Elgeyo Marakwet 49.4 6.2 7.4 7.4 1.2 3.7 5.0 7.4 7.4 2.5 0.0 2.5 0.0 0.0 0.0 Kajiado 48.1 15.8 8.7 8.7 1.1 5.5 4.9 1.1 0.5 1.6 2.2 0.0 0.0 1.1 0.5 Garissa 39.0 37.8 8.5 3.7 1.2 2.4 1.2 1.2 0.0 4.9 0.0 0.0 0.0 0.0 0.0 Meru 37.1 15.6 9.9 9.9 7.8 2.4 5.5 1.0 4.4 3.1 1.0 1.0 0.7 0.3 0.3 Isiolo 34.8 13.0 8.7 13.0 21.7 4.3 0.0 0.0 4.3 0.0 0.0 0.0 0.0 0.0 0.0 Nairobi 33.5 18.0 12.0 5.4 8.0 4.5 3.5 5.6 3.7 2.3 2.1 1.1 0.3 0.0 0.0 Narok 32.7 6.7 23.3 7.3 5.3 9.3 6.7 0.0 4.0 0.7 2.0 0.0 0.0 2.0 0.0 Samburu 32.1 7.1 17.9 3.6 7.1 14.3 0.0 7.1 0.0 7.1 0.0 3.6 0.0 0.0 0.0 Nandi 31.8 3.0 22.7 9.1 3.0 9.1 4.5 4.5 6.1 1.5 4.5 0.0 0.0 0.0 0.0 Bomet 31.0 15.0 16.8 12.4 4.4 6.2 3.6 7.1 0.0 0.9 0.9 0.9 0.0 0.9 0.0 Uasin Gishu 31.0 10.3 10.3 8.6 6.9 5.2 6.9 6.9 3.4 3.4 1.7 1.7 0.0 3.4 0.0 Migori 27.9 21.9 15.5 4.3 5.2 3.4 5.6 6.9 3.9 1.3 1.3 0.9 0.9 1.3 0.0 Homa Bay 27.4 12.3 22.6 9.4 1.9 0.9 5.6 3.8 8.5 0.9 1.9 0.9 3.8 0.0 0.0 Bungoma 25.6 26.3 15.9 3.0 9.3 2.2 5.9 3.0 3.3 1.1 1.5 2.2 0.4 0.4 0.0 Kitui 25.6 14.5 17.4 13.0 8.7 4.3 1.9 0.5 5.8 6.8 0.5 0.5 0.0 0.5 0.0 Mandera 25.6 26.8 18.3 4.9 2.4 11.0 1.2 1.2 4.9 0.0 1.2 1.2 0.0 1.2 0.0 Vihiga 24.5 15.0 15.0 4.8 9.5 13.6 4.8 2.0 2.7 3.4 0.7 1.4 1.4 0.7 0.7 Kisii 24.3 32.2 18.8 6.4 5.0 3.0 2.5 1.5 3.5 1.0 1.5 0.5 0.0 0.0 0.0 Siaya 24.0 13.5 26.0 2.9 3.8 1.0 3.8 5.8 8.7 2.9 2.9 1.0 0.0 1.9 1.9 West Pokot 23.2 11.6 12.5 8.0 1.8 5.4 8.0 9.8 10.7 1.8 3.6 0.9 1.8 0.9 0.0 Nyamira 22.3 24.1 16.1 6.3 0.9 8.0 7.2 1.8 9.8 0.9 1.8 0.0 0.0 0.0 0.9

152
152
County
County analysis (in percentage) of actions the local community ought to take to address corruption in public service institutions
Rep
ort c
orru
ptio
n to
the
rele
vant
au
thor
ities
Enga
ge in
com
mun
ity se
nsiti
zatio
ns
agai
nst c
orru
ptio
n
Uni
te a
nd sp
eak
in o
ne v
oice
ag
ains
t cor
rupt
ion
Dem
onst
rate
aga
inst
cor
rupt
ion
Com
mun
ity m
embe
rs to
des
ist
from
giv
ing
brib
es
Not
coo
pera
te u
nles
s pro
per
stru
ctur
es
are
put i
n pl
ace
to a
ddre
ss c
orru
ptio
n
Part
icip
ate
in c
omm
unity
pol
icin
g
and
Nyu
mba
Kum
i Ini
tiativ
e
Com
ply
with
law
s of t
he c
ount
ry
Elec
t onl
y le
ader
s with
inte
grity
and
tr
ansp
aren
cy in
to p
ublic
pos
ition
s
Dem
and
the
righ
t to
publ
ic se
rvic
e
Cul
tivat
e co
nfid
ence
in
anti-
corr
uptio
n sy
stem
Puni
sh c
orru
ptio
n of
fend
ers
Seek
div
ine
inte
rven
tion
ag
ains
t cor
rupt
ion
Adv
ocat
e fo
r au
tom
atio
n
of g
over
nmen
t ser
vice
s
Adv
ocat
e fo
r tr
ansf
er
of c
orru
pt p
ublic
offi
cial
s
Kirinyaga 21.1 15.5 19.7 4.2 11.3 0.0 2.8 4.2 8.5 4.2 1.4 7.0 0.0 0.0 0.0 Tharaka Nithi 20.7 28.1 14.0 10.7 18.2 0.8 1.6 1.7 0.8 0.8 0.0 1.7 0.0 0.0 0.8 Machakos 20.6 17.8 19.6 9.8 4.2 11.2 2.8 5.6 5.1 0.5 0.9 1.4 0.0 0.5 0.0 Kilifi 20.4 25.5 12.2 16.3 6.1 1.0 6.1 2.0 5.1 2.0 0.0 3.1 0.0 0.0 0.0 Kakamega 20.0 25.1 17.5 4.4 6.2 6.9 5.1 4.4 2.9 1.8 0.4 2.2 2.5 0.0 0.7 Turkana 19.9 22.0 9.9 5.7 1.4 5.0 14.9 6.4 3.5 1.4 0.7 4.3 5.0 0.0 0.0 Nyandarua 19.4 13.9 22.2 9.7 15.3 6.9 2.8 4.2 4.2 1.4 0.0 0.0 0.0 0.0 0.0 Busia 19.0 30.4 14.8 10.1 5.9 3.4 1.6 2.1 5.5 1.7 2.1 2.5 0.0 0.8 0.0 Murang'a 18.1 11.0 25.8 6.5 4.5 12.3 5.1 2.6 6.5 3.9 3.2 0.0 0.6 0.0 0.0 Nyeri 17.9 14.3 15.5 6.0 4.8 2.4 4.8 13.1 3.6 2.4 6.0 7.1 1.2 1.2 0.0 Embu 17.6 16.2 8.5 12.0 14.8 12.0 6.3 6.3 1.4 0.0 2.1 1.4 0.0 1.4 0.0 Kisumu 17.1 28.1 17.6 6.2 1.4 5.2 7.1 3.8 6.7 2.9 1.4 0.5 0.5 1.0 0.5 Kwale 16.7 15.3 26.4 6.9 4.2 2.8 8.4 5.6 8.3 0.0 4.2 1.4 0.0 0.0 0.0 Marsabit 16.1 10.7 7.1 7.1 26.8 10.7 1.8 3.6 3.6 8.9 0.0 1.8 1.8 0.0 0.0 Mombasa 16.1 19.3 21.8 7.9 3.6 5.4 7.8 7.5 5.0 1.4 1.1 0.7 1.1 1.4 0.0 Kiambu 15.8 8.6 25.2 9.5 12.6 7.7 9.0 1.8 3.2 1.8 2.3 0.0 1.4 0.5 0.9 Trans Nzoia 13.4 18.8 18.8 2.7 4.5 7.1 4.5 16.1 4.5 3.6 4.5 0.0 0.9 0.9 0.0 Makueni 13.0 26.1 21.7 11.6 8.7 7.2 4.3 2.9 1.4 0.0 0.0 1.4 0.0 1.4 0.0 Lamu 12.9 19.4 9.7 3.2 0.0 0.0 16.1 16.1 9.7 0.0 0.0 0.0 3.2 9.7 0.0 Taita Taveta 12.9 12.9 16.1 19.4 3.2 3.2 12.9 6.5 0.0 0.0 0.0 9.7 3.2 0.0 0.0 Nakuru 10.8 11.8 25.3 5.8 9.7 12.6 3.8 3.7 9.9 1.4 1.4 1.2 1.4 0.6 0.4 Tana River 10.0 30.0 18.3 15.0 1.7 5.0 1.7 1.7 10.0 3.3 0.0 1.7 1.7 0.0 0.0 Baringo 8.5 16.9 22.0 6.8 10.2 10.2 3.3 6.8 9.3 2.5 0.0 1.7 0.0 0.8 0.8 Laikipia 2.2 20.0 20.0 6.7 15.6 11.1 13.3 8.9 0.0 2.2 0.0 0.0 0.0 0.0 0.0 Total number of counties where each of the 9 major actions the local community ought to take to address corruption in public service institutions (based on the top three highest percentages in each of the 47 analyzed counties) is prominent
43 41 39 10 8 8 4 3 1
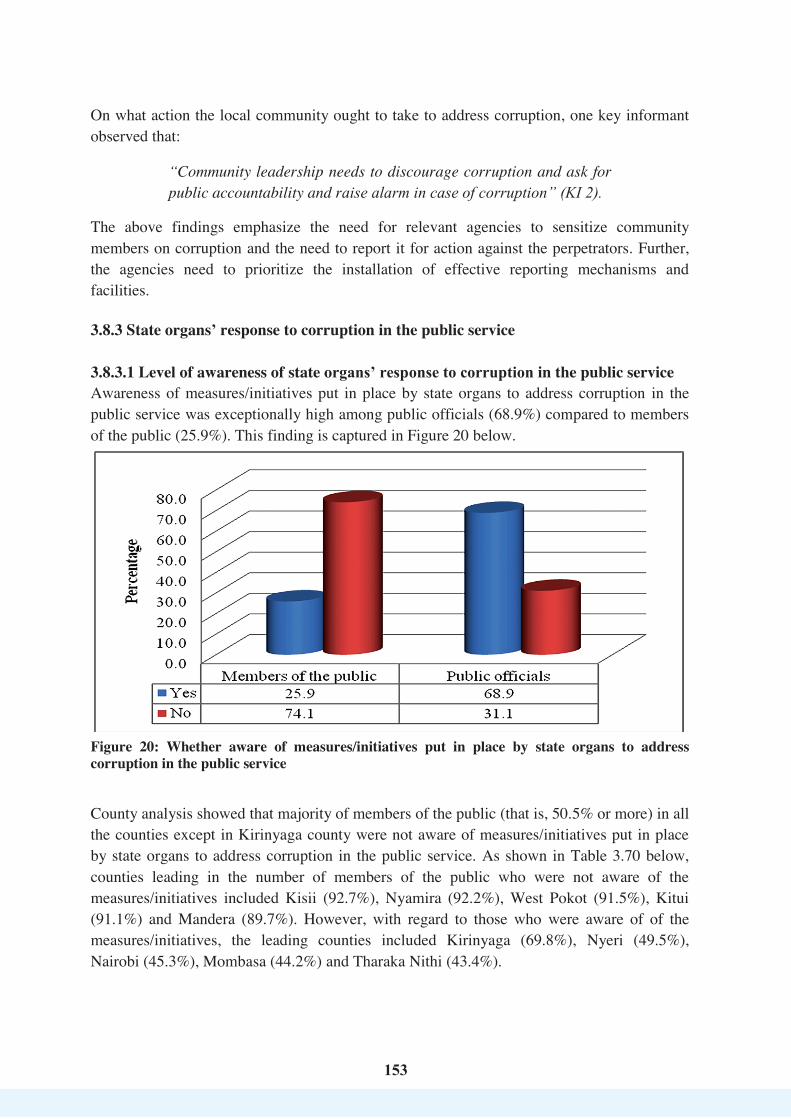

154
154
Table 3.70: County level responses by members of the public on whether they are aware of measures/initiatives put in place by state organs to address corruption
County County level responses by members of the public (in percentage) on whether they are aware of measures/initiatives put in place by state organs to address corruption in the public service
Yes No Kirinyaga 69.8 30.2 Nyeri 49.5 50.5 Nairobi 45.3 54.7 Mombasa 44.2 55.8 Tharaka Nithi 43.4 56.6 Nyandarua 42.9 57.1 Samburu 38.7 61.3 Machakos 37.3 62.7 Meru 36.2 63.8 Bungoma 36.1 63.9 Uasin Gishu 34.7 65.3 Isiolo 33.3 66.7 Kericho 29.8 70.2 Makueni 29.7 70.3 Kisumu 29.1 70.9 Busia 29.0 71.0 Bomet 28.9 71.1 Wajir 28.6 71.4 Embu 24.4 75.6 Kiambu 23.0 77.0 Kakamega 22.3 77.7 Nakuru 21.6 78.4 Baringo 21.5 78.5 Garissa 20.3 79.7 Elgeyo Marakwet 20.3 79.7 Turkana 19.6 80.4 Murang'a 19.0 81.0 Trans Nzoia 18.9 81.1 Homa Bay 18.3 81.7 Narok 18.1 81.9 Siaya 17.4 82.6 Kajiado 17.1 82.9 Lamu 16.2 83.8 Kilifi 15.6 84.4 Marsabit 15.2 84.8 Tana River 15.0 85.0 Vihiga 13.7 86.3 Laikipia 12.7 87.3 Migori 12.4 87.6 Nandi 11.9 88.1 Taita Taveta 11.8 88.2 Kwale 11.1 88.9 Mandera 10.3 89.7 Kitui 8.9 91.1 West Pokot 8.5 91.5 Nyamira 7.8 92.2 Kisii 7.3 92.7

155155
The above findings depict a gap in knowledge on the part of the members of the public on the initiatives put in place by the state organs in the fight against corruption. Therefore, an aggressive public communication on the state organs’ anti-corruption initiatives and achievements is inevitable. 3.8.3.2 Awareness on specific state organs addressing corruption in the public service Slightly over two-thirds (67.1%) of the members of the public and 65.1% of the public officials said they were aware that the Ethics and Anti-Corruption Commission (EACC) was one of the state organs addressing corruption in the public service in Kenya. According to 11.3% of the members of the public, the other major specific state organ addressing corruption in the public service was the National Police Service and especially the Directorate of Criminal Investigations (DCI). The state organs that were least reported by members of the public and public officials as addressing corruption in the public service included the National Cohesion and Integration Commission (NCIC), Witness Protection Agency, Internal Corruption Committees, Ministry of Environment and Probation and Aftercare Services. The full list of the state organs deemed to be addressing corruption in the public service is captured in Table 3.71 below. Table 3.71: Awareness on specific state organs addressing corruption in the public
service Specific state organ/office addressing corruption in the public service
Frequency and Percentage Members of the
public Public officials
EACC 1,411(67.1%) 678(65.1%) National Police Service (especially DCI) 238(11.3%) 83(8.0%) National Government Administrative Office 152(7.2%) 46(4.4%) Office of the President 92(4.4%) 26(2.5%) Judiciary 86(4.1%) 111(10.7%) County Government offices 57(2.7%) 53(5.1%) Office of the Auditor General 53(2.5%) 30(2.9%) ODPP 43(2.0%) 30(2.9%) Kenya National Commission on Human Rights 40(1.9%) 11(1.1%) Ministry of Education 39(1.9%) 20(1.9%) IPOA 34(1.6%) 11(1.1%) Nyumba Kumi 27(1.3%) 4(0.4%) Huduma Centre 26(1.2%) 16(1.5%) Commission on Administrative Justice (Ombudsman)
20(1.0%) 47(4.5%)
NTSA 20(1.0%) 2(0.2%) National Assembly (including Public Accounts Committee)
14(0.6%) 9(0.9%)
Ministry of Devolution and the ASALS 12(0.6%) 3(0.3%) Hospitals 11(0.5%) 6(0.6%) The National Treasury 6(0.3%) 17(1.6%) Media 6(0.3%) 4(0.4%)
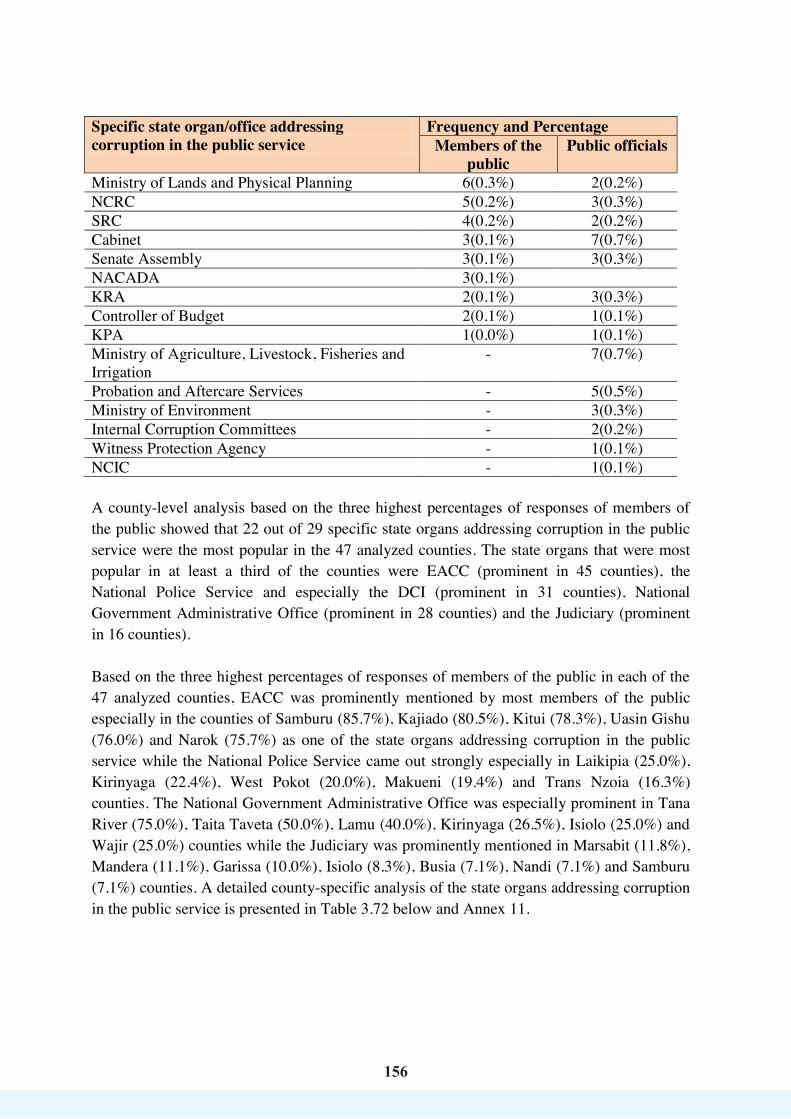
156
156
Specific state organ/office addressing corruption in the public service
Frequency and Percentage Members of the
public Public officials
Ministry of Lands and Physical Planning 6(0.3%) 2(0.2%) NCRC 5(0.2%) 3(0.3%) SRC 4(0.2%) 2(0.2%) Cabinet 3(0.1%) 7(0.7%) Senate Assembly 3(0.1%) 3(0.3%) NACADA 3(0.1%) KRA 2(0.1%) 3(0.3%) Controller of Budget 2(0.1%) 1(0.1%) KPA 1(0.0%) 1(0.1%) Ministry of Agriculture, Livestock, Fisheries and Irrigation
- 7(0.7%)
Probation and Aftercare Services - 5(0.5%) Ministry of Environment - 3(0.3%) Internal Corruption Committees - 2(0.2%) Witness Protection Agency - 1(0.1%) NCIC - 1(0.1%) A county-level analysis based on the three highest percentages of responses of members of the public showed that 22 out of 29 specific state organs addressing corruption in the public service were the most popular in the 47 analyzed counties. The state organs that were most popular in at least a third of the counties were EACC (prominent in 45 counties), the National Police Service and especially the DCI (prominent in 31 counties), National Government Administrative Office (prominent in 28 counties) and the Judiciary (prominent in 16 counties). Based on the three highest percentages of responses of members of the public in each of the 47 analyzed counties, EACC was prominently mentioned by most members of the public especially in the counties of Samburu (85.7%), Kajiado (80.5%), Kitui (78.3%), Uasin Gishu (76.0%) and Narok (75.7%) as one of the state organs addressing corruption in the public service while the National Police Service came out strongly especially in Laikipia (25.0%), Kirinyaga (22.4%), West Pokot (20.0%), Makueni (19.4%) and Trans Nzoia (16.3%) counties. The National Government Administrative Office was especially prominent in Tana River (75.0%), Taita Taveta (50.0%), Lamu (40.0%), Kirinyaga (26.5%), Isiolo (25.0%) and Wajir (25.0%) counties while the Judiciary was prominently mentioned in Marsabit (11.8%), Mandera (11.1%), Garissa (10.0%), Isiolo (8.3%), Busia (7.1%), Nandi (7.1%) and Samburu (7.1%) counties. A detailed county-specific analysis of the state organs addressing corruption in the public service is presented in Table 3.72 below and Annex 11.
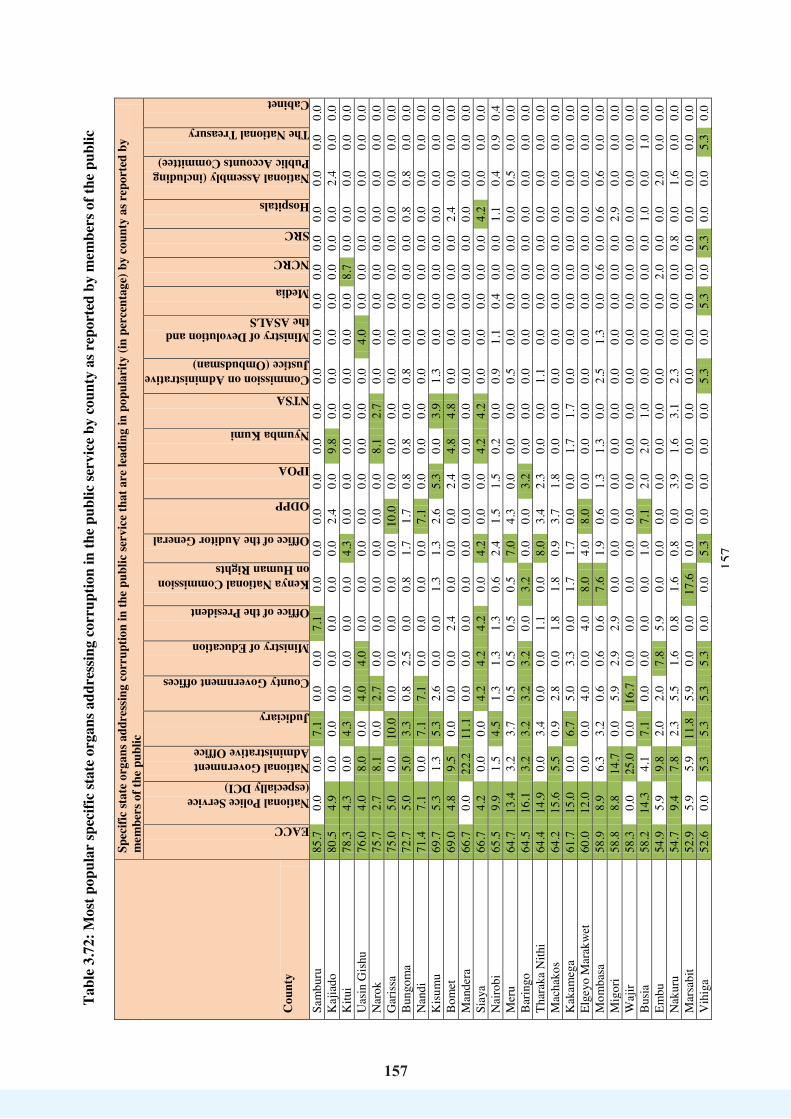
157
157
Tabl
e 3.
72: M
ost p
opul
ar sp
ecifi
c st
ate
orga
ns a
ddre
ssin
g co
rrup
tion
in th
e pu
blic
serv
ice
by c
ount
y as
rep
orte
d by
mem
bers
of t
he p
ublic
Cou
nty
Spec
ific
stat
e or
gans
add
ress
ing
corr
uptio
n in
the
publ
ic se
rvic
e th
at a
re le
adin
g in
pop
ular
ity (i
n pe
rcen
tage
) by
coun
ty a
s rep
orte
d by
m
embe
rs o
f the
pub
lic
EACC
National Police Service (especially DCI) National Government Administrative Office
Judiciary
County Government offices
Ministry of Education
Office of the President
Kenya National Commission on Human Rights
Office of the Auditor General
ODPP
IPOA
Nyumba Kumi
NTSA Commission on Administrative Justice (Ombudsman)
Ministry of Devolution and the ASALS
Media
NCRC
SRC
Hospitals
National Assembly (including Public Accounts Committee)
The National Treasury
Cabinet
Sam
buru
85
.7
0.0
0.0
7.1
0.0
0.0
7.1
0.0
0.0
0.0
0.0
0.0
0.0
0.0
0.0
0.0
0.0
0.0
0.0
0.0
0.0
0.0
Kaj
iado
80
.5
4.9
0.0
0.0
0.0
0.0
0.0
0.0
0.0
2.4
0.0
9.8
0.0
0.0
0.0
0.0
0.0
0.0
0.0
2.4
0.0
0.0
Kitu
i 78
.3
4.3
0.0
4.3
0.0
0.0
0.0
0.0
4.3
0.0
0.0
0.0
0.0
0.0
0.0
0.0
8.7
0.0
0.0
0.0
0.0
0.0
Uas
in G
ishu
76
.0
4.0
8.0
0.0
4.0
4.0
0.0
0.0
0.0
0.0
0.0
0.0
0.0
0.0
4.0
0.0
0.0
0.0
0.0
0.0
0.0
0.0
Nar
ok
75.7
2.
7 8.
1 0.
0 2.
7 0.
0 0.
0 0.
0 0.
0 0.
0 0.
0 8.
1 2.
7 0.
0 0.
0 0.
0 0.
0 0.
0 0.
0 0.
0 0.
0 0.
0 G
aris
sa
75.0
5.
0 0.
0 10
.0
0.0
0.0
0.0
0.0
0.0
10.0
0.
0 0.
0 0.
0 0.
0 0.
0 0.
0 0.
0 0.
0 0.
0 0.
0 0.
0 0.
0 B
ungo
ma
72.7
5.
0 5.
0 3.
3 0.
8 2.
5 0.
0 0.
8 1.
7 1.
7 0.
8 0.
8 0.
0 0.
8 0.
0 0.
0 0.
0 0.
0 0.
8 0.
8 0.
0 0.
0 N
andi
71
.4
7.1
0.0
7.1
7.1
0.0
0.0
0.0
0.0
7.1
0.0
0.0
0.0
0.0
0.0
0.0
0.0
0.0
0.0
0.0
0.0
0.0
Kis
umu
69.7
5.
3 1.
3 5.
3 2.
6 0.
0 0.
0 1.
3 1.
3 2.
6 5.
3 0.
0 3.
9 1.
3 0.
0 0.
0 0.
0 0.
0 0.
0 0.
0 0.
0 0.
0 B
omet
69
.0
4.8
9.5
0.0
0.0
0.0
2.4
0.0
0.0
0.0
2.4
4.8
4.8
0.0
0.0
0.0
0.0
0.0
2.4
0.0
0.0
0.0
Man
dera
66
.7
0.0
22.2
11
.1
0.0
0.0
0.0
0.0
0.0
0.0
0.0
0.0
0.0
0.0
0.0
0.0
0.0
0.0
0.0
0.0
0.0
0.0
Siay
a 66
.7
4.2
0.0
0.0
4.2
4.2
4.2
0.0
4.2
0.0
0.0
4.2
4.2
0.0
0.0
0.0
0.0
0.0
4.2
0.0
0.0
0.0
Nai
robi
65
.5
9.9
1.5
4.5
1.3
1.3
1.3
0.6
2.4
1.5
1.5
0.2
0.0
0.9
1.1
0.4
0.0
0.0
1.1
0.4
0.9
0.4
Mer
u 64
.7
13.4
3.
2 3.
7 0.
5 0.
5 0.
5 0.
5 7.
0 4.
3 0.
0 0.
0 0.
0 0.
5 0.
0 0.
0 0.
0 0.
0 0.
0 0.
5 0.
0 0.
0 B
arin
go
64.5
16
.1
3.2
3.2
3.2
3.2
0.0
3.2
0.0
0.0
3.2
0.0
0.0
0.0
0.0
0.0
0.0
0.0
0.0
0.0
0.0
0.0
Thar
aka
Nith
i 64
.4
14.9
0.
0 3.
4 0.
0 0.
0 1.
1 0.
0 8.
0 3.
4 2.
3 0.
0 0.
0 1.
1 0.
0 0.
0 0.
0 0.
0 0.
0 0.
0 0.
0 0.
0 M
acha
kos
64.2
15
.6
5.5
0.9
2.8
0.0
1.8
1.8
0.9
3.7
1.8
0.0
0.0
0.0
0.0
0.0
0.0
0.0
0.0
0.0
0.0
0.0
Kak
ameg
a 61
.7
15.0
0.
0 6.
7 5.
0 3.
3 0.
0 1.
7 1.
7 0.
0 0.
0 1.
7 1.
7 0.
0 0.
0 0.
0 0.
0 0.
0 0.
0 0.
0 0.
0 0.
0 El
geyo
Mar
akw
et
60.0
12
.0
0.0
0.0
4.0
0.0
4.0
8.0
4.0
8.0
0.0
0.0
0.0
0.0
0.0
0.0
0.0
0.0
0.0
0.0
0.0
0.0
Mom
basa
58
.9
8.9
6.3
3.2
0.6
0.6
0.6
7.6
1.9
0.6
1.3
1.3
0.0
2.5
1.3
0.0
0.6
0.0
0.6
0.6
0.0
0.0
Mig
ori
58.8
8.
8 14
.7
0.0
5.9
2.9
2.9
0.0
0.0
0.0
0.0
0.0
0.0
0.0
0.0
0.0
0.0
0.0
2.9
0.0
0.0
0.0
Waj
ir 58
.3
0.0
25.0
0.
0 16
.7
0.0
0.0
0.0
0.0
0.0
0.0
0.0
0.0
0.0
0.0
0.0
0.0
0.0
0.0
0.0
0.0
0.0
Bus
ia
58.2
14
.3
4.1
7.1
0.0
0.0
0.0
0.0
1.0
7.1
2.0
2.0
1.0
0.0
0.0
0.0
0.0
0.0
1.0
0.0
1.0
0.0
Embu
54
.9
5.9
9.8
2.0
2.0
7.8
5.9
0.0
0.0
0.0
0.0
0.0
0.0
0.0
0.0
0.0
2.0
0.0
0.0
2.0
0.0
0.0
Nak
uru
54.7
9.
4 7.
8 2.
3 5.
5 1.
6 0.
8 1.
6 0.
8 0.
0 3.
9 1.
6 3.
1 2.
3 0.
0 0.
0 0.
0 0.
8 0.
0 1.
6 0.
0 0.
0 M
arsa
bit
52.9
5.
9 5.
9 11
.8
5.9
0.0
0.0
17.6
0.
0 0.
0 0.
0 0.
0 0.
0 0.
0 0.
0 0.
0 0.
0 0.
0 0.
0 0.
0 0.
0 0.
0 V
ihig
a 52
.6
0.0
5.3
5.3
5.3
5.3
0.0
0.0
5.3
0.0
0.0
0.0
0.0
5.3
0.0
5.3
0.0
5.3
0.0
0.0
5.3
0.0
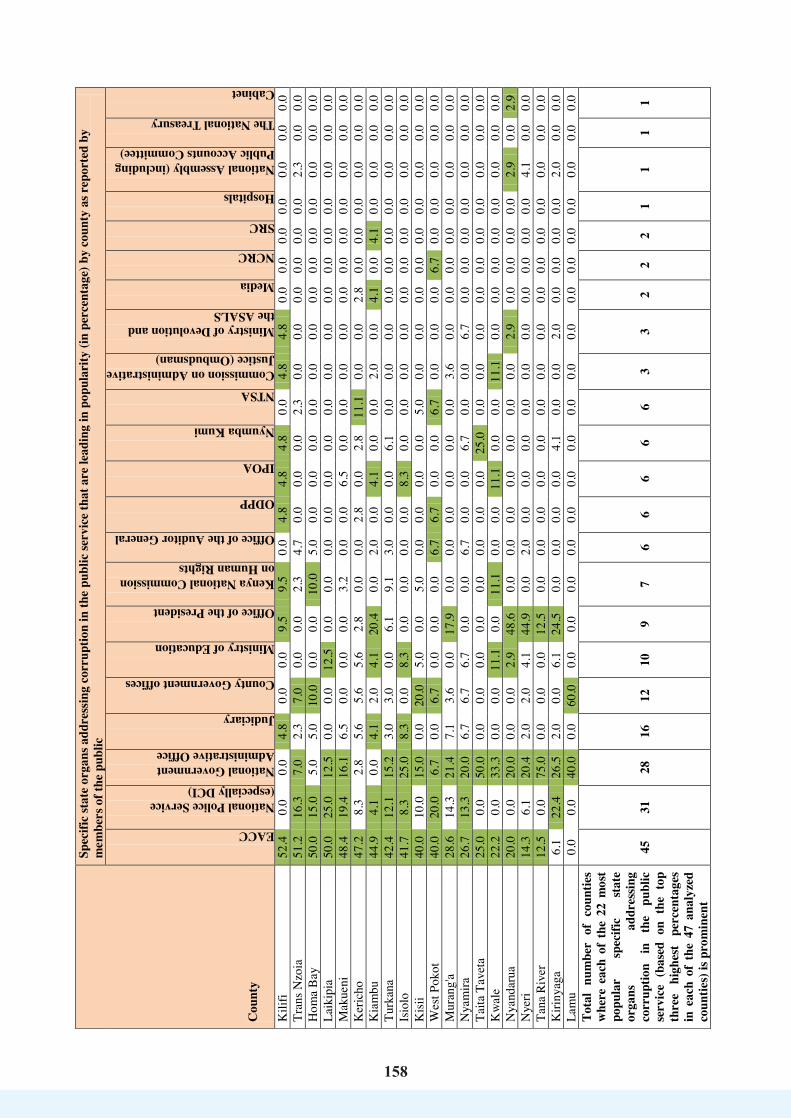
158
158
Cou
nty
Spec
ific
stat
e or
gans
add
ress
ing
corr
uptio
n in
the
publ
ic se
rvic
e th
at a
re le
adin
g in
pop
ular
ity (i
n pe
rcen
tage
) by
coun
ty a
s rep
orte
d by
m
embe
rs o
f the
pub
lic
EACC
National Police Service (especially DCI) National Government Administrative Office
Judiciary
County Government offices
Ministry of Education
Office of the President
Kenya National Commission on Human Rights
Office of the Auditor General
ODPP
IPOA
Nyumba Kumi
NTSA Commission on Administrative Justice (Ombudsman)
Ministry of Devolution and the ASALS
Media
NCRC
SRC
Hospitals
National Assembly (including Public Accounts Committee)
The National Treasury
Cabinet
Kili
fi 52
.4
0.0
0.0
4.8
0.0
0.0
9.5
9.5
0.0
4.8
4.8
4.8
0.0
4.8
4.8
0.0
0.0
0.0
0.0
0.0
0.0
0.0
Tran
s Nzo
ia
51.2
16
.3
7.0
2.3
7.0
0.0
0.0
2.3
4.7
0.0
0.0
0.0
2.3
0.0
0.0
0.0
0.0
0.0
0.0
2.3
0.0
0.0
Hom
a B
ay
50.0
15
.0
5.0
5.0
10.0
0.
0 0.
0 10
.0
5.0
0.0
0.0
0.0
0.0
0.0
0.0
0.0
0.0
0.0
0.0
0.0
0.0
0.0
Laik
ipia
50
.0
25.0
12
.5
0.0
0.0
12.5
0.
0 0.
0 0.
0 0.
0 0.
0 0.
0 0.
0 0.
0 0.
0 0.
0 0.
0 0.
0 0.
0 0.
0 0.
0 0.
0 M
akue
ni
48.4
19
.4
16.1
6.
5 0.
0 0.
0 0.
0 3.
2 0.
0 0.
0 6.
5 0.
0 0.
0 0.
0 0.
0 0.
0 0.
0 0.
0 0.
0 0.
0 0.
0 0.
0 K
eric
ho
47.2
8.
3 2.
8 5.
6 5.
6 5.
6 2.
8 0.
0 0.
0 2.
8 0.
0 2.
8 11
.1
0.0
0.0
2.8
0.0
0.0
0.0
0.0
0.0
0.0
Kia
mbu
44
.9
4.1
0.0
4.1
2.0
4.1
20.4
0.
0 2.
0 0.
0 4.
1 0.
0 0.
0 2.
0 0.
0 4.
1 0.
0 4.
1 0.
0 0.
0 0.
0 0.
0 Tu
rkan
a 42
.4
12.1
15
.2
3.0
3.0
0.0
6.1
9.1
3.0
0.0
0.0
6.1
0.0
0.0
0.0
0.0
0.0
0.0
0.0
0.0
0.0
0.0
Isio
lo
41.7
8.
3 25
.0
8.3
0.0
8.3
0.0
0.0
0.0
0.0
8.3
0.0
0.0
0.0
0.0
0.0
0.0
0.0
0.0
0.0
0.0
0.0
Kis
ii 40
.0
10.0
15
.0
0.0
20.0
5.
0 0.
0 5.
0 0.
0 0.
0 0.
0 0.
0 5.
0 0.
0 0.
0 0.
0 0.
0 0.
0 0.
0 0.
0 0.
0 0.
0 W
est P
okot
40
.0
20.0
6.
7 0.
0 6.
7 0.
0 0.
0 0.
0 6.
7 6.
7 0.
0 0.
0 6.
7 0.
0 0.
0 0.
0 6.
7 0.
0 0.
0 0.
0 0.
0 0.
0 M
uran
g'a
28.6
14
.3
21.4
7.
1 3.
6 0.
0 17
.9
0.0
0.0
0.0
0.0
0.0
0.0
3.6
0.0
0.0
0.0
0.0
0.0
0.0
0.0
0.0
Nya
mira
26
.7
13.3
20
.0
6.7
6.7
6.7
0.0
0.0
6.7
0.0
0.0
6.7
0.0
0.0
6.7
0.0
0.0
0.0
0.0
0.0
0.0
0.0
Taita
Tav
eta
25.0
0.
0 50
.0
0.0
0.0
0.0
0.0
0.0
0.0
0.0
0.0
25.0
0.
0 0.
0 0.
0 0.
0 0.
0 0.
0 0.
0 0.
0 0.
0 0.
0 K
wal
e 22
.2
0.0
33.3
0.
0 0.
0 11
.1
0.0
11.1
0.
0 0.
0 11
.1
0.0
0.0
11.1
0.
0 0.
0 0.
0 0.
0 0.
0 0.
0 0.
0 0.
0 N
yand
arua
20
.0
0.0
20.0
0.
0 0.
0 2.
9 48
.6
0.0
0.0
0.0
0.0
0.0
0.0
0.0
2.9
0.0
0.0
0.0
0.0
2.9
0.0
2.9
Nye
ri 14
.3
6.1
20.4
2.
0 2.
0 4.
1 44
.9
0.0
2.0
0.0
0.0
0.0
0.0
0.0
0.0
0.0
0.0
0.0
0.0
4.1
0.0
0.0
Tana
Riv
er
12.5
0.
0 75
.0
0.0
0.0
0.0
12.5
0.
0 0.
0 0.
0 0.
0 0.
0 0.
0 0.
0 0.
0 0.
0 0.
0 0.
0 0.
0 0.
0 0.
0 0.
0 K
iriny
aga
6.1
22.4
26
.5
2.0
0.0
6.1
24.5
0.
0 0.
0 0.
0 0.
0 4.
1 0.
0 0.
0 2.
0 0.
0 0.
0 0.
0 0.
0 2.
0 0.
0 0.
0 La
mu
0.0
0.0
40.0
0.
0 60
.0
0.0
0.0
0.0
0.0
0.0
0.0
0.0
0.0
0.0
0.0
0.0
0.0
0.0
0.0
0.0
0.0
0.0
Tota
l nu
mbe
r of
cou
ntie
s w
here
eac
h of
the
22
mos
t po
pula
r sp
ecifi
c st
ate
orga
ns
addr
essin
g co
rrup
tion
in
the
publ
ic
serv
ice
(bas
ed o
n th
e to
p th
ree
high
est
perc
enta
ges
in e
ach
of t
he 4
7 an
alyz
ed
coun
ties)
is p
rom
inen
t
45
31
28
16
12
10
9 7
6 6
6 6
6 3
3 2
2 2
1 1
1 1
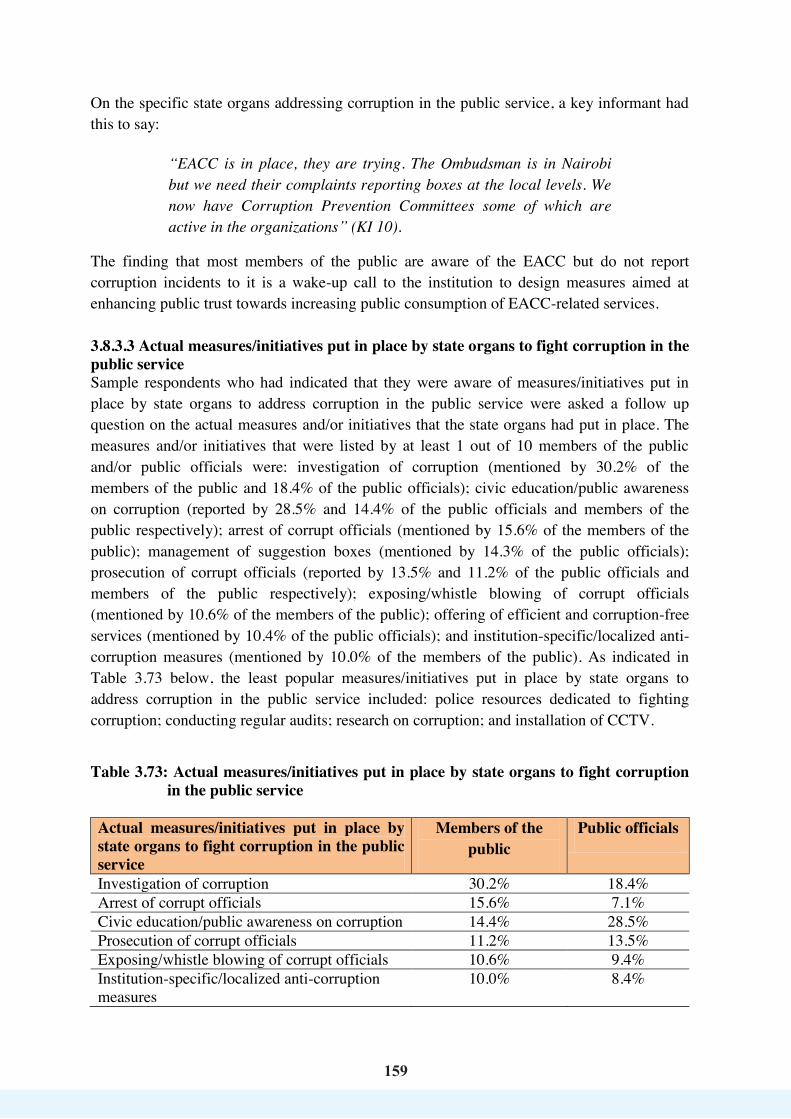
159
159
On the specific state organs addressing corruption in the public service, a key informant had this to say:
“EACC is in place, they are trying. The Ombudsman is in Nairobi but we need their complaints reporting boxes at the local levels. We now have Corruption Prevention Committees some of which are active in the organizations” (KI 10).
The finding that most members of the public are aware of the EACC but do not report corruption incidents to it is a wake-up call to the institution to design measures aimed at enhancing public trust towards increasing public consumption of EACC-related services. 3.8.3.3 Actual measures/initiatives put in place by state organs to fight corruption in the public service Sample respondents who had indicated that they were aware of measures/initiatives put in place by state organs to address corruption in the public service were asked a follow up question on the actual measures and/or initiatives that the state organs had put in place. The measures and/or initiatives that were listed by at least 1 out of 10 members of the public and/or public officials were: investigation of corruption (mentioned by 30.2% of the members of the public and 18.4% of the public officials); civic education/public awareness on corruption (reported by 28.5% and 14.4% of the public officials and members of the public respectively); arrest of corrupt officials (mentioned by 15.6% of the members of the public); management of suggestion boxes (mentioned by 14.3% of the public officials); prosecution of corrupt officials (reported by 13.5% and 11.2% of the public officials and members of the public respectively); exposing/whistle blowing of corrupt officials (mentioned by 10.6% of the members of the public); offering of efficient and corruption-free services (mentioned by 10.4% of the public officials); and institution-specific/localized anti-corruption measures (mentioned by 10.0% of the members of the public). As indicated in Table 3.73 below, the least popular measures/initiatives put in place by state organs to address corruption in the public service included: police resources dedicated to fighting corruption; conducting regular audits; research on corruption; and installation of CCTV. Table 3.73: Actual measures/initiatives put in place by state organs to fight corruption
in the public service Actual measures/initiatives put in place by state organs to fight corruption in the public service
Members of the public
Public officials
Investigation of corruption 30.2% 18.4% Arrest of corrupt officials 15.6% 7.1% Civic education/public awareness on corruption 14.4% 28.5% Prosecution of corrupt officials 11.2% 13.5% Exposing/whistle blowing of corrupt officials 10.6% 9.4% Institution-specific/localized anti-corruption measures
10.0% 8.4%
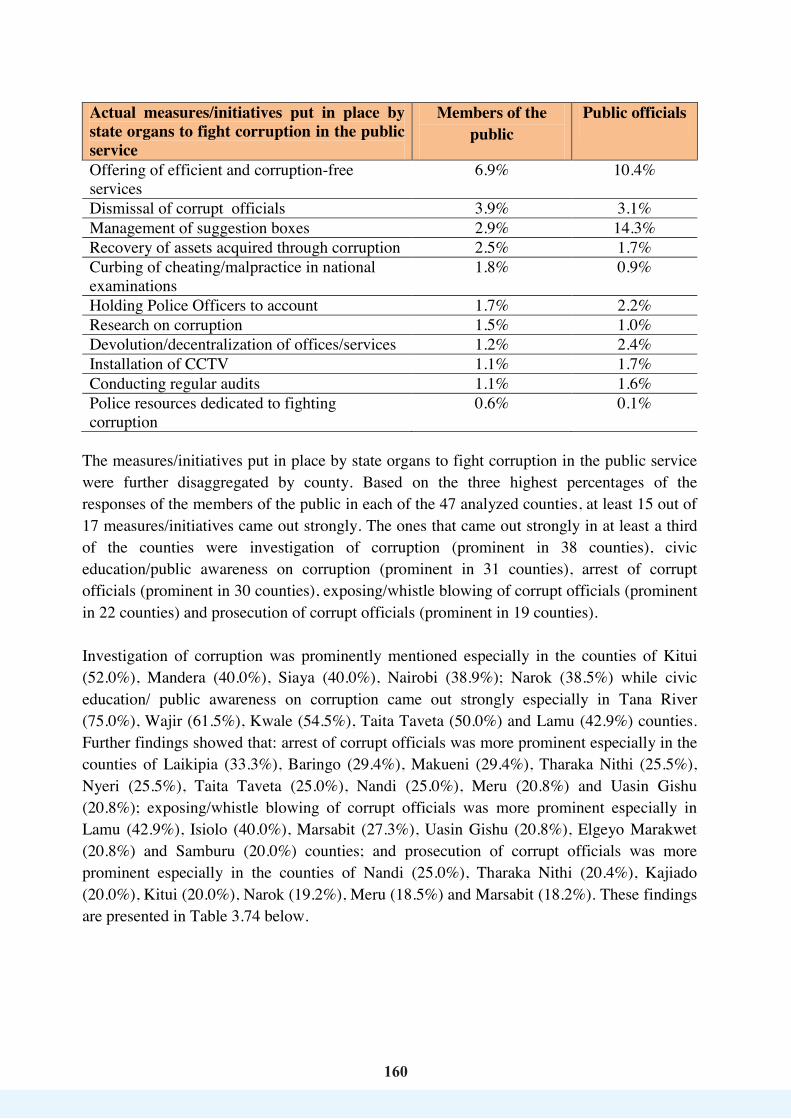
160160
Actual measures/initiatives put in place by state organs to fight corruption in the public service
Members of the public
Public officials
Offering of efficient and corruption-free services
6.9% 10.4%
Dismissal of corrupt officials 3.9% 3.1% Management of suggestion boxes 2.9% 14.3% Recovery of assets acquired through corruption 2.5% 1.7% Curbing of cheating/malpractice in national examinations
1.8% 0.9%
Holding Police Officers to account 1.7% 2.2% Research on corruption 1.5% 1.0% Devolution/decentralization of offices/services 1.2% 2.4% Installation of CCTV 1.1% 1.7% Conducting regular audits 1.1% 1.6% Police resources dedicated to fighting corruption
0.6% 0.1%
The measures/initiatives put in place by state organs to fight corruption in the public service were further disaggregated by county. Based on the three highest percentages of the responses of the members of the public in each of the 47 analyzed counties, at least 15 out of 17 measures/initiatives came out strongly. The ones that came out strongly in at least a third of the counties were investigation of corruption (prominent in 38 counties), civic education/public awareness on corruption (prominent in 31 counties), arrest of corrupt officials (prominent in 30 counties), exposing/whistle blowing of corrupt officials (prominent in 22 counties) and prosecution of corrupt officials (prominent in 19 counties). Investigation of corruption was prominently mentioned especially in the counties of Kitui (52.0%), Mandera (40.0%), Siaya (40.0%), Nairobi (38.9%); Narok (38.5%) while civic education/ public awareness on corruption came out strongly especially in Tana River (75.0%), Wajir (61.5%), Kwale (54.5%), Taita Taveta (50.0%) and Lamu (42.9%) counties. Further findings showed that: arrest of corrupt officials was more prominent especially in the counties of Laikipia (33.3%), Baringo (29.4%), Makueni (29.4%), Tharaka Nithi (25.5%), Nyeri (25.5%), Taita Taveta (25.0%), Nandi (25.0%), Meru (20.8%) and Uasin Gishu (20.8%); exposing/whistle blowing of corrupt officials was more prominent especially in Lamu (42.9%), Isiolo (40.0%), Marsabit (27.3%), Uasin Gishu (20.8%), Elgeyo Marakwet (20.8%) and Samburu (20.0%) counties; and prosecution of corrupt officials was more prominent especially in the counties of Nandi (25.0%), Tharaka Nithi (20.4%), Kajiado (20.0%), Kitui (20.0%), Narok (19.2%), Meru (18.5%) and Marsabit (18.2%). These findings are presented in Table 3.74 below.
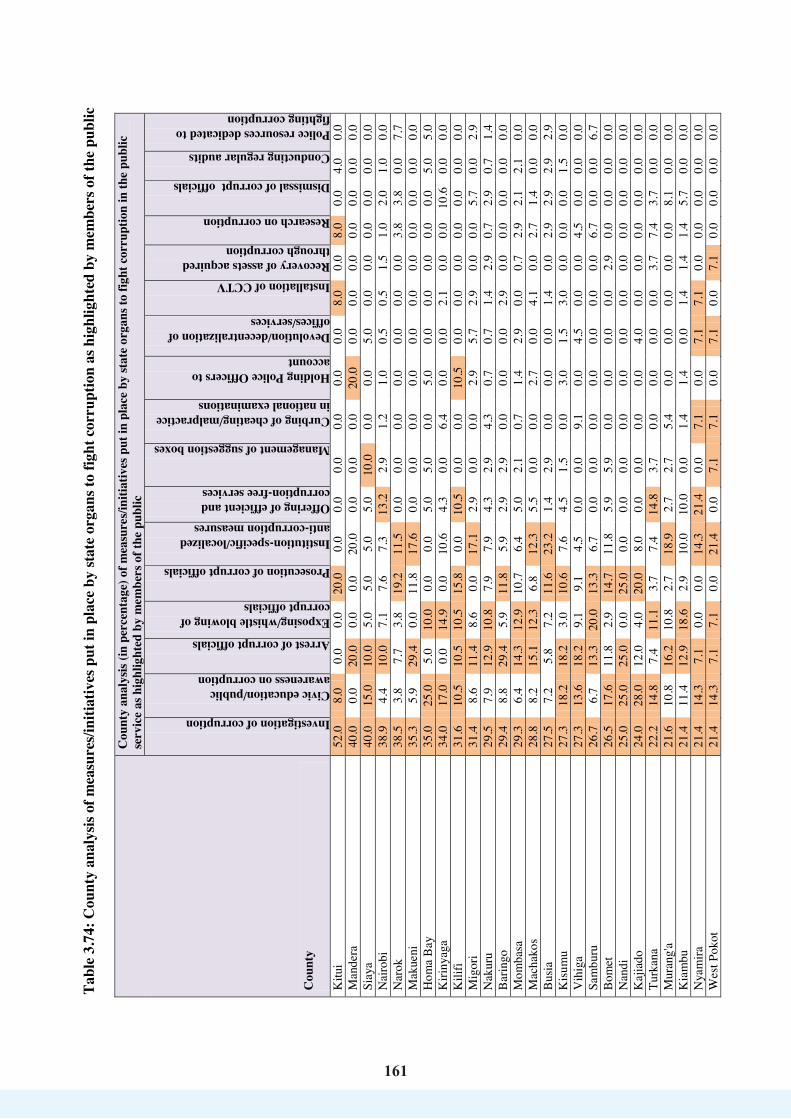
161
161
Ta
ble
3.74
: Cou
nty
anal
ysis
of m
easu
res/i
nitia
tives
put
in p
lace
by
stat
e or
gans
to fi
ght c
orru
ptio
n as
hig
hlig
hted
by
mem
bers
of t
he p
ublic
Cou
nty
Cou
nty
anal
ysis
(in p
erce
ntag
e) o
f mea
sure
s/ini
tiativ
es p
ut in
pla
ce b
y st
ate
orga
ns to
figh
t cor
rupt
ion
in th
e pu
blic
se
rvic
e as
hig
hlig
hted
by
mem
bers
of t
he p
ublic
Investigation of corruption
Civic education/public awareness on corruption
Arrest of corrupt officials
Exposing/whistle blowing of corrupt officials
Prosecution of corrupt officials
Institution-specific/localized anti-corruption measures Offering of efficient and corruption-free services
Management of suggestion boxes
Curbing of cheating/malpractice in national examinations
Holding Police Officers to account
Devolution/decentralization of offices/services
Installation of CCTV Recovery of assets acquired through corruption
Research on corruption
Dismissal of corrupt officials
Conducting regular audits
Police resources dedicated to fighting corruption
Kitu
i 52
.0
8.0
0.0
0.0
20.0
0.
0 0.
0 0.
0 0.
0 0.
0 0.
0 8.
0 0.
0 8.
0 0.
0 4.
0 0.
0 M
ande
ra
40.0
0.
0 20
.0
0.0
0.0
20.0
0.
0 0.
0 0.
0 20
.0
0.0
0.0
0.0
0.0
0.0
0.0
0.0
Siay
a 40
.0
15.0
10
.0
5.0
5.0
5.0
5.0
10.0
0.
0 0.
0 5.
0 0.
0 0.
0 0.
0 0.
0 0.
0 0.
0 N
airo
bi
38.9
4.
4 10
.0
7.1
7.6
7.3
13.2
2.
9 1.
2 1.
0 0.
5 0.
5 1.
5 1.
0 2.
0 1.
0 0.
0 N
arok
38
.5
3.8
7.7
3.8
19.2
11
.5
0.0
0.0
0.0
0.0
0.0
0.0
0.0
3.8
3.8
0.0
7.7
Mak
ueni
35
.3
5.9
29.4
0.
0 11
.8
17.6
0.
0 0.
0 0.
0 0.
0 0.
0 0.
0 0.
0 0.
0 0.
0 0.
0 0.
0 H
oma
Bay
35
.0
25.0
5.
0 10
.0
0.0
0.0
5.0
5.0
0.0
5.0
0.0
0.0
0.0
0.0
0.0
5.0
5.0
Kiri
nyag
a 34
.0
17.0
0.
0 14
.9
0.0
10.6
4.
3 0.
0 6.
4 0.
0 0.
0 2.
1 0.
0 0.
0 10
.6
0.0
0.0
Kili
fi 31
.6
10.5
10
.5
10.5
15
.8
0.0
10.5
0.
0 0.
0 10
.5
0.0
0.0
0.0
0.0
0.0
0.0
0.0
Mig
ori
31.4
8.
6 11
.4
8.6
0.0
17.1
2.
9 0.
0 0.
0 2.
9 5.
7 2.
9 0.
0 0.
0 5.
7 0.
0 2.
9 N
akur
u 29
.5
7.9
12.9
10
.8
7.9
7.9
4.3
2.9
4.3
0.7
0.7
1.4
2.9
0.7
2.9
0.7
1.4
Bar
ingo
29
.4
8.8
29.4
5.
9 11
.8
5.9
2.9
2.9
0.0
0.0
0.0
2.9
0.0
0.0
0.0
0.0
0.0
Mom
basa
29
.3
6.4
14.3
12
.9
10.7
6.
4 5.
0 2.
1 0.
7 1.
4 2.
9 0.
0 0.
7 2.
9 2.
1 2.
1 0.
0 M
acha
kos
28.8
8.
2 15
.1
12.3
6.
8 12
.3
5.5
0.0
0.0
2.7
0.0
4.1
0.0
2.7
1.4
0.0
0.0
Bus
ia
27.5
7.
2 5.
8 7.
2 11
.6
23.2
1.
4 2.
9 0.
0 0.
0 0.
0 1.
4 0.
0 2.
9 2.
9 2.
9 2.
9 K
isum
u 27
.3
18.2
18
.2
3.0
10.6
7.
6 4.
5 1.
5 0.
0 3.
0 1.
5 3.
0 0.
0 0.
0 0.
0 1.
5 0.
0 V
ihig
a 27
.3
13.6
18
.2
9.1
9.1
4.5
0.0
0.0
9.1
0.0
4.5
0.0
0.0
4.5
0.0
0.0
0.0
Sam
buru
26
.7
6.7
13.3
20
.0
13.3
6.
7 0.
0 0.
0 0.
0 0.
0 0.
0 0.
0 0.
0 6.
7 0.
0 0.
0 6.
7 B
omet
26
.5
17.6
11
.8
2.9
14.7
11
.8
5.9
5.9
0.0
0.0
0.0
0.0
2.9
0.0
0.0
0.0
0.0
Nan
di
25.0
25
.0
25.0
0.
0 25
.0
0.0
0.0
0.0
0.0
0.0
0.0
0.0
0.0
0.0
0.0
0.0
0.0
Kaj
iado
24
.0
28.0
12
.0
4.0
20.0
8.
0 0.
0 0.
0 0.
0 0.
0 4.
0 0.
0 0.
0 0.
0 0.
0 0.
0 0.
0 Tu
rkan
a 22
.2
14.8
7.
4 11
.1
3.7
7.4
14.8
3.
7 0.
0 0.
0 0.
0 0.
0 3.
7 7.
4 3.
7 0.
0 0.
0 M
uran
g'a
21.6
10
.8
16.2
10
.8
2.7
18.9
2.
7 2.
7 5.
4 0.
0 0.
0 0.
0 0.
0 0.
0 8.
1 0.
0 0.
0 K
iam
bu
21.4
11
.4
12.9
18
.6
2.9
10.0
10
.0
0.0
1.4
1.4
0.0
1.4
1.4
1.4
5.7
0.0
0.0
Nya
mira
21
.4
14.3
7.
1 0.
0 0.
0 14
.3
21.4
0.
0 7.
1 0.
0 7.
1 7.
1 0.
0 0.
0 0.
0 0.
0 0.
0 W
est P
okot
21
.4
14.3
7.
1 7.
1 0.
0 21
.4
0.0
7.1
7.1
0.0
7.1
0.0
7.1
0.0
0.0
0.0
0.0
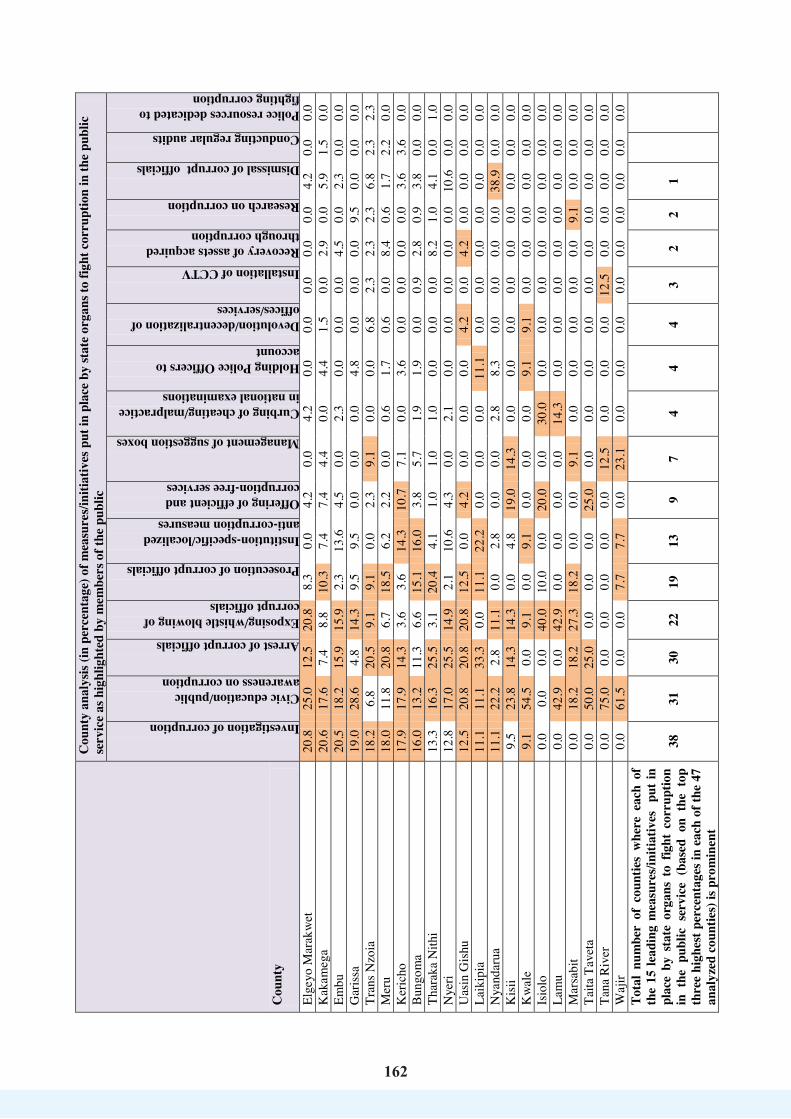
162
162
Cou
nty
Cou
nty
anal
ysis
(in p
erce
ntag
e) o
f mea
sure
s/ini
tiativ
es p
ut in
pla
ce b
y st
ate
orga
ns to
figh
t cor
rupt
ion
in th
e pu
blic
se
rvic
e as
hig
hlig
hted
by
mem
bers
of t
he p
ublic
Investigation of corruption
Civic education/public awareness on corruption
Arrest of corrupt officials
Exposing/whistle blowing of corrupt officials
Prosecution of corrupt officials
Institution-specific/localized anti-corruption measures Offering of efficient and corruption-free services
Management of suggestion boxes
Curbing of cheating/malpractice in national examinations
Holding Police Officers to account
Devolution/decentralization of offices/services
Installation of CCTV Recovery of assets acquired through corruption
Research on corruption
Dismissal of corrupt officials
Conducting regular audits
Police resources dedicated to fighting corruption
Elge
yo M
arak
wet
20
.8
25.0
12
.5
20.8
8.
3 0.
0 4.
2 0.
0 4.
2 0.
0 0.
0 0.
0 0.
0 0.
0 4.
2 0.
0 0.
0 K
akam
ega
20.6
17
.6
7.4
8.8
10.3
7.
4 7.
4 4.
4 0.
0 4.
4 1.
5 0.
0 2.
9 0.
0 5.
9 1.
5 0.
0 Em
bu
20.5
18
.2
15.9
15
.9
2.3
13.6
4.
5 0.
0 2.
3 0.
0 0.
0 0.
0 4.
5 0.
0 2.
3 0.
0 0.
0 G
aris
sa
19.0
28
.6
4.8
14.3
9.
5 9.
5 0.
0 0.
0 0.
0 4.
8 0.
0 0.
0 0.
0 9.
5 0.
0 0.
0 0.
0 Tr
ans N
zoia
18
.2
6.8
20.5
9.
1 9.
1 0.
0 2.
3 9.
1 0.
0 0.
0 6.
8 2.
3 2.
3 2.
3 6.
8 2.
3 2.
3 M
eru
18.0
11
.8
20.8
6.
7 18
.5
6.2
2.2
0.0
0.6
1.7
0.6
0.0
8.4
0.6
1.7
2.2
0.0
Ker
icho
17
.9
17.9
14
.3
3.6
3.6
14.3
10
.7
7.1
0.0
3.6
0.0
0.0
0.0
0.0
3.6
3.6
0.0
Bun
gom
a 16
.0
13.2
11
.3
6.6
15.1
16
.0
3.8
5.7
1.9
1.9
0.0
0.9
2.8
0.9
3.8
0.0
0.0
Thar
aka
Nith
i 13
.3
16.3
25
.5
3.1
20.4
4.
1 1.
0 1.
0 1.
0 0.
0 0.
0 0.
0 8.
2 1.
0 4.
1 0.
0 1.
0 N
yeri
12.8
17
.0
25.5
14
.9
2.1
10.6
4.
3 0.
0 2.
1 0.
0 0.
0 0.
0 0.
0 0.
0 10
.6
0.0
0.0
Uas
in G
ishu
12
.5
20.8
20
.8
20.8
12
.5
0.0
4.2
0.0
0.0
0.0
4.2
0.0
4.2
0.0
0.0
0.0
0.0
Laik
ipia
11
.1
11.1
33
.3
0.0
11.1
22
.2
0.0
0.0
0.0
11.1
0.
0 0.
0 0.
0 0.
0 0.
0 0.
0 0.
0 N
yand
arua
11
.1
22.2
2.
8 11
.1
0.0
2.8
0.0
0.0
2.8
8.3
0.0
0.0
0.0
0.0
38.9
0.
0 0.
0 K
isii
9.5
23.8
14
.3
14.3
0.
0 4.
8 19
.0
14.3
0.
0 0.
0 0.
0 0.
0 0.
0 0.
0 0.
0 0.
0 0.
0 K
wal
e 9.
1 54
.5
0.0
9.1
0.0
9.1
0.0
0.0
0.0
9.1
9.1
0.0
0.0
0.0
0.0
0.0
0.0
Isio
lo
0.0
0.0
0.0
40.0
10
.0
0.0
20.0
0.
0 30
.0
0.0
0.0
0.0
0.0
0.0
0.0
0.0
0.0
Lam
u 0.
0 42
.9
0.0
42.9
0.
0 0.
0 0.
0 0.
0 14
.3
0.0
0.0
0.0
0.0
0.0
0.0
0.0
0.0
Mar
sabi
t 0.
0 18
.2
18.2
27
.3
18.2
0.
0 0.
0 9.
1 0.
0 0.
0 0.
0 0.
0 0.
0 9.
1 0.
0 0.
0 0.
0 Ta
ita T
avet
a 0.
0 50
.0
25.0
0.
0 0.
0 0.
0 25
.0
0.0
0.0
0.0
0.0
0.0
0.0
0.0
0.0
0.0
0.0
Tana
Riv
er
0.0
75.0
0.
0 0.
0 0.
0 0.
0 0.
0 12
.5
0.0
0.0
0.0
12.5
0.
0 0.
0 0.
0 0.
0 0.
0 W
ajir
0.0
61.5
0.
0 0.
0 7.
7 7.
7 0.
0 23
.1
0.0
0.0
0.0
0.0
0.0
0.0
0.0
0.0
0.0
Tota
l nu
mbe
r of
cou
ntie
s w
here
eac
h of
th
e 15
lead
ing
mea
sure
s/ini
tiativ
es
put i
n pl
ace
by s
tate
org
ans
to f
ight
cor
rupt
ion
in t
he p
ublic
ser
vice
(ba
sed
on t
he t
op
thre
e hi
ghes
t per
cent
ages
in e
ach
of th
e 47
an
alyz
ed c
ount
ies)
is p
rom
inen
t
38
31
30
22
19
13
9 7
4 4
4 3
2 2
1


164
164
and that the agencies were doing their work effectively. Other explanations on the satisfaction levels by both the members of the public and public officials are summarized in Table 3.75 below. Table 3.75: Explanations for general satisfaction levels in the fight against corruption
Explanations on satisfaction with the measures/initiatives put in place to address corruption
Members of the public Public officials
No serious action taken against corruption 31.6% 34.8% Concerned agencies are reliable in their services and they do their work effectively
18.0% 20.8%
No confidence in the anti-corruption system 9.9% 7.6% Inadequate arrests and/or jailing of perpetrators 9.4% 5.9% Organs where corruption is reported are also corrupt
6.2% 4.5%
Prosecution process takes long while some cases are never resolved
4.7% 6.1%
Some organs lack sufficient powers to fight corruption
4.5% 6.0%
Some organs sensitize the community about corruption
3.8% 5.6%
There is no transparency in the fight against corruption
3.5% 3.9%
There are no offices at the village level for fighting corruption
3.3% 2.0%
There is increased research on corruption and work efficiency
2.6% 1.6%
Only corrupt junior officers are taken to court 2.1% 2.5% There is inadequate investigation of corruption in all counties
1.1% 0.2%
The fight against corruption is sabotaged 1.1% 1.0% There is heightened criticism of those engaging in corruption
1.0% 0.3%
People are scared of reporting corruption 0.7% 0.6% Anti-corruption officials are not easily available 0.6% 0.1%
County-specific analysis of general satisfaction with the measures/initiatives put in place by state organs to address corruption in the public service showed that majority of the members of the public in at least 40 counties were generally not satisfied with the measures/initiatives. This implied that measures put in place by state organs in addressing corruption in 87.2% of the 47 counties were generally not satisfactory to most of the members of the public. Further, general dissatisfaction with the measures/initiatives came out strongly especially in the counties of Garissa (94.4%), Samburu (92.3%), Machakos (91.7%), Tana River (88.9%) and Kilifi (88.9%). These findings are summarized in Table 3.76 below.
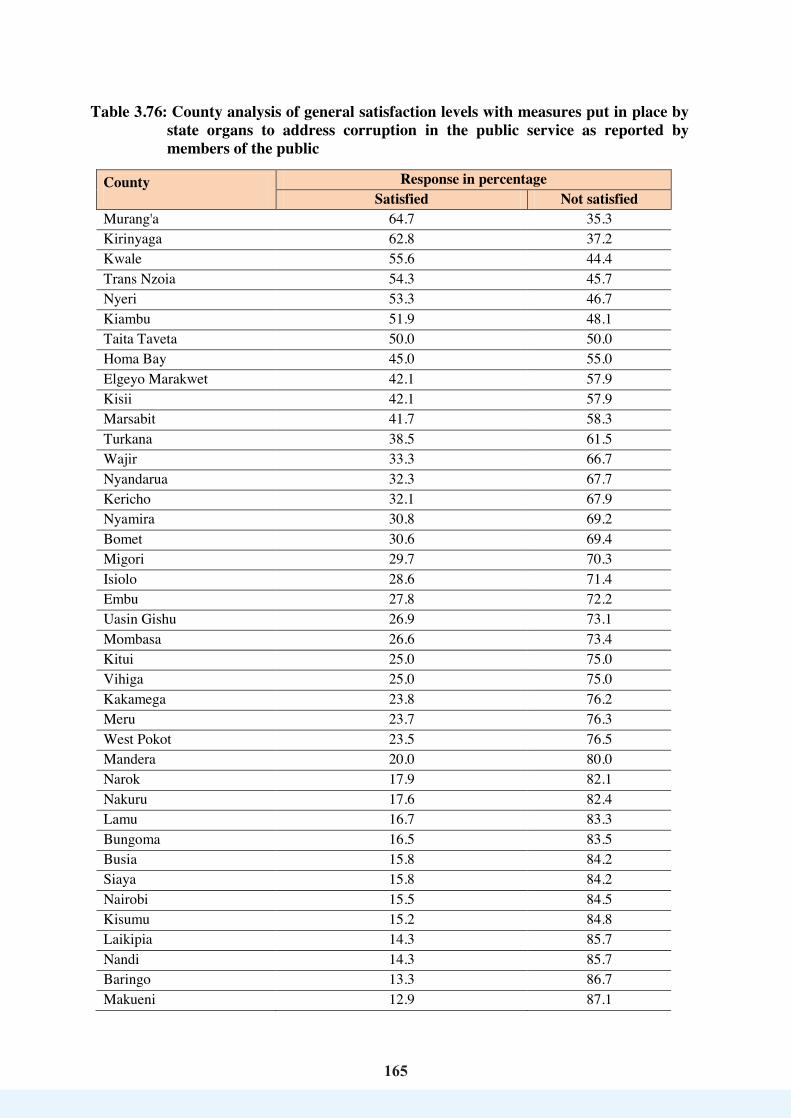
165
165
Table 3.76: County analysis of general satisfaction levels with measures put in place by state organs to address corruption in the public service as reported by members of the public
County Response in percentage Satisfied Not satisfied
Murang'a 64.7 35.3 Kirinyaga 62.8 37.2 Kwale 55.6 44.4 Trans Nzoia 54.3 45.7 Nyeri 53.3 46.7 Kiambu 51.9 48.1 Taita Taveta 50.0 50.0 Homa Bay 45.0 55.0 Elgeyo Marakwet 42.1 57.9 Kisii 42.1 57.9 Marsabit 41.7 58.3 Turkana 38.5 61.5 Wajir 33.3 66.7 Nyandarua 32.3 67.7 Kericho 32.1 67.9 Nyamira 30.8 69.2 Bomet 30.6 69.4 Migori 29.7 70.3 Isiolo 28.6 71.4 Embu 27.8 72.2 Uasin Gishu 26.9 73.1 Mombasa 26.6 73.4 Kitui 25.0 75.0 Vihiga 25.0 75.0 Kakamega 23.8 76.2 Meru 23.7 76.3 West Pokot 23.5 76.5 Mandera 20.0 80.0 Narok 17.9 82.1 Nakuru 17.6 82.4 Lamu 16.7 83.3 Bungoma 16.5 83.5 Busia 15.8 84.2 Siaya 15.8 84.2 Nairobi 15.5 84.5 Kisumu 15.2 84.8 Laikipia 14.3 85.7 Nandi 14.3 85.7 Baringo 13.3 86.7 Makueni 12.9 87.1
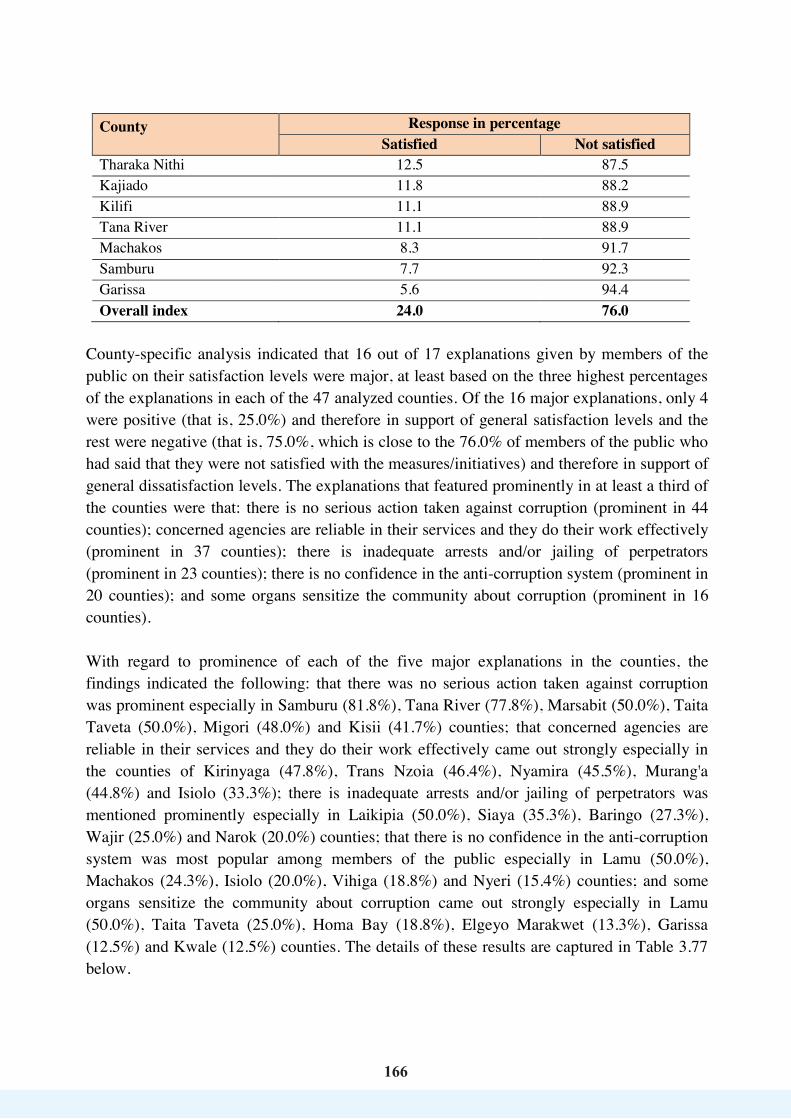
166166
County Response in percentage Satisfied Not satisfied
Tharaka Nithi 12.5 87.5 Kajiado 11.8 88.2 Kilifi 11.1 88.9 Tana River 11.1 88.9 Machakos 8.3 91.7 Samburu 7.7 92.3 Garissa 5.6 94.4 Overall index 24.0 76.0
County-specific analysis indicated that 16 out of 17 explanations given by members of the public on their satisfaction levels were major, at least based on the three highest percentages of the explanations in each of the 47 analyzed counties. Of the 16 major explanations, only 4 were positive (that is, 25.0%) and therefore in support of general satisfaction levels and the rest were negative (that is, 75.0%, which is close to the 76.0% of members of the public who had said that they were not satisfied with the measures/initiatives) and therefore in support of general dissatisfaction levels. The explanations that featured prominently in at least a third of the counties were that: there is no serious action taken against corruption (prominent in 44 counties); concerned agencies are reliable in their services and they do their work effectively (prominent in 37 counties); there is inadequate arrests and/or jailing of perpetrators (prominent in 23 counties); there is no confidence in the anti-corruption system (prominent in 20 counties); and some organs sensitize the community about corruption (prominent in 16 counties). With regard to prominence of each of the five major explanations in the counties, the findings indicated the following: that there was no serious action taken against corruption was prominent especially in Samburu (81.8%), Tana River (77.8%), Marsabit (50.0%), Taita Taveta (50.0%), Migori (48.0%) and Kisii (41.7%) counties; that concerned agencies are reliable in their services and they do their work effectively came out strongly especially in the counties of Kirinyaga (47.8%), Trans Nzoia (46.4%), Nyamira (45.5%), Murang'a (44.8%) and Isiolo (33.3%); there is inadequate arrests and/or jailing of perpetrators was mentioned prominently especially in Laikipia (50.0%), Siaya (35.3%), Baringo (27.3%), Wajir (25.0%) and Narok (20.0%) counties; that there is no confidence in the anti-corruption system was most popular among members of the public especially in Lamu (50.0%), Machakos (24.3%), Isiolo (20.0%), Vihiga (18.8%) and Nyeri (15.4%) counties; and some organs sensitize the community about corruption came out strongly especially in Lamu (50.0%), Taita Taveta (25.0%), Homa Bay (18.8%), Elgeyo Marakwet (13.3%), Garissa (12.5%) and Kwale (12.5%) counties. The details of these results are captured in Table 3.77 below.
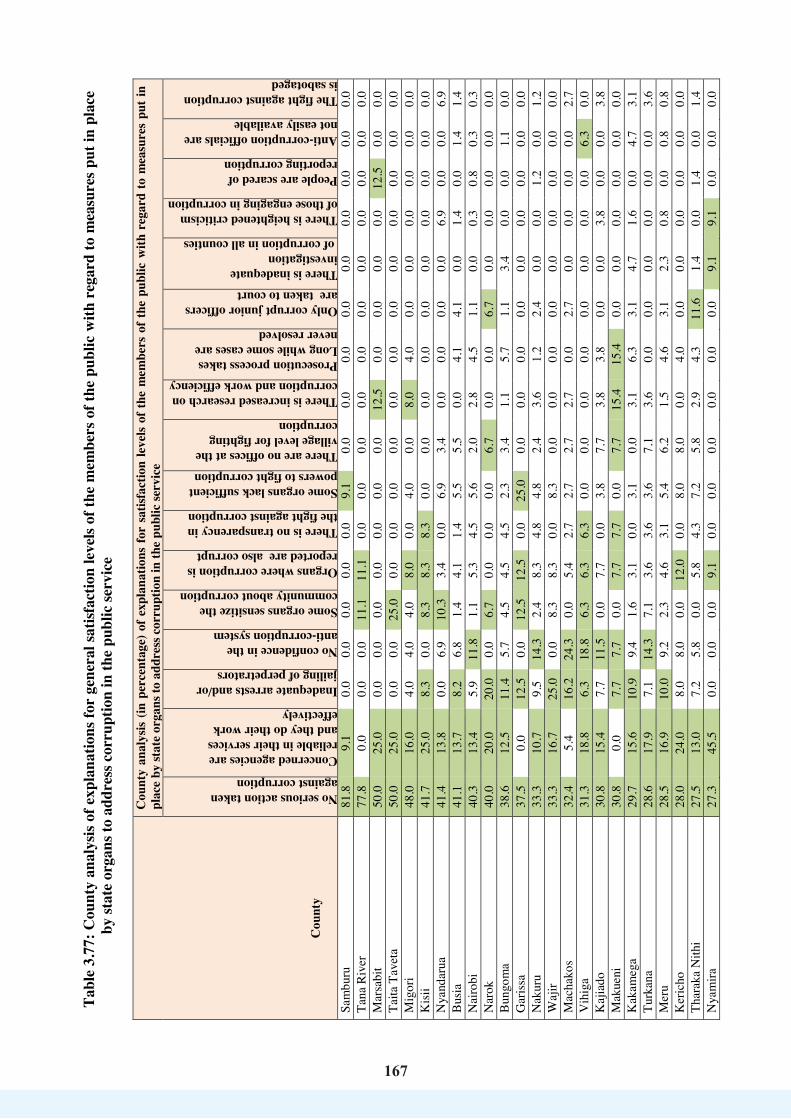
167
167
Tabl
e 3.
77: C
ount
y an
alys
is of
exp
lana
tions
for
gene
ral s
atisf
actio
n le
vels
of th
e m
embe
rs o
f the
pub
lic w
ith r
egar
d to
mea
sure
s put
in p
lace
by
stat
e or
gans
to a
ddre
ss c
orru
ptio
n in
the
publ
ic se
rvic
e
Cou
nty
Cou
nty
anal
ysis
(in p
erce
ntag
e) o
f exp
lana
tions
for
satis
fact
ion
leve
ls of
the
mem
bers
of t
he p
ublic
with
reg
ard
to m
easu
res
put i
n pl
ace
by st
ate
orga
ns to
add
ress
cor
rupt
ion
in th
e pu
blic
serv
ice
No serious action taken against corruption
Concerned agencies are reliable in their services and they do their work effectively
Inadequate arrests and/or jailing of perpetrators
No confidence in the anti-corruption system
Some organs sensitize the community about corruption
Organs where corruption is reported are also corrupt
There is no transparency in the fight against corruption
Some organs lack sufficient powers to fight corruption There are no offices at the village level for fighting corruption
There is increased research on corruption and work efficiency Prosecution process takes Long while some cases are never resolved
Only corrupt junior officers are taken to court There is inadequate investigation of corruption in all counties
There is heightened criticism of those engaging in corruption
People are scared of reporting corruption
Anti-corruption officials are not easily available
The fight against corruption is sabotaged
Sam
buru
81
.8
9.1
0.0
0.0
0.0
0.0
0.0
9.1
0.0
0.0
0.0
0.0
0.0
0.0
0.0
0.0
0.0
Tana
Riv
er
77.8
0.
0 0.
0 0.
0 11
.1
11.1
0.
0 0.
0 0.
0 0.
0 0.
0 0.
0 0.
0 0.
0 0.
0 0.
0 0.
0 M
arsa
bit
50.0
25
.0
0.0
0.0
0.0
0.0
0.0
0.0
0.0
12.5
0.
0 0.
0 0.
0 0.
0 12
.5
0.0
0.0
Taita
Tav
eta
50.0
25
.0
0.0
0.0
25.0
0.
0 0.
0 0.
0 0.
0 0.
0 0.
0 0.
0 0.
0 0.
0 0.
0 0.
0 0.
0 M
igor
i 48
.0
16.0
4.
0 4.
0 4.
0 8.
0 0.
0 4.
0 0.
0 8.
0 4.
0 0.
0 0.
0 0.
0 0.
0 0.
0 0.
0 K
isii
41.7
25
.0
8.3
0.0
8.3
8.3
8.3
0.0
0.0
0.0
0.0
0.0
0.0
0.0
0.0
0.0
0.0
Nya
ndar
ua
41.4
13
.8
0.0
6.9
10.3
3.
4 0.
0 6.
9 3.
4 0.
0 0.
0 0.
0 0.
0 6.
9 0.
0 0.
0 6.
9 B
usia
41
.1
13.7
8.
2 6.
8 1.
4 4.
1 1.
4 5.
5 5.
5 0.
0 4.
1 4.
1 0.
0 1.
4 0.
0 1.
4 1.
4 N
airo
bi
40.3
13
.4
5.9
11.8
1.
1 5.
3 4.
5 5.
6 2.
0 2.
8 4.
5 1.
1 0.
0 0.
3 0.
8 0.
3 0.
3 N
arok
40
.0
20.0
20
.0
0.0
6.7
0.0
0.0
0.0
6.7
0.0
0.0
6.7
0.0
0.0
0.0
0.0
0.0
Bun
gom
a 38
.6
12.5
11
.4
5.7
4.5
4.5
4.5
2.3
3.4
1.1
5.7
1.1
3.4
0.0
0.0
1.1
0.0
Gar
issa
37
.5
0.0
12.5
0.
0 12
.5
12.5
0.
0 25
.0
0.0
0.0
0.0
0.0
0.0
0.0
0.0
0.0
0.0
Nak
uru
33.3
10
.7
9.5
14.3
2.
4 8.
3 4.
8 4.
8 2.
4 3.
6 1.
2 2.
4 0.
0 0.
0 1.
2 0.
0 1.
2 W
ajir
33.3
16
.7
25.0
0.
0 8.
3 8.
3 0.
0 8.
3 0.
0 0.
0 0.
0 0.
0 0.
0 0.
0 0.
0 0.
0 0.
0 M
acha
kos
32.4
5.
4 16
.2
24.3
0.
0 5.
4 2.
7 2.
7 2.
7 2.
7 0.
0 2.
7 0.
0 0.
0 0.
0 0.
0 2.
7 V
ihig
a 31
.3
18.8
6.
3 18
.8
6.3
6.3
6.3
0.0
0.0
0.0
0.0
0.0
0.0
0.0
0.0
6.3
0.0
Kaj
iado
30
.8
15.4
7.
7 11
.5
0.0
7.7
0.0
3.8
7.7
3.8
3.8
0.0
0.0
3.8
0.0
0.0
3.8
Mak
ueni
30
.8
0.0
7.7
7.7
0.0
7.7
7.7
0.0
7.7
15.4
15
.4
0.0
0.0
0.0
0.0
0.0
0.0
Kak
ameg
a 29
.7
15.6
10
.9
9.4
1.6
3.1
0.0
3.1
0.0
3.1
6.3
3.1
4.7
1.6
0.0
4.7
3.1
Turk
ana
28.6
17
.9
7.1
14.3
7.
1 3.
6 3.
6 3.
6 7.
1 3.
6 0.
0 0.
0 0.
0 0.
0 0.
0 0.
0 3.
6 M
eru
28.5
16
.9
10.0
9.
2 2.
3 4.
6 3.
1 5.
4 6.
2 1.
5 4.
6 3.
1 2.
3 0.
8 0.
0 0.
8 0.
8 K
eric
ho
28.0
24
.0
8.0
8.0
0.0
12.0
0.
0 8.
0 8.
0 0.
0 4.
0 0.
0 0.
0 0.
0 0.
0 0.
0 0.
0 Th
arak
a N
ithi
27.5
13
.0
7.2
5.8
0.0
5.8
4.3
7.2
5.8
2.9
4.3
11.6
1.
4 0.
0 1.
4 0.
0 1.
4 N
yam
ira
27.3
45
.5
0.0
0.0
0.0
9.1
0.0
0.0
0.0
0.0
0.0
0.0
9.1
9.1
0.0
0.0
0.0

168
168
Cou
nty
Cou
nty
anal
ysis
(in p
erce
ntag
e) o
f exp
lana
tions
for
satis
fact
ion
leve
ls of
the
mem
bers
of t
he p
ublic
with
reg
ard
to m
easu
res
put i
n pl
ace
by st
ate
orga
ns to
add
ress
cor
rupt
ion
in th
e pu
blic
serv
ice
No serious action taken against corruption
Concerned agencies are reliable in their services and they do their work effectively
Inadequate arrests and/or jailing of perpetrators
No confidence in the anti-corruption system
Some organs sensitize the community about corruption
Organs where corruption is reported are also corrupt
There is no transparency in the fight against corruption
Some organs lack sufficient powers to fight corruption There are no offices at the village level for fighting corruption
There is increased research on corruption and work efficiency Prosecution process takes Long while some cases are never resolved
Only corrupt junior officers are taken to court There is inadequate investigation of corruption in all counties
There is heightened criticism of those engaging in corruption
People are scared of reporting corruption
Anti-corruption officials are not easily available
The fight against corruption is sabotaged
Kitu
i 26
.3
5.3
15.8
10
.5
10.5
5.
3 0.
0 0.
0 0.
0 10
.5
0.0
5.3
0.0
5.3
5.3
0.0
0.0
Embu
25
.0
18.8
8.
3 8.
3 6.
3 12
.5
4.2
0.0
4.2
2.1
4.2
0.0
2.1
0.0
2.1
0.0
2.1
Kili
fi 25
.0
6.3
12.5
6.
3 6.
3 6.
3 6.
3 6.
3 6.
3 12
.5
6.3
0.0
0.0
0.0
0.0
0.0
0.0
Laik
ipia
25
.0
0.0
50.0
0.
0 0.
0 25
.0
0.0
0.0
0.0
0.0
0.0
0.0
0.0
0.0
0.0
0.0
0.0
Siay
a 23
.5
11.8
35
.3
5.9
0.0
5.9
5.9
5.9
0.0
0.0
5.9
0.0
0.0
0.0
0.0
0.0
0.0
Mom
basa
23
.3
20.7
11
.2
8.6
0.9
7.8
4.3
5.2
1.7
0.9
9.5
1.7
0.9
0.9
0.9
0.9
0.9
Bar
ingo
22
.7
9.1
27.3
13
.6
0.0
9.1
4.5
0.0
0.0
4.5
4.5
0.0
4.5
0.0
0.0
0.0
0.0
Kis
umu
20.0
11
.1
11.1
6.
7 11
.1
6.7
6.7
4.4
2.2
2.2
15.6
0.
0 0.
0 2.
2 0.
0 0.
0 0.
0 N
andi
20
.0
0.0
10.0
10
.0
0.0
10.0
10
.0
0.0
20.0
0.
0 0.
0 20
.0
0.0
0.0
0.0
0.0
0.0
Uas
in G
ishu
18
.8
12.5
6.
3 6.
3 0.
0 25
.0
6.3
12.5
6.
3 0.
0 6.
3 0.
0 0.
0 0.
0 0.
0 0.
0 0.
0 B
omet
18
.5
14.8
18
.5
14.8
3.
7 0.
0 0.
0 0.
0 11
.1
7.4
3.7
0.0
3.7
0.0
0.0
0.0
3.7
Tran
s Nzo
ia
17.9
46
.4
0.0
14.3
10
.7
0.0
0.0
0.0
0.0
3.6
3.6
0.0
3.6
0.0
0.0
0.0
0.0
Kia
mbu
15
.2
32.6
8.
7 8.
7 8.
7 6.
5 0.
0 2.
2 6.
5 0.
0 2.
2 0.
0 0.
0 2.
2 2.
2 0.
0 4.
3 M
uran
g'a
13.8
44
.8
6.9
10.3
10
.3
0.0
0.0
3.4
0.0
0.0
0.0
3.4
0.0
0.0
0.0
3.4
3.4
Isio
lo
13.3
33
.3
0.0
20.0
0.
0 20
.0
6.7
0.0
0.0
6.7
0.0
0.0
0.0
0.0
0.0
0.0
0.0
Kiri
nyag
a 13
.0
47.8
8.
7 0.
0 8.
7 4.
3 2.
2 0.
0 0.
0 0.
0 10
.9
0.0
0.0
2.2
2.2
0.0
0.0
Nye
ri 12
.8
23.1
7.
7 15
.4
2.6
7.7
5.1
5.1
0.0
2.6
5.1
5.1
2.6
2.6
2.6
0.0
0.0
Hom
a B
ay
12.5
18
.8
18.8
0.
0 18
.8
0.0
6.3
6.3
0.0
0.0
0.0
6.3
12.5
0.
0 0.
0 0.
0 0.
0 K
wal
e 12
.5
25.0
0.
0 12
.5
12.5
0.
0 0.
0 12
.5
12.5
12
.5
0.0
0.0
0.0
0.0
0.0
0.0
0.0
Elge
yo M
arak
wet
6.
7 26
.7
13.3
13
.3
13.3
0.
0 6.
7 0.
0 13
.3
0.0
6.7
0.0
0.0
0.0
0.0
0.0
0.0
Lam
u 0.
0 0.
0 0.
0 50
.0
50.0
0.
0 0.
0 0.
0 0.
0 0.
0 0.
0 0.
0 0.
0 0.
0 0.
0 0.
0 0.
0 W
est P
okot
0.
0 27
.3
0.0
0.0
0.0
9.1
9.1
9.1
0.0
9.1
9.1
0.0
0.0
27.3
0.
0 0.
0 0.
0 To
tal
num
ber
of c
ount
ies
whe
re
each
of
the
16 m
ajor
exp
lana
tions
fo
r sa
tisfa
ctio
n le
vels
(bas
ed o
n th
e to
p th
ree
high
est
perc
enta
ges
in
each
of
the
46 a
naly
zed
coun
ties)
is
prom
inen
t
44
37
23
20
16
15
8 7
7 7
6 4
2 2
1 1
169
169
A number of key informants observed that they were not satisfied with measures put in place by state organs to address corruption in the public service and said that:
“No, i am not satisfied because corruption is still rampant and every political class seems to cherish it” (KI 9).
“No, i am not satisfied because corruption continues to be very high each and every day” (KI 1).
The finding that most sample respondents were not satisfied with the measures put in place by state organs to address corruption are consistent with earlier findings which showed that the measures were not effective and hence the reason behind the respondents’ reluctance to engage in anti-corruption activities such as reporting corruption incidents to the relevant agencies. Therefore, the concerned agencies need to take serious action (such as effective investigations, arrests and prosecutions) against the perpetrators of corruption in order to gain public confidence and support. 3.8.3.4 Perceptions on extent to which state organs have successfully addressed corruption in the public service Members of the public and public officials were asked of their opinion on the extent to which different state organs had successfully addressed corruption in the public service in Kenya. An overall index, computed as an average of all responses across different state organs, showed that 57.6% of the members of the public and 18.9% of the public officials did not know the extent to which such state organs were successful in addressing corruption in the public service. Of the members of the public who could rate the success of the state organs in addressing corruption, most of them reported that all the organs were not successful at all, with those leading being the Judiciary’s Anti-Corruption Courts (27.5%), the DCI (25.3%) and the EACC (23.7%). On the other hand, most of the public officials thought that the state organs had achieved some level of success and hence rated the organs as majorly successful to a small extent, with the least performing organs being the EACC (46.4%), Judiciary’s Anti-Corruption Courts (43.6%) and the ODPP (43.5%). These findings are captured in Table 3.78 below.

170
170
Table 3.78: Perceptions on extent to which specific state organs have successful addressed corruption in the public service
State Organ Responses in percentage
Members of the public - N=8,658 Public officials - N= 1,795 Extent to which the state organ has been successful in addressing corruption in the public service
Extent to which the state organ has been successful in addressing corruption in the public service
Larg
e
Smal
l
Not
at a
ll
Not
sure
I don
’t kn
ow
Larg
e
Smal
l
Not
at a
ll
Not
sure
I don
’t kn
ow
Office of the Auditor General
5.5 10.5 17.1 9.0 57.9 22.1 35.5 12.3 13.4 16.7
EACC 4.9 19.0 23.7 7.3 45.1 10.8 46.4 21.8 10.0 10.9 DCI 4.6 14.2 25.3 8.6 47.3 9.4 39.1 19.3 15.5 16.7 Judiciary’s Anti-Corruption Courts
3.4 15.7 27.5 7.9 45.5 10.1 43.6 18.2 11.5 16.7
ODPP 2.5 11.5 20.4 9.1 56.6 9.8 43.5 16.8 14.1 15.9 Office of the Attorney General
2.3 11.8 22.6 9.8 53.6 7.5 37.7 18.2 17.7 18.9
National Anti-Corruption Campaign Steering Committee
2.0 7.2 12.6 8.0 70.3 7.6 28.5 19.6 16.7 27.6
Internal Audit Department/Section in Ministries
1.3 5.9 16.0 8.9 67.9 17.3 34.8 17.3 12.0 18.5
Internal Corruption Prevention Committees in public institutions
0.7 3.3 13.1 8.8 74.1 8.0 25.2 22.3 16.7 27.8
Overall Index (%) 3.0 11.0 19.8 8.6 57.6 11.4 37.1 18.4 14.2 18.9 From the findings in the Table above, most members of the public did not know the extent to which the listed state organs were successful in addressing corruption in the public service hence demonstrating a knowledge gap on the part of the members of the public on the success rates of the measures/initiatives put in place by the organs. This could therefore mean that the measures/initiatives put in place by the organs are either not adequately visible and/or well understood by this category of respondents. Most public officials could rate the success rates of the organs because all public offices in the country have a component of anti-corruption mainstreaming in their performance contracts and programmes involving most of the listed organs. For example, all public offices have an annual external audit exercise

171171
conducted by the Office of the Auditor General. As stated earlier, aggressive public communication and popularization of the measures/initiatives is necessary. Considering the results from the sample respondents who could rate the state organs, it was clear that most of the organs were rated generally as unsuccessful (that is, successful to a small extent and not successful at all all) in addressing corruption. Therefore, all the state organs need to review their processes based on an analysis and remedial measures of the circumstances and/or factors within their specific institutions on why the government loses corruption cases. Members of the public and public officials were further asked to substantiate their answers with regard to the extent the specific state organs had succeeded in addressing corruption in the public service. Focusing on each state organ, their feedback is presented and discussed below. Office of the Attorney General According to the findings of the study presented in Table 3.79 below, the highest percentages on the explanations by members of the public and public officials were to the effect that the Office of the Attorney General was not successful at all or was successful to a small extent in addressing corruption in the public service. The explanations given by at least 1 out of 10 members of the public and/or public officials were that the Office: had no impact as corruption was still rampant and/or increasing (reported by 32.0% and 27.9% of the members of the public and public officials respectively); and was not adequately devolved and well known and felt (according to 13.7% of the members of the public). Table 3.79: Explanations on extent of success of the Office of the Attorney General in
addressing corruption in the public service Explanations for the responses on the extent of success of the Office of the Attorney General in addressing corruption in the public service
Members of the public
Public officials
Explanations in support of responses that the Office is successful to a large extent
That the Office:
Has some corruption cases taken to court for prosecution 3.9% 5.3% Has cases with sufficient evidence sustaining conviction 3.2% 2.5% There is partial positive change in the fight against corruption
3.0% 3.3%
Makes efforts to follow up corruption cases 2.2% 2.0% Had exposed some corrupt public officials 1.4% 1.6% Educates people on the importance of living in a corruption-free country
0.5% 0.6%
Explanations in support of responses that the Office is not successful at all or is successful to a small extent
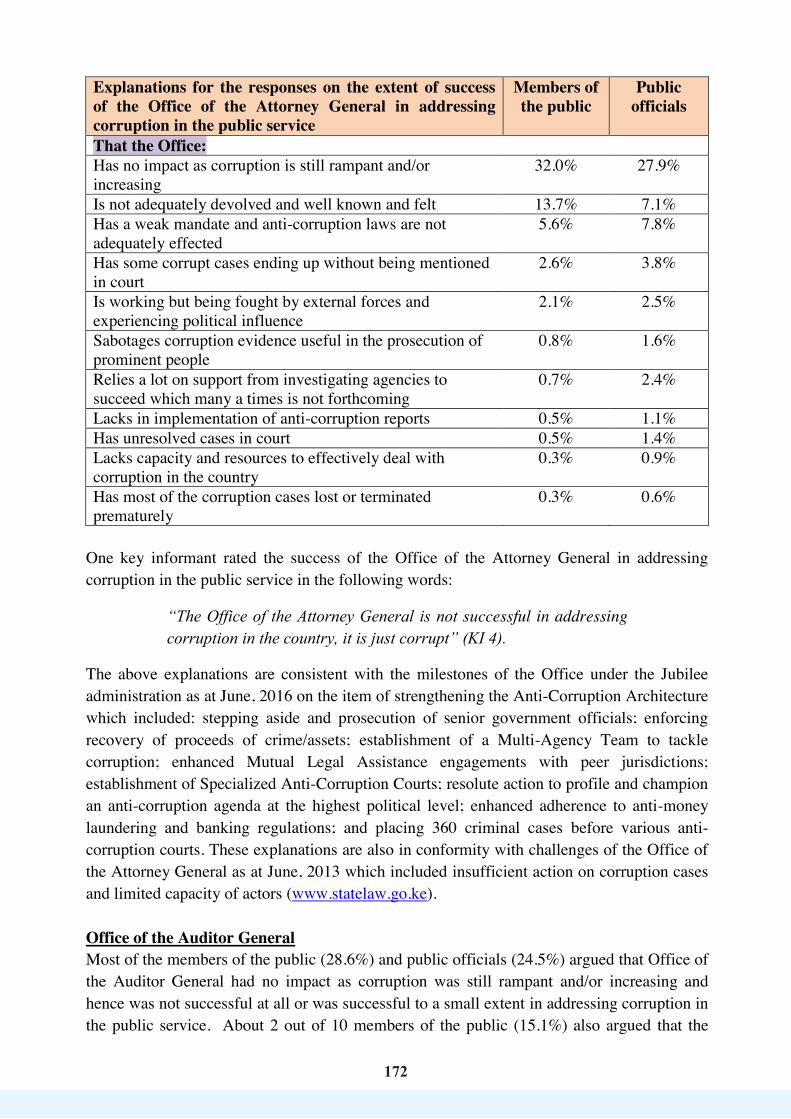
172
172
Explanations for the responses on the extent of success of the Office of the Attorney General in addressing corruption in the public service
Members of the public
Public officials
That the Office: Has no impact as corruption is still rampant and/or increasing
32.0% 27.9%
Is not adequately devolved and well known and felt 13.7% 7.1% Has a weak mandate and anti-corruption laws are not adequately effected
5.6% 7.8%
Has some corrupt cases ending up without being mentioned in court
2.6% 3.8%
Is working but being fought by external forces and experiencing political influence
2.1% 2.5%
Sabotages corruption evidence useful in the prosecution of prominent people
0.8% 1.6%
Relies a lot on support from investigating agencies to succeed which many a times is not forthcoming
0.7% 2.4%
Lacks in implementation of anti-corruption reports 0.5% 1.1% Has unresolved cases in court 0.5% 1.4% Lacks capacity and resources to effectively deal with corruption in the country
0.3% 0.9%
Has most of the corruption cases lost or terminated prematurely
0.3% 0.6%
One key informant rated the success of the Office of the Attorney General in addressing corruption in the public service in the following words:
“The Office of the Attorney General is not successful in addressing corruption in the country, it is just corrupt” (KI 4).
The above explanations are consistent with the milestones of the Office under the Jubilee administration as at June, 2016 on the item of strengthening the Anti-Corruption Architecture which included: stepping aside and prosecution of senior government officials; enforcing recovery of proceeds of crime/assets; establishment of a Multi-Agency Team to tackle corruption; enhanced Mutual Legal Assistance engagements with peer jurisdictions; establishment of Specialized Anti-Corruption Courts; resolute action to profile and champion an anti-corruption agenda at the highest political level; enhanced adherence to anti-money laundering and banking regulations; and placing 360 criminal cases before various anti-corruption courts. These explanations are also in conformity with challenges of the Office of the Attorney General as at June, 2013 which included insufficient action on corruption cases and limited capacity of actors (www.statelaw.go.ke). Office of the Auditor General Most of the members of the public (28.6%) and public officials (24.5%) argued that Office of the Auditor General had no impact as corruption was still rampant and/or increasing and hence was not successful at all or was successful to a small extent in addressing corruption in the public service. About 2 out of 10 members of the public (15.1%) also argued that the

173
173
Office was not adequately devolved and well known and felt. However, the sample respondents who rated the Office as successful to a large extent in addressing corruption in the public service argued that the Office: had exposed corrupt public officers (mentioned by 23.5% and 12.9% of the public officials and members of the public respectively); and had performed in curbing the misuse of public funds (mentioned by 15.5% and 13.6% of the public officials and members of the public respectively). These results are presented in Table 3.80 below. Table 3.80: Explanations for responses on extent of success of the Office of the Auditor
General in addressing corruption in the public service Explanations for the responses on the extent of success of the Office of the Auditor General in addressing corruption in the public service
Members of the public
Public officials
Explanations in support of responses that the Office is successful to a large extent
Has performed in curbing misuse of public funds 13.6% 15.5% Office has exposed corrupt public officers 12.9% 23.5% There is partial positive change in the fight against corrupion
3.6% 4.0%
Explanations in support of responses that the Office is not successful at all or is successful to a small extent
Office has no impact as corruption is still rampant and/or increasing
28.6% 24.5%
Is not adequately devolved and well known and felt
15.1% 4.1%
Auditor General's officers are themselves corrupt 7.1% 8.7% Office is working but being fought by external forces and experiencing political influence
7.1% 8.2%
No proper auditing is done 5.5% 3.4% There is lack of implementation of the Office's reports
3.6% 5.9%
Office has a weak mandate 1.5% 4.4% Office is only active in the media 1.3% 0.3% Office is threatened and has no freedom 0.9% 0.4% Office is under-staffed 0.2% 0.1%
On the success rate of the Office of the Auditor General in addressing corruption in the public service, a key informant had this to say:
“They try to audit government expenditure; they point out where there is misuse of resources” (KI 5).
While the Office of the Auditor General conducts external audit on all public offices every year, identifies systemic weaknesses and/or loopholes and gives recommendations for
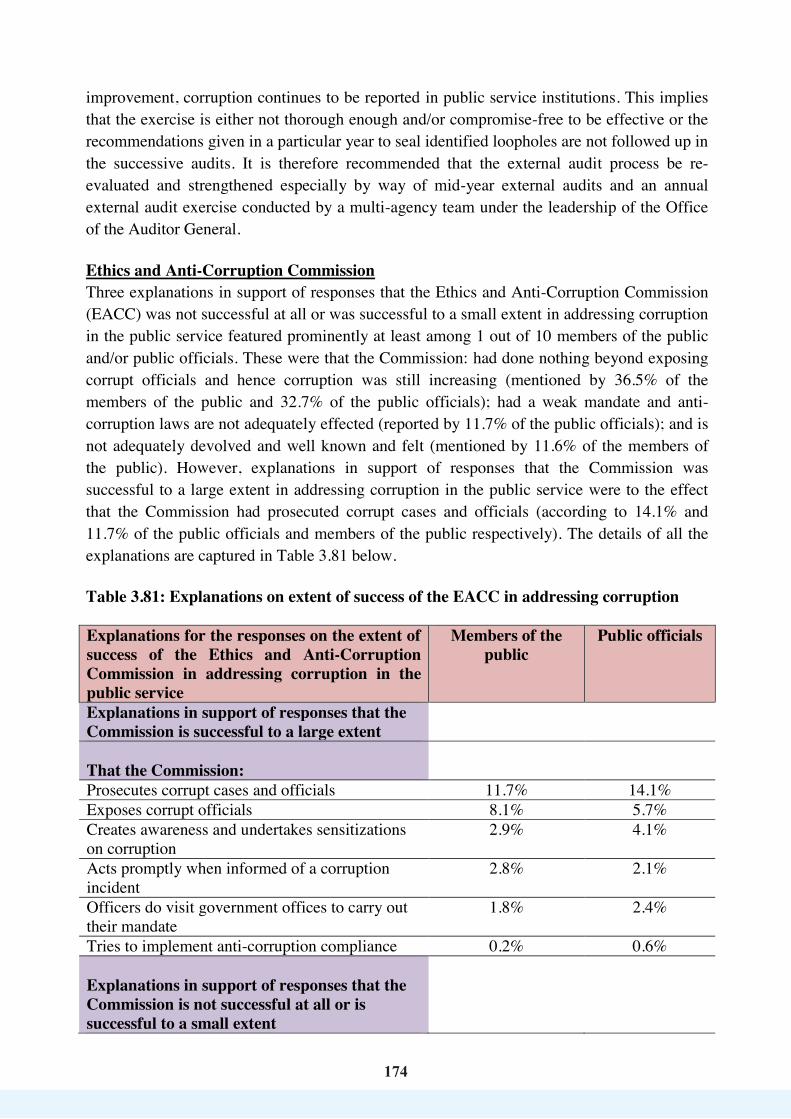
174174
improvement, corruption continues to be reported in public service institutions. This implies that the exercise is either not thorough enough and/or compromise-free to be effective or the recommendations given in a particular year to seal identified loopholes are not followed up in the successive audits. It is therefore recommended that the external audit process be re-evaluated and strengthened especially by way of mid-year external audits and an annual external audit exercise conducted by a multi-agency team under the leadership of the Office of the Auditor General. Ethics and Anti-Corruption Commission Three explanations in support of responses that the Ethics and Anti-Corruption Commission (EACC) was not successful at all or was successful to a small extent in addressing corruption in the public service featured prominently at least among 1 out of 10 members of the public and/or public officials. These were that the Commission: had done nothing beyond exposing corrupt officials and hence corruption was still increasing (mentioned by 36.5% of the members of the public and 32.7% of the public officials); had a weak mandate and anti-corruption laws are not adequately effected (reported by 11.7% of the public officials); and is not adequately devolved and well known and felt (mentioned by 11.6% of the members of the public). However, explanations in support of responses that the Commission was successful to a large extent in addressing corruption in the public service were to the effect that the Commission had prosecuted corrupt cases and officials (according to 14.1% and 11.7% of the public officials and members of the public respectively). The details of all the explanations are captured in Table 3.81 below. Table 3.81: Explanations on extent of success of the EACC in addressing corruption Explanations for the responses on the extent of success of the Ethics and Anti-Corruption Commission in addressing corruption in the public service
Members of the public
Public officials
Explanations in support of responses that the Commission is successful to a large extent
That the Commission:
Prosecutes corrupt cases and officials 11.7% 14.1% Exposes corrupt officials 8.1% 5.7% Creates awareness and undertakes sensitizations on corruption
2.9% 4.1%
Acts promptly when informed of a corruption incident
2.8% 2.1%
Officers do visit government offices to carry out their mandate
1.8% 2.4%
Tries to implement anti-corruption compliance 0.2% 0.6% Explanations in support of responses that the Commission is not successful at all or is successful to a small extent
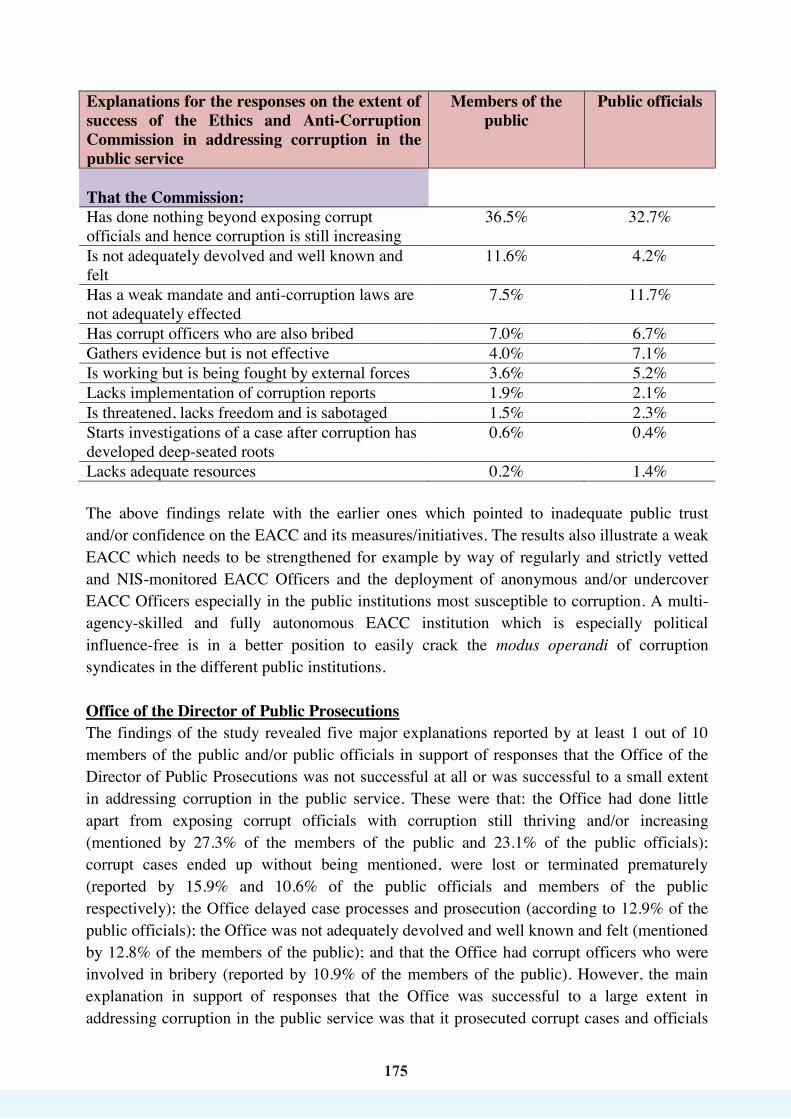
175175
Explanations for the responses on the extent of success of the Ethics and Anti-Corruption Commission in addressing corruption in the public service
Members of the public
Public officials
That the Commission:
Has done nothing beyond exposing corrupt officials and hence corruption is still increasing
36.5% 32.7%
Is not adequately devolved and well known and felt
11.6% 4.2%
Has a weak mandate and anti-corruption laws are not adequately effected
7.5% 11.7%
Has corrupt officers who are also bribed 7.0% 6.7% Gathers evidence but is not effective 4.0% 7.1% Is working but is being fought by external forces 3.6% 5.2% Lacks implementation of corruption reports 1.9% 2.1% Is threatened, lacks freedom and is sabotaged 1.5% 2.3% Starts investigations of a case after corruption has developed deep-seated roots
0.6% 0.4%
Lacks adequate resources 0.2% 1.4% The above findings relate with the earlier ones which pointed to inadequate public trust and/or confidence on the EACC and its measures/initiatives. The results also illustrate a weak EACC which needs to be strengthened for example by way of regularly and strictly vetted and NIS-monitored EACC Officers and the deployment of anonymous and/or undercover EACC Officers especially in the public institutions most susceptible to corruption. A multi-agency-skilled and fully autonomous EACC institution which is especially political influence-free is in a better position to easily crack the modus operandi of corruption syndicates in the different public institutions. Office of the Director of Public Prosecutions The findings of the study revealed five major explanations reported by at least 1 out of 10 members of the public and/or public officials in support of responses that the Office of the Director of Public Prosecutions was not successful at all or was successful to a small extent in addressing corruption in the public service. These were that: the Office had done little apart from exposing corrupt officials with corruption still thriving and/or increasing (mentioned by 27.3% of the members of the public and 23.1% of the public officials); corrupt cases ended up without being mentioned, were lost or terminated prematurely (reported by 15.9% and 10.6% of the public officials and members of the public respectively); the Office delayed case processes and prosecution (according to 12.9% of the public officials); the Office was not adequately devolved and well known and felt (mentioned by 12.8% of the members of the public); and that the Office had corrupt officers who were involved in bribery (reported by 10.9% of the members of the public). However, the main explanation in support of responses that the Office was successful to a large extent in addressing corruption in the public service was that it prosecuted corrupt cases and officials
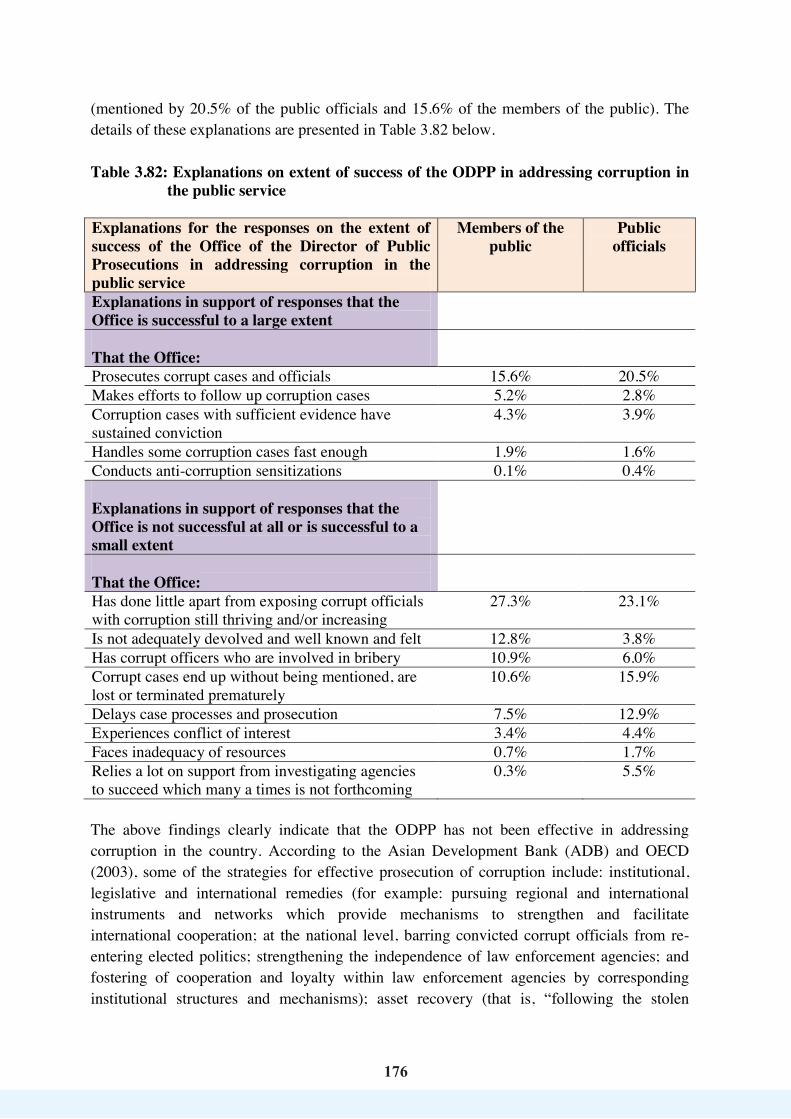
176
176
(mentioned by 20.5% of the public officials and 15.6% of the members of the public). The details of these explanations are presented in Table 3.82 below. Table 3.82: Explanations on extent of success of the ODPP in addressing corruption in
the public service Explanations for the responses on the extent of success of the Office of the Director of Public Prosecutions in addressing corruption in the public service
Members of the public
Public officials
Explanations in support of responses that the Office is successful to a large extent
That the Office:
Prosecutes corrupt cases and officials 15.6% 20.5% Makes efforts to follow up corruption cases 5.2% 2.8% Corruption cases with sufficient evidence have sustained conviction
4.3% 3.9%
Handles some corruption cases fast enough 1.9% 1.6% Conducts anti-corruption sensitizations 0.1% 0.4% Explanations in support of responses that the Office is not successful at all or is successful to a small extent
That the Office:
Has done little apart from exposing corrupt officials with corruption still thriving and/or increasing
27.3% 23.1%
Is not adequately devolved and well known and felt 12.8% 3.8% Has corrupt officers who are involved in bribery 10.9% 6.0% Corrupt cases end up without being mentioned, are lost or terminated prematurely
10.6% 15.9%
Delays case processes and prosecution 7.5% 12.9% Experiences conflict of interest 3.4% 4.4% Faces inadequacy of resources 0.7% 1.7% Relies a lot on support from investigating agencies to succeed which many a times is not forthcoming
0.3% 5.5%
The above findings clearly indicate that the ODPP has not been effective in addressing corruption in the country. According to the Asian Development Bank (ADB) and OECD (2003), some of the strategies for effective prosecution of corruption include: institutional, legislative and international remedies (for example: pursuing regional and international instruments and networks which provide mechanisms to strengthen and facilitate international cooperation; at the national level, barring convicted corrupt officials from re-entering elected politics; strengthening the independence of law enforcement agencies; and fostering of cooperation and loyalty within law enforcement agencies by corresponding institutional structures and mechanisms); asset recovery (that is, “following the stolen
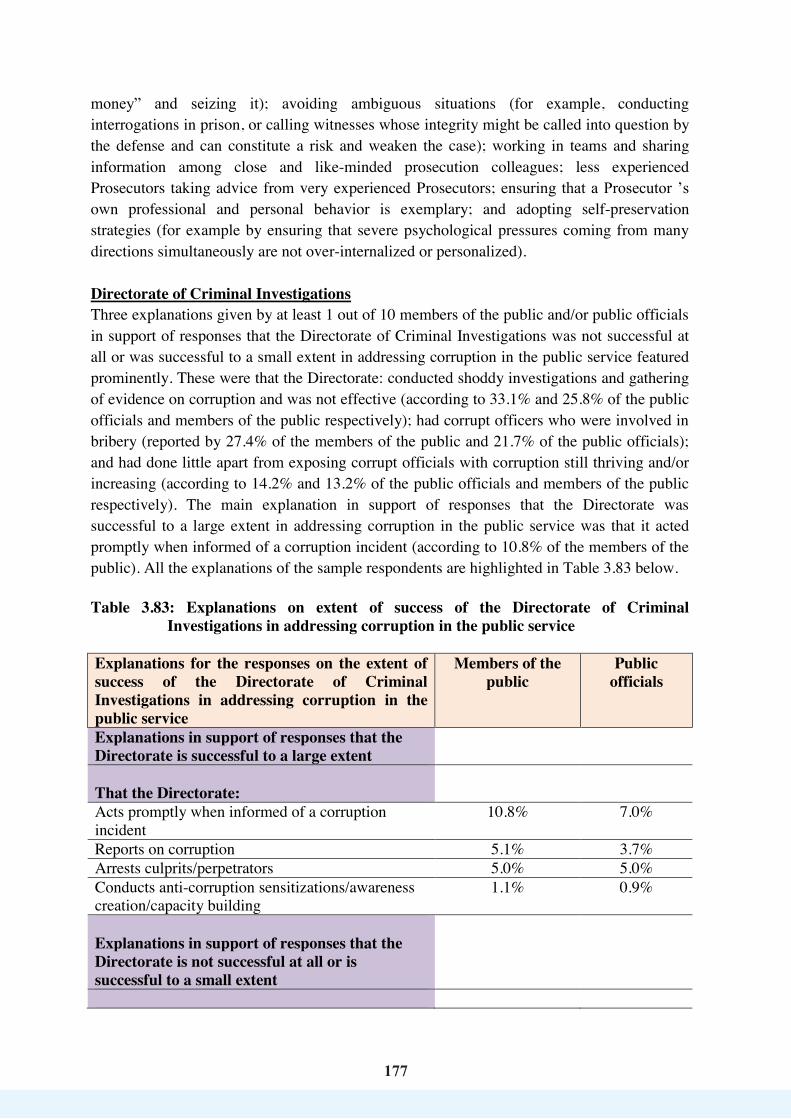
177
177
money” and seizing it); avoiding ambiguous situations (for example, conducting interrogations in prison, or calling witnesses whose integrity might be called into question by the defense and can constitute a risk and weaken the case); working in teams and sharing information among close and like-minded prosecution colleagues; less experienced Prosecutors taking advice from very experienced Prosecutors; ensuring that a Prosecutor ’s own professional and personal behavior is exemplary; and adopting self-preservation strategies (for example by ensuring that severe psychological pressures coming from many directions simultaneously are not over-internalized or personalized). Directorate of Criminal Investigations Three explanations given by at least 1 out of 10 members of the public and/or public officials in support of responses that the Directorate of Criminal Investigations was not successful at all or was successful to a small extent in addressing corruption in the public service featured prominently. These were that the Directorate: conducted shoddy investigations and gathering of evidence on corruption and was not effective (according to 33.1% and 25.8% of the public officials and members of the public respectively); had corrupt officers who were involved in bribery (reported by 27.4% of the members of the public and 21.7% of the public officials); and had done little apart from exposing corrupt officials with corruption still thriving and/or increasing (according to 14.2% and 13.2% of the public officials and members of the public respectively). The main explanation in support of responses that the Directorate was successful to a large extent in addressing corruption in the public service was that it acted promptly when informed of a corruption incident (according to 10.8% of the members of the public). All the explanations of the sample respondents are highlighted in Table 3.83 below. Table 3.83: Explanations on extent of success of the Directorate of Criminal
Investigations in addressing corruption in the public service Explanations for the responses on the extent of success of the Directorate of Criminal Investigations in addressing corruption in the public service
Members of the public
Public officials
Explanations in support of responses that the Directorate is successful to a large extent
That the Directorate:
Acts promptly when informed of a corruption incident
10.8% 7.0%
Reports on corruption 5.1% 3.7% Arrests culprits/perpetrators 5.0% 5.0% Conducts anti-corruption sensitizations/awareness creation/capacity building
1.1% 0.9%
Explanations in support of responses that the Directorate is not successful at all or is successful to a small extent
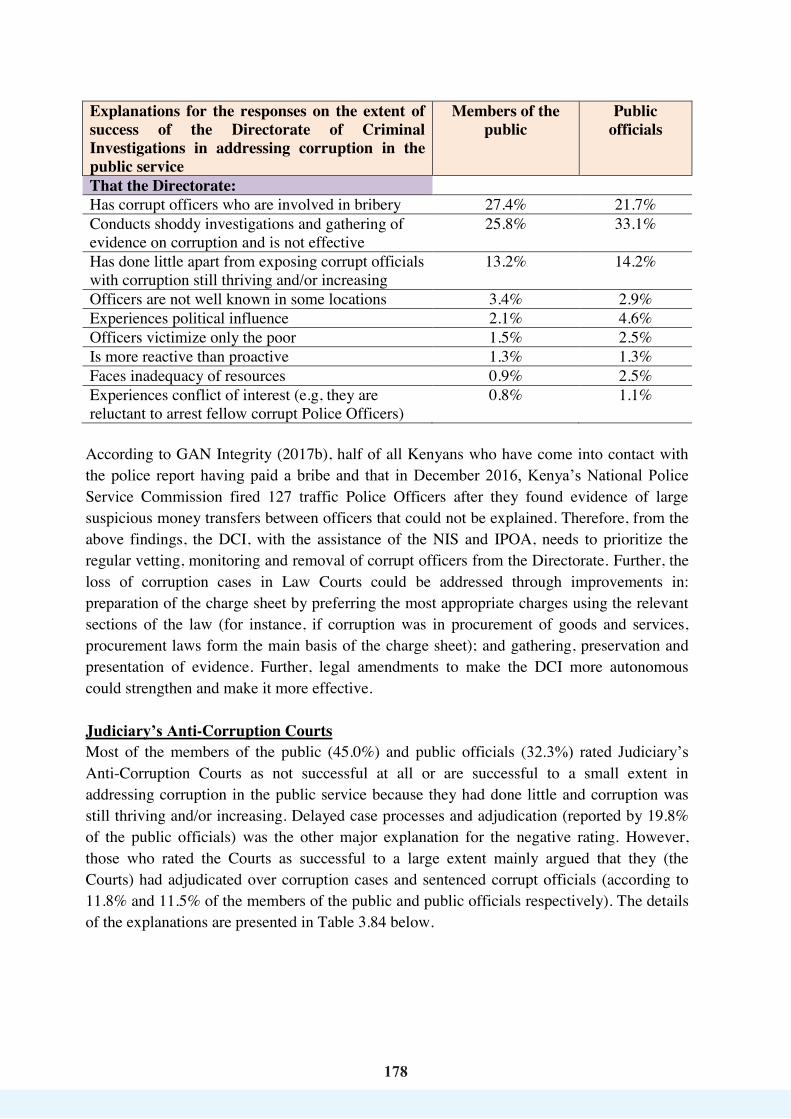
178
178
Explanations for the responses on the extent of success of the Directorate of Criminal Investigations in addressing corruption in the public service
Members of the public
Public officials
That the Directorate: Has corrupt officers who are involved in bribery 27.4% 21.7% Conducts shoddy investigations and gathering of evidence on corruption and is not effective
25.8% 33.1%
Has done little apart from exposing corrupt officials with corruption still thriving and/or increasing
13.2% 14.2%
Officers are not well known in some locations 3.4% 2.9% Experiences political influence 2.1% 4.6% Officers victimize only the poor 1.5% 2.5% Is more reactive than proactive 1.3% 1.3% Faces inadequacy of resources 0.9% 2.5% Experiences conflict of interest (e.g, they are reluctant to arrest fellow corrupt Police Officers)
0.8% 1.1%
According to GAN Integrity (2017b), half of all Kenyans who have come into contact with the police report having paid a bribe and that in December 2016, Kenya’s National Police Service Commission fired 127 traffic Police Officers after they found evidence of large suspicious money transfers between officers that could not be explained. Therefore, from the above findings, the DCI, with the assistance of the NIS and IPOA, needs to prioritize the regular vetting, monitoring and removal of corrupt officers from the Directorate. Further, the loss of corruption cases in Law Courts could be addressed through improvements in: preparation of the charge sheet by preferring the most appropriate charges using the relevant sections of the law (for instance, if corruption was in procurement of goods and services, procurement laws form the main basis of the charge sheet); and gathering, preservation and presentation of evidence. Further, legal amendments to make the DCI more autonomous could strengthen and make it more effective. Judiciary’s Anti-Corruption Courts Most of the members of the public (45.0%) and public officials (32.3%) rated Judiciary’s Anti-Corruption Courts as not successful at all or are successful to a small extent in addressing corruption in the public service because they had done little and corruption was still thriving and/or increasing. Delayed case processes and adjudication (reported by 19.8% of the public officials) was the other major explanation for the negative rating. However, those who rated the Courts as successful to a large extent mainly argued that they (the Courts) had adjudicated over corruption cases and sentenced corrupt officials (according to 11.8% and 11.5% of the members of the public and public officials respectively). The details of the explanations are presented in Table 3.84 below.

179
179
Table 3.84: Explanations on extent of success of the Judiciary’s Anti-Corruption Courts in addressing corruption in the public service
Explanations for the responses on the extent of success of the Judiciary’s Anti-Corruption Courts in addressing corruption in the public service
Members of the public
Public officials
Explanations in support of responses that the Anti-Corruption Courts are successful to a large extent
The Anti-Corruption Courts:
Adjudicate over corruption cases and sentence corrupt officials
11.8% 11.5%
Sustain conviction for corruption cases with sufficient evidence
6.9% 6.1%
Handle some corruption cases fast enough 3.0% 3.0% Expose corrupt officials 1.2% 1.3% Explanations in support of responses that the Anti-Corruption Courts are not successful at all or are successful to a small extent
The Anti-Corruption Courts:
Have done little and corruption is still thriving and/or increasing
45.0% 32.3%
Delay case processes and adjudication 9.0% 19.8% Corrupt cases end up without being mentioned, are lost or terminated prematurely
7.3% 5.3%
Have some Judges and Magistrates who are themselves corrupt
5.0% 3.5%
Have unresolved corruption cases in court 3.9% 6.2% Experience political influence 1.8% 3.4% Rely a lot on support from other agencies to succeed which many a times is not forthcoming
1.1% 6.0%
Face the challenge of weak anti-corruption laws 0.8% 1.6% As an independent referee and arbitrator in the administration of justice, the Judiciary needs to put measures in place to eliminate corruption leveled against its officers so as to gain confidence from the other arms of government and the public (GAN Integrity, 2017b). Without compromising its independence and referee role, and in the interest of effective protection of public good, the Judiciary needs to consider highlighting and sharing with other stakeholders the areas of weaknesses Judges and Magistrates observe in the investigation and prosecution of corruption cases. Internal Audit Department/Section in Ministries Most of the members of the public (47.2%) and public officials (43.6%) were of the view that the Internal Audit Department/Section in Ministries had done little and corruption was still

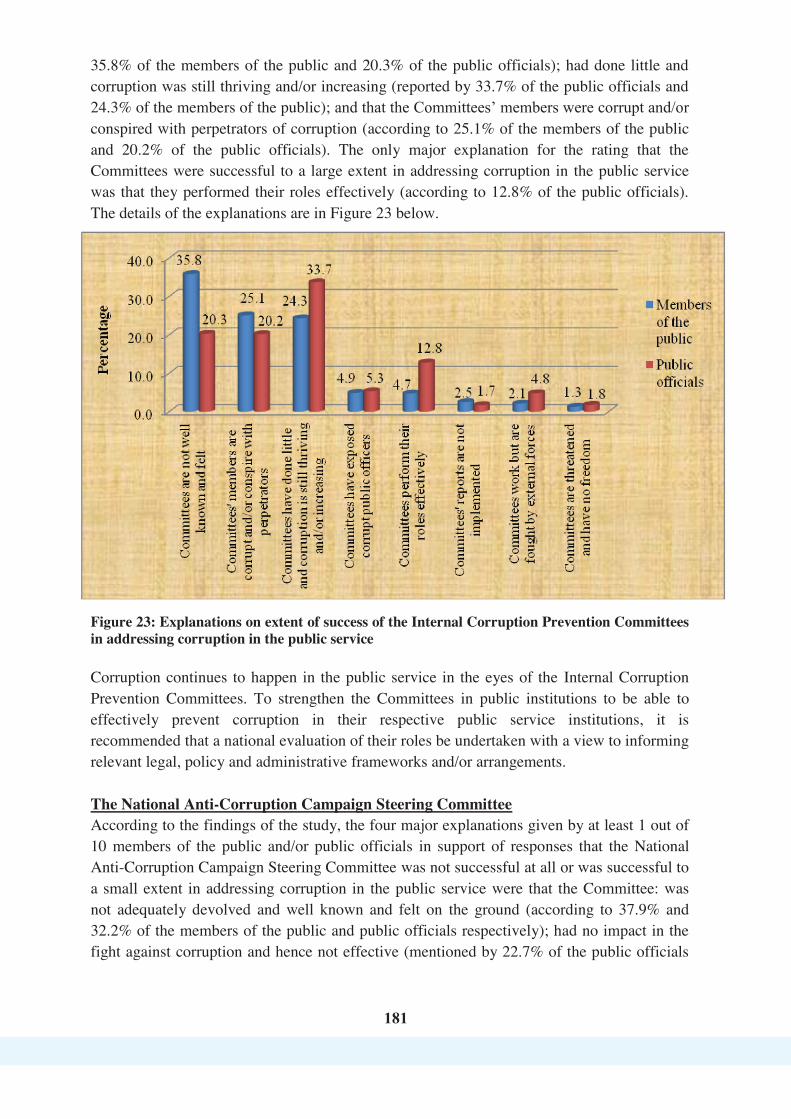
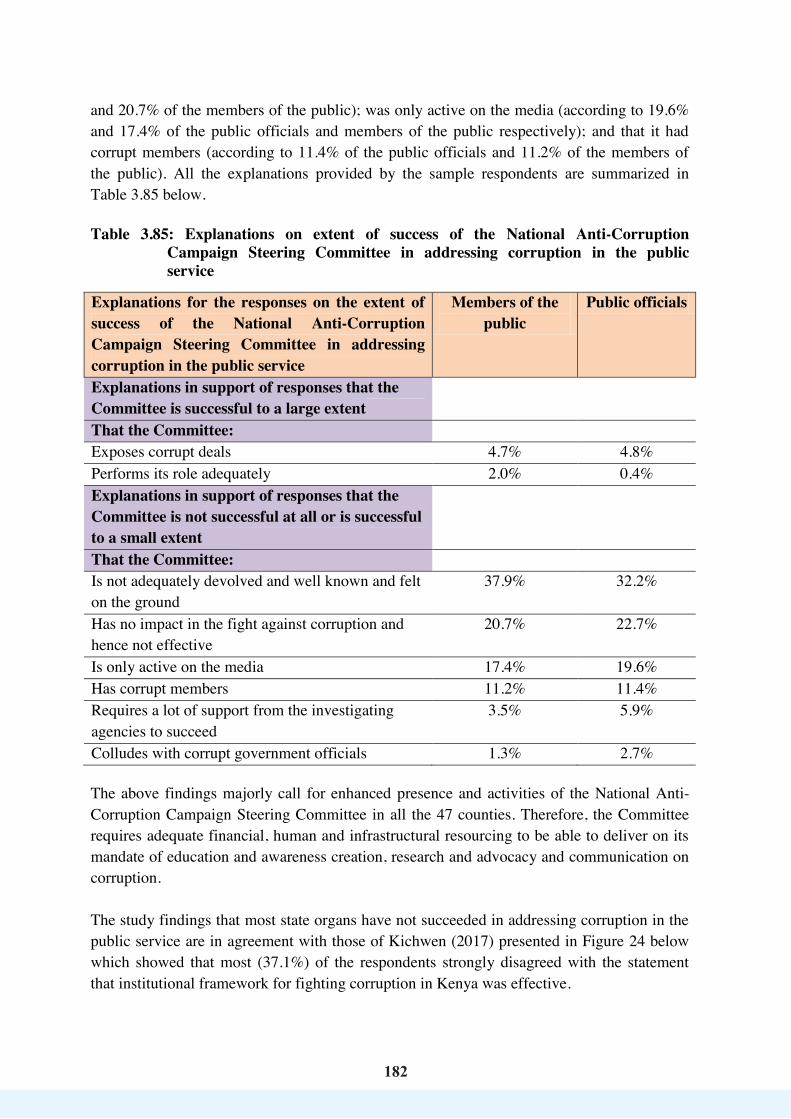
182
182
and 20.7% of the members of the public); was only active on the media (according to 19.6% and 17.4% of the public officials and members of the public respectively); and that it had corrupt members (according to 11.4% of the public officials and 11.2% of the members of the public). All the explanations provided by the sample respondents are summarized in Table 3.85 below. Table 3.85: Explanations on extent of success of the National Anti-Corruption
Campaign Steering Committee in addressing corruption in the public service
Explanations for the responses on the extent of success of the National Anti-Corruption Campaign Steering Committee in addressing corruption in the public service
Members of the public
Public officials
Explanations in support of responses that the Committee is successful to a large extent
That the Committee: Exposes corrupt deals 4.7% 4.8% Performs its role adequately 2.0% 0.4% Explanations in support of responses that the Committee is not successful at all or is successful to a small extent
That the Committee: Is not adequately devolved and well known and felt on the ground
37.9% 32.2%
Has no impact in the fight against corruption and hence not effective
20.7% 22.7%
Is only active on the media 17.4% 19.6% Has corrupt members 11.2% 11.4% Requires a lot of support from the investigating agencies to succeed
3.5% 5.9%
Colludes with corrupt government officials 1.3% 2.7% The above findings majorly call for enhanced presence and activities of the National Anti-Corruption Campaign Steering Committee in all the 47 counties. Therefore, the Committee requires adequate financial, human and infrastructural resourcing to be able to deliver on its mandate of education and awareness creation, research and advocacy and communication on corruption. The study findings that most state organs have not succeeded in addressing corruption in the public service are in agreement with those of Kichwen (2017) presented in Figure 24 below which showed that most (37.1%) of the respondents strongly disagreed with the statement that institutional framework for fighting corruption in Kenya was effective.
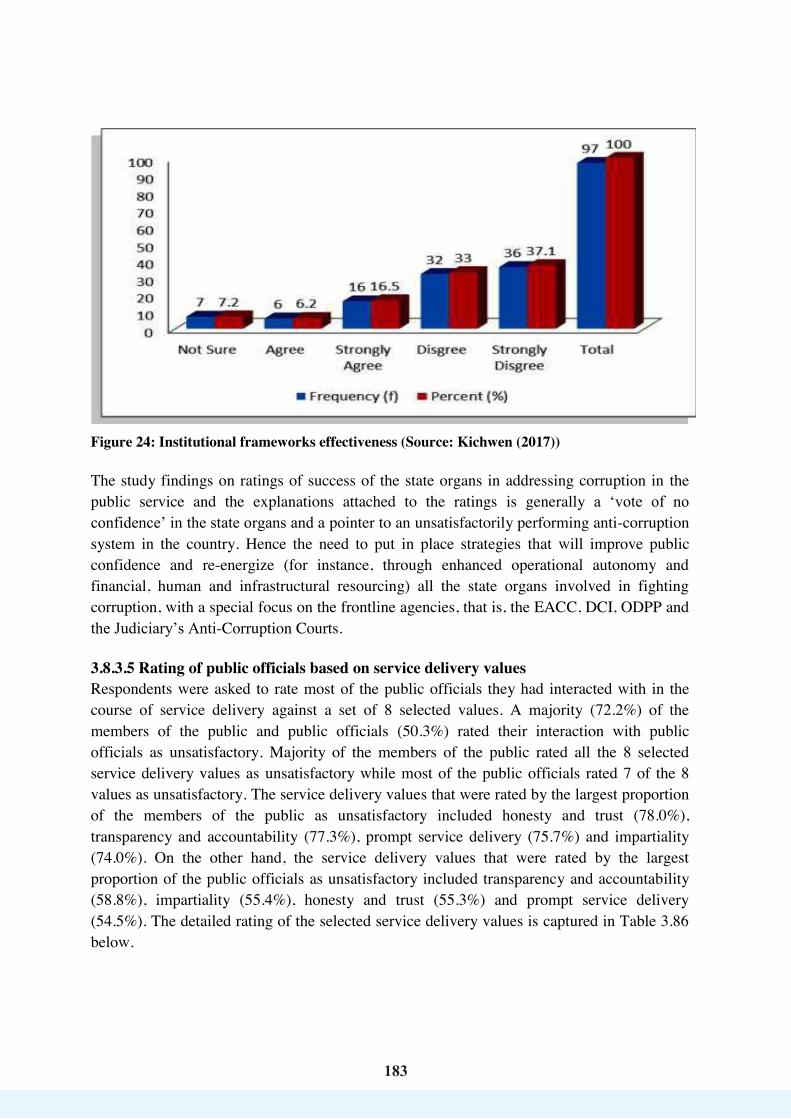
183
183
Figure 24: Institutional frameworks effectiveness (Source: Kichwen (2017)) The study findings on ratings of success of the state organs in addressing corruption in the public service and the explanations attached to the ratings is generally a ‘vote of no confidence’ in the state organs and a pointer to an unsatisfactorily performing anti-corruption system in the country. Hence the need to put in place strategies that will improve public confidence and re-energize (for instance, through enhanced operational autonomy and financial, human and infrastructural resourcing) all the state organs involved in fighting corruption, with a special focus on the frontline agencies, that is, the EACC, DCI, ODPP and the Judiciary’s Anti-Corruption Courts. 3.8.3.5 Rating of public officials based on service delivery values Respondents were asked to rate most of the public officials they had interacted with in the course of service delivery against a set of 8 selected values. A majority (72.2%) of the members of the public and public officials (50.3%) rated their interaction with public officials as unsatisfactory. Majority of the members of the public rated all the 8 selected service delivery values as unsatisfactory while most of the public officials rated 7 of the 8 values as unsatisfactory. The service delivery values that were rated by the largest proportion of the members of the public as unsatisfactory included honesty and trust (78.0%), transparency and accountability (77.3%), prompt service delivery (75.7%) and impartiality (74.0%). On the other hand, the service delivery values that were rated by the largest proportion of the public officials as unsatisfactory included transparency and accountability (58.8%), impartiality (55.4%), honesty and trust (55.3%) and prompt service delivery (54.5%). The detailed rating of the selected service delivery values is captured in Table 3.86 below.
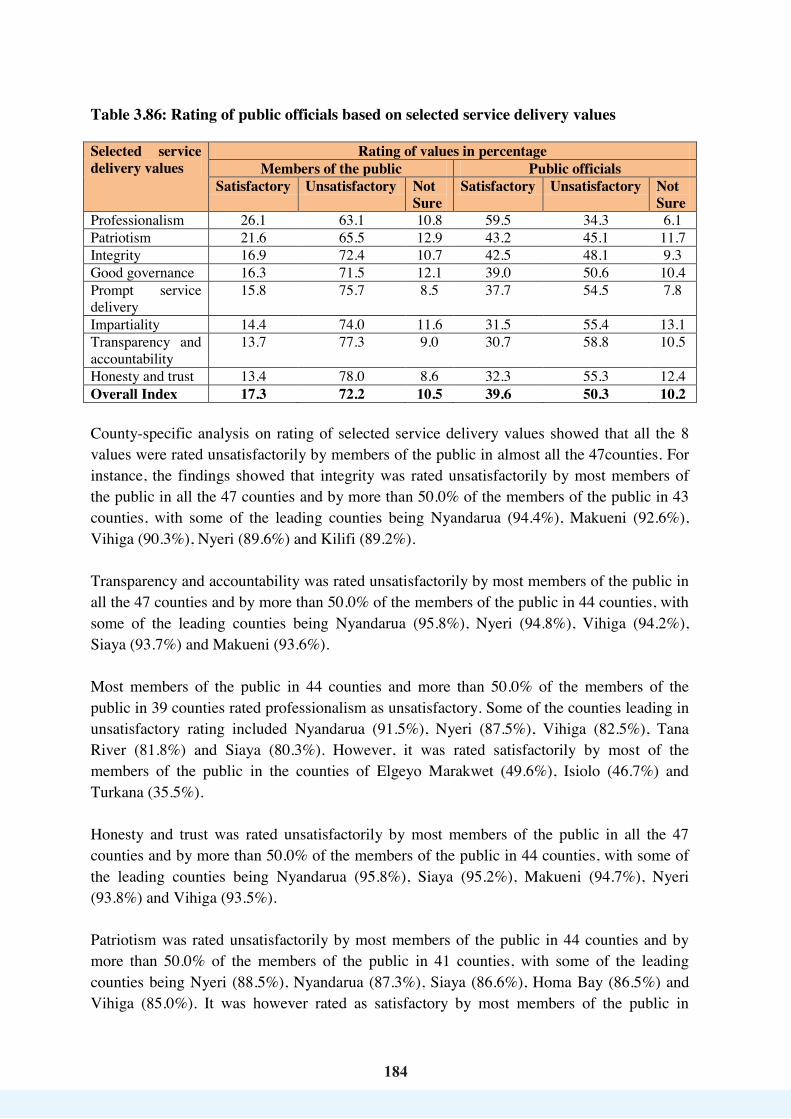
184
184
Table 3.86: Rating of public officials based on selected service delivery values Selected service delivery values
Rating of values in percentage Members of the public Public officials
Satisfactory Unsatisfactory Not Sure
Satisfactory Unsatisfactory Not Sure
Professionalism 26.1 63.1 10.8 59.5 34.3 6.1 Patriotism 21.6 65.5 12.9 43.2 45.1 11.7 Integrity 16.9 72.4 10.7 42.5 48.1 9.3 Good governance 16.3 71.5 12.1 39.0 50.6 10.4 Prompt service delivery
15.8 75.7 8.5 37.7 54.5 7.8
Impartiality 14.4 74.0 11.6 31.5 55.4 13.1 Transparency and accountability
13.7 77.3 9.0 30.7 58.8 10.5
Honesty and trust 13.4 78.0 8.6 32.3 55.3 12.4 Overall Index 17.3 72.2 10.5 39.6 50.3 10.2 County-specific analysis on rating of selected service delivery values showed that all the 8 values were rated unsatisfactorily by members of the public in almost all the 47counties. For instance, the findings showed that integrity was rated unsatisfactorily by most members of the public in all the 47 counties and by more than 50.0% of the members of the public in 43 counties, with some of the leading counties being Nyandarua (94.4%), Makueni (92.6%), Vihiga (90.3%), Nyeri (89.6%) and Kilifi (89.2%). Transparency and accountability was rated unsatisfactorily by most members of the public in all the 47 counties and by more than 50.0% of the members of the public in 44 counties, with some of the leading counties being Nyandarua (95.8%), Nyeri (94.8%), Vihiga (94.2%), Siaya (93.7%) and Makueni (93.6%). Most members of the public in 44 counties and more than 50.0% of the members of the public in 39 counties rated professionalism as unsatisfactory. Some of the counties leading in unsatisfactory rating included Nyandarua (91.5%), Nyeri (87.5%), Vihiga (82.5%), Tana River (81.8%) and Siaya (80.3%). However, it was rated satisfactorily by most of the members of the public in the counties of Elgeyo Marakwet (49.6%), Isiolo (46.7%) and Turkana (35.5%). Honesty and trust was rated unsatisfactorily by most members of the public in all the 47 counties and by more than 50.0% of the members of the public in 44 counties, with some of the leading counties being Nyandarua (95.8%), Siaya (95.2%), Makueni (94.7%), Nyeri (93.8%) and Vihiga (93.5%). Patriotism was rated unsatisfactorily by most members of the public in 44 counties and by more than 50.0% of the members of the public in 41 counties, with some of the leading counties being Nyeri (88.5%), Nyandarua (87.3%), Siaya (86.6%), Homa Bay (86.5%) and Vihiga (85.0%). It was however rated as satisfactory by most members of the public in
185
185
Elgeyo Marakwet (48.4%) and Turkana (40.3%) counties and an equal percentage of 43.3% rating it as both satisfactory and unsatisfactory in Isiolo County. Most members of the public in all the 47 counties and more than 50.0% of the members of the public in 44 counties rated prompt service delivery as unsatisfactory. The counties that were leading in the rating of prompt service delivery as unsatisfactory included Vihiga (96.0%), Nyandarua (95.8%), Siaya (93.7%), Tana River (92.8%) and Homa Bay (92.7%). On the service delivery value of impartiality, most members of the public in all the 47 counties and more than 50.0% of the members of the public in 43 counties rated it as unsatisfactory. Counties that were leading in the rating of impartiality as unsatisfactory included Nyandarua (100.0%), Makueni (94.7%), Nyeri (94.7%), Homa Bay (91.8%), Vihiga (90.7%) and Kirinyaga (90.3%). On good governance, most members of the public in all the 47 counties and more than 50.0% of the members of the public in 42 counties rated it as unsatisfactory. Counties that were leading in the rating of good governance as unsatisfactory included Nyandarua (98.6%), Homa Bay (96.4%), Nyeri (95.8%), Makueni (93.7%), Siaya (93.7%) and Vihiga (92.6%). The detailed ratings of all the service delivery values in the public service in each of the 47 counties are captured in Table 3.87 below.
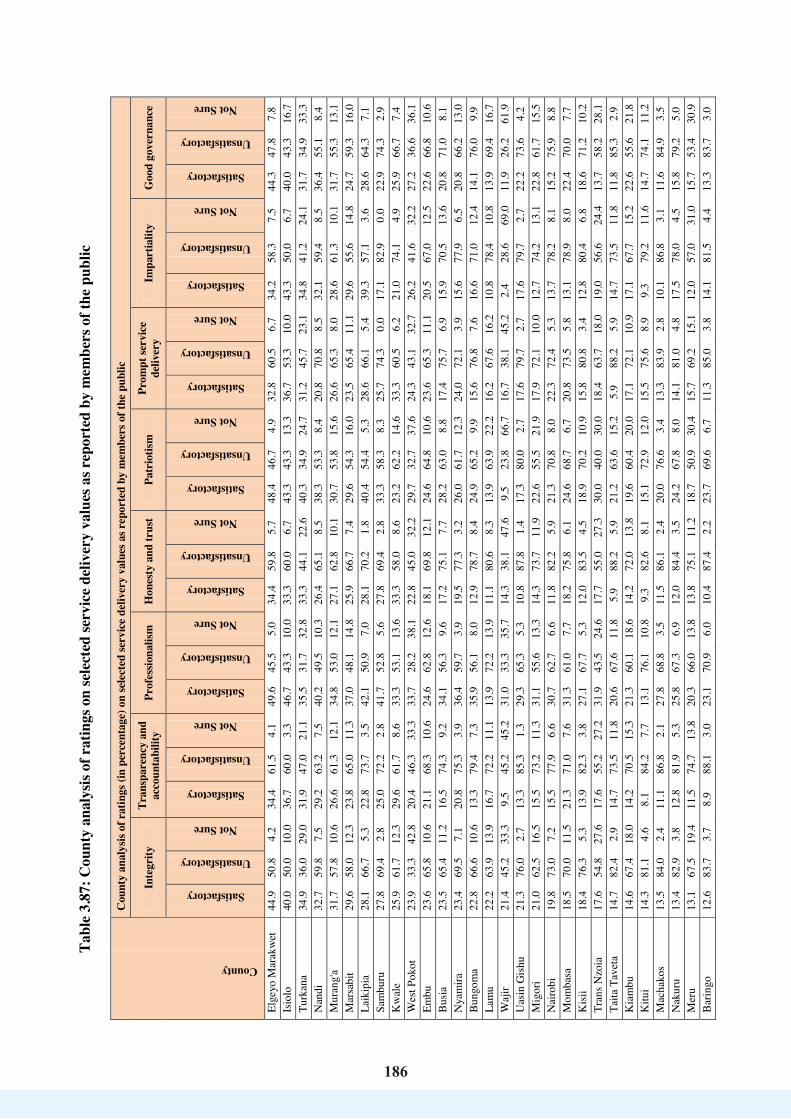
186
186
Tabl
e 3.
87: C
ount
y an
alys
is of
rat
ings
on
sele
cted
serv
ice
deliv
ery
valu
es a
s rep
orte
d by
mem
bers
of t
he p
ublic
County
Cou
nty
anal
ysis
of r
atin
gs (i
n pe
rcen
tage
) on
sele
cted
serv
ice
deliv
ery
valu
es a
s rep
orte
d by
mem
bers
of t
he p
ublic
Inte
grity
Tr
ansp
aren
cy a
nd
acco
unta
bilit
y Pr
ofes
sion
alis
m
Hon
esty
and
trus
t Pa
trio
tism
Pr
ompt
serv
ice
deliv
ery
Impa
rtia
lity
Goo
d go
vern
ance
Satisfactory
Unsatisfactory
Not Sure
Satisfactory
Unsatisfactory
Not Sure
Satisfactory
Unsatisfactory
Not Sure
Satisfactory
Unsatisfactory
Not Sure
Satisfactory
Unsatisfactory
Not Sure
Satisfactory
Unsatisfactory
Not Sure
Satisfactory
Unsatisfactory
Not Sure
Satisfactory
Unsatisfactory
Not Sure
Elge
yo M
arak
wet
44
.9
50.8
4.
2 34
.4
61.5
4.
1 49
.6
45.5
5.
0 34
.4
59.8
5.
7 48
.4
46.7
4.
9 32
.8
60.5
6.
7 34
.2
58.3
7.
5 44
.3
47.8
7.
8 Is
iolo
40
.0
50.0
10
.0
36.7
60
.0
3.3
46.7
43
.3
10.0
33
.3
60.0
6.
7 43
.3
43.3
13
.3
36.7
53
.3
10.0
43
.3
50.0
6.
7 40
.0
43.3
16
.7
Turk
ana
34.9
36
.0
29.0
31
.9
47.0
21
.1
35.5
31
.7
32.8
33
.3
44.1
22
.6
40.3
34
.9
24.7
31
.2
45.7
23
.1
34.8
41
.2
24.1
31
.7
34.9
33
.3
Nan
di
32.7
59
.8
7.5
29.2
63
.2
7.5
40.2
49
.5
10.3
26
.4
65.1
8.
5 38
.3
53.3
8.
4 20
.8
70.8
8.
5 32
.1
59.4
8.
5 36
.4
55.1
8.
4 M
uran
g'a
31.7
57
.8
10.6
26
.6
61.3
12
.1
34.8
53
.0
12.1
27
.1
62.8
10
.1
30.7
53
.8
15.6
26
.6
65.3
8.
0 28
.6
61.3
10
.1
31.7
55
.3
13.1
M
arsa
bit
29.6
58
.0
12.3
23
.8
65.0
11
.3
37.0
48
.1
14.8
25
.9
66.7
7.
4 29
.6
54.3
16
.0
23.5
65
.4
11.1
29
.6
55.6
14
.8
24.7
59
.3
16.0
La
ikip
ia
28.1
66
.7
5.3
22.8
73
.7
3.5
42.1
50
.9
7.0
28.1
70
.2
1.8
40.4
54
.4
5.3
28.6
66
.1
5.4
39.3
57
.1
3.6
28.6
64
.3
7.1
Sam
buru
27
.8
69.4
2.
8 25
.0
72.2
2.
8 41
.7
52.8
5.
6 27
.8
69.4
2.
8 33
.3
58.3
8.
3 25
.7
74.3
0.
0 17
.1
82.9
0.
0 22
.9
74.3
2.
9 K
wal
e 25
.9
61.7
12
.3
29.6
61
.7
8.6
33.3
53
.1
13.6
33
.3
58.0
8.
6 23
.2
62.2
14
.6
33.3
60
.5
6.2
21.0
74
.1
4.9
25.9
66
.7
7.4
Wes
t Pok
ot
23.9
33
.3
42.8
20
.4
46.3
33
.3
33.7
28
.2
38.1
22
.8
45.0
32
.2
29.7
32
.7
37.6
24
.3
43.1
32
.7
26.2
41
.6
32.2
27
.2
36.6
36
.1
Embu
23
.6
65.8
10
.6
21.1
68
.3
10.6
24
.6
62.8
12
.6
18.1
69
.8
12.1
24
.6
64.8
10
.6
23.6
65
.3
11.1
20
.5
67.0
12
.5
22.6
66
.8
10.6
B
usia
23
.5
65.4
11
.2
16.5
74
.3
9.2
34.1
56
.3
9.6
17.2
75
.1
7.7
28.2
63
.0
8.8
17.4
75
.7
6.9
15.9
70
.5
13.6
20
.8
71.0
8.
1 N
yam
ira
23.4
69
.5
7.1
20.8
75
.3
3.9
36.4
59
.7
3.9
19.5
77
.3
3.2
26.0
61
.7
12.3
24
.0
72.1
3.
9 15
.6
77.9
6.
5 20
.8
66.2
13
.0
Bun
gom
a 22
.8
66.6
10
.6
13.3
79
.4
7.3
35.9
56
.1
8.0
12.9
78
.7
8.4
24.9
65
.2
9.9
15.6
76
.8
7.6
16.6
71
.0
12.4
14
.1
76.0
9.
9 La
mu
22.2
63
.9
13.9
16
.7
72.2
11
.1
13.9
72
.2
13.9
11
.1
80.6
8.
3 13
.9
63.9
22
.2
16.2
67
.6
16.2
10
.8
78.4
10
.8
13.9
69
.4
16.7
W
ajir
21.4
45
.2
33.3
9.
5 45
.2
45.2
31
.0
33.3
35
.7
14.3
38
.1
47.6
9.
5 23
.8
66.7
16
.7
38.1
45
.2
2.4
28.6
69
.0
11.9
26
.2
61.9
U
asin
Gis
hu
21.3
76
.0
2.7
13.3
85
.3
1.3
29.3
65
.3
5.3
10.8
87
.8
1.4
17.3
80
.0
2.7
17.6
79
.7
2.7
17.6
79
.7
2.7
22.2
73
.6
4.2
Mig
ori
21.0
62
.5
16.5
15
.5
73.2
11
.3
31.1
55
.6
13.3
14
.3
73.7
11
.9
22.6
55
.5
21.9
17
.9
72.1
10
.0
12.7
74
.2
13.1
22
.8
61.7
15
.5
Nai
robi
19
.8
73.0
7.
2 15
.5
77.9
6.
6 30
.7
62.7
6.
6 11
.8
82.2
5.
9 21
.3
70.8
8.
0 22
.3
72.4
5.
3 13
.7
78.2
8.
1 15
.2
75.9
8.
8 M
omba
sa
18.5
70
.0
11.5
21
.3
71.0
7.
6 31
.3
61.0
7.
7 18
.2
75.8
6.
1 24
.6
68.7
6.
7 20
.8
73.5
5.
8 13
.1
78.9
8.
0 22
.4
70.0
7.
7 K
isii
18.4
76
.3
5.3
13.9
82
.3
3.8
27.1
67
.7
5.3
12.0
83
.5
4.5
18.9
70
.2
10.9
15
.8
80.8
3.
4 12
.8
80.4
6.
8 18
.6
71.2
10
.2
Tran
s Nzo
ia
17.6
54
.8
27.6
17
.6
55.2
27
.2
31.9
43
.5
24.6
17
.7
55.0
27
.3
30.0
40
.0
30.0
18
.4
63.7
18
.0
19.0
56
.6
24.4
13
.7
58.2
28
.1
Taita
Tav
eta
14.7
82
.4
2.9
14.7
73
.5
11.8
20
.6
67.6
11
.8
5.9
88.2
5.
9 21
.2
63.6
15
.2
5.9
88.2
5.
9 14
.7
73.5
11
.8
11.8
85
.3
2.9
Kia
mbu
14
.6
67.4
18
.0
14.2
70
.5
15.3
21
.3
60.1
18
.6
14.2
72
.0
13.8
19
.6
60.4
20
.0
17.1
72
.1
10.9
17
.1
67.7
15
.2
22.6
55
.6
21.8
K
itui
14.3
81
.1
4.6
8.1
84.2
7.
7 13
.1
76.1
10
.8
9.3
82.6
8.
1 15
.1
72.9
12
.0
15.5
75
.6
8.9
9.3
79.2
11
.6
14.7
74
.1
11.2
M
acha
kos
13.5
84
.0
2.4
11.1
86
.8
2.1
27.8
68
.8
3.5
11.5
86
.1
2.4
20.0
76
.6
3.4
13.3
83
.9
2.8
10.1
86
.8
3.1
11.6
84
.9
3.5
Nak
uru
13.4
82
.9
3.8
12.8
81
.9
5.3
25.8
67
.3
6.9
12.0
84
.4
3.5
24.2
67
.8
8.0
14.1
81
.0
4.8
17.5
78
.0
4.5
15.8
79
.2
5.0
Mer
u 13
.1
67.5
19
.4
11.5
74
.7
13.8
20
.3
66.0
13
.8
13.8
75
.1
11.2
18
.7
50.9
30
.4
15.7
69
.2
15.1
12
.0
57.0
31
.0
15.7
53
.4
30.9
B
arin
go
12.6
83
.7
3.7
8.9
88.1
3.
0 23
.1
70.9
6.
0 10
.4
87.4
2.
2 23
.7
69.6
6.
7 11
.3
85.0
3.
8 14
.1
81.5
4.
4 13
.3
83.7
3.
0

187
187
County
Cou
nty
anal
ysis
of r
atin
gs (i
n pe
rcen
tage
) on
sele
cted
serv
ice
deliv
ery
valu
es a
s rep
orte
d by
mem
bers
of t
he p
ublic
Inte
grity
Tr
ansp
aren
cy a
nd
acco
unta
bilit
y Pr
ofes
siona
lism
H
ones
ty a
nd tr
ust
Patr
iotis
m
Prom
pt se
rvic
e de
liver
y Im
part
ialit
y G
ood
gove
rnan
ce
Satisfactory
Unsatisfactory
Not Sure
Satisfactory
Unsatisfactory
Not Sure
Satisfactory
Unsatisfactory
Not Sure
Satisfactory
Unsatisfactory
Not Sure
Satisfactory
Unsatisfactory
Not Sure
Satisfactory
Unsatisfactory
Not Sure
Satisfactory
Unsatisfactory
Not Sure
Satisfactory
Unsatisfactory
Not Sure
Hom
a B
ay
11.7
84
.7
3.6
7.2
92.8
0.
0 18
.9
77.5
3.
6 7.
2 91
.9
0.9
11.7
86
.5
1.8
6.4
92.7
0.
9 7.
3 91
.8
0.9
2.7
96.4
0.
9 K
isum
u 11
.6
82.8
5.
6 6.
0 90
.1
3.9
20.3
73
.3
6.5
5.2
90.9
3.
9 12
.1
81.0
6.
9 7.
9 89
.0
3.1
10.0
86
.5
3.5
8.3
87.8
3.
9 N
yeri
10.4
89
.6
0.0
5.2
94.8
0.
0 12
.5
87.5
0.
0 6.
3 93
.8
0.0
11.5
88
.5
0.0
8.3
90.6
1.
0 4.
2 94
.7
1.1
4.2
95.8
0.
0 Si
aya
10.2
87
.4
2.4
6.3
93.7
0.
0 19
.7
80.3
0.
0 4.
0 95
.2
0.8
10.2
86
.6
3.1
5.6
93.7
0.
8 10
.3
88.9
0.
8 6.
3 93
.7
0.0
Gar
issa
10
.0
67.5
22
.5
2.5
75.0
22
.5
17.5
61
.3
21.3
5.
0 73
.8
21.3
10
.0
70.0
20
.0
7.5
66.3
26
.3
8.9
63.3
27
.8
7.6
64.6
27
.8
Kiri
nyag
a 9.
8 86
.9
3.3
9.7
88.7
1.
6 23
.0
77.0
0.
0 6.
6 93
.4
0.0
19.7
80
.3
0.0
11.3
88
.7
0.0
8.1
90.3
1.
6 11
.3
87.1
1.
6 B
omet
9.
2 73
.9
17.0
6.
5 80
.4
13.1
16
.9
59.7
23
.4
7.1
76.6
16
.2
24.2
53
.6
22.2
9.
1 76
.6
14.3
12
.3
59.1
28
.6
9.2
73.9
17
.0
Man
dera
9.
0 69
.7
21.3
1.
1 79
.8
19.1
12
.4
68.5
19
.1
0.0
77.5
22
.5
13.5
67
.4
19.1
3.
5 80
.2
16.3
5.
8 75
.6
18.6
11
.6
72.1
16
.3
Kak
ameg
a 8.
5 87
.8
3.7
7.1
89.5
3.
4 14
.9
79.4
5.
7 7.
1 88
.9
4.1
11.5
82
.7
5.8
5.1
89.5
5.
4 6.
8 87
.1
6.1
12.9
82
.0
5.1
Ker
icho
7.
7 78
.8
13.5
10
.5
78.1
11
.4
22.9
61
.0
16.2
10
.5
77.1
12
.4
15.4
70
.2
14.4
17
.1
74.3
8.
6 11
.4
73.3
15
.2
14.3
75
.2
10.5
K
ajia
do
7.4
86.4
6.
2 6.
9 86
.5
6.5
20.4
71
.8
7.8
4.5
89.3
6.
1 19
.7
70.9
9.
4 7.
0 87
.7
5.3
7.8
85.7
6.
6 7.
8 83
.1
9.1
Mak
ueni
7.
4 92
.6
0.0
5.3
93.6
1.
1 29
.8
66.0
4.
3 5.
3 94
.7
0.0
16.0
84
.0
0.0
7.4
90.5
2.
1 5.
3 94
.7
0.0
5.3
93.7
1.
1 K
ilifi
7.2
89.2
3.
6 6.
4 86
.4
7.3
18.2
77
.3
4.5
4.5
91.9
3.
6 16
.2
70.3
13
.5
7.2
87.4
5.
4 9.
0 82
.0
9.0
8.1
84.7
7.
2 V
ihig
a 7.
1 90
.3
2.6
3.2
94.2
2.
6 13
.6
82.5
3.
9 3.
9 93
.5
2.6
9.2
85.0
5.
9 1.
3 96
.0
2.6
4.6
90.7
4.
6 3.
4 92
.6
4.0
Nar
ok
6.4
80.8
12
.8
4.1
85.9
10
.0
19.6
64
.8
15.5
5.
9 85
.5
8.6
20.0
66
.4
13.6
6.
4 84
.9
8.7
5.5
79.3
15
.2
6.4
77.5
16
.1
Tana
Riv
er
5.8
87.0
7.
2 8.
7 88
.4
2.9
6.1
81.8
12
.1
10.1
87
.0
2.9
13.0
76
.8
10.1
5.
8 92
.8
1.4
8.6
88.6
2.
9 5.
7 91
.4
2.9
Thar
aka
Nith
i 4.
6 71
.9
23.5
3.
9 85
.0
11.1
15
.0
71.9
13
.1
11.1
76
.5
12.4
7.
2 71
.9
20.9
3.
9 78
.3
17.8
3.
3 72
.8
23.8
9.
9 67
.5
22.5
N
yand
arua
2.
8 94
.4
2.8
2.8
95.8
1.
4 8.
5 91
.5
0.0
4.2
95.8
0.
0 9.
9 87
.3
2.8
4.2
95.8
0.
0 0.
0 10
0.0
0.0
1.4
98.6
0.
0 Su
mm
ary
of
the
nu
mbe
r of
co
untie
s (ou
t of 4
7 co
untie
s)
whe
re
over
50
%
of
m
embe
rs
of
the
publ
ic
gave
un
satis
fact
ory
ratin
g of
se
rvic
e de
liver
y va
lues
43
44
39
44
41
44
43
42

188
188
The above findings indicate that all the service delivery values were unsatisfactory in at least 39 of the 47 counties. The top four unsatisfactory service delivery values reported by both the members of the public and public officials were: honesty and trust; transparency and accountability; prompt service delivery; and impartiality. These findings are consistent with those of the Public Service Commission (PSC) in Kenya which established that performance for the three indicators of good governance, transparency and accountability was below average during the year 2015/2016. The Commission further established that six (6) of the eleven (11) indicators for improvement in service delivery averaged below 55 percent (PSC, 2016b). Therefore, deliberate measures must be put in place to secure satisfaction among service recipients on all the values but with a special focus on the four values rated as most unsatisfactory.
3.9 Challenges in and Recommendations for Addressing Corruption 3.9.1 Perceptions on why corruption persists despite the presence of anti-corruption laws and institutions Members of the public and public officials were asked to give their opinions on why corruption remained unabated despite the presence of anti-corruption laws and institutions. The major reasons given by at least 1 out of 10 members of the public and/or public officials were: inadequate close monitoring of public officials’ ethical conduct, weak legal frameworks and/or compromised and lax law enforcement (reported by 43.4% of the public officials and 36.2% of the members of the public); culture of impunity, pro-corruption attitude on consequences and rationalization of corruption as part of the public service system (mentioned by 26.1% of the members of the public and 18.1% of the public officials); citizens’ ignorance, lack of confidence and their inadequate involvement from the grassroots level in the fight against corruption (reported by 14.4% and 12.2% of the public officials and members of the public respectively); and inadequate government leadership commitment to fight corruption, bad governance and corrupt leadership (reported by 12.5% and 9.9% of the public officials and members of the public respectively). The least reported reasons included inadequate resources for the fight against corruption, poverty and low wages. All the reasons provided by the sample respondents are captured in Table 3.88 below. Table 3.88: Reasons why corruption remains unabated despite the presence of anti-
corruption laws and institutions Opinions on why corruptions remains unabated despite presence of anti-corruption laws and institutions
Members of the public
Public officials
Inadequate close monitoring of public officials’ ethical conduct, weak legal frameworks and/or compromised and lax law enforcement
36.2% 43.4%
Culture of impunity, pro-corruption attitude on consequences and rationalization of corruption as part of the public service system
26.1% 18.1%
Citizens’ ignorance, lack of confidence and their 12.2% 14.4%
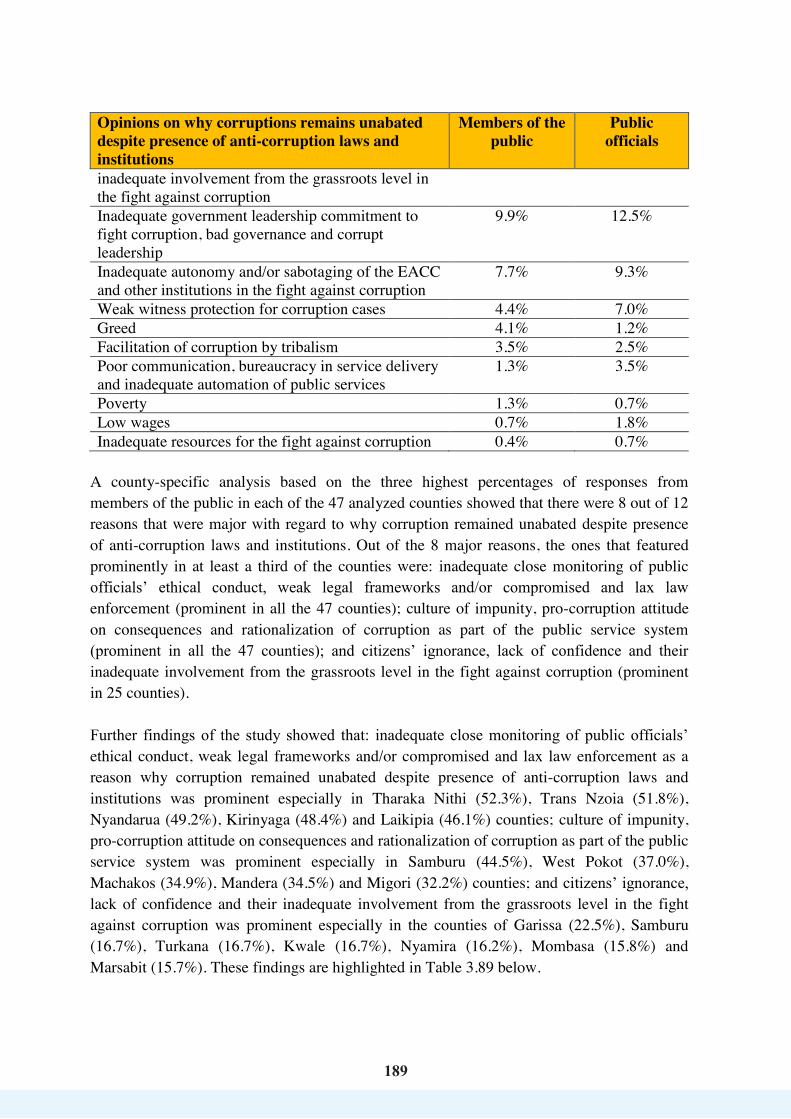
189
189
Opinions on why corruptions remains unabated despite presence of anti-corruption laws and institutions
Members of the public
Public officials
inadequate involvement from the grassroots level in the fight against corruption Inadequate government leadership commitment to fight corruption, bad governance and corrupt leadership
9.9% 12.5%
Inadequate autonomy and/or sabotaging of the EACC and other institutions in the fight against corruption
7.7% 9.3%
Weak witness protection for corruption cases 4.4% 7.0% Greed 4.1% 1.2% Facilitation of corruption by tribalism 3.5% 2.5% Poor communication, bureaucracy in service delivery and inadequate automation of public services
1.3% 3.5%
Poverty 1.3% 0.7% Low wages 0.7% 1.8% Inadequate resources for the fight against corruption 0.4% 0.7%
A county-specific analysis based on the three highest percentages of responses from members of the public in each of the 47 analyzed counties showed that there were 8 out of 12 reasons that were major with regard to why corruption remained unabated despite presence of anti-corruption laws and institutions. Out of the 8 major reasons, the ones that featured prominently in at least a third of the counties were: inadequate close monitoring of public officials’ ethical conduct, weak legal frameworks and/or compromised and lax law enforcement (prominent in all the 47 counties); culture of impunity, pro-corruption attitude on consequences and rationalization of corruption as part of the public service system (prominent in all the 47 counties); and citizens’ ignorance, lack of confidence and their inadequate involvement from the grassroots level in the fight against corruption (prominent in 25 counties). Further findings of the study showed that: inadequate close monitoring of public officials’ ethical conduct, weak legal frameworks and/or compromised and lax law enforcement as a reason why corruption remained unabated despite presence of anti-corruption laws and institutions was prominent especially in Tharaka Nithi (52.3%), Trans Nzoia (51.8%), Nyandarua (49.2%), Kirinyaga (48.4%) and Laikipia (46.1%) counties; culture of impunity, pro-corruption attitude on consequences and rationalization of corruption as part of the public service system was prominent especially in Samburu (44.5%), West Pokot (37.0%), Machakos (34.9%), Mandera (34.5%) and Migori (32.2%) counties; and citizens’ ignorance, lack of confidence and their inadequate involvement from the grassroots level in the fight against corruption was prominent especially in the counties of Garissa (22.5%), Samburu (16.7%), Turkana (16.7%), Kwale (16.7%), Nyamira (16.2%), Mombasa (15.8%) and Marsabit (15.7%). These findings are highlighted in Table 3.89 below.

190
190
Tabl
e 3.
89:
Cou
nty
anal
ysis
of r
easo
ns w
hy c
orru
ptio
n re
mai
ns u
naba
ted
desp
ite p
rese
nce
of a
nti-c
orru
ptio
n la
ws
and
inst
itutio
ns a
s rep
orte
d by
mem
bers
of t
he p
ublic
Cou
nty
Cou
nty
anal
ysis
(in p
erce
ntag
e) o
f rea
sons
why
cor
rupt
ion
rem
ains
una
bate
d de
spite
pre
senc
e of
ant
i-cor
rupt
ion
law
s and
inst
itutio
ns a
s rep
orte
d by
mem
bers
of t
he p
ublic
Inadequate close monitoring of public officials’ ethical conduct, weak legal frameworks and/or compromised and lax law enforcement
Culture of impunity, pro-corruption attitude on consequences and rationalization of corruption as part of the public service system
Citizens’ ignorance, lack of Confidence and their inadequate involvement from the grassroots level in the fight against corruption
Inadequate government Leadership commitment to fight corruption, bad governance and corrupt leadership
Inadequate autonomy and/or Sabotaging of the EACC and other institutions in the fight against corruption
Facilitation of corruption by tribalism
Greed
Poverty
Weak witness protection for corruption cases
Low wages
Poor communication, Bureaucracy in service delivery and inadequate automation of public services
Inadequate resources for the Fight against corruption
Thar
aka
Nith
i 52
.3
13.9
11
.3
2.7
11.3
1.
3 2.
6 0.
7 2.
0 0.
7 0.
7 0.
7 Tr
ans N
zoia
51
.8
15.5
6.
2 7.
9 1.
7 3.
1 6.
2 0.
9 3.
5 1.
8 1.
2 0.
0 N
yand
arua
49
.2
15.9
11
.5
1.4
0.0
14.5
0.
0 0.
0 5.
8 0.
0 0.
0 1.
4 K
iriny
aga
48.4
19
.3
3.2
8.0
3.2
6.5
3.2
1.6
6.5
0.0
0.0
0.0
Laik
ipia
46
.1
9.6
7.7
3.8
9.6
1.9
7.7
11.5
1.
9 0.
0 0.
0 0.
0 K
eric
ho
45.6
20
.8
8.9
9.0
5.0
0.0
3.0
2.0
3.0
0.0
3.0
0.0
Kitu
i 44
.8
17.3
13
.8
7.5
6.0
3.2
2.5
0.7
3.9
0.0
0.8
0.0
Kili
fi 42
.5
16.5
6.
9 15
.7
5.1
2.6
1.7
3.5
0.9
2.6
1.7
0.0
Kaj
iado
41
.2
19.1
8.
9 13
.5
2.3
0.5
5.1
0.5
7.4
0.5
1.0
0.5
Mer
u 40
.8
25.2
9.
7 7.
0 3.
5 2.
9 6.
2 0.
5 2.
9 0.
5 0.
8 0.
0 B
omet
40
.3
21.9
12
.3
8.7
2.1
0.7
5.8
2.2
4.4
0.7
0.7
0.0
Nak
uru
39.8
20
.8
9.3
7.2
10.5
3.
3 2.
3 2.
7 2.
3 0.
3 1.
4 0.
2 N
arok
39
.1
25.0
12
.5
8.8
2.5
3.1
4.7
0.0
4.2
0.0
0.0
0.0
Tana
Riv
er
38.5
17
.2
7.7
11.5
15
.3
1.9
3.8
0.0
3.8
0.0
0.0
0.0
Lam
u 36
.1
13.9
5.
6 16
.8
11.2
8.
3 0.
0 0.
0 5.
6 2.
8 0.
0 0.
0 M
igor
i 34
.2
32.2
10
.1
6.5
2.4
2.1
6.6
0.7
1.7
1.0
2.1
0.3
Siay
a 33
.9
21.6
11
.5
11.5
3.
6 9.
4 2.
2 0.
7 3.
6 0.
0 0.
7 1.
4 G
aris
sa
33.6
20
.2
22.5
6.
7 6.
7 5.
6 0.
0 0.
0 3.
4 0.
0 1.
1 0.
0 K
isii
33.4
20
.3
12.1
6.
3 9.
4 2.
3 7.
4 1.
2 5.
4 0.
0 2.
0 0.
4 Is
iolo
33
.3
23.3
6.
7 20
.0
3.3
3.3
6.7
0.0
0.0
0.0
3.3
0.0
Mar
sabi
t 32
.8
21.5
15
.7
4.3
8.6
1.4
8.6
1.4
2.9
2.9
0.0
0.0
Mur
ang'
a 32
.4
28.8
5.
5 7.
5 12
.5
4.5
4.5
0.0
2.0
0.5
1.5
0.5
Bun
gom
a 32
.1
28.1
14
.4
8.2
9.0
1.4
1.8
0.7
2.2
0.4
1.5
0.4
Nye
ri 31
.7
13.8
14
.9
10.9
10
.9
4.0
3.0
2.0
6.9
0.0
2.0
0.0
Kak
ameg
a 31
.7
19.9
13
.4
11.3
10
.7
2.3
2.7
0.0
5.7
0.7
1.7
0.0

191
191
Cou
nty
Cou
nty
anal
ysis
(in p
erce
ntag
e) o
f rea
sons
why
cor
rupt
ion
rem
ains
una
bate
d de
spite
pre
senc
e of
ant
i-cor
rupt
ion
law
s and
inst
itutio
ns a
s rep
orte
d by
mem
bers
of t
he p
ublic
Inadequate close monitoring of public officials’ ethical conduct, weak legal frameworks and/or compromised and lax law enforcement
Culture of impunity, pro-corruption attitude on consequences and rationalization of corruption as part of the public service system
Citizens’ ignorance, lack of Confidence and their inadequate involvement from the grassroots level in the fight against corruption
Inadequate government Leadership commitment to fight corruption, bad governance and corrupt leadership
Inadequate autonomy and/or Sabotaging of the EACC and other institutions in the fight against corruption
Facilitation of corruption by tribalism
Greed
Poverty
Weak witness protection for corruption cases
Low wages
Poor communication, Bureaucracy in service delivery and inadequate automation of public services
Inadequate resources for the Fight against corruption
Kia
mbu
31
.0
29.8
9.
9 6.
5 8.
8 4.
2 4.
5 0.
4 3.
4 0.
8 0.
8 0.
4 N
airo
bi
30.8
26
.4
11.6
10
.0
7.2
2.1
1.9
1.6
6.3
0.2
1.0
0.7
Uas
in G
ishu
30
.2
26.4
5.
1 12
.6
2.6
5.0
6.3
0.0
10.0
0.
0 2.
5 0.
0 W
est P
okot
30
.0
37.0
10
.2
6.3
5.5
0.8
1.6
1.6
6.3
0.0
0.0
0.8
Bar
ingo
29
.7
20.5
4.
9 7.
0 19
.1
2.8
6.4
2.8
2.1
3.5
0.7
0.0
Bus
ia
29.5
21
.7
11.6
13
.7
13.5
2.
3 0.
0 0.
4 3.
9 0.
4 2.
4 0.
8 Ta
ita T
avet
a 29
.4
29.4
11
.7
8.8
11.8
0.
0 0.
0 0.
0 2.
9 0.
0 5.
8 0.
0 M
omba
sa
28.5
24
.7
15.8
7.
0 10
.9
3.3
0.7
0.3
4.6
1.0
1.3
0.7
Man
dera
28
.1
34.5
3.
3 11
.9
1.1
16.1
0.
0 0.
0 4.
3 0.
0 0.
0 1.
1 N
andi
27
.9
28.9
14
.4
11.3
7.
2 2.
1 1.
0 2.
1 2.
1 0.
0 2.
1 1.
0 M
acha
kos
26.8
34
.9
6.6
9.3
2.7
1.9
10.0
1.
9 3.
1 2.
3 0.
4 0.
4 K
wal
e 26
.5
26.4
16
.7
15.3
5.
6 1.
4 4.
2 0.
0 4.
2 0.
0 0.
0 0.
0 M
akue
ni
26.4
29
.7
6.6
18.7
1.
1 0.
0 14
.3
0.0
2.2
1.1
0.0
0.0
Waj
ir 26
.2
21.5
9.
6 4.
8 21
.5
4.8
0.0
0.0
7.1
2.4
2.4
0.0
Kis
umu
25.9
25
.0
11.4
11
.8
8.6
6.6
2.3
2.0
2.0
1.6
1.6
1.6
Elge
yo M
arak
wet
25
.7
30.1
12
.4
14.3
2.
7 5.
3 0.
9 0.
0 7.
1 0.
9 0.
9 0.
0 H
oma
Bay
25
.2
17.9
13
.8
15.4
8.
9 4.
9 0.
8 0.
8 8.
9 0.
8 1.
6 0.
8 Tu
rkan
a 23
.7
30.9
16
.7
8.6
2.1
2.2
2.2
4.3
4.3
1.4
3.6
0.0
Nya
mira
23
.2
26.5
16
.2
6.4
6.4
1.3
9.7
1.9
5.2
0.0
2.5
0.0
Vih
iga
20.4
21
.0
18.6
19
.2
7.8
5.4
0.0
0.0
4.2
0.0
1.8
1.2
Sam
buru
19
.4
44.5
16
.7
5.6
8.4
0.0
0.0
0.0
2.8
0.0
2.8
0.0
Embu
18
.8
28.0
14
.3
7.0
4.5
5.4
12.7
2.
9 3.
9 1.
0 1.
5 0.
5 To
tal
num
ber
of
coun
ties
whe
re
each
of
th
e 8
maj
or
reas
ons
why
co
rrup
tion
rem
ains
un
abat
ed
desp
ite
pres
ence
of
an
ti-co
rrup
tion
law
s an
d in
stitu
tions
(ba
sed
on
the
top
thre
e hi
ghes
t pe
rcen
tage
s in
eac
h of
the
47
anal
yzed
cou
ntie
s) is
pro
min
ent
47
47
25
15
8 2
1 1
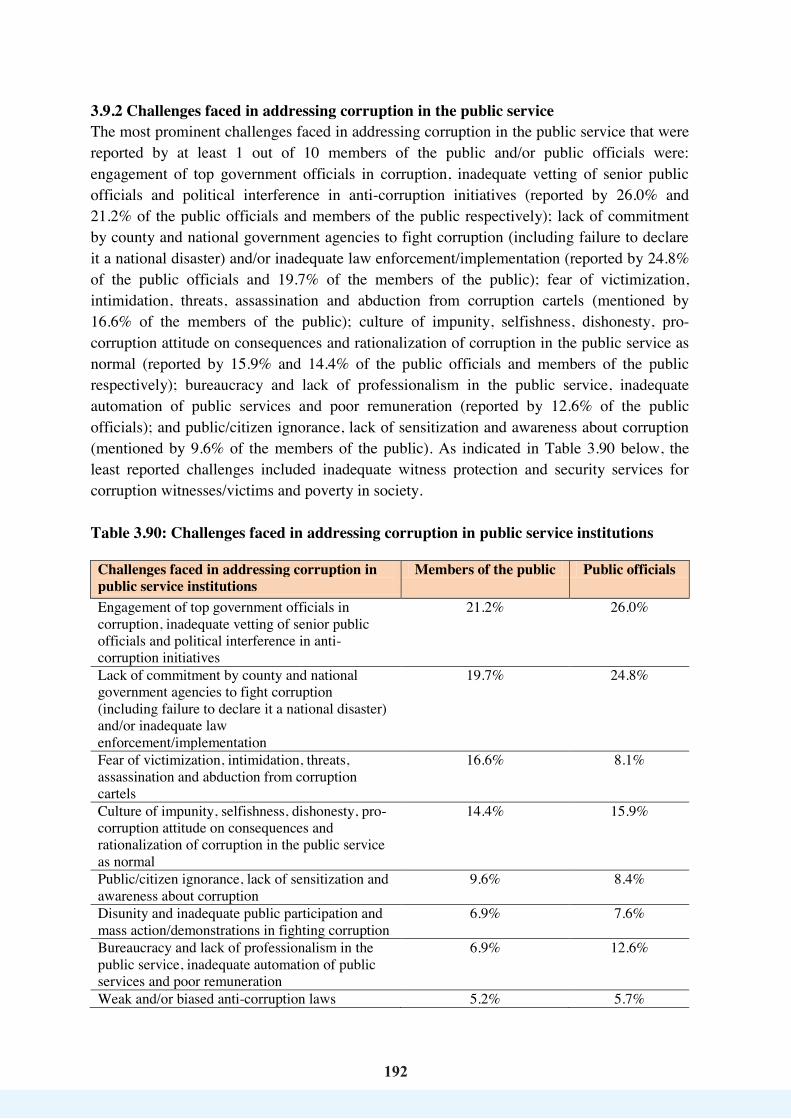
192
192
3.9.2 Challenges faced in addressing corruption in the public service The most prominent challenges faced in addressing corruption in the public service that were reported by at least 1 out of 10 members of the public and/or public officials were: engagement of top government officials in corruption, inadequate vetting of senior public officials and political interference in anti-corruption initiatives (reported by 26.0% and 21.2% of the public officials and members of the public respectively); lack of commitment by county and national government agencies to fight corruption (including failure to declare it a national disaster) and/or inadequate law enforcement/implementation (reported by 24.8% of the public officials and 19.7% of the members of the public); fear of victimization, intimidation, threats, assassination and abduction from corruption cartels (mentioned by 16.6% of the members of the public); culture of impunity, selfishness, dishonesty, pro-corruption attitude on consequences and rationalization of corruption in the public service as normal (reported by 15.9% and 14.4% of the public officials and members of the public respectively); bureaucracy and lack of professionalism in the public service, inadequate automation of public services and poor remuneration (reported by 12.6% of the public officials); and public/citizen ignorance, lack of sensitization and awareness about corruption (mentioned by 9.6% of the members of the public). As indicated in Table 3.90 below, the least reported challenges included inadequate witness protection and security services for corruption witnesses/victims and poverty in society. Table 3.90: Challenges faced in addressing corruption in public service institutions Challenges faced in addressing corruption in public service institutions
Members of the public Public officials
Engagement of top government officials in corruption, inadequate vetting of senior public officials and political interference in anti-corruption initiatives
21.2% 26.0%
Lack of commitment by county and national government agencies to fight corruption (including failure to declare it a national disaster) and/or inadequate law enforcement/implementation
19.7% 24.8%
Fear of victimization, intimidation, threats, assassination and abduction from corruption cartels
16.6% 8.1%
Culture of impunity, selfishness, dishonesty, pro-corruption attitude on consequences and rationalization of corruption in the public service as normal
14.4% 15.9%
Public/citizen ignorance, lack of sensitization and awareness about corruption
9.6% 8.4%
Disunity and inadequate public participation and mass action/demonstrations in fighting corruption
6.9% 7.6%
Bureaucracy and lack of professionalism in the public service, inadequate automation of public services and poor remuneration
6.9% 12.6%
Weak and/or biased anti-corruption laws 5.2% 5.7%

193
193
Challenges faced in addressing corruption in public service institutions
Members of the public Public officials
Facilitation of corruption by tribalism/nepotism/favoritism
5.1% 7.0%
Inadequate resources for the fight against corruption
3.6% 6.3%
Dynamic and complex nature of corruption and its forms and mode of execution
3.6% 4.1%
Poverty in society 2.6% 2.4% Inadequate autonomy and/or sabotaging of the EACC and other institutions in the fight against corruption
2.1% 3.2%
Inadequate witness protection and security services for corruption witnesses/victims
2.0% 1.6%
Challenges faced in addressing corruption in public service institutions and reported by members of the public were analyzed by county. Based on the three highest percentages of the challenges reported in each of the 47 analyzed counties, 11 out of 14 challenges featured prominently. Out of these 11 major challenges, the ones that featured prominently at least in a third of the counties were 4 and these were: engagement of top government officials in corruption, inadequate vetting of senior public officials and political interference in anti-corruption initiatives (prominent in 38 counties); lack of commitment by county and national government agencies to fight corruption (including failure to declare it a national disaster) and/or inadequate law enforcement/implementation (prominent in 36 counties); fear of victimization, intimidation, threats, assassination and abduction from corruption cartels (prominent in 26 counties); and culture of impunity, selfishness, dishonesty, pro-corruption attitude on consequences and rationalization of corruption in the public service as normal (prominent in 21 counties). With regard to the leading counties in each of the 4 major challenges, engagement of top government officials in corruption, inadequate vetting of senior public officials and political interference in anti-corruption initiatives was prominently reported by members of the public especially in Kericho (25.8%), Isiolo (25.1%), Narok (25.0%), Kajiado (24.9%) and Kiambu (24.4%) counties while lack of commitment by county and national government agencies to fight corruption (including failure to declare it a national disaster) and/or inadequate law enforcement/implementation came out strongly in Nyandarua (35.2%), Taita Taveta (31.5%), Nyamira (26.3%), Migori (25.9%) and Nyeri (25.3%) counties. The challenge of fear of victimization, intimidation, threats, assassination and abduction from corruption cartels came out strongly in the counties of Kitui (31.0%), Vihiga (28.3%), Kilifi (26.7%), Lamu (25.0%) and Murang'a (24.4%) while that of culture of impunity, selfishness, dishonesty, pro-corruption attitude on consequences and rationalization of corruption in the public service as normal was prominent especially in Kitui (26.8%), Embu (21.9%), Kericho (21.4%), Makueni (21.1%) and Nandi (20.3%) counties. These findings are presented in detail in Table 3.91 below.

194
194
Tabl
e 3.
91:
Cou
nty
anal
ysis
of c
halle
nges
fac
ed in
add
ress
ing
corr
uptio
n in
pub
lic s
ervi
ce in
stitu
tions
as
high
light
ed b
y m
embe
rs o
f th
e pu
blic
Cou
nty
C
ount
y an
alys
is (in
per
cent
age)
of c
halle
nges
face
d in
add
ress
ing
corr
uptio
n in
pub
lic se
rvic
e in
stitu
tions
as h
ighl
ight
ed b
y m
embe
rs o
f the
pub
lic
Engagement of top government officials in corruption, inadequate vetting of senior public officials and political interference in anti- corruption initiatives
Lack of commitment by county and national government agencies to fight corruption (including failure to declare it a national disaster) and/or inadequate law enforcement/implementation
Fear of victimization, intimidation, threats, assassination and abduction from corruption cartels
Culture of impunity, selfishness, dishonesty, pro-corruption attitude on consequences and rationalization of corruption in the public service as normal
Public/citizen ignorance, lack of sensitization and awareness about corruption
Disunity and inadequate public participation and mass action/ demonstrations in fighting corruption
Bureaucracy and lack of professionalism in the public service, inadequate automation of public services and poor remuneration
Poverty in society
Dynamic and complex nature of corruption and its forms and mode of execution
Weak and/or biased anti-corruption laws
Inadequate autonomy and/or sabotaging of the EACC and other institutions in the fight against corruption
Inadequate resources for the fight against corruption
Facilitation of corruption by tribalism/nepotism/favoritism Inadequate witness protection and security services for corruption witnesses/victims
Ker
icho
25
.8
8.9
10.1
21
.4
7.8
5.6
5.6
1.1
0.0
2.2
5.6
3.4
1.1
1.1
Isio
lo
25.1
15
.7
0.0
12.5
12
.6
9.4
9.4
3.1
3.1
3.1
0.0
0.0
6.3
0.0
Nar
ok
25.0
10
.5
15.0
19
.4
3.3
5.0
3.9
0.6
2.8
3.9
0.6
1.1
8.3
0.6
Kaj
iado
24
.9
13.9
11
.7
15.4
2.
7 2.
6 3.
7 1.
6 5.
9 3.
2 1.
1 3.
2 8.
0 2.
1 K
iam
bu
24.4
18
.5
15.5
14
.7
3.7
1.5
3.7
0.7
3.0
2.9
4.4
0.4
4.4
2.2
Bom
et
23.9
13
.4
12.4
19
.2
4.8
2.0
3.9
3.8
1.9
5.8
1.0
3.8
3.8
1.0
Tran
s Nzo
ia
23.2
18
.6
7.9
8.6
7.3
5.7
1.7
0.6
6.8
4.0
2.8
1.1
7.9
4.0
Siay
a 23
.0
18.5
13
.3
11.8
3.
7 5.
2 4.
4 1.
5 1.
5 5.
1 4.
4 1.
5 5.
9 0.
0 M
arsa
bit
22.7
24
.2
6.0
7.5
4.5
12.1
9.
0 0.
0 9.
1 1.
5 0.
0 1.
5 1.
5 0.
0 M
omba
sa
21.8
18
.8
12.2
11
.3
4.4
4.5
9.5
1.4
3.4
4.8
0.3
0.3
6.5
0.7
Bus
ia
21.6
7.
8 13
.5
10.8
9.
6 7.
2 7.
8 1.
2 2.
1 2.
7 1.
8 4.
2 8.
4 1.
5 M
eru
20.9
22
.0
6.5
10.6
7.
5 4.
0 3.
7 1.
9 3.
7 12
.8
0.7
3.7
1.2
0.9
Uas
in G
ishu
20
.7
8.4
11.0
17
.0
6.1
9.8
1.2
1.2
4.9
1.2
1.2
8.5
7.3
1.2
Thar
aka
Nith
i 20
.4
24.8
0.
0 6.
8 20
.9
2.3
4.0
0.0
1.1
14.1
0.
6 2.
8 1.
7 0.
6 N
andi
20
.3
17.8
15
.2
20.3
6.
4 7.
6 1.
3 0.
0 2.
5 2.
5 0.
0 3.
8 1.
3 1.
3 Em
bu
19.7
21
.8
2.7
21.9
9.
9 4.
9 2.
2 1.
6 6.
0 3.
8 1.
1 1.
1 2.
7 0.
5 B
ungo
ma
19.4
8.
8 17
.1
12.1
8.
8 2.
4 7.
5 3.
2 3.
2 4.
3 2.
7 4.
5 4.
8 1.
4 N
yam
ira
19.3
26
.3
6.2
15.2
4.
8 4.
9 9.
0 1.
4 0.
0 6.
2 1.
4 0.
7 1.
4 3.
5 M
akue
ni
19.3
13
.2
7.9
21.1
18
.4
1.8
5.3
0.0
2.6
5.3
0.0
2.6
1.8
0.9
Mac
hako
s 19
.2
20.2
5.
2 13
.7
11.7
7.
2 4.
4 1.
7 8.
6 4.
1 0.
7 1.
0 1.
0 1.
0 M
ande
ra
19.1
11
.8
3.6
2.7
21.8
4.
5 7.
2 1.
8 0.
9 10
.9
0.9
8.2
5.5
0.9
Mur
ang'
a 19
.1
16.3
24
.4
9.6
3.8
6.2
4.3
0.0
9.1
2.4
3.3
0.0
1.0
0.5
Elge
yo M
arak
wet
19
.0
15.0
16
.0
14.0
10
.0
4.0
3.0
3.0
6.0
0.0
1.0
0.0
9.0
0.0
Kis
ii 18
.7
23.6
10
.6
9.3
7.4
7.8
7.3
0.0
2.4
4.9
0.8
4.5
1.6
0.8
Nai
robi
17
.7
12.6
17
.8
8.2
9.0
6.2
5.9
2.0
1.9
2.4
1.7
3.4
7.2
4.0
Sam
buru
17
.1
9.7
12.2
19
.6
9.8
0.0
0.0
4.9
14.6
2.
4 2.
4 2.
4 4.
9 0.
0

195
195
Cou
nty
C
ount
y an
alys
is (in
per
cent
age)
of c
halle
nges
face
d in
add
ress
ing
corr
uptio
n in
pub
lic se
rvic
e in
stitu
tions
as h
ighl
ight
ed b
y m
embe
rs o
f the
pub
lic
Engagement of top government officials in corruption, inadequate vetting of senior public officials and political interference in anti- corruption initiatives
Lack of commitment by county and national government agencies to fight corruption (including failure to declare it a national disaster) and/or inadequate law enforcement/implementation
Fear of victimization, intimidation, threats, assassination and abduction from corruption cartels
Culture of impunity, selfishness, dishonesty, pro-corruption attitude on consequences and rationalization of corruption in the public service as normal
Public/citizen ignorance, lack of sensitization and awareness about corruption
Disunity and inadequate public participation and mass action/ demonstrations in fighting corruption
Bureaucracy and lack of professionalism in the public service, inadequate automation of public services and poor remuneration
Poverty in society
Dynamic and complex nature of corruption and its forms and mode of execution
Weak and/or biased anti-corruption laws
Inadequate autonomy and/or sabotaging of the EACC and other institutions in the fight against corruption
Inadequate resources for the fight against corruption
Facilitation of corruption by tribalism/nepotism/favoritism Inadequate witness protection and security services for corruption witnesses/victims
Mig
ori
17.0
25
.9
6.4
12.0
6.
4 3.
6 9.
6 1.
8 4.
6 6.
1 1.
1 2.
1 2.
1 1.
5 K
wal
e 16
.9
15.3
7.
7 6.
2 18
.5
17.0
9.
2 0.
0 4.
6 1.
5 0.
0 0.
0 1.
5 1.
5 K
akam
ega
16.9
17
.5
18.1
13
.9
5.9
5.2
5.2
0.9
2.2
3.7
1.5
4.0
2.8
2.1
Nye
ri 16
.9
25.3
11
.9
10.1
4.
2 11
.0
0.0
2.5
0.8
1.6
11.9
0.
8 1.
7 0.
8 K
isum
u 16
.3
17.5
15
.6
6.8
5.0
7.6
4.9
0.8
4.6
3.1
1.9
4.9
8.7
2.3
Hom
a B
ay
16.0
16
.8
9.6
6.4
15.2
11
.2
4.8
2.4
4.0
1.6
0.0
5.6
4.8
1.8
Gar
issa
14
.9
19.2
0.
0 10
.8
15.0
4.
2 5.
0 0.
0 1.
7 5.
8 0.
8 10
.0
9.2
3.3
Laik
ipia
13
.8
10.8
13
.8
9.2
9.2
9.2
10.7
12
.3
1.5
6.1
0.0
0.0
3.1
0.0
Vih
iga
13.8
17
.4
28.3
7.
2 9.
0 5.
4 1.
2 0.
0 0.
6 9.
6 4.
8 1.
2 1.
2 0.
0 K
itui
13.6
8.
4 31
.0
26.8
5.
2 2.
6 4.
5 1.
0 0.
3 0.
9 0.
6 2.
6 2.
3 0.
0 N
akur
u 12
.8
13.7
20
.6
11.1
5.
9 7.
7 7.
9 6.
2 1.
2 3.
2 0.
4 5.
5 2.
4 1.
4 K
iriny
aga
11.7
23
.3
4.7
9.3
3.5
5.9
7.0
5.8
2.3
3.5
8.1
1.2
8.1
5.9
Turk
ana
10.6
10
.0
13.3
11
.9
9.4
6.3
9.4
11.3
0.
6 1.
9 0.
6 3.
1 8.
8 2.
5 La
mu
10.0
12
.5
25.0
5.
0 17
.5
7.5
2.5
7.5
2.5
0.0
0.0
2.5
5.0
2.5
Nya
ndar
ua
9.9
35.2
3.
3 15
.4
4.4
3.3
0.0
0.0
2.2
3.3
17.6
1.
1 3.
3 1.
1 B
arin
go
9.6
14.1
20
.5
8.9
5.1
10.2
8.
3 4.
5 1.
9 7.
1 0.
6 2.
6 2.
6 3.
9 W
est P
okot
8.
9 24
.8
11.9
6.
0 10
.9
9.0
5.9
5.9
4.0
3.0
3.0
2.0
4.0
1.0
Kili
fi 8.
1 19
.3
26.7
7.
3 6.
6 7.
4 10
.4
2.2
0.7
5.9
1.5
1.5
0.7
1.4
Tana
Riv
er
3.9
15.7
18
.5
14.4
9.
2 10
.5
5.2
5.3
1.3
6.6
0.0
2.6
1.3
5.2
Waj
ir 2.
2 6.
7 4.
4 11
.1
42.3
13
.3
13.3
0.
0 0.
0 4.
4 0.
0 2.
2 0.
0 0.
0 Ta
ita T
avet
a 0.
0 31
.5
11.5
20
.0
8.6
5.8
14.4
0.
0 0.
0 2.
9 0.
0 5.
7 0.
0 0.
0 To
tal
num
ber
of
coun
ties
whe
re e
ach
of t
he 1
1 m
ajor
ch
alle
nges
fa
ced
in
addr
essin
g co
rrup
tion
in
publ
ic
serv
ice
inst
itutio
ns
(bas
ed
on
the
top
thre
e hi
ghes
t pe
rcen
tage
s in
eac
h of
the
47
anal
yzed
cou
ntie
s)
is pr
omin
ent
38
36
26
21
10
4 3
2 1
1 1

196
196
Ankamah and Khoda (2017) argue that lack of political will, that is, the demonstrated credible intent of political actors (who include elected or appointed leaders, civil society watchdogs and stakeholder groups) to attack perceived causes or effects of corruption at a systemic level, is a major obstacle to government's anti-corruption efforts. According to Kpundeh (1998), unwavering determination to fight corruption is not only a problem for leaders and bureaucratic reformers but that the private sector too, may lack the will to overcome corrupt systems of governance. 3.9.3 Options for surmounting challenges faced in addressing corruption in public service institutions There were six (6) major options for surmounting challenges faced in addressing corruption in public service institutions that were reported by at least 1 out of 10 members of the public and/or public officials. These options were: strengthening and/or indiscriminately implementing/enforcing anti-corruption laws, including the arrest and dismissal of corrupt officials and recovery of corruptly-acquired assets (mentioned by 31.9% and 27.6% of the public officials and members of the public respectively); undertaking public/citizen sensitization and awareness creation about the different aspects of corruption (reported by 23.9% and 17.1% of the public officials and members of the public respectively); reforming and/or professionalizing the public service (for example through proper recruitment and deployment of competent officers, use of technology and automation of services, proper remuneration and merger of institutions with similar/related roles) which was reported by 20.3% of the public officials and 14.5% of the members of the public; whole of government commitment in the fight against corruption including non-politicization of anti-corruption iniatiatives (reported by 14.3% and 13.7% of the public officials and members of the public respectively); appointment and/or election of leaders of integrity (mentioned by 12.7% of the members of the public and 10.3% of the public officials); and enhancing the resourcing and strengthening the operations of the EACC and other anti-corruption institutions up to the devolved units (according to 9.7% of the public officials). These findings are indicated in Table 3.92 below. Table 3.92: Proposed options for surmounting challenges faced in addressing
corruption in public service institutions Proposed options for surmounting challenges faced in addressing corruption in public service institutions
Members of the public
Public officials
Strengthening and/or indiscriminately implementing/enforcing anti-corruption laws (including arrest and dismissal of corrupt officials and recovery of corruptly-acquired assets)
27.6% 31.9%
Undertaking public/citizen sensitization and awareness creation about the different aspects of corruption
17.1% 23.9%
Reforming and/or professionalizing the public service (for example through proper recruitment and deployment of competent officers, use of
14.5% 20.3%

197
197
Proposed options for surmounting challenges faced in addressing corruption in public service institutions
Members of the public
Public officials
technology and automation of services, proper remuneration and merger of institutions with similar/related roles) Whole of government commitment in the fight against corruption including non-politicization of anti-corruption iniatiatives
13.7% 14.3%
Appointment and/or election of leaders of integrity 12.7% 10.3% Unity, demonstrations and public participation in the fight against corruption
8.1% 4.2%
Enhancing the resourcing and strengthening the operations of the EACC and other anti-corruption institutions up to the devolved units
7.3% 9.7%
Strengthening witness protection on corruption cases
6.2% 2.5%
Encouraging culture change and positive attitude towards avoiding and fighting corruption
2.7% 4.9%
Undertaking equitable distribution of resources and poverty alleviation measures in society
1.7% 2.2%
Enhancing participation of faith-based and civil society organizations in the fight against corruption
1.4% 1.1%
Use of a foreign body to fight corruption 0.8% 0.4% Controlling population growth 0.5% 0.3% Undertaking research on corruption and its dynamics
0.4% 0.5%
County-specific analysis based on the three highest percentages of responses of members of the public in each of the 47 counties showed that 9 out of 14 proposed options for surmounting challenges faced in addressing corruption in the public service were prominent. The proposed options that featured prominently in at least a third of the counties were: strengthening and/or indiscriminately implementing/enforcing anti-corruption laws (including arrest and dismissal of corrupt officials and recovery of corruptly-acquired assets) which was prominent in 42 counties; undertaking public/citizen sensitization and awareness creation about corruption (prominent in 28 counties); whole of government commitment in the fight against corruption including non-politicization of anti-corruption iniatiatives (prominent in 24 counties); appointment and/or election of leaders of integrity (prominent in 23 counties); and reforming and/or professionalizing the public service (for example through proper recruitment and deployment of competent officers, use of technology and automation of services, proper remuneration and merger of institutions with similar/related roles) which came out strongly in 19 counties. Further results of the study on the proposed options for surmounting challenges faced in addressing corruption in the public service showed that: strengthening and/or indiscriminately implementing/enforcing anti-corruption laws (including arrest and dismissal
198198
of corrupt officials and recovery of corruptly-acquired assets) was prominent especially in the counties of Meru (42.2%), Tharaka Nithi (39.3%), Murang'a (39.0%), Kiambu (37.2%) and Kirinyaga (30.5%); undertaking public/citizen sensitization and awareness creation about the different aspects of corruption came out strongly in Wajir (57.8%), Elgeyo Marakwet (40.3%), Kwale (30.6%), Busia (27.3%), Mandera (24.8%) and Makueni (24.0%) counties; whole of government commitment in the fight against corruption including non-politicization of anti-corruption iniatiatives was prominent especially in Machakos (21.1%), Nyeri (19.8%), West Pokot (18.9%), Marsabit (17.7%), Nandi (17.6%) and Trans Nzoia (17.6%) counties; appointment and/or election of leaders of integrity came out strongly especially in the counties of Isiolo (25.0%), Marsabit (21.0%), Samburu (20.0%), Narok (18.7%) and Laikipia (17.2%); and reforming and/or professionalizing the public service (e.g through proper recruitment and deployment of competent officers, use of technology and automation of services, proper remuneration and merger of institutions with similar/related roles) was mentioned prominently especially in Garissa (26.6%), Siaya (20.0%), West Pokot (20.0%), Laikipia (18.9%), Kitui (17.3%) and Trans Nzoia (16.8%) counties. These findings are presented in Table 3.93 below.
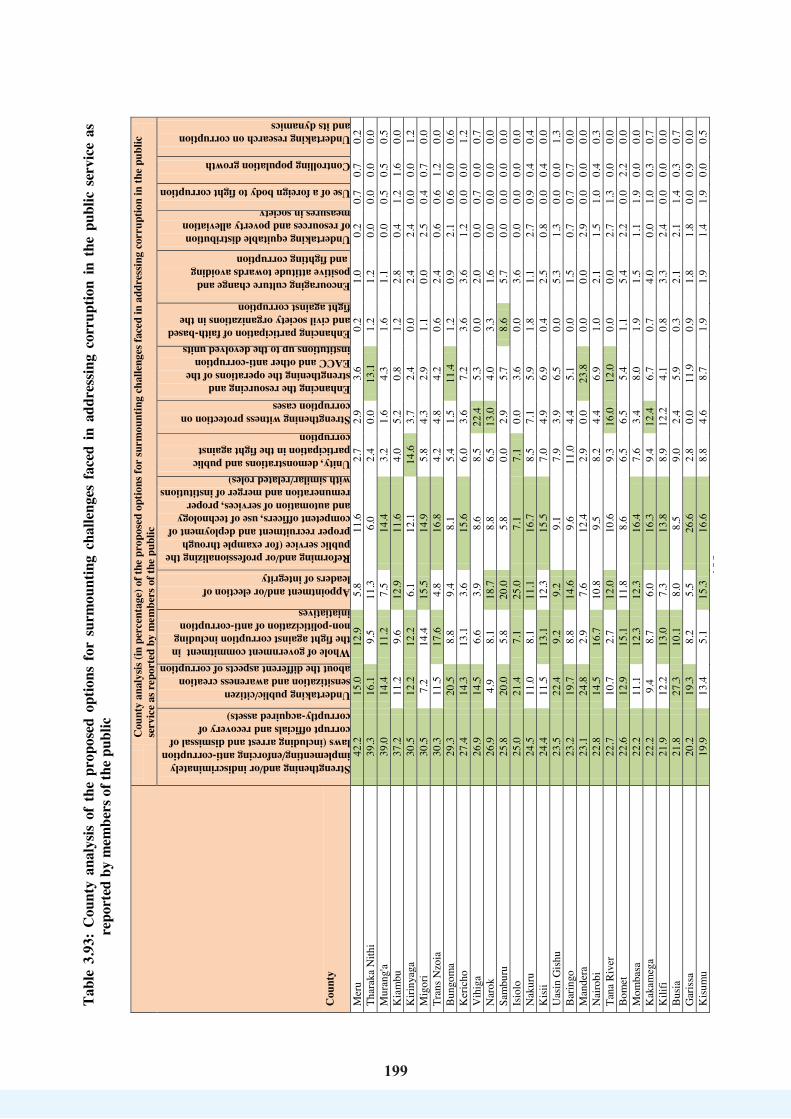
199
199
Tabl
e 3.
93:
Cou
nty
anal
ysis
of t
he p
ropo
sed
optio
ns f
or s
urm
ount
ing
chal
leng
es f
aced
in
addr
essin
g co
rrup
tion
in t
he p
ublic
ser
vice
as
repo
rted
by
mem
bers
of t
he p
ublic
C
ount
y
C
ount
y an
alys
is (in
per
cent
age)
of t
he p
ropo
sed
optio
ns fo
r su
rmou
ntin
g ch
alle
nges
face
d in
add
ress
ing
corr
uptio
n in
the
publ
ic
serv
ice
as r
epor
ted
by m
embe
rs o
f the
pub
lic
Strengthening and/or indiscriminately implementing/enforcing anti-corruption laws (including arrest and dismissal of corrupt officials and recovery of corruptly-acquired assets)
Undertaking public/citizen sensitization and awareness creation about the different aspects of corruption Whole of government commitment in the fight against corruption including non-politicization of anti-corruption iniatiatives
Appointment and/or election of leaders of integrity
Reforming and/or professionalizing the public service (for example through proper recruitment and deployment of competent officers, use of technology and automation of services, proper remuneration and merger of institutions with similar/related roles) Unity, demonstrations and public participation in the fight against corruption Strengthening witness protection on corruption cases Enhancing the resourcing and strengthening the operations of the EACC and other anti-corruption institutions up to the devolved units Enhancing participation of faith-based and civil society organizations in the fight against corruption
Encouraging culture change and positive attitude towards avoiding and fighting corruption
Undertaking equitable distribution of resources and poverty alleviation measures in society
Use of a foreign body to fight corruption
Controlling population growth
Undertaking research on corruption and its dynamics
Mer
u 42
.2
15.0
12
.9
5.8
11.6
2.
7 2.
9 3.
6 0.
2 1.
0 0.
2 0.
7 0.
7 0.
2 Th
arak
a N
ithi
39.3
16
.1
9.5
11.3
6.
0 2.
4 0.
0 13
.1
1.2
1.2
0.0
0.0
0.0
0.0
Mur
ang'
a 39
.0
14.4
11
.2
7.5
14.4
3.
2 1.
6 4.
3 1.
6 1.
1 0.
0 0.
5 0.
5 0.
5 K
iam
bu
37.2
11
.2
9.6
12.9
11
.6
4.0
5.2
0.8
1.2
2.8
0.4
1.2
1.6
0.0
Kiri
nyag
a 30
.5
12.2
12
.2
6.1
12.1
14
.6
3.7
2.4
0.0
2.4
2.4
0.0
0.0
1.2
Mig
ori
30.5
7.
2 14
.4
15.5
14
.9
5.8
4.3
2.9
1.1
0.0
2.5
0.4
0.7
0.0
Tran
s Nzo
ia
30.3
11
.5
17.6
4.
8 16
.8
4.2
4.8
4.2
0.6
2.4
0.6
0.6
1.2
0.0
Bun
gom
a 29
.3
20.5
8.
8 9.
4 8.
1 5.
4 1.
5 11
.4
1.2
0.9
2.1
0.6
0.0
0.6
Ker
icho
27
.4
14.3
13
.1
3.6
15.6
6.
0 3.
6 7.
2 3.
6 3.
6 1.
2 0.
0 0.
0 1.
2 V
ihig
a 26
.9
14.5
6.
6 3.
9 8.
6 8.
5 22
.4
5.3
0.0
2.0
0.0
0.7
0.0
0.7
Nar
ok
26.9
4.
9 8.
1 18
.7
8.8
6.5
13.0
4.
0 3.
3 1.
6 0.
0 0.
0 0.
0 0.
0 Sa
mbu
ru
25.8
20
.0
5.8
20.0
5.
8 0.
0 2.
9 5.
7 8.
6 5.
7 0.
0 0.
0 0.
0 0.
0 Is
iolo
25
.0
21.4
7.
1 25
.0
7.1
7.1
0.0
3.6
0.0
3.6
0.0
0.0
0.0
0.0
Nak
uru
24.5
11
.0
8.1
11.1
16
.7
8.5
7.1
5.9
1.8
1.1
2.7
0.9
0.4
0.4
Kis
ii 24
.4
11.5
13
.1
12.3
15
.5
7.0
4.9
6.9
0.4
2.5
0.8
0.0
0.4
0.0
Uas
in G
ishu
23
.5
22.4
9.
2 9.
2 9.
1 7.
9 3.
9 6.
5 0.
0 5.
3 1.
3 0.
0 0.
0 1.
3 B
arin
go
23.2
19
.7
8.8
14.6
9.
6 11
.0
4.4
5.1
0.0
1.5
0.7
0.7
0.7
0.0
Man
dera
23
.1
24.8
2.
9 7.
6 12
.4
2.9
0.0
23.8
0.
0 0.
0 2.
9 0.
0 0.
0 0.
0 N
airo
bi
22.8
14
.5
16.7
10
.8
9.5
8.2
4.4
6.9
1.0
2.1
1.5
1.0
0.4
0.3
Tana
Riv
er
22.7
10
.7
2.7
12.0
10
.6
9.3
16.0
12
.0
0.0
0.0
2.7
1.3
0.0
0.0
Bom
et
22.6
12
.9
15.1
11
.8
8.6
6.5
6.5
5.4
1.1
5.4
2.2
0.0
2.2
0.0
Mom
basa
22
.2
11.1
12
.3
12.3
16
.4
7.6
3.4
8.0
1.9
1.5
1.1
1.9
0.0
0.0
Kak
ameg
a 22
.2
9.4
8.7
6.0
16.3
9.
4 12
.4
6.7
0.7
4.0
0.0
1.0
0.3
0.7
Kili
fi 21
.9
12.2
13
.0
7.3
13.8
8.
9 12
.2
4.1
0.8
3.3
2.4
0.0
0.0
0.0
Bus
ia
21.8
27
.3
10.1
8.
0 8.
5 9.
0 2.
4 5.
9 0.
3 2.
1 2.
1 1.
4 0.
3 0.
7 G
aris
sa
20.2
19
.3
8.2
5.5
26.6
2.
8 0.
0 11
.9
0.9
1.8
1.8
0.0
0.9
0.0
Kis
umu
19.9
13
.4
5.1
15.3
16
.6
8.8
4.6
8.7
1.9
1.9
1.4
1.9
0.0
0.5
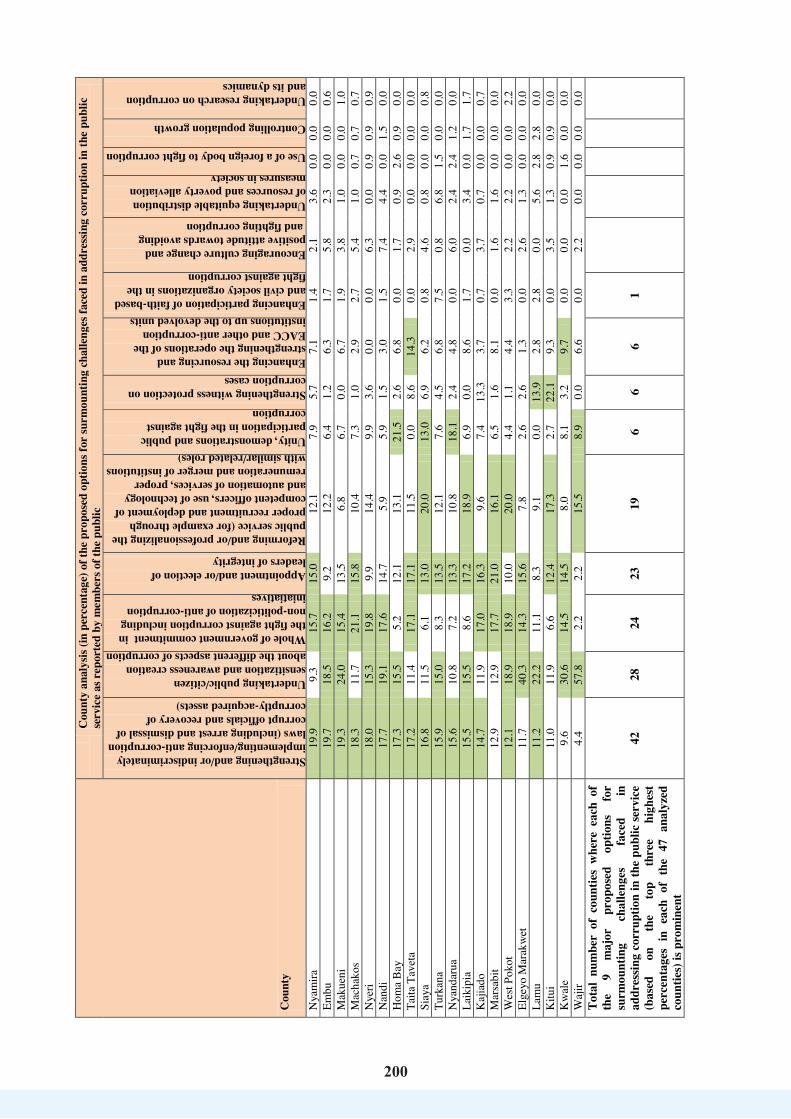
200
200
Cou
nty
C
ount
y an
alys
is (in
per
cent
age)
of t
he p
ropo
sed
optio
ns fo
r su
rmou
ntin
g ch
alle
nges
face
d in
add
ress
ing
corr
uptio
n in
the
publ
ic
serv
ice
as r
epor
ted
by m
embe
rs o
f the
pub
lic
Strengthening and/or indiscriminately implementing/enforcing anti-corruption laws (including arrest and dismissal of corrupt officials and recovery of corruptly-acquired assets)
Undertaking public/citizen sensitization and awareness creation about the different aspects of corruption Whole of government commitment in the fight against corruption including non-politicization of anti-corruption iniatiatives
Appointment and/or election of leaders of integrity
Reforming and/or professionalizing the public service (for example through proper recruitment and deployment of competent officers, use of technology and automation of services, proper remuneration and merger of institutions with similar/related roles) Unity, demonstrations and public participation in the fight against corruption Strengthening witness protection on corruption cases Enhancing the resourcing and strengthening the operations of the EACC and other anti-corruption institutions up to the devolved units Enhancing participation of faith-based and civil society organizations in the fight against corruption
Encouraging culture change and positive attitude towards avoiding and fighting corruption
Undertaking equitable distribution of resources and poverty alleviation measures in society
Use of a foreign body to fight corruption
Controlling population growth
Undertaking research on corruption and its dynamics
Nya
mira
19
.9
9.3
15.7
15
.0
12.1
7.
9 5.
7 7.
1 1.
4 2.
1 3.
6 0.
0 0.
0 0.
0 Em
bu
19.7
18
.5
16.2
9.
2 12
.2
6.4
1.2
6.3
1.7
5.8
2.3
0.0
0.0
0.6
Mak
ueni
19
.3
24.0
15
.4
13.5
6.
8 6.
7 0.
0 6.
7 1.
9 3.
8 1.
0 0.
0 0.
0 1.
0 M
acha
kos
18.3
11
.7
21.1
15
.8
10.4
7.
3 1.
0 2.
9 2.
7 5.
4 1.
0 0.
7 0.
7 0.
7 N
yeri
18.0
15
.3
19.8
9.
9 14
.4
9.9
3.6
0.0
0.0
6.3
0.0
0.9
0.9
0.9
Nan
di
17.7
19
.1
17.6
14
.7
5.9
5.9
1.5
3.0
1.5
7.4
4.4
0.0
1.5
0.0
Hom
a B
ay
17.3
15
.5
5.2
12.1
13
.1
21.5
2.
6 6.
8 0.
0 1.
7 0.
9 2.
6 0.
9 0.
0 Ta
ita T
avet
a 17
.2
11.4
17
.1
17.1
11
.5
0.0
8.6
14.3
0.
0 2.
9 0.
0 0.
0 0.
0 0.
0 Si
aya
16.8
11
.5
6.1
13.0
20
.0
13.0
6.
9 6.
2 0.
8 4.
6 0.
8 0.
0 0.
0 0.
8 Tu
rkan
a 15
.9
15.0
8.
3 13
.5
12.1
7.
6 4.
5 6.
8 7.
5 0.
8 6.
8 1.
5 0.
0 0.
0 N
yand
arua
15
.6
10.8
7.
2 13
.3
10.8
18
.1
2.4
4.8
0.0
6.0
2.4
2.4
1.2
0.0
Laik
ipia
15
.5
15.5
8.
6 17
.2
18.9
6.
9 0.
0 8.
6 1.
7 0.
0 3.
4 0.
0 1.
7 1.
7 K
ajia
do
14.7
11
.9
17.0
16
.3
9.6
7.4
13.3
3.
7 0.
7 3.
7 0.
7 0.
0 0.
0 0.
7 M
arsa
bit
12.9
12
.9
17.7
21
.0
16.1
6.
5 1.
6 8.
1 0.
0 1.
6 1.
6 0.
0 0.
0 0.
0 W
est P
okot
12
.1
18.9
18
.9
10.0
20
.0
4.4
1.1
4.4
3.3
2.2
2.2
0.0
0.0
2.2
Elge
yo M
arak
wet
11
.7
40.3
14
.3
15.6
7.
8 2.
6 2.
6 1.
3 0.
0 2.
6 1.
3 0.
0 0.
0 0.
0 La
mu
11.2
22
.2
11.1
8.
3 9.
1 0.
0 13
.9
2.8
2.8
0.0
5.6
2.8
2.8
0.0
Kitu
i 11
.0
11.9
6.
6 12
.4
17.3
2.
7 22
.1
9.3
0.0
3.5
1.3
0.9
0.9
0.0
Kw
ale
9.6
30.6
14
.5
14.5
8.
0 8.
1 3.
2 9.
7 0.
0 0.
0 0.
0 1.
6 0.
0 0.
0 W
ajir
4.4
57.8
2.
2 2.
2 15
.5
8.9
0.0
6.6
0.0
2.2
0.0
0.0
0.0
0.0
Tota
l nu
mbe
r of
cou
ntie
s w
here
eac
h of
th
e 9
maj
or
prop
osed
op
tions
fo
r su
rmou
ntin
g ch
alle
nges
fa
ced
in
addr
essin
g co
rrup
tion
in th
e pu
blic
serv
ice
(bas
ed
on
the
top
thre
e hi
ghes
t pe
rcen
tage
s in
eac
h of
the
47
anal
yzed
co
untie
s) is
pro
min
ent
42
28
24
23
19
6 6
6 1
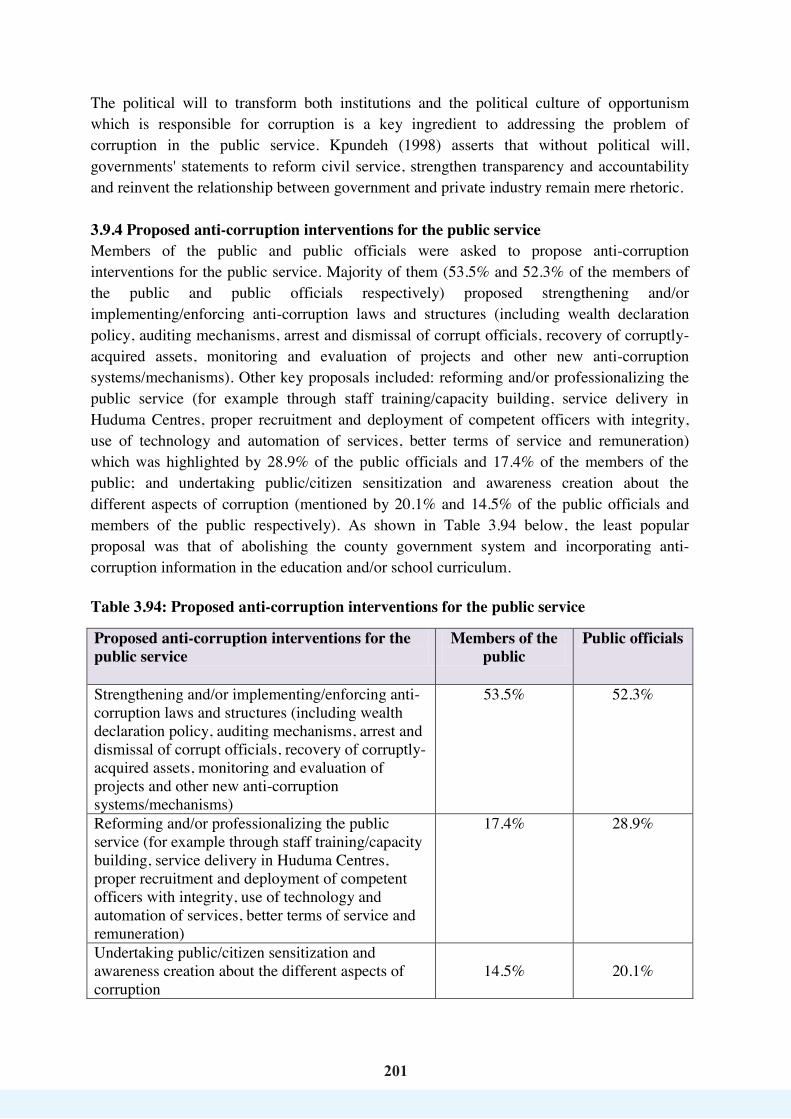
201
201
The political will to transform both institutions and the political culture of opportunism which is responsible for corruption is a key ingredient to addressing the problem of corruption in the public service. Kpundeh (1998) asserts that without political will, governments' statements to reform civil service, strengthen transparency and accountability and reinvent the relationship between government and private industry remain mere rhetoric. 3.9.4 Proposed anti-corruption interventions for the public service Members of the public and public officials were asked to propose anti-corruption interventions for the public service. Majority of them (53.5% and 52.3% of the members of the public and public officials respectively) proposed strengthening and/or implementing/enforcing anti-corruption laws and structures (including wealth declaration policy, auditing mechanisms, arrest and dismissal of corrupt officials, recovery of corruptly-acquired assets, monitoring and evaluation of projects and other new anti-corruption systems/mechanisms). Other key proposals included: reforming and/or professionalizing the public service (for example through staff training/capacity building, service delivery in Huduma Centres, proper recruitment and deployment of competent officers with integrity, use of technology and automation of services, better terms of service and remuneration) which was highlighted by 28.9% of the public officials and 17.4% of the members of the public; and undertaking public/citizen sensitization and awareness creation about the different aspects of corruption (mentioned by 20.1% and 14.5% of the public officials and members of the public respectively). As shown in Table 3.94 below, the least popular proposal was that of abolishing the county government system and incorporating anti-corruption information in the education and/or school curriculum. Table 3.94: Proposed anti-corruption interventions for the public service
Proposed anti-corruption interventions for the public service
Members of the public
Public officials
Strengthening and/or implementing/enforcing anti-corruption laws and structures (including wealth declaration policy, auditing mechanisms, arrest and dismissal of corrupt officials, recovery of corruptly-acquired assets, monitoring and evaluation of projects and other new anti-corruption systems/mechanisms)
53.5% 52.3%
Reforming and/or professionalizing the public service (for example through staff training/capacity building, service delivery in Huduma Centres, proper recruitment and deployment of competent officers with integrity, use of technology and automation of services, better terms of service and remuneration)
17.4% 28.9%
Undertaking public/citizen sensitization and awareness creation about the different aspects of corruption
14.5% 20.1%
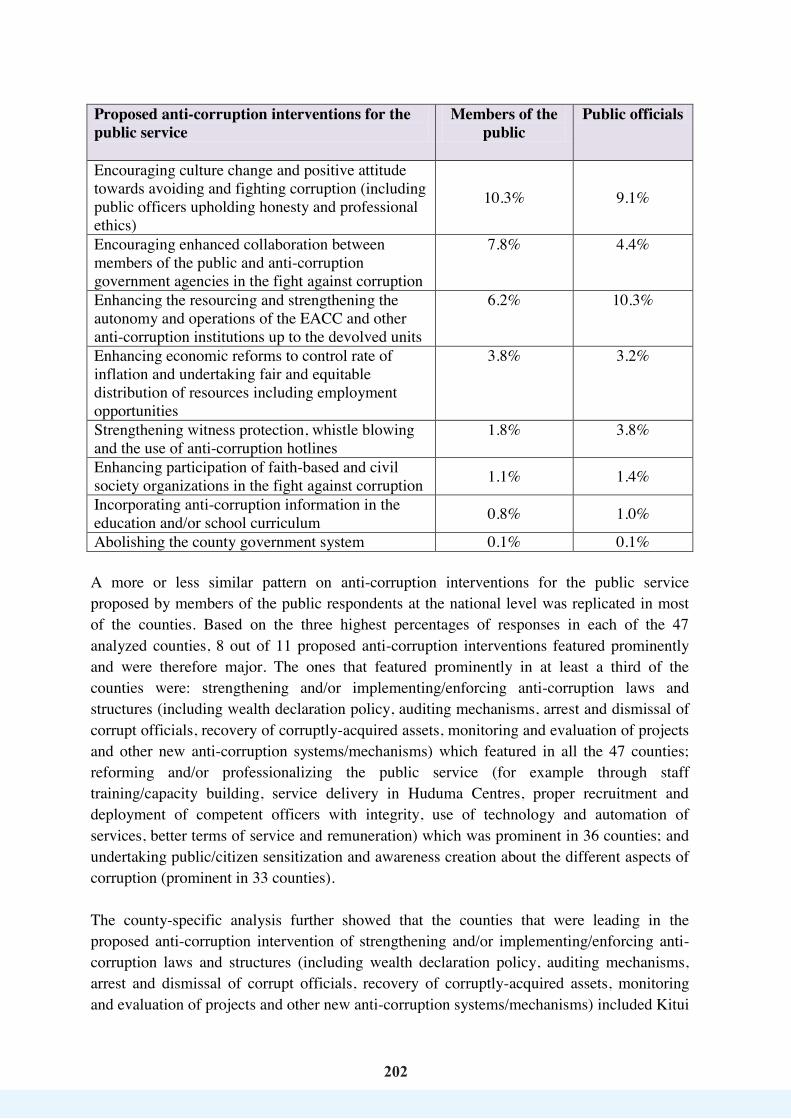
202
202
Proposed anti-corruption interventions for the public service
Members of the public
Public officials
Encouraging culture change and positive attitude towards avoiding and fighting corruption (including public officers upholding honesty and professional ethics)
10.3% 9.1%
Encouraging enhanced collaboration between members of the public and anti-corruption government agencies in the fight against corruption
7.8% 4.4%
Enhancing the resourcing and strengthening the autonomy and operations of the EACC and other anti-corruption institutions up to the devolved units
6.2% 10.3%
Enhancing economic reforms to control rate of inflation and undertaking fair and equitable distribution of resources including employment opportunities
3.8% 3.2%
Strengthening witness protection, whistle blowing and the use of anti-corruption hotlines
1.8% 3.8%
Enhancing participation of faith-based and civil society organizations in the fight against corruption 1.1% 1.4%
Incorporating anti-corruption information in the education and/or school curriculum 0.8% 1.0%
Abolishing the county government system 0.1% 0.1% A more or less similar pattern on anti-corruption interventions for the public service proposed by members of the public respondents at the national level was replicated in most of the counties. Based on the three highest percentages of responses in each of the 47 analyzed counties, 8 out of 11 proposed anti-corruption interventions featured prominently and were therefore major. The ones that featured prominently in at least a third of the counties were: strengthening and/or implementing/enforcing anti-corruption laws and structures (including wealth declaration policy, auditing mechanisms, arrest and dismissal of corrupt officials, recovery of corruptly-acquired assets, monitoring and evaluation of projects and other new anti-corruption systems/mechanisms) which featured in all the 47 counties; reforming and/or professionalizing the public service (for example through staff training/capacity building, service delivery in Huduma Centres, proper recruitment and deployment of competent officers with integrity, use of technology and automation of services, better terms of service and remuneration) which was prominent in 36 counties; and undertaking public/citizen sensitization and awareness creation about the different aspects of corruption (prominent in 33 counties). The county-specific analysis further showed that the counties that were leading in the proposed anti-corruption intervention of strengthening and/or implementing/enforcing anti-corruption laws and structures (including wealth declaration policy, auditing mechanisms, arrest and dismissal of corrupt officials, recovery of corruptly-acquired assets, monitoring and evaluation of projects and other new anti-corruption systems/mechanisms) included Kitui
203203
(63.0%), Laikipia (62.1%), Nyandarua (61.2%), Baringo (59.6%) and Garissa (58.5%). Counties which had most members of the public propose reforming and/or professionalizing the public service (e.g through staff training/capacity building, service delivery in Huduma Centres, proper recruitment and deployment of competent officers with integrity, use of technology and automation of services, better terms of service and remuneration) as an anti-corruption intervention included Isiolo (28.5%), Samburu (22.5%), Murang'a (22.5%), Embu (21.9%), Kiambu (20.0%) and Kisii (19.4%). Further, the counties leading in the proposal on undertaking public/citizen sensitization and awareness creation about the different aspects of corruption included Wajir (53.3%), Kisumu (23.9%), Marsabit (21.7%), Vihiga (20.7%), Turkana (20.0%) and West Pokot (20.0%). These findings are presented in Table 3.95 below.
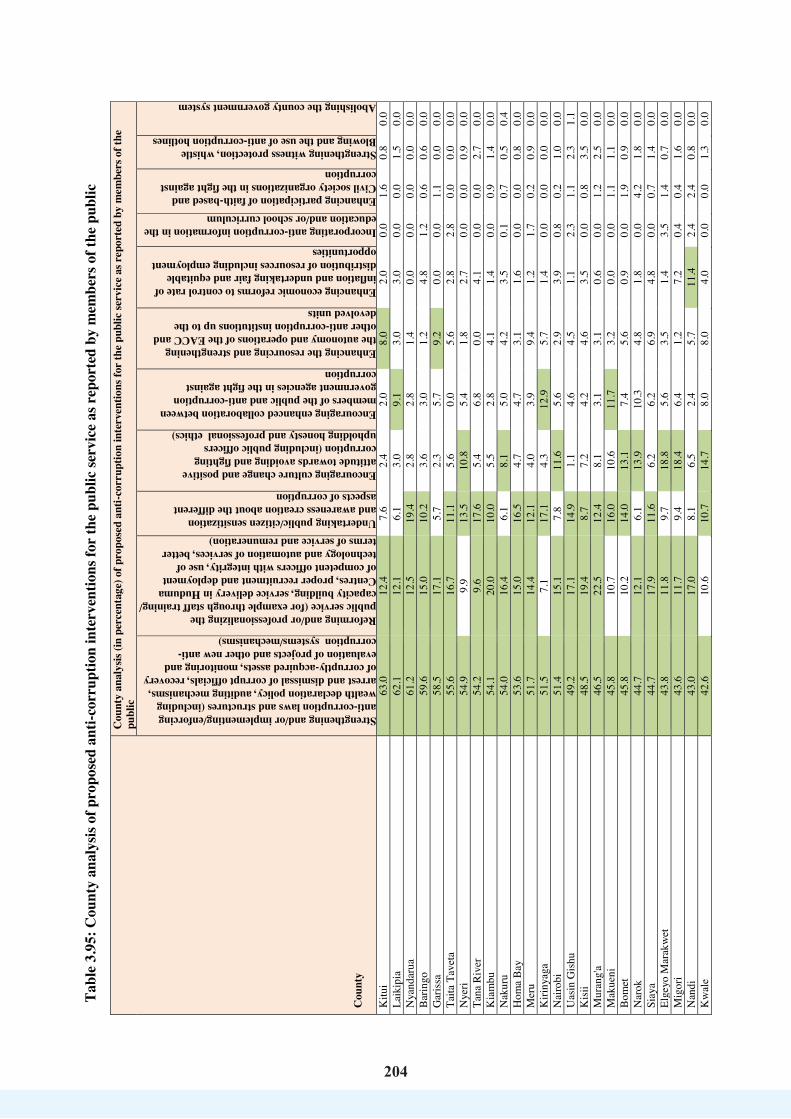
204
204
Tabl
e 3.
95: C
ount
y an
alys
is of
pro
pose
d an
ti-co
rrup
tion
inte
rven
tions
for
the
publ
ic se
rvic
e as
rep
orte
d by
mem
bers
of t
he p
ublic
Cou
nty
Cou
nty
anal
ysis
(in p
erce
ntag
e) o
f pro
pose
d an
ti-co
rrup
tion
inte
rven
tions
for
the
publ
ic se
rvic
e as
rep
orte
d by
mem
bers
of t
he
publ
ic
Strengthening and/or implementing/enforcing anti-corruption laws and structures (including wealth declaration policy, auditing mechanisms, arrest and dismissal of corrupt officials, recovery of corruptly-acquired assets, monitoring and evaluation of projects and other new anti-corruption systems/mechanisms)
Reforming and/or professionalizing the public service (for example through staff training/ capacity building, service delivery in Huduma Centres, proper recruitment and deployment of competent officers with integrity, use of technology and automation of services, better terms of service and remuneration) Undertaking public/citizen sensitization and awareness creation about the different aspects of corruption
Encouraging culture change and positive attitude towards avoiding and fighting corruption (including public officers upholding honesty and professional ethics)
Encouraging enhanced collaboration between members of the public and anti-corruption government agencies in the fight against corruption
Enhancing the resourcing and strengthening the autonomy and operations of the EACC and other anti-corruption institutions up to the devolved units
Enhancing economic reforms to control rate of inflation and undertaking fair and equitable distribution of resources including employment opportunities
Incorporating anti-corruption information in the education and/or school curriculum Enhancing participation of faith-based and Civil society organizations in the fight against corruption
Strengthening witness protection, whistle Blowing and the use of anti-corruption hotlines
Abolishing the county government system
Kitu
i 63
.0
12.4
7.
6 2.
4 2.
0 8.
0 2.
0 0.
0 1.
6 0.
8 0.
0 La
ikip
ia
62.1
12
.1
6.1
3.0
9.1
3.0
3.0
0.0
0.0
1.5
0.0
Nya
ndar
ua
61.2
12
.5
19.4
2.
8 2.
8 1.
4 0.
0 0.
0 0.
0 0.
0 0.
0 B
arin
go
59.6
15
.0
10.2
3.
6 3.
0 1.
2 4.
8 1.
2 0.
6 0.
6 0.
0 G
aris
sa
58.5
17
.1
5.7
2.3
5.7
9.2
0.0
0.0
1.1
0.0
0.0
Taita
Tav
eta
55.6
16
.7
11.1
5.
6 0.
0 5.
6 2.
8 2.
8 0.
0 0.
0 0.
0 N
yeri
54.9
9.
9 13
.5
10.8
5.
4 1.
8 2.
7 0.
0 0.
0 0.
9 0.
0 Ta
na R
iver
54
.2
9.6
17.6
5.
4 6.
8 0.
0 4.
1 0.
0 0.
0 2.
7 0.
0 K
iam
bu
54.1
20
.0
10.0
5.
5 2.
8 4.
1 1.
4 0.
0 0.
9 1.
4 0.
0 N
akur
u 54
.0
16.4
6.
1 8.
1 5.
0 4.
2 3.
5 0.
1 0.
7 0.
5 0.
4 H
oma
Bay
53
.6
15.0
16
.5
4.7
4.7
3.1
1.6
0.0
0.0
0.8
0.0
Mer
u 51
.7
14.4
12
.1
4.0
3.9
9.4
1.2
1.7
0.2
0.9
0.0
Kiri
nyag
a 51
.5
7.1
17.1
4.
3 12
.9
5.7
1.4
0.0
0.0
0.0
0.0
Nai
robi
51
.4
15.1
7.
8 11
.6
5.6
2.9
3.9
0.8
0.2
1.0
0.0
Uas
in G
ishu
49
.2
17.1
14
.9
1.1
4.6
4.5
1.1
2.3
1.1
2.3
1.1
Kis
ii 48
.5
19.4
8.
7 7.
2 4.
2 4.
6 3.
5 0.
0 0.
8 3.
5 0.
0 M
uran
g'a
46.5
22
.5
12.4
8.
1 3.
1 3.
1 0.
6 0.
0 1.
2 2.
5 0.
0 M
akue
ni
45.8
10
.7
16.0
10
.6
11.7
3.
2 0.
0 0.
0 1.
1 1.
1 0.
0 B
omet
45
.8
10.2
14
.0
13.1
7.
4 5.
6 0.
9 0.
0 1.
9 0.
9 0.
0 N
arok
44
.7
12.1
6.
1 13
.9
10.3
4.
8 1.
8 0.
0 4.
2 1.
8 0.
0 Si
aya
44.7
17
.9
11.6
6.
2 6.
2 6.
9 4.
8 0.
0 0.
7 1.
4 0.
0 El
geyo
Mar
akw
et
43.8
11
.8
9.7
18.8
5.
6 3.
5 1.
4 3.
5 1.
4 0.
7 0.
0 M
igor
i 43
.6
11.7
9.
4 18
.4
6.4
1.2
7.2
0.4
0.4
1.6
0.0
Nan
di
43.0
17
.0
8.1
6.5
2.4
5.7
11.4
2.
4 2.
4 0.
8 0.
0 K
wal
e 42
.6
10.6
10
.7
14.7
8.
0 8.
0 4.
0 0.
0 0.
0 1.
3 0.
0
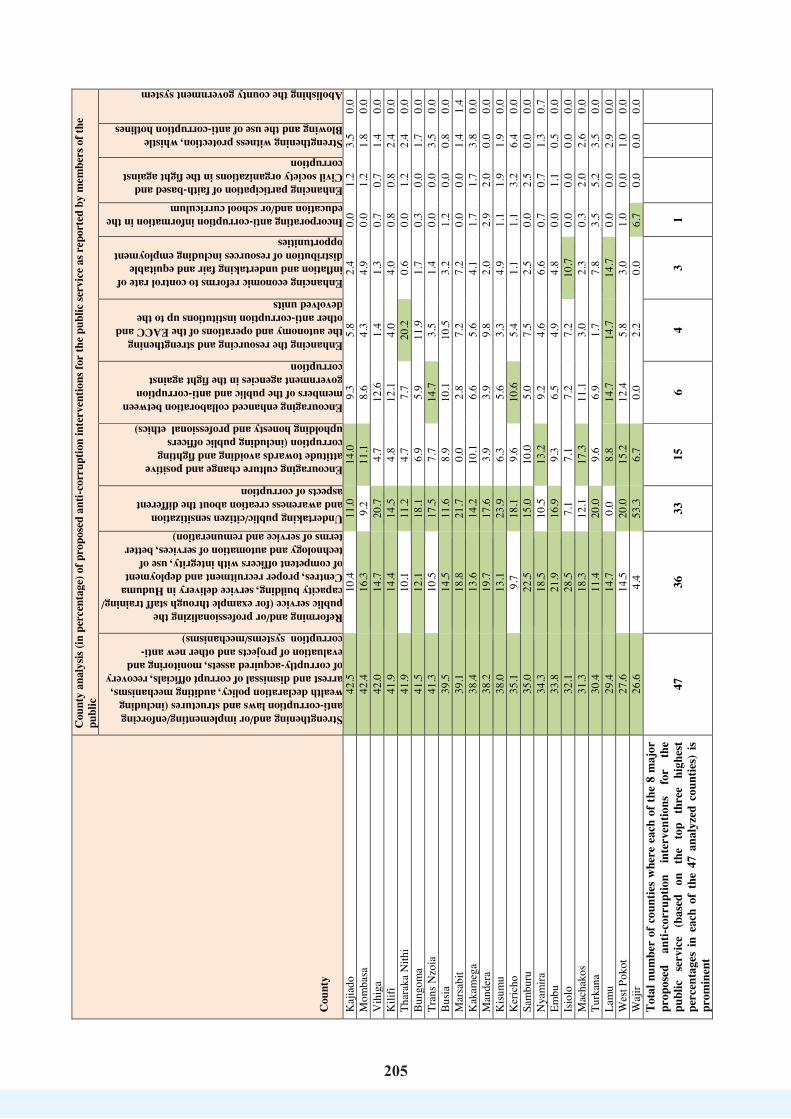
205
205
Cou
nty
Cou
nty
anal
ysis
(in p
erce
ntag
e) o
f pro
pose
d an
ti-co
rrup
tion
inte
rven
tions
for
the
publ
ic se
rvic
e as
rep
orte
d by
mem
bers
of t
he
publ
ic
Strengthening and/or implementing/enforcing anti-corruption laws and structures (including wealth declaration policy, auditing mechanisms, arrest and dismissal of corrupt officials, recovery of corruptly-acquired assets, monitoring and evaluation of projects and other new anti-corruption systems/mechanisms)
Reforming and/or professionalizing the public service (for example through staff training/ capacity building, service delivery in Huduma Centres, proper recruitment and deployment of competent officers with integrity, use of technology and automation of services, better terms of service and remuneration) Undertaking public/citizen sensitization and awareness creation about the different aspects of corruption
Encouraging culture change and positive attitude towards avoiding and fighting corruption (including public officers upholding honesty and professional ethics)
Encouraging enhanced collaboration between members of the public and anti-corruption government agencies in the fight against corruption
Enhancing the resourcing and strengthening the autonomy and operations of the EACC and other anti-corruption institutions up to the devolved units
Enhancing economic reforms to control rate of inflation and undertaking fair and equitable distribution of resources including employment opportunities
Incorporating anti-corruption information in the education and/or school curriculum Enhancing participation of faith-based and Civil society organizations in the fight against corruption
Strengthening witness protection, whistle Blowing and the use of anti-corruption hotlines
Abolishing the county government system
Kaj
iado
42
.5
10.4
11
.0
14.0
9.
3 5.
8 2.
4 0.
0 1.
2 3.
5 0.
0 M
omba
sa
42.4
16
.3
9.2
11.1
8.
6 4.
3 4.
9 0.
0 1.
2 1.
8 0.
0 V
ihig
a 42
.0
14.7
20
.7
4.7
12.6
1.
4 1.
3 0.
7 0.
7 1.
4 0.
0 K
ilifi
41.9
14
.4
14.5
4.
8 12
.1
4.0
4.0
0.8
0.8
2.4
0.0
Thar
aka
Nith
i 41
.9
10.1
11
.2
4.7
7.7
20.2
0.
6 0.
0 1.
2 2.
4 0.
0 B
ungo
ma
41.5
12
.1
18.1
6.
9 5.
9 11
.9
1.7
0.3
0.0
1.7
0.0
Tran
s Nzo
ia
41.3
10
.5
17.5
7.
7 14
.7
3.5
1.4
0.0
0.0
3.5
0.0
Bus
ia
39.5
14
.5
11.6
8.
9 10
.1
10.5
3.
2 1.
2 0.
0 0.
8 0.
0 M
arsa
bit
39.1
18
.8
21.7
0.
0 2.
8 7.
2 7.
2 0.
0 0.
0 1.
4 1.
4 K
akam
ega
38.4
13
.6
14.2
10
.1
6.6
5.6
4.1
1.7
1.7
3.8
0.0
Man
dera
38
.2
19.7
17
.6
3.9
3.9
9.8
2.0
2.9
2.0
0.0
0.0
Kis
umu
38.0
13
.1
23.9
6.
3 5.
6 3.
3 4.
9 1.
1 1.
9 1.
9 0.
0 K
eric
ho
35.1
9.
7 18
.1
9.6
10.6
5.
4 1.
1 1.
1 3.
2 6.
4 0.
0 Sa
mbu
ru
35.0
22
.5
15.0
10
.0
5.0
7.5
2.5
0.0
2.5
0.0
0.0
Nya
mira
34
.3
18.5
10
.5
13.2
9.
2 4.
6 6.
6 0.
7 0.
7 1.
3 0.
7 Em
bu
33.8
21
.9
16.9
9.
3 6.
5 4.
9 4.
8 0.
0 1.
1 0.
5 0.
0 Is
iolo
32
.1
28.5
7.
1 7.
1 7.
2 7.
2 10
.7
0.0
0.0
0.0
0.0
Mac
hako
s 31
.3
18.3
12
.1
17.3
11
.1
3.0
2.3
0.3
2.0
2.6
0.0
Turk
ana
30.4
11
.4
20.0
9.
6 6.
9 1.
7 7.
8 3.
5 5.
2 3.
5 0.
0 La
mu
29.4
14
.7
0.0
8.8
14.7
14
.7
14.7
0.
0 0.
0 2.
9 0.
0 W
est P
okot
27
.6
14.5
20
.0
15.2
12
.4
5.8
3.0
1.0
0.0
1.0
0.0
Waj
ir 26
.6
4.4
53.3
6.
7 0.
0 2.
2 0.
0 6.
7 0.
0 0.
0 0.
0 To
tal n
umbe
r of
cou
ntie
s w
here
eac
h of
the
8 m
ajor
pr
opos
ed
anti-
corr
uptio
n in
terv
entio
ns
for
the
publ
ic
serv
ice
(bas
ed
on
the
top
thre
e hi
ghes
t pe
rcen
tage
s in
eac
h of
the
47
anal
yzed
cou
ntie
s) i
s pr
omin
ent
47
36
33
15
6 4
3 1
206
206
Members of the public and public officials were further asked, in conclusion, to provide any other relevant comments on fighting corruption. The key comments were that: the Government needed to be committed in the fight against corruption (reported by 25.8% and 22.2% of the members of the public and public officials respectively); there was need for concerted efforts to fight corruption (reported by 13.1% and 22.0% of the members of the public and public officials respectively); continuous sensitization and education of members of the public about corruption and its consequences was paramount (reported by 7.8% and 9.0% of the members of the public and public officials respectively); and public participation against corruption should be embraced in line with the constitutional provisions (reported by 5.6% and 7.6% of the members of the public and public officials respectively). The above findings on proposed anti-corruption interventions for the public service in Kenya have been applied in other jurisdictions. According to the Independent Commission Against Corruption (ICAC), some of the corruption prevention strategies prioritized by the New South Wales public sector include: identifying and documenting corruption risks; putting in place codes of conduct for public staff; formulating gifts and benefits policies and gift registers; use of information management and technology; providing information on ethical work practices to staff; well laid out audit procedures; protected disclosures; and strengthened internal investigation capacity in public service agencies (ICAC, 2003).
207207
CHAPTER FOUR: SUMMARY OF FINDINGS, CONCLUSION AND RECOMMENDATIONS
4.1 Introduction This study on perceptions and experiences of corruption in the public service in Kenya aimed at providing critical information relating to, and within the public service. It sought to: establish the public perceptions on the common and emerging types of corruption; establish the public experiences on the common and emerging types of corruption; identify the different perpetrators of corruption; ascertain the root cause of corruption in public service institutions; appraise the consequences of corruption; assess public response to corruption; and identify the challenges and make appropriate recommendations for addressing corruption in the public service. 4.2 Summary of Major Findings 4.2.1 Public perceptions on the common and emerging types of corruption in the public service According to the findings of the study, corruption in the public service was majorly perceived as: bribery, that is, soliciting for and/or receiving bribes (according to 23.1% of the members of the public and 16.8% of the public officials); embezzlement/misuse/ misappropriation ofpublic funds/resources (according to 19.6% of the members of the public and 17.4% of the public officials); abuse of power and/or office (according to 14.2% of the public officials); dishonesty by public officials (according to 12.8% of the public officials); and giving and/or receiving a valuable public resource in exchange for personal favours (according to 10.6% of the public officials). A greater proportion (92.6%) of the members of the public compared to public officials (85.0%) perceived that there was corruption in public service institutions in Kenya with more than 63.0% of the members of the public in each of the 47 counties perceiving that corruption existed in these institutions. Based on the average perceptions of the members of the public and public officials, corruption was perceived to exist in all the arms of government, with the highest to the lowest ranked arm of government being the National Executive (85.5%), County Executive (83.9%), County Assembly (73.5%), Judiciary (71.2%), National Assembly (59.7%) and the Senate Assembly (39.2%). The findings showed that more than 50.0% of the members of the public perceived corruption to be high in all the arms of government, with the Executive Arm of National Government leading with a percentage of 80.4% followed by the Executive Arm of County Government (77.7%), County Assembly (75.5%), National Assembly (68.9%), Judiciary (65.5%) and the least being the Senate Assembly at 51.8%. On the other hand, more than 40.0% of the public officials perceived corruption to be high in all the arms of government led by the Executive Arm of County Government (70.7%) followed by the County Assembly (69.6%), National Assembly (58.8%), Executive Arm of National Government (51.2%),
208
208
Judiciary (45.7%) and the least being the Senate Assembly (40.2%). A county-specific analysis based only on the proportion of the members of the public who perceived that there was high level of corruption showed that more than 50.0% of the members of the public perceived corruption to be high: in the National Executive in all the 47 counties; in the County Executive in 46 counties; in the County Assembly in 45 counmties; in the Judiciary in 42 counties; in the National Assembly in 32 counties; and in the Senate Assembly in 18 counties. According to the findings of the study, the specific public service institutions where corruption was perceived to be most prevalent were the: National Police Service (NPS), particularly the Traffic Police and Police in border areas (according to 38.1% and 56.3% of the members of the public and public officials respectively); County Government (reported by 17.8% and 16.2% of the members of the public and public officials respectively); Ministry of Health (reported by 15.8% of the members of the public); Ministry of Lands and Physical Planning (as reported by 15.0% of the public officials); Judiciary/Law Courts (reported by 14.6% of the public officials); and the Ministry of Interior and Coordination of National Government (reported by 14.4% of the members of the public). Based on the three highest percentages recorded from members of the public in each of the counties on where corruption was most prevalent, the institutions featuring in at least a third of the counties were the National Police Service (in 46 counties), County Government (in 31 counties), Ministry of Interior and Coordination of National Government (in 25 counties) and the Ministry of Health (in 24 counties). Further findings showed that the perceived leading common and emerging types of corruption in the Executive Arm of the National Government were: bribery (soliciting for and/or receiving bribes) which was reported by 50.5% and 30.8% of the members of the public and public officials respectively; flouting procurement (reported by 30.9% of the public officials); embezzlement/misuse/misappropriation of public funds/resources (reported by 23.3% and 18.3% of the members of the public and public officials respectively); and nepotism in service delivery (reported by 9.5% of the public officials). On the basis of the three highest percentages reported by members of the public in each of the counties, the common and emerging types of corruption featuring in at least a third of the counties were bribery (prominent in all the 47 counties), embezzlement/misuse/misappropriation of public funds/resources (prominent in 39 counties) and nepotism in service delivery (prominent in 16 counties). The major perceived common and emerging types of corruption in the Executive Arm of the County Government reported by at least 1 out of 10 members of the public and/or public officials were found to be: flouting procurement regulations (reported by 33.6% of the public officials); bribery, that is, soliciting for and/or receiving bribes (reported by 29.4% and 20.7% of the members of the public and public officials respectively); embezzlement/misuse/misappropriation of public funds/ bribes (reported by 28.0% and 24.7% of the members of the public and public officials respectively); nepotism in service

209
209
delivery (reported by 16.0% and 15.7% of the members of the public and public officials respectively); and corruption in job recruitments (reported by 14.8% of the public officials). The perceived common and emerging types of corruption reported by members of the public and featuring in at least a third of the counties (based on the three highest percentages reported by members of the public in each of the counties) were bribery (prominent in 41 counties), embezzlement/misuse/misappropriation of public funds/resources (prominent in 37 counties) and nepotism in service delivery (prominent in 33 counties). The perceived common and emerging type of corruption in the County Assembly were: embezzlement/misuse/misappropriation of public funds/resources (reported by 30.3% and 20.2% of the members of the public and public officials respectively); bribery, that is, soliciting for and/or receiving bribes (reported by 20.8% and 27.4% of the members of the public and public officials respectively); flouting procurement regulations (reported by 17.4% of the public officials); nepotism in service delivery (reported by 16.0% of the members of the public); discrimination in service delivery (reported by 15.2% of the members of the public); abuse of office (reported by 11.4% of the public officials); and passing defective laws (reported by 10.1% of the public officials). On the basis of the three highest percentages in each of the analyzed counties reported by members of the public, the common and emerging types of corruption featuring in at least a third of the 45 counties were embezzlement/misuse/misappropriation of public funds/resources (prominent in 43 counties), nepotism in service delivery (prominent in 34 counties), bribery (prominent in 30 counties) and discrimination in service delivery (prominent in 28 counties). The findings of the study showed that the major perceived common and emerging types of corruptions in the Judiciary were: bribery, that is soliciting for and/or receiving bribes (reported by 71.4% of the members of the public and 54.2% of the public officials); influenced cases/unjust verdicts (reported by 16.5% and 24.0% of the members of the public and public officials respectively) and delay/dragging of service delivery (reported by 9.8% and 17.1% of the members of the public and public officials respectively). County analysis of perceptions of members of the public based on the three highest percentages in each of the counties showed that the common and emerging types of corruption featuring in at least a third of the counties were bribery (prominent in all the 47 counties), influenced cases/unjust verdicts (prominent in 41 counties), delay/dragging of service delivery (prominent in 32 counties) and discrimination in service delivery (prominent in 16 counties). The common and emerging types of corruption in the National Assembly perceived by at least 1 out of 10 members of the public and/or public officials were: embezzlement/misuse/ misappropriation of public funds/resources (reported by 36.6% and 18.6% of the members of the public and public officials respectively); bribery, that is, soliciting for and/or receiving bribes (reported by 19.5% and 31.1% of the members of the public and public officials respectively); abuse of office (reported by 15.2% of the public officials); passing defective (reported by 14.3% of the public officials); nepotism in service delivery (reported by 13.7% of the members of the public); and discrimination in service delivery (reported by 12.8% of
210
210
the members of the public). The common and emerging types of corruption featuring in at least a third of the counties (based on the three highest percentages reported by members of the public in each of the counties) were embezzlement/misuse/misappropriation of public funds/resources (prominent in 37 counties), bribery (prominent in 23 counties), nepotism in service delivery (prominent in 22 counties) and discrimination in service delivery (prominent in 21 counties). The most perceived common and emerging type of corruption in the Senate Assembly were: bribery (reported by 33.3% of the members of the public and 32.9% of the public officials); embezzlement/misuse/misappropriation of public funds/resources (reported by 19.6% and 13.4% of the members of the public and public officials respectively); and abuse of office (reported by 13.8% and 17.9% of the members of the public and public officials respectively). Based on the three highest percentages reported by members of the public in each of the analyzed counties, the common and emerging types of corruption featuring in at least a third of the 33 counties were bribery (prominent in 23 counties), embezzlement/ misuse/misappropriation of public funds/resources (prominent in 20 counties), abuse of office (prominent in 16 counties), nepotism in service delivery (prominent in 14 counties) and discrimination in service delivery (prominent in 14 counties). 4.2.2 Public experiences on the common and emerging types of corruption in the public service Corruption in the public service is experienced majorly in the context of seeking services. Nationally, the findings showed that 69.5% of the members of the public and/or their close family members and 64.6% of the public officials and/or their close family members had sought services from the public service. County-specific analysis also showed that more than 50.0% of the members of the public and/or their close family members in 45 out of the 47 counties had sought public services. Nationally, the most sought services that were reported by at least 1 out of 10 members of the public and/or public officials were: registration of persons services (according to 20.9% and 27.3% of the members of the public and public officials respectively); hospital/medical-related services (reported by 19.9% of the members of the public), lands-related services (reported by 14.3% of the public officials), employment/recruitment services (reported by 13.8% of the public officials), police-related services (reported by 11.7% of the public officials) and bursary services (reported by 10.1% of the members of the public). Based on the three highest percentages recorded from members of the public in each of the counties, the services featuring in at least a third of the counties were registration of persons services (prominent in 42 counties), hospital/medical-related services (prominent in 37 counties), bursary services (prominent in 24 counties) and employment/recruitment services (prominent in 21 counties). According to the findings, nationally, majority (71.3%) of the members of the public and public officials (55.0%) and/or their close family members had, 12 months prior to the study, encountered corruption-related challenges while seeking services from public institutions. County-specific analysis showed that at least 50.0% of the members of the public and/or their close family members in 44 out of 47 counties had encountered these challenges. With regard
211
211
to the nature of the corruption-related challenges members of the public and public officials and/or their close family members had faced while seeking public services, at least 1 out of 10 members of the public and/or public officials affirmed that they had faced: bribery, that is, soliciting for and/or receiving bribes (reported by 45.2% of the members of the public and 45.1% of the public officials); delay in delivery of justice and/or services (reported by 18.1% and 22.8% of the members of the public and public officials respectively); and poor service delivery (reported by 11.3% and 12.5% of the members of the public and public officials respectively). The findings further showed that the corruption-related challenges featuring in at least a third of the 47 counties (based on the three highest percentages recorded from members of the public in each of the counties) were bribery (prominent in all the 47 counties), delay in delivery of justice and/or services (prominent in 38 counties), poor service delivery (prominent in 29 counties) and favoritism and/or intimidation (prominent in 16 counties). Nationally, majority (58.6%) of the members of the public and about half (49.3%) of the public officials confirmed that they and/or their close family members had witnessed corruption incidents in the public service 12 months prior to the survey. Nationally, bribery was the most common corruption-related incident witnessed by 73.4% of the members of the public and 71.9% of the public officials) and/or their close family members. In all the counties, at least 2 out of 10 members of the public and/or their close family members had witnessed corruption in the public service. However, 33 out of 47 counties had more than 50.0% of the members of the public and/or their close family members witness corruption incidents. County analysis (based on the three highest percentages in each of the counties) of the corruption incidents witnessed by members of the public 12 months prior to the survey showed that the forms of corruption incidents featuring in at least a third of the counties were bribery (prominent in all the 47 counties), discrimination and/or favoritism and/or nepotism in service delivery (prominent in 39 counties), poor service delivery (prominent in 36 counties) and extortion (prominent in 19 counties). The results of the study showed that corruption incidents were witnessed by members of the public and public officials 12 months prior to the survey majorly within the National Police Service (as reported by 52.6% and 46.2% of the public officials and members of the public respectively), County Government (as reported by 16.4% and 9.9% of the public officials and members of the public respectively) and the National Government Administrative Office (as reported by 12.7% of the members of the public). On the basis of the three highest percentages recorded from members of the public in each of the counties, the institutions (where corruption incidents were witnessed) featuring in at least a third of the 47 counties were the National Police Service (prominent in 46 counties), National Government Administrative Office (prominent in 35 counties) and the county government (prominent in 30 counties). The findings of this study established that majority (52.7%) of the members of the public and more than a third (36.1%) of the public officials and/or their close family members had

212
212
experienced acts of corruption in the public service 12 months prior to the survey. In all the counties, at least 2 out of 10 members of the public and/or their close family members had experienced acts of corruption with majority of them having experienced corruption in at least 27 of the 47 counties. With regard to corruption experiences within the specific arms of government during the period 12 months prior to the study, the following was established: majority (75.8%) of the members of the public and public officials (74.5%) and/or their close family members had experienced corruption in the National Executive arm of government; majority of the members of the public (56.1%) and public officials (71.6%) and/or their close family members had experienced acts of corruption in the County Executive arm of government; majority (55.3%) of the members of the public and more than a quarter (28.7%) of the members of the public and/or close members of their families had experienced different acts of corruption in the Judiciary; more than a quarter (26.7%) of members of the public and about half (47.6%) of the public officials and/or their close family members had experienced corruption-related cases in the County Assembly; about a quarter (24.4%) of the public officials and about a tenth (13.3%) of the members of the public and/or their close family members had experienced corruption in the National Assembly; and the least proportion of members of the public (6.1%) and public officials (11.6%) and/or their close family members had experienced corruption in the Senate Assembly. Therefore, in order of ranking of the arms of government from the highest to the lowest, corruption was experienced by members of the public and public officials and/or their close family members from the National Executive arm of government followed by County Executive arm of government, Judiciary, County Assembly, National Assembly and the Senate Assembly. Other findings showed that larger proportions of public officials and/or their close family members than members of the public and/or their close family members had experienced corruption in 5 of the 6 sections of the three broad arms of government. With regard to institutions within the National Executive arm of government where corruption was experienced by members of the public and public officials and/or their close family members during the period 12 months prior to the survey, the most adversely mentioned were the: National Police Service (mentioned by 57.1% and 37.6% of the public officials and members of the public respectively); National Government Administrative Office (mentioned by 18.2% of the members of the public); National Registration Bureau (mentioned by 14.7% and 11.0% of the members of the public and public officials respectively); and the Ministry of Lands and Physical Planning (mentioned by 12.9% of the public officials). Bribery was the most common and/or emerging type of corruption experienced in the National Executive (according to 75.5% of the members of the public and 79.6% of the public officials). Findings of the study from at least 1 out of 10 members of the public and/or public officials showed that institutions within the County Executive arm of government where members of the public and public officials and/or their close family members experienced corruption

213
213
during the period 12 months prior to the survey were the general County Government Executive (reported by 42.4% and 48.4% of the members of the public and public officials respectively) followed specifically by the Ministry of Health (mentioned by 18.2% of the members of public), the Governor’s Office (mentioned by 17.0% of the members of the public and 9.5% of the public officials) and the Procurement Department (mentioned by 12.4% of the public officials). In order of prominence, the common and emerging type of corruption most experienced in the County Executive were bribery (reported by majority (51.0%) of the members of the public and most (41.5%) of the public officials); flouting of procurement regulations (reported by 14.4% of the public officials), nepotism in service delivery (reported by 11.6% and 10.2% of the public officials and members of the public respectively), corruption in job recruitments (reported by 10.6% of the public officials) and embezzlement/misuse/misappropriation of public funds/resources (reported by 9.9% of the members of the public). Within the Judiciary, the common and/or emerging types of corruption mostly experienced by at least 1 out of 10 members of the public and/or the public officials and/or their close family members during the period 12 months prior to the survey were: bribery (reported by 69.7% and 60.8% of the members of the public and public officials respectively); delay/dragging of service delivery (reported by 18.3% of the public officials); and influenced cases/unjust verdicts (reported by 14.5% and 11.4% of the public officials and members of the public respectively). Other findings of this study reported by at least 1 out of 10 members of the public and/or public officials on corruption within the Senate Assembly were that: majority (55.6%) of the public officials and more than a third (37.3%) of the members of the public and/or their close family members had, during the period 12 months prior to the survey, experienced abuse of office; bribery (reported by 30.7% and 22.2% of the members of the public and public officials respectively) and embezzlement/misuse/misappropriation of public funds/resources (reported by 13.7% of the members of the public). According to the findings, the specific institutions within the National Assembly where corruption was experienced by members of the public and/or the public officials and/or their close family members during the period 12 months prior to the survey were the Constituency Development Fund (CDF) Office (reported by 61.6% and 50.0% of the members of the public and public officials respectively) and the Member of Parliament’s Office (reported by 53.6% of the public officials and 43.5% of the members of the public). The most experienced common and emerging types of corruption in the National Assembly were: embezzlement/misuse/misappropriation of public funds/resources (reported by 38.4% of the members of the public); bribery (reported by 26.1% and 21.0% of the public officials and members of the public respectively); nepotism in service delivery (reported by 19.2% of the members of the public); actual and/or facilitation of implementation of shoddy/ghost /white elephant projects (reported by 13.0% of the public officials); abuse of office (reported by

214
214
11.4% of the members of the public); and discrimination in service delivery (reported by 10.5% of the members of the public). Within the County Assembly arm of government, corruption was experienced during the period 12 months prior to the survey by majority of the public officials (93.8%) and members of the public (90.9%) and/or their close family members in the Ward-level MCA’s Office. The leading common and/or emerging types of corruption were: abuse of office (reported by 28.2% and 19.4% of the public officials and members of the public respectively); embezzlement/misuse/misappropriation of public funds/resources (reported by 20.7% of the members of the public); discrimination in service delivery (reported by 19.8% and 19.7% of the members of the public and public officials respectively); nepotism in service delivery (reported by 18.5% of the members of the public); and bribery (reported by 13.7% and 11.8% of the public officials and members of the public respectively). 4.2.3 Perpetrators of corruption in the public service Results of the study showed that majority of the members of the public (87.8%) and public officials (77.4%) agreed with the statement that corruption in the public service was perpetrated by a public official partnering with another public official. Further, majority of the public officials (77.8%) and members of the public (74.8%) agreed with the statement that corruption in the public service was perpetrated by a public official partnering with a non-public official. Hence corruption in the public service majorly has the involvement of at least two public officials and a non-public official. The findings of the study showed that the perceived major general perpetrators of corruption in the public service singled out by at least 1 out of 10 members of the public and/or public officials, were public servants in general (according to 41.1% of the public officials and 24.6% of the members of the public); Police Officers (reported by 35.2% and 22.6% of the members of the public and public officials respectively); members of the public (reported by 18.7% of the public officials); County Government staff (reported by 13.5% of the members of the public); and Chiefs (reported by 9.8% of the members of the public). On the basis of the three highest percentages in each of the counties, the categories of major general perpetrators featuring in at least a third of the 47 counties were Police Officers (prominent in 47 counties), public servants (prominent in 33 counties), County Government staff (prominent in 25 counties) and Chiefs (prominent in 16 counties). The leading public official perpetrators of corruption in the public service with regard to their work designations and/or roles and in order of prominence (based on the highest percentage reported by either the members of the public or the public officials) were Police Officers (31.6%), National Government Administrative Officers (10.7%), procurement staff (9.5%), Members of County Assembly (9.2%), Governors (5.5%) and Accountant (5.3%). The main categories of public official perpetrators featuring in at least a third of the 47 counties (according to the three highest percentages recorded from members of the public) were

215
215
Police Officers (prominent in 45 counties), National Government Administrative Officers (prominent in 33 counties) and Member of County Assembly (prominent in 31 counties). According to majority (61.0%) of the public officials and most (47.2%) of the members of the public, corruption in the public service was also perpetrated by non-public office holders with the main ones being business persons (according to 40.1% of the public officials and 29.9% of the members of the public), the general public (mentioned by 37.2% and 25.5% of the members of the public and public officials respectively), other professionals (reported by 14.2% and 10.3% of the public officials and members of the public respectively) and brokers (reported by 11.9% and 10.9% of the members of the public and public officials respectively). County data from members of the public based on the three highest percentages in each of the counties showed that the main categories of non-public office holders featuring in at least a third of the 47 counties were business persons (prominent in 47 counties), general public (prominent in 44 counties), brokers (prominent in 24 counties) and other professionals (prominent in 22 counties). The major roles of the non-public office holders in the perpetration of corruption in the public service were: giving bribes to public officials (reported by 55.0% and 44.3% of the members of the public and public officials respectively); colluding (including with drug peddlers) to influence public offices (reported by 22.4% and 18.4% of the public officials and members of the public respectively); and canvassing for tenders (reported by 13.0% of the public officials). The three most prominent responses of the members of the public in each of the counties on the roles of non-public office holders in the perpetration of corruption showed that the roles that were prominent in at least a third of the counties were giving bribes (prominent in all the 47 counties), colluding (including with drug peddlers) to influence public office (prominent in all the 40 counties) and canvassing for tenders (prominent in all the 23 counties). With regard to characteristics of public official perpetrators of corruption, the findings showed that public official perpetrators of perceived corruption were majorly middle aged, that is, 36-50 years old (according to 68.8% and 68.4% of the members of the public and public officials respectively) and males (according to 93.1% and 90.7% of the public officials and members of the public respectively) who were in the middle to senior cadre level in terms of seniority in the public service (according to 87.6% and 79.0% of the public officials and members of the public respectively), with most of them being in the senior cadre level (according to 57.8% and 46.2% of the public officials and members of the public respectively). The findings also showed that public official perpetrators of experienced corruption were majorly middle aged, that is, 36-50 years old (according to 72.0% and 69.1% of the members of the public and public officials respectively) and males (according to 90.1% and 86.7% of the public officials and members of the public respectively) who were in the middle to senior cadre level in terms of seniority in the public service (according to 80.2% and 75.6% of the public officials and members of the public respectively), with most of them being in the senior cadre level (according to 41.8% of the public officials).
216
216
4.2.4 Root causes and reasons for engaging in corruption in the public service The major root cause of corruption in the public service was greed (reported by 54.4% and 38.9% of the members of the public and public officials) followed by low wages (reported by 39.0% and 12.3% of the public officials and members of the public respectively), poverty (mentioned by 19.0% and 10.2% of the members of the public and public officials respectively), poor management (reported by 15.7% and 9.8% of the public officials and members of the public respectively) and rationalization of corruption (reported by 14.0% of the public officials). The root causes of corruption featuring in at least a third of the counties (based on the three highest responses recorded from members of the public) were greed (prominent in 47 counties), poverty (prominent in 40 counties), low wages (prominent in 22 counties) and poor management (prominent in 18 counties). The reasons (in order of prominence) that were identified by at least 1 out of 10 members of the public and/or public officials on why some recipients of public services engage in corrupt practices were: urgency of needed service (mentioned by 42.7% and 29.7% of the members of the public and public officials respectively); greed (reported by 27.1% and 14.0% of the public officials and members of the public respectively); culture of impunity (reported by 15.1% of the public officials); limited alternatives for improved livelihood (reported by 12.6% of the members of the public); and quest for financial freedom (reported by 9.8% of the public officials). County-specific analysis of responses from members of the public on the basis of the three highest percentages in each of the counties showed that the reasons featuring in at least a third of the counties were urgency of needed service (prominent in all the 47 counties), greed (prominent in 32 counties) and limited alternatives for improved livelihood (prominent in 24 counties). The main reasons why some providers of public services engaged in corrupt practices in the public service were found to be: greed (reported by majority of the members of the public (67.3%) and public officials (54.1%); low wages (reported by 27.2% and 15.1% of the public officials and members of the public respectively); poor governance systems in the country (mentioned by 10.5% of the public officials); and lack of respect for public offices and other Kenyans (mentioned by 10.0% of the public officials). Similarly, based on the three highest percentages recorded from members of the public in each of the counties, the reasons featuring in at least a third of the counties were greed (prominent in all the 47 counties), low wages (prominent in 44 counties) and lack of respect for public offices and other Kenyans (prominent in 25 counties). 4.2.5 Consequences of corruption in the public service The main consequences (in order of prominence) listed by at least 1 out of 10 members of the public and/or public officials were: delayed and/or poor services (mentioned by 39.6% and 18.2% of the public officials and members of the public respectively); underdevelopment (reported by 36.4% and 36.2% of the members of the public and public officials respectively); increased levels of poverty (reported by 29.1% of the members of the public and 12.1% of the public officials); loss of jobs (reported by 12.0% of the members of the
217
217
public and 11.9% of the public officials); social inequality (mentioned by 11.3% and 10.7% of the public officials and members of the public respectively); and loss of public resources (according to 10.8% of the public officials). County-specific analysis of responses from members of the public on the basis of the three highest percentages in each of the counties showed that the consequences featuring in at least a third of the counties were underdevelopment (prominent in 46 counties), increased levels of poverty (prominent in 45 counties) and delayed and/or poor services (prominent in 28 counties). 4.2.6 Public response to corruption in the public service The findings of the study showed that majority of the members of the public (88.6%) and public officials (83.6%) and/or their close family members who had either witnessed or experienced corruption did not report the corruption incidents. A similar pattern of non-reporting of corruption incidents was observed in all the counties with majority (over 69.0%) of the members of the public respondents and/or their close family members who had witnessed or experienced corruption incidents in each of the 47 counties not reporting the incidents. The main reasons on why experienced or witnessed corruption incidents were not report were that: nothing happens even when you report (reported by 29.5% and 17.0% of the public officials and members of the public respectively); there is fear of victimization (reported by 23.9% and 21.9% of the public officials and members of the public respectively); some people do not know where to report (reported by 15.4% of the members of the public); corruption is almost normal, hence no need for reporting (reported by 13.1% and 11.5% of the public officials and members of the public respectively); there is no confidence in corruption reporting (reported by 12.3% and 10.9% of the public officials and members of the public respectively); and that there is nowhere to report (reported by 11.6% of the members of the public). Based on the three highest percentages of the responses of memers of the public in each of the counties, the reasons for not reporting that were prominent in at least a third of the counties were: fear of victimization (prominent in 43 counties); nothing happens even when you report (prominent in 33 counties); some people do not know where to report (prominent in 32 counties); no confidence in corruption reporting (prominent in 19 counties); nowhere to report (prominent in 18 counties); and corruption is almost normal, hence no need for reporting (prominent in 16 counties). The findings showed that at least 1 out of 10 members of the public and/or public officials and/or their close family members who had reported the corruption incidents they had witnessed or experienced reported to: the National Government Administrative Office, that is, County Commissioner and line officers (mentioned by 23.5% of the members of the public); National Police Service (mentioned by 22.6% and 22.4% of the public officials and members of the public respectively); Journalists (mentioned by 21.2% of the public officials and 17.7% of the members of the public); and unspecified Senior Management Office (according to 20.4% and 10.6% of the public officials and members of the public respectively). Based on the three highest percentages of responses from members of the

218
218
public in each of the counties, the institutions where corruption incidents were reported and that featured at least in a third of the counties were the National Government Administrative Office, that is, County Commissioner and line officers (prominent in 39 counties), National Police Service (prominent in 33 counties), unspecified Senior Management Office (prominent in 29 counties) and unspecified County Government Office (prominent in 19 counties). Nationally, the most popular corruption reporting mechanisms used by individuals were: verbal reporting (mentioned by majority (61.7%) of the members of the public and most (49.3%) of the public officials); Complaints and/or Suggestion Box (mentioned by 25.3% and 18.5% of the public officials and members of the public respectively); Complaints Register and/or Occurrence Book (mentioned by 11.4% of the members of the public); official letter (mentioned by 9.6% of the public officials) and anonymous letter (mentioned by 9.6% of the public officials). Based on the three highest percentages in each of the counties, the mechanisms featuring prominently in at least a third of the counties were verbal reporting (prominent in 45 counties), Complaints and/or Suggestion Box (prominent in 29 counties), Complaints Register and/or Occurrence Book (prominent in 21 counties), telephone call (prominent in 18 counties) and official letter (prominent in 18 counties). Further, majority of the members of the public (64.5%) and public officials (63.1%) pointed out that no action was taken after reporting corruption incidents they and/or their close family members had experienced or witnessed. Absence of action by the relevant agencies against the reported witnessed or experienced corruption incidents was also mentioned by more than half of the members of the public respondents in 32 out of 47 counties (that is, in 68.1% of the counties). With regard to what actions individuals who have experienced or witnessed corruption ought to take to address it, the most popular actions were: reporting corruption cases to relevant authority (mentioned by 66.4% of the members of the public and 77.6% of the public officials); desisting from engaging in corruption (mentioned by 11.3% of the members of the public and 10.7% of the public officials); and being uncooperative to corrupt public officials until they stop being corrupt (mentioned by 9.6% of the members of the public ). On the basis of the three highest percentages recorded from members of the public in each county, the actions that ought to be taken by individuals that featured in at least a third of the counties were: reporting corruption to relevant authorities (prominent in all the 47 counties); desisting from engaging in corruption (prominent in 42 counties); and being uncooperative to corrupt public officials until they stop being corrupt (prominent in 35 counties). On whether or not the local community had taken action to address corruption in public service institutions, majority (64.2%) of the members of the public and most (36.2%) of the public officials argued that it had not. However, according to the few who argued that the local community had taken some actions, the most popular actions were: public demonstrations against corruption (reported by 34.1% and 25.9%) of the public officials and members of the public respectively); reporting corrupt officers to relevant authorities
219
219
(reported by 33.1% and 23.2% of the public officials and members of the public respectively); anti-corruption civic education (reported by 20.5% of the members of the public and 17.0% of the public officials); and exposing corrupt practices (reported by 10.4% of the members of the public). Based on the three highest percentages in each of the counties, the actions that featured in at least a third of the counties were: reporting corrupt officers to relevant authorities (prominent in 43 counties); public demonstrations against corruption (prominent in 41 counties); anti-corruption civic education (prominent in all the 38 counties); exposing corruption practices (prominent in 18 counties); and refusing to engage in corruption (prominent in 18 counties). Findings of the study indicated that the actions that the local community ought to take to address corruption in public service institutions were: reporting corruption to the relevant authorities (highlighted by 43.1% of the public officials and 25.4% of the members of the public); engaging in community sensitizations against corruption (reported by 19.4% and 18.4% of the members of the public and public officials respectively); uniting and speaking in one voice against corruption (highlighted by 17.7% and 10.9% of the members of the public and public officials respectively); and community members desisting from giving bribes (reported by 15.7% of the public officials). The actions that the local community ought to take to address corruption in the public service that featured in at least a third of the counties (based on the three highest percentages of responses of members of the public in each of the counties) were reporting corruption to the relevant authorities (prominent in 43 counties), engaging in community sensitizations against corruption (prominent in 41 counties) and uniting and speaking in one voice against corruption (prominent in 39 counties). The results of the study showed that awareness of measures/initiatives put in place by state organs to address corruption in the public service was exceptionally high among public officials (68.9%) compared to members of the public (25.9%). Further, majority of the members of the public (that is, 50.5% or more) in all the counties except in Kirinyaga county were not aware of the measures/initiatives put in place by state organs to address corruption in the public service. With regard to awareness on specific state organs addressing corruption in the public service, the most popular state organs were the Ethics and Anti-Corruption Commission (mentioned by 67.1% of the members of the public and 65.1% of the public officials) and the National Police Service and especially the Directorate of Criminal Investigations (according to 11.3% of the members of the public). A county-level analysis based on the three highest percentages of responses of members of the public showed that the state organs that were most popular in at least a third of the counties were the Ethics and Anti-Corruption Commission (prominent in 45 counties), the National Police Service and especially the Directorate of Criminal Investigations (prominent in 31 counties), National Government Administrative Office (prominent in 28 counties) and the Judiciary (prominent in 16 counties).
220
220
The measures and/or initiatives put in place by state organs to fight corruption in the public service that were listed by at least 1 out of 10 members of the public and/or public officials were: investigation of corruption (mentioned by 30.2% of the members of the public and 18.4% of the public officials); civic education/public awareness on corruption (reported by 28.5% and 14.4% of the public officials and members of the public respectively); arrest of corrupt officials (mentioned by 15.6% of the members of the public); management of suggestion boxes (mentioned by 14.3% of the public officials); prosecution of corrupt officials (reported by 13.5% and 11.2% of the public officials and members of the public respectively); exposing/whistle blowing of corrupt officials (mentioned by 10.6% of the members of the public); offering of efficient and corruption-free services (mentioned by 10.4% of the public officials); and institution-specific/localized anti-corruption measures (mentioned by 10.0% of the members of the public). Based on the three highest percentages of the responses of the members of the public in each of the 47 analyzed counties, the measures and/or initiatives that came out strongly in at least a third of the counties were investigation of corruption (prominent in 38 counties), civic education/public awareness on corruption (prominent in 31 counties), arrest of corrupt officials (prominent in 30 counties), exposing/whistle blowing of corrupt officials (prominent in 22 counties) and prosecution of corrupt officials (prominent in 19 counties). Findings of the study showed that majority of the members of the public (76.0%) and public officials (71.8%) were generally not satisfied with the measures/initiatives put in place by state organs to address corruption in the public service. Overall, most of the sample respondents gave negative explanations to emphasize why they were not satisfied with the measures, with the most prominent explanations being that there was no serious action taken against corruption (according to 31.6% of the members of the public and 34.8% of the public officials) and that they had no confidence in the anti-corruption system (reported by 9.9% of the members of the public). Only 18.0% of the members of the public and 20.8% of the public officials observed that concerned agencies were reliable in their services and that the agencies were doing their work effectively. Further, county-specific analysis showed that majority of the members of the public in at least 40 counties was generally not satisfied with the measures/initiatives. This implied that measures put in place by state organs in addressing corruption in 87.2% of the 47 counties were generally not satisfactory to most of the members of the public. County-specific analysis based on the three highest percentages of the explanations in each of the counties indicated that 12 out of 16 major explanations given by members of the public on their satisfaction levels were negative (that is, 75.0%, which is close to the 76.0% of members of the public who had said that they were not satisfied with the measures/initiatives) and therefore in support of general dissatisfaction levels. The negative explanations that featured prominently in at least a third of the counties (based on the three highest ercentages of responses of the members of the public in each county) were that: there is no serious action taken against corruption (prominent in 44 counties); there is inadequate arrests and/or jailing of perpetrators (prominent in 23 counties); and there is no confidence in the anti-corruption system (prominent in 20 counties).
221
221
With regard to the perceptions on the extent to which state organs had successfully addressed corruption in the public service, an overall index, computed as an average of all responses across different state organs, showed that 57.6% of the members of the public and 18.9% of the public officials did not know the extent. However, of the members of the public who could rate the success of the state organs in addressing corruption, most of them reported that all the state organs were not successful at all, with those leading in being unsuccessful being the Judiciary’s Anti-Corruption Courts (27.5%) followed by the DCI (25.3%) and the EACC (23.7%). On the other hand, most of the public officials thought that the state organs had achieved some marginal level of success and hence rated the organs as majorly successful to a small extent, with the least performing organ being the EACC (46.4%) followed by Judiciary’s Anti-Corruption Courts (43.6%) and the ODPP (43.5%). Findings on rating of public officials based on 8 selected service delivery values showed that majority (72.2%) of the members of the public and public officials (50.3%) rated their interaction with public officials as unsatisfactory. Majority of the members of the public rated all the 8 selected service delivery values as unsatisfactory while most of the public officials rated 7 of the 8 values as unsatisfactory. The service delivery values that were rated by the largest proportion of the members of the public as unsatisfactory included honesty and trust (78.0%), transparency and accountability (77.3%), prompt service delivery (75.7%) and impartiality (74.0%). On the other hand, the service delivery values that were rated by the largest proportion of the public officials as unsatisfactory included transparency and accountability (58.8%), impartiality (55.4%), honesty and trust (55.3%) and prompt service delivery (54.5%). Therefore, the top four unsatisfactory service delivery values reported by both the members of the public and public officials were: honesty and trust; transparency and accountability; prompt service delivery; and impartiality. County-specific analysis on rating of selected service delivery values showed that all the 8 values were rated unsatisfactorily by more than 50.0% of the members of the public in at least 39 of the 47counties. 4.2.7 Challenges in and recommendations for addressing corruption in the public service The major reasons given by at least 1 out of 10 members of the public and/or public officials on why corruption remained unabated despite the presence of anti-corruption laws and institutions were: inadequate close monitoring of public officials’ ethical conduct, weak legal frameworks and/or compromised and lax law enforcement (reported by 43.4% of the public officials and 36.2% of the members of the public); culture of impunity, pro-corruption attitude on consequences and rationalization of corruption as part of the public service system (mentioned by 26.1% of the members of the public and 18.1% of the public officials); citizens’ ignorance, lack of confidence and their inadequate involvement from the grassroots level in the fight against corruption (reported by 14.4% and 12.2% of the public officials and members of the public respectively); and inadequate government leadership commitment to fight corruption, bad governance and corrupt leadership (reported by 12.5% and 9.9% of the public officials and members of the public respectively). Based on the three highest percentages of responses from members of the public in each of the counties, the reasons that featured prominently in at least a third of the counties were: inadequate close monitoring of
222
222
public officials’ ethical conduct, weak legal frameworks and/or compromised and lax law enforcement (prominent in all the 47 counties); culture of impunity, pro-corruption attitude on consequences and rationalization of corruption as part of the public service system (prominent in all the 47 counties); and citizens’ ignorance, lack of confidence and their inadequate involvement from the grassroots level in the fight against corruption (prominent in 25 counties). The most prominent challenges faced in addressing corruption in the public service were: engagement of top government officials in corruption, inadequate vetting of senior public officials and political interference in anti-corruption initiatives (reported by 26.0% and 21.2% of the public officials and members of the public respectively); lack of commitment by county and national government agencies to fight corruption (including failure to declare it a national disaster) and/or inadequate law enforcement/implementation (reported by 24.8% of the public officials and 19.7% of the members of the public); fear of victimization, intimidation, threats, assassination and abduction from corruption cartels (mentioned by 16.6% of the members of the public); culture of impunity, selfishness, dishonesty, pro-corruption attitude on consequences and rationalization of corruption in the public service as normal (reported by 15.9% and 14.4% of the public officials and members of the public respectively); bureaucracy and lack of professionalism in the public service, inadequate automation of public services and poor remuneration (reported by 12.6% of the public officials); and public/citizen ignorance, lack of sensitization and awareness about corruption (mentioned by 9.6% of the members of the public). Based on the three highest percentages of the challenges reported in each of the counties by members of the public, the challenges that featured prominently at least in a third of the counties were: engagement of top government officials in corruption, inadequate vetting of senior public officials and political interference in anti-corruption initiatives (prominent in 38 counties); lack of commitment by county and national government agencies to fight corruption (including failure to declare it a national disaster) and/or inadequate law enforcement/implementation (prominent in 36 counties); fear of victimization, intimidation, threats, assassination and abduction from corruption cartels (prominent in 26 counties); and culture of impunity, selfishness, dishonesty, pro-corruption attitude on consequences and rationalization of corruption in the public service as normal (prominent in 21 counties). The study established six (6) major options for surmounting challenges faced in addressing corruption in public service institutions and these were: strengthening and/or indiscriminately implementing/enforcing anti-corruption laws, including the arrest and dismissal of corrupt officials and recovery of corruptly-acquired assets (mentioned by 31.9% and 27.6% of the public officials and members of the public respectively); undertaking public/citizen sensitization and awareness creation about the different aspects of corruption (reported by 23.9% and 17.1% of the public officials and members of the public respectively); reforming and/or professionalizing the public service (for example through proper recruitment and deployment of competent officers, use of technology and automation of services, proper remuneration and merger of institutions with similar/related roles) which was reported by

223
223
20.3% of the public officials and 14.5% of the members of the public; whole of government commitment in the fight against corruption including non-politicization of anti-corruption iniatiatives (reported by 14.3% and 13.7% of the public officials and members of the public respectively); appointment and/or election of leaders of integrity (mentioned by 12.7% of the members of the public and 10.3% of the public officials); and enhancing the resourcing and strengthening the operations of the EACC and other anti-corruption institutions up to the devolved units (according to 9.7% of the public officials). Based on the three highest percentages of responses of members of the public in each of the counties, the proposed options that featured prominently in at least a third of the counties were: strengthening and/or indiscriminately implementing/enforcing anti-corruption laws (including arrest and dismissal of corrupt officials and recovery of corruptly-acquired assets) which was prominent in 42 counties; undertaking public/citizen sensitization and awareness creation about corruption (prominent in 28 counties); whole of government commitment in the fight against corruption including non-politicization of anti-corruption iniatiatives (prominent in 24 counties); appointment and/or election of leaders of integrity (prominent in 23 counties); and reforming and/or professionalizing the public service (for example, through proper recruitment and deployment of competent officers, use of technology and automation of services, proper remuneration and merger of institutions with similar/related roles) which came out strongly in 19 counties. The study found out that the major proposed anti-corruption interventions for the public service were: strengthening and/or implementing/enforcing anti-corruption laws and structures (including wealth declaration policy, auditing mechanisms, arrest and dismissal of corrupt officials, recovery of corruptly-acquired assets, monitoring and evaluation of projects and other new anti-corruption systems/mechanisms) which was proposed by 53.5% and 52.3% of the members of the public and public officials respectively; reforming and/or professionalizing the public service (for example through staff training/capacity building, service delivery in Huduma Centres, proper recruitment and deployment of competent officers with integrity, use of technology and automation of services, better terms of service and remuneration) which was highlighted by 28.9% of the public officials and 17.4% of the members of the public; and undertaking public/citizen sensitization and awareness creation about the different aspects of corruption (mentioned by 20.1% and 14.5% of the public officials and members of the public respectively). Based on the three highest percentages of responses of members of the public in each of the counties, the proposed interventions that featured prominently in at least a third of the counties were: strengthening and/or implementing/enforcing anti-corruption laws and structures (including wealth declaration policy, auditing mechanisms, arrest and dismissal of corrupt officials, recovery of corruptly-acquired assets, monitoring and evaluation of projects and other new anti-corruption systems/mechanisms) which featured in all the 47 counties; reforming and/or professionalizing the public service (for example through staff training/capacity building, service delivery in Huduma Centres, proper recruitment and deployment of competent officers with integrity, use of technology and automation of services, better terms of service and remuneration) which was prominent in 36 counties; and undertaking public/citizen
224
224
sensitization and awareness creation about the different aspects of corruption (prominent in 33 counties).
4.3 Conclusions This study purposed to examine the perceptions and experiences of corruption in the public service in Kenya. This was premised on the assertion that corruption was a national security threat concern which had also invited mixed reactions on its magnitude and impact on Kenya’s socio-economic and political development. Further, the complexity of corruption at the national and county level appeared to be unclear and to frustrate and confound both the top political and professional leadership (whether elected, nominated, appointed or ordained) especially with regard to its negative effects on the provisions of the Kenya Constitution 2010 in general and the realization of Kenya Vision 2030 aspirations, the ‘Big Four’ agenda and the 2018- 2022 Medium Term Plan (MTP) III in particular. Although the findings of the study showed that the popularly held view of high levels of corruption in the country was majorly a perception as opposed to a reality issue (judging by the lower levels of corruption experiences compared to the higher levels of perceptions), it was confirmed that corruption existed in real terms in public service institutions falling under all the arms of government at the national and county level. It is against this background that addressing corruption in the country will require well thought-out strategic approaches targeted on the key issues established by the study, with a special focus on the: public services and institutions most prone to corruption; most prevalent common and/or emerging types of corruption; public and non-public office holder perpetrators of corruption and their roles; root causes of corruption and the reasons why public service providers and recipients engage in the vice; challenges faced in addressing corruption and the reasons why corruption remains unabated despite the presence of anti-corruption laws and institutions; negative consequences of corruption; gaps in public response to corruption; and the gaps in anti-corruption interventions/measures spearheaded by state organs responsible for addressing corruption in the country. 4.4 Recommendations 4.4. 1 Key Policy Recommendations Based on the findings, this study makes the following recommendations: 1. There is need for corruption prevention to form a deliberate standing agenda
among all heads of the arms of government and the heads of Ministries, Departments and Agencies (MDAs) especially those responsible for the National Police Service, National Government Administrative Office, National Registration Bureau, Ministry of Lands and Physical Planning, County Government, Ministry of Health, Governor’s Office, Members of Parliament Office, CDF Office, Ward-level Member of County Assembly Office, County Assembly’s Office and the Judiciary as part of raising vigilance against the vice.
225
225
Findings of the study showed that: corruption was majorly perceived to exist and to be high in all the arms of the government; and that corruption was mainly witnessed or experienced in all arms of the government and especially within the National Police Service, National Government Administrative Office, National Registration Bureau, Ministry of Lands and Physical Planning, County Government, Ministry of Health, Governor’s Office, Members of Parliament Office, CDF Office, Ward-level Member of County Assembly Office, County Assembly’s Office and the Judiciary. The major challenges faced in addressing corruption in the public service included: the engagement of top government officials in corruption, inadequate vetting of senior public officials and political interference in anti-corruption initiatives; and lack of commitment by county and national government agencies to fight corruption (including failure to declare it a national disaster) and/or inadequate law enforcement/implementation. One of the major reasons why corruption remained unabated despite the presence of anti-corruption laws and institutions was inadequate government leadership commitment to fight corruption, bad governance and corrupt leadership. Whole of government commitment in the fight against corruption including non-politicization of anti-corruption initiatives was proposed as one of the major options for surmounting challenges faced in addressing corruption. It is therefore recommended that corruption prevention forms a deliberate standing agenda among all heads of the arms of government and the heads of Ministries, Departments and Agencies (MDAs) especially responsible for the National Police Service, National Government Administrative Office, National Registration Bureau, Ministry of Lands and Physical Planning, County Government, Ministry of Health, Governor’s Office, Members of Parliament Office, CDF Office, Ward-level Member of County Assembly Office, County Assembly’s Office and the Judiciary as part of raising vigilance against the vice.
2. The Ethics and Anti-Corruption Commission, in partnership with the Central Bank of Kenya, Kenya Bankers Association, Kenya Institute of Bankers and the Kenya Revenue Authority, needs to prioritize disruption of professional enablers of corruption by undertaking regular vetting and impromptu internal and external monetary, unaccounted wealth accumulation and lifestyle audit and trail of all public officials (and especially the middle to senior cadre level male officials aged 36-50 years working as Police Officers, National Government Administrative Officers, procurement staff, Member of County Assembly, Governor and Accountant)
According to the findings, corruption was majorly perpetrated by a public official partnering with another public official. The most prominent general perpetrators of corruption in the public service were found to be Police Officers, general public servants, general County Government staff and Chiefs. The main category of public official perpetrators of corruption by work designations and/or roles were again the Police Officers, National Government Administrative Officer, procurement staff, Member of County Assembly, Governor and Accountant. Some providers of public services were reported to engage in corrupt practices because of poor governance systems in the

226
226
country. Poor management was also identified as one of the major root causes of corruption. Inadequate close monitoring of public officials’ ethical conduct, weak legal frameworks and/or compromised and lax law enforcement was a major reason why corruption remained unabated despite the presence of anti-corruption laws and institution. Engagement of top government officials in corruption, inadequate vetting of senior public officials and political interference in anti-corruption initiatives was a major challenge faced in addressing corruption in public service institutions. Good governance among public officials was rated unsatisfactorily by more than 50.0% of the members of the public and public officials. Strengthening and/or implementing/enforcing anti-corruption laws and structures (including wealth declaration policy, auditing mechanisms, arrest and dismissal of corrupt officials, recovery of corruptly-acquired assets, monitoring and evaluation of projects and other new anti-corruption systems/mechanisms) was a major anti-corruption intervention for the public. Other findings indicated that public officials perpetrating corruption were mainly middle aged, that is, 36-50 years old male officials who were in the middle to senior cadre level in terms of seniority in the public service (with most of them being the senior cadre). Therefore, the Ethics and Anti-Corruption Commission, in partnership with the Central Bank of Kenya, Kenya Bankers Association, Kenya Institute of Bankers and the Kenya Revenue Authority, needs to prioritize disruption of professional enablers of corruption by undertaking regular vetting and monetary, unaccounted wealth accumulation and lifestyle audit and trail of all public officials (and especially the middle to senior cadre level male officials aged 36-50 years working as Police Officers, National Government Administrative Officer, procurement staff, Member of County Assembly, Governor and Accountant).
3. The Ethics and Anti-Corruption Commission needs to partner with the National Intelligence Service, Directorate of Criminal Investigations, Central Bank of Kenya, Kenya Bankers Association, Kenya Institute of Bankers, Kenya Revenue Authority and the Registrar of Companies to sanitize records of companies doing business with the government (especially with regard to location of the companies/business entities, their financial transactions and true identities of their directors/owners) and undertake identification, profiling, audit and trailing of wealth accumulation (including by way of wealth declaration), investment/business portfolios and lifestyles of non-public official disguised perpetrators of corruption
Findings of the study showed that the general members of the public were perceived to be perpetrators of corruption in the public service and that corruption was perpetrated by a public official partnering with a non-public official. The main non-public officials perpetrating corruption in the public service were the general public and business persons, brokers and other professionals. The major roles played by the non-public officials in perpetrating corruption was giving bribes, colluding (including with drug peddlers) to influence public office and canvassing for tenders. Therefore, the Ethics and Anti-Corruption Commission needs to partner with the National Intelligence Service, Directorate of Criminal Investigations, Central Bank of Kenya, Kenya Bankers

227
227
Association, Kenya Institute of Bankers, Kenya Revenue Authority and the Registrar of Companies to sanitize records of companies doing business with the government (especially with regard to location of the companies/business entities, their financial transactions and true identities of their directors/owners) and undertake identification, profiling, audit and trailing of wealth accumulation (including by way of wealth declaration), investment/business portfolios and lifestyles of non-public official disguised perpetrators of corruption.
4. Public service institutions need to prioritize development and/or implementation of
innovative service delivery models premised on transparent, quality and timely services anchored in the enhanced utilization of the Huduma Centres’ framework, technology-supported integrated public services through the Huduma Namba platform, e-Citizen platform and cashless payment systems for all public services and especially those most susceptible to corruption
Corruption in the public service takes place in the context of the services sought. The findings showed that the most sought services were registration of persons’ services, hospital/medical-related services, bursary services, employment/recruitment services, police-related services and lands-related services. Other findings showed that at least 1 out of 10 members of the public and/or public officials and/or their close family members had experienced corruption especially within the institutions offering the said services. The major reason why some recipients of public services engaged in corrupt practices was found to be the urgency of needed services. Bureaucracy and lack of professionalism in the public service, inadequate automation of public services and poor remuneration was one of the major challenges faced in addressing corruption in the public service institutions. The service delivery value of professionalism of public officials was rated by most of the members of the public as unsatisfactory while more than 50.0% of the members of the public and public officials rated prompt service delivery as unsatisfactory. Reforming and/or professionalizing the public service (for example through use of technology and automation of services and merger of institutions with similar/related roles) was one of the most popular options for surmounting challenges faced in addressing corruption. Reforming and/or professionalizing the public service (for example through service delivery in Huduma Centres and use of technology and automation of services) was also proposed as one of the most popular anti-corruption intervention for the public service. There is therefore need for public service institutions to prioritize development and/or implementation of innovative service delivery models premised on transparent, quality and timely services anchored in the enhanced utilization of the Huduma Centres’ framework, technology-supported integrated public services through the Huduma Namba platform, e-Citizen platform and cashless payment systems for all public services and especially those most susceptible to corruption.
5. There is need for Parliament to enact and the Kenya Revenue Authority, the Ethics
and Anti-Corruption Commission and other relevant state and non-state actors to

228
228
implement a comprehensive harmonized law covering lifestyle audit, income, tax and wealth declaration (that for example requires all Kenyans to file income sources and amounts, expenditure of income, tax and wealth declaration returns together) in order to tame both public and private sector corruption majorly perpetrated through unexplained wealth accumulation and investments, disguised investments and tax evasion by disguised public and non-public official perpetrators
Findings of the study showed that non-public office holders perpetrated corruption in the public service in ways such as giving bribes to public officials, canvassing for tenders and supplying substandard goods and services. This implied that private sector corruption had a strong influence on and/or link to public sector corruption. This may be the case where perpetrators do not declare and/or declare low taxable incomes (sometimes through facilitation by public officials) and/or move significant amounts of monies as sales proceeds without evidence of purchase transactions and/or huge investments (such as in commercial and residential buildings and construction materials’ hardware outlets) without corresponding funding sources. This study therefore recommends that Parliament enacts and the Kenya Revenue Authority, the Ethics and Anti-Corruption Commission and other relevant state and non-state actors a comprehensive harmonized law covering lifestyle audit, income, tax and wealth declaration (that for example requires all Kenyans to file tax and wealth declaration returns together) in order to tame both public and private sector corruption majorly perpetrated through unexplained wealth accumulation and investments, disguised investments and tax evasion by disguised public and non-public official perpetrators.
6. The national and county legislature to institute stringent and stiff anti-corruption
laws to be implemented by the Judiciary and the Executive which will require the burden of proof to be on the defence/accused (rather than the prosecution) and the relative value of the benefits of corruption to be lower than the imposed sanctions which will include the recovery of 100% corruptly-acquired assets and embezzled public funds and/or resources and the barring of all those who fail the leadership and integrity test from holding public office and doing business with any public service institution
Weak legal frameworks were cited as one of the major reasons why corruption remained unabated despite the presence of anti-corruption laws and institutions and that strengthening anti-corruption laws was the key option for surmounting challenges faced in addressing corruption and the major anti-corruption intervention. The culture of impunity was found to be: one of the major reasons why some recipients of public services engaged in corrupt practices; one of the major reasons why corruption remained unabated despite the presence of anti-corruption laws and institutions; and one of the major challenges faced in addressing corruption in public service institutions. Corruption in the public service was responsible for a number of serious negative consequences, the

229
229
major ones being underdevelopment, increased levels of poverty, delayed and/or poor services, loss of jobs, social inequality and loss of public resources. In order to mitigate against these consequences and prevent further corruption, this study recommends that the national and county legislature institute stringent and stiff anti-corruption laws to be implemented by the Judiciary and the Executive which will require the burden of proof to be on the defence/accused (rather than the prosecution) and the relative value of the benefits of corruption to be lower than the imposed sanctions which will include the recovery of 100% corruptly-acquired assets and embezzled public funds and/or resources and the barring of all those who fail the leadership and integrity test from holding public office and doing business with any public service institution. This will also serve as deterrence to those bent on perpetrating corruption and/or have embraced a culture of corruption tolerance.
7. The Ethics and Anti-Corruption Commission, in partnership with the Commission
on Administrative Justice (Ombudsman), needs to put in place innovative corruption reporting mechanisms such as locating clearly-marked EACC-managed reporting facilities (for example mail boxes and/or toll-free telephone booths and lines) in strategic yet convenient, confidential and security-friendly environments such as public play grounds, Huduma Centres, Post Offices, banking institutions, premises of religious institutions and on the streets for citizens to freely and confidently report corruption incidents
The findings of this study showed that majority of the members of the public and most of the public officials had witnessed corruption incidents in the public service while majority of the members of the public and at least 4 out of 10 public officials had experienced corruption incidents in the public service. Although management of suggestion boxes was one of the key measures/initiatives put in place by state organs to fight corruption, majority of the members of the public and public officials did not report the witnessed and/or experienced corruption majorly because: of fear of victimization; nothing happens even when you report; some people do not know where to report; there is no place to report; and some people have no confidence in corruption reporting. Again, only a minority of individuals and local community members reported corruption majorly by way of verbal reporting and use of Complaints and/or Suggestion Boxes. This implied that the mechanisms and measures/initiatives put in place for reporting corruption were not effective. Further findings emphasized the need for individuals and the local community to report corruption to the relevant agencies if corruption was to be addressed. To encourage reporting of corruption, ensure anonymity in reporting and address the challenge of fear of victimization, this study recommends that the Ethics and Anti-Corruption Commission, in partnership with the Commission on Administrative Justice (Ombudsman), puts in place innovative corruption reporting mechanisms such as locating clearly-marked EACC-managed reporting facilities (for example mail boxes and/or toll-free telephone booths and lines) in strategic yet convenient, confidential and security-friendly environments such as public play grounds, Huduma Centres, Post
230
230
Offices, banking institutions, premises of religious institutions and on the streets for citizens to freely and confidently report corruption incidents.
8. Concerted efforts of the Ethics and Anti-Corruption Commission, Directorate of
Criminal Investigations, National Intelligence Service, Office of the Director of Public Prosecutions and the Office of the Auditor General are needed with regard to intelligence sharing on corruption, multi-layered oversight of public service institutional financial transactions and innovative identification, detection, investigation and free-from-influence prosecution mechanisms appropriate for each of the specific most prevalent types of corruption with a special focus on bribery (soliciting for and/or receiving bribes) and embezzlement/misuse/misappropriation of public funds/resources
The main common and/or emerging types of corruption experienced by members of the public and/or public officials and/or their close family members in all the arms of the government were bribery (soliciting for and/or receiving bribes), nepotism in service delivery, embezzlement/misuse/misappropriation of public funds/resources, corruption in job recruitments, flouting procurement regulations, abuse of office, nepotism in service delivery, discrimination in service delivery, actual and/or facilitation of implementation of shoddy/ghost /white elephant projects, influenced cases/unjust verdicts and delay/dragging of service delivery. The service delivery value of transparency and accountability of public officials was rated by more than 50.0% of the members of the public and public officials as unsatisfactory. Despite there being key measures/initiatives such as investigation, arrest and prosecution of corrupt officials superintended over by key state organs such as the Ethics and Anti-Corruption Commission, the National Police Service (especially the Directorate of Criminal Investigations) and the Judiciary to fight corruption in the public service, corruption had continued to be witnessed or experienced in the public service. This partly explained why most members of the public and public officials were not satisfied with the measures. They also held perceptions that the Ethics and Anti-Corruption Commission, Directorate of Criminal Investigations, Judiciary’s Anti-Corruption Courts, Office of the Director of Public Prosecutions, Office of the Attorney General, National Anti-Corruption Campaign Steering Committee, Internal Audit Department/Section in Ministries and Internal Corruption Prevention Committees in public institutions were not successful at all or were only successful to a small extent in addressing corruption majorly because corruption was still rampant and rising in magnitude. As a national security threat, addressing corruption therefore requires the concerted efforts of the Ethics and Anti-Corruption Commission, Directorate of Criminal Investigations, National Intelligence Service, Office of the Director of Public Prosecutions and the Office of the Auditor General with regard to intelligence sharing on corruption, multi-layered oversight of public service institutional financial transactions and innovative identification, detection, investigation and free-from-influence prosecution mechanisms appropriate for each of the specific most prevalent types of

231
231
corruption with a special focus on bribery (soliciting for and/or receiving bribes) and embezzlement/misuse/misappropriation of public funds/resources.
9. The Ethics and Anti-Corruption Commission and the National Anti-Corruption
Campaign Steering Committee, in partnership with other relevant state and non-state actors (especially faith-based organizations and the mass media), need to prioritize the use of anti-corruption socio-cultural messaging approaches that sensitize and create awareness on different aspects of corruption, leadership and integrity and inculcate (for example through religious and learning institutions) a culture of legitimate hard work, upholding and practicing moral principles (such as kindness, honesty and tolerance and respect for others), patriotism and social justice (such as access, equity, citizens’ rights and participation in public services and/or opportunities)
The results of the study showed that corruption was mainly a socio-cultural and specifically a morality, behavior, attitude and culture problem. According to the findings, some of the major root causes of corruption were greed and rationalization of corruption. One of the major reasons why some recipients of public services engaged in corrupt practices was greed. Some of the main reasons why some providers of public services engaged in corrupt practices were greed and lack of respect for public offices and other. According to 1 out of 10 members of the public and/or public officials, corruption was almost normal and hence there was no need for reporting it. The culture of impunity, pro-corruption attitude on consequences and rationalization of corruption as part of the public service was a reason why corruption remained unabated despite the presence of anti-corruption laws and institutions. Public/citizen ignorance, lack of sensitization and awareness about corruption and the culture of impunity, selfishness, dishonesty, pro-corruption attitude on consequences and rationalization of corruption in the public service as normal were found to be challenges faced in addressing corruption in the public service. The service delivery values of patriotism, integrity, impartiality and honesty and trust of public officials were rated by most of the members of the public and public officials as unsatisfactory. Although most of the members of the public and public officials had a general understanding of what corruption was, undertaking public/citizen sensitization and awareness creation about the different aspects of corruption was proposed by respondents as one of the key options for surmounting challenges faced in addressing corruption in public service institutions. It was also suggested as one of the key proposed anti-corruption interventions for the public service. Encouraging culture change and positive attitude towards avoiding and fighting corruption was also cited as one of the key anti-corruption interventions for the public service. This study therefore recommends that the Ethics and Anti-Corruption Commission and the National Anti-Corruption Campaign Steering Committee, in partnership with other relevant state and non-state actors (especially faith-based organizations and the mass media), prioritize the use of anti-

232
232
corruption socio-cultural messaging approaches that sensitize and create awareness on different aspects of corruption, leadership and integrity and inculcate (for example through religious and learning institutions) a culture of legitimate hard work, upholding and practicing moral principles (such as kindness, honesty and tolerance and respect for others), patriotism and social justice (such as access, equity, citizens’ rights and participation in public services and/or opportunities).
10. There is need for Parliament and the National Treasury, with the support of development partners, to increase the operational capacity of the Ethics and Anti-Corruption Commission and other anti-corruption institutions up to the devolved units through strengthening of their autonomy and enhanced financial, human and infrastructural resourcing
Most of the state organs involved in addressing corruption in the public service were generally rated as not successful at all or were successful to a small extent. Enhancing the resourcing and strengthening the autonomy and operations of the EACC and other anti-corruption institutions up to the devolved units was reported to be a major option for surmounting challenges faced in addressing corruption and was also said to be an anti-corruption intervention for the public service. Strengthening anti-corruption structures and systems/mechanisms was identified as a key anti-corruption intervention for the public service. Therefore, this study recommends that Parliament and the National Treasury, with the support of development partners, increase the operational capacity of the Ethics and Anti-Corruption Commission and other anti-corruption institutions up to the devolved units through strengthening of their autonomy and enhanced financial, human and infrastructural resourcing.
11. The Ethics and Anti-Corruption Commission and the National Anti-Corruption
Campaign Steering Committee to prioritize putting in place innovative anti-corruption public participation in governance, decision making and access to information strategies through forums such as public open-air outreach and vernacular radio and television programmes which will also boost citizens’ awareness of the efforts state organs have put in place to stamp out corruption
Citizens’ ignorance, lack of confidence and their inadequate involvement from the grassroots level in the fight against corruption was cited as one of the reasons why corruption remained unabated despite the presence of anti-corruption laws and institutions. County-specific findings of the study showed that the key actions that individuals (who had experienced or witnessed corruption) and the local community ought to take to address corruption in the public service was reporting corruption to the relevant authorities, engaging in community sensitizations against corruption and uniting and speaking in one voice against corruption. Other findings showed that individuals (who had witnessed and/or experienced corruption) and/or the local community had made some efforts to address corruption majorly by engaging in actions such as public

233
233
demonstrations against corruption, reporting corrupt officers and anti-corruption civic education. However, to effectively encourage public participation against corruption, this study recommends that the Ethics and Anti-Corruption Commission and the National Anti-Corruption Campaign Steering Committee put in place innovative anti-corruption public participation in governance, decision making and access to information strategies through forums such as public open-air outreach and vernacular radio and television programmes which will also boost citizens’ awareness of the efforts state organs have put in place to stamp out corruption.
12. The Ethics and Anti-Corruption Commission to undertake county-specific
mapping of public service institutions in all the arms of government where corruption is most prevalent and put in place anti-corruption strategies that seal corruption loopholes specific to the institutions’ mode of service delivery
The results showed that members of the public and/or public officials mainly perceived corruption to be most prevalent in most public offices but prominently within the National Police Service (especially Traffic Police and Police in border areas), County Government, Ministry of Health, Ministry of Interior and Coordination of National Government, Ministry of Lands and Physical Planning and the Judiciary/ Law Courts. Corruption was also witnessed especially within the National Police Service, County Government and the National Government Administrative Office. Further, corruption was majorly experienced especially within the National Police Service, National Government Administrative Office, National Registration Bureau, Ministry of Lands and Physical Planning, most County Government Offices, Ministry of Health, Governor’s Office, Procurement Department, the Judiciary/Law Courts, Senate Assembly Office, MP’s Office, CDF Office, Ward-level MCA’s Office and County Assembly’s Office. Since different public service institutions may have unique ways of delivering their services to the general public, this study recommends that the Ethics and Anti-Corruption Commission undertakes county-specific mapping of public service institutions in all the arms of government where corruption is most prevalent and puts in place anti-corruption strategies that seal corruption loopholes specific to the institutions’ mode of service delivery.
13. The Ethics and Anti-Corruption Commission needs to leverage on public
trust/confidence on the National Police Service and the National Government Administrative Office especially with regard to reporting of corruption witnessed and/or experienced outside these two institutions, and the three institutions to nurture this trust/confidence
The findings of the study showed that corruption in the National Executive was majorly witnessed and/or experienced within the National Police Service, National Government Administrative Office, National Registration Bureau and the Ministry of Lands and Physical Planning. Interestingly, those who had witnessed and/or experienced corruption

234
234
in any public service institution reported it to the National Police Service and the National Government Administrative Office (and not to the Ethics and Anti-Corruption Commission) thus pointing to some level of public trust/confidence on the two institutions, which the Ethics and Anti-Corruption Commission could take advantage of. This study therefore recommends that the Ethics and Anti-Corruption Commission leverages on public trust on the National Police Service and the National Government Administrative Office especially with regard to reporting of corruption witnessed and/or experienced outside these two institutions and the three institutions to nurture this trust/confidence.
14. The Government, through all relevant ministries, needs to prioritize fighting
corruption through the approach dubbed ‘skills and tool box for youth in technical and vocational training centres’ which has the potential to create employment opportunities and improve livelihoods for the general public and the youth in particular and eventually minimize the drivers of their involvement in public sector corruption
Some of the major reasons why some recipients of public services engaged in corrupt practices included limited alternatives for improved livelihood and quest for financial freedom. The major root causes of corruption in the public service included poverty and unemployment. Corruption itself has key negative consequences such as underdevelopment, increased levels of poverty and loss of jobs. Youth form the bulk of the country’s population and have a share in the perpetration of corruption as they seek for livelihoods. Hence their potential needs to be harnessed through technical and vocational skills. However, releasing trained and skilled youth from technical and vocational training centres without tools of work negates the efforts, time and other resources spent on them. Therefore, this study recommends that the Government, through all relevant ministries, prioritizes fighting corruption through the approach dubbed ‘skills and tool box for youth in technical and vocational training centres’ which has the potential to create employment opportunities and improve livelihoods for the general public and the youth in particular which in turn can have the ripple effect of addressing corruption in the country.
15. There is need for the Witness Protection Agency, in collaboration with the Ethics
and Anti-Corruption Commission, the Office of the Director of Public Prosecutions and the Judiciary to put in place an effective witness protection programme for key corruption cases
The study established that the major reason why reporting of corruption was shunned by those who had witnessed or experienced corruption was the fear of victimization. This may be a contributor to the culture of impunity which was identified as a significant reason why corruption remained unabated despite the presence of anti-corruption laws and institutions and was also a key challenge faced in addressing corruption in public
235
235
service institutions. Since witnesses and their safety are paramount in the effective prosecution of corruption cases, the Witness Protection Agency, in collaboration with the Ethics and Anti-Corruption Commission, the Office of the Director of Public Prosecutions and the Judiciary, needs to put in place an effective witness protection programme for key corruption cases.
16. The Government needs to undertake performance management reforms premised
on proper staff recruitment, deployment and capacity building practices, objective job evaluation, harmonized and improved terms of service across the public service with a special focus on departments in the mainstream Civil Service Ministries with a view of minimizing corruption incidents arising from public staff performance and employment-related factors
Corruption was reported variably across the different public service institutions with departments in the mainstream Civil Service Ministries being the most affected. Low wages were identified as one of the major root causes of corruption in the public service. Low wages were also cited as one of the major reasons why providers of public service engaged in corrupt practices. Reforming the public service (for example through proper recruitment, deployment of competent officers, staff training/capacity building and proper remuneration) was one of the most popular options for surmounting challenges faced in addressing corruption. Public service reform in the way of better terms of service and remuneration for public officials was cited as a major anti-corruption intervention. It is therefore recommended that the Government undertakes performance management reforms premised on proper staff recruitment, deployment and capacity building practices, objective job evaluation, harmonized (to address pay disparities towards equal pay for equal work done) and improved terms of service across the public service with a special focus on departments in the mainstream Civil Service Ministries with a view of minimizing corruption incidents arising from public staff performance and employment-related factors.
4.4. 2 Recommendations for Further Research The factors that predispose the executive arm of the National Government to corruption were not the core subject matter of this study and may therefore require a further research. A further research on the underlying factors behind a lesser claim of corruption at the Senate Assembly compared with the other arms of government aimed at unpacking the hypothesis that there is an association between the amount of resources controlled by public service institutions, the service delivery interaction levels with members of the public and the level of corruption may also be necessary. Again, the quantified economic and/or financial cost and/or burden of public service corruption crime in the country was not covered in the current study and may therefore be an area of interest for further studies. Last but not least, a detailed study on the inter-play between private and public sector corruption is recommended.
236
236
REFERENCES Adebayo, A. O. (2014). Ethical Issues in Public Service. International Journal of Social
Science and Humanity, Vol. 4, No. 5, September 2014. Retrieved January 13, 2018, from http://www.ijssh.org/papers/388-C10006.pdf
Akech, M. (2011). Abuse of Power and Corruption in Kenya: Will the New Constitution Enhance Government Accountability? Indiana Journal of Global Legal Studies. Vol. 18, No. 1 (Winter 2011), 341-394. Retrieved August 18, 2018, from https://www.repository.law.indiana.edu/cgi/viewcontent.cgi?article=1447&context=ijgls
Ankamah, S. S. & Khoda, S. M. M. E. (2017, December 4). Political will and government anti-‐corruption efforts: What does the evidence say? Public Administration and Development. Article retrieved March 19, 2018, from https://onlinelibrary.wiley.com/doi/full/10.1002/pad.1815#accessDenialLayout
Asian Development Bank (ADB) and Organization for Economic Co-operation and Development (OECD). (2003). Effective Prosecutionof Corruption: Report on the Master Training Seminar. Manila: Asian Development Bank. Retrieved April 9, 2018, from https://www.oecd.org/site/adboecdanti-corruptioninitiative/regionalseminars/35023374.pdf
Basel Institute on Governance. (2017). New perspectives in e-government and the prevention of corruption. Basel Institute on Governance Working Paper 23. ISSN: 2624-9650. Retrieved August 29, 2018, from https://www.baselgovernance.org/sites/default/files/2019-06/WP_23_web.pdf
Bhargava, V. (2005). The Cancer of Corruption. World Bank Global Issues Seminar Series. Retrieved March16, 2018, from http://siteresources.worldbank.org/EXTABOUTUS/Resources/Corruption.pdf
Bhaskar, R. N. (2018, November 14). The state of corruption in India. Observer Research Foundation. Retrieved November 17, 2018, from https://www.orfonline.org/research/the-state-of-corruption-in-india-45529/
Center for International Private Enterprise (CIPE). (2011). “Combating Corruption: A Private Sector Approach” Reform Toolkit. Washington DC: CIPE.
Chepkwony, M. (2018, February 22). Kenya’s latest ranking in global corruption index. Standard Digital. Retrieved April 13, 2018, from
https://www.standardmedia.co.ke/business/article/2001270749/how-kenya-ranks-in-world-corruption-index
237
237
Chetwynd, E., Chetwynd, F. & Spector, B. (2003) Corruption and Poverty: A Review of Recent Literature Final Report January 2003. Management Systems International. 600 Water Street, SW Washington, DC 20024 USA. Retrieved June 13, 2018, from https://www.eldis.org/document/A14857
Cohen, L. E. & Felson, M. (1979). Social Change and Crime Rate Trends: A Routine Activity Approach. ResearchGate. Retrieved July 13, 2018, from https://www.researchgate.net/publication/238322365_Social_Change_and_Crime_Rate_Trends_A_Routine_Activity_Approach
Cytonn. (2018, July 29). The Fight Against Corruption in Kenya…Yet Another Chapter. Retrived August 12, 2018, from https://www.cytonn.com/topicals/the-fight-against-corruption-in-kenyayet-another-chapter
Daily Nation Reporter. (2018, December 23). Police, civil servants top list of graft convicts. Daily Nation. Retrieved December 28, 2018, from https://www.nation.co.ke/news/Top-List-Graft-Convicts-/1056-4907320-baik3y/index.html
D’Amico, N. (2015). Corruption and Economic Growth in China: An Empirical Analysis. Article retrieved April 27, 2018 from https://collected.jcu.edu/cgi/viewcontent.cgi?article=1077&context=honorspapers
Ethics and Anti-Corruption Commission. (2012). National Corruption Perception Survey (2011). Ethics and Anti-Corruption Commission Directorate of Preventive Services.
Ethics and Anti-Corruption Commission. (2013). National Survey on Corruption and Ethics, 2012. Ethics and Anti-Corruption Commission Directorate of Preventive Services.
Ethics and Anti-Corruption Commission. (2015). Corruption and Ethics Survey Report, 2014. Research and Transformation Department.
Ethics and Anti-Corruption Commission. (2017). Corruption and Ethics in Devolved Services: County Public Officers’ Experiences, 2015.
Ethics and Anti-Corruption Commission. (2017). National Ethics and Corruption Survey, 2015 Report.
Ethics and Anti-Corruption Commission. (2018). National Corruption Survey, 2017. Ethics and Anti-Corruption Commission Directorate of Preventive Services. EACC Research Report No. 6 of May, 2018.
Forson, J. A., Baah-Ennumh, T. Y., Buracom, P., Chen, G. & Peng, Z. (2016, November). Causes of Corruption: Evidence from sub-Saharan Africa. Retrieved April 21, 2018, from https://www.researchgate.net/publication/310803480_Causes_of_Corruption_Evidence_from_sub-Saharan_Africa

238
238
GAN Integrity. (2017a). Russia Corruption Report -Snapshot. Retrived February 13, 2018, from https://www.ganintegrity.com/portal/country-profiles/russia/
GAN Integrity. (2017b). Kenya Corruption Report -Snapshot. Retrived February 13, 2018, from https://www.ganintegrity.com/portal/country-profiles/kenya/
Gedan, B. N., & Alonso, D. R. (2018, November 15). Only criminals can clean up Argentina’s corruption. FP news. Retrieved November 18, 2018, from https://foreignpolicy.com/2018/11/15/only-criminals-can-clean-up-argentinas-corruption/
Graaf, G. de (2007). “Causes of Corruption: Towards a Contextual Theory of Corruption”. ResearchGate. Retrieved February 21, 2018, from https://www.researchgate.net/publication/236676886_Causes_of_Corruption_Towards_a_Contextual_Theory_of_Corruption/link/0c960531ff5f6787d7000000/download
Hamilton, A., & Hammer, C. (2018). Can We Measure the Power of the Grabbing Hand? A Comparative Analysis of Different Indicators of Corruption. The World Bank Group Policy Research Working Paper 8299. Retrieved March 23, 2018, from https://scholar.google.com/scholar?q=Policy+Research+Working+Paper+8299&hl=en&as_sdt=0&as_vis=1&oi=scholart
Independent Commission Against Corruption ICAC (2003). Profiling the NSW Public Sector: Functions, risks and corruption resistance strategies. Sydney: ICAC.
Kempe, R. H. (2014, September 10). Kenya's corruption problem: Causes and consequences. Commonwealth & Comparative Politics. Vol. 52, 2014 – Issue 4. Retrieved May 12, 2018, from https://www.tandfonline.com/doi/abs/10.1080/14662043.2014.955981?journalCode=fccp20
Kenya National Bureau of Statistics. (2017). Economic Survey 2017. Nairobi: Government Printers.
Kenya National Bureau of Statistics. (2018). 2015/16 Kenya Integrated Household Budget Survey. Nairobi: Government Printers.
Ki-moon, B. (2018, November 2). “Global anti-corruption conference opens with simple message: To achieve sustainable development, we must end corruption”.UNODC. Retrieved November 5, 2018, from https://www.unodc.org/unodc/en/frontpage/2015/November/Global_anti-corruption_conference_opens_with_simple_message_To_achieve_sustainable_development_we_must_end_corruption.html
Kimuyu, H. (2018, February 9). Drama as three traffic officers arrested taking bribes from motorists – VIDEO. Nairobi News. Retrieved March 7, 2018, from https://nairobinews.nation.co.ke/news/traffic-officers-arrested-taking-bribes
239
239
King, E. (2018, May 1). How auditors can help fight corruption in local government. ACCANews. Retrieved May 17, 2018, from https://www.accaglobal.com/my/en/member/member/accounting-business/2018/05/insights/fight-corruption.html
Klitgaard, R. (1988). Controlling Corruption. In Nuhu, S. & Mpambije, C. J. (2017). Land Access and Corruption Practices in the Peri-Urban Areas of Tanzania: A Review of Democratic Governance Theory. Open Journal of Social Sciences, Vol.5, No.4. Retrived March 23, 2018, from https://www.scirp.org/(S(lz5mqp453edsnp55rrgjct55))/reference/ReferencesPapers.aspx?ReferenceID=2028802
Kpundeh, S. J. (1998). Political Will in Fighting Corruption. In UNDP (1998), Corruption and Integrity Initiatives in Developing Countries. New York: UNDP.
Manda, D. K. (2001). Incentive Structure and Efficiency in the Kenyan Civil Service. United Nations University World Institute for Development (UNU-WIDER) Working Paper. Retrieved July 15, 2018, from https://www.wider.unu.edu/publication/incentive-structure-and-efficiency-kenyan-civil-service
Mulwa, E. M. (2018, May 10). Traffic police officers arrested collecting bribes along Thika-Garissa highway. Standard Digital. Retrieved May 16, 2018, from https://www.standardmedia.co.ke/article/2001280035/traffic-police-officers-arrested-collecting-bribes-along-thika-garissa-highway
Mutavi, L. (2018, May 21). Ex-Nairobi county official fined Sh530,000 in bribery case. The Star. Retrieved May 25, 2018, from https://www.the-star.co.ke/news/2018-05-21-ex-nairobi-county-official-fined-sh530000-in-bribery-case/
National Council for Law Reporting. (2003a). Public Officers Act 2003. Nairobi: Government Printers.
National Council for Law Reporting. (2003b). Anti-Corruption and Economic Crimes Act 2003. Nairobi: Government Printers.
National Council for Law Reporting. (2010). The Constitution of Kenya 2010. Nairobi: Government Printers.
National Council for Law Reporting. (2011). Ethics and Anti-Corruption Act 2011. Nairobi: Government Printers.
National Council for Law Reporting. (2012a). Public Finance Management Act 2012. Nairobi: Government Printers.
National Council for Law Reporting. (2012b). Leadership and Integrity Act 2012. Nairobi: Government Printers.

240
240
National Council for Law Reporting. (2012c). The County Government Act 2012. Nairobi: Government Printers.
National Council for Law Reporting. (2015). Public Service (Values and Principles) Act 2015. Nairobi: Government Printers.
National Crime Research Centre. (2016). Election Crimes and Offences in Kenya. Nairobi: NCRC.
National Crime Research Centre. (2017). Emerging Crimes: The Case of Kidnappings in Kenya. Nairobi: NCRC.
National Crime Research Centre. (2018). Borderland-related Crimes and Security Threats in Kenya. Nairobi: The Jomo Kenyatta Foundation.
Nuhu, S. & Mpambije, C. J. (2017, April 30). Land Access and Corruption Practices in the Peri-Urban Areas of Tanzania: A Review of Democratic Governance Theory. Open Journal of Social Sciences, Vol.5, No.4. Retrived March 23, 2018, from https://www.scirp.org/(S(lz5mqp453edsnp55rrgjct55))/reference/ReferencesPapers.aspx?ReferenceID=2028802
Organization for Economic Co-operation and Development (OECD). (2018). State-Owned Enterprises and Corruption: What Are the Risks and What Can Be Done?. Paris: OECD Publishing. Retrieved December 12, 2018, from https://read.oecd-ilibrary.org/governance/state-owned-enterprises-and-corruption_9789264303058-en#page1
Podger, A. (2002, January). The ethical challenges in the public service. ResearchGate. Article retrieved March 26, 2018, from https://www.researchgate.net/publication/237234831_THE_ETHICAL_CHALLENGES_IN_THE_PUBLIC_SERVICE/link/544a60e60cf21cdb24f7725c/download
Public Service Commission (PSC). (2014). Evaluation Report for the year 2013/2014 on Public Service Compliance with the Values and Principles in Article 10 and 232 of the Constitution. Nairobi: Government Printers.
Public Service Commission (PSC). (2016a). Human Resource Policies and Procedures
Manual, May 2016. Nairobi: PSC.
Public Service Commission (PSC). (2016b). Evaluation Report for the year 2015/2016 on Public Service Compliance with the Values and Principles in Article 10 and 232 of the Constitution. Nairobi: Government Printers.
Sumah, S. (2017, October 17). Corruption, Causes and Consequences. Abstract retrieved June 12, 2018, from https://www.intechopen.com/books/trade-and-global-market/corruption-causes-and-consequences
241
241
The World Bank. (2007). The World Bank Annual Report 2007. Washington DC: The World Bank.
Transparency International (2004). Political parties are most corrupt institution worldwide according to TI Global Corruption Barometer 2004. Transparency International. Retrieved May 13, 2018, from https://www.transparency.org/news/pressrelease/political_parties_are_most_corrupt_institution_worldwide_according_to_ti_gl
Transparency International. (2010). Global Corruption Barometer. Berlin: Transparency International.
Transparency International Kenya. (2014). Annual Report 2012 - 2013. Nairobi: Transparency International.
Transparency International. (2015). Global corruption Perception, Africa 2015. Berlin: Transparency International.
Transparency International. (2017). Corruption Perceptions Index 2017. Berlin: Transparency International.
Transparency International-Kenya. (2018, February 22). No Marked Improvement for Kenya in the 2017 Global Corruption Perceptions Index. Transparency International. Retrieved February, 26, 2018, from https://tikenya.org/no-marked-improvement-for-kenya-in-the-2017-global-corruption-perceptions-index/
United Nations Office on Drugs and Crime (UNODC). (2004). United Nations Convention Against Corruption. Vienna: Vienna International Centre. Retrieved July 25, 2018, from https://www.unodc.org/documents/brussels/UN_Convention_Against_Corruption.pdf
Wallis, J. J. (2004, December). The concept of systematic corruption in American political and economic history. National Bureau of Economic Research. Abstract retieved June 14, 2018, from https://www.nber.org/papers/w10952.pdf
Wike, R., Simmons, K., Vice, M., & Bishop, C. (November 14, 2016). Kenyans worried about economy and corruption, but optimistic for the future. PEW Research Center. Retrieved April 5, 2018, from https://www.pewresearch.org/global/2016/11/14/kenyans-worried-about-economy-and-corruption-but-optimistic-for-the-future/

242
242
APPENDICES
NATIONAL CRIME RESEARCH CENTRE
A STUDY ON PERCEPTIONS AND EXPERIENCES OF CORRUPTION IN THE PUBLIC SERVICE IN KENYA
Appendix 1: Questionnaire/Interview Schedule for Members of Public Sample Respondents (to be answered by household head or spouse or most aged Offspring/child) County: ___________________________________________________________________
Constituency _______________________________________________________________
Ward: ____________________________________________________________________
Date of interview: ___________________________________________________________
Time of interview: Start Time:…………...End Time:…………..Time taken:…………….
Introduction
How are you today? My name is…………………………………………..and I am collecting data for the National Crime Research Centre (NCRC), a State Corporation established by the National Crime Research Centre Act (CAP, 62 L.o.K). The survey is on “ A Study on Perceptions and Experiences of Corruption in the Public Service in Kenya”. The findings of the study are aimed at informing policies and programmes towards addressing the problem of corruption in the country. We would therefore like to ask you some questions related to the subject. All the information you give will be treated in utmost confidence and your identity will not be revealed. We would highly appreciate if you spared some time to respond to the following questions.
Thank you in advance.
Signature of interviewer___________________ Date _________________________
[ ] RESPONDENT AGREES TO BE INTERVIEWED
[ ] RESPONDENT DOES NOT AGREE TO BE INTERVIEWED END

243
243
Section A: Background Information
1. Status in the Head hold 1. Head of household 2. 1st wife/Spouse 3. Additional wife 4. Son or daughter (Tick one) 5. Son/daughter in-law (Tick one) 6. Grandson/daughter (Tick one) 7. Mother or father of Head of household (Tick one) 8. Father/mother in-law of Head of household (Tick one) 9. Brother or sister of Head of household (Tick one) 10. Other relatives (Specify)______________________ 11. Adopted child
2. Gender
1) Male 2) Female
3. Age of respondents in years
1) 18 – 25 2) 26 – 33 3) 34 – 41 4) 42 – 49 5) 50 – 57 6) 58 – 65 7) 66 – 73 8) 74+
4. Marital status:
1) Single/Never Married 2) Married 3) Divorced 4) Separated 5) Widowed
5. Highest level of education:
1) None 2) Primary 3) Secondary 4) Middle Level College 5) University 6) Adult literacy 7) Other (Specify)
6. Religion:
1. Traditional 2. Christian

244
244
3. Islam 4. Other (Specify) ______________
7. Main occupation
1) Farmer 2) Business 3) Formal Employment
i. Public Sector (a) Permanent (b) Temporary (Casual/Contract)
ii. Private Sector (a) Permanent (b) Temporary (Casual/Contract)
4) Other (including House wife, student/pupil, unemployed, retiree, volunteer, intern) –Specify______________________________________________________________
Section B: Public perceptions on common and emerging types of corruption in the public service 8. In your own understanding, what is corruption?_________________________________
________________________________________________________________________________________________________________________________________________
9. (a) (i) Generally, would you say that there is corruption in public service institutions in this County? 1. Yes 2. No 3. I don’t know
(ii) If Yes in Q9 (a) (i), in your opinion, in which specific public service institution (s) is corruption most prevalent?_______________________________________________ ______________________________________________________________________
(b) Would you say that there is corruption in the following Arms of Government in this county and what is the level?
No. Arm of Government Is there corruption? (Tick one option)
If Yes, what would you say is the level of corruption? (Tick one option)
Yes (1)
No (2)
I don’t know (3)
High (1)
Middle (2)
Low (3)
Not Sure (4)
I don’t know (5)
1. Executive Arm of National Government
2. Executive Arm of County Government
3. Judiciary 4. Senate Assembly
Legislature (Applicable to Nairobi County only)
5. National Assembly Legislature(Applicable to Nairobi County only)
6. County Assembly Legislature

245
245
10. If Yes in Q 9 (a) (i), what do you think are the common and emerging types of corruption in the following Arms of Government in this county?
No. Arm of Government Common and emerging types of corruption 1. Executive Arm of
National Government
2. Executive Arm of County Government
3. Judiciary
4. Senate Assembly Legislature (Applicable to Nairobi County only)
5. National Assembly Legislature(Applicable to Nairobi County only)
6. County Assembly Legislature
Section C: Public experiences on common and emerging types of corruption in the public service 11. (a) During the LAST 12 MONTHS, have you or a close member of your family sought
any service (s) from any public service institution (s) in this county? 1. Yes 2. No
(b) If Yes, which service (s)?________________________________________ _______________________________________________________________________________________________________________________________________________________________________________________________________________
12. (a) If Yes in Q11 (a), did you encounter any challenges (in receiving the public services you sought or attempted to seek) which you can attribute to corruption in the concerned public service institution (s) in this county? 1. Yes 2. No
(b) If Yes in Q12 (a), please explain___________________________________________ _______________________________________________________________________________________________________________________________________________________________________________________________________________
13. (a) During the LAST 12 MONTHS, have you or a close member of your family witnessed any corruption incident (s) in a public service institution (s) in this county? 1. Yes 2. No

246
246
(b) If Yes in Q13 (a), what was the corruption incident (s) that you or a close member of your family witnessed?_____________________________________________________ ______________________________________________________________________________________________________________________________________________
(c) If Yes in Q13 (a), in which specific public service institution (s)/office was it?_____ __________________________________________________________________________________________________________________________________________
14. (a) During the LAST 12 MONTHS, have you or a close member of your family
experienced any act (s) of corruption in any public service institution in this county? 1. Yes 2. No (b) If Yes in Q 14 (a), please respond to the following questions with regard to experience of acts of corruption in this county.
No. Arm of Government
Whether you or a close member of your family has experienced any act of corruption in this county (Tick your choice)
If Yes, specify the institution/office
If Yes, list the common and/or emerging type of corruption
Yes (1) No (2) 1. Executive Arm
of National Government
2. Executive Arm of County Government
3. Judiciary
4. Senate Assembly Legislature (Applicable to Nairobi County only)
5. National Assembly Legislature (Applicable to Nairobi County only)
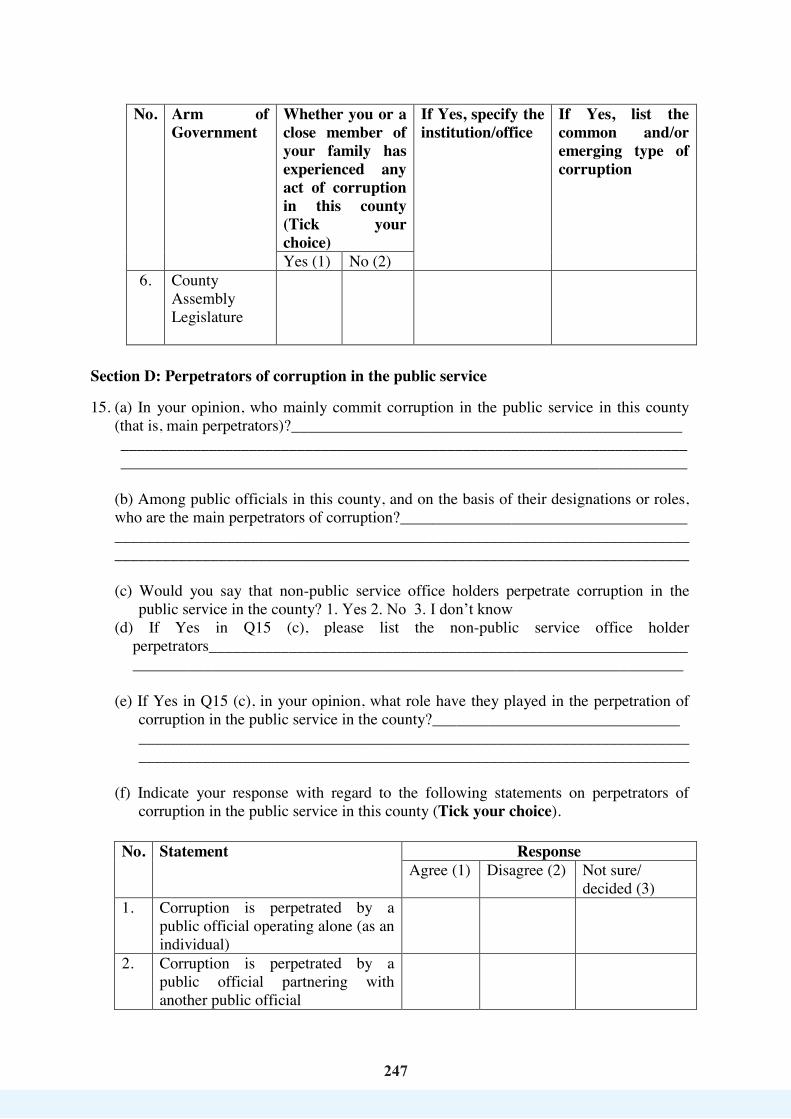
247
247
No. Arm of Government
Whether you or a close member of your family has experienced any act of corruption in this county (Tick your choice)
If Yes, specify the institution/office
If Yes, list the common and/or emerging type of corruption
Yes (1) No (2) 6. County
Assembly Legislature
Section D: Perpetrators of corruption in the public service
15. (a) In your opinion, who mainly commit corruption in the public service in this county (that is, main perpetrators)?_________________________________________________ ______________________________________________________________________________________________________________________________________________
(b) Among public officials in this county, and on the basis of their designations or roles, who are the main perpetrators of corruption?____________________________________ ________________________________________________________________________________________________________________________________________________
(c) Would you say that non-public service office holders perpetrate corruption in the
public service in the county? 1. Yes 2. No 3. I don’t know (d) If Yes in Q15 (c), please list the non-public service office holder
perpetrators_________________________________________________________________________________________________________________________________
(e) If Yes in Q15 (c), in your opinion, what role have they played in the perpetration of
corruption in the public service in the county?_______________________________ __________________________________________________________________________________________________________________________________________
(f) Indicate your response with regard to the following statements on perpetrators of
corruption in the public service in this county (Tick your choice).
No. Statement Response Agree (1) Disagree (2) Not sure/
decided (3) 1. Corruption is perpetrated by a
public official operating alone (as an individual)
2. Corruption is perpetrated by a public official partnering with another public official
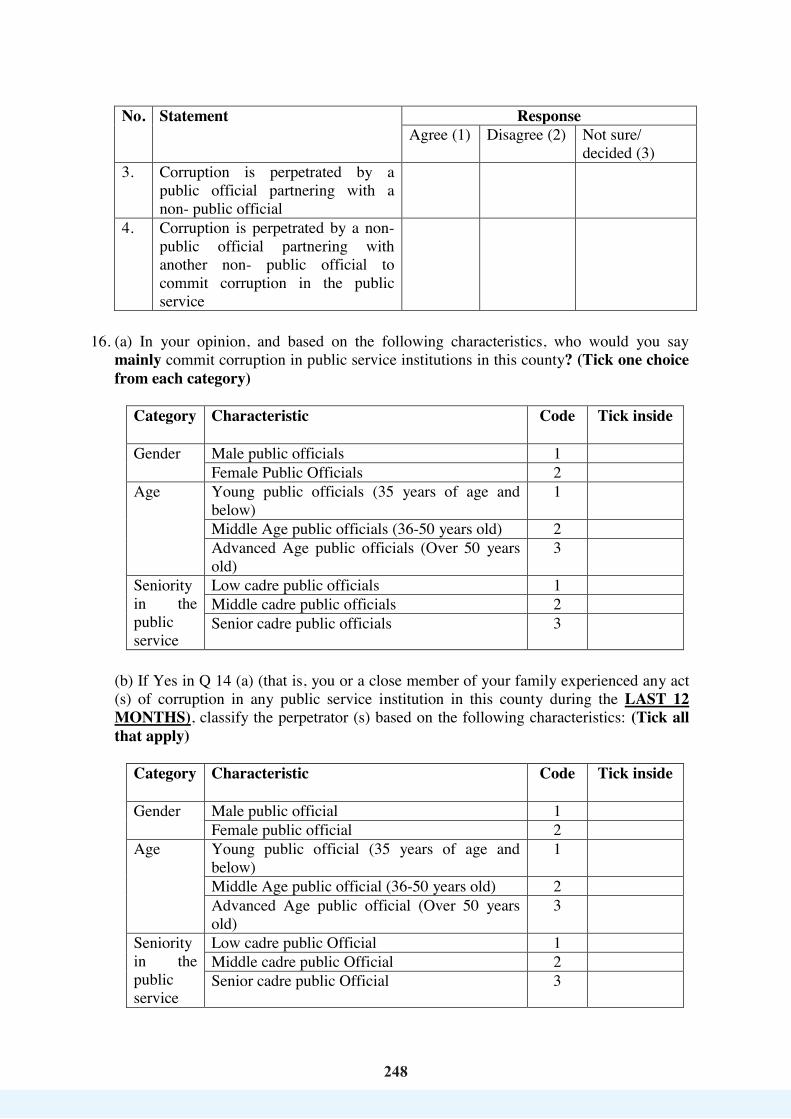
248
248
No. Statement Response Agree (1) Disagree (2) Not sure/
decided (3) 3. Corruption is perpetrated by a
public official partnering with a non- public official
4. Corruption is perpetrated by a non-public official partnering with another non- public official to commit corruption in the public service
16. (a) In your opinion, and based on the following characteristics, who would you say
mainly commit corruption in public service institutions in this county? (Tick one choice from each category)
Category Characteristic Code Tick inside
Gender Male public officials 1 Female Public Officials 2
Age Young public officials (35 years of age and below)
1
Middle Age public officials (36-50 years old) 2 Advanced Age public officials (Over 50 years old)
3
Seniority in the public service
Low cadre public officials 1 Middle cadre public officials 2 Senior cadre public officials 3
(b) If Yes in Q 14 (a) (that is, you or a close member of your family experienced any act (s) of corruption in any public service institution in this county during the LAST 12 MONTHS), classify the perpetrator (s) based on the following characteristics: (Tick all that apply)
Category Characteristic Code Tick inside
Gender Male public official 1 Female public official 2
Age Young public official (35 years of age and below)
1
Middle Age public official (36-50 years old) 2 Advanced Age public official (Over 50 years old)
3
Seniority in the public service
Low cadre public Official 1 Middle cadre public Official 2 Senior cadre public Official 3
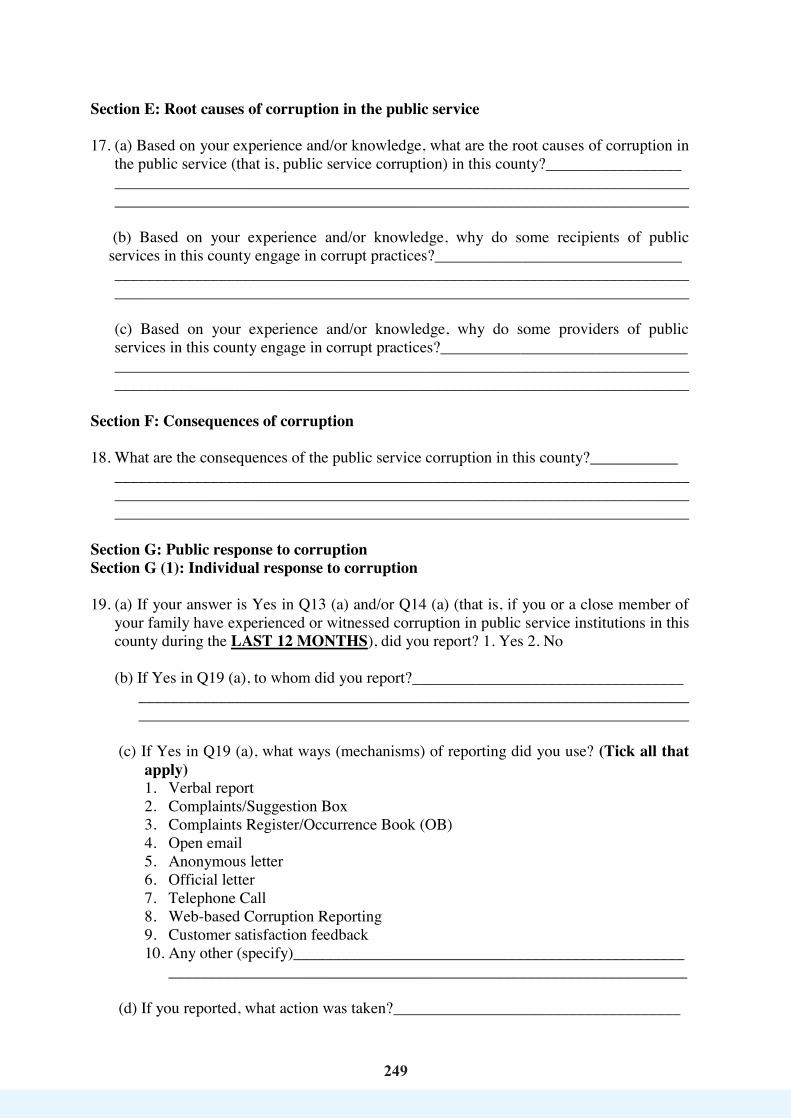
249
249
Section E: Root causes of corruption in the public service
17. (a) Based on your experience and/or knowledge, what are the root causes of corruption in the public service (that is, public service corruption) in this county?_________________ ________________________________________________________________________________________________________________________________________________
(b) Based on your experience and/or knowledge, why do some recipients of public services in this county engage in corrupt practices?_______________________________ ________________________________________________________________________________________________________________________________________________ (c) Based on your experience and/or knowledge, why do some providers of public services in this county engage in corrupt practices?_______________________________ ________________________________________________________________________________________________________________________________________________
Section F: Consequences of corruption 18. What are the consequences of the public service corruption in this county?___________
________________________________________________________________________ ________________________________________________________________________________________________________________________________________________
Section G: Public response to corruption Section G (1): Individual response to corruption 19. (a) If your answer is Yes in Q13 (a) and/or Q14 (a) (that is, if you or a close member of
your family have experienced or witnessed corruption in public service institutions in this county during the LAST 12 MONTHS), did you report? 1. Yes 2. No (b) If Yes in Q19 (a), to whom did you report?__________________________________
__________________________________________________________________________________________________________________________________________
(c) If Yes in Q19 (a), what ways (mechanisms) of reporting did you use? (Tick all that apply) 1. Verbal report 2. Complaints/Suggestion Box 3. Complaints Register/Occurrence Book (OB) 4. Open email 5. Anonymous letter 6. Official letter 7. Telephone Call 8. Web-based Corruption Reporting 9. Customer satisfaction feedback 10. Any other (specify)_________________________________________________
_________________________________________________________________
(d) If you reported, what action was taken?____________________________________

250
250
________________________________________________________________________________________________________________________________________
(e) If No in Q19 (a), why did you not report?___________________________________ __________________________________________________________________________________________________________________________________________
20. What action does an individual who has experienced or witnessed corruption in public service institutions in this county needs to take to address the vice?__________________
_______________________________________________________________________________________________________________________________________________________________________________________________________________
Section G (2): Local community response to corruption 21. (a) Has the local community taken any action to address corruption in public service
institutions in this county?1. Yes 2. No 3. I don’t know (b) If Yes, what action (s) has the local community taken?_________________________
__________________________________________________________________________________________________________________________________________
(c) What action does the local community need to take to address corruption in public service institutions in this county?____________________________________________
__________________________________________________________________________________________________________________________________________
Section G (3): State Organs’ response to corruption 22. (i) (a) Do you know of any measure (s)/initiative (s) put in place by any state organ to
address public service corruption in this county? 1. Yes 2. No (b) If Yes in Q22 (i) (a), specify the state organ/office___________________________ ________________________________________________________________________________________________________________________________________________ (c) If Yes in Q22 (i) (a), list the measure (s)/initiative (s)__________________________ ________________________________________________________________________________________________________________________________________________ (ii) If Yes in Q22 (i) (a), generally speaking, how satisfied are you with the measures/initiatives put in place by state organs to address corruption in the public service in this county? 1. Satisfied 2. Not satisfied Please explain your answer__________________________________________________ ________________________________________________________________________________________________________________________________________________
23. (a) In your opinion, to what extent has the Office of the Attorney General been successful in addressing corruption in the public service in this county?
1. Large 2. Small 3. Not at all 4. I am not sure 5. I don’t know
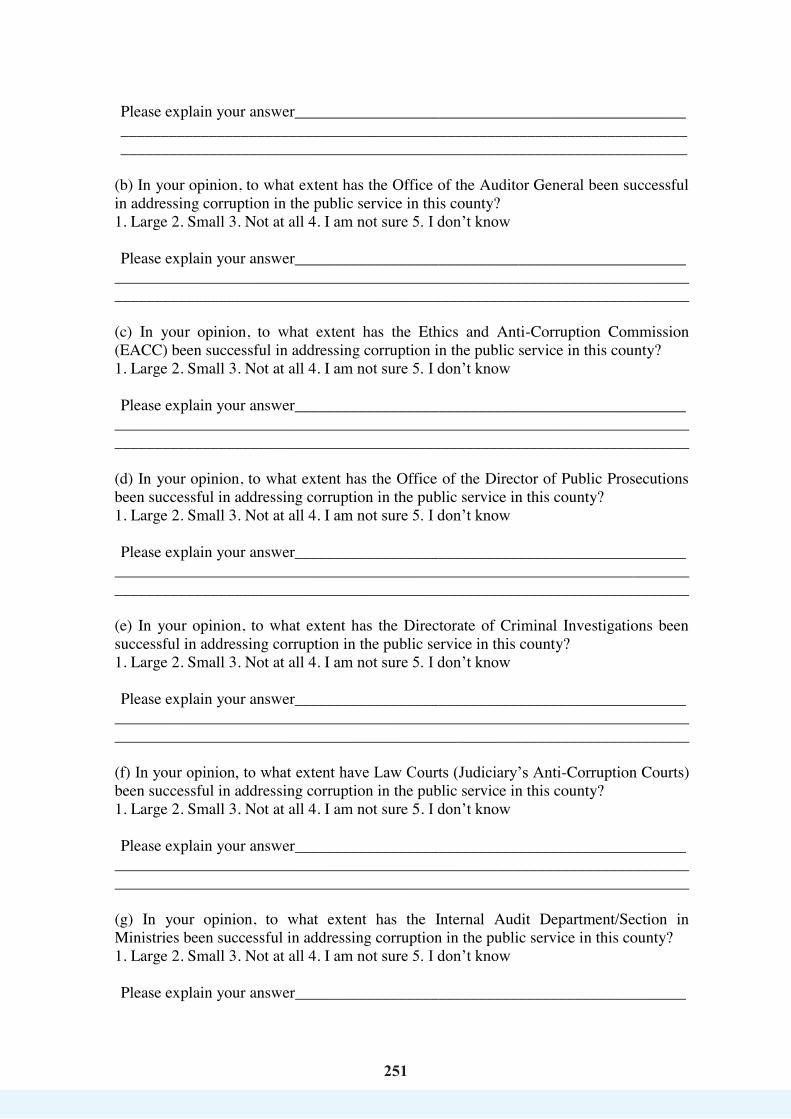
251
251
Please explain your answer_________________________________________________ ______________________________________________________________________________________________________________________________________________
(b) In your opinion, to what extent has the Office of the Auditor General been successful in addressing corruption in the public service in this county?
1. Large 2. Small 3. Not at all 4. I am not sure 5. I don’t know
Please explain your answer_________________________________________________ ________________________________________________________________________________________________________________________________________________ (c) In your opinion, to what extent has the Ethics and Anti-Corruption Commission (EACC) been successful in addressing corruption in the public service in this county?
1. Large 2. Small 3. Not at all 4. I am not sure 5. I don’t know
Please explain your answer_________________________________________________ ________________________________________________________________________________________________________________________________________________ (d) In your opinion, to what extent has the Office of the Director of Public Prosecutions been successful in addressing corruption in the public service in this county?
1. Large 2. Small 3. Not at all 4. I am not sure 5. I don’t know
Please explain your answer_________________________________________________ ________________________________________________________________________________________________________________________________________________ (e) In your opinion, to what extent has the Directorate of Criminal Investigations been successful in addressing corruption in the public service in this county?
1. Large 2. Small 3. Not at all 4. I am not sure 5. I don’t know
Please explain your answer_________________________________________________ ________________________________________________________________________________________________________________________________________________ (f) In your opinion, to what extent have Law Courts (Judiciary’s Anti-Corruption Courts) been successful in addressing corruption in the public service in this county?
1. Large 2. Small 3. Not at all 4. I am not sure 5. I don’t know
Please explain your answer_________________________________________________ ________________________________________________________________________________________________________________________________________________ (g) In your opinion, to what extent has the Internal Audit Department/Section in Ministries been successful in addressing corruption in the public service in this county?
1. Large 2. Small 3. Not at all 4. I am not sure 5. I don’t know
Please explain your answer_________________________________________________

252
252
________________________________________________________________________________________________________________________________________________ (h) In your opinion, to what extent have Internal Corruption Prevention Committess in public institutions been successful in addressing corruption in the public service in this county?
1. Large 2. Small 3. Not at all 4. I am not sure 5. I don’t know
Please explain your answer_________________________________________________ ________________________________________________________________________________________________________________________________________________ (i) In your opinion, to what extent has the National Anti-Corruption Campaign Steering Committee been successful in addressing corruption in the public service in this county?
1. Large 2. Small 3. Not at all 4. I am not sure 5. I don’t know
Please explain your answer_________________________________________________ ________________________________________________________________________________________________________________________________________________
24. Generally, rate most of the public officials you have interacted with in the course of service delivery in the values listed below.
Values Scale
Satisfactory (1) Unsatisfactory (2) Not Sure (3) Integrity Transparency and accountability
Professionalism Honesty and Trust Patriotism
Prompt service delivery
Impartiality
Good governance
Section H: Challenges and recommendations in addressing corruption 25. Kenya has operational anti-corruption laws and institutions but corruption continues to be
reported. What do you have to say?___________________________________________ ________________________________________________________________________________________________________________________________________________________________________________________________________________________
26. (a) What do you think are the challenges faced in addressing corruption in public service institutions in this county?__________________________________________________ ________________________________________________________________________________________________________________________________________________
253
253
(b) How can the challenges be addressed?______________________________________
__________________________________________________________________________________________________________________________________________
(c) What anti-corruption interventions do you propose for the public service in this county?________________________________________________________________________________________________________________________________________________________________________________________________________
27. Please give any other relevant comments____________________________________ __________________________________________________________________________________________________________________________________________
Thank you for your cooperation and stay well.
254
254
NATIONAL CRIME RESEARCH CENTRE
A STUDY ON PERCEPTIONS AND EXPERIENCES OF CORRUPTION IN THE PUBLIC SERVICE IN KENYA
Appendix 2: Questionnaire/Interview Schedule for Public Officials Sample Respondents
County: ___________________________________________________________________
Constituency _______________________________________________________________
Ward: ____________________________________________________________________
Name of Public Service Institution where Respondent works (see annexure):__________
Specify whether Respondent is working for National Government or County Government:_______________________________________________________________
Date of interview: ___________________________________________________________
Time of interview: __________________________________________________________
INTRODUCTION
How are you today? My name is…………………………………………..and I am collecting data for the National Crime Research Centre (NCRC), a State Corporation established by the National Crime Research Centre Act (CAP, 62 L.o.K). The survey is on “ A Study on Perceptions and Experiences of Corruption in the Public Service in Kenya”. The findings of the study are aimed at informing policies and programmes towards addressing the problem of corruption in the country. We would therefore like to ask you some questions related to the subject. All the information you give will be treated in utmost confidence and your identity will not be revealed. We would highly appreciate if you spared some time to respond to the following questions.
Thank you in advance.
Signature of interviewer___________________ Date _________________________
[ ] RESPONDENT AGREES TO BE INTERVIEWED
[ ] RESPONDENT DOES NOT AGREE TO BE INTERVIEWED END
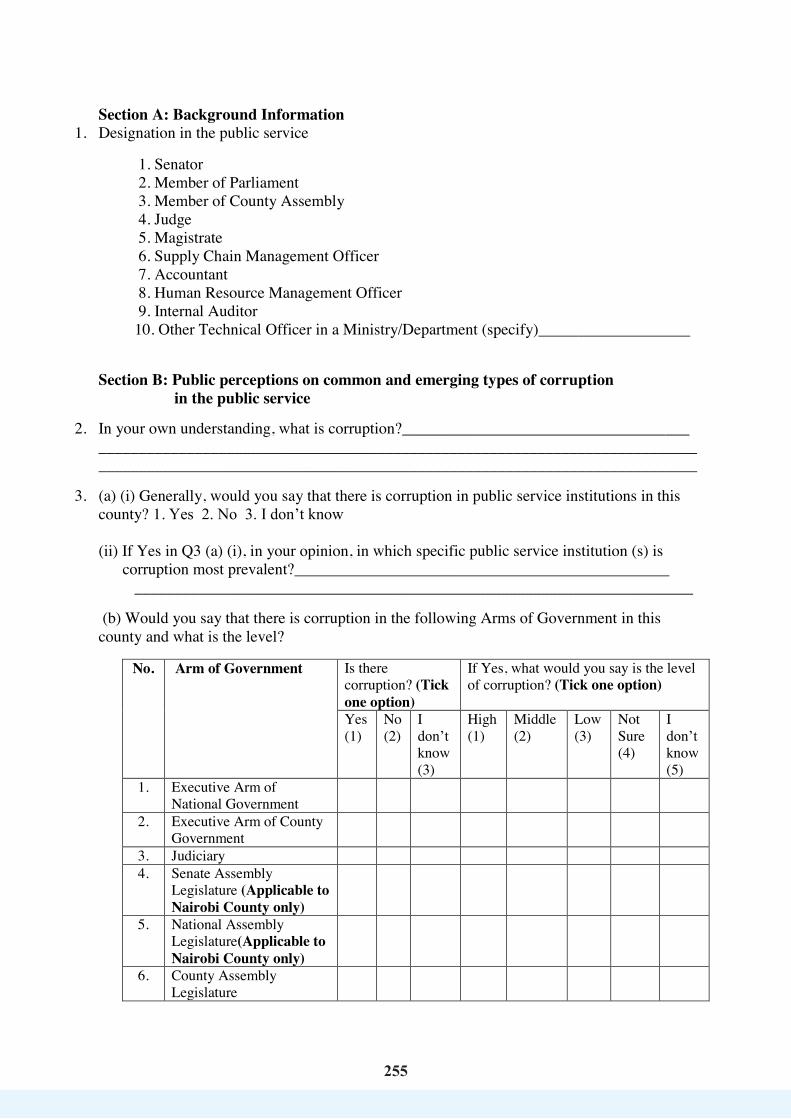
255
255
Section A: Background Information 1. Designation in the public service
1. Senator 2. Member of Parliament 3. Member of County Assembly 4. Judge 5. Magistrate 6. Supply Chain Management Officer 7. Accountant 8. Human Resource Management Officer 9. Internal Auditor 10. Other Technical Officer in a Ministry/Department (specify)___________________
Section B: Public perceptions on common and emerging types of corruption in the public service
2. In your own understanding, what is corruption?____________________________________ ______________________________________________________________________________________________________________________________________________________
3. (a) (i) Generally, would you say that there is corruption in public service institutions in this county? 1. Yes 2. No 3. I don’t know (ii) If Yes in Q3 (a) (i), in your opinion, in which specific public service institution (s) is
corruption most prevalent?_______________________________________________ ______________________________________________________________________
(b) Would you say that there is corruption in the following Arms of Government in this county and what is the level?
No. Arm of Government Is there corruption? (Tick one option)
If Yes, what would you say is the level of corruption? (Tick one option)
Yes (1)
No (2)
I don’t know (3)
High (1)
Middle (2)
Low (3)
Not Sure (4)
I don’t know (5)
1. Executive Arm of National Government
2. Executive Arm of County Government
3. Judiciary 4. Senate Assembly
Legislature (Applicable to Nairobi County only)
5. National Assembly Legislature(Applicable to Nairobi County only)
6. County Assembly Legislature
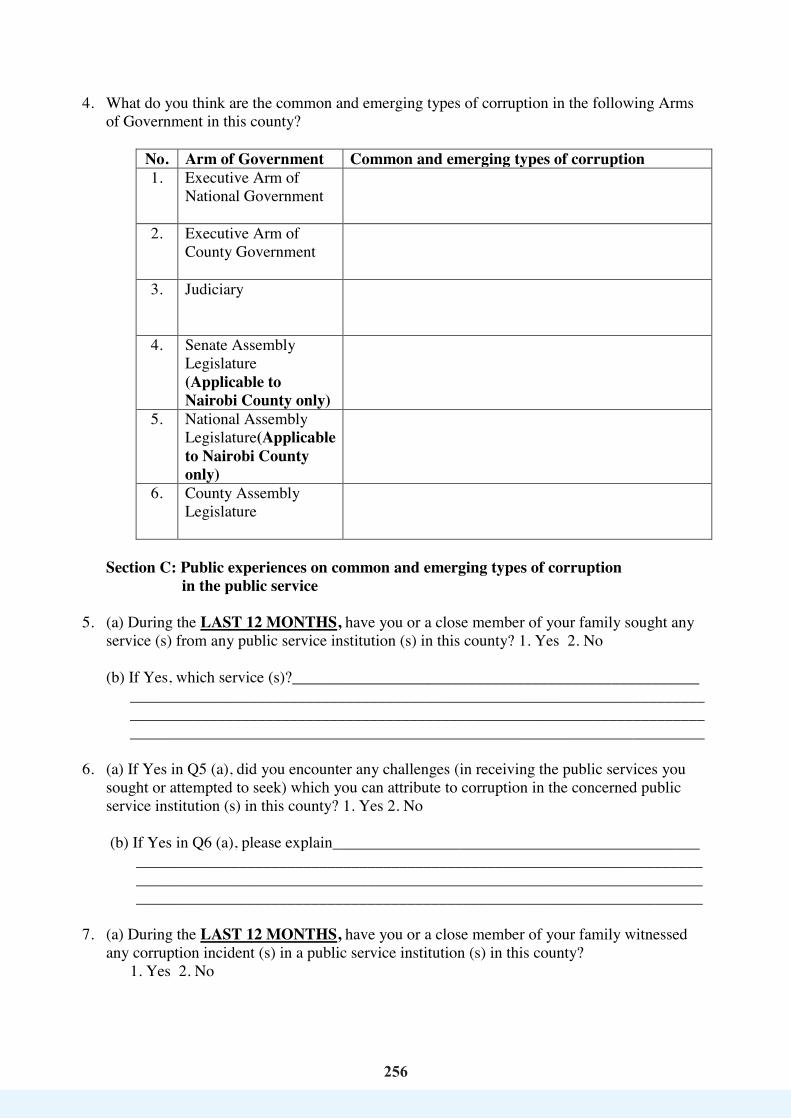
256
256
4. What do you think are the common and emerging types of corruption in the following Arms of Government in this county?
No. Arm of Government Common and emerging types of corruption 1. Executive Arm of
National Government
2. Executive Arm of County Government
3. Judiciary
4. Senate Assembly Legislature (Applicable to Nairobi County only)
5. National Assembly Legislature(Applicable to Nairobi County only)
6. County Assembly Legislature
Section C: Public experiences on common and emerging types of corruption in the public service
5. (a) During the LAST 12 MONTHS, have you or a close member of your family sought any service (s) from any public service institution (s) in this county? 1. Yes 2. No
(b) If Yes, which service (s)?___________________________________________________
________________________________________________________________________________________________________________________________________________________________________________________________________________________
6. (a) If Yes in Q5 (a), did you encounter any challenges (in receiving the public services you
sought or attempted to seek) which you can attribute to corruption in the concerned public service institution (s) in this county? 1. Yes 2. No
(b) If Yes in Q6 (a), please explain______________________________________________
_____________________________________________________________________________________________________________________________________________________________________________________________________________________
7. (a) During the LAST 12 MONTHS, have you or a close member of your family witnessed
any corruption incident (s) in a public service institution (s) in this county? 1. Yes 2. No

257
257
(b) If Yes in Q7 (a), what was the corruption incident (s) that you or a close member of your family witnessed?_____________________________________________________ ______________________________________________________________________________________________________________________________________________
(c) If Yes in Q7 (a), in which specific public service institution (s)/office was it?_____ __________________________________________________________________________________________________________________________________________
8. (a) During the LAST 12 MONTHS, have you or a close member of your family experienced
any act (s) of corruption in any public service institution in this county? 1. Yes 2. No
(b) If Yes in Q 8 (a), please respond to the following questions with regard to experience of acts of corruption in this county.
No. Arm of
Government Whether you or a close member of your family has experienced any act of corruption in this county (Tick your choice)
If Yes, specify the institution/office
If Yes, list the common and/or emerging type of corruption
Yes (1) No (2) 1. Executive Arm
of National Government
2. Executive Arm of County Government
3. Judiciary
4. Senate Assembly Legislature (Applicable to Nairobi County only)
5. National Assembly Legislature (Applicable to Nairobi County only)

258
258
No. Arm of Government
Whether you or a close member of your family has experienced any act of corruption in this county (Tick your choice)
If Yes, specify the institution/office
If Yes, list the common and/or emerging type of corruption
Yes (1) No (2) 6. County
Assembly Legislature
Section D: Perpetrators of corruption in the public service
9. (a) In your opinion, who mainly commit corruption in the public service in this county (that is, main perpetrators)?_________________________________________________________ ______________________________________________________________________________________________________________________________________________________
(b) Among public officials in this county, and on the basis of their designations or roles, who are the main perpetrators of corruption?___________________________________________ ______________________________________________________________________________________________________________________________________________________ (c) Would you say that non-public service office holders perpetrate corruption in the public service in the county? 1. Yes 2. No 3. I don’t know (d) If Yes in Q9 (c), please list the non-public service office holder perpetrators____________________________________________________________________________________________________________________________________________ (e) If Yes in Q9 (c), in your opinion, what role have they played in the perpetration of
corruption in the public service in the county?_______________________________ ______________________________________________________________________________________________________________________________________________
(f) Indicate your response with regard to the following statements on perpetrators of
corruption in the public service in this county (Tick your choice).
No. Statement Response Agree (1) Disagree (2) Not sure/
decided (3) 1. Corruption is perpetrated by a
public official operating alone (as an individual)
2. Corruption is perpetrated by a public official partnering with another public official
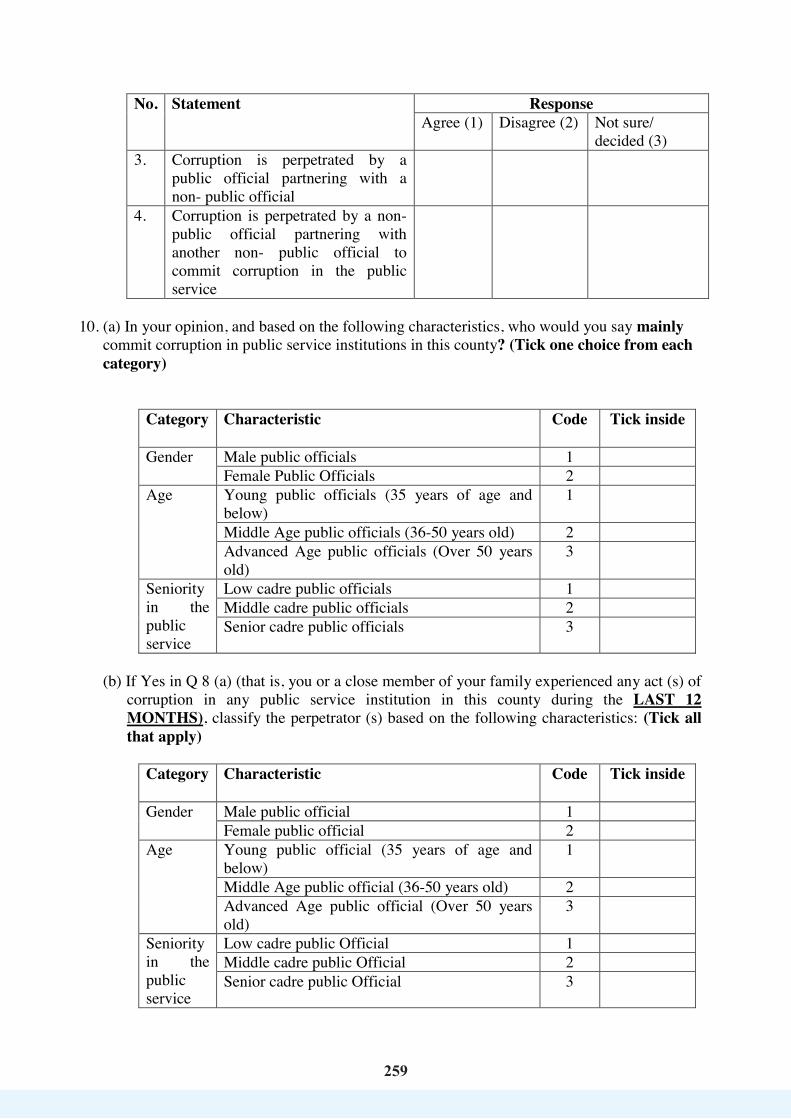
259
259
No. Statement Response Agree (1) Disagree (2) Not sure/
decided (3) 3. Corruption is perpetrated by a
public official partnering with a non- public official
4. Corruption is perpetrated by a non-public official partnering with another non- public official to commit corruption in the public service
10. (a) In your opinion, and based on the following characteristics, who would you say mainly
commit corruption in public service institutions in this county? (Tick one choice from each category)
Category Characteristic Code Tick inside
Gender Male public officials 1 Female Public Officials 2
Age Young public officials (35 years of age and below)
1
Middle Age public officials (36-50 years old) 2 Advanced Age public officials (Over 50 years old)
3
Seniority in the public service
Low cadre public officials 1 Middle cadre public officials 2 Senior cadre public officials 3
(b) If Yes in Q 8 (a) (that is, you or a close member of your family experienced any act (s) of
corruption in any public service institution in this county during the LAST 12 MONTHS), classify the perpetrator (s) based on the following characteristics: (Tick all that apply)
Category Characteristic Code Tick inside
Gender Male public official 1 Female public official 2
Age Young public official (35 years of age and below)
1
Middle Age public official (36-50 years old) 2 Advanced Age public official (Over 50 years old)
3
Seniority in the public service
Low cadre public Official 1 Middle cadre public Official 2 Senior cadre public Official 3
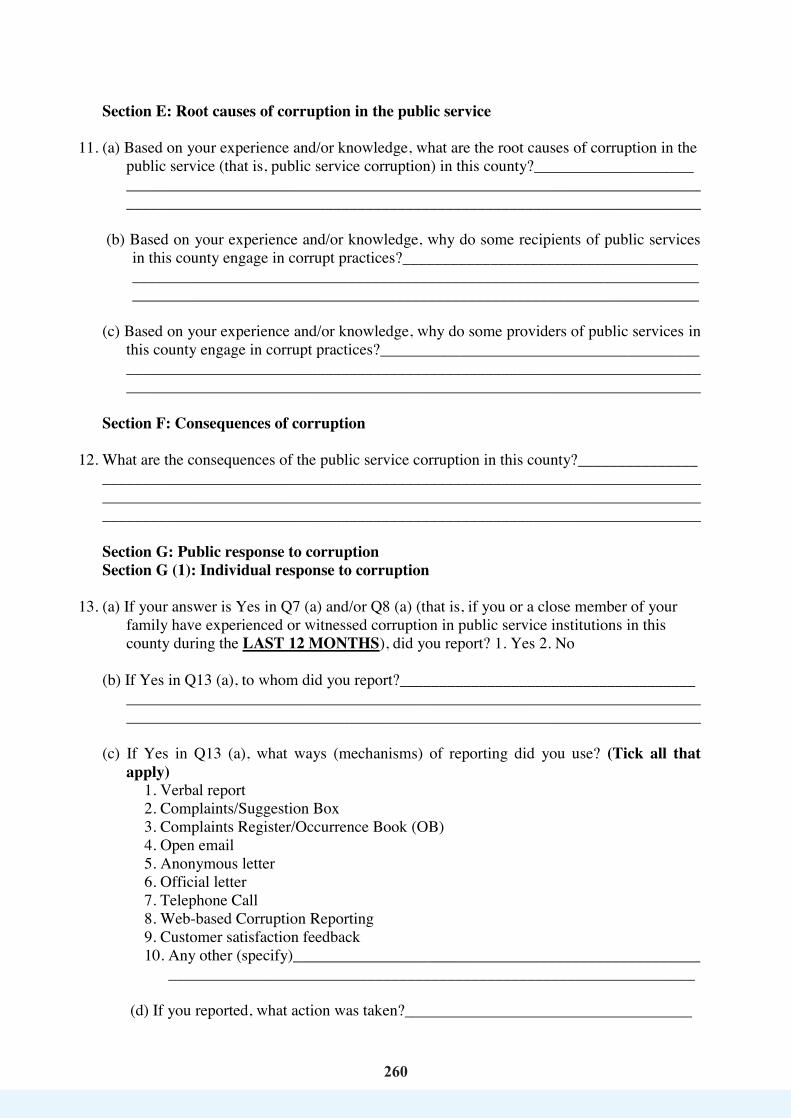
260
260
Section E: Root causes of corruption in the public service
11. (a) Based on your experience and/or knowledge, what are the root causes of corruption in the public service (that is, public service corruption) in this county?____________________ ________________________________________________________________________________________________________________________________________________
(b) Based on your experience and/or knowledge, why do some recipients of public services in this county engage in corrupt practices?_____________________________________ ______________________________________________________________________________________________________________________________________________
(c) Based on your experience and/or knowledge, why do some providers of public services in
this county engage in corrupt practices?________________________________________ ________________________________________________________________________________________________________________________________________________
Section F: Consequences of corruption
12. What are the consequences of the public service corruption in this county?_______________ ___________________________________________________________________________ ______________________________________________________________________________________________________________________________________________________ Section G: Public response to corruption Section G (1): Individual response to corruption
13. (a) If your answer is Yes in Q7 (a) and/or Q8 (a) (that is, if you or a close member of your family have experienced or witnessed corruption in public service institutions in this county during the LAST 12 MONTHS), did you report? 1. Yes 2. No
(b) If Yes in Q13 (a), to whom did you report?_____________________________________ ________________________________________________________________________________________________________________________________________________
(c) If Yes in Q13 (a), what ways (mechanisms) of reporting did you use? (Tick all that
apply) 1. Verbal report 2. Complaints/Suggestion Box 3. Complaints Register/Occurrence Book (OB) 4. Open email 5. Anonymous letter 6. Official letter 7. Telephone Call 8. Web-based Corruption Reporting 9. Customer satisfaction feedback 10. Any other (specify)___________________________________________________
__________________________________________________________________
(d) If you reported, what action was taken?____________________________________

261
261
________________________________________________________________________________________________________________________________________
(e) If No in Q13 (a), why did you not report?___________________________________ __________________________________________________________________________________________________________________________________________
14. What action does an individual who has experienced or witnessed corruption in public service institutions in this county needs to take to address the vice?_____________________ _________________________________________________________________________________________________________________________________________________________________________________________________________________________________
Section G (2): Local community response to corruption
15. (a) Has the local community taken any action to address corruption in public service institutions in this county?1. Yes 2. No 3. I don’t know
(b) If Yes, what action (s) has the local community taken?____________________________ ________________________________________________________________________________________________________________________________________________
(c) What action does the local community need to take to address corruption in public service
institutions in this county?__________________________________________________ ________________________________________________________________________________________________________________________________________________
Section G (3): State Organs’ response to corruption
16. (i) (a) Do you know of any measure (s)/initiative (s) put in place by any state organ to address public service corruption in this county? 1. Yes 2. No (b) If Yes in Q16 (i) (a), specify the state organ/office___________________________ ________________________________________________________________________________________________________________________________________________ (c) If Yes in Q16 (i) (a), list the measure (s)/initiative (s)__________________________ ________________________________________________________________________________________________________________________________________________
(ii) If Yes in Q16 (i) (a), generally speaking, how satisfied are you with the measures/initiatives put in place by state organs to address corruption in the public service in this county? 1. Satisfied 2. Not satisfied
Please explain your answer_________________________________________________
________________________________________________________________________________________________________________________________________________
17. (a) In your opinion, to what extent has the Office of the Attorney General been successful in addressing corruption in the public service in this county?

262
262
1. Large 2. Small 3. Not at all 4. I am not sure 5. I don’t know
Please explain your answer_________________________________________________ ______________________________________________________________________________________________________________________________________________
(b) In your opinion, to what extent has the Office of the Auditor General been successful in
addressing corruption in the public service in this county? 1. Large 2. Small 3. Not at all 4. I am not sure 5. I don’t know
Please explain your answer_________________________________________________ ________________________________________________________________________________________________________________________________________________
(c) In your opinion, to what extent has the Ethics and Anti-Corruption Commission (EACC) been successful in addressing corruption in the public service in this county?
1. Large 2. Small 3. Not at all 4. I am not sure 5. I don’t know
Please explain your answer_________________________________________________ ________________________________________________________________________________________________________________________________________________
(d) In your opinion, to what extent has the Office of the Director of Public Prosecutions been successful in addressing corruption in the public service in this county?
1. Large 2. Small 3. Not at all 4. I am not sure 5. I don’t know
Please explain your answer_________________________________________________ ________________________________________________________________________________________________________________________________________________
(e) In your opinion, to what extent has the Directorate of Criminal Investigations been successful in addressing corruption in the public service in this county?
1. Large 2. Small 3. Not at all 4. I am not sure 5. I don’t know
Please explain your answer_________________________________________________ ________________________________________________________________________________________________________________________________________________
(f) In your opinion, to what extent have Law Courts (Judiciary’s Anti-Corruption Courts) been successful in addressing corruption in the public service in this county?
1. Large 2. Small 3. Not at all 4. I am not sure 5. I don’t know
Please explain your answer_________________________________________________ ________________________________________________________________________________________________________________________________________________
(g) In your opinion, to what extent has the Internal Audit Department/Section in Ministries been successful in addressing corruption in the public service in this county?
1. Large 2. Small 3. Not at all 4. I am not sure 5. I don’t know

263
263
Please explain your answer_________________________________________________ ________________________________________________________________________________________________________________________________________________
(h) In your opinion, to what extent have Internal Corruption Prevention Committess in public institutions been successful in addressing corruption in the public service in this county?
1. Large 2. Small 3. Not at all 4. I am not sure 5. I don’t know
Please explain your answer_________________________________________________ ________________________________________________________________________________________________________________________________________________
(i) In your opinion, to what extent has the National Anti-Corruption Campaign Steering Committee been successful in addressing corruption in the public service in this county?
1. Large 2. Small 3. Not at all 4. I am not sure 5. I don’t know
Please explain your answer_________________________________________________ ________________________________________________________________________________________________________________________________________________
18. Generally, rate most of the public officials you have interacted with in the course of service delivery in the values listed below.
Values Scale
Satisfactory (1) Unsatisfactory (2) Not Sure (3) Integrity Transparency and accountability
Professionalism Honesty and Trust Patriotism
Prompt service delivery
Impartiality
Good governance
Section H: Challenges and recommendations in addressing corruption
19. Kenya has operational anti-corruption laws and institutions but corruption continues to be reported. What do you have to say?______________________________________________ _________________________________________________________________________________________________________________________________________________________________________________________________________________________________
20. (a) What do you think are the challenges faced in addressing corruption in public service
institutions in this county?_____________________________________________________ ______________________________________________________________________________________________________________________________________________________

264
264
(b) How can the challenges be addressed?_________________________________________
________________________________________________________________________________________________________________________________________________
(c) What anti-corruption interventions do you propose for the public service in this
county?______________________________________________________________________________________________________________________________________________________________________________________________________________
21. Please give any other relevant comments__________________________________________
__________________________________________________________________________________________________________________________________________
Thank you for your cooperation and stay well.

265
265
Annexure for Appendix 2: Public Service Institutions
(a) Ministry Departments 1. Agriculture 2. Arts and Culture 3. Basic Education 4. Broadcasting & Telecommunications 5. Cooperatives 6. Correctional Services 7. Defence 8. Devolution 9. EAC Integration 10. Energy 11. Environment 12. Fisheries 13. Interior 14. Youth and Public Service 15. Health 16. Housing & Urban Development 17. ICT & Innovation 18. Industry & Enterprise Development 19. Infrastructure 20. Foreign Affairs 21. International Trade 22. Irrigation 23. Labour 24. Lands 25. Livestock 26. Maritime Commerce 27. Mining 28. National Treasury 29. National Water Services 30. Natural Resources 31. Petroleum 32. Planning & Statistics 33. Public Works 34. Social Security & Services 35. Special Programmes 36. Sports Development 37. Tourism 38. Transport 39. University (Higher) Education 40. Vocational & Technical Training 41. Gender Affairs
(b) State Corporation (specify which one)__________________________________
(c) Commissions and Independent Offices (specify which Commission or Independent Office)_____________________________________________________________

266266
(d) Judiciary
(e) Legislature (specify using categories below)
(i) National Assembly
(ii) The Senate
(iii) County Assemblies

267
267
NATIONAL CRIME RESEARCH CENTRE
A STUDY ON PERCEPTIONS AND EXPERIENCES OF CORRUPTION IN THE PUBLIC SERVICE IN KENYA
Appendix 3: Key Informant Guide
County: ___________________________________________________________________
Constituency _______________________________________________________________
Ward: ____________________________________________________________________
Name of Public Service Institution where Respondent works (see annexure):__________
Specify whether Respondent is working for National Government or County Government:_______________________________________________________________
Date of interview: ___________________________________________________________
Time of interview: __________________________________________________________
INTRODUCTION
How are you today? My name is…………………………………………..and I am collecting data for the National Crime Research Centre (NCRC), a State Corporation established by the National Crime Research Centre Act (CAP, 62 L.o.K). The survey is on “ A Study on Perceptions and Experiences of Corruption in the Public Service in Kenya”. The findings of the study are aimed at informing policies and programmes towards addressing the problem of corruption in the country. We would therefore like to ask you some questions related to the subject. All the information you give will be treated in utmost confidence and your identity will not be revealed. We would highly appreciate if you spared some time to respond to the following questions.
Thank you in advance.
Signature of interviewer___________________ Date _________________________
[ ] RESPONDENT AGREES TO BE INTERVIEWED
[ ] RESPONDENT DOES NOT AGREE TO BE INTERVIEWED END
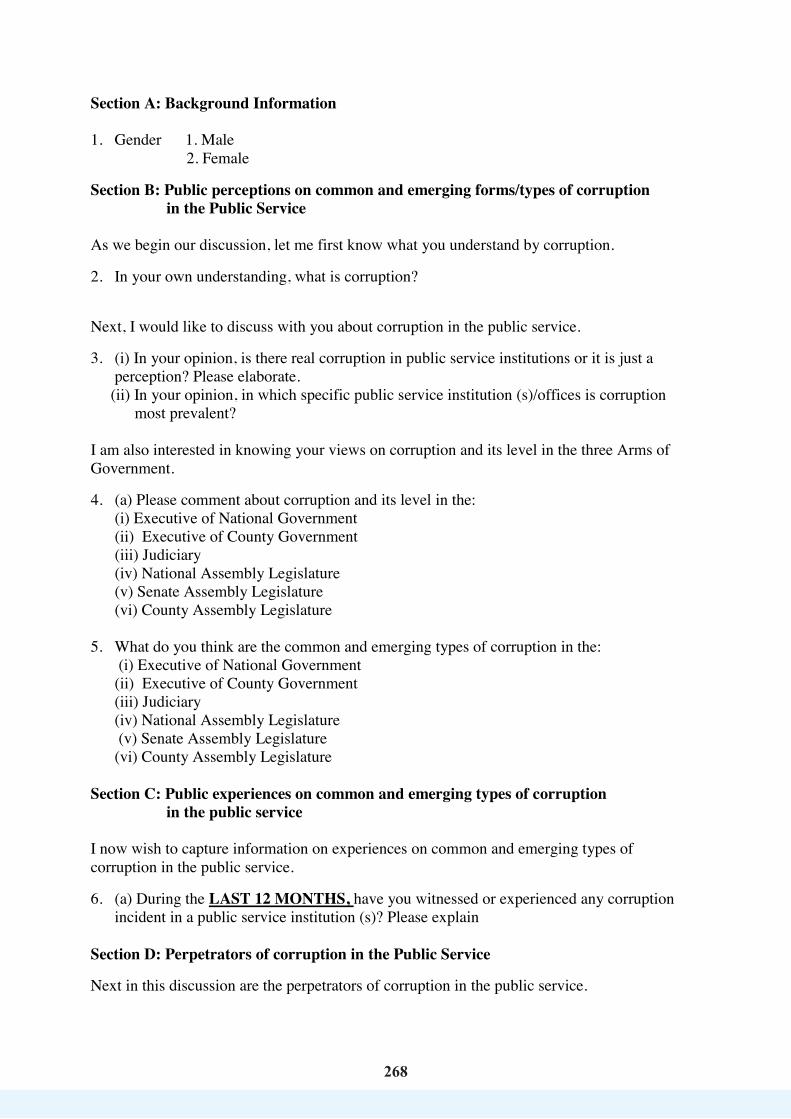
268
268
Section A: Background Information 1. Gender 1. Male 2. Female
Section B: Public perceptions on common and emerging forms/types of corruption in the Public Service As we begin our discussion, let me first know what you understand by corruption.
2. In your own understanding, what is corruption?
Next, I would like to discuss with you about corruption in the public service.
3. (i) In your opinion, is there real corruption in public service institutions or it is just a perception? Please elaborate.
(ii) In your opinion, in which specific public service institution (s)/offices is corruption most prevalent? I am also interested in knowing your views on corruption and its level in the three Arms of Government.
4. (a) Please comment about corruption and its level in the: (i) Executive of National Government (ii) Executive of County Government (iii) Judiciary
(iv) National Assembly Legislature (v) Senate Assembly Legislature (vi) County Assembly Legislature
5. What do you think are the common and emerging types of corruption in the:
(i) Executive of National Government (ii) Executive of County Government (iii) Judiciary
(iv) National Assembly Legislature (v) Senate Assembly Legislature
(vi) County Assembly Legislature Section C: Public experiences on common and emerging types of corruption in the public service I now wish to capture information on experiences on common and emerging types of corruption in the public service.
6. (a) During the LAST 12 MONTHS, have you witnessed or experienced any corruption incident in a public service institution (s)? Please explain
Section D: Perpetrators of corruption in the Public Service
Next in this discussion are the perpetrators of corruption in the public service.
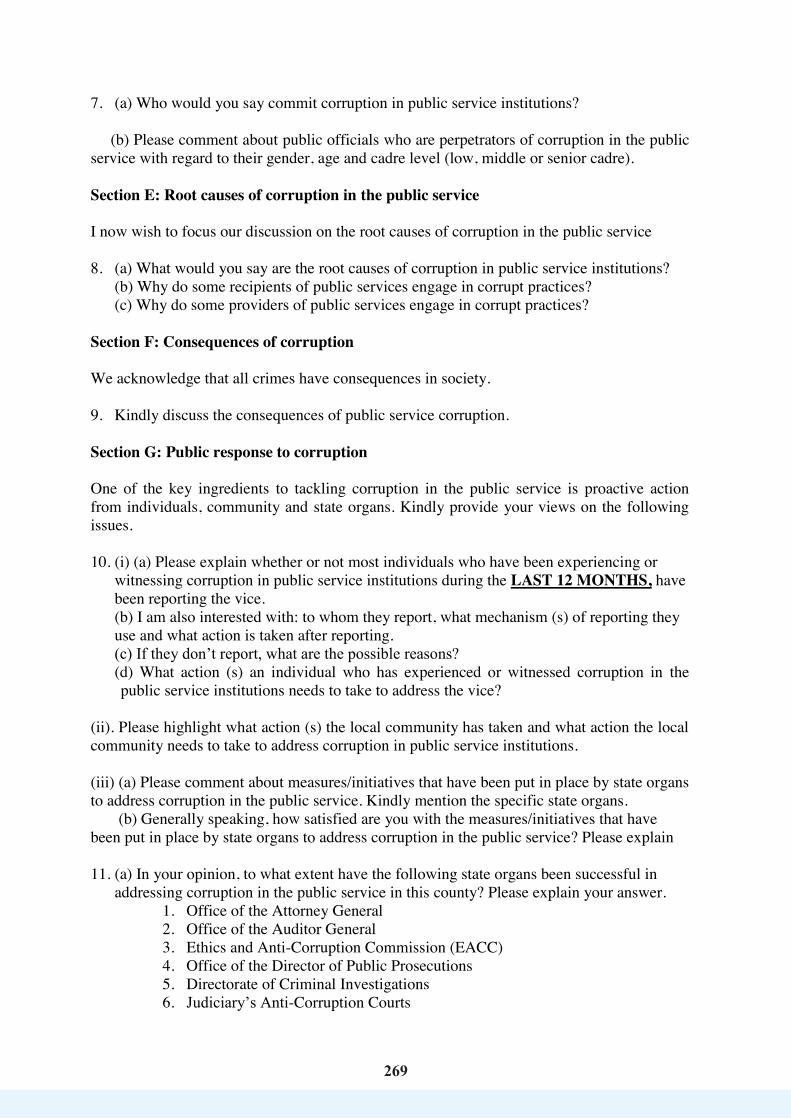
269
269
7. (a) Who would you say commit corruption in public service institutions?
(b) Please comment about public officials who are perpetrators of corruption in the public service with regard to their gender, age and cadre level (low, middle or senior cadre).
Section E: Root causes of corruption in the public service I now wish to focus our discussion on the root causes of corruption in the public service 8. (a) What would you say are the root causes of corruption in public service institutions?
(b) Why do some recipients of public services engage in corrupt practices? (c) Why do some providers of public services engage in corrupt practices?
Section F: Consequences of corruption We acknowledge that all crimes have consequences in society. 9. Kindly discuss the consequences of public service corruption. Section G: Public response to corruption One of the key ingredients to tackling corruption in the public service is proactive action from individuals, community and state organs. Kindly provide your views on the following issues. 10. (i) (a) Please explain whether or not most individuals who have been experiencing or
witnessing corruption in public service institutions during the LAST 12 MONTHS, have been reporting the vice. (b) I am also interested with: to whom they report, what mechanism (s) of reporting they use and what action is taken after reporting. (c) If they don’t report, what are the possible reasons? (d) What action (s) an individual who has experienced or witnessed corruption in the public service institutions needs to take to address the vice?
(ii). Please highlight what action (s) the local community has taken and what action the local community needs to take to address corruption in public service institutions. (iii) (a) Please comment about measures/initiatives that have been put in place by state organs to address corruption in the public service. Kindly mention the specific state organs. (b) Generally speaking, how satisfied are you with the measures/initiatives that have been put in place by state organs to address corruption in the public service? Please explain
11. (a) In your opinion, to what extent have the following state organs been successful in
addressing corruption in the public service in this county? Please explain your answer. 1. Office of the Attorney General 2. Office of the Auditor General 3. Ethics and Anti-Corruption Commission (EACC) 4. Office of the Director of Public Prosecutions 5. Directorate of Criminal Investigations 6. Judiciary’s Anti-Corruption Courts

270
270
7. Internal Audit Department/Section in Ministries 8. Internal Corruption Prevention Committees in public institutions
12. Generally, rate most of the public officials you have interacted with in the course of
service delivery in the values listed below. Values Scale
Satisfactory (1) Unsatisfactory (2) Not Sure (3) Integrity Transparency and accountability
Professionalism Honesty and Trust Patriotism
Prompt service delivery
Impartiality
Good governance
Section H: Challenges and recommendations in addressing corruption Finally, I wish to understand from you about challenges and recommendations in the control of corruption. 13. (a) Kenya has operational anti-corruption laws and institutions but corruption continues
to be reported. What do you have to say? (b) What do you think are the challenges faced in the control of corruption in public service institutions and how can they be addressed? (c) What anti-corruption interventions do you propose for the public service?
14. Please give any other relevant comments.
Thank you for your cooperation and stay well.
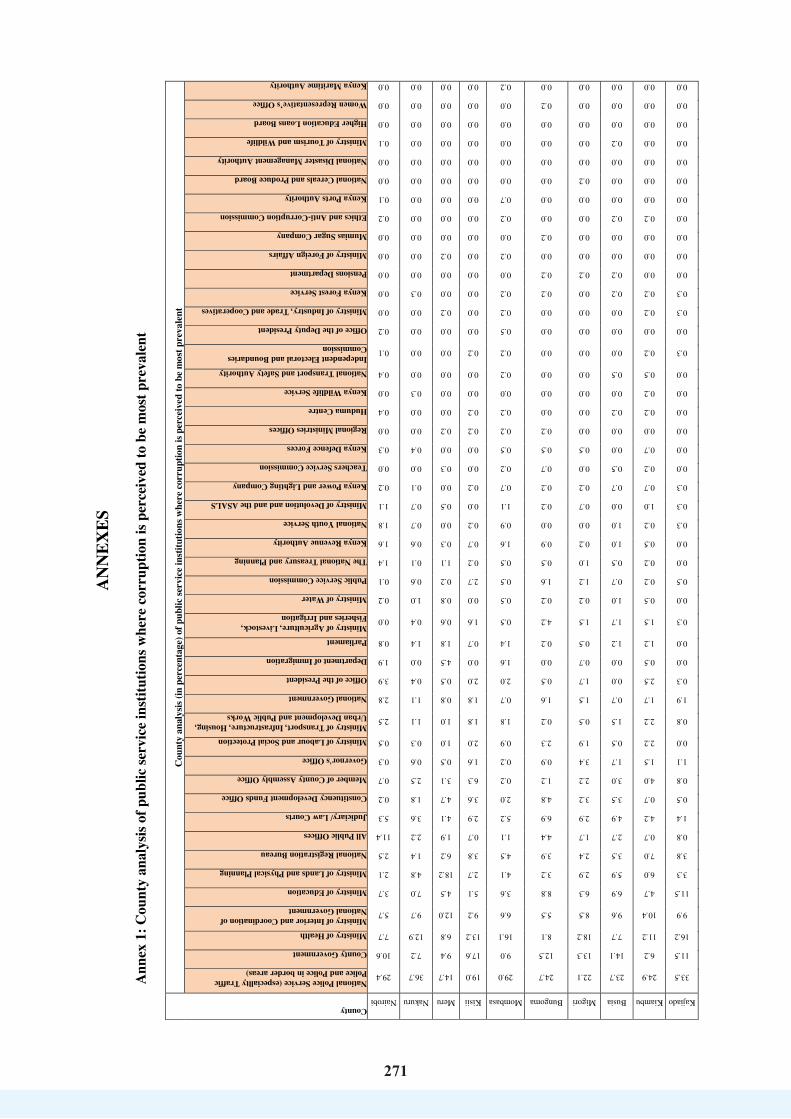
271
271
AN
NEX
ES
Ann
ex 1
: Cou
nty
anal
ysis
of p
ublic
serv
ice
inst
itutio
ns w
here
cor
rupt
ion
is pe
rcei
ved
to b
e m
ost p
reva
lent
County
Cou
nty
anal
ysis
(in p
erce
ntag
e) o
f pub
lic se
rvic
e in
stitu
tions
whe
re c
orru
ptio
n is
perc
eive
d to
be
mos
t pre
vale
nt
National Police Service (especiallty Traffic Police and Police in border areas)
County Government
Ministry of Health
Ministry of Interior and Coordination of National Government
Ministry of Education
Ministry of Lands and Physical Planning
National Registration Bureau
All Public Offices
Judiciary/ Law Courts
Constituency Development Funds Office
Member of County Assembly Office
Governor's Office
Ministry of Labour and Social Protection
Ministry of Transport, Infrastructure, Housing, Urban Development and Public Works
National Government
Office of the President
Department of Immigration
Parliament
Ministry of Agriculture, Livestock, Fisheries and Irrigation
Ministry of Water
Public Service Commission
The National Treasury and Planning
Kenya Revenue Authority
National Youth Service
Ministry of Devolution and and the ASALS
Kenya Power and Lighting Company
Teachers Service Commission
Kenya Defence Forces
Regional Ministries Offices
Huduma Centre
Kenya Wildlife Service
National Transport and Safety Authority
Independent Electoral and Boundaries Commission
Office of the Deputy President
Ministry of Industry, Trade and Cooperatives
Kenya Forest Service
Pensions Department
Ministry of Foreign Affairs
Mumias Sugar Company
Ethics and Anti-Corruption Commission
Kenya Ports Authority
National Cereals and Produce Board
National Disaster Management Authority
Ministry of Tourism and Wildlife
Higher Education Loans Board
Women Representative’s Office
Kenya Maritime Authority
Nairobi
29.4
10.6
7.7
5.7
3.7
2.1
2.5
11.4
5.3
0.2
0.7
0.3
0.5
2.5
2.8
3.9
1.9
0.8
0.0
0.2
0.1
1.4
1.6
1.8
1.1
0.2
0.0
0.3
0.0
0.4
0.0
0.4
0.1
0.2
0.0
0.0
0.0
0.0
0.0
0.2
0.1
0.0
0.0
0.1
0.0
0.0
0.0
Nakuru
36.7
7.2
12.9
9.7
7.0
4.8
1.4
2.2
3.6
1.8
2.5
0.6
0.3
1.1
1.1
0.4
0.0
1.4
0.4
1.0
0.6
0.1
0.6
0.7
0.7
0.1
0.0
0.4
0.0
0.0
0.3
0.0
0.0
0.0
0.0
0.3
0.0
0.0
0.0
0.0
0.0
0.0
0.0
0.0
0.0
0.0
0.0
Meru
14.7
9.4
6.8
12.0
4.5
18.2
6.2
1.9
4.1
4.7
3.1
0.5
1.0
1.0
0.8
0.5
4.5
1.8
0.6
0.8
0.2
1.1
0.3
0.0
0.5
0.0
0.3
0.0
0.2
0.0
0.0
0.0
0.0
0.0
0.2
0.0
0.0
0.2
0.0
0.0
0.0
0.0
0.0
0.0
0.0
0.0
0.0
Kisii
19.0
17.6
13.2
9.2
5.1
2.7
3.8
0.7
2.9
3.6
6.3
1.6
2.0
1.8
1.8
2.0
0.0
0.7
1.6
0.0
2.7
0.2
0.7
0.2
0.0
0.2
0.0
0.0
0.2
0.2
0.0
0.0
0.2
0.0
0.0
0.0
0.0
0.0
0.0
0.0
0.0
0.0
0.0
0.0
0.0
0.0
0.0
Mombasa
29.0
9.0
16.1
6.6
3.6
4.1
4.5
1.1
5.2
2.0
0.2
0.2
0.9
1.8
0.7
2.0
1.6
1.4
0.5
0.5
0.5
0.5
1.6
0.9
1.1
0.7
0.2
0.5
0.2
0.2
0.0
0.2
0.2
0.5
0.2
0.2
0.0
0.2
0.0
0.2
0.7
0.0
0.0
0.0
0.0
0.0
0.2
Bungoma
24.7
12.5
8.1
5.5
8.8
3.2
3.9
4.4
6.9
4.8
1.2
0.9
2.3
0.2
1.6
0.5
0.0
0.2
4.2
0.2
1.6
0.5
0.9
0.0
0.2
0.2
0.7
0.5
0.2
0.0
0.0
0.0
0.0
0.0
0.0
0.2
0.2
0.0
0.2
0.0
0.0
0.0
0.0
0.0
0.0
0.2
0.0
Migori
22.1
13.3
18.2
8.5
6.3
2.9
2.4
1.7
2.9
3.2
2.2
3.4
1.9
0.5
1.5
1.7
0.7
0.5
1.5
0.2
1.2
1.0
0.2
0.0
0.7
0.2
0.0
0.5
0.0
0.0
0.0
0.0
0.0
0.0
0.0
0.0
0.2
0.0
0.0
0.0
0.0
0.2
0.0
0.0
0.0
0.0
0.0
Busia
23.7
14.1
7.7
9.6
6.9
5.9
3.5
2.7
4.9
3.5
3.0
1.7
0.5
1.5
0.7
0.0
0.0
1.2
1.7
1.0
0.7
0.5
1.0
1.0
0.0
0.7
0.5
0.0
0.0
0.2
0.0
0.5
0.0
0.0
0.0
0.2
0.2
0.0
0.0
0.2
0.0
0.0
0.0
0.2
0.0
0.0
0.0
Kiambu
24.9
6.2
11.2
10.4
4.7
6.0
7.0
0.7
4.2
0.7
4.0
1.5
2.2
2.2
1.7
2.5
0.5
1.2
1.5
0.5
0.2
0.2
0.5
0.2
1.0
0.7
0.2
0.7
0.0
0.2
0.2
0.5
0.2
0.0
0.2
0.2
0.0
0.0
0.0
0.2
0.0
0.0
0.0
0.0
0.0
0.0
0.0
Kajiado
33.5
11.5
16.2
9.9
11.5
3.3
3.8
0.8
1.4
0.5
0.8
1.1
0.0
0.8
1.9
0.3
0.0
0.0
0.3
0.0
0.5
0.0
0.0
0.3
0.3
0.3
0.0
0.0
0.0
0.0
0.0
0.0
0.3
0.0
0.3
0.3
0.0
0.0
0.0
0.0
0.0
0.0
0.0
0.0
0.0
0.0
0.0

272
272
County C
ount
y an
alys
is (in
per
cent
age)
of p
ublic
serv
ice
inst
itutio
ns w
here
cor
rupt
ion
is pe
rcei
ved
to b
e m
ost p
reva
lent
National Police Service (especiallty Traffic Police and Police in border areas)
County Government
Ministry of Health
Ministry of Interior and Coordination of National Government
Ministry of Education
Ministry of Lands and Physical Planning
National Registration Bureau
All Public Offices
Judiciary/ Law Courts
Constituency Development Funds Office
Member of County Assembly Office
Governor's Office
Ministry of Labour and Social Protection
Ministry of Transport, Infrastructure, Housing, Urban Development and Public Works
National Government
Office of the President
Department of Immigration
Parliament
Ministry of Agriculture, Livestock, Fisheries and Irrigation
Ministry of Water
Public Service Commission
The National Treasury and Planning
Kenya Revenue Authority
National Youth Service
Ministry of Devolution and and the ASALS
Kenya Power and Lighting Company
Teachers Service Commission
Kenya Defence Forces
Regional Ministries Offices
Huduma Centre
Kenya Wildlife Service
National Transport and Safety Authority
Independent Electoral and Boundaries Commission
Office of the Deputy President
Ministry of Industry, Trade and Cooperatives
Kenya Forest Service
Pensions Department
Ministry of Foreign Affairs
Mumias Sugar Company
Ethics and Anti-Corruption Commission
Kenya Ports Authority
National Cereals and Produce Board
National Disaster Management Authority
Ministry of Tourism and Wildlife
Higher Education Loans Board
Women Representative’s Office
Kenya Maritime Authority
Kakamega
16.9
9.5
8.6
10.0
6.3
3.4
1.7
3.4
4.0
12.9
3.4
1.1
1.7
1.1
1.1
0.6
2.3
0.9
1.1
0.6
1.7
1.7
0.0
0.9
0.6
0.9
0.0
0.6
0.0
0.6
0.0
0.0
0.0
0.0
0.6
0.0
0.0
0.0
1.7
0.0
0.0
0.0
0.0
0.0
0.0
0.0
0.0
Narok
22.4
11.8
19.0
10.9
11.2
0.9
2.3
0.3
1.4
1.4
2.9
4.9
0.3
2.3
1.1
0.6
0.0
0.9
0.6
0.6
0.0
0.0
0.3
0.3
0.9
0.3
0.0
0.0
0.3
0.0
0.9
0.0
0.0
0.6
0.0
0.0
0.0
0.0
0.0
0.0
0.0
0.6
0.0
0.3
0.0
0.0
0.0
Kitui
30.7
21.6
6.7
17.8
1.8
1.5
0.9
2.0
3.2
1.8
2.6
1.2
0.0
0.3
0.9
0.3
0.0
0.6
0.0
1.2
0.3
0.3
0.0
0.6
0.6
0.0
2.0
0.3
0.0
0.3
0.0
0.3
0.0
0.0
0.0
0.0
0.0
0.3
0.0
0.0
0.0
0.0
0.0
0.0
0.0
0.0
0.0
Machakos
25.5
9.8
7.7
16.0
2.7
0.9
5.6
15.7
3.3
1.2
0.6
2.1
0.0
0.6
0.6
1.2
0.6
0.3
0.0
0.9
0.3
0.3
0.6
1.2
0.6
0.0
0.6
0.0
0.9
0.0
0.0
0.0
0.3
0.0
0.0
0.0
0.0
0.0
0.0
0.0
0.0
0.0
0.0
0.0
0.0
0.0
0.0
Kisumu
25.2
12.7
11.8
8.5
5.8
3.9
3.6
4.5
1.8
0.9
1.2
5.5
0.9
2.1
0.6
2.4
1.8
0.6
0.6
0.9
0.6
0.9
0.9
0.0
0.0
0.3
0.9
0.0
0.0
0.0
0.0
0.0
0.0
0.3
0.0
0.0
0.6
0.0
0.0
0.0
0.0
0.0
0.0
0.0
0.0
0.0
0.0
Murang'a
21.1
8.6
12.1
11.2
4.5
8.3
6.1
0.3
5.4
1.3
3.2
2.6
2.9
1.9
0.6
1.0
0.0
2.9
3.2
1.3
0.0
0.0
0.3
0.0
0.0
1.0
0.0
0.0
0.3
0.0
0.0
0.0
0.0
0.0
0.0
0.0
0.0
0.0
0.0
0.0
0.0
0.0
0.0
0.0
0.0
0.0
0.0
Tharaka Nithi
20.1
17.1
5.4
12.0
1.7
9.0
3.7
0.7
4.0
5.0
11.0
1.0
0.3
1.0
0.0
1.0
1.7
2.3
0.0
0.0
0.3
0.3
0.0
0.7
0.7
0.3
0.3
0.0
0.3
0.0
0.0
0.0
0.0
0.0
0.0
0.0
0.0
0.0
0.0
0.0
0.0
0.0
0.0
0.0
0.0
0.0
0.0
Embu
28.8
14.4
9.1
7.4
6.0
7.7
4.2
1.1
3.5
2.1
1.4
1.8
1.4
1.1
3.2
0.0
0.0
0.7
1.1
0.0
0.4
0.4
0.0
1.1
1.1
0.0
0.0
1.1
0.4
0.7
0.0
0.0
0.4
0.0
0.0
0.0
0.0
0.0
0.0
0.0
0.0
0.0
0.0
0.0
0.0
0.0
0.0
Trans Nzoia
17.6
6.5
14.2
21.8
5.0
1.5
5.7
1.1
1.5
6.9
3.4
5.4
3.1
0.0
0.4
0.4
0.0
0.0
1.5
0.8
1.1
0.0
0.8
0.0
0.0
0.0
0.0
0.0
0.4
0.0
0.0
0.0
0.0
0.0
0.0
0.0
0.0
0.0
0.0
0.0
0.0
0.0
0.4
0.0
0.4
0.0
0.0
Nyamira
16.8
21.2
14.6
6.2
5.8
0.9
1.8
2.2
1.3
2.2
2.7
2.7
3.1
3.5
2.2
2.2
0.9
0.9
2.7
0.0
0.9
1.3
0.0
0.4
0.4
0.0
0.4
0.4
0.0
0.4
0.0
0.0
0.4
0.9
0.0
0.0
0.0
0.4
0.0
0.0
0.0
0.0
0.0
0.0
0.0
0.0
0.0
Vihiga
12.2
11.2
10.2
12.2
8.1
3.0
0.5
1.0
5.1
11.2
2.0
1.0
7.1
0.5
2.0
0.0
5.1
0.5
0.0
1.5
1.0
1.5
0.0
0.0
0.0
1.5
0.0
0.0
0.0
0.0
0.0
0.0
0.0
0.0
0.5
0.0
0.0
1.0
0.0
0.0
0.0
0.0
0.0
0.0
0.0
0.0
0.0

273
273
County C
ount
y an
alys
is (in
per
cent
age)
of p
ublic
serv
ice
inst
itutio
ns w
here
cor
rupt
ion
is pe
rcei
ved
to b
e m
ost p
reva
lent
National Police Service (especiallty Traffic Police and Police in border areas)
County Government
Ministry of Health
Ministry of Interior and Coordination of National Government
Ministry of Education
Ministry of Lands and Physical Planning
National Registration Bureau
All Public Offices
Judiciary/ Law Courts
Constituency Development Funds Office
Member of County Assembly Office
Governor's Office
Ministry of Labour and Social Protection
Ministry of Transport, Infrastructure, Housing, Urban Development and Public Works
National Government
Office of the President
Department of Immigration
Parliament
Ministry of Agriculture, Livestock, Fisheries and Irrigation
Ministry of Water
Public Service Commission
The National Treasury and Planning
Kenya Revenue Authority
National Youth Service
Ministry of Devolution and and the ASALS
Kenya Power and Lighting Company
Teachers Service Commission
Kenya Defence Forces
Regional Ministries Offices
Huduma Centre
Kenya Wildlife Service
National Transport and Safety Authority
Independent Electoral and Boundaries Commission
Office of the Deputy President
Ministry of Industry, Trade and Cooperatives
Kenya Forest Service
Pensions Department
Ministry of Foreign Affairs
Mumias Sugar Company
Ethics and Anti-Corruption Commission
Kenya Ports Authority
National Cereals and Produce Board
National Disaster Management Authority
Ministry of Tourism and Wildlife
Higher Education Loans Board
Women Representative’s Office
Kenya Maritime Authority
Bomet
35.2
8.2
14.3
11.2
12.8
1.5
2.6
1.0
1.5
2.6
1.0
1.0
0.0
2.0
0.5
0.0
0.5
0.5
0.5
0.5
0.0
0.0
0.5
0.0
0.0
0.5
0.0
0.5
0.0
0.0
0.0
0.5
0.0
0.0
0.0
0.0
0.0
0.0
0.0
0.5
0.0
0.0
0.0
0.0
0.0
0.0
0.0
Siaya
17.7
19.9
12.4
5.4
9.7
3.8
2.7
2.7
3.8
3.2
1.6
1.1
2.2
4.8
0.0
0.5
0.5
0.5
0.5
2.2
0.0
0.5
0.0
0.0
0.0
1.1
0.0
0.0
0.0
0.0
0.5
0.0
0.0
1.1
0.5
0.5
0.0
0.0
0.0
0.0
0.0
0.5
0.0
0.0
0.0
0.0
0.0
Baringo
38.0
8.0
13.5
9.8
4.9
3.1
0.6
0.6
3.7
1.2
2.5
2.5
2.5
0.0
0.0
0.6
0.6
1.8
0.6
1.8
0.0
0.0
0.6
0.6
0.0
0.0
1.2
0.0
0.6
0.0
0.0
0.0
0.0
0.0
0.0
0.6
0.0
0.0
0.0
0.0
0.0
0.0
0.0
0.0
0.0
0.0
0.0
Kilifi
22.6
17.0
11.3
5.0
6.3
2.5
1.9
1.3
3.8
6.9
2.5
1.9
2.5
3.1
1.9
0.0
0.0
1.9
1.9
3.1
0.0
0.6
0.6
0.0
1.3
0.0
0.0
0.0
0.0
0.0
0.0
0.0
0.0
0.0
0.0
0.0
0.0
0.0
0.0
0.0
0.0
0.0
0.0
0.0
0.0
0.0
0.0
Homa Bay
22.7
27.3
14.7
4.0
5.3
3.3
2.7
2.0
1.3
0.7
1.3
0.0
0.7
1.3
0.0
1.3
0.0
1.3
4.0
2.0
1.3
0.0
0.0
0.7
0.7
0.7
0.0
0.0
0.0
0.0
0.0
0.0
0.0
0.0
0.0
0.0
0.0
0.0
0.0
0.0
0.0
0.0
0.0
0.0
0.0
0.0
0.7
Turkana
27.3
18.7
3.6
5.0
3.6
2.2
2.2
5.0
0.7
4.3
2.2
0.7
6.5
0.0
0.7
1.4
0.0
0.7
1.4
0.7
1.4
3.6
0.7
2.9
0.7
0.0
0.0
0.0
0.0
1.4
0.0
0.0
0.0
0.0
0.0
0.0
0.0
0.0
0.0
0.0
0.0
0.0
1.4
0.0
0.7
0.0
0.0
Elgeyo Marakwet
36.5
13.1
1.5
3.6
2.2
2.9
6.6
9.5
5.1
7.3
1.5
0.0
0.0
0.0
2.2
0.7
0.0
0.7
0.0
1.5
0.7
0.0
0.0
0.7
0.0
0.0
0.0
0.0
0.7
0.0
0.0
1.5
0.7
0.0
0.0
0.0
0.0
0.0
0.0
0.0
0.0
0.0
0.0
0.0
0.0
0.7
0.0
Kericho
33.3
8.1
16.3
11.9
11.9
0.7
3.0
0.7
3.7
1.5
1.5
0.7
0.0
0.7
0.7
0.7
0.0
0.7
1.5
0.0
0.0
0.7
0.0
0.0
0.0
0.7
0.0
0.0
0.7
0.0
0.0
0.0
0.0
0.0
0.0
0.0
0.0
0.0
0.0
0.0
0.0
0.0
0.0
0.0
0.0
0.0
0.0
Kwale
22.4
0.7
26.1
9.7
4.5
7.5
5.2
0.0
2.2
0.0
1.5
0.0
1.5
0.7
0.7
0.0
2.2
2.2
1.5
1.5
0.7
0.7
3.7
1.5
0.0
0.7
0.0
0.0
0.0
0.0
0.0
0.0
0.0
0.0
1.5
0.0
0.0
0.0
0.0
0.0
0.7
0.0
0.0
0.0
0.0
0.0
0.0
West Pokot
33.8
16.2
2.3
14.6
4.6
0.0
1.5
7.7
0.0
2.3
2.3
3.1
1.5
0.0
0.8
0.8
0.8
0.0
1.5
0.0
1.5
0.0
0.0
0.0
0.8
0.0
2.3
0.0
0.0
0.8
0.0
0.0
0.0
0.0
0.0
0.0
0.0
0.0
0.0
0.0
0.0
0.8
0.0
0.0
0.0
0.0
0.0
Mandera
26.4
12.0
8.8
4.8
8.0
2.4
19.2
1.6
4.0
1.6
0.0
3.2
2.4
0.0
0.0
0.0
0.8
0.0
0.0
4.0
0.0
0.0
0.0
0.0
0.0
0.0
0.0
0.0
0.0
0.8
0.0
0.0
0.0
0.0
0.0
0.0
0.0
0.0
0.0
0.0
0.0
0.0
0.0
0.0
0.0
0.0
0.0

274
274
County C
ount
y an
alys
is (in
per
cent
age)
of p
ublic
serv
ice
inst
itutio
ns w
here
cor
rupt
ion
is pe
rcei
ved
to b
e m
ost p
reva
lent
National Police Service (especiallty Traffic Police and Police in border areas)
County Government
Ministry of Health
Ministry of Interior and Coordination of National Government
Ministry of Education
Ministry of Lands and Physical Planning
National Registration Bureau
All Public Offices
Judiciary/ Law Courts
Constituency Development Funds Office
Member of County Assembly Office
Governor's Office
Ministry of Labour and Social Protection
Ministry of Transport, Infrastructure, Housing, Urban Development and Public Works
National Government
Office of the President
Department of Immigration
Parliament
Ministry of Agriculture, Livestock, Fisheries and Irrigation
Ministry of Water
Public Service Commission
The National Treasury and Planning
Kenya Revenue Authority
National Youth Service
Ministry of Devolution and and the ASALS
Kenya Power and Lighting Company
Teachers Service Commission
Kenya Defence Forces
Regional Ministries Offices
Huduma Centre
Kenya Wildlife Service
National Transport and Safety Authority
Independent Electoral and Boundaries Commission
Office of the Deputy President
Ministry of Industry, Trade and Cooperatives
Kenya Forest Service
Pensions Department
Ministry of Foreign Affairs
Mumias Sugar Company
Ethics and Anti-Corruption Commission
Kenya Ports Authority
National Cereals and Produce Board
National Disaster Management Authority
Ministry of Tourism and Wildlife
Higher Education Loans Board
Women Representative’s Office
Kenya Maritime Authority
Makueni
29.5
5.7
5.7
23.8
4.1
1.6
0.8
17.2
0.0
1.6
0.0
0.0
0.0
0.0
1.6
3.3
0.8
0.8
0.0
0.0
1.6
0.8
0.0
0.0
0.0
0.0
0.0
0.0
0.0
0.0
0.0
0.0
0.0
0.0
0.0
0.0
0.0
0.8
0.0
0.0
0.0
0.0
0.0
0.0
0.0
0.0
0.0
Garissa
39.2
10.8
4.2
7.5
5.0
0.8
13.3
1.7
5.0
0.0
0.0
0.0
0.0
0.0
2.5
0.8
0.8
0.0
0.0
0.0
3.3
0.8
1.7
0.0
0.0
0.0
0.0
2.5
0.0
0.0
0.0
0.0
0.0
0.0
0.0
0.0
0.0
0.0
0.0
0.0
0.0
0.0
0.0
0.0
0.0
0.0
0.0
Uasin Gishu
34.5
7.8
1.7
6.9
1.7
5.2
7.8
7.8
4.3
4.3
4.3
0.9
2.6
0.0
0.9
0.9
2.6
0.9
0.0
0.0
0.0
0.0
0.9
0.0
0.9
0.0
0.0
0.9
0.0
0.0
0.9
0.0
0.9
0.0
0.0
0.0
0.9
0.0
0.0
0.0
0.0
0.0
0.0
0.0
0.0
0.0
0.0
Nyeri
16.8
16.8
5.3
8.0
8.0
4.4
1.8
5.3
4.4
13.3
0.9
0.9
0.9
0.0
1.8
2.7
0.9
0.0
1.8
1.8
0.9
0.0
0.0
1.8
0.0
0.0
0.9
0.0
0.0
0.0
0.0
0.0
0.0
0.0
0.0
0.0
0.0
0.9
0.0
0.0
0.0
0.0
0.0
0.0
0.0
0.0
0.0
Nandi
22.5
11.7
9.0
15.3
4.5
1.8
3.6
10.8
2.7
0.9
0.9
0.9
2.7
1.8
0.0
0.9
0.0
1.8
0.9
0.9
0.0
0.0
0.0
0.0
0.0
4.5
0.0
0.0
0.0
0.9
0.0
0.0
0.0
0.0
0.0
0.0
0.9
0.0
0.0
0.0
0.0
0.0
0.0
0.0
0.0
0.0
0.0
Tana River
4.1
7.1
10.2
5.1
7.1
1.0
5.1
4.1
2.0
10.2
4.1
4.1
2.0
2.0
0.0
1.0
0.0
0.0
1.0
18.4
2.0
1.0
0.0
0.0
3.1
2.0
0.0
0.0
1.0
0.0
0.0
0.0
1.0
0.0
1.0
0.0
0.0
0.0
0.0
0.0
0.0
0.0
0.0
0.0
0.0
0.0
0.0
Marsabit
33.0
12.5
5.7
11.4
1.1
3.4
13.6
0.0
2.3
1.1
0.0
4.5
1.1
0.0
0.0
0.0
4.5
0.0
0.0
0.0
0.0
0.0
0.0
0.0
0.0
0.0
0.0
2.3
0.0
0.0
0.0
1.1
0.0
0.0
0.0
0.0
1.1
0.0
0.0
0.0
0.0
0.0
1.1
0.0
0.0
0.0
0.0
Nyandarua
20.7
17.1
7.3
7.3
3.7
6.1
1.2
15.9
0.0
4.9
0.0
0.0
0.0
0.0
0.0
0.0
0.0
8.5
0.0
0.0
1.2
1.2
0.0
0.0
0.0
0.0
0.0
0.0
2.4
1.2
0.0
0.0
0.0
0.0
0.0
0.0
0.0
0.0
0.0
0.0
1.2
0.0
0.0
0.0
0.0
0.0
0.0
Kirinyaga
28.0
9.3
5.3
9.3
8.0
5.3
1.3
4.0
9.3
5.3
0.0
2.7
0.0
0.0
2.7
2.7
0.0
0.0
1.3
0.0
0.0
0.0
1.3
2.7
0.0
0.0
0.0
0.0
1.3
0.0
0.0
0.0
0.0
0.0
0.0
0.0
0.0
0.0
0.0
0.0
0.0
0.0
0.0
0.0
0.0
0.0
0.0
Laikipia
41.3
4.8
11.1
11.1
9.5
3.2
1.6
0.0
1.6
0.0
1.6
3.2
1.6
0.0
0.0
0.0
1.6
1.6
1.6
3.2
0.0
0.0
0.0
0.0
0.0
1.6
0.0
0.0
0.0
0.0
0.0
0.0
0.0
0.0
0.0
0.0
0.0
0.0
0.0
0.0
0.0
0.0
0.0
0.0
0.0
0.0
0.0
Wajir
41.5
20.8
1.9
3.8
1.9
1.9
1.9
11.3
7.5
0.0
0.0
0.0
1.9
1.9
0.0
0.0
0.0
0.0
0.0
0.0
0.0
1.9
0.0
1.9
0.0
0.0
0.0
0.0
0.0
0.0
0.0
0.0
0.0
0.0
0.0
0.0
0.0
0.0
0.0
0.0
0.0
0.0
0.0
0.0
0.0
0.0
0.0
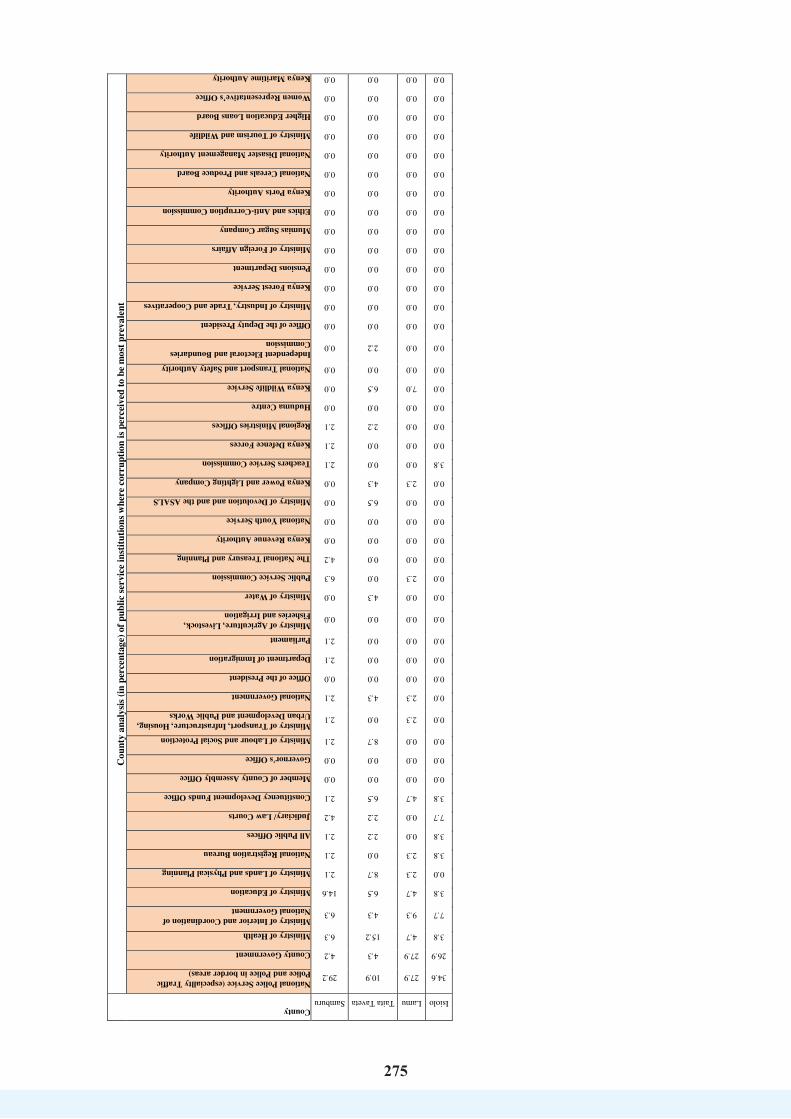
275
275
County
Cou
nty
anal
ysis
(in p
erce
ntag
e) o
f pub
lic se
rvic
e in
stitu
tions
whe
re c
orru
ptio
n is
perc
eive
d to
be
mos
t pre
vale
nt
National Police Service (especiallty Traffic Police and Police in border areas)
County Government
Ministry of Health
Ministry of Interior and Coordination of National Government
Ministry of Education
Ministry of Lands and Physical Planning
National Registration Bureau
All Public Offices
Judiciary/ Law Courts
Constituency Development Funds Office
Member of County Assembly Office
Governor's Office
Ministry of Labour and Social Protection
Ministry of Transport, Infrastructure, Housing, Urban Development and Public Works
National Government
Office of the President
Department of Immigration
Parliament
Ministry of Agriculture, Livestock, Fisheries and Irrigation
Ministry of Water
Public Service Commission
The National Treasury and Planning
Kenya Revenue Authority
National Youth Service
Ministry of Devolution and and the ASALS
Kenya Power and Lighting Company
Teachers Service Commission
Kenya Defence Forces
Regional Ministries Offices
Huduma Centre
Kenya Wildlife Service
National Transport and Safety Authority
Independent Electoral and Boundaries Commission
Office of the Deputy President
Ministry of Industry, Trade and Cooperatives
Kenya Forest Service
Pensions Department
Ministry of Foreign Affairs
Mumias Sugar Company
Ethics and Anti-Corruption Commission
Kenya Ports Authority
National Cereals and Produce Board
National Disaster Management Authority
Ministry of Tourism and Wildlife
Higher Education Loans Board
Women Representative’s Office
Kenya Maritime Authority
Samburu
29.2
4.2
6.3
6.3
14.6
2.1
2.1
2.1
4.2
2.1
0.0
0.0
2.1
2.1
2.1
0.0
2.1
2.1
0.0
0.0
6.3
4.2
0.0
0.0
0.0
0.0
2.1
2.1
2.1
0.0
0.0
0.0
0.0
0.0
0.0
0.0
0.0
0.0
0.0
0.0
0.0
0.0
0.0
0.0
0.0
0.0
0.0
Taita Taveta
10.9
4.3
15.2
4.3
6.5
8.7
0.0
2.2
2.2
6.5
0.0
0.0
8.7
0.0
4.3
0.0
0.0
0.0
0.0
4.3
0.0
0.0
0.0
0.0
6.5
4.3
0.0
0.0
2.2
0.0
6.5
0.0
2.2
0.0
0.0
0.0
0.0
0.0
0.0
0.0
0.0
0.0
0.0
0.0
0.0
0.0
0.0
Lamu
27.9
27.9
4.7
9.3
4.7
2.3
2.3
0.0
0.0
4.7
0.0
0.0
0.0
2.3
2.3
0.0
0.0
0.0
0.0
0.0
2.3
0.0
0.0
0.0
0.0
2.3
0.0
0.0
0.0
0.0
7.0
0.0
0.0
0.0
0.0
0.0
0.0
0.0
0.0
0.0
0.0
0.0
0.0
0.0
0.0
0.0
0.0
Isiolo
34.6
26.9
3.8
7.7
3.8
0.0
3.8
3.8
7.7
3.8
0.0
0.0
0.0
0.0
0.0
0.0
0.0
0.0
0.0
0.0
0.0
0.0
0.0
0.0
0.0
0.0
3.8
0.0
0.0
0.0
0.0
0.0
0.0
0.0
0.0
0.0
0.0
0.0
0.0
0.0
0.0
0.0
0.0
0.0
0.0
0.0
0.0
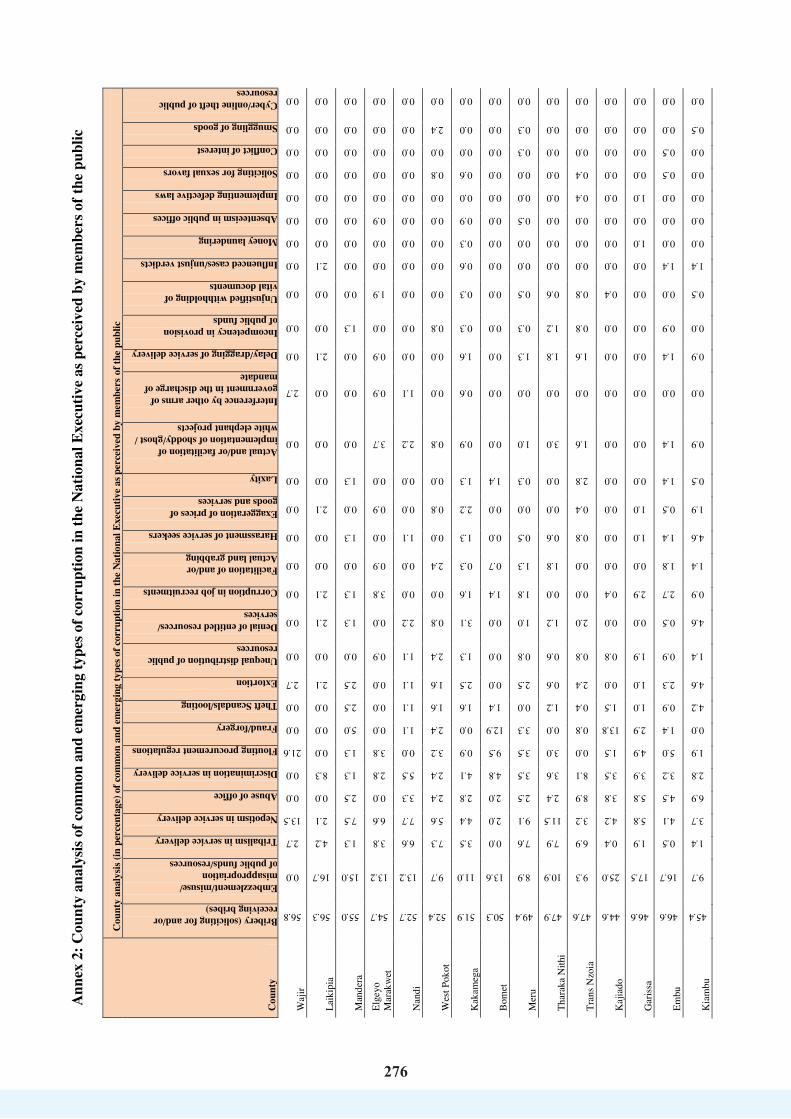
276
276
Ann
ex 2
: Cou
nty
anal
ysis
of c
omm
on a
nd e
mer
ging
type
s of c
orru
ptio
n in
the
Nat
iona
l Exe
cutiv
e as
per
ceiv
ed b
y m
embe
rs o
f the
pub
lic
Cou
nty
Cou
nty
anal
ysis
(in p
erce
ntag
e) o
f com
mon
and
em
ergi
ng ty
pes o
f cor
rupt
ion
in th
e N
atio
nal E
xecu
tive
as p
erce
ived
by
mem
bers
of t
he p
ublic
Bribery (soliciting for and/or receiving bribes)
Embezzlement/misuse/ misappropriation of public funds/resources
Tribalism in service delivery
Nepotism in service delivery
Abuse of office
Discrimination in service delivery
Flouting procurement regulations
Fraud/forgery
Theft Scandals/looting
Extortion
Unequal distribution of public resources
Denial of entitled resources/ services
Corruption in job recruitments
Facilitation of and/or Actual land grabbing
Harassment of service seekers
Exaggeration of prices of goods and services
Laxity
Actual and/or facilitation of implementation of shoddy/ghost / white elephant projects
Interference by other arms of government in the discharge of mandate
Delay/dragging of service delivery
Incompetency in provision of public funds
Unjustified withholding of vital documents
Influenced cases/unjust verdicts
Money laundering
Absenteeism in public offices
Implementing defective laws
Soliciting for sexual favors
Conflict of interest
Smuggling of goods
Cyber/online theft of public resources
Waj
ir
56.8
0.0
2.7
13.5
0.0
0.0
21.6
0.0
0.0
2.7
0.0
0.0
0.0
0.0
0.0
0.0
0.0
0.0
2.7
0.0
0.0
0.0
0.0
0.0
0.0
0.0
0.0
0.0
0.0
0.0
Laik
ipia
56.3
16.7
4.2
2.1
0.0
8.3
0.0
0.0
0.0
2.1
0.0
2.1
2.1
0.0
0.0
2.1
0.0
0.0
0.0
2.1
0.0
0.0
2.1
0.0
0.0
0.0
0.0
0.0
0.0
0.0
Man
dera
55.0
15.0
1.3
7.5
2.5
1.3
1.3
5.0
2.5
2.5
0.0
1.3
1.3
0.0
1.3
0.0
1.3
0.0
0.0
0.0
1.3
0.0
0.0
0.0
0.0
0.0
0.0
0.0
0.0
0.0
Elge
yo
Mar
akw
et
54.7
13.2
3.8
6.6
0.0
2.8
3.8
0.0
0.0
0.0
0.9
0.0
3.8
0.9
0.0
0.9
0.0
3.7
0.9
0.9
0.0
1.9
0.0
0.0
0.9
0.0
0.0
0.0
0.0
0.0
Nan
di
52.7
13.2
6.6
7.7
3.3
5.5
0.0
1.1
1.1
1.1
1.1
2.2
0.0
0.0
1.1
0.0
0.0
2.2
1.1
0.0
0.0
0.0
0.0
0.0
0.0
0.0
0.0
0.0
0.0
0.0
Wes
t Pok
ot
52.4
9.7
7.3
5.6
2.4
2.4
3.2
2.4
1.6
1.6
2.4
0.8
0.0
2.4
0.0
0.8
0.0
0.8
0.0
0.0
0.8
0.0
0.0
0.0
0.0
0.0
0.8
0.0
2.4
0.0
Kak
ameg
a
51.9
11.0
3.5
4.4
2.8
4.1
0.9
0.0
1.6
2.5
1.3
3.1
1.6
0.3
1.3
2.2
1.3
0.9
0.6
1.6
0.3
0.3
0.6
0.3
0.9
0.0
0.6
0.0
0.0
0.0
Bom
et
50.3
13.6
0.0
2.0
2.0
4.8
9.5
12.9
1.4
0.0
0.0
0.0
1.4
0.7
0.0
0.0
1.4
0.0
0.0
0.0
0.0
0.0
0.0
0.0
0.0
0.0
0.0
0.0
0.0
0.0
Mer
u
49.4
8.9
7.6
9.1
2.5
3.5
3.5
3.3
0.0
2.5
0.8
1.0
1.8
1.3
0.5
0.0
0.3
1.0
0.0
1.3
0.3
0.5
0.0
0.0
0.5
0.0
0.0
0.3
0.3
0.0
Thar
aka
Nith
i
47.9
10.9
7.9
11.5
2.4
3.6
3.0
0.0
1.2
0.6
0.6
1.2
0.0
1.8
0.6
0.0
0.0
3.0
0.0
1.8
1.2
0.6
0.0
0.0
0.0
0.0
0.0
0.0
0.0
0.0
Tran
s Nzo
ia
47.6
9.3
6.9
3.2
8.9
8.1
0.0
0.8
0.4
2.4
0.8
2.0
0.0
0.0
0.8
0.4
2.8
1.6
0.0
1.6
0.8
0.8
0.0
0.0
0.0
0.4
0.4
0.0
0.0
0.0
Kaj
iado
44.6
25.0
0.4
4.2
3.8
3.5
1.5
13.8
1.5
0.0
0.8
0.0
0.4
0.0
0.0
0.0
0.0
0.0
0.0
0.0
0.0
0.4
0.0
0.0
0.0
0.0
0.0
0.0
0.0
0.0
Gar
issa
46.6
17.5
1.9
5.8
5.8
3.9
4.9
2.9
1.0
1.0
1.9
0.0
2.9
0.0
1.0
1.0
0.0
0.0
0.0
0.0
0.0
0.0
0.0
1.0
0.0
1.0
0.0
0.0
0.0
0.0
Embu
46.6
16.7
0.5
4.1
4.5
3.2
5.0
1.4
0.9
2.3
0.9
0.5
2.7
1.8
1.4
0.5
1.4
1.4
0.0
1.4
0.9
0.0
1.4
0.0
0.0
0.0
0.5
0.5
0.0
0.0
Kia
mbu
45.4
9.7
1.4
3.7
6.9
2.8
1.9
0.0
4.2
4.6
1.4
4.6
0.9
1.4
4.6
1.9
0.5
0.9
0.0
0.9
0.0
0.5
1.4
0.0
0.0
0.0
0.0
0.0
0.5
0.0

277
277
Cou
nty
Cou
nty
anal
ysis
(in p
erce
ntag
e) o
f com
mon
and
em
ergi
ng ty
pes o
f cor
rupt
ion
in th
e N
atio
nal E
xecu
tive
as p
erce
ived
by
mem
bers
of t
he p
ublic
Bribery (soliciting for and/or receiving bribes)
Embezzlement/misuse/ misappropriation of public funds/resources
Tribalism in service delivery
Nepotism in service delivery
Abuse of office
Discrimination in service delivery
Flouting procurement regulations
Fraud/forgery
Theft Scandals/looting
Extortion
Unequal distribution of public resources
Denial of entitled resources/ services
Corruption in job recruitments
Facilitation of and/or Actual land grabbing
Harassment of service seekers
Exaggeration of prices of goods and services
Laxity
Actual and/or facilitation of implementation of shoddy/ghost / white elephant projects
Interference by other arms of government in the discharge of mandate
Delay/dragging of service delivery
Incompetency in provision of public funds
Unjustified withholding of vital documents
Influenced cases/unjust verdicts
Money laundering
Absenteeism in public offices
Implementing defective laws
Soliciting for sexual favors
Conflict of interest
Smuggling of goods
Cyber/online theft of public resources
Ker
icho
45.2
26.0
1.0
4.8
6.7
0.0
5.8
5.8
1.9
0.0
0.0
0.0
0.0
0.0
0.0
0.0
1.0
2.0
0.0
0.0
0.0
0.0
0.0
0.0
0.0
0.0
0.0
0.0
0.0
0.0
Nye
ri
44.9
24.7
3.4
1.1
9.0
1.1
4.5
3.4
4.5
1.1
0.0
0.0
0.0
0.0
0.0
0.0
0.0
2.2
0.0
0.0
0.0
0.0
0.0
0.0
0.0
0.0
0.0
0.0
0.0
0.0
Mig
ori
44.9
19.5
7.9
5.1
3.8
5.8
0.3
0.3
2.4
2.7
2.1
1.0
0.7
0.3
0.3
0.7
0.7
0.0
0.3
0.3
0.0
0.3
0.0
0.0
0.0
0.0
0.3
0.0
0.0
0.0
Mur
ang'
a
44.8
4.9
0.6
2.5
4.3
4.9
0.6
0.0
4.3
3.7
1.2
9.2
0.6
0.6
6.1
1.2
3.1
3.0
0.6
1.2
0.6
0.0
0.6
0.0
0.6
0.0
0.0
0.6
0.0
0.0
Nar
ok
42.9
17.7
0.0
2.2
3.9
3.5
0.4
19.9
2.6
1.3
0.4
0.0
0.4
0.4
0.0
0.0
0.0
3.4
0.4
0.4
0.0
0.0
0.0
0.0
0.0
0.0
0.0
0.0
0.0
0.0
Kitu
i
42.2
6.6
11.1
8.7
4.5
3.1
1.0
0.0
12.5
2.1
3.8
0.7
0.7
0.7
0.3
0.0
0.7
0.3
0.3
0.3
0.0
0.3
0.0
0.0
0.0
0.0
0.0
0.0
0.0
0.0
Uas
in G
ishu
41.9
9.5
6.8
8.1
1.4
1.4
6.8
2.7
1.4
1.4
2.7
5.4
4.1
0.0
0.0
0.0
2.7
0.0
0.0
0.0
0.0
0.0
0.0
1.4
1.4
0.0
0.0
0.0
1.4
0.0
Mar
sabi
t
40.8
11.3
12.7
4.2
7.0
4.2
1.4
4.2
1.4
0.0
0.0
2.8
4.2
1.4
1.4
0.0
1.4
1.4
0.0
0.0
0.0
0.0
0.0
0.0
0.0
0.0
0.0
0.0
0.0
0.0
Bus
ia
40.5
9.7
10.0
10.4
2.6
4.8
3.3
1.1
0.7
1.9
2.6
2.2
2.6
0.7
0.7
0.7
0.0
1.9
0.0
0.0
1.1
0.0
0.0
0.4
0.4
0.7
0.4
0.0
0.0
0.4
Vih
iga
40.1
12.2
0.7
7.5
2.0
8.2
0.7
0.0
1.4
12.9
1.4
4.1
1.4
0.0
0.7
1.4
0.0
2.0
0.7
0.7
0.7
0.7
0.0
0.0
0.7
0.0
0.0
0.0
0.0
0.0
Sam
buru
40.0
8.6
11.4
5.7
0.0
14.3
5.7
2.9
0.0
0.0
5.7
0.0
0.0
0.0
2.9
2.9
0.0
0.0
0.0
0.0
0.0
0.0
0.0
0.0
0.0
0.0
0.0
0.0
0.0
0.0
Turk
ana
39.4
15.6
6.4
6.4
1.8
3.7
8.3
0.0
0.9
0.0
4.6
3.7
2.8
0.0
0.9
0.0
0.9
2.7
0.9
0.0
0.0
0.0
0.0
0.9
0.0
0.0
0.0
0.0
0.0
0.0
Nya
ndar
ua
39.0
32.5
0.0
5.2
2.6
1.3
1.3
1.3
2.6
2.6
1.3
1.3
0.0
3.9
0.0
0.0
0.0
1.3
0.0
0.0
0.0
0.0
0.0
0.0
1.3
0.0
0.0
2.6
0.0
0.0
Mom
basa
38.9
18.1
2.8
4.0
6.2
4.0
2.8
0.9
2.5
3.4
1.9
2.8
1.9
0.6
1.9
0.9
1.2
3.1
0.6
0.3
0.0
0.0
0.3
0.3
0.0
0.0
0.0
0.0
0.3
0.0
Kis
ii
38.4
18.4
13.8
0.6
5.9
4.4
0.9
1.6
3.8
1.3
1.3
1.9
1.3
0.6
0.6
0.3
1.9
1.2
0.0
0.3
0.3
0.3
0.3
0.0
0.3
0.0
0.0
0.3
0.0
0.0
Nya
mira
37.3
20.1
8.9
3.6
4.1
8.3
0.6
0.6
2.4
1.8
1.8
1.8
2.4
0.6
0.6
1.8
0.0
1.2
0.6
0.0
1.2
0.0
0.0
0.0
0.0
0.0
0.6
0.0
0.0
0.0

278
278
Cou
nty
Cou
nty
anal
ysis
(in p
erce
ntag
e) o
f com
mon
and
em
ergi
ng ty
pes o
f cor
rupt
ion
in th
e N
atio
nal E
xecu
tive
as p
erce
ived
by
mem
bers
of t
he p
ublic
Bribery (soliciting for and/or receiving bribes)
Embezzlement/misuse/ misappropriation of public funds/resources
Tribalism in service delivery
Nepotism in service delivery
Abuse of office
Discrimination in service delivery
Flouting procurement regulations
Fraud/forgery
Theft Scandals/looting
Extortion
Unequal distribution of public resources
Denial of entitled resources/ services
Corruption in job recruitments
Facilitation of and/or Actual land grabbing
Harassment of service seekers
Exaggeration of prices of goods and services
Laxity
Actual and/or facilitation of implementation of shoddy/ghost / white elephant projects
Interference by other arms of government in the discharge of mandate
Delay/dragging of service delivery
Incompetency in provision of public funds
Unjustified withholding of vital documents
Influenced cases/unjust verdicts
Money laundering
Absenteeism in public offices
Implementing defective laws
Soliciting for sexual favors
Conflict of interest
Smuggling of goods
Cyber/online theft of public resources
Mac
hako
s
35.9
33.7
8.6
4.3
2.5
2.1
1.5
0.6
2.8
0.6
2.1
0.3
1.5
0.3
0.0
0.9
0.3
0.9
0.0
0.0
0.6
0.0
0.0
0.3
0.0
0.0
0.0
0.0
0.0
0.0
Isio
lo
34.3
20.0
2.9
5.7
17.1
5.7
0.0
2.9
2.9
0.0
5.7
0.0
0.0
0.0
2.9
0.0
0.0
0.0
0.0
0.0
0.0
0.0
0.0
0.0
0.0
0.0
0.0
0.0
0.0
0.0
Nak
uru
32.3
28.4
5.1
7.3
3.6
4.9
2.2
1.0
2.4
1.4
1.0
2.4
1.2
2.0
0.8
0.8
0.0
0.5
0.7
0.5
0.2
0.0
0.0
0.7
0.0
0.0
0.2
0.2
0.2
0.2
Mak
ueni
31.0
35.4
13.3
3.5
3.5
0.0
0.9
0.0
2.7
0.0
1.8
0.9
3.5
0.0
0.0
0.0
0.0
3.6
0.0
0.0
0.0
0.0
0.0
0.0
0.0
0.0
0.0
0.0
0.0
0.0
Kw
ale
30.4
15.2
2.5
3.8
6.3
12.7
0.0
2.5
1.3
1.3
1.3
2.5
1.3
3.8
1.3
2.5
1.3
1.3
0.0
1.3
3.8
0.0
2.5
0.0
0.0
0.0
0.0
1.3
0.0
0.0
Taita
Tav
eta
30.0
10.0
10.0
13.3
20.0
6.7
0.0
0.0
0.0
0.0
0.0
3.3
0.0
0.0
0.0
0.0
0.0
3.3
0.0
0.0
0.0
0.0
3.3
0.0
0.0
0.0
0.0
0.0
0.0
0.0
Lam
u
30.0
5.0
17.5
2.5
15.0
7.5
0.0
7.5
0.0
7.5
0.0
0.0
0.0
2.5
0.0
0.0
0.0
2.5
0.0
0.0
0.0
0.0
2.5
0.0
0.0
0.0
0.0
0.0
0.0
0.0
Kiri
nyag
a
29.9
28.4
4.5
6.0
9.0
1.5
3.0
0.0
1.5
0.0
1.5
0.0
1.5
1.5
1.5
0.0
0.0
3.0
6.0
0.0
1.5
0.0
0.0
0.0
0.0
0.0
0.0
0.0
0.0
0.0
Bar
ingo
28.4
29.1
5.0
3.5
1.4
12.1
2.8
0.7
0.0
0.7
3.5
2.1
0.7
0.0
1.4
0.0
1.4
1.4
0.0
0.7
1.4
0.0
0.7
2.8
0.0
0.0
0.0
0.0
0.0
0.0
Bun
gom
a
27.8
13.3
6.7
9.0
3.1
4.7
5.5
2.0
2.7
3.1
3.9
0.4
4.7
1.2
0.4
2.4
1.2
3.2
2.4
0.4
0.4
0.4
0.4
0.4
0.0
0.4
0.0
0.0
0.0
0.0
Nai
robi
27.5
24.4
12.9
5.2
5.2
1.5
6.8
1.8
1.4
0.5
0.9
0.1
1.4
2.4
0.2
1.1
0.5
1.3
3.2
0.1
0.7
0.1
0.0
0.0
0.0
0.5
0.0
0.1
0.1
0.1
Tana
Riv
er
25.7
8.1
10.8
6.8
10.8
9.5
0.0
2.7
0.0
4.1
2.7
9.5
0.0
1.4
0.0
0.0
1.4
1.4
1.4
1.4
0.0
1.4
0.0
0.0
1.4
0.0
0.0
0.0
0.0
0.0
Siay
a
24.4
17.6
9.9
12.2
4.6
4.6
3.1
0.8
4.6
2.3
5.3
0.8
1.5
0.0
0.0
1.5
0.8
1.6
0.8
0.8
1.5
0.0
0.0
0.0
0.0
0.8
0.8
0.0
0.0
0.0
Kis
umu
23.7
22.0
4.7
11.6
3.9
4.3
6.9
1.7
2.6
2.6
2.2
0.0
1.7
0.0
0.4
3.4
0.4
3.0
0.0
1.3
1.3
0.9
0.0
0.0
0.0
1.3
0.0
0.0
0.0
0.0
Hom
a B
ay
22.5
25.0
14.2
5.0
0.0
5.0
5.8
5.8
1.7
0.8
3.3
0.8
0.0
1.7
1.7
0.0
2.5
1.7
0.8
0.8
0.0
0.0
0.0
0.0
0.0
0.0
0.0
0.8
0.0
0.0
Kili
fi
21.2
16.1
9.3
9.3
11.9
3.4
5.9
0.0
1.7
5.1
5.1
3.4
0.0
0.8
0.8
0.8
0.8
2.5
0.0
0.8
0.0
0.8
0.0
0.0
0.0
0.0
0.0
0.0
0.0
0.0

279
279
Ann
ex 3
: Cou
nty
anal
ysis
of c
omm
on a
nd e
mer
ging
type
s of c
orru
ptio
n in
the
Cou
nty
Exec
utiv
e as
per
ceiv
ed b
y m
embe
rs o
f the
pub
lic
Cou
nty
Cou
nty
anal
ysis
(in p
erce
ntag
e) o
f com
mon
and
em
ergi
ng ty
pes o
f cor
rupt
ion
in th
e C
ount
y Ex
ecut
ive
as p
erce
ived
by
mem
bers
of t
he p
ublic
Bribery (soliciting for and/or receiving bribes)
Embezzlement/misuse/ misappropriation of public funds/resources Nepotism in service delivery
Discrimination in s ervice delivery
Tribalism in service delivery
Abuse of office
Flouting procurement regulations
Actual and/or facilitation of implementation of shoddy/ ghost /white elephant projects
Fraud/forgery and/or money laundering
Unequal distribution of public resources
Corruption in job recruitments
Extortion
Harassment of service seekers
Lack of professionalism
Incompetency in provision of public funds
Laxity
Impunity Cyber/online theft of public resources
Soliciting for sexual favors
Rigging during elections
Interference by other arms of government in the discharge of mandate
Kak
ameg
a 37
.6
15.1
8.
1 6.
6 3.
9 3.
1 4.
7 3.
5 1.
2 3.
1 5.
8 2.
3 0.
4 0.
8 1.
6 0.
4 1.
6 0.
0 0.
0 0.
0 0.
4 K
itui
36.5
13
.3
13.0
3.
8 3.
4 1.
7 11
.6
4.1
1.0
3.4
0.7
3.1
0.3
1.4
0.3
0.7
1.0
0.0
0.7
0.0
0.0
Mig
ori
35.6
23
.7
5.8
7.7
10.3
1.
9 0.
3 1.
0 1.
0 2.
6 1.
3 1.
9 0.
6 3.
5 0.
0 1.
3 0.
3 0.
6 0.
6 0.
0 0.
0 W
ajir
33.3
0.
0 28
.9
0.0
2.2
0.0
31.1
0.
0 0.
0 0.
0 4.
4 0.
0 0.
0 0.
0 0.
0 0.
0 0.
0 0.
0 0.
0 0.
0 0.
0 M
acha
kos
32.6
30
.9
8.9
2.0
3.9
3.3
2.3
3.6
3.3
2.6
0.0
1.3
0.0
3.6
0.7
0.3
0.3
0.3
0.0
0.0
0.0
Elge
yo
Mar
akw
et
31.0
12
.9
12.1
3.
4 6.
9 2.
6 9.
5 6.
0 1.
7 3.
4 4.
3 1.
7 0.
0 1.
7 1.
7 0.
0 0.
0 0.
9 0.
0 0.
0 0.
0 Tr
ans N
zoia
30
.7
11.2
4.
5 13
.4
8.9
8.4
1.1
1.1
1.7
1.1
0.6
6.7
1.7
5.6
0.6
1.7
0.6
0.0
0.0
0.6
0.0
Ker
icho
28
.3
20.7
12
.0
8.7
0.0
3.3
6.5
7.6
8.7
0.0
1.1
1.1
0.0
1.1
0.0
0.0
0.0
0.0
1.1
0.0
0.0
Turk
ana
27.4
11
.3
17.9
3.
8 4.
7 3.
8 14
.2
2.8
0.9
3.8
5.7
0.0
1.9
0.9
0.0
0.0
0.9
0.0
0.0
0.0
0.0
Kia
mbu
26
.8
20.8
4.
9 2.
7 2.
7 8.
2 4.
4 7.
1 4.
4 4.
9 0.
5 3.
8 1.
1 4.
4 1.
6 0.
5 0.
0 0.
0 0.
5 0.
5 0.
0 N
airo
bi
26.6
28
.8
7.2
2.0
10.2
4.
6 5.
4 2.
3 3.
6 2.
8 0.
8 1.
1 0.
5 1.
5 0.
9 0.
3 0.
1 0.
5 0.
0 0.
3 0.
5 U
asin
Gis
hu
26.2
6.
0 16
.7
8.3
11.9
6.
0 9.
5 2.
4 2.
4 4.
8 3.
6 0.
0 0.
0 1.
2 0.
0 1.
2 0.
0 0.
0 0.
0 0.
0 0.
0 M
omba
sa
26.2
9.
7 16
.1
11.4
4.
7 3.
7 5.
4 3.
0 2.
0 1.
0 2.
0 5.
4 4.
0 4.
4 0.
0 0.
7 0.
3 0.
0 0.
0 0.
0 0.
0 M
akue
ni
25.5
28
.4
13.7
0.
0 1.
0 3.
9 4.
9 7.
8 1.
0 2.
9 7.
8 2.
9 0.
0 0.
0 0.
0 0.
0 0.
0 0.
0 0.
0 0.
0 0.
0 V
ihig
a 25
.0
19.4
8.
3 13
.9
3.7
3.7
3.7
3.7
0.9
4.6
2.8
7.4
0.0
1.9
0.0
0.0
0.0
0.0
0.9
0.0
0.0
Kis
ii 24
.7
25.5
17
.1
9.4
2.3
1.8
1.6
3.9
1.8
2.3
1.0
4.7
0.5
0.8
0.0
1.0
0.3
0.5
0.5
0.3
0.0
Man
dera
23
.5
8.2
11.8
5.
9 10
.6
5.9
8.2
0.0
10.6
11
.8
3.5
0.0
0.0
0.0
0.0
0.0
0.0
0.0
0.0
0.0
0.0
Mur
ang'
a 22
.6
17.0
3.
1 5.
0 0.
6 6.
3 3.
1 9.
4 0.
6 1.
9 1.
9 5.
7 1.
3 8.
8 4.
4 5.
7 1.
9 0.
0 0.
0 0.
6 0.
0 N
yeri
22.0
37
.0
9.0
3.0
2.0
8.0
4.0
4.0
4.0
1.0
2.0
0.0
0.0
0.0
1.0
0.0
1.0
0.0
2.0
0.0
0.0
Nan
di
22.0
22
.0
16.0
7.
0 10
.0
4.0
5.0
7.0
0.0
4.0
0.0
1.0
0.0
0.0
0.0
0.0
0.0
0.0
0.0
2.0
0.0
Nya
mira
20
.7
22.8
17
.2
8.6
6.0
4.7
2.6
4.3
1.7
1.7
1.3
2.2
0.4
4.3
0.0
0.4
0.4
0.4
0.0
0.0
0.0
Bun
gom
a 20
.6
17.4
9.
6 8.
9 3.
6 2.
8 9.
3 1.
8 2.
8 7.
1 6.
0 4.
3 0.
7 1.
4 1.
8 0.
0 0.
0 0.
4 0.
7 0.
0 0.
7 M
eru
20.5
16
.9
14.6
6.
2 4.
2 3.
4 5.
3 5.
6 3.
7 4.
2 4.
8 3.
4 0.
6 2.
0 2.
2 2.
2 0.
3 0.
0 0.
0 0.
0 0.
0 La
ikip
ia
20.4
34
.7
4.1
12.2
10
.2
0.0
2.0
2.0
2.0
2.0
6.1
2.0
0.0
0.0
0.0
0.0
2.0
0.0
0.0
0.0
0.0
Gar
issa
20
.4
11.7
23
.3
3.9
12.6
2.
9 10
.7
0.0
1.9
6.8
3.9
0.0
1.0
1.0
0.0
0.0
0.0
0.0
0.0
0.0
0.0
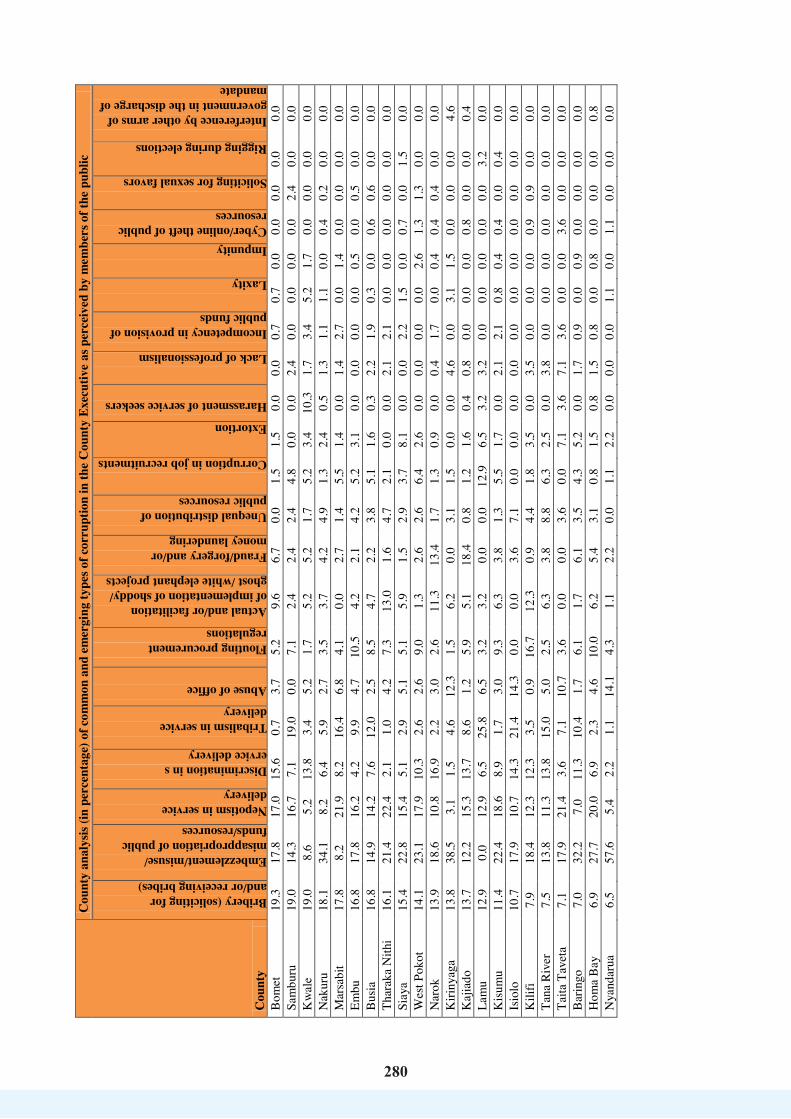
280
280
Cou
nty
Cou
nty
anal
ysis
(in p
erce
ntag
e) o
f com
mon
and
em
ergi
ng ty
pes o
f cor
rupt
ion
in th
e C
ount
y Ex
ecut
ive
as p
erce
ived
by
mem
bers
of t
he p
ublic
Bribery (soliciting for and/or receiving bribes)
Embezzlement/misuse/ misappropriation of public funds/resources Nepotism in service delivery
Discrimination in s ervice delivery
Tribalism in service delivery
Abuse of office
Flouting procurement regulations
Actual and/or facilitation of implementation of shoddy/ ghost /white elephant projects
Fraud/forgery and/or money laundering
Unequal distribution of public resources
Corruption in job recruitments
Extortion
Harassment of service seekers
Lack of professionalism
Incompetency in provision of public funds
Laxity
Impunity Cyber/online theft of public resources
Soliciting for sexual favors
Rigging during elections
Interference by other arms of government in the discharge of mandate
Bom
et
19.3
17
.8
17.0
15
.6
0.7
3.7
5.2
9.6
6.7
0.0
1.5
1.5
0.0
0.0
0.7
0.7
0.0
0.0
0.0
0.0
0.0
Sam
buru
19
.0
14.3
16
.7
7.1
19.0
0.
0 7.
1 2.
4 2.
4 2.
4 4.
8 0.
0 0.
0 2.
4 0.
0 0.
0 0.
0 0.
0 2.
4 0.
0 0.
0 K
wal
e 19
.0
8.6
5.2
13.8
3.
4 5.
2 1.
7 5.
2 5.
2 1.
7 5.
2 3.
4 10
.3
1.7
3.4
5.2
1.7
0.0
0.0
0.0
0.0
Nak
uru
18.1
34
.1
8.2
6.4
5.9
2.7
3.5
3.7
4.2
4.9
1.3
2.4
0.5
1.3
1.1
1.1
0.0
0.4
0.2
0.0
0.0
Mar
sabi
t 17
.8
8.2
21.9
8.
2 16
.4
6.8
4.1
0.0
2.7
1.4
5.5
1.4
0.0
1.4
2.7
0.0
1.4
0.0
0.0
0.0
0.0
Embu
16
.8
17.8
16
.2
4.2
9.9
4.7
10.5
4.
2 2.
1 4.
2 5.
2 3.
1 0.
0 0.
0 0.
0 0.
0 0.
5 0.
0 0.
5 0.
0 0.
0 B
usia
16
.8
14.9
14
.2
7.6
12.0
2.
5 8.
5 4.
7 2.
2 3.
8 5.
1 1.
6 0.
3 2.
2 1.
9 0.
3 0.
0 0.
6 0.
6 0.
0 0.
0 Th
arak
a N
ithi
16.1
21
.4
22.4
2.
1 1.
0 4.
2 7.
3 13
.0
1.6
4.7
2.1
0.0
0.0
2.1
2.1
0.0
0.0
0.0
0.0
0.0
0.0
Siay
a 15
.4
22.8
15
.4
5.1
2.9
5.1
5.1
5.9
1.5
2.9
3.7
8.1
0.0
0.0
2.2
1.5
0.0
0.7
0.0
1.5
0.0
Wes
t Pok
ot
14.1
23
.1
17.9
10
.3
2.6
2.6
9.0
1.3
2.6
2.6
6.4
2.6
0.0
0.0
0.0
0.0
2.6
1.3
1.3
0.0
0.0
Nar
ok
13.9
18
.6
10.8
16
.9
2.2
3.0
2.6
11.3
13
.4
1.7
1.3
0.9
0.0
0.4
1.7
0.0
0.4
0.4
0.4
0.0
0.0
Kiri
nyag
a 13
.8
38.5
3.
1 1.
5 4.
6 12
.3
1.5
6.2
0.0
3.1
1.5
0.0
0.0
4.6
0.0
3.1
1.5
0.0
0.0
0.0
4.6
Kaj
iado
13
.7
12.2
15
.3
13.7
8.
6 1.
2 5.
9 5.
1 18
.4
0.8
1.2
1.6
0.4
0.8
0.0
0.0
0.0
0.8
0.0
0.0
0.4
Lam
u 12
.9
0.0
12.9
6.
5 25
.8
6.5
3.2
3.2
0.0
0.0
12.9
6.
5 3.
2 3.
2 0.
0 0.
0 0.
0 0.
0 0.
0 3.
2 0.
0 K
isum
u 11
.4
22.4
18
.6
8.9
1.7
3.0
9.3
6.3
3.8
1.3
5.5
1.7
0.0
2.1
2.1
0.8
0.4
0.4
0.0
0.4
0.0
Isio
lo
10.7
17
.9
10.7
14
.3
21.4
14
.3
0.0
0.0
3.6
7.1
0.0
0.0
0.0
0.0
0.0
0.0
0.0
0.0
0.0
0.0
0.0
Kili
fi 7.
9 18
.4
12.3
12
.3
3.5
0.9
16.7
12
.3
0.9
4.4
1.8
3.5
0.0
3.5
0.0
0.0
0.0
0.9
0.9
0.0
0.0
Tana
Riv
er
7.5
13.8
11
.3
13.8
15
.0
5.0
2.5
6.3
3.8
8.8
6.3
2.5
0.0
3.8
0.0
0.0
0.0
0.0
0.0
0.0
0.0
Taita
Tav
eta
7.1
17.9
21
.4
3.6
7.1
10.7
3.
6 0.
0 0.
0 3.
6 0.
0 7.
1 3.
6 7.
1 3.
6 0.
0 0.
0 3.
6 0.
0 0.
0 0.
0 B
arin
go
7.0
32.2
7.
0 11
.3
10.4
1.
7 6.
1 1.
7 6.
1 3.
5 4.
3 5.
2 0.
0 1.
7 0.
9 0.
0 0.
9 0.
0 0.
0 0.
0 0.
0 H
oma
Bay
6.
9 27
.7
20.0
6.
9 2.
3 4.
6 10
.0
6.2
5.4
3.1
0.8
1.5
0.8
1.5
0.8
0.0
0.8
0.0
0.0
0.0
0.8
Nya
ndar
ua
6.5
57.6
5.
4 2.
2 1.
1 14
.1
4.3
1.1
2.2
0.0
1.1
2.2
0.0
0.0
0.0
1.1
0.0
1.1
0.0
0.0
0.0

281
281
Ann
ex 4
: Cou
nty
anal
ysis
of s
ervi
ces
soug
ht fr
om p
ublic
ser
vice
inst
itutio
ns 1
2 m
onth
s pr
ior
to th
e su
rvey
as
repo
rted
by
mem
bers
of t
he
publ
ic
Cou
nty
Cou
nty
anal
ysis
(in p
erce
ntag
e) o
f ser
vice
s sou
ght f
rom
pub
lic se
rvic
e in
stitu
tions
12
mon
ths p
rior
to th
e su
rvey
as r
epor
ted
by m
embe
rs o
f the
pub
lic
Registration of persons services
Hospital/medical-related services
Bursary services
Employment/recruitment
Police-related services
Lands-related services
National Government Administrative Office services
Education -related services
Judiciary/Law Court services
County Government services
Labour and Social Protection services
Immigration-related services
Trade-related services (e.g, Business Permit)
Youth empowerment-related services
CDF services
Huduma Centre services
Renew of license
Agriculture-related services
KRA services
Water-related services
NHIF services
Ministry of Energy-related services
IEBC services
KNEC services
Procurement services
Transport-related services
Judicial Service Commission services
HELB services
KMTC services
KFS services
Postal services
Finance-related services
EACC services
Tourism-related services
Elge
yo
Mar
akw
et
52.8
2.8
8.3
5.6
5.6
6.9
2.8
1.4
1.4
4.2
1.4
0.0
0.0
2.8
0.0
0.0
0.0
0.0
0.0
0.0
1.4
1.4
1.4
0.0
0.0
0.0
0.0
0.0
0.0
0.0
0.0
0.0
0.0
0.0
Mar
sabi
t
40.0
1.8
1.8
9.1
14.5
1.8
0.0
1.8
0.0
0.0
10.9
3.6
1.8
1.8
0.0
0.0
0.0
0.0
1.8
0.0
0.0
0.0
3.6
1.8
0.0
1.8
0.0
1.8
0.0
0.0
0.0
0.0
0.0
0.0
Gar
issa
37.0
21.7
0.0
21.7
8.7
2.2
0.0
0.0
2.2
0.0
2.2
0.0
0.0
2.2
0.0
0.0
0.0
0.0
0.0
2.2
0.0
0.0
0.0
0.0
0.0
0.0
0.0
0.0
0.0
0.0
0.0
0.0
0.0
0.0
Uas
in G
ishu
35.2
7.4
7.4
14.8
5.6
5.6
1.9
3.7
0.0
0.0
1.9
1.9
1.9
1.9
1.9
0.0
0.0
3.7
0.0
0.0
0.0
0.0
0.0
0.0
0.0
1.9
0.0
1.9
0.0
0.0
0.0
0.0
1.9
0.0
Sam
buru
32.0
16.0
4.0
20.0
8.0
4.0
0.0
4.0
0.0
4.0
0.0
0.0
4.0
4.0
0.0
0.0
0.0
0.0
0.0
0.0
0.0
0.0
0.0
0.0
0.0
0.0
0.0
0.0
0.0
0.0
0.0
0.0
0.0
0.0
Waj
ir
29.6
0.0
0.0
37.0
11.1
3.7
3.7
0.0
3.7
3.7
3.7
0.0
0.0
0.0
0.0
0.0
0.0
0.0
0.0
0.0
0.0
0.0
0.0
0.0
0.0
0.0
3.7
0.0
0.0
0.0
0.0
0.0
0.0
0.0
Kia
mbu
29.5
16.8
2.0
2.0
8.6
10.2
5.3
3.3
3.7
1.2
4.1
0.8
5.3
0.8
1.2
0.4
1.6
0.4
0.4
0.4
1.2
0.0
0.0
0.4
0.0
0.0
0.0
0.0
0.0
0.0
0.0
0.0
0.0
0.0
Tana
Riv
er
29.2
12.5
22.9
12.5
2.1
0.0
0.0
0.0
2.1
0.0
4.2
0.0
0.0
0.0
0.0
0.0
0.0
0.0
2.1
8.3
0.0
0.0
0.0
0.0
4.2
0.0
0.0
0.0
0.0
0.0
0.0
0.0
0.0
0.0
Nan
di
28.6
19.6
8.9
1.8
0.0
19.6
5.4
3.6
0.0
1.8
1.8
1.8
0.0
3.6
1.8
0.0
0.0
0.0
0.0
0.0
0.0
0.0
1.8
0.0
0.0
0.0
0.0
0.0
0.0
0.0
0.0
0.0
0.0
0.0
Laik
ipia
26.5
32.4
2.9
5.9
17.6
5.9
2.9
0.0
5.9
0.0
0.0
0.0
0.0
0.0
0.0
0.0
0.0
0.0
0.0
0.0
0.0
0.0
0.0
0.0
0.0
0.0
0.0
0.0
0.0
0.0
0.0
0.0
0.0
0.0
Nak
uru
25.6
16.9
6.4
6.6
7.8
8.0
4.7
1.2
2.4
2.6
2.4
2.1
2.8
1.2
1.2
0.7
0.0
1.2
0.5
1.4
0.2
0.9
2.4
0.2
0.5
0.2
0.0
0.0
0.0
0.0
0.0
0.0
0.0
0.0
Embu
25.5
14.8
6.7
5.4
7.4
12.1
4.7
3.4
2.0
2.7
0.7
0.7
2.0
0.7
2.0
2.0
1.3
1.3
0.7
0.0
2.7
0.0
1.3
0.0
0.0
0.0
0.0
0.0
0.0
0.0
0.0
0.0
0.0
0.0
Mur
ang'
a
25.3
21.8
4.0
0.6
6.9
13.2
6.3
3.4
3.4
1.1
2.3
0.0
0.6
0.0
1.1
0.0
1.7
1.1
1.7
1.7
0.6
1.7
0.0
0.6
0.0
0.6
0.0
0.0
0.0
0.0
0.0
0.0
0.0
0.0
Kis
umu
23.8
16.9
11.5
12.3
4.6
6.2
3.8
2.3
3.1
2.3
1.5
3.1
0.0
0.8
1.5
0.0
1.5
0.0
0.8
0.0
1.5
0.0
0.8
0.0
0.0
0.0
0.0
1.5
0.0
0.0
0.0
0.0
0.0
0.0
Siay
a
23.5
22.2
13.6
9.9
2.5
4.9
4.9
1.2
0.0
3.7
0.0
2.5
3.7
0.0
0.0
1.2
0.0
1.2
0.0
2.5
0.0
0.0
0.0
0.0
1.2
0.0
0.0
0.0
1.2
0.0
0.0
0.0
0.0
0.0

282
282
Cou
nty
Cou
nty
anal
ysis
(in p
erce
ntag
e) o
f ser
vice
s sou
ght f
rom
pub
lic se
rvic
e in
stitu
tions
12
mon
ths p
rior
to th
e su
rvey
as r
epor
ted
by m
embe
rs o
f the
pub
lic
Registration of persons services
Hospital/medical-related services
Bursary services
Employment/recruitment
Police-related services
Lands-related services
National Government Administrative Office services
Education -related services
Judiciary/Law Court services
County Government services
Labour and Social Protection services
Immigration-related services
Trade-related services (e.g, Business Permit)
Youth empowerment-related services
CDF services
Huduma Centre services
Renew of license
Agriculture-related services
KRA services
Water-related services
NHIF services
Ministry of Energy-related services
IEBC services
KNEC services
Procurement services
Transport-related services
Judicial Service Commission services
HELB services
KMTC services
KFS services
Postal services
Finance-related services
EACC services
Tourism-related services
Tran
s Nzo
ia
23.4
22.2
13.8
6.0
6.0
1.8
3.0
5.4
2.4
1.8
3.6
0.0
1.2
2.4
1.2
0.0
1.2
1.8
0.0
1.2
0.0
0.0
0.0
0.6
0.0
0.6
0.0
0.0
0.0
0.0
0.6
0.0
0.0
0.0
Bus
ia
23.4
8.3
9.8
15.6
7.8
7.8
2.9
2.9
3.4
0.0
2.0
0.0
1.0
1.0
2.4
0.5
0.5
3.9
2.4
2.0
0.5
2.0
0.0
0.0
0.0
0.0
0.0
0.0
0.0
0.0
0.0
0.0
0.0
0.0
Bar
ingo
22.7
22.7
5.7
9.1
6.8
5.7
8.0
1.1
1.1
3.4
1.1
0.0
0.0
3.4
2.3
1.1
1.1
1.1
1.1
1.1
1.1
0.0
0.0
0.0
0.0
0.0
0.0
0.0
0.0
0.0
0.0
0.0
0.0
0.0
Bom
et
22.2
32.4
3.7
8.3
3.7
8.3
1.9
4.6
0.0
2.8
4.6
0.0
1.9
1.9
1.9
0.0
0.9
0.0
0.0
0.0
0.0
0.0
0.0
0.0
0.0
0.0
0.0
0.9
0.0
0.0
0.0
0.0
0.0
0.0
Wes
t Pok
ot
21.2
24.7
4.7
5.9
4.7
2.4
7.1
10.6
1.2
2.4
2.4
2.4
0.0
1.2
0.0
0.0
2.4
5.9
0.0
0.0
0.0
0.0
0.0
0.0
0.0
1.2
0.0
0.0
0.0
0.0
0.0
0.0
0.0
0.0
Nai
robi
20.8
13.0
5.7
7.7
7.3
2.5
0.8
5.7
2.5
1.8
1.5
13.5
2.0
0.7
0.7
2.0
4.0
0.0
2.8
0.7
1.3
0.2
1.0
0.7
0.2
0.3
0.0
0.0
0.3
0.2
0.2
0.0
0.0
0.2
Vih
iga
20.8
9.2
15.4
6.2
3.1
4.6
3.1
5.4
4.6
1.5
10.0
1.5
2.3
2.3
2.3
2.3
0.0
0.0
0.0
2.3
0.0
1.5
0.8
0.8
0.0
0.0
0.0
0.0
0.0
0.0
0.0
0.0
0.0
0.0
Mom
basa
20.4
21.1
10.4
2.9
6.5
2.9
3.6
1.8
4.7
0.4
1.1
3.2
2.5
3.2
1.1
5.7
2.2
0.0
2.5
0.4
0.7
0.7
0.7
0.7
0.0
0.0
0.0
0.4
0.4
0.0
0.0
0.0
0.0
0.0
Nar
ok
19.6
27.2
8.9
8.2
3.8
3.8
1.9
4.4
5.1
2.5
1.3
0.0
4.4
2.5
1.3
0.0
1.3
0.6
0.0
0.0
1.3
0.0
0.0
0.6
0.0
0.0
0.6
0.0
0.0
0.6
0.0
0.0
0.0
0.0
Mac
hako
s
18.5
17.4
5.1
4.1
10.3
7.2
9.2
2.6
9.7
4.1
1.5
0.0
2.1
0.5
1.0
2.1
0.5
1.0
0.5
1.0
0.5
0.0
0.5
0.5
0.0
0.0
0.0
0.0
0.0
0.0
0.0
0.0
0.0
0.0
Kw
ale
18.1
45.8
4.2
6.9
4.2
4.2
5.6
4.2
1.4
0.0
0.0
2.8
0.0
0.0
1.4
0.0
0.0
0.0
0.0
0.0
0.0
1.4
0.0
0.0
0.0
0.0
0.0
0.0
0.0
0.0
0.0
0.0
0.0
0.0
Ker
icho
16.7
19.7
7.6
10.6
7.6
4.5
3.0
10.6
6.1
1.5
1.5
0.0
0.0
0.0
1.5
1.5
1.5
0.0
1.5
1.5
0.0
1.5
1.5
0.0
0.0
0.0
0.0
0.0
0.0
0.0
0.0
0.0
0.0
0.0
Kaj
iado
16.6
31.0
9.1
9.1
4.8
5.9
3.2
5.3
1.6
2.7
0.5
0.5
4.3
0.0
1.6
0.0
0.0
0.5
1.6
0.0
0.5
0.5
0.0
0.0
0.0
0.0
0.0
0.0
0.0
0.5
0.0
0.0
0.0
0.0
Mer
u
16.2
9.0
11.8
4.3
5.5
20.2
7.8
3.8
5.2
2.6
2.0
0.3
2.6
1.4
1.7
1.4
0.9
0.9
0.3
0.6
0.0
0.3
0.3
0.0
0.6
0.0
0.0
0.3
0.0
0.0
0.0
0.0
0.0
0.0
Mak
ueni
15.8
21.1
10.5
1.3
11.8
2.6
14.5
6.6
5.3
1.3
1.3
1.3
0.0
2.6
2.6
0.0
0.0
0.0
1.3
0.0
0.0
0.0
0.0
0.0
0.0
0.0
0.0
0.0
0.0
0.0
0.0
0.0
0.0
0.0
Hom
a B
ay
14.1
31.8
7.1
5.9
4.7
5.9
4.7
1.2
2.4
2.4
2.4
1.2
1.2
1.2
3.5
7.1
0.0
0.0
1.2
0.0
0.0
1.2
0.0
0.0
0.0
0.0
0.0
0.0
1.2
0.0
0.0
0.0
0.0
0.0
Turk
ana
14.1
31.5
9.8
14.1
4.3
1.1
2.2
6.5
0.0
6.5
2.2
1.1
0.0
1.1
3.3
1.1
0.0
0.0
0.0
0.0
0.0
0.0
0.0
0.0
0.0
0.0
0.0
0.0
0.0
0.0
0.0
1.1
0.0
0.0

283
283
Cou
nty
Cou
nty
anal
ysis
(in p
erce
ntag
e) o
f ser
vice
s sou
ght f
rom
pub
lic se
rvic
e in
stitu
tions
12
mon
ths p
rior
to th
e su
rvey
as r
epor
ted
by m
embe
rs o
f the
pub
lic
Registration of persons services
Hospital/medical-related services
Bursary services
Employment/recruitment
Police-related services
Lands-related services
National Government Administrative Office services
Education -related services
Judiciary/Law Court services
County Government services
Labour and Social Protection services
Immigration-related services
Trade-related services (e.g, Business Permit)
Youth empowerment-related services
CDF services
Huduma Centre services
Renew of license
Agriculture-related services
KRA services
Water-related services
NHIF services
Ministry of Energy-related services
IEBC services
KNEC services
Procurement services
Transport-related services
Judicial Service Commission services
HELB services
KMTC services
KFS services
Postal services
Finance-related services
EACC services
Tourism-related services
Kak
ameg
a
14.1
4.7
18.4
12.5
6.7
8.2
4.7
3.5
3.1
2.7
1.6
1.2
2.7
2.0
3.5
0.8
0.4
3.1
0.8
1.6
0.8
1.2
0.0
0.4
0.0
0.4
0.8
0.0
0.0
0.0
0.0
0.0
0.0
0.0
Bun
gom
a
13.6
7.6
12.7
18.2
11.9
5.5
2.1
2.5
4.2
3.0
3.0
0.8
1.3
2.5
2.1
0.8
0.4
2.1
0.8
0.0
0.0
0.8
0.0
0.8
1.7
0.8
0.4
0.0
0.0
0.0
0.0
0.0
0.0
0.0
Nye
ri
13.3
21.7
20.5
2.4
1.2
12.0
2.4
4.8
1.2
2.4
0.0
3.6
1.2
2.4
0.0
7.2
0.0
0.0
0.0
2.4
1.2
0.0
0.0
0.0
0.0
0.0
0.0
0.0
0.0
0.0
0.0
0.0
0.0
0.0
Man
dera
12.5
32.5
7.5
17.5
7.5
0.0
0.0
2.5
2.5
7.5
2.5
0.0
0.0
0.0
0.0
0.0
0.0
0.0
0.0
7.5
0.0
0.0
0.0
0.0
0.0
0.0
0.0
0.0
0.0
0.0
0.0
0.0
0.0
0.0
Kili
fi
12.2
12.2
26.7
4.4
7.8
6.7
3.3
3.3
4.4
5.6
0.0
0.0
0.0
3.3
3.3
0.0
2.2
1.1
0.0
1.1
0.0
0.0
0.0
0.0
2.2
0.0
0.0
0.0
0.0
0.0
0.0
0.0
0.0
0.0
Nya
mira
11.1
37.0
9.3
13.9
2.8
5.6
0.9
3.7
0.9
2.8
0.9
0.0
0.9
0.0
1.9
1.9
0.9
0.9
0.0
0.9
1.9
0.9
0.0
0.9
0.0
0.0
0.0
0.0
0.0
0.0
0.0
0.0
0.0
0.0
Kiri
nyag
a
10.5
21.1
12.3
1.8
8.8
8.8
5.3
5.3
8.8
0.0
1.8
0.0
1.8
0.0
1.8
5.3
0.0
3.5
0.0
0.0
1.8
0.0
1.8
0.0
0.0
0.0
0.0
0.0
0.0
0.0
0.0
0.0
0.0
0.0
Kis
ii
10.3
35.8
9.8
12.7
5.9
3.4
2.5
3.9
1.5
1.5
2.9
0.0
0.5
3.4
1.5
1.5
0.0
1.0
0.0
0.5
0.5
0.5
0.0
0.0
0.0
0.0
0.5
0.0
0.0
0.0
0.0
0.0
0.0
0.0
Nya
ndar
ua
10.1
34.8
10.1
2.9
1.4
17.4
5.8
1.4
0.0
1.4
2.9
0.0
0.0
2.9
0.0
5.8
1.4
0.0
0.0
0.0
0.0
0.0
1.4
0.0
0.0
0.0
0.0
0.0
0.0
0.0
0.0
0.0
0.0
0.0
Kitu
i
9.4
7.3
5.7
14.6
18.8
5.2
15.6
2.1
4.7
7.3
1.6
0.0
1.6
0.5
0.0
1.0
2.6
0.5
0.5
0.5
0.0
0.0
0.0
0.5
0.0
0.0
0.0
0.0
0.0
0.0
0.0
0.0
0.0
0.0
Thar
aka
Nith
i
8.7
8.7
18.1
7.9
6.3
11.0
4.7
1.6
6.3
7.9
6.3
0.8
2.4
3.1
1.6
0.0
0.0
0.8
0.8
0.0
0.0
0.8
0.0
0.8
0.8
0.0
0.8
0.0
0.0
0.0
0.0
0.0
0.0
0.0
Mig
ori
4.9
38.4
11.9
9.2
5.9
4.3
3.8
3.8
2.2
1.6
2.7
1.6
0.0
0.5
2.7
1.1
0.0
1.6
0.0
0.5
0.5
0.5
0.0
1.1
0.0
0.0
0.5
0.0
0.0
0.0
0.0
0.5
0.0
0.0
Taita
Tav
eta
4.3
34.8
4.3
0.0
4.3
13.0
13.0
4.3
4.3
4.3
8.7
0.0
0.0
0.0
0.0
0.0
0.0
0.0
0.0
0.0
0.0
4.3
0.0
0.0
0.0
0.0
0.0
0.0
0.0
0.0
0.0
0.0
0.0
0.0
Lam
u
3.7
3.7
14.8
3.7
14.8
3.7
11.1
3.7
0.0
7.4
0.0
0.0
0.0
22.2
0.0
3.7
3.7
0.0
0.0
3.7
0.0
0.0
0.0
0.0
0.0
0.0
0.0
0.0
0.0
0.0
0.0
0.0
0.0
0.0
Isio
lo
0.0
26.1
26.1
8.7
8.7
0.0
0.0
4.3
4.3
4.3
0.0
17.4
0.0
0.0
0.0
0.0
0.0
0.0
0.0
0.0
0.0
0.0
0.0
0.0
0.0
0.0
0.0
0.0
0.0
0.0
0.0
0.0
0.0
0.0
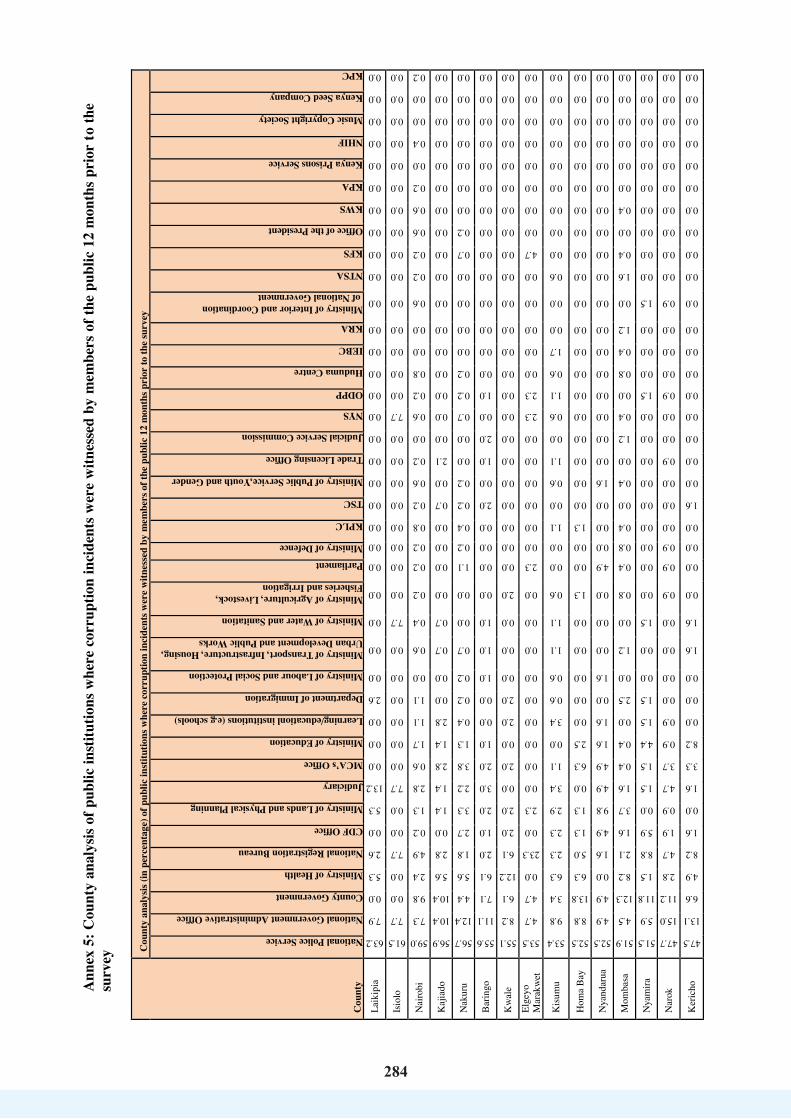
284
284
Ann
ex 5
: Cou
nty
anal
ysis
of p
ublic
inst
itutio
ns w
here
cor
rupt
ion
inci
dent
s wer
e w
itnes
sed
by m
embe
rs o
f the
pub
lic 1
2 m
onth
s pri
or to
the
surv
ey
Cou
nty
Cou
nty
anal
ysis
(in p
erce
ntag
e) o
f pub
lic in
stitu
tions
whe
re co
rrup
tion
inci
dent
s wer
e w
itnes
sed
by m
embe
rs o
f the
pub
lic 1
2 m
onth
s pri
or to
the
surv
ey
National Police Service
National Government Administrative Office
County Government
Ministry of Health
National Registration Bureau
CDF Office
Ministry of Lands and Physical Planning
Judiciary
MCA’s Office
Ministry of Education
Learning/educationl institutions (e.g schools)
Department of Immigration
Ministry of Labour and Social Protection
Ministry of Transport, Infrastructure, Housing, Urban Development and Public Works
Ministry of Water and Sanitation
Ministry of Agriculture, Livestock, Fisheries and Irrigation
Parliament
Ministry of Defence
KPLC
TSC
Ministry of Public Service,Youth and Gender
Trade Licensing Office
Judicial Service Commission
NYS
ODPP
Huduma Centre
IEBC
KRA
Ministry of Interior and Coordination of National Government
NTSA
KFS
Office of the President
KWS
KPA
Kenya Prisons Service
NHIF
Music Copyright Society
Kenya Seed Company
KPC
Laik
ipia
63.2
7.9
0.0
5.3
2.6
0.0
5.3
13.2
0.0
0.0
0.0
2.6
0.0
0.0
0.0
0.0
0.0
0.0
0.0
0.0
0.0
0.0
0.0
0.0
0.0
0.0
0.0
0.0
0.0
0.0
0.0
0.0
0.0
0.0
0.0
0.0
0.0
0.0
0.0
Isio
lo
61.5
7.7
0.0
0.0
7.7
0.0
0.0
7.7
0.0
0.0
0.0
0.0
0.0
0.0
7.7
0.0
0.0
0.0
0.0
0.0
0.0
0.0
0.0
7.7
0.0
0.0
0.0
0.0
0.0
0.0
0.0
0.0
0.0
0.0
0.0
0.0
0.0
0.0
0.0
Nai
robi
59.0
7.3
9.8
2.4
4.9
0.2
1.3
2.8
0.6
1.7
1.1
1.1
0.0
0.6
0.4
0.2
0.2
0.2
0.8
0.2
0.6
0.2
0.0
0.6
0.2
0.8
0.0
0.0
0.6
0.2
0.2
0.6
0.6
0.2
0.0
0.4
0.0
0.0
0.2
Kaj
iado
56.9
10.4
10.4
5.6
2.8
0.0
1.4
1.4
2.8
1.4
2.8
0.0
0.0
0.7
0.7
0.0
0.0
0.0
0.0
0.7
0.0
2.1
0.0
0.0
0.0
0.0
0.0
0.0
0.0
0.0
0.0
0.0
0.0
0.0
0.0
0.0
0.0
0.0
0.0
Nak
uru
56.7
12.4
4.4
5.6
1.8
2.7
3.3
2.2
3.8
1.3
0.4
0.2
0.2
0.7
0.0
0.0
1.1
0.2
0.4
0.2
0.2
0.0
0.0
0.7
0.2
0.2
0.0
0.0
0.0
0.0
0.7
0.2
0.0
0.0
0.0
0.0
0.0
0.0
0.0
Bar
ingo
55.6
11.1
7.1
6.1
2.0
1.0
2.0
3.0
2.0
1.0
0.0
0.0
1.0
1.0
1.0
0.0
0.0
0.0
0.0
2.0
0.0
1.0
2.0
0.0
1.0
0.0
0.0
0.0
0.0
0.0
0.0
0.0
0.0
0.0
0.0
0.0
0.0
0.0
0.0
Kw
ale
55.1
8.2
6.1
12.2
6.1
2.0
2.0
0.0
2.0
0.0
2.0
2.0
0.0
0.0
0.0
2.0
0.0
0.0
0.0
0.0
0.0
0.0
0.0
0.0
0.0
0.0
0.0
0.0
0.0
0.0
0.0
0.0
0.0
0.0
0.0
0.0
0.0
0.0
0.0
Elge
yo
Mar
akw
et
53.5
4.7
4.7
0.0
23.3
0.0
2.3
0.0
0.0
0.0
0.0
0.0
0.0
0.0
0.0
0.0
2.3
0.0
0.0
0.0
0.0
0.0
0.0
2.3
2.3
0.0
0.0
0.0
0.0
0.0
4.7
0.0
0.0
0.0
0.0
0.0
0.0
0.0
0.0
Kis
umu
53.4
9.8
3.4
6.3
2.3
2.3
2.9
3.4
1.1
0.0
3.4
0.6
0.6
1.1
1.1
0.6
0.0
0.0
1.1
0.0
0.6
1.1
0.0
0.6
1.1
0.6
1.7
0.0
0.0
0.6
0.0
0.0
0.0
0.0
0.0
0.0
0.0
0.0
0.0
Hom
a B
ay
52.5
8.8
13.8
6.3
5.0
1.3
1.3
0.0
6.3
2.5
0.0
0.0
0.0
0.0
0.0
1.3
0.0
0.0
1.3
0.0
0.0
0.0
0.0
0.0
0.0
0.0
0.0
0.0
0.0
0.0
0.0
0.0
0.0
0.0
0.0
0.0
0.0
0.0
0.0
Nya
ndar
ua
52.5
4.9
4.9
0.0
1.6
4.9
9.8
4.9
4.9
1.6
1.6
0.0
1.6
0.0
0.0
0.0
4.9
0.0
0.0
0.0
1.6
0.0
0.0
0.0
0.0
0.0
0.0
0.0
0.0
0.0
0.0
0.0
0.0
0.0
0.0
0.0
0.0
0.0
0.0
Mom
basa
51.9
4.5
12.3
8.2
2.1
1.6
3.7
1.6
0.4
0.4
0.0
2.5
0.0
1.2
0.0
0.8
0.4
0.8
0.4
0.0
0.4
0.0
1.2
0.4
0.0
0.8
0.4
1.2
0.0
1.6
0.4
0.0
0.4
0.0
0.0
0.0
0.0
0.0
0.0
Nya
mira
51.5
5.9
11.8
1.5
8.8
5.9
0.0
1.5
1.5
4.4
1.5
1.5
0.0
0.0
1.5
0.0
0.0
0.0
0.0
0.0
0.0
0.0
0.0
0.0
1.5
0.0
0.0
0.0
1.5
0.0
0.0
0.0
0.0
0.0
0.0
0.0
0.0
0.0
0.0
Nar
ok
47.7
15.0
11.2
2.8
4.7
1.9
0.9
4.7
3.7
0.9
0.9
0.0
0.0
0.0
0.0
0.9
0.9
0.9
0.0
0.0
0.0
0.9
0.0
0.0
0.9
0.0
0.0
0.0
0.9
0.0
0.0
0.0
0.0
0.0
0.0
0.0
0.0
0.0
0.0
Ker
icho
47.5
13.1
6.6
4.9
8.2
1.6
0.0
1.6
3.3
8.2
0.0
0.0
0.0
1.6
1.6
0.0
0.0
0.0
0.0
1.6
0.0
0.0
0.0
0.0
0.0
0.0
0.0
0.0
0.0
0.0
0.0
0.0
0.0
0.0
0.0
0.0
0.0
0.0
0.0
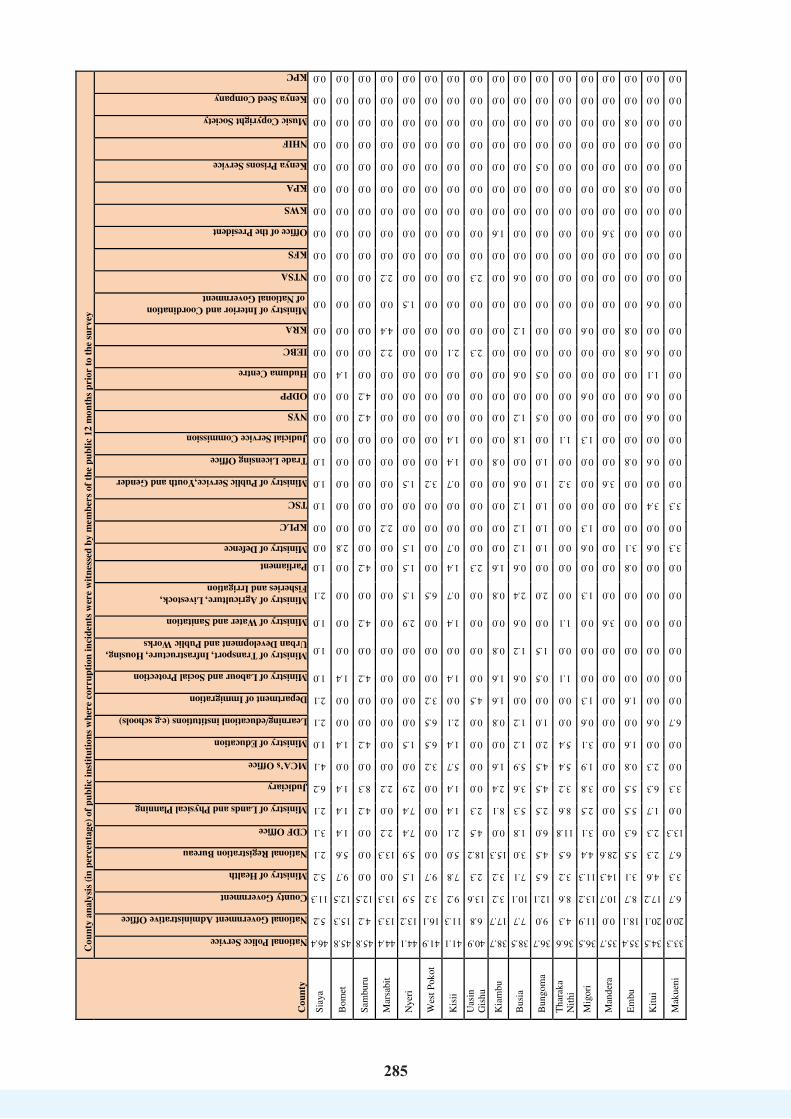
285
285
Cou
nty
Cou
nty
anal
ysis
(in p
erce
ntag
e) o
f pub
lic in
stitu
tions
whe
re co
rrup
tion
inci
dent
s wer
e w
itnes
sed
by m
embe
rs o
f the
pub
lic 1
2 m
onth
s pri
or to
the
surv
ey
National Police Service
National Government Administrative Office
County Government
Ministry of Health
National Registration Bureau
CDF Office
Ministry of Lands and Physical Planning
Judiciary
MCA’s Office
Ministry of Education
Learning/educationl institutions (e.g schools)
Department of Immigration
Ministry of Labour and Social Protection
Ministry of Transport, Infrastructure, Housing, Urban Development and Public Works
Ministry of Water and Sanitation
Ministry of Agriculture, Livestock, Fisheries and Irrigation
Parliament
Ministry of Defence
KPLC
TSC
Ministry of Public Service,Youth and Gender
Trade Licensing Office
Judicial Service Commission
NYS
ODPP
Huduma Centre
IEBC
KRA
Ministry of Interior and Coordination of National Government
NTSA
KFS
Office of the President
KWS
KPA
Kenya Prisons Service
NHIF
Music Copyright Society
Kenya Seed Company
KPC
Siay
a
46.4
5.2
11.3
5.2
2.1
3.1
2.1
6.2
4.1
1.0
2.1
2.1
1.0
1.0
1.0
2.1
1.0
0.0
0.0
1.0
1.0
1.0
0.0
0.0
0.0
0.0
0.0
0.0
0.0
0.0
0.0
0.0
0.0
0.0
0.0
0.0
0.0
0.0
0.0
Bom
et
45.8
15.3
12.5
9.7
5.6
1.4
1.4
1.4
0.0
1.4
0.0
0.0
1.4
0.0
0.0
0.0
0.0
2.8
0.0
0.0
0.0
0.0
0.0
0.0
0.0
1.4
0.0
0.0
0.0
0.0
0.0
0.0
0.0
0.0
0.0
0.0
0.0
0.0
0.0
Sam
buru
45.8
4.2
12.5
0.0
0.0
0.0
4.2
8.3
0.0
4.2
0.0
0.0
4.2
0.0
4.2
0.0
4.2
0.0
0.0
0.0
0.0
0.0
0.0
4.2
4.2
0.0
0.0
0.0
0.0
0.0
0.0
0.0
0.0
0.0
0.0
0.0
0.0
0.0
0.0
Mar
sabi
t
44.4
13.3
13.3
0.0
13.3
2.2
0.0
2.2
0.0
0.0
0.0
0.0
0.0
0.0
0.0
0.0
0.0
0.0
2.2
0.0
0.0
0.0
0.0
0.0
0.0
0.0
2.2
4.4
0.0
2.2
0.0
0.0
0.0
0.0
0.0
0.0
0.0
0.0
0.0
Nye
ri
44.1
13.2
5.9
1.5
5.9
7.4
7.4
2.9
0.0
1.5
0.0
0.0
0.0
0.0
2.9
1.5
1.5
1.5
0.0
0.0
1.5
0.0
0.0
0.0
0.0
0.0
0.0
0.0
1.5
0.0
0.0
0.0
0.0
0.0
0.0
0.0
0.0
0.0
0.0
Wes
t Pok
ot
41.9
16.1
3.2
9.7
0.0
0.0
0.0
0.0
3.2
6.5
6.5
3.2
0.0
0.0
0.0
6.5
0.0
0.0
0.0
0.0
3.2
0.0
0.0
0.0
0.0
0.0
0.0
0.0
0.0
0.0
0.0
0.0
0.0
0.0
0.0
0.0
0.0
0.0
0.0
Kis
ii
41.1
11.3
9.2
7.8
5.0
2.1
1.4
1.4
5.7
1.4
2.1
0.0
1.4
0.0
1.4
0.7
1.4
0.7
0.0
0.0
0.7
1.4
1.4
0.0
0.0
0.0
2.1
0.0
0.0
0.0
0.0
0.0
0.0
0.0
0.0
0.0
0.0
0.0
0.0
Uas
in
Gis
hu
40.9
6.8
13.6
2.3
18.2
4.5
2.3
0.0
0.0
0.0
0.0
4.5
0.0
0.0
0.0
0.0
2.3
0.0
0.0
0.0
0.0
0.0
0.0
0.0
0.0
0.0
2.3
0.0
0.0
2.3
0.0
0.0
0.0
0.0
0.0
0.0
0.0
0.0
0.0
Kia
mbu
38.7
17.7
3.2
3.2
15.3
0.0
8.1
2.4
1.6
0.0
0.8
1.6
1.6
0.8
0.0
0.8
1.6
0.0
0.0
0.0
0.0
0.8
0.0
0.0
0.0
0.0
0.0
0.0
0.0
0.0
0.0
1.6
0.0
0.0
0.0
0.0
0.0
0.0
0.0
Bus
ia
38.5
7.7
10.1
7.1
3.0
1.8
5.3
3.6
5.9
1.2
1.2
0.0
0.6
1.2
0.6
2.4
0.6
1.2
1.2
1.2
0.6
0.0
1.8
1.2
0.0
0.6
0.0
1.2
0.0
0.6
0.0
0.0
0.0
0.0
0.0
0.0
0.0
0.0
0.0
Bun
gom
a
36.7
9.0
12.1
6.5
4.5
6.0
2.5
4.5
4.5
2.0
1.0
0.0
0.5
1.5
0.0
2.0
0.0
1.0
1.0
1.0
1.0
1.0
0.0
0.5
0.0
0.5
0.0
0.0
0.0
0.0
0.0
0.0
0.0
0.0
0.5
0.0
0.0
0.0
0.0
Thar
aka
Nith
i
36.6
4.3
8.6
3.2
6.5
11.8
8.6
3.2
5.4
5.4
0.0
0.0
1.1
0.0
1.1
0.0
0.0
0.0
0.0
0.0
3.2
0.0
1.1
0.0
0.0
0.0
0.0
0.0
0.0
0.0
0.0
0.0
0.0
0.0
0.0
0.0
0.0
0.0
0.0
Mig
ori
36.5
11.9
13.2
11.3
4.4
3.1
2.5
3.8
1.9
3.1
0.6
1.3
0.0
0.0
0.0
1.3
0.0
0.6
1.3
0.0
0.0
0.0
1.3
0.0
0.6
0.0
0.0
0.6
0.0
0.0
0.0
0.0
0.0
0.0
0.0
0.0
0.0
0.0
0.0
Man
dera
35.7
0.0
10.7
14.3
28.6
0.0
0.0
0.0
0.0
0.0
0.0
0.0
0.0
0.0
3.6
0.0
0.0
0.0
0.0
0.0
3.6
0.0
0.0
0.0
0.0
0.0
0.0
0.0
0.0
0.0
0.0
3.6
0.0
0.0
0.0
0.0
0.0
0.0
0.0
Embu
35.4
18.1
8.7
3.1
5.5
6.3
5.5
5.5
0.8
1.6
0.0
1.6
0.0
0.0
0.0
0.0
0.8
3.1
0.0
0.0
0.0
0.8
0.0
0.0
0.0
0.0
0.8
0.8
0.0
0.0
0.0
0.0
0.0
0.8
0.0
0.0
0.8
0.0
0.0
Kitu
i
34.5
20.1
17.2
4.6
2.3
2.3
1.7
6.3
2.3
0.0
0.6
0.0
0.0
0.0
0.0
0.0
0.0
0.6
0.0
3.4
0.0
0.6
0.0
0.6
0.6
1.1
0.6
0.0
0.6
0.0
0.0
0.0
0.0
0.0
0.0
0.0
0.0
0.0
0.0
Mak
ueni
33.3
20.0
6.7
3.3
6.7
13.3
0.0
3.3
0.0
0.0
6.7
0.0
0.0
0.0
0.0
0.0
0.0
3.3
0.0
3.3
0.0
0.0
0.0
0.0
0.0
0.0
0.0
0.0
0.0
0.0
0.0
0.0
0.0
0.0
0.0
0.0
0.0
0.0
0.0
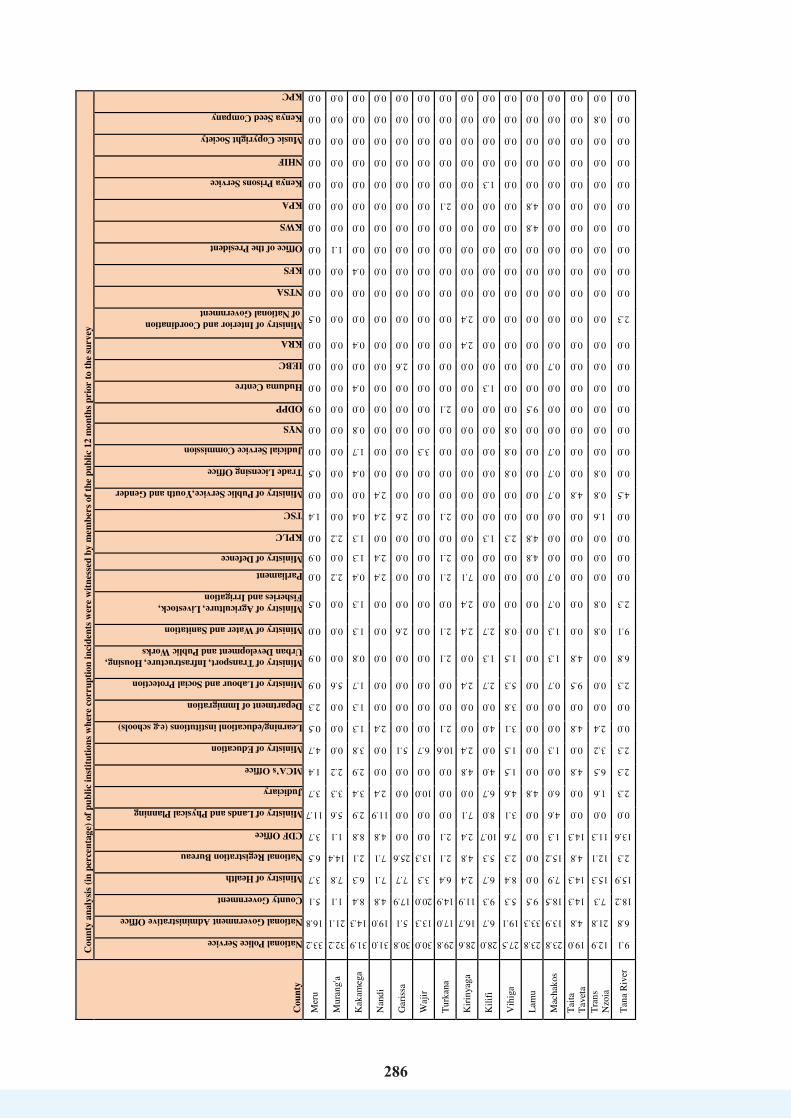
286
286
Cou
nty
Cou
nty
anal
ysis
(in p
erce
ntag
e) o
f pub
lic in
stitu
tions
whe
re co
rrup
tion
inci
dent
s wer
e w
itnes
sed
by m
embe
rs o
f the
pub
lic 1
2 m
onth
s pri
or to
the
surv
ey
National Police Service
National Government Administrative Office
County Government
Ministry of Health
National Registration Bureau
CDF Office
Ministry of Lands and Physical Planning
Judiciary
MCA’s Office
Ministry of Education
Learning/educationl institutions (e.g schools)
Department of Immigration
Ministry of Labour and Social Protection
Ministry of Transport, Infrastructure, Housing, Urban Development and Public Works
Ministry of Water and Sanitation
Ministry of Agriculture, Livestock, Fisheries and Irrigation
Parliament
Ministry of Defence
KPLC
TSC
Ministry of Public Service,Youth and Gender
Trade Licensing Office
Judicial Service Commission
NYS
ODPP
Huduma Centre
IEBC
KRA
Ministry of Interior and Coordination of National Government
NTSA
KFS
Office of the President
KWS
KPA
Kenya Prisons Service
NHIF
Music Copyright Society
Kenya Seed Company
KPC
Mer
u
33.2
16.8
5.1
3.7
6.5
3.7
11.7
3.7
1.4
4.7
0.5
2.3
0.9
0.9
0.0
0.5
0.0
0.9
0.0
1.4
0.0
0.5
0.0
0.0
0.9
0.0
0.0
0.0
0.5
0.0
0.0
0.0
0.0
0.0
0.0
0.0
0.0
0.0
0.0
Mur
ang'
a
32.2
21.1
1.1
7.8
14.4
1.1
5.6
3.3
2.2
0.0
0.0
0.0
5.6
0.0
0.0
0.0
2.2
0.0
2.2
0.0
0.0
0.0
0.0
0.0
0.0
0.0
0.0
0.0
0.0
0.0
0.0
1.1
0.0
0.0
0.0
0.0
0.0
0.0
0.0
Kak
ameg
a
31.9
14.3
8.4
6.3
2.1
8.8
2.9
3.4
2.9
3.8
1.3
1.3
1.7
0.8
1.3
1.3
0.4
1.3
1.3
0.4
0.0
0.4
1.7
0.8
0.0
0.4
0.0
0.4
0.0
0.0
0.4
0.0
0.0
0.0
0.0
0.0
0.0
0.0
0.0
Nan
di
31.0
19.0
4.8
7.1
7.1
4.8
11.9
2.4
0.0
0.0
2.4
0.0
0.0
0.0
0.0
0.0
2.4
2.4
0.0
2.4
2.4
0.0
0.0
0.0
0.0
0.0
0.0
0.0
0.0
0.0
0.0
0.0
0.0
0.0
0.0
0.0
0.0
0.0
0.0
Gar
issa
30.8
5.1
17.9
7.7
25.6
0.0
0.0
0.0
0.0
5.1
0.0
0.0
0.0
0.0
2.6
0.0
0.0
0.0
0.0
2.6
0.0
0.0
0.0
0.0
0.0
0.0
2.6
0.0
0.0
0.0
0.0
0.0
0.0
0.0
0.0
0.0
0.0
0.0
0.0
Waj
ir
30.0
13.3
20.0
3.3
13.3
0.0
0.0
10.0
0.0
6.7
0.0
0.0
0.0
0.0
0.0
0.0
0.0
0.0
0.0
0.0
0.0
0.0
3.3
0.0
0.0
0.0
0.0
0.0
0.0
0.0
0.0
0.0
0.0
0.0
0.0
0.0
0.0
0.0
0.0
Turk
ana
29.8
17.0
14.9
6.4
2.1
2.1
0.0
0.0
0.0
10.6
2.1
0.0
0.0
2.1
2.1
0.0
2.1
2.1
0.0
2.1
0.0
0.0
0.0
0.0
2.1
0.0
0.0
0.0
0.0
0.0
0.0
0.0
0.0
2.1
0.0
0.0
0.0
0.0
0.0
Kiri
nyag
a
28.6
16.7
11.9
2.4
4.8
2.4
7.1
0.0
4.8
2.4
0.0
0.0
2.4
0.0
2.4
2.4
7.1
0.0
0.0
0.0
0.0
0.0
0.0
0.0
0.0
0.0
0.0
2.4
2.4
0.0
0.0
0.0
0.0
0.0
0.0
0.0
0.0
0.0
0.0
Kili
fi
28.0
6.7
9.3
6.7
5.3
10.7
8.0
6.7
4.0
0.0
4.0
0.0
2.7
1.3
2.7
0.0
0.0
0.0
1.3
0.0
0.0
0.0
0.0
0.0
0.0
1.3
0.0
0.0
0.0
0.0
0.0
0.0
0.0
0.0
1.3
0.0
0.0
0.0
0.0
Vih
iga
27.5
19.1
5.3
8.4
2.3
7.6
3.1
4.6
1.5
1.5
3.1
3.8
5.3
1.5
0.8
0.0
0.0
0.0
2.3
0.0
0.0
0.8
0.8
0.8
0.0
0.0
0.0
0.0
0.0
0.0
0.0
0.0
0.0
0.0
0.0
0.0
0.0
0.0
0.0
Lam
u
23.8
33.3
9.5
0.0
0.0
0.0
0.0
4.8
0.0
0.0
0.0
0.0
0.0
0.0
0.0
0.0
0.0
4.8
4.8
0.0
0.0
0.0
0.0
0.0
9.5
0.0
0.0
0.0
0.0
0.0
0.0
0.0
4.8
4.8
0.0
0.0
0.0
0.0
0.0
Mac
hako
s
23.8
13.9
18.5
7.9
15.2
1.3
4.6
6.0
0.0
1.3
0.0
0.0
0.7
1.3
1.3
0.7
0.7
0.0
0.0
0.0
0.7
0.7
0.7
0.0
0.0
0.0
0.7
0.0
0.0
0.0
0.0
0.0
0.0
0.0
0.0
0.0
0.0
0.0
0.0
Taita
Ta
veta
19.0
4.8
14.3
14.3
4.8
14.3
0.0
0.0
4.8
0.0
4.8
0.0
9.5
4.8
0.0
0.0
0.0
0.0
0.0
0.0
4.8
0.0
0.0
0.0
0.0
0.0
0.0
0.0
0.0
0.0
0.0
0.0
0.0
0.0
0.0
0.0
0.0
0.0
0.0
Tran
s N
zoia
12.9
21.8
7.3
15.3
12.1
11.3
0.0
1.6
6.5
3.2
2.4
0.0
0.0
0.0
0.8
0.8
0.0
0.0
0.0
1.6
0.8
0.8
0.0
0.0
0.0
0.0
0.0
0.0
0.0
0.0
0.0
0.0
0.0
0.0
0.0
0.0
0.0
0.8
0.0
Tana
Riv
er
9.1
6.8
18.2
15.9
2.3
13.6
0.0
2.3
2.3
2.3
0.0
0.0
2.3
6.8
9.1
2.3
0.0
0.0
0.0
0.0
4.5
0.0
0.0
0.0
0.0
0.0
0.0
0.0
2.3
0.0
0.0
0.0
0.0
0.0
0.0
0.0
0.0
0.0
0.0
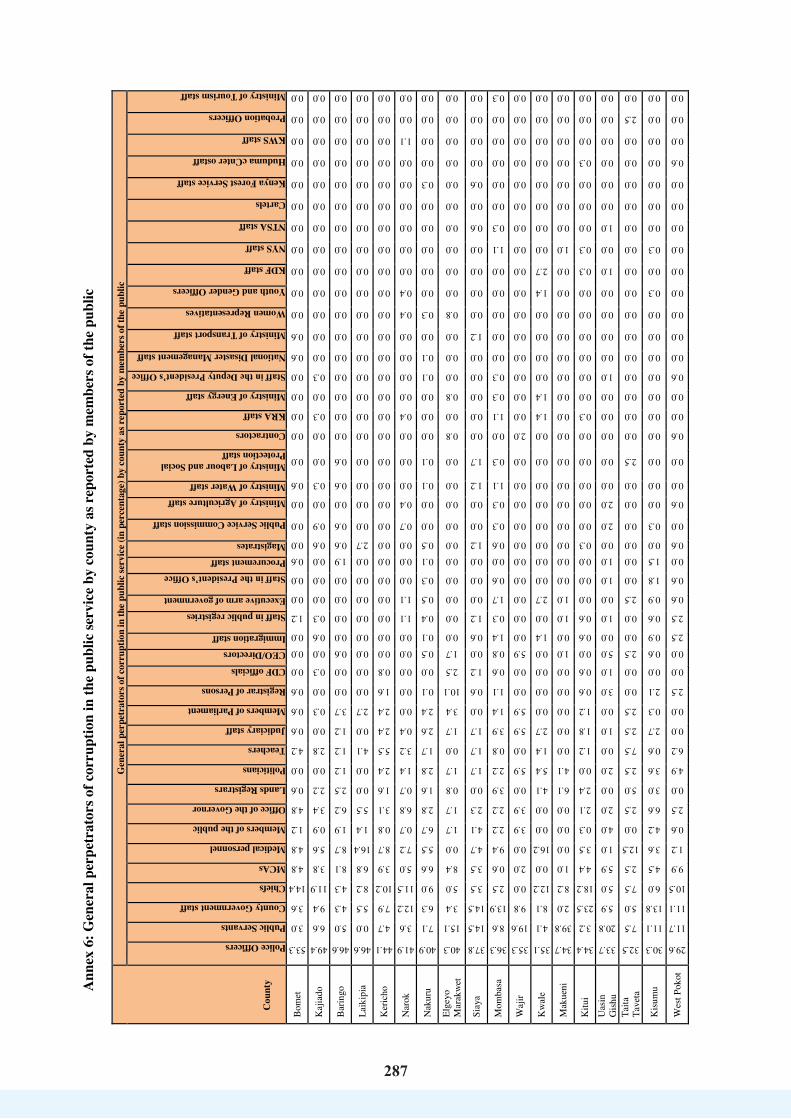
287
287
Ann
ex 6
: Gen
eral
per
petr
ator
s of c
orru
ptio
n in
the
publ
ic se
rvic
e by
cou
nty
as r
epor
ted
by m
embe
rs o
f the
pub
lic
Cou
nty
Gen
eral
per
petr
ator
s of c
orru
ptio
n in
the
publ
ic se
rvic
e (in
per
cent
age)
by
coun
ty a
s rep
orte
d by
mem
bers
of t
he p
ublic
Police Officers
Public Servants
County Government staff
Chiefs
MCAs
Medical personnel
Members of the public
Office of the Governor
Lands Registrars
Politicians
Teachers
Judiciary staff
Members of Parliament
Registrar of Persons
CDF officials
CEO/Directors Immigration staff
Staff in public registries Executive arm of government
Staff in the President’s Office Procurement staff Magistrates
Public Service Commission staff
Ministry of Agriculture staff Ministry of Water staff
Ministry of Labour and Social Protection staff
Contractors
KRA staff
Ministry of Energy staff
Staff in the Deputy President’s Office
National Disaster Management staff
Ministry of Transport staff
Women Representatives
Youth and Gender Officers
KDF staff
NYS staff
NTSA staff
Cartels
Kenya Forest Service staff
Huduma cCnter ostaff
KWS staff
Probation Officers
Ministry of Tourism staff
Bom
et
53.3
3.0
3.6
14.4
4.8
4.8
1.2
4.8
0.6
0.0
4.2
0.6
0.6
0.6
0.0
0.0
0.0
1.2
0.0
0.0
0.6
0.0
0.0
0.0
0.6
0.0
0.0
0.0
0.0
0.0
0.6
0.6
0.0
0.0
0.0
0.0
0.0
0.0
0.0
0.0
0.0
0.0
0.0
Kaj
iado
49.4
6.6
9.4
11.9
3.8
5.6
0.9
3.4
2.2
0.0
2.8
0.0
0.3
0.0
0.3
0.0
0.6
0.3
0.0
0.0
0.0
0.6
0.9
0.0
0.3
0.0
0.0
0.3
0.0
0.3
0.0
0.0
0.0
0.0
0.0
0.0
0.0
0.0
0.0
0.0
0.0
0.0
0.0
Bar
ingo
46.6
5.0
4.3
4.3
8.1
8.7
1.9
6.2
2.5
1.2
1.2
1.2
3.7
0.0
0.0
0.6
0.0
0.0
0.0
0.0
1.9
0.6
0.6
0.0
0.6
0.6
0.0
0.0
0.0
0.0
0.0
0.0
0.0
0.0
0.0
0.0
0.0
0.0
0.0
0.0
0.0
0.0
0.0
Laik
ipia
46.6
0.0
5.5
8.2
6.8
16.4
1.4
5.5
0.0
0.0
4.1
0.0
2.7
0.0
0.0
0.0
0.0
0.0
0.0
0.0
0.0
2.7
0.0
0.0
0.0
0.0
0.0
0.0
0.0
0.0
0.0
0.0
0.0
0.0
0.0
0.0
0.0
0.0
0.0
0.0
0.0
0.0
0.0
Ker
icho
44.1
4.7
7.9
10.2
3.9
8.7
0.8
3.1
1.6
2.4
5.5
2.4
2.4
1.6
0.8
0.0
0.0
0.0
0.0
0.0
0.0
0.0
0.0
0.0
0.0
0.0
0.0
0.0
0.0
0.0
0.0
0.0
0.0
0.0
0.0
0.0
0.0
0.0
0.0
0.0
0.0
0.0
0.0
Nar
ok
41.9
3.6
12.2
11.5
5.0
7.2
0.7
6.8
0.7
1.4
3.2
0.4
0.0
0.0
0.0
0.0
0.0
1.1
1.1
0.0
0.0
0.0
0.7
0.4
0.0
0.0
0.0
0.4
0.0
0.0
0.0
0.0
0.4
0.4
0.0
0.0
0.0
0.0
0.0
0.0
1.1
0.0
0.0
Nak
uru
40.9
7.1
6.3
9.0
6.6
5.5
6.7
2.8
1.6
2.8
1.7
2.6
2.4
0.1
0.0
0.5
0.1
0.4
0.5
0.3
0.1
0.5
0.0
0.0
0.1
0.1
0.0
0.0
0.0
0.1
0.1
0.0
0.3
0.0
0.0
0.0
0.0
0.0
0.3
0.0
0.0
0.0
0.0
Elge
yo
Mar
akw
et
40.3
15.1
3.4
5.0
8.4
0.0
1.7
1.7
0.8
1.7
0.0
1.7
3.4
10.1
2.5
1.7
0.0
0.0
0.0
0.0
0.0
0.0
0.0
0.0
0.0
0.0
0.8
0.0
0.8
0.0
0.0
0.0
0.8
0.0
0.0
0.0
0.0
0.0
0.0
0.0
0.0
0.0
0.0
Siay
a
37.8
14.5
14.5
3.5
3.5
4.7
4.1
2.3
0.0
1.7
1.7
1.7
0.0
0.6
1.2
0.0
0.6
1.2
0.0
0.0
0.0
1.2
0.0
0.0
1.2
1.7
0.0
0.0
0.0
0.0
0.0
1.2
0.0
0.0
0.0
0.0
0.6
0.0
0.6
0.0
0.0
0.0
0.0
Mom
basa
36.3
8.6
13.9
2.5
0.6
9.4
2.2
2.2
3.9
2.2
0.8
3.9
1.4
1.1
0.6
0.8
1.4
0.3
1.7
0.6
0.0
0.6
0.3
0.3
1.1
0.3
0.0
1.1
0.3
0.3
0.0
0.0
0.0
0.0
0.0
1.1
0.3
0.0
0.0
0.0
0.0
0.0
0.3
Waj
ir
35.3
19.6
9.8
0.0
2.0
0.0
3.9
3.9
0.0
5.9
0.0
5.9
5.9
0.0
0.0
5.9
0.0
0.0
0.0
0.0
0.0
0.0
0.0
0.0
0.0
0.0
2.0
0.0
0.0
0.0
0.0
0.0
0.0
0.0
0.0
0.0
0.0
0.0
0.0
0.0
0.0
0.0
0.0
Kw
ale
35.1
4.1
8.1
12.2
0.0
16.2
0.0
0.0
4.1
5.4
1.4
2.7
0.0
0.0
0.0
0.0
1.4
0.0
2.7
0.0
0.0
0.0
0.0
0.0
0.0
0.0
0.0
1.4
1.4
0.0
0.0
0.0
0.0
1.4
2.7
0.0
0.0
0.0
0.0
0.0
0.0
0.0
0.0
Mak
ueni
34.7
39.8
2.0
8.2
1.0
0.0
0.0
0.0
6.1
4.1
0.0
0.0
0.0
0.0
0.0
1.0
0.0
1.0
1.0
0.0
0.0
0.0
0.0
0.0
0.0
0.0
0.0
0.0
0.0
0.0
0.0
0.0
0.0
0.0
0.0
1.0
0.0
0.0
0.0
0.0
0.0
0.0
0.0
Kitu
i
34.4
3.2
23.5
18.2
4.4
3.5
0.3
2.1
2.4
0.0
1.2
1.8
1.2
0.6
0.6
0.0
0.6
0.6
0.0
0.0
0.0
0.3
0.0
0.0
0.0
0.0
0.0
0.3
0.0
0.0
0.0
0.0
0.0
0.0
0.3
0.3
0.0
0.0
0.0
0.3
0.0
0.0
0.0
Uas
in
Gis
hu
33.7
20.8
5.9
5.0
5.9
1.0
4.0
2.0
0.0
2.0
0.0
1.0
0.0
3.0
1.0
5.0
0.0
1.0
0.0
1.0
1.0
0.0
2.0
2.0
0.0
0.0
0.0
0.0
0.0
1.0
0.0
0.0
0.0
0.0
1.0
0.0
1.0
0.0
0.0
0.0
0.0
0.0
0.0
Taita
Ta
veta
32.5
7.5
5.0
7.5
2.5
12.5
0.0
2.5
5.0
2.5
7.5
2.5
2.5
0.0
0.0
2.5
0.0
0.0
2.5
0.0
0.0
0.0
0.0
0.0
0.0
2.5
0.0
0.0
0.0
0.0
0.0
0.0
0.0
0.0
0.0
0.0
0.0
0.0
0.0
0.0
0.0
2.5
0.0
Kis
umu
30.3
11.1
13.8
6.0
4.5
3.6
4.2
6.6
3.0
3.6
0.6
2.7
0.3
2.1
0.0
0.6
0.9
0.6
0.9
1.8
1.5
0.0
0.3
0.0
0.0
0.0
0.0
0.0
0.0
0.0
0.0
0.0
0.0
0.3
0.0
0.3
0.0
0.0
0.0
0.0
0.0
0.0
0.0
Wes
t Pok
ot
29.6
11.7
11.1
10.5
9.9
1.2
0.6
2.5
0.0
4.9
6.2
0.0
0.0
2.5
0.0
0.0
2.5
2.5
0.6
0.6
0.0
0.6
0.0
0.6
0.0
0.0
0.6
0.0
0.0
0.6
0.0
0.0
0.0
0.0
0.0
0.0
0.0
0.0
0.0
0.6
0.0
0.0
0.0

288
288
Cou
nty
Gen
eral
per
petr
ator
s of c
orru
ptio
n in
the
publ
ic se
rvic
e (in
per
cent
age)
by
coun
ty a
s rep
orte
d by
mem
bers
of t
he p
ublic
Police Officers
Public Servants
County Government staff
Chiefs
MCAs
Medical personnel
Members of the public
Office of the Governor
Lands Registrars
Politicians
Teachers
Judiciary staff
Members of Parliament
Registrar of Persons
CDF officials
CEO/Directors Immigration staff
Staff in public registries Executive arm of government
Staff in the President’s Office Procurement staff Magistrates
Public Service Commission staff
Ministry of Agriculture staff Ministry of Water staff
Ministry of Labour and Social Protection staff
Contractors
KRA staff
Ministry of Energy staff
Staff in the Deputy President’s Office
National Disaster Management staff
Ministry of Transport staff
Women Representatives
Youth and Gender Officers
KDF staff
NYS staff
NTSA staff
Cartels
Kenya Forest Service staff
Huduma cCnter ostaff
KWS staff
Probation Officers
Ministry of Tourism staff
Gar
issa
29.5
25.4
8.2
3.3
2.5
0.0
13.1
0.0
0.0
4.1
0.0
0.8
2.5
0.8
0.0
0.8
0.8
0.8
0.8
0.0
4.9
0.0
0.0
0.0
0.0
0.0
1.6
0.0
0.0
0.0
0.0
0.0
0.0
0.0
0.0
0.0
0.0
0.0
0.0
0.0
0.0
0.0
0.0
Kiri
nyag
a
29.3
10.9
10.9
4.3
7.6
1.1
3.3
8.7
4.3
2.2
2.2
4.3
7.6
0.0
0.0
0.0
0.0
1.1
1.1
1.1
0.0
0.0
0.0
0.0
0.0
0.0
0.0
0.0
0.0
0.0
0.0
0.0
0.0
0.0
0.0
0.0
0.0
0.0
0.0
0.0
0.0
0.0
0.0
Hom
a B
ay
28.9
7.9
25.0
5.3
6.6
4.6
2.0
5.3
2.0
0.7
2.0
0.7
1.3
1.3
0.0
0.7
0.0
0.0
0.0
0.0
0.0
0.0
0.0
1.3
1.3
0.7
0.7
0.0
0.0
0.7
0.0
0.0
0.7
0.0
0.0
0.0
0.0
0.0
0.0
0.0
0.0
0.0
0.0
Sam
buru
26.9
21.2
11.5
1.9
1.9
3.8
9.6
1.9
1.9
5.8
5.8
0.0
0.0
1.9
0.0
1.9
0.0
0.0
0.0
0.0
0.0
0.0
0.0
0.0
0.0
0.0
0.0
0.0
0.0
0.0
0.0
0.0
0.0
0.0
0.0
0.0
0.0
0.0
0.0
0.0
3.8
0.0
0.0
Tran
s N
zoia
26.9
5.5
7.4
18.1
8.9
6.6
0.7
1.5
0.4
0.4
3.7
0.7
0.4
4.4
4.1
0.7
0.0
2.2
0.0
1.5
0.4
0.0
0.4
0.7
0.0
2.6
0.4
0.7
0.0
0.0
0.4
0.0
0.0
0.0
0.0
0.0
0.0
0.0
0.0
0.4
0.0
0.0
0.0
Kia
mbu
24.6
3.4
6.8
9.8
9.5
11.0
0.8
3.8
6.1
1.9
0.8
3.0
1.1
8.0
0.8
0.0
0.0
0.4
1.9
1.9
0.0
0.4
0.0
0.0
0.4
0.8
0.0
0.4
0.4
0.0
0.0
1.5
0.0
0.0
0.4
0.0
0.0
0.0
0.0
0.0
0.0
0.4
0.0
Mac
hako
s
23.9
40.1
11.7
5.8
2.6
1.0
1.9
1.0
3.2
0.6
0.6
0.3
1.3
0.3
0.0
0.3
0.0
0.6
0.6
1.3
0.0
1.0
0.0
0.0
0.6
0.0
0.0
0.0
0.0
0.0
0.3
0.0
0.0
0.3
0.0
0.0
0.0
0.3
0.0
0.0
0.0
0.0
0.0
Mar
sabi
t
23.6
27.3
4.5
5.5
3.6
2.7
3.6
1.8
0.9
5.5
0.0
1.8
0.0
10.9
1.8
0.0
1.8
0.9
0.0
0.0
0.9
0.0
0.9
0.0
0.0
0.0
0.0
0.0
0.9
0.0
0.0
0.0
0.0
0.0
0.0
0.0
0.9
0.0
0.0
0.0
0.0
0.0
0.0
Man
dera
22.6
40.6
2.8
2.8
1.9
3.8
10.4
3.8
0.0
0.0
0.0
0.9
0.0
1.9
0.0
2.8
0.0
0.9
0.0
0.0
0.0
0.9
0.0
0.0
0.0
0.0
2.8
0.0
0.0
0.0
0.0
0.0
0.0
0.0
0.0
0.0
0.0
0.0
0.0
0.9
0.0
0.0
0.0
Mig
ori
22.6
23.1
11.1
7.9
3.7
10.3
3.2
2.9
1.5
0.7
1.0
1.5
0.2
0.7
0.7
1.2
0.5
1.7
0.7
1.5
0.0
0.2
0.5
0.7
0.0
0.0
0.0
0.7
0.5
0.0
0.0
0.0
0.2
0.0
0.0
0.0
0.0
0.2
0.0
0.0
0.0
0.0
0.0
Isio
lo
22.5
20.0
15.0
7.5
5.0
2.5
12.5
2.5
0.0
5.0
0.0
2.5
0.0
0.0
2.5
0.0
0.0
0.0
0.0
0.0
0.0
0.0
0.0
0.0
0.0
0.0
0.0
0.0
0.0
0.0
0.0
0.0
0.0
0.0
2.5
0.0
0.0
0.0
0.0
0.0
0.0
0.0
0.0
Mur
ang'
a
21.2
5.8
11.1
4.8
10.1
9.1
0.0
5.3
5.3
1.4
1.9
3.8
3.4
3.4
1.4
0.0
1.0
0.5
1.0
0.0
1.4
0.5
0.0
1.4
2.4
1.9
0.5
0.0
1.0
0.0
0.5
0.0
0.0
0.0
0.0
0.0
0.0
0.0
0.0
0.0
0.0
0.0
0.0
Lam
u
20.5
7.7
12.8
23.1
2.6
0.0
2.6
2.6
0.0
5.1
2.6
0.0
7.7
0.0
0.0
2.6
0.0
2.6
0.0
0.0
0.0
0.0
0.0
0.0
0.0
0.0
0.0
0.0
0.0
0.0
0.0
0.0
2.6
0.0
0.0
0.0
0.0
5.1
0.0
0.0
0.0
0.0
0.0
Nan
di
20.5
12.5
4.5
17.0
6.3
2.7
1.8
0.9
7.1
2.7
4.5
0.9
4.5
4.5
3.6
0.0
0.0
0.0
0.9
0.9
0.0
0.9
0.0
0.0
0.0
0.0
0.9
0.0
1.8
0.0
0.0
0.0
0.0
0.0
0.9
0.0
0.0
0.0
0.0
0.0
0.0
0.0
0.0
Kili
fi
19.8
12.3
8.6
3.7
6.8
2.5
1.2
9.9
1.9
8.6
2.5
1.2
4.3
0.6
1.2
4.9
0.0
1.2
0.6
0.0
1.9
0.0
1.9
0.0
0.6
0.0
0.0
1.2
1.2
0.0
0.0
0.6
0.0
0.0
0.0
0.0
0.0
0.0
0.0
0.0
0.0
0.6
0.0
Nye
ri
19.3
21.0
16.0
4.2
8.4
1.7
1.7
3.4
4.2
3.4
4.2
0.8
6.7
0.8
0.0
0.0
0.0
0.8
0.0
1.7
0.0
0.0
0.0
0.0
0.0
0.0
0.0
0.0
0.8
0.0
0.0
0.0
0.8
0.0
0.0
0.0
0.0
0.0
0.0
0.0
0.0
0.0
0.0
Nai
robi
19.2
42.2
8.9
1.2
0.6
1.0
12.5
1.5
1.0
1.3
0.5
1.1
0.9
0.2
0.0
1.5
0.4
0.0
1.7
1.7
0.6
0.3
0.1
0.0
0.0
0.0
0.4
0.0
0.0
0.7
0.0
0.0
0.0
0.0
0.0
0.0
0.3
0.1
0.1
0.0
0.0
0.0
0.0
Mer
u
18.7
19.4
7.9
7.5
3.6
3.8
2.3
0.8
10.8
0.5
1.7
4.5
2.8
1.8
2.2
0.3
4.5
1.0
0.5
0.2
2.2
1.0
0.2
0.2
0.0
0.0
0.2
0.0
0.2
0.0
0.7
0.2
0.0
0.0
0.0
0.0
0.0
0.5
0.0
0.0
0.0
0.2
0.0
Embu
18.5
33.7
5.1
2.5
3.6
4.0
5.4
2.9
4.0
3.3
0.7
2.5
0.7
3.3
0.7
1.1
1.1
3.3
0.0
0.7
0.0
1.1
0.0
0.0
0.0
0.0
0.4
0.0
0.0
0.0
0.0
0.0
0.4
0.4
0.0
0.0
0.0
0.0
0.0
0.4
0.4
0.0
0.0
Nya
ndar
ua
17.9
15.4
10.6
9.8
8.9
1.6
2.4
6.5
1.6
9.8
0.0
0.8
8.1
0.8
0.0
0.0
0.0
0.8
0.0
1.6
0.0
0.0
0.0
0.0
0.8
0.0
0.0
0.0
0.0
0.8
0.0
0.0
0.0
0.0
0.0
0.0
0.0
0.0
1.6
0.0
0.0
0.0
0.0
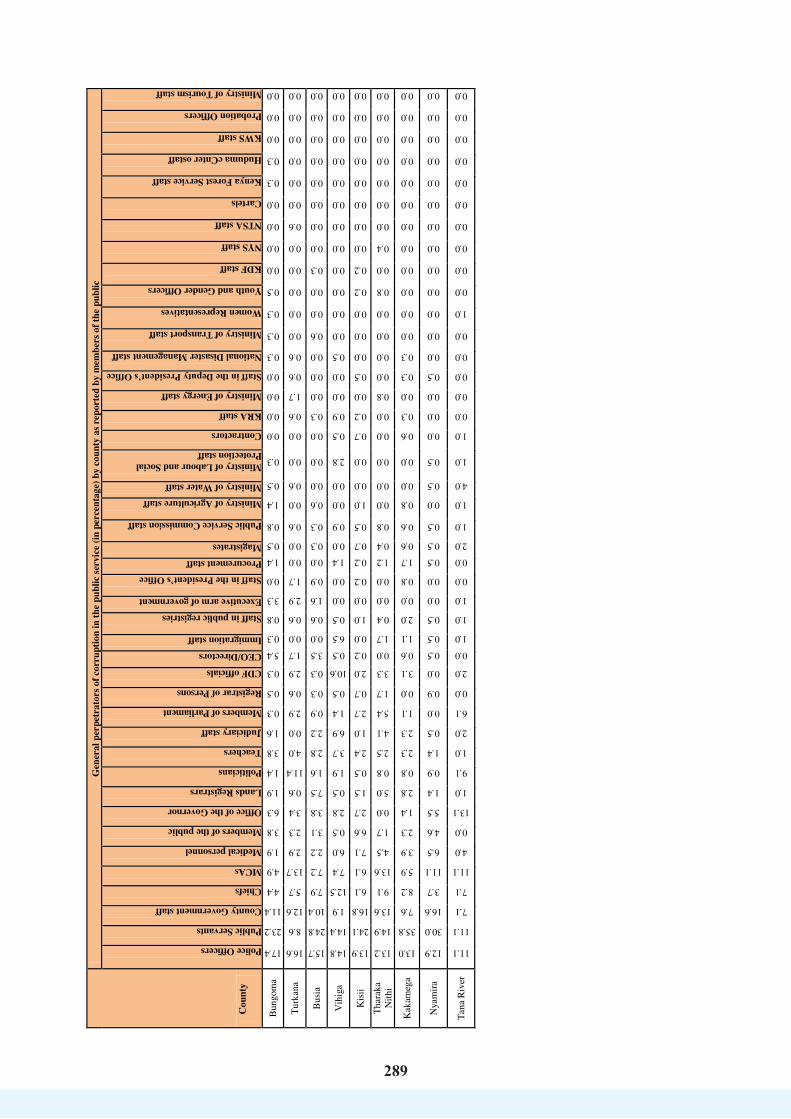
289
289
Cou
nty
Gen
eral
per
petr
ator
s of c
orru
ptio
n in
the
publ
ic se
rvic
e (in
per
cent
age)
by
coun
ty a
s rep
orte
d by
mem
bers
of t
he p
ublic
Police Officers
Public Servants
County Government staff
Chiefs
MCAs
Medical personnel
Members of the public
Office of the Governor
Lands Registrars
Politicians
Teachers
Judiciary staff
Members of Parliament
Registrar of Persons
CDF officials
CEO/Directors Immigration staff
Staff in public registries Executive arm of government
Staff in the President’s Office Procurement staff Magistrates
Public Service Commission staff
Ministry of Agriculture staff Ministry of Water staff
Ministry of Labour and Social Protection staff
Contractors
KRA staff
Ministry of Energy staff
Staff in the Deputy President’s Office
National Disaster Management staff
Ministry of Transport staff
Women Representatives
Youth and Gender Officers
KDF staff
NYS staff
NTSA staff
Cartels
Kenya Forest Service staff
Huduma cCnter ostaff
KWS staff
Probation Officers
Ministry of Tourism staff
Bun
gom
a
17.4
23.2
11.4
4.4
4.9
1.9
3.8
6.3
1.9
1.4
3.8
1.6
0.3
0.5
0.3
5.4
0.3
0.8
3.3
0.0
1.4
0.5
0.8
1.4
0.5
0.3
0.0
0.0
0.0
0.0
0.3
0.3
0.3
0.5
0.0
0.0
0.0
0.0
0.3
0.3
0.0
0.0
0.0
Turk
ana
16.6
8.6
12.6
5.7
13.7
2.9
2.3
3.4
0.6
11.4
4.0
0.0
2.9
0.6
2.9
1.7
0.0
0.6
2.9
1.7
0.0
0.0
0.6
0.0
0.6
0.0
0.0
0.6
1.7
0.6
0.6
0.0
0.0
0.0
0.0
0.0
0.6
0.0
0.0
0.0
0.0
0.0
0.0
Bus
ia
15.7
24.8
10.4
7.9
7.2
2.2
3.1
3.8
7.5
1.6
2.8
2.2
0.9
0.3
0.3
3.5
0.0
0.6
1.6
0.9
0.0
0.3
0.3
0.6
0.0
0.0
0.0
0.3
0.0
0.0
0.0
0.6
0.0
0.0
0.3
0.0
0.0
0.0
0.0
0.0
0.0
0.0
0.0
Vih
iga
14.8
14.4
1.9
12.5
7.4
6.0
0.5
2.8
0.5
1.9
3.7
6.9
1.4
0.5
10.6
0.5
6.5
0.5
0.0
0.0
1.4
0.0
0.9
0.0
0.0
2.8
0.5
0.9
0.0
0.0
0.5
0.0
0.0
0.0
0.0
0.0
0.0
0.0
0.0
0.0
0.0
0.0
0.0
Kis
ii
13.9
24.1
16.8
6.1
6.1
7.1
6.6
2.7
1.5
0.5
2.4
1.0
2.7
0.7
2.0
0.2
0.0
1.0
0.0
0.2
0.2
0.7
0.5
1.0
0.0
0.0
0.7
0.2
0.0
0.5
0.0
0.0
0.0
0.2
0.2
0.0
0.0
0.0
0.0
0.0
0.0
0.0
0.0
Thar
aka
Nith
i
13.2
14.9
13.6
9.1
13.6
4.5
1.7
0.0
5.0
0.8
2.5
4.1
5.4
1.7
3.3
0.0
1.7
0.4
0.0
0.0
1.2
0.4
0.8
0.0
0.0
0.0
0.0
0.0
0.8
0.0
0.0
0.0
0.0
0.8
0.0
0.4
0.0
0.0
0.0
0.0
0.0
0.0
0.0
Kak
ameg
a
13.0
35.8
7.6
8.2
5.9
3.9
2.3
1.4
2.8
0.8
2.3
2.3
1.1
0.0
3.1
0.6
1.1
2.0
0.0
0.8
1.7
0.6
0.6
0.8
0.0
0.0
0.6
0.3
0.0
0.3
0.3
0.0
0.0
0.0
0.0
0.0
0.0
0.0
0.0
0.0
0.0
0.0
0.0
Nya
mira
12.9
30.0
16.6
3.7
11.1
6.5
4.6
5.5
1.4
0.9
1.4
0.5
0.0
0.9
0.0
0.5
0.5
0.5
0.0
0.0
0.5
0.5
0.5
0.0
0.5
0.5
0.0
0.0
0.0
0.5
0.0
0.0
0.0
0.0
0.0
0.0
0.0
0.0
0.0
0.0
0.0
0.0
0.0
Tana
Riv
er
11.1
11.1
7.1
7.1
11.1
4.0
0.0
13.1
1.0
9.1
1.0
2.0
6.1
0.0
2.0
0.0
1.0
1.0
1.0
0.0
0.0
2.0
1.0
1.0
4.0
1.0
1.0
0.0
0.0
0.0
0.0
0.0
1.0
0.0
0.0
0.0
0.0
0.0
0.0
0.0
0.0
0.0
0.0

290
290
Ann
ex 7
: C
ount
y an
alys
is of
mai
n ca
tego
ries
of
publ
ic o
ffici
al p
erpe
trat
ors
of c
orru
ptio
n by
wor
k de
signa
tion
or r
oles
as
repo
rted
by
mem
bers
of t
he p
ublic
C
ount
y
Cou
nty
anal
ysis
(in p
erce
ntag
e) o
f mai
n ca
tego
ries
of p
ublic
off
icia
l per
petr
ator
s of c
orru
ptio
n by
wor
k de
signa
tion
or r
oles
as r
epor
ted
by m
embe
rs o
f the
pub
lic
Police Officer
National Government Administrative Officer
Member of County Assembly
Governor
Pharmacist and/or Nurse
Clerk (including Court Clerks)
Member of Parliament
Human Resource Management Officer
Procurement staff
Land surveyor
Magistrate
TSC staff (including teachers)
Registrar
Chief Executive Officer
Accountant
Revenue Officer
CDF Manager
Finance Officer
Public Prosecution Counsel
Water Connection Officer
Senator
Auditor
Forest Officer
KDF Officer
Fisheries Officer
Bom
et
58.4
16
.8
5.4
4.0
4.7
0.7
0.0
0.0
0.0
0.0
0.7
2.0
1.3
0.7
0.0
0.0
0.0
0.0
0.0
0.0
0.0
0.0
0.7
0.0
0.0
Gar
issa
55
.2
1.1
2.3
4.6
0.0
1.1
1.1
2.3
2.3
0.0
1.1
0.0
8.0
3.4
3.4
1.1
0.0
1.1
0.0
0.0
0.0
0.0
0.0
0.0
0.0
Kaj
iado
51
.6
12.5
4.
5 3.
8 4.
5 0.
0 0.
3 1.
0 0.
7 1.
7 0.
0 1.
7 0.
3 0.
7 0.
3 2.
8 0.
3 0.
0 0.
0 0.
0 0.
3 0.
0 0.
3 0.
0 0.
0 La
ikip
ia
49.2
10
.2
1.7
1.7
11.9
0.
0 1.
7 0.
0 0.
0 0.
0 0.
0 3.
4 0.
0 0.
0 0.
0 0.
0 0.
0 0.
0 0.
0 0.
0 0.
0 0.
0 0.
0 0.
0 0.
0 B
arin
go
46.2
3.
2 7.
7 5.
1 5.
8 3.
8 7.
1 0.
0 4.
5 1.
3 0.
6 0.
6 0.
0 1.
3 0.
0 0.
6 0.
6 0.
6 0.
0 0.
6 0.
0 0.
0 0.
0 0.
0 0.
0 K
eric
ho
44.6
10
.7
9.9
0.8
9.1
0.8
1.7
3.3
1.7
0.8
0.0
2.5
0.0
0.8
1.7
1.7
0.0
0.0
0.0
0.0
0.0
0.0
0.0
0.0
0.0
Nar
ok
41.3
14
.0
6.1
11.0
7.
2 0.
4 0.
4 1.
1 0.
0 0.
8 0.
0 3.
0 0.
8 0.
4 0.
0 0.
4 0.
0 0.
0 0.
4 0.
4 0.
0 0.
0 1.
1 0.
0 0.
0 N
akur
u 39
.8
9.5
9.1
3.5
6.7
3.5
2.3
0.6
1.1
1.4
3.1
3.0
0.1
0.6
0.1
0.6
0.4
0.0
1.1
0.0
0.1
0.0
0.1
0.1
0.0
Waj
ir 37
.7
3.8
1.9
1.9
0.0
0.0
3.8
9.4
1.9
0.0
3.8
1.9
1.9
3.8
5.7
0.0
0.0
0.0
0.0
0.0
1.9
1.9
0.0
0.0
0.0
Siay
a 37
.6
7.5
8.1
9.8
4.6
2.3
1.7
1.2
2.3
2.3
4.0
1.2
1.2
1.7
1.7
0.6
0.0
0.6
0.6
0.6
0.0
0.0
0.0
0.0
0.0
Man
dera
35
.3
5.9
5.9
7.6
2.5
2.5
3.4
0.8
0.0
4.2
3.4
0.0
14.3
0.
0 2.
5 0.
0 0.
0 0.
0 0.
0 1.
7 2.
5 0.
0 0.
0 0.
0 0.
0 El
geyo
Mar
akw
et
34.2
4.
3 6.
0 0.
0 0.
0 1.
7 1.
7 0.
0 4.
3 0.
0 0.
0 0.
0 8.
5 0.
9 0.
9 0.
9 0.
0 0.
0 0.
0 0.
0 0.
0 0.
9 0.
0 0.
9 0.
0 K
itui
31.9
20
.3
5.5
2.3
3.5
0.6
1.0
1.6
2.3
1.3
1.9
1.0
0.0
0.0
0.6
0.0
0.0
0.0
0.0
0.0
0.0
0.0
0.0
0.3
0.3
Tran
s Nzo
ia
29.0
17
.9
8.9
2.7
5.4
7.6
0.4
0.4
0.0
0.0
0.0
2.2
3.6
0.9
0.4
0.9
3.1
0.0
0.0
0.0
0.0
0.0
0.0
0.0
0.0
Hom
a B
ay
28.5
6.
9 11
.1
5.6
4.2
1.4
0.7
8.3
3.5
0.7
1.4
0.7
0.0
2.8
0.7
0.7
0.0
0.0
0.0
1.4
0.0
0.7
0.0
0.0
0.7
Mom
basa
28
.0
2.5
1.6
2.5
6.9
4.4
1.6
2.2
1.6
0.3
3.5
0.6
0.3
0.3
1.3
6.0
0.6
0.3
1.3
0.3
0.6
0.0
0.0
0.3
0.3
Kis
umu
27.0
8.
4 6.
7 6.
4 4.
9 2.
3 0.
3 5.
2 6.
7 2.
3 1.
2 0.
6 2.
0 0.
6 1.
5 0.
3 0.
0 0.
6 0.
3 0.
9 0.
6 0.
0 0.
0 0.
0 0.
0 K
isii
24.5
8.
3 17
.1
8.3
6.0
4.8
4.2
1.4
0.7
0.0
2.8
1.8
0.5
0.0
0.0
0.2
0.9
0.0
0.0
0.0
0.0
0.0
0.2
0.2
0.2
Wes
t Pok
ot
24.3
9.
3 5.
7 3.
6 1.
4 1.
4 0.
0 5.
7 1.
4 0.
0 0.
0 2.
9 1.
4 5.
7 4.
3 0.
0 0.
0 0.
0 0.
0 0.
0 0.
0 0.
0 0.
0 0.
0 0.
0 K
iam
bu
23.6
10
.7
6.2
2.9
10.3
4.
5 2.
5 0.
0 0.
8 2.
5 1.
7 0.
8 5.
0 0.
4 0.
0 0.
8 0.
0 0.
8 0.
0 0.
8 0.
8 0.
0 0.
0 0.
4 0.
0 M
igor
i 23
.4
6.9
7.6
5.1
8.4
2.0
1.0
1.5
0.3
1.3
0.5
1.3
0.5
1.3
0.5
1.3
0.3
0.5
0.0
0.5
0.0
0.0
0.3
0.5
0.0
Nan
di
23.4
15
.0
6.5
2.8
1.9
0.0
4.7
0.9
5.6
4.7
3.7
2.8
4.7
1.9
0.0
0.0
0.9
0.0
0.9
0.0
0.0
0.0
0.9
0.9
0.0
Sam
buru
23
.3
7.0
7.0
4.7
2.3
0.0
4.7
7.0
9.3
0.0
0.0
2.3
0.0
0.0
0.0
0.0
2.3
0.0
0.0
0.0
0.0
0.0
0.0
2.3
0.0
Uas
in G
ishu
21
.8
5.0
3.0
1.0
1.0
5.9
1.0
5.0
2.0
1.0
0.0
0.0
2.0
1.0
5.0
0.0
1.0
0.0
0.0
0.0
1.0
1.0
1.0
0.0
0.0
Mur
ang'
a 20
.1
5.3
13.4
4.
8 8.
1 2.
4 3.
8 0.
0 2.
4 3.
3 3.
3 0.
5 1.
4 0.
5 0.
0 0.
0 0.
5 0.
0 1.
0 1.
4 0.
0 0.
0 0.
0 0.
0 0.
5 Is
iolo
20
.0
8.6
11.4
0.
0 2.
9 0.
0 2.
9 5.
7 0.
0 0.
0 0.
0 2.
9 0.
0 0.
0 0.
0 0.
0 0.
0 0.
0 0.
0 0.
0 0.
0 0.
0 0.
0 0.
0 0.
0 M
eru
19.2
10
.8
1.3
0.5
2.2
7.3
2.9
1.6
1.8
7.5
2.2
1.1
2.5
0.2
1.1
0.0
2.7
0.7
0.4
0.4
0.0
0.0
0.2
0.2
0.0
Kw
ale
19.0
6.
3 5.
1 2.
5 11
.4
3.8
6.3
0.0
0.0
0.0
0.0
0.0
0.0
2.5
0.0
0.0
0.0
1.3
0.0
0.0
0.0
1.3
0.0
0.0
0.0
Nai
robi
18
.9
1.4
4.0
2.7
0.9
1.4
1.7
1.1
0.6
0.1
1.0
0.6
0.0
1.6
0.4
0.6
0.0
0.0
0.1
0.0
0.4
0.0
0.0
0.0
0.0
Mar
sabi
t 18
.6
7.2
2.1
1.0
2.1
5.2
0.0
0.0
0.0
0.0
0.0
1.0
2.1
1.0
0.0
1.0
1.0
0.0
0.0
0.0
0.0
0.0
0.0
0.0
0.0
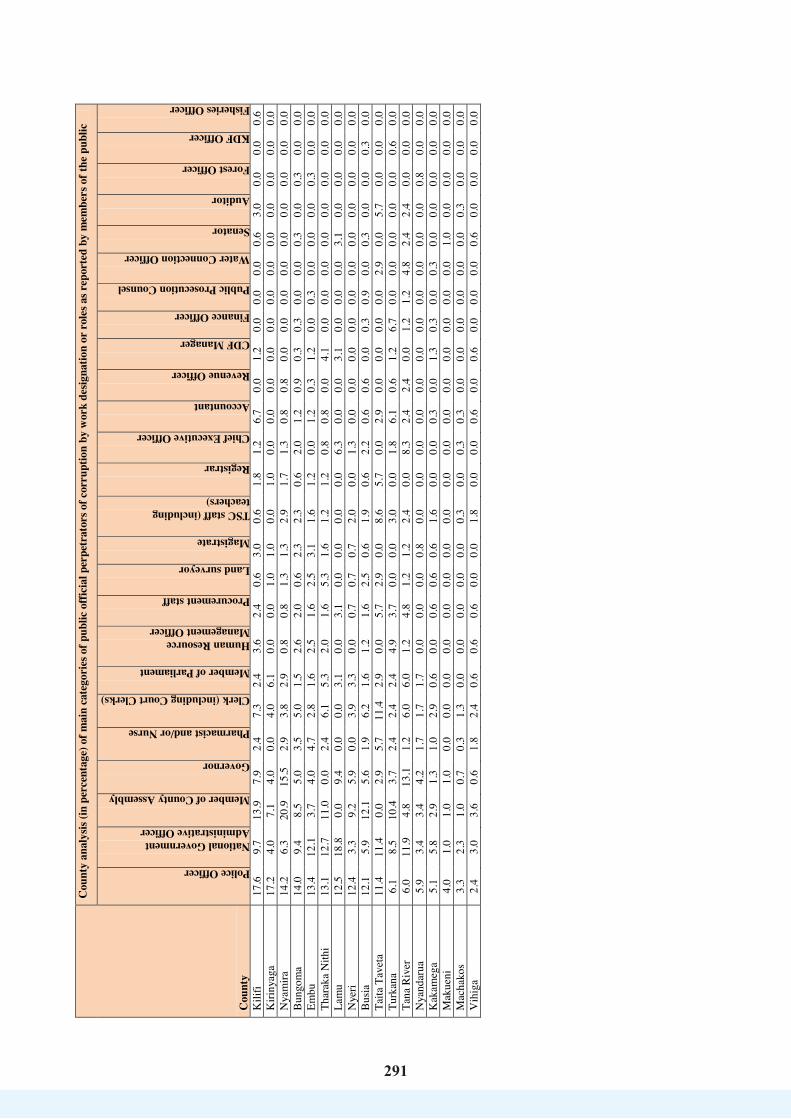
291
291
Cou
nty
Cou
nty
anal
ysis
(in p
erce
ntag
e) o
f mai
n ca
tego
ries
of p
ublic
off
icia
l per
petr
ator
s of c
orru
ptio
n by
wor
k de
signa
tion
or r
oles
as r
epor
ted
by m
embe
rs o
f the
pub
lic
Police Officer
National Government Administrative Officer
Member of County Assembly
Governor
Pharmacist and/or Nurse
Clerk (including Court Clerks)
Member of Parliament
Human Resource Management Officer
Procurement staff
Land surveyor
Magistrate
TSC staff (including teachers)
Registrar
Chief Executive Officer
Accountant
Revenue Officer
CDF Manager
Finance Officer
Public Prosecution Counsel
Water Connection Officer
Senator
Auditor
Forest Officer
KDF Officer
Fisheries Officer
Kili
fi 17
.6
9.7
13.9
7.
9 2.
4 7.
3 2.
4 3.
6 2.
4 0.
6 3.
0 0.
6 1.
8 1.
2 6.
7 0.
0 1.
2 0.
0 0.
0 0.
0 0.
6 3.
0 0.
0 0.
0 0.
6 K
iriny
aga
17.2
4.
0 7.
1 4.
0 0.
0 4.
0 6.
1 0.
0 0.
0 1.
0 1.
0 0.
0 1.
0 0.
0 0.
0 0.
0 0.
0 0.
0 0.
0 0.
0 0.
0 0.
0 0.
0 0.
0 0.
0 N
yam
ira
14.2
6.
3 20
.9
15.5
2.
9 3.
8 2.
9 0.
8 0.
8 1.
3 1.
3 2.
9 1.
7 1.
3 0.
8 0.
8 0.
0 0.
0 0.
0 0.
0 0.
0 0.
0 0.
0 0.
0 0.
0 B
ungo
ma
14.0
9.
4 8.
5 5.
0 3.
5 5.
0 1.
5 2.
6 2.
0 0.
6 2.
3 2.
3 0.
6 2.
0 1.
2 0.
9 0.
3 0.
3 0.
0 0.
0 0.
3 0.
0 0.
3 0.
0 0.
0 Em
bu
13.4
12
.1
3.7
4.0
4.7
2.8
1.6
2.5
1.6
2.5
3.1
1.6
1.2
0.0
1.2
0.3
1.2
0.0
0.3
0.0
0.0
0.0
0.3
0.0
0.0
Thar
aka
Nith
i 13
.1
12.7
11
.0
0.0
2.4
6.1
5.3
2.0
1.6
5.3
1.6
1.2
1.2
0.8
0.8
0.0
4.1
0.0
0.0
0.0
0.0
0.0
0.0
0.0
0.0
Lam
u 12
.5
18.8
0.
0 9.
4 0.
0 0.
0 3.
1 0.
0 3.
1 0.
0 0.
0 0.
0 0.
0 6.
3 0.
0 0.
0 3.
1 0.
0 0.
0 0.
0 3.
1 0.
0 0.
0 0.
0 0.
0 N
yeri
12.4
3.
3 9.
2 5.
9 0.
0 3.
9 3.
3 0.
0 0.
7 0.
7 0.
7 2.
0 0.
0 1.
3 0.
0 0.
0 0.
0 0.
0 0.
0 0.
0 0.
0 0.
0 0.
0 0.
0 0.
0 B
usia
12
.1
5.9
12.1
5.
6 1.
9 6.
2 1.
6 1.
2 1.
6 2.
5 0.
6 1.
9 0.
6 2.
2 0.
6 0.
6 0.
0 0.
3 0.
9 0.
0 0.
3 0.
0 0.
0 0.
3 0.
0 Ta
ita T
avet
a 11
.4
11.4
0.
0 2.
9 5.
7 11
.4
2.9
0.0
5.7
2.9
0.0
8.6
5.7
0.0
2.9
0.0
0.0
0.0
0.0
2.9
0.0
5.7
0.0
0.0
0.0
Turk
ana
6.1
8.5
10.4
3.
7 2.
4 2.
4 2.
4 4.
9 3.
7 0.
0 0.
0 3.
0 0.
0 1.
8 6.
1 0.
6 1.
2 6.
7 0.
0 0.
0 0.
0 0.
0 0.
0 0.
6 0.
0 Ta
na R
iver
6.
0 11
.9
4.8
13.1
1.
2 6.
0 6.
0 1.
2 4.
8 1.
2 1.
2 2.
4 0.
0 8.
3 2.
4 2.
4 0.
0 1.
2 1.
2 4.
8 2.
4 2.
4 0.
0 0.
0 0.
0 N
yand
arua
5.
9 3.
4 3.
4 4.
2 1.
7 1.
7 1.
7 0.
0 0.
0 0.
0 0.
8 0.
0 0.
0 0.
0 0.
0 0.
0 0.
0 0.
0 0.
0 0.
0 0.
0 0.
0 0.
8 0.
0 0.
0 K
akam
ega
5.1
5.8
2.9
1.3
1.0
2.9
0.6
0.0
0.6
0.6
0.6
1.6
0.0
0.0
0.3
0.0
1.3
0.3
0.0
0.3
0.0
0.0
0.0
0.0
0.0
Mak
ueni
4.
0 1.
0 1.
0 1.
0 0.
0 0.
0 0.
0 0.
0 0.
0 0.
0 0.
0 0.
0 0.
0 0.
0 0.
0 0.
0 0.
0 0.
0 0.
0 0.
0 1.
0 0.
0 0.
0 0.
0 0.
0 M
acha
kos
3.3
2.3
1.0
0.7
0.3
1.3
0.0
0.0
0.0
0.0
0.0
0.3
0.0
0.3
0.3
0.0
0.0
0.0
0.0
0.0
0.0
0.3
0.0
0.0
0.0
Vih
iga
2.4
3.0
3.6
0.6
1.8
2.4
0.6
0.6
0.6
0.0
0.0
1.8
0.0
0.0
0.6
0.0
0.6
0.0
0.0
0.0
0.6
0.0
0.0
0.0
0.0
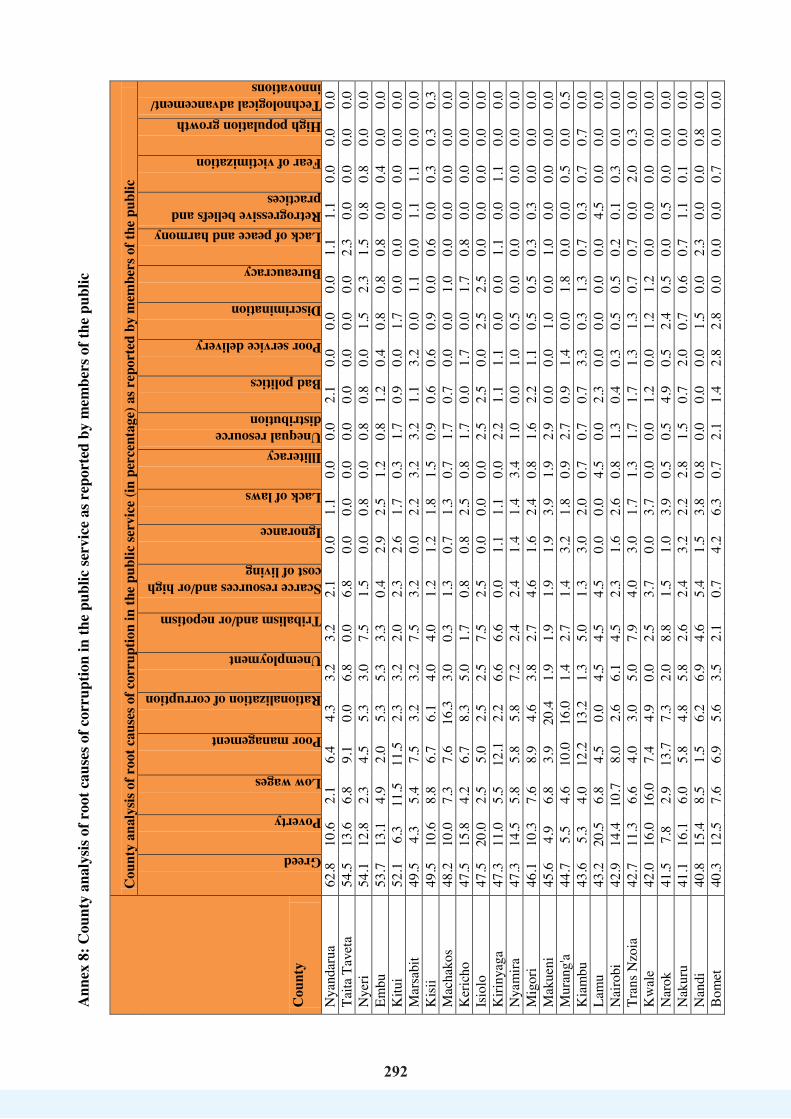
292
292
Ann
ex 8
: Cou
nty
anal
ysis
of r
oot c
ause
s of c
orru
ptio
n in
the
publ
ic se
rvic
e as
rep
orte
d by
mem
bers
of t
he p
ublic
C
ount
y
Cou
nty
anal
ysis
of r
oot c
ause
s of c
orru
ptio
n in
the
publ
ic se
rvic
e (in
per
cent
age)
as r
epor
ted
by m
embe
rs o
f the
pub
lic
Greed
Poverty
Low wages
Poor management
Rationalization of corruption
Unemployment
Tribalism and/or nepotism
Scarce resources and/or high cost of living
Ignorance
Lack of laws
Illiteracy Unequal resource distribution
Bad politics
Poor service delivery
Discrimination
Bureaucracy
Lack of peace and harmony Retrogressive beliefs and practices
Fear of victimization
High population growth Technological advancement/ innovations
Nya
ndar
ua
62.8
10
.6
2.1
6.4
4.3
3.2
3.2
2.1
0.0
1.1
0.0
0.0
2.1
0.0
0.0
0.0
1.1
1.1
0.0
0.0
0.0
Taita
Tav
eta
54.5
13
.6
6.8
9.1
0.0
6.8
0.0
6.8
0.0
0.0
0.0
0.0
0.0
0.0
0.0
0.0
2.3
0.0
0.0
0.0
0.0
Nye
ri 54
.1
12.8
2.
3 4.
5 5.
3 3.
0 7.
5 1.
5 0.
0 0.
8 0.
0 0.
8 0.
8 0.
0 1.
5 2.
3 1.
5 0.
8 0.
8 0.
0 0.
0 Em
bu
53.7
13
.1
4.9
2.0
5.3
5.3
3.3
0.4
2.9
2.5
1.2
0.8
1.2
0.4
0.8
0.8
0.8
0.0
0.4
0.0
0.0
Kitu
i 52
.1
6.3
11.5
11
.5
2.3
3.2
2.0
2.3
2.6
1.7
0.3
1.7
0.9
0.0
1.7
0.0
0.0
0.0
0.0
0.0
0.0
Mar
sabi
t 49
.5
4.3
5.4
7.5
3.2
3.2
7.5
3.2
0.0
2.2
3.2
3.2
1.1
3.2
0.0
1.1
0.0
1.1
1.1
0.0
0.0
Kisi
i 49
.5
10.6
8.
8 6.
7 6.
1 4.
0 4.
0 1.
2 1.
2 1.
8 1.
5 0.
9 0.
6 0.
6 0.
9 0.
0 0.
6 0.
0 0.
3 0.
3 0.
3 M
acha
kos
48.2
10
.0
7.3
7.6
16.3
3.
0 0.
3 1.
3 0.
7 1.
3 0.
7 1.
7 0.
7 0.
0 0.
0 1.
0 0.
0 0.
0 0.
0 0.
0 0.
0 K
eric
ho
47.5
15
.8
4.2
6.7
8.3
5.0
1.7
0.8
0.8
2.5
0.8
1.7
0.0
1.7
0.0
1.7
0.8
0.0
0.0
0.0
0.0
Isio
lo
47.5
20
.0
2.5
5.0
2.5
2.5
7.5
2.5
0.0
0.0
0.0
2.5
2.5
0.0
2.5
2.5
0.0
0.0
0.0
0.0
0.0
Kiri
nyag
a 47
.3
11.0
5.
5 12
.1
2.2
6.6
6.6
0.0
1.1
1.1
0.0
2.2
1.1
1.1
0.0
0.0
1.1
0.0
1.1
0.0
0.0
Nya
mira
47
.3
14.5
5.
8 5.
8 5.
8 7.
2 2.
4 2.
4 1.
4 1.
4 3.
4 1.
0 0.
0 1.
0 0.
5 0.
0 0.
0 0.
0 0.
0 0.
0 0.
0 M
igor
i 46
.1
10.3
7.
6 8.
9 4.
6 3.
8 2.
7 4.
6 1.
6 2.
4 0.
8 1.
6 2.
2 1.
1 0.
5 0.
5 0.
3 0.
3 0.
0 0.
0 0.
0 M
akue
ni
45.6
4.
9 6.
8 3.
9 20
.4
1.9
1.9
1.9
1.9
3.9
1.9
2.9
0.0
0.0
1.0
0.0
1.0
0.0
0.0
0.0
0.0
Mur
ang'
a 44
.7
5.5
4.6
10.0
16
.0
1.4
2.7
1.4
3.2
1.8
0.9
2.7
0.9
1.4
0.0
1.8
0.0
0.0
0.5
0.0
0.5
Kia
mbu
43
.6
5.3
4.0
12.2
13
.2
1.3
5.0
1.3
3.0
2.0
0.7
0.7
0.7
3.3
0.3
1.3
0.7
0.3
0.7
0.7
0.0
Lam
u 43
.2
20.5
6.
8 4.
5 0.
0 4.
5 4.
5 4.
5 0.
0 0.
0 4.
5 0.
0 2.
3 0.
0 0.
0 0.
0 0.
0 4.
5 0.
0 0.
0 0.
0 N
airo
bi
42.9
14
.4
10.7
8.
0 2.
6 6.
1 4.
5 2.
3 1.
6 2.
6 0.
8 1.
3 0.
4 0.
3 0.
5 0.
5 0.
2 0.
1 0.
3 0.
0 0.
0 Tr
ans N
zoia
42
.7
11.3
6.
6 4.
0 3.
0 5.
0 7.
9 4.
0 3.
0 1.
7 1.
3 1.
7 1.
7 1.
3 1.
3 0.
7 0.
7 0.
0 2.
0 0.
3 0.
0 K
wal
e 42
.0
16.0
16
.0
7.4
4.9
0.0
2.5
3.7
0.0
3.7
0.0
0.0
1.2
0.0
1.2
1.2
0.0
0.0
0.0
0.0
0.0
Nar
ok
41.5
7.
8 2.
9 13
.7
7.3
2.0
8.8
1.5
1.0
3.9
0.5
0.5
4.9
0.5
2.4
0.5
0.0
0.5
0.0
0.0
0.0
Nak
uru
41.1
16
.1
6.0
5.8
4.8
5.8
2.6
2.4
3.2
2.2
2.8
1.5
0.7
2.0
0.7
0.6
0.7
1.1
0.1
0.0
0.0
Nan
di
40.8
15
.4
8.5
1.5
6.2
6.9
4.6
5.4
1.5
3.8
0.8
0.0
0.0
0.0
1.5
0.0
2.3
0.0
0.0
0.8
0.0
Bom
et
40.3
12
.5
7.6
6.9
5.6
3.5
2.1
0.7
4.2
6.3
0.7
2.1
1.4
2.8
2.8
0.0
0.0
0.0
0.7
0.0
0.0
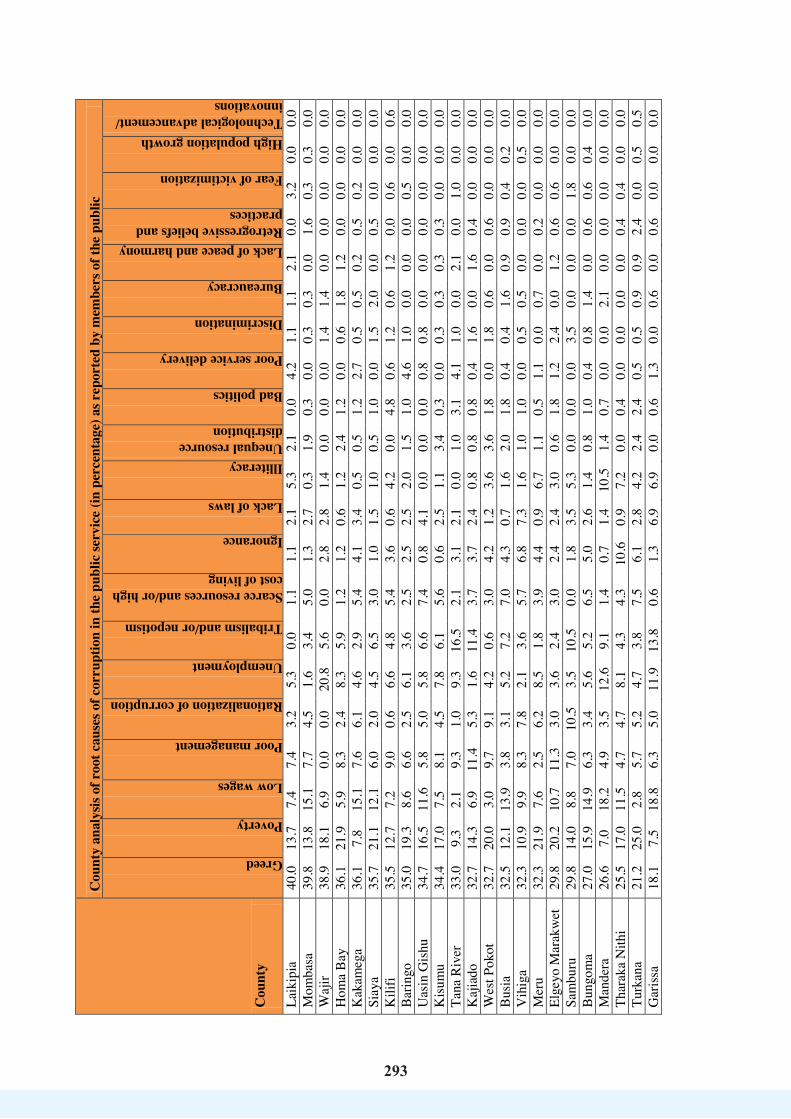
293
293
Cou
nty
Cou
nty
anal
ysis
of r
oot c
ause
s of c
orru
ptio
n in
the
publ
ic se
rvic
e (in
per
cent
age)
as r
epor
ted
by m
embe
rs o
f the
pub
lic
Greed
Poverty
Low wages
Poor management
Rationalization of corruption
Unemployment
Tribalism and/or nepotism
Scarce resources and/or high cost of living
Ignorance
Lack of laws
Illiteracy Unequal resource distribution
Bad politics
Poor service delivery
Discrimination
Bureaucracy
Lack of peace and harmony Retrogressive beliefs and practices
Fear of victimization
High population growth Technological advancement/ innovations
Laik
ipia
40
.0
13.7
7.
4 7.
4 3.
2 5.
3 0.
0 1.
1 1.
1 2.
1 5.
3 2.
1 0.
0 4.
2 1.
1 1.
1 2.
1 0.
0 3.
2 0.
0 0.
0 M
omba
sa
39.8
13
.8
15.1
7.
7 4.
5 1.
6 3.
4 5.
0 1.
3 2.
7 0.
3 1.
9 0.
3 0.
0 0.
3 0.
3 0.
0 1.
6 0.
3 0.
3 0.
0 W
ajir
38.9
18
.1
6.9
0.0
0.0
20.8
5.
6 0.
0 2.
8 2.
8 1.
4 0.
0 0.
0 0.
0 1.
4 1.
4 0.
0 0.
0 0.
0 0.
0 0.
0 H
oma
Bay
36
.1
21.9
5.
9 8.
3 2.
4 8.
3 5.
9 1.
2 1.
2 0.
6 1.
2 2.
4 1.
2 0.
0 0.
6 1.
8 1.
2 0.
0 0.
0 0.
0 0.
0 K
akam
ega
36.1
7.
8 15
.1
7.6
6.1
4.6
2.9
5.4
4.1
3.4
0.5
0.5
1.2
2.7
0.5
0.5
0.2
0.5
0.2
0.0
0.0
Siay
a 35
.7
21.1
12
.1
6.0
2.0
4.5
6.5
3.0
1.0
1.5
1.0
0.5
1.0
0.0
1.5
2.0
0.0
0.5
0.0
0.0
0.0
Kili
fi 35
.5
12.7
7.
2 9.
0 0.
6 6.
6 4.
8 5.
4 3.
6 0.
6 4.
2 0.
0 4.
8 0.
6 1.
2 0.
6 1.
2 0.
0 0.
6 0.
0 0.
6 B
arin
go
35.0
19
.3
8.6
6.6
2.5
6.1
3.6
2.5
2.5
2.5
2.0
1.5
1.0
4.6
1.0
0.0
0.0
0.0
0.5
0.0
0.0
Uas
in G
ishu
34
.7
16.5
11
.6
5.8
5.0
5.8
6.6
7.4
0.8
4.1
0.0
0.0
0.0
0.8
0.8
0.0
0.0
0.0
0.0
0.0
0.0
Kisu
mu
34.4
17
.0
7.5
8.1
4.5
7.8
6.1
5.6
0.6
2.5
1.1
3.4
0.3
0.0
0.3
0.3
0.3
0.3
0.0
0.0
0.0
Tana
Riv
er
33.0
9.
3 2.
1 9.
3 1.
0 9.
3 16
.5
2.1
3.1
2.1
0.0
1.0
3.1
4.1
1.0
0.0
2.1
0.0
1.0
0.0
0.0
Kaj
iado
32
.7
14.3
6.
9 11
.4
5.3
1.6
11.4
3.
7 3.
7 2.
4 0.
8 0.
8 0.
8 0.
4 1.
6 0.
0 1.
6 0.
4 0.
0 0.
0 0.
0 W
est P
okot
32
.7
20.0
3.
0 9.
7 9.
1 4.
2 0.
6 3.
0 4.
2 1.
2 3.
6 3.
6 1.
8 0.
0 1.
8 0.
6 0.
0 0.
6 0.
0 0.
0 0.
0 B
usia
32
.5
12.1
13
.9
3.8
3.1
5.2
7.2
7.0
4.3
0.7
1.6
2.0
1.8
0.4
0.4
1.6
0.9
0.9
0.4
0.2
0.0
Vih
iga
32.3
10
.9
9.9
8.3
7.8
2.1
3.6
5.7
6.8
7.3
1.6
1.0
1.0
0.0
0.5
0.5
0.0
0.0
0.0
0.5
0.0
Mer
u 32
.3
21.9
7.
6 2.
5 6.
2 8.
5 1.
8 3.
9 4.
4 0.
9 6.
7 1.
1 0.
5 1.
1 0.
0 0.
7 0.
0 0.
2 0.
0 0.
0 0.
0 El
geyo
Mar
akw
et
29.8
20
.2
10.7
11
.3
3.0
3.6
2.4
3.0
2.4
2.4
3.0
0.6
1.8
1.2
2.4
0.0
1.2
0.6
0.6
0.0
0.0
Sam
buru
29
.8
14.0
8.
8 7.
0 10
.5
3.5
10.5
0.
0 1.
8 3.
5 5.
3 0.
0 0.
0 0.
0 3.
5 0.
0 0.
0 0.
0 1.
8 0.
0 0.
0 B
ungo
ma
27.0
15
.9
14.9
6.
3 3.
4 5.
6 5.
2 6.
5 5.
0 2.
6 1.
4 0.
8 1.
0 0.
4 0.
8 1.
4 0.
0 0.
6 0.
6 0.
4 0.
0 M
ande
ra
26.6
7.
0 18
.2
4.9
3.5
12.6
9.
1 1.
4 0.
7 1.
4 10
.5
1.4
0.7
0.0
0.0
2.1
0.0
0.0
0.0
0.0
0.0
Thar
aka
Nith
i 25
.5
17.0
11
.5
4.7
4.7
8.1
4.3
4.3
10.6
0.
9 7.
2 0.
0 0.
4 0.
0 0.
0 0.
0 0.
0 0.
4 0.
4 0.
0 0.
0 Tu
rkan
a 21
.2
25.0
2.
8 5.
7 5.
2 4.
7 3.
8 7.
5 6.
1 2.
8 4.
2 2.
4 2.
4 0.
5 0.
5 0.
9 0.
9 2.
4 0.
0 0.
5 0.
5 G
ariss
a 18
.1
7.5
18.8
6.
3 5.
0 11
.9
13.8
0.
6 1.
3 6.
9 6.
9 0.
0 0.
6 1.
3 0.
0 0.
6 0.
0 0.
6 0.
0 0.
0 0.
0
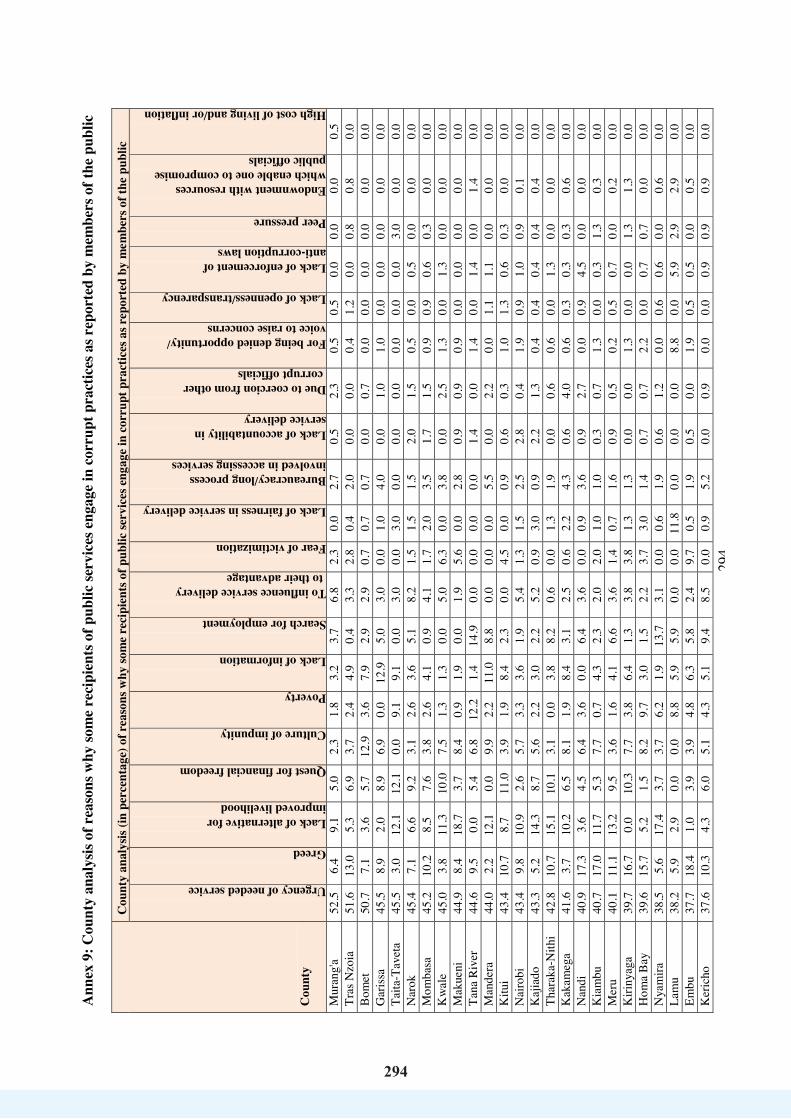
294
294
Ann
ex 9
: Cou
nty
anal
ysis
of r
easo
ns w
hy so
me
reci
pien
ts o
f pub
lic se
rvic
es e
ngag
e in
cor
rupt
pra
ctic
es a
s rep
orte
d by
mem
bers
of t
he p
ublic
C
ount
y
Cou
nty
anal
ysis
(in p
erce
ntag
e) o
f rea
sons
why
som
e re
cipi
ents
of p
ublic
serv
ices
eng
age
in c
orru
pt p
ract
ices
as r
epor
ted
by m
embe
rs o
f the
pub
lic
Urgency of needed service
Greed
Lack of alternative for improved livelihood
Quest for financial freedom
Culture of impunity
Poverty
Lack of information
Search for employment
To influence service delivery to their advantage
Fear of victimization
Lack of fairness in service delivery
Bureaucracy/long process involved in accessing services
Lack of accountability in service delivery
Due to coercion from other corrupt officials
For being denied opportunity/ voice to raise concerns
Lack of openness/transparency
Lack of enforcement of anti-corruption laws
Peer pressure
Endownment with resources which enable one to compromise public officials
High cost of living and/or inflation
Mur
ang'
a 52
.5
6.4
9.1
5.0
2.3
1.8
3.2
3.7
6.8
2.3
0.0
2.7
0.5
2.3
0.5
0.5
0.0
0.0
0.0
0.5
Tras
Nzo
ia
51.6
13
.0
5.3
6.9
3.7
2.4
4.9
0.4
3.3
2.8
0.4
2.0
0.0
0.0
0.4
1.2
0.0
0.8
0.8
0.0
Bom
et
50.7
7.
1 3.
6 5.
7 12
.9
3.6
7.9
2.9
2.9
0.7
0.7
0.7
0.0
0.7
0.0
0.0
0.0
0.0
0.0
0.0
Gar
issa
45
.5
8.9
2.0
8.9
6.9
0.0
12.9
5.
0 3.
0 0.
0 1.
0 4.
0 0.
0 1.
0 1.
0 0.
0 0.
0 0.
0 0.
0 0.
0 Ta
ita-T
avet
a 45
.5
3.0
12.1
12
.1
0.0
9.1
9.1
0.0
3.0
0.0
3.0
0.0
0.0
0.0
0.0
0.0
0.0
3.0
0.0
0.0
Nar
ok
45.4
7.
1 6.
6 9.
2 3.
1 2.
6 3.
6 5.
1 8.
2 1.
5 1.
5 1.
5 2.
0 1.
5 0.
5 0.
0 0.
5 0.
0 0.
0 0.
0 M
omba
sa
45.2
10
.2
8.5
7.6
3.8
2.6
4.1
0.9
4.1
1.7
2.0
3.5
1.7
1.5
0.9
0.9
0.6
0.3
0.0
0.0
Kw
ale
45.0
3.
8 11
.3
10.0
7.
5 1.
3 1.
3 0.
0 5.
0 6.
3 0.
0 3.
8 0.
0 2.
5 1.
3 0.
0 1.
3 0.
0 0.
0 0.
0 M
akue
ni
44.9
8.
4 18
.7
3.7
8.4
0.9
1.9
0.0
1.9
5.6
0.0
2.8
0.9
0.9
0.9
0.0
0.0
0.0
0.0
0.0
Tana
Riv
er
44.6
9.
5 0.
0 5.
4 6.
8 12
.2
1.4
14.9
0.
0 0.
0 0.
0 0.
0 1.
4 0.
0 1.
4 0.
0 1.
4 0.
0 1.
4 0.
0 M
ande
ra
44.0
2.
2 12
.1
0.0
9.9
2.2
11.0
8.
8 0.
0 0.
0 0.
0 5.
5 0.
0 2.
2 0.
0 1.
1 1.
1 0.
0 0.
0 0.
0 K
itui
43.4
10
.7
8.7
11.0
3.
9 1.
9 8.
4 2.
3 0.
0 4.
5 0.
0 0.
9 0.
6 0.
3 1.
0 1.
3 0.
6 0.
3 0.
0 0.
0 N
airo
bi
43.4
9.
8 10
.9
2.6
5.7
3.3
3.6
1.9
5.4
1.3
1.5
2.5
2.8
0.4
1.9
0.9
1.0
0.9
0.1
0.0
Kaj
iado
43
.3
5.2
14.3
8.
7 5.
6 2.
2 3.
0 2.
2 5.
2 0.
9 3.
0 0.
9 2.
2 1.
3 0.
4 0.
4 0.
4 0.
4 0.
4 0.
0 Th
arak
a-N
ithi
42.8
10
.7
15.1
10
.1
3.1
0.0
3.8
8.2
0.6
0.0
1.3
1.9
0.0
0.6
0.6
0.0
1.3
0.0
0.0
0.0
Kak
ameg
a 41
.6
3.7
10.2
6.
5 8.
1 1.
9 8.
4 3.
1 2.
5 0.
6 2.
2 4.
3 0.
6 4.
0 0.
6 0.
3 0.
3 0.
3 0.
6 0.
0 N
andi
40
.9
17.3
3.
6 4.
5 6.
4 3.
6 0.
0 6.
4 3.
6 0.
0 0.
9 3.
6 0.
9 2.
7 0.
0 0.
9 4.
5 0.
0 0.
0 0.
0 K
iam
bu
40.7
17
.0
11.7
5.
3 7.
7 0.
7 4.
3 2.
3 2.
0 2.
0 1.
0 1.
0 0.
3 0.
7 1.
3 0.
0 0.
3 1.
3 0.
3 0.
0 M
eru
40.1
11
.1
13.2
9.
5 3.
6 1.
6 4.
1 6.
6 3.
6 1.
4 0.
7 1.
6 0.
9 0.
5 0.
2 0.
5 0.
7 0.
0 0.
2 0.
0 K
iriny
aga
39.7
16
.7
0.0
10.3
7.
7 3.
8 6.
4 1.
3 3.
8 3.
8 1.
3 1.
3 0.
0 0.
0 1.
3 0.
0 0.
0 1.
3 1.
3 0.
0 H
oma
Bay
39
.6
15.7
5.
2 1.
5 8.
2 9.
7 3.
0 1.
5 2.
2 3.
7 3.
0 1.
4 0.
7 0.
7 2.
2 0.
0 0.
7 0.
7 0.
0 0.
0 N
yam
ira
38.5
5.
6 17
.4
3.7
3.7
6.2
1.9
13.7
3.
1 0.
0 0.
6 1.
9 0.
6 1.
2 0.
0 0.
6 0.
6 0.
0 0.
6 0.
0 La
mu
38.2
5.
9 2.
9 0.
0 0.
0 8.
8 5.
9 5.
9 0.
0 0.
0 11
.8
0.0
0.0
0.0
8.8
0.0
5.9
2.9
2.9
0.0
Embu
37
.7
18.4
1.
0 3.
9 3.
9 4.
8 6.
3 5.
8 2.
4 9.
7 0.
5 1.
9 0.
5 0.
0 1.
9 0.
5 0.
5 0.
0 0.
5 0.
0 K
eric
ho
37.6
10
.3
4.3
6.0
5.1
4.3
5.1
9.4
8.5
0.0
0.9
5.2
0.0
0.9
0.0
0.0
0.9
0.9
0.9
0.0

295
295
Cou
nty
Cou
nty
anal
ysis
(in p
erce
ntag
e) o
f rea
sons
why
som
e re
cipi
ents
of p
ublic
serv
ices
eng
age
in c
orru
pt p
ract
ices
as r
epor
ted
by m
embe
rs o
f the
pub
lic
Urgency of needed service
Greed
Lack of alternative for improved livelihood
Quest for financial freedom
Culture of impunity
Poverty
Lack of information
Search for employment
To influence service delivery to their advantage
Fear of victimization
Lack of fairness in service delivery
Bureaucracy/long process involved in accessing services
Lack of accountability in service delivery
Due to coercion from other corrupt officials
For being denied opportunity/ voice to raise concerns
Lack of openness/transparency
Lack of enforcement of anti-corruption laws
Peer pressure
Endownment with resources which enable one to compromise public officials
High cost of living and/or inflation
Mac
hako
s 33
.9
3.5
30.7
6.
7 5.
8 0.
6 2.
6 0.
3 5.
4 0.
6 1.
9 2.
5 1.
6 1.
6 0.
3 1.
3 0.
0 0.
0 0.
6 0.
0 V
ihig
a 33
.3
6.4
16.4
7.
0 4.
1 0.
6 8.
8 4.
1 4.
7 0.
6 1.
8 1.
2 2.
3 4.
1 2.
3 1.
2 0.
6 0.
0 0.
6 0.
0 M
igor
i 32
.5
9.4
19.2
2.
3 3.
6 5.
5 1.
9 7.
5 6.
8 0.
6 2.
6 1.
9 1.
6 1.
6 0.
6 0.
6 0.
3 0.
0 1.
3 0.
0 W
est P
okot
31
.6
11.0
5.
1 2.
2 11
.0
5.1
11.8
1.
5 5.
1 3.
7 3.
7 2.
2 2.
2 0.
0 2.
2 0.
7 0.
0 0.
7 0.
0 0.
0 W
ajir
30.9
38
.2
0.0
1.8
1.8
7.3
9.1
9.1
0.0
0.0
0.0
0.0
0.0
0.0
0.0
0.0
0.0
1.8
0.0
0.0
Sam
buru
29
.8
17.0
2.
1 6.
4 4.
3 10
.6
4.3
10.6
0.
0 4.
3 4.
3 2.
1 2.
1 0.
0 0.
0 0.
0 2.
1 0.
0 0.
0 0.
0 El
geyo
M
arak
wet
29
.6
10.4
0.
7 7.
4 4.
4 8.
9 6.
7 3.
0 11
.1
2.2
5.9
2.9
2.2
0.7
0.0
2.2
0.7
0.0
0.7
0.0
Bun
gom
a 29
.4
21.4
4.
5 4.
8 8.
0 9.
1 6.
7 4.
3 3.
2 1.
3 0.
8 1.
6 0.
8 1.
6 0.
3 0.
3 0.
5 0.
8 0.
5 0.
0 Si
aya
28.8
17
.5
18.1
5.
6 1.
9 5.
6 5.
0 0.
0 4.
4 1.
9 0.
6 6.
3 0.
0 1.
9 0.
0 0.
0 0.
6 1.
3 0.
6 0.
0 M
arsa
bit
28.4
19
.8
7.4
13.6
3.
7 4.
9 2.
5 6.
2 7.
4 1.
2 0.
0 2.
5 0.
0 0.
0 2.
5 0.
0 0.
0 0.
0 0.
0 0.
0 N
akur
u 28
.1
14.8
15
.6
4.3
4.6
13.2
3.
9 7.
0 2.
9 0.
1 1.
0 0.
9 0.
6 0.
7 0.
6 0.
4 0.
4 0.
4 0.
6 0.
0 N
yeri
28.0
24
.3
3.7
4.7
0.0
0.9
7.5
1.9
2.8
4.7
1.9
0.9
9.3
0.0
8.4
0.9
0.0
0.0
0.0
0.0
Bar
ingo
27
.6
14.5
15
.9
6.2
6.2
13.1
2.
8 6.
9 1.
4 0.
7 2.
1 0.
0 0.
7 0.
0 0.
7 0.
7 0.
0 0.
0 0.
7 0.
0 N
yand
arua
27
.5
28.8
3.
8 10
.0
2.5
1.3
3.8
5.0
2.5
8.8
0.0
0.0
5.0
0.0
1.3
0.0
0.0
0.0
0.0
0.0
Bus
ia
27.0
14
.5
7.1
7.4
6.2
8.6
8.0
4.5
1.8
1.5
2.4
2.1
1.2
1.2
0.6
1.2
1.5
2.1
1.2
0.0
Kili
fi 26
.8
22.8
9.
4 5.
5 0.
8 6.
3 6.
3 5.
5 4.
7 3.
9 1.
6 1.
6 0.
8 0.
0 0.
8 0.
0 0.
0 1.
6 0.
8 0.
8 K
isum
u 26
.2
15.2
12
.8
7.9
9.7
5.5
5.5
2.8
1.4
2.1
0.3
3.8
0.3
3.8
1.0
0.0
0.7
0.0
1.0
0.0
Kis
ii 25
.3
7.7
11.4
12
.1
5.9
9.9
1.8
9.2
9.5
1.8
1.5
0.8
1.1
1.1
0.0
0.7
0.0
0.0
0.4
0.0
Laik
ipia
22
.8
11.4
10
.1
3.8
5.1
16.5
3.
8 6.
3 11
.4
3.8
1.3
1.3
0.0
0.0
0.0
2.5
0.0
0.0
0.0
0.0
Uas
in G
ishu
21
.6
23.0
4.
1 6.
8 6.
8 4.
1 1.
4 4.
1 4.
1 1.
4 2.
7 4.
2 1.
4 4.
1 0.
0 1.
4 0.
0 1.
4 4.
1 0.
0 Is
iolo
17
.2
3.4
20.7
0.
0 3.
4 13
.8
6.9
10.3
0.
0 0.
0 6.
9 3.
4 6.
9 0.
0 0.
0 3.
4 3.
4 0.
0 0.
0 0.
0 Tu
rkan
a 17
.0
17.0
12
.7
4.8
10.3
10
.9
10.9
4.
8 0.
6 1.
2 1.
2 0.
6 0.
0 1.
8 0.
0 1.
2 1.
2 2.
4 0.
6 0.
6

296
296
Ann
ex 1
0: C
ount
y an
alys
is of
con
sequ
ence
s of c
orru
ptio
n in
the
publ
ic se
rvic
e re
port
ed b
y m
embe
rs o
f the
pub
lic
Cou
nty
Cou
nty
anal
ysis
(in p
erce
ntag
e) o
f con
sequ
ence
s of
cor
rupt
ion
in th
e pu
blic
serv
ice
as r
epor
ted
by m
embe
rs o
f the
pub
lic
Underdevelopment
Increased levels of poverty
Delayed and/or poor services
Loss of jobs
Social inequality
Insecurity
High cost of living
Disunity and/or hatred
Injustice
Loss of life
Unwarranted charging of services
Increased levels of immorality and diseases (such as high HIV prevalence)
Increase in road accidents
Lack of trust in the public office
Loss of public resources
Low wages
Misuse of public office
Increased rate of crime (including corruption itself)
Political instability
High levels of illiteracy
Reduced citizen participation in development initiatives
Industrial actions, strikes, demonstrations and protests
Tribalism
Tainted reputation
Loss of business
Waj
ir 40
.7
11.9
10
.2
23.7
0.
0 1.
7 5.
1 3.
4 1.
7 0.
0 0.
0 0.
0 0.
0 0.
0 0.
0 0.
0 0.
0 0.
0 0.
0 1.
7 0.
0 0.
0 0.
0 0.
0 0.
0 M
acha
kos
34.9
20
.8
8.4
7.7
6.0
3.6
2.2
2.9
2.4
3.1
0.7
0.2
0.0
0.0
1.2
0.2
0.7
0.2
0.2
1.4
0.7
0.2
1.0
0.7
0.5
Elge
yo
Mar
akw
et
33.7
8.
4 8.
4 7.
2 13
.3
4.2
3.6
4.8
4.8
1.2
0.0
1.2
0.6
1.8
1.2
0.0
0.0
0.0
1.8
1.2
0.6
0.6
0.0
0.6
0.6
Nan
di
32.6
17
.8
7.0
6.2
10.1
3.
9 1.
6 1.
6 6.
2 0.
0 0.
0 0.
0 0.
0 1.
6 2.
3 0.
0 1.
6 0.
0 1.
6 1.
6 0.
8 0.
8 3.
1 0.
0 0.
0 M
akue
ni
31.3
26
.0
4.7
6.0
10.0
3.
3 1.
3 3.
3 1.
3 3.
3 3.
3 0.
7 0.
0 0.
0 0.
7 0.
0 0.
0 0.
7 0.
0 2.
0 1.
3 0.
0 0.
0 0.
0 0.
7 K
iam
bu
30.8
18
.6
14.8
1.
2 9.
0 1.
5 3.
5 6.
4 2.
9 2.
3 0.
6 0.
3 0.
0 2.
0 2.
3 0.
3 0.
3 0.
9 0.
0 0.
3 0.
0 0.
6 1.
2 0.
0 0.
3 U
asin
Gis
hu
30.6
18
.0
7.2
6.3
12.6
1.
8 1.
8 1.
8 5.
4 0.
9 0.
9 0.
9 0.
9 0.
9 3.
6 0.
0 0.
9 1.
8 0.
9 0.
0 0.
0 1.
8 0.
0 0.
9 0.
0 M
igor
i 28
.6
28.9
6.
8 10
.8
4.9
3.8
4.9
3.5
1.1
1.1
0.3
0.8
0.0
0.3
0.5
0.0
0.3
0.3
0.5
0.5
0.8
0.0
0.0
1.4
0.0
Man
dera
27
.8
17.9
15
.9
7.3
3.3
6.0
5.3
4.6
0.0
0.0
0.0
0.0
0.0
0.7
0.0
0.0
0.0
0.0
5.3
4.0
0.7
0.0
0.7
0.7
0.0
Mur
ang'
a 27
.3
14.1
23
.0
2.7
12.1
2.
0 1.
2 1.
2 2.
7 3.
1 0.
4 0.
4 0.
4 1.
2 3.
5 0.
0 0.
0 0.
8 0.
4 0.
4 1.
6 0.
4 0.
0 0.
4 0.
8 G
aris
sa
27.3
8.
4 23
.8
9.1
3.5
7.7
6.3
3.5
2.1
0.0
1.4
0.0
0.0
0.7
1.4
0.0
0.7
0.7
0.7
0.0
0.7
1.4
0.0
0.7
0.0
Kis
ii 26
.7
26.7
11
.6
9.1
9.3
2.8
3.0
1.5
2.5
1.3
0.0
0.5
0.0
0.8
0.8
0.0
0.3
0.3
0.5
1.0
0.5
0.3
0.0
0.8
0.0
Kiri
nyag
a 26
.5
22.4
8.
2 6.
1 8.
2 7.
1 1.
0 11
.2
2.0
2.0
0.0
1.0
0.0
0.0
1.0
0.0
0.0
0.0
0.0
0.0
0.0
0.0
1.0
2.0
0.0
Nya
ndar
ua
26.4
27
.3
3.6
3.6
5.5
2.7
4.5
11.8
1.
8 1.
8 0.
0 0.
0 0.
0 0.
0 3.
6 0.
0 0.
0 0.
0 3.
6 2.
7 0.
0 0.
9 0.
0 0.
0 0.
0 N
yeri
25.9
22
.3
1.4
7.2
2.9
4.3
7.2
10.1
6.
5 1.
4 1.
4 0.
0 0.
0 0.
0 2.
2 0.
7 1.
4 0.
0 3.
6 0.
7 0.
0 0.
7 0.
0 0.
0 0.
0 V
ihig
a 25
.6
14.2
11
.4
9.5
9.0
3.8
4.3
3.8
1.9
1.9
0.5
0.5
0.0
1.9
4.3
0.0
0.0
0.5
0.5
1.9
1.4
0.0
0.9
2.4
0.0
Siay
a 25
.5
13.2
15
.9
8.6
5.5
6.4
5.9
4.1
0.9
2.3
0.9
0.0
0.9
1.4
1.8
0.0
0.0
0.5
0.0
0.9
2.3
0.5
0.5
1.8
0.5
Nai
robi
25
.3
13.0
12
.0
8.4
6.8
4.3
9.2
3.2
2.1
2.2
0.7
0.4
0.0
2.1
3.3
0.5
0.9
1.0
0.4
1.4
0.3
0.0
1.3
0.8
0.3
Nya
mira
25
.2
24.3
8.
1 10
.8
10.8
1.
8 3.
2 5.
0 1.
8 1.
4 0.
5 0.
0 0.
0 1.
8 0.
0 0.
0 0.
5 0.
5 0.
5 3.
2 0.
0 0.
0 0.
0 0.
5 0.
5 N
akur
u 24
.6
15.7
12
.2
7.5
6.4
2.6
3.0
6.1
4.6
2.6
0.9
0.7
0.7
2.0
1.7
0.0
0.5
1.3
1.0
2.2
0.2
0.1
1.4
0.7
1.3
Kaj
iado
24
.4
29.5
9.
1 8.
1 3.
2 1.
9 4.
9 3.
6 2.
9 1.
3 1.
6 0.
6 1.
0 1.
0 3.
2 0.
0 0.
3 0.
6 0.
0 0.
3 0.
0 0.
3 1.
3 0.
3 0.
3 K
isum
u 24
.3
12.0
12
.5
10.6
3.
7 7.
4 2.
9 3.
2 2.
0 3.
2 0.
0 0.
0 0.
7 3.
2 4.
4 0.
5 0.
5 1.
5 1.
5 0.
0 1.
5 2.
0 0.
5 0.
7 1.
2 K
eric
ho
24.3
23
.5
15.4
8.
1 6.
6 4.
4 3.
7 2.
2 2.
9 1.
5 0.
0 0.
0 0.
0 1.
5 2.
9 0.
0 0.
7 0.
7 0.
0 0.
7 0.
0 0.
0 0.
0 0.
0 0.
7 K
ilifi
23.8
16
.1
11.3
8.
3 4.
8 4.
8 3.
0 4.
8 5.
4 4.
2 0.
6 0.
0 0.
6 1.
2 3.
0 0.
0 1.
2 0.
0 1.
2 4.
2 0.
0 0.
6 0.
0 0.
6 0.
6 Ta
ita T
avet
a 23
.4
25.5
12
.8
6.4
8.5
0.0
0.0
4.3
2.1
6.4
0.0
2.1
2.1
0.0
0.0
0.0
2.1
0.0
0.0
2.1
2.1
0.0
0.0
0.0
0.0
Thar
aka
Nith
i 23
.2
24.9
12
.4
2.6
3.9
7.3
4.3
1.7
2.6
3.9
0.0
0.4
0.0
0.0
5.6
0.0
0.0
1.3
0.4
1.3
0.4
0.0
0.0
0.9
3.0
Bom
et
23.1
29
.6
14.1
6.
5 5.
0 2.
5 1.
5 3.
5 2.
0 1.
5 1.
0 1.
0 0.
5 0.
5 4.
5 0.
0 0.
0 0.
0 1.
0 0.
5 0.
5 0.
5 0.
0 0.
0 0.
5 N
arok
22
.6
28.9
9.
7 4.
4 7.
2 1.
3 2.
5 3.
5 2.
5 4.
7 0.
6 0.
9 0.
6 0.
6 1.
9 0.
0 0.
6 0.
6 0.
0 1.
3 0.
0 2.
5 0.
9 0.
3 1.
6 Em
bu
22.3
13
.7
9.4
6.8
7.9
1.1
2.9
4.3
12.9
5.
8 1.
1 1.
1 0.
4 5.
0 0.
0 0.
4 0.
7 0.
4 1.
1 0.
4 0.
4 0.
0 0.
7 1.
1 0.
4 K
akam
ega
22.1
21
.9
8.9
9.1
7.8
3.9
3.7
1.7
1.1
1.3
2.4
1.1
1.1
2.8
2.0
0.4
0.4
1.5
0.2
2.2
0.9
0.4
0.2
2.4
0.4
Mom
basa
22
.0
15.9
10
.9
6.1
7.7
6.8
5.9
3.4
3.4
4.1
0.7
0.7
1.1
0.7
3.2
0.0
0.2
0.7
0.7
1.4
0.5
0.2
0.0
1.8
1.8

297
297
Cou
nty
Cou
nty
anal
ysis
(in p
erce
ntag
e) o
f con
sequ
ence
s of
cor
rupt
ion
in th
e pu
blic
serv
ice
as r
epor
ted
by m
embe
rs o
f the
pub
lic
Underdevelopment
Increased levels of poverty
Delayed and/or poor services
Loss of jobs
Social inequality
Insecurity
High cost of living
Disunity and/or hatred
Injustice
Loss of life
Unwarranted charging of services
Increased levels of immorality and diseases (such as high HIV prevalence)
Increase in road accidents
Lack of trust in the public office
Loss of public resources
Low wages
Misuse of public office
Increased rate of crime (including corruption itself)
Political instability
High levels of illiteracy
Reduced citizen participation in development initiatives
Industrial actions, strikes, demonstrations and protests
Tribalism
Tainted reputation
Loss of business
Hom
a B
ay
21.3
16
.4
8.2
10.6
6.
3 9.
2 4.
8 1.
9 1.
9 2.
4 2.
9 1.
9 0.
0 1.
0 0.
5 1.
4 0.
0 1.
0 2.
9 2.
9 0.
5 0.
0 1.
4 0.
5 0.
0 B
arin
go
20.2
18
.0
7.0
10.1
5.
3 7.
0 3.
9 7.
0 7.
0 2.
6 0.
9 0.
4 0.
0 2.
2 2.
2 0.
0 0.
4 0.
9 0.
4 0.
9 1.
3 0.
4 0.
9 0.
9 0.
0 Is
iolo
20
.0
5.0
5.0
10.0
10
.0
2.5
5.0
10.0
17
.5
2.5
0.0
0.0
2.5
2.5
0.0
0.0
0.0
7.5
0.0
0.0
0.0
0.0
0.0
0.0
0.0
Bus
ia
19.7
16
.2
15.8
7.
0 7.
8 2.
5 5.
5 3.
1 2.
5 3.
3 0.
4 1.
8 0.
4 3.
3 4.
1 0.
0 0.
2 0.
4 0.
4 1.
6 0.
2 1.
0 1.
2 0.
6 1.
2 M
eru
19.6
19
.3
18.9
5.
2 6.
6 3.
6 3.
4 1.
8 4.
8 5.
4 1.
1 0.
2 0.
2 1.
6 2.
1 0.
2 0.
2 0.
7 0.
4 2.
0 0.
0 0.
4 0.
2 0.
2 2.
1 W
est P
okot
19
.0
27.0
6.
5 6.
0 2.
5 7.
0 4.
0 3.
0 1.
0 6.
0 1.
5 1.
0 0.
5 2.
5 1.
5 0.
0 0.
5 1.
0 1.
5 4.
5 1.
5 1.
0 0.
5 0.
0 0.
5 K
wal
e 18
.9
12.3
14
.2
8.5
8.5
3.8
2.8
5.7
2.8
5.7
2.8
0.9
0.9
2.8
2.8
0.0
0.9
0.0
0.9
0.0
0.9
0.0
0.9
1.9
0.9
Sam
buru
18
.2
13.6
10
.6
9.1
13.6
6.
1 1.
5 1.
5 6.
1 0.
0 0.
0 1.
5 0.
0 6.
1 4.
5 0.
0 0.
0 0.
0 3.
0 0.
0 1.
5 0.
0 3.
0 0.
0 0.
0 La
mu
17.4
19
.6
4.3
8.7
4.3
8.7
4.3
6.5
4.3
4.3
2.2
0.0
2.2
6.5
0.0
2.2
4.3
0.0
0.0
0.0
0.0
0.0
0.0
0.0
0.0
Bun
gom
a 17
.2
17.2
14
.9
10.3
6.
3 2.
4 3.
4 3.
2 3.
5 2.
4 0.
4 2.
2 0.
0 4.
7 4.
1 0.
6 1.
1 0.
7 0.
7 2.
1 0.
9 0.
0 0.
6 0.
7 0.
4 K
itui
16.3
14
.3
9.8
8.3
9.3
3.8
2.5
4.5
12.3
2.
0 0.
0 0.
0 4.
3 2.
5 2.
5 0.
0 0.
8 1.
0 0.
8 1.
8 0.
0 0.
5 0.
3 0.
3 2.
8 La
ikip
ia
15.9
21
.5
3.7
8.4
10.3
9.
3 0.
9 6.
5 5.
6 2.
8 0.
9 1.
9 0.
9 0.
9 2.
8 0.
0 0.
0 0.
0 0.
9 0.
9 0.
9 0.
0 4.
7 0.
0 0.
0 Tr
ans N
zoia
13
.9
13.0
18
.9
8.3
7.1
5.9
5.9
4.7
5.6
1.8
1.2
0.6
0.3
2.7
2.1
0.3
0.0
0.9
0.6
1.2
0.9
0.0
2.7
1.2
0.6
Tana
Riv
er
12.8
16
.5
12.8
8.
3 6.
4 8.
3 2.
8 11
.0
3.7
2.8
0.0
0.9
0.0
0.9
1.8
0.0
0.0
0.0
0.0
5.5
0.9
0.0
3.7
0.9
0.0
Turk
ana
11.4
33
.9
3.4
5.1
3.8
8.5
1.7
5.9
0.4
14.4
0.
0 0.
0 0.
0 0.
4 0.
8 0.
0 0.
0 0.
4 1.
7 4.
7 0.
0 0.
4 0.
0 1.
7 1.
3 M
arsa
bit
6.2
17.5
13
.4
17.5
5.
2 7.
2 3.
1 3.
1 14
.4
2.1
1.0
0.0
0.0
0.0
2.1
0.0
0.0
1.0
1.0
2.1
0.0
1.0
0.0
2.1
0.0

298
298
Ann
ex 1
1: A
war
enes
s on
spec
ific
stat
e or
gans
add
ress
ing
corr
uptio
n in
the
publ
ic se
rvic
e by
cou
nty
as r
epor
ted
by m
embe
rs o
f the
pub
lic
Cou
nty
Aw
aren
ess (
in p
erce
ntag
e) o
n sp
ecifi
c st
ate
orga
ns a
ddre
ssin
g co
rrup
tion
in th
e pu
blic
serv
ice
by c
ount
y as
rep
orte
d by
mem
bers
of t
he p
ublic
EACC
National Police Service (especially DCI)
National Government Administrative Office
Office of the President
Judiciary
County Government offices
Office of the Auditor General
ODPP
Kenya National Commission on Human Rights
Ministry of Education
IPOA
Nyumba Kumi
Huduma Centre
Commission on Administrative Justice (Ombudsman)
NTSA
Ministry of Devolution and the ASALS
Hospitals
National Assembly (including Public Accounts Committee)
The National Treasury
Media
Ministry of Lands and Physical Planning
NCRC
SRC
Cabinet
Senate Assembly
NACADA
Controller of Budget
KRA
KPA
Sam
buru
85.7
0.0
0.0
7.1
7.1
0.0
0.0
0.0
0.0
0.0
0.0
0.0
0.0
0.0
0.0
0.0
0.0
0.0
0.0
0.0
0.0
0.0
0.0
0.0
0.0
0.0
0.0
0.0
0.0
Kaj
iado
80.5
4.9
0.0
0.0
0.0
0.0
0.0
2.4
0.0
0.0
0.0
9.8
0.0
0.0
0.0
0.0
0.0
2.4
0.0
0.0
0.0
0.0
0.0
0.0
0.0
0.0
0.0
0.0
0.0
Kitu
i
78.3
4.3
0.0
0.0
4.3
0.0
4.3
0.0
0.0
0.0
0.0
0.0
0.0
0.0
0.0
0.0
0.0
0.0
0.0
0.0
0.0
8.7
0.0
0.0
0.0
0.0
0.0
0.0
0.0
Uas
in G
ishu
76.0
4.0
8.0
0.0
0.0
4.0
0.0
0.0
0.0
4.0
0.0
0.0
0.0
0.0
0.0
4.0
0.0
0.0
0.0
0.0
0.0
0.0
0.0
0.0
0.0
0.0
0.0
0.0
0.0
Nar
ok
75.7
2.7
8.1
0.0
0.0
2.7
0.0
0.0
0.0
0.0
0.0
8.1
0.0
0.0
2.7
0.0
0.0
0.0
0.0
0.0
0.0
0.0
0.0
0.0
0.0
0.0
0.0
0.0
0.0
Gar
issa
75.0
5.0
0.0
0.0
10.0
0.0
0.0
10.0
0.0
0.0
0.0
0.0
0.0
0.0
0.0
0.0
0.0
0.0
0.0
0.0
0.0
0.0
0.0
0.0
0.0
0.0
0.0
0.0
0.0
Bun
gom
a
72.7
5.0
5.0
0.0
3.3
0.8
1.7
1.7
0.8
2.5
0.8
0.8
0.8
0.8
0.0
0.0
0.8
0.8
0.0
0.0
0.0
0.0
0.0
0.0
0.8
0.8
0.0
0.0
0.0
Nan
di
71.4
7.1
0.0
0.0
7.1
7.1
0.0
7.1
0.0
0.0
0.0
0.0
0.0
0.0
0.0
0.0
0.0
0.0
0.0
0.0
0.0
0.0
0.0
0.0
0.0
0.0
0.0
0.0
0.0
Kis
umu
69.7
5.3
1.3
0.0
5.3
2.6
1.3
2.6
1.3
0.0
5.3
0.0
0.0
1.3
3.9
0.0
0.0
0.0
0.0
0.0
0.0
0.0
0.0
0.0
0.0
0.0
0.0
0.0
0.0
Bom
et
69.0
4.8
9.5
2.4
0.0
0.0
0.0
0.0
0.0
0.0
2.4
4.8
0.0
0.0
4.8
0.0
2.4
0.0
0.0
0.0
0.0
0.0
0.0
0.0
0.0
0.0
0.0
0.0
0.0
Man
dera
66.7
0.0
22.2
0.0
11.1
0.0
0.0
0.0
0.0
0.0
0.0
0.0
0.0
0.0
0.0
0.0
0.0
0.0
0.0
0.0
0.0
0.0
0.0
0.0
0.0
0.0
0.0
0.0
0.0
Siay
a
66.7
4.2
0.0
4.2
0.0
4.2
4.2
0.0
0.0
4.2
0.0
4.2
0.0
0.0
4.2
0.0
4.2
0.0
0.0
0.0
0.0
0.0
0.0
0.0
0.0
0.0
0.0
0.0
0.0
Nai
robi
65.5
9.9
1.5
1.3
4.5
1.3
2.4
1.5
0.6
1.3
1.5
0.2
2.8
0.9
0.0
1.1
1.1
0.4
0.9
0.4
0.2
0.0
0.0
0.4
0.0
0.0
0.0
0.2
0.0
Mer
u
64.7
13.4
3.2
0.5
3.7
0.5
7.0
4.3
0.5
0.5
0.0
0.0
0.5
0.5
0.0
0.0
0.0
0.5
0.0
0.0
0.0
0.0
0.0
0.0
0.0
0.0
0.0
0.0
0.0
Bar
ingo
64.5
16.1
3.2
0.0
3.2
3.2
0.0
0.0
3.2
3.2
3.2
0.0
0.0
0.0
0.0
0.0
0.0
0.0
0.0
0.0
0.0
0.0
0.0
0.0
0.0
0.0
0.0
0.0
0.0
Thar
aka
Nith
i
64.4
14.9
0.0
1.1
3.4
0.0
8.0
3.4
0.0
0.0
2.3
0.0
0.0
1.1
0.0
0.0
0.0
0.0
0.0
0.0
0.0
0.0
0.0
0.0
0.0
0.0
1.1
0.0
0.0
Mac
hako
s
64.2
15.6
5.5
1.8
0.9
2.8
0.9
3.7
1.8
0.0
1.8
0.0
0.0
0.0
0.0
0.0
0.0
0.0
0.0
0.0
0.0
0.0
0.0
0.0
0.0
0.9
0.0
0.0
0.0
Kak
ameg
a
61.7
15.0
0.0
0.0
6.7
5.0
1.7
0.0
1.7
3.3
0.0
1.7
0.0
0.0
1.7
0.0
0.0
0.0
0.0
0.0
1.7
0.0
0.0
0.0
0.0
0.0
0.0
0.0
0.0
Elge
yo M
arak
wet
60.0
12.0
0.0
4.0
0.0
4.0
4.0
8.0
8.0
0.0
0.0
0.0
0.0
0.0
0.0
0.0
0.0
0.0
0.0
0.0
0.0
0.0
0.0
0.0
0.0
0.0
0.0
0.0
0.0

299
299
Cou
nty
Aw
aren
ess (
in p
erce
ntag
e) o
n sp
ecifi
c st
ate
orga
ns a
ddre
ssin
g co
rrup
tion
in th
e pu
blic
serv
ice
by c
ount
y as
rep
orte
d by
mem
bers
of t
he p
ublic
EACC
National Police Service (especially DCI)
National Government Administrative Office
Office of the President
Judiciary
County Government offices
Office of the Auditor General
ODPP
Kenya National Commission on Human Rights
Ministry of Education
IPOA
Nyumba Kumi
Huduma Centre
Commission on Administrative Justice (Ombudsman)
NTSA
Ministry of Devolution and the ASALS
Hospitals
National Assembly (including Public Accounts Committee)
The National Treasury
Media
Ministry of Lands and Physical Planning
NCRC
SRC
Cabinet
Senate Assembly
NACADA
Controller of Budget
KRA
KPA
Mom
basa
58.9
8.9
6.3
0.6
3.2
0.6
1.9
0.6
7.6
0.6
1.3
1.3
0.6
2.5
0.0
1.3
0.6
0.6
0.0
0.0
0.0
0.6
0.0
0.0
1.3
0.6
0.0
0.0
0.0
Mig
ori
58.8
8.8
14.7
2.9
0.0
5.9
0.0
0.0
0.0
2.9
0.0
0.0
0.0
0.0
0.0
0.0
2.9
0.0
0.0
0.0
0.0
0.0
0.0
0.0
0.0
0.0
0.0
0.0
2.9
Waj
ir
58.3
0.0
25.0
0.0
0.0
16.7
0.0
0.0
0.0
0.0
0.0
0.0
0.0
0.0
0.0
0.0
0.0
0.0
0.0
0.0
0.0
0.0
0.0
0.0
0.0
0.0
0.0
0.0
0.0
Bus
ia
58.2
14.3
4.1
0.0
7.1
0.0
1.0
7.1
0.0
0.0
2.0
2.0
1.0
0.0
1.0
0.0
1.0
0.0
1.0
0.0
0.0
0.0
0.0
0.0
0.0
0.0
0.0
0.0
0.0
Embu
54.9
5.9
9.8
5.9
2.0
2.0
0.0
0.0
0.0
7.8
0.0
0.0
5.9
0.0
0.0
0.0
0.0
2.0
0.0
0.0
2.0
2.0
0.0
0.0
0.0
0.0
0.0
0.0
0.0
Nak
uru
54.7
9.4
7.8
0.8
2.3
5.5
0.8
0.0
1.6
1.6
3.9
1.6
0.8
2.3
3.1
0.0
0.0
1.6
0.0
0.0
0.8
0.0
0.8
0.0
0.0
0.0
0.0
0.8
0.0
Mar
sabi
t
52.9
5.9
5.9
0.0
11.8
5.9
0.0
0.0
17.6
0.0
0.0
0.0
0.0
0.0
0.0
0.0
0.0
0.0
0.0
0.0
0.0
0.0
0.0
0.0
0.0
0.0
0.0
0.0
0.0
Vih
iga
52.6
0.0
5.3
0.0
5.3
5.3
5.3
0.0
0.0
5.3
0.0
0.0
0.0
5.3
0.0
0.0
0.0
0.0
5.3
5.3
0.0
0.0
5.3
0.0
0.0
0.0
0.0
0.0
0.0
Kili
fi
52.4
0.0
0.0
9.5
4.8
0.0
0.0
4.8
9.5
0.0
4.8
4.8
0.0
4.8
0.0
4.8
0.0
0.0
0.0
0.0
0.0
0.0
0.0
0.0
0.0
0.0
0.0
0.0
0.0
Tran
s Nzo
ia
51.2
16.3
7.0
0.0
2.3
7.0
4.7
0.0
2.3
0.0
0.0
0.0
2.3
0.0
2.3
0.0
0.0
2.3
0.0
0.0
0.0
0.0
0.0
0.0
0.0
0.0
2.3
0.0
0.0
Hom
a B
ay
50.0
15.0
5.0
0.0
5.0
10.0
5.0
0.0
10.0
0.0
0.0
0.0
0.0
0.0
0.0
0.0
0.0
0.0
0.0
0.0
0.0
0.0
0.0
0.0
0.0
0.0
0.0
0.0
0.0
Laik
ipia
50.0
25.0
12.5
0.0
0.0
0.0
0.0
0.0
0.0
12.5
0.0
0.0
0.0
0.0
0.0
0.0
0.0
0.0
0.0
0.0
0.0
0.0
0.0
0.0
0.0
0.0
0.0
0.0
0.0
Mak
ueni
48.4
19.4
16.1
0.0
6.5
0.0
0.0
0.0
3.2
0.0
6.5
0.0
0.0
0.0
0.0
0.0
0.0
0.0
0.0
0.0
0.0
0.0
0.0
0.0
0.0
0.0
0.0
0.0
0.0
Ker
icho
47.2
8.3
2.8
2.8
5.6
5.6
0.0
2.8
0.0
5.6
0.0
2.8
0.0
0.0
11.1
0.0
0.0
0.0
0.0
2.8
2.8
0.0
0.0
0.0
0.0
0.0
0.0
0.0
0.0
Kia
mbu
44.9
4.1
0.0
20.4
4.1
2.0
2.0
0.0
0.0
4.1
4.1
0.0
2.0
2.0
0.0
0.0
0.0
0.0
0.0
4.1
2.0
0.0
4.1
0.0
0.0
0.0
0.0
0.0
0.0
Turk
ana
42.4
12.1
15.2
6.1
3.0
3.0
3.0
0.0
9.1
0.0
0.0
6.1
0.0
0.0
0.0
0.0
0.0
0.0
0.0
0.0
0.0
0.0
0.0
0.0
0.0
0.0
0.0
0.0
0.0
Isio
lo
41.7
8.3
25.0
0.0
8.3
0.0
0.0
0.0
0.0
8.3
8.3
0.0
0.0
0.0
0.0
0.0
0.0
0.0
0.0
0.0
0.0
0.0
0.0
0.0
0.0
0.0
0.0
0.0
0.0
Kis
ii
40.0
10.0
15.0
0.0
0.0
20.0
0.0
0.0
5.0
5.0
0.0
0.0
0.0
0.0
5.0
0.0
0.0
0.0
0.0
0.0
0.0
0.0
0.0
0.0
0.0
0.0
0.0
0.0
0.0
Wes
t Pok
ot
40.0
20.0
6.7
0.0
0.0
6.7
6.7
6.7
0.0
0.0
0.0
0.0
0.0
0.0
6.7
0.0
0.0
0.0
0.0
0.0
0.0
6.7
0.0
0.0
0.0
0.0
0.0
0.0
0.0
Mur
ang'
a
28.6
14.3
21.4
17.9
7.1
3.6
0.0
0.0
0.0
0.0
0.0
0.0
3.6
3.6
0.0
0.0
0.0
0.0
0.0
0.0
0.0
0.0
0.0
0.0
0.0
0.0
0.0
0.0
0.0
Nya
mira
26.7
13.3
20.0
0.0
6.7
6.7
6.7
0.0
0.0
6.7
0.0
6.7
0.0
0.0
0.0
6.7
0.0
0.0
0.0
0.0
0.0
0.0
0.0
0.0
0.0
0.0
0.0
0.0
0.0
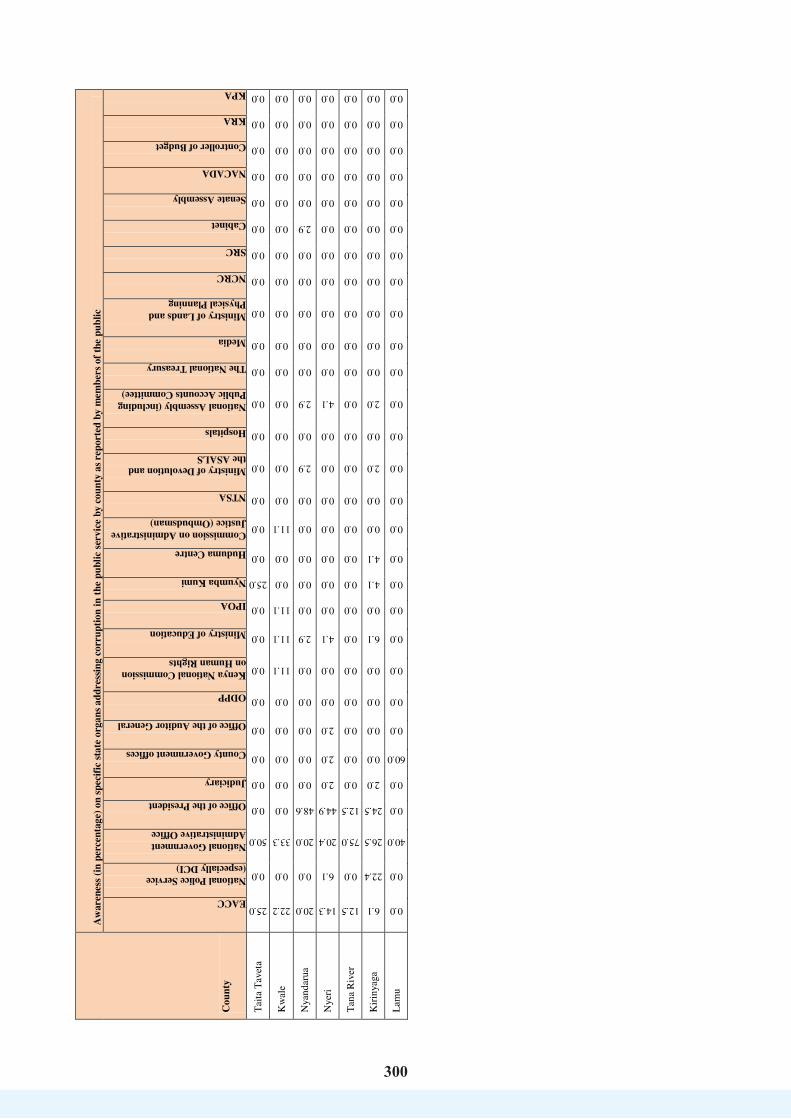
300
300
Cou
nty
Aw
aren
ess (
in p
erce
ntag
e) o
n sp
ecifi
c st
ate
orga
ns a
ddre
ssin
g co
rrup
tion
in th
e pu
blic
serv
ice
by c
ount
y as
rep
orte
d by
mem
bers
of t
he p
ublic
EACC
National Police Service (especially DCI)
National Government Administrative Office
Office of the President
Judiciary
County Government offices
Office of the Auditor General
ODPP
Kenya National Commission on Human Rights
Ministry of Education
IPOA
Nyumba Kumi
Huduma Centre
Commission on Administrative Justice (Ombudsman)
NTSA
Ministry of Devolution and the ASALS
Hospitals
National Assembly (including Public Accounts Committee)
The National Treasury
Media
Ministry of Lands and Physical Planning
NCRC
SRC
Cabinet
Senate Assembly
NACADA
Controller of Budget
KRA
KPA
Taita
Tav
eta
25.0
0.0
50.0
0.0
0.0
0.0
0.0
0.0
0.0
0.0
0.0
25.0
0.0
0.0
0.0
0.0
0.0
0.0
0.0
0.0
0.0
0.0
0.0
0.0
0.0
0.0
0.0
0.0
0.0
Kw
ale
22.2
0.0
33.3
0.0
0.0
0.0
0.0
0.0
11.1
11.1
11.1
0.0
0.0
11.1
0.0
0.0
0.0
0.0
0.0
0.0
0.0
0.0
0.0
0.0
0.0
0.0
0.0
0.0
0.0
Nya
ndar
ua
20.0
0.0
20.0
48.6
0.0
0.0
0.0
0.0
0.0
2.9
0.0
0.0
0.0
0.0
0.0
2.9
0.0
2.9
0.0
0.0
0.0
0.0
0.0
2.9
0.0
0.0
0.0
0.0
0.0
Nye
ri
14.3
6.1
20.4
44.9
2.0
2.0
2.0
0.0
0.0
4.1
0.0
0.0
0.0
0.0
0.0
0.0
0.0
4.1
0.0
0.0
0.0
0.0
0.0
0.0
0.0
0.0
0.0
0.0
0.0
Tana
Riv
er
12.5
0.0
75.0
12.5
0.0
0.0
0.0
0.0
0.0
0.0
0.0
0.0
0.0
0.0
0.0
0.0
0.0
0.0
0.0
0.0
0.0
0.0
0.0
0.0
0.0
0.0
0.0
0.0
0.0
Kiri
nyag
a
6.1
22.4
26.5
24.5
2.0
0.0
0.0
0.0
0.0
6.1
0.0
4.1
4.1
0.0
0.0
2.0
0.0
2.0
0.0
0.0
0.0
0.0
0.0
0.0
0.0
0.0
0.0
0.0
0.0
Lam
u
0.0
0.0
40.0
0.0
0.0
60.0
0.0
0.0
0.0
0.0
0.0
0.0
0.0
0.0
0.0
0.0
0.0
0.0
0.0
0.0
0.0
0.0
0.0
0.0
0.0
0.0
0.0
0.0
0.0

Copyright © 2022 FDOKUMEN