a study on occupational stress of employees in paper industry ...
277
1 A STUDY ON OCCUPATIONAL STRESS OF EMPLOYEES IN PAPER INDUSTRY, WITH SPECIAL REFERENCE TO TAMIL NADU THESIS Submitted to the BHARATHIDASAN UNIVERSITY for the award of the degree of DOCTOR OF PHILOSOPHY IN MANAGEMENT Submitted By G.GOPALAKRISHNAN Under the Supervision and Guidance of Dr.M.ARUNACHALAM, M.Sc., M.B.A., Ph.D., Principal, RDB College of Arts and Science, Papanasam – 614 025 Thanjavur BHARATHIDASAN UNIVERSITY TIRUCHIRAPALLI, TAMILNADU, INDIA. MAY 2011
-
Upload
khangminh22 -
Category
Documents
-
view
0 -
download
0
Transcript of a study on occupational stress of employees in paper industry ...
1
A STUDY ON OCCUPATIONAL STRESS OF EMPLOYEES IN PAPER INDUSTRY, WITH SPECIAL REFERENCE TO TAMIL NADU
THESIS
Submitted to the BHARATHIDASAN UNIVERSITY
for the award of the degree of
DOCTOR OF PHILOSOPHY IN MANAGEMENT
Submitted By
G.GOPALAKRISHNAN
Under the Supervision and Guidance of
Dr.M.ARUNACHALAM, M.Sc., M.B.A., Ph.D., Principal, RDB College of Arts and Science,
Papanasam – 614 025
Thanjavur
BHARATHIDASAN UNIVERSITY TIRUCHIRAPALLI, TAMILNADU, INDIA.
MAY 2011
2
CERTIFICATE
This is to certify that the thesis, entitled “A STUDY ON
OCCUPATIONAL STRESS OF EMPLOYEES IN PAPER
INDUSTRY, WITH SPECIAL REFERENCE TO TAMIL NADU”,
submitted to the Bharathidasan University, Tiruchirapalli in partial
fulfillment of the requirements for the award of the Degree of DOCTOR
OF PHILOSOPHY IN MANAGEMENT is a record of original research
work done by Mr. G. GOPALAKRISHNAN, during the period 2008-2011
of his study in the Department of Management Studies, Rajagiri Dawood
Batcha College of Arts and Science, Papanasam, under my supervision and
guidance and the thesis has not formed the basis for the award of any
Degree / Diploma / Associateship / Fellowship or other similar title to any
candidate of any University.
Place : Papanasam Signature of Research Supervisor
Date : (Dr.M.Arunachalam)
3
DECLARATION
I, G.GOPALAKRISHNAN hereby declare that the thesis, entitled
“A STUDY ON OCCUPATIONAL STRESS OF EMPLOYEES IN
PAPER INDUSTRY, WITH SPECIAL REFERENCE TO TAMIL
NADU”, submitted to the Bharathidasan University, Tiruchirapalli in partial
fulfillment of the requirements for the award of the Degree of DOCTOR
OF PHILOSOPHY IN MANAGEMENT is a record of original and
independent research work done by me during 2008-2011 under the
supervision and guidance of Dr.M.ARUNACHALAM, M.Sc., M.B.A.,
Ph.D., Principal, Rajagiri Dawood Batcha College of Arts and Science,
Papanasam, Thanjavur and it has not formed the basis for the award of any
Degree / Diploma / Associateship / Fellowship or other similar title to any
candidate of any University.
Station: Salem Signature of the candidate
Date :
Counter Signed
(Dr.M.ARUNACHALAM)
Research Supervisor
4
ACKNOWLEDGEMENTS
I am ever grateful to many personalities, who have extended their
expertise and experience which helped me a lot in the preparation of this
thesis work.
I am highly indebted to my research supervisor, Dr.M.Arunachalam,
M.Sc., M.B.A., Ph.D., Principal, RDB College of Arts and Science,
Papanasam – 614 025 Thanjavur, Tamilnadu, India, under whose able
guidance this study was carried out. His fluent, frank and frequent advice
have got me on the right direction whenever and wherever I have deviated. I
owe much for his labour and pains. Without his endeavour, sacrifice,
constructive criticism and constant encouragement, this thesis would not
have been completed so successfully in time.
My deep sense of respect and gratitude goes to The Management,
Paavai Educational Trust, Rasipuram, Namakkal District for granting me an
opportunity to do this research work and complete the thesis in a successful
manner.
I am grateful to The Head of the Department, Faculty Members
and the Students of Management Studies for giving their support to
successfully complete of this work.
5
A special note of thanks is expressed to Mr. M. Murali and his
colleagues at Aryaa Infostat Technologies, Erode, for their continuous
assistance in providing me the technical details of this work and their
patience during the countless revisions of the manuscript which enabled me
to prepare the thesis.
I am really grateful to my parents, brother, my wife, my childrens and
friends who have encouraged me in completing this work.
G.GOPALAKRISHNAN
6
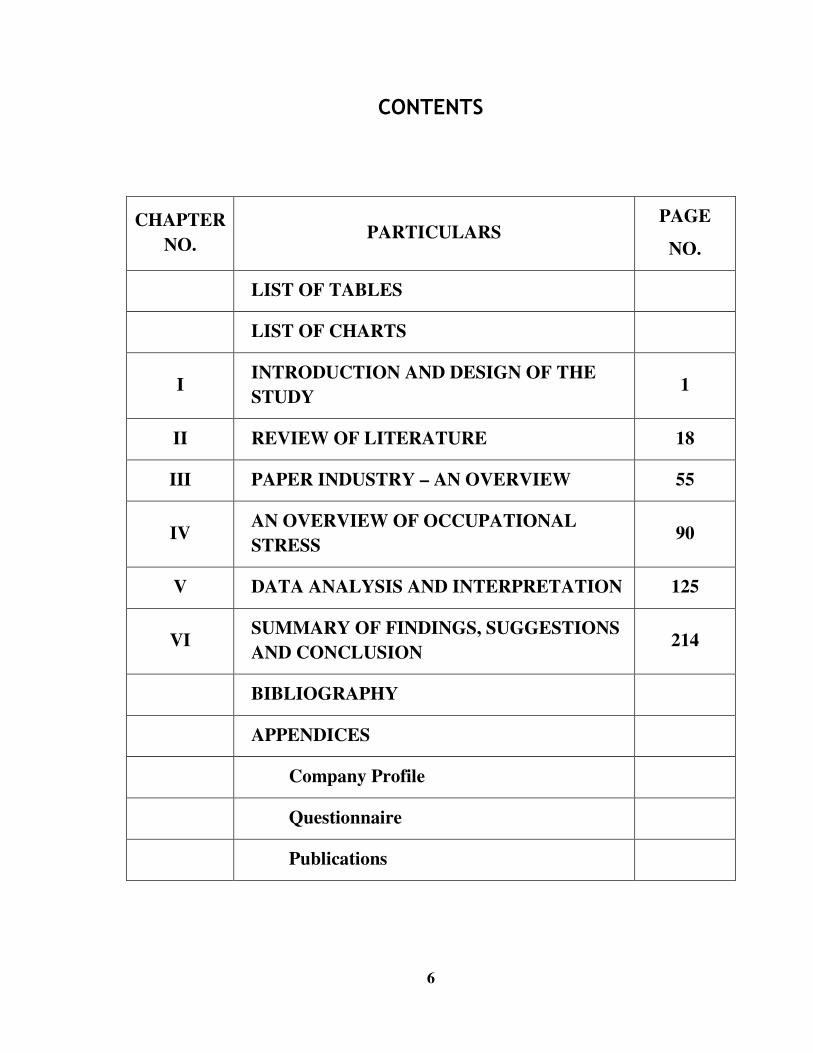
CONTENTS
CHAPTER
NO. PARTICULARS
PAGE
NO.
LIST OF TABLES
LIST OF CHARTS
I INTRODUCTION AND DESIGN OF THE
STUDY 1
II REVIEW OF LITERATURE 18
III PAPER INDUSTRY – AN OVERVIEW 55
IV AN OVERVIEW OF OCCUPATIONAL
STRESS 90
V DATA ANALYSIS AND INTERPRETATION 125
VI SUMMARY OF FINDINGS, SUGGESTIONS
AND CONCLUSION 214
BIBLIOGRAPHY
APPENDICES
Company Profile
Questionnaire
Publications
7
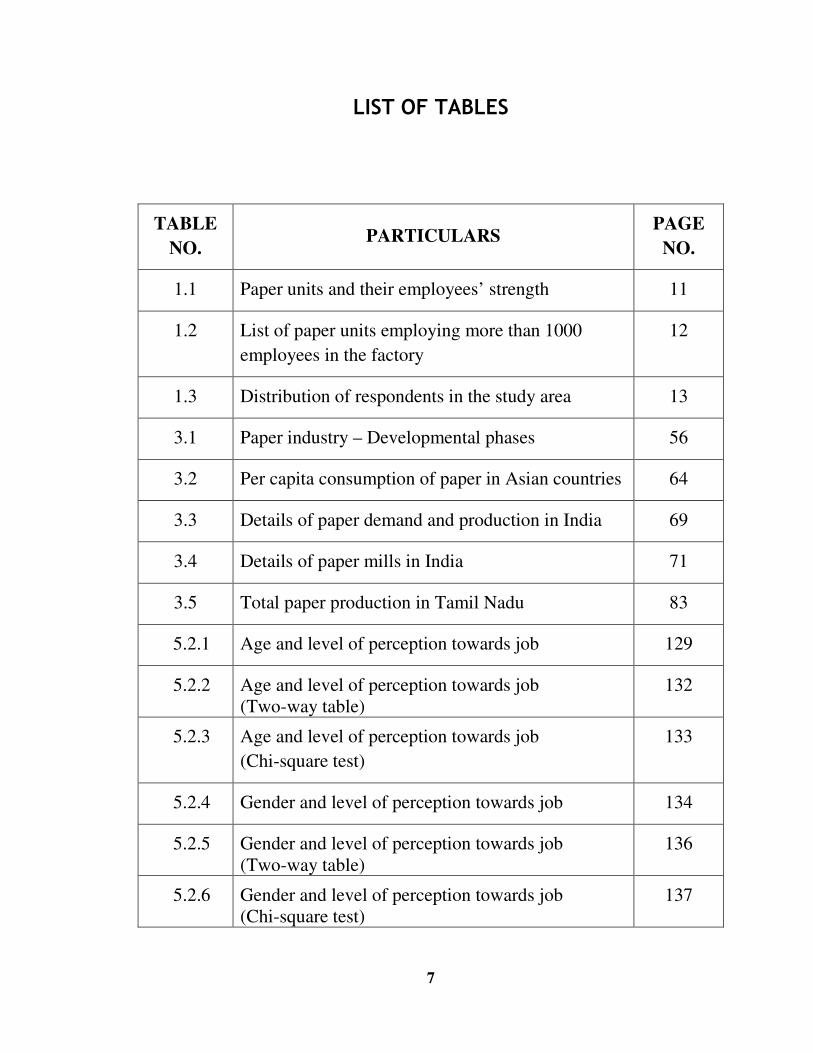
LIST OF TABLES
TABLE
NO. PARTICULARS
PAGE
NO.
1.1 Paper units and their employees’ strength 11
1.2 List of paper units employing more than 1000
employees in the factory
12
1.3 Distribution of respondents in the study area 13
3.1 Paper industry – Developmental phases 56
3.2 Per capita consumption of paper in Asian countries 64
3.3 Details of paper demand and production in India 69
3.4 Details of paper mills in India 71
3.5 Total paper production in Tamil Nadu 83
5.2.1 Age and level of perception towards job 129
5.2.2 Age and level of perception towards job (Two-way table)
132
5.2.3 Age and level of perception towards job
(Chi-square test)
133
5.2.4 Gender and level of perception towards job 134
5.2.5 Gender and level of perception towards job (Two-way table)
136
5.2.6 Gender and level of perception towards job (Chi-square test)
137
8
TABLE
NO. PARTICULARS
PAGE
NO.
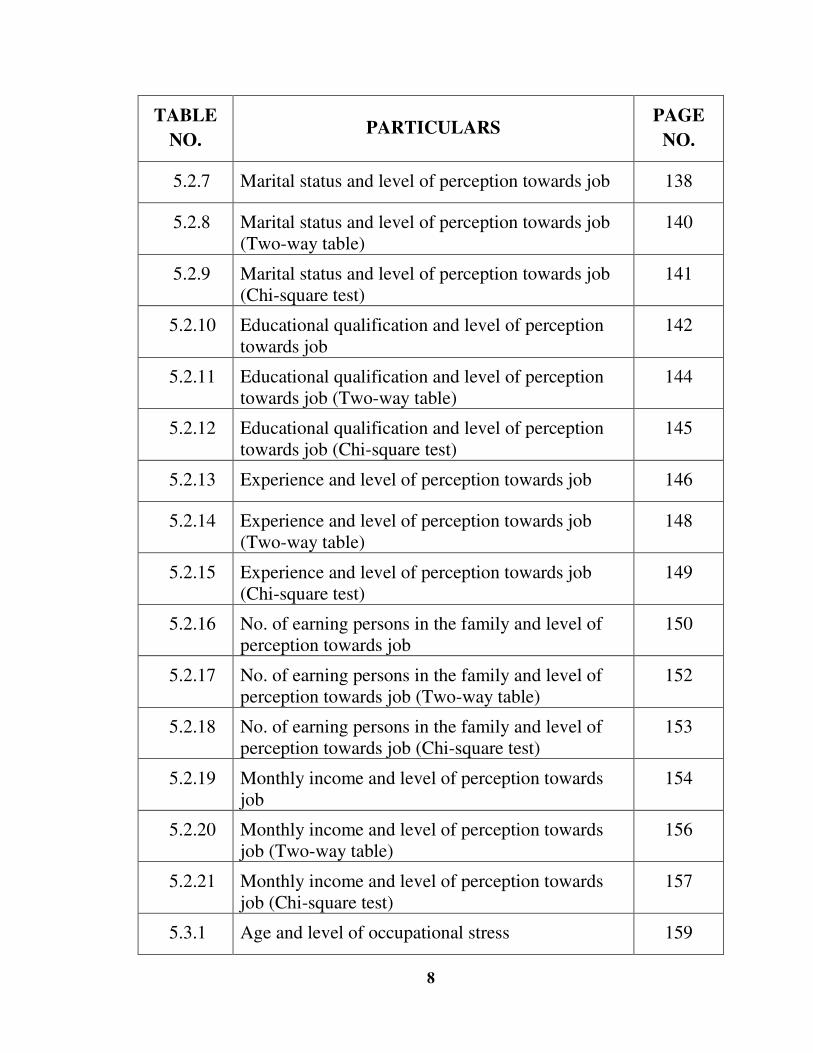
5.2.7 Marital status and level of perception towards job 138
5.2.8 Marital status and level of perception towards job (Two-way table)
140
5.2.9 Marital status and level of perception towards job (Chi-square test)
141
5.2.10 Educational qualification and level of perception towards job
142
5.2.11 Educational qualification and level of perception towards job (Two-way table)
144
5.2.12 Educational qualification and level of perception towards job (Chi-square test)
145
5.2.13 Experience and level of perception towards job 146
5.2.14 Experience and level of perception towards job (Two-way table)
148
5.2.15 Experience and level of perception towards job (Chi-square test)
149
5.2.16 No. of earning persons in the family and level of perception towards job
150
5.2.17 No. of earning persons in the family and level of perception towards job (Two-way table)
152
5.2.18 No. of earning persons in the family and level of perception towards job (Chi-square test)
153
5.2.19 Monthly income and level of perception towards job
154
5.2.20 Monthly income and level of perception towards job (Two-way table)
156
5.2.21 Monthly income and level of perception towards job (Chi-square test)
157
5.3.1 Age and level of occupational stress 159
9
TABLE
NO. PARTICULARS
PAGE
NO.
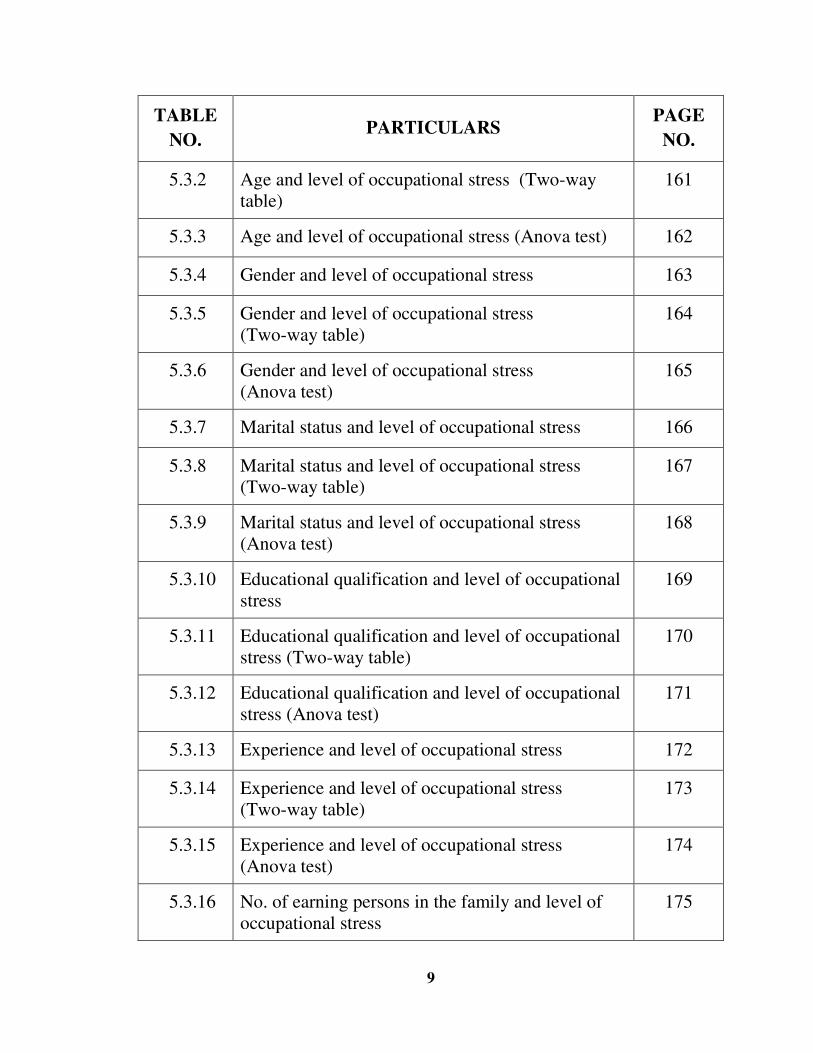
5.3.2 Age and level of occupational stress (Two-way table)
161
5.3.3 Age and level of occupational stress (Anova test) 162
5.3.4 Gender and level of occupational stress 163
5.3.5 Gender and level of occupational stress (Two-way table)
164
5.3.6 Gender and level of occupational stress (Anova test)
165
5.3.7 Marital status and level of occupational stress 166
5.3.8 Marital status and level of occupational stress (Two-way table)
167
5.3.9 Marital status and level of occupational stress (Anova test)
168
5.3.10 Educational qualification and level of occupational stress
169
5.3.11 Educational qualification and level of occupational stress (Two-way table)
170
5.3.12 Educational qualification and level of occupational stress (Anova test)
171
5.3.13 Experience and level of occupational stress 172
5.3.14 Experience and level of occupational stress (Two-way table)
173
5.3.15 Experience and level of occupational stress (Anova test)
174
5.3.16 No. of earning persons in the family and level of occupational stress
175
10
TABLE
NO. PARTICULARS
PAGE
NO.
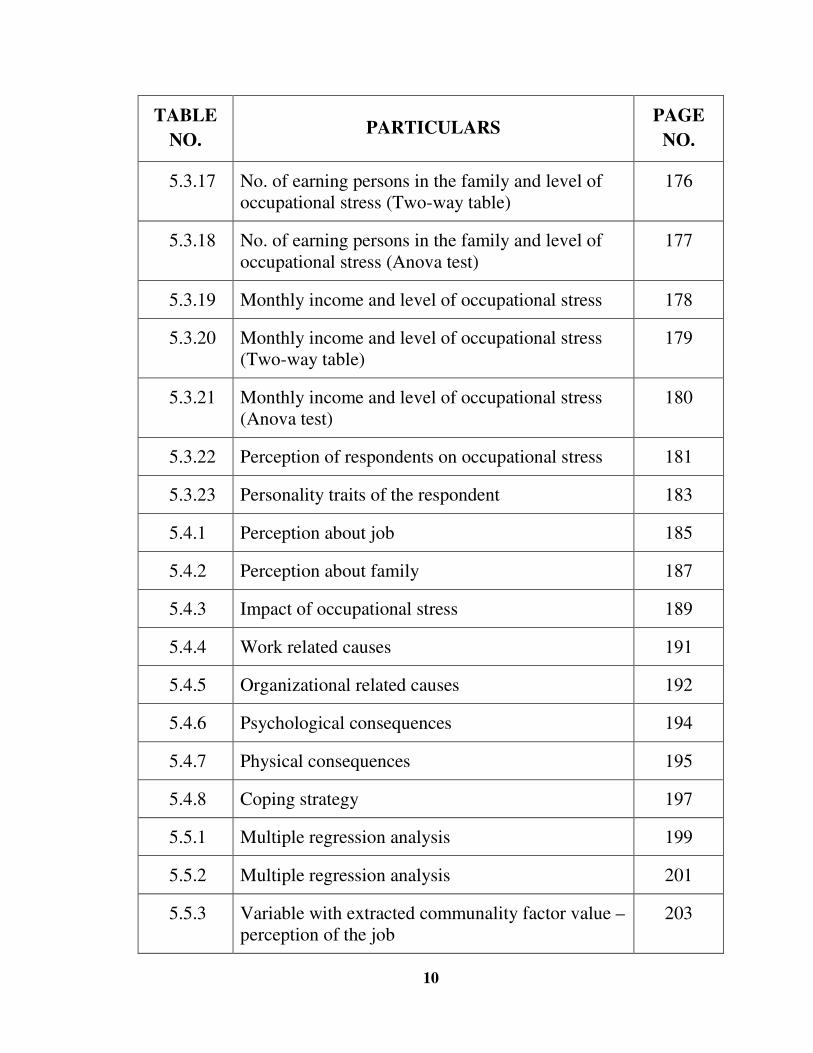
5.3.17 No. of earning persons in the family and level of occupational stress (Two-way table)
176
5.3.18 No. of earning persons in the family and level of occupational stress (Anova test)
177
5.3.19 Monthly income and level of occupational stress 178
5.3.20 Monthly income and level of occupational stress (Two-way table)
179
5.3.21 Monthly income and level of occupational stress (Anova test)
180
5.3.22 Perception of respondents on occupational stress 181
5.3.23 Personality traits of the respondent 183
5.4.1 Perception about job 185
5.4.2 Perception about family 187
5.4.3 Impact of occupational stress 189
5.4.4 Work related causes 191
5.4.5 Organizational related causes 192
5.4.6 Psychological consequences 194
5.4.7 Physical consequences 195
5.4.8 Coping strategy 197
5.5.1 Multiple regression analysis 199
5.5.2 Multiple regression analysis 201
5.5.3 Variable with extracted communality factor value – perception of the job
203
11
TABLE
NO. PARTICULARS
PAGE
NO.
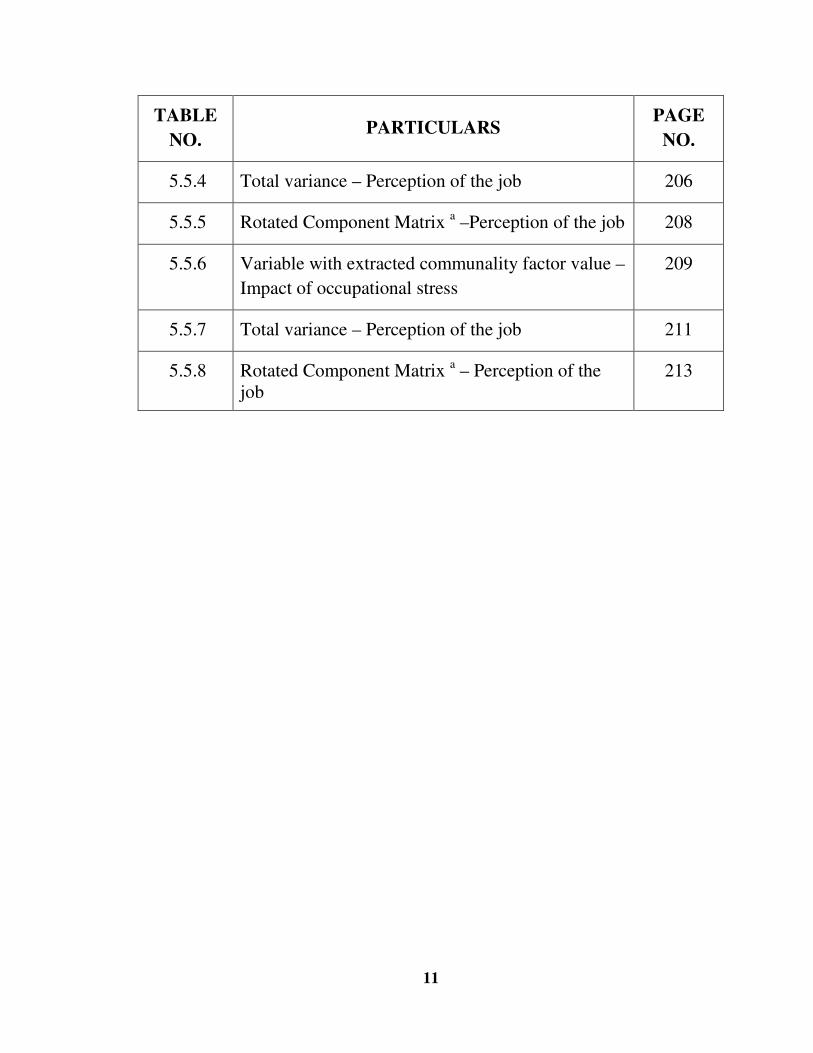
5.5.4 Total variance – Perception of the job 206
5.5.5 Rotated Component Matrix a –Perception of the job 208
5.5.6 Variable with extracted communality factor value –
Impact of occupational stress
209
5.5.7 Total variance – Perception of the job 211
5.5.8 Rotated Component Matrix a – Perception of the job
213
12
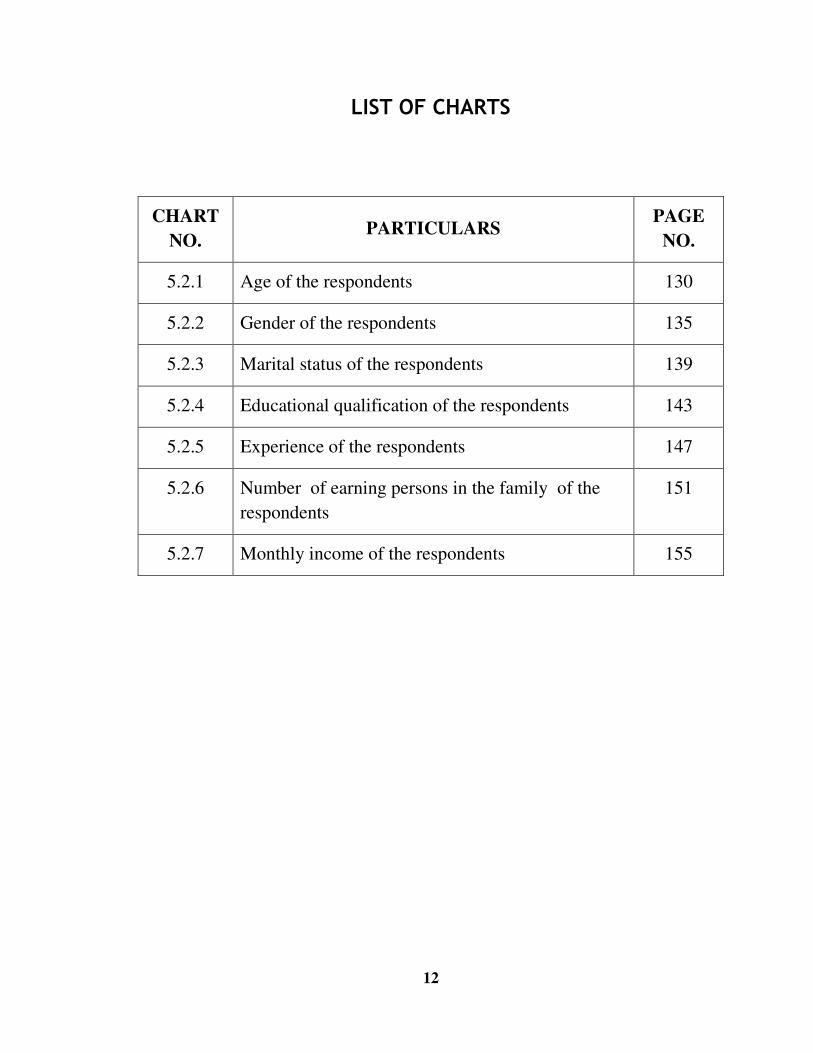
LIST OF CHARTS
CHART
NO. PARTICULARS
PAGE
NO.
5.2.1 Age of the respondents 130
5.2.2 Gender of the respondents 135
5.2.3 Marital status of the respondents 139
5.2.4 Educational qualification of the respondents 143
5.2.5 Experience of the respondents 147
5.2.6 Number of earning persons in the family of the
respondents
151
5.2.7 Monthly income of the respondents 155
13
CHAPTER – I
INTRODUCTION AND DESIGN OF THE STUDY
1. INTRODUCTION
Stress is an inevitable concomitant of organizational life. Its source in
an organization is task or role related. An organization, being a network of
roles performed in interconnected positions, is dynamic in nature. The
complex and dynamic environment of organization adds to further stress at
work. These environmental forces include: 1. Rapid technological
advancements, 2. The demands made on employee skills, 3. Increased
employee expectations about the quality of work – life and incongruence
between these expectations and the perceived organizational outcomes, and
4. Changes in organizations like downsizing, mergers, etc. These factors
influence employment security, social relations at work and upward
mobility, which, in turn, will result in stress of the employees.1
A lot of researches have been conducted about stress over the last
hundred years. Some of the theories behind it are now settled and accepted;
others are still being researched and debated. During this time, it seems that
open warfare between competing theories and definitions does exist. Views
have been passionately held and aggressively defended.
1 K. Harigopal, “Organisational Stress”, Universities Press (India) Ltd., Hyderabad, 1995.
14
Stress occurs when there is an imbalance between demand made on a
person and the resources available to respond to the demand. The demand
may be real (i.e. things outside the person's control, such as departure time
of a plane and traffic) or perceived (how the person views the situation, i.e.
within his/her control or sphere of influence or not). Similarly, the resources
may be real (fact) or perceived (what you think, feel, imagine, etc).
1.1 CONCEPT OF STRESS
1.1.1 Definitions
Hans Selye was one of the founding fathers of stress research. His
view in 1956 was that “stress is not necessarily something bad – it all
depends on how you take it. The stress of exhilarating, creative successful
work is beneficial, while that of failure, humiliation or infection is
detrimental.”2 Selye believed that the biochemical effects of stress would be
experienced irrespectively whether the situation was positive or negative.
Since then a great deal of further research has been conducted, ideas
have moved further. Stress is now viewed as a "bad thing", with a range of
harmful biochemical and long-term effects.3 These effects have rarely been
observed in positive situations.
The most commonly accepted definition of stress (mainly attributed to
Richard S Lazarus) is that stress is a condition or feeling experienced, when
a person perceives that “demands exceed the personal and social resources,
2 Hans Selye, “The Nature of Stress”, International Institute of Stress, University of Montreal,
Canada. 3 Ibid.,
15
the individual is able to mobilize.”4 In short, it's what we feel when we think
of losing control over events.
We also recognize that there is an intertwined instinctive stress
response to unexpected events. The stress response inside us is part instinct
and part to do with the way we think.
It is generally thought that stress will always have bad effect. It is not
always true. Stress may result in better effects also. The twin effects of
stress are explained below. The stress which results in good stress is called
eustress and that which results in bad effects is called distress.
1.1.2 Eustress
Good stress (i.e.) Eustress can have a positive impact on a person.
This form of stress is achieved, when the brain and body feel challenged and
want to extend themselves in order to respond to the situation. This is caused
when a person is feeling as though (he or she):
1. has ideas of possible solutions to the challenge ("Look at all these
possibilities!")
2. has the resources (internal and external) to solve the challenge
("I can do it!");
3. has some control over what's happening ("I have choices!");
4. has had sufficient rest between his/her challenges.
4 Richard S Lazarus, www.fatfreekitchen.com/stress
16
1.1.3 Distress
When we talk of bad stress (Distress), we're talking about something
that directly causes the brain and body to shrink in its working capacity,
resulting in low-performance levels. It is caused when a person feels
anxious, threatened (may be embarrassed, pressed for time, loss of prestige)
or is overwhelmed with feelings of helplessness. This occurs when a person
feels he or she:
1. is being forced to face a challenge that he does not want to ("I do not
want to do it");
2. cannot think of a solution to the challenge ("I do not know how");
3. lacks the resources (internal, as in brain capacity, or external as in
materialistic) to solve the challenge ("I cannot do it");
4. has little or no control over the situation ("I am helpless").
These perceptions can be real (the person actually has no control or
power over changing the situation) or imagined (the person could have
influence over the situation) but the effects are the same: the person feels
threatened and in danger. This danger could be physical safety or to his
psychological state of mind.
The present study deals only with the negative effect of stress (i.e.)
this report deals with distress.

17
1.2 FACTORS THAT INFLUENCE THE SEVERITY OF STRESS
The severity of stress is the amount or level of stress that is felt as a
result of a stressor. There are certain factors which influence the degree of
stress experienced; these have an impact on the person's wellbeing both
physically and mentally.
The characteristics of the stressor that influence stress include the
following:
1.2.1 Significance
How much change will an event exert dependence upon how much
the event is important and critical to the individual. For example, the death
of his/her beloved one, failing in an examination, breakup with boy/girl
friend, etc., may have adverse effect on the individual. Similarly, a pass in
an interview, winning a lottery, promotion to higher position, etc, may have
positive effect on the individual. The greater the significance and change is,
the higher the impact of the stressor is.
1.2.2 Time length
If a stressor continues over a long period of time, it will result in
higher stress levels. For example, insufficient sleep over an extended period
of time will result in higher stress.
18
1.2.3 Cumulative Effect
This is when stressors are built up over a period of time & left
unnoticed. It results in cumulative effect. For example, a long series of little
irritations and annoyances could result in a massive blowout between two
people.
1.2.4 Multiplicity
A number of stressors at one time will result in higher stress levels
than their sum. For example, a fight with one's parents, final exams around
the corner and loss of a loved one, etc., all this happening at a time will be
more stressful than each of these events that happened separately.
1.2.5 Approaching deadline
If a demand has been made a few weeks or months in advance of the
deadline, the degree of stress will increase as the due date approaches. For
example, if a person is given a project assignment two months in advance, it
will probably seem too far away to get worked up about. As the deadline
approaches, his stress level will increase until he does something about the
project.
1.3 IMPORTANCE OF THE STUDY
The word ‘stress’ has been repeatedly used in the recent years as a
way to describe many symptoms seen in working individuals. The studies
suggest that work-stress may increase a person’s risk for cardiovascular
disease, psychological disorders, workplace injury and other health
19
problems. Early warning symptoms may include headaches, sleep
disturbances, difficulties in concentration, job dissatisfaction and low
morale. Stressful working conditions are also associated with increased
absenteeism, tardiness, disability claims, and other factors that reduce a
company’s productivity and competitiveness. The studies indicate that one
fourth of the work force views their jobs as the number one stressor in their
lives and that worker widely perceives job stress as being on the rise.5
Corporate profitability is affected due to employee stress. But certain
factors are avoidable. Heavy work load, conflicting job responsibilities and
job insecurity are stressors across organizations. The risk for the job stress
can be reduced through smart strategic action.
The cost of the effects of stress is very high in American industry
which is estimated over $300 billion annually as a result of accidents,
absenteeism, employee turnover, diminished productivity, direct medical,
legal and insurance costs.6
In this context, managers must recognize the financial impact of
stress. An organization can be significantly higher in its performance in the
absence of stress among its employees. Under these circumstances a study
on stress management to suggest measures to reduce the impact of stress is
very much important.
5 Susan Cantrell and David Smith, “Workforce of One”, Book Excerpt, April 30, 2010. 6 Ron Ball, Inroads, LLC, “Workplace Stress Sucks $300 Billion Annually From Corporate
Profits”, TMC Customer Interaction Solution, November 2004.
20
1.4 LITERATURE SURVEY
Sufficient literature is available on stress management. Also, a large
number of research works have been conducted on stress. Details of nearly
sixty research works have been included in the main thesis. A review of
such works shows that they have all concentrated on the various work
environment factors leading to stress. No doubt, off the job environment
(i.e. family environment) also result in stress. Hence, the present study
concentrates not only on work environment but also the family environment
which leads to the stress of employees. It is a well known fact that work life
and home life are interrelated with each other.
1.5 SCOPE OF THE STUDY
The organizations have now realized the importance of stress
management. As already mentioned, stress in due to work environment and
also family circumstance. However, the organizations focus on the reduction
or management of the job-related stressors alone. But the impact of personal
stressors like family and social commitments which have a bearing on the
emotional stability and physical ability of the employees has not been taken
care of by these organizations. The scope of the study is extended to include
the personal stressors also. It is just not enough to treat the causes but the
consequences of stress on physical, emotional and behavioral areas also
require due attention. This study focuses on the identification of the
consequences of stress with a view to enable the employees in the better
management of their response to stress.
21
1.6 STATEMENT OF THE PROBLEM
The expectations of modern society are that everything should be fast
track. As the pace of life has speeded up, the incidence of certain forms of
stress illness such as coronary heart disease, stomach ulcers and strokes has
also increased. With the introduction of new high speed information
technology, increased global competitiveness and reduced staff levels,
employees have less job security. They are carrying heavier workloads and
working longer hour for the purpose of continuing in their jobs. A marked
increase in the stress levels at work is being experienced on a universal
scale.
Stress affects different people in different ways. While some take
stress home with them everyone tries to make some personal changes to deal
with it.
However, it is shocking to note that, stress is considered something
glamorous among certain individuals and industries. Many people leading a
hard life style, are showing their commitment to their career and
significance. While this belief damages an individual personally, it harms
the institution too. Stress would deteriorate the employees’ efficiency and
organizational effective functioning.
Now the institutions have started realizing the impact of Job stress;
they no more think that dealing with job stress is the individual
responsibility. Encouragingly, many institutions have come out with such
interventions as they feel necessary to combat the effect of stress on the
individuals and organizations.
22
In this context, it will be worthwhile and social relevant for the health
of employees for undertaking a study to identify the causes and coping
strategies of stress with reference to paper industry in Tamilnadu.
1.7 OBJECTIVES OF THE STUDY
The following are the objectives of the study,
1. To identify the major sources of stress of the employees in the paper
industry.
2. To evaluate the level of occupational stress among the employees in
the paper industry.
3. To find out the impact of occupational stress in different dimensions
among the employees in the paper industry.
4. To suggest better ways and means to reduce stress among the
employees in the paper industry
1.8 RESEARCH METHODOLOGY
1.8.1 Research design
A research design is the basic framework or plan for a study that
guides the collection of data and analysis of the data. The present study is
descriptive in nature. A descriptive research is one which is concerned with
describing the characteristics of a particular individual or of a group. Since
this study describes the characteristics of employees influenced by stress and
behaves in different ways, this research is certainly a descriptive one.
23
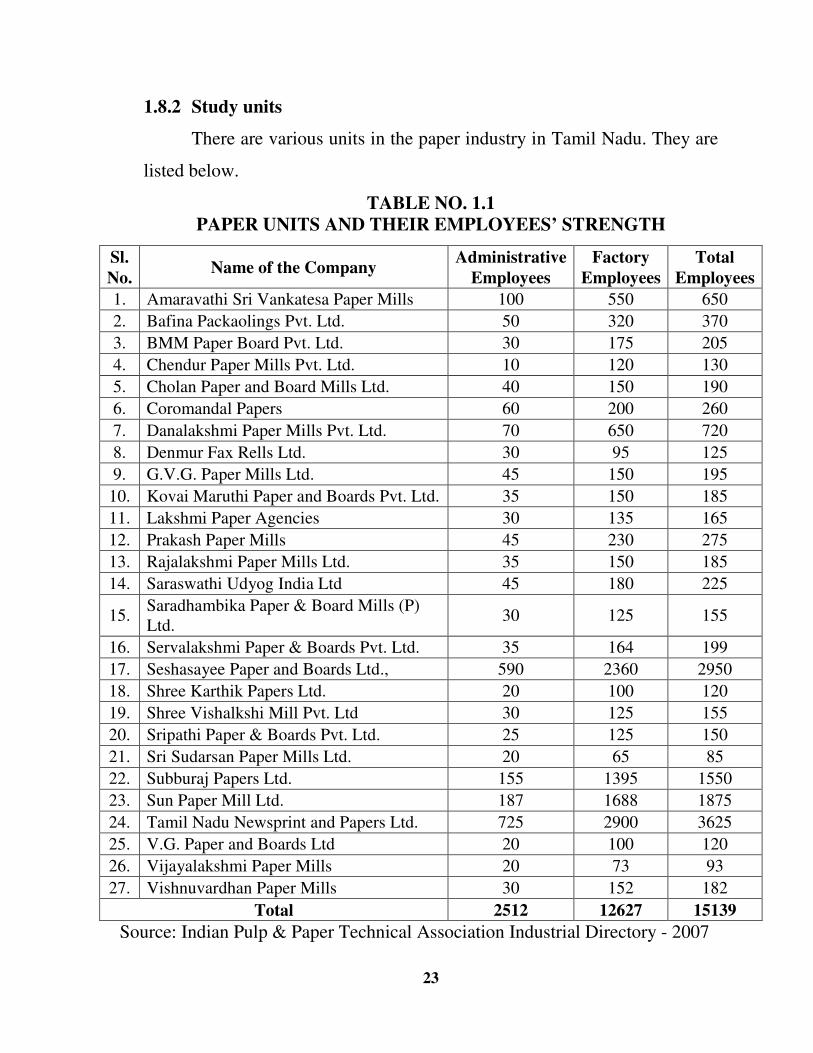
1.8.2 Study units
There are various units in the paper industry in Tamil Nadu. They are
listed below.
TABLE NO. 1.1 PAPER UNITS AND THEIR EMPLOYEES’ STRENGTH
Sl.
No. Name of the Company
Administrative
Employees
Factory
Employees
Total
Employees
1. Amaravathi Sri Vankatesa Paper Mills 100 550 650
2. Bafina Packaolings Pvt. Ltd. 50 320 370
3. BMM Paper Board Pvt. Ltd. 30 175 205
4. Chendur Paper Mills Pvt. Ltd. 10 120 130
5. Cholan Paper and Board Mills Ltd. 40 150 190
6. Coromandal Papers 60 200 260
7. Danalakshmi Paper Mills Pvt. Ltd. 70 650 720
8. Denmur Fax Rells Ltd. 30 95 125
9. G.V.G. Paper Mills Ltd. 45 150 195
10. Kovai Maruthi Paper and Boards Pvt. Ltd. 35 150 185
11. Lakshmi Paper Agencies 30 135 165
12. Prakash Paper Mills 45 230 275
13. Rajalakshmi Paper Mills Ltd. 35 150 185
14. Saraswathi Udyog India Ltd 45 180 225
15. Saradhambika Paper & Board Mills (P) Ltd.
30 125 155
16. Servalakshmi Paper & Boards Pvt. Ltd. 35 164 199
17. Seshasayee Paper and Boards Ltd., 590 2360 2950
18. Shree Karthik Papers Ltd. 20 100 120
19. Shree Vishalkshi Mill Pvt. Ltd 30 125 155
20. Sripathi Paper & Boards Pvt. Ltd. 25 125 150
21. Sri Sudarsan Paper Mills Ltd. 20 65 85
22. Subburaj Papers Ltd. 155 1395 1550
23. Sun Paper Mill Ltd. 187 1688 1875
24. Tamil Nadu Newsprint and Papers Ltd. 725 2900 3625
25. V.G. Paper and Boards Ltd 20 100 120
26. Vijayalakshmi Paper Mills 20 73 93
27. Vishnuvardhan Paper Mills 30 152 182
Total 2512 12627 15139
Source: Indian Pulp & Paper Technical Association Industrial Directory - 2007
24
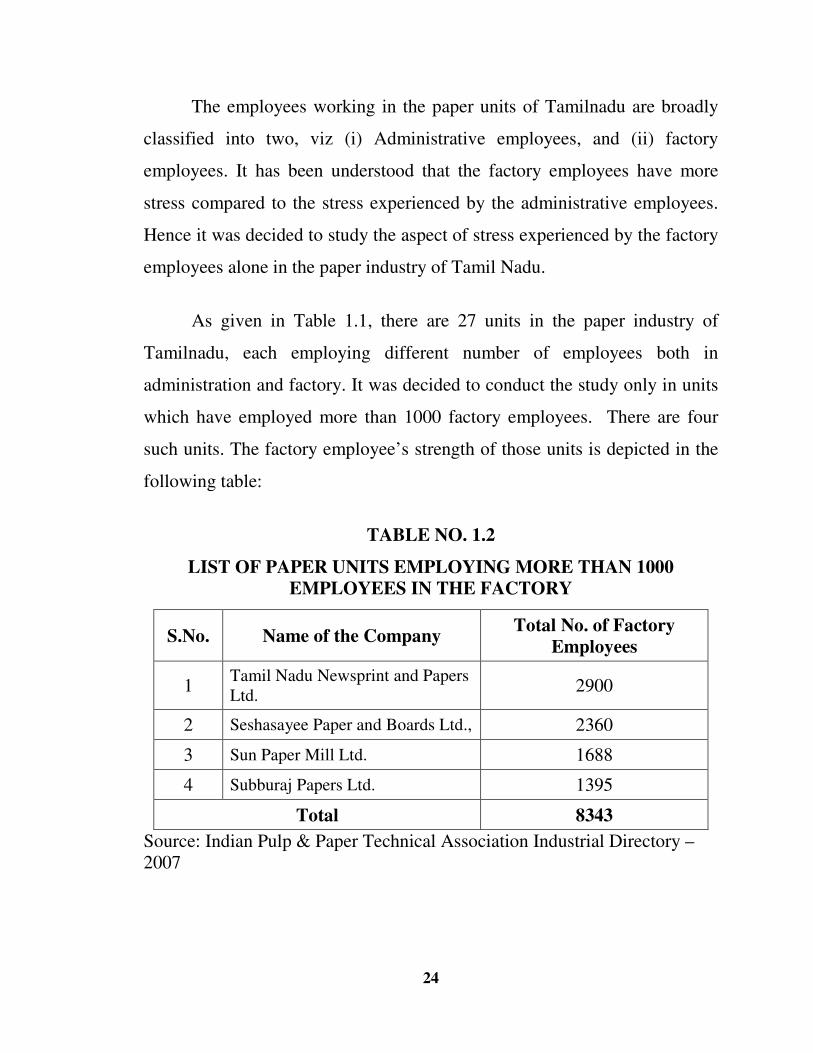
The employees working in the paper units of Tamilnadu are broadly
classified into two, viz (i) Administrative employees, and (ii) factory
employees. It has been understood that the factory employees have more
stress compared to the stress experienced by the administrative employees.
Hence it was decided to study the aspect of stress experienced by the factory
employees alone in the paper industry of Tamil Nadu.
As given in Table 1.1, there are 27 units in the paper industry of
Tamilnadu, each employing different number of employees both in
administration and factory. It was decided to conduct the study only in units
which have employed more than 1000 factory employees. There are four
such units. The factory employee’s strength of those units is depicted in the
following table:
TABLE NO. 1.2
LIST OF PAPER UNITS EMPLOYING MORE THAN 1000 EMPLOYEES IN THE FACTORY
S.No. Name of the Company Total No. of Factory
Employees
1 Tamil Nadu Newsprint and Papers Ltd.
2900
2 Seshasayee Paper and Boards Ltd., 2360
3 Sun Paper Mill Ltd. 1688
4 Subburaj Papers Ltd. 1395
Total 8343
Source: Indian Pulp & Paper Technical Association Industrial Directory –2007
25
1.8.3 Population of the study
The population of the study is all the factory employees employed in
the various units of the paper industry in Tamil Nadu.
1.9 SAMPLE DESIGN
As already stated, four units employing more than 1000 factory
employees each, have been taken for the study. Hence, the sample is selected
from these units,
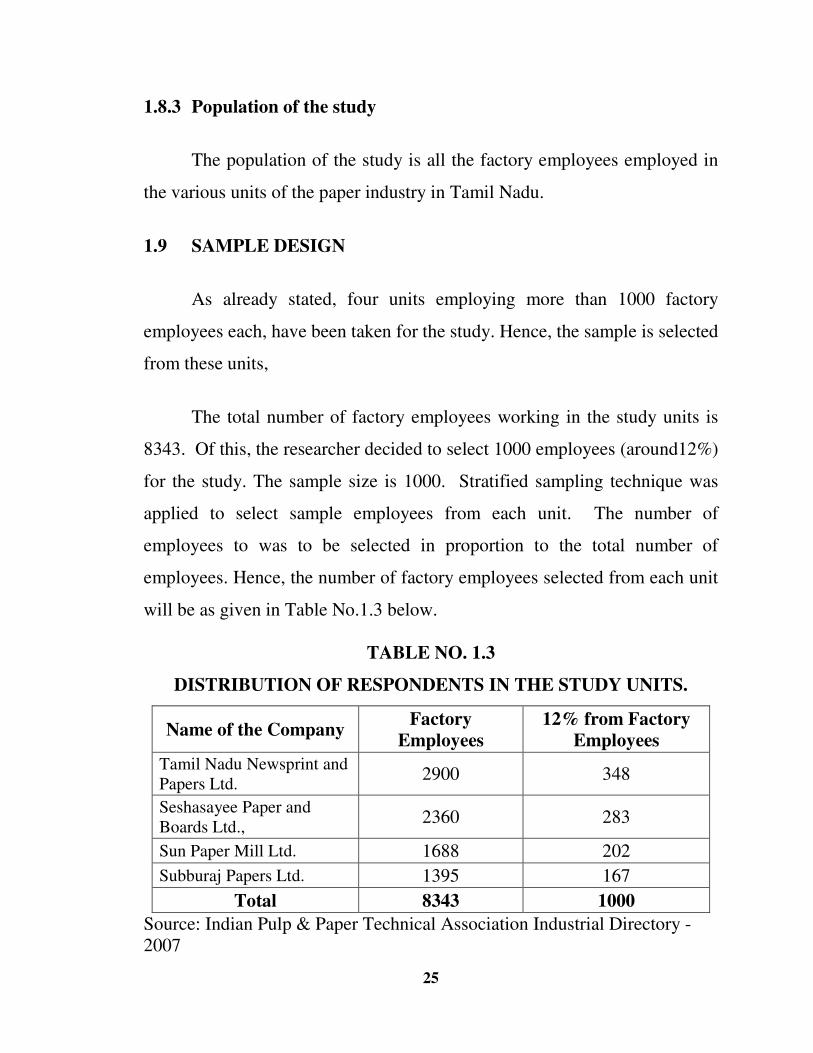
The total number of factory employees working in the study units is
8343. Of this, the researcher decided to select 1000 employees (around12%)
for the study. The sample size is 1000. Stratified sampling technique was
applied to select sample employees from each unit. The number of
employees to was to be selected in proportion to the total number of
employees. Hence, the number of factory employees selected from each unit
will be as given in Table No.1.3 below.
TABLE NO. 1.3
DISTRIBUTION OF RESPONDENTS IN THE STUDY UNITS.
Name of the Company Factory
Employees 12% from Factory
Employees
Tamil Nadu Newsprint and Papers Ltd.
2900 348
Seshasayee Paper and Boards Ltd.,
2360 283
Sun Paper Mill Ltd. 1688 202
Subburaj Papers Ltd. 1395 167
Total 8343 1000
Source: Indian Pulp & Paper Technical Association Industrial Directory - 2007
26
1.9.1 SAMPLING TECHNIQUES
The actual respondent from each unit for the present study was
selected at random. Thus the sampling technique used was stratified
sampling technique, followed by random sampling technique.
1.10 DATA COLLECTION
The necessary data have been collected from both primary sources
and secondary sources.
1.10.1 Primary Data
The primary data are collected afresh. It is original in character. The
primary data were collected with the help of a questionnaire. Moreover, The
researcher used personal interview method and observation method.
1.10.2 Secondary Data
The secondary data, on the other hand, are those which was already
collected by someone else and which was already passed through the
statistical process. The secondary data for this study is collected from the
company records, company reports, magazines, websites and published
articles.
1.11 DATA COLLECTION TOOLS
i. Questionnaire: A questionnaire with questions, dichotomous, rank and
statements, open ended and close ended questions were used to collect
27
data. The questionnaire was pre-tested and finalised before putting
into use for primary data collection.
ii. Personal interview: The questionnaire was used to collect opinions of
the respondents about their experience on stress. But, some of their
opinions or feelings which could not be expressed through the
questionnaire were collected through personal interviews.
iii. Observation: The researcher felt that there was certain information
which could not be collected from either questionnaire or personal
interview. Therefore, the researcher observed the problems found by
the respondents due to stress at work place.
1.12 TOOLS FOR ANALYSIS
The statistical tools used to analyze the data with reference to the
selected objectives of the study, include Simple Percentage, Chi square Test,
ANOVA, Multiple Regression, Henry Garrett Ranking Technique, and
Factor analysis.
a. The chi-square test is used to identify the association between two
heterogeneous groups of employees in the factory. This test shows the
level of perception on jobs and the factors like age, gender, income
level and experience.
b. ANOVA test is used to measure the variance of the population in two
different ways. First, within the sample, and second out of the sample.
c. Multiple regression analysis is used to show the relationship between
the level of perception towards job and level of occupational stress.
28
d. In this research, the ranking technique is applied and the ranks are
given to the factors based on the responses given by the respondent
regarding work-related causes, organizational related causes,
psychological consequences and physical consequences.
e. Several factors have been considered in this study. To identify the
internal relationship of a set of factors, the factor analysis is applied.
1.13 PERIOD OF THE STUDY
The study is confined to a period of 10 years (From 1999 to 2008).
1.14 LIMITATIONS OF THE STUDY
The following are the limitations of the study.
1. The behavioural symptoms of stress were excluded from the study.
2. Due to time constraints, only large scale units were taken up for this
study.
3. The study is confined to the factory employees only in the paper
industry.
1.15 CHAPTER SCHEME ARRANGEMENTS:
The study is presented in six chapters. Brief content of these chapters
are given below:
The First Chapter deals with the introduction and design of the study.
The Second Chapter presents a comprehensive literature review.
The Third Chapter evaluates the overview of paper industry.
29
The Fourth Chapter gives the glimpses of occupational stress.
The Fifth Chapter analyses the employees’ opinion about occupational
stress.
The Sixth Chapter presents the summary of findings, suggestions and
conclusion.
At the end of the report, bibliography and annexure are given.
30
CHAPTER – II
REVIEW OF LITERATURE
2.1 INTRODUCTION
Review of literature paves way for a clear understanding of the areas
of research already undertaken and throws a light on the potential areas
which are yet to be covered. Keeping this view in mind, an attempt has been
made to make a brief survey of the work undertaken on the field of
occupational stress.
This chapter deals with the review of literature concerned with the
subject of this study. Many studies have been conducted. It highlights the
occupational stress from different angles.The review of some of the
important studies are presented below.
Amir Shani and Abraham Pizam7 in their article “Work-Related
Depression among Hotel Employees” conducted a study on the depression
of work among hotel employees in Central Florida. They have confirmed the
incidence of depression among workers in the hospitality industry by
evaluating the relationship between the occupational stress and work
characteristics.
7 Amir Shani and Abraham Pizam, “Work-Related Depression among Hotel Employees”, Cornell
Hospitality Quarterly, Vol. 50, No. 4, 446-459 (2009)
31
Viljoen, J.P., and Rothmann, S.8 aimed at studying and investigating
the relationship between “occupational stress, ill health and
organizational commitment” (2009). The results were that organizational
stressors contributed significantly to ill health and low organizational
commitment. Stress about job security contributed to both physical and
psychological ill health. Low individual commitment to the organization was
predicted by five stressors, namely work-life balance, overload, control, job
aspects and pay.
Schmidt, Denise Rodrigues Costa; Dantas, Rosana Aparecida
Spadoti; Marziale, Maria Helena Palucci and Laus, Ana Maria.9 In
their work title on “Occupational stress among nursing staff in surgical
settings” This study aimed at evaluating the presence of occupational stress
among nursing professionals working in surgical settings and investigating
the relations between occupational stress and work characteristics.
Li-fang Zhang10conducted a study titled “Occupational stress and
teaching approaches among Chinese academics” (2009) He suggested
that controlling the self-rating abilities of the participants, the conducive
conceptual change in teaching approach and their role insufficiency
predicated that the conceptual change in teaching strategy is negative.
8 Viljoen, J.P., & Rothmann, S. (2009). Occupational stress, ill health and organisational
commitment of employees at a university of technology. SA Journal of Industrial Psychology/SA
Tydskrif vir Bedryfsielkunde, 35(1), Art. #730, 11 pages. DOI: 10.4102/sajip.v35i1.730. 9 Schmidt, Denise Rodrigues Costa; Dantas, Rosana Aparecida Spadoti; Marziale, Maria Helena
Palucci and Laus, Ana Maria, “Occupational stress among nursing staff in surgical settings”, Texto contexto - enferm. [online]. 2009, vol.18, n.2, pp. 330-337.
10 Li-fang Zhang, “Occupational stress and teaching approaches among Chinese academics”, Educational Psychology, Volume 29, Issue 2, March 2009 , pages 203 - 219
32
Kayoko Urakawa and Kazuhito Yokoyam 11 in their journal “Sense
of Coherence (SOC) may Reduce the Effects of Occupational Stress on
Mental Health Status among Japanese Factory Workers” (2009) has
resulted the adverse effects on mental health due to the job demand and job
strees was positively associated with SOC (sense of coherence), the mental
health status of males in managerial work was adversely negative, where as
it was positive among the female co-workers. Thus, SOC is an important
factor determining the coping ability over the job stress for both the genders
J.E. Agolla12
in his research article titled “Occupational Stress
Among Police Officers: The Case of Botswana Police Service”, (2009)
has conducted a study among the police to find out work stress symptoms
and coping strategies among the police service in Botswana. This study
reveals that the police work stressors are; getting injured while on duty and
the use of force when the job demands to do so, etc. The coping strategies
were identified as exercising, socializing, healthy eating or diets, career
planning and employee training.
Connolly, John F and Willock, Joyce and Hipwell, Michele and
Chisholm, Vivienne13 in their research titled “Occupational Stress &
Psychological Well Being following University Relocation” (2009) they
describe and analyze that management standards for work related stress
11 Kayoko Urakawa and Kazuhito Yokoyam, “Sense of Coherence (SOC) may Reduce the Effects of
Occupational Stress on Mental Health Status among Japanese Factory Workers”, Journal of Industrial Health, Vol. 47 , No. 5 pp.503-508
12 J.E. Agolla, Occupational Stress Among Police Officers: The Case of Botswana Police Service”, ccupational Stress Among Police Officers: The Case of Botswana Police Service, Vol. 3, Issue 1, pp. 25-35, 2009.
13 Connolly, John F and Willock, Joyce and Hipwell, Michele and Chisholm, Vivienne (2009) Occupational Stress & Psychological Well Being following University Relocation: six months on. Project Report. Queen Margaret University. (Unpublished).
33
(demand, support, control, role, relationships and change) can be analysed
by examining 1) overall levels of psychological strain 2) job satisfaction,
and 3) the psychosocial working conditions
Chen, Wei-Qing; Wong, Tze-Wai; Yu, Tak-Sun14
in their book
titled “Direct and interactive effects of occupational stress and coping
on ulcer-like symptoms among Chinese male off-shore oil workers”,
(2009) has suggested that gastric/ulcer like health problems, age,
educational qualification, marital status has been positively associated with
occupational stress and ‘internal behaviour’ coping methods, but negatively
associated with ‘external/social behaviour’ coping methods.
Chang-qin Lu; Oi-ling Siu; Wing-tung Au; Sandy S. W.
Leung15in their article titled “Manager's occupational stress in state-
owned and private enterprises in the People's Republic of China” (2009)
has showed that managers in private enterprises experienced higher levels of
occupational stressors and psychological strains than those in state-owned
enterprises. Moreover, ‘Organizational structure and climate’ was also found
to be a major stressor when predicting both psychological and physical strain
in both economic sectors.
Stewart Collins16
in his book titled “Statutory Social Workers:
Stress, Job Satisfaction, Coping, Social Support and Individual
Differences” (2008) he is highlighted that healthy or unhealthy coping
14 Chen, Wei-Qing; Wong, Tze-Wai; Yu, Tak-Sun, “Direct and interactive effects of occupational
stress and coping on ulcer-like symptoms among Chinese male off-shore oil workers”, American journal of industrial medicine, Vol.52, Issue 6, pp.500-8.
15 Chang-qin Lu; Oi-ling Siu; Wing-tung Au; Sandy S. W. Leung, “Manager's occupational stress in state-owned and private enterprises in the People's Republic of China”, The International Journal of Human Resource Management, Volume 20, Issue 8, August 2009 , pages 1670 - 1682
16 Stewart Collins, “Statutory Social Workers: Stress, Job Satisfaction, Coping, Social Support and Individual Differences”, British Journal of Social Work 2008, Vol. 38 No. (6): pp. 1173-1193;
34
strategies have gender difference and the importance of support in various
forms with in the work setting, where as mutual group support accompanied
by individual differences are linked to good self-esteem, personal hardiness
and resilience.
Richardson, K. M., and Rothsetin, H.R.17in their article titled
“Effects of occupational stress management intervention programs”
(2008) they provided an empirical review of stress management
interventions, employing meta-analysis procedures. The results also revealed
that relaxation interventions were the most frequent type of intervention.
Further, there were a few stress interventions focused on the organizational
level. More specific results also indicated that cognitive-behavioural
interventions produced larger effects than other types of interventions.
Pal, S., and Saksvik, P.18 In their article titled “Work-family
conflict and psychosocial work environment stressors as predictors of
job stress in a cross-cultural study” (2009) conducted a study on job stress
on 27 Norwegian doctors and 328 nurses and 111 Indian doctors and 136
nurses. The result was that work-family conflict was not predictive of job
stress in Norwegian doctors, but work-family conflict, high job demands,
and low flexibility in working hours predict job stress in Norwegian nurses.
For the Indian sample, job stress was predicted by high family-work conflict
and low social support in nurses and low job control in doctors. Hence, it
seems to be overlapping and some differences in cultures when considering
the role of demands, control, support, and flexibility in predicting strain. 17 Richardson, K. M., & Rothsetin, H. R. (2008). Effects of occupational stress management
intervention programs: A meta-analysis. Journal of Occupational Health Psychology, Vol. 13 (1), pp.69-93
18 Pal, S., & Saksvik, P. (2008). Work-family conflict and psychosocial work environment stressors as predictors of job stress in a cross-cultural study. International Journal of Stress Management, Vol. 15, No. (1), 22-42.
35
Nagesh, P. and Murthy, M. S. Narasimha19
in their study titled
“Stress Management at IT Call Centres” (2008) has identified that the six
factors contribute to workplace stress: demands of the job, control over
work, support from colleagues and management, working, clarity of role,
and organizational change. This paper also suggested measures in the form
of training to enable organizations and individuals to manage stress at
workplaces in general and IT call centres in particular. The paper is based on
a study carried out in respect of a few selected IT call centres.
Mäki K, Vahtera J, Virtanen M, Elovainio M, Keltikangas-
Järvinen L and Kivimäki M.20
in their study titled “Work stress and new
onset migraine in a female employee population” (2008) examined
whether work stress, as indicated by the job strain model and the effort-
reward imbalance model, predicts new-onset migraine among 19 469 female
employees with no history of migraine at study entry. The proportion of
new migraine cases attributable to high effort-reward imbalance was
6.2percentage. This study suggested that the high effort-reward imbalance
might function as a modifiable risk factor for new-onset migraine.
Magee, and Bill21 in their article titled "Stress, Anxiety and Anger
about Home and Work" (2009) they suggested that mediate associations
between the differentiated forms of work with me matching effects at home.
19 Nagesh, P. and Murthy, M. S. Narasimha , Stress Management at IT Call Centers: A Case Study
(December 18, 2008). The Icfai University Journal of Soft Skills, Vol. 2, No. 4, pp. 51-68, December 2008.
20 Mäki K, Vahtera J, Virtanen M, Elovainio M, Keltikangas-Järvinen L & Kivimäki M. Work stress and new onset migraine in a female employee population. Cephalalgia 2008; Vol. 28: pp.18-25. London. ISSN 0333-1024,
21 Magee, Bill. "Stress, Anxiety and Anger About Home and Work" Paper presented at the annual meeting of the American Sociological Association Annual Meeting, Sheraton Boston and the Boston Marriott Copley Place, Boston, MA, Jul 31, 2008 <Not Available>. 2009-05-23 http://www.allacademic.com/meta/p237397_index.html.
36
Their interference seems to play a relatively limited role in maintaining the
cross-domain association which is affected in either form of negative or
positive.
Kopp, Maria S; Stauder, Adrienne; Purebl, Gyorgy; Janszky,
Imre; Skrabski, Arpad22
in their research paper titled “Work stress and
mental health in a changing society” (2008) they conducted a study
indicates that a cluster of stressful working and psychosocial conditions are
responsible for a substantial part of variation in self reported mental and
physical health with work related factors.
Katherine Pollak. Eisen. George J. Allen. Mary Bollash and Linda
S. Pescatello23
in their book titled “Stress management in the workplace”
(2009) it suggested that work stress significantly contribute to corporate
health costs. Comparison through randomised controlled design of stress
management and intervention provided by an instructor-led group and
computer presented format, has resulted in significantly higher attrition in
computer based presentation format.
Hampel, Petra; Meier, Manuela; Kummel, and Ursula24
in their
article “School-Based Stress Management Training for Adolescents:
Longitudinal Results from an Experimental Study” (2008) they
investigated the effectiveness of a school-based universal preventive stress
22 Kopp, Maria S; Stauder, Adrienne; Purebl, Gyorgy; Janszky, Imre; Skrabski, Arpad, “Work stress
and mental health in a changing society”, European Journal of Public Health. 18(3):238-244, June 2008.
23 Katherine Pollak. Eisen. George J. Allen. Mary Bollash and Linda S. Pescatello, “Stress management in the workplace: A comparison of a computer-based and an in-person stress-management intervention”, Vol.24, Issue 2, pp. 486-496, 2008.
24 Hampel, Petra; Meier, Manuela; Kummel, Ursula, “School-Based Stress Management Training for Adolescents: Longitudinal Results from an Experimental Study”, ournal of Youth and Adolescence, v37 n8 p1009-1024 Sep 2008.
37
management training program for early and middle adolescents in
comparison with a no-treatment control group. The experimental group
scored higher on perceived self-efficacy compared to the control group at the
follow-up assessment.
Gbolahan and Gbadamosi25 in their research titled “Stress at
Work: Any Potential Redirection from an African Sample” (2008) they
conducted a study which explored the relationship among perceived stress,
perception of sources of stress, satisfaction, core self-evaluation, perceived
health and well being. Data were collected from 355 employees in botswana.
Result indicated that significant links existed between perceived stress,
Satisfaction, Core self-evaluation and Well being.
D.R. Rutter and M.J. Lovegrove26 in their research titled
“Occupational stress and its predictors in radiographers”, (2009) they
conducted a study to establish the level of occupational stress in UK NHS
radiographers, and to examine its causes. The result was significantly lower
in the mammography group than in the others. However, the junior staff
reported low level stress due to role ambiguity, role conflict and work
problems and the superintendents reported a high level stress; but the effects
were sometimes buffered by social support from colleagues.
25 Gbolahan Gbadamosi, (2008) Stress at Work: Any Potential Redirection From an African Sample?
International Academy of African Business and Development (IAABD) , United States. ISBN 0-9765288-3-5.
26 .R. Rutter and M.J. Lovegrove, “Occupational stress and its predictors in radiographers”, Vol.14, Issue 2, pp.138-143, 2009.
38
Christopoulos, M. And Hicks, R.E. 27 in their article titled
“Perfectionism, occupational stress and depression among Australian
university students”. (2008) they carried out a study and investigated the
relationship of perfectionism between occupational stress and depression in
the context of an Australian university student population. The study
revealed that as expected maladaptive perfectionism significantly correlated
with occupational stress and depression; however, unexpectedly adaptive
perfectionism did not correlate significantly with occupational stress and
depression.
Buddeberg-Fischer, B; Klaghofer, R; Stamm, M; Siegrist, J;
Buddeberg,28
in their book titled “Work stress and reduced health in
young physicians: prospective evidence from Swiss residents” (2008)
they investigated the perceived job stress, its association with the amount of
working hours, and its impact on young physicians’ self-reported health and
their satisfaction with life during residency. Stress at work in young
physicians, especially when being experienced over a longer period in
postgraduate training, has to be a matter of concern because of its negative
impact on health and life satisfaction and the risk of developing symptoms
of burnout in the long run.
27 Christopoulos, M. & Hicks, R.E. (2008). Perfectionism, occupational stress and depression among
Australian university students. In S. Boag (Ed.), Personality down under: Perspectives from Australia (pp. 41-52). New York, United States: Nova Science Publishers. ISBN: 9781604567946.
28 Buddeberg-Fischer, B; Klaghofer, R; Stamm, M; Siegrist, J; Buddeberg, C (2008), “Work stress
and reduced health in young physicians: prospective evidence from Swiss residents”. International Archives of Occupational and Environmental Health, Vol. 82 No.(1): pp.31-38
39
Sang, Katherine J. C.; Dainty, Andrew R. J.; Ison, Stephen G.29 In
their research titled. “Gender: a risk factor for occupational stress in the
architectural profession” (2007) jointly aimed to research gender
differences in occupational health and well-being. In this study, the female
respondents reported significantly lower overall job satisfaction and due to
it, significantly higher levels of insomnia and constipation, work-life conflict
and turnover intentions.
Upson, John W.; Ketchen Jr., David J.; Ireland, R. Duane30
in
their article titled “Managing Employee Stress: A Key to the
Effectiveness of Strategic Supply Chain Management” (2007) focused
their research on supply chain activities and studied the dangerous role of
stress among supply chain members. They have also given measures to
address this stress. The researchers concluded that by using the suggested
initiatives, both employees' quality of life and the organization's
performance can improve.
The study by Mikolajczak, Moïra; Menil, Clémentine; Luminet,
Olivier31 in their article “Explaining the protective effect of trait
emotional intelligence regarding occupational stress: Exploration of
emotional labour processes” (2007) focused that, when confronted with
emotional labour, high trait EI individuals experience lower levels of
29 Sang, Katherine J. C.; Dainty, Andrew R. J.; Ison, Stephen G.. “Gender: a risk factor for
occupational stress in the architectural profession?”, Construction Management & Economics, Dec2007, Vol. 25 Issue 12, p1305-1317, 13p
30 Upson, John W.; Ketchen Jr., David J.; Ireland, R. Duane. “Managing Employee Stress: A Key to the Effectiveness of Strategic Supply Chain Management”, Organizational Dynamics, 2007, Vol. 36 Issue 1, p78-92, 15p.
31 Mikolajczak, Moïra; Menil, Clémentine; Luminet, Olivier. “Explaining the protective effect of trait emotional intelligence regarding occupational stress: Exploration of emotional labour processes”, Journal of Research in Personality, Oct2007, Vol. 41 Issue 5, p1107-1117, 11p.
40
burnout and somatic complaints, and this effect was found to be mediated by
the choice of emotional labour strategies.
Wated, Guillermo; Sanchez, Juan I.,32 in their research titled “The
Role of Accent as a Work Stressor on Attitudinal and Health-Related
Work Outcomes”, (2006) has stated that, data collected from the
employees who spoke English with a supported accent and prediction, by
examining in their role in group, self-efficiency and perceived control in the
process where none of the proposed coping mechanism had an impact of
perceived discrimination on employees accent.
W. de Vente; J.H. Kamphuis; P.M.G. Emmelkamp33
in their
article. “Alexithymia, Risk Factor or Consequence of Work-Related
Stress” (2006) they investigated the level and the type of alexithymia
associated with occupational stress. Group differences in alexithymia were
analyzed using ANOVAs. The type of alexithymia was investigated by (a)
determining absolute and relative stability, (b) exploring state dependence
by adjusting alexithymia for burnout and distress complaints and (c)
associating recovery of complaints with change in alexithymia. According to
them, Alexithymia was significantly elevated among the patients. In the
patient group, absolute stability of two alexithymia dimensions (identifying
feelings, describing feelings) and relative stability of one alexithymia
dimension (identifying feelings) was lower than they were in the healthy
group.
32 Wated, Guillermo; Sanchez, Juan I. “The Role of Accent as a Work Stressor on Attitudinal and
Health-Related Work Outcomes”, International Journal of Stress Management, Aug2006, Vol. 13 Issue 3, p329-350, 22p.
33 W. de Vente; J.H. Kamphuis; P.M.G. Emmelkamp. “Alexithymia, Risk Factor or Consequence of Work-Related Stress?”, Psychotherapy & Psychosomatics, Aug2006, Vol. 75 Issue 5, p304-311, 8p.
41
Stetz, Thomas A.; Stetz, Melba C.; Bliese, Paul D.34
In their article
titled “The importance of self-efficacy in the moderating effects of social
support on stressor–strain relationships” (2005) has explained that
organizational constraints, co-workers support and self efficiency had
significant interaction for predicting the job satisfaction and psychological
well being. It had resulted that intervention aimed for reducing strains are
expected through increased social support and considering self efficiency of
individual.
Richards, David; Bee, Penny; Barkham, Michael; Gilbody,
Simon; Cahill, Jane; Glanville, Julie.35 In their research article “The
prevalence of nursing staff stress on adult acute psychiatric in-patient
wards” (2006) their study reviewed the prevalence of low staff morale, due
to stress, burnout, job satisfaction and psychological well-being amongst
staff working in in-patient psychiatric wards. It has resulted that particular
mental health studies has specific and non specific samples, it explain that
using of validating measures of stress together with personal and
organisational variation requires the process influencing the stress over the
staff.
Raidén, Ani Birgit; Dainty, Andrew R. J.; Neale, Richard H.36 in
their study on “Balancing employee needs, project requirements and
34 Stetz, Thomas A.; Stetz, Melba C.; Bliese, Paul D.. “The importance of self-efficacy in the
moderating effects of social support on stressor–strain relationships”, Work & Stress, Jan-Mar2006, Vol. 20 Issue 1, p49-59, 11p.
35 Richards, David; Bee, Penny; Barkham, Michael; Gilbody, Simon; Cahill, Jane; Glanville, Julie. “The prevalence of nursing staff stress on adult acute psychiatric in-patient wards”, Social Psychiatry & Psychiatric Epidemiology, Jan2006, Vol. 41 Issue 1, p34-43, 10p.
36 Raidén, Ani Birgit; Dainty, Andrew R. J.; Neale, Richard H. “Balancing employee needs, project requirements and organisational priorities in team deployment”, Construction Management & Economics, Aug2006, Vol. 24 Issue 8, p883-895, 13p.
42
organisational priorities in team deployment” (2006) the team
deployment strategies of a large construction company with the view of
establishing how a balance could be achieved between organizational
strategic priorities, operational project requirements and individual
employee needs and preferences, suggested that project priorities often took
precedence over the delivery of the strategic intentions of the organisation in
meeting employees’ individual needs.
Noblet, Andrew; LaMontagne, Anthony D.37 conducted a study on
“The role of workplace health promotion in addressing job stress”
(2006). The enormous human and economic costs associated with
occupational stress suggested that initiatives designed to prevent and /or
reduce employee stress should be high on the agenda of Workplace Health
Promotion (WHP) program. The aim of the second part of this study is a
detailed description of what the comprehensive approach to stress
prevention/reduction looks like in practice and to examine the means by
which WHP can help develop initiatives that address both the sources and
the symptoms of job stress.
Kushnir, Talma; Melamed, and Samuel38
in their study titled
“Domestic Stress and Well-Being of Employed Women”. (2006)
Respondents were 133 mothers employed in secretarial and managerial jobs.
It is suggested that in families (as in teams), shared decision control may be
a more potent coping resource than personal control.
37 Noblet, Andrew; LaMontagne, Anthony D. “The role of workplace health promotion in addressing
job stress”, Health Promotion International, Dec2006, Vol. 21 Issue 4, p346-353, 8p. 38 Kushnir, Talma; Melamed, Samuel. “Domestic Stress and Well-Being of Employed Women:
Interplay Between Demands and Decision Control at Home”, Sex Roles, May2006, Vol. 54 Issue 9/10, p687-694, 8p.
43
Keeva, and Steven39
in their article titled “Depression Takes a Toll”
(2006) deal with the high rates of mental depression among lawyers in the
U.S. Studies which highlighted the depression problem among lawyers are
cited. It discusses the suicide of Judge Mack Kidd of Austin, Texas. It
explores the role of occupational stress in depression among lawyers.
Jackson, Leon; Rothmann, Sebastiaan40 in their titled
“Occupational stress, organisational commitment, and ill-health of
educators in the North West Province” (2006) discussed to determine the
differences between occupational stress and strain of educators in different
biographical groups, and to assess the relationship between occupational
stress, organizational commitment and ill-health. A sample of 1170 was
selected and Organizational Stress Screening Tool and a biographical
questionnaire were administered. The results show differences between the
occupational stress, organizational commitment and ill-health of educators
of different ages, qualifications and associated with different types of
schools.
H., Azlihanis A.; L., Naing; D., Aziah B.; N., Rusli41 in their titled
“Socio-demographic, Occupational And Psychosocial Factors
Associated With Job Strain Among Secondary School Teachers In Kota
Bharu, Kelantan” (2006) they conducted a study to identify the factors
associated with job strain among teachers working in secondary schools in
39 Keeva, Steven. “Depression Takes a Toll”, ABA Journal, Jan2006, Vol. 92 Issue 1, p37-38, 2p 40 Jackson, Leon; Rothmann, Sebastiaan. “Occupational stress, organisational commitment, and ill-
health of educators in the North West Province”, South African Journal of Education, Feb2006, Vol. 26 Issue 1, p75-95, 21p, 8.
41 H., Azlihanis A.; L., Naing; D., Aziah B.; N., Rusli. “Socio-demographic, Occupational And Psychosocial Factors Associated With Job Strain Among Secondary School Teachers In Kota Bharu, Kelantan”. Malaysian Journal of Medical Sciences, Jan2006 Supplement, Vol. 13, p18-18, 1p.
44
Kota Bharu, Kelantan. A sample size of 580 teachers was taken. The result
was significant. There was linear relationship between job strain and the
duration of service in the present employment, duration of working hours,
job insecurity and social support.
Coetzer, and W.J.; Rothmann, S.42 In their article titled
“Occupational stress of employees in an insurance company”, (2006)
they identified occupational stressors for employees in an insurance
company. The results showed that job insecurity as well as pay and benefits
were the highest stressors in the insurance industry. They also assessed the
relationships between occupational stress, ill health and organisational
commitment.
Botha, Christo; Pienaar, and Jaco43
in their titled “South African
correctional official occupational stress: The role of psychological
strengths” (2006) conducted a study to determine the dimensions of
occupational stress of employees of the Department of Correctional Services
in a management area of the Freestate Province of South Africa. The results
indicated that an external locus of control and negative affect contributed to
the experience of occupational stress.
Bernhart, and Molly44
in their article, “Work intensity showing up
in stress, employee attrition”, (2006) focused the intensification of work
by employers to increase productivity with fewer employees, where human
42
Coetzer, W. J.; Rothmann, S. “Occupational stress of employees in an insurance company”, South African Journal of Business Management, Sep2006, Vol. 37 Issue 3, p29-39, 11p
43 Botha, Christo; Pienaar, Jaco. “South African correctional official occupational stress: The role of psychological strengths”, Journal of Criminal Justice, Jan/Feb2006, Vol. 34 Issue 1, p73-84, 12p.
44 Bernhart, Molly. “Work intensity showing up in stress, employee attrition”, Employee Benefit News, Oct2006, Vol. 20 Issue 13, p26-26, 1p.
45
resource turnover are in large number due to shortage of skilled workers,
retiring employees, stressed out workers, work-life option should be set up
in such way to eliminate employee stress for filling the vacancy by bridging
the gap between retiring employees and stress out workers.
Barzilai-Pesach, Vered; Sheiner, Einat K.; Sheiner, Eyal;
Potashnik, Gad; Shoham-Vardi, Ilana45
in their research work titled “The
Effect of Women's Occupational Psychologic Stress on Outcome of
Fertility Treatments”, (2006) examined the possible association between
women's occupational stress and its outcome during pregnancy has made the
women workers perceive that their job demanding more was less to achieved
work load, by measuring full time with part time job it was found that
woman who conceived are significantly associated less with full time job
until successful completion of the pregnancy period.
Akerboom, and S.; Maes S.46 in their paper titled “Beyond demand
and control: The contribution of organizational risk factors in assessing
the psychological well-being of health care employees.”, (2006)
examined that both the unique and the additional contribution of
organizational characteristics and the organizational Risk Factors explain the
importance part of their outcome and their training opportunities which
gives importance to carriers and job satisfaction.
45 Barzilai-Pesach, Vered; Sheiner, Einat K.; Sheiner, Eyal; Potashnik, Gad; Shoham-Vardi, Ilana.
The Effect of Women's Occupational Psychologic Stress on Outcome of Fertility Treatments”, Journal of Occupational & Environmental Medicine, Jan2006, Vol. 48 Issue 1, p56-62, 7p.
46 Akerboom, S.; Maes, S.. “Beyond demand and control: The contribution of organizational risk factors in assessing the psychological well-being of health care employees.”, Work & Stress, Jan-Mar2006, Vol. 20 Issue 1, p21-36, 16p.
46
Adriaenssens, Liesbeth; De Prins, Peggy; VloeberghS, and Daniël.
47 In their work titled “Work Experience, Work Stress and HRM at the
University”, (2006) investigated (1) the well-being of academic staff at the
University of Antwerp, (2) the specific factors of the work environment that
have an impact on employee well-being, and (3) the interaction between HR
practices and employee well-being. They have concluded the work with
suggestions of improvement of the work environment.
Adams, Richard E.; Boscarino, Joseph A.; Figley, and Charles R.
48 Conducted their study titled “Compassion Fatigue and Psychological
Distress among Social Workers: A Validation Study”, (2006) the article
highlights the factors analysed and indicated that the compassion fatigue
(CF) scale measured multiple dimensions, which measures increasing ability
of professionals meet the emotional needs of their clients which results in
stressful environment without experiencing CF (compassion fatigue)
Yates, and Iva49
in their research work titled “Reducing
Occupational Stress”, (2005) the survey explains in detail that 40% of
worker in a manufacturing company reported that their job was very
stressful and another 25% expressed that this job was extremely increasing
the stress towards their family life, this survey has identified various job
conditions that can be adopted to maintain a stress less work life which leads
to a stress less family life.
47 Adriaenssens, Liesbeth; De Prins, Peggy; VloeberghS, Daniël. “Work Experience, Work Stress
and HRM at the University”, Management Revue, 2006, Vol. 17 Issue 3, p344-363, 20p. 48 Adams, Richard E.; Boscarino, Joseph A.; Figley, Charles R.. “Compassion Fatigue and
Psychological Distress Among Social Workers: A Validation Study”, American Journal of Orthopsychiatry, Jan2006, Vol. 76 Issue 1, p103-108, 6p.
49 Yates, Iva. “Reducing Occupational Stress”, Caribbean Business, 2/24/2005, Vol. 33 Issue 7, p79-79, 3/4p.
47
Wiesner, Margit; Windle, Michael; Freeman, Amy50 in their
research article titled “work stress, substance use, and Depression among
young adult Workers (2005) they examined the main and moderated
relationships between 5 job stressors using data from a community sample of
583 young adults (mean age = 23.68 years). Analyses revealed a few direct
associations among the job stressors of high job boredom, low skill variety,
low autonomy, depression measures and heavy alcohol use.
Van Vegchel, Natasja; de Jonge, Jan; Landsbergis, Paul A.51
In
their article titled “Occupational stress in (inter)action: the interplay
between job demands and job resources” (2005) they addressed
theoretical issues involving different interaction effects between job
demands and job resources in an analysis on 471employees. Results
including cross-validation showed that only a multiplicative interaction term
yielded consistent results for both the DC model and the ERI model.
Theoretical as well as empirical results argue for a multiplicative interaction
term to test the DC model and the ERI model.
Vakola, Maria; Nikolaou, Loannis52 In their article titled,
“Attitudes towards organizational change” (2005) they suggested that
occupational stress and organizational change are now widely accepted as
two major issues in organizational life. The study explored the linkage
between employees' attitudes towards organizational change and two of the
50 Wiesner, Margit; Windle, Michael; Freeman, Amy., “Work Stress, Substance Use, and Depression
Among Young Adult Workers: An Examination of Main and Moderator Effect Models”, Journal of Occupational Health Psychgy, Apr2005, Vol. 10 Issue 2, p83-96, 14p.
51 van Vegchel, Natasja; de Jonge, Jan; Landsbergis, Paul A., “Occupational stress in (inter)action: the interplay between job demands and job resources”, Journal of Organizational Behavior, August 2005, Vol. 26 Issue 5, p535-560, 26p.
52 Vakola, Maria; Nikolaou, Loannis. “Attitudes towards organizational change: What is the role of employees' stress and commitment?”, Employee Relations, 2005, Vol. 27 Issue 2, p160-174, 15p.

48
most significant constructs in organizational behaviour; occupational stress
and organizational commitment. The results were in the expected direction
showing negative correlations between occupational stressors and attitudes
to change, indicating that highly stressed individuals demonstrate decreased
commitment and increased reluctance to accept organizational change
interventions.
Salmond, Susan; Ropis, Patricia E.,53 In their research work titled,
“Job Stress and General Well-Being: A Comparative Study of Medical-
Surgical and Home Care Nurses” (2005)they analysed the job stress
among medical-surgical and home care nurses in the U.S. According to
them, high stress leads to negative work environments that deprive nurses of
their spirit and passion about their job. Key factors contributing to
workplace stress include team conflict, unclear role expectations, heavy
workload, and lack of autonomy.
Ryan, P.; Hill, R.; Anczewska, M.; Hardy, P.; Kurek, A.; Nielson,
K.; Turner, C.54 In their book titled, “occupational stress reduction”
(2005) they have attempted to address the issue of work-related stress
through whole team training programmes, on a background of largely
ineffective stress reduction training programmes offered to individuals
within the workplace. The findings show significant implications to the
conceptual, methodological and everyday organizational practice levels of
tackling this central issue to the health of the workplace.
53 Salmond, Susan; Ropis, Patricia E.. “Job Stress and General Well-Being: A Comparative Study of
Medical-Surgical and Home Care Nurses”, MEDSURG Nursing, Oct2005, Vol. 14 Issue 5, p301-309, 9p.
54 Ryan, P.; Hill, R.; Anczewska, M.; Hardy, P.; Kurek, A.; Nielson, K.; Turner, C. “Team-based occupational stress reduction: A European overview from the perspective of the OSCAR project” International Review of Psychiatry, Oct2005, Vol. 17 Issue 5, p401-408, 8p.

49
Oliver, A.; Tomás, J. M.. Ansiedad y Estrés55 In their research work
titled, “Consequences of Work Stress” (2005) empirically tested the two
broad hypotheses of Warr's vitamin model: non-linear effects of working
conditions on well-being, and moderator effects of personal characteristics
on these relationships. The results did not support the non-linear hypothesis
of Warr's model, and the support for the moderator effects of personal
characteristics on the stressors-well being is weak.
Ogińska-Bulik, Nina56
In their article titled “Emotional Intelligence
In The Workplace”, (2005) explored the relationship between emotional
intelligence and perceived stress in the workplace and health-related
consequences in human service workers. They selected 330 respondents as
sample size. Three methods were used in the study, namely, the Emotional
Intelligence Questionnaire with Polish modification, the Subjective Work
Evaluation Questionnaire developed in Poland, and the General Health
Questionnaire with Polish modification. The results confirmed an essential,
but not very strong, role of emotional intelligence in perceiving occupational
stress and preventing employees of human services from negative health
outcomes.
Noblet, Andrew; Teo, Stephen T.T.; McWilliams, John; Rodwell,
John J.57 In their research work titled, “work characteristics predict
55 Oliver, A.; Tomás, J. M. Ansiedad Y. Estrés, “Consequences of Work Stress: An application of
Warr's Vitamin Model to predict Anxiety and Depression”, Dec2005, Vol. 11 Issue 2/3, p233-245, 13p.
56 Ogińska-Bulik, Nina, “Emotional Intelligence In The Workplace: Exploring Its Effects On Occupational Stress And Health Outcomes In Human Service Workers”, International Journal of Occupational Medicine & Environmental Health, Apr2005, Vol. 18 Issue 2, p167-175, 9p.
57 Noblet, Andrew; Teo, Stephen T. T.; McWilliams, John; Rodwell, John J. “Which work characteristics predict employee outcomes for the public-sector employee? An examination of generic and occupation-specific characteristics”, International Journal of Human Resource Management, Aug2005, Vol. 16 Issue 8, p1415-1430, 16p.
50
employee outcomes for the public-sector employee” (2005) indicted that
the middle managers and HR managers can have positive impact on
employees through the introduction of new public management which is
caused be reducing the employee’s job strain. It is done through the useful
tool “job strain model” which has increasing utility in public sector
environment.
Michailidis, Maria; Georgiou, Yiota58 In their article titled,
“Employee occupational stress in banking”,(2005) have stated that
occupational stress literature emphasized the importance of assessment and
management of work related stress. The recognition of the harmful physical
and psychological effects of stress on both individuals and organizations is
widely studied in many parts of the world. A sample of 60 bank employees
at different organizational levels and with different educational backgrounds
was used. Data collection utilized the Occupational Stress Indicator (OSI). It
implied that educational levels affect the degree of stress they experience in
various ways finally, the drinking habits (alcohol) of the employees were
found to play a significant role in determining the levels of occupational
stress.
Marsella, Anthony; Wong, Paul T. P.; Wong, Lilian C. J.; Leong,
Frederick T. L.; Tolliver, Dwight59 In their article titled, “Towards an
Understanding of Occupational Stress Among Asian Americans”,
(2005) explained how the stress literature on Asian Americans can help
58 Michailidis, Maria; Georgiou, Yiota., “Employee occupational stress in banking”, Work, 2005,
Vol. 24 Issue 2, p123-137, 15p. 59 Marsella, Anthony; Wong, Paul T. P.; Wong, Lilian C. J.; Leong, Frederick T. L.; Tolliver,
Dwight. “Towards an Understanding of Occupational Stress Among Asian Americans”, Handbook of Multicultural Perspectives on Stress & Coping, 2005, p535-553, 19p.
51
understand and conduct future research on occupational stress. In an attempt
to stimulate more direct research on this topic, they used the theoretical
framework of occupational stress developed by Osipow and Spokane (1987)
to guide us in this review.
Härenstam, Annika60 In their book titled, “working life and
increasing occupational stress” (2005) discussed two types of objectives in
their article. First, it provided an explanation for the increase in occupational
stress and sick leaves in Sweden in terms of the structural and organizational
conditions. Second, it discussed measures that address these issues. The
results indicated that management technologies distribute risks between
segments of the labour market,
Haraway, Dana L.; Haraway III, William M.61 In their book titled,
“Analysis of the Effect of Conflict-Management and Resolution
Training on Employee Stress at a Healthcare Organization”, (2005)
conducted a study in which, 23 supervisors and managers in a local
healthcare organization participated in for 3-hour sessions designed to teach
practical conflict-management strategies immediately applicable to their
workplace duties and responsibilities. A comparison of pre test and post test
measures indicated statistically that there were differences in four areas and
suggested a positive influence of the brief intervention. This is clearly
explained in the article titled “Analysis of the Effect of Conflict-
60 Härenstam, Annika. “Different development trends in working life and increasing occupational
stress require new work environment strategies”, Work, 2005, Vol. 24 Issue 3, p261-277, 17p. 61 Haraway, Dana L.; Haraway III, William M. “Analysis of the Effect of Conflict-Management and
Resolution Training on Employee Stress at a Healthcare Organization”, Hospital Topics, Fall2005, Vol. 83 Issue 4, p11-17, 8p.

52
Management and Resolution Training on Employee Stress at a Healthcare
Organization”,
Green, Rosemary; Lonne, Bob62 In their article titled, “Great
Lifestyle, Pity about the Job Stress” (2005) examined the rural practice
and occupational stress. While employers and colleagues may attribute stress
reactions to the individual practitioner's inability to cope with the demands
of rural practice, strategies that are both systemic and structural, are required
to address this significant occupational issue.
Gillen, Mark C.; Ed Chung63 In their article titled, “An Initial
Investigation of Employee Stress Related to Caring for Elderly and
Dependent Relatives at Home”, (2005) examined that the problems
confronting individuals who not only had employment obligations to their
employers, but who also had responsibilities as caregivers to aging/sick
parents or other family members at home. The modern organizational person
has come to accept the importance of task interests--getting the job done--in
exchange for ways to further their career interests and perhaps directly or
indirectly their personal interests.
Demetri Kantarelis64 In his article titled, “Occupational stress:
some microeconomic issues”, (2005) found that the theoretical concepts are
proposed to capture the substance of issues associated with occupational
stress. Reduction below the profit maximizing stress level may be achieved
62 Green, Rosemary; Lonne, Bob. “Great Lifestyle, Pity about the Job Stress': Occupational Stress in
Rural Human Service Practice”, Rural Society, 2005, Vol. 15 Issue 3, p252-266, 15p. 63 Gillen, Mark C.; Ed Chung. “An Initial Investigation of Employee Stress Related to Caring for
Elderly and Dependent Relatives at Home”, International Journal of Sociology & Social Policy, 2005, Vol. 25 Issue 9, p78-93, 16p.
64 Demetri Kantarelis “Occupational stress: some microeconomic issues”, International Journal of Management Concepts & Philosophy, 2005, Vol. 1 Issue 3, pN.PAG, 00p.
53
only if a firm's increase in cost for stress relief in the work place guarantees
productivity and profit improvement in exchange for a reduction in
employee health damages due to stress.
Chen, W. Q.; Yu, I. T.-S.; Wong, T.W.65
In their article titled,
“Impact of occupational stress and other psychosocial factors on
musculoskeletal pain among Chinese offshore oil installation workers”,
(2005) explored the relation between psychosocial factors and
musculoskeletal pain in Chinese offshore oil installation workers.
Significant associations were found between various psychosocial factors
and musculoskeletal pain in different body regions after adjusting for
potential confounding factors. Occupational stressors, in particular stress
from safety, physical environment, and ergonomics, were important
predictors of musculoskeletal pain.
Béjean, Sophie; Sultan-Taäeb, Hélène66 In their article titled,
“Modelling the economic burden of diseases imputable to stress at
work”, (2005) have evaluated the costs of work-related stress in France.
Three illnesses-cardiovascular diseases, musculoskeletal diseases and back
pain-that may result from exposure to stress are identified and the
proportions of cases attributable to the risk factor are calculated from
epidemiological studies. Two methodological hypotheses allow us to
provide complementary evaluations of the social cost of occupational stress
and raise the ethical questions inherent in the choice of methodology. Work-
65 Chen, W. Q.; Yu, I. T.-S.; Wong, T. W, “Impact of occupational stress and other psychosocial
factors on musculoskeletal pain among Chinese offshore oil installation workers”, Occupational & Environmental Medicine, Apr2005, Vol. 62 Issue 4, p251-256, 6p.
66 Béjean, Sophie; Sultan-Taäeb, Hélène, “Modeling the economic burden of diseases imputable to stress at work”, European Journal of Health Economics, Mar2005, Vol. 6 Issue 1, p16-23, 8p.
54
related stress costs society between €1,167 million and €1,975 million in
France, or 14.4-24.2 percentage of the total spending of social security
occupational illnesses and work injuries branch.
Arthur, Andrew R.67 In their article titled, (2005) found that 86 per
cent of employees who experience stress in the workplace sought help from
their workplace counselling schemes. This study found that almost high
levels of mental health problems existed (86 per cent) in employees who
remained at their work. This finding was at variance with the usual co-
morbid presentation of anxiety and depression found in community based on
mental health services and suggests that depression may be an important
differentiating factor between those who can remain at work and use
counselling and those who cannot.
Alves, Steve L.68 In their article titled, “anxiety and depression in
employees who use occupational stress counselling schemes”, (2005)
Data analyses revealed the compression between the CRNA (Collaboration
in Nurse Anaesthetists) with hospital employees. It resulted as low stress
level for CRNA over the hospital employees. And they suggested
counselling as a stress resolution tool for the hospital employees.
Aldred, Carolyn.69 In his research work titled, “lower claims
standards in stress-related suits”, (2005) reported that recent Appeal Court
67 Arthur, Andrew R.. “When stress is mental illness: A study of anxiety and depression in
employees who use occupational stress counselling schemes”, Stress & Health: Journal of the International Society for the Investigation of Stress, Oct2005, Vol. 21 Issue 4, p273-280, 8p.
68 Alves, Steve L.. AANA “A study of occupational stress, scope of practice, and collaboration in nurse anesthetists practicing in anesthesia care team settings”, Journal, Dec2005, Vol. 73 Issue 6, p443-452, 10p.
69 Aldred, Carolyn.” U.K. companies face lower claims standards in stress-related suits”, Business Insurance, 4/4/2005, Vol. 39 Issue 14, p13-14, 2p.
55
ruling lowers the standard for stress claims against Great Britain employers
and allows companies to be held vicariously liable for the actions of
workers' supervisors. The Court of Appeal in London ruled that an employee
could sue his former employer under the Harassment Act of 1997 for
allegedly harassed by his manager. The ruling marks for the first time the
Harassment Act (which is a public-order statute) has been successfully used
as a ground for an occupational stress claim.
Tyson, Paul D.; Pongruengphant, Rana70 In their article titled,
“Five-year follow-up study of stress among nurses in public and private
hospitals in Thailand”, (2004) examined the sources of occupational stress,
coping strategies, and job satisfaction. A sample of 200 nurses was
compared to 147 nurses sampled from the same hospital wards after 5 years
and revealed a significant increase in nurses’ workload, involvement with
life and death situations, and pressure from being required to perform tasks
outside of their competence. Although nurses working in public hospitals
generally reported more stress than private hospitals, surprisingly nurses’
satisfaction with their job increased particularly in public hospitals, which
may be attributable to age, improvements in monetary compensation, and
organizational support.
Torkelson, Eva; Muhonen, Tuija71 In their article titled, “The role
of gender and job level in coping with occupational stress” (2004)
investigated that resulted the employees working at sugar factory were
70 Tyson, Paul D.; Pongruengphant, Rana., “Five-year follow-up study of stress among nurses in
public and private hospitals in Thailand”, International Journal of Nursing Studies, Mar2004, Vol. 41 Issue 3, p247, 8p.
71 Torkelson, Eva; Muhonen, Tuija., “The role of gender and job level in coping with occupational stress”, Work & Stress, Jul2004, Vol. 18 Issue 3, p267-274, 8p.
56
studies through an investigation has resulted with more mental health
problems due to insufficient emotional support from the management and
also in times the disengagement of drug/alcoholic consumption also have
resulted with the same symptoms.
Terluin, Berend; Van Rhenen, Willem; Schaufeli, Wilmar B.; De
Haan, Marten72 In their article titled, “The four-dimensional symptom
questionnaire (4DSQ): measuring distress and other mental health
problems in a working population”, (2004) expressed that valid
instrument can be used in a working population to distinguish between
stress-related symptoms and psychiatric illness.
Lords73
In his article titled, “employers need to look for signs of
stress.” (2004) revealed that the ruling made by the Great Britain House of
Lords in the case of Barber versus Somerset County Council has made it
clear that being unsympathetic to complaints of occupational stress or
having autocratic or bullying leadership could count against an employer.
The information on the case was based on the remarks from Cloister, the law
firm which represented former school teacher Leon Barber.
Muhonen, Tuija; Torkelson, Eva74 In their article titled, “Work
locus of control and its relationship to health and job satisfaction from a
gender perspective”, (2004) suggested that the work locus of control was a
72 Terluin, Berend; Van Rhenen, Willem; Schaufeli, Wilmar B.; De Haan, Marten., “The four-
dimensional symptom questionnaire (4DSQ): measuring distress and other mental health problems in a working population”, Work & Stress, Jul2004, Vol. 18 Issue 3, p187-207, 21p.
73 “Lords' ruling means employers need to look for signs of stress.” Occupational Health, May2004, Vol. 56 Issue 5, p5-5, 1/3p
74 Muhonen, Tuija; Torkelson, Eva. “Work locus of control and its relationship to health and job satisfaction from a gender perspective”, Stress & Health: Journal of the International Society for the Investigation of Stress, Feb2004, Vol. 20 Issue 1, p21-28, 8p.
57
significant predictor of both symptoms of ill-health and job satisfaction, but
only for women. This indicates that separate analyses for women and men
are needed in order to investigate potential gender differences that might
otherwise go unnoticed.
Korn, Adam75 In his article titled, “Stressing the point the
employee” (2005) identified the complexity of the causes of mental illness
that depend upon the interaction between the patient's personality and a
number of factors in the patient's life;
Gaumer, Carol J.; Shah, Amit J.; Ashley-Cotleur, Cathy76
In their
article titled, “Causes and Effects of Stress on Women”, (2005) have
analysed that the organizations respond to stressors and the environment
they create has the potential for enhancing its competitiveness in the market
place. Several corporate cases are included to represent examples of
corporate excellence and strategies that may be adopted by other
organizations.
According to Aldred, Carolyn77 In their work titled, “U.K. decision
increases employer duty to closely manage employee stress claims”,
(2004) the employers should ensure that they step in, investigate and
actively manage employment-related stress. In addition, employers should
apply management techniques that are more sympathetic to employee
concerns about stress. The ruling will also allow more teachers to pursue
compensation claims for stress.
75 Korn, Adam., “Stressing the point The employee” Lawyer. Vol. 18 Issue 24, 2005, p25-25, 1/2p 76 Gaumer, Carol J.; Shah, Amit J.; Ashley-Cotleur, Cathy.” Enhancing Organizational
Competitiveness: Causes and Effects of Stress on Women”, Journal of Workplace Behavioral Health, 2005, Vol. 21 Issue 2, p31-43, 13p.
77 Aldred, Carolyn. “U.K. decision increases employer duty to closely manage employee stress claims”, Business Insurance, 4/12/2004, Vol. 38 Issue 15, p17-19, 2p.
58
Noblet, Andrew78
In his article titled, “Building health promoting
work settings: identifying the relationship between work characteristics
and occupational stress”, (2003) revealed that the work characteristics,
viz, ‘social support’ and ‘job control’ accounted for large proportions of
explained variance in job satisfaction and psychological health. In addition
to these generic variables, several job-specific stressors were found to be
predictive of the strain experienced by employees.
Lewig, K. A.; Dollard, M. F.79 In their article titled, “Emotional
dissonance, emotional exhaustion and job satisfaction in call centre
workers”, (2003) confirmed the central role of emotional labour variables in
the experience of emotional exhaustion and satisfaction at work. Specifically
the research confirmed the pre-eminence of emotional dissonance compared
to a range of emotional demand variables in its potency to account for
variance in emotional exhaustion and job satisfaction. Specifically,
emotional dissonance mediated the effect of emotional labour (positive
emotions) on emotional exhaustion. Furthermore, emotional dissonance was
found to be equal in its capacity to explain variance in the outcomes
compared to the most frequently researched demand measure in the work
stress literature (psychosocial demands). Finally, emotional dissonance was
found to exacerbate the level of emotional exhaustion at high levels of
psychosocial demands, indicating jobs combining high levels of both kinds
of demands are much more risky.
78 Noblet, Andrew, “Building health promoting work settings: identifying the relationship between
work characteristics and occupational stress in Australia”, Health Promotion International, Dec2003, Vol. 18 Issue 4, p351-359, 9p.
79 Lewig, K. A.; Dollard, M. F., “Emotional dissonance, emotional exhaustion and job satisfaction in call centre workers”, European Journal of Work & Organizational Psychology, Dec2003, Vol. 12 Issue 4, p366-392, 27p.
59
Gardner, L.J.; Stough, C.80 In his research work titled,
“Exploration of the relationships between workplace Emotional
Intelligence, occupational stress and employee health”, (2003) examined
the relationship between Emotional Intelligence, occupational stress and
physical and psychological health, in 80 employees. They hypothesised that
participants reporting higher levels of Emotional Intelligence would be
better able to manage stress and would have better physical and
psychological health than those reporting lower levels of Emotional
Intelligence. The results of the study indicated that the ability to recognise
and express emotions, to manage and control emotions measured by the
Swinburne University Emotional Intelligence Test (SUEIT) were related to
wellbeing.
Fevre, Mark Le; Matheny, Jonathan; Kolt, Gregory S.81 In their
article titled, ‘Eustress, distress, and interpretation in occupational
stress.”, (2003) discussed the meaning assigned to the word ‘stress’ that has
shifted from Selye's original formulation, and that this shift, in conjunction
with the use of the Yerkes Dodson Law, leads to inappropriate management
of stress in organizations. The result revealed that some stress is good.
Performance should be rejected in favour of more useful and accurate
concepts.
80 Gardner, L.J.; Stough, C., “Exploration of the relationships between workplace Emotional
Intelligence, occupational stress and employee health”, Australian Journal of Psychology, Aug2003 Supplement, Vol. 55, p181-181, 1/4p.
81 Fevre, Mark Le; Matheny, Jonathan; Kolt, Gregory S. ‘Eustress, distress, and interpretation in occupational stress.”, Journal of Managerial Psychology, 2003, Vol. 18 Issue 7, p726-744, 19p.
60
Edwards, D.; Barnard, P.82 In their review titled, “stress is a
problem for mental health nurses but research on interventions is
insufficient”, (2003) analysed the sources of stress for mental health
included workload, poor resources, role conflict, job insecurity and client
issues. They have concluded that research about stress management
techniques is insufficient and cannot be generalized due to problems with the
methods of existing research.
Nikolaou, Ioannis; Tsaousis, Ioannis83 In their research article titled,
. “Emotional Intelligence In The Workplace: Exploring Its Effects On
Occupational Stress And Organizational Commitment”, (2002) Found
their results in the expected direction, showing a negative correlation
between emotional intelligence and stress at work, indicating that high
scorers in overall Emotional Intelligence suffered less stress related to
occupational environment. A positive correlation was also found between
emotional intelligence and organizational commitment.
Nicoll, Anne84 In her research work titled, “employee stress claims
are rising: what you can do about it”, (2002) discussed the importance of
considering the impact of the September 11, 2001 terrorist attacks on
employees in Canada, effect of increased layoffs on employees; discussion
on incentive to be proactive in the workforce; management processes that
have helped manage time loss.
82 Edwards, D.; Barnard, P. “Review: stress is a problem for mental health nurses but research on
interventions is insufficient”, Evidence-Based Mental Health, Nov2003, Vol. 6 Issue 4, p126-126, 1p.
83 Nikolaou, Ioannis; Tsaousis, Ioannis. “Emotional Intelligence In The Workplace: Exploring Its Effects On Occupational Stress And Organizational Commitment”, International Journal of Organizational Analysis (1993 - 2002), 2002, Vol. 10 Issue 4, p327, 16p.
84 Nicoll, Anne. “employee stress claims are rising: what you can do about it”, HR Professional, Feb/Mar2002, Vol. 19 Issue 1, p23, 2p.
61
Morris, Jodi E.; Long, Bonita C.85 In their article titled, “Female
Clerical Workers' Occupational Stress: The Role of Person and Social
Resources, Negative Affectivity, and Stress Appraisals”, (2002) tested
main, moderating, and mediating effects of appraisals on the relationship
between resources and change in depression and partially replicated on an
independent sample, which controlled for negative affectivity (a pervasive
tendency toward negative emotionality). Results were consistent with
predictions that primary appraisals (i.e., threats to self-esteem) contribute to
change in depression beyond the effects of person and social resources and
negative affectivity. There was modest evidence that control appraisals
moderate the effects of optimism and work support.
Rees, Christopher J.; Redfern, David86
In their article titled,
“Recognising the perceived causes of stress--a training and development
perspective”, (2000) aimed to provide examples of how different
perspectives of occupational stress can be identified and highlighted.
Training and development specialists can play an important role in ensuring
that a balanced and eclectic approach to occupational stress is adopted in the
workplace.
Lyne, Kenneth D.; Barrett, Paul T.; Williams, Christine; Coaley,
Keith87
In their review titled, “A psychometric evaluation of the
85 Morris, Jodi E.; Long, Bonita C. “Female Clerical Workers' Occupational Stress: The Role of
Person and Social Resources, Negative Affectivity, and Stress Appraisals”, Journal of Counseling Psychology, Oct2002, Vol. 49 Issue 4, p395, 16p.
86 Rees, Christopher J.; Redfern, David “Recognising the perceived causes of stress--a training and
development perspective”, Industrial & Commercial Training, 2000, Vol. 32 Issue 4, p120-127, 8p.
87 Lyne, Kenneth D.; Barrett, Paul T.; Williams, Christine; Coaley, Keith. “A psychometric
evaluation of the Occupational Stress Indicator”, Journal of Occupational & Organizational Psychology, Jun2000, Vol. 73 Issue 2, p195-220, 26p.
62
Occupational Stress Indicator”, Journal of Occupational &
Organizational Psychology,” (2000) examined the degree to which the
psychometric structure of the test was reflected in the published score key.
The three datasets were comprehensively analysed using item analysis and
exploratory factor analysis. Their study concluded that the current norms for
the test were of dubious validity and findings were replicated.
Hlen, Craig R.; Cluskey Jr., G. R.; Rivers, Richard A.88 In their
research work titled, “Reducing Stress from Workload Compression:
Coping Strategies That Work in CPA Firms”, (2000) conducted a study
on accounting practitioners titled ‘reducing stress from work load
comparison – coping strategies that work in CPA firms’ according to them
the practising accountants experience greater stress in October (than in
February) since during october they have high job demands of that work.
Zohar, Dov89
In his review titled, “When things go wrong: The
effect of daily work hassles on effort, exertion and negative mood”,
(1999) discussed the effect of occupational hassles on negative mood and
effort exertion. Using pooled-time series analysis on daily records of a
sample of military jump masters (parachute trainers), it was shown that
hassles severity predicted end-of-day mood, fatigue and subjective
workload. Author indicated that, despite their transient nature, daily hassles
at work constitute a significant factor whose effect has been overlooked by
available methods of occupational stress.
88 Ehlen, Craig R.; Cluskey Jr., G. R.; Rivers, Richard A. “Reducing Stress from Workload
Compression: Coping Strategies That Work in CPA Firms”, Journal of Applied Business Research, Winter2000, Vol. 16 Issue 1, p9, 7p.
89 Zohar, Dov. “When things go wrong: The effect of daily work hassles on effort, exertion and negative mood”, Journal of Occupational & Organizational Psychology, Sep99, Vol. 72 Issue 3, p265-283, 19p.
63
Savery, Lawson K.90 In his article titled, “The Influence of Social
Support on the Reaction of an Employee.” (1988) discussed the influence
of social support groups on relieving occupational stress among employees
resulting in an increase of job satisfaction and productivity. The study was
conducted on the role of various social support agents on occupational
performance and stress.
Garnitz, Rick91
In his article titled, “Managing the
interrelationship of work, family and finances”, (1988) discussed the
need for employers to address the interrelationship of work, family and
finances. They emphasise on employee self-reliance and empowering
employees through education and suggest evolving work-life benefit
programs to relieve employee stress.
Struebing, Laura92 In their article titled, “Eight ways to reduce
employee stress”, (1996) expressed that according to the American Society
for Training and Development (ASTD). They have conducted survey in
several manufacturing units in various states in United States, such as
California, Peru, chille. They have found that many of the employees have
stress related health problems hence they suggested to Teach people to
negotiate alternatives; Setting realistic deadlines; Paying for overtime hours
in time; Encouraging regular exercise, Offering nutritious snacks during
breaks.
90 Savery, Lawson K., “The Influence of Social Support on the Reaction of an Employee.”, Journal
of Managerial Psychology, 1988, Vol. 3 Issue 1, p27, 5p. 91 Garnitz, Rick. “Managing the interrelationship of work, family and finances”, Employee Benefits
Journal, Mar1998, Vol. 23 Issue 1, p18, 2p. 92 Struebing, Laura. “Eight ways to reduce employee stress”, Quality Progress, Jul96, Vol. 29 Issue
7, p14, 2p.
64
Leong, C. S.; Furnham, Adrian; Cooper, Cary L.93
In their
research article titled, “The Moderating Effect of Organizational
Commitment on the Occupational Stress Outcome Relationship”, (1996)
attempted to examine the effect of organizational commitment as a
moderator of the stress-outcome of administrative officers from various
departments of a public sector organization. Each completed a questioner
with six scale measurement to identify the Occupational Stress Indicator.
The questioner had six questions relating to stressors, six relating to coping
strategies, three relating to type A behaviour, three to locus of control as
well as three outcome measures.
Hurrell Jr., Joseph J. 94 In their article titled, “Police work,
occupational stress and individual coping”, (1995) studied the selection of
employees on the basis of their ability to cope with organizational stressors
or training them to better tolerate. Indeed, altering the job or aspects of the
organization as a means of reducing employee stress, represents a preferred
approach because the focus is on changing the source of the problem
(stressors), not the symptoms of stress.
Heaney, Catherine A.; Price, Richard H.; Rafferty, Jane95 In their
article titled, “Increasing coping resources at work: a field experiment to
93 Leong, C. S.; Furnham, Adrian; Cooper, Cary L. “The Moderating Effect of Organizational
Commitment on the Occupational Stress Outcome Relationship”, Human Relations, Oct96, Vol. 49 Issue 10, p1345-1363, 19p.
94 Hurrell Jr., Joseph J. “Police work, occupational stress and individual coping”, Journal of Organizational Behavior, Jan95, Vol. 16 Issue 1, p27-28, 2p.
95 Heaney, Catherine A.; Price, Richard H.; Rafferty, Jane. “Increasing coping resources at work: a field experiment to increase social support, improve work team functioning, and enhance employee mental health”, Journal of Organizational Behavior, Jul95, Vol. 16 Issue 4, p335-352, 18p.
65
increase social support, improve work team functioning, and enhance
employee mental health”, (1995) have indicated that the field experiment
enhanced the work team climate and reduced depressive symptoms. Also
according the experiment, though who are at high risk are willing for
relieving their job. And dissatisfaction in those most at risk for leaving their
jobs. The program was also effective in increasing the amount of supervisor
support received on the job and strengthening perceptions of coping abilities
in those workers most likely to participate in the program.
Bogg, Janet and Cooper, Cary96 In their review titled, “Job
Satisfaction, Mental Health, and Occupational Stress Among Senior
Civil Servants”, (1995) have indicated that the main sources of stress
among the senior civil servants were "factors intrinsic to the job" such as
poor pay and working conditions, and a strong feeling of possessing little
control over their job and their organization.
Savery, Lawson K.97
In their research work titled, “Effect of
Motivators on Job Satisfaction”, (1987) have pointed out the effect of
motivators on job satisfaction. Perceptions of the enterprise’s concern with
and the people's desire for, intrinsic and extrinsic motivators, role of
immediate supervisors and their subordinates act as motivators for job
satisfaction.
96 Bogg, Janet and Cooper, Cary “Job Satisfaction, Mental Health, and Occupational Stress Among
Senior Civil Servants”, Human Relations; Mar95, Vol. 48 Issue 3, p327-341, 15p. 97 Savery, Lawson K., “Effect of Motivators on Job Satisfaction”, Journal of Managerial Psychology,
1987, Vol. 2 Issue 3, p28, 4p.
66
CONCLUSION
The above studies concentrated on various aspects of HRM practices
on stress management followed by both government and private
organisations including, telecom, hospital, school, bank, sugar mill, safety
and health, colleges, universities, police, insurance, professionals like
lawyer, doctor, home makers, IT, off shore operations, manufacturing, hotel,
training and development sector, transport and others. Few of the above
studies deal with physical and mental performance of employees and their
stress management. The studies rarely highlighted the occupational stress
and health of the employees. There was no comprehensive study to realise
the job satisfaction and job stress among the employees of paper industry
especially its factory workers whose jobs are stressful and risky. The studies
failed to measure:
i. what was the level of attitude and perception of the employees
towards Human Resource Management followed by paper
industry in Tamilnadu
ii. what was the level of job stress among employees in paper
industry, and
iii. what was the relationship between job stress and health of the
employees
These issues have not been addressed by the earlier studies in paper
industry. Having this fact in mind, the researcher has made an attempt to
address the above social issues in the paper industry of Tamilnadu.
67
CHAPTER – III
PAPER INDUSTRY – AN OVERVIEW
3.1 INTRODUCTION TO PAPER INDUSTRY:
It is fact that paper is inevitable for the development of human race,
and the economy of country. Hence the paper industry of any country plays
vital role. In this chapter how the present material form of paper has come in
to existence, how they worked paper industry is, the role of Indian paper
industry and that of Tamilnadu are explained.
The origin of paper goes to the early Egyptian civilization. The
Egyptians used the stalks of the papyrus plant to manufacture a material
resembling paper. Several changes have been made and many new materials
have been used in the paper making process, but base of most papers is still
fiber form plant.
3.2 HISTRICAL DEVELOPMENT OF PAPER INDUSTRY IN THE
WORLD
Paper making can be traced to about 105 AD, when T’Sai Lun, an
official in the imperial court of China created a sheet of paper using
mulberry and other bast fibres along with fishnets, old rags and hemp
waste.98 In its slow travel westward, the art of papermaking reached
Samarkand, in central asia, in 751 AD and in 793 AD the first paper was
made in Baghdad during the time of Harunat-Rashid, with the golden age of
98 http://great100persons.blogspot.com/2009/09/07tsai-lun.html.
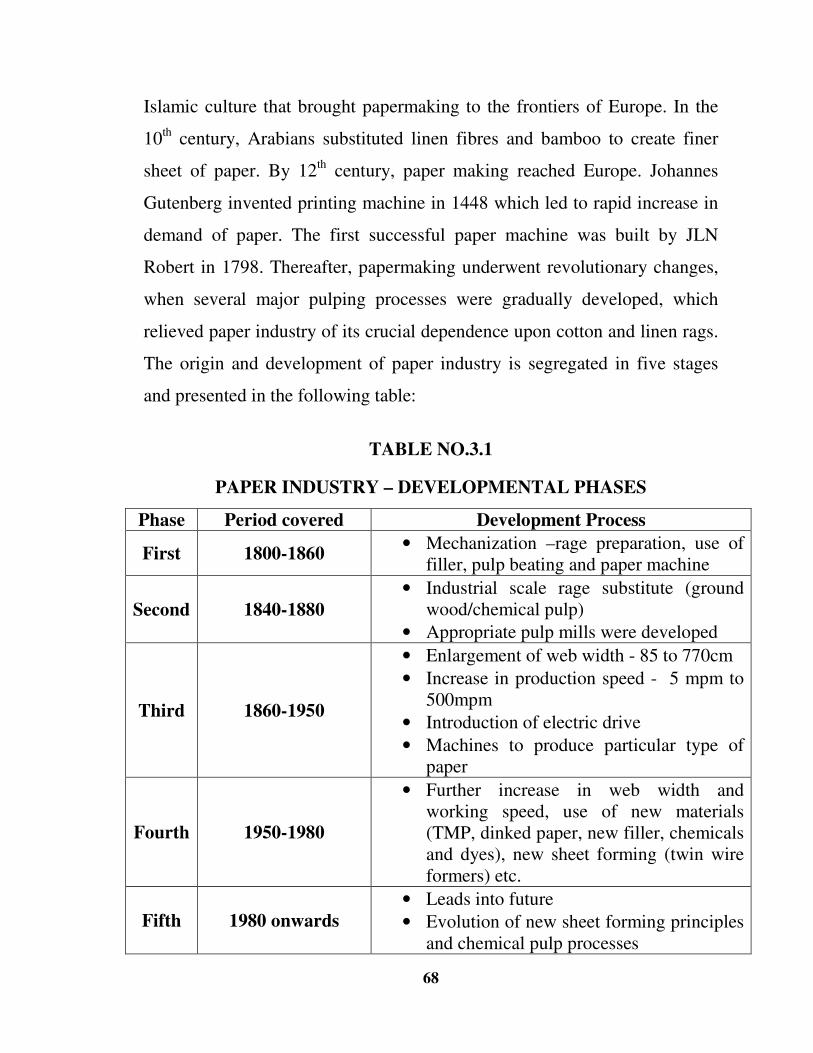
68
Islamic culture that brought papermaking to the frontiers of Europe. In the
10th century, Arabians substituted linen fibres and bamboo to create finer
sheet of paper. By 12th century, paper making reached Europe. Johannes
Gutenberg invented printing machine in 1448 which led to rapid increase in
demand of paper. The first successful paper machine was built by JLN
Robert in 1798. Thereafter, papermaking underwent revolutionary changes,
when several major pulping processes were gradually developed, which
relieved paper industry of its crucial dependence upon cotton and linen rags.
The origin and development of paper industry is segregated in five stages
and presented in the following table:
TABLE NO.3.1
PAPER INDUSTRY – DEVELOPMENTAL PHASES
Phase Period covered Development Process
First 1800-1860 • Mechanization –rage preparation, use of
filler, pulp beating and paper machine
Second 1840-1880
• Industrial scale rage substitute (ground wood/chemical pulp)
• Appropriate pulp mills were developed
Third 1860-1950
• Enlargement of web width - 85 to 770cm
• Increase in production speed - 5 mpm to 500mpm
• Introduction of electric drive
• Machines to produce particular type of paper
Fourth 1950-1980
• Further increase in web width and working speed, use of new materials (TMP, dinked paper, new filler, chemicals and dyes), new sheet forming (twin wire formers) etc.
Fifth 1980 onwards
• Leads into future
• Evolution of new sheet forming principles and chemical pulp processes
69
3.3 VARIOUS PAPER PRODUCTS:
3.3.1 TYPES OF PAPERS PRODUCED IN PAPER INDUSTRY
There are different types and grades of paper for different uses, which
are often reflected in their names. Coated text and cover are used for the
majority of four-color printing. Uncoated text and cover are also used
regularly. Bond, book, offset, label, index, and news-print are some of the
other grades used commercially. Paper choice can make a major difference
in the appearance of the finished job. A dull or plain design can be perked up
with an exciting color or texture.
a) Coated Papers
It is best suited for higher-quality jobs. Coated papers may be gloss-
coated, dull-coated, machine-coated, and cast-coated on one or both sides.
Printing ink does not soak into a coated sheet as much as it does with an
uncoated paper. So, coated papers can make halftones and color images
look richer. Coated papers are associated with corporate capability brochures
and annual reports. Since coated papers come in several grades and prices,
user should not have to shy away from using them. Today, more and more
coated papers are recycled, which also lowers their costs.
b) Uncoated Papers
Uncoated papers are also known as text. These papers can be
excellent sheets for printing. Some uncoated papers are so smooth that it's
hard to tell that they're not coated. Uncoated papers are manufactured in

70
many textures and colors. Uncoated papers are used for halftones, when the
designer is trying to achieve a certain effect or look.
c) Bond
It is often used for stationery. It takes ink well from a laser printer or
a pen. Part of this absorbency comes from the paper's rag content, which is
the percentage of cotton fiber in a sheet of bond. Twenty five per cent or 50
percent is the usual amount added.
d) Note Book Paper
It is used, for books and textbooks. These papers come in antique or
smooth finishes. They also come in many weight so that a book can be
bulked up or down.
e) Offset Papers
It is similar to the coated and uncoated sheets. It resists the moisture
that occurs in offset printing.
f) Index Papers
It is stiff. It takes writing ink well. Index papers are less expensive
than cover grades. Index papers are used for cards or tabs and are also used
in place of the more expensive cover stocks. They come in a smooth or
vellum finish.
71
g) Newsprint Papers
As their name suggests, they are used for newspapers. The sheets are
not as white as other papers. Ink tends to soak into them. Being relatively
inexpensive, newsprint is ideal for the large volumes of paper that modern
newspapers need.
h) Computer Paper
This is the general term used to describe paper used in a computer. It
can also refer to paper used with a copier or for a laser printer. Although the
“fan-fold” paper was probably the Copier Paper, or just plain bond paper.
This is because of the move from the dot-matrix printer to the laser and
inkjet printers. If so, take a look below for some valuable information that
may help you in your search.
i) Copier Paper
It is standard paper used for copies. It is 20 per grams square meter,
thin and somewhat transparent. Copier Paper has many different properties
that affect the quality of the copies. White Point - Contrast is a key element
between the toner and the paper. The whiter the paper the better your copies,
Texture- The smoother the paper, the better the toner transfers to it.
Smoother paper gives sharper copies and better fills. Smooth paper,
however, can sometimes be difficult to feed.

72
j) Coating
Coating paper needs some type of clay or dust coating to help the
paper separate and feed it. Most copier paper will have some type of
indicator to show which side should be copied on.
k) Gloss Paper
It is ideal for photographic images, posters and printing of graphic
designs. Matte Paper -is a high resolution bright white coated paper. Ideal is
for everyday printing and it features superior drying properties.
l) Picture Paper
It is water resistant. It dries spontaneously for easy handling. This
inkjet paper, in the popular 4" x 6" format, is ideal for consumer use.
m) Inkjet Paper
If the task is a printing of a document an email or memo, plain copier
paper will work best. If color is important, then coated paper stock is
preferred. Coated paper allows colors to be sharper than regular copier
paper. A high level of coating allows for a high print resolution from 600 dpi
-1440 dpi. There are many different types of paper available. But, only
coated papers designed specifically for inkjet printers, will give the highest
quality output.
73
The product segments in the paper industry can be broadly classified
as newsprint, printing and writing paper, industrial paper and specialty
papers. Based on the primary raw material used, the companies in the paper
industry are categorizing in to wood based, agro based and waste paper
based companies.
Some of the paper products are sheet paper, paper boxes, tissues,
paper bags, stationery, envelopes, and printed-paper products such as books,
periodicals, and newspapers. Specialty papers like sandpaper, blueprint
paper, carbon paper are not a part of paper products industry. Stationery
includes greeting cards, printing and writing papers, school and office
papers. The toiletry products include paper towels, tissue paper, and bath
tissue.
3.3.2. VARIOUS TYPES OF PAPER INDUSTRY:-
a) Wood Based industry
Forest policy should be revised wish a view to raising plantation by
industry/Cooperatives of farmers/State Government.
b) Waste Paper based Industry
Introduction of ecolabeling system wherein products made from
recycled fibre, are rated higher than the products made from virgin fibre.
74
c) Agro Based Industry
Funds are made available for technology up-gradation for handling
and processing of agro residue fibre, in small and medium scale industries.
3.4 WORLD PAPER INDUSTRY
Although modern inventions and engineering have transformed an
ancient craft into a highly technical industry, the basic operations in
papermaking remain the same to this day. The steps in the process are as
follows (1) suspension of cellulose fibre is prepared by beating it in water,
so that the fibres are throughly separated and saturated with water; (2) the
paper stock is filtered on a woven screen to form a matted sheet of fibre; (3)
the wet sheet is pressed and compacted to squeeze out a large proportion of
water; (4) the remaining water is removed by evaporation; and (5) depending
upon the use and requirements, the dry paper sheet is further compressed,
coated or impregnated. The differences among various grades and types of
paper are determined by the type of fibre or pulp, the degree of beating, the
addition of various materials to stock, formation conditions of the sheet,
including basis weight, or substance per unit are, and the physical or
chemical treatment applied to the paper after its formation.
Government has completely delicensed the paper industry with effect
from 17th July, 1997. The entrepreneurs are now required to file an Industrial
Entrepreneur Memorandum with the Secretariat for Industrial Assistance for
75
setting up a new paper mill or substantial expansion of the existing mill in
permissible locations. 99
The new millennium is going to be the millennium of knowledge. So
demand for paper would go on increasing in times to come. In view of paper
industry's strategic role for the society and also for the overall industrial
growth, it is necessary that the paper industry performs well. The Paper
industry is a priority sector for foreign collaboration and foreign equity
participation up to 100 percent receives automatic approval by Reserve Bank
of India. Several fiscal incentives have also been provided to the paper
industry, particularly to those mills which are based on non-conventional
raw material.
Global production of paper and paper board was around 350 million
tons which contributes to about 3.5 percent of world‘s Industrial production
and 2 percentage of world’s trade. India was ranked 15th in the World in
terms of paper and boards production capacity.
The world paper industry was growing at a CAGR (Compound
Annual Growth Rate) of 2.8 percent with a per capita consumption of 45
Kilograms. The per capita consumption is 152 Kilograms in developed
countries and 12 Kilograms in developing countries and in India it is around
6 Kilograms.
The per capita consumption of paper in Asian countries is shown in
Table No.3.2.
99 Das Subir, “Future Prospects of Paper Industry”, Savvica Inc., Gurragon, India, 2011,
http://nuvvo.com/lesson/15902-future-prospects-of-paper-industry
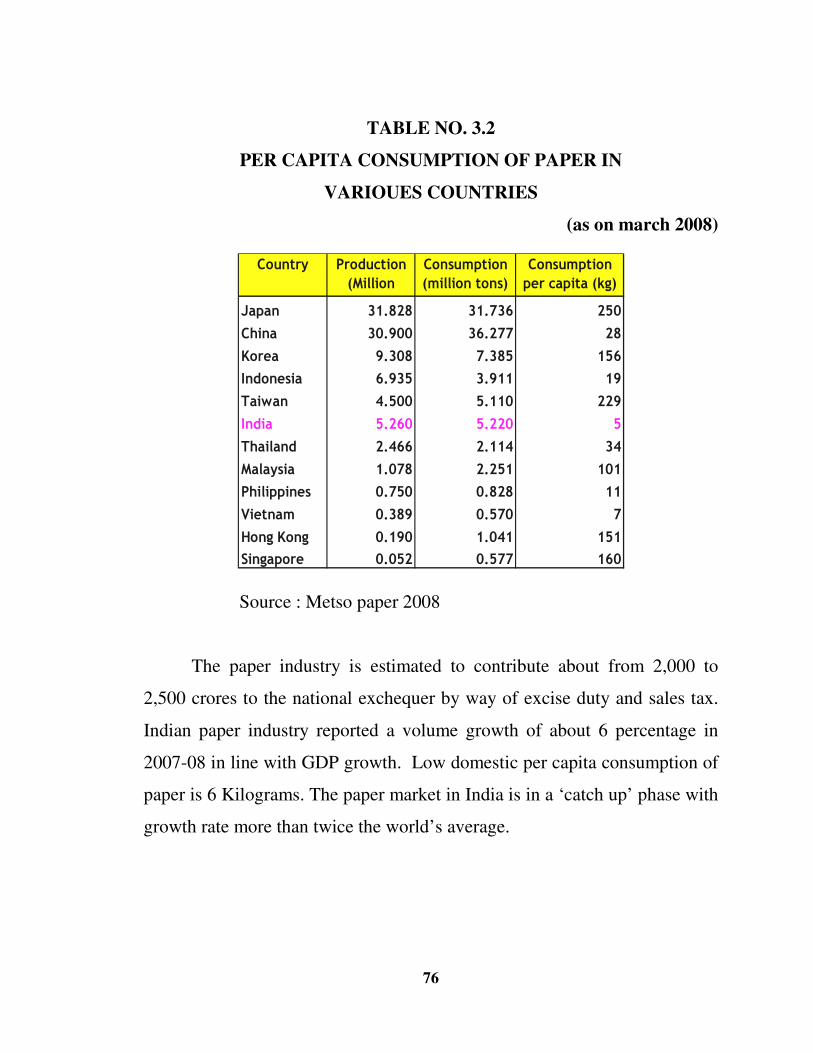
76
TABLE NO. 3.2
PER CAPITA CONSUMPTION OF PAPER IN
VARIOUES COUNTRIES
(as on march 2008)
Country Production
(Million
tons)
Consumption
(million tons)
Consumption
per capita (kg)
Japan 31.828 31.736 250
China 30.900 36.277 28
Korea 9.308 7.385 156
Indonesia 6.935 3.911 19
Taiwan 4.500 5.110 229
India 5.260 5.220 5
Thailand 2.466 2.114 34
Malaysia 1.078 2.251 101
Philippines 0.750 0.828 11
Vietnam 0.389 0.570 7
Hong Kong 0.190 1.041 151
Singapore 0.052 0.577 160
Source : Metso paper 2008
The paper industry is estimated to contribute about from 2,000 to
2,500 crores to the national exchequer by way of excise duty and sales tax.
Indian paper industry reported a volume growth of about 6 percentage in
2007-08 in line with GDP growth. Low domestic per capita consumption of
paper is 6 Kilograms. The paper market in India is in a ‘catch up’ phase with
growth rate more than twice the world’s average.
77
3.4.1 GLOBAL COMPETITIVENESS
With India becoming a member of World Trade Organization, it has
become important for the Indian industry to develop a strategy to become
globally competitive. During the phase of industrialization after
independence, the immediate focus of this industry was essentially on
growth and expansion. In a regulated market under a mixed economy, it had
developed a feeling of complacence. For a long time, it often compromised
quality, perhaps due to monopolistic conditions in a closed market scenario.
Indeed, for several decades, a major part of the Indian paper industry never
really came to attach significance to terms such as market forces, economy
of scale, quality and customer satisfaction.
Demand of Paper has been around 15 per cent. During the years
2006-09. While newsprint registered a growth of 13 per cent, Writing and
Printing paper, Container board, Carton board and others registered growth
of 5 per cent, 11 per cent, 9 per cent and 1 per cent respectively. So far, the
growth in paper industry has mirrored the growth in GDP and has grown on
an average 6-7 per cent over the last few years. The futuristic view is that
growth in paper consumption would be in multiples of GDP. Hence, an
increase in consumption by one kg per capita would lead to an increase in
demand of 1 million tons.
As per the estimation of industry, paper production is likely to grow at
a CAGR (Compound Aggregate Growth Rate) of 8.4 per cent where as
paper consumption will grow at a CAGR of 9 per cent till 2012-13. The
import of pulp & paper products is likely to show a growing trend. During
last few years, the Indian paper market witnessed a five-fold jump in the
78
import of coated paper. The total import of this paper rose to 10,000 tons in
2008.100
3.5 PAPER INDUSTRY IN INDIA
In India, first machine-made paper was manufactured in 1812. During
this time there were 15 mills with a total production of lakh tones. In India
the soft wood is the principal raw material used for making paper especially
newsprint and high class printing papers. With rise in population and
broadening of education, the demand for paper has been constantly
escalated. Owing to very narrow forest resources, wood pulp is in a shortage.
As soft woods grow in temperate climate, India is in short supply of such
woods. Thus, in such circumstances, the Bamboo became the major raw
materials for the manufacture of paper in the country as it grows very
quickly even after cutting
Paper industry primarily depends upon forest-based raw materials.
The first paper mill in India was set up at Sreerampur, West Bengal, in the
year 1812. It uses grasses and jute as raw material. Large scale mechanized
technology of papermaking was introduced in India in early 1905. Since the
raw material for the paper industry underwent a number of changes over a
period of time, wood , bamboo, and other non-conventional raw materials
have been developed for use in the papermaking. The Indian pulp and paper
industry at present is very well developed and established. Now, the paper
industry is categorized as forest-based, agro-based and others (waste paper,
secondary fibre, bast fibres and market pulp).
100 http://www.ipma.co.in/paper_industry_overview.asp
79
In 1951, there were 17 paper mills but, today there are about 400 units
engaged in the manufacture of paper, paperboards and newsprint in India.
The pulp and paper industries in India have been categorized into large-scale
and small-scale. Those paper industries, which have the capacity of above
24,000 tonnes per annum, are designated as large-scale paper industries.
India is self-sufficient in manufacture of most varieties of paper and
paperboards. Import is confined only to certain specialty papers. To meet
part of its raw material needs, the industry has to rely on the imported wood
pulp and waste paper.101
Growth of paper industry in India has been constrained due to high
cost of production caused by inadequate availability and high cost of raw
materials, power cost and concentration of mills in one particular area.
Government has taken several policy measures to remove the bottlenecks of
availability of raw materials and infrastructure development.
India is facing era of profound economical change. Economic
liberalization and reduced import duties for paper as well as paper product
has triggered a significant restructuring in the India pulp and paper industry.
The domestic supplier’s ability to meet the rapidly growing demand of
printing industry of paper product is limited by the high quality fiber
shortage and also technology gap prevailing in India. Securing the fiber
supply is an important precondition for the growth of the domestic pulp and
paper industry. Surging environmental awareness and concern with
mounting economic limitation has forced many mills not available in the
dynamic market environment. The shift from small to medium and large
101 http://www.cpcb.nic.in/oldwebsite/News%20Letters/Archives/Cleaner%20Production
%20Options%20for%20Pulp%20&%20Paper%20Industry/ch2-CLEANPRO.html

80
scale operation has become important due to the erosion of important tariff
barriers and consequent supply pressures from abroad. The changing market
scenario made paper manufacturers to rethink and plan the strategies to
sustain future markets. The industry has to respond with a challenge to the
change in situation prevailing in paper market.
3.5.1. POSITION OF INDIAN PAPER INDUSTRY:
Paper industry in India is the 15th largest paper industry in the world.
It provides employment to nearly 1.3 million people and contributes Rs.25
billion to the government's kitty. The government regards the paper industry
as one of the 35 high priority industries of the country.
India’s population is forecast to grow from 923 million in 1994 to
1.23 billion by 2010, corresponding to an average long term growth rate of
1.8 per cent the literacy rate in India has been sturdily growing (52 per cent)
in 1995 to at least 70 to 75 per cent during next ten years. The average GDP
growth is expected to remind at beyond 8 to 9 per cent per annum in the next
5 to 10 years and for every increase of one per cent in GDP paper demand
increases by one lakhs tones annually. The Indian paper industry is highly
fragmented with the capacity of paper mills ranging from 3300 tons per
annum to 2 lakhs tons per annum
It is estimated that 400 paper mills are in India with total capacity
about 51 lakhs tpa (1999-2000). Of the total effective capacity of 51 lakhs
tons per annum 39 per cent is accounted for wood based units. And 32 per
cent by agro residual based mills. The total supply in the country including
all grades from organized sector was about 28.3 lakhs tones in 1994-95 and
38.8 lakhs during 1999-2000.
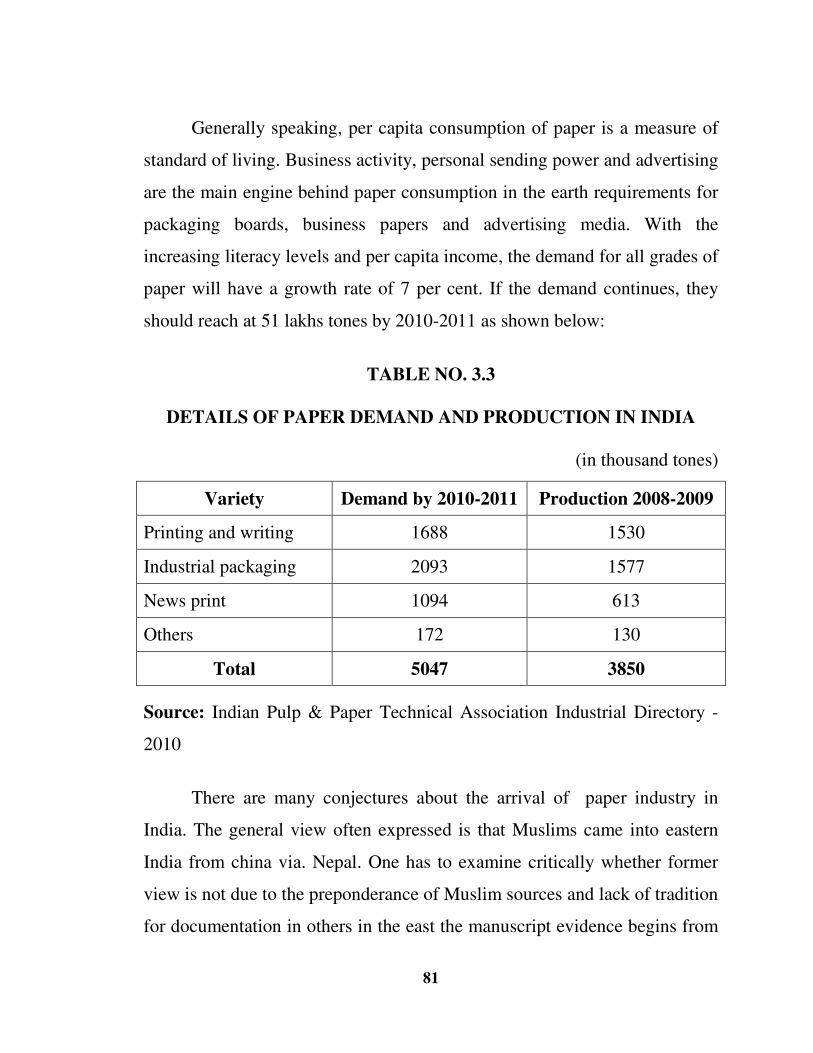
81
Generally speaking, per capita consumption of paper is a measure of
standard of living. Business activity, personal sending power and advertising
are the main engine behind paper consumption in the earth requirements for
packaging boards, business papers and advertising media. With the
increasing literacy levels and per capita income, the demand for all grades of
paper will have a growth rate of 7 per cent. If the demand continues, they
should reach at 51 lakhs tones by 2010-2011 as shown below:
TABLE NO. 3.3
DETAILS OF PAPER DEMAND AND PRODUCTION IN INDIA
(in thousand tones)
Variety Demand by 2010-2011 Production 2008-2009
Printing and writing 1688 1530
Industrial packaging 2093 1577
News print 1094 613
Others 172 130
Total 5047 3850
Source: Indian Pulp & Paper Technical Association Industrial Directory -
2010
There are many conjectures about the arrival of paper industry in
India. The general view often expressed is that Muslims came into eastern
India from china via. Nepal. One has to examine critically whether former
view is not due to the preponderance of Muslim sources and lack of tradition
for documentation in others in the east the manuscript evidence begins from

82
the 12th century onwards and these are non-Muslims libraries. in both eastern
and western India, Hindu, Buddhist and Jain manuscript libraries made
extensive use of papers. But only after Muslim conquest of India, records of
invention, use and manufacture of paper are scant in non-Muslim sources.
Indian Paper Industry accounts for about 1.6 per cent of the world’s
production of paper and paperboard. The estimated turnover of the industry
is Rs 25,000 crore, and its contribution to the exchequer is around Rs. 2918
crore.
Demand of paper has been around 15 per cent. During 2006-09,
newsprint registered a growth of 13 per cent. Newsprint and publication
paper consumption account for 2 million tonnes, of which 1.2 million tonnes
of newsprint paper is manufactured in India and the remaining 0.8 million
tonnes is imported.
The industry provides employment to more than 3 million people
directly and another 1 million people indirectly.
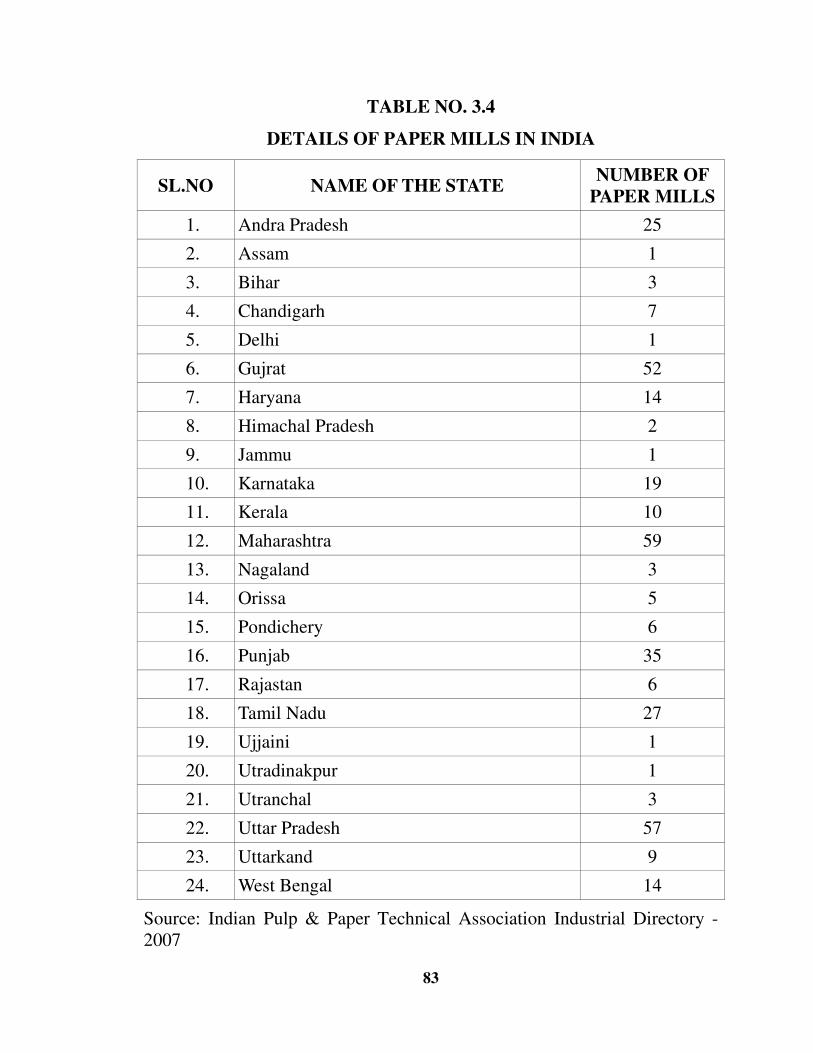
83
TABLE NO. 3.4
DETAILS OF PAPER MILLS IN INDIA
SL.NO NAME OF THE STATE NUMBER OF
PAPER MILLS
1. Andra Pradesh 25
2. Assam 1
3. Bihar 3
4. Chandigarh 7
5. Delhi 1
6. Gujrat 52
7. Haryana 14
8. Himachal Pradesh 2
9. Jammu 1
10. Karnataka 19
11. Kerala 10
12. Maharashtra 59
13. Nagaland 3
14. Orissa 5
15. Pondichery 6
16. Punjab 35
17. Rajastan 6
18. Tamil Nadu 27
19. Ujjaini 1
20. Utradinakpur 1
21. Utranchal 3
22. Uttar Pradesh 57
23. Uttarkand 9
24. West Bengal 14
Source: Indian Pulp & Paper Technical Association Industrial Directory - 2007

84
3.5.2 PAPER INDUSTRY AFTER ECONOMIC REFORMS
With liberalization, the industry is thrown open to competition from
mills abroad without providing a level field. Shortage of fiber supply, high
cost of energy and old technology has plagued the industry. The three years
ending with the financial year 2005-2006 has been extremely difficult for the
paper industry. In the domestic market, the supply outstripped the demand.
Improved newsprint was available at rock bottom prices. Domestic
newsprint prices have been rolled back by 30 per cent. As the prices in the
international market were ruling low, export of printing and writing from the
country also dwindled down. Even now the industry is under the grip of
several recessions.
Now, with the global economic slowdown, the demand for newsprint
has started declining from January 2001. Consequently, the prices in the
international have become soft since January 2001. This has begun to affect
the price in the domestic market. Over supplying Asia has also affected the
printing and writing papers segment since January 2001. Unlike in the past
when a market downturn would seriously impact its profitability, the mills
can do reasonably well by cost reduction of imported pulp and flexibility in
product mix.
The last decade of the twentieth century will certainly be characterized
as one of accelerating globalization. Although individual countries and
regions of the globe experience change and react to it in unique ways, it is
clear that they are becoming increasingly interdependent. Corporations are
becoming more and more multinational through expansion, mergers, and
acquisitions. Trade barriers are falling away. Public policy issues, notably
85
those concerning environment, are having worldwide impact,
democratization is changing social and political patterns in the direction of
increased co-operation and accord. The pulp and paper industry worldwide is
dearly a participant and is profoundly affected by these changes. An
international perspective is essential today, both in developing longer term
strategy and in making shorter term business decisions.
The Indian paper industry presents a unique picture, with a mix of
large and small paper mills, having capacities ranging from 5 to 600 tonnes
per day, with an average size of 11,500 tonnes per year. There are more
than 400 pulp and paper mills produce nearly 6.2 million tonnes per year of
paper and board as against its installed capacity of 8.6 million tonnes. The
industry has a turnover of more than Rs.25000 Crore, employing nearly
3,00,000 people directly and another one million indirectly.
But in the wake of the economic liberalization, triggered by the new
economic policy of the government in 1991, the Indian paper industry found
itself confronted with international competition. Almost overnight, the
industry was exposed to the difficult task of integrating into the global
economy. This also had an evolutionary effect on the traditional Indian
management style, triggering a serious redesign of strategies to ensure
survival. Today, the concept of globalization, eco-cycle compatibility and
other environmental issues are being integrated at the planning level by the
major domestic players.
Among the above three segments of the Indian paper industry, the
forest-based pulp and paper industry is slowly moving towards
competitiveness through adequate modernization. However, a significant
86
proportion of this segment has yet to undertake modernization programs.
Areas identified for technological improvement in these mills include the
installation of oxygen delignification for low kappa pulp and improved
online control of stock preparation and paper machines.
In the agro-residue-based segment, there are a few mills complying
with quality and environmental requirements. Furthermore, the majority of
units do not have the proper technology to produce good quality products at
a competitive price. This segment is also having serious environmental
problems due to the lack of chemical recovery systems.
Major portions of this segment require modernization to become
competitive. Upgrading pulp washing systems to reduce the organic
carryover to the bleach plant, extracting the maximum amount of chemicals
(addition of extra rotary drum washer) and building a common chemical
recovery plant for a cluster of mills have been identified as the main
technological initiatives needed.
The third segment, recycled fibre, also has a number of small pulp and
paper mills that are based on obsolete technology. One of the major concerns
of these mills is a lack of adequate equipment for processing recycled fibre.
As a consequence, the quality of paper products produced from these mills
does not conform to international standards. The competitiveness of this
segment without modernization would be poor. Among the areas identified
for improvement in this sector are upgrades of secondary fibre processing
systems and the installation of a common effluent treatment plant for a
cluster of mills.
87
In a vibrant, growth-oriented economy, the demand for paper is
expected to be increasing, which in turn is expected to foster growth in the
Indian paper industry. Pressure for technological improvements is also
closely tied to demands for greater environmental responsibility in the
country. The industry has to comply with the Charter on Corporate
Responsibility for Environmental Protection (CREP) wherein the emission
limits have already been fixed for the future.
3.5.3. PROBLEMS AND ISSUES OF INDIAN PAPER INDUSTRY
The Indian paper industry faces the following problems
(1) Non-availability of good quality of raw materials:
It is obvious that a right combination of pulp and paper markets and
wood raw materials is a prerequisite for developing new industries and
establishes a basis for selecting the type and size of the development. While
domestic or regional markets in the tropical countries are often relatively
limited and can support a type and size of plant which would not be
internationally competitive, these markets are often protected and can in
some cases accept products which are not of the best quality. To be
competitive on international markets, pulp and paper development normally
needs large quantities of wood at relatively low cost. The type and quality of
wood which a pulp and paper mill can use from the technical point of view
and the price the mill can afford to pay for the wood vary widely depending
on the market. The three basic and most important questions regarding the
feasibility of using wood for pulp and paper production are thus:
88
1. Markets for products,
2. Type and quality of wood,
3. Quantity and cost of wood.
Forecasting future markets is a well-established and relatively simple
procedure which needs no further discussion within the scope of this paper.
Classifying the wood to be either coniferous or broad-leaved type is
sufficient to indicate the broad pulp and paper categories for which it can be
used. Regarding quality, an extremely important factor is uniformity of
wood in terms of uniform density and uniform fibre dimensions. Other
factors affecting quality are hemi-cellulose, extractive and parenchymatic
and vessel cell contents in the wood. It should be noted that, while the
softwood species have a wider and more versatile use for pulp and paper
products than hardwood species, long-fibred softwood cannot be said to be
of better quality than short-fibred hardwood without specifying for what
product the wood is used and without considering product quality
requirements and economics of operation.
(2) Lack of modernization and basic infrastructure:
This point explains the investments in modernization and innovation
on productivity in a sample of firms in the global pulp and paper industry.
This industry is important because it has traditionally accounted for
significant amounts of employment and capital investment. In contrast to
much of the existing literature which focuses on the impact of R&D and
patents on firms’ performance and productivity, actual investment
transactions in four main areas of operations such as mechanicals,
chemicals, monitoring devices and Information technology.
89
We find that firms which made decisions to implement a greater
number of investment transactions in modernization achieved higher
productivity, and these estimated quantitative effects are greater than the
impact of standard innovation variables such as patents and R&D.
3. Increased emerging environmental issues
a) Deforestation
Worldwide consumption of paper has risen by 400% in the past 40
years, with 35% of harvested trees being used for paper manufacture.
Logging of old growth forests accounts for less than 10% of wood pulp, but
is one of the most controversial issues. Plantation forest, from where the
majority of wood for pulping is obtained, is generally a monoculture and this
raises concerns over the ecological effects of the practice. Wood chipping to
produce paper pulp is a contentious environmental issue in the world.
b) Air pollution
Nitrogen dioxide (NO2) sulfur dioxide (SO2) and carbon dioxide
(CO2) are all emitted during paper manufacturing. Nitrogen dioxide and
sulfur dioxide are major contributors of acid rain, where as CO2 is
a greenhouse gas responsible for climate change.
c) Water pollution
Waste water discharges for a pulp and paper mill contains solids,
nutrients and dissolved organic matter, and unless at low levels these are
classed as pollutants. Organic matter dissolved in fresh water, measured
90
by Biological Oxygen Demand (BOD), changes ecological characteristics,
and in worse case scenarios leads to death of all higher living organisms..
(3) Resource Development
The problem of practice described in this paper is a resource
allocation problem in innovation. And how make resource allocation
decisions in Research and Development. More specifically, the paper will
investigate contextual patterns as to when organizations rely on markets
versus hierarchies in technological innovation. Based on the taxonomy of the
decision making process, this paper will describe trajectories along which
economic entities make resource allocation decisions and suggest a
framework linking decision making variables with strategic considerations.
Currently companies face pressures not only from the customers and
competitors but also from other agents of the distribution channel such a
retailers and wholesalers. In this situation, companies are trying to
differentiate themselves from domestic and international competition
through innovation, branding and product marketing. However, decisions in
innovation are becoming more complex since new technologies involve high
risk and uncertainty. Moreover, consumer expectations have continuously
risen and continue to challenge manufacturers in the area of product cost,
speed to market, and innovative feature sets. The question that professionals
like how to innovate in an environment that is shaped by high uncertainty
and volatility, where suppliers and collaborators can become competitors
and vice versa. Moreover, these situations are subject to the opportunistic
behavior of the economic agents. Moreover, companies talk about core
competencies in a competitive world.
91
3.5.4 PAPER MANUFACTURE CENTRES IN INDIA
With the rapid demand of writing materials, the paper making centres
were established in different parts of the country like in Sialkot (Punjab);
Zafarabad in district Jaunpur (Oudh); Bihar Sharif in district Azimabad
(Patna) and Arwal in district Gaya (Bihar); Murshidabad and Hooghly
(Bengal) ; Ahmedabad, Khambat and Patan (Gujarat) ; and Aurangabad and
Mysore in the south.
• Out of these, the Punjab was the leading centre. Sialkot paper was
white in colour and very thick. It was used throughout Punjab.
• In Uttar Pradesh, Zafarabad is a famous town in Jaunpur district. It
was known as Kaghdi Shahar (paper city) in olden times. It produced
a very fine, glossy and strong variety of bamboo paper. Generally, two
varieties of paper were produced here. The first was the polished
paper, which was exceedingly glossy, and the second was unpolished
paper.
• Bihar had two major papermaking centers in medieval times. The first
was Arwal town in district Gaya, and the second was Bihar Sharif in
district Azimabad (Patna).
• In Bengal, Murshidabad and Hooghly were the major papermaking
centers in the medieval times. At a later period, Dinajpur also started
manufacturing paper.
• After some time, Gujarat developed as the largest producer of paper.
It supplied paper to the rest of India and also exported it to the West,
other Asian countries and Turkey also. In Gujarat, Ahmedabad was
the largest papermaking centre. It produced white and glossy paper.

92
• During the Mughal period, Daulatabad, having Aurangabad as its
capital, emerged as an important papermaking center. The most
remarkable feature of Daulatabadi paper was its durability and
glossiness. Daulatabad was the chief supply centre of paper to south
India.
• Tipu Sultan developed papermaking centres in Mysore. The paper
produced by Mysore was a high quality paper, which was employed
only for royal use.
• Other big paper making centres of medieval India were: Sanganer (in
Jaipur, Rajasthan), Kotah (Rajasthan), Tijarah (in Alwar, Rajasthan),
Kannauj (in Farrukhabad, Uttar Pradesh), Kalpi and Pukharayan in
Kanpur (Uttar Pradesh), Maler-Kotlal (Punjab), Hariharganj(in district
Shahabad, Bihar), Kalita (in district Pabna, now in Bangladesh),
Panchamnagar (in district Damoh, Madhya Pradesh), Dharangaon and
Erandel town (in district East Khandesh, Maharashtra) and Poona.
Generally Indian papermaking centres produced glazed paper.
Rahman has categorized ancient paper into seven categories: Kashmiri,
Ahmedabadi, Hyderabadi, Faizabadi, Khasah-i-Jahangiri, Kanpuri and
Aurangabadi.
• Ahmedabadi paper was a little thick and was of two qualities: fine and
superfine. The paper had extra whiteness and glossiness.
• Kashmiri paper was thick and glazed. Some Kashmiri centres
produced superfine paper called silken paper.
• Khasah-i-Jahangiri paper was made at Sialkot. The paper was glossy,
thin, polished and bluish white.
93
• Hyderabadi paper was well glazed; some was polished and of brown
colour with very fine shades.
• Faizabadi paper had three varieties: i) unpolished paper (medium
quality); ii) pale yellow; and iii) polished dark yellow.
• Kanpuri paper was prepared from bamboo and was greyish in colour.
• Aurangabadi paper was glossy and thick. It had a few varieties like,
Bahadur Khani (medium quality paper, thick, stout and durable),
Sahib Khani paper (medium quality, thick), Murad Shahi paper (fine
quality), Sharbati paper (thick and fine), Qasim Begi paper (thick),
Ruba-Kari paper (This variety was made in to four or five different
grades) and Balapuri paper (four or five varieties of different colures).
3.5.5 ECONOMIC ASPECTS OF PAPER INDUSTRY
There are, at present, about 400 units engaged in the manufacture of
paper, paperboards and newsprint in India. The country is almost self-
sufficient in manufacture of most varieties of paper and paperboards. Import,
however, is confined only to certain specialty papers. To meet part of its raw
material needs, the industry has to rely on the imported wood pulp and waste
paper. Production of paper and paperboard during the year 2007-08 was
24.52 lakhs tonnes. At present, about 60.8 per cent of the total production is
based on non-wood raw material and 39.2 per cent is based on wood.
Performance of the industry is constrained due to high cost of
production caused by inadequate availability, high cost of raw materials,
power cost and concentration of mills in one particular area. Several policy
measures are initiated in recent years to remove the bottlenecks of
availability of raw materials and infrastructure development. The capacity
94
utilization of the industry is low at 60 percentage. About 125 paper mills,
particularly small mills, are sick and are lying closed. Several policy
measures have been initiated in recent years.
The import of paper and paper products has been growing over the
years. However, it increased during 2009-10 after a fall in 2008-09. About
70,000 tons of paper was exported in 2009-10 mainly to the neighbour
countries. India's per capita consumption of paper is around 6.00 kg, which
is one of the lowest in the world. With an expected increase in literacy rate
and growth of the economy, an increase in the per capita consumption of
paper is expected.
3.6 PAPER INDUSTRY IN TAMIL NADU
Tamil Nadu is one of the well developed states in terms of industrial
development. It has enjoyed a significant position in India’s geopolitical
space and economic progress. Logistical advantages due to presence of three
major seaports, an international airport and several domestic airports, quality
of human resources, a peaceful industrial climate and a positive work culture
have strengthened Tamil Nadu’s standing in the industrial world. The State’s
business-friendly policies and proactive initiatives have played a key role in
this resurgence.
Tamil Nadu continues to be one of the forerunners in the production
of paper and paper products. There are 28 paper mills in operation in Tamil
Nadu. The total paper production was 3.7 lakh tons in 2005 - 06, which
accounts for 17.30 per cent share of the national production, next only to
Andhra Pradesh. As the country’s forest cover is much below the desired
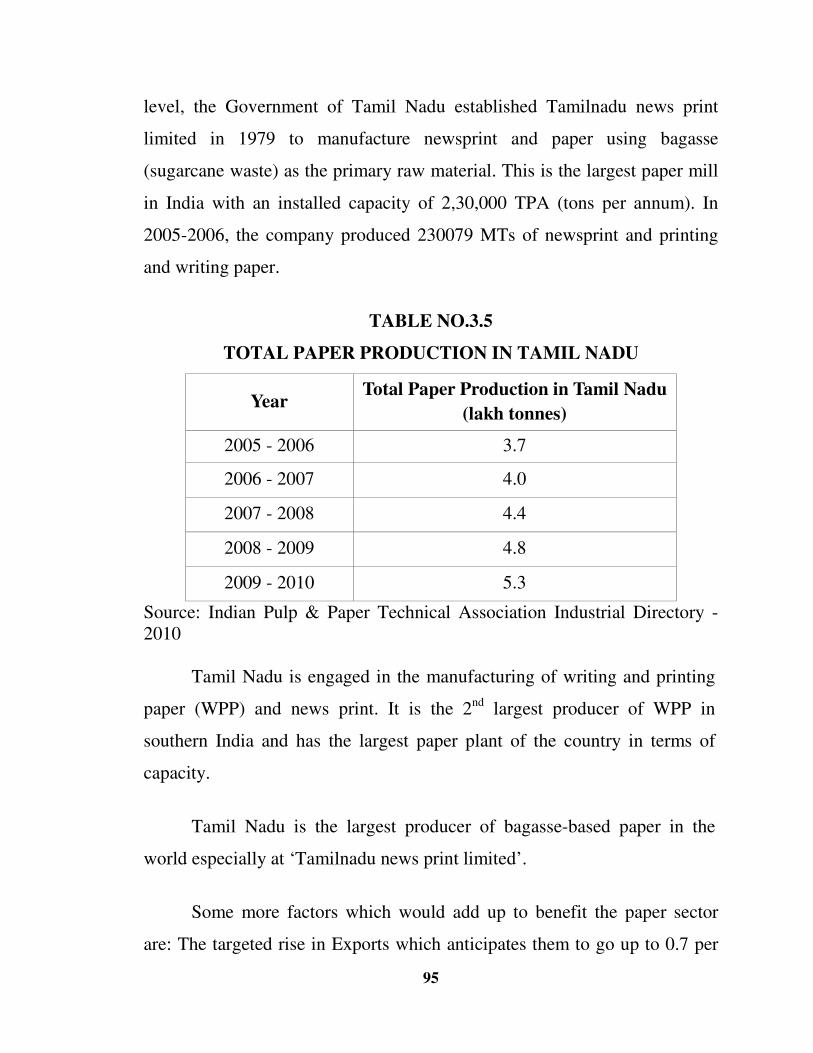
95
level, the Government of Tamil Nadu established Tamilnadu news print
limited in 1979 to manufacture newsprint and paper using bagasse
(sugarcane waste) as the primary raw material. This is the largest paper mill
in India with an installed capacity of 2,30,000 TPA (tons per annum). In
2005-2006, the company produced 230079 MTs of newsprint and printing
and writing paper.
TABLE NO.3.5
TOTAL PAPER PRODUCTION IN TAMIL NADU
Year Total Paper Production in Tamil Nadu
(lakh tonnes)
2005 - 2006 3.7
2006 - 2007 4.0
2007 - 2008 4.4
2008 - 2009 4.8
2009 - 2010 5.3
Source: Indian Pulp & Paper Technical Association Industrial Directory - 2010
Tamil Nadu is engaged in the manufacturing of writing and printing
paper (WPP) and news print. It is the 2nd largest producer of WPP in
southern India and has the largest paper plant of the country in terms of
capacity.
Tamil Nadu is the largest producer of bagasse-based paper in the
world especially at ‘Tamilnadu news print limited’.
Some more factors which would add up to benefit the paper sector
are: The targeted rise in Exports which anticipates them to go up to 0.7 per
96
cent of global trade, Increased agriculture export which would also benefit
the sector in terms of increased demand for packaging material, similar
would be the effect of a booming Indian Retail Market & Robust FMCG
players.
3.6.1 MAJOR PLAYERS IN TAMILNDAU
The following are the of the paper units are major player in Tamilnadu
A) Tamil Nadu Newsprint and Papers Ltd.
B) Seshasayee Paper and Boards Ltd.,
C) Sun Paper Mill Ltd.
D) Subburaj Papers Ltd.
The particulars of operational efficiency and other details of such
units are given in Annexure part of this report.
3.6.2 ROLE OF PAPER INDUSTRY IN ECONOMIC DEVELOPMENT
Paper industry is the second largest sector providing employment to
0.3 million directly and about 1 million people indirectly. Industry turnover
is 120 billion rupees and contributes about 2.3 percentage of overall Indian
industry’s output. Generally, the composition of Indian paper industry is
wood-based (35-40 percent) and non-wood based (60-65 percent). The wood
based industries are functioning under imported/indigenous hardwood/
softwood, bamboo and the non wood based industries are classified as agro-
residue based (functions under baggase and sabai grass, Jute/rag, wheat
straw) and waste paper based (imported/ indigenous waste paper,
97
corrugated/kraft waste paper, waste cuttings). The end products of paper
industry are classified under
(i) Cultural paper accounts for 44 percentage of total domestic
demand. It consists of writing and printing paper, office stationery,
communication paper and specialty paper such as cheques and
currency papers. The demand is a function of the GDP, the
population, the literacy levels, and the standard of living.
(ii) Industrial paper accounts for 43 percentage the total demand in
India. It consists of kraft paper, pulp board and duplex board, and is
used in packaging applications. Demand depends on growth in
industrial production, consumer durables, processed food, and other
kind of packaging. This segment is relatively price inelastic.
(iii) Newsprint accounts for 80 percentage of the output. It depends on
the number of newspapers, the size of the paper and the circulation. It
has been placed under the OGL which means that newspaper
companies are free to import any quantity of newsprint.
Large size mills (above 50,000 tpa) are reasonably modern and
efficient but design capacities of world paper machines are about 20-
30 times the capacity of the best Indian paper machines. Smaller size
machines result in higher energy consumption besides quality
constraints. Quality benchmarking with international standards
improved technology are being used for cleaner, brighter and stronger
paper. High speed machines of more than 1000 mpm are not many in
India.

98
Paper industry represents an important segment of the Indian
economy. The Industry has witnessed. A steady increase in installed
capacity and production over the decades. The paper industry in India is
primarily tree-free as 62 per cent of the market is catered by paper products
from non-conventional raw material like agro-waste, agro-resides and
recycled papers. The demand is estimated to be around 84.80 lakh tons in
2012-2014 on the basis of growth rate of 6.5 per cent for the period 2007-08
to 2012-2014.
At present, there are about 400 mills in the country with an annual
installed capacity of about 51 lakh tons. They account for more than 5 per
cent of the total installed capacity and production. At present, the capacity
utilization in the paper industry is about 67 percent, as 125 paper mills
particularly small mills are sick and are lying closed. Several fiscal
incentives have also been provided to the paper industry, particularly to
those mills which are based on non-conventional raw material. Import was
2.20 lakhs tons in 2009-10 and 3.05 lakhs tons in 2010-11. It is estimated to
be almost 4.20 lakh tons in 2011-12. About 70,000 tons of paper is exported
per annum mainly to the neigh bouring countries.
India is the 10th largest industrialized sector in the world and it
accounts for Asia’s 4th largest economy. The GDP growth rate is around
7 percent, one of the highest in the world and the GNP per capita is
Rs.21,9576 or GNP 22,834 billion rupees. The economy size contributed to
US $ 600 billion, growing @ 6 percent for the last five years. The value of
exports (2007-08) is Rs.28,3605 crore and the values of Imports (2007-08)
is Rs 34,6475.
99
3.6.3 NEWSPAPER DEVELOPMENT COMMISSION:
Newspaper Development Commission was started in 1st September
1982. The commission proposed the establishment of a Newspaper
Development Commission (NDC) funded by a newsprint cess (ie specific
tax) and an advertisement tax to help the growth of Indian-language, local
and other small and medium newspapers. As well as owning large swathes
of Pondicherry, the ashram also employs half its citizens in cottage
industries producing goods ranging from perfumes to paper it even runs a
number of guesthouses including the Seaside Guest house.
The State, once a pioneer in the industry, has been virtually wiped out
from the country's paper production map, Andhra Pradesh, Tamil Nadu,
Gujarat, Punjab, Uttar Pradesh, and Orissa were playing an important role
for the continuous growth and development of the domestic paper industry.
And The Calcutta Paper Traders Association (2008) CPTA has urged the
West Bengal Government to take a fresh initiative to revive the State's paper
industry. Tamil nadu, Punjab, Uttar Pradesh and Orissa were playing an
important role for the continuous growth and development of the domestic
paper industry.
Industries and Finance Secretaries (2004) considered it wiser to spend
the money meant for Tamil Nadu News Print Ltd TNPL on ten mini paper
mills to which they have not polluted the rivers. The paper industry is one
example, before 2003, there was no excise duty on the first clearance of
paper up to 2500 tonnes. Thereafter, the rate of duty was 16 per cent. The
sales tax levied on paper was about 10 per cent in Tamil Nadu.
100
In order to improve the strength of the paper, spray starches were
developed. Modified starches were also used in food industries as a
thickener. It acted as a binding agent to improve consistency and shelf life of
the product. In 22 colleges in Karnataka, Tamil Nadu, Andhra Pradesh and
Kerala the smart card has been introduced and the benefits The benefits of
the system are many. The lecturers and students have become tech-savvy.
There is saving in terms of usage of paper.
State Industries Department has recently carried out an exercise to
assess the requirements of technically trained manpower in sectors like
mainly Paper, Engineering & Auto, Textiles and Chemicals. A company has
launched a Rs 66-crore project for life cycle extension of the first paper
machine. This was completed by March. Mr.Farooqui, who is the Tamil
Nadu Secretary for Industries, said that the company has also embarked on a
backward integration.
Selection is based on Tamil Nadu Common Admissions (TANCA)
Test. During this period, newsprint, writing & printing, container board,
carton board and others registered growth of 13 per cent, 5 per cent, 11 per
cent, 9 per cent and 1 per cent respectively. The Indian Paper Industry
accounts for about 1.6 per cent of the world's production of paper and
paperboard.
With complete Implementation of the Mill Development plan in all
respects, the company has moved from conventional bleaching to Elemental
Chlorine Free process. The Paper industry is expected to grow to10 million
tonnes by 2010 and to 15 million tonnes by 2015.
101
3.7 CONCLUSION
The paper industry has been providing noble mobility services to the
public more than hundred years. It has a vast fleet strength catering the paper
needs of our state with the aim of extending economical and efficient service
facility. Though it adhered to strict rules and procedures formulated by the
state government, in resolving the grievances of employees and in
understanding their attitude. Streamlining the Human Resource practices
would be very essential to implement the best practices and enable the
detailed study of the occupational stress of the employees.
102
CHAPTER – IV
AN OVERVIEW OF OCCUPATIONAL STRESS
4.1 INTRODUCTION
Stress is an inherent factor in any type of vocation or career. At its
best, the presence of stress can be a motivator that urges the individual to
strive for excellence. However, excess amounts of stress can lead to a lack of
productivity, a loss of confidence, and the inability to perform routine tasks.
As a result, quality employees lose their enthusiasm for their work and
eventually withdraw from the company.
Occupational Stress is defined in terms of its psychological and
physiological effects on a person (or thing). Stress is mental, physical or
emotional strain or tension or it is a situation or factor that can cause this.
Occupational stress occurs, when there is a discrepancy between the
demands of the environment/workplace and an individual’s ability to carry
out and complete these demands .Often a stressor can lead the body to have a
physiological effect, which, in turn, will result in strain on a person
physically as well as mentally. One of the main causes of occupational stress
is work overload. Occupational stress is often caused by an increased
workload without the addition of employees to take on that additional work.
Instead, the increased amount of work is given to the current employees to
finish it in the same time span that they would be asked to finish their
regular or standard workload.
103
During the middle of the 20th century, employers began to initiate
programs to help corporate cultures in an effort to minimize the amount of
productive stress found in the workplace. For many companies, With the
working definition in place, employers began to utilize resources such as
confidential reporting methods, professional counselling, and employee
committees to identify areas, where the corporate climate could be enhanced
and reduce stress levels at the same time.
The human body has a natural chemical response to a threat or
demand, commonly known as the “flight or fight” reaction, which includes
the release of adrenalin. Once the threat or demand is over, the body can
return to its natural state. A stressor is an event or set of conditions that
causes a stress response. Stress is the body’s physiological response to the
stressor, and strain is the body’s longer-term reaction to chronic stress.
Occupational stress can affect one’s health, when the stressors of the
workplace exceed the employee’s ability to have some control over their
situation.102
This has led to stressful working conditions for employees who might
have to face problems due to with:
• Downsizing/Privatization
• Hiring freezes
• Contingent work
• Shift work/Rotating schedules
• Quality Programs/Worker Participation schemes
102
Baker, D.B. (1985). The study of stress at work. Annual Review of Public Health, 6, 367-381.
104
4.2 SOURCES OF STRESS:
The following are the important sources of stress.
• Little autonomy or control over one’s job
• Non-existent career ladders
• Inadequate resources to do the job
• High demands, workload, time pressures
• Lack of job security
• Understaffing
• Mandatory overtime
• Violence/Harassment103
4.3 CAUSES FOR STRESS IN PAPER INDUSTRY
Some scholars note that an increase in workload, a hostile work
environment, downsizing and shift work can result in occupational stress.
Often workloads remain immense, although the employee does his or her
best to complete them. The high demand and time pressures contribute to the
stress. There is privatizing of a company downsizing might occur. When
downsizing occurs, employees are laid off or fired. Those who still have
their jobs have to worry about whether they will be next on the list of
employees to be laid off. Those who have been laid off, have to deal with the
stressful situation of finding another job. If superiors aren’t supportive,
discriminate towards certain employees while favouring others, do not offer
encouragement or create a hostile work environment, this can cause stress
103 Ashkanasy, N., Hartel, C., & Zerbe, W. (2000). Emotions in the workplace: research, theory, and
practice. London: Quorum Books.
105
for an employee. Interpersonal conflicts within the workplace, uncertainty
about the stability of job security and underutilized job abilities are also
causes for occupational stress.
4.4 EFFECTS OF STRESS ON EMPLOYEES
Physical symptoms due to occupational stress are fatigue, headache,
stomach problems, muscles aches and pains, chronic mild illness, sleep
disturbances and eating disorders. Psychological and behavioural problems
of stress are anxiety, irritability, alcohol and drug use, feeling powerless and
low morale. If exposure to stressors in the workplace is prolonged, then
chronic health problems can occur including stroke. The studies among the
Japanese population specifically showed. That there is a more than 2-fold
increase in the risk of total stroke among men with job strain (combination
of high job demand and low job) control. Along with the risk of stroke, high
blood pressure comes. and immune system dysfunctions. Prolonged
occupational stress can lead to occupational burnout.104
4.5 STRESS MODELS
Over the years, the tools are used to identify and effectively deal with
occupational stress. Today, there is a standard occupational stress index that
is used in many stress management programs to assess the potential for
negative stress to undermine one or more employees. There are also various
incarnations of an occupational stress indicator listing that can help
individuals determine if general conditions have the potential to lead to
unhealthy stress levels.
104 Beehr, T. (1998). An organizational psychology meta-model of occupational stress. In C. L.
Cooper (Ed.), Theories of Organizational Stress. (pp. 6-27). Oxford: Oxford University Press
106
In response to tools such as the occupational stress scale, counselling
and employee training programs often include individual and group
counselling opportunities. These programs seek to teach employers and
employees how to look at the workplace objectively, then take steps to
contain or eliminate factors that are likely to undermine the confidence and
function of employees. As a result, the company enjoys a higher level of
productivity and the employee enjoys a more positive work environment
within a company that is more likely to provide employment for many years.
The Demand Control model and the Effort Reward Imbalance model
are two work stress models that help to identify particular job characteristics
for employee’s well being. The Demand Control model predicts that the
most adverse health effects of psychological strain occur, when job demands
are high and decision latitude is low. The Effort Reward Imbalance model
assumes that emotional distress and adverse health effects occur, when there
is an imbalance between efforts and occupational rewards. These models are
able to help employees and managers understand the correlation between job
demand and high emotional and physiological distress. If so, more
preventive actions can be taken.
4.5.1 OCCUPATIONAL BURNOUT PREVENTION
Occupational burnout is characterized by exhaustion, cynicism, and
reduced professional efficacy within the workplace. More accurately
defined, exhaustion refers to the depletion or draining of emotional
resources. Cynicism refers to the indifference or distant attitude of work, and
reduced professional efficacy refers to the lack of satisfaction with
past/present expectations. Occupational burnout is typically and particularly

107
found within the human service professions. Such jobs that naturally
experience high amounts of occupational burnout include: social workers,
nurses, teachers, lawyers, physicians, and police officers. The reason why
burnout is so prevalent in the human service professions is due in part to the
high stress environment, emotional investment.
In order to quell occupational burnout, it is important to reduce or
remove the negative aspects of the three main components that make up
occupational burnout. However, it is difficult to treat all three components as
the three burnout symptoms. It reacts differently to the same preventive or
treatment activities. Exhaustion is more easily treated than cynicism and
professional efficacy, which tend to be more resistant to treatment.
Burnout prevention programs in the past, focused on cognitive-
behavior, cognitive restructuring, didactic stress management, and
relaxation. These types of prevention programs rely on reducing the
exhaustion component of occupational burnout. However, recent research
indicates that, at the individual level, cognitive-behavioral strategies have
the best potential for success. It is more complicated at the organizational
level, where reducing or removing job stressors have been shown to
decrease burnout. Burnout experts believe that a strategy of combining both
organizational and individual level activities may be the most beneficial
approach to reduce the three main symptoms in order to reduce occupational
burnout. Improving upon job-person fit by focusing attention on the
relationship between the person and the job situation appears to be a
promising way to deal with burnout.
108
The individuals, who are most vulnerable to occupational burnout are
ones who are strongly motivated, dedicated, and involved in the work in
which they partake. As work for these individuals is a source of importance
in which they derive meaning in life, it is significant that they find meaning
by achieving their goals and expectations. Therefore, the process of burning
out is the realization and reflection of the failure to find meaning and growth
in life.
Occupational burnout is associated with increased work experience,
increased workload, absenteeism and time missed from work, impaired
empathy and cynical attitudes toward clientele, and thoughts of quitting.105
4.5.2 Employee Rehabilitation
Employee rehabilitation is defined as a tertiary preventive intervention
which means the strategies used to alleviate, as well as prevent, burnout
symptoms. Such rehabilitation of the working population includes
multidisciplinary activities with the intent of maintaining and improving
employees’ working ability and ensuring a supply of skilled and capable
labour in society.
4.5.3 Insulation from Burnout
Several studies suggest that social-cognitive processes such as
commitment to work, self-efficacy, learned resourcefulness, and hope may
insulate individuals from experiencing occupational burnout.
105 Blonna R., ‘Coping with stress in a changing world’ Tata McGraw Hill Edition, New Delhi
(2000).

109
4.6 STRESS MANAGEMENT IN PAPER INDUSTY
Stress management is the amelioration of stress and especially chronic
stress often for the purpose of improving everyday functioning. Stress
produces numerous symptoms which vary according to persons, situations,
and severity. These can include physical health decline as well as
depression.
4.6.1 Transactional model
Richard Lazarus and Susan Folk man suggested in 1984 that stress
can be thought of as resulting from an “imbalance between demands and
resources” or as occurring when “pressure exceeds one's perceived ability to
cope”. Stress management was developed and premised on the idea that
stress is not a direct response to a stressor but rather one’s resources and
ability to cope with and mediate the stress response and are amenable to
change, thus allowing stress to be controllable.
In order to develop an effective stress management programme it is
first necessary to identify the factors that are central to a person controlling
his/her stress, and to identify the intervention methods which effectively
target these factors. Lazarus and Folk man’s interpretation of stress focuses
on the transaction between people and their external environment (known as
the Transactional Model). The model conceptualizes stress as a result of how
a stressor is appraised and how a person appraises his/her resources to cope
with the stressor. The model breaks the stressor deficient coping strategies,
stress may not necessarily follow the presence of a potential stressor.
110
The model proposes that stress can be reduced by helping stressed
people change their perceptions of stressors, providing them with strategies
to help them cope and improving their confidence in their ability to do so.106
4.6.2 Health realization health model
The health realization/innate health model of stress is also founded on
the idea that stress does not necessarily follow the presence of a potential
stressor. Instead of focusing on the individual's appraisal of so-called
stressors in relation to his or her own coping skills, the health realization
model focuses on the nature of thought, stating that it is ultimately a person's
thought processes that determine the response to potentially stressful
external circumstances. In this model, stress results from appraising oneself
and one's circumstances through a mental filter of insecurity and negativity,
whereas a feeling of well-being results from approaching the world with a
"quiet mind," "inner wisdom," and "common sense".
This model proposes that helping stressed individuals to understand
the nature of thought-especially providing them with the ability to recognize
when they are in the grip of insecure thinking, disengage from it, and access
natural positive feelings-will reduce their stress.
4.6.3 Measuring stress in paper industry
Levels of stress can be measured. The use of the Holmes and Rahe
Stress Scale is be one way to rate stressful life events. Changes in blood
pressure and galvanic skin response can also be measured to test stress
106 Cartwright, S., & Cooper, C.L. (1997). Managing Workplace Stress. Thousand Oaks, California:
Sage Publications.
111
levels, and changes in stress levels. A digital thermometer can be used to
evaluate changes in skin temperature, which can indicate the activation of
the fight-or-flight response drawing blood away from the extremities.
4.6.4 Effectiveness of stress management in paper industry
Positive outcomes are observed using a combination of non-drug
interventions.
• treatment of anger or hostility,
• autogenic training
• talking therapy (around relationship or existential issues)
• biofeedback
• cognitive therapy for anxiety or clinical depression
Work-life balance is a broad concept including proper prioritizing
between "work" (career and ambition) on one hand and "life" (pleasure,
leisure, family and spiritual development) on the other.
4.6.5 Work statistics
According to a survey conducted by the National Life Insurance
Company, four out of ten employees state that their jobs are "very" or
"extremely" stressful. Those in high stress jobs are three times more likely
than others to suffer from stress-related medical conditions and are twice as
likely to quit. The study states that women, in particular, report stress,
related to the conflict between work and family.
112
4.7 STRESS AND WORK LIFE BALANCE IN PAPER INDUSTRY
The number of stress-related disability claimed by American
employees has doubled according to the Employee Assistance Professionals
Association in Arlington, Virginia. Seventy-five to ninety percent of
physician visits are related to stress. According to the American Institute of
Stress, the cost to industry has been estimated at $200 billion-$300 billion a
year.
Steven L. Sauter, Chief of the Applied Psychology and Ergonomics
Branch of the National Institute for Occupational Safety and Health in
Cincinnati, Ohio, states that recent studies show that "the workplace has
become the single greatest source of stress". Michael Feuerstein, Professor
of clinical psychology at the Uniformed Services University of the Health
Sciences at Bethesda Naval Hospital states, "We're seeing a greater increase
in work-related neuroskeletal disorders from a combination of stress and
ergonomic stressors".
It is clear that problems caused by stress have become a major
concern to both employers and employees. Symptoms of stress are
manifested both physiologically and psychologically. Persistent stress can
result in cardiovascular disease, sexual health problems, a weaker immune
system and frequent headaches, stiff muscles, or backache. It can also result
in poor coping skills, irritability, jumpiness, insecurity, exhaustion, and
difficulty in concentrating. Stress may also perpetuate or lead to binge
eating, smoking, and alcohol consumption.
113
According to James Campbell Quick, a professor of organizational
behavior at the University of Texas-Arlington, “The average tenure of
presidents at land-grant universities in the past ten years has dropped from
approximately seven to three-and-a-half years”.
“To get ahead, a seventy-hour work week is the new standard. What
little time is left is often divided up among relationships, kids, and sleep.”
This increase in work hours over the past two decades means that less time
will be spent with family, friends, and community as well as pursuing
activities that one enjoys and taking the time to grow personally and
spiritually.
Texas Quick, an expert witness at trials of companies who were
accused of overworking their employees, states that “when people get
worked beyond their capacity, companies pay the price.” Although some
employers believe that workers should reduce their own stress by
simplifying their lives and making a better effort to care for their health,
more experts feel that the chief responsibility for reducing stress should be
management.
According to Esther M. Orioli, President of Essi Systems, a stress
management consulting firm, “Traditional stress-management programs
placed the responsibility of reducing stress on the individual rather than on
the organization-where it belongs. No matter how healthy individual
employees are when they start out, if they work in a dysfunctional system,
they’ll burn out”.
114
4.7.1 Responsibilities of the employer
Companies have begun to realize how important the work-life balance
is to the productivity and creativity of their employees. Research by Kenexa
Research Institute in 2007 shows that those employees who were more
favorable toward their organization’s efforts to support work-life balance
also indicated a much lower intent to leave the organization.
Employers can offer a range of different programs and initiatives,
such as flexible working arrangements in the form of part time, casual and
telecommuting work. More proactive employers can provide compulsory
leave, strict maximum hours and foster an environment that encourages
employees not to continue working after hours.
4.7.2 Changes in Workplace to Reduce Stress
This handout assumes a working knowledge of the relationship
between occupational stress and both psychological and physical strain,
including cardiovascular disease. It is assured that some of the
organizational costs of high stress levels to your workplace and employees
have been identified. Another key assumption is that you are interested in a
change strategy that includes structural, or organizational change. The
approach discussed in this handout views individual approaches as
augmenting, not replacing organizational change. Finally, it is assumed that
the employee has the opportunity to improve the quality of work in their
working organization.
115
If these assumptions are correct, health and possibly the productivity
of your employees. This handout will detail this process of healthy
organizational change. Basically, this handout has two goals: 1. Identifying
the major features of healthy organizational change. 2. Developing
organizational and individual change strategies.
This handout will not review various theoretical models of change. It
is intended to be a concrete and practical guide for healthy organizational
change. For a review of theoretical models and references for additional
examples, one can refer to Interventions to Reduce Job Strain. A serious
organizational change effort has two important levels to it. The first is the
content of the change and the second is the process of the change. In
common terms, the content of change is what you want to do and the process
is how you are going to do it. In practical terms, the process of the change
effort is the more crucial aspect. The primary goal of any change process
needs to reflect that overarching goal. 107
4.7.3 Real Commitment to Stress Reduction
Probably, the most important step in healthy organizational change is
to make a serious and sustained commitment to it. In non-unionized
workplaces, this commitment should be made by top management. In
unionized workplaces, both top management and union representatives need
to be involved. Healthy organizational change takes lot of time. No serious
change effort should be initiated with a time frame limited to weeks or a few
months. Healthy organizational change includes employee health and
107 Dwivedi R.S. ‘Human Relations and organizational Behaviour’ Macmillan India Ltd., New Delhi
(2001).
116
satisfaction as an explicit and independent outcome measure. These
outcomes should be the key goals of the change effort, not potential by
products.
4.8 OCCUPATIONAL STRESS WORKSHOP An occupational safety and health training agency in Massachusetts
offered a stress reduction workshop to a diverse group of workers. They
expected that the workshop would be of utmost interest to human service
workers as well as other public sector workers. However, a number of
workers from the manufacturing sector also came to the workshop and were
active participants. One concrete benefit from the initial workshop was that
both the training agency and the manufacturing workers realized the extent
to which stress on the job was negatively impacting on the workers' home
lives. This led to additional training on coping skills and family dynamics.
Workers participating in this second round of training found it to be
extremely useful. A serious problem was identified, and employees were
motivated to address it during the initial occupational stress workshop.108
4.8.1 Occupational Stress Committee
A reasonable next step might be the formation of an occupational
stress committee. This group could meet on an ongoing basis and formulate
a strategy for improving the work environment in your organization. This
group should have a unique identity and focus. Group membership should
include both labor and management. If employees are represented by a union
108 Epstein Robert, ‘the Big Book of stress relief Games: Quick fun. McGraw-Hill Professional, New
Delhi (2000).
117
or bargaining unit, they should be included in the committee. Potential
conflicts with the collective bargaining process need to be avoided. If no
bargaining unit exists, then a representative group of employees and
administrators should attend the meetings. Since this committee is
examining issues of the work environment, everyone involved in that work
environment including clerical, support and maintenance staff should be
involved.
Employees from various departments, divisions, shifts, and work
groups should be included. Management representatives should include
persons with real authority in the organization. It is also essential that
employee representatives should be protected from discrimination for their
participation in the committee. The committee should be provided with
adequate resources to make a serious and sustained effort. These resources
might include access to relevant consultants, training materials, relevant
records, and release time.
Social scientists have written many volumes on what good group
process is, but here are a few, Brief common sense guidelines to start with:
� Every member of the group should be valued and have a chance to
speak.
� There should be no negative consequences to opinions expressed in
the meetings.
� The groups should be given a clear mandate and the authority to make
specific recommendations. This includes a clear understanding of
what issues they may not address because of collective bargaining
restraints. (As one example, discussing salary levels and job
118
categories would not be allowed outside of a collective bargaining
process).
� Meetings should have a clear starting and ending time. Participants
should understand that their time is valuable.
� The chairperson of the committee should be rotated between
management and employees.
� The committee needs to be distinguished from other ongoing
committees. This is not a training committee, or a productivity
committee. This is an occupational stress committee and reducing
stress levels and enhancing coping strategies should be its focus.
4.8.2 STRESS MANAGEMENT IN WORK PLACE
The key point here is to increase real control and participation; not the
illusion of control. Possible workplace strategies. Using staff meetings more
effectively to encourage participation and input.
A state law had been passed in California, insisting the requirement of
more frequent staff meeting in hospitals. In one hospital, an organizational
psychologist is appointed to work with employees and management to
measure the effects of participation in decision-making on job stress, job
satisfaction, absenteeism and turnover. Units where the intervention was
carried out, reported greater influence, less role conflict and ambiguity, less
emotional strain, and greater job satisfaction, at 3-month and 6-month
follow-up.
119
4.8.3 Develop autonomous work groups
Blue-Collar employees in a British confectionary company reported
low scores on three job characteristics (autonomy, task identity and
feedback), low work motivation, low job satisfaction and high levels of
emotional distress. Increases in group autonomy were attempted by shifting
responsibility and control to work teams and away from the supervisor.
Teams had control over the work place, organization of rest breaks, and
allocation of overtime and assignments. Six months and 18-month follow up
revealed the reduced emotional distress and lasting increases in autonomy.
4.8.4 Increasing the Skill Levels of Employees
Healthy work is skillful work. It allows for the ongoing development
of new skills and the opportunity to use them. There has been a great deal of
discussion at the national level concerning to the importance of high skill,
high wage work in increasing the productivity of U.S. companies.
Unfortunately, many of the jobs being added to the economy are extremely
low skill ones.
4.8.5 Increased skill based training.
A public sector child welfare agency initiated a competency based
training program that targeted core practice skills. The trainings were
designed to improve the professional skills of the staff in handling difficult
client situations. Participants in the training showed a significant decrease in
psychological strain symptoms compared with a control group. Skill
120
development from this perspective should benefit the employee as well as
the organization.
1) Use of career ladders to reward skill development.
2) Use of job rotation to expand skills.
3) Use of job redesign to increase range of skill needed.
4) Healthy use of computers for skill development.
An intervention designed to improve the case practice skills of child
protective workers utilized interactive, multimedia computer-based training
to both provide information, and to encourage further development of
computer skills. This project also had extensive input from the staff
regarding the design and implementation of software utilized by the agency.
4.8.6 Increasing Levels of Social Support
Key components to social support in the workplace are supervisory
support and coworker support. Possible workplace strategies: The
supervisory approach emphasizes positive feedback, employee growth and
development, open lines of communication, and strong levels of support.
1) Training in conflict resolution and team building.
2) Appropriate use of staff retreats.
4.8.7 Changes that Improve Physical Working Conditions
There is extensive evidence that poor physical working conditions
contribute not only to physical hazards, but also stress levels as well.
Possible workplace strategies:
121
1) Improving indoor air quality.
2) Reducing levels of physical hazards such as noise, toxins, chemicals, etc.
3) Job redesign to reduce incidence of repetitive strain injuries (that is,
reducing repetitive work, awkward work postures and/or heavy lifting.
4.9 HEALTHY PRACTICES
More and more of our working time is spent in front of machines. It
can also increase stress levels if the machine work is poorly designed.
Cumulative trauma disorders can be a particular physical hazard of increased
machine use.
Good ergonomics is a key to healthy machine use. State health
departments usually have someone who is an expert in this area. They can
help you with proper equipment, lighting and pace of work issues. They can
also help you reduce the risk of repetitive strain injuries among the staff.109
4.9.1 Staff involvement in choosing new equipment:
This is a common sense strategy that is often overlooked. This can
have payoffs for both job satisfaction and productivity.
A large state human service agency was planning to buy new machine
work stations for its 3000 employees. This represented a tremendous
expenditure for the agency. Instead of making a unilateral decision, they put
three different work stations in one office and left them there for two
months. At the end of that time, they asked the staffs which work station
109 Gardner, H. (1993). Frames of Mind: The Theory of Multiple Intelligences. New York: Basic
Books.
122
they preferred, and the overwhelming favorite turned out to be the least
expensive, and was purchased state wide.
For lots of us, the job we do is often one of the largest causes of stress
in our lives - this is known as ‘Job Related Stress’ or ‘occupational stress’.
Being unable to cope with the day to day needs of the employees, job can
easily lead to acute stress levels building up. Equally (and maybe
surprisingly) identifying the causes of employees stress is the first and
foremost important step in self stress management. Without identifying
where the stress in employees’ life is stemming from, the industry never is
able to take the proper steps to control it. So, read through this list of
possible causes of occupational stress.
4.9.2 PRESENT CONDITIONS OF EMPLOYEE WORKING:
Technology was supposed to shorten our working week and give us
more leisure time, but the reverse seems to be happening. We’re all working
longer hours and spending less time on family and leisure activities. Rapid
changes in your working environment and working practices often lead to
increased job-related stress levels. Many people in many different types of
jobs and occupations are finding themselves struggling to keep up with the
pace of change of modern technology.
Now-a-days, workers often feel that they are a part of the machine,
rather than individuals. More people than ever before work alone or in
isolation from their colleagues.
123
4.9.3 Shift Work
This is a prime source of occupational stress. It upsets your normal
body clock and can interrupt the employees sleep patterns - this in turn will
make you tired, irritable and eventually lead to stress.
4.9.4 Deadlines
Jobs with constant deadlines are another potential source of
occupational stress. Time pressures and urgent deadlines always lead to job
stress. This effect is doubled if the employees are prone to setting yourself
unrealistic goals and deadlines.
4.9.5 Longer Working Hours
If the employees work too many hours in a week, he/she become
unproductive and tired and stress set in. Not getting enough proper sleep is a
major cause of stress; a good night’s sleep is essential. Managing time at
work efficiently is one of the most important parts of controlling job related
stress. Try not to work long hours and ask whether flexible working hours
are available.
4.9.6 Commuting to Work
We tend to work farther away from home and to travel too much. It
leads to stress in congested roads and railways. This also greatly extends to
working day, lessening the time available for non work activities.
Commuting is often one of the most stressful parts of the working day,
causing employee to arrive at work with the wrong frame of mind and
124
stopping you from concentrating properly. If the daily commute to work is a
main cause of the employees’ job related stress, then try to do something
practical about the problem, this may not be easy to achieve.
4.9.7 Working Conditions
Working in unhealthy conditions will contribute to increased stress
levels. Noisy or overly hot, cramped or cluttered, excessively busy places or
air conditioned windowless offices - all contribute to occupational stress.
4.9.8 Interest on job
Working in a job just for the money, this leads to a lack of self value
and lack of fulfillment. Most people failed to realize how stressful this can
be and they underestimate the long term effects on their health.
4.9.9 Work Colleagues
Working with people that one does not like and does not get on with'
can be a huge source of job related stress. Spending many hours each day
with people may be very bad for the employees. It may affect their health
over long run as they may get angry or resentful frequently.
4.9.10 Job Security
Gone are the days of a 'job for life'. The threat of losing a job makes
life generally very stressful. Worker also put up with more hassles just to
keep a job. Changing occupations is far more common now days - this can
be one of the most stressful times in a person’s life.
125
4.9.11 Being a Boss
All very stressful. Being in charge of people is often one of the most
stressful types of jobs. Whatever the main reasons for the stress in
employees working life, the first step in effective stress management is to
identify the main causes. After that, the thing would be to find practical,
workable solutions to lower long term dangerous stress.
4.10 TECHNIQUES OF MANAGING STRESS
There are several ways of coping with stress. Some techniques of time
management may help a person to control stress. In the face of high
demands, effective stress management involves learning to set limits and to
say “No” to some demands that others make. The following techniques have
been recently dubbed “Destressitizers” by The Journal of the Canadian
Medical Association. A destressitizer is any process by which an individual
can relieve stress. Techniques of stress management will vary according to
the theoretical paradigm adhered to, but may include some of the following:
• Autogenic training
• Cognitive therapy
• Conflict resolution
• Exercise
• Getting a hobby
• Meditation
• Relaxation techniques
• Artistic Expression
• Spas
126
• Spending time in nature
• Stress balls
• Natural medicine
• Time management
• Listening to certain types of relaxing music, particularly:
o New Age music
o Classical music
o Psychedelic music
o Sleep Music.
a). Autogenic Training :
Autogenic Training has been developed by Dr. Schultz who published
the first book on the subject in 1932. Dr. Schultz recognized that during
hypnosis the subject experiences various feelings such as warmth and
heaviness. He went on to teach practices to self induce these feelings and,
consequently, hypnotic states. From this, self induction practice is named as,
Autogenic Training. Auto-genic means self created. Autogenic Training has
more in common with Yoga.
b). Cognitive therapy
Cognitive therapy helps the patient to overcome difficulties by
identifying and changing dysfunctional thinking, behavior, and emotional
responses. This involves helping patients to develop skills for modifying
beliefs, identifying distorted thinking, relating to others in different ways,
and changing behaviors
127
c). Conflict resolution
Conflict resolution is a wide range of methods of addressing sources
of conflict - whether at the inter-personal level or between states - and of
finding means of resolving a given conflict or of continuing it in less
destructive forms than, say, armed conflict. Processes of conflict resolution
generally include negotiation, mediation, diplomacy and creative peace
building. The term "conflict resolution" is sometimes used interchangeably
with the terms ‘dispute resolution’ or ‘alternative dispute resolution’.
d). Exercise
Exercise increases overall health and sense of well-being, which puts
more pep in step every day. But, exercise also has some direct stress-busting
benefits.
It pumps up endorphins. Physical activity helps to bump up the
production of one brain's feel-good neurotransmitters, called endorphins.
Although this function is often referred to as a runner's high, a rousing game
of tennis or a nature hike also can contribute to this same feeling.
It's meditation in motion. After a fast-paced game of racquetball or
several laps in the pool, he / she shall often find that they have forgotten the
day's irritations and concentrated only on their body's movements. As they
begin to shed their daily tensions through movement and physical activity,
they may find that this focus on a single task, and the resulting energy and
optimism, can help them remain calm and clear in everything that they do.
128
It improves mood. Regular exercise can increase self-confidence and
lower the symptoms associated with mild depression and anxiety. Exercise
also can improve one’s sleep, which is often disrupted by stress, depression
and anxiety. All this can ease their stress levels and give them a sense of
command over their body and life.
e). Getting a hobby
With today's stressful lifestyles, it's important to have time that takes
to do something just for the fun of it. While there are many great hobbies to
choose from. Here is a list of hobbies that are particularly useful in relieving
stress. Some of the major hobbies are gardening, Explore Photography,
Scrapbooking, Maintain a Saltwater Aquarium, Puzzles, Drawing, Painting,
knitting, Playing The Piano and writing. Learn about the benefits of each,
and find resources to get started on a new great hobby for stress relief.
f). Meditation
Meditation is a group of mental training techniques. One can use
meditation to improve not only mental health and capacities, but also the
physical health. Some of these techniques are very simple, so one can learn
from a book or an article; and others may require guidance from a qualified
meditation teacher. Meditation may sometimes give problems for people
suffering from mental diseases, epilepsy, serious heart problems or
neurological diseases. On the other hand, meditation is helpful for the
treatment of these ailments.
129
g). Relaxation Techniques
Relaxation is a skill. With frequent practice, he/she will improve these
kills to control employees’ emotions and improve their physical well being.
These techniques can be practiced either day or night to assist the employees
to relax and feel in control. It is really important to practice regularly.
Slow Breathing Technique: This is useful for the employees start to
over breath and when they are feeling the first signs of anxiety or stress.
Muscle Relaxation Technique: This technique involves the
employees using their slow breathing technique in conjunction with muscle
relaxation. This can be practiced any time. The more you practice the easier
it will be to achieve total relaxation and also the duration of feeling relaxed
and being stress free will last longer.
h). Artistic Expression
Expressing oneself through the arts can be a natural stress buster. The
arts include visual arts, playing or creating musical arrangements, creative
writing or poetry, as well as different forms of dance. He / she does not
need to be a professional artist in any of these arts.
i). SPAS
It's a steam bath, followed by a great massage, which is a great way to
relieve stress. Stress is one of the major causes of diseases like cancer and
many other sicknesses. It has been proven that the benefits of this experience
are very effective in reducing stress.

130
j). Spending time in nature
Spending time in nature reduces anxiety. It calms minds, soothes
soul, and lifts spirits. Just looking at the colour green can give us health
benefits. If he / she are feeling sad, fearful, or anxious, perhaps they just
need to get outside and interact with Mother Nature a bit. Just a few minutes
can do wonders. If they are not able to get outside, there are still ways to
incorporate nature and the outdoors into their day.
k). Stress balls
A stress ball is a malleable toy, usually not more than 7 cm in
diameter. It is squeezed in the hand and manipulated by the fingers,
ostensibly to either relieve stress and muscle tension or to exercise the
muscles of the hand. Stress balls are being used by many people for stress
relief.
l). Natural medicine
Naturopathy or Natural Medicine is a form of alternative medicine
based on a belief in vitalism, which posits that a special energy called vital
energy or vital force guides bodily processes such as metabolism,
reproduction, growth, and adaptation. some of the herbals can reduce stress,
support emotional wellness and health, lessen common feelings of the blues,
support the nervous system, support a healthy motivated attitude, support a
positive mental attitude, address common menstrual moodiness, maintain a
well-adjusted outlook and positive temperament, support healthy sleep
patterns and a healthy balanced appetite and etc.
131
J). Time management
Time management is essential if one is to handle a heavy workload
without excessive stress. By using time management skills effectively, they
can reduce work stress by being more in control of their time, and by being
more productive. This ensures that they have time to relax outside work.
Effective time management will help a person to get more done each
day. It has important health benefits too. By managing time more wisely,
they can minimize stress and improve their quality of life.
4.11 STRESS AFFECTS THE BRAIN AND EMPLOYEE
PERFORMANCE
To appreciate truly how seriously stress affects employee safety, it’s
helpful to understand how stress affects the human brain. The bottom line is
this: stress interferes with brain functioning because our brain’s ability to
function is directly related to our emotional state. When we’re in appositive
emotional state, our brain works best, enabling us to perform at our best.
When we’re in a negative emotional state, such as feeling nervous, angry,
depressed, or stressed out in any way, our brain works less effectively. This
process was labeled ‘Downshifting’ by Dr. Leslie Hart, an educator who
studied employees performance under varying emotional states. Dr. Hart’s
interest in how stress affects the brain arose from his observation that
employees’ ability to think and learn decreased as their stress level
increased. Just as a car’s speed and performance decrease if the driver
downshifts from high gear to low gear, the brain’s performance decreases
when it downshifts. Dr. Hart’s research, along with a great deal of other
132
scientific research, shows that when people downshift, their intellectual,
psychological, and behavioural responses deteriorate. Because downshifting
plays such an important role in how stress affects employee performance and
vulnerability to accidents and injuries. It’s important to understand how it
gets acted out in the workplace. To make sense of this concept, we will
break downshifting down into its component parts and give descriptions and
examples of each.
4.11.1 Intellectual Downshifting
When we downshift intellectually, our thinking becomes less creative,
our problem-solving ability diminishes, and our overall ability to process
information deteriorates. One symptom of intellectual downshifting is the
“deer in the headlights” when they experience information overload. In this
overloaded state, their ability to think literally shuts down. A common
example of the combination of high stress and information overload leading
to intellectual downshifting is the dreaded computer crash, followed by the
even more dreaded call to a tech support hotline. In this stressed state, we
have great difficulty understanding directions and processing information. If
we’re peppered with questions, and those questions include terms and jargon
we know nothing about, our brain will likely shut down. In this downshifted
state, nothing the other person says registers; it’s almost like they are
speaking a foreign language. Another example of intellectual downshifting
is when we are nervous and blurt out we ask a nonsensical question. Yet
another example of the information overload aspect of downshifting is when
you’re driving with the radio. Many people will shut off the radio at this
point or ask their passengers to stop talking. So, they can focus their
attention on their driving. In this overloaded, stressed-out state, their brain
133
can’t handle all the information coming in and perform its job effectively.
Intellectual downshifting can cause serious safety problems. If an employee
isn’t thinking clearly or sharply, they are likely to make poor decisions,
including those involving taking appropriate safety precautions. In such an
overloaded, downshifted state, they are less likely to think clearly about
potential consequences or dangers.
4.11.2 Psychological Downshifting
Not only does a person’s emotional state affect their intellectual
functioning, it also affects their psychological functioning. When we
downshift psychologically, we become immature. We’ve all seen that adults
have temper tantrums or behave in childish ways, when they were stressed
out. Other examples of psychological downshifting are throwing or
slamming things around, becoming defensive, acting rebelliously, and
interacting with people in childish ways such as mocking, mimicking, and
pouting. Sometimes a whole workforce can be psychologically downshifted
if the organization has a negative emotional climate of fear or resentment.
One of the most common causes of such a situation is managers who are
disrespectful and/or over controlling. When they act in this way, their
workers tend to act more like rebellious teenagers than adults. This creates
many problems for the company. Psychologically downshifted employees
are harder to manage. They don’t perform well. They are more likely to
have accidents and injuries. Psychologically downshifted employees are at
higher risk of accidents and injuries because, being in an adolescent mind-
set, they are less likely to listen to safety precautions. They are also likely to
do the opposite of what they are told, to prove that no one can tell them what
to do just like teenagers do.
134
4.11.3 Behavioural Downshifting
When we downshift behaviorally, we become rigid and inflexible in
our responses to problems and challenges. We also become more awkward
and clumsy in our movements. One common example of increased
behavioral rigidity due to downshifting occurs when we’re running late and
can’t find our car keys. In this frantic, stressed-out state, we often look for
our car keys several times in the same location. We might reach into our
pockets or peek under the same pile of papers several times, as if our keys
will materialize on the next attempt. When we downshift, we tend to repeat
behaviors, even though they are not working. This makes workers more apt
to break equipment, because they are more likely to continue to try to force a
piece of equipment to move a certain way or do something it wasn’t made to
do. Rather than switching gears and doing something else, the downshifted
worker is likely to continue trying to make the piece of equipment do what
he wants it to do by using more force. The increased behavioral rigidity
caused by downshifting also increases the chances that employees will
continue to engage in behaviors that will injure them. The downshifted
employee is less likely to stop engaging in a physical activity that is causing
them pain and start doing something else or seek help. Instead, they will
likely doggedly continue the activity, despite harmful signals. Physical
downshifting also increases one’s risk of injury because it makes people
more clumsy. When people are feeling rushed or pressured, they are more
prone to bang into things. When nervous, people are more liable to drop or
fumble objects. One way to understand how downshifting causes these
problems is to think of stress as overloading the brain’s circuits. Because the
brain is so busy processing whatever is causing the person stress, it doesn’t
135
have that processing power available to deal with all the information
required to produce effective hand and eye coordination or graceful body
movements. Thus, if a person is stressed out and their brain circuits
overloaded, they become clumsy and awkward in their movements, making
them vulnerable to accidents and injuries.
4.11.4 Other Consequences of Downshifting
Downshifting impact on employee performance and the bottom line
goes far beyond its impact on safety. Without going into detail, the
following list indicates how costly a problem downshifting is in terms of its
overall effects and influences on other than safety-related issues.
When people downshift, they are more likely to become:
• fearful of, and resistant to, change
• over reactive to minor hassles, inconveniences, and frustrations
• immature
• aggressive
• defensive and paranoid
• territorial
• distrustful of anybody who is different from themselves- seeing
the world in an “us versus them” way
• “control freaks”
• “power hungry”
• simplistic in their thinking
• self-centered, interpersonally dense, and unable to empathize
with others
136
The preceding list of characteristics is obviously not a formula for the
ideal employee. Unfortunately, many organizations have some - if not the
majority- of their employees who display these characteristics. Because their
employees are stressed out and downshifted, the company gets the worst out
of them, rather than the best. When people become stressed, their brain
downshifts. When in a downshifted state, their ability to function
intellectually, psychologically, and behaviorally is all compromised. This
makes them more vulnerable to accidents and injuries. Downshifting also
causes a large number of other undesirable qualities and behaviors that lead
to performance problems.
4.12 CONCLUSION
Most organisations have realised that living ethical would be of no
good industrial practice but would pay in the long run. An organization that
would be interested in growth and profits must establish relationship with
the employees based on trust. Improvement of the employer – employee
relationship would be vital for both parties giving to several reasons. First
the productivity of employees would increase, when employees treated
humanely rather than mechanically. Second, the employees could feel that
increased ethical power on their part actually resulted in higher
compensations. Third even if there was no material gain ethically,
appropriate behaviors are provided on intrinsic sense of self satisfaction.
Therefore, it would be advantageous for every organization to maintain high
ethical standard to provide stress free work and to view impartially the
organization and its employees.
137
CHAPTER – V
DATA ANALYSIS AND INTERPRETATION
5.1 INTRODUCTION
The relationship between man and occupation has always been
attracted the attention of the researchers, scientists and novalties. A major
part of man’s life would be spent in work. Work not only provides status to
an individual but also bound him to the society. By working on a job men
could gravity many of their needs, but not financial needs alone. If men
worked for money alone, there would be no way of explaining the fact that
some men who had plenty of money still continued work. Work in this
regard would be a potent some of need gratification of all types such as
physical, security, Social and ego needs (Pestonjee 1991, p.70). People do
work because getting on the job would enable them to achieve whatever they
wanted to achieve off the fob. The job would remain the means to achieve
the desired needs.
The word occupation would refer to a specific task, where as
occupational satisfaction derived from being engaged in work to in any
pursuit of a higher order. If would be essentially related to human needs and
their fulfilment through work. It would be generated by the individual’s
perception of how well his occupational satisfaction his various needs.
Occupational dissatisfaction would be the pleasurable conditional state
resulting from the appraisal of one’s occupation as achieving facilitating
138
the achievement of one’s occupational values. Occupational dissatisfaction
would be the un pleasurable emotional state resulting from the appraisal of
one’s occupation as frustrating or blocking the attainment of one’s
occupational values or as blocking the attainment of one’s occupational
values or as entailing disvalues. Occupational satisfaction and dissatisfaction
would remain the function of the perceived relationship between what are
want from one’s occupation and what one’s perceived it as offering or
entailing. Therefore occupational happiness would be regarded as an
important factor in positive behaviour like productive efficiency, employee
on male, mental health of a worker and the relationship between employer
and employee and also in negative job behaviour like accidents, absenteeism
and turn over.
Therefore the chapter explained the result of analyse of employee
perception an occupation and occupation stress. The analysis made under the
heads viz, (1) analysis perception above occupation on the basis of
democratic factors and (2) on the basis of democratic factor we analyse the
stress of the employees in paper industry
5.2 OCCUPATIONAL PERCEPTION OF THE EMPLOYEE
The study of occupational perception and satisfaction became popular
with the famous how throne studies in 1930’s. Historically speaking, interest
in occupational satisfaction starts when the central condition of modern
organization appeared about 175 years ago (Davis keith: 1961, pp 176-193)
In early preliterate days, work has been man’s total way of life of was
not separated from other spheres of life. The incentive for work was
139
immediate satisfaction of need. But as society changed magic and aesthetic
considerations were stripped off from work. Even when it formed the most
important activity of man in ancient days, manual work was thought to be
avoided by elites. For better or worse the modern employees have to spend
many of their working hours at work. In addition to working in assigned
tasks, they would typically interact with other persons (supervisor, fellow
employees) and would get exposed to organizational policies and practices.
All these in turn would influence employees, feelings about their job; and
organization that employed them. These feelings would broadly labelled as
job attitudes.
An occupation would become satisfying when there was a match
between the expectation of the occupation and the needs of the employee or
individual. When an employee was expected to perform well on a particular
occupation, he, in term would also expect that the management or
organization should full fill his expectations various occupational factors
such as promotion, transfer, salary and benefit.
According to Peling (1990, p.143) the best predictor of occupational
stress would be when the employees personal values matched with the
occupational factors. Wild and Dawsan (1972, p.150) examined that the
influence of certain biological variables like age marital status and length of
service on the relationship between specific job attitude and over all
occupational satisfaction. The results indicated that age and marital status
had significant impact on the relationship of specific occupational attitude to
over all occupational perception. Length of service also appeared as a
significant variable. Therefore in order to find out the level of perception of
140
employees, the following analyses were taken place. Therefore level of
perception of employees towards their occupation are analyzed by using chi-
square test,
Chi-square association test is a non parametric test useful to establish
an associated between to categorical variables. The frequency dumping in
each cell of the cross tabs of heterogeneous groups and also the nature of
cases in that particular cell. It also exhibits linear by linear relationship, and
crammer’s phi statistics to study the relationship.
5.2.1 AGE AND LEVEL OF PERCEPTION TOWARDS JOB
Age has been an important demographical variable and it net only
determined individual’s physical and mental attitude but also deputed his or
her like experience. It determined whether one was economically active or
dependent upon others. It decided the active participation of the individual in
the attains of the organization (Ravichandran and Revathibala; 2008, p.109).
Age has also been an important consideration in determining a man’s
promotion of his failure to receive it. In terms of HRM dimensions and
Hantman (2000, p .5) found that age influenced employees attitudes towards
affirmative action.
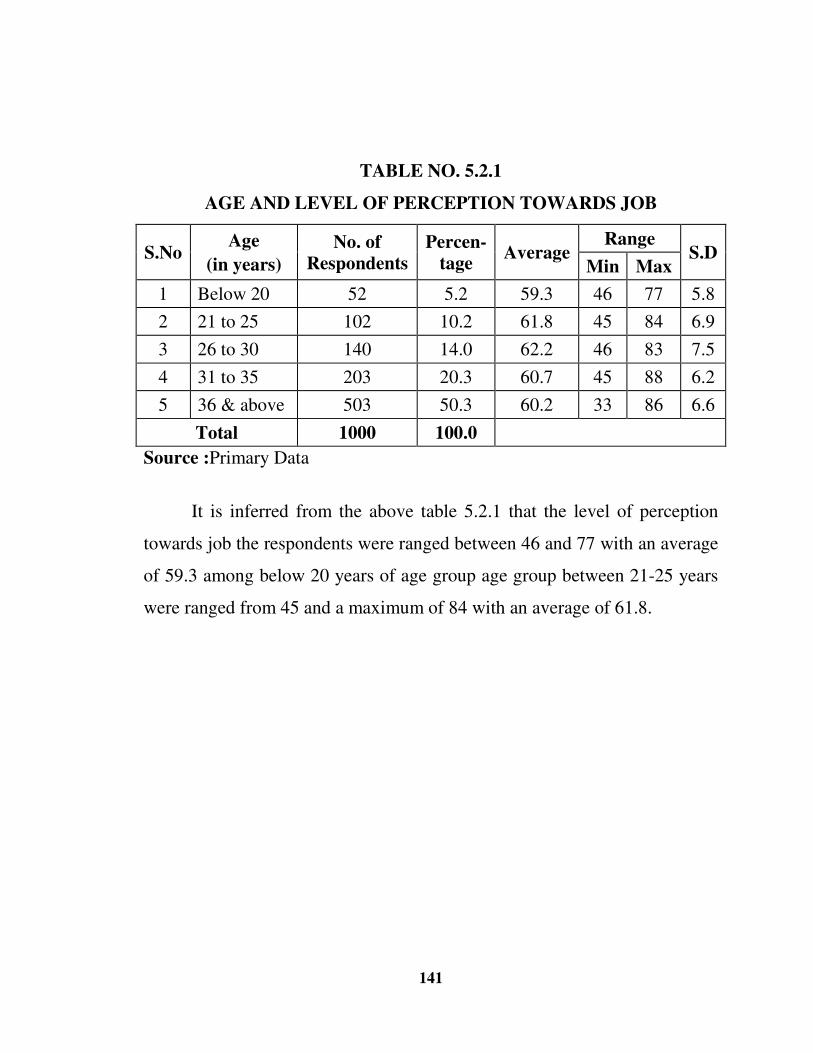
141
TABLE NO. 5.2.1
AGE AND LEVEL OF PERCEPTION TOWARDS JOB
S.No Age
(in years)
No. of Respondents
Percen-tage
Average Range
S.D Min Max
1 Below 20 52 5.2 59.3 46 77 5.8
2 21 to 25 102 10.2 61.8 45 84 6.9
3 26 to 30 140 14.0 62.2 46 83 7.5
4 31 to 35 203 20.3 60.7 45 88 6.2
5 36 & above 503 50.3 60.2 33 86 6.6
Total 1000 100.0
Source :Primary Data
It is inferred from the above table 5.2.1 that the level of perception
towards job the respondents were ranged between 46 and 77 with an average
of 59.3 among below 20 years of age group age group between 21-25 years
were ranged from 45 and a maximum of 84 with an average of 61.8.
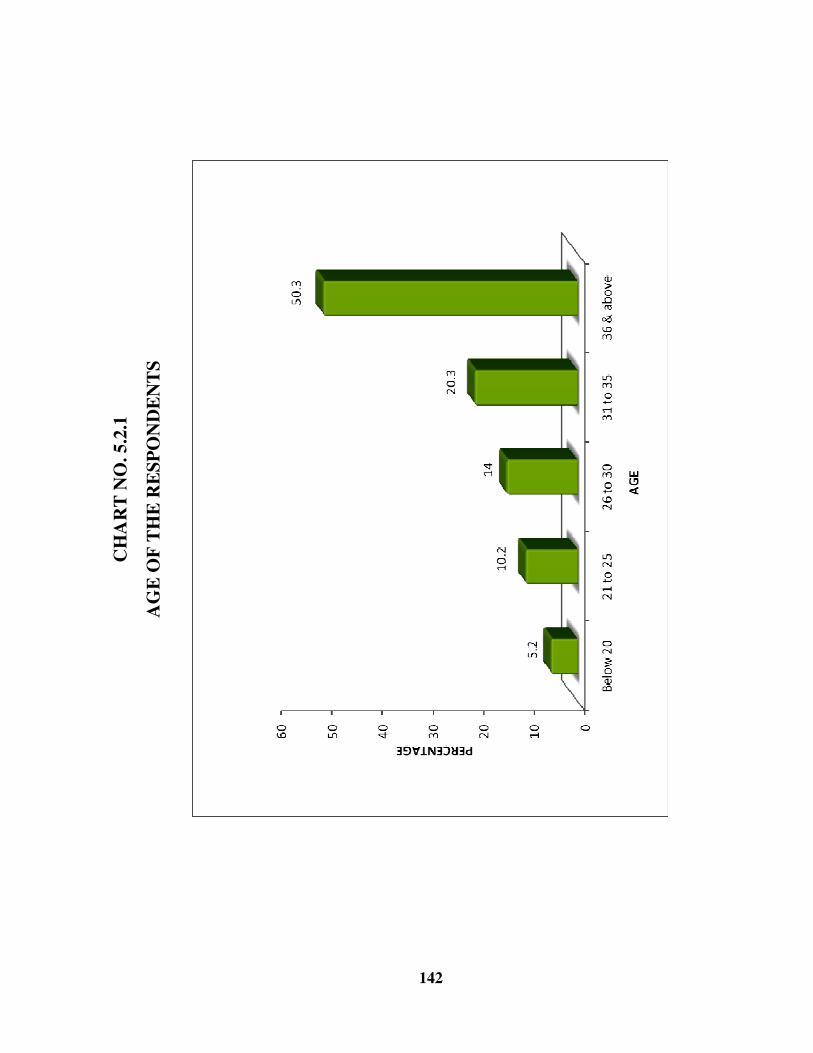
142
CH
AR
T N
O. 5
.2.1
AG
E O
F T
HE
RE
SP
ON
DE
NT
S
143
The age of the respondents from 26-30 years were ranged between a
minimum of 46 and the maximum range of 83 with an average of 62.2. But
the respondents who are the above the age of36 years were ranged between
33 and 86 with an average of 60.2. From the above analysis it is formed that
the maximum level of perceptions towards the job were placed among the
age group of 36 and above.
Null Hypothesis (H0): There is no significant relationship between age and
level of perception towards job.
Alternative Hypothesis (H1): There is significant relationship between age
and level of perception towards job.
Two -way table
With a view to find out the degree of association between the age of
the respondents and their level of perception towards job, a two-way table
was constructed as shown in Table No.5.2.2.
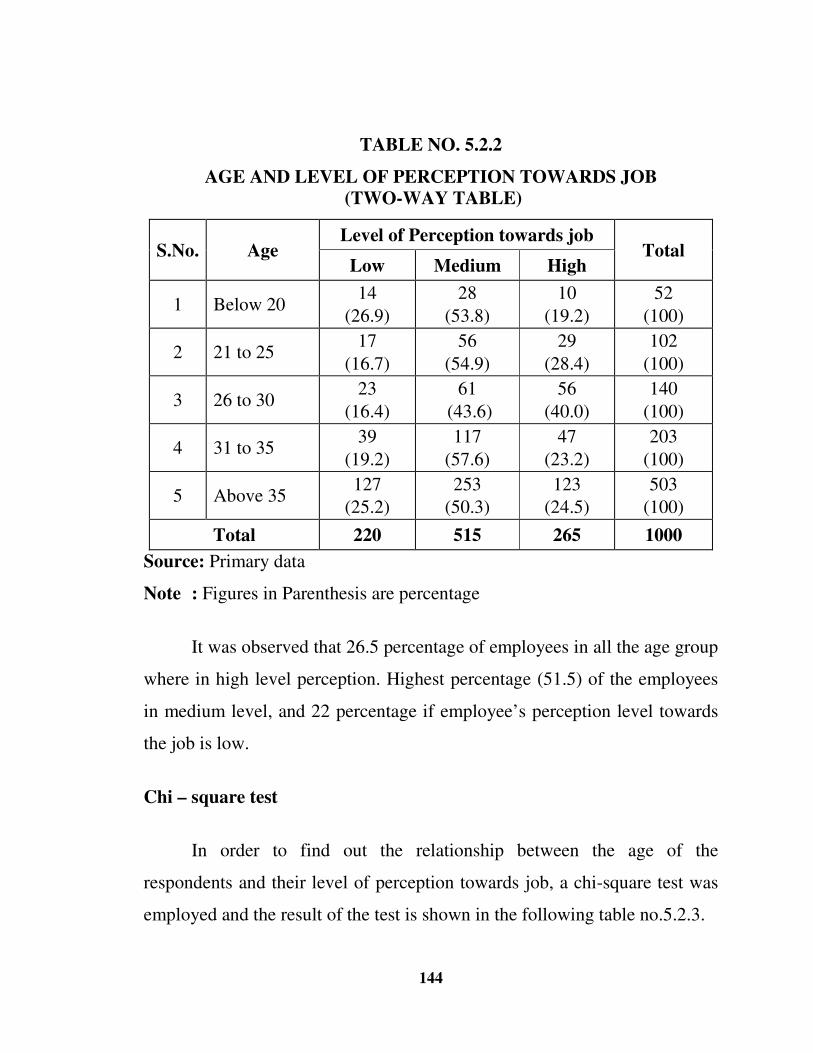
144
TABLE NO. 5.2.2
AGE AND LEVEL OF PERCEPTION TOWARDS JOB (TWO-WAY TABLE)
S.No. Age Level of Perception towards job
Total Low Medium High
1 Below 20 14
(26.9)
28
(53.8)
10
(19.2)
52
(100)
2 21 to 25 17
(16.7)
56
(54.9)
29
(28.4)
102
(100)
3 26 to 30 23
(16.4)
61
(43.6)
56
(40.0)
140
(100)
4 31 to 35 39
(19.2)
117
(57.6)
47
(23.2)
203
(100)
5 Above 35 127
(25.2)
253
(50.3)
123
(24.5)
503
(100)
Total 220 515 265 1000
Source: Primary data
Note : Figures in Parenthesis are percentage
It was observed that 26.5 percentage of employees in all the age group
where in high level perception. Highest percentage (51.5) of the employees
in medium level, and 22 percentage if employee’s perception level towards
the job is low.
Chi – square test
In order to find out the relationship between the age of the
respondents and their level of perception towards job, a chi-square test was
employed and the result of the test is shown in the following table no.5.2.3.
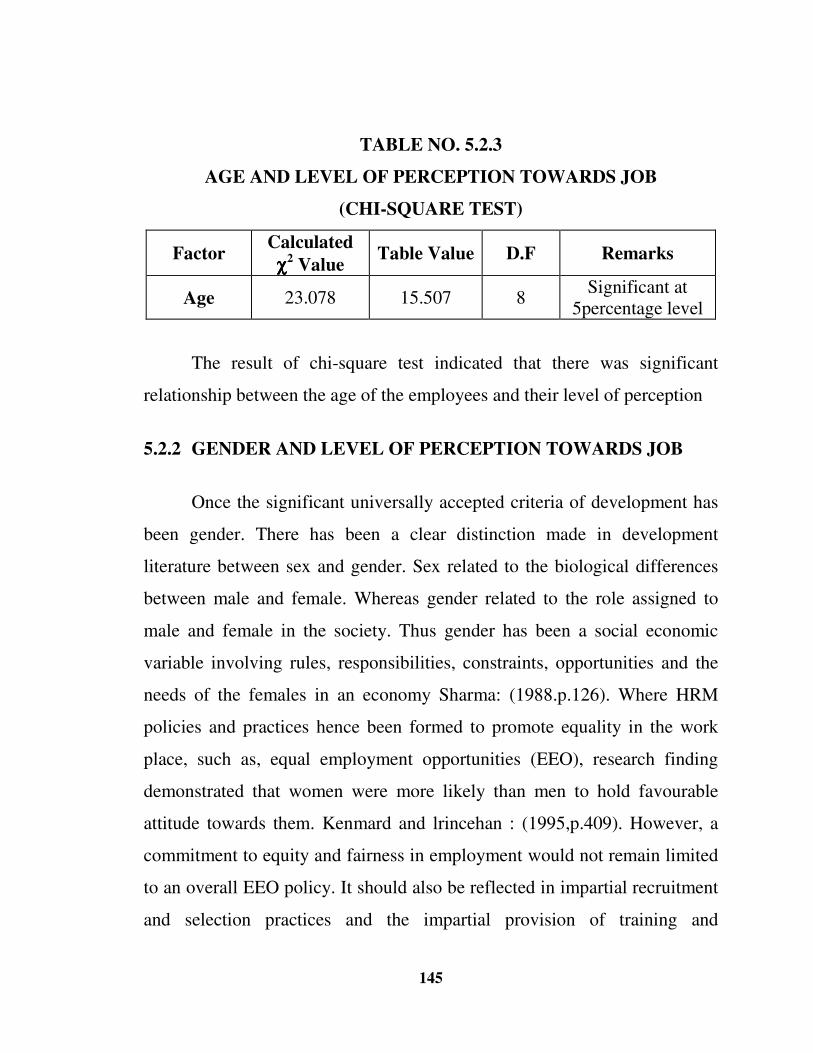
145
TABLE NO. 5.2.3
AGE AND LEVEL OF PERCEPTION TOWARDS JOB
(CHI-SQUARE TEST)
Factor Calculated
χχχχ2 Value
Table Value D.F Remarks
Age 23.078 15.507 8 Significant at
5percentage level
The result of chi-square test indicated that there was significant
relationship between the age of the employees and their level of perception
5.2.2 GENDER AND LEVEL OF PERCEPTION TOWARDS JOB
Once the significant universally accepted criteria of development has
been gender. There has been a clear distinction made in development
literature between sex and gender. Sex related to the biological differences
between male and female. Whereas gender related to the role assigned to
male and female in the society. Thus gender has been a social economic
variable involving rules, responsibilities, constraints, opportunities and the
needs of the females in an economy Sharma: (1988.p.126). Where HRM
policies and practices hence been formed to promote equality in the work
place, such as, equal employment opportunities (EEO), research finding
demonstrated that women were more likely than men to hold favourable
attitude towards them. Kenmard and lrincehan : (1995,p.409). However, a
commitment to equity and fairness in employment would not remain limited
to an overall EEO policy. It should also be reflected in impartial recruitment
and selection practices and the impartial provision of training and

146
development opportunities to all employees including women (the Hindu
2007 p-5 ). Thus, three areas of HRM viz., training and development, EEO,
Recruitment and selection have been perceived as more important them men
(Kerton and Grecrce : 2000, p.37). Therefore the details of gender and level
of perception depicted in table 5.2.4.
TABLE NO. 5.2.4
GENDER AND LEVEL OF PERCEPTION TOWARDS JOB
S.
No. Gender
No. of Respondents
Percentage
Ave
Rage
Range
S.D Min Max
1 Male 936 93.6 60.7 33 88 6.8
2 Female 64 6.4 60.2 52 84 6.0
Total 1000 100.0
Source: Primary data It is inferred from the above table that the level of perception towards
job of the male respondents ranged between 33 and 88 with an average of
60.7 and the level of perception of the female respondents were ranged
between 52 and 84 with an average of 60.2. From the above analysis it is
concluded that the maximum level of perception towards job perceived by
the male respondents were more than female respondents.
Null Hypothesis (H0): There is no significant relationship between gender
and level of perception towards job.
Alternative Hypothesis (H1): There is significant relationship between
gender and level of perception towards job.
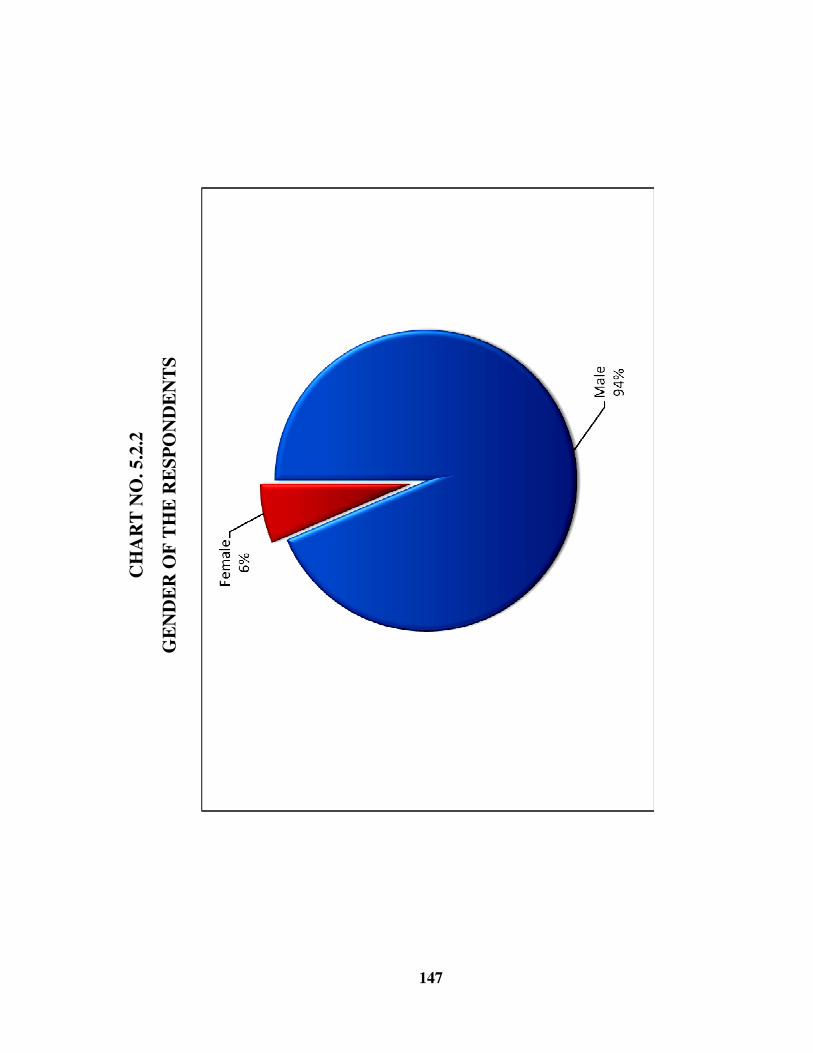
147
CH
AR
T N
O. 5
.2.2
GE
ND
ER
OF
TH
E R
ES
PO
ND
EN
TS
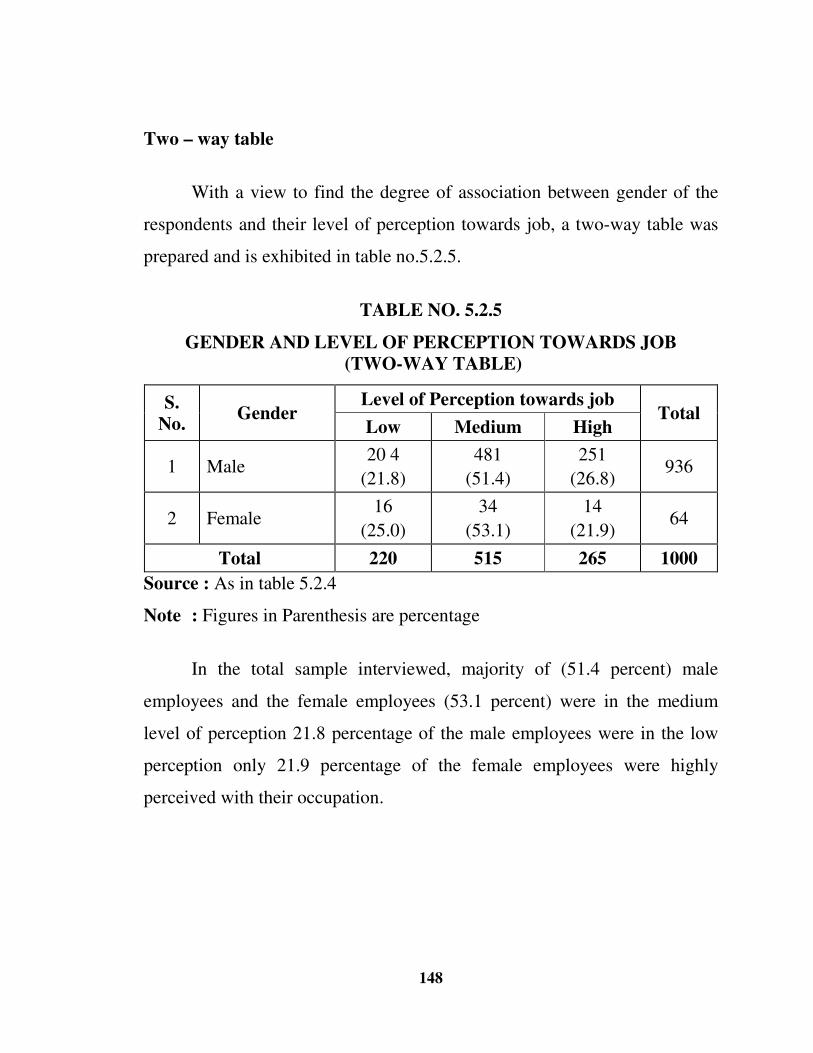
148
Two – way table
With a view to find the degree of association between gender of the
respondents and their level of perception towards job, a two-way table was
prepared and is exhibited in table no.5.2.5.
TABLE NO. 5.2.5
GENDER AND LEVEL OF PERCEPTION TOWARDS JOB (TWO-WAY TABLE)
S. No.
Gender Level of Perception towards job
Total Low Medium High
1 Male 20 4
(21.8)
481
(51.4)
251
(26.8) 936
2 Female 16
(25.0)
34
(53.1)
14
(21.9) 64
Total 220 515 265 1000
Source : As in table 5.2.4
Note : Figures in Parenthesis are percentage
In the total sample interviewed, majority of (51.4 percent) male
employees and the female employees (53.1 percent) were in the medium
level of perception 21.8 percentage of the male employees were in the low
perception only 21.9 percentage of the female employees were highly
perceived with their occupation.
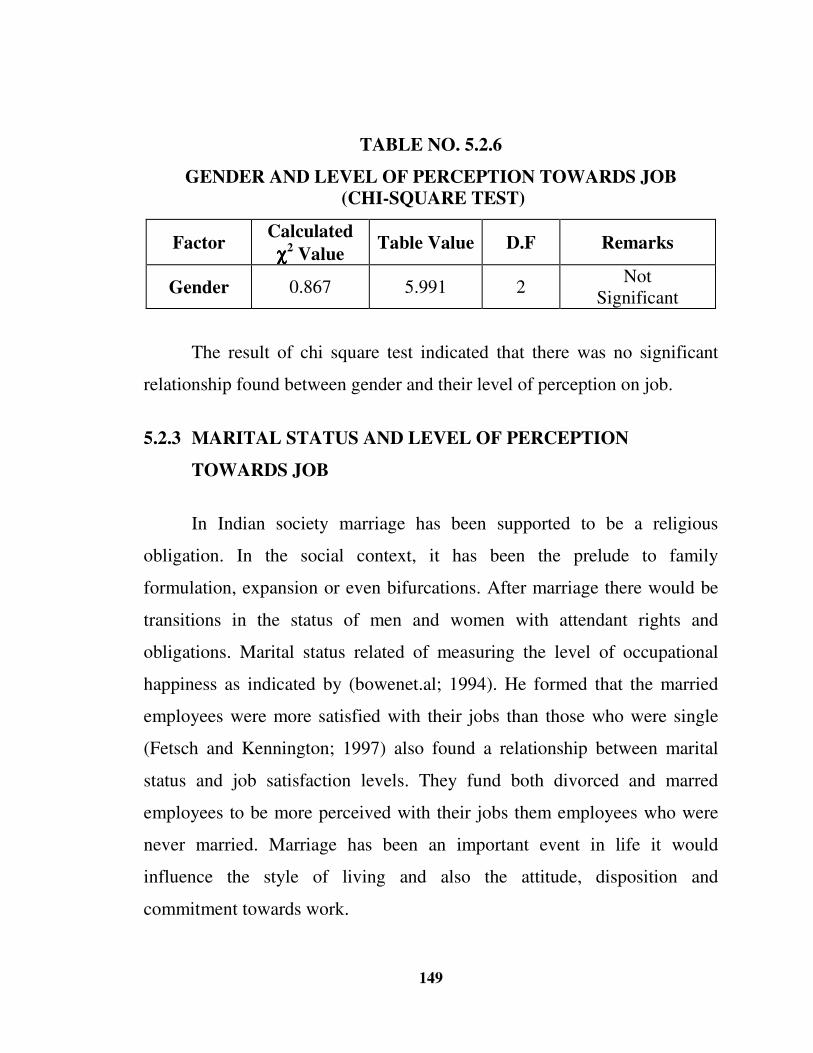
149
TABLE NO. 5.2.6
GENDER AND LEVEL OF PERCEPTION TOWARDS JOB (CHI-SQUARE TEST)
Factor Calculated
χχχχ2 Value
Table Value D.F Remarks
Gender 0.867 5.991 2 Not
Significant
The result of chi square test indicated that there was no significant
relationship found between gender and their level of perception on job.
5.2.3 MARITAL STATUS AND LEVEL OF PERCEPTION
TOWARDS JOB
In Indian society marriage has been supported to be a religious
obligation. In the social context, it has been the prelude to family
formulation, expansion or even bifurcations. After marriage there would be
transitions in the status of men and women with attendant rights and
obligations. Marital status related of measuring the level of occupational
happiness as indicated by (bowenet.al; 1994). He formed that the married
employees were more satisfied with their jobs than those who were single
(Fetsch and Kennington; 1997) also found a relationship between marital
status and job satisfaction levels. They fund both divorced and marred
employees to be more perceived with their jobs them employees who were
never married. Marriage has been an important event in life it would
influence the style of living and also the attitude, disposition and
commitment towards work.
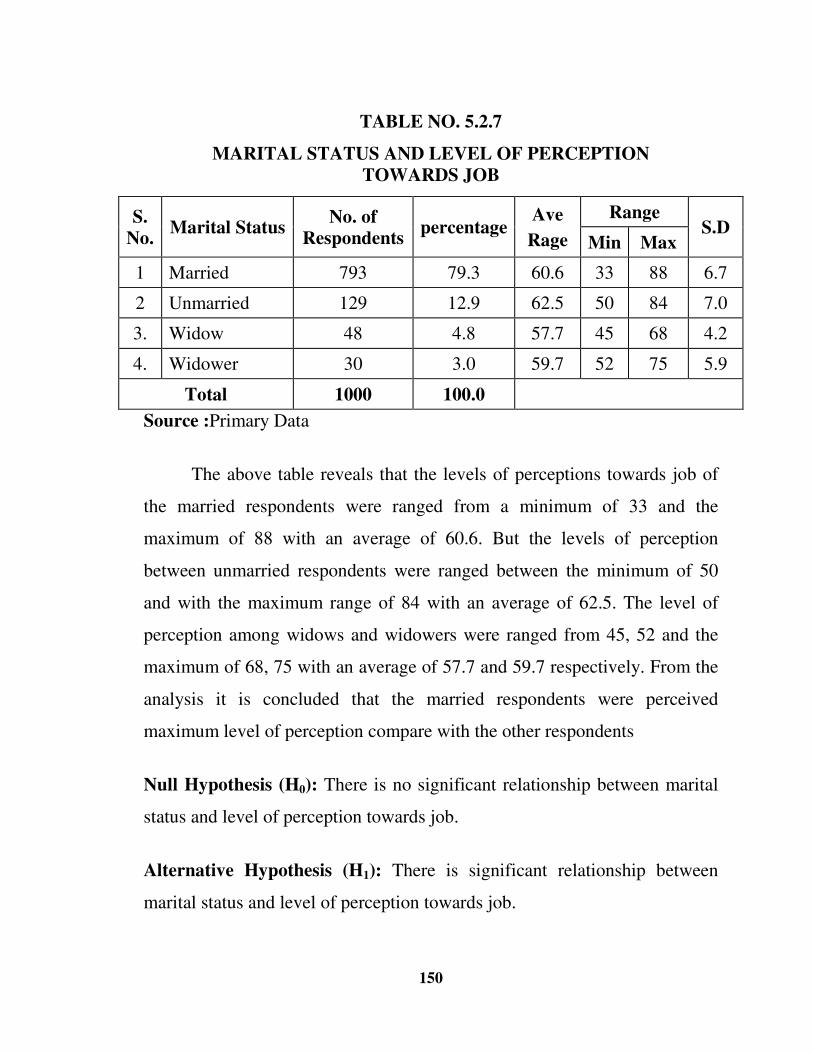
150
TABLE NO. 5.2.7
MARITAL STATUS AND LEVEL OF PERCEPTION TOWARDS JOB
S. No.
Marital Status No. of
Respondents percentage
Ave
Rage
Range S.D
Min Max
1 Married 793 79.3 60.6 33 88 6.7
2 Unmarried 129 12.9 62.5 50 84 7.0
3. Widow 48 4.8 57.7 45 68 4.2
4. Widower 30 3.0 59.7 52 75 5.9
Total 1000 100.0
Source :Primary Data
The above table reveals that the levels of perceptions towards job of
the married respondents were ranged from a minimum of 33 and the
maximum of 88 with an average of 60.6. But the levels of perception
between unmarried respondents were ranged between the minimum of 50
and with the maximum range of 84 with an average of 62.5. The level of
perception among widows and widowers were ranged from 45, 52 and the
maximum of 68, 75 with an average of 57.7 and 59.7 respectively. From the
analysis it is concluded that the married respondents were perceived
maximum level of perception compare with the other respondents
Null Hypothesis (H0): There is no significant relationship between marital
status and level of perception towards job.
Alternative Hypothesis (H1): There is significant relationship between
marital status and level of perception towards job.
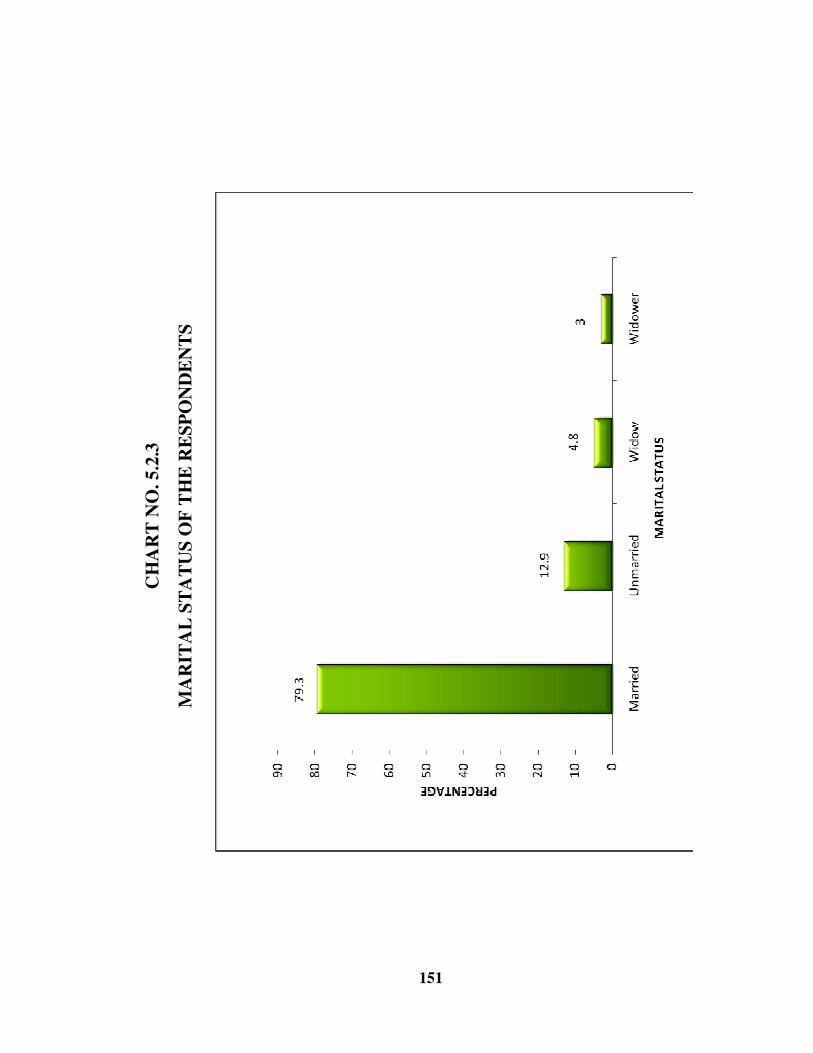
151
CH
AR
T N
O. 5
.2.3
MA
RIT
AL
ST
AT
US
OF
TH
E R
ES
PO
ND
EN
TS
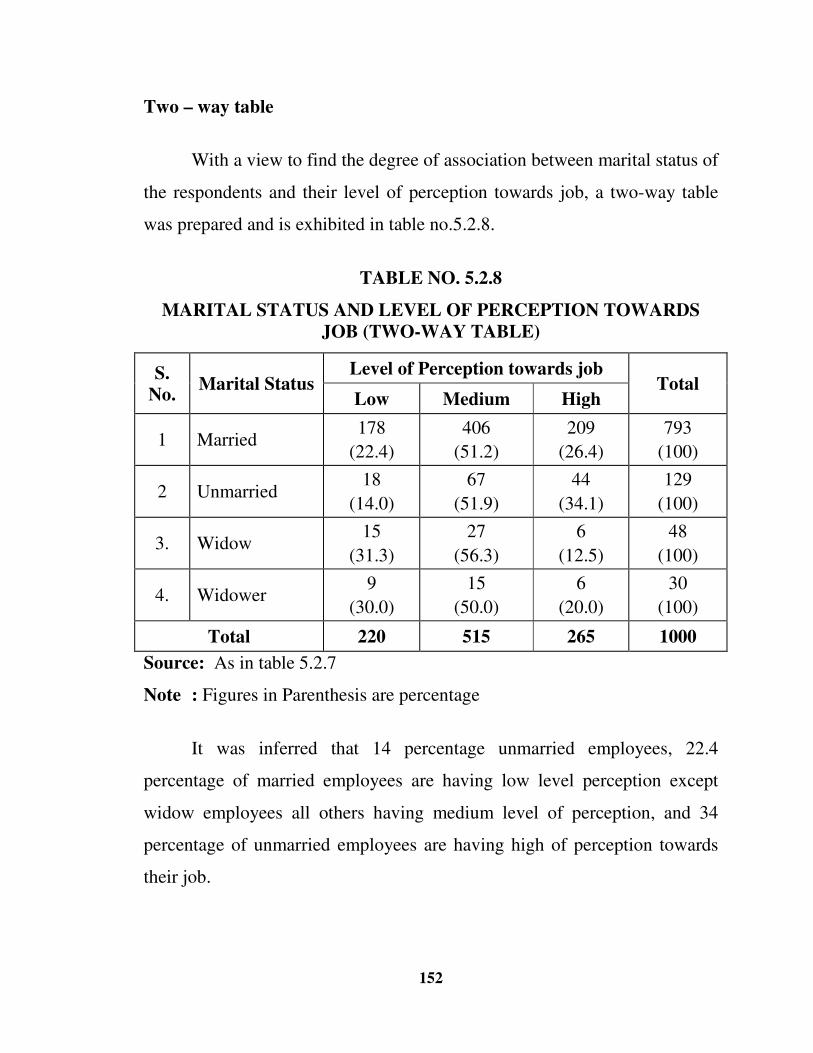
152
Two – way table
With a view to find the degree of association between marital status of
the respondents and their level of perception towards job, a two-way table
was prepared and is exhibited in table no.5.2.8.
TABLE NO. 5.2.8
MARITAL STATUS AND LEVEL OF PERCEPTION TOWARDS
JOB (TWO-WAY TABLE)
S. No.
Marital Status Level of Perception towards job
Total Low Medium High
1 Married 178
(22.4)
406
(51.2)
209
(26.4)
793
(100)
2 Unmarried 18
(14.0)
67
(51.9)
44
(34.1)
129
(100)
3. Widow 15
(31.3)
27
(56.3)
6
(12.5)
48
(100)
4. Widower 9
(30.0)
15
(50.0)
6
(20.0)
30
(100)
Total 220 515 265 1000
Source: As in table 5.2.7
Note : Figures in Parenthesis are percentage
It was inferred that 14 percentage unmarried employees, 22.4
percentage of married employees are having low level perception except
widow employees all others having medium level of perception, and 34
percentage of unmarried employees are having high of perception towards
their job.
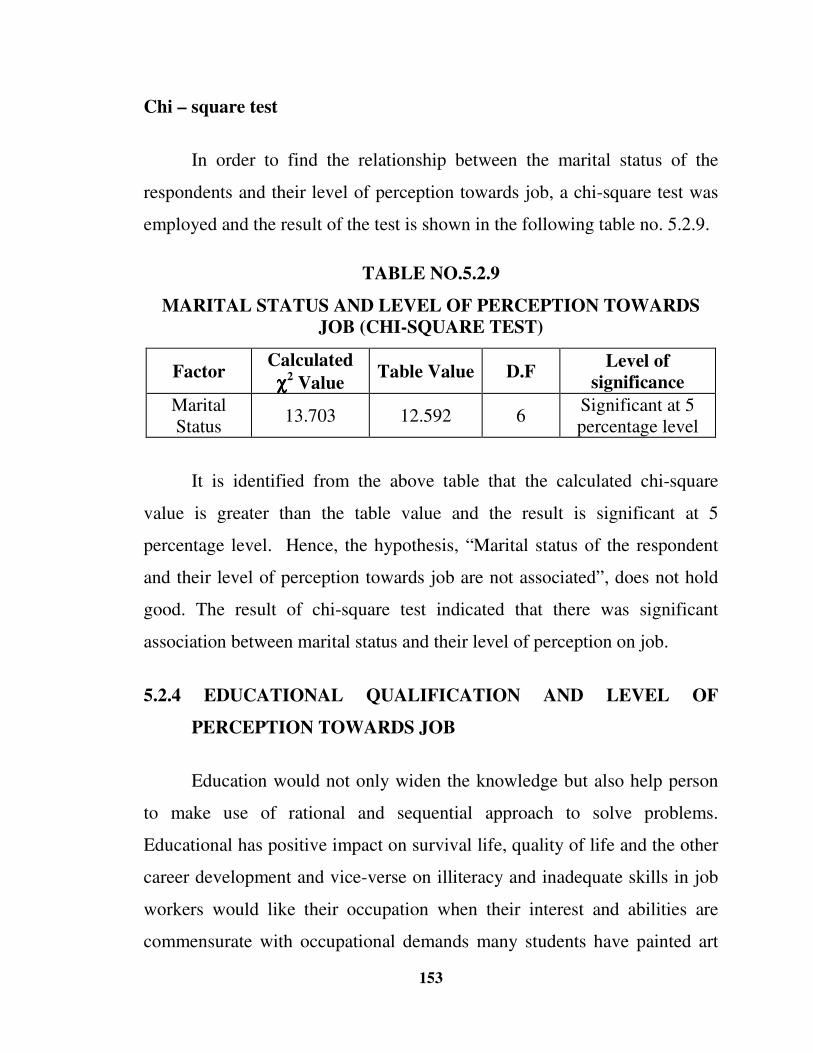
153
Chi – square test
In order to find the relationship between the marital status of the
respondents and their level of perception towards job, a chi-square test was
employed and the result of the test is shown in the following table no. 5.2.9.
TABLE NO.5.2.9
MARITAL STATUS AND LEVEL OF PERCEPTION TOWARDS JOB (CHI-SQUARE TEST)
Factor Calculated
χχχχ2 Value
Table Value D.F Level of
significance
Marital Status
13.703 12.592 6 Significant at 5 percentage level
It is identified from the above table that the calculated chi-square
value is greater than the table value and the result is significant at 5
percentage level. Hence, the hypothesis, “Marital status of the respondent
and their level of perception towards job are not associated”, does not hold
good. The result of chi-square test indicated that there was significant
association between marital status and their level of perception on job.
5.2.4 EDUCATIONAL QUALIFICATION AND LEVEL OF
PERCEPTION TOWARDS JOB
Education would not only widen the knowledge but also help person
to make use of rational and sequential approach to solve problems.
Educational has positive impact on survival life, quality of life and the other
career development and vice-verse on illiteracy and inadequate skills in job
workers would like their occupation when their interest and abilities are
commensurate with occupational demands many students have painted art
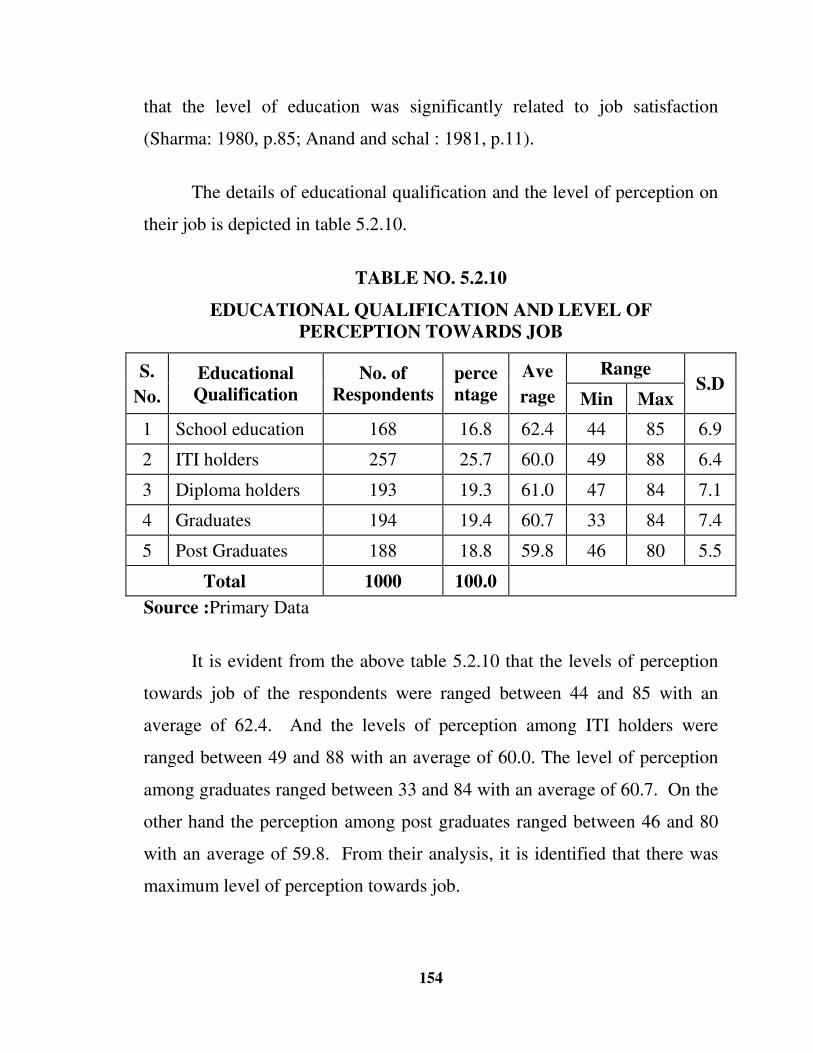
154
that the level of education was significantly related to job satisfaction
(Sharma: 1980, p.85; Anand and schal : 1981, p.11).
The details of educational qualification and the level of perception on
their job is depicted in table 5.2.10.
TABLE NO. 5.2.10
EDUCATIONAL QUALIFICATION AND LEVEL OF
PERCEPTION TOWARDS JOB
S.
No.
Educational Qualification
No. of Respondents
percentage
Ave
rage
Range S.D
Min Max
1 School education 168 16.8 62.4 44 85 6.9
2 ITI holders 257 25.7 60.0 49 88 6.4
3 Diploma holders 193 19.3 61.0 47 84 7.1
4 Graduates 194 19.4 60.7 33 84 7.4
5 Post Graduates 188 18.8 59.8 46 80 5.5
Total 1000 100.0
Source :Primary Data
It is evident from the above table 5.2.10 that the levels of perception
towards job of the respondents were ranged between 44 and 85 with an
average of 62.4. And the levels of perception among ITI holders were
ranged between 49 and 88 with an average of 60.0. The level of perception
among graduates ranged between 33 and 84 with an average of 60.7. On the
other hand the perception among post graduates ranged between 46 and 80
with an average of 59.8. From their analysis, it is identified that there was
maximum level of perception towards job.
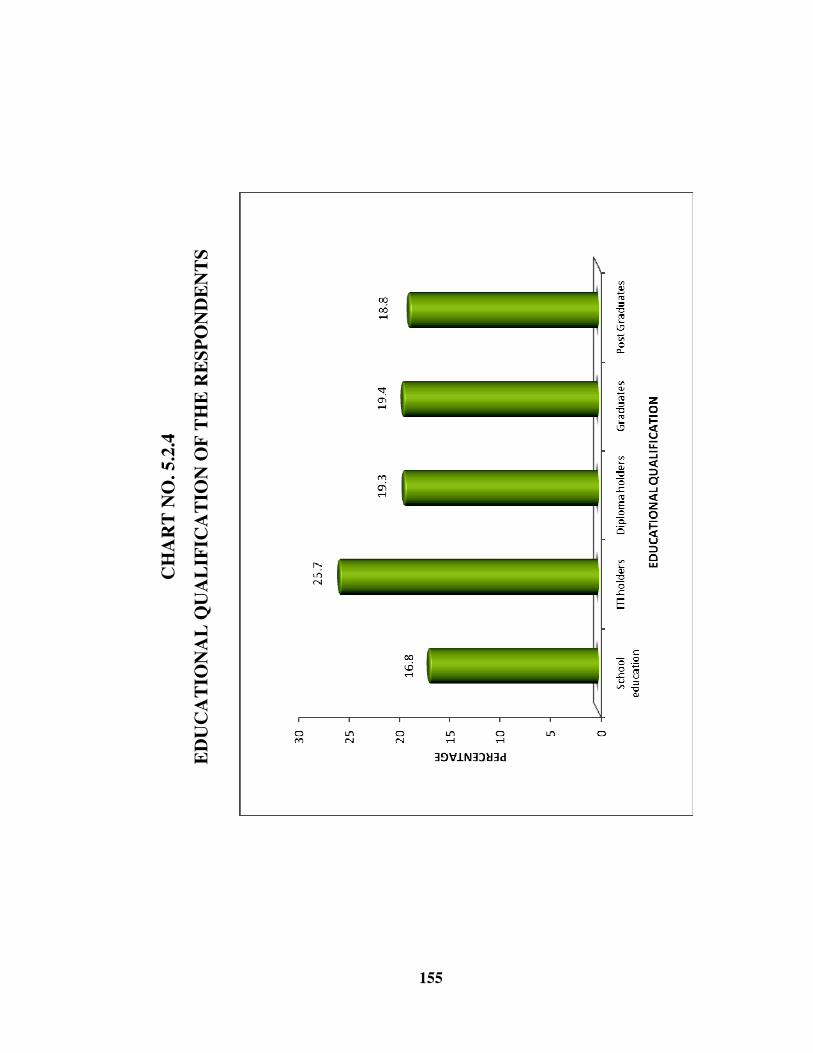
155
CH
AR
T N
O. 5
.2.4
ED
UC
AT
ION
AL
QU
AL
IFIC
AT
ION
OF
TH
E R
ES
PO
ND
EN
TS
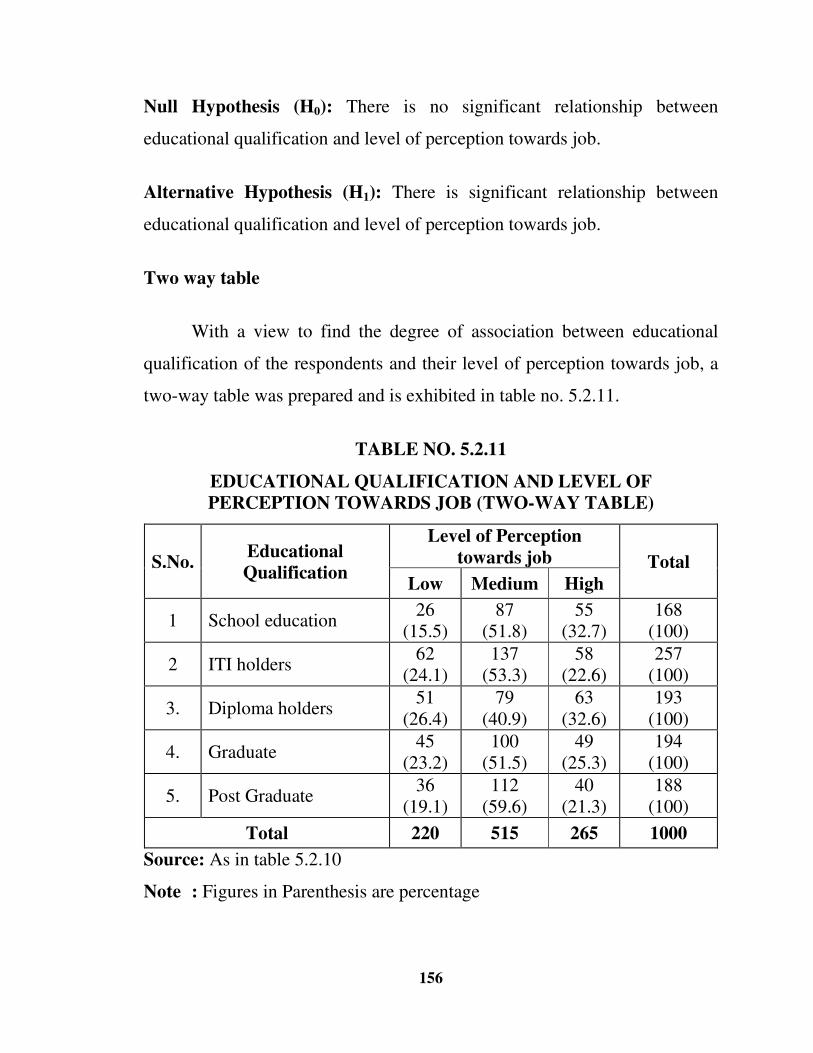
156
Null Hypothesis (H0): There is no significant relationship between
educational qualification and level of perception towards job.
Alternative Hypothesis (H1): There is significant relationship between
educational qualification and level of perception towards job.
Two way table
With a view to find the degree of association between educational
qualification of the respondents and their level of perception towards job, a
two-way table was prepared and is exhibited in table no. 5.2.11.
TABLE NO. 5.2.11
EDUCATIONAL QUALIFICATION AND LEVEL OF PERCEPTION TOWARDS JOB (TWO-WAY TABLE)
S.No. Educational Qualification
Level of Perception
towards job Total
Low Medium High
1 School education 26
(15.5) 87
(51.8) 55
(32.7) 168
(100)
2 ITI holders 62
(24.1) 137
(53.3) 58
(22.6) 257
(100)
3. Diploma holders 51
(26.4) 79
(40.9) 63
(32.6) 193
(100)
4. Graduate 45
(23.2) 100
(51.5) 49
(25.3) 194
(100)
5. Post Graduate 36
(19.1) 112
(59.6) 40
(21.3) 188
(100)
Total 220 515 265 1000
Source: As in table 5.2.10
Note : Figures in Parenthesis are percentage
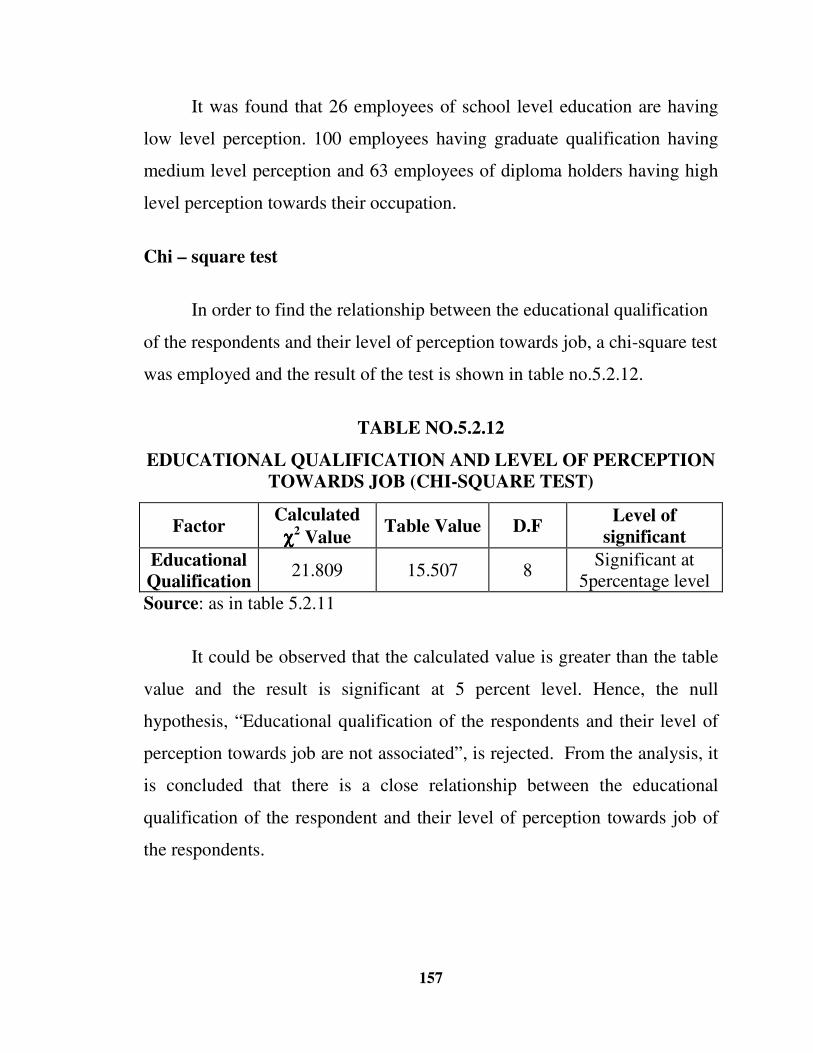
157
It was found that 26 employees of school level education are having
low level perception. 100 employees having graduate qualification having
medium level perception and 63 employees of diploma holders having high
level perception towards their occupation.
Chi – square test
In order to find the relationship between the educational qualification
of the respondents and their level of perception towards job, a chi-square test
was employed and the result of the test is shown in table no.5.2.12.
TABLE NO.5.2.12
EDUCATIONAL QUALIFICATION AND LEVEL OF PERCEPTION TOWARDS JOB (CHI-SQUARE TEST)
Factor Calculated
χχχχ2 Value
Table Value D.F Level of
significant
Educational Qualification
21.809 15.507 8 Significant at
5percentage level
Source: as in table 5.2.11
It could be observed that the calculated value is greater than the table
value and the result is significant at 5 percent level. Hence, the null
hypothesis, “Educational qualification of the respondents and their level of
perception towards job are not associated”, is rejected. From the analysis, it
is concluded that there is a close relationship between the educational
qualification of the respondent and their level of perception towards job of
the respondents.
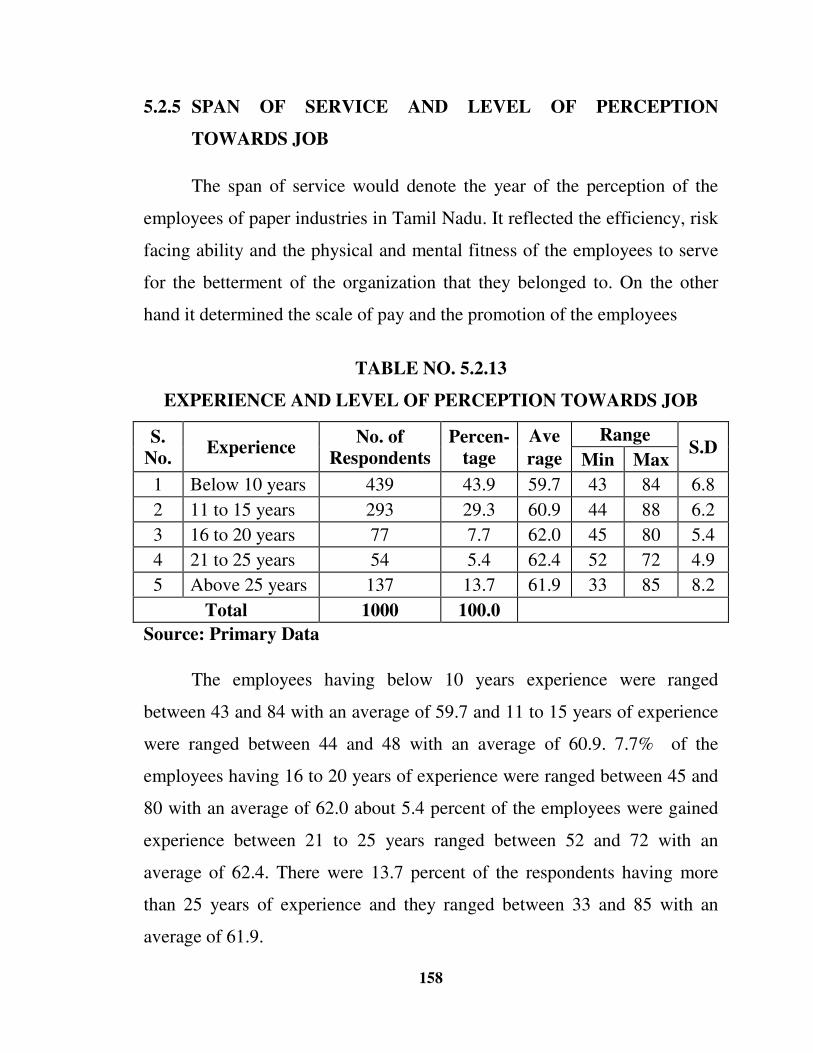
158
5.2.5 SPAN OF SERVICE AND LEVEL OF PERCEPTION
TOWARDS JOB
The span of service would denote the year of the perception of the
employees of paper industries in Tamil Nadu. It reflected the efficiency, risk
facing ability and the physical and mental fitness of the employees to serve
for the betterment of the organization that they belonged to. On the other
hand it determined the scale of pay and the promotion of the employees
TABLE NO. 5.2.13
EXPERIENCE AND LEVEL OF PERCEPTION TOWARDS JOB
S. No.
Experience No. of
Respondents Percen-
tage
Ave
rage
Range S.D
Min Max
1 Below 10 years 439 43.9 59.7 43 84 6.8
2 11 to 15 years 293 29.3 60.9 44 88 6.2
3 16 to 20 years 77 7.7 62.0 45 80 5.4
4 21 to 25 years 54 5.4 62.4 52 72 4.9
5 Above 25 years 137 13.7 61.9 33 85 8.2
Total 1000 100.0
Source: Primary Data
The employees having below 10 years experience were ranged
between 43 and 84 with an average of 59.7 and 11 to 15 years of experience
were ranged between 44 and 48 with an average of 60.9. 7.7% of the
employees having 16 to 20 years of experience were ranged between 45 and
80 with an average of 62.0 about 5.4 percent of the employees were gained
experience between 21 to 25 years ranged between 52 and 72 with an
average of 62.4. There were 13.7 percent of the respondents having more
than 25 years of experience and they ranged between 33 and 85 with an
average of 61.9.

159
CH
AR
T N
O. 5
.2.5
EX
PE
RIE
NC
E O
F T
HE
RE
SP
ON
DE
NT
S
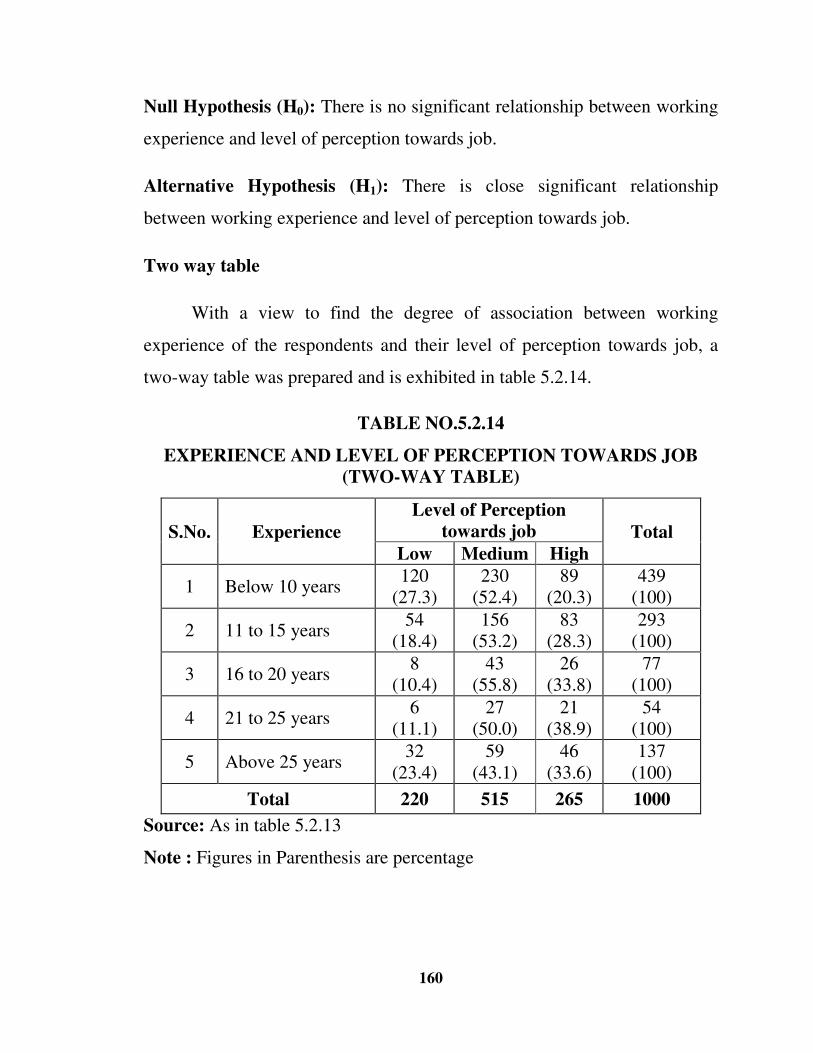
160
Null Hypothesis (H0): There is no significant relationship between working
experience and level of perception towards job.
Alternative Hypothesis (H1): There is close significant relationship
between working experience and level of perception towards job.
Two way table
With a view to find the degree of association between working
experience of the respondents and their level of perception towards job, a
two-way table was prepared and is exhibited in table 5.2.14.
TABLE NO.5.2.14
EXPERIENCE AND LEVEL OF PERCEPTION TOWARDS JOB (TWO-WAY TABLE)
S.No. Experience
Level of Perception towards job Total
Low Medium High
1 Below 10 years 120
(27.3) 230
(52.4) 89
(20.3) 439
(100)
2 11 to 15 years 54
(18.4) 156
(53.2) 83
(28.3) 293
(100)
3 16 to 20 years 8
(10.4) 43
(55.8) 26
(33.8) 77
(100)
4 21 to 25 years 6
(11.1) 27
(50.0) 21
(38.9) 54
(100)
5 Above 25 years 32
(23.4) 59
(43.1) 46
(33.6) 137
(100)
Total 220 515 265 1000
Source: As in table 5.2.13
Note : Figures in Parenthesis are percentage
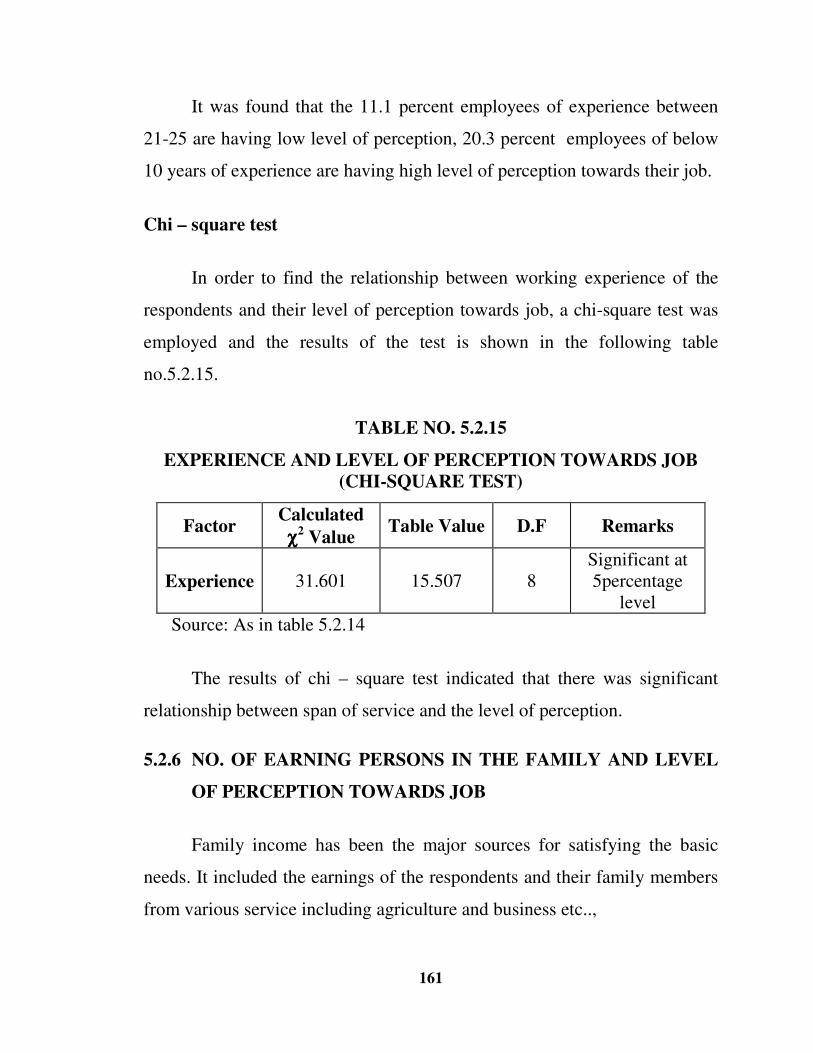
161
It was found that the 11.1 percent employees of experience between
21-25 are having low level of perception, 20.3 percent employees of below
10 years of experience are having high level of perception towards their job.
Chi – square test
In order to find the relationship between working experience of the
respondents and their level of perception towards job, a chi-square test was
employed and the results of the test is shown in the following table
no.5.2.15.
TABLE NO. 5.2.15
EXPERIENCE AND LEVEL OF PERCEPTION TOWARDS JOB (CHI-SQUARE TEST)
Factor Calculated
χχχχ2 Value
Table Value D.F Remarks
Experience 31.601 15.507 8 Significant at 5percentage
level
Source: As in table 5.2.14
The results of chi – square test indicated that there was significant
relationship between span of service and the level of perception.
5.2.6 NO. OF EARNING PERSONS IN THE FAMILY AND LEVEL
OF PERCEPTION TOWARDS JOB
Family income has been the major sources for satisfying the basic
needs. It included the earnings of the respondents and their family members
from various service including agriculture and business etc..,
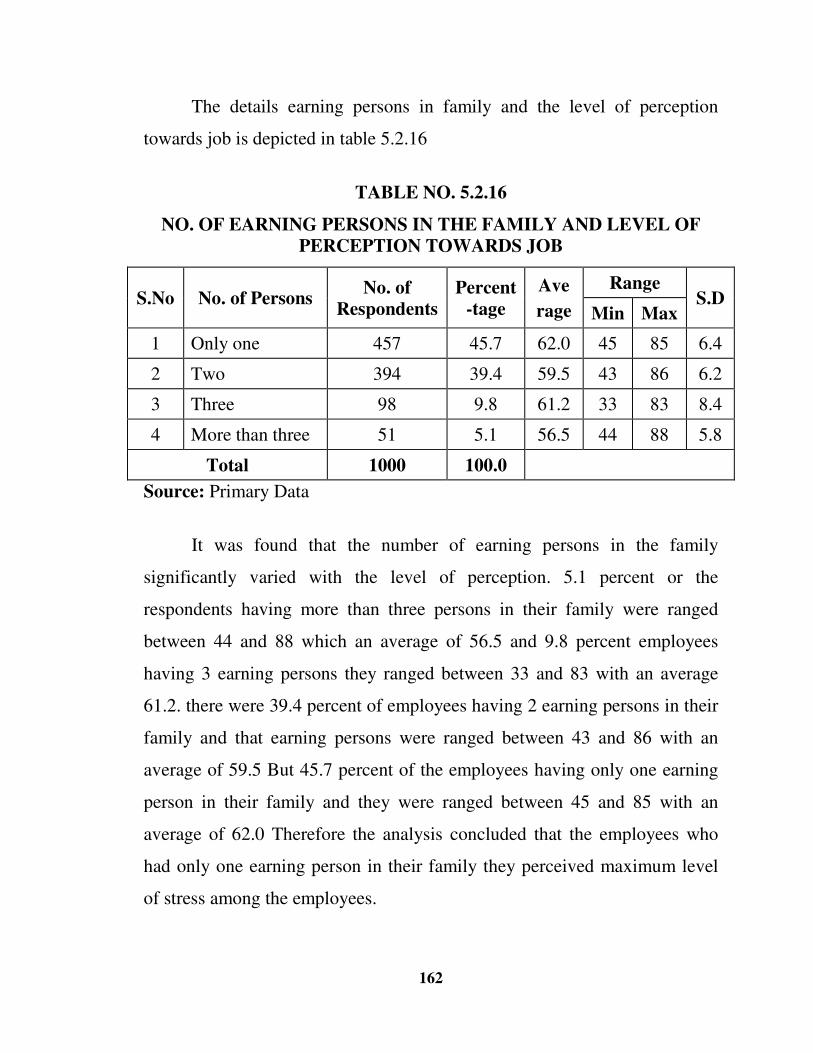
162
The details earning persons in family and the level of perception
towards job is depicted in table 5.2.16
TABLE NO. 5.2.16
NO. OF EARNING PERSONS IN THE FAMILY AND LEVEL OF PERCEPTION TOWARDS JOB
S.No No. of Persons No. of
Respondents Percent
-tage
Ave
rage
Range S.D
Min Max
1 Only one 457 45.7 62.0 45 85 6.4
2 Two 394 39.4 59.5 43 86 6.2
3 Three 98 9.8 61.2 33 83 8.4
4 More than three 51 5.1 56.5 44 88 5.8
Total 1000 100.0
Source: Primary Data
It was found that the number of earning persons in the family
significantly varied with the level of perception. 5.1 percent or the
respondents having more than three persons in their family were ranged
between 44 and 88 which an average of 56.5 and 9.8 percent employees
having 3 earning persons they ranged between 33 and 83 with an average
61.2. there were 39.4 percent of employees having 2 earning persons in their
family and that earning persons were ranged between 43 and 86 with an
average of 59.5 But 45.7 percent of the employees having only one earning
person in their family and they were ranged between 45 and 85 with an
average of 62.0 Therefore the analysis concluded that the employees who
had only one earning person in their family they perceived maximum level
of stress among the employees.
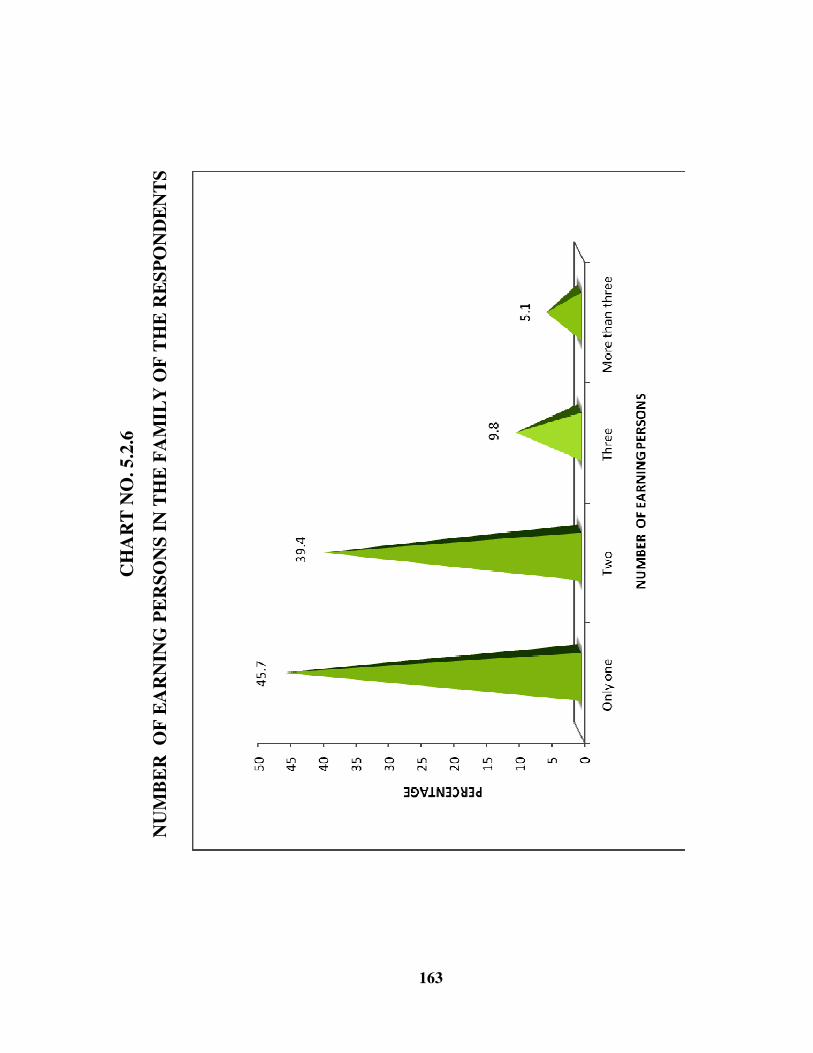
163
CH
AR
T N
O. 5
.2.6
NU
MB
ER
O
F E
AR
NIN
G P
ER
SO
NS
IN
TH
E F
AM
ILY
OF
TH
E R
ES
PO
ND
EN
TS
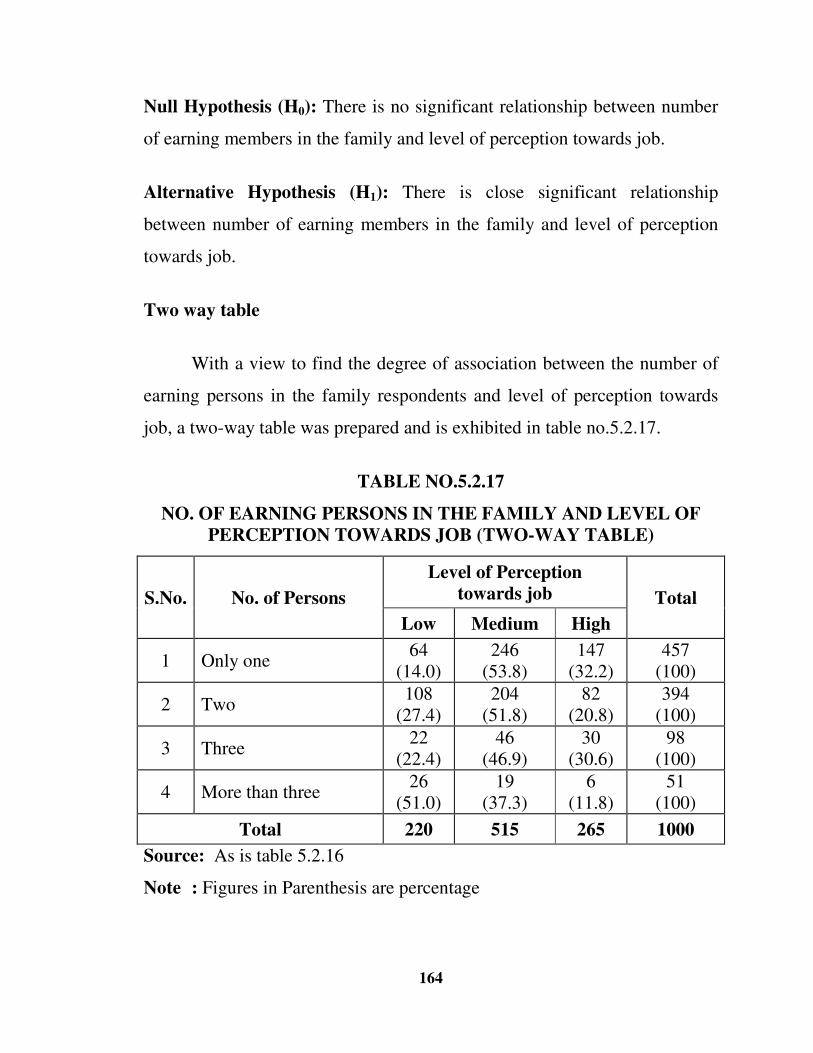
164
Null Hypothesis (H0): There is no significant relationship between number
of earning members in the family and level of perception towards job.
Alternative Hypothesis (H1): There is close significant relationship
between number of earning members in the family and level of perception
towards job.
Two way table
With a view to find the degree of association between the number of
earning persons in the family respondents and level of perception towards
job, a two-way table was prepared and is exhibited in table no.5.2.17.
TABLE NO.5.2.17
NO. OF EARNING PERSONS IN THE FAMILY AND LEVEL OF PERCEPTION TOWARDS JOB (TWO-WAY TABLE)
S.No. No. of Persons
Level of Perception towards job Total
Low Medium High
1 Only one 64
(14.0) 246
(53.8) 147
(32.2) 457
(100)
2 Two 108
(27.4) 204
(51.8) 82
(20.8) 394
(100)
3 Three 22
(22.4) 46
(46.9) 30
(30.6) 98
(100)
4 More than three 26
(51.0) 19
(37.3) 6
(11.8) 51
(100)
Total 220 515 265 1000
Source: As is table 5.2.16
Note : Figures in Parenthesis are percentage
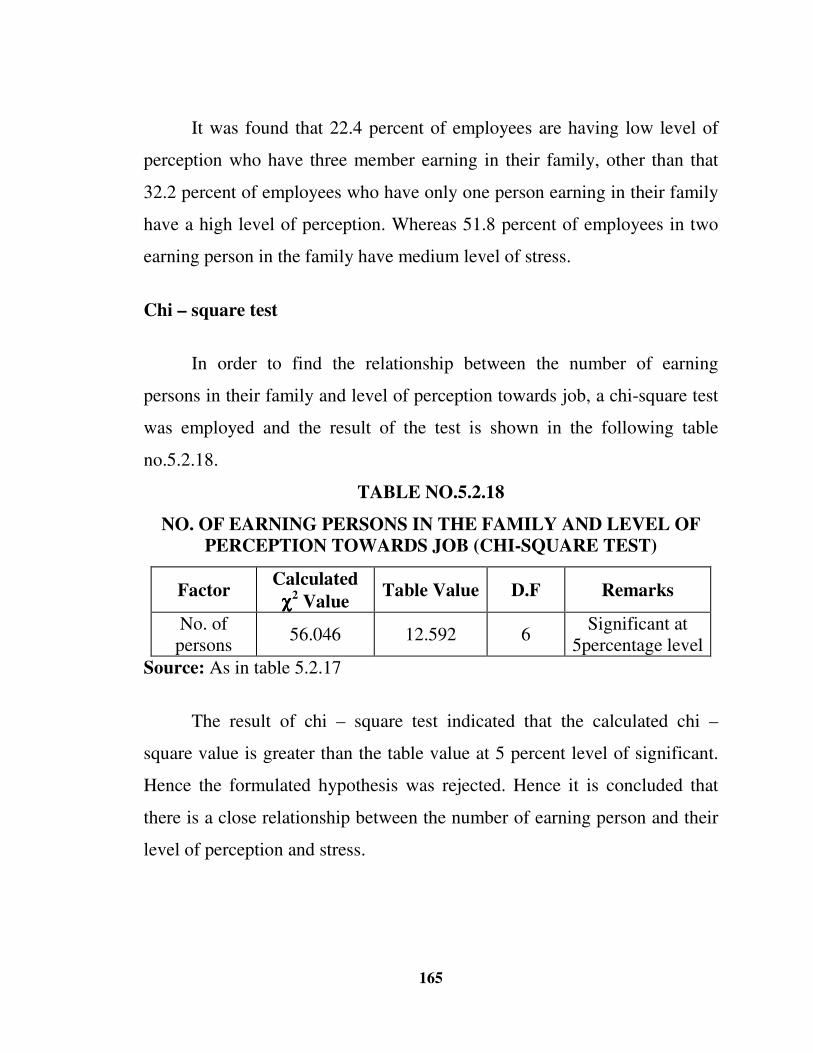
165
It was found that 22.4 percent of employees are having low level of
perception who have three member earning in their family, other than that
32.2 percent of employees who have only one person earning in their family
have a high level of perception. Whereas 51.8 percent of employees in two
earning person in the family have medium level of stress.
Chi – square test
In order to find the relationship between the number of earning
persons in their family and level of perception towards job, a chi-square test
was employed and the result of the test is shown in the following table
no.5.2.18.
TABLE NO.5.2.18
NO. OF EARNING PERSONS IN THE FAMILY AND LEVEL OF PERCEPTION TOWARDS JOB (CHI-SQUARE TEST)
Factor Calculated
χχχχ2 Value
Table Value D.F Remarks
No. of persons
56.046 12.592 6 Significant at
5percentage level
Source: As in table 5.2.17
The result of chi – square test indicated that the calculated chi –
square value is greater than the table value at 5 percent level of significant.
Hence the formulated hypothesis was rejected. Hence it is concluded that
there is a close relationship between the number of earning person and their
level of perception and stress.
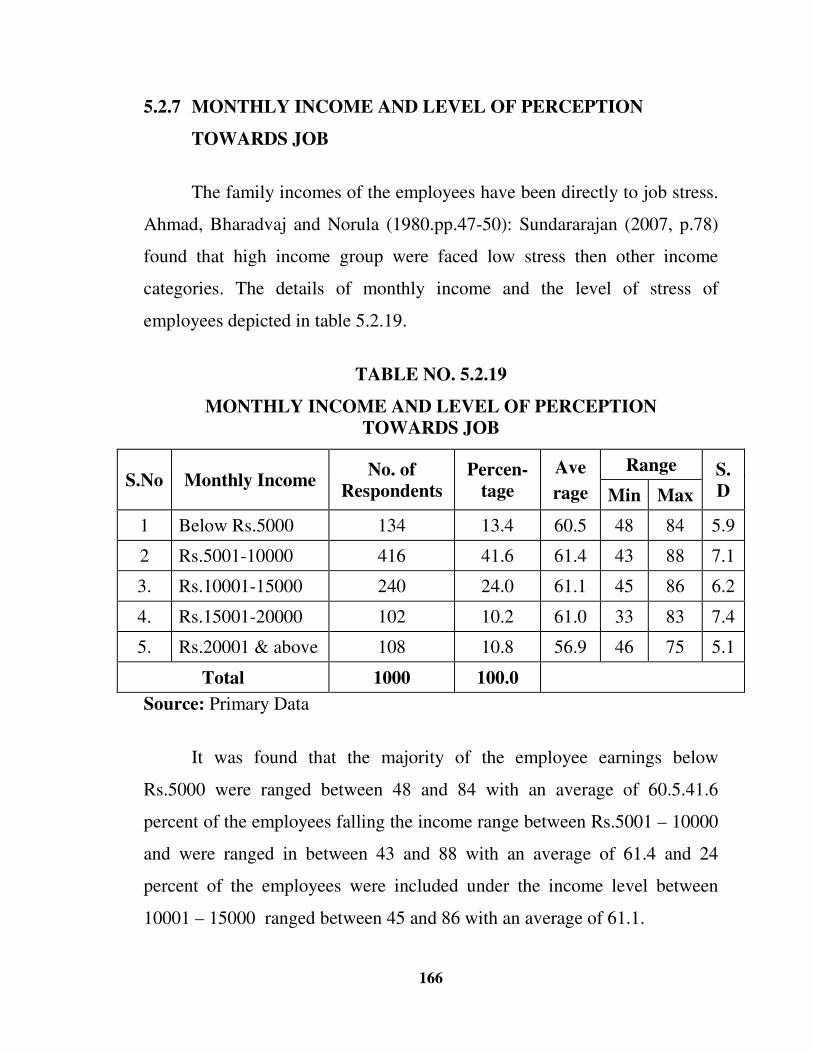
166
5.2.7 MONTHLY INCOME AND LEVEL OF PERCEPTION
TOWARDS JOB
The family incomes of the employees have been directly to job stress.
Ahmad, Bharadvaj and Norula (1980.pp.47-50): Sundararajan (2007, p.78)
found that high income group were faced low stress then other income
categories. The details of monthly income and the level of stress of
employees depicted in table 5.2.19.
TABLE NO. 5.2.19
MONTHLY INCOME AND LEVEL OF PERCEPTION TOWARDS JOB
S.No Monthly Income No. of
Respondents Percen-
tage
Ave
rage
Range S.D Min Max
1 Below Rs.5000 134 13.4 60.5 48 84 5.9
2 Rs.5001-10000 416 41.6 61.4 43 88 7.1
3. Rs.10001-15000 240 24.0 61.1 45 86 6.2
4. Rs.15001-20000 102 10.2 61.0 33 83 7.4
5. Rs.20001 & above 108 10.8 56.9 46 75 5.1
Total 1000 100.0
Source: Primary Data
It was found that the majority of the employee earnings below
Rs.5000 were ranged between 48 and 84 with an average of 60.5.41.6
percent of the employees falling the income range between Rs.5001 – 10000
and were ranged in between 43 and 88 with an average of 61.4 and 24
percent of the employees were included under the income level between
10001 – 15000 ranged between 45 and 86 with an average of 61.1.
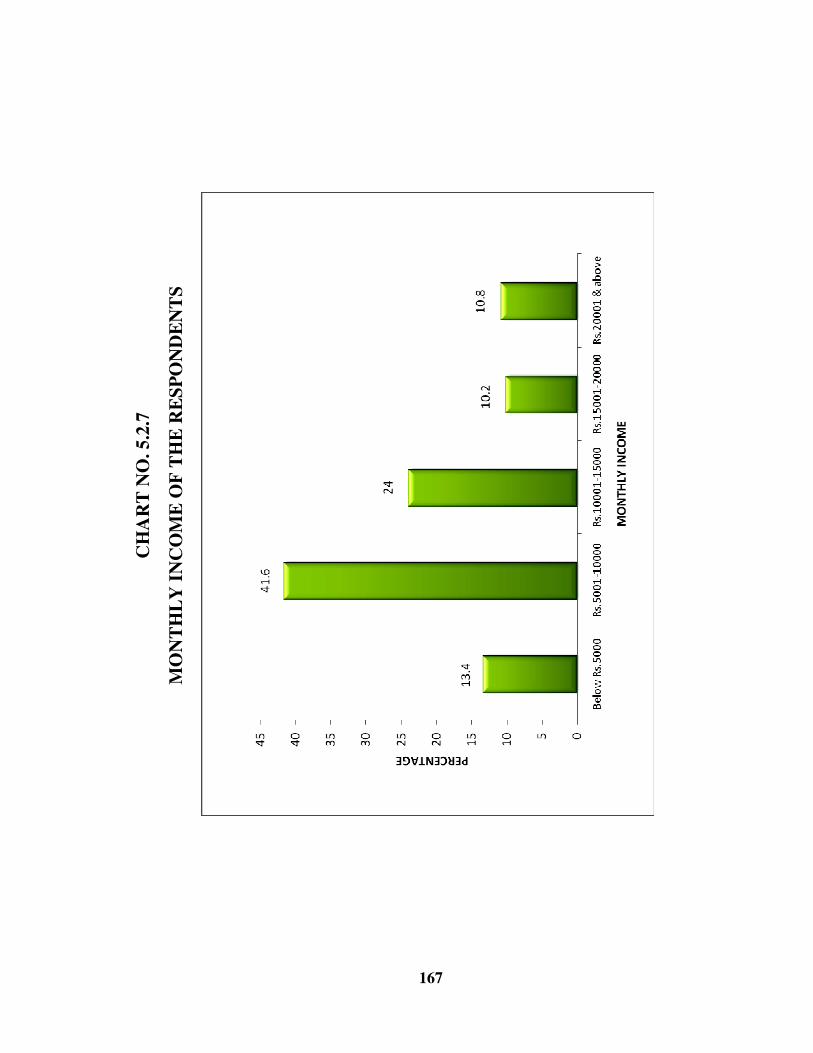
167
CH
AR
T N
O. 5
.2.7
MO
NT
HL
Y I
NC
OM
E O
F T
HE
RE
SP
ON
DE
NT
S
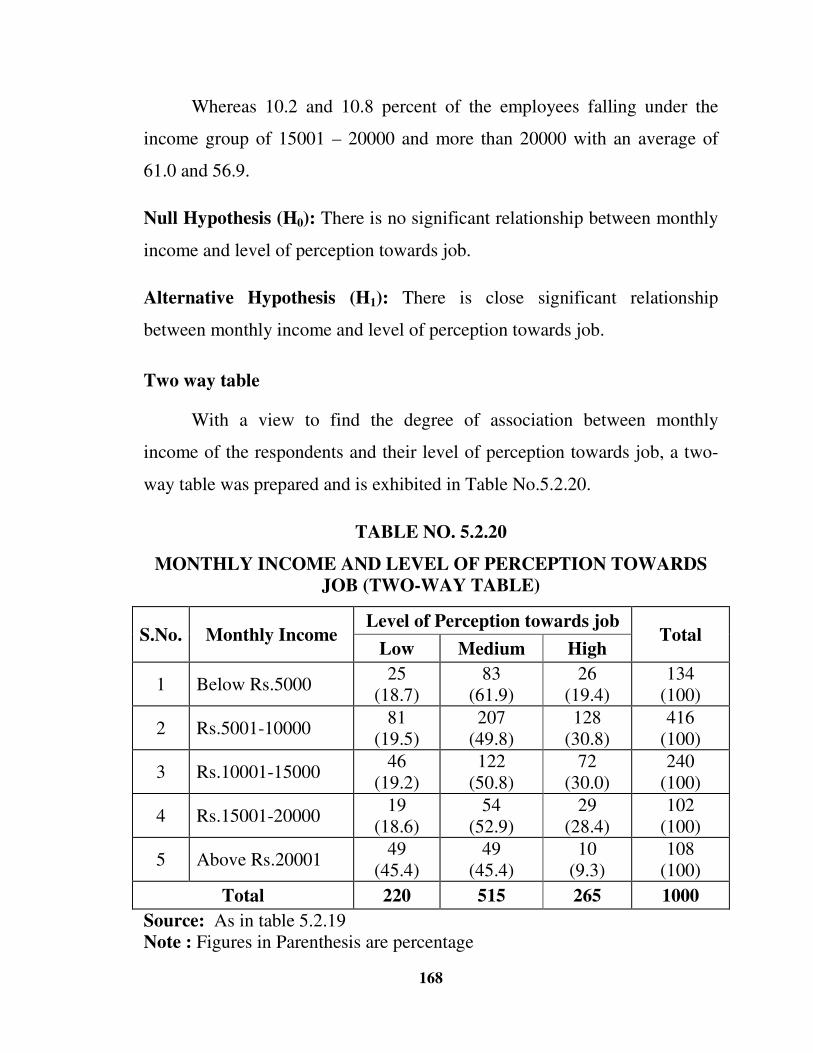
168
Whereas 10.2 and 10.8 percent of the employees falling under the
income group of 15001 – 20000 and more than 20000 with an average of
61.0 and 56.9.
Null Hypothesis (H0): There is no significant relationship between monthly
income and level of perception towards job.
Alternative Hypothesis (H1): There is close significant relationship
between monthly income and level of perception towards job.
Two way table
With a view to find the degree of association between monthly
income of the respondents and their level of perception towards job, a two-
way table was prepared and is exhibited in Table No.5.2.20.
TABLE NO. 5.2.20
MONTHLY INCOME AND LEVEL OF PERCEPTION TOWARDS JOB (TWO-WAY TABLE)
S.No. Monthly Income Level of Perception towards job
Total Low Medium High
1 Below Rs.5000 25
(18.7) 83
(61.9) 26
(19.4) 134
(100)
2 Rs.5001-10000 81
(19.5) 207
(49.8) 128
(30.8) 416
(100)
3 Rs.10001-15000 46
(19.2) 122
(50.8) 72
(30.0) 240
(100)
4 Rs.15001-20000 19
(18.6) 54
(52.9) 29
(28.4) 102
(100)
5 Above Rs.20001 49
(45.4) 49
(45.4) 10
(9.3) 108
(100)
Total 220 515 265 1000
Source: As in table 5.2.19 Note : Figures in Parenthesis are percentage

169
The above table indicates that the 30.8 percent of the respondents
earning between Rs.5001 – 10000 were in the high level perception and 9.3
percent of the employees getting more than Rs.20000 also were in the high
level perception. But in the same case 61.9 percent of the employees earning
below Rs.5000 were in the medium level of perception and 45.4 percent of
the employees earning more than Rs.20000 were in the middle level
perception.
In case of low level perception among the employees were 45.4 even
their monthly income was more than 20000 and at the same time 18.6
percent of the employees falling in the income range between Rs.15001 –
20000 were in low level perception
TABLE NO. 5.2.21
MONTHLY INCOME AND LEVEL OF PERCEPTION TOWARDS JOB (CHI-SQUARE TEST)
Factor Calculated
χχχχ2 Value
Table Value D.F Level of
significance
Monthly Income
52.811 15.507 8 5percentage
level
Source : As in table 5.2.20
It was found from the above table that the calculated value is greater
than the table value and the result is significant at 5percentage level. Hence,
the null hypothesis, “Monthly income of the respondents and their level of
perception towards job are not associated”, is rejected. From the analysis, it
is concluded that there is a significant relationship between the monthly
income of the respondents and their level of perception towards job.
170
5.3 OCCUPATIONAL STRESS
Occupation stress can be defined as the harmful physical and
emotional response that occurred when the requirements of the job did not
match the capabilities, resources or need of the workers. Job stress worked
lead to poor health problems ranging from cardio vascular disease to cancer.
Stressful working conditions would also interfere with an employee’s ability
to work safely, contributing to work injuries and illness. In the work place of
the 1900s, the mostly highly ranked and frequently reported job stresses
were potential job loss, technological advances and ineffective top
management. At the work unit level work load, poor supervision and
inadequate training have been the top ranking stress (www.sedr.net).
Relationship demand physical as well as mental health problems, pressure at
work places, meeting and deadlines, growing up tension. All these
conditions and situations have been valid causes of stress.
(www.lifepositive.com)
Measurement of job stress prevailing among the employees of paper
industries in Tamil Nadu:
To find out the level of job stress of the employees, the statement
relation to job stress have been quantified which were responded through
range and ANOVA tests.
ANOVA allows for the study of a single factor or several factors but
will only measure on variable ( Bray and Monwall 1985 Towncend 2002).
An ANOVA works by measuring the variance of population in two different
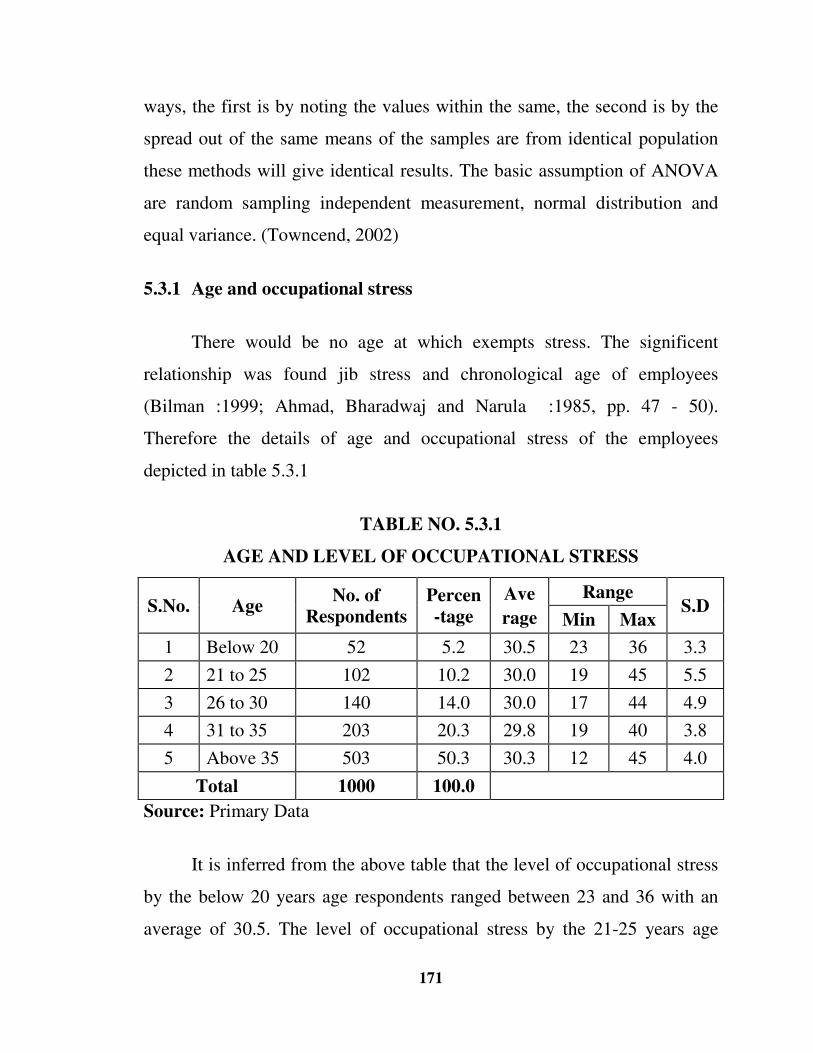
171
ways, the first is by noting the values within the same, the second is by the
spread out of the same means of the samples are from identical population
these methods will give identical results. The basic assumption of ANOVA
are random sampling independent measurement, normal distribution and
equal variance. (Towncend, 2002)
5.3.1 Age and occupational stress
There would be no age at which exempts stress. The significent
relationship was found jib stress and chronological age of employees
(Bilman :1999; Ahmad, Bharadwaj and Narula :1985, pp. 47 - 50).
Therefore the details of age and occupational stress of the employees
depicted in table 5.3.1
TABLE NO. 5.3.1
AGE AND LEVEL OF OCCUPATIONAL STRESS
S.No. Age No. of
Respondents Percen-tage
Ave
rage
Range S.D
Min Max
1 Below 20 52 5.2 30.5 23 36 3.3
2 21 to 25 102 10.2 30.0 19 45 5.5
3 26 to 30 140 14.0 30.0 17 44 4.9
4 31 to 35 203 20.3 29.8 19 40 3.8
5 Above 35 503 50.3 30.3 12 45 4.0
Total 1000 100.0
Source: Primary Data
It is inferred from the above table that the level of occupational stress
by the below 20 years age respondents ranged between 23 and 36 with an
average of 30.5. The level of occupational stress by the 21-25 years age
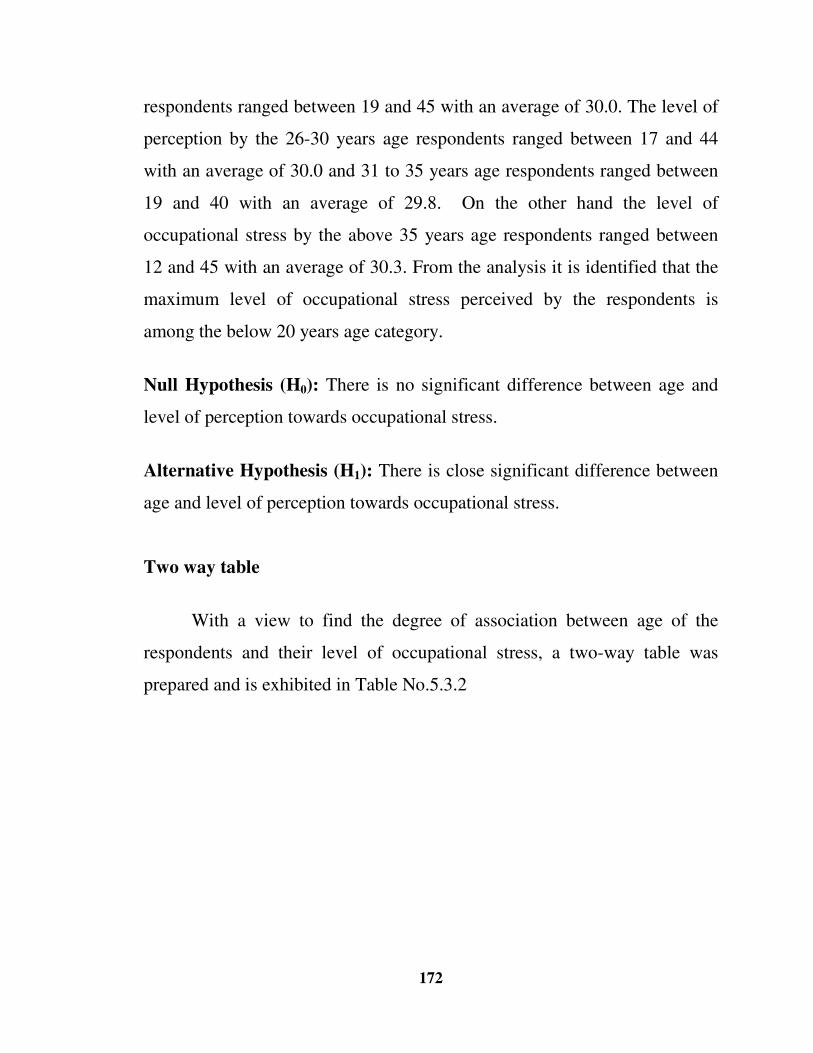
172
respondents ranged between 19 and 45 with an average of 30.0. The level of
perception by the 26-30 years age respondents ranged between 17 and 44
with an average of 30.0 and 31 to 35 years age respondents ranged between
19 and 40 with an average of 29.8. On the other hand the level of
occupational stress by the above 35 years age respondents ranged between
12 and 45 with an average of 30.3. From the analysis it is identified that the
maximum level of occupational stress perceived by the respondents is
among the below 20 years age category.
Null Hypothesis (H0): There is no significant difference between age and
level of perception towards occupational stress.
Alternative Hypothesis (H1): There is close significant difference between
age and level of perception towards occupational stress.
Two way table
With a view to find the degree of association between age of the
respondents and their level of occupational stress, a two-way table was
prepared and is exhibited in Table No.5.3.2
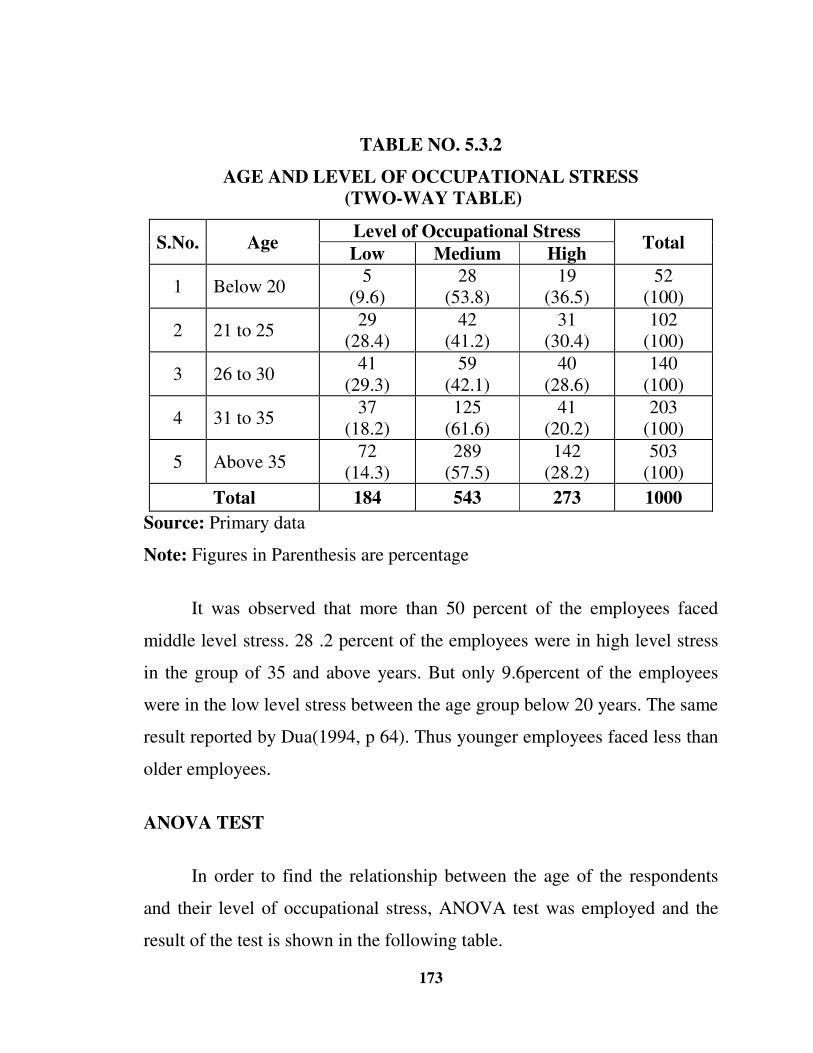
173
TABLE NO. 5.3.2
AGE AND LEVEL OF OCCUPATIONAL STRESS (TWO-WAY TABLE)
S.No. Age Level of Occupational Stress
Total Low Medium High
1 Below 20 5
(9.6) 28
(53.8) 19
(36.5) 52
(100)
2 21 to 25 29
(28.4) 42
(41.2) 31
(30.4) 102
(100)
3 26 to 30 41
(29.3) 59
(42.1) 40
(28.6) 140
(100)
4 31 to 35 37
(18.2) 125
(61.6) 41
(20.2) 203
(100)
5 Above 35 72
(14.3) 289
(57.5) 142
(28.2) 503
(100)
Total 184 543 273 1000
Source: Primary data
Note: Figures in Parenthesis are percentage
It was observed that more than 50 percent of the employees faced
middle level stress. 28 .2 percent of the employees were in high level stress
in the group of 35 and above years. But only 9.6percent of the employees
were in the low level stress between the age group below 20 years. The same
result reported by Dua(1994, p 64). Thus younger employees faced less than
older employees.
ANOVA TEST
In order to find the relationship between the age of the respondents
and their level of occupational stress, ANOVA test was employed and the
result of the test is shown in the following table.
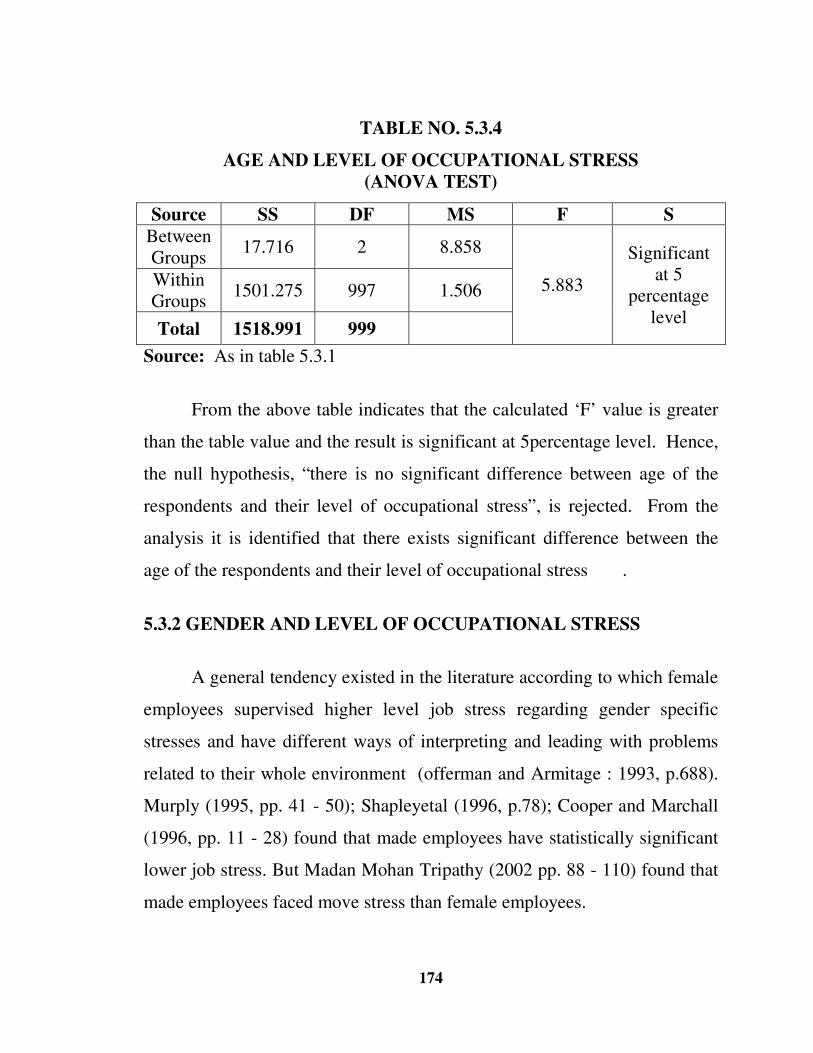
174
TABLE NO. 5.3.4
AGE AND LEVEL OF OCCUPATIONAL STRESS
(ANOVA TEST)
Source SS DF MS F S
Between Groups
17.716 2 8.858
5.883
Significant at 5
percentage level
Within Groups
1501.275 997 1.506
Total 1518.991 999
Source: As in table 5.3.1
From the above table indicates that the calculated ‘F’ value is greater
than the table value and the result is significant at 5percentage level. Hence,
the null hypothesis, “there is no significant difference between age of the
respondents and their level of occupational stress”, is rejected. From the
analysis it is identified that there exists significant difference between the
age of the respondents and their level of occupational stress .
5.3.2 GENDER AND LEVEL OF OCCUPATIONAL STRESS
A general tendency existed in the literature according to which female
employees supervised higher level job stress regarding gender specific
stresses and have different ways of interpreting and leading with problems
related to their whole environment (offerman and Armitage : 1993, p.688).
Murply (1995, pp. 41 - 50); Shapleyetal (1996, p.78); Cooper and Marchall
(1996, pp. 11 - 28) found that made employees have statistically significant
lower job stress. But Madan Mohan Tripathy (2002 pp. 88 - 110) found that
made employees faced move stress than female employees.
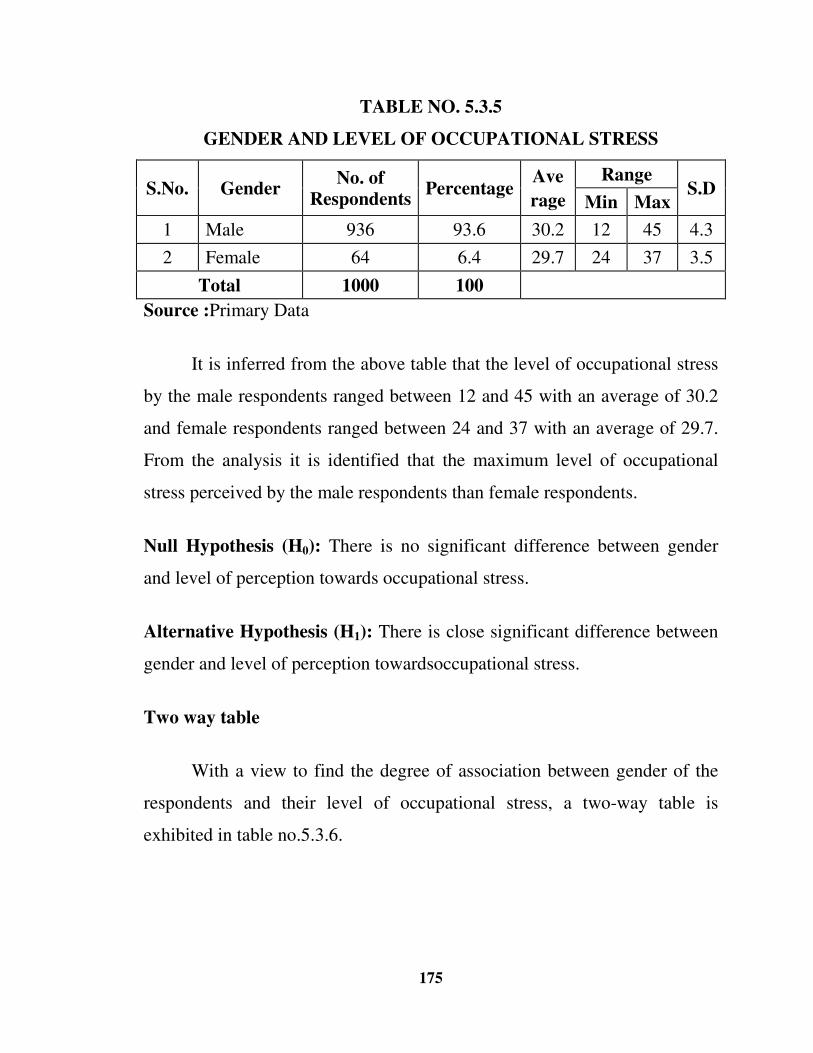
175
TABLE NO. 5.3.5
GENDER AND LEVEL OF OCCUPATIONAL STRESS
S.No. Gender No. of
Respondents Percentage
Ave
rage
Range S.D
Min Max
1 Male 936 93.6 30.2 12 45 4.3
2 Female 64 6.4 29.7 24 37 3.5
Total 1000 100
Source :Primary Data
It is inferred from the above table that the level of occupational stress
by the male respondents ranged between 12 and 45 with an average of 30.2
and female respondents ranged between 24 and 37 with an average of 29.7.
From the analysis it is identified that the maximum level of occupational
stress perceived by the male respondents than female respondents.
Null Hypothesis (H0): There is no significant difference between gender
and level of perception towards occupational stress.
Alternative Hypothesis (H1): There is close significant difference between
gender and level of perception towardsoccupational stress.
Two way table
With a view to find the degree of association between gender of the
respondents and their level of occupational stress, a two-way table is
exhibited in table no.5.3.6.
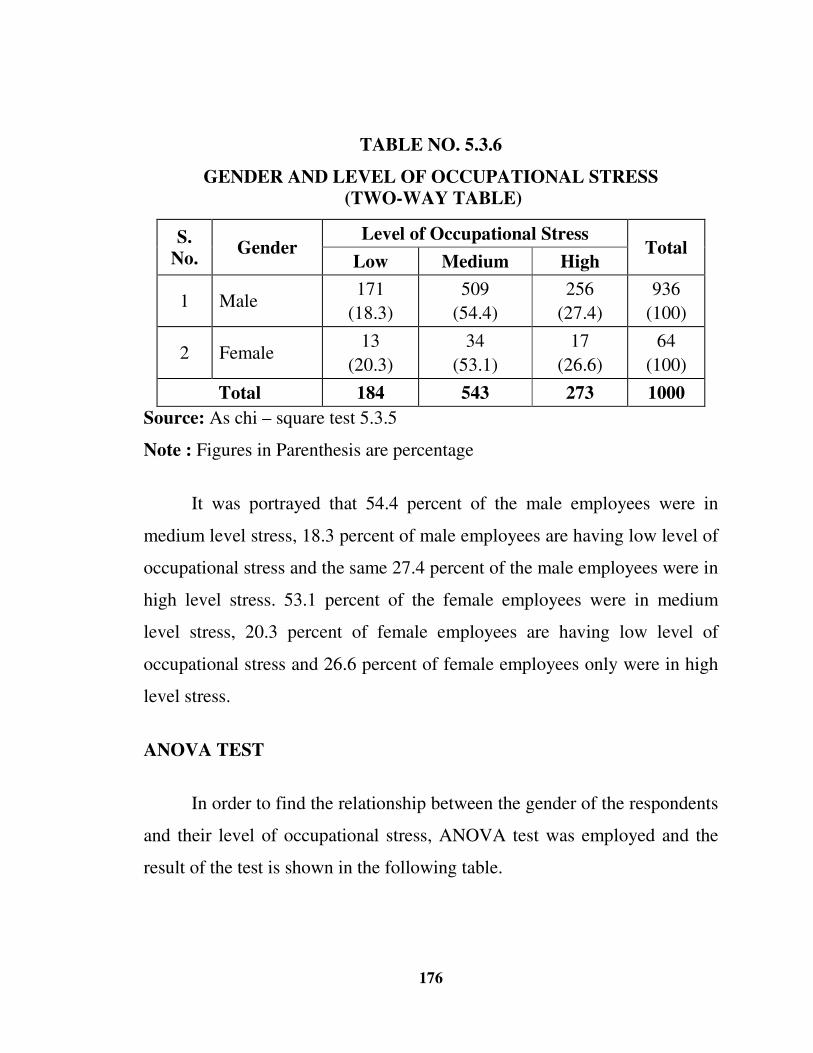
176
TABLE NO. 5.3.6
GENDER AND LEVEL OF OCCUPATIONAL STRESS (TWO-WAY TABLE)
S. No.
Gender Level of Occupational Stress
Total Low Medium High
1 Male 171
(18.3)
509
(54.4)
256
(27.4)
936
(100)
2 Female 13
(20.3)
34
(53.1)
17
(26.6)
64
(100)
Total 184 543 273 1000
Source: As chi – square test 5.3.5
Note : Figures in Parenthesis are percentage
It was portrayed that 54.4 percent of the male employees were in
medium level stress, 18.3 percent of male employees are having low level of
occupational stress and the same 27.4 percent of the male employees were in
high level stress. 53.1 percent of the female employees were in medium
level stress, 20.3 percent of female employees are having low level of
occupational stress and 26.6 percent of female employees only were in high
level stress.
ANOVA TEST
In order to find the relationship between the gender of the respondents
and their level of occupational stress, ANOVA test was employed and the
result of the test is shown in the following table.
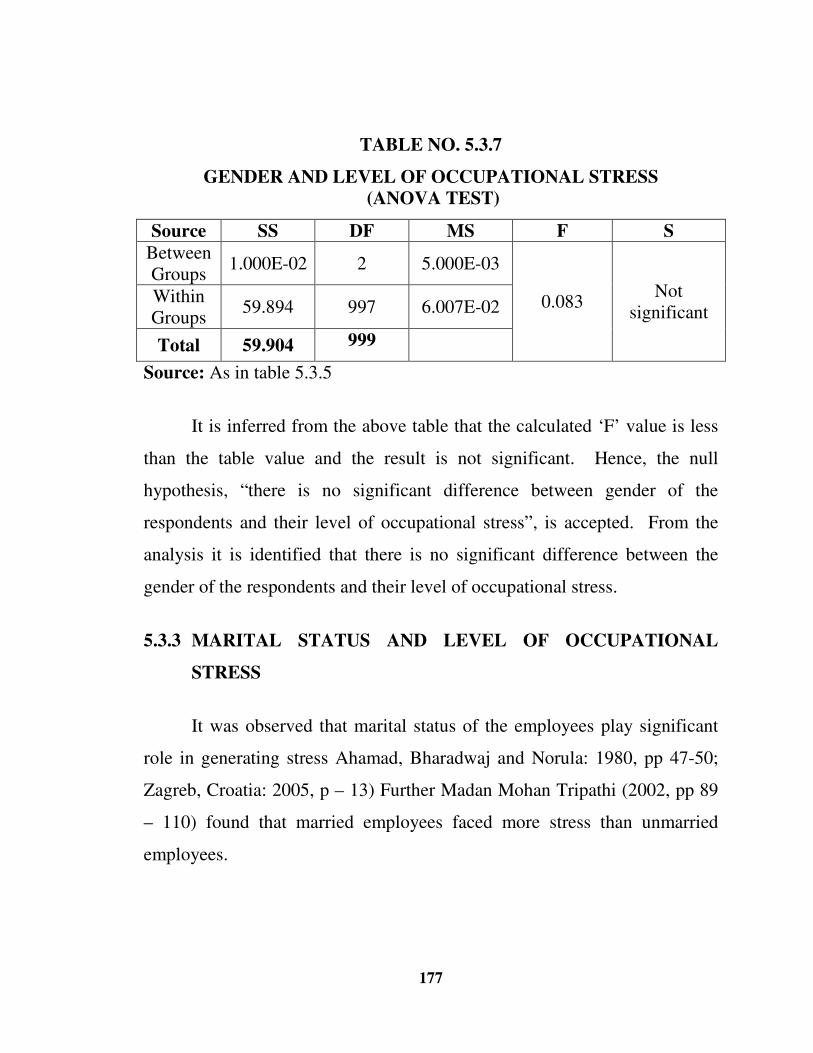
177
TABLE NO. 5.3.7
GENDER AND LEVEL OF OCCUPATIONAL STRESS (ANOVA TEST)
Source SS DF MS F S
Between Groups
1.000E-02 2 5.000E-03
0.083 Not
significant Within Groups
59.894 997 6.007E-02
Total 59.904 999
Source: As in table 5.3.5
It is inferred from the above table that the calculated ‘F’ value is less
than the table value and the result is not significant. Hence, the null
hypothesis, “there is no significant difference between gender of the
respondents and their level of occupational stress”, is accepted. From the
analysis it is identified that there is no significant difference between the
gender of the respondents and their level of occupational stress.
5.3.3 MARITAL STATUS AND LEVEL OF OCCUPATIONAL
STRESS
It was observed that marital status of the employees play significant
role in generating stress Ahamad, Bharadwaj and Norula: 1980, pp 47-50;
Zagreb, Croatia: 2005, p – 13) Further Madan Mohan Tripathi (2002, pp 89
– 110) found that married employees faced more stress than unmarried
employees.
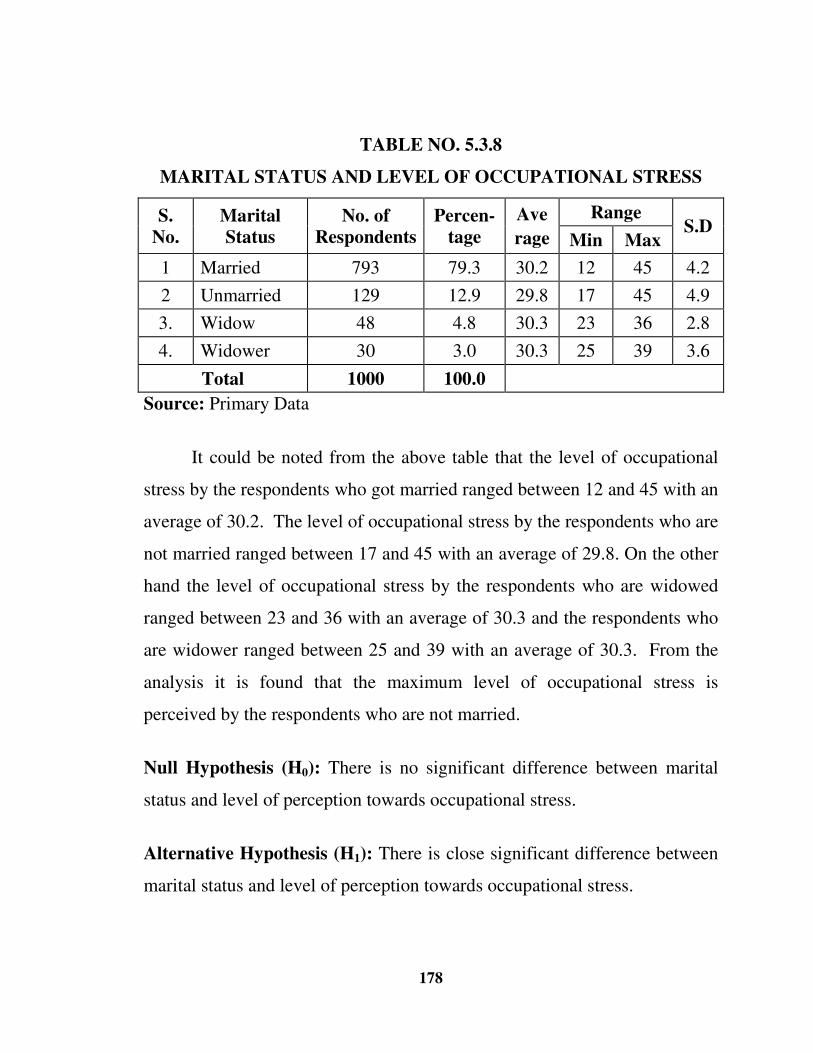
178
TABLE NO. 5.3.8
MARITAL STATUS AND LEVEL OF OCCUPATIONAL STRESS
S. No.
Marital Status
No. of Respondents
Percen-tage
Ave
rage
Range S.D
Min Max
1 Married 793 79.3 30.2 12 45 4.2
2 Unmarried 129 12.9 29.8 17 45 4.9
3. Widow 48 4.8 30.3 23 36 2.8
4. Widower 30 3.0 30.3 25 39 3.6
Total 1000 100.0
Source: Primary Data
It could be noted from the above table that the level of occupational
stress by the respondents who got married ranged between 12 and 45 with an
average of 30.2. The level of occupational stress by the respondents who are
not married ranged between 17 and 45 with an average of 29.8. On the other
hand the level of occupational stress by the respondents who are widowed
ranged between 23 and 36 with an average of 30.3 and the respondents who
are widower ranged between 25 and 39 with an average of 30.3. From the
analysis it is found that the maximum level of occupational stress is
perceived by the respondents who are not married.
Null Hypothesis (H0): There is no significant difference between marital
status and level of perception towards occupational stress.
Alternative Hypothesis (H1): There is close significant difference between
marital status and level of perception towards occupational stress.
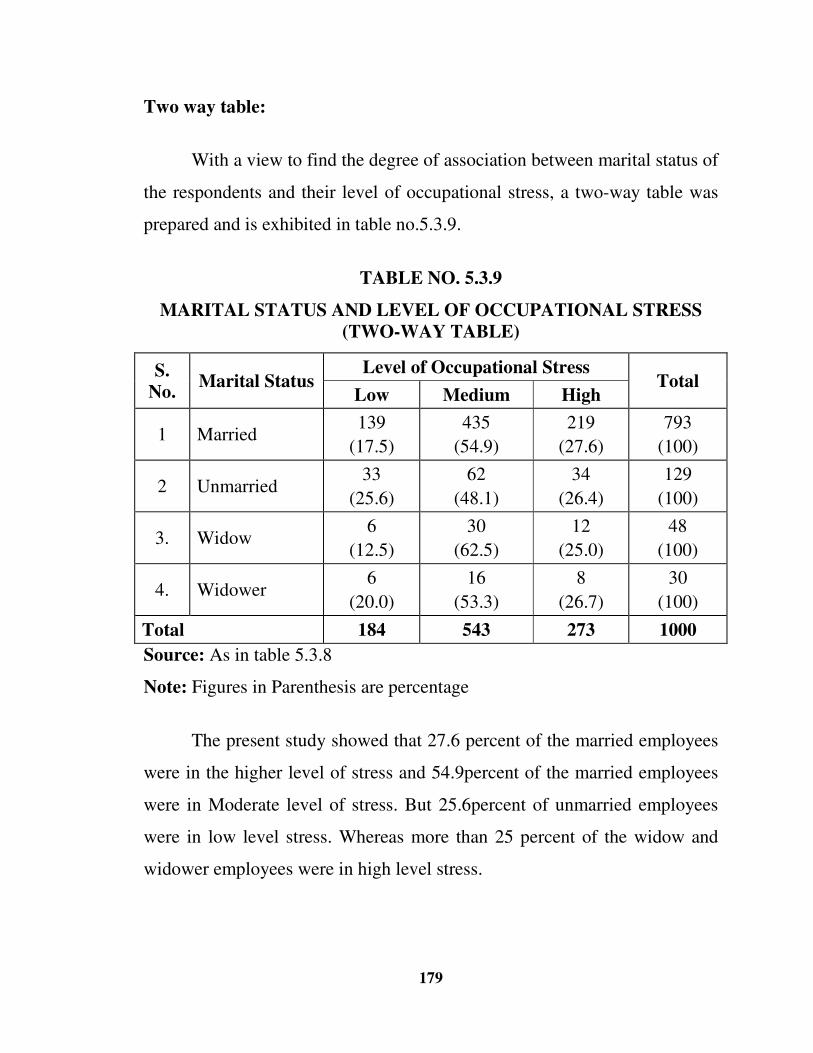
179
Two way table:
With a view to find the degree of association between marital status of
the respondents and their level of occupational stress, a two-way table was
prepared and is exhibited in table no.5.3.9.
TABLE NO. 5.3.9
MARITAL STATUS AND LEVEL OF OCCUPATIONAL STRESS
(TWO-WAY TABLE)
S. No.
Marital Status Level of Occupational Stress
Total Low Medium High
1 Married 139
(17.5)
435
(54.9)
219
(27.6)
793
(100)
2 Unmarried 33
(25.6)
62
(48.1)
34
(26.4)
129
(100)
3. Widow 6
(12.5)
30
(62.5)
12
(25.0)
48
(100)
4. Widower 6
(20.0)
16
(53.3)
8
(26.7)
30
(100)
Total 184 543 273 1000
Source: As in table 5.3.8
Note: Figures in Parenthesis are percentage
The present study showed that 27.6 percent of the married employees
were in the higher level of stress and 54.9percent of the married employees
were in Moderate level of stress. But 25.6percent of unmarried employees
were in low level stress. Whereas more than 25 percent of the widow and
widower employees were in high level stress.
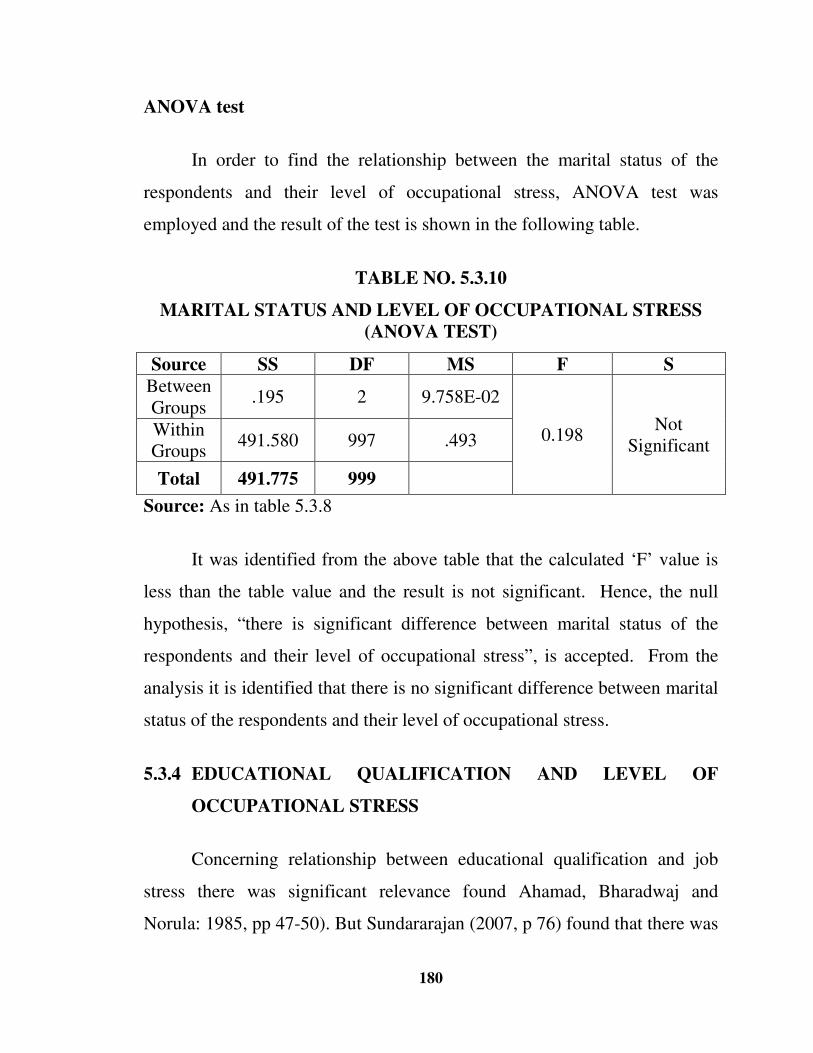
180
ANOVA test
In order to find the relationship between the marital status of the
respondents and their level of occupational stress, ANOVA test was
employed and the result of the test is shown in the following table.
TABLE NO. 5.3.10
MARITAL STATUS AND LEVEL OF OCCUPATIONAL STRESS
(ANOVA TEST)
Source SS DF MS F S
Between Groups
.195 2 9.758E-02
0.198 Not
Significant Within Groups
491.580 997 .493
Total 491.775 999
Source: As in table 5.3.8
It was identified from the above table that the calculated ‘F’ value is
less than the table value and the result is not significant. Hence, the null
hypothesis, “there is significant difference between marital status of the
respondents and their level of occupational stress”, is accepted. From the
analysis it is identified that there is no significant difference between marital
status of the respondents and their level of occupational stress.
5.3.4 EDUCATIONAL QUALIFICATION AND LEVEL OF
OCCUPATIONAL STRESS
Concerning relationship between educational qualification and job
stress there was significant relevance found Ahamad, Bharadwaj and
Norula: 1985, pp 47-50). But Sundararajan (2007, p 76) found that there was
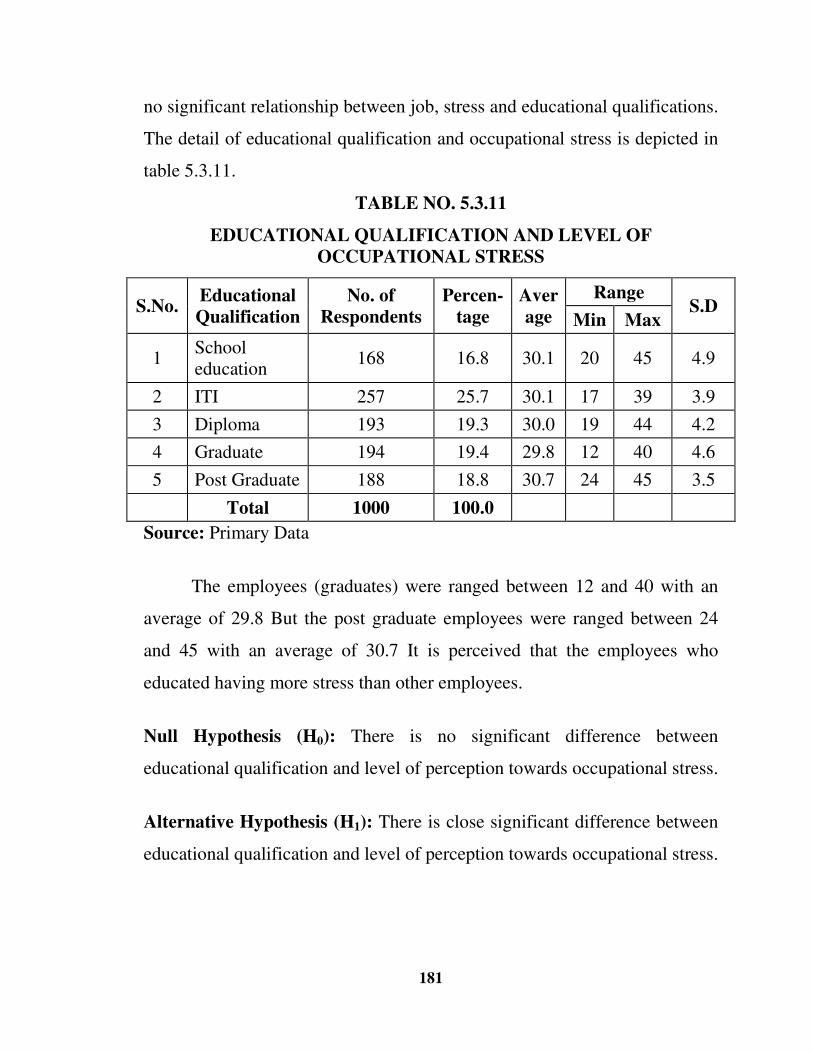
181
no significant relationship between job, stress and educational qualifications.
The detail of educational qualification and occupational stress is depicted in
table 5.3.11.
TABLE NO. 5.3.11
EDUCATIONAL QUALIFICATION AND LEVEL OF OCCUPATIONAL STRESS
S.No. Educational Qualification
No. of Respondents
Percen-tage
Average
Range S.D
Min Max
1 School education
168 16.8 30.1 20 45 4.9
2 ITI 257 25.7 30.1 17 39 3.9
3 Diploma 193 19.3 30.0 19 44 4.2
4 Graduate 194 19.4 29.8 12 40 4.6
5 Post Graduate 188 18.8 30.7 24 45 3.5
Total 1000 100.0
Source: Primary Data
The employees (graduates) were ranged between 12 and 40 with an
average of 29.8 But the post graduate employees were ranged between 24
and 45 with an average of 30.7 It is perceived that the employees who
educated having more stress than other employees.
Null Hypothesis (H0): There is no significant difference between
educational qualification and level of perception towards occupational stress.
Alternative Hypothesis (H1): There is close significant difference between
educational qualification and level of perception towards occupational stress.
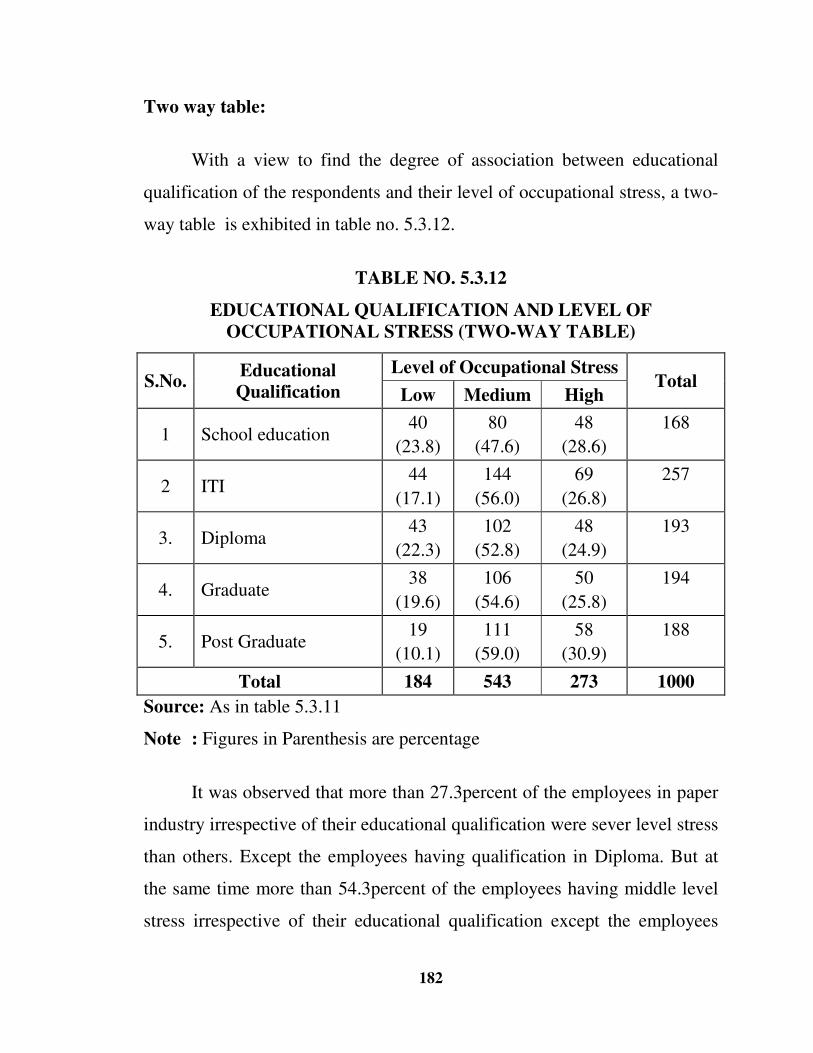
182
Two way table:
With a view to find the degree of association between educational
qualification of the respondents and their level of occupational stress, a two-
way table is exhibited in table no. 5.3.12.
TABLE NO. 5.3.12
EDUCATIONAL QUALIFICATION AND LEVEL OF
OCCUPATIONAL STRESS (TWO-WAY TABLE)
S.No. Educational Qualification
Level of Occupational Stress Total
Low Medium High
1 School education 40
(23.8)
80
(47.6)
48
(28.6)
168
2 ITI 44
(17.1)
144
(56.0)
69
(26.8)
257
3. Diploma 43
(22.3)
102
(52.8)
48
(24.9)
193
4. Graduate 38
(19.6)
106
(54.6)
50
(25.8)
194
5. Post Graduate 19
(10.1)
111
(59.0)
58
(30.9)
188
Total 184 543 273 1000
Source: As in table 5.3.11
Note : Figures in Parenthesis are percentage
It was observed that more than 27.3percent of the employees in paper
industry irrespective of their educational qualification were sever level stress
than others. Except the employees having qualification in Diploma. But at
the same time more than 54.3percent of the employees having middle level
stress irrespective of their educational qualification except the employees
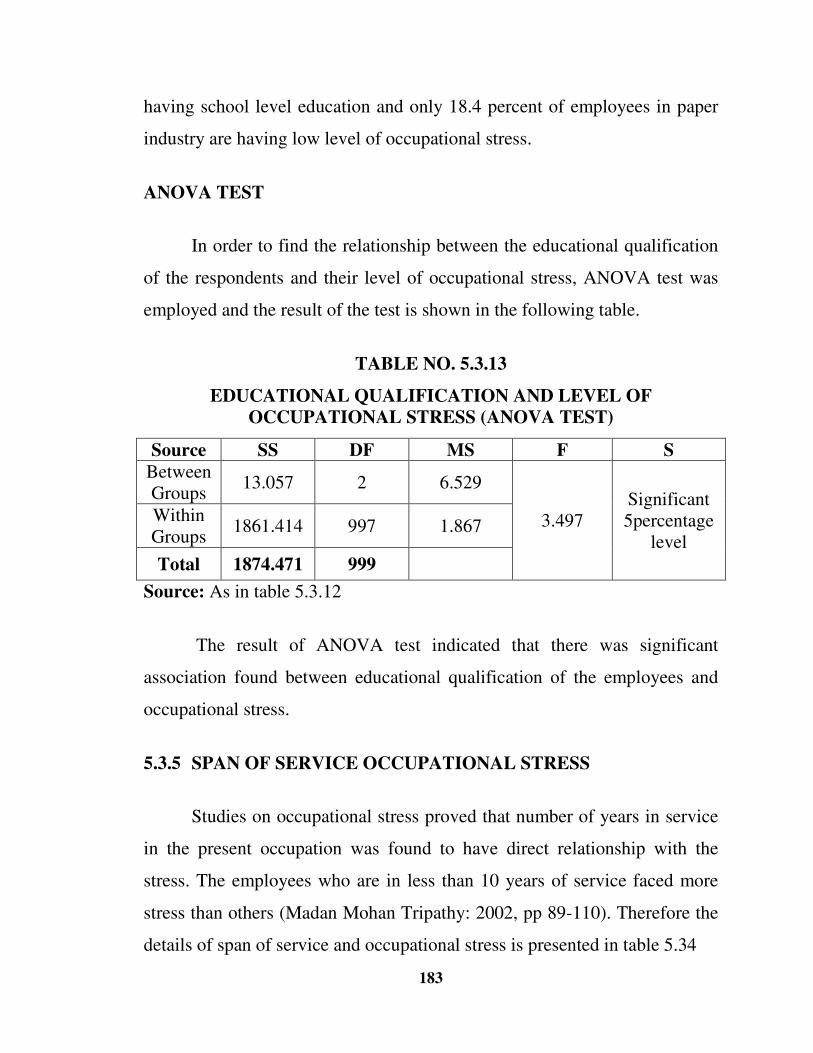
183
having school level education and only 18.4 percent of employees in paper
industry are having low level of occupational stress.
ANOVA TEST
In order to find the relationship between the educational qualification
of the respondents and their level of occupational stress, ANOVA test was
employed and the result of the test is shown in the following table.
TABLE NO. 5.3.13
EDUCATIONAL QUALIFICATION AND LEVEL OF OCCUPATIONAL STRESS (ANOVA TEST)
Source SS DF MS F S
Between Groups
13.057 2 6.529
3.497 Significant 5percentage
level
Within Groups
1861.414 997 1.867
Total 1874.471 999
Source: As in table 5.3.12
The result of ANOVA test indicated that there was significant
association found between educational qualification of the employees and
occupational stress.
5.3.5 SPAN OF SERVICE OCCUPATIONAL STRESS
Studies on occupational stress proved that number of years in service
in the present occupation was found to have direct relationship with the
stress. The employees who are in less than 10 years of service faced more
stress than others (Madan Mohan Tripathy: 2002, pp 89-110). Therefore the
details of span of service and occupational stress is presented in table 5.34
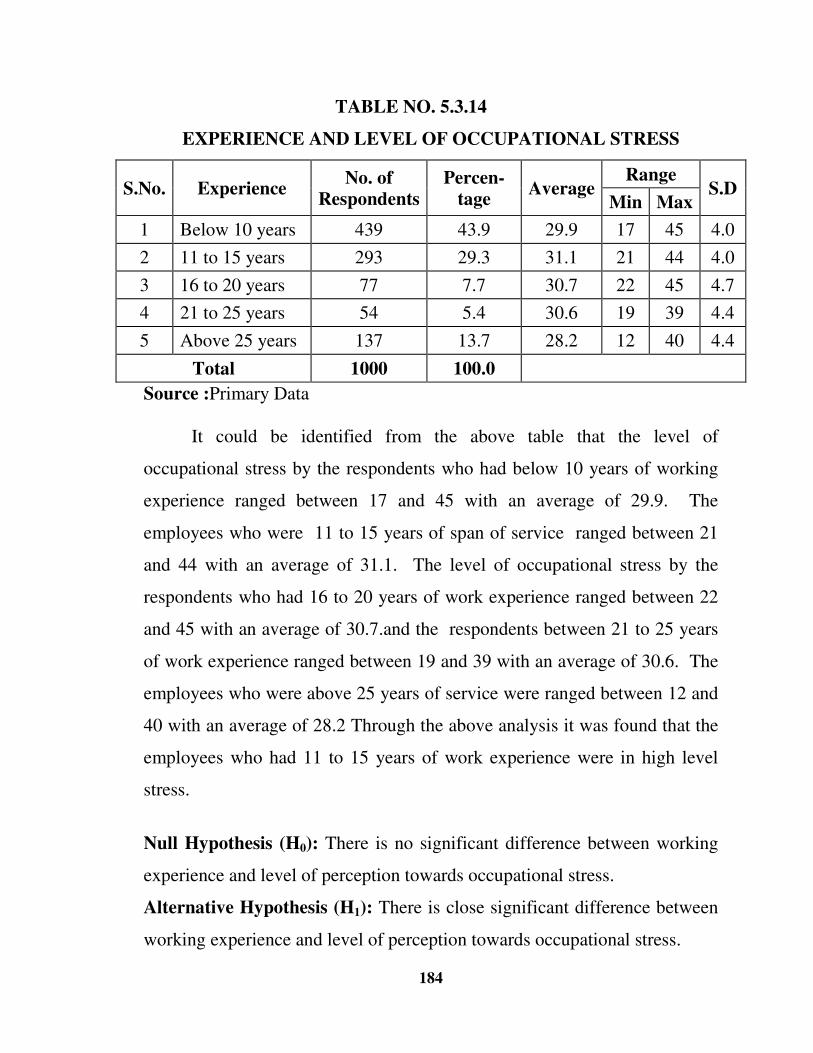
184
TABLE NO. 5.3.14
EXPERIENCE AND LEVEL OF OCCUPATIONAL STRESS
S.No. Experience No. of
Respondents Percen-
tage Average
Range S.D
Min Max
1 Below 10 years 439 43.9 29.9 17 45 4.0
2 11 to 15 years 293 29.3 31.1 21 44 4.0
3 16 to 20 years 77 7.7 30.7 22 45 4.7
4 21 to 25 years 54 5.4 30.6 19 39 4.4
5 Above 25 years 137 13.7 28.2 12 40 4.4
Total 1000 100.0
Source :Primary Data
It could be identified from the above table that the level of
occupational stress by the respondents who had below 10 years of working
experience ranged between 17 and 45 with an average of 29.9. The
employees who were 11 to 15 years of span of service ranged between 21
and 44 with an average of 31.1. The level of occupational stress by the
respondents who had 16 to 20 years of work experience ranged between 22
and 45 with an average of 30.7.and the respondents between 21 to 25 years
of work experience ranged between 19 and 39 with an average of 30.6. The
employees who were above 25 years of service were ranged between 12 and
40 with an average of 28.2 Through the above analysis it was found that the
employees who had 11 to 15 years of work experience were in high level
stress.
Null Hypothesis (H0): There is no significant difference between working
experience and level of perception towards occupational stress.
Alternative Hypothesis (H1): There is close significant difference between
working experience and level of perception towards occupational stress.

185
TWO WAY TABLE:
With a view to find the degree of association between working
experience of the respondents and their level of occupational stress, a two-
way table is exhibited in table no. 5.35.
TABLE NO. 5.3.15
EXPERIENCE AND LEVEL OF OCCUPATIONAL STRESS
(TWO-WAY TABLE)
S.No. Experience Level of Occupational Stress
Total Low Medium High
1 Below 10 years 83
(18.9)
250
(56.9)
106
(24.1)
439
(100)
2 11 to 15 years 34
(11.6)
160
(54.6)
99
(33.8)
293
(100)
3 16 to 20 years 20
(26.0)
27
(35.1)
30
(39.0)
77
(100)
4 21 to 25 years 6
(11.1)
27
(50.0)
21
(38.9)
54
(100)
5 Above 25 years 41
(29.9)
79
(57.7)
17
(12.4)
137
(100)
Total 184 543 273 1000
Source: As in table 5.3.14
Note : Figures in Parenthesis are percentage
The above table found that the percentage of high level of
occupational stress was the highest (39.0percentage) among the respondents
who have 16 to 20 years of working experience and the same was the lowest
(11.1percentage) among the respondents above 21 - 25 years of working
experience. The percentage of medium level of occupational stress was the
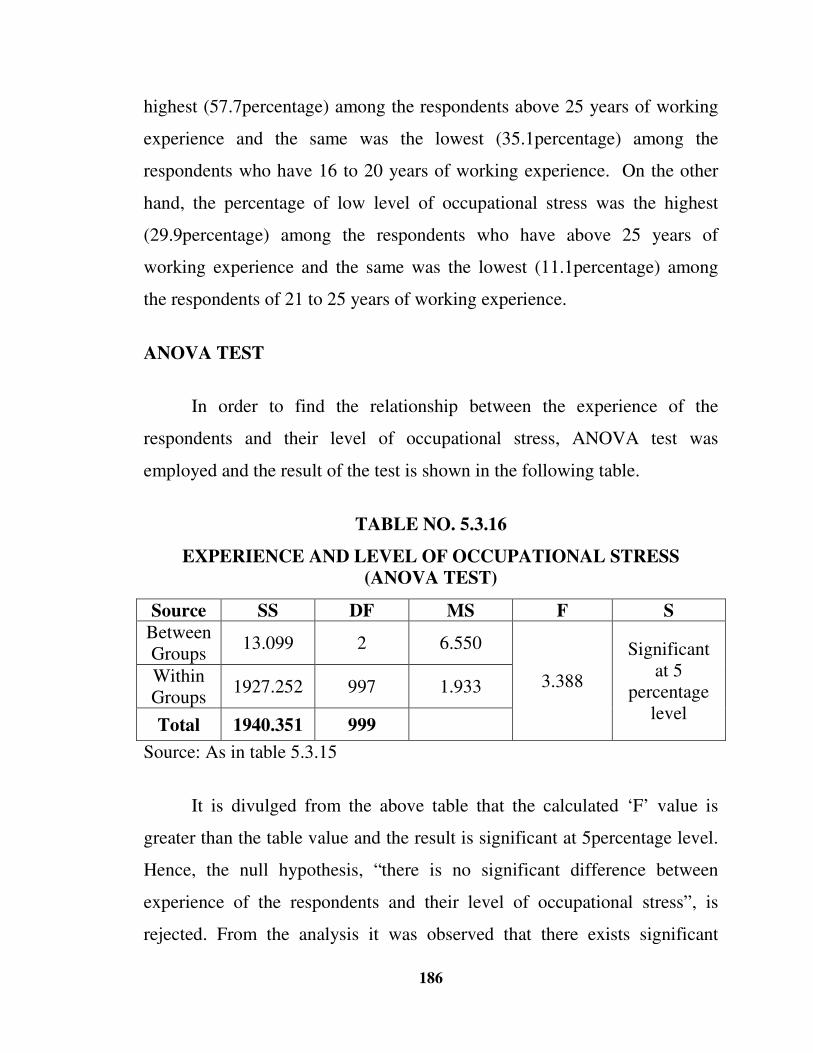
186
highest (57.7percentage) among the respondents above 25 years of working
experience and the same was the lowest (35.1percentage) among the
respondents who have 16 to 20 years of working experience. On the other
hand, the percentage of low level of occupational stress was the highest
(29.9percentage) among the respondents who have above 25 years of
working experience and the same was the lowest (11.1percentage) among
the respondents of 21 to 25 years of working experience.
ANOVA TEST
In order to find the relationship between the experience of the
respondents and their level of occupational stress, ANOVA test was
employed and the result of the test is shown in the following table.
TABLE NO. 5.3.16
EXPERIENCE AND LEVEL OF OCCUPATIONAL STRESS (ANOVA TEST)
Source SS DF MS F S
Between Groups
13.099 2 6.550
3.388
Significant at 5
percentage level
Within Groups
1927.252 997 1.933
Total 1940.351 999
Source: As in table 5.3.15
It is divulged from the above table that the calculated ‘F’ value is
greater than the table value and the result is significant at 5percentage level.
Hence, the null hypothesis, “there is no significant difference between
experience of the respondents and their level of occupational stress”, is
rejected. From the analysis it was observed that there exists significant

187
difference between the experience of the respondents and their level of
occupational stress.
5.3.6 NUMBER OF EARNING MEMBERS AND LEVEL OF
OCCUPATIONAL STRESS
Family income has been the major sources for satisfying the basic
needs. It includes the earnings and the employees and their family members
from various sources like employment, business and agriculture etc.
Therefore the details of the earning persons of the employee and the level of
occupational stress is depicted in table 5.3.17
TABLE NO. 5.3.17
NO. OF EARNING PERSONS IN THE FAMILY AND LEVEL OF OCCUPATIONAL STRESS
S.No. No. of Persons No. of
Respondents Percen-
tage
Average
Range
S.D Min Max
1 Only one 457 45.7 30.4 12 45 4.7
2 Two 394 39.4 30.3 19 41 3.6
3 Three 98 9.8 29.4 12 39 4.3
4 More than three 51 5.1 27.8 22 36 2.9
Total 1000 1000
Source: Primary Data
45 percent of employees who had only one earning person in their
family ranged between 12 and 45 with an average of 30.4 But 39.4 percent
of the employees who had two earning person were ranged between 19 and
41 with an average of 30.3. This analysis revealed that majority of the
employees (45.7 percent)
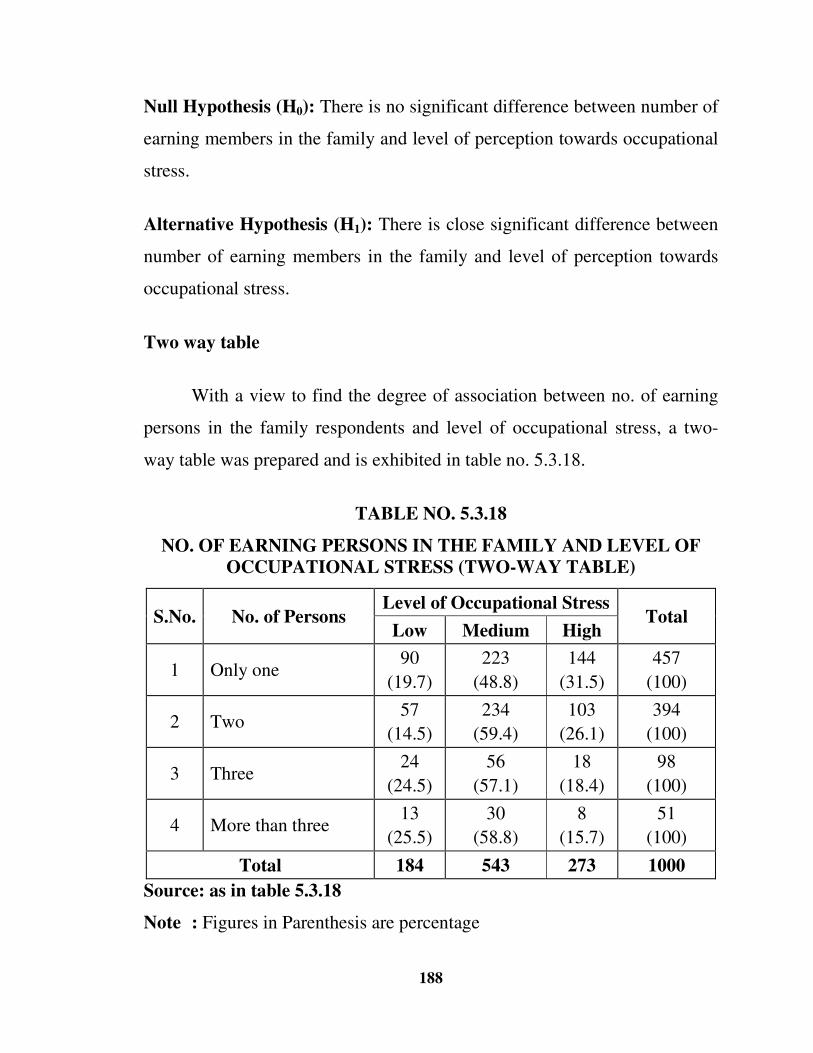
188
Null Hypothesis (H0): There is no significant difference between number of
earning members in the family and level of perception towards occupational
stress.
Alternative Hypothesis (H1): There is close significant difference between
number of earning members in the family and level of perception towards
occupational stress.
Two way table
With a view to find the degree of association between no. of earning
persons in the family respondents and level of occupational stress, a two-
way table was prepared and is exhibited in table no. 5.3.18.
TABLE NO. 5.3.18
NO. OF EARNING PERSONS IN THE FAMILY AND LEVEL OF OCCUPATIONAL STRESS (TWO-WAY TABLE)
S.No. No. of Persons Level of Occupational Stress
Total Low Medium High
1 Only one 90
(19.7)
223
(48.8)
144
(31.5)
457
(100)
2 Two 57
(14.5)
234
(59.4)
103
(26.1)
394
(100)
3 Three 24
(24.5)
56
(57.1)
18
(18.4)
98
(100)
4 More than three 13
(25.5)
30
(58.8)
8
(15.7)
51
(100)
Total 184 543 273 1000
Source: as in table 5.3.18
Note : Figures in Parenthesis are percentage
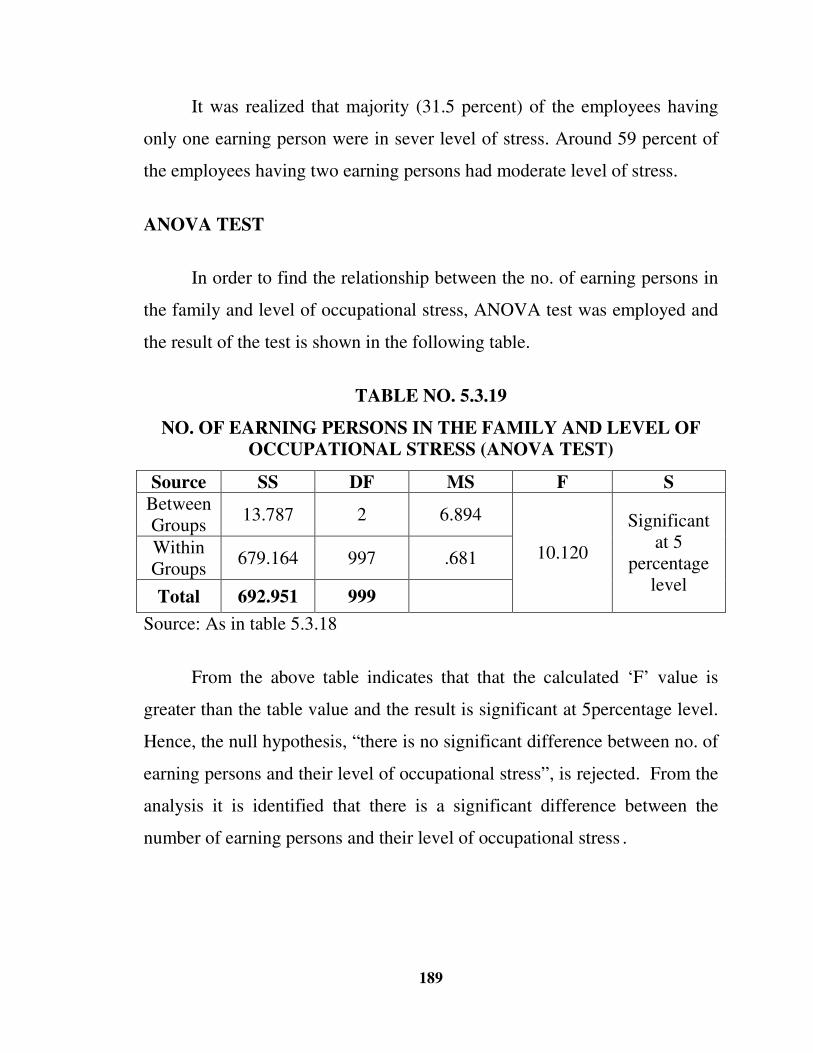
189
It was realized that majority (31.5 percent) of the employees having
only one earning person were in sever level of stress. Around 59 percent of
the employees having two earning persons had moderate level of stress.
ANOVA TEST
In order to find the relationship between the no. of earning persons in
the family and level of occupational stress, ANOVA test was employed and
the result of the test is shown in the following table.
TABLE NO. 5.3.19
NO. OF EARNING PERSONS IN THE FAMILY AND LEVEL OF OCCUPATIONAL STRESS (ANOVA TEST)
Source SS DF MS F S
Between Groups
13.787 2 6.894
10.120
Significant at 5
percentage level
Within Groups
679.164 997 .681
Total 692.951 999
Source: As in table 5.3.18
From the above table indicates that that the calculated ‘F’ value is
greater than the table value and the result is significant at 5percentage level.
Hence, the null hypothesis, “there is no significant difference between no. of
earning persons and their level of occupational stress”, is rejected. From the
analysis it is identified that there is a significant difference between the
number of earning persons and their level of occupational stress .

190
5.3.6 MONTHLY INCOME LEVEL AND LEVEL OF OCCUPATIONAL
STRESS
The family income of the employees has been directly linked to
occupational stress. Ahamad, Bharadwaj and Norula (1980, pp 47-50);
Soundarajan (2007, p 78) found that high income group were faced low
stress than other income categories.
The distribution of the sample respondents according to monthly
income level of the respondents and their occupational stress is discussed in
the following table.
TABLE NO. 5.3.20
MONTHLY INCOME AND LEVEL OF OCCUPATIONAL STRESS
S.No. Monthly Income No. of
Respondents Percen-
tage Ave rage
Range S.D
Min Max
1 Below Rs.5000 134 13.4 30.3 21 45 4.1
2 Rs.5001-10000 416 41.6 30.2 17 44 4.5
3. Rs.10001-15000 240 24.0 30.7 19 40 4.0
4. Rs.15001-20001 102 10.2 30.1 12 39 4.5
5. Above Rs.20001 108 10.8 28.4 20 36 2.8
Total 1000 1000
Source :Primary Data
41.6 percent of the employees whose income was Rs.5001-10000
ranged between 17 and 44 with an average of 30.2.24 percent of the
employees falling under the income group of Rs.10001-15000 were ranged
between 19 and 40 with an average of 30.7. Around 10 percent of the
employees earning above the income of Rs. 15000 were ranged between 12
and 39 with an average of 30 percent. This analysis portrayed that the
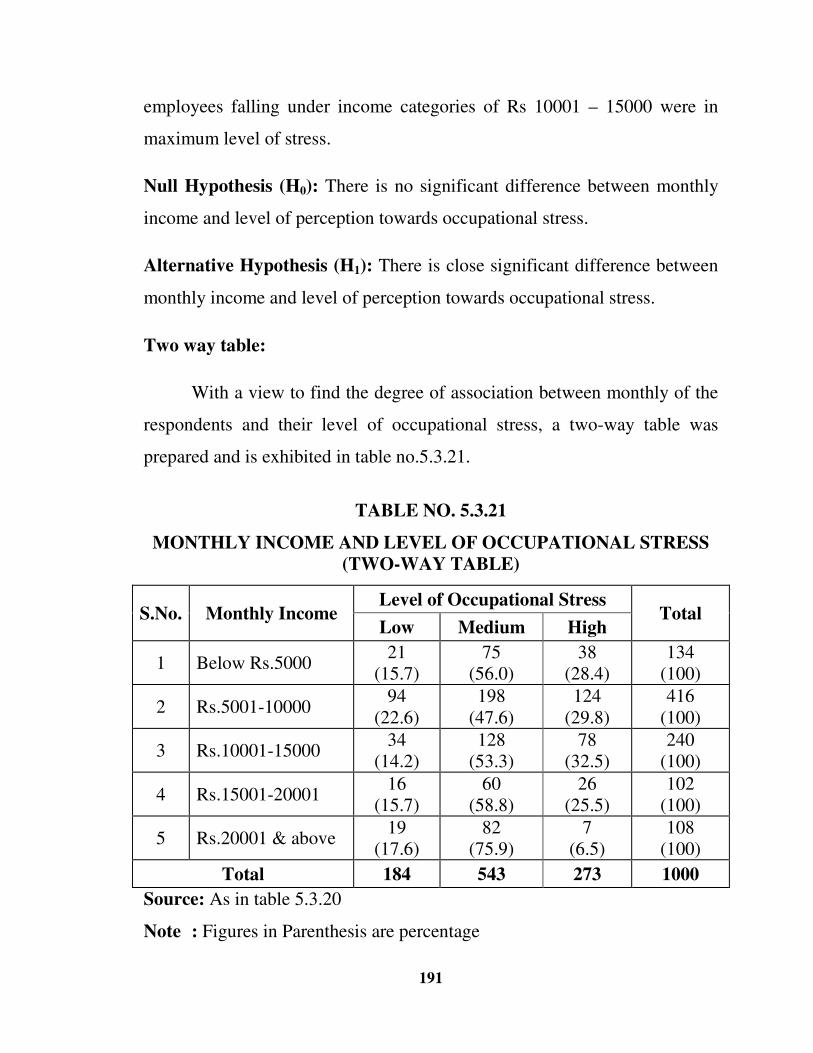
191
employees falling under income categories of Rs 10001 – 15000 were in
maximum level of stress.
Null Hypothesis (H0): There is no significant difference between monthly
income and level of perception towards occupational stress.
Alternative Hypothesis (H1): There is close significant difference between
monthly income and level of perception towards occupational stress.
Two way table:
With a view to find the degree of association between monthly of the
respondents and their level of occupational stress, a two-way table was
prepared and is exhibited in table no.5.3.21.
TABLE NO. 5.3.21
MONTHLY INCOME AND LEVEL OF OCCUPATIONAL STRESS (TWO-WAY TABLE)
S.No. Monthly Income Level of Occupational Stress
Total Low Medium High
1 Below Rs.5000 21
(15.7) 75
(56.0) 38
(28.4) 134
(100)
2 Rs.5001-10000 94
(22.6) 198
(47.6) 124
(29.8) 416
(100)
3 Rs.10001-15000 34
(14.2) 128
(53.3) 78
(32.5) 240
(100)
4 Rs.15001-20001 16
(15.7) 60
(58.8) 26
(25.5) 102
(100)
5 Rs.20001 & above 19
(17.6) 82
(75.9) 7
(6.5) 108
(100)
Total 184 543 273 1000
Source: As in table 5.3.20
Note : Figures in Parenthesis are percentage
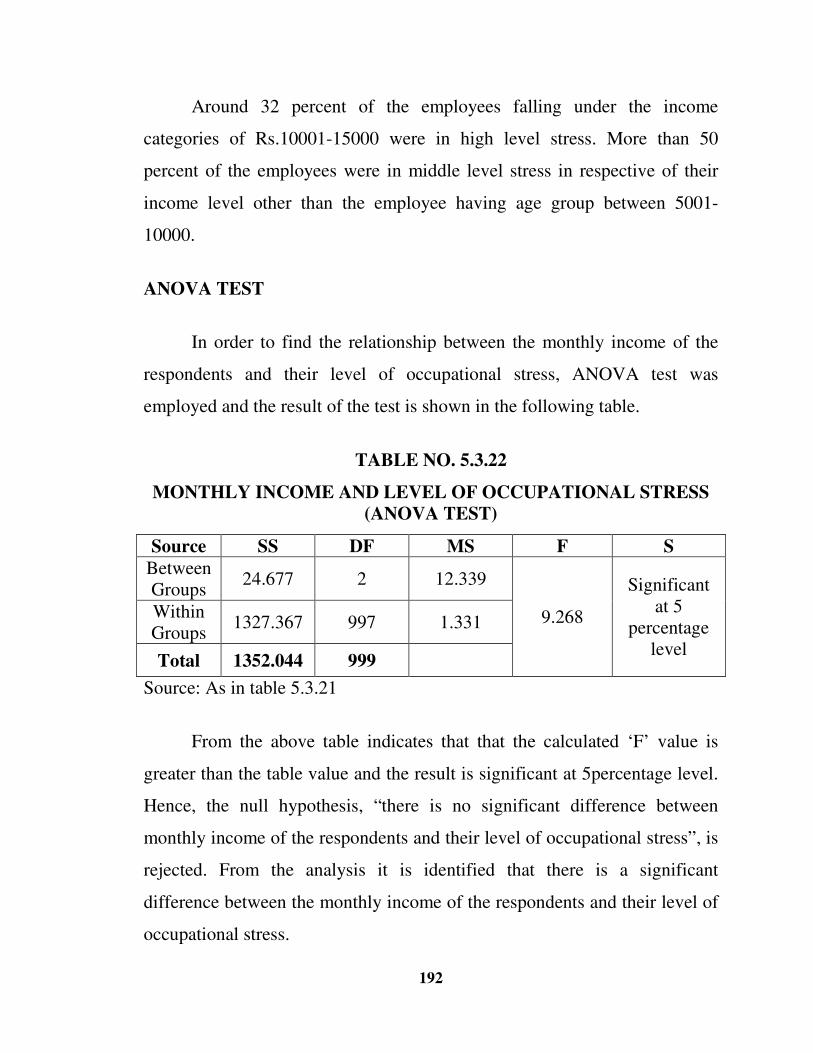
192
Around 32 percent of the employees falling under the income
categories of Rs.10001-15000 were in high level stress. More than 50
percent of the employees were in middle level stress in respective of their
income level other than the employee having age group between 5001-
10000.
ANOVA TEST
In order to find the relationship between the monthly income of the
respondents and their level of occupational stress, ANOVA test was
employed and the result of the test is shown in the following table.
TABLE NO. 5.3.22
MONTHLY INCOME AND LEVEL OF OCCUPATIONAL STRESS (ANOVA TEST)
Source SS DF MS F S
Between Groups
24.677 2 12.339
9.268
Significant at 5
percentage level
Within Groups
1327.367 997 1.331
Total 1352.044 999
Source: As in table 5.3.21
From the above table indicates that that the calculated ‘F’ value is
greater than the table value and the result is significant at 5percentage level.
Hence, the null hypothesis, “there is no significant difference between
monthly income of the respondents and their level of occupational stress”, is
rejected. From the analysis it is identified that there is a significant
difference between the monthly income of the respondents and their level of
occupational stress.
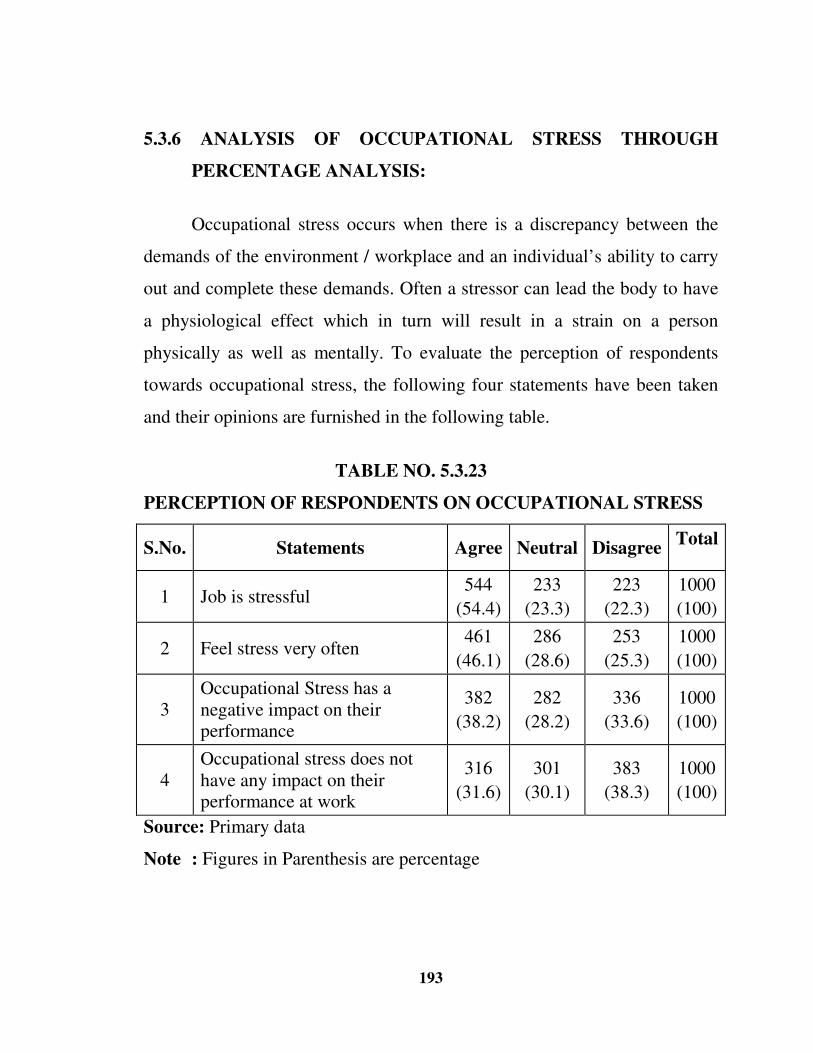
193
5.3.6 ANALYSIS OF OCCUPATIONAL STRESS THROUGH
PERCENTAGE ANALYSIS:
Occupational stress occurs when there is a discrepancy between the
demands of the environment / workplace and an individual’s ability to carry
out and complete these demands. Often a stressor can lead the body to have
a physiological effect which in turn will result in a strain on a person
physically as well as mentally. To evaluate the perception of respondents
towards occupational stress, the following four statements have been taken
and their opinions are furnished in the following table.
TABLE NO. 5.3.23
PERCEPTION OF RESPONDENTS ON OCCUPATIONAL STRESS
S.No. Statements Agree Neutral Disagree Total
1 Job is stressful 544
(54.4)
233
(23.3)
223
(22.3)
1000
(100)
2 Feel stress very often 461
(46.1)
286
(28.6)
253
(25.3)
1000
(100)
3 Occupational Stress has a negative impact on their performance
382
(38.2)
282
(28.2)
336
(33.6)
1000
(100)
4 Occupational stress does not have any impact on their performance at work
316
(31.6)
301
(30.1)
383
(38.3)
1000
(100)
Source: Primary data
Note : Figures in Parenthesis are percentage
194
The above table shows that around (54 percentage) of the respondents
agreed that their job is stressful whereas 22.3 percentage of the employees
were felt that the job is not stress full. Whereas 25.3Percent of employees
where felt that the stress is not very often. 46.1 percent of the employees
were felt that the stress was very often and 38.2 percent of employees were
agreed that the negative impact on their performance. But only 31.6 percent
of the employees were felt that there was no impact on their performance at
work and the work environment. Finally the above analysis concluded that
majority of the employees felt that their occupation is stressful.
5.4.1 PERSONALITY TRAITS OF THE RESPONDENT
Traits are distinguishing qualities or characteristics of a person. Traits
are a readiness to think or act in a similar fashion in response to a variety of
different situations. 110In general, trait theory assumes that people differ on
variables or dimensions that are continuous. People are seen to differ in the
amounts or quantities of a characteristic rather than differ in the quality of
their characteristics. To find out the personality traits of the respondents it is
discussed with ten statements which are given in the following table.
110 http://wilderdom.com/personality/traits/PersonalityTraitsDefinitions.html.
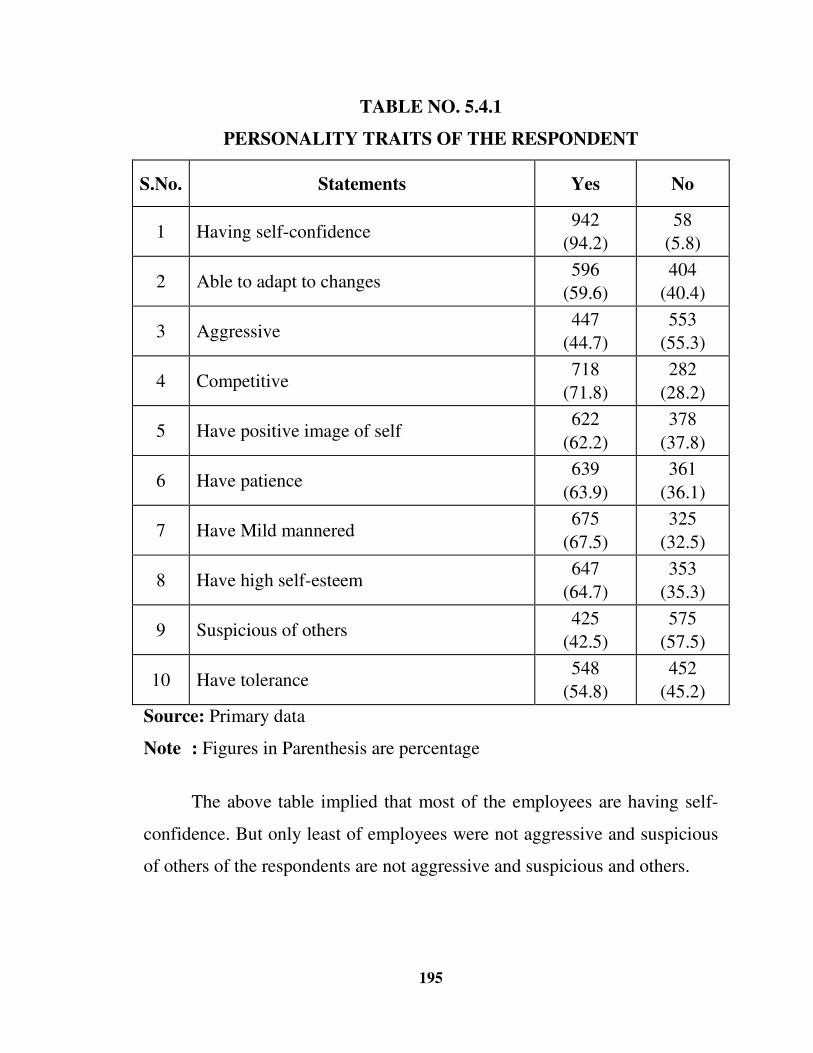
195
TABLE NO. 5.4.1
PERSONALITY TRAITS OF THE RESPONDENT
S.No. Statements Yes No
1 Having self-confidence 942
(94.2)
58
(5.8)
2 Able to adapt to changes 596
(59.6)
404
(40.4)
3 Aggressive 447
(44.7)
553
(55.3)
4 Competitive 718
(71.8)
282
(28.2)
5 Have positive image of self 622
(62.2)
378
(37.8)
6 Have patience 639
(63.9)
361
(36.1)
7 Have Mild mannered 675
(67.5)
325
(32.5)
8 Have high self-esteem 647
(64.7)
353
(35.3)
9 Suspicious of others 425
(42.5)
575
(57.5)
10 Have tolerance 548
(54.8)
452
(45.2)
Source: Primary data
Note : Figures in Parenthesis are percentage
The above table implied that most of the employees are having self-
confidence. But only least of employees were not aggressive and suspicious
of others of the respondents are not aggressive and suspicious and others.

196
5.4.1 PERCEPTION ABOUT JOB
Conflicting job perceptions can hinder career decisions, work
performance and job satisfaction. It identifies the behavior requirements of
the job. Perception, as used here, is something conscious that is deliberate
and intentional, such as the instantaneous flash of insight that can come
when the employees intentionally look at something in a new way. To
examine the perception of the job, eighteen statements have been selected
and opinion collected from the sample respondents and which is analyzed by
using five point scaling technique.
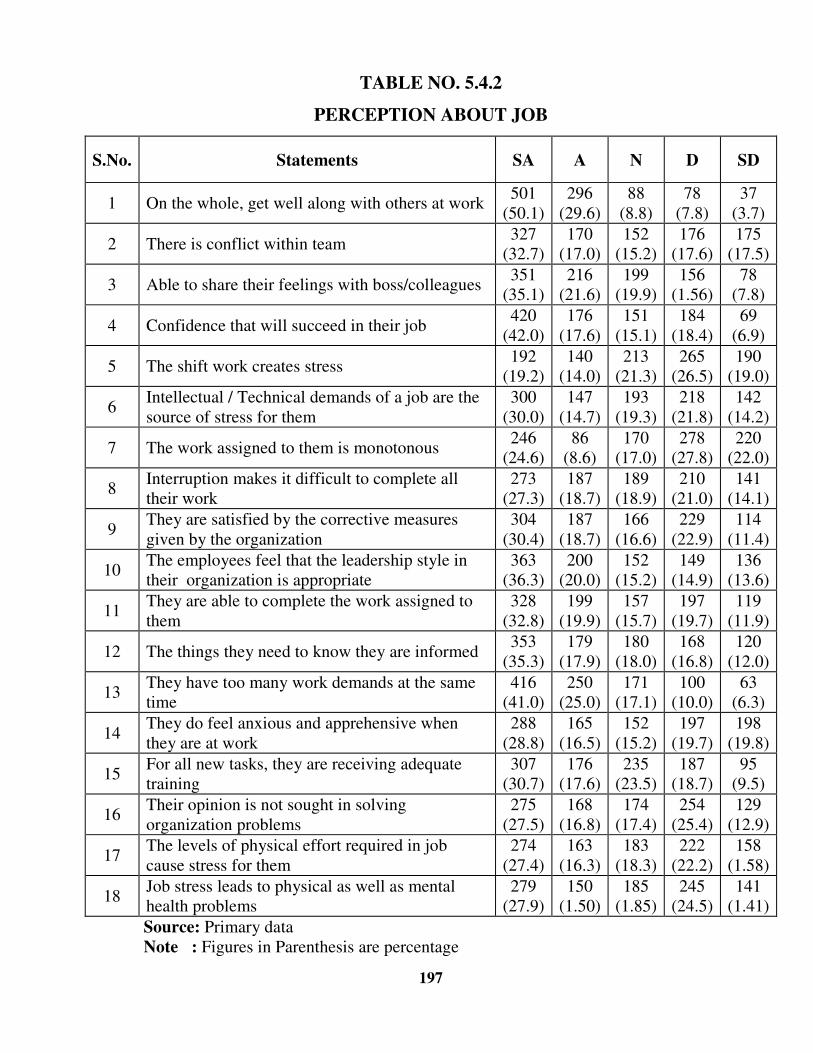
197
TABLE NO. 5.4.2
PERCEPTION ABOUT JOB
S.No. Statements SA A N D SD
1 On the whole, get well along with others at work 501
(50.1) 296
(29.6) 88
(8.8) 78
(7.8) 37
(3.7)
2 There is conflict within team 327
(32.7) 170
(17.0) 152
(15.2) 176
(17.6) 175
(17.5)
3 Able to share their feelings with boss/colleagues 351
(35.1) 216
(21.6) 199
(19.9) 156
(1.56) 78
(7.8)
4 Confidence that will succeed in their job 420
(42.0) 176
(17.6) 151
(15.1) 184
(18.4) 69
(6.9)
5 The shift work creates stress 192
(19.2) 140
(14.0) 213
(21.3) 265
(26.5) 190
(19.0)
6 Intellectual / Technical demands of a job are the source of stress for them
300 (30.0)
147 (14.7)
193 (19.3)
218 (21.8)
142 (14.2)
7 The work assigned to them is monotonous 246
(24.6) 86
(8.6) 170
(17.0) 278
(27.8) 220
(22.0)
8 Interruption makes it difficult to complete all their work
273 (27.3)
187 (18.7)
189 (18.9)
210 (21.0)
141 (14.1)
9 They are satisfied by the corrective measures given by the organization
304 (30.4)
187 (18.7)
166 (16.6)
229 (22.9)
114 (11.4)
10 The employees feel that the leadership style in their organization is appropriate
363 (36.3)
200 (20.0)
152 (15.2)
149 (14.9)
136 (13.6)
11 They are able to complete the work assigned to them
328 (32.8)
199 (19.9)
157 (15.7)
197 (19.7)
119 (11.9)
12 The things they need to know they are informed 353
(35.3) 179
(17.9) 180
(18.0) 168
(16.8) 120
(12.0)
13 They have too many work demands at the same time
416 (41.0)
250 (25.0)
171 (17.1)
100 (10.0)
63 (6.3)
14 They do feel anxious and apprehensive when they are at work
288 (28.8)
165 (16.5)
152 (15.2)
197 (19.7)
198 (19.8)
15 For all new tasks, they are receiving adequate training
307 (30.7)
176 (17.6)
235 (23.5)
187 (18.7)
95 (9.5)
16 Their opinion is not sought in solving organization problems
275 (27.5)
168 (16.8)
174 (17.4)
254 (25.4)
129 (12.9)
17 The levels of physical effort required in job cause stress for them
274 (27.4)
163 (16.3)
183 (18.3)
222 (22.2)
158 (1.58)
18 Job stress leads to physical as well as mental health problems
279 (27.9)
150 (1.50)
185 (1.85)
245 (24.5)
141 (1.41)
Source: Primary data Note : Figures in Parenthesis are percentage

198
Employees Perception on Occupation
It was portrayed that around 50 percent of the employees were
strongly perceived about their job. 42 percent of the employees were
strongly agreed that their self confidence directed them to perform the work.
Whereas 35.1 percent of the employee were opined that they able to share
the feeling with their boss and colleagues. 41 percent of the employees were
perceived that they have assigned more of work at the work place. But 24.6
percent to 35.3 percent of the employees were felt that job stress leads to
physical as well as health problem, inadequate training reduced the job
involvement and they felt that the management should implement the proper
leadership style in their organisation and the management should analyse
each every activities of organisation and the employees problem to
overcome the stress.
5.4.3 PERCEPTION ABOUT FAMILY
Perception about the family creates stress in their work among the
employees. To examine the perception in their family life is studied with ten
statements and discussed in the following table.
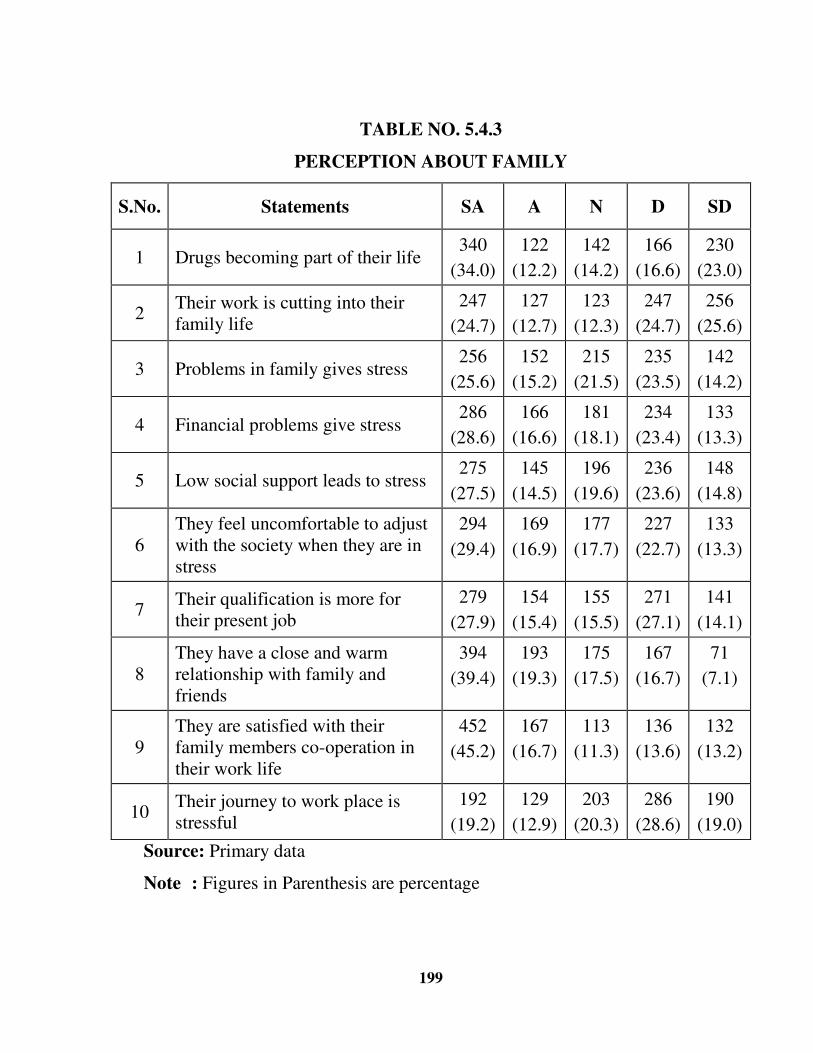
199
TABLE NO. 5.4.3
PERCEPTION ABOUT FAMILY
S.No. Statements SA A N D SD
1 Drugs becoming part of their life 340
(34.0)
122
(12.2)
142
(14.2)
166
(16.6)
230
(23.0)
2 Their work is cutting into their family life
247
(24.7)
127
(12.7)
123
(12.3)
247
(24.7)
256
(25.6)
3 Problems in family gives stress 256
(25.6)
152
(15.2)
215
(21.5)
235
(23.5)
142
(14.2)
4 Financial problems give stress 286
(28.6)
166
(16.6)
181
(18.1)
234
(23.4)
133
(13.3)
5 Low social support leads to stress 275
(27.5)
145
(14.5)
196
(19.6)
236
(23.6)
148
(14.8)
6 They feel uncomfortable to adjust with the society when they are in stress
294
(29.4)
169
(16.9)
177
(17.7)
227
(22.7)
133
(13.3)
7 Their qualification is more for their present job
279
(27.9)
154
(15.4)
155
(15.5)
271
(27.1)
141
(14.1)
8 They have a close and warm relationship with family and friends
394
(39.4)
193
(19.3)
175
(17.5)
167
(16.7)
71
(7.1)
9 They are satisfied with their family members co-operation in their work life
452
(45.2)
167
(16.7)
113
(11.3)
136
(13.6)
132
(13.2)
10 Their journey to work place is stressful
192
(19.2)
129
(12.9)
203
(20.3)
286
(28.6)
190
(19.0)
Source: Primary data
Note : Figures in Parenthesis are percentage
200
Employee’s perception about Family:
It was analysed that around 45 percent of the employees were satisfied
with their occupation and their family relation. 19.2 percent to 34 percent of
the employees were felt that their job was more stress in different angles like
travelling, educational qualification, financial problem, low social support,
lack of interest with their work and family, drugs was being a part of their
life. Whereas around 12 percent to 19.3 percent of the employees were
agreed that the 10 factors which were influenced occupational stress apart
from the family life. On the other hand 13percent to 28.6 percent of the
employees were disagreed that there was no relationship between their job
and their family.
This analysis concluded that the employees perception were closely
related with the attitude and emerging financial needs and other basis needs
of the employees of paper industry.
5.4.4 IMPACT OF OCCUPATIONAL STRESS
No doubt, occupational stress changes every one’s life. The impact of
occupational stress was studied with the help of nine selected statements and
the results are furnished in the following table.

201
TABLE NO. 5.4.4
IMPACT OF OCCUPATIONAL STRESS
S.No. Statements SA A N D SD
1 I feel completely exhausted at the end of the day at the work place
456
(45.6)
180
(18.0)
154
(15.4)
97
(9.7)
113
(11.3)
I look irritated, nervous, angry and tensed while performing my job
218
(21.8)
148
(14.8)
184
(18.4)
238
(23.8)
212
(21.2)
3 I feel dissatisfied with my job 311
(31.1)
130
(13.0)
234
(23.4)
177
(17.7)
148
(14.8)
4 I often think of quitting my job 235
(23.5)
143
(14.3)
225
(22.5)
215
(21.5)
182
(18.2)
5 I feel calm and relaxed at work 288
(28.8)
179
(17.9)
229
(22.9)
177
(17.7)
127
(12.7)
6 I have taken a number of days of leave due to severe stress
261
(26.1)
122
(12.2)
236
(23.6)
212
(21.2)
169
(16.9)
7 I am able to complete my work in the stipulated time
376
(37.6)
210
(21.0)
182
(18.2)
133
(13.3)
99
(9.9)
8 I feel that I am doing work in the best way.
332
(33.2)
214
(21.4)
179
(17.9)
163
(16.3)
112
(11.2)
9
I feel that my official assignments are more important than my personal interests.
320
(32.0)
223
(22.3)
216
(21.6)
146
(14.6)
95
(9.5)
Source: Primary data
Note : Figures in Parenthesis are percentage
202
Impact on Occupational Stress:
It was found that out of sample respondent around 45 percent of the
employees were strongly agreed that there job was completely exhausted at
the end of day. Whereas 21.8 percent to 37.6 percent of the employees
opined that their work environment was stressful in different aspects. But
13-22 percent of the employees were agreed that their occupation was
stressful. Whereas 13-23.8 percent of the employees were felt that there was
no stress and around 10-18 percent of the employees where felt that, there
was stress free environment. This analysis concluded that the employees
were working in stressful environment. But impact of stress was varied
person to person based on their nature of work.
5.4.5. WORK RELATED CAUSES
Sometimes work causes difficulties that can affect other aspects of our
life. At some point in their career, respondents will experience burnout. It
would be far less aversive than facing their boss, co-workers, clients, and
desk. Almost one third of employees in a company feel overworked, or
overwhelmed by the amount of work they have to do. For finding their
causes while at work nine work related problems have been considered viz.,
Temperature, Noise, Lighting, Technology, Accidents at work place,
Cleanliness, Overcrowding, Air Pollution and Excess work load. The
factors causing stress in a person has been called as stressors. As the social
and organizational demands on us tends to increase with complexities, there
intensity of stressors for an employee. In the employee’s view point, factor
which more caused to generate stress during the work was presented in
table 5.4.5.
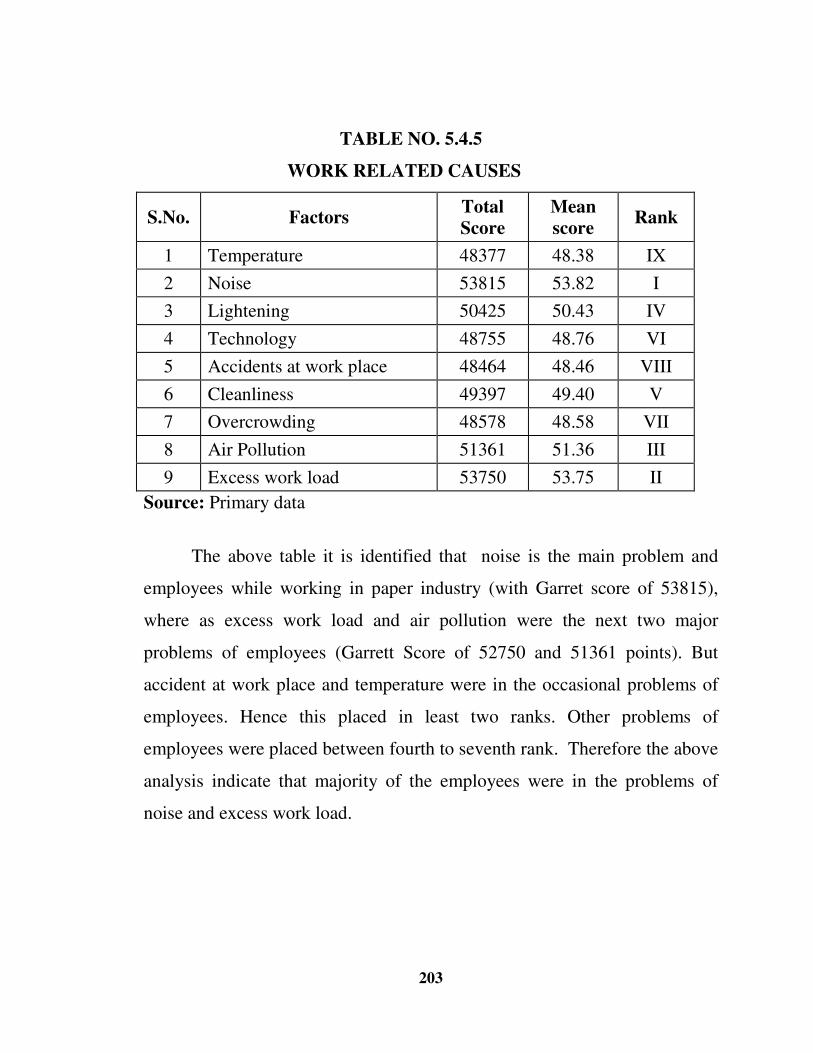
203
TABLE NO. 5.4.5
WORK RELATED CAUSES
S.No. Factors Total Score
Mean score
Rank
1 Temperature 48377 48.38 IX
2 Noise 53815 53.82 I
3 Lightening 50425 50.43 IV
4 Technology 48755 48.76 VI
5 Accidents at work place 48464 48.46 VIII
6 Cleanliness 49397 49.40 V
7 Overcrowding 48578 48.58 VII
8 Air Pollution 51361 51.36 III
9 Excess work load 53750 53.75 II
Source: Primary data
The above table it is identified that noise is the main problem and
employees while working in paper industry (with Garret score of 53815),
where as excess work load and air pollution were the next two major
problems of employees (Garrett Score of 52750 and 51361 points). But
accident at work place and temperature were in the occasional problems of
employees. Hence this placed in least two ranks. Other problems of
employees were placed between fourth to seventh rank. Therefore the above
analysis indicate that majority of the employees were in the problems of
noise and excess work load.
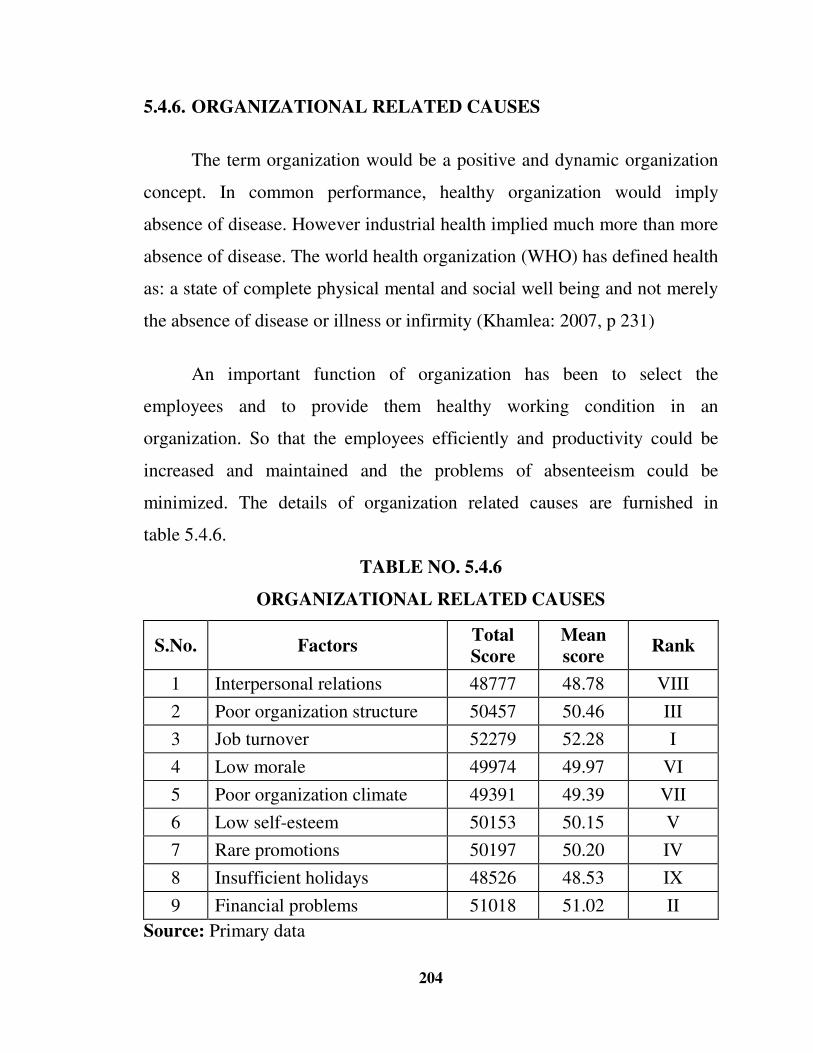
204
5.4.6. ORGANIZATIONAL RELATED CAUSES
The term organization would be a positive and dynamic organization
concept. In common performance, healthy organization would imply
absence of disease. However industrial health implied much more than more
absence of disease. The world health organization (WHO) has defined health
as: a state of complete physical mental and social well being and not merely
the absence of disease or illness or infirmity (Khamlea: 2007, p 231)
An important function of organization has been to select the
employees and to provide them healthy working condition in an
organization. So that the employees efficiently and productivity could be
increased and maintained and the problems of absenteeism could be
minimized. The details of organization related causes are furnished in
table 5.4.6.
TABLE NO. 5.4.6
ORGANIZATIONAL RELATED CAUSES
S.No. Factors Total Score
Mean score
Rank
1 Interpersonal relations 48777 48.78 VIII
2 Poor organization structure 50457 50.46 III
3 Job turnover 52279 52.28 I
4 Low morale 49974 49.97 VI
5 Poor organization climate 49391 49.39 VII
6 Low self-esteem 50153 50.15 V
7 Rare promotions 50197 50.20 IV
8 Insufficient holidays 48526 48.53 IX
9 Financial problems 51018 51.02 II
Source: Primary data
205
The above table discusses the organizational related problems. The
selected sample respondents faced the nine organizational related causes.
From these nine problems, most of the respondents faced the major problem
‘Job turnover’ which was ranked as first by them with Garrett scored as
52279 points. The respondents faced the second and third problems
‘financial problems’ and ‘Poor organization structure’ with Garrett scored as
51018 and 50457 points respectively. ‘Rare promotions’, ‘Low self-esteem’
and ‘Low morale’ occupied the fourth, fifth and sixth positions which are
faced by the selected sample respondents with Garrett scores of 50197,
50153 and 49974 points. Further, the two problems ‘Poor organization
climate’ and ‘Interpersonal relations’ are faced by the employees which are
ranked in the order of seventh and eight positions with the Garrett score of
49391 and 48777 points. On the other hand, the respondents faced the final
problem of ‘Insufficient holidays’ with Garrett scores of 48526 points. It is
found from the above analysis that majority of the respondents are mostly
affected by the organizational related problems ‘Job turnover’ followed by
‘Financial problems’.
5.4.7 PSYCHOLOGICAL CONSEQUENCES
Psychological complaints affect one third of all employees, and
consequently increasing numbers of employees the paper industry. Between
50 percent and 70 percent of these cases involve problems arising in the
workplace, such as mounting stress and workloads. The number of
individuals declared unfit for work as a result of psychological complaints
rose during 1990s. These problems are categorized into eight factors that are
Anxiety, Boredom, Low self esteem, Forgetfulness, Depression, Angry,

206
Apathy / worry and Insomnia (Sleepless). The detailed results of the analysis
are furnished in the following table.
TABLE NO. 5.4.7
PSYCHOLOGICAL CONSEQUENCES
S.No. Factors Total Score
Mean score
Rank
1 Anxiety 46264 46.26 VIII
2 Boredom 50847 50.85 IV
3 Low self esteem 49985 49.99 V
4 Forgetfulness 49175 49.18 VI
5 Depression 51470 51.47 II
6 Angry 51317 51.32 III
7 Apathy / worry 48847 48.85 VII
8 Insomnia (Sleepless) 52366 52.37 I
Source: Primary data
The above table throws light on the psychological consequences. The
selected sample respondents opined about the psychological consequences
with eight factors. Out of these eight factors, most of the respondents faced
the major psychological consequence is ‘Insomnia (Sleepless)’ which is
ranked first by them with Garrett scored as 52366 points. The respondents
faced the second and third consequence factors ‘depression’ and ‘angry’
with Garrett scores of 51470 and 51317 points respectively. ‘Boredom’,
‘Low self esteem’ and ‘forgetfulness’ occupied the fourth, fifth and sixth
consequences which are faced by the selected sample respondents with
Garrett scored as 51317, 50847 and 49985 points respectively. On the other
hand, the two problems ‘Apathy / worry’ and ‘Anxiety’ are faced by the
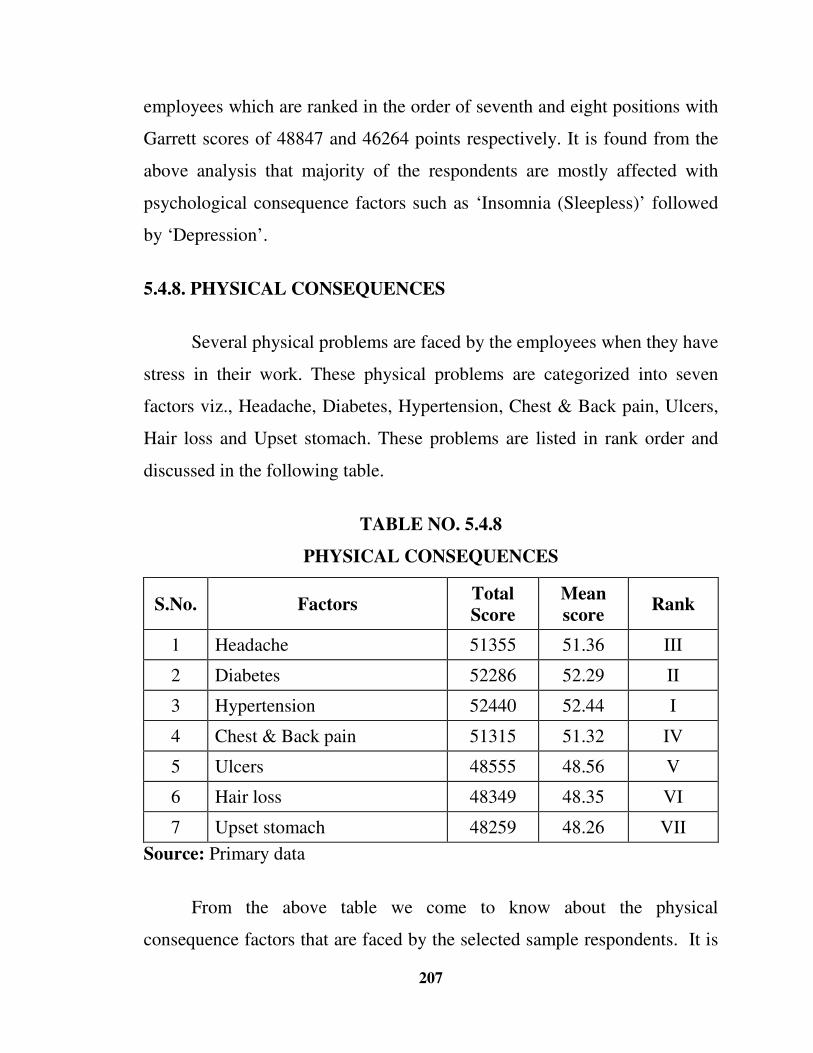
207
employees which are ranked in the order of seventh and eight positions with
Garrett scores of 48847 and 46264 points respectively. It is found from the
above analysis that majority of the respondents are mostly affected with
psychological consequence factors such as ‘Insomnia (Sleepless)’ followed
by ‘Depression’.
5.4.8. PHYSICAL CONSEQUENCES
Several physical problems are faced by the employees when they have
stress in their work. These physical problems are categorized into seven
factors viz., Headache, Diabetes, Hypertension, Chest & Back pain, Ulcers,
Hair loss and Upset stomach. These problems are listed in rank order and
discussed in the following table.
TABLE NO. 5.4.8
PHYSICAL CONSEQUENCES
S.No. Factors Total Score
Mean score
Rank
1 Headache 51355 51.36 III
2 Diabetes 52286 52.29 II
3 Hypertension 52440 52.44 I
4 Chest & Back pain 51315 51.32 IV
5 Ulcers 48555 48.56 V
6 Hair loss 48349 48.35 VI
7 Upset stomach 48259 48.26 VII
Source: Primary data
From the above table we come to know about the physical
consequence factors that are faced by the selected sample respondents. It is

208
revealed from the above analysis that majority of the respondents faced the
main problem towards physically that ‘Hypertension’ which ranked first by
them with Garrett scored as 52440 points. The selected respondents faced
the second and third physical problems ‘Diabetes’ and ‘Headache’ with
Garrett score of 52286 and 51355 points respectively. The fourth and fifth
physical problems are ‘Chest & back pain’ and ‘Ulcers’ which are faced by
the sample respondents with Garrett score of 51315 and 48555 points. The
sixth and seventh problems are ‘Hair loss’ and ‘Upset stomach’ with Garrett
scores of 48349 and 48259 points respectively. It is found from the above
analysis that majority of the respondents mostly faced the physical problem
‘Hypertension’ followed by ‘Diabetes’.
5.5.1. COPING STRATEGY FOLLOWED FOR REDUCE THE
STRESS
Coping Strategy is a behavior that helps us to function better in a
given situation. 111Coping skills can be positive or negative. Positive coping
skills help us get through situations at nearly the same level as those which
do not have the disadvantage. Negative coping skills, however, may provide
short-term relief or distraction, but ultimately worsen our disadvantage.
While considering the details about the coping skills the researcher made an
attempt to find the coping strategies followed by the selected sample
respondents in the study area. For this purpose twelve coping strategies like
Prayer, Laugh, Listening to Music, Share with colleagues, Moving from the
place, Meditation, Exercise, Smoking / Chewing, Drinking water, Rest and
feel fresh, Ignoring the problems and Keeping quiet and Cool have been
111 http://depression.about.com/od/copingskills/Coping_Skills.htm
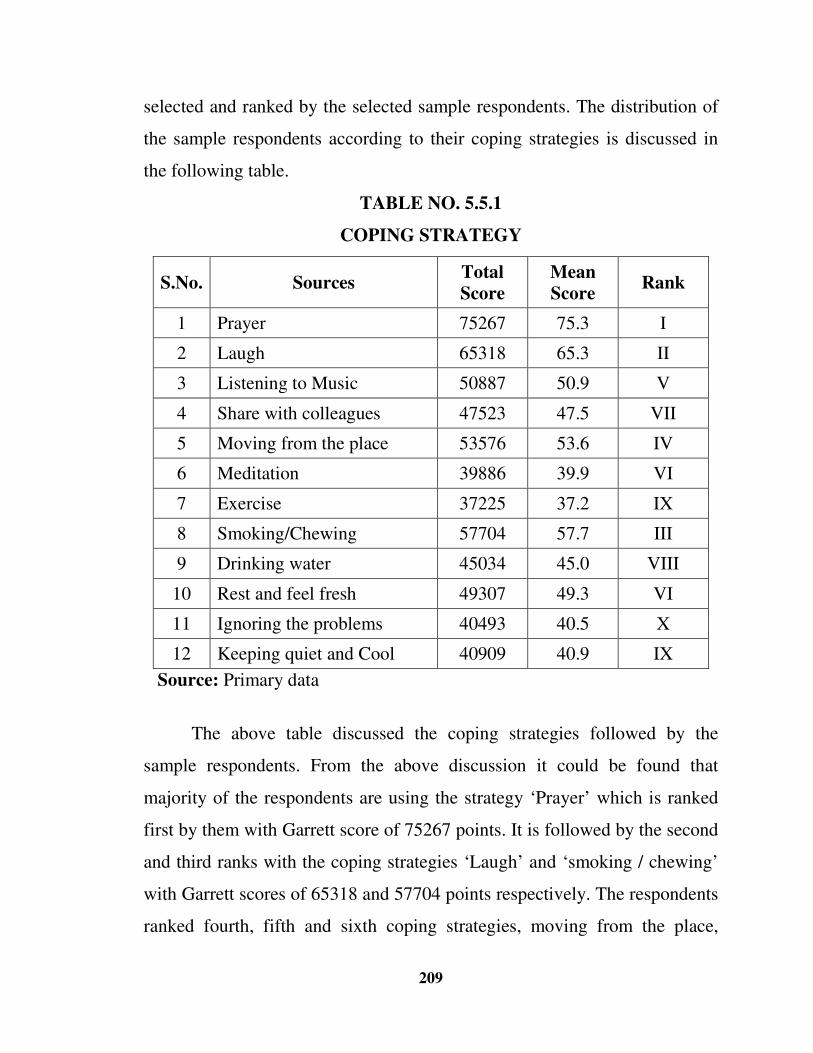
209
selected and ranked by the selected sample respondents. The distribution of
the sample respondents according to their coping strategies is discussed in
the following table.
TABLE NO. 5.5.1
COPING STRATEGY
S.No. Sources Total Score
Mean Score
Rank
1 Prayer 75267 75.3 I
2 Laugh 65318 65.3 II
3 Listening to Music 50887 50.9 V
4 Share with colleagues 47523 47.5 VII
5 Moving from the place 53576 53.6 IV
6 Meditation 39886 39.9 VI
7 Exercise 37225 37.2 IX
8 Smoking/Chewing 57704 57.7 III
9 Drinking water 45034 45.0 VIII
10 Rest and feel fresh 49307 49.3 VI
11 Ignoring the problems 40493 40.5 X
12 Keeping quiet and Cool 40909 40.9 IX
Source: Primary data
The above table discussed the coping strategies followed by the
sample respondents. From the above discussion it could be found that
majority of the respondents are using the strategy ‘Prayer’ which is ranked
first by them with Garrett score of 75267 points. It is followed by the second
and third ranks with the coping strategies ‘Laugh’ and ‘smoking / chewing’
with Garrett scores of 65318 and 57704 points respectively. The respondents
ranked fourth, fifth and sixth coping strategies, moving from the place,
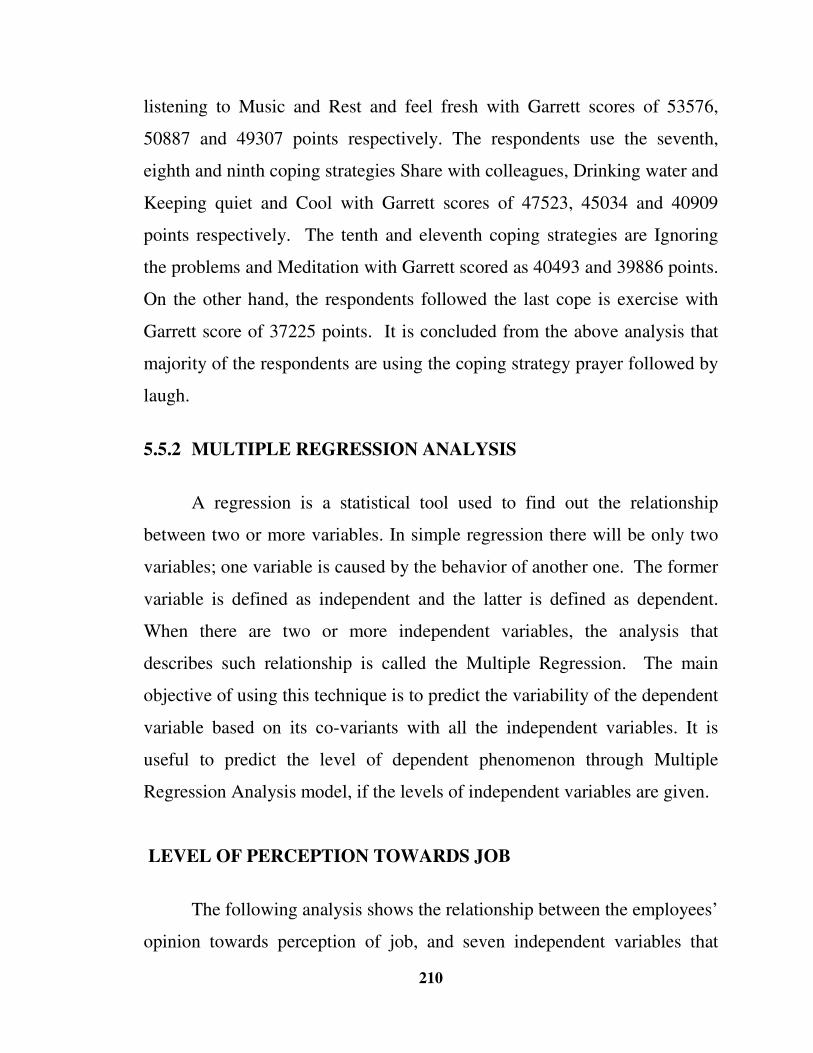
210
listening to Music and Rest and feel fresh with Garrett scores of 53576,
50887 and 49307 points respectively. The respondents use the seventh,
eighth and ninth coping strategies Share with colleagues, Drinking water and
Keeping quiet and Cool with Garrett scores of 47523, 45034 and 40909
points respectively. The tenth and eleventh coping strategies are Ignoring
the problems and Meditation with Garrett scored as 40493 and 39886 points.
On the other hand, the respondents followed the last cope is exercise with
Garrett score of 37225 points. It is concluded from the above analysis that
majority of the respondents are using the coping strategy prayer followed by
laugh.
5.5.2 MULTIPLE REGRESSION ANALYSIS
A regression is a statistical tool used to find out the relationship
between two or more variables. In simple regression there will be only two
variables; one variable is caused by the behavior of another one. The former
variable is defined as independent and the latter is defined as dependent.
When there are two or more independent variables, the analysis that
describes such relationship is called the Multiple Regression. The main
objective of using this technique is to predict the variability of the dependent
variable based on its co-variants with all the independent variables. It is
useful to predict the level of dependent phenomenon through Multiple
Regression Analysis model, if the levels of independent variables are given.
LEVEL OF PERCEPTION TOWARDS JOB
The following analysis shows the relationship between the employees’
opinion towards perception of job, and seven independent variables that
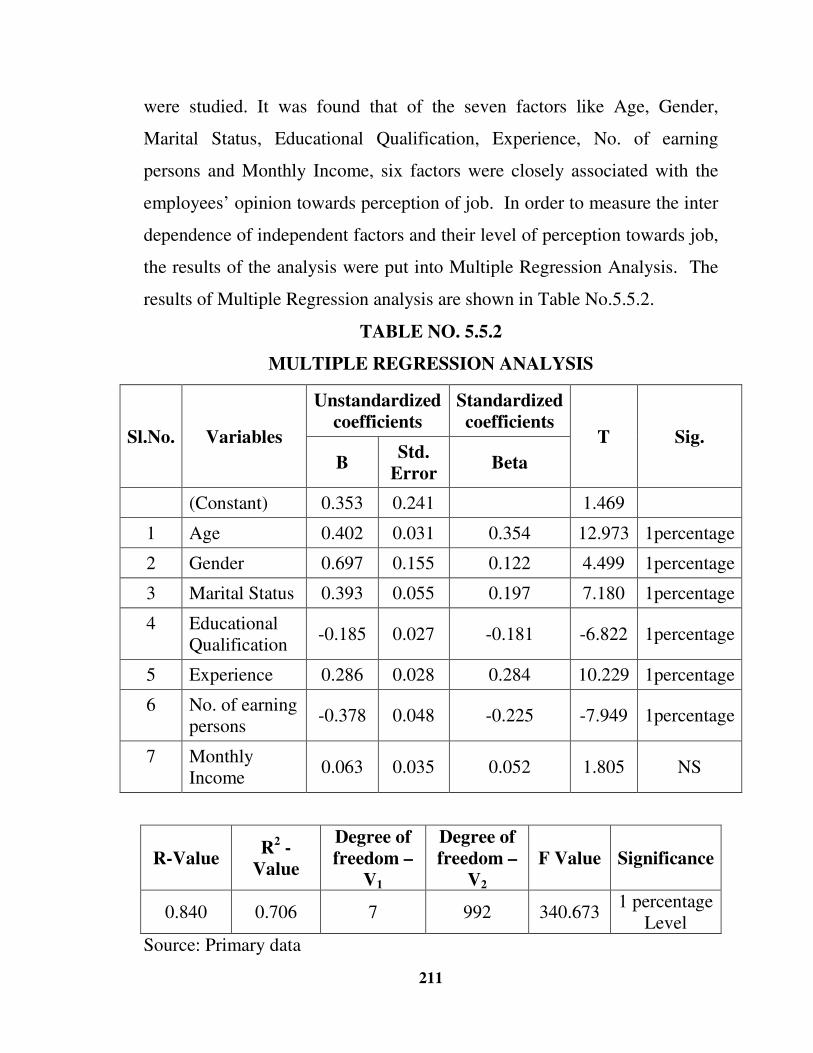
211
were studied. It was found that of the seven factors like Age, Gender,
Marital Status, Educational Qualification, Experience, No. of earning
persons and Monthly Income, six factors were closely associated with the
employees’ opinion towards perception of job. In order to measure the inter
dependence of independent factors and their level of perception towards job,
the results of the analysis were put into Multiple Regression Analysis. The
results of Multiple Regression analysis are shown in Table No.5.5.2.
TABLE NO. 5.5.2
MULTIPLE REGRESSION ANALYSIS
Sl.No. Variables
Unstandardized coefficients
Standardized coefficients
T Sig.
B Std.
Error Beta
(Constant) 0.353 0.241 1.469
1 Age 0.402 0.031 0.354 12.973 1percentage
2 Gender 0.697 0.155 0.122 4.499 1percentage
3 Marital Status 0.393 0.055 0.197 7.180 1percentage
4 Educational Qualification
-0.185 0.027 -0.181 -6.822 1percentage
5 Experience 0.286 0.028 0.284 10.229 1percentage
6 No. of earning persons
-0.378 0.048 -0.225 -7.949 1percentage
7 Monthly Income
0.063 0.035 0.052 1.805 NS
R-Value R
2 -
Value
Degree of freedom –
V1
Degree of freedom –
V2 F Value Significance
0.840 0.706 7 992 340.673 1 percentage
Level
Source: Primary data
212
The Multiple linear regression component (dependent variable) is
found statistically a good fit as R2 is 0.706. It shows that seven independent
variables contribute about 71percentage on the variations in employees’
opinion towards perception of job, and this is statistically significant at
1percentage level.
The table indicates that the co-efficient of age, gender, marital status
and experience are positively associated with the level of perception.
Further, it indicates that these variables that contribute to the level of
perception are statistically significant implying that their influence is
stronger than that of other variables.
The rate of increase in employees’ level of perception towards their
job could be increased with better performance of the independent variable
such as the unit change in experience of the respondents with 0.286; with
0.393 units change in marital status; with 0.697 unit change in gender and
with 0.402 unit change in age.
Thus from the above analysis the following observations could be
made. The perception perceived by the employees towards their job is
positively associated with the factors like age, gender, marital status and
experience.
5.5.3 LEVEL OF OCCUPATIONAL STRESS
In the following analysis, the relationship between the respondents’
level of occupational stress in paper industry and seven independent factors
was studied. It was found that out of seven variables only four variables
were closely associated with the level of occupational stress among the
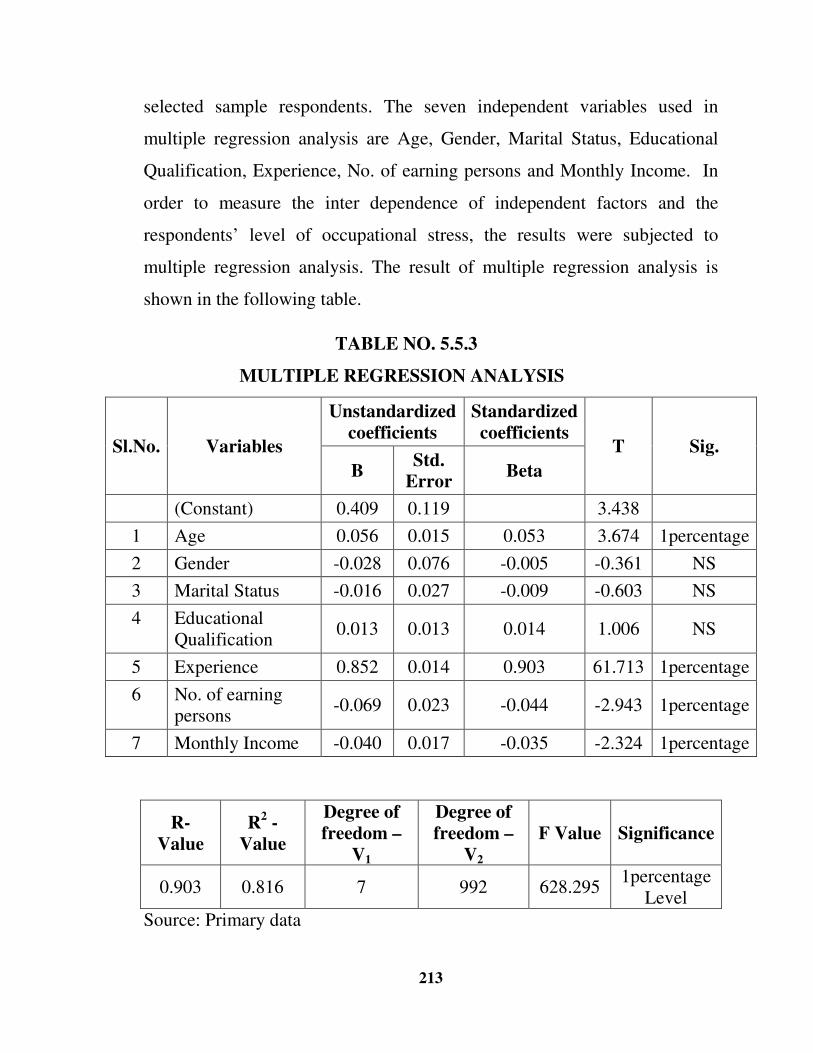
213
selected sample respondents. The seven independent variables used in
multiple regression analysis are Age, Gender, Marital Status, Educational
Qualification, Experience, No. of earning persons and Monthly Income. In
order to measure the inter dependence of independent factors and the
respondents’ level of occupational stress, the results were subjected to
multiple regression analysis. The result of multiple regression analysis is
shown in the following table.
TABLE NO. 5.5.3
MULTIPLE REGRESSION ANALYSIS
Sl.No. Variables
Unstandardized coefficients
Standardized coefficients
T Sig.
B Std.
Error Beta
(Constant) 0.409 0.119 3.438
1 Age 0.056 0.015 0.053 3.674 1percentage
2 Gender -0.028 0.076 -0.005 -0.361 NS
3 Marital Status -0.016 0.027 -0.009 -0.603 NS
4 Educational Qualification
0.013 0.013 0.014 1.006 NS
5 Experience 0.852 0.014 0.903 61.713 1percentage
6 No. of earning persons
-0.069 0.023 -0.044 -2.943 1percentage
7 Monthly Income -0.040 0.017 -0.035 -2.324 1percentage
R-Value
R2 -
Value
Degree of freedom –
V1
Degree of freedom –
V2 F Value Significance
0.903 0.816 7 992 628.295 1percentage
Level
Source: Primary data
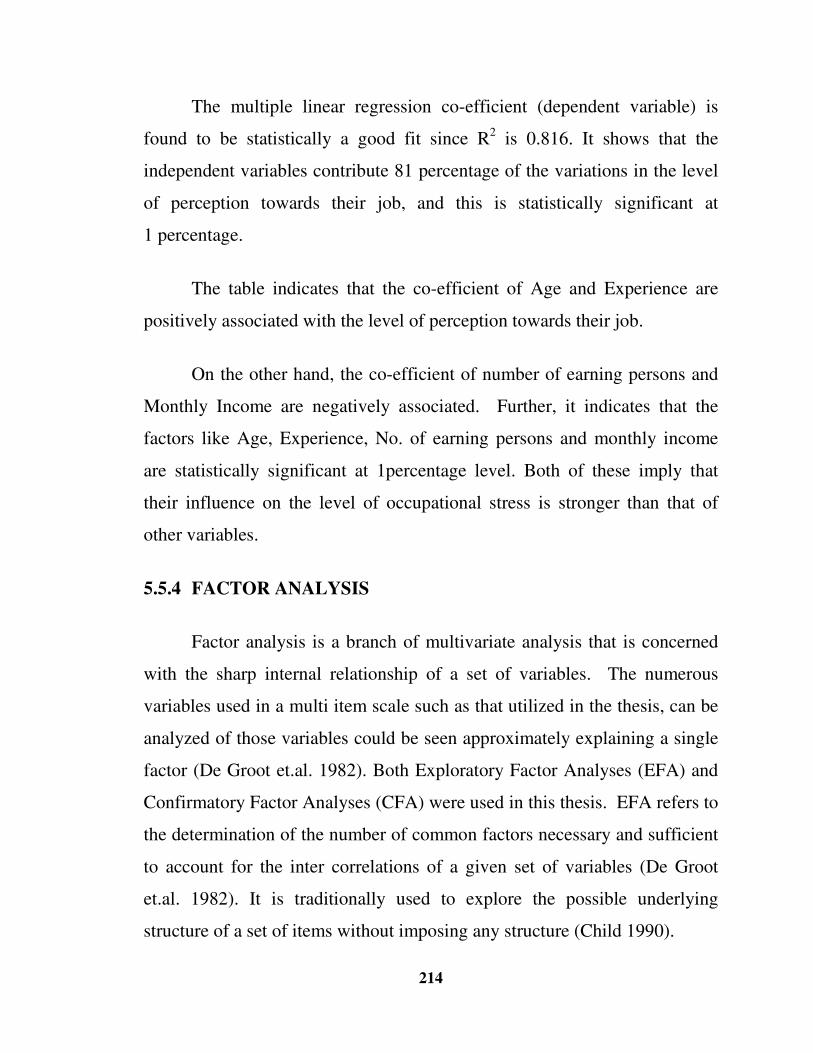
214
The multiple linear regression co-efficient (dependent variable) is
found to be statistically a good fit since R2 is 0.816. It shows that the
independent variables contribute 81 percentage of the variations in the level
of perception towards their job, and this is statistically significant at
1 percentage.
The table indicates that the co-efficient of Age and Experience are
positively associated with the level of perception towards their job.
On the other hand, the co-efficient of number of earning persons and
Monthly Income are negatively associated. Further, it indicates that the
factors like Age, Experience, No. of earning persons and monthly income
are statistically significant at 1percentage level. Both of these imply that
their influence on the level of occupational stress is stronger than that of
other variables.
5.5.4 FACTOR ANALYSIS
Factor analysis is a branch of multivariate analysis that is concerned
with the sharp internal relationship of a set of variables. The numerous
variables used in a multi item scale such as that utilized in the thesis, can be
analyzed of those variables could be seen approximately explaining a single
factor (De Groot et.al. 1982). Both Exploratory Factor Analyses (EFA) and
Confirmatory Factor Analyses (CFA) were used in this thesis. EFA refers to
the determination of the number of common factors necessary and sufficient
to account for the inter correlations of a given set of variables (De Groot
et.al. 1982). It is traditionally used to explore the possible underlying
structure of a set of items without imposing any structure (Child 1990).
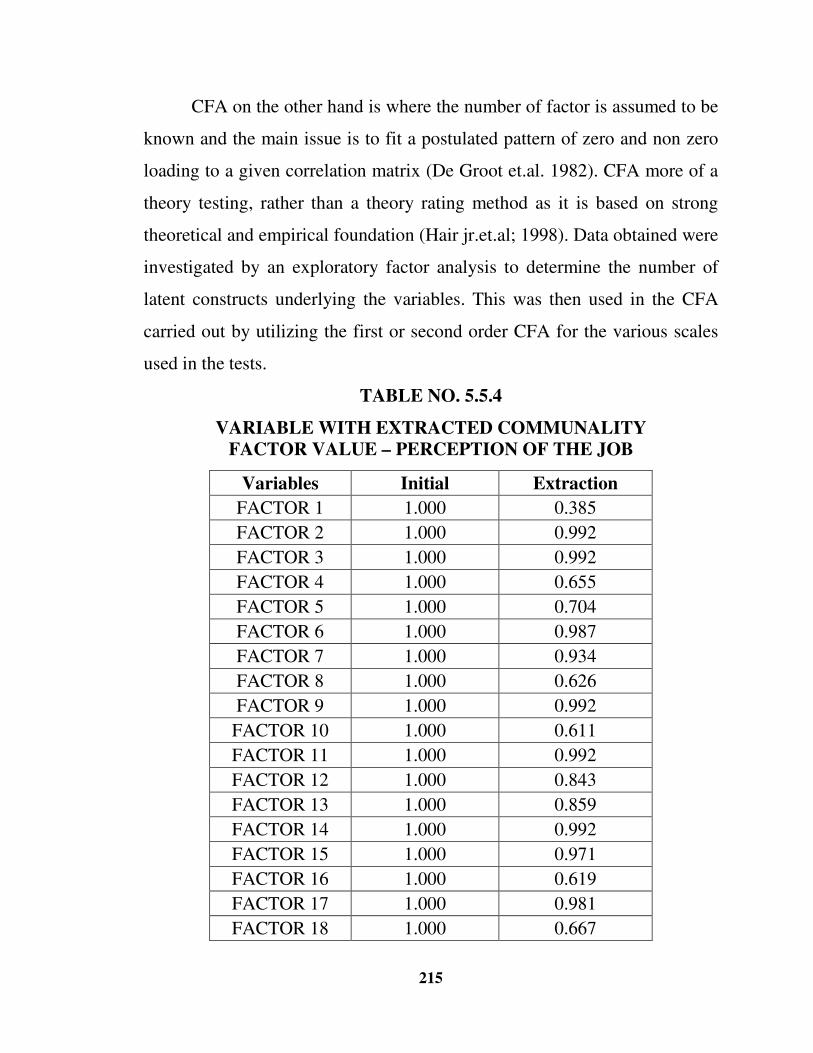
215
CFA on the other hand is where the number of factor is assumed to be
known and the main issue is to fit a postulated pattern of zero and non zero
loading to a given correlation matrix (De Groot et.al. 1982). CFA more of a
theory testing, rather than a theory rating method as it is based on strong
theoretical and empirical foundation (Hair jr.et.al; 1998). Data obtained were
investigated by an exploratory factor analysis to determine the number of
latent constructs underlying the variables. This was then used in the CFA
carried out by utilizing the first or second order CFA for the various scales
used in the tests.
TABLE NO. 5.5.4
VARIABLE WITH EXTRACTED COMMUNALITY FACTOR VALUE – PERCEPTION OF THE JOB
Variables Initial Extraction
FACTOR 1 1.000 0.385
FACTOR 2 1.000 0.992
FACTOR 3 1.000 0.992
FACTOR 4 1.000 0.655
FACTOR 5 1.000 0.704
FACTOR 6 1.000 0.987
FACTOR 7 1.000 0.934
FACTOR 8 1.000 0.626
FACTOR 9 1.000 0.992
FACTOR 10 1.000 0.611
FACTOR 11 1.000 0.992
FACTOR 12 1.000 0.843
FACTOR 13 1.000 0.859
FACTOR 14 1.000 0.992
FACTOR 15 1.000 0.971
FACTOR 16 1.000 0.619
FACTOR 17 1.000 0.981
FACTOR 18 1.000 0.667
216
Where,
Factor 1 - On the whole, they get well along with others at work
Factor 2 - There is conflict within team
Factor 3 - They are able to share their feelings with boss/colleagues
Factor 4 - They have confidence that they will succeed in their job
Factor 5 - The shift work creates stress
Factor 6 - Intellectual / Technical demands of a job are the source
of stress for them
Factor 7 - The work assigned to them is monotonous
Factor 8 - Interruption makes it difficult to complete all their work
Factor 9 - They are satisfied by the corrective measures given by
the organization
Factor 10 - The employees feel that the leadership style in their
organization is appropriate
Factor 11 - They are able to complete the work assigned to them
Factor 12 - The things they need to know they are getting informed
Factor 13 - They have too many work demands at the same time
Factor 14 - They feel anxious and apprehensive when they are at
work
Factor 15 - For all new tasks, they are receiving adequate training
Factor 16 - Their opinion is not sought in solving organization
problems
Factor 17 - The levels of physical effort required in job are stress for
them
Factor 18 - Job stress leads to physical as well as mental health
problems
217
The following table reveals that the extraction has been undertaken by
using principal-component method and the initial Eigen values are
formulated from the communalities table and the same has been developed
as extraction sums of squared loadings with percentage of variance and the
relative cumulative percentage. From the initial Eigen values and the
extraction sums of squared loadings values, the rotation sums of squared
loadings has been formulated and shown in the following table.
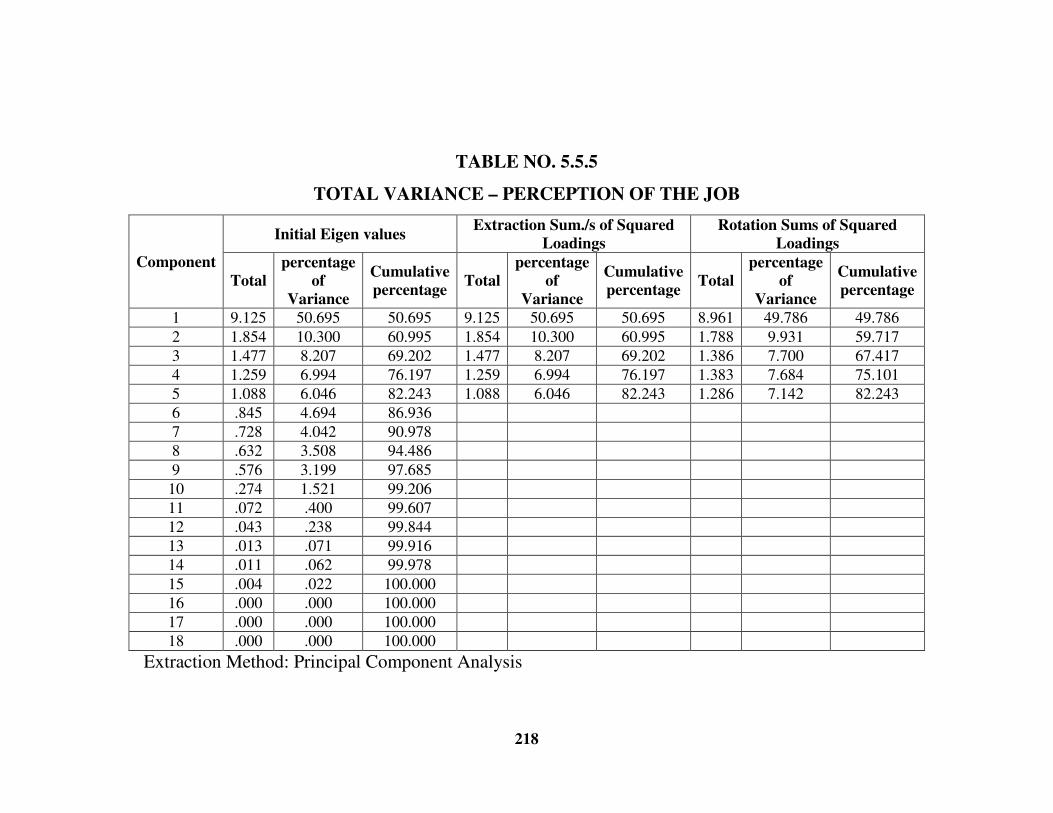
218
TABLE NO. 5.5.5
TOTAL VARIANCE – PERCEPTION OF THE JOB
Component
Initial Eigen values Extraction Sum./s of Squared
Loadings
Rotation Sums of Squared
Loadings
Total
percentage
of
Variance
Cumulative
percentage Total
percentage
of
Variance
Cumulative
percentage Total
percentage
of
Variance
Cumulative
percentage
1 9.125 50.695 50.695 9.125 50.695 50.695 8.961 49.786 49.786
2 1.854 10.300 60.995 1.854 10.300 60.995 1.788 9.931 59.717
3 1.477 8.207 69.202 1.477 8.207 69.202 1.386 7.700 67.417
4 1.259 6.994 76.197 1.259 6.994 76.197 1.383 7.684 75.101
5 1.088 6.046 82.243 1.088 6.046 82.243 1.286 7.142 82.243
6 .845 4.694 86.936
7 .728 4.042 90.978
8 .632 3.508 94.486
9 .576 3.199 97.685
10 .274 1.521 99.206
11 .072 .400 99.607
12 .043 .238 99.844
13 .013 .071 99.916
14 .011 .062 99.978
15 .004 .022 100.000
16 .000 .000 100.000
17 .000 .000 100.000
18 .000 .000 100.000
Extraction Method: Principal Component Analysis

219
The extraction process has been carried out by using principal-
component method, and it is found from the rotation sums of squared
loadings and the total sum of twenty five variables has been extracted and
the same has been grouped into five components which have Eigen value of
more than one. It ranges from component no. 1 to component no. 5 with the
cumulative percentage from 50.695 percent to 82.243 percent. The
percentage of variance ranges from 49.786percentage to 7.142percentage.
For the fifth component of initial Eigen values, the total, percentage of
variance and the cumulative percentage values are 1.088, 6.046percentage
and 82.243 respectively. The extracted sum of squared loadings for the
same are 1.088, 6.046percentage and 82.243percentage respectively. The
rotation sums of squared loadings for the above are 1.286, 7.142 and 82.243
respectively.
From the analysis, it is inferred that the factor analysis has been
supported up to 82.243percentage in this study. This is an excellent result
and made the study reliable to the analysis.
The following table has been formulated by using ‘principal-
component method’ for extraction of variables into components and
Varimax with Kaiser Normalization has been done by using ‘rotation
method’. All the eighteen variables have been grouped into five components
and each component consists of sets of factors and the analysis has been
made to identify the influence of one variable over another.
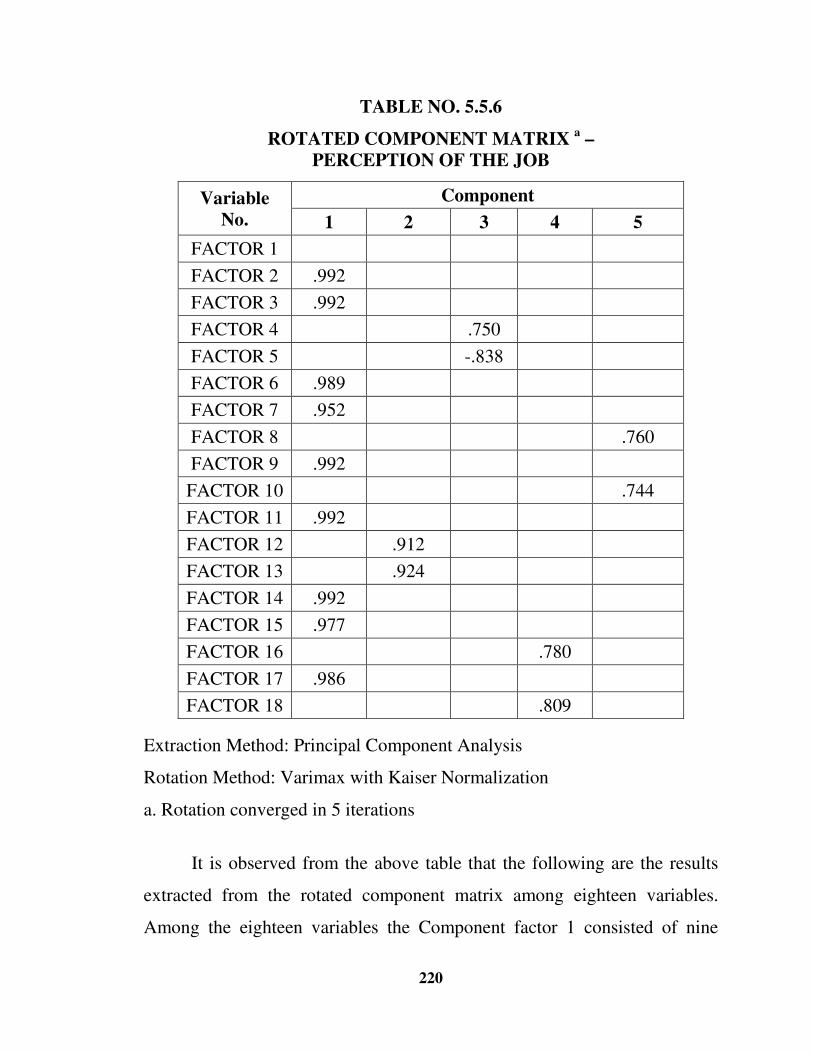
220
TABLE NO. 5.5.6
ROTATED COMPONENT MATRIX a –
PERCEPTION OF THE JOB
Variable No.
Component
1 2 3 4 5
FACTOR 1
FACTOR 2 .992
FACTOR 3 .992
FACTOR 4 .750
FACTOR 5 -.838
FACTOR 6 .989
FACTOR 7 .952
FACTOR 8 .760
FACTOR 9 .992
FACTOR 10 .744
FACTOR 11 .992
FACTOR 12 .912
FACTOR 13 .924
FACTOR 14 .992
FACTOR 15 .977
FACTOR 16 .780
FACTOR 17 .986
FACTOR 18 .809
Extraction Method: Principal Component Analysis
Rotation Method: Varimax with Kaiser Normalization
a. Rotation converged in 5 iterations
It is observed from the above table that the following are the results
extracted from the rotated component matrix among eighteen variables.
Among the eighteen variables the Component factor 1 consisted of nine
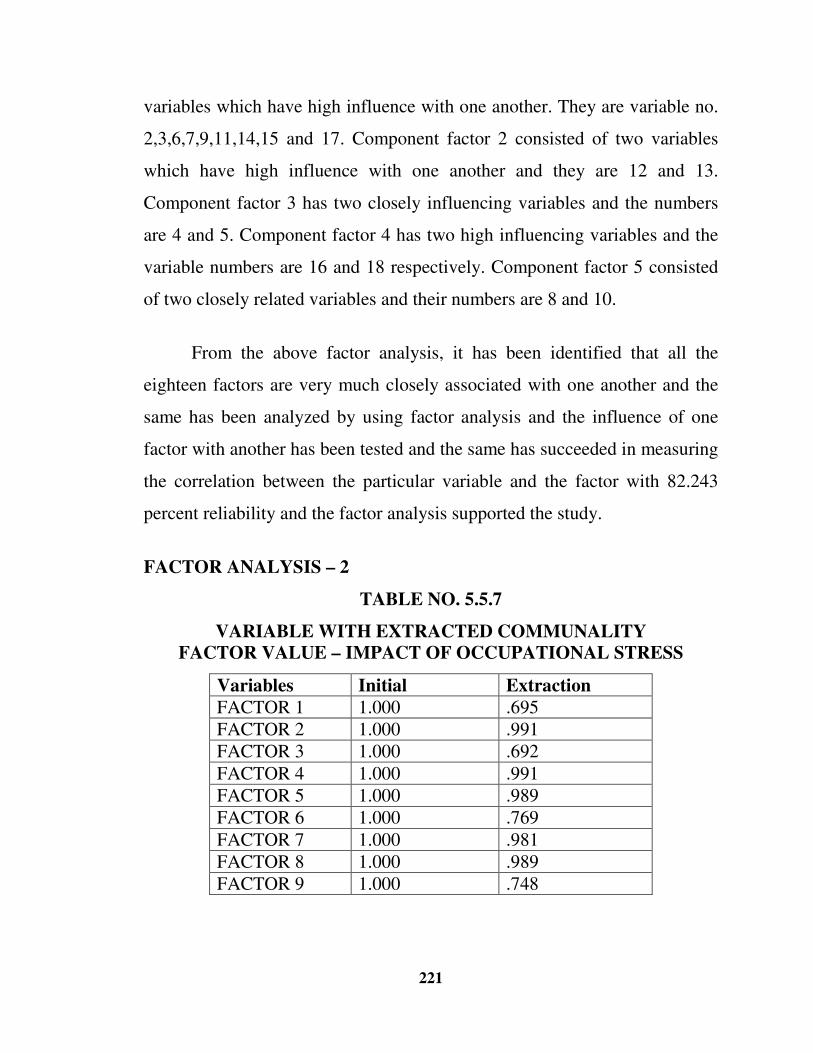
221
variables which have high influence with one another. They are variable no.
2,3,6,7,9,11,14,15 and 17. Component factor 2 consisted of two variables
which have high influence with one another and they are 12 and 13.
Component factor 3 has two closely influencing variables and the numbers
are 4 and 5. Component factor 4 has two high influencing variables and the
variable numbers are 16 and 18 respectively. Component factor 5 consisted
of two closely related variables and their numbers are 8 and 10.
From the above factor analysis, it has been identified that all the
eighteen factors are very much closely associated with one another and the
same has been analyzed by using factor analysis and the influence of one
factor with another has been tested and the same has succeeded in measuring
the correlation between the particular variable and the factor with 82.243
percent reliability and the factor analysis supported the study.
FACTOR ANALYSIS – 2
TABLE NO. 5.5.7
VARIABLE WITH EXTRACTED COMMUNALITY FACTOR VALUE – IMPACT OF OCCUPATIONAL STRESS
Variables Initial Extraction
FACTOR 1 1.000 .695 FACTOR 2 1.000 .991 FACTOR 3 1.000 .692
FACTOR 4 1.000 .991 FACTOR 5 1.000 .989 FACTOR 6 1.000 .769
FACTOR 7 1.000 .981 FACTOR 8 1.000 .989 FACTOR 9 1.000 .748
222
where,
Factor 1 - They feel completely exhausted at the end of the day at
their work place
Factor 2 - They look irritated, nervous, angry and tensed while
performing their job
Factor 3 - They feel dissatisfied with their job
Factor 4 - They often think of quitting their job
Factor 5 - They feel calm and relaxed at work
Factor 6 - They have taken a number of days of leave due to severe
stress
Factor 7 - They are able to complete their work in the stipulated
time
Factor 8 - They feel that they are doing work in the best way.
Factor 9 - They feel that their official assignments are more
important than their personal interests.
The following table reveals that the extraction has been undertaken by
using principal-component method and the initial Eigen values are
formulated from the communalities table and the same has been developed
as extraction sums of squared loadings with percentage of variance and the
relative cumulative percentage. From the initial Eigen values and the
extraction sums of squared loadings values, the rotation sums of squared
loadings has been formulated and shown in the following table.
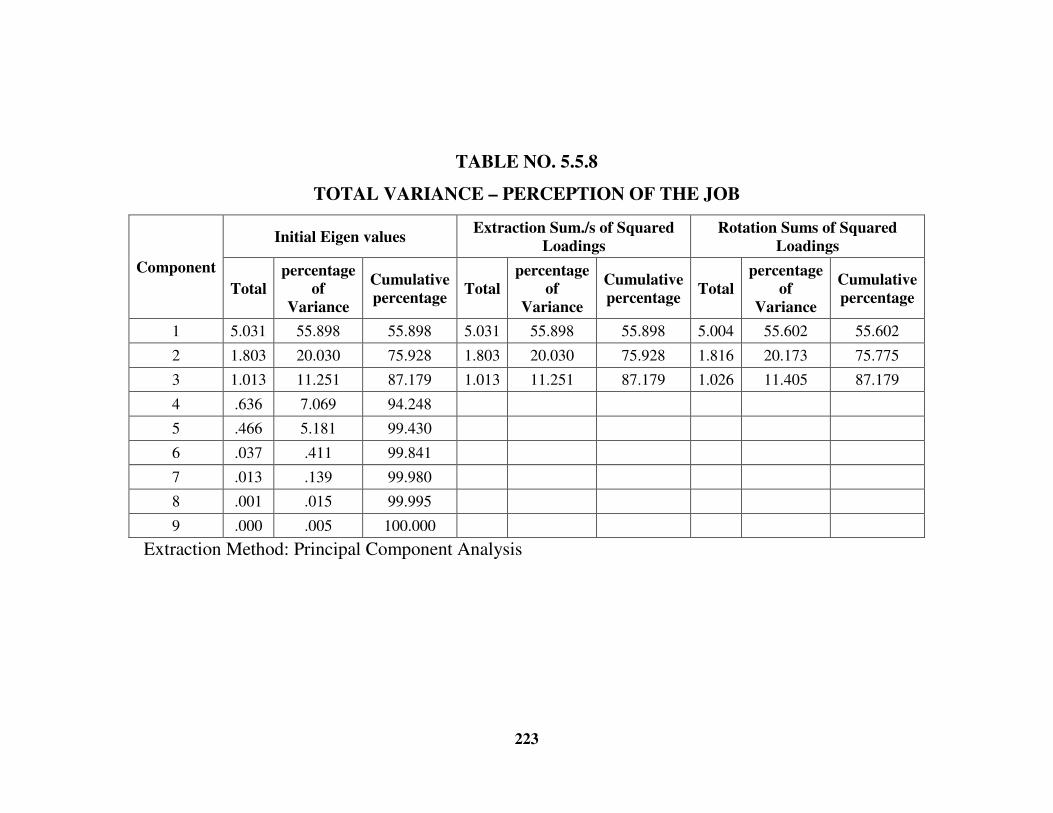
223
TABLE NO. 5.5.8
TOTAL VARIANCE – PERCEPTION OF THE JOB
Component
Initial Eigen values Extraction Sum./s of Squared
Loadings
Rotation Sums of Squared
Loadings
Total
percentage of
Variance
Cumulative
percentage Total
percentage of
Variance
Cumulative
percentage Total
percentage of
Variance
Cumulative
percentage
1 5.031 55.898 55.898 5.031 55.898 55.898 5.004 55.602 55.602
2 1.803 20.030 75.928 1.803 20.030 75.928 1.816 20.173 75.775
3 1.013 11.251 87.179 1.013 11.251 87.179 1.026 11.405 87.179
4 .636 7.069 94.248
5 .466 5.181 99.430
6 .037 .411 99.841
7 .013 .139 99.980
8 .001 .015 99.995
9 .000 .005 100.000
Extraction Method: Principal Component Analysis
224
The extraction process has been carried out by using principal-
component method, and it is found from the rotation sums of squared
loadings and that total sum of nine variables has been extracted and the same
has been grouped into three components which have Eigen value of more
than one. It ranges from component no. 1 to component no. 3 with the
cumulative percentage from 55.898 percent to 87.179 percent. The
percentage of variance ranges from 55.898percentage to 11.251percentage.
For the third component of initial Eigen values, the total percentage of
variance and the cumulative percentage values are 1.013, 11.251percentage
and 87.179 respectively. The extracted sum of squared loadings for the
same are 1.013, 11.251percentage and 87.179percentage respectively. The
rotation sums of squared loadings for the above are 1.023, 11.405 and
87.179 respectively.
From the analysis, it is inferred that the factor analysis has been
supported up to 87.179percentage in this study. This is an excellent result
and has made the study reliable to the analysis.
The following table has been formulated by using ‘principal-
component method’ for extraction of variables into components and
Varimax with Kaiser Normalization has been undergone by using ‘rotation
method’. All the nine variables have been grouped into three components
and each component consists of sets of factors and the analysis has been
made to identify the influence of one variable over another.
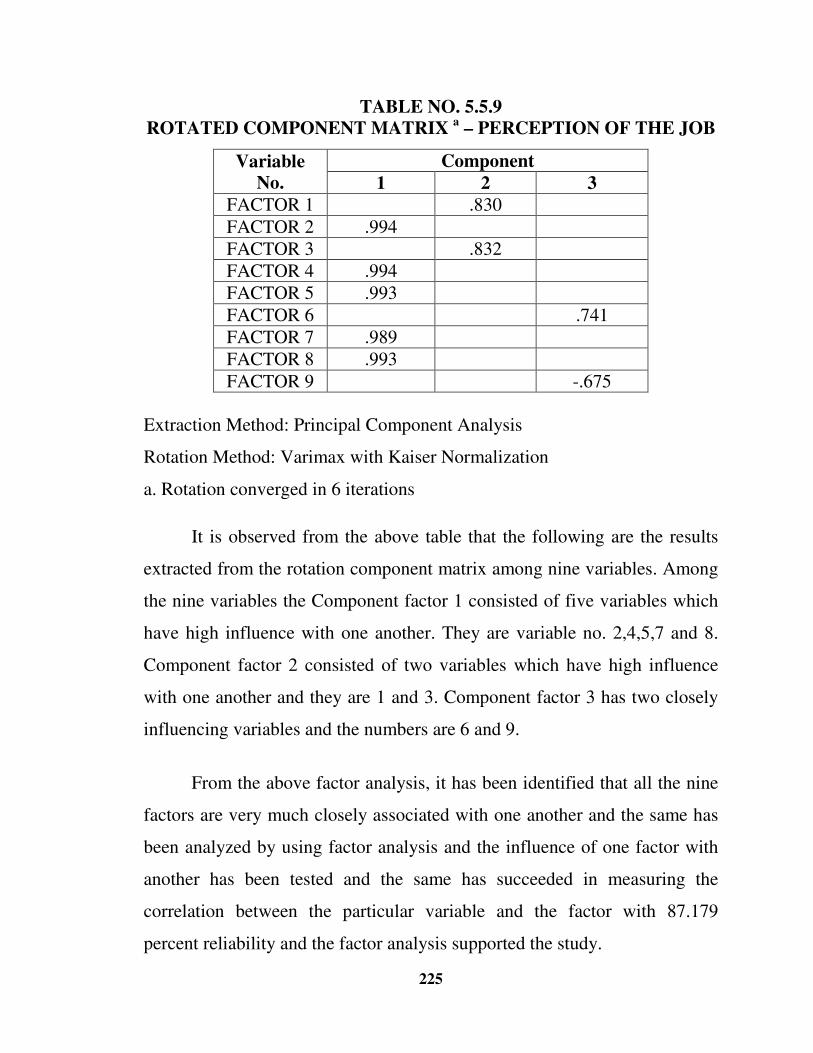
225
TABLE NO. 5.5.9 ROTATED COMPONENT MATRIX
a – PERCEPTION OF THE JOB
Variable No.
Component
1 2 3
FACTOR 1 .830
FACTOR 2 .994 FACTOR 3 .832 FACTOR 4 .994 FACTOR 5 .993
FACTOR 6 .741 FACTOR 7 .989 FACTOR 8 .993
FACTOR 9 -.675 Extraction Method: Principal Component Analysis
Rotation Method: Varimax with Kaiser Normalization
a. Rotation converged in 6 iterations
It is observed from the above table that the following are the results
extracted from the rotation component matrix among nine variables. Among
the nine variables the Component factor 1 consisted of five variables which
have high influence with one another. They are variable no. 2,4,5,7 and 8.
Component factor 2 consisted of two variables which have high influence
with one another and they are 1 and 3. Component factor 3 has two closely
influencing variables and the numbers are 6 and 9.
From the above factor analysis, it has been identified that all the nine
factors are very much closely associated with one another and the same has
been analyzed by using factor analysis and the influence of one factor with
another has been tested and the same has succeeded in measuring the
correlation between the particular variable and the factor with 87.179
percent reliability and the factor analysis supported the study.
226
CHAPTER – VI
SUMMARY OF FINDINGS, SUGGESTIONS AND CONCLUSION
6.1 INTRODUCTION
The present study was undertaken in paper industry in Tamilnadu. It
has been purposively selected for its familiarity and unique performance in
utilization of manpower productivity. During the recent years, the whole
environment has undergone significant changes regarding working times,
years of employment, role of organization, type of employment contracts
and working conditions. In this thesis, consequence of these changes on
occupational stress and employee’s health and safety have been examined.
These include the disruption of human biological rhythms, the increase of
whole fatigue due to changes in pattern of working hours and years of
employment, job insecurity and occupational stress, which have a serious
impact on workers health and may result in an increase in occupational
stress. Unsafe work practices related to work load and time pressure, the
impact of work changes on public safety and the deterioration of worker’s
living conditions with respect to income, social-family life and health and
benefit are also described.
6.2 FINDINGS
The findings derived at from the foregoing chapters of the study
would be summarized below:
227
6.2.1 Findings based on major sources of employee’s occupational stress
1) Considering the age and the level of perception of employees on their
job the level of perception was high among the employees, whose age
is between 26 to 30 years.
2) 21.8 percent of the male employees were in low level of perception of
job and there was no significant association found between gender and
level of perception.
3) It was inferred that 22.4 percent of married employees had low level
perception of job where as 34.1 percent of the unmarried employees
were highly perceived on their job. It was observed that the
employee’s perception towards occupation is associated significantly
with regard to marital status of all categories of employees.
4) It was indentified that 15.5 percent of the employees having education
up to HSC (School education) were in the low level of perception of
their jobs. More than 25 percent of the employees having different
level of education except ITI holder were in the high level of
perception. It is concluded that there was a significant association
between educational qualification and the level of perception of job.
5) 27.3 percent of the employees, below 10 years of service, had low
level of perception. Above 50 percent of the employees having
between 11 to 25 years of service was in middle level of perception.
There was significant association found between span of service and
occupational perception of employees.
6) It was observed that 51 percent of the employees having more than
four earning persons in their family were in low level perception on
228
job. Thus, employee’s perception on occupation had significantly
associated with the number of earning person in the family of the
employees in paper industry.
7) It was found that 30.8 percent of the employees earning between
Rs.5000-10000 were in the high level perception on job, whereas 52.9
percent of the employee’s in the income range of Rs.15001-20000
were in middle level perception. There was significant association
between the monthly income and level of perception of employees on
occupation.
8) It was observed that general 52 percent of the employees felt that their
occupation was more stressful. 36.2 - 46.1 percent of the employees
were in negative impact on their occupational performance. Thus, this
analysis indicates that there was more stress among the employees of
paper industries due to the nature of work and work environment.
9) It was identified that around 94 percent of the employees have self
confidence on their work performance. 71 percent of the employees
felt that their job was highly competitive, about 60.5 percent of
employees were in positive image, good patience, high self esteem
and tolerance towards their occupation. 44.7 percent of the employees
turned aggressive due to their occupation. It was concluded that the
employees experienced changes their attitude along with the change in
work environment of the paper industry.
10) All the employees irrespective of their qualification do have job
stress. However, employees with PG qualification have more stress
compared to others with qualification such as school education, ITI
diploma, UG degrees.
229
11) Though employees have different years of experience, the employees
having experience between 11 to 15 years are affected by the
occupational stress. It is proved by the ANOVAs test.
12) While analyzing the number of earning members in their family, the
respondents who have only one earning member in his family, had
severe stress than other categories of the respondents. The result of
ANOVAs test also supported the result.
13) Among the five group of the income level of the respondents,
employees with income range of Rs.10001 to 15000 are having severe
occupational stress than others, which is also proved by the ANOVAs
test.
14) Most of the respondents have self-confidence, ability to change,
competitive mind, positive image of their self, patience, mild
mannerism, high self-esteem and tolerance.
15) To a question about successful completion of the works, the
respondence replied that they were able to complete the work assigned
to them with the help of good leadership and receiving of required
information. However they felt that to many work demands at the
same time created anxious and apprehensiveness.
16) Majority of the respondents strongly agree that drugs are one of the
main parts of their life, their job cuts their involvement in their family
life, family and financial problem create stress in their jobs.
17) It is clear from the analysis that of the statements, eight statements
like they feel completely exhausted at the end of the day at their work
place. Employee felt dissatisfied with their occupation.
230
18) Out of seven factors, six factors are closely associated with the level
of perception towards job. The factors are age, gender, marital status,
educational qualification, experience and no. of earning persons. The
factors like age, gender, marital status and experience are positively
associated with the level of perception. This shows that the level of
perception towards job is at high level and their relationship with the
company is good.
19) It could be observed from the multi-regression analysis that out of
seven factors, four factors are closely associated with the level of
occupational stress. The factors are age, experience, no. of earning
persons and monthly income. The factors like age and experience are
positively associated with the level of occupational stress.
20) To study the perception of respondents about their job, eighteen
statements were considered and the opinions of the correspondents
about these statements were analyzed through factor analysis which
has reported that all these eighteen statements were very much closely
associated with one another. It is evident from the results of the factor
analysis with 82.2438% reliability.
21) To study the impact of occupational stress, nine factors were
considered and their relationship with one another are studied through
factor analysis which has reported that all the nine factors are very
much closely associated with one another and the influence of one
factor with another has been tested and the same has succeeded in
measuring the correlation between the particular variable and the
factor with 87.179 percent reliability and the factor analysis supported
the study.
231
6.2.2 Findings based on level of occupational stress of employees
1) High percent (36.5 percent) of employees in the below 20 years of age
group were in sever level of stress. It also revealed that the job stress
had not significantly associated among age group of employees and
the level of occupational stress.
2) It was portrayed that 54.4 percent of the employees were in mild
stress and 7.4 percent of the employees were in severe level of stress.
Further, the job stress had not associated significantly with the male
and female employees of paper industry.
3) 54.9% of the married employees and 48% of the unmarried employees
were in the moderate level of stress while 27.6%of the married
employees and 26% of the unmarried employees were in severe level
of stress. Further in the case of widow and widower employees 53%
in moderate level of stress and 26% were in severe level of stress thus,
job distrust had significantly associated with the marital status of the
employees.
4) When the relationship between the educational qualifications of the
respondents and their level of stress, it was observed that more than
27 percent of the employees in paper industry are having high level of
stress, 54 percent have medium/moderate stress and 18 percent have
low level of stress. The result of ANOVA test indicated that there was
significant association between educational qualification and
employee’s occupational stress.
5) 56 percent of the employees having service below 10 years had
moderate level of stress. 39 percent of the employees having
experience between 16-20 years had higher level of stress. 11.1
232
percent of employees between 21-25 years of experience have low
level stress. The job stress had significantly associated with the
employees experience in the paper industry.
6) 31.5 percent of the employees having only one earning person were in
severe level of stress. Around 59 percent of the employees having two
earning person were in moderate level of stress. Job stress and number
of earning persons had not significantly associated among employees.
But it was significantly associated with the employees having 3 or
more earning persons in their family.
7) 75.9 percent of the employees falling under income categories of
more than Rs.20001 were in moderate level of stress. 32.5 percent and
29.8 percent of the employees falling under income categories
Rs.10001-15000 and 5001-10000 respectively had severe level of
stress. It was revealed that family income of the employees had not
significantly associated with the employees.
8) It was analyzed that the major problems of employees were heavy
noise, air pollution and overwork load and. Hence, there was
significant relationship between the employees and the level of
occupational stress on their related work in paper industry.
9) It was concluded that finance was the basic factor for creating stress
than the other problems like, promotions, lesser holidays, poor
interpersonal relationship between employees, employees turnover,
etc. These problems were registered as predetermining factors for
causes of stress in an organisation.
10) It was observed from the analysis that due to workforce, the
employees were mostly affected by loss of sleep, anger, depression.
This psychological consequence resulted in the increase of the
233
employees stress level. Hence, the significant relationship between
the occupational stress of employees and the factors of psychological
consequences.
11) It was analyzed that irrespective of various occupational stress, the
employees were affected by hypertension, diabetes and headache
rather than the other physical problems like chest pain, back pain,
ulcers, hair loss and upset stomach etc,.
6.2.3 Findings based on impact of occupational stress and coping
strategy
1) Majority of the respondents agreed that their job is stressful, They feel
stress very often Occupational Stress has a negative impact on their
performance whereas the statement ‘Occupational stress does not have
any impact on their performance at work’ was disagreed by the
sample respondents.
2) It was observed from the analysis that the work force of employees
were mostly affected by sleep, anger, depression. This psychological
consequences were resulted that increasing the employees stress level.
Hence, there was significant relationship between the occupational
stress of employees and the factors of psychological consequences.
3) It was found that irrespective of various occupational stresses, no
particular method was adopted by the employees to reduce the stress
level. Employees expressed that prayer, chatting with friends and
their family members, smoking and drinking water were the dreamful
methods followed by them to reduce the stress level. On the other
hand, it is noted that very few of them only engaged in little yoga and
meditation.
234
6.3 SUGGESTIONS
From the foregoing analysis and findings of the study, it can be
understood that the paper industry of Tamilnadu plays a vital role in our
country. However, it can also be understood that the performance of the
various units of the industry is not that much satisfactory, owing to some
inherent problems of stress. To overcome such problems and to make the
paper industry successful, the following suggestions are made.
1. EXTERNAL COUNSELORS: Identification of factors leading to
stress is not so easy for all. Hence it is suggested that external
counselors may be appointed to identify the problems faced by the
employees which could result in stress and take steps to reduce such
stress.
2. AWARENESS PROGRAMMES ON ILL EFFECTS OF DRUGS:
The workers are under misconception that using narcotic drugs and
cigars will reduce the degree of the stress. But, they are least bothered
of the fact that these practices are injurious to health. So, it is
suggested that the company should periodically organize awareness
programs for the employees on ill effects of using drugs and cigars.
3. YOGA, MEDITATION AND EXERCISE: It has been scientifically
proved that yoga, meditation and physical exercise will release stress.
Hence, it is suggested that the organization should arrange proper
training programs on yoga, meditation and physical exercise for their
employees. Such training programs may be arranged especially for the
employees in the age group of 26 to 30 years as, according to one of
our findings, they have more stress.

235
4. STRESS MANAGEMENT TRAININGS: The sample units
concentrate only on their growth through production and sales. They
hardly care for the physical and mental strains of their workers this
result in the presence of stress in their employees. Hence it is
suggested that proper training program on stress management must be
organized in order to create confidence in the minds of the employees
to face the situation and handle problems independently.
5. PROMOTIONAL POLICIES: The employees, whose experiences
exceed 12 years, feel unhappy over their position, on the ground that
they are deprived of promotion. This feeling increases the intensity of
stress and leads to psychological problems. So, to avoid this, it is
suggested that the promotional polices should be renovated so that
even the more experience person feels happy over his position it is
further suggested that apart from efficiency based promotions, time-
bound may also be introduced. This will help the employees to get
promotion periodically. Further, the managements should evolve clear
promotional policies on merit cum seniority or seniority alone. It
would pave the way to reduce the stress and the entry of young and
new talents to the industries.
6. SCIENTIFIC SYSTEM OF PERFORMANCE APPRAISAL: As
a majority of the workers feel that the Performance Appraisal system
which is presently in use is not open and frank. Hence it is suggested
that the companies may devise the performance appraisal system
scientifically in consultation with experts. This will reduce the stress
of the workers due to the unknown outcome of performance appraisal.
7. GRIEVANCES REDRESSAL PROCEDURE: There is grievances
redressal procedures in all sample units. But they are not followed
236
properly. For example, the agreaved persons directly approach the
trade unions for their grievances redressal instesd of approaching the
appropriate authority. This results in either redressing the grievance
after a long period or not at all redressed. Hence it is suggested that
employees must be made aware of the grievances redressal procedures
and must be encouraged to express their feeling and grievances freely.
8. WAGES AND SALARY ADMINISTRATION: In fixing wages
and salary to their employees, the companies were unmindful of
educational qualification and experiences. This has created
dissatisfaction among the highly qualified and more experienced
workers. Hence, it is suggested that the companies should give
weightage for educational qualification an and length of service while
revising wages and salary. Take this into account while fixing salary.
9. PARTICIPATIVE MANAGEMENT: At present, the employees are
not given opportunity to participate in decision making process. This
does not make the employees involve in organizational activities and
help make the organization successful. Hence it is suggested that the
concept of Participative Management may be followed by the
management to involve their employees in making the organizations
successful.
10. CORDIAL EMPLOYER-EMPLOYEE RELATIONS: It is felt
that there is no cordial relationship between the management and the
employees. These exists a gap between these two. This gap must be
lessened for this it is suggested that participative management,
grievances redresses schemes, etc.. must be implemented and
improved.
237
11. RECOGNITION OF TRADE UNIONS: Presently, there are
different trade unions functioning in each units the managements
have recognized some trade unions of their organizations. Though
the Trade Unions Act and other labour laws in our country require the
managements of organizations to take decisions on labour matters in
consultation with recognized trade unions, it has been practice of
managements to consult only the trade unions backed by ruling
political parties, whether such unions are recognized or unrecognized.
This creates many problems between the management and the labour
resulting in loss of production and even leading to the closure of
organizations. Hence it is suggested that the managements must
consult only the recognized trade unions of their companies for
tacking decision on labour matters.
12. INCENTIVES: The sample units have limited themselves in giving
incentives only to the finishing house department where paper
counting and packing are done. As the employees of other
departments are not happy with the non-availability of incentive
system for them, it is suggested that if possible, incentive system may
be implemented in other departments of the units. The assistance of
external agencies such as Productivity Council, Management
Association, etc, may be availed to fix work standard and their by to
implement incentive system, either for individuals or groups.
13. WELFARE MEASURES: We know that the various welfare
measures available to the workers of the Indian paper industry in
general and of Tamilnadu in particular may be broadly classified as
statutory welfare measures and non-statutory welfare measures.
Though there is no problem in the provision of statutory welfare
238
measures, the employees of the sample units are not satisfied with the
provision of non-statutory welfare measures. Hence it is suggested
that the management should improve the non-statutory welfare
measures provided them to their employees. An example where
welfare measures could be improved is given below
As paper industry is a continuous process industry, the
factories work round the clock and hence the factory workers have to
attend to their work at different times in day and night times
depending upon their shifts. Under this circumstance, if the workers
are provided with transport facility and /or quarters, they will feel free
and experience less stress.
It is understood that some of the units are not providing
transport facility and quarters either to all or a portion of their
employees. Hence ti is suggested that the all the employees may be
given quarters or transport facilities depending upon the financial
condition of the respective units.
14. RECREATIONAL FACILITIES: It is a fact that recreation will
reduce stress. Hence, it is suggested that the organization to take steps
to provide recreational facilities to their employees. This facility may
be provided either in the office complex or residential quarters or
both. In view of the benefits to organization from tension free
employees, it is suggested that a reasonable pat of the net profits of
the companies may be spent in providing recreation facilities. What is
reasonable part of profit depends upon the net profits of accompanies
and it’s number of employees.
239
15. REFRESHMENT AND MENTAL EASE FACILITIES: The
responsibilities of workers become high due to their overloaded work,
which in turn increases stress of workers. Hence, to reduce the
tension of the stressed workers, it is suggested that company may
provide facilities, in the work place, such as playing music, installing
vending machines to supply refreshing beverages, etc. Further, the HR
department may conduct work measurement studies and on the basis
of results, if necessary, additional workers may be appointed to
balance the works of each employee.
16. CRECHE: As women are also employed in paper industy, it is
suggested that crèches may be established in each unit to help them
maintain their children below the age of 3.
17. SCHOLARSHIPS AND EDUCATIONAL ASSISTANCE: To help
the employees reduce their tension about the education of their
children It is suggested that the managements may grant scholarships
or extend financial assistance on liberal interest and repayment
condition.
18. JOB ROTATION: It is understood that most of the workers are
doing the same job for long periods. They feel that it has bored them
and has resulted in the creation of stress. Hence it is suggested that,
wherever possible, job rotation scheme may be implemented.
19. MEDICAL CHECK-UPS: It has been proved that stress leads to
physical and mental illness. No doubt that this illness must necessarily
be cured. Hence, for this purpose, it is suggested that periodical
medical checkups must be conducted for each worker. During the
check up if any health mental problem is identified, such worker(s)
240
may be subject to proper treatment (either by the management or the
concerned worker).
20. GROUP INSURANCE: Statistics shows that some of the employees
working in the paper industries were prone to acute disease such as
cancer , paralysis, ulcer, tuber culosis, ets.. such people could not
continue their service and also could not be offered to spend huge
amounts for treatment. Hence it is suggested that the managements
may introduce group insurance systems by collecting a very nominal
insurance premium. This will create confidence in the minds of
workers about their treatment for the deceases and also their life.
21. HEALTH SAFETY MEASURES: There is more opportunity to
spoil the health of the work man in the chipper house, boiler plant and
paper production department. In chipper house more dust is emitted as
wood chipped in this area. In the case of boiler plant, enormous heat is
emanated. In paper production department much noise is produced.
No doubt, these will affect the health of the workers employed in this
department. Hence for the purpose of maintaining normal health by
this workers of the area, it is suggested that the workers in the chipper
house may be provided with dust masks, an A/C room may be
provided works of boiler plant and ear stubs may be provide to the
workers employed in the paper production department.
22. FOUR A-MODEL: Presently programs to inform employees about
the reasons for and the effects of symptoms like, cognitive symptoms,
emotional symptoms, physical symptoms and behavioral symptoms
are absent. Hence, it is suggested that managements may train the
employees with positive stress stimulators by adopting four A-model
241
viz., Avoid the stressor, Alter the stress, Adopt the stress, and Accept
the stress.
23. WORK-LIFE BALANCE: The imbalance between life at work
place and life at house leads the workers to face stress-related
problems. Hence, it is suggested that the companies may organize get-
together meetings, picnics, mini tours etc. For the employees and their
family members. This will ease their mind and bring them back to
have control over mind and body. The cost of such programme may
either be wholly borne by the managements or shared between the
managements and the workers on an agreed basis.
24. RELATIONSHIP AMONG EMPLOYEES: The lack of
interrelationships among the staff yields less productivity and more
stress. Zohar and Dov opine that the interrelationships among the co-
workers is inevitable for the sustenance and success of organizations.
So, it is suggested that the organizations should take initiatives to
strengthen interrelationship of staff by conducting orientation
programmes, sports, introduction of group incentives, etc..
The suggestions listed above are only a sample based on the findings
and the study. It is hoped that if these suggestions are implemented in their
real sense and sprit, it is certain that the employees working in the factory
site of the paper industry of Tamil Nadu will be free from stress to the
maximum extent and this will result in increased production and
productivity for the organization.

242
6.4 CONCLUSION
Most of the employees in the paper industry get stress due to their and
working conditions, management policies, irrational promotional policies,
work load disproportionate to salary and favoritism.
Inter-personal relationship is a vital HRD system which creates a
conducive HRD climate. The flaws in this relationship lead to stress among
the employees.
Employee’s personal health and family circumstances are crucial
factors for the quality of work life and stress. The maximum percentage of
employees for their poor performance is due to physiological and
psychological problems.
The organisational climate influencing stress in the paper industry is
predominant. It was found that the demographic variables like education,
age, salary and experience of in the employees in paper industry have been
creating stress among the employees and especially the experience of
employees force them to practice stress management to avoid unnecessary
impediments to developmental activities.
The top level executives are very much enthusiastic in implementing
the stress management elements. The management policies in favour of
stress management, performance appraisal and organisational development
are useful for the smooth conduct of the organisation without stress.
Organisation climate influences stress in the paper industry. The top
level executives implement stress management techniques in the
243
organisation to accrue the benefits in the form of individual efficiency,
organisational efficiency, productivity and environmental change.
Maintaining an optimistic organisational climate conditions bring a
simultaneous change in organisational development. So, this innovative
method brings more weight age to the organisational climate, influencing the
employee’s stress.
The stress experienced by the employees in their job often reflected in
behaviour and attitudes. The stresses have been recognised as a disease
which spoils the health of the employees and reduce their level of job
performance. In short, a set of satisfactory human resource practices would
result in stress free work life and high jab satisfaction.
6.5 SCOPE FOR FURTHER RESEARCH
The present study has aimed at the identification of the relavant
factors influencing the level of occupational stress of employees.
Employee’s job satisfaction related to total involvement along with stress
free work environment. In this study, the researcher has concentrated more
on the level of occupational stress of employees in paper industry. The
findings of the present study offer scope for further research on the
following topics.
1. A comparative study on the level of employee’s occupational stress in
public sector paper industry and private sector paper industry in India.
2. A study may be conducted to identify how occupational stress
influences the morale and motivation of employees of the paper
industry.
244
3. Also the job stress among all level of employees in paper industry
may be studied.
4. A study on the effects occupational stress on the various human
resource development practices in paper industry may be conducted.
5. A comparative study on employee’s attitude towards human resource
management in selected public and private sector paper industry.
245
BIBLIOGRAPHY
BOOKS
� Ashkanasy, N., Hartel, C., & Zerbe, W. , ‘Emotions in the workplace:
research, theory, and practice’. London: Quorum Books, 2000.
� Blonna R., ‘Coping with stress in a changing world’, Tata Mc-Graw
Hill Edition, New Delhi, 2000.
� Cartwright, S., & Cooper, C.L. ‘Managing Workplace Stress.
Thousand Oaks, California, Sage Publications, 1997.
� Christopoulos, M. & Hicks, R.E. ‘Perfectionism, Occupational Stress
and Depression Among Australian University Students’. S. Boag
(Ed.), Personality down under: Perspectives from Australia (pp. 41-
52). New York, United States: Nova Science Publishers. ISBN:
9781604567946, 2008.
� Dwivedi R.S. ‘Human Relations and organizational Behaviour’
Macmillan India Ltd., New Delhi, 2001.
� Epstein Robert, ‘the Big Book of stress relief Games: Quick fun’.
McGraw-Hill Professional, New Delhi, 2000.
� Gardner, H. ‘Frames of Mind: The Theory of Multiple Intelligences’,
New York, Basic Books, 1993.
� Gbolahan Gbadamosi, ‘Stress at Work: Any Potential Redirection
From an African Sample? International Academy of African Business
and Development (IAABD)’, United States. ISBN 0-9765288-3-5,
1998.
246
� Hans Selye, ‘The Nature of Stress’, International Institute of Stress,
University of Montreal, Canada.
� Harigopal, K., Organisational Stress, Universities Press (India) Ltd.,
Hyderabad, 1995.
� Marsella, Anthony; Wong, Paul T. P.; Wong, Lilian C. J.; Leong,
Frederick T. L.; Tolliver, Dwight. “Towards an Understanding of
Occupational Stress among Asian Americans”, Handbook of
Multicultural Perspectives on Stress & Coping, 2005, p535-553, 19p.
JOURNALS AND MAGAZINES
� Adams, Richard E.; Boscarino, Joseph A.; Figley, Charles R..
“Compassion Fatigue and Psychological Distress Among Social
Workers: A Validation Study”, American Journal of Orthopsychiatry,
Jan2006, Vol. 76 Issue 1, p103-108, 6p.
� Adriaenssens, Liesbeth; De Prins, Peggy; VloeberghS, Daniël. “Work
Experience, Work Stress and HRM at the University”, Management
Review, 2006, Vol. 17, Issue 3, p344-363, 20p.
� Akerboom, S.; Maes, S. “Beyond demand and control: The
contribution of organizational risk factors in assessing the
psychological well-being of health care employees”, Work & Stress,
Jan-Mar2006, Vol. 20 Issue 1, p21-36, 16p.
� Aldred, Carolyn. “U.K. decision increases employer duty to closely
manage employee stress claims”, Business Insurance, 4/12/2004, Vol.
38 Issue 15, p17-19, 2p.
247
� Aldred, Carolyn.” U.K. companies face lower claims standards in
stress-related suits”, Business Insurance, 4/4/2005, Vol. 39 Issue 14,
p13-14, 2p.
� Alves, Steve L., Aana. “A study of occupational stress, scope of
practice, and collaboration in nurse anesthetists practicing in
anesthesia care team settings”, Journal, Dec2005, Vol. 73 Issue 6,
p443-452, 10p.
� Amir Shani and Abraham Pizam, “Work-Related Depression among
Hotel Employees”, Cornell Hospitality Quarterly, Vol. 50, No. 4, 446-
459 (2009)
� Arthur, Andrew R. “When stress is mental illness: A study of anxiety
and depression in employees who use occupational stress counselling
schemes”, Stress & Health: Journal of the International Society for the
Investigation of Stress, Oct2005, Vol. 21 Issue 4, p273-280, 8p.
� Azlihanis, H.A.; L., Naing; D., Aziah B.; N., Rusli. “Socio-
demographic, Occupational And Psychosocial Factors Associated
With Job Strain Among Secondary School Teachers In Kota Bharu,
Kelantan”. Malaysian Journal of Medical Sciences, Jan2006
Supplement, Vol. 13, p18-18, 1p.
� Baker, D.B. (1985). The study of stress at work. Annual Review of
Public Health, 6, 367-381.
� Barzilai-Pesach, Vered; Sheiner, Einat K.; Sheiner, Eyal; Potashnik,
Gad; Shoham-Vardi, Ilana. The Effect of Women's Occupational
Psychologic Stress on Outcome of Fertility Treatments”, Journal of
Occupational & Environmental Medicine, Jan2006, Vol. 48 Issue 1,
p56-62, 7p.
248
� Beehr, T. ‘An organizational psychology meta-model of occupational
stress’, C. L. Cooper (Ed.), Theories of Organizational Stress. (pp. 6-
27). Oxford: Oxford University Press, 1998.
� Béjean, Sophie; Sultan-Taäeb, Hélène, “Modelling the economic
burden of diseases imputable to stress at work”, European Journal of
Health Economics, Mar2005, Vol.6, Issue 1, p16-23, 8p.
� Bernhart, Molly. “Work intensity showing up in stress, employee
attrition”, Employee Benefit News, Oct2006, Vol. 20 Issue 13, p26-
26, 1p.
� Bogg, Janet and Cooper, Cary “Job Satisfaction, Mental Health, and
Occupational Stress Among Senior Civil Servants”, Human Relations;
Mar95, Vol. 48 Issue 3, p327-341, 15p.
� Botha, Christo; Pienaar, Jaco. “South african correctional official
occupational stress: The role of psychological strengths”, Journal of
Criminal Justice, Jan/Feb2006, Vol. 34 Issue 1, p73-84, 12p.
� Buddeberg-Fischer, B; Klaghofer, R; Stamm, M; Siegrist, J;
Buddeberg, C (2008), “Work stress and reduced health in young
physicians: prospective evidence from Swiss residents”. International
Archives of Occupational and Environmental Health, Vol. 82 No.(1):
pp.31-38
� Chang-qin Lu; Oi-ling Siu; Wing-tung Au; Sandy S. W. Leung,
“Manager's occupational stress in state-owned and private enterprises
in the People's Republic of China”, The International Journal of
Human Resource Management, Volume 20, Issue 8, August 2009 ,
pp.1670 – 1682
� Chen, W. Q.; Yu, I. T.-S.; Wong, T. W, “Impact of occupational stress
and other psychosocial factors on musculoskeletal pain among
249
Chinese offshore oil installation workers”, Occupational &
Environmental Medicine, Apr2005, Vol.62, Issue 4, p251-256, 6p.
� Chen, Wei-Qing; Wong, Tze-Wai; Yu, Tak-Sun, “Direct and
interactive effects of occupational stress and coping on ulcer-like
symptoms among Chinese male off-shore oil workers”, American
Journal of Industrial Medicine, Vol.52, Issue 6, pp.500-8.
� Coetzer, W.J.; Rothmann, S. “Occupational stress of employees in an
insurance company”, South African Journal of Business Management,
Sep2006, Vol. 37 Issue 3, p29-39, 11p
� Das Subir, “Future Prospects of Paper Industry”, Savvica Inc.,
Gurragon, India, 2011, http://nuvvo.com/lesson/15902-future-
prospects-of-paper-industry
� Demetri Kantarelis “Occupational stress: some microeconomic
issues”, International Journal of Management Concepts & Philosophy,
2005, Vol.1, Issue 3, pN.PAG.
� Edwards, D.; Barnard, P. “Review: stress is a problem for mental
health nurses but research on interventions is insufficient”, Evidence-
Based Mental Health, Nov2003, Vol.6, Issue 4, p126-126, 1p.
� Ehlen, Craig R.; Cluskey Jr., G. R.; Rivers, Richard A. “Reducing
Stress from Workload Compression: Coping Strategies That Work in
CPA Firms”, Journal of Applied Business Research, Winter2000, Vol.
16 Issue 1, p9, 7p.
� Fevre, Mark Le; Matheny, Jonathan; Kolt, Gregory S. ‘Eustress,
distress, and interpretation in occupational stress”, Journal of
Managerial Psychology, 2003, Vol.18, Issue 7, p726-744, 19p.
� Gardner, L.J.; Stough, C., “Exploration of the relationships between
workplace Emotional Intelligence, occupational stress and employee
250
health”, Australian Journal of Psychology, Aug2003 Supplement, Vol.
55, p181-181, 1/4p.
� Garnitz, Rick. “Managing the interrelationship of work, family and
finances”, Employee Benefits Journal, Mar1998, Vol. 23 Issue 1, p18,
2p.
� Gaumer, Carol J.; Shah, Amit J.; Ashley-Cotleur, Cathy, “Enhancing
Organizational Competitiveness: Causes and Effects of Stress on
Women”, Journal of Workplace Behavioral Health, 2005, Vol. 21
Issue 2, p31-43, 13p.
� Gillen, Mark C.; Ed Chung. “An Initial Investigation of Employee
Stress Related to Caring for Elderly and Dependent Relatives at
Home”, International Journal of Sociology & Social Policy, 2005,
Vol. 25 Issue 9, p78-93, 16p.
� Green, Rosemary; Lonne, Bob. “Great Lifestyle, Pity about the Job
Stress': Occupational Stress in Rural Human Service Practice”, Rural
Society, 2005, Vol. 15 Issue 3, p252-266, 15p.
� Hampel, Petra; Meier, Manuela; Kummel, Ursula, “School-Based
Stress Management Training for Adolescents: Longitudinal Results
from an Experimental Study”, Journal of Youth and Adolescence, v37
n8 p1009-1024 Sep 2008.
� Haraway, Dana L.; Haraway III, William M., “Analysis of the Effect
of Conflict-Management and Resolution Training on Employee Stress
at a Healthcare Organization”, Hospital Topics, Fall2005, Vol. 83
Issue 4, p11-17, 8p.
� Härenstam, Annika. “Different development trends in working life
and increasing occupational stress require new work environment
strategies”, Work, 2005, Vol. 24 Issue 3, p261-277, 17p.
251
� Heaney, Catherine A.; Price, Richard H.; Rafferty, Jane. “Increasing
coping resources at work: a field experiment to increase social
support, improve work team functioning, and enhance employee
mental health”, Journal of Organizational Behavior, Jul95, Vol. 16
Issue 4, p335-352, 18p.
� Hurrell Jr., Joseph J. “Police work, occupational stress and individual
coping”, Journal of Organizational Behavior, Jan95, Vol. 16 Issue 1,
p27-28, 2p.
� J.E. Agolla, Occupational Stress Among Police Officers: The Case of
Botswana Police Service”, ccupational Stress Among Police Officers:
The Case of Botswana Police Service, Vol. 3, Issue 1, pp. 25-35,
2009.
� Jackson, Leon; Rothmann, Sebastiaan. “Occupational stress,
organisational commitment, and ill-health of educators in the North
West Province”, South African Journal of Education, Feb2006, Vol.
26 Issue 1, p75-95, 21p, 8.
� Katherine Pollak. Eisen. George J. Allen. Mary Bollash and Linda S.
Pescatello, “Stress management in the workplace: A comparison of a
computer-based and an in-person stress-management intervention”,
Vol.24, Issue 2, pp.486-496, 2008.
� Kayoko Urakawa and Kazuhito Yokoyam, “Sense of Coherence
(SOC) may Reduce the Effects of Occupational Stress on Mental
Health Status among Japanese Factory Workers”, Journal of Industrial
Health, Vol. 47 , No. 5 pp.503-508
� Keeva, Steven. “Depression Takes a Toll”, ABA Journal, Jan2006,
Vol. 92 Issue 1, p37-38, 2p
252
� Kopp, Maria S; Stauder, Adrienne; Purebl, Gyorgy; Janszky, Imre;
Skrabski, Arpad, “Work stress and mental health in a changing
society”, European Journal of Public Health. 18(3):238-244, June
2008.
� Korn, Adam, “Stressing the point the employee” Lawyer. Vol. 18
Issue 24, 2005, p25-25, 1/2p
� Kushnir, Talma; Melamed, Samuel. “Domestic Stress and Well-Being
of Employed Women: Interplay Between Demands and Decision
Control at Home”, Sex Roles, May2006, Vol. 54 Issue 9/10, p687-
694, 8p.
� Leong, C. S.; Furnham, Adrian; Cooper, Cary L. “The Moderating
Effect of Organizational Commitment on the Occupational Stress
Outcome Relationship”, Human Relations, Oct96, Vol. 49 Issue 10,
p1345-1363, 19p.
� Lewig, K.A.; Dollard, M. F., “Emotional dissonance, emotional
exhaustion and job satisfaction in call centre workers”, European
Journal of Work & Organizational Psychology, Dec2003, Vol.12,
Issue 4, p366-392, 27p.
� Li-fang Zhang, “Occupational stress and teaching approaches among
Chinese academics”, Educational Psychology, Volume 29, Issue 2,
March 2009 , pages 203 - 219
� Lyne, Kenneth D.; Barrett, Paul T.; Williams, Christine; Coaley,
Keith. “A psychometric evaluation of the Occupational Stress
Indicator”, Journal of Occupational & Organizational Psychology,
Jun2000, Vol. 73 Issue 2, p195-220, 26p.
� Magee, Bill. "Stress, Anxiety and Anger About Home and
Work" Article presented at the annual meeting of the American
253
Sociological Association Annual Meeting, Sheraton Boston and the
Boston Marriott Copley Place, Boston, MA, Jul 31, 2008.
http://www.allacademic.com/meta/p237397_ index.html.
� Mäki K, Vahtera J, Virtanen M, Elovainio M, Keltikangas-Järvinen L
& Kivimäki M. Work stress and new onset migraine in a female
employee population. Cephalalgia 2008; Vol. 28: pp.18-25. London.
ISSN 0333-1024,
� Michailidis, Maria; Georgiou, Yiota, “Employee occupational stress
in banking”, Work, 2005, Vol. 24 Issue 2, p123-137, 15p.
� Mikolajczak, Moïra; Menil, Clémentine; Luminet, Olivier.
“Explaining the protective effect of trait emotional intelligence
regarding occupational stress: Exploration of emotional labour
processes”, Journal of Research in Personality, Oct2007, Vol. 41 Issue
5, p1107-1117, 11p.
� Morris, Jodi E.; Long, Bonita C. “Female Clerical Workers'
Occupational Stress: The Role of Person and Social Resources,
Negative Affectivity, and Stress Appraisals”, Journal of Counseling
Psychology, Oct2002, Vol. 49 Issue 4, p395, 16p.
� Muhonen, Tuija; Torkelson, Eva. “Work locus of control and its
relationship to health and job satisfaction from a gender perspective”,
Stress & Health: Journal of the International Society for the
Investigation of Stress, Feb2004, Vol. 20 Issue 1, p21-28, 8p.
� Nagesh, P. and Murthy, M. S. Narasimha, Stress Management at IT
Call Centers: A Case Study (December 18, 2008). The Icfai
University Journal of Soft Skills, Vol. 2, No. 4, pp. 51-68, December
2008.
254
� Nicoll, Anne. “Employee stress claims are rising: what you can do
about it”, HR Professional, Feb/Mar2002, Vol.19, Issue 1, p23, 2p.
� Nikolaou, Ioannis; Tsaousis, Ioannis. “Emotional Intelligence In The
Workplace: Exploring Its Effects On Occupational Stress And
Organizational Commitment”, International Journal of Organizational
Analysis (1993 - 2002), 2002, Vol. 10 Issue 4, p327, 16p.
� Noblet, Andrew, “Building health promoting work settings:
identifying the relationship between work characteristics and
occupational stress in Australia”, Health Promotion International,
Dec2003, Vol.18, Issue 4, p351-359, 9p.
� Noblet, Andrew; LaMontagne, Anthony D. “The role of workplace
health promotion in addressing job stress”, Health Promotion
International, Dec2006, Vol. 21 Issue 4, p346-353, 8p.
� Noblet, Andrew; Teo, Stephen T. T.; McWilliams, John; Rodwell,
John J. “Which work characteristics predict employee outcomes for
the public-sector employee? An examination of generic and
occupation-specific characteristics”, International Journal of Human
Resource Management, Aug2005, Vol. 16 Issue 8, p1415-1430, 16p.
� Ogińska-Bulik, Nina, “Emotional Intelligence In The Workplace:
Exploring Its Effects On Occupational Stress And Health Outcomes
In Human Service Workers”, International Journal of Occupational
Medicine & Environmental Health, Apr2005, Vol. 18 Issue 2, p167-
175, 9p.
� Oliver, A.; Tomás, J. M. Ansiedad Y. Estrés, “Consequences of Work
Stress: An application of Warr's Vitamin Model to predict Anxiety
and Depression”, Dec2005, Vol. 11 Issue 2/3, p233-245, 13p.
255
� Pal, S., & Saksvik, P. (2008). Work-family conflict and psychosocial
work environment stressors as predictors of job stress in a cross-
cultural study. International Journal of Stress Management, Vol.15,
No. (1), 22-42.
� R. Rutter and M.J. Lovegrove, “Occupational stress and its predictors
in radiographers”, Vol.14, Issue 2, pp.138-143, 2009.
� Raidén, Ani Birgit; Dainty, Andrew R. J.; Neale, Richard H.
“Balancing employee needs, project requirements and organisational
priorities in team deployment”, Construction Management &
Economics, Aug2006, Vol. 24 Issue 8, p883-895, 13p.
� Rees, Christopher J.; Redfern, David “Recognising the perceived
causes of stress--a training and development perspective”, Industrial
& Commercial Training, 2000, Vol. 32 Issue 4, p120-127, 8p.
� Richards, David; Bee, Penny; Barkham, Michael; Gilbody, Simon;
Cahill, Jane; Glanville, Julie. “The prevalence of nursing staff stress
on adult acute psychiatric in-patient wards”, Social Psychiatry &
Psychiatric Epidemiology, Jan2006, Vol. 41 Issue 1, p34-43, 10p.
� Richardson, K. M., & Rothsetin, H. R. (2008). Effects of occupational
stress management intervention programs: A meta-analysis. Journal of
Occupational Health Psychology, Vol. 13 (1), pp.69-93
� Ron Ball, Inroads, LLC, “Workplace Stress Sucks $300 Billion
Annually From Corporate Profits”, TMC Customer Interaction
Solution, November 2004.
� Ryan, P.; Hill, R.; Anczewska, M.; Hardy, P.; Kurek, A.; Nielson, K.;
Turner, C. “Team-based occupational stress reduction: A European
overview from the perspective of the OSCAR project” International
Review of Psychiatry, Oct2005, Vol. 17 Issue 5, p401-408, 8p.
256
� Salmond, Susan; Ropis, Patricia E. “Job Stress and General Well-
Being: A Comparative Study of Medical-Surgical and Home Care
Nurses”, MEDSURG Nursing, Oct2005, Vol. 14 Issue 5, p301-309,
9p.
� Sang, Katherine J. C.; Dainty, Andrew R. J.; Ison, Stephen G.
“Gender: a risk factor for occupational stress in the architectural
profession?”, Construction Management & Economics, Dec2007, Vol.
25 Issue 12, p1305-1317, 13p.
� Savery, Lawson K., “Effect of Motivators on Job Satisfaction”,
Journal of Managerial Psychology, 1987, Vol. 2 Issue 3, p28, 4p.
� Savery, Lawson K., “The Influence of Social Support on the Reaction
of an Employee”, Journal of Managerial Psychology, 1988, Vol. 3
Issue 1, p27, 5p.
� Schmidt, Denise Rodrigues Costa; Dantas, Rosana Aparecida Spadoti;
Marziale, Maria Helena Palucci and Laus, Ana Maria, “Occupational
stress among nursing staff in surgical settings”, Texto contexto -
enferm. [online]. 2009, vol.18, n.2, pp. 330-337.
� Stetz, Thomas A.; Stetz, Melba C.; Bliese, Paul D. “The importance
of self-efficacy in the moderating effects of social support on stressor–
strain relationships”, Work & Stress, Jan-Mar2006, Vol. 20 Issue 1,
p49-59, 11p.
� Stewart Collins, “Statutory Social Workers: Stress, Job Satisfaction,
Coping, Social Support and Individual Differences”, British Journal of
Social Work 2008, Vol. 38 No. (6): pp.1173-1193.
� Struebing, Laura. “Eight ways to reduce employee stress”, Quality
Progress, Jul96, Vol. 29 Issue 7, p14, 2p.
257
� Susan Cantrell and David Smith, “Workforce of One”, Book Excerpt,
April 30, 2010.
� Terluin, Berend; Van Rhenen, Willem; Schaufeli, Wilmar B.; De
Haan, Marten., “The four-dimensional symptom questionnaire
(4DSQ): measuring distress and other mental health problems in a
working population”, Work & Stress, Jul2004, Vol. 18 Issue 3, p187-
207, 21p.
� Torkelson, Eva; Muhonen, Tuija., “The role of gender and job level in
coping with occupational stress”, Work & Stress, Jul2004, Vol. 18
Issue 3, p267-274, 8p.
� Tyson, Paul D.; Pongruengphant, Rana., “Five-year follow-up study
of stress among nurses in public and private hospitals in Thailand”,
International Journal of Nursing Studies, Mar2004, Vol. 41 Issue 3,
p247, 8p.
� Upson, John W.; Ketchen Jr., David J.; Ireland, R. Duane. “Managing
Employee Stress: A Key to the Effectiveness of Strategic Supply
Chain Management”, Organizational Dynamics, 2007, Vol. 36 Issue
1, p78-92, 15p.
� Vakola, Maria; Nikolaou, Loannis. “Attitudes towards organizational
change: What is the role of employees' stress and commitment?”,
Employee Relations, 2005, Vol. 27 Issue 2, p160-174, 15p.
� Van Vegchel, Natasja; de Jonge, Jan; Landsbergis, Paul A.,
“Occupational stress in (inter)action: the interplay between job
demands and job resources”, Journal of Organizational Behavior,
August 2005, Vol. 26 Issue 5, p535-560, 26p.
� Viljoen, J.P., & Rothmann, S. (2009). Occupational stress, ill health
and organisational commitment of employees at a university of
258
technology. SA Journal of Industrial Psychology/SA Tydskrif vir
Bedryfsielkunde, 35(1), Art. #730, 11 pages. DOI:
10.4102/sajip.v35i1.730.
� W. de Vente; J.H. Kamphuis; P.M.G. Emmelkamp. “Alexithymia,
Risk Factor or Consequence of Work-Related Stress?”, Psychotherapy
& Psychosomatics, Aug2006, Vol. 75 Issue 5, p304-311, 8p.
� Wated, Guillermo; Sanchez, Juan I. “The Role of Accent as a Work
Stressor on Attitudinal and Health-Related Work Outcomes”,
International Journal of Stress Management, Aug2006, Vol. 13 Issue
3, p329-350, 22p.
� Wiesner, Margit; Windle, Michael; Freeman, Amy., “Work Stress,
Substance Use, and Depression Among Young Adult Workers: An
Examination of Main and Moderator Effect Models”, Journal of
Occupational Health Psychology, Apr2005, Vol. 10 Issue 2, p83-96,
14p.
� Yates, Iva. “Reducing Occupational Stress”, Caribbean Business,
2/24/2005, Vol. 33 Issue 7, p79-79, 3/4p.
� Zohar, Dov. “When things go wrong: The effect of daily work hassles
on effort, exertion and negative mood”, Journal of Occupational &
Organizational Psychology, Sep99, Vol. 72 Issue 3, p265-283, 19p.
THESIS AND DISSERTATION
� Connolly, John F and Willock, Joyce and Hipwell, Michele and
Chisholm, Vivienne (2009) Occupational Stress & Psychological Well
Being following University Relocation: six months on. Project Report.
Queen Margaret University. (Unpublished).
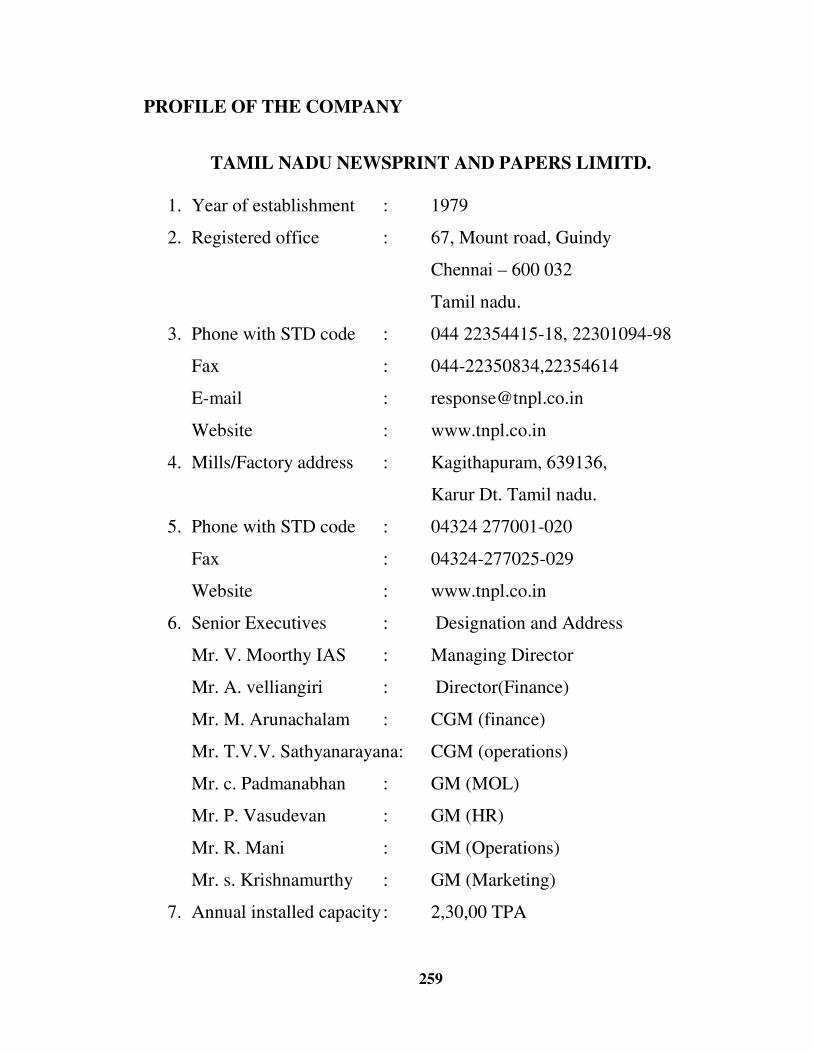
259
PROFILE OF THE COMPANY
TAMIL NADU NEWSPRINT AND PAPERS LIMITD.
1. Year of establishment : 1979
2. Registered office : 67, Mount road, Guindy
Chennai – 600 032
Tamil nadu.
3. Phone with STD code : 044 22354415-18, 22301094-98
Fax : 044-22350834,22354614
E-mail : [email protected]
Website : www.tnpl.co.in
4. Mills/Factory address : Kagithapuram, 639136,
Karur Dt. Tamil nadu.
5. Phone with STD code : 04324 277001-020
Fax : 04324-277025-029
Website : www.tnpl.co.in
6. Senior Executives : Designation and Address
Mr. V. Moorthy IAS : Managing Director
Mr. A. velliangiri : Director(Finance)
Mr. M. Arunachalam : CGM (finance)
Mr. T.V.V. Sathyanarayana: CGM (operations)
Mr. c. Padmanabhan : GM (MOL)
Mr. P. Vasudevan : GM (HR)
Mr. R. Mani : GM (Operations)
Mr. s. Krishnamurthy : GM (Marketing)
7. Annual installed capacity : 2,30,00 TPA
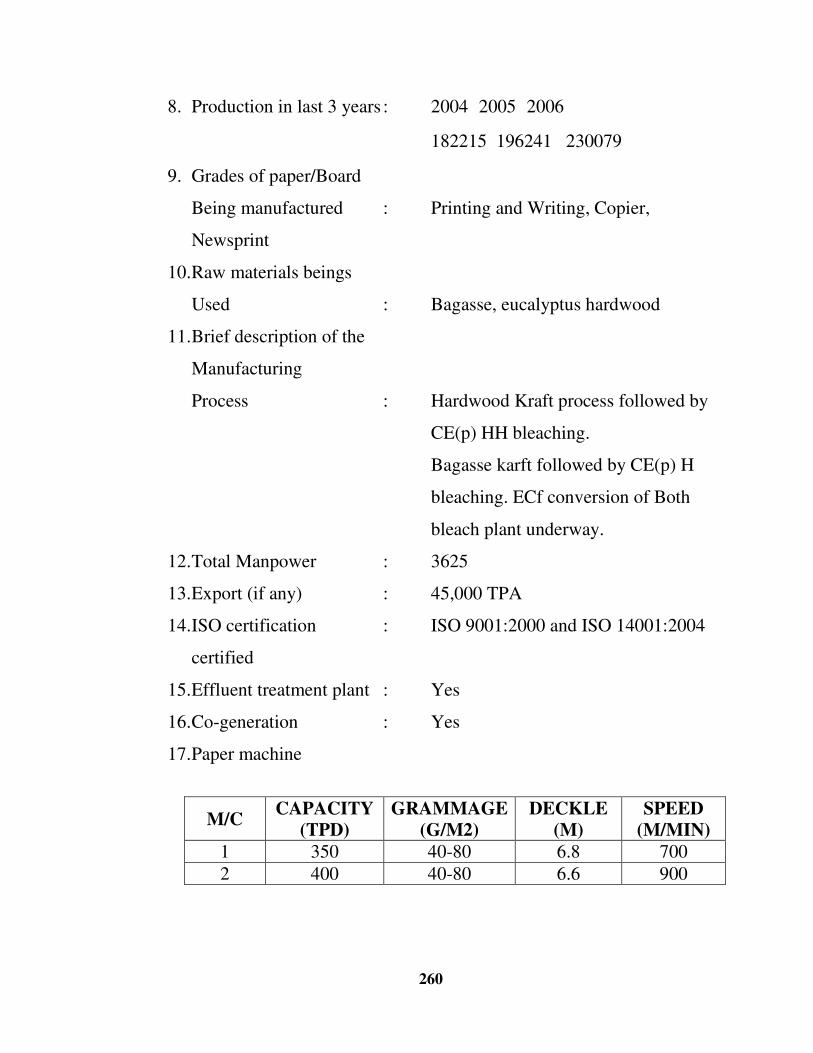
260
8. Production in last 3 years : 2004 2005 2006
182215 196241 230079
9. Grades of paper/Board
Being manufactured : Printing and Writing, Copier,
Newsprint
10. Raw materials beings
Used : Bagasse, eucalyptus hardwood
11. Brief description of the
Manufacturing
Process : Hardwood Kraft process followed by
CE(p) HH bleaching.
Bagasse karft followed by CE(p) H
bleaching. ECf conversion of Both
bleach plant underway.
12. Total Manpower : 3625
13. Export (if any) : 45,000 TPA
14. ISO certification : ISO 9001:2000 and ISO 14001:2004
certified
15. Effluent treatment plant : Yes
16. Co-generation : Yes
17. Paper machine
M/C CAPACITY
(TPD) GRAMMAGE
(G/M2) DECKLE
(M) SPEED
(M/MIN)
1 350 40-80 6.8 700
2 400 40-80 6.6 900
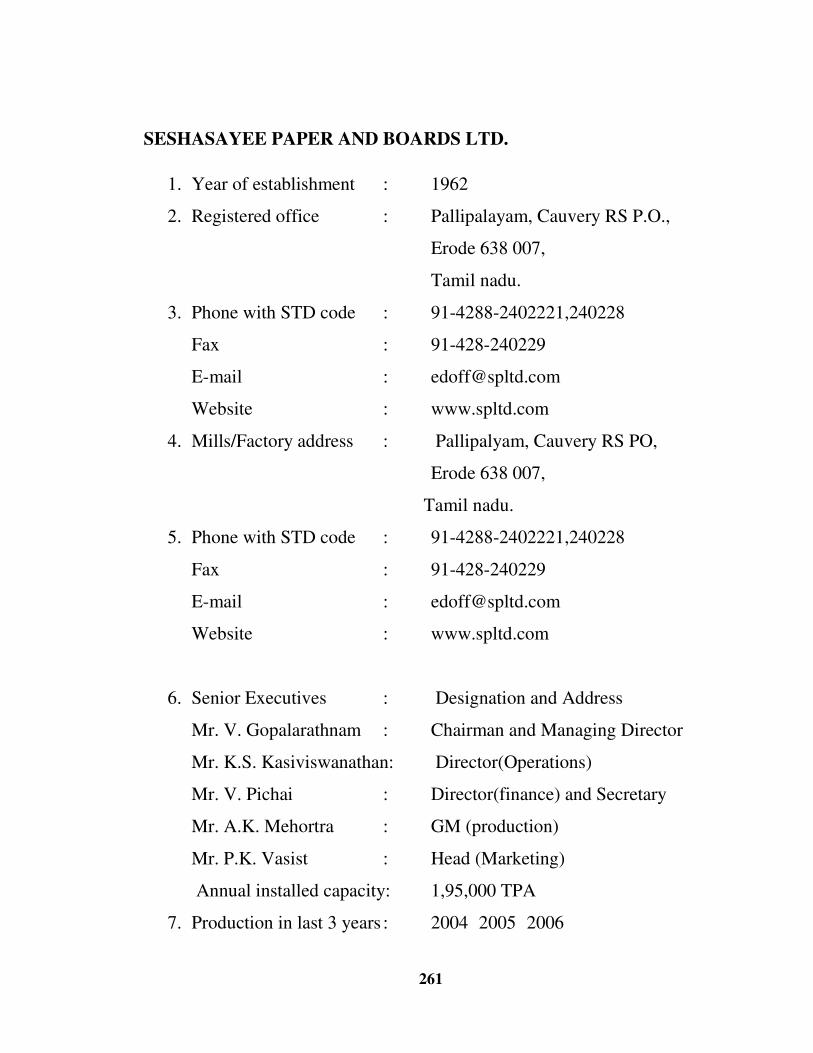
261
SESHASAYEE PAPER AND BOARDS LTD.
1. Year of establishment : 1962
2. Registered office : Pallipalayam, Cauvery RS P.O.,
Erode 638 007,
Tamil nadu.
3. Phone with STD code : 91-4288-2402221,240228
Fax : 91-428-240229
E-mail : [email protected]
Website : www.spltd.com
4. Mills/Factory address : Pallipalyam, Cauvery RS PO,
Erode 638 007,
Tamil nadu.
5. Phone with STD code : 91-4288-2402221,240228
Fax : 91-428-240229
E-mail : [email protected]
Website : www.spltd.com
6. Senior Executives : Designation and Address
Mr. V. Gopalarathnam : Chairman and Managing Director
Mr. K.S. Kasiviswanathan: Director(Operations)
Mr. V. Pichai : Director(finance) and Secretary
Mr. A.K. Mehortra : GM (production)
Mr. P.K. Vasist : Head (Marketing)
Annual installed capacity: 1,95,000 TPA
7. Production in last 3 years : 2004 2005 2006

262
147271 148854 152003
8. Grades of paper/Board
Being manufactured : Printing and Writing, Poster, Kraft,
Pulp Board, Copier,
Coated paper, graphic, Super fine
paper, Base paper for no carbon
required (NCR)
9. Raw materials beings
Used : Wood, Bagasse, Imported Pulp and
Waste paper
10. Brief description of the
Manufacturing
Process : Sulphate process
11. Total Manpower : 2950
12. Export (if any) : 50,000 TPA
13. ISO certification : ISO 9001:2000
14. Effluent treatment plant : Yes
15. Co-generation : Yes
16. Paper machine
M/C CAPACITY
(TPD) GRAMMAGE
(G/M2) DECKLE
(M) SPEED
(M/MIN)
1 40 45-95 3.1 235
2 60 70-290 3.1 130 3 20 28-80 2.4 155 4 55 45-140 3.1 315
5 160 45-120 2.8 850
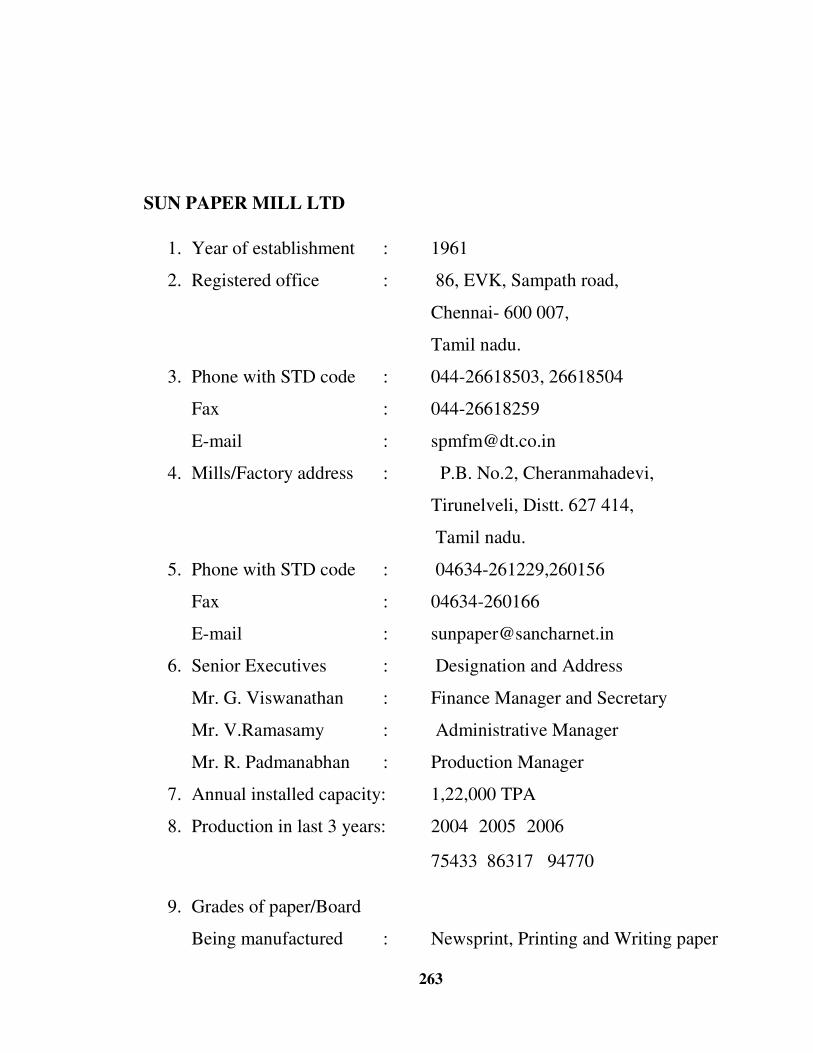
263
SUN PAPER MILL LTD
1. Year of establishment : 1961
2. Registered office : 86, EVK, Sampath road,
Chennai- 600 007,
Tamil nadu.
3. Phone with STD code : 044-26618503, 26618504
Fax : 044-26618259
E-mail : [email protected]
4. Mills/Factory address : P.B. No.2, Cheranmahadevi,
Tirunelveli, Distt. 627 414,
Tamil nadu.
5. Phone with STD code : 04634-261229,260156
Fax : 04634-260166
E-mail : [email protected]
6. Senior Executives : Designation and Address
Mr. G. Viswanathan : Finance Manager and Secretary
Mr. V.Ramasamy : Administrative Manager
Mr. R. Padmanabhan : Production Manager
7. Annual installed capacity: 1,22,000 TPA
8. Production in last 3 years: 2004 2005 2006
75433 86317 94770
9. Grades of paper/Board
Being manufactured : Newsprint, Printing and Writing paper
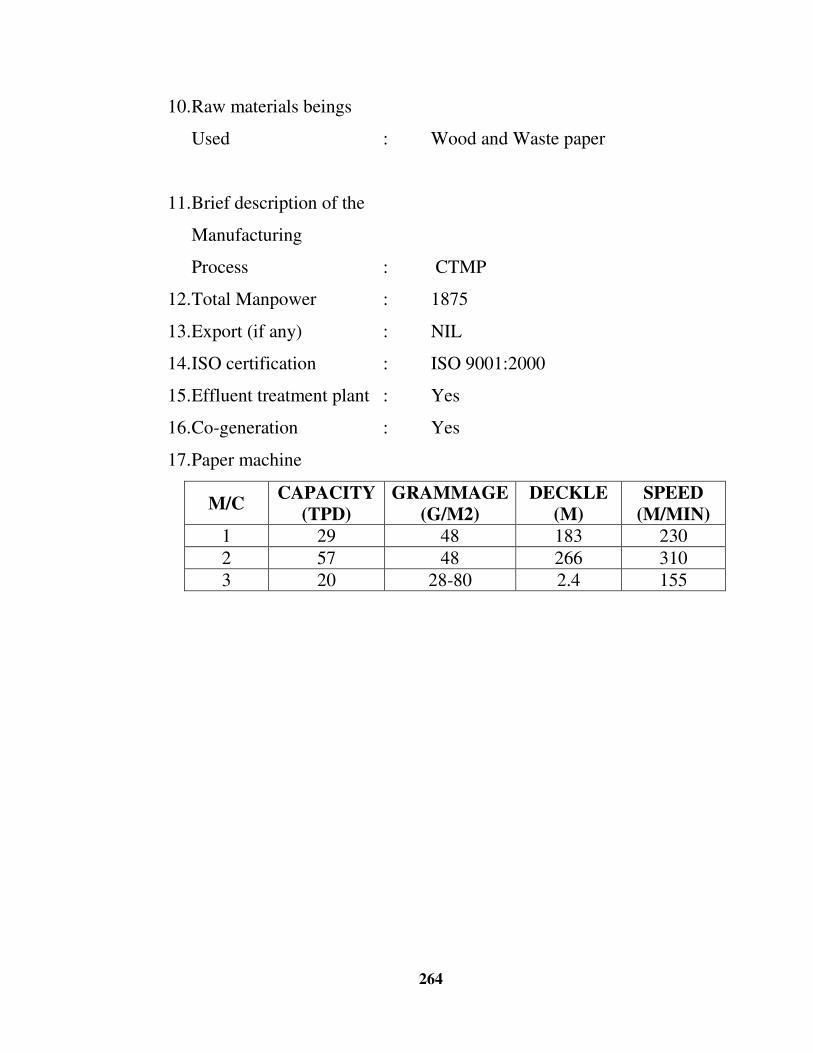
264
10. Raw materials beings
Used : Wood and Waste paper
11. Brief description of the
Manufacturing
Process : CTMP
12. Total Manpower : 1875
13. Export (if any) : NIL
14. ISO certification : ISO 9001:2000
15. Effluent treatment plant : Yes
16. Co-generation : Yes
17. Paper machine
M/C CAPACITY
(TPD) GRAMMAGE
(G/M2) DECKLE
(M) SPEED
(M/MIN)
1 29 48 183 230
2 57 48 266 310 3 20 28-80 2.4 155
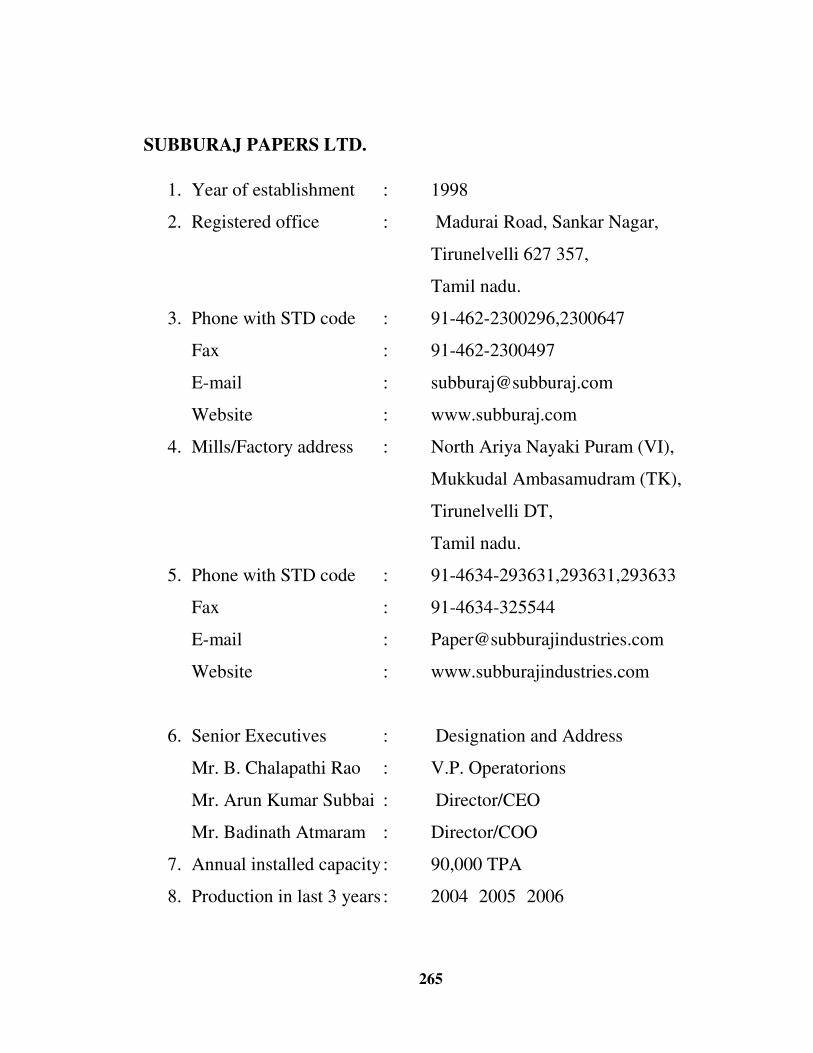
265
SUBBURAJ PAPERS LTD.
1. Year of establishment : 1998
2. Registered office : Madurai Road, Sankar Nagar,
Tirunelvelli 627 357,
Tamil nadu.
3. Phone with STD code : 91-462-2300296,2300647
Fax : 91-462-2300497
E-mail : [email protected]
Website : www.subburaj.com
4. Mills/Factory address : North Ariya Nayaki Puram (VI),
Mukkudal Ambasamudram (TK),
Tirunelvelli DT,
Tamil nadu.
5. Phone with STD code : 91-4634-293631,293631,293633
Fax : 91-4634-325544
E-mail : [email protected]
Website : www.subburajindustries.com
6. Senior Executives : Designation and Address
Mr. B. Chalapathi Rao : V.P. Operatorions
Mr. Arun Kumar Subbai : Director/CEO
Mr. Badinath Atmaram : Director/COO
7. Annual installed capacity : 90,000 TPA
8. Production in last 3 years : 2004 2005 2006
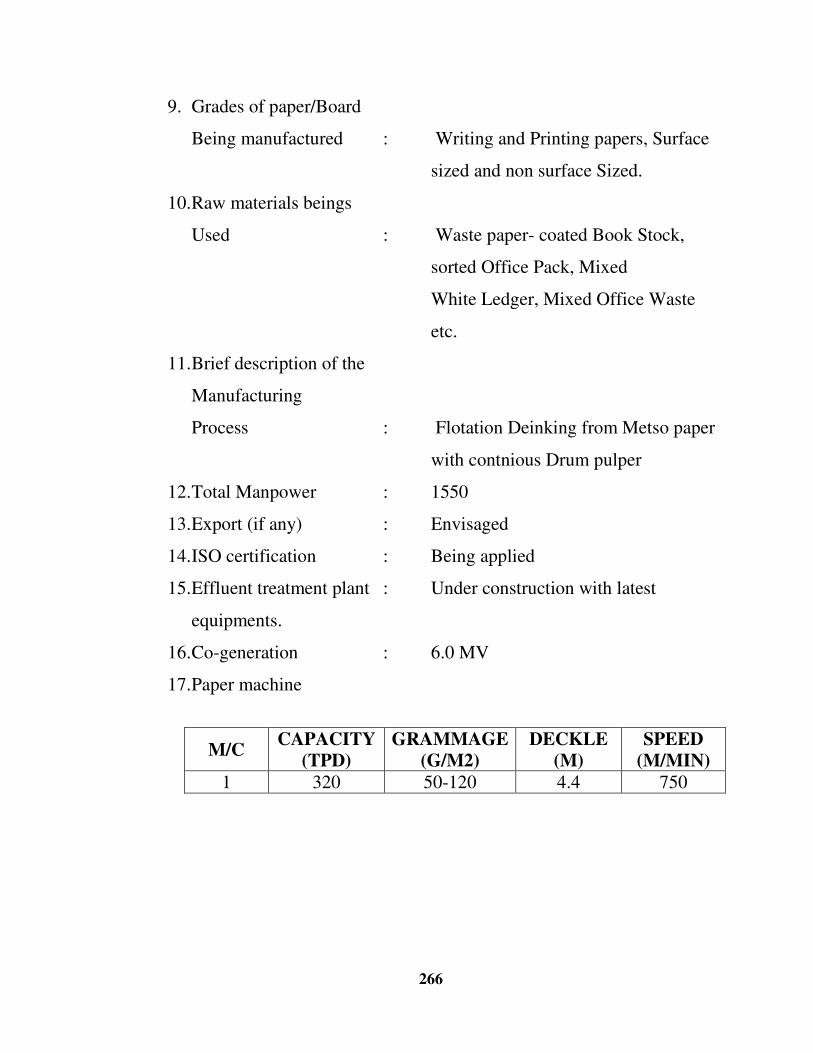
266
9. Grades of paper/Board
Being manufactured : Writing and Printing papers, Surface
sized and non surface Sized.
10. Raw materials beings
Used : Waste paper- coated Book Stock,
sorted Office Pack, Mixed
White Ledger, Mixed Office Waste
etc.
11. Brief description of the
Manufacturing
Process : Flotation Deinking from Metso paper
with contnious Drum pulper
12. Total Manpower : 1550
13. Export (if any) : Envisaged
14. ISO certification : Being applied
15. Effluent treatment plant : Under construction with latest
equipments.
16. Co-generation : 6.0 MV
17. Paper machine
M/C CAPACITY
(TPD) GRAMMAGE
(G/M2) DECKLE
(M) SPEED
(M/MIN)
1 320 50-120 4.4 750
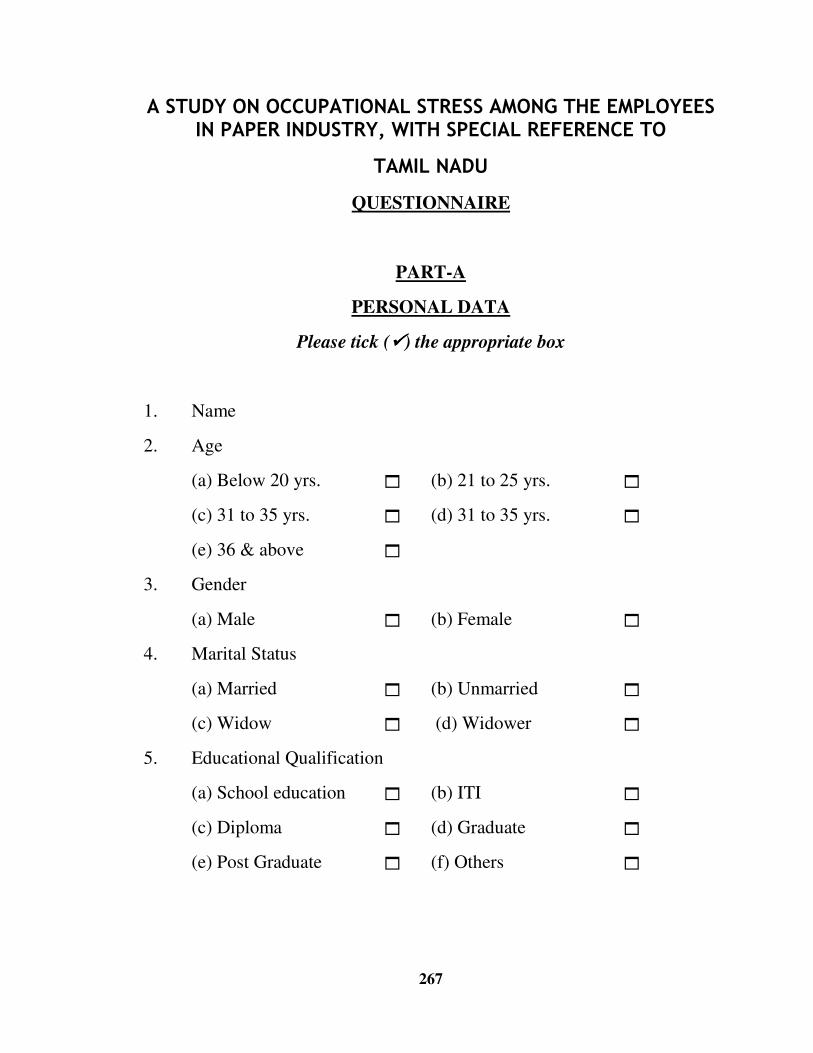
267
A STUDY ON OCCUPATIONAL STRESS AMONG THE EMPLOYEES IN PAPER INDUSTRY, WITH SPECIAL REFERENCE TO
TAMIL NADU
QUESTIONNAIRE
PART-A
PERSONAL DATA
Please tick (����) the appropriate box
1. Name
2. Age
(a) Below 20 yrs. � (b) 21 to 25 yrs. �
(c) 31 to 35 yrs. � (d) 31 to 35 yrs. �
(e) 36 & above �
3. Gender
(a) Male � (b) Female �
4. Marital Status
(a) Married � (b) Unmarried �
(c) Widow � (d) Widower �
5. Educational Qualification
(a) School education � (b) ITI �
(c) Diploma � (d) Graduate �
(e) Post Graduate � (f) Others �
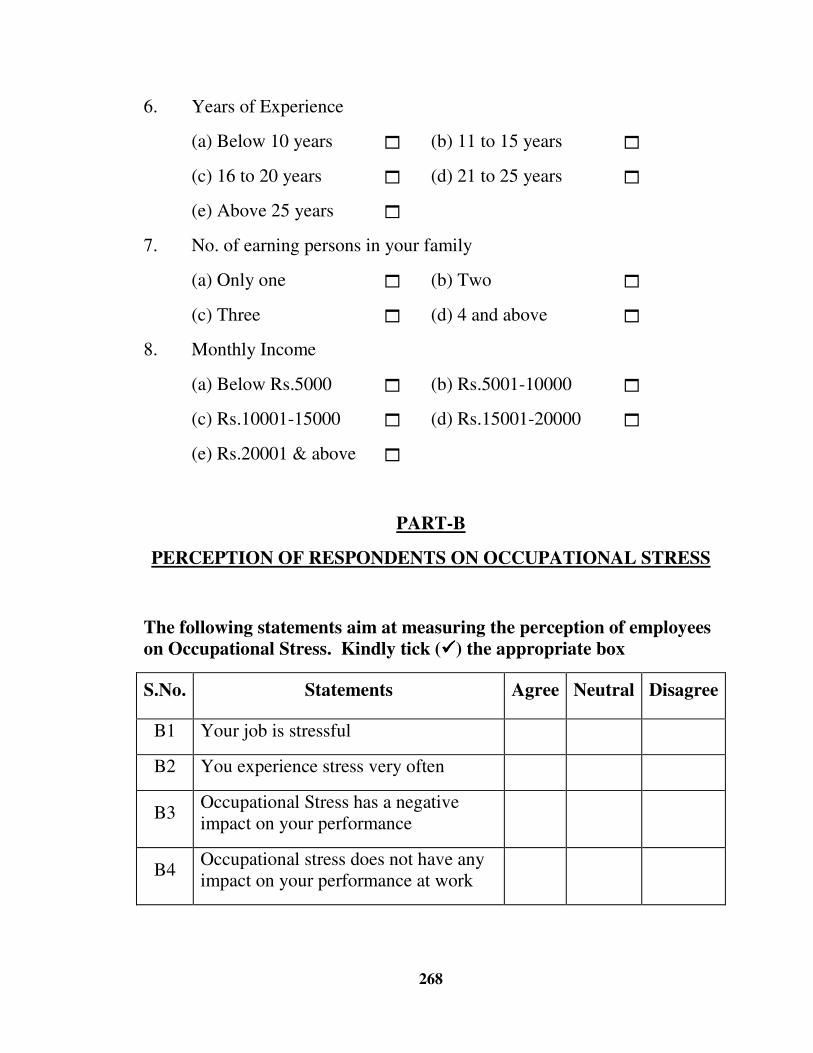
268
6. Years of Experience
(a) Below 10 years � (b) 11 to 15 years �
(c) 16 to 20 years � (d) 21 to 25 years �
(e) Above 25 years �
7. No. of earning persons in your family
(a) Only one � (b) Two �
(c) Three � (d) 4 and above �
8. Monthly Income
(a) Below Rs.5000 � (b) Rs.5001-10000 �
(c) Rs.10001-15000 � (d) Rs.15001-20000 �
(e) Rs.20001 & above �
PART-B
PERCEPTION OF RESPONDENTS ON OCCUPATIONAL STRESS
The following statements aim at measuring the perception of employees on Occupational Stress. Kindly tick (����) the appropriate box
S.No. Statements Agree Neutral Disagree
B1 Your job is stressful
B2 You experience stress very often
B3 Occupational Stress has a negative impact on your performance
B4 Occupational stress does not have any impact on your performance at work
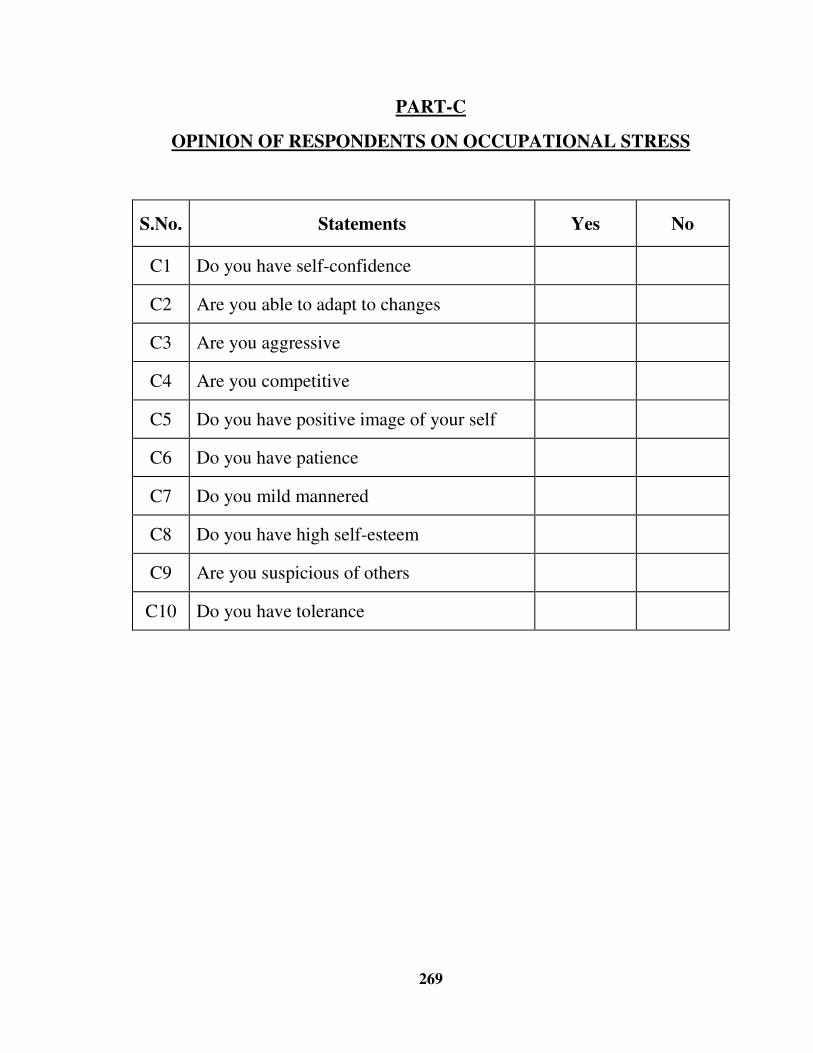
269
PART-C
OPINION OF RESPONDENTS ON OCCUPATIONAL STRESS
S.No. Statements Yes No
C1 Do you have self-confidence
C2 Are you able to adapt to changes
C3 Are you aggressive
C4 Are you competitive
C5 Do you have positive image of your self
C6 Do you have patience
C7 Do you mild mannered
C8 Do you have high self-esteem
C9 Are you suspicious of others
C10 Do you have tolerance
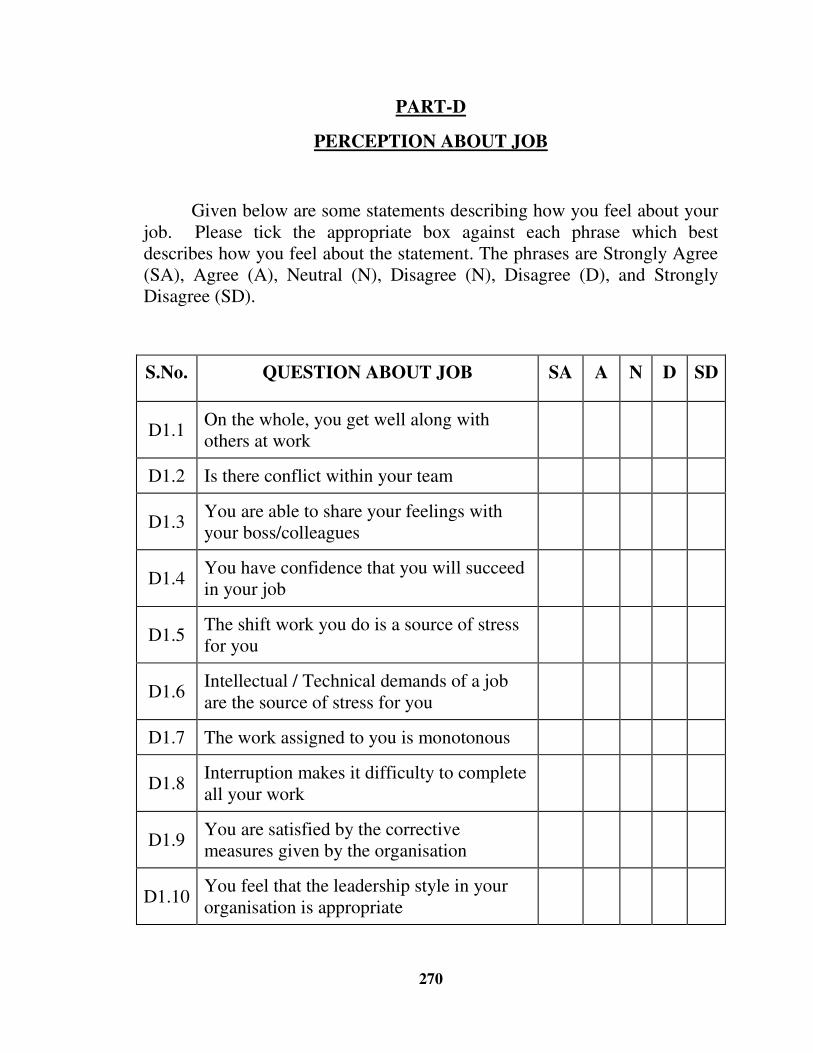
270
PART-D
PERCEPTION ABOUT JOB
Given below are some statements describing how you feel about your job. Please tick the appropriate box against each phrase which best describes how you feel about the statement. The phrases are Strongly Agree (SA), Agree (A), Neutral (N), Disagree (N), Disagree (D), and Strongly Disagree (SD).
S.No. QUESTION ABOUT JOB SA A N D SD
D1.1 On the whole, you get well along with others at work
D1.2 Is there conflict within your team
D1.3 You are able to share your feelings with your boss/colleagues
D1.4 You have confidence that you will succeed in your job
D1.5 The shift work you do is a source of stress for you
D1.6 Intellectual / Technical demands of a job are the source of stress for you
D1.7 The work assigned to you is monotonous
D1.8 Interruption makes it difficulty to complete all your work
D1.9 You are satisfied by the corrective measures given by the organisation
D1.10 You feel that the leadership style in your organisation is appropriate
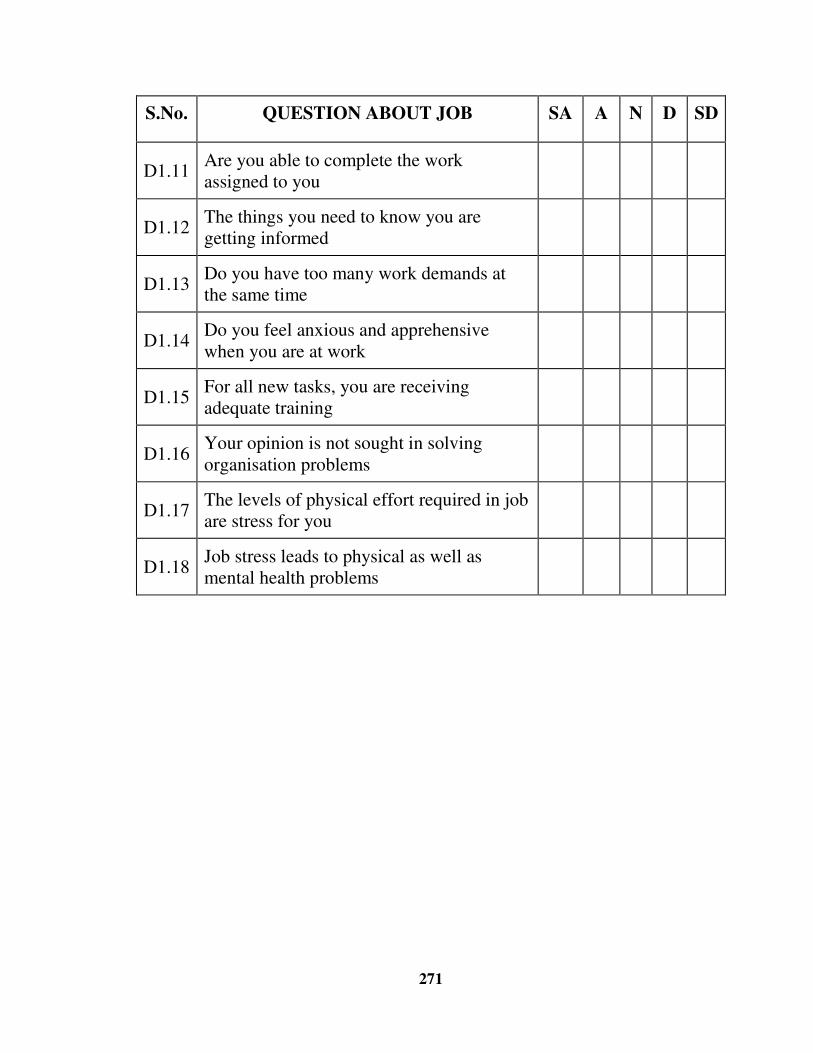
271
S.No. QUESTION ABOUT JOB SA A N D SD
D1.11 Are you able to complete the work assigned to you
D1.12 The things you need to know you are getting informed
D1.13 Do you have too many work demands at the same time
D1.14 Do you feel anxious and apprehensive when you are at work
D1.15 For all new tasks, you are receiving adequate training
D1.16 Your opinion is not sought in solving organisation problems
D1.17 The levels of physical effort required in job are stress for you
D1.18 Job stress leads to physical as well as mental health problems
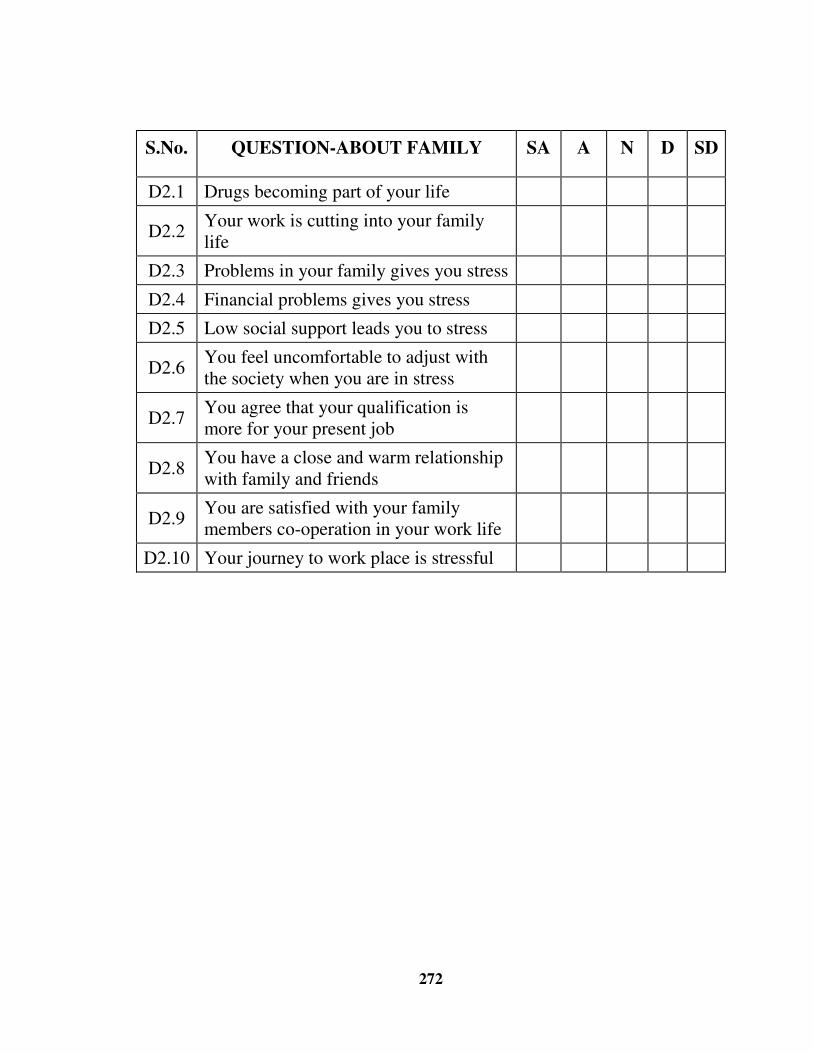
272
S.No. QUESTION-ABOUT FAMILY SA A N D SD
D2.1 Drugs becoming part of your life
D2.2 Your work is cutting into your family life
D2.3 Problems in your family gives you stress
D2.4 Financial problems gives you stress
D2.5 Low social support leads you to stress
D2.6 You feel uncomfortable to adjust with the society when you are in stress
D2.7 You agree that your qualification is more for your present job
D2.8 You have a close and warm relationship with family and friends
D2.9 You are satisfied with your family members co-operation in your work life
D2.10 Your journey to work place is stressful
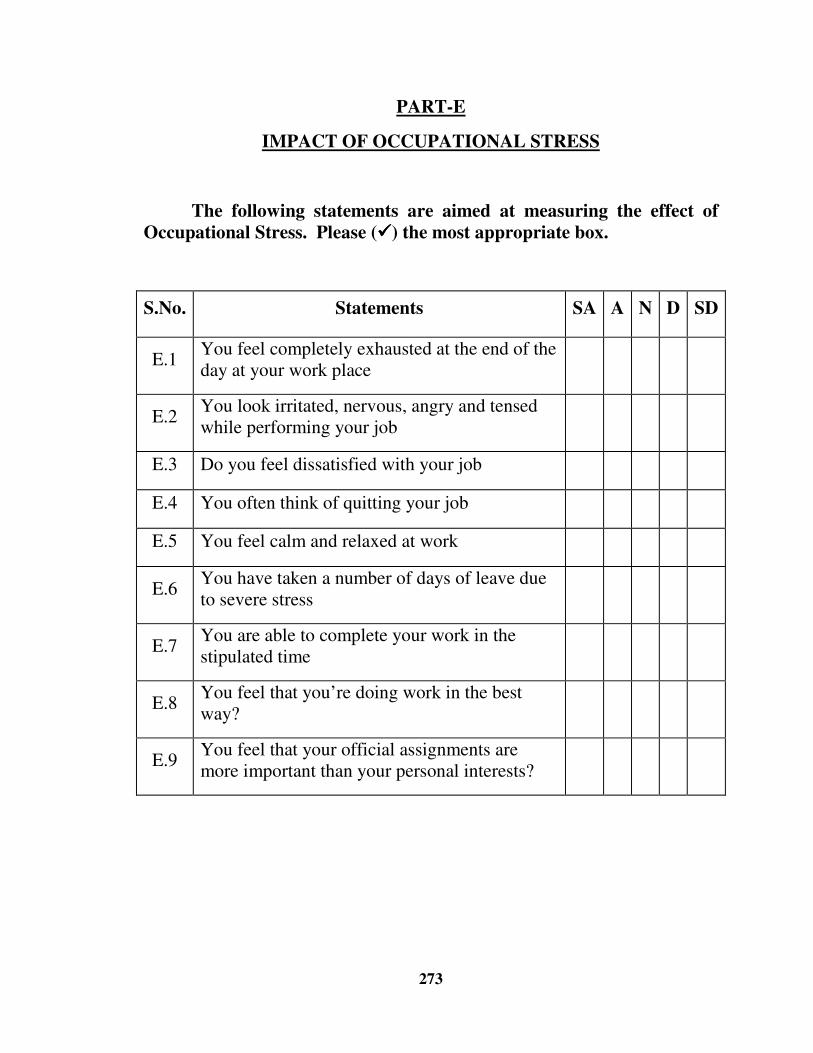
273
PART-E
IMPACT OF OCCUPATIONAL STRESS
The following statements are aimed at measuring the effect of
Occupational Stress. Please (����) the most appropriate box.
S.No. Statements SA A N D SD
E.1 You feel completely exhausted at the end of the day at your work place
E.2 You look irritated, nervous, angry and tensed while performing your job
E.3 Do you feel dissatisfied with your job
E.4 You often think of quitting your job
E.5 You feel calm and relaxed at work
E.6 You have taken a number of days of leave due to severe stress
E.7 You are able to complete your work in the stipulated time
E.8 You feel that you’re doing work in the best way?
E.9 You feel that your official assignments are more important than your personal interests?
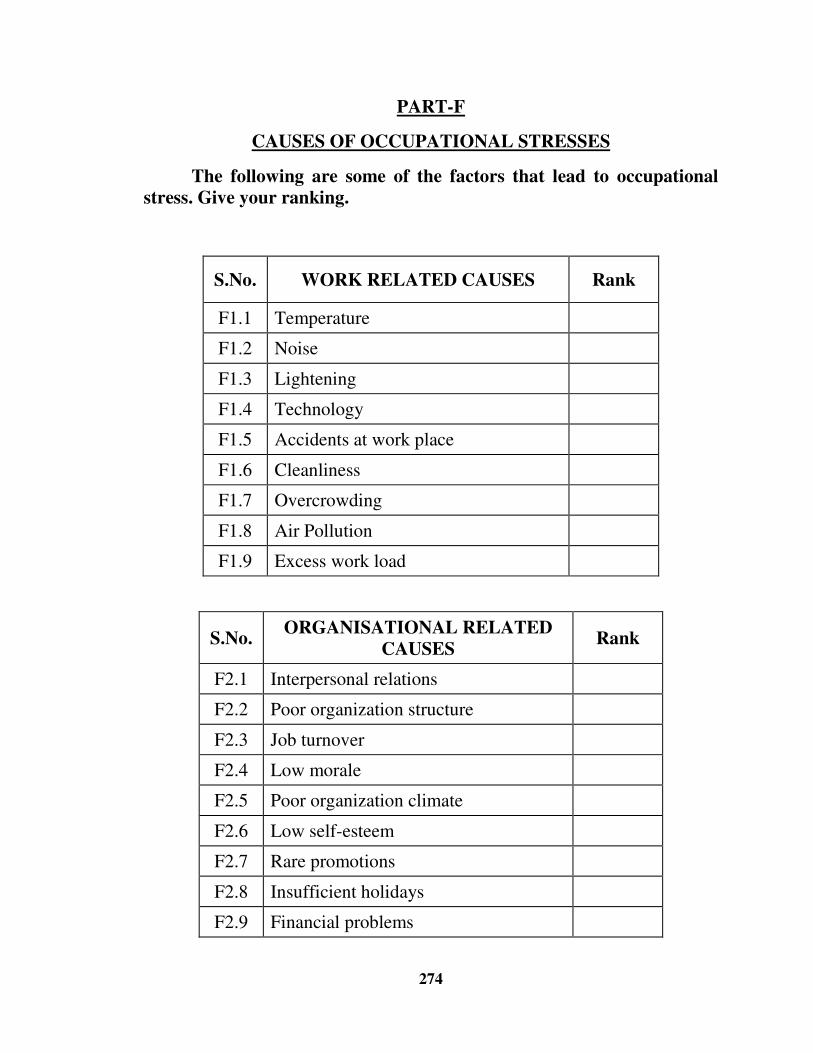
274
PART-F
CAUSES OF OCCUPATIONAL STRESSES
The following are some of the factors that lead to occupational stress. Give your ranking.
S.No. WORK RELATED CAUSES Rank
F1.1 Temperature
F1.2 Noise
F1.3 Lightening
F1.4 Technology
F1.5 Accidents at work place
F1.6 Cleanliness
F1.7 Overcrowding
F1.8 Air Pollution
F1.9 Excess work load
S.No. ORGANISATIONAL RELATED
CAUSES Rank
F2.1 Interpersonal relations
F2.2 Poor organization structure
F2.3 Job turnover
F2.4 Low morale
F2.5 Poor organization climate
F2.6 Low self-esteem
F2.7 Rare promotions
F2.8 Insufficient holidays
F2.9 Financial problems

275
PART-G
CONSEQUENCES OF OCCUPATIONAL STRESS
The following are some of the psychological and physical consequences when you are in stress? Please rank the following.
S.No. PSYCHOLOGICAL
CONSEQUENCES Rank
G1.1 Anxiety
G1.2 Boredom
G1.3 Low self esteem
G1.4 Forgetfulness
G1.5 Depression
G1.6 Angry
G1.7 Apathy / worry
G1.8 Insomnia (Sleepless)
S.No. PHYSICAL
CONSEQUENCES Rank
G2.1 Headache
G2.2 Diabetes
G2.3 Hypertension
G2.4 Chest & Back pain
G2.5 Ulcers
G2.6 Hair loss
G2.7 Upset stomach
G2.8 Others
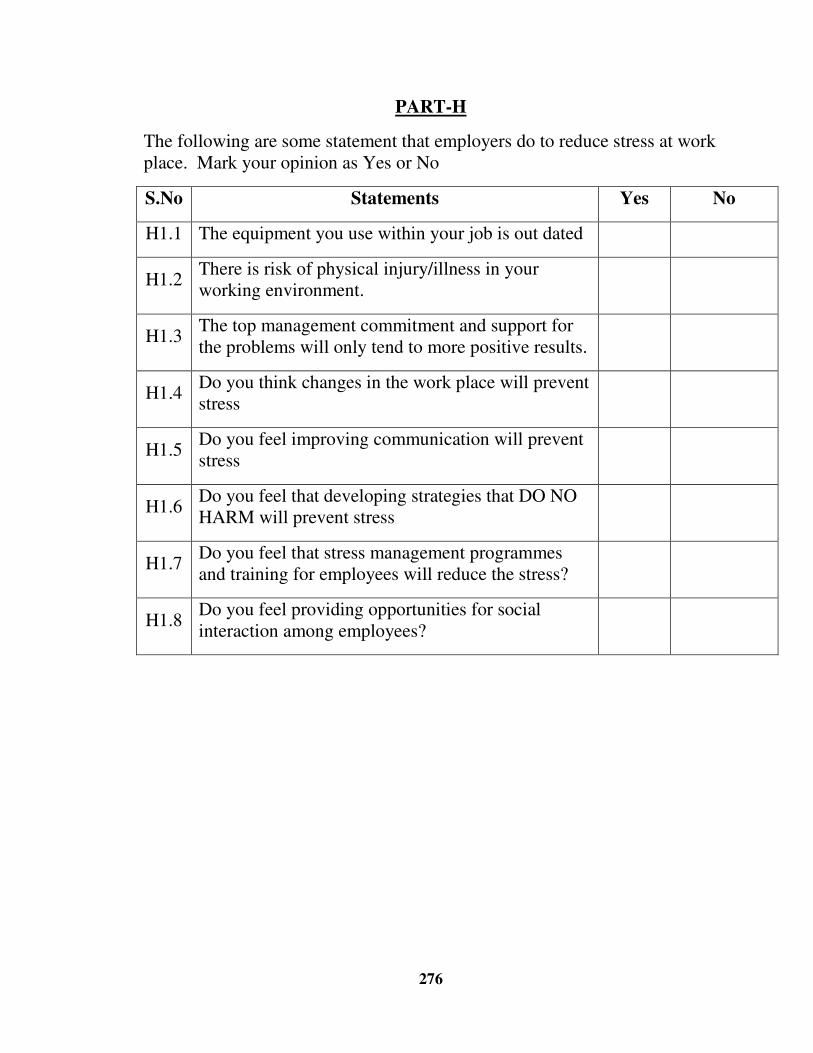
276
PART-H
The following are some statement that employers do to reduce stress at work place. Mark your opinion as Yes or No
S.No Statements Yes No
H1.1 The equipment you use within your job is out dated
H1.2 There is risk of physical injury/illness in your working environment.
H1.3 The top management commitment and support for the problems will only tend to more positive results.
H1.4 Do you think changes in the work place will prevent stress
H1.5 Do you feel improving communication will prevent stress
H1.6 Do you feel that developing strategies that DO NO HARM will prevent stress
H1.7 Do you feel that stress management programmes and training for employees will reduce the stress?
H1.8 Do you feel providing opportunities for social interaction among employees?
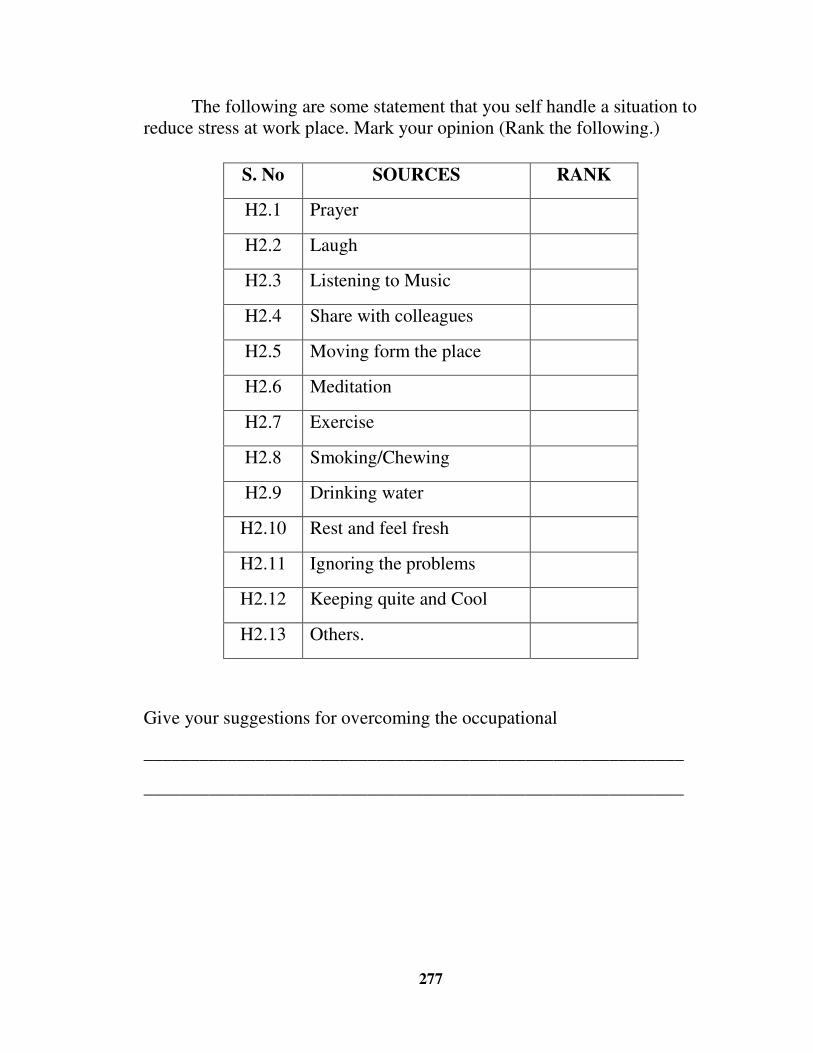
277
The following are some statement that you self handle a situation to reduce stress at work place. Mark your opinion (Rank the following.)
Give your suggestions for overcoming the occupational
__________________________________________________________
__________________________________________________________
S. No SOURCES RANK
H2.1 Prayer
H2.2 Laugh
H2.3 Listening to Music
H2.4 Share with colleagues
H2.5 Moving form the place
H2.6 Meditation
H2.7 Exercise
H2.8 Smoking/Chewing
H2.9 Drinking water
H2.10 Rest and feel fresh
H2.11 Ignoring the problems
H2.12 Keeping quite and Cool
H2.13 Others.