A STUDY ON MARKETING STRATEGY WITH REFERENCE ...
95
A STUDY ON MARKETING STRATEGY WITH REFERENCE TO BAMUL [NANDHINI] SUBMITTED IN PARTIAL FULFILMENT OF THE REQUIREMENTS OF BACHELOR OF BUSINESS MANAGEMENT DEGREE COURSE OF BANGALORE UNIVERSITY 2015-2016 BY KEERTHI.M.S REG.NO. (13VFC24046) UNDER THE GUIDANCE OF SHILPA JOSHI R V
-
Upload
khangminh22 -
Category
Documents
-
view
2 -
download
0
Transcript of A STUDY ON MARKETING STRATEGY WITH REFERENCE ...

A STUDY ON MARKETING STRATEGY WITH
REFERENCE TO
BAMUL [NANDHINI]
SUBMITTED IN PARTIAL FULFILMENT OF THE
REQUIREMENTS OF BACHELOR OF BUSINESS
MANAGEMENT DEGREE COURSE OF BANGALORE
UNIVERSITY
2015-2016
BY
KEERTHI.M.S
REG.NO. (13VFC24046)
UNDER THE GUIDANCE OF
SHILPA JOSHI R V

STUDENT DECLARATION
I hereby declare that this project entitled “A STUDY ON MARKETING
STRATEGY OF BAMUL” was prepared by me during the year “2015-
2016” and was submitted in partial fulfillment of the requirements for the
award of degree in Business Management of Bangalore University.
I also declare that this project report is original and genuine and has not been
submitted to any other University for the award of any degree, diploma or
other similar titles or purposes.
Date: Signature
Bangalore KEERTHI.M.S
(13VFC24046)

GUIDE CERTIFICATE
This is to certify that the project report entitled “ A STUDY ON
MARKETING STRATEGY OF BAMUL” submitted by
KEERTHI.M.S to Bangalore University for the award of Degree
in Business Management is an outcome of genuine research
work carried under my guidance and it has not been submitted
for the award of any other degree, diploma or prize.
Date: Signature
Bangalore SHILPA JOSHI R V

HOD CERTIFICATE
This is to certify that KEERTHI.M.S. is a bonafide student of Bachelors of
Business Management. The project work entitled “ A STUDY ON MARKETING
STRATEGY OF BAMUL” is a bonafide work carried out by KEERTHI.M.S in
partial fulfillment of the requirements for the award of degree in Business
Management of Bangalore University during the year 2015-2016. It is certified that
all correcting/ suggestions have been incorporated in the project report and a copy
is deposited in the department library. This project work has been approved as it
satisfies the academic requirements for the award of Bachelors’ of Business
Management Degree.
Date: Signature
Bangalore PRASANNA PRAKASH

PRINCIPAL CERTIFICATE
This is to certify that KEERTHI.M.S is a bonafide student of this college.
The project work entitled “A STUDY ON MARKETING STRATEGY OF
BAMUL” is a bonafide work carried out by KEERTHI.M.S in partial
fulfillment of the requirements for the award of degree in Business
Management of Bangalore University during the Year 2015-2016.
Date: Signature
Bangalore R.BODHISATVAN

EXECUTIVE SUMMARY

EXECUTIVE SUMMARY
Milk and milk products are a basic food in many societies where cattle and other
animals form an important part of the agricultural production system. If you review the
history of dairying in most the European and North American countries, one sees the
share of liquid milk and milk products in the dairy industry changing over of economic
and technological development in their societies.
In developing countries like India depending on the level of the dairy industry, products
range from a few indigenous dairy products and raw milk to pasteurized liquid milk and
milk products and a small proportion of other “LUXURY” products. Thus liquid milk is
still the most important base for developing the dairy industry in developing countries.
India has become the worlds No.1 milk producing country, so it is also rich in its milk
products with output in the year 2010-2011 (marketing year ending March 2011)
forecasted at 95 million tonnes. In the India context of poverty and malnutrition, milk has
a special role to play for its many nutritional advantages as well as providing
supplementary income to some 70 million farmers in over 500,000 remote villages.
After liberalization Indian market is open to wide competition in both consumer market
as well as industrial market. Industrial buying process is influenced by so many factors.
Before purchasing raw materials they conduct an intense discussion and buying process
passes through different stages and finally adopt suitable one.
Consumers consider many factors like quality service, price availability of materials etc.
while purchasing the raw materials.

The main objective of this study is to know the marketing strategy and retailers opinion
about nandini milk products.
The methodology of this study was collection of data through structured questionnaire
and personal interview with consumer in various areas of Bangalore city. The sample size
was 100 at simple random sampling method and 56 for retailers. Then evaluation of
collected data is been done.
It can be concluded that Nandini is one such a brand, which has entered the
daily life of the customers. It has the monopolistic market in some products and can be
utilized fully. BAMUL is one such organization where, it is striving hard for its customer
satisfaction. This project report at the end gives some suggestion, if adopted can lead to
much higher development in sales.
AKNOWLEDGEMENT

I am highly thankful to NEW HORIZON COLLEGE for giving me this
opportunity to undertake my project work in the
BAMUL(NANDHINI),BANGALORE
I am grateful to the MR.VIJAY SRINIVAS, for giving me permission to complete
the project in BAMUL(NANDHINI). I would express my sincere thanks to Ms.
Shilpa joshi.R.V for helping me a lot in gathering information for my project.
I also express my gratitude to my Parents and my friends who had been a constant
source of encouragement and provided me the necessary help during the period of
my project.
Last but not least, I express my sincere thanks to God Almighty for showering his
blessings upon me and also all those who helped me directly or indirectly
throughout my project work.
Place :
Date :
CONTENTS
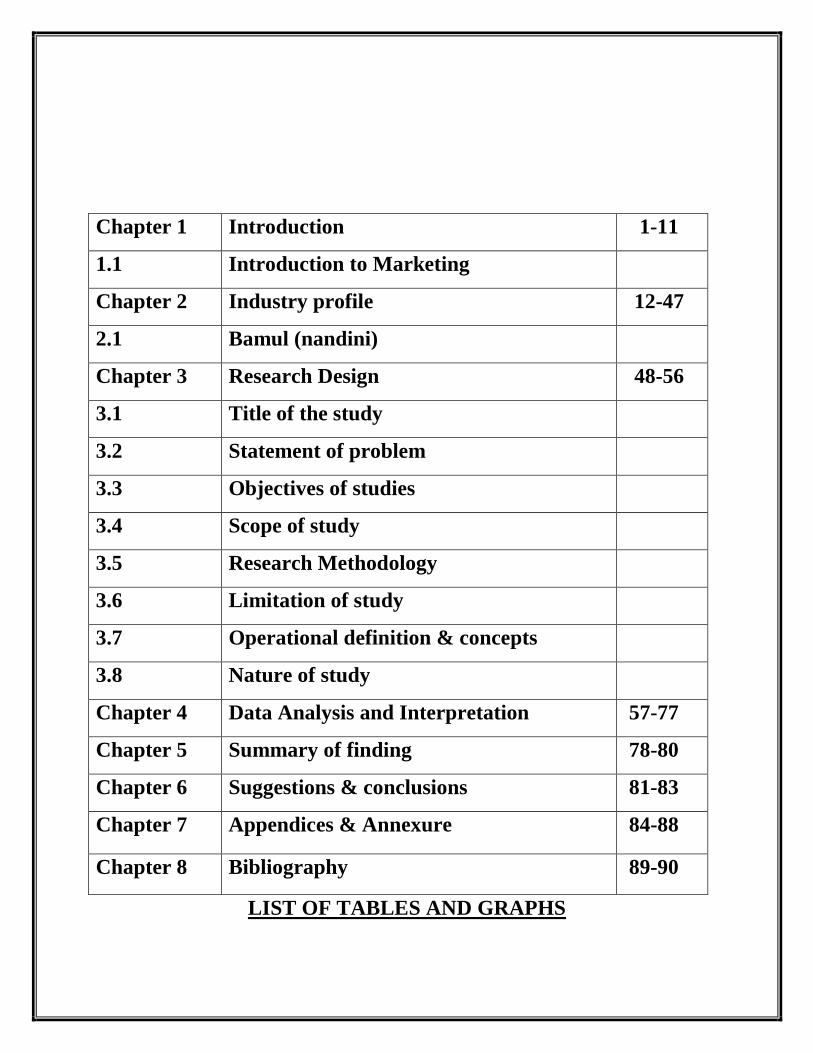
LIST OF TABLES AND GRAPHS
Chapter 1 Introduction 1-11
1.1 Introduction to Marketing
Chapter 2 Industry profile 12-47
2.1 Bamul (nandini)
Chapter 3 Research Design 48-56
3.1 Title of the study
3.2 Statement of problem
3.3 Objectives of studies
3.4 Scope of study
3.5 Research Methodology
3.6 Limitation of study
3.7 Operational definition & concepts
3.8 Nature of study
Chapter 4 Data Analysis and Interpretation 57-77
Chapter 5 Summary of finding 78-80
Chapter 6 Suggestions & conclusions 81-83
Chapter 7 Appendices & Annexure 84-88
Chapter 8 Bibliography 89-90

SERIAL
NO.
LIST OF TABLES AND GRAPHS PAGE NO.
(TABLES)
1 AGE OF RESPONDENTS 58-58
2 OCCUPATION OF RESPONDENTS 59-59
3 HOW DID YOU COME TO KNOW ABOUT
THE NANDHINI MILK PRODUCT
60-60
4 WHY DO YOU PREFER NANDHINI MILK
PRODUCT
61-61
5 WHAT DO YOU PERCIEVE ABOUT THE
QUALITY OF NANDHINI MILK PRODUCT
62-62
6 WHAT DO YOU THINK ABOUT PRICINMG
POLICY OF NANDINI MILK PRODUCT
63-63
7 WHAT DO YOU FEEL ABOUT THE
PACKAGING OF NANDHINI MILK
PRODUCT
64-64
8 WHICH OTHER BRANDS DO YOU PREFER 65-65
9 WHAT DO YOU FEEL ABOUT THE TASTE
OF NANDHINI MILK PRODUCT
66-66
10 HOW DO YOU FIND THE PACKAGING OF
NANDINI MILK PRODUCT
67-67
11 HOW MUCH SATISFIED ARE YOU WITH
NANDINI MILK PRODUCT
68-68
12 SINCE HOW LONG ARE YOU DEALING
WITH NANDINI MILK PRODUCT
69-69
13 WHAT IS YOUR OPINION ON THE
MARGIN OF COMMISSION GIVEN TO
NANDINI MILK PRODUCTS
70-70
14 DO YOU FIND SEASONAL VARIATIONS IN
DEMAND FOR NANDINI MILK PRODUCTS
71-71

15 ARE THE PRODUCTS SUPPLIED
EFFICIENTLY THROUGHOUT THE YEAR
72-72
16 WHAT IS YOUR OPINION ON NANDHINI
MILK PRODUCT
73-73
17 ARE SUPPLIERS AS PER SCHEDULE 74-74
18 WHAT IS YOUR MODE OF PAYMENT 75-75
19 IF YOU GIVE BULK ORDERS WILL YOU
GET IMMEDIATE SUPPLY
76-76
20 DO YOU COME ACROSS ANY DAMAGED
GOODS
77-77
1
Marketing: marketing has been seen as the task of creating, promoting and delivering goods
and services to consumers and businesses. Marketing does not only refer to selling of services,
experiences, events, persons, places, properties, organizations, information and ideas.
Marketing refers to stimulating a demand for the company‟s product. In order to meet the
organizational goals. The role of marketing in any organization is an important as the role of
production or finance as the role of production or finance as without marketing the goods which
are produced, there will be no finance for further production.
Definations of marketing:
Many authors have attempted to define the term marketing, to state a few….
Marketing is a social and managerial process by which individuals and groups obtain what they
need and want through creating, offering, and exchanging products of value with others.
: Philip kotler
The American marketing association most recently defined Marketing as "the activity, set of
institutions, and processes for creating, communicating, delivering, and exchanging offerings that
have value for customers, clients, partners, and society at large."
: The American marketing association
Marketing is the process of planning and executing the conception, pricing, promotion, and
distribution of ideas, goods, services, organizations, and events to create and maintain
relationships that will satisfy individual and organizational objectives.
: Boone and Kurtz

2
Marketing is the message and/or action that causes messages and/or action.
:Jay Baer
Marketing is meeting the needs and wants of a consumer.
: Andrew Cohen
Marketing is creating irresistible experiences that connect with people personally and creates the
desire to share with others.
: Saul Colt.
Marketing is essentially involved in outward communication, in promoting the corporate goals
of the company it is serving. It is the process through which companies accelerate returns by
aligning all communication objectives (advertising, marketing, sales, etc), into one department to
more efficiently achieve the overall corporate goals.
: Antoine Didienne
Core concepts of marketing:
Core concepts of
marketing
Needs,
Wants and
Demands
Products
Value, Cost
And
Satisfaction
Markets,
Marketers,
Prospects
Relationship
And
Networks
Exchange
And
Transaction

3
1. Needs, Wants and Demand:
A Need is a state of deprivation of basic satisfaction, people require food, clothing, safety,
shelter, belonging and esteem. These needs are not created by society or by marketers but they
exists in the very texture of human biology and human condition.
Wants are desires for specific satisfiers of needs, human wants are continually shaped and
reshaped by social forces and institutions, including churches, schools, families and business
corporations.
Demands are wants for specific products that are backed up by the ability to buy them, wants
become demands when supported by purchasing power
2. Products:
A product is anything that can be offered to satisfy a need or a want, people satisfy their needs
or their wants with products.
A product or a service can consist of three components.
Goods
Services
Ideas
3. Value, Cost and Satisfaction:
Value is the consumer‟s estimates of the products overall capacity to satisfy his or her needs.
Cost depends mainly upon the consumer‟s economic position.
Satisfaction of the customer-requirements at the lowest possible cost of acquisition, ownership
and use.
4. Exchange and Transaction:
Marketing occurs when people decide to satisfy their needs and wants through the means of
exchange.
Exchanging is the act of obtaining a desire product from someone by offering something in
return.
A Transaction is a trade of values between two or more parties. There are two types of
transaction.
i. Monetary transactions

4
ii. Barter transactions
A transaction involves several dimensions, at least two things of value, agreed upon conditions, a
time of agreement and a place of agreement.
5. Relationships And Networks:
Relationship marketing is the practice of building long terms satisfying relations with key
parties such as customers, suppliers, distributors, in order to maintain long-term preference and
business.
A Marketing Network consists of the company and all of its supporting stake holders,
customers, employees, university scientists, and others with whom it has build mutually
profitable business relationship.
The operating principle now a days is simple; build a good network of relationship with key
shareholders and profits will follow.
6. Markets:
A Market consists of all the potential customers sharing a particular need or want who might be
willing and able to engage in exchange to satisfy the need of want.
7. Marketer and prospects:
Marketing means working with markets to actualize potential exchanges for the purpose of
satisfying human needs and wants.
A marketer is someone seeking one or more prospects that might enter engage in an exchange of
values.
A prospects is someone whom the marketer identifies as potentially willing and able to engage
in an exchange or values.
Introduction to marketing strategy:
Marketing Strategy is the „route‟ or „routes‟ that a business intends to take to get to its chosen
„destination‟, the Marketing Objective. Whilst Marketing Objectives can themselves be seen as
identified 'milestones' on a longer journey toward the overall Corporate goals/aims of the
business.

5
To better understand the nature and role of Marketing Objectives and Strategy, we should
consider their position within both the Marketing Planning and Corporate Planning process.
In order to develop appropriate marketing strategies a business must first understand „Where it
is‟ in terms of the business and its markets, before going onto decide „Where it wants to get to‟
in terms of Marketing Objectives and „How its going to get there‟ the Marketing Strategies to be
employed. This is achieved through completion of a Marketing Audit, which through market
research will provide.
Meaning:
„Marketing strategy is the marketing logic by which the business unit hopes to achieve its
marketing objectives‟.
Definition:
An organization‟s strategy that combines all of its marketing goal into one comprehensive plan.
A good marketing strategy should be drawn from marketing research and focus on the right
product mix in order to achieve the maximum profit potential and sustain the business. The
marketing strategy is the foundation of a marketing plan.
Elements of marketing strategy:
1. Segments
The first big decision is who should be our customers and who should not. In other words, what
customer segments will be addressed. This is based first on the overall strategic intent of the
firm, for example to be a high-end exclusive and low-volume provider, or to compete in mass
markets where price is critical. The decision is also based on research that indicates the
profitability of different customers groups and how well the company is able to compete in each
segment.
2. Brand
The brand is the overall intended message of the company, its products and services. It
describes what customers and others should think and feel whenever they encounter the
company or its products and services. Brand is influenced by and influences the strategic intent
of the firm and helps focus all other communications, products and interactions. Brand is fragile

6
in that it is what customers think and feel rather than what the company communicates. This
makes shaping decisions about brand critical.
3. Competition
An important marketing decision is the nature of competition, for example whether to compete
on quality, price, service, etc. Decisions here will be affected by brand and will shape further
activity such as the approach towards promotion, the use of advertising, the response to
competitive action, and so on.
4. Products
Having understood and selected customers, marketing strategy should have a significant
influence on the products created. This not only includes the overall functionality but also the
focus on quality, features, price points and so on, in order to produce products that align with
the brand and complete effectively in the marketplace.
5. Price
While the exact price may not decided in strategic planning, the price ranges should be
understood particularly in terms of what the target customers are willing and able to pay, and
also what price breaks are important to be able to compete in the markets being addressed.
6. Promotion
Promotional strategy includes decisions about what approaches to promotion will be used, for
example TV advertising, direct marketing and so on.
Promotion can be extremely expensive, so a key part of the strategic decision here is in the
amount of budget that is being allocated.
7. Communication
Related to brand and promotion, the way that communications with customers and other
stakeholders (such as the media) needs to be decided. This includes broadcast information about
products, one-to-one and things in between. It also includes how service conversations will be
conducted, for example using web interfaces or direct phone conversation.
8. Outsourcing
A big decision that can be applied within any of the above is the 'make or buy' choice of
whether to do things in-house, bring in external experts or pass on the work to third party
suppliers. Two key factors in the outsourcing decisions are first the ability of the company to do
the work in comparison with suppliers, and secondly the costs of doing this. The impact on
brand should be a key consideration also. Many companies who outsource such as service calls
have suffered huge brand damage from suppliers who do not deliver brand values.

7
Features of marketing strategy:
1. Defining your product or service: How is your product or service packaged?
What is it that your customers are really buying? You may be selling web-based software tools
but your clients are buying increased productivity, improved efficiency and cost savings. And if
you offer several products or services which ones are the most viable to promote?.
2. Identifying your target market: Everyone or anybody might be potential clients
for your product. However, you probably don‟t have the time or money to market to Everyone or
Anybody. Who is your ideal customer? Who does it make sense for you to spend your time and
money promoting your service to? You might define your ideal customer in terms of income,
age, geographic area, number of employees, revenues, industry, etc. For example a massage
therapist might decide her target market is women with household incomes of $75,000 or more
who live in the Uptown area.
3. Knowing your competition: Even if there are no direct competitors for your
service, there is always competition of some kind. Something besides your product is competing
for the potential client‟s money. What is it and why should the potential customer spend his or
her money with you instead? What is your competitive advantage or unique selling proposition?
4. Finding a niche: Is there a market segment that is not currently being served or is not
being served well? A niche strategy allows you to focus your marketing efforts and dominate
your market, even if you are a small player.
5. Developing awareness: It is difficult for a potential client to buy your product or
service if they don‟t even know or remember it exists. Generally a potential customer will have
to be exposed to your product 5 to 15 times before they are likely to think of your product when
the need arises. Needs often arise unexpectedly. You must stay in front of your clients
consistently if they are going to remember your product when that need arises.
6. Building credibility: Not only must clients be aware of your product or service, they
also must have a positive disposition toward it. Potential customers must trust that you will
deliver what you say you will. Often, especially with large or risky purchases, you need to give
them the opportunity to “sample”, “touch”, or “taste” the product in some way. For example, a
trainer might gain credibility and allow potential customers to “sample” their product by offering
free, hour long presentations on topics related to their area of specialty.
7. Being Consistent: Be consistent in every way and in everything you do. This includes
the look of your collateral materials, the message you deliver, the level of customer service, and
the quality of the product. Being consistent is more important than having the “best” product.
This in part is the reason for the success of chains. Whether you‟re going to Little Rock,

8
Arkansas or New York City, if you reserve a room at a Courtyard Marriott you know exactly
what you‟re going to get.
8. Maintaining Focus: Focus allows for more effective utilization of the scarce
resources of time and money. Your promotional budget will bring you greater return if you use
it to promote a single product to a narrowly defined target market and if you promote that same
product to that same target market over a continuous period of time.
Advantages of marketing strategy:
1. Saves time and money: Time and money are important primary factors of
success in the business industry. As you will see below, a marketing strategy helps
owners to define a brand so that they spend loads of productivity time marketing a
product to the wrong people. A marketing plan provides a blue print for business owners
to follow with hopes to bring in more than they put out.
2. Provides a plan: A marketing strategy is a plan after all, isn‟t it? Yes this is true to
an extent, but not every business uses the same methods to market. Not everyone markets
according to a plan, and this is the very reason one should write down a plan and stick to
it.
3. Defines the brand: This is a very important element of the marketing plan
because without, a business without it, a business wouldn‟t last long. They would be
exhausted. Defining a brand means knowing what you are selling, and to whom you‟re
selling it to. In other words, you must also define your audience. Without knowing who to
market to, business owners can lose valuable time.
4. Simplifies business decision: For example your marketing strategy is focused
on customer retention. And the key focus is customer services and communication.
Taking the above example you may have an idea for an email campaign or a series that
you heard gets results with new blog subscribers. This marketing tactics does not support
the marketing strategy and wastes time and money.

9
5. Targeted approach: Marketing strategies can give your marketing efforts and
campaigns a focus. Instead of hoping that customers find their way to your small business
or marketing to everyone all the time, marketing strategies help to divide what is an ocean
of consumers into navigable segments. These segments can then be addressed
individually so that your marketing message is attractive to each. The result is often a
more effective campaign and the development of a consistent level of brand recognition
amongst the target segment.
6. Better information: Marketing strategies provide you with information that you
would not have access to otherwise. Marketing strategies often require market research
and that research can help you to gain a better understanding of the market, how it works
and who your customers really are. A strategy can also help you to form goals based on a
combination of past performance and future projections. The nature of marketing
strategies and marketing plans are such that they provide a breakdown of the schedule and
the specific initiatives that are to be carried out. Such attention to performance and returns
helps create accurate and realistic annual goals and projections.
Disadvantages of marketing strategy:
1. Getting stuck: A major downside of marketing strategies is the dependency
they cause for small businesses. When a small business selects its marketing strategy
for the year, it must follow through to the end no matter the consequences. If the
market changes or the strategy fails, the amount of resources and effort put into its
development and distribution are often too great to allow for alterations and
repositioning. A one-dimensional approach to marketing is never a good idea, but in
some cases even multifaceted campaigns fall victim to too much similarity between
initiatives and too much focus on a single target market.
2. Expenses: The costs involved with some marketing strategies places them out of
reach for many small businesses. Small businesses are not able to accumulate data,
purchase information and produce specified marketing campaigns to address each
segment of the market in the same way that large corporations can. Those that do
have the means to develop and launch a comprehensive marketing strategy may find

10
it difficult to rebound with new material should changes occur or the return on
investment not be as expected. The catch is that without a marketing strategy your
small business is not likely to grow as quickly, so while expenses stay down, so does
revenue.
3. Solution: An undifferentiated marketing strategy is preferred by many small
businesses. It combines the benefits of a cohesive marketing strategy with the
freedom of operating without one. Undifferentiated or mass marketing strategies are
based on widespread, non-targeted marketing campaigns that are concerned only with
getting the word out to as many consumers as possible. There is no research involved
and no specific message to any one market segment. Instead, the small business
creates a one-size-fits-all initiative and carries it out in whatever way it sees fit. The
cost is low, the return on investment is typically high and it can be used either as a
first step toward devising more targeted strategies in the future or it can remain your
strategy for the long term.
4. Development: In order to develop a marketing strategy, each aspect must be
examined for both advantages and disadvantages. During the process, cost is usually
factored into weighing the pros against the cons of a strategy. Although an advantage
might be to bring in new customers, the disadvantage to the strategy could be it could
cost too much to gain the new customers.
5. Distribution: If a marketing strategy concerns itself with distribution, examining
and accessing the cost of different distribution methods will reveal if the strategy
should be implemented. For example, one way to distribute information is through
email marketing. Although the advantage is email marketing is relatively
inexpensive, the disadvantage is that because of the high volume of spam junk mail,
many Internet service providers have set up elaborate filters to keep out unsolicited
emails.
6. Decision: For example, although an effective marketing strategy for a product
might include TV advertising with programs that have high audience ratings, a
disadvantage to that could entail sponsoring a program that some might find
offensive or in questionable taste, which might lead to a boycott of the product or
service. Deciding whether to alienate one group over enticing another group would
need to be determined by the team behind the marketing strategy and the company
itself.

11
The Bangalore Milk Union Ltd., (BAMUL) was established during 1975 under operation Flood
II by keeping “AMUL” as its role model. At present bamul has Bangalore urban, Bangalore
rural and Ramanagara districts of Karnataka state as its area of operation for milk procurement
and selling milk in part of Bruhath Bangalore Mahanagara Palika (BBMP) area. Since its
inception the union is constantly striving further for dairy development and marketing activities
in its milk shed area.
OBJECTIVES:
To organize milk producers co-operative society(MPCS) at village level and disseminations of
information like good dairy, animal husbandry and breeding practices and clean milk production
through Extension services.
To provide assured market and remunerative price for the milk produced by the farmer members
of the co-operative societies.
To provide technical input services like veterinary services, artificial insemination, supply of
balanced cattle field and fooder seed materials etc., to milk producers.
To facilitate rural development by providing opportunities for self employment at village level,
thereby preventing migration to urban areas, introducing cash economy and opportunity for
steady income.
To provide quality milk and milk products to urban consumers at competitive prices.
Background:
On January 1st 1958 a pilot scheme to cater the Bangalore milk market, department of
animal husbandry, government of Karnataka was started milk processing facilities and veterinary
hospitals at national dairy research institute (NDRI) later in 1962, the Bangalore milk supply
scheme came into existence as an independent body. With the great efforts by then Honble
Minister for revenue and dairing government of Mysore sir M.V.Krishnappa, a joint venture of
UNCIF, government of India and government of Mysore was dedicated Bangalore dairy to the
people of Karnataka state on 23rd
January 1965 by then the Honble Prime minister late Sri Lal

12
bahadhu shastriji. The Bangalore dairy scattering over an area of 52 acres of land, the dairy had
an initial capacity to process 50000ltrs of milk per day. Bangalore dairy underwent a structural
change in December 1975, handed over to Karnataka dairy development co-operation (KDDC).
Rural milk scheme of Mysore, Hassan and Kudige districts was started under operation flood II
and then transferred to Karnataka milk federations (KMF) in May 1984 as a successor of KDDC.
To cater to the growing demand for milk by the consumers of Bangalore city, the capacity was
increased to 1.5lakhs liters per day under the operations flood II during 1981 and later increased
to 3.5lakhs liters per day under operation flood III during 1994.
As per the policies of the national dairy development board (NDDB), Bangalore dairy was
handed over to Bangalore milk union LTD., (BAMUL) on 1st September 1988. The union is
capable of processing the entire milk procured, by timely implementation of several
infrastructure projects like commissioning of new mega dairy state-of-the-art technology with the
processing capacity of 6.0lakhs liters per day, new chilling centers, renovation of product block
etc.,
The milk shed area of Bamul comprises of 2611 revenue villages. As of now the Union has
organized 2076 milk producers co-operative Society (MPCS) in 4320 villages in these three
districts. In these MPCS‟s there members are women and 59032 members belong to Schedule
Caste and Schedule Tribes.
The philosophy of this co-operative milk producer‟s organization is to eliminate middlemen and
organize institutions owned and managed by milk producers, by employing professionals.
Achieve economies of scale of rural milk producers by ensuring maximum returns and at the
same time providing wholesome milk at reasonable price to urban consumers ultimately, the
complex network of co-operative organization should build a strong bridge between masses of
rural producers and millions of urban consumers to achieve a socio-economic revolution in the
village community.
Bamul has being registered under MMPO by central registration authority. Today, the union has
become the biggest milk co-operative union in southern India. Bamul has being certified for ISO
22000:2005 and ISO 9001-2000 for quality management and food safety systems.
In recognition to this efforts and achievements, the national productivity council (NPC) of
government of India as conferred “Best Productivity Award” Five Times and “Energy
Conservation Award” by Bureau of Energy Efficiency (BEE) to the union

13
Organization status:
The member producers and there are the vital constituent of the union and their progress
in the judging yard stick on the efficiency of the unions organization. Hence the maximum
importance has been given to their development. The union is making intensive efforts over the
years to organize MPCS‟s in more and more villages of the three districts in the milk shed area.
Importance has been given to enroll more and more milk producers in the villages as members
of these MPCS‟s. While enrolling these members and to organize more women managed
MPCS‟s under step (support to training and employment program for women). It is heartening to
note that there is an active participation of women/weaker sections of society in all the dairy
development activities of the union. They have become main stay of all the developmental
programs of the union. This has resulted in the build-up of economical benefits to the most
vulnerable sections of the rural mass.
Milk procurement:
The milk produced by 108051 farms at village level will be collected every day morning and
evening at MPCS. Under clean milk production programme, to maintain the freshness of quality
of the milk 178 bulk milk coolers covering 498 MPCS of total capacity 3,30,000 liters were
installed at MPCS level. During the year the union‟s daily average milk procurement is 12.66
lakh kgs, which works out to be 630 kgs per day per MPCS. The milk procurement has increased
by 3.00% when compared to the last yea
331544 340307 337419 340448 344176 347498
105804 109834 110357 111894 118193 120239
2010-11 2011-12 2012-13 2013-14 2014-15 2015-16
Total Membership & Women Membership at DCS

14
Year 2009-10 2010-11 2011-12 2012-13 2013-14 2014-15 2015-16
Avg. Milk
procurement in Lakhs8.29 8.87 9.44 10.48 11.45 12.66 14.19
% Growth 13% 2% 11% 11% 9% 10% 11%
AVG. Milk PROCUREMENT PERDAY
8.298.87 9.44 10.48
11.4512.66
14.19
2009-10 2010-11 2011-12 2012-13 2013-14 2014-15 2015-16
Till Oct‟ 15
Bamul is offering the most remunerative milk procurement price to member producers. The
operational efficiency is reflected on procurement prices paid to the member producers. The
average milk procurement price paid during the year was Rs.23.17 for every Kg of milk supplied
to the Union.
Milk collected at MPCS will be transported to chilling centers, through 125 Milk Procurement
can routes, by travelling 20,685 Km‟s every day. 32 Bulk milk cooler (BMC) Routes, are also in
operation, which collects milk from 179 BMC centers of 506 MPCS directly transported to
Bangalore dairy through insulated tankers.
Liquid milk marketing:
The Bangalore milk union is marketing milk and milk products in brand name of “Nandini”
through 1668 retailers, 70 franchise outlets, 33 milk parlours, 286 distribution routes. The key
success factor of bamul in becoming a market leader is the narrow price spread maintained
between purchase and sale, marketing higher volumes of milk. The volume of sales plays a
critical role in determining costs. Hence, the market strategy of Bangalore milk union is to regard
selling of market milk as its core marketing activity and to concentrate its efforts in these
directions to increase the volume of milk sales. The impressive growth in the sale of milk by
bamul over the years is due to the persistence effort to maintain timely supply, maintaining
quality and attending to the complaints of consumers and agents with prompt follow-up action.

15
Year 2009-10 2010-11 2011-12 2012-13 2013-14 2014-152015-16
till Oct'15
Avg. Milk Sales in
Lakhs6.68 6.97 7.56 7.85 7.94 8.45 8.93
% Growth 3% 4% 9% 378% 1% 4% 1%
AVG. Milk SALES PERDAY
6.68 6.97 7.56 7.85 7.94 8.458.93
2009-10 2010-11 2011-12 2012-13 2013-14 2014-15 2015-16 till Oct'15
Bamul is also organizing consumer awareness programme as a part of market Development to
create awareness of “Nandini” milk through personal contacts, door to door campaigns,
organizational meetings, school children mega dairy plant visit etc., are conducting regularly.
Types of Milk & Milk products marketing by Bamul:
Nandini Toned Milk
Nandini Curd
Nandini Special Milk. Containing 4.0% Fat and 9.0 % SNF.
A rich, creamier and tastier milk, Ideal for preparing
home-made sweets & savories. Available in 500ml
packs.
Karnataka's most favorite milk, Nandini Toned Milk.
Fresh and Pure milk containing 3.0% fat and 8.5% SNF.
Available in 520ml and 1ltr & 6 Ltr packs. Better to use
within a day from the date of pack.

16
Year 2011-12 2012-13 2013-14 2014-15 2015-16 till Oct'15
Avg. Curd Sales in '000 95.52 100.73 98.9 115.33 124
% Growth 5% 5% -2% 14% 7%
AVG. Curd SALES PERDAY
95.52100.73 98.9
115.33124
2011-12 2012-13 2013-14 2014-15 2015-16 till Oct'15
Nandini Ghee
Nandini Butter
Nandini peda
INFRASTRUCTURE DEVELOPMENT:
The strategy of Bangalore Milk Union is “Procure More, Sell More & Serve More” and
reaping the benefits of economies of scale. In order to realize this strategy, the Union has
implemented the following projects so that more and more milk can be procured and processed.
This will help us to serve our producer members by passing on the maximum benefits; we are
consciously adopting the growth-oriented strategy of helping our producers to grow by ourselves
growing constantly.
Rich, smooth and delicious. Nandini Butter is made out of fresh
pasteurized cream. Rich taste, smooth texture and the rich purity
of cow's milk, makes any preparation a delicious treat. Available in
100 gms (salted), 200 gms and 500gms cartons both salted and
unsalted.
A taste of purity. Nandini Ghee, made from pure butter. It is
fresh and pure with a delicious flavour. Hygienically
manufactured and packed in a special pack to retain the
goodness of pure ghee. Shelf life of 6 months at ambient
temperatures. Available in 200ml, 500ml, 1000ml sachets &
15.0 kg tins.
No matter what you are celebrating! Made from pure milk,
Nandini Peda is a delicious treat for the family. Store at room
temperature approximately 7 days. Available in 250gms pack
containing 10 pieces each.

17
Mega Dairy with a capacity to
process 9 lakh litres of milk per
day expandable to 10 llpd has
been built by investing Rs. 38.70
crores obtained as term loan from
National Dairy Development
Board. The Mega Dairy, has
latest state-of-the-art
technological facilities in dairy
processing and the Union will
have the ability to manufacture
milk and milk products to world
class standards.
Although Bamul sets standards for its products for better serve to customers, it was not
possible to keep the standards stability due to manual operations. In designing mega dairy,
Bamul looked towards an automated system that would allow it to achieve consistent quality
parameters for each product. Energy and manpower would also be more effectively optimized
and controlled and all plant equipment would be integrated.
TECHNICAL INPUT SERVICES:
Bangalore Milk Union is providing various Technical Input & Extension Services to the milk
producer members & their Dairy animals through TWELVE Camp Offices situated in each Taluk
i.e., Anekal, Bangalore East, Bangalore South, Yelahanka (Bangalore North), Channapattana,
Devanahalli, Doddaballapura, Hosakote, Kanakapura, Solur (Magadi), Nelamangala &
Ramanagara. From these camps the Technical Input services like Weekly Mobile Veterinary
Service, Emergency Veterinary Service, Artificial Insemination Service, Periodical Vaccinations,
Balanced Cattle Feed Sales, Mineral Mixture Sales, Fodder development and Fodder Seed
Production, Clean Milk Production practices, Extension Services for Cattle Feeding, breeding,
insurance and milk production etc., will be carried over.
ANIMAL HEALTH AND OTHER ACTIVITIES ANIMAL
HEALTH:
The Union is taking special care to promote the health of the cattle of member milk producers.
Veterinary facilities have been extended to all the MPCS. Mobile veterinary routes, emergency
veterinary routes, Health camps, vaccination against foot & mouth disease and thaileriosis
diseases, etc., are being regularly done. Regularly Deworming is also done for the cattle. There
is also a backup of First Aid Services to needy MPCS‟s.

18
Particulars 2010-11 2011-12 2012-13 2013-14 2014-15 2015-16
MVR Cases Treated 43761 171613 251925 246788 205628 84888
Health Camp cases Treated 118307 - - -
Emergency Cases Treated 74773 88440 96617 92978 122545 90206
F& M Vaccination 528259 506479 757432 789648 - -
Rakshavac 26227 22176 21548 29980 - -
Till Oct‟15
ARTIFICIAL INSEMINATION :
Artificial Insemination (AI) has been the main functional tool in dictating this upsurge of
development of Dairying in Bamul. Farmers have taken up cross-breeding from way back in
1962. The Union has surveyed and appropriately located AI centers based on cattle population.
It is also popularized the idea of cluster AI centers and replace the Single AI centers in a phased
manner. The use of progeny tested semen from “Nandini Sperm Station” is also giving a further
boost to the breeding activities.
Particulars 2010-11 2011-12 2012-13 2013-14 2014-15 2015-16
Single AI Centers 259 242 241 241 262 260
AI Done Single 115521 110780 109822 109933 122649 74537Cluster AI
Centers 101 111 114 118 127 127
AI Done Clusters 195645 221761 261439 287774 315708 221747
Total AI Done 311166 332541 371261 397707 438357 296284
Total PD Done 232556 267275 310596 353580 372764 231489
*Till Oct‟15
To reduce infertility in cattle, a frontal attack has been continuously attempted by conducting
Special Infertility Camps under the expert guidance and by the use of infertility connected drugs.
During 1999-2000, a Vertical Silo of 10,000 liter capacity for storing Liquid Nitrogen has been
installed under TMDD program in collaboration with National Dairy Development Board and
Karnataka Milk Federation. In addition this facility is being used for supplying liquid nitrogen to
neighboring Unions and also to Department of Animal Husbandry. This has helped in protecting
the quality of semen straws, thereby considerably increasing the probability of conception during
artificial insemination of cattle.
CATTLE FEED & FODDER DEVELOPMNET:
The Union is implementing several programs to increase milk production and also to reduce the
cost of milk production in the milk shed area. Balanced cattle feed is being procured from the
Cattle Feed Plants of KMF for distribution among member producers.

19
Fodder seeds are distributed to member producers at subsidized rates. In addition to this,
technical advice, Silage Demonstrations, Azzolla Demonstrations and Straw Treatment
Demonstrations are also being conducted at MPCS level. Chaff Cutters are supplied at
subsidized rates.
Cattle Feed Sales:
Particulars 2010-11 2011-12 2012-13 2013-14 2014-15 2015-16
CF Sales (in MT’s) 40529 45233 45870 46271 57264 43822
A Seed Processing plant was commissioned at Rajankunte by investing Rs. 41 lakhs. The Union
is catering to the Seed production needs of many Unions in Karnataka and also of Southern India.
YASHASVINI HEALTH INSURANCE:
Yashasvini Health Insurance Scheme was muted by Government of Karnataka during the year
2013-14. This scheme was implemented by Co-operative department, Members of Co-operative
Societies and their family members are the beneficiaries of this scheme. The annual premium is
Rs. 250/- per beneficiary. All major hospitals are adopted for this scheme, all types of surgery
will be covered under this health scheme. Bangalore Milk union has covered 2.41 Lakh
beneficiaries under this scheme by contributing Rs 50/- towards premium per beneficiary.
CATTLE INSURANCE:
Bangalore Milk Union is providing Insurance Coverage to the Dairy animals in collaboration
with United India Insurance Ltd., 1,37,853 animals are covered under this Insurance. The annual
premium is 2.60% of the value of the animal. 50% of the annual premium of Rs. 112.01 Lakh
was borne by bamul.
FINANCE:

20
1278.94 1487.17 1728.021813.37
2494.51
3844.17
0
500
1000
1500
2000
2500
3000
3500
4000
4500
2009-10 2010-11 2011-12 2012-13 2013-14 2014-15
Share Capital (in Lakh Rupees)
5663369828
8821696597
124450139996
2009-10 2010-11 2011-12 2012-2013 2013-2014 2014-15
Annual Turn-over (in Lakh Rupees)
279.32 216.89486.25 521.83
3203
748.61
2009-10 2010-11 2011-12 2012-13 2013-14 2014-15
NET PROFIT (In Lakh Rupees)

21
IN Future:
We want to become not only the largest Union, but also become one amongst the best-run milk
unions in the country. The Union is aware of the challenges of the new private entrants, who are
mainly thriving on unfair trade practices.They procure milk at least cost, without bothering about
the welfare of the producers and without extending any technical inputs for improving milk
production.They market milk by resorting to unhealthy and unethical practices deceiving the
unsuspecting consumers. The Union wants to counter this in a positive manner by trying to
improve its efficiency of operation and market promotion. It wants to become well trenched in

22
the market as market leader. It wants to follow the strategy of cost-competitiveness, which is
hard to match by the competitors.
PROGRESS AND ACHIEVEMENT OF THE UNION
SINCE ITS INCEPTION:
1. Establishment of the Union:
Bangalore Co-operative Milk Producers’ Societies Union Ltd. was established on 16th
November 1976.
After the bifurcation of the above Union, into two separate union for Bangalore Districts
(Urban and Rural) and Kolar District, Bangalore Urban and Rural District Co-operative Milk
Producers‟ Societies Union Ltd. (BAMUL) on 23rd
March 1987.
Bangalore Dairy was took over by BAMUL on 1st September 1988.
Bangalore Mega Dairy started functioning on 17th
December 2000
MMPO-1992 Registration No 42/R.MMPO/93
Bangalore Dairy ISO 22000-2005 & ISO 9001-2000 Certified by Standard Australia
International (SAI) Global Ltd., a reputed Australian based company during 2006.
2. Infrastructure at the time of inception & subsequent expansion –
year-wise in terms of the following:
A. Capacity of the Dairy and Chilling Centers
1. Main Dairy
Milk Processing capacity was 60,000 Liters per day (LPD) at the time of establishment of
the dairy on 23rd
January 1965.
Milk Processing capacity was expanded to 1.5 lakh LPD on 1st February 1981.
Milk Processing capacity was expanded to 3.5 lakh LPD during 1994.
Milk Processing capacity of 6,00,000 Liters per day (LPD) fully automated Mega Dairy
started functioning from 17th
December 2000.
Converted the old building as a Product Block during 2002.
a. Anekal Chilling Center
Anekal Chilling Center was started on 12th
September 1964 with a milk chilling capacity
of 20,000 LPD.
Later the milk chilling capacity was expanded to 60,000 LPD on 28th
February 1999.

23
b. Byrapatna Chilling Center
Byrapatna Chilling Center was started on 19th
May 1962 with a milk chilling capacity of
20,000 LPD.
Later the milk chilling capacity was expanded to 60,000 LPD
c. Doddaballapur Chilling Center
Doddaballapur Chilling Center was started on 5th
January 1967 with a milk chilling
capacity of 20,000 LPD.
Later the milk chilling capacity was expanded to 60,000 LPD
d. Vijayapura Chilling Center
Vijayapura CC was established on 1st February 1995 with a milk chilling capacity of 1
lakh LPD.
e. Solur Chilling Center
Solur Chilling Center was established on 31st January 1999 with a milk chilling capacity
of 60,000 LPD.
f. Hoskote Chilling Center
Hoskote Chilling Center was commissioned on 29th
March 2000 with a milk chilling
capacity of 1.5 lakh LPD.
h. Kanakapura Chilling Center
Kanakapura Chilling Center was commissioned on 1st October 2004 with milk chilling
capacity of 60,000 LPD.
NEW PROJECTS:
Refrigeration expansion at Main Dairy with investment of Rs.700 lakhs.
To process and handle the present surplus milk a mega dairy of 5 lakh ltrs capacity is
proposed in Ramanagara district.
To process the entire milk procured by 2025, second mega dairy of 5 Lakh ltrs capacity is
proposed in Bangalore Urban District.
Implementation of NDP-1 (RBP- outlay Rs.357.72 lakhs , VBMPS- outlay Rs.4046.2 lakhs
& FD – Outlay Rs.172 lakhs)
Soluru, DB Pura, Kanakapura and Anekal Chilling Centers Up gradation are under progress..
Hosakote Dairy with processing capacity of 200 TLPD expandable to 300 TLPD with an
investment of Rs. 3866 Lakhs.
New Milk Product Block at Bangalore Dairy with an investment of Rs. 2732 Lakhs
New Curd Block Capacity of 2 Lakh ltrs with an investment of Rs 1000 Lakhs entrusted to
KMF on turnkey basis.

24
Proposal has been sent to KMF for new Byrapatna Chilling Centre of capacity 1 lakh ltrs
with an investment of 900 lakhs.
Proposal has been sent to KMF for UHT plant at BAMUL premises
8 Bulk Milk Coolers - under process by Union„s own funds.
Up gradation of Mega Dairy plant with Milk pasteurizer, cream separator and HMST
transfer line to process to 2.5 Lakh ltrs of milk.
VARIOUS SUBSIDIES/ INCENTIVES EXTENDED FOR
PRODUCTION ENHANCEMENT:
Rs. 2,50,000 grant for construction of new MPCS building.
Milk bill Advance- Interest free up to 1.5 lacs
Books and materials for commissioning of new MPCS
Furniture grant of Rs.10,500 for new MPCS
Maintenance charges for BMCs
Quality Incentives for MPCS staff
Subsidy of Rs.50/ for General & low income group and Rs.40 for SC/ST members for
yashashwini health insurance.
Subsidy of Rs.5/Semen straw and free supply of LN2 and sheaths for A.I work
A.I (Rs.10) &Calf born (Rs.10) incentives for A.I workers
Free Periodic Mass Deworming Program
Chaff cutters- 50% subsidy
Milking Machines-50% subsidy
Cattle insurance – 50% premium subsidy.
OTHER SERVICES:
Incentives to milk producers Rs.4/lit by GOK
Progeny Testing Scheme under NDDB and KMF
Ration Balancing Program & FD under NDP-1 by GOI
Calf Rearing Scheme under GOI / RKVY
Yashaswini Health Insurance under GOK
Subsidy towards Janashree Bheema Yojane-GOI
GOI Sponsored STEP Program
Farmers Orientation Program
Clean Milk Production Awareness Program
Training Programs to MPCS Staff, Managing Committee Members & Producers In KMF
CTI.

25
Competitors:
The success of each and every business unit is mainly depending on how brilliantly it faces the
competitions Mother dairy is not out of completion it has 80% market share in Bangalore &
Presently it is the brand leader for milk products. The main competitors to Mother Dairy are:
Heritage
Arogya
Good Morning
Swastik
amul
Vision, Mission and Quality policy:
Vision:
Model Co-operative in the Country:
To march forward with a missionary zeal which will make KMF a trailblazer of
exemplary performance and achievements beckoning other Milk Federations in the
country in pursuit of total emulation of its good deeds.
To ensure prosperity of the rural Milk producers who are ultimate owners of the
Federation.
To promote producer oriented viable cooperative society to impart an impetus to the
rural income, dairy productivity and rural employment.
To abridge the gap between price of milk procurement and sale price.
To develop business acumen in marketing and trading disciplines so as to serve
consumers with quality milk, give a fillip to the income of milk producers.
To compete with MNCs and Private Dairies with better quality of milk and milk
products and in the process sustain invincibility of cooperatives.

26
MISSION:
Ushering Rural Prosperity in the Lives of Member Milk Producers.
Heralding economic, social and cultural prosperity in the lives of our milk
producer members by promoting vibrant, self-sustaining and holistic cooperative
dairy development in Karnataka State
To provide good quality milk and milk products to the people,keeping in mind milk is
basic requirement of every individual
Quality policies:
During the last ten years, the Federation is giving greater emphasis on procuring quality milk
from DCSs under the concept of “Quality Excellence from Cow to Consumer”. Many
Clean Milk Production (CMP) initiatives have been implemented at all the stages of
procurement, processing and marketing. Among these CMP initiatives, noteworthy initiative
is the setting up of Community Milking Parlours in villages.
The KMF is forerunner to introduce this innovative technological initiative for bringing
about revolutionary improvement in quality of milk collected in DCSs. This system has
several advantages such as elimination of mastitis in milch animals and improvement of
productivity. The milk from milking machines, collected through Automatic Computerized
Milk Collection Units is chilled directly in Bulk Milk Coolers. This chilled raw milk,
untouched and unadulterated by human hands, has very high microbiological quality,
comparable to international standards. This high quality milk is being utilized for
manufacturing high quality value added milk products, for both domestic as well as
international markets.
Other Clean Milk Production (CMP) Initiatives include:
Training of milk producers on modern dairy husbandry practices and CMP.
Providing SS utensils, antiseptic solutions for udder cleaning on pre and post milking,
etc. to producers.
Training to DCS staff and officers of the Unions on CMP.
Replacing Aluminium milk cans and collection vessels with SS –304.
Posters, documentary films and booklets on Clean Milk Production.

27
Product profile:
Nandini milk products:
Nandini pasteurised toned milk:
Curd :
Nandini curd:

28
Nandini ghee and butter products:
Nandini sweets:
Ghee in standy Pouches Butter Salted & Unsalted Ghee in Bag
Ghee in Pet Jar Ghee in Sachet
Mysore pak Premium cashew burfi Pure milk peda

29
Manufacturing Process (Butter)
In the manufacturing of butter cream is separated from milk with the centrifugal action.
Cream is separated and thereafter acidity and other properties are tested. Then neutralization
is done to adjust the acidity of cream to keep pH 6.8-7.0 by addition of alkaline salts like
calcium oxide, calcium hydroxide, calcium carbonate, magnesium oxide and other salts.
Pasteurization of the cream is done after neutralization to improve its keeping quality as long
as standard requires. Milk is kept at 165oF for 30 minutes for removal of cream by using a
vacuum chamber in conjunction with pasteurization. After pasteurization, cream is
immediately cooled, upto 68-72oF, 5-10% of the starter is added. Keeping cream at 70oF for
several hours a fermentation takes place. A characteristic flavour and aroma will be imported
for the cream to be carried into the resulting butter.
Nandini dharwad peda Nandini khova Nandini paneer

30
Colour of butter depends upon the season. It is therefore a standard practice to add edible
colours to cream before churning, usually based on flavour, odour, acidity and appearance.
After adding these ingredients butter is cut into desirable size and packing of pieces is done,
it is placed at low temperature in cold storage.
MILK POWDER MANUFACTURING PROCESS:
SEPARATION / STANDARDIZATION:
The conventional process for the production of milk powders starts with taking the raw milk
received at the dairy factory and pasteurising and separating it into skim milk and cream
using a centrifugal cream separator. If WMP is to be manufactured, a portion of the cream is
added back to the skim milk to produce a milk with a standardised fat content (typically 26-
30% fat in the powder). Surplus cream is used to make butter or anhydrous milkfat.
PREHEATING:
The next step in the process is "preheating" during which the standardised milk is heated to

31
temperatures between 75 and 120_C and held for a specified time from a few seconds up to
several minutes (cf. pasteurisation: 72_C for 15 s). Preheating causes a controlled
denaturation of the whey proteins in the milk and it destroys bacteria, inactivates enzymes,
generates natural antioxidants and imparts heat stability. The exact heating/holding regime
depends on the type of product and its intended end-use. High preheats in WMP are
associated with improved keeping quality but reduced solubility. Preheating may be either
indirect (via heat exchangers), or direct (via steam injection or infusion into the product), or a
mixture of the two. Indirect heaters generally use waste heat from other parts of the process
as an energy saving measure.
EVAPORATION:
In the evaporator the preheated milk is concentrated in stages or "effects" from around 9.0%
total solids content for skim milk and 13% for whole milk, up to 45-52% total solids. This is
achieved by boiling the milk under a vacuum at temperatures below 72_C in a falling film
on the inside of vertical tubes, and removing the water as vapour. This vapour, which may be
mechanically or thermally compressed, is then used to heat the milk in the next effect of the
evaporator which may be operated at a lower pressure and temperature than the preceding
effect. Modern plants may have up to seven effects for maximum energy efficiency. More
than 85% of the water in the milk may be removed in the evaporator. Evaporators are
extremely noisy because of the large quantity of water vapour travelling at very high speeds
inside the tubes.
SPRAY DRYING:
Spray drying involves atomising the milk concentrate from the evaporator into fine droplets.
This is done inside a large drying chamber in a flow of hot air (up to 200_C) using either a
spinning disk atomiser or a series of high pressure nozzles. The milk droplets are cooled by
evaporation and they never reach the temperature of the air. The concentrate may be heated
prior to atomisation to reduce its viscosity and to increase the energy available for drying.
Much of the remaining water is evaporated in the drying chamber, leaving a fine powder of
around 6% moisture content with a mean particle size typically of < 0.1 mm diameter. Final
or "secondary" drying takes place in a fluid bed, or in a series of such beds, in which hot air

32
is blown through a layer of fluidised powder removing water to give product with a moisture
content of 2-4%. Precautions must be taken to prevent fires and to vent dust explosions
should they occur in the drying chamber or elsewhere. Such explosions can be extremely
dangerous to life, property and markets.
PACKAGING AND STORAGE:
Milk powders are immensely more stable than fresh milk but protection from moisture,
oxygen, light and heat is needed in order to maintain their quality and shelf life. Milk
powders readily take up moisture from the air, leading to a rapid loss of quality and caking or
lumping. The fat in WMPs can react with oxygen in the air to give off-flavours, especially at
higher storage temperatures (> 30_C) typical of the tropics.
Milk powder is packed into either plastic-lined multi-wall bags (25 kg) or bulk bins
(_ 600 kg). WMPs are often packed under nitrogen gas to protect the product from oxidation
and to maintain their flavour and extend their keeping quality. Packaging is chosen to
provide a barrier to moisture, oxygen and light. Bags generally consist of several layers to
provide strength and the necessary barrier properties. Shipments of milk powder should
never suffer prolonged exposure to direct sunshine especially in tropical countries. A few
hours at elevated temperatures (> 40_C) during transshipment can negate many weeks of
careful storage.
AGGLOMERATED POWDERS:
Standard powders, because of their fine dusty nature, do not reconstitute well in water.
"Agglomerated" and "instant" powders were specifically developed to counter this. The
manufacture of an agglomerated powder initially follows the standard process of evaporation
and drying, described above. However, during spray drying small particles of powder
leaving the drier (the "fines") are recovered in cyclones and returned to the drying chamber in
the close proximity of the atomiser. The wet concentrate droplets collide with the fines and
stick together, forming larger (0.1-0.3 mm), irregular shaped "agglomerates". Agglomerated
powders disperse in water more rapidly and are less dusty and easier to handle than standard

33
Production of Peda:
Manufacturing process:
It is one of the sweets prepared.
Only milk and sugar that is nearly 7% of sugar and only whole milk is added.
For every batch 1 -1.45minutes time is taken.
Yield is 23-24%.
Peda contract Packing is done 250gm, 1kg, 10kg, and 20kgs.
Production of khova:
Khova is prepared without addition of sugar.
The yield is 16%.
There is rapid agitation.
Dehydration of moisture.
Vaporization takes pace.
Steam is operated and circulated.
Agitation will be more in the final stage.

34
Organizational structure:
C
Managing director
General manager
Marketing Administration Finance P & I QC Production Purchase
/sales
Manager
Deputy
manager
Assistant
manager
Zonal
officer
Super-
intendent
Marketing
assistant
Deputy
manager
Assistant
manager
Administrative
assistant-II
Administrative
assistant-I
Super-
intendent
AO/PRO/
PS/TO
manager
Deputy
manager
Assistant
manager
Accounts
officer
Super-
intendent
AA-
I/II/III
Manager
extension
officer
Assistant
manager
Super-
intendent
Deputy
manager
AA-
I/II/III
Chemist I
Technical
officer
Assistant
manager
Deputy
Manager
Manager
r
Chemist II
Chemist
Technical
manager
Assistant
manager
Deputy
manager
Manage
r
Assistant
manager
Deputy
manager
manager
Dairy
operators
PO/SO
Super-
intenden
t
AA-
I/II/III

35
Key Functional Areas:
1. PURCHASE DEPARTMENT
PURCHASE DEPARTMENT STRUCTURE
This is fact that, every organization requires material during functioning. Hence purchase
department fulfill all the material needed for each and every department.
General Manager
Deputy Manager
Assistant Manager
Purchase/Store
Officer
Superintendent
Account Assistant I
Account Assistant II
Account Assistant III

36
BAMUL has a centralized purchase department headed by a well experienced and qualified
purchase officer/purchase manager who in turn is assisted by assistant manager.
If the materials to be purchased are less than worth purees one lakh, the quotations are
collected from suppliers or the enquirer of Bamul. If the quality of the material is at par, the
purchase committee negotiates the price with the supplier. The purchase committee
comprising of managing director and section heads of each departments.
If the materials purchased are more than worth Rs 1 lkh, a tender notice is published in a
leading daily newspaper. The producer to bit for the tender is mentioned in the notice itself
and selection of the supplier is done on the basis of low-bid with the necessary condition that
the material complies as per the desired quality.
TERMS AND CONDITIONS:
Price: No enhancement in price during this contract will be allowed. Taxes and duties,
specifically agreed will be paid to the supplier on production of relevant certificates.
The Bamul reserves the right to cancel the order. If the cancellation of order is due to
noncompliance by the suppliers then the supplier shall be responsible for any direct
and indirect loss that Bamul may suffer in making alternative arrangements for the
materials, without prejudicing to the Bangalore dairy‟s right to over liquidated
damages.
The materials will be subject to test and inspection by the bamul the decision of
Bamul as to rejection of the materials shall be final and binding on the supplier.
The supplier shall be responsible for any defects in the materials that may develop
when they are used arising from faulty materials, workmanship or otherwise.
Rejections: Any materials rejected by Bamul, shall be collected by the supplier and
removed within 15days from the date of receipt of information of such rejection at
their risk and costing to the materials.
Risk: The materials shall be supplied at the risk of the supplier.
Sample: Sample has to be submitted by the supplier whenever asked for free of cost.
FUNCTIONS OF PURCHASE DEPARTMENT:

37
Evaluating and rating of suppliers.
Selecting of suppliers.
Finalization of terms of purchase.
Placement of purchase orders.
Follow-up
Approval of payment to suppliers.
2. PRODUCTION DEPARTMENT
PRODUCTION DEPARTMENT STRUCTURE
Objective:
Execute co-ordinate, organize and monitor the production activities.
Increase the input as for as possible.
Deputy Manager
Assistant Manager
Technical Manager
Chemists
Dairy Reports
General Manager

38
Decrease the cost of production and wastages in production as much as possible.
Ensure process, control and quality of products manufactured.
Also ensure that the production meets the planned requirements within stipulated
time.
Functions:
.Maintain and produce the standard quality products.
Cost of production
Using of advanced technology.
Maintain inventory of both raw materials and finished products.
Produce different quality products to meet the market needs and wants
3. MARKETING DEPARTMENT:
Marketing Department structure
Deputy Manager
Assistant Manager
Zonal Officer
Superintendent
Marketing Assistant
General Manager

39
MILK PRODUCTS MARKETING:
The products produced has to reach to its end consumers in a good quantity so the marketing
department has a vital role at BAMUL. Even though the production department produces the
product they have to know the quality of their product. To the entire Bangalore city and to
other states BAMUL is marketing its milk products through 148 distribution routes. The
volume of sales plays a critical role in determining cost. Milk products have been distributed
twice in a day that is in morning and in afternoon. The distribution routes are allotted to other
basis of quantity of milk products or the number of creates in geographically convenient
pattern.
OBJECTIVES OF MARKETING DEPARTMENTS:
To meet the expectation of the customers.
The integrated business plan of union is to achieve the sales target.
Undertake promotional activities in order to create awareness about the product.
Channel members needs are fulfilled.
Nandini products are known to occupy their leadership in the market.
They make the payment through to identical ways that is through cheque and cash. In cheque
there should be at least minimum deposit of Rs.45,000 in order to achieve this scheme. The
cheque received by the dairy are presented in their concerned banks and if it is bounced
necessary action will be taken. In cash basis the minimum deposit is Rs.15,000.according to
this agents make there payments incase if the agent fails the next day the milk supply is
stopped. Agents are the retailers who make the orders in bulk.
The wholesalers are the intermediates who will purchases in large quantity. Usually dairy
supplies the milk and other products in the quality prescribed by distributors.
Promotions:
They have a good brand loyalty among the consumers for media of Promotional activities but
still they are struggling to occupy the market share. dairy has good market share. They spend
only a small amount of profit towards the advertisement of their products but other dairy like
KMF and mother dairy are mostly concerned in promotional activities. Through newspaper,
television etc., they promote.

40
Functions:
They conduct the market survey to analyze the consumers feedback of their product.
Required step is taken to improve market share.
Advertising the sales promotion.
4. FINANCE DEPARTMENT
FINANCE DEPARTMENT STRUCTURE
Deputy Manager
Assistant Manager
Accounts Officer
Superintendent
Account Assistant I
Account Assistant II
Account Assistant III
Deputy Manager
General manager

41
Objectives:
The main objective of finance department is as follows:
To reduce the funds and to protect the financial interest of the company.
To assess the working capital requirements.
To monitor the budget and also funds and payments.
Sources of Finance:
Finance department is the main source for any organization. In BAMUL the main source of
finance is sale realization. The analysis of financial statements is a process of evaluating
relationships between component parts of financial statements to obtain a better
understanding of the firm‟s position and performance. The portability period of other milk
products is slightly more i.e., for 3-4 months and sales are released and the money gained out
of it can be classified as long-term source of finance. Sometimes they even get grant from
government. The operating profit in the year 2004-05 has come down by 53.5% because
heavy advertising and selling expenses.
Functions:
Maintaining proper accounts for milk purchased and sold every day.
Maintaining of general ledgers and store books.
Maintaining of profit and loss account and balance sheet systematically.
Make use of available financial resources properly.
Paying taxes and insurance in time.
Maintain liquidity of assets properly to earn maximum profit.

42
5. ADMINSTRATION DEPARTMENT
Personnel Department
Functions:-
Recruit the candidates and select the suitable candidate for the job.
Conduct the training to the new employees as well as to the existing
employees.
Maintain shifts timing, etc.
Maintenance of attendance and service records
Deputy Manager
Assistant Manager
Administrative
Officer/Personal Secretary/
Time Officer/Public Relation Officer
Superintendent
Administrative Assistant GR I
Administrative Assistant GR II/ steno
SR typist
General manager

43
Recruitment policy:
Recruitment to any service or posts shall be made by direct recruitment which may
be either by competitive examination or interview or selection, which may be either
by selection on the basis of merit-cum seniority provided that that is respect of direct
recruitment to any service of post, when the method of recruitment is not specified in
rules of recruitment. Appointments for the posts shall be resaved for the members of
SC/ST CAT-I and other categories of back word classes to such extent and in such
manner as may be specified by the government under class 4 of the article 16 of
constitution of India. There is the provision even for physically handicapped and ex-
servicemen. The reservation for women shall be in accordance with the provisions of
government orders from time to time.
Few Benefits provided to employees:
Employees are provided with certain allowances.
In BAMUL they provide shift allowance to the employees.
Training is provided to all employees in their particular fields,
Half liter of milk per employee is given free flush season and at half of price
for remaining 10 months.
Cheaper rates in the canteen.
They provide tea in the break time and 1Kg ghee per year.
Training is given to all those employees appointed on direct recruitment basis. A
probationer of trainer is appointed by BAMUL to conduct the training program.
Promotion may be either through means of selection or from one cadre to higher
cadre on the basis of seniority cum merit and automatic grant of special promotion
to seniti employees if provided.
Salary to the employees include the basic pay, dear allowance and other allowance. The
termination to the employees at Bamul happens on the events of if a permanent employee
completes 58 years of age, Expired while on service, Terminated for resigned from service.

44
Functions:
Selection of the right person.
Employees are trained in an efficient manner
Good working environment
Motivation is given to the employees and benefits are provided.
Increasing the performance of employees.
Compensation
SWOT ANALYSIS:
STRENGTHS:
Wide distribution network leads to regular and timely supply.
Milk processed is local therefore reduced transportation cost.
Automated Computerized plant.
Wide product range
An ISO, HACCP, EMS certified company
Prompt consumer‟s complaint redressed.
Maintaining uniform quality
Automatic correction power factor unit
Brand loyalty among consumers

45
WEAKNESS:
Excess manpower
Less advertisement
Lack of flexibility in the system
Promotion is based on seniority
Retention of brilliant brain is difficult
OPPORTUNITIES:
Checking the processing and packing unit.
Addition of new varieties to the existing products
It has an opportunity to introduce new products like ready to eat sweets,
cheese, low fat milk chocolates and biscuits
Can expand its marketing activities all over the India
It can increase its sales and grab the unoccupied market share.
THREATS:
Irregular power shutdowns and inter-dairy competition.
Entering of MNC‟s.
Entry of loose milk providers at cheap rates.

46
Title of the study:
A study on “Marketing Strategies at Nandini milk products of BAMUL”.
Statement of the problem:
To understand and determine the marketing strategy of Nandini milk products and the
challenges faced by Nandhini. And to know the challenges.
Objectives of the study:
There were two main objectives for this study. One is primary objectives and another is
secondary objectives.
To understand the marketing strategy towards Nandini milk products.
To determine the retailers opinion on Nandini milk product and the problem faced by
them.
To get the feedback on what the consumer expects from NANDINI.
To determine the needs of the retailer.
Scope of the study:
The study relates all agents/retailers and users of NANDINI milk products in
bangalore.
Nature of the study:
A descriptive research has undertaken for the present study. Descriptive research
includes survey and facts findings of different kinds.

47
Data collection:
The present study was designed by the help of both primary and secondary
information data.
Primary data: Primary data was collected from respondents through survey
method with a structured questionnaire designed for two segments i.e. consumers as
well as retailers. A part of primary data was also collected from the marketing
department of the company.
Secondary data: The present project is framed with help of several information. The
information is from various secondary sources. These includes information about the
milk industry from journals. Also in the review of literature the different web-sites
helped a lot to get some idea for the present project. A bunch of information was
collected from various news articles and dissertation. Different libraries helped a lot
to make the base a strong one. Secondary data was also collected from various
sources for e.g. text books, periodicals, newspapers, and from various web-sites
Universe:
In case of Consumers the universe is infinite.
In case of Retailers the universe is finite.
Sampling plan:
As the universe under study was large and time was limited it was quite impossible to contact
each and every consumer of milk and also retailers of milk. So a simple survey was adopted.
The sampling plan used in the present study is as follows:
Sampling unit: The target respondents were individuals who consumes milk and milk
related products and the retailers/agents of Nandini milk products.
Sample size: Agents/Retailers:56
Consumers:100

48
Type of sampling:
Systematic sampling Technique is used for retailers wherein every 10th
retailer is being
considered out of 565 retailer outlets of NANDINI in bangalore North.
Convenient sampling technique is used for consumer where 100 consumers of the
NANDINI milk products is being considered.
Tools for data collection:
Two structured questionnaires were designed as tools for primary data collection. The
questionnaire comprised of both close and open ended question. Each questionnaire shows
the demographic characteristics of individuals consumers and as well as retailers.
Limitations of the study:
The following were the main limitations of the study:-
Most of the respondents were either busy or were unable to respond properly to the given
questionnaire.
Time was the main constraint for the present study.
The respondent‟s response to the given questionnaire was sometime biased and the study
was based on the assumptions that the information provided is correct.
The sample was restricted to only 100 due to limited time. This may be very small compare
to total universe. So the study also suffers with the limitations of the generalizing the result.
Theoretical Background of the study:

49
Introduction to marketing
Marketing is the performance of business activities that direct the flow of goods and services
from the producer to customer.
-American Marketing Association
Many organizations have involved in marketing activities to satisfy the needs and wants
of a group of customers. Now-a-days marketing is not considered as a mere physical process
or set of activities connected with the exchange of goods. It is regarded as a philosophy of
business. It is concerned with creation of customers.
It includes all those activities connected with identifying the need of the consumable and
then, organizing the according to meet the needs of the consumers.
Importance of marketing management:
Marketing management is the most important function in the business
organization.
It looks after the marketing system of the firm
It plans the develops the product on the basis of know demand.
It has to prepare appropriate marketing plans or marketing mix to achieve the
business goals.
Function of marketing management:
The function of marketing management is summarized as follows:
Determination of marketing goals
Formulation marketing plans, procedures, policies etc
Designing marketing strategies and marketing mix

50
Planning marketing programmers
Marketing is a comprehensive term and it includes all resource and a set of activities
necessary to direct and facilities the flow of goods and services from producer to consumer in
the process of distribution. Business man regards marketing as a management function to
plan, promote and deliver products to the clients or customers. Human efforts finance and
management constitute the primary resources in marketing.
Main view point’s management is as follows:
Analyzing, planning, implantation and Control programs.
Mutual and personal gain
Achieving effective response.
Modern marketing concept:
The marketing concepts evolved over a century starting from on set of industrial revolution,
production concept and selling concept, social marketing concept right up to date.
Consumer:
The term “consumer” refers to a person who buys goods or services for his personal or
household use and not resale. Consumer behaviour is the process whereby individual decide,
what, when, where, how and whom to purchase goods and services”
Consumer behaviour has been gaining importance since 1960. the growth of
consumerism and enactment of consumer legislations emphasizes the importance of
consumer behaviour study. Today the consumer behaviour is the central topic in modern
marketing. Since the ultimate aim of marketing is consumer satisfaction and profit earning.
Importance:

51
In olden days marketing was seller oriented and there was seller market. The
consumer had to purchase whatever was offered to him. They had no choice. So the study of
consumer behaviour was not important to marketers. Now things have changed modern
marketing has become consumer oriented and there is a buyer market. If the choices,
performance tastes and attitudes of the consumer are neglected.
No marketing efforts can be successful. Therefore the study of consumer behaviour is
very much essential success in business.
The study of marketing strategy is important for the following
purposes:
Production policies
Price policies
Distribution policies
Sales promotion policies exploiting marketing opportunities
Plan for customer service:
Understand customer expectations
Establish customer priority
Define service goals
Get external commitment from top to bottom
Establish service infrastructure
Develop employee through training and compensations
Measure customer satisfaction
Set customer expectation

52
Search for complainers.
Factors influencing consumer behaviour:
Consumers do not make purchase decision simply. Their buying behaviour is influenced by
culture, social, personal, and psychological determinants or factors. All these factors are
controllable and beyond the hands of a marketer. They are considered in understanding buyer
behaviour.
Determinants of consumer behaviour:
The “satisfaction of the customer “can be easily canalized studying the behaviour of the
customers. Customer Behaviour can be said to be the study of how individuals make decision
on how spend their available resources (time, money and effort) on the various consumption
Cultural factors
Religion, caste, beliefs
Social factors
Social classes
Personal factors
Age, gender, income, education, occupation
Psychological factors
Personality, learning, perception, attitude

53
related items. This simple definition of customer behaviour tells marketers to resolve every
activity around the ultimate customer and gauge their behaviour.
The behaviour of the customer helps the marketing to study, what factors influence the
decision making process of the customers. The decision making process identifies the number
of people who are involved in this process and ascribe a role of them.
All the firms have started considering “COSTUMER AS THE KING “or “QUEEN”. The
market place is flooded with many new players including the host of MNC‟s resulting is
available of more number of brands in every segment of the market. On account of this
customer stated being choosy about what to buy.

54
1. Age of the respondents
Table 1
ANALYSIS: From the total number of respondents we come to know that, maximum
number of respondents are between the age group of 31-40
Age
>40
31-40
20-30
15-20
INTERPRETATION: The above graph shows that number of respondents are in the age
group of 31-40. This Graph shows that most of the numbers of respondents are mature, and
the response given can be considered.
AGE Frequency Percent Cumulative
Percent
15-20 10 10.0 10.0
20-30
25
25.0
35.0
31-40
45
45.0
80.0
>40
20
20.0
100.0
Total
100
100.0

55
2. Occupation of the respondents
Table 2
OCCUPATION Frequency Percent Cumulative Percent
Housewife 58 58.0 58.0
Businessman 10 10.0 68.0
Employed
12 12.0 80.0
Unemployed
16 16.0 96.0
Others
4 4.0 100.0
Total
100 100.0
ANALYSIS: The above table has been designed to know about the respondent‟s occupation.
This table shows that 58% of them are housewiwes,who know the product well as they are
the one mostly using the product.
Occupation
Occupation
OthersUnemployedEmployedBusinessmanHouse Wife
Fre
quen
cy
70
60
50
40
30
20
10
0
INTERPRETATION: The above graph shows that the majority of the respondents are
housewives.

56
3. How did you come to know about Nandini milk products.
Table 3
Valid Frequency Percent Cumulative
Percent
Advertisements 28 28.0 28.0
Recommended By family
And Friends
36 36.0 64.0
Company's Promotional
Schemes
15 15.0 79.0
Others
21 21.0 100.0
Total
100 100.0
ANALYSIS: The above table is prepared to know how the respondents came to know about
the products. It can be observed that, 36% of the respondents are got the information from
family & friends, 21% of the respondents from others, 28% of the respondents have got much
more information from advertisements, & lest number of respondents ie 15%got the
information from Company's Promotional Schemes.
Promotion
Promotion
Others
Company's Promotiona
Recommended By famil
Advertisements
Fre
quen
cy
40
30
20
10
0
INTERPRETATION: The above chart shows that maximum number of respondents have
collected the information from their friends and relatives.it also shows that least no of

57
respondents got to know about the products from Company's Promotional Schemes.So, the
company need to invest more on their Promotional Schemes.
4. Why do you prefer nandini products
Table 4
Valid Frequency Percent Cumulative
Percent
Taste 52 52.0 52.0
Hygiene Packaging
14
14.0
66.0
Price
8
8.0
74.0
Quality
14
14.0
88.0
Others
12
12.0
100.0
Total
100
100.0
ANALYSIS: The above table shows that, out of 100 respondents, 52% of the respondents
like the product because of its taste, 14% of the respondents like hygiene, 8% of the
consumers prefer price,14% like it because of its quality and 12% of the respondents like
other features of the product.
Factors Influencig
Factors Influencig
OthersQualityPriceHygiene PackagingTaste
Freq
uenc
y
60
50
40
30
20
10
0
INTERPRETATION: Graph shows that, the major portion of the respondents like the
product‟s taste, and the graph also shows that company should improve the quality & packing
of the product to further satisfy consumers.
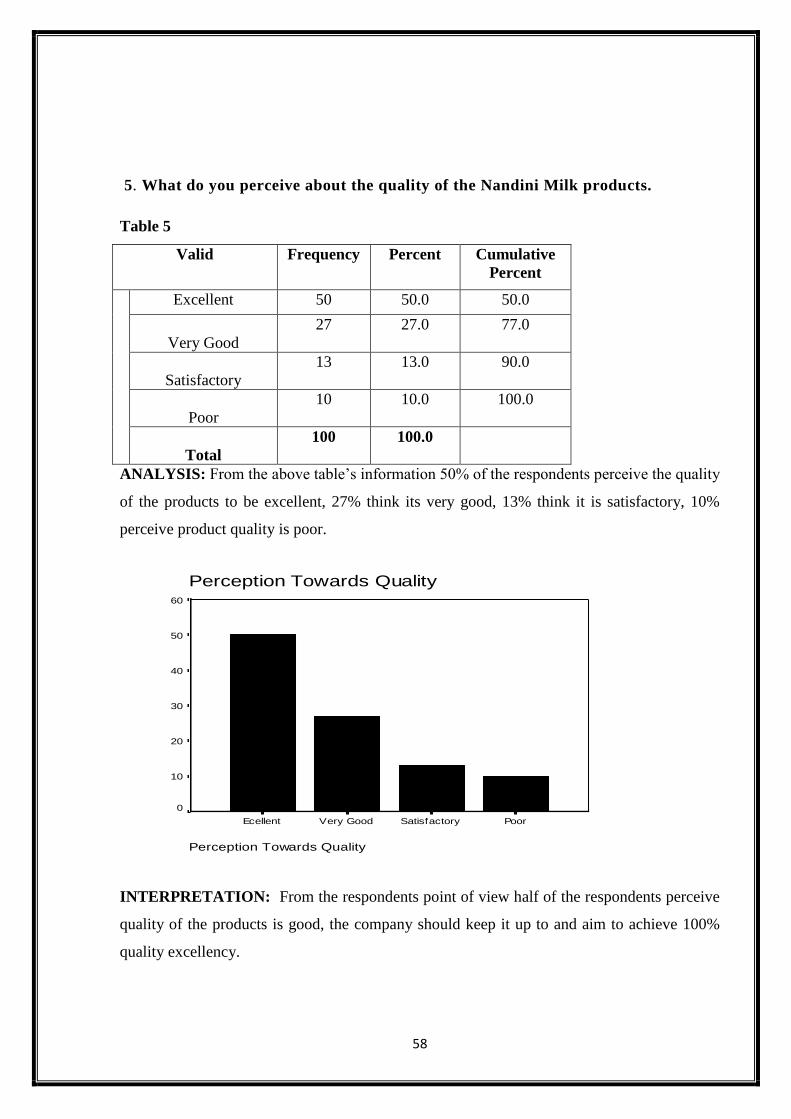
58
5. What do you perceive about the quality of the Nandini Milk products.
Table 5
Valid Frequency Percent Cumulative
Percent
Excellent 50 50.0 50.0
Very Good
27 27.0 77.0
Satisfactory
13 13.0 90.0
Poor
10 10.0 100.0
Total
100 100.0
ANALYSIS: From the above table‟s information 50% of the respondents perceive the quality
of the products to be excellent, 27% think its very good, 13% think it is satisfactory, 10%
perceive product quality is poor.
Perception Towards Quality
Perception Towards Quality
PoorSatisfactoryVery GoodEcellent
Fre
quen
cy
60
50
40
30
20
10
0
INTERPRETATION: From the respondents point of view half of the respondents perceive
quality of the products is good, the company should keep it up to and aim to achieve 100%
quality excellency.

59
6. What do you think about the pricing policy of the Nandini Milk products
Table 6
Valid Frequency Percent Cumulative
Percent
Expensive 8 8.0 8.0
Moderate
52 52.0 60.0
Reasonable
23 23.0 83.0
Cheap
17 17.0 100.0
Total
100 100.0
ANALYSIS: From the above chart out of 100 respondents 8 respondents think it is expensive
& 52 respondents feel the price is moderate & affordable, 23 respondents feel the price is
reasonable compared to other products, and the remaining of the respondents ie 17 of them
think the product is cheap.
Perception Towards Price
Perception Towards Price
CheapReasonableModerateExpensive
Fre
quen
cy
60
50
40
30
20
10
0
INTERPRETATION: Most of the respondents feel the product is affordable & lest number
of respondents think the products are expensive.

60
7. What do you feel about the packaging of the Nandini Milk products
Table 7
Valid Frequency Percent Cumulative
Percent
Exellent 8 8.0 8.0
Good
62 62.0 70.0
Average
20 20.0 90.0
Bad
10 10.0 100.0
Total
100 100.0
ANALYSIS: The above table has been designed to know the opinion about the packaging of
nandini products. From the respondents point of view 62% of the respondents feel it is good,
8% of them think it is excellent, 20% feel it is up to average, 10% feel it is bad.
Prception Towards Packaging
Prception Towards Packaging
BadAverageGoodExellent
Fre
qu
en
cy
70
60
50
40
30
20
10
0
INTERPRETATION: This graph reveals that, most of the respondents feel the packaging is
good, and only 10% of the respondents feel it is bad so it shows that company has good
packaging for their products.

61
8.Which other brand do you prefer.
Table 8
Valid Frequency Percent Cumulative
Percent
Heritage 12 12.0 12.0
Amul
42 42.0 54.0
Dodla
32 32.0 86.0
Nilgiris
14 14.0 100.0
Total
100 100.0
ANALYSIS: The above table shows that, out of 100 respondents, 12% of the respondents
would opt for heritage, 42% of the respondents would opt for amul, 32% of the respondents
would opt for dodla and 14% of the respondents would opt for nilgiris.
Preffered Other Brands
Preffered Other Brands
NilgirisDodlaAmulHeritage
Freq
uenc
y
50
40
30
20
10
0
INTERPRETATION: the above graph shoes that the majority of the respondents opt for
amul & dodla brand, these brands pose as the nearest competitors to nandini.

62
9. What do you feel about the taste of the Nandini milk Products
Table 9
Valid Frequency Percent Valid
Percent
Cumulative
Percent
Excellent 40 40.0 40.0 40.0
Good
44 44.0 44.0 84.0
Moderate
14 14.0 14.0 98.0
Bad
2 2.0 2.0 100.0
Total
100 100.0 100.0
ANALYSIS: the table shows that out of 100 respondents 40% feel that taste of the product is
excellent, 44% thin it is good, 14% feel the taste is moderate,& only 2% feel the taste is bad
Perception Towards Taste
Perception Towards Taste
BadModerateGoodExellent
Fre
quen
cy
50
40
30
20
10
0
INTERPRETATION: as the above graph shows that maximum number of the respondents
feel the taste is good and excellent and the company can use this feature in its promotional
and advertisement activities to further boost the sales of their product.

63
10. How do you find the packing of Nandini milk products
Table 10
Valid Frequency Percent Valid
Percent
Cumulative
Percent
Attractive 85 85.0 85.0 85.0
Not Attractive
15 15.0 15.0 100.0
Total
100 100.0 100.0
ANALYSIS: The above table shows the perception of the respondents towards the
attractiveness of packaging of nandini products in which we can see that out of 100
respondents 85 of them perceive the packaging is attractive and rest if them ie 15 respondents
feel the packaging to be not attractive.
Perception Towards Attarctiveness
Perception Towards Attarctiveness
Not AttractiveAttractive
Freq
uenc
y
100
80
60
40
20
0
INTERPRETATION: As maximum number of respondents perceive the product packaging
is attractive the company can continue with its packaging, and may improve to gain 100%
satisfaction.

64
11. How much satisfied are you with Nandini milk products.
Table 11
Valid Frequency Percent Cumulative
Percent
Very Satisfied 26 26.0 26.0
Satisfied
34 34.0 60.0
Fairly Satisfied
38 38.0 98.0
Not Satisfied
2 2.0 100.0
Total
100 100.0
ANALYSIS: The above table has been designed to know the satisfaction level derived by
consumers from nandini products. From the respondents point of view 26% of the
respondents are very satisfied, 34% of them are just satisfied, 38% feel the product is fairly
satisfying,and only 2% feel they are not satisfied.
Satisfaction Level
Satisfaction Level
Not SatisfiedFairly SatisfiedSatisfiedVery Satisfied
Freq
uenc
y
50
40
30
20
10
0
INTERPRETATION: The above chart shows that maximum number of respondents are
very satisfied or fairly satisfied. It also shows that very least no of respondents are not
satisfied by the product.

65
RETAILERS:
1. Since how long are you dealing with Nandini milk products.
Table 1
Period Frequency Percent Cumulative
Percent
less than 1 year 4 7.1 7.1
1-2 years
11 19.6 26.8
2-3 years
15 26.8 53.6
more than 3 years
26 46.4 100.0
Total
56 100.0
ANALYSIS: From the above table‟s information 7.1% of the respondents have been dealing
with nandini products for less than a year, 19.6% are dealing from 1-2 yrs, 26.8% are dealing
from2-3yrs,and 46.4% are maximum respondents are dealing for more than 3 years.
Period
more than 3 years
2-3 years
1-2 years
less than 1 year
INTERPRETATION: as the maximum number of respondents are dealing with the products
for more than 3 yrs they have sufficient experience of the product and the product market

66
hence, the response given by them can be considered to make the necessary changes in the
products.

67
2.What is opinion on the margin of commission given for Nandini milk products
Table 2
Margin Of
Commission
Frequency Percent Cumulative
Percent
very satisfied 15 26.8 26.8
Satisfied
17 30.4 57.1
fairly satisfied
18 32.1 89.3
not satisfied
6 10.7 100.0
Total
56 100.0
ANALYSIS: the above table is designed to show how satisfied the retailers are with
their commission.26.8%of them are very satisfied, 30.4% of them are satisfied, 32.1%
of them are fairly satisfied, and least number of retailers i .e. 10.7% of them are not
satisfied.
Margin Of Commission
Margin Of Commission
not satisfiedfairly satisfiedsatisfiedvery satisfied
Fre
qu
en
cy
20
10
0
INERPRETATION: the above graph shows that almost 90% of the retailers are
satisfied to some extent and only about 10% of them are not satisfied. We can assume
that nandini is giving its retailers a good rate of commission.

68
3. Do you find seasonal variations in demand for Nandini milk Products.
Table 3
Variation in
Demand
Frequency Percent Cumulative
Percent
Yes 6 10.7 10.7
No
50 89.3 100.0
Total
56 100.0
ANALYSIS: From the above table‟s information only 10.7% of the retailers say there are
seasonal variations in demand, and 89.3% of the respondents say they do not find any
variations in seasonal demand.
Variation in Demand
Variation in Demand
NoYes
Fre
qu
en
cy
60
50
40
30
20
10
0
INTERPRETATION: The above graph shows, what the retailers think about the seasonal
variations in Nandini products.

69
4. Are the products supplied efficiently throughout the year.
Table 4
Efficient
Supply
Frequency Percent Cumulative
Percent
Yes 48 85.7 85.7
No
8 14.3 100.0
Total
56 100.0
ANALYSIS: the above table shows the retailers‟ opinion about the efficient supply of
the products throughout the year, for which 85.7% of them say the supply is efficient
and 14.3% of them say there is no efficient supply.
Effiient Supply
Effiient Supply
NoYes
Fre
qu
en
cy
60
50
40
30
20
10
0
INTERPRETATION: the above graph shows that the company delivers its products
efficiently to most of the retailers and the company should aim to deliver its products with
same efficiency to all the retailers in all the areas.

70
5. What is your opinion on Nandini milk products.
Table 5
Opinion on Nandini
Milk Products
Frequency Percent Cumulative
Percent
Very Good 32 57.1 57.1
Average
22 39.3 96.4
Bad
2 3.6 100.0
Total
56 100.0
ANALYSIS: the above table shows the retailers opinion towards nandini milk
products in which 57.1% of them say it is very good, 39.3% of them say it is average
and only 3.6% of them say it is bad.
Opinion on Nandini Milk Products
Opinion on Nandini Milk Products
BadAverageVery Good
Fre
quen
cy
40
30
20
10
0
INTERPRETATION: the above chart shows the retailers opinion i e the whole picture of
the products that include their ,commission, storage, incentives/gifts given to them, etc. For
which out of 56 respondents 32 say it is very good, and only 2 retailers say it is bad.

71
6. Are suppliers as per schedule.
Table 6
Suppliers on
Schedule
Frequency Percent Cumulative
Percent
Yes 45 80.4 80.4
No
11 19.6 100.0
Total
56 100.0
ANALYSIS: the above table shows what the retailers feel about the timely supply of
the products for which 80% of the retailer say the suppliers are on schedule and 19.6%
of the retailers say there is no timely supply.
Suppliers on Schedule
Suppliers on Schedule
NoYes
Fre
qu
en
cy
50
40
30
20
10
0
INTERPRETATION: The above graph shows that most of the retailers i e 80.4% of them
receive their goods on schedule and 19.6% of the retailers don‟t get their products on
schedule.
The company should concentrate on the supply of their products so that both the retailer and
the company can gain from it.

72
7. What is your mode of payment.
Table 7
Mode of
Payment
Frequen
cy
Perce
nt
Cumulati
ve
Percent
Cash 56 100.0 100.0
Credit 0 0 0
ANALYSIS: The above table shows the mode of payment to the company done by the
retailers in which out of 56 retailers all the retailers prefer to pay through cash and
none of them opt for credit.
Mode of Payment
Mode of Payment
Cash
Fre
qu
en
cy
60
50
40
30
20
10
0
INTERPRETATION: As all the retailers prefer to pay in cash the company can have good
financial turn over periodically and the need to maintain records and appointing of personnel
to collect the dues from the retailers is not necessary.

73
8. If you give bulk orders will you get immediate supply.
Table 8
If Bulk Order
will you get
Immediate
Supply
Frequency Percent Cumulative
Percent
Yes 11 19.6 19.6
No
45 80.4 100.0
Total
56 100.0
ANALYSIS: The above table shows whether the company gives immediate supply if a bulk
order is placed. For which most of the respondents i.e. 80.4% say no and only 19.6% say
they get immediate supply.
INTERPRETATION: The above chart shows that only 19.6% of the retailers get immediate
supply for the bulk orders placed.
The company can concentrate on this type of bulk orders and deliver immediately so that it
encourages the retailer to place more such bulk orders and also the company can save on the
transportation expenses in this order.
11
45
yes
no
Immediate
supply

74
9. Do you come across any damaged goods
Table 9
Damage Goods Frequency Percent Cumulative
Percent
Yes 42 75.0 75.0
No
14 25.0 100.0
Total
56 100.0
ANALYSIS: The above table shows whether the retailers receive any damaged good.
For which 75% of the respondents ray they receive damaged goods and 25% of the
respondents say they do not receive any damaged goods.
INTERPRETATION: The above table shows that 75% of the retailers s receive damaged
goods the company should avoid this as the damaged goods is a loss for both the retailer and
the company. The company should improve its packing of the products to reduce this kind of
damages.
42
14
yes
no

75
FINDINGS FROM THE CONSUMERS AND RETAILERS
It was found from the survey that majority of the respondents of them are
housewives
It was found from the survey that majority of respondents are in the age
group of 31-40
The survey shows that the access to Nandini Milk is quite convenient for most
of the respondents.
The opinion about quality is excellent
Most of the respondents were influenced by the taste of the Nandini Milk
products.
More than half of the respondents of them consider the price of the Nandini
Milk products as moderate.
The packaging is viewed as good by the consumers.
Out of 100 respondents an majority of the respondents majority of them
came to know about the product by the family and the friends
Consumers consider Amul as the next better product
It was found from the survey that majority of the respondents are satisfied
by the Nandini product.

76
It was found from the survey that majority of the respondents have no
complaints from the Nandini product.
Most of the retailers are holding the dealership for more than 3 years but they
are not satisfied by the margin of commission.
Even though the supply is on time when there is a bulk order there is no back
up by the KMF.
Most of the retailers have good opinion on the nandini milk products but they
receive some damage goods.
Retailers also like consumers feel there is lack of promotion to the products
and no executive visit at all.

77
Suggestions:
“Consumer is king” is the traditional beliefs amongst the Indian businessmen. It holds good
even today and will be more so in the highly competitive days ahead. . The emphasis on
quality relates not only to product quality but also to the quality of service.
Retailers dealing with Nandini Milk Products has to be given more incentives
to push the sales of Nandini Milk Products.
Due to the increasing competition the company has to adopt new and
improved promotional strategies to attract new and retain existing customers
through better relationship with the retailers.
It is better to conduct a continuous or periodic market research to identify the
position of the market and to know about the changes what customers want in
their products.
Considering greater market demand the research suggested Nandini to adopt
middleman as well as retailer in order to proper distribution and smooth functioning
of the product in the market.
The density of milk should improve in order to get better quality of the product.
During the survey it has been observed that the purchasing decision are mostly guided
by the availability of the product. So the company has to make optimum use of its
present distribution system to make the product available through agents and retailer
outlets throughout the day, if possible.
With a view of motivating employees and agents, it is recommended that the company
provide bonus, retirement benefits and reward respectively for doing their job better.
Company should increase “Nandini Milk Products” parlor at different places of city.
As demand is more at Matikere , Mekri circle and Rajajinagar they have to give
special importance to these areas.
It has been observed that sometimes retailers suggest the consumer for buying the
particular brand because they get higher commission as compared to other brands.

78
So, it is recommended to the company that should think for giving attractive
commission to the retailers if possible, otherwise company could give some reward if
they achieve more targets.
CONCLUSION:
From the above findings we can conclude that Nandini is doing better in marketing
of the milk and milk products by keeping into consideration the aspects like price,
quality, availability but it is somewhat lacking in its promotional activities as per the
survey conducted to the retailers with regard to their perception towards Nandini
milk products in Bangalore City North . It is competing with other brands by
acquiring a greater market share so it is necessary to take the steps with regard to
promotional activities to both the retailers and consumers to build its brand name
and acquire a greater market share.

79
QUESTIONNAIRE (CONSUMERS)
I, Ms keerthi.m.s, BBM Student of “NEW HORIZON COLLEGE MARATHALLI”,
conducting study to evaluate “MARKETING STRATEGY TOWARDS NANDINI
MILK PRODUCTS” at BAMUL,
I request you to kindly spare few minutes of your schedule to answer the following
questions
1. Name: …………………………………………
2. Address: ……………………………………………………
……………………………………………………………………
3. Age:
a) 15-20 ( ) c) 31 -40( )
b) 21-30 ( ) d) <40( )
4. Occupation: ……………………………………………
a)Housewife ( ) b)Businessman ( )
c)Employed ( ) d)Un Employed ( )
5. How did you come to know about Nandini milk products.
a) Advertisement ( ) c) Companies Promotional Schemes ( )
b) Recommended by Family and friends( ) d) Others ( )
6. What do you perceive about the quality of the Nandini Milk products.
a)Excellent ( ) c)Satisfactory( )
b)Very ( ) d) Good Poor( )
7. What do you think about the pricing policy of the Nandini Milk products
a) Expensive ( ) c) Reasonable ( )
b) Moderate ( ) d) Cheap ( )
8. What do you feel about the packaging of the Nandini Milk products.

80
a)Excellent ( ) c) Average( )
b) Good ( ) d) Bad ( )
9. Which other brand do you prefer.
a) Heritage ( ) c) Dodla( )
b) Amul ( ) d) Nilgiris( )
10. What do you feel about the taste of the Nandini milk Products
a) Excellent ( ) c) Moderate( )
b) Good ( ) d) Bad( )
11. How do you find the packing of Nandini milk products
a) Attractive( )
b) Not Attractive( )
12. How much satisfied are u with Nandini milk products
a) Very Satisfied( ) c)Fairly Satisfied ( )
b) Satisfied ( ) d) Not Satisfied( )
13. Have you encountered any problem or complaints
a) Yes( )
b) No( )
If Yes nature of complaint……………………………………….
14. Has the complaint been attended successfully
a) Yes( )
b) No( )
15. Any other suggestions towards the Nandini milk Products.
DATE: SIGNATURE
PLACE:

81
QUESTIONNAIRE
FOR THE RETAILER
1. Name: …………………………………………
2. Address: ……………………………………………………
……………………………………………………………………
3. Since how long are you dealing with Nandini milk products.
a) Less than 1 year ( ) c)2-3 years ( )
b) 1-2 years ( ) d) More than 3 years (
)
4.What is opinion on the margin of commission given for Nandini milk products.
a) Very Satisfied( ) c)Fairly satisfied ( )
b) Satisfied ( ) d) Not satisfied ( )
5. Do you find seasonal variations in demand for Nandini milk Products.
a) Yes ( )
b) No ( )
6. Are the products supplied effiently throughout the year
a) Yes ( )
b) No ( )
7. What is your opinion on Nandini milk products
a) Very good ( ) c) Bad ( )
b) Average ( )
8. Are suppliers as per schedule.
a) Yes ( )
b) No ( )
9. What is your mode of payment.
a) Cash ( )
b) Credit ( )
10. If you get bulk orders will you get immediate supply.
a) Yes ( )
b) No ( )
11. Do you come across any damaged goods.
a) Yes ( )

82
b) No ( )
12. Does consumers complain about the product.
a) Yes ( )
b) No ( )
If yes what kind of
complaints……………………………………………………………………………………..
14. Does the executive visit often.
a) Very often ( ) c) Never ( )
b) Often ( )
15. Opinion on the promotional strategies of Nandini.
a) Very Good ( ) c) Bad ( )
b) Average ( )
16. How do you rate the displays and POP of BAMUL
a) Excellent ( ) c) Average( )
b) Good( )
17. What are your suggestion for the success of Nandini milk products
…………………………………………………………………………………………………
…………………………………
…………………………………………………………………………….…………
DATE;
PLACE;
SIGNATURE

83
BIBLOGRAPHY
TEXTBOOKS:
Author Title Edition Year
J C Gandhi Marketing 11th
1998
S A Shrelekar Essential of 04th
1998
Marketing
Philip Kotler Marketing 09th
1999
Management
C.N. Sontakki Marketing 01st 1999
Management
Interviews : Direct contact
Company library : BAMUL(NANDINI)
Websites : WWW.KMFNANDINI.COOP
: WWW.GOOGLE.COM