A Study on Budgetary Control System at Volvo Construction ...
85
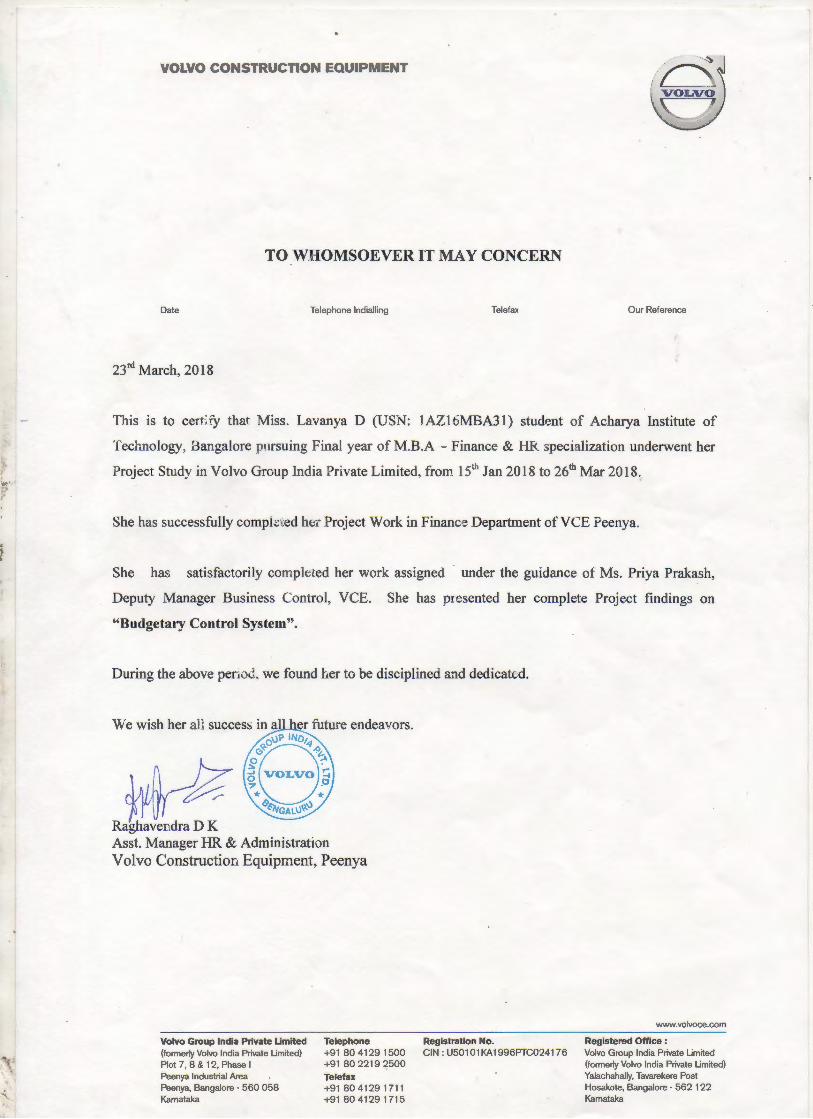
.... .. p ,. VOLVO CONSTRUCTION EQUIPMENT TO WHOMSOEVER IT MAY CONCERN Date Telephone lndialling Telefax Our Reference 23rd March, 2018 This is to cert:fy that Miss. Lavanya D (USN: 1AZ16MBA31) student of Acharya Institute of Technology, Bangalore pnrsuing Final year of M.B.A - Finance & HR :;pecialization underwent her Project Study in Volvo Group India Private Limited, from 15th Jan 2018 to 26th Mar 2018 . She has successfully comph: i: ed h<: r Project Work in Finance Department ofVCE Peenya. She has satisfactorily compk ted her work assigned under the guidance of Ms. Priya Prakash, Deputy Manager Business Control, VCE. She has presented her complete Project findings on "Budgetary Control System's. During the above peno ... ;. we found her to be disciplined and Raghavendra D K Asst. Manager HR & Administration Volvo Construction Equipment, Peenya Volvo Group India Private Umited (formerly Volvo India Private Limited) Plot 7, 8 & 12, Phase I Peenya Industrial Area Peenya, Bangalore - 560 058 Kamataka Telephone +91 80 41291500 +91 80 2219 2500 Telefax +91 80 41291711 +91 80 4129 1715 Registration No. CIN : U501 01 KA 1996 PTC024176 www.volvoce.com Registered Office : Volvo Group India Private Limited (formerly Volvo India Private Li mited) Yalachahally, Tavarekere Post Hosakote, Bangalore - 562 122 Karnataka
-
Upload
khangminh22 -
Category
Documents
-
view
4 -
download
0
Transcript of A Study on Budgetary Control System at Volvo Construction ...
...... p ,.
VOLVO CONSTRUCTION EQUIPMENT
TO WHOMSOEVER IT MAY CONCERN
Date Telephone lndialling Telefax Our Reference
23rd March, 2018
This is to cert:fy that Miss. Lavanya D (USN: 1AZ16MBA31) student of Acharya Institute of
Technology, Bangalore pnrsuing Final year of M.B.A - Finance & HR :;pecialization underwent her
Project Study in Volvo Group India Private Limited, from 15th Jan 2018 to 26th Mar 2018 ..
She has successfully comph: i:ed h<:r Project Work in Finance Department ofVCE Peenya.
She has satisfactorily compkted her work assigned under the guidance of Ms. Priya Prakash,
Deputy Manager Business Control, VCE. She has presented her complete Project findings on
"Budgetary Control System's.
During the above peno ... ;. we found her to be disciplined and dedicat~,;,d.
~ Raghavendra D K Asst. Manager HR & Administration Volvo Construction Equipment, Peenya
Volvo Group India Private Umited (formerly Volvo India Private Limited) Plot 7, 8 & 12, Phase I Peenya Industrial Area Peenya, Bangalore - 560 058 Kamataka
Telephone +91 80 41291500 +91 80 2219 2500
Telefax +91 80 41291711 +91 80 4129 1715
Registration No. CIN : U50 1 01 KA 1996PTC024176
www.volvoce.com
Registered Office : Volvo Group India Private Limited (formerly Volvo India Private Limited) Yalachahally, Tavarekere Post Hosakote, Bangalore - 562 122 Karnataka
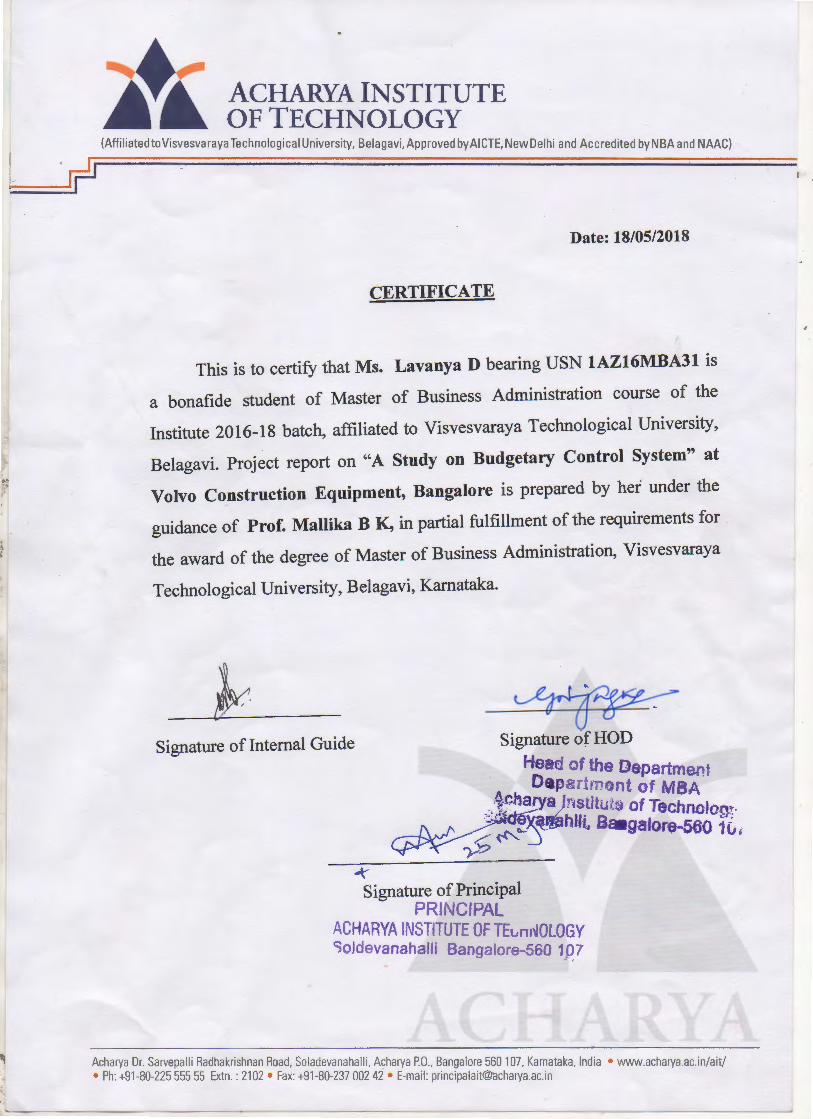
ACHARYA INSTITUTE OF TECHNOLOGY
(Affiliated to Visvesvaraya Technological University, Belagavi, Approved by AICTE, New Delhi and Accredited byNBA and NAAC)
Date: 18/05/2018
CERTIFICATE
This is to certify that Ms. Lavanya D bearing USN 1AZ16MBA31 is
a bonafide student of Master of Business Administration course of the
Institute 2016-18 batch, affiliated to Visvesvaraya Technological University,
Belagavi. Project report on "A Study on Budgetary Control System" at
Volvo Construction Equipment, Bangalore is prepared by her under the
guidance of Prof. Mallika B K, in partial fulfillment of the requirements for
the award of the degree of Master of Business Administration, Visvesvaraya
Technological University, Belagavi, Kamataka.
Signature of Internal Guide
--t
~ Signature of HOD
Head of the Departmoo* D• par!mont of MBA _,
;;:~~:~~::.:~~=n, -y'?
Signature of Principal PRINCIPAL
ACHARYA INSTITUTE OF TEvn 1~0lOGY 'Soldevanahalli Banga!ore-560 107
! charya ~r . Sarvepalli Radhakrishnan Road. _Soladevanahalli, Acharya PO .. Bangalore 560 107. Karnataka. India • www.acharya.ac.in/ait/ Ph. +91 80-225 555 55 Extn . . 2102 • Fax. +91-80-237 002 42 • E-mail: [email protected]

DECLAR.\ TIO~
I, LA V ANY A.D hereby declare that the project report titled --study on Budgetary Control
System" with reference to ··volvo Construction Equipment"", Bangalore" prepaTed by me
under the guidance of Mrs. MaHika B.K, faculty of M.B.A. Department, Acharya Institute of
technology and external assistance of Mrs. Priya Prakash, Deputy Manager, Volvo
Construction Equipment Private Ltd, Bangalore.
I also declare that this project work is towards the partial fultilment of the university
regulations for the award of degree of Master of Business Administration by Visvesvaraya
Technological University, Belgaum.
I have undergone a summer project for a period of ten weeks. I further declare that this
project is based on the original study undertaken by me and has not been submitted for the
award of any degree/Diploma from any other University I Institution.
Date: d-5 fosjo)otg
Place: B J cJ...o lS ~
Signature of Student
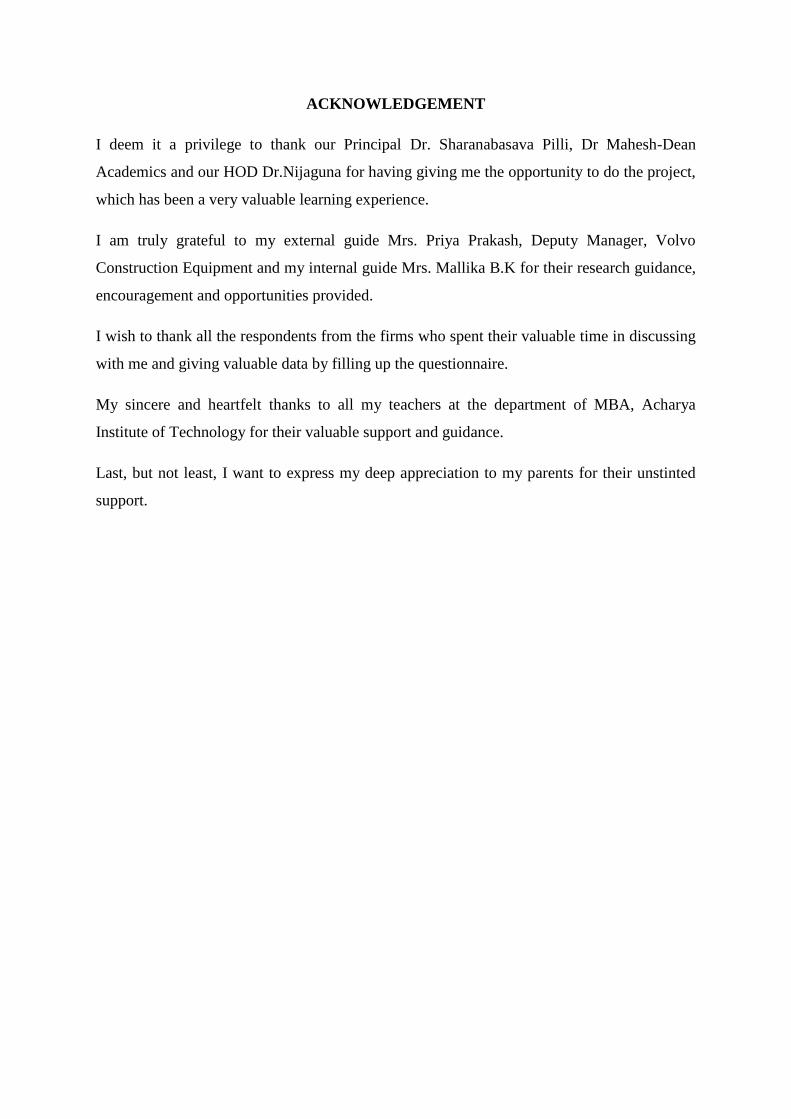
ACKNOWLEDGEMENT
I deem it a privilege to thank our Principal Dr. Sharanabasava Pilli, Dr Mahesh-Dean
Academics and our HOD Dr.Nijaguna for having giving me the opportunity to do the project,
which has been a very valuable learning experience.
I am truly grateful to my external guide Mrs. Priya Prakash, Deputy Manager, Volvo
Construction Equipment and my internal guide Mrs. Mallika B.K for their research guidance,
encouragement and opportunities provided.
I wish to thank all the respondents from the firms who spent their valuable time in discussing
with me and giving valuable data by filling up the questionnaire.
My sincere and heartfelt thanks to all my teachers at the department of MBA, Acharya
Institute of Technology for their valuable support and guidance.
Last, but not least, I want to express my deep appreciation to my parents for their unstinted
support.
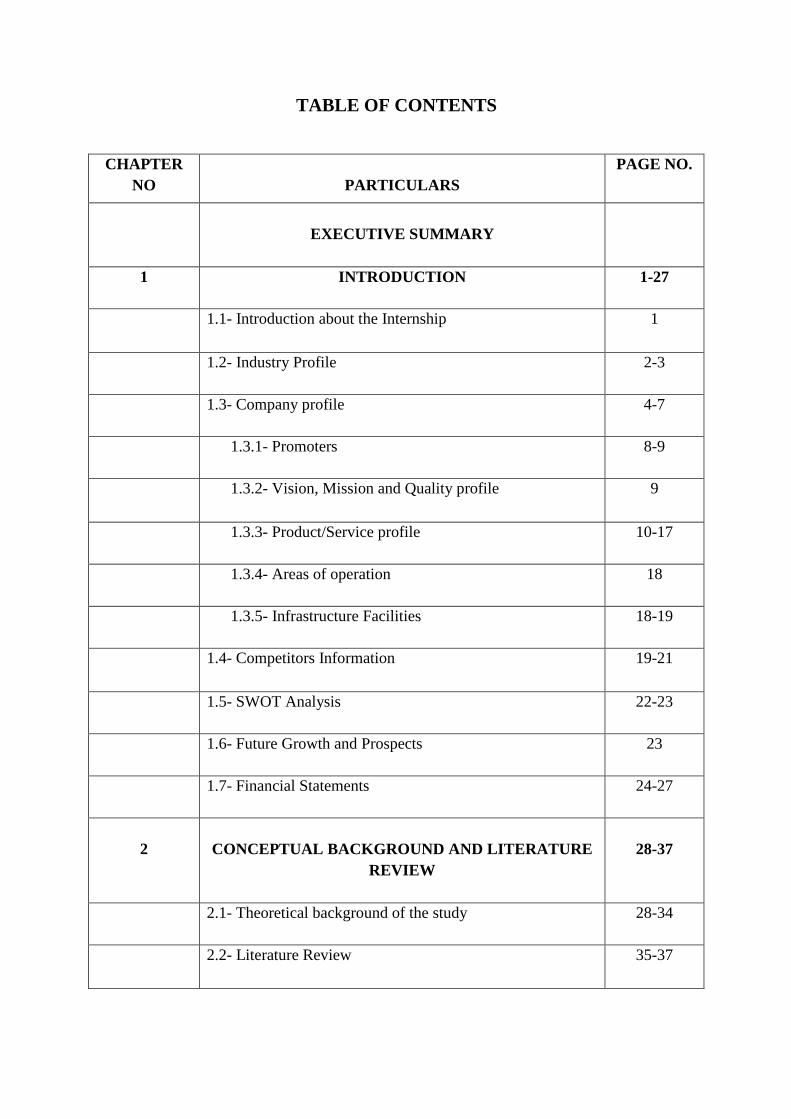
TABLE OF CONTENTS
CHAPTER
NO
PARTICULARS
PAGE NO.
EXECUTIVE SUMMARY
1 INTRODUCTION 1-27
1.1- Introduction about the Internship 1
1.2- Industry Profile 2-3
1.3- Company profile 4-7
1.3.1- Promoters 8-9
1.3.2- Vision, Mission and Quality profile 9
1.3.3- Product/Service profile 10-17
1.3.4- Areas of operation 18
1.3.5- Infrastructure Facilities 18-19
1.4- Competitors Information 19-21
1.5- SWOT Analysis 22-23
1.6- Future Growth and Prospects 23
1.7- Financial Statements 24-27
2
CONCEPTUAL BACKGROUND AND LITERATURE
REVIEW
28-37
2.1- Theoretical background of the study 28-34
2.2- Literature Review 35-37
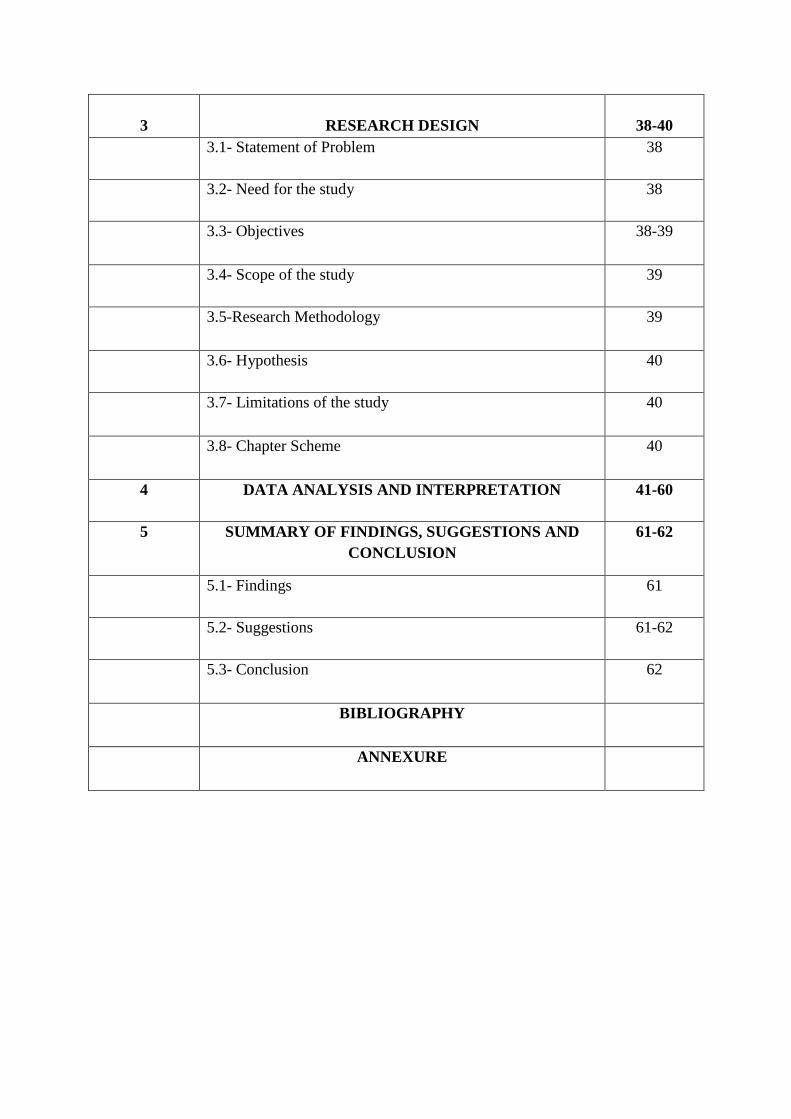
3
RESEARCH DESIGN
38-40
3.1- Statement of Problem 38
3.2- Need for the study 38
3.3- Objectives 38-39
3.4- Scope of the study 39
3.5-Research Methodology 39
3.6- Hypothesis 40
3.7- Limitations of the study 40
3.8- Chapter Scheme 40
4 DATA ANALYSIS AND INTERPRETATION 41-60
5 SUMMARY OF FINDINGS, SUGGESTIONS AND
CONCLUSION
61-62
5.1- Findings 61
5.2- Suggestions 61-62
5.3- Conclusion 62
BIBLIOGRAPHY
ANNEXURE
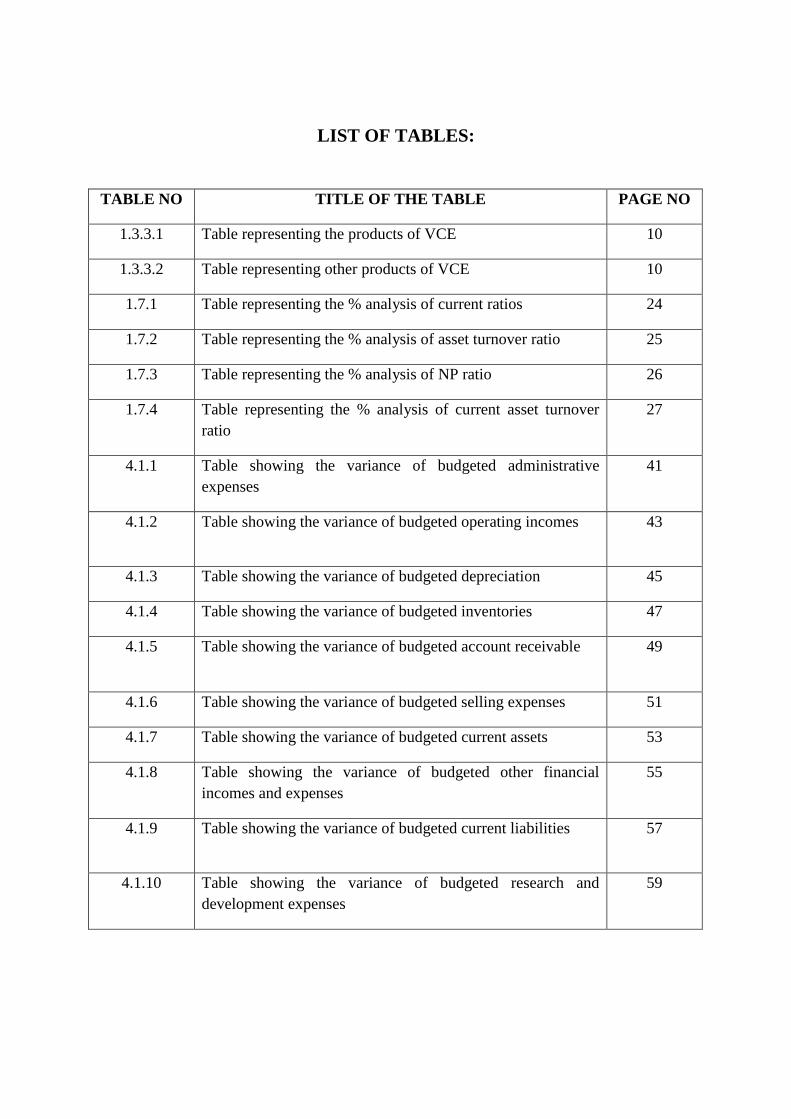
LIST OF TABLES:
TABLE NO TITLE OF THE TABLE PAGE NO
1.3.3.1 Table representing the products of VCE 10
1.3.3.2 Table representing other products of VCE 10
1.7.1 Table representing the % analysis of current ratios 24
1.7.2 Table representing the % analysis of asset turnover ratio 25
1.7.3 Table representing the % analysis of NP ratio 26
1.7.4 Table representing the % analysis of current asset turnover
ratio
27
4.1.1 Table showing the variance of budgeted administrative
expenses
41
4.1.2 Table showing the variance of budgeted operating incomes 43
4.1.3 Table showing the variance of budgeted depreciation 45
4.1.4 Table showing the variance of budgeted inventories 47
4.1.5 Table showing the variance of budgeted account receivable 49
4.1.6 Table showing the variance of budgeted selling expenses 51
4.1.7 Table showing the variance of budgeted current assets 53
4.1.8 Table showing the variance of budgeted other financial
incomes and expenses
55
4.1.9 Table showing the variance of budgeted current liabilities 57
4.1.10 Table showing the variance of budgeted research and
development expenses
59
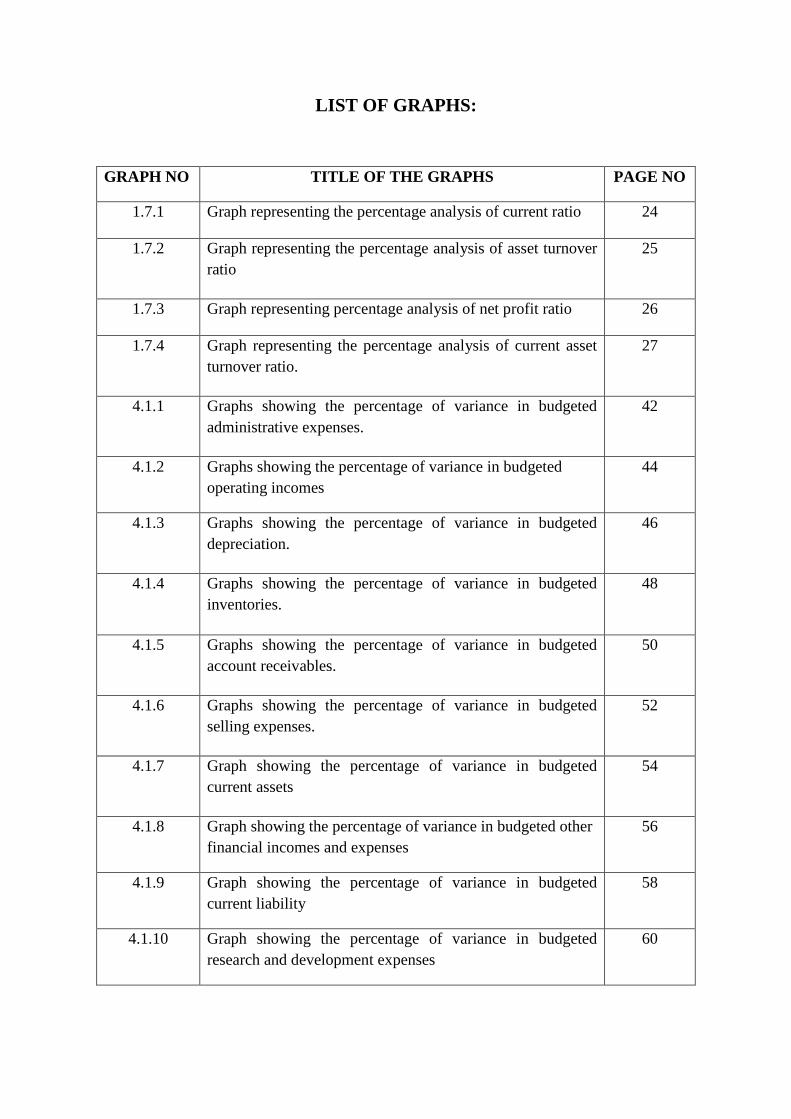
LIST OF GRAPHS:
GRAPH NO TITLE OF THE GRAPHS PAGE NO
1.7.1 Graph representing the percentage analysis of current ratio 24
1.7.2 Graph representing the percentage analysis of asset turnover
ratio
25
1.7.3 Graph representing percentage analysis of net profit ratio 26
1.7.4 Graph representing the percentage analysis of current asset
turnover ratio.
27
4.1.1 Graphs showing the percentage of variance in budgeted
administrative expenses.
42
4.1.2 Graphs showing the percentage of variance in budgeted
operating incomes
44
4.1.3 Graphs showing the percentage of variance in budgeted
depreciation.
46
4.1.4 Graphs showing the percentage of variance in budgeted
inventories.
48
4.1.5 Graphs showing the percentage of variance in budgeted
account receivables.
50
4.1.6 Graphs showing the percentage of variance in budgeted
selling expenses.
52
4.1.7 Graph showing the percentage of variance in budgeted
current assets
54
4.1.8 Graph showing the percentage of variance in budgeted other
financial incomes and expenses
56
4.1.9 Graph showing the percentage of variance in budgeted
current liability
58
4.1.10 Graph showing the percentage of variance in budgeted
research and development expenses
60
LIST OF CHARTS:
CHART NO TITLE OF THE CHART PAGE NO
1.3.1 Charts representing Volvo production system 5
1.3.2 Charts representing 5’S of Volvo 6
1.4.1 Charts representing competitor’s information 19
1.5.1 Charts representing SWOT analysis 22
2.1.1 Charts representing types of budget 29

EXECUTIVE SUMMARY
The project work for the study was done in “Volvo Construction Equipment”, Peenya,
Bengaluru. The topic selected to conduct a study on project work was “Budgetary Control
System”.
The main intention for the study of project work is to have a practical exposure related to the
topic (Budgetary Control System), To study budgetary concepts, methods and practices
adopted by the company to forecast the budget for future, to find out the loopholes and to
provide a corrective measure, and to know the benefits of Budgetary Control System.
Budget is an estimated future plan that helps that company to estimate the future cost, to
control the cost which in turn increases the profit of the company. Budgetary Control System
refers to controlling of budget by properly allocating the costs to various department and co-
ordinates among the various department.
Volvo is a Swedish Multinational company which manufactures different types of
products like trucks, buses, wheel Loaders, Pavers, etc. Volvo Construction Equipment is a
part of Volvo Group which involves in manufacture of Compactor, Paver, Excavators, Wheel
Loaders, and Volvo dumpers.
Volvo Construction Equipment has different department like purchase department, HR
department, Research and Development Department, Finance Department and Taxation
department. The company has manufacturing and consumables team. Volvo Construction
Equipment has different shops for the manufacture of the products like Assembly line,
Fabrication line, Parts Paints Shop and Touch-up Paints Shop.
The company focuses on increasing its profit by providing quality products and services.
The analysis on budgeted data with that of actuals are done to know whether the company has
achieved its targets and policies as specified earlier which increases the efficiency,
effectiveness and profitability of the business concern.
1
CHAPTER 1
INDUSTRY & COMPANY PROFILE
1.1 – INTRODUCTION
A project work is a good experience that acts as a value added to the studies. The main
aim of project work conducted was to gain a practical exposure, to study the theoretical
concept related to study, to know about the corporate policies relating
to study and to examine the policy objectives relating to the topic related.
In order to increases the efficiency and effectiveness of the business it is necessary for
the organization to maintain the available resource and to utilize them optimally. This plays a
very important role to the organization related to cost control.
Budget is a future estimated plan of expenses and incomes which the company may
incur. It helps the organization to control the cost and to increase the efficiency, effectiveness
and also profitability of the business. Budget is essential to forecast future and to see whether
the company has reached its target as specified in the budget.
Budgetary control is an act of controlling the budgets by planning, organizing, directing,
controlling and co-ordinating the required budgets among various departments in the
organization. Based on the company’s nature, the type of budgets like master budget, Fixed
budget, Flexible budget, zero based budgets, financial budget, operating budgets are selected.
It plays a very important role in planning and controlling aspects, determining the policies,
coordinates among various department, to solve discrepancies and to take necessary measures
if necessary. Budget centre, budget manual, budget committee, Budget period, etc. has to be
decided by the organization for the better implementation of the budget system in the
organization. It acts has a support system which help the companies to know its target to be
achieved.
2
1.2 - INDUSTRY PROFILE:
Volvo Construction Equipment is a manufacturing-based industry as they are the
manufacturers, suppliers and traders of pavers, compactors and excavators. The raw materials
which are required for the manufacturing of compactor, pavers and excavators are bought and
are distributed to different manufacturing units in order to obtain the finished goods.
Manufacturing unit involves fabrication line, assembly line, parts paint shop and touch up
paint shop.
Construction of equipment is one of the manufacturing sectors. Heavy power
machines are taken to perform certain specific function of construction and demolition. One
such company which emphasis on construction equipment is Volvo. It is one of the world’s
leading manufacturers of trucks, bus, drive systems for marine construction equipment, etc.
Manufacturing industry is one of the type of industry which deals with the process of
converting raw materials into semi-finished or finished goods. The finished goods obtained
can be used for sale of goods to the customers or as intermediate goods used in the process of
production.
Raw Materials Semi-finished goods Finished Goods
It plays a very important role in the industrial sector of the economy as it employs
huge labour force and produces the products which are required as per the demand, needs and
wants of the customer. These industries help in reducing unemployment problem and poverty
and also helps in bringing the foreign exchange. In today’s scenario, Manufacturing industry
is more innovative, competitive and is updated with the latest technology. Therefore, it acts
has a backbone for Indian economy.
Studies have indicated that the productivity in manufacturing industry in India is
approximately 1/5th
of the productivity in the manufacturing industry of US. Indian
manufacturing sector currently contributes 16-17% to GDP and gives employment around
12% of the country’s workforce.
3
Manufacturing starts with the process of designing the products and specification of
materials are done from which the product is made. Manufacturing used to take place more in
rural areas before the industrial revolution. The concept of manufacturing depends upon the
ideas for transforming raw materials (organic or inorganic) into products that are used by the
society.
Manufacturing industry is divided into engineering industry, construction industry,
electronics industry, chemical industry, energy industry, textile industry, food and beverage
industry, plastic industry, transportation industry and telecommunication industry. Each of
these industries have their own contribution towards the development of Indian economy.
Being a manufacturing company, a company must link their objectives with that of
their strategic business objectives. This plays a very important role for the effectiveness and
efficiency of the company. Manufacturing objectives basically states about reducing the cost,
increasing the quality of goods, increases in speed and production and flexibility to adapt
changes. This helps the company to compete with their competitor and are able to meet the
demands of the customers.
The major manufacturing companies are:
1. ITC group
2. Volvo Group
3. Ashok Leyland
4. Bajaj Auto
5. BPL group
6. Aditya Birla group
7. Apollo Tyres
8. Hindustan Lever group
9. Larsen and Lever group
10. L&T
4
1.3 - COMPANY PROFILE
The word Volvo came into existence from a Latin word which means “I roll”. Volvo
groups are a Swedish Multinational Company headquartered in Gothenburg. It focuses on
production, distribution and sale of trucks, buses and other construction equipment’s. Volvo
was started in the year 1915.Volvo trademark holding AB is owned equally by AB Volvo and
Volvo Car operation. The brand name of Volvo was originally registered as a trade mark in
May 1911 with an intention to be used for a series of SKF ball bearing. Volvo also supplies
marine and industrial drive system and provides financial services.
History of Volvo Group
Volvo as a group has diversified its business by opening its branches in different
countries. It is a leading manufacturer of automobile, marine and industrial engines, buses,
trucks, cars, construction equipment’s and also manufactures certain components for the
aerospace industry. Volvo Group has its strong brand and also has a broad coverage market.
First bus named B1 was launched in the year 1934. At the beginning of 1940’s their also
started manufacturing aircraft engines. Though Volvo was established in 1915 as a subsidiary
of AB SKF, a Swedish ball bearing manufacturer, the auto manufacturer considers itself
officially founded on 4th
April, 1927 when the first car, Volvo OV4 series, affectionately
known as “JACOB”, rolled out of the factory in Hisingen, Gothenburg.
Renault sold to Volvo during 2001 and Volvo renamed it as Renault truck in2002 and
Renault became Volvo biggest shareholder with 19.9% stake as part of the deal and later in
the year 2010, it increased the shareholding to 21.7%.
Volvo Group has approximately 115000 employees, production facility in 19 countries
and sells its products in more than 190 market. Volvo Group has grown and developed
throughout the year through the process of mergers and acquisition.
Volvo Production System
It was introduced in the year 2007. The main aim of VPS is to improve the quality,
efficiency of delivery and productivity. It is a Volvo way in action- How Volvo goes from
words to action. This system contains certain practical tools which helps the organization to
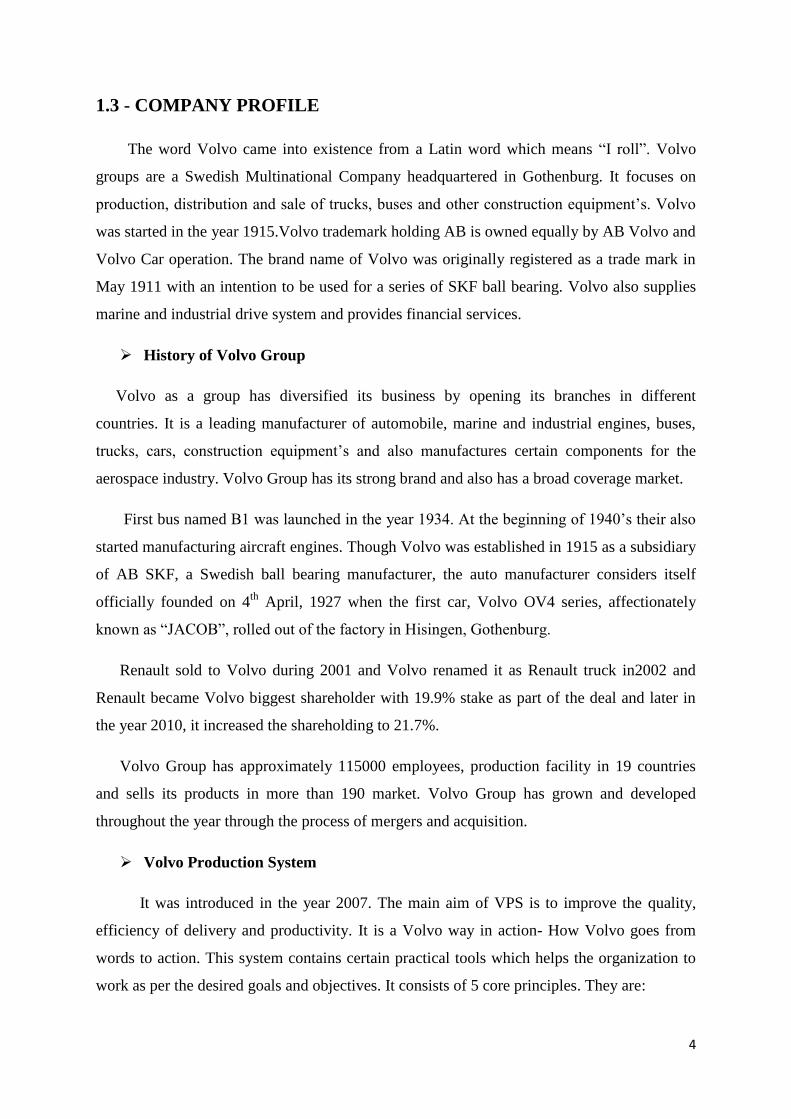
work as per the desired goals and objectives. It consists of 5 core principles. They are:
5
Chart no- 1.3.1
1. Leadership
Leadership plays a very important role in the organization. Worker are divided into
teams and are headed by the leader in order to increase the efficiency and effectiveness.
2. Safety & Health
The workers in the factory are treated as assets of the company. The premises of the
factory, assembly procedures and the process of manufacturing the products are designed
keeping safety in mind. The employees are provided with safety shoes and jackets for safety
concern.
3. Environmental Care
The company strive to minimize the waste by optimal utilization of available resources.
It is avoiding the use of chemicals. Emission norms are followed.
4. Lean Manufacturer
It is a production practice that consider the expenditure of resources for any goal either
than the creation of value for the end customer.
Core
Principles
Leadership
Safety & Health
Environmental care
Lean Manufacturer
6
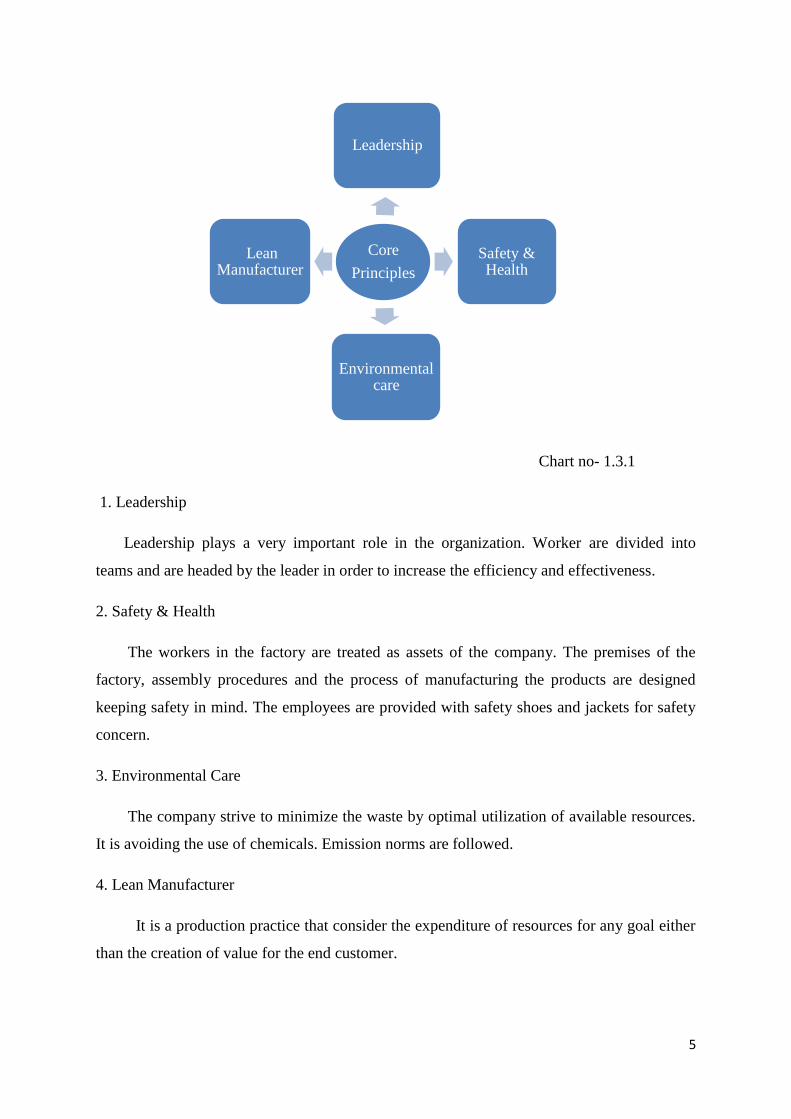
5’S of Volvo
These are the key components of establishing a visual workplace and focuses on have
visual order, organization cleanliness and standardisation. These 5’s plays a very
important role and acts as a key component for the sustainability of the organization. This
is followed in the organization in order to improve their profitability, efficiency,
effectiveness, service and safety. The 5’S are:
Chart no -1.3.2
Volvo Construction Equipment
Volvo Construction Equipment is a part of Volvo groups and is a major international
company that develops, manufactures, and markets equipment’s for the construction and
related industries. It manufactures certain products like excavators, paver, and compactors. It
has its production facilities in Sweden, USA, Brazil, France, Germany, Poland, India, China,
Russia, Korea, etc. Volvo Construction Equipment has two teams manufacturing and
consumables team and has different departments like Purchase department, Production
department, HR department, Research and development department, Finance department and
Taxation department.
5'S
SORD
SET IN ORDER
SHINE STANDARDIZE
SUSTAIN
7
Volvo construction equipment was founded by Johan Theofron Munktell and the brothers
Jean Bolinder and Carl Gerhard Bolinder. It was started in the year 1832 in Eskilstuna, which
is the oldest industrial company in the world which is still active in the construction
equipment.
Volvo Construction Equipment Pvt Ltd is a subsidiary of Volvo AB, Sweden. Volvo has
invested around 90 crores INR for plant expansion and excavator project. The facility at
peenya, Bangalore manufactures road machinery to cater primarily to Indian market and also
for exports. To meet the demands of construction industry, a new excavator assembly line
was added to the plant in September 2011.
The plant was started its operations in the year 1978 to satisfy the needs of mining
industry and road construction sector. Out of 204 permanent employees there are 144 white
collars and 60 blue collars work in the facility. Their core values are safety quality and
Environment.
Global Scenario:
The world demand is expected to grow for the construction industry for about 3.91% in
2019. The reason for these demand is government investment in development projects like oil
prices, public private partnership, industrial residential growth and global economic growth.
The construction equipment for road machinery have a huge demand in market in order to
carter the requirements of the customer.
8
1.3.1 - PROMOTERS
1. Assar Gabrielsson
Assar Gabrielsson is one of the promoters of Volvo Group. He was born in the
year 13th
August 1891. He is also co- founder of Volvo and a Swedish industrialist.
He pursued his bachelor degree in economics. He worked as a sales manager in
Gothenburg with a bearing manufacturer SKF and he is also employed as sales
manager in sales department by Bjorn Prytz and was also appointed as a sales
manager in SKF company group.
From 1956-1962, he was a chairman of board AB Volvo. Later he left his position
as a sales manager for SKF and was appointed has a president and a managing
director for new Volvo AB on Jan 1st 1927. He held his position has a managing
director for AB Volvo until 1956 when he became the chairman of Volvo Group.
His contribution towards Volvo Group is enormous. Once after becoming the
chairman and managing director Volvo Group had a huge success where the company
started earning more profits. The policies, procedures, strategies and techniques
adopted by him worked out well. The production of each product like trucks, car
increased due to demand in the market has it had an innovative feature.
2. Gustaf Larson
Gustaf Larson is one of the Swedish automobile engineer and a promoter of Volvo.
He pursued his master of science in mechanical engineering and was born in the year
8th
July 1887.
His main plan was to establish the manufacturing of new Swedish automobile. He
was appointed has a president and technical manager on 1927 and left his
employment in AB Galco.
Some 10 prototype cars were never sold except one which was sold to Volvos
photographer and later donated to Volvo Industrial Museum. Later those unsold cars
used as a transaction vehicle within a manufacturing plant.
His contribution is enormous especially in the field of cars and trucks. The
modern styled car named PV444 with a completely new design and innovative
featured car was introduced which became a huge success after the production of cars
increased due to its brand name.
9
He was mainly responsible for technical design of 1st Volvo modern OV4 which
was introduced in the year 1927. He and Assar Gabrielsson founded Volvo and he
was appointed as a Vice president and as a technical manager for AB Volvo in
Gothenburg.
He worked for Volvo until his death in the year 1968.
3. Martin Lundsted
He is a Swedish Businessman and a president and has been a president in CEO of
Volvo Group. He pursued his MSc in the university of Gothenburg. He was well-
versed in the field of production and sales and had 25 years of experience in the field
of production and sales within the heavy automobile industry.
1.3.2 - VISION, MISSION AND QUALITY POLICY
Vision
To be the most desired and successful transport solution provider in the world.
Mission
Driving prosperity through transport solutions.
Quality Policy
Volvo Group concentrates on satisfying the customers by providing the best quality
products and services. The company’s quality policy focuses on certain aspects as
stated below:
1. Customer focus
The company focuses on satisfying the customer’s needs, demands and
wants by providing good quality products and services. It’s aims is to reach
the expectation of the customer by providing the products as they demand.
2. Commitment and participation by everyone.
The employees in the organization are dedicated towards their work and are
committed towards the objective of the organization.
3. Process approach and continuous improvement
Customer needs, wants and desires may also lead the company towards the
continuous improvement process by satisfying their needs by providing them
the products and services as they desire.
10
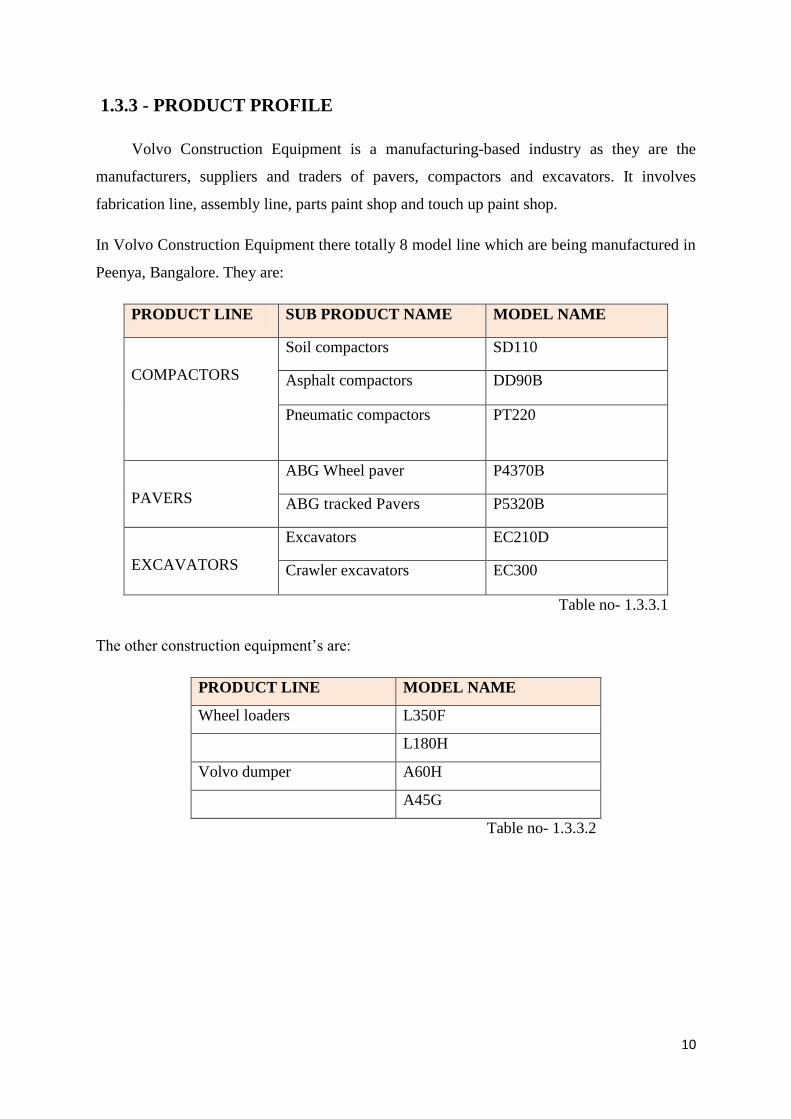
1.3.3 - PRODUCT PROFILE
Volvo Construction Equipment is a manufacturing-based industry as they are the
manufacturers, suppliers and traders of pavers, compactors and excavators. It involves
fabrication line, assembly line, parts paint shop and touch up paint shop.
In Volvo Construction Equipment there totally 8 model line which are being manufactured in
Peenya, Bangalore. They are:
PRODUCT LINE SUB PRODUCT NAME MODEL NAME
COMPACTORS
Soil compactors SD110
Asphalt compactors DD90B
Pneumatic compactors PT220
PAVERS
ABG Wheel paver P4370B
ABG tracked Pavers P5320B
EXCAVATORS
Excavators EC210D
Crawler excavators EC300
Table no- 1.3.3.1
The other construction equipment’s are:
PRODUCT LINE MODEL NAME
Wheel loaders L350F
L180H
Volvo dumper A60H
A45G
Table no- 1.3.3.2
11
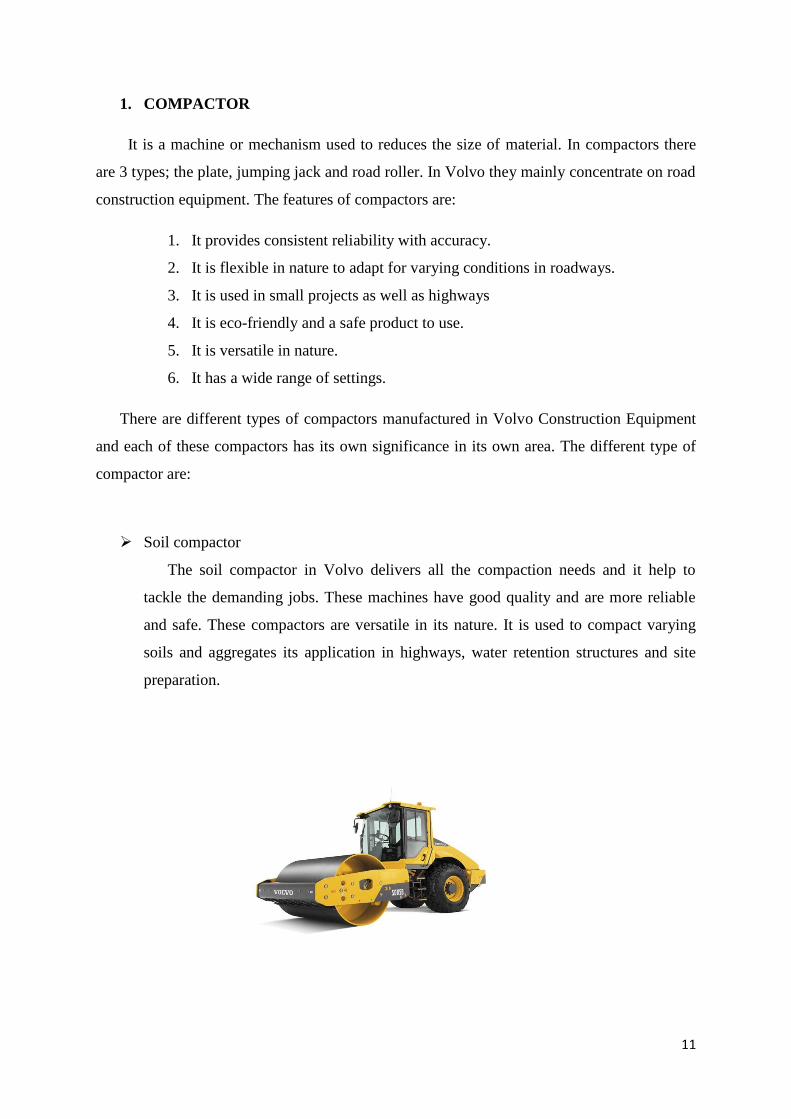
1. COMPACTOR
It is a machine or mechanism used to reduces the size of material. In compactors there
are 3 types; the plate, jumping jack and road roller. In Volvo they mainly concentrate on road
construction equipment. The features of compactors are:
1. It provides consistent reliability with accuracy.
2. It is flexible in nature to adapt for varying conditions in roadways.
3. It is used in small projects as well as highways
4. It is eco-friendly and a safe product to use.
5. It is versatile in nature.
6. It has a wide range of settings.
There are different types of compactors manufactured in Volvo Construction Equipment
and each of these compactors has its own significance in its own area. The different type of
compactor are:
Soil compactor
The soil compactor in Volvo delivers all the compaction needs and it help to
tackle the demanding jobs. These machines have good quality and are more reliable
and safe. These compactors are versatile in its nature. It is used to compact varying
soils and aggregates its application in highways, water retention structures and site
preparation.
12
Asphalt compactor
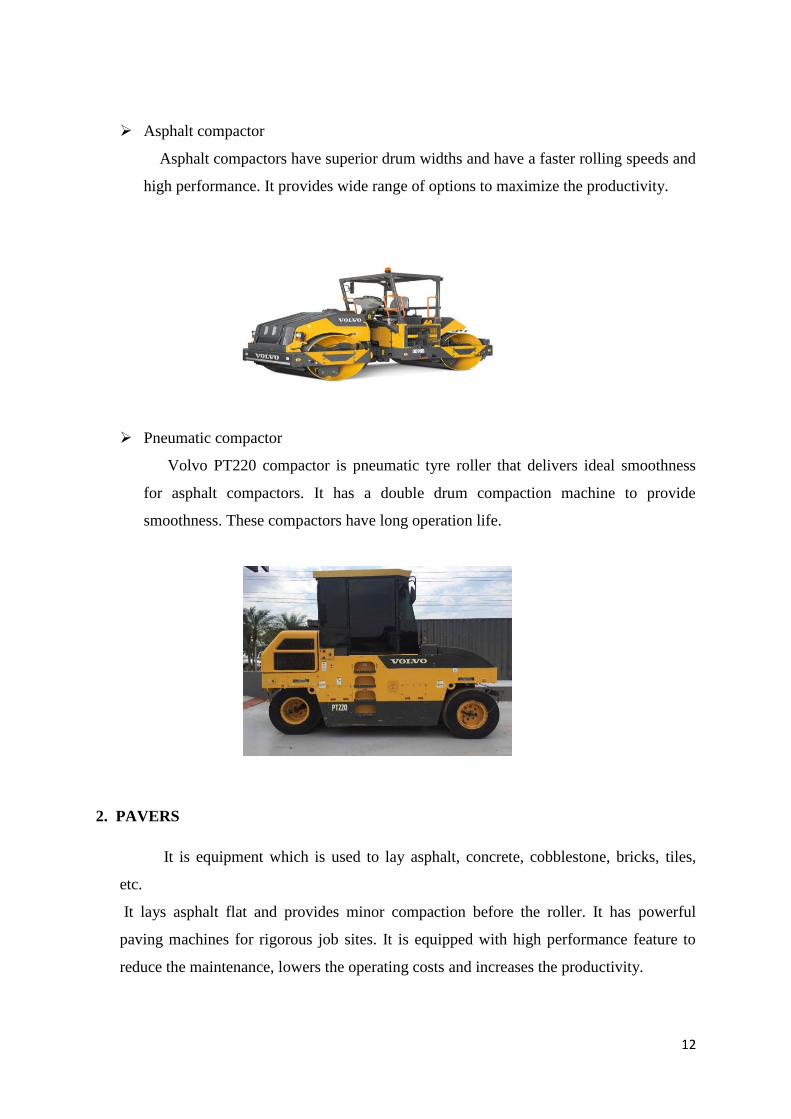
Asphalt compactors have superior drum widths and have a faster rolling speeds and
high performance. It provides wide range of options to maximize the productivity.
Pneumatic compactor
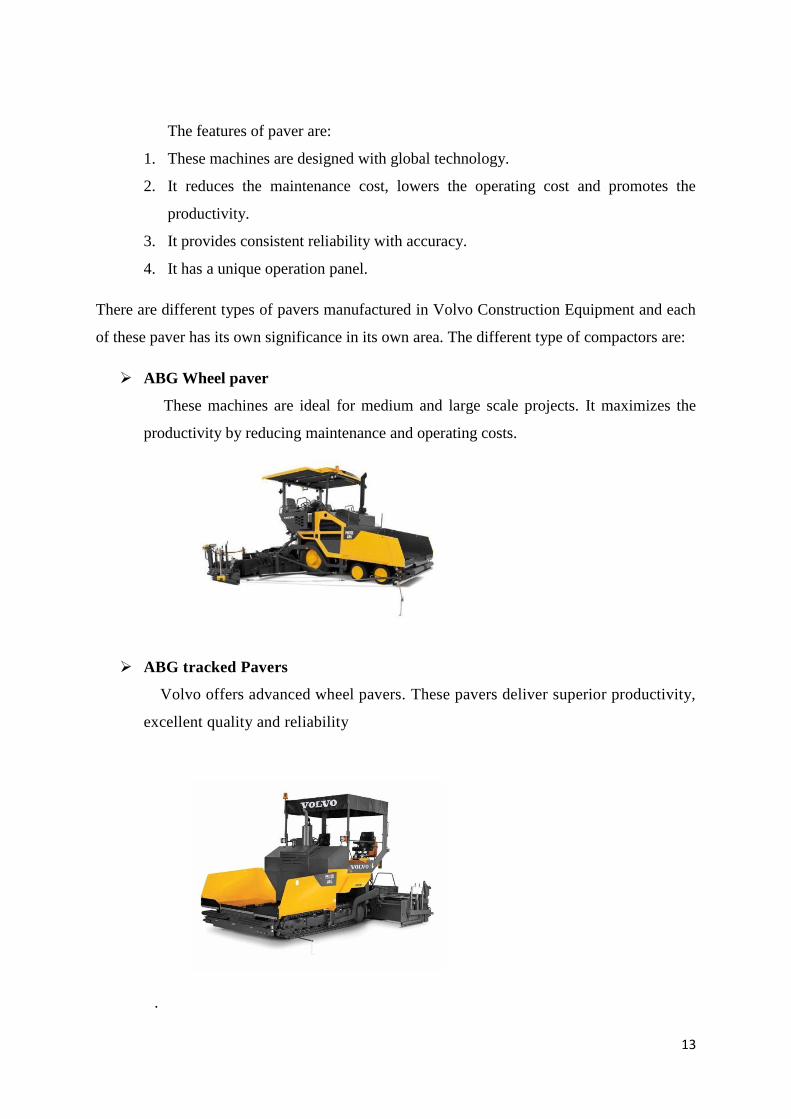
Volvo PT220 compactor is pneumatic tyre roller that delivers ideal smoothness
for asphalt compactors. It has a double drum compaction machine to provide
smoothness. These compactors have long operation life.
2. PAVERS
It is equipment which is used to lay asphalt, concrete, cobblestone, bricks, tiles,
etc.
It lays asphalt flat and provides minor compaction before the roller. It has powerful
paving machines for rigorous job sites. It is equipped with high performance feature to
reduce the maintenance, lowers the operating costs and increases the productivity.
13
The features of paver are:
1. These machines are designed with global technology.
2. It reduces the maintenance cost, lowers the operating cost and promotes the
productivity.
3. It provides consistent reliability with accuracy.
4. It has a unique operation panel.
There are different types of pavers manufactured in Volvo Construction Equipment and each
of these paver has its own significance in its own area. The different type of compactors are:
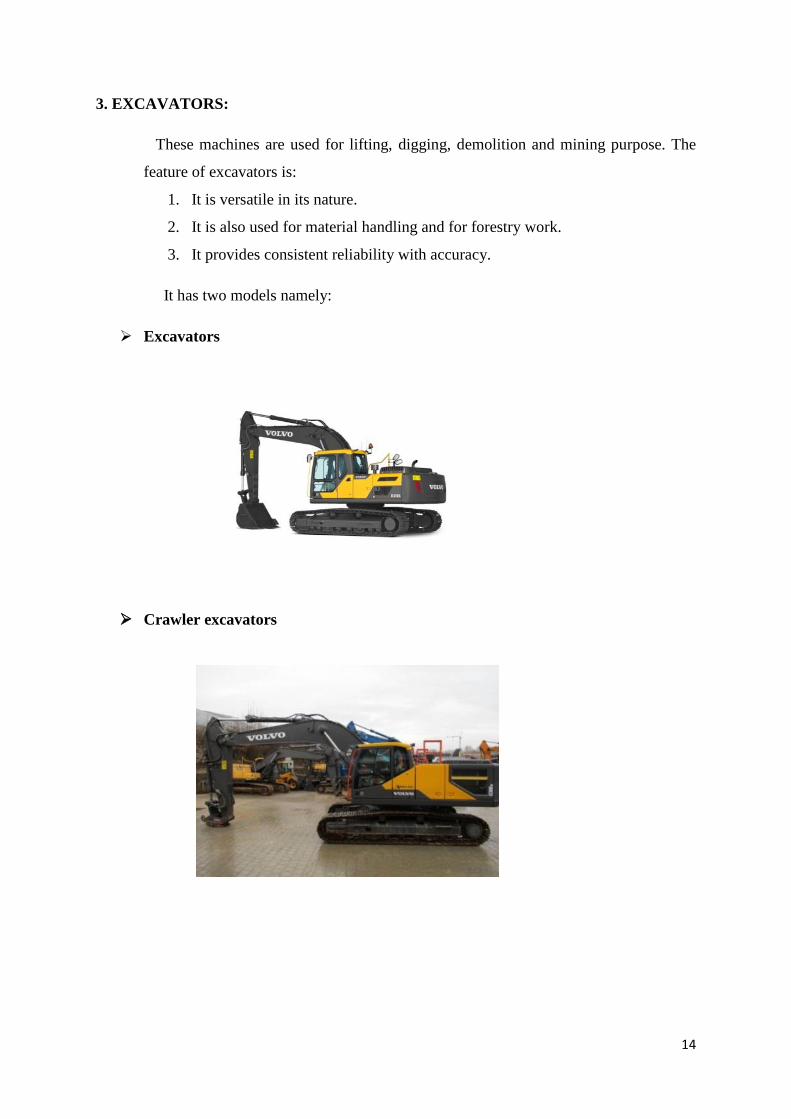
ABG Wheel paver
These machines are ideal for medium and large scale projects. It maximizes the
productivity by reducing maintenance and operating costs.
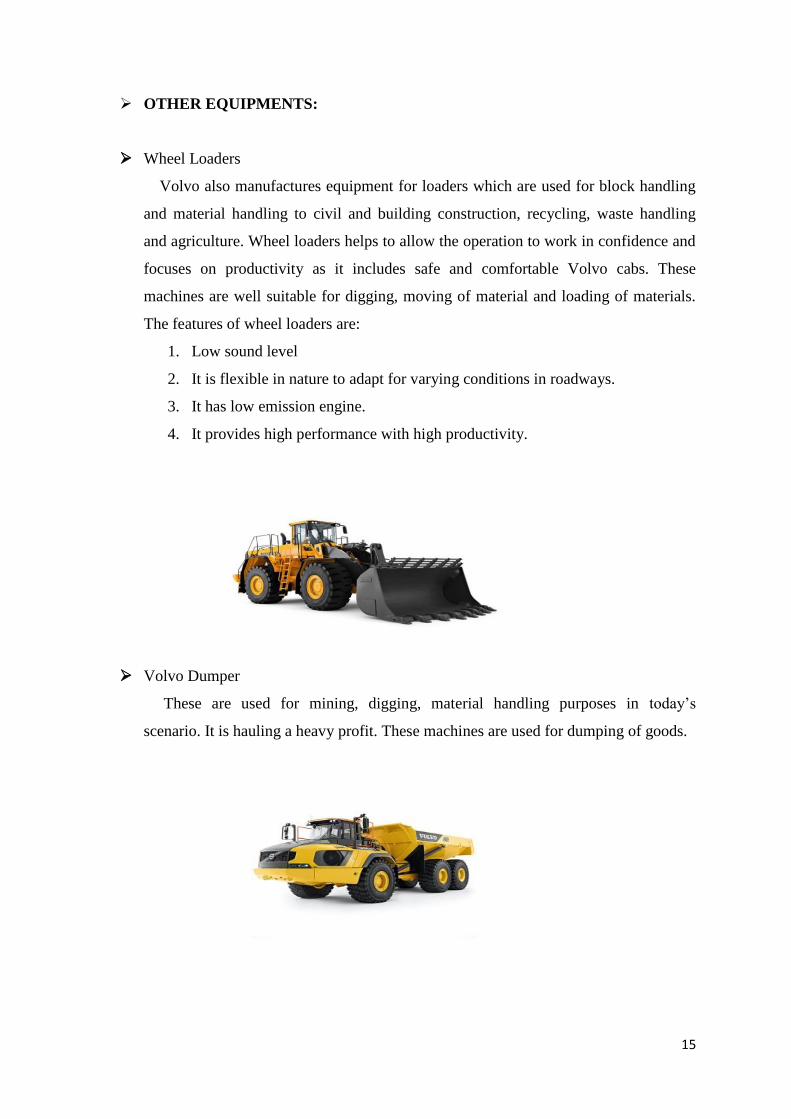
ABG tracked Pavers
Volvo offers advanced wheel pavers. These pavers deliver superior productivity,
excellent quality and reliability
.
14
3. EXCAVATORS:
These machines are used for lifting, digging, demolition and mining purpose. The
feature of excavators is:
1. It is versatile in its nature.
2. It is also used for material handling and for forestry work.
3. It provides consistent reliability with accuracy.
It has two models namely:
Excavators
Crawler excavators
15
OTHER EQUIPMENTS:
Wheel Loaders
Volvo also manufactures equipment for loaders which are used for block handling
and material handling to civil and building construction, recycling, waste handling
and agriculture. Wheel loaders helps to allow the operation to work in confidence and
focuses on productivity as it includes safe and comfortable Volvo cabs. These
machines are well suitable for digging, moving of material and loading of materials.
The features of wheel loaders are:
1. Low sound level
2. It is flexible in nature to adapt for varying conditions in roadways.
3. It has low emission engine.
4. It provides high performance with high productivity.
Volvo Dumper
These are used for mining, digging, material handling purposes in today’s
scenario. It is hauling a heavy profit. These machines are used for dumping of goods.
16
Volvo Parts
1. Maintenance parts
It is very important for the company to keep the machinery in a good
condition by periodically maintaining the machinery. Volvo offers a wide
range of maintenance parts like:
Filters
The Volvo genuine filters have pure productivity so that it increases
the smoothness of machinery intern it increases the productivity. These
filters clean the fluids and air from dirt.
Volvo care kits
It includes those necessary parts and tools which are required for
repair, maintenance and services of machinery. For example: nuts,
screws, Greece, etc.
Volvo lubricants
These are the lubricants(oil) which protects the machinery from wear
and tear. These are developed to support the performance of machine
by deducting the fuel and oil consumption and increases the individual
component life.
Volvo Genuine battery.
These have enough power to meet the demands of customers with the
truly demanding situation and condition. These batteries have the
service life of 20% more than other batteries. It recharges rapidly and
is safe to handle.
2. Genuine Volvo repair parts
Volvo offers remanufactured components and exchange services and has a
right repair parts and solution for the machine.
3. Volvo Wear parts
These are the parts that are tested to see that they meet the highest
expectation. To keep the machinery in good condition certain parts are offered
by Volvo in order to run the machinery smoothly.
Volvo wear parts consists of:
17
Tooth system
Volvo offers certain patented teeth’s and adopters. They are easy to fit
and have ability to withstand a high stress level.
Genuine Volvo undercarriage parts
Volvo undercarriage parts are developed to ensure high standard
quality and performance.
Volvo rubber pad-on
These rubber bolts are usually used for trucked excavators in order to
increase its versatility and durability.
Volvo services
Volvo offers wide range of service to meet the demands and to satisfy the
customers need and demand. The services offered by them are:
1. Uptime Services
The company provides the services on time with related to oil analysis, care
inspection and engine protection.
2. Safety Services
These are the services that reduces the rate of risk that is accidence.
3. Fuel efficiency Services
These are the services that are done to improve the working condition of
the machine by deducing the overall fuel consumption and CO2, fuel
efficiency is conducted.
4. Financial services
Where a customer can own a machine through loan or lease a machine.
5. Productivity Services
These are the services that are done to ensure the efficiency and
effectiveness of business.

18
1.3.4 - AREAS OF OPERATION
Volvo Group includes manufacturing of all products including logistics, assembly and
remanufacturing and also in the development of industrial footprint. Volvo Group has its
global presence and its one of the world’s leading manufacturers of trucks, buses,
construction equipment and industrial engines. The also provide complete solutions for
financing and services.
In Volvo Group there are approximately 95,000 employees all over in Asia (16500), North
America (14200), South America (4800), and Africa & Oceania (2400). Volvo has its
production plant in around 18 countries and they market and sell their products in 190
markets.
1.3.5 – INFRASTRUCTURE FACILITIES
The infrastructure of the company plays a very important role to carry on the operations
smoothly and effectively. Volvo Group has a good infrastructure facility which includes
canteen facility, parking area, cafeteria, etc.
Volvo Construction Equipment facilitates good infrastructure. The company treats the
employees as a real asset of the company and provides certain facilities like canteen facility,
refreshment area, parking area, workshop area, road area where the products manufactured
are tested here before suppling to the customers.
The company also facilitates certain cab facility to their employees. Employees are
provided with a well-equipped cabin. Company has seminar hall, board rooms and are also
provided with certain facility that are required to perform works effectively like lights, AC
facilities, etc. The company also provides purified water facility and cafeteria.
19
Volvo Construction Equipment has different shop areas like Touch-up paints shop
(TUP), Parts paints shop (PPS), Excavators assembly and fabrication area, Compactor
assemble and fabrication area and Pavers assembly and fabrication area. Each of these
products are manufactured separately in their shop areas.
In order to bridge the gap between the theoretical concept (in academic learnings) and
practical exposure of industrial needs, Volvo Group gas come up with “RASTA” centre to
provide training for Resource centre for Asphalt and Soil Training Academy.
Other infrastructure and facilities provided by the company are:
Research and Development
The company’s product is innovative in its nature. They manufacture the products
with the latest technological upgradation.
Productive Facilities
The company facilitates production across the world in around 19 countries
Distributive Facilities
There are certain dealers who link the gap between company and the customer.
They facilitate the distribution of products to the customers.
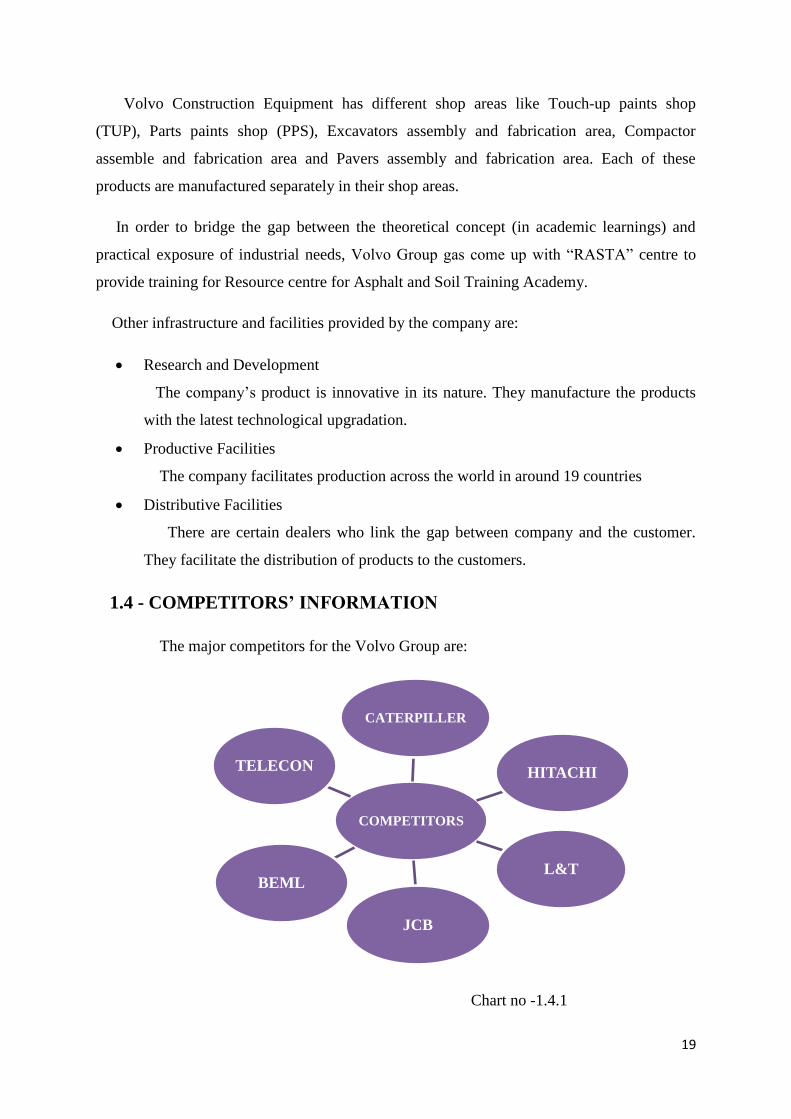
1.4 - COMPETITORS’ INFORMATION
The major competitors for the Volvo Group are:
Chart no -1.4.1
COMPETITORS
CATERPILLER
HITACHI
L&T
JCB
BEML
TELECON
20
Caterpillar
It is an American Corporation which manufactures the construction equipment’s.
It was founded in the year 15th
April 1925 (92 year ago) in California, US. They
provide services in terms of financing, insurance, maintenance and training. The
company manufactures certain products like bulldozers, excavators, wheel loaders,
trucks and diesel engines. They are the largest manufactures of the Wheel Loaders.
The products of Caterpillar companies are used in construction, mining, forestry,
transportation, road building and material handling.
The machinery of the company is distributed through an organization of dealer’s
network. The company supports customers with related to certain segments:
1. Energy and Transportation segment which are related to power generation,
marine, oil and gas, rail and industrial application.
2. Construction industry segment - Company provides a support to the customer
by using a machinery infrastructure, forestry and building construction.
3. Resource Industry Segment – This segment supports the customer in the field
of mining, quarry, waste and material handling application.
4. Financial Product Segment – The company provides certain services
financially through its financial product segment.
Hitachi
It is one of the construction machinery manufacturing company. It is an India based
joint venture between Tata Motors and HCM. It manufactures certain electronic
products, industrial machinery, telecommunication, equipment’s, power plants,
information system, automotive components, materials, defence technology and
construction equipment’s. It also provides consulting and financial services. This
company was founded in the year 1961.It has more than half of the market shares in
Excavator segments. It is one of the leading manufacturer, suppliers and traders of
construction equipment’s.
L&T
L&T started its operation in the year 1975 in Bangalore. It was formed in the year
1998 with a joint venture of L&T and Komatsu Asian Pacific Limited. L&T Komatsu
is now changed as L&T construction equipment limited. It is wholly owned
subsidiary of Larson and Toubro ltd.
21
It is one of the leading players of construction manufacturing equipment. It has
highly proactive sales network. The products of L&T have meet the high standards of
safety, reliability and productivity. This company has introduced the various models
of excavators into the Indian market.
JCB
JCB India Limited is the world’s largest construction equipment manufacturer. J.C
Bamford Excavators Limited named as JCB is an English multinational company
which was founded in the year 1945. This company manufactures certain equipment’s
for construction, agriculture, waste handling and demolition. It manufactures around
300 types of machine including diesel engines, truck, excavators and diggers.
It has 18 factories in UK, Germany, North and South America, Australia, India and
China. The JCB company is creating an employment and entrepreneurship among the
youths by opening 15 operating training centres in India. JCB manufactures trucked
excavators, wheel loaders, compaction equipment’s and fabrication for the group. The
products are exported to more than 85 countries about the world.
BEML
Bharat Earth Mover Limited is an Indian Public Sector undertaking with its
headquarters in Bangalore. It manufactures certain heavy equipment, transportation,
mining and earth moving. It was founded in the year 1964. It manufactures certain
products relating to earth moving, equipment’s, underground mining equipment,
railways equipment’s, high power diesel engines and heavy duty hydraulic
aggregates. It is the Asia’s second; largest manufacturers. It also consists of 70% of
India’s market share in its sector.
TELECON
TELECON Construction Equipment company Limited is a leading manufacturer,
supplier and traders of construction equipment. It is a subsidiary of Tata Motors
which holds 60% of the shares and Hitachi holding balance 40%. The company was
started in the year 1996. In the year1984 it collaborated with HCM for the
manufacturing of construction equipment’s.
22
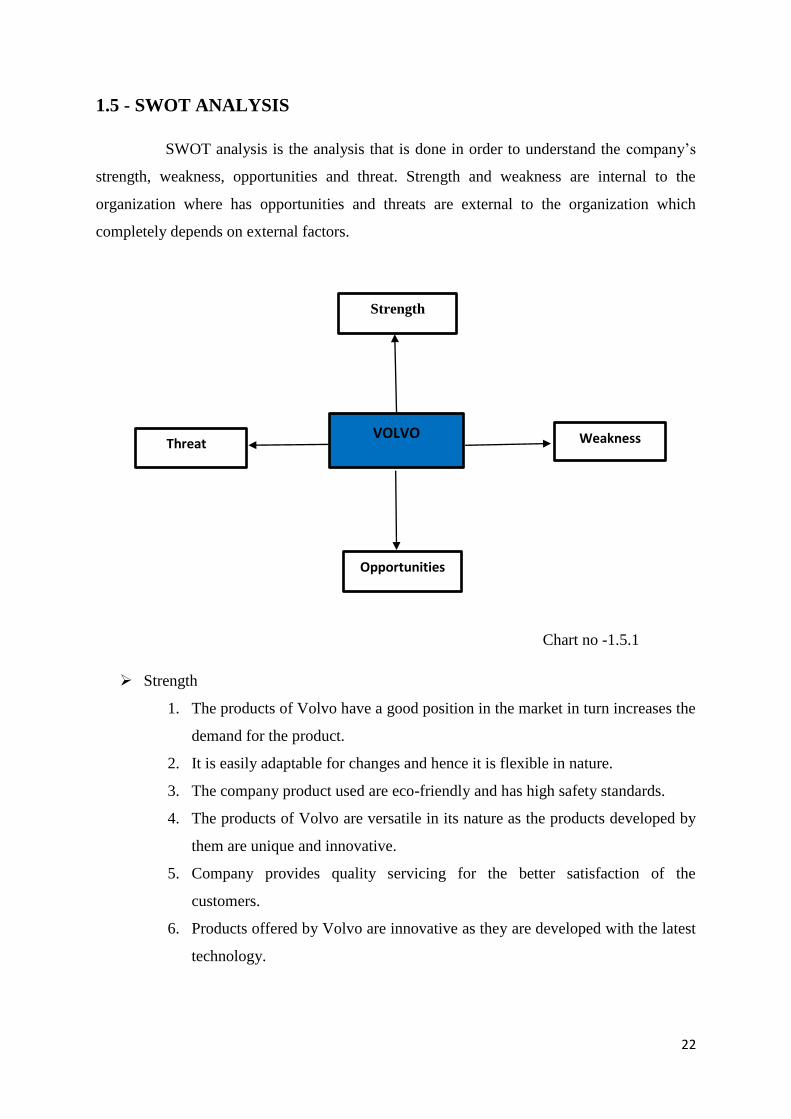
1.5 - SWOT ANALYSIS
SWOT analysis is the analysis that is done in order to understand the company’s
strength, weakness, opportunities and threat. Strength and weakness are internal to the
organization where has opportunities and threats are external to the organization which
completely depends on external factors.
Chart no -1.5.1
Strength
1. The products of Volvo have a good position in the market in turn increases the
demand for the product.
2. It is easily adaptable for changes and hence it is flexible in nature.
3. The company product used are eco-friendly and has high safety standards.
4. The products of Volvo are versatile in its nature as the products developed by
them are unique and innovative.
5. Company provides quality servicing for the better satisfaction of the
customers.
6. Products offered by Volvo are innovative as they are developed with the latest
technology.
VOLVO
Strength
Weakness
Opportunities
thTThreat
23
Weakness
1. The advertisement given related to the company’s product are low so it may
not reach to more audience(customer).
2. Based on the demands of the customer manufacturing of the product is done
and hence it involves less marketing.
3. Cost of the product is high when compared to the other competitors so middle
and low income group may not be affordable to buy.
Opportunity
1. It provides a great opportunity for the market expansion which in turn leads to
the growth of the company.
2. It provides an opportunity to increase the per-capita income and purchasing
power.
Threat
1. Competition from the similar kind of industry definitely effects the operation.
2. Frequent environmental changes may affect the business operation.
3. If the exchange rates fluctuate then the risk of threat arises.
4. If there is a sudden change in the government policies, then kit may lead to
market risk.
1.6 - FUTURE GROWTH AND PROSPECTS
1. In almost next 7-10 years’ company is looking for compound annual growth rate
(CAGR) 10-15% and the company says that it is the rate at which industry will grow
effectively and comfortably.
2. Volvo Group is about to bring full electric bus in future for which they are
concentrating at present.
3. The company is aiming tom achieve more targets than the expected ones.
4. The company’s aim is to be a leader of the market in terms of quality of products, fuel
efficiency and safety.
24
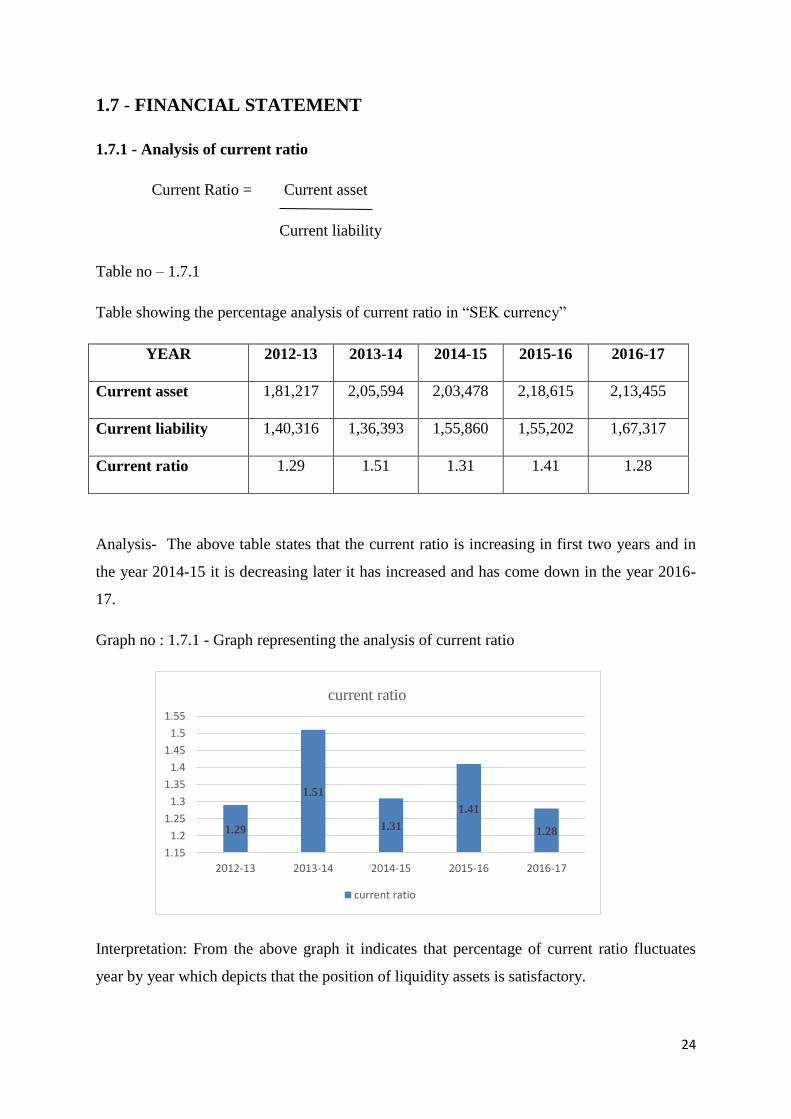
1.7 - FINANCIAL STATEMENT
1.7.1 - Analysis of current ratio
Current Ratio = Current asset
Current liability
Table no – 1.7.1
Table showing the percentage analysis of current ratio in “SEK currency”
YEAR 2012-13 2013-14 2014-15 2015-16 2016-17
Current asset 1,81,217 2,05,594 2,03,478 2,18,615 2,13,455
Current liability 1,40,316 1,36,393 1,55,860 1,55,202 1,67,317
Current ratio 1.29 1.51 1.31 1.41 1.28
Analysis- The above table states that the current ratio is increasing in first two years and in
the year 2014-15 it is decreasing later it has increased and has come down in the year 2016-
17.
Graph no : 1.7.1 - Graph representing the analysis of current ratio
Interpretation: From the above graph it indicates that percentage of current ratio fluctuates
year by year which depicts that the position of liquidity assets is satisfactory.
1.29
1.51
1.31
1.41
1.28
1.15
1.2
1.25
1.3
1.35
1.4
1.45
1.5
1.55
2012-13 2013-14 2014-15 2015-16 2016-17
current ratio
current ratio
25
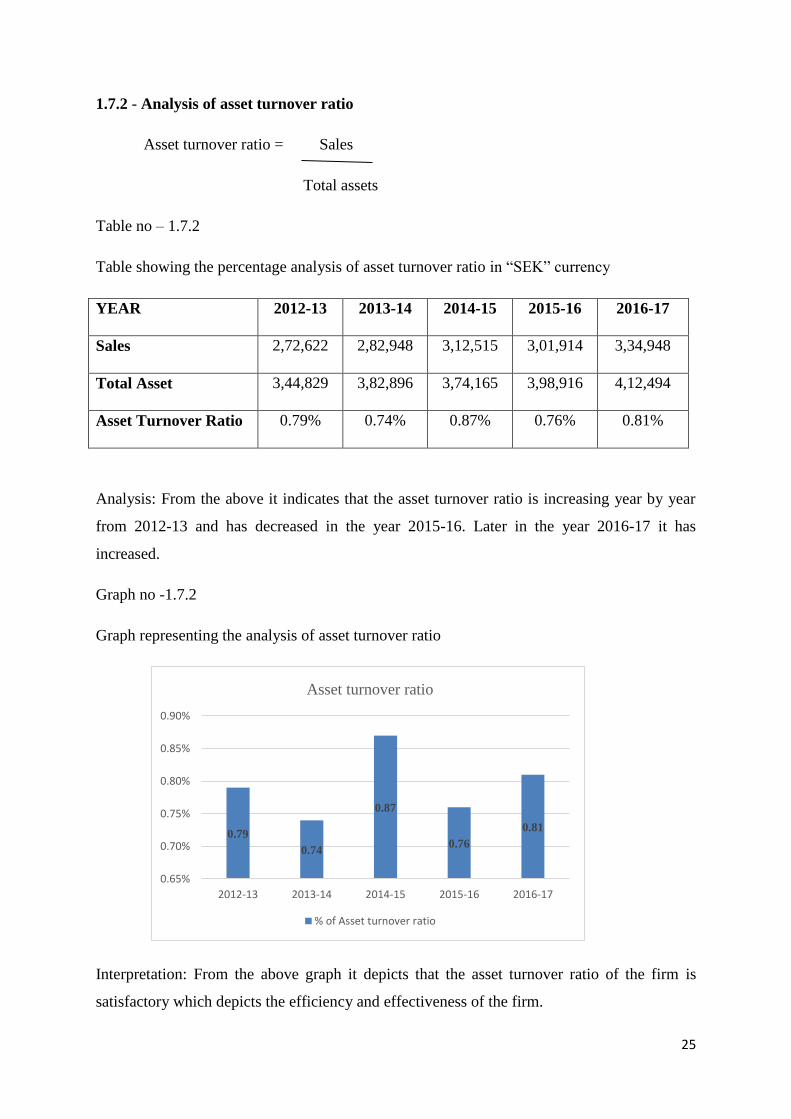
1.7.2 - Analysis of asset turnover ratio
Asset turnover ratio = Sales
Total assets
Table no – 1.7.2
Table showing the percentage analysis of asset turnover ratio in “SEK” currency
YEAR 2012-13 2013-14 2014-15 2015-16 2016-17
Sales 2,72,622 2,82,948 3,12,515 3,01,914 3,34,948
Total Asset 3,44,829 3,82,896 3,74,165 3,98,916 4,12,494
Asset Turnover Ratio 0.79% 0.74% 0.87% 0.76% 0.81%
Analysis: From the above it indicates that the asset turnover ratio is increasing year by year
from 2012-13 and has decreased in the year 2015-16. Later in the year 2016-17 it has
increased.
Graph no -1.7.2
Graph representing the analysis of asset turnover ratio
Interpretation: From the above graph it depicts that the asset turnover ratio of the firm is
satisfactory which depicts the efficiency and effectiveness of the firm.
0.79
0.74
0.87
0.76
0.81
0.65%
0.70%
0.75%
0.80%
0.85%
0.90%
2012-13 2013-14 2014-15 2015-16 2016-17
Asset turnover ratio
% of Asset turnover ratio
26
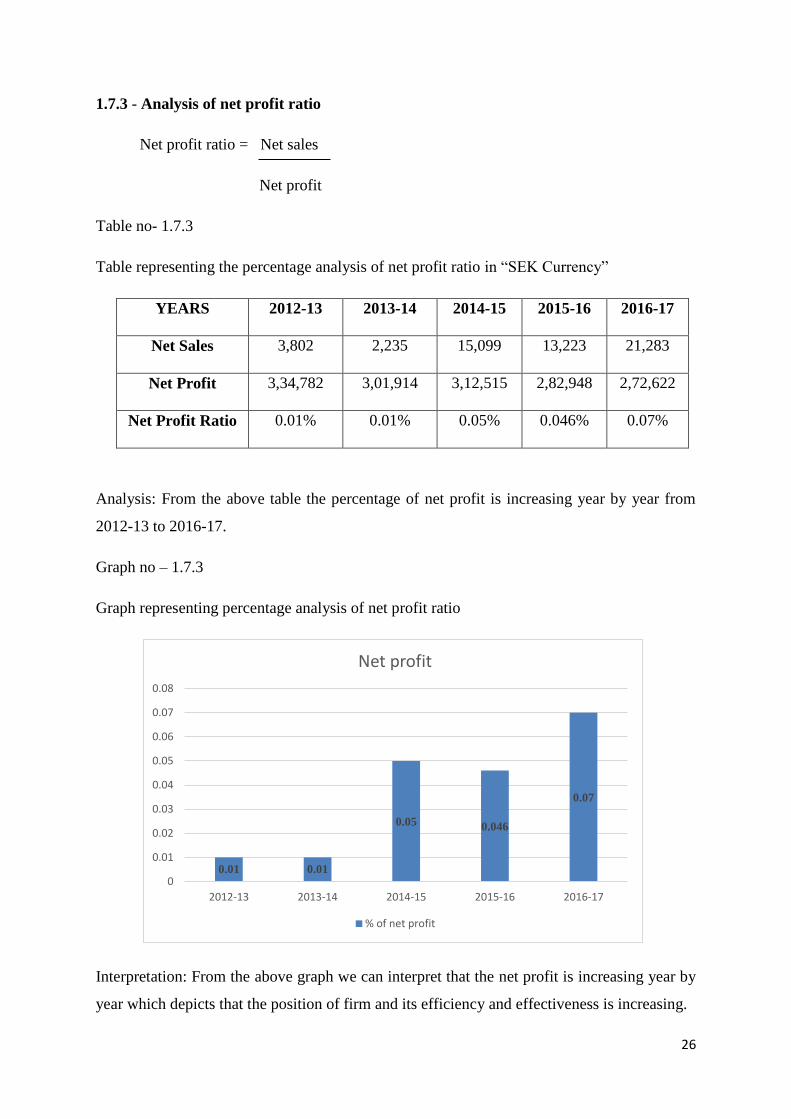
1.7.3 - Analysis of net profit ratio
Net profit ratio = Net sales
Net profit
Table no- 1.7.3
Table representing the percentage analysis of net profit ratio in “SEK Currency”
YEARS 2012-13 2013-14 2014-15 2015-16 2016-17
Net Sales 3,802 2,235 15,099 13,223 21,283
Net Profit 3,34,782 3,01,914 3,12,515 2,82,948 2,72,622
Net Profit Ratio 0.01% 0.01% 0.05% 0.046% 0.07%
Analysis: From the above table the percentage of net profit is increasing year by year from
2012-13 to 2016-17.
Graph no – 1.7.3
Graph representing percentage analysis of net profit ratio
Interpretation: From the above graph we can interpret that the net profit is increasing year by
year which depicts that the position of firm and its efficiency and effectiveness is increasing.
0.01 0.01
0.05 0.046
0.07
0
0.01
0.02
0.03
0.04
0.05
0.06
0.07
0.08
2012-13 2013-14 2014-15 2015-16 2016-17
Net profit
% of net profit
27
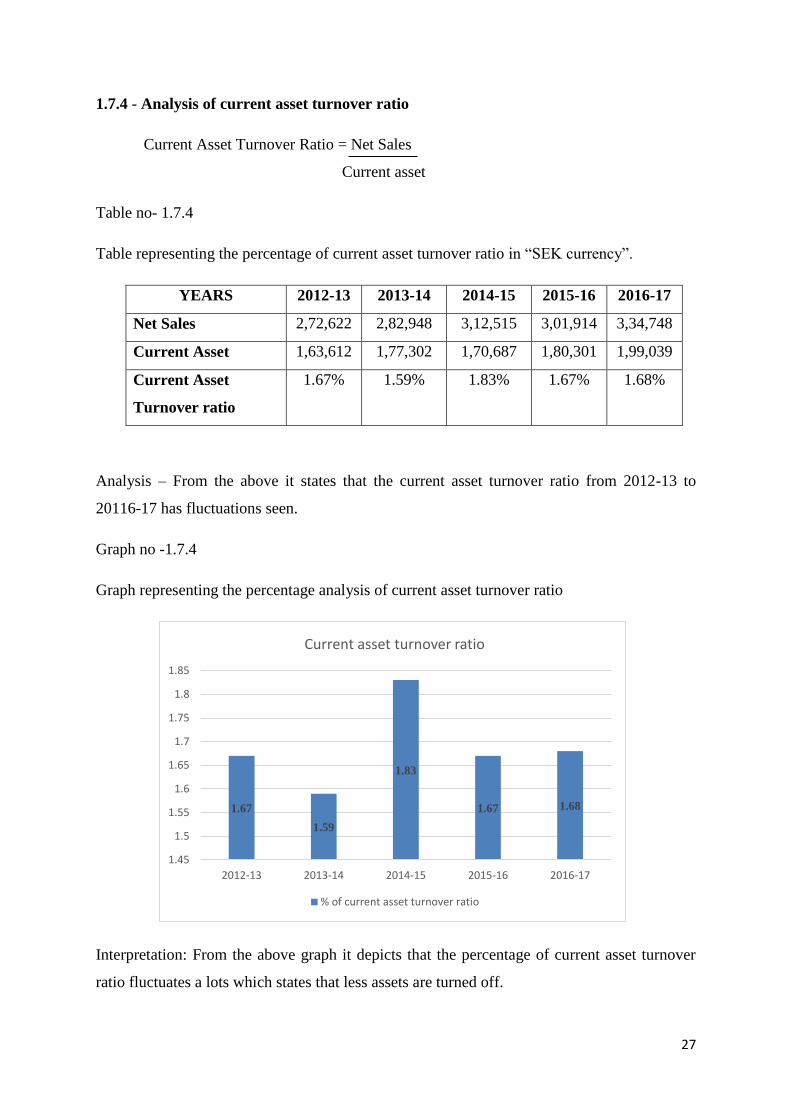
1.7.4 - Analysis of current asset turnover ratio
Current Asset Turnover Ratio = Net Sales
Current asset
Table no- 1.7.4
Table representing the percentage of current asset turnover ratio in “SEK currency”.
YEARS 2012-13 2013-14 2014-15 2015-16 2016-17
Net Sales 2,72,622 2,82,948 3,12,515 3,01,914 3,34,748
Current Asset 1,63,612 1,77,302 1,70,687 1,80,301 1,99,039
Current Asset
Turnover ratio
1.67% 1.59% 1.83% 1.67% 1.68%
Analysis – From the above it states that the current asset turnover ratio from 2012-13 to
20116-17 has fluctuations seen.
Graph no -1.7.4
Graph representing the percentage analysis of current asset turnover ratio
Interpretation: From the above graph it depicts that the percentage of current asset turnover
ratio fluctuates a lots which states that less assets are turned off.
1.67
1.59
1.83
1.67 1.68
1.45
1.5
1.55
1.6
1.65
1.7
1.75
1.8
1.85
2012-13 2013-14 2014-15 2015-16 2016-17
Current asset turnover ratio
% of current asset turnover ratio
28
CHAPTER 2:
CONCEPTUAL BACKGROUND AND LITERATURE
REVIEW
2.1- Conceptual Background of study:
Introduction
It is very important for the organization to maintain its resources effectively and
efficiently so that the goals and objectives of the organization can be achieved. This
implies that the organization should reach its objectives and goals by minimizing the
cost and maximizing the profit.
Budget is a future plan which states about the estimated expenses and incomes
which the company may earn. It places a very important aspect for the organization to
know its targets to be achieved in the mere future. This helps the organization to
overcome the competitors and to meet the demands and expectation of the customers.
In order to make the estimated plan more effective it is very important for the
organization to have a proper planning, organizing, staffing, directing, co-ordinating
and controlling of the resources in the organization. Therefore, the budgeting
procedure places a very important role to evaluate activities and helps the company to
see whether the company is running in a good track as planned.
Budget
Budget is a future plan which states about the estimated expenses and incomes
which the company may earn for a specified period of time. It is expressed in a
quantitative form which states about the estimated action by the company.
Characteristics of Budget
1. It is an estimated future plan of action.
2. It acts as a blueprint to the organization to achieve its desired objective.
3. It is expressed in a quantitative form.
4. It helps in comparison of actual results with that of the standards.
5. It is prepared for future specified period of time.
29
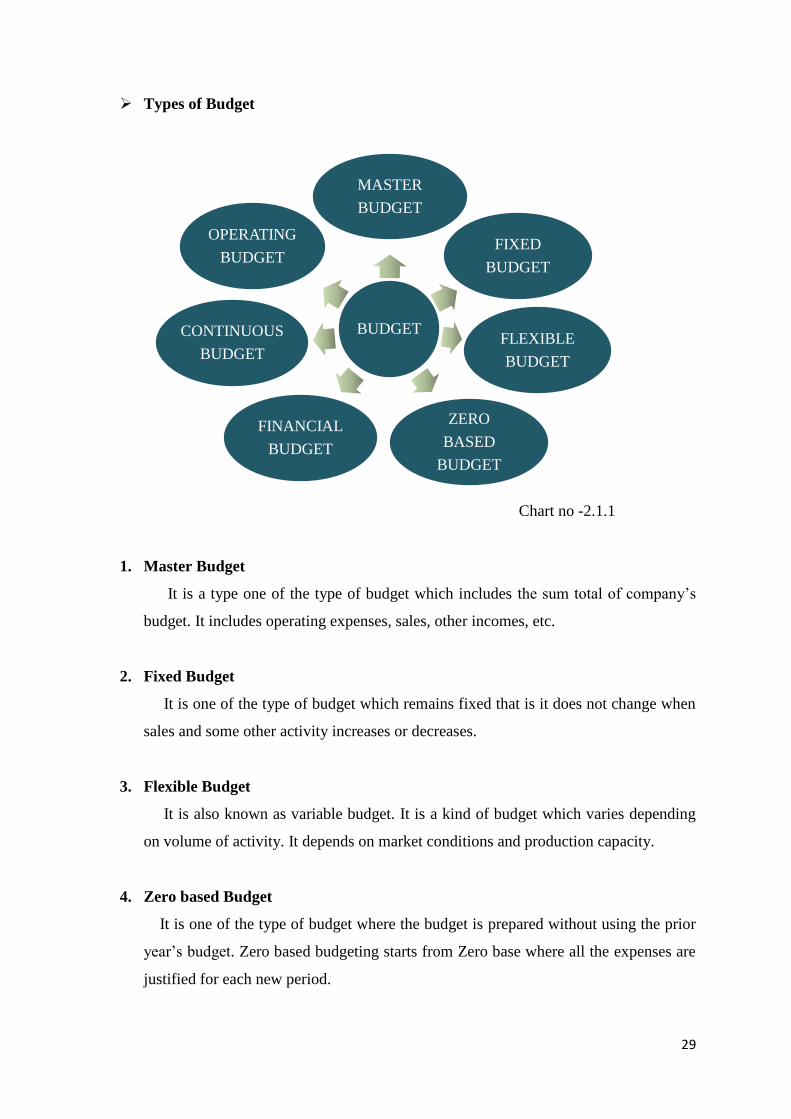
Types of Budget
Chart no -2.1.1
1. Master Budget
It is a type one of the type of budget which includes the sum total of company’s
budget. It includes operating expenses, sales, other incomes, etc.
2. Fixed Budget
It is one of the type of budget which remains fixed that is it does not change when
sales and some other activity increases or decreases.
3. Flexible Budget
It is also known as variable budget. It is a kind of budget which varies depending
on volume of activity. It depends on market conditions and production capacity.
4. Zero based Budget
It is one of the type of budget where the budget is prepared without using the prior
year’s budget. Zero based budgeting starts from Zero base where all the expenses are
justified for each new period.
BUDGET
MASTER
BUDGET
FIXED
BUDGET
FLEXIBLE
BUDGET
ZERO
BASED
BUDGET
FINANCIAL
BUDGET
CONTINUOUS
BUDGET
OPERATING
BUDGET
30
5. Financial Budget
These are the assets including balance sheet which depicts the effect on asset,
liabilities and equities.
6. Continuous Budget
It is one of the type of budget where the periodical preparation of budget is done.
Here the budgets are prepared more than twice in a year.
7. Operating Budget
It is a budget prepared relating to the functional activity of a business. It plans
about the number of resources and the total value of its which is required to perform
the business operations.
Budgeting
Budgeting basically states that how the company achieves its goals and objectives
by establishing an estimated plan. That entire process of preparing budget is said as
budgeting.
Budgetary Control
Budgetary control acts as a control tool for the purpose of planning and controlling
the cost. Budgetary control is an end result obtained. He actuals incomes and
expenses are compared with that of the standard which helps the company to know
whether the plan and policies adopted by them are suitable and are being followed by
the employees of the organization. It plays a very important role in order to achieve
the desired targets or goals of the organization.
Features of Budgetary control
1. Planning and controlling acts as two important tools in budgetary control in order
to achieve the goals of an organization.
2. Actual results are compared with that of the standards which helps the company to
see whether the plans are followed properly.
3. It increases the efficiency and effectiveness of organization by controlling the
cost.
4. It helps the company to achieve the desired targets/goals.
31
Objectives of Budgetary control
1. Determines policies
It determines set of policies to be achieved in order to meet the desired
objectives and goals of an organization within a specified period of time. It acts
has a blueprint to the organization to achieve its desired objective based on which
the further process is done. Policies should be determined by keeping those
objectives that the company need to achieve.
2. Co-ordination
It co-ordinates the activities to various department which helps in achieving the
goals and implementation of policies are done successfully. When there is a better
co-ordination it increases the effectiveness of the organization.
3. Increases efficiency
Budgetary control acts as a control tool for planning and co-ordinating the cost.
It increases the efficiency and effectiveness of the organization by controlling the
cost and by co-ordinating it among the various departments in the organization.
This intern increases the smoothness of the work in the organization.
4. Takes corrective measures
In case of any discrepancies found, the corrective measures can be taken at a
proper time so that the desired targets planned can be achieved by the organization
within a specified period of time.
5. Communication
It communicates the required results to be achieved by the company by
controlling the cost and by increasing the profitability.
5. Planning and controlling
It is one of the important objectives of Budgetary control. It states about the
detail estimated plan for the purpose of planning and controlling the cost.
Therefore, it acts as a blueprint to the organization to achieve the desired result.
6. Performance assessment
As the estimated plan is already established, it helps the managers to assess the
performance of the employees based on the target fixed to them. This helps to
know whether the employees have achieved their targets.
32
Advantages of Budgetary control
1. It helps to achieve the required results as it is estimated before.
2. It reduces controlling cost and increases profitability.
3. It helps to solve discrepancies by taking corrective actions to achieve the
goals.
4. Budgetary control is an action of plan. This helps to have a smooth running of
the business operation.
5. It co-ordinates among various departments which intern increases the
efficiency and effectiveness of business operations.
6. Actual results are compared with that of the standards which helps the
company to see whether the plans are followed properly.
7. It helps in determination of policies in order to achieve the desired objectives
of an organization.
Disadvantages of Budgetary control
1. Preparation of budget is difficult at the time of inflation.
2. As the future is uncertain, the circumstances may change. This upsets budget
estimated.
3. It is an expensive technique which requires qualified personnel’s. Therefore, a
small business concern may find difficult.
33
Other Concepts
1. Sales Budget
It is an estimated future plan of action which states about the estimated number
of sales unit and its sales cost per unit. It is a component of master budget which
deals with the sales aspects.
2. Labour Budget
This budget states about the estimated number of labours required and the
estimated number of labours required and also states about the estimated labour
cost which are required to undertake the production activity.
3. Cash Budget
Cash budget is a type of budget which states about the cash inflows and
outflows that the company may incurs for a specified period of time. It is an
estimated plan of cash inflows and outflows.
4. Purchase Budget
This budget states about the detail future plan for the procurement of raw
materials which are required to undertake the production. It estimates the cost of
purchase and the number of quantity required for the production activity.
5. Production Budget
Production Budget is one of the component of budget which states about the
estimated number of units to be produced as per the plan.
6. Capital Expenditure Budget
It is a budget which states the capital expenditure like purchase of land,
building, etc. for a specified period.

34
Essentials of Budgetary Control
For the better implementation of Budgetary Control, there are certain steps which
are required to be followed by the organization. They are:
1. Organization for Budgetary Control
The proper organization plays an important role for the purpose of planning,
organizing, maintaining and preparation of budgets. Each department has a head
and Chief executive will be in-charge of overall activity of budgetary control.
2. Budget centres
It may be a department, section or any other part of organization where the
budgets are prepared. It is a place where cost control takes place in the
organization.
3. Budget manual
A budget manual is a document which contains the description of duties and
responsibilities of each member in the organization.
4. Budget officers
Chief executive will be charge of overall activity of budgetary control in the
organization and it is he who appoints the Budget officer. He can make the
necessary changes in case if the circumstances demand. He acts as a monitor and
co-ordinator of different department.
5. Budget Committee
The heads of each department are made has a member of the budget committee
and are responsible for the preparation and execution of budget.
6. Budget period
Budget period states about the time taken for the preparation of budget. It
depends on certain factors like type of budget, nature of industry and product, etc.
7. Determination of key factor
The budgets are prepared for each functional areas of operation and the
budgets of each functional area are linked with one another. If the supply of raw
material is limited then the sales, production budget is dependent on raw material
budget. Hence the proper co-ordination places a very important role.

35
2.2 - LITERATURE REVIEW
1. Welch, Hilton, Gordon (1998) states that budgeting process is a planning and
controlling process which not only recognizes two important budgetary function
but also describes the process of budgeting briefly than it is stated.
2. Blocher and Lawson (2013) states about the long-term necessaries that the
students of accounting should possess to have success in entry level and states that
budget also help to allocate, utilizes the resources, co-ordinates and controls the
activity and acts as a base for the assessments of performance.
3. Herath S.K and Indriani M.W(2007) explains Budgetary control system as a
management control system that helps to create the competitiveness among the
company. It plays a very important role in management control system for the
growth of the company.
4. Charles (1997) describes budget as a future plan of action expressed in a
quantitative form. These plans are implemented and co-ordinated to carry out
various functions like planning, performance evaluation, etc. to reach the
objectives of the organization.
5. D. Acquah, S. Kwaku, O.S Princeyantakyi (2016), a study was conducted
where four hospitals were taken into consideration for study. For undertaking the
research 60 workers at various hospitals were taken as a sample population to
know how performance impact budget based on it they found out that poor budget
leads to poor performance and an effective budget leads to effective performance
in the organization.
6. Hudson, MC Elroy, Susan L, Paul E. Keck, Harrison G. pope and James I
(1992), the process of deciding the estimated plan for future related to the
treatment of bipolar disorder based on the information provided which help to
have an optimal utilization of available resources and helps to maintain
effectiveness and efficiency in the organization.
36
7. Griffin, R.W Welsh and Moorhead G (1981), states budgeting as converting the
objectives of the business into an estimated plan for future which considers
multidimensional factors if taken into consideration it provides good judgement,
identifies manager’s responsibility and states how to implement it in-order to
increase the efficiency and effectiveness, and helps to achieve objectives.
8. Lucey BM, Larkin C and Gurdgiev.C(2014), describes the budget as a
quantitative statement plan of the organization for the various department in the
organization which includes sales, production, and other items like incomes,
expenses, etc.
9. Modetola odeleye (1991), Budgetary control is a control tool that takes a
corrective measure if required and links the gap between the actual results and
budgeted results.
10. Reynols (2015), states that budget act as an effective tool in today’s competitive
environment and helps to know the estimated profits of future.
11. Panday (2008), defines budget as a future estimated plan for a short period of
time that helps the manager in achieving the targets in order to meet the objectives
of the organization.
12. Horngren C.T (2004), an estimated future plan stated in a quantitative form and
directs, co-ordinate and takes necessary actions to implement its.
13. Conlon, Thomas (2004), states that budgets are the estimated future plan. The
challenge associated with estimated future plan will be more successful only when
it is accurate.
14. Neely A, Bourne M, Adams C (2003), states that to have an effectiveness in
budget the strategies of the business should be proper for the purpose of
performance management.
37
15. Egan & Wong K.S (1993), states that the importance of budgetary control is to
forecast the future. Without proper planning and controlling it definitely affects
the budgetary system in the organization.
16. Swink, Morgan & Micheal (1995), Budget is the best financial planning and
controlling tool to know about the resources and is a good manufacturing strategy.
As the actual result is different from the estimated ones, it gives an idea to the
manger when to evaluate the plan and to take corrective measures if required.
17. Churchill and Harper (1984), states about planning, directing, controlling co-
ordinating and decision making. These features act as a base for budgeting and
plays a very important role to put the plan of budget into action.
18. Kaplan and Norton (1992), Budgeting and budgetary control increases the
efficiency and effectiveness of the business operations by fixing the targets and by
allocating the resources to the various department based on the target fixed.
19. Emmanuel, Otley, and Merchant (1990), states that the process of budgeting
and budgetary control moves around the estimated budgets/ performance and the
actual performance. This takes place through proper planning and controlling.
20. Eichorn (2000), states about the method of approaches which a company may
choose based on the desires of the management. Top-down approach states that
the top-level management prepares the budget and passes on to operational level
for implementation. Bottom up approach where budget is prepared by operational
level and then moved toward top level. Top down/ bottom up approach which is
the combination of both the approaches.
38
CHAPTER 3:
RESEARCH DESIGN
3.1 STATEMENT OF PROBLEM
Budgets are prepared to analyse the variance of actual expenses with the
budgetary expenses. This is one of the tool used to have cost control. In this regard,
the company in order to minimize certain cost there is a requirement for calculation of
certain cost variance like office and administration cost, selling and distribution cost
and also the variance of profit. This helps the company to frame proper policy
regarding to cost control which helps the organization to achieve its objectives.
3.2 NEED OF STUDY
1. To forecast future by preparing the future estimated plan of incomes and
expenditure and to set the targets within which it has to be achieved.
2. To plan and control the cost related to how the cost can be reduced by proper
planning and controlling the cost in order to increase the profitability.
3. To find out the loopholes and to take corrective measures related to Budgetary
control.
4. To have a practical exposure about the Budgetary control system in Volvo and
gain working experience.
5. To have a working exposure with a company work culture.
6. To know about the policies, procedure and techniques that the companies follow
to achieve its target.
3.3 - OBJECTIVE
1. To study the budgeting concepts and to know the budgeting control methods and
practices.
2. To study the theoretical aspects of budget and budgetary control.
3. To compare the actual results with that of estimated (budgeted) results which
helps to know whether the policies and plans are followed correctly.
39
4. To examine the policy objectives and its benefits towards budgetary control.
5. To study the theoretical aspect of budget and budgetary control.
6. To have a detailed analysis of different budget centres and the responsibility of
each of it.
7. To have a detailed study related to the essentials of Budgetary control related to
Budget committee, budget centres, budget period, budget officers, etc.
3.4 - SCOPE OF STUDY
1. To have a detailed study and to analyse the budgetary control system at Volvo CE
with reference to their objectives and goals was unable due to shortage of time and
study was limited only for Volvo construction Equipment.
2. Data was collected mainly from secondary sources through Volvo journals, statistical
records, magazines, etc.
3.5 - RESEARCH METHODOLOGY
RESEARCH DESIGN
Sample Design:
The study is concerned with financial characteristics of Volvo Construction Equipment.
The period of study is for 4 years from 2012-2013 to 2015-2016.
Data Collection:
The data can be collected by primary and secondary sources.
Primary data
It is collected through personal interview with the manager and officers & taking
their perception with regard to topic of the study.
Secondary data
It is collected from the past financial records of the company, i.e. balance sheets,
profit & loss account, annual reports of the company and other financial statements.
And also, from journals, newspapers, magazines, publication and websites are
referred to obtain information.
40
3.6 - HYPOTHESIS
Ho: Budgets are effective means of planning organizational activity.
H1: Budgets are not effective means of planning organizational activity.
3.7 - LIMITATION
1. Use of resources by the company may be restricted due to the budget factor.
2. Frequent changes may be done due to the changes in the industrial climate.
3. Preparation of budget is difficult at the time of inflation.
4. The analysis of study is limited for a specified period of time and is limited up to the
information and date provided by the company.
3.8 – CHAPTER SCHEME
Chapter 1 – Introduction
This chapter gives the details about the industry and company profile, competitors
information, SWOT analysis, Future growth and prospects and Financial statements.
The company profile includes promoters detail, Vision, mission and quality policy,
product details, infrastructure and areas of operations.
Chapter 2 – Conceptual background and literature review
This chapter describes about theoretical background of study and literature review.
Chapter 3 – Research Design
This chapter includes statement of problem, Needs, objectives, scope of study,
Research methodology, Hypothesis, Limitations of study and chapter scheme.
Chapter 4 – Data Analysis and Interpretation
This chapter states about the data analysis and interpretation and is represented in
the form of graphs.
Chapter 5 – Summary of Findings, Suggestions and Conclusion
Summary of findings, suggestions and conclusions are covered under this chapter.
41
CHAPTER 4:
DATA ANALYSIS AND INTERPRETATION
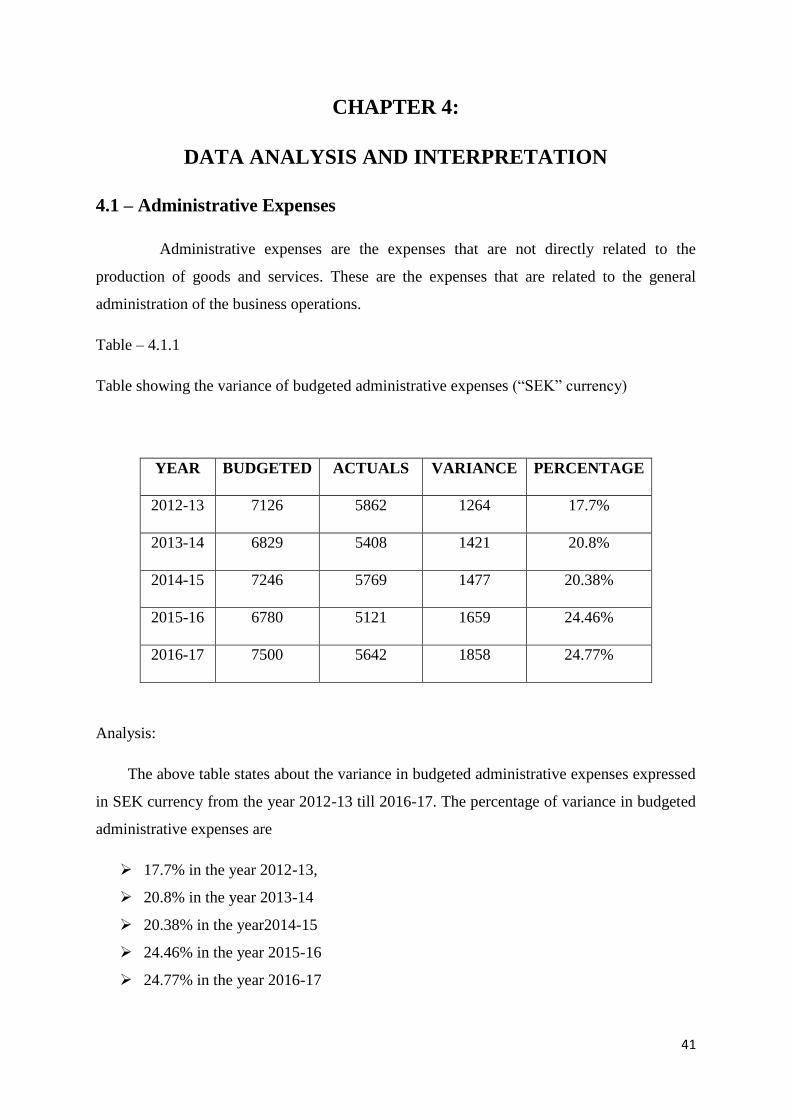
4.1 – Administrative Expenses
Administrative expenses are the expenses that are not directly related to the
production of goods and services. These are the expenses that are related to the general
administration of the business operations.
Table – 4.1.1
Table showing the variance of budgeted administrative expenses (“SEK” currency)
YEAR BUDGETED ACTUALS VARIANCE PERCENTAGE
2012-13 7126 5862 1264 17.7%
2013-14 6829 5408 1421 20.8%
2014-15 7246 5769 1477 20.38%
2015-16 6780 5121 1659 24.46%
2016-17 7500 5642 1858 24.77%
Analysis:
The above table states about the variance in budgeted administrative expenses expressed
in SEK currency from the year 2012-13 till 2016-17. The percentage of variance in budgeted
administrative expenses are
17.7% in the year 2012-13,
20.8% in the year 2013-14
20.38% in the year2014-15
24.46% in the year 2015-16
24.77% in the year 2016-17
42
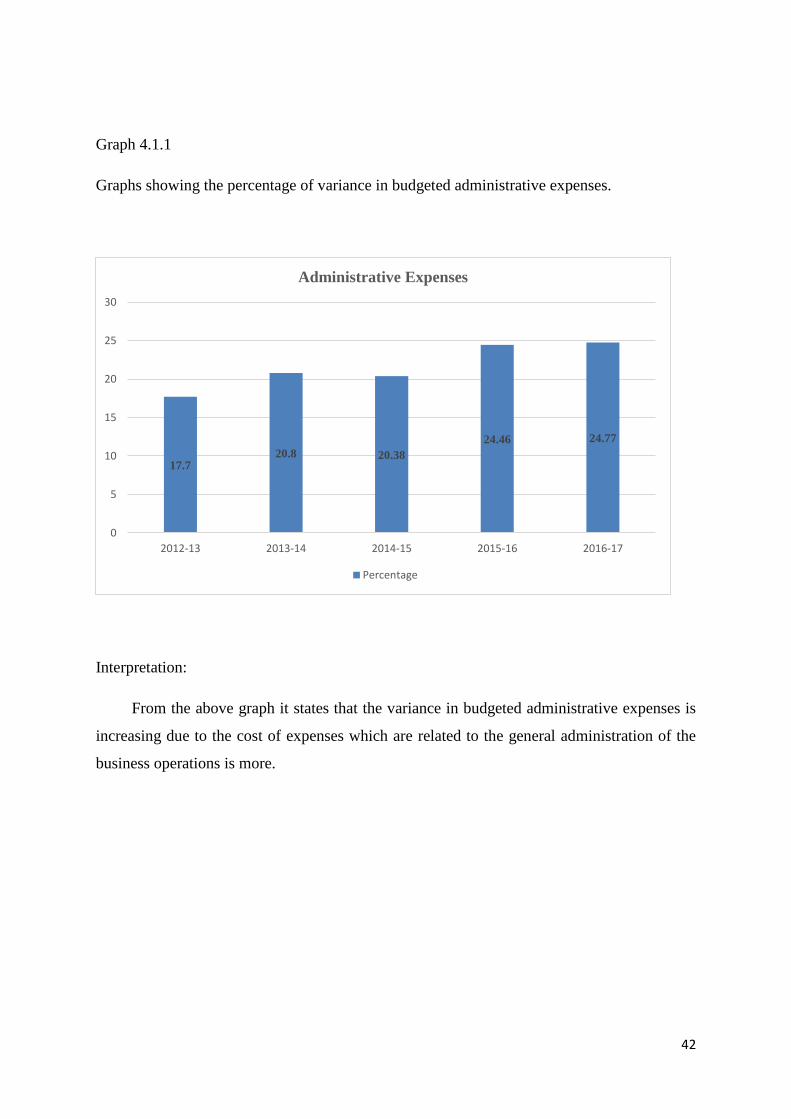
Graph 4.1.1
Graphs showing the percentage of variance in budgeted administrative expenses.
Interpretation:
From the above graph it states that the variance in budgeted administrative expenses is
increasing due to the cost of expenses which are related to the general administration of the
business operations is more.
17.7 20.8 20.38
24.46 24.77
0
5
10
15
20
25
30
2012-13 2013-14 2014-15 2015-16 2016-17
Administrative Expenses
Percentage
43
4.2 – Operating incomes
Operating incomes are the incomes or earnings before interest and tax (EBIT). It does
not include any profit earned from firm’s investment. It is also known as operating profits.
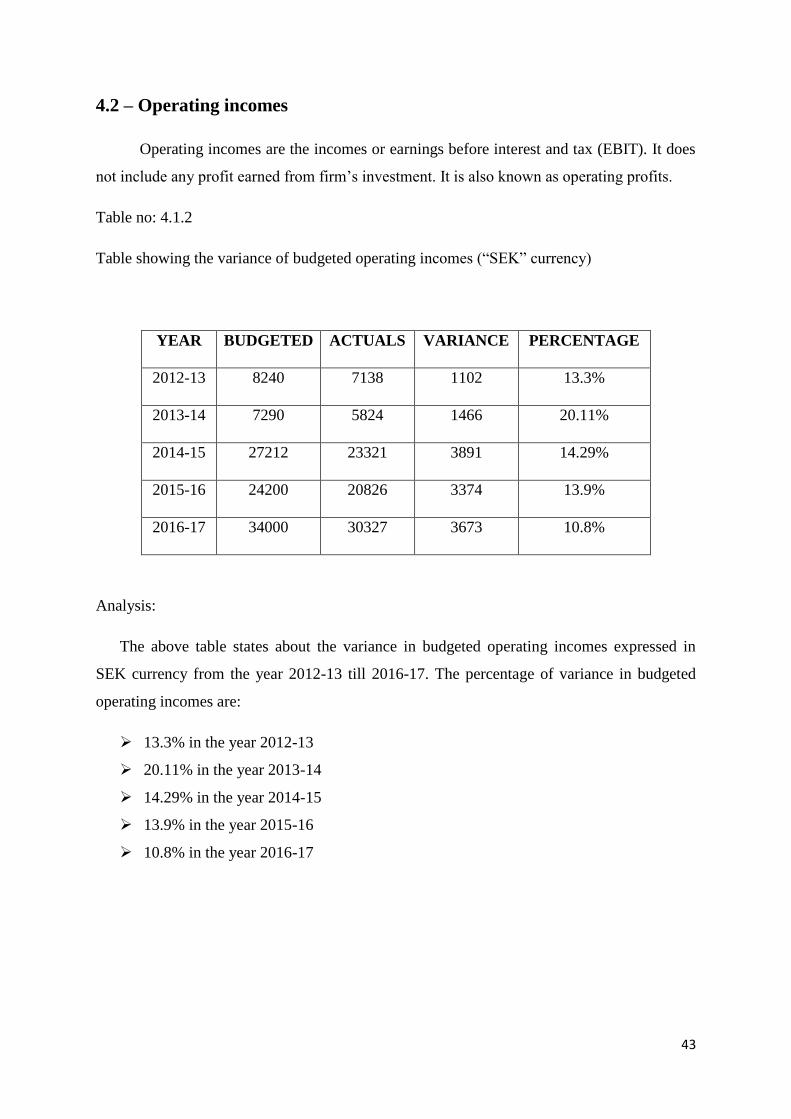
Table no: 4.1.2
Table showing the variance of budgeted operating incomes (“SEK” currency)
YEAR BUDGETED ACTUALS VARIANCE PERCENTAGE
2012-13 8240 7138 1102 13.3%
2013-14 7290 5824 1466 20.11%
2014-15 27212 23321 3891 14.29%
2015-16 24200 20826 3374 13.9%
2016-17 34000 30327 3673 10.8%
Analysis:
The above table states about the variance in budgeted operating incomes expressed in
SEK currency from the year 2012-13 till 2016-17. The percentage of variance in budgeted
operating incomes are:
13.3% in the year 2012-13
20.11% in the year 2013-14
14.29% in the year 2014-15
13.9% in the year 2015-16
10.8% in the year 2016-17
44
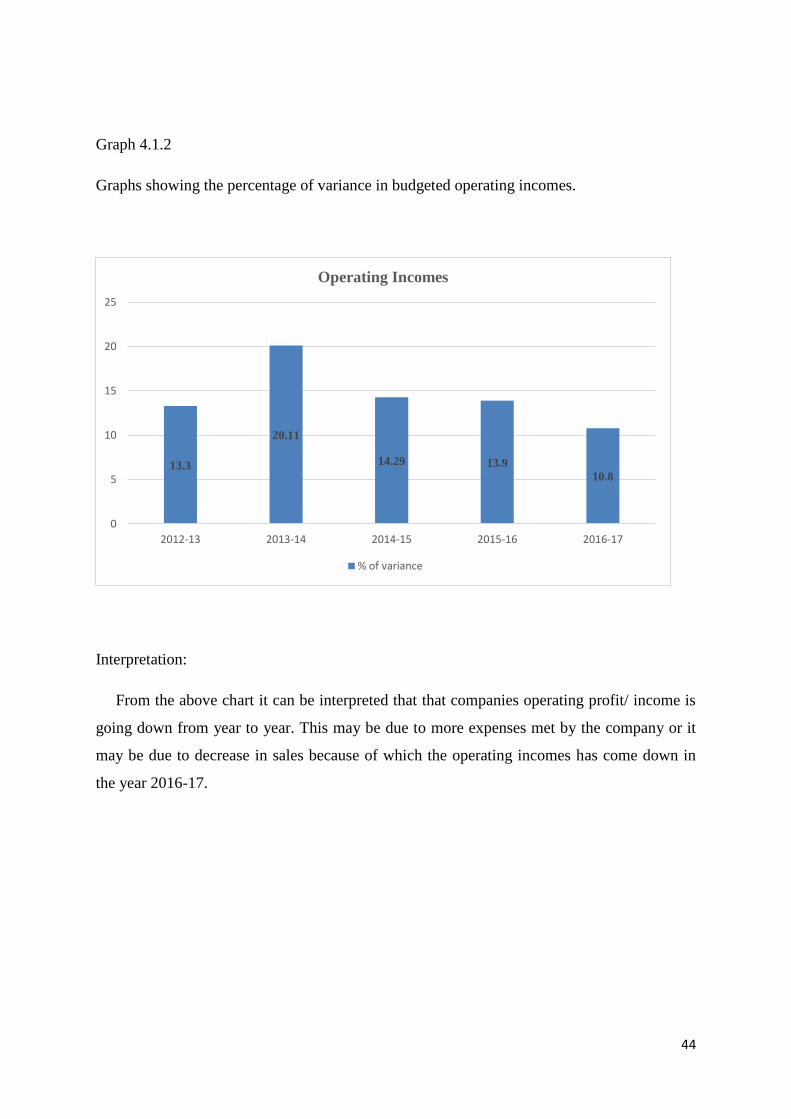
Graph 4.1.2
Graphs showing the percentage of variance in budgeted operating incomes.
Interpretation:
From the above chart it can be interpreted that that companies operating profit/ income is
going down from year to year. This may be due to more expenses met by the company or it
may be due to decrease in sales because of which the operating incomes has come down in
the year 2016-17.
13.3
20.11
14.29 13.9
10.8
0
5
10
15
20
25
2012-13 2013-14 2014-15 2015-16 2016-17
Operating Incomes
% of variance
45
4.3 – Depreciations
Depreciation means decrease in the value of asset over a period of time. It is one of the
way to collect the funds in order to replace the old asset with that of new ones. The asset
value might reduce due to the wear and tear of machinery.
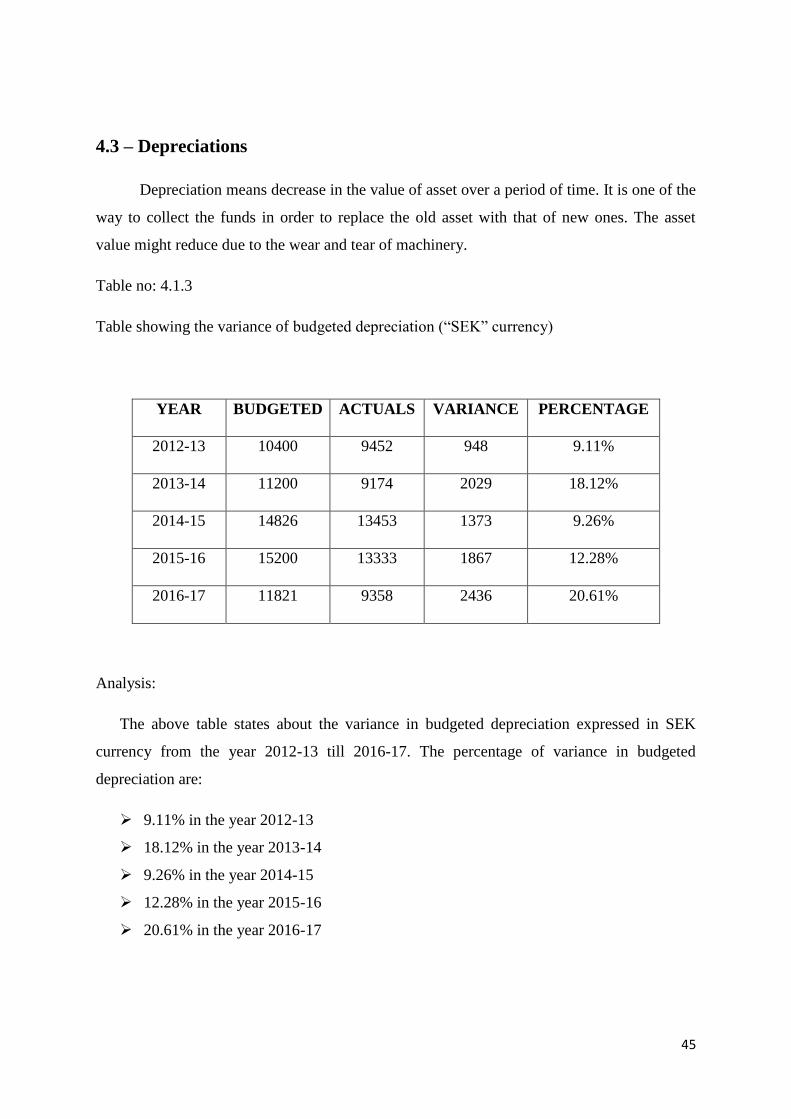
Table no: 4.1.3
Table showing the variance of budgeted depreciation (“SEK” currency)
YEAR BUDGETED ACTUALS VARIANCE PERCENTAGE
2012-13 10400 9452 948 9.11%
2013-14 11200 9174 2029 18.12%
2014-15 14826 13453 1373 9.26%
2015-16 15200 13333 1867 12.28%
2016-17 11821 9358 2436 20.61%
Analysis:
The above table states about the variance in budgeted depreciation expressed in SEK
currency from the year 2012-13 till 2016-17. The percentage of variance in budgeted
depreciation are:
9.11% in the year 2012-13
18.12% in the year 2013-14
9.26% in the year 2014-15
12.28% in the year 2015-16
20.61% in the year 2016-17
46
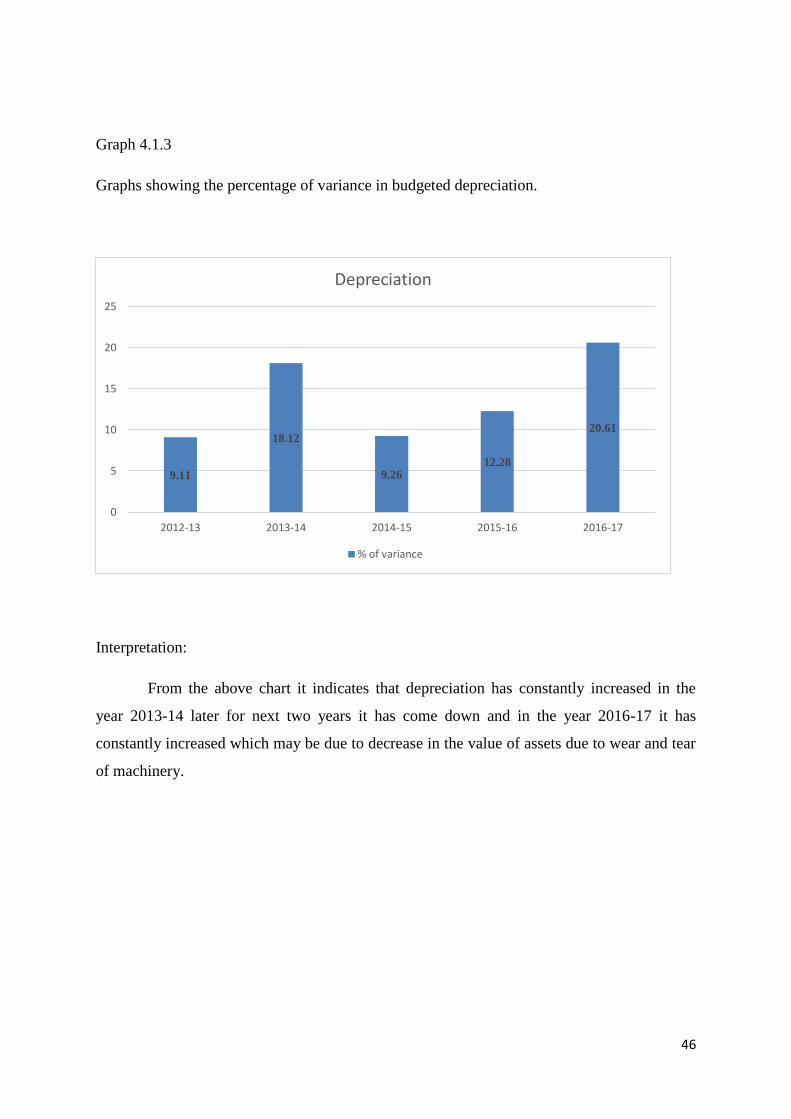
Graph 4.1.3
Graphs showing the percentage of variance in budgeted depreciation.
Interpretation:
From the above chart it indicates that depreciation has constantly increased in the
year 2013-14 later for next two years it has come down and in the year 2016-17 it has
constantly increased which may be due to decrease in the value of assets due to wear and tear
of machinery.
9.11
18.12
9.26 12.28
20.61
0
5
10
15
20
25
2012-13 2013-14 2014-15 2015-16 2016-17
Depreciation
% of variance
47
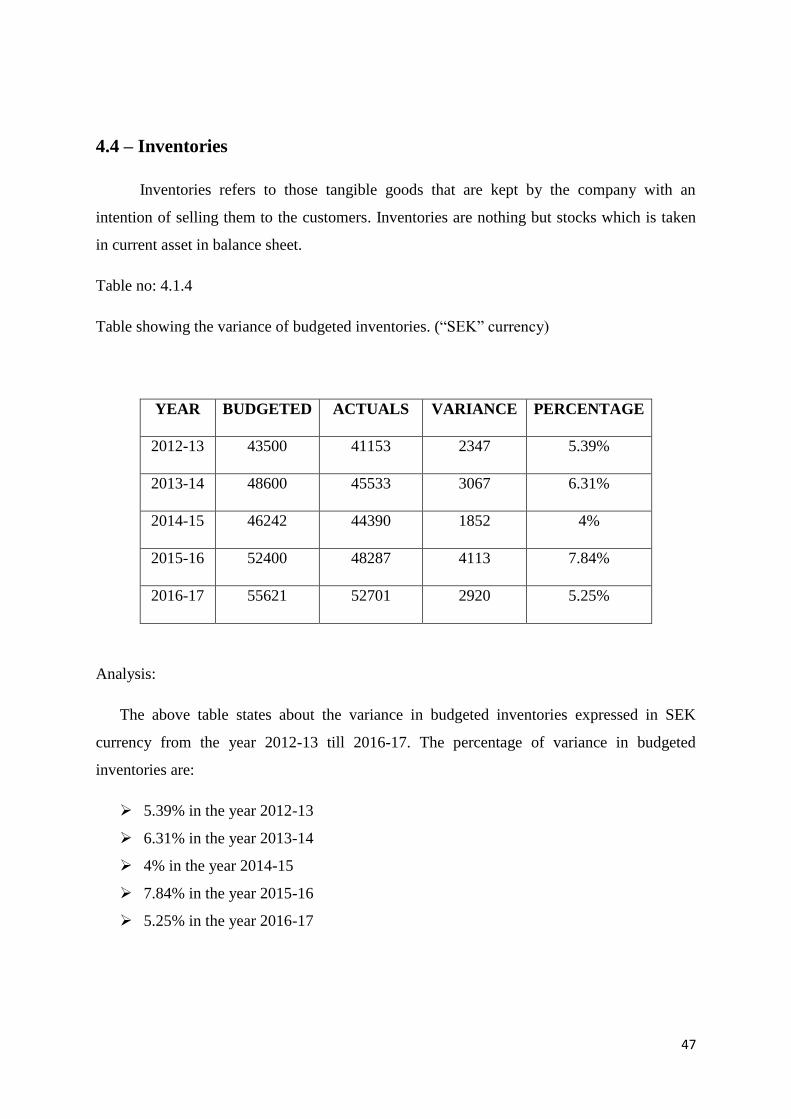
4.4 – Inventories
Inventories refers to those tangible goods that are kept by the company with an
intention of selling them to the customers. Inventories are nothing but stocks which is taken
in current asset in balance sheet.
Table no: 4.1.4
Table showing the variance of budgeted inventories. (“SEK” currency)
YEAR BUDGETED ACTUALS VARIANCE PERCENTAGE
2012-13 43500 41153 2347 5.39%
2013-14 48600 45533 3067 6.31%
2014-15 46242 44390 1852 4%
2015-16 52400 48287 4113 7.84%
2016-17 55621 52701 2920 5.25%
Analysis:
The above table states about the variance in budgeted inventories expressed in SEK
currency from the year 2012-13 till 2016-17. The percentage of variance in budgeted
inventories are:
5.39% in the year 2012-13
6.31% in the year 2013-14
4% in the year 2014-15
7.84% in the year 2015-16
5.25% in the year 2016-17
48
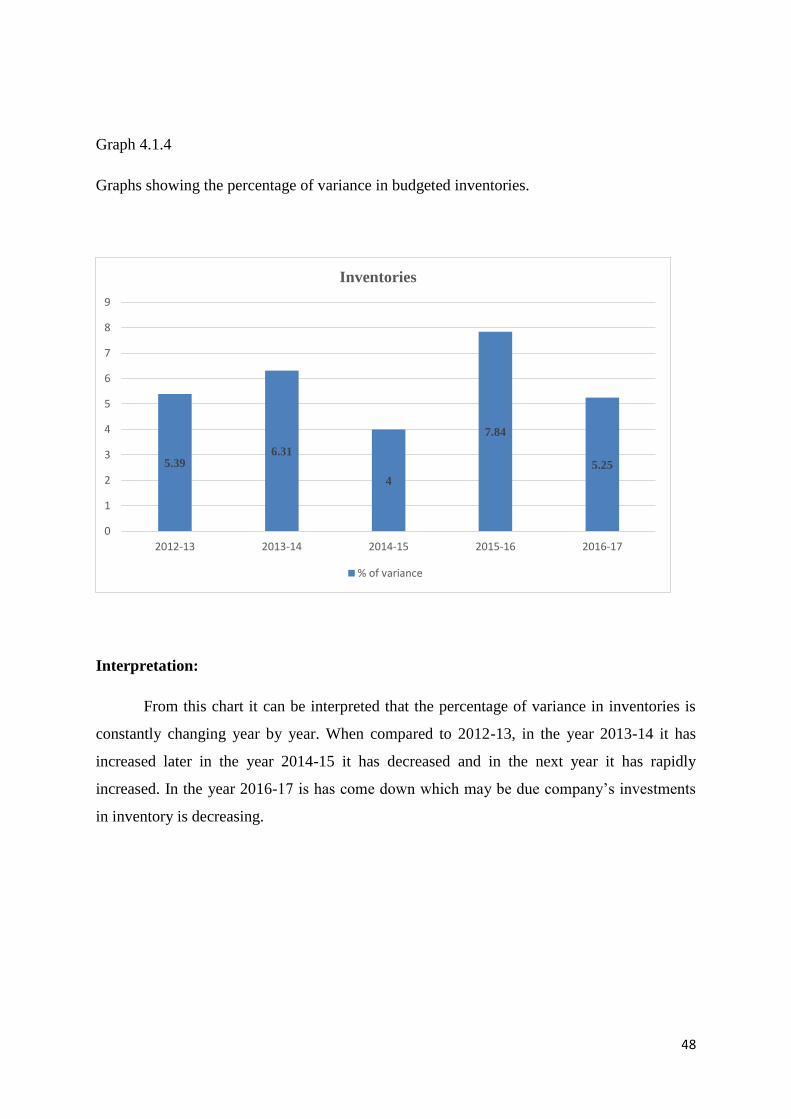
Graph 4.1.4
Graphs showing the percentage of variance in budgeted inventories.
Interpretation:
From this chart it can be interpreted that the percentage of variance in inventories is
constantly changing year by year. When compared to 2012-13, in the year 2013-14 it has
increased later in the year 2014-15 it has decreased and in the next year it has rapidly
increased. In the year 2016-17 is has come down which may be due company’s investments
in inventory is decreasing.
5.39 6.31
4
7.84
5.25
0
1
2
3
4
5
6
7
8
9
2012-13 2013-14 2014-15 2015-16 2016-17
Inventories
% of variance
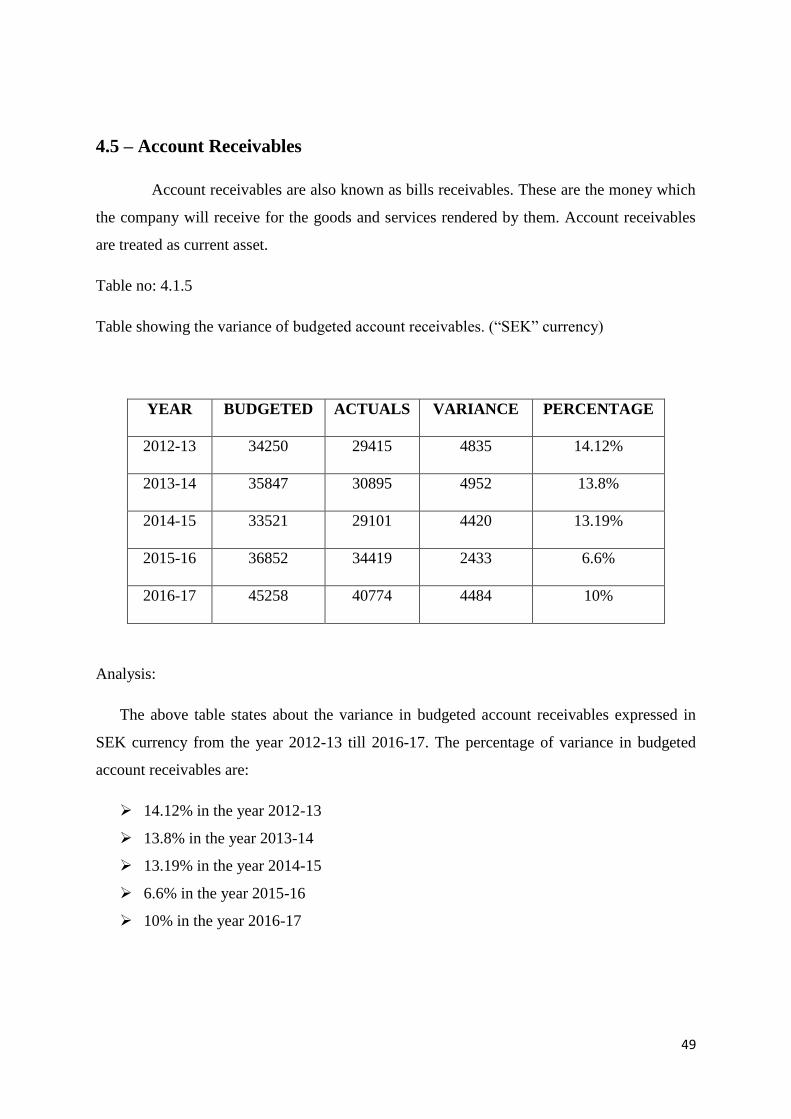
49
4.5 – Account Receivables
Account receivables are also known as bills receivables. These are the money which
the company will receive for the goods and services rendered by them. Account receivables
are treated as current asset.
Table no: 4.1.5
Table showing the variance of budgeted account receivables. (“SEK” currency)
YEAR BUDGETED ACTUALS VARIANCE PERCENTAGE
2012-13 34250 29415 4835 14.12%
2013-14 35847 30895 4952 13.8%
2014-15 33521 29101 4420 13.19%
2015-16 36852 34419 2433 6.6%
2016-17 45258 40774 4484 10%
Analysis:
The above table states about the variance in budgeted account receivables expressed in
SEK currency from the year 2012-13 till 2016-17. The percentage of variance in budgeted
account receivables are:
14.12% in the year 2012-13
13.8% in the year 2013-14
13.19% in the year 2014-15
6.6% in the year 2015-16
10% in the year 2016-17

50
Graph 4.1.5
Graphs showing the percentage of variance in budgeted account receivables.
Interpretations:
From the chart it indicates that the percentage of variance in budgeted account
receivables is more in first three years from 2012-2015 later in the year 2015-2016 it has
come down and has constantly increased in the year 2016-2017 this states that the money
which the company will receive for the goods and services rendered have increased in the
year 2016-17.
14.12 13.8 13.19
6.6
10
0
2
4
6
8
10
12
14
16
2012-13 2013-14 2014-15 2015-16 2016-17
Account Receivables
% of variance
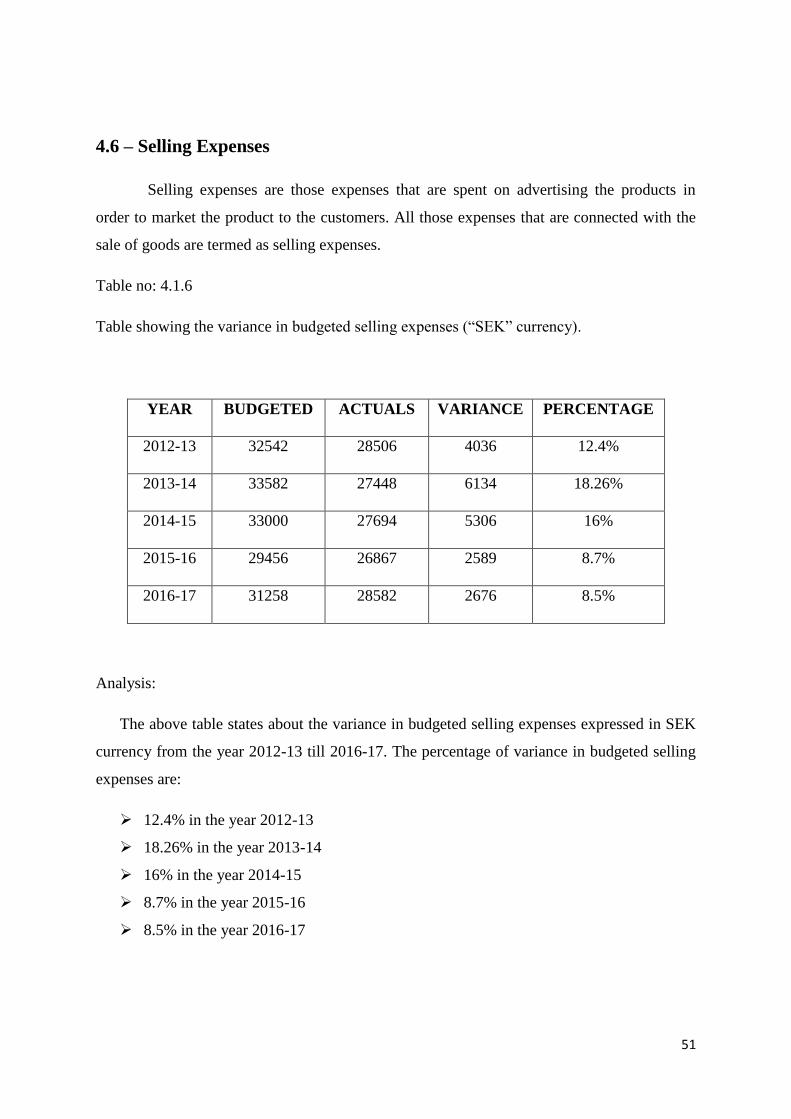
51
4.6 – Selling Expenses
Selling expenses are those expenses that are spent on advertising the products in
order to market the product to the customers. All those expenses that are connected with the
sale of goods are termed as selling expenses.
Table no: 4.1.6
Table showing the variance in budgeted selling expenses (“SEK” currency).
YEAR BUDGETED ACTUALS VARIANCE PERCENTAGE
2012-13 32542 28506 4036 12.4%
2013-14 33582 27448 6134 18.26%
2014-15 33000 27694 5306 16%
2015-16 29456 26867 2589 8.7%
2016-17 31258 28582 2676 8.5%
Analysis:
The above table states about the variance in budgeted selling expenses expressed in SEK
currency from the year 2012-13 till 2016-17. The percentage of variance in budgeted selling
expenses are:
12.4% in the year 2012-13
18.26% in the year 2013-14
16% in the year 2014-15
8.7% in the year 2015-16
8.5% in the year 2016-17
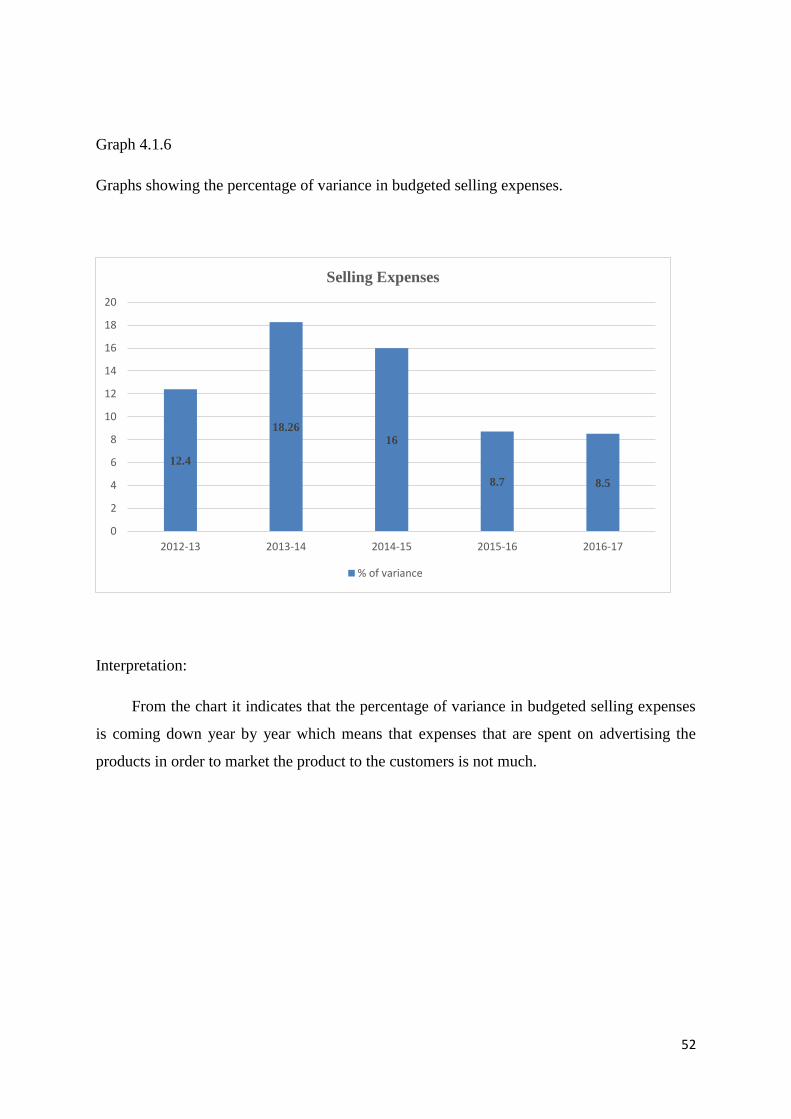
52
Graph 4.1.6
Graphs showing the percentage of variance in budgeted selling expenses.
Interpretation:
From the chart it indicates that the percentage of variance in budgeted selling expenses
is coming down year by year which means that expenses that are spent on advertising the
products in order to market the product to the customers is not much.
12.4
18.26 16
8.7 8.5
0
2
4
6
8
10
12
14
16
18
20
2012-13 2013-14 2014-15 2015-16 2016-17
Selling Expenses
% of variance

53
4.7 – Current asset
Current assets are those assets (includes prepaid expenses, inventories, account
receivables, etc.) which can be easily converted into cash within a short period of time. It
occurs in balance sheet asset side.
Table no – 4.1.7
Table showing the variance in budgeted current assets (“SEK” currency)
YEAR BUDGETED ACTUALS VARIANCE PERCENTAGE
2012-13 184241 163612 20629 11.2%
2013-14 192482 177302 15180 7.89%
2014-15 166542 170687 -4145 -2.5%
2015-16 204802 180301 24501 11.9%
2016-17 225480 199039 26441 11.72%
Analysis:
The above table states about the variance in budgeted current assets in SEK currency
from the year 2012-13 to 2016-17. The percentage of variance in budgeted current assets are
stated below:
11.2% in the year 2012-13
7.89% in the year 2013-14
-5% in the year 2014-15
11.9% in the year 2015-16
11.72% in the year 2016-17
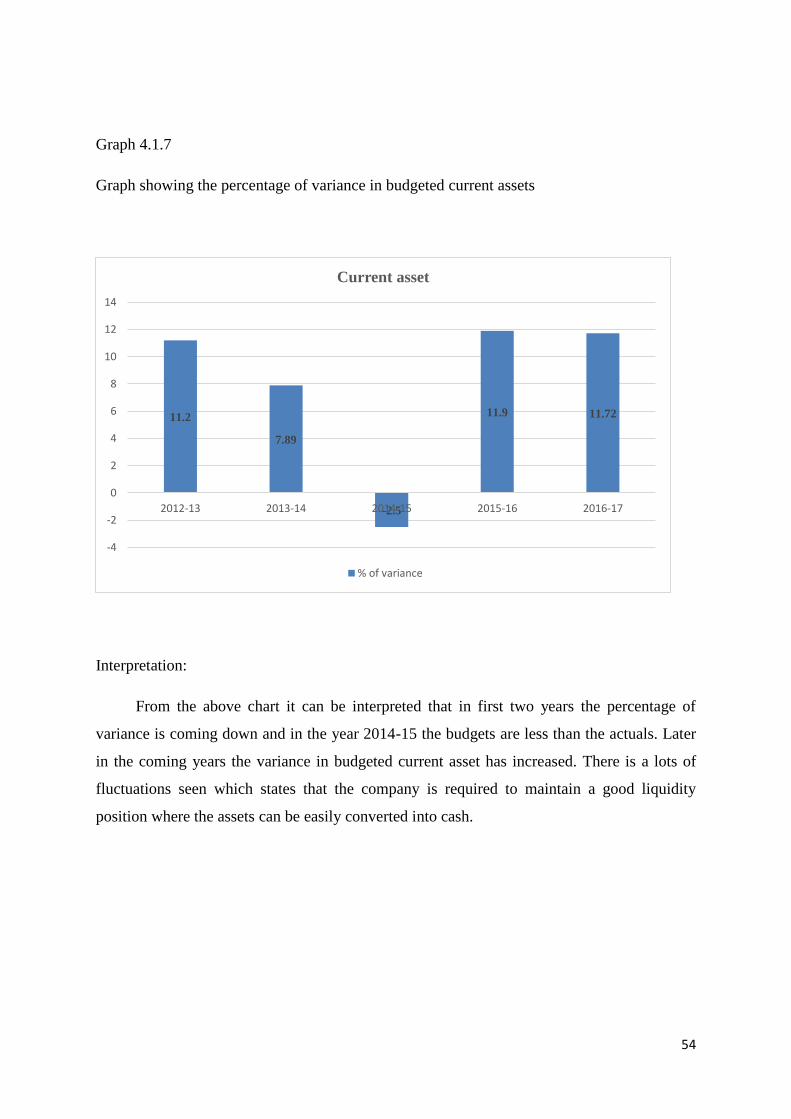
54
Graph 4.1.7
Graph showing the percentage of variance in budgeted current assets
Interpretation:
From the above chart it can be interpreted that in first two years the percentage of
variance is coming down and in the year 2014-15 the budgets are less than the actuals. Later
in the coming years the variance in budgeted current asset has increased. There is a lots of
fluctuations seen which states that the company is required to maintain a good liquidity
position where the assets can be easily converted into cash.
11.2
7.89
-2.5
11.9 11.72
-4
-2
0
2
4
6
8
10
12
14
2012-13 2013-14 2014-15 2015-16 2016-17
Current asset
% of variance
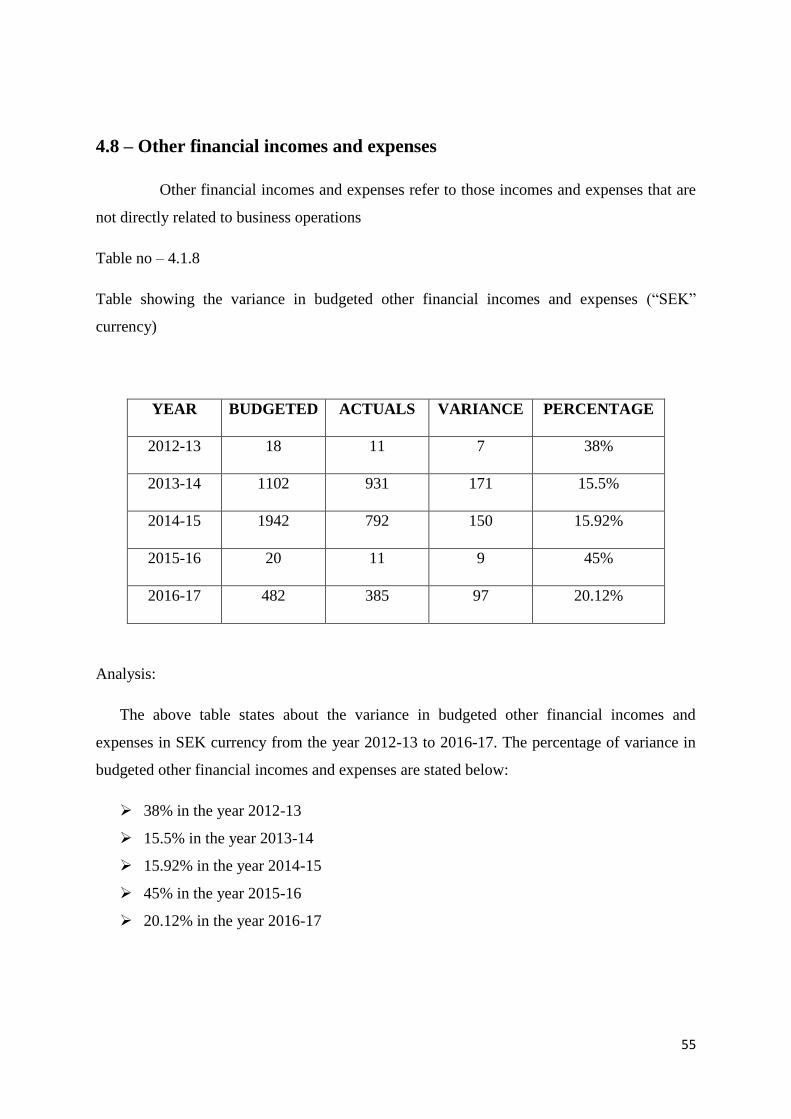
55
4.8 – Other financial incomes and expenses
Other financial incomes and expenses refer to those incomes and expenses that are
not directly related to business operations
Table no – 4.1.8
Table showing the variance in budgeted other financial incomes and expenses (“SEK”
currency)
YEAR BUDGETED ACTUALS VARIANCE PERCENTAGE
2012-13 18 11 7 38%
2013-14 1102 931 171 15.5%
2014-15 1942 792 150 15.92%
2015-16 20 11 9 45%
2016-17 482 385 97 20.12%
Analysis:
The above table states about the variance in budgeted other financial incomes and
expenses in SEK currency from the year 2012-13 to 2016-17. The percentage of variance in
budgeted other financial incomes and expenses are stated below:
38% in the year 2012-13
15.5% in the year 2013-14
15.92% in the year 2014-15
45% in the year 2015-16
20.12% in the year 2016-17
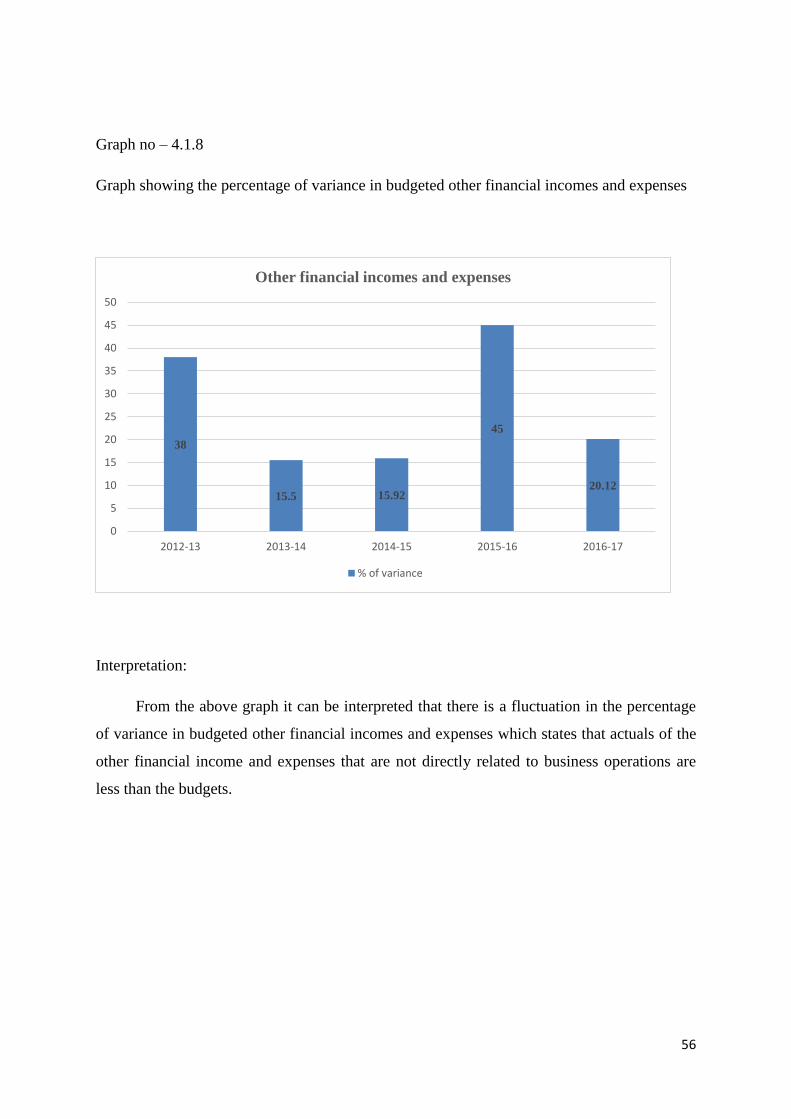
56
Graph no – 4.1.8
Graph showing the percentage of variance in budgeted other financial incomes and expenses
Interpretation:
From the above graph it can be interpreted that there is a fluctuation in the percentage
of variance in budgeted other financial incomes and expenses which states that actuals of the
other financial income and expenses that are not directly related to business operations are
less than the budgets.
38
15.5 15.92
45
20.12
0
5
10
15
20
25
30
35
40
45
50
2012-13 2013-14 2014-15 2015-16 2016-17
Other financial incomes and expenses
% of variance
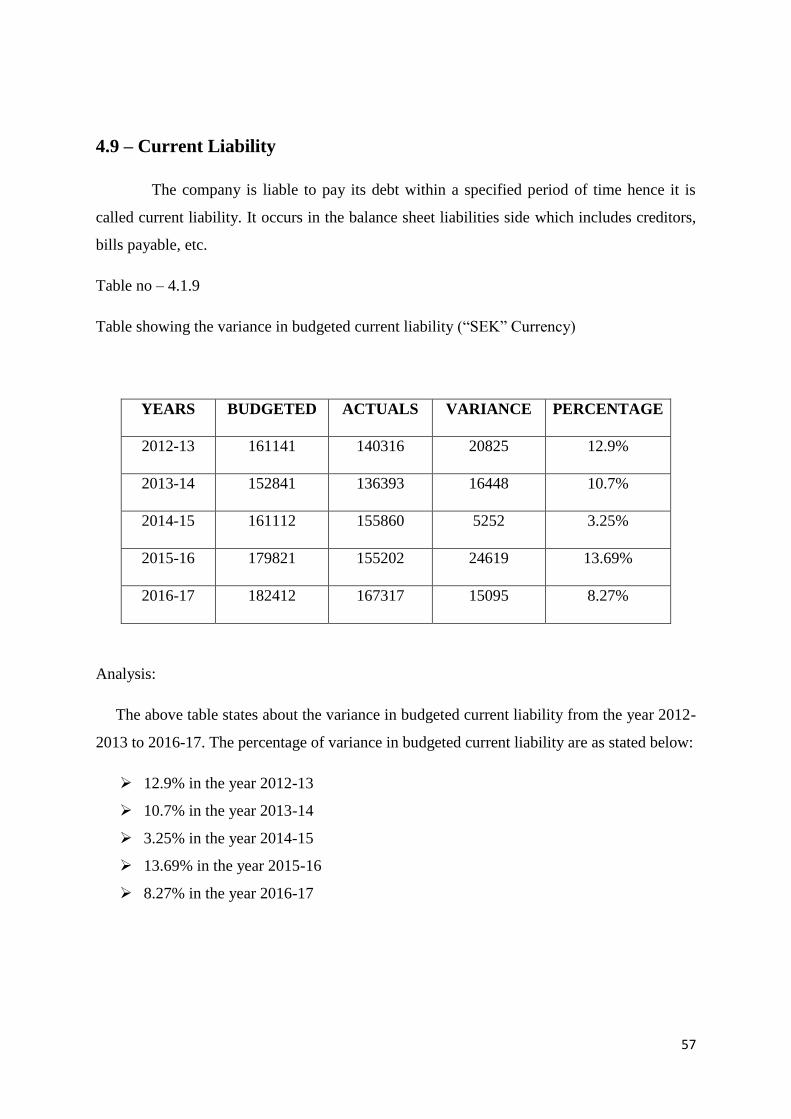
57
4.9 – Current Liability
The company is liable to pay its debt within a specified period of time hence it is
called current liability. It occurs in the balance sheet liabilities side which includes creditors,
bills payable, etc.
Table no – 4.1.9
Table showing the variance in budgeted current liability (“SEK” Currency)
YEARS BUDGETED ACTUALS VARIANCE PERCENTAGE
2012-13 161141 140316 20825 12.9%
2013-14 152841 136393 16448 10.7%
2014-15 161112 155860 5252 3.25%
2015-16 179821 155202 24619 13.69%
2016-17 182412 167317 15095 8.27%
Analysis:
The above table states about the variance in budgeted current liability from the year 2012-
2013 to 2016-17. The percentage of variance in budgeted current liability are as stated below:
12.9% in the year 2012-13
10.7% in the year 2013-14
3.25% in the year 2014-15
13.69% in the year 2015-16
8.27% in the year 2016-17
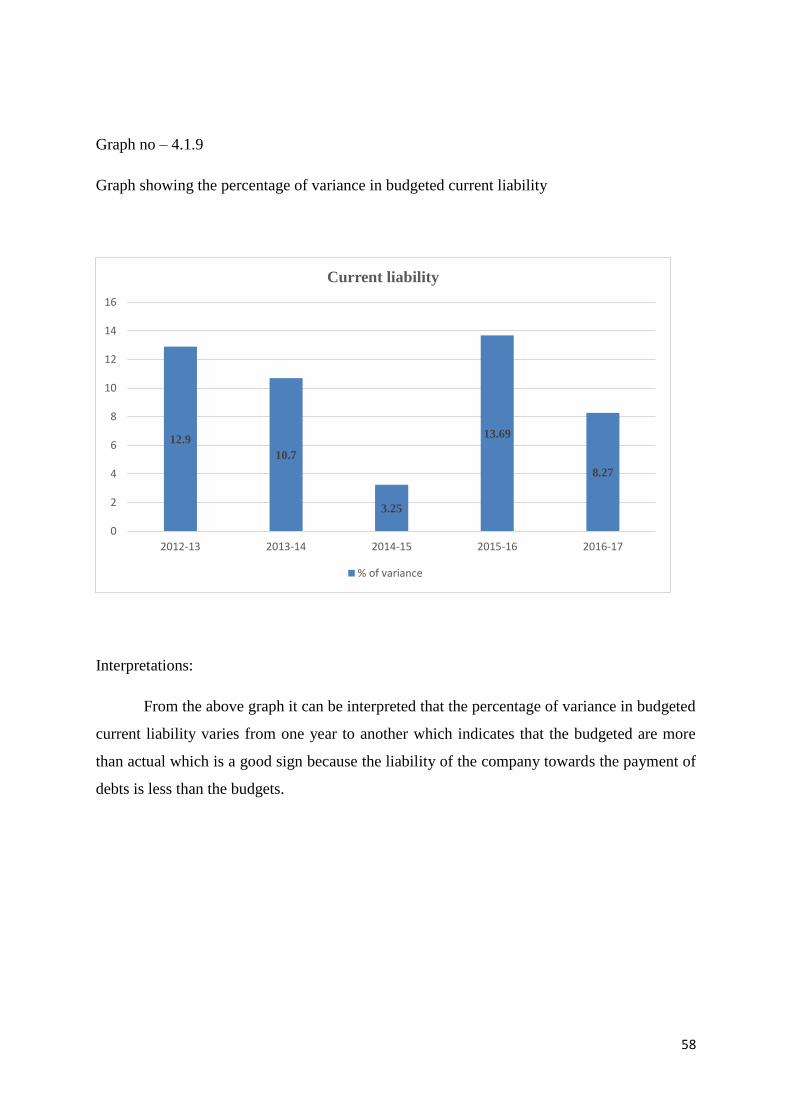
58
Graph no – 4.1.9
Graph showing the percentage of variance in budgeted current liability
Interpretations:
From the above graph it can be interpreted that the percentage of variance in budgeted
current liability varies from one year to another which indicates that the budgeted are more
than actual which is a good sign because the liability of the company towards the payment of
debts is less than the budgets.
12.9
10.7
3.25
13.69
8.27
0
2
4
6
8
10
12
14
16
2012-13 2013-14 2014-15 2015-16 2016-17
Current liability
% of variance
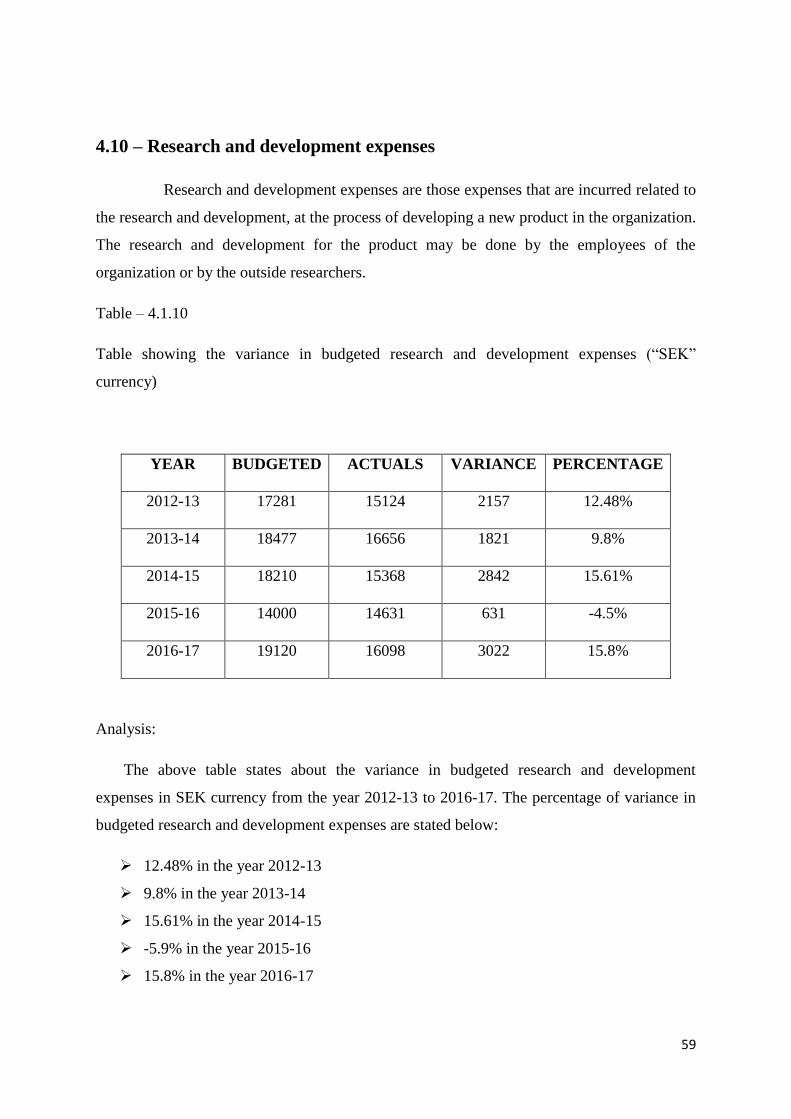
59
4.10 – Research and development expenses
Research and development expenses are those expenses that are incurred related to
the research and development, at the process of developing a new product in the organization.
The research and development for the product may be done by the employees of the
organization or by the outside researchers.
Table – 4.1.10
Table showing the variance in budgeted research and development expenses (“SEK”
currency)
YEAR BUDGETED ACTUALS VARIANCE PERCENTAGE
2012-13 17281 15124 2157 12.48%
2013-14 18477 16656 1821 9.8%
2014-15 18210 15368 2842 15.61%
2015-16 14000 14631 631 -4.5%
2016-17 19120 16098 3022 15.8%
Analysis:
The above table states about the variance in budgeted research and development
expenses in SEK currency from the year 2012-13 to 2016-17. The percentage of variance in
budgeted research and development expenses are stated below:
12.48% in the year 2012-13
9.8% in the year 2013-14
15.61% in the year 2014-15
-5.9% in the year 2015-16
15.8% in the year 2016-17
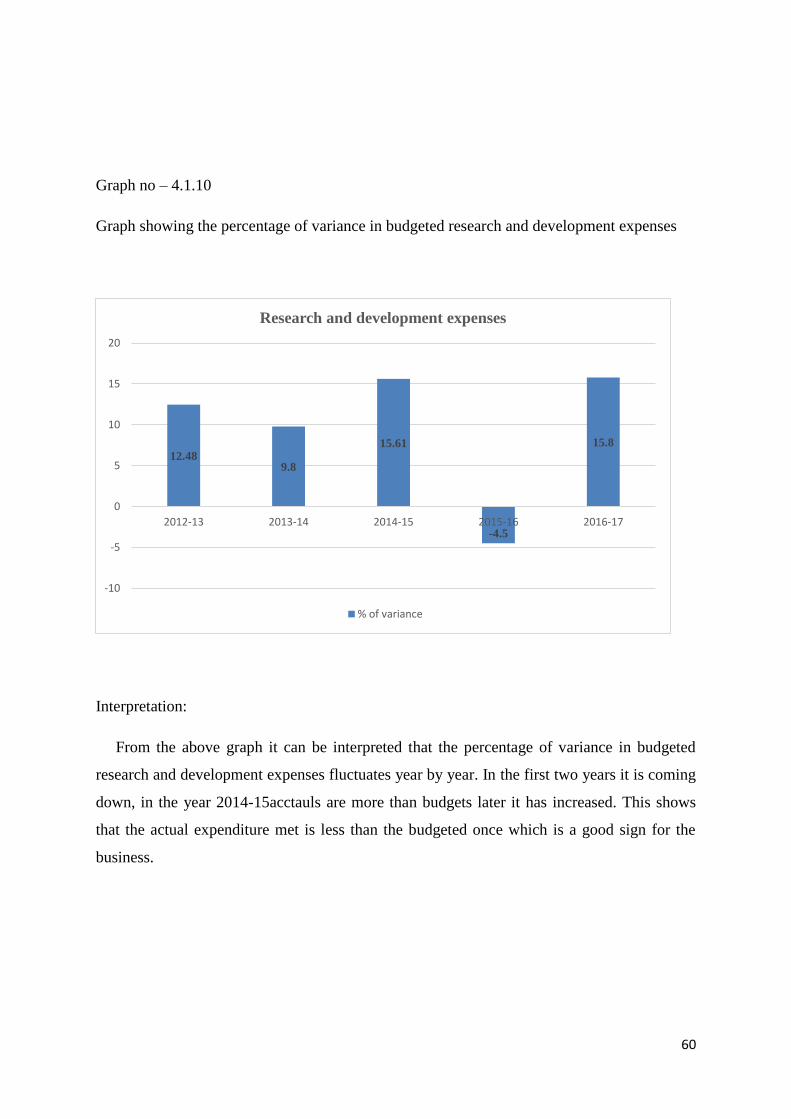
60
Graph no – 4.1.10
Graph showing the percentage of variance in budgeted research and development expenses
Interpretation:
From the above graph it can be interpreted that the percentage of variance in budgeted
research and development expenses fluctuates year by year. In the first two years it is coming
down, in the year 2014-15acctauls are more than budgets later it has increased. This shows
that the actual expenditure met is less than the budgeted once which is a good sign for the
business.
12.48 9.8
15.61
-4.5
15.8
-10
-5
0
5
10
15
20
2012-13 2013-14 2014-15 2015-16 2016-17
Research and development expenses
% of variance
61
CHAPTER: 5
FINDINGS, CONCLUSIONS AND SUGGESTIONS
5.1 – Findings
It is found that the company Volvo Group has a leading market position among its
competitors and is increasing its income from year to year.
The products of the company are versatile in its nature and are coming up with a new
product in future which states about the demand of the product and about the
acceptance of the company’s products due to its quality features.
In the year 2016-17, Volvo Groups has increased its sales and also its profitability
when compared to the previous year especially in sale of trucks.
In the year 2016-17, there was no risk involved in terms of number of accidents/ loss
on fire etc. in Volvo construction equipment.
After few years the Volvo Construction Equipment has an improvement in earnings in
2016-17 by reducing the cost which in-tern lead to increase in the profitability of the
company.
Volvo buses which is a part of Volvo Group had a record in sale of buses from years
and has continued its record interns of sale which lead to increase in the efficiency
and effectiveness of business.
5.2 – Conclusion
Every organization has its own objectives and goals to be achieved but reaching those
objectives and goals by proper planning, controlling and co-ordinating makes it to be more
effective. The company can only increase its efficiency, effectiveness and profit only if the
execution of those plan are well planned and are delivered properly. This also implies that the
company should reach its goals by minimizing the cost and by maximizing the profits.
62
In order to achieve the desired result and to fix the targets, Budget plays a very important
role. Budgetary control act has a control tools helps the organization in terms of planning and
controlling the cost which intern reduces the elimination of unnecessary cost and increases
profitability. It also helps in fixing the target within which the work is to be done. Hence the
budgetary control plays a very important role in the organization and acts as a framework for
the company to achieve its desired result.
We can conclude that the Volvo Group has a good financial position in each of the
segments as it has achieved the desired target fixed. At the time of comparison maximum of
actuals expenses are less than the budgeted ones which states that the company is minimizing
its cost by increasing its profitability.
5.3 - Suggestion
A continuous comparison of actual performance with that of the budgeted
performance.
To have a proper planning and to take certain precautionary measures.
Better formation of policy which helps to achieve the desired result in the
organization.
Periodical maintenance of machinery has to be done which may avoid certain
percentage of breakdown machinery which intern increases the profitability.
Better co-ordination among the employees among the various department.
To take corrective measure if any discrepancies found.

BIBLIOGRAPHY
Books:
Management Accounting- Author: M.N Arora, First edition
Management Accounting- Author: M.Y Khan and P.K Jain, Fifth edition
Cost Accounting- Author: Narang K.L, Fifth edition
Cost Management
Magazines:
Times of India
Business World
Economic times
Articles:
Welch, Hilton, Gordon (1998), “Budgets and Budgetary control as a management tool
for Ghana Metropolitan Assemblies”, Journal of Finance and Accounting, Vol-3, No-
5, page no:160-161
Blocher E.J, Lawson R.A, Brewer P.C, Cokins.G, Sorensen J.E, Stout D.E, Wouters
M.J (2013), “Focusing accounting curricula on students” long run careers:
Recommendations for an integrated competency-based framework for accounting
education, Issues in Accounting Education,29(2), pg. no:295-317.
Herath S.K and Indriani M.W(2007), “Budgeting as competitive advantage evidence
from Sri Lanka”, Journal of American Academy of Business, Vol-2, pg.no-79-91.
Charles (1997), “A systematic Review of Budgeting and Budgeting Control in
Government owned organization”, Research journal of Finance and Accounting,
Vol:6, pg.no- 4-5.
D.Acquah, S. Kwaku, O.S Princenyantakyi (2016), “Impact of budgets and budgetary
control on performance (A case study of selected public hospitals in Kumasi
Metropolis).
Hudson, MC Elroy, Susan L, Paul E. Keck, Harrison g. pope and James I (1992),
“Valproate in the treatment of bipolar disorder: literature review and clinical
guidelines”, Journal of clinical psychopharmacology.
Griffin, R.W Welsh and Moorhead G (1981), “Perceived task characteristics and
employee performance: A literature review”, Academy of management review 6, no-
4, pg.no:655-664.
Lucey BM, Larkin C and Gurdgiev.C (2014), “Learning from the Irish experience- a
clinical case study in banking failure, Comparative Economic Studies,56(2), pg. no-
295-312.
Modetola odeleye (1991), “International Evidence”, Journal of banking and finance,
Indian Institute of Finance, Vol-19, Delhi, India.
Reynols (2015), “Analysis, Forecasting and Control” Managerial Auditing Journal 21.
1/2 (2006): 148-165
Pandey (2008), “A systematic Review of Budgeting and Budgeting Control in
Government owned organization”, Research journal of Finance and Accounting,
Vol:6, pg.no- 1-2.
Horngren C.T (2004), “Management account: some comments.”, Journal of
management accounting research,16(1), pg. no-207-211.
Conlon, Thomas J (2004), “A review of informal learning literature, theory and
implications for practice in developing global professional competences.”, Journal of
European industrial training 28(2/3/4), pg.no:283-295.
Neely A, Bourne M, Adams C (2003), “Better budgeting or beyond budgeting?”,
Measuring business excellence,7(3), pg.no-22-28.
Egan & Wong K.S (1993), “Dimensions of trade show exhibiting management”,
Journal of marketing management, 9(1), pg.no:55-63.
Swink, Morgan & Micheal (1995), “Manufacturing strategy: propositions, current
research, renewed directions, International journal of operations & production
management, 15(7), pg.no- 4-26.
Churchill and Harper (1984), “Analysis, Forecasting and Control” Managerial
Auditing Journal 21. 1/2 (2006): 148-165.
Kaplan and Norton (1992), “Participative Budgeting” The Financial Review 203-230,
Killington, United Kingdom”.
Emmanuel, Otley, and Merchant (1990), “Budgets and Budgetary control as a
management tool for Ghana Metropolitan Assemblies”, Journal of Finance and
Accounting, Vol-3, No-5, page no:160.
Eichorn (2000), “Business and Economics” Industrial Management Review, Vol:186,
41-49, United states.
Websites
www.wikipedia.com
www.yourarticle.library.com
www.vovlogroup.com
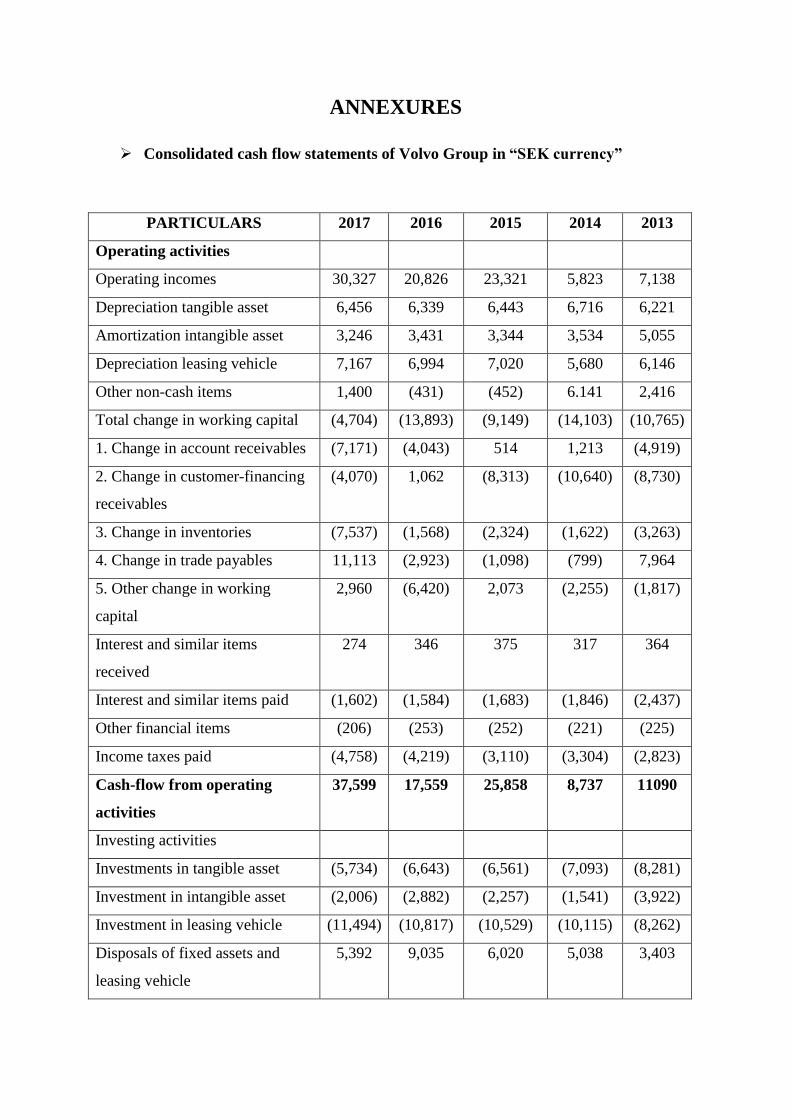
ANNEXURES
Consolidated cash flow statements of Volvo Group in “SEK currency”
PARTICULARS 2017 2016 2015 2014 2013
Operating activities
Operating incomes 30,327 20,826 23,321 5,823 7,138
Depreciation tangible asset 6,456 6,339 6,443 6,716 6,221
Amortization intangible asset 3,246 3,431 3,344 3,534 5,055
Depreciation leasing vehicle 7,167 6,994 7,020 5,680 6,146
Other non-cash items 1,400 (431) (452) 6.141 2,416
Total change in working capital (4,704) (13,893) (9,149) (14,103) (10,765)
1. Change in account receivables (7,171) (4,043) 514 1,213 (4,919)
2. Change in customer-financing
receivables
(4,070) 1,062 (8,313) (10,640) (8,730)
3. Change in inventories (7,537) (1,568) (2,324) (1,622) (3,263)
4. Change in trade payables 11,113 (2,923) (1,098) (799) 7,964
5. Other change in working
capital
2,960 (6,420) 2,073 (2,255) (1,817)
Interest and similar items
received
274 346 375 317 364
Interest and similar items paid (1,602) (1,584) (1,683) (1,846) (2,437)
Other financial items (206) (253) (252) (221) (225)
Income taxes paid (4,758) (4,219) (3,110) (3,304) (2,823)
Cash-flow from operating
activities
37,599 17,559 25,858 8,737 11090
Investing activities
Investments in tangible asset (5,734) (6,643) (6,561) (7,093) (8,281)
Investment in intangible asset (2,006) (2,882) (2,257) (1,541) (3,922)
Investment in leasing vehicle (11,494) (10,817) (10,529) (10,115) (8,262)
Disposals of fixed assets and
leasing vehicle
5,392 9,035 6,020 5,038 3,403
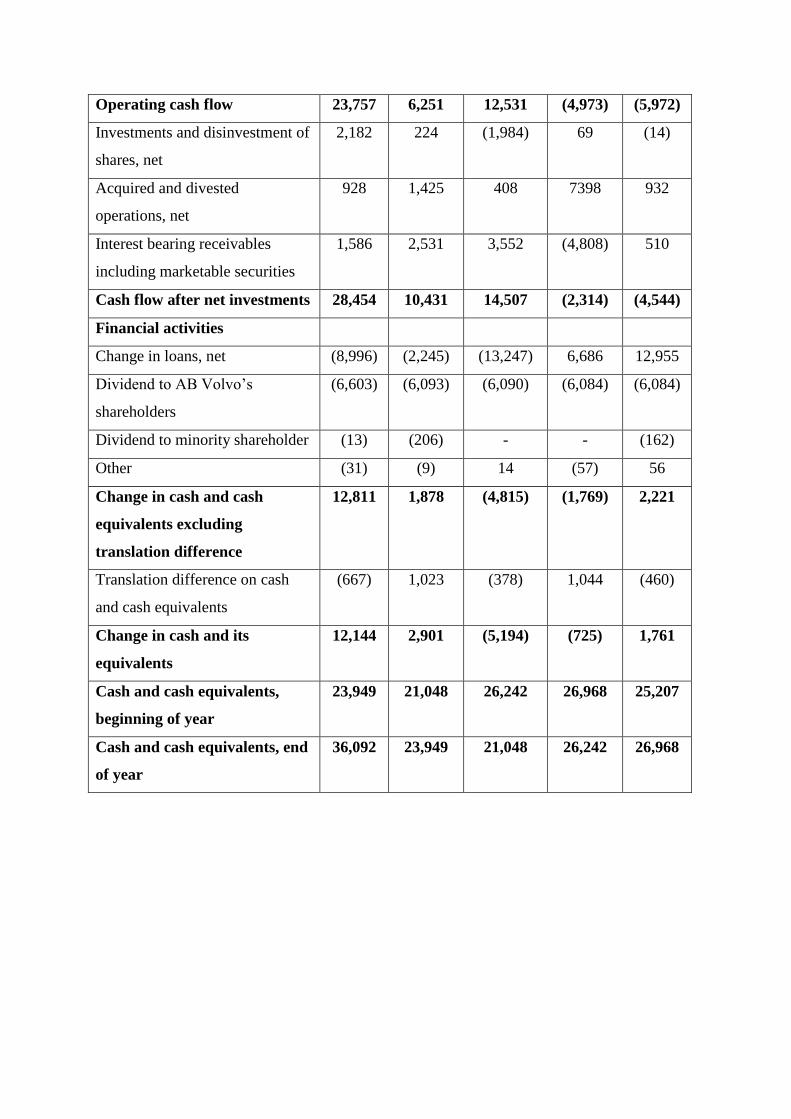
Operating cash flow 23,757 6,251 12,531 (4,973) (5,972)
Investments and disinvestment of
shares, net
2,182 224 (1,984) 69 (14)
Acquired and divested
operations, net
928 1,425 408 7398 932
Interest bearing receivables
including marketable securities
1,586 2,531 3,552 (4,808) 510
Cash flow after net investments 28,454 10,431 14,507 (2,314) (4,544)
Financial activities
Change in loans, net (8,996) (2,245) (13,247) 6,686 12,955
Dividend to AB Volvo’s
shareholders
(6,603) (6,093) (6,090) (6,084) (6,084)
Dividend to minority shareholder (13) (206) - - (162)
Other (31) (9) 14 (57) 56
Change in cash and cash
equivalents excluding
translation difference
12,811 1,878 (4,815) (1,769) 2,221
Translation difference on cash
and cash equivalents
(667) 1,023 (378) 1,044 (460)
Change in cash and its
equivalents
12,144 2,901 (5,194) (725) 1,761
Cash and cash equivalents,
beginning of year
23,949 21,048 26,242 26,968 25,207
Cash and cash equivalents, end
of year
36,092 23,949 21,048 26,242 26,968
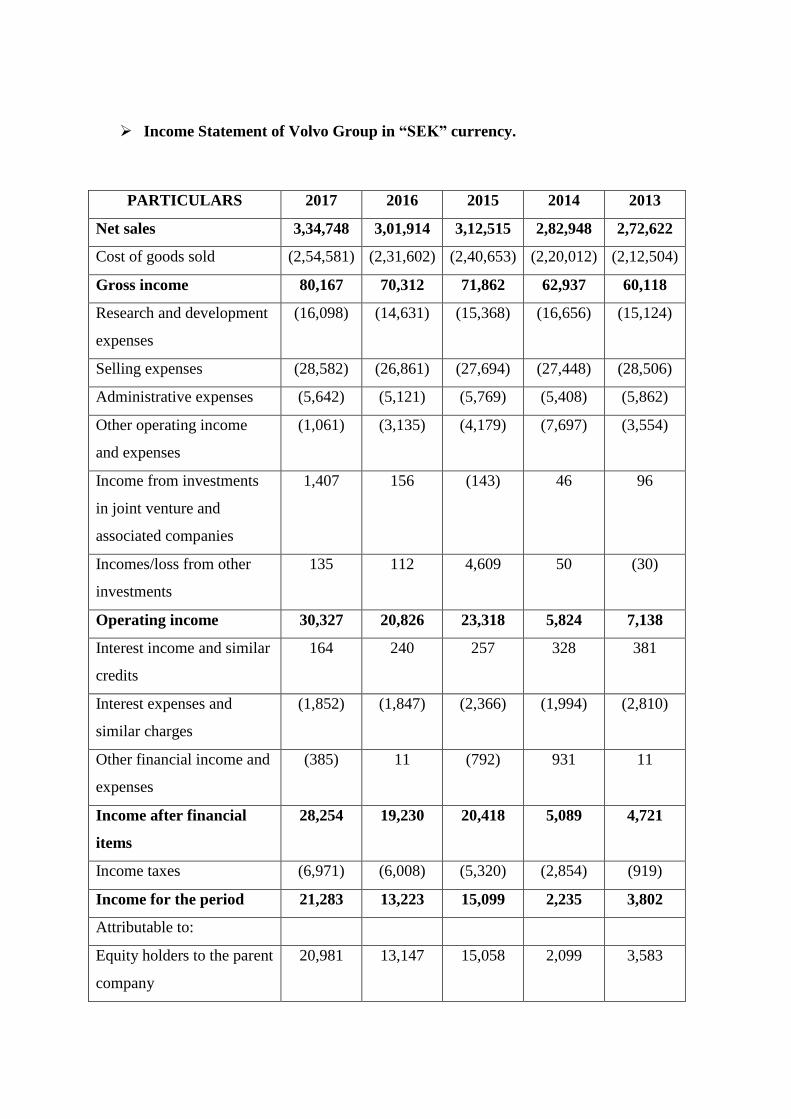
Income Statement of Volvo Group in “SEK” currency.
PARTICULARS 2017 2016 2015 2014 2013
Net sales 3,34,748 3,01,914 3,12,515 2,82,948 2,72,622
Cost of goods sold (2,54,581) (2,31,602) (2,40,653) (2,20,012) (2,12,504)
Gross income 80,167 70,312 71,862 62,937 60,118
Research and development
expenses
(16,098) (14,631) (15,368) (16,656) (15,124)
Selling expenses (28,582) (26,861) (27,694) (27,448) (28,506)
Administrative expenses (5,642) (5,121) (5,769) (5,408) (5,862)
Other operating income
and expenses
(1,061) (3,135) (4,179) (7,697) (3,554)
Income from investments
in joint venture and
associated companies
1,407 156 (143) 46 96
Incomes/loss from other
investments
135 112 4,609 50 (30)
Operating income 30,327 20,826 23,318 5,824 7,138
Interest income and similar
credits
164 240 257 328 381
Interest expenses and
similar charges
(1,852) (1,847) (2,366) (1,994) (2,810)
Other financial income and
expenses
(385) 11 (792) 931 11
Income after financial
items
28,254 19,230 20,418 5,089 4,721
Income taxes (6,971) (6,008) (5,320) (2,854) (919)
Income for the period 21,283 13,223 15,099 2,235 3,802
Attributable to:
Equity holders to the parent
company
20,981 13,147 15,058 2,099 3,583
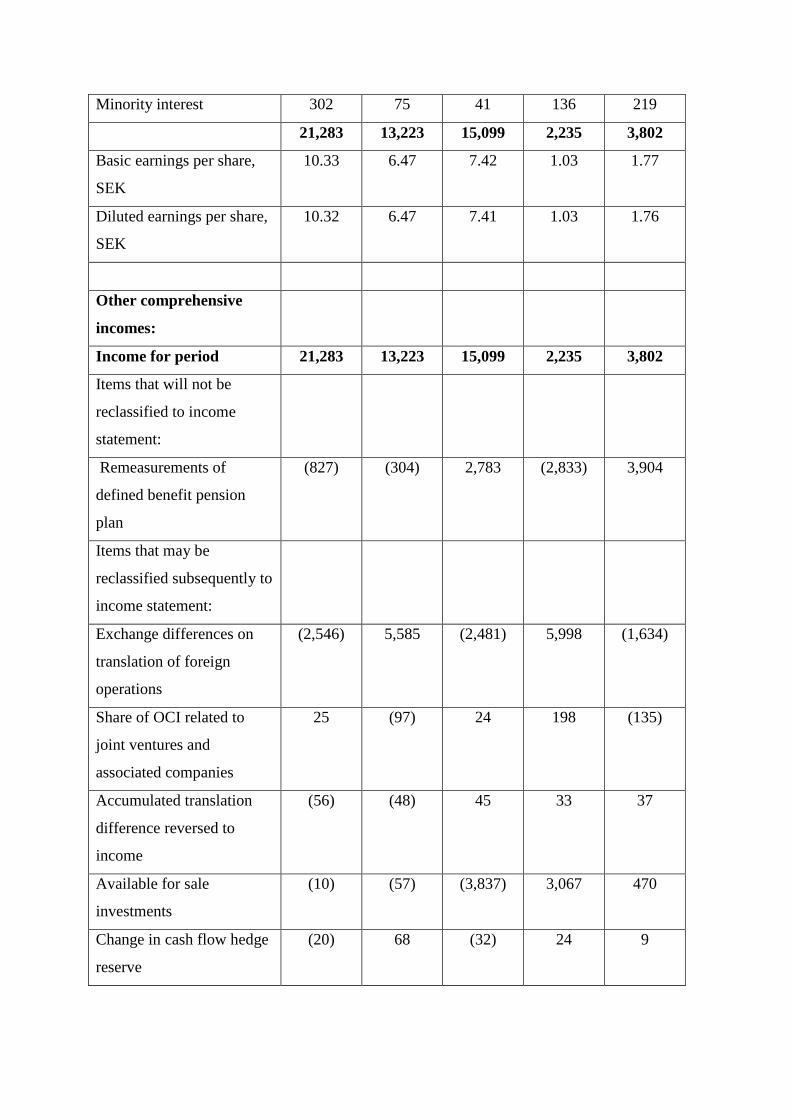
Minority interest 302 75 41 136 219
21,283 13,223 15,099 2,235 3,802
Basic earnings per share,
SEK
10.33 6.47 7.42 1.03 1.77
Diluted earnings per share,
SEK
10.32 6.47 7.41 1.03 1.76
Other comprehensive
incomes:
Income for period 21,283 13,223 15,099 2,235 3,802
Items that will not be
reclassified to income
statement:
Remeasurements of
defined benefit pension
plan
(827) (304) 2,783 (2,833) 3,904
Items that may be
reclassified subsequently to
income statement:
Exchange differences on
translation of foreign
operations
(2,546) 5,585 (2,481) 5,998 (1,634)
Share of OCI related to
joint ventures and
associated companies
25 (97) 24 198 (135)
Accumulated translation
difference reversed to
income
(56) (48) 45 33 37
Available for sale
investments
(10) (57) (3,837) 3,067 470
Change in cash flow hedge
reserve
(20) 68 (32) 24 9
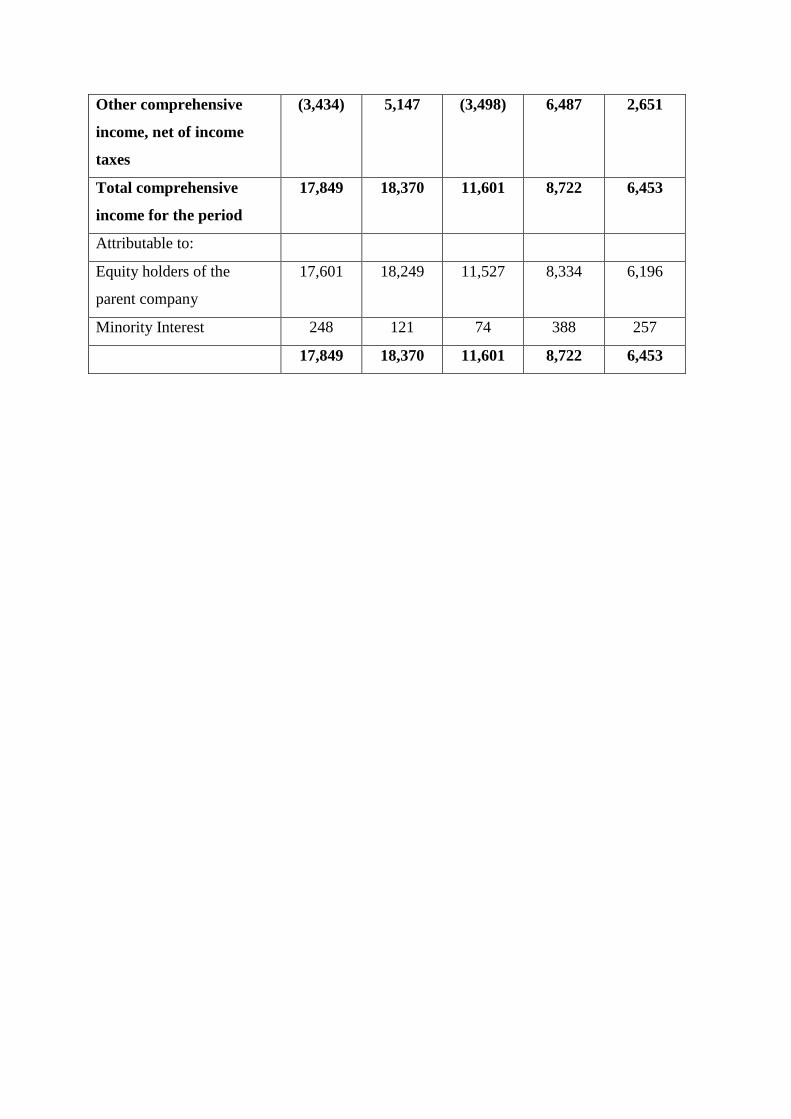
Other comprehensive
income, net of income
taxes
(3,434) 5,147 (3,498) 6,487 2,651
Total comprehensive
income for the period
17,849 18,370 11,601 8,722 6,453
Attributable to:
Equity holders of the
parent company
17,601 18,249 11,527 8,334 6,196
Minority Interest 248 121 74 388 257
17,849 18,370 11,601 8,722 6,453
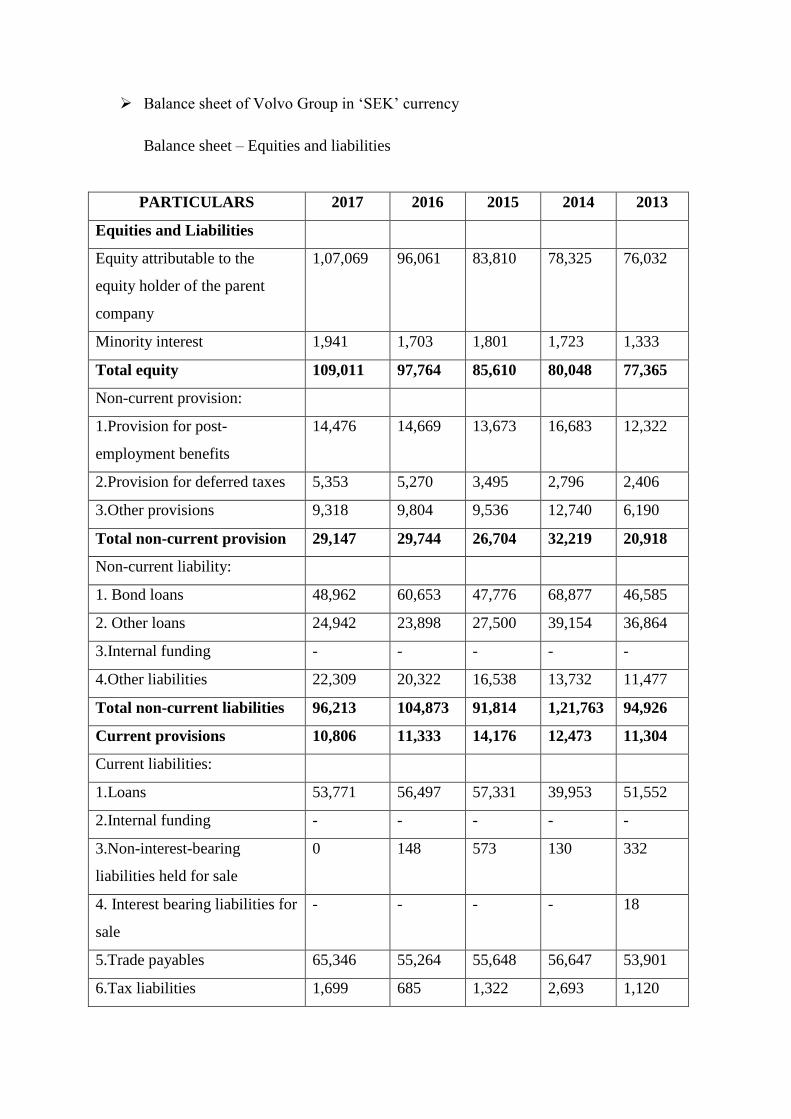
Balance sheet of Volvo Group in ‘SEK’ currency
Balance sheet – Equities and liabilities
PARTICULARS 2017 2016 2015 2014 2013
Equities and Liabilities
Equity attributable to the
equity holder of the parent
company
1,07,069 96,061 83,810 78,325 76,032
Minority interest 1,941 1,703 1,801 1,723 1,333
Total equity 109,011 97,764 85,610 80,048 77,365
Non-current provision:
1.Provision for post-
employment benefits
14,476 14,669 13,673 16,683 12,322
2.Provision for deferred taxes 5,353 5,270 3,495 2,796 2,406
3.Other provisions 9,318 9,804 9,536 12,740 6,190
Total non-current provision 29,147 29,744 26,704 32,219 20,918
Non-current liability:
1. Bond loans 48,962 60,653 47,776 68,877 46,585
2. Other loans 24,942 23,898 27,500 39,154 36,864
3.Internal funding - - - - -
4.Other liabilities 22,309 20,322 16,538 13,732 11,477
Total non-current liabilities 96,213 104,873 91,814 1,21,763 94,926
Current provisions 10,806 11,333 14,176 12,473 11,304
Current liabilities:
1.Loans 53,771 56,497 57,331 39,953 51,552
2.Internal funding - - - - -
3.Non-interest-bearing
liabilities held for sale
0 148 573 130 332
4. Interest bearing liabilities for
sale
- - - - 18
5.Trade payables 65,346 55,264 55,648 56,647 53,901
6.Tax liabilities 1,699 685 1,322 2,693 1,120
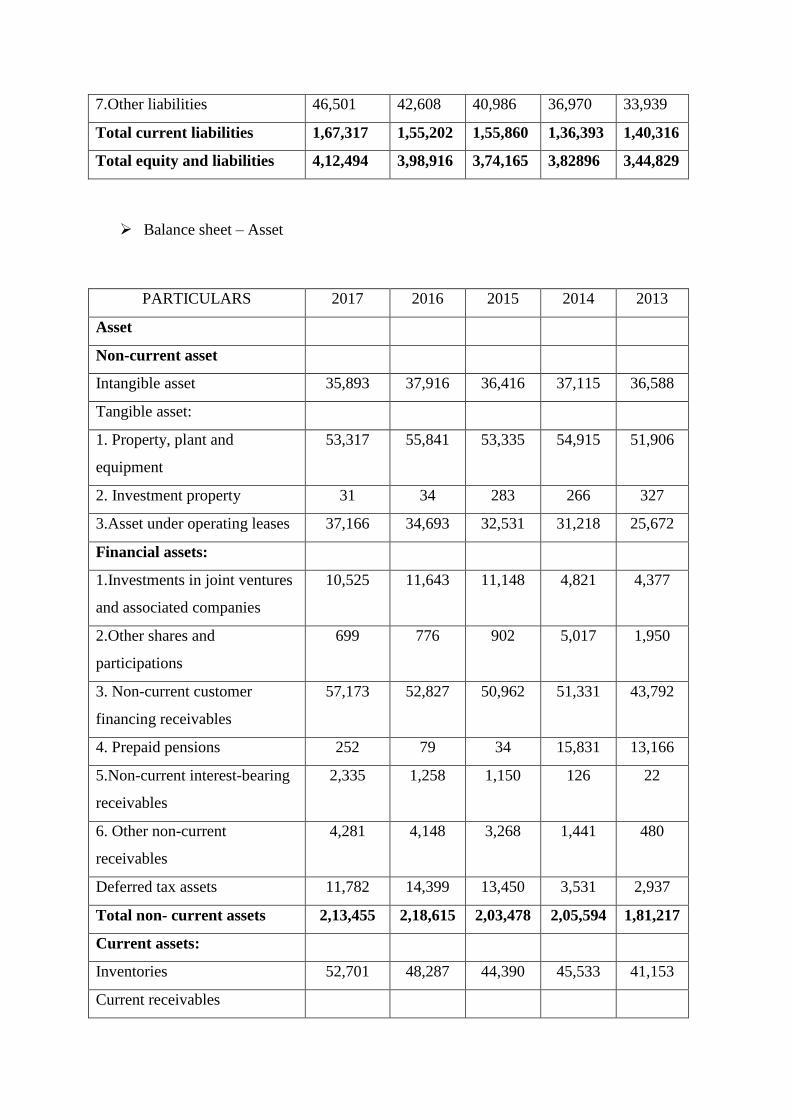
7.Other liabilities 46,501 42,608 40,986 36,970 33,939
Total current liabilities 1,67,317 1,55,202 1,55,860 1,36,393 1,40,316
Total equity and liabilities 4,12,494 3,98,916 3,74,165 3,82896 3,44,829
Balance sheet – Asset
PARTICULARS 2017 2016 2015 2014 2013
Asset
Non-current asset
Intangible asset 35,893 37,916 36,416 37,115 36,588
Tangible asset:
1. Property, plant and
equipment
53,317 55,841 53,335 54,915 51,906
2. Investment property 31 34 283 266 327
3.Asset under operating leases 37,166 34,693 32,531 31,218 25,672
Financial assets:
1.Investments in joint ventures
and associated companies
10,525 11,643 11,148 4,821 4,377
2.Other shares and
participations
699 776 902 5,017 1,950
3. Non-current customer
financing receivables
57,173 52,827 50,962 51,331 43,792
4. Prepaid pensions 252 79 34 15,831 13,166
5.Non-current interest-bearing
receivables
2,335 1,258 1,150 126 22
6. Other non-current
receivables
4,281 4,148 3,268 1,441 480
Deferred tax assets 11,782 14,399 13,450 3,531 2,937
Total non- current assets 2,13,455 2,18,615 2,03,478 2,05,594 1,81,217
Current assets:
Inventories 52,701 48,287 44,390 45,533 41,153
Current receivables
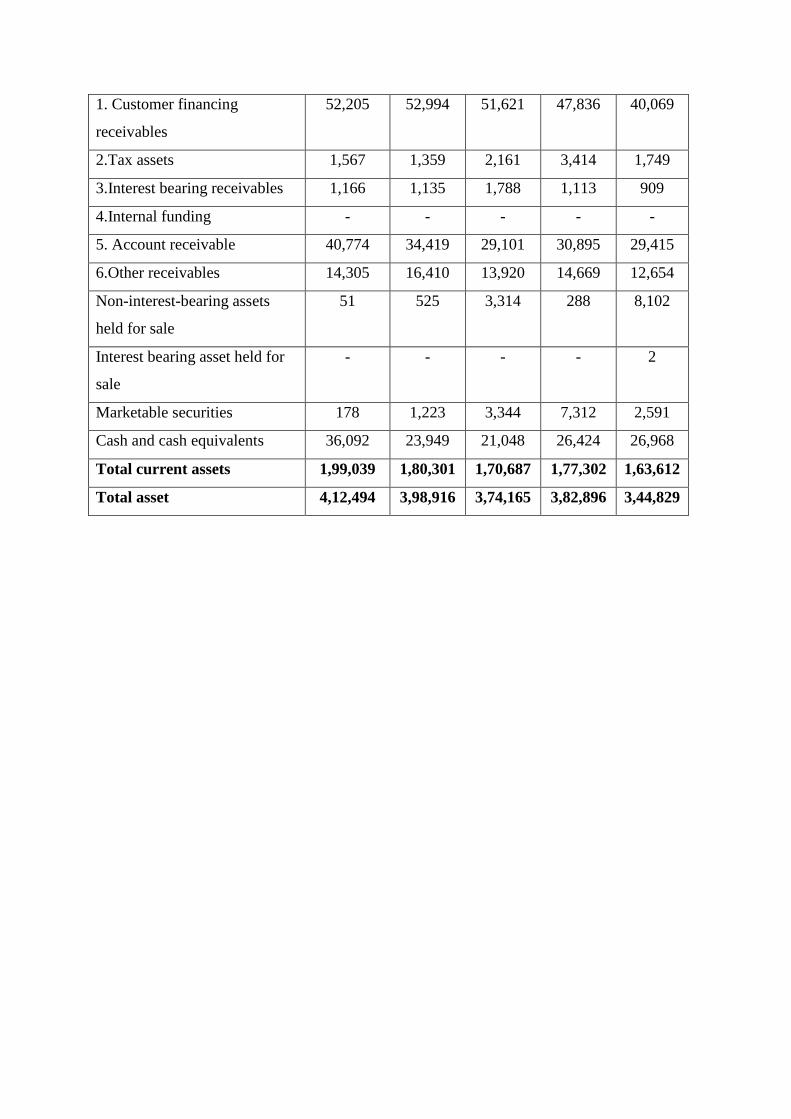
1. Customer financing
receivables
52,205 52,994 51,621 47,836 40,069
2.Tax assets 1,567 1,359 2,161 3,414 1,749
3.Interest bearing receivables 1,166 1,135 1,788 1,113 909
4.Internal funding - - - - -
5. Account receivable 40,774 34,419 29,101 30,895 29,415
6.Other receivables 14,305 16,410 13,920 14,669 12,654
Non-interest-bearing assets
held for sale
51 525 3,314 288 8,102
Interest bearing asset held for
sale
- - - - 2
Marketable securities 178 1,223 3,344 7,312 2,591
Cash and cash equivalents 36,092 23,949 21,048 26,424 26,968
Total current assets 1,99,039 1,80,301 1,70,687 1,77,302 1,63,612
Total asset 4,12,494 3,98,916 3,74,165 3,82,896 3,44,829
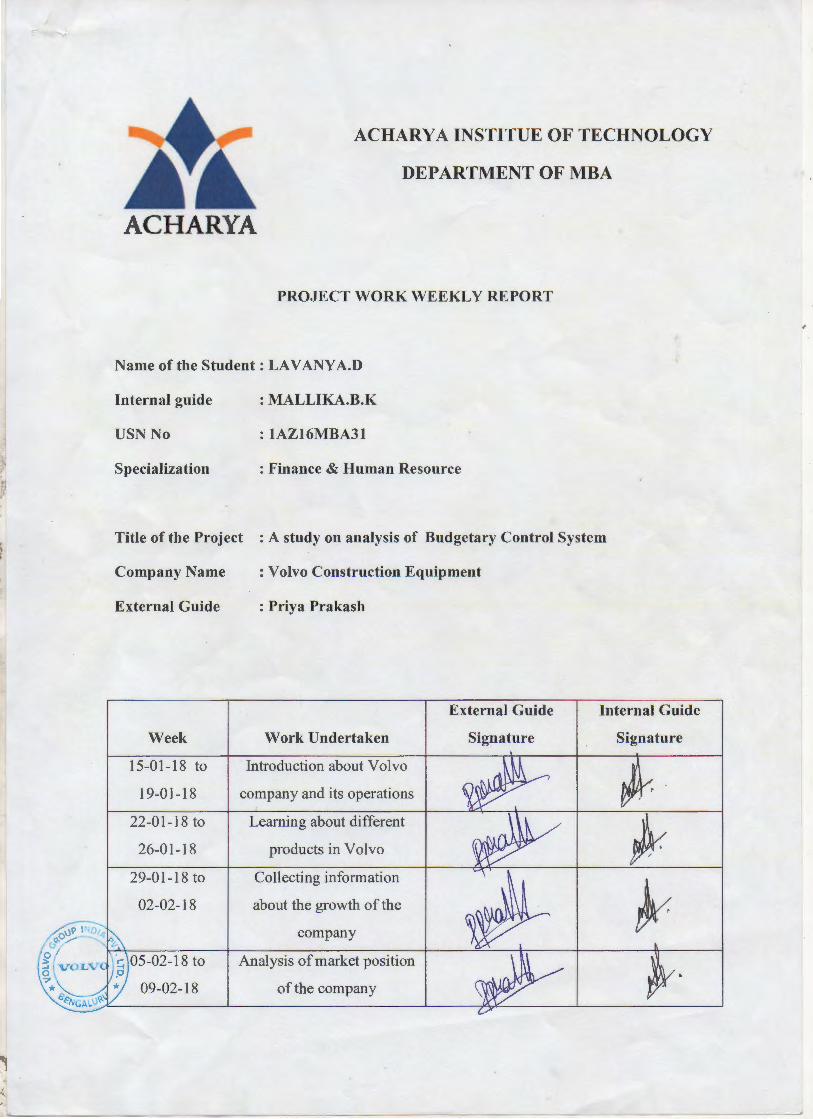
ACHARYA INSTITUE OF TECHNOLOGY
DEPARTMENT OF MBA
ACHARYA
PROJECT WORK WEEKLY REPORT
N arne of the Student : LA V ANY A.D
Internal guide : MALLIKA.B.K
USN No : 1AZ16MBA31
Specialization :Finance & Human Resource
Title of the Project : A study on analysis of Budgetary Control System
Company Name :Volvo Construction Equipment
External Guide : Priya Prakash
Week
15-01-18 to
19-01-18
22-01-18 to
26-01-18
29-01-18 to
02-02-18
09-02-18
Work Undertaken
Introduction about Volvo
company and its operations
Learning about different
products in Volvo
Collecting information
about the growth of the
company
Analysis of market position
of the company
External Guide
Signature
Internal Guide
Signature
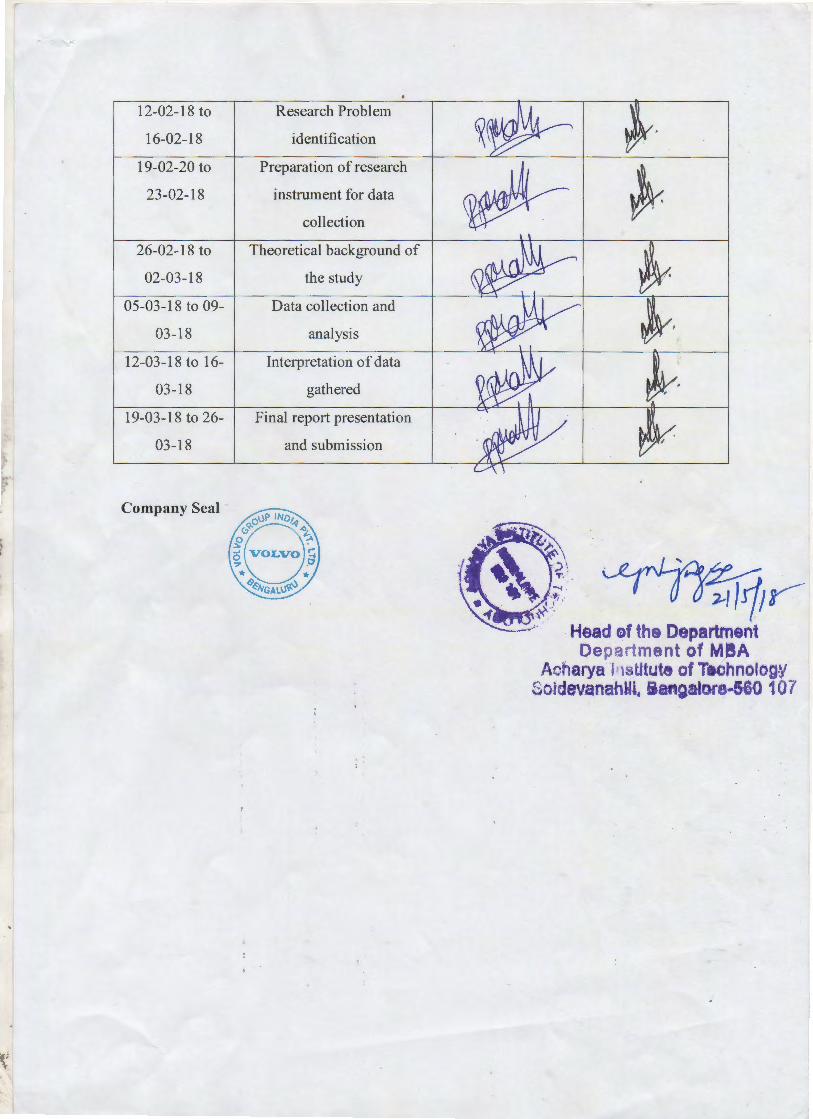
12-02-18 to Research Problem
16-02-18 identification
19-02-20 to Preparation of research
}. 23-02-18 instrument for data
collection
26-02-18 to Theoretical background of
02-03-18 the study
05-03-18 to 09- Data collection and
03-18 analysis
12-03-18 to 16- Interpretation of data
03-18 gathered
19-03-18 to 26- Final report presentation
03-18 and submission
Company Seal