Certificate of Approval of Increase of Capital Stock of MPIC
Upload
independentCategory
view
3download
0
1
A study of the seismic response of the city of Benevento (Southern Italy) through a combined 1analysis of seismological and geological data 2
3G. Di Giulio1, L. Improta1, G. Calderoni2 and A. Rovelli24
51 Istituto Nazionale di Geofisica e Vulcanologia, Via del Castel D’Aquino, Grottaminarda (Av), Italy62 Istituto Nazionale di Geofisica e Vulcanologia, Via di Vigna Murata 605, Rome, Italy7
8corresponding author: [email protected] 9TEL: ++39 0651860613 FAX: ++39 065186050710
11
12
Abstract13
14
A previous analysis (Improta et al., 2005) of small magnitude earthquakes recorded at 12 sites within 15
the city of Benevento has stressed the significant role played by near-surface geology in causing variability 16
of the ground motion. In this paper, we extend the study of the seismic response from 12 sites to the entire 17
urban area. Based on inferences from the comparison at the 12 sites between earthquake and ambient 18
vibration results, we have collected ambient noise at about 100 sites within the city, intensifying 19
measurements across the main shallow geological variations. We use borehole data to interpret ambient noise20
H/V spectral ratios in terms of near-surface geology comparing H/V curves to theoretical transfer functions 21
of 1D models along five well-constrained profiles. 22
On the basis of geological, geotechnical, and seismic data, we identify three main typologies of seismic 23
response in the city. Each type of response is associated to zones sharing common soil conditions and similar 24
soil classes according to building codes for seismic design. Moreover, we find that the spatial variation of the 25
seismic response in the ancient town area is consistent with the damage pattern produced by a very 26
destructive, well-documented historical earthquake that struck the city in 1688, causing MCS intensity of IX-27
X in Benevento.28
Finally, we use ground motions recorded during the experiment by Improta et al. (2005) to generate 29
synthetic seismograms of moderate to strong (Mw 5.7, Molise 2002 and Ms 6.9, 1980 Irpinia) earthquakes. 30
We calibrate the random summation technique by Ordaz et al. (1995) using recordings of these earthquakes 31
available in Benevento. After a satisfactory fit between observed and synthetic seismograms, we compute 32
response spectra at different sites and speculate on effects of the geology class at large level of shaking, 33
including soil nonlinearity. We find that large discrepancies from design spectra prescribed by seismic codes 34
can occur for a wide sector of Benevento, especially for periods < 0.5 sec.35
36
Keywords: site effects, ambient noise, Empirical Green’s Functions, response spectra, Benevento 37
38
1. Introduction39
The city of Benevento was the capital of the Sannio region (southern Italy). The ancient population of 40
Samnites founded the city along the confluence of two rivers (Sabato and Calore rivers). After the third 41
Samnite war (298-290 B.C.) Benevento was conquered by Romans becoming one of the most important 42
* ManuscriptClick here to download Manuscript: Manuscript_digiulio.doc

2
towns in southern Italy. In the Middle Ages the city was ruled by Lombards, by Byzantines (XIth century) 43
and then by Popes. 44
Nowadays Benevento preserves an important historical heritage witnessing its long past. Significant45
monuments within the city are the Trajan Arch (114 A.D.) built by the roman Emperor Trajan to celebrate46
the win against Dacia, the Roman theatre and amphitheatre (I-II sec A.D.) and the church of Santa Sofia (762 47
A.D.). Benevento, with over 60.000 inhabitants at the present time, is a typical example of historical Italian 48
city showing a typology of buildings spanning from ancient to modern age. The precious monumental 49
heritage preserved in the old town is indeed surrounded by modern and densely populated areas. 50
The Sannio region is one of the Italian areas with highest potential for a future strong earthquake. This 51
region is surrounded by large seismogenetic structures such as Matese and Irpinia located about 20 km to the 52
north and 25 km to the south, respectively. These structures were responsible for five destructive earthquakes53
that struck the town between 1456 and 1805, with magnitude ranging from 6.4 to 7.0 (Boschi et al., 2000). 54
Since 1805, the Sannio region experienced only one moderate event in 1962 (ML 6.1; Westaway, 1987), 55
while the present-day seismicity is low and characterized by rare low-magnitude (M<3) swarms (Chiarabba 56
and Amato, 1997; Bisio et al., 2004). The long quiescence following the 1805 event makes Benevento to be 57
highly exposed to seismic hazard. In addition, local amplifications of the ground-shaking level are expected 58
in the urban area due to strong lithological changes and widespread soft soil conditions. Lithological 59
heterogeneities are indeed responsible for rapid variation of the shallow S-wave velocities (from 200 to 1700 60
m/s). Local site effects are also suggested by anomalies in the damage distribution (Castenetto and Romeo, 61
1992) during the strongest event experienced by the city in the 1688. Its local intensity was estimated to be 62
as large as X of the Mercalli-Cancani-Sieberg (MCS) scale.63
For the aforementioned reasons, Benevento has been the subject of important projects for earthquake64
risk mitigation (Mayer-Rosa, 1989 and 1991; Marcellini et al., 1991; Marcellini et al., 1995a; Traiano 65
project, 2002). The great deal of borehole data collected in the framework of these projects has been used to 66
define the shallow geologic structure and the geotechnical classifications, both however suffering of the 67
extreme subsoil complexity (Pescatore et al., 1996; Improta, 1998). Site effects in the city were investigated 68
by several authors based on the analysis of active seismic data (Iannaccone et al., 1995), 1D/2D numerical 69
modelling (Fäh and Suhadolc, 1994; Marcellini et al., 1995 b; Marrara and Suhadolc, 1998) and noise 70
measurements (Duval, 1994; Maresca et al., 2003).71
Recently, Improta et al. (2005) installed temporary seismological stations in the city and analyzed local 72
ground motion applying standard spectral techniques. They used seismic noise and weak-earthquake73
recordings (2.1 ≤ M ≤ 5.5; Fig. 1) collected from July 2000 until March 2004. These data were recorded at74
twelve stations representative of the main soil categories present in the city (Fig. 2). The number of 75
earthquake data with a good signal-to-noise ratio ranges from 33 to 157 depending on the station. Seismic76
data available at these sites were analyzed using classical site-reference (HHSR) (Borcherdt, 1970; Tucker 77
and King, 1984) and not-reference spectral techniques (HVNSR and HVSR) (Nakamura, 1989; Lermo and 78
Chavez-Garzia, 1994; Field and Jacob, 1995). 79
The present article is aimed at extending the analysis on local effects from few discrete sites to a large 80
3
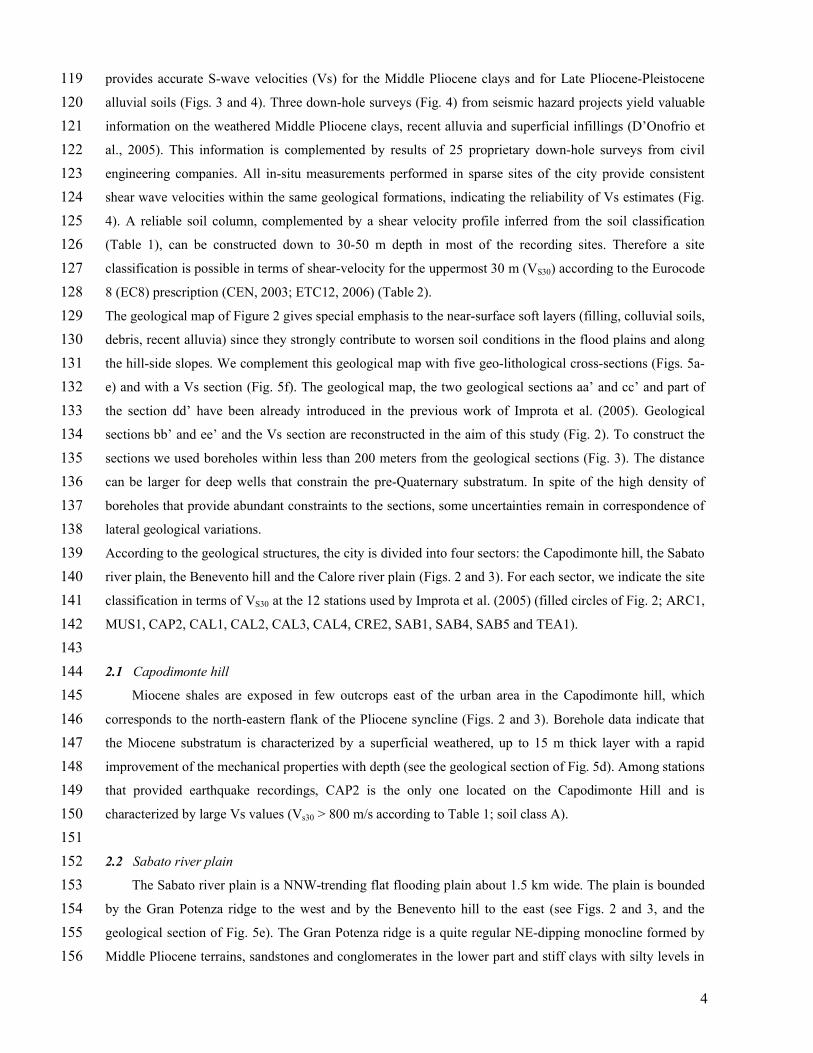
sector of the urban area. Microtremor surveys are performed and results are interpreted taking into account81
geological/geotechnical constraints. The distribution of noise measurements was chosen to give spatial 82
continuity to the information obtained at the twelve sparse sites. Seismic and geological data allow to 83
identify three main typologies of local response and define the spatial areas of the city to be associated with 84
each typology. The collection of weak earthquakes in seismogenic zones surrounding Benevento allowed the 85
application of the Empirical Green’s Function method to derive response spectra of moderate and strong86
magnitude (M 5.7 and 6.9) earthquakes at several sites. In this approach, the computed spectral ordinates 87
include the effects of near-surface properties and are compared with values prescribed by seismic codes.88
89
2. Geological Structure and Geotechnical classification90
Results from crustal geophysical exploration indicate that the main upper structure in the Benevento 91
area is a NW-trending syncline deforming a tectonic melange consisting of Miocene shales with sandstones 92
and marly limestones (Fig. 3, bottom panel). This syncline is filled by Middle Pliocene conglomerates, 93
sandstones and clays belonging to a typical regressive cycle. The city of Benevento spreads on the north-94
eastern margin of the syncline, where Quaternary continental deposits reach their maximum thickness (about 95
100 m) and cover both Miocene and Pliocene terrains (Fig. 3). Shallow geology in the urban area is 96
extremely complex. Pescatore et al. (2005) recognizes a main ancient alluvial complex covering the pre-97
Quaternary substratum. This complex dates to Late Pliocene-Early Pleistocene times and consists of three 98
facies: stiff cemented conglomerates (facies A), very dense gravels and sands (facies B) and palustrine fine 99
soils (facies C) (Table 1). The geological evolution has been dominated since Early Pleistocene times by 100
intense flooding-depositional and erosion alluvial cycles. The Calore and Sabato rivers, which encircle the 101
ancient town (Figs. 2 and 3), are indeed responsible for several alluvial and palustrine Quaternary 102
sequences, which are difficult to distinguish because of the variability of both grain size and cementation103
degree within the same sequence.104
We use a subsoil model of Benevento which is based on borehole data collected and interpreted during 105
previous studies (Marcellini et al., 1995a; Pescatore et al., 1996; Improta, 1998). About 250 boreholes 106
drilled for civil engineering purposes provide information on the structure down to about 30-50 m depth107
(Fig. 3). The data set also includes boreholes specifically drilled for earthquakes hazard research projects,108
which allow an accurate lithostratigraphic characterization (Pescatore et al., 2005) (Fig. 3). In particular, 109
seven 50 to 100 m deep drillings (Fig. 3) improve our knowledge on the hard-rock basement formations and 110
shallow soil conditions with respect to previous studies. 111
The velocities for the main geological units of Benevento (Table 1) are mainly defined by means of112
cross-hole and down-holes surveys (Fig. 3). Only seismic refraction investigations are available for the 113
Middle Pliocene sandstones/conglomerates and for the Miocene mélange, which exhibit P-wave velocity114
around 2600 m/s (Improta, 1998). We assign to these terrains a reference S-wave velocity of 1300 m/s 115
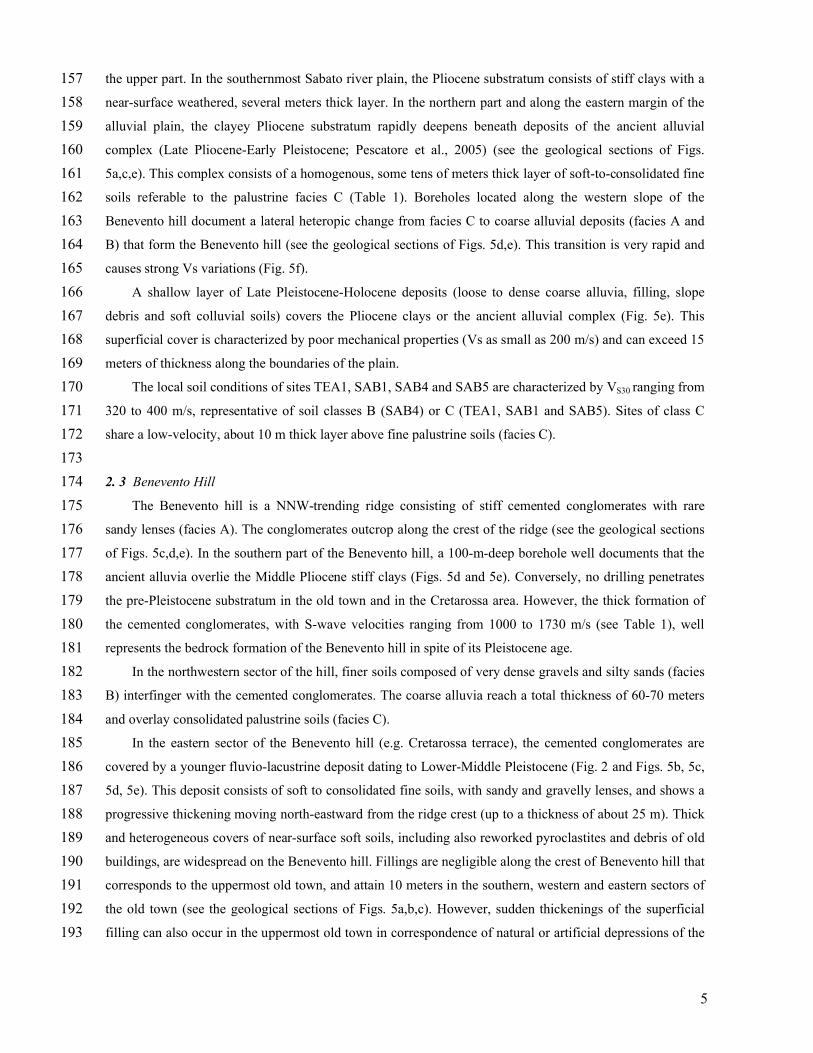
setting the Vp/Vs ratio to 2 as inferred from local earthquake tomography in the Sannio area (Bisio et al., 116
2004). One cross-hole and 28 down-holes define the velocities for the near-surface geology (Table 1). The 117
cross-hole from 100-m-deep boreholes located in the southern part of the Benevento hill (Lanzo, 1996) 118
4
provides accurate S-wave velocities (Vs) for the Middle Pliocene clays and for Late Pliocene-Pleistocene 119
alluvial soils (Figs. 3 and 4). Three down-hole surveys (Fig. 4) from seismic hazard projects yield valuable 120
information on the weathered Middle Pliocene clays, recent alluvia and superficial infillings (D’Onofrio et 121
al., 2005). This information is complemented by results of 25 proprietary down-hole surveys from civil 122
engineering companies. All in-situ measurements performed in sparse sites of the city provide consistent 123
shear wave velocities within the same geological formations, indicating the reliability of Vs estimates (Fig. 124
4). A reliable soil column, complemented by a shear velocity profile inferred from the soil classification 125
(Table 1), can be constructed down to 30-50 m depth in most of the recording sites. Therefore a site 126
classification is possible in terms of shear-velocity for the uppermost 30 m (VS30) according to the Eurocode 127
8 (EC8) prescription (CEN, 2003; ETC12, 2006) (Table 2).128
The geological map of Figure 2 gives special emphasis to the near-surface soft layers (filling, colluvial soils, 129
debris, recent alluvia) since they strongly contribute to worsen soil conditions in the flood plains and along 130
the hill-side slopes. We complement this geological map with five geo-lithological cross-sections (Figs. 5a-131
e) and with a Vs section (Fig. 5f). The geological map, the two geological sections aa’ and cc’ and part of 132
the section dd’ have been already introduced in the previous work of Improta et al. (2005). Geological133
sections bb’ and ee’ and the Vs section are reconstructed in the aim of this study (Fig. 2). To construct the 134
sections we used boreholes within less than 200 meters from the geological sections (Fig. 3). The distance 135
can be larger for deep wells that constrain the pre-Quaternary substratum. In spite of the high density of 136
boreholes that provide abundant constraints to the sections, some uncertainties remain in correspondence of 137
lateral geological variations.138
According to the geological structures, the city is divided into four sectors: the Capodimonte hill, the Sabato 139
river plain, the Benevento hill and the Calore river plain (Figs. 2 and 3). For each sector, we indicate the site 140
classification in terms of VS30 at the 12 stations used by Improta et al. (2005) (filled circles of Fig. 2; ARC1, 141
MUS1, CAP2, CAL1, CAL2, CAL3, CAL4, CRE2, SAB1, SAB4, SAB5 and TEA1). 142
143
2.1 Capodimonte hill144
Miocene shales are exposed in few outcrops east of the urban area in the Capodimonte hill, which 145
corresponds to the north-eastern flank of the Pliocene syncline (Figs. 2 and 3). Borehole data indicate that146
the Miocene substratum is characterized by a superficial weathered, up to 15 m thick layer with a rapid 147
improvement of the mechanical properties with depth (see the geological section of Fig. 5d). Among stations 148
that provided earthquake recordings, CAP2 is the only one located on the Capodimonte Hill and is 149
characterized by large Vs values (Vs30 > 800 m/s according to Table 1; soil class A). 150
151
2.2 Sabato river plain152
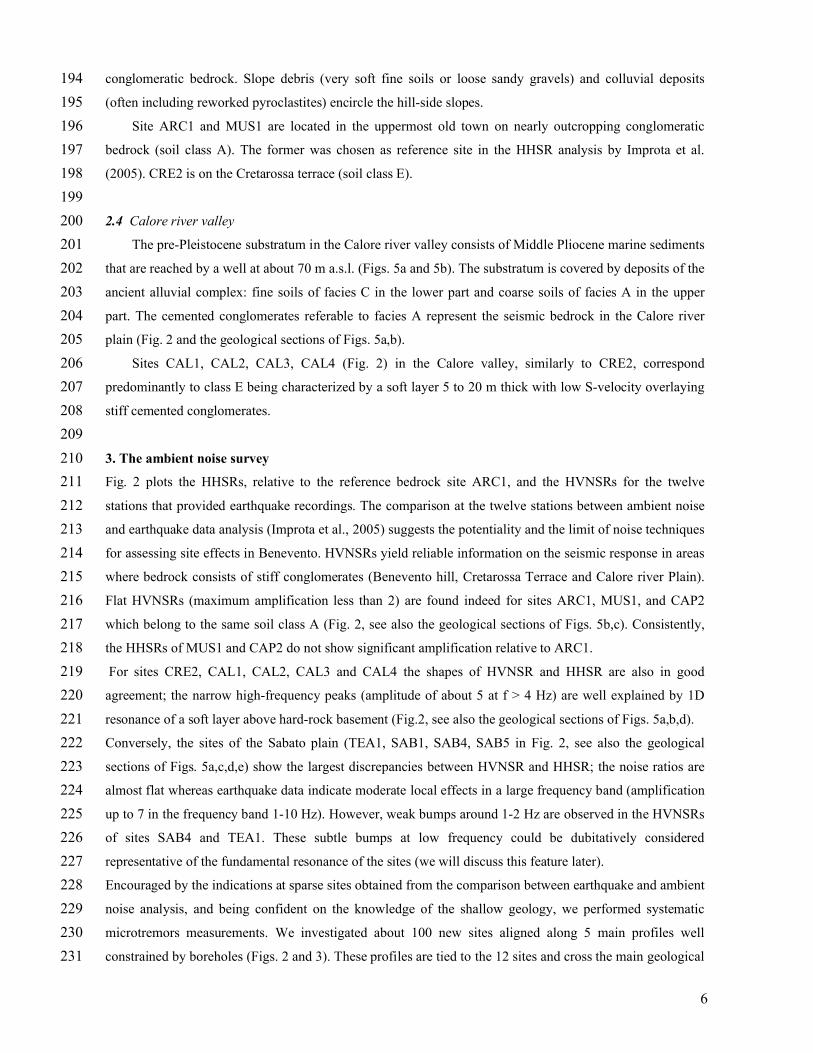
The Sabato river plain is a NNW-trending flat flooding plain about 1.5 km wide. The plain is bounded 153
by the Gran Potenza ridge to the west and by the Benevento hill to the east (see Figs. 2 and 3, and the 154
geological section of Fig. 5e). The Gran Potenza ridge is a quite regular NE-dipping monocline formed by 155
Middle Pliocene terrains, sandstones and conglomerates in the lower part and stiff clays with silty levels in 156
5
the upper part. In the southernmost Sabato river plain, the Pliocene substratum consists of stiff clays with a 157
near-surface weathered, several meters thick layer. In the northern part and along the eastern margin of the 158
alluvial plain, the clayey Pliocene substratum rapidly deepens beneath deposits of the ancient alluvial 159
complex (Late Pliocene-Early Pleistocene; Pescatore et al., 2005) (see the geological sections of Figs.160
5a,c,e). This complex consists of a homogenous, some tens of meters thick layer of soft-to-consolidated fine 161
soils referable to the palustrine facies C (Table 1). Boreholes located along the western slope of the 162
Benevento hill document a lateral heteropic change from facies C to coarse alluvial deposits (facies A and 163
B) that form the Benevento hill (see the geological sections of Figs. 5d,e). This transition is very rapid and 164
causes strong Vs variations (Fig. 5f).165
A shallow layer of Late Pleistocene-Holocene deposits (loose to dense coarse alluvia, filling, slope 166
debris and soft colluvial soils) covers the Pliocene clays or the ancient alluvial complex (Fig. 5e). This167
superficial cover is characterized by poor mechanical properties (Vs as small as 200 m/s) and can exceed 15 168
meters of thickness along the boundaries of the plain.169
The local soil conditions of sites TEA1, SAB1, SAB4 and SAB5 are characterized by VS30 ranging from170
320 to 400 m/s, representative of soil classes B (SAB4) or C (TEA1, SAB1 and SAB5). Sites of class C171
share a low-velocity, about 10 m thick layer above fine palustrine soils (facies C).172
173
2. 3 Benevento Hill174
The Benevento hill is a NNW-trending ridge consisting of stiff cemented conglomerates with rare 175
sandy lenses (facies A). The conglomerates outcrop along the crest of the ridge (see the geological sections 176
of Figs. 5c,d,e). In the southern part of the Benevento hill, a 100-m-deep borehole well documents that the 177
ancient alluvia overlie the Middle Pliocene stiff clays (Figs. 5d and 5e). Conversely, no drilling penetrates 178
the pre-Pleistocene substratum in the old town and in the Cretarossa area. However, the thick formation of 179
the cemented conglomerates, with S-wave velocities ranging from 1000 to 1730 m/s (see Table 1), well 180
represents the bedrock formation of the Benevento hill in spite of its Pleistocene age.181
In the northwestern sector of the hill, finer soils composed of very dense gravels and silty sands (facies 182
B) interfinger with the cemented conglomerates. The coarse alluvia reach a total thickness of 60-70 meters 183
and overlay consolidated palustrine soils (facies C).184
In the eastern sector of the Benevento hill (e.g. Cretarossa terrace), the cemented conglomerates are 185
covered by a younger fluvio-lacustrine deposit dating to Lower-Middle Pleistocene (Fig. 2 and Figs. 5b, 5c,186
5d, 5e). This deposit consists of soft to consolidated fine soils, with sandy and gravelly lenses, and shows a 187
progressive thickening moving north-eastward from the ridge crest (up to a thickness of about 25 m). Thick 188
and heterogeneous covers of near-surface soft soils, including also reworked pyroclastites and debris of old 189
buildings, are widespread on the Benevento hill. Fillings are negligible along the crest of Benevento hill that190
corresponds to the uppermost old town, and attain 10 meters in the southern, western and eastern sectors of 191
the old town (see the geological sections of Figs. 5a,b,c). However, sudden thickenings of the superficial 192
filling can also occur in the uppermost old town in correspondence of natural or artificial depressions of the 193
6
conglomeratic bedrock. Slope debris (very soft fine soils or loose sandy gravels) and colluvial deposits 194
(often including reworked pyroclastites) encircle the hill-side slopes.195
Site ARC1 and MUS1 are located in the uppermost old town on nearly outcropping conglomeratic 196
bedrock (soil class A). The former was chosen as reference site in the HHSR analysis by Improta et al. 197
(2005). CRE2 is on the Cretarossa terrace (soil class E). 198
199
2.4 Calore river valley200
The pre-Pleistocene substratum in the Calore river valley consists of Middle Pliocene marine sediments 201
that are reached by a well at about 70 m a.s.l. (Figs. 5a and 5b). The substratum is covered by deposits of the 202
ancient alluvial complex: fine soils of facies C in the lower part and coarse soils of facies A in the upper 203
part. The cemented conglomerates referable to facies A represent the seismic bedrock in the Calore river 204
plain (Fig. 2 and the geological sections of Figs. 5a,b).205
Sites CAL1, CAL2, CAL3, CAL4 (Fig. 2) in the Calore valley, similarly to CRE2, correspond 206
predominantly to class E being characterized by a soft layer 5 to 20 m thick with low S-velocity overlaying 207
stiff cemented conglomerates. 208
209
3. The ambient noise survey210
Fig. 2 plots the HHSRs, relative to the reference bedrock site ARC1, and the HVNSRs for the twelve 211
stations that provided earthquake recordings. The comparison at the twelve stations between ambient noise 212
and earthquake data analysis (Improta et al., 2005) suggests the potentiality and the limit of noise techniques 213
for assessing site effects in Benevento. HVNSRs yield reliable information on the seismic response in areas 214
where bedrock consists of stiff conglomerates (Benevento hill, Cretarossa Terrace and Calore river Plain).215
Flat HVNSRs (maximum amplification less than 2) are found indeed for sites ARC1, MUS1, and CAP2216
which belong to the same soil class A (Fig. 2, see also the geological sections of Figs. 5b,c). Consistently, 217
the HHSRs of MUS1 and CAP2 do not show significant amplification relative to ARC1. 218
For sites CRE2, CAL1, CAL2, CAL3 and CAL4 the shapes of HVNSR and HHSR are also in good 219
agreement; the narrow high-frequency peaks (amplitude of about 5 at f > 4 Hz) are well explained by 1D 220
resonance of a soft layer above hard-rock basement (Fig.2, see also the geological sections of Figs. 5a,b,d). 221
Conversely, the sites of the Sabato plain (TEA1, SAB1, SAB4, SAB5 in Fig. 2, see also the geological 222
sections of Figs. 5a,c,d,e) show the largest discrepancies between HVNSR and HHSR; the noise ratios are 223
almost flat whereas earthquake data indicate moderate local effects in a large frequency band (amplification 224
up to 7 in the frequency band 1-10 Hz). However, weak bumps around 1-2 Hz are observed in the HVNSRs225
of sites SAB4 and TEA1. These subtle bumps at low frequency could be dubitatively considered 226
representative of the fundamental resonance of the sites (we will discuss this feature later).227
Encouraged by the indications at sparse sites obtained from the comparison between earthquake and ambient228
noise analysis, and being confident on the knowledge of the shallow geology, we performed systematic229
microtremors measurements. We investigated about 100 new sites aligned along 5 main profiles well 230
constrained by boreholes (Figs. 2 and 3). These profiles are tied to the 12 sites and cross the main geological 231
7
transitions. We use the HVNSR technique to map the spatial distribution of the resonance frequencies that 232
are then interpreted in terms of local geology. In detail, the microtremor surveys are aimed at achieving the 233
following targets:234
235
- to explore the sensitivity of HVNSRs to the nature of surface covers and of substratum (Pleistocene 236
conglomerates and Middle Pliocene clays in the Benevento hill and in the Sabato river plain, respectively);237
- for environments with conglomeratic bedrock, to discriminate between areas where the resonance of the 238
shallow low-velocity layers causes high-frequency amplification (i.e. narrow peaks in HVNSRs), and areas 239
where no significant amplification occurs because of bedrock outcrops (i.e. flat HVNSRs);240
- to evaluate the resonance frequencies in the old town, where local effects depend on widespread filling 241
characterized by rapid variations of both thickness and shear-velocities. Moreover, to find out whether242
inferences based on ambient noise, earthquake results and geological constraints are confirmed by the 243
damage distribution of the 1688 destructive earthquake;244
- finally, to combine seismic and geotechnical/geological data in order to identify the spatial boundaries 245
between areas with a different seismic response.246
247
The spacing between adjacent measurement sites varies from about 100 m up to values as large as 500 248
m; the former is adopted in the old town and along the hill-side slopes affected by strong lateral variations, 249
the latter in the central part of the Sabato plain which is a rather simple layered structure. All recording sites 250
were far as much possible from sources potentially affecting the quality of noise recordings (industry, 251
railway stations, underground parking, etc. etc.). We use a homogenous set of 6 stations composed of 252
MarsLite digitizers equipped with Lennartz 3D-5s velocimeters using a sampling rate of 125 Hz. A time 253
series of at least half-hour has been recorded at each site. The HVNSR has been computed following the254
processing procedures developed within the SESAME project (Site Effects Using Ambient Excitations 255
[SESAME, 2004]). For each noise record, the stationary portion of the signal was selected adopting an anti-256
trigger algorithm to remove strong transients inside time histories. This selection provided, at each site, a 257
number of at least 10 time windows 40 sec long. The time windows were detrended and 5% cosine tapered. 258
The Fourier amplitude spectra were computed and then smoothed following Konno and Omachi (1998), 259
with the parameter b set to 40. The two horizontal components spectra were combined into quadratic mean 260
before dividing by the vertical component spectrum. The final geometric mean of the HVNSR and standard 261
deviation are obtained by averaging the H/V ratios from all windows. Details on the software are in the 262
SESAME deliverable no. D09.03 (http://sesame-fp5.obs.ujf-263
grenoble.fr/SES_TechnicalDoc.htm). The fundamental resonance frequency and the associated 264
amplitude were visually selected from the HVNSR curves. The field-experiment took two days265
characterized by calm meteorological conditions.266
267
4. Results of ambient noise data268

8
The spatial distribution of the fundamental resonances resulting from the overall dataset of HVNSRs 269
depends on the nature of geologic substratum. Figure 6 reveals that two areas can be roughly defined on the 270
basis of the fundamental resonance frequency at high- or low-frequency. The first area includes large sectors 271
of the Calore river plain, the Benevento hill and the Cretarossa Terrace, where HVNSRs show an evident 272
spectral peak occurring above 3-4 Hz. In these sectors, superficial soft deposits cover the stiff basement 273
composed of Pleistocene cemented conglomerates. The second area includes the Gran Potenza ridge, the 274
Sabato river plain and the western slope of the Benevento hill (Fig. 6). Here, many sites show a HVNSR 275
with a weak broad bump (amplitude less than 3) in the low frequency range (0.6-3 Hz) and the stiff Middle276
Pliocene clay can be assumed as substratum.277
In Figures 5a-e we show, for each geological section, the contouring of HVNSRs linearly interpolated 278
at adjacent sites. Moreover, we compare HVNSRs with S-wave 1D theoretical transfer functions (Haskell, 279
1960) for those sites where accurate subsurface information allows constructing realistic soil columns (upper 280
frame of Figs. 5a-e). This comparison is aimed at assessing the reliability of the resonance frequency 281
inferred from HVNSRs (Bonnefoy-Claudet et al., 2006; Gueguen et al., 2007).282
Section aa’ crosses from north to south the Calore river plain, the westernmost part of the old town and 283
the Sabato river plain (Figs. 2 and 5a). In the first two sectors, the noise spectral content shows maxima at 284
high frequencies that shift from about 10 to 8 Hz proceeding southward according to a thickening of shallow 285
soft layers. The largest amplitude (about a factor of 5) of HVNSR occurs at site BB21 where soft fillings up 286
to 10 m thick directly overlie cemented conglomerates (Fig. 5a). Moving further into the Sabato river plain,287
the peaks in HVNSRs jump to 3-5 Hz (sites BB3 and CAL4) and vanish afterward.288
Sections bb’ and cc’ cross the old town and the Cretarossa terrace from west to east (Fig. 2). As shown 289
in figures 5b and 5c, the HVNSRs are very sensitive to the thickness variation of fillings in the old town. 290
Fillings are responsible for sharp peaked spectral ratios in the westernmost old town (CAL1, BB21, BB06).291
Flat HVNSRs are instead observed on the crest of the hill where the bedrock is nearly outcropping (BB07, 292
ARC1, MUS1, BB20). However, maxima in the HVNSRs can occur in few isolated sites of the uppermost 293
old town where depressions of the bedrock are filled by very soft materials including ruins of ancient 294
collapsed buildings (i.e. site BB10, Fig. 5c). Sites located on the fluvio-lacustrine sediments of the 295
Cretarossa Terrace exhibit high-frequency amplifications (sites BB22, BB11, BB14, BB16, CRE2; Figs. 296
5b,c). The sudden change in the shape of the HVNSRs at the edge of the old town (e.g. compare BB11 and 297
MUS1 in Fig. 5b) is strictly related to local soil condition and well matches the margin of the Cretarossa 298
Terrace. A correlation between the frequency where the HVNSR peak occurs and the depth of the 299
conglomeratic bedrock is evident (e.g. compare site BB14 with BB16, Fig. 5b). HVNSRs do not show 300
significant amplification in the southern part of the old town spreading on the Sabato river plain (Fig. 5c).301
Section dd’ extends from the Capodimonte hill to the northern-eastern edge of the Sabato river plain302
(Figs. 2 and 5d). No amplification is observed where Miocene rocks are outcropping. Moving westward into303
the Cretarossa terrace, HVNSRs confirm high-frequency resonance as shown by profiles bb’ and cc’. The 304
resonances shift from 4 to 8 Hz is in good agreement with the rise of the bedrock (sites CC04, CC06, CC07, 305
CC09; Fig. 5d) that crops out along the crest of the Benevento hill (site CC12). 306

9
Section ee’ extends from the Gran Potenza Ridge to the slope of the Benevento hill across the Sabato 307
river plain (Fig. 2). Noise spectral ratios of Fig. 5e present amplification only at four sites located at the 308
boundaries of the Sabato river plain near the Gran Potenza Ridge (CC26, AA15) and on the hill slopes 309
(CC18, CC19). Their HVNSRs show high-frequency maxima (4-7 Hz) superimposed on the low-frequency 310
weak bump suggesting a complex layered structure with velocity contrasts at very different scales.311
Figures 5a-e and the spatial distribution of the fundamental resonance frequency (Fig. 6), which is the most 312
relevant parameter in estimates of site effects, suggest a strict correlation between the shapes of the HVNSR 313
curves and the shear-wave velocity local structure. To better illustrate the dependence of HVNSRs on the 314
impedance contrast, in Fig. 5f we present a Vs section for a profile extending from the Cretarossa terrace to 315
the Sabato river plain. The Vs section, partly overlapping the geological section dd’ (see Fig. 3), has been 316
obtained by linear interpolation of the 1D Vs profile associated to each borehole based on the soil 317
classification. The comparison between Vs section and corresponding HVNSR contouring (Fig. 5f and 5d, 318
respectively) confirms that i) a strong impedance contrast at shallow depth is responsible for high-frequency 319
noise resonances observed in Cretarossa terrace; ii) nearly outcropping stiff conglomerates are consistent 320
with flat HVNSRs observed in the upper part of the Benevento hill, and, iii) more ambiguous HVNSR 321
curves are observed where the impedance contrast is weak, as in the Sabato river plain. A further comment 322
concerns the comparison between HVSNRs and 1D theoretical transfer functions (Haskell, 1960). The best 323
match between HVNSRs and 1D model is found for sites with narrow peaks at high frequencies (f > 4 Hz), 324
as expected for uniformly layered structures with an impedance contrast larger than 3 (Bard, 1999; 325
Bonnefoy-Claudet, 2004). According to Table 1 and Fig. 5f, the presence of very soft surface soils over326
shallow cemented conglomerates (8-15 m deep) can produce a velocity contrast larger than 5. This kind of 327
sites shows a resonance at the highest frequencies (f 7 Hz) (sites AA4, BB21, BB6, BB10 in Figs. 5a,b,c 328
consistently with results obtained at CAL1, CAL2 and CAL3 in Fig. 2). The spectral noise peak appears329
broader and at lower frequencies where consolidated fluvio-lacustrine or dense coarse deposits are330
interspersed between shallow soft soils and bedrock. This causes a lower velocity contrast in most sites of 331
the Cretarossa Terrace (e.g. sites BB11, BB14, BB16, CC7, CC6, CC4 consistently with CRE2) (Figs. 5b,d)332
and in a few sites in the northernmost Sabato river plain (e.g. sites BB3, CAL4) (Fig. 5a).333
Borehole data and 1D modeling indicate that the fundamental resonance frequency (f < 3 Hz, see Fig. 6) 334
observed in the Sabato plain can be associated to a deep, weak velocity contrast (< 2) existing in the 335
Pliocene synform between clays and deeper sandstone/conglomerates (Table 1). Therefore, weak spectral 336
bumps around 1-2 Hz (i.e. sites BB2, AA11, CC28 and CC29, Figs. 5c,e; sites TEA1 and SAB4 of Fig. 2) 337
are diagnostic of the Pliocene stiff clays that represent the substratum of the Sabato river plain. The higher 338
frequency content observed at sites along the hill-side slopes (i.e. CC26, AA15, CC19, CC18, Fig. 5e) is339
related to soft colluvial soils and debris (Vs around 200 m/s), which cover the large-scale layered structure 340
of the Sabato river plain (Fig. 5f). 341
In general, the comparison at the 12 sites (Fig. 2) among HVNSR, 1D modelling and HHSR, shows a 342
similar level of amplitude at the fundamental resonance frequency, as discussed in Improta et al. (2005). In 343
spite of this similarity, no clear agreement has been established in literature concerning the accuracy of the 344
10
level of HVNSR peak as site amplification factor. The most recent explanations link the amplitude of 345
HVNSR peak to the effects of converted waves (Parolai and Richwalski, 2004) and to the presence of Love346
waves within the noise wavefield (Bonnefoy-Claudet et al., 2007). From a quantitative point of view, a more 347
reliable estimate of the site amplification factor is obtained through the S-wave transfer function computed 348
on earthquake data, this technique having a stronger theoretical basis than HVNSR (nevertheless the349
selection of an appropriate reference site is crucial). Within these limitations, the amplitudes inferred from 350
ambient noise give indication on the reliability of the resonance frequency but cannot be considered as a 351
direct estimate of the amplification factor of sites (Sesame project, 2004).352
353
5. Simulations of ground motion in Benevento using Empirical Green’s Functions354
The waveforms of small magnitude earthquakes located in seismogenic zones around Benevento (Fig. 355
1) and recorded at twelve sparse sites of the city (Improta et al., 2005) are now used as a catalogue of 356
Empirical Green’s Functions (EGF) representative of seismogenic sources of interest for the city. The 357
technique consists in generating synthetic seismograms of larger earthquakes in far-field approximation 358
using co-located low magnitude earthquakes (Hartzell, 1978; Joyner and Boore, 1986; Ordaz et al., 1995; 359
Calderoni et al., 2005). The basic assumption is that the small event represents the Green’s function for all 360
points of the rupture area of the large earthquake. Following the Wennerberg (1990) approach, we assume a 361
probability density function of the time delays over the rupture duration T of the target event. If the source 362
spectra obey the omega-squared spectral model (Aki, 1967), the spectrum of the target earthquake [Targ] can 363
be written as a random summation of the spectrum of the small event [subev] 364
365
N
j
ti jew1
)(subev)(Targ (1)366
367
where tj is the shift time distributed in a random way within the rupture duration T, w and N are the scale 368
factor and the number of stack, respectively. Their expressions are: 369
370
3/4
arg
3/1
,
arg,0
subev
T
subevo
T
M
Mw
371
(2)372
373
374
375
where and M0 are the Brune stress drop (Brune, 1970) in bar and the seismic moment in dyne·cm, 376
respectively. They are related to the corner frequency of the event (fc):3773/1
0
6109.4
Mfc
(3)378
379
3/4
arg
3/4
,
arg,0
subev
T
subevo
T
M
MN

11
where is the S-wave velocity (3.5 km/s). The duration T is assessed through (fc)-1.380
Under the assumptions of the method, this approach can be used to derive synthetics for a potential rupture in 381
a seismogenic area starting from recordings of co-located small earthquakes. The method cannot be applied 382
to close sub-events (source distance R must be significantly larger than the fault length L) because the 383
omega-squared spectrum is a far-field model. We restrict the sub-event selection to low-magnitude events 384
falling within the mesoseismal area of two recent moderate-to-large magnitude earthquakes: the Mw 5.7,385
2002 Molise (Valensise et al., 2004) and the Ms 6.9, 1980 Irpinia earthquakes (Westaway and Jackson, 1987; 386
Bernard and Zollo, 1989). These two cases are particularly suited because of the occurrence of two 387
favourable conditions: i) distance from the faults was large enough to minimize the near-field terms, and ii) 388
the level of excitation in Benevento was low minimizing the role of nonlinearity that might become 389
significant at those magnitudes. For the two earthquakes, the availability of main-shock seismograms in 390
Benevento allowed us to validate the technique of ground motion prediction for moderate-to-large magnitude 391
earthquakes using weak events. After computing synthetics of the two target events through (1), we compare 392
the acceleration response spectra on different geological formations with the shape of design spectra393
prescribed by seismic codes.394
395
5.1 Mw 5.7, 2002 Molise earthquake396
On October-November 2002 a seismic sequence, about 60 km north of Benevento, struck the southern 397
part of Molise (Fig. 1). The two main shocks of October 31 and November 1, 2002 were characterized by a 398
pure-lateral strike slip over a east-west striking fault and attained Mw 5.7 (Valensise et al., 2004). 399
Macroseismic MCS intensity of Benevento was IV. The twelve stations installed in Benevento recorded the 400
entire sequence. Unfortunately, the seismograms of the two largest shocks were clipped at ±0.25 cm/s due to 401
the digital saturation. Despite the limitation of clipping, these data can be suitably used for many research 402
applications because: i) saturation did not affect the first 10-12 sec of the recordings, where is concentrated 403
the largest part of the high-frequency content of the mainshocks; ii) at the rock reference station (ARC1), the 404
amplitude underestimation due to saturation was of the order of 5% (a detailed discussion can be found in405
Calderoni et al., 2007). Therefore, the spectral estimate on the entire record of ARC1 was not significantly 406
affected by clipping. However, we computed the conventional spectral ratios (with ARC1 as reference site) 407
for the two Molise mainshocks using the unclipped portion of the seismograms. These spectral ratios overlap408
the ±1 s.d. interval estimated through weak motions (Improta et al., 2005). This confirms that, as expected, 409
nonlinear effects did not occur at such low ground shaking level (less than 10 gals).410
Thus, the random summation method is used to construct synthetic ground motions at stations where 411
the recordings were clipped. Synthetic seismograms for the Mw 5.7 shock have been generated starting from 412
two of the largest aftershocks (Mw 3.7 and 3) of the Molise sequence recorded in Benevento. We have 413
applied the technique of Ordaz et al. (1995), constraining low- (through seismic moments) and high-414
frequency (through stress drop) amplitudes. The analyzed frequency band was 0.5-10 Hz. According to the 415
scaling law found by Calderoni et al. (2007) we use a value of 8 bars for the mainshocks and 4 and 2 bars for 416
two subevents. We first checked the suitability of the method by comparing true (clipped) and synthetic 417
12
ground motions for the stations in Benevento. The same clipping (0.25 cm/s) of real data has been applied to 418
synthetics. Figure 7 shows a good consistency in amplitudes and duration between clipped synthetics and 419
real seismograms for stations in Benevento that recorded the aftershocks. The synthetic seismogram that best 420
reproduced the duration of clipping and the amplitudes of the real seismograms was selected as 421
representative of ground motion of the Mw 5.7 earthquake in Benevento. This allowed us to use the best 422
(unclipped) synthetics of the Mw 5.7 earthquake and to compute the corresponding elastic spectra. Figure 8423
shows the 5% damped acceleration response spectra of the synthetics of the Mw 5.7 earthquakes for the two 424
horizontal components. These spectra are compared with the Sabetta and Pugliese (1996) expectations for 425
stiff and shallow alluvium (dashed-dotted and dashed curves in Fig. 8, respectively) computed at the same 426
magnitude and source distance (Mw 5.7 and R 60 km). The design response spectra prescribed by the 427
National code (‘’Norme Tecniche per le Costruzioni’’ of September 23, 2005), for the different soil classes428
(Table 2), are also included. The Italian building code prescribes i) to anchor the shape of the design spectra 429
to the maximum horizontal ground acceleration on bedrock (PGA), and, ii) to adopt a different PGA for 430
class1 and class2 buildings (probability of exceedance of 10% and less than 5% in 50 years, respectively).431
We first anchored the shape of design response spectra at T=0 sec to the PGA predicted at stiff-site by the 432
Sabetta and Pugliese (1996) regression for that magnitude and source distance. Figure 8 (left panel) shows 433
that amplitudes of the two Mw 5.7 Molise shocks are significantly smaller than both the statistical 434
expectations of Sabetta and Pugliese (1996) and the National code prescriptions. This effect is due to the low 435
energy release of 2002 Molise events which are about 10 times smaller in stress drop than moderate-436
magnitude normal-faulting earthquakes in the Apennines, as discussed in Calderoni et al. (2007).437
To emphasize relative variations of response spectra between stations, we have anchored the design 438
spectra at T=0 sec to the PGA value (about 4 gals) estimated for the rock reference site (ARC1). Figure 8439
(right panel) indicates that the shapes of response spectra vary consistently with the local geology. The soft 440
sites TEA1, CAL4 and SAB5 show, at short periods (T < 1 sec ), larger spectral ordinates than the rock site 441
ARC1, thus exceeding the design response spectrum of soil class B and C (representative of soft sites). 442
443
5.2 Ms 6.9, 1980 Irpinia earthquake444
A second check on the reliability of the EGF approach deals with the Ms 6.9, 1980 Irpinia earthquake. 445
It was recorded in Benevento by an SMA-1 analog accelerograph located at the southern limits of the 446
Benevento hill (see cross symbol in Figs. 2, 3 and Fig. 4). The accelerograph was installed on very dense 447
gravely soils and consolidated clays, which belong to the facies B of the ancient alluvia formation. The448
cross-hole of Fig. 4 (Lanzo, 1996) documents a VS30 > 800 m/s (soil class A according to EC8). The 449
available recording in Benevento shows a PGA of about 50 gal for this event characterized by a local MCS 450
intensity of VI (Boschi et al., 2000).451
Two co-located small events of magnitude around 3 were recorded by our stations. Their epicentres are 452
located within the seismogenetic area of the 1980 event (Fig. 1). These two events were used to generate 453
synthetics in the frequency band 0.5 < f < 10 Hz, where signal-to-noise ratio of the weak motions resulted to 454
be larger than 3. The weak motion of co-located events, recorded in several sites of the city, allows us to 455
13
derive the Ms 6.9 synthetics for the different soil categories. We use a stress drop of 100 bars (Cocco and 456
Rovelli, 1989) for the mainshock and 30 bars for the subevents. Figure 9 (upper frame) compares the 457
response spectra of the accelerogram recorded in Benevento with those simulated using the weak motions of 458
ARC1 and MUS1, which share the soil class A being located on stiff cemented conglomerates. The 459
agreement of response spectra between Ms 6.9 recorded and Ms 6.9 simulated is satisfactory, with a 460
maximum discrepancy of about 30% limited to a very narrow interval of periods (around 0.2 sec). Figure 9461
(bottom frame) also shows the acceleration response spectra for the Ms 6.9 synthetic seismograms at the462
stations in Benevento that recorded the M 3 earthquakes. The response spectra simulated using EGFs are 463
overimposed to the design spectra of the national ordinance anchored to the PGA predicted by Sabetta and 464
Pugliese (1996) for rock site (Fig. 9). Adopting this PGA anchoring, the spectral ordinates of sites in the 465
Sabato river valley largely exceed the design spectra of class B and C especially for periods less than 1 sec.466
The response spectra of the Ms 6.9 synthetics at sites ARC1 and MUS1 agree, on the average, with the 467
shapes of response spectra prescribed by the National code for soil class A (Fig. 9). A good fit is also 468
observed for site CRE2 (soil class E), although the spectral ordinates at T=0.2 sec slightly exceeds the 469
plateau of design response spectra. The comparison between Fig. 9 and Fig. 8 (right panel) shows a general470
agreement, in terms of local amplifications at the different sites, between results inferred from the synthetics 471
of the Molise and Irpinia earthquakes.472
In order to assess the role of soil nonlinearity in modifying the spectral amplification, we consider 473
nonlinear models applied to the soil types of Benevento. We include variation of shear modulus and damping 474
ratio with shear strain following Marcellini et al. (1995a) and Lanzo (1996), who assigned mechanical 475
properties to the soil classes in Benevento through cyclic and dynamic laboratory tests and correlation with 476
index properties. The cyclic soil behaviour is described assuming a linear-equivalent approach according to 477
the Ramberg-Osgood-Masing model (Silvestri, 1991). We consider the soil nonlinearity for SAB5 since this 478
site shows the largest spectral ordinates (see Fig. 9). We assume that the Ms 6.9 seismograms recorded in the 479
Benevento hill can be adopted as bedrock-input-motion for site SAB5 located in the Sabato river plain. 480
Therefore we convolve the seismogram of the Ms 6.9 earthquake recorded at the stiff site with the soil 481
column of SAB5 (see Fig. 2) using an equivalent-linear approach (EERA code, Bardet et al. 2000). At each 482
type of soil of SAB5, a corresponding curve of shear modulus and damping ratio is assigned. Fig. 10 shows 483
the acceleration response spectra of the Ms 6.9 accelerogram recorded at the cross-hole stiff site in 484
Benevento for the two horizontal components. Fig. 10 also shows the response acceleration spectra of485
synthetics computed through convolution of stiff site seismograms with the soil column of SAB5. The 486
convolution was performed both taking into account the soil nonlinearity and adopting a constant shear 487
modulus with no damping variation. As shown in Figure 10, we observe that the main effect of soil 488
nonlinearity is to decrease of about 15% the largest spectral ordinates at about 0.2 sec on the EW component. 489
The negligible amplitude depletion induced by soil nonlinearity at low periods is consistent with the 490
relatively low ground shaking level caused by a Ms 6.9 event at 50 km of distance (about 50 gal at rock 491
sites).492
493
14
6. Inferences on site effects during the 1688 destructive earthquake494
The results previously discussed emphasize a strong dependence of ground motions on local geology, in 495
the range from ambient vibrations up to 50 gals. We now use seismic and geological information to 496
investigate a possible role of site effects in increasing the damage during an earthquake with destructive 497
effects in Benevento. The damage pattern of the 1688 Sannio earthquake (Me 6.7; Boschi et al., 2000),498
which is the most destructive one experienced by the city (local MCS intensity of X, Fig. 1), can shed light 499
on this issue. Starting from detailed historical chronicles of this event, Castenetto and Romeo (1992) 500
reconstructed the spatial distribution of the damage in the old town (Fig. 6 and Fig. 11). The most damaged 501
zone, with more than 75% of buildings collapsed, was the south-western one extending towards the Sabato 502
river plain (Fig. 11). Damage was lower (less than 50% of buildings collapsed) along the crest of the hill 503
whereas intermediate damage (50-75 % of building collapsed) was reported for the north-western and 504
eastern sectors, the latter corresponding to the Cretarossa Terrace. 505
Recordings of small magnitude earthquakes are available for four sites of the historical area (Fig. 11): 506
TEA1 and CAL4 in the most damaged zone, ARC1 and MUS1 in the area that experienced the lowest level 507
of damage, whereas no earthquake data are available in the zones of intermediate damage.508
The lower level of ground motion observed at the hard-rock sites ARC1 and MUS1 for weak 509
earthquakes is consistent with the lowest damage. The HHSRs at soft sites TEA1 and CAL4 (using ARC1 as 510
reference site) document both broad-band and high-frequency effects in the mostly damaged zone. Similar 511
site effects are also shown by HHSRs of sites CAL1, SAB1 and SAB4 (Figs. 2 and 11). Although these sites 512
are outside the target area, they surround the zone that suffered the strongest damage toward the west and 513
the south, respectively. 514
Ambient noise data are available at numerous sites in the old town (Fig. 11). In the lowest damage zone,515
the HVNSRs show a predominant flat shape. In intermediate damage zones, HVNSRs indicate a distinct 1D 516
resonance. In the most damaged sector, HVNSRs identify fundamental resonance both at low- and high-517
frequency (broad spectral bumps and narrow peaks, respectively) (Fig. 11). 518
However, HHSR and HVNSR provide a relationship between site effects and damage that is only qualitative519
and cannot be applied, a priori, for destructive earthquakes because of possible nonlinear behaviour of soil.520
This aspect is now faced by means of a real record of the Ms 6.9, 1980 Irpinia earthquake. We use the strong 521
motion accelerogram of the hard-rock station of Sturno located about 30 km south of Benevento (Fig. 11). 522
Recordings show PGA of 0.25 and 0.36 g for the NS and EW horizontal components, respectively. We523
adopt the same procedure explained above for Fig. 10. The Sturno accelerograms are first assumed as input-524
bedrock-motion in Benevento and then are convolved with the non-linear response of the soil column of 525
sites using an equivalent linear approach. After the convolution we compare the acceleration response 526
spectra of sites in the historical area with the design spectra. According to the National decree (‘’Norme 527
Tecniche per le Costruzioni’’ of September 23, 2005) that assigns the PGA value of 0.35 g to class 1 528
buildings in the whole area of Benevento, we anchor the design response spectra at T=0 sec to this value.529
The acceleration response spectra (Fig. 11) in the lowest damage zone of stiff sites (ARC1 and MUS1; i.e. 530
soil class A) are below the design spectra, on the average. In the intermediate and most damaged sectors, the 531
15
spectral content is well above the design spectra especially for T < 0.5 sec. At periods between 0.5 and 1 532
sec, the response spectra of TEA1 show a spectral content larger than the other sites (Fig. 11). 533
To sum up, the lowest damage zone of the 1688 earthquake corresponds to the uppermost area of the old 534
town where stiff conglomerates are nearly outcropping (soil class A) and consistently we found not 535
significant site effects (see also Fig. 5f). In the intermediate damage zone, a spectral increase at high-536
frequencies with respect to the hilltop is related to the resonance of superficial filling and fluvio-lacustrine 537
soft deposits. The response spectra, computed including the near-surface soil properties, document narrow 538
high peaks (amplitude > 2 g) at periods < 0.5 sec. In the southern sector of the old town, which experienced 539
the most severe damage, we found spectral magnification in the largest frequency band (1-10 Hz) (Fig. 11). 540
Furthermore, building vulnerability must be taken into account in relating damage to ground motion. During 541
the 1688 earthquake, the vulnerability was likely rather uniform in the urbanized area but for potential future 542
large earthquakes vulnerability could play an important role. The existing urban settlement is very 543
heterogeneous showing typologies of construction that range from medieval to modern age. Recent and very 544
densely populated areas spread in the Sabato river plain. Part of this plain was urbanized between the 1940s 545
and 1960s, with popular buildings mostly of rectangular shape (3-5 stories) and composed of reinforced546
concrete of poor quality (Pecce et al., 2004). For this kind of structures, an estimate of damage scenario in 547
the Sabato plain yields a large percent of collapses in case of a strong earthquake (Cosenza et al., 2005). 548
Recent buildings were built with reinforced concrete in the zones of Cretarossa Terrace and Calore river 549
valley, whereas old masonry and stone structures are common in the old town. The soil resonance often 550
observed at f 4 Hz could be reasonably close to the resonance frequency of small structures at 3-5 stories 551
widespread in Benevento.552
Finally, we want to characterize quantitatively the different typologies of seismic response during significant 553
earthquakes. We consider the integral of the acceleration response spectra within periods 0-2 seconds at sites 554
where we have estimated numerically strong ground motions. An amplification factor (AF) at each site is 555
assessed through the ratio556
AF =
2
0
_
2
0
))((
)(
T
SITESTIFF
T
dTTS
dTTS
(4)557
where S is the acceleration response spectrum computed using synthetics of the simulated cases (the Mw 5.7 558
Molise event, the Ms 6.9 Irpinia earthquake and the scenario using the Sturno recordings; see Figs. 8, 9 and 559
11, respectively). The results are shown in Table 3. As expected, the significant role of surface geology is 560
confirmed in terms of response spectra with variations from AF close to 1 at stiff sites (soil class A) up to 561
more than 2 at sites in the Sabato river valley.562
563
7. Conclusions564
We first mapped the spatial variations of the fundamental resonance frequency within the city by means 565
of noise data analysis. Then, we focused on five profiles well-constrained by boreholes and crossing the 566
16
main geologic environments to explore the sensitivity of microtremors to the variations of near-surface 567
properties. We found a clear dependence of the noise spectral ratios on the shallow soil conditions and the 568
type of stiff-rock formation. These results, combined with the indication given by earthquake recordings at 569
twelve sites, legitimated us to define the spatial boundaries between zones that should undergo a different 570
seismic response. Seismic analysis and local geology consistently discriminate three main typologies of 571
seismic response during weak-to-moderate ground motion (Fig. 12): (I) relative low amplification (light grey 572
in Fig. 12), (II) 1D resonance with a sharp high-frequency (f 4 Hz) peak (intermediate grey), and (III) 573
moderate amplification in a wide frequency band (1-10 Hz) (dark grey). 574
The three kinds of local response are representative of the soil classes within the city depending on VS30575
and velocity contrasts. Behaviour of type I characterizes areas where hard-rock formations (Pleistocene 576
cemented conglomerates or Miocene rocks) are nearly outcropping. This is the case of the uppermost old 577
town spreading along the crest of the Benevento hill where VS30 exceeds 800 m/s (soil class A) (Fig. 5f). 578
Spectral peaks of type II are observed in the northwestern and eastern sectors of the city consistently with a 579
strong velocity contrast at shallow depth (Fig. 5f). These sites belong predominantly to soil class E580
widespread in the Calore river valley and in the Cretarossa Terrace.581
A response of type III is typical of the Sabato river plain. It is likely controlled at low frequency (f < 2 Hz) 582
by the weak velocity contrast between the Pliocene stiff clays and the underlying sandstones/conglomerates. 583
The resonance of shallow soft soils contributes to amplify ground motion at higher frequencies. Local soil 584
conditions in the Sabato river plain are indicative of soil class B or C.585
Interestingly, the spatial distribution of the seismic responses in the old town (Fig. 12) well correlates with586
the damage pattern caused by the strongest historical earthquake experienced by Benevento (1688, local 587
MCS intensity of X).588
Besides contributing to the microzonation of the city, the waveforms of weak earthquakes recorded in 589
Benevento were used to describe shaking features of moderate-to-large magnitude earthquakes using the 590
Empirical Green’s Function (EGF) technique. Calibration tests adopting the random summation method by 591
Ordaz et al. (1995) were performed for the Irpinia 1980 (Ms 6.9) and Molise 2002 (Mw 5.7) earthquakes, 592
whose recordings are available in Benevento. We obtain a satisfactory fit between observed and synthetic593
seismograms. This allows us to extend our discussion on local effects in terms of design response spectra594
that are computed for the soil categories present in Benevento. The Irpinia and Molise synthetics consistently595
show large amplifications at soft sites (Table 3). A difference is found in terms of absolute amplitudes of 596
acceleration response spectra. Using the anchoring PGA predicted by the attenuation law usually adopted in 597
Italy (Sabetta and Pugliese, 1996), the Irpinia earthquake results to exceed at low periods the design spectra 598
especially at sites of the Sabato river valley (Fig. 9). In contrast, the spectral ordinates of the low stress drop 599
Molise event are well below the design spectra (Fig. 8 left). In order to speculate on a larger level of shaking, 600
we assume the seismograms of a near-source rock-station (Sturno) of the Irpinia earthquake as input for 601
Benevento. The acceleration response spectra, computed including soil nonlinearity (Fig. 11), confirm that 602
the largest discrepancies with design spectra still occur for sites with seismic response of type II and III, 603
especially for periods < 0.5 sec. If we group the stations of Table 3 according to the three seismic response604

17
typologies and compute the average amplification factor (<AF>) and the 1 standard deviation interval, we 605
found that amplification increases from type I to type III, with a large average value (more than a factor of 2) 606
that is found for the southern part of downtown Benevento and the Sabato river plain (Fig. 12). The values of 607
<AF> for each typology with their statistical uncertainties are shown in the inset of Fig. 12. It is worthy of 608
note that the one standard deviation intervals around the mean are well separated among the three 609
kind of seismic responses.610
The case study of Benevento shows that a combined analysis of geological and seismological data can be611
useful to investigate the seismic response and to discriminate the near-surface soil conditions. These 612
indications are of clear interest, in urban areas, to the local authorities and to the civil engineering 613
community dealing with strategies for seismic risk mitigation (taking in account the seismic codes). From a 614
practical point of view, the collection of earthquake data at sites sampling different geological environments 615
of an urban area is a difficult task, especially in regions with a low rate of seismicity. Hence seismic 616
microzonation studies largely employ the single-station noise technique because of its low cost, low time-617
consuming and simplicity of use. As well-known in the literature, the HVNSR yields the best evidences of618
site effects in presence of strong velocity contrast caused by soft layer above a stiff basement. In this case,619
the HVNSRs show a clear resonance peak (response of type II in the present paper) which is, for 1D 620
structures, closely related to the thickness and Vs of the soft soil. Recent studies (Panou et al., 2005; Cara et 621
al., 2007) assess the spatial distribution of soft sediments in urban environments using a large number of622
noise measurements, finding a promising correlation between HVNSR results and damage pattern caused 623
by past earthquakes of engineering importance. However, it is important to stress that the H/V noise method, 624
in presence of complex geological conditions or weak velocity contrast (such the Sabato river plain), can 625
lead to erroneous interpretation in evaluating the depth or the average shear-wave velocity of deposits. The 626
reliability of noise measurements should be therefore validated by independent627
geological/geophysical/seismological approach when the 1-D model assumption is not fully verified.628
629
630
Acknowledgements631
This research was conducted with INGV internal research funds and the contribution of the MIUR Prosis 632
Project. The seismic network in Benevento was financed by the GNDT Traiano Project. We are grateful to 633
Fabrizio Cara, Angela Chesi, Giovanna Cultrera, Carlo De Santis, Rosalba Maresca and the students of the634
University of Sannio for their help during the noise measurements. Special thanks are due to the Associate 635
Editor and to two reviewers for their constructive comments. We thank Maria Rosaria Senatore, Tullio636
Pescatore, Modestino Boscaino and Massimiliano Romito for useful discussion on the Benevento geology.637
We also thank Anna D’Onofrio who kindly provided down-hole data.638
639
640
641
642
18
Figure captions643
644
Figure 1 - Epicentres of the small magnitude ( 2.1 ≤ M ≤ 5.5 ) earthquakes (open circles) recorded by 12 645
seismic stations in Benevento, used by Improta et al. (2005) to estimate the local response. The black 646
continuous and dashed lines correspond to isoseismals of large historical earthquakes that struck the city in 647
1688 (Io=XI of the MCS scale), 1702 (Io=X), 1732 (Io=X) and 1805 (Io=X). Focal mechanisms and 648
epicentres (white stars) of the 1980 Ms 6.9 Irpinia (1) and of the 2002 Mw 5.7 Molise earthquakes (2) are 649
also shown.650
651
Figure 2 - Geologic map of Benevento (redrawn from Improta et al., 2005). The geological units are 652
described in Table 1. The dashed black lines indicate the five geological sections (aa’, bb’, cc’, dd’, ee’). The 653
red line bounds the old town. The filled stars and circles show sites of the microtremor survey and location 654
of 12 seismic stations, respectively. For each of the 12 stations we draw the previous results by Improta et al. 655
(2005) plotting i) the HHSR (± 1 standard deviation around the mean value) using the site ARC1 as 656
reference for the earthquakes of Fig. 1, and, ii) the HV noise spectral ratio. We also plot the 1D theoretical 657
transfer function (dashed lines). We also indicate the soil class as defined by National decree (‘’Norme 658
Tecniche per le Costruzioni’’ of September 23, 2005) (Table 2). For Type E soil, the average shear velocity 659
of the surface alluvium layer is indicated as VsBED .660
661
Figure 3 - (Upper panel) Position of the boreholes (modified after Improta et al., 2005) used in this study to 662
construct the five geological sections (black lines). Boreholes are grouped on the basis of the available 663
information: (1) only stratigraphy; (2) stratigraphy and Standard Penetration Test (SPT); (3) stratigraphy and 664
laboratory measurements; (4) stratigraphy, SPT and laboratory measurements; (5) Down-hole surveys; (6) 665
Cross-hole survey; (7) deep (50 < z < 90 m) exploration wells with detailed core analysis. The dashed line 666
bounds the old town. The dotted grey line indicates the Vs section of Fig. 5f.667
(Lower panel) Schematic geologic section of the upper crust in the Benevento area based upon commercial 668
reflection profiles, refraction and gravity data modelling.669
670
Figure 4 – Comparison of Vs vertical profiles for down-hole and cross-hole surveys carried out in different 671
geological environments of Benevento. The inset map shows the location of boreholes. Down-holes DH1 672
and DH2 were performed for civil engineering investigations, DH3 in the framework of a seismic 673
hazard research project (Anna D’Onofrio, personal communication), cross-hole CH1 is redrawn 674
from Lanzo (1996). Note the consistency of Vs values within the same geological formations (as 675
described in Table 1).676
677
Figure 5a-e - Geological cross-sections and coloured contouring of HVNSRs (mean). The geotechnical 678
classification is described in Table 1 and the sections traces are reported in Figures 2 and 3. The vertical 679
black lines in the geological sections indicate the positions and depth of boreholes. The 12 seismic stations680

19
with earthquake data are shown as black filled triangles. Sites of microtremor measurements with an accurate 681
subsurface characterization are indicated as grey circles. The H/V noise spectral ratios (± 1 standard 682
deviation around the mean) of these sites are plotted in the upper frame. All sites are classified according to 683
the EC8 code. For soft sites (soil classes B, C, E), the noise spectral ratios are compared with 1D S-wave 684
theoretical transfer function (thick dashed lines) using the soil column on the left. Geological sections of Fig. 685
5a, 5c and 5d are modified after Improta et al. (2005).686
687
Figure 5f – Shear-wave velocity section across the Sabato river plain and the Cretarossa terrace. The section 688
trace is reported in Figure 3 as dotted grey line. The Vs section has been obtained by linear interpolation of 689
1D Vs profile associated to each borehole based on the soil classification. The arrows indicate the projections690
of the used boreholes.691
692
Figure 6 - Fundamental resonance frequencies and associated amplifications estimated through H/V noise 693
ratios (upper and lower panel, respectively). The size of triangles is proportional to the values of frequency694
(top) and amplification (bottom). Squares depict nearly flat H/V ratios (i.e, without clear peaks; amplitude 695
values less than 2) or H/V ratios showing unclear low-frequency bumps. Grey symbols refer to the twelve 696
sparse seismic stations. The traces of the geological sections are also shown. The latitude and longitude 697
values are in Gauss-Boaga projection. The thin black lines, in the upper frequency map, bound the sectors 698
that suffered a different level of damage during the 1688 earthquake (after Castenetto and Romeo, 1992).699
700
Figure 7 - Real seismograms (at sites ARC1, TEA1, SAB5 and CAL4) of the October 31, 2002, Molise 701
mainshock (upper waveforms) of the two horizontal components are compared with two synthetic702
seismograms modelled from weak motions through Eq. 1 (EGFs). We have applied an artificial clipping at 703
the synthetics using the same saturation threshold of the real data: the consistency between real and synthetic 704
seismograms guarantees the reliability of results.705
706
Figure 8 - The thin black lines depict the 5% damped acceleration response spectra of the two horizontal 707
components computed from synthetics of the Mw 5.7 Molise earthquakes for a source distance of R=60 km. 708
(Left) The design acceleration spectra (as prescribed by National decree ‘’Norme Tecniche per le 709
Costruzioni’’ of September 23, 2005 for class 1 building and for different soil classes ) are plotted as thick 710
grey curves and their shapes are anchored at T=0 sec to the PGA predicted by the Sabetta-Pugliese 711
regression for stiff site. The Sabetta-Pugliese regressions for deep and shallow alluvium are plotted as 712
dashed-dotted and dashed curves, respectively. Note the spectral deficit of the 2002 Molise earthquakes. 713
(Right) The shapes of design spectra are anchored to the PGA of the reference rock site (ARC1). 714
715
Figure 9 – (Top) Acceleration response spectra of the Ms 6.9, 1980 Irpinia earthquake for a stiff-site 716
accelerogram recorded in Benevento (black and grey continuous lines for NS and EW components, 717
respectively) are compared with the response spectra computed from synthetics of MUS1 and ARC1 (dashed 718
20
lines). Synthetics were generated through EGFs of co-located weak-motion earthquakes. Note the significant 719
consistency between real and synthetic data for stiff sites. (Bottom) The response spectra of synthetics for the 720
1980 Irpinia earthquake computed for both hard-rock and soft-soil sites are compared with the shape of721
design response spectra (National decree ‘’Norme Tecniche per le Costruzioni’’ of September 23, 2005); the 722
latter are anchored to the PGA of the Sabetta-Pugliese regression for stiff-site. The grey areas confine the 723
envelopes of response spectra computed on the two horizontal components of synthetics. 724
725
Figure 10 - Response spectra of the Ms 6.9, 1980 Irpinia earthquake computed from a stiff-site accelerogram 726
recorded in Benevento (EW and NS components) are compared with response spectra after convolution with 727
the soil profile of SAB5. The modelling was performed both with and without soil nonlinearity.728
729
Figure 11 – (Top) Horizontal components of the Ms 6.9, 1980 Irpinia recorded at the station of Sturno.730
(Bottom) Map of the old town with the damage variations caused by the 1688 earthquake (modified from 731
Castenetto and Romeo, 1992). The largest, intermediate and smallest damage zones are in heavy, 732
intermediate and light grey, respectively. The dashed-thick black line shows the extension of the town during 733
Roman times; the absence of grey shadowing indicates the sector where no damage information is available. 734
Recording sites are classified according to the shape of the H/V noise ratios: sharp peaks at f > 3 Hz (filled 735
triangles), weak low-frequency bumps (open triangles), nearly flat ratios (filled squares). HHSRs, HVNSRs736
and response spectra of the Sturno-convolved-seismograms (continuous and dashed lines for EW and NS 737
components, respectively) are also shown for sites having earthquake data available.738
739
Figure 12 - Light grey: sector of Benevento with no-significant site effects characterized by a nearly 740
outcropping bedrock (seismic response of type I). Intermediate grey: sector characterized by mainly 1D high-741
frequency (f 4 Hz) resonance of shallow layers overlaying the conglomeratic bedrock (type II). Dark grey:742
zones characterized by moderate broad-band (1-10 Hz) amplifications related to a thick layering of soft-to-743
consolidated fine soils overlaying stiff Pliocene terrains (type III). For each type of seismic response, the 744
average of amplification factor (as defined in Eq. 4) and the 1 standard deviation are reported in the inset. 745
The old town is bounded by a dashed black line.746
747
748749750751752753754755756757758759

21
760761
TABLE 1. For each geological class, we indicate the range of shear-wave velocities (Vs) and a weighted 762
value ( <Vs>) used in 1D numerical modelling. Density values of continental deposits and Middle Pliocene 763
clays are those reported by Marcellini et al. (1991) and Improta (1998) based on standard laboratory tests. 764
The density assigned to the Middle Pliocene sandstones/conglomerates and to the Miocene melange has been 765
proposed by Improta et al. (2003) based on gravity data modelling performed in the Sannio region.766
767CLASS LITHOLOGY (t/mc) Vs (m/s) <Vs>
Near-surface Soils: Filling (F),
Colluvial soils (Cl) and Slope Debris (Db)
Very soft fine soils with organic content, weathered
pyroclastites (Cl) and debris of masonry (F).
Loose sandy gravels and very soft silty clays (Db).
1.7-1.8 200330 270
Late Pleistocene-Holocene Alluvia
(Al2A,B)
Loose to dense sandy gravels and silty sands. 1.8-2.0 330430 380
Lower-Middle Pleistocene fluvio-lacustrine soils
(Al1) andFine Ancient Alluvia (palustrine facies C
- AAC)
Soft to consolidated silty clays, with sandy lenses and
peats.1.9
2.0
shallow 320440
deep 430610
360
520
Coarse Ancient Alluvia (facies B -
AAB)
Dense to very dense sandy gravels and silty sands. 2.2
shallow 460600
deep 8601210
530
1090
Coarse Ancient Alluvia (facies A -
AAA)Weathered
Conglomerates (AAAW)
Stiff Cemented conglomerates.
Very dense gravels.
2.3
2.2
10001730
-
1410
810
Pliocene Clays (Pag)
Superficial weathered Pliocene Clays (PagW)
Stiff silty clays. 2.1
1.9
600800
330540
710
350
Pliocene Sandstones (Ps)
Miocene Melange (M)
Sandstones with conglomerates.Shales, sandstones, marly
limenstones.2.35 1300
768769770771772773774
775
776
777
778
22
779
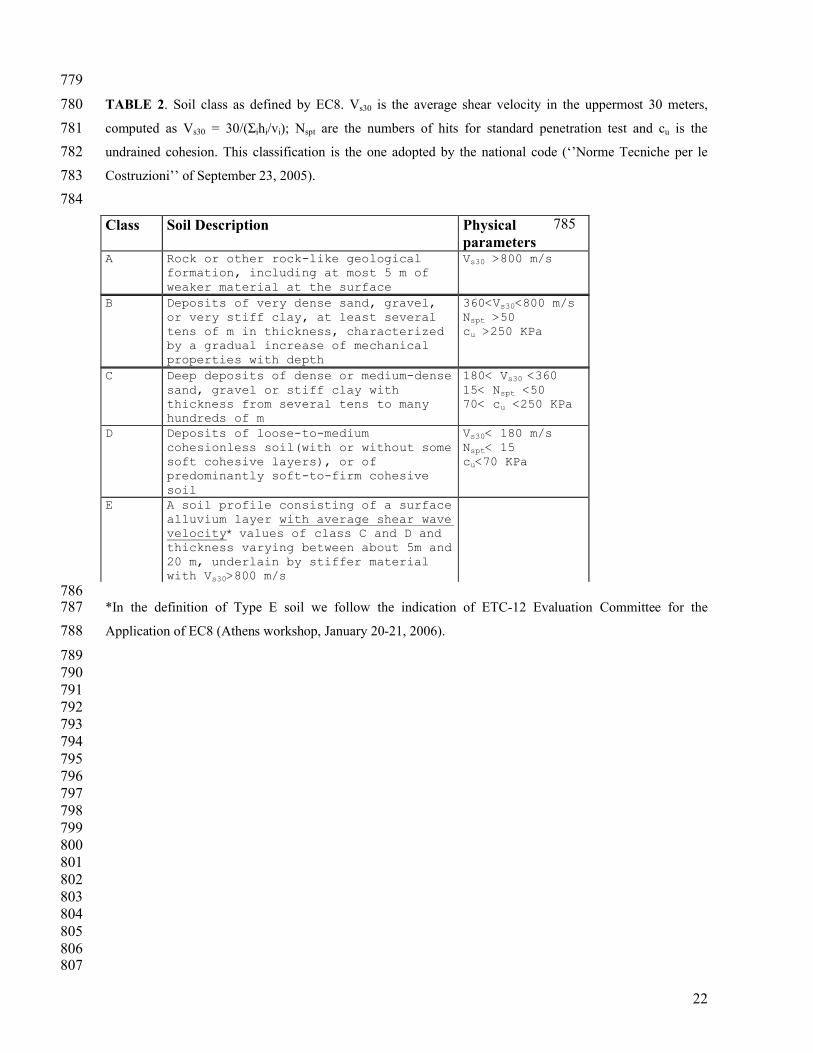
TABLE 2. Soil class as defined by EC8. Vs30 is the average shear velocity in the uppermost 30 meters, 780
computed as Vs30 = 30/(Σihi/vi); Nspt are the numbers of hits for standard penetration test and cu is the 781
undrained cohesion. This classification is the one adopted by the national code (‘’Norme Tecniche per le 782
Costruzioni’’ of September 23, 2005).783
784
785
786*In the definition of Type E soil we follow the indication of ETC-12 Evaluation Committee for the 787
Application of EC8 (Athens workshop, January 20-21, 2006).788
789790791792793794795796797798799800801802803804805806807
Class Soil Description Physical parameters
A Rock or other rock-like geological formation, including at most 5 m of weaker material at the surface
Vs30 >800 m/s
B Deposits of very dense sand, gravel, or very stiff clay, at least several tens of m in thickness, characterized by a gradual increase of mechanical properties with depth
360<Vs30<800 m/s Nspt >50 cu >250 KPa
C Deep deposits of dense or medium-dense sand, gravel or stiff clay with thickness from several tens to many hundreds of m
180< Vs30 <360 15< Nspt <50 70< cu <250 KPa
D Deposits of loose-to-medium cohesionless soil(with or without some soft cohesive layers), or of predominantly soft-to-firm cohesive soil
Vs30< 180 m/s Nspt< 15 cu<70 KPa
E A soil profile consisting of a surface alluvium layer with average shear wave velocity* values of class C and D and thickness varying between about 5m and 20 m, underlain by stiffer material with Vs30>800 m/s

23
TABLE 3. Amplification factor (AF) as defined by Eq. 4. For each site we also indicate the soil class.808The last column shows the typology of seismic response as discussed in the text.809
810
811812813814815816817818819820821822823824825826827828829830831832833834835836837838839840841842843844845846847848849850851852853854
24
References855856
Aki, K. (1967). The scaling law of seismic spectrum, J. Geophys. Res. 72, 1217-1231.857858
Bard, P.Y. (1999). Microtremor measurements: a tool for site effect estimation?, State-of-the-art paper, 859Second International Symposium on the Effects of Surface Geology on seismic motion, Yokohama,860December 1-3, 1998, Irikura, Kudo, Okada and Sasatani Eds., Balkema, 3, 1251-1279.861
862Bardet, J.P., K. Ichii, and C.H. Lin (2000). EERA, A Computer Program for Equivalent-linear Earthquake 863site Response Analyses of Layered Soil Deposits, University of Southern California, Department of Civil 864Engineering .865
866Bernard, P., and A. Zollo (1989). The Irpinia (Italy) 1980 earthquake: Detailed analysis of a complex normal 867faulting, J. Geophys. Res. 94, 1631-1647.868
869Bisio, L., R. Di Giovambattista, G. Milano, and C. Chiarabba (2004). 3-D earthquake locations and upper 870crustal structure of the Sannio-Matese region (southern Italy), Tectonophysics 385, 121-136. 871
872Bonnefoy-Claudet, S. (2004). Nature du bruit de fond sismique: Implications pour les études des effets de 873site. Ph.D. thesis,University Joseph Fourier, Grenoble, France. (In French with English abstract).874
875Bonnefoy-Claudet, S., C. Cornou, P.Y. Bard, and F. Cotton (2006). H/V ratio: a tool for site effects 876evaluation. Results from 1D noise simulations. Geophys. J. Int. 167, 827-837, doi:10.1111/j.1365-877246X.2006.03154.x 878
879Bonnefoy-Claudet, S., A. Koehler, C. Cornou, M. Wathelet, and P.Y. Bard (2007). Effects of Love waves on 880microtremors H/V ratio, Bull. Seism. Soc. Am., in press881
882Borcherdt, R.D. (1970). Effect of local geology near San Francisco Bay, Bull. Seism. Soc. Am. 60, 29-61.883
884Boschi, E., E. Guidoboni, G. Ferrari, D. Mariotti, G. Valensise, and P. Gasperini (2000). Catalogue of strong 885Italian earthquakes, Annali di Geofisica 43, 4, pp. 268 (full database on CD-ROM).886
887Brune, J.N. (1970). Tectonic stress and the spectra of seismic shear waves from earthquakes, J. Geophys. 888Res. 75, 4997-5009 (and correction, J. Geophys. Res. 76, 5002).889
890Calderoni, G., A. Rovelli, G. Cultrera, R.M. Azzara, and G. Di Giulio (2005). Assessment of Ground 891Motions in Palermo (Italy) during the September 6, 2002, Mw 5.9 , Bull. Seism. Soc. Am. 95, 6, 2342-2363, 892doi:10.1785/0120050063, 2005.893
894Calderoni, G., A. Rovelli, G. Milana, and G. Valensise (2007). Low stress drop in the October-November 8952002 earthquakes in Molise, central-southern Italy: evidence for reutilization of Mesozoic faults?, J. 896Geophys. Res, submitted 2007.897
898Cara, F., G. Cultrera, R.M. Azzara, V. De Rubeis, G. Di Giulio, M.S. Giammarinaro, P. Tosi, P. Vallone, and 899A. Rovelli (2007). Microtremor Measurements in the City of Palermo, Italy: Analysis of the Correlation with 900Local Geology and Damage, Bull. Seism. Soc. Am. , submitted 2007.901
902Castenetto, R., and R. Romeo (1992). Il terremoto del Sannio del 5 Giugno 1688: analisi del danneggiamento 903subito dalla città di Benevento, Atti 11° Convegno G.N.G.T.S., Roma, 1992.904
905CEN (Comité Européen de Normalisation), (2003). Eurocode 8: Design of Structures for Earthquake 906Resistance. Part 1: General rules, seismic actions and rules for buildings. stage 49 draft, Brussels. 907
908Chiarabba, C., and A. Amato (1997). Upper crustal structure of the Benevento area (Southern Italy): Fault 909heterogeneities and potential for large earthquakes, Geophys. J. Int. 130, 229-239. 910
911
25
Cocco, M., and A. Rovelli (1989). Evidence for the variation of stress drop between normal and thrust 912faulting earthquakes in Italy, J. Geophys. Res. 94, 9399-9416.913
914Cosenza, E., G. Manfredi, M. Polese, and G.M. Verderame (2005). Una metodologia per l’analisi della 915vulnerabilità sismica di classi di edifici in c.a.: l’applicazione al Rione Libertà di Benevento, Convegno916GNDT, Ext. Abst., Genova 15-16 February 2005.917
918D’Onofrio, A., F. Santucci de Magistris, and F. Vinale (2005). Caratterizzazione geotecnica ed analisi della 919vulnerabilità sismica del sottosuolo per il comune di Benevento, Convegno GNDT, Ext. Abst., Genova 15-16920February 2005.921
922Duval A.M., 1994. Détermination de la réponse d'un site aux séismes à l'aide du bruit de fond: évaluation 923expérimentale. Université Pierre-et-Marie Curie, Ph.D. Thesis (In french), 264pp., Paris, France924
925ETC-12. Geotechnical evaluation and application of the seismic Eurocode EC8 2003-2006 (2006). 926Proceedings of the Athens Workshop, January 20 & 21 2006, Edited by G. Bouckovalas 927
928Fäh, D., and P. Suhadolc (1994). Application of numerical wave-propagation techniques to study local soil 929effects: the case of Benevento (Italy), Pageoph. 143, 4, 513-536.930
931Field, E.H., and K.H. Jacob (1995). A comparison and test of various site-response estimation techniques, 932including three that are not reference-site dependent, Bull. Seism. Soc. Am. 85, 1127-1143.933
934Gueguen, P., C. Cornou, S. Garambois, and J. Banton (2007). On the Limitation of the H/V Spectral Ratio 935Using Seismic Noise as an Exploration Tool: Application to the Grenoble Valley (France), a Small Apex 936Ratio Basin, Pure Appl. Geophys. 164, 115–134, doi 10.1007/s00024-006-0151-x.937
938Hartzell, S.H. (1978). Earthquake aftershocks as Green’s Functions, Geophys. Res. Lett. 5, 1-4. 939
940Haskell, N.A. (1960). Crustal reflection of plane SH waves, J. Geophys. Res. 65, 4147-4150.941
942Konno, K., and T. Ohmachi (1998). Ground motion characteristics estimated from spectral ratio between 943horizontal and vertical components of microtremor, 1998, Bull. Seism. Soc. Am. 88, 1, 228-241.944
945Iannaccone, G., L. Improta, G. Biella, M. Castellano, A. Deschamps, R. De Franco, L. Malagnini, L. 946Mirabile, R. Romeo, and A. Zollo A. (1995). A study of local site effects in the Benevento town (Southern 947Italy) by the analysis of seismic records of explosions, Annali di Geofisica 38, n.3-4, 411-428.948
949Improta, L. (1998). Studio degli effetti delle eterogeneità geologiche a scala crostale e locale sulla 950propagazione della radiazione sismica: applicazioni alla regione del Sannio, University of Naples, Ph.D.951Thesis, 184pp., Naples, Italy.952
953Improta, L., L. Bonagura, P. Capuano and G. Iannaccone (2003). An integrated geophysical investigation of 954the upper crust of the epicentral area of the 1980, Ms 6.9, Irpinia earthquake (Southern Italy). 955Tectonophysics, 361 (1-2), 139-169.956
957Improta, L., G. Di Giulio, and A. Rovelli (2005). Variations of local seismic response in Benevento 958(Southern Italy) using earthquakes and ambient noise recordings, J. Seism. 9, 191-210.959
960Joyner, W.B. and D.M. Boore (1986). On simulating large earthquakes by Green’s function addition of 961smaller earthquakes , in Earthquake Source Mechanics, Maurice Ewing Series 6, S. Das, J. Boatwright, and 962C. Sholtz Eds., American Geophysical Monograph 37, Washington, D.C., 269-274.963
964Lanzo, G. (1996). Modulo di taglio iniziale di alcuni terreni naturali da prove di sito ed in laboratorio, in 965Studi e Ricerce del Dip. di Ingegneria Strutturare e Geotecnica, Università La Sapienza, Roma, 21-96.966
967Lermo, J., and F.J. Chàvez-Garcia (1994). Are microtremors useful in site response evaluation?, Bull. Seism. 968
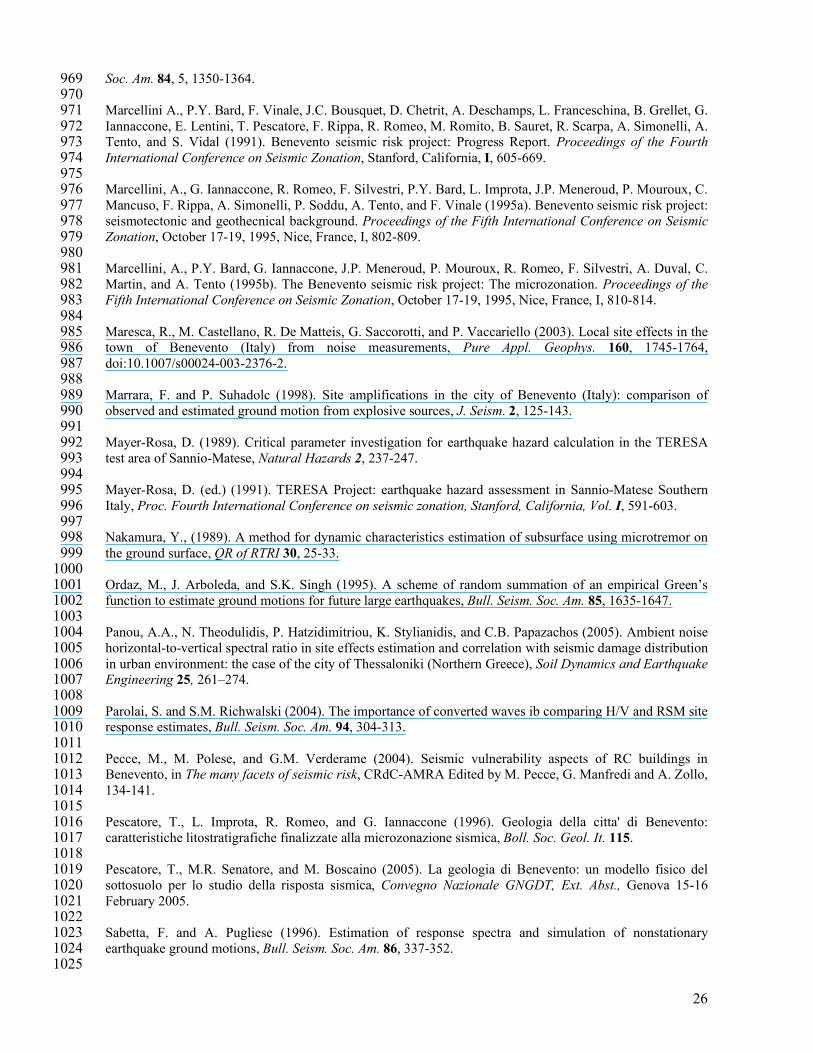
26
Soc. Am. 84, 5, 1350-1364.969970
Marcellini A., P.Y. Bard, F. Vinale, J.C. Bousquet, D. Chetrit, A. Deschamps, L. Franceschina, B. Grellet, G. 971Iannaccone, E. Lentini, T. Pescatore, F. Rippa, R. Romeo, M. Romito, B. Sauret, R. Scarpa, A. Simonelli, A. 972Tento, and S. Vidal (1991). Benevento seismic risk project: Progress Report. Proceedings of the Fourth 973International Conference on Seismic Zonation, Stanford, California, I, 605-669.974
975Marcellini, A., G. Iannaccone, R. Romeo, F. Silvestri, P.Y. Bard, L. Improta, J.P. Meneroud, P. Mouroux, C. 976Mancuso, F. Rippa, A. Simonelli, P. Soddu, A. Tento, and F. Vinale (1995a). Benevento seismic risk project: 977seismotectonic and geothecnical background. Proceedings of the Fifth International Conference on Seismic 978Zonation, October 17-19, 1995, Nice, France, I, 802-809.979
980Marcellini, A., P.Y. Bard, G. Iannaccone, J.P. Meneroud, P. Mouroux, R. Romeo, F. Silvestri, A. Duval, C. 981Martin, and A. Tento (1995b). The Benevento seismic risk project: The microzonation. Proceedings of the 982Fifth International Conference on Seismic Zonation, October 17-19, 1995, Nice, France, I, 810-814.983
984Maresca, R., M. Castellano, R. De Matteis, G. Saccorotti, and P. Vaccariello (2003). Local site effects in the 985town of Benevento (Italy) from noise measurements, Pure Appl. Geophys. 160, 1745-1764,986doi:10.1007/s00024-003-2376-2.987
988Marrara, F. and P. Suhadolc (1998). Site amplifications in the city of Benevento (Italy): comparison of 989observed and estimated ground motion from explosive sources, J. Seism. 2, 125-143. 990
991Mayer-Rosa, D. (1989). Critical parameter investigation for earthquake hazard calculation in the TERESA 992test area of Sannio-Matese, Natural Hazards 2, 237-247.993
994Mayer-Rosa, D. (ed.) (1991). TERESA Project: earthquake hazard assessment in Sannio-Matese Southern 995Italy, Proc. Fourth International Conference on seismic zonation, Stanford, California, Vol. I, 591-603. 996
997Nakamura, Y., (1989). A method for dynamic characteristics estimation of subsurface using microtremor on 998the ground surface, QR of RTRI 30, 25-33. 999
1000Ordaz, M., J. Arboleda, and S.K. Singh (1995). A scheme of random summation of an empirical Green’s 1001function to estimate ground motions for future large earthquakes, Bull. Seism. Soc. Am. 85, 1635-1647. 1002
1003Panou, A.A., N. Theodulidis, P. Hatzidimitriou, K. Stylianidis, and C.B. Papazachos (2005). Ambient noise 1004horizontal-to-vertical spectral ratio in site effects estimation and correlation with seismic damage distribution 1005in urban environment: the case of the city of Thessaloniki (Northern Greece), Soil Dynamics and Earthquake 1006Engineering 25, 261–274.1007
1008Parolai, S. and S.M. Richwalski (2004). The importance of converted waves ib comparing H/V and RSM site 1009response estimates, Bull. Seism. Soc. Am. 94, 304-313.1010
1011Pecce, M., M. Polese, and G.M. Verderame (2004). Seismic vulnerability aspects of RC buildings in 1012Benevento, in The many facets of seismic risk, CRdC-AMRA Edited by M. Pecce, G. Manfredi and A. Zollo, 1013134-141.1014
1015Pescatore, T., L. Improta, R. Romeo, and G. Iannaccone (1996). Geologia della citta' di Benevento: 1016caratteristiche litostratigrafiche finalizzate alla microzonazione sismica, Boll. Soc. Geol. It. 115.1017
1018Pescatore, T., M.R. Senatore, and M. Boscaino (2005). La geologia di Benevento: un modello fisico del 1019sottosuolo per lo studio della risposta sismica, Convegno Nazionale GNGDT, Ext. Abst., Genova 15-16 1020February 2005.1021
1022Sabetta, F. and A. Pugliese (1996). Estimation of response spectra and simulation of nonstationary 1023earthquake ground motions, Bull. Seism. Soc. Am. 86, 337-352.1024
1025

27
SESAME Project (2004). Site EffectS using AMbient Excitations, http://sesame-fp5.obs.ujf-grenoble.fr10261027
Silvestri, F. (1991). Stress-strain behaviour of natural soils by means of cyclic/dynamic torsional shear test, 1028Proc. Symphosium on experimental characterization and modelling of soils and soft rocks, Naples, Italy.1029
1030Traiano Project (2002). Project for the assessment and the reduction of vulnerability of urban areas, 1031http://www.ingv.it/gndt/Att_scient/PE2002_Brief_Reports/brief_reports_con_int.htm1032
1033Tucker, B., and J. King (1984). Dependence of sediment-filled valley response on input amplitude and valley 1034properties, Bull. Seism. Soc. Am. 74, 153-165.1035
1036Valensise, G., D. Pantosti, and R. Basili (2004). Seismology and tectonic setting of the Molise earthquake 1037sequence of October 31 – November 1 2002, Earthquake Spectra 20, 1-15.1038
1039Wennerberg, L. (1990). Stochastic summation of empirical Green's functions, Bull. Seism. Soc. Am. 80, 10401418-1432.1041
1042Westaway, R. (1987). The Campania, Southern Italy, earthquake of 1962 August 21, Geophys. J. R. Astr. 1043Soc. 88, 1-24. 1044
1045Westaway, R., and J. Jackson (1987). The earthquake of the 1980 Novembre 23 in Campania Basilicata 1046(Southern Italy), Geophy. J. R. Astr. Soc. 90, 375-443.1047
104810491050
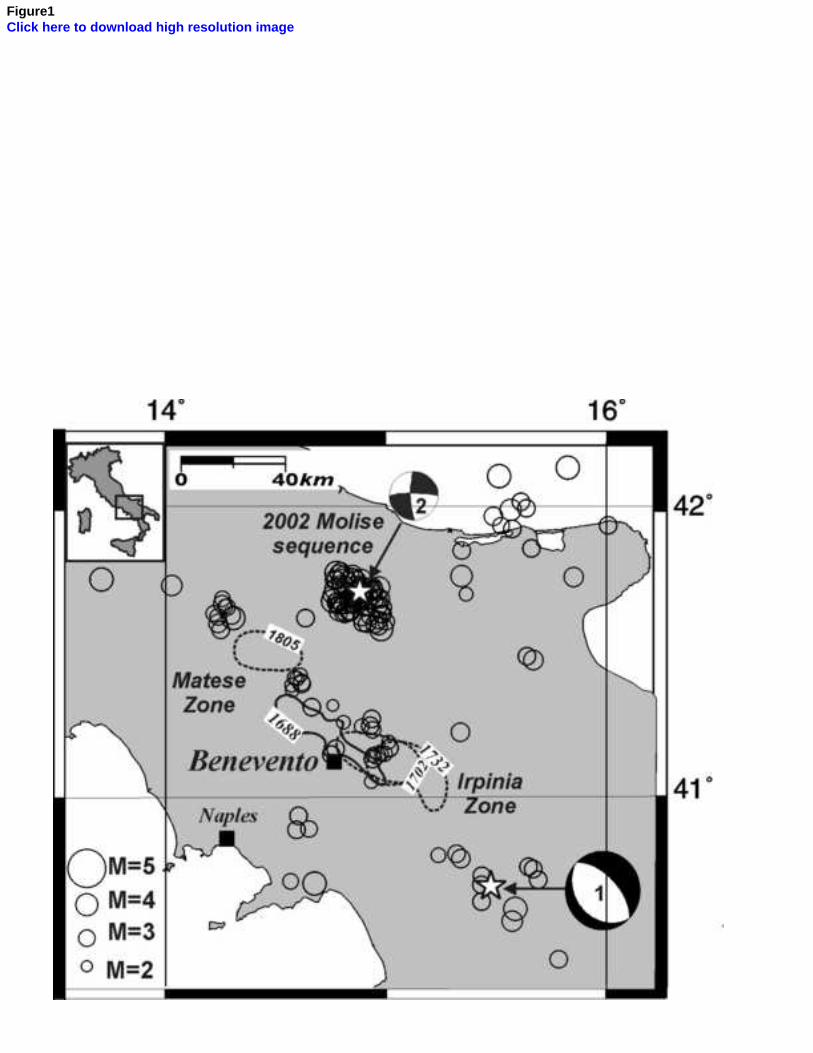
Figure1Click here to download high resolution image
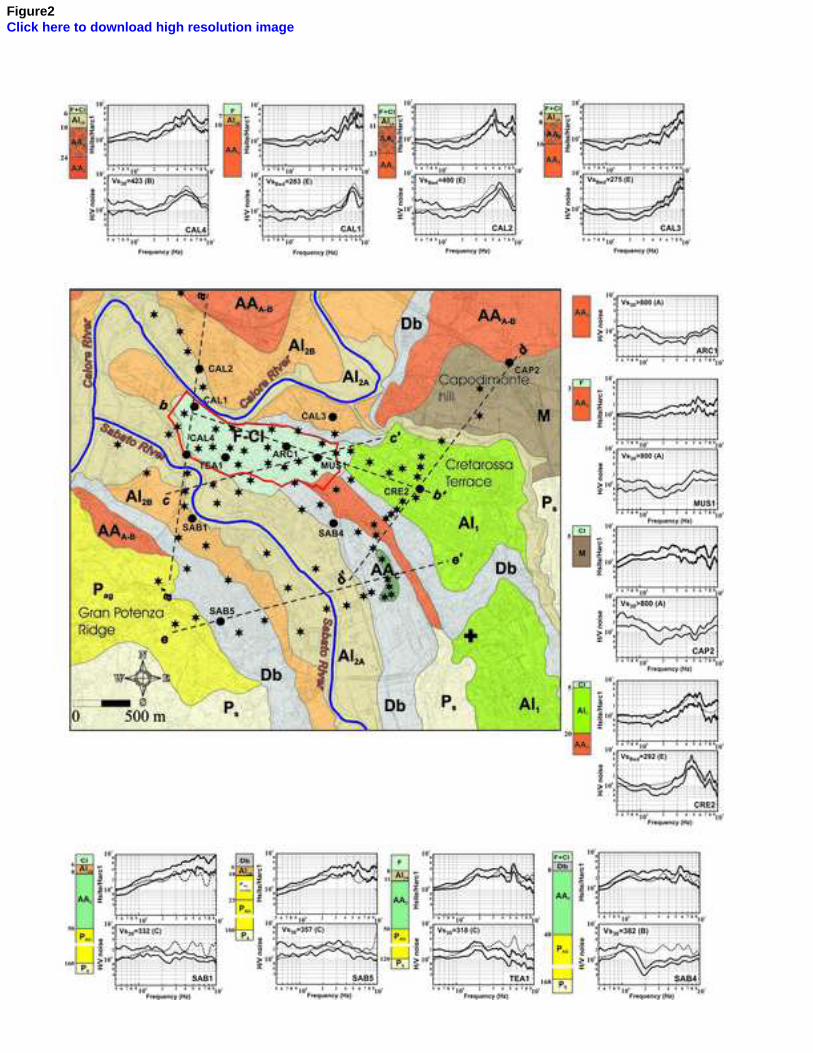
Figure2Click here to download high resolution image
Figure3Click here to download high resolution image
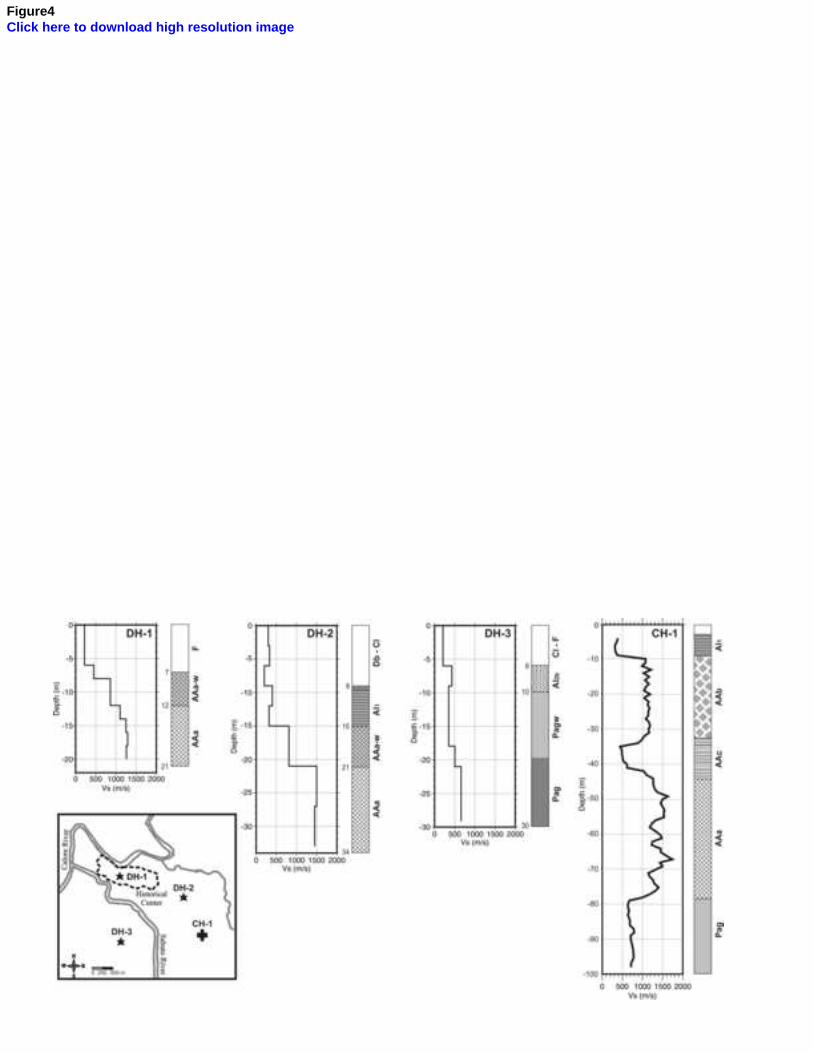
Figure4Click here to download high resolution image

Figure5aClick here to download high resolution image

Figure5bClick here to download high resolution image
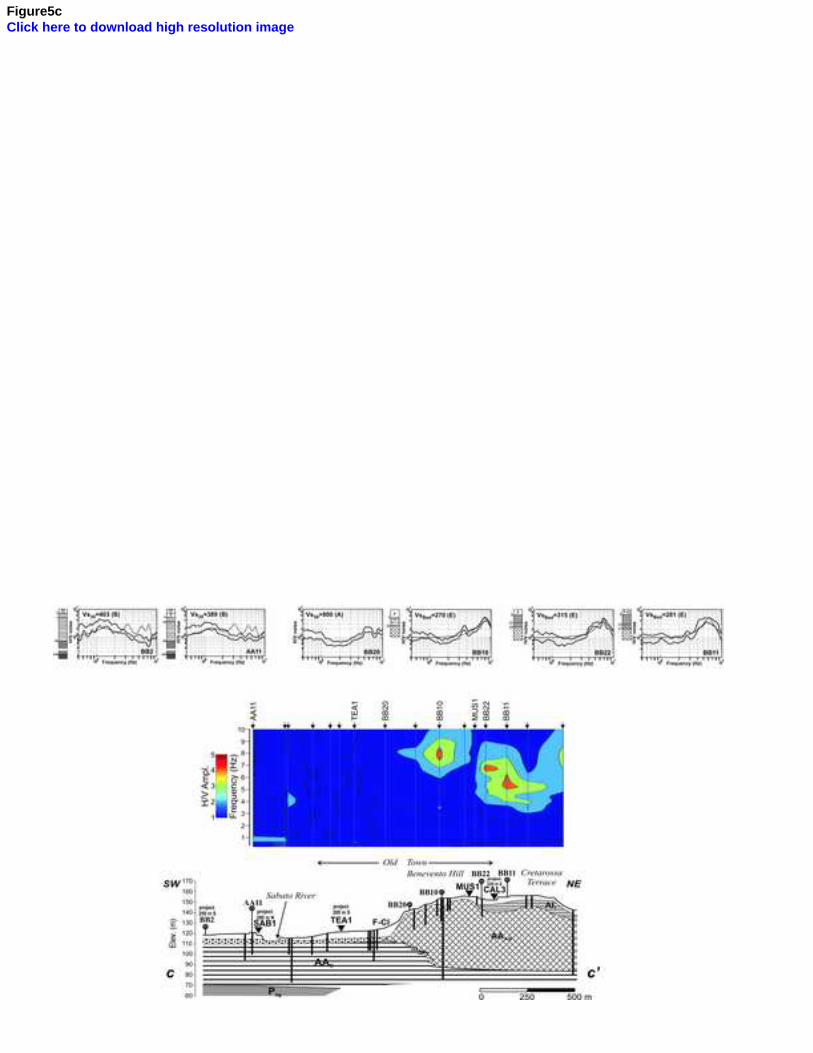
Figure5cClick here to download high resolution image
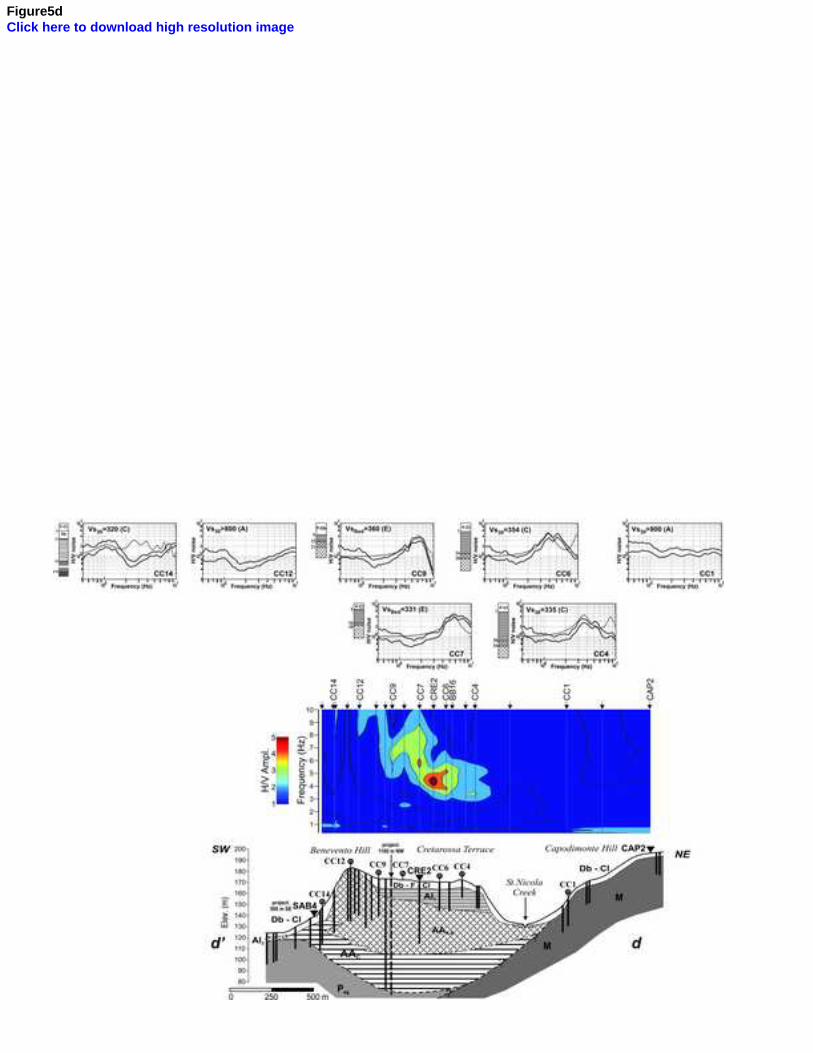
Figure5dClick here to download high resolution image
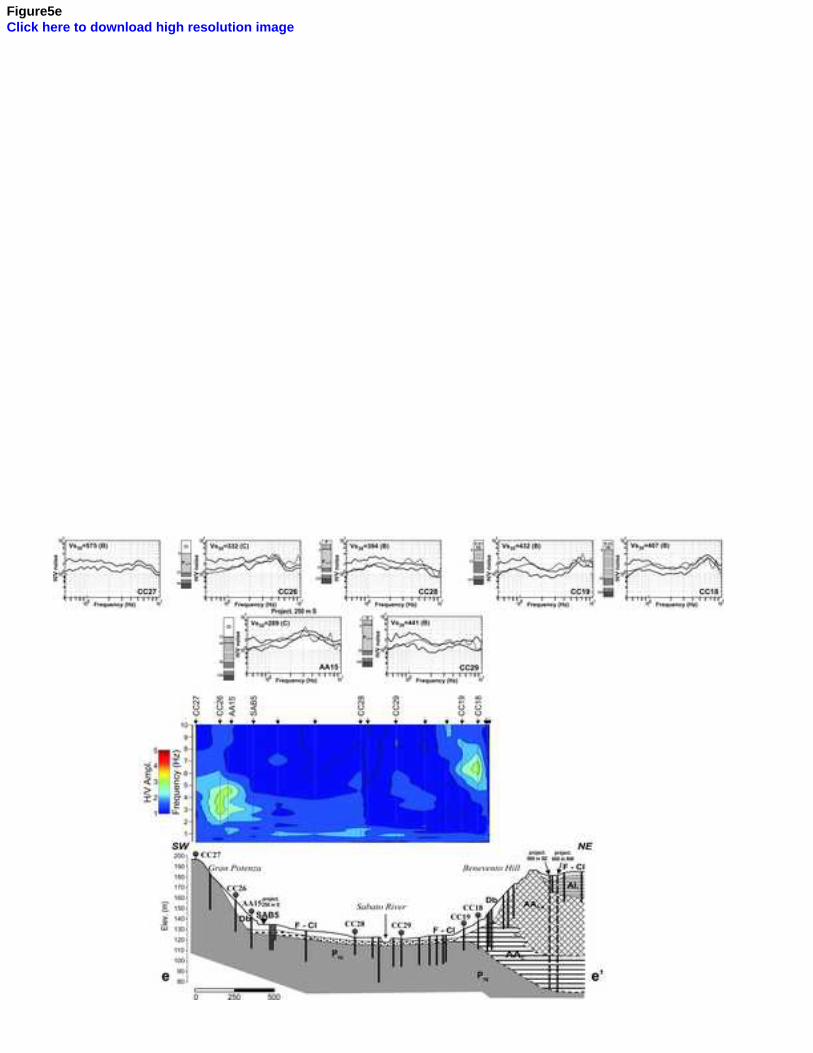
Figure5eClick here to download high resolution image

Figure5fClick here to download high resolution image
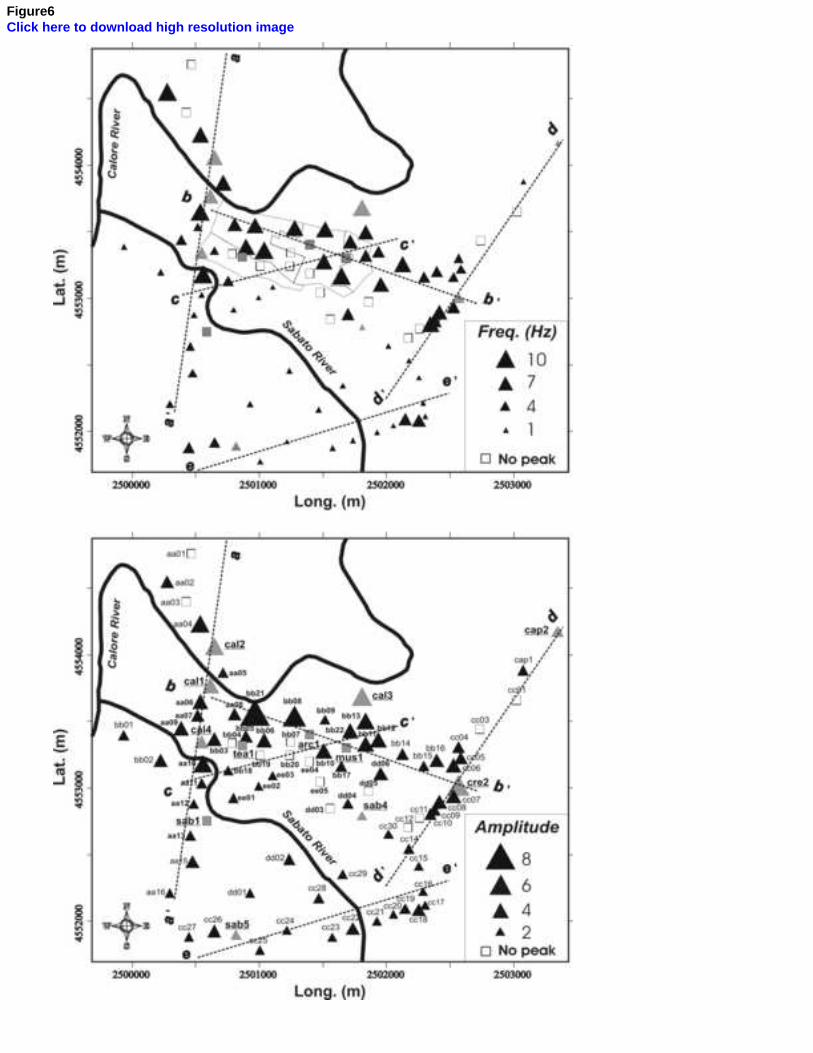
Figure6Click here to download high resolution image
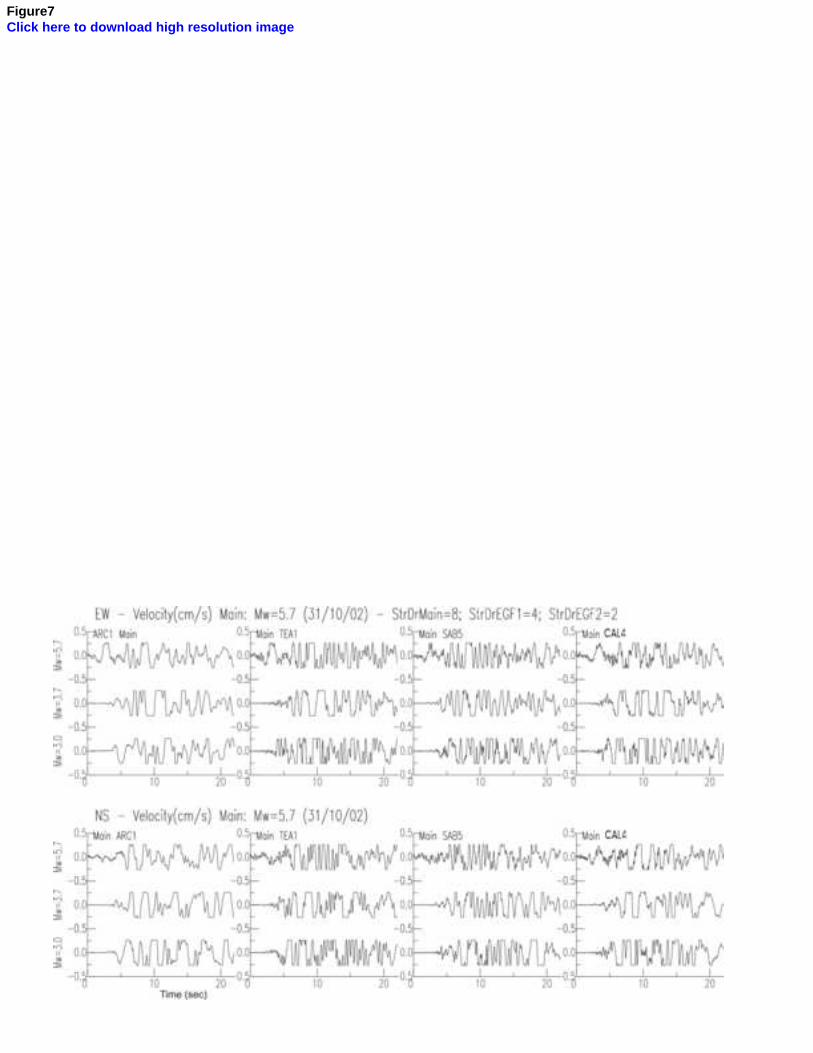
Figure7Click here to download high resolution image

Figure8Click here to download high resolution image
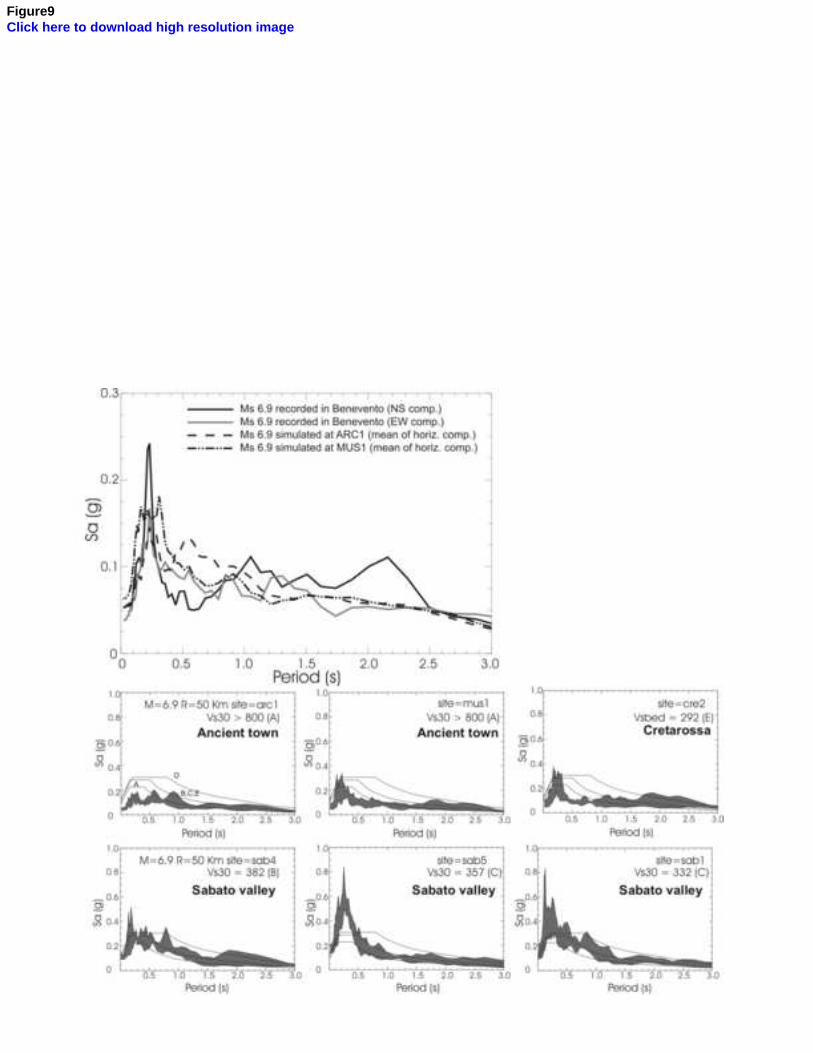
Figure9Click here to download high resolution image
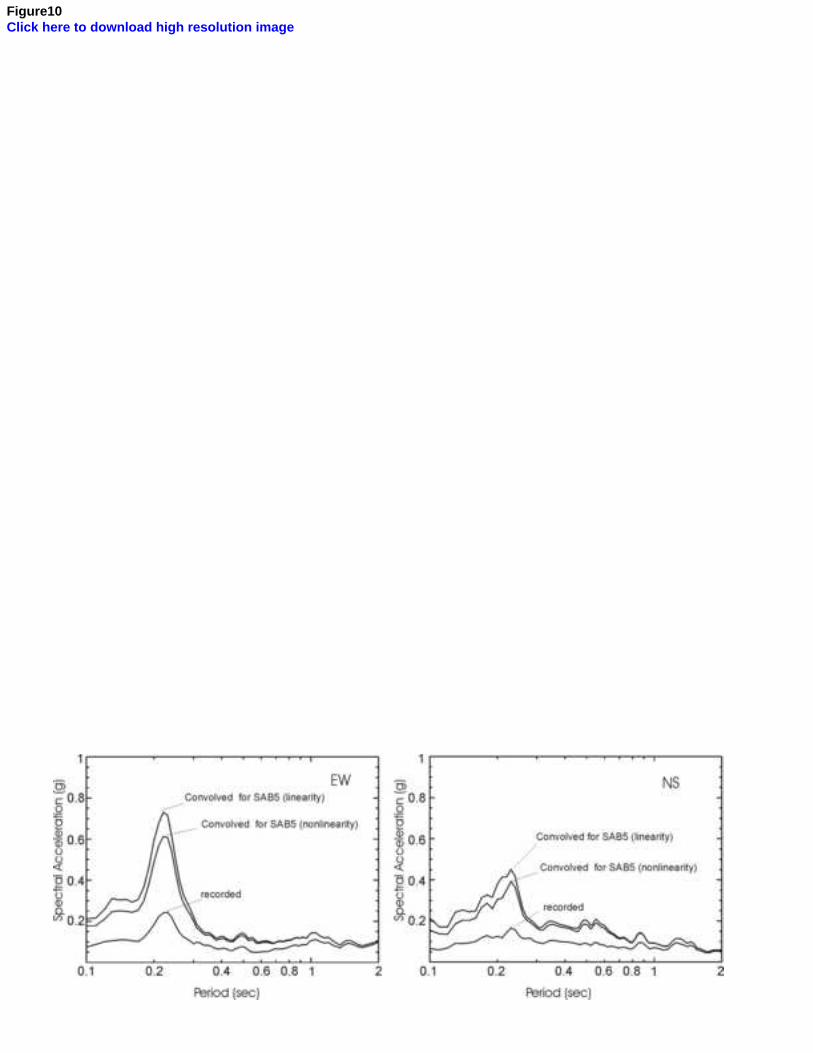
Figure10Click here to download high resolution image
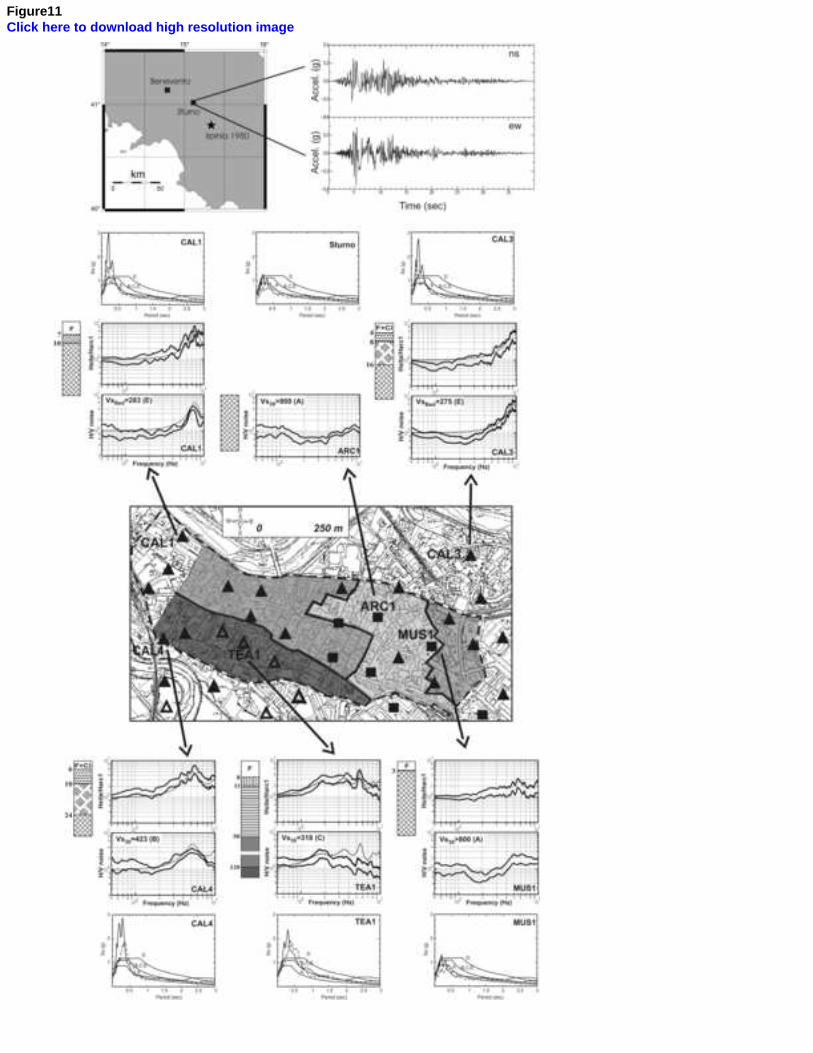
Figure11Click here to download high resolution image
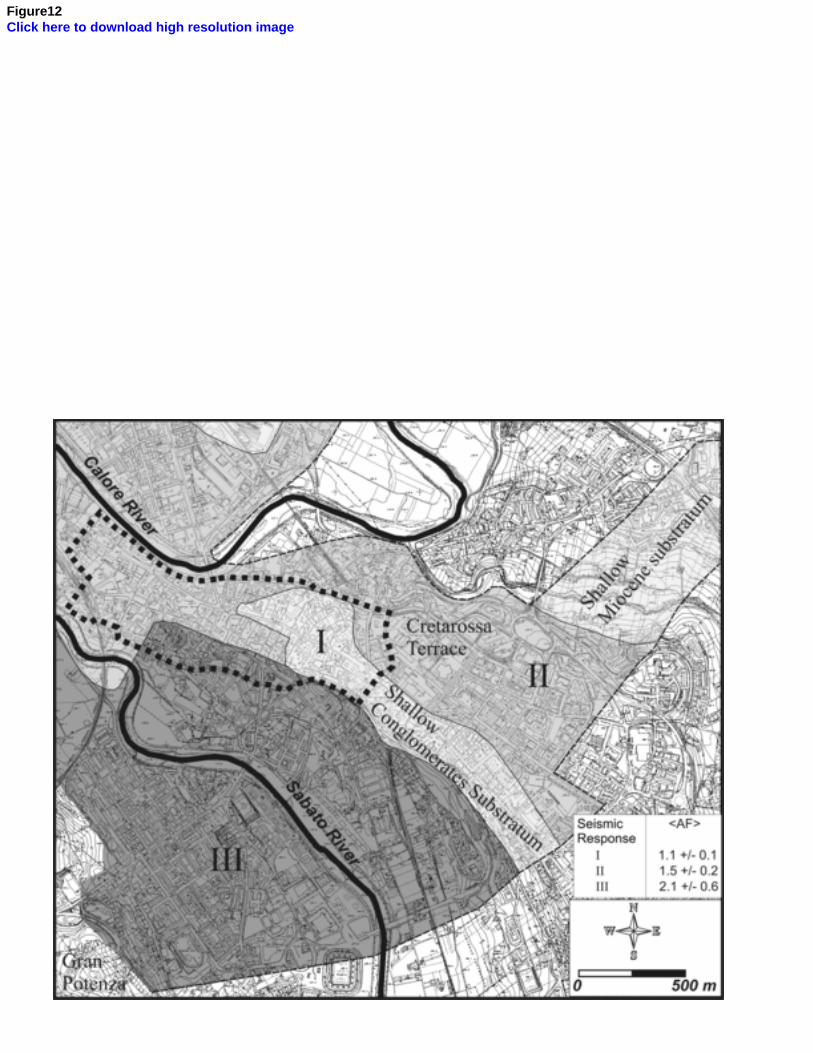
Figure12Click here to download high resolution image
Copyright © 2022 FDOKUMEN