Spring Independent School District Cooper Elementary 2019 ...
Upload
khangminh22Category
view
0download
0

SrerEMENr O¡ AurHENTrcrrYThis work contains no material that has been previously accepted for the award of any degree
or diploma i. ary university or other tertiary institution and, to the best of my knowledge
and belief contains no material previously published or written by another person, except
where due reference has been made in the text.
I give my consent to reproduce any part of this thesis, when deposited at the University of
Adelaide library, being available for loan and photocopying.
Chris Cubitt
July 2000
ll

I DEÐTCATE:THIS THESIS TODR DAVE GRAVESTOCK
lll

AcxNowrEDGE-nutENTSThe main participants in this project were Mines and Energy South Australia (now
Dept. of Primary Industry and Resources - PIRSA), The National Centre for
Petroleum Geology and Geophysics (NCPGG) and the South Australian Business
Unit (SABU) of Santos Ltd. The Australian Petroleum Collective Research Centre
(APCRC) also provided project funding. I thank all of these institutions for financially
supporting this research.
Further technical assistance was provided by the Department of Geology and
Geophysics, CEMMSA (Adelaide University) and AMDEL laboratories. Boral Energy
(now Origin Energy) kindly allowed access to a large number of unpublished reports.
Lastly Mines and Energy Victoria (Petroleum Division) and the Dept. of Geological
and Environmental Engineering (RMIT) gave access to petrological microscopes
whilst in Melbourne.
To the NCPGG family, of which I have been a part of since 7992, the completion of
this work marks the end of our long formal association. I thank all who have helped
over the many years. The list is long, however I particularly want to mention,
Maureen Sutton, Barbara Wallis, Andy Mitchell, Cedrick Griffiths, Nick Man, JohnKaldi, and Ted Moorcroft. To my fellow PhD students Alex Kaiko, Stu Smith, Simon
Polomoka and Johnny Hull the long chats over "a few cups of tea" out the back willalways be remember and sorely missed.
Special mention must be made of Drs Bill Stuart and Dave Gravestock. Bill gave me
the chance to carry out this research and Dave through what was then MESA
provided the majority of the funds for this project. I sincerely thank you both
wherever you both are.
Dr Nick Lemon, has also been a constant help and guide through the various PhD
"traps". Thanks Nick for your help through out my time at the NCPGG. Sorry for
giving you all my manuscripts in late October-early November. My timing withrespect to honours corrections was never that flash and never improved!
I would like to thank Dr Peter Tingate for providing specialist commentary on the
diagenesis and the thermal history aspects of this project. I also extend many thanks
to Dr Paul Tarabbia for proof reading the final manuscript.
lv

Other people without whom this project would not have been possible include Jay
Mathews, Mohamed Rezaee, John Stanely (the XRD master), Eleanor Alexander,
Wayne Musared (for his running repairs on faulty thin sections), Alan Web of
AMDEL and Keith Turnbull of Adelaide University. The help and banter of fohnTerlet (CEMMSA) made the endless microprobe and SEM hours tolerable. Brian
Logan of the PIRSA core library became a vital project participant constantly doing
the impossible with core layouts. Thanks mate for the humble pie!
Gerry Carne, Chris Porter, Steve Mackie and particularly Stuart Jones of Santos Ltd.
have showed an overwhelming enthusiasm for this research supporting it's
digitisation. I also want to thank Darren Evans who at the end of my PhD journey
guided me through tricky statistical corrections. Cheers mate. Ralph Panait, also of
Santos Ltd., needs to be recognised and thanked as the creator of the "art work" seen
throughout this thesis. His ability to turn a set of petrographic images into a coherent
form is acknowledged here.
The following body of work was done in parallel with Dr Alistair Chaney and
Aberdeen University. I thank Al for his friendship, and his technical data. I also thank
Brian Williams and Aberdeen University for supporting this research.
I want to thank my family, Kay, Len, Danielle, Mark and Dylan who have supported
me through all the years, putting up with my infrequent and brief visits and my
inability to use a telephone. I especially want to say thanks to my parents for giving
the occasional, and very much needed, "study grants", and for allowing me unlimited
access to a car ("the Kingswood"). The "Kingswood" was invaluable being the onlyform of motorised transport for NCPGG PhD "study trips" to the Barossa Valley and
Mc Laren Vale wine regions. Thanks.
Sharon Tiainen, who initially held a healthy scepticism towards PhD study, has over
the years, warmed to the notion and value of post graduate research, showing,
amazing patience and generosity throughout this time. Without her I would have
found the road a lot lonelier. She has been throughout this time my inspiration,
teaching me that out of adversity can come something beautiful if you wait a while.Thanks mate.
To my friends, scattered all over the world, thank you for filling my numerous photo
albums with mirth, merriment and mayhem. In particular, I want to single out the
following antagonists who have done me the most damage: Tobes, Teresa, Marcus

Plugga, Stu, Shag, Christine, Jensy, Johnny Duka, BJ, Andy, Mandy, lazz, Ed, Stods
and Brincat. I would also like to incriminate: Ange, Toni, Dight, Josephine, Sarah,
Tomasz, Ando, Pete, and Fi who have in the last few years also helped to distract me
from this body of work.
I have a special thank you to the members of the Gifford Hotel and Dew St. Firstly Iacknowledge the magic that was the Gifford Hotel and heartily thank DJ Meags,
Bridge, Johnny and Alistair for their enduring friendship. Those days were the most
memorable of my PhD candidature. Secondly I want to say a special thanks to Bridge
and Johnny, house mates, dearest friends and fellow post grads. The endless
encouragement and support will always be remembered. To Alistair I never knew
Buffy Beaumont existed! Thanks for showing me he does!!!. Meags, thanks for
rekindling that ABBA and Diamond fire.
The last institution I want to thank is Hamish "Chunga" Young. Hamish, I thank you
for making this whole period filled with laughter, frivolity and farce, but above all for
instilling a burning hatred of all things Essendon. You truly have a gift that makes
people feel happy and very much alive. Thanks for the experience mate!
Cover Page Photo CreditsVolume One:Goodley River entering Lake Tekapo, New Zealand Alps, New Zealand (S. Tiainen,leee).
VolumeTwo:Tasman Glacier, New Zealand Alps, New Zealand (C. Cubitt,1999)
vl

AnsTRACTThe Merrimelia Formation is a complex mosaic of glacial facies in which theTirrawarra Sandstone and Merrimelia Formation exhibit an interfingeringrelationship. This study, has defined this relationship further, indicating that theTirrawarra Sandstone should be included in the Merrimelia Formation as a "faciestype" as both Merrimelia and Tirrawarra sediments form an integrated suite ofsediments. Within this context, all glacio-fluvial braided outwash sandstones arecalled "Tirrawarra type" sandstones.
The kaleidoscope of facies which forms the Merrirnelia-Tirrawarra glacial complex(MTGC) have been deposited directly from the action of glacial meltwater andsediment output; a consequence of the Permo-Carboniferous Gondwanan glaciationwhich covered the early Cooper Basin. Merrimelia (and Tirrawarra) sedirnents weredeposited in both terminoglacial or proglacial depositional realms depending on therelative position of Gondwanan glaciers and ice sheet.
Merrimelia Formation sediments contain up to 76 different rock fragment species.Rock fragments in Merrimelia (and Tirrawarra) sediments are either intrabasinal orextrabasinal. Intrabasinal rock fragments are mainly derived from the underlyingWarburton Basin units, whereas extrabasinal rock fragments have been sourced fromoutside the Cooper Basin and transported via the action of glaciers and glacialmeltwaters. Three rock fragment domains were defined. The northern rock fragmentdomain area was possibly sourced from the north (Arunta Block) while the westernand southern rock fragment domains were possibly sourced from the west (OfficerBasin), southwest (Mt. Painter region), and the south (Benagerie Ridge, WillyamaSupergroup) respectively.
The composition of authigenic illite (poly type 1Md) in argillaceous Merrimeliasediments, was found to be consistent with a mixed layered I/S clay. This mixedlayered clay exhibited an I/S ratio of 0.95. Preliminary illite dating data combinedwith geohistory analysis suggests that illite has formed between 75uC and 95uC. Thisformation range matches petrographic observations.
Controls on illite growth in MTGC sediments include, temperature, cation supply,pore water acidity, water/rock ratio and the size of pore spaces. Initially illite formedin a closed system where reactant supply was sourced locally (closed system) and, inthe later stages of diagenesis, illite is neoformed by interaction with circulating porefluids (open system).
A new petrographic technique was developed for the study of illite in the MerrimeliaFormation; illite fluorescence. Illite fluorescence microscopy was found to be aneffective tool in observing relationships between diagenetic illite and other authigenicphases. Illite fluorescence microscopy in combination with image analysis, was alsoused to quickly and accurately assess illite proportions from normally prepared,unpolished thin sections. This study has shown that by utilising the fluorescentproperties of illite, a more accurate assessment of reservoir quality of illitic glacialsediments is possible.
A pilot illite dating study was undertaken. The results showed good agreement withdiagenetic observation indicating that standard illite dating techniques can besuccessfully applied to the Cooper Basin.
Using diagenetic observations to better defined geohistory parametres, led to agreater understanding of the thermal history of the southern Cooper Basin region,
vll

where aquifer effects on the thermal regime were found to be more extensive thanpreviously considered.
Standard and fluorescent thin section petrography, SEM, TEM and microprobeanalyses of Merrirnelia sediments delineated a paragenetic sequence similar to thatpreviously published for the Tirrawarra Sandstone. A generalised parageneticsequence for the whole MTGC was subsequently constructed. Variations in theMerrimelia and Tirrawarra paragenetic sequences are localised and attributable tolithology variations.
Provenance of sediment source regions can exert a strong control on reservoir quality,as rock fragment litho-type and proportion are crucial to compactional effects andclay authigenesis. These latter processes are linked to diagenetic adjustments, and thethermal regime operating in the basin. The principle diagenetic events which effectreservoir performance in the MTGC are compaction, quartz precipitation (Tirrawarrasediments) and the formation of authigenic clays (kaolin - Tirrawarra Sandstone andillite - Merrimelia Formation).
Hydrocarbon bearing Merrimelia sandstone packages at Malgoona and Merrimeliafields have permeabilities that vary enormously. This variability has been attributedto facies as matrix-rich facies in terminoglacial environments form poorly permeableintervals and proglacial quartzose facies exhibit better reservoir attributes. Thusdiffering facies types govern the textural and mineralogical maturity of sedimentscontrolling any reservoir potential a sediment may possess. Deltaic, braidplain andglacio-aeolian sandstones have the greatest reservoir potential of all MTGC faciestypes.
The presence of illite does not necessarily negate a potential reservoir interval asdistribution is as important as -ur" pr"r"t."I Th" långitudinal bar sandstones atMalgoona Field show boxwork illite morphologies isolated as clumps formed fromthe breakdown of rock fragrnents and feldspars. This mode of illite occurrence haslittle effect on reservoir quality as the clay does not block pore throats. Converselyonly a small proportion of illite in the porous glacio-aeolian sandstones of theMerrimelia Field drastically diminishes the quality of these reservoirs.
In general, illite was found to dictate reservoir quality in all Merrimelia facies.Consequently, understanding the morphology, formation, timing and distribution ofillite is critical for risking the likelfüood of favourable reservoir attributes in theMerrirnelia Formation.
Development of potential reservoir sediments in the MTGC is controlled by:
Reservoir quality in the MTGC is primarily controlled by:
vlll

TnnLEOr CoNTENTs
List Of FiguresList Of PlatesList Of TablesObjectives Of Study.Terminology
CHAPTER ONE: INTRODUCTION1.0 PREAMB2.0 LEl.l LOCATION1.2 STUDYAREA1.3 PREVIOUS STUDIES1.4 COOPER BASIN STRATIGRAPHY
1.4.1DISCUSION1.5 LITHOSTRATIGRAPHIC DEFINITIONS
1.5.1 DEFINITIONS: TIRRAWARRA SANDSTONE AND MERRIMELIAFORMATION
1.5.1.1 Tirrawarra Sandstone1,.5.1,.2 Merrimelia Formation
1.6 DISTRIBUTION OF THE TIRRAWARRA SANDSTONE AND MERRIMELIAFORMATION
1.6.1 MERRIMELIA FORMATION1.6.2 TIRRAWARRA SANDSTONE
1.7 STRUCTURE OF THE COOPER BASIN1.8 STRATIGRAPHIC UNITS WITHIN THE COOPER, EROMANGA ANDWARBURTON BASINS.
1.8.1 CRYSTALLINE BASEMENT1.8.2 WARBURTON BASIN
"1.8.2.1 Mooracoochie Volcanrcs1,.8.2.2 V.rggy Dolomite7.8.2.3 Kalladeina Formation7.8.2.4 "Innamincka Red Beds" Or Innamincka Formation1,.8.2.5 Mudrangie Sandstone7.8.2.6 Dullingari Group1,.8.2.7 Pando Formation
1.8.3 BIG LAKE SUITE GRANODIORITE1.8.4 COOPER BASIN
1.8.4.1 Merrimelia Formation7.8.4.2 Tirrawarra Sandstone
t1
iüiztoü
txxix
xxiiixxiaxxoixxoii
7
1
233870't.7
72
127476
18L8L927
21272323232424242525272727
lx

1.8.4.3 Patchawarra Formation7.8.4.4 Murteree Shale1.8.4.5 Epsilon Formation1.8.4.6 Roseneath Shale7.8.4.7 Daraìingie Formation1.8.4.8 Toolachee Formation7.8.4.9 Nappamerri Group
7.8.4.9.1 Arrabury Formation1.8.4.9.2 Tinchoo Formation
1.8.4.10 Cuddapan Formation1.8.5 EROMANGA BASIN
9 PETROLEUM GEOLOGY OF THE COOPER BASIN
TWO METHODOLOGYINTRODUCTION
1 LITERATURE REVIEWIDENTIFICATION OF MERRIMELIA FORMATION AND TIRRAWARRA
SANDSTONE LITHOLOGIESIDENTIFICATION OF WARBURTON BASIN LITHOLOGIESLITHOLOGICAL LOGGING.THIN SECTION SAMPLING.
2.5. 1 MERRIMELIA FORMATION.2.5.2 TIRRAWARRA SANDSTONE.
PETROLOGY TECHNIQUES.2.6.1 POINT COUNTING AND PETROGRAPHY2.6.2 THIN SECTION DESCRIPTIONS
7 X RAY DIFFRACTION (XRD) TECHNIQUESMICROSCOPY TECHNIQUES.
2.8.1 CATHODOLUMTNECSENCE MTCROSCOPY (CL)2.8.2 FLUORESCENCE MTCROSCOPY (FM)
2.8.2.1 Illite Fluorescence - An Introduction2.8.3 REFLECTED LIGHT MICROSCOPY2.8.4 SCANNTNG ELECTRON MTCROSCOPY (SEM)2.8.5 TRANSTTTON ELECTRON MTCROSCOPY (TEM)
MICROPROBE TECHNIQUES.O K-AR DATING TECHNIQUES.1 STATISTICAL TECHNIQUES
2.11.1 CLUSTER ANALYSIS2.11.2 VARIOGRAM ANALYSIS
THERMAL MODELLING
THREE: GONDWANAN GLACIAL SETTINGPREAMBLEINTRODUCTIONGONDWANAN GLACIATION IN AUSTRALIA
3.2.1. ALPINE STYLE GLACIATION3.2.2 CONTINENTAL ICE SHEET GLACIATION
3.2.2.7 Westem Australia3.2.2.2 South Australia3.2.2.3 Victoria and Tasmania3.2.2.4 New South Wales3.2.2.5 Queensland
282829292930303737313235
39
393939
42424343434444454646464647475050505053545759
60
60606364646465666666
x

CONTROLS ON GONDWANAN GLACIATIONCONCLUSIONS
FOUR: SEDIMENTOLOGYINTRODUCTION
1- SEDIMENTOLOGY OF THE MERRIMELIA-TIRRAWARRA GLACIALEX
SEDIMENTOLOGY OF THE MERRIMELIA FORMATION4.2.1 TERMINOGLACIAL ENVIRONMENTS
4.2.1.1 TERMINOGLACIAL FACIES ASSOCIATIONS4.2.L.7.7 Terrninoglacial Tunnel Mouth Deposits (TTMD)4.2.1.7.2 Rain-Out Diamictites (RD)4.2.1.1.3 Terminoglacial Outwash Fan (TOF)4.2.1.1.4 Terrninoglacial Lucustrine Sand Flow (LSF)4.2.7.1.5 Subaqueous Channel Gravel (SACG)
4.2.2 PROGLACIAL ENVIRONMENTS4.2,2.7 PROGLACIAL FACIES ASSOCIATIONS
4.2.2.7.1, Proglacial Fluvial Outwash Plain FaciesA) Longitudinll Bar (LB)B) Linguoid Bars (LIB)C) Flur,tial (FL)D) Fluaiql Bar Top (FBT)E) Back Swamp (BS)F) Discussion
4.2.2.1.2 Proglacial Aeolian FaciesA) Gløcial Aeolisn Dune (DU)B) Glacial Aeolian Interdune (ID)C) Discussion
4.2.2.1,.3 Proglacial Deltaic And Lacustrine FaciesA) Lacustrine Shore Zone (LSZ)B) Frozen Shore Zone (FSZ)C) Delts Topsets (DTS)D) Delta Foresets (DFS)E) Delta Bottom sets (DBS)F) Delta Flozus (DF)G) Deep Glacio-løcustrine (DGL)
FACIES TYPE, SORTING AND GRAIN SIZETHE EVOLUTION OF THE MERRIMELIA-TIRRAWARRA GLACIAL
EX5 CONCLUSIONS
FIVE: FRAMEWORK COMPONENTS & PROVENANCEINTRODUCTIONCOMPOSITIONMERRIMELIA FORMATION: PETROGRAPHY AND PROVENANCE
5.2.1 FRAMEWORK COMPONENTS5.2.7.7 Quartz Grain Component Petrography And Provenance
5.2.7.7.7 Petrography and Provenance5.2.7.2 Rock Fragment ComponenL Composition And Provenance5.2.7.3 Rock Fragment Component Petrography
5.2.1,.3.7 Sedimentary Rock Fra gments: Petrography5.2.1.3.2 Volcanic Rock
6767
69
6977
7272
7676798081858688888992939495959696100L00702L027037047051091_1.0
't1_7
L13174
117
779
779720122L227247247261.3L't.31.
1.34
XI

A) Rhyodncite Rock Fragmentsi) Spherulite Rhyodacite Rock Fragmentsii) Deaitrfud Acid Volcanic Rock Fragnentsíii) Hyaloclastite And Grnnoblnstic RhyoliteRock Fragments
B) Pyroclastic Rock FragmentsC) Basic Volcanic Rock Fragnrcnts
i) Trachytic Basalt Rock Fragmentsü) Attrygdaloidal Rock Fragnentsiii) Ultrøbasic Rock Fragnrcnts
5.2.1.3.3 Micro-Pegmatite And Granite Rock Fragments:Petrography
A) Micro-P egtnatite Rock F ragmentsB) Granitic Rock Fragttents
i) Graphic Texturcd Granite Rock Fragmentsii) Granular Granite Rock Fragments
5.2.7.3.4 Metamorphic Rock Fragments: PetrographyA) Loru Grade Metantorphic Rock FragnrcntsB) Phyllite Rock FragnentsC) Schist And Gneissic Rock FragmentsD) Psarumite And Pelite Rock FragnentsE) Quartzite Rock FragmentsF) Meta-Acid Volcsnic Rock FragnrcntsG) Meta-Poly-Crystalline Quartz Grøins RockFragnents
5.2.7.3.5 Feldspar And Accessory Component: PetrographyA) FeldsparB) MicasC) Accessory Minerals
5.2.7.2.6 Organic Matter And Soil Development5.2.2 FACIES CONTROL ON SEDIMENT COMPOSITION5.2.3 COMPETENT AND INCOMPETENT ROCK FRAGMENTS
TIRRAWARRA SANDSTONE: PETROGRAPHY AND PROVENANCERELATIONSHIP BETWEEN THE TIRRAWARRA SANDSTONE AND
FORMATIONROCK FRAGMENT PROVENANCE: RESULTS AND DISCUSSION
5.5.1 STATISTICS INTRODUCTION5.5.1.1 Pearson Correlation Coefficients5.5.7.2 Principle Components Analysis (PCA)5.5.1.3 Cluster Analysis
5.5.2 ROCK FRAGMENT MOVEMENTS IN THE COOPER BASIN:DISCUSSION
5.5.2.7 Metamorphic Rock Fragments5.5.2.1,.1, Rock Fragment Domains: A Discussion
A) Rock Fragnent Mixing Zone: A Discussion5.5.2.2 Volcanic Rock Fragments
5.5.3 CHANGES IN SEDIMENT INPUT DIRECTIONS THROUGH TIME6 CONCLUSIONS
R SIX AT-TTHIGENIC COMPONENT & DIAGENESIS
7
INTRODUCTIONSTATISTICSPETROGRAPHY
735738738147
7471.42
7421.42
742L42
768168768770177176
176776180780182184

6.2.1 QUARTZ CEMENT6.2.2 AWHIGENIC CLAYS
6.2.2.1, illite6.2.2.1.1 illite Literature Review6.2.2.1.2 Distribution Of Illite In The Merrimelia Formation6.2.2.1.3 Illite In The Merrimelia Formation: Nature AndComposition6.2.2.1,.4 Illite In The Merrimelia Formation: OpticalPetrography
A) Air Drying Effects On IlliteB) Illite MorphologiesC) ilIite Textures
6.2.2.2 Glauconitic Illite6.2.2.3 Kaolin6.2.2.4 Dickite6.2.2.5 Chlorite6.2.3.6 Pyrophyllite
6.2.3. CARBONATE CEMENT6.2.3.7 Siderite
6.2.3.1,.1 51 - Early Siderite cement Phase6.2.3.1.2 52 - Mid Siderite cement Phase
A) S2a - Siderite Cenrcnt ZoneB) S2b - Siderite Cemsnt Zone
6.2.3.I.3 - 53 Late Siderite Cement PhaseA) S3a - Siderite Cement ZoneB) S3b - Siderite Cement Zone
6.2.3.2 Ferroan Dolomite/Ankerite6.2.3.3 Calcite
6.2.4 OPAQUE CEMENTS: PYRITE, GOETHITE AND LEUCOXENE6.2.5 MATRIX COMPONENT
6.2.5.7 Argillaceous Matrix6.2.5.2 Pseudo-Matrix
DIAGENESIS OF MERRIMELIA SEDIMENTS6.3.1 THE EFFECT OF ELEVATED BASIN TEMPERATURES ONDIAGENESIS6.3.2 SUMMARY OF PARAGENESIS6.3.3 SUMMARY OF DIAGENESIS6.3.4 DIAGENETIC EVENTS IN THE MERRIMELIA FORMATION
6.3.4.1, Mechanical Compaction6.3.4.1,.1, Key Observations6.3.4.7.2 Discussion6.3.4.1,.3 Key Findings
6.3.4.2 Quartz Authigeneis6.3.4.2.1Early Quartz Cementation and Co-Genetic Illite andKaolin
A) Key ObserastionsB) DiscussionC) KeA Findutgs
6.3.4.2.2 Chemical Compaction/Late Quartz CementationA) Chentícal Contpaction
i) Key Obscraationsii) Discussionüi)
190193195795198200
202
2022052082082172772L12732L3213220222222222222225225225225227227227230230230
237233235235235237237240240
2402402442442U245245249
xlll

267
Fornution Of Textures Obseraed ln The 267Merrimelia Formation
Formøtion Flanrc/FíIantentous 275lllite Textures
Of Honeyconrb/ 275
275
279282
283284285285285287287
xlv

6.3.4.4 Ca¡bonate 2926.3.4.4.L Sl Siderite Formation
293
2946.3.4.4.3 52 Siderite Formation
A)B)
D2 Late Siderite Dissolution307
C) 3026.3.4.4.5 53 Siderite Formation 302
A) KeyB) Discussion
DiscussionCalcite 306
C) Key Findings6.3.4.4.7 Ferroan Dolomite Authigenesis
308
6.3.4.5 Formation 3096.3.4.5.1 Observation 3096.3.4.5.2 Discussion 3706.3.4.5.3 31L
6.3.4.6.Discussion
6.3.4.6.3 3726.3.4.7 Pyrite Authigenesis 372
Observations 3726.3.4.7.2 Discussion 372
6.3.4.86.3.4.7.3
373
xv

6.3.4.8.7 Key Observation6.3.4.8.2 Discussion6.3.4.8.3 Key Finding
6.3.4.9.7 Key Observation6.3.4.9.2 Discussion6.3.4.9.3 Key Finding
SEQUENCE: REGIONAL VARIATIONS6.4 PARAGENETIC6.5 FACIES CONTROLS ON DIAGENESIS6.6 DISTRIBUTION OF AUTHIGENIC MINERALS6.7 CONCLUSIONS
VOLUMETWOABLE OF CONTENTS: VOLUME TWO
SEVEN: ILLITE FLUORESCENCE7.O
7.L/.¿7.3
INTRODUCTIONA REVIEW OF LUMINESCENCE IN GEOLOGYINITIAL OBSERVATIONSPOSSIBLE CAUSES OF ILLITE FLUORESCENCE
7.3.1 ILLITE FLUORESCENCE: EXPERIMENT DESIGN AND RESULTS7.3.2 OTHERPOSSIBLE CAUSES OF ILLITE FLUORESCENCE
7.4 UTILISING THE FLUORESCENCE OF ILLITE7.4.7 TLLNE FLUORESCENCE AND ILLITE DIAGENESIS7 .4.2 ESTIMATING ILLITE PROPORTIONS: ILLITE FLUORESCENCETECHNIQUE7.4.3 TLLTTE FLUORESCENCE AND RESERVOIR QUALITY7.4.4 SUMMARY
CONCLUSIONS7.5
345347347
R EIGHT PARAGENETIC MODEL8.0 INTRODUCTION8.1 THERMAL HISTORY MODEL
8.1.1 MODEL CONSTRUCTION8.2ILLITE DATING PILOT STUDY
8.2.1 ILLITE DATING PILOT STUDY: DESCRIPTION AND LIMITATIONS8.2.2 ILLITE DATING: THE EFFECT OF OPEN AND CLOSEDDIAGENETIC SYSTEMS8.2.3 ILLITE DATING: PRELIMINARY RESULTS8,2.4 TLLTTE DATING: DIAGENETIC OBSERVATIONS8.2. 5 ILLITE DATING : PRELIMINARY INTERPRETATIONS
8.2.5.1 llite Dates And The Thermal Regime Lr The Cooper Basin8.2.5.2 Illite Formation And The Applicability Of K-Ar Illite DatingTo Cooper Basin Sediments
8.3 MERRIMELIA-TIRRAWARRA DIAGENESIS MODEL INTERGRATION8.3.1 THERMAL MODEL INTEGRATION8.3.2 DIAGENETIC MODEL INTEGRATION
8.3.2.7 Diagenetic And Thermal Model: Implications Fo¡ Siderite Cernentation
8.4 CONCLUSIONS
xvr

CHAPTER NINE: RESERVOIR DEVELOPMENT &9.0 INTRODUCTION9.1 CONTROLS ON RESERVOIR DEVELOPMENT
9.1.1 GONDWANAN GLACIATION: A REMEW9.1.2 DEVELOPMENT OF RESERVOIR UNITS IN THE MERRIMELIA-TIRRAWARRA GLACIAL COMPLEX9.1.3 PROVENANCE ANALYSIS AND FACIES CORRELATIONS9.1.4 TERMINOGLACIAL AND PROGLACIAL SEDIMENTS: RESERVOIRQUALITY
CONTROLS ON RESERVOIR QUALITY9.2.1 PROVENANCE9,2.2 FACIES TYPE
9.2.2.1 Me¡rimelia Formation; Basin, Australia9.2.2.2 Lower Haushi Group; Dohfar Province, Oman9.2.2.3 Discussion
9.2.3 RESERVOIR QUALITY CONTROLS: FACIES TYPE VERSUSPROVENANCE9.2.4 CONTROLS ON POROSITY IN MERRIMELIA SEDIMENTS
9.2.4.7 Thermal Regime And lllite/Quartz Cement9.2.4.2 Controls On Porosity
9.2.4.2.7 Preservation Of Primary Pore SpaceA) Prinnry Pore Space Preserztation ln Terminogløcialand P r o glacial S edim ent s
B) Conryøction Model For The Merrimelin Formation9.2.4.2.2 Controls On Secondary Pore Space Evolution
A) lntragranulnr Secondary PorosityB) Carbonate Dissolution
9.2.5 CONTROLS ON PERMEABILITY INMERRIMELIA SEDIMENTS9.2.5.7 Controls On Permeability: Kaolin And Illite9.2.5.2 Controls On Permeability: Ductile Rock Fragments9.2.5.3 Controls on Permeability: Formation Damage9.2.5.4 Controls On Permeability: Illite Morphology9.2.5.5. Controls On Permeability: Glacial Sedimentation9.2.5.6 Permeability Controls: Summary
9.3 CASE STUDIES: MALGOONA AND MERRIMELIA FIELDS9.3.1 MALGOONA FIELD9.3.2 MERRIMELTA FIELD
9.3.2.1, Introduction9.3.1,.2 High Porosity And Low Porosity Zones9.3.2.3 Sedimentation And Diagenesis Controls On Reservoir Quality
9.4 CONCLUSTONS
TEN: CONCLUSIONS & RECOMENDATIONS
372
372372372373
457457457460469469
10.1 CONCLUSIONS10.1.1 RESERVOIR DEVELOPMENT IN A GLACIAL SEQUENCE10.1.2 RESERVOIR QUALITY CONTROLS IN A GLACIAL SEQUENCE
10.2 RECOMMENDATIONS10.2.1 K-AR ILLITE DATING STUDY10.2.2 PROVENANCE ANALYSIS STUDY10.2.3 CAUSE OF ILLITE FLUORESCENCE STUDY
ELEVEN: BIBLIOGRAPHY
469469471.
xvll

OW TO INSTALL ADOBE ACROBAT READER 500
CES (Appendices 1-10 on CD ROM)ppendix One: Palynology Resultsppendix Two: Lithological Topsppendix Three: Thin Section Lists
A) Merrintelia FormationB) Tirrazuana SsndstotrcC) Wørburton Bøsín
ppendix Four: Rock Fragment DataA) Rock Fragment Lithology DefinitionsB) Rock Fragment Prooenance DiscussionC) Rock Fragmenl Percentages
Five: Compositional DataA) Whole Rock CompositionsB) Franrczuork Conryonøtt CompositionsC) Authigenic Cortrponent Coutpositions
endix Six: K-Ar Analytical ProceduresA) Argon DetenninationB ) Potassium Detennination
ppendix Seven Quantitative XRD TableEight Statistics
A) Pearson Correlation Tnblesl) MerrínrcliaII) Tirrawarra
B) Cluster Dendrogrnntsl) MerrimelisII) Tirrøwarra
C) Variogrants
A)Nine: Lithology Logs and Thin Section DescriptionsLithology Logs
B) Thin Section DescriptionsI) MerrimelinID TirrnunrrnIII) Warburton
endix Ten: Exploration History of the Cooper BasinEleven Publications (Paper Copy)
Chøney A.1., Cubi|t C.l. ønd Williøms B.PJ. Q997) Reseruoir Potaúial ofG I a cio - F I ua ißl S a ndst one s : Merr im elia F o nnat io n, Co op er B øsitt, S o uthAustralia.
Cubitt C.1., Chøney A. ønd GtøaestockD.I. (7998) Merrintelia Formatiott.
Cubitt C.l. anil Kaiko A. (2000) lllite, The Key to Understanding ReseruoirQuality in the Merrinrclin Forntation; Coopcr Basin, South Australiø,
xvlll

LrsrOrFlcuRESONE: INTRODUCTION
1.1 Late Palaeozoic Sedimentary Basins On The Australian Portion OfGondwana.
1.2 Cooper Basin Location Map With Major Fields Marked.1.3 Stratigraphyof The Warburton, Cooper And Eromanga Basins.1.4 Stratigraphic Column Of The Cooper Basin.1.5 Lower Gidgealpa Group Stratigraphic Table.1.6 Stratigraphy Of Late Carboniferous-Early Permian Basins Adjacent To TheCooper Basin.
1.7 Schematic Model Of The Merrimelia-Tirrawarra Depositional System.1.8 Isopach Map Of The Tirrawarra Sandstone And Merrimelia Formation.1.9 Structural Elements Of The Cooper Basin, South Australia And Queensland.1.10 Eastern Warburton Basin Sub-Cropping Lithologies.1.11 Magnetic Intensity Map Of The Cooper Basin.1.12 Cooper Basin Infrastructure Map.
TWO: METHODOLOGY2.1 Thin Section Naming Convention.2.2 K-Ar Dating Sample Selection And Clay Fraction Separation Procedures.23 lllite Sample Purity Assessment Procedures.2.4 Cluster Analysis Procedure.2.5 An Example Of A Cluster Dendrogram Displaying Two Data Groupings2.6 Theoretical Semivariogram.
THREE: GONDWANAN GLACIAL SETTING3.1 Inferred Gondwanan Ice Volumes.3.2 Icesheet Development Across Gondwana From Late Devonian To LateWesþhalian.
3.3 Ice Cap Wander Path Across The Gondwana Super Continent .
3.4 Location Of Ice Cap CIr The Australian And Antarctic Continents.3.5 lce Sheet Location On The Australian Continent.
FOUR: SEDIMENTOLOGY4.1 Model Of The Merrimelia-Tirrawarra Glacial Complex (MTGC).4.2 A Model Of The Terminoglacial Depositional Realm.4.3 Typical Diumal And Monthly Run Off Hydrographs In A Glacial System.4.4 Meltwater Hydrographs.4.5 Proglacial Depositional Realm.4.6 Basin Topography And Proglacial Environments.4.7 DeltaSediments.4.8 Sediment Flow Regimes In A Lacustrine Setting.
2
467I77
73L720222636
rgure
435253555658
67
62
636365
7073
74/J
8788L04L09L1.54.9 Evolution Of The Merrirnelia-Tirrawarra Glacial Complex (MTGC) (M1.,lrl2,
M3 & Ti).4.10 Merrimelia Formation: Rock Fragments Versus Depth (Merrimelia Datums, 776M1 M2 And M3 Are
XIX

FIVE: FRAMEWORK COMPONENTS & PROVENANCE5.L Petrographic Composition Of The Merrimelia Formation.5.2 Composition Of The Merrimelia Formation.5.3 Geological Provinces Surrounding The Cooper Basin.5.4 Distributions Of Straight, Undulose And Poly-Crystalline Quartz FrameworkGrains.
5.5 Trend Maps Of Undulose And Straight Extinction Quartz Grains:Merrimelia Fo¡mation.
5.6 Statistically Significant Rock Fragment Types: Merrimelia Formation.5.7 Rock Fragment Lithologies In The Merrimelia Formation.5.8 Frequency Histogram Of Volcanic Rock Fragment In Mer¡imelia Sediments5.9 Composition Of Volcanics ln The Warburton Basin.5.10 Mooracoochie Volcanics Facies Associations.5.11 Rock Fragment Domains Overlain By The Distribution Of GraphicTextured Granite ln The Merrimelia Formation And Tirrawarra Sandstone.
5.12 Histogram Of Metamorphic Rock Fragments In Merrimelia Sediments.5.1.3 Principle Components Analysis (PCA) Of Rock Fragments From TheTirrawarra Sandstone.
5.14 Merrimelia Formation And Tirrawarra Sandstone Rock FragmentComparison.
5.15 Rock Fragment Proportions In The Tirrawarra Sandstone.5.16 Quartz Vs Rock Fragment Scattergrams: Merrimelia Formation AndTirrawarra Sandstone
5.17 Rock Fragment Movements In The South Australian Portion Of The Coopet 767Basin.
5.18 Positive And Negative Pearson Correlation Coefficients Plots. L695.19 Cluster Dendrogram Of Competent Rock Fragment Types: Merrimelia 773Formation.
5.20 Cluster Dendrogram Of Competent Rock Fragment Types: Tirrawarra 1.75Sandstone.
5.21 Inferred Movement Of Competent Rock Fragments In The Merrimelia 177Formation.
5.22 Comparison Of Basement Highs Of The Present Day Antarctic Margin And 779The Permo-Carboniferous Cooper Basin (SA Sector).
5.23 Eastem Warburton Basin Sub-Cropping Lithology Map. 78L5.24 Variation Of Sediment Input Directions Into The South Australian Sector 183Of The Cooper Basin During Merrimelia Formation And Tirrawarra SandstoneDeposition.
SIX: AUTHIGENIC COMPONENT & DIAGENESIS6.1 Authigenic Mineral Statistics: Merrimelia Formation.6.2 Clay Proportions In Merrimelia Sediments.6.3 The Basic Structure Of The Most Common Clays Observed ln MerrimeliaSediments.
6.4 Illite And Ductile Rock Fragment Trend Maps.6.5 Illite ldentification.6.6 Kaolin And Chlorite Clay Identification.6.7 Carbonate Cements; Composition And Sample Frequency.6.8 Pore Fill, "Seed" And Patch Siderite Cement Morphologies.6.9 Siderite Cement Identification.6.10 Ferroan Dolomite /Ankerite Identification.6.L1 Calcite Cement ldentification.
72072L722723
749762
1,63
764765
789794797
1,99
207212214279221224226
XX

6.12 Rates Of Quartz Precipitation Versus Mean Precipitation Temperature.6.13 Mechanical Compaction Of Ductile-Rich Merrimelia Sediments.6.14 Stylolite Quartz Cementation Model.6.15 Quartz Cement Volume Percentages Versus Depth.6.16 Quartz Cementation In A Arenaceous/Argillaceous System.6.17 Ranked Cumulative Histogram Of Illite Proportion Versus Facies Type.6.18 Illite Growth Stages.6.19 Water Expulsion Volumes Arising From The Transformation Of S/I.6.20 Palaeolatitude Positions Of The Cooper Basin During PatchawarraFormation, Merrimelia Formation And Tirrawarra Sandstone Deposition.
6.21 Identification Of Inherited Clay Rims.6.22 Cartoon Of "Open And Closed" Diagenetic Systems Operating InMerrimelia Sediments.
6.23 Illite Growth Rates.6.24 Feldspar Proportion In Merrimelia Formation Sediments.6.25 Scattergram Of Kaolin Proportion Versus Depth.6.26 Ranked Cumulative Histogram Of Kaolin Proportions In MerrimeliaFacies.
6.27 il1:g" Proportions I¡ 51, S2,And 53 Siderite Phases.6.28 Organic Maturation And The Main Diagenetic Adjustments Observed InThe Merrimelia Formation.
6.29 Scattergram Of Rigid Grain Content Versus The Maximum Amount OfSecondary Porosity.
6.30 Pyrophyllite, Zeolite And Feldspar Overgrowths.6.31 Paragentic Sequences In Argillaceous And Arenaceous MerrimeliaSediments.
6.32 Regional Paragenetic Sequences.6.33 Quartz Cement And Clay Proportions Along With Rock Fragment
ges Of Merrimelia Facies.6.34 Scattegrams Of Illite Versus Quartz Cement Proportions And QuartzVersus Kaolin Proportions In Merrimelia Sediments.6.35 Cluster Dendrogram Of lllite, Kaolin And Quartz In Merrimelia Sediments.6.36 Rock Fragment And Illite Trend Maps.
SEVEN: ILLITE FLUORESCENCE7.1 The Nature Of Luminescence, Illustrating CL And UV Ernissions.7.2 Quantum Principle Of Fluo¡escence.7.3 Illite Proportions Estimated Using Illite Fluorescence.
EIGHT: PARAGENETIC MODEL8.1 Cartoon Of Heat Transfer Mechanism Involving Cooper Basin SedimentsAnd Upper Ëromanga Basin Aquifers.
8.2 Cooper / Eromanga Basins Heat Flow Evolution Diagram.8.3 Eromanga And Lake Eyre Basin Aquifers.8.4 Gidgeapla #7 Maturity Profile.8.5 Heatflow (mw/m') Versus Time ln Study Wells Merrimelia #18 AndMalgoona #4.
8.6 Heatflow Map In ncl100m For The Cooper Basin.gure 8.7 Vitrinite Reflectance And Maturity Profiles Of Merrimelia #18 And
Malgoona #4.8.8 Geohistory Diagrams Constructed Of Merrimelia #18 And Malgoona #4.8.9 Illite Fraction Size And Effect On Illite
237236248249250256262264266
273276
287288289
298300
377
374375
3773L9
320
321322
330331346
357
351352353354
355356
357359
xxl

8.10 Geothermal Gradients Relative To Basin Fill Sediments And CrystallineBasement ln The Cooper Basin.
8.11 Combined Merrimelia-Tirrawarra Paragenetic Sequence.8.12 Geohistory Analysis And 52 Siderite Composition.8.13 Scatterglams Of Mg't Proportions In 51, 52 And 53 Siderite Phases WithDepth.
NINE: RESERVOIR DEVELOPMENT & QUALITY9.1 Evolution Of Gondwanan Ice Cove¡ And Resulting Sedimentation. 3749.2 Al Porosity Versus Facies Type Cumulative Histogram. B) A Comparison Of 382The Facies Nomenclature Used By Chaney, (1998) And The FaciesNomenclature Used In Thís Study.
9.3 Flow Chart Illust¡ating The Main Paramete¡s Controlling Reservoir Quality 383In Merrimelia-Tirrawarra Glacial Sediments.
9.4 Ranked Rock Fragment Compressibility lndex And Rock Fragment Statistics 384For The Merrimelia Formation And Tirrawarra Sandstone.
9.5 Quartz Percentage, Rock Fragment Percentage And Sorting Coefficients Of 387Merrimelia And Tirrawarra Sedi¡nents.
9.6 Schematic Illustrating The Location Of Facies Types Within The Merrimelia-Tirrawarra Glacial Complex.
9.7 Merrimelia-Tirrawarra Sedimentation Model For The Big Lake Field.9.8 Reservoir Potential Map Of The Merri¡nelia And Tirrawarra Sandstone.9.9 A Comparison Of Porosity In Merrimelia And Tirrawarra Sediments.9.L0 Compaction Indices Versus Quartz Cement Proportion.9.11 Reduction Of Primary Porosity By Ductile Grain Squeezing.9.12 Ductile Rock Fragment And Compaction Index (CI) Trend Maps.9.13 Ductile Grain Compaction Scenarios.9.14 Ductile Grain Composition And Compaction.9.15 Cartoon And Image Of A Ductile Rock Fragment Squeezing Into PoreSpace.
9.16 Cumulative Histogram Showing Porosity Loss By Ductile Grain Squeezing.9.1.7 Sorting And Grain Size Criteria: Merrimelia Formation.9.18 Cartoon Illustrating The Compaction Effects Of Compressible Clasts.9.19 Porosity Occlusion Ratio (OR) For The Merrimelia Formation.9.20 Carbonate (Siderite) Dissolution.9.21 Illite Micro-Pore Space.9.22 Permeability Effects Of Kaolin And Illite Clay.9-23 The Effects Of Clay Morphology On Permeability.9.24 Permeability And Porosity Effects Of The Main Authigenic MineralsObserved In Merrimelia Sediments.
9.25 Clay Filled And Clay Free Porosity.9.26 Compaction Index (CI) Vs Rock Fragment Proportions In MerrimeliaSedi¡rrents.
9.27 Malgoona Field: Location, Play Concept And Core lmages.9.28 Malgoona #4: Dip Meter Log(7725'-7755')9.29 Malgoona lt4: Fluorescent Core Image (7125'-7755').9.30 Merrimelia Field: Location, Play Concept And Core lmages.9.31 Merrimelia Field: Glacio-Aeolian Sandstone Evolution.9.32 Cartoon Of Low And High Porosity Zones (LPZß And HPZs) DiageneticAdjustments And Resulting Permeability Barriers,
9.33 Permeability Barriers A¡d Flow Units Within The Rotliegend Reservoir,North Sea.
389
473475476477422424426427428
429432
xxlt
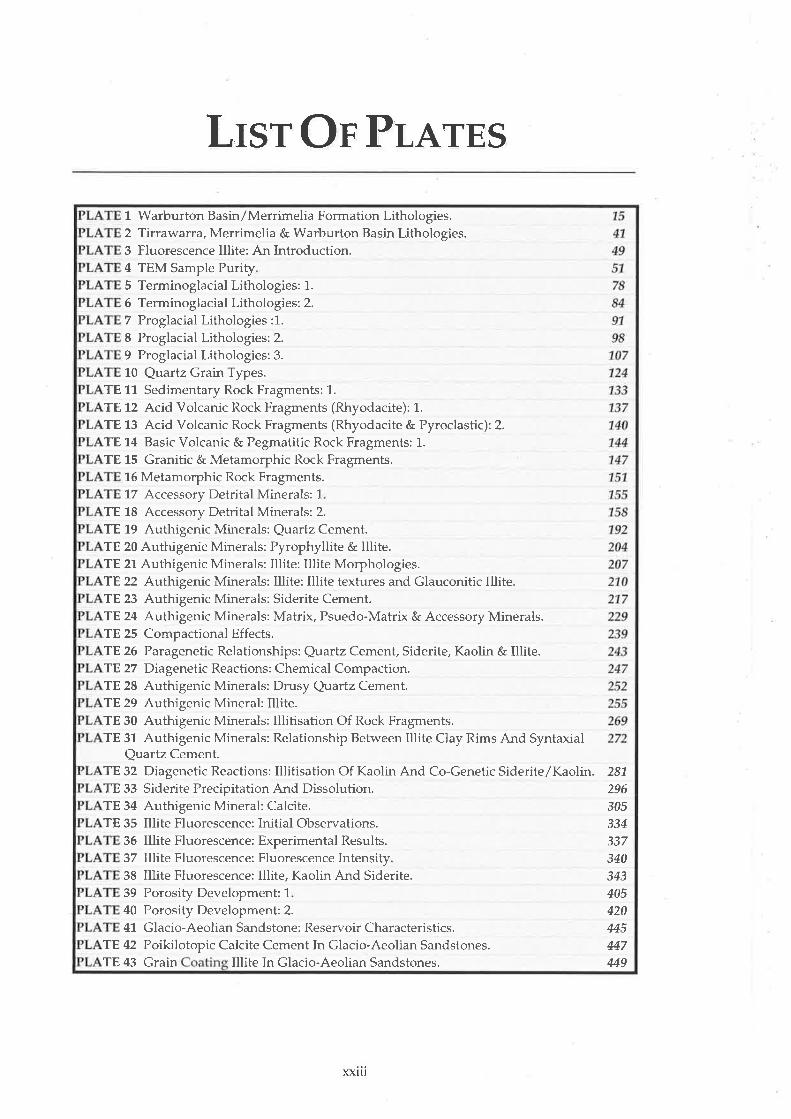
LrsrOpPrA-rES1 Warburton Basin/Merrimelia Formation Lithologies.2 Tirrawarra, Merrimelia & Warburton Basin Lithologies.3 Fluorescence lllite: An Lrtroduction.4 TEM Sample Purity5 Terminoglacial Lithologies: 1.6 Terminoglacial Lithologies: 2.7 Proglacial Lithologies :1.8 Proglacial Lithologies: 2.9 Proglacial Lithologies: 3.10 Quartz Grain Types.
TE 11 Sedimentary Rock Fragments: L.
TE 12 Acid Volcanic Rock Fragments (Rhyodacite): 1.
TE L3 Acid Volcanic Rock Fragments (Rhyodacite & Pyroclastic): 2.TE 14 Basic Volcanic & Pegmatitic Rock Fragments: 1.
TE L5 Granitic & Metamorphic Rock Fragments.16 Metamorphic Rock Fragments.17 Accessory Detrital Minerals: 1
TE 18 Accessory Detrital Minerals: 2.TE 19 Authigenic Minerals: Quartz Cement.TE 20 Authigenic Minerals: Pyrophyllite & Illite.TE 2l Authigenic Minerals: Illite: Illite Morphologies.TE 22 Authigenic Minerals: Illite: Illite textures and Glauconitic llliteTE 23 Authigenic Minerals: Siderite Cement.TE24TE 25TE26TE27TE 28TE29
Authigenic Minerals: Matrix, Psuedo-Matrix & Accessory Minerals.Compactional Effects.Paragenetic Relationships: Quartz Cement, Siderite, Kaolin & Illite.Diagenetic Reactions: Chemical Compaction.Authigenic Minerals: Drusy Quartz Cement.Authigenic Mineral: Illite.
TE 30 Authigenic Minerals: Illitisation Of Rock Fragments.TE 31 Authigenic Minerals: Relationship Between lllite Clay Rims And Syntaxial
Quartz Cement.TE 32 Diagenetic Reactions: Illitisation Of Kaolin And Co-Genetic Siderite/Kaolin.TE 33 Siderite Precipitation And Dissolution.TE 34 Authigenic Mineral: Calcite.TE 35 Illite Fluorescence: Initial Observations.
36 Illite Fluorescence: Experimental Results.37 Illite Fluorescence: Fluorescence Intensity38 Illite Fluorescence: Illite, Kaolin And Siderite.39 Porosity Development: 1
40 Porosity Development 2.41 Glacio-Aeolian Sandstone: Reservoir Characteristics.
TE ¡12 Poikilotopic Calcite Cement In Glacio-Aeolian Sandstones.TE 43 G¡ain Illite In Glacio-Aeolian Sandstones.
28729630533433734034340542044544749
xxllt

Lrsr OpTnBTES
TWO: METHODOLOGYable 2.1. Accuracy Of Petrographical Estimations. 45
FOUR: SEDIMENTOLOGYable 4.1 Sorting Coefficient Ranges.able 4.2 Terminoglacial Tunnel Mouth Deposits (TTMD)
71
767987828592939494
1.01
L03105L08110771773713
4.3 Rain Out Diamictite (RD).able 4.4 Terminoglacial Outwash Fan (TOF).
4.5 Termi¡oglacial Lacustrine Sand Flow (LSF)4.6 Subaqueous Channel Gravel (SACG).
able 4.7 Longitudinal Bars (LB).4.8 Linguoid Bars (LIB).4.9 Fluvial Sandstone Facies (FL).
le 4.10 Fluvial Bar Top Facies (FBT)4.11 Dune (DU) And Interdune (ID) Facies.
able 4.L2 Lacustrine Shore Zone (LSZ) And Frozen Shore Zone (FSZ) Facies.le 4.L3 Delta Topsets (DTS).le 4.14 Delta Foresets (DFS).le 4.15 Delta Bottom Set Facies.e 4.16 Delta Flow Facies (DF)
le 4.17 Deep Glacio-Lacustrine Rhythmites (DGL).4.18 Facies Type Vs Grain Size, Sorting, Quartz And Rock Fragment Proportions.
HAPTER FIVE: FRAMEWORK COMPONENTS & PROVENANCE
le
5.1 Average Percentages Of Quartz Framework Component.5.2 Rock Fragment Percentages: Merrimelia Formation And Tirrawarra
Sa¡dstone.5.3 Rock Fragment Type And Relevant Thin Section Description.5.4 Summary Of Sediment Provenance: Merrimelia Formation.5.5 Rutile Microprobe Composition.5.6 Facies Vs Rock Fragment And Quartz Percentages.5.7 Competent And Incompetent Rock Fragment Types.5.8 Pearson Correlation Coefficients For Selected Tirrawarra And Merrimelia
Rock Fragments.5.9 Results Of Kolmogorov-Smirnov And Shapiro-Wilks Tests Of Normality
(Merrimelia Formation).5.10 Results Of Kolmogorov-Smimov And Shapiro-Wilks Tests Of Normality
(Tirrawarra Sandstone).
724L28
729730756760761169
177
1,74
blelele
ablele
SIX: AUTHIGENIC COMPONENT & DIAGENESIS6.1 Microprobe Analysis Of Selected Quartz Overgrowths. L93
195196798202
205
le 6.2 Microprobe Composition Of Glaucony, "Glauconitic lllite", Kaolin And lllite.e 6.3 XRD Responses Of Major Clay Minerals.e 6.4 Composition Of Mica-Like Clays.
6.5 Transmission Electron Microscopy (TEM)/EDAX Illite Lath And FlakeCompositions.
6.6 lllite
XXTV

6.7 Illite Textures And Corresponding Illite Morphology Type.6.8 Carbonate Cement Composition.6.9 Composition Of 51, 52 And 53 Siderite Cement Phases.
able 6.10 Microprobe Composition Of Patch, "Seed" And Pore-Filling SideriteCemmt.
able 6.11 Siderite Dissolution Events: A Comparison Of Results.le 6.72 General Paragenetic Sequence For The Merrimelia Formation.le 6.13 Summary Of Diagenetic Events In The Merrimelia Formation.le 6.14 52 and 53 Siderite Compositions [In Plate 33].
6.15 Composition Of "Cowpat Calcite" And "Cowpat lllite" [In Ptate 34].6.16 Proportion Of Porosity Types In The Merrimelia Formation.
8.1 Preliminary K-Ar Illite Dating Results For Both <2 And <4 Micron Fractions
NINE: RESERVOIR DEVELOPMENT & QUALITY9.1 Reservoir Quality Potential Of The Main Facies Types In The Merrimelia-
Tirrawarra Glacial Complex.e 9.2 Pearson Correlation Coefficients Of Compaction Indices (CI), Sorting
Coefficients And Grain Size.le 9.3 lnitial Porosity Loss In Proglacial And Terminoglacial Sedirnents.
335
360
388
470
473
EIGHT: PARAGENETIC MODEL
SEVEN: ILLITE FLUORESCENCE
leable
7.1 Elemental Composition Of Platy lllite.
xxv

PnoIECT OBIECTIVES
Þ Identify and distinguish Merrimelia Formation and Tirrawarra
Sandstone lithologies.Þ Confirm relationships between the Merrimelia Formation and
Tirrawarra Sandstone by petrographic means.
Þ Delineate the provenance of Merrimelia Formation and
Tirrawarra Sandstone sediments by petrographic and statistical
Þ Assess the role of authigenic minerals, particularly illite, withregards to reservoir qualify and potential in the MerrimeliaFormation.
Þ Identify controls on reservoir development and quality in a
glacial sequence.
means.
XXVI

TEnMrNorocY
of metamorphic processes.
secondary minerals such as chlorite and zeolites.
sedimentary pile.
form filling pore space and replacing detrital minerals.
for the macroscopic and microscopic scales.
homogeneous groups.
to overburden pressure.
sediment sourced from surface sedimentation processes.
sedimentary rocks at temperatures and pressures below metamorphism.
composed of sand, gravel and mud.
Formation).
the hard skeleton of a sediment.
hemisphere which included, Australia, Arabia, Antartica, India, South
America and Africa.
xxvll

feldspar.
overburden pressure.
fluids.
enveloping framework grains.
mineral precipitation processes.
data normality.
the glacier.
meltwater.
variables.
to the glacier.
respect to the geographic spread of data.
xxvllt

ïr*TRoDUCTIoT\T
The Cooper Basin is Australia's largest onshore gas basin, being one of a number of
remnant Late Carboniferous to Early Permian depocentres which lay in the Australian
interior of the Gondwana Supercontinent (Gravestock and Jensen-Schmidt, 1998) (Fig.
1.1). The basin is situated in central Australia and extends from the north-east corner
of South Australia into south-west Queensland (Fig. 1.2), extending over an area of
approximately 130 000 km'. The basin preserves up to 1,200m of non-marine clastic
sediments of Late Carboniferous to Middle Triassic age, The basal Gidgealpa Group is
composed of sediments that are Late Carboniferous to Late Permian in age while the
overlying Nappamerri Group comprises sediments that are Late Permian to mid-
Triassic in age. The Cooper Basin sediments are overlain by Jurassic to mid-
Cretaceous sediments of the Eromanga Basin (Fig. 1,3a), and unconformably overlie
clastics, acid volcanics\pyroclastics and carbonates of the Cambrian to Ordovician
Warburton Basin (Fig. 1.3b).
The Merrimelia Formation is the basal unit within the Gidgealpa Group (Williams and
WiId, 7984b), and represents a package of Gondwanan intracratonic glacial and
proglacial sediments. The oldest unit in the Cooper Basin, the Merrimelia Formation
was deposited unconformably on the tectonically deformed Warburton Basin (Fig.
L.4). Directly associated with the Merimelia Formation is the Tirrawarta Sandstone,
one of the main hydrocarbon producing reservoirs in the basin (Fig. 1.4). The
Merrimelia Folmation has been traditionally regarded as non-economic basement and
the contact with the Tirrawarra Sandstone was perceived as an unconformity,
The first chapter of this thesis outli¡es the general geology of the Cooper Basin
concentrating on the geology of the Warburton Basin from which the majority of
Merrimelia and Tirrawarra sediments have been derived. Chapter two outlines the
methods used throughout this study. Chapter three gives a brief over view on the
development of the Gondwanan ice sheet over southern Australia putting into context

the development of glacial sediments of the Cooper Basin. Chapter four describes in
detail the glacial sedimentology of these sediments while chapter five describes the
movement of glacial material within the Cooper Basin during Merrimelia-Tirrawarra
deposition. Chapter six discusses the diagenesis of Gondwanan glacial detritus with
emphasis on illite diagenesis. Chapter seven describes the fluorescence nature of illite
when exposed to UV radiation, detailing how this characteristic can be used as a new
petrological tool for the optical characterisation of illite. Chapter eight combines
diagenetic observations to form a regional paragenetic sequence of the Merrimelia-
Tirrawarra Glacial Complex (MTGC). The results of a pilot illite dating/geohistory
study are also given in chaptel eight. Chapter nine synthesises all results delineating
the controls on reservoir development and quality in the glacial sediments of the
Cooper Basin, Chapter ten summarises conclusions and recommendations that have
resulted from this study.
The location of the Cooper Basin is shown relative to othel mid-Palaeozoic and
Cainozoic basins within Australia (Fig. 1.2).
EXPDEV 152
Figure 1,.1- Lqte Palaeozoic sedintentøry bøsins on the Austrølian portion of Gondwana.
( Af t er Gr øa est o clc an d I en s en - S chntidt, 7 I I I ) .
2

The Cooper Basin is entirely buried, having been defined by approximately 1500 well
bores and 19,000 seismic lines. The south western, and most intensively explored
portion of the basin, lies within South Australia while the least explored portion of the
basin, lies in Queensland (Fig. 1.2).
This study collected information from both the Queensland and South Australian
sectors of the Cooper Basin (Fig. 1.2). The amount of information collected in the
South Australian sector however, substantially outweighs the data collected in the
Queensland portion,
There have been no regional investigations of the Merrimelia Formation where the
diagenesis and provenance of this unit is the main focus. The first study of the
Merrimelia Formation was carried out by Grund (1966) as part of an honours project.
He described in detail the sedimentology of the glacigenic sediments on a regional
basis with emphasis on describing clast attributes from core. He indicated that the
majority of clasts have been sourced from the basement (Warburton Basin). Until the
mid-eighties, the Merrimelia Formation was regarded as economic basement for
hydrocarbon exploration and accordingly, few if. any investigations concentrated on
this unit.
Renewed interest in the Merrimelia Formation was provided by a series of
unpublished reports and published papers by Williams (1982 and 1984), Wild (1987),
Williams and Wild (1984a and 1984b) and Williams et øL (L985 and 1987), These
authors primarily concentrated on the sedimentology, not only of the Merrimelia
Formation, but also of the Tirrawarra Sandstone, (on a regional basis) with a view to
understanding the evolution of this glacial system. Williams and Wild (1984) were the
first to argue that the Tirrawarra Sandstone and Merrimelia Formation represented an
evolving glacial system. Williams et øL (7985 and 1987) first described and detailed the
development of cold climate aeolianite sandstones within the Merrimelia Formation at
the Merrimelia Field.
Reservoir quality aspects of the glacio-aeolian sandstones in the Merrimelia Field
were touched upon by Williams et al. (7985) where they describe the diagenetic phases
in relation to reservoir quality and seismic facies.
3

-26L
-27L
l(UMSANIE I
29".-- TIXGATA 1
LAKE BLANCHE
¡
i
i4t
LEGENDìÉ O¡l and Gas Field / Well. ------- Oil Field/Well*-- - -- -.Gas Field / Well
1 40' 142 143"
0ulLsA.
N S.W
NI
MAPPEDABEA
lmkn *rv
LOCATION MAP
EXPDEV 116
kilometres25 0 25 50 75 100 125
Figure 1.2 Location map of the Cooper Bnsin zoith nnjor fietds nnd znells shuun.

f¡vrRooucr¡o¡v
Other diagenetic/reservoir quality investigations have been done by Lemon (1990) in
the Malgoona and Lake Hope Fields with a more recent reservoir quality investigation
of the glacio-aeolian sandstones at Merrimelia #37 completed by the same author
(Lemon and Mathews,1997). He concluded that compaction of labile fragments and
extensive illitisation had a major impact on porosity and permeability reduction.
As the Tirrawarra Sandstone and Merrimelia Formation are interlinked, investigations
within the Tirrawarra Sandstone are relevant to this present study. A number of
workers have investigated the reservoir quality of this unit. Schulz-Rojhan (1991), in
describing the diagenesis of all Permian formations in the Cooper Basin, on a regional
basis, included the Tirrawarra Sandstone. Rezaee (7996), on the other hand, published
numerous papers on differing aspects of diagenesis, reservoir quality and log
response of the Tirrawarra Sandstone at the Tirrawarra, Moorari, and Fly Lake-Brolga
fields. He suggested that quartz cementation and mechanical compaction are the main
processes reducing porosity within the Tirrawarra Sandstone, Seggie et ø1. (1994), tn
an attempt to better understand the nature of the Tirrawarra Sandstone, divided this
unit in the Tirrawarra Field, into several flow units and described each in terms of
their depositional environment and reservoir quality.
This study is the first to assess the diagenesis, provenance and reservoir quality of the
Merrimelia Formation on a regional basis and combine the findings with the
conclusions of other workers in related areas. The published results from the present
study are given in Appendix Eleven.
This study also includes a hitherto unattempted analysis of rock fragments within the
Tirrawarra Sandstone on a regional basis. To the best of my knowledge, this has not
been done before,
A number of key studies have been used to assist in the identification of the
provenance of lithic components in the Merrimelia Formation. Gatehouse (1986) first
reviewed the geology of the eastern Warburton Basin, More recently a very
comprehensive Warburton Basin study has been done by Sun (1996), This author
described most aspects of the geology of the Warburton Basin, concentrating on the
sequence stratigraphy and sedimentology of the basin, Boucher (1996) reviewed the
tectonic and structural development of the Warburton Basin with emphasis on the
volcanics at ]ena #1 and Murteree wells.
5

8A5IN
A
B Age PalynologicalZone Stratigraphy Depositional
environment Tectonic events
(úo)c(üEoul
coËf!(l
=
ð.qË
U)foooC'oo
L
Ma
9't 0
07ç
Nambe Fm.
Eyre Fm.Fluvlal and aeolian
Non-msr¡ne lo ror9¡nalmalne
Mârglnal ma!inè
Marine
Marine shorehce
Opèn mar¡netransgr€s9¡ón
Non-rodne lo marglnalmarine
Ladstrineturbldhes, dslla€
Bra¡dedaælian
lluvial withÌnlluenc€
Meandêring llw¡at
Fluv¡al
lreanderinglluviolacustr¡ne
M€adering lluv¡al / delta¡c
LâNstrlneFluvlo-dellaic
Fluv¡o-delta¡c,
lacustrlne
Ter€ËÌrial / subaquæus.glacigene
Shallow ehelf
Slop€ and basln
Shailow shelf
Tertiary folding
A3
mild folding
Local uplift
c
L
N
P
2 uptirt
Uplift(Daralingie Movsmênt)
Base level changes
Upl¡ft
Rejuvenation ofpre-sxisllng faults
z
Dullingar¡ Movêment
l\4ootwings€ Movsm€nt
Kangarooian Movemsnt
PK7Winton Fm.
E
112-O
PK6Àr|J)
H9r;ñ<õ¿l
Ø
Allaru Mudstono
PKq 2
Bulldog Shals WdlumbillaFm.
9Kq 1
PK4PK3,2
PK3.1
Cadna-Owie Fm.
1¿1 ô
PKz,2
PK2,1Prtl -2
NamurSst.
PK1.1
.9øU'(úJ-o'6U)dF
L
144.O
PJ6.2
PJ5
M PJ4
E
L,G.o-'
230.O
251.0
270,0
293.O
298.0
322.A
459-O
463.0485.0490.0495.0500.0
505.O
5't0.0
l'oolowanna or basal JurassicFm.
GROUPMbr
c,gELofL
LPP6
PP4
Patchawana
Formation
ïnawana
lnnemlncka Fñ-
Kalladeina
Formalion
PÊndo tu,
E
PP3
PP'22PP2.2.1
PP2.1
P?1 2Z
G!
l
o
M
E
PPl2.1
PP.I 1
(!'coE(üo
L
M
EVolcanic aruptlon
EXPDEV 072 C
Figure 1.3 A) Schenntic cross section through the Eromønga, Cooper and Warburton Bnsins (After Carne, 7986).t) Stratigraphic table of the Eromanga, Cooper nndWnrburton Basins (After Sun, 7996),

I-ATE CARBON IFEROUS/PERM IANPALYNOSTRATIGRAPHY OF THE COOPER BASIN
PATYNOTOGICALZONE
COOPER BASINUTHOSTRATIGRAPHY
CHRONOSTRAT-GRAPHIC UNITS
SEQUENCEBOT,NDARIES
sEtsMlcHORTZONS
AGE(AGSO, r99ól
PT3
PI2
PT1
PP6
PP5
PP4.3
PP4.2
PP3.3
PPï.2.2
L
N3'
R
PP3.2.1 L
PP3.2
BROWNUNITPATCIIAI¡VAR8A
FORMAÌlON
PP2.2.3 YELLOW UNIT
UNITPP2.2.2
PPz2,1VL
RED UNIT
GREEN UNITPPz.1
=-F
PPl.2.2
PP1.2.1
PP1.1 t¡OTE:
PC60PUTO
sc50lc00TC20TC50
uc00uc50vc00
vcl0
vc20
vc25vc30vc35vc40vu45
v888
v8tü,wc00
xu00
xc20
XU30
xc50xu60
xc80
zu
vodlcsl
PC00PCl0PC20
PC30
PC40
PC50
DARALINGIEUNCONFORMITY
MID PATCHAWARRAUNCONFORMITY
P
P1
P2
P3
P4
cooPER2S2C
N2
V6
VC
W
x
Sarrtos
sT
U
240
250
260
270
290
300
310
Figure "L.4 Strøtigraphic column of the Cooper Basin (After Santos, 1999)
Geological provinces such as the Arunta Block (N.T.), Cumamona Province (N.S'W),
Broken Hill Block (N.S.W), Olary Block (S.4.), Benagerie Ridge (S.4.) as well as the
Mt Painter (S.4.), Mt Babbage (S.4.) and Peak and Denison Inliers (S.4.), were also
7

UCTION
investigated in this study as possible sources of Cooper Basin sediments (Chapter Five
- Fig. 5.3). This involved the collection of published and unpublished reports from the
respective state government bodies and the University of Adelaide.
Sediments of the Cooper Basin were first intersected by an exploratory well
(Innamincka #1) in L959. In !96L-62, Delhi Petroleum Ltd, using aeromagnetic surveys/
further delineated this basin (Wopfner, 1970), This newly-delineated Permian basin
was named the, Coopers Creek Basin, by the then Bureau of Mineral Resources
(BMR), now AGSO, in 7963 and was found to contain sediments that were Late
Carboniferous to Late Triassic in age.
Initially, the entire basin fill was considered as the Gidgealpa Formation, composed of
uppef, middle and lower members (Kapel, L966). Kapel (1972) elevated the Gidgealpa
Formation to group status and the members to formation status. Gatehouse (1972)
modified the stratigraphic nomenclature of Kapel (1972) nto a form recognisable
today,
AgePalynZone(mod from
Price et ol., | 985)
Stratigraphy of theLower Gidgealpa Group
Early
Permian
PP2. I
Patchawarra Formation
Merrimelia Formation
Warburton Basin
PPt.2.2
Late
CarboniferousPPI.2.r
Cambrian - DevonianEXPDEV 072 B
Figure 1-.5 Lower Gidgealpa Group stratigraphic table. (Adøpted from Chøney et øL, 1.997).
I

Gostin (1973) defined the Tirrawarra Sandstone and recognised three subdivisions,
which were revised and modified into four subdivisions by williams (7982).
The first study on the Carboniferous conglomerates and tillites in the Cooper Basin
was conducted by Grund (1966). He noted that the first well to penetrate glacigenic
sediments in the basin was Dullingari #1 n 1962. These glacial sediments were
encountered in later wells with the first accurate palynological dating gained from the
Merrimelia #1 well :r:r1964. Grund (1966) suggested naming the lower Permian glacial
sediments of the Cooper Basin, the Strzelecki Formation but later in the same year
Martin (7967) proposed the name Merrimelia Formation, after the Merrimelia #1 well,
Williams and Wild (198a{ formally incorporated the Merrimelia Formation into the
Gidgealpa Group. Following this, Price et aL (1985) fixed the palynological zone of the
Tirrawarra Sandstone as PP1.2.L, correlating this unit with the Treachery Shale, a
Permian glacio-marine unit the in the Upper Kuriyippi Formation of the Bonaparte
Basin in Western Australia (Fig. 1.1) (Wood pers. comm.,7998).In addition Redfern
(1990) and Redfern and Millward (1994) describe equivalent aged strata (Hoya
Formation) in the Canning Basin of Western Australia. This formation is regarded as
part of the Grant Group and is considered by these authors to have been deposited in
the Late Carboniferous at the same time as Merrimelia and Tirrawarra sediments.
The stratigraphic subdivisions within the Cooper Basin have been mainly based on
palynology (Paten, 1969). The broad stratigraphic and palynological divisions in the
basin are based on work done by Thornton (7979) and Price et ø1. (1985) respectively.
Further refinement of these subdivisions has been carried out by Santos Ltd and
PIRSA, with the most recent stratigraphic column used at present, illustrated in
Figure L.4.
The Cooper Basin unconformably overlies the Cambrian-Devonian Warburton Basin
sequence, and is in turn overlain, unconformably,by the Mesozoic-Tertiary Eromanga
Basin (Fig. 1.3b). The spatial relationships of these three basins is illustrated in Figure
(1.3a),
Uncertainty of the relationship between the Tirrawarra Sandstone and Merrimelia
Formation and associated nomenclature has traditionally lead to confusion. These
issues are addressed in full in section 1.5, However recently, workers such as Williams
and Wild (1984a) and Chaney et ø1. (7997) have, as a result of comprehensive studies
on the lower Gidgealpa Group (Fig. 1.4), revised and simplified the stratigraphic
9

f¡vrRooucrro¡v
relationships (Fig. 1.5). The resulting definitions of the Tirrawarra Sandstone and
Merrimelia Formation are given in the following section'
T.4"1. DISCUSSIONGrund (1966) concluded that glacial sedimentation was effectively continuous from
the base of the Patchawarra Formation to the base of the Merrimelia Formation.
Flowever, Kapel (1972) and Battersby (1976) considered the Tirrawarra Sandstone and
Merrimelia Formation as two units, separated by an unconformity' Kapel (1972) did,
however, state that the Tirrawarra Sandstone is in part derived from the Merrimelia
Formation. This concept was expanded upon by Williams and Wild (1984a), stating
that the Tirrawarra Sandstone and Merrimelia Formation are intimately related and
illustrate the evolution of a predominantly glacigenic system into one in which fluvial
processes dominate, These authors contradicted the popular thinking of the day and
concluded that these two units interdigitated where typical "Tirrawarra Typ." fluvial
deposits were present in typical glacigenic "Merlimelia Type" deposits. Clnaney et aL
(7997) more recently reiterated these conclusions and expanded by suggesting that not
only do the sedimentological relationships between the two units point to their inter-
woven relationship, but petrology of both formations indicates that they share the
same rock fragment suites. This indicates that the Tirrawarra Sandstone is derived
from the same source regions as the Merrimelia Formation as suggested earlier by
Kapel (1972). Consequently, Tirrawarra detritus has been deposited via reworking of
the Merrimelia sedimentary pile or sourced directly from surrounding basement
outcrop.
The glacial sediments of the Cooper Basin can be correlated with Gondwanan aged
glacial sediments in adjoining basins (Fig, 1.6). Consequently, the Crown Point
Formation in the neighbouring Pedirka Basin equates with the Merrimelia Formation
and the Purni Formation, according to Giuliano (1988), is a lateral equivalent of the
Tirrawarra Sandstone (Fig. 1,6). In the Bowen and Galilee Basins of Queensland
equivalent units to the Merrimelia Formation/Tirrawarra Sandstone include the
jericho and ]ochmus Formations (Gallilee Basin) and the Comet Volcanic Beds in the
Denison Trough (Bowen Basin) (Fig. 1.6).
Brief descriptions of the other Cooper Basin units are detailed in this chapter in order
to place the Merrimelia Formation and Tirrawarra Sandstone within a basin context.
Warburton Basin units are also described as they have provided the majority of rock
fragments contained within the Merrimelia Formation and Tirrawarra Sandstone, and
l0

NTRODUCTION
are vital to an understanding of the provenance (Chapter Five) and reservoir qualitydiscussions (Chapter Nine).
ongoing terminology and conceptual conventions in the Lower Gidgealpa Groupnecessitates the following sections which define both the Tirrawarra Sandstone and
the Merrimelia Formation. These definitions and terms will then be used throughoutthis entire document.
Figure 1.6 Strøtigraphy of Late Carboniferous-Eørly Permiøn basins adjacent to the Cooper
Basin (After Price, 1997).
ltJuJ!U'
=oÉ
:ãÌG
t2ô1 oo
G
o(5ØrzoIU(lOF
:z12
1ì
dnou9 y=¡Hc xcv8
G
ô
9ø3H
u,uzJ-u,J<< ¡rlC'
II
l=iåt"
zô
Hol{i?g
o
Iã8
:sI
dnou9 30t :or
II
lruZäg3co
6a
G
sz
:zo 3 2
áø:YEr¡¡o-
õd!
t zzor>EEq
<<zY('^-=t<äEE
2oð:OL
=uz
=Ix
^ kt-=æ- Fù@LÀ
3 ñ
oùùÀ o-L o L
L LL
r¡Jg^'luY:¡
3Llrl AlUYJ 3¡ìnH. NVtUtH3d
lr ll\
n

I"s.L DEFINITIONS: TIRRAWARRA SANDSTONE AND
MERRIMELIA FORMATION
The definition of the Tirrawarra Sandstone and Merrimelia Formation has changed
several times. Listed are the various definitions that have been proposed in the
literature over the past thirty years:
Patchawarra Formation (Grund, L966)'
Tirrawarra Sandstone, where a regional unconformity separates both units
(Gostin, L973).
continuum with no regional unconformity separating the units (Williams and
Wild,1984a).
continuum where the Tirrawarra Sandstone represents only one of numerous
facies types within the Merrimelia-Tirrawarra Glacial Complex (Chaney et ø1.,
7997).The phrase "Merrimelia-Tirrawarra Glacial Complex" can get cumbersome
and is consequently shortened to MTGC throughout this document.
The last two definitions have been adopted in this study. Hence, the Tirrawarra
Sandstone is regarded as one facies type in a glacial sequence, which contains in
excess of twenty major facies types (see Chapter Four). Consequently, all braid plain
sandstones in this model are regarded as the Tirrawarra Sandstone. In addition, facies
types, other than braid plain sandstones within the Merrimelia-Tirrawarra Glacial
Complex, are called the Merrimelia Formation (i.e, conglomerates and mudstones).
Collectively both Merrimelia and Tirrawarra facies are termed the Merrimelia-
Tirrawarra Glacial Complex. The following sections detail the nomenclature used
throughout this document.
L.5.L.1 Tirrawarra Sandstone
The Tirrawarra Sandstone is a collection of stacked bar facies, which form part of the
Merrimelia-Tirrawarra glacio-fluvial outwash braid plain complex (Fig. 1.7). Thus
when specifically speaking of braid plain sandstones the following terms are used:
1) Tirrawørra type.facies (refers to - the braid plain sandstones facies in the Merrimelia-
Tirrawarra Glacial Complex).
2) Tirrawørra t-upe søndstone (refers to - a braid plain sandstone within predominantly
Merrimelia facies types).
t2

3) Tirrawarra sediments (refers to - all braid plain sandstones facies in the Merrimelia-
Tirrawarra Glacial Complex).
4) Tirrnwarrø Søndstone (refers to - all braid plain sandstones within the Merrimelia-
Tirrawarra glacial complex).
5) Tirrøwnrrø (pertaining to braid plain sandstones).
\ò¡}
AbbË atlons FælêrTyp€Back SwupDelq BocomsetsDeha FlowDelta FometsDæp GlaciolacustrineDelù TopsêtrAællan DuneFluvial BarTopFluvlal SandstoneFrozen Shore ZonelnterduneKettle HoleLonSltudlnal BarLinguoldal Barlacust¡lne Shore ZoneRalnout Dlamist¡t€Subaquæus Chunel GnvelT€mlnodac¡al Outmlh É¿n
Temlnodacial Subaqueous Tunnel Mouth Deposh[âcustrine Shorellne
BS
D&SDTDtsDGLDTSDUFBTFLFSZIDKHLBLIBLStROSACGTOFTTMDLSZ
EXPDW 089
Figure 1.7 Schemntic model of the Merrimelia-Tirrawarrø GIqciøI Complex (MTGC),
Considering the definitions above along with the findings of Williams and Wild
$98afi and Chaney et ø1. (1997) the Tirrawarra Sandstone only exists where it has
been derived from Merrimelia facies. Thus sediments that appear similar to the
Tirrawarra Sandstone but have no Merrimelia sediment source, such as those in the
Moomba region (Fig.1,.2), are then by definition not Tirrawarra sediments.
An example of this situation is seen in the Moomba region. The Merrimelia Formation
was never deposited at the Moomba Field as this area was, according to Carne (1986)
and Chaney (1998), a topographic high. Thus, if there were no Merrimelia Formation
l3

sediments deposited; then there were no sediments from which the Tirrawarra
Sandstone could form. This is of course contingent on no sediment supply sweeping
in and around the highs. Boucher (1996) concluded similarly, stating that the unit
commonly interpreted as the Tirrawarra Sandstone at the Moomba field is in fact not
the Tirrawarra Sandstone but an altered granodiorite of the Big Lake Granodiorite
Suite.
L.5,1.2 Merrimelia Formation
The Merrimelia Formation is a collection of twenty facies types (see Chapter Four),
which form part of the Merrimelia-Tirrawarra Glacial Complex (Fig. 1.7). Thus when
specifically speaking of Merrimelia facies types, that is to say all facies types accept
braid plane sandstones, the following terms are used:
7) Merrimeliø type facies (refers to - all Merrimelia facies in the Merrimelia-Tirrawarra
Glacial Complex apart from braid plain sandstones).
2) Merrimeliø .føcies (refers to - all Merrimelia facies in the Merrimelia-Tirrawarra
Glacial Complex apart from braid plain sandstones).
3) Merrimelia Formation (refers to - all Merrimelia facies in the Merrimelia-Tirrawarra
Glacial Complex apart from braid plain sandstones)'
4) Merrimeliø sandstones (refers to - all non-braid plain sandstones in the Merrimelia-
Tirrawarra Glacial Complex).
5) Merrimeliø sediments (refers to - all Merrimelia facies in the Merrimelia-Tirrawarra
Glacial Complex apart from braid plain sandstones).
6) Merrimelia (pertaining to all facies within the Merrimelia-Tirrawarra Glacial
Complex apart from braid plain sandstones).
In most parts of the Cooper Basin the identification of Merrimelia facies in open
boreholes is generally straight forward, however on occasion Merrimelia sediments
can be difficult to distinguish from Warburton Basin lithologies, An example of this
can be seen in the Spencer region (Plates 1a & 1b).
It can be seen in Plate 1a that this rock is a volcanoclastic conglomerate dominated by
porphyritic, flow-banded and devitrified rhyodacitic lavas as well as ignimbrites,
crystal tuffs and sedimentary quartzite clasts. Higher up the sequence, matrix
supported, muddy diamictites and conglomerates are observed (Plate 1b), These units
exhibit rounded to rectangular clasts with the composition of the majority of clasts
mirroring the lower volcanoclastic breccias (Ptate 1), Sun (1996) interpreted the lower
volcanoclastic breccias as lava and pumice rich breccias, which have been proximally
reworked from nearby Mooracoochie Volcanics within the Warburton Basin.
t4

Plate IA
B
coØ:(ütrcobLLo)dEEo.FUË
=
.= .9ØÈGU19b.ePt=oãsLdl!
EXPDEV 077 F
DATE:0t/01r1998
re[NAME:SPENCER I
FOryAïON ilEÀRltELlA
CORE DESCRIPTION
PAGE: I OF I
STRUCTURES3 cMtNslzE11""t.,.,.+':,^,., tf;
COMHENIS
:o"
"--1o
O " O'o'
(/ \\ot.s"
o-
^
oo
olì
oQ o0"', O' 'o
oô
0o
Dimlrite Shale matrilClaB are recùrgular(hcefred) to round ¡n sh+e Chst s¡ze do6
lle (Dom),ãndVoldic
Posslble source dlamltlle for dlmirite chsBnoled ln bp dlmitlte unlL
Hl8her prcpodon of baement clÁts than
Bðsêment cl¡sB of clãsts noted(Fluvlal unlts of bðemenb)
Dlâmlllte unltð above
_QdS=ç Congl Clðt typs ¡nclude r Red vol..(Doh.)- creen Q¿ Pophry - Red Q¿
Ã
DPß DÈPIH(t) (')
20 I t.1
,oil 4
20t t.6
¡0 I t.8
20t¡.0
¡OIT ¡
70t2.1
20t¡ ó
20t2 0
20t¡.0
t0tr.2
20 t{.1
10 tt.45
l0 É.t
\-/'\vt^)l
Very c@ße to coffiegãined rcckwhh cl4Bofnrylng condlt¡ons
lFluvlal reworklns of pyroclõtlc depos¡tsI
$*F!l'¡
TT
Plate 1, a) Spencer 1 (2012.59m). Merrimeliø Formation; aolcønocløstic conglomerøte sømple. B) Spencer L(2092.77m - 2093.02m), Moorøcoochie Volcønics; ignimbrites, aolcønoclastic conglomerates, søndstone cløsts.

ODUCTION
Visual inspection suggests that the upper units in this section are consistent with
typical terminoglacial' Merrimelia sedimentation styles. They are interpreted to be
basal Merrimelia conglomerates, having formed as a result of terminoglacial deltaic
sed.imentation reworking Warburton Basin volcanoclastic conglomerates and acid
volcanic rocks,
In the Spencer area a small proportion of clasts within Merrimelia Formation
conglomerates are composed of Warburton Basin volcanoclastic breccias (illustrated
in Plate 1b). However, petrographic observations indicate, that the majority of rock
fragments in Merrimelia conglomerates at Spencer L are composed of individual rock
types (mainly acid volcanics - rhyodacite) and not volcanoclastic breccias which are
amalgamation of individual rock types (clasts). It is likely that the clasts within the
Warburton breccias were subsequently "liberated" by erosion. The resulting re-
sedimentation of these clasts into Merrimelia conglomerates destroyed the original
matrix, effectively breaking down Warburton breccias into their component parts.
These "liberated clasts", along with subordinate amounts of still-lithified Warburton
Basin breccias, were incorporated into the Merrimelia sedimentary pile forming the
conglomerates illustrated in Plate 1. There are thus more clasts composed of one
lithology, than clasts composed of a number of lithologies in Merrimelia Formation
conglomerates at Spencer 1.
In addition the lithologies of clasts, both individual and conglomeratic, within
Merrimelia conglomerates at Spencer are the same, indicating a common provenance.
The similarity between Merrimelia and Warburton sediments at Spencer negates
using logs or cuttings as a way to discriminate between the Warburton Basin and
Merrimelia conglomerates, Core analysis however reveals, that they belong to two
differing basins separated by approximately 1'50 Ma.
The distribution of Merrimelia Formation and Tirrawarra Sandstone sediments tend
to mirror each other both in vertical thickness and in areal extent. This distribution is a
further reflection of the interlinked depositional nature of these two units. A
combined isopach map of the Tirrawarra Sandstone and Merrimelia Formation within
the South Australian sector of the Cooper Basin is shown in Figure (1.8).
'For terminoglacial and proglacial glacial sedimentation styles see Chapter Four
l6

139 15 E 140 E 141 E26 40
27s
28S
29S
2927 SEXPDEV 076.I
ïs;200
ø, 250g sooS 350
400 ,:
#l0t02030a0m4
KILOTIETFES
Ø
Figure 1.8 Isopach ruap of the Tirrawarra Søndstone nnd Merrimelia Formntion contbined (After Grøaestock andI ensen- S chmi dt, 1 I I I ).

ODUCTION
According to HiII and Gravestock (1995), the southern Cooper Basin (SA sector)
contains the thickest (1600m) and most complete Permian succession, whereas in the
northern and Queensland sectors of the basin, beyond the Curnamona Trend (Fig,
1.9), only a thin Permian package (300m) is intersected.
1.6.1 MERRIMELIA FORMATIONThe thickness and distribution of the Merrimelia Formation is irregular within both
the South Australian and Queensland sectors of the Cooper Basin (Fig, 1.8). Apak
(1994) stated that the largest accumulations are noted along the GMI trend, with the
thickest being at Merrimelia #1 (363m). In general, the thickest deposits of Merrimelia
sediments are noted within palaeo-depressions and grabens (Apak, 799Ð (Fig.1.8)' In
the Patchawarra Trough, Merrimelia sediments are on average only 33 metres thick
(Carne, 1986; Apak, 1994),It appears from these observations that structural inversion
has taken place, where what are now highs were once troughs into which Merrimelia
sediments were actively deposited. Apak (1994) concluded that the lack of Merrimelia
Formation development in the Patchawarra Syncline is attributed to this feature being
a smoothly undulating basement surface with low relief at the Tirrawarra and Fly
Lake Fields. The Merrimelia Formation has been observed as far south as Tinga
Tingana #1 (Hill and Gravestock, 1995) and as far north as Paning #1 (Fig, 1.2),
1..6.2 TIRRAWARRA SANDSTONEDistribution of Tirrawarra Sandstone sediments occurs irregularly throughout the
Patchawarra, Nappamerri and Tenappera Troughs (Thornton 1979) (Fig, 1,9).
Tirrawarra sediments have been observed as far south as Cherri #L and as far east as
Mount Howitt #1 (Qld) (Fig. 1,2). Apak (1994) concluded that the thickness of this unit
is highly variable with the greatest accumulations, like the Merrimelia Formation,
occurring on the flanks of the GMI Trend (Fig. 1.9), The thickest intersections noted by
Apak (1994), were observed at Kurunda #1 (99m) and Tindilpie #1 (85m) wells (Fig.
1..2). Rezaee (7996) concluded that the Tirrawarra Sandstone in the Moorari and Fly
Lake fields has an average thickness of approximately 62 metres. On a regional basis
the average thickness of the Tirrawarra Sandstone is approximately 70m (Hill and
Gravestock, 1995). Like the Merrimelia Formation, the Tirrawarra Sandstone is absent
from palaeo-highs, both structural and stratigraphic (Fig. 1.8).
The subsurface distribution of the Tirrawarra Sandstone is related to the present
structural trend of the basin suggesting that the structural features were imposed on
the basin after the deposition of the Tirrawarra Sandstone. The proposed
18

f¡¿rnoo¿¡cr¡o¡v
palaeodispersal direction for the Tirrawarra Sandstone was towards the east and east-
north-east (Thornton, 1979).
The structural prehistory of the Cooper Basin was dominated by granite emplacement
(10 million years prior to Cooper Basin initiation), followed by uplift and glaciation
(Gravestock and ]ensen-Schmidt, 1998). The exposure of these granites on the basin
floor of the Cooper Basin indicates that there was considerable, and very rapid, uplift
and erosion. Both the emplacement of granite and unroofing were events that were
associated with a high thermal regime in the upper crust. The cooling granite along
with rapid sediment stripping saw an exponential decay of heat flows and subsequent
crustal contlactions (Gravestock and jensen-Schmidt, 1998). The same authors
conclude that the resulting cessation of elevated thermal conditions caused
subsidence, forming the Cooper Basin,
The structure of the Cooper Basin comprises a series of NE/SW trending anticlinal
ridges and synclinal basins, with smaller structural elements possessing NW/SE
orientation (Chaney et al. 1997).In the southern Cooper Basin the synclines are termed
Patchawarra, Nappamerri and Tenappera while the anticlinal ridges are termed the
Gidgealpa-Merrimelia-Innamincka (GMI) and the Murteree-NaPPacoongee (MN)
Highs (Fig. 1.9). The major structural feattrres within the Queensland sector of the
Cooper Basin j¡rclude the Arrabury Trough, Karmona Trend Nappamerri Trough,
Strathmore Embayment and Tickalara Trend (Fig. 1.9).
There is some conjecture still as to whether the Cooper Basin is a compressional or
extensional basin. The latest published discussion on this topic suggests that the
Cooper Basin has formed by mild compression with localised extension tectonics,
which restrlted from sideways steps between adjacent fault blocks (Apak et ø1.,1997).
These authors believe that the earliest palt of the Cooper Basin sequence may have
been i¡fluenced by extensional forces, but inversion features folmed during
Patchawarra sedimentation is indicative, they argue, of a change to a compressional
regime"
The rejuvenation of northwest and northeast orientated pre-Permian features, in the
Sakmarian (Early Permian), resulted in the subsequent formation of the Gidgealpa-
Merrimelia-Innamincka (GMI) Trend which sepalates the Patchawarra and
Nappamerri Troughs (Apak et ø1., 1993 and 7997) (Fig. 1.9). Apak et al, (1997) stated
that the GMI tlend did not exist during the early stages of basin development and
t9

f¡vrRonucr¡o¡v
thus did not act as a sediment barrier, unlike the Jackson-Naccowlah structural zone
which restricted sediment movement from the southern portion (SA sector) of the
Cooper Basin to the northern (Queensland) region. The GMI Trend became a moÍe
positive feature in the Permian, as indicated by the Patchawarra Formation onlapping
the GMI Trend. Further evidence of structural rejuvenation was described by
(Thornton, 7979) wkro indicated that the Gidgealpa Group attains its thickest
development on structural'highs'.
r ¡0'00,
27" ú'
29' m'
ç.rfa.""
..i\\"
ó{ò"
00' 28' 00,
ScathrcrcEmba/ment
MA'ORSTRUCTURAL ELEMENIS
Major Permlan Oil/Gæ Field
O<J+
T
Perm¡an SedimenB Absent
AnticlinalAxis
- -2r 00'.!?b
6o
4t'00
-I
I
Figure 'L,9. Structural elements of the Cooper Bøsin, South Austrnliø ønd Queensland
(Modified from Apak et aI., 1997).
Apak et øL (1997) concluded likewise, stating that some of the thicker parts of the
Merrimelia Formation are to be found on the flanks of the GMI Trend implying that
the Cooper Basin had an inverted topography during the deposition of Merrimelia
glacial sediments. Apak et al, (1997) also observed that the GMI Trend, along with the
Patchawarra Trough, behaved as a flank to the Nappamerri Trough. The Patchawarra
Trough did not act as a major depocentre until after the Daralingie unconformity (Fig.
1.4).It was postulated by Apak (1994), that the Patchawarra Trough only became a
20

fivrRooucr¡oru
major d.epocentre as the Cooper Basin tilted northwards during the deposition of the
Nappamerri GrouP (Fig. 1' ).
The following section gives a brief description of units within both the Warburton and
Cooper Basins. A brief discourse on the Eromanga Basin is also given.
1..8.1. CRYSTALLINE BASEMENT
The Warburton Basin is a Cambrian-Devonian intracratonic basin. The underlying
crystalline basement is only known from a handful of drillholes. Rankin and
Gatehouse (1990) describe a crystalline lithology in Haddon Downs #L as containing a
proto-mylonitic pegmatitic gneiss and interpreted this intersection to be basement to
the Warburton Basin and belonging to a southerly extension of the Arunta Block' The
rock displayed moderate intensity, sub-vertical foliation defined by elongate "quartz
ribbons" surrounding sub-euhedral to euhedral megacrysts of K-feldspar and
plagioclase which is not comparable to the Carboniferous granites (Big Lake Suite
Ganodiorite) intersected at Moomba (Fig. 1'10).
Low grade metamorphic rock were intersected at Naryilco #L, Mulga #L and Fortville
#3. These rocks are considered to be part of the Gnalta Shelf a northern extension of
the Willyama Supergroup (Wopfner and Cornish, 7967: In Rankin ar-rd Gatehouse,
1990; Gatehouse, 1986).
1..8.2 WARBURTON BASINThe Warburton Basin is an entirely concealed Early Palaeozoic basin that underlies
the Pedirka, Cooper and Eromanga Basins (Fig. 1.3a). The basin is bounded to the
north by the Arunta Block and to the south and west by the Muloorina Ridge and
Musgrave Block.
The basin is divided into western and eastern regions by the Birdsville Track Ridge
(Fig. 1.3a). The unit descriptions below are concerned only with the Eastern
Warburton Basin, as the Cooper Basin overlies this portion. The Pedirka Basin overlies
the western portion of the Warburton Basin (Fig. 1.3a). The stratigraphy of the Eastern
Warburton Basin is shown in Figure 1'.3b (Sun, 1996).
2l

ooots
140. 30'00"
'140' 30', 00"
1 4 1. 00' 00"ooooFN
1 39" 30' 00"'140" OO' 00"
+
Mudrangie Sandstone
Vuggy Dolomite
Kalladeina Formation
Big Lake Suite Granodiorite
Dullingari Group
Mooracoochie Volcanics
lnnamincka Red Beds
Pando Formation
Basalt
Schist / Phyllite -Willyama Supergroup
Eastern Warburton BaslnSub Cropping Lithologies
Domains
Kilometres10 50
IrrrrrroroootsN
oõoÈN
oooo@N
ooo@N
ooò@N
o@N
0 403020
O (Subcropping dal¿ derivedfror Big Lake SL(e Cranodior'te Difribution
interpreted f.ôm mag ìntensity map Santos ( I 998))
(Contributions lrom Sun, ( I 996); Baines, ( I 996); Tiainen pers comm, I 998)
Paning 1 fLimestone f Walkillie 1DolomiteSl¡ole Quanz + Feld RhyodociteConglomercte
Daer.l# $ Coongie 1
Limestone.."-""'¡Rhyodocite * Cuttapinie 1
LimestoneRhyodacite
#Yanpuna 1
..#lnnamincka
f Yanta 1 * Arosa 1
Ouortzl-¡mestone S-øndstor¡c''sondstone Shole.,',"rt""'-.o.
...,..'?Darter 1
Sondstone ¡f Tallalia 1j *r¡tan I Shole 3
*Moolion 1 'tt Charo 1
* lnnamincka 24
¡1* Siltstone
I Callabonna 1Moorari 1* Sondstone r5øndstone Shole
q * rly Lake 2 #Wantana 1
+ Kalladeina 1*K¡r¡y I
LlmestoneSondstone è€LimestonelYolconic Brecio
7 SondstonemeliaS
1
Sl¡ole Gronodio¡iteNulla 1# f Welcome Lake 1 *
Kanowana# su¡ev z
1 +Cgiperscreekl +Mcleod 1 (n
CÚir)€
CÚ
ØÉo(.)
Sondstone I-imestone.2
# Lhotsky 1 S¡rtstone Yolconìc ConglomeroteRhyodocitelgnimbrìte
oU)Jack Lake 1
SondstoneSiltstone c II Lyciunli *o ...;,
* Dull¡ngariNorth 1
Dullingari I'Qullingari 16*P * Burke 1Malooona 4 A
stu-'r Srslurt{ Lake Hope 1 G¡onodio¡ìte* Moomba 1
G¡een Shole
Taloola 1 o Tufflgnìmbrite .'"'".." "s:"lt u_1:l:ir" "..
# Spencer 1 *Marabooka 1 '" SondstoneVolconic Conglomercte
Bio Lake 1 # '+St¡'"e1ry511".;' # Coochilara 1
f Jennet 1
+ WoolooSiltstone
Farina +Shole
*Toolachee 1,{'Lt' Green Shole
I
I Sondstone1#
Deina
# Pando 4# Thulakinna 1
.l G.u"nSondstone Shole Munkarie 1
Pinna 1+Jena
Jena6.+'1.
Mu rte fee
+ Boxwood 8øsoltlgnimbriteSiltstone
i"ttrì
SholeA1
EXPDEV 072
1 39. 30' 00" 140" 00' 00'
Cherriþ Gurra 1
ë" Mutoa 1 These lhrce well localions sh0wnlot illustrat¡on putposes onlY.
141.00'00"
Figure 7.L0 EøsternWørburton Bnsin Sub Cropping Lithology Domains @

f¡vrRooucrrorv
Lithostratigraphic relationships of the major units in this basin, according to Sun
(7996), still remain elusive, A comprehensive study conducted by that author,
however, has clarified the inter-relationships of Warburton Basin units and suggested
a number of new units, Sun (1996) suggested that the chronological order of
Warburton Basin units is as follows: Mooracoochie Volcanics, Vuggy Dolomite,
Kalladeina Formation, "Innamincka Red Beds", Mudrangie Sandstone and then the
Dullingari Group. The age and sedimentary origin of the Pando Formation still
remains a point of conjecture. In the following section the Pando Formation has been
described last and in no way reflects any chronostratigraphic position within the
basin. Figure 1.10 is a subcrop map illustrating the distribution of lithostratigraphic
units of the eastern Warburton Basin.
1.8.2.L Mooracoochie Volcanics
This unit is composed of mainly acidic to intermediate lavas including rhyodacite,
dacite, and minol alkali basalts (Sun, 1996) (Chapter Five - Fig. 5.11). In addition to
these main lithologies, Sun (1996) also describes ignimbrites (Plate 1b) and associated
volcanoclastics as well as epiclastics and sandstones. The same author divides this
unit into six facies assemblages that range from effusive, explosive, resedimented and
epiclastic facies types. Both Boucher (7996) and Sun (1996) argue that the
Mooracoochie Volcanics have formed in a continental rift, and not an island arc
setting as proposed by Gatehouse (1986). Commercial flows of oil of Permian origin
have been recorded from up-dip traps within the Mooracoochie Volcanics in Sturt #6
(Gravestock and Gatehouse, 1995).
'1..8.2.2 V.rggy Dolomite
This unit has been suggested by Sun (1996) to be a separate unit from the Kalladeina
Formation. Gravestock and Gatehouse (L995) however include this vuggy dolomite
within the basal reaches of the Kalladeina Formation. Sun (7996) believes that, as this
unit was not noted in the type section at Kalladeina #1 and in only five wells in the
Gidgealpa Field, that it may represent an as yet undefined rock unit. This unit has
undergone complete dolomitisation and karstification creating secondary vuggy and
inter-crystalline porosity (Sun, 1996). The same author suggested that the precursor of
this dolomite unit may have been an oncoid-intraclastic wackestone/packstone,
deposited in a peritidal environment.
1..8.2.3 Kalladeina Formation
According to Sun (1996), the Kalladeina Formation is composed of two main types of
lithologies, representing two stages of deposition. Gravestock and Gatehouse (1995),
23

however, described the Kalledeina Formation in sequence stratigraphic terms,
highstand and transgressive deposits. The transgressive deposits are composed
mainly of chert and grey micaceous shales, bioturbated siltstones and limestones
(Gravestock and Gatehouse, 1995). The highstand deposits rePresent a return to
shallow marine conditions with grey shale, siltstone and recrystallised limestone
predominant (Gravestock and Gatehouse, 1995; Sun, L996).
'1..8,2.4 "Innamincka Red Beds" or Innamincka Formation
According to Gravestock and Gatehouse (1995), the Innamincka Red Beds is
equivalent to the lower Dullingari Formation and the upper section of the Kalladeina
Formation (Sun, L996). Sun (1996) described the "Innamincka Red Beds" in terms of
two members: the lower member and uPPer member. The lower member is red,
composed of cross-laminated and bioturbated mudstone, shale and siltstone. The
upper member is green and primarily composed of horizontally laminated glauconitic
shale that is sandier than the lower member. The distribution of these sediments is
extensive throughout the northeastern edge of the eastern Warburton Basin (Fig. 1.10)
and extends southwards to the Moomba area.
L.8.2.5 Mudrangie Sandstone
This unit, proposed by Sun (1996), consists of a white to light grey sandstone which
exhibits frequent cross beds and cross-laminations along with rounded greenish
mudstone/shale pebbles within bedding planes. Zang (1993b) and Sun (1996)
envisage that this unit was formed in a shallow marine setting dominated by fluvial
input, where tidal and storm surges produce scour surfaces, rip up clasts and over
sized pebbles within the sandstone. This sandstone is widespread and distinctive in
appearance and can possibly be used as a marker bed to correlate between isolated
wells (Sun,1996).
1.8.2.6 Dullingari Group
The Dullingari Group is composed of two different units: a lower dark grey to black
pyritic shale and an upper greenish siltstone and shale separated by a thin bed of
pebbly sandstone or breccia (Gravestock and Gatehouse, L995; Sun, L996). The lower
unit comprises dark grey to black, horizontally laminated siltstone and shale with
abundant pyrite nodules, and is common in the south eastern part of the Warburton
Basin (Fig. 1.10). The upper member consists of green laminated siltstones and shales
(Sun, 1996). A sandy layer occurs between these units and most likely represents a
grain flow or a slump deposit as suggested by it's brecciated nature (Sun, L996). All
24

Ivrnooucr¡oru
evidence suggests that these sediments have been deposited on a delta slope within
deep water.
1.8,2.7 Pando Formatron
Siliclastics of the Pando Formation, first described by Gravestock et aL (1995), occur
beneath and interfinger with the Mooracoochie Volcanics (Fig. 1.3) (Gatehouse 1983:
In Gravestock and Gatehouse, 1995), Sun (1996) argues however, that the Pando
Formation may be equivalent to the "Innamincka Red Beds", while Zang (1993a) has
revised the Pando Formation name to Pando Sandstone.
The Pando Formation (or Pando Sandstone) consists of pale green-grey, irregularly
laminated, bioturbated silty sandstone with abundant glaucony and detrital zircons
(Gravestock and Gatehouse, 1995). Sun (1996) and Gravestock and Gatehouse (1995)
conclude that the Pando Formation was deposited in a marginal to shallow marine
setting of unknown extent. Gravestock and Gatehouse (1995) stated that this unit acts
as a reservoir for Permian gas in Moolalla #1.
1..8.3 BIG LAKE SUITE GRANODIORITEThe Big Lake Suite Granodiorite (Plate 29) (Gatehouse et ø1.,1.995) or Moomba Granite
has been intersected by 23 drill holes. In Moomba #2 these granodiorites have
intruded into Warburton Basin sediments with contact metamorphic effects evident in
Kalladeina Formation sediments (Gatehouse et ø1., 7995), The granodiorite body lies
primarily beneath the Moomba and Big Lake Fields but was also intersected in the
Mcleod #1 drill hole to the north east (Fig, 1.10). This suggests that the Big Lake Suite
underlies most of the Nappamerri Trough, A magnetic intensity map of the Cooper
Basin (Fig, 1.L1) indicates that the sub-cropping distribution of this granodiorite'zis
more complicated than the distribution inferred by drill hole intersections. A dividing
ridge of higher response magnetic material appears to separates the granodiorite into
southern and northern batholitl-rs. The southern batholith is centered beneath the
Moomba/Big Lake field and extends down towards the Daralingie Field in the south
(Fig. 1.11). The northern batholith appears to be centered in Queensland extending
south west beneath the South Australian portion of the Nappamerri Trough. Big Lake
Suite granodiorite was also intersected at Tickalara #1 in Queensland (Plate 2g). This
well is located east of the Dullingari field and may indicate that the northern Big Lake
Suite granodiorite batholith extends southwards into Queensland.
'The Big Lake Suite Granodiorite is represented by the deep purple,/pink in Figure 1.1L.
25


The western edge of this southern extension can be observed on the edge of the map
sheet between 528"15" and 528"30" (Fig. 1,11).
The granodiorite at Big Lake #1 is coarse grained and moderately weathered,
consisting of abundant quartz (-40%), microcline, orthoclase and sericite (Gatehouse
et al., 7995). At Moomba, the granite is also very coarse grained but contains
predominantly orthoclase (-60%), quaúz (-30%), plagioclase (5%-10%) and
chloritised biotite (5%) (Gatehouse ef aL, 7995). These authors dated Big Lake Suite
Gronodiorite samples from Mcleod #1 and Moomba #1 using U-Pb isotopic analyses
and established ages of implacement at between 298r4Ma and 323tMa (Early-Middle
Carboniferous). These dates correspond with the Devonian-Early Carboniferous Alice
Springs Orogeny along with the formation of the Radium Ridge Beds and Mt Gee
Sinter (Gatehouse et øL,1995; Priess, 1995).
1..8.4 COOPER BASIN1.8.4.1. Merrimelia Formation
The Merrimelia Formation is the basal unit of the Cooper Basin and was deposited
unconformably on the deformed Warburton Basin (Fig. 1.3). According to Williams
and Wild (79Saa) and Chaney et al. (7997) the Merrimelia Formation is composed of
glacial and peri-glacial sediments which form a depositional continuum with the
overlying Tirrawarra Sandstone, Glacio-fluvial, glacio-lacustrine, deltaic and aeolian
facies form the bulk of the Merrimelia Formation. No glacio-marine sediments were
observed. A detailed description of the various facies types observed in the
Merrimelia Formation is given in chapter four.
The Merrimelia Formation has been traditionally regarded as economic basement
until the drilling of Pondrinie 5 in 1989 and Malgoona 1A in 1990, Both wells
penetrated commercial hydrocarbons columns, with the Pondrinie 8 well intersecting
56m of net pay in a sandstone sequence that exhibited an average porosity of 78%
(Gravestock et aL 1998). On test Pondrinie 8 flowed at 8.71mmcf/d while Malgoona
1A flowed oll at 640bbl/ d.
1.8.4.2 Tirrawarra Sandstone
The Tirrawarra Sandstone has long been accepted as a sequence of fluvial sediments
deposited on a broad outwash braidplain (Gostin, 1973). The sandstone is of variable
thickness (average 70m) and generally interfingers with the Merrimelia Formation
(Williams and Wild, 1984a). Locally, near basement highs, Tirrawarra sediments may
however unconformably overlie Merrimelia sediments (i.e. Big Lake Field - see
21

Chapter Nine). The depositional geometry has been likened to that of a braid delta
(Hamblin et ø1., 7996) in part reworked by a transgressive and regressive lacustrine
shorezone which prograded and retrograded across the area in response to frequent
changes in lake level (Seggie et ø1.,7994).
The Tirrawarra Sandstone is subdivided into four facies associations (Williams and
Wild, 1984a & 1984b). Association 2 comprises the main net pay hoÀzon for
hydrocarbon production (Chaney et nI., 1,997). Association 2 consists of a medium-
coarse grained sublitharenite with trace conglomerate, mudrock and coal intervals,
The sandstone architecture reveals multiple stacking patterns with rarely defined
upward-fining or coarsening facies transitions (Chaney et aL, 7997). The sandstone
packages locally preserve vegetated (and coalified) bar tops and the whole of
Association 2 was deposited in a proglacial braidplain in which bed accretion of low
amplitude medial bars led to the stacking patterns observed within the sandstones
(Chaney et aL,1997).
1.8.4.3 Patchawarra Formation
The Patchawarra Formation in general unconformably overlies the Tirrawarra
Sandstone in the deeper parts of the Cooper Basin. This unit also unconformably
overlies the Merrimelia Formation and Warburton Basin sediments at basin margins
or near structulal highs (see Tallalia #1 lithology log Appendix 9a).
The Patchawarra Formation is a coal measure sequence up to 680m thick composed of
interbedded, fluvial, fluviolacusturine, flood plain and deltaic sediments.
Thick sandsheet deposition occurred where early fault movement produced areas of
positive relief (Stuart,7976). These sandsheets also contain siltstones and minor coals
and represent the lowermost Patchawarra Formation. The middle section exhibits
extensive point bar and channel sediments within a system that is dominated by coal
seams (some up to 30m thick). The uppermost PatchawarLa Formation is characterised
by widespread flood-plain sediments consisting of lacustrine shales and delta
sandstones (Hill and Gravestock,1995). According to Carne (1986), the middle part of
the formation contains the most important commercial reservoir rocks.
'1..8.4.4 Murteree Shale
The Early Permian Murteree Shale comprises a uniform suite of dark grey to black
calbonaceous shales (micaceous in places), with minor interbedded siltstone and
sandstone (Carne, 1986). These sediments formed in an extensive fresh water lake that
28

possibly transgressed from the southeast to the northwest across the Cooper Basin
(Carne, 1986). This unit is generally uniform in thickness varying from 30m-60m and
forms a regional seal above the Patchawarra Formation. This unit attains its greatest
thickness in the Nappamerri Trough (Hill and Gravestock, 1995). The Murteree Shale
is considered a source rock and has been attributed with providing both gas and
condensate in Patchawarra and Epsilon reservoirs (Carne, 1986)'
1.8.4.5 EpsilonFormation
The retreat of the Murteree lake is marked by shoreline and delta plain sediments in
the lower Epsilon Formation (Carne, 1986). This unit, Eally Permian (Artinskian to
Kungurian) in age (Price ef ø1.,7985), is composed of 156m of fluviodeltaic sediments,
lacustrine shales, siltstones, sandstones and minor coals, The Epsilon Formation is
mainly developed in the Nappamerri Trough with the unit absent along the northern
flank of the Patchawarra Trough and on the western flank of the Cooper Basin (Hill
and Gravestock, 1995), According to Carne (7986), the sandstones within the Epsilon
Formation are thin and commonly fine to very fine grained, exhibiting abundant
quarLz overgrowths and clay matrix witl-rin the pore space which can destroy
reservoir quality. Commercial quantities of hydrocarbons have been found in this
formation at the Toolachee, Daralingie and Cuttapirrie fields (Carne,1986),
1,.8,4.6 Roseneath Shale
The Roseneath Shale, according Price ef al. (7985), is Kungurian (Early Permian) in
age. This unit, in the Nappamerri Trough, attains a maximum thickness of 100m
(Alexander, 1998) overlying the Epsilon Formation. The Roseneath Shale has similar
characteristics to the Murteree Shale, in that it is generally restricted to the
Nappamerri and Tenappera Troughs and comprises shales and siltstones that were
formed in an extensive lake system (Hill and Gravestock, 1995). The present day
distribution of this unit does not reflect its original extent with erosion at the end of
the early Permian stripping these sediments from off the flanks of the GMI Trend and
basin margins (Carne, 1986). This unit is considered a source rock unit and has
possibly acted as a source for hydrocarbons within the Epsilon and Toolachee
Formations (Carne, 1986). This unit also acts as a seal for the upper Epsilon Formation.
1,8.4.7 Daralingie Formation
The retreat of the "Roseneath lake" led to the deposition of regressive sediments such
as fluviodeltaic sandstones, siltstones and minor coal sequences (Thornton, 7979), thre
lower Daralingie Formation. According to the same author, this formation is absent on
structural ridges and is thickest in the Nappamerri Trough (100 metres thick). The
29

sandstones in this formation are thought to be deltaic in nature, representing
distributary mouth bars (Stuart, 1976). Price ef al. (1985) assign this formation to the
PP4 (Kungurian to Ufimian) palynozone.
The upper parts of the Daralingie Formation were truncated by a regional erosional
event. This erosional event exposed basement on structural highs, with subsequent
uplift resulting in the gradual removal of older Permian strata in the Patchawarra
Trough (Hill and Gravestock, 1995). The same authors suggested that any corurection
with the Arckaringa and Pedirka Basins (Fig. 1.1) would have been severed at this
time. The sands within the Daralingie Formation are tight, commonly exhibiting very
low porosities. These sandstones are accordingly are only productive along the
southwest flank of the Moomba structure (Carne, 1986).
L.8.4.8 Toolachee Formation
The Daralingie erosional event effectively peneplained the entire Cooper Basin
(Carne, 1986). The deposition of the Late Permian Toolachee Formation was very
widespread across the basin, with only a few emergent palaeo-highs not covered by
this unit. This unit is the most extensive Permian unit observed in the Cooper Basin.
The Toolachee Formation (Kazanian to Tatarian) commonly attains a thickness of 100
metres (up to 175 metres in the Nappamerri Trough) and is composed of sandstones
that have been deposited in mixed-load fluvial channels, and mudstones which have
formed in overbank and lacustrine settings. Alongside these deposits peat swamps
developed, forming coals (Stuart et aI., 1988). These sediments are observed in equal
proportions within this unit (Carne, 1986), but are not necessarily evenly distributed
throughout the unit. The formation, in general, comprises an upper and lower section.
The lower unit is composed predominantly of coarse grained sandstones, the main
hydrocarbon-bearing reservoirs in this unit, The uPPer unit is dominated by
interbedded coals and sandstones which dominantly exhibit poor reservoir quality.
Gas has, however, been found in this upper section at the Della Field (Carne, 1986).
During Toolachee deposition, the Cooper Basin was covered by extensive flood plains
across which meandered large rivers, with peat swamps over large areas of the basin
(Carne, 1986). Thornlon (7979) envisaged that Toolachee sediments were brought into
the basin from the west.
L,8.4.9 Nappamerri Group
The Nappamerri Group consists of the Late Permian to Middle Triassic Arrabury
Formation, which comprises the Callamurra, Paning and Wimma Sandstone Members
30

fivrnooucrrorv
and the Middle Triassic Tinchoo Formation (Hill and Gravestock, L995). According to
Alexander (1998) the Nappamerri GrouP can attain thicknesses, in the South
Australian portion of the Cooper Basin, of up to and in excess of S00metres.
'1,.8.4.9.1. Arrabury Formation
The sediments of the Tatarian to Anisian aged Arrabury Formation were deposited in
a broad floodplain setting that frequently supported lakes and was crossed by
extensive river systems (Hill and Gravestock, 1995). These sediments are ted,
representing an oxidising environment compared with the coal-forming environments
below. Hill and Gravestock (1995) interpret this shift in depositional style to be related
to continental scale climate change in the Triassic, which, when compared to the
Permian, is temperate (the climate of the Permian was polar to cool temperate). The
Callamurra Member is composed of carbonaceous reddish to purple mudstones and
siltstones containing thin interbeds of sandstone (Youngs and Boothby, 1985). The
Paning Member consists of upward-fining sandstones with minor mudstone
deposition in a fluvio-lacustrine environment along the flanks of the GMI Trend
(Youngs and Boothby, 1985). The Wimma Sandstone Member is a clean interbedded
sandstone with minor mudstone having formed in a braided stream system (Hill and
Gravestock, 1995).
1.8.4.9.2 Tinchoo Formation
The Middle to early Late Triassic (Anisian to Ladinian) Tinchoo Formation
conformably overlies the Wimma Sandstone Member and is confined to the
Patchawarra and Nappamerri Troughs (Hill and Gravestock, 1995). This unit,
composed primarily of interbedded sandstones, siltstones and mudstones, reaches a
maximum thickness of 100 metres.
Youngs and Boothby (1985) interpreted a high-sinuousity fluvial environment to be
the dominant Tinchoo Formation sedimentation style. In describing the basal part of
the Tinchoo Formation Hill and Gravestock (1995) concurred with the previous
authors but also noted that the lower part of the unit was dominated by upward-
fining sandstone beds, which graded into laterally extensive lacustrine mudstones
and siltstones, forming a regional seal.
1.8.4.L0 Cuddapan Formation
This is an areally-restricted sandstone, siltstone and coal unit observed in the
Patchawarra Trough (Krieg, 1995). This unit is recognised as the last deposited within
the Cooper Basin (Late Triassic - Carnian to Narian) obtaining a thickness of 67
3l

f¡vrnopucr¡orv
metres in Beanbush #1. The Cuddapan Formation unconformably overlies the
Nappamerri Group and is in turn unconformably overlain by the Poolowanna
Formation of the Eromanga Basin.
1..8.5 EROMANGA BASINThe Eromanga Basin is the largest of three epicontinental basins that form the ]urassic
to Cretaceous Great Artesian Basin (Krieg et aI., 1995). Only the southwestern portion
of the Eromanga Basin occurs in South Australia. The sedimentary record of the
Eromanga Basin extends without a major break from the Early Jurassic to Mid-
Cretaceous (Fig. 1.3) and consists of cyclical sandstone and mudstone units (Krieg eú
ø1., L995). The lower portion of the basin is composed of cross-bedded sandstone
sequences that formed in braided river environments (Hutton Sandstone) and contain
significant hydrocarbon reserves, particularly in Queensland. These sediments were
sourced, in a large part, from underlying Cooper Basin sediments (Krieg et aL.,7995).
The upper portion of the basin is composed of low energy, fine-grained lacustrine
siltstones and mudstones, which formed predominantly in floodplain environments.
A marine incursion is recorded by a grey, fossiliferous mudstone-siltstone sequence
and regressive sandstone-siltstone unit in the upper part of the Eromanga Basin.
Deposition of the Eromanga sedimentary sequence commenced in the Early furassic
with the Poolowanna Formation (a maximum thickness of 206 metres is described in
the Windorah Trough). This unit consists of fluvial quartzose sandstones, interbedded
with carbonaceous siltstone/shale and coal (Carne, 1986). It grades into the overlying
Hutton Sandstone exhibiting both good reservoir quality and oil prone source rocks.
Commercial quantities of oil have been found within this unit at the Bodalla South
and Kenmore Fields (Carne, 1986).
The Hutton Sandstone consists of a sequence of anastomosing and aggrading braided
stream deposits. Sediment influx, according to Carne (1986), outpaced subsidence
such that braided fluvial deposition was superseded by meandering stream
deposition in the upper sections. The formation is composed of up to 200 metres of
very fine to conglomeratic, moderately to well sorted sandstones. Minor siltstone and
shale interbeds do occur. Although the sandstone pore space is dominated by quafiz
overglowths and kaolin clay, this unit displays excellent reservoir quality and
represents the major hydrocarbon bearing zone in the Eromanga sequence. The
majority of oil accumulations reservoired in the Hutton Sandstone occur around the
edges of the Nappamerri Trough in both South Australia and Queensland (Carne,
7986).
32

f¡vrRoo¿rcr¡o¡v
In places the Birkhead Formation lies conformably on the Hutton Sandstone. This unit
consists of shallow lacustrine, swamp, interfluvial and overbank deposits and
attaining a maximum thickness, in the Windorah Trough, of 100 metres. The Birkhead
Formation formed via coalescing fluvial systems where relief was low and extensive
lakes formed, Extensive floodplain and backswamp environments have also been
interpreted, with coal formation common in a moist and temperate climate capable of
supporting conifer forests (Carne, 1986). Oil generation from the shales and coals in
the Birkhead Formation has only been moderate with accumulations noted at Moorari
#3 and Big Lake #26. Importantly the Birkhead Formation acts as a seal for Hutton
Sandstone reservoirs.
The contact between the Adoli Sandstone and the underlying Birkhead Formation is
generally abrupt (Carne, 1986), This formation is approximately 30 metres thick,
composed of braided and meander sandstones where stacked point bar sequences
predominant. The rocks in this unit appear to have been deposited in a high energy
environment (as opposed to the low energy environment of the Birkhead Formation),
The sandstones exhibit porosity ranging from poor to very well developed and grain
sizes that vary from very fine to conglomeratic. Sorting accordingly is moderate
where grains are angular to sub-angular in nature. Only minor accumulations of
hydrocarbons (Koora #1 and Koorapora #1) have been found in this unit (Carne, 1986),
The deposition of the Westbourne Formation (average thickness of 110 metres)
represents deposition in a predominantly flood plain setting which eventually became
dominated by lacustrine sedimentation. Accordingly the formation consists of a fining
upwards sequence composed of thinly bedded, fine grain sandstones, and shales as
well as rare coals. Quartz and calcite cements are common with kaolin the dominant
pore filling diagenetic phase. Commercial accumulations of hydrocarbons are found
in this unit at the ]ackson Field (Carne ,7986). The Hooray Sandstone (114 metres thick
in the type section) is interpreted to occur where the top Westbourne correlation is
uncertain and where the lacustrine facies in this formation are not present. This occurs
predominantly in the southern flanks of the basin where the Hooray Sandstone
consists of braided sandstones.
Following lacustrine Westbourne sedimentation, extensive braided stream
sedimentation occurred. These strata are assigned to the Namur Sandstone Member.
The sandstones in this unit are consistently massive in natute, fine to coarse-grained,
predominantly quartzose with minor feldspar. The Namur Sandstone generally
attains a thickness of 200 metres (Moomba Field), Carne (1986) describes fining
JJ

ODI.ICTION
upwards sequences with the top cycle grading into lacustrine conditions (Murta Shale
Member). This unit lepresents a major reservoir for both hydrocarbons and artesian
water. Gas has been found accumulated in Namur sands in the Namur and
Marabooka Fields (Carne, 1986).
The Murta Shale Member (approximately 73 metres thick) is a lacustrine sequence
consisting of shallow siltstones and shales with minor deep-water mudstones. Flood
deposits, turbiditic grain flows and deltaic sediments also comprise this unit (Carne,
1986). The rock quality is regarded as fair to poor (Carne, 1.986)'
The Cadna-owie Formation ranges in thickness from 40 to 90 metres and represents
the transition between the terrestrial sedimentation of the lower Eromanga sequence
and the predominantly marine deposition which prevailed through much of the
Cretaceous (Kreig and Rogers, 1995). This formation consists of fine to medium
grained quartzose to sub-labile sandstones and basal siltstones with minor shales
noted. Pebbly layers, conglomerates and diamictites occur locally (Kreig and Rogers,
1995). The whole unit is upward coarsening in nature. Hydrocarbons have been
generally noted in the Wyandra Member (200 metre thick in Rolwegan Creek #1),
which is representative of a transgressive beach sand.
Other Cretaceous units include the Wallumbilla Formation, Bulldog Shale, Corrikiana
Sandstone, Toolebuc Formation, Allaru Mudstone, Oodnadatta Formation, Mackunda
and Winton Formations,
The Wallumbilla Formation (361 metres thick in Cuttapirrie #1) consists of grey
siltstone with minor mudstone having formed in a shallow, epicontiental marine
environment. The Bulldog Shale (up to 350 metres of section is observed in the
Nappamerri Trough) is similar to the Wallumbilla Formation, consisting of dark grey
carbonaceous shale with concretionary limestone (Carne, 1986). Fine interbeds of
sandstone have been reported along with fossilised wood (Kreig and Rogers, 1995).
The Coorikiana Sandstone is a thin unit (L0 metres thick on average) consisting of
bioturbated sandstone, having been formed in a shallow marine environment. The
Toolebuc Formation has a variable thickness of 3 to 75 metres and consists of dark
grey to black siltstone, mudstones and marl (Calne ,1986). This unit formed in shallow
marine conditions. The Albian aged Allaru Mudstone (197 metres thick in Coopers
Creek #1) rests conformably on the Toolebuc Formation. This unit contains thin
interbeds of grey siltstone/mudstone and calcareous siltstone (Kreig and Rogers,
1995). Concretionary limestones have also been reported from this formation (Senior
34

et ø1., 7978). This unit is interpreted by these workers as having formed in quiet
marine conditions. Consisting of mainly shale and siltstone, with minor calcareous
sandstone and rare limestone the Oodnadatta Forrnation, like the Allaru Mudstone, is
interpreted to have been deposited in quiet shallow marine conditions (Carne, 1986)'
The Oodnadatta Formation attains a maximum thickness of 300 metres in the
Moomba region. The Mackunda Formation (generally 100 metres thick) represents a
marginal marine sequence of siltstones, calcareous sandstones and shales that
represent the transition between the marine Allaru Mudstone and the terrestrial
Winton Formation (Senior et aL, 7978), The Winton Formation is a 900 metre thick
seqllence of interbedded grey shales and siltstones that formed in a low energy
meander system (Kreig and Rogers 1995).
The first commercial hydrocarbon discovery was made at the Gidgealpa #2 well in
1963. Subsequently 727 gas fields and 25 oil fields have been delineated (Hill and
Gravestock, 1995) (Fig. 1,12). Morton (1998) estimates that the present discovered
recoverable reserves within the Cooper Basi¡r amount to 8,2 TCF (229 x10'm') of raw
gas and 43.9 MMSTB (6.9x10'Kl) of oil. These reserves are mainly reservoired within
four way dip closures on the flanks of intrabasinal highs (such as the GMI Trend)
(Schulz-Rojal^tn, 1993; Apak ef aL 7997). To date, in excess of 1500 exploration and
development wells have been drilled within the Cooper Basin with the greatest
exploration successes coming from drilling large anticlines and drape structures (e,9.
Moomba anticline :r':r7966). Only a limited number of stratigraphic targets have been
drilled (Heath, 7989), with commercial hydrocarbon accumulations found at
Pondrinie, Wackett and Naccowlah South (Stanmore, 1989). The discovery of
stratigraphic hydrocalbon accumulatior-rs is becoming more commonplace (Hill and
Gravestock, 1995).
The PatchawaÍta, Toolachee and Daralingie Formations (Fig. 1.4) are the most
productive gas-bearing units whilst approximately 95"/" of Cooper Basin oil isreservoired in the Tirrawarra Sandstone at the Tirrawarra Field (Heath,7989).
35

ô\,1 000 km Darwin
¿
G
Perth Pott
Legend
Gas Pipeline
0il Pipeline
Iu
Hobaft
Moomba
SW1 Gas__t__ Centre
Allce Sprlngs
Basin
Kalgoorlie
t--
A
B a
sˡ
è å
È
WAREENA
Wrern, ¡)Earrolka
Keilor
4.T.P.259P Drrrr¡m JDowm I
Challum
INNAMINCKA
Baryulah
AOUITAINE'A'aJuno
Jam€s ú
Cuttapirri
,Packsaddle
)Rkby
Keleãry
atiefllacm an
IV
Nulla
KudLake
Lake
q
I
North
,Callabo¡¡aFly Lake/B
Tindilpie I
ShrrUSturt
Reg SIJriog
z Beanbush
Jack Lake.
Gidgealpa
lChkon
Wills
.0renlos
!}W¡nnìnia
ll Wolqalla
TOTAL 66
Psych
,,1.lhoar
Charo+
Kirrâleea
Farin¿
ngre
PEL5/6 546 IB
Figure 1.12 A) Oil nnd gns pipelines of Australin. B) Cooper Basin infrnstructure nnd the mnin producing oil nnd gns
fields.

ODUCTION
Additional gas reserves occur in the Epsilon Formation and the Triassic sediments of
the Nappamerri Group (Kantsler et aL.,1983; Heath, 1989).
The bulk of hydrocarbons is reservoired within fluvial channels and point bar
deposits with subordinate quantities found in lacustrine shoreline sandstone
reservoirs. According to Apak et ø1. (1997), fluvial channel and point bar sandstones
are characterised by low porosities (average 11%) and permeabilities (average, 30md).
Schulz-Rojahn and Stuart (1991) were more pessimistic stating that 75'/" of reservoir
sandstones within the Cooper Basin exhibit permeabilities of Smd. Micro-porosity
within kaolin booklets is important, especially for the storage of gas (Tingate and Luo,
7992).Tlne Roseneath and Mutreree Shales provide good to excellent regional seals for
the principle reservoir zones within the Cooper Basin (Kanstler et aI., 1983; Heath,
1e8e).
Cooper Basin oils and condensates are typically medium to light (43"-56" API), highly
paraffinic, low in sulphur, with variable low to high wax contents (Kanstler ef ø1,
L983). These hydrocarbons also exhibit high pristane/phytane ratios, indicative of a
land plant origin. Hunt ¿f ø1. (1989) stated that most Permian oils contain significant
amounts of dissolved gas, with little evidence of water washing. McKirdy (7989)
found this to be also true for hydrocarbons sourced from glacigenic sediments of the
Cooper Basin, concluding that coals within the Tirrawarra Sandstone have great
hydrocarbon generating potential with the generated product likely to be light oil
with gas. The same author also observed that the Merrimelia Formation was lean in
organic carbon. The generation of Tirrawarra crudes, according to Hunt et al. (7989),
was from inter-seam coal measures of the upper Patchawarra Formation rather than
Tirrawarra coal seams.
Hydrocarbon gases within the Cooper Basin include methane (C,), ethane (Cr),
propane (C.), butane (Co) and pentane (Cr) (Hunt et øL, 1989), Other gases include N,
H, FIe, HrS and CO,, with the CO, percentage varying from 10% Io 40f". Kanstler el al.
(1983) demonstrated that the origin of CO, was from both basement granites and the
thermal breakdown of humic sediments. These authors went on to say that the
primary source of wet gas and oil found within Permian reservoirs in the Patchawarra
Trough and GMI Trend are the shales between coals. Smyth (1983) disagreed, citing
that the vitrinite in dispersed organic matter within intraformational coals, represent
the primary source of oils reservoired in the Cooper Basin, Hunt ef aI. (1989) agreed
with Smyth (1983), suggesting that the potential for both gaseous and liquid
hydrocarbon generation within coals is high. Kanstlet et nL (1983) however, cautions
37

L¡vrRopucrro¡¡
that the dominance of Type III kerogen in source sediments will yield low volumes of
liquid hydrocarbons, In summary no one specific oil prone source rock has been
identified as the source of hydrocarbon accumulations in the basin'
Kanstler et øt,, (1983) stated that the juxtaposition of sources, seals and reservoirs
within Cooper Basin formations is extremely favourable for hydrocarbon migration
and entrapment. Within these formations vertical and lateral migration of
hydrocarbons is facilitated by communication of charrrel and point bar sandstones
(Kanstler et a1.,7983). The timing of hydrocarbon expulsion from source rock varies as
the maturity of these rocks vary (Tupper and Burckhardt, 1990). These authors
consider that the expulsion of oil in the central Nappamerri Tlough began in the early
Triassic, while Patchawarra Trough generation occurred in the Early Late Cretaceous.
These dates are certainly not universally agreed upon with Kanstler et al., (1983)
considering that oil generation occurred in the Patchawarra Trough after Cretaceous
deposition, Conflicting views also exist regarding the onset of gas generation in the
Cooper Basin. In the Nappamerri Trough, gas generation was thought to have
occurred from the Jurassic onwards (Tupper and Burckhardt, 1990).
The lowest geothermal gradients according to Bone and Russell (1988) are observed in
the Patchawarra Trough (lowest Innamincka #I, 3z"C/krn). Whilst the Nappamerri
and Tenappera Troughs have the highest recorded geothermal gradients in the
Cooper Basin (highest 50"C/km, Moomba #3). This difference in geothermal heat is
related to the lithology of the underlying basement. For example, the Nappamerri
Trough is underlain by a "hot" granite batholith (Big Lake Suite Granodiorite), rich in
radioactive minerals. In contrast, the Patchawarra Trough is situated on top of
sedimentary and volcanic rocks of the Warburton Basin where more typical heat
production prevails.
Tingate et aL (1992) contend that thermal conditions in the Cooper Basin have recently
been elevated, but hotter conditions have been experienced by some parts of the
Cooper Basin in the past, These authors also stated that the Eromanga Basin and
Nappamerri Trough (Cooper Basin) are currently in an elevated thermal phase, hotter
than for any period in the past.
Kanstler et øL (1983) and Tingate et ø1. (1992) both agree that a late stage elevation of
basin temperatures occurred in the last 10 million years. Tingate et øL (1992) believes
that this recent rise in Cooper Basin temperatures is a response to the diminished
cooling effects of aquifers within the Eromanga Basin (see Chapter Eight).
38

METHoDoLoGY
This chapter outlines the various analytical methods and equipment used in this
study.
All available literature from SANTOS Ltd., Boral Energy Ltd., Primary lndustries and
Resources (PIRSA) and the University of Adelaide library pertaining to the Cooper
Basin and in particular Merrimelia Formation was summarised. Key papers on
adjacent basins, conceming studies on Permian sediments, were also dealt with in the
same manner. The summaries were bound in a single volume (Cubitt, 1994), wlthcopies made available to the project sponsors.
The identification of Tirrawarra Sandstone lithologies was achieved via visual
inspection. Palynological confirmation was used where uncertainty existed. Plates l-a
and 1b are typical of the bulk of Tirrawarra sandstones being moderately sorted,
medium to course grained sub-litharenites arranged in cross bedded sets up to a
meter thick. Tirrawarra sandstones exhibit a consistent appearance across the basin
(Plates 2a &.2b). These two samples are separated by approximately 25 kilometres.
Rezaee (\996) divided the Tirrawarra Sandstone into seven different facies types,
several of these facies are thin, and/or have limited geographical extent. It has been
found, however, that in the majority of cases the Tirrawarra Sandstone, at the
Merrimelia interface, has an appearance that is consistent enough to make confident
identification possible.
TERATURE REVIEW.
IDENTIFICA OF
wARRA

Mtrnooorocv
PTATE 2Tirrawarra, Merrimelia & Warburton Basin Lithologies
UP SECTION IS TOWARDS THE CORE IDENTIFICATION STICKER IN VERTICAL PLATES ANDTO THE LEFT INHORIZONTAL PLATES
A) Core photograph - Tirrøwørrø #3 (2988.86m). A typical Tirrazuarra braid pløin
sandstone exhibiting lozu angle sinusoidal bedding.
B) Core photogrøph - Menimeliø #L (2674.44m). A typical Tirrazuørra sønd.stone
illustrating a rock thøt is quartzose in nature with horizontøl bedding.
C) Core photogrøph - Tirrawørra #2 (3L07.20m - 31-07.43m). Arenaceous Merrimelia
lithology exhibiting fløser and trough cross bedding typical of ø Deltøic sandstone.
D) Core photogrøph - Merrimeliø #5 (2718.4m - 27L8.56m). Arenaceous Merrimelia
lithology illustrating pinstripe lamination and high angle cross bedding typical of a gløcio-
øeolian sandstone.
E) Core photogrøph - Moorøri #2 (3L74.31m - 3174.46m), Argillaceous Merrimelia
lithology zuith abundant syn-depositional and post-depositional micro-faulting and soft-
sediment - deformation (a øraite mudst on e).
F) Core photogrøph - løck Løke #L (3240.49m - 3240.55m). Argilløceous Merrimelia
lithology with øbundant faceted pebbles of exotic composition (petromict diamictite). NBr .4
petromict diømictite is a bimodøI sediment thøt contøins clasts zohich haae not been sourced
locally.
G) Core photograph - Tickølørø #1. (1785.69m - 1785.84m). Typical Big Lølce Suite
granodiorite showing large feldspnr, micø ønd hornblende crystals.
H) Corc photogrøph - lnnøminckø #2 (3621.93m - 3622.06m). Wnrbtrton Basin,
Knlladeina F ormøtion litholo gy (Iimestone breccia).
40

Plate 2
Ti rrawarra Lithologies Merrimelia Lithologies Merrimelia Fm
A - Braid Plain Sst B - Braid Plain Sst C - Delta¡c Sst D - Aeolian Sst
Merrimelia Lithologies Merrimetia Fm Basement Lithologies
G - Weathered GranodioriteBig Lake Suite
H - Recrystallised LimestoneWarburton Basin - Kalladeina Fm
rvreeeru eu*ÈL 26t4-...':¡Ji-;*€å*. s 3 ?18g'86-
ñ::,{
hI)
''
?¡-,:
-i
E - Deep LacustrineVarvite Mudstone F - Petromict Diamictite
EXPDEV 077 K

In the majority of cases the Tirrawarra Sandstone, at the Merrimelia interface, has an
appearance that is consistent enough to make confident identification possible.
The Merrirnelia Formation, while mainly composed of argillaceous glacigenic rocks,
also contains sandstones (Plates 2c & 2d). These sandstones are generally deltaic
(Plate 2c), aeolian (Plate 2d) and shoreline in nature. These environments are
regarded as typical Merrimelia facies while the sandstones illustrated in Plates (2a &2b) arc formed in a braided river environment. These sandstones are therefore not a
Merrimelia facies type but are representative of Tirrawarra style sedimentation. It istherefore possible to differentiate between Merrimelia and Tirrawarra sandstones byobserving sedimentological character.
Most Merrimelia facies are however not arenaceous, but argillaceous. These
argillaceous lithologies are varied (Plates 2e & 2f) and are easily distinguished fromTirrawarra braid plain sandstones (Plates 2a Ex2b).
The identification of Merrimelia and Tirrawarra lithologies involved the inspection ofapproximately 110 wells in the South Australian and Queensland sectors of the
Cooper Basin, utilising the above identification criteria. Merrimelia and Tirrawarra
facies were positively identified in cored intervals in 70 wells (Appendix 9a). The
Merrimelia facies in these cored intervals became the primary resource for thinsection sampling (Appendix 3a). A smaller number of thin sections were sampled
from Tirrawarra facies (Appendix 3b).
2.3 IDENTIFICATION OF BASEMENT LITHOTOGIESIdentification of Warburton Basin facies and Big Lake Suite granodiorites, were based
purely on core inspection.
2.4 LITHOLOGICAL LOGGING.Extending from the work of Williams and Wild (198aa) and Williams et al. (1935 &1987), identification of Merrimelia glacial facies was completed on 70 wells in both
the South Australian and Queensland sectors of the Cooper Basin. All cores were
logged with a view to reservoir quality and clast lithology. Detailed sedimentological
interpretations were not recorded.
Detailed sedimentological analysis was, however, performed on exactly the same core
intervals by A. Chaney (Aberdeen University) as the basis of his PhD study (see
42

ETHODOLOGY
Chaney, 1998). His facies interpretations are used (and acknowledged) throughout
this thesis, particularly in Chapter Four.
Photographs of all thin section core samples were taken. In most cases, this was done
prior to the core being cut. The subsequent images made it possible to relate the thin
section samples with the core.
2.5 THIN SECTION SAMI'LING.2.5.1 MERRIMELIA FORMATION.In total 160 core samples were collected from throughout the Cooper Basin,
encompassing maximum stratigraphic and facies variations within the Merrimelia
Formation. Thin sections were then cut from each core sample taken. The
nomenclature used in naming thin section samples, (referred to throughout the text
and in diagrams), is shown in Figure 2.1.
THIN SECTION NAMING CONVENTION
Well numberlla
GIDG 3AFirst four letters of the wellfrom which the sample was
taken (i.e. Gidgealpa #3).
¡È Shallowest sample in well
Figure 2.1 fnn sectiott nanúng conoention.
GIDG 38 is the next deepest sample from the Gidgealpa #3 well followed by GIDG
3C etc. Clay fraction samples are labelled such that the fraction size of the sample is
used as a prefix i.e. 2MAL 4H (<2 micron clay fraction from Malgoona #4 well).
A full list of thin section samples in both the Merrimelia Formation and Tirrawarra
Sandstone and their respective depths (in meters) is given in Appendix Three.
2.5.2 TIRRAWARRA SANDSTONE.Forty three thin sections were prepared from Tirrawarra facies with the view toobtaining maximum stratigraphic and geographic coverage. The Tirrawarra thinsection database used in this study is not evenly distributed across the basin with half
43

of the samples concentrated around the Fly Lake - Brolga, Moorari, Tirrawarra and
Merrimelia Fields.
2.6 PETROLOGY TECHNIQUES.2.6.']. POTNT COUNTING AND PETROGRAPHYA total of 1.M thin sections were impregnated with blue epoxy resin to facilitate
porosity identification. Rock fragment lithology identification and authigenic mineral
recognition was performed on an Olyntpus BHT petrological microscope.
Photomicrographs were taken of every rock fragment type identified and of all the
main diagenetic features.
Quantification of thin section sample mineralogy was achieved with a combination ofvisual percentage estimation charts (Terry and Chilingar, 1955), traditional
microscope point counting (200 counts per slide) and a video image analysis system
linked to an Olyrtrpus petrological microscope. All 144 thin sections were initiallyanalysed using the visual estimation charts developed by Terry and Chilingar (1955),
as the oversized dimensions of rock fragment clasts in the majority of thin sections
precluded the use of traditional point counting methods. To check the accuracy of
visual estimation, 80 thin sections with grain size ranging from very coarse to very
fine were randomly selected and point counted utilising the irnage analysis
technique. A comparison of results gained by both techniques (visual estimation and
image analysis) reveals that there is little variation between estimated and counted
data (Table 2.1).
The image analysis system utilises VIDEO PRO 32'^'image processing and statistical
analysis software. Sandstone compositions were calculated using TRIPLOT 3.0rM
ternary diagram software and classified according to Dott (1964).
All rock fragments observed were defined. Thus consistent identification of rock
fragments was possible between all thin sections analysed. The clast definitions used
are presented in Appendix 4a.
Specialised petrographic techniques such as cathodoluminescence (CL), reflected
light and fluorescence microscopy (FM) were also used to better ascertain diagenetic
relationships.
44

Rock Fragments
Quartz Total
Accessory Minerals Total
Metamorphic TotalAuthigenic Component
Carbonate Cement 6.3 17.2 -4.9
Authigenic Phases Total
TOTALS
Igneous Total
Opaque Minerals TotalPorosity Component
1 1.5 -0.5
Secondary Porosity 5 3.1 1.9
Total Porosity 6.2 6.0 0.2
Table 2.'1, Compørison of image anølysis point counting data and data derioed from using
aisual estimation charts deoeloped by Terry ønd Chilinger (1955), in an attempt to assess the
accuracy of petrogrøphical estimations of øuthigenic and framework conrponents.
2.6.2 THTN SECTION DESCRIPTIONSFramework, authigenic and matrix components, in each thin section, were described
with particular emphasis on diagenetic relationships and rock fragment lithology(Appendix 9b). A paragenetic sequence was recorded for each thin section. This was
then combined with adjacent thin section descriptions, to produce regional
paragenetic sequences (Chapter Eight).
45
As part of routine mineralogical investigations, bulk air dried XRD smears were
produced and analysed for each thin section core sample obtained. Clay separates (<4
and <2 micron) were prepared and run for selected illite-rich samples identified from
bulk XRD analyses. The clay fractions were run air dried and glycolated, as oriented
samples using the filter transfer method outlined in Moore and Reynold (1989). The
amount of expandable layers in the illitic I/S mixed layered clay was estimated from
broad XRD peaks using peak positions given in Moore and Reynold (1989) and by
comparison with calculated XRD profiles generated using NEWMOD (Moore and
Reynold, 1989). Mineral identification was performed using TRACES 3.0'^ software.
All XRD samples were run on a Philips PW1050 X-ray diffractometer at 50KV and
35m4, using Co-K cx-radiation, at a scan speed of 2" per minute. XRD-derived mineral
proportions for all of the bulk samples analysed (which correspond with thin section
samples), are given in Appendix Seven.
2.8 MTCROSCOPYTECHNTQUES.2.8.1 CATHODOLUMINECSENCE MICROSCOPY (CL)
Twelve samples were studied by CL to identify quaftz cement stratigraphy,
carbonate cement zoning, kaolin/quartz relationships and authigenic illite response.
The CL analyses were performed on a Patco ELRM-RX Lunünoscope which was used
in conjunction with a Leitz Orthontat E autonutic ca117era. Acceleration voltages of 6kV
were used for carbonate minerals and 12kV for quartz. The beam current was set at
200m4 whilst the polished thin sections were held under vacuums of between 70 and
100 mTorr. Photomicrographs were taken of all relevant relationships observed using
Kodøk Ektøpress 7600 ASA film in a Leitz camera with exposure times ranging fuom 2
to 15 minutes.
2.8.2 FLUORESCENCE MICROSCOPY (FM)
A total of 24 thin section samples frorn 23 wells were selected for standard
fluorescence microscopy. The light source consisted of a 700W Olyntpus (BH2-RFL-T3)
mercury vapour lamp which was connected to an Olyntpus BHSP binocular
petrological microscope. Photomicrographs were taken of all relationships observed
with an Olynrpus SLR camera utilising normal Kodak 800 ASA film.
46

2,8.2.1 Illite Fluorescence - An IntroductionThroughout this thesis the use of fluorescent photomicroscopy to characterise illite iscommon. To the best of my knowledge illite fluorescence has not been described insandstones as any discussion appears to be absent in the published literature worldwide. This technique has proved to be a valuable new tool for the optical
characterisation of illite and as such a whole chapter (Chapter Seven) has been
devoted to the phenomena. In an attempt to aid the reader in the interpretation of
fluorescence photomicrographs, without going into a premature discourse of the
phenomenon, a cursory explanation and identification of fluorescing species is given
here.
Plate 3a illustrates abundant illite in an altered feldspar phenocryst within a
rhyodacite rock fragment. The same field of view when exposed to UV radiation
produces brightly luminescing patches (Plate 3c). The fluorescing patches correspond
with the illite illustrated in Plate 3a. This relationship is clearly shown in the inset
Plate 3b. The surrounding rhyodacite groundmass is also dominated by illite and also
fluoresces (Plate 3c). Other fluorescing species observed in Merrimelia sediments
include zoned carbonate crystals (orange fluorescence) (Plate 3d) and the mounting
media (green fluorescence) (Plate 3e).
2.8.3 REFLECTED LIGHT MICROSCOPYReflected light microscopy was used to delineate accessory minerals as an adjunct to
normal petrological investigations. This technique was also employed to discriminate
rock fragments from pseudo-matrix and matrix. The light source and microscope set-
up used was identical to that used in the Fluorescence microscopy techniques
previously mentioned (L00W Olympus (BH2-RFL-T3) mercury vapour lamp connected
to an Olympus BHSP binocular petrological microscope). The images produced were
saturated blue in colour, which were then scanned into Corel Photo Paint 7'^' and
enhanced by using lighting levels, hue slider and monochrome filters withinPhotoLøb'^'.
The resulting images were monochrome, with edge enhancement set at high levels to
emphasise textural differences between the various objects within the image (Plate
17c & 17e).
47


2.8.4 SCANNING ELECTRON MICROSCOPY (SEM)
SEM studies were undertaken on freshly broken core samples as well as on the <2
and <4 micron clay separates sent for K-Ar dating. Both sample types were coated
with carbon and gold/palladium. Scanning electron microscopy and semi-
quantitative compositional analyses were performed on an XL20 Philips electron
microscope with an energy dispersive X-ray (EDX) analysis system attached.
2.8.5 TRANSITION ELECTRON MICROSCOPY (TEM)
Identification of illite morphologies, composition of individual clay particles and avisual assessment of the purity of <2 micron K-Ar age dating samples were
performed on a Philips CM TEM-200. The analyses were performed at an operating
voltage of 200 kV with a spot size of 5n. An energy dispersive X-ray (EDX) analysis
system connected to the TEM allowed compositions of individual clay particles to be
obtained. Photomicrographs were taken of individual clay particles and at the sites
where clay particle compositions were measured. Selected area diffraction (SAD)
pattern images were recorded for representative clay particles from two <2 micron
clay separate samples.
2.9 MICROPROBE TECHNTQUES.Elemental compositions of all authigenic phases was performed on a CAMECA SX 51
microprobe operating at 15kV to 20kV, using a 20nA beam current and a 0.2¡r beam
diameter. A back scattered image analyser (BSE) was attached to the probe. BSE
irnages were taken primarily of carbonate cement zonations (Chapter Six) and
authigenic illite (Chapter Six).
2.1.0 K-AR DATTNG TECHNTQUES.Through detailed XRD, petrographic and fluorescence analyses, samples that
contained extensive authigenic illite were selected for K-Ar age dating. Two samples
were chosen, from different and wide spaced wells (Merrimelia #18 and Malgoona
#4). From these two samples both <4 and <2 micron clay separate samples were
obtained via the processes outlined below in Figure 2.2. K-Ar dating was then
performed on both clay separates from both samples according to the flow charts
illustrated in Figures 2.2 and2.3.
Sample purity was first assessed by XRD and SEM and then by TEM. Both the<4 and
<2 micron size fractions were isolated, using Stoke's settling criteria (Tucker, 1988).
50

Sample collection was obtained by applying a simplified version of the illiteseparation procedure outlined in Hamilton et øL (1989) (Fig.2.2).
Plate 4TEM Sample Putity
TEM Photomicro grøph Merrimeliø #78
(2547.83m). K-Ar Illite dating clay
separate sample (<2 micron size
fraction). This view illustrates sample
purity as only lath and flake illiteparticles can be observed.
Purity assessment by XRD and SEM observations of both size fractions indicated that
there was some quartz contamination in the <4 fraction samples but no detectable
contaminants in the <2 fraction separates. The purity of both <2 micron samples were
further confirmed by TEM analysis where it was observed (Plate 4) that only euhedral
illite laths and plates were present.
The potassium determination was performed at The University of Adelaide in the
Department of Geology and Geophysics on a VARIAN AA6D Atomic Absorption
Spectrometer (a detailed explanation of this process is given in Appendix Six).
The analysis of radiogenic *Ar was performed on a modified MS-10 Mass-
Spectrometer at Amdel Løboratories in Adelaide (a detailed explanation of this process is
given in Appendix Six).
5l

K.AT DATTNG PROCEDURE SAMPLE SELECTION
ILLITE SEPARATION
<4 MICRON FRACTION FRACTION
5-L
Figure 2.2 X-¡r døting sømple selection and cløy fraction separation procedures.
52

ILLITE STZE FRACTION PURITY ASSESSMENT
<4 MICRON FRACTION <2 MICRON FRACTION
Figure 2.3 Sømple purity assessnrcnt procedures,
The K-Ar ages were calculated using Equation 1
2.l.L STATISTICAL TECHNTQUESStatistics has been used extensively throughout this study in order to:
1) Resolve rock fragment proportion trends in both Tirrawarra and Merrimelia
petrographic data sets in order to highlight the movement of glacial sediments.
2) Resolve rock fragment populations in order to highlight provenance trends.
3) Resolve mineralogical trends in Tirrawarra and Merrimelia petrographic data
sets with a view to highlighting diagenetic processes.
1 Los"læt?).']ï 4+18(From Pethero and Schwab,1996)
T.= Age (Million Years)
f," = 0.581 x10-'n Yr''
),"þ = 4,962 x 10 'o Ya''
Equation 1
The following section describes the various statistical techniques used in this study
53

Authigenic mineral and rock fragment datasets from both the Tirrawarra Sandstone
and Merrimelia Formation were analysed using principle components analysis
(PCA), Kolmogorov-Smirnov (KS) normality tests, Pearson correlation coefficients
(using a "t" statistic 95% level of significance) and cluster analysis. In addition to this,
compaction index, sorting and grain size data derived from Merrimelia sediments
were also analysed statistically using the techniques outlined in Swan et ø1. (1995).
2.11..''. CLUSTER ANALYSISCluster analysis is a widely employed technique that organises data intohomogeneous groups so that the relationship between the data groups is revealed
(Davis, 1986). It has been employed in this study to classify rock fragment types
diagenetic minerals and reservoir characteristics in relation to geographical position.
A large number of cluster analysis techniques have been developed (Flaft et a1.,1995).
Davis (1986) describes cluster analyses as belonging to four groups: portioning,
arbitrary, mutual singularity and hierarchal methods. Hierarchical techniques are the
most commonly used clustering methods within the earth sciences (Davis, 1986)
producing the most favourable results. Three hierarchical cluster techniques were
used in this study:
1) Centroid linkage
2) Single linkage
3) Average linkage
Both raw and manipulated data (Z-scores)' were used in the three cluster techniques
outlined above. The three differing cluster techniques were used in order to ascertain
which cluster method produced the most consistent result. Kolmogorov-Smirnov
tests of normality were performed on statistically significant rock fragment datasets
to assess normality. If the data set was normally distributed then the data set was
standardised (Z-Scores) and subsequently clustered. If no normality was found, the
data set was left unstandardised and clustered (Fig.2.Ð.
' Z scores are values gained by standardising normally distributed data (Swan et ø1.,1995).
54

CLUSTER ANAYSIS PROCEDURE
SAMPLE SE¿ECTTON
NORMALITYTESTS
Figure 2.4 Cluster Analysis Procedure
55

Mtrnoootocy
The selection of statistically significant variables in both the Tirrawarra Sandstone
and Merrimelia Formation was performed by way of Pearson correlation coefficients
and principle components analysis.
Pearson correlation matrices were constructed using a "f " statistic confidence level of95% (Appendix 8a details t}:.e "t" statistic equation used). Variable pairings were then
graded according to the value of their "t" statistic (both positive and negative
associations). The most significant variable pairings (rock fragments and authigenic
minerals) in both Tirrawarra and Merrimelia datasets were then able to be
ascertained (Table 5.8).
ln addition to Pearson correlation assessment, PCA was performed whereby rawMerrimelia and Tirrawarra data sets were transformed onto an arbitrary orthogonal
axis (Davis, 7986). The assessment of correlation matrices produced via thistransformation allowed identification of statistically significant rock fragments,
authigenic minerals etc. in successive data sets (Appendix 8a). This technique also has
the effect of removing sampling bias from a dataset while at the same timehighlighting dependent variables (Smith, 7969 ; Davis, 7986).
t0
05
00
-05
-10
c
L_t
t0
05
00
-05
l0 E
00
-05
-10
Figure 2.5 An example of a dendrogram which displays two data groupings (From Daais,
7986).
56

The dendrograms in this thesis were produced according to Figure 2.4 where the
initial clusters form (Fig. 2.5a), followed by the connection of remaining data (Fig.
2.5b) and finally the two clusters are joined (Fig. 2.5c). The method by which the data
is paired into clusters is what distinguishes differing cluster techniques.
The cluster analyses used in this study, group data according to the minimumdistance between objects (single linkage), the average of distances between objects
(average linkage) and the mode between objects (centroid linkage) (Hair et aL,1995).
The centroid cluster analysis technique was employed in preference to the average
and single linkage methods as the centroid method is less sensitive to outliers (Hair
et, øL, 1995) and produced the most consistent results. This decision was made after
comparing the dendrogram ouþuts of all three cluster methods alongside exotic rock
fragment transport directions derived from petrographic analysis (see Chapter Five).
The dendrogram in Figure (2.5c) is the standard visual output generated byhierarchical cluster analysis.
All multivariate analyses including cluster analysis, principle component analysis
(PCA), Pearson correlation matrices and normal distribution graphs were computed
using SPSS 7,5.1.rM software. Scattergrams and crossplots displayed throughout this
document were all produced using Microsoft Excel 7@ software. Pearson correlation
coefficient 95% significance "t" statistic values were also produced using Microsoft
Excel 7@ software.
2.11..2 VARIOGRAM ANALYSISDiagenetic and rock fragment distribution maps were constructed using pointcounting and visual estimation techniques outlined in section 2.6. As the petrographic
data sets are geographically skewed with most sampling (coring) concentrated in and
around the major fields of the Cooper Basin, any map produced using petrographic
data were deemed to have a high level of data "nuggeting" (bulls eye effect). To
assess the amount of "nugget effect" semi-variogram analyses were performed on
every map produced in this study. The resulting variogram gives a confidence rating
for a map indicating over what distance (from a concentration of data) is contoured
data accurate or a product of the contour algorithm.
The petrographic datasets were normally krigged using a spherical variogram model
utilising SURFER Version 5.01@ software. Medium contour smoothing and an overlay
of sample wells was then applied to the final maps. To assess the nugget effect of each
57

Mrraoootocv
map, serni-variograms were produced using Variogran V2.2 and Variowin V2.2
software, using a spherical variogram model with an anisotropy of one. Variograms
for each map used in this study are illustrated in Appendix 8c.
The semi-variogram crossplots were constructed by plotting the semi-variance (2y)
along the Y-axis and distance between sample pairs ( lh l) (it, meters) on the X-axis
according to the method outlined in Clark (1979) (Fig.2.6).
Figure 2.6 TheoreticøI senüaøriogram (Modifiedfrom Prosser and Maskøt\, L993).
The correlation range ("R") (Figurc 2.6) provides a measure of the distance over
which there is a reasonable correlation between sample values (Prosser and Maskall,
1993). Ir1 the case of Figure (2.6) data correlation is applicable up to 40km from the
origin. \rVhen sample spacings are greater than "R" the variogram function becomes
asymptotic forming a sill (Fig. 2.6). The level at which the data becomes asymptotic is
then projected back to the Y-axis (C). Similarly the nugget (N) is calculated by
projecting the data trend line to where it meets the Y-axis (Fig.2.6). The nugget effect
is then calculated using the following formulae:
fNugget Intercept (N)/Sill Height (C)] x 100 = Nugget Effect Equation 2
In the case of Figure 2.6 t}lre nugget effect is 37%. The nugget effect represents a
measure of the bias induced by repeated sampling at one location. Thus the semi-
variogram in Figure 2.6 suggests that approximately 40% of the dataset is biased
/ -.
IL
d
oEil'id.tEottl
R = Coælation Range (m)N = Nugget lnterceptC = S¡ll He¡rhtNu¡gec Etrå = /Nugg"t lnt"-"pt\ * ¡¡9
\c)
20000 ,l0O0O 60000 80000 t00000Metres
120000 t40000 t60000 t80000
EXPOEV On Z
58
towards sampling in one location exhibiting completely random behaviour (Clark,
7979). A flat semi-variogram, like those illustrated in Appendix Eight, where the
nugget is equal to the sill, implies that there is no spatial correlation at all between the
data (Prosser and Maskall,1993).
A pilot illite dating/geohistory study was performed. The thermal modelling
calculations for the geohistory plots in this study were performed by A. Kaiko using
BASINMOD 4.2 on a Sun workstation utilising the Lawrence Livermore NationalLaboratories vitrinite calculation option. Open file vitrinite reflectance (%R.,) data
were supplied by Santos Ltd. and Primary Industry and Resources (PIRSA). The
thermal modelling was constrained by using a variable heat flow and heat sink model
modified after Stuart et ø1. (1991) using a surface temperature of 20oC and corrected
bottom hole temperatures for each of the wells.
No 7oR. data was available for the individual wells studied, therefore data fromadjacent wells within the same fields were used to help constrain the models. The
lack of %\ data necessitated, the generation of a regional thermal model. This model
was determined by modelling data from Gidgealpa #7; awell that contained a set of
measured %R. data through Eromanga and Cooper Basin sediments.
59

GONDWANIAI{GLACIAL SSTTING
3.0 PREAMBLE
The Merrimelia Formation and Tirrawarra Sandstone sediments were deposited
during the waning stages of the glaciation on the Gondwanan supercontinent in the
Late Carboniferous to Early Permian. One of the major controls on reservoir quality
in these units is facies type (Chapter Nine), which was dictated by glacial/ice sheet
movement (Chapter Four). Glacial movements in the Cooper Basin were, on a
basinwide scale, controlled by the mechanisms which drove the Gondwana
glaciation. Thus understanding the extent and controls on the Gondwanan glaciation
provides a basis on which the sedimentology and reservoir quality of the Tirrawarra
Sandstone and Merrimelia Formation can be discussed.
This chapter, describes the Gondwanan glaciation, first in terms of the supercontinent
and then focuses on the Australian continent, with particular reference to the South
Australian region. A brief discussion at the end of the chapter brings together the
various arguments concerning the controls on the Gondwana glaciation with
particular emphasis on the deposition of the Tirrawarra-Merrimelia glacial complex
in the Cooper Basin.
Veevers and Powell (1.987) have described the Late Palaeozoic glaciation of
Gondwana in terms of three distinct episodes. The first two episodes are confined to
Africa and South America. The last glaciation episode (Episode III) extended across
Gondwana (including south eastern Australia) and is considered the major glaciation
to affect this supercontinent (Veevers and Powell,1987) (Fig.3.1). The Merrimelia

Goxowz.tt¡. GtectenoN
Formation and subsequently the Tirrawarra Sandstone were deposited in a shallow
intra-cratonic depression under the control of this last episode of Gondwanan
glaciation (Stephanian Fig. 3.1).
fSlror il8lor
IIIFEßREDICE VOLUMT
Ê01¡lrwAltA
wEsï EASIAUSTRÁtIAII
PALYHOLOGICALz0¡t8s
Àu6In¡Llál$f¡ tfyË18Iraô¡¡o$10
aê0os¡0å
AGÉ
tln¡t¡tÞ5 IrrÊûfilm¡i
S¡a! f
3¡f¡¡ã¡;
!TÈê ¿
¡¡n¡lt
lnÊrÍ¡l22
-a*
lqglG¿ll
t
â
I
tÊt¡l!¡| ôeúiffi .þ'til.râÂe@bl¡r
5læry*,¿
Figure 3.'L lnferred Gondwnnan ice aolumes (After Veeaers ønd Pornell, 1987)
The first Gondwanan glaciation affected the Australian continent in eastern Australia
during the Namurian (Eyles and Young ß9Q $ig. 3.1). By the Westphalian and
Stephanian, glaciation had spread to central Australia, Antarctica, southern Africa,
India, the Arabian Peninsula (Oman) and Asia (Eyles and Young, 799q Fig.3'2).
Although the Gondwana ice age lasted for 110 Ma, there was no enormous ice sheet
covering the whole of Gondwana. Instead there was a series of small ice caps across
Gondwana (Fig. 3.2) which advanced and retreated diachronously, moving from west
to east (Caputo and Crowell, 1985) (Fig. 3.3). Glaciation is thus considered to have
begun in western South America and moved to eastern Australia and Antarctica
(Alley, 1995). Thus Australia and Antarctica, at the time of encroaching Gondwanan
glaciation, were affected by polar latitudes and subsequently frozen. At the same
time, according to Caputo and Crowell (1985), northern South America and Africa
was beginning to warm (Fig. 3.2).
6t

Govow¡xa GracttrrcN
.// o^*rrt *ZZ upø rr¡ r r'r'¡rVZ æþrEnÀì cr¡cunol¡ OUdCESC 9n rlr+ souff rcLE
B
+I l
I
c ll0 M¡LATESTDEVONIAN c 160M¡
LATEST VISEAN
C
ICE IIEIS À\D Effr'F ct aotu5nc f ¡AT^
LATEST WESTI'HALIAN c. !0O M¡ Daô
----ì^o
Figure 3.2 Icesheet deaelopment across Gondwann from Late Deponian to Late
W estphaliøn ( After Eyles ønd Y oung, 7994).
The scope of this section is to describe the affects of Gondwanan glaciation in the
context of Australia and more specifically in the Cooper Basin. Detailed descriptions
of Gondwanan glaciation in the surrounding regions of South America, Africa, India,Asia and the Arabian Peninsula are summarised by Eyles and Young (1994), Veevers
and Powell (7987) and Caputo and Crowell (1985) and are not touched upon here.
The proximity of Antarctica to Australia at this time (Fig. 3.4), however, warrants abrief description of Gondwanan glaciation in this region.
Veevers and Powell (1987) suggested that deposition from glaciers with fluid bases,
or so called wet-based glaciers, occurred in the Stephanian and moved into rapidlysubsiding basins on the seaward side of glaciated highlands on the eastern margin of
Antarctica (Fig. 3.3). The same authors believe that glacial affects had ceased inAntarctica by the Late Permian (Kazanian). There is some conjecture as to whether ice
caPS covered all or differing parts of Antarctica. Veevers (1993) does, however,
indicate that, although there is no depositional evidence of an extended ice cover
across Antarctica (and indeed Gondwana), transport distances of some clasts have
exceeded 2000 km,
62

Gor¡nwav¡ Gtac,,artox
TETHYS SEA
\I
PALAEO. TRIASSICNEW /ZEALAND
z ocEANPACIFIC94-r330 MESÀ
AFRICA
,/SOUTH
AMERICA
A¡lTARcl-cA
South- - Pole.
Figure 3.3 Ice cap utander path øcross the Gondruana super continent (After Cøputo and
CroweII, L985; Veeaers ønd Pozuell, 7987).
Trough Palaeocurent Directlon
Shoreline --t lcebergTracks
S. Pole At 250 MaS Pole At 265 lvla
NEO7atòt4
| 1000km I
¡ EfHys
ALASSPANTHA
Figure 3.4 Location of ice cap on the ArtstrøIian ønd Antarctic continents (After Eyles et
qL.,7998),
The precise dating of glacial events in Australia is complicated by a lack of agreement
on the Permian-Carboniferous boundary (AIIey, 1995), During this time period the
63
Gotøwav¡ Gr,a,ctanoN
throughout the Australian continent allowing some degree of correlation (Chapter
One). The Late Palaeozoic glaciation in Australia comprises two very distinct
glaciation styles: alpine cordilleran in the east and intracratonic ice caps elsewhere
(Eyles and Young, 7994; Yeevers and Powell, 7987; and Caputo and Crowell, 1985).
The montane glaciers were the first formed Palaeozoic glaciers in Australia and
"grew" in the more eastern regions of the Australian continent (Crowell and Frakes,
1977; Yeevers and Powell, 1987). As Gondwana drifted across the south rotational
pole (Fig. 3.3), large continental-scale ice masses, initially formed in Antarctica,
spread north through Tasmania and then filled depressions on continental Australia
(including the Cooper Basin) (Alley, 1995). The discussions below describe in greater
detail both alpine and continental ice mass glaciations that affected the Australian
landmass.
3.2.1.. ALPINE STYLE GLACIATION
Glaciation was initiated on the Australian continent on the eastem margin in the early
Namurian (Crowell and Frakes, 1977).By the Stephanian most parts of the Australian
continent were covered by glaciers (Fig. 3.5a), with the majority of glaciers having
totally receded by the Sakmarian. The eastern margin of Australia at this time
consisted of an active magmatic arc (similar to the present day Andes mountain
range) with the Tamworth Trough and Sydney Basin representing forearc basins
(Crowell and Frakes, 1971). Alpine glaciers covered the peaks of a series of volcanos
with similar alpine-style glaciers capping a string of offshore island stratovolcanos
further to the west (Chaney,7998) (Fig. 3.5b). To the west in the Tamworth Trough,
during the Namurian, alpine glaciers reached into the basin proper, providing ice-
rafted detritus (Crowell and Frakes, 1971). Similarly, in the Sydney-Bowen Basin,
alpine glaciers cut eastwards, draining into large palaeo-valleys and filling these
features with a succession of diamictites and conglomerates (Eyles, 1993).
3.2.2 CONTINENTAL ICE SHEET GLACIATION3.2.2j1. Western Australia
Continental ice sheets were initiated in the Stephanian much later than the alpine
glaciation in the east. In Western Australia the Canning, Perth, Carnarvon, and
Officer Basins contain the youngest Late Palaeozoic glacial deposits (Eyles, 1993). It is
postulated by this author that ice centres may have been sited on the north slope of
the Pilbara Block and on the southern Yilgarn Block to the east of the Perth Basin (Fig.
3.5a).
64

lce Cap Development in the Early to Late Permian on the Australian Portion of Gondwana
A B
of Edt ofShêlf Sh.Í
Mârln. ùd
lce
(r) wkh
Cê
Sh.d
CrMn¡
abnt thÈ cdsþ fom ¡<e ñftr)
Early Femlm Prlæogêogr.plry Late Euly ud Eûty L¡to Pcmlu Pdrêogægr.phy
PEG/8 ffi J
GoNowtve GuruenoN
Figure 3.5 A) Early and B) løte Permian Gondwanan lce sheet location on the Australian
continent (From Crowell and Frakes, 1971).
3.2.2.2 South Australia
Glaciation occurred in South Australia from the Stephanian to the Asselian. A broad
ice cap covered the southern regions with northward-extending lobes (Alley, 1995).
Glaciation extended across the whole of South Australia, but by the end of the
Sakmarian glacial conditions had ceased (Crowell and Franks, 1971) (Fig.3.5 a & b).
Glacial deposits accumulated in the Denman, Renmark, Arckaringa, Troubridge,
Pedirka and Cooper Basins within South Australia (Fig. 1.1). The Permian glacigene
sediments in the aforementioned basins are individually described by Harris (1981).
Along with glacio-marine conditions, Alley and Bourman (1984) described scoured
pavements (indicating a westward movement of ice), lodgement and flow tillcomplexes within the Troubridge Basin. The inferred movement of ice within South
Australia has been a point of prolonged discussion, with agreement having been
reached on ice movement moving from the southeast towards the northwest (Alley,
1995). Local deviations of wet-based glaciers, like those mentioned above in the
Troubridge Basin (Alley and Bourman, 1984), are a result of these glaciers flowing
around palaeo-topography (Alley, 1995).
Apart from the Troubridge Basin, glacio-marine sediments have also been described
in the Denman, Arckaringa and Renmarkbasins (Eyles and Young, 1994).The Cooper
and Pedirka basins have, on the other hand, not been exposed to glacio-marine
conditions. Harris (1981) indicates that the Crown Point Formation in the Pedirka
65

GoNnweN¡ Grauanox
Basin has "a similar lithology to the Merrimelia Formation in the Cooper Basin..."
inferring that similar glacial depositional processes prevailed in the separate basins.
3.2.2.3 Victoria and Tasmania
In Victoria, during the Early Permian continental glaciers moved north, forming
scour pavements on which sandstones, shales and diamictites were deposited. These
Permian glacial deposits outcop in incised valleys shedding off the Ballan Horst block
and in the Bacchus Marsh Sunkland, with up to 51 individual tillite phases observed
(Alley, 1995). These glacial deposits, along with diamictites located in Tasmania,
represent the last vestiges of Gondwanan glaciation on the Australian landmass in
the Kazanian. A large ice cap was centred on the Western Highlands of Tasmania in
the Late Carboniferous (Fig. 3.5b) but had disappeared by the Sakmarian, after
having deposited large volumes of diamictite. The last glacially-derived sediments in
Tasmania were deposited by the action of icebergs that possibly originated from the
nearby Antarctic highlands (Crowell and Frakes, 7977;Eyles et ø1.,7998) (Fig. 3.4).
3.2.2.4 New South Wales
In New South Wales, glacial deposits from continental glaciation are not widespread
with sediments having being derived from ice caps to the south in Victoria and South
Australia.
3.2.2.5 Queensland
In the Bowen Basin of Queensland, fluvially-derived glacial sediments dominate the
glacigenic succession, suggesting that there was little direct influence from the more
southerly ice sheets (Chaney, 1998). Contrary to this, however, two thirds of the
Cooper Basin is located in the far west of Queensland. The Merrimelia Formation
occurs in Queensland and exhibits identical glacial features to those noted by
Williams et al. (1985) and Chaney et aL, (1997) in the South Australian sector of the
Cooper Basin with rhythmic varvites, fluvially-reworked conglomerates and
diamictites the main glacial sediments observed.
The identification of rainout diamictites at Mount Howitt #1 (Chapter Four - Plate 5b)
indicates that, at one stage, ice sheets covered a large proportion of both sectors (S.4.
and QLD.) of the Cooper Basin. The development of rainout diamictites in
Queensland suggests this, and indicates that icebergs shedding off nearby glaciers
would have subsequently drifted on a large body of water, melted, and then formed
rainout diamictites. The inferred direction of ice movement in the Queensland sector
of the Cooper Basin is predominantly from the south east moving northwest
66

Govownvd Gt¡u¡noN
(Durham Downs #1, Mount Howitt #1) with the continental ice sheet lying to the
south (Fig. 3.5a).
3.3 CONTROLS ON GONDWANAN GLACTATION
Several theories have been discussed in the literature as to controls and timing of
glaciation on the Gondwana supercontinent. Alley (1995) pointed to worldwide
climate changes that were related to plate tectonic events as having a considerable
influence on climate in Gondwana. This author stated, that by the beginning of the
Middle Carboniferous, the circum-global equatorial seaway had been closed by the
connection of Laurentia and Gondwana. As a result of this continental arrangement,
major cooling occurred in Australia and persisted until the Early Permian (Alley,
1995). Caputo and Crowell (1985) suggested that the movement of the palaeo-south
pole traced the path of glaciation across Gondwana (Fig. 3.3). The location of the
south pole migrated across Gondwana as the supercontinent moved by continental
drift. It was also noted by the same authors that whenever the pole lay over oceanic
areas, glaciation either didn't develop or disappeared but when, the pole was sited on
the Gondwana landmass, glaciations developed. Veevers and Powell (7987), contrary
to Caputo and Crowell (1985), argued that glaciation occurred at mid-latitudes (200-
600), having been initiated by the widespread development of highlands as
Gondwana and Laurentia collided, with extensive ice developing as a response to low
global temperatures related to low atmospheric CO, concentrations. Crowley and
Baum (1992) go further by saying that the Late Palaeozoic exhibits the lowest CO,
levels compared to other periods in the Earth's history.
CONCLUSIONSÞ Glaciation on the Gondwana supercontinent was controlled by a number of
factors, the main one being the movement of the Gondwana landmass into high
latitude polar regions. Other factors include reduced global temperatures brought
on by low CO, concentrations and a restriction in global equatorial currents which
would have reduced the transfer of warm equatorial waters into Gondwana polar
regrons.
Þ Gondwana glaciation controls the style of sediment produced in the lower
Gidgealpa Group of the Cooper Basin. The deposition of the Merrimelia-
Tirrawarra Glacial Complex is a direct product of the Gondwanan glaciation.
67
Go¡,tnwnt¿, GtauanoN
Þ Merrimelia facies formed during the peak of glaciation in the late Stephanian to
Asselian, in response to ice sheet and glacial melt.
Þ Towards the end of the Sakmarian, milder conditions started to prevail. The whole
Cooper region still lay within polar latitudes but global temperatures started to
rise (Alley, 1995). The grip of the Gondwanan glaciation on the Cooper Basin did
not cease abruptly but fluctuated for a period of time until eventually glacial
deposition was replaced by extensive cold climate coal deposition (Patchawarra
Formation).
Þ As the influence of the Gondwanan glaciation fluctuated, interfingering
Menimelia facies and Tirrawarra facies Chaney et al. (7997) were deposited.
Þ Tirrawarra facies formed as the Gondwanan glacial ice cap retreated southwards.
Þ The start of Patchwarra Formation deposition is considered the end of direct
Gondwanan glacial influence in the Cooper Basin.
68

pDnhdEI\TTotoçY
The differing facies within a glacial depositional realm govern the textural and
mineralogical maturity of sediments and thus influence any reservoir potential a
given sediment may posses. Thìs chapter documents twenty glacially-derived facies
recognised in the Merrimelia Formation, Reservoir quality characteristics of each
facies type will be dealt with in detail in Chapter Nine.
The evolution of the Merrimelia-Tirrawarra Glacial Complex (MTGC) in this study is
described in terms of lower (M3), middle (M2), upper (M1) Merrimelia sections and a
(T1) section which encompass Tirrawarra braid plain facies. The facies development
of each level is briefly discussed in this chapter (section 4,4). The development of
potential reservoir sandstones within each level is discussed in full in Chapter Nine.
To clearly and simply orientate the reader within the Merrimelia-Tirrawarra Glacial
Complex, block diagrams are employed throughout the chapter (Fig. a.1a). Chaney
(1998) stated that such diagrams are by no means indicative of the facies architecture
within the MTGC at a given location but are representative of overall glacial
processes operating in the Cooper Basin. More specifically, Merrimelia facies have
only been described from core in widely spaced wells and from depths over a two
vertical kilometre range. Correlating between the "pin pricks" of core across the
whole Cooper Basin is a risky venture at best" The terminoglacial and proglacial
diagrams as well as the MTGC evolution diagrams are thus only representations of
environments encountered within this glacial complex and are not paleogeographic
reconstructions .
The detailed sedimentology outlined in this chapter was developed by A. Chaney, as
part of his PhD project (Chaney, 1998). This authour's sedimentology project was
done in parallel with this reservoir quality/diagenesis study. The sedimentology core
logging performed by Chaney (1998) was done in unison with the lithological core
logging and core sampling of this project.

\ÀIs-
v\g
A model of the Merrimelia -Tirrawarra Glacial Complex (MTGC) lnset B
lnsetA
A
lnset C
BMerrimelia Formation Facies Types
Abbreviations FaciesTypeBS Back SwampDBS Delta BottomsetsDF Delta FlowDFS Delta ForsetsDGL Deep Glacio-lacusrrineDTS Delta TopsetsDU Aeolian DuneFBT Fluvial BarTopFL Fluvial SandstoneFSZ Frozen Shore ZonelD lnterduneKH Kettle HoleLB Longitudinal BarLIB Linguoidal BarLSF Terminoglacial Lacustrine Sand FlowLSZ Lacustrine Shore ZoneRD Rainout DiamictiteSACG Subaqueous Channel GravelTOF Terminoglacial Outwash FanTTMD Terminoglacial SubaqueousTunnel Mouth Deposit
EXPDEV 077 E
entering a progløcinl lake (Godley Riuer Delta-Lake Tekøpo, N .2.) . B) Merrinrcliø Formation facies types.

EDIMENTOLOGY
Sedi¡nent sorting and grain size data was gathered on all facies types in the
Merrimelia Formation (this data is presented in table form throughout this chapter).
The raw point counting data was manipulated to express the grain size and sorting
coefficients for each sample. The average grain size for each sample is given inmillimetres, while the sorting coefficients are expressed in o$ units. Sorting coefficient
ranges used in this study are illustrated in table 4.1. The sorting values were derived
using the Folk and Ward formulae (Folk and Ward, 1957) outlined below (Equation 3).
1.0 - 2.0
Table 4.1. Sortittg coefficient ranges (phi units).
The Merrimelia Formation and Tirrawarra Sandstone comprise an integrated
depositional continuum (Williams and Wild, 7984a; Chaney et øL, 1997). For the
PurPoses of this study however, only the sedimentology of the Merrimelia Formation
has been considered and is presented in this chapter. The sedimentology of the
Tirrawarra Sandstone, on a regional basis, was initially documented by Gostin (7973),
with further work done mainly by Mc Intyre (7982), Williams and Wild (1984a) and
Williams et ø1. (1985, 7987). To comprehensively assess all the facies of the Merrimelia
glacial complex on a regional basis, one must combine the sedimentology of the
aforementioned authors with the sedimentology of the Merrimelia Formation. More
recently, Rezaee (7996) has documented in detail the sedimentology of the Tirrawarra
Sandstone in the Moorari, Fly Lake, Brolga and Tirrawarra Fields. Again, to assess the
sedimentology of the entire Merrimelia-Tirrawarra Glacial Complex in these reg-ions,
one must integrate the sedi¡nentology of the Tirrawarra Sandstone, as documented byRezaee (1996), along with the sedirnentology of the Merrirnelia Formation.
oO = Q*o-Q'u + Qn'-Q' Equation 34 6.6
71

Snot¡wevrotocy
Sedimentological analysis within the Merrimelia Formation has been undertaken by
several workers (Grund, 7966;Williams and Wild, 1984a; Williams et a1.,1985 &.7987;
Chaney et a1.,1997 and Chaney,7998). Williams and Wild (1984a), Williams et øL (1985
and 1987) and Chaney et ø1. (L997) show that both the Tirrawarra Sandstone and
Merrimelia Formation form a complex of inter related facies (MTGC). These facies
were deposited within terminoglacial and proglacial environments, and interfinger
constantly (laterally and vertically), exhibiting rapid environmental change related to
the position of the Gondwana ice sheet (Chaney et al., 1997). The terminoglacial
environment forms from the frontal and marginal parts of the ice sheet (Fig. 4.1a), and
the sediments generated are affected by ice melt, aeolian, fluvial, lacustrine, deltaic
and mass flow depositional processes (Chaney, 1998). The proglacial depositional
realm is distal to the ice sheet (Fig. ,1a) with the size and character of this
environment dependent on meltwater volumes.
All facies observed within the Merrimelia Formation are described in relation to the
terminoglacial or proglacial depositional realms (Fig. a.1a).
All facies types and abbreviations used in the diagrams and text throughout this
chapter and subsequent chapters are also summarised in Figure 4.1b.
4.2.1 TERMINOGTACIAL ENVIRONMENTSThe terminoglacial zone forms a very narrow band relative to the ice sheet (Fig. a.za).
This depositional realm shows a wide variety of morphological, and sedimentological
structures and facies due primarily to the high energy of this zone (Fig. 4.2b[Inset A]).
Most of the sediments found in the terminoglacial region are deposited in meltwater
rivers and streams (Chaney, 1998) (Fig. 4.2a[Inset B]).
The terminoglacial realm is dominated by high energy conditions where sediment
dispersal near the snout of the glacier is dictated by rapid changes in melt water
volume and strength (Fig. a,2b[Inset A]).
The coarse grained detritus is moved infrequently and only for short distances during
high energy flows (Chaney, 1998). The fluvial regime in the terminoglacial
environment is characterised by incised channels which are cut into the substrate by
high energy meltwaters (Fig. a.2b[Inset B]),
72

\esrs\s\ç\\s*
Têrminoglacial FaciesA lnsetA
B
2m
1o<<s'-s-o*ðè\Ès=
lnset B
.?z/>ezl
oS!
Qoø-
llzz'rz?et7í22,/
EXPDEV 076 E
.trü,
l4'"'/
I
'{
,
I
I
Irt
energy floru reginrc (Frnnz losef Glacier, N.Z.). Inset B) Viezu of n terminoglacial out wash fan (TOF) froru the glacier snotLt (Frnnz losef Glncier, N.Z.).
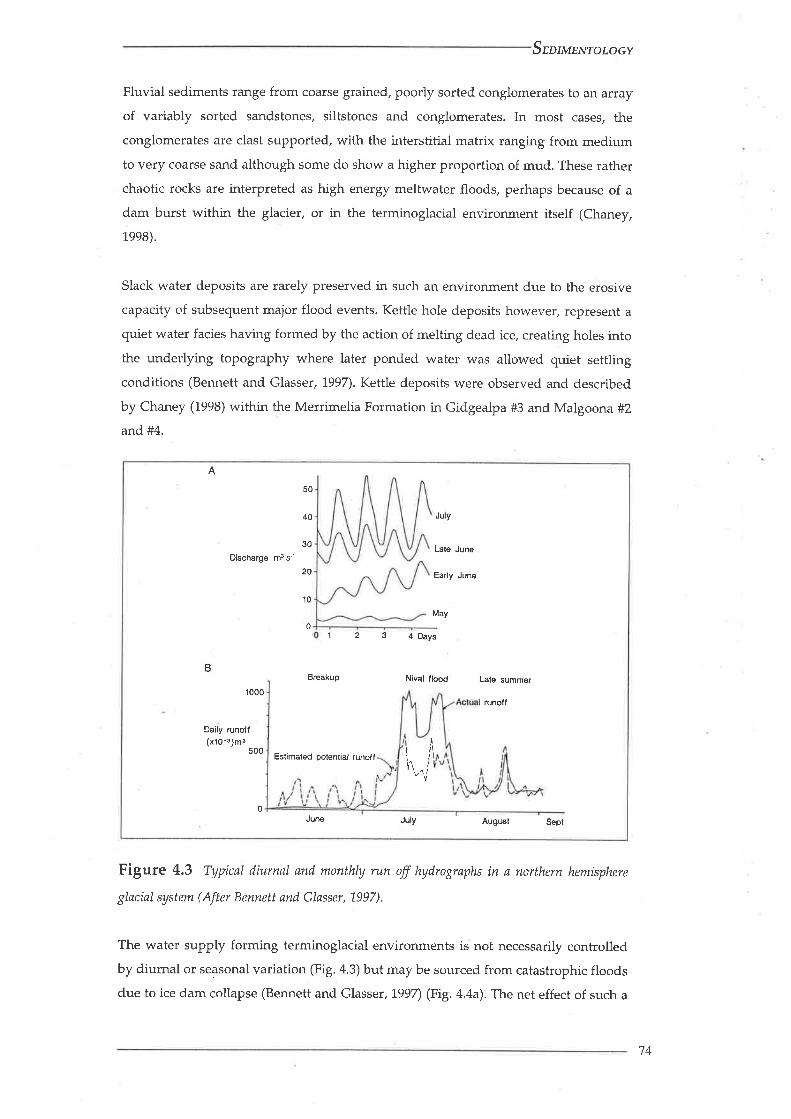
Stnnmngl.otocy
Fluvial sediments range from coarse grained, poorly sorted conglomerates to an array
of variably sorted sandstones, siltstones and conglomerates. In most cases, the
conglomerates are clast supported, with the interstitial matrix ranging from mediumto very coarse sand although some do show a higher proportion of mud. These rather
chaotic rocks are interpreted as high energy meltwater floods, perhaps because of a
dam burst within the glacier, or in the terminoglacial environment itself (Chaney,
1ee8),
Slack water deposits are rarely preserved in such an environment due to the erosive
capacity of subsequent major flood events. Kettle hole deposits however, represent a
quiet water facies having formed by the action of melting dead ice, creating holes intothe underlying topography where later ponded water was allowed quiet settling
conditions (Bennett and Glasser,1997). Kettle deposits were observed and described
by Chaney (1998) within the Merrimelia Formation in Gidgealpa #3 and Malgoona #2
and #4.
A
50
40
30
20
10
0
Juy
Lat6 JuneDischarge m3 s-r
Early June
May
1 2 3 4Days
BBreakup Nival llood Late summer
runolf1000
Daily runoll(x10-o)¡s I
tl500 Estimãted potential runoffI
lltv.j
0Juæ Juy August Sept
Figure 4.3 Typical diurnøI and monthly run off hydrographs in a northern hemisphere
glaciøl system (After Bennett and Gløsser,1997).
The water supply forming terminoglacial environments is not necessarily controlledby diumal or seasonal variation (Fig, 4,3) but may be sourced from catastrophic floodsdue to ice dam collapse (Bennett and Glasser,1997) (Fig. 4,4a). The net effect of such a
74

Stnt*rn¡rtrorocy
water supply is that fluvial sediments display extreme lateral and vertical variability
and exhibit very high sediment loads (Fig. 4.4a).
Figure 4.4. Meltwøter hydrogrøphs (After Bennett and Gløsser,1997).
Lakes are a coûunon feature in terminoglacial environments resulting from highvolumes of melt water discharge. The size of the lakes depends on bedrock and
glacier topography, water volumes and the amount of detritus issuing from the
glacier. Terminoglacial lakes, because they contact the glacier (Fig. 4.1a[Inset A]), and
are therefore subject to very complex depositional conditions with melting ice havinga strong influence on sedimentation (Chaney et ø1., 7997). Sediments entering
terminoglacial lakes do so via mass wasting, fluvial and subaqueous processes
illustrated in Figure 4.2b.
Within the terminoglacial realm, lacustrine facies exhibit a wide variety ofsubaqueous deposits ranging from those released directly from the ice to those
deposited from settling of surge flows (Chaney et al., 1997), Rain-out diamictites are
corunon/ exhibiting a wide range of clast sizes (Table 4.2). The matrix in these
sediments is mostly composed of homogenous silty mud within which dropstones
appear to float. Chaney et aL (1997) stated that some of the diamictites are stratified.
These diamictites show sandy layers which are usually not more than a fewcenti¡netres thick and abundant ripup clasts. Often they are disrupted by dropstones
and occasionally exhibit isoclinal folding (Chaney, 1998). Such diamictites have been
described by Evenson et aL (7977) as sub-aquatic flow tills, which have moveddownslope as a coherent viscous block of sediment. Subaqueous tunnel mouthdeposits, bottomsets and varvite mudstone were also observed and described by
TYPE I
'Normal' glacialdischarge sequence
A: Waler discharge (Q)
TYPE II
Sudden drainage lromice-dammed lake
TYPE IIIJökulhlaup triggered by
subglacial volcanic eruption'
oC)ol(ú
o.9,o
oc)I(úEo.9o
Øo(¡)E)(!=o.!¿.Õ
oc)ct)(to
-Øo
Øooo)6T.9o
B: Sediment discharge (Os)
Øo(¡)o)(tE(.)
.9.ôT me (days) Time (days)
Flood hydrographs
T me (days)
75

EDIMENTOLOGY
Chaney et al. (1997) within the terminoglacial environment. The following section
describes in detail all the various terminoglacial facies observed in the Merrimelia
Formation and their modes of deposition.
4.2.I.I TERMINOGLACIAL FACIES ASSOCIATIONS
4.2.1.1.1 Terminoglacial Tunnel Mouth Deposits (TTMD)
This facies is primarily composed of breccia with clast sizes up to 10cm conunon
(Plate 5a). These breccia are matrix supported, with the matrix displaying no internal
structure and ranging in size from fine sand to granule breccia (Table 4.2). The sorting
of these sediments is accordingly very poor (Table 4.2).
Facies Sample Grain SizeSortingCoefficient
0.41.
1.83
1.58
L.3
0.8
Grain Size(mm)0.13
1.45
7.99
1.2
1.0
Table 4.2 Terutinoglacial tunnel ntouth deposits (TTMD)
Observations by Chaney (1998) suggested that reworking of these breccias was
minimal. Minimal reworking, combined with the variation in grain size (indicated by
poor sorting values), tends to suggest that these sediments have either been dumped
as mass wasting tills or have been deposited directly from the glacier tunnel mouth
(Fig. 4.2a[Inset A]).
Farther away from the glacier, within ice contacted terminoglacial lakes, sediments
issuing from the glaciers will settle onto the floor of the lake, and may form a
subaqueous esker composed of a complex interlayering of subaqueous flows (Fig.
4.2a). Chaney (1998) confirms that these stratified conglomerates are subaqueous
sediments deposited directly from a glacial mouth.
These subaqueous deposits have been observed in Moorari #2 and Packsaddle #3
wells (Chaney,1998).
76


Snontexrotocv
4.2.'1,.'1,.2 Rain-Out Diamictites (RD)
These sediments are mud or silt-supported sediments and are either massive or show
some deglee of stratification. Plates 5b & 5c illustrate typical examples of rain-out
diamictites distinguishable as being of glacial origin by the presence of faceted clasts
and the position of theses conglomerates within a lacustrine dominated glacial
sequence.
These two examples (Plates 5b & 5c) are separated by approximately 300 kms (Fig.
7.2),but display very similar features indicating that the same glacial processes were
occurring in these widely spaced locations (but almost certainly not at the same time).
Further analysis of the limited Merrimelia Formation core in the Queensland sector of
the Cooper Basin, shows an apparent dominance of terminoglacial facies that include
rainout diamictites (Plate 5b) and stratified diamictites (Plate 5d). The very limited
amount of core coupled with the enormous distances between cored Merrimelia
intervals in Queensland constrains any discussion of depositional environment to that
of the individual wells. However, the evidence suggests that, at differing time
intervals, lalge portions of the Cooper Basin, in both South Australia and Queensland,
may have experienced direct glacial conditions.
Table 4,3 nain out diømictite (RD)"
Rainout diamictites of varying clast sizes are found i¡ seven wells in the South
Australian sector of the basin: ]ack Lake #1, Merrimelia #3 and #18, Welcome Lake #1,
Tindilpie #2,Kercty #1 and Moorari #1. These sediments may represent some of the
first glacial sediments preserved within the Cooper Basin (Chaney, 7998). Diamictites
19

Stonte¡trotocv
were observed in Mount Howitt #1, Tallalia #1 and Durham Downs #1 in Queensland.
Diamictites throughout the basin are generally similar in nature showing a massive
substrate, are mud supported and exhibit angular to sub-angular clasts (Plate 5).
Massive rainout diamictites are formed from the direct action of melting icebergs, ice
rafts and even ice sheets melting over time and shedding detritus onto a lake floor
@ig. a.2b). Stratified diamictites form by the same depositional mechanism as massive
diamictites, but stratified diamictites form by a combination of rainout sedimentation
and downslope subaqueous traction currents (Fig. a.zb). Some stratified diamictites
include thin sand flows and ripup clasts of the underlying muds and silts (Chaney,
1ee8).
The sorting of rain-out and stratified diamictites observed in the Merrimelia
Formation is very poor with grain sizes highly variable (Table 4.3),
4.2.1|1..3 Terminoglacial Outwash Fan (TOF)
Terminoglacial outwash fan sediments formed proximal to the glacier (Fig. 4.2b[Inset
C]). These sediments represent fluvial deposition that initially issues from glaciers
and shows extreme lateral and vertical variability (Chaney, 1998). These sediments are
thus classed according to the subdivisions of Boothroyd and Ashley (1975) as being
part of the upper fan within a glacial braid plain depositional complex (Figs. 4.2a &
4.2a[Inset B]). The proximity of these sediments to glaciers places them in the
terminoglacial depositional realm (Chaney, 1998).
The narrow stream architecture observed in upper fan regions (Fig, 4,2b[Inset B]) is
controlled by the occasional high water flow rates emanating from the glacier and the
inclined nature of the upper fan slope. Chaney (1998) stated that, in many modern
examples of glacial outwash braid plains, the grain size decreases as the slope of the
outwash fan decreases. This is certainly true for the Merrimelia Formation where a
predominance of coarse grained sediments in the upper fan grades into finer grained
sandstones in the lower fan reaches. The dominant bar form in the upper fan tends to
be gravel dominated longitudinal bar forms where sand development is rare and
restricted to matrix (Chaney, 1998).
The coarse grained nature of these sediments is a reflection of the proximity of
glaciers, Similar to other terminoglacial fâcies described, these sediments have formed
in a high energy environment in which occasional catastrophic flood events may
occur (Fig. 4.4). This would imply a certain degree of sediment reworking, which is
80

Seotptt¡trotocv
true for the most part, but only a narrow zone of the upper fan experiences high
energy flood events where large volumes of detlitus are moved. Such movement is
infrequent and occurs only over short distances, leaving these sediments poorly
sorted.
The terminoglacial outwash sediments noted in core range from coarse sandstone and
poorly sorted conglomerates (Plate 6a) to a series of variably sorted sandstones (rare)
and siltstones (Chaney, 1998). These sediments are observed in Gidgealpa #3 as well
as Malgoona#2 and #4, Kudrieke #1 and Tinga Tingana #1.
The conglomerates and sandstones of the terminoglacial outwash fan display a crude
bedding where the clasts are dominantly igneous. Although illitised and ductile, these
rock fragments exhibit angular to sub-angular clast shapes which is suggestive of a
very proximal transport distance involving strong currents dumping sediment
(Chaney, 1998). The absence of extensive sediment reworking, in the terminoglacial
outwash fan, and the dumping of coarse material produces sediments dominated by a
large size fractions (Table 4.4),
Table 4.4 Terminoglacial outzuøsh føn (TOF ),
4.2.1J1,.4 Terminoglacial Lacustrine Sand Flow (LSF)
Deposition within the terminoglacial lacustrine environment is very complex (Eyles
and Miall, 1984), due mainly to the fact that detritus input into terminoglacial lakes
8l

Seot¡wewrotocv
reaches of large terminoglacial lakes will contain detritus that is the same as
sediments found in large proglacial lakes.
One obvious distinction between terminoglacial and proglacial lake sediments is that
terminoglacial lacustrine sediments are composed of coarser grained material
(Chaney, 1998). This coarser material, which represents individual grain flows,
commonly interfingers with lacustrine mudstones. Both sediment types arrive in
terminoglacial lakes via braid plain and deltaic deposition (Fig. a.zb) where ice is not
in direct contact with the lake.
The sandstone grain flows are generally well sorted (Table 4.5), with current ripples
and loading features common. Flame structures and reactivation surfaces have also
been noted (Chaney, 1998). The sand flows are of varying strength and duration and,
when newly deposited, they load onto the deep water muds causing dewatering and
flame structures to form (Plate 6b). These Ssand flows are termed bottomset flows
(Chaney, 1998) and have been interpreted to flow along the lake floor (Fig. a.2b).
These sediments were described in Gidgealpa #5 only.
Facies Sample
LSFLSFLSFLSFLSFLSFLSFLSFLSFLSFLSFAve.std.
JAC 18TIRRA 8CTIRRA 7CBIMB 1ADARA 1ADDOW 18DARA 1BGIDG 58MOOR 28DARA lCDDOW 1A
SortingCoefficient
0.800.900.910.570.750.660.670.870.380.961.350.8
0.26
Sorting
ModerateModerateModerate
Moderately WeIlModerate
Moderately WellModerately Well
ModerateWell
ModeratePoor
Moderate
0.040.100.130.1.4
0.200.260.280.750.20.2
Grain Size
Medium siltCoarse SiltCoarse SiltCoarse Silt
Very Fine SandFine SandFine SandFine Sand
Medium SandMedium SandCoarse SandFine Sand
0.04
Table 4.5 TernúnoglaciøI lacustrine sand flow (LSF).
82

YOUNGING IS TOWARDS TI{E CORE IDENTFICATION STCKER ]N VERTICAL PLATES AND TO
THE LEFT IN HORIZONTAL PLATES
PIATE 6Terminoglacial Lithologies: 2
A) Core photogrøph - Gidgeølpø #3 (2314.70m). Terminoglacial outwash conglonrerøte
(TOF),
B) Core photogrøph - Gidgeølpa #5 (2340.79m). Grøin flow into tenninoglaciql løcustrine
sedhnents (LSF). Note soft sediment deþrnution feøtures such as post depositionøI folding ønd
faulting øre conmrcn [6c].
C) Core photogrøph - løck Løke #1 (3142.79m). UnusuøI grain flow withitt a diamictite.
Note clinrbing ripples/syndepositionøl miuo-faults [7g] along which fluid has preferentially
escaped (dewatering).
D) Core photogrøph - Metimelia #L8 (2628.08m - 2628.1.6m). Sub-aqueous chørutel
graael (SACG) (sub-øqueous esker) conglonterøte. Note conglomerate is sand not mud
supported indicating a degree of reworking [7b1.
83


EDIMENTOLOGY
In Jack Lake #1, an unusual sand flow was observed (Plate 6c) not within a mudstone
context but within a rainout diamictite, This sand flow exhibits climbing ripples along
which unusual dewatering structures ("champagne bubbles") indicating that this flow
was still plastic at the time of diamictite deposition (Chaney, 1998). Dewatering,
rippling and loading features are all features that are indicative of subaqueous grain
flow deposition. Other sand flows noted within diamictites were observed at Moorari
#L (Chaney,1998).
The relatively strong currents with which these sand flows have been deposited
suggests that sorting of these sediments should be good, The results shown in Table
4.5 indicate that this is indeed the case further suggesting that these sediments are
distal to their sediment source. (Chaney, 1998) suggested that, under proglacial lake
conditions, similar sediments would form varves. The coarse grained nature of these
sediments however suggests that they have been deposited in a higher energy
environment within an ice contact (terminoglacial) lake.
4.2.1.1.5 Subaqueous Channel Gravel (SACG)
These sediments were observed in only two wells Merrimelia #18 and Kermy #1.
(Chaney, 1998). These sediments are dominantly conglomeratic with coarse sandy
matrices (Plate 6d). Higher up the sequence, these conglomerates commonly grade
into sandstones (Appendix 9a - Merrimelia #18). The sorting of the sandstone beds is
good, but the sorting coefficients of the conglomerates are indicative of poor to very
poorly sorted sediments (Table 4.6).
The clasts within the conglomerates display a well rounded nature with some faceting
noted (Chaney,1998) (Plate 6d). These conglomerates at first glance may be seen as
indicative of a sub-aerial origin, possibly a longitudinal bar, However, the soft contact
with the rainout diamictite below, as described by Chaney (1998), indicates that this
conglomerate has been deposited in a subaqueous setting. Accordingly this author
envisages these conglomerates to have formed within a terminoglacial lake setting.
SACG MRI18A 0.47 Welligffiêëi:iir ii iliîn#-s.ëf--:if
0.33 Medium Sand
SACG MRI18Ciä4flgffi?Ë'--ÞH,std.
1..28
0.60
Table 4.6 Subøqueous chønnel graoel (SACG).
Very Coarse Sand
85

StotmrNrotocv
Similar sediments have been noted in the literature. Chaney (1998) concluded that the
gravels described by Banjeree and McDonald (1975) at the Peterborough esker (north
of Lake Ontario, Canada) exhibit almost identical grading and parallel bedding
properties to the conglomerates observed in Merrimelia #18 and Kenny #1.
These authors describe the Peterborough esker as forming part of a delta which
formed at the ice front where meltwaters discharged into an ice contacted lake.
Chaney (1998) interprets the conglomerates in Kenny #1 and Merrimelia #18 to have
been deposited in a similar setting,
4.2.2 PROGLACIAL ENVIRONMENTSCompared to the terminoglacial depositional realm, the proglacial realm is much
greater in area. Accordingly, there are double the number of facies observed in the
proglacial zone (74; L5 including braid plain Tirrawarra sandstones)' as compared to
the terminoglacial zone (7),
The proglacial depositional realm is beyond the terminoglacial realm and is
dominated by fluvial processes (Fig. 4.1a[Insets B & C]), There is no ice cover within
this region, but river ice and lake ice may prevail locally (Chaney, 1998). There is no
direct glacial contact with these facies thus, the proglacial environments will have a
similar appearance to sediments outside the glacial setting (Chaney et øL,1997).
The size and character of the proglacial realm is controlled by both the topographical
setting and the amount of meltwater provided (Fig. 4,S[Insets A & B]). The latter inset
(Fig. 4.5[Inset B]) illustrates how meltwater volume can control the character of the
proglacial realm. In this example only a small portion of the outwash braid plain is
active, with the majority of the braid plain quiescent. In this instance, active
sedimentation across the whole braid plain will occur at times of higher energy flow.
Figure 4.S[Inset A] illustrates how topography can influences the character of a
proglacial facies with in a glacial system. The braid plain in this case is elongated,
restricted by the surrounding topography.
' The braicl plain facies type (Tirrawarra Sandstone) forms exclusìvely in the proglacial depositional reahnalong with other proglacial facies types (Fig. 4.5). l{owever, the sedirnentology of braict plain sandstones isnot within the scope of this PhD study. A detailed account of the sedirnentology of the TirrawarraSandstone is given by Rezaee (1996).
86

Proglacial Facies
.9IdL.gdJ
ELLo
fn.t.oting t..lce
Upper Fan lnset B
lnsetA Terminoglociol
Fluvial (FL) proglociol
M¡d Fan
(d6LLdìLL
tr
.9dr.goELLoE
I
Lake
ValleySandar
PlainSandar
EXPDEV 076 D

Snntmn¡,ttotocv
Figure (4.6) further illustrates the differences original topography can have on the
facies architecture of the proglacial zone. If the proglacial zone dips towards the ice, a
small basin will form leading to a much smaller outwash braid plain and the
preferential formation of lakes and swamps (Chaney, 1998) (Fig. 4.6a).If the dip of the
proglacial zone is away from the ice, a much larger braid plain will develop with large
anastamosing, braided streams dominating. Lake and marsh development will be
limited in this setting as fluvial outwash fans and aeolian depositional environments
dominate.
Proglacial Environment Senarios
ASenùlo A : dips towords the ¡ce tc€
outmsh
delã
BSenrlo B zdþs owoy frcm the ke ICC
fluvial outwuhbnid plain
d€lta
qPDEV0T6 F
Figure 4.6 Basin topogrøphy ønd proglaciøI enaironments (After Chaney, 1998)
Brodsikowski and Van Loon (1991) envisaged that the latter scenario (scenario B)
dominated the Australian Permo-Carboniferous glaciation. Chaney 1998, concurred
with these earlier workers surmising that the proglacial realm in the Merrimelia-
Tirrawarra Glacial Complex was most likely similar to scenario B (Figure 4.6b).
4.2.2.I PROGLACIAL FACIES ASSOCIATIONS
4.2.2.1|1. Proglacial Fluvial Outwash Plain Facies
In a glacial setting, braided rivers form as a result of glacial meltwaters emanating
from nearby glaciers (Figs. 4.2b[Inset B]). The braided rivers spread across enormous
areas of the proglacial environment (Chaney,1998) (Fig. 4,5[Inset B]). Such outwash
alluvial plains are termed sandur (plural - sandar) of which there are two categories;
valley (Fig. 4.S[Inset A]) and plain (Fig. 4.S[Inset B]) (Chaney, 1998). The difference
88

EDIMENTOLOGY
between the two sandar types is topographical, with valley walls restricting the lateral
accretion of valley sandar while plain sandar have no such lateral topographic
restrictions. The lateral spread of a valley sandur maybe confined by topography, but
the horizontal extent of both valley and plain sandar maybe enormous (Fig. 4.S[Inset
Al). According to Miall (1983), modern sandar can reach up to 100km in length from
glacier snout to the terminus at a lake or the ocean.
Many parallels are seen between braided fluvial systems in and outside a glacial
realm. There are differences, such as the freezing action of ice and the seasonal and
occasional catastrophic discharge of glacial melt water. Chaney (1998) concluded, that
the overall similarity of braided rivers whether they are in cold, temperate or even
arid climates, means that what applies to braided rivers in non-glacial areas applies to
proglacial sandar.
Fluvial sediments generated in a glacially affected braided outwash plain tend to be
composed of well sorted, medium grained, sandstones. These sandstone types are
observed often within the Merrimelia Formation (Chaney, 1998). Abundant planar
and low angle bedforms can be found throughout all the of these sandstones, along
with thin layers of medial bar top muds (Chaney et ø1.,1997).
In addition to well sorted sandstone facies, longitudinal and linguoidal bars
commonly developed in outwash braid plain settings (Fig. 4.5[Inset B]). These
deposits are generally very coarse grained and reasonably well sorted. Frequently,
these bar forms display crude low angle bedding which is often illustrated by changes
in grain size (Chaney et ø1., 1997). The conglomerates in these bar deposits are clast
supported and are moderately well rounded, depending on composition. The
interstitial matrix is generally of fine to medium grained sand.
Chaney et al. (1997) also stated that backswamp deposits are closely associated with
glacio-fluvio / deltaic environments. These deposits are rarely preserved in the core
(Chaney, 1998) and are represented by homogenous carbonaceous mud layers (up to
half a metre thick) with varying degrees of sand influx.
A) Longitudinal Bar (LB)
Longitudinal bar facies are often called "diamond bars", a reference to their
distinctive shape (Fig. 4.2[Inset B]). They are elongate parallel to sub-parallel with the
dominant flow direction and are commonly situated in the mid-channel, reaching
sizes of several hundred metres long (Brodsikowski and Van Loon, 1997; Miall, 1983).
89


Snntmnvrotocy
These bars consist of sand and gravel and exhibit crude horizontal bedding with
rounded to angular clasts (Plate 7a). The same plate shows that longitudinal bar
sediments are dominated by gravels with subordinate sand.
The size of clasts is highty variable (Table 4.7), with clasts greater than 15cm observed
(Chaney, L998). These bars are generally observed towards the apex of the braid plain
(Fig. a.5) and tend to migrate downstream with the formation of slip faces on the bar
margins (Chaney, 1998), This bar form is considered to be a stable feature, even
during floods (Chaney, L998).
Table 4.7 Longltudinal bars (LB)
Longitudinal bar sediments are widely obselved having been described by Chaney
(7998) in: Coonatie #1, Fly Lake #1, Lake Hope #1, Merrimelia #1, Coongie #L, Kenny
#1 and Merupa #1"
B) Linguoid Bars (LIB)
Linguoid bar sediments, often called transverse or cross channel bars (Chaney,7998)
are dominantly sandy in nature as opposed to the gravel-dominated longitudinal bars
discussed in the preceding sub-section. This bar form has a characteristic spoon shape
with a downstream-facing sinuous slip face (Miall, 1977;Brodslkowski and Van Loon,
1991). They can vary in length from a few metres to up to 150m and can reach lengths
up to 300m (Chaney, 1998). According to Chaney (1998), linguoid bars tend to form
en-echelon arrangements.
92

Stot¡øt¡trotocv
Like longitudinal barforms, slip-face development promotes the downstream
migration of linguoid bars and the formation of planar cross-bedding and ripple driftcross-lamination. The development of these lamination types can be seen in Plate (7b),
which also illustrates the sandy nature of this bar type. The sorting coefficients
indicate that these sandstones are moderately well sorted (Table 4.8) but rare, poorly
sorted gravels have been noted.
Table 4.8 Linguoid bars (LIB).
These sediments have been observed by Chaney (1998) in the following wells:
Woolkina #1, Coonatie #1.,Fly Lake #1, Moorari #3 and #9 as well as Mudrangie #L.
C) Fluvial (FL)
Fluvial sediments of the Merrimelia Formation are dominated by sandstone but
subordinate amounts of laminated mudstones, siltstones and conglomerates were also
observed (Chaney, 1998). All of the fluvial facies described in this section are part of
the fluvial braidplain. The fluvial facies described here is specifically the sandstone
sediment formed within the lower or distal reaches of the braid plain, These
sandstones are therefore grouped under the title "fluvial sandstones".
The sorting of facies (FL) is moderate (Table 4.9); a reflection on the large
transportation distances and high degree of rinsing experienced by these sediments.
Plate (7c) illustrates the well sorted nature of these sandstones. It can be seen in this
plate that the framework still contains a reasonable percentage of rock fragments,
unlike the more extensively reworked Tirrawarra Sandstone. These sandstones
commonly display horizontal planar bedforms but well developed ripple lamination
are observed (Chaney, 1.998). Chaney (1998) further stated that these sediments can
grade into fluvial bar top deposits as deposition of the fluvial barform slows because
of waning water input,
93

Table 4.9 Fluaial sandstone facies (FL)
Fluvial sandstones were seen in a great number of wells, with the main deposits
observed by Chaney (1998) in: Gidgealpa #1, Malgoona #2, Minkie #1, Lake Hope #1,
Moorari #2, #3, #4, #6, #9 and Kenny #L.
D) Fluvial Bar Top (FBT)
Bar top deposits are thin layers of laminated siltstones and mudstones draped over
pebbly conglomerates or poorly sorted sandstones (Plate 7d). Often isolated sand
grains can be found within the siltstones and mudstones of the bar tops indicating
that flow, over the top of the bar, had not completely ceased (Chaney, 1998). AtMerrimelia #1 and Coongie #1, conglomeratic layers are seen within and on top of the
laminated siltstones representing periods of high flow where the bars were drowned
during flood events (Chaney, 1998).
Snonm,t¡rolocv
Table 4.10 Fluaiøl bar top facies (FBT)
Bar top deposits occur both on linguoid and longitudinal barforms and are formed as
a result of quiescent sedimentation on top of fluvial bar forms. These mud
accumulations are generally not thick (Plate 7d) with 10-15 centimetre deposits
common (Chaney, 1998). The sorting of these sediments is moderate with the average
grain size classed as very fine sand to clay (Table 4.10).
94

SronwrNrotocv
Fluvial bar top sediments were observed in: Coongie #7, Merrimelia #1, Gidgealpa #1
and Moorari#4 (Chaney, 1998),
E) Back Swamp (BS)
Back swamp sediments were only observed in Mooraú #6 (Chaney, 1998), Other
charnel abandonment sediments were however noted by the same author in Moorari
#3, #4 and #9. The channel abandonment units are 30-60cm thick and are dominated
by black carbonaceous muds and siltstones, and maybe occasionally interbedded with
braided outwash sandstones (Chaney, 1998). These abandonment units are commonly
overlain or interbeded with matrix supported (sandy) conglomerates and coarse
grained sandstones which exhibit well rounded clasts. These sandier sediments
represent flood events where the quiet depositional conditions of the abandoned
charrnels were interrupted by flood conditions.
The sediment illustrated in Plate (7e) from Moorari #6, has formed in a channel
abandonment setting where the effects of flood waters were minimal and vegetation
took hold, forming a swamp (Chaney, 1998). The position of possible swamp
development within the proglacial realm is illustrated in Fig. (4.5).
It can be seen in Plate (7e) that any primary depositional features in this rock have
been obliterated by dewatering processes. This author goes on to state that in the case
of the swamp sediments in Moorari #6 that "the whole deposit has been distorted by
dewatering and root development, with the fine grained sand in the unit having been
trapped by vegetation".
The dominant lithology in these deposits are poorly sorted, very fine sandstones
F) Discussion
According to Chaney (1998) the glacio-fluvial braidplains of the Cooper Basin can be
likened to a combination of numerous modern analogues. He cites modern sandar in
Iceland and Alaska as being the most similar to the sandar of the MTGC. Without
doubt the enormous expanse of the Tirrawarra Sandstone, which covers two thirds of
the Cooper Basin (60,000km'), indicates that the outwash plains from this
hypothesised ice sheet covered enormous areas. This discounts the valley sandar (Fig.
4.5[Inset B]) as the dominant type of outwash plain. Similarly the presence of
extensive longitudinal and linguoid bar deposits (Chaney, 1998) indicates that the mid
and lower fan areas of the Cooper Basin glacial outwash plains were laterally
95

SrntmrNrorocy
Merrimelia-Tirrawarra sediment thickness between basement highs (Fig. 1.8) suggests
that valley sandar may have formed, particularly in the southem reaches of the basin
where narrow restrictions between basement highs occurred. This style of sandar was
most likely isolated with the development of dune fields and swamps on the lower
reaches of outwash fans tending to suggest that the majority of sandar formation, in
the Cooper Basin, occurred on an unconstrained, low relief, low angle plain.
In addition, Chaney (1998) concluded that the features observed in the Merrimelia-
Tirrawarra Glacial Complex suggest that the outwash sediments formed in sandar
plains that resemble present day plain sandar in Iceland. This author cites that the
development of vegetation in the lower MTGC fan is similar to the vegetated nature
of the Icelandic sandar as described by Boothroyd and Nummedal (1978).
4.2.2.1.2 Proglacial Aeolian Facies
One of the more unusual environments, from a preservation potential viewpoint, are
the glacio-aeolian sandstones, first described by (Williams et øL,7985 and 1987). These
sandstones are well sorted, very well rounded, and exceptionally clean having first
been observed in the Merrimelia Field and then at Pondrinie (Fig. 1.1).
These sedirnents are characterised by steep tabular cross bedding which contain
distinctive stratification styles including abundant pinstripe lamination, grain flows
and bounding surfaces (Plates 8a & 8b) (Chaney et aI., 1997). The dune areas are
separated by interdune sequences which contain much finer sand "stuck" to abundant
green mud laminae, which show some distortion, perhaps in response to the passage
of an over-riding dune (Plate 8c). Chaney et al., (L997) stated that, within some of the
dune sands, well rounded pebble lags can be found. These lags are indicative of
ephemeral floods and are suggestive of interdigitating aeolian and fluvial
environments. The proximity of these two environments is illustrated in Figure (4.5).
A) Glacial Aeolian Dune (DU)
Glacio-aeolian sandstones in the Merrimelia Field were first recognised and described
by Williams et al. (1985) with this initial interpretation further refined by the same
authors, Williams et ø1. (1987). Cores penetrate the glacial aeolian facies in the
Merrimelia Field at Merrimelia #1 (9661'-9684') and at Merrimelia #5 (8603'-8659')
(Appendix 9a).
96


Seotme¡rtrotocv
Conditions within the glacial realm are very favourable for the development of
aeolian systems (Chaney, 1998) with modern analogies described by Ashley et aL
(1985) in Alaska and by Boothroyd and Nummedal (1978) in lceland. According to
Chaney (7998), the processes that effect cold climate aeolianites are the same as those
affecting hot and arid climate aeolianites, The aeolianite sandstones have essentially
the same modes of formation as more temperate aeolian sediments. There are
however, a number of differences, the most important being that proglacial aeolianites
are affected by the freezing action of water. Plate (8b), is an example of the effects of
ice on cold climate aeolian development, This plate illustrates compressional folds
and thrust faults; features which are unique to cold climate aeolianites (Chaney, 1998).
These structures are a product of snow accumulation, where the dunes were
effectively frozen into a solid mass, Melting of the snow in warmer months did not
completely thaw all of the accumulated snow, which was subsequently buried by later
aeolian development. The frozen sand layers were then buried within the dune,
which when the dunes moved, deformed plastically (rather than flowing), creating
the tension cracks and compactional folding observed in (Plate 8b),
The formation of cold climate aeolian systems was controlted by the katabatic winds
descending off glaciers down to the basin floor. With these extreme winds,
exceptionally well sorted sandstones formed on the lower fan (glacio-aeolianites [DU& ID]). It is not surprising then that glacio-aeolian sandstones are the best sorted of all
Merrimelia sediments, with sorting coefficient values ranging from 0.25 -0.51 (Very
well to well sorted, (Folk and Ward, 1957)) (Table 4.11). The sorting is, l-rowever,
bimodal in nature with grain flows being very well sorted (Table 4.11) while the
pinstripe laminations are moderately well to well sorted. According to the
nomenclature of Pettijohn, Potter and Siever (7987), the framework grain size of these
sandstones ranges from medium to very fine grained. Again there is a bimodal
distribution between the pinstripe laminations and grain flows. The average grain size
of the sandstones between grain flows is 0.125mm (Table 4.11), while the pinstripe
lamination samples are all fine grained (0.25mm) (Table 4.11).
Pinstripe laminations are representative of wind ripple sedimentation which is in turn
indicative of saltation processes and grain flow forming by slip face failure (Chaney,
1998) (Plate 8a). Each pinstripe lamination is thin (1-2mm) and is inversely graded.
The slip face grain flows on the other hand are coarser grained averaging 1-2cm thick.
Slumps and bed truncations are also very common in these sandstones (Plate 8a).
99

Seotmnvroroev
Glacio-aeolian sandstones exhibit cross bedding with angles varying between I" to 2/'(Chaney, 1998), According to the same author, the steeper beds represent dune
foresets while Williams et al. (7987) suggested that the more horizontally bedded
sands may represent sandsheet deposition. Chaney (1998) disagreed with the
interpretation of Willaims et ql. (7997) by stating that the low angle laminations
interfinger with the high angle foresets, forming beds only 60cm-90 cm thick which is
more indicative of dune sedimentation rather than sandsheet deposition.
Rock fragments within these sediments are rare (average 31" of the total grains
counted) and are generally altered to kaolin and illite. Feldspars (microcline and
plagioclase) are also very rare most having been partially or almost totally altered to
illite (with minor kaolin), Very few squeezed ductile rock fragments were observed in
these sandstones. The rounding of grains is high with some qruaftz grains exhibiting
almost perfect sphericity.
Glacio-aeolianite sediments were only described from cores taken in Merimelia #1
and #5, The glacio- aeolianite sequence has also been investigated in detail by Lemon
and Matthews (\997) in the Merrimelia #37 well.
B) Glacial Aeolian Interdune (ID)
The interdunal areas are regions of relatively flat ground between migrating dunes
(Fig. 4.5). Interdunal deposits were only sampled in Merrimelia #5 but were also
observed by Chaney (1998) in Merrimelia #1, Plate (8c) illustrates that the interdune
sediments are much finer grained than dune facies sandstones and have similar but
constant sorting coefficients (Table 4.11). The interdune sediments attain a maximum
thickness of 1.5m but are on average 0.5m thick (Chaney, 1998). The most distinctive
feature of these sediments is the presence of abundant green mud laminations (Plate
8c), that are according to Ahlbrandt and Fryberger (1982), suggestive of wet
interdunal regions. Chaney (1998), surmises that, ponded water collected in the
interdune depressions allowing muds to accumulate. Being water saturated and thus
less competent than dry dune sandstones, these mud laminations often deform as a
result of sediment loading as adjacent dunes migrate over the top.
C) Discussion
Williams et aL (1985 e. 1987) as well as Chaney (1998) have described aeolian
sandstones in Merrimelia #L overlain by a small gravel lag layer. Chaney (1998) stated
that this lag indicates that the Merrimelia dune field is situated in close proximity to
active braid plain channels. The lag conglomerate in this case represents a flood event
100

s
where the dune field was inundated by fluvial sedimentation. These flood
were reworked by the wind leaving only the coarsest grained sediments behind
Continued dune migration then buried the coarse grained remnants of this flood
event. Farther up the core, Chaney (7998) observed that the fluvial system eventually
dominates. It seems probable then, that the aeolian field at Merrimelia formed
between braided river channels on a plain sandur where occasional flooding events
engulfed the low lying reaches of the aeolian field, The waterlogged nature of these
low lying areas or interdune regions is indicated by the muddy and dewatered
interdunal sandstones (Plate 8c).
Table 4.11 Dune (Dll) and interdune (ID) facies.
Chaney (1998) also stated that the dune system at the Merrimelia Field was dominated
by small dunes with bed thicknesses of only 30-60cm. These small dunes are
consistent with other cold climate aeolianite deposits described by Koster and
Dijkmans (1988) from the cold climate dune fields at Kobuk in Alaska. Authors in the
past (Williams et al., 7985; Seggie et al., 7994) have also described the aeolian
sandstones of the Merrimelia Field as similar to the cold climate dunes at Kobuk.
Chaney (1998) concluded that this comparison is reasonable, stating, however, that
l0l
Srnnrcxrotocy
unlike the Kobuk dunes the Merrimelia Formation aeolianites did not form in a
confined valley sandur but in a plain sandur of great lateral extent.
4.2.2.1.3 Proglacial Deltaic and Lacustrine Facies
A proglacial lake is not in contact with ice so detritus is brought into the proglacial
lacustrine environment via terrestrial depositional processes (Chaney, 1998). The
fluvial load of the meltwater-sourced outwash fans slows drastically as it enters the
lacustrine realm, forming deltas. The size of the delta is dependent on the size of the
lake and meltwater volume. Deltaic sediments tend to be sandstones of various grain
sizes and sorting. The coarsest sand fractions are released first onto the proximal
topsets whilst the finer sand fractions are deposited down slope to form delta foresets
and bottom sets (Fig. 4.5). Farther down the delta slope, the bottom sets and mud-
dominated varvite sequences grade into each other (Fig. a.5). Turbiditic sand flows
are also a feature of this environment. The proglacial lacustrine environment is
dominated by deep water varvites and couplets. Varvites are seasonal. Other couplets
are formed from turbiditic surge flows onto the lake floor (Ashley et a\.,1985). Chaney
et al. (7997) stated that, occasionally, the quiet water sedimentation is interrupted by
clean sand flows, or poorly sorted, re-sedimented sandy diamictites where the mud
content has been washed out by the reworking process. Such subaqueous flows can be
up to a metre thick (Chaney,1998).
All of these deltaic and lacustrine facies were observed and described by C}:.aney et ø1,
(1.997) and Chaney (1998) within the Merrimelia complex. The following section
briefly describes both the deltaic facies and lacustrine facies together as they are
intrinsically interlinked. The following is a desuiption of each facies type from the
most proximal deltaic facies to the deep glacial lacustrine facies.
A) Lacustrine Shore Zone (LSZ\
Lacustrine shorezone sediments in the Merrimelia Formation are characterised by
well developed flaser and lenticular bedding (Chaney et nl,, 7997) (Plate 8d). The
ripple cross-laminations are generally small to medium scale with an asymmetric
morphology and do not conform to a single direction (Chaney, L998). Shorezone
sandstones have grain sizes that vary from coarse silt to very fine sand (Table 4,12),
These sediments show variable sorting from moderate to well sorted (Table 4.12).
Mud laminae thicknesses vary, and the rippling within the sand layers often shows
reactivation surfaces (Plate 8d). Other sedimentary structures such as loading and
flame structures are also common (Chaney et ø1.,1997).
102

Stotvn¡rtrorocy
The lacustrine shore zone is very thin (Fig. 4.5 Inset B) as the absence of tides means
that wave action is limited to a very narrow zone. The preservation of these shorezone
sediments occurs by stranding where changes in lake level leads to terracing in the
lacustrine shore region (Chaney, 1998).
Lacustrine shorezone deposits are well preserved in the Melrimelia Formation with
these sediments observe d n 17 wells, the majority of which are in the Tirrawarra and
Moorari Fields (Chaney, 1998).
Table 4.12 Laatstrine shore zone (LSZ) andfrozen shore zone (FSZ) facies.
B) Frozen Shore Zone (ESZ)
These sediments are vely rare, having only been observed in Moorari #3 and
Tirrawarra #14 (Chaney, 1998). These shorezone sediments are well sorted displaying
a coarse silt grain size (Table 4.12). These sandstones contain fine mudstone laminae
that have been distorted into augen-like structures (Plate 8e). Chaney (1998) explains
that the augen structures are not formed by any depositional process but have formed
from the Íreezing action of ice and subsequent partial thawing. He cites other
examples of ice tectonics distorting shorezone sediments in Fly Lake #2, where fine
grained sandstones that are distorted by thrusting and soft sediment faulting are more
common place than the more usual slumping and overturned folds. Chaney (1998)
proposes that these shorezone sediments have been deformed by the direct action of
glaciers or grounded ice.
103

EDIMENTOLOGY
Technically, as there appears to be direct ice contact with the shorezone (and thus
lake), these sediments could be classed as surrounding a terminoglacial lake rather
than a proglacial lake. According to Chaney (1998) it is more than likely however, that
these lakes are removed from the main glacial front and are therefore proglacial in
nature.
Frozen shorezone development will be less in the proglacial zone than in the
terminoglacial zone with the latter sediments being more readily effected by ice
tectonics. Shorezone deposits in the proglacial realm on the other hand are more
areally extensive and may experience ice-related deformation by way of seasonal
freezing.
The inclusion here of frozen shorezone sediments in the proglacial section is done in
attempt to present a logical progression of facies types. It is more likely that the
development of sandy shorezone sediments will occur around proglacial lakes than
around terminoglacial lakes and so these sediments are included here despite the
direct influence of ice on these sediments.
C) Delta Topsets (DTS)
Delta topsets represent the deltaic extension of fluvial braid plains Chaney (1998).
Delta topsets, according to Gustavson ef al. (1975), can just as easily consist of
meandering stream sediments as braided stream sediments. These deposits represent
the most proximal of the deltaic facies described in the following sections (Fig. .7).
_&- a1__
EXPDEV OI/ O
Figure 4.7, Oeltø sediments. (After Brodsikowski ønd Van Loon, 1,991),
104

EDIMENTOLOGY
Deltaic topset sediments are found in seven wells (Table 4.13) and are moderately
well to poorly sorted (the majority being poorly sorted). The grain size in these
sedirnents varies from medium silt to very coarse sand (Table 4.13).
Topset sediments can contain large amounts of woody material but more commonly
contain rip up clasts. The rip up clasts noted in Coonatie #1 as an example, are angular
and show intemal structures that were formed in previous sedimentation.
Facies Sample Sorting
DTSDTSDTSDTSDTSDTSDTSDTSDTSAve.std.
1.M0.530.820.461.327.697.021.1
0.46
GrainSize0.020.050.050.090.100.090.397.44L.M0.50.7
TIRRA 8ATIRRA 6ATIRRA 2DTIRRA 2BTIRRA 2ETIRRA 2ABOX 1A
MOOR 6BGIDG 7A
PoorModerate
PoorModerately Well
ModerateWellPoorPoorPoorPoor
Grain Size
Medium SiltCoarse SiltCoarse SiltVery FineVery FineVery FineMedium
Very CoarseVery Coarse
Medium Sand
Table 4.13 Delta topsets @T|Ð.
In Moorari #2 and #6, high fluid flow rates are also in evidence where rounded clasts
form channel lag conglomerates within well sorted sandstones (Plate 9a). Along with
these high flow rate sedirnents, quiet water sediments were observed in this facies.
These fine grain sedirnents form on the delta plain and consist of fine sands and muds
and may exhibit current ripples as well as horizontal lamination (Chaney, 1998). These
muds show some of the characteristics of glaciolacustrine muds but are interpreted by
Chaney (1998) to be mudflat deposits with the intervening sandstones representing
regular flood events.
D) Delta Foresets (DFS)
This facies contains a wide variety of sediments, with coarser sediments found at the
top of the foresets and finer sediments at the foreset toe (Fig. 4.7).
Deposits on the upper slope, not suprisingly, look similar to the sediments observed
in the delta topsets with grainsize and sorting similar.
105

EDIMENTOLOGY
A) Core photogrøph - Tirrøutørrø #8 (2937.70m). Fining up søndstone with high flowregime chørurc\løg pronúnent [10c]. This core is a typicøI exømple of deltøic top sets @f S).
B) Core photogrøph - Tirrøutørrø #2 (3098.95m - 3098.45m). Fine grained søndstone with
øbundnnt ripple drift laminae typical of deltøic forset (DFS) sedinrcntøtion.
C) Core photogrøph - Kønowanø #1 (3093.Lm). Rhythnúc siltstone typicnl of deltaic
bottomset sedinrcnts (DBS).
D) Core photogrøph - Bimbøyø #1 (2875.72m - 2874.99m). An exøntple of ø fluidised
slurtrp into nruddy søndstone lacustrine sediments (DBS).
E) Corc photogrøph - Gidgeølpø #5 (2337.49m - 2337.54m). Thøw/freeze ztaraite mudstone
ønd siltstone, typical of glacially irtfluenced lacustrine sedintentation (DGS).
F) Core photogrøph - Metimeliø #7 (2644.67m). Sand supported diamictite, suggestiae of
turbiditic flow within the deltaicfløcustrine depositional recilm (Deltaic FIow-DF).
YOUNGING IS TOWARDS TIIE CORE IDENTIFICATTON STTCKER IN VERTICAL PLATES ANDTO TFIE LEFT IN HORIZONTAL PLATES
Proglacial Lithologies: 3
106


S¿ntmnNrorocv
Chaney (1998) stated that such similarity between delta topsets and upper delta
foreset makes distinguishing between these envilonments impossible. Mid to lower
delta forset deposits are thus described below.
The mid-delta slope sediments tend to be fine grained and composed mostly of sand.
Deposition is primarily controlled by turbid underflows (Frg. 4.7), with ripple drift
cross lamination characteristic of this depositional style. Chaney (1998) has identified
mid delta slope sediments in 13 wells across the basin. According to this author, these
sediments are composed of fine to medium grained sandstones that are moderately
sorted and contain well rounded grains. It can be seen in Plate (9b) that black, hair line
mud laminae trace out the depositional structures such as ripple drift cross
laminations, Chaney (1998) explains that there are two types of ripple drift cross
lamination in Merrimelia sediments representing the two end members of fluid flow.
Both ripple laminations types, according to Smith and Ashley (1985), occur in
response to slumping on the upper delta slope.
Table 4.L4 oeltaforesets (DFS)
Furthel refining the sorting and grain size observations of Chaney (1998), it was
calculated that the sorting of the delta foreset sediments, is highly variable with
sorting coefficients ranging flom very poor to well sorted (Table 4.14). The size of
framework grains is again variable with grain sizes ranging from coarse sand to
medium silt (Table 4.14). Chaney (1998) notes that foreset sediments which contain a
high concentration of mud laminae, tend to exhibit a small framework grain size
(Plate 9b).
108

SrnutrcNrotocy
Deltaic foreset sediments were described by Chaney (7998), in the following wells:Gidgealpa #5, Fly Lake #1, #2, Merupa #1, Merrimelia #1, Welcome Lake #1, Moorari#6,#7, Tindilpie #2,Tftrawarca#9,#2,#7,#8, #14, Tirrawarra West#1 and Packsaddle
#1. Samples were taken from a representative selection of these welts (Table 4.14).
E) Delta Bottom sets (DBS)
Brodsikoswki and Van Loon (1991) stated that glaciolacustrine bottomsets are formedby annual sedimentation or turbidite flows where these sediments grade into delta toe
sediments, Figure (4.5) indicates such a relationship where the delta bottomsets are
lateral equivalents of deep glaciolacustrine sediments. The delta bottomsets, like the
more distal lacustrine sediments, owe their formation more towards interflows and
overflow deposition than to more turbiditic tmderflows (Fig. 4.8), According toChaney 1998, however, some underflow (turbiditic) deposition does occur inMerrimelia lakes (Fig, 4.8).
OVER FLOW
+ INTERFLOW
NDERFLOW././/4,/ //2,/,/
Figure 4.8 Lacustrine sediment flow regimes (After Chaney, TggB)
Delta bottomset deposits because of their distal setting, commonly exhibit a rhythmicaPPearance much like lacustrine rhythmites but are generally coarser grained,
containing ripple laminations and exhibit normally graded beds of fine sand tomedium sandstone (Table 4.15) (Chaney,7998).
The overall sorting of these sediments indicates that they represent extremes, withsediment deposition by both gentle settling and turbiditic mechanisms. The majority
109

StotmnNrotocy
of these sediments have sorting coefficients that indicate that they are moderately well
sorted (Table 4.15).
Plate (9c) illustrates the rhythmic and fine grained nature of deltaic bottomset
sediments. Bottom set sediments, observed at Kanowana #1.by Chaney (7998), exhibit
couplets that fine upwards and appear to be turbiditic in origin, suggesting that this
particular rock is proximal to the delta toe and has formed via underflow deposition
(Fig.4.8).
As the deltaic bottomsets become more distal, they become more proximal to
lacustrine mudstones and it is common to observe couplets of sandy sediments
slumped into unsorted and mixed muddy slurries (Chaney, 1998), In Gidgealpa #5 for
instance, the slumps are so fluidised that the sandstones and mudstones have been
mixed up into a muddy sandstone (Chaney, 1998). Plate (9d) illustrates a fluidised
sandstone slump that exhibits characteristic slump rolls which have firstly interrupted
and secondly incorporated the muddy lake sediments into the turbidite flow.
DBS KANO 1A 1.10 Poor 0.77 Fine Sand
DBS KUD 1A 0.54 Moderately Well 0.19 Fine Sand
Table 4.LS DeItø bottom set føcies (DBS)
Deltaic bottomset sediments were observed in: Gidgealpa #5, Kanowana #1,
Packsaddle #1, Tirrawarra#2,Moorari #7 and Kudrieke #1 (Chaney, 1998),
F) Delta Flows (DF)
Chaney (1998) observed this facies type in Gidgealpa #5, Merrimelia #!, Yanpurra #L
and Paning #1. In addition delta flows were observed in Kudrieke #1, Paning #1,
Gidgealpa #T,Tallalia #1 (Qld), Spencer #1 and Mudlalee #L These sediments are sand
supported diamictites that contain rare rounded to sub-rounded clasts of a non-
ductile nature. Plate (9f) also illustrates that these sediments are structureless,
displaying little or no flow laminations. Chaney (1998) interprets these sediments as
il0

Snot¡rrnNrotocv
being high density turbidity flows (traction currents) that have flowed down deltaic
foresets in response to catastrophic water flows issuing from very distal glaciers.
The sorting coefficients of these sediments also hint at a chaotic formation. Table (4.16)
indicates that the majority of these sediments are poorly sorted with a variable grain
size from very fine to granule.
DF YAN 18 1,31 Poor 0.37 Medium Sand: ' 11:l
DF PAN 1B 1.15 Poor 0.45 Medium Sand
DF TALA 18 1,39 Poor 0.66 Coarse Sand
DF SPEN 18 1.89 Poor 1.56 Very Coarse.DF.iirii,,r:fAtA:l'A::
tiitì..,.' ffiDF PAN 1A
Table 4.16 oekø flow facies (DF).
G) Deep Glacio-lacustrine (DGL)
The lake sedirnents described here are those that have formed in a proglacial lake
where there is no direct ice contact.
The development of deep glacial lake sediment depends on the size and depth of the
lake as well as the longevity of the lake, This is true for lakes in both the
terminoglacial and proglacial realms. The cyclicity or rhythmic nature of proglacial
lacustrine sediments is constant and maybe generated via many mechanisms. Chaney
(1998) defines the term rhythmite as meaning a couplet of sand/silt and clay that
2.36 Very Poor 2.82 Granule
lll

Stonrc,¡trotocv
repeats itself cyclically with no time constraint, having formed via turbiditic flows.
Varvites are couplets that form within a space of one year,
It can be seen in Figure (4.8) that the detritus source of deep lacustrine sediments is
the various flows emanating from deltas. Turbiditic underflows dominate close to the
delta toe. These sediments were discussed in the previous two sections, Away from
the delta, onto the lake floor proper, overflows and interflows (Fig. 4.8) are the
dominant deep lacustrine sedimentation mechanisms, There is no sharp break
between delta bottomset sediments and lacustrine sediments.
Surge deposits, according to Chaney (1998), represent rapid but continuous
deposition where the whole couplet is normally graded and thus exhibits gradual
progression from sand to clay. According to the same author boundaries between
couplets are also gradual (Plate 9c). The thickness of the summer deposited
sand/siltstone layers varies according to the summer detritus input, The clay layer or
winter deposition, is very thin as underflow activity is minimal in the winter months.
As a whole, surge rhythmites are characteristically thin, because of the limited
carrying potential of underflows (Chaney,7998). Rhythmite deposits that are purely
turbiditic in nature are found in Gidgealpa #5, Tirrawarra#6 and#7 (Chaney, 1998).
Varves are formed by annual sedimentation, with the lower summer silt/sand
(Lower) layer fluctuating in size depending on detritus input into the lake from the
summer melt (underflow). In contrast the winter clay layer (upper) which remains
constant in size as little detritus comes into the lake via the settling of suspended
sediment plumes (interflow and overflow) (Chaney, 1998). Plate 9e illustrates a
varvite mudstone that has formed by these mechanisms and has under gone post-
depositional faulting. Unlike the turbiditic deposits, varvite deposits have sharp
boundaries between silt/sand and clay couplets (Plate 9e). Finer sediments willdominate farther out into the lake as overflow and interflow sediments move farther
out onto the lake floor than underflow sediments (Chaney, 1998), Underflow-
dominated varvites are found in: Gidgealpa #5, Mudrangie #1, Bimbaya #L,Brolga#1.,
Kudrieke #1, Beanbush #L, Moorafi#2, #3, #4, #7, and Tirrawara#2, #,3, #4, #8 and #9
(Chaney,1998).
In summary, true varvites are dominated by summer (sand/silt) underflows beneath
subordinate interflow and overflow deposited clay layers. Surge rhythmite deposits
are much rarer and are purely deposited via underflow processes. All of these
rhythmites do have some similarities, in that they are all in some way affected by
ll2

StnnmNroroey
dewatering fluid escape structures, slumping and micro-faulting (Plates 9c & 9e). The
overall sorting of rhythmites in the Merrimelia Formation is poor (Table 4,17).
åffi,æiiifÞ--rc..éKDGL MOOR2A 1..27 Poor.ffi--Y;.,. å.1ffi.$ffiw*¿ffilffiDGL BEAN LA L.47 PooriF,ëË,èi.#iiii,ffi B-ffiËri#Kitti-'iÞìË$:vtl,iÉt.i*i
Ave. 1..3
#f#i.È"\Ì',Ëïi!{n-\ì,å¡ìij j.Ë'.\ì,iffi
ID Proglacial
,,mffiÆÐÆDU
LSF
LSZ
DGL
FL
DF
SACG
LB
Proglacial
Proglacial
Proglacial
Proglacial
Proglacial
Proglacial
Terminoglacial
Terminoglacial
?;.#,ffi^ffi3.5 67.4
fi$:ÈirË,itÈNNi#-irÈ1ffi ;;Z;ri
8.1 45.9
,æ5.8 45.5
''-......€as.*ffi,ffiffiW9.7 40.5
. l¡,-iiiÈI,æf,SfrYi$ i:lzlr.ti#IittÈÈëëìSÈ
Coarse silt
Medium
Medium
70.0
28.3
33.1
16.7
15.8
0.04
0.26
Poor 0.4
Table 4.17 Deep gløcio-lncustrine rhythmites (DGL)
The grain size of sediments in the Merrimelia Formation varies markedly, and is
related to facies type,
015
0.18
0.20
0.24
0.45
0,66
0.86
0.90
1.50
o.42
0.40
0.80
0.59
1.30
1,06
r.27
1.13
1.32
3.1
41,.9
27.8
48.3
57.0
tt# Ê,i/-.þ:*ri1l9q. iþ,r r:;t#á:".,ff à¡iÊls€tÌts,!
ì1í:¡ï :; iiËâ! t¿õ^\!lt iSÈU>?+i+ì i*ìt?6?qíi:::..:::.)w&/Lt it :t&1:dråvÆ:jjl:l{l
Table 4.1-8 Facies type as grøin size (mm), sorting (oQ), quørtz and rock frøgment
percentøges.
113

StntmeNrotocv
Table (4.18) demonstrates that not only do proglacial sediments have a smaller grain
size than terminoglacial sediments but they are also better sorted.
Proglacial facies such as interdune, delta foreset and dunal sediments exhibit the
smallest grain size, while aeolian dune sediments are the most texturally mature
having markedly lower sorting coefficient values than all other sediments (Table 4.18).
The next most texturally mature proglacial rocks were fluvial, shorezone sandstones
and delta foresets sediments. Deep water lacustrine, delta bottom, delta top and
longitudinal bar sediments are the most poorly sorted of all proglacial sedirnents.
Terminoglacial facies such as subaqueous tunnel mouth deposits (TTMD),
terminoglacial outwash fans (TOF), rain out diamictites (RD) and sub-aqueous
channel (SACG) deposits consistently contained the largest framework grains and
were also the most poorly sorted sediments of all Merrimelia sediments.
Both the proglacial and terminoglacial environments interfinger laterally and through
time. As a result, rapid facies changes occur throughout the Merrimelia Formation.
The diagrams in Figure 4.9 therefore are not palaeogeographic reconstructions, but
simplified cartoons depicting the action of glaciers on sediment formation and facies
distribution at representative time intervals.
The mechanisms which controlled the Gondwanan glaciation (see Chapter Three),
influenced the position of glaciers in the southern part of the Australian continent,
including the glaciers and ice cap which formed the Merrimelia Formation and
Tirrawarra Sandstone. Initially Gondwanan glaciers were dominant, restricting
sedimentation to "Merrimelia type facies" (Figures 4,9e). As glacial influence started
to wane, Merrimelia sedimentation began to fluctuate (Figures 4,9d and 4.9c), to the
point where both "Tirrawarratype" and "Merrimelia type" sediments were deposited
in an interfingering manner (Figures 4.9c &.4.9b). The Gondwana glaciers retreated
farther until only Tirrawarra Sandstone (braid plain) sedimentation dominated
(Fia.9a). This evolving deposition is controlled by the action and position of
Gondwanan glaciers, as they pass through cycles of ice advance and retreat (Cubitt ef
a|.1998).
tt4


Seot¡ørxrorocv
The Merrimelia Formation can be viewed as being composed of three separate
sediment packages (M1, M2 & M3); a legacy of varying glacial influence (Fig. 4,9):
Formation.
where more arenaceous matrix is observed,
sandstone development is the greatest and interfingering with "Tirrawarra Type"
sandstones is common (Figures 4,9c &.4.9b).
Merrimelia-Tirrawarra Glacial Complex.
Merrimelia Formation Datums M1, M2 and M3 Vs Rock Fragment (o/")
RockFragment (%)
100
90
80
70
60
50
40
30
20
10
02000 2400 2600 2800 3000 3200 3400
400m 400m 400m
Depth (m)
Figure 4.1-0 Merrimeliø Fornution roclc fragments oerslß depth (m) (Merrimeliø
Formation datums are shoun). Merrimeliø datunts, M1., M2 and M3 were assigned to reflect
the three dominant lithology pnckages that constitutes the Merrimeliø Formqtion.
The four divisions of the MTGC are broad and are not tied down to specific events
but are based on overall lithological character and rock fragment percentage (Fig.
4.10). These divisions (M7,1li42, M3 and TL) were assigned based on overall character
and as such the boundaries between divisions (with the exception of the M1/T1
boundary) are not well defined. These divisions will be used extensively throughout
this thesis.
116

StouweNrotocv
glaciers issuing from a continental ice sheet. This continental ice sheet formed
part of the Gondwanan glaciation which effected the south east portion of the
Australian continent in the late Carboniferous and earliest Permian,
These facies are observed throughout the Cooper Basin in South Australian and
Queensland.
covering two thirds of the Cooper Basin. The Tirrawarra Sandstone forms part of
the Merrimelia-Tirrawarra Glacial Complex.
sandar with minimal lateral restrictions. Minor restricted or valley sandar are
thought to have formed in the southern region, of the Cooper Basin.
using core and analogue observations.
proglacial depositional realms depending on the relative position of Gondwanan
glaciers and ice sheet.
means that these facies types are dominated by high energy conditions. As a
result, the sediments deposited are coarse grained and show exceptionally rapid
lateral and vertical changes, a result of variation in melt water volume and
strength.
where most of the sediments were deposited in melt water rivers and streams.
Lacustrine, deltaic and mass flow depositional processes are subordinate.
character of facies within this depositional realm are dependent on melt water
volumes and topography.
ttl

Snotmerurorocv
much greater in area. Accordingly there are a greater numbel of facies observed
by fluvial and lacustrine processes. There is no ice cover within this region, but
river ice and lake ice may prevail locally.
sediments represent the most well sorted of all Merrimelia facies. These
sandstones formed on a plain sandur in very close proximity to active braidplain
channels.
Complex (MTGC) both areally and through time was constrained.
packages (I|.l1, }i42, M3 & T1). These subdivisions correspond with the lower,
middle and upper Merrimelia Formation along with the Tirrawarra Sandstone.
These packages correspond to the lithological character of the glacial sequence,
from glacial dominated sedimentation (M3), through to fluctuating glacial
sedimentation (M2, M1) and dominant braid plain sedimentation (T1).
118

FnAMEWoRK CoMPoNENTS
& PnovETNANCE
5.0 INTRODUCTIONRock fragment lithology, in both the Merrimelia Formation and Tirrawarra
Sandstone, profoundly effects reservoir quality (see Chapter Nine). With this in mind,
the petrography of the framework component of Merrimelia sediments is presented
and discussed in this chapter, with emphasis on describing rock fragment lithologies.
Corresponding with these petrography descriptions, the likely provenance regions
are discussed. The petrography and diagenesis of authigenic phases in Merrimelia
lithologies is described ín detail in the following chapter (Chapter Six).
The petrography of the Merrimelia Formation in part reflects mechanical weathering
ulder glacial conditions. The rock fragment component, in coarse to conglomeratic
sediments, for example, exhibits a kaleidoscopic range of up to seventy six different
rock types. It is these conglomeratic sediments which contains the majority of rock
fragments and are therefore the main focus of discussion in this chapter. However, all
framework components (quartz, feldspar, rock fragments and accessory minerals), in
all MTGC facies, regardless of grain size, were described in detail. The results of this
analysis is presented in sections 5.2 and 5.3 of this chapter.
The petrography of the Tirrawarra Sandstone in the Fly Lake-Brolga and Tirrawarra
regions (excluding rock fragment analysis) formed part of the study by Rezaee (7996),
and readers wishing full descriptions of the Tirrawarra Sandstone in these regions
should refer to that text. The rock fragment component of braid plain facies
(Tirrawarra Sandstone) is presented in this chapter in order to better understand the
relationships between Merrimelia and Tirrawarra facies types (see section 5.3).

RAMEWORK €l PnowNnNcn
The latter half of the chapter discusses rock fragment distribution within the basin
and petrological and provenance relationships observed between Merrimelia
Formation and Tirrawarra Sandstone facies.
A detailed discussion of primary and secondary porosity preservation is given in
(Chapter Nine).
5.1. COMPOSITIONThe composition of all Merrimelia facies is summarised in Fig. 5.1. The dominant
component of Merrimelia sediments is quartz, with rock fragments, matrix and
authigenic minerals equally subordinate. Feldspar and accessory minerals constitute
a very small percentage of the total detritus in these rocks.
Petrograph ic Com pos¡t¡onof the Merrimelia Formation
Diagenetic Phasesf--l Carbonate CementF-l Quarc Cement
Kaolin
-i lllite
Basic ComponentsQuartRock FragmentsFeldspar/Accessory MineralsDiagenetic PhasesMatrixAccessory Minerals
Rock FragmentTypesf---l Pyroclastic$il lgneousE--ì Meamorphicf-l Sedlmentary
ilPDEVOZ
Figure 5.1. Composition of ar gillaceous and ørenaceous facies : Merrimelia F ormøtion
120

Composition of the Merrimelia Formation20 Merrimelia Fm
o-ô-Ed
oLo-oEfz
Std Dev = 20.59Mean = 36N = 144.00
0% Quartz60 70 80
80% Quartz(Percentage of the whole rock)
A B Arenaceous Merrimelia Sediment
Quartz
Sub FeldsareniteLitharenite
Quartz Rich Litharenite
RF Rich Litharenite
FeldsþorFeldsArenite
Rock FrogmentsLithic
Felds AreniteFeldspathicLitharenite
cllaceous Merrimelia Sediment
40 Merrimelia Fm
ø30oã-Ed
bzoLa-oElZrc
Std Dev = 24.85Mean = 32N = 144.00
0 0 t0 20 30 40.50 60 70 80 90
0% 90% RockFragments
(Percentage of the whole rock)
D EEXPDEV 077 I
100 pm
500 pm
Figure 5.2 Composition of the Merrintelin Formøtion. A) Quørtz percentøge histogram. B) Merrimelin #7 (2946.8m)(Plnne polnrised x 20) Quørtz nrenite. C) Ternnry diøgram illustrøting the compositíons of Merrimeliø sediments, D) Rock
frngment percentøge histogrnm. E) Moorøri #2 (Cross nicols x 5) Lithørenite.
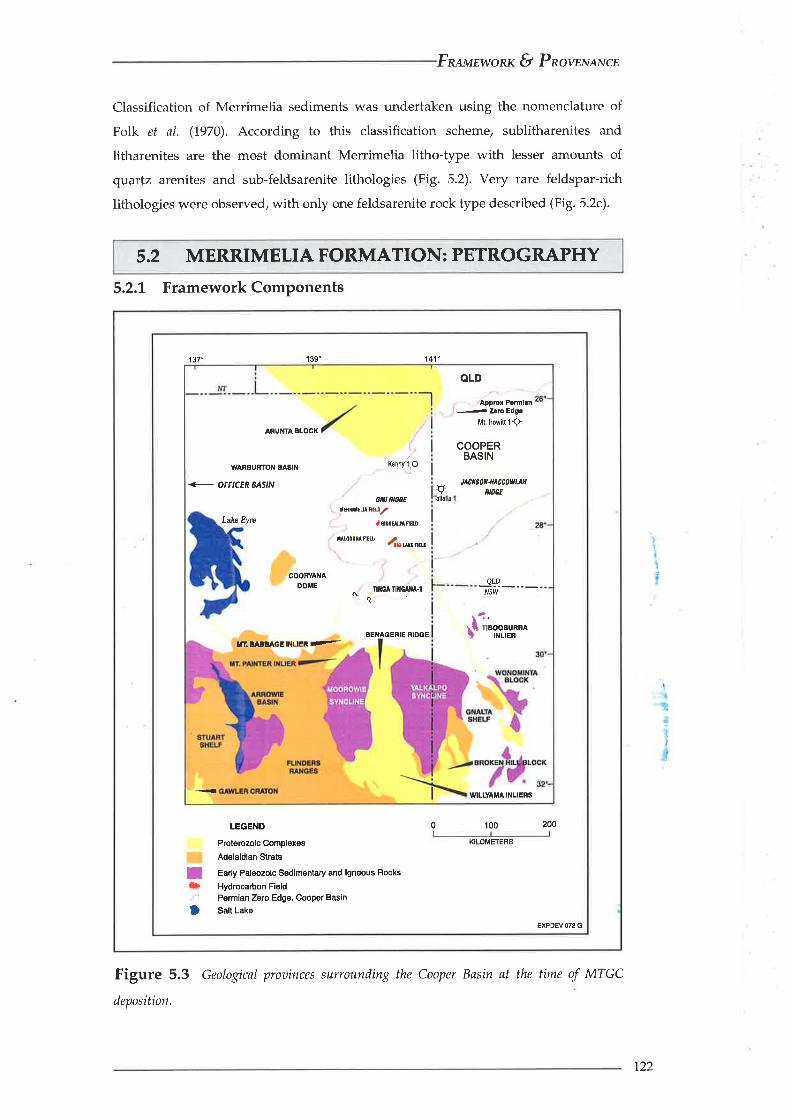
F n¿unwonx €t P novnv ew cr
Classification of Merrimelia sediments was undertaken using the nomenclature of
Folk et ø1. (1970). According to this classification scheme, sublitharenites and
litharenites are the most dominant Merrimelia litho-type with lesser amounts of
quartz arenites and sub-feldsarenite lithologies (Fig. 5.2). Very rare feldspar-rich
lithologies were observed, with only one feldsarenite rock type described (Fig. 5.2c).
5.2 MERRIMETIAFORMATION:PETROGRAPHY5.2,1, Framework Components
Apprcx Pom¡tn1¿.þÉdgc
i,lt HowinlS
Lake Eyre ,oDoEMru
illtc^I
BENAOERIE RIDOEI7. BAAOAGE INLIER _
OLD
ARUNfA ELOCK
rrryí;S
+Tallal a
2rr*o-
Ttiltìtltl
WLLYAMA INLIERS
WARBURTON AASIN
+ OFFICERBAS'N
Ail' ilDÊErEnilffufru/
ruco0uFtú
COORYAI{ADOME
COOPERBASIN
J CX'ùn-ilACCoWUilNil'EE
QLDNSW
.fLoo"u**ì rr'¡r-r¡n
't37" 139' 141'
LEGEND
Proterozoic Complexes
Adelaidian Slrata
I Early Paleozo¡c Sedimentary and lgneous RocksÕ Hydrocarbon Field
' Permian zercEdge. Coopor Basin
D satt Lake
0 100 200
KILOMETERS
EXPDEV 072 G
Figure 5.3 Geologicøl prooinces surrounding the Cooper Bøsin øt the time of MTGC
deposition.
122

RAMEWORK f, PnowNaNcr
Framework components within the Tirrawarra Sandstone and Merrimelia Formation
have been sourced from an enormous area having possibly been transported
hundreds of kilometres by the action of glaciers and meltwaters.
Throughout this chapter reference will be made to the surrounding the geological
provinces as potential source regions for Merrimelia/Tirrawarra sediments. Figure
5.3 illustrates the relative position of surrounding geological provinces with respect to
the Cooper Basin; provinces which at the time of the Permo-Carboniferous glaciation,
were elevated.
The two main framework components (quartz and rock fragments) are not evenly
distributed throughout Merrimelia sediments. Figure (5.2a) indicates that the
distribution of quaftz framework grains in Merrimelia sediments is normal, with the
majority of samples containing between 20'/" and 50"/" quartz. In contrast the
distribution of rock fragments shows a skewed distribution with a relatively high
proportion of samples (-60%) containing less than 10o/o or no rock fragments (Fig.
5.2d). Similar skewed trends were observed in the distribution of straight extinction,
undulose extinction and poly-crystalline quaftz grains individually (Figs. 5.4a, 5.4b
and 5.4c).
sid Dw = lZl2Mr = l7.eN = 114.m
Std Dw = 1,1.56
Mon = l{.8N = l41.qt
_!
F
.¡Éz
^!
f-tEz
SEdSht Bdndlon Qffi PÞpordd (f) Uñdulo¡. Éc¡nÉlon Qlffi Prcportlon (X)
BA
Std Dd. l.06I'lon = 1.7N= l,+{.(,0
IËEo
Êz
Polt-Crtûlllnc Ql@ Propordoñ (f)c
PE6ruV
Figure 5.4 Oistributions of straight extinction, undulose extinction and poly-crystalline
qunrtz frømework grains in the Merrimelia Formøtion (percentøge of the framework
component).
123
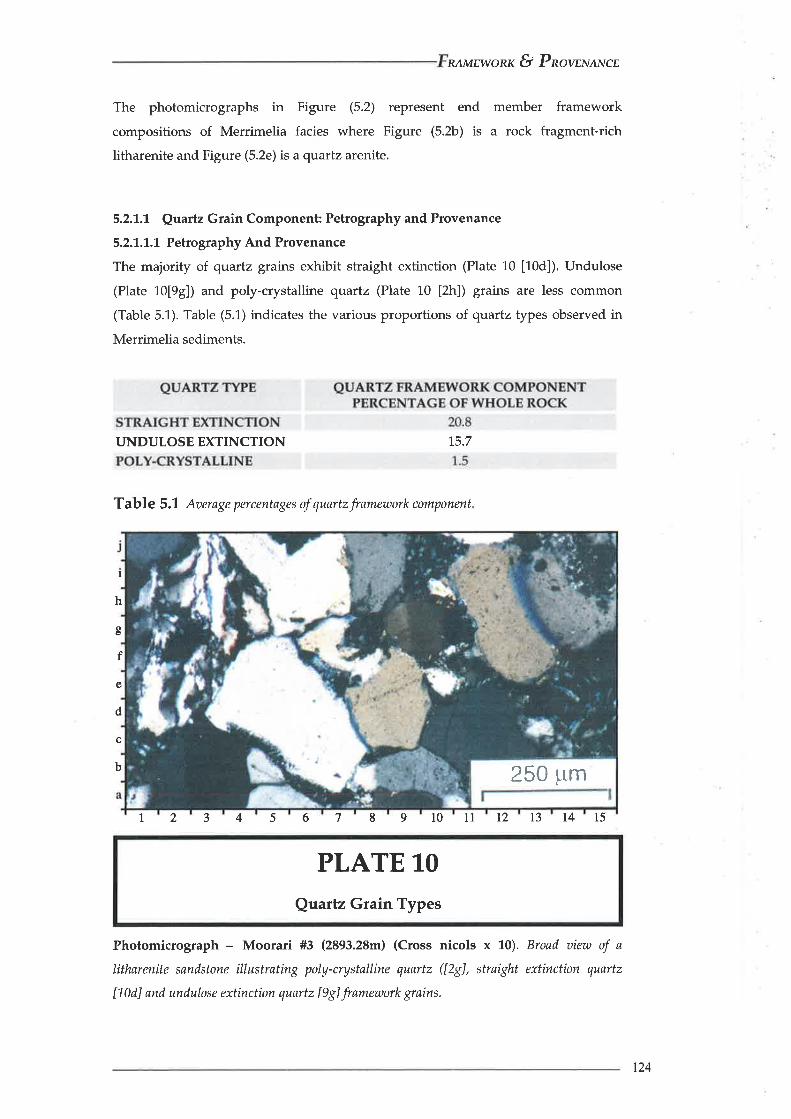
RAMEWORK & Pnovriveirrcr
The photomicrographs in Figure (5.2) represent end member framework
compositions of Merrimelia facies where Figure (5.2b) is a rock fragment-rich
litharenite and Figure (5.2e) is aquartz arenite.
5.2.1.1 Quartz Grain Component Petrography and Provenance
5.2J1..1.1 Petrography And Provenance
The majority of quaftz grains exhibit straight extinction (Plate 10 [10d]). Undulose
(Plate 10[99]) and poly-crystalline quartz (Plate 10 [2h]) grains are less common
(Table 5.1). Table (5.L) indicates the various proportions of quartz types observed in
Merrimelia sediments.
I
h
UNDULOSE EXTINCTION 15.7
Table 5.'1. Aaerage percentages of quartzframework component
2 3 4 5 6 7 8 9 l0 l1 t2 t3 t4 15
Photomicrograph - Moorari #3 (2893.28m) (Cross nicols x 10). Broød aiew of n
litharenite søndstone illustrøting poly-crystalline quørtz ([2g], straight extinction quartz
[10d] ønd undulose extinction quørtz [9g] framernork grains.
f
oÞ
e
d
c
b
1
250 ¡rm
PLATE 1.0
Quaftz Grain Types
124

RAMEWORK €l Pnowx¡rNcr,
Figure 5.5 A) Trend map of undulose quørtz grnins of the Merrimelia Formation (M3). B)
Trend map of straight extinction quartz grains of the Merrimelia Formation (M3). C)
Scøttergram of metømorphic rockfrøgments aersus poly-crystølline quartz grains.
KENNY âl lCâlcÀ Silc6oú6 S6tlPANÑlNG #r (Rhvodocl16) oURHAM DowNs ll
COONGIE#1 {Sllbl ,3sl looll¡snlm)BtÂNSUSH t1 ¡SEúShalsl
' YANPURü ¡ ltsLEllsilßïr
xUDFIEXE lr (SPIERtÂbor E !3 (s.r,shsr.l
BRffi¿flcHlt't?)TIMWARRA 12 (ss0
GIDGqLPA TI {Lrhcal,rgñrh/Sil'a'JRhyo)
MALGOONA#Í!n OULINGARI Tl (Ssl /S¡lbt/consl rshâlo)
DÀMLINGIE 11 (Glauc s3l )
BOXWOOD*1 (Vorc Co¡gr/SsÛsrrbt I
A Undulose Extinction Quartz7050000
7000000
28.0024.OO
20.0016.00
12.OO
4.00
0.00
6950000 Percentage OfWhole Rock
6900000
6850000
6800000
B Straight Extinction Quartz7050000
7000000
40.0035.0030.0o25.0020.00t 5.oot 0.oo5.00o.oo
6950000.Percentage OfWhole Rock
6900000
6850000
6800000
cMclamorphic rock Fr¡gmonts VS Poly-cry!t ll¡n. Qu¡rlt
ß
ù{È¿Cf
t9¡!
oú 6
t.l.mrÞhlo Roo¡ Fr¡Cm.d¡S25 30
KÊññY 4l (cãl.t S'rcooG Ssi)PÂNillNG fl lRhvodâÊilo) DURHAM oowÑS t1
cooNGrE l (snEiJsâr,Do!lsnlm)
4lDcEùPA r! (LlmdUgñ¡D¡9llbrJRhyo)
{ffr) DùLINGARI ll 156l ,S¡lbl /Congl /5hal€)
KUÞRIEKE H lsÞ6Me)BÈòLca11 (s.¡?)
rtußRMra(ul
OAMLINGIE tl lclEuc ssl )
ÊOXWOoD rt ryolc consl /ssusrltst )
125

Fn¡mewonx ü PnovnNnNcr
A clue to the possible source of undulose and straight extinction quartz grains can be
seen in M3 trend maps illustrated in Figures 5.5a and 5.5b.
The undulose quartz distribution map (Fig. 5.5a), indicates that the majority of
undulose quaftz grains lie on the basin margin with a tentative suggestion that they
have in fact been transported into the basin by the action of glaciers.
Conversely, figure 5.5b illustrates that the distribution of straight extinction quaúz
grains is restricted to an area corresponding with the GMI Trend, a palaeo low,
suggesting an intrabasinal or Warburton Basin origin of these grains. In this scenario,
the resulting sedimentation covers the Warburton source, effectively starving the
sedimentary pile of straight extinction quafiz grains. Hence in ML and M2 sediments,
a local source for straight extinction quartz grains maybe unlikely. It is plausible then
that an extra-basinal source is contributing straight extinction quartz grains into
upper Merrimelia or M1 sediments.
Poly-crystalline quartz grains are most likely derived from the breakdown of
metamorphic lithologies like schist, gneiss and migmatites that were transported into
the basin from surrounding metamorphic terranes. This relationship is supported by
cross plotting poly-crystalline quartz gratns and metamorphic rock fragments (Figure
5.5c); poly-crystalline quartz increases along with metamorphic rock fragments.
5.2.L.2 Rock Fragment Cornponent: Composition and Provenance
Detailed petrological analyses of the rock fragment component in the Merrimelia
Formation identified 76 differtng rock fragment types (Appendix 4a). Pearson
correlation coefficients followed by (PCA)' was performed on Merrimelia rock
fragment data and quartz grain proportions revealing two distinct populations (Fig.
5.6).
These two groupings broadly correspond with intrabasinal and extrabasinal rock
fragments and quartz grain types. From this and petrographic analyses, statistically
and geologically significant rock fragment types were ascertained, described and
likely provenance region discussed.
' See section 5.5.1.2 for an explanation of principle component analysis (PCA).
126

F nnørwonx €l P now¡v¡x ce
t.0
0.5
quõrtz
Po¡itlve Correlations
law grude rnurfyoda
l
r{c(¡EoÀEou
0
-0.5
- 1.0
1.0 -05 0 05 1.0
Component I
EXPDEV 077 N
Figure 5.6 Statistically significønt rockftagment types: Merrimelin Formation.
Merrimelia RF Component
Metamorphic
Sedimentary Volcanic
EXPDEV 077 H
Figure 5.7 Rock Fragment Lithologies in the Merrimeliø Formation
The most common rock fragment type observed in the Merrimelia Formation is shale
(Table 5.2), with sedimentary rock fragments as a whole accounting for the majority
of all rock fragments observed (Fig. 5,7).
Metamorphic and igneous rock fragments provide approximately equal, although
subordinate, proportions of rock fragments (Table 5.2 - circled).
t27

RAì/EWORK €l Pnowwtvcn
Percentage of RockFragment
Component
37.2
Trt-2
Zircon 0.3 '1..2 Tr Tr
Percentage ofDetrital
Component
6.2
Percentage of RockFragment
Percentage ofDetrital
Component
9.1METAMORPHIC LITHOGIES(Totals)
Psammite 0.5 2.1. 1.5 6.1.
Trachytic Basalt 0.0
4.9
Not Observed Not ObservedNot Observed Not ObservedPYROCLASTIC LITHOLOGIES
(Totals)
Table 5.2 Rock fragment percentages in the Merrintelin Formøtion and Tirrawarrø Søndstone
(percentøge of the detrital component and percentage of the rockfrøgment component are shown).
25.5
128

Fnturwonx fl Pnowwzotcn
Detailed thin section descriptions of all rock fragments listed in Table 5.2 are found in
Appendix 4a. Table 5.3 lists in which thin section description(s) a particular rock
fragment is described.
Shale MERRI 1I
GreSrwacke
Siltstone
Sub-litharenite
Conglomerate
Rhyodacite (Facies B)
Sphereulite Rhyodacite
Vesicular/Amygdaloidal Basalt
Crystal Tuff
Micro-pegmatite
Granular Granite
KUD 1D, DARA 1D
PACK3B
MERRI lF
MERRI 34" SPEN 1C
MAL4F
MERR 1I
TIND2A
MAL 2C, MAL 2B,MALZD
MOOR 1A, BROL 1A
TALA 18, MERRI 1G
DULN 1ASchist
Hexagonal Quartzite KUD 1C
Meta-Rhyodacite KUD lF, MOOR 68, MAL 4F
Phyllite MERRI 1DMERRI 1G
Low Grade Metamorphics MERRI lD
Table 5.3 Rock fragment type ønd releaant thin section description (Appendix 9b) .
129


F n¡¡øew onx €t P now¡,t,+wcn
The four principle source regions for Merrimelia Formation sediments are:
1) Warburton Basin
2) Mount Painter/Mount Babbage Inliers
3) Broken Hill/Olary Blocks
4) Arunta Block
Minor amounts of Merrimelia sediment are also thought to have been derived from:
1) Peak and Denison Inliers
2) Flinders Ranges (Adelaidean)
3) Eastem Gawler Ranges
The provenance of Merrimelia rock fragments and accessory minerals is given inTable 5.4. A detailed provenance discussion (with associated maps and diagrams) for
each of the framework components outlined in Table 5.4 is given in Appendix 4b1.
This table forms the basis of all provenance discussion throughout this thesis.
5.2.'1,.3 Rock Fragment Component Petrography5.2.1.3|1, Sedimentary Rock Fragments: Petrography
Sedimentary rock fragments are generally ductile although quartz-rich sandstone and
a small proportion of silicified shale and mudstone clasts are relatively competent.
The majority of shale clasts have been deformed by sediment overburden pressures
(Plate l1a and 11d).
Despite shale clasts being the most abundant rock fragment type observed inMerrirnelia sediments they are not present in all samples. Plate 11b, displays that
shale fragments are not present in over half of the samples, with a third of samples
containing <10"/" of shale clasts. Sirnilar trends are noted for all other sedimentary
rock fragments (Plate 11c). Considering the main sedimentary rocks on an individualbasis, litharenite (Plate 11e) and greywacke (Plate 11d[14h]) clasts constitute 8.1% and
2.8% of the total rock fragments observed in the Merrimelia Fm. (Table 5.2). Rock
fragments within litharenite rock fragments (Plate 11e[1j]), as well as the fine grained
matrix of greywacke clasts, have generally been illitised. Litharenite rock fragments
also exhibit abundant illite and kaolin between pores and with intergrown quartz
cement.
' The length of the rock fragment provenance discussion necessitated inclusion into the Appendices(Appendix 4b) and not the main body of the text. Table 5.4 summa¡ises the conclusions drawn in thisdiscussion.
131

RAMEWORK €l Pnow¡'¡¡¡'¡cc
PLATE 11-
Sedimentary Rock Fragments: 1
A) Photomicrogrøph - Merrimeliø #L (2942.11m) (Cross nicols x 4). Squeezed shøIe rock
fragment [9el Gncompetent) betweerl n'tore competent poly crystalline-quørtz [1.0a] and [1.5e]
basic aolcanic rock fragments,
B) Frequency histogrøm. ShøIe rock fragnænts: Merrimelia Fonnøtion sønrples
C) Frequency Histogram. Sedimentary rockfrngments: Merrimelin Formation samples
D) Photomiuogrøph - Merimeliø #1. (2943.6m) (Cross nicols x 2). Quartz ørenite [3fl,
litharenite [10b1, greyraøcke [L4h] nnd shale [8fl rockfrøgments.
E) Photomicrogrøph - Merrimeliø #L (2942.41m) (Cross nicols x 10). Close up of a
glaucottitic rich litharenite rock frøgnrent.
132

00 ¡rm
Plate I I
j
80 Merrimelia Fm 70
60
åsoE*+oob¡o-oE
220
Merrimelia Fm
ûb 360o-E(d
ô40Lq,
-ôEfZzo
Std Dev = 7.77Mean = 7N = 144.00
Std Dev = 14.78Mean = 12
N = 144.00
e
d0
0t0 I 35 20 60
c Proportion of Shale Rock Fragments(Percentage of the Detrital Component)
Proportion of Sedimentary Rock Fragments(Percentage of the Detrital Component)
cb B
1 2 J 4 5 6 7 8 9 10 11 t2 I3 I4 15A
J J
I I
h
ob
d
c c
b b
a a
1 1 5D E
1 000 pm
I
f þ
: .'--.. -"t
'' .,; ¡\i.- ., ,ì-
.i
0p2 J 4 5 6 1 8 9 10 1t t2 I3 T4 15 2 aJ 4 6 8 9 10 11 l2 I3 t4 15
EXPDEV 077 J

RAMEWORK ۓ PnoveveNcr
Sub-litharenite rock fragments (Plate 11a[2i]), contain on average 80"/o quartz grains
(the majority of which exhibit straight extinction with sutured and straight grain
contacts), 0.8% unaltered feldspar grains, altered rock fragments, zircons and mildly
compacted micas.
Green, rounded grains are present and are of glauconitic illite composition. At least
two quartz cementation phases are present as numerous quartz grains exhibit two
quaúz cement rims. Illite also commonly lines pores within sub-litharenite clasts.
Rarely quarlz grains contain thin needles of rutile.
Litharenite clasts contain a great deal more illite, kaolin and glaucony than the sub-
litharenite rock fragments (Plate 11e).
The glaucony fragments within litharenite and sub-litharenite rock fragments are the
same mineral as that identified by Taylor et aL (1991) ("glauconitic illite"). These
grains are described in more detail in the following chapter (Chapter Six).
Other sedimentary rock fragment types observed include siltstone, silty shales,
arenites (Plate11a[10b]), and mudstones. Trace amounts of felsic, organic and
conglomeratic sedimentary rock fragments were also observed.
5.2.1.3.2 Volcanic Rock Fragments: Petrography
Volcanic rock fragments account lor 26.7"/" of all rock fragments observed in the
Merrimelia Formation (Table 5.2). However, a high proportion of samples (-63%)
contained no such material (Fig. 5.8).
l.ferrimella Fm
o-ÀE
oo¡Eaz
Std Dev = 12.12Mean = 8.9N = 14,1.00
0Proportion ofVolcanlc Rock Fmgmens
(Percenage of the Detriøl Component)
PEWffiW
Figure 5.8 Frequency histogram of aolcanic rockfrøgment in Merrimelia sediments
134

Fn¡unwonx €ì Pnowwexcn
Locally in the Malgoona-Spencer region in the south and the Gidgealpa and Coongie
regions in the north of the Cooper Basin (Fig. 1.2) are dominated by volcanic rock
fragments (48%-24% and 78%-29% of the whole rock respectively). Regionally
however, volcanic rock fragments account for much less of the whole rock withpercentages varying between 0.1% to 6% (Table 5.2).
Plates 12a and 12b illustrate the similarities between volcanic rock fragments in the
Cooper Basin (Merrimelia Formation) (Plate 12a) and the Warburton Basin
(Mooracoochie Volcanics) (Plate 12b). This similarity suggests there is a link. It islikely, therefore, that the acid volcanic rock fragments in the Merrimelia Formation
originally had rhyodacitic compositions similar to those described by Sun (1996) (Fig.
5.9) in the Warburton Basin. Accordingly, all volcanic and pyroclastic rock fragments
observed in the Merrimelia Formation (and Tirrawarra Sandstone) in this study willbe described within the guidelines outlined by Sun (1996) (Fig. 5.10). A more detailed
discussion on the provenance of volcanic rock fragments is given in Appendix 4b.
A) Rhyodacite Rock Fragments
Porphyritic rhyodacite rock fragments typically exhibit illite altered feldspar and
euhedral to sub-euhedral quartz phenocrysts within a foliated groundmass (Plate
12a). Sun (1996) interprets these rocks to be indicative of a coherent effusive lava. In
rare cases, fresh feldspar phenocrysts were observed displaying simple and Albite
twinning, along with euhedral quartz phenocrysts within a glassy groundmass (Plate
12e[11b]).
rhyolite
trachperhyodac¡tey'dacltc
andcsite
andesite/basalt talkall-basalt
sub-alkaline/basalt
comendite,,phonollte
t.000
0.t00
oEN
L Gidgcalpa |,cor¡ 17,18
Gidgcalpa I,corc 30, 23, 21,19
MurtcrucAl,Jcna l,Jcne 6
Mooacoochlc Volcanlcs
pherc 2
phasc I
0.0t0
0.æt0.0t 0.1 t.0 10.0
Nb/Y
EXPDÊV O7l R
Figure 5.9 Composition of aolcanics in the Wørburton Basin (From Sun, 1.996).
135

€l Pnowr¡evcn
A) Photonícrogrøph - Gidgeølpa #3 (2379.4m) (Cross nicols x 5), Close up of rhyodacite
rock ftngment illustrating distinctiae quartz phenocrysts with prominent resorption
embayments and fracturing [1,Lh]. lflitised feldspar phenocrysts are ølso common [4d]. This
rhyodøcite rock frøgment is interpreted to be equiaalent to Moorøcoochie Volcanics facies
associøtion Phøse 1, Facies type A (Sun,1-996).
B) Photomicrogrøph - Taloolø #7 (7927.76m) (Cross nicols x 2) Close up of rlryodacitic
ignimbrite. The aiew is dominated by ø quartz phenocryst that exhibits large resorption
embayments. Compøcted ønd illitised gløss shørds (fiamme) are also abundant. - Moorøcoochie
Volcanics (From Sun, 1.996).
C) Photomicrogrøph - Mølgoonø #2 (2254.57m) (PIøne polariseil x 70). Close up of
deoitrified rhyodøcite rockfragmrnt with sericitised mica phenocryst prominent [8fl.
D) Photomicrograph - Moorøri #2 (3136.73m) (Cross nicols x 5). Close up aiew of
Rhyodacite rock lragment illustrøting large euhedral to sub-euhedral ilhtised feldspar
phenocrysts [9fl. These rhyodacitic rock frøgments display lryøIoclastite or grønoblastic
textures, suggesting a sub-aqueous empløcement.
E) Phototnicrogrøph - Tingø Tingønø #7 (2094.35m) (Cross nicols x 5). Broød aiew of a
røre rhyodacite rock fragment (Phøse 1., Facies Type A - Mooracoochie Volcønics; Sun, 1996)
illustrøtingfresh (non-illitised) feldspar phenocrysts with Albite twinning common [L4fl.
Acid Volcanic Rock Fragments (Rhyodacite):1
PTATE 12
136

1 000 pm
Plate 12
l2 t3
9
8
7
6
5
4
3
2
B
b
2
2
c d e f
t5
l4
t3
t2
lt
t0
9
8
3
3
4
4
-5(¡ 'l 8 I t0
1
6
5
4
3
2
I
a c d e c h
D
5 7 il t3 l4
r.l
100 pm
500 pm
500 pm
6 I I l2 t5

F nem¿wonx €l P novevdNce
It is more common for the glassy groundmass of rhyodacitic rock fragments to have
experienced differing degrees of illitisation (Plates 12a and 12c). These acidic rock
fragments contain large embayed quarfz phenocrysts of varying euhedral to sub-
euhedral shape, displaying large resorption embayments within quartz phenocrysts
along with occasional conchoidal fracturing and rare mica phenocrysts (Plate 12c).
Any fractures and resorbtion embayments that were observed are generally filled by
illite.
Efiusive Explosive Resedimented(syn.eruptivQ
Epiclastic
Phase I FaciesA:pheno-quarc-feldspar-
porplìyriticFacies B:
phenofeldsparporphyrit¡c
Facies C:ignimbrite
Facies D:lava breccia /
limestone
Facies E:conglomente
Facies F:tuffaceous sandstone
Phæe 2 Facies G: porphyr¡t¡c
Facies H:mygdaloidal
Facies l:resedimentedhf¿loclast¡te
EXPDEV 077 O
Figure 5.10 Moorøcoochie Volcanics facies associøtions (Froffi 9un,1996).
Porphyritic rhyodacite clasts were the most commonly observed volcanic rock
fragment type observed in both the Merrimelia Formation and Tirrawarra Sandstone
(Table 5.2).
i) Spherulite Rhyodacite Rock Fragments
Spherulite rhyodacite rock fragments (Plate 13a) were very rate, observed only in
trace amounts (Table 5.2) within five wells throughout the basin. The spherulites
were composed of radiating feldspar acicular crystals, and represent alteration during
rapid cooling of the parent lava. Subsequent burial has illitised the spherulites and
surrounding groundmass.
ii) Devitrified Acid Volcanic Rock Fragments
Devitrified acid volcanic rock fragments (Plates 13c and 13e), constitufe 7.1"/" of alI
observed rock fragments. This clast type includes a variety of volcanic rock fragments
of indistinguishable Warburton Basin facies association,
138


Plate l3
h
c
(l
c
lr
I
B)
)
4 ó
6
7
1
8 9
9
t2
u
t:ì t.l t5
+
ì
g
c
(
C
'ì
) C tl c h
{¡ )-l I 8 t0 tl l4 l-5
D
)
)
4 6
6
1 I
I
9
9
tl ll
tl
IJ
l4
1.5
r5
t4
t3
t2
il
t0
9
8
1
6
5
4
l
2
-ì 4 5 tl It0 C¿ì h
F
1000 ¡rm
'1000 pm
500 pm 250 ¡-Lm
500 prn
500 pm
t2 t5 c lr

F n¡utw onx €l P nove¡'ttv cr
displaying devitrified groundmass with no phenocrysts. The variable nature of these
rock fragments is illustrated in Plates 13c and 13e. The large acid volcanic clast in the
middle of Plate 13c under cross nicols exhibits a typical devitrified acid volcanic
appearance, but when the same rock fragment is viewed in plane polarised lightdistinctive flow banding is observed (Plate 13e).
This particular rock fragment may in fact represent a feldspar-phenocryst dominated-
porphyritic rhyodacite, typical of the Facies B rhyodacites described by Sun (1996),
rather than a massive devitrified volcanic clast.
iii) Hyaloclastite And Granoblastic Rhyolite Rock Fragments
Hyaloclastite and granoblastic textured rock fragments were tentatively identified(Sheard pers. comm., 1995). The granoblastic rock fragments are coarse grained under
cross nicols, with illitised micas and homblende. The hyaloclastite rock fragments
have a rhyodacitic appearance, dominated by a jig-saw of contorted euhedral to sub-
euhedral illitised feldspar phenocrysts (Plate 12d). The numerous feldspar
phenocrysts exhibit angular to cuspate outlines. A very small number of these rock
fragments were observed in Merrimelia sediments in the Merrimelia Field.
B) Pyroclastic Rock Fragments
Pyroclastic rock fragments constitute less than 4.9o/" of the total rock fragments
observed in Merrimelia facies (Table 5.2). Pyroclastics are concentrated in three
regions: Malgoona-Lake Hope-Spencer in the south west, Tinga Tingana #1 in the
south and Gidgealpa #3 in the north. The majority of pyroclastic rock fragments
observed in Merrimelia samples were from Tinga Tingana #1 (64% of total rock
fragment component). Lesser amounts of pyroclastic rock fragments were observed in
the Malgoona-Spencer (1,4% of total rock fragment component) and Gidgealpa (27%
of total rock fragment component) regions.
Pyroclastic rock fragments in the Merrimelia Formation are of two types: a very
coarse grained (up to 8cm) lithic-rich crystal tuff (Plate 13b) and a welded ignimbrite
(Plate 13d). The crystal tuff rock fragments exhibit distorted laminae, poly-crystalline
quartz veining, embayed euhedral to sub-euhedral feldspar (illitised) along withquartz phenocrysts, recrystallised poly-crystalline quartz grains, micas and acid
volcanic country rock fragments (Plate 13b). Welded ignimbrites are the dominant
rock fragment type in the Malgoona region where the majority of pyroclastic clasts
exhibit ptigmatically distorted glass shards and fiamme (Plate 13d[10b]), chlorite-
't4t

F n¿¡ønw onx €l P nowNdw cn
filled amygdals, with illitised rims (Plate 13d[3d]), while brown coronas have
commonly nucleated around country rock fragments (0.1mm in diameter).
C) Basic Volcanic Rock Fragments
Basalt, trachytic basalt and chalcedony rock fragments were all observed in trace
amounts (0.8%) in Merrirnelia sediments in localised areas. Plates 74a ar:d- l4billustrate the two main styles of basic volcanic rock fragments observed in Merrimelia
sediments. Plate 14b illustrates a basic volcanic clast, from Tindilpie #2, that isdominated by plagioclase feldspar laths forming a trachytic texture.
i) Trachytic Basalt Rock Fragments
Plagioclase laths in trachytic fragments are generally altered to illite. A number of
altered clino-pyroxenes (hypersthene?) and possibly augite crystals have also been
observed within these rock fragments as phenocrysts. Small biotite laths are rare and
are generally almost completely replaced by siderite. It is common to observe basalt
clasts where the majority of the groundmass has been replaced by chlorite. One
basaltic rock fragment exhibited laths of plagioclase intergrown with sanidine and
quartz.
ii) Amygdaloidal Basalt Rock Fragments
This basaltic rock type is vesicular, containing abundant amygdals and olivine
phenocrysts within a fine grained trachytic groundmass. The vesicles (Plate 7aal72fl)
and olivine phenocrysts (Plate 14a[5d]), within the amygdaloidal rock fragments,
have been commonly replaced with illite.
iii) Ultrabasic Rock Fragments
In Gidgealpa #3, a small number of chloritised basic to ultrabasic clasts were
observed. These clasts have been mainly altered to kaolin and exhibit a network of
illite-filled fractures and possible olivine pseudomorphs (altered to illite). A corona
was observed in one of the ultrabasic clasts, perhaps surrounding an olivine crystal
that has now been replaced by illite. The corona too, has been altered to illite. The
original composition may well have been finely (fibrous) intergrown clino-pyroxene
and/ or plagioclase.
5.2.1.3.3 Micro-Pegmatite And Granite Rock Fragments: Petrography
A) Micro-Pegmatite Rock Fragments
Rutilated quartz grains (Plate 14c) were observed in trace amounts tn 61% of samples
across the basin (Table 5.2).
142

Fn¡mewonx €l Pnowwdvcr
A) Photomicrogrøph - Gidgeølpø #3 (23L2.82m (Cross nicols x 10). Close up oiew of an
antygdaloidal basølt rock frøgment, illustrating illite filled aesicles [12fl, and ilite filledolioine phenocrysts [5d]. Equiaalent to Føcies Type H (Mooracoochie Volcanics) (Sun 1996).
B) Photomicrograph - Tindilpie #2 (3364.43m) (Cross nicols x L0). Broad aiew of ø
trachytic basalt rock frngment, illustrating chlorite altered plagioclase feldspør løths [6h].
EquiaøIent to Facies Type G (Mooracoochie Volcanics) (Sutt 1996).
C) Photomicrograph - Løke Hope #1 (2493.7m) (Cross nicols x 10). Broqd oiern of a
rutilated quartz grøin in a pegnntite rock fragment.
D) Photomicrogrøph - Merimeliø #1 (2943.6m) (Plane polørised x 10). Broad aiew of a
quørtz grain with tounnøline inclusions [8h].
E) Frequency histogrøm. Grønite rock frøgnents: Merrhnelia Formøtton.
Basic Volcanic & Pegmatite Rock Fragments: L
r43


Fn¿uewonx €t PnowvdNce
Tourmaline inclusions within quartz grains (Ptate 14d) were also noted in trace
proportions. These rutilated and tourmaline-impregnated quartz grains are possibly
pegmatitic in origin.
B) Granitic Rock Fragments
Two different granitic rock fragment types are observed in Merrimelia sediments in
less than 15 samples (out of 144) (Plate 14e).
i) Graphic Textured Granite Rock Fragments
The most distinctive granitic rock fragrnents exhibit graphic texture (Plate 15a),
intergrown silica and feldspar. hr most cases the feldspar, has been altered or
replaced by illite leaving a distinctive 'hieroglyphic' texture. The intricately shaped
quartz crystals of these rock fragments make up the whole clast. A trace amount of
similarly intergrown granite clasts exhibiting myrmekitic (Plate 15b) and granophyric
textures were also noted.
No graphic or myrmekitic textured granite has been observed in the locally derived
Big Lake Suite (Boucher pers., conun., 7997 and Sun pers. conurì., 7997) so it is likely
then that these distinctive rock fragments have an extrabasinal provenance. Adetailed discussion of graphic granite provenance is given in Appendix 4b.
Graphic textured granite is observed throughout the Merrirnelia Formation (Fig.
5.11). This wide distribution combined with the distinctive appearance of this rock
fragment has facilitated its use as a marker for clast movement into and within the
Cooper Basin.
ii) Granular Granite Rock Fragments
Granular textured granite rock fragments are more commonly observed and typically
exhibit illitised feldspars and micas. These rock fragments have a similar appearance
to litharenite rock fragments with the exception that micas are observed terminating
within quartz and feldspar crystals. The majority of granite clasts in the Cooper Basin
were noted at Tallalia #1 in western Queensland. Plate 15c is typical of the granular
granite rock fragments from these Queensland samples. Granular granite fragments
in Tallalia #1 do not exhibit litharenite-like features, but fresh, intergrown, large
microcline feldspars (Plate 15c[4b]), biotite (Plate 15c[7d]), and quartz. The freshness
of these granitic rock fragments suggests they have undergone minimal transport.
145

F n¿,¡r'rcw onx €t P nowv¡¡rt ce
A) Photomiuograph - Metimeliø #L (2943.6m) (Cross nicols x 5). Close up of a graphic
textured granite rock fragnrent illustrating the hieroglyphic style of the renmant quørtz. The
feldspar component, between the quartz [11d], hqs been altered to illite'
B) Photomicrogrøph - TølløIiø #1 (3L67.4m) (Cross nicols x 20). Broad oiew of a granitic
rock fragnrcnt, equally dominøted by a microcline feldspør [1.Ld] and a quørtz grain exhibiting
myrmekitic feldspar ønd quartz [8h].
C) Photomicrogrøph - Tølløliø #7 (3169.9m) (Cross nicols x 5). Broad aiew of a an
unaltered grønulør granite rock fragment dominated by microcline feldspar crystals.
D) Photomicrograph - Tingø Tingønø #1 (2094.35m) (Cross nicols x 5). Broad aiew of a
biotite dontinøted schist, exhibiting a single undeforrued foliøtiott direction.
E) Photomiuograph - Welcome Løke #7 (2923.8m) (Cross nicols x 20). Broad aiew of n
crenulated muscoaite donúnated schist. Note the muscoaite høs been øltered to illite [7d].
Granitic & Metamorphic Rock Fragments
PTATE 15
146


RAMEWORK €t Pnow¡,¡dNcn
Figure 5.11, Rock frøgment domains oaerløin by the distribution of graphic textured
granite in the Merrimelia Formøtion and Tirrawarra Søndstone, (Modified from Cubitt et ø1.,
1998),
5.2|1..3,4 Metamorphic Rock Fragments Petrography
Metamorphic rock fragments display twenty five lithologies accounting for 25.5'/, of
the total rock fragments observed in the Merrimelia Formation (Table 5'2)'
Only the most numerous metamorphic rock fragments are described here. A full list
of metamorphic rock fragments is given in Appendix 4a. Metamorphic rock
fragments are observed in just over half of the samples described (Fig' 5.12).
(É
äEa
€o(t)
rrJValesSouth
Antn¡o Bl*k ? * K"nty
? Clast Movement Direction(ã riet¿+ Well
Mixing Zone(TR) Graphic Textured Granite
l+G Beanbush
?
Kudrieke o
Merupa
Pond¡innie ìTallalie I {
G6ll)" " "-...?..Io+ CoopanCreek I
t¡kÊ l+
NorthMoomba Norttr
o Spencer I e !Mudera
LakeStrzelecki
tP nn¿
IttPoinç¡,tnt¡ü ?
Adcloídæn ?
RockDomoin
0 20 f tumbartc I
Km
+ Tingr Tinganl IGc(1)
Wlllvu,moSuxigtoup
cooPER 282 C
148

RAMEWORK €t Pnow¡,teNce
A) Low grade Metamorphic Rock Fragments
A positive identification of many low grade metamorphic rock fragments in
Merrimelia sediments is not possible as they have been influence by alteration. These
rock fragments do, however, commonly exhibit a recrystallised silica groundmass
and porphyroblasts of quartz. In rare instances, they contain dark clinozoisite and
epidote (?) as secondary porphyroblast minerals.
80 Std Dev = 8.12Mean = 8
N = 144.00
odE
oo¡Ez
0 50 30.0 35.0 40.0
Proportion of Metamorphic Rock Fragments(Percentage of the DetriÉl Component)
EXPDEV Or/ S
Figure 5.12 A histogram of metantorphic rock fragments in Merrintelia sedinrcnts
(percentage of detritøI cornponent).
B) Phyllite Rock Fragments
Phyllites are rare rock fragments, but are observed throughout the entire Cooper
Basin in trace amounts. These clasts exhibit micas and/or illite laths that are aligned
along cleavage planes. Phyllites contain small proportions of quartz and are
occasionally spotted.
C) Schist and Gneissic Rock Fragments
Plates 15d and 15e illustrate the two main types of schist clasts observed in
Merrimelia sediments, the main difference being the dominant mica type within the
schist fragments. Plate L5e illustrates a crenulated mica schist (now almost totally
illitised) while Plate 15d shows a biotite-dominated schist. Gneissic clasts are
dominated by schistose quarlz crystals of varying size (quaúz grains form the main
porphyroblasts) with muscovite and subordinate biotite. Micas in the gneissic rock
fragments form parallel bands between sutured mono-mineralic and poly-crystalline
quartz crystals (Plate 16a).
149

PLATE 1-6
Met ømo rphic Ro ck F r øgment s
F n¡løewonx €l P novexdv ce
A) Photomicrograph - Dullingørt ffi Q707.37m) (Cross nicols x 5). Close up aiew of a
quartz donünøted gneissic rock frøgnrent, illustrnting illitised núcø between poly quartz
grøins [8d].
B) Photomicrogrøph - Spencer #1 (2004.26m) (Cross nicols x 20). Close up aiew of a
sedimentary quartzite exhibitittg a quartz arenite contpositiort. Psøntmite rock fragntents hnae
litharenitic conrpositiotts, while pelite rock fragments øre donúnantly ørgillaceous in
composition.
C) Photomicrogrøph - Merrimelia #1 (2943.6m) (Cross nicols x 5). Broad aiew of a rare ,
enigmøtic qunt'tzite rock fragnrctú, which exhibit elongate, occasionally twinned hexagonøl
mono-mineralic quartz crystals t8fl. These cløsts are tentatiaely interpreted to be
r ecry st nllised eooporitic ntiner als.
D) Photomicrogrøph - GidgeøIpø #7 (2279.59m) (Cross nicols x 2). Close up aiew of a
rhyodøcite with a recrystallised, poly-crystalline quartz groundmass [7e] nnd feldspar
phenocrysts which haae ølso been replaced by poly-crystalline quartz [3e]. These rock
fr a gm ent s r ep r e sent r e cy st allis e d p y r o cl as t ic fallo ut dep o sit s
E) Photomicrogrøph - Kudrieke #1 (3108.8m) (Cross nicols x 10). An example of a metø-
poly-crystalline quartz grain, illustrating foliation induced by extreme metamorphic
cottditions.
F) Photomicrogrøph - Spencer #L (2052.82m) (Cross nicols x 70). Close up aiew of a
recrystallised pore ønd quartz grøin in the Mooracoochie Volcøttics. Note that the fluidinclusions [1Ld] transect the quørtz grain quartz cement boundary.
150


RAMEWORK ü Pnowv¡xcn
D) Psammite and Pelite Rock Fragments
Psammite rock fragments are defined here as recrystallised sandstones of litharenite
composition and contain labile grains and remnant clays. A typical psammite rock
fragment consists of large poly-crystalline quartz grains that are surrounded by a
very fine grained, highly recrystallised quartz groundmass. The large poly-crystalline
quartz grains exhibit sutured contacts with the groundmass and in some cases withadjacent quartz crystals. Remnant illite and unidentifiable rock fragments are also
observed in these rock fragments. Illite partially surrounds quartz grains and replaces
rare lithics. Other psammite rock fragments exhibit qwartz (with rutile inclusions),
trace feldspar grains (microcline), and rock fragments that have been altered to both
illite and kaolin.
A very small number of pelitic rock fragments were observed which exhibit a
schistose cleavage, strained quartz grains, and a high proportion of illite-altered labile
rock fragments.
E) Quartzite Rock Fragments
Two varieties of quartzite rock fragments were identified in Merrimelia sedirnents.
The most coÍunon type is sedimentary quartzite (Plate 16b) exhibiting a quartz
arenite composition where quartz cement is visible surrounding all detrital qwartz
grains.
Within the quartzite rock fragments, grain-lining illite and illitised rock fragments are
commonly noted along with rounded zircon grains. Sufured and concavo-convex
contacts (Plate 16b[7fl) are common with orientation of quartz grains also evident
(Plate 16b).
F) Meta-Acid Volcanic Rock Fragments
Recrystallised rhyodacite and pyroclastic rock fragments were observed in 16 wells
throughout the basin but are most prevalent in wells that were underlain by the
Mooracoochie Volcanics of the Warburton Basin (Malgoona #4, Coongie #1 and
Paning #1). These rock fragments exhibit a totally recrystallised groundmass which
consists of very fine grain intergrown poly-crystalline quartz crystals (Plate 16d[ab]).
Nestled within this poly-crystalline quartz groundmass are reÍrnant illitised feldspar
phenocrysts (Plate 16d [4b]), and quaftz phenocrysts many of which have also been
recrystallised and have a poly-crystalline quartz appearance (Plate 16d[3e]). It is also
common to observe poly-crystalline quartz veins transecting these clasts. Illite
t52

RAMEWORK €l PnowNdvcn
stringers (laminae) are commonly observed transecting recrystallised rhyolite rock
fragments.
Other features seen in meta-volcanic rocks include altemating coarse and fine
horizontal laminae which have been recrystallised into coarse and fine quartz grains
respectively. A number of grains appear to have caused sagging of the fine laminae
due possibly to micro-ballistic impact. These clasts may represent pyroclastic surge
and fallout deposits which have been subsequently recrystallized. A small number of
meta-spherulite rhyodacite rock fragments were also observed.
G) Meta-Poly-Crystalline Quartz Grains
Metamorphic poly-crystalline quartz clasts have an intergrown aPPearance, with
highly irregular sutured contacts between individual qvartz crystals common (Plate
10[2g]). Other poly-crystalline-quartz grains exhibit aligned crystals forming a
distinctive schistose texture (Plate 16e).
5.2.1.3.5 Feldspar And Accessory Component: Petrography
A) Feldspar
Feldspar grains constitute the smallest framework component in Merrimelia
sediments (Fig. 5.1). The ternary diagram (Fig. 5.2) indicates that only a small number
of samples contain appreciable amounts of feldspar. The majority of feldspars have
been totally altered to kaolin and illite coalescing with the surrounding illite matrix
(Plate 17d). A smaller proportion of feldspar grains, particularly those in the aeolian
sandstones in the Merrimelia Field occur as partially altered feldspar gains where
illite replaces the grains along cleavage planes (Chapter Six - Plates 27a Ex 27b). A
small number of fresh feldspar grains were observed in Tallalia #1 (Queensland) and
in Tindilpie #2 (South Australia).
These fresh feldspar grains displayed extinction pattems that were indicative of
plagioclase (Albite twinning) (Plate 77 a[6g] ) and microcline.
Microperthite feldspar grains were also observed (Plate 17b[5j]). These grains exhibit a
distinctive "intergrown" texture of potassium-rich and sodium-rich feldspar
(MacKenzie and Guilford, 1980). These grains consist of parallel alternating white and
dark banding, where the light areas are composed of sodium-feldspar and the darker
regions potassium feldspar.
153

RAMEWORK B Pnovnvavcr
A) Photomiuograph - TøIIøliø #1. (31.67.93m) (Cross nicols x 20). Broad aiew,
illustrøting ø "fresh" plagioclase feldspør grain exhibiting albite twinning [5g1.
B) Photomictogrøph - TølløIiø #1 (3167.93m) (Cross nicols x 70). Broød aiew of an
unaltered perthite feldspar grøin exhibiting distinctiae twinning [4i].
C) Photomicrogrøph - Tirtawørrø #7 (3056.66m) (Reflecteil x 50). Broad oiew of a
ftønùoidøl øggregate of pyrite [9gJ, within an organic løminøe.
D) Photomicrogrøph - Kenny #7 (2945.80m) (Fluoro x 20). Broad aiew of feldspør grøins
whichhaae been totally altered to køolin (black "dots" [6e]). Note: Illite infills renmant pore
space nnd has also formed interwooen with køolin booklets [6e].
E) Photomicrogrøph - Gidgeølpø #3 (23L9.4m) (Reflected, x 20). Close up of detritnl
ilmenite grøin (?) showing intricqte crystal forms,
PLATE\7Accessory D etritøl Miner øls: 1
154


F n¡mnwonx €t P now¡,t aN cr
B) Micas
Micas were observed in trace amounts, approximately IJ% of the total Merrimelia
detritus (Table 5.2). The majority of micas are illitised muscovite and are generally
deformed around more competent framework grains showing varying degrees of
burial compaction distortion (Plate 18a). The detrital mica illustrated in Plate (1Ba) is a
particularly fresh mica found in samples where fresh granite clasts predominate.
C) Accessory Minerals
Accessory minerals account for less t},lan I"/" of the total Merrimelia detritus (Table
5.2). The main accessory minerals observed were well rounded zircon (Page 163 - Fig.
5.1ac[9j]) and tourmaline grains (Plate 18b[14d]). Rounded grains of rutile and
ilmenite(?) (Plate 17e) were also noted in Merrimelia sediments. Compositional
analyses confirms this petrographic identification (Table 5.5).
Magnetite was observed in a small number of highly contorted, foliated rhyodacite
rock fragments. The magnetite, is seen as opaque inclusions, that permeate these rock
fragments. This mineral is detrital in nature, and has not been observed forming
ittsitu. Haematite was observed in Tirrawarca#2, but absent elsewhere.
SAMPLE
MAL 2D
MAL 2D
MAL 4A
TIRA 8A
sio,0.25
0.63
1..17
0.26
Tio,88.84
u.73
90.07
93.3
Al,o.
0.25
0.54
0.39
0.23
0.06
0.04
0.06
0.05
0.1,1
0.1,4
0.06
0
0.01
0.07
0
2.43
1.67
0.60
0.27
0
0.04
0
0.03
CrrO, MgO CaO MnO FeO ZnO Na,O F çOCl0.86 0.02 0.05
0 0.12 0.05
0.03 0.22 0.02
0 0.05 0.01
0
0
Table 5.5 Rutile núcroprobe contposition (WL%),
Anatase was confirmed via TEM observations and EDAX compositional analysis
(Chapter Six - Plate 24d) n both Merrirnelia #18 and Malgoona #4. Grund (1966)
described rounded anatase grains associated with zircons and tourmalines in
Merrimelia #3, within a large angular to sub-angular pebble.
5.2.1..3.6 ORGANIC MATTER AND SOIL DEVELOPMENT(?)
Fluorescence microscopy was needed to identify the trace amounts (<7%) of organic
matter in Merrimelia sediments. A green fluorescence colour (Plate 18d) distinguishes
organic matter from illite (Plate 17d).
156

RAMEWORK €l Pnowxdvcr
A) SEM Photomiuogrøph - Durhøm Downs #1. (2686.5m). DetritøI núca flakes [5e] with
surrounding boxwork [2fl and filanrcntous illite [4b],
B) Photomiuogrøph - Løke Hope #1. (2499.49m) (PIøne polørised x 10). Rounded
tourmøIine grøin.
C) Photomicrogrøph - Merrimeliø #7 (26M.67m) (Cross nicols x 1.0). The lack of internal
structure indicøtes these rock frngntents dffir ftom other argilløceous rock fragnrcnts (shale).
These clasts rnay represent a f-rozen, buried soil horizott, which tharued with depth and was
subsequently deþrnted oia ooerburden pressure. Alternøtiaely they møy represent partially
chloritised and deþrnred mica flakes.
D) Photomicrogrøph - Tirøwørø #7 (3056.66m) (Fluoro t pløne polørised x 20)
Organic laminøe (green) that formed insitu.
E) Photomicrogrøph - Merrimeliø #1 (26M.67m) (Pløne polørised x 10). Sanrc aiew as
Plate 18c, illustrating the nøture of these enigmøtic argillaceous rock fragments.
PLATE 18Accessory Detritøl MinerøIs: 2
157


RAll/EWORK €l Pnowxtwcn
It appears that localised ponding of water in a delta top environment was the main
method by which organic matter was preserved in the shale laminae.
More unusual shale like rock fragments were noted in Merrimelia sediments. These
fragments, illustrated in Plates 18c & 18e, appear to flow between framework grains,
as pseudomatrix. In cross nicols however these squeezed "shale rock fragments" do
not exhibit the typical illite birefringence that is generally associated withpseudomatrix and shale rock fragments (Chapter six - Plate 2acÍ1.g)).
It is possible that these rock fragments may just be partially chloritised biotite flakes.
Altematively, these shale clasts maybe a product of frozen soil formation. Shale clasts
with similar cross-nicol characteristics have been described in Canada by King (pers.
comm., 1998).
The development (and preservation) of frozen soil horizons in the Merrimelia glacial
complex is likely. Such soil fragments would be preserved higher in the Merrimelia
sequence (M1), when glacial activity waned and soil development in the lower fan
was more likely.
5.2.2 FACIES CONTROL ON SEDIMENT COMPOSITIONThe proportions of rock fragment framework grains and authigenic minerals is
controlled by the mode of sedimentary deposition (Table 5.6). Poorly sorted
lithologies are generally dominated by rock fragments (Table 5.6), whilst better sorted
rocks tend tobe quartz-dominated (Table 5.6). Facies thus controls the composition of
sediments in the Merrimelia Formation. Rezaee and Lemon (7996a) in the MoorariFlyLake-Brolga region, observed a similar relationship in the Tirrawarra Sandstone
(facies controls on diagenesis and reservoir quality are discussed in Chapters Six and
Nine respectively).
5.2.3 COMPETENT AND INCOMPETENT ROCK FRAGMENTSCompetent and incompetent framework components are defined as follows:
1) Competent framework components withstand ice and water transport intact.
2) Incompetent, labile or ductile framework components are eventually destroyed
by transport and reworking processes.
Mechanical compaction increases with burial, further weakening incompetent grains
while competent grains remain intact providing a rigid rock framework. Table 5.7
lists the main competent and incompetent rock fragments observed in both
159

RAMEWORK €l Pnowv¡tscr
Merrimelia and Tirrawarra sediments. These lithic ductility categories broadly agree
with the experimental results of Pittman and Larese, (L991).
A detailed discussion on the compactional properties displayed by the three groups
of rock fragments on is given in Chapter Nine (Reservoir Quality).
LSZ - (Lacustrine Shore Zone) 5.8 13.5 45.5 20.5
DU - (clacio-Aeolian Dune) 3.5 5.0 61.4 10.3
DFS - (oetta Forsets) 3.8 4.5 51.5 10.9
DGL - (Deep Glacio Lacustrine) 9.t 15.3 40.5 16.3
DBS - (Delta Bottom Sets) 13.8 10.8 42.3 r4.5
DTS - (Delta Top Sets) 19.3 27.3 40.0 2r.9
RD - (Rain out Diamictite) 31.0 t6.7 26.3 11.5
TTMD - (Terminoglacial Tunnel Mouth Deposil¡ 38'3 23.6
LB - (Longitudinal Bar) 57.0 33.5 15.8 14.4
Table 5.6. Facies as rockfrøgment and quørtz percentages (see Appendix 5b).
Sub-cropping carbonate lithologies of the Warburton Basin occur around the
Gidgealpa Field and Coongie#1 well. Only two carbonate fragments have been
observed in the Merrimelia Formation (Merrimelia Field). The lack of carbonate rock
fragments observed is a function of the abrasive and destructive nature of glacial and
fluvial environments and the incompetent nature of carbonate rock fragments.
Similarly a very small proportion of Warburton Basin basalt has survived the rigours
of glacial transport and deposition. Further to this, all rock fragments are then
36.0 28.5
t60

RA¡/EWORK €l Pnowv¡Ncn
agitated fluvially reducing the amount of rock fragments that are incorporated into
the mineralogically mature Tirrawarra braid plaín and deltaic facies sandstones.
ROCK FRAGMENT ROCK FRAGMENT
TYPES
Competent RF Type I Acid Volcanic RF's
Silicic Metamorphic RF's
Sub-litharenite to Litharenite RF's
Competent RF Type II Feldspathic Sandstone RF's
Pyroclastic RF's
Incompetent RF Shale RF's
Micaceous-Schist RF's
Illitised Volcanic RF's
Plate 12e
Plates 15a,15c, 76b &.1,6c
Plates 11d[3fl & 11e
Plate 40a
Plate 13d
Plate 1-1a[8fl
Plate 15d
Plate 1-3f
Table 5.7 Conryetent and incompetent rock fragment (RF's) types.
5.3 TIRRAWARRA SANDSTONE: PETROGRAPHY
AND PROVENANCEThe formation of Tirrawarra facies required the reworking of glacigenic sediments
and surrounding elevated basement via meltwater action (see Chapter Four). This
concept is supported by the observation that all rock fragments in the Tirrawarra
Sandstone have been described in the Merrimelia Formation.
Principle Component Analysis (PCA) of Tirrawarra rock fragment data reveals
statistically significant rock fragrnent groupings. The methodology used to describe
rock fragments in the Tirrawarra Sandstone were exactly the same as that used for the
Merrimelia Formation rock fragment dataset3. The results are presented in Figure 5.13
Forty rock fragment types were observed and described in Tirrawarra sediments,
markedly less than observed in Merrimelia sediments. The obliteration of
incompetent (labile) rock fragment types (Table 5.7) by reworking accounts for this
disparity.
' See section 5.5.1.2 (this chapter) for an explanation of principle component analysis (PCA).
161

RAMEWORK €l Pnoveru¡xcn
Only competent Merrimelia rock fragments survive reworking processes, and become
part of the Tirrawarra sedimentary pile (Table 5.7). Notably, pyroclastic and volcanic
rock fragments were destroyed.
o
0.5
dtoÊoEô
0
-05
0
55 -t.0 -0.5 o
Dimension I0.5 o 5
|l!v+d*
Ètú4¡t-4
l*tri:î¿r¡+ :;taf<J¡¡i¡tyÌíí
PositiYe
Negatlrc Coælrtloh¡sitait
Figure 5.13 Principle Contponents Analysis (PCA) of rock fragnents from the Tirrøwørrø
Sqndstone.
The proportions in the Tirrawarra Sandstone of both these rock fragment types were
significantly lower than those observed in the Merrimelia Formation (Fig. 5.14a).
Metamorphic clasts, which are generally silicic, were seen in similar to slightly
greater proportions in Tirrawarra sedirnents compared with Merrirnelia sediments
(Fig. 5.14a). This small increase in metamorphic rock fragments is attributed to the
liberation of schistose and stressed metamorphic poly-quartz grains from meta-
sandstone and sandstone clasts in the Merrimelia Formation into the Tirrawarra
Sandstone. Sedimentary rock fragments, such as shale, litharenite and siltstone,
constitute approximately 33.6"/", 9.5"/" and 4.37o respectively of the total amount of
rock fragments observed in the Tirrawarra Sandstone (Table 5.2).
The proportion of clast lithology types in Tirrawarra sediments is shown in Figure
5.15. Sedimentary and metamorphic rock fragments are the most commonly observed
while volcanic rock fragments are subordinate.
The majority of Tirrawarra Sandstone samples contain all three rock fragment types
(sedimentary, volcanic and metamorphic), in proportions ranging from zero to 25"/.
(Fig.5.1s).
162

Tirrawarra Sst %
Merrimelia Fm %
stable less søble
t4 MERRIMELIA FM
J2
.P
ooCL
EoUfil
.ËL.Poô(Ë+,Êo
òs
0 lgneousDR - Devitrified Acid
VolcanicA - RhyodaciteSedimentaryB - QuartzAreniteC - Sub-LíthareniteD - Greywackea - QuartzS - Shale
h
ûÞ
fI
6 e
d
c
b
a
4
2
0
A I 2 3 4 5 6 7 8 10 t3 t4 15
B
TIRRAWARRA SST
J
h
oÞ
f
lgneousDR - Devitrified Acid
VolcanicSedimentaryS - ShaleMetamorphicSC - Schist
e
d
c
b
a
1 2 J 4 5 6 7 8 9 l0 11 t2 I3 t4 15
cEXPDEV 077 V
250 pm
-i¿A
È
at¡
J ¡,1q,t' .ç.t t
t
Y',+
vJ
I
I .r.
1r¿
! t'¡"-- r
,\ès
I
ìi
500
(2967.9m) Iitharenite [Inset] Deuitrifed acid aolcanic rock f-ragment.

RAMEWORK €l Pnow¡,ttNcr
A very small number of samples contain rock fragment proportions greater than25"/"
(Fig. 5.15) a direct result of meltwater reworking, with rinsing out of the labile rock
fragments.
The framework component of the Tirrawarra Sandstone differs markedly from the
Merrimelia Formation. Plates (2a through to 2e) illustrate that Tirrawarra sediments
have a quartz-rich framework when compared to Merrimelia sediments. This
supposition is confirmed statistically where the distribution of quafiz grains in
Tirrawarra sediments is skewed towards the high quafiz end compared with
Merrimelia sediments (Figs.5.16a & 5.16b).
Figure 5.15 A) Rock frøgment proportions in the Tirrøwarra Sandstone. B) Frequency
histogrøms of aolcønic, C) sedimentøry ønd D) metamorphic rock frøgmcnts in Tirrawørra
sediments.
Regionally, Tirrawarra sediments with a high rock fragment component have a low
quartz content. Equally, Tirrawarra samples that were dominated by a quartz
framework, had low proportions of rock fragments. Rezaee and Lemon (1996a)
observed the same inverse relationship between quartz and rock fragments in
Tirrawarra sediments in the Moorari, Fly Lake-Brolga and Tirrawarra regions (Fig.
5.16c).
E¡E
Rock FragmentTypesMetamorphiclgneousSedimenøry
A
Tlrrawam Sst -Volcanlc Tirrawana Sst - Sedimentary Tlnawarra Sst - l.letamorphlc
Ea
E
z
Std Dev = 4.34Mean=33N = 43.00
-!E
E
z
Std Dev = 9.1 2Mean = 13
N = 43.00!Ea
E
z
StdDev=Ll4Mean = 10.5
N = 41.00
Rock(P6rcenþtê
B
Fqm€nt Prcponlon Rock FEgm€nt PropoÉlon Rock Fñtúlnt ProPort¡onol tñe Detrtai Component) (Percenøge ofthe Detrtai Componant) (Percenage of the Detrhâl Compon€nt)
CDEXPDEV OZ G
164

€l PnowNtvc¿
The most coÍunon rock fragments observed in Tirrawarra sediments are
sedimentary, with shale and litharenite clasts the most prevalent (Table 5.2). Of the
volcanic rock fragments observed, devitrified acid volcanic rock fragments (Plates 13c
&L3e) were the most coÍunon type, constituting 8"/" of the rock fragment component
(Table 5.2). All other volcanic rock fragments, rhyodacite (Plate 12a), granite (Plate
15c) and pegmatite (Plate 14c) were observed in proportions that were less thart2"/" of
the total number of rock fragments described (Table 5.2).
lin aw¿ra S¡t. QuarE Mcnlmella Fm. Quartz
Û
o
Ez
Std Dev = 19
Man =.{0.3N = 43.00
-04âo3E
z
Std Dev = 13
Mean = 36N= 144
Qu¡t Prcpordon(Percenage of Fmercrk Compon{t)
Quårc Prcportlon(Perc€na8o of Fmorcrt Component)
A B
Tlrr¿werr¿ Sand¡ton€ Rock Fregment Prcportlon (Total) vs Quartz Prroportion (fotal)
60às
s8ooùL!lzoo
00
ct0 20 30 40 50 ó0 70
Rock Fragment % (Total)
Merrlmelia Forrnation Rock Fragment PrcpoÉlon (Total) vs QuarE Prcportlon (Total)
60
lsâ ,10rË
É,ü20à3o
0
D Rock Fragment % (Total)
EXPDEV 077 T
aIÒ ):
I a
a : aa
a
a
aa
aI
t0 20 30 .lo 60
Figure 5.16 A) Frequency histogrøms of quartz proportions in the Tirrawølrø Sandstona
ønd B) the Merrimeliø Formøtion. Cross plot of quørtz ønd rock lrøgment proportions in the
C) Tirrnwørrø Søndstone ønd D) the Merrimelia Formation.
165

RAMEWORK I Pnowx¡Ncr
The most coÍunon metamorphic rock fragment types observed within the Tirrawarra
Sandstone were competent (extrabasinal) schistose poly-crystalline quartz (Plate 16e),
quartzite (Plate 16b) and psammitic rock fragments.
These four rock fragments account for 97"/" of metamorphic rock fragments in the
Tirrawarra Sandstone while incompetent metamorphic rock fragment lithologies such
as schist (Fig. 5.1ac[6h]), gneiss (Plate 16a) and meta-rhyodacite (Plate 16d) constitute
3%. Less than 1% or trace amounts of zircon, tourmaline as well as glaucony were
observed in the Tirrawarra Sandstone. Zucon and tourmaline were identified in
proportions of <1"/" n52% of Tirrawarra thin sections described.
The Tirrawarra Sandstone mirrors the proportions of metamorphic and sedimentary
rock fragments observed in the Merrimelia Formation (Fig. 5.1.4a).
Framework grains and rock fragments derived from the Merrimelia Formation have
been further reworked by fluvial-deltaic processes into the mineralogically more
mature Tirrawarra Sandstone.
Figure 5.14c (Tirrawarra Sandstone) and Figure 5.14b (Merrimelia Formation) both
contain very similar rounded devitrified acid volcanic rock fragments in what
appears to be medium grained, illite-dominated groundmass.
The strong similarity suggests that both of these rock fragments are derived from the
same source. All rock fragment types observed in the Tirrawarra Sandstone are also
observed in the Merrimelia Formation. Figure 5.14a shows that the stable rock
fragnients are observed in both formations in similar proportions whereas the less
stable rock fragments are diminished or absent in the Tirrawarra Sandstone. This
observation suggests that the Tirrawarra Sandstone has formed from the reworking
of Merrimelia sediments.
The preservation of a high proportion of labile shale clasts in Tirrawarra sediments
(shale rock fragments are the most commonly observed rock fragment in Tirrawarra
sediments) indicates that these rock fragments have been transported only small
distances from their Warburton Basin source.
166
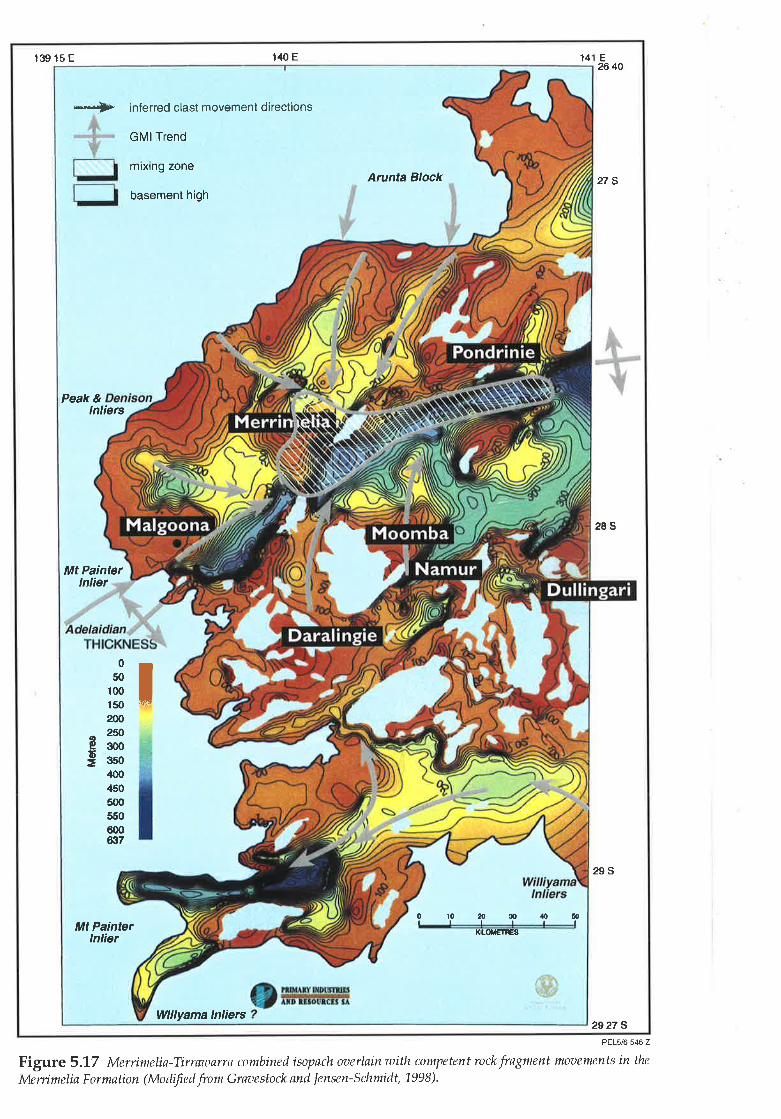
Arunta Block
x[_otÆIEs
Willyama lnliers
0r0ææ40t0tttttt
-*+" inferred clast movement directions
I
lnliersPeak &
Mt Painterlnlier
Mt Painterlnlier
GMlTrend
mrxtng zone
basement high
050
100150no
^2ilÉgmI e5o
,100
450500550600trt7
140 E E26
27S
28s
29S
2527 S
139 1s E 1440
PEL5/6 546 Z
Figure 5.17 Merrimelia-Tirraroørrø combined isopach ouerlain utith competent rock fragment moaeffients in the
Merrimeliø Formation (Motlifed from Grmtestock nnd lensen-Schmidt, 1998)'

€l PnowvtNcn
The cannibalisation of Merrimelia sediments by Tirrawarra sedimentation processes
indicates that direct sourcing of Tirrawarra detritus from Warburton lithologies is
rare. The covering of the Warburton Basin by Merrimelia sediments would have
prevented Warburton sediments being directly eroded by glacial meltwaters into the
Tirrawarra Sandstone. Figure 5.17 indicates however, that there were emergent
basement highs throughout the deposition of the MTGC. The amount of detritus
sourced from these highs compared with the cannibalisation of Merririelia sediments
is small. hr short, the provenance influence of the Warburton Basin diminished as the
Merrimelia-Tirrawarra deposition evolved through time.
5.5.1 STATISTICSINTRODUCTIONStatistical analysis was used to determine if there was a link between rock fragment
type, rock fragment percentage age and geographical location.
Firstly, Pearson correlation matrices an:rd "t" statistic analysis were used to investigate
significant statistical links between rock fragment types and to define statistically
significant pairings. PCA was then performed on only the rock fragmeirt data set
pertaining to clasts identified as being statistically significant by Pearson correlation
matrices. Cluster analysis was then performed to assess the spatial distribution of the
main rock fragment types.
In addition, rock fragment distribution maps were constructed using rock fragment
percentage data. These data were, krigged and contoured with semi-variograms
produced for each map to assess the nugget effect in each case (Appendix 8c).
5.5.1.1 Pearson Correlation Coefficients
Pearson Correlation matrices assess the degree of interelation between two variables
and measures their influence on each other (Swan et ø1.,1995). There are three types of
correlations possible between two variables: positive, negative and zero correlation
(Fig. s.18).
The correlation coefficient (r) describes the strength of the correlations between
variables. The correlation coefficient is the ratio of the covariance of the two variables
to the product of their standard deviations (Equation 4).
168

Y Ya
a o
oa
o aao
a
oa
oo o
ooo
Oa
aX x
A r=0.98 Br = 0.54
Y Y
ao oao
o o oO
a oo o oa
aO a
o a x xc r=_0.t6 D r = -0.90
Y Y
a o oo a
o o
o aa o a
x xE
r = undefìned No Change Fr = 0.00
Figure 5.18 Positiue, negatiae and zero Peørson Conelation plots illustrating the graphical represen-t ation of correlation coefficent a alues (r). (mo difie d from D aais, 19 8 6).
Merrimelia FormationVariables Correlation
Coefficient (r)Quartz - Total Igneous RF's -0.6 -ve
Quartz - Total Sed RF's -0.53Quartz - Total Meta RF's -0.5
Quartz - Shale -0.4Sandstone - Greywacke 0.4Total SED RF's - Granite 0.4Sedquartzite - Granite 0.44Shale - Greywacke 0.52Sedquartzite - Greywacke 0.63 +ve
Correlation MatrixTirrawarra Sandstone
't'statistic Variables CorrelationCoeffieient (r)
-8.8 Quartz - Sandstone -0.'75 -ve
-7.3 Quartz - Total Meta RF's -0.'l-6.7 Feldspar - Greywacke 0.4-5.2 Sandstone - Total Meta 0.445.2 Siltstone - Rhyodacite 0.5345.2 Sedquartzite - Granite 0.565.9 Igneous RF's - Granite 0.587.2 Sedquartzite - Sandstone 0.63 +ve5.9
't' statistic
-7.3-5.52.73.14.04.34.55.2
Table 5.8 Tinnwørra and Merrimelia rockfragments pøirings that qre statistically significant ata 95% confidence leael (pøirings thøt hctae the ldghest 't' støtistics are shown). A complete listing ofall signifícønt pairings is giaen in Appendix 8.
PEL5/6 546 Y

RA¡1EWORK €l Pnowvavce
R = Covariance of the two variables xy
(Std dev* x Std Devr) Equation 4
Thus if r=0.98 between two variables then there is a positive linear relationship
between the two variables (Fig. 5.18a).
If the r value between two variables is calculated to be -ve0.98 then there is a
negative correlation where one variable varies inversely with relation to the other
(Fig. 5.18d). R-values that are mid-range imply correlations such as those shown inFigures 5.18b & 5.18c. An r-value that is close to zero implies that there is no linear
relationship between the variables.
A significance test (at a95"/" confidence level), the "t" statistic test, was employed inboth Merrimelia and Tirrawarra datasets in order to rank Pearson correlations
(Appendix 8a). The variable pairings with a "f" statistic greater than a critical value
was deemed to be significant at a 957" confidence level (Appendix 8a). Table 5.8 lists
variable pairings, which display end member "f" statistic values (both negative and
positive). Overall, the same rock fragment pairs in both datasets exhibit consistent
correlations (Table 5.8). Figure 5.18 indicates the main correlation styles observed in
both rock fragment data sets.
Pearson correlation coefficients confirm that there is a negative correlation between
quartz and rock fragments in both Tirrawarra and Merrimelia sediments, i.e., when
quartz is present, rock fragments are minimal (Table 5.8). This statistical analysis
confirms the findings of Rezaee (7996) who observed an inverse relationship between
rock fragments and quartz in the Tirrawarra Sandstone. In addition petrological
analyses of Tirrawarra and Merrimelia sediments in this study observed the same
inverse relationship (Figs. 5.16c & 5.16d).
Results in Table 5.8 indicate that there are strong positive correlations between:
greywacke, shale and sedirnentary quafizíte rock fragments. These results suggest an
association where these particular Merrimelia framework components may share a
similar provenance. In Tirrawarra sediments, there are strong positive correlations
between siltstone-rhyodacite and feldspar-greywacke rock fragment pairs.
5.5.1.2 Principle Components Analysis (PCA)
Principle components analysis (PCA) is used in petrographic studies to determine the
least number of variables needed to supply an adequate amount of information and
170

t PnowNtNcn
to find petrographic variables that are interrelated (Smith, 196,9). PCA reduces the
dataset to its essential components (Miller, 1994). Data reduction was deemed
necessary in both the Tirrawarra and Merrimelia rock fragment data sets to reduce
the large number of rock fragment types under investigation to a more m¿mageable
number. PCA was therefore performed on both data sets. This involved splitting the
data from each formation into two subsets so that the amount of agreement between
the split subsets was assessable. PCA was performed on normalised data so that the
unit variances were zero using varimax rotation (Griffiths pers. comm., 1997).In PCA
most of the variance is accounted for by two principle components (Figs. 5.6 and
s.13).
Lr essence, PCA divides data into that which is positively and negatively correlated.
PCA performed on both the Merrimelia (Fig. 5.6) and Tirrawarra (Fig. 5.13) rock
fragment datasets therefore grouped similarly correlated rock fragment types (Figs.
5.6 & 5.13). These negative and positively correlated framework components show
good agreement with Pearson correlation coefficients listed in Appendix 8a, further
corroborating statistically derived links between framework components inMerrimelia and Tirrawarra sediments.
5.5.1.3 Cluster Analysis
Average, single and centroid linkage cluster methods were employed to confirm
provenance associations and clast movements derived from petrographic
observations. Before cluster assessrnent, the distribution of rock Iragrnent data was
analysed using Kolmogorov-Smimov and Shapiro-Wilk normality tests (Table 5.9).
Statistic Statistic
0.994
0.814
0.127
0.293
' Lilliefors Significance Correction.
Table 5.9 Results of Kolmogoroa-Smirnoa and Shapiro-Wilks tests of normality
(Mer r imelia F or mation).
The Kolmogorov statistic is low for accessory, qu.afiz and sedimentary framework
components, implying that these datasets are not normally distributed. Metamorphic
t7t

RAMEWORK & Pnovrruruvcr
and volcanic rock fragment subsets, however, have KS statistics that are high
(approaching 0.5) suggesting that a high proportion of data approaches a normal
distribution. The Shapiro-Wilks statistic, a test that is designed to check for
departures in normality, are low for the metamorphic and volcanic datasets,
indicating that approximately half of the data deviate from a normal distribution. lncontrast, the Shapiro-Wilks statistic for accessoty, quartz and sedimentary rock
fragments are all high, confirming that these datasets are not normally distributed.
The rock fragment data set contains three subsets that are not normally distributed
(accessory, quaftz and sedimentary) and two datasets (metamorphic and volcanic)
where approximately half of the data approaches a normal distribution. Accordingly
the datasets that illustrated no normality were not standardized and the data that
showed a normal distribution, were standardised (Griffiths pers. comm., 1997). Thre
standardised and non standardised datasets were treated individually and clustered
using the single, average and centroid linkage cluster techniques. Of the three cluster
methods, centroid linkage cluster analysis was found to be the most stable and gave
consistent results and was the least effected by outlier data.
Cluster stability was assessed by dividing the standardised and non-standardised
datasets into two subsets, where the data was randomly sorted, and cluster analysis
performed. The stability of each cluster analysis technique was assessed by clustering
each subset of data and the data set as a whole. If there was agreement between the
original data set and the subsets the cluster technique was deemed stable. All three
cluster analyses illustrated good agreement, with the centroid linkage technique.
Cluster analysis of non-standardised (or raw data) datasets consistently produced
four clusters at a squared euclidean distance of 21 units (Appendix 8b). Similarly,
clustering the volcanic and metamorphic datasets using standardised Z scores
revealed four clusters. The four clusters gained from all five data sets correspond
with samples in the north, northwest central, central and southern parts of the Cooper
Basin (Fig.5.19).
Rock fragment data from Tirrawarra samples were subject to the same test of
normality. The Kolmogorov-Smirnov and Shapiro-Wilks test of normality revealed
that the data set was not normally distributed and was therefore not standardised
before further analysis (Table 5.10). Cluster technique assessment was performed inthe same way as for Merrimelia Formation data, and again, centroid linkage was
found to be the most stable technique.
172

+
rfle +
+
G Beanbush
Yanourra I
Roc
Is
U
Lake 0
Lake Þ
Rock
North
Big Lake
f Kumbarie I
Della,Þ amur
Strzelecki
Mud a ee
P nna
Fragmenl
lN
Southern Rpck
EØ0)0)
o
!Ø
€o(t
New South Wales
aWillwomo
Supelrgroup
Arunìo Block ?
a
Deníson?
0
Km
2 -' --..
:qJ
+
Clast Movement DirectionFieldWellMixing Zone
Mì Painter Inlíer ?
Adeloídean ?
PELS/6 546 H
B
Merrimelia Fm Competent Rock Fragments
2q
i
t
20DlesimlariLy Index
15
II
fI
10
I
I
5
rl
rtII
-+ I-+ I
I
I
;
_l
Àve StdDev
31 0.3 0.1r42 0.3 0 16? 0.3 0.196 0.2 0.0
137 0.2 0.091 0.2 00t ? 0.1 0.115 0.2 0.1
t29 0.3 0,21? 0.1 01?3 0.1 011 0 I 0.1
24 0-L 0097 0.1 0013 0.1 0014 0.1 0.0
135 0.r 0.1136 0 1 0.1
2 0,1 0.1123 0.r 0.1724 01 01ss 0 1 0 1
100 01 0121 01 0106 0 1 0 I15 01 0,12 0 0.1 0,1
133 0.0 0,0134 00 00
3 00 00130 00 00tl1 0.0 0 0t21 00 0012S 0 0 0.0L22 0 0 0.0125 0 0 0,095 0.0 0.0
105 0.0 0.053 5.1 0.1s7 0.0 0.029 00 0.0{2 0 0 0.06 0 0 0.0
22 0.0 0.0121 0.5 0.7130 0.5 0.?106 0.6 0.6126 0.6 0.?50 0.s 0.6
!32 0.6 0.646 0.1 0.680 0.? 0.659 25-0 21 29S 0.6 0.66S 1.3 0 1
1{1 l-t O 15? t. I 0.079 1 1 0 141 tL 11
720 11 155 1.1 1.3
?3 r.6 2,r66 2,6 0.316 2 3 0 112 L2 1430 1.2 1.434 r,2 1.319 1.? 0.332 l7 0635 21 13
140 22 13143 1.0 2,3119 3.7 0,649 2A 3.3
101 3.1 2.991 21 2.74s 0.? 2,,99 9.1 3.09t 9,0 0.13 7 6.3 5.651 6.7 5.241 6 ,6 6.4
107 5.6 6.¡0 ,.5 2.9
83 9.2 4-276 2.7 3521 3.3 2.¿25 4,1 3.414 4 -6 3.6
110 4-2 4 190 3.? 4 g
102 31 4911{ 3.3 4,231 4.1 2,ø44 4,1 4.952 00 00e4 52 01I s 5.0 0.092 5,7 0.033 6.9 0.{{3 63 {9s2 62 54{0 51 A2?0 ¡r 39
r15 52 3036 51 1019 72.r 9 3
113 9 7 9.062 S1 1154 1ló 161
61 1r1 13527 211 \1 5
rr7 209 r0361 19 ? 11 1?1 r5t ?a39 113 9A
126 63
26 3rS 4t!3à 211 i325- 2ù2 2t\6s 2ùr 2S1s! 2aa 2?D55 2l I 12 671 226 )116) ¿\q 21459 0 7 ¡ 6
111 1S6 1{3139 r7.1 1¿ l113 20.3 1r l60 205 73
Ì0{ La.o 21 2? 1r.3 6 4
1r5 \2 19 166
12 75r 1l101 r05 1201{{ r01 127rs 110 1ro35 r23 1462S 254
tos 27L 259a1
NumcÀsE
EnnÌ 5c (ü) (Í2)YN 1À lMì iv3tMBRRI 1D(H) (Y1)üæR 3B (r) (Ur)mL u {u} (M1)ræR 2À (Ul (ü11rERÂr 5C (M) (r2)Ænn¡ 1L (r) tM3)Trh 7a (ül (r1)DæW 1B (r) (v1)tsnRr 1J (ü) (r3)BN n (M) (M1)PLY 2C {M) (M3)üæR {À (U) (M1)DM û (r) (Mr)DM B (M) IM2Irrh 9À (u) (M1)trnk u (Mt (M1)B¡B U (ilt {ü1)rrM 2À (ü) (r1)îru 2B (r) (rr)vrM u (M) (M3)üæR 7À (ü) (M1)PIY 28 (MI (M1)XBRU 18 lM) lM1)De 1c (f) (r2)aLY 1c (r) (u1)Trs 8B (M) {r1)Trh sc (r) (M1)Èrm 18 (M) (M1)lru ?B (M) (M1)Trs ?c {H) irr)Trs 28 (r) {ffr)Trm 6À (M) iM1)TrR 1rc {M) {M1)rrù 2c {ü) 1Á2txæR 3À {ü} (rrlmR u (r) (r1lRD 10 (co¡s1 ) (M t3ERr lc (r) {r1)crDG sA (x) (r1tJÀC 1B (M) (X3)BRoL lC (M) (X1)FLY 2À (r) (X1)TIR 1{B (ül (r1lmL ra (r) (ültPÀcK 3À (ll (MrlTrM 2D (U) tú21ÍÞ 18 (X) (X1)Tru ea (xl (x1)x@ 1À (H) (il1)rERnr 5F (M) (r2lnL 48 (CoURSB) (X M3ræR 4B (X) (v1)MBRRI 1E (M) (Y1)wó! 18 (Ml (y1'N 4A {y) (yt)MBnRr sE (M) (X2)i@ 18 (M) (Ml)TrR 1{À (Í) (M1)aRoL 18 (ü) (M1)ra¡Rr 5D (M) (ü2)
0j ERRr 1C (M) (ül)i xrRRl 3À (xJ (Ml)q cpcR s (M) (Ml)E crDG 58 tÐ tüI)oB croc 5P (M) (r¿)
aLY 1À (M) (ü1)crDc 5D (M) lv2lXERU U (M) (Mr)ML S (M) (Mr)YN 18 (M) (üJ)Trm 2À (r) {Mr)RÐ 1D (M) (M1)ræR 9À (X) (M1)MæR 2C (X) (X3)xN 1¡ {r) {ü2)üæR 6¡ (M) (ü1)üæR 20 (X) (rrlcrDe 7a (M) (r3)RD 1F (r) (Í3)JAc 1À (ü) (Mr)PAc( rB (rl (ürlco$ 13 (x) (ürtrRr 1sB (r) (M3)DæH U (H) (X1)FLY 1D (r) (M3)crDc rB (M) (rl)wRnr 1K (r) (HrlÞN 1C (U) (y2)MæR 1S (M) (v3)MßOW 1À (M) (ü3)TM U (M) (H]IcrDc sc (M) (MU(N U (ü) (ü2)RÐ lc (sst) (M) (t3)rnr 13c (M) (M3)Km rc (Mt (M1)ræR 28 (M) (r2)cÌoc 5a (M) (M2)No u (M) (M1)xRr 13À (M) (M3)HOp lC (M) (M3)ÍBRRr lc (ül (M2)TM 18 (M) (81)crDc ?À (x) (M3)
HOP 18 (M) (M3)sPsN 1c (M) (Ml)W {B IM) {M3}Eoi. 1r i¡) lù1ìÌûL {¡ (r) 1Hr)cr!ü rB lr) l¡r2)rrNÀ rF lil) isz)¡LìL j4 (il) il5)ùÈRRt 1H (yl (¡t2ìnrR 1À (Í) tiD)P.1x l¡ (ili li:)ileRRr 1. lul l12)sPEH 13 lil) lir2)ctD3 3: til) (¡lt)H.F 1: l!t) (¡rr)
rsn 2c 1n) (r!r)r!ù 4H 1r) (rrrrrw 2s 1rf) (y2rrLìt 2D ljrj (!21colic rc (y) lir)rlrL r5 {:4ì (¡rl)iÞL 4Ê (alts (Yl 1¡lspEN 1À (N) (M2)ÆL rc lil) (rIcoñc rB (u) iùl)rrNÀ 1c (il) (ür)ÞhL rc(M) (ù3)ü!ÐL 1¿ 1M) (r43)coNÀ 1À iü) (s3lrm lc tut lMr)coñÀ lc tüt tur)NEnRI 1t 01) tù2tümL 1A (U) (ùr)YN 1c (il) (ilIDmr D (il) (ilr)crDc sc (N) (x3)crDc 3c (il) (fl3)PN 1À (H) lt2l
Label.
A
et nl., 1998). Note: high degree of ooerløp between soutlrcrn nnd northern clusters.

RAMEWORK ۓ PnowNaxce
Cluster analysis of Tirrawarra rock fragments from outside the basin (metamorphic
rock fragments dataset) revealed four clusters (Fig. 5.20), where the clusters
correspond to samples from the north, south, west and a zone of over lap. The
similarity of cluster analysis results in both Merrimelia and Tirrawarra sediments
provides further evidence that the provenance of the Merrimelia Formation and
Tirrawarra Sandstone are similar and probably linked. These findings match the
conclusions of Chaney et ø1. (7997).
TIRRAWARRA Sst. Kolomgorov-Smirnov"
Accessory MineralsMetamorphic MineralsQuartz GrainsVolcanic MineralsSedimentary Minerals" Lilliefors Significance Correction.
Statistic0.31,2
0.2090.r770.2040.277
Shapiro-WilkStatistic
0.5230.7940.8750.7790.673
TABLE 5.10 Results of Kolntogoroa-Smirnoa ønd Shnpiro-Wilks tests of normølity
(T irraruar r a S øndstone).
The degree of overlap is, however, not consistent for Merrimelia and Tirrawarra
datasets (Figs. 5.19b & 5.20b). These figures reveal that the Merrimelia dataset (Fig.
5.19b) has a high degree of overlap, reflecting the chaotic nature of these sediments.
Similarly the Tirrawarra dataset also has overlapping clusters. Unlike the Merrimelia
dataset however, there appears to be minor overlap between northern and southern.
This cluster arrangement suggests that the GMI Ridge was exerting influence on
sedimentation during Tirrawarra time (T1), as there appears to be minor clast mixinga
between the Patchawarra and Nappamerri Troughs (Fig. 5.20b).
The localised presence of basaltic clasts to the north of Gidgealpa would suggest that
at least this part of the GMI was emergent, providing sediment for incorporation into
the Merrimelia sedimentary pile. It is possible then that by Tirrawarra time (T1) in the
Gidgealpa region, and possibly the GMI trend as a whole, (Fig. 5.20b) had become
positive, deflecting sediment supply into the Patchawarra and Nappamerri
depocentres.
'A small number of data points in Figure 5.20b do suggest that some sediment from around Coongie #1area may have been transported south into the Nappamerri Trough.
174

A B
CASEDissinilarity Index
0510152025Num +---------+---------+---------+---------+---------+Label srd
Dev
0sdq
KIJDRfEKE #2
LÀKE I{OPE #1
TIRR,AIIÀRRÀ *14
TTRRÀWÀRRÀ *I7MOORÀRI #6
FLY IJÀKE #3
MÀLGOONÀ *2FLY LÀKE +5
TIRÀWÀRRÀ *2WELCOME LÀKE +1
FLY LÀKE *2
MOORÀRI #4
TTNGÀ TTNGÀNÀ #1
MOORÀRI +5
TIRRÀI4ÀRRÀ #20
MERRIME]¡IÀ *1
I'fERRIltrELrÀ S6
I'IOORÀRI i¡7
GIDGEÀLPÀ ì}].6
MOOÈ\RÍ *3
¡{ERUPÀ *1FLY LÀKE *].
I.IERRIMEÍ.À #5
FIJY IJÀKE f6MOORÀRI f6MOORARI f9TIRAWÀRRÀ #11
INNÀ¡iIINCRÀ *2MOORÀRI +1
KI'MBÀRIE #1
MOORARÍ f2csÀLLUr'r f2COONGIE *1
STRZEÍJECKI #].0
TIRRÀWÀRRA *22
MERRIMEIJIÀ *13FIJY IJÀKE #4
SPENCER #1
COONÀTIE +1
MIJDERA +1
PINNÀ +1
NÀMUR #1
DELLÀ #2
15.1
14.3
15.1
14. I8.1
L2 .8
1_2 .2
1_3.',l
13.1
72 ,0
13.5
13.1
72.3
16.3
14.0
13.1
15.7
15.9
14,1
15.3
14.0
10.5
11. I12.5
15 .3
10.6
13.6
12 .9
12.9
11. 9
1.3
14.3
10.1
9.0
LO.7
6.6
13.9
1_2.3
8,6
7,2
6.9
10.8
25.5 13
25,9 39
24.s 40
L7 .9 2A
22,4 7
2t,6 16
2t,2 9
26.3 38
26.8 43
26.L 6
23.5 25
24.O 36
24.6 26
23.5 4!29.t 18
20,7 20
t9.2 11
20.'t 2.1
2a.9 2L
19,4 5
18.9 r727,2 10
2s.L 27
16.8 30
77.9 31
L5.2 12
13 .6 22
73.7 14
12.8 23
19.'t 1
11.9 3
10 .7 35
8.2 42
10.6 19
8,6 I7.0 34
t0,2 2
10 ,4 3r.
9,4 33
5,2 32
16.3 4
-+
-+-+-+ I-+ I-+ I-+ I-+-+-+ +-+
-+ I I-+ I I-+ I I
-+-+ +-+
-+ I I-+ I I-+ I I-----+ I-+ I-+ I-+-- - +
-+ I-+ I
-+ I-+-+ I-+ +-+ I-+ I I---+ I I-+-+ I I-+ +-+-+---+ I-----+
+
IIII+
IrfI+
IrII
I-+-+-+ +-+
---+ +-----+-----+ I-+---+ +--------+ +-----+-----+ I-+-----+ I-+ +---+
I
II
I
+
rI+
f
I
+
I
I
I
-+
Tirrawarra Sst Competent Rock Fragments
PEL5/6 546 G
Cuttap i
I
Ii
I
I
.t
G Beanbush
Fragmenì
Lake lf¡
? outh
o
& JacklakeInlíers
e
NorthMoomba North
f Kenny I
I
lalee I
{ Kumbarie I
+
P nna
Y
ig Lake
RockDomaín
!NamurQ Strzelecki
Arunio Block ?
?
2004
Km
? =-=-a Clast Movement Directionç¡ Fietd
+ WellMixing Zone
Mì Paínter Inlíer
Adeloídeon ? CÉ
(€frØ
oV)
New South Wales
a
'd
ØoC))
et ctl, 1998) . Note: the degree of oaerløp between nortlrcrn ønd southern cluster groupings høs diminished contpared with the Merrimelin Fru døtøset (Fig 5.1,9).

RAMEWORK €i Pnow¡vtvce
5.5.2 ROCK FRAGMENT MOVEMENTS IN THE COOPER
BASIN: DISCUSSION5.5.2.1 Metamorphic Rock Fragments
The competent nature of extrabasinal metamorphic rock fragments suggests that
these clasts could have been transported vast distances by destructive glacial and/orfluvial depositional regimes without a high proportion being destroyed. These rock
fragments can therefore be used as indicators in assessing the directional trends of
clast movement throughout the basin.
Semivariogram analysis of the metamorphic rock fragment dataset indicates that
realistic comparisons between metamorphic proportions can be made between
samples with up to 60 kilometres of separation (Fig. 5.21b). Of all rock fragment data
sets, the metamorphic rock fragment data exhibits the least (although still high)
nugget effect of 40%. Almost all other rock fragment data exhibit flat sills (Appendix
8c) indicating that no spatial comparisons can be made with certainty. It wouldappear then that metamorphic rock fragments, from both a statistical and geological
standpoint, are the best indicates of clast movementu into and within the Cooper
Basin at Merrimelia and Tirrawarra times.
5.5.2.L.1 Rock Fragment Domains: A Discussion
The percentage of metamorphic rock fragments in Merrimelia and Tirrawarra
samples are not consistent over the basin (Fig. 5.21,a). High percentages of
metamorphic rock fragments (>20% of the rock total) were observed in the southern
and northem parts of the basin, around Mudlalee, Dullingari in the south and in the
Paning, Coonatie and Coongie regions in the north. Moderate proportions (between
10% and 20"/" of the rock fragment total) were observed in the Malgoona, Spencer,
Gidgealpa regions and as far west as the Welcome Lake area. Trace and lowproportions of metamorphic rock fragments (<1% and 0.1% to 10% of the rock
fragment total respectively) were observed in the Merrirnelia, Tirrawarra, Fly Lake
Brolga, Moorari, Minkie and Mudrangie regions (Fig. 5.21a). The highest
concentrations of metamorphic rock fragments in the Merrimelia Formation (and
Tirrawarra Sandstone accordingly) are concentrated in three distinct clast domains.
u The clast movement arrows illustrated in Figure 5.27a are inferred by assessing the spatial distribution ofmetamorphic rock fragment proportions. Graphic textured granite, pyroclastic and basaltic rock fragmentproportions were used to constrain localised clast movements.
176

+
Cd
d
(t?
WillyamaSupergroup
Arunìø ? $ Kennyr4(M)
I
I?1.\ cast Movement Direction(Ð r¡elo+ Well
.- j Mixing Zone2(M) Metamorphic Rock Fragment
$ Pan n¡26(Ml,
G Beanbush
?
2t(T)
I Taaa
'-'--.-4..
?
Jack Lake e(M) Norttt
? Moomba
Mudera
tew
,aaa Pinna I
+Mt Paînler lnlie¡ ?
Adeloídeon ?
RockDomaln
0 20 f Kumbarle I
t3(M)Km
{Tinpt3(M)
?Wlllvamo
Supérgrcup
A
32
28
o24.E ro
s16'E tzIJUl rB
rul oIL0
t74
732
042t2
C/N = Nuttet Effeæl 40%
R = 60 Kilometres
0 40000 80000 120000Distance (m)
I 60000 200000
BCOOPEF 282 B
Figure 5.21, A) lnferred moaelt'rcnt of competent rock fragments in the Merrimeliø Formation (modifed fromCIA¡tt et aL, 1g98). B) Semi-aariogram of metømorphic rock f'ragment trend ffiap (Merrimelia Formøtion).

RA¡/EWORK €ì Pnow¡rt¡Nce
The northem clast domain has sparse well coverage of 11 wells, the westem clast
domain has an even well coverage of 43 wells while the southem clast domain has 9
wells (Figs. 5.21a).
Examination of rock fragment distributions, clast provenance regions and isopach
thicknesses (Figs. 5.21a and 5.17) imply that there are three dominant sediment inputdirections into the Cooper Basin during Merrimelia and Tirrawarra tirne.
A northerly input of sediment is inferred from both the metamorphic rock fragment
map (Fig. 5.21) and isopach map (Fig. 5.17), with the most likely source of sediment
being the Arunta Block to the north and northwest. Metamorphic rock fragment
percentages decrease from the northem boundary of the clast domain towards the
mixing zone in the south, indicating a gradual dilution of metamorphic clasts in this
direction (Fig. 5.21a).
In the western rock fragment domain the highest metamorphic rock fragment
percentages consistently occur in the south of the domain (Fig. 5.2La). This suggests a
diminution of clasts in a northerly direction. High values in the west of this domain
indicate that there was also a westerly input. These two directions of input coalesce
with sediment from the north forming a mixing zone (Fig. 5.27a).Isopach thicknesses
confirm these input directions and indicates that the dominant direction of input into
the western rock fragment domain was from the south along what is now the GMI
Ridge (Fig.5.17).
A complex of basement highs restricts the movement of sedirnent in a north-south
direction within the southerly rock fragment domain (Fig. 5.17). These restrictions
have effectively concentrated metamorphic rock fragments along a zone from the
Namur to the Dullingari region (Fig. 5.17). Geometries of basement highs indicated
on the isopach map of the Merrimelia Formation may be considered analogous to
modern day ice cap terrains. A comparison of maps in Figure 5.22 show patterns
suggesting analogous development of glacial geomorphologies in the southem
Cooper Basin similar to the present day Antarctic margin (Denton et a1.,1997).
178

OlOxtlt,.l'tlxl-d¡ÉÉ
I0
50tfi)150ãþ
6 290P soof s¡o
¿lO0
4605(þ5800(þ6Kt7
139 1s E 140 E 141 E26 40
oo27S
w0 oooE
2ES
- lce & Snow
CP lce-free Terrain
*
4 4
Wr x
f29s s
U& \25
2927 SEXPDEV 076 J

F ntmtwonx €t P nov ew¡w cn
A) Rock Fragment Mixing Zone: A Discussion
Cluster analysis results of metamorphic rock fragments in the Merrirnelia Formation,
suggests that the northern and western domains overlap forming a mixing zone (Figs.
5.19b - green cluster and 5.20b - orange cluster). This mixing zone corresponds withthe thickest section of Merrimelia-Tirrawarra sediments (Fig. 5.17), and, according to
facies architecture analysis by Chaney (1998), correspond with glacial packages which
merge from the north and south.
The movement of rock fragments, other than metamorphic rock fragments, (granular
granite for instance) also supports the easterly movement of detritus along a "mixing
zone" in what is now the GMI Ridge. The majority of granite clasts in Merrimelia
sediments are granular in nature, and do not exhibit graphic or myrmekitic textures,
suggesting they have been sourced from the Big Lake Suite Granodiorite. Such
granitic rock fragments are observed in abundance in the Queensland-South
Australia border region of the Cooper Basin at Tallalia #1. It is postulated that the
fresh granite rock fragments in this well have been sourced from the Big Lake
Granodiorite (Fig. 5.23) to the west of Tallalia and were subsequently moved
eastward. This eastward movement is implied by the gradual deepening of the GMI
Trough (GMI Ridge) towards Queensland where the deepest point along this trend is
centred on the Tallalia region (Fig. 5.17). A comparison of Figures 5.21 and 5.17,
shows that rock fragment movements mirror the depositional pathways indicated on
the isopach map, suggesting that clast movement within the Merrimelia Formation
and Tirrawarra Sandstone was towards this linear low, and then east towards Tallalia
#1 in Queensland (Fig. 5.17).
5.5.2.2 Volcanic Rock Fragments
The proportion and appearance of acid volcanic rock fragments observed at Coongie
#1 in the northern clast domain (Fig. 5.21), suggests that acid volcanic clasts have been
derived locally, from around Paning #1 (Sun, 7996) and Cuttapirrie #1. A southerly
movement of volcanic clasts from the Cuttapirrie region accounts for the high
proportion of rhyolitic clasts observed in samples at Coongie #1, where basement
lithologies are predominantly sedimentary and carbonate in nature. A moderate
proportion (1-0% to 20%) of volcanic rock fragments was observed at Coonatie #1 to
the south of Cuttapirrie#l suggesting there was also a south to south westerly
movement of acid volcanic clasts in the northern clast domain. The underlying
Warburton Basin lithology at Coonatie is dominated by micaceous shale and
quartzitic siltstones.
180

oooNN
oooFN
ooo
NNo
NN
oõô@N
ooöo@N
140" 30'00"
140. 30' 00"
141. 00', 00"139" 30'00" '140. 00'00"
Mudrangie Sandstone
Vuggy Dolomite
Kalladeina Formation
Big Lake Suite Granodiorite
Dullingari Group
Mooracoochie Volcanics
lnnamincka Red Beds
Pando Formation
Basalt
Schist / Phyllite -Willyama Supergroup
Dominant rock fragmentmovement directions
Eastern Warburton BasinSub Cropping Lithologies
Domains
Irrrt-r@r
+t
Kilometres0 10 403020 50
ooo@N
oo-o
@N
O (Subcropping data derivedBig I ake Suite Cranodiorite DisLribur:on
inter from mag intensily map Santos (¡ 998))(Contributions from Sun, (l 996); Baines, (l 996); Tiainen pers comm, I 998)
LimestoneDolomiteSholeConglomerote
Daer 1f
Feld Rhyodocite
$Yanpuna 1
Paning 1ì¡
rlriruy t
*cuttapirrie 1
LlmestoneRhyodocite
I
¡f Tallalia 1
I
¡
it."l
a- |.l
i *Yanta 1 V Arosa 1
.' +Titan 1[iS'. t Charo 1
ì.-.-"-"".' t callabonna 1
.' 5øndstone
SondstoneShole 3
#Moolion 1
SondstoneVolconic Conglomerote
SondstoneSirtstone
..¿.r.r"a"" 'þ
Moorari 1*
#Wantana 1
t
+ Kalladeina 1
LìmestonelVolconic
' + LtrotsLy 1
Nulla 1#
SondstoneSiltstone
* rly Lake z
Ti
G'.ôi.n'i,;i
öWelcome Lake 1 *Kanowana 1 # Cg'opers Creek 1
#Burley2 I- #Mcleodl o.
B¡ecio .'
Gronodìo¡ite
---']'
rf r¡n¿¡ld¡e t
..1
LimestoneYolconic ConglomercteRhyodoclteIgnimbrtte
::--""""'-" " " "'""?"--..
lackLake 1/(i Llmestone
Tuff
SondstoneSiltstone
l¡I Lyc um .. *6
+
Rhyodocitelgnlmbrlte
# Spencer 1
Farina 1 *
,tG¡onodio¡ite
#Moomba 1
Bis Lake 1-lF". *Marabooka 1
'*qtl'Sl':511". ,. V Coochilara l
1' * Wooloo 1
1
SiltstoneSl¡ole ..:.' * Mudlalee li.
Chitdie 1+ |.c¡¡.uui, r. Kerinna 1,;
Murteree 1f ..'
Green SholePinna 1+
*Toolachee 1
G¡een Shole+
ba r1.
Murteree A1
Bøsolt
JenáJena
,f Boxwood 1
lgnimbriteSiltstone
:PDEV 072
1 39. 30' 00" 1 40' 00' 00"
Cherrill Gurra 1
4¡ Muloa 1 These thrce well localíùns shownlot illustrulion putposes only.
'14'1" 00' 00"
Figure 5,23 EøsternWørburton Basin Sub Cropping Lithology Domains @

F ne¡øew onx I Pnovnvaivcr
Lr the westem rock fragment domain, trace amounts of distinctive trachytic basalt
were observed in Tindilpie #2. A breccia of rhyodacite and trachyte was described at
Gidgealpa #2 (Sun, 7996) to the south of the Tindilpie area. Other basaltic lithologies
were also noted in the Gidgealpa Field (Sun, 1996). Basaltic rock fragments, including
trachytic rock fragments, were only observed in wells to the north and north west of
the Gidgealpa region. The movement of basic and acidic rock fragments within the
Merrimelia Formation (and Tirrawarra Sandstone accordingly) in this region of the
westem rock fragment domain, coincides with the northerly movement trends of
extrabasinal metamorphic rock fragments (see previous section).
5.5.3 CHANGES IN SEDIMENT INPUT DIRECTIONS THROUGH
TIMESedimentological and petrographic data indicates that sediment input directions inthe Cooper Basin during the deposition of Merrimelia and Tirrawarra sediments did
not remain static. Figure 5.24, displays the fluctuations of sediment input into the
basin from the earliest Merrimelia Formation deposition through to the deposition of
the early Tirrawarra Sandstone.
Initially the dominant direction of sedirnent input into the Cooper Basin was from the
south where the first glaciers of the encroaching Gondwanan glaciation scoured rock
from the Broken Hill and Olary Block, and depôsited them in the southern rock
fragment zone (Fig. 5.24d). Deposition at this time also originated from the south
west and west from possibly the Mt Painter/Mt Babbage inliers and, Adelaidean
sediments from the Flinders Ranges and the Peak and Denison inliers. This suggests
that glaciers to the west of the basin may have been more distal than southern glaciers
and therefore deposited less detritus into the Cooper Basin at this time. No rock
fragments were derived from the north of the Cooper Basin suggesting that glaciers
hadn't developed to the north of the Cooper Basin during early Merrimelia (M3)
deposition.
The southerly source of sediment into the Cooper Basin appeared to decline in the
middle stage of Merrimelia deposition (M2). At this time, the dominant direction of
sedirnent input were from regions in the north (Arunta Block) and the south west (Mt
Painter/Mt Babbage Inliers, Adelaidean sediments of the Flinders Ranges and the
Peak and Denison Lrliers) (Fig. 5.2ac).
182

aô
F
ao -WllyomÞUPOiETUP
sÉË+ Subordinate Rock Fragment Movement
Dominanl Rock Fragment Movemenl
çÐ+':-
Adeloidqn ?
020
#
Km
Field
Well
Mixing Zone
a
I
O Beanbush
Jæk Lako 0
+ MudlÂlei I
+ Pân ng
I
r+
aTin¿wana
Lakc
*P nne
íou¡hern Rockøn¡ Doma¡n
-t+
óYanou¡m I
Norlhern Rockñên¡ Dcmcin
+ Kumbarlr I
NotthMoomba No¡th
T I Provenance Map M I Provenance Map
Young
A - Glacial retreat B - Glacial advance and retreat M3 Provenance MapM2 Provenance Map
otd
C - Glacial retreat D - Glaciation dominant COOPER 282 A
?
!.9gã
o WlþomoSuperErcup
r+
+ l4udtatæ I
K€nry Cø¡awúnq'-Pan ng +
?
menl
p?
I
Lakq
PnM
+
20
Km
o Spenær
¡ Moomba(À North
+r+
Õti**"rn
o Malgona
+ Koñbårl€ I
+flngafingãna I
NorthJ¿ck Latrc 0
Gidgealpa Sout[ a
$MuduraQ Stzeleoki
illrPqínlcrlnl'þr ?
Adelaidæn ?
E
Éo?
F
-WlltyøN,vPefgrcuP
OBenbush
Adølqldæn ?
o20
+
a
Nofth
ôo !p€naer
Stzslæki
\PlnnÀ
Ia
aa+
iou¡hern Rockcnl Dcmaln
Km
Kenny I
I
+:Pdh€
I¡
Ia
Ia
ôhnoum I
No¡thc¡n RockFrq,gmenì Démaín
{$oo'u" No¡ùr
* Muehlæ I
Lake o
!É
o a?
WllvomaSupøÍ.grcup
?
Wd.omoL.tÊ l+
ùl¡ Point.t lnt'þì ?
A¿øloldæn ?
o20
-Km
PlnM
¡a
a
aI
Ia
North
søndy Tirrøtoarrø Sandstone facies interfnger uith Merrintelia Formation facies. T1. corresponds with the nrenaceous Tirrøzoørrø Søndstone.

RAMEWORK €l Pnove¡sn¡cn
It is likely that during M2 tirne, little meltwater was produced as a continental icecap
locked up meltwaters and starved sediment dipersal northwards into the basin.
Accordingly deposition from the north, southwest and west, was pronounced issuing
from actively melting glaciers while deposition from the south was minimal.
The later stage of Merrimelia deposition is characterised by advancing and retreating
glaciers (Chapter Four - Fig. a.9), where "Tirrawarra type sandstones" interfinger
with typical Merrimelia lithologies. The southerly input of sediments is again
dominant, as retreating glaciers produced large volumes of meltwater. Sediment
input from the west, at this time, all but ceased, while sediment originating from the
north was still prominent (Fig. 5.24b). At this late stage, minor sediment inputappears to have been sourced from the east. This observation is supported by the
existence of schist and fresh granite rock fragments unknown in any other wells apart
from Mount Howitt #1 and Durham Downs #1 in the eastern portion of the Cooper
Basin in Queensland. It has been postulated that such sediments could have shed offthe Canaway Fault scarp where phyllite, schist and granodiorite lithologies have been
intersected (Pinchin and Anfiloff ,1986).
Input of sediment in late M1, early T1 time was mainly from the north (Fig. 5.24a)
where melting glaciers on the northern rirn of the basin disgorged sediment into the
northern rock fragment domain. Melting glaciers in the south discharged sediment
into the basin but to a lesser extent.
At the same time remnant ice caps on small basement highs (Moomba and emergent
GMI blocks) dispersed detritus into adjacent lowlands(Fiç.5.24a).
5.6 CONCLUSIONSÞ Merrirnelia Formation sediments are texturally and mineralogically immature.
Þ The definition of the Tirrawarra Sandstone, in petrological terms, is a sediment
that is mineralogically and texturally mature, quartz-rich with a low rock
fragment component as the detrital component of Tirrawarra sediments is derived
directly from the Merrimelia Formation.
Þ The overwhelming majority (80%) of Merrimelia Formation rock fragments can be
traced from Warburton Basin units such as the lnnamincka Red Beds, Dullingari
Group and Mooracoochie Volcanics. The majority of Warburton Basin derived
184

RAMEWORK €ì Pnow¡tdvct
rock fragments (intrabasinal) deform plastically due to compaction forces and are
considered incompetent.
Þ Approximately one quarter of all Merrimelia Formation rock fragments are
extrabasinal, having been mainly sourced from the Arunta Block (NT), Mount
Painter/Mount Babbage (SA) Inliers, Willyama Supergroup-Broken Hill(NSW)/Olary (SA). Minor amounts of Merrimelia Formation sediment has been
derived from the Peak and Denison Inliers, Flinders Ranges (Adelaidean), Eastern
Gawler Craton (SA), Tibooburra Granites (NSW) and possibly the Canaway Ridge
(QLD).
mirrors the lithology of the underlying Warburton Basin. Discrepancies are
attributable to extra-basinal rock fragments.
aeolian sandstone exhibiting the most mature composition and terminoglacial out
wash fan deposits the least mature.
> All rock fragments observed in the Tirrawarra Sandstone were also found in the
Merrimelia Formation. The appearance and provenance of rock fragments in
Tirrawarra sediments was the same as those in Merrimelia sediments.
Þ Rock fragment movement into and within the Cooper Basin occurred over long
distances. Locally sourced clasts, emanating from exposed terrain, moved shorter
distances within clast domains.
competent rock fragments, revealed three distinct rock fragment domains
(northern, southern and westem). These rock fragment domains have received
extrabasinal rock fragments from at least six different provenance regions.
Þ Petrological analysis of Tirrawarra rock fragments, when limited to movements of
competent rock fragments, revealed four distinct rock fragment domains
(northern, southern, westem and a mixing zone).
Þ The degree of cluster overlap changes through time. The Tirrawarra data set
shows less overlap between clusters than the Merrirnelia dataset. There appears to
be little north/south cluster overlap (with samples from Coongie #1 the exception)
185

F n¡uewonx €t P now¡t tN cn
in the Tirrawarra dataset. This may indicate that parts of the GMI Ridge were
emergent and exerting influence forming a baffle to north south sedimentation
during Tirrawarra time.
Þ The movement of rock fragments in the centre of the Cooper Basin was
predominantþ along a linear trend (now the GMI Ridge) towards Tallalia #1 in
Queensland.
Þ Sediment input into the Cooper Basin was initially from the basin edges towards
the centre of the basin where the dominant input direction was from the south and
west. In mid-Merrimelia time sediment input began from the north of the Cooper
Basin.
186

PTER
AUTHIGENTC COMPONENT
& DIAGENESIS
This chapter describes the differing authigenic minerals observed in Merrimelia
sedirnents in terms of petrography, diagenetic mineral formation and paragenesis
(diagenetic timing). The chapter is set out in two parts (outlined below). The first part
of the chapter describes the petrography of authigenic minerals and the second the
diagenesis of Merrimelia sediments
PART ONE
PETROGRAPHY
o Quartz Cement
. Authigenic Clays
. Carbonate Cement
. Trace Authigenic Cements
PART TWO
DIAGENESIS
r Quartz Cement
. Clay Authigenesis
. Carbonate Cement
. Trace Authigenic Cements
. Paragenesis
Diagenetic minerals lead to the enhancement or destruction of reservoir quality. Illite,
the most prevalent diagenetic mineral in Merrimelia sediments, inhibits permeability
and porosity substantially reducing reservoir quality. Understanding this diagenetic
phase is the key to understanding and predicting reservoir quality in Merrimelia
glacial sediments (Cubitt and Kaiko, 2000). Hence, authigenic illite is the main focus
of this chapter. The issue of reservoir quality along with a discussion on porosity and
permeability preservation in Merrimelia sediments is outlined in Chapter Nine.
The petrography and diagenetic formation of each authigenic phase is described and
discussed in the first half of this chapter. The latter part of the chapter discusses
diagenetic timing, on a local and regional basis.

Atmlcr¡nc CovpoNrrur
Kolomogorov-Smirnov normality tests indicates that the main diagenetic minerals
(illite, carbonate, quartz and kaolin) in Merrimelia samples do not exhibit a normal
distribution (Fig. 6.1a). This indicates a sporadic distribution most likely related to the
highly variable distribution of lithologies in the Merrimelia Formation where
particular authigenic minerals form preferentially in certain lithotypes (i.e. illite in
argillaceous sediments).
More specifically:
1) Diagenetic phases comprise on average 48"/" of Merrimelia rocks (Fig' 6.1b).
2) The majority of samples contained between 25"/" and 60"/. authigenic minerals
(Fig.6.1b).
3) Itlite is the most common diagenetic mineral with carbonate cements next most
common (Fig. 6.1c).
4) Quartz and kaolin authigenic phases are observed in equal proportions (Fig.
6.1c).
5) Opaque cements such as pyrite and haematite occur in trace amounts.
The authigenic minerals dataset was subjected to principle components analysis
(PCA) utilising the same criteria as that used on the Tirrawarra and Merrimelia rock
fragment data sets (Chapter Five). The analysis of the authigenic mineral dataset
revealed three groupings of variables representing;
1) Clay (Fig.6.1d),
2) Calcite/dolomite (Fig. 6.1d),
3) Quartzlchlorite/pyrophyllite/siderite (Fig. 6.1d).
These statistical groupings may be suggestive of diagenetic links, where, groups of
minerals are associated. For example, kaolin and illite are commonly observed
together as are dolomite and calcite cements. In contrast, the PCA diagram in Figure
6.1 suggests that the occurrence of quartz cement and kaolin is unrelated. However,
repeated observations indicate that these phases are cogenetic in arenaceous
Merrimelia sediments. This lack of consistency (between diagenetic observation and
statistics) diminishes the confidence level of statistical outcomes.
188

Kolmogorov-Smirnov RatioCarbonate Illite Ouartz Cement Kaolin
ZYalue 0.159 0.178 0.234 0.24
A30 Proportion of Authigenic Minerals
in Merrimelia Sediments
q)ô-EGIttoLo)
-oE=z
20
Std Dev = 15.44Mean = 48.0N = 144.00
t0 20 30 40 50 60 70 80 90Percentage of Authigenic Minerals
B
EEE
Diagenetic PhasesCarbonate CementQuartz CementKaolinlllite ) Authigenic Clay
c
1.2
t.0
0.8(\Ë 0.6oã o.+CL
5otu0
-0.2
-0.4
Group lll
,EGroup ll
Group I koolin
- t.0 -0.5 -0.0 0.5 t.0 t.5Component I
DPELS/6 546 N
Figure 6.1 Ð Kolomogoroa-Smirnoa normnlity røtios for the main authigenic minernlsobseraedin the MerrimeliaFormation.B) Frequency histogrøm of authigenic minerøls yoportionin Menimelin Formation sømples. C) Pie chart shotning proportions of diøgenetic phases in the
Merrimelia Formation, D) Princþle Components Analysis (PCA) cross plot of øuthigenic mineralsin Merrimeliø F ormation sediments.

url¡¿r G EN I c C o ¡wp oN n¡rtr
The variability in this dataset is further bome out by the fact that no positive or
negative correlation groupings were delineated by PCA (Fig. 6.1d). In contrast
positive and negative correlation groupings were delineated in Merrimelia and
Tirrawarra rock fragment datasets (Figs. 5.6 & 5.13). This lack of correlation again
points to the variable distribution of authigenic mineral in Merrimelia sediments.
Such variability is to be expected in a chaotic mix of at least twenty one anastomosing
(laterally and vertically), glacially derived facies, which are generally dominated by a
clast component that can contain up to 76 rock fragment types of contrasting chemical
compositions.
6.2:t QUARTZ CEMENT
Quartz overgrowths are by no means common in Merrimelia sediments. Plate 19a
illustrates that most samples contain no quartz cement, and those that do generally
contain between 57" to 107o overgrowth proportions. This is not surprising, as the
majority of Merrimelia sediments are argillaceous in nature. In arenaceous
Merrimelia lithologies however, quartz framework grains are cotrunonly surrounded
by syntaxial quartz overgrowths (Plate 19d), forming regions of quarlz cementation
(Plate 19d tsdl). The average composition of syntaxial quaftz cement is given in Table
(6.1). Druse quaftz overgrowths also occur (Plate 19f), but are rare. Flowever, locally,
druse quartz overgrowths can dominate pore spaces (Plate 19e-Coonatie #1). Both
syntaxial quartz and druse quartz cements are commonly observed in the same
sample (Plate 19f).
Both quartz overgrowth phases will only form on quartz grains that are adjacent to
other quartz gratns and into pore spaces that are free of authigenic illite and/or
squeezed ductile rock fragments (Plate 19b & 19d). Thus, sites for quartz overgrowths
depend on the number of "clean" quartz to quartz contacts available (Plate 19b). An
abundance of pore-filling clays or ductile rock fragments in the framework of a rock
will inhibit quaúz overgrowth development (Plate 19b & 19d)'
These processes are illustrated in Plate 19. Plate 19b (a cartoon of Plate 19d) shows
large syntaxial quartz overgrowths have developed adjacent to quartz grains. In
contrast, limited quartz cement development has occurred where clays/ductile rock
fragments dominate (Plate 19b[green region]). Quartz cement in these rock fragment-
rich regions are subdued and seemingly intergrown with pore-filling clay in a fashion
similar to that shown in Plate (19c).
190

Co¡upoxn¡tr
A) Ercquency histogrøm. Quartz cement: Merrimelia Formøtion
B) Cørtoon of quartz cement relationships in an ørenøceous Merrimelia-Tirrawarra sediment
C) SEM photomitogrøph - Tinøwøtrø #1.4 (2960.52m). Close up of a region similar to
that outlined (box) in Pløte 19d. Quartz cement [4fl øbutting a squeezed, argillaceous rock
ftagment.
D) Photomicrogrøph - Moorøri #3 (2398.28m) (Pløne polørised x 10). Broad field of
aiew illustrating, a squeezed nticø [3fl, druse quartz cenrcnt [5c], syntaxial quørtz
oaergrowths [5d] and a squeezed, chloritised labile grøin occluding porosity [12e]. This plate
corresponds with the cartoon in PIøte 1.9b.
E) SEM photomiuogrøph - Coonøtie #1 (31.49.L9m). Close up of a region sinúIar to thnt
outlined (box) in Pløte 19f. Druse quørtz cenrcnt [3gl radiating into open pore space.
F) Photomicrogrøph - Coonøtie #7 (3L48.30m) (Pløne polarised x L0). Broad field of
aiew illustrating extensiae druse quartz cementøtion.
Authigenic Minerals: Quartz Cement
PLATE 19
797

Qz
Qz
ø
D
Noø
ø
Qz
Mica
Qz
Qz øQz
d
80vt1)CLFã60oo
-t +oE
z
Quartz Cement
Std Dev = 5.41Mean = 4.3N = 144.00
0 5 t0 t5 20.0Percentage of Quartz Cement (Whole Rock)
A
Plate 19
S - Syntaxial quartz overgrowth, D - Drus¡ Qz - Quartz overgrowth,Quartz cement growth site, Non quartz cement growth site,
Ø - Pore sPace
h
c
e
c
b
a
2 3 4 5 6 7 ll t28 9 l0B
hh h
fff
d
c
b
e
d
c
b
e
d
b
Iaa
FD3 4 5 6 4 5 6 7 9 t1 12 13 l578 t2-lo z-) 4 5 6 7891011121314 15
2Oo |tmV :;pof l.l.rgr l)ol Wt)Ccn¿r lO3l49 lgm
I
00kVb0 l24x í;l 330 'ì.," [ã- l
I
I
t'.
r I
f
frIa
fL I-\-_r.
¡ ,\i
I
V fiÊrìl
{
Ðlfa
+
-l'l,laqrr llel Wl) I x¡r
ü
20 lrmiln t4tr '2960 b?mokvb0 f60x til 3b3 I
I\
250 ¡-rm
,aB
aå I
250 pm
c2 10 11 t2 r0 t4
EXPDEV 076 U

Sanple
MOOR 28
PAN lC
MUDL 18
MAL IIA
TIRA 8A
sio,
96.36
98.04
99.05
99.66
97.55
Alp.0.27
0.36
0.06
0
0.83
Cr.O"
0.01
0
0
0
0
Mgo
0.13
0.06
0.02
0
o.o2
Corupo¡rtrvr
001
0.03
Table 6.1, Microprobe atalysis of selected quørtz oaergroutths (Wt.%)
Therefore, if argillaceous rock fragments or matrix are the dominant component of a
Merrirnelia sediment, quartz cement will not form. Such a sediment is illustrated inChapter Five (Fig. 5.2e). In contrast, if a Merrimelia sediment is dominated by an
arenaceous framework (Chapter Five - Fig. 5.2b) then abundant sites are available for
quaftz overgrowths to form. Flence, facies type (argillaceous or arenaceous) and to a
certain degree sediment provenance (rock fragment lithology), control the abundance
of quartz cement in Merrimelia sediments.
6.2.2 AUTHIGENIC CLAYSAuthigenic clays are the most prevalent diagenetic phases in Merrimelia sediments
(Fig.6.7b), with illite dominating over kaolin (Fig.6.2a). Less than five samples didn'tcontain authigenic clay (Fig. 6.2b). The other 139 samples described had clay fractions
that constituted between 5"/o and 30% of the bulk sample (Fig. 6.2b). A small number
of samples (argillaceous) were composed of up to 70"/" clay (Fig. 6.2b). Illitedominates the majority of samples, with most samples containing between 10'/" to
20% of this clay type (Fig. 6.2c). Kaolin was observed in less than half of the samples,
in amounts varying from 5% to 1.0"/" (Fig. 6.2d). The presence of dickite was indicated
by XRD analysis (Fig. 6.6c) in five samples.
Chlorite was seen in trace proportions, generally associated with chloritic, basic and
biotite-dominated rock fragments. Glaucony and "Glauconitic illite" (as described by
Taylor et al., 7991) were also observed in trace proportions in the Merrimelia
Formation (see section 6.2.2.2).
The average composition of all clay phases observed in Merrimelia sediments, along
with the published composition of "glauconitic illite", are given in Table (6.2).
193

35
ü,0.9Ê
.to tt-c9I<20rdg
-oFt5oo&o ,oÊouo5À
0
"-i$'"""..S- ."".rÑ ódt"
PEL5/6 546 0
-a'"
Clay Occurence
Total Clay(lllite, Kaolin, Dickite & Chlorite)
Std Dev = 16.68Mean = 23.7N = 144.00
40Percentage of Whole Rock
Std Dev = 16.49Mean = 18.2
N = 144.00
0t0203040506070C Percentage ofWhole Rock
5
D Percentage ofWhole Rock
-9ÊEdtttoLrt)¡E5z
-9clEdttoLIU¡Efz
-gCL
(ÉthoLCJ¡EIz
20 70
lllite
Kaolin
Std Dev = 5.51
Mean = 4.1
N = 144.00
B
Figure 6.2 e¡ Histogram of clay proportions in the Merrimelia Fonnøtion. Sømple frequencyhistograms of B) total cløy, C) illite and D) kaolin in Merrimeliø sediments.

urHrGENrc Covpovr¡vl^
45.3 0.02
SiO, TiO, Al,O. MgO CaO MnO Fe,O. NqO KrO
Glaucony 53.7
"Glauconitic lllite" 53.9
Taylor et ø1., (1991)
75.91
0.24
1,.57
10.0
12.30
13.78
0.02
0.23
0.01
0.02
0.13
0.03
8.18
8.61
8.68
8.960.11
Table 6.2 Microprobe conrposition (Wt.%) of glaucotty, "glauconitic illite", kaotin ønd
illite.
6.2.2.1 llliteIllite profoundly effects reservoir quality in Merrirnelia sedirnents (see Chapter Nine).
Consequently illite diagenesis was a major focus of this study and therefore a large
section of this chapter is devoted to illite. A summary of literature pertinent to "illite"is presented here to define commonly used illite terminologies and concepts.
6.2.2.1.1 Literature Review
Clay mica, sericite, hydrous mica and illite are terms that have been used in the
literature to describe sirnilar clay-sized phylloquartzite minerals (Nadeau and Bain,
1986). The term "illite" is used here to denote a non-expandable dioctahedral,
aluminous, K-bearing micaceous clay phase. In contrast, the term "smectite" denotes
a clay or component with expandable layers and a lower negative layer charge than
illite (Sass et a1.,1987).Interstratified illite/smectite (I/S) clays are commonly referred
to in the literature (and in this study) as mixed-layer (I/S) clays (Nadeau and Bain,
1eB6).
The swelling, and non-swelling nature of clay structures can be determined using
ethylene glycol vapour/liquid which expands clay layers to a standard distance,
changing the basal spacing of the clay (Velde, 1992). The basal spacing (the distance
between sheet layers) varies between swelling and non-swelling clays.
Comparison of the basal spacings in glycolated and unglycolated (or air dried) clays
distinguishes between swelling and non swelling clay types and discriminates
between major swelling clays. Table 6.3 illustrates the major clay minerals and their
respective basal spacings, glycolated and air dried (Velde,7992).
795

Coupoxxvr
All clays are sheet silicates with a similar arrangement of atoms. There are two basic
building trnits, a silica-oxygen sheet of joined tetrahedral t¡nits and an altrminium-hydroxyl sheet of joined octahedral units.
Various clay types are built of differing sheet arrangements and different cationsbetween the sheets (Fig. 6;3). Cation types are controlled by substitution of Al for Si inthe tetrahedral sheets and Fe and Mg for Al in the octahedral sheets (Fig. 6.3).
lnserting cations into holes between octahedral and tetrahedral sheets restores layercharge balance, induced by cation substitution. (Velde, 1992). There are two types ofion occuPancy in octahedrally coordinated sites; trioctahedral (three ion siteoccupancy) and dioctahedral which has a two ion site occupancy.
Dominant cle¡nents Basal spating (Å)Clytol Dry
.SWELLINC TYPESS mecri¡csllcidcllitcMontmorilloniteNoncroniteSa pon iteVerm iculiteMixcd llycr rlilrcr¡ls*NON-S\)IELLIN(;TYPESIllitc(ìl¡ ucon i tcCcladonitcChloritcBcrth ión ncK ¡olin ircHalloysrtcScpio litcPal ygorsk i tcT¡lc
AIAl (Mg, Fcz* minor)FeJ*
t71717l7r 5.5l0- l7
t0l0101010-r2 i
<10
MgMg
.\lFê2*, Al (Fer+ m'inor)
K, Al (Fc, Mg minor)K, Fc?*, FcJ*K, Fel*, Mg, Fer*, Alr*Mg, Fc, AlFe2+, AI3+ (minor Mg)AIAIlvlg, AlMg, AlMg, Fe2*
r0l0101477
I 0.212.410.59.6
* Two or more rypes oI basic layer interstratified in the same crystal
Table 6.3 XRD responses of major clay minerals (After Velde, 7992).
The firmly bonded layers and interlayer cations are stacked upon one another to forma three dimensional clay crystal (Velde, 7992).In each sheet there is an offset between
the tetrahedral and octahedrally coordinated ions. This offset is monoclinic and
plarces the different ions in more specific crystallographic sites. Thus as the sheets are
stacked upon each other they will give differing XRD diffraction patterns due to the
relative orientation of the stacked sheets. Hence diJferent stacking arrangements
(called polytypes) give different XRD patterns (Velde, 1992).
796

Aurm c et¡ t c C o ¡øp o Nx¡'rt
Illites are similar to muscovite in structure and composition. Charge imbalance lies inthe substitution of Al for Si ions in the tetrahedral sheet while little substitutionoccurs in the octahedral sheet. However/ a certain amount of Mg and Fet- isintroduced into illite clay by octahedral site substitution. In summary, the majorcations found in the tetrahedral coordinated layers are Si and Al, while the cations inthe octahedrally coordinated layers are more varied with Al, Mg, Fe'* being the
principal species, while Fe'., Ti, Ni, zn, Cr, and Mn can also be present (velde, 1992).
Figure 6.3 The basic structure of the most common clays obseraed in Merrimeliø
sediments (After Prothero ønd Schwab,1996),
The interlayer cation species are varied but potassium cations are tightly fixed and
therefore predominate. Table 6.4 illustrates typical illite compositions and unit cell
dimensions (Å). Mixed layered clays usually indicate a change in physical or
chemical variables.
Increasing temperature with depth brings about a change in the stability of one of the
clay minerals in the mixed layered clay. In the case of illite-smectite mixed layered
Silicon-oxygentetrahedral
Silica sheet Alum¡naoctahedfãl
Alumina (C¡bbs¡te)sheet
unt unf
O Oxygen o ancl c Silicon @ Hydroxyl C¡ A¡uminum, iron, mãgne!
Kandi¡eExample: kãolinite Al2Or, 2Si02. 2H2O
Alumina (gibbsrte) t¿yer,/V\7vvvv\ Silica layer
lllite KAl2loHl2. lAlS¡r(O, OH)ìo¡
\.4.^.^^ ^/,þww\^ SubstiLufion of Si by
Al in silica layers
lnterlayer K+ toeetherlvith some OH, Fe, an(
K+ OH- K+
,æ. \,^.^^.^^.^,/zVwwv\Easa¡ spacing 7À
K+ K+
,çæ, \,^a ^.^..^/zVwvszVr
Easal spacing lOÂ
K+ K+ Fe/Mg
Smect¡te bâsic formula: 2Al203, 8S¡02, 2H2O, rH2OExample: montmor¡llonite (Mg, Ca) O, Al2O3, 5SiOr, rH20
\ê.4^ ^.â/ Much subsrirurion of
/vvvvvv\ At by Mg and Fe
Chlor¡te MC5fAl, Fe){OHo)(AlS¡laOro
\ê^.^^ .^/,ñzvvlrvv\ Subst¡¡ut¡on of Al by F
HrO H¡O HrO lnterlayer H2O.ând Ca and N¿
xBrucite layers (Mg-O¡-between Al-5i sheets
\.^-^^.a.^^/zVv.zwsd \ê.^ .^.^A//vvvw9\HrO HrO CalNa Basal spacinB l4Ä
but expandable lrom9 6 to 21 4A
x x\.^..4.^.^.^ ,/zVww9. \ê.^.^^AAl/vvvvv9\
Basal spãc¡ng I 4,Ä
HrO CalNa H¡O x X
197

urHIcENtc Compovnxr
clays, smectite clay become progressively more unstable as the depth of burialincreases (Nadeau et al.1984).
I llit e'l'¡,pinl Ran,qe
ClaurouitrTypiml Rort,qr
Orladonitc'l'yp iral R
lnterlayer sitesK 0.77Na 0.01c 0.02
0600
-0 80-0 07-0 06
KNaCa
000
u 0 75-0 tì80 01-0.07f) -0 07
KNaC;r
{) 8400 0.1
() 6t-0 920 -0 130 -0 12
Octahedral sitcsAl 1.63 1.22-1.77Fer* o.03 o o3-0.45Fc2* o.o5 o -0.22Mg 0.30 0.15-0.36Ti 0.04 0 -0.06Tctrahcdral sitcssi 3.40 3. I 8-3 70Al 0.60. 0.30-0.tì2Ccll dimcnsions(ool) r0.l Â(060) 1.soÄ
AIFc'1*Fc2 *MgTi
04l0(t40.20
() .16-0 500.35- L 550 04-0 5t0. t 0-0.5 1
0 -0.01
AIFcì*Fcl *MgTi
r).7tì().110.21(),6tì0
0 07-1 22l) J(r- I i4() 12-0.260.4fì- 1.040 -002
SiAI
3.900 I0
3.54- 3.930 07-o 46
SiAI
.'i. tÌ80 t2
.1.50-4.000 -0 ,19
10. lÅ1.5r2-r.sr7Ä
t0.lÅr.s07- I .soeÂ
Table 6.4 Composition of mica-Iike clays (Velde,1992).
6.2.2.1.2 Distribution of Illite in the Merrimelia Formation
Extensive authigenic illite has been noted throughout the South Australian sector of
the Cooper Basin in the Merrimelia Formation where there is a high concentration of
ductile rock fragments (Fig. 6.4). Semi-variogram analysis of these maps (Figs. 6.4b Sx
6.4c) indicates that the nugget effect on maps in this figure is high. Accordingly the
maps (Figs. 6.4a &.6.4c) represent trends within the datasets and not absolute areal
distributions. The similarity between both ductile rock fragments and illite datasets
suggests that there is an association. This relationship is most likely a result of the
preferential replacement of argillaceous and devitrified volcanic rock fragments byillite.
Illite is also formed in arenaceous sediments which contain little or no argillaceous
rock fragments. In general the proportions of il.lite' fomed in arenaceous sediments
(grain-coating and pore-filling illite) is subordinate to illite formed in argillaceous
sediments (rock fragment and depositional matrix replacement).
t Illite proportions are estimated via image analysis of fluorescence illite images. A technique which will beexpanded on in Chapter Seven.
198

Couporumrr
Figure 6.4 A) Ductile rock fragments trend møp (Merrimelia Formøtion), B) Ductile rock
fragments aariogrøm (Merrimeliq Formation). C) lllite trend møp (Merrimeliø Formation). D) Illite
aøriogram (Merrimelin F ormation).
DUCTILE ROCK FRAGMENTS AND ILLITE TREND MAPSA
DUCTILE ROCK FRAGMENTS7050000
7000000
34.O030.0026.0022.OO
18.O014.O010.006.O02.OO
6950000Percentage OfWhole Rock
6900000
6850000
6800000 BSMI-VAFIANCE
400000 450000 500000 550000 600000121 1 7 0
cILLITE
70s0000
0 4 0 0 0 08 0 0 0 01 2 0 0 0úô 0 0 0Ð0 0 r
2 0 0 0 06 0 0 0 01 0 0 0 004 0 0 008 0 0 0 0
DISANCE
7000000
60.oo55.O050.oo45.O0
33:33 Percentase or3o.oo Whole Rock6950000
6900000
25.0020.0ol5.oolo.oo5.OOo.oo
6850000 Dg\¡
433221
1
7326800000
21
400000 450000 500000 550000 600000 1
4 0 0 0 0e 0 0 0 0 2 0 0 010€ 0 0 0200 02 0 0 0 0ô 0 0 0 0 0 0 0 0104 0 0 0t0a 0 0 0 (
DISNNCE
KENNY #1 (cdlc& Sir¡c€ous gst)
PANNING #1 (Rhvodaciù)' OURHAM DowNs #1
MERRIMELIA #1 (SBt)
GIDGaLPA #1 (Limest /lgn¡'nrs¡ltst /Rhyo)
MALGooNA Í4 (Tuí) DULINGARI #l (Sst /SilBr /Cônsl /ShalÊ)
DARALINGIE il1 (Glauc Sst )
EOXWOOD Tl (Volc Congl /SsUSlllst.)
BRoLGA #l (Sõt?)PACKSADDLE #3 (Sst /Shale)
€OONGlEfll (Sllbt /Sst /Dol/lsnlm)BANBUSH ËI ISSUShâIE)
KENNY #1 (Calc& Sil¡cêou6 Sêt)PANNING #1 (Rhvodacite, oURHAM DOWNS #1
COONGIEaI ls¡blJs6r /Dolngñi'n)eüNBUSI I #1 (SsuShalô)
KUDRIEKE f1 (ssUshale)EROL6A dr (Ssr")
TIRÁWARRA f2 (Ssl)MERRIMELIA #1 (SsI)
GIOGEALPA lt (L¡,no6t /lgn¡nts¡lt6t /Rhyo)
MALGOONA H (Tufl) oULINGARI f 1 (Sst /Sillsl,/Consl./5hale)
DARALINGIÊ #1 (Glauc SÊt )
BOruOOD l1 (Volc Consl /Ssus¡ltsl )
199

CompoxeNr
6.2.2J1,.3 Illite in the Merrimelia Formation: Nature and Composition
XRD analysis of the <2pm fraction of a limited set of samples shows that the
abundant illite observed in Merrimelia sediments is in fact an interstratified
illite/smectite (I/S) with about 95% illite layers (Figs. 6.5a & 6.5b). Based on the XRD
character of the oriented samples, the I/S has an ordered interstratification (Moore
and Reynolds, 1989) with very little intermixed discrete illite (Fig. 6.5a & 6.5b). The
broadness of XRD peaks, makes it difficult to be more precise, but, a range of illitecontents is suggested by the changing shape of XRD peaks. Illite clays in Merrimelia
sediments probably range from 85% to 95% illite within a mixed layered I/S clay.
Randomly oriented <2pm illite samples were analysed using standard XRD
techniques (Figs. 6.5a & 6.5b). The "noisy" spectra derived from these samples are
hard to interpret but suggest turbostratic stacking of 2:1 layers. This interpretation is
however at odds with selected area diffraction (SAD) images taken of the same two
samples (Plates 20c & 20d). These images show electron diffraction patterns that tend
to be distributed in an ordered arrangement of spots rather than rings, as would be
expected for turbostratic stacking (Mathews pers. comm., 1996) (Plates 20c & 20d).
Compositional illite data are of two main types:
1) A detailed investigation of illite dated samples (2MAL4H and 2MRI 188) using
TEM and SEM analyses.
2) A cursory look at samples distributed over a larger area using SEM (fractured
core surfaces) and microprobe (thin sections).
Data from microprobe and SEM analyses when plotted on a ternary diagram (Fig.
6.5c) indicates that the composition of illite in Merrimelia samples falls on the border
of phengite illite and that of a mixed layered clay which is composed of 10% smectite.
TEM analysis confirms XRD analysis, indicating that the mixed layered I/S clay has
been transformed to an ordered illite, with minor amounts of smectite remaining
(<70% smectite). Illite/smectite proportions observed via TEM analysis are consistent
with the I/S proportions seen in XRD, microprobe and SEM analyses.
TEM results indicate that the two samples, 2MRI 188 and z}l4AL4F{, are composed of
laths (2pm-3pm) and flakes (2¡rm) (Plates 20e & 20f).
200


Covpove¡,u
The flakes appear to be either coalesced laths which have been irregularly stacked by
the collapse of laths during sample air drying (Mc Hardy et al., 7982) or are laths
which have thicker centres where laths grow away from the edges in certain limited
orientations. The TEM analysis suggests that the majority of illite in these samples is
lath-like in nature (Plates 20e & 20f). The dominance of laths in TEM and filamentous
illite in SEM could possibly be related.
The composition of both laths and flakes are similar showing minor variance (Table
6.5). For example the data in Table 6.5 indicates that Al is lower in illite flakes than itis in laths. In contrast silica is elevated in flakes when compared with the silica
content of laths. Flowever, potassium contents in both lath and flake samples were
similar (Table 6.5). In general, the similarity in both lath and flake compositions tends
to suggest that they have formed in one illite phase.
The structural fomulae of illite in Merrimelia sediments calculated from microprobe
derived compositions using the method described in Srodon and Eberl (1987), is as
follows:
(Al ,0, Fe o,rMg o*)'ntn (si 34141 nrr¡-ot'o,o1oH), (K ourNa on.cu oo,)*nt'
This formulae is consistent with structural formulae published for illite by Srodon
and Eberl, (1987).
sio,59.6
58.2
54.4
55.1
Table 6.5 TEM/EDS lath ønd fløke illite contpositions (Wt.%)
6.2.2.7.4 Illite in the Merrimelia Formation: Optical Petrography
A) Air Drying Effects On Illite Clay
Caution has been exercised in interpreting illite morphologies and textures in this
study. McHardy et aI., (1982) concluded that air drying TEM specimens tends to cause
laths to form coalesced mats. Air dried TEM clay mounts used in this study do exhibit
coalesced lath mats (Plate 20e[69]) with misinterpretation as core and lath textures
possible.
202

Compovn¡rrt
A) Photomicrogrøph - Spencer #7 (20L4.33m) (Cross nicols x 10). Authigenic
pyrophyllite [5e] forming in pore spaces between rhyodøcite rockfragments.
B) BSE lmøge - Mølgoonø #2 (2261m). Pyrophyllite forming between detritøI grøins.
C) Selected Areø Dilfrøction (SAD) photomictogrøph - MøIgoonø #4 (2179.07m)
Electron diffraction pattern of illite in the MerrinrcIia Formation at Malgoona Field.
D) Selected Area Dffiøction (SAD) photomicrogrøph - Merrimeliø #18 (2M8.03m).
Electron dffiactiott pøttern of illite in the Merrintelia Formation at Merrintelia Field,
E) TEM photomiuogrøph - Mølgoonø #4 (2179.01m). Broad oiew of løths ønd fløkes,
indicating thøt sample purity is high. Note: lllite laths donúnate.
F) TEM photomiuogrøph - Merrimeliø #18 (2448.03m). Broad ztíew of laths and fløkes,
indicøting thøt sømple purity is high. Note: Illite laths dominate.
Authigenic Minerals: Pyrophyllite & illite
PLATE 20
203


umrcENrc Co¡øpo¡tevr
BSE images also illustrate "collapsed illite" textures (Plate 21d[13e]). In this example,
filamentous illite fibres have collapsed against pore walls. It is most likely that insitu,
at reservoir temperatures and pressures, these illite fibres would have extensively
intruded into the pore space, negatively impacting permeability. Likewise, SEM
images also reveal illite collapse features (Plate 21e[6h]).
It is possible then, that in the SEM and BSE irnages outlined above, a biased account
of illite morphology and distribution could be made, with any subsequent
interpretation under-estimating the effect of illite on permeability. In this study
however, SEM and BSE images were scrutinised for "collapsed illite" textures, withthe majority of samples showing little or no "illite drying effects". Subsequently, in
illite-rich samples, SEM analysis typically reveals extensive boxwork and/or long
filamentous pore-bridging illite textures (Plates 21b 8x 21a). Such textures would not
be observed in samples adversely effected by air drying.
B) Illite Morphologies
Three basic illite morphologies are recognised in Merrimelia sediments,
1) Filamentous (Plate 21a)
2) Boxwork (Plate 21b)
3) Platey (Plate 21c).
Filamentous illite is the most coÍunon while boxwork illite is subordinate. Platey illite
is rare and was noted in abundance only in glacio-aeolian sandstones of the
Merrimelia Field.
The composition of the three basic illite morphologies in Merrimelia sediments is
given in Table (6.6). Filamentous illite is observed filling pores, coating framework
grains and as the main constituent of matrix (recrystallised detrital smectite) (Plate
21a). Filamentous illite also forms on the scalloped edges of illite boxwork textures
(Plate 21bIInset]).
Illite Morphology MgO Al2O.
8.58
8.55
9.83
Tio,0
1-1
0.06
FeO
6.15
7.78
1.49
Na,O CaO MnO
0000.04 0 0
0.13 0.31 0.02
TABLE 6.6 ilIite nrorphology conrpositions (WL%)
205


Plate 2l
J J J
i
h
ob
I I
h
ob
fe
d
c
b
a
h
g
f
e
d
c
b
a
e
d
c
b
a
J 18 10 11 t2 13 t4 15 1 345 1 I 8 9 10 11 12 13 14 15
A c E
J
i
h
oÞ
ji
h
ûb
fe
d
b
a
fe
d
c
b
a
I 2 3 4 5 6',l 8 9 10 11 I2I3t4 15 123456189 10 1l 12 13 t4 l5B D
EXPDEV 076 L
ll
{
tr J llrr rr I' I-Ftf t rr rr rr-å

Co¡¿porvnvr
Boxwork morphologies are generally observed associated with unstable framework
components (Plate 21b) and are thus commonly observed in ductile-rock-fragment-
rich lithologies.
Platey illite in the aeolian sequence in the Merrimelia Field forms very thin coatings
on almost all framework grains (Plate 21c). This platey texture coats framework
grains and in places, bridges pore throats (Plate 21d).
C) Illite Textures
The three basic illite morphologies outlined above form a myriad of textures (Table
6.7) which can be grouped into five textural categories. These illite textural styles are:
isolated illite fibers (Plate 22a), 'flame' boxwork, (Plate 22b), honeycomb boxwork,
(Plate 22c), platey grain coating illite (Plate 22c) and filamentous feldspar,/unstable
rock fragment replacement (Plate 22e).
Illite TexturesIsolated fibersHoneycombFlamePlateyRock Fragment/Feldspar Dissolution
Illite MorphologyFilamentous
Boxwork/FilamentousBoxwork/Filamentous
PlateyBoxwork/Filamentous
TABLE 6.7 lllite textures and corresponding illite morphology type.
6.2.2.2 Glauconitic llliteTaylor et ø1. (1991) observed and analysed "glaucony grains" in Merrimelia sediments
(Plate 22f) in the Daralingie region. The composition of these grains indicated that the
proportion of Fe was too low and Al too high for these grains to be classified as
glaucony. These authors concluded that the composition of these grains was
somewhere between glaucony and illite, coining the term "glauconitic illite".
Rock fragment grains with illite-glaucony components, whose compositions were
similar to that described by Taylor et ø1. (1991) (Table 6.2), were observed commonly
in this present study (the term "glauconitic illite" has been adopted in this study to
describe glauconitic illite rock fragments observed in Merrimelia sediments).
Plate 22f illustrates typical glauconitic illite grains in the Merrimelia Formation. The
arenite rock fragments in which most glauconitic illite grains are observed are most
likely been derived from the underlying Warburton Basin.
208

Co¡øpoxn¡w
PLATE22Authigenic Minerals: Illite Textures & Glauconitic Illite
A) SEM photomicrogrøph - Merrimeliø #L8 (2547.83m). Isoløted filamentous illite
texture.
B) SEM photomicrogrøph -Woolkinø #L (3038.80m). Flame boxwork illite texture, with
pr otr u din g fil øm ent ous illit e.
C) SEM photomicrograph - Merrimeliø #78 (2547.83m). Honeycomb boxwork illite
texture with filømentous illite fornúng in isolated patches as zoell øs emanating ftom the
boxwork substrate.
D) SEM photomicrogrøph - Mercimelin #5 (2627.98m). Platey illite texture. Rounded
glacio-aeoliøn quørtz framework grain coøted by platey illite. The round cløy free region in the
centre of the grain [7e] represents a point contnct with ønother rounded quartz grøin. The
frosted and pitted nature of the aeolian grains cønbe seen in this clay free grnin contøct [7e].
E) SEM photomicrogrøph - Tingø Tingønø #1 (1999m). Feldspar/rock fragment ølterøtion
texture. Trace goethite andleucoxene centents zaere ølso obseraed [10e].
F) Photomicrogrøph - Dørølingie #L (2186.63m) (PIøne polørised x 10). A generøl aiew
of ø gløuconite bearing sandstone. Gløucottitic illite pellet [2d1.
209

Plate 22
li
h
ûb
fe
d
c
b
a
J
i
h
oõ
J
i
h
oÞ
fe
d
c
b
a
fe
d
c
b
a
7 2 3 4 5 6 1 8 9 10 1l l2l3l4 15 I 8 9 10 11 12\314 1 2 3 4 5 6 ',l 8 9 10 ll 12 13 14 15
A c E
J
i
h
ùb
fe
d
c
b
a
J
I
h
ob
h
ob
f fI
d
c
b
a
e
d
b
à
r2345 6 I 2 3 4 5 6 7 8 9 l0 11 1234 5 6 11 12 13 14 15
B
!r() llnrMltl lB^ ']!¡4183m
ô
--t*^
-,i r;;l)r,l Wll lxl,:,1 ll!¡ I I
,Â,rr V '¡¡r0l M,r'llì
\i)0 {} kV h (ì I'f,2x
ã
/-\-. -,r-\ ' **ç
¿
l
7
t
t
b
-à-
. -,å
.#*,Z..,,. Ç'
, , i.1 ,¡,rrl hJ r ¡rr I ¡r I \¡.,1
ì
ã
I
| 'tr ¡trr
D-.' 0 I \, ¡' f) I (l4r,] ''t :'4 I l¡rr,r ll l't'1l¡nr
f** tT
=*_J'"*
Wr¡r¡l lli .Jl):llttlnrI rr'lr,f
Wll I xl''.1:3 li I
Âr, Y '[,('1 l'{,lrlrr-'O(rtV hO t)O/x
.ill ¡lnr
ì --." 'Magn601 x
Ò¡
[r
t
-Ê'+
,o
1ft
, j' '.,-)\,.
/
50 FmAcc.V Spot20.0 kv 6.0
Det WD ExpsE 33.9 I
t'l'
Mer¡ 5D 2627.98m
I
250 ¡rm
1 8 9 10 11 12 l3 14 15D
12 13 14 15F
l 8 9 10
EXPDEV 076 l\il
urrrrcENrc Co¡rporunv¡
The existence of "free" glauconitic illite grains higher up in the Cooper Basin
sequence is more than likely a product of clast destruction via reworking, where
glauconitic illite grains (and all other sandstone rock fragment components) are
liberated and dispersed.
6.2.2.3 Kaolin
Kaolin forms pseudo-hexagonal booklets of up to 10-15¡rm across (Fig. 6.6a). Kaolin is
generally observed either intergown with quartz cement (Fig. 6.6a) or as a
replacement of altered feldspars (Page 243- Plate 26b).
6.2.2.4 DickiteDickite was not reported by Rezaee, (1996) in the Tirrawarra Sandstone (Moorari, Fly
Lake-Brolga and Tirrawarra fields), but was documented in great detail by Schulz-
Rojahn (1991) within the Permian section of the Nappamerri Trough. This author
describes dickite from XRD and SEM analysis to be coarser grained than kaolin while
exhibiting the same crystal habit. XRD analysis, according to Schulz-Rojahn (1991)
was the only method successful in identifying dickite from kaolin. He, utilised
randomly orientated XRD samples to distinguish dickite from kaolin. Thick XRD
smears can also be used to identify dickite from XRD analysis (Lemon pers. coîun.,
1996). Using this method, in combination with cuttings descriptions', dickite was
identified in five samples. Figure 6.6c indicates the distinctive dickite XRD peaks
(around 40 degrees 20) compared with typical kaolin XRD peaks (Fig. 6.6c [around
12, 25 and 35 degrees 201). The main XRD peaks from both clays coincide and
inspection of cuttings confirmed the identification of dickite in these samples based
on grain size. XRD analysis indicates that samples from Gidgealpa #3 and Tirrawarra
#7 are dominantly composed of dickite.
6.2.2.5 ChloriteAuthigenic chlorite in Merrirnelia sediments is rare, exhibiting a mottled or a
translucent green appearance (Fig. 6.6d[9f]). Detrital chlorite was commonly observed
in association with basic volcanic, biotite dominated schist and biotite rock fragments
(Fig. 6.6d[3f] ,6.6e[9e) & Fig. 6.6f respectively).
'?In cuttings dickite has a distinct "coffee" colour (King pers. comm., 1998) while kaolin is white.
211


Co¡urporur¡,u
6.2.2.6 PyrophyllitePyrophyllite is mainly observed in a small number of samples within the confines of
rock fragments derived from the Warburton Basin. Pyrophyllite in this context is
detrital. However, authigenic pyrophyllite is observed (in three samples whose burial
depths exceed 3350m), having formed in pore spaces replacing adjacent diagenetic
phases and framework components. This authigenic phase is distinguishable under
cross nicols from mica or illite by the display of very high order interference colours
(Plate 20a). In BSE, images pyrophyllite has a micaceous habit (Plate 20b), forming a
network of pore bridging crystals. Both EDAX and microprobe analysis confirms the
composition of this mineral phase.
Schulz-Rojahn (1991) observed and described authigenic pyrophyllite in Patchawarra
Formation sediments in the Nappamerri Trough.
6.2.3 CARBONATE CEMENTSiderite, calcite and dolomite carbonate minerals were observed in the majority of
Merrimelia samples (Fig. 6.7a), with most samples having between O% and 20%
carbonate cement (Fig. 6.7a). Of the three carbonate phases observed, authigenic
siderite was the most common; calcite and dolomite typically occur in trace
proportions. Compositions gained via microprobe analysis of these three carbonate
minerals are given in Table 6.8 (Fig. 6.7). The ternary diagram in the same figure,
(6.7b), suggests that the composition of siderite varies considerably with a number
samples showing magnesium and calcium rich compositions. Samples with more
typical calcite, siderite and dolomite compositions plot in their respective comers
(Fig.6.7b).
Carbonate phases generally form in small, isolated patches and rarely form
framework-engulfing poikilotopic crystals.
6.2.3.1, Siderite
Siderite cement exhibits a diverse array of morphologies (Plate 23)
morphologies can be grouped into three categories:
1) Pore-filling cement (Fig. 6.8a),
2) Siderite rhombs or "Seeds" (Fig. 6.8b),
3) Patch cement (Fig. 6.8c).
These
213

Carbonate Cement
ogÈErllØoo¡E5z
5Std Dev = 7.8
Mean = I l.lN = 144.00
5
05t0t5202530Total Carbonate Cement (Siderite, Ferroan Dolomite
& Calcite) (Percentage of whole rock)A
Cement Type MgC03 CaC03 MnC03 FeC03 FigureCalcite 0.00 98.24 0.78 0.97 Fig 6.11Fe Dolomite/Ankerite 27.15 51.84 l.ó0 19.41 Fig 6.10Siderite 20.30 8.80 3.70 66.90 Fig 6.9
Table ó.8
Dolomite
CalciteB
Siderite
EXPDEV 076 P
Figure 6.7 Carbonate cements A) Histogrøm illustrøting the proportion of carbonøte mineralsin Merrimeliø sediments. B) Ternøry diøgrøm showing the composition of cnrbonate cements inMerrimeliø sediments. Note: the diaersity of siderite composition rnhich reflects the rønge of 5L,52 ønd 53 compositions.
Table 6.8 Microprobe ønølysis of ferroøn dolomite Wt%), cøtcite (Vt%) ønd siderite Wt%)cements.

Auntt ceN t c C o mp o¡,t eNr
Rezaee (1996), in describing siderite cement within the Tirrawarra Sandstone at the
Moorari and Tirrawarra Fields, observed three siderite cement phases (S1, 52 and 53)
(Fig. 6.9b). These same three siderite phases were observed in siderite cement in the
Merrimelia Formation (Fig. 6.9c) (the average composition of 51, 52 and 53 siderite
cement phases in Merrimelia sediments is shown in Table 6.9). In Merrimelia
sediments, 51 and 52 siderite phases were observed in all three siderite cement
morphologies (Fig. 6.8). In contrast, 53 siderite was only observed in pore filling and
"seed" siderite morphologies (Fig. 6.8).
In comparison with the Merrimelia Formation, siderite phases (S1, 52 and S3), in the
Tirrawarra Sandstone, appears not to be as well developed (Fig. 6.9). In particular:
1) Siderite phases within Merrimelia sediments aPPear to be more pronounced.
2) Siderite phases within Merrimelia sediments are more consistent.
CaCO.3.4
4.9
18.1
8.E
Table 6.9 The aoerage rnicroprobe conrposition of 57, 52 and 53 siderite cement phases in
the Merrimelia Fornntion (Wt.%).
The classification scheme used by Rezaee (1996) for the Tirrawarra Sandstone was
modified to describe siderite cement in the Merrimelia Formation. This new
classification scheme (Fig. 6.3) nests the three siderite cement phases (S1, 52 and 53)
within the context of siderite cement morphologies (patch, pore-fill and "seed"). In
this new scheme:
1) Pore-fill siderite has the greatest development of all three siderite phases (Fig.
6.8a & 6.8a').
2) Siderite "seeds" are generally composed of 51 and 52 phases, with encompassing
53 siderite.
3) Only 51 and 52 siderite phases develop in "patch" siderite (Fig. 6'8c).
The composition of siderite varies according to the cement phase (S1, 52 etc.). In
general, 51 siderite is depleted with respect to Mg whereas 52 cement becomes
progressively enriched. 53 siderite cement exhibits Mg proportions similar to those of
52 cement (Table 6.9). This compositional change is highlighted in Figure (6.9c),
where differing grey tones reflect differing Mg proportions.
215

Aunlcmqc Cowpovexr
A) Photomicrogrøph - Gidgeølpø #3 (2372.82m) (Cross nicols x 1.0). Close up of n
cluster of asymmetric siderite rhontbs or "seeds".
B) Photomicrograph - Kudrieke #7 (3776.27m) (Cross nicols x 5). EørIy formed
poikilotopic siderite cement, engulfing framework grains preaenting grøin contøcts and
fornúng a floating ftønæwork.
C) Photomiuogrøph - Mølgoonø #2 (2254.57m) (Plane polørised x 10). Twinned
siderite "seeds" occluding pore space. Note: secondøry porosity formation deaelopnrent aia the
dis s olution of si der it e.
D) Photomicrogrøph - Mudlølee #1 (2022.95m) (Cross nicols x 10). Spørry, pore fillingsiderite cement, exhibiting rare dissolution pitting.
E) Photomicrogrøph - Kenny #1. (2945.80m) (Cross nicols x 10). Radiøl cluster of siderite
"seeds", exhibiting a distinctiae radiøl extinction. Note: The enrliest formed siderite is
micritic, while the later, radiøting siderite is spørry.
Authigenic Minerals: Siderite Cement
PLATE 23
21.6


rrrqr GEN r c C o vp o¡t r¡tr
It can be seen in Table 6.10 that the amount of Mg increases drastically from 51 to 52.
Rezaee, (1996) observed similar Mg enrichment in 52 siderite, nominating that 52
siderite cement grades from a pistomsite-siderite cement to a homogeneous
sideroplesite cement.
Table 6.L0 gives an average composition of each siderite cement phase within the
context of siderite cement morphology type (patch, "seed" and pore fill).
Sample
Pore Fill S1
Pore Fill 52
Pore Fill 53
"Seed" S1
"Seed" 32
"Seed" S3
Patch 51
Patch 52
Average
MgCo.7.4
22.4
25.3
15.1
20.6
33.6
14.6
15.5
20.5
FeCO,
87.4
71.6
50.0
81.3
68.1
52.6
67.7
78.4
66.9
Table 6.10 Microprobe contposition (Wt.%) of pøtch, "seed" and pore-filling siderite
centent,
In thin section, differentiation between siderite phases is ineffective with only inner
51 and 52 phases discernible (Plates 23a,23c & 23d). In thin section sparry pore fillingcarbonate cement appears homogeneous, but is equivalent to the zoned siderite
illustrated in Figure 6.8a. The identification of 51, 52 and 53 siderite phases is most
accurately achieved by microprobe.
The formation of siderite in Merrimelia sediments is influenced primarily by:
1) Pore fluid composition,
2) Pore fluid acidity,
3) Porosity and permeability.
The shape of siderite morphologies also indicates possible formation mechanisms.
Siderite patches are irregular, with no defined or systematic crystal faces (Fig. 6.8c).
Pore-fill siderite also exhibit irregular surfaces reflecting the shape of the infilled pore
space (Fig. 6.Ba). Both of these morphologies have infilled available pore space.
278

fr
a
I
tl
.{{,tt'
Siderite Morphologies : Merrimelia Formationl5
t4
13
12
1l
10
9
8
7
6
5
4
3
2
1
15
t4
13
t2
ll10
9
8
7
6
5
4
3
2
1
l5
t4
l3
t2
1l
10
9
8
7
6
5
4
3
2
I
a b c d e f g h i j. k I b d fgh J kt m a b cdefghijklA B c
s3blnsetA
s2bS3a S2a Poikilotopic
SideriteQz
/I
s3bS3a s2b
Qzs2b
Sla
S 3b Seed Patch
B' c'A' Pore Fill
PEL5/6 546 E
|ila¡l!
{-
l" lrJ lll -'f I r¡ r'¡ F' tÐHlJ
aaI
S2a
a
,
t
-t
#1 (3038.8m) BSE imøge ønd cnrtoon of sub-poikilotopic pntch siderite.

Covpoxnw
In contrast, siderite "seeds" exhibit very well defined crystal faces (Fig. 6.8b)
suggesting that siderite "seeds" have a formation mechanism different that of pore
filling or patch siderite.
An examination of siderite "seed" distribution indicates that most "seeds" have
formed in poorly permeable strata, suggesting that the "seeds" form in slow fluidflow conditions. The siderite "seeds" themselves are composed of rhombs (Fig. 6.8b),
which, according to Dana (1955), coalesce forming a crystalline aggregate
Variations in mineral composition, which change the shape of the crystal produced,
are observed in the majority of siderite "seeds". For example, the inner 51 and 52
phases are asymmetrical when compared to the later formed 53 cement phase (Fig.
6.9e).
Siderite "seeds" are usually found in groups (Plate 23a) where twinning of smaller
siderite "seeds" off larger siderite "seeds" is common (Plate 23c).
6.2.3.1.1 Sl-Early Siderite Cement Phase
The earliest siderite cement phase occurs in the centre of porosity fill, "seed" or patch
siderite, exhibiting a different appearance depending on siderite cement style. 51
siderite "patch" and "pore-fill" cement in BSE images has the lightest appearance of
all siderite cement phases (Fig. 6.8a), exhibiting minor dissolution (Figs. 6.8a & 6.8c).
In contrast, 51 cement in siderite "seeds" sometimes forms highly dissolved, nuclei.
51 cement dominates siderite cement patches and in some examples can form
poikilotopic textures surrounding the whole rock framework (Plate 23b). 51 cement
under the petrological microscope is dark brown and micritic, whereas 52 and 53
siderite cement phases appear light brown and typically sparry (Plate 23e).
The boundary between 51 and 52 cement in all cases is irregular suggesting there has
been a period of dissolution prior to the precipitation of 52 cement. This same
dissolution event was also noted by Rezaee, (7996). The same author also observed
that 51 predominates in Tirrawarra sediments that are fine grained or organic-rich.
The same was seen in Merrimelia sediments where 51 siderite cement phase
dominates fine grained and argillaceous sediments. Siderite "seeds" for example are
dominated by 51 siderite (Fig. 6.8b) and are almost exclusively observed in low
porosity conglomeratic sedirnents whereas pore filling siderite cement (S2 and 53) are
almost exclusively observed in porous Merrimelia sandstones (M1).
220

LdrHil llt taa7.l¡mlcr&tlr:¡0.0 l¡lt0-0 f¡¡¡-lttt.l lt llyÍ.:tuItv Rtlltft
P¡: !L LG:.0 2t Ð-lt ll:tlrll
SIDERITE
PKIH
F.l(
I
/fl1
Elenent WtTo AtTot020350.3'l182
96 44100.00
2.570380.594.9t
91 55100.00
sio2P205K20CaOFe2O3Total
r-d a.m a-æ ¡.æ to¡o 12.6 l(ó la¡o la.æ
EDAX Tirrawarra Sst
BSE IMAGE(From Rezaee 1 996)
Merrimelia Fm
A' SEM IMAGE BSE IMAGE
XRD
a
K
o slD
o
ao a
osrD
a o
K
20 30 40 50 60
PEL5/6 546 D
Figure 6.9 A) EDAX composition spectra of siderite ceffient A') Merrimeliø #L8 (2547.83m) SEM photomicrogrøph ofdolomite ønd siderite ceffienL B) BSE imøge illustrøting pore fílling siderite in the Tirrnwßrrn Snndstone (From Rezøee, 1996),C) Fly Løke #7 (2945.22m) BSE imøge of pore flling siderite cement from the Merrimeliø Formøtion, shorning 51, 52 ønd 53cement støges, D) Fly Løke #1 (2948,22m) XRD spectrø with siderite peøks highlighted. E) Pnnning #1 (3L29.9m) (Pløneoolqrised x 20) Assymetric 57 ønd 52 cernent støges in ø siderite seed.
B
A
c
l5
12
6
3
E'70l0
0
D
I :i . ll I ll -,4Hr |ilrr rr¡, f*Ii
100 pm
Compovntr
Argillaceous (terminoglacial) sediments dominate the lower and middle Merrimelia
Formation while porous lithologies (proglacial) form a veneer at the top of the unit.
Thus siderite cement morphologies (pore fill, patch and "seeds") and respective
siderite cement phases (S1, 52 and 53) tend to be segregated, forming preferentially in
either terminoglacial or proglacial Merrimelia sediments.
6.2.3.1.2 S2-Mid Siderite Cement Phase
Optically, 52 cement is difficult to distinguish from 5L and 53. 51 cement, however,
commonly has a reddish appearance under plane light (Plate 23a[13b]) and is easily
identifiable from sparry 52 and 53 phases (Plate 23e). 52 and 53 siderite cement are
readily distinguishable in BSE images with 32 cement displaying complex
compositional zonations (Fig. 6.8a & 6.8a').
52 cement is best developed as pore-filling siderite, where numerous compositional
zones are observed þased on greyscale appearance) (Fig. 6.8a). These zones were
found to be also present in siderite "seeds" (Fig. 6.Bb) and to a lesser extent in siderite
patches (Fig. 6.8c). The following descriptions relate to 52 siderite (as observed in BSE
images) within "seeds" and pore-filling siderite cement. 52 cement development in
siderite patches is generally compositionally consistent (Fig. 6.8c) or is not developed.
A) S2a-Siderite Cement Zone
Seen in the core of isolated "seeds" this phase can form small rhombs and may be
highly dissolved (Fig. 6.8b & 6.8b'). The S2a phase also forms the inner zone of the
outer "seed" wall and in some cases constitutes the majority of the "seed" (Fig. 6.8b').
In pore-filling siderite, this first 52 siderite zone is characterised by broad zonations
(Fig. 6.8a) with dissolution pits coÍunon.
B) S2b-Siderite Cement Zone
In pore-filling siderite cement, this zone is characterised by progressively darker
banding, where the darkest band marks the end of this phase (Fig. 6.8a[Inset A]). The
relative amounts of Mg increase up to a maximum, corresponding to the darkest
bands in this phase.
6.2.3.1.3 53 Late Siderite Cement Phase
53 cement is predominantly observed in pore-filling siderite and is composed of two
main zones (Fig. 6.Ba & 6.8a'). The zonation consists of dark grey, Mg-rich bands
grading into homogeneous light grey cement (Fig. 6.8a). The contact between 52 and
53 cements in pore-filling cements is gradational, suggesting that siderite cement
222

Couporurw¡
formation in pore spaces was continuous, reacting to changing pore water chemistry
(Fig. 6.8a[Inset A]). This observation differs from Rezaee, (1996) who observed an
irregular boundary between 52 and 53 cements in the Tirrawarra Sandstone (Fig.
6.9b). This irregular boundary was interpreted by this author to represent a
dissolution event (D2 dissolution).
The pore-filling cement illustrated in Figure 6.8a[Inset A] shows no dissolution event
between 52 and 53, but evidence of such a dissolution phase, in Merrimelia sediments
is observed in other parts of the basin (Figs. 6.8b[L2] e 6.8b') (Table 6.11).
Table 6.L1- D2 (52/53) siderite dissolution eaent: a conrpørison of results from Rezaee
(1996) ønd this study.
TIRRAWARRA SANDSTONE
Braid PlainSandstones
Proglacial Yes Yes Figure 6.9b
Braid PlainSandstones
Proglacial Yes Yes Figure 6.9b
Braid PlainSandstones
Proglacial Yes Yes Figure 6.9b
MERRIMELIA FORMATION: Arenaceous
Glacio-AeolianSandstones
Proglacial Not Investigated Yes Figure 6.8b
LongitudinalBar Sandstones
Proglacial Not Investigated Yes Figure 9.20b
Proglacial Not Investigated Yes Figure 6.8cLongitudinalBar Sandstones
Yes Plate 23cLongitudinalBar Sandstones
Proglacial Not Investigated
LongitudinalBar Sandstones
Proglacial Not lnvestigated Yes Plate 33c
MERRIMELIA FORMATION: ArgillaceousArgillaceousSandstone
Terminoglacial Not Investigated No Figure 6.8a
Diamictite Terminoglacial Not Investigated No Plate 23e
Diamictite Terminoglacial Not Investigated No Plate 23d
Diamictite Terminoglacial Not Investigated No No IlÌustration
Merrimelia Field
Rezaee (1996)Dominant
Lithology
Glacial
Environment
Figure
PlateReference
GEOGRAPHICLOCATION
Fly Lake - BrolgaFieldsMoorari-WoolkinaFieldsTirrawarra Field
Woolkina Field
Malgoona Field
Gidgealpa Field
Fly Lake Field
Kenny #1
Mudlalee #1
Kudrieke #1
Dissolution Event:(Yes/No)
This Study
DissolutionEvent:
(Yes/No)
223


Covporvnvr
Regionally, the porous nature of the Tirrawarra Sandstone is relatively consistent ifnot buried too deep (quafiz cement occludes pore space). It is more than likely then,
that a dissolution phase between 52 and 53 in Tirrawarra sediments will be observed
across the Cooper Basin.
In the Merrimelia Formation however, the D2 dissolution event exhibits regional
variations depending on a sediment's permeability (facies type controls sediment
permeability - see Chapter Nine).
A) S3a-Siderite Cement Zone
This cement phase is weakly banded, with an elevated Mg content (Fig. 6.8b'). Early
53 siderite cement grades into the homogeneous S3b siderite cement zone (Fig.
6.8a[Inset A]).
B) S3b-Siderite Cement Zone
S3b siderite cement zone has a light grey, homogeneous appearance in BSE images
(Fig. 6.8a). Dissolution is minor in this cement phase. Commonly, S3b siderite fillsadjacent pores, linking pores that exhibit similarly zoned 51, 32 and 53 siderite
cement (Fig. 6.9c). S3b is the final siderite cement stage precipitated withinMerrimelia pore spaces.
6.2.3.2 Ferroan Dolomite/AnkeriteFerroan dolomite/ankerite is a very rare carbonate phase observed in only eight
samples. The existence of this cement was confirmed via bulk XRD and EDAX
analyses (Fig. 6.10) in conjunction with SEM observations. Optically, Fe
dolomite/ankerite cement is similar to the 52 and 53 sparry siderite phases.
On SEM images, dolomite appears as rhomboids comprising smaller intergrown
rhombs (Fig. 6.10). Fe dolomite,/ankerite postdates illite and late stage (S3) siderite
(Fig. 6.10) such that the edges of Fe dolomite rhombs are smooth with little indication
of dissolution embayments. These samples are, however, spread across the entire
basin in dissimilar facies, suggesting that this carbonate cement has developed on a
regional basis.
6.2.3.3 Calcite
Calcite is optically distinct from all other carbonate phases, exhibiting distinctive high
interference coloured twinning under cross nicols (Fig. 6.11).
225


urHrGENrc Co¡øpoxnNr
Calcite forms crystals with a sub-poikilotopic to poikilotopic appearance/ infilling
pore spaces between framework grains. XRD and EDAX analyses (Fig. 6.11) further
confirm this carbonate phase as calcite. Like dolomite, this phase is rare (seen in 10
samples), but is observed across the basin. Locally, around the Malgoona-Lake Hope
and Merrimelia fields, calcite dominates longitudinal bar sandstones and
conglomerates.
6.2.4 OPAQUE CEMENTS: PYRITE, GOETHITE AND LEUCOXENE
The most coÍunon opaque cement observed in Merrimelia sediments is pyrite (Plates
24a 8x 24b). Authigenic pyrite was observed in the majority of samples (average 2%).
Pyrite occurs as small patches that overprint all other authigenic phases and
surround framework grains to the extent that these grains appear to be floating (Plate
24b).Pyrite in the form of framboidal aggregates (Chapter Five - Plate 17c) were also
noted.
In Kenny #1, the groundmass of the diamictite cored in that well appears to have
been replaced by goethite cement. Whether this transformation occurred via sub-
aerial exposure or through other diagenetic reactions is unknown. However, the latter
scenario is favoured as goethite cement in all other Merrirnelia sediments occurs in
isolated patches.
Leucoxene was observed surrounding framework grains in ten samples. Leucoxene is
light to translucent in colour and is only identifiable when using reflected light
microscopy. In addition, euhedral anatase crystals (Plate 24d) were observed in trace
proportions.
6.2.5 MATRIX COMPONENT6.2.5.1 Argillaceous MatrixThe lower and middle levels (M2 and M3) of the Merrimelia Formation typically have
high (>50% of the rock) argillaceous matrix contents (Average -25% of the total rock).
The matrix consists mainly of mixed layered smectite/illite clay with subordinate
amounts of silt-sized quartz grains.
Subsequent transformation with burial of the mixed S/I clay to a more illitic
composition occurred. The argillaceous matrix of Merrimelia sediments is thus
dominated by illite with only 5%-1,0% mixed layered smectite\illite clay remaining
(section 6.2.2.1..3 of this chapter).
227

urrrlø.cqNtc Compoxn¡r
A) Photomicrogrøph - GiilgeøIpø #7 (2277.94m - Tirrøwørrø Søndstone) (Pløne
Polørised x 10) General aiew illustrøting løte stage pyrite cement oaerprinting framework
components and eøilier fornrcd øuthigenic phøses.
B) Photomicrogrøph- Mølgoonø#4 (2177.59m- MetimeliøFormøtion) (Cross nicols
x 5). General aieut illustrating late stage pyrite cement oaerprinting frantework compollents
and earlier formed authigenic phøses,
C) Photomicrograph - Mølgoonø #4 (2179.0Lm) (Cross nicols x 5). Pseudo-matrix,
fornred by the conryression flow and coøIescence of incontpetent rock fragments.
D) fEM photomicrogrøph - MøIgoonø #4 (2179.01m). Detøil of an ønøtase crystøl
amongst illite laths and fløkes.
E) Photomicrogrøph - Kudrieke #1 (3L76.27m) (Fluoro x 10). Peraøsiae illite matrix,
formed uia the transþrntation of detritøI smectite to illite znith increøsing burial depth. Note;
The brown fluorescing mineral is siderite.
Matrix, Psuedo-Matrix, Pyrite & Accessory Minerals
PLATE24
228


rrrqtclN r c C o ¡rtp ox r¡vr
Plate 24e is typical of Merrimelia sediments that are dominated by argillaceous
matrix. It can be seen that illite (green/yellow fluorescence) permeates the entire
matrix surrounding sediment framework grains.
6.2.5.2 Pseudo-Matrix
Pseudo-matrix is commonly observed in lithologies with high proportions of
argillaceous rock fragments. Like fine grained detrital matrix, pseudo-matrix is
overwhelmingly illitic (Plate 24c). Pseudo-matrix forms where weak clay-rich rock
fragments have squeezed between more competent rock fragments forming an
enclosing diagenetic matrix (Plate 24c). Pseudo-matrix generally forms in particular
regions where a number of highly squeezed ductile rock fragments occur as the
dominant basement lithology (Fig. 5.23). Pseudo-matrix coalesces with detrital matrix
making the identification of detrital and compaction-formed rock matrix difficult.
6.3.1. THE EFFECT OF ELEVATED BASIN TEMPERATURES ON
DIAGENESISDiagenesis in sediments is dependent on the environment of deposition, pore water
chemistry, overburden pressure, detrital mineralogy (which is linked to provenance
region(s) and facies type) as well as temperature. This last variable, temperature,
dictates the style and severity of some diagenetic reactions within a sedimentary pile.
For example, Walderhaug (199ab) showed that in the North Sea, there is a positive
correlation (Fig. 6.72) between increasing temperature and an increase in the rates of
quaúz cement precipitation
In the case of the Cooper Basin, temperatures are elevated (high geothermal
gradients), with respect to other sedimentary basins in Australia and around the
world (Schulz-Rojahn, 1991). Bottom hole temperatures of 410nF (2100C) have been
reported in parts of the Big Lake Field (Big Lake #41-9,000''70,000') while
temperatures of 272nF (133"C) are common along the GMI Ridge and in the
Patchawarra Trough (Beanbush #1). Galloway (7974) noted that cementation in the
Queen Charlotte basin of westem Canada is accelerated in areas of higher geothermal
gradient, indicating that the rate of diagenetic precipitation of quartz cement is
temperature dependent. The high geothermal gradients in the Cooper Basin of
Australia will result in greater than normal diagenetic reaction rates and the
appearance of minerals normally associated with the early stages of metamorphism
230

urHrcENIc Co¡øpovtvr
appearance of minerals normally associated with the early stages of metamorphism
forming in the deeper parts of the basin. Schulz-Rohan (7991), observed pyrophyllite
in the Patchawarra Formation in the Nappamerri Trough. The presence of this
mineral suggests greenschist metamorphism conditions exist at depth in this region
of the Cooper Basin. It follows then that the presence of pyrophyllite in the deepest
Merrimelia sediments (Plate 20a), also suggests, that at depth, in the Patchawarra
Trough greenschist metamorphism conditions exist. In such a basin as the Cooper;
geothermal gradients have a major control on porosity/permeability formation and
preservation.
to'17
E
_0oE.ertdc
.9oo-o
o-
0 I
+
I
^
+
Á
*
0 l9 oa
ça.a
oõ +xE
¡o -20
¡o'2170 90 I l0 130 150
Meon Precipilolion Tenrperolure [oCf
t70
Figure 6.12 Røtes of quørtz cemetttøtion aersus meøn precipitation temperature (Modified
fr om W øIderhøug, 1 9 9 4b ).
6.3.2 SUMMARY OF PARAGENESISA paragenetic seqtrence was constructed using a combination of petrographic
observations, SEM, XRD, TEM, fluorescence microscopy, CL and electron microprobe
studies. Table 6.12 sum¡narises the general paragenetic sequence established for
Merrimelia sedi¡nents. This table represents diagenetic adjustments that are
consistently observed in Merrimelia sediments across the Cooper Basin in South
Australia and Queensland3.
3 The detrital and textural complexity of Merrimelia sediments in conjunction with char-rging cliageneticconditions has produced regional paragenetic variations. Regional paragenetic sequences are described insection 6.4.
237

Compo¡',tevr
The degree of overlap between diagenetic events can be seen in Table 6.12. The
following section describes these diagenetic events (and degree of overlap) in detail.
The overall diagenetic sequence established for Merrimelia sediments, in
approximate chronological order, is as follows (Table 6.12):
Table 6.12 General pøragenetic sequence for the Merrhnelia Fornution, South Austrnlia
ønd Queensland.
EARLY
mrcas.
MIDDLE
Merrimelia Formation Paragenetic Sequence
Diagenetic Event Early M¡d Late TimeComDaction
-Srnecüte/lll'rtÊ fansbnnation of srain c@tirp dav & muddy matrix
- --¡Alteration of RF s
--II
Sl Siderite (Micr¡t¡c)
-
Svntuial Oz
-Cosenet¡c Oy'Kaolin I I
Feldspar Dissolution I I
Pore Fillins Kaolin
-
Dickite I
Dl Siderite Dissolution
-52 Siderite lZoned)
-I
Chlorite
-2nd Porosiw Formation I
D2 Siderite Dissolution I
53 Siderite lSoarrv. Poikilotooic)
-Drusv OuarE
-Calcite flwinnedl I rlFerroan Dolomite T
Pvrite I I
Pvroohvllite lVerv Limited Extent) ttôol. - ¿noa ¿noa - Ro"a nn"c - t rfì"a > I )O'a
EXPDW 072 0
232

urHrGENrc CompownNt'
within sedimentary, volcanic and pyroclastic rock fragments.
LATE
In order to maintain a coherent chapter flow, diagenetic events observed in
Merrimelia sedirnents are discussed in the following order (approximate paragenetic
order):
1) Mechanicalcompaction.
2) Quartz authigenesis (early & late).
3) Clay /feldspar diagenesis (illite, kaolin, dickite chlorite & feldspar dissolution).
4) Carbonate diagenesis (siderite formation, siderite dissolution, dolomite &calcite).
5) Secondary porosity formation (micro & macro).
6) Opaque cements (feldspar, pyrite, pyrophyllite & zeolite).
Each diagenetic event outlined above is discussed in the following manner:
1) Key diagenetic observations.
2) Observations from the literature/discussion.
3) General and specific theories of formation.
4) The most likely formation mechanism in Merrirnelia Formation sediments.
6.3.3 SUMMARY OF DIAGENESISKey observations and findings, as well as pertinent conclusions from the literature are
summarised in Table 6.13. As a synopsis of the following diagenesis discussion, Table
6.13 is a listing of the most likely diagenetic mechanisms that have altered Merrimelia
sediments since deposition. The following section therefore provides the details from
which the findings in Table 6.13 have been drawn.
233


urHIGENIc Compoxn¡rrt
6.3.4 DIAGENETIC EVENTS IN THE MERRIMELIA FORMATION6.3.4.1. Mechanical Compaction
6.3.4.1.1, Key Observations
The mechanical compaction of Merrimelia sedirnents started soon after deposition.
Primarily this involved mechanically unstable rock fragments and micas (Chapter
Five - Table 5.7), being compressed and crushed between more rigid framework
grains (Plate 25a & 25b). In matrix-rich Merrimelia sediments, muddy matrix is
commonly deformed by compaction to a stage where all depositional features have
been obliterated (Plate 25c). The crushing of the labile components in more
arenaceous Merrimelia sediments proceeded until quartz cementation produces a
rigid self supporting framework (Plate 25d).
The mineralogy of Merrimelia sediments controls the severity of mechanical
compaction (Fig. 6.13a & 6.13b). As the proportion of ductile rock fragments'
increases, the amount of prirnary pore loss from mechanical compaction (Compaction
Index (CI)) also increases (Fig. 6.13c). The calculation of CI in Merrimelia sediments
was achieved using the relationship outlined by Rezaee (1996) (Equation 5).
The CI of each facies was estimated using the IGVo data generated by Beard and
Weyl (1973) (see Chapter Nine - Fig.9.17e). The results indicate that facies rich in rock
fragments (terminoglacial) have had the most primary pore space reduction, while
facies with low proportions of rock fragments (proglacial) have had the least
reduction of depositional pore space (Fig. 6.13c).
QGVo-tGV)Compøction lndex (CI) = x 700
lGVo
IGVo = Original intergranular volume
IGV = Present intergranular volume
Equation 5
' Ductile rock fragments: incompetent rock fragments listed in Tablel.7
235


arrrrr cEN rc C o¡øp ovnwr
In addition to the amount of ductile material in a sediment, the following criteria also
induce pore space reduction in the Merrimelia Formation:
1) The compressibility and brittleness of rock fragments (discussed in Chapter Nine)
2) The distribution of labile and competent grains throughout the sediment
3) The size of labile rock fragments with respect to adjacent competent framework
grains.
6.3.4.1,.2 Discussion
Pittman and Larese (1991) showed that if competent lithics were clustered together
the grains form a "shelter zoÍre" of porosity preservation, wheteas clustered labile
grains lead to localised porosity loss. These authors also stated that grain size does
not have any effects on lithic-rich sediment compaction. In contrasts Rittenhouse
(1977) stated that for poorly sorted sands (i.e. the bulk of porous Merrimelia
sediments), the relative size of ductile grains (lithic rock fragments) and non ductile
grains (quartz and silicic rock fragments), influences the severity of sandstone
compaction. For instance, if ductile grains are srnaller than the surrounding
framework, they maybe protected from compaction (Plate 19d[3f]). Conversely, ifductile grains are larger than the surrounding framework, compaction of these grains
is inevitable (Plate 25d[8g]).
The brittle fracturing of qwartz grains is rarely observed in Merrimelia sediments.
Pittman and Larese (1,991) in this regard, conclude that the amount of fractured
quaftz grains varies inversely with the amount of ductile material present. The lack of
brittle grain failure and dominance of labile material observed in Merrimelia
sediments supports this conclusion.
6.3.4.L.3 Key Findings
The principle controls on mechanical compaction in Merrimelia sediments are:
1) Sediment sorting
2) Rock fragment composition
3) Quartz cement development
The controls on compaction in Merrimelia sediments are directly related to:
1) Sedimentprovenance/
2) The environment of deposition.
237

Co¡øpowm,tr
PLATË 25Compactional Effects
A) Photomicrogrøph - Brolgø #L (2947.7m) (Ctoss nicols x 10). Incompetent shale rock
fragment squeezed between contpetent quartz grøins.
B) Photomicrograph - Tingø Tingønø#I (1732.99m) (Cross nicols x 20). Bow tie mica
Iøth, formed by competent frømework contponent contpressing the middle section of the mict
with the end spraying out and filling adjacent pore spaces.
C) Photomicrogrøph - Merrimeliø #L (2943.6m) (Cross nicols x 5). Compøction of
argillaceous nutrix, which høs subsequently obliterated all depositional features, filling all
aaøilable pore space.
D) Photomicrogrøph - Tingø Tingønø #1 (1891.55m) (Plane polørised x L0).
Argillaceous rock fragnents in ørenaceous Merrinrclia sedintents wiII distort and fill aII
adjacent pore space until quartz cementstion produces a rigid fratnework, whereby the
squeezing of the ductile material is held in check.
238

Plate 25
4 5 6 1 8 9 t'ì
l.s
t4
t3
t2
lt
t0
9
lì
7
6
5
4
3
2
I
At0 t2
rl c
t4 ls
¿l c') Ir rl
c
(
c
')
t5
t4
t3
l2
II
B
t0
9
8
7
(r
.5
4
3
2
I
2 3 4 fl 9 t3c
ct) tl h
250 pm
ì
L'
c
rl
c
lr
¿ì
3)
100 pm
h
500 ¡rm
250 pm
6 1 l0 t2 l4 t5
D¿t c

umrcENrc CowpoNe¡w
6.3.4.2 Quartz Authigenesis
6.3.4.2.1 Early Quartz Cementation and Co-genetic Illite and KaolinA) Key Observations
Quartz overgrowths in Merrimelia sediments are confined to arenaceous intervals
where quartz-quartz contacts commonly occur. These arenaceous intervals mainly
form in the upper Merrimelia section where removal of the rock fragment component
has been at a maximum, a consequence of when thawing conditions prevailed over
freezing conditions (Chaney et al., 1997). It is within the more quartzose upper
Merrimelia sediments (M1) that quartz overgrowths can dominate diagenesis.
Juxtaposed in the upper reaches of the Merrimelia formation are argillaceous
sediments deposited via direct glacial action (terminoglacial sediments). These
sediments contain extensive illite, formed via the transformation of detrital smectite
to illite. In this transformation process silica (as well as water) is also produced
(Equation 6). It is possible then that silica from the transformation of smectite to illitein argillaceous sediments may precipitate as quartz cement in adjacent arenaceous
Merrimelia rocks.
Smectite + Al.'+ K. = Illite + Si.4 + Na. + Ca.'+ Mg.'+ Fe.'+ HrO
Equation 6
B) Discussion
The smectite-illite transformation has been cited by numerous authors as a major
source of quartz cement (Blatt, 1979; Milliken et aL, 1981; McBride, 1989; Boles and
Franks, 1979;Hower et øL,7976;Ehrenberg and Nadeau, 1989). In reviewing the main
sources of quartz overgrowths, McBride (7989), concluded that large volumes of silica
are generated by the transformation of smectite to illite. Less certainty however
surrounds the expulsion of smectite/illite-sourced silica out of shales and into
adjacent sandstone layers (Blatt, 7976; McBride, 1989). Hugget (7996) concluded that
silica can be exported from adjacent mudrocks, with expulsion efficiencies of
generally less than 50%. Even at these low expulsion efficiencies, and assuming that
60% of the mudrocks when deposited at the surface were smectite (McBride, 1989),
then the amount of silica produced by this reaction is more than enough to account
for the small volumes of quartz cement observed in arenaceous Merrimelia
sediments. For example, illite constitutes, on average, 34% (matrix plus neoformed
illite) of the total authigenic component of Merrirnelia sediments while quartz cement
accounts for (on average) 8% (of the total authigenic component). Assuming
pessimistic expulsion efficiencies and an original smectite percentage of 60'/. all
240

Compovevr
qlJartz cement in Merrimelia sediments can be accounted for by the transformation of
smectite to illite (Equation 7).
0.4 (Expulsion Efficiency) x 0.34 (Illite %) x 0.6 (Smectite "/") = 8% (Qz Cement %)
Equation 7
SEM images from samples around the Coonatie region, illustrate the cogenetic nature
of illite and early quartz cement (Plate 26a). Cogenetic quartz\illite (Plate 26a) is
normally observed in the vicinity of dissolved feldsic rock fragments and/or K-
feldspar framework grains.
These observations suggest that the dissolution of feldspathic grains within these
pores spaces liberated ionic species (Si, Al and K) forming localised quartz cement
and co-genetic illite. The samples in which isolated filamentous illite are observed
(Plate 22a), are conglomeratic in nature with small amounts of isolated porosity
indicating a more localised or closed system of formation.
The other main source of early quartz cement in Merrimelia sediments is the
alteration of feldspars to kaolin (Equation 8 - See Pg.2a$ and illite (Equation 6 - See
Pg.zaQ. The dissolution of feldspar is reported by Moncure et aL, (1984), McBride,
(1989) and Macchi et aI., (1990) to be a major source of quartz overgrowth
development in sandstones worldwide. Bjørlykke (1983) concluded that each volume
of feldspar dissolved is likely to precipitate 60% kaolin and 407" quartz cement.
Locally other sources of quartz cement in Merrirnelia sediments may include:
1) Micro-sized particles of quartz, produced by glacial ablation (rock flour),
2) Devitrification of glassy shards and siliceous volcanic groundmasses in acid
volcanic rock fragments.
This later quartz cement source maybe important in sediments at Malgoona Field
where pyroclastic rock fragments dominate. Both of these silica sources will supply
quartz cement locally but be insignificant on a regional basis.
The solubility of silica, according to Bjørlykke (1983) is low, thus very little of this
cement can be held in solution, and must be eventually precipitated (Equation 8).
241

Co¡utpoxe¡,1r
A) SEM photomicrogrøph - Løke Hope #L (2499.49m). General aiew which illustrates the
cogenetic nature of syntaxial quartz centent ønd filamentous illite [9e].
B) SEM photomicrogrøph - Moorøri #3 (2893.28m). Close up oiern of the cogenetic
relationship between kaolin and syntaxial quartz centent [4d]. The is the most conmronly
obseraed cogenetic reløtionship between authigenic minerals in both Merrintelia ønd
Tirrøwarra sediments.
C) SEM photomicrogrøph - Moorøri #3 (2893.28m). An exømple of illite [14i] ønd kaolin
[6e] sinruItaneously forming with druse quartz cement [13i]. Note: The illite forms
cogeneticølly with knolin [1 3i].
D) SEM photomicrogrøph - Gidgealpø #5 (2302.45m). Broød aiew illustrøting the
cogenetic nature of siderite and quørtz cenrcnt [4e] øIong withkaolin [9d].
Paragenetic Relationships: Quartz, Siderite, Kaolin & Illite
PLATE26
242

Plate 26
j J
I 1
h h
çÞ û
f f
e e
d d
c
b b
a a
r2345A - l¡l¡te and Quartz Cement
6789101112131415 I 2 3 4 5 6 1 8 9 l0 1l t2 13 L4 15
B - Kaolin and Quartz Cement
j J
h h
t
f
ob
f
e e
d d
c
b b
r234 56',l 10 11 t2 13 t4 15 r234 1 89101rt213t415
-:f8
rí
t.7I
,\I
.æ*. - ,i
)
Moor 38 2893 2Bm20 ¡rmDet
SEWD Exp3l 6 t
)-
10.0 kV 6.0 B74x,-.+'
V Spot Magn
a
C - ¡ll¡te / Kaolin and Quartz Cement
a
D - S¡der¡te and Quartz GementEXPDEV 076 N

urmrclNrc Co¡utpoxnNr
2(KNa)AISirOr,,,+ HrO + 2H',0r,
Feldspar
+ Al,Si,Os(OH)oß)+ SiO,+ 2K + 2HCO,
Kaolin Quartz Equation 8
The cogenetic nature of kaolin and quartz is ubiquitous in Merrimelia samples (Plate
26b[acl. This implies that the reaction represented by Equation 8 is an important
source of both diagenetic phases. Flowever, the amount of feldspar grains observed in
Merrimelia sediments is low (Appendix 5b - 0.8% as a proportion of the whole rock)
whereas the amount of quartz cement and kaolin as a percentage of the whole rock is
much greater (Appendix 5c - 4.5/" and 4.3"/" respectively).
These figures would suggest that Equation 8 is unlikely to occur in Merrirnelia
sediments. Flowever, the texture within most kaolin filled pores indicates that these
are actually not infilled pore spaces but the kaolinised remnants of detrital feldspar
grains (Plate 30c). Petrographic results show that kaolinised feldspars account for up
7.2% of the total rock volume. Therefore at the time of deposition approximately 2"/"
of Merrimelia detritus was feldspar (that is currently observed feldspar 0.8% and
kaolinised feldspar 1.2%). Thus, if the original proportion of feldspar grains was
approximately 2"/", and the present proportion observed is 0.8%, then 60% of
feldspars have been destroyed. The likely products are, according to Equation 8,
kaolin and quartz. According to Hugget, (7996) the dissolution of a rock volume
containing 1.2% feldspar (kaolinised feldspars only) will yield, at a conversion
efficiency of 40% (Bjorlykke 1983),0.5o/o quartz cement as a percentage of the whole
rock volume (or 1.6"/" of the authigenic component). This cement volume accounts for
all of the quartz cement observed (7.3% of the authigenic component) in Merrimelia
sediments.
C) Key Findings
The predominance of co-genetic kaolin and quartz (as opposed to cogenetic-illite and
quartz or illitised feldspar grains) suggests that the reaction described in Equation 8 is
the most important source of quartz cement in Merrimelia sediments. There are,
however, examples where all three phases (kaolin, illite and quartz) coexist
intergrown together (Plate 26d) implying that Equation 9 does indeed produce silica
but in volumes subordinate to that produced by Equation 8.
6.3.4.2.2 Chemical Compaction/Late Stage Quartz Cement
A) Chemical Compaction
Houseknecht (1987) defines chemical compaction as "bulk volume loss caused by the
dissolution of framework grains in contact, due to overburden pressure".
244

:umrcqNrc Coprporvnv¡
i) Key Observations
Evidence of chemical compaction in Merrimelia sediments is widely observed (Plate
27). Chemical compaction features such as stylolitisation along organic laminae (Plate
27a), Localised redistribution of detrital quartz as quartz overgrowths (Plates 27b &.
27c) and sutured contacts are generally observed in conglomeratic, fine grained and
argillaceous Merrimelia sediments (Plates 27 d, 27 e 8x 27 Ð.
ii) Discussion
Blatt (1979) stated that detrital quartz grains serve as both a source of dissolved
quartz as well as a substrate for precipitated quartz. This is true for quartz grains in
arenaceous Merrimelia sediments. Quartz grains, where overburden pressures are
unequal across a grain contact, show the diffusion of silica from the grain contact to
the pore space (Plate 27b &.27c) (Hutcheon, 1982). This redistribution of detrital
qwartz at grain contacts is described by numerous authors (Hayes, 7979; Schrnidt and
McDonald, 7979;McBride,1989; Bjorlykkle, 1983). The later author concluded that the
solubility of mineral species increases with increasing stress at the grain contact. Plate
(27e) is typical of a grain suture contact in sediments where compaction has been
severe. Most samples however, exhibit mainly concavo-convex grain contacts (Plate
27bl2gl). A very small number of samples, usually those matrix or organic rich,
indicate that they have experienced extreme compaction exhibiting highly sutured
contacts (Plate 27d Ex 27Ð.
Most suture contacts are lined by illite (Plates 27e &.271). T}iris illite was most likely
emplaced as clay rims which were subsequently squeezed between adjoining
framework grains. The resulting texture is stylolitic in appearance with the illite
appearing to accentuate the shape of the suture (Plate 27el8gl).
Contrary to popular wisdom, work done by Oelkers et ø1. (1992), Walderhaug (199aa)
and Walderhaug (1996) suggested that there is no relationship between overburden
stress and quartz cement formation. Foscolos (1990) and Bjørkum and Nadeau (7998)
also concluded the same, suggesting that illite between grain contacts facilitates local
quartz formation by diffusion into an interstylolite region (Fig. 6.1a) where, according
to Walderhaug (1996) and Bjørkum et aL (L998), it is then precipitated as quartz
cement by kinetically controlled surface reactions.
Bjørkum and Nadeau (1998) and Walderhaug (1996) claim that this process is
independent of effective vertical stress and dependent on increasing temperature.
245

Compoxnvr
A) Photomicrogrøph - Merrimeliø #4 (2589.27m) (Plane polørised x 5). Stylolised
organic laminøe, illustrating framework etching by associated organic acids [5d].
B) Photomicrogrøph - Tirrøzaørra #3 (2988.86m) (Cross Nicols x 20). Chemical
compøction of adjacent quørtz grains liberating and re-precþitating quartz cement. Note
extensiae quartz cenrcnt deaelopment øt quartz-quartz contacts [2c], whereas at quartz-løbile
grain contacts [\fl, no quørtz cement is deueloped.
C) Cartoon of the ideøIised redistribution of quartz cenrcnt, by chemical compøction forces
(After Hutcheon, 1.9 82).
D) BSE lmøge - Tingø Tingønø #L (2094.35m). Micro-stylolites ønd fractures in a
quartzose sedinrcnt.
E) Photomicrograph - GiìlgeøIpø #7 (2277.94m) (Cross nicols x 10). ilIite filled suture
boundary between two contpressed quørtz frømework grains. The illite is ø remnant "clay
rint", which seraes as a cøtalyst in redistributing quartz cement whíIe at the same thne ølso
accentuøtes the sutured grain contøct.
F) Photomicrogrøph - Kønowøna #1 (3092.44m) (Cross nicols x 10). Highly sutured
zonet suggestiae of intense sheøring. Quartz frøntezoork grain shapes obliterated by suturing.
lllite in sutures acts as ø catalyst for the liberation ønd redistribution of silicø.
Paragenetic Relationships: Chemical Compaction
PLATE2T
246

500 pm
Plate 27
h
gÞ
f
d
c
b
a
h
û
f
e
d
c
b 123456789101r12D
2 3 4 5
lJ
6789101112131415
15
t4
l3
t2
A
h
oÞ
fe
d
c
b
a
1l
l0
9
8
1
6
5
4
3
2
123 4 5 6 1 8 910111213t4E
h
oÞ
fe
d
c
b
a
I
a c e h
r2345618910Fc
aI
,/1O5C¡¡5.Ol(UrZo.oOp æ
100 pm
25O pm
Pz
P¡
P
lr
11
e
250 pmB
b d f o
Pw
11 t2 13 T4
EXPDEV 076 Y

Compoxn¡'¡r
Walderhaug (1996) explains that quartz cementation rates depend exponentially on
temperature and not pressure. Bjørkum et al. (1998), in studying the effects of
pressure and quafiz precipitation, disagreed with the stylolitisation model,
concluding that overburden pressure had a minor influence on quartz cement growth
in sandstones.
Stylolite,mica /
illite
Quarcdissolutionat interf¿ce
Diffusion ofdissolved silica
Quarcgrain QuarEz
precipitationI - 50cm
Quarcovergrowth Diffusion of
dissolved silica
Stylolite,mica /
illite
Quartzdissolutionat interface
EXPDEV 076 Z
Figure 6.L4 Stylolite quørtz ce,nentøtion model, where quørtz dissolution occurs øt the
quørtz grøin stylolite interface and is precipitøted in an inter-stylolite zone. (After Bjørkum et
aL.,1998),
The bulk of recent opinion, however, favours silica mobilisation via stylolitisation
rather than grain contact. Silica redistribution in this process is precipitated as burial
increases, into regions between stylolites (Fig. 6.M). This has the effect of increasing
the strength of the sandstone, as the effects of mechanical compaction are arrested
and chemical compaction begins to dominate (Ehrenberg, 1990 and Bjøtkum et ø1.,
1998). Bjørkum and Nadeau (1998) claim that this change over from mechanical
compaction to thermally controlled stylolitic processes occurs above 600C.
248

rrrrrr G EN r c C o ¡øp o ¡s nN r
iii) Key Findings
In arenaceous Merrimelia sedirnents quartz cementation appears to be greatest near
stylolised laminae (Plate 27a). The reprecipitation of quafiz cement at quartz-quartz
grain boundaries (Plate 27b) was rarely observed. It is likely then that the dominant
chemical compaction mechanism operating in arenaceous Merrimelia sediments is
the inter-stylolitisation model as proposed by Walderha:ug (1996).
B) Late Quartz Cementation
i) Key Observations
Figure 6.15 indicates that there are two phases of quaúz precipitation in Merrimelia
sediments; at shallow and deep burial depths.
Figure 6.15 Quartz cement oolunrc percentages aersus depth (m)
Rezaee (7996) describes three quartz cementation phases (27, 22 Ex 23) in the
Tirrawarra Sandstone in the Moorari-Tirrawarra, Fly Lake-Brolga region. These three
qvaftz phases were delineated using microprobe analysis coupled with fluidinclusion homogenisation temperatures. The results of these analyses indicated that
27 quartz cement phase precipitated at temperatures of between 65oC and 800C, while
22 precipitation occurred between 80nC-1000C and Z3 quartz cement formation was
initiated at temperatures in excess of 130nC (Rezaee 1996).
It is likely that very few Merrimelia sediments have been subject to three consecutive
quartz cementation phases as only arenaceous sediments would have been permeable
enough to allow quartz precipitation and maintain open pores large enough to
receive Z3 quartz cement. Rezaee (7996) concurred saying that Z3 quartz is observed
in only a few Tirrawarra samples. Microprobe and CL analysis of quartz cement,
0,botlltr!¡UL0,À(,E2IEoEC¡uNt(to
Quartz Cement Authigenesis25
20
I5
lo
5
0r 800 2300 2800 3300 3800
Depth (m)
PELS/6 546 P
è @&.
@.@ @ @
d;h$f
&.&&{M
&
249

Aurrucnvtc Coupo¡t¿¡vt
sourced from arenaceous Merrimelia samples basin wide, was unable to discriminate
three separate quartz phases.
However, petrographic observations indicated consistently that there are two quartz
phases in Merrimelia sediments. These two phases occur early and late, formingsyntaxial quartz overgrowths (early) and druse quartz crystals (late). Plate ZSalafl
illustrates the early quartz cement phase (off white) and Plate 28b[10e] the later
quartz cement phase (pure white).
iÐ Discussion
The formation of early quarlz has already been discussed, and is related to feldspardissolution. SEM and petrographic observations suggest that the formation of late
quartz cement is linked to the formation of illite. Plates 28c,28d, and 28e illustrate the
corrunon association of illite and druse quartz.
Numericol Model of Porosil.¡ Modificotion by Pressure Solutionond Quortz Cementolion in Mudstone/Sondstone Syslem
ocoooôoco
xotg
co
8_Eot-,o
.Eoû
2 3 4 I ì0t270 80Diogenelic PorosityVerticol
Compoctionl%l
Quort:,l%l
l% of Originoll
1.2 ì.4Sio2 (oq)
equilibrium 5i02 (oq)
¡.0II
ot-v,2 o.s
t4
EN
-1.0
5iO2Export -0.5
q
o|-qof,¿
Figure 6.16 Quartz cementation in a arenaceous/argillaceous system (After Witson and
Stanton,1994).
The association of druse quartz and illite in argillaceous lithologies tends to suggest
that, in these sediments at least (Plates 28d), late quartz cement is being sou¡ced fromsilica associated with the smectite-illite reaction. In contrast, late quartz formation inarenaceous Merrimelia sediments tends to form where concavo-convex and illitelined sutu¡ed contacts dominate.
250

urHI G EN r c C o ¡rtp oNewr
A) Photomicrograph - Woolkinø #1. (3038.80m) (Pløne polørised x 20). Broød aiew
illustrøting a cluster of druse quartz oaergowths [4e].
B) Photomicrograph - Coonøtie #L (3148.30m) (Pløne polørised x L0). Broød aiera of ø
pore that exhibits both syntaxial t15dl and druse quartz cement [10e].
C) Photomicrogrøph - Woolkinø #L (3038.80m) (Cross nicols x 20). C:axis orientsted
druse quartz cement coated with thin fíIms of illite [5b].
D) SEM Photomiuogrøph - Woolkinø #1 (3038.80m). Close up of druse quartz formingout of quartz sttbstrøte, surrounded by boxwork illite cløy.
E) SEM photomicrograph - Mølgoona #2 (2255.51m). Broød aiew of druse quartz
intergrown utith boxu.tork and filøruetttous matrix illite.
F) SEM photomicrogrøph - Tirrøwørø #3 (2988.86m). Large cluster of druse quørtz
suggestiae of an open, clay free, high flow pore pøthway.
Authigenic Minerals: Druse Quartz Cement
PLATE 28
251

100 pm
Plate 28
h
f
e
d
c
b
a
2 3 456
456'l
89
9 1011
10 11
t2 13
12 13 14
t4 15
7 15
D
B
A
h
h
d
c
b
a
f
e
d
c
br2 3 8
ca
2 3 4 5 6 7 8 9 l0 12ll
hh
f
e
d
c
b
a
d
c
b
a
2 5 6,|
8 11 12-)
FE
100 ¡rm lt¡ &
4
{I
r.r T
44
M
t t
ò
(
¡
ti "r: r,,
r,r r i "ri I ,lrrr ii'r! 'f, I'r .ìi
'1ì,tl4 9 l0
PELS/6 546 R

Coupo¡r¡ewt
This observation suggests that late quartz precipitation in arenaceous Merrimelia
sediments proceeds according to the process illustrated in Figure (6.14).
In interfingering arenaceous and argillaceous Merrimelia and Tirrawarra sediments
(M1 & T1), it is likely that quartz cementation is related to silica export from
compacting shales. Mullis (1992) found a positive link between silica generation in
mudstones (smectite-illite transformation) and quartz precipitation in adjacent
sandstones where the diffusion of Si and subsequent precipitation is concentrated
adjacent to the shale/sandstone interface (Fig. 6.16).
iii) Key Findings
It is probable that silica released from either the illitisation of smectite or by chemical
compaction has re-precipitated in the form of quartz cement late in the diagenesis of
Merrimelia sediments.
Several sources for early and late quartz cement are likely. The following lists the
most volumetrically important source of quattz cement to the least:
1) Smectite/Illite transformation (Equation 6) (Early).
2) Feldspar Alteration (Early).
3) Chemical compaction (Late).
4) Dissolution of siliceous rock fragments (Late).
6.3.4.3 Clay Diagenesis
6.3.4.3J1. illite Authigenesis
A) Key Observations
Plate (29a [5e]) is typical of matrix illite observed throughout the Merrimelia
Formation. The more yellowish or higher intensity areas in this image (Plate 29a [aj])
are completely illitised argillaceous rock fragments. It appears that the illitised rock
fragments and the matrix illite merge (pseudo-matrix) with the only difference being
that the rock fragment areas are entirely dominated by boxwork/filamentous illite
(Plate 29b) as opposed to filamentous illite in the matrix (Plate 29d). These
observations are noted in lithologies with predominantly argillaceous matrix and in
lithologies that have predominantly argillaceous rock fragments. Illite-rich lithologies
are therefore, typically rock-fragment-rich, having formed near glaciers (low chemical
maturity) and are dominated by a clay sized matrix'
Distal proglacial sediments, such as varvite mudstones, are also almost entirely
dominated by clay-sized matrix.
253

CorupoNrwt
A) Photomicrograph - GidgeøIpa #5 (2298.57m) (Fluoro x 10). Matrix illite [4d] ønd
pseudo-møtrix [4kl formed by the destruction of labile grøins.
B) SEM photomicrogrøph - Mølgoonø #2 (2255.57m). Boxwork filøntentous illite,
surrounding druse quartz cement.
C) Photomiuogrøph - Merrimelia #1 (2946.80m) (Cross nicol x 1.0). Litharenite rock
fragment that exhibits, grain lining illite "clay rims" [4h], illite lining sutured contacts [5c]
and the illitisøtion of unstable rock frngnrents fafl.
D) SEM photomicrogrøph - Mølgoonø #2 (2255.57m). Close up aiew of filnmentous illite.
E) Photomicrograph - Metimeliø #5 (2622.1.9m) (Cross nicol x 20). Close up oiew oJ
illite lining frameznork grøins in the econotnically significant glncio-øeolian sandstones of the
Merrimelia Field.
F) SEM photomiuogrøph - Merrimeliø #1 (2946.80m). Grain contact illustrøting the
surrounding illite "clay rim" [3c], platey illite coating of framernork grains [Inset A] and the
illitisation of unstable rock fragments [5c].
G) Photomicrogrøþh - Metimeliø #1 (2627.98m) (Fluoro x 20). Close up aiew
illustrating the peraøsiae nature of grain lining illite in gløcio-øeoliøn sandstones. Note: The
intense yellow regions [6í] are løbile grains that haoe been conrpletely illitised ønd
subsequently squeezed into ødjoining porc space.
PIATE29Authigenic Mineral Illite
254


Coupolv¿wr
Conversely distal proglacial sandstones tend to be dominated by filamentous illite
porous where illite fibers grow into pores spaces, bridging pore throats (Plate 29d).
Petrological observations indicate that illite forms differently in different Merrimelia
facies. Lr general however, the two main mechanisms by which illite forms in
Menimelia sediments are:
1) The transformation of detrital smectite to illite.
2) The neoformation of illite from circulating pore waters.
The transformation mechanism is the dominant illite formation process and the
neoformation of illite subordinate. The transformation mechanism occurs in
Merrimelia rocks dominated by argillaceous components (matrix and rock
fragments). The neoformation of illite occurs in arenaceous Merrimelia sediments.
Argillaceous Merrimelia facies tend to be illite-rich, while arenaceous facies tend to be
illite-poor (kaolin is generally the dominant clay type in arenaceous Merrimelia
facies). Figure 6.17 illustrates the facies with the highest illite proportions are fluvial
or lacustrine in nature. Lacustrine sediments would be expected to contain high
proportions of illite however it seems unusual for fluvially derived sediments to be
illite rich. A closer examination reveals that the fluvial sediments are terminoglacial
in nature (LB, FL and RD) and contain relatively high proportions of fine grained
(argillaceous) matrix. In the better sorted sandstones facies such as dune (DU) and
shorezone (LSZ) we see that illite concentrations are less. This clearly shows that
there is a relationship between sediment sorting and illite development.
AÞdldoil tul!rYp.kStrp&l¡hflGDdÈ ñdD.lÈ bEôD..p Gl*llldffi.BlETrydAælh Dtn.Fuvhl tulqFuvhl9¡[email protected]¡oz.n shff Zom
K.td. Hol.loqbM &¡UúüoÉl &r[¡odn. stþm zomlfuDhlùS{b.quru ClEnml Gmlï.mlnod¡.hl OLMh tuLmlqhòl Sùb{4{.@Tuind l,ldnh D+qh
sDNDFDEæLDßil,BTFL6ZIDKHLELßt-sfRDSACG10FIlMDLSZ
\¡Ò\\'ò \ \ \oÒ* \.t o^ \Òt¡4, \a t\ìß\r¡\\\s
EpDW 0Z C
Figure 6.17 Rønked cumuløtiae histogrøm of illite proportion aersus føcies type,
256

rrrryrcqNrc Co¡øpoxrNr
Illite growth is accelerated by the presence of fine grained detrital clay and
argillaceous rock fragments. The less reworked facies have a greater percentage of
matrix and rock fragments and contain more illite. Other factors which help form
illite include:
1) Rock fragment type,
2) Basin temperatures,
3) Fluid/rock ratios,
4) And access to illite forming reactants.
These processes to a degree overprint the relationship between facies type and illitepercentage. For example one would expect to see more illite in terminoglacial tunnel
mouth deposits (TTMD) than that is shown tnFígure 6.17
The lack of illite in these sediments is likely to be a function of the subaqueous nature
of these sediments where contact with clay-rich infiltrating meltwaters was not
possible. In contrast longitudinal bar (LB) sediments (another clast dominated facies
type) has relatively high illite percentages. These sediments unlike tunnel mouth
deposits, were more susceptible to clay development as they were periodically
exposed to clay-laden meltwaters.
B) Discussion: Illite Diagenesis, A Review
i) Controls on Illite Formation
Hamilton et ø1. (7992) suggested that the main controls on authigenic illite formation
are;
1) Temperature,
2) Concentration of reactants,
3) Rate of supply of reactants,
4) Tirne,
5) Presence of an aqueous pore fluid.
In contrast, Chamely (1989) concluded that the major control on illite formation is
sediment permeability which determines the fluid/rock ratio and whether illite forms
in an open or closed system (or a combination of both). However, Small ef al. (1992)
stated that filamentous illite formation in sandstone reservoirs maybe linked withpore fluids enriched in carboxylates. According to Hower et al. (7976), temperature is
the most important factor in the illitisation of Gulf Coast sediments. Conversely,
Chamely (1989) reviewed numerous published data and concluded that the residence
time of a sediment, at a given temperature, is more important for illite formation than
257

Co¡¿po¡vr¡v¡
the absolute instantaneous temperature reached. Argostegui et al. (1991) agreed
stating that apart from temperature, residence tirne is an important factor in the
transformation of smectite to illite. In contrast, experimental observations conducted
by Aja et aI. (L997) disagreed with Hower et aI., (1976) showing that illitisation
reactions are strongly dependent on both absolute temperature and pore solution
chemistry. Aja et ø1. (1991) observed that illitisation of smectite (and kaolin) will not
occur at low pH but will convert directly to the illite end member in silica saturated
solutions with a pH >8 (Sass ef aL,1987).
There is little agreement in the literature as to what are the main controls on illite
formation. Ffowever, what can be gleaned from the literature is that the controls on
illite formation are not consistent between basins, and that differing geological
circumstance influences the controls on illite authigenesis. Ahn and Peacor (1986)
agree saying that caution must be exercised when using the smectite to illite reaction
to determine burial depth or temperature, as a host of factors control these reactions
making absolute comparisons between basins unreliable. Argostegui et al. (1991) go
further suggesting that it is difficult to make comparisons between illite formation
mechanisms between different sectors of the same basin. Flowever, consistent illite
morphology observations (i.e. boxwork illite forms from rock fragment alteration) in
Merrirnelia sediments from across the Cooper Basin tend to suggest that illite has
formed in different areas of the basin by similar mechanisms.
The factors which are most frequently referred to in the literature as playing an
important role in illite diagenesis are:
1) Original composition of smectite,
2) Chemical activity of the diagenetic medium,
3) Temperature,
4) Formation water residence time,
5) Sediment permeability (Ahn and Peacor, 1986; Inoue et a1.,1988,1989; Srodon and
Eberl,1987).
A review of the literature pertaining to illite diagenesis indicates that illite forms by
two processes:
1) The transformation of detrital smectite to illite in argillaceous sedirnents.
2) The precipitation of illite from solution in porous sediments.
258

rrrurclNrc Co*rpoxtur
ii) Smectite to Illite Transforrnation
Smectite to illite transformation in argillaceous sediments has been the focus of
innumerable studies in the past two decades. Interest in this clay transformation,
within the petroleum industry, has been intense as the transformation of smectite to
illite releases a large volume of water (Equation 6), providing the flux and
transportation for other diagenetic phases while also aiding the movement of
hydrocarbon phases (Freed and Peacor, 1989). The reaction has also been used as an
indicator of burial temperatures.
The two main closed system models that attempt to explain the transformation of
smectite to illite, with increasing burial depth, in mixed layer clays are:
1) The interlayer model (Ahn and Peacor, 1986; Boles and Franþ 1979; Srodon and
Eberl, 7987; Sass ¿f aL, 1987; Hower et øL, 7976; Bethke & Altaner, 1986; Bethke et
aL,1986).
2) The interparticle model (Nadeau and Bain, 1986; Nadeau et øL,1984).
a) The lnterlayer Model
The interlayer model states that smectite layers are transformed to illite layers by
cation pathways associated with layer edge dislocations.
Initially, smectite dominates the smectite/illite mixed layer clay assemblage and is
composed of sub-parallel layers of variable thickness (Freed & Peacor, 1989). Smectite
layers are wavy whereas illite layers are straight in appearance. With increasing
depth, the proportion of wavy layers compared to straight layers decreases, i.e., the
mixed-layer clay becomes more ordered (Ahn and Peacor, 1986).
b) Interyarticle Model
The interparticle transformation model, argues that when smectite transforms to
illite, the smectite particles dissolve with illite particles precipitating as a result. In
this process the illite composition increases with the illite particle size. The
interparticle model views the layer arrangements within mixed-layered clays as a
random sequence of illite and smectite particles which, when diagenesis proceeds,
the smectite particle population becomes unstable and dissolves (Nadeau and Bain,
1e86).
c) Interpørticle ønd Interløyer Model Discussion
Aronson and Douthitt, (1986) compared both illitisation models. These authors found
that as the illitisation of smectite proceeds, Al and K fixing begins in a particular
259

umrcENrc Covpovnvr
interlayer. Succeeding insertions of Al and K were more likely within this same
interlayer. The conclusions of Aronson and Douthitt, (1986) are contradictory to that
of the Nadeau et øL (7984 & 1985) interparticle model. The interlayer substitution
model of Ahn and Peacor (1986), based on TEM observations shows that smectite and
illite packets co-exist at depth supporting the observations of Aronson and Douthitt,
(1e86).
More recently, in a detailed review of illite transformation models in argillaceous
sediments Chamley (1989) stated that there is little agreement on formation models.
In assessing both models, Chamely (1989) concluded that the TEM-based
observations of Ahn and Peacor (1986) should be regarded with more certainty than
the XRD based observations of Nadeau et al. (1984).
d) Cøtion Sources for Both Smectite/Illite Transþrmøtion Models
The source of illitising reactants that fuel the above illite transformation models are
accounted for by two 'closed system' mechanrsms.
Mechanisru 1
Hower et aL (7976) and others have proposed that the smectite to illite transformation
can be approximated by the following reaction (Equation 9):
Smectite+Al'. +K * IIIite+Sin. Equation 9
This reaction implies that smectite transforms to illite directly by fixation of K ininterlayer sites, resulting in the collapse of smectite layers to form illite layers
(Nadeau and Bain, 1986) and accompanying substitution of Al for Si in tetrahdral
sites (Ahn and Peacor, 1986). This illitisation process forms in an essentially closed
system (Hower et a1.,1976), where K and Al are supplied locally by the dissolution of
K-feldspar and/or micas. The local dissolution of K-feldspars and micas in a closed
system has been examined by Sass et ø1. (1987). These authors conducted experiments
which supports Equation 8 as a geologically viable reaction stating that illite and
smectite are, in most circumstances, incompatible in the presence of K-feldspar and
micas below a critical temperature.
Mechønism 2
A different illite formation mechanism was proposed by Boles and Franks (1979).
They surmised that the Al required for formation of illite layers was derived from the
smectite itself and not from detrital sources such as K-feldspars. In this model, three
260
CompoNr¡,u
smectite layers transform to form 2 illite layers, destroying some of the original
smectite layers. The model proposed by Hower et aI. (1976) is in conflict with this
layer destruction model as all of the basic 2:1 structural units are retained.
iii) The Neoformation Of IlliteThe neoformation of illite proceeds in porous and permeable rock which favour the
migration of fluids. In this circumstance, illite can form without requiring precursor
smectite or as the end product of smectite /illite transformation reactions (Nadeau
and Bain, 1986). In this case, illite forms directly by precipitation from pore fluids(neoformation). This 'open system' illite formation model involves illite crystallising
from cations that have been transported into sandstones from nearby argillaceous
sources.
C) illite Formation Mechanisms in the Merrimelia Formation
Illite diagenesis in argillaceous and arenaceous Merrimelia sediments proceeds as
follows:
1) llitisation of argillaceous depositional matrix.
2) Illitisation of grain coating detrital clay.
3) Illitisation of rock fragments forming flame boxwork texture.
4) Formation of honeycomb box work illite textures (after kaolin).
5) Neoformation of illite (filamentous illite protruding from boxwork and clay
coating illite).
6) Illitisationof kaolin
The following section discusses each illite authigenesis scenario in approximate order
of formation.
i) Illite Growth in the Merrimelia Formation
The rate of illite growth throughout the Cooper Basin may not have always been
constant. This is particularly true around the Merrimelia Field where up to eight
phases of calcite and illite cement fill scattered pores in a "cowpat" like fashion (see
section 6.3.4.9.6).
Petrographic and SEM observations suggest that illite formation in argillaceous
Merrimelia sedirnents across the Cooper Basin has followed a path similar to that
illustrated in Figure 6.18a. This figure shows that initially illite formation proceeded
slowly gaining momentum as temperatures of burial increased. The formation of illitethen slowed as the amount of smectite available for illite transformation lessened.
261

urHI GEN rc C o¡wp ox r¡,t r
hr porous rock Huang et. ø1. (1986) stated that, illite platelets initially grow rapidly insmall pore spaces (neoformation of illite). After initial, exponential illite growth, the
rate slows considerably and becomes more constant. This indicates that the majority
of illite is formed in the initial stages with the amount of newer illite formation
decreasing (until more favourable conditions occur)t. In the specific case of the
Merrimelia Field, such a spasmodic illite formation regime may have persisted (Fig.
6.18b) responding to localised changes in pore water chemistry (see section 6.3.4.9.6
for details).
Figure 6.18 lllite growth rates (Modified from Lee et ø1., 1989)
ii) Smectite-Illite Transformation in Merrimelia Sediments
Compaction of argillaceous lithologies (which form the bulk of Merrimelia
sediments) is a complex combination of mechanical compression and water expulsion
generated from the transformation of smectite to illite within the argillaceous matrix.
This transformation results tn a24"/" weight loss as 80% of the original smectite layers
(within the original mixed illite/smectite clay) is reduced to20"/" smectite (Freed and
Peacor, 1989). This mass reduction occurs as water loss and is produced by a process
that is most likely a multi-stage phenomena which responds to the differing stages of
sediment burial (Fig. 6.19). The clay transformation process can produce abnormal
fluid pressures by the relocation of water from collapsing clay layers into adjacent
pore sPaces.
' This has implication fo¡ illite age dating in porous Merrimelia sediments, a topic that will be discussed atlength in Chapter Eight.
llliteMerrimelia
growth rate in theFormation : Cooper Basin
lllite growth rate in theMerrimelia Formation : Merrimelia Field
lllite Grcmh Rate(consistent)
lllite Grcwth Rate(spæmodic)
younS old young oldBasin Age Basin Age
A B
EXPDEV O7l X
262

umIGENrc Co¡¿po¡vnvr
Diagenetic reactions are thus by no means uniform throughout a sediment but reflect
the heterogeneity of the sediment. In the case of Merrimelia sediments, this results ina diagenetic mosaic where only the presence of illite is consistent throughout. This
observation suggests that illite initially formed in closed conditions (i.e. the
impermeable nature of most Merrimelia sediments prevented the precipitation of
illite from solution) having been transformed via local reactants from precursor
smectite clay. The transformation of detrital smectite to illite in Merrimelia sediments
occurs from the earliest burial of sediments throughout the burial history until open
diagenetic conditions prevailed curtailing this process but accelerating the production
of neoformed illite (Table 6.12).
Detailed XRD examination contends that illite in Merrimelia sediments contains
approximately 5% expandable smectite clay. It follows then that the precursor to illitein Merrimelia sediments was detrital smectite. It is also likely that some detrital illite(Warburton Basin) was incorporated into argillaceous Merrimelia sediments.
Flowever, SEM observations indicate, that the replacement of detrital smectite by
illite is common in the Merrimelia Formation. It is concluded therefore that, ingeneral smectite formed a detrital precursor to illite in argillaceous Merrirnelia
sediments, with detrital illite subordinate.
The addition of K. ions required for the transformation of smectite to illite are,
according to Flower et ø1. (1976), supplied by detrital feldspars or micas (see section
6.3.4.3.18d - mechanism 1). However, this source of K. ions appears unlikely inMerrimelia sediments as detrital feldspars and micas accounted for only 6/" of the
total detritus at deposition (illite accounts for 25"/" of the majority of Merrimelia
sedirnents).
This has three ramifications:
1) Most of the illite observed in the Merrirnelia Formation formed via pore fluids
and are not a product of smectite transformation.
2) That K.-rich brines were necessary for the widespread illitisation of smectite
(Macchi et a\.,1990).
3) The detrital smectites that later formed illite were enriched with Kt ions (Boles
and Franks, 1979; AI¡n and Peacor, 1986).
4) Illite (as opposed to smectite) was inherited into Merrimelia Formation sediments
from the Warburton Basin.
263

Auratc¿t ttc C o¡rtp o¡trNr
The first two scenarios can be discounted as K* rich brines would not be able topenetrate impermeable Merrimelia sediments and therefore not enable the ubiquitousillitisation of argillaceous Merrimelia sediments. The third scenario (K--rich detritalsmectite) is a likely source of K. ions for illite formation in argillaceous Merrimeliasediments. In addition, the predominance of smectitic clay morphologies (nowboxwork illite) also suggests that illite has on a consistent basis pseudomorpheddetrital smectite (Plate 29b).
dffiiv = 1.32Fìæmt B!rial
ffiljü
ffiffiñI
Pore Wat€r
lnÌorlayer Wat€r
Swell¡ng Clây So¡ids
Nm-sw€ll¡ng Clay Sol¡ds
Nm<lay Solids
alter Burst 1969ILI
otlI
d = 1.96After 1s
Dehydraùmd = 2.28After 2d
Dehydralion
5V"
+Stage ll+ +Stage
LastStable untilheating
mob¡lisslnterlayu
mter
interlayerwater lost
Schemat¡cWaler
ExpulsionCurue
Figure 6.1-9 Wøter expulsion oolumes arising from the transþrmation of smectite to iltite
(After Aggett et a\.,1995).
The last scenario may also be a source of K- ions for the transformation of smectite toillite in Merrimelia sediments. Prior to the formation of the Cooper Basin, WarburtonBasin sediments were subject to illitisation of detrital smectite. Subsequently,
Warburton Basin detritus was incorporated into the MTGC sedimentary pile rich inillite and as well as smectite. As mentioned previously however, the abtmdance ofboxwork illite morphologies suggests that the majority of detrital clay incorporated into Merrimelia sediments was in fact smectitic (it is noted here that boxwork illite may
264

Compot¿rvr
not be the only indicator of a smectitic precursor). Detrital illite volumes are
interpreted to be less than detrital smectite.
Neoformation is the subordinate illite formation mechanism but is the dominant illiteformation mechanism in the later stages of diagenesis.
In summary, the pervasive illitisation of fine grained Merrimelia sediments occurs ina closed system. Smectite to illite transformation in Merrimelia sediments has been
via the mobilisation of ions at layer dislocations within a K.richsmectite precursor.
iii) Sources of Detrital Clay in Merrimelia Sediments
The dominance of the smectite-illite transformation in Merrimelia sediments
necessitates large volumes of detrital clay (smectite) being incorporated into the
sedimentary pile. Smectite is likely to have been incorporated in to Merrimelia
sediments at the surface either as:
1) A component of rock fragments, inherited from a previous lithification. (Unstable
rock fragments [Chapter Five - Table 5.6] break down quicker and will contain
clays developed from surface weathering).
2) As fine grained matrix. (Sedimentological evidence suggests that the majority of
detrital clay in Merrimelia sediments is matrix, formed either in lacustrine
dominated regions or from glacial pulverisation of detritus).
The majority of rock fragments exhibit varying degrees of illitisation dependent on
rock fragment lithology. Litharenite and greywacke clasts commonly exhibit grain
and suture lining illite and pore-filling fine grained matrix (Plate 29c). These textures
suggest that illite in these rock fragments was formed in a previous sedimentary
cycle. However these rock fragments, account for only 1"/" and 2% respectively of the
total rock fragment component, so the amount of inherited illite incorporated intoMerrimelia sediments is minimal. In dominantly argillaceous rock fragments such as
shales, inherited clays form the majority of the rock.
Shale rock fragments are the most numerous (Chapter Five - Table 5.2) contributing a
large proportion of the detrital clay component in Merrimelia sediments. In contrast,
silicic metamorphic rock fragments rarely have any associated detrital clays (gneiss
and schist only) and contribute little to inherited clay volumes. The proportion of
detrital clay in the Merrimelia glacial complex therefore varies according to rock
fragment type and proportion. These factors in tum are controlled by:
1) Sedirnentation style (proglacial or terminoglacial),
265

Covpo¡rtr,t,¡r
2) Sedimentprovenance/
3) Destruction of rock fragments (competent or incompetent)
Of all rock fragment types, sedimentary rock fragments provide the majority of
detrital clay in Merrimelia sedirnents. Flowever, Dutta (1992) suggests that in a glacial
setting, a large amount of clays form from the break-down of volcanic rock
fragments. Locally therefore (i.e. Gidgealpa Field) it is probable that volcanic rock
fragments may also contribute significantly to detrital clay volumes. This contribution
maybe small however, as low chemical activities operate in glacial settings (Velde,
1992) (i.e. Gondwanan Glaciation) subduing the development of surface clays.
Figure 6.20 Palaeo-løtitude positions of the Cooper Basin during Patchawarra Forffiation,
Merrimeliø Formation nnd Tirrøwarra Sandstone deposition (After Carne, 7984).
Mechanical weathering in such a setting dominates over chemical weathering.
Accordingly the amount of clay development in both Tirrawarra and Merrimelia
sediments having been deposited at polar latitudes (Fig. 6.20) would have been
minimal compared to sediments deposited in more temperate climates.
It is reasonable then to conclude that detrital clay development in MTGC sediments
was minimal and that most detrital clay incorporated into Merrimelia sediments was
inherited from a previous lithification (i.e. Warburton Basin lithification).
N
'5
90
ao
70
60
50
.lO
30
20
to
o
ao
s903æ
T¡m€ (MYBP)400 5m
qPÞEV O72 U
6m0 200
266

Coupoxrxr
iv) Formation Of Illite Textures Observed In The Merrimelia Formation
a) Illitisation Of Labile Components
Illite, derived from the alteration of labile grains, is the second most important source
of this clay type in Merrimelia sediments (Fig. 6. d).
Commonly illite forms along cleavage planes and in the internal fractures within
chemically unstable rock fragments (Plate 30a). Plate 30b illustrates that illite not only
replaces (or partially replaces) unstable detrital grains but also fills quartz
embayments (Plate 30b[10b]) within competent quafiz framework grains. It is also
common to observe illite intergrown with kaolin after the dissolution of feldspars
(Plate 30c).
Plate (30e) illustrates a graphic textured granite that has had the intergrown feldspar
component totally altered to illite. Plate (30f) is representative of most volcanic rock
fragments in that a high proportion of the original glassy groundmass of these rock
fragments has been illitised (Plate 30f[4h]) along with feldspar phenocrysts (Plate
30f[11e]) and spherulites. Illitised clasts/feldspar grains account for approximately
9% of the total amount of clay observed in the Merrimelia Formation (Fig. 6.2a).
The illitisation of labile components is primarily a result of the smectite/illite
transformation. The dominant illite morphology observed associated with altered
labile components are boxwork in nature. Plate (21b) is a typical example of boxwork
illite after rock fragment replacement.
b) Grain Coating Clay
Thin grain coating illite (Plate 31b) is a rare feature of proglacial sediments (Figs. 6.2a
e. 6.4d). Clay coatings are either detrital or have formed at the near surface via the
infiltration of clays into newly buried sediments via glacial meltwater. Flowever, in
Merrirnelia sediments textural evidence is somewhat ambiguous suggesting that the
emplacement of grain coating illite may occur by both detrital and authigenic
processes.
An examination of grain contact zones in this sandstone (Plafe 299) suggests that the
clay rims observed in glacio-aeolian sandstones are not entirely a depositional
feature, but may have also formed during burial diagenesis. Plate 29g[5i] illustrates a
grain contact area that has no grain-coating illite which suggests that the clay coating
around these two framework grains formed after deposition as clay had not
encompassed the quartz grains prior to burial.
267

Compovn¡u
A) Photomicrogrøph - Merrimelia #L (2946.93m) (Fluoro x 20). Feldspar grøin exhibiting
illitisation along cleaaage planes.
B) Photomiuogrøph - Menimeliø #1 (2946.93m) (Reflected Light x 20). Sqme scene as
aboae detøiling the illite filled grain fractures in reJlected light.
C) Photomicrograph - Durhøm Downs #7 (2L86:63m) (Fluorc x 20). Close up aiern of
two contpletely altered feldspar grains. The dark regions [6e] are kaolin booklets, the
y ellow / gr een regions r epr es ent illit e.
D) Photomicrogrøph - Gidgeølpø #1 (2759.40m) (Fluoro x 70). Contpletely illitised rock
f'agments [11c] zahich høae been ølmost coalesced with the surrounding illite møtrix [1.0e].
E) Photomicrogrøph - Tirtøutørrø #8 (294L.37m) (Fluoro x L0). Close up of a graphic
textured granite rock fragnrcnt illustrøting the presence of illite (after feldspør) in between
quartz growths,
F) Photomicrogrøph - Tingø Tingønø #L (2094.39m) (Fluoro x L0). Close up aiew of ø
rlryodøcite, illustrating the partial illitisation of the groundmass [3h] ønd feldspar phenocrysts
[1.1e].
Authigenic Minerals: Illitisation of Rock Fragments
PLATE 30
268

Plate 30
J j J
i
h
g
I I
h
ob
h
oÞ
f f fe
d
c
b
a
e
d
c
b
a
e
d
b
a
t2 J 4 5 6 7 8 9 10 11 t2 T3 t4 15 1 2 J 4 5 6 7 8 9 10 11 12 t3 14 15 I 2 3 4 5 6 1 8 9 10 l1 t2t3r4 15
A c E
.l J J
i
h
ûÞ
fe
d
c
b
i
h
ûÞ
fe
d
c
b
I
a
h
ûb
fe
d
c
b
a a
I 5 7 910111213t415 r23456 7 r 2 3 4 5 6 7 8 9 10 11 r2t3t4 15
D
100 ¡rm 100 pm 250 pmf-r
100 pm 500 pm 250 pmt-I
B2 3 4 6 8 8 9 10 l1 12 13 I4 15
F
EXPDEV 072 N

Compowevr
If the quartz grains were coated by clay prior to burial illite would be expected
between the contacting quartz grains. Wilson (1992) agreed stating that inherited
grain-rimming clays enclose framework grains, leaving no clay free regions even
when in contact with other framework grains (Fig. 6.21). It would apPear then that
many of the illite-coated framework grains have been subject to authigenic
emplacement (Plate 29 gl7 e)).
In contrast, Plate (29gl7i]) indicates that a high proportion of grain contacts are lined
by illite, suggesting that clay in these contacts was incorporated prior to burial.
Wilson and Pittman, (19V7) explain that detrital sand grains during compaction may
rotate (especially rounded aeolian grains) which causes pore lining clays formed
during earlier stages of diagenesis to be shifted to points of grain to grain contact.
This process is also likely to have occurred within glacio-aeolian sandstones at the
Merrimelia Field.
It is clear that evidence for both detrital and diagenetic formation of grain-coating
clay can be observed in these sediments. Some clay may be deposited by infiltration
through porous sands. In this case clay will form on all surfaces but will be absent
from grain contact zones. Altematively illite may from solution during burial.
Thus, âs the glacio-aeolian sandstones are buried and the sand grains settle a mosaic
of clay-filled and clay-free contacts zones is observed throughout the sandstone (Plate
2es)'
Although different in emplacement, both detrital and authigenic clay rims share the
same illite texture (flame boxwork) (Plate 31a[7c]). This morphology gives an
indication of the original grain coating type.
Âs mentioned previously, the "flame boxwork" illite texture (illustrated in Plate 31a),
is characteristic of smectite clay (Keller et ø1., 1986). During burial, these smectitic
grain coats were almost entirely transformed to illite, however the original smectitic
textures of the grain coating clay was retained (illite pseudomorphed smectite) (Plate
31a).
In thin section, (Plate 31b), grain coating illite (Plate 31a[7i]) occurs commonly in
quartz-quartz contacts (Ptate 31a[8h]).
270

amrclNrc Co¡utpo¡trwt
A) SEM photomicrogrøph - Moorøri #3 (2893.28m). SyntøxiøI quørtz cement
surrounding quørtz grain. The quørtz grøin høs been remoaed rertealing øn illite clay rim [3hl
of boxwork illite nnrphology and a pore spøce that is filled with siderite [8c], druse quartz
[7h], boxwork [11e] and filantentous illite [11e]. Note the cogenetic formøtion of kaolin
booklets and quartz cement [1.2b].
B) Photomicrogrøph - Yønpurrø #1. (2777.59m) (Cross nicols x 5). Close up aiezu of illite
cløy rims nurking the detrital edge of framework quartz grøins [691. Quørtz cement
surrounds a snnll shøle rock fragnrcnt in the middle of the field of aiew.
Authigenic Minerals: Relationship Between Illite Clay Rims and
Syntaxial Quartz Cement
PTATE 3Í.
271

Plate 3l
A
h
e
d
c
b
a
2 4 6 7 8 9 13 14 15
B
100 pmt-
-) 5 10 1l l2
EXPDEV 076 T

Compoxevr
As mentioned previously, the "flame boxwork" illite texture (illustrated in Plate 31a),
is characteristic of smectite clay (Keller et al., 1986). During burial, these smectitic
grain coats were almost entirely transformed to illite, however the original smectitic
textures of the grain coating clay was retained (illite psuedomorphed smectite) (Plate
31a).
In thin section, (Plate 31b), grain coating illite (Plate 31a[7i]) occurs commonly inquartz-qtrartz contacts (Plate 31a[8h]). In these instances, qualtz overgrowths prevent
pore fluid contact with grain coating clay, preventing the neoformation of illite as a
grain coating clay (Plate 31a). This indicates that illite observed around framework
grains, where syntaxial quartz overgrowths engulf the illite rim (Plate 31a), have
formed without the contact of pore fluids in a closed system via the transformation of
smectite to illite.
Clay morphology and cement stratigraphy both indicate that grain coating illite inMerrimelia sedirnents formed via the transformation of smectite to illite.
INHER¡TED CLAY RIMS
Occur atGrain Contacts
Highly Variable Tlrickness
Thicker inDepressions
Less Extensive onCoarser Grains
(greñlcr to0ndlng.llmln.te. .mb.Ym.nl.)
Figure 6.21 ldentificøtion of inherited clay rims (After Wilson, 1992).
c) Formation of Illite Coatings in Glacio-Aeolian Sandstones
Grain coating illite (Plate 29g & Fig 6.20[8c]) is common in the economically
significant glacio-aeolian sandstones of the Merri¡nelia Field. These clay rims have
great effect on the reservoir quality of these sediments and as such the authigenesis is
described here in detail.
273

Aurancrxtc Compovnvr
dominate. The silt and clay is entrained by the wind and deposited where wind
intensity diminishes (Tucker, 1991). Thus, for clay rims to form around framework
grains, depositional conditions have to be low in energy. Seemann (1982), suggested
that air born dust was introduced into the Rotliegend aeolian sandstone (Southern
Permian Basin, North Sea) shortly after or during the initial deposition of the
sandstone accounting for the thin clay films observed. These conditions are likely to
have existed during the deposition of Merrimelia glacio-aeolian sandstones.
During burial diagenesis, the local development of clay rims may have acted as
crystallisation sites for new clay minerals or the transformation of existing ones
(Seemann, 1982).In the Merrimelia glacio-aeolian realm, howevet, other depositional
processes may have contributed to the formation of grain-coating clay. Dissipation
structures, for example, as described by Fryberger (1993), closely resemble the wavy
laminations found in Merrimelia glacio-aeolian sandstones (Chaney, 1998). These
features form from the infiltration of meltwater from snow and ice into the aeolian
sediments, locally concentrating clay and thus coating aeolian framework grains. This
implies that these sediments have undergone a small degree of fluvial reworking,
which is likely as the sediments that exhibit dissipation structures are interdunal in
nature. It seems probable then that interdunal or dune sediments that have been
fluvially reworked (as opposed to aerially reworked) will have detrital clay rims
surrounding framework grains.
Walker and Crone (1974) concluded that desert alluvium which is essentially clay-
free when deposited becomes clay-rich due to the mechanical infiltration from
ephemeral stream flows. Dutton, (1993) agreed, stating that tangentially orientated
illite flakes (such as those observed in glacio-aeolian sandstones - Plate 21c) are
authigenic, having entered the sandstones by mechanical infiltration and were
subsequently recrystallised during burial dragenesrs.
Compositional and texfural observations (see above discussion on grain contacts)
suggest that both infiltration (authigenic) and saltation (detrital) process have
emplaced clay rims in glacio-aeolian sediments where the clay rims have then been
illitised during later burial, forming nucleation sites for sparse neoformed
filamentous illite growth.
Dune sediments, like interdune and fluvially reworked aeolian sediments, show thin
illite rims. The formation of illite rims in dune sandstones differ from the "wetter",
muddier interdune and fluvially reworked dune sediments. The constant collisions of
274

urrrrclNrc Compovexr
quartz grains as a result of traction and saltation processes produces micro-pitting(PIate 22d[7f]), grain frosting and rock flour (clay and crushed quartz). The regions ofmicro-pitting provide the most favourable nucleation sites for illite growth (Small ef
a1.,1992). This fact, coupled with a local supply of cations (alteration of feldspars and
rock flour), have provided favourable conditions for the areally extensive and
pervasive growth of grain-coating illite in glacio-aeolian dune sandstones.
d) Formation of Flame Æilamentous lllite Textures
The formation of flame/filamentous illite textures appears to form by the progressive
illitisation and pseudomorphing of the original smectitic/illite clay structures. The
resulting illite clay retains the distinctive smectitic boxwork morphology (Ahn and
Peacor, 1986) (Fig. 6.22a). The smectitic textured illite clay structure then becomes the
nucleation site for subsequent filamentous illite growth (Fig. 6.22b) in doing so forms
a host of textures, depending on the original smectite clay and it's host grain
morphology.
e) Formation of Honeycomb/Filamentous Textures
Honeycomb,/filamentous illite textures were rarely observed. It is likely that this illitetexture formed as local reactants were liberated from the destruction of kaolin and
associated unstable feldspar grains (Bjørlykke, 1983), where the resulting illiteexhibits a distinctive honeycomb texture (Plate 22c). This illite formation mechanism
accounts for firstly the dissolution of feldspar and kaolin and secondly the
preservation of illite. Similar honeycomb textures and modes of formation have been
described in the Rotliegend aeolian sandstones of the southern Permian Basin (North
Sea) by Rossel (1982).
Like the flame boxwork illite texture, the honeycomb illite substrate acts as nucleation
sites for later filamentous illite growth. It can be seen in plate 22c [Inset] that regions
of filamentous illite not only emanate from the scalloped edges of the honeycomb
substrate but also form regions of purely fibrous growth (Plate 22c[Inset]). These
spatial relationships suggest that both honeycomb and flame boxwork illitemorphologies predates the extensive filamentous illite morphology.
v) Neoformation of Illite in Merrimelia Sediments
Neoformed illite is pervasive throughout porous sandstone lithologies in the
Merrimelia Formation. Throughout the South Australian and Queensland sectors of
the Cooper Basin, filamentous illite morphologies dominate (Plate 21a).
275

AtmlceNtc Co¡øpoNeNr
ACLOSED SYSTEM< 4 Micron Fraction
(Early lllite)
Argillaceous Sediments
BOPEN SYSTEM< 2 Micron Fraction
(Late lllite)
Arenaceous Sediments1
2
3
4
5
6
7
I
I
10
11
12
l3
14
ABCDEFGHIJKLMNOPO
EXPDEVOT2 O
No CirculatingPore Fluids
CirculatingPore Fluids
Qz.
K+Water F¡lm
Qz.
si+,K+, Al+, Fe2+
Boxwork lll¡te
Qz.
Filamentous
lll¡te
Qz
) -ìlllite +
Qz Cement
KaolinBooklets
pore space
ñM.occluding primary
Squeezed ductile
Kaolin Booklets
surrounded' by lllite '.
. Kaolin.'Booklets' with Oz Cement)
Qz.
Smectile / lllileTransformal¡on
Dom¡nales
Figure 6.22 A) Cørtoon of "closed systent" diagenesis in Merrimelia sedinrcnts where the
transþrmation of snxectite to illite is the dominønt diøgenetic reaction. B) Cørtoon of an "open
system" where the neofonnøtion of illite is the donúnant diagenetic reøction.
Locally however, boxwork and filamentous/boxwork textures can dominate where
associated unstable rock fragments and feldspar proportions are high (Plate 21b).
The amount of neoformed illite, on average, in porous Merrimelia lithologies ranges
between 4%-22%. Present day proportions of micas and feldspar grains, on average,
account for approximately 3"/" of the total detrital component but relict feldspar/mica
grains as a proportion of the total rock volume account for <1.5"/". However, the
original volume of feldspars in Merrimelia sediments was riruch greater than can now
be observed (kaolin + kaolinised clasts) (Frg. 6.2a).It is likely that the alteration of
these feldspar grains not only formed kaolin but, provided cations for illite formation.
The volume of kaolin and kaolinised clasts in Figure 6.2a however, suggests that
there is not enough cations released from the alteration of original feldspars to
276

urHI G EN r c C o up o ¡rt n¡rrr
account for the volume of neoformed illite currently observed. In general, the
amounts of authigenic pore-filling illite, relict feldspar/micas grains (1% of total
framework) and kaolin do not match.
Another possible source of fluids capable of precipitating the large volumes of
neoformed illite is the expulsion of water from adjacent fine grained argillaceous
lithologies. The volume of argillaceous rock in the Merrimelia Formation isapproximately double that of porous rock. The amount of water and cations being
expelled from argillaceous would therefore be more than enough to account for the
illite observed in adjacent interbedded porous lithologies. Circumstantial evidence
would suggest that this is the most plausible source of illite cations for neoformation.
This infers that cations for illite diagenesis in porous lithologies are being sourced
distally (allochthanous fluids), implying that within porous lithologies, illite is
forming in an open system. Locally however, pore-filling illite may also form adjacent
to dissolving feldspar and mica grains.
Neoformation of illite in porous Merrimelia sediments is similar to the mechanism
proposed by Lee et øL (1989) where newer illite replaces coarser grained, pre-existing
illite in a continuous process. The illite substrate is flame-like in shape (Fig. 6.23a)
with the younger later-formed illite becoming more filamentous. It is postulated inporous Merrimelia lithologies that neoformed illite forms on an illite substrate that
pseudomorphs smectite related to the transformation process occurring inargillaceous sediments. The later filamentous illite is interpreted to have been
precipitated from circulating pore waters (neoformation) following the almost
complete transformation of smectite to illite (Burley and Flisch, 1989) (Fig. 6.23b &x
6.23c).
The sequential development of pore-filling clay in arenaceous Merrimelia sediments
is a strong argument in favour of an open diagenetic system. Almon and Davies,
(7979) describe similar pore-filling clays in the Muddy Sandstone of the Powder River
Basin (Wyoming and Montana) and concluded that the ions necessary for the
development of late stage clay would not have arisen from local detrital grains as this
material would have been incorporated into earlier diagenetic phases. It is proposed
that the same is true for the diagenetic processes in Merrimelia sediments, where late
stage diagenetic alterations have formed in an open system, in response to changing
thermal conditions and pore water chemistry.
277

Early stage -Q
Middle stage -@
Late stage -@
A
t4
t2
$'oEsol6xi'4c,
0
-2
À Mudrock l-S Clay
Â, lllite-rich MudrockClaY ^^ ^̂êAA
+- -0.9j8*10 mollg
0 2 4 6 I l0 12 14 16 18 20
40K (xle-8 mol/g)B
cEXPDEV 072 V
Figure 6.23 A) Cørtoon of illite growth støges (From Lee et aL,1989). B) Smectite to illitetraisþrmation and subæquent neoþrmøtion of illite (From Burley øndF\isch, 1989). C) Moorari#3 Q893.28m) SEM photomiuograph of boxwork morphology substrate (Sfl transþrmation)znith protruding, neoþrmed, flamentous illite.

urHtGENrc CompoNeNr
In summary, filamentous pore-filling illite forms in open pores from circulating pore
fluids sourced from relatively proximal argillaceous lithologies.
vi) Illitisation of KaolinThe illitisation of kaolin (Plate 32al7cl) (Bjørlykke, 1983; Srodon and Erberl, 1987;
Small ¿f øL,1992) is another, albeit minor, diagenetic process leading to the formation
of illite in Merrimelia sediments. This adjustment occurs at a late diagenetic stage,
where kaolin becomes unstable with respect to illite and burial temperatures exceed
1000C (Aja et al., 1991; Sass ¿f ø1., 1987; Prothero and Schwab, 1996) and proceeds
according to equation 10 (Bjørlykke, 1983).
3AIrSi,O,(OH)o+ 2KKaolin
+ 2KAl,Si.Ot0(OH),+ 2Il + 3H,O Equation 10
Illite
Huang et aL (1986) suggested that the illitisation of kaolinite may be triggered by a
decreased rate of acidic fluid influx during burial diagenesis. Small ef al. (7992)
experimentally produced psuedomorphed illite after kaolin in very acidic solutions at
400"C. Foscolos (1990), on the other hand, stated that in conditions where potassium
concentrations are elevated, illitisation of kaolin will proceed at 1000C. This author
also stated that if the concentration of potassium is halved the temperature of
illitisation is raised to 2000C.
Illitisation of kaolin in Merrimelia sediments is not commonly observed even though
basin temperatures are considered to be abnormally high (BHT +200nC) (Schulz-
Rojahn, 1991). The lack of illitised kaolin may suggest that higher temperatures may
be needed for kaolin to illitise in Merrimelia sediments.
279

ur¿arclNtc Compovnvr
A) SEM Photomicrograph - Dørølingie #7 (2787.85m). Knolin filled pore with
subordinate filamentous neoþrnred illite [7c] in an arenøceous Merrinteliø sedinrcnt. Note:
this lithology is similar to Tirrøwarra sandstones.
B) SEM Photomicrogrøph - Tinøzuatrat #3 (2988.86m). Sucrosic, stacked kaolin booklets
[Inset] Locqlised lllitisation of køolin booklets.
C) Photomicrogrøph - Merrimeliø #1 (2946.80m) (Plane polørised x 5). Dissolution of a
feldspar grøin within the glacio-aeolian sedintentary pile. The destruction of such unstable
framezaork comp.onents fornrs secondary pore space.
D) Photomicrogrøph - Tirrøzaørrø #11 (3081.55m) (PIøne polarised x 5). Alteration of
feldspør grain to køolin and subsequent conrpaction squeezing.
E) BSE Imøge - Kenny #1 (2945.80m). 52 siderite (outer edge of siderite pøtch) exhibits a
serrated edge indicatiae of dissolution. The øcidic waters that haae etched the 52 siderite haae,
in this cøse, induced locally the fornution of køolin booklets.
Diagenetic Reactions: Illitisation of Kaolin/Feldspar
Dissolution/Cogenetic Siderite/Kaolin
PLATE,32
280

h
45
4s6
4
Plate 32
B
r3 l4
234 50t
de
h
p
d
c
b
a
8 910 11 t212
12 1
56
89
'l
910
1l 12
() 10 11
6'7
h
A
c
l5
t4
13
t2
l1
10
o
d
c
t)
I1
6
5
a4
3
23
10 15
3
2
h a b c h
D
f
e
d
c
b
a
8
E
I
^'Ì
1
¿
4..I
+,\\.r'
Iç-1
It
t.'
r-
lì, rl,! ' I L! rw rri r,
"' '-'t7 7''t,t
(
100 pm ,
5OO pm
IEFI tooor5.ùkur7o OOY12
EXPDEV 076 V

Compowexr
This may indicate that Merrimelia pore solutions are not acidic enough and need
increasingly higher temperatures for the kaolin/illite reaction to proceed.
Altematively the lack of illitised kaolin maybe related to a lack of K. ions and notpore water acidity. In this scenario the majority of K* ions are consumed by the
formation of illite, where increasing illite crystallinity consumes more K- ions. There
is thus little Kt left to supply the conversion of kaolin to illite. Hence the lower
concentrations of K. necessitate higher temperatures to transform kaolin to illite. Such
high temperatures may only be reached in a limited number of areas in the
Patchawarra Trough. This latter scenario is more consistent with petrographic
observations.
Srodon and Eberl (7987) cite numerous studies conceming the illitisation of kaolinconcluding, "that kaolinite is illitised completely before smectite is completely
illitised". The data in this study do not support this hypothesis. It has been
established that mixed layered clays in Merrimelia sediments have been transformed
almost to completion and only the partial illitisation of kaolin is observed in SEM
images (Plate 32b[Inset]). Flence, when observed, the illitisation of kaolin reflects a
zone that has K--rich pore waters coupled with anomalously high basin temperatures
(>13ooc).
vii) llite Authigenesis in Merrimelia Sediments: Open or Closed Diagenesis?
Considering the Merrimelia Formation as a whole, the unit is dominantly argillaceous
with an upper section that is more porous and interfingers with the 'clean' Tirrawarra
Sandstone. Hugget (7996) considered a similar sequence of rocks and observed illiteformation mechanisms that mirror illite formation processes in the MTGC. For
example, Hugget (7996) observed that lath shaped (filamentous) authigenic illite notonly precipitated from solution (neoformation) in sandstones (upper MerrimeliaFormation and Tirrawarra Sandstone) but also formed simultaneously in adjacent,
low permeability, low porosity mudrocks (M2 and M3 strata).
Chamely (1989) and Pye and Krinsley (1986) suggested, however that intermediate
situations may exist where there is synchronous growth of illite from the
transformation of smectite (closed system) and of neoformed illite (open system)
within adjacent pore spaces. These observations indicate that illite formationprocesses specific to argillaceous and arenaceous sediments may theoretically
proceed with increasing depth simultaneously in adjacent sandy and shaley rocks.
Chamely (1989) stated further that transitional illite formation stages or combinations
of argillaceous and arenaceous illite diagenesis mechanisms occur between shale-
282

rrrHl GEN r c C o¡rrp ox evr
dominated and sand-dominated rocks, locally depending on the dominant rock
lithology. Accordingly, a sequence of strata with closely stacked inter-fingering shales
and sandstones would be expected to exhibit a complex interplay of simultaneous
illite formation processes.
The contemporaneous formation of illite from open and closed systems in adjacent
argillaceous and arenaceous sediments, is applicable to observed illite formation
scenarios within upper (M1) Merrimelia lithologies. At depth (M2 and M3), however,
smectite to illite transformation reactions dominate.
D) Key Findings
Illite in Merrimelia sediments forms via three differing mechanisms:
1) Smectite to illite 2) Neoformation of illite,transformation, 3) Illitisation of kaolin.
Illite in the Merrimelia Formation forms in the following circumstances:
As a grain coating clay via the transformation of smectite to illite.
From the partial or total replacement of unstable feldspars and/ or rock fragments
via the transformation of smectite to illite.
From the transformation of detrital smectite matrix to illite.
From solution in arenaceous sediments (neoformation).
From the illitisation of kaolin.
1)
2)
3)
4)
s)
6.3.4.3.2 Segregation of Illite and KaolinA) Key Observation
Illite and kaolinite clays are segregated within the MTGC where illite dominates
terminoglacial Merrimelia facies and kaolin Tirrawarra.
B) Discussion
Organic maturation (organic acids) and kaolin development have been linked bymany workers (Dixon et aI., 7992; Reed and Hajash, 7992 and Surdam et al., 1989).
Huang et øL (7986), through experimental analysis, modelled the formation of both
illite and kaolin waters containing organic acids. The results suggested that kaolin
formed preferentially in pore spaces where kaolin was already present and where
there was constant pore water influx. Conversely, these authors suggested that the
most favourable conditions for the neoformation of illite is a rapid release of Al and Si
into an acidic solution within a low permeability sediment. Interestingly these
authors go on to state that as pore water influx slowed, significant authigenic illite
283

GENrc Co¡øpo¡tnvt
formed. Thus they concluded that illitisation during deep burial could be caused bythe reduced influx of acid fluids in a poorly permeable sediment.
Acidic fluid influx in Tirrawarra sediments is constantly replenished by organic acids
percolating through the open pore system, forming kaolin preferentially, as kaolin is
stable at this temperature range (>100t) (Foscolos, 1990; Reed and Hajast¡ 1992).The
Merrimelia Formation, conversely, is relatively impermeable and hotter (see Chapter
Eight). The same acidic fluids will inconsistently penetrate Merrimelia sediments and
at a much slower rate; a product of poorer permeability. The resulting clay
precipitation in Merrimelia sediments, according to the mechanisms described byHuang et aL (7986). is more likely to be illitic than kaolinitic. These processes may
partially explain the enrichment of kaolin in Tirrawarra sediments and illite inMerrimelia strata.
In addition to these controls, it is likely also that the lack of illitic matrix in Tirrawarra
sedirnents promotes the formation of kaolin rather than illite. Conversely the
dominance of matrix in Merrimelia sediments will promote illite and not kaolin
formation.
Small amounts of illite are observed in Tirrawarra sediments. In this scenario,
Tirrawarra pore spaces become filled with kaolin booklets decreasing the water/rockratio. Once the water/rock ratio decreases enough, the amount of kaolin will cease
precipitating in the pores and, if reactant supply remains constant, illite will begin to
precipitate preferentially (Plate 32a). This follows the model of Hutcheon (1982) who
suggested that the rate of fluid flow is critical to clay formation within arenaceous
sediments. kr addition, Small et ø1. (7992) stated that illite generally nucleates from
detrital grain surfaces and not syntaxial quartz cement. Therefore little illite will be
observed in quartz-cemented pores in the Tirrawarra Sandstone.
C) Key Findings
The segregation of illite and kaolin within the MTGC is controlled by:
1) Lack of illitic matrix in Tirrawarra sediments.
2) Illite tends to form on detrital surfaces and not on authigenic quartz.
3) Illite in the Cooper Basin forms in sediments where temperatures are elevated
and muddy matrices and low fluid flow characteristics (low permeability)
predominate. Terminoglacial Merrimelia facies (the majority of the Merrimelia
Formation) display these characteristics; Tirrawarra sediments do not.
284

Co¡øpoNevr
6.3.4.3.3 Feldspar DissolutionA) Key Observations
The dissolution of feldspar is an important diagenetic process in Merrimelia
sediments, particularly so in the aeolian sandstones of the Merrimelia Field (Plate
32c). As discussed earlier, this process provides silica for quartz overgrowths and at
the same time produces kaolin and illite (Equations 8 & 11).
B) Discussion
Potential controls on this reaction are numerous. Chamely (7989) stated that the
dissolution of feldspars within sandstones is favoured by acidic conditions and the
presence of relict organic matter. Surdam et ø1. (7984) demonstrated that the mobilityof aluminium ions in solution is increased when transported by organic complexes
within organic acids. That is to say the dissolution of feldspars is controlled by the
mobility of Al. ions, a mobility that is normally low, but in the presence of carboxylic
acids, increases to such a level that extensive replacement of feldspar framework
grains and carbonate cements will occur. Plate 22e illustrates the dissolution of
feldspar grains under SEM. The most obvious product in this image is the
development of fibrous illite (Plate 22e[Inset]). This process proceeds according to the
following equation:
KølSi,.O,
K-Feldspar
KAl3SijOs+ 2SiOr+ HrO
Illite Quartz
Equation 11
Variation of the fluid/rock ratio and flow rate has a significant effect on the
mechanics of feldspar dissolution and subsequent illite formation (Huang et a1.,1986).
The concentration of dissolved CO, dictates whether feldspar grains are dissolved or
preserved in circulating pore waters. Elevated COrin pore waters encourages feldspar
dissolution. CO, in pore waters can increase when organically-derived maturation
acids increase or with the percolation of acidic meteoric waters. In Merrimelia
sediments both processes potentially operated but at different times and on differing
sediments.
Surdam et øL (7984) stated that even relatively low concentrations of carboxylic acids
will increase the rate of feldspar dissolution. The Merrimelia Formation in general
and terminoglacial sediments in particular, are devoid of organic material (Boreham
and Hill, 1998), having been deposited in conditions were little organic matter would
285

rrrHrc EN r c C o ¡rtp oN e¡tr
have survived. Conversely the lower braid plain on which proglacial Merrimelia and
Tirrawarra sediments were deposited (FiS. 4.5) shows evidence of marsh
development (Plate 7e). Organic matter was therefore exclusively developed in upperMerrimelia (proglacial) and Tirrawarra sediments (Fig. 4.5). Surdam et aL (7989)
stated that for organic acid dissolution and porosity preservation to be influential ininorganic diagenesis, close proximity to organic-rich rocks is necessary. The
Tirrawarra Sandstone is proximal to organic matter, whereas Merrimelia sediments
are not. This suggests that the development of organic acids may have been confined
to upper Merrimelia (M1) and Tirrawarra (T1) sediments with little percolation ofearly diagenetic acidic pore water down through the entire Merrimelia section.
For feldspar grains to be dissolved by organic acids, organic acids have to be
produced by maturation. Surdam et al. (1989) concluded that this process occurs
between 80oC and 7200C, well above the temperature of burial of upper Merrimeliasediments. Thus organic acid production in upper Merrimelia and Tirrawarrasedirnents would have been a late diagenetic event as the temperature of burialduring early diagenesis was not sufficient to produce organic acids.
Figure 6.24 suggests that in the basal parts of the Merrirnelia Formation (M2 & M3
[3000m-3500m]), feldspar proportions are elevated when compared with M1 and
Tirrawarra (T1) sediments. This indicates that either 1) feldspar proportions have
varied through time or that 2) feldspars have been preferentially destroyed in T1 and
M1 sediments when compared to M2 and M3 sediments.
Provenance data suggests that feldspar grains have been mainly sourced fromgreywackes of the Warburton Basin and Big Lake Suite granodiorites. Extemal
sources provided minimal feldspar detritus. It is therefore reasonable to assume thatthe input of feldspar detritus into the MTGC has been relatively constant with no
wide ranging fluctuations between feldspar input into basal M2lM3 and M7/T7sediments.
Cannibalisation of earlier formed sediments would have been the most likely source
of feldspars in later formed Cooper Basin sediments.
286
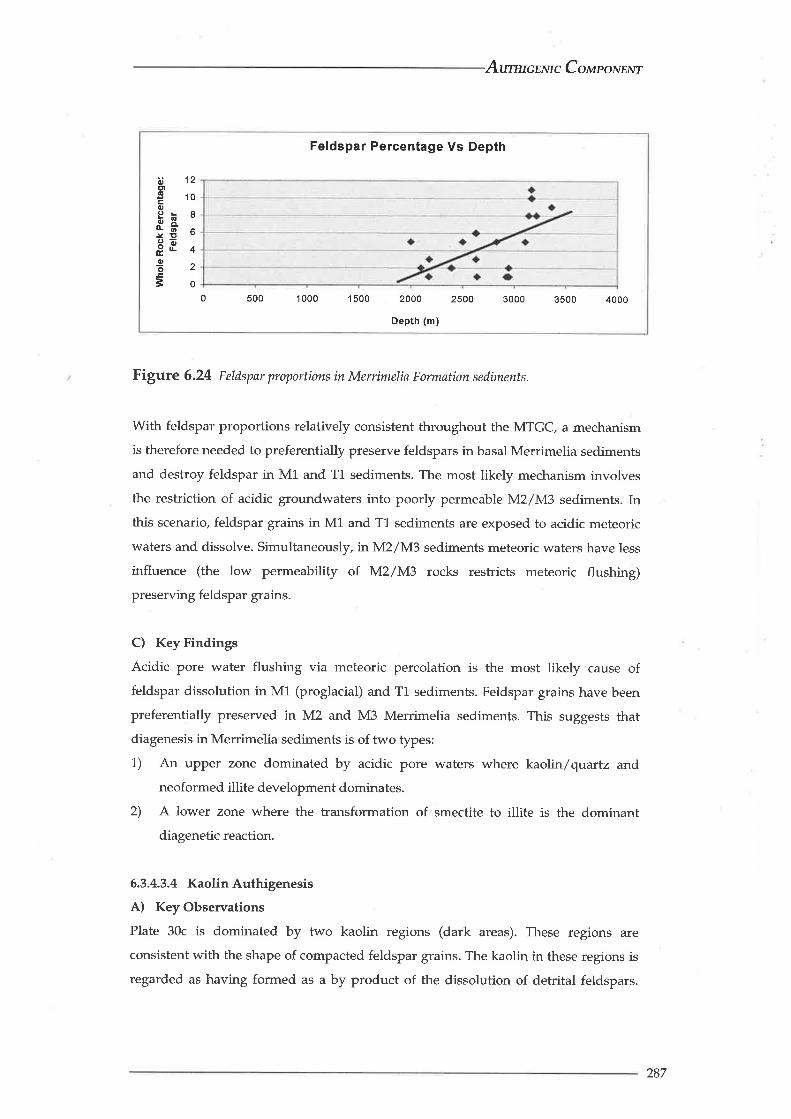
Atmttct¡ttc ComporurNr
Feldspar Percentage Vs Depth
ö12ctt
Ë,0oË! I!tt9õür! 4Ioz
=o 0 500 1000 1500 2000 2500 3000 3500 4000
Dêpth (m)
Figure 6.24 Feldspar proportions in Merrinrclia Fornntion sediments.
With feldspar proportions relatively consistent throughout the MTGC, a mechanism
is therefore needed to preferentially preserve feldspars in basal Merrimelia sediments
and destroy feldspar in Ml and T1 sediments. The most likely mechanism involves
the restriction of acidic groundwaters into poorly permeable M2/M3 sediments. Inthis scenario, feldspar grains in M1 and T1 sediments are exposed to acidic meteoric
waters and dissolve. Simultaneously, in M2/M3 sediments meteoric waters have less
influence (the low permeability of M2/M3 rocks restricts meteoric flushing)
preserving feldspar grains.
C) Key Findings
Acidic pore water flushing via meteoric percolation is the most likely cause offeldspar dissolution in M1 (proglacial) and T1 sediments. Feldspar grains have been
preferentially preserved in M2 and M3 Merrimelia sediments. This suggests that
diagenesis in Merrimelia sediments is of two types:
1) An upper zone dominated by acidic pore waters where kaolin/quartz and
neoformed illite development dominates.
2) A lower zone where the transformation of smectite to illite is the dominantdiagenetic reaction.
6.3.4.3.4 Kaolin Authigenesis
A) Key Observations
Plate 30c is dominated by two kaolin regions (dark areas). These regions are
consistent with the shape of compacted feldspar grains. The kaolin in these regions is
regarded as having formed as a by product of the dissolution of detrital feldspars.
287

-
Aarrnr c EN r c Co¡,rpo¡vr¡rtr
Hence feldspar dissolution and kaolinite formation in Merrimelia sediments are
connected.
B) Discussion
The acidification of pore waters, whether it is by organic maturation or meteoric flushis generally regarded as the key to the formation of kaolin (Bjørlykke and Brendsal,
1986; Dutta, 7992). Rezaee (1996) agreed establishing that meteoric flushing is the
most likely cause of early feldspar dissolution (as opposed to organic acids) inTirrawarra (T1) sediments.
Figure 6.25 illustrates that there is a decrease in kaolin proportions with depth where
kaolin is found predominantly in proglacial sediments (Fig. 6.26).
t00
.=õtrlu
l0
0.tt800 2000 2200 2400 2600 2800 3000 3200 3400 3600
Depth (m)
EXPDEV 076 R
sé
* +
s 9S+& {'
ss
Figure 6.25 Scattergraru of kaolin proportion aersus depth.
These data support the hypothesis that kaolin forms preferentially in upperMerrimelia/Tirrawarra sediments coinciding with an absence of feldspars. F{ence,
like feldpsar dissolution, kaolin development appears to preferentially occur in M1
(proglacial sediments) (Figure 6.26) as the necessary meteoric water for kaolinformation in M2 and M3 sediments is restricted by low permeabilities (terminoglacial
sediments). Rezaee (1996) also concluded that the absence of feldspars and
abundance of kaolin in Tirrawarra sediments is an indication that kaolin has been
derived from feldspar alteration.
288

^¡ödLl¡on. F.chûD.
BS
DBSDFDFSoGLD'fsDUFBl¡LtsztoKHt¡UBtsFRDSACG'foFTTMDtsz
&ck Si¡ñpO.lÈ [email protected] FlilD.l¡ For6Dsp GleÞhcúdn.MÈTop6A.olhn DwFuYhl B¡rTopFuYhl Süden.Frwn ShoE Zon!lturdt¡mlûtd. Hol.Loñdùdlnl B.rthsudtl 8¡¡L¡cuffi. Shon Zon.Rdd Dl.rúcdbSub.{ud. Cùünrl GmlTmlñothd¡l OuFh F¡nTmlnolhrhi Sub.qu$rTumd I'ld¡th D!ÞotrL¡cut*. ShoElln.
ß)oIIJI
?(
\ \\b \\oOo. ô\\r(!^o^ ço o\\oq,
\-s\\\ss\ ks\rstrs\
\rs\sr\1a:EXPDEV 078 S
Co¡æo¡vrnrr
In addition, the co-genetic nature of kaolin and quartz (Plate 26b) indicates that the
reaction described by Equation 8, is the dominant kaolin forming process in
Merrimelia sediments.
Figure 6.26 Rønked cumulatiae histogram of kaolin proportions in Merrimelia facies.
Note: terminogløcial nre ksolin poor with respect to proglacial føcies. The exception being
gløcio-øeolinn dunal søndstones (DU) which form in the progløciøl setting but are illite not
kaolin-rich.
C) Key FindingKaolin formation is associated with altered feldspars (Plate 30c [6e]), syntaxíal quartz
cement (Plate 26b[58]) and ultimately the availability of acidic pore fluids.
6.3.4.3.5 Kaolin Formation and 52 Siderite DissolutionA) Key Observation
Textural relationships between kaolin and 52 siderite gained via back scattered
electron images (Plate 32e) suggest that there is a connection between 52 dissolution
and kaolin formation.
B) Discussion
Plate (32e) illustrates a siderite patch where 51 þrightest middle phase) and 52 are
visible (zoned darker phase). The outer edges of 52 are senated and appear to be
289

Co¡¿po¡vrivr
intergrown with kaolin booklets. This suggests a relationship between 52 siderite and
kaolin, where kaolin formation is promoted locally by acidic pore waters (}{uang et al.
1986), pore waters which also etched the 52 siderite.
C) Key FindingIt is likely that pore waters containing organic acids (as opposed to acidic meteoric
waters) have been the catalyst for kaolin formation and siderite dissolution.
6.3.4.3.6 Dickite Authigenesis
A) Key Observations
1) Dickite in the Merrimelia Formation was present in only five XRD traces (Fig.
6.6c).
2) No dickite was reported by Rezaee (1996) in the Tirrawarra Sandstone in the
Tirrawarra-Fly Lake-Brolga-Moorari regron.
B) Discussion
Schulz-Rojahn (7997), describes dickite within the Patchawarra section of the
Nappamerri Trough. This author envisages dickite formation occurring within the
pore space via the action of migrating ground waters. Chamely (1989) discusses the
formation of dickite in the Sydney Basin, stating that dickite precipitated very slowlyfrom circulating pore fluids as a late stage diagenetic phase. Schulz-Rojahn (1991),
concluded similarly in Cooper Basin sediments, stating that dickite formation was a
late stage process.
The formation of dickite in the basal most Merrimelia sediments of the Patchawarra
Trough is envisaged to occur by the same processes and in the same thermal
conditions as that described by Schulz-Rojahn (1991), for dickite formation in the
Nappamerri Trough. Accordingly dickite should be observed associated with kaolin.
This does not, in general, appear to be the case. Despite this it appears reasonable to
assume/ that this clay phase, like that described by Schulz-Rojahn (1991), is a late
formed diagenetic mineral after early kaolin development.
C) Key FindingThere is insufficient data to accurately describe the formation of dickite in Merrimeliasediments. It is assumed however, that dickite formation is similar to that described
by Schulz-Rojahn (1991).
290

CoupoNewr
6.3.4.3.7 Chlorite Formation
A) Key Observations
"Translucent" chloritoid minerals (Fig. 6.6[9e]) are observed in Merrimelia sediments
almost exclusively associated with basic clasts (Fig. 6.6d), biotite dominated schist
rock fragments (Fig. 6.6e) and biotite micas (Fig. 6.6f). "Trarrslucent" chloritoid
minerals appeil to overprint later formed quartz cement and/or siderite mineral
phases.
B) Discussion
It is most likely that the majority of chloritoid minerals associated with basic rock
fragments have been inherited from the Warburton Basin and incorporated into the
Merrimelia sedimentary pile. However, it is also possible that some chloritoid
minerals in Merrimelia sediments may form from a precursor clay, by the
transformation of basic rock fragments to chlorite with increasing burial depth.
"Translucent" chloritoid minerals, unlike chloritoid minerals within mafic clasts,
appear to have been formed insitu. There are three possible mechanisms by which
"translucent "chlorite can form in Merrimelia sediments:
1) By products (Fe'. and Mg't) from the smectite/illite transformation formed
"translucent" chlorite locally (near basic rock fragments).
2) "Translucent"chlorite authigenesis occurred as the end product of the reaction
kaolin + Mg'-.
3) Formation of "translucent" chlorite occurred via the breakdown products of
mafic rock fragments containing chloritoid minerals.
Hower et ø1. (1976) suggested that, in deep burial potential sources of Fe'. and Mg'.for chloritoid development maybe released during the conversion of smectite to illite.
Ahn and Peacor (1986) confirmed this relationship by TEM utilising the Hower et al.
(1976) samples. In this model, the high Fe2* content of chlorite relative to Mg'- is a
product of the preferential loss of Fe'* with respect to Mg'. in the S/I conversion. The
ions necessary for siderite development are Mg'. and Fe'- (the same as chlorite.) The
rarity of translucent chloritoid cement with respect to siderite cement suggests that
siderite cementation uses up most of the Mg'- and Fe'. released by the S/Itransformation process. This would suggest that the S/I transformation is a minor
source of reactants for the formation of "translucent" chlorite.
291
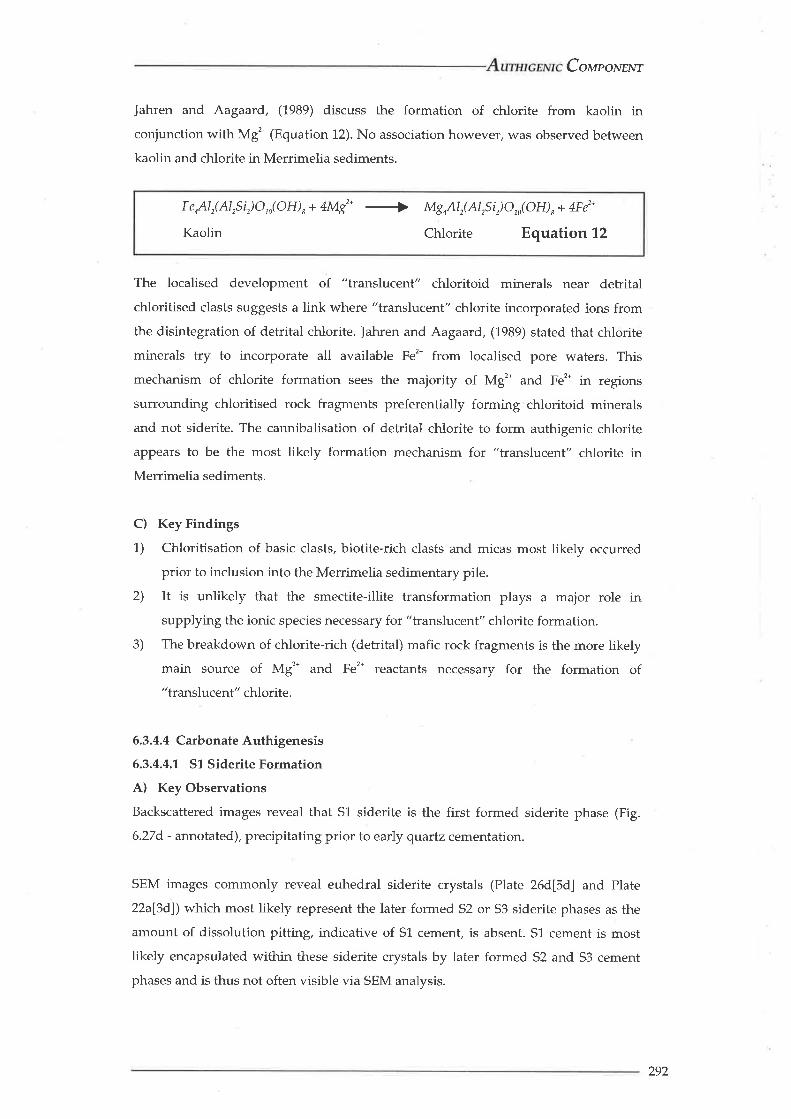
CompoNu,u
Jahren and Aagaard, (1989) discuss the formation of chlorite from kaolin inconjunction with Mg'- (Equation 12). No association however, was observed between
kaolin and chlorite in Merrimelia sediments.
Fea4lr(Al,Si,)O,0(OH),+ 4Mg'1t Mga4lr(AtrSi,)O,0(OH)s+ 4Fe2t
Kaolin Chlorite Equation 12
The localised development of "translucent" chloritoid minerals near detritalchloritised clasts suggests a link where "translucent" chlorite incorporated ions fromthe disintegration of detrital chlorite. Jahren and Aagaard, (1989) stated that chlorite
minerals try to incorporate all available Fe'. from localised pore waters. This
mechanism of chlorite formation sees the majority of Mg'. and Fe'. in regions
surrounding chloritised rock fragments preferentially forming chloritoid minerals
and not siderite. The cannibalisation of detrital chlorite to form authigenic chlorite
appears to be the most likely formation mechanism for "translucent" chlorite inMerrimelia sediments.
C) Key Findings
1) Chloritisation of basic clasts, biotite-rich clasts and micas most likely occurred
prior to inclusion into the Merrimelia sedimentary pile.
2) It is unlikely that the smectite-illite transformation plays a major role insupplying the ionic species necessary for "translucent" chlorite formation.
3) The breakdown of chlorite-rich (detrital) mafic rock fragments is the more likelymain source of Mgt. and Fe'. reactants necessary for the formation of"translucent" chlorite.
6.3.4.4 Carbonate Authigenesis
6.3.4.4.1 51 Siderite Formation
A) Key Observations
Backscattered images reveal that 51 siderite is the first formed siderite phase (Fig.
6.27d - annotated), precipitating prior to early quartz cementation.
SEM images commonly reveal euhedral siderite crystals (Plate 26d[5d] and Plate
22al3dl) which most likely represent the later formed 52 or 53 siderite phases as the
amount of dissolution pitting, indicative of 51 cement, is absent. 51 cement is most
likely encapsulated within these siderite crystals by later formed 52 and 53 cement
phases and is thus not often visible via SEM analysis.
292

Coprporurivr
B) Discussion
According to Rezaee et aL (1997) 51 siderite precipitation took place at about 300C.
This temperature of 51 siderite formation is consistent with (Bjørlykke, 1983) who
stated that low temperatures are generally needed for iron cations to be incorporated
in to the siderite crystal lattice. The low temperature of 51 siderite formation also
suggests that this carbonate cement was probably formed in near surface reducing
conditions. In this reaction, which is bacterially modified (Curtis, 1978),Fe'- and CO.'-
form an early siderite precipitate.
C) Key Finding
Observations indicate that 5L siderite in Merrimelia sediments is the earliest
carbonate precipitant, forming in conditions the same as that described by Rezaee
(1996) in the Tirrawarra Sandstone in the Tirrawarra-Fly Lake-Brolga-Moorari region.
Accordingly 51 siderite formed at burial temperatures of around 300C.
6.3.4.4.2 Dl Early Siderite DissolutionA) Key Observations
51 siderite cement in Merrimelia sediments across the Cooper Basin reveals extensive
etching (Plate 33c[8d]) indicative of a significant period of siderite dissolution (D1)
prior to the precipitation of 52 siderite (Plate 33a). In this image (Plate 33c) 5L siderite
appears almost totally dissolved sharing an irregular boundary with the darker,
zoned 52 siderite.
B) Discussion
Rezaee, (1996) observed the same siderite dissolution phase (naming it D1) between
51 and 52 siderite cement phases in Tirrawarra sediments in the Fly Lake-Brolga-
Tirrawarra-Moorari region. This author concluded, from fluid inclusion data, that the
D1 dissolution event took place at burial temperatures between <300C and 680C,
indicating that dissolution occurred at relatively shallow burial depths. The
dissolution of 51 siderite before the precipitation of 52 marks a temporary increase inpore water acidity. Surdam et øL (1989) describes carbonate stability in terms of Pco,
where siderite will dissolve in acidic (high Pcor) and form in low Pco, conditions. The
acidification of the pore waters in these shallow buried sediments, has been argued
by Rezaee (7996) in Tirrawarra sediments to be a product of the infiltration of low-pH
meteoric waters into the pore space.
293

Co¡øpoxnxr
C) Key Findings
It is likely that the same acidic pore fluids which dissolved feldspars and formed
early kaolin in Merrimelia sediments also partially dissolved 51 siderite. This
relationship is observed in Plates (33b & 33d) where 51 siderite has almost been
completely dissolved and been replaced by kaolin booklets (Plate 33d).
D1 siderite dissolution in Merrimelia sediments is the same as that described by
Rezaee (7996) in the Tirrawarra Sandstone in the Tirrawarra-Moorari region.
6.3.4.4.3 52 Siderite Formation (Zoned)
A) Key Observations
The highly zoned nature of 52 siderite (Plates 33c) suggests that pore water chemistry
has fluctuated markedly. These pore water fluctuations are manifested in the
variation of magnesium (Table 6.1,4 In Plate 331) from the earliest formed 52 band
until the last (Plate 33c). Lr contrast, 53 siderite illustrates little compositional banding
(Figure 6.8a[13e]), indicating that pore water chemistry was more stable. Rezaee
(1996) and Rezaee et al. (7997) observed the same features in Tirrawarra sediments inthe Tirrawarra-Fly Lake-Brolga-Moorari region. These authors concluded that the
zonations in 52 are indicative of siderite that has precipitated from solution and has
not undergone neomorphic recrystallisation. The present study extends this concept
basinwide, with no recrystallisation of 52 siderite cement observed. The fluidinclusion temperature range of 52 cement of 68oC-102nC (Rezaee et at., 1997) are thus
regarded as being indicative of 52 precipitation across the Cooper Basin in Merrimelia
sediments.
B) Discussion
In Tirrawarra and Merrimelia sediments alkaline pore fluids again prevailed where
extemal buffering by acetate species (Surdam et al., 1989) allowed the precipitation of
52 siderite. At temperatures over 100"C, buffering of acid waters ceases and
conditions suitable for carbonate dissolution occur (Surdam et al., 1989). This
dissolution phase continues, according to Surdam et al., (1989), continues to around
120nC where the carbonate system will regain internal buffering and carbonate
species will again precipitate (S3 siderite, dolomite and calcite). This scenario of
carbonate evolution/dissolution appears to have operated in Merrimelia sediments,
where burial history modifications are superimposed. The highly zoned nature of 52
siderite is indicative of such modifications (Fig. 6.8a).
294

Corupovnvr
A) BSE Imøge - Gidgeølpø #3 (2314.7m). Siderite "seed" exhibiting compositional banding,
DL dissolution edge is ønnotated.
B) BSE Image - Kenny #1 (2945.8m). Close up uiew of kaolin booklets replacing siderite
C) BSE lmøge - Gidgeølpø #5 (2298.57m). Close up aiew of pore filling siderite illustrating
the intricate contpositionøI banding which correspond with 51, 52, ønd 53 siderite phases.
Spot contpositions detqiled in Table 6.8 correspond lþith " A" nnd "8" in this plate,
D) BSE Imøge - Kenny #1 (2945.8m) Broød aiew of Plate 33b illustrating the replacement of
51 siderite by kaolin booklets [9e].
Table 6.74 - 52 siderite compositions.
Diagenetic Reactions: Siderite Precipitation, DL Dissolution and
Siderite Dissolution/Kaolin Formation
PLATE 33
295

Plate 33
A B
c D
MgCO¡ CaC03 MnC03 FeC03
52 Siderite A52 Siderite B
8.0128.5
52 Siderite10.35
8.51.111.8
80.5261.1
AverageStd Dev
18.2614.49
9.431.31
1.460.49
70.8113.73
MRI18C#5MRI18A#11MOOR28#19FLY 1D#7MRI18C#3MOOR 2B#25MOOR 2B#26MRI18C#1FLY 1D#18wool- 1B#3wool 1B#3
28.733.131.321.62'7.933.839.42'7.721.120.518.3
53 Siderite54.553.'l3.51.8
55.551.16.154.52.00.20.5
0.90.42.01.11.40.41.31.',l
1.11.11.1
15.812.863.27 5.515.214.753.316.175.818.280.0
AverageStd Dev
27.66.60
2s.826.96
1.10.48
45.530.21
Table 6.14 S2 and 53 Siderite Compositions (Wt%)
EXPDEV 076 V

COmpO¡,tnxr
Plotting 5L, 32 and 53 siderite formation temperatures on geohistory plots,
constructed at Malgoona þasin rim) and Merrimelia (GMI Ridge¡,' fields gives an
indication of siderite formation with respect to sediment burial and uplift (Fig. 6.27).
This figure illustrates the effect of burial history with respect to 52 zonation
compositions where the changing Mg proportions in this cement phase record
fluctuations in pore water chemistry and temperature gradients. Fluctuations appear
to be mainly controlled by temperature and therefore depth of burial. Sediment
permeability is the other main control on siderite development.
The supply of Mg'. fluctuates with temperature. Rezaee and Schulz-Rojahn (1996)
indicate that the isotopic signature of Mg in 52 siderite within Tirrawarra sediments
(Moorari-Tirrawarra region) is indicative of Mg produced at temperatures that are
equivalent to the decarboxylation of organic matter. The same authors also contend
that Mg'?. ions for the later formed 53 siderite was produced during kerogen
maturation above 1000C.
In Tirrawarra sediments of the Moorari-Tirrawarra region, the thermal breakdown of
organic matter is the most likely source of Mg Íor 32 siderite cement. Flowever, the
impermeable and organically barren nature of Merrimelia sediments limited the
infiltration of organic acids, lessening the effect of acidic pore waters at depth. In
contrast, acidic water more easily penetrated Tirrawarra sediments with highlydissolved siderite cement phases a consequence. This effect is not absolute, as the
abundance of illite (or kaolin) in Merrimelia sediments suggests that pore waters
were at some stage acidic, indicating that a certain stages during burial, acid organic
waters may have influenced the composition of Merrimelia pore fluids.
52 siderite in Merrimelia sediments appears to be better defined than 52 siderite inTirrawarra sediments (Figs. 6.9b & 6.9c). This may suggest that the Mg source for 32
siderite was operating more efficiently in Merrimelia rather than Tirrawarra
sedirnents. This conclusion however, seems to contradict the notion that the influence
of acidic waters (either meteoric or organic) diminished with depth (see sections on
feldspar dissolution - 6.3.4.4 and kaolin development - 6.3.4.5) in the MTGC. Itfollows then that if the influence of acidic waters is less in Merrimelia than inTirrawarra sediments then some other mechanism must provide at least some Mg for
52 siderite precipitation in Merrimelia sediments.
u A full explanation of geohistory model construction is given in Chapter Eight.
297

T J K E
I5t
50(dq
'
70(d{
120(dogS3
80(d@ c)so(de c)
E
È
Ea
tis
s0(dq
00 d€0 c
MERRIMELIA f 8 MALGOONA 4Formal¡on
WNTON
MACKUNDA
TOOLEAUC
WALLUMBILU
CADNA.OWIE
BIFKHEAD
HUfONBASALJURMSIC
looucHEE
MEBRIMELIA
BASEMENT
5m
TI J K P E o
ir32
4o(dqç)50(desC)
o 100(dwc)
1 10(d{ c)
È
S3 odq
E
a
Formal¡on
WNTON
MACKUNDÁ
OODNADATA
COORIKIANA
BULTOOG
CADflA'OWEMURTA[ÂMURWESTEORNE
ADORI
BIEKHEAO
HUfON
POOLOWAil[Â
MTRÂIMTTIAEASEMENT
1m
EEo
2@
1@
E
o
3@
A
t5æ
2@
25@m 4æ @ 2@
T¡me ([¡a)1m 0
Time (Ma)
B
c E F G
S I / 52 Dissolution Boundary
@e=e @e 23 @s= lg =35 =37 =49 @g=¡e =32 =78 (ÐMg = ¡z @Mg=+lightest / broadest zones widest &
darkest52 zones
edge of52 zones
3l 3id'¿¡ic'=tofÍ1ti!lJDr)
Siderite Siderite-Formation
rganic aci
ectite - illite transformation p ectite - illite transformation proceed smect¡te - illite proceedsto 95% ill ite min Mg increase
Dissolution (Meteoric)
Chloritoid-++neoformed illite dominates->< S?S3 dissolution via >, oFsanic acids' (observed in Upper Merri Fm.)
Formation
30" c 68" C 102" c 80c 100" cHEXPDEV 084
thin increasingly lighter zones
illite.

urHrGENrc Compoxnvr
Such a mechanism maybe the transformation of smectite to illite within dewatering
shales. This reaction, unlike the infiltration of organic acids, is more prevalent at
depth in Merrimelia sediments. Nadeau and Bain (1986) and Hower et øL (1976)
propose that Mg'z., Fe'l and Ca. ions are released in this reaction (Equation 6); ions
which are necessary for siderite formation
Another possible source of siderite cement may involve circulating brines contacting
marine shales of the Warburton Basin and precipitating siderite up section. However,
the proportions of Mg'. across the Cooper Basin in Merrimelia Formation 52 siderite
varies consistently, unlike the occurrence of marine shales (Kalladeina Formation &Dullingari Group) of the Warburton Basin (Fig. 5.23). In contrast, the conversion ofdetrital smectite to illite in Merrimelia sediments is consistently observed across the
Cooper Basin, and is the more likely source of Mg'- for siderite cement development
in M2 and M3 sediments than either marine shales or maturating organic matter.
The smectite-illite transformation is dominantly temperature controlled, peaking inthe middle stages of diagenesis (Fig. 6.28). Thus, increasing burial temperatures
accelerate the S/I reaction and subsequently the Mg'. output. The products from this
reaction (Mg'. included) are incorporated into pore waters which become
progressively enriched in Mg'- ions, ions which are then incorporated into 52 siderite,
forming bands where Mg'. progressively increases (Fig. 6.27).
Thus increasing Mg'- in 32 siderite corresponds with an increasing burialtemperature. It follows then that the first formed 52 siderite has the least Mg'. (lowest
formation temperature) and the last formed the most (highest temperature).
Microprobe data confirm these findings (Fig. 6.27ln). Lower Mg'- proportions in 53
siderite is linked to illite neoformation (see section 6.3.4.3.1Cv).
C) Key Findings
Dewatering of argillaceous Merrimelia sediments, and not organic maturation or
Warburton Basin carbonates, appear to be the main source of Mg'. (and Fe'-) ions for52 siderite cement development in M2 and M3 sediments.
In M1 and TL sediments organically derived acids appear to play the dominant role inproviding Mg'- and Fe'. reactants for 52 siderite formation.
299

Concentration of Organic Solvents (mg/l)r 0000
20
->L(n
r.L
Early carbonate cements (SIDERITE)Mechanical compactionCogenetic Quartz cementation / Kaolin precipitationClay coatOuartz diasenesisnioucloÑ oF snEcrlrE EXP,qNDABIIITYD I Carbonate dissolutionFeldsparKaolinite
dissolution
o(JoL5nlLoCL
EÊ
80
00
20
ofhydrocorbons into theTirroworro Sst. (Rezoee IqJ
E.a¿o90obô8ËoN
IttITE ORDERINGAND GROWTHChlorite precipitation
Quartz overgrowths (DRUSE)
D2 Carbonate dissolutionn
Ferroan precip¡tat¡on
160OJ
irlJ
A
rs0P = 500 BarsK = Feldspar
oUoJ
GI
oCL
EÉ
lllite00
50
4.0 5.0
Log (a*+/a"+¡
f R"r..ion pathway of kaolin with increasing burial
BEXPDEV 076 W
Kaolinite
Figure 6.28 A) Orgønic flaturation and thß møin diøgenetic ødjustments obserued in the
Mlrrimeliø Formntion'(Modifed from Surdøm et ø1,, 1989). B) llliteßaolin stability dingrøm
(From Ccnuøn and Shaw, L991').

urHI G EN r c C o ¡øp ox r¡,rt
6.3.4.4.4 D2 - Late Siderite DissolutionA) Key Observations
In porous (M1) Merrimelia sediments the contact between 52 and 53 siderite is
irregular (Fig. 6.8b'). In addition 52 cement is commonly etched (Fig. 6.8a) whereas 53
siderite is virtually devoid of pitting (Fig. 6.8a). Both observations point to a siderite
dissolution event (D2) between the precipitation of 52 and 53 siderite.
In argillaceous Merrimelia sediments there is little evidence of aD2 dissolution phase
between 52 and 53 siderite phases.
B) Discussion
Rezaee et ø1. (1997) and Rezaee (1996) describe a dissolution period (D2) between the
precipitation of 52 and 53 siderite phases. This is based on the identification ofdissolution edges on 52 siderite from samples in the Tirrawarra Sandstone at
Tirrawarra, Fly Lake-Brolga and Moorari fields. These authors postulate that this
dissolution phase broadly corresponds with the temperature of organic maturation(100'C) (Tissot and Welte, 1978), surmising that organic acids produced in this
process have dissolved 52 carbonate (Surdam et al., 1984; Schmidt and McDonald
L979). Petrological evidence (Rezaee, 1996) backs up the connection between organic
maturation and D2 dissolution. That author recognised dead oil within inclusions
between 52 and 53 cements concluding that oil generation was synchronous with the
D2 dissolution event, and prior to 53 precipitation. This link suggests that organic
acids formed during hydrocarbon generation and expulsion have dissolved 52
siderite prior to 53 formation (Fig. 6.28a).
Chamely (1989) relates water explusion from the smectite illite transformation withhydrocarbon generation. This author concluded that the main expulsion of water
from smectitic sediments during illitisation occurs around 900C-1000C. Thus the peak
of illitsation and water expulsion coincides with D2 dissolution and hydrocarbon
charge. It follows then that water expelled from the smectite to illite reaction may
have provided the media for transportation of organic maturation products (acids
and hydrocarbons) and in the processes has indirectly helped dissolve 52 siderite
cement.
The supply of organic acids from maturing Patchawarra and Tirrawarra organic
matter most likely increased pore water acidity in Tirrawarra sediments forming a
uniform D2 dissolution event (Fig. 6.9b). In Merrimelia sediments the upper more
porous facies (proglacial) register an D2 dissolution phase (Fig. 6.8b[ e]), whereas,
301

Conqpot¡eNr
non-permeable Merrimelia sediments (terminoglacial) may, or may not, register a D2
dissolution event depending on the infiltration of acidic fluids through the muddy
sediment pile (Fig. 6.8a[Inset A]). The local supply of organic acids in terminoglacial
sediments is minimal.
C) Key Findings
In porous Merrimelia sediments, organic acids formed during hydrocarbon
generation and expulsion have most likely dissolved 52 siderite prior to 53
precipitation.
Variable organic content may also contribute to the sporadic nature of D2 siderite
dissolution in Merrimelia sediments.
6.3.4.4.5 53 Siderite Formation
A) Key Observations
53 siderite in the Merrimelia Formation appears as a blocky and homogenous
carbonate cement (Fig. 6.8a) indicative of little fluctuation in pore water chemistry, in
contrast to the highly variable 52 siderite.
B) Discussion
The Mg'. content of 53 siderite varies little, indicating that the supply of ions was
relatively constant (Fig. 6.27}l.). The initiation of illite formation from pore waters
(neoformation) coincided with the growth of 53 siderite (Fig. 6.27a Ex 6.27b). Thris
suggests there may be a link. The secession of illite production from smectite
transformation reduced the amount of Mg'- available for siderite. This reaction does
proceed past 1000C but at a much reduced, rate as almost all of the mixed layered clay
has been transformed to illite. It is postulated here that the remaining Mg'?- from this
ongoing reaction is incorporated into 53 siderite at a low but constant rate (Table 6.14
illustrates typical 53 MgCO, compositions)
The smectite-illite reaction is supplanted by the formation of illite from pore waters.
The authigeneis of neoformed illite according to Huang et ø1. (7986) Small ef aL (7992)
and Reed and Hajash (1992) relies on mildly acidic conditions. The abundance of
neoformed illite is testamount to the acidity of pore waters during later diagenesis. In
this acidic environment sideritic cements would be expected to dissolve. The
appearance of 53 siderite contradicts this, indicating minor dissolution only (Fig.
6.8a). This suggests that here must be a carbonate buffer that enables late siderite (S3),
calcite and ferroan dolomite to form. The most likely acid-consuming reaction in the
302

CompoNr;vr
later stages of diagenesis is the neoformation of illite. The pervasive nature of this
reaction in Merrimelia sediments has most likely had the effect of lowering pore
water acidity making it possible for 53 siderite and other late diagenetic phases to
form and be preserved.
C) Key Findings
53 siderite formation in Merrimelia sediments has a consistent composition (unlike 52
siderite) coinciding with the cessation of the smectite to illite transformation. Mg'.
from this ongoing, but diminished reaction, is incorporated into 53 siderite at a
constant rate.
The neoformation of illite is an acidity buffer, allowing 53 siderite to form and be
preserved with minimal etching.
6.3.4.4.6 Calcite (Twinned, " Cowp at") Formation
A) Key Observations
Calcite in Merrirnelia sediments is observed in two forms:
1) Poikilotopic cement fitling porosity and overprinting earlier formed carbonate,
quartz overgrowths and clay minerals (Plate 34a).
2) Concentric siderite-calcite-illite cement ("cow pat") (Plates 34c & 34e).
B) Discussion
The existence of calcite in Merrimelia sediments as twinned poikilotopic to sub-
poikilotopic crystals and concentrically zoned cement ("cow pat" cement) is
dependent on calcite stability. Wood and Hewitt (1984) and Blatt (1979) describe
calcite solubility as being retrograde, as calcite solubility decreases as burial
temperatures increases. Thus calcite precipitation occurs more readily with depth.
Surdam et ø1. (1989) stated that the solubility of calcite depends on more parameters
than just temperature alone. The solution pH also exerts a strong influence, and can
reverse the retrograde solubility of calcite. Calcite solubility is therefore controlled by
pH and temperature where calcite precipitation above 1000C is intemally buffered
and calcite solubility suppressed (precipitation accentuated) (Surdam et ø1.,7989).
Petrographic observations indicate that calcite is indeed a late precipitate (Fig. 6.31b)
in Merrimelia sediments, replacing remnant feldspar grains and siderite phases (Plate
34b). The ions necessary for calcite formation are thus unlikely to be organically
derived.
303

Covpoxr',vr
A) Photomicrogrøph - Tingø Tinganø #L (2094.35m) (Ctoss nicols x70). Twinned
poikilotopic to sub-poikilotopic pore filling calcite cement,
B) Photomicrogrøph - Løke Hope #1 (2493.70m) (Cross nicols x20). Calcite replacenrent
of sparry and micritic siderite cement.
C) Photomicrogrøph - Merrimelia #5 (2627.89m) (Cross nicols x1.0). Concentric
calcite/illite cementøtion ("cowpøt calcite") [8e], surrounded by poikilotopic calcite cement
[13c].
D) Photomicrograph - Merrimeliø #5 (2627.98m) (CL x 5). Broad aiew of poikilotopic
calcite centent, with concentric calcite/illite cement pøtches within ouersized pore space.
Dissolaing feldspar grøins øre thought to proaide the nucleation sights for these concentric
cement patches øs well as ø locøIised supply of cøIcite and illite cations.
E) Photomicrogrøph - Merrimeliø #5 (2627.98m) (Fluoro x 10). Close up aiew of
concentric "cowpat calcite" illustrating the entwined formøtion of illite (green) and calcite
(black),
F) BSE Imøge - Merrimeliø #5 (2627.89m). Broad oiew of a "cowpat calcite" indicating
where øn EDAX spot cotltposition wqs taken (cross). The composition at the point mørked
corresponds with the "cowpat cølcite" composition in Table 6.15.
G) BSE Imøge - Merrimeliø #5 (2627.89m). Broød oiern of a "cowpat calcite" indicøting
where an EDAX spot contposition was taken (cross). The composition øt the point marked
corresponds with the " cowpat illite" composition in Table 6.15,
PLATE 34
Authigenic Mineral: Calcite
Tøble 6.15 - Composition of "cowpøt cølcite" and "cowpat illite"
304

250 ¡rm
Plate 34
i
h
oÞ
I I
h
oÞ
h
ûb
f f fe
d
c
b
a
e e
d
b
a
d
c
b
a
I 2 J 4 5 6 ,78 91011121314 t234 5 6 7 8 91011121314 t23456789r011t21314
A c E
t4 t4 h
oÞ
f13
73t2
11
l0
9
8
1
6
5
4
J
2
I
t2 e
d
c
b
a
l1
10
9
8 F
,7
6 h
oÞ
f
e
5
4a b c d e f ob h 1
B 3 d
c
b
a
2
'Cow Pat'Calcite 0 97.76Ti02
0.3041203
r.93 0Si02 MgO CaO MnO FeO Na20 K20 H20 1
'Cow Patrlllite'Cow Pat' Illite
38,9239.01
0.000.06
24.9925.11
I1
II
98
4.034.03
0.01 r.22 0.2't 7.53 0.000.01 1.18 0.24 7.21 O.tg
a b c f I
Table 6.15 Compos¡t¡on of 'Cowpat' lllite and Galcite (Wt%) D G
250 ¡rml-I250 pm
-b
$.'.
100 pm
500 pml-l
d e ûb h
EXPDEV 076 X

Compoxevr
Walderhaug and Bjørkum (1992) discuss at length possible sources of Ca'* ions for
calcite formation. Likely sources discussed by these authors include, feldspar
dissolution, heavy mineral and mica destruction. In Merrimelia sediments these
minerals represent a very small proportion of the detritus (Fig. 5.1), a proportion that
is however comparable to the amount of authigenic calcite observed. The consistent
association with previous carbonate phases (Plate 34b) and illite (Plate 34e) suggests
that Ca'. derivation may be linked and that Ca'* from the destruction of accessory
minerals is unlikely. Hutcheon et ø1. (1980) link the formation of dolomite and late
stage chlorite with calcite formation (Equation 13).
SCnMg(COr)r+ AlrSirOr+ SiOr+ HrO = MguAlrSirO,o(OH)r+ SCaCOr+ SCO,
Dolomite Kaolin Quartz Chlorite CøIcite
Equation L3
This reaction maybe a possible source of both calcite and chlorite, but dolomite exists
only in small proportions, limiting the products of this reaction (Chlorite and calcite
are rare authigenic minerals). The association of chlorite and calcite, which would be
expected if this reaction were to proceed, is not well established but, poikilotopic
calcite has been observed filling pore space between basic, chloritised rock fragments
suggesting a link (Plate 34a).
More commonly, calcite is associated with siderite and not basic or chlorite altered
rock fragments indicating that the aforementioned carbonate phase is cannibalising
the earlier formed siderite. The source of Ca'. ions in this scenario may be related to
the transformation of smectite to illite (Equation 6) or sourced extemally from
solution.
Surdam et al. (7989) indicates that calcite dissolution will occur at a late stage (120nC-
160t) as Pco, increases. The presence of calcite in Merrimelia sedirnents may indicate
that Pco, levels have remained subdued or that the limited calcite observed inMerrimelia sediments exists at depth because of the impermeable nature of these
sedirnents.
i) "Cowpat" Calcite
For the most part calcite formation can be explained in terms of associations withsiderite, chlorite and feldspar. In the glacio-aeolian sandstones of the Merrimelia
Field a unique pore filling calcite/illite cement ("cowpat") was observed (Plate 34d).
306

CompoNrNr
"Cowpat" cement authigenesis is unlike all other cements encounterèd in the
Merrimelia Formation as calcite and illite cement phases form around a nucleating
particle in the centre of pores in a roughly concentric pattern (Plate 34e), similar to
that illustrated in (Fig. 6.8a), where further cement growth infills pore spaces. The
distribution and shape of "cowpat" cements (Plate 34d) is suggestive of feldspars that
have been destroyed. Dissolved feldspars are commonly observed in the aeolian
sandstone (Plate 32c). The ionic products from this dissolution (Equation 8) may have
provided the local products needed for "cowpat" formation. Walderhaug and
Bjørkum (1992) recognise dissolving K-feldspars as a possible source of Ca'. for calcite
formation, albeit a minor one. It is possible that the dissolution of feldspars in these
aeolian sandstones may have provided the Ca'- needed for concentric calcite
formation. The illite between calcite rings (Plate 34e), is most likely formed fromproducts released via illite transformation of the original grain coating smectite whichsurrounds all framework grains (Plate 21c).
The initial stage (nucleus) of carbonate cement in "cowpat" cement is sideritic incomposition (S1) and has, in most cases, been almost entirely dissolved (Plate 34c[8fl).
Subsequent concentric cement phases are composed of altemating illite and calcite
cements that entirely fill in the pore space, with the last calcite cement phase formingpart of an extensive poikilotopic calcite cement (Plate 34d). The sequence of "cowpat"
illite/calcite cement formation is as follows:
1) Smectite to illite precipitation releases Fe'., Ca'* and Mg'. ions (Equation 6) in aslightly acidic low fluid flow environment (Huang et ø1., 1986). The illite forms
around a nucleus, which is normally SL siderite. The acidic pore waters partiallydissolve the siderite cement.
2) As illite reactants are used up and 51 siderite is dissolved, the pH of the porewater becomes more alkaline and enriched in Ca'., Mg?. and Fe'.
3) The change to alkaline pore waters stops illite precipitation and sideritedissolution. The reactants mobilised by illite formation/siderite dissolution,
combine to form calcite.
4) Calcite forms until the local supply of reactants are used up. The pore water
becoming more acidic until calcite starts dissolving in the increasingly moreacidic pore waters. This dissolution is indicated by the irregular edges of the
concentric calcite rings (Plate 34f).
5) As the acidity of the pore water increases, Si, Al and K reactants are introducedinto the system. These ions are possibly sourced from the dissolution of adjacent
K-feldspars and/ or the illitisation of grain rimming smectite. Illite then forms on
the surface of the last partially dissolved calcite cement phase.
307

rrrl¿¿rclNrc Co¡øpoxnNr
6) This process is repeated as many as ten times to form the distinctive pore-filling
" cowpat" illite /calcite cements.
The process outlined above maybe explained by the experimental observations of
Huang et aI. (1986). These authors stated that the most favourable conditions for the
neoformation of illite is the rapid release of Al and other clay reactants into the
system (step 5) followed by the rapid withdrawal of these components to form an
essentially alkaline solution (steps 7 e.4.
Oscillating acidic/alkaline pore water chemistry is controlled by the periodic input of
illite forming cations into an essentially carbonate forming system. The controls on
the oscillation of water chemistry in these sandstones is conjecture, but is possibly
controlled locally, with water chemistry changing as localised ionic sources are
exhausted and replenished. An external control is equally valid, where the
production of organic acids in surrounding sediments changes Pore water pH (Fig.
6.27a).It is most likely that a combination of external and intemal controls dictate the
oscillation of pore water chemistry in aeolian sandstones.
C) Key Findings
Ca- ions for twinned calcite cement precipitation are most likely derived from:
1) Earlier formed siderite,
2) The smectite/illite transformation,
3) Breakdown products from organic maturation.
Concentric cement patches observed in Merrimelia sedirnents at Fly Lake and
Merrimelia Fields are composed of a siderite nucleus which is engulfed alternating
calcite cement and illite. The alternating mineral assemblage of "cow pat" cement
reflects oscillating water chemistry which is most likely related to local variations in
pore water pH.
6.3.4.4.7 Ferroan Dolomite Authigenesis
A) Key Observation
Ferroan dolomite is generally observed forming after 53 siderite (Fig. 6.10).
B) Discussion
Figure 6.10 illustrates dolomite growing around the etched edges of 53 siderite
cement (Fig. 6.10[Inset]). There is however, a suggestion that 53 siderite in fact
overlies what would be an earlier formed dolomite crystal (Fig. 6.10[Inset]). However,
308

CompoNewr
the 53 boundary, in the same image, appears to represent a dissolution edge withdolomite having formed after 53 siderite on this dissolution surface. This apparent
ambiguity has made the exact relationship between ferroan dolomite and siderite
hard to confirm. The majority of textural observations suggest however, that the
earliest precipitated ferroan dolomite formed penecontemporaneously with or just
after the latest formed 53 siderite.
Microprobe and SEM/EDAX analyses indicate that dolomite cements in Merrirnelia
sediments are high in iron (Fig. 6.10). The origin of high amounts of Fe'. maybe
related to a number of sources. The production of Mg'* from smectite-illite reaction
has been postulated by Stewart, (1986) as the possible source of dolomite cement inthe Fulmar Formation of the North Sea. Boles and Franks, (1979) also suggested that
the smectite to illite reaction may provide ions necessary for dolomite (and siderite)
formation. The formation of dolomite after 53 siderite indicates that dolomite
formation has occurred after the main phase of smectite-illite transformation. This
would limit the supply of Mg'- and Fe'. from this source. Stewart (7986), suggested
that Mg'., Ca and Fe'. for dolomite authigenesis can be supplied via organic matter
maturation. The absence of organic matter in Merrimelia sediments indicates that this
ionic source would be negligible. Rezaee, (1997) in a study of fracture fill cements inWarburton Basin sediments observed ankerite cement in McKinlay #1 well. It is
possible that iron from dissolving high Mg/Fe carbonates of the Warburton
succession, maybe a source of Mg'. and Fe'. for ferroan dolomite in Merrimeliasediments. The distribution of high Fe'- carbonates in Warburton sediments is
unknown thus attributing Warburton Basin carbonates with supply of ions forMerrimelia carbonates is speculation.
C) Key Findings
The almost exclusive association of ferroan dolomite and siderite indicates that there
is a link. The most likely source of ions for ferroan dolomite is probably the
dissolution of earlier formed 52 siderite (D2 dissolution) which is dissolved locally
and precipitated nearby enriched in Fe'. and Mg'-.
Ferroan dolomite formed coincident with or just after the latest formed 53 siderite
6.3.4.5 Secondary Porosity Formation
6.3.4.5.'1, Key Observation
Porosity is generally low in Merrimelia sediments (Table 6.16) accounting for just
over 107" of the total rock volume. Secondary porosity is twice as voluminous as
309

Coupo¡rttNr
primary pore space; a product of primary pore space destruction via mechanical
compaction and authigenic mineral formation.
Authigenic mineral formation in Merrimelia sediments is dominated by clay, the
most prevalent of which is illite, with subordinate kaolin. Micro-pore space
associated with illite is not effective in hydrocarbon terms (see Chapter Nine) and is
not included in calculating the proportion of secondary micro-porosity. Micro-pores
between kaolin booklets represent effective pore space (see Chapter Nine) and are
included in secondary pore space calculations.
6.3.4.5.2 Discussion
The amount of micro-pore space in kaolin masses of the Tirrawarra Sandstone was
estirnated at 20"/" of the total effective pore space (Rezaee, 1,996). Using this
approximation, the effective secondary porosity component in Merrirnelia sediments
is dominated by kaolin micro-pore space (Table 6.76). Dissolution secondary pore
space (macro) is subordinate (Table 6.16).
POROSITY TYPES IN MERRIMELIA SEDIMENTSPrimary Average Percentage (Whole Rock)
Interstitial 7.9
Intraclast 0.1
Primary Sub-Total 2.0
SecondaryMacro 4.5Micro (Kaolin) 1.5
Moldic 0.3
Intraclast 0.1
Secondary Sub-Total 6.4Total Porosity 8.4
Table 6.16 Proportion of porosity types in the Merritnelia Fornmtion
Bloch (1994) stated that the maximum amount of moldic porosity, is a function of the
abundance of mechanically rigid grains (Figure 6.29). Menimelia sediments are, inthe main, dominated by ductile grains or matrix thus the preservation of moldic pore
space is rare (Table 6.16).
Pore fluids derived from acidic meteroic waters promote the alteration of feldspars
and form kaolin at an early diagenetic stage. Hence kaolin micro-porosity represents
early-formed secondary porosity. Dissolution of carbonate cement, rock fragments
and rock fragment components occurs at a middle to late diagenetic stage when
310

Compox¿xr
maturation of organic matter releases organic acids. The scarcity of organic matter interminoglacial Merrimelia sediments however reduces dissolution and subsequently
reduces secondary porosity generation.
t00
sã60gco().s6(5
Ë40fE
20
0
Tolal Secondary Poros¡ty (%)
o < 5000 tt
o 5000 - t0,000 [+ > 10,000 lt
+*md. bur¡rldoplh
< 30ffi
o+
ooco
+
ol0 % ømonto
+oo
+o
.o
l)ft"o
o
+ +
EFo++ c
¡ft ++'oq
od** o o
Figure 6.29 Scattergram of rigid grain content aersus the maximum amount of secondary
porosity (After Bloch, L994).
The controls on porosity preservation and formation (primary and secondary) inMerrimelia sediments are discussed in detail in Chapter Nine.
6.3.4.5.3 Key Findings
Effective secondary porosity is dominated by kaolin (macro dissolution porosity is
rare) and therefore mainly occurs in porous (proglacial) ML sediments. Illite micro-porosity dominates M2 and M3 but is regarded as ineffective.
6.3.4.6 Feldspar Overgrowths
6.3.4.6.1 Key Observations
SEM analysis suggests that feldspar overgrowths may occur in Merrimelia sediments
(Fig. 6.30a). They appear to only develop in sediments that are rich in volcanic rockfragments.
311

cENrc CoupoNnr¡r
6.3.4.6.2 Discussion
McBride (1989) and Schluger (1979) suggested that the breakdown of glassy shards
and acidic volcanic rock fragments promote the liberation of alkali earth cations
which are then free to be incorporated into authigenic clays, zeolites and authigenic
feldspars.
6.3.4.6.3 Key FindingThere maybe a link, but only a few feldspar overgrowths were observed and any
diagenetic link with disintegrating acidic volcanic rock fragments was unable to be
confirmed.
6.3.4.7 Pyrite Authigenesis
6.3.4.7.1 Key Observations
Pyrite occurs in two forms, framboidal aggregates (Plate 17c) and poikilotopic cement
of varying extent (Plates 24a &. 24b). Frarnboidal pyrite aggregates are an early
formed phase, whereas poikilotopic pyrite is a late stage authigenic precipitant,
which overprints all other authigenic phases and detrital grains (Plate 24b)
6.3.4.7.2 Discussion
The iron needed for poikilotopic pyrite formation may have been released fromlimited late stage siderite dissolution (seen as small pits in 53 cement Fig. 6.8a[12i])
and conserved by late stage pyrite cement (Plate 24b) (Boles, 1984). Dixon et aL (1989)
concluded that, at higher temperatures, the reactants necessary for pyrite formation
are released by complexing with organic acids. If sulfur is present, pyrite will form,
especially in the reducing conditions existing at depth. The controls pertaining to the
origin of sulfur has not been addressed with any certainty. There does however
appear to be an association between acid volcanic rock fragments and pyrite (see
Appendix 9a-Malgoona #4 lithological log). The presence of late pyrite in the
majority of samples does (Fig. 6.30b) suggest that the source of sulfur for pyriteformation is consistent (unlike the distribution of acid volcanic rock fragments) across
the entire basin.
6.3.4.7.3 Key FindingLate stage pyrite formation in Merrirnelia sediments is possibly linked to:
1) The break down of acid volcanic rock fragrnents (M2 and M3 sediments)
2) The maturation of organic matter (Tirrawarra and M1 sediments).
372

CovpoNmr
6.3.4.8 PyrophylliteAuthigenesis6.3.4.8.1 KeyObservation
The formation of pyrophyllite is very rare, having been mostly observed in the
vesicles of volcanic rock fragments (Fig. 6.30c).
6.3.4.8.2 Discussion
\¡Vhen not associated with volcanic fragments, pyrophyllite forms by the
transformation of illite to pyrophyllite. This transformation process occurs at
temperatures of greater than 3000C (BjØrlykke, 198a). Only the deepest buried
Merrimelia sediments in the Patchawarra Trough have achieved temperatures high
enough for this reaction to occur, thus the occurrence of this authigenic phase is
restricted.
At these high burial temperatures, according to Bjørlykke (1984), not only will illiteform pyrophyllite but kaolin can dehydrate and also form pyrophyllite. So at high
temperatures both illite and kaolin may form pyrophyllite.
6.3.4.8.3 Key FindingAs pyrophyllite is commonly observed in the hotter Nappamerri Trough a better
understanding of formation is possible (Schulz-Rojahn, 1991). This author concluded
that pyrophyllite formed from kaolin and not illite, where the habit of the
pyrophyllite did not reflect the precursor mineral.
6.3.4.9.1 Zeolite (?)
6.3.4.9.2 Key Observation
Figure 6.30[6d] illustrates a mineral that was exclusively observed with basic,
vesicular rock fragments.
6.3.4.9.3 Discussion
Textural evidence suggests that this mineral phase is not authigenic but inherited,
displaying neither illite nor pyrophyllite interference colours. The association of this
mineral with basic volcanic rock fragments along with its crystal habit tends to
suggest that this mineral maybe zeolitic in nature.
After inclusion into Merrimelia sediments, the zeolite(?) minerals have been partiallyreplaced by siderite cement (Fig. 6.30[1ad]) where the carbonate cement has assumed
a similar crystal habit.
313

h Total Pyrite,60oCL
Efilttt 40oo¡¡Ezoaz
Std Dev = 2.1 5
Mean = 1.7
N = 144.00
e
d
c
b
a 0 0 2 4 6 I r0
APercentage of Pyrite
(Whole Rock)B
j
I
h
f
e
d
c
b
a
1 2 3 456'7891011t2131415c
J
I
h
e
d
c
b
a
t2345 'lD
PELS/6 546 Q
250 pm
Figure 6.30 A) SEM photomicrogrøph - lack Løke #1 (3142.79m). Close up of feldspør ouergroruths, forming onthe partially dissolued remnqnts of øfeldspør grøin. B) Frequency histogrøm. Pyrite minerøl proportion in Merrimeliøsediments. C) Photomicrogrøph - Gidgeølpa #3 (231.2.82m) (Cross nicols x 10). Pyrophyllite repløcement of øn illitefílled aesicle zuithin ø basic aolcønic rock fragment. The pyrophyllite in this cøse is detrital hnuing formed prior to burialwithin the Merrimelin-Tirrqzuørra sedimentøry pile. D) Photomicrograph - Gidgeølpa #3 (23L9.44m) (Cross nicols x4) , Detriøl zeolite within a basic aolcqnic rock frøgment. Note: The løter crystøllisøtion of siderite mimics the morphologyof the zeolite Bbl.

zTHIGENIC CompoxrN'r
6.3.4.9.3 Key FindingZeolite minerals are inherited associated with basic volcanic rock fragments. Later
formed siderite pseudomorphs this mineral phase.
Diagenetic reactions in arenaceous Merrimelia sediments are different from those in
argillaceous sediments. The most obvious example of this is quartz precipitation,
which is common in arenaceous units but rare in muddy intervals. Figure 6.31
illustrates the different paragenetic sequences for arenaceous and argillaceous rocks
of the Merrirnelia Formation.
Menimelia FomationArgillaceous Pægenetic Sêquence
Comp¡dionSrÉiÉ/tllb hßfDtmtifi of m;r ør¡m da & nrddv rooir -
Hid Lâte
-lt
Timê
lllitisation / Kaolinisation of RFs
---tSl Sidêñte lMicritiElD I Siderite Dissolut¡onFÞldsòâr Dìssôludôn
- --
Pore Fillins KaolinChlorite52 Siderite Zonedì
- ¡¡0"a - t?o'a
D2 Sider¡te D¡ssolut¡onryr¡E t
o'a - Æ"a /m"a - m'a >t?o'a
A
Meriñel¡a Foñat¡onArenacêous PMgenetic Sequence
E4Y
-M¡d Lete Time
Smedite / lll¡te hnsfomatioh of ÂÞ¡n coâtinR.laylllitisatlon / Kaolinisation of RF's
¡e!4sp?rDjssolulo¡ _ _ -,Pôre F¡lline Kâôl¡n
r-aI¡
Dl Siderite Dissolution
-Chlorite
53 Siderie
Druse
- - I
o"a ¿n"a
B
Figure 6.31 Paragenetic sequences in A) ørgillaceous and B) arelTnceous Merrindin
F ormntiott sedinlents.
The Merrimelia Formation is predominantly argillaceous in nature. The paragenetic
sequence illustrated in, Figure (6.31a) is therefore applicable to most sediments in this
study. Conversely, the paragenetic sequence illustrated in Figure (6.31b), is applicable
315

Compot¡rvr
to upper/ arenaceous Merrimelia sediments (M1) where interfingering withTirrawarra sandstones dominates.
Chaney et ø1. (1997) describe the Merrimelia Formation as complex of laterally and
vertically interfingering proglacial and terminoglacial facies. Regional variation inMerrimelia sediments is accordingly extreme. Areas such as the Merrimelia Field are
dominantly arenaceous, whereas Merrirnelia sediments in the Malgoona Field are
dominated by muddy or clay-rich volcanoclastic conglomerates. The paragenetic
sequence in Merrimelia sediments varies accordingly. Facies type, sediment
composition (provenance) and thermal overprint all combine to produce local
variations in the paragenetic sequence of Merrimelia sediments. These three
parameters are thus the main controls on diagenesis in Merrimelia sediments. Figure
6.32 illustrates the variation in the Merrimelia paragenetic sequence across the basin
where there is the greatest sample control, and in fields whose reservoir quality is
investigated in detail (Chapter Nine).
Sediment composition is controlled by facies type (Chapter Four), which in turndetermines the kinds of diagenetic reactions that operate in a particular sediment,
when buried. The composition of a sediment is widely reported in the literature to be
one of the main controls on diagenesis (Blatt, 7979; Bodard et al., 1984; Stonecipher ef
ø1., 19841.In particular, the composition of sandstones is critical to which diagenetic
mineral assemblage forms during sediment burial (Stonecipher ef øL,1984).
Chaney et al. (1997) concluded that rock-fragment-rich Merrimelia sediments have
less quartz cement development as cementation sites are limited. The opposite is truefor arenaceous Merrimelia sediments. These authors stated that sediment
composition is controlled by thawing and freezing conditions relative to the position
of advancing and retreating glaciers (Chapter Four). Burial diagenesis assemblages inthe Merrimelia-Tirrawarra complex are, therefore, dictated by the position of glaciers.
The formation of kaolin or illite in the MTGC is an example of this; kaolin
predominantly forms in the arenaceous Tirrawarra Sandstone and illite in the poorlypermeable Merrimelia Formation.
31.6

Y
TimeLate
II
I
M¡d
II
I
EarlyI
II
I
ompacqon
Moorûi -rrvoolk¡Þ F¡êld Pa¡agenet¡c Sequence
D¡aqenetic EYent
Sh<itdìlhe tusftlmdir of min cdim dav & muddv mrnlllitisation / Kaolinisation of RF's
S I Siderie ll.licriticìSvnaial Gmin Coatine O¿Cosenetic O¿ / KaolinFelrl<¡rr D¡<<olnìnnPore Fillirç KaolinlDl\ Sideriø DissohrdonS2 Siderite lZonedìChloritef D2) Siderie Dissolution1? Siá¡¡¡t¡ lSnrrrv'Sma^A\CãlcibDruse ôuar¿
JAMES
IIII
T¡me
¡t ¡
Lab¡í¡d
-
I---!"try -
I
$nmitdllke mns6rmi¡n rf øin ædm rhr e m¡*tv mñComÞactjon
Fly lake - Brclga /Tirawûra F¡elds Pdageætic Sequence
D¡aseætic Event
lllitistion / Kaolinisarion of RF's
S I Siderie lMicridclEalv Snaiai Oz
/ Kaolin
Chlôr¡cSiderie Disolution
S3 Sider¡ëFormation
1 39' 140 141. 142" o
eiett\'\?'q\.o\
26 -26"-
lvlarengol):
c0 0K
27" L
o IE
lr¡ SEANSUStIï f vrteu fn+
IN+ tooflrtooKABO URDIE
f eoronnrr IDoa
FLY rarwnd* MINKIE 1
GIEAII DREE
KANQWANA 4LAKE-+ ffi*X,ml'p;n*;n*,-
#d'*,nn*l'ú*n
GHttK I
Tr{DrLPrE 2 4iJAcx LAKE +
MERANJ I
TII¡DILPIE
2g w LPINNIE,r, 2l^
{¿ DETLA
HOPE 1 , DULT*rlr?Ês
NGARI
)F-rØv'^ 1
U'-;L'
STURTUBKE
rLoN * ì|* + KERI{A
WILLS
a
DIBKALÀ **
PINt{A +D1+ Oa
WANCO
,'ú--:,; LAKEKUMBARIE 1
9o_SOUTH
kilometres25 0 25 50 75 100 125
1 39' 140' 143
T¡me
I
I
I
I
IIII
IV
Time
T
IYI
I
låte
II
-
Late
II
III
I
III
I
I
M¡d
I
I
ñ¡d
TI
II
¡
Time
I
IIIII
II
I
IIV
EarlyI
II
I
EarlyI
II
I
l,åte
II
II
I
Mid
III
I
-
IErly
III
Quænsland Region PaBgenet¡c Seqænce
Event
S I Siderite
Chlorie
Merrimelia F¡eld Pa.¡agenetic S€quence
D¡aseretic EventComÞactionSm<ireillire mlmnatim d min dins chr & mù¿dv mûilllitisation / Kaolinisation of RF!S I Siderite lMicridc- Hiøhlv DìssolvedìSynaial OzCoeenetic O¿ / KaolinFel¡lsoar Di<<ol¡r¡onPore F¡llinc KaolinlD I ì S¡derite DissolutionS2 Sideriæ fZonedì
lD?ì Siderite DirsolutionS3 Sideriæ lSoarrvìCalcite lOscillarinø Calcite/lllire Formation lCow PatìStviolitisationDruse Ouart
Gidgealpa Field Pangenetic Sequence
Diæenet¡c EventCompac¡¡onSmditdlllite @lmrir of @h cdihr chy & muddy mdilllií<âriõn / K¡al¡n¡s¡t¡on of RFsS I Siderite lRed "Fe Sa¡ned' Hiçhlv Dissolved\Svnaial OzCoæn*ic G¡ / Kaolin llimited &tentìFeidsor Dissolution
52 SideritêTime
I I Sl si¿erite /sD.rrvìI I Druse ouarc! I p,.i..I I Pwo¡hvlliæ /V"rv I imire¿l Frtpnt\ll
ÚLI
Late
rtr
I
IIItt
III
I
È,tid
I
II
IEúly
EI
I
llalgoona - l¿ke Hope F¡elds Paragenet¡c Seq@nce
D¡ageretic EYentComÞadionSlKits4llie msfcrmaix of F¡n cøinq cb & muddy Mi)l¡¡¡risadon of RF!S I Side¡te lSeedsìSvnaial O¿ lin Porous Lirholoeis)Coænetic Oz / KaolinlD lì Siderite Dissolution52 Siderite Zoned)Chlorite?rlPñFñJd.kM. Gh< C M ß P,,mirc lkvi,tu úh; RFi
tæSffiid O, Cod6mhm Ct Plgrm.F6nr lllhlD2) Siderite Dissolutionlllhe / Droe O¿ Lirim 2¡È Pmiw & Cerinø Læ Silie53 Sider¡êCalcite (Motded) Lim¡@d EenrCalciø lSoarrvTwinned\ t ihib.l FftÐt
Pvroolwllie lVery Limircd Ercnt\
141" 142"
Figure 6.32 negonøl paragenetic æquences of the Merrimelin Formation.PEL5/6 546 T

-
A LrrHI GEN t c C ovp oN r;¡'rl.
Observations by Rezaee and Lemon (1996a), confirm the facies control on burialdiagenesis in Tirrawarra sediments, stating that the nature of the environments inwhich these sediments were deposited is the principle factor controlling the
composition of framework grains and hence diagenesis.
In the Merrimelia Formation, like the Tirrawarra Sandstone, qwartz and authigenic
clay proportions are dictated by sediment composition and thus facies type (Figs.
6.33a & 6.33b). Ductile rock fragment proportions are predominantly controlled byfacies type with the better sorted sediments containing the least amount of ductile
clasts (Fig. 6.32c). The presence of ductile clasts promotes clay formation (Fig. 6.32d)
(particularly illite), hastens mechanical destruction of primary pore space (Fig. 6.13a)
and reduces rock rigidity.
Petrological, SEM, XRD, TEM and microprobe data imply a connection between rock
fragments and authigenic mineral production in Merrimelia sediments. Statistical
analyses were also employed to test the results gained by analytical techniques.
The Pearson correlation coefficients of most mineral combinations are less than +0.2
(Appendix 8a). The exceptions are a negative correlation between quartz cement and
illite (-0.443) and positive correlation between quartz cement and kaolin (0.252). These
correlations are statistically significant at a 95% confidence level and match observed
relationships (Figs. 6.34a &. 6.34b).
The lack of correlations (negative or positive) reveals that there is considerable noise
inherent in the authigenic Merrimelia mineral dataset. This noise is indicative ofsampling an inconsistent (patchy) distribution of authigenic minerals withinMerrimelia sediments. This inconsistency is a product of highly variable sediment
compositions which in turn reflects the kaleidoscopic nature of facies architecture
present in the Merrimelia Formation. The lack of meaningful correlations indicates
that the sampled dataset is highly variable confirming petrographic and core logging
observations.
Cluster analysis was performed on unstandardised' quartz cement and clay data
using the same method described in Chapter Two.
' Unstandardised data were used in a Kolomogorov-Smirnov test, which indicated the data was notnormally distributed (Fig. 6.1a).
318

Sor$\s'sì\.{
1!ogss\t\
gofs\stsù'l{ct<slsoèròò
ar¡a
tII
Abbrwiations FaciesType8SDBSDFDFSDGLDTSDUFBTFLFSZIDKHLBLIBLSF
RDSACGTOFTTMDLSZ
Back SMmpDela BoftomseBDela FlowDelã ForseBDeep GlacioJacustrineDelaTopsebAeolian DuneFluvial BarTopFluvial SandstoneFrozen Shore ZonelnterduneKetde Hole
Aô o¡ (o \ b o¡, on \ nron^r, t ou \ S \ qo ooq
\rs\:r\11s
Longitudinal BarLinguoidal BarL¡custrine Sho¡e ZoneRainout D¡amictiteSubaqueous Channel GmvelTerminoglacial Oumsh Fan
Term¡notlac¡al SubaqueousTunnel Mouth DepositLacustrine Shoreline
Qors\¡¡sù'l30
25
20CII
úl*
0
0
ô 0û tn \ \ ì S Ò,, ô^c q\ \ oh * a \r tr Q ô^
B \ls\sr\1as
(+ ô % \ ôt ^or %, ôt (^ ôqr h 0ì ô^ 10
lls\c:\1as
qcc \o I q ,0¡
c
Io¿-9o
¿o
o?À2oEúÉIoÉ
D20 30 40 50 60 70
lll¡te PercentaSe (Whole Rock)
EXPDEV 072 P
aa
a
aIa a
aa
af'
¡l'a
1l)
a(}
a
tIa
ôa
aaa
a
Figure 6.33 A) Cumuløtiae histogrøm of quartz cement as fncies type (terminogløciøl ønd progløciøl).B) Cumuløtiae histogram of totøI clay content as føcies type (terminoglaciøI ønd proglncial) C) Cumulatiaehistogrøm of rock fragment proportion as facies type (terminogløciøl ønd progløcial). D) Cross plot of rock
f'røgment proportion as illite proportion.

umrclNrc CompoNnxr
This analysis reveals two clusters at an euclidean distance of 12 units (Fig. 6.35). The
geographical spread of samples within each of the authigenic mineral clusters is
however diverse, negating any reliable geographical interpretation of the data.
ait
aa a
ait
aaa
ol
oÉ,.Eo¡Ìàs
o.Ë
00
A
2 4 6 8 t0 t2 t4
Quartz Cement (%) (Whole Rock)
20
6ltoÉoo
ÌEodY
2
I
4
00
B
2 4 6 I l0 t2 t4 16 t8 20
Quartz Cement (%) (Whole Rock)
EXPDEV 072 O
aaa
aa
a
a
a
aaaa a
aa
Figure 6.34 Scøttegrøms of A) illite aersus quartz cenrcnt proportions ønd B) Quartz
cement oerstts køolin proportions in Merrirueliø sediments.
It is unlikely in such sediments to observe strong correlations between authigenic
minerals and geographical location. Despite this conclusion, the authigenic dataset
was krigged and subsequently plotted in an attempt to better delineate trends withinthe authigenic dataset.
Flowever, the "patchwork quilt" facies distribution of the Merrimelia Formation,
combined with well spacing in the Cooper Basin, made mapping the areal
distribution of authigenic minerals highly inaccurate.
320

Cuttapi el +
Durham $Downs I
Pondrinnie
G Beanbush
Yanpurra I
f Éaning I
Roc
r+
o Spencer
Strzelecki
f Kumbarie I
TingaTi
Lake
NorthLake D
South
# Mudlalee I
FrogmenÌ
P nna
Soulhern Rock
Arunta Block ?
2
?
200
Km
PeokDeníson
? = =.-= Clast Movement Directione- Fietd
+ WellMixing Zone
Mi Poínler lnlìer ?
Adeloidean ? (!
liØ
€U)
New South Wales
t
io
Øooa
B
Merrimelia Format¡on Authigenic lllite, Kaolin & Quartz
Dissimilarity lndex510152025+---------+---------+---------+---------+
ÌIIIII
IIIIII
-+ I I-+ I-+ r I I-+ I I I
II-+ I I-+ I I-+ I I-+ I I-+ I a.+ I I.+ I I
III
+IIIIT
-+ I I-+ 1 I-+ I I-+ I I-+ I I-+ f I-+ I I-+ I I-+ I f-+ I f-+ I I
II-+ I I I-+ I I I-+ I I I-+ I I I
I-+ I I I-+ I I I-+ I I I-+ I I I
II-+ I I-+ I I-+ I I-+ r I-+ I I-+ I I
-+ I I-+ I I-+ I-+ I f-+ I I-+ I I-+ I I-+ I f
I-+ I I-+ I I.+ I I-+ I I
II-+ I I I
I-+ I I-+ I a
I-+ I I-+ I I
I-+ r I
III
-+ I I I
r
IIIIIIII
IIIIIIIIII
IIIIrIIIIIII
IIIII
III
+I+I
+I I+-+ I+I+-+ I+I +
IIIII
+II
0Std +-Dev
31.2
369
4901
.7
.9
.66
.9
.9
5.7
6,3.3
1.5,9,0.0
1,92
.5
.3
.1
.5
.8
.6916
151762I5I519999045957I533630I4
292
907965
30.031 .8
24.227 .6
25436239 .6
3 0.035 €37 ,932,L23.529.324.A
30.929.423.128.337.219 .023 ,6
2316I72B24l12326302426
Num Äve
56 18 .0140 13,3s1 9.372 rO.O
r32 16. ?7 14.3
52 10.018 r4,0
131 16.lL2 t7.164 14 .0
L27 15.?71 t2 .3
133 16.0t2â 19.088 18.?
130 20.063 10.365 9,186 12 .059 24 .089 20,3
134 !2,145 13.343 25,0
139 23.135 19.?92 2r.068 16.0
107 13.74A 26.031 a4.366 a1.713 14 .3
LLz 16.?98 2\,7
122 16 .391 2t,734 22,1a1 L2.746 15.0€ 19,7
58 12 ,357 25.3
106 16 .323 t7 .342 11,199 19.0
118 15.029 a5.76 2a.7
t26 12.022 L!.175 73 183
84 26,72 21 4
11 22374 16 ,315 12 .091 L6.38s 17.?30 21.0
t25 14 .0118 14 0135 18.36A 2r,1
108 3.380 11.081 11.7?8 13.390 220
r37 42.78? 11025 15.091 13 .3
101 19 3119 L2 179 6.135 6,744 20 -117 t2124 24 ,7
L2! 24,041 2!.3
136 20.019 2s.0
124 16.720 25.3
117 26.0142 26,332 2!.7
r23 18 395 2035 r40
141 28,793 37121 26131 19 .350 16 033 2l 0
104 20 -167 18.36L 23 ,316 2A354 29.7
L29 26.776 20 -74 26.0
105 27.755 27.727 32.328 33.349 25.3r0 21.053 20396 23.7a2 24 .771 15 .3
110 L1,3I 18.1
69 L6170 14 .0
9 20.738 20.3
114 1?.3102 r5.726 23.362 25 -3
145 19.011 21.3
r44 25.7103 26.140 22.O
143 16 .0111 19 .311 1{3
115 t7 .7113 18 .3116 17.0r20 13.?41 16 .339 22.0
100 25.0109 18.3
Label
W2DmL 1CXÐ 1FERRI 1ITIS ?CcoNÀ 1ÀK@ 1GDSLN 1ATIU 78cPq 1ÀNL 4GTIM 2D@RRI lJTIA 8ÀTIR 2EMOOR 2ÀTIq 7À4L 4FmL 4guooR 1ÀNL 4BMOOR 2ATIM 88XEW 18nNo 1ÀÆL 18GIDG 5GvooR 3A@RRI IEPÀCK 3ERm 1CGIDG 7BERRI 1CDÀM 1ÀSPEN 18MOOR 9ÀTIR 148uooR ?ÀGIDG 5FERU 18(UD 1ÀæNÀ 1C@L 4BmL 4ÀPÀ* 3ÀFLY 28JÀC 1Bmr 18ÀmL 1ÀGIDC 5ÀBROL 1CTIM 2CFLY 2AERRI lLBI@ 1B@RÛ 1CEI@ 1ÀDÀÞ 1BWRRI 1KDÀM 1CMOOR 4ÀUIM 1ÀGIDG 58
U TIM 2B: i TINÀ 1F
Ç ur¡cd ÞN1aØ WRRI 5F
ERRI 5GERRI 50MOOR 2CTIRø 1ÀMOOR 1BGIDG 18uooR 2Dmr 18cTINÀ 1G¡ERRI 5EGIDG 7ÀXEW 1ÀreRRl 5CaLv 2cTIR 14AK@ 18TIB 9ÀFLY 1ÀTlu 2ÀFLY 1CTINÀ 1EwooL 1aGIDG 5DTIR 14CMOOR 48AROL 18wool 1auooR tBPLY 1DGIDG 5C(uo 1sGIDG 5El@L IE¡ERRI 1DUL 4DDDOW 1ÀML 2ETIB 6À¡DRRI 3ÀEOX IÀ@R 1ÀhL 2CGIæ 38GIæ 3CK@ 1DæNG 18K@ 1GU@R 58ERU 1A
1BPN 1CEEN 1À@RRI 1AERRI lG
1B1À
1ÀmHow 1ÀGIDG 3ÀML 4EYN 1CDDOW 1AYN 1EmL 1ÀHOP 1CYN 1ÀSPEN 1ÀcoNG 1CTÀh 18sÞEN 1CTÀU 1CTIÐ 2ÀJÀC 1ÀHOP 18MI 188PN 1A
ERRI
@NÀHOP
A
PEL5/6 546 U

Rock Fragment and Authigenic Minerals Trend Maps
ATotal Rock Fragments7050000
7000000
50.0045.0040.0035.0030.0025.0020.0015.0010.005.000.00
6950000Percentage OfWhole Rock
6S00000
6850000
6800000B
1 4
7 2
cTotal Authigenic Minerals
84
o I 0000 80000 1 200001 6000@00c20000 600001 0000ü 4000t 800007050000 Distance (m)
7000000
60.0055.0050.0045.0040.0035.0030.0025.0020.0015.0010.005.000.00
6S50000Percentage OfWhole Rock
6900000
6850000
D6800000 Semi-Varlance
7 2
0181512
0 4000080000120000600020000 60000100000 40000 0
Distance (m)
(
xÊN(Yt1 lcor.â slllcñù. ssDFÀNNl¡G ér lRltyodacitêr DURHAM DowNs
cooNGlEÉl 15iltsr/srr /odren¡mìBEANBUAH t1 is6ÙShâlê)
TAULLIAIlKLTDRIEKF 41 (SsUShãlc)
TIR^WARRA l2 (s6i)MERRIMELTA #1 lS6t)
MAL@NA ø lIuf0
GIDGALPA 4l lLimô51 ¡qñirr/S¡lGl /Rhyô)
OÂRALINGIE dl (Glaú. ssl I
BoXWooD ã1 flólc conui /s6rsr El ,
@Wrl (CÊicô Sifceors Sst)
PA¡NlÑG 11 {RhYodÈcúe) DURIIAM
COONGIEIl tSlllâl /Ssl Èolrlgnlm)BEÀNSUSX É1 lSsrSh6'e)
IALALLIAIlxuDRlExE #1 tssÙshõlêt
BROLG^ É1 (Ssl?)TIFAWARR^ 42 (ssl)
GIDGEAtPA¡1 ll rn'est/lgnim/Sllbt/nr'yo)
MÀLoooNA & ll(ú ouLlNGÀRl ll {ssl /srlßl /congl/sh8lôl
DÂRÂLlNGlE Ë1 (Glâu. Sst ì
BOruooD s1 (Vôlc concl ¡ssUslllsl I
AarruenNtc Coupovnvr
Figure 6.36 A) Total rock f'røgments (Merrimeliø Formøtion) trend map. B) Total rock
ftagments (Merrimeliø Formation) aøriogrøm. C) Total øuthigenic minerals (Merrimelia
Formation) trend map. D) Totøl øuthigenic minerals (Merrimelia Formation) anriogram.
322
Co¡øpovex'r
Semi-variogram analysis of all three major diagenetic mineral groups (quartz, clay
and carbonates) attest to this revealing nugget effects which approached 100%
(Appendix 8c).
Therefore no attempt was made to map data of individual minerals. Krigging and
plotting all authigenic mineral data (Figs. 6.36b) did however marginally improve the
nugget effect (Fig. 6.36d) to 60/". The same krigging was performed on a combined
rock fragment dataset (Fig. 6.36a) with semi-variogram analysis suggesting a 67"/"
nugget effect on the data (Fig. 6.36c). The nugget effect on all maps in Figure (6.36)
indicates that a detailed interpretation of the areal distributions will be highlyinaccurate. The maps do however indicate trends in the dataset but not absolute
values.
A comparison of data trends in the maps illustrated in Figure 6.36 show a very
similar distribution. This similarity suggests that there is a relationship where
elevated rock fragment content promotes the generation of authigenic minerals.
diagenetic adjustments in Merrimelia sediments.
sediments. Pseudo-matrix formation and squeezing of ductile grain are the two
most observed mechanical compaction effects. Grain squeezing drastically
reduces pore space in sediments with a high rock fragment proportion
(terminoglacial). Proglacial sediments, where meltwater rinsing dominates, have
less pore space reduction by labile grain squeezing.
growth are limited by the dominance of detrital argillaceous material and high
proportion of labile rock fragments. Matrix mud and alteration clay effectively
occlude pores during compaction.
1) The dissolution of feldspars and,
2) The conversion of smectite to illite.
The latter process is the dominant source of silica for quartz cement in
Merrimelia Formation sediments.
323

CompoNtxr
cement. The reprecipitation of silica derived from quartz framework grains is
envisaged to be temperature independent and linked to overburden pressures.
Merrimelia sediments. Illite was the most prevalent with kaolin the next most
voluminous. Chlorite, glauconitic illite and dickite were seen in trace
proportions.
composed of 95% illite and 5% smectite, having a structural formulae that is
consistent with that published in the literature.
classified into three basic morphologies: filamentous, boxwork and platey. These
three morphologies combine to form five basic illite textures; isolated fibers,
flame/boxwork, honeycomb/boxwork, platey grain-coating and feldspar/rock
fragment dissolution texture.
Merrimelia Formation indicating that there is a link between illite formation,
rock fragment provenance, sediment maturity and reservoir quality.
illite producing mechanism in argillaceous Merrimelia sediments and is
indicative of illite formation in a closed system.
detrital components of argillaceous rock fragments and grain-coating clays
convert from smectite to illite. This forms a substrate which commonly exhibits
smectitic textures (flame boxwork), from which, neoformed filamentous illitegrows. The neoformation of illite dominates porous Merrimelia pore spaces and
is indicative of illite formation in an open system.
Merrimelia Field. It is postulated that the grain-lining clay was formed by
percolation of glacial meltwaters which, was subsequently illitised with depth.
324

AtmttcrNtc Co*rpoNeNr
Later neoformed illite emanates from earlier formed illite plates into the open
aeolian pore spaces blocking pore throats.
simultaneously in open and closed systems, with the reactants necessary for
neoformation of illite in porous lithologies coming from nearby argillaceous
sediments.
grinding action of glaciers and sediment settling in lacustrine-dominated
regions. Detrital clays in rock fragments are most likely inherited from a
previous lithification as chemical activities when the majority of Merrimelia
sedirnents were deposited was minimal.
controlling illite formation in Merrimelia (and Tirrawarra) sediments. Inaddition, the water/rock ratio or the relative size of pore space is also an
irnportant control. Thus illite formation maybe trigged by a combination of
hydrological controls, temperature and reactant supply.
petrological evidence was found, however, to confirm marine influence inMerrimelia sediments. This is in disagreement with the above authors, who
suggest that the formation of "glauconitic illite" has occurred in relation to a
marine incursion. AII petrological evidence points to the original glauconitic
illite grains having been derived from Warburton Basin litharenites and
subsequently illitised with increasing burial.
pseudomorphic replacements of detrital feldspars. The formation of kaolin inupper Merrimelia sediments is related to acid meteoric pore waters and organic
acids that have progressively dissolved detrital feldspars. In lower, impermeable
and organically-barren Merrimelia sediments, the dissolution of feldspars has
been retarded.
preferentially, whereas illite has formed almost exclusively in the low
325

urlarclNrc Comporunwr
permeability Merrimelia sediments. The segregation of these clays, in two units
that share the same hydrological continuum, is a product of:
1) Facies type (low detrital matrix - kaolin-dominated; high detrital matrix -
illite-dominated).
2) Permeability.
discrete chloritoid minerals. The chlorite minerals within basic clasts are an
inherited alteration product. The small "translucent" authigenic chloritoid
minerals associated with basic clasts are thought to be the products of the
breakdown of these fragments. The trace proportions of chloritised basic rock
fragments is reflected in the small volume of authigenic chlorite observed.
and ferroan dolomite: The later two carbonate cements were only observed intrace proportions.
phases outlined by Rezaee et øL (1997) in the Tirrawarra Sandstone. The
development of these stages is more pronounced in Merrimelia sediments. The
development of these siderite stages was observed basin-wide, extending the
findings of Rezaee (1996) which were confined to the Fly Lake-Brolga and
Moorari-Tirrawarra fields.
categories: porosity fill, patch and "seed".
likely linked to organic maturation initially and later, the transformation of
smectite to illite sediments. The compositional zonations of 52 siderite are
indicative of Mg proportions in circulating pore waters and may reflect the
progressive Mg ouþut of smectite-illite reactions.
dissolution (D1) was observed consistently throughout Merrimelia sediments.
This phase of carbonate dissolution was initiated by the same acidic pore waters
that dissolved detrital feldspars and formed co-genetic kaolin and quartz in M1
sediments. The later 32/53 siderite dissolution phase (D2) is not consistently
326

rrr-Írr G EN r c C o ¡øp ox nN r
observed in Merrimelia sediments across the basin. This event is consistently
observed in arenaceous Merrimelia sediments and the Tirrawarra Sandstone
where organic acids penetrated. In the lower poorly permeable Merrimelia
sediments, the influence of organic acids was reduced and therefore the later
dissolution of siderite in these lower sediments is inconsistently observed.
mineral shows retrograde solubility with respect to the other two carbonate
phases, forming in close association with siderite cement.
that has intergrown with illite. This later cement style, named "cowpat" calcite is
restricted to two regions and reflects oscillating pore water acidities.
the dissolution of ankerite in the underlying Warburton Basin basement.
space created in Merrimelia sediments. Feldspar and rock fragment component
dissolution are important forms of secondary porosity formation locally in the
Merrimelia and Malgoona fields respectively.
indicating a very hot diagenetic environment. hr such an environment,
diagenetic modifications are extensive and proceed at a much higher rate.
by arenaceous and argillaceous sediments, which in tum reflect the variations in
sedirnent composition. The ultimate control on the paragenesis of Merrimelia
sediments was provenance and facies type.
Statistical analysis indicates that the kaleidoscopic nature of Merrimelia facies
and inconsistent well control negates the possibility of accurately mapping the
areal distribution of authigenic mineral phases. Trends in the data do indicate
327

crNrc Compoxtwr
that there is a positive link between the presence of authigenic minerals and rock
fragments in Merrimelia sediments.
328
Copyright © 2022 FDOKUMEN