A Study of Statement of Financial Analysis at URSS ...
78
PROJECT REPORT (17MBAPR407) on “A STUDY OF STATEMENT OF FINANCIAL ANALYSIS AT URSS TECHSERVICES PVT. LTD., JAIPUR” By AYUSH NAIR 1AZ17MBA13 Submitted to VISVESVARAYA TECHNOLOGICAL UNIVERSITY, BELAGAVI In partial fulfilment of the requirements for the award of the degree of MASTER OF BUSINESS ADMINISTRATION Under the guidance of INTERNAL GUIDE EXTERNAL GUIDE Prof. SHASHI KUMAR Mr. Ashok Sharma Department of MBA Finance Manager Acharya Institute of Technology URSS Techservices Pvt. Ltd. Department of MBA Acharya Institute of technology, Soldevanahalli, Hesaragatta Main Road, Bengaluru March 2019
-
Upload
khangminh22 -
Category
Documents
-
view
1 -
download
0
Transcript of A Study of Statement of Financial Analysis at URSS ...

PROJECT REPORT (17MBAPR407)
on
“A STUDY OF STATEMENT OF FINANCIAL ANALYSIS AT URSS
TECHSERVICES PVT. LTD., JAIPUR” By
AYUSH NAIR
1AZ17MBA13 Submitted to
VISVESVARAYA TECHNOLOGICAL UNIVERSITY, BELAGAVI
In partial fulfilment of the requirements for the award of the degree of
MASTER OF BUSINESS ADMINISTRATION Under the guidance of
INTERNAL GUIDE EXTERNAL GUIDE
Prof. SHASHI KUMAR Mr. Ashok Sharma
Department of MBA Finance Manager
Acharya Institute of Technology URSS Techservices Pvt. Ltd.
Department of MBA Acharya Institute of technology, Soldevanahalli,
Hesaragatta Main Road, Bengaluru
March 2019

URSS Techservices Private Limited B - 2, Jayanti Market, M.I. Road , Jaipur-302 001 Authorised Dealer for Cummins India Limited
URSS/GEN/253
16/02/2019
TO WHOMSOEVER IT MAY CONCERN
Th is is to cert ify that Mr. Ayush Na ir MBA Student bearing USN NO. 1AZ17MBA13 from Acharya
Institute ofTechnology, Bangalore 560090 affiliated to Vishveswaraya Technological University
Belgaum has undergone train ing program in our Organization from 03.01.2019 to 16.02 .2019.
During his Training with us, we found his to be sincere, hardworking and highly committed .
We wish his all success in his future endeavors.
For URSS TE~~~~~V}~ES1 P~Ji. LTD. for URSS 1°, '~-·-" 1
~ J~:W story Ashok Sharma
HR - MANAGER
Our Goal : Zero Engine Down
Phone : (0141 ) 2367884, 2367883, 2367890 Fax : (0141) 2362559 E-mail : [email protected] Service Centre : A (407) E, Road No.14, VKIA, Jaipur Phone (s .c) : (0141 ) 2330747, 2331435 Fax : 0141 -2330723
ISO 9001
BUREAU VERITAS Certification i
Branch Offices:
• Alwar 98290-69848
• Bhiwadi 01493-51 2944. 98290-50944
• Bikaner 98290-67886
• Jodhpur (0291 ) 2618328. 98290-61832
• Khetri Nager 94613030107
• Sri Ganganager 98290-50945
C

ACHARYA INSTITUTE OF TECHNOLOGY
(Affil iated to Visvesvaraya Technolog ical University, Belagavi, Approved by AICTE, New Delh i and Accred ited by NBA and NAAC)
Date: 04/04/2019
CERTIFICATE
This is to certify that Mr. Ayush Nair bearing USN lAZl 7MBA13 is
a bonafide student of Master of Business Administration course of the
Institute 2017-19 batch, affiliated to Visvesvaraya Technological University,
Belagavi. Project report on "A Study on Statement of Financial Analysis at
URSS TcchScrviccs Pvt. Ltd, Jaipur" is prepared by him under the
guidance of Prof. Shashi Kumar C R. in purtial fulfillment of the
requirements for the award of the degree of Master of Bu~;incss
/\dn'!inistration, Visvesvaraya Tcchn.ological University, Bclagavi, Karnataka.
Signature of Internal Guide
Signature of Principal/Dean Academics
Dr. Devarajaiah R.M. Dean-Academics
ACHARYA iNSTITUTE OF TECl-!NOLOG'/ Bengal um~ 107.
Acharya Dr. Sarvepalli Radhakrishnan Road , Soladevanahall i, Acharya PO, Bengaluru 560 107, Karnataka, Ind ia • www acharya.ac.in/ait • Ph: +91-80-225 555 55 Extn. : 2102 • Fax +91-80-237 002 42 • E-ma il: pri nc ipa lait@acharya .ac .in

DECLARATION
I, Ayush Nair, hereby declare that the Project report entitled "STATEMENT OF
FINANCIAL ANALYSIS" with reference to "URSS TECHSERYICES PVT.
LTD." prepared by me under the guidance of Prof. SHASHI KUMAR, faculty of
M.B.A Department, (Acharya Institute of Technology) and external assistance by
Mr Ashok Sharma, Finance Manager, URSS Techservices Pvt. Ltd. I also
declare that this Project work is towards the partial fulfilment of the university
Regulations for the award of degree of Master of Business Administration by
Visvesvaraya Technological University, Belagavi . I have undergone a summer
project for a period of six weeks. I further declare that this Project is based on the
original study undertaken by me and has not been submitted for the award of any
degree/diploma from any other University / Institution .
Place: Bangalore
Date: 05/04/2019

ACKNOWLEDGEMENT
I wish to express my sincere thanks to our respected Principal, Dr. Prakash M.
R., beloved Dean-Academics, Dr. Devarajaiah R. M., and deep sense of
gratitude to Dr. M. Bagali, HOD, Acharya Institute of Technology, Bengaluru
for their kind support and encouragement in completion of the Internship
Report.
I would like to thank Prof. Shashi Kumar, Professor, Department of MBA,
Acharya Institute of Technology, Bengaluru and external guide Mr. Ashok
Sharma, Finance Manager, URSS Tech Services Pvt. Ltd., Jaipur, who gave
me golden opportunity to do this wonderful Project in the esteemed
organization, which helped me to learn various concepts.
Finally, I express my sincere thanks to my Parents, Friends and all the Staff of
MBA department of AIT for their valuable suggestions in completing this
Project Report.
Place: Bangalore NAME: AYUSH NAIR
Date: USN: 1AZ17MBA13

TABLE OF CONTENTS
Chapter no. Chapter name Page no.
Executive Summary 1
1 Introduction
1.1 Introduction
1.2 Industry profile
1.3 Company Profile
1.3.1 Promoters
1.3.2 Vision, Mission & Quality Policy
1.3.3 Products & Services profile
1.3.4 Areas of operations
1.3.5 Infrastructure facilities
1.3.6 Competitors Analysis
1.4 SWOT Analysis
1.5 Future growth and prospects
2 - 17
2 Conceptual background & Literature review
2.1 Theoretical background of the study
2.2 Literature review
18 -35
3 Research Design
3.1 Statement of the problem
3.2 Need of the study
3.3 Objectives
3.4 Scope of the study
3.5 Research methodology
3.6 Limitations
3.7 Chapter Scheme
36 - 40
4 Analysis and Interpretation
4.1 Profit and Loss Statement
4.2 Balance Sheet
4.3 Ratio Analysis
41 - 62
5 Summary of Findings, Suggestions and Conclusions
5.1 Findings
5.2 Suggestions
5.3 Conclusions
63 - 68
Bibliography 69
Annexure 70

LIST OF TABLES
Table No. Particulars Page Nos.
Table - 4.1 Table showing Net Profit Ratio 45
Table – 4.2 Table showing Gross Profit Ratio 46
Table – 4.3 Table showing Operating Ratio 47
Table – 4.4 Table showing Current Ratio 49
Table – 4.5 Table showing Quick Ratio 49
Table – 4.6 Table showing Cash Ratio 50
Table – 4.7 Table showing Total Asset Turnover Ratio 51
Table – 4.8 Table showing Fixed Asset Turnover Ratio 52
Table – 4.9 Table showing Capital Employed Turnover Ratio 53
Table – 4.10 Table showing Inventory Turnover Ratio 54
Table – 4.11 Table showing Debtors Turnover Ratio 55
Table – 4.12 Table showing Creditors Turnover Ratio 56
Table – 4.13 Table showing Debt-To-Equity Ratio 57
Table – 4.14 Table showing Debt-to-Capital Ratio 58
Table – 4.15 Table showing Interest Coverage Ratio 59
Table – 4.16 Table showing Earnings Per Share 60
Table – 4.17 Table showing Market Price per Share 61
Table – 4.18 Table showing Price Earnings Ratio 62

LIST OF FIGURES AND CHARTS
Chart No. Particulars Page Nos.
Chart - 4.1 Chart showing Net Profit Ratio 45
Chart - 4.2 Chart showing Gross Profit Ratio 46
Chart - 4.3 Chart showing Operating Ratio 47
Chart - 4.4 Chart showing Current Ratio 49
Chart - 4.5 Chart showing Quick Ratio 49
Chart - 4.6 Chart showing Cash Ratio 50
Chart - 4.7 Chart showing Total Asset Turnover Ratio 51
Chart - 4.8 Chart showing Fixed Asset Turnover Ratio 52
Chart - 4.9 Chart showing Capital Employed Turnover Ratio 53
Chart – 4.10 Chart showing Inventory Turnover Ratio 54
Chart – 4.11 Chart showing Debtors Turnover Ratio 55
Chart – 4.12 Chart showing Creditors Turnover Ratio 56
Chart - 4.13 Chart showing Debt-To-Equity Ratio 57
Chart - 4.14 Chart showing Debt-To-Capital Ratio 58
Chart - 4.15 Chart showing Interest Coverage Ratio 59
Chart - 4.16 Chart showing Earnings Per Share 60
Chart - 4.17 Chart showing Market Price Per Share 61
Chart - 4.18 Chart showing Chart showing Price Earnings Ratio 62

1
EXECUTIVE SUMMARY
The course of MBA is provided by Visvesvaraya Technological University consists of
prescribed syllabus which needs its students to choose an internship opportunity with top
entities or corporations for a term of approximately six weeks in fourth semester starting from
3.01.2019 till 16.02.2019. This project was prepared on “Study on financial aspects of URSS
(Upper Rajasthan Sales and Services) Techservices Pvt. Ltd.” helps to understand the market
which deals in selling and servicing of engine equipment and parts along with the oiling of
the engine parts which includes support from top management for enhancing customer
relationship with URSS TECHSERVICES PVT. LTD. All the project was carried out as per
the terms and conditions prescribed by the guidelines of VTU. The target respondents were
the visitors of URSS TECHSERVICES PVT. LTD., with an uncountable proportion for the
study of statement of financial analysis of the company. Tables & charts of the company were
proposed for translating responses into a vital & crucial database from those accumulated
data with understandable information along with other inferences and additional examination.
This report includes the profile of the company along with the information on the industry
profile and the future growth and the prospects of the economy in the financial sector,
company’s vision, mission and quality policy. The report also consists of the data
interpretation and the research conducted with respect to the research and findings of the
whole organisation.
The project also reflects SWOT analysis of the company which refers to the strength and
weakness of the company as well as the opportunities and the threats in the external
environment. It also includes the financial analysis of the company that helps one define the
financial weakness and the strength of the company. This report has the following
organization’s financial statement that is the trading and profit/loss statement comparative
balance sheets and inflow outflow of cash liquidity. It also shows relationship between the
company’s financial assets and the various ratios. The ratios include all kinds of liquidity,
profitability, solvency and turnover based ratios.
Every research study consists of the financial aspects and performance capabilities of the
entity based on sales and services. At the end it also has the bibliography.

2
CHAPTER 1
INTRODUCTION

3
Chapter 1
Introduction
1.1 Introduction
An Internship means a work done in a company say for a period of 1 , 2, 3 or 6 months or
even for a full year and for that particular period the internee would be called the intern of the
company who will manage the affairs of the company either by spending time amongst the
other employees and helping them or observing each and every step according to set rules
and regulations and work ethics specified by the company. It is most likely for the students
who are pursuing their graduation or most frequently taken by those college going students to
contribute their leisure time in the working of the corporate world while building positive
attitude and building a constant and healthy relationship with other personnel. Overall this
training session provided to the students helps them in facing all kinds of corporate culture
along with dissimilar situation.
This applies to those enterprises to implement business solutions with certain attributes for
giving advantages for the entity as well as the employees. There are many kinds of roles and
responsibilities that an intern has to face during the internship period. Students gets a lot of
benefits and it also helps them for personal grooming and building self-confidence whenever
they join a corporation in the future.
There are so many cultural and theoretical aspects to study to understand a corporate situation
and those fields include science and technology commerce trade industry innovation media
tourism and all types of laws and permanent issues. After all the internship period the intern
has to submit their reports and the company would scan them and comes to know whether the
intern has understood something on his or her journey with the entity.

4
1.2 Industry Profile
The first automobile was built in 1885 by Karl Benz which he installed first internal
combustion engine on a tricycle and was awarded by a patent by German government for the
invention by the end of 1908. Every single part was built in a factory which was hand made
later on in 1908 ford motor company came up with an idea of mass production. This resulted
in expansion of the industry wherein various parts were now manufactured by various
companies by this expansion has result in till date by end of 2018 to have somewhere around
1500 companies supplying various parts like Piston, Connecting Rod, ECU’s sensors and
various motors to biggest manufacturers to the smallest manufacturers. This industry has
many phases which are divided into various parts like engine manufactures, engine part
manufacturers, brake manufacturers, brake pads and brake calliper manufacturers.
This part supply industry for sensors and pumps is till date ruled by Bosch international they
manufacture various sensors like door sensors wiper sensors speed sensors fuel supply
sensors etc. they also do manufacture fuel pumps wiper blades wiper arms head lights break
sensors parking sensors etc in an average Bosch gets 190 to 120 patents a month.
Volkswagen Salzgitter is the top engine manufacturer for the Volkswagen group who
manufacture top of the line engines for Audi Bugatti Skoda, Porsche and other VW
companies currently Toyota motor company is the leading automobile part manufacturers
who produces ecus brakes transmissions engines and sensors for top manufacturers like
Tesla, Toyota, Subaru and some other local Japanese companies they also do produce diesel
generators for electric supply in buildings as well.
An automobile sector contains numerous varieties of organisations which does many
operations like production marketing sales development and design. This sector had
generated vast sales amongst the whole world. it’s worth is countless and are in terms of
millions and trillions in the whole world. It also inculcates all heavy weighted equipment cars
SUV’s trucks tractors parts oil and all kinds of lubricants for maintaining and smoothening
the process of vehicles which consists of 2 wheelers 3 wheelers and 4 wheelers and multi
wheelers.

5
There are many kinds of cars which are categorised into many different categories these are
as follows:
Passenger Cars
Hindustan Motors, Calcutta
Addison's
Premier Automobiles,
Standard Motor Products of India, Madras
Light Commercial and Utility Based Vehicles
Mahindra & Mahindra, Bombay -
Bajaj Tempo, Poona now Force Motors
Standard Motor Products of India
Heavy and Medium Range Vehicles
Heavy Vehicles factory, Chennai
Tata Motors, Poona, then known as TELCO
Ashok Motors, later Ashok Leyland, Madras
Hindustan Motors
Premier Automobiles
Simpsons & Co, Madras
2 Wheelers Including Motorcycles and Scooters
In initial 1960’s Bajaj brand-based vehicle called the “Bajaj Chetak” had most sales revenue
in all continents. All types manufacturers of two wheelers received appropriate licenses along
with the commission based on tariffs were issued.
Bajaj Auto, Poona
Automobile Products of India, Bombay
Mopeds India Limited, Tirupati
Escorts Group, New Delhi
Ideal Jawa, Mysore

6
Top automobile companies
There are 5 top players currently in India those are as follows:
Tata Motors
They are the top automobile manufacturing company of India and are currently counted as
the leading successful market player amongst all other competitors in India and overseas as
well
Hindustan Motors Limited
They are one of the car manufacturing company which has captured good market share in the
recent years through its low-priced cars it was founded by BM Birla in the year 1942.

7
Ashok Leyland
It was founded in the year 1948 by Hinduja group is group and is the 10th
in the world for the
manufacturer of cars
Maruti Suzuki India
It is still the biggest automobile company jointly manufactured by Maruti an Indian company
and Suzuki a Japanese company which holds 53 % stake in the Indian automobile market
Bajaj Auto
Bajaj auto is a company formed by Jamnalal Bajaj a Rajasthan based businessman who
manufactures 2 wheelers and 3 wheelers all over the world
Hyundai Motors
These are those motor companies who have successfully captured a decent market share in
India although it’s a south Korean company which originates from Seoul city
Recent trends and growth of financial sector
There is a lot of potential growth to be seen in the future with autonomous driving electric
vehicles and self-charging cars tyre less cars multi terrain cars (cars which can travel over
water as well as on land). In future we can expect flying cars as well. For this daily there is a
research going on various aspects some of the future cars are also seen testing on roads.
The automobile sector has been successful in achieving significant growth in the past years
due to increase in demand for household and building new infrastructure facilities. There
were many challenges and hurdles which were overcame in this sector with an increment in
the demographics that is people from different fields are managing to get their own personal
vehicle and maintain it during regular intervals with servicing and oiling.

8
By the end of 2020 there are new and improved supercars awaited by the customers which
have never before seen facilities with enhanced and optimised safety feature with
differentiation in in its pricing range from diverse set of customers. People are expecting new
designs and features to travel anywhere in the world they want to explore. Increased
competition had brought a huge big change in the automobile sector each brand has to bring
innovation in the field who will attract more customers within certain time limit will survive
in this competition.
1.3 Company Profile
URSS (Upper Rajasthan Sales & Services) Techservices Private Limited is a service
dealership company which deals in sales & servicing of engine parts like fuel pump,
emission, air filter etc of various company’s engines which includes Cummins limited for
generators & engines and Valvoline limited for industrial & engine oils across Rajasthan.
It is a leading service organisation for marketing products and market support to
reputed multi-national corporations with respect to engineering products.
It also includes service workshop managed for approximately 3000 customers in
Rajasthan.
It has excellent business relations with nearly every manufacturing industrial unit of
the state, Cement plants, Textile units, Marble/Granite mining & processing industry,
engineering industry like MICO Hi-Tech gears, NBC and other bearing industrial units, Govt.
departments like PHED, Railways, GWD, Rajasthan State Mines & Minerals, Hindustan
Copper, Hindustan Zinc, ONGC, Suratgarh Thermal Power Station, UltraTech cement etc.

9
1.3.1 Promoters
The promoters of URSS TECHSERVICES private limited are as follows:
Rajeev Singh Managing
Director
Ajay Sharma Marketing Manager
OP Sharma Finance Manager
Neewani Gupta KSB Division Manager
MP Venugopalan Service Manager
Ajay Kumar Head Office Parts
Rajeev Singh 70
Sadhana Raghuvanshi 16
Archana Singh 3.8
Aditya Vikram 10.2
1.3.2 Vision, Mission & Quality Policy
Vision
URSS Techservices Pvt. Ltd. is known as a great organization for providing quality products
and Prompt, Reliable & Quality service at affordable price.
Mission
Its primary aim is to provide products and services to engineering companies for healthy and
smooth functioning of heavy weighed vehicles like tractors and trucks which carry lots of
loads onto it. It strongly believes that success will be achieved through a customer service
philosophy of understanding customer’s needs and responding with products and service
solutions that offer more value than our competition.
Quality Policy

10
They consider Quality to be the consistent satisfaction of Customer expectations.
Business Philosophy:
URSS is a service organization and strongly believe that success will be achieved through a
customer service philosophy of understanding customer’s needs and responding with
products and service solutions that offer more value than our competition.
Milestones:
It was established in the year 1976 as a Cummins dealer.
In 1984, it became a dealer for KSB industrial Pumps.
In 1999, it set up Cummins Service Centre for overhauling Cummins engines above 500
KVA to factory standards.
In 2000, it became Valvoline Cummins oil dealer.
In 2001, it became Chicago Pneumatic dealer.
In 2006, it set up TATA authorised service centre for complete range of commercial vehicles.
1.3.3 Products & Services Profile
It usually deals only in those companies which manufactures parts of the engines and
servicing of them. The products of URSS Techservices Pvt Ltd are as follows:
1. Cummins limited - Generators & engines
Cummins limited is a company which was founded by local mechanics William Glanton
Irwin and Clessie Cummins in the year 1919 at Columbus, Indiana which sells at a minimum
of 190 region across the globe with diversified network above 600 corporations &
distributors and involves more than 6000 dealers for products that generates engines air
handling and fuel systems and semi-trucks.

11
2. Chicago pneumatic limited - Air compressors
Chicago pneumatic limited is a company founded in the year 1894 at Chicago, Illunios by
John W. Duntley which is an industrial manufacturer of air compressor generators light
towers and other hydraulic equipment. It’s a global manufacturer company which provides
wide distribution across the world.
3. KSB Limited - Pumps & valves
KSB limited is one of the top lenders of valves, pumps with services headquartered at
Frankenthaler, Germany by Stephan Timmermann, Matthias Schmitz Ralf Kannefass &
Stephan Bross in the year 1871. The company KSB consists of manufacturing, marketing and
service facilities along with 16000 personnel and have per annum worth in crores.

12
The Services of URSS Techservices Pvt Ltd are as follows:
1. TATA Authorised service stations
TATA motors are an automobile-based company headquartered Mumbai Maharashtra in the
year 1945 which is widely spread across India and have countless and unorganised service
stations through the nation and even the company is ranked amongst the top automotive
companies in the world.

13
2. Valvoline limited - Engine and industrial oils
Valvoline limited is a subsidiary company of Ashland incorporation which was founded in
the year 1986 at Lexington, Kentucky, United States which provides automotive service
services along with oil changes and anti-freezing changes across the globe.
1.3.4 Areas of Operations
It operates across the whole state of Rajasthan through internet platform those cities are as
follows:
Ganganagar
Hanumangarh
Churu
Bikaner
Dhaulpur

14
Jaisalmer
Jhunjhunu
Jodhpur
Bhilwara
Barmer
Pali
Jalor
Bundi
Karauli
Ajmer
Jaipur
Dausa
Alwar
Bharatpur
Sawai madhopur
Tonk
Sirohi
Udaipur
Banswara
Dingapur
Kota
Baran
Jhalawar
Chittorgarh
1.3.5 Infrastructure Facilities
URSS Techservices Pvt. Ltd is an organisation which is an authorised sale and services-based
dealer of CUMMINS Diesel Sales and Services Pvt Ltd Pune and it has 2 branch offices one
at jodhpur and Bhiwandi and it was established in the year 1976 with over 150 employees
and a gross turnover of Rs 30 crores. It is the first choice of customers who wants to buy
engine oils and stuffs undertaken with maintenance and repairs of diesel engines Stanford
electrics and control panels of DC sets. This company had a full-fledged service enter with an

15
area of 10000 sq. ft. for repairing overhauling and testing diesel engine from 50 HP to 2500
HP. They operating in Jaipur from 1995. And this facility is provided to all Cummins
customers in northern parts of India. A group of 15 highly motivated commercial staffs works
in various departments like parts and service and finance etc support the field as well as
service centre team. Adequate computerized inventory ensures timely availability of spared
so as to have minimum equipment downtime. Other facilities are as follows
A strength of 32 field service engineers and 36 service mechanics supported by a
dedicated team of 22 commercial staff catering to over 6000 engines
Offices at jodhpur Bhiwadi and services engine at Khetri, Alwar, Bikaner, Jaisalmer
and Sriganganagar.
5 Service staff and 3 Commercial staff At Jodhpur.
4 Service staff and 2 Commercial staff At Bhiwadi.
4 Service staff At Jaisalmer.
To support this population and 500 KVA above population in North India. It is a joint
venture between URSS and Cummins.
1.3.6 Competitors Information
There are not many competitors for UPPER RAJASTHAN SALES AND SERVICES
TECHSERVICES PRIVATE LIMITED as they are involved in dealing all engine oiling
selling and servicing of parts of the product and they are the dealers for VALVOLINE engine
oils tata services and CUMMINS for engine and KSB for air compressors or generators.
Some of them are as follows:
Bajrang engine auto parts
Volvo service and parts centre
Kirloskar spare parts
General motors
Continental engines limited
Force motors
Ashok Leyland
Bharat diesel
Azad engine spare parts
New Hadoti Diesel
Triumph motors

16
1.4 SWOT Analysis
SWOT analysis help ascertaining all the strengths weaknesses opportunities and threats of a
specific company which in determining the position and helps conquering all the future goals
and adopt strategies for achievement of goal soon.
WITH REFERENCE TO THE COMPANY
STRENGTH
Dedicated and skilled empowered employees
Dealer of reputed companies like CUMMINS, CP, TATA & KSB
Employee friendly management
Modern workshop facilities
Huge customer base
Expertise in strategic thinking and implementation
WEAKNESS
System lacks like improper supply delivery services
Limited financial resources
Problems in management of inventories
Lacking in regular oiling and servicing of engineering companies
Rigid structure and payment collection

17
OPPORTUNITY
Strong demand for engine products in future will help in expansion.
Government contracts of railways will increase the demand for product
Inventio of new technology will help them to improve the quality of engines.
Opportunity to expand business abroad.
THREAT
Entrance of private players in to the market
Intervention of the government or local authority
Ever increasing prices of raw materials
1.5 Future Growth and Prospects
There is a lot of growth in this industry in the future considering all the financial analysis of
the organisation they contribute more to the gross domestic product of the country and as per
the current statistics and reports of this organisation it deals with the engine parts servicing
along with the oiling of the small engine components and their accessories.
It is believed that this private limited company has a high growth potential considering its
past business and its current performance it does benefits in selling and servicing of the
California based company CUMMINS, other high market base and intensified company of
the world like us based Valvoline KSB, Chicago Pneumatic and TATA.
This company has a lot of potential for growth in the north Indian market where it is very
difficult for the people to search for servicing and maintenance of their personal or office
based vehicles they can even expanded to the south Indian market through the
recommendations and a positive word of mouth of their own particular regular customers
they have huge service camps and stations across Rajasthan with is yielding handsome profits
and have made a lot of growth and advantages over the other major players in the market
with selected product and service based marketing strategy.

18
Chapter 2
CONCEPTUAL BACKGROUND & LITERATURE
REVIEW

19
Chapter 2
Conceptual Background and Literature Review
2.1 Theoretical background of the study
Financial analysis is a procedure through which assessing organisations, ventures, spending
plans and other funds along with the related elements of deciding execution and
appropriateness. Ordinarily, financial analysis is utilized to breakdown whether a substance is
steady or sufficiently gainful to warrant a financial speculation. When taking about an
organisation, a money related expert examination behaviour is highly concentrating on salary
explanation, monetary record and income articulation
Usage by Stakeholders
It is utilised by a surge of partners for example credit and value speculators, the
administration, the open and the leaders inside the association. All these partners have a
distinctive interest and they apply a wide range of systems to address their issues, for instance
value speculators are keen on the high-income intensity of the association and maybe the
management ability and developments of profits. Leasers need to guarantee that the chief is
paid on the association’s obligation of securities whenever due.
Usage by Managers
The financial ratios are those ratios which is very important to check the magnitude of any
two numerical values and it helps in scrutinizing the monetary worth and value of any kind of
corporation. These ratios are opted to know the firm current creditors and the professional
owners too.
Usage by Company
the achievement of any business firm is greatly dependent upon its cost awareness. Along
these lines the administration should dependably remember the cost factor is the way to
progression. All monetary investigation examines the financial exchanges of the firm. It
provides light to all long term and short-term assets of the firm are properly manged and
utilized. Regardless of whether monetary assets are utilized for long purposes like procuring
any hardware or gear or so forth.

20
How to analyse
The examination should call the attention to with respect to what is the pattern of the firm in
stretching out credit to its clients.at that point normally the firm should bear the occurrence of
enthusiasm on its working capital raised from the bank and would affect the organisation. It
should help in finding ways against letters of credit. For example, when these reports are
revealed the firm enters the sales proceeds.
How to conduct a financial study
This study conducted on the statement of financial analysis has made the helps to know and
understand the current market positions and well as performance of the company and its
business that where it is running smoothly in an effective and efficient way.
The financial statements must acquire those data which must relate to the monetary affairs of
the entity it would also be very crucial for the bankers and the investors who could use this
vital information to survey the associations execution to take budgetary choices like
allowable bank fund limit and expectations about the future. Accordingly, budget summary
gives the information which is expected to access the future of corporation from benefits of
incomes
It consists of income statement along with the comparative balance sheet with the ratio
analysis is very feasible in conducting the business research and analysing the past and the
current trends of the entity as a result there should be appropriate future growth with ample pf
profits and reserves for the survival of the business.
Objectives of Financial Analysis
It helps in profit maximisation of shareholders
It helps in proper and optimal utilization of finance
It helps in building a good corporate image of the firm
It creates goodwill for the benefit of the company
It maximizes the wealth of the shareholders
It helps in monitoring the cash inflows and outflows
It helps in creating resources with minimal utilization of each of them

21
It improves coordination within the internal management of the company
It reduces overall cost of capital
It provides guidance for planning the capital structure of the company
It reduces operating risks
Scope of Financial Analysis
All scope for financial analysis is categorized into two approaches which are mentioned
below:
1. Traditional Approach
2. Modern Approach
1. Traditional Approach
It consists of following functions which must be played the financial manager which is as
follows:
Mobilization of funds through all the financial instruments like preference and equity
shares, bonds & debentures
Compliance of legal finance for distribution and procurement of funds
Systematic allocation of short- and long-term funds
2. Modern Approach
It consists of the following functions which must be played the financial manager which is
justified below:
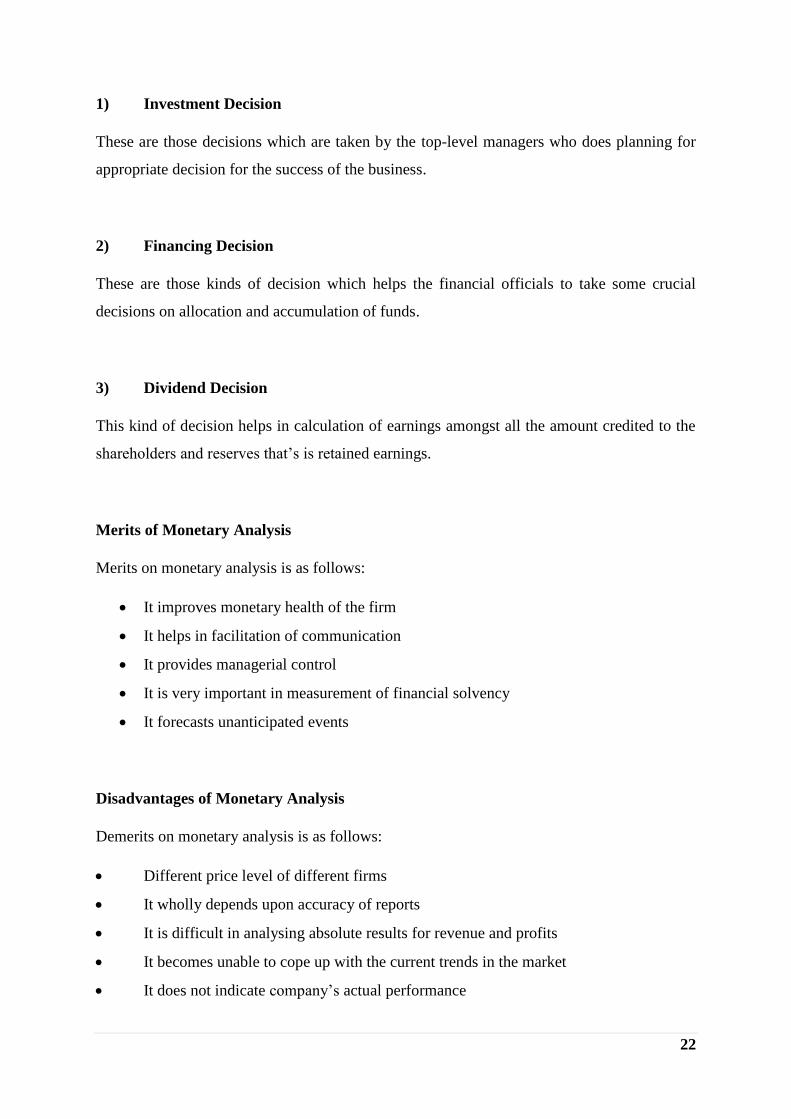
1) Investment Decision
2) Financing Decision
3) Dividend Decision
22
1) Investment Decision
These are those decisions which are taken by the top-level managers who does planning for
appropriate decision for the success of the business.
2) Financing Decision
These are those kinds of decision which helps the financial officials to take some crucial
decisions on allocation and accumulation of funds.
3) Dividend Decision
This kind of decision helps in calculation of earnings amongst all the amount credited to the
shareholders and reserves that’s is retained earnings.
Merits of Monetary Analysis
Merits on monetary analysis is as follows:
It improves monetary health of the firm
It helps in facilitation of communication
It provides managerial control
It is very important in measurement of financial solvency
It forecasts unanticipated events
Disadvantages of Monetary Analysis
Demerits on monetary analysis is as follows:
Different price level of different firms
It wholly depends upon accuracy of reports
It is difficult in analysing absolute results for revenue and profits
It becomes unable to cope up with the current trends in the market
It does not indicate company’s actual performance

23
Sources of Financial Analysis
there are 4 sources of financial analysis through which each and every firm or company have
to go through those are as follows
1. Gains and Expense Account
2. Income Statement
3. Balance Sheet
4. Cash Flow Statement
1. Trading and Profit and Loss Account
Trading and profit and loss account is calculated to determine profit levels. It provides vital
information on future of shareholders wealth along with the total expenditure occurred while
revenue generation. Trading and profit and loss account is crucial for evaluating new
opportunities and trends based on current and previous year.
2. Income Statement
Income statement is useful to every business because:
To know profitability position of the organization
It also helps in determining the status and prestige of the company who is running its
business
It provides the organisation a clear picture of the entity along with its current position
It determines the worth to pay off the shareholders within a reasonable time frame to
measure success in the long run.

24
3. Balance Sheet
It consists of equity and liabilities side as well as a side for assets of the company which is
crucial and vital to dispose in front of the public to entertain a market standard and strength to
compete in this big competitive world.
The Analysis of the financial statements is the process of overseeing and analysing financial
statement which includes:
Monetary strength at the conclusion of a year
It contains assets and liabilities which generates benefits
It helps in generating cash inflow
It consists of asset side and liabilities side
Assets consists of investments, non-current assets which consists of fixed tangible
assets and intangible assets, current assets which consists of inventories, accounts
receivables and cash and cash equivalents
Equity and Liabilities consists of shareholders’ equity, provisions & accounts payable
The total of equity and liabilities matches with the total of the asset
4. Cash Flow Statement
Cash flow statement status shows the related finance acquired to utilise for working capital
and requirement of cash. It is also very helpful to evaluate the cash availability with banks
and the entity. This information shows a cash’s incoming and outgoing from the organisation.
Objectives of cash flow statements is as follows:
It reveals liquidity condition about a firm
It helps in evaluating an organisations future profit potential
It helps the organisation to take vital financial decisions on maximum permissible
finance limit of a bank, along with prediction for future
It helps in crucial investing decisions
25
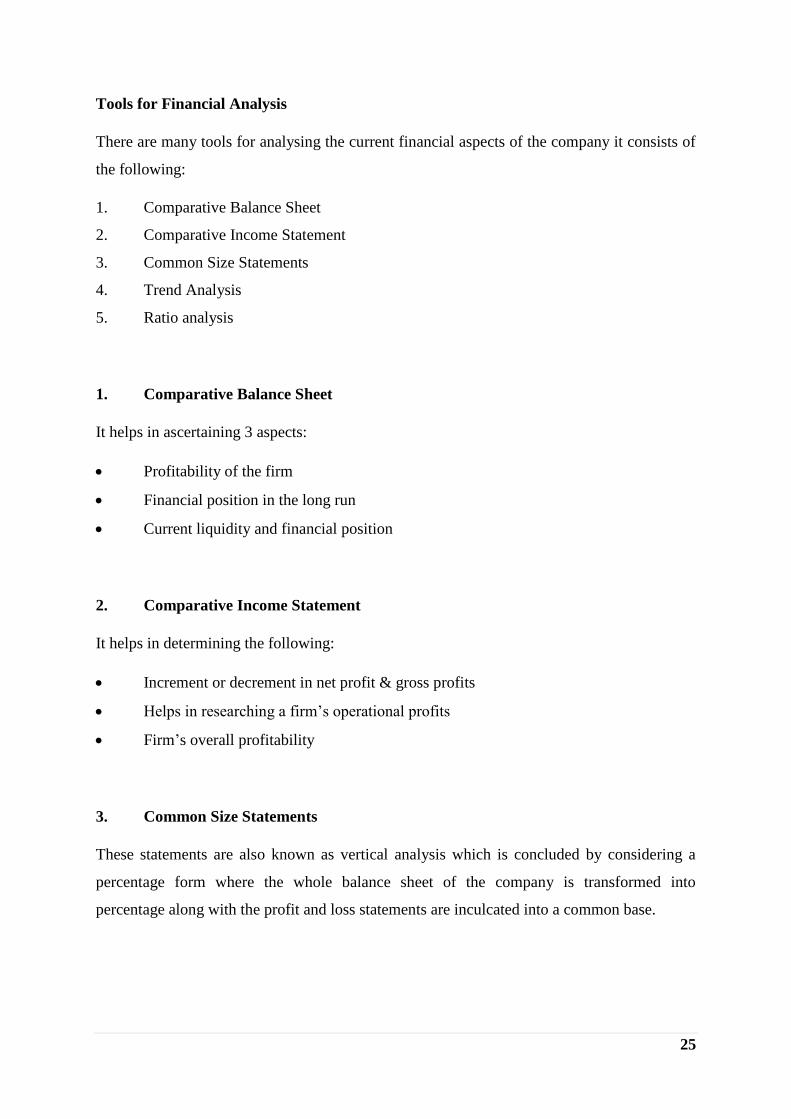
Tools for Financial Analysis
There are many tools for analysing the current financial aspects of the company it consists of
the following:
1. Comparative Balance Sheet
2. Comparative Income Statement
3. Common Size Statements
4. Trend Analysis
5. Ratio analysis
1. Comparative Balance Sheet
It helps in ascertaining 3 aspects:
Profitability of the firm
Financial position in the long run
Current liquidity and financial position
2. Comparative Income Statement
It helps in determining the following:
Increment or decrement in net profit & gross profits
Helps in researching a firm’s operational profits
Firm’s overall profitability
3. Common Size Statements
These statements are also known as vertical analysis which is concluded by considering a
percentage form where the whole balance sheet of the company is transformed into
percentage along with the profit and loss statements are inculcated into a common base.

26
4. Trend Analysis
This analysis shows the company’s current trend in the whole market through a graphical or
diagrammatic representation over a series of years which represents an upward or a backward
trend and a comparison between the past and the current year is highlighted. As a result,
quality and performance of the management is detected through good and poor sign.
5. Ratio analysis
This analysis reveals the consistency of 2 opted number values extracted from financial
statements of an organisation. Moreover, they are screened in plenty standards to analyse the
monetary condition of an organisation. For all the content analysis of the financial statements
5 kinds of ratios are used those are mentioned as follows:
A. Profitability Ratios
Profitability ratios determines a firm’s usage of financial assets and monitoring the
expenditures to know the return. It helps in revealing a true financial position of the
enterprise in monetary terms there are many kinds of profitability ratios some of them are as
follows:
1) Net Profit Ratio
It helps in evaluation of efficiency of management to profitably conduct a business from
organisation’s eye. It indicates profit on shareholders wealth. A business entity considers
higher net profit ratio for better efficiency.
PBDIT = profit before depreciation, interest and tax
Net Profit Ratio = Net Profit/Net Sales*100
2) Gross profit ratio
This is a type of ratio in which the company compares its gross profit with that of its revenue
basically it justifies basic profitability of the firm. It’s called margin ratio too which indicates
percentage of sales.

27
Gross Profit Ratio = Gross Profit/Revenue from Operations*100
3) Operating profit ratio
Operating Profit Margin is productivity or execution, proportion which is used to compute the
level of benefits an organisation produces from its activities, before subtracting expenses and
determining charges.
Operating Profit Ratio =Gross Profit / Sales
B. Liquidity Ratio
Liquidity ratio evaluates how should debt cover the cash of entity. It helps in measuring the
short-term adequacy for certain time intervals to check and measure the solvency level. There
are many kinds of liquidity ratios some of them are as follows:
1) Current Ratio
To quantify the outlet or dissolvability for an examination and comparing the current liability
with those current assets to reach the possible obligation and ability of an establishment. 2:1
is the ideal one for this.
Current Ratio = Current Assets / Current Liabilities
2) Quick Ratio
It considers firm’s strengths to pay off its subsequent debts by realising only quick assets that
is prepaid expenses stock and marketable securities. These ratios are also called acid test ratio
and the ideal ratio seems to be 1:1.
Quick Asset = Current Asset – Stock – Prepaid Expenses
Quick Ratio=Quick Asset/Current Liability
3) Cash Ratio
This ratio measures the firm’s liquid assets to that of entity’s subsequent liabilities which
helps in the determination of knowing if the firm would be able to cover its short period
liabilities.
The ideal ratio in it is 2 :1.
Cash Ratio=Cash and Cash Equivalents/Current Liability

28
C. Activity ratios
Activity ratio also called efficiency ratios, as well as turnover ratios which measures the
entity’s impact through the optimally utilizing assets. It helps in interpreting the efficiencies
of the establishment. In short, it indicates the position of assets usage. There are many kinds
of activity ratios 3 of them are as follows:
1) Fixed Asset Turnover Ratio
The fixed asset turnover ratio is a productivity ratio that estimates the organisations arrival on
their interests in property plant by contrasting net sales and fixed assets. In other words, it
computes how productively an organisation is creating deal with its machine and gear.
Fixed Asset Turnover Ratio =Revenue /Fixed Asset
2) Total Asset Turnover Ratio
The asset turnover ratio is an effectiveness proportion that estimates an organisations capacity
to generate revenue through the usage of all assets. Moreover, it demonstrates how
proficiently an organisation can utilize its revenue through proper resources.
Total Assets Turnover Ratio=Net Sales/ Total Assets
3) Capital Employed Turnover Ratio
A capital employed turnover ratio is a kind of ratio in with which a firm estimates the deals
generated utilizing its current fixed resources. It sets up a connection between capital utilized
and the deals.
Capital Employed = Total Assets – Current Liabilities
Capital Employed Turnover Ratio=Net Sales/ Capital Employed
4) Inventory Turnover Ratio
A stock turnover ratio is an effectiveness ratio with which it is very easy to derive how a firm
adequately tales the load of the entity by separating cost of merchandise sold with the normal
stocks prevailed in a company.
Average Inventory = (Opening Stock + Closing Stock)/2
COGS = Opening Stock + Purchases + Direct Expenses – Closing Stock

29
Inventory Turnover Ratio=COGS / Average Inventory
COGS = Cost of Goods Sold
5) Debtors Yield Ratio
A debtor’s yield ratio is an efficiency ratio with which a firm how effectively the firm
collects payments from its debtors
Average Receivables = (Opening Debtors &B/R + Closing Debtors & B/R)/2
Net Credit Sales = Sales – Sales Return
6) Creditors Yield Ratio
A creditor’s yield ratio is an efficiency ratio with which a firm how effectively the firm pays
off its debt.
Average Receivables = (Opening Creditors & B/P + Closing Creditors & B/P)/2
Net Credit Purchase = Purchases – Purchase Return
D. Debt Ratios
Leverage or debt ratio estimates the time taken to waive off all liabilities of the firm. It
interprets whether organisation would be able to reimburse future debt obligations within
stipulated time limit and the debt financed by proportion. Major types of debt or leverage
ratios are mentioned below:
1) Debt Equity Ratio
debt equity ratio is a ratio demonstrating the general extent of proprietor’s equity and the
obligation used to fund an establishment’s assets. closely identifies with utilizing, the
proportion is otherwise called liability ratio
Debt Equity Ratio= Total Liability/ Share Holders Equity

30
2) Debt to Capital Ratio
The debt capital ratio is a kind of leverage ratio in which the company’s capital structure
level of risk with monetary solvency is measured during a point of time when the company is
running in a good pace.
Debt to Capital Ratio= Total Debt/ (Total Debt + Total Equity)
3) Interest Coverage Ratio (%)
The interest coverage is utilized to decide how effectively an organisation can pay their
advantage costs in extraordinary obligation. This ratio is determined by separating an
organisations’ profit before earnings before interest and tax (EBIT) for a similar period
Interest Coverage Ratio= EBIT / Interest Expenses
E. Market ratios
Market ratio helps in evaluating the price of stock and shares which included the comparison
of investment and profits of the establishment. It also helps in determining whether the shares
are undervalued or overvalued. Major types of market ratios are mentioned below:
1) Earnings Per Share
EPS considers in estimating performance at a business and where the actual income of the
company is derived, and it is simultaneously compared with the shares which are held by the
company.
EPS = Earnings Available for Equity Shareholders – Preference Dividend / Equity Shares
Held
2) Market Price Per Share
It’s a share at which share price of an establishment could be used at market place, like a
stock exchange. An investor has to make sure that the stocks or shares are charged at
sufficiently low price. It helps the investors to buy shares at a low level from the open
market.

31
Market Price per share = Current Market Price / Number of Outstanding Shares
3) Price Earnings Ratio
Price earnings ratio helps company to know whether the stocks have been priced at an
undervalued or overvalued rate during a stage of competition amongst multiple firms for the
success of any business.
Price earnings ratio = Market price per share / Earnings per share
2.2 Literature Review
1. N. K. Nair (1991) had concentrated on part in India’s fortify trade. Thus, review
accepted concrete, building objects possessed key in economy. Review uncovered in 1990 –
1991 the trade had introduced a limit of forty-eight metric tonnes with a creation of 48
million tons. It also had estimated a bond industry limit development of approximately 100
million tons by the year 2000. This review had additionally concentrated on probability and
monetary related execution list of the concrete business with a specific end target to
differentiate between fundamentals and perspective.
2. Hempel, Simonpson (1998) has examined in financial institutions based on
budgetary administrative effectiveness in Taiwan. The review found that the higher the return
on assets, the higher the money related execution or productivity of the financial institution
3. Miller (1977) said that all that insignificant favourable position of additional
commitment constructs lessons as a proof of those arguments based on commitments, while
fringe benefit costs gradually raise upward which will focus on the trade-off while packing all
the evaluations and important returns that are used in financing any kind of projects
4. Govind Rao and Roe (1999) concentrated on the effect of working capital and those
financial analysis which made a huge impact on and huge gains in the concrete industry of
India. Both the positive and the negative connections that could be investigated between
working capital ratio proportion and the gains from resourcefulness

32
5. Elizabeth Duncan and Elliott (2004) had expressed report at the level of
productivity, client administration, financial finishing amongst Aussies money related entity
demonstrated that all kinds of measures of budgetary execution, for instance, edge of
premium, profit from optimally maintaining the resources and capital ampleness are prior
only connected with those clients and the quality of administration.
6. Pandey (1985) thinking along those lines it is watched that at the first an investigation
of the financing and the speculation choices accessible to the entity outright to be done, and
on assessment of execution by identifying with the destinations set up towards the start of the
budgetary arrangement. In the usage of the arrangement which consists of an agenda and the
rectifications of the projections is the key in capacity of the varieties of outside and inside air
of the association.
7. Eisenhardt (1989) states that it is the second issue of the hazardous conveyance that
emerges when the main and the operator have diverse demeanours towards this vulnerability.
This issue here is that the standard and the operator may lean toward various activities
considering various vulnerable inclinations.
8. Gitman (1997) stated that the periodical change is as indicated by the movement and
interests of the association. This will help lessen the instabilities or dangers that can be a
hindrance to the development of that organisation. This wholly guarantees dependability and
gainfulness in the worry. Along these lines, the monetary arrangement can be extremely
helpful for those entrepreneurs to withstand awful circumstances and exceed expectations
amid great circumstances.
9. Brealey and Myers (1998) said that this gives us all details on finance as there are
even software’s based on some methods that calculate the possibility of variation for each of
the component of the plan which itself is based upon some area of study

33
10. Adolphus J. Toby (2008) has conducted the study on the liquidity performance
proportion ratio of the Nigeria based manufacturing firms. The result of the study had put
forward a significant relationship between liquidity, profitability, efficiency and leverage
values. The study had also attempted to suggest that to guide money supply, monetary policy
could be used to facilitate the monetary transmission mechanism by integrating minimum
liquidity requirement for the manufacturing industry.
11. Hajihassani (2012) he stated that correlation of monetary execution in the concrete
part in Iran. This review demonstrated an examination of the monetary execution for the
review from 2006 to 2009. The correlation of the money related execution of certain bond
organisation can be evaluated by utilising different monetary ratios and it estimates the
concrete entities working in the boundaries of Iran. The money related portion are divided
into 3 classifications. In this it is presumed that the execution of concrete entity on the
premise of various productivity proportions then in the view of the liquidity proportion and
the used proportion.
12. A Rachchh Minaxi (2011) have proposed an examination of budgetary explanations
which includes the investigation of those monetary articulations to concentrate on those data
that could encourage basic leadership factor. It is the way through which the connection
between segments of the monetary explanation’s gets a superior comprehension of the
position and execution of the element
13. Greninger (1996) distinguished and refined monetary proportions utilising a Delphi
technique considering all the regions of liquidity, reserved funds, resource distribution,
lodging expenses, taxation rate, security against swelling and insolvency. In the view of the
Delphi discoveries it projected that part of monetary prosperity to common person.
14. T Salmi And Marthikainen T (1994) has stated that here there was a survey
conducted on hypothetical as well as experimental establishments of monetary ratio-based
investigation which proposed that a deliberate structure for dissecting budgetary explanations
together with the watched isolate which inquiries about the patterns that could be useful for
cultivating the improvements of research. On the off chance that the after affects of the
research in the evaluation of cash-based relationship which are very helpful for leaders, the
outcomes ought to be hypothetically reliable.

34
15. Robert Halsey F , J John Wild And Subramanyam K. R. (2006) had expressed
and analysed the information of budgetary articulations in the use of exemplary devices and
systems to universally useful money based proclamations and related information to
determine valuable assessments and inductions in the examination of business, and as a result
it also diminishes dependence on future predictions, guess works and instant decision making
for dealing with those choices.
16. Snehalata GC Bhodiakhera (2015) has analysed that proportion of examination has
been done to look at the money related proclamations and monetary records of Mahindra and
Mahindra co also offer recommendations of the change for the effectiveness of the
organisation.
17. Bell and Brown (1968) Beaver (1968) And Beaver Et Al. (1980) has analysed
greatness in value fluctuations encompassing appraisal in an organisation’s yearly profits.
Their outcomes demonstrated that the connection happened rapidly and, in this manner, the
EMH in the semi solid frame holds ground.
18. Amalendu Bhunia, Sri Somnath Mukhti and Sri Gautam Roy (2011) has
investigated to differentiate the budgetary qualities and shortcomings of Indian open segment
pharmaceutical businesses by properly setting up link in components within accounts.
19. Altman and Eberhart (1994) told usage in neural framework of separating
verification that grieved corporate through Italian national. Operating further than 1000
examined firms with proportions in able factors, create arrangement in neural systems very
close to accomplishment tests.
20. Carlose Correia (2007) clarified an investigation in organisation, regardless of
administration, speculators or else invested individuals, ought to incorporate an examination
of the establishment’s monetary transactions. The clearest and properly accessible
wellsprings of this kind of data is the firms yearly predicted reports. As per the large
acknowledged book keeping rehearse, the money related articulations will genuinely show
the conditions of the establishments business and consequences of operations for the
particular year.
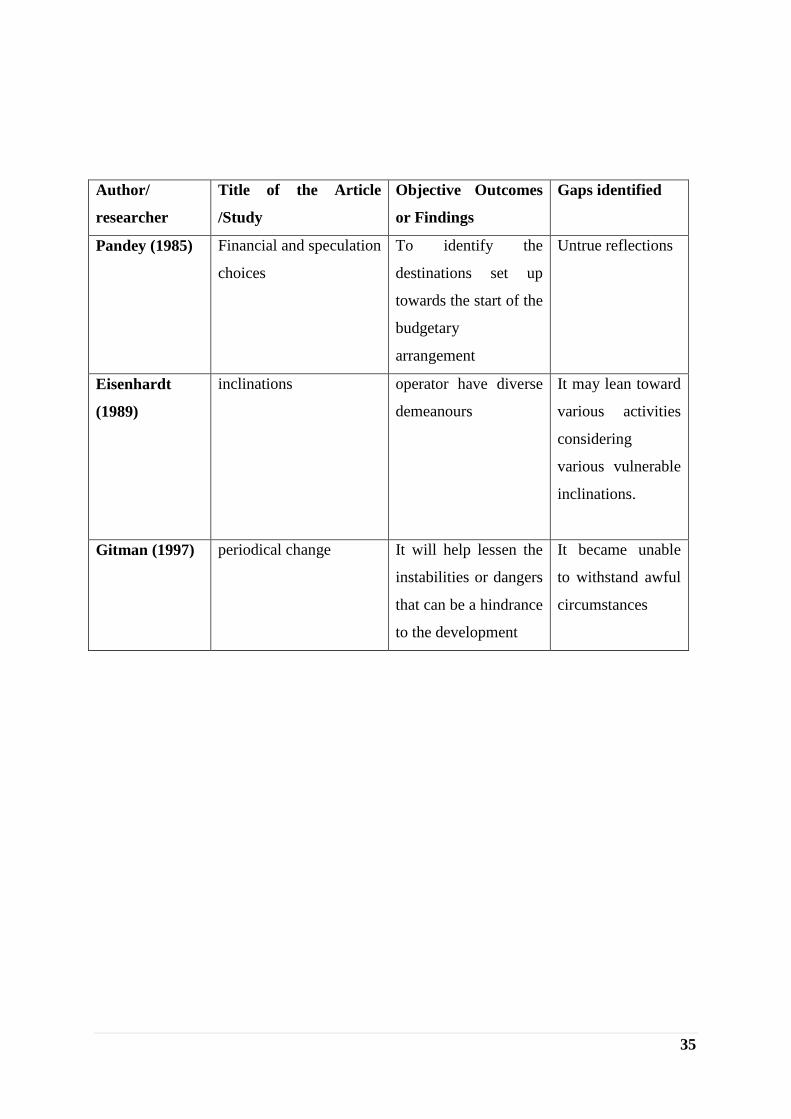
35
Author/
researcher
Title of the Article
/Study
Objective Outcomes
or Findings
Gaps identified
Pandey (1985) Financial and speculation
choices
To identify the
destinations set up
towards the start of the
budgetary
arrangement
Untrue reflections
Eisenhardt
(1989)
inclinations operator have diverse
demeanours
It may lean toward
various activities
considering
various vulnerable
inclinations.
Gitman (1997) periodical change It will help lessen the
instabilities or dangers
that can be a hindrance
to the development
It became unable
to withstand awful
circumstances

36
CHAPTER 3
RESEARCH DESIGN

37
Chapter 3
Research Design
3.1 Statement of the problem
The financial aspect of the company helps in discovering the monetary situation of the whole
organisation. It is helpful in evaluating the quality and shortcomings of the firm which is
legitimately settled by the connection between the thing those consolidated profit and loss
account along with the balance sheet and the problem of the statement is that ratios do not
give the clear picture of the firm’s financial position and strength amongst other firms and
entities.
3.2 Need of the study
The need for the study is that there is enough potential of growth for the individual as well as
the organisation and both the fields would be able to work with their full effort and interest to
tackle almost each and every problem of the deal of servicing and selling the products to their
customers and making a far better relationship then other competitors in this vast world of
technology people will bring new inventions to conquer any business which might be next to
impossible.
The study conducted on the financial analysis of URSS Techservices Private Limited has a
large and steady market in Rajasthan and it also encourages the employees and the financial
analysists to evaluate the current tax rate slabs goods and services tax and various other kinds
of taxes which is levied according to the rules and guidelines levied by the government with
inclusion of exemptions and deductions.
3.3 Objectives
To determine the profitability using techniques in an entity
It helps to identify the cash coverability factor for company
For examining leverage of an organisation
To formulate the market trends of the company

38
3.3 Scope of the study
An investigation of the capital structure includes the examination of the long haul and
additionally here and now sources that an organisation taps to meet its necessities of those
funds. The extent of the review is bound to the sources that URSS Techservices Pvt. Ltd.
Throughout the year is under review from 2015 – 2018
3.4 Research methodology
It is absolute and it’s a is also a basic structure of the review that aids the accumulation and
evaluation of the information. Research is an important and a logical approach towards taking
care of the issue and it helps in progression of then organisation to enhance its own potential.
This showcases a conceivable strategy for gathering vital information from a roundabout
technique, one by one and touching base at the best arrangement considering the exploration
of the well-arranged opinion of the research.
RESEARCH DESIGN
In this design we will think about the subjective and quantitative way toward dealing with the
available information which is assembled and accumulated in a one place which concentrates
the last outcomes with utilizing research apparatuses. As a result, this experiment configures
the basic methodology what we have chosen. we can make our examination without any
issues.
COLLECTION OF DATA
The above information had been accumulated from the yearly report, apparent sites and all
places where an organisation information is available:
Sources of Data Collection
Secondary Data
1. Company’s yearly reports

39
2. www.urssjpr.com
3. Company Audited Final Statement and Conclusions
4. Company’s Registration Websites
3.6 Limitations
The study is basically done in light of the auxiliary information given in the monetary
explanations.
This study depends upon the recorded information and the data given in the yearly
reports and all the audited financial report statement of the organisation.
This study does not provide a clear picture of the organisation’s financial accounts
and aspects as all companies should follow the rules and regulations prescribes by the
government of India as well as the registrar of companies.
This study helps in evaluating an organisation’s funding on different departments and
their individual requirement with an aim to reserve profits for future development of
the organisation but these profits would be generated in the business is mainly
dependent on the individual performance of the organisation.
This study does not clearly indicate how the organisation is moving on in this vast
world with huge number of competitors.

40
3.7 Chapter Scheme
Chapter 1: Introduction
This chapter includes Introduction, Industry profile & Company Profile which also consists
of Promoters, Vision, Mission & Quality Policy, Services along with the product profile,
scope of the operations, Infrastructure facilities, SWOT Analysis, Future growth and
prospects
Chapter 2: Conceptual background & Literature review
This chapter describes Theoretical background of the study& Literature review
Chapter 3: Research Design
This chapter includes Statement of the problem, need of the study, Objectives, Scope of the
study, Research techniques adopted, Limitations & at last Chapter Scheme
Chapter 4: data Analysis and Interpretation
This chapter contains all the Financial Analysis, Observation on Statement of P&L and
Statement of Balance Sheet & Ratio Analysis
Chapter 5: Summary of Findings, Conclusion and suggestions
This chapter contains Findings, Conclusions & Suggestions

41
Chapter 4
ANALYSIS AND INTERPRETATION

42
Chapter 4
Data analysis and interpretation
4.1 Profit and Loss Statement
PARTICULARS Mar'18 Mar'17 Mar'16
Revenue from operations 503868565.82 466696066.16 461729097.31
Excise Duty .00 .00
Other Income 2902570.02 9818174.33 8229457.48
TOTAL INCOME 506771135.84 476514240.49 469958554.79
EXPENDITURE:
Material Consumed 381528108.70 360191690.35 360063387.41
Employee benefit expenses 64750152.66 58774057.00 55972226.43
Finance costs 8631751.35 8087181.39 7659716.98
Depreciation & amortization
expenses
2451978.67 2002081.24 2144939.18
Other expenses 33040438.95 31700393.01 31584376.96
TOTAL EXPENDITURE 490402430.33 460755402.99 45424646.96
Profit before tax 16368705.51 15758837.50 12533904.83
Tax expenses 6571162.22 5805019.00 5512809.63
Profit for the year 9797543.29 9953818.50 7021098.20
Appropriation of profit
Dividend
Net profit for the year 9797543.29 9953818.50 7021098.20

43
4.2 Balance Sheet
PARTICULARS Mar 18 Mar 17 Mar 16
LIABILITIES AND EQUITIES
OWNER’S FUNDS
Equity Share Capital 2500000.00 2500000.00 2500000.00
Reserves & surplus 134918438.11 125120894.82 115167076.32
Money received against warrants
on shares
Total Owner’s Fund 137418438.11 127620894.82 117667076.32
NON-CURRENT LIABILITIES
Long Term Borrowings 3271918.93 770629.93 346507.13
Others long term debts
Long Term Provisions
Total Non-Current Liabilities 3271918.93 770629.93 346507.13
CURRENT LIABILITIES
Short Term Borrowings 64307485.15 59216599.50 58579278.77
Trade Payables 43067970.74 44089420.62 30030417.15
Other Current Liabilities 1745008.40 5868922.33 658676.54
Short Term Provisions 9503191.45 8729263.02 6612078.53
Total Current Liabilities 118623655.74 117904205.47 95880450.99
Total Capital and Liabilities 259314012.78 246295730.22 213894034.44
ASSETS
NON-CURRENT ASSETS
Fixed Assets
Tangible Assets 17467954.25 14983287.25 11283970.93
Intangible Assets
Non-Current Investments 12950000.00 2385000.00 2835000.00
Long Term Loans and Advances 40488570.00 41307771.00 45619449.92
Other Non-Current Assets 3948901.28 8570278.19
Total Non-Current Assets 74855425.53 67246336.44 59738420.85

44
PARTICULARS Mar 18 Mar 17 Mar 16
CURRENT ASSETS
Inventories 104701703.34 99701375.22 87721523.80
Cash and bank balances 32349789.92 20399176.62 19280420.79
Trade receivables 43807376.69 51221360.92 42779691.28
Other Current Assets 3599708.30 7727481.02 4373977.22
Total Current Assets 184458587.25 179049393.78 154155613.59
Total Assets 259314012.78 246295730.22 193974221.68
45
4.3 Ratio Analysis
PROFITABILITY RATIOS
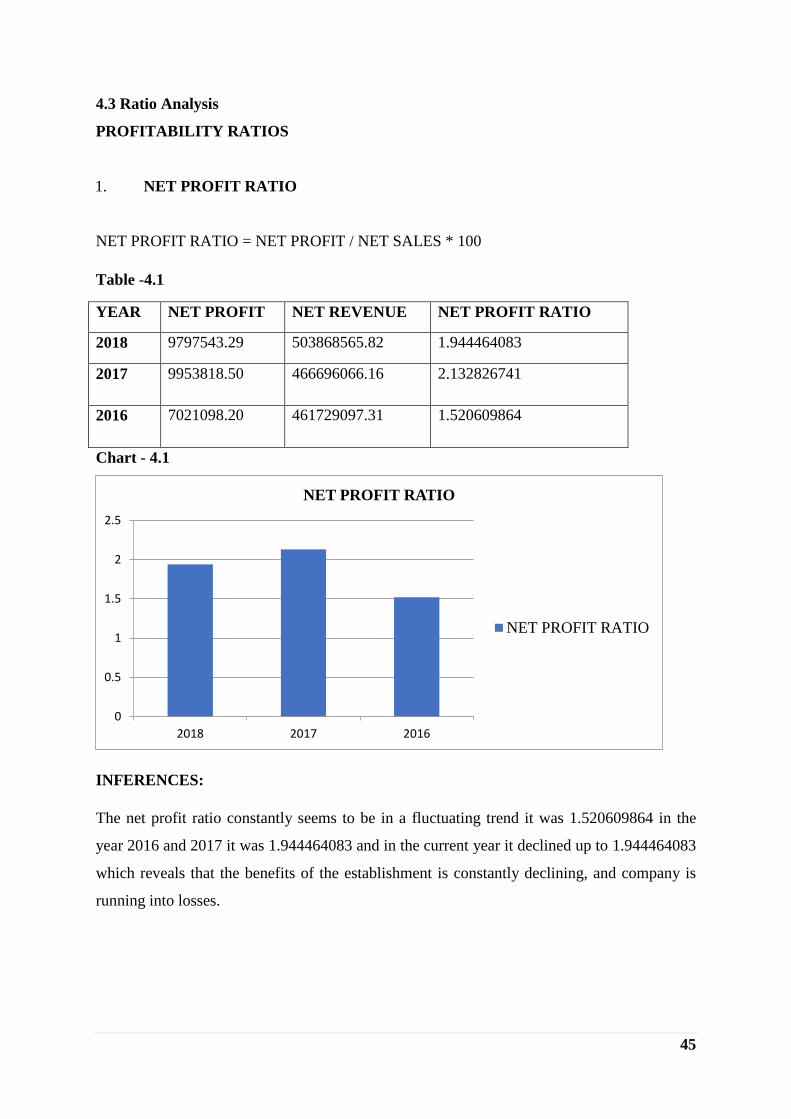
1. NET PROFIT RATIO
NET PROFIT RATIO = NET PROFIT / NET SALES * 100
Table -4.1
YEAR NET PROFIT NET REVENUE NET PROFIT RATIO
2018 9797543.29 503868565.82 1.944464083
2017 9953818.50 466696066.16 2.132826741
2016 7021098.20 461729097.31 1.520609864
Chart - 4.1
INFERENCES:
The net profit ratio constantly seems to be in a fluctuating trend it was 1.520609864 in the
year 2016 and 2017 it was 1.944464083 and in the current year it declined up to 1.944464083
which reveals that the benefits of the establishment is constantly declining, and company is
running into losses.
0
0.5
1
1.5
2
2.5
2018 2017 2016
NET PROFIT RATIO
NET PROFIT RATIO

46
2. GROSS PROFIT RATIO
GROSS PROFIT RATIO = GROSS PROFIT/REVENUE FROM OPERATIONS*100
Table – 4.2
Chart - 4.2
INFERENCES:
The Gross profit ratio constantly seems to be in an unsteady trend it was 2.714558147 in th
year 2016 & 2017 it as reduced to 3.376681023 and in the current year it declined up to
3.248606208 which interprets the benefits of the establishment are constantly declining and
company is running into huge losses.
0
0.5
1
1.5
2
2.5
3
3.5
4
2018 2017 2016
GROSS PROFIT RATIO
GROSS PROFIT RATIO
YEAR GROSS PROFIT REVENUE
FROM
OPERATIONS
GROSS PROFIT RATIO
2018 16368705.51 503868565.82 3.248606208
2017 15758837.50 466696066.16 3.376681023
2016 12533904.83 461729097.31 2.714558147

47
3. OPERATING PROFIT RATIO
OPERATIONAL BENEFIT RATIO = GROSS BENEFIT / SALES
Table
– 4.3
Chart - 4.3
INFERENCES:
Operational benefit ratio is decreasing continuously from 2.714558147 in 2016 to that of
3.376681023 in 2017 and in the current year it is3.248606208 which means that it would
have a fewer edge of working benefit for the instalments of profits and the production of
stores
59
60
61
62
63
64
65
66
67
68
2018 2017 2016
OPERATING PROFIT RATIO
OPERATING PROFIT
RATIO
YEAR OPERATING
PROFIT
SALES OPERATING PROFIT
RATIO
2018 16368705.51 503868565.82 3.248606208
2017 15758837.50 466696066.16 3.376681023
2016 12533904.83 461729097.31 2.714558147
48
LIQUIDITY RATIOS
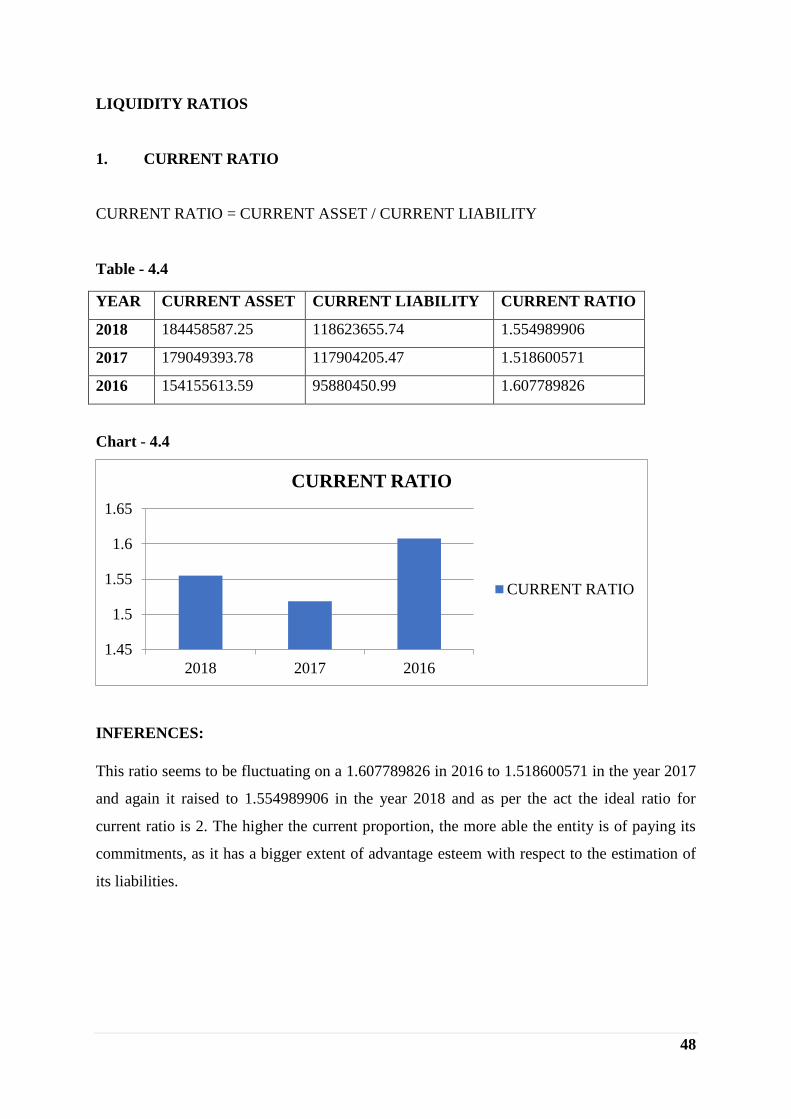
1. CURRENT RATIO
CURRENT RATIO = CURRENT ASSET / CURRENT LIABILITY
Table - 4.4
YEAR CURRENT ASSET CURRENT LIABILITY CURRENT RATIO
2018 184458587.25 118623655.74 1.554989906
2017 179049393.78 117904205.47 1.518600571
2016 154155613.59 95880450.99 1.607789826
Chart - 4.4
INFERENCES:
This ratio seems to be fluctuating on a 1.607789826 in 2016 to 1.518600571 in the year 2017
and again it raised to 1.554989906 in the year 2018 and as per the act the ideal ratio for
current ratio is 2. The higher the current proportion, the more able the entity is of paying its
commitments, as it has a bigger extent of advantage esteem with respect to the estimation of
its liabilities.
1.45
1.5
1.55
1.6
1.65
2018 2017 2016
CURRENT RATIO
CURRENT RATIO

49
2. QUICK RATIO
QUICK ASSET = CURRENT ASSETS – STOCK – PREPAID EXPENSES
QUICK RATIO = QUICK ASSET / CURRENT LIABILITY
Table – 4.5
YEAR QUICK ASSET CURRENT LIABILITY QUICK RATIO
2018 79756883.91 118623655.74 0.672352267
2017 79348018.56 117904205.47 0.672987178
2016 66434089.79 95880450.99 0.692884619
Chart - 4.5
INFERENCES:
As compared to the previous years the Quick ratio seems to be declining on a 0.692884619 in
2016 to 0.672987178in the year 2017 and again it diminished 0.672352267 in the year 2018
and as per the act the ideal ratio for quick ratio is 1:1. The more the quick ratio, the more the
fit the entity is paying off its commitments, as it has a bigger extent of advantage esteem in
respect of the estimation of its liabilities.
0.66
0.665
0.67
0.675
0.68
0.685
0.69
0.695
2018 2017 2016
QUICK RATIO
QUICK RATIO

50
1. CASH RATIO
LIQUID CASH RATIO = CASH and CASH EQUIVALENTS / CURRENT LIABILITY
Table – 4.6
YEAR BALANCE OF
CASH
CURRENT LIABILITY CASH RATIO
2018 32349789.92 118623655.74 0.272709433
2017 20399176.62 117904205.47 0.173014835
2016 19280420.79 95880450.99 0.201088132
Chart - 4.6
INFERENCES:
As compared to the previous years the Cash ratio seems to be fluctuating on a 0.201088132
in 2016 to 0.173014835 in the year 2017 and again it reached up to 0.272709433 in the year.
The higher the monetary proportion, the more skilled will be the entity to pay off certain
liabilities up to a limited extent.
0
0.05
0.1
0.15
0.2
0.25
0.3
2018 2017 2016
CASH RATIO
CASH RATIO

51
ACTIVITY RATIO
1. FIXED ASSET TURNOVER RATIO
FIXED ASSET EFFICIENCY RATIO = NET REVENUE / FIXED ASSETS
Table – 4.7
Chart - 4.7
INFERENCES:
The fixed asset turnover ratio of the company is constantly declining from 40.91902577 in
the year 2016 to 31.14777541 in the year 2017 and in the current year it is 28.8453106 which
indicates better utilization of fixed assets as compared to previous years.
0
10
20
30
40
50
2018 2017 2016
FIXED ASSET EFFICIENCY RATIO
FIXED ASSET
TURNOVER RATIO
YEAR NET
REVENUE
FIXED
ASSETS
FIXED ASSET EFFICIENCY
RATIO
2018 503868565.82 17467954.25 28.8453106
2017 466696066.16 14983287.25 31.14777541
2016 461729097.31 11283970.93 40.91902577

52
2. TOTAL ASSETS TURNOVER RATIO
TOTAL ASSETS EFFICIENCY RATIO = NET REVENUE / TOTAL ASSETS
Table – 4.8
Chart - 4.8
INFERENCES:
This ratio is fluctuating from 2.380363191in 2016 to 1.894860564 in 2017 and in current
year it is 1.943082676 which implies that that the entity is not properly utilising its
advantages productively and doubtlessly have the board or creation issue.
0
0.5
1
1.5
2
2.5
2018 2017 2016
TOTAL ASSETS EFFICIENCY RATIO
TOTAL ASSET
TURNOVER RATIO
YEAR NET
REVENUE
TOTAL ASSETS TOTAL ASSETS
EFFICIENCY RATIO
2018 503868565.82 259314012.78 1.943082676
2017 466696066.16 246295730.22 1.894860564
2016 461729097.31 193974221.68 2.380363191

53
3. CAPITAL EMPLOYED TURNOVER RATIO
CAPITAL EMPLOYED = TOTAL ASSETS – CURRENT LIABILITIES
CAPITAL EFFICIENCY RATIO = NET REVENUE / CAPITAL EMPLOYED
Table – 4.9
Chart - 4.9
INFERENCES:
Total Capital employed turnover ratio of the company is constantly declining from
4.707017521 in 2016 to 3.634944494 in 2017 and in current year it is 3.581400862 which
means that the entity is not equally monitoring its capital structure to lose the market share in
a competition.
0
1
2
3
4
5
2018 2017 2016
CAPITAL EFFICIENCY RATIO
CAPITAL EMPLOYED
TURNOVER RATIO
YEAR NET
REVENUE
CAPITAL
EMPLOYED
CAPITAL EFFICIENCY
RATIO
2018 503868565.82 140690357 3.581400862
2017 466696066.16 128391524.8 3.634944494
2016 461729097.31 98093770.69 4.707017521
54
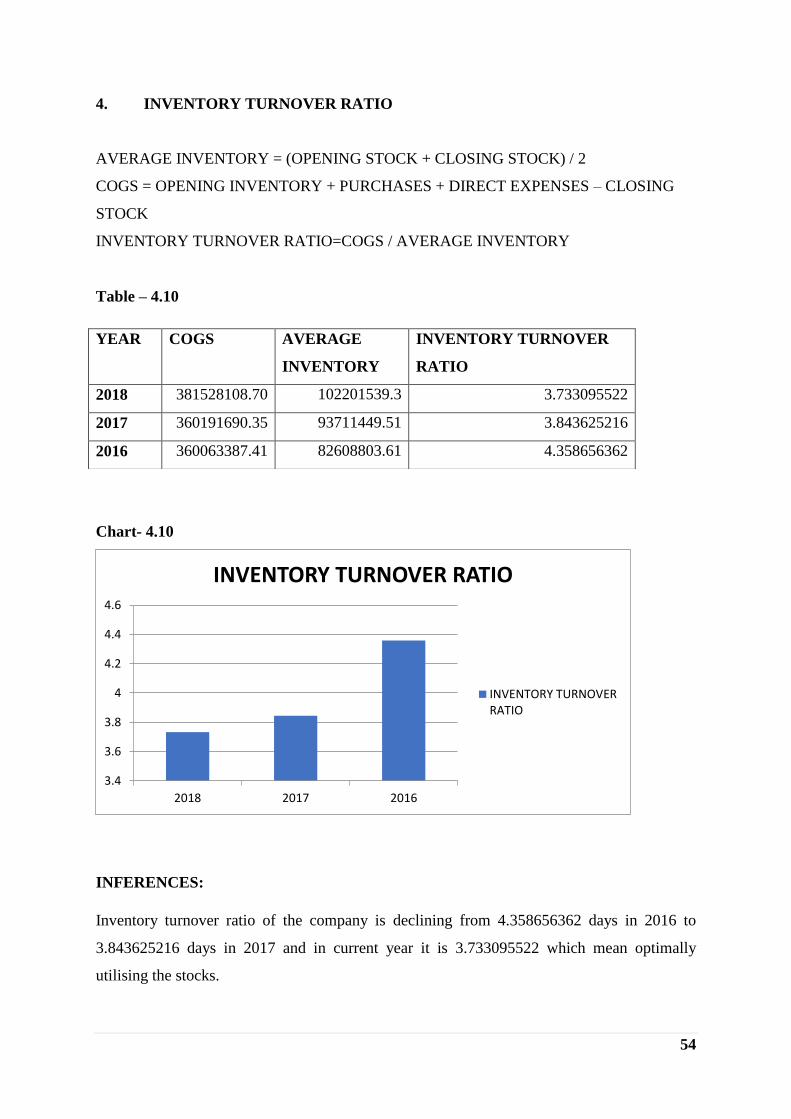
4. INVENTORY TURNOVER RATIO
AVERAGE INVENTORY = (OPENING STOCK + CLOSING STOCK) / 2
COGS = OPENING INVENTORY + PURCHASES + DIRECT EXPENSES – CLOSING
STOCK
INVENTORY TURNOVER RATIO=COGS / AVERAGE INVENTORY
Table – 4.10
Chart- 4.10
INFERENCES:
Inventory turnover ratio of the company is declining from 4.358656362 days in 2016 to
3.843625216 days in 2017 and in current year it is 3.733095522 which mean optimally
utilising the stocks.
3.4
3.6
3.8
4
4.2
4.4
4.6
2018 2017 2016
INVENTORY TURNOVER RATIO
INVENTORY TURNOVERRATIO
YEAR COGS AVERAGE
INVENTORY
INVENTORY TURNOVER
RATIO
2018 381528108.70 102201539.3 3.733095522
2017 360191690.35 93711449.51 3.843625216
2016 360063387.41 82608803.61 4.358656362

55
5. DEBTORS EFFICIENCY RATIO
AVERAGE RECEIVABLES = (OPENING TRADE RECEIVABLES + CLOSING TRADE
RECEIVABLES) / 2
DEBTORS EFFICIENCY RATIO = NET CREDIT SALES / AVERAGE DEBTORS
Table – 4.11
Chart- 4.11
INFERENCES:
This ratio is fluctuating initially through 10.77 for 2016 to 9.92 for 2017 and in current year it
is 10.60 days to get payments from debtors which more from the last year which is again a
fluctuation in its threshold
9.4
9.6
9.8
10
10.2
10.4
10.6
10.8
11
2018 2017 2016
DEBTORS EFFICIENCY RATIO
DEBTORS
TURNOVER RATIO
YEAR
NET CREDIT
SALES
AVERAGE
RECEIVABLES
DEBTORS TURNOVER
RATIO
2018 503868565.82 47514368.81 10.60455139
2017 466696066.16 47000526.1 9.929592387
2016 461729097.31 42848569.99 10.77583447

56
6. CREDITORS TURNOVER RATIO
AVERAGE RECEIVABLES = (OPENING CREDITORS &B/P + CLOSING CREDITORS
& B/P)/2
Table – 4.12
Chart- 4.12
INFERENCES:
Creditors turnover ratio of the company is fluctuating from 14.13 days in 2016 to 10.04 days
in 2017 and in current year it is 8.87 days to pay off certain debts of the company
0
2
4
6
8
10
12
14
16
2018 2017 2016
CREDITORS EFFICIENCY RATIO
CREDITORS
EFFICIENCY RATIO
YEAR NET CREDIT
BUY
MEAN
PAYABLES
CREDITORS EFFICIENCY
RATIO
2018 386528436.82 43578695.68 8.869665115
2017 372171541.70 37059918.89 10.04242731
2016 370288827.8 26210608.02 14.12744136

57
LEVERAGE RATIOS
1. DEBT EQUITY RATIO
DEBT EQUITY RATIO = TOTAL LIABILITY/ SHARE HOLDERS EQUITY
Table – 4.13
Chart - 4.13
INFERENCES:
As the ideal debt equity ratio is 2:1 which is currently at 1.8870394 and therefore it is
hazardous in light of the fact that it demonstrated that financial specialists are subsidized
those activities as much as leasers have another was speculators don’t have a much skin in the
amusement as the loan bosses do and the company is also not financially sound.
1.75
1.8
1.85
1.9
1.95
2018 2017 2016
DEBT EQUITY RATIO
DEBT EQUITY RATIO
YEAR TOTAL
LIABILITIES
SHARE HOLDERS
FUND
DEBT EQUITY RATIO
2018 259314012.78 137418438.11 1.8870394
2017 246295730.22 127620894.82 1.9299013
2016 213894034.44 117667076.32 1.81779

58
2. DEBT CAPITAL RATIO
DEBT TO CAPITAL RATIO= ALL DEBTS / (ALL DEBTS+ALL EQUITIES)
Table – 4.14
Chart - 4.14
INFERENCES:
As the ideal debt to capital ratio is 1:1and tit seems that the company is declining from the
year 2016 and 2017 that is 0.49608 and 0.48183 it raised up to 0.4700 in the current financial
year which indicates that it got a high financial strength in the current year with a low debt
cost.
0.455
0.46
0.465
0.47
0.475
0.48
0.485
0.49
0.495
0.5
2018 2017 2016
DEBT TO CAPITAL RATIO
DEBT TO CAPITAL
RATIO
YEAR ALL DEBT ALL DEBT + ALL
EQUITY
DEBT TO
CAPITAL
RATIO
2018 121895574.7 259314012.78 0.47006937
2017 118674835.4 246295730.22 0.481838785
2016 96226958.12 193974221.68 0.496081166

59
3. INTERST COVERING RATIO
INTEREST COVERAGE RATIO = EBIT / EXPENSES OF INTEREST
Table – 4.15
Chart - 4.15
INFERENCE:
In 2018 the interest coverage ratio was 2.490 which was lower as compared to year 2017 and
2016 which is 2.27 and 2.714 it shows us an improved feasibility report of financials and its
capability had also been successful in crossing interest duties which is bound to be paid
2
2.1
2.2
2.3
2.4
2.5
2.6
2.7
2.8
2018 2017 2016
INTEREST COVERING PROPORTION
INTEREST
COVERAGE RATIO
YEAR EBIT EXPENSES OF
INTEREST
INTEREST COVERAGE
PROPORTION
2018 16368705.51 6571162.22 2.490990933
2017 15758837.50 5805019.00 2.714691804
2016 12533904.83 5512809.63 2.273596527

60
MARKET RATIOS
1. EARNINGS PER SHARE (EPS)
EPS = (EARNINGS AVAILABLE FOR EQUITY SHAREHOLDERS – PREFERENCE
DIVIDEND) / EQUITY SHARES HELD
Table – 4.16
Chart - 4.16
INFERENCE:
In 2018 the EPS was lower as compared to year 2017 in which it was 3919.017316 and it
indicates that EPS was fluctuating in every financial year which mean that the shareholders
wealth was maximising.
0
1000
2000
3000
4000
5000
2018 2017 2016
EPS
EPS
YEAR EARNINGS
AVAILABLE
EQUITY SHARES HELD EPS
2018 9797543.29 2500 3919.017316
2017 9953818.50 2500 3981.5274
2016 7021098.20 2500 2808.43928

61
2. MARKET PRICE PER SHARE (MPS)
MARKET PRICE PER SHARE = CURRENT MARKET PRICE / NUMBER OF
OUTSTANDING SHARES
Table – 4.17
Chart - 4.17
INFERENCE:
In 2018 the MPS was fluctuating throughout years and it 2016 it was the highest with 4.862
and in 2017 it diminished to a 1.296 and in the current year it was raised a little to 2.278
which indicates that firms market value was not worth and the customers were switching over
to another organizations.
0
1
2
3
4
5
6
2018 2017 2016
MPS
MPS
YEAR CURRENT MARKET
PRICE
NO. OF OUTSTANDING
SHARES
MPS
2018 22.78 10 2.278
2017 86.87 67 1.296
2016 68.08 14 4.862

62
3. PRICE EARNING RATIO
PRICE EARNING RATIO = MPS (Market Price Per Share ) / EPS(Earning Price Per Share)
Table – 4.18
Chart - 4.18
INFERENCE:
In 2018 the price earnings ratio was lower which is currently at 0.726393796 and it indicates
a slow financial growth and the company has started reducing all profits and they were able
to recover some amount of investment as compared to the year 2016 in which it has
recovered some proportion of their standard price set.
0
0.5
1
1.5
2
2.5
2018 2017 2016
PRICE EARNINGS RATIO
PRICE EARNINGS RATIO
YEAR MPS EPS PRICE EARNINGS RATIO
2018 2.278 3.13604 0.726393796
2017 1.296 1.39549 0.928706046
2016 4.862 2.40448 2.022058824

63
CHAPTER 5
SUMMARY OF FINDINGS SUGGESTIONS AND
CONCLUSIONS

64
Chapter 5
Summary of Findings, Conclusion and Suggestions
1.1 Findings
Margin benefit ratio is constantly declining as far as concerned about the company it is
running into huge losses are at 1.944464083 in the current year.
Gross profit ratio of the company is constantly declining and the company is running
into huge losses are at 3.248606208 in the current year.
Operating profit ratio indicates that the company is not running smoothly and
efficiently and not providing more value in terms of profit to its shareholders and is
now at 3.24860
Current proportion should be 2:1. The higher the current proportion, the more able the
entity is of paying its commitments, as it has a bigger extent of advantage esteem with
respect to the estimation of its liabilities.at 1.554989906 in the current year.
Quick ratio of the company should be at 1:1 and the establishment should check
whether the liabilities are properly used for paying liabilities which is at 0.672352267
in the current year.
Cash proportion must be at 1:1 indicating that the organisation is not able to reimburse
off certain liabilities from the past years and it currently shows 0.272709433 of current
liabilities

65
The fixed asset turnover proportion is of 28.84 days showing entity whether its capable
of paying all kinds of expenses as liabilities and the organisation is financially stable
and healthy
the total asset turnover ratio of the company is 1.94 days for the current year which
indicates that the performance would be reflected from converting inventory into sales
The capital employed ratio of the company are 3.58 days in the current year which
means mean organisation did not had appropriate structure to lose the market share in a
competition.
Stock turnover proportion for this establishment for the current year is at 3.643953217
which mean optimally utilising the stocks.
Debtors turnover ratio of the company of current year is 11 days to get payments from
debtors
Creditors turnover proportion in the current annum are 8.97 days to pay off certain
debts of firm
the debt equity ratio of the company is also not financially sound and in the current year
it is 1.8870394 :1 which indicates that the firm has more debts as compared to equity.
The debt to capital ratio seems to be at a stagnant position at 0.47006937
The interest coverage ratio of the company is currently at 2.49 which than past year
which shows an improved financials and its capability had also been successful in
crossing interest duties which is bound to be paid

66
EPS of current year is 3919.017316 that indicates that the shareholders wealth was
maximising.
MPS to 2.278 which indicates that firms market value was not worth and the customers
were switching over to other organizations from the past years fluctuating results
Price Earnings Ratio of the current year is 0.72 which indicates a slow financial growth
and the company has started reducing all profits and they were able to recover some
amount of investment over the past few years

67
5.2 Suggestions
Through this training what I concluded is that in this world of uncertainty and change,
the policy of the dealership-based company should be to diversify its risk & properly
manage its portfolio so that maximum benefit is achieved.
Transparency of data within the organization is necessary.
They need to cope up with the problems of internal management so as to tackle all the
external problems and compete other dealers across the state of Rajasthan.
They should have a proper understanding of their work and the management could be
adopted in such a way all the employees and the mangers can work with utmost good
faith and interests to build more outputs and bring more profits in the future years
A motivation training session to all employees for performance improvements and
control of their work activities to effectively manage time as time is money for each
and every entity
The entity has to be more creative towards value creation amongst the customers
They do not have to entirely receive quotations for the products and services from
websites
They have to build tie ups with the local businesses for expansion purpose
Improve the quality of work through building good relation with the customers

68
5.3 Conclusions
The study conducted In Upper Rajasthan Sales and Services Private Limited on the
financial analysis had some conclusions which made a handsome profit in some years due to
support from the market and low competitors and reliable market in the Rajasthan circle or
territory.
Although the products and services are low and the availability across the state and the
company is gradually changing its strategies according to the demand available in the whole
market where engine equipment, air compressors, pumps and valves along with generators
and power supplier for those bulky or heavy weighed machinery for achievement of
handsome profits. At last the company have a plan for expansion in the future so that other
customers from different states might buy for their projects on office site or site of residency.
Moreover this company has shown a significant growth in achievements in the past few years
through proper management and less rigid structure. Now a days many top leading firms are
using new and latest techniques to conquer the peoples minds and curiosity top acquire all the
capacity across the city with limited resources available for them.
This organisation had successfully defeated all the competitors and satisfied their customers
along with enhancement in personnel’s productivity. Managing every resources within
possible requirements is not very easy for any entity with the help of lots of workers,
employees and professionals too.
At last but not he least this establishment had performed brilliantly to benefit the society as
well as the government of Rajasthan for building everlasting ultimate relationship for easily
carrying any kind of activities and processes throughout its life cycle

BIBLIOGRAPHY
BOOKS:
Khan & Jain, Financial Management, Vikas Publications, 5th
Edition
Varshini & Maheshwari, Managers Accounting, Vikas Publications, 3rd
Edition
I.M. Pandey, Financial Management, Vikas Publications, 11th Edition
Eugene F. Brigham, Financial Management-Theory & Practice, Atlantic Publications 8th
Edition
ARTICLES:
Williams, E. E., & Dobelman, J. A. (2017). Financial statement analysis. World Scientific
Book Chapters, 109-169.
Alexander, C. (2001). Market models: A guide to financial data analysis. John Wiley &
Sons.
Helfert, E. A., & Helfert, E. A. (2001). Financial analysis: tools and techniques: a guide for
managers (pp. 221-296). New York: McGraw-Hill.
Altman, E. I. (1968). Financial ratios, discriminant analysis and the prediction of corporate
bankruptcy. The journal of finance, 23(4), 589-609.
Foster, G. (2004). Financial Statement Analysis, 2/e. Pearson Education India.
Higgins, R. C., & Reimers, M. (1995). Analysis for financial management (No. s 53).
Chicago: Irwin.
Penman, S. H., & Zhang, X. J. (2002). Modelling sustainable earnings and P/E ratios with
financial statement analysis. E Ratios with Financial Statement Analysis (June 1, 2002).
Fraser, L. M., Ormiston, A., & Fraser, L. M. (2010). Understanding financial statements.
Pearson.
WEBLIOGRAPY:
www.ursjpr.com
www.wiki.com/cumminsltd
www.wikipedia.com/valvolineltd
www.moneycontrol.com/
www.google.com//

l♦i A.CHARY A INSTITUTE OF TECHNOLOGY
DEPARTVIENT OF MBA
PROJ ECT( 17MBAPR407) -WEEKLY REPORT ACHARYA
NAME Of THE STUDENT: A YUSH NAIR
INTER~AL GUIDE: PROFESSOR SHASHI K li iVIAR C. R.
lJSN: I AZ 17M BA 13
COMPANY NAME: URSS TECHSERVICES P\T. LTD.
- ----------- --------- - ------- -, EXTERNAL I INTERNAi.
\\'EEK WORK UNDFRTA KEN GUIDE GUIDE SIGNATURJ SIGNATURF
3rd Jan 2U 19 - 9'h : Industry Pro tile and Company
.Ian 20 19 Profile ------ ---i-----------------+-------+-- - -
JO'h Jan 2019 -1 t h Jan 2019
I 8t11 Jan 20 19 -25 th J.:m 20: Cf
26 th Jan 2019 -2"uFeb 20 I 9
3rd Feb 2() 19 - 9th
Feb 20 19
Preparation of Research instrument for data collection
Data collection
Analysis and finalization of report
Finding::. and Suggestions
llY 11 Feb 2Ul9 -l6th Feb 2019 Conclusion and Final Report
-. /-';/ I / -- ---
~
company Seal H~:p nt ,,f({tt Acharya I ,f, , u.0 d ~. ,..·~ ,
~ Id . .~ ~ ..... ,. ..... ~:: ...... ~,n:: ,c~\( ,,,o evanar.w . - .;:_,
' ., '<,