A Study of Murshidabad District, West Bengal
20
University of Nebraska - Lincoln University of Nebraska - Lincoln DigitalCommons@University of Nebraska - Lincoln DigitalCommons@University of Nebraska - Lincoln Library Philosophy and Practice (e-journal) Libraries at University of Nebraska-Lincoln Spring 2-2021 The Role of Information in Availing the Benefits of NSAP The Role of Information in Availing the Benefits of NSAP Schemes: A Study of Murshidabad District, West Bengal Schemes: A Study of Murshidabad District, West Bengal Niti Mollah [email protected] Follow this and additional works at: https://digitalcommons.unl.edu/libphilprac Part of the Library and Information Science Commons Mollah, Niti, "The Role of Information in Availing the Benefits of NSAP Schemes: A Study of Murshidabad District, West Bengal" (2021). Library Philosophy and Practice (e-journal). 5162. https://digitalcommons.unl.edu/libphilprac/5162
-
Upload
khangminh22 -
Category
Documents
-
view
2 -
download
0
Transcript of A Study of Murshidabad District, West Bengal
University of Nebraska - Lincoln University of Nebraska - Lincoln
DigitalCommons@University of Nebraska - Lincoln DigitalCommons@University of Nebraska - Lincoln
Library Philosophy and Practice (e-journal) Libraries at University of Nebraska-Lincoln
Spring 2-2021
The Role of Information in Availing the Benefits of NSAP The Role of Information in Availing the Benefits of NSAP
Schemes: A Study of Murshidabad District, West Bengal Schemes: A Study of Murshidabad District, West Bengal
Niti Mollah [email protected]
Follow this and additional works at: https://digitalcommons.unl.edu/libphilprac
Part of the Library and Information Science Commons
Mollah, Niti, "The Role of Information in Availing the Benefits of NSAP Schemes: A Study of Murshidabad District, West Bengal" (2021). Library Philosophy and Practice (e-journal). 5162. https://digitalcommons.unl.edu/libphilprac/5162
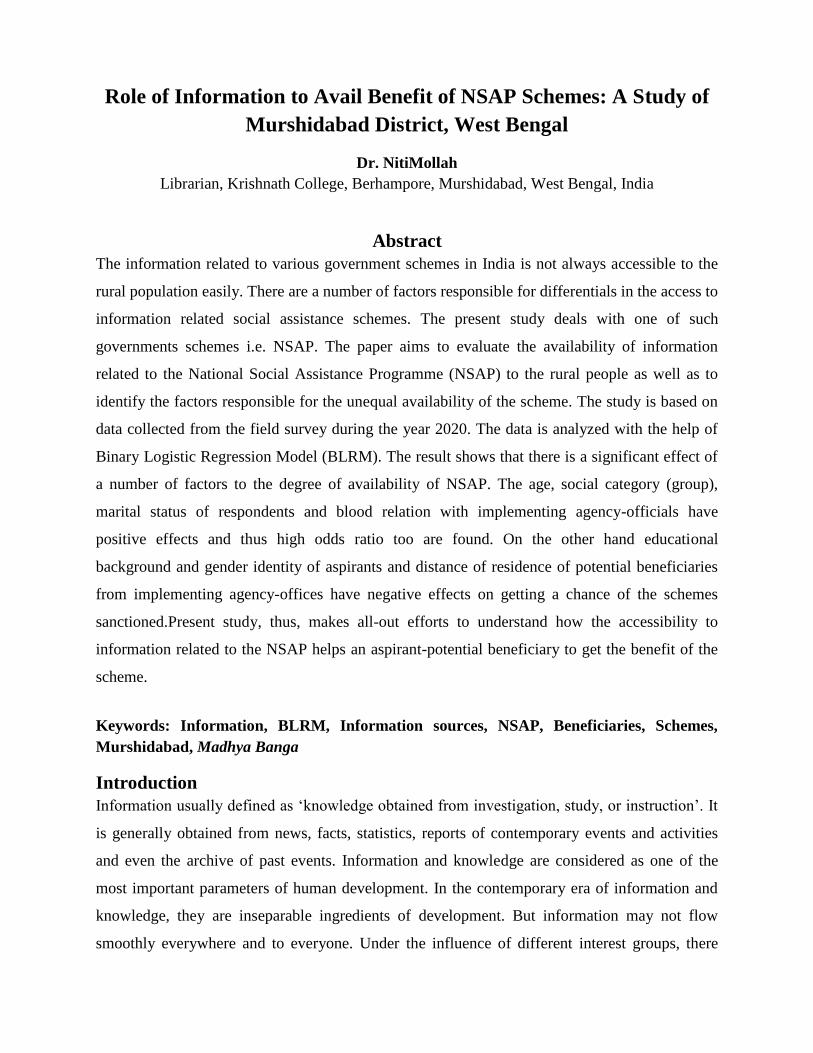
Role of Information to Avail Benefit of NSAP Schemes: A Study of
Murshidabad District, West Bengal
Dr. NitiMollah
Librarian, Krishnath College, Berhampore, Murshidabad, West Bengal, India
Abstract
The information related to various government schemes in India is not always accessible to the
rural population easily. There are a number of factors responsible for differentials in the access to
information related social assistance schemes. The present study deals with one of such
governments schemes i.e. NSAP. The paper aims to evaluate the availability of information
related to the National Social Assistance Programme (NSAP) to the rural people as well as to
identify the factors responsible for the unequal availability of the scheme. The study is based on
data collected from the field survey during the year 2020. The data is analyzed with the help of
Binary Logistic Regression Model (BLRM). The result shows that there is a significant effect of
a number of factors to the degree of availability of NSAP. The age, social category (group),
marital status of respondents and blood relation with implementing agency-officials have
positive effects and thus high odds ratio too are found. On the other hand educational
background and gender identity of aspirants and distance of residence of potential beneficiaries
from implementing agency-offices have negative effects on getting a chance of the schemes
sanctioned.Present study, thus, makes all-out efforts to understand how the accessibility to
information related to the NSAP helps an aspirant-potential beneficiary to get the benefit of the
scheme.
Keywords: Information, BLRM, Information sources, NSAP, Beneficiaries, Schemes,
Murshidabad, Madhya Banga
Introduction
Information usually defined as „knowledge obtained from investigation, study, or instruction‟. It
is generally obtained from news, facts, statistics, reports of contemporary events and activities
and even the archive of past events. Information and knowledge are considered as one of the
most important parameters of human development. In the contemporary era of information and
knowledge, they are inseparable ingredients of development. But information may not flow
smoothly everywhere and to everyone. Under the influence of different interest groups, there

may have evolved a wide spread information gap between information rich and information poor
in the rural areas in particular, which has been systematically exploited to siphon off the govt.
aid/assistance allocated for social assistance depriving the actual target group. The present study,
therefore, designed such a way that barriers and the bottlenecks of flow of information are
identified and remedial measures are prescribed so as to plug them.
The information related to various developments and social support schemes offered by
both central govt. of India at the national as well as at the state level are not accessible to all
stakeholders equally. As a matter of fact access to the information decides often who will get the
benefit of a government sponsored scheme. Access to information to rural people is often, in
many cases, influenced by a number of factors, such as age, gender, religious background, social
category, marital status, level of educational attainment, occupation of the aspirant-beneficiary
and distance of the residence from govt. offices, and also blood relation with the officials, and
also political affiliation etc. aspects of potential beneficiaries.
Among many social assistance, pro-poor and support schemes for the poor and destitute,
five popular schemes that are in operation for at least 10 years have been selected for the study.
Among the selected schemes for the purpose, Annapurna Yojna (AY), Indira Gandhi National
Disability Pension Scheme (IGNDPS), Indira Gandhi National Old Age Pension Scheme
(IGNOAPS), Indira Gandhi National Widow Pension Scheme (IGNWPS), and National Family
Benefit Scheme (NFBS) are taken into account as they are also commonly found NSAP schemes
in the Murshidabad district as well in the state of West Bengal.
Background Problem
In the age of fast economic development and information explosion, isolation of any kind is a
curse. Though a huge amount is paid in the union budget for getting rid of the severity of this
curse, a large section of our society still faces a lot of problems as the common mass is often
unaware of information regarding these government schemes meant for them. The investment
actually provided to help the disadvantaged are sometimes diverted and drained out and reach to
the hands of already „haves‟ leaving behind the „have-nots‟ in dimness and aversion.
The present study area, the district of Murshidabad, is one of the backward districts in the
state from the point of view of poverty and socio-economic development. The poverty is so acute
that as high as 39.01 % are found to be living below the poverty line (2005). Similarly, 21.93%
households are landless and as high as 20.24 % households reported at least one male
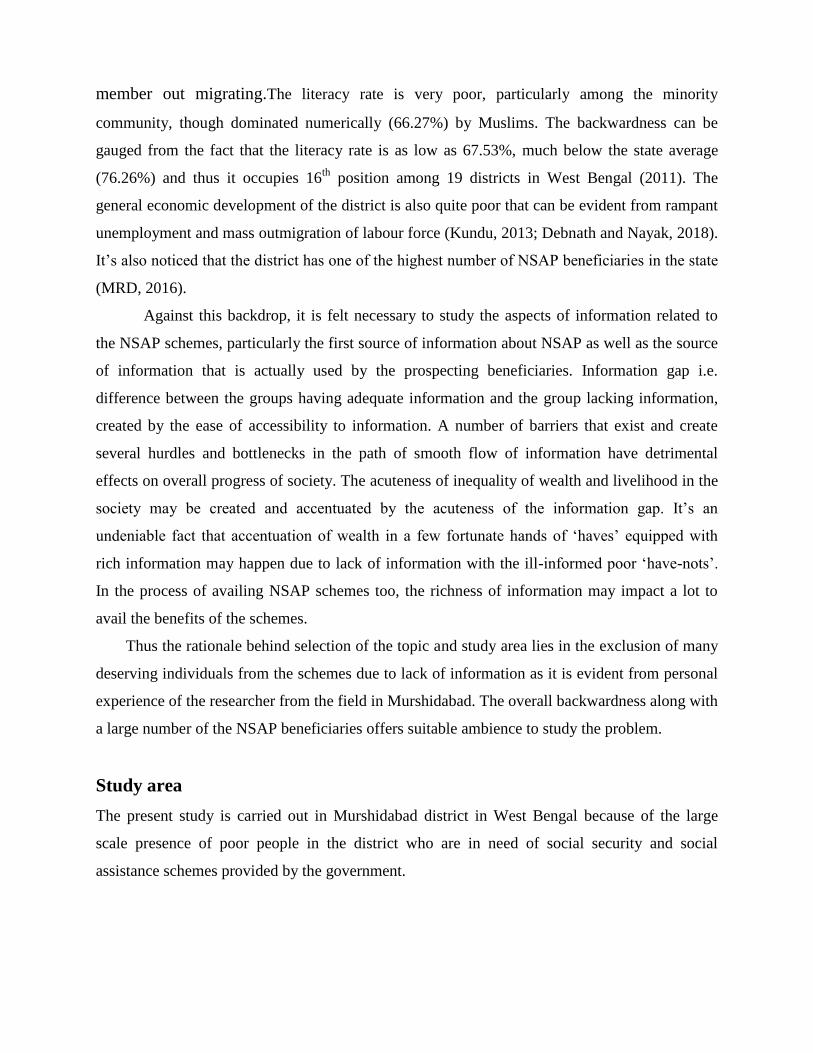
member out migrating.The literacy rate is very poor, particularly among the minority
community, though dominated numerically (66.27%) by Muslims. The backwardness can be
gauged from the fact that the literacy rate is as low as 67.53%, much below the state average
(76.26%) and thus it occupies 16th
position among 19 districts in West Bengal (2011). The
general economic development of the district is also quite poor that can be evident from rampant
unemployment and mass outmigration of labour force (Kundu, 2013; Debnath and Nayak, 2018).
It‟s also noticed that the district has one of the highest number of NSAP beneficiaries in the state
(MRD, 2016).
Against this backdrop, it is felt necessary to study the aspects of information related to
the NSAP schemes, particularly the first source of information about NSAP as well as the source
of information that is actually used by the prospecting beneficiaries. Information gap i.e.
difference between the groups having adequate information and the group lacking information,
created by the ease of accessibility to information. A number of barriers that exist and create
several hurdles and bottlenecks in the path of smooth flow of information have detrimental
effects on overall progress of society. The acuteness of inequality of wealth and livelihood in the
society may be created and accentuated by the acuteness of the information gap. It‟s an
undeniable fact that accentuation of wealth in a few fortunate hands of „haves‟ equipped with
rich information may happen due to lack of information with the ill-informed poor „have-nots‟.
In the process of availing NSAP schemes too, the richness of information may impact a lot to
avail the benefits of the schemes.
Thus the rationale behind selection of the topic and study area lies in the exclusion of many
deserving individuals from the schemes due to lack of information as it is evident from personal
experience of the researcher from the field in Murshidabad. The overall backwardness along with
a large number of the NSAP beneficiaries offers suitable ambience to study the problem.
Study area
The present study is carried out in Murshidabad district in West Bengal because of the large
scale presence of poor people in the district who are in need of social security and social
assistance schemes provided by the government.
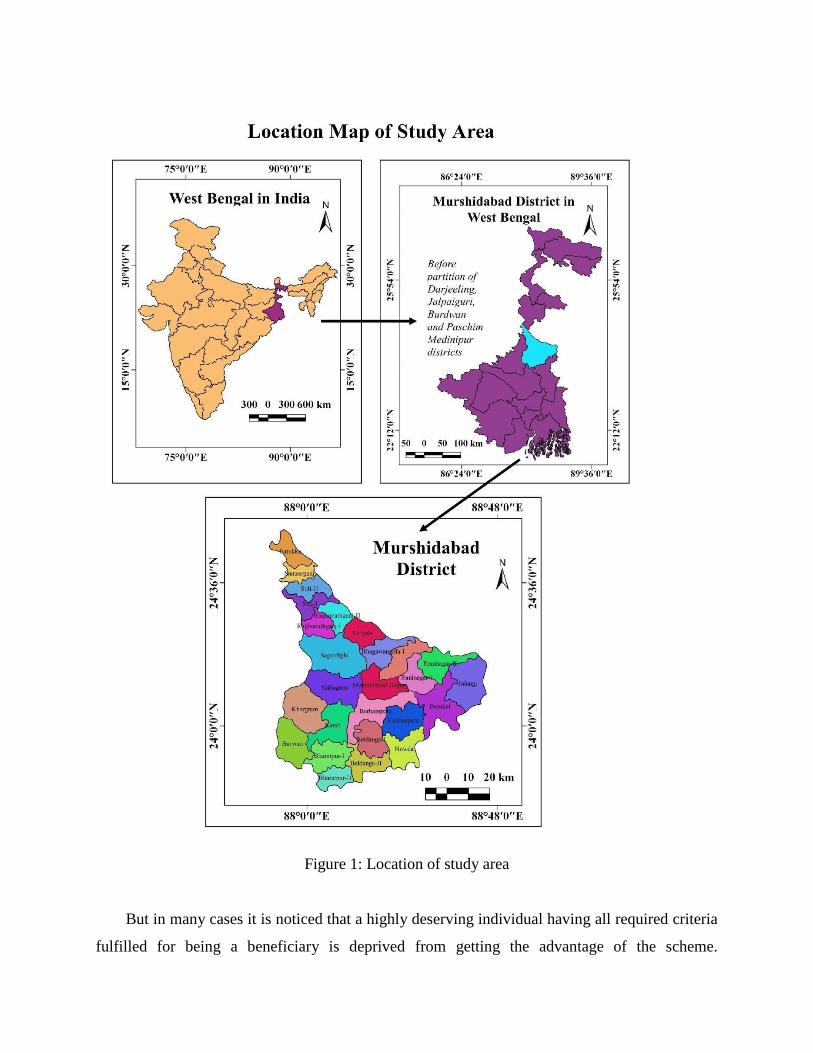
Figure 1: Location of study area
But in many cases it is noticed that a highly deserving individual having all required criteria
fulfilled for being a beneficiary is deprived from getting the advantage of the scheme.
Geographically the district is situated in the central part of the lower Gangetic plain, popularly
known as Madhya Ganga, with almost a flat topography. It is dominantly an agrarian society
with intensive subsistence agriculture practiced all over. A predominantly rural district has the
percentage of population living in the rural area as high as 80% (Census of India, 2011). The
district is one of the socially and economically backward districts in West Bengal. It is also
characterized by poor literacy rate (66.59 per cent) below the state average and it occupied 16th
position among 19 districts in the state in 2011 (Census of India, 2011).The district has very high
concentration of Muslim minority (66 per cent) community among all the districts of West
Bengal. Unemployment and outmigration of the labour force are predominant features of the
district along with adoption of very marginal jobs including Bidi rolling.
The justification for selection of the study area is in view of keeping out of many deserving
persons from the mentioned NSAP schemes as it is apparent from personal experience of the
researcher from the field. The study area being one of the most backward districts having large
section of poor population forms the sound basis for selecting the district as study area
Objectives
The present study aims at fulfilling the following objectives:
1. To evaluate the availability and access to information regarding government sponsored
National Social Assistance Schemes (NSAP).
2. To evaluate different sources of information related to the NSAP schemes functioning in
the rural area for the people of the district.
3. To identify the factors controlling accessibility to information to the rural population
related to the NSAP.
Literature review
Pandey and Pant (2000) analysed the weaknesses and strengths of the Social Sector Programme
like National Social Assistance Programme (NSAP) and observed the lack of effective
information related to those programmes. Kapur and Chowdhury (2012) and World Bank Report
(1998) discussed about different aspects e.g. trends in allocations and expenditures, state-wise
progress, and scheme-wise progress of NSAP with special emphasis on Indira Gandhi National
Old Age Pension Scheme (IGNOAPS) using government data. On the other hand detail analysis
and implication of rural poverty alleviation schemes in the Hisar district of Haryana has been

discussed in the paper entitled “Role of credit institutions in rural poverty alleviation: a study of
Hisar district, Haryana” by Singh, Patel and Suhag (2007).
A number of literatures such as Abu Bakar (2011); Anwar and Supaat (1998); Du and
Haines (2017); Patrick and Ferdinand (2016); and Zhang and Yu (2009) showed that common
needs of information and information seeking behaviour among rural dwellers of developed and
developing countries are mostly of similar pattern. They also identified that the information
needs of the common masses in rural life are generally related to their daily life. In their study
researchers namely Islam and Mezbah-ul-Islam (2008); Issa, Omopupa and Salman (2012);
Kamba 2009; Mchombu (1996); and Mtega (2012) from Bangladesh, Nigeria, Tanzania, and
different areas of rural Africa studied and identified the access, use and various kinds of
available sources of information directly and indirectly related to the social and economic
development of rural people in the respective regions.
Agarwal, Xu and Poo (2011) defined and categorized different types of information
sources and examined the preferences and frequencies of use of those of sources to satisfy their
information needs. They identified and mentioned print and online, personal and impersonal,
traditional and nontraditional sources of information in their studies. Besides the mentioned
sources of information a few researchers (Woudstra, van den Hooff and Schouten 2016; Zimmer,
Henry and Butler 2007) showed information sources to be relational and non-relational or human
or non-human in the context of information need. Similarly, a large number of researchers
(Momodu 2002; Chakrabarti 2001; Mooko 2005; Msoffe and Ngulube 2016) conceptualized
personal and impersonal information sources e.g. friends, relatives, neighbours, newspapers, TV,
Radio, etc. with their wide uses among the rural people. On the contrary, the emerging sources
like digital sources are not widely acceptable and accessible among the rural dwellers to fulfill
their daily information needs (Okwu and Lorkaa 2011; Mahindarathne and Min 2019;
Mwantimwa 2020). On the other hand there are a number of literatures which identified and
evaluated the contributions of public library disseminating information particularly related to the
rural development in different countries (Iwe 2003; Abubakar 2013; Martin 1983; Proctor and
Usherwood 1997; Ellis 1983 and McDonald 1986). Thus it is found that there is much limited
literature on sources of information as well as access to information.
Methodology
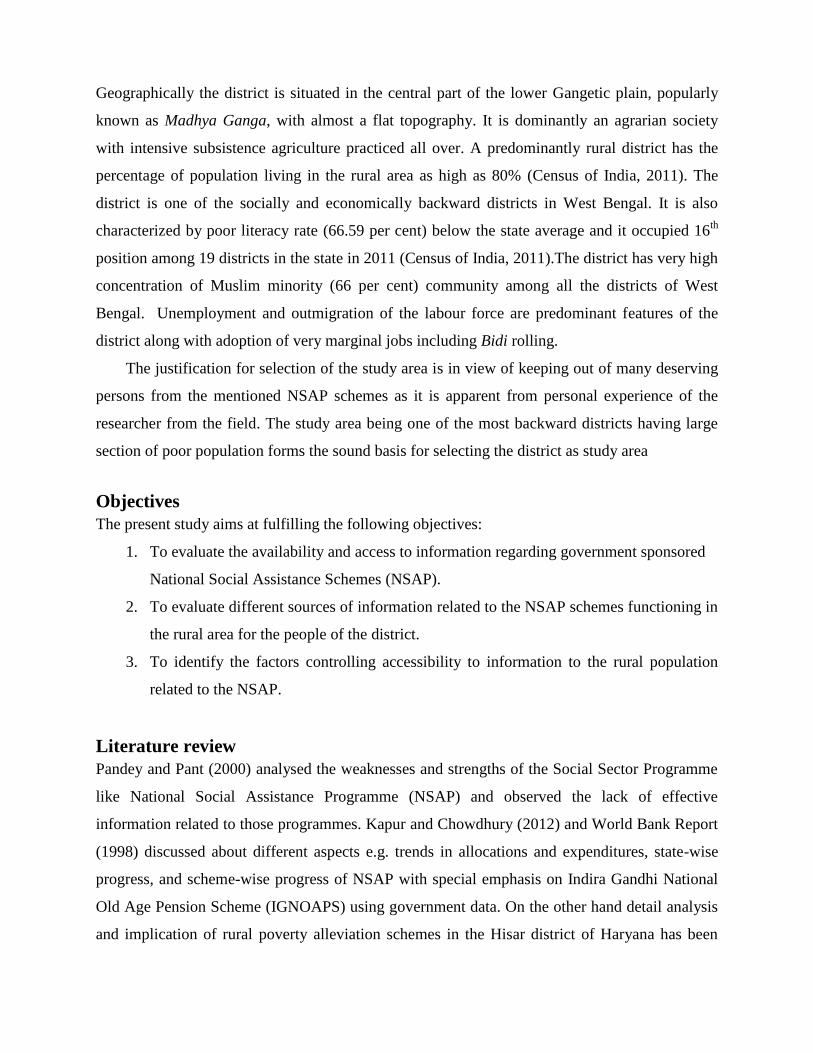
A field survey method has been used to collect primary data for the study. A total of 200
respondents were selected from eight villages that are surveyed for this study.
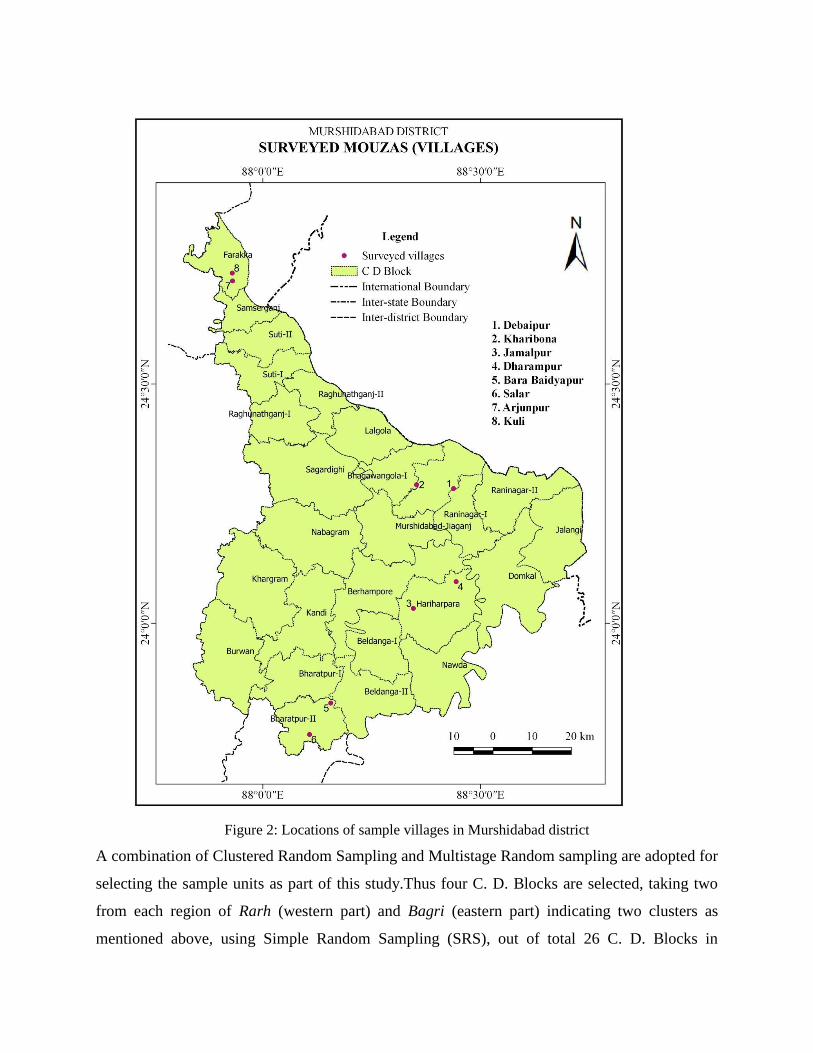
Figure 2: Locations of sample villages in Murshidabad district
A combination of Clustered Random Sampling and Multistage Random sampling are adopted for
selecting the sample units as part of this study.Thus four C. D. Blocks are selected, taking two
from each region of Rarh (western part) and Bagri (eastern part) indicating two clusters as
mentioned above, using Simple Random Sampling (SRS), out of total 26 C. D. Blocks in

Murshidabad district in the first stage. In the second stage two Gram Panchayats (GP) have been
selected using Simple Random Sampling (SRS) from each selected C D Block numbering a total
of 4×2=8 GPs. In the third stage one inhabited village (mouza) has been selected using Simple
Random Sampling (SRS) from each selected GP numbering a total of 8×1=8 villages. In the
fourth stage 25 respondents have been selected using Systematic Random Sampling (SRS) from
each selected village. Thus total 8×25=200 respondents have been administered with a pre-
designed survey schedule (questionnaire). Out of 200 respondents, 100 were selected from
among the beneficiaries and 100 were selected from non-beneficiaries but who were applicants.
The data thus collected through survey of the respondents were analysed with the help of
SPSS(16.0) software. Beside adoption of descriptive statistics, Binary Logistic Regression
(BLR) method is used to examine the relationship between the variables in order to get better
results.
Logistic Regression Model (LRM)
To determine the factors which have a significant role in having a required level of information
on the government‟s social assistance schemes, the logistic regression model may generally be
used. This model is specifically used when the outcome variable is dichotomous in nature i.e.
having a value of 0 or1, where 1 indicates beneficiary respondent and 0 indicates non-beneficiary
respondent. If is the set of parameters that considers socio-economic and some respondent-
specific characteristics e.g. age, gender, religious background (group), social category, marital
status, level of educational attainment (class passed), occupation, distance from govt. offices,
blood relation with officials, political affiliation etc. which influence the level of information of
the ith respondent to get the access and availing the benefit of the schemes.
Then for the respondent is an indirect utility derived from getting the benefit of the scheme,
which is a linear function of k explanatory variables (X), and is expressed as:
∑ … … … (1)
Where, is the intercept and , , …. are the coefficients associated with each
explanatory variable , , … . The probability that the respondent gets benefit of
the NSAP by the presence of these factors ( ) is given by:
… … … (2)
Where, is the probability of Respondent of being a beneficiary is 1 and otherwise 0. The
odds is defined as the ratio of the probability that a respondent being benefitted ( ) to the
probability of not being benefitted (1– ). Taking the natural log, the odds ratio:

(
– ) ∑
= … … … (3)
Equation (3) is the prediction equation for the respondent where, is the log of the odds
ratio of the beneficiary respondents.
Variables used in the empirical model
In the study, 10 variables are taken under consideration in the logistic regression model (LRM).
The variables are as follows:
a) Age of the respondent: AGE
b) Gender of the respondent: GEND
c) Religion of the respondent: REGLN
d) Social category of the respondent: CATGR
e) Marital status of the respondent: MARTL
f) Level of education of respondent: EDU
g) Distance of residence of the respondent from BDO office: DISTBDO
h) Distance of residence of the respondent from GP office: DISTGP
i) Blood relation of the respondent with implementing agency/people's
representatives: BLOODREL
j) Political affiliation of the respondent : POLAFFL
Result and Discussion
Socio-economic characteristics of the respondents
Respondents‟ socio-economic characteristics are intimately related and play a significant role in
accounting their accessibility to government schemes. According to the survey data, the majority
of the respondents are female (66%) and the mean age of the respondents is 58.7 years. The level
of education plays a significant role in getting information related to the NSAP.
Table-1: Statistics of characteristics of respondents
N Minimum Maximum Mean
Age of respondents (years) 200 20 78 59 years
Family size (number of members) 200 2 8 4
Annual income (Rs) 200 12000 178000 65000
Education (class passed) 200 I XII IV
Distance from BDO Office (km) 200 4 km 30 km 18.5 km
Distance from GP Office (km) 200 0.5 km 10 km 3.5 km
Source: Field survey, 2020
The study reveals that approximately 30% of the respondents are educated while about 70% have
no formal education. The dominant occupation of the respondent is farming and daily wage
earner. The mean family size is four persons. The average household annual income is nearly Rs.

65000. Most of the respondents have no access to formal credit facilities from the banks or other
financial institutions.
Table-2: Socio-economic Characteristics of the respondents
Socio-economic features Beneficiaries Non-beneficiaries Total (%)
Gender
Male 19 49 68 (34%)
Female 81 51 132 (66%)
Age (years)
<20 years 0 0 0
20-50 13 29 42 (21%)
50 and above 87 71 158 (79%)
Social category
SC 23 28 51 (25.5%)
ST 0 0 NIL
OBC 43 42 85 (42.5%)
General 34 30 64 (32%)
Educational status (Class passed)
Illiterate 78 61 139 (69.5%)
Primary 13 21 34 (17%)
Secondary 9 15 24 (12%)
Higher 0 3 3 (1.5%)
Marital status
Currently married 28 57 85 (42.5%)
Divorced/ Separated 0 0 NIL
Widow/Widower 72 43 115 (57.5%)
Family size (No. of members)
Less than 5 52 47 99 (49.5%)
5 to 10 35 33 68 (34%)
More than 10 13 20 33 (16.5%)
Annual Family income (Rs)
Less than 50000 35 23 58 (29%)
50000-100000 56 62 118 (59%)
100000 and above 9 15 24 (12%)
Source: Field Survey, 2020
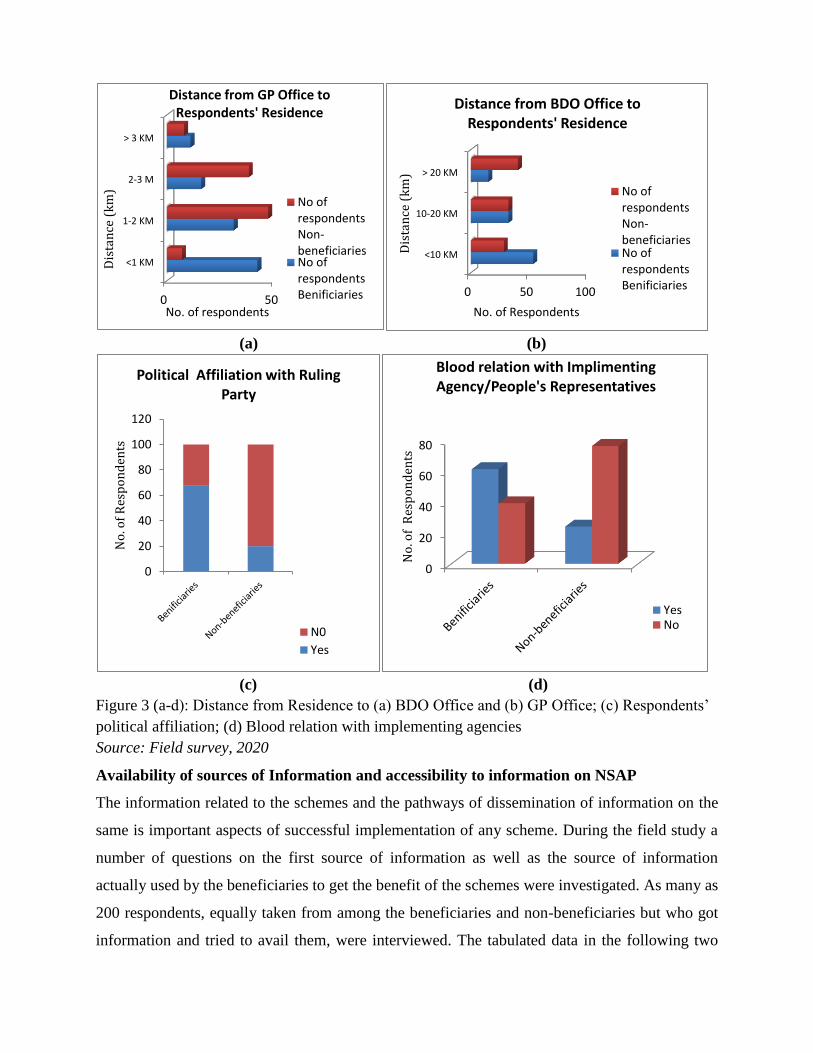
It is found that the majority of the respondents (42.5%) belong to OBC i.e. from Other Backward
Classes followed by general category (32%). A good share (57.5%) of the respondents is either widows or
widowers. Figure 1 (a-d) exhibits distances of BDO office and GP office from respondents‟ residences,
their political affiliation with the ruling party of the area and blood relation with peoples‟ representatives
or member of implementing agencies.
(a) (b)
(c) (d)
Figure 3 (a-d): Distance from Residence to (a) BDO Office and (b) GP Office; (c) Respondents‟
political affiliation; (d) Blood relation with implementing agencies
Source: Field survey, 2020
Availability of sources of Information and accessibility to information on NSAP
The information related to the schemes and the pathways of dissemination of information on the
same is important aspects of successful implementation of any scheme. During the field study a
number of questions on the first source of information as well as the source of information
actually used by the beneficiaries to get the benefit of the schemes were investigated. As many as
200 respondents, equally taken from among the beneficiaries and non-beneficiaries but who got
information and tried to avail them, were interviewed. The tabulated data in the following two
0 50
<1 KM
1-2 KM
2-3 M
> 3 KM
No. of respondents
Dis
tan
ce (
km
) Distance from GP Office to
Respondents' Residence
No ofrespondentsNon-beneficiariesNo ofrespondentsBenificiaries 0 50 100
<10 KM
10-20 KM
> 20 KM
No. of Respondents
Dis
tan
ce (
km
)
Distance from BDO Office to Respondents' Residence
No ofrespondentsNon-beneficiariesNo ofrespondentsBenificiaries
0
20
40
60
80
100
120
No
. of
Res
po
nd
ents
Political Affiliation with Ruling Party
N0
Yes
0
20
40
60
80
No
. of
Res
po
nd
ents
Blood relation with Implimenting Agency/People's Representatives
YesNo
tables present quite a few interesting patterns related to the source of information and actual
information used by the people.
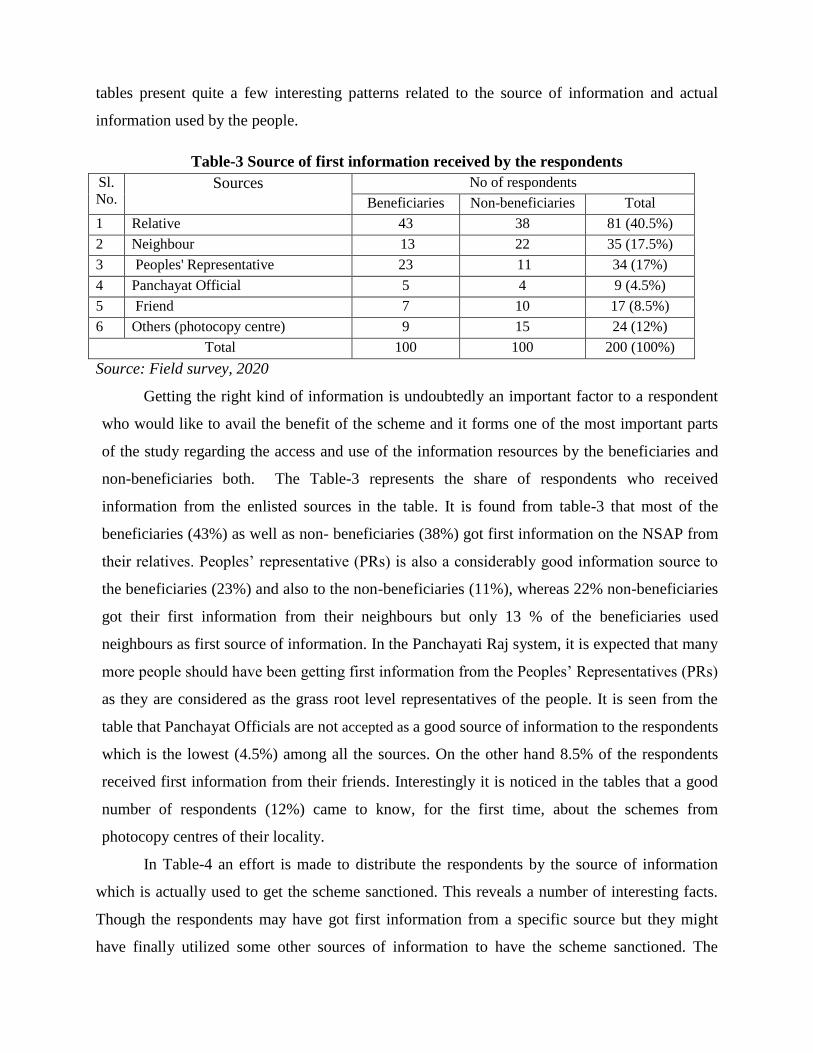
Table-3 Source of first information received by the respondents
Sl.
No. Sources No of respondents
Beneficiaries Non-beneficiaries Total
1 Relative 43 38 81 (40.5%)
2 Neighbour 13 22 35 (17.5%)
3 Peoples' Representative 23 11 34 (17%)
4 Panchayat Official 5 4 9 (4.5%)
5 Friend 7 10 17 (8.5%)
6 Others (photocopy centre) 9 15 24 (12%)
Total 100 100 200 (100%)
Source: Field survey, 2020
Getting the right kind of information is undoubtedly an important factor to a respondent
who would like to avail the benefit of the scheme and it forms one of the most important parts
of the study regarding the access and use of the information resources by the beneficiaries and
non-beneficiaries both. The Table-3 represents the share of respondents who received
information from the enlisted sources in the table. It is found from table-3 that most of the
beneficiaries (43%) as well as non- beneficiaries (38%) got first information on the NSAP from
their relatives. Peoples‟ representative (PRs) is also a considerably good information source to
the beneficiaries (23%) and also to the non-beneficiaries (11%), whereas 22% non-beneficiaries
got their first information from their neighbours but only 13 % of the beneficiaries used
neighbours as first source of information. In the Panchayati Raj system, it is expected that many
more people should have been getting first information from the Peoples‟ Representatives (PRs)
as they are considered as the grass root level representatives of the people. It is seen from the
table that Panchayat Officials are not accepted as a good source of information to the respondents
which is the lowest (4.5%) among all the sources. On the other hand 8.5% of the respondents
received first information from their friends. Interestingly it is noticed in the tables that a good
number of respondents (12%) came to know, for the first time, about the schemes from
photocopy centres of their locality.
In Table-4 an effort is made to distribute the respondents by the source of information
which is actually used to get the scheme sanctioned. This reveals a number of interesting facts.
Though the respondents may have got first information from a specific source but they might
have finally utilized some other sources of information to have the scheme sanctioned. The
perception of reliability of source of information plays an important role and thus they are
always in search of dependable sources of information.
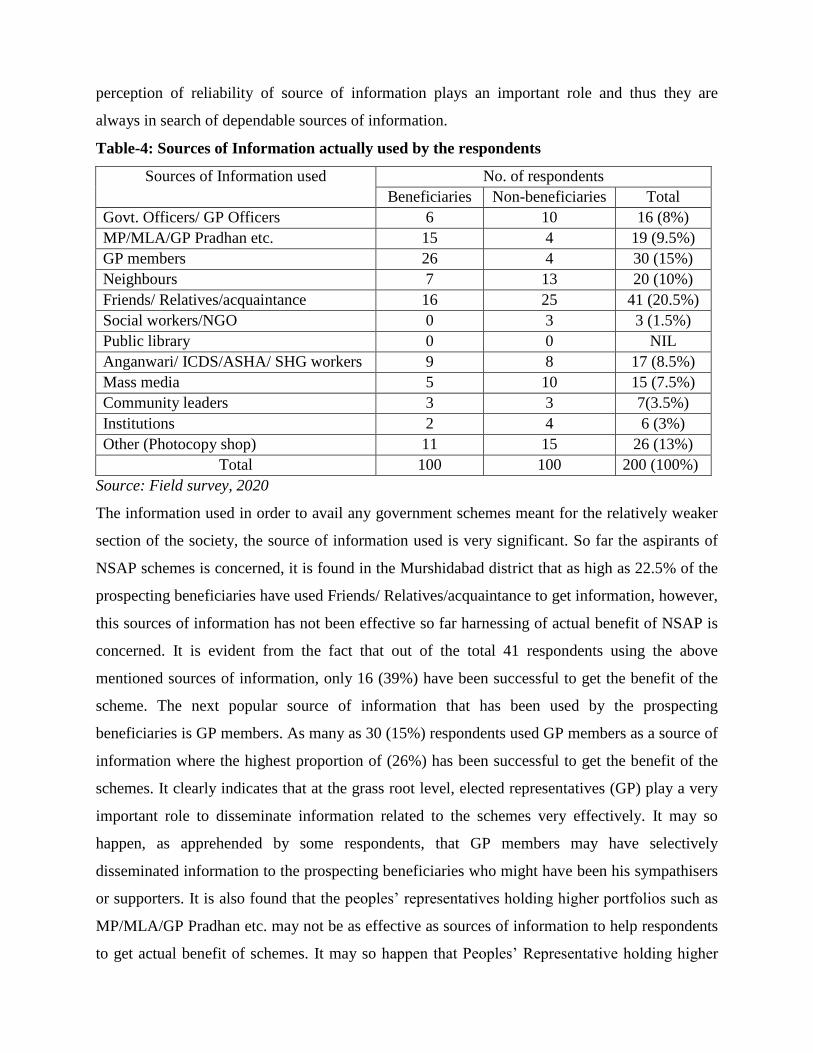
Table-4: Sources of Information actually used by the respondents
Sources of Information used No. of respondents
Beneficiaries Non-beneficiaries Total
Govt. Officers/ GP Officers 6 10 16 (8%)
MP/MLA/GP Pradhan etc. 15 4 19 (9.5%)
GP members 26 4 30 (15%)
Neighbours 7 13 20 (10%)
Friends/ Relatives/acquaintance 16 25 41 (20.5%)
Social workers/NGO 0 3 3 (1.5%)
Public library 0 0 NIL
Anganwari/ ICDS/ASHA/ SHG workers 9 8 17 (8.5%)
Mass media 5 10 15 (7.5%)
Community leaders 3 3 7(3.5%)
Institutions 2 4 6 (3%)
Other (Photocopy shop) 11 15 26 (13%)
Total 100 100 200 (100%)
Source: Field survey, 2020
The information used in order to avail any government schemes meant for the relatively weaker
section of the society, the source of information used is very significant. So far the aspirants of
NSAP schemes is concerned, it is found in the Murshidabad district that as high as 22.5% of the
prospecting beneficiaries have used Friends/ Relatives/acquaintance to get information, however,
this sources of information has not been effective so far harnessing of actual benefit of NSAP is
concerned. It is evident from the fact that out of the total 41 respondents using the above
mentioned sources of information, only 16 (39%) have been successful to get the benefit of the
scheme. The next popular source of information that has been used by the prospecting
beneficiaries is GP members. As many as 30 (15%) respondents used GP members as a source of
information where the highest proportion of (26%) has been successful to get the benefit of the
schemes. It clearly indicates that at the grass root level, elected representatives (GP) play a very
important role to disseminate information related to the schemes very effectively. It may so
happen, as apprehended by some respondents, that GP members may have selectively
disseminated information to the prospecting beneficiaries who might have been his sympathisers
or supporters. It is also found that the peoples‟ representatives holding higher portfolios such as
MP/MLA/GP Pradhan etc. may not be as effective as sources of information to help respondents
to get actual benefit of schemes. It may so happen that Peoples‟ Representative holding higher
portfolios may not be accessible to the ordinary aspirants of the schemes. The other effective
sources of information found in the field are Photocopy Centre, Social workers/NGO,
Neighbours, Anganwari/ ICDS/ASHA/ SHG workers, and Govt. officers/ GP Officers etc.
It is very interesting to note that the mass media has played moderately significant role to
disseminate information but only one third of those using sources from Mass Media have
beensuccessful to get benefit of NSAP. One may suspect some kind of conspiracy or nepotism
where in spite of getting information through Mass Media it could not be effectively used to
convert it to actual benefit. Another anomaly of high significance can be noticed in the
Murshidabad villages that in spite of having a public (Government sponsored) information
dissemination network, a considerably high proportion (13%) of the respondents used the
photocopy centre as sources of information. The survey data also shows that out of total 26
respondents who used the photocopy centre as sources of information as high as 11 received the
benefit of the scheme successfully.
It is a matter of great surprise and serious concern as well that the Public Library has
been of very low effect in the process of dissemination of information related to such schemes.
The effect is so poor that out of 200 respondents, none responded to have used the Public Library
as sources of information, though 20% of the reported to have familiarity with the existence of a
public library and 10% have reported visiting a public library at least once. This shows the nearly
unfathomable gap that exists between prospecting users and public libraries as point/source of
dissemination of information. Similarly, the role of public institutions is also nearly negligible
thus there is a need to strengthen interaction of public libraries/ institutions with the local people
so that information is disseminated timely and effectively. Thus the information bottlenecks can
effectively be dismantled allowing smooth flow of information.
Result of the logistic regression model
To determine the factors influencing the accessibility to NSAP, the Binary Logistic Regression
(BLR) is employed on SPSS (16.0) software using maximum likelihood method. The model fit
was tested using the Hosmer and Lemishow statistic. The overall percentage of correct prediction
is 87%, the result shows that there is a significant difference between the observed and predicted
value of the dependent variables.
Table-5 (a-b) presents the Binary Logistic Regression estimate of the present study. It is
found that there is a positive relationship between age and access to benefits of NSAP. Though,

the seekers of benefit of some NSAP schemes get eligibility only after attaining a certain age, yet
the trend is found to be true in the field data. The odds ratio for age of the respondents is 3.258
which implies that with the increase of age of respondent the probability in getting NSAP benefit
increases at about three times. It is evident from the fact that in major cases, the aged persons
approach to avail such kind of benefit from government schemes. On the other hand level of
education, though may sound absurd, has a negative effect on availing the benefits of NSAP i.e.
the more educated respondent are less likely to get the benefits of the schemes. It may be because
of the fact that the educated persons may not like to hobnob with peoples‟ representatives who
are basically from political background and that may cause exclusion of such persons. The odds
ratio for education is 0.590 indicating that an increase in the level of education of respondents
leads to a decrease in the probability of getting the benefit. This is true in the sense that the
highly educated people do not approach these government schemes rather they try to get jobs. It
is also found that the gender has a clear bias in the selection process of the beneficiary and it is
found that female respondents are more likely to get benefit of NSAP and thus the odds ratio for
gender is 0.109 implying the male respondents‟ have less probability to get benefits from these
schemes. This is partially explained by gender specific schemes of IGNWPS, however, other
schemes are universal in nature so far the gender perspective is concerned.
Table-5 (a-b): Model summary
(a) Model Summary
Step -2 Log likelihood Cox & Snell R Square Nagelkerke R Square
1 179.437a .587 .716
a. Estimation terminated at iteration number 5 because parameter estimates changed by less than .001.
(b) Hosmer and Lemeshow Test
Step Chi-square df Sig.
1 41.470 8 .000
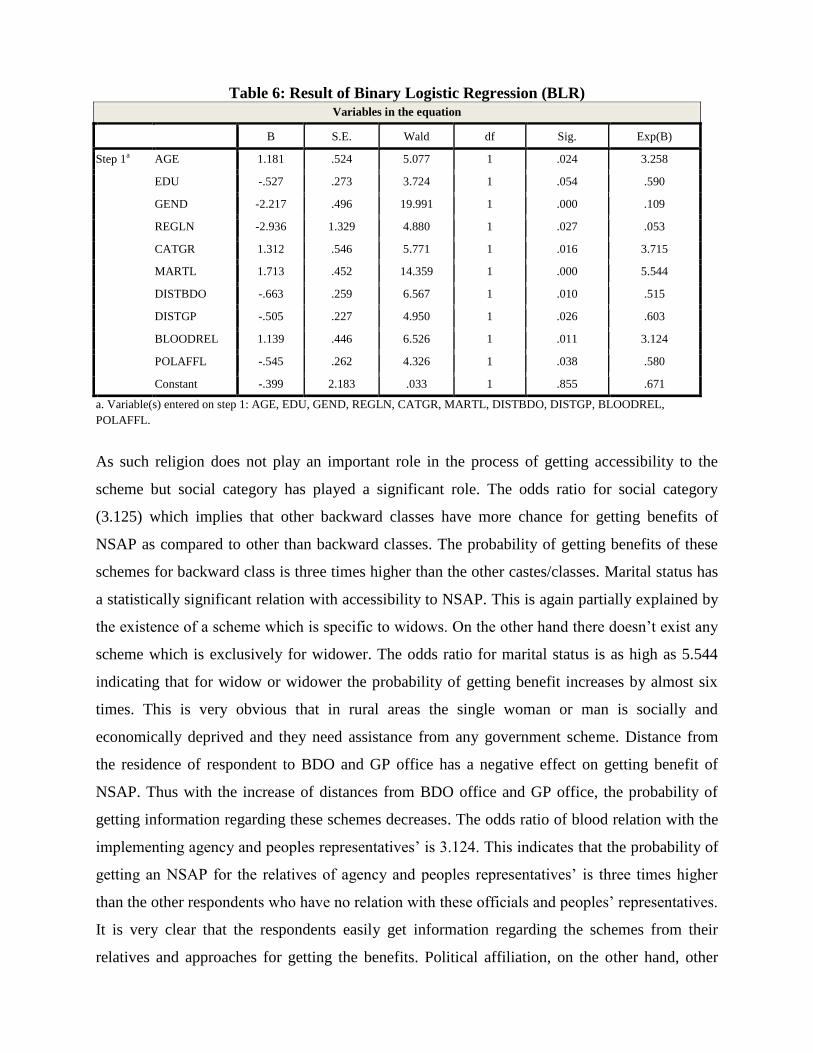
Table 6: Result of Binary Logistic Regression (BLR) Variables in the equation
B S.E. Wald df Sig. Exp(B)
Step 1a AGE 1.181 .524 5.077 1 .024 3.258
EDU -.527 .273 3.724 1 .054 .590
GEND -2.217 .496 19.991 1 .000 .109
REGLN -2.936 1.329 4.880 1 .027 .053
CATGR 1.312 .546 5.771 1 .016 3.715
MARTL 1.713 .452 14.359 1 .000 5.544
DISTBDO -.663 .259 6.567 1 .010 .515
DISTGP -.505 .227 4.950 1 .026 .603
BLOODREL 1.139 .446 6.526 1 .011 3.124
POLAFFL -.545 .262 4.326 1 .038 .580
Constant -.399 2.183 .033 1 .855 .671
a. Variable(s) entered on step 1: AGE, EDU, GEND, REGLN, CATGR, MARTL, DISTBDO, DISTGP, BLOODREL,
POLAFFL.
As such religion does not play an important role in the process of getting accessibility to the
scheme but social category has played a significant role. The odds ratio for social category
(3.125) which implies that other backward classes have more chance for getting benefits of
NSAP as compared to other than backward classes. The probability of getting benefits of these
schemes for backward class is three times higher than the other castes/classes. Marital status has
a statistically significant relation with accessibility to NSAP. This is again partially explained by
the existence of a scheme which is specific to widows. On the other hand there doesn‟t exist any
scheme which is exclusively for widower. The odds ratio for marital status is as high as 5.544
indicating that for widow or widower the probability of getting benefit increases by almost six
times. This is very obvious that in rural areas the single woman or man is socially and
economically deprived and they need assistance from any government scheme. Distance from
the residence of respondent to BDO and GP office has a negative effect on getting benefit of
NSAP. Thus with the increase of distances from BDO office and GP office, the probability of
getting information regarding these schemes decreases. The odds ratio of blood relation with the
implementing agency and peoples representatives‟ is 3.124. This indicates that the probability of
getting an NSAP for the relatives of agency and peoples representatives‟ is three times higher
than the other respondents who have no relation with these officials and peoples‟ representatives.
It is very clear that the respondents easily get information regarding the schemes from their
relatives and approaches for getting the benefits. Political affiliation, on the other hand, other
than ruling party with the ruling party has a negative effect on getting NSAP i.e. respondents
having affiliation with other political parties has less probability of getting benefit from these
schemes.
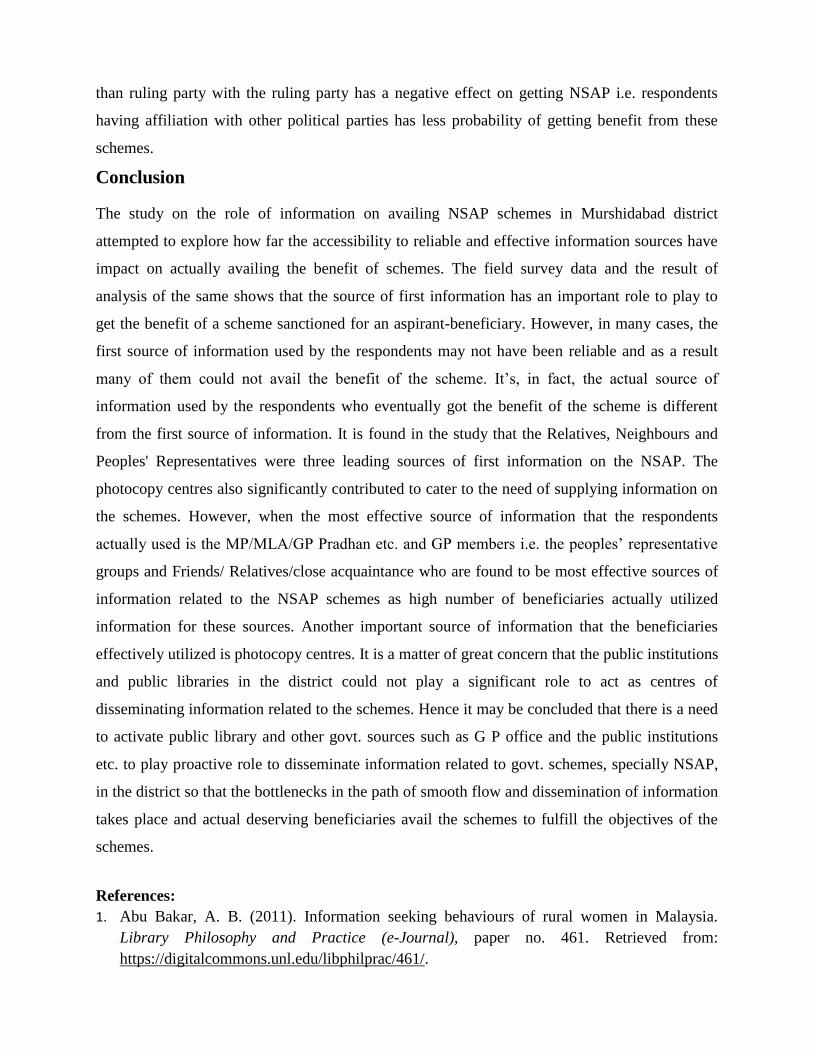
Conclusion
The study on the role of information on availing NSAP schemes in Murshidabad district
attempted to explore how far the accessibility to reliable and effective information sources have
impact on actually availing the benefit of schemes. The field survey data and the result of
analysis of the same shows that the source of first information has an important role to play to
get the benefit of a scheme sanctioned for an aspirant-beneficiary. However, in many cases, the
first source of information used by the respondents may not have been reliable and as a result
many of them could not avail the benefit of the scheme. It‟s, in fact, the actual source of
information used by the respondents who eventually got the benefit of the scheme is different
from the first source of information. It is found in the study that the Relatives, Neighbours and
Peoples' Representatives were three leading sources of first information on the NSAP. The
photocopy centres also significantly contributed to cater to the need of supplying information on
the schemes. However, when the most effective source of information that the respondents
actually used is the MP/MLA/GP Pradhan etc. and GP members i.e. the peoples‟ representative
groups and Friends/ Relatives/close acquaintance who are found to be most effective sources of
information related to the NSAP schemes as high number of beneficiaries actually utilized
information for these sources. Another important source of information that the beneficiaries
effectively utilized is photocopy centres. It is a matter of great concern that the public institutions
and public libraries in the district could not play a significant role to act as centres of
disseminating information related to the schemes. Hence it may be concluded that there is a need
to activate public library and other govt. sources such as G P office and the public institutions
etc. to play proactive role to disseminate information related to govt. schemes, specially NSAP,
in the district so that the bottlenecks in the path of smooth flow and dissemination of information
takes place and actual deserving beneficiaries avail the schemes to fulfill the objectives of the
schemes.
References:
1. Abu Bakar, A. B. (2011). Information seeking behaviours of rural women in Malaysia.
Library Philosophy and Practice (e-Journal), paper no. 461. Retrieved from:
https://digitalcommons.unl.edu/libphilprac/461/.

2. Abubakar, B. M. (2013). Poverty alleviation through strategic public library services in
Nigeria in the 21st century: a model. International Federation of Library Associations and
Institutions, 39(1), 4–14.
3. Agarwal, N.K., Xu, Y. and Poo, D.C. (2011). A context-based investigation into source use
by information seekers. Journal of the American Society for Information Science and
Technology, 62(6), 1087-1104
4. Anwar, M.A. and Supaat, H.I. (1998). Information needs of rural Malaysians: An exploratory
study of a cluster of three villages with no library service. International Information &
Library Review, 30(1), 23-36.
5. Chakrabarti, B. (2001). Over the edge of information in the information age: Information
behaviour of the Totos: A small marginal tribal community in sub-Himalayan North Bengal,
India. One individual perspective. The International Information & Library Review, 33(2-3),
167-180
6. Du, J. T. and Haines, J. (2017). Indigenous Australians‟ information behaviour and Internet
use in everyday life: an exploratory study. Information Research, 22(1), paper 737. Retrieved
from: http://InformationR.net/ir/22-1/paper737.html
7. Ellis, L. (1983). An evaluation of a public library service to four ethnic communities.
Australian Library Journal, 32(4), 13-23.
8. Islam, M. A., &Mezbah-ul-Islam, M. (2008). Community Information Centers: A Step to
Bring Connectivity of the Rural Communities in Bangladesh. PLANNER, 55-69.
9. Issa, A.O., Omopupa, K.T., & Salman, A.A. (2012). Rural Information Provision for
National Development: A Study of Kwara North Senatorial District of Kwara State, Nigeria.
PNLA Quarterly,76(2), 171.
10. Iwe, J. I. (2003). Libraries and Information in Sustainable Rural Development in Nigeria.
Information Development, 19(3), 169-177.
11. Kamba, M. A. (2009). Access to information: The dilemma for rural community development
in Africa. Paper presented at GLOBELICS 2009, 7th International Conference, 6-8 October,
Dakar, Senegal.
12. Kapur, A. &Chowdhury, A. (2012). National Social Assistance Programme (NSAP) 2012-
13. Budget Briefs-NSAP, 4(6), February. Retrieved from
http://www.accountabilityindia.in/expenditure_track on 01/10/2013.
13. Mahindarathne, M.G.P.P. and Min, Q. (2019). Factors that influence farmers‟ information
seeking behaviour: A study of Sri Lankan vegetable farmers. Journal of Information &
Knowledge Management, 18(3), 1950037.
14. Martin, J. R. (1983). Rural public libraries: an examination of certain aspects of state public
library service points in communities of 1000 to 5000 people, Information Studies, 75.
15. McDonald, M. M. (1986). Public library service to young adults 15-25. IFLA Journal, 12(2).
16. Mchombu, K. (1996). A survey of information needs for rural development. Resource
Sharing and Information Networks, 12(1), 75-81.
17. Momodu, M.O. (2002). Information needs and information seeking behaviour of rural
dwellers in Nigeria: A case study of Ekpoma in Esan West local government area of Edo
State, Nigeria. Library Review, 51(8), 406-410.
18. Mooko, N.P. (2005). The information behaviors of rural women in Botswana. Library &
Information Science Research, 27(1), 115-127
19. Msoffe, G. E. and Ngulube, P. (2016). Information needs of poultry farmers in selected rural
areas of Tanzania. Information Development, 32(4), 1085-1096
20. Mtega, W. P. (2012). Access to and Usage of Information among Rural Communities: a Case
Study of Kilosa District Morogoro Region in Tanzania. The Canadian Journal of Library
and Information Practice and Research, 7(1),Unpaginated paper. Retrieved from
https://journal.lib.uoguelph.ca/index.php/perj/article/view/1646 on 15/10/2013.
21. Mwantimwa, K. (2020). Livelihood information and knowledge needs, access, and exchange
in rural communities in the Bunda District, Tanzania. Rural Society, 29(1), 30-43.
22. Okwu O.J. and Lorkaa T.I. (2011). An assessment of farmers‟ use of new information and
communication technologies as sources of agricultural information in Shongo Local
Government Area, Benue State, Nigeria. Journal of Sustainable Development in Africa,
13(2), 41-52
23. Pandey, J. & Pant, S. K. (2000). Performance of social sector schemes in rural areas of Uttar
Pradesh (Planning Commission Sponsored Study Report), Allahabad: GovindBallabh Pant
Social Science Institute.
24. Patrick, I.O. and Ferdinand, O.A. (2016). Rural women and their information seeking
behavior. Library Philosophy and Practice, paper no. 1396. Retrieved from
https://digitalcommons.unl.edu/libphilprac/1396/.
25. Proctor, R. &Usherwood, B. (1997). What happens when a public library service closes
down? Library Management, 75(1-2), 59-64.
26. Singh, B., Patel, R K., &Suhag, K. S. (2007). Role of credit institutions in rural poverty
alleviation: a study of Hisar district, Haryana. Journal of rural development, 26 (4), 503-522.
27. World Bank (1998). Poverty Alleviation Programmes. Retrieved from
planningcommission.nic.in/plans/mta/mta-9702/mta-ch6.pdf on 11/80/2013. Washington,
DC: The World Bank.
28. Woudstra, L., van den Hooff, B. and Schouten, A. (2016). The quality versus accessibility
debate revisited: A contingency perspective on human information source selection. Journal
of the Association for Information Science and Technology, 67(9), 2060-2071
29. Zhang, Y. and Yu, L. (2009). Information for social and economic participation: A review of
related research on the information needs and acquisition of rural Chinese. The International
Information & Library Review, 41(2), 63-70.
30. Zimmer, J. C., Henry, R. M. and Butler, B. S. (2007). Determinants of the Use of Relational
and Nonrelational Information Sources. Journal of Management Information Systems, 24(3),
297-331.