A Study of Associate Degree Nursing Program Success
48
Final Report State Board of North Carolina Community Colleges October 15, 2008 Erin Fraher, Director Dan Belsky, Research Assistant Jessica Carpenter, Data Coordinator Katie Gaul, Research Associate NC Health Professions Data System A Study of Associate Degree Nursing Program Success: Evidence from the 2002 Cohort
-
Upload
khangminh22 -
Category
Documents
-
view
2 -
download
0
Transcript of A Study of Associate Degree Nursing Program Success
Final ReportState Board of North Carolina Community Colleges October 15, 2008
Erin Fraher, DirectorDan Belsky, Research AssistantJessica Carpenter, Data CoordinatorKatie Gaul, Research AssociateNC Health Professions Data System
A Study of Associate Degree Nursing Program Success: Evidence from the 2002 Cohort
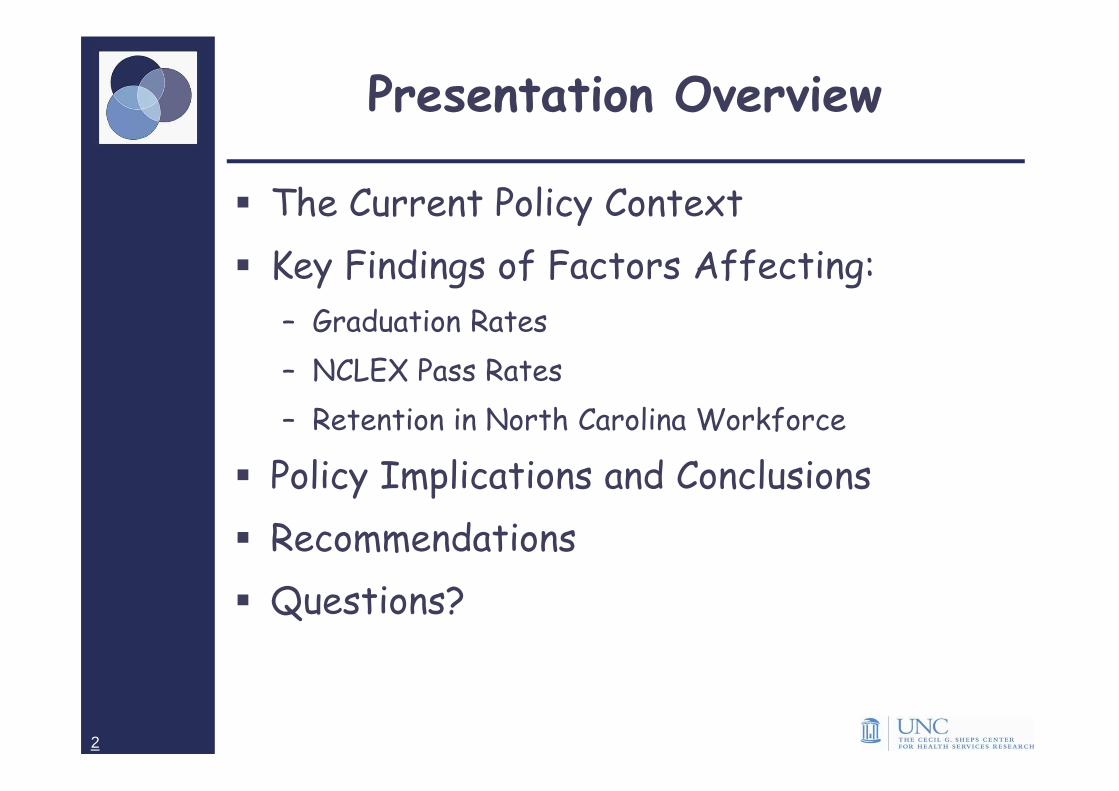
Presentation Overview
� The Current Policy Context
� Key Findings of Factors Affecting:
– Graduation Rates
– NCLEX Pass Rates
– Retention in North Carolina Workforce
� Policy Implications and Conclusions
� Recommendations
� Questions?
2
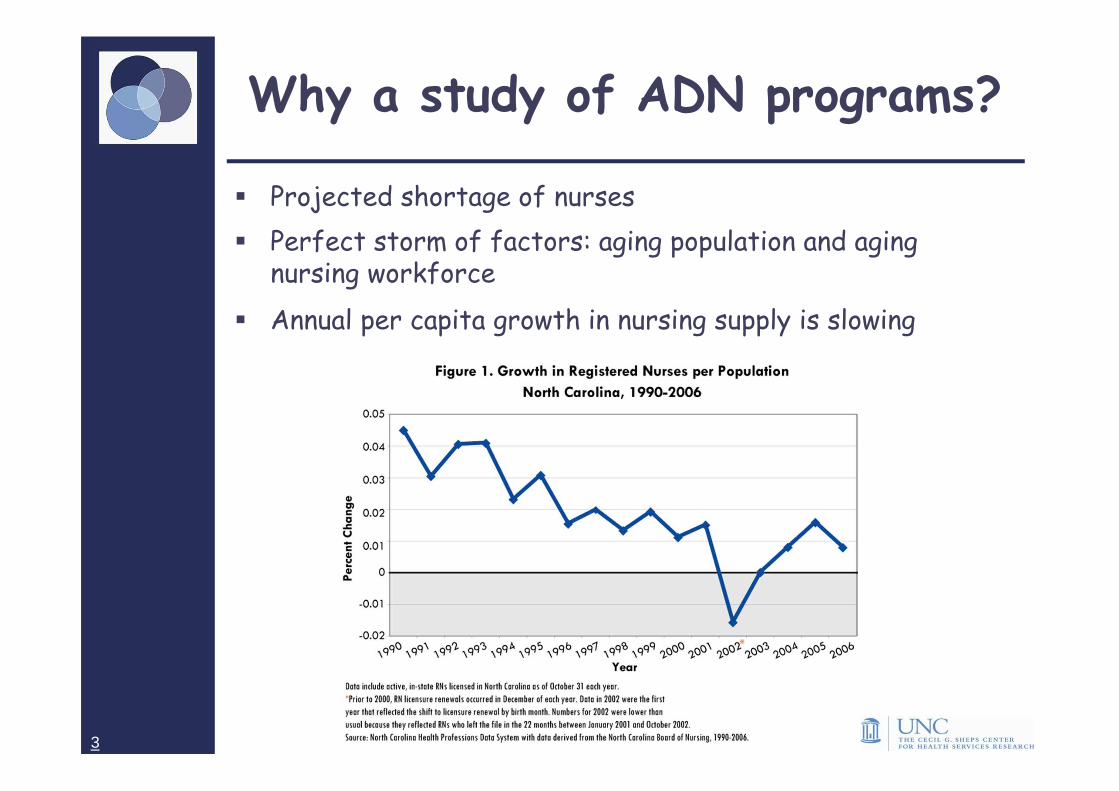
Why a study of ADN programs?
� Projected shortage of nurses
� Perfect storm of factors: aging population and aging nursing workforce
� Annual per capita growth in nursing supply is slowing
3
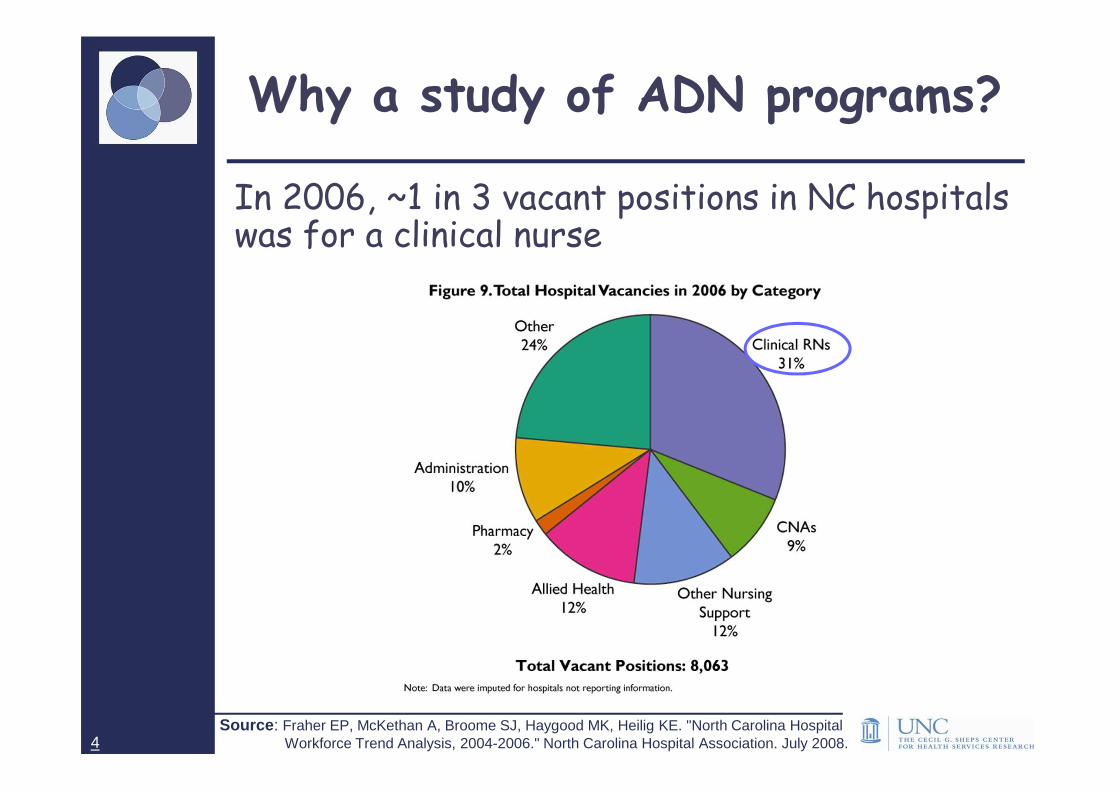
Why a study of ADN programs?
In 2006, ~1 in 3 vacant positions in NC hospitals was for a clinical nurse
Source: Fraher EP, McKethan A, Broome SJ, Haygood MK, Heilig KE. "North Carolina Hospital Workforce Trend Analysis, 2004-2006." North Carolina Hospital Association. July 2008.4
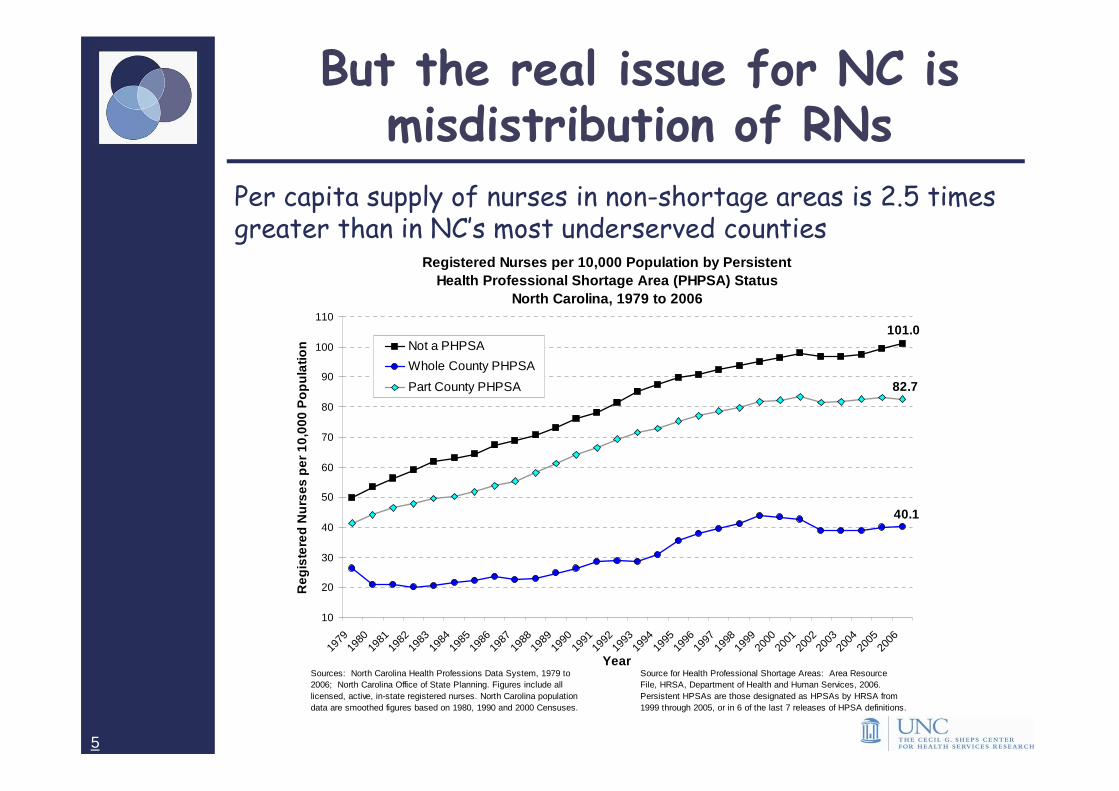
But the real issue for NC is misdistribution of RNs
Per capita supply of nurses in non-shortage areas is 2.5 times greater than in NC’s most underserved counties
Registered Nurses per 10,000 Population by PersistentHealth Professional Shortage Area (PHPSA) Status
North Carolina, 1979 to 2006
101.0
40.1
82.7
10
20
30
40
50
60
70
80
90
100
110
1979
1980
1981
1982
1983
1984
1985
1986
1987
1988
1989
1990
1991
1992
1993
1994
1995
1996
1997
1998
1999
2000
2001
2002
2003
2004
2005
2006
Year
Reg
iste
red
Nu
rses
per
10,
000
Po
pu
latio
n Not a PHPSA
Whole County PHPSA
Part County PHPSA
Source for Health Professional Shortage Areas: Area Resource File, HRSA, Department of Health and Human Services, 2006.Persistent HPSAs are those designated as HPSAs by HRSA from 1999 through 2005, or in 6 of the last 7 releases of HPSA definitions.
Sources: North Carolina Health Professions Data System, 1979 to 2006; North Carolina Office of State Planning. Figures include all licensed, active, in-state registered nurses. North Carolina population data are smoothed figures based on 1980, 1990 and 2000 Censuses.
5
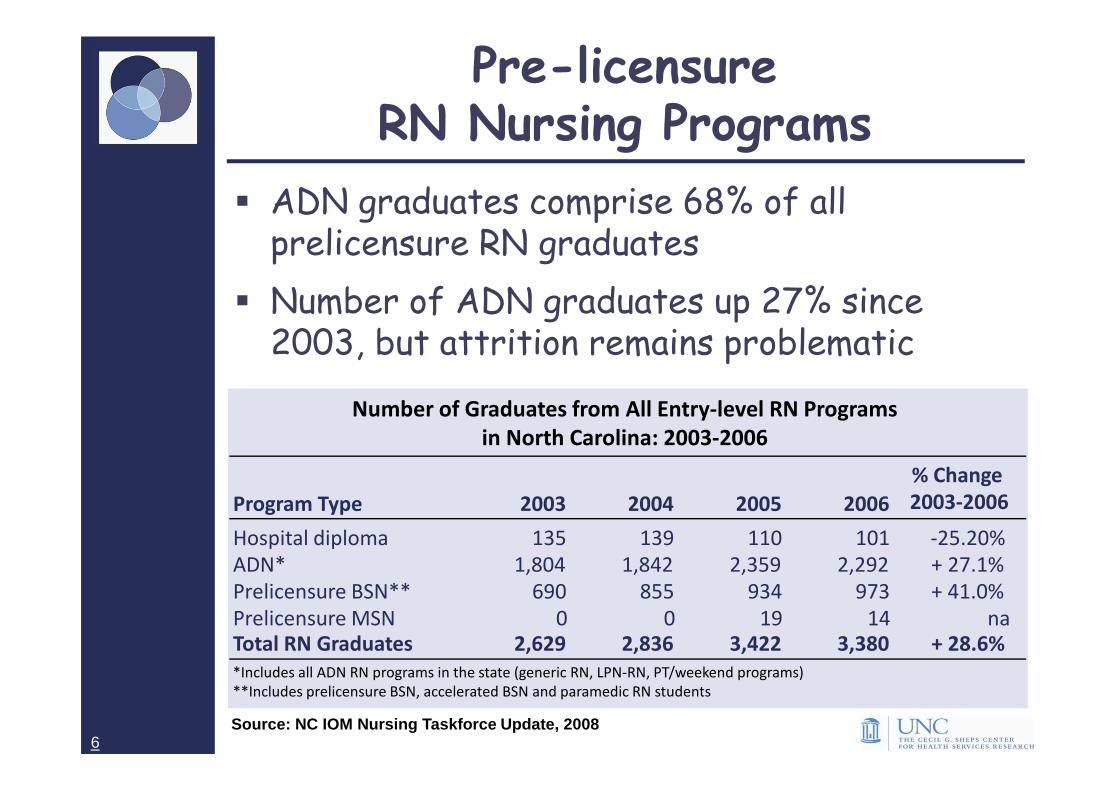
Pre-licensure RN Nursing Programs
� ADN graduates comprise 68% of all prelicensure RN graduates
� Number of ADN graduates up 27% since 2003, but attrition remains problematic
Source: NC IOM Nursing Taskforce Update, 2008
Number of Graduates from All Entry-level RN Programs
in North Carolina: 2003-2006
*Includes all ADN RN programs in the state (generic RN, LPN-RN, PT/weekend programs)
**Includes prelicensure BSN, accelerated BSN and paramedic RN students
Program Type 2003 2004 2005 2006
% Change
2003-2006
Hospital diploma 135 139 110 101 -25.20%
ADN* 1,804 1,842 2,359 2,292 + 27.1%
Prelicensure BSN** 690 855 934 973 + 41.0%
Prelicensure MSN 0 0 19 14 na
Total RN Graduates 2,629 2,836 3,422 3,380 + 28.6%
6
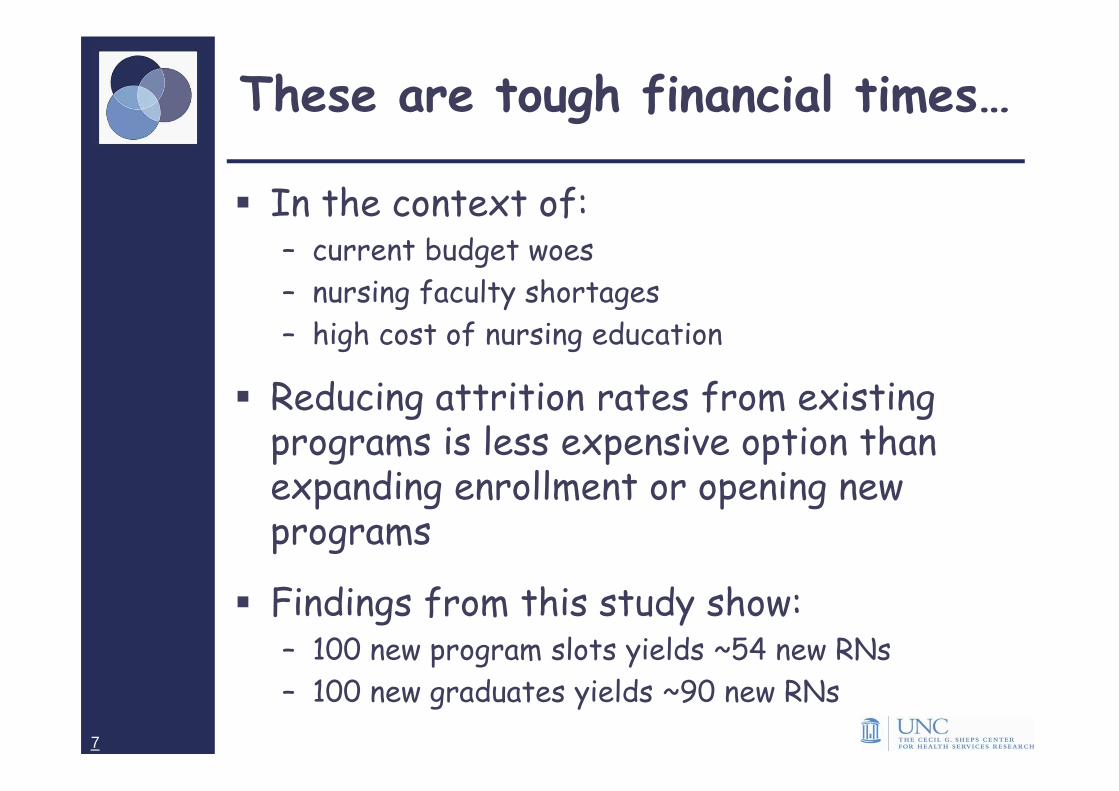
These are tough financial times…
� In the context of:– current budget woes
– nursing faculty shortages
– high cost of nursing education
� Reducing attrition rates from existing programs is less expensive option than expanding enrollment or opening new programs
� Findings from this study show:– 100 new program slots yields ~54 new RNs
– 100 new graduates yields ~90 new RNs
7
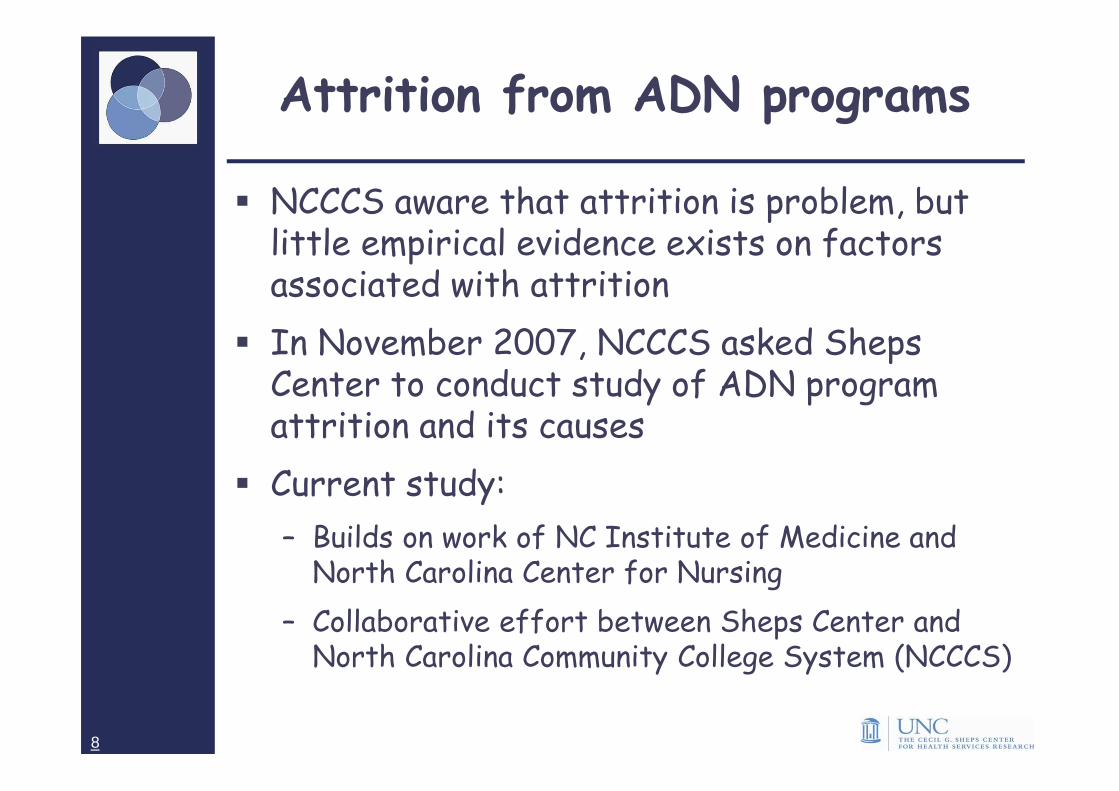
Attrition from ADN programs
� NCCCS aware that attrition is problem, but little empirical evidence exists on factors associated with attrition
� In November 2007, NCCCS asked Sheps Center to conduct study of ADN program attrition and its causes
� Current study:
– Builds on work of NC Institute of Medicine and North Carolina Center for Nursing
– Collaborative effort between Sheps Center and North Carolina Community College System (NCCCS)
8
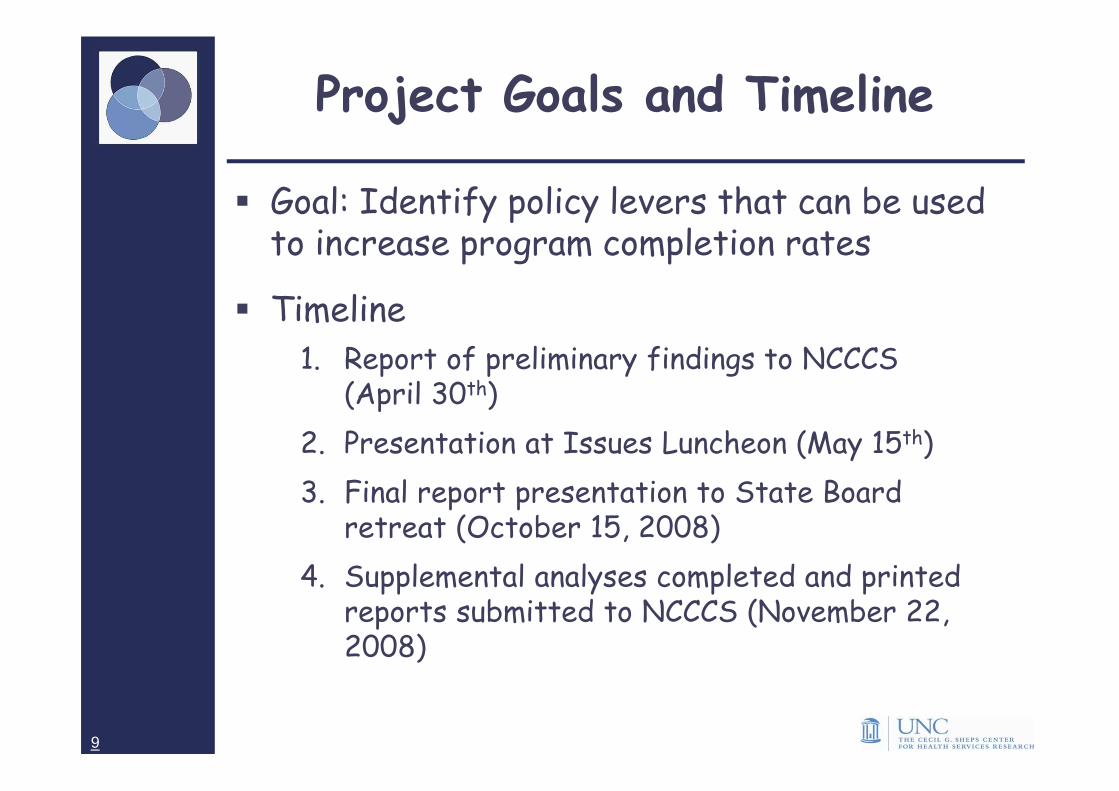
Project Goals and Timeline
� Goal: Identify policy levers that can be used to increase program completion rates
� Timeline
1. Report of preliminary findings to NCCCS (April 30th)
2. Presentation at Issues Luncheon (May 15th)
3. Final report presentation to State Board retreat (October 15, 2008)
4. Supplemental analyses completed and printed reports submitted to NCCCS (November 22, 2008)
9
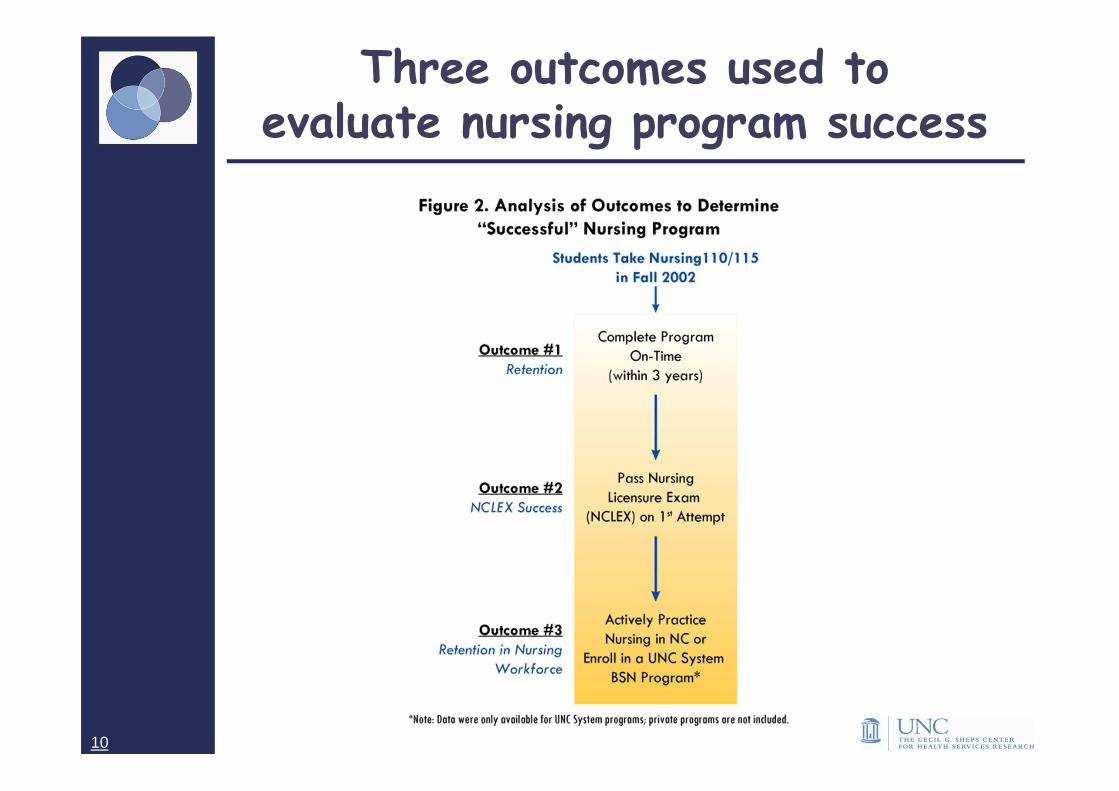
Three outcomes used to evaluate nursing program success
10
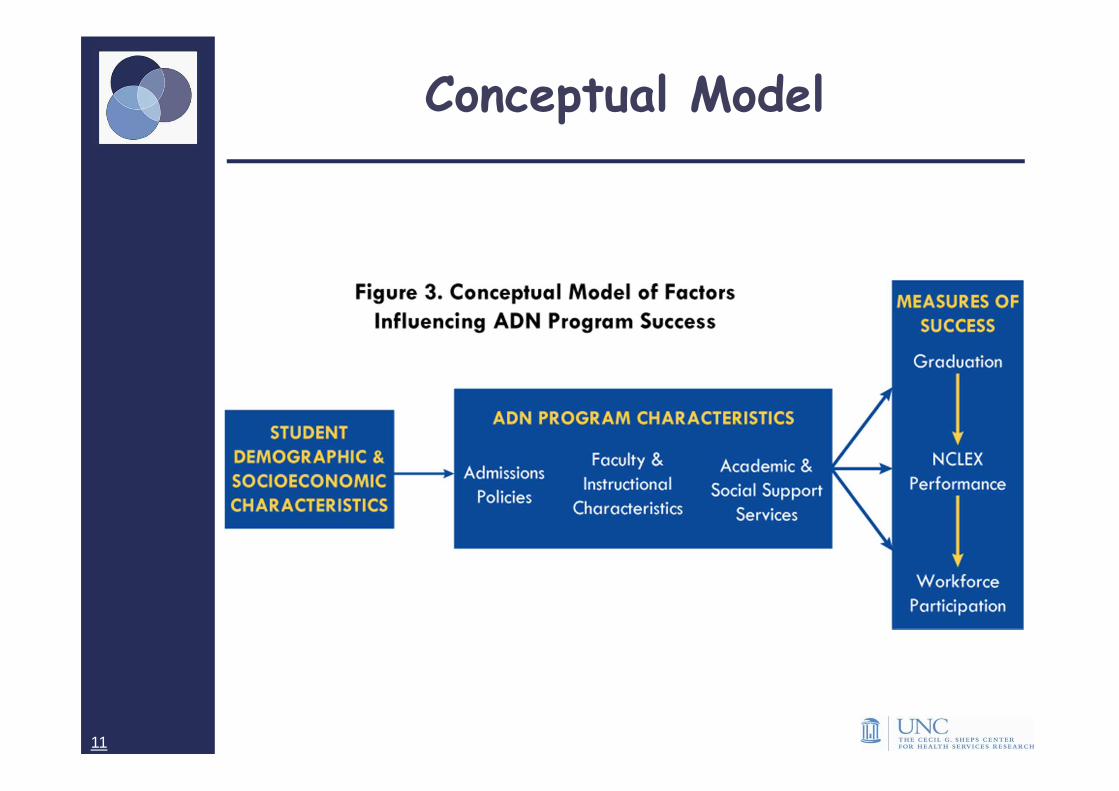
Conceptual Model
11

Characteristics of Student Cohort
Tracked in the Study
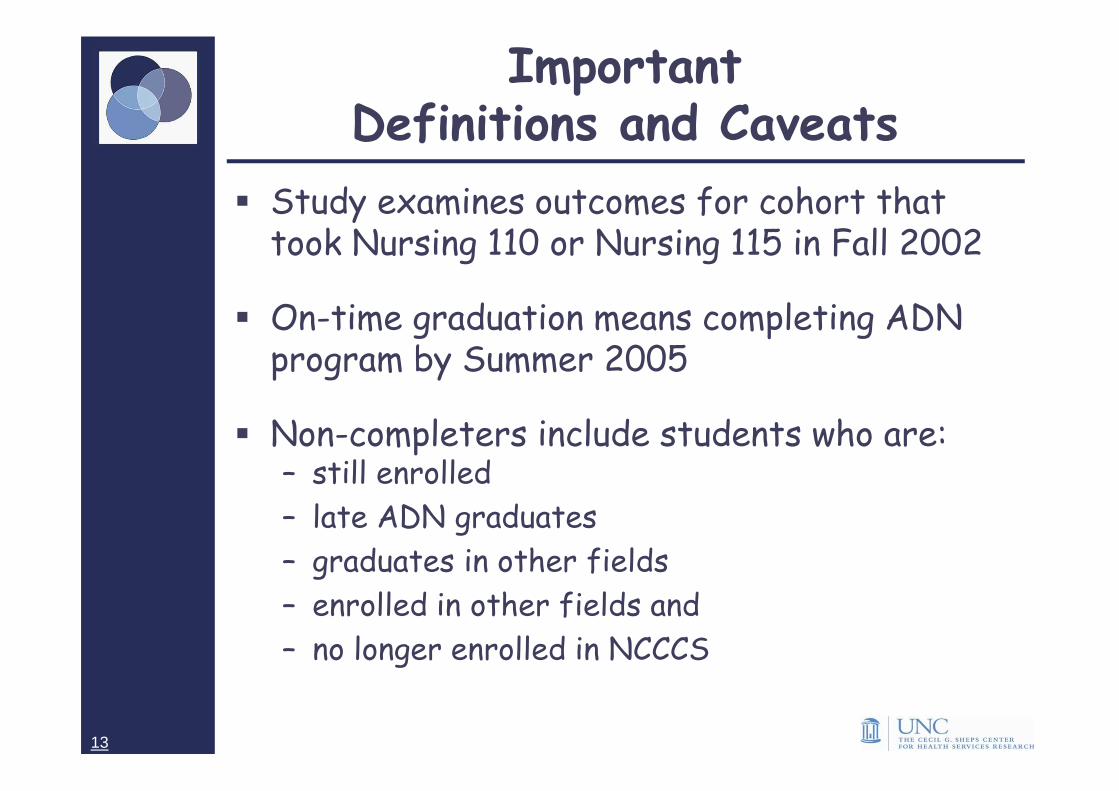
ImportantDefinitions and Caveats
� Study examines outcomes for cohort that took Nursing 110 or Nursing 115 in Fall 2002
� On-time graduation means completing ADN program by Summer 2005
� Non-completers include students who are:– still enrolled
– late ADN graduates
– graduates in other fields
– enrolled in other fields and
– no longer enrolled in NCCCS
13
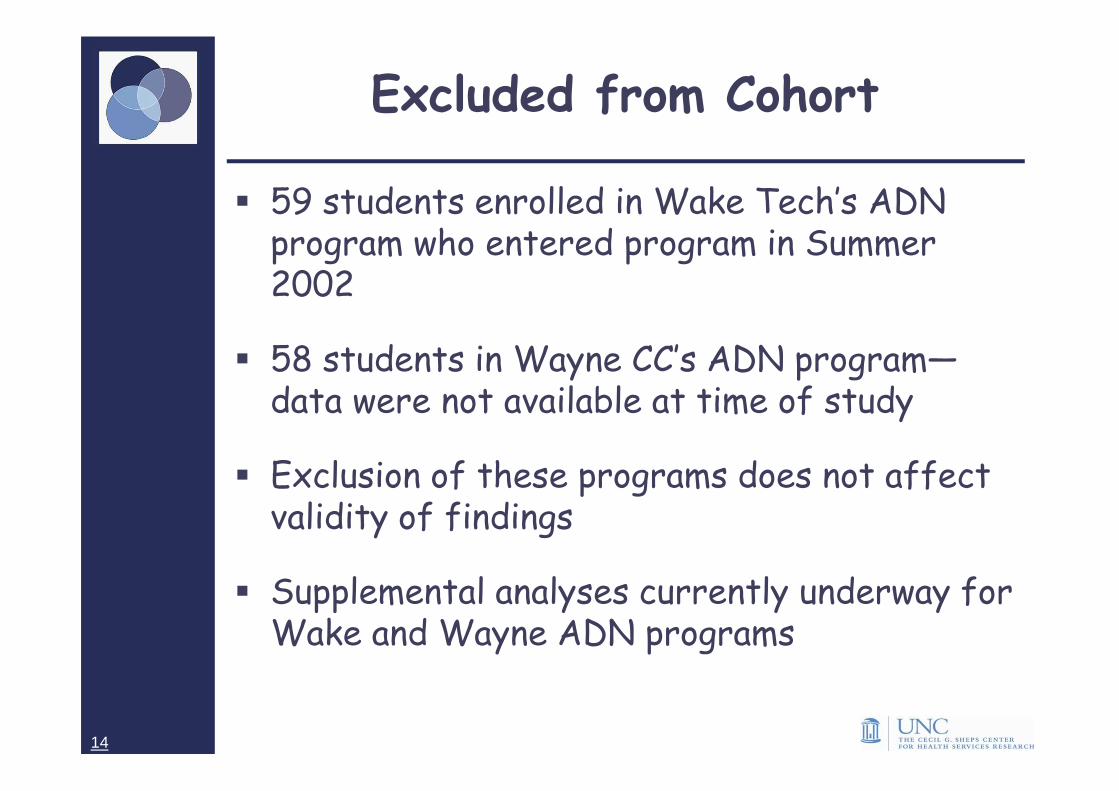
Excluded from Cohort
� 59 students enrolled in Wake Tech’s ADN program who entered program in Summer 2002
� 58 students in Wayne CC’s ADN program—data were not available at time of study
� Exclusion of these programs does not affect validity of findings
� Supplemental analyses currently underway for Wake and Wayne ADN programs
14
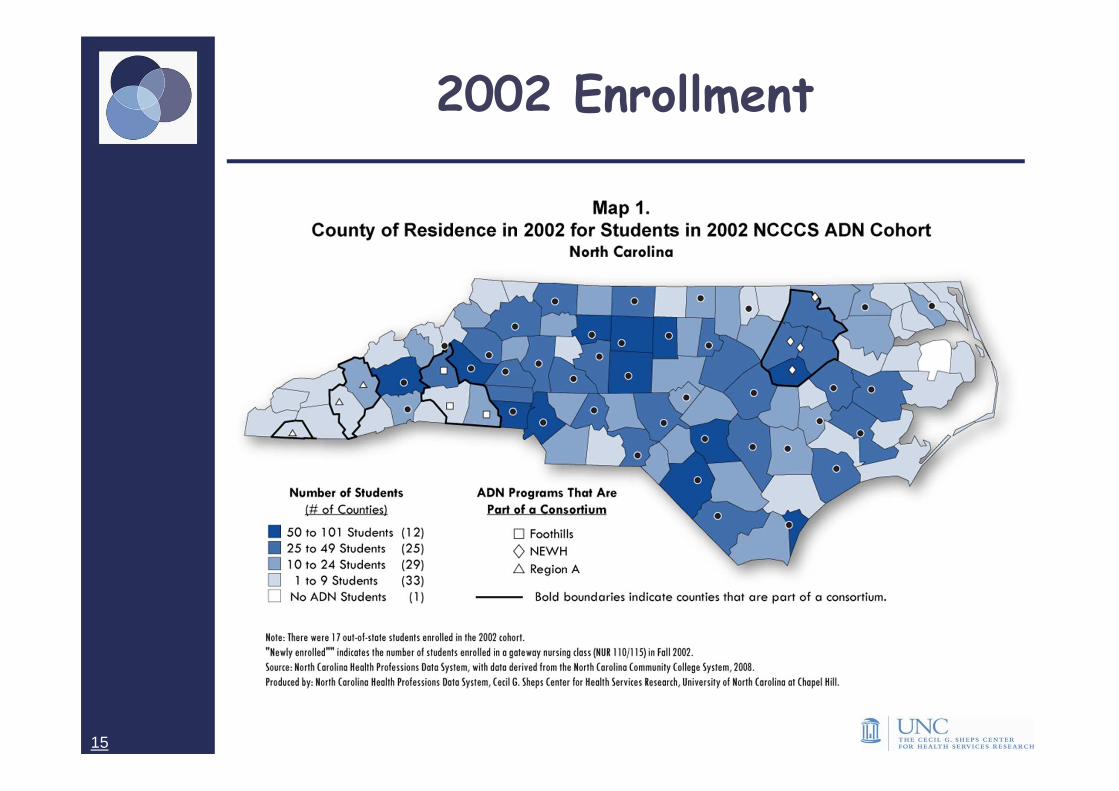
2002 Enrollment
15
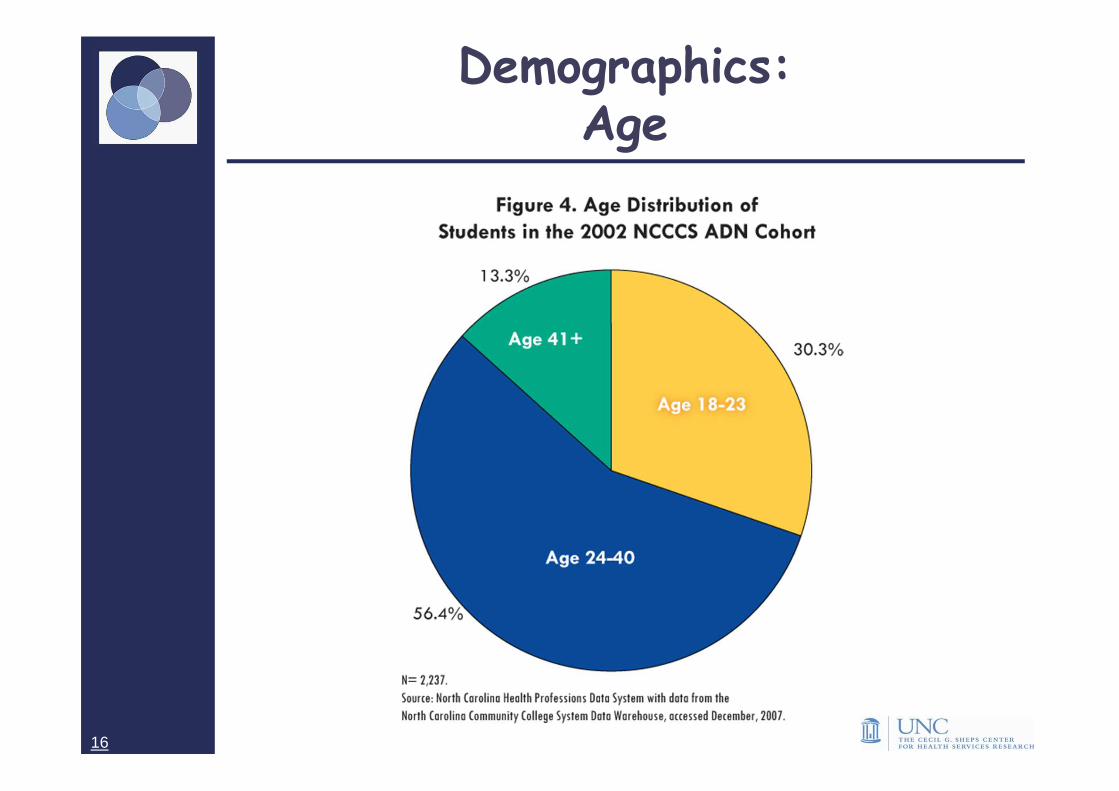
Demographics:Age
16
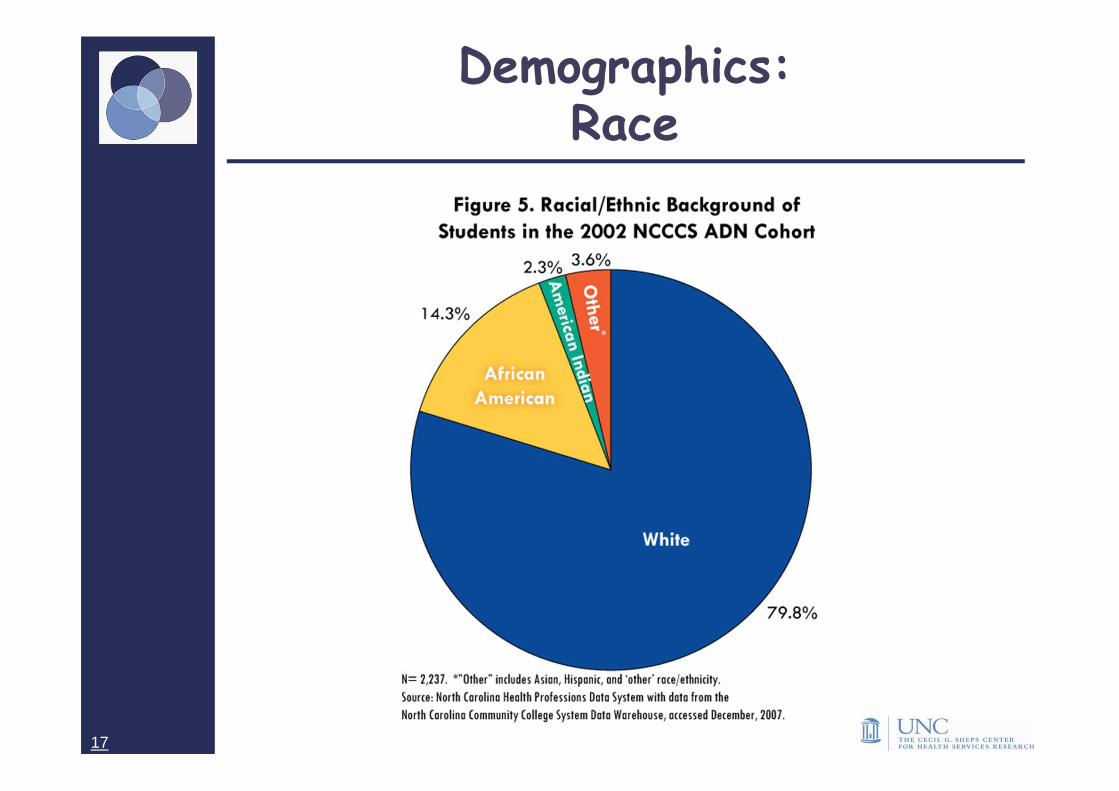
Demographics:Race
17
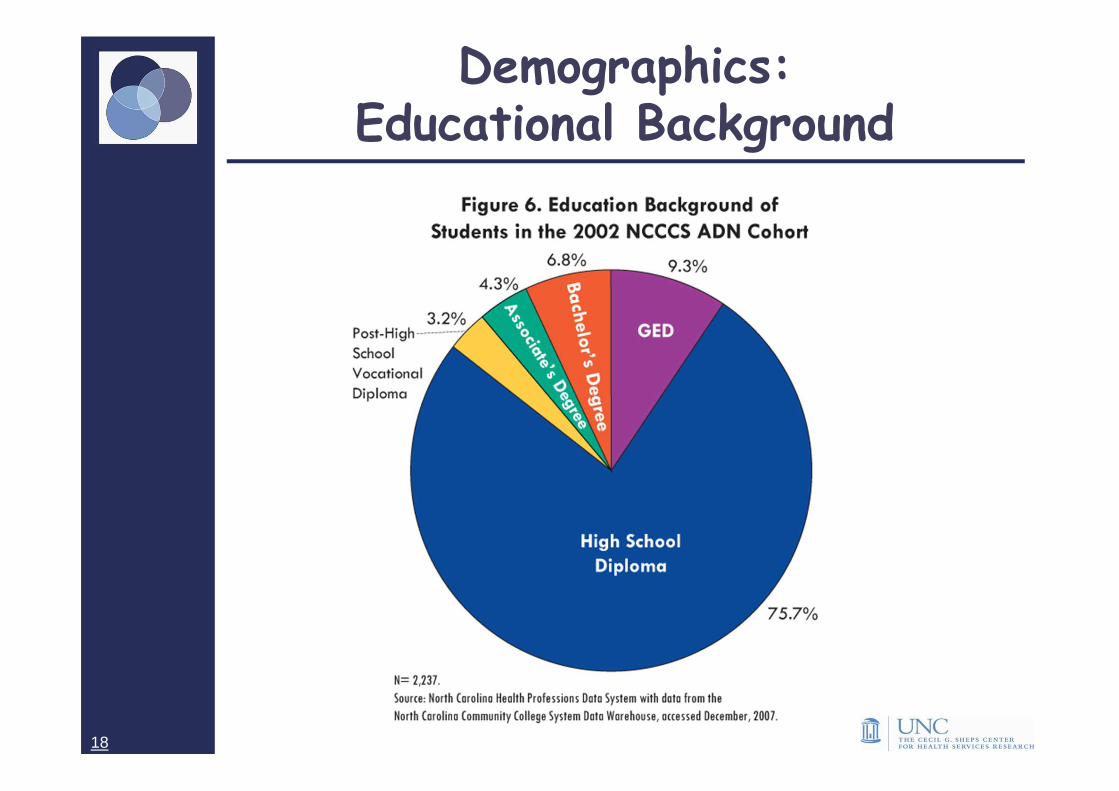
Demographics: Educational Background
18
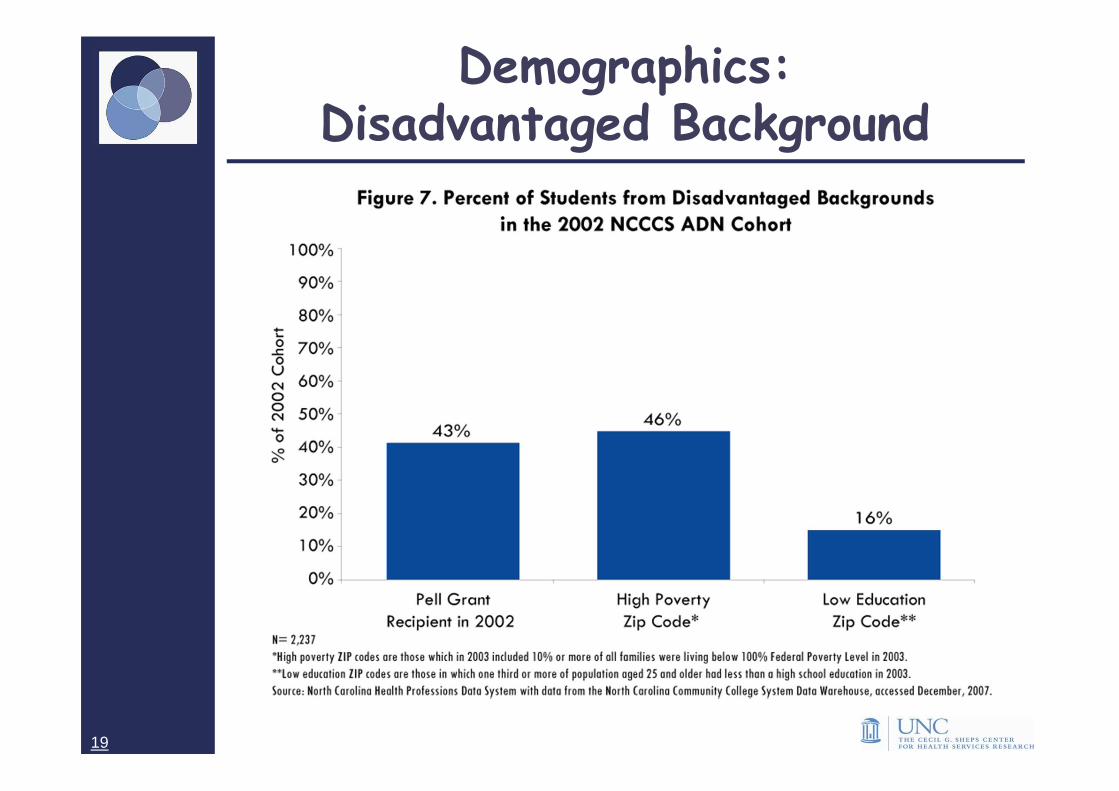
Demographics:Disadvantaged Background
19

Outcome 1: Graduation Rates
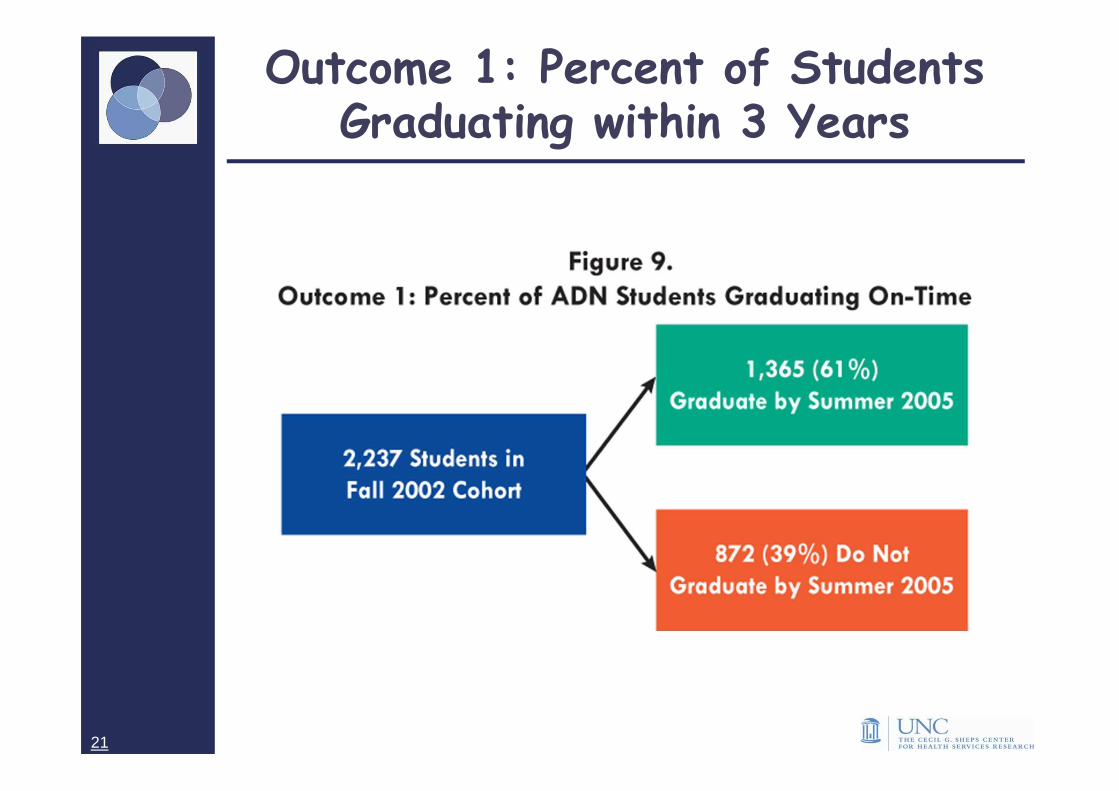
Outcome 1: Percent of Students Graduating within 3 Years
21
Influence of Student-Level Characteristics on Graduation Rates
� To what degree do student characteristics explain variation in on-time graduation rates?
� Used statistical analyses to account for fact that:
– Student characteristics are often correlated with one another — students from diverse racial and ethnic backgrounds may also have Pell Grants
– Important differences exist between ADN programs in admission policies, student support services, instructional techniques, as well as faculty academic preparation and remuneration.
22
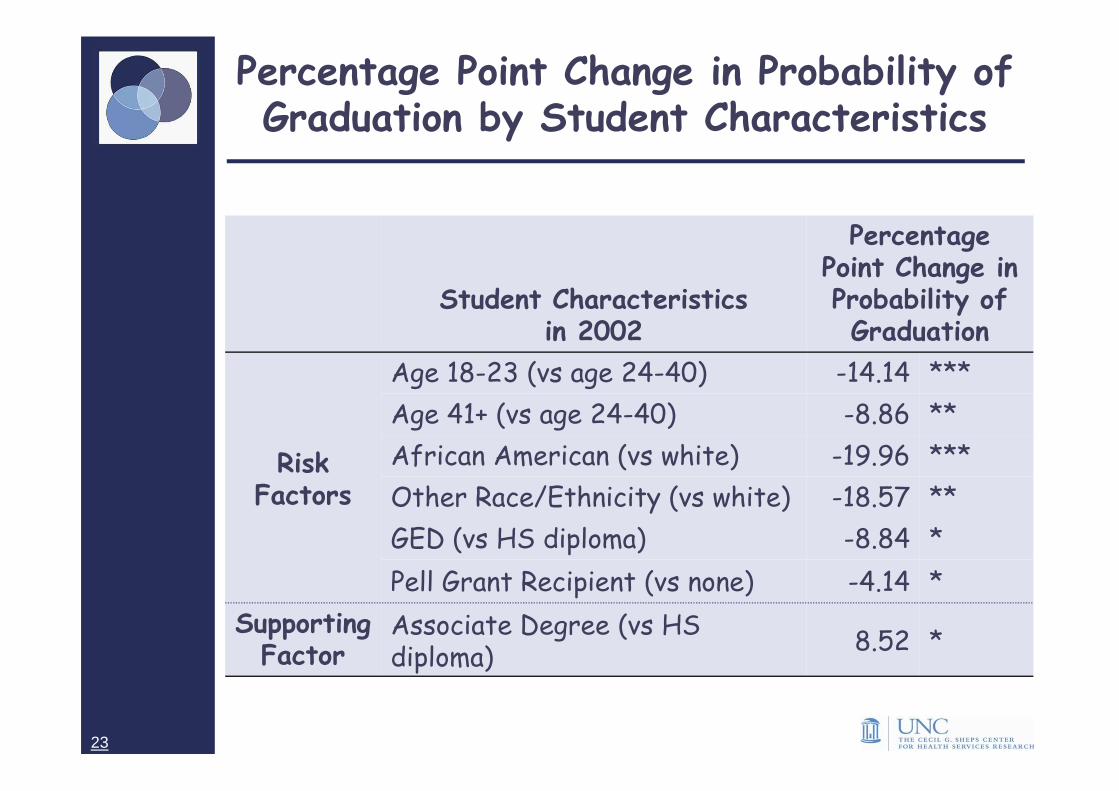
Percentage Point Change in Probability of Graduation by Student Characteristics
Student Characteristicsin 2002
Percentage Point Change in Probability of Graduation
Risk Factors
Age 18-23 (vs age 24-40) -14.14 ***
Age 41+ (vs age 24-40) -8.86 **
African American (vs white) -19.96 ***
Other Race/Ethnicity (vs white) -18.57 **
GED (vs HS diploma) -8.84 *
Pell Grant Recipient (vs none) -4.14 *
Supporting Factor
Associate Degree (vs HS diploma)
8.52 *
23
High- vs Low-Performing Programs
� On-time graduation rates by ADN program ranged from 24% to 85%
� Distribution of student risk characteristics not spread evenly across ADN programs
� Challenge: how to identify programs that performed better or worse than expected given their student populations?
24
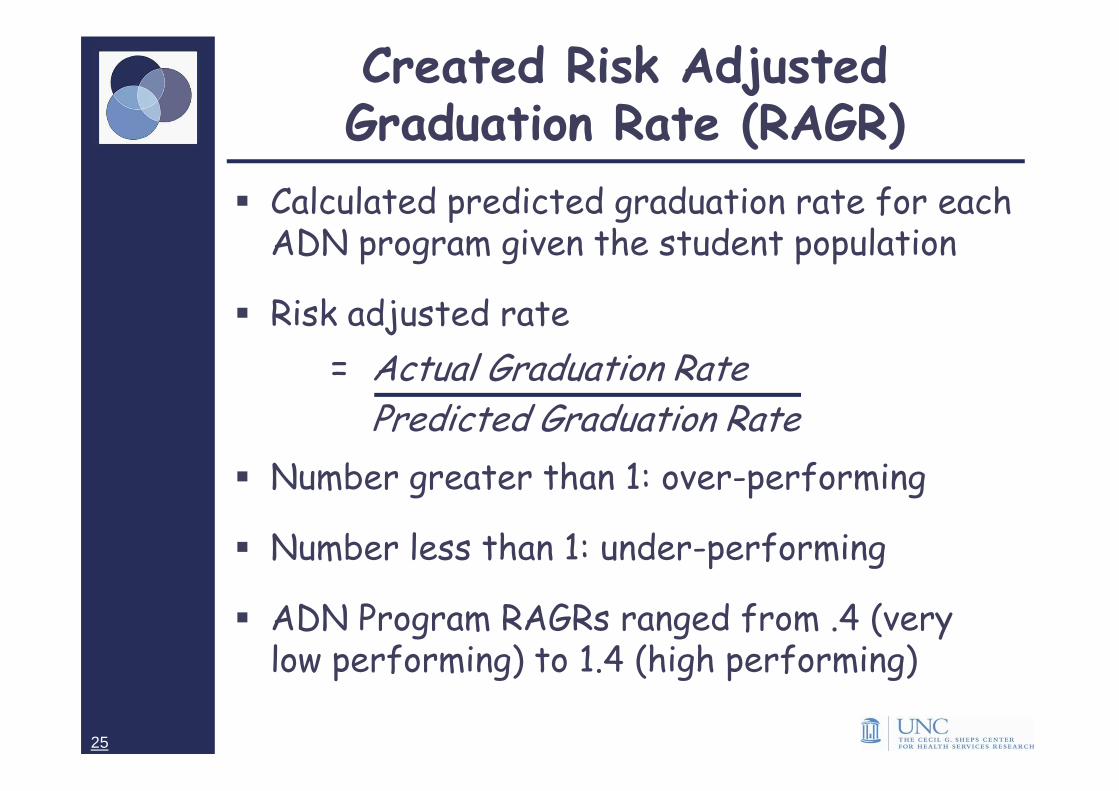
Created Risk Adjusted Graduation Rate (RAGR)
� Calculated predicted graduation rate for each ADN program given the student population
� Risk adjusted rate
= Actual Graduation RatePredicted Graduation Rate
� Number greater than 1: over-performing
� Number less than 1: under-performing
� ADN Program RAGRs ranged from .4 (very low performing) to 1.4 (high performing)
25
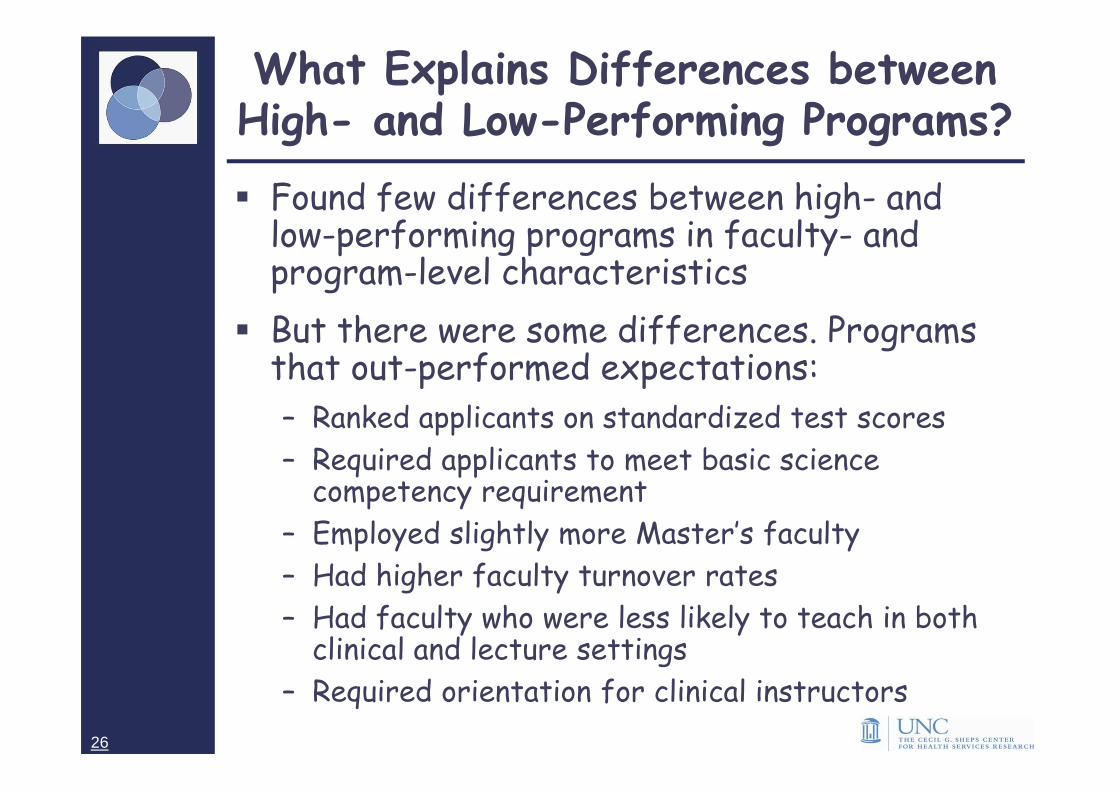
What Explains Differences between High- and Low-Performing Programs?
� Found few differences between high- and low-performing programs in faculty- and program-level characteristics
� But there were some differences. Programs that out-performed expectations:
– Ranked applicants on standardized test scores
– Required applicants to meet basic science competency requirement
– Employed slightly more Master’s faculty
– Had higher faculty turnover rates
– Had faculty who were less likely to teach in both clinical and lecture settings
– Required orientation for clinical instructors
26
Outcome 2: NCLEX Pass Rates
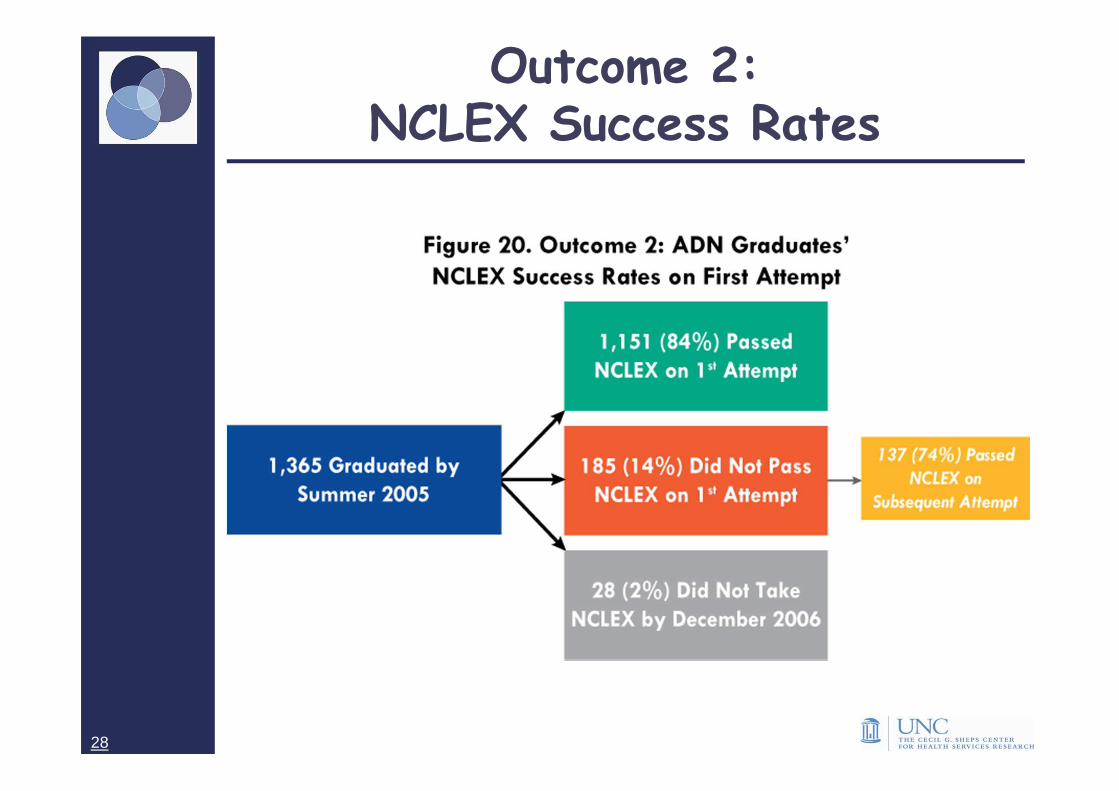
Outcome 2: NCLEX Success Rates
28
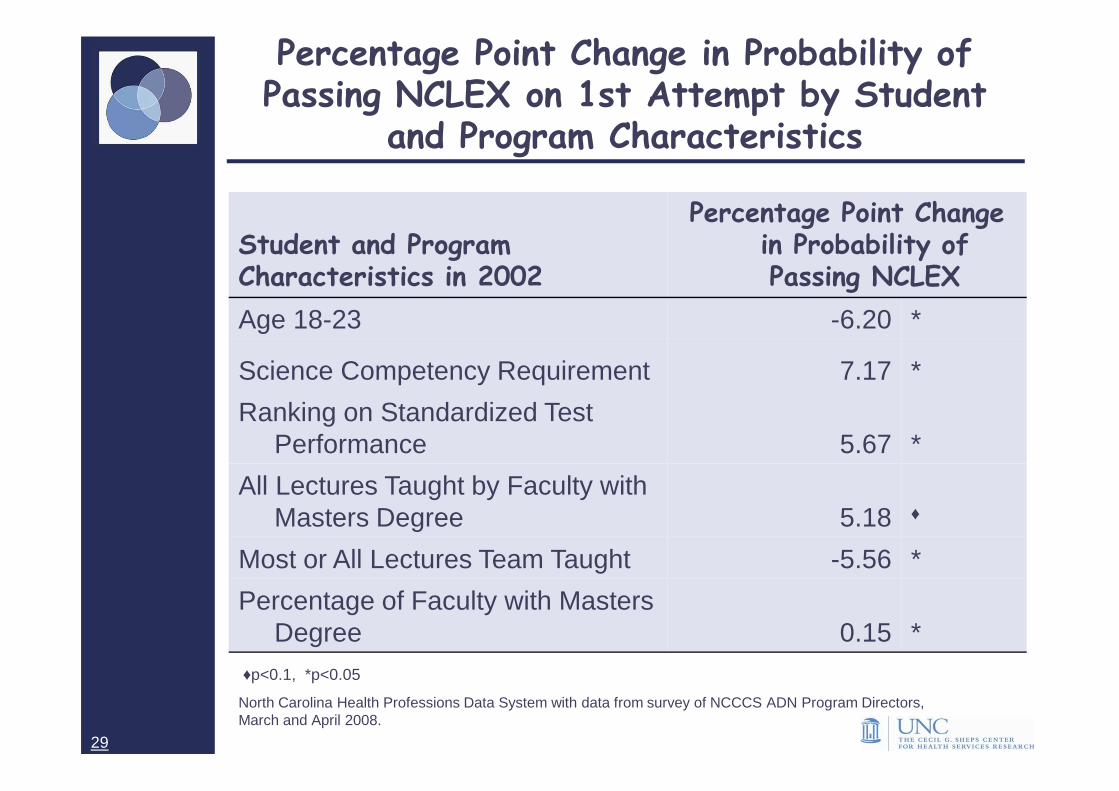
Percentage Point Change in Probability of Passing NCLEX on 1st Attempt by Student
and Program Characteristics
Student and ProgramCharacteristics in 2002
Percentage Point Change in Probability of Passing NCLEX
Age 18-23 -6.20 *
Science Competency Requirement 7.17 *
Ranking on Standardized Test Performance 5.67 *
All Lectures Taught by Faculty with Masters Degree 5.18 ♦
Most or All Lectures Team Taught -5.56 *
Percentage of Faculty with Masters Degree 0.15 *
♦p<0.1, *p<0.05
North Carolina Health Professions Data System with data from survey of NCCCS ADN Program Directors,March and April 2008.
29
Creating the Right Incentives: The Tradeoff between Graduation vs. NCLEX
� NCLEX pass rate ranged from 59% to 100%
� NCLEX pass rate important because of Board of Nursing requirement for 3 year average pass rate > 95% of US average
� Current incentive structure may focus too much on high NCLEX pass rates
� Good number of programs with high NCLEX pass rates have low graduation rates
30
Creating the Right Incentives: The Tradeoff between Graduation vs. NCLEX
How to evaluate program performance?
� Need for a composite measure that combines risk-adjusted graduation rate with NCLEX pass rate
� Composite measure would:– Shift emphasis away from test performance as goal unto itself
– Put emphasis on program output into workforce
– Remove incentive to achieve high NCLEX pass rates at expense of high attrition rates
– Be more equitable and efficient way of evaluating program performance
31
Outcome 3:Retention in
Nursing Workforcein North Carolina
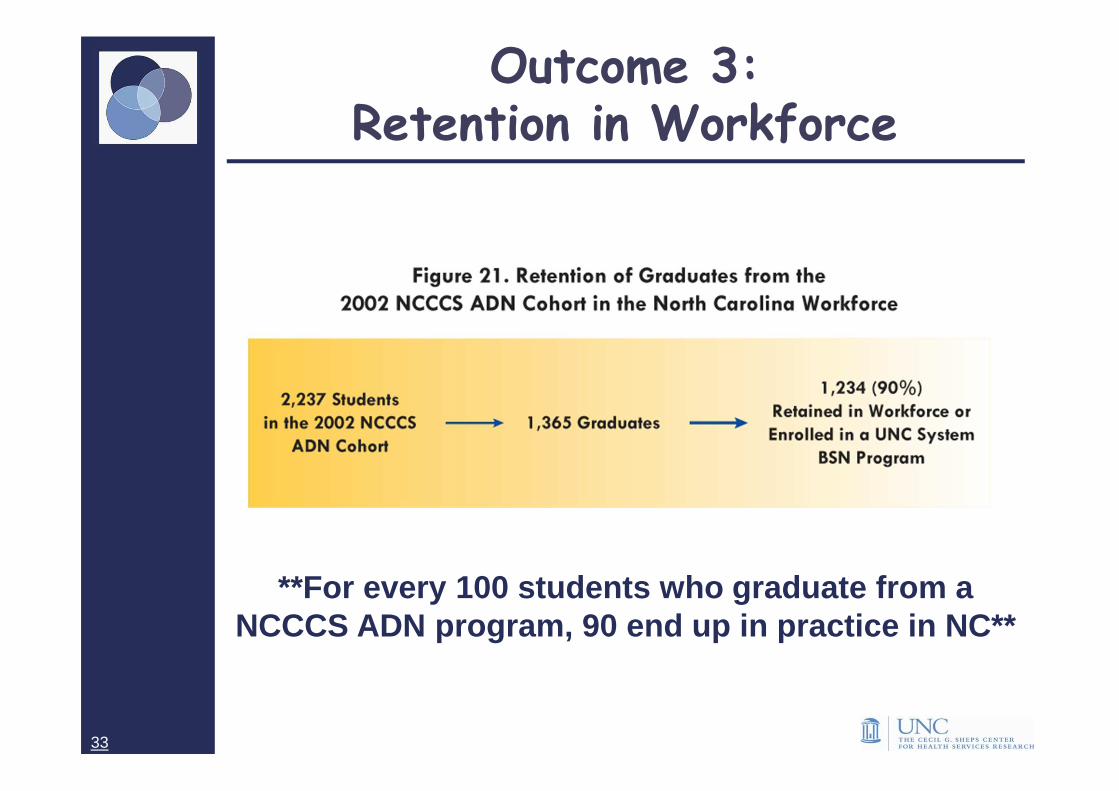
**For every 100 students who graduate from a NCCCS ADN program, 90 end up in practice in NC**
Outcome 3:Retention in Workforce
33
Key Findings about Retention: Geographic Distribution
� NCCCS ADN nurses retained in high numbers in NC
� NCCCS ADN nurses practice close to where they were educated
� Compared to NC BSN cohort that graduated at same time, NCCCS ADN nurses are
– Two times more likely to practice in rural areas
– Three times more likely to practice in NC’s most underserved communities
34
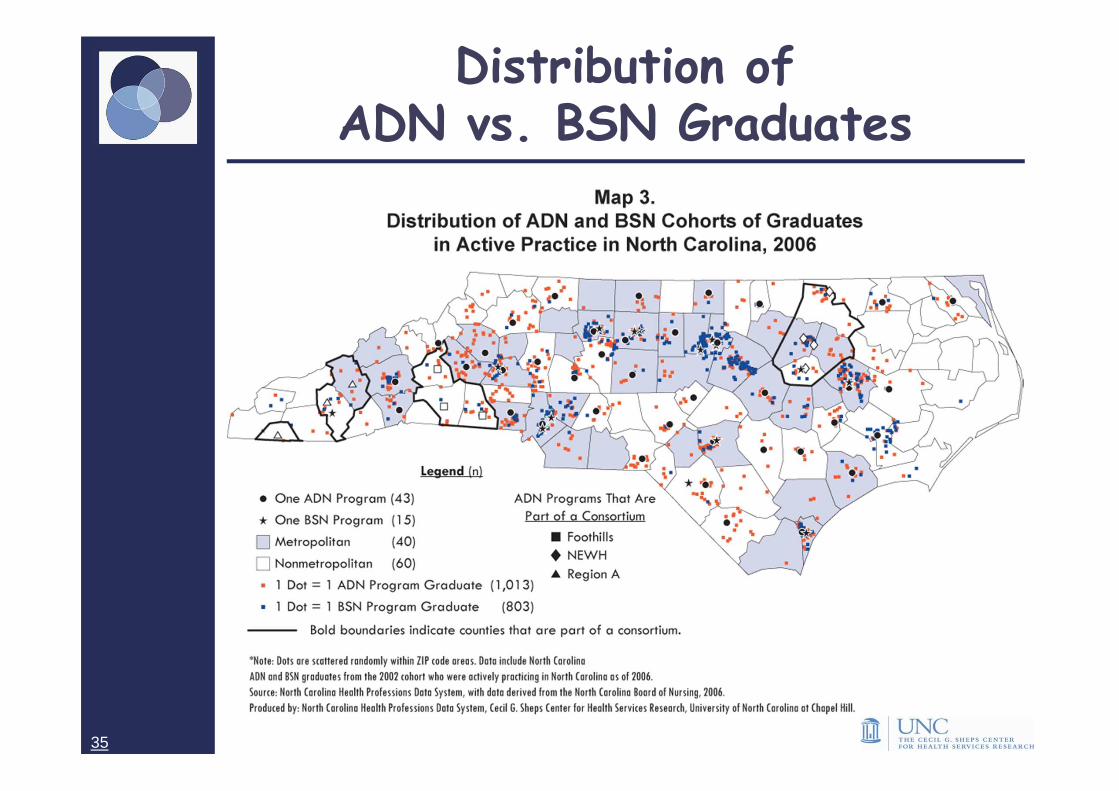
Distribution of ADN vs. BSN Graduates
35
Key Findings about Retention: Employment Setting
� Most new graduates go into in-patient hospital settings
� But, if graduates from ADN cohort had distributed in equal proportions as BSN cohort, there would have been:
– 37 fewer RNs in home care/hospice
– 48 fewer RNs in long-term care
– 13 fewer RNs in mental health facilities
� Key finding: ADN nurses cluster near where they were educated.
– Graduates enter practice in home communities which are more likely to be rural and underserved and are employed in practice settings more common in these communities.
36
Summary of Findingsabout Retention
� Existing policy debate has focused on overall supply of nurses, findings of this study emphasize importance of ADN graduates to distribution of nurses both geographically and by employment setting.
� Fact that ADN nurses are retained in high numbers and practice in underserved communities/settings makes compelling case to address attrition.
37

Recommendations
Recommendations
Performance Measures
� A uniform method should be used by the NCCCS and the North Carolina Board of Nursing (NC BoN) to calculate retention rates.
� Definition of “on-time” graduation should be based on National League of Nursing definition of 150% of program length.
� NC BoN and NCCCS should explore whether 1st time NCLEX pass rate is best measure of performance. In this study ~75% of students taking NCLEX on subsequent attempt passed.
39
Recommendations
Performance Measures
� Adjust evaluation of performance to reflect differences in service populations
� ADN programs vary substantially in student populations served. Programs in communities with high poverty rates, low quality primary/secondary education systems, and other social challenges should not be penalized for serving population at core of NCCCS mission.
� NC BoN and NCCCS should consider using the risk adjusted graduation measure developed in this study to evaluate & reward program performance.
40
Recommendations
Best Practices
� Several characteristics of high performing programs emerged from study and could be used by programs wishing to improve graduation and NCLEX rates:
– Use standardized tests to rank applicants and require basic science competency
– Require orientation for clinical instructors
– Seek resources needed to attract/retain Master’s prepared faculty
41
Recommendations
Registered Nurse Workforce Policy
� BSN-educated nurses less likely to practice in underserved geographic and employment settings.
� Move toward 60:40 ratio of BSN/ADN & diploma nurses needs to be carefully managed to not adversely affect distribution of nurses into geographic areas and practice settings that experience chronic shortages.
But, not all BSN–educated nurses are alike.
42
Recommendations
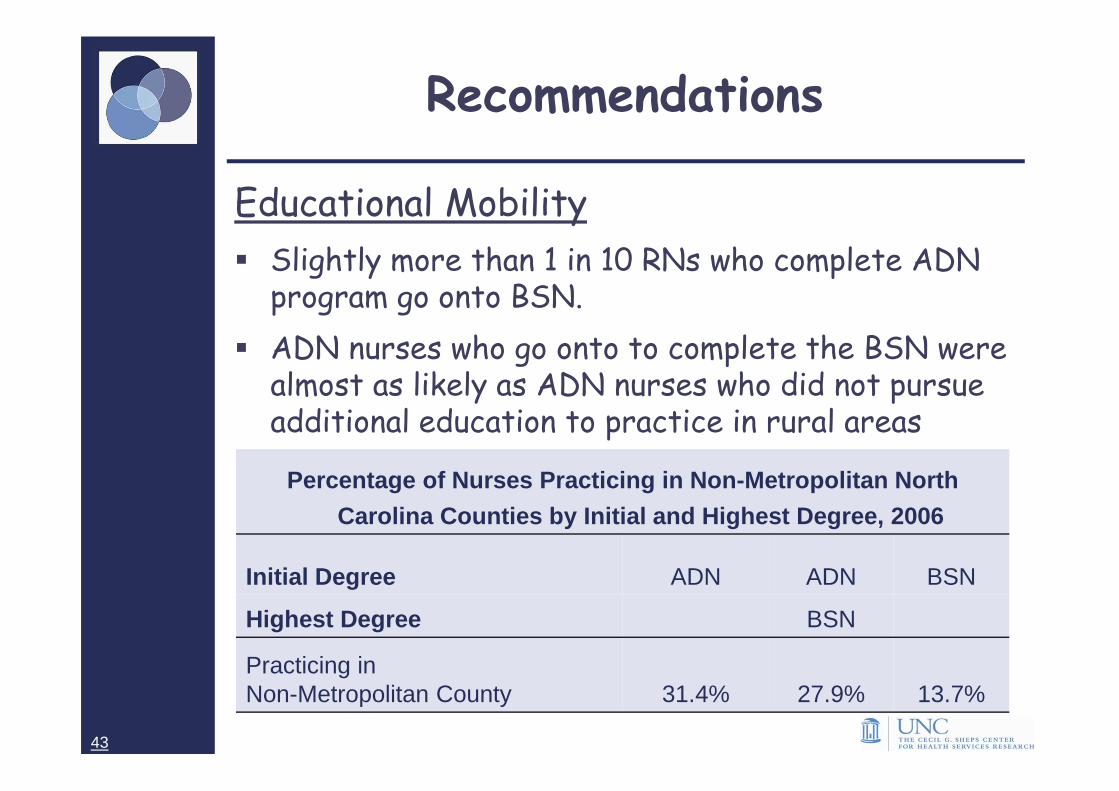
Educational Mobility
� Slightly more than 1 in 10 RNs who complete ADN program go onto BSN.
� ADN nurses who go onto to complete the BSN were almost as likely as ADN nurses who did not pursue additional education to practice in rural areas
Percentage of Nurses Practicing in Non-Metropolitan North
Carolina Counties by Initial and Highest Degree, 2006
Initial Degree ADN ADN BSN
Highest Degree BSN
Practicing inNon-Metropolitan County 31.4% 27.9% 13.7%
43
Recommendations
Educational Mobility
� Key finding: BSN nurses who first earned an ADN degree are more likely to practice in rural areas and in high need employment settings.
� Implication: As state moves towards increasing ratio of BSN nurses, there needs to be careful planning of pathways for ADN nurses to purse BSN education.
44
Recommendations
Educational Mobility
� First step: State Board could request that the NC General Assembly direct that a Nursing Articulation Legislative Study be conducted to identify barriers and opportunities for ADN nurses to pursue BSN education.
45
Recommendations
Investing in Ongoing Workforce Analyses to Inform State Health Workforce Policy
� Decisions about whether to open/expand programs, change regulation of education programs and other policy decisions are source of contentious debate.
� Need objective, timely, and data-driven analyses to inform policy makers and create evidence base.
� NCCCS should pursue funding to support additional workforce analyses to policy makers about where to best invest scare resources to meet demands of NC’s rapidly growing and aging population.
46
Final Thoughts and Reflections
Data, findings and methods employed in this this study:
� Have potential to influence state and national policy
� Provide model for future inter-agency cooperation and workforce analyses
� Underscore importance of objective analyses to confront difficult policy issues
� Have provided Sheps team with tremendous learning opportunity
47

Questions?