
A saliency map based on sampling an image into random rectangular regions of interest
12
This article appeared in a journal published by Elsevier. The attached copy is furnished to the author for internal non-commercial research and education use, including for instruction at the authors institution and sharing with colleagues. Other uses, including reproduction and distribution, or selling or licensing copies, or posting to personal, institutional or third party websites are prohibited. In most cases authors are permitted to post their version of the article (e.g. in Word or Tex form) to their personal website or institutional repository. Authors requiring further information regarding Elsevier’s archiving and manuscript policies are encouraged to visit: http://www.elsevier.com/copyright
Transcript of A saliency map based on sampling an image into random rectangular regions of interest

This article appeared in a journal published by Elsevier. The attachedcopy is furnished to the author for internal non-commercial researchand education use, including for instruction at the authors institution
and sharing with colleagues.
Other uses, including reproduction and distribution, or selling orlicensing copies, or posting to personal, institutional or third party
websites are prohibited.
In most cases authors are permitted to post their version of thearticle (e.g. in Word or Tex form) to their personal website orinstitutional repository. Authors requiring further information
regarding Elsevier’s archiving and manuscript policies areencouraged to visit:
http://www.elsevier.com/copyright

Author's personal copy
A saliency map based on sampling an image into random rectangularregions of interest
Tadmeri Narayan Vikram a,b,n, Marko Tscherepanow a, Britta Wrede a,b
a Applied Informatics Group, Bielefeld University, Bielefeld 33615, Germanyb Research Institute for Cognition and Robotics (CoR Lab), Bielefeld University, Bielefeld 33615, Germany
a r t i c l e i n f o
Available online 22 February 2012
Keywords:
Visual attention
Saliency map
Salient region detection
Eye-gaze prediction
Bottom-up attention
a b s t r a c t
In this article we propose a novel approach to compute an image saliency map based on computing
local saliencies over random rectangular regions of interest. Unlike many of the existing methods, the
proposed approach does not require any training bases, operates on the image at the original scale and
has only a single parameter which requires tuning. It has been tested on the two distinct tasks of salient
region detection (using MSRA dataset) and eye gaze prediction (using York University and MIT
datasets). The proposed method achieves state-of-the-art performance on the eye gaze prediction task
as compared with nine other state-of-the-art methods.
& 2012 Elsevier Ltd. All rights reserved.
1. Introduction
Visual attention and its associated cognitive neurobiology hasbeen a subject of intense research over the last five decades. Theattention mechanism in humans helps them in focusing theirlimited cognitive resources to the context relevant stimuli whilesuppressing the ones which are not important. Having an artificialsystem which could simulate this attention mechanism couldpositively impact upon the way in which various cognitive andinteractive systems are designed. In view of this, the computerscience community has invested considerable time and efforts torealize a computational model of visual attention which at leastpartially exhibits the characteristics of a human visual attentionsystem. Several computational approaches to visual attention havebeen proposed in the literature since the seminal work of Koch andUllman in 1985 [1]. The same authors proposed the concept of asaliency map, which constitutes the surrogate representation of thevisual attention span over an input image for a free viewing task.Saliency maps are now employed for several applications inrobotics, computer vision and data transmission. Some of thesuccessful applications are object detection [2,3], object recognition[4], image summarization [5], image segmentation [6,7], imagecompression [8] and attention guidance for human–robot interaction[9,10]. Most of the existing visual attention approaches process pixels
or image windows sequentially, which is in contrast to the way thehuman visual system operates. It has been shown in the literaturethat the receptive fields inside the retina operate randomly at bothpositional and scale spaces while processing the visual stimuli [11].
Motivated by this, we propose a simple and efficient methodwhich is based on random sampling of the image into rectangularregions of interest and computing local saliency values. Theproposed method is shown to have comparable performance withexisting methods for the task of salient region detection. Further-more, the proposed method also achieves state-of-the-perfor-mance for the task of predicting eye-gaze. The method has beentested on MSRA [12], York University [13], MIT [14] datasets andbenchmarked along with nine of the other existing state-of-the-art methods to corroborate its performance.
The paper is organized as follows. We provide a review of theexisting computational approaches to visual attention with a briefdescription of their strengths and shortcomings in Section 2. Themotivation leading to the current work is described in Section 3.The proposed approach is described by means of a pseudo-codeand a graphical illustration in Section 4. In Section 5, we describethe experiments carried out to validate the performance of theproposed method for the tasks of eye-gaze prediction and salientregion detection. Finally, we conclude this work by highlightingits current shortcomings with a brief discussion about the futuredirections of the current work in Section 6.
2. Literature review
The theoretical framework for the computation of saliencymaps was first proposed in [1] and later realized in [15].
Contents lists available at SciVerse ScienceDirect
journal homepage: www.elsevier.com/locate/pr
Pattern Recognition
0031-3203/$ - see front matter & 2012 Elsevier Ltd. All rights reserved.
doi:10.1016/j.patcog.2012.02.009
n Corresponding author at: Applied Informatics Group, Bielefeld University,
Bielefeld 33615, Germany. Tel.: þ49 521 106 12229.
E-mail addresses: [email protected],
[email protected] (T.N. Vikram),
[email protected] (M. Tscherepanow),
[email protected] (B. Wrede).
Pattern Recognition 45 (2012) 3114–3124
Author's personal copy
Subsequently it has led to the development of several othersaliency approaches based on different mathematical and com-putational paradigms. The existing approaches can be classifiedinto seven distinct categories based on the computational schemethey employ.
� Hierarchical approaches: They perform a multi-scale imageprocessing and aggregate the inputs across different scales tocompute the final saliency map.� Spectral approaches: They operate by decomposing the input
image into Fourier or Gabor spectrum channels and obtain thesaliency maps by selecting the prominent spectral coefficients.� Power law based approaches: These approaches compute
saliency maps by removing redundant patterns based on theirfrequency of occurrence. Rarely occurring patterns are con-sidered salient while frequently occurring patterns are labeledredundant.� Image contrast approaches: The mean pixel intensity value of
the entire image or of a specified sub-window is utilized tocompute the contrast of each pixel in the image. The contrastis analogously treated as the image saliency.� Entropy-based approaches: The mutual information between
patterns is employed to optimize the entropy value, where alarger entropy value indicates that a given pattern is salient.� Center-surround approaches: These approaches compute the
saliency of a pixel by contrasting the image features within awindow centered on it.� Hybrid approaches: Models of this paradigm employ a classi-
fier in combination with one or more approaches to computesaliency.
We briefly explore the existing saliency approaches based onthe aforementioned categories in the sub-sections to follow.Interested readers are pointed to [16,17] for a more detailedand exhaustive review on saliency approaches.
2.1. Hierarchical approaches
The most popular approach in this category is the oneproposed by Itti et al. [15]. This approach computes 41 differentfeature maps for a given input image based on color, texture,gradient and orientation information. The resulting feature mapsare fused into a single map using a winner takes all (WTA)network and an inhibition of return mechanism (IOR). Thisapproach has served as a classical benchmark system. Despitebeing biologically inspired and efficient, its performance is con-strained by the fusion of multiple maps and the requirement toprocess multiple features. The fusion method employed to com-pute the master saliency map from the various feature maps playsa vital role in its accuracy. Arriving at a generalized rule of fusionfor various maps is complicated and requires intensive cross-validation to fine tune the fusion parameters. In general, hier-archical methods tend to ignore visually significant patternswhich are locally occurring as they are primarily driven by globalstatistics of an image [15].
2.2. Spectral approaches
Several approaches to compute a saliency map which operateat the spectral domain have thus been proposed in the literature.A Gabor wavelet analysis and multi-scale image processing basedapproach was proposed in [18]. Fourier transform has also beenextensively utilized to generate saliency maps as seen from [8,19].In the approach of [8], the input image is decomposed into fourdifferent channels based on opponent colors and intensity.A quaternion Fourier analysis of the decomposed channels is
carried out to compute the master saliency map. Two dimensionalGabor wavelets of Fourier spectrum have also been utilized forcomputing saliency maps in [20] and the final saliency map is re-weighted using a center-bias matrix. Spectral residual approachesproposed in [21,22] are another class of approaches which high-light the saliency by removing redundancy from the Fourierspectrum. The saliency map is thus constructed from a residualfrequency spectrum obtained by the difference between an imagefrequency spectrum and a mean frequency spectrum. Thoughstraight forward, the method is compounded due to the fact thatthe pattern of mean frequency spectrum is subjective. Thesemethods are found to be successful in detecting proto-objects inimages. As it can be seen from the illustrations in [8], Fourier-based methods are affected by the number of coefficients selectedfor image reconstruction and the scale at which the input image isprocessed. Like subspace analysis, the method results in the lossof information during image reconstruction and is compromisedby illumination, noise and other image artifacts.
2.3. Power law based approaches
Power laws are basically used to model human visual percep-tion. Several approaches to saliency which employ power lawshave thus been proposed. A Zipf’s law based saliency map hasbeen proposed in [23]. This work is similar to those of [21,22],except that it operates directly on the pixels rather than on thespectral space. An integrated Weibull’s distribution based sal-iency map has been proposed in [24], and its performance on theeye-gaze data is shown to be better than other power law basedapproaches. The method employs maximum likelihood estimates(MLE) to set the parameters of various distributions. Despite itstheoretic appeal, the Weibull’s distribution based saliency maphas a large parameter set and the heuristic to fix and optimizethem constitutes a major drawback.
2.4. Image contrast approaches
A simple but efficient approach based on computing the absolutedifference of a pixel and the image mean was proposed in [25].Similar approaches proposed by the same authors in [26,7], employmaximal symmetric regions and novel dissimilarity metrics respec-tively to compute the final saliency map. Another symmetry basedsaliency approach was proposed in [27], which employs color,orientation and contrast symmetry features to generate the finalsaliency map. It also reasonably simulates eye-gaze for free viewingtask in case of natural sceneries with no specific salient objects in it.A distance transform based approach was proposed in [28], whichcomputes an edge map for each gray scale threshold and fuses themto generate a final saliency map. These methods are successfullyapplied for proto-object detection and out-beats many state-of-the-art methods without having many of their drawbacks. Poor globalcontrast of an image affects the performance of these methods andlocal-statistics based approaches for saliency computation havebeen proposed in the literature to address this problem.
2.5. Entropy-based approaches
The popular approach of [29] is based on local contrasts andmaximizes the mutual information between features by employingindependent component analysis (ICA) bases. A set of ICA bases ispre-computed using a patch size of 7 �7 pixels. Subsequently it isused to compute the conditional and joint distribution of featuresfor information maximization. Experiments conducted on the YorkUniversity eye-gaze dataset [13] have proven its efficiency. But thismethod is constrained by its emphasis on edges and neglects salientregions [30]. It also adds a spurious border effect to the resultant
T.N. Vikram et al. / Pattern Recognition 45 (2012) 3114–3124 3115

Author's personal copy
image and requires re-scaling of the original image to a lower scalein order to make the computational process more tractable. AnotherICA based approach was proposed in [31] where image self-information is utilized to estimate the probability of a target ateach pixel position. It is further fused with top-down featuresderived from ICA bases to build the final saliency map. The methodproposed in [32] employs sparse bases to extract sub-band featuresfrom an image. The mutual information between the sub-bandfeatures is calculated by realizing a random-walk on them andinitializing the site entropy rate as the weight of the edges in thegraph. An extension of this paradigm can been seen in the recentapproach proposed in [33], where entropy of a center versus asurround region is computed as the saliency value of a pixel. Otherentropy-based approaches like [34,35] employ incremental codinglength to compute the final saliency map. These methods which relyon information theoretic approaches are in general constrained bythe requirements of training bases, the patch size parameters andthe size of the training bases.
2.6. Center-surround approaches
A saliency map based on discriminant center-surroundentropy contrast which does not require training bases wasproposed in [36]. It correlates well with human eye-gaze databut is constrained by the subjectivity involved in the computationof weights for fusing the different maps to compute the mastersaliency map. A recent center-surround contrast method [37],identifies pre-attentive segments and computes the mutual sal-iency between them. An innovative application of this saliencymap has been found useful for pedestrian detection. A multi-scalecenter-surround saliency map was proposed in the work of [38],where the saliency of a pixel is determined by the dissimilarity ofthe center to its surround over multiple scales. Local analysis ofgradients along with center-surround paradigm is advocated asan alternative to multi-scale image analysis as it can be seen in[39,40]. In [39], local steering kernels are employed to computethe saliency of a pixel by contrasting the gradient covariance of asurrounding region. The method is shown to be robust to noiseand drastic illumination changes, but it is computationallyexpensive as a set of compound features needs to be computedfor each pixel in the image. In order to achieve a tractable run-time, the image is down-scaled. The approach proposed in [40]uses color and edge orientation information to compute thesaliency map, using a framework similar to the one presented in[39]. Selecting an appropriate window size for center and sur-round patches plays an important role in obtaining a higherquality saliency map.
2.7. Hybrid approaches
To overcome the issue of patch size parameters, manymachine learning based saliency approaches have been proposed.A graph-based visual saliency approach is proposed in [41] whichimplements a Markovian representation of feature maps andutilizes a pyscho-visual contrast measure to compute the dissim-ilarities between features. A saliency map based on modeling eye-movements using support vector machines (SVMs) is proposed in[42]. However, this approach requires enormous amounts of datato learn saliency weights reasonably. Another successful approachbased on kernel density estimation (KDE) is proposed in [43]. Theauthors recommend to construct a set of KDE approaches basedon region segmentation using the mean shift algorithm. Based onits color distinctiveness and spatial distribution, the color saliencyand spatial saliency of each KDE approach are evaluated. Themethod is found to be successful in salient object detection, buthas unwieldy run-time as it relies on image segmentation.
A salient object selection mechanism based on an oscillatorycorrelation approach was proposed in [44]. The method outputsan object saliency map, which resembles image segmentation.The method requires fine tuning of neural network weights for aninhibitory mechanism which is heuristic and hence cannot beused for real-time visual attention. A Hebbain neural networkbased saliency mechanism which simulates lateral surroundinhibition is proposed in [45]. Unlike [44], the method in [45] iscomputationally efficient as it employs the pulsed cosine trans-form to produce the final saliency map.
A color saliency boosting function is introduced in [46] whichis obtained from an isosalient image surface. The final saliencymap is based on the statistics of color image derivatives andemploys an information theoretic approach to boost the colorinformation content of an image. An extension of this work can befound in [47]. It performs reasonably well on both eye-gazefixation and salient object detection datasets. In [48], the prob-ability distribution of colors and orientations of an image iscomputed and either of these features are selected to computethe final saliency map. This method avoids multi-scale imageanalysis but fails when the image has a low color or gradientcontrast.
A few hybrid approaches attempt to combine the positiveaspects of multi-scale analysis, sub-band decomposition, colorboosting and as well as center-surround paradigms. Fusion of thecenter-surround hypothesis and oriented sub-band decomposi-tion to develop a saliency map has been proposed in [49].A radically different approach which tries to detect salient regionsby estimating the probability of detecting an object in a givensliding window is proposed in [50]. They employ the concept ofsuper pixel straddling, coupled with edge density histograms,color contrasts and the saliency map of [15]. A linear classifier istrained on an image dataset to build a bag-of-features to arrive ata prior for an object in an image. The method is theoretically veryattractive, but is subjected to high variations in the performanceas too many features, maps and parameters are involved whichrequire fine tuning.
3. Motivation
As it can observed from our previous review, many of theexisting computational approaches to visual attention are con-strained by one or more of the following issues like : requirementof training bases, large set of tunable parameters, integration ofcomplex classifiers, downscaling of the original image in order toobtain a tractable computational run-time, high, complexityassociated with programming, and not being biologically moti-vated. Most of the existing approaches to compute saliency mapsprocess input image pixels sequentially with fixed sliding win-dows. But salient regions or objects can occur at arbitrarypositions, shapes and scales in an image. Research in visionsciences has shown that the human visual system has itsreceptive fields scattered randomly and does not process inputstimuli in a sequential manner [11,51]. Furthermore, it has beenshown in [52] that each visual stimulus is biased by every otherstimulus present in the attention space.
In view of the aforementioned discussion, we propose arandom center-surround method which operates by computinglocal saliencies over random regions of an image. This captureslocal contrasts unlike the global methods for computing saliencymaps. Furthermore, it does not require any training priors and hasonly a single parameter which needs tuning. The proposedmethod also avoids competition between multiple saliency mapswhich is in contrast to the approaches proposed by [15,41].
T.N. Vikram et al. / Pattern Recognition 45 (2012) 3114–31243116
Author's personal copy
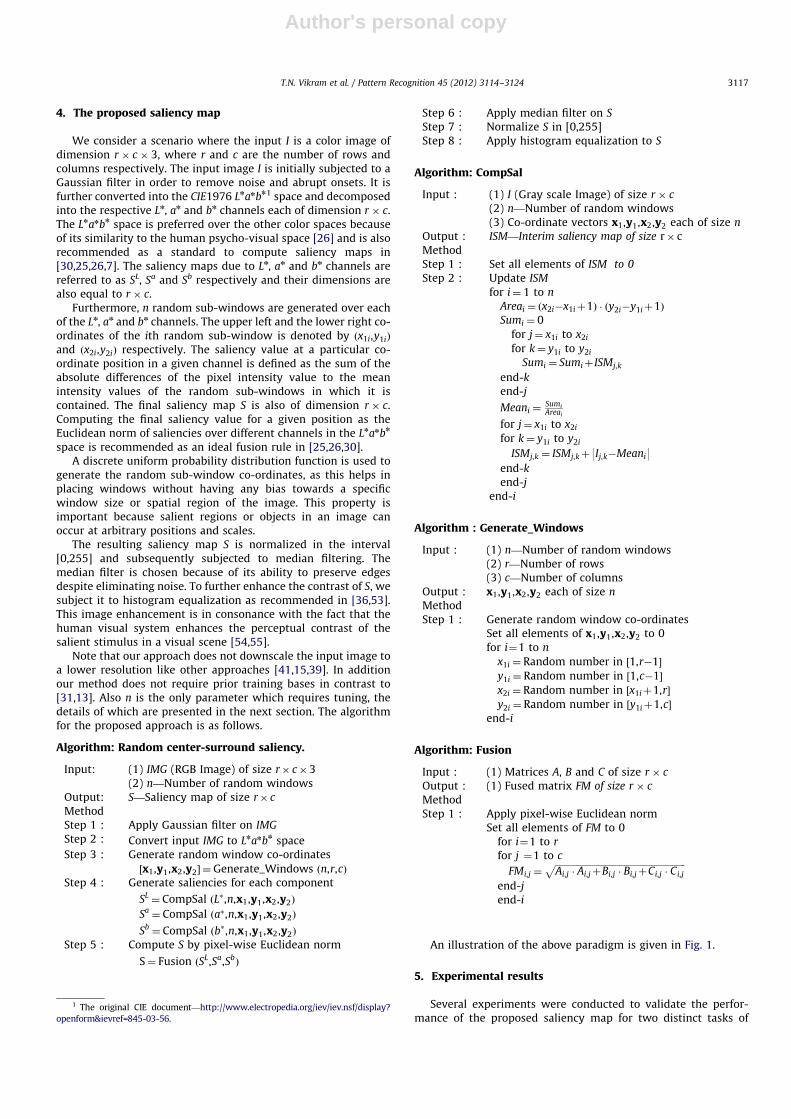
4. The proposed saliency map
We consider a scenario where the input I is a color image ofdimension r � c � 3, where r and c are the number of rows andcolumns respectively. The input image I is initially subjected to aGaussian filter in order to remove noise and abrupt onsets. It isfurther converted into the CIE1976 Lnanbn1 space and decomposedinto the respective Ln, an and bn channels each of dimension r � c.The Lnanbn space is preferred over the other color spaces becauseof its similarity to the human psycho-visual space [26] and is alsorecommended as a standard to compute saliency maps in[30,25,26,7]. The saliency maps due to Ln, an and bn channels arereferred to as SL, Sa and Sb respectively and their dimensions arealso equal to r � c.
Furthermore, n random sub-windows are generated over eachof the Ln, an and bn channels. The upper left and the lower right co-ordinates of the ith random sub-window is denoted by ðx1i,y1iÞ
and ðx2i,y2iÞ respectively. The saliency value at a particular co-ordinate position in a given channel is defined as the sum of theabsolute differences of the pixel intensity value to the meanintensity values of the random sub-windows in which it iscontained. The final saliency map S is also of dimension r � c.Computing the final saliency value for a given position as theEuclidean norm of saliencies over different channels in the Lnanbn
space is recommended as an ideal fusion rule in [25,26,30].A discrete uniform probability distribution function is used to
generate the random sub-window co-ordinates, as this helps inplacing windows without having any bias towards a specificwindow size or spatial region of the image. This property isimportant because salient regions or objects in an image canoccur at arbitrary positions and scales.
The resulting saliency map S is normalized in the interval[0,255] and subsequently subjected to median filtering. Themedian filter is chosen because of its ability to preserve edgesdespite eliminating noise. To further enhance the contrast of S, wesubject it to histogram equalization as recommended in [36,53].This image enhancement is in consonance with the fact that thehuman visual system enhances the perceptual contrast of thesalient stimulus in a visual scene [54,55].
Note that our approach does not downscale the input image toa lower resolution like other approaches [41,15,39]. In additionour method does not require prior training bases in contrast to[31,13]. Also n is the only parameter which requires tuning, thedetails of which are presented in the next section. The algorithmfor the proposed approach is as follows.
Algorithm: Random center-surround saliency.
Input: (1) IMG (RGB Image) of size r� c�3(2) n—Number of random windows
Output: S—Saliency map of size r� c
MethodStep 1 : Apply Gaussian filter on IMG
Step 2 : Convert input IMG to Lnanbn spaceStep 3 : Generate random window co-ordinates
½x1,y1,x2,y2� ¼Generate_Windows ðn,r,cÞStep 4 : Generate saliencies for each component
SL¼ CompSal ðL�,n,x1,y1,x2,y2Þ
Sa¼ CompSal ða�,n,x1,y1,x2,y2Þ
Sb¼ CompSal ðb�,n,x1,y1,x2,y2Þ
Step 5 : Compute S by pixel-wise Euclidean norm
S¼ Fusion ðSL,Sa,SbÞ
Step 6 : Apply median filter on S
Step 7 : Normalize S in [0,255]Step 8 : Apply histogram equalization to S
Algorithm: CompSal
Input : (1) I (Gray scale Image) of size r � c
(2) n—Number of random windows(3) Co-ordinate vectors x1,y1,x2,y2 each of size n
Output : ISM—Interim saliency map of size r� cMethodStep 1 : Set all elements of ISM to 0
Step 2 : Update ISM
for i¼ 1 to n
Areai ¼ ðx2i�x1iþ1Þ � ðy2i�y1iþ1ÞSumi ¼ 0
for j¼ x1i to x2i
for k¼ y1i to y2i
Sumi ¼ Sumiþ ISMj,k
end-k
end-j
Meani ¼SumiAreai
for j¼ x1i to x2i
for k¼ y1i to y2i
ISMj,k ¼ ISMj,kþ9Ij,k�Meani9end-k
end-j
end-i
Algorithm : Generate_Windows
Input : (1) n—Number of random windows(2) r—Number of rows(3) c—Number of columns
Output : x1,y1,x2,y2 each of size n
MethodStep 1 : Generate random window co-ordinates
Set all elements of x1,y1,x2,y2 to 0for i¼1 to n
x1i ¼ Random number in ½1,r�1�
y1i ¼ Random number in ½1,c�1�
x2i ¼ Random number in ½x1iþ1,r�
y2i ¼ Random number in ½y1iþ1,c�end-i
Algorithm: Fusion
Input : (1) Matrices A, B and C of size r � c
Output : (1) Fused matrix FM of size r � c
MethodStep 1 : Apply pixel-wise Euclidean norm
Set all elements of FM to 0for i¼1 to r
for j ¼1 to c
FMi,j ¼ffiffiffiffiffiffiffiffiffiffiffiffiffiffiffiffiffiffiffiffiffiffiffiffiffiffiffiffiffiffiffiffiffiffiffiffiffiffiffiffiffiffiffiffiffiffiffiffiffiffiffiffiffiffiffiffiffiAi,j � Ai,jþBi,j � Bi,jþCi,j � Ci,j
p
end-j
end-i
An illustration of the above paradigm is given in Fig. 1.
5. Experimental results
Several experiments were conducted to validate the perfor-mance of the proposed saliency map for two distinct tasks of
1 The original CIE document—http://www.electropedia.org/iev/iev.nsf/display?
openform&ievref=845-03-56.
T.N. Vikram et al. / Pattern Recognition 45 (2012) 3114–3124 3117

Author's personal copy
eye-gaze prediction and salient region detection in free viewingconditions. Salient region detection and eye-gaze prediction arethe two most significant applications of saliency maps. Salientregion detection is relevant in the context of computer visiontasks like object detection, object localization and object trackingin videos [25]. Automatic prediction of eye-gaze is important inthe context of image aesthetics, image quality assessment,human–robot interaction and other tasks which involve detectingimage regions that are semantically interesting [14]. The con-temporary saliency maps are either employed to detect salientregions as in the case of [30,25,28], or are used to predict eye-gazepatterns as in [31,39]. Only few of the existing saliencyapproaches like [41,15] have consistent performance on both ofthese tasks. Although these two tasks appear similar, there aresubtle differences between them. Salient regions of an image arethose which are visually interesting. But human eye-gaze whichfocuses mainly on salient regions are also distracted by semanti-cally relevant regions [56]. The performance on the eye-gazeprediction task was validated on two different datasets of YorkUniversity [13] and MIT [14]. Subsequent experiments to corro-borate the performance on salient object detection task wereconducted on the popular MSRA dataset [12].
The following parameter settings were used as a standard forall the experiments carried out. A rotational symmetric Gaussianlow pass filter (size 3�3 with s¼ 0:5; the default Matlabconfiguration) was used as a pre-processor on the images fornoise removal as recommended in [25,26]. The number of distinctrandom sub-windows n was set to 0:02� r � c, as it led to a morestable performance. Details about fine tuning n is given in Section5.1. A median filter of size 11�11 was employed to smooth theresultant saliency map before being enhanced by histogramequalization. The employed Gaussian filter, median filter andhistogram equalization are based on the usual straight forwardmethods. All experiments were conducted using Matlab v7.10.0(R2010a) on an Intel Core 2 Duo processor with Ubuntu 10.04.1LTS (Lucid Lynx) as operating system. The inbulit srgb2lab Matlab
routine was used to convert the input image from RGB colorspaceto Lnanbn colorspace. This results in Ln, an and bn images whosepixel intensity values are normalized in the range of [0, 255]. Weselected nine state-of-the-art methods of computing saliencymaps to compare and contrast the proposed method. The meth-ods are global contrast2 [25], entropy3 [29], graphical approach4
[41], multi-scale5 [15], local steering kernel6 [39], distance trans-form7 [28], self-Information8 [31], weighted contrast9 [30] andsymmetric contrast10 [26] based image saliency approaches.
The experiments conducted to corroborate the performance ofthe proposed method for eye-gaze correlation in a free viewingtask is described in the following sub-section.
5.1. Experiments on eye-gaze prediction task
In order to empirically evaluate the performance on eye-gazecorrelation task, we have employed the receiver operating char-acteristic (ROC)–area under the curve (AUC) as a benchmarkingmetric. Several popular and recent works like [41,42,49,57,20,30]employ the ROC–AUC metric to evaluate eye-gaze fixation corre-lation. An ROC graph is a general technique for visualizing,ranking and selecting classifiers based on their performance[58]. The ROC graphs are two-dimensional graphs in which thetrue positive rate (TPR) is plotted on the Y axis and the falsepositive rate (FPR) rate is plotted on the X axis. The TPR (also
Fig. 1. An illustration of the proposed method. The input image is subjected to Gaussian filter in the first stage. Subsequently it is converted into the Lnanbn space and the
individual Ln, an and bn channels are obtained. For the sake of simplicity we have considered three random regions of interest (ROI) on the respective Ln, an and bn channels.
Local saliencies are computed over each of these ROIs and the channel specific saliency maps (SL, Sa and Sb) are updated. The final saliency map is then computed by fusing
the channel specific saliency maps by a pixel-wise Euclidean norm.
2 http://ivrg.epfl.ch/supplementary_material/RK_CVPR09/SourceCode/Salien
cy_CVPR2009.m3 http://www-sop.inria.fr/members/Neil.Bruce/AIM.zip4 http://www.klab.caltech.edu/�harel/share/gbvs.zip5 http://www.klab.caltech.edu/�harel/share/simpsal.zip6 http://users.soe.ucsc.edu/�rokaf/download.php7 http://users.cs.cf.ac.uk/Paul.Rosin/resources/salience/salience.zip8 http://cseweb.ucsd.edu/� l6zhang/code/imagesaliency.zip9 Available from our previous work10 http://ivrg.epfl.ch/supplementary_material/RK_ICIP2010/code/Saliency_MSSS_
ICIP2010.m
T.N. Vikram et al. / Pattern Recognition 45 (2012) 3114–31243118

Author's personal copy
called hit rate and recall) and FPR (also called false alarm rate)metrics are computed as in [30,32]:
TPR¼tp
tpþ fnð1Þ
FPR¼fp
fpþtnð2Þ
where tp is the number of true positives, tn is the number of truenegatives, fp is the number of false positives and fn is the numberof false negatives.
An ROC graph depicts relative trade-offs between benefits(TPR) and costs (FPR). Since the AUC is a portion of the area ofthe unit square, its value will always be between 0 and 1.0.An ideal classifier would give an AUC of 1.0 while randomguessing produces an AUC of less than 0.5 [59]. The saliencymap and the corresponding ground truth fixation density map arebinarized at each discrete threshold in [0, 255]. This results in apredicted binary mask (from the saliency map) and a groundtruth binary mask (from the fixation density map) for eachbinarizing threshold. The TPR and FPR for each threshold aresubsequently computed. The ROC curve is generated by plottingthe obtained FPRs versus TPRs and the AUC is calculated. In ourcase, the AUC indicates how well the saliency map predicts actualhuman eye fixations. This measurement also has the desiredcharacteristic of transformation invariance, in that the ROC–AUCdoes not change when applying any monotonically increasingfunction (such as logarithm) to the saliency measure [31].
We have considered two popular datasets of York University [13]and MIT [14] for the eye-gaze prediction task. The York University[13] dataset contains eye fixation records from 20 subjects for a totalof 120 images of size 681 � 511 pixels. This dataset does not consistof images with human faces, animals or images of activities likesports, music concerts etc. which have semantic meanings attrib-uted to them. The MIT dataset [14] consists of eye fixation recordsfrom 15 subjects for 1003 images of size 1024 �768 pixels. Unlikethe York University dataset [13], the [14] consists of images whichmay contain faces, expressions, sporting activities which attractattention and are semantically relevant. The variation in imagedimensions, the objects consisted, semantics, topology of arrange-ment in objects between these two considered eye-gaze datasetsoffers a test-bed to evaluate the robustness of a saliency map. Alsonote that the age group of the viewers, the eye-gaze recordingequipments, and viewing conditions were not identical whilecreating these two eye-gaze datasets.
The performance in terms of ROC–AUC11 is measured and theresulting plots for the York University dataset [13] and the MITdataset [14] are shown in Figs. 2 and 3 respectively. It can beobserved from Fig. 2, that the proposed method has a similar ROCplot as compared to graph-based [41] saliency, and clearly out-performs all the other methods considered. The same holds truein case of its performance vis-a-vis the MIT dataset [14] as it canbe seen in Fig. 3. To quantitatively evaluate the performance wecomputed the ROC–AUC which is shown in Table 1. Note that theproposed method has the highest ROC–AUC performance onthe York dataset [13] and attains a performance equivalent tothe graph-based [41] method on the MIT dataset [14] as it can beobserved in Table 1. This is despite the fact that the proposedmethod is simple and is devoid of the sophistication associatedwith the graph-based [41], multi-scale [15] or self-information[31] based saliency methods. For the MIT dataset [14] we havenot been able to obtain the ROC plots and area under the curve forthe self-information [31] and random center-surround approaches [30], since the original source codes of these methods
do not work on images as large as 1024 �768 pixels. Wepreferred not to rescale the input images as this might lead to abias during the evaluation.
Fig. 2. ROC performance plots for the York University [13] dataset. Note that the
proposed method has similar performance like the graph-based [41] saliency approach
and outperforms all the other methods in consideration. Observe that symmetric
contrast [26] and global contrast [25] based methods have near linear slopes for their
ROC-plots, which indicates their ineffectiveness for the task of eye-gaze prediction.
Fig. 3. ROC performance plots for the MIT [14] dataset. The proposed method
attains a similar performance like the graph-based [41] saliency approach while
outperforming the others. Note that symmetric contrast [26] and global contrast
[25] based methods have a near linear slope, which was similar to their
performance on the York dataset [13] as shown in Fig. 2. Observe that the
performance of the proposed method and the graph-based [41] method does not
suffer despite the change in eye fixation dataset.
Table 1The performance of the methods under consideration in terms of ROC–AUC on the
York University [13] and MIT [14] datasets. It can be observed that the proposed
method has state-of-the-art performance on both of the eye fixation datasets.
Saliency map York University [13] MIT [14]
Global contrast [25] 0.54 0.53
Symmetric contrast [26] 0.64 0.63
Graph-based [41] 0.84 0.81Multi-scale [15] 0.81 0.76
Entropy-based [29] 0.83 0.77
Self information [31] 0.67 NA
Local steering kernel [39] 0.75 0.72
Weighted contrast [30] 0.75 NA
Distance transform [28] 0.77 0.75
Proposed 0.85 0.81
11 Source code used for ROC–AUC computation in this article—http://mark.
goadrich.com/programs/AUC/auc.jar.
T.N. Vikram et al. / Pattern Recognition 45 (2012) 3114–3124 3119
Author's personal copy
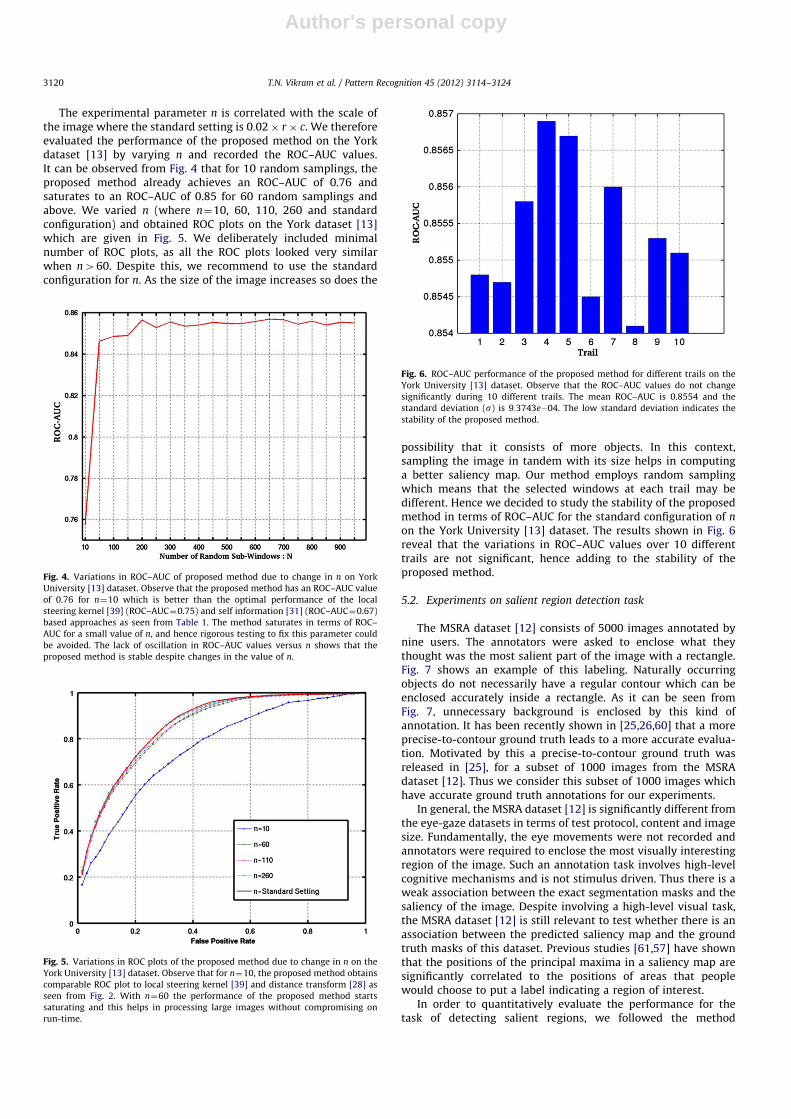
The experimental parameter n is correlated with the scale ofthe image where the standard setting is 0:02� r � c. We thereforeevaluated the performance of the proposed method on the Yorkdataset [13] by varying n and recorded the ROC–AUC values.It can be observed from Fig. 4 that for 10 random samplings, theproposed method already achieves an ROC–AUC of 0.76 andsaturates to an ROC–AUC of 0.85 for 60 random samplings andabove. We varied n (where n¼10, 60, 110, 260 and standardconfiguration) and obtained ROC plots on the York dataset [13]which are given in Fig. 5. We deliberately included minimalnumber of ROC plots, as all the ROC plots looked very similarwhen n460. Despite this, we recommend to use the standardconfiguration for n. As the size of the image increases so does the
possibility that it consists of more objects. In this context,sampling the image in tandem with its size helps in computinga better saliency map. Our method employs random samplingwhich means that the selected windows at each trail may bedifferent. Hence we decided to study the stability of the proposedmethod in terms of ROC–AUC for the standard configuration of n
on the York University [13] dataset. The results shown in Fig. 6reveal that the variations in ROC–AUC values over 10 differenttrails are not significant, hence adding to the stability of theproposed method.
5.2. Experiments on salient region detection task
The MSRA dataset [12] consists of 5000 images annotated bynine users. The annotators were asked to enclose what theythought was the most salient part of the image with a rectangle.Fig. 7 shows an example of this labeling. Naturally occurringobjects do not necessarily have a regular contour which can beenclosed accurately inside a rectangle. As it can be seen fromFig. 7, unnecessary background is enclosed by this kind ofannotation. It has been recently shown in [25,26,60] that a moreprecise-to-contour ground truth leads to a more accurate evalua-tion. Motivated by this a precise-to-contour ground truth wasreleased in [25], for a subset of 1000 images from the MSRAdataset [12]. Thus we consider this subset of 1000 images whichhave accurate ground truth annotations for our experiments.
In general, the MSRA dataset [12] is significantly different fromthe eye-gaze datasets in terms of test protocol, content and imagesize. Fundamentally, the eye movements were not recorded andannotators were required to enclose the most visually interestingregion of the image. Such an annotation task involves high-levelcognitive mechanisms and is not stimulus driven. Thus there is aweak association between the exact segmentation masks and thesaliency of the image. Despite involving a high-level visual task,the MSRA dataset [12] is still relevant to test whether there is anassociation between the predicted saliency map and the groundtruth masks of this dataset. Previous studies [61,57] have shownthat the positions of the principal maxima in a saliency map aresignificantly correlated to the positions of areas that peoplewould choose to put a label indicating a region of interest.
In order to quantitatively evaluate the performance for thetask of detecting salient regions, we followed the method
Fig. 4. Variations in ROC–AUC of proposed method due to change in n on York
University [13] dataset. Observe that the proposed method has an ROC–AUC value
of 0.76 for n¼10 which is better than the optimal performance of the local
steering kernel [39] (ROC–AUC¼0.75) and self information [31] (ROC–AUC¼0.67)
based approaches as seen from Table 1. The method saturates in terms of ROC–
AUC for a small value of n, and hence rigorous testing to fix this parameter could
be avoided. The lack of oscillation in ROC–AUC values versus n shows that the
proposed method is stable despite changes in the value of n.
Fig. 5. Variations in ROC plots of the proposed method due to change in n on the
York University [13] dataset. Observe that for n¼10, the proposed method obtains
comparable ROC plot to local steering kernel [39] and distance transform [28] as
seen from Fig. 2. With n¼60 the performance of the proposed method starts
saturating and this helps in processing large images without compromising on
run-time.
Fig. 6. ROC–AUC performance of the proposed method for different trails on the
York University [13] dataset. Observe that the ROC–AUC values do not change
significantly during 10 different trails. The mean ROC–AUC is 0.8554 and the
standard deviation (s) is 9:3743e�04. The low standard deviation indicates the
stability of the proposed method.
T.N. Vikram et al. / Pattern Recognition 45 (2012) 3114–31243120

Author's personal copy
recommended in [25,28,26,30], where the saliency map is binar-ized and compared with the ground truth mask. The saliency mapis thresholded within [0, 255] to obtain a binary mask and isfurther compared with the ground truth. The thresholds arevaried from 0 to 255 and recall–precision metrics are computedat each binarizing threshold. The recall–precision metric is foundto be more suitable to evaluate the salient region detectionperformance than the ROC–AUC metric [25,30]. The recall (alsocalled TPR or hit-rate) and precision metrics are computed as in[30]:
recall¼tp
tpþ fnð3Þ
precision¼tp
tpþ fpð4Þ
The resulting recall versus precision curve is shown in Fig. 8.This curve provides a reliable comparison of how well varioussaliency maps highlight salient regions in images. It can beobserved from Fig. 8, that the proposed method has comparableperformance with the graph-based [41] method and outperformsall the other approaches in consideration with an exception of theweighted contrast [30] based method. However, it could be notedfrom our previous experiments on eye fixation datasets that theweighted contrast [30] based method fails to work when the sizeof the input is large and has far below performance in terms ofROC–AUC as compared to the graph-based [41] approach and theproposed method. Despite being simple, the proposed methodfares well in both the tasks of eye-gaze correlation as well assalient region detection and has as an equivalent performance tothe graph-based [41] approach.
A common threshold to binarize different saliency maps mightnot be suitable, as the binarization threshold depends on the
image specific statistics. Thus we employ Tsai’s moment preservingalgorithm12 [62] which has also been recommended in [28] to selectthe map specific binarization threshold. We further evaluate theaccuracy of the obtained binary masks to the ground truth masks byemploying F-measure as suggested in [49,25,48,26,28,30]. The for-mula for F-measure is given in Eq. (5).
F-measure¼2 � precision � recall
precisionþrecallð5Þ
It can be observed from Table 2 that the proposed method andthe graph-based method have an identical F-measure perfor-mance of 0.64. The weighted contrast-based [30] saliency attainsthe highest F-measure of 0.71, but does not perform well in theeye-gaze correlation task. The entropy-based [29] method has thelowest F-measure performance of 0.43 despite achieving a goodperformance on the eye-gaze task. Apart from the proposedmethod and graph-based [41] saliency, only the multi-scaleapproach [15] with a F-measure of 0.58 is seen to perform equallywell on eye-gaze detection task.
We demonstrate the performance of the various approachesconsidered on the task of salient region detection by consideringthree sample images from the MSRA [12] dataset as shown inFig. 9. For the purpose of illustration we overlaid the originalimage with ground truth masks and the other masks obtainedafter binarizing the respective saliency maps by Tsai’s momentpreserving algorithm [62]. It can be observed from Fig. 9, that theentropy-based [29] saliency approach fails to effectively localizethe salient object in the image. In case of the image consisting ofthe yellow flower, the entire image is shown as salient; while thesalient region of the glowing bulb is treated as irrelevant. Despitebeing efficient the global contrast [25] and symmetric contrast[26] based methods ignore the finer details of the salient region,as both the methods operate on mean pixel intensity value of theimage. Conversely, the multi-scale [15] and local steering kernel[39] based saliencies highlight the minute details but suppress
Fig. 7. Rectangular and exact segmentation masks. To the left is the sample image from the MSRA dataset [12], the image in the center shows the original rectangular
annotation and at right is the accurate-to-countour annotation. Observe the reduction in background information between rectangular and exact annotations.
Fig. 8. Recall–precision plot on the MSRA [12] dataset. Observe that the proposed
method has a superior recall–precision plot as compared to all the methods except
for the graph-based [41] and weighted contrast [30] based approaches.
Table 2The recall,precision and F-measure performance of saliency maps from the various
methods under consideration. Observe that the proposed method has an equiva-
lent performance to the graph-based [41] method.
Saliency map Recall Precision F�measure
Global contrast [25] 0.49 0.63 0.51
Symmetric contrast [26] 0.40 0.66 0.47
Graph-based [41] 0.73 0.62 0.64Multi-scale [15] 0.67 0.56 0.58
Entropy-based [29] 0.98 0.29 0.43
Self information [31] 0.55 0.44 0.46
Local steering kernel [39] 0.48 0.50 0.46
Weighted contrast [30] 0.84 0.66 0.71Distance transform [28] 0.85 0.33 0.45
Proposed 0.71 0.63 0.64
12 http://www.cs.tut.fi/�ant/histthresh/HistThresh.zip
T.N. Vikram et al. / Pattern Recognition 45 (2012) 3114–3124 3121

Author's personal copy
salient regions as they have a bias towards strong gradients. Theself information [31] based approach highlights rare segments ofthe image as salient, and consequently it discards regions ofuniform appearance which can be observed from column nine ofFig. 9. Only the weighted contrast [30] based method has a nearperfect performance on detecting the salient regions. But theprevious experiments on eye-gaze prediction have shown that theweighted contrast [30] based approach is not highly effective.The proposed method highlights the salient regions along withthe finer details effectively which shows that it is not biasedtowards edges like the other methods.
5.3. Computational run time
We evaluated the run-time of the proposed saliency approachwith reference to the other methods in consideration. The run-time of the various methods were benchmarked on three differentscales of a color image as shown in Table 3. The original plugins ofglobal contrast [25], symmetric contrast [26], weighted contrast[30], entropy-based [29] and self information-based [31] saliencyapproaches are pure Matlab codes. While the codes pertaining tolocal steering kernel [39], multi-scale [15] and graph-basedmethods [41] are quasi Matlab codes which call Cþþ functionsfor run-time optimization. The original plugin for distance
transform [28] is a binary executable while its original codinglanguage is unknown. The proposed method is programmed inMatlab. An absolute comparison on the basis of run-time mightpenalize the methods which are coded in Matlab script as they arerelatively slower than their Cþþ counterparts. Nevertheless, itgives a relative overview of run-time performance of the allmethods under consideration.
Fig. 9. Qualitative analysis of results for MSRA [12] dataset. The first column contains the original image. The remaining columns contain the images overlaid with
thresholded (using Tsai’s algorithm [62]) saliency maps obtained from the respective methods mentioned in the figure header. Observe that the proposed method
highlights the salient regions along with its finer details effectively, which most of the other methods in consideration fails to achieve.
Table 3The computational run-time(in s) of various saliency methods under considera-
tion. Run-times were computed using Matlab v7.10.0 (R2010a), on an Intel Core
2 Duo processor with Ubuntu 10.04.1 LTS (Lucid Lynx) as operating system.
Saliency map Code type Run-time(in s) w.r.t. image size
205�103 308�195 410�259
Global contrast [25] Matlab 0.0652 0.0898 0.1539
Symmetric contrast [26] Matlab 0.0976 0.1172 0.2050
Graph-based [41] Matlab with Cþþ 0.6256 0.4788 0.5577
Multi-scale [15] Matlab with Cþþ 0.4388 0.3820 0.3661
Entropy-based [29] Matlab 2.1448 5.0761 10.3915
Self information [31] Matlab 1.6466 4.0714 7.6242
Local steering kernel [39] Matlab 3.0590 3.1187 3.1133
Weighted contrast [30] Matlab 0.2701 0.5939 1.2038
Distance transform [28] Binary 0.1266 0.2806 0.5308
Proposed Matlab 0.3430 0.5422 1.0766
T.N. Vikram et al. / Pattern Recognition 45 (2012) 3114–31243122
Author's personal copy
It can be observed from Table 3 that the run-time of the localsteering kernel [39], the graph-based [41] and the multi-scale-based [15] saliency approaches do not change significantlyirrespective of the size of the input image. This is on accountthat the input image is rescaled to pre-specified dimensionmentioned in their source codes. The rest of the methods processthe input image in its original scale and hence the run-timechanges with the input image dimension.
6. Discussion and conclusion
We have compared and contrasted nine existing state-of-the-artapproaches to compute a saliency map along with the proposedmethod for the two different tasks of eye-gaze correlation andsalient region detection. Experiments were carried out on largepublicly available datasets of York University [13], MIT [14] for eye-gaze correlation and the MSRA dataset [12] for salient regiondetection. Our results have shown that the proposed method attainsstate-of-the-art performance on the task of eye-gaze correlation andalso has a comparable performance with the other methods for thetask of salient region detection. Most of the existing approaches tocompute a saliency map fail to perform equally well on both of theaforementioned tasks. But our method along with the graph-based[41] approach has a reliable performance on both these diversetasks. It should be observed that the proposed method achieves thisperformance despite being simple as compared to graph-based [41],local steering kernel-based [39] and other existing sophisticatedmethods. It has also been shown in the experiments that a verysmall number of random rectangles (n¼60) is adequate to attaingood results. Despite this we recommend to tune the sampling ratein direct proportion to the size of the image, as generating largenumber of arbitrary sized image windows often leads to a higherprobability of completely enclosing a salient region or an object. Inspite of its simplicity and elegance the proposed method fails tocapture saliency when color contrast is either low or not being theprincipal influence. In future, we plan to address this bottleneck andfurther improve our method to capture higher level semantics likedetecting pop-outs in terms of orientation, shape and proximities.Exploiting the ability of the proposed method to detect a salientregion as a pre-processor for object detection is also envisaged.
Acknowledgments
Tadmeri Narayan Vikram would like to thank his colleaguesMiranda Grahl, Torben Toniges, Christian Schnier and SubhashreeVikram who proof read this article at various stages.
This work has been supported by the RobotDoC Marie CurieInitial Training Network funded by the European Commissionunder the 7th Framework Programme (Contract no. 235065).
References
[1] C. Koch, S. Ullman, Shifts in selective visual attention: towards the underlyingneural circuitry, Human Neurobiology 4 (1985) 219–227.
[2] F. Moosmann, D. Larlus, F. Jurie, Learning saliency maps for object categor-ization, in: Proceedings of the ECCV International Workshop on the Repre-sentation and Use of Prior Knowledge in Vision, 2006.
[3] P. Khuwuthyakorn, A. Robles-Kelly, J. Zhou, Object of interest detection bysaliency learning, in: Proceedings of the European Conference on ComputerVision, 2010, pp. 636–649.
[4] J. Bonaiuto, L. Itti, Combining attention and recognition for rapid sceneanalysis, in: Proceedings of the IEEE Conference on Computer Vision andPattern Recognition—Workshops, 2005, pp. 90–97.
[5] L. Shi, J. Wang, L. Xu, H. Lu, C. Xu, Context saliency based image summariza-tion, in: Proceedings of the IEEE International Conference on Multimedia andExpo, 2009, pp. 270–273.
[6] M. Donoser, M. Urschler, M. Hirzer, H. Bischof, Saliency driven total variationsegmentation, in: Proceedings of the IEEE International Conference onComputer Vision, 2009, pp. 817–824.
[7] R. Achanta, F. Estrada, P. Wils, S. Susstrunk, Salient region detection andsegmentation, in: Proceedings of the International Conference on ComputerVision Systems, 2008, pp. 66–75.
[8] C. Guo, L. Zhang, A novel multiresolution spatiotemporal saliency detectionmodel and its applications in image and video compression, IEEE Transac-tions on Image Processing 19 (2010) 185–198.
[9] A. Borji, M.N. Ahmadabadi, B.N. Araabi, M. Hamidi, Online learning of task-driven object-based visual attention control, Image and Vision Computing 28(2010) 1130–1145.
[10] Y. Nagai, From bottom-up visual attention to robot action learning, in:Proceedings of the IEEE International Conference on Development andLearning, 2009, pp. 1–6.
[11] C.L. Colby, M.E. Goldberg, Space and attention in parietal cortex. in:Proceedings of the Annual Review of Neuroscience, vol. 22, 1999,pp. 319–349.
[12] T. Liu, J. Sun, N.-N. Zheng, X. Tang, H.-Y. Shum, Learning to detect a salientobject, in: Proceedings of the IEEE Conference on Computer Vision andPattern Recognition, 2007, pp. 1–8.
[13] N.D.B. Bruce, Features that draw visual attention: an information theoreticperspective, Neurocomputing 65-66 (2005) 125–133.
[14] T. Judd, K. Ehinger, F. Durand, A. Torralba, Learning to predict where humanslook, in: Proceeding of the IEEE International Conference on Computer Vision,2009, pp. 2106–2113.
[15] L. Itti, C. Koch, E. Niebur, A model of saliency-based visual attention for rapidscene analysis, IEEE Transactions on Pattern Analysis and Machine Intelli-gence 20 (1998) 1254–1259.
[16] M. Begum, F. Karray, Visual attention for robotic cognition: a survey, IEEETransactions on Autonomous Mental Development 3 (2011) 92–105.
[17] S. Frintrop, R. Erich, H.I. Christensen, Computational visual attention systemsand their cognitive foundations: a survey, ACM Transactions on AppliedPerception 7 (2010). 6:1–6:39.
[18] D.B. Walther, C. Koch, Attention in hierarchical models of object recognition,Progress in Brain Research 165 (2007) 57–78.
[19] C. Guo, Q. Ma, L. Zhang, Spatio-temporal saliency detection using phasespectrum of quaternion fourier transform, in: Proceedings of the IEEEConference on Computer Vision and Pattern Recognition, 2008, pp. 1–8.
[20] M. Wang, J. Li, T. Huang, Y. Tian, L. Duan, G. Jia, Saliency detection based on2d log-gabor wavelets and center bias, in: Proceedings of the InternationalConference on Multimedia, 2010, pp. 979–982.
[21] X. Hou, L. Zhang, Saliency detection: a spectral residual approach, in:Proceedings of the IEEE Conference on Computer Vision and Pattern Recogni-tion, 2007, pp. 1–8.
[22] X. Cui, Q. Liu, D. Metaxas, Temporal spectral residual: fast motion saliencydetection, in: Proceedings of the ACM International Conference on Multi-media, 2009, pp. 617–620.
[23] Y. Caron, P. Makris, N. Vincent, Use of power law models in detecting regionof interest, Pattern Recognition 40 (2007) 2521–2529.
[24] V. Yanulevskaya, J.M. Geusebroek, Significance of the Weibull distributionand its sub-models in natural image statistics, in: Proceedings of theInternational Conference on Computer Vision Theory and Applications, 2009,pp. 355–362.
[25] R. Achanta, S. Hemami, F. Estrada, S. Susstrunk, Frequency-tuned salientregion detection, in: Proceedings of the IEEE Conference on Computer Visionand Pattern Recognition, 2009, pp. 1597–1604.
[26] R. Achanta, S. Susstrunk, Saliency detection using maximum symmetricsurround, in: Proceedings of the IEEE International Conference on ImageProcessing, 2010, pp. 2653–2656.
[27] G. Kootstra, B. de Boer, L. Schomaker, Predicting eye fixations on complexvisual stimuli using local symmetry, Cognitive Computation 3 (2011)223–240.
[28] P.L. Rosin, A simple method for detecting salient regions, Pattern Recognition42 (2009) 2363–2371.
[29] N.D.B. Bruce, J.K. Tsotsos, Saliency based on information maximization,Advances in Neural Information Processing Systems (2005) 155–162.
[30] T.N. Vikram, M. Tscherepanow, B. Wrede, A random center surround bottomup visual attention model useful for salient region detection, in: Proceedingsof the IEEE Workshop on Applications of Computer Vision, 2011,pp. 166–173.
[31] L. Zhang, M.H. Tong, T.K. Marks, H. Shan, G.W. Cottrell, Sun: a Bayesianframework for saliency using natural statistics, Journal of Vision 8 (2008)1–20.
[32] W. Wang, Y. Wang, Q. Huang, W. Gao, Measuring visual saliency by siteentropy rate, in: Proceedings of the IEEE Conference on Computer Vision andPattern Recognition, 2010, pp. 2368–2375.
[33] Y. Lin, B. Fang, Y. Tang, A computational model for saliency maps by usinglocal entropy, in: Proceedings of the AAAI Conference on Artificial Intelli-gence, 2010, pp. 967–973.
[34] X. Hou, L. Zhang, Dynamic visual attention: searching for coding lengthincrements, Advances in Neural Information Processing Systems (2008)681–688.
[35] Y. Li, Y. Zhou, L. Xu, X. Yang, J. Yang, Incremental sparse saliency detection, in:Proceeding of the IEEE International Conference on Image Processing, 2009,pp. 3093–3096.
T.N. Vikram et al. / Pattern Recognition 45 (2012) 3114–3124 3123

Author's personal copy
[36] D. Gao, V. Mahadevan, N. Vasconcelos, The discriminant center-surroundhypothesis for bottom-up saliency, Advances in Neural Information Proces-sing Systems (2008) 497–504.
[37] T. Avraham, M. Lindenbaum, Esaliency (extended saliency): meaningfulattention using stochastic image modeling, IEEE Transactions on PatternAnalysis and Machine Intelligence 32 (2010) 693–708.
[38] R. Huang, N. Sang, L. Liu, Q. Tang, Saliency based on multi-scale ratio ofdissimilarity, in: Proceedings of the International Conference on PatternRecognition, 2010, pp. 13–16.
[39] H.J. Seo, P. Milanfar, Static and space-time visual saliency detection by self-resemblance, Journal of Vision 9 (12) (2009) 1–27. 15.
[40] W. Kim, C. Jung, C. Kim, Saliency detection: a self-ordinal resemblanceapproach, in: Proceedings of the IEEE International Conference on Multi-media and Expo, 2010, pp. 1260–1265.
[41] J. Harel, C. Koch, P. Perona, Graph-based visual saliency, Advances in NeuralInformation Processing Systems (2007) 545–552.
[42] W. Kienzle, F.A. Wichmann, B. Scholkopf, M.O. Franz, A nonparametricapproach to bottom-up visual saliency, Advances in Neural InformationProcessing Systems (2007) 689–696.
[43] Z. Liu, Y. Xue, L. Shen, Z. Zhang, Nonparametric saliency detection usingkernel density estimation, in: Proceedings of the IEEE International Con-ference on Image Processing, 2010, pp. 253–256.
[44] Y. Yu, B. Wang, L. Zhang, Hebbian-based neural networks for bottom-upvisual attention systems, in: Proceedings of the International Conference onNeural Information Processing, 2009, pp. 1–9.
[45] M.G. Quiles, D. Wang, L. Zhao, R.A.F. Romero, D.-S. Huang, Selecting salientobjects in real scenes: an oscillatory correlation model, Neural Networks 24(2011) 54–64.
[46] R. Valenti, N. Sebe, T. Gevers, Image saliency by isocentric curvedness andcolor, in: Proceedings of IEEE International Conference on Computer Vision,2009, pp. 2185–2192.
[47] G. Cao, F. Cheikh, Salient region detection with opponent color boosting, in:Proceedings of the European Workshop on Visual Information Processing,2010, pp. 13–18.
[48] V. Gopalakrishnan, Y. Hu, D. Rajan, Salient region detection by modelingdistributions of color and orientation, IEEE Transactions on Multimedia 11(2009) 892–905.
[49] O. Le Meur, P. Le Callet, D. Barba, D. Thoreau, A coherent computationalapproach to model bottom-up visual attention, IEEE Transactions on PatternAnalysis and Machine Intelligence 28 (2006) 802–817.
[50] B. Alexe, T. Deselaers, V. Ferrari, What is an object? in: Proceedings of theIEEE Conference on Computer Vision and Pattern Recognition, 2010,pp. 73–80.
[51] A.J. Ahumada, Learning receptor positions, in: Computational Models ofVisual Processing, MIT Press, 1991, pp. 23–34.
[52] R.M. Nosofsky, Stimulus bias, asymmetric similarity, and classification,Cognitive Psychology 23 (1991) 94–140.
[53] M.H. Wilder, M.C. Mozer, C.D. Wickens, An integrative, experience-basedtheory of attentional control, Journal of Vision 11 (2) (2011) 1–30.
[54] J.A. Taosheng Liu, M. Carrasco, Voluntary attention enhances contrastappearance, Psychological Science 20 (3) (2009) 354–362.
[55] S. Treue, Perceptual enhancement of contrast by attention, Trends inCognitive Sciences 8 (10) (2004) 435–437.
[56] A.L. Rothenstein, J.K. Tsotsos, Attention links sensing to recognition, Imageand Vision Computing 26 (2008) 114–126.
[57] O. Le Meur, J.-C. Chevet, Relevance of a feed-forward model of visualattention for goal-oriented and free-viewing tasks, IEEE Transactions onImage Processing 19 (2010) 2801–2813.
[58] P. Sharma, F.A. Cheikh, J.Y. Hardeberg, Face saliency in various human visualsaliency models, in: Proceedings of International Symposium on Image andSignal Processing and Analysis, 2009, pp. 327–332.
[59] J. Davis, M. Goadrich, The relationship between precision–recall and ROCcurves, in: Proceedings of International Conference on Machine Learning,2006, pp. 233–240.
[60] Z. Wang, B. Li, A two-stage approach to saliency detection in images, in:Proceedings of IEEE International Conference on Acoustics, Speech and SignalProcessing, 2008, pp. 965–968.
[61] L. Elazary, L. Itti, Interesting objects are visually salient, Journal of Vision 8(2008) 1–15.
[62] W.H. Tsai, Moment-preserving thresholding: a new approach, ComputerVision, Graphics, and Image Processing 29 (1985) 377–393.
Tadmeri Narayan Vikram has received Masters of Computer Applications from University of Mysore, India, in 2006. He worked as a research engineer at GREYC,University of Caen, France between 2008 and 2010. He is awarded the prestigious Marie Curie fellowship since 2010, to pursue Ph.D. at the Applied Informatics Group inBielefeld University, Germany. His research interests include computational modeling of visual attention and its applications in developmental robotics.
Marko Tscherepanow received his diploma degree in computer science from Ilmenau Technical University, Germany, in 2003. Afterwards, he joined the AppliedInformatics Group at Bielefeld University, Germany. In December 2007, he finished his Ph.D. thesis entitled ‘‘Image Analysis Methods for Location Proteomics’’. His currentresearch interests include incremental on-line learning, neural networks, evolutionary optimization, feature selection, and the application of such methods in cognitiverobotics.
Britta Wrede received her masters degree in computational linguistics and the Ph.D. degree (Dr.-Ing.) in computer science from Bielefeld University in 1999 and 2002respectively. From 1999 to 2002 she pursued a Ph.D. program at Bielefeld University in joint affiliation with the Applied Informatics Group and the graduate program task-oriented communication. After her Ph.D. she received a DAAD PostDoc fellowship at the speech group of the International Computer Science Institute (ICSI) at Berkeley,USA. Currently she heads the Applied Informatics Group at Bielefeld University.
T.N. Vikram et al. / Pattern Recognition 45 (2012) 3114–31243124