
A review of the physics of ice surface friction and the development of ice skating
20
1 A review on the physics of ice surface friction and the development of ice skating. Federico Formenti Research in Sports Medicine (2014), 22(3):276-293 Permalink: http://dx.doi.org/10.1080/15438627.2014.915833 This is an Author’s Original Manuscript of an article published by Taylor & Francis Group in Research in Sports Medicine on 20/06/2014, available online:http://www.tandfonline.com/doi/full/10.1080/15438627.2014.915833 Contact information: Nuffield Division of Anaesthetics, Nuffield Department of Clinical Neurosciences, University of Oxford, John Radcliffe Hospital, Oxford, OX3 9DU, UK Email: federico.formenti @ ndcn. ox. ac. uk Abstract Our walking and running movement patterns require friction between shoes and ground. The surface of ice is characterized by low friction in several naturally occurring conditions, and compromises our typical locomotion pattern. Ice skates take advantage of this slippery nature of ice; the first ice skates were made more than 4,000 years ago, and afforded the development of a very efficient form of human locomotion. This review presents an overview of the physics of ice surface friction, and discusses the most relevant factors that can influence ice skates’ dynamic friction coefficient. It also presents the main stages in the development of ice skating, describes the associated implications for exercise physiology, and shows the extent to which ice skating performance improved through history. This article illustrates how technical and materials’ development, together with empirical understanding of muscle biomechanics and energetics, led to one of the fastest forms of human powered locomotion. Keywords: ice skating, friction, human locomotion, muscle biomechanics and energetics
Transcript of A review of the physics of ice surface friction and the development of ice skating

1
A review on the physics of ice surface friction and the development of ice
skating.
Federico Formenti
Research in Sports Medicine (2014), 22(3):276-293
Permalink: http://dx.doi.org/10.1080/15438627.2014.915833
This is an Author’s Original Manuscript of an article published by Taylor & Francis Group in
Research in Sports Medicine on 20/06/2014, available
online:http://www.tandfonline.com/doi/full/10.1080/15438627.2014.915833
Contact information: Nuffield Division of Anaesthetics, Nuffield Department of Clinical
Neurosciences, University of Oxford, John Radcliffe Hospital, Oxford, OX3 9DU, UK
Email: federico.formenti @ ndcn. ox. ac. uk
Abstract
Our walking and running movement patterns require friction between shoes and ground. The
surface of ice is characterized by low friction in several naturally occurring conditions, and
compromises our typical locomotion pattern. Ice skates take advantage of this slippery nature of
ice; the first ice skates were made more than 4,000 years ago, and afforded the development of a
very efficient form of human locomotion. This review presents an overview of the physics of ice
surface friction, and discusses the most relevant factors that can influence ice skates’ dynamic
friction coefficient. It also presents the main stages in the development of ice skating, describes
the associated implications for exercise physiology, and shows the extent to which ice skating
performance improved through history. This article illustrates how technical and materials’
development, together with empirical understanding of muscle biomechanics and energetics, led
to one of the fastest forms of human powered locomotion.
Keywords: ice skating, friction, human locomotion, muscle biomechanics and energetics
2
THE PHYSICS OF ICE SURFACE, A SLIPPERY MATTER
A few miles from One Ton Depot, Ross Ice Shelf, Antarctica; Saturday 3rd March 1912
“The (ice) surface, lately a very good hard one, is coated with a layer of woolly crystals […]
(that) cause impossible friction to the runners. God help us, we can’t keep up this pulling, that is
certain”. Captain Robert Falcon Scott (1913).
The surface of ice is made of a thin layer of molecules that behaves like a liquid, in several
natural conditions
Ice as a solid material is truly peculiar: it is a solid, but one of its most distinct characteristics is
that, even when air is below freezing temperature, its surface is covered with a thin layer of water,
the presence of which still puzzles many physicists (Rosenberg 2005, Kietzig, Hatzikiriakos et al.
2010, Watkins, Pan et al. 2011). A block of ice floats on water because it is less dense than water.
The increase in the volume of water with temperature decreasing below 0º C also explains why a
bottle full of water can ‘explode’, if we forget it in the freezer for too long. The reverse also
applies: if we compress ice hard enough, it melts and turns into water. This melting caused by
pressure was proposed in the mid 19th century as the main mechanism through which a water film
would form under ice skates’ blades’ pressure, which were assumed to be sufficiently high.
However, it was later understood that the magnitude of the pressure increase caused by a skater
would generally not be sufficient to determine the melting of the ice. In fact, this increase in
pressure would result in a small temperature increase, say in the order of 1º C, insufficient to
explain the low friction of ice skates at very low temperatures. Moreover, it was observed that the
pressure required for melting ice at low temperatures is so great that it would squeeze the water
film away from the underside of the skate’s blade (Colbeck 1995). Overall, it is now generally
accepted that pressure melting plays a minor role in determining the low friction of skates on ice,
other than at temperatures near the melting point.
Whenever motion with friction occurs, some of the kinetic energy is converted to heat. This is
why our hands become warmer when we rub them together rapidly; here, some of the heat caused
by friction between our hands warms them up, and some heat is lost in the air. Bowden and
Hughes (1939) applied this concept to the study of skis sliding on ice and snow. Their experiments
took place in an ice cave near the High Altitude Research Station Jungfraujoch in Switzerland, at
3
an altitude of 3,346 m above sea level, where they observed that miniature sliders made of brass
were characterised by a considerably greater dynamic coefficient of friction than miniature sliders
made of ebonite, and they explained this phenomenon through the materials’ thermal conductivity.
During the sliding process, brass would take up much of the heat generated through friction, so
relatively little heat would be available to melt the ice. Colbeck et al. also supported that heat
would decrease the coefficient of friction on ice through experiments where temperature was
measured underneath skates (Colbeck 1995, 1997). He observed that blades’ temperature
increases with velocity, and with thermal insulation of most of the blade; also, he observed that the
blade’s sliding leaves warm tracks on the surface of ice behind the skates, suggesting that
frictional heating may be an important determinant of ice skates’ low dynamic coefficient of
friction. This finding was replicated in more recent experiments (Baurle, Szabo et al. 2006).
Neither of the two scenarios presented above, namely pressure melting and frictional heating, can
explain why ice is slippery even when we simply stand on it. One of the first experimental
observations on the liquid-like nature of the ice surface was presented by Michael Faraday (1859).
In simple terms, he observed that, although the surface of ice is slippery, two ice blocks would
stick if put one on top of the other, like if there were some water that would freeze in between, a
phenomenon called regelation. Following these observations made in the mid 19th century, studies
on the physics of ice surface have not made much progress until the second half of the 20th
century, when the wide multidisciplinary importance of ice as a material became apparent. Several
mechanisms have been proposed in order to explain the slippery nature of ice surface. One of the
most recent and plausible explanations is that, at molecular level, the surface of ice vibrates.
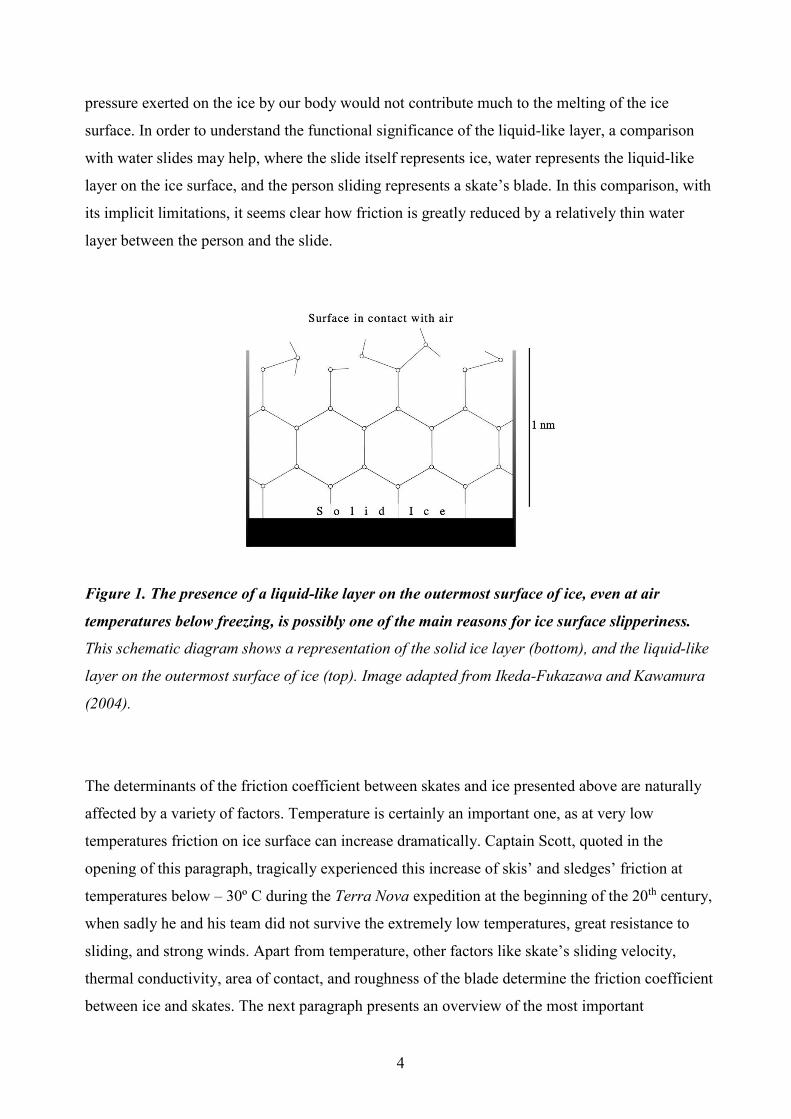
In most crystalline materials each surface molecule has an identical binding energy, while in the
surface of ice molecules are bound by different forces (Watkins, Pan et al. 2011). In the lower part
of Figure 1 the solid ice layer is represented by a frame of hexagons with a periodic structure,
characterised by several and regular chemical bonds represented by thin lines. In contrast, the
liquid-like layer on the surface of ice is represented with relatively fewer and less regular bonds.
Due to this weaker physical structure, atoms in the ice surface can move rather freely, similarly to
what they do in water. It is thought that the interaction of these moving atoms in the surface of ice
with the solid ice immediately underneath generates the superficial lubricating film of water (also
known as the liquid-like layer), independently of any frictional heat or pressure generated by ice
skates. This can explain why ice is slippery even when we simply stand on it, a situation where we
do not generate much frictional heat on the surface of ice and where, as discussed above, the
4
pressure exerted on the ice by our body would not contribute much to the melting of the ice
surface. In order to understand the functional significance of the liquid-like layer, a comparison
with water slides may help, where the slide itself represents ice, water represents the liquid-like
layer on the ice surface, and the person sliding represents a skate’s blade. In this comparison, with
its implicit limitations, it seems clear how friction is greatly reduced by a relatively thin water
layer between the person and the slide.
Figure 1. The presence of a liquid-like layer on the outermost surface of ice, even at air
temperatures below freezing, is possibly one of the main reasons for ice surface slipperiness.
This schematic diagram shows a representation of the solid ice layer (bottom), and the liquid-like
layer on the outermost surface of ice (top). Image adapted from Ikeda-Fukazawa and Kawamura
(2004).
The determinants of the friction coefficient between skates and ice presented above are naturally
affected by a variety of factors. Temperature is certainly an important one, as at very low
temperatures friction on ice surface can increase dramatically. Captain Scott, quoted in the
opening of this paragraph, tragically experienced this increase of skis’ and sledges’ friction at
temperatures below – 30º C during the Terra Nova expedition at the beginning of the 20th century,
when sadly he and his team did not survive the extremely low temperatures, great resistance to
sliding, and strong winds. Apart from temperature, other factors like skate’s sliding velocity,
thermal conductivity, area of contact, and roughness of the blade determine the friction coefficient
between ice and skates. The next paragraph presents an overview of the most important
5
determinants of ice skates’ friction coefficient; more extensive reviews on this topic are published
elsewhere (Rosenberg 2005, Kietzig, Hatzikiriakos et al. 2010).
Several physical factors can influence ice skates’ friction coefficient
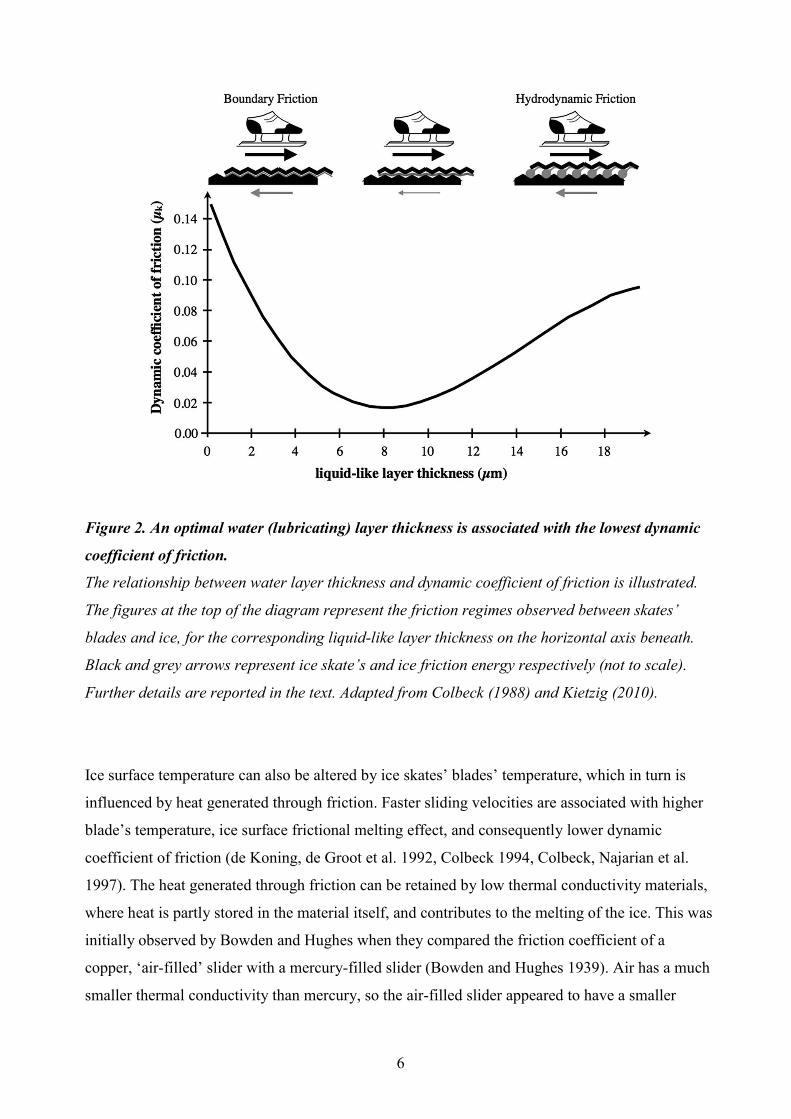
Ambient and blades’ temperature influence the thickness of the superficial layer of water on ice,
which is ultimately the greatest determinant of skates’ dynamic coefficient of friction. The layer of
water becomes thinner with decreasing ambient temperatures, and this reduction in thickness is
normally associated with an increase in the friction coefficient. At ambient temperatures close to
the melting point, the thickness of the layer of water becomes relatively excessive, resulting in
drag forces that increase friction between ice and skate. This concept is illustrated in Figure 2. As
mentioned above, some of the earliest experiments investigating the effects of temperature on ice
friction were performed by Bowden and Hughes (1939). In their experiments, they used solid
carbon dioxide and liquid air to alter temperature, and observed a marked increase in the dynamic
coefficient of friction between slider and ice for temperatures decreasing to – 40º C and below.
Bowden’s experimental results showing a relationship between temperature and ice friction were
replicated in more recent studies, which considered different materials, sliders’ velocities and ice
conditions (Calabrese, Buxton et al. 1980, Slotfeldt-Ellingsen and Torgensen 1983, de Koning, de
Groot et al. 1992, Albracht, Reichel et al. 2004). The minimum coefficient of friction is often
recorded at temperatures around – 5º C in most of these studies.
6
Figure 2. An optimal water (lubricating) layer thickness is associated with the lowest dynamic
coefficient of friction.
The relationship between water layer thickness and dynamic coefficient of friction is illustrated.
The figures at the top of the diagram represent the friction regimes observed between skates’
blades and ice, for the corresponding liquid-like layer thickness on the horizontal axis beneath.
Black and grey arrows represent ice skate’s and ice friction energy respectively (not to scale).
Further details are reported in the text. Adapted from Colbeck (1988) and Kietzig (2010).
Ice surface temperature can also be altered by ice skates’ blades’ temperature, which in turn is
influenced by heat generated through friction. Faster sliding velocities are associated with higher
blade’s temperature, ice surface frictional melting effect, and consequently lower dynamic
coefficient of friction (de Koning, de Groot et al. 1992, Colbeck 1994, Colbeck, Najarian et al.
1997). The heat generated through friction can be retained by low thermal conductivity materials,
where heat is partly stored in the material itself, and contributes to the melting of the ice. This was
initially observed by Bowden and Hughes when they compared the friction coefficient of a
copper, ‘air-filled’ slider with a mercury-filled slider (Bowden and Hughes 1939). Air has a much
smaller thermal conductivity than mercury, so the air-filled slider appeared to have a smaller
7
coefficient of friction. This finding was replicated in different materials by Itagaki et al. (1989).
The roughness of skates’ blades’ material also influences blades’ temperature and dynamic
coefficient of friction (Calabrese, Buxton et al. 1980, Itagaki, Huber et al. 1989). A rough material
would determine a great friction, hence a great increase in temperature and great melting effect;
however, the roughness of the surface would also be associated with an increased actual contact
surface area (for a given apparent contact area), and greater interlocking asperities that would
work against the sliding movement. In this respect, a smooth material is preferred for skates’
blades because it is characterised by a reduced surface asperity, and ultimately results in a lower
coefficient of friction. For a material with a given roughness level, the orientation of polishing
marks (e.g. on the blade’s lateral or sagittal plane) can also influence the friction coefficient
(Itagaki, Huber et al. 1989). A large-scale example is the underside of cross-country skis, where
the deep groove represents a sagittal plane polishing mark. Clearly, polishing marks that are
aligned with the blade’s direction of motion are associated with low dynamic coefficient of
friction, and may contribute to the control of the blade too.
The pressure exerted on a surface is a function of a normal force, and the contact area over which
the force is applied. As discussed above, pressure does not appear to be a strong determinant of ice
skates friction, so changes in normal force or blades’ contact area would not be expected to affect
skates’ friction coefficient significantly. Studies investigating effects of different normal forces
and geometric contact areas on the dynamic coefficient of friction reported contrasting evidence
(Bowden and Hughes 1939, Calabrese, Buxton et al. 1980, Albracht, Reichel et al. 2004, Baurle,
Szabo et al. 2006, Baurle, Kaempfer et al. 2007), where no clear relationship between these
variables appeared. It is possible that the variety of experimental conditions (e.g. temperatures,
materials, velocities) have determined different outcomes that are difficult to compare. In this
regard, possibly through empirical understanding of skates’ friction on ice, the geometry of skates’
blades has changed through history (Formenti and Minetti 2007). The apparent contact area of
modern ice skates’ blades is only about a third of blades used centuries ago. For a given skater’s
weight, this decrease in blades’ contact area results in a greater pressure exerted on ice, and in a
relatively greater pressure-melting effect. However, as mentioned before, a skater is unlikely to
generate the amount of pressure required for ice melting. Supporting the minor role of pressure for
ice skates’ low friction, modern ice skates’ blades are relatively long (more than 400 mm). Rather
than a small contact area, it seems important for a blade to have a small frontal area in contact
with the ice, so that ‘frontal’ friction is as low as possible (Houdijk, Wijker et al. 2001), and to
distribute the skater’s weight over a great length; in other words, modern long blades allow the
8
skate to ‘float’ on (not sink in) the water layer on the surface of ice. It is possible that the length of
modern blades is an optimum in terms of low pressure levels on ice, and manoeuvrability. Shorter
blades would be associated with greater pressure levels that may still not be sufficient to generate
a pressure-melting effect on the ice, but could be sufficient to squeeze part of the water film away
from the blade, resulting in greater solid-solid contact and high wear rates; longer blades would be
heavier, and could be more difficult to manoeuvre. Recalling the water slide example, a
comparison could be drawn with a person sliding in the seated position (short blade), when the
pressure they exert on the water is relatively big, so water is squeezed out from below the person,
determining solid-solid contact (person-slide) and relatively great friction. In contrast, when the
person slides in a supine position (long blade), the smaller pressure exerted on the water allows
some water to remain between person and slide, resulting in the presence of a lubricating water
layer that reduces friction. This hypothesis needs to be tested through models and experiments.
In conclusion, several physical factors contribute to determining skates’ friction on ice. Findings
from previous studies have only in part elucidated the physics of ice skates’ friction, with results
often difficult to compare due to different experimental conditions, including ice properties that
change significantly at different temperatures and humidity levels. Nevertheless, it seems
generally accepted that an optimum water layer thickness exists where the dynamic coefficient of
friction is minimum. The possibility to skate on this optimum water layer thickness depends on a
combination of ice skates and ice properties.
Different friction regimes can co-exist between skate and ice
Due to the presence of the water layer on the surface of ice, dry friction between ice skate’s blade
and ice may be observed only over an extremely limited actual contact area, at least in natural
conditions. As discussed in the previous paragraph, the thickness of the water layer varies
depending on multiple factors, and is associated with different friction regimes. Figure 2 illustrates
the three main different friction regimes that characterise ice skates’ gliding. Especially at very
low temperatures, a very thin liquid-like layer (left, thin grey line) is associated with boundary
friction, where the thickness of the liquid-like layer is smaller than the ‘height’ of ice and blade
surface asperities. This boundary friction regime is similar to that observed when rubbing two
solids on each other, but the friction coefficient is lower than in dry friction. In contrast, at
ambient temperatures near the melting point or above, an excessively thick liquid-like layer (right,
9
grey icons represent water drops with capillary water bridges between asperities (Colbeck 1988))
is associated with hydrodynamic friction, a regime similar to that observed between a boat and
water. In the hydrodynamic friction regime, the thickness of the liquid-like layer is greater than
the ‘height’ of the surface asperities. An optimal liquid-like layer thickness, where the dynamic
coefficient of friction is minimum, can be observed at intermediate thickness values (middle,
thicker grey line). This scenario if often called mixed friction regime, where the thickness of the
liquid-like layer is greater than in boundary friction, but still smaller than the ‘height’ of the
surface asperities, so relatively limited capillary water bridges form between surface asperities. In
the schematic diagram at the top of figure 2, black and grey arrows represent ice skate’s and ice
friction energy respectively. Greater friction energy is encountered in boundary (left) and
hydrodynamic (right) friction regimes than in the intermediate friction regime. Here, the optimum
lubricating layer thickness affords the minimum loss of energy caused by friction.
In contrast with this simplified model, a blade most likely shows a variety of friction regimes
when we skate. This variety may be influenced by ice surface’s irregularity, blade’s velocity (even
within the gliding phase), blade’s orientation, distribution of pressure over the blade, blade’s and
ambient temperature, and several other skater’s related factors. The schematic representation
above is only a reduced model of a rather complex physics problem: some of the main variables
that influence ice friction are fairly well understood (e.g. temperature, velocity), but others (e.g.
surface structure) are still an exciting area of exploration.
HUMAN LOCOMOTION ON ICE
Ice was certainly a surface that humans tried to avoid travelling on for millennia, as its slippery
nature increases risks of falls and injury, limits walking velocity, and increases walking metabolic
energy cost. However, as early as four thousand years ago, our ancestors realised that this
slipperiness could be used to their advantage, and invented an entirely new form of human-
powered locomotion: bone skating. The next part of this chapter presents the development of
human locomotion on ice through history, and discusses the relevant biomechanical and
physiological implications.
10
Skating on animal bones may have reduced time and energy cost for human powered
transport in Scandinavia more than three thousand years ago
Most research studies on human locomotion on ice focused on its current relevance for sport and
exercise physiology and biomechanics (di Prampero, Cortili et al. 1976, Marino 1977, van Ingen
Schenau and Bakker 1980, de Groot, Hollander et al. 1987, van Ingen Schenau, de Boer et al.
1989, Smith and Roberts 1990, de Koning, de Groot et al. 1992, Allinger and Van den Bogert
1997, Rundell, Nioka et al. 1997, Foster, Rundell et al. 1999, Houdijk, Heijnsdijk et al. 2000).
Fewer studies explored the origins and the development of this ingenious form of human powered
locomotion (Heathcote, Tebbutt et al. 1892, Munro 1893, Brown 1959, Blauw 2001, Muhonen
2005, Formenti and Minetti 2007, Formenti and Minetti 2008).
Humans started skating on ice around the second millennium before Christ, as suggested by
archaeological specimens. The first ice skates were possibly made of animal bones (Jacobi 1976),
on which the skater would stand; skates were used together with a pointy stick pushed backwards
on the ice surface for propulsion (Olaus 1555). No clear evidence supports any of the different
hypotheses as to why bone skating started. Also, the most ancient archaeological specimens
cannot be clearly ordered chronologically, so it is difficult to identify ice skates’ birthplace.
Archaeological evidence helps making possible connections between bone skates’ qualitative
features and tool making traditions in different European regions thousands of years ago. This
approach still leaves a wide spectrum of candidates as for the location where bone skates might
have been used first.
Most of the oldest bone skates were found in areas where water covers more than 5% of the
corresponding modern country, namely Finland (with over 60 000 lakes), the Netherlands,
Sweden, and Norway. The energy-saving principle was hypothesised to be a determinant factor in
the birth of bone skates (Formenti and Minetti 2008). These authors created replicas of ancient
bone skates, and measured velocity and metabolic energy cost of bone skating. The average
velocity recorded on bone skates was about 1.2 m s-1. In terms of metabolic energy cost, this
velocity is similar to the optimal velocity of walking on firm ground, but the metabolic energy
cost of skating on bones was 4.6 J kg-1 m-1, about two times greater than the cost of walking. They
then used the recorded metabolic energy cost values as input for computer simulations of travel in
the above mentioned Northern European regions, and in Germany, where relatively many bone
11
skates were found. Assuming a given metabolic power (5.3 W kg-1) for walking and bone skating,
they calculated the energy cost and speed of travelling for a number of simulated journeys (total of
2,400 km over five countries). These journeys were simulated in two conditions: ‘walking and
skating’, and ‘walking only’. For the ‘walking and skating’ simulations, the distance to be
travelled was constant (10 km), but the cost and velocity of locomotion varied depending on the
presence and dimensions of frozen lakes on route. In contrast, for the ‘walking only’ simulation,
the distance to be travelled varied according to the presence of lakes to be avoided: if lakes were
present on the route, the authors measured the shortest path connecting the starting point to the
final destination. Formenti and Minetti estimated that the greatest reduction in metabolic energy
cost of transport would be observed in Finland, where using bone skates allowed saving about half
the energy for the average journey considered in the study. The reduction in metabolic energy cost
of transport was not as great in the other countries considered. Finally, they estimated that ancient
Finnish hunters and fishermen using bone skates for winter travel could have saved almost 10 per
cent of the energy needed to survive for a period of four months. On the basis of their metabolic
energy measurements and computer simulations, they suggest that the use of bone skates in areas
characterised by a high density of lakes allowed travelling shorter routes, hence reduced times and
metabolic cost of transport. In conclusion, it is fascinating to notice that, alongside modern ice
skates’ models, bone skates were still in use in the 18th century “in Iceland, Gotland and in parts
of Hungary and Germany” (Roes 1963).
Technical and materials’ development supported the evolution of human locomotion on ice
Ever since the first bone skates were used, several subsequent modifications lead to the current
fastest ice skate, called the klapskate. Most of these modifications were based on empirical
evidence for ice friction and exercise physiology, as discussed later. Only some of these
modifications originated from research studies. The first contribution to understanding the
kinematics of ice skating is attributed to Tebbutt (Heathcote, Tebbutt et al. 1892). In Amsterdam,
he took a series of instantaneous photographs of skaters travelling on three different skates, and
consequently adopting different skating techniques. He observed that the fastest skate was the one
that allowed for the longest strides and that required the smallest lateral deviation from the
forward motion, indicating that little of the power generated was wasted laterally. In the 1970s van
Ingen Schenau and colleagues started a most comprehensive and informative series of studies on
the biomechanics and physiology of ice skating at the Vrije Universiteit in Amsterdam. They
12
investigated the effect of air friction on speed skating performance, showing that it accounted for
about 70% of energy loss through friction at a speed of 9.2 m s-1 (van Ingen Schenau, 1982;
previously reported by di Prampero et al. 1976). They created the first biomechanical models (van
Ingen Schenau and Bakker, 1980) and investigated applied physiology of this form of locomotion
implying peculiar mixed features such as isometric contractions for long periods of time during
the gliding phase as well as fast powerful push-offs (de Groot et al., 1987). The adoption of
klapskates at world level competitions gave a strong impulse for further research trying to explain
the reasons for faster velocities on klapskates rather than on traditional skates (van Ingen Schenau
et al., 1987, van Ingen Schenau, 1998, de Koning et al., 2000, Houdijk et al., 2000a, Houdijk et
al., 2000b, Houdijk et al., 2001, Houdijk et al., 2003). Skating posture does not change during
skating on klapskates and traditional skates, consequently no difference in air frictional losses
could be measured. Lower friction between blade and ice was suggested to be a major determinant
of faster velocities, because it was thought that the pressure of the tip of the blade in the ice at the
end of each push-off could cause a great dissipation of power. Houdijk et al. (2000a) showed that
this difference in friction determined a relatively small energy dissipation difference (only 0.84 W,
compared with a 54 W dissipated by ice friction). Skating velocity increased because of a higher
power output, determined by an 11 J increase in work per stroke and a higher stroke frequency
(from 1.30 to 1.36 strokes s-1). Moving the position of the klapskate hinge along the skate’s main
axis directly alters the levers’ system used by the lower limb muscles. Van Horne and Stefanyshyn
(2005) investigated the effects of different klapskate hinge’s position, and found an intermediate
optimum position in terms of lower limbs’ power generation.
No study explored the biomechanics and energetics of skating on more ancient models, and their
evolution through history. Formenti and Minetti hypothesised that, similarly to cross-country
skiing (Formenti, Ardigò et al. 2005), ice skating developed in order to reduce energy cost and
time of travel. They conducted an in-depth historical research, and identified five skates
displaying significantly different features from previous models, that could consequently
determine a better performance in terms of velocity and energy demand (Formenti and Minetti
2007). The models used in these experiments are shown at the top of Figure 3. Apart from the
bone skates mentioned in the previous paragraph, skates used in the 13th, 15th, and 18th century, as
well as modern skates were included in the study. The main technical steps in the development of
ice skates were identified with the use of thinner and longer metal blades, the reduction in skates’
dynamic coefficient of friction and weight, the increase in the foot height over the ice, and the use
13
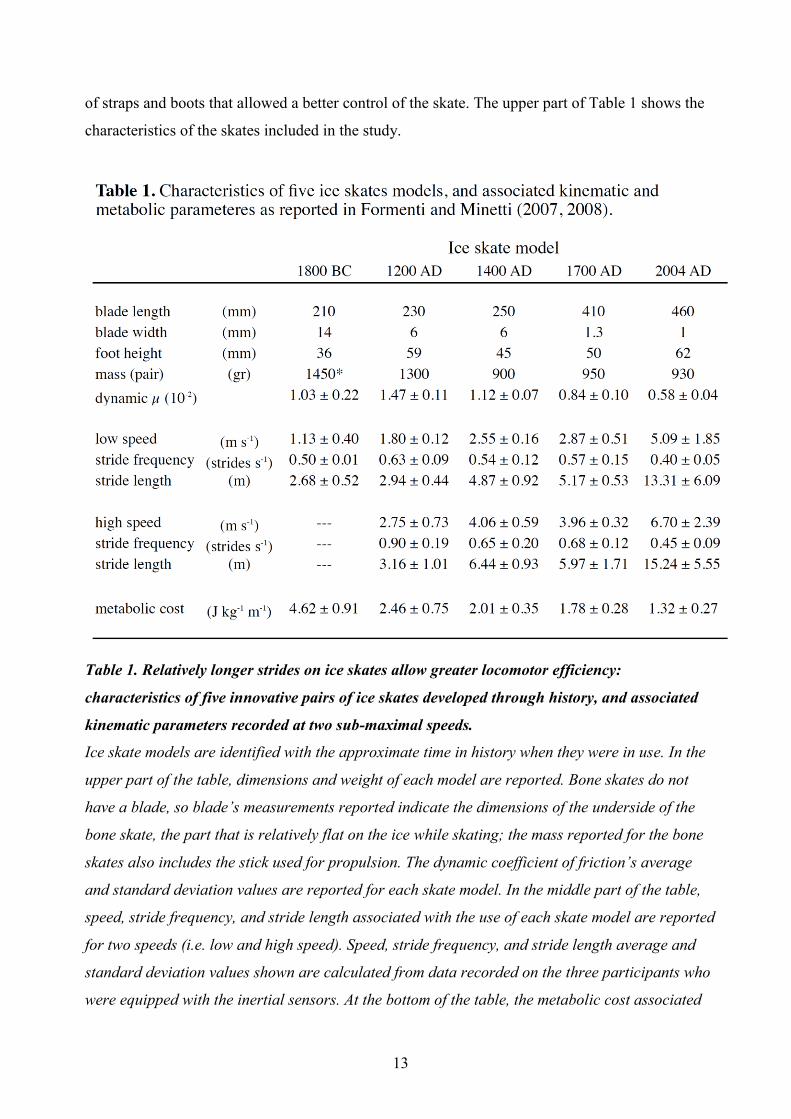
of straps and boots that allowed a better control of the skate. The upper part of Table 1 shows the
characteristics of the skates included in the study.
Table 1. Relatively longer strides on ice skates allow greater locomotor efficiency:
characteristics of five innovative pairs of ice skates developed through history, and associated
kinematic parameters recorded at two sub-maximal speeds.
Ice skate models are identified with the approximate time in history when they were in use. In the
upper part of the table, dimensions and weight of each model are reported. Bone skates do not
have a blade, so blade’s measurements reported indicate the dimensions of the underside of the
bone skate, the part that is relatively flat on the ice while skating; the mass reported for the bone
skates also includes the stick used for propulsion. The dynamic coefficient of friction’s average
and standard deviation values are reported for each skate model. In the middle part of the table,
speed, stride frequency, and stride length associated with the use of each skate model are reported
for two speeds (i.e. low and high speed). Speed, stride frequency, and stride length average and
standard deviation values shown are calculated from data recorded on the three participants who
were equipped with the inertial sensors. At the bottom of the table, the metabolic cost associated
14
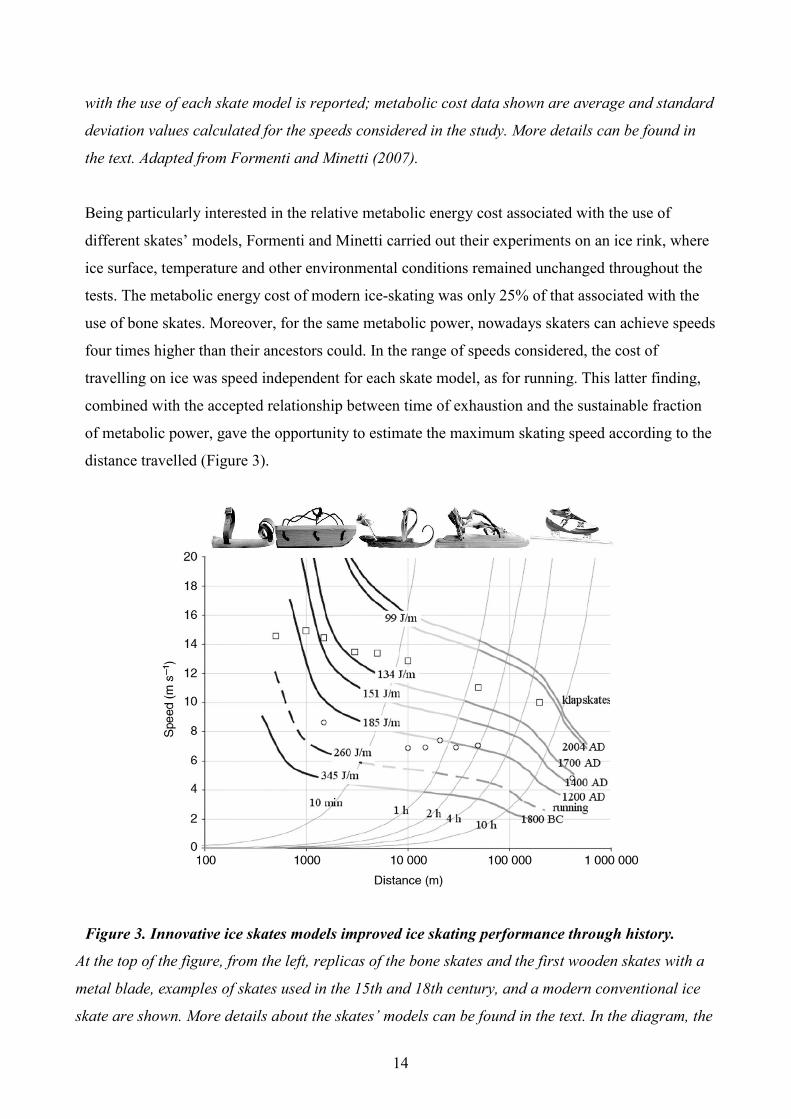
with the use of each skate model is reported; metabolic cost data shown are average and standard
deviation values calculated for the speeds considered in the study. More details can be found in
the text. Adapted from Formenti and Minetti (2007).
Being particularly interested in the relative metabolic energy cost associated with the use of
different skates’ models, Formenti and Minetti carried out their experiments on an ice rink, where
ice surface, temperature and other environmental conditions remained unchanged throughout the
tests. The metabolic energy cost of modern ice-skating was only 25% of that associated with the
use of bone skates. Moreover, for the same metabolic power, nowadays skaters can achieve speeds
four times higher than their ancestors could. In the range of speeds considered, the cost of
travelling on ice was speed independent for each skate model, as for running. This latter finding,
combined with the accepted relationship between time of exhaustion and the sustainable fraction
of metabolic power, gave the opportunity to estimate the maximum skating speed according to the
distance travelled (Figure 3).
Figure 3. Innovative ice skates models improved ice skating performance through history.
At the top of the figure, from the left, replicas of the bone skates and the first wooden skates with a
metal blade, examples of skates used in the 15th and 18th century, and a modern conventional ice
skate are shown. More details about the skates’ models can be found in the text. In the diagram, the
15
three-colour (black, light grey, dark grey) lines illustrate the maximum sustainable speed/distance
relationships, calculated for constant metabolic cost (iso-cost lines) for each skate model, identified
with the approximate time in history when they were in use. The light grey curves are iso-duration
speed/distance pairs, and the respective durations are reported (10 min to 10 h). The broken line
illustrates values for running, and is shown as a means of comparison with the ice-skating
performance data. Also reported as a means of comparison are the ice-skating top records (open
squares), and records for cross-country skiing (open circles). Adapted from Formenti and Minetti
(2007).
Data shown for klapskates in Figure 3 were calculated assuming 5% faster speeds, according to
Houdijk et al. (2000). The three-colour lines were calculated through equations provided by
Wilkie (1980), Saltin (1973), and Davies (1981), and were calculated assuming that the available
fraction of the metabolic power used for a given movement pattern (ice skating), is inversely
related to the time to exhaustion. From the left, the black, light grey, and dark grey lines
respectively illustrate the maximum sustainable speed calculated for periods of time ranging from
40 s to 10 min, from 10 min to 1 h, and from 1 to 24 h. For the calculations, the maximum
metabolic power available was set at 21.3 W kg–1. An example might be helpful in order to clarify
the information reported in Figure 3: the energy cost of skating on bones (1800 BC) is indicated
by the thick 345 J m–1 iso-cost line (bottom line in the diagram). The intersection between this iso-
cost line and the light 10 min iso-time line shows that in 10 min, for an energy cost of 345 J m–1, a
person skating on bones could cover a distance of approximately 2.6 km at an average speed of
4.4 m s–1 (~ 16 km h-1) before exhaustion. This is indicated by the intersection of the 345 J m-1 iso-
cost and the 10 min iso-time lines in the diagram. In contrast, the energy cost of modern ice-
skating is only 99 J m–1, less than one-third of the energy cost associated with skating on bones.
On the basis of the equations from Wilkie (1980) and Saltin (1973), it appears that a skater could
cover a distance of about 9.2 km in 10 min, at an average speed of about 15.3 m s-1 (~ 56 km h–1)
before exhaustion. In the diagram this is indicated by the intersection between the 99 J m–1 iso-
cost curve and the 10 min iso-time line. The 10 km speed skating men world record at the time of
writing is 12 min and 41 s, achieved at an average speed of about 47 km h-1 (ISU 2012), not far
from the values predicted above. The main limitation of this approach becomes evident when
observing the difference between the iso-cost lines for modern skates and klapskates, and the
actual records (open squares) for events shorter than 10 minutes; here, the model used largely
overestimates the maximum sustainable speed. In their study, Formenti and Minetti recorded
16
oxygen consumption at steady state speeds up to about 10 m s-1; this could explain why their
model predicts long distance events better than events where the energetic demand of the initial
acceleration plays a major role in determining the overall performance.
This figure can also help suggesting when people could travel faster on ice than on land, (moving
at their maximum sustainable velocity). On frozen Dutch canals in the 13th century, ice skaters
could cover a distance of about 26 km in an hour, a much longer distance than the 18 km that
could possibly be travelled by running. This level of performance afforded by ice skates had no
equal amongst other forms of human powered locomotion until the advent of bicycles centuries
later (Minetti, Pinkerton et al. 2001).
Ice skates were the first passive tools for human locomotion that took advantage of skeletal
muscle biomechanical properties
Contraction of skeletal muscle can generate its maximum power when it shortens at about one
third of its fastest shortening speed. Even when travelling at relatively high speeds, the skating
movement pattern requires muscles to shorten slowly, so they can also develop a considerable
amount of force; this is the greatest advantage of skating over running. When we run, the velocity
of muscle shortening is coupled to the velocity of running: the faster we run, the faster our
muscles need to shorten. From a biomechanical perspective, this coupling of muscle shortening
velocity and locomotion velocity is the main limiting factor for our fastest running speed. In
contrast, when we skate, we can travel faster by taking longer strides, avoiding the need to shorten
our muscles very rapidly, hence generating a greater power at each stride. If we compared a runner
with a skater travelling at the same speed, the runner would take about six steps for every ‘skating
step’. For a similar heart rate, say 130 beats per minute, the skater would travel almost four times
as fast as the runner. The stride frequencies and lengths recorded reported by Formenti and Minetti
(2007) are presented in Table 1; these results suggest that our ancestors empirically understood the
above mentioned, important biomechanical properties of skeletal muscle contraction. For
example, participants were asked to skate at a low and at a high speed, defined as sustainable for 8
and 4 hours respectively, simulating the speed that might have been adopted for a journey. It is
clear that the ‘natural selection’ of ice skates favoured models that allowed higher speeds,
associated with longer strides and low stride frequencies. Travelling fast on modern skates was
17
associated with a metabolic energy cost which was even lower than that recorded on slow, old
skates. Overall, subsequent models of ice skates dramatically improved our locomotion efficiency,
allowing faster travel at lower metabolic energy cost.
Modern klapskates require a movement pattern that, in terms of push-off mechanics, is slightly
different from that of jumping (or running). When travelling on klapskates, no flexion of the
metatarsal joint occurs: the ankle is extended, but the foot rotates as a single element around the
hinge between the boot and the blade. By contrast, when we perform a standing jump (or when we
run), just before our foot loses contact with the ground, it bends at the metatarsal–phalangeal joint
level. The tendons in the arch of the foot, storing some elastic energy during the extension of the
metatarsal joint, normally return a substantial portion of energy during these structures’ elastic
recoil (Hick’s windlass effect), possibly playing a role in determining performance. I expect that a
block that gives the opportunity to bend the foot at the level of the metatarsal–phalangeal joint in
the last stage of the pushing phase would contribute to a small, but perhaps significant increase in
ice skating performance.
18
REFERENCES
Albracht, F., S. Reichel, V. Winkler and H. Kern (2004). "On the influences of friction on ice."
Materialwissenschaft Und Werkstofftechnik 35(10-11): 620-625.
Allinger, T. L. and A. J. Van den Bogert (1997). "Skating technique for the straights, based on the
optimization of a simulation model." Med Sci Sports Exerc 29(2): 279-286.
Baurle, L., U. Kaempfer, D. Szabo and N. D. Spencer (2007). "Sliding friction of polyethylene on
snow and ice: Contact area and modeling." Cold Regions Science and Technology 47(3): 276-289.
Baurle, L., D. Szabo, M. Fauve, H. Rhyner and N. D. Spencer (2006). "Sliding friction of
polyethylene on ice: tribometer measurements." Tribology Letters 24(1): 77-84.
Blauw, W. (2001). Van glis tot klapschaats, Franeker.
Bowden, F. P. and T. P. Hughes (1939). "The Mechanism of Sliding on Ice and Snow."
Proceedings of the Royal Society of London. Series A, Mathematical and Physical Sciences
172(949): 280-298.
Brown, N. (1959). Ice Skating, a History. London, Nicholas Kaye.
Calabrese, S. J., R. Buxton and G. Marsh (1980). "Frictional Characteristics of Materials Sliding
against Ice." Lubrication Engineering 36(5): 283-289.
Colbeck, S. C. (1988). "Kinetic friction on snow." J of Glaciology 34: 78-86.
Colbeck, S. C. (1994). "Bottom temperatures of skating skis on snow." Med Sci Sports Exerc
26(2): 258-262.
Colbeck, S. C. (1995). "Pressure melting and ice skating." Am. J. Phys. 63: 888-890.
Colbeck, S. C., L. Najarian and H. B. Smith (1997). "Sliding temperatures of ice skates."
American Journal of Physics 65(6): 488-492.
Davies, C. T. M. (1981). Physiology of ultra-long distance running. Physiological chemistry of
exercise and training. P. E. d. Prampero and J. R. Portsman. Basel, Karger. 13: 77-84.
de Groot, G., A. P. Hollander, A. J. Sargeant, G. J. van Ingen Schenau and R. W. de Boer (1987).
"Applied physiology of speed skating." J Sports Sci 5(3): 249-259.
de Koning, J. J., G. de Groot and G. J. van Ingen Schenau (1992). "Ice friction during speed
skating." J Biomech 25(6): 565-571.
de Koning, J. J., G. de Groot and G. J. van Ingen Schenau (1992). "A power equation for the sprint
in speed skating." J Biomech 25(6): 573-580.
di Prampero, P. E., G. Cortili, P. Mognoni and F. Saibene (1976). "Energy cost of speed skating
and efficiency of work against air resistance." J Appl Physiol 40(4): 584-591.
Faraday, M. (1859). "Note on regelation." Proceedings of the Royal Society of London 10: 440-
450.
19
Formenti, F., L. P. Ardigò and A. E. Minetti (2005). "Human locomotion on snow: determinants
of economy and speed of skiing across the ages." Proc. R. Soc. London B 272: 1561-1569.
Formenti, F. and A. E. Minetti (2007). "Human locomotion on ice: the evolution of ice-skating
energetics through history." Journal of Experimental Biology 210(10): 1825-1833.
Formenti, F. and A. E. Minetti (2008). "The first humans travelling on ice: an energy-saving
strategy?" Biological Journal of the Linnean Society 93(1): 1-7.
Foster, C., K. W. Rundell, A. C. Snyder, J. Stray-Gundersen, G. Kemkers, N. Thometz, J. Broker
and E. Knapp (1999). "Evidence for restricted muscle blood flow during speed skating." Med Sci
Sports Exerc 31(10): 1433-1440.
Heathcote, J. M., C. G. Tebbutt and T. Maxwell (1892). Skating. London, Longmans green and
Co.
Houdijk, H., J. J. de Koning, G. de Groot, M. F. Bobbert, And and G. J. van Ingen Schenau
(2000). "Push-off mechanics in speed skating with conventional skates and klapskates." Med Sci
Sports Exerc 32(3): 635-641.
Houdijk, H., E. A. Heijnsdijk, J. J. de Koning, G. de Groot and M. F. Bobbert (2000).
"Physiological responses that account for the increased power output in speed skating using
klapskates." Eur J Appl Physiol 83(4 -5): 283-288.
Houdijk, H., A. J. Wijker, J. J. de Koning, M. F. Bobbert and G. de Groot (2001). "Ice friction in
speed skating: can klapskates reduce ice frictional loss?" Med. Sci. in Sports and Exerc. 33(3):
499-504.
Ikeda-Fukazawa, T. and K. Kawamura (2004). "Molecular-dynamics studies of surface of ice Ih."
Journal of Chemical Physics 120(3): 1395-1401.
ISU. (2012). "Speed skating records." 2012, from http://www.isu.org.
Itagaki, K., N. P. Huber, G. Lemieux, C. R. Research and E. L. . (1989). Dynamic Friction of a
Metal Runner on Ice: 1. Model Sled Test, US Army Cold Regions Research & Engineering
Laboratory.
Jacobi, H. W. (1976). De Nederlandse Glissen, Middeleeuwse Archeologie.
Kietzig, A. M., S. G. Hatzikiriakos and P. Englezos (2010). "Physics of ice friction." Journal of
Applied Physics 107(8): 081101-081115.
Marino, G. W. (1977). "Kinematics of ice skating at different velocities." Res Q 48(1): 93-97.
Minetti, A. E., J. Pinkerton and P. Zamparo (2001). "From bipedalism to bicyclism: evolution in
energetics and biomechanics of historic bicycles." Proc. R. Soc. Lond. B 268: 1351-1360.
Muhonen, T. (2005). Bone skates. Historia. 1: 42-45.
20
Munro, R. (1893). "Notes on ancient bone skates." Proceedings of the Society of Antiquaries of
Scotland 28: 185-197.
Olaus, M. (1555). Historia de gentibus septentrionalibus. Rome, Italy.
Roes, A. (1963). Bone and antler objects from the Frisian terp-mounds. Haarlem, Tjeenk Willink,
H.D., Zoom, N.V.
Rosenberg, R. (2005). "Why is ice slippery?" Physics Today 58(12): 50-55.
Rundell, K. W., S. Nioka and B. Chance (1997). "Hemoglobin/myoglobin desaturation during
speed skating." Med Sci Sports Exerc 29(2): 248-258.
Saltin, B. (1973). Oxygen transport by the circulatory system during exercise in man. Limiting
factors of physical performance. J. Keul. Stuttgart, Germany, George Thieme: 235-252.
Scott, R. F. (1913). Captain Scott's Diary. London, British Library Add. MS 51035, f.39.
Slotfeldt-Ellingsen, D. and L. Torgensen (1983). "Water in ice: influence on friction." J Phys D
16: 1715-1719.
Smith, D. J. and D. Roberts (1990). "Heart rate and blood lactate concentration during on-ice
training in speed skating." Can J Sport Sci 15(1): 23-27.
Van Horne, S. and D. J. Stefanyshyn (2005). "Potential method of optimizing the klapskate hinge
position in speed skating." Journal of Applied Biomechanics 21(3): 211-222.
van Ingen Schenau, G. J. and K. Bakker (1980). "A biomechanical model of speed skating."
Journal of Human Movement Studies 6: 1-18.
van Ingen Schenau, G. J., R. W. de Boer and G. de Groot (1989). "Biomechanics of speed
skating." in Biomechanics of Sport, C.L. Vaughan Ed., Boca Raton, FL: CRC Press.: 122-167.
Watkins, M., D. Pan, E. G. Wang, A. Michaelides, J. VandeVondele and B. Slater (2011). "Large
variation of vacancy formation energies in the surface of crystalline ice." Nature Materials 10(10):
794-798.
Wilkie, D. R. (1980). Equations describing power input by humnas as a function of duration of
exercise. Exercise bioenergetics and gas exchange. P. Cerretelli and B. J. Whipp. North Holland,
Elseviewer: 75-80.
This unformatted version of the article has been through peer-review and was published in Research in Sports
Medicine (2014), 22(3):276-293. It is archived according to the Green Open Access condition.
http://www.tandfonline.com/page/openaccess