A REVIEW OF THE NOTIONS OF QUALITY OF LIFE (QOL) AND LIVABILITY BASED ON ACKOVIAN SYSTEMS THINKING
20
2513 AMERICAN RESEARCH THOUGHTS ISSN: 2392 – 876X Impact Factor: 2.0178 (UIF) Volume 1 │ Issue 11 │ September 2015 Available online at: www.researchthoughts.us http://dx.doi.org/10.6084/m9.figshare.1528199 A REVIEW OF THE NOTIONS OF QUALITY OF LIFE (QOL) AND LIVABILITY BASED ON ACKOVIAN SYSTEMS THINKING Joseph Kim-keung Ho Independent Trainer, Hong Kong, China Abstract: The notions of quality of life (QOL) and livability have been employed in Housing Studies and other social sciences subjects. Their underlying ideas and relationship are reviewed here. The paper also undergoes an evaluation of them via R.L. Ackoff’s systems thinking (i.e., Ackovian systems thinking) as well as a Facebook-based questionnaire survey in the context of Hong Kong. The main survey findings indicate that respondents in Hong Kong generally hold a more negative view on QOL at the city and district levels than at the family and personal levels. The paper also recommends the employment of systems thinking, notably Ackovian systems thinking, to pursue QOL and livability at all levels of analysis. On the whole, it makes additional clarification on the quality of life and livability notions, which makes them more employable in research works, e.g., housing studies. Key Words: Ackovian systems thinking; Development; Facebook-based survey; Interactive Planning; Livability; Multiple regression analysis; Quality of life INTRODUCTION The topic of quality of life (QOL) and livability catch the writer’s attention in the course of dissertation project supervision for his Housing Studies students. Right now, it is also quite a social issue in Hong Kong where this writer is located, as witnessed by the reported plunge in global ranking of Hong Kong as a livable city (Ejinsight, 2015; Ting, 2015; Lee, 2015). In this paper, the writer conducts a literature review of the two closely related concepts of quality of life (QOL) and livability. In particular, the two concepts are examined using R.L. Ackoff (1981)’s systems thinking (i.e., Ackovian systems thinking). The discussion is also informed by a Facebook-based survey on QOL and
-
Upload
independent -
Category
Documents
-
view
3 -
download
0
Transcript of A REVIEW OF THE NOTIONS OF QUALITY OF LIFE (QOL) AND LIVABILITY BASED ON ACKOVIAN SYSTEMS THINKING

2513
AMERICAN RESEARCH THOUGHTS ISSN: 2392 – 876X
Impact Factor: 2.0178 (UIF)
Volume 1 │ Issue 11 │ September 2015 Available online at: www.researchthoughts.us
http://dx.doi.org/10.6084/m9.figshare.1528199
A REVIEW OF THE NOTIONS OF QUALITY OF
LIFE (QOL) AND LIVABILITY BASED ON
ACKOVIAN SYSTEMS THINKING
Joseph Kim-keung Ho
Independent Trainer, Hong Kong, China
Abstract: The notions of quality of life (QOL) and livability have been employed in Housing Studies
and other social sciences subjects. Their underlying ideas and relationship are reviewed here. The
paper also undergoes an evaluation of them via R.L. Ackoff’s systems thinking (i.e., Ackovian systems
thinking) as well as a Facebook-based questionnaire survey in the context of Hong Kong. The main
survey findings indicate that respondents in Hong Kong generally hold a more negative view on QOL
at the city and district levels than at the family and personal levels. The paper also recommends the
employment of systems thinking, notably Ackovian systems thinking, to pursue QOL and livability at
all levels of analysis. On the whole, it makes additional clarification on the quality of life and livability
notions, which makes them more employable in research works, e.g., housing studies.
Key Words: Ackovian systems thinking; Development; Facebook-based survey; Interactive
Planning; Livability; Multiple regression analysis; Quality of life
INTRODUCTION
The topic of quality of life (QOL) and livability catch the writer’s attention in the course
of dissertation project supervision for his Housing Studies students. Right now, it is also
quite a social issue in Hong Kong where this writer is located, as witnessed by the
reported plunge in global ranking of Hong Kong as a livable city (Ejinsight, 2015; Ting,
2015; Lee, 2015). In this paper, the writer conducts a literature review of the two closely
related concepts of quality of life (QOL) and livability. In particular, the two concepts
are examined using R.L. Ackoff (1981)’s systems thinking (i.e., Ackovian systems
thinking). The discussion is also informed by a Facebook-based survey on QOL and
Joseph Kim-keung Ho- A REVIEW OF THE NOTIONS OF QUALITY OF LIFE (QOL) AND LIVABILITY BASED
ON ACKOVIAN SYSTEMS THINKING
2514 AMERICAN RESEARCH THOUGHTS- Volume 1 │ Issue 11 │2015
livability perceptions. This study is intended to offer both academic and pedagogical
values to readers interested in these two concepts.
BASIC IDEAS ABOUT QUALITY OF LIFE AND LIVABILITY
The ideas of quality of life (QOL) and livability have been explained in different ways in
the literature with inspirations coming from ecology, city planning, sociology and
biology (Veehoven, 2005). What is done here is to offer a terse account of the two ideas
and their inter-relationship, which can subsequently be analyzed with the systems
thinking lens of R.L. Ackoff. Simply put, quality is life (QOL) is “the general well-being
of individuals and societies” (Wikipedia, 2015a), wherein well-being is understood as
“the condition of an individual or group, for example their social, economic,
psychological, spiritual or medical state” (Wikipedia, 2015b). It is also tersely defined as
“the degree to which a person enjoys the important possibilities of his/her life” (The
global development research center. 2015), which underlines the subjectivity attribute of
the QOL notion. QOL differs from standards of living which is a much narrower
measure of “the quantity and quality of goods and services available to people” (The
global development research center, 2015). As to livability, it is taken as “the sum of the
factors that add up to a community’s quality of life – including the built and natural
environments, economic prosperity, social stability and equity, educational
opportunity, and cultural, entertainment and recreation possibilities” (Partners’ for
Livable Communities, 2015). These definitions highlight two things: (i) livability
examines a set of factors and the summation of their contribution to the QOL of a
society or community and (ii) QOL encompasses livability with the additional coverage
of the analysis level in smaller social units, i.e., the family and personal levels. In this
regard, both notions have a spatial scope attribute (e.g., city and district) and a social
unit attribute (e.g., the community of a city or district, a family and an individual). On
the QOL/ livability factors per se, the writer adopts the ones from Veehoven (2010) in
developing his line reasoning, namely:
a. Livability of the environment, i.e., whether the living condition is good or not.
b. Life-ability of the person, i.e., how well-equipped we are to cope with life problems.
c. Utility of life, i.e., how good life is for things of higher value, e.g., ecological
preservation and cultural development.
d. Satisfaction of life, i.e., the subjective well-being and happiness for an individual.

Joseph Kim-keung Ho- A REVIEW OF THE NOTIONS OF QUALITY OF LIFE (QOL) AND LIVABILITY BASED
ON ACKOVIAN SYSTEMS THINKING
2515 AMERICAN RESEARCH THOUGHTS- Volume 1 │ Issue 11 │2015
These factors comprise the external and internal states of well-being experience (i.e.,
factors (a), (c) and (d).) as well as QOL enabling elements (i.e., factors (b) and (c).) In
practice, QOL and livability indexes, e.g., numbeo.com (2015) and the Hong Kong
Quality of Life Index (Hong Kong Institute of Asia-Pacific Studies, 2015), focus mainly
on their outcome domains, e.g., cost of living and purchasing power, affordability of
housing, pollution, crime rats, health system quality and traffic (commute times)
(numbeo.com, 2015), thus crude in pointing out exactly what are the fundamental
causes or effective points of leverage to improve them in a specific communityi. For
example, when it is reported by the ECA International that Hong Kong has dropped in
ranking in the world’s most livable cities partly due to deteriorating political
environment with the Umbrella Movement, Chan kin-man, Occupy Central co-founder
said that “ECA only saw the surface of the problems in Hong Kong<. The development
of the city’s political system lags behind its social development, and that is the hidden
problem that led to unrest during the Umbrella Movement” (Ejinsight, 2015). The causal
factor pointed out by Chan kin-man is not identified in the QOL report of ECA
International and, naturally, Chan’s view is not accepted by his political opponents.
More often than not, discussion of the fundamental causes on QOL/ livability is
controversial. Readers are referred to Ho (2015) for additional basic information on the
notions of QOL and livability. With the main terms involved in quality of life and
livability defined, it is now feasible to synthesize the underlying ideas into the form of a
Table, see Table 1.
i Some basic cause-effect relationships among the component measures of QOL are suggested in the
systems model of QOL proposed by the University of Oklahoma School of Social Work (The global
development research center, 2015).

Joseph Kim-keung Ho- A REVIEW OF THE NOTIONS OF QUALITY OF LIFE (QOL) AND LIVABILITY BASED
ON ACKOVIAN SYSTEMS THINKING
2516 AMERICAN RESEARCH THOUGHTS- Volume 1 │ Issue 11 │2015
Table 1: quality of life and livabilityii with different levels of analysis
Quality of life
(QOL) factors
City level
(level 3)
District level
(level 2)
Family level
(level 1)
Personal level
(level 0)
QOL factor 1:
Livability of the
environment
More aggregate
measurement <---- ---->
Less aggregate
measurement
QOL factor 2:
Life-ability of the
person
More aggregate
measurement <---- ---->
Less aggregate
measurement
QOL factor 3:
Utility of life
More aggregate
measurement <---- ---->
Less aggregate
measurement
QOL factor 4:
Satisfaction with
life
More aggregate
measurement <---- ---->
Less aggregate
measurement
Table 1 consists of two dimensions, as represented by the columns and rows of the
table. Table column covers the level of analysis, namely, the city level (level 3), the
district level (level 2), the family level (level 1) and the personal level (level 0) while
table row acknowledges the four QOL factors of Veehoven (2010). Moreover, Table 1
also recognizes the main difference between the notions of QOL and livability. That is,
QOL can be employed at all levels of analysis (0 to 3) while livability is only applied at
the aggregate analysis levels of 2 and 3. It is unclear whether this view of the writer on
their difference is widely shared in the academic community. By sticking to one version
of explanation on all the key ideas underlying QOL and livability and with the
consolidated framework in the form of Table 1, the writer portrays a neat and easily
comprehensible view of these two concepts to readers. Apparently, Table 1 is not the
only way to synthesize the underlying ideas of QOL and livability. For instances, the
table does not explicitly consider all the ingredient output domain measures of QOL
and livability; it does not cover other subcategories of QOL, e.g., physical health,
ii The notion of livability covers all the cells for levels 2 (district level) and 3 (city level) in Table 1.

Joseph Kim-keung Ho- A REVIEW OF THE NOTIONS OF QUALITY OF LIFE (QOL) AND LIVABILITY BASED
ON ACKOVIAN SYSTEMS THINKING
2517 AMERICAN RESEARCH THOUGHTS- Volume 1 │ Issue 11 │2015
psychological well-being, functional status, life satisfaction, social functioning and
social relations of Addae-Dapaah (2008) and the being, belonging and becoming domains
of the global development research center (2015). Lastly, it does not identify more
refined and idiosyncratic causal factors of QOL and livability.
AN ASSESSMENT OF QOL AND LIVABILITY VIA THE ACKOVIAN SYSTEMS
THINKING LENS
To start with, QOL and livability are the outcome property from the interactions of a
number of factors. In systems thinking parlance, they are the emergent properties of a
system comprising a set of related QOL/livability factors. On the notion of system, Ackoff
(1980) explains that it “is a set of two or more elements of any kind” with three
properties:
Property 1: “The properties or behavior of each element in the set has an effect on the
properties or behavior of the set as a whole”.
Property 2: “The properties and behavior of each part and the way they affect the whole
depends on the properties and behavior of at least one other element in the set”.
Property 3: “Every possible subgroup of elements in the set has the first two properties;
that is, each has an effect, and none has an independent effect, on the whole”.
Recognizing the systemic nature of QOL and livability, the writer primarily draws on
the systems thinking works of Ackoff (1980; 1981) in the discussion of them. So, for
Ackoff (1981), who refers to the ancient Greek philosophers, there are four pursuits that
together lead to development of men. They are: truth, plenty, good and beauty. These
outcomes of the four pursuits of development are similarly measured by a typical set of
QOL indicators, e.g., material living conditions, productive or main activity, health,
education, leisure and social interactions, economic and physical safety, governance
and basic rights, natural and living environment, and overall experience of life
(eurostat, 2015). More fundamentally, development comprises a desire and an ability
(Ackoff, 1981), therefore not able to be given to a person by another person. Based on
this view on development, (i) “a developed men with limited resources can often
improve his quality of life and that of others more than a less developed man with
unlimited resources” (Ackoff, 1981: 36), and (ii) the QOL that can be realized “is the
joint product of their development and the resources available to them (Ackoff, 1981:

Joseph Kim-keung Ho- A REVIEW OF THE NOTIONS OF QUALITY OF LIFE (QOL) AND LIVABILITY BASED
ON ACKOVIAN SYSTEMS THINKING
2518 AMERICAN RESEARCH THOUGHTS- Volume 1 │ Issue 11 │2015
36). As such, to be compatible with a development initiative, planningiii for a desirable
future for a community at the society and district level so as to improve QOL and
livability requires the endorsement of three operating principles (Ackoff, 1980; 1981):
(i) The participative principle: that “the principal benefit of planning comes from engaging
in it” (Ackoff, 1980).
(ii) The principle of continuity: that planning “should be continuous” (Ackoff, 1980).
(iii) The holistic principle: that “every part of a system and every level of it should be
planned for simultaneously and interdependently” (Ackoff, 1980).
Another reason for embracing these three operating principles when dealing
with QOL and livability is that a community is a social systemiv. Such a system is
obsessed with three types of responsibility at the same time (Ackoff, 1981): (i) “to the
purposes of the system they manage (control)”, (ii) to the purposes of the people who
are part of the managed system (humanization), and (iii) to the purposes of the
containing system and other systems that it contains (environmentalization)”. There is a
corresponding responsibility on QOL with these three types of social system
responsibility on its purposes at the society, district, family and personal levels.
Specifically, when applied to the QOL and livability concern, these three operating
principles of Ackoff point to requirement on the continuous pursuit (the continuity
principle) of QOL and livability by all the stakeholders involved (the participative
principle) at the society, district, family and personal levels (re: Table1) (the holistic
principle). In this case, the QOL and livability indexes are not recommended to be used
by planners to produce some kind of optimization models to be employed in city and
district planning for its stakeholders. More explicitly, based on Ackovian systems
thinking, planners cannot simply plan for others with the QOL/ livability indexes.
Instead, QOL and livability indexes should be utilized by the stakeholders involved to
plan for themselves so as to cope with the emergent and systemic nature of QOL and
livability effectively. The holistic principle of Ackoff also points to the need to consider
QOL and livability indexes at different levels of analysis (re: Table 1) simultaneously by
the stakeholders involved in their planning for themselves. At this point, one can
contrast the Ackovian way (i.e., interactive planning approach) to manage QOL and
iii Such a planning approach, which is a soft systems methodology, is called interactive planning (Ackoff
(1981).
iv A social system possesses purposeful parts and is also purposeful as a whole (Ackoff and Gharajedaghi,
1996).
Joseph Kim-keung Ho- A REVIEW OF THE NOTIONS OF QUALITY OF LIFE (QOL) AND LIVABILITY BASED
ON ACKOVIAN SYSTEMS THINKING
2519 AMERICAN RESEARCH THOUGHTS- Volume 1 │ Issue 11 │2015
livability with that of the “predict and prepare” approach of preactivismv (Ackoff,
1981), as exemplified by Wyatt (2009) who states that: “<city planners trying to boost
urban livability can only adopt approximate and heuristic strategies which they think
might increase livability and which will probably do no harm<”. From the Ackovian
systems thinking perspective, such QOL/ livability planning approach based on
preactivism simply does not work.
The Ackovian systems thinking lens offers insights on clarifying and employing
the QOL and livability notions and indexes. It is quite prepared to consider both the
objective and subjective topics in QOL/ livability studies in its interactive planning
approach. Nevertheless, Ackoff’s systems thinking itself has been subject to criticisms in
the systems community. On that, interested readers are referred to Jackson (2003:
chapter 9) for details. Lastly, the exercise of drawing a boundary on exactly what factors
should be included in various analysis levels of QOL requires an approach more critical
than that of Ackovian systems thinking. An example is Critical Systems Heuristics of
Ulrich (1983). The next section provides some empirical survey findings on people’s
perception on QOL in the context of Hong Kong.
FACEBOOK-BASED SURVEY FINDINGS ON THE PERCEPTIONS OF QOL IN
HONG KONG
A Facebook-based questionnaire survey was conducted from August 15 to 17 on the
writer’s Facebook by the writer. The online questionnaire was created using the free-of-
charge survey tool provided by kwiksurveys.com. Readers interested in Facebook-
based survey are referred to Ho (2014) for a more detailed discussion. The question was
posted on the writer’s Facebook wall as well as a number of his Facebook groups on
some social sciences subjects. Invitations were also sent via the Facebook message to the
writer’s Facebook friends. These Facebook friends are mainly the existing and former
students of the writer. At the time of the survey, there were 500 friends on his Facebook.
Most of them are located in Hong Kong. Subsequently, 117 respondents participated in
the survey; see Appendix 1 for the survey questions and basic survey statistics. The
survey questions cover the respondents’ profile as well as their perceptions toward
v According to Ackoff (1981: 58-59), preactivists believe in management by objectives and seek for
optimum solutions based on “quantitative science-based techniques”; planning, for them, is about
“predicting the future and preparing for it”.

Joseph Kim-keung Ho- A REVIEW OF THE NOTIONS OF QUALITY OF LIFE (QOL) AND LIVABILITY BASED
ON ACKOVIAN SYSTEMS THINKING
2520 AMERICAN RESEARCH THOUGHTS- Volume 1 │ Issue 11 │2015
certain QOL concerns in Hong Kong. The survey questions deliberately avoid using the
more technical term livability. Instead, they utilize the term quality of life (QOL), which
is more comprehensible to ordinary people. One set of questions focuses on QOL issues
at the society level; others deal with QOL issues at the district, family and personal
levels. Thus, the survey questions are informed by the ideas underlying Table 1. The
following are the five survey findings:
Finding 1 (re: survey questions 6, 7, 8 and 9): On perceived quality of life deterioration
over the last 2 years at different levels of analysis, the following statistics are provided
in Table 2:
Table 2: perception of quality of life deterioration over the last 2 years at different levels of
analysis
Society level District level Family level Personal level
Strongly agree 40.17% 26.5% 14.66% 19.66%
Mildly agree 44.44% 45.3% 35.34% 35.9%
Do not agree 13.68% 26.5% 45.69% 41.88%
No idea or
comment 1.71% 1.71% 4.31% 2.56%
With reference to Table 2, the majority of the respondents feel that the quality of life has
deteriorated over the last 2 years at all analysis levels. Such QOL perceptions are
stronger at the macro-environmental levels, i.e., the society and the district levels, than
at the family and personal levels.
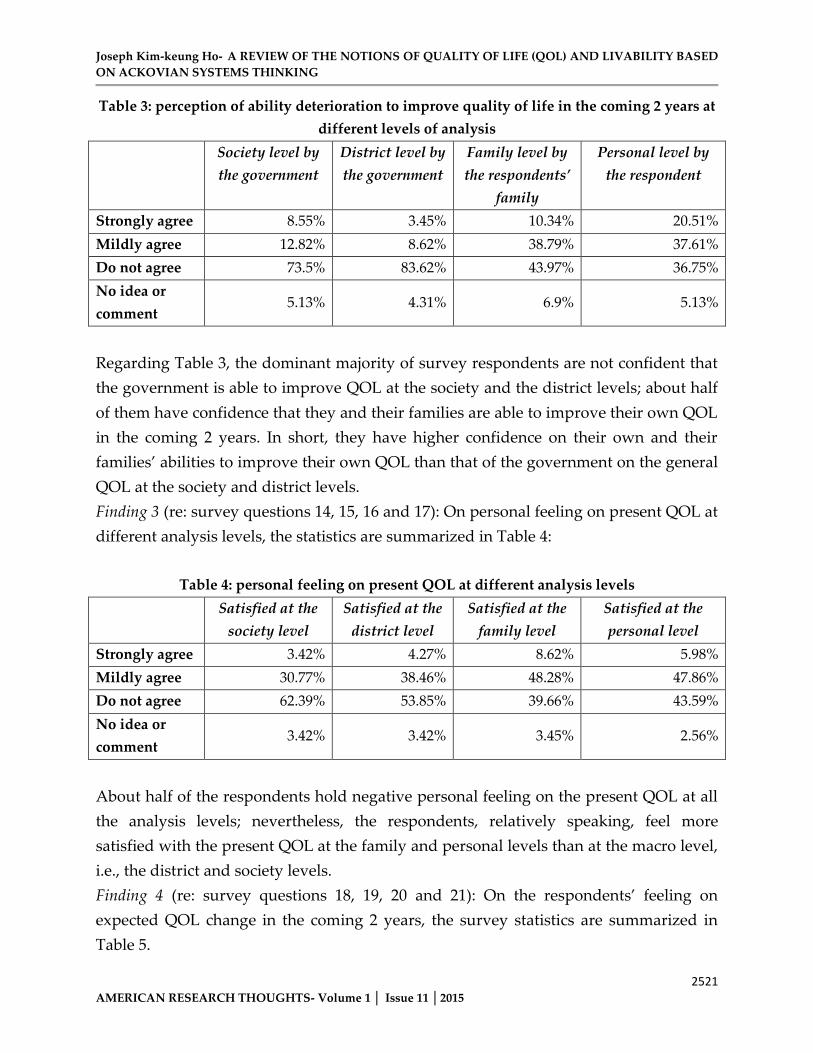
Finding 2 (re: survey questions 10, 11, 12 and 13): On perceived ability deterioration to
improve quality of life in the coming 2 years at different levels of analysis, the following
statistics are provided in Table 3:
Joseph Kim-keung Ho- A REVIEW OF THE NOTIONS OF QUALITY OF LIFE (QOL) AND LIVABILITY BASED
ON ACKOVIAN SYSTEMS THINKING
2521 AMERICAN RESEARCH THOUGHTS- Volume 1 │ Issue 11 │2015
Table 3: perception of ability deterioration to improve quality of life in the coming 2 years at
different levels of analysis
Society level by
the government
District level by
the government
Family level by
the respondents’
family
Personal level by
the respondent
Strongly agree 8.55% 3.45% 10.34% 20.51%
Mildly agree 12.82% 8.62% 38.79% 37.61%
Do not agree 73.5% 83.62% 43.97% 36.75%
No idea or
comment 5.13% 4.31% 6.9% 5.13%
Regarding Table 3, the dominant majority of survey respondents are not confident that
the government is able to improve QOL at the society and the district levels; about half
of them have confidence that they and their families are able to improve their own QOL
in the coming 2 years. In short, they have higher confidence on their own and their
families’ abilities to improve their own QOL than that of the government on the general
QOL at the society and district levels.
Finding 3 (re: survey questions 14, 15, 16 and 17): On personal feeling on present QOL at
different analysis levels, the statistics are summarized in Table 4:
Table 4: personal feeling on present QOL at different analysis levels
Satisfied at the
society level
Satisfied at the
district level
Satisfied at the
family level
Satisfied at the
personal level
Strongly agree 3.42% 4.27% 8.62% 5.98%
Mildly agree 30.77% 38.46% 48.28% 47.86%
Do not agree 62.39% 53.85% 39.66% 43.59%
No idea or
comment 3.42% 3.42% 3.45% 2.56%
About half of the respondents hold negative personal feeling on the present QOL at all
the analysis levels; nevertheless, the respondents, relatively speaking, feel more
satisfied with the present QOL at the family and personal levels than at the macro level,
i.e., the district and society levels.
Finding 4 (re: survey questions 18, 19, 20 and 21): On the respondents’ feeling on
expected QOL change in the coming 2 years, the survey statistics are summarized in
Table 5.

Joseph Kim-keung Ho- A REVIEW OF THE NOTIONS OF QUALITY OF LIFE (QOL) AND LIVABILITY BASED
ON ACKOVIAN SYSTEMS THINKING
2522 AMERICAN RESEARCH THOUGHTS- Volume 1 │ Issue 11 │2015
Table 5: expected QOL change in the coming 2 years at different analysis levels
Will get worse at
the society level
Will get worse
at the district
level
Will get worse at
the family level
Will get worse at
the personal level
Strongly agree 25.22% 17.24% 10.26% 10.26%
Mildly agree 47.83% 49.14% 38.46% 35.04%
Do not agree 14.78% 18.97% 37.61% 37.61%
No idea or
comment 12.17% 14.66% 13.68% 17.09%
With reference to Table 5, the majority of the respondents hold a rather pessimistic view
on QOL change at the society and district levels in the coming 2 years. In comparison,
the sentiment of them is slightly less negative at the family and personal levels. There is
also a significant minority of respondents who have no idea or comment on this topic,
reflecting some uncertainty and bewilderment on this topic.
Finding 5 (re: survey questions 1, 2, 3, 4, 14, 15, 16 and 17): By means of the statistical
technique of multiple regression analysis (Lind et al., 2001) with the MS Excel tool, the
following multiple regression formula is formulated:
Interest in learning the subject of QOL (variable y) = a + b1 x (x1: gender) + b2 x (x2: age
group) + b3 x (x3: education background) + b4 x (x4: self-perceived social class) + b5 x
(x5: satisfaction with present QOL at the society level) + b6 x (x6: satisfaction with the
present QOL at the district level) + b7 x (x7: satisfaction with the present QOL at the
family level) + b8 x (x8: satisfaction with the present QOL at the personal level)
Additional information on the variables in the multiple regression formula is as follows:
Interest in learning the subject of QOL (variable y) is the dependent variable based on
survey question 22.
Gender (x1) is an independent variable based on survey question 1.
Age group (x2) is an independent variable based on survey question 2.
Education background (x3) is an independent variable based on survey question 3.
Self-perceived social class (x4) is an independent variable based on survey question 4.

Joseph Kim-keung Ho- A REVIEW OF THE NOTIONS OF QUALITY OF LIFE (QOL) AND LIVABILITY BASED
ON ACKOVIAN SYSTEMS THINKING
2523 AMERICAN RESEARCH THOUGHTS- Volume 1 │ Issue 11 │2015
Satisfaction with present QOL at the society level (x5) is an independent variable based on
survey question 14.
Satisfaction with the present QOL at the district level (x6) is an independent variable based
on survey question 15.
Satisfaction with the present QOL at the family level (x7) is an independent variable based
on survey question 16.
Satisfaction with the present QOL at the personal level (x8) is an independent variable based
on survey question 17.
To enable Excel to produce the variable values for multiple regression analysis, the
following coding scheme is used:
For perception items:
Yes, very much so: 3
Yes, I have this feeling mildly: 2
No, I do not feel this way: 1
For gender:
Female: 1
Male: 2
For age group:
18 to 27: 22.5
28 to 37: 32.5
38 to 47: 42.5
48 to 57: 52.5
58 to 67: 62.5
68 or above: 72.5

Joseph Kim-keung Ho- A REVIEW OF THE NOTIONS OF QUALITY OF LIFE (QOL) AND LIVABILITY BASED
ON ACKOVIAN SYSTEMS THINKING
2524 AMERICAN RESEARCH THOUGHTS- Volume 1 │ Issue 11 │2015
For education background:
Finished Ph.D. Degree study: 4
Finished Master Degree study: 3
Finished Undergraduate Degree study: 2
Not yet a degree-holder: 1
For self-perceived social class:
Upper class: 3
Middle class: 2
Lower class: 1
Based on the Excel report on the multiple regression analysis, the following resultant
formula is obtained (re: Appendix 2):
Interest in learning the subject of QOL (variable y) = 1.9228 – 0.17338 x (x1: gender) +
0.0118 x (x2: age group) – 0.2326 x (x3: education background) + 0.2544 x (x4: self-
perceived social class) – 0.2421 x (x5: satisfaction with present QOL at the society
level) + 2.9448 x (x6: satisfaction with the present QOL at the district level) + 0.7410 x
(x7: satisfaction with the present QOL at the family level) – 0.7650 x (x8: satisfaction
with the present QOL at the personal level)
Interpretation: The b1 value of -0.17338 for x1 indicates that female respondents have
slightly higher interest in learning the subject of QOL than male respondents.
Respondents with higher level of education background, with b2 value at 0.0118, also
have slightly higher interest in learning QOL. Respondents with higher education level
have slightly lower interest in QOL learning (re: b3 value is -0.2326). Referring to b4
(0.2544), respondents with higher self-perceived social class have slightly higher interest
in learning QOL. Regarding b5 (-0.2421), respondents who are less satisfied with the
present QOL at the society level have slightly higher interest in learning QOL.
Respondents who are more satisfied with the present QOL at the district level (with b6
value at 2.9448) have higher interest in learning QOL. Those who are more satisfied
with QOL at the family level have slightly more interest to learn QOL (re: b7 value is
0.7410). Finally, those who have less satisfaction with QOL at the personal level have
Joseph Kim-keung Ho- A REVIEW OF THE NOTIONS OF QUALITY OF LIFE (QOL) AND LIVABILITY BASED
ON ACKOVIAN SYSTEMS THINKING
2525 AMERICAN RESEARCH THOUGHTS- Volume 1 │ Issue 11 │2015
somewhat more interest in learning QOL (re: b8 value is -0.7650). It is important to note
that only the last two independent variables of QOL at the family level (variable x7) and
personal level (variable x8) have p-value below 2.5% (or 5% critical value for a two-
tailed test), which implies that the null-hypotheses of their b values (i.e., b7 and b8)
being zero can be rejected. As to independent variables x1 to x6, their corresponding p-
values are all beyond the 2.5% critical value. Thus, the null hypothesis for their b-values
being zero cannot be rejected.
Overall, the survey findings reveal that respondents have more confidence in
their own ability to improve their family and personal QOL than in what the
government is able to do for them on QOL. It is also clear that correlations among
variables per se, as shown in the multiple regression formula here, do not establish
cause-effect relationship among them. Such empirical findings lend support to the
appropriateness of the 3 operating principles of Ackoff’s interactive planning as
guidance for QOL and livability planning and management.
CONCLUDING REMARKS
By focusing on the basic underling ideas of QOL and livability, this paper comes up
with a consolidated framework expressed in the form of Table 1. Also, via the Ackovian
systems thinking lens, the notions of QOL and livability have been further clarified
(point 1); the value of using the Interactive Planning of Ackoff and its operating
principles in managing QOL and livability is underlined (point 2); and, the importance
of human development for the pursuit of QOL and livability is emphasized (point 3)vi.
The findings from the Facebook-based survey on QOL and livability in the Hong Kong
context can be fruitfully interpreted with the main line of reasoning anchored on
Ackovian systems thinking. All in all, the paper illustrates the intellectual value of the
Ackovian systems thinking view on QOL and livability to academicians and educators
interested in QOL/ livability study. Additional clarification on the two notions, done in
this paper, also makes them more comprehensible to employ in research works, e.g., in
housing studies.
vi A related theoretical question on the value of creative holism pursuit (Jackson, 2003) as a pathway for
QOL/livability improvement is not examined in this paper. [Creative holism is a notion in critical systems
thinking while development is a concept in Ackoff’s version of soft systems thinking (Jackson, 2003).]

Joseph Kim-keung Ho- A REVIEW OF THE NOTIONS OF QUALITY OF LIFE (QOL) AND LIVABILITY BASED
ON ACKOVIAN SYSTEMS THINKING
2526 AMERICAN RESEARCH THOUGHTS- Volume 1 │ Issue 11 │2015
BIBLIOGRAPHY
1. Ackoff, R.L. 1980. “2. The systems revolution” in Lockett, M. and R. Spear
(editors) Organizations as Systems. The Open University Press, Milton Keynes: 26-
33.
2. Ackoff, R.L. 1981. Creating the corporate future. Wiley. Chichester.
3. Ackoff, R.L. and J. Gharajedaghi. 1996. “Reflection on Systems and their Models”
Systems Research 13(1). Wiley: 13-23.
4. Addae-Dapaah, K. 2008. “Age Segregation and the Quality of Life of the Elderly
People in Studio Apartments” Journal of Housing For the Elderly 22 (1-2).
Routledge: 127-161.
5. Ejinsight. 2015. “HK plummets in global ranking of livable cities” ejinsight
January 23. (url address: http://www.ejinsight.com/20150123-hk-plummets-in-
global-ranking-of-livable-cities/) [visited at August 14, 2015].
6. Eurostat. 2015. “Quality of life indicators – measuring quality of life” Statistics
Explained June 1. Eurostat. (url address: http://ec.europa.eu/eurostat/statistics-
explained/index.php/Quality_of_life_indicators_-_measuring_quality_of_life)
[visited at August 16, 2015].
7. Ho J.K.K. 2014. “A Research Note on Facebook-based questionnaire survey for
academic research in business studies” European Academic Research 2(7) October:
9243-9257.
8. Ho, J.K.K. 2015. “Livability and quality of life study” Facebook Album of J.K.K.
Ho (url address:
https://www.facebook.com/josephho33/media_set?set=a.10153444326092090.1073
742048.713727089&type=3) [visited at August 26, 2015].
9. Hong Kong Institute of Asia-Pacific Studies. 2015. “Hong Kong Quality of Life
Index” Hong Kong Institute of Asia-Pacific Studies, The Chinese University of
Hong Kong (url address: http://www.cuhk.edu.hk/ssc/qol/eng/hkqol.html)
[visited at August 26, 2015].
10. Jackson, M.C. 2003. Systems Thinking: Creative Holism for Managers. Wiley.
Chichester.
11. KwikSurveys.com. An online survey builder (url address:
https://kwiksurveys.com/).
12. Lee, E. 2015. “Occupy protests hits Hong Kong’s liveability, says Economist
Intelligence Unit” South China Morning Post August 18 (url address:

Joseph Kim-keung Ho- A REVIEW OF THE NOTIONS OF QUALITY OF LIFE (QOL) AND LIVABILITY BASED
ON ACKOVIAN SYSTEMS THINKING
2527 AMERICAN RESEARCH THOUGHTS- Volume 1 │ Issue 11 │2015
http://www.scmp.com/news/hong-kong/politics/article/1850420/occupy-protests-
hit-hong-kongs-liveability-says-economist) [visited at August 18, 2015].
13. Lind, D.A., W.G. Marchal and R.D. Mason. 2001. Statistical Techniques in Business
& Economics. McGraw-Hill Irwin. Boston.
14. Numbeo.com. 2015. “Quality of life index for country 2015 mid year”
Numbeo.com (url address: http://www.numbeo.com/quality-of-
life/rankings_by_country.jsp) [visited at August 20, 2015].
15. Partners for Livable Communities. 2015. What is Livability. Partners for Livable
Communities. 1429 21st Street, NW, Washington, DC 20036 (url address:
http://livable.org/about-us/what-is-livability) [visited at August 16, 2015].
16. Schmitt, R.B. and H.H. Noll. 2000. “Towards a European System of Social
Reporting and Welfare Measurement: Conceptual Framework and Structure of a
European System of Social Indicators” EU Reporting Working Paper 9, Centre for
Survey Research and Methodology (ZUMA).
17. The global development research center. 2015. “Notes on “Quality of Life”.” The
global development research center (url address: http://www.gdrc.org/uem/qol-
define.html) [visited at August 26, 2015].
18. Ting, S. 2015. “H.K. Declines in Livable City Survey for Asian Expats” Bloomberg
January 23 (url address: http://www.bloomberg.com/news/articles/2015-01-
23/hong-kong-falls-out-of-top-30-most-livable-cities-survey-shows) [visited at
August 14, 2015].
19. Ulrich, W. 1983. Critical Heuristics of Social Planning: A New Approach to Practical
Philosophy. Wiley.
20. Veehoven, R. 2005. “Is life getting better?” How long and happy people live in
modern society” European Psychology 10: 330-343.
21. Veenhoven, R. 2010. “Capability and Happiness: Conceptual difference and
reality links” Journal of Socio-Economics 30: 344-350.
22. Wikipedia. 2015a. Quality of life. Wikipedia.com (url address:
https://en.wikipedia.org/wiki/Quality_of_life) [visited August 16, 2015].
23. Wikipedia. 2015b. Well-being. Wikipedia.com (url address:
https://en.wikipedia.org/wiki/Well-being). [visited August 16, 2015].
24. Wyatt, R. 2009. “Heuristic Approaches to Urban Livability” Malaysian Journal of
Environmental Management 10(1): 43-65.

Joseph Kim-keung Ho- A REVIEW OF THE NOTIONS OF QUALITY OF LIFE (QOL) AND LIVABILITY BASED
ON ACKOVIAN SYSTEMS THINKING
2528 AMERICAN RESEARCH THOUGHTS- Volume 1 │ Issue 11 │2015
APPENDIX
Appendix 1: the Facebook-based survey questions (22 questions) and responses statistics
(from August 15 to 17, 2015).
Survey questions Survey statistics
Question 1: What is your gender? Male: 49 (41.88%)
Female: 68 (58.12%)
Standard deviation: 9.5
Responses: 117
Question 2: What is your age? 18 to 27: 11 (9.4%)
28 to 37: 53 (45.3%)
38 to 47: 42 (35.9%)
48 to 57: 10 (8.55%)
58 to 67: 1 (0.85%)
68 or above: 0 (0%)
Standard deviation: 20.47
Responses: 117
Question 3: What is your education
background?
Not yet a degree-holder: 18 (15.38%)
Finished University Undergraduate Degree study: 78
(66.67%)
Finished Master Degree study: 21 (17.95%)
Finished Ph.D. Degree study (or equivalent): 0 (0%)
Standard deviation: 29.27
Responses: 117
Question 4: What is your perceived
own social class?
Upper class: 3 (2.56%)
Middle class: 65 (55.56%)
Lower class: 38 (32.48%)
Not applicable/ no idea: 11 (9.4%)
Standard deviation: 24.38
Responses: 117
Question 5: What is your marital
status?
Single: 58 (49.57%)
Married: 53 (45.3%)
Complicated/ no comment: 6 (5.13%)
Standard deviation: 23.42
Responses: 117
Question 6: Do you feel that the
quality of life for the society as a
Yes, very much so: 47 (40.17%)
Yes, I have this feeling mildly: 52 (44.44%)

Joseph Kim-keung Ho- A REVIEW OF THE NOTIONS OF QUALITY OF LIFE (QOL) AND LIVABILITY BASED
ON ACKOVIAN SYSTEMS THINKING
2529 AMERICAN RESEARCH THOUGHTS- Volume 1 │ Issue 11 │2015
whole has got worse over the last 2
years?
No, I do not feel this way: 16 (13.68%)
No idea/ no comment: 2 (1.71%)
Standard deviation: 20.92
Responses: 117
Question 7: Do you feel that the
quality of life at the district level of
your residence has got worse over the
last 2 years?
Yes, very much so: 31 (26.5%)
Yes, I have this feeling mildly: 53 (45.3%)
No, I do not feel this way: 31 (26.5%)
No idea/ no comment: 2 (1.71%)
Standard deviation: 18.12
Responses: 117
Question 8: Do you feel that the
quality of life at your family level has
got worse over the last 2 years?
Yes, very much so: 17 (14.66%)
Yes, I have this feeling mildly: 41 (35.34%)
No, I do not feel this way: 53 (45.69%)
No idea/ no comment: 5 (4.31%)
Standard deviation: 18.97
Responses: 116
Question 9: Do you feel that the
quality of life at your personal level
has got worse over the last 2 years?
Yes, very much so: 23 (19.66%)
Yes, I have this feeling mildly: 42 (35.9%)
No, I do not feel this way: 49 (41.88%)
No idea/ no comment: 3 (2.56%)
Standard deviation: 17.89
Responses: 117
Question 10: Do you feel that the
present Hong Kong government is
able to improve the quality of life at
the society level in the coming 2
years?
Yes, very much so: 10 (8.55%)
Yes, I have this feeling mildly: 15 (12.82%)
No, I do not feel this way: 86 (73.5%)
No idea/ no comment: 6 (5.13%)
Standard deviation: 32.92
Responses: 117
Question 11: Do you feel that the
present Hong Kong government is
able to improve the quality of life at
the district level of your residence in
the coming 2 years?
Yes, very much so: 4 (3.45%)
Yes, I have this feeling mildly: 10 (8.62%)
No, I do not feel this way: 97 (83.62%)
No idea/ no comment: 5 (4.31%)
Standard deviation: 39.33
Responses: 116
Question 12: Do you feel that your
family is able to improve the quality
of life at your family level in the
Yes, very much so: 12 (10.34%)
Yes, I have this feeling mildly: 45 (38.79%)
No, I do not feel this way: 51 (43.97%)
Joseph Kim-keung Ho- A REVIEW OF THE NOTIONS OF QUALITY OF LIFE (QOL) AND LIVABILITY BASED
ON ACKOVIAN SYSTEMS THINKING
2530 AMERICAN RESEARCH THOUGHTS- Volume 1 │ Issue 11 │2015
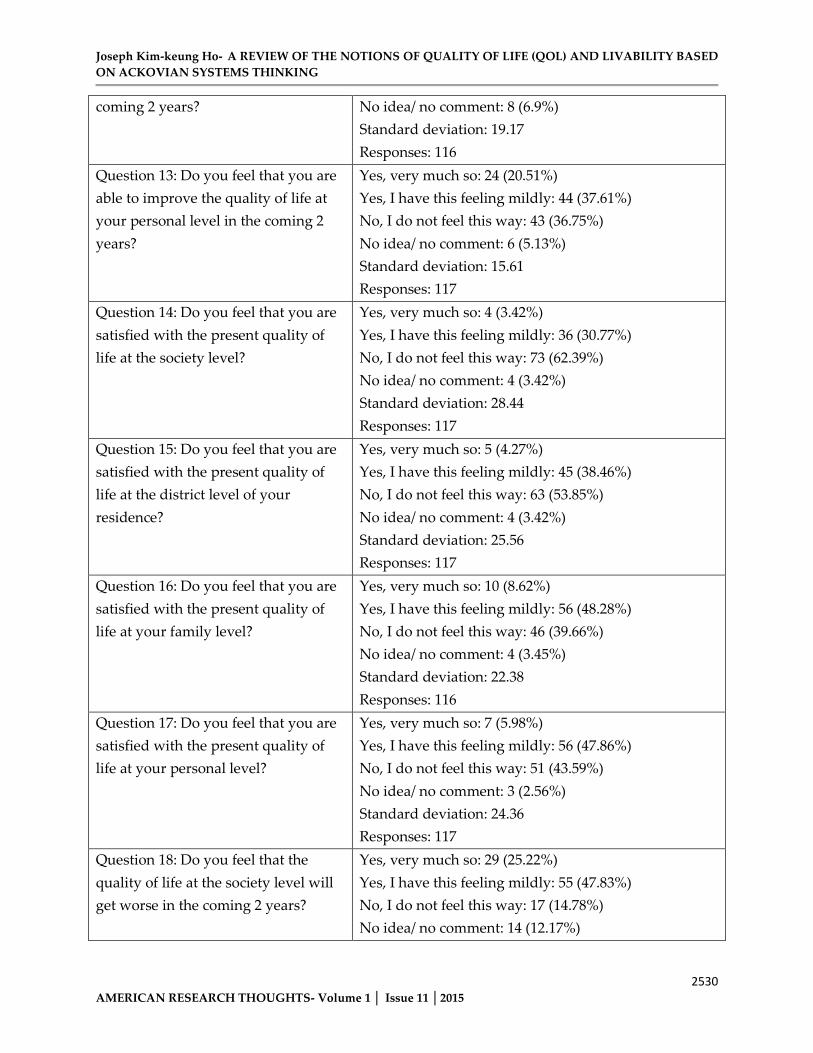
coming 2 years? No idea/ no comment: 8 (6.9%)
Standard deviation: 19.17
Responses: 116
Question 13: Do you feel that you are
able to improve the quality of life at
your personal level in the coming 2
years?
Yes, very much so: 24 (20.51%)
Yes, I have this feeling mildly: 44 (37.61%)
No, I do not feel this way: 43 (36.75%)
No idea/ no comment: 6 (5.13%)
Standard deviation: 15.61
Responses: 117
Question 14: Do you feel that you are
satisfied with the present quality of
life at the society level?
Yes, very much so: 4 (3.42%)
Yes, I have this feeling mildly: 36 (30.77%)
No, I do not feel this way: 73 (62.39%)
No idea/ no comment: 4 (3.42%)
Standard deviation: 28.44
Responses: 117
Question 15: Do you feel that you are
satisfied with the present quality of
life at the district level of your
residence?
Yes, very much so: 5 (4.27%)
Yes, I have this feeling mildly: 45 (38.46%)
No, I do not feel this way: 63 (53.85%)
No idea/ no comment: 4 (3.42%)
Standard deviation: 25.56
Responses: 117
Question 16: Do you feel that you are
satisfied with the present quality of
life at your family level?
Yes, very much so: 10 (8.62%)
Yes, I have this feeling mildly: 56 (48.28%)
No, I do not feel this way: 46 (39.66%)
No idea/ no comment: 4 (3.45%)
Standard deviation: 22.38
Responses: 116
Question 17: Do you feel that you are
satisfied with the present quality of
life at your personal level?
Yes, very much so: 7 (5.98%)
Yes, I have this feeling mildly: 56 (47.86%)
No, I do not feel this way: 51 (43.59%)
No idea/ no comment: 3 (2.56%)
Standard deviation: 24.36
Responses: 117
Question 18: Do you feel that the
quality of life at the society level will
get worse in the coming 2 years?
Yes, very much so: 29 (25.22%)
Yes, I have this feeling mildly: 55 (47.83%)
No, I do not feel this way: 17 (14.78%)
No idea/ no comment: 14 (12.17%)

Joseph Kim-keung Ho- A REVIEW OF THE NOTIONS OF QUALITY OF LIFE (QOL) AND LIVABILITY BASED
ON ACKOVIAN SYSTEMS THINKING
2531 AMERICAN RESEARCH THOUGHTS- Volume 1 │ Issue 11 │2015
Standard deviation: 16.16
Responses: 115
Question 19: Do you feel that the
quality of life at your district level will
get worse in the coming 2 years?
Yes, very much so: 20 (17.24%)
Yes, I have this feeling mildly: 57 (49.14%)
No, I do not feel this way: 22 (18.97%)
No idea/ no comment: 17 (14.66%)
Standard deviation: 16.26
Responses: 116
Question 20: Do you feel that the
quality of life at your family level will
get worse in the coming 2 years?
Yes, very much so: 12 (10.26%)
Yes, I have this feeling mildly: 45 (38.46%)
No, I do not feel this way: 44 (37.61%)
No idea/ no comment: 16 (13.68%)
Standard deviation: 15.32
Responses: 117
Question 21: Do you feel that the
quality of life at your personal level
will get worse in the coming 2 years?
Yes, very much so: 12 (10.26%)
Yes, I have this feeling mildly: 41 (35.04%)
No, I do not feel this way: 44 (37.61%)
No idea/ no comment: 20 (17.09%)
Standard deviation: 13.59
Responses: 117
Question 22: Do you feel that you are
interested in learning more about the
subject of quality of life?
Yes, very much so: 35 (29.91%)
Yes, I have this feeling mildly: 49 (41.88%)
No, I do not feel this way: 21 (17.95%)
No idea/ no comment: 12 (10.26%)
Standard deviation: 14.04
Responses: 117

Joseph Kim-keung Ho- A REVIEW OF THE NOTIONS OF QUALITY OF LIFE (QOL) AND LIVABILITY BASED
ON ACKOVIAN SYSTEMS THINKING
2532 AMERICAN RESEARCH THOUGHTS- Volume 1 │ Issue 11 │2015
Appendix 2: Excel report on multiple regression analysis.
SUMMARY OUTPUT
Regression Statistics
Multiple R 0.439092276
R Square 0.192802027
Adjusted R Square 0.083351455
Standard Error 0.712048932
Observations 68
ANOVA
df SS MS F
Regression 8 7.1450163 0.893127 1.761544253
Residual 59 29.91380723 0.5070137
Total 67 37.05882353
Coefficients Standard Error t Stat P-value
Intercept 1.922845279 0.593164458 3.2416731 0.001956132
Gender -0.173379721 0.189787053 -0.9135487 0.364672247
Age group 0.011791454 0.010839019 1.0878709 0.281076209
Education background -0.232629615 0.168236102 -1.3827568 0.171950861
Self-perceived social
class 0.254382051 0.181747523 1.3996452 0.166855728
QOL satisfaction at
society level -0.242129073 0.233914722 -1.0351169 0.304838494
QOL satisfaction at
district level 0.294475682 0.215048485 1.3693455 0.176081351
QOL satisfaction at
family level 0.740995643 0.276054465 2.6842371 0.009421134
QOL satisfaction at
personal level -0.765048659 0.313619574 -2.4394162 0.017736761