A Review of Testing Object-Based Environment Perception for ...
23
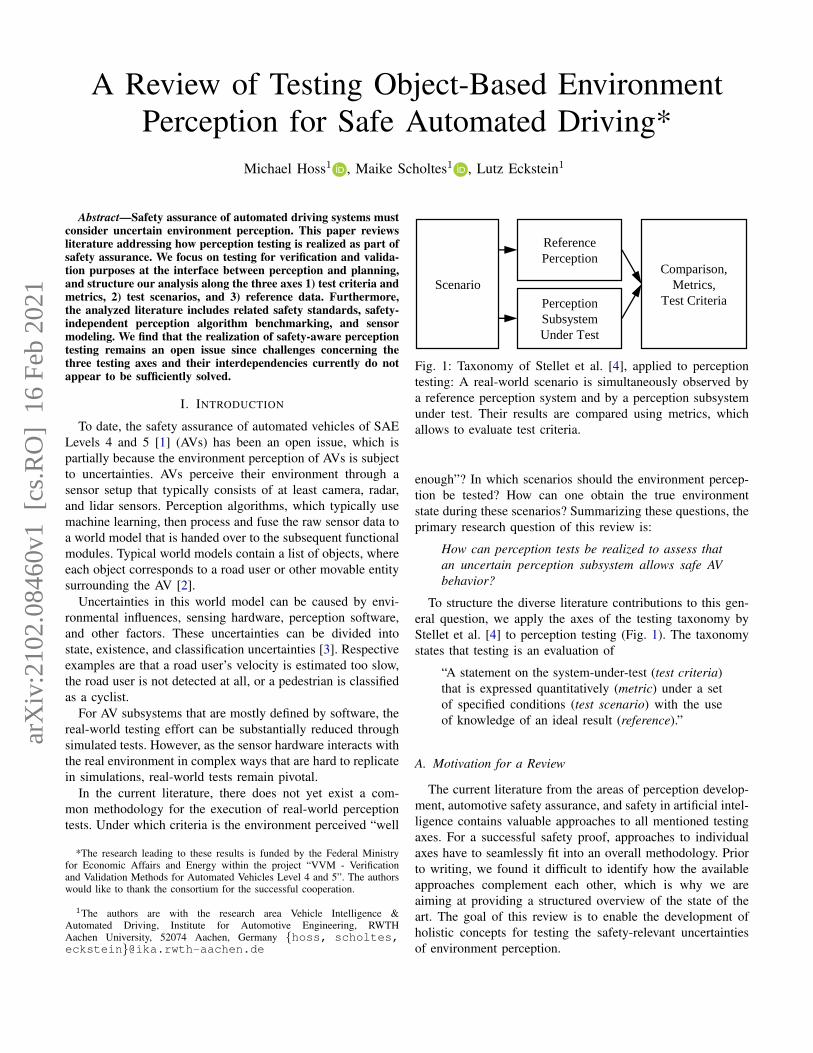
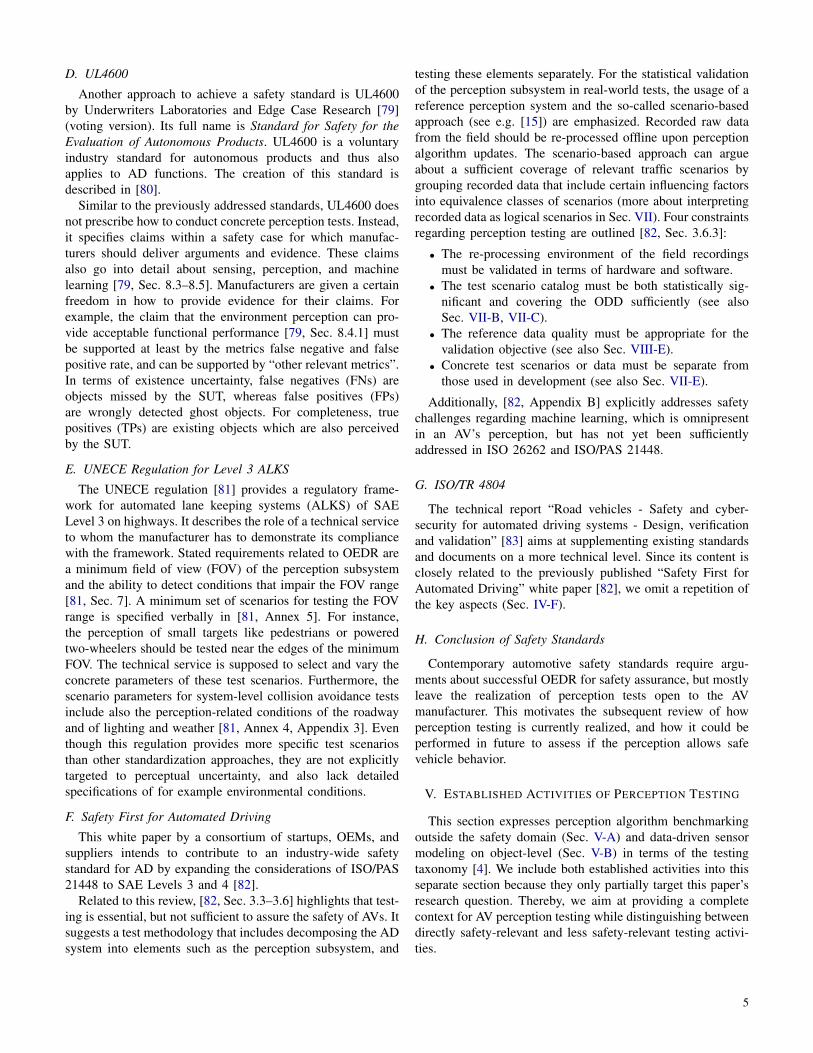
A Review of Testing Object-Based Environment Perception for Safe Automated Driving* Michael Hoss 1 , Maike Scholtes 1 , Lutz Eckstein 1 Abstract—Safety assurance of automated driving systems must consider uncertain environment perception. This paper reviews literature addressing how perception testing is realized as part of safety assurance. We focus on testing for verification and valida- tion purposes at the interface between perception and planning, and structure our analysis along the three axes 1) test criteria and metrics, 2) test scenarios, and 3) reference data. Furthermore, the analyzed literature includes related safety standards, safety- independent perception algorithm benchmarking, and sensor modeling. We find that the realization of safety-aware perception testing remains an open issue since challenges concerning the three testing axes and their interdependencies currently do not appear to be sufficiently solved. I. I NTRODUCTION To date, the safety assurance of automated vehicles of SAE Levels 4 and 5 [1] (AVs) has been an open issue, which is partially because the environment perception of AVs is subject to uncertainties. AVs perceive their environment through a sensor setup that typically consists of at least camera, radar, and lidar sensors. Perception algorithms, which typically use machine learning, then process and fuse the raw sensor data to a world model that is handed over to the subsequent functional modules. Typical world models contain a list of objects, where each object corresponds to a road user or other movable entity surrounding the AV [2]. Uncertainties in this world model can be caused by envi- ronmental influences, sensing hardware, perception software, and other factors. These uncertainties can be divided into state, existence, and classification uncertainties [3]. Respective examples are that a road user’s velocity is estimated too slow, the road user is not detected at all, or a pedestrian is classified as a cyclist. For AV subsystems that are mostly defined by software, the real-world testing effort can be substantially reduced through simulated tests. However, as the sensor hardware interacts with the real environment in complex ways that are hard to replicate in simulations, real-world tests remain pivotal. In the current literature, there does not yet exist a com- mon methodology for the execution of real-world perception tests. Under which criteria is the environment perceived “well *The research leading to these results is funded by the Federal Ministry for Economic Affairs and Energy within the project “VVM - Verification and Validation Methods for Automated Vehicles Level 4 and 5”. The authors would like to thank the consortium for the successful cooperation. 1 The authors are with the research area Vehicle Intelligence & Automated Driving, Institute for Automotive Engineering, RWTH Aachen University, 52074 Aachen, Germany {hoss, scholtes, eckstein}@ika.rwth-aachen.de Scenario Reference Perception Perception Subsystem Under Test Comparison, Metrics, Test Criteria Fig. 1: Taxonomy of Stellet et al. [4], applied to perception testing: A real-world scenario is simultaneously observed by a reference perception system and by a perception subsystem under test. Their results are compared using metrics, which allows to evaluate test criteria. enough”? In which scenarios should the environment percep- tion be tested? How can one obtain the true environment state during these scenarios? Summarizing these questions, the primary research question of this review is: How can perception tests be realized to assess that an uncertain perception subsystem allows safe AV behavior? To structure the diverse literature contributions to this gen- eral question, we apply the axes of the testing taxonomy by Stellet et al. [4] to perception testing (Fig. 1). The taxonomy states that testing is an evaluation of “A statement on the system-under-test (test criteria) that is expressed quantitatively (metric) under a set of specified conditions (test scenario) with the use of knowledge of an ideal result (reference).” A. Motivation for a Review The current literature from the areas of perception develop- ment, automotive safety assurance, and safety in artificial intel- ligence contains valuable approaches to all mentioned testing axes. For a successful safety proof, approaches to individual axes have to seamlessly fit into an overall methodology. Prior to writing, we found it difficult to identify how the available approaches complement each other, which is why we are aiming at providing a structured overview of the state of the art. The goal of this review is to enable the development of holistic concepts for testing the safety-relevant uncertainties of environment perception. arXiv:2102.08460v1 [cs.RO] 16 Feb 2021
-
Upload
khangminh22 -
Category
Documents
-
view
2 -
download
0
Transcript of A Review of Testing Object-Based Environment Perception for ...
A Review of Testing Object-Based EnvironmentPerception for Safe Automated Driving*
Michael Hoss1 , Maike Scholtes1 , Lutz Eckstein1
Abstract—Safety assurance of automated driving systems mustconsider uncertain environment perception. This paper reviewsliterature addressing how perception testing is realized as part ofsafety assurance. We focus on testing for verification and valida-tion purposes at the interface between perception and planning,and structure our analysis along the three axes 1) test criteria andmetrics, 2) test scenarios, and 3) reference data. Furthermore,the analyzed literature includes related safety standards, safety-independent perception algorithm benchmarking, and sensormodeling. We find that the realization of safety-aware perceptiontesting remains an open issue since challenges concerning thethree testing axes and their interdependencies currently do notappear to be sufficiently solved.
I. INTRODUCTION
To date, the safety assurance of automated vehicles of SAELevels 4 and 5 [1] (AVs) has been an open issue, which ispartially because the environment perception of AVs is subjectto uncertainties. AVs perceive their environment through asensor setup that typically consists of at least camera, radar,and lidar sensors. Perception algorithms, which typically usemachine learning, then process and fuse the raw sensor data toa world model that is handed over to the subsequent functionalmodules. Typical world models contain a list of objects, whereeach object corresponds to a road user or other movable entitysurrounding the AV [2].
Uncertainties in this world model can be caused by envi-ronmental influences, sensing hardware, perception software,and other factors. These uncertainties can be divided intostate, existence, and classification uncertainties [3]. Respectiveexamples are that a road user’s velocity is estimated too slow,the road user is not detected at all, or a pedestrian is classifiedas a cyclist.
For AV subsystems that are mostly defined by software, thereal-world testing effort can be substantially reduced throughsimulated tests. However, as the sensor hardware interacts withthe real environment in complex ways that are hard to replicatein simulations, real-world tests remain pivotal.
In the current literature, there does not yet exist a com-mon methodology for the execution of real-world perceptiontests. Under which criteria is the environment perceived “well
*The research leading to these results is funded by the Federal Ministryfor Economic Affairs and Energy within the project “VVM - Verificationand Validation Methods for Automated Vehicles Level 4 and 5”. The authorswould like to thank the consortium for the successful cooperation.
1The authors are with the research area Vehicle Intelligence &Automated Driving, Institute for Automotive Engineering, RWTHAachen University, 52074 Aachen, Germany {hoss, scholtes,eckstein}@ika.rwth-aachen.de
Scenario
Reference
Perception
Perception
Subsystem
Under Test
Comparison,
Metrics,
Test Criteria
Fig. 1: Taxonomy of Stellet et al. [4], applied to perceptiontesting: A real-world scenario is simultaneously observed bya reference perception system and by a perception subsystemunder test. Their results are compared using metrics, whichallows to evaluate test criteria.
enough”? In which scenarios should the environment percep-tion be tested? How can one obtain the true environmentstate during these scenarios? Summarizing these questions, theprimary research question of this review is:
How can perception tests be realized to assess thatan uncertain perception subsystem allows safe AVbehavior?
To structure the diverse literature contributions to this gen-eral question, we apply the axes of the testing taxonomy byStellet et al. [4] to perception testing (Fig. 1). The taxonomystates that testing is an evaluation of
“A statement on the system-under-test (test criteria)that is expressed quantitatively (metric) under a setof specified conditions (test scenario) with the useof knowledge of an ideal result (reference).”
A. Motivation for a Review
The current literature from the areas of perception develop-ment, automotive safety assurance, and safety in artificial intel-ligence contains valuable approaches to all mentioned testingaxes. For a successful safety proof, approaches to individualaxes have to seamlessly fit into an overall methodology. Priorto writing, we found it difficult to identify how the availableapproaches complement each other, which is why we areaiming at providing a structured overview of the state of theart. The goal of this review is to enable the development ofholistic concepts for testing the safety-relevant uncertaintiesof environment perception.
arX
iv:2
102.
0846
0v1
[cs
.RO
] 1
6 Fe
b 20
21
incl. downstream driving
function
environ-
ment
perception
Layer 0: Information Access
Layer 1: Information Reception
Layer 2: Information Processing
Layer 3: Situational Understanding
Layer 4: Behavioral Decision
Layer 5: Action
Information
Accessible Inform.
Sensor Raw Data
(Subjective) Scene/
(World Model)
Vehicle Motion
incl. environmental influences
incl. sensor mounting positions
incl. sensor HW performance
incl. perception algorithm
perception
subsystem
plan & act
subsystems
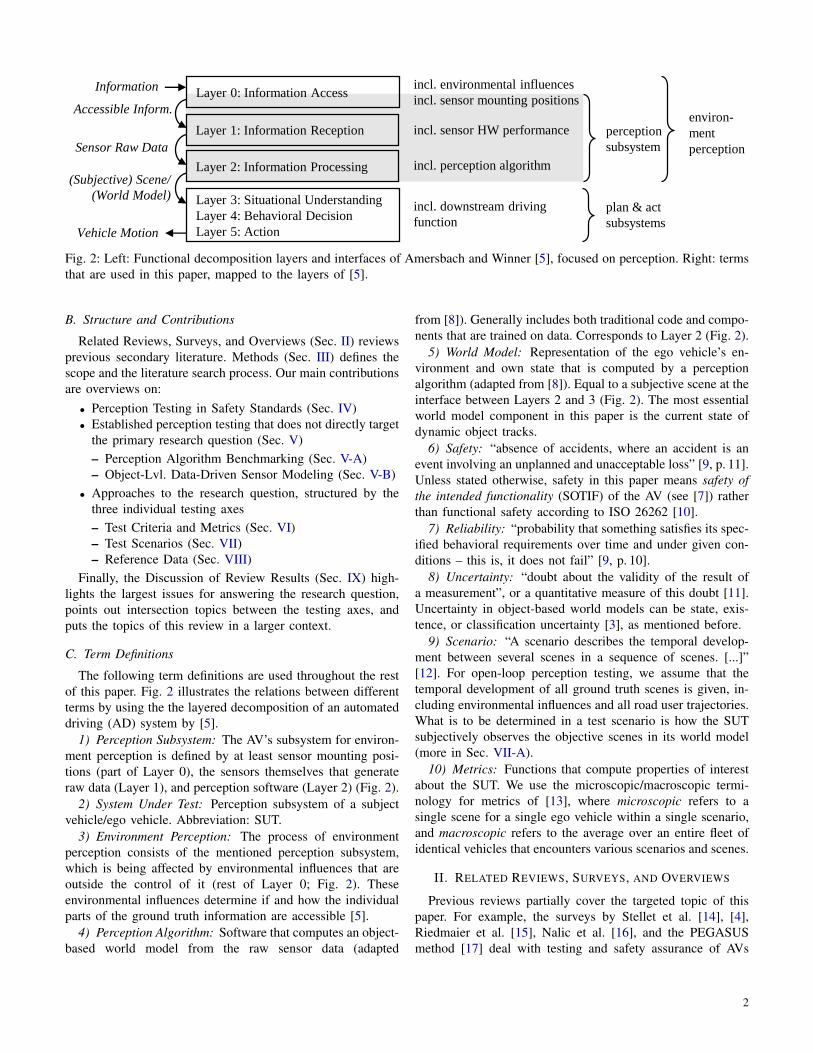
Fig. 2: Left: Functional decomposition layers and interfaces of Amersbach and Winner [5], focused on perception. Right: termsthat are used in this paper, mapped to the layers of [5].
B. Structure and Contributions
Related Reviews, Surveys, and Overviews (Sec. II) reviewsprevious secondary literature. Methods (Sec. III) defines thescope and the literature search process. Our main contributionsare overviews on:
• Perception Testing in Safety Standards (Sec. IV)• Established perception testing that does not directly target
the primary research question (Sec. V)– Perception Algorithm Benchmarking (Sec. V-A)– Object-Lvl. Data-Driven Sensor Modeling (Sec. V-B)
• Approaches to the research question, structured by thethree individual testing axes– Test Criteria and Metrics (Sec. VI)– Test Scenarios (Sec. VII)– Reference Data (Sec. VIII)
Finally, the Discussion of Review Results (Sec. IX) high-lights the largest issues for answering the research question,points out intersection topics between the testing axes, andputs the topics of this review in a larger context.
C. Term Definitions
The following term definitions are used throughout the restof this paper. Fig. 2 illustrates the relations between differentterms by using the the layered decomposition of an automateddriving (AD) system by [5].
1) Perception Subsystem: The AV’s subsystem for environ-ment perception is defined by at least sensor mounting posi-tions (part of Layer 0), the sensors themselves that generateraw data (Layer 1), and perception software (Layer 2) (Fig. 2).
2) System Under Test: Perception subsystem of a subjectvehicle/ego vehicle. Abbreviation: SUT.
3) Environment Perception: The process of environmentperception consists of the mentioned perception subsystem,which is being affected by environmental influences that areoutside the control of it (rest of Layer 0; Fig. 2). Theseenvironmental influences determine if and how the individualparts of the ground truth information are accessible [5].
4) Perception Algorithm: Software that computes an object-based world model from the raw sensor data (adapted
from [8]). Generally includes both traditional code and compo-nents that are trained on data. Corresponds to Layer 2 (Fig. 2).
5) World Model: Representation of the ego vehicle’s en-vironment and own state that is computed by a perceptionalgorithm (adapted from [8]). Equal to a subjective scene at theinterface between Layers 2 and 3 (Fig. 2). The most essentialworld model component in this paper is the current state ofdynamic object tracks.
6) Safety: “absence of accidents, where an accident is anevent involving an unplanned and unacceptable loss” [9, p. 11].Unless stated otherwise, safety in this paper means safety ofthe intended functionality (SOTIF) of the AV (see [7]) ratherthan functional safety according to ISO 26262 [10].
7) Reliability: “probability that something satisfies its spec-ified behavioral requirements over time and under given con-ditions – this is, it does not fail” [9, p. 10].
8) Uncertainty: “doubt about the validity of the result ofa measurement”, or a quantitative measure of this doubt [11].Uncertainty in object-based world models can be state, exis-tence, or classification uncertainty [3], as mentioned before.
9) Scenario: “A scenario describes the temporal develop-ment between several scenes in a sequence of scenes. [...]”[12]. For open-loop perception testing, we assume that thetemporal development of all ground truth scenes is given, in-cluding environmental influences and all road user trajectories.What is to be determined in a test scenario is how the SUTsubjectively observes the objective scenes in its world model(more in Sec. VII-A).
10) Metrics: Functions that compute properties of interestabout the SUT. We use the microscopic/macroscopic termi-nology for metrics of [13], where microscopic refers to asingle scene for a single ego vehicle within a single scenario,and macroscopic refers to the average over an entire fleet ofidentical vehicles that encounters various scenarios and scenes.
II. RELATED REVIEWS, SURVEYS, AND OVERVIEWS
Previous reviews partially cover the targeted topic of thispaper. For example, the surveys by Stellet et al. [14], [4],Riedmaier et al. [15], Nalic et al. [16], and the PEGASUSmethod [17] deal with testing and safety assurance of AVs
2
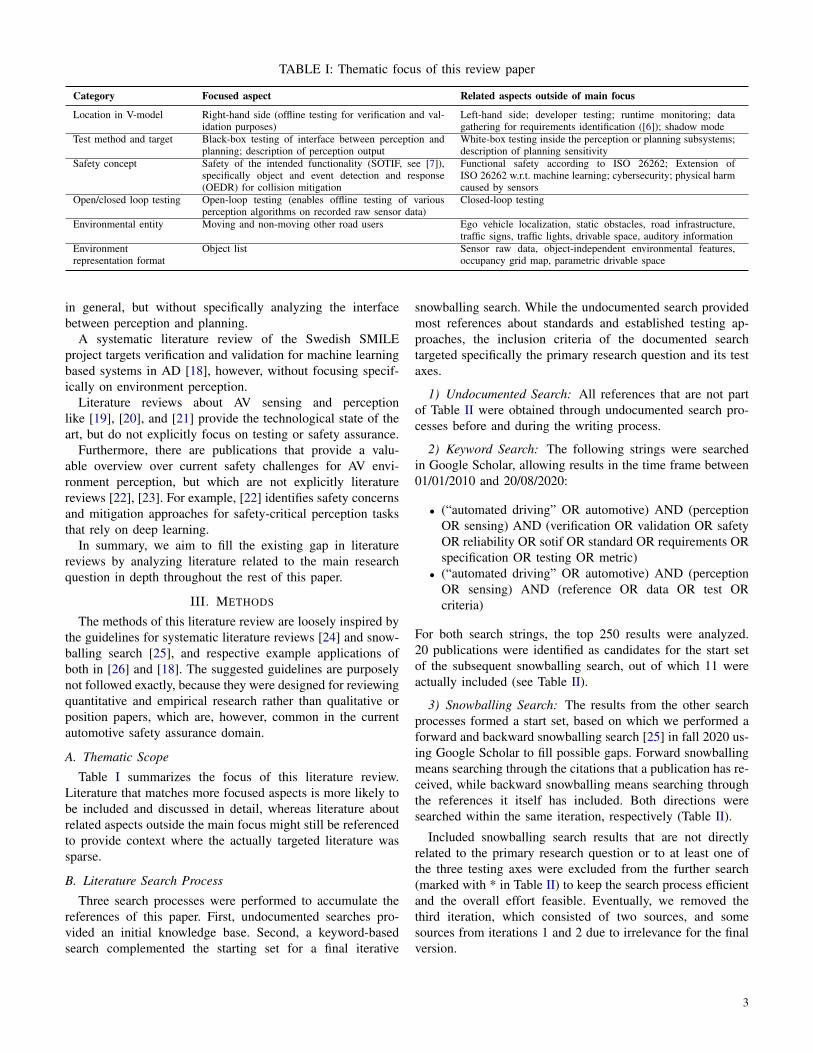
TABLE I: Thematic focus of this review paper
Category Focused aspect Related aspects outside of main focus
Location in V-model Right-hand side (offline testing for verification and val-idation purposes)
Left-hand side; developer testing; runtime monitoring; datagathering for requirements identification ([6]); shadow mode
Test method and target Black-box testing of interface between perception andplanning; description of perception output
White-box testing inside the perception or planning subsystems;description of planning sensitivity
Safety concept Safety of the intended functionality (SOTIF, see [7]),specifically object and event detection and response(OEDR) for collision mitigation
Functional safety according to ISO 26262; Extension ofISO 26262 w.r.t. machine learning; cybersecurity; physical harmcaused by sensors
Open/closed loop testing Open-loop testing (enables offline testing of variousperception algorithms on recorded raw sensor data)
Closed-loop testing
Environmental entity Moving and non-moving other road users Ego vehicle localization, static obstacles, road infrastructure,traffic signs, traffic lights, drivable space, auditory information
Environmentrepresentation format
Object list Sensor raw data, object-independent environmental features,occupancy grid map, parametric drivable space
in general, but without specifically analyzing the interfacebetween perception and planning.
A systematic literature review of the Swedish SMILEproject targets verification and validation for machine learningbased systems in AD [18], however, without focusing specif-ically on environment perception.
Literature reviews about AV sensing and perceptionlike [19], [20], and [21] provide the technological state of theart, but do not explicitly focus on testing or safety assurance.
Furthermore, there are publications that provide a valu-able overview over current safety challenges for AV envi-ronment perception, but which are not explicitly literaturereviews [22], [23]. For example, [22] identifies safety concernsand mitigation approaches for safety-critical perception tasksthat rely on deep learning.
In summary, we aim to fill the existing gap in literaturereviews by analyzing literature related to the main researchquestion in depth throughout the rest of this paper.
III. METHODS
The methods of this literature review are loosely inspired bythe guidelines for systematic literature reviews [24] and snow-balling search [25], and respective example applications ofboth in [26] and [18]. The suggested guidelines are purposelynot followed exactly, because they were designed for reviewingquantitative and empirical research rather than qualitative orposition papers, which are, however, common in the currentautomotive safety assurance domain.
A. Thematic Scope
Table I summarizes the focus of this literature review.Literature that matches more focused aspects is more likely tobe included and discussed in detail, whereas literature aboutrelated aspects outside the main focus might still be referencedto provide context where the actually targeted literature wassparse.
B. Literature Search Process
Three search processes were performed to accumulate thereferences of this paper. First, undocumented searches pro-vided an initial knowledge base. Second, a keyword-basedsearch complemented the starting set for a final iterative
snowballing search. While the undocumented search providedmost references about standards and established testing ap-proaches, the inclusion criteria of the documented searchtargeted specifically the primary research question and its testaxes.
1) Undocumented Search: All references that are not partof Table II were obtained through undocumented search pro-cesses before and during the writing process.
2) Keyword Search: The following strings were searchedin Google Scholar, allowing results in the time frame between01/01/2010 and 20/08/2020:
• (“automated driving” OR automotive) AND (perceptionOR sensing) AND (verification OR validation OR safetyOR reliability OR sotif OR standard OR requirements ORspecification OR testing OR metric)
• (“automated driving” OR automotive) AND (perceptionOR sensing) AND (reference OR data OR test ORcriteria)
For both search strings, the top 250 results were analyzed.20 publications were identified as candidates for the start setof the subsequent snowballing search, out of which 11 wereactually included (see Table II).
3) Snowballing Search: The results from the other searchprocesses formed a start set, based on which we performed aforward and backward snowballing search [25] in fall 2020 us-ing Google Scholar to fill possible gaps. Forward snowballingmeans searching through the citations that a publication has re-ceived, while backward snowballing means searching throughthe references it itself has included. Both directions weresearched within the same iteration, respectively (Table II).
Included snowballing search results that are not directlyrelated to the primary research question or to at least one ofthe three testing axes were excluded from the further search(marked with * in Table II) to keep the search process efficientand the overall effort feasible. Eventually, we removed thethird iteration, which consisted of two sources, and somesources from iterations 1 and 2 due to irrelevance for the finalversion.
3
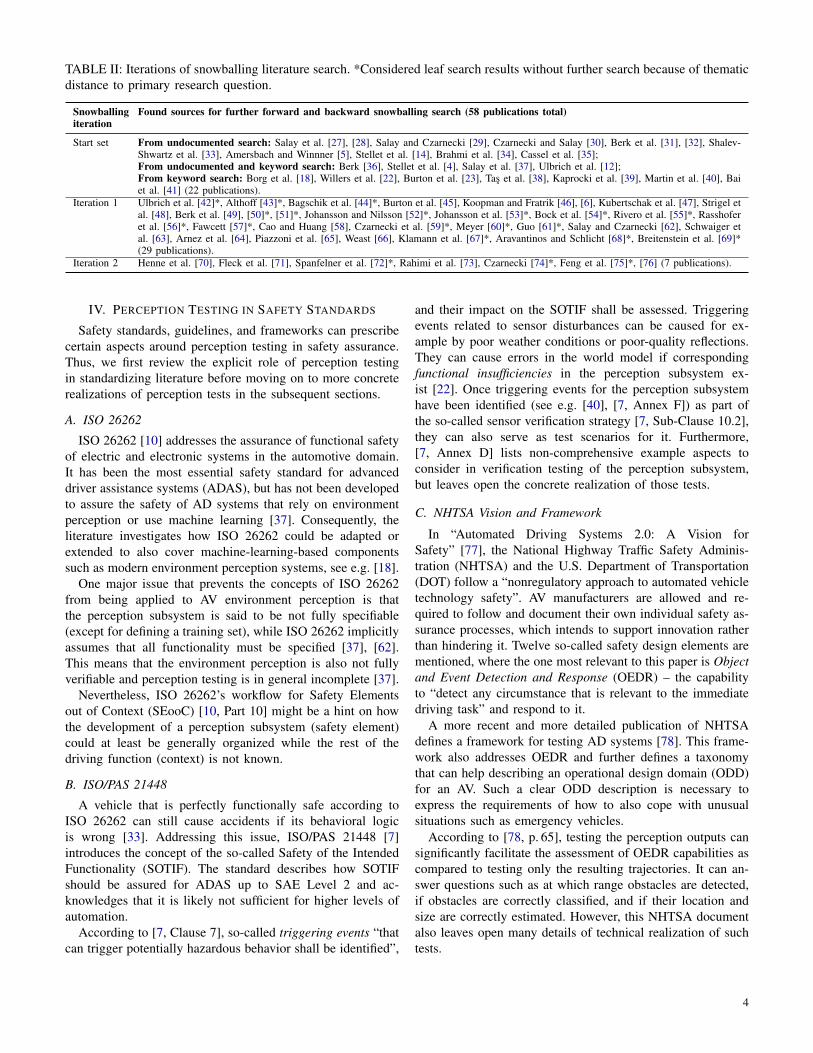
TABLE II: Iterations of snowballing literature search. *Considered leaf search results without further search because of thematicdistance to primary research question.
Snowballingiteration
Found sources for further forward and backward snowballing search (58 publications total)
Start set From undocumented search: Salay et al. [27], [28], Salay and Czarnecki [29], Czarnecki and Salay [30], Berk et al. [31], [32], Shalev-Shwartz et al. [33], Amersbach and Winnner [5], Stellet et al. [14], Brahmi et al. [34], Cassel et al. [35];From undocumented and keyword search: Berk [36], Stellet et al. [4], Salay et al. [37], Ulbrich et al. [12];From keyword search: Borg et al. [18], Willers et al. [22], Burton et al. [23], Tas et al. [38], Kaprocki et al. [39], Martin et al. [40], Baiet al. [41] (22 publications).
Iteration 1 Ulbrich et al. [42]*, Althoff [43]*, Bagschik et al. [44]*, Burton et al. [45], Koopman and Fratrik [46], [6], Kubertschak et al. [47], Strigel etal. [48], Berk et al. [49], [50]*, [51]*, Johansson and Nilsson [52]*, Johansson et al. [53]*, Bock et al. [54]*, Rivero et al. [55]*, Rasshoferet al. [56]*, Fawcett [57]*, Cao and Huang [58], Czarnecki et al. [59]*, Meyer [60]*, Guo [61]*, Salay and Czarnecki [62], Schwaiger etal. [63], Arnez et al. [64], Piazzoni et al. [65], Weast [66], Klamann et al. [67]*, Aravantinos and Schlicht [68]*, Breitenstein et al. [69]*(29 publications).
Iteration 2 Henne et al. [70], Fleck et al. [71], Spanfelner et al. [72]*, Rahimi et al. [73], Czarnecki [74]*, Feng et al. [75]*, [76] (7 publications).
IV. PERCEPTION TESTING IN SAFETY STANDARDS
Safety standards, guidelines, and frameworks can prescribecertain aspects around perception testing in safety assurance.Thus, we first review the explicit role of perception testingin standardizing literature before moving on to more concreterealizations of perception tests in the subsequent sections.
A. ISO 26262
ISO 26262 [10] addresses the assurance of functional safetyof electric and electronic systems in the automotive domain.It has been the most essential safety standard for advanceddriver assistance systems (ADAS), but has not been developedto assure the safety of AD systems that rely on environmentperception or use machine learning [37]. Consequently, theliterature investigates how ISO 26262 could be adapted orextended to also cover machine-learning-based componentssuch as modern environment perception systems, see e.g. [18].
One major issue that prevents the concepts of ISO 26262from being applied to AV environment perception is thatthe perception subsystem is said to be not fully specifiable(except for defining a training set), while ISO 26262 implicitlyassumes that all functionality must be specified [37], [62].This means that the environment perception is also not fullyverifiable and perception testing is in general incomplete [37].
Nevertheless, ISO 26262’s workflow for Safety Elementsout of Context (SEooC) [10, Part 10] might be a hint on howthe development of a perception subsystem (safety element)could at least be generally organized while the rest of thedriving function (context) is not known.
B. ISO/PAS 21448
A vehicle that is perfectly functionally safe according toISO 26262 can still cause accidents if its behavioral logicis wrong [33]. Addressing this issue, ISO/PAS 21448 [7]introduces the concept of the so-called Safety of the IntendedFunctionality (SOTIF). The standard describes how SOTIFshould be assured for ADAS up to SAE Level 2 and ac-knowledges that it is likely not sufficient for higher levels ofautomation.
According to [7, Clause 7], so-called triggering events “thatcan trigger potentially hazardous behavior shall be identified”,
and their impact on the SOTIF shall be assessed. Triggeringevents related to sensor disturbances can be caused for ex-ample by poor weather conditions or poor-quality reflections.They can cause errors in the world model if correspondingfunctional insufficiencies in the perception subsystem ex-ist [22]. Once triggering events for the perception subsystemhave been identified (see e.g. [40], [7, Annex F]) as part ofthe so-called sensor verification strategy [7, Sub-Clause 10.2],they can also serve as test scenarios for it. Furthermore,[7, Annex D] lists non-comprehensive example aspects toconsider in verification testing of the perception subsystem,but leaves open the concrete realization of those tests.
C. NHTSA Vision and Framework
In “Automated Driving Systems 2.0: A Vision forSafety” [77], the National Highway Traffic Safety Adminis-tration (NHTSA) and the U.S. Department of Transportation(DOT) follow a “nonregulatory approach to automated vehicletechnology safety”. AV manufacturers are allowed and re-quired to follow and document their own individual safety as-surance processes, which intends to support innovation ratherthan hindering it. Twelve so-called safety design elements arementioned, where the one most relevant to this paper is Objectand Event Detection and Response (OEDR) – the capabilityto “detect any circumstance that is relevant to the immediatedriving task” and respond to it.
A more recent and more detailed publication of NHTSAdefines a framework for testing AD systems [78]. This frame-work also addresses OEDR and further defines a taxonomythat can help describing an operational design domain (ODD)for an AV. Such a clear ODD description is necessary toexpress the requirements of how to also cope with unusualsituations such as emergency vehicles.
According to [78, p. 65], testing the perception outputs cansignificantly facilitate the assessment of OEDR capabilities ascompared to testing only the resulting trajectories. It can an-swer questions such as at which range obstacles are detected,if obstacles are correctly classified, and if their location andsize are correctly estimated. However, this NHTSA documentalso leaves open many details of technical realization of suchtests.
4
D. UL4600
Another approach to achieve a safety standard is UL4600by Underwriters Laboratories and Edge Case Research [79](voting version). Its full name is Standard for Safety for theEvaluation of Autonomous Products. UL4600 is a voluntaryindustry standard for autonomous products and thus alsoapplies to AD functions. The creation of this standard isdescribed in [80].
Similar to the previously addressed standards, UL4600 doesnot prescribe how to conduct concrete perception tests. Instead,it specifies claims within a safety case for which manufac-turers should deliver arguments and evidence. These claimsalso go into detail about sensing, perception, and machinelearning [79, Sec. 8.3–8.5]. Manufacturers are given a certainfreedom in how to provide evidence for their claims. Forexample, the claim that the environment perception can pro-vide acceptable functional performance [79, Sec. 8.4.1] mustbe supported at least by the metrics false negative and falsepositive rate, and can be supported by “other relevant metrics”.In terms of existence uncertainty, false negatives (FNs) areobjects missed by the SUT, whereas false positives (FPs)are wrongly detected ghost objects. For completeness, truepositives (TPs) are existing objects which are also perceivedby the SUT.
E. UNECE Regulation for Level 3 ALKS
The UNECE regulation [81] provides a regulatory frame-work for automated lane keeping systems (ALKS) of SAELevel 3 on highways. It describes the role of a technical serviceto whom the manufacturer has to demonstrate its compliancewith the framework. Stated requirements related to OEDR area minimum field of view (FOV) of the perception subsystemand the ability to detect conditions that impair the FOV range[81, Sec. 7]. A minimum set of scenarios for testing the FOVrange is specified verbally in [81, Annex 5]. For instance,the perception of small targets like pedestrians or poweredtwo-wheelers should be tested near the edges of the minimumFOV. The technical service is supposed to select and vary theconcrete parameters of these test scenarios. Furthermore, thescenario parameters for system-level collision avoidance testsinclude also the perception-related conditions of the roadwayand of lighting and weather [81, Annex 4, Appendix 3]. Eventhough this regulation provides more specific test scenariosthan other standardization approaches, they are not explicitlytargeted to perceptual uncertainty, and also lack detailedspecifications of for example environmental conditions.
F. Safety First for Automated Driving
This white paper by a consortium of startups, OEMs, andsuppliers intends to contribute to an industry-wide safetystandard for AD by expanding the considerations of ISO/PAS21448 to SAE Levels 3 and 4 [82].
Related to this review, [82, Sec. 3.3–3.6] highlights that test-ing is essential, but not sufficient to assure the safety of AVs. Itsuggests a test methodology that includes decomposing the ADsystem into elements such as the perception subsystem, and
testing these elements separately. For the statistical validationof the perception subsystem in real-world tests, the usage of areference perception system and the so-called scenario-basedapproach (see e.g. [15]) are emphasized. Recorded raw datafrom the field should be re-processed offline upon perceptionalgorithm updates. The scenario-based approach can argueabout a sufficient coverage of relevant traffic scenarios bygrouping recorded data that include certain influencing factorsinto equivalence classes of scenarios (more about interpretingrecorded data as logical scenarios in Sec. VII). Four constraintsregarding perception testing are outlined [82, Sec. 3.6.3]:
• The re-processing environment of the field recordingsmust be validated in terms of hardware and software.
• The test scenario catalog must be both statistically sig-nificant and covering the ODD sufficiently (see alsoSec. VII-B, VII-C).
• The reference data quality must be appropriate for thevalidation objective (see also Sec. VIII-E).
• Concrete test scenarios or data must be separate fromthose used in development (see also Sec. VII-E).
Additionally, [82, Appendix B] explicitly addresses safetychallenges regarding machine learning, which is omnipresentin an AV’s perception, but has not yet been sufficientlyaddressed in ISO 26262 and ISO/PAS 21448.
G. ISO/TR 4804
The technical report “Road vehicles - Safety and cyber-security for automated driving systems - Design, verificationand validation” [83] aims at supplementing existing standardsand documents on a more technical level. Since its content isclosely related to the previously published “Safety First forAutomated Driving” white paper [82], we omit a repetition ofthe key aspects (Sec. IV-F).
H. Conclusion of Safety Standards
Contemporary automotive safety standards require argu-ments about successful OEDR for safety assurance, but mostlyleave the realization of perception tests open to the AVmanufacturer. This motivates the subsequent review of howperception testing is currently realized, and how it could beperformed in future to assess if the perception allows safevehicle behavior.
V. ESTABLISHED ACTIVITIES OF PERCEPTION TESTING
This section expresses perception algorithm benchmarkingoutside the safety domain (Sec. V-A) and data-driven sensormodeling on object-level (Sec. V-B) in terms of the testingtaxonomy [4]. We include both established activities into thisseparate section because they only partially target this paper’sresearch question. Thereby, we aim at providing a completecontext for AV perception testing while distinguishing betweendirectly safety-relevant and less safety-relevant testing activi-ties.
5
A. Perception Algorithm BenchmarkingDevelopers of computer vision and moving object tracking
algorithms across multiple industries are already using estab-lished benchmark datasets and test metrics for their algorithm’sresults. The idea behind these testing activities is typicallyto provide a quantitative ranking among different algorithmsrather than evaluating whether safety-relevant pass-fail criteriaare met. The hardware and software that provide the rawsensor data are usually not analyzed.
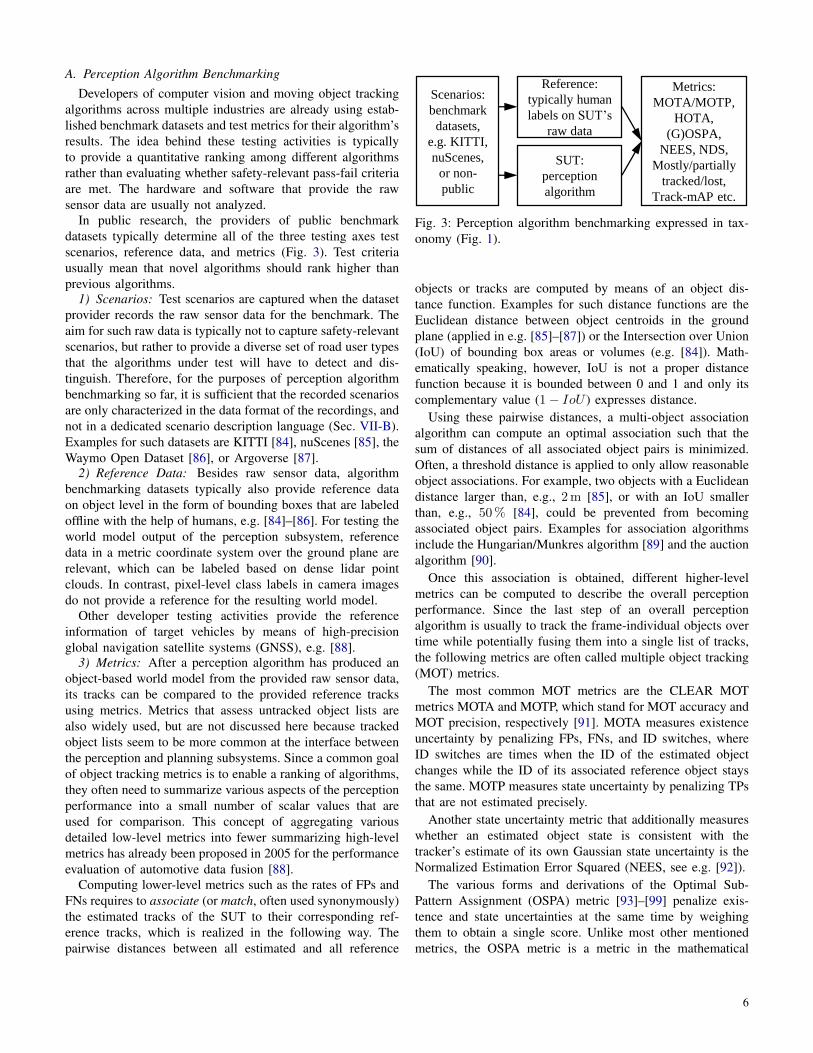
In public research, the providers of public benchmarkdatasets typically determine all of the three testing axes testscenarios, reference data, and metrics (Fig. 3). Test criteriausually mean that novel algorithms should rank higher thanprevious algorithms.
1) Scenarios: Test scenarios are captured when the datasetprovider records the raw sensor data for the benchmark. Theaim for such raw data is typically not to capture safety-relevantscenarios, but rather to provide a diverse set of road user typesthat the algorithms under test will have to detect and dis-tinguish. Therefore, for the purposes of perception algorithmbenchmarking so far, it is sufficient that the recorded scenariosare only characterized in the data format of the recordings, andnot in a dedicated scenario description language (Sec. VII-B).Examples for such datasets are KITTI [84], nuScenes [85], theWaymo Open Dataset [86], or Argoverse [87].
2) Reference Data: Besides raw sensor data, algorithmbenchmarking datasets typically also provide reference dataon object level in the form of bounding boxes that are labeledoffline with the help of humans, e.g. [84]–[86]. For testing theworld model output of the perception subsystem, referencedata in a metric coordinate system over the ground plane arerelevant, which can be labeled based on dense lidar pointclouds. In contrast, pixel-level class labels in camera imagesdo not provide a reference for the resulting world model.
Other developer testing activities provide the referenceinformation of target vehicles by means of high-precisionglobal navigation satellite systems (GNSS), e.g. [88].
3) Metrics: After a perception algorithm has produced anobject-based world model from the provided raw sensor data,its tracks can be compared to the provided reference tracksusing metrics. Metrics that assess untracked object lists arealso widely used, but are not discussed here because trackedobject lists seem to be more common at the interface betweenthe perception and planning subsystems. Since a common goalof object tracking metrics is to enable a ranking of algorithms,they often need to summarize various aspects of the perceptionperformance into a small number of scalar values that areused for comparison. This concept of aggregating variousdetailed low-level metrics into fewer summarizing high-levelmetrics has already been proposed in 2005 for the performanceevaluation of automotive data fusion [88].
Computing lower-level metrics such as the rates of FPs andFNs requires to associate (or match, often used synonymously)the estimated tracks of the SUT to their corresponding ref-erence tracks, which is realized in the following way. Thepairwise distances between all estimated and all reference
Scenarios:
benchmark
datasets,
e.g. KITTI,
nuScenes,
or non-
public
Reference:
typically human
labels on SUT’s
raw data
SUT:
perception
algorithm
Metrics:
MOTA/MOTP,
HOTA,
(G)OSPA,
NEES, NDS,
Mostly/partially
tracked/lost,
Track-mAP etc.
Fig. 3: Perception algorithm benchmarking expressed in tax-onomy (Fig. 1).
objects or tracks are computed by means of an object dis-tance function. Examples for such distance functions are theEuclidean distance between object centroids in the groundplane (applied in e.g. [85]–[87]) or the Intersection over Union(IoU) of bounding box areas or volumes (e.g. [84]). Math-ematically speaking, however, IoU is not a proper distancefunction because it is bounded between 0 and 1 and only itscomplementary value (1− IoU ) expresses distance.
Using these pairwise distances, a multi-object associationalgorithm can compute an optimal association such that thesum of distances of all associated object pairs is minimized.Often, a threshold distance is applied to only allow reasonableobject associations. For example, two objects with a Euclideandistance larger than, e.g., 2m [85], or with an IoU smallerthan, e.g., 50% [84], could be prevented from becomingassociated object pairs. Examples for association algorithmsinclude the Hungarian/Munkres algorithm [89] and the auctionalgorithm [90].
Once this association is obtained, different higher-levelmetrics can be computed to describe the overall perceptionperformance. Since the last step of an overall perceptionalgorithm is usually to track the frame-individual objects overtime while potentially fusing them into a single list of tracks,the following metrics are often called multiple object tracking(MOT) metrics.
The most common MOT metrics are the CLEAR MOTmetrics MOTA and MOTP, which stand for MOT accuracy andMOT precision, respectively [91]. MOTA measures existenceuncertainty by penalizing FPs, FNs, and ID switches, whereID switches are times when the ID of the estimated objectchanges while the ID of its associated reference object staysthe same. MOTP measures state uncertainty by penalizing TPsthat are not estimated precisely.
Another state uncertainty metric that additionally measureswhether an estimated object state is consistent with thetracker’s estimate of its own Gaussian state uncertainty is theNormalized Estimation Error Squared (NEES, see e.g. [92]).
The various forms and derivations of the Optimal Sub-Pattern Assignment (OSPA) metric [93]–[99] penalize exis-tence and state uncertainties at the same time by weighingthem to obtain a single score. Unlike most other mentionedmetrics, the OSPA metric is a metric in the mathematical
6
sense, meaning it satisfies the three properties 1.) identity ofindiscernibles, 2.) symmetry, and 3.) the triangle inequality.This property makes it interesting for research on objecttracking on a detailed mathematical level, e.g. [100], [101].
Besides existence and state uncertainties, the nuScenesdetection score (NDS) [85] also considers classification un-certainties, as its goal is to represent the entire object trackingperformance by only one scalar. Otherwise, metrics for clas-sification uncertainty would be precision, recall, or the areaunder the so-called receiver-operating characteristic (ROC)curve [57].
One evaluation concept that explicitly considers temporalaspects of the object tracking performance is the Mostlytracked/Partially tracked/Mostly lost approach, which countsthe number of reference trajectories that were tracked duringmore than 80% or less than 20% of their lifetimes [102].
The so-called Higher-Order Tracking Accuracy (HOTA)metric has been proposed to balance various sub-metrics ina single higher-order metric [103]. While the sub-metrics candescribe individual performance aspects in detail, the higher-order metric can balance those sub-metrics without over-emphasizing one aspect over another [103]. We refer the readerto the same publication [103] for a more general introductionto MOT algorithm benchmarking metrics and an in-depthanalysis of popular metrics, which further include the meanaverage precision for tracking (Track-mAP) and the IDF1-score.
Recently, the “Planning Kullback-Leibler divergence”(PKL) [104] has emerged from the field of perception algo-rithm benchmarking. It is the only metric from this field thatwe are aware of that explicitly considers the actual influenceof perceptual uncertainties on the downstream motion planner.Various influences on the metric have been analyzed on thesubmissions of the nuScenes object detection challenge [105].Interestingly, the submission rankings would be significantlydifferent if PKL was used as the main benchmark insteadof mAP [105]. Moreover, the PKL was found to be moreconsistent with human intuition than the NDS about whichperceptual uncertainties are actually dangerous [104] and hasbeen included into the official submission evaluation. Due toits direct relevance for this paper’s research question, technicaldetails on the PKL are discussed later along with other safety-aware microscopic metrics (Sec. VI-B3).
4) Difficulties with Association Uncertainty: There seemsto be a fuzzy border between state and existence uncertainties,because a fixed threshold on the distance function that distin-guishes TPs from FPs/FNs is not likely to produce intuitive as-sociations under all circumstances. Therefore, the studies [106]and [107] tune their offline object association in a way thatit reproduces human annotations of object association. Theseapproaches seem to lead to subjectively better associations, buthave the cost of less human understanding of how the trainedassociator and subsequently also the test metric works.
5) Relevance for Vehicle Safety: Except for PKL [104], thementioned state-of-the art metrics for object perception andtracking do not consider safety, but rather provide informa-
tion about the average similarity to a reference dataset [22,Safety Concern 9]. This issue is described in more detailin [65]. According to [29], it is possible to completely specifypass-fail criteria for such safety-independent metrics. AlsoISO/PAS 21448 suggests to use safety-independent perceptionmetrics [7, Annex D, 11)]. However, those criteria wouldonly represent non-functional requirements, while functionalrequirements needed for safety assurance remain an openissue [29].
Similarly, the authors of [68] point out that metrics likea FP rate cannot provide safety-relevant information becausesome FPs might be highly safety-relevant while others arenot. Therefore, they suggest to formulate realistic fault models,which already exist in ISO 26262 for e.g. hardware faults, alsofor perception algorithms. Such fault models should depend onthe safety requirements of the overall vehicle. Given examplesinclude the differentiation of e.g. a FP for a pedestrian from aFP for a bicycle, or to discretize continuous state uncertaintyto obtain boolean faults. Nevertheless, formulating such faultmodels in accordance with the safety requirements seems non-trivial, which motivates for a further analysis of metrics andtest criteria in Sec. VI.
B. Object-Level Data-Driven Sensor Modeling
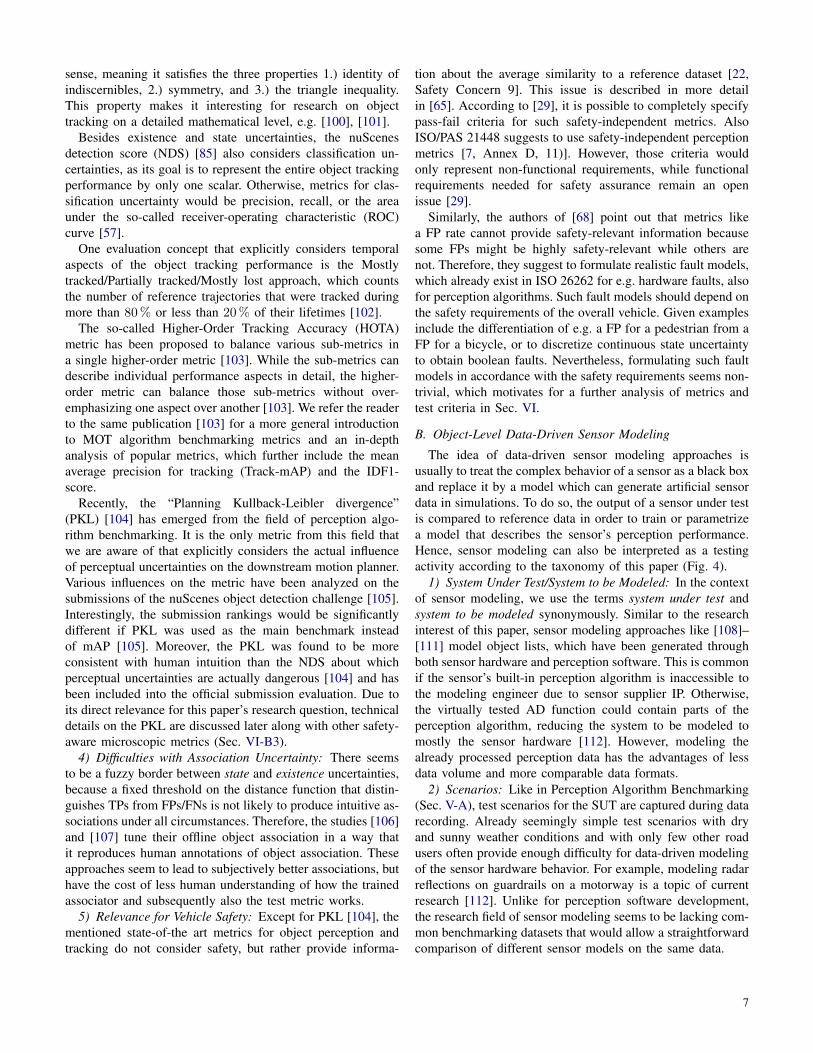
The idea of data-driven sensor modeling approaches isusually to treat the complex behavior of a sensor as a black boxand replace it by a model which can generate artificial sensordata in simulations. To do so, the output of a sensor under testis compared to reference data in order to train or parametrizea model that describes the sensor’s perception performance.Hence, sensor modeling can also be interpreted as a testingactivity according to the taxonomy of this paper (Fig. 4).
1) System Under Test/System to be Modeled: In the contextof sensor modeling, we use the terms system under test andsystem to be modeled synonymously. Similar to the researchinterest of this paper, sensor modeling approaches like [108]–[111] model object lists, which have been generated throughboth sensor hardware and perception software. This is commonif the sensor’s built-in perception algorithm is inaccessible tothe modeling engineer due to sensor supplier IP. Otherwise,the virtually tested AD function could contain parts of theperception algorithm, reducing the system to be modeled tomostly the sensor hardware [112]. However, modeling thealready processed perception data has the advantages of lessdata volume and more comparable data formats.
2) Scenarios: Like in Perception Algorithm Benchmarking(Sec. V-A), test scenarios for the SUT are captured during datarecording. Already seemingly simple test scenarios with dryand sunny weather conditions and with only few other roadusers often provide enough difficulty for data-driven modelingof the sensor hardware behavior. For example, modeling radarreflections on guardrails on a motorway is a topic of currentresearch [112]. Unlike for perception software development,the research field of sensor modeling seems to be lacking com-mon benchmarking datasets that would allow a straightforwardcomparison of different sensor models on the same data.
7
Scenarios:
often
purposely
recorded
for the
phenomena
that shall
be modeled
Reference:
typically from
RTK-GNSS-
IMUs
SUT: especially
sensor HW,
also perc. algo.
“Metrics”:
sensor error
model, used for
generation of
artificial
perception data
Fig. 4: Object-level data-driven sensor modeling expressed intaxonomy (Fig. 1).
3) Reference Data: Modeling the behavior of sensor hard-ware in a data-driven approach requires an independent refer-ence to the sensor hardware. This makes RTK-GNSS-IMUs(see Sec. VIII-B1) a suitable and typically used source ofreference data (see e.g. [108], [113] for their application).
4) Metrics: Metrics in this paper are quantitative statementson the SUT. Since parametrized or trained sensor models candescribe how similar the SUT’s perception is to the referenceperception, they are interpreted as test metrics here. Notethat sensor models are usually not single-score metrics, butrather for example probability distributions of the sensor’serrors [108]. Note also that the term metric in sensor modelingliterature is used differently - there, metrics make a statementon the modeling approach rather than on the SUT [114].
Actual statements on the SUT can be for example the meanvalues and standard deviations of Gaussian distributions thatdescribe the SUT objects’ state errors in e.g. position andvelocity [110]. A nonparametric distribution for such errorsthat is based on a Gaussian mixture model is used e.g. in [108].There are various further ways of expressing the SUT’s errorsby sensor models, which are however mostly outside the focusof this paper.
5) Relevance for Safety-Aware Perception Testing: Typi-cally, sensor models aim at describing the specific phenomenaof a sensor modality as detailed as feasible, no matter howsafety-relevant these phenomena are [109], [114]. However,some sensor modeling activities explicitly address this paper’sresearch question. For example, [65] models perception errorswhile considering the effect they have on robust decisionmaking. In the context of validation of sensor models, [115]argues that a key property of modeled sensor data should bethat they induce the same behavior in the downstream drivingfunction like the real sensor data would do. Such topics arefurther elaborated in Sec. VI-B2 about the perception-controllinkage.
VI. TEST CRITERIA AND METRICS
This section and the following two sections each cover onetesting axis of the used taxonomy from [4] (Fig. 1) and arededicated to the primary research question of this paper.
According to the taxonomy, test criteria and metrics are“a statement on the system-under-test (test criteria) that isexpressed quantitatively (metric)” [4]. For example, a criterion
that is qualitative at first could be quantified by means ofspecifying intervals on a related metric that determine passingor failing a test.
After examining how to specify perception requirements andtest criteria (Sec. VI-A), we deal with safety-aware micro-scopic metrics and criteria (Sec. VI-B). Furthermore, metricson the self-reporting and confidence estimation capabilities ofthe SUT are discussed (Sec. VI-C), as well as macroscopicmetrics towards approval (Sec. VI-D).
A. Specification of Requirements and Criteria
A perception subsystem shall enable the AV to reach its des-tination safely, comfortably, and in reasonable time. Therefore,it shall provide information in sufficient quality about all roadusers that are relevant for fulfilling the driving task. However,such requirements are not specific enough to be tested [116].Thus, how can one specify “relevant for fulfilling the drivingtask”, or “sufficient quality” for usage as binary test criteria?
In the following, it may be useful to differentiate betweenconcept specification and performance specification of envi-ronment perception [30]. In the mentioned source, conceptspecification refers to defining the properties to be perceivedsuch as a pedestrian’s pose, extent, and dynamic state, givenan ODD. In contrast, the performance specification defineshow well these properties should be perceived, for example interms of detection range, confidence, and timing [30].
1) The Difficulty of Specifying Perception: AVs are ex-pected to operate in unstructured, public, real-world environ-ments, which are called open context in [117]. Accordingto [72], a complete concept specification of the environmentperception may not be possible because a model about theenvironment generally cannot cover all necessary relations andproperties in such an open context. This issue has also beencalled ontological uncertainty [118]. For example, to specifythe perception of pedestrians, one would have to specify whata pedestrian is, which is, however, only partially possible usingrules such as necessary or sufficient conditions [29]. Providingexamples of pedestrians in a training set is how machinelearning engineers specify the concept of a pedestrian. On theone hand, this can enable driving automation of SAE Levels3 and above, but on the other hand, it prevents a traditionalspecification according to ISO 26262 [29].
Besides specifying the perception concept and performancefor discrete environmental aspects like the classification of aroad user, another key challenge is to identify when uncertaintyin continuous and dynamic environmental aspects, like a car’svelocity, leads to safety-relevant failures [116].
2) Concrete Approaches of Specifying Perception: Contri-butions from the field of machine learning investigate how tospecify the perception subsystem by using pedestrian detectionas a benchmark example [29], [73]. On a higher level, [29]emphasizes the importance of an adequate language for spec-ification and the potential of deliberate partial specifications.The paper proposes and evaluates several methods for incorpo-rating partial specifications into the development process. Fur-ther literature with concrete specification approaches include
8
creating an ontology of the exemplary “pedestrian” domain(concept specification) [73], and taking human perceptionperformance as a reference (performance specification) [119].A formal language for specifying requirements on the perfor-mance of object detection in the absence of reference data isproposed in [120], [121].
Instead of using an environmental concept like a pedestrianas the center of investigation, the methodology of [67] outlineshow particular test criteria for AV subsystems can be definedin a top-down way, starting from overall safety goals. Themethodology is, however, not yet applied specifically to theperception subsystem.
As mentioned earlier, the complexity of the open contextcan cause gaps in the specified requirements. To fill thesegaps, many organizations collect large numbers of real-worldmileage to discover so far unknown scenarios [6]. Theserecorded scenarios can also serve as test scenarios if they areidentified as test-worthy (Sec. VII-C).
Besides the approaches mentioned so far, there are alsoconsiderations on perception requirements that aim at comply-ing with the traditional ISO 26262 functional safety standard.The sources [35], [52], [53] propose dynamically associatingan Automotive Safety Integrity Level (ASIL) with a givendriving situation such that for example, the perception isrequired to comply with the stricter ASIL D in high-risksituations and with the less strict ASIL A in low-risk situations.An example of how functional safety requirements for theperception subsystem can be derived based on a fault treeanalysis (FTA) is given in [122] in the context of automatedvalet parking.
The following subsections deal with metrics for measuringquantitatively whether specified test criteria are met.
B. Microscopic Test Criteria and Metrics
The currently most established perception performance met-rics, which are typically used in machine learning, do notrepresent whether the perception output is sufficient for safevehicle operation [22, Safety Concern 9] (Sec. V-A5). Thissection therefore reviews literature about metrics and criteriathat explicitly distinguish safety-relevant from safety-irrelevantperception errors.
1) Heuristic for the Safety-Relevance: The authors of [49]provide a simple approach towards the safety-criticality ofperception errors in the existence uncertainty domain. Certainfractions of the binary error types FP and FN are assumed tobe safety-critical, where the fractions depend on the error’sposition of occurrence within the ego vehicle’s FOV. Forexample, perception errors directly in front of the ego vehiclecan heuristically be estimated to be more likely to be safety-critical than perception errors occurring farther away or with alateral offset [49, Figure 3]. The benefit of this approach is thatonce its numerical values are set, it does not need to considerany downstream driving function for computing safety-criticalfailure rates.
2) Modeling the Perception-Control Linkage: However,whether a perception error turns out to be safety-critical or not
generally does depend on the downstream driving function.Thus, we describe different ways of modeling the interfacebetween perception and planning/control, which is also calledthe perception-control linkage [28].
The above-mentioned fractions of safety-critical perceptionerrors could be determined by means of closed-loop faultinjection simulations [49]. However, if the downstream drivingfunction receives a minor update, the perception metrics wouldhave to be recomputed, which would render such a directapproach unpractical for iterative development.
Alternatively, one could abstract the perception and planningsubsystems such that test results of the perception subsystemcan be re-used for varying planners. For this purpose, modularfunctional system architectures [5], [116], [42], [38] could beimplemented with contracts, assumptions, and guarantees atthe interfaces between the perception and planning subsys-tems [23], [45], [60], [35].
Such a modular approach would enable different safetyassurance methodologies for the different subsystems. For ex-ample, the following section discusses data-driven perceptiontesting and formal safety assurance of the planner. The ideabehind such formal methods is to always assure a certain safeplanning behavior, given that the environment is perceivedwell enough. Popular formal models for safe planning includeResponsibility-Sensitive Safety (RSS) [33] and reachabilityanalysis [43], [123].
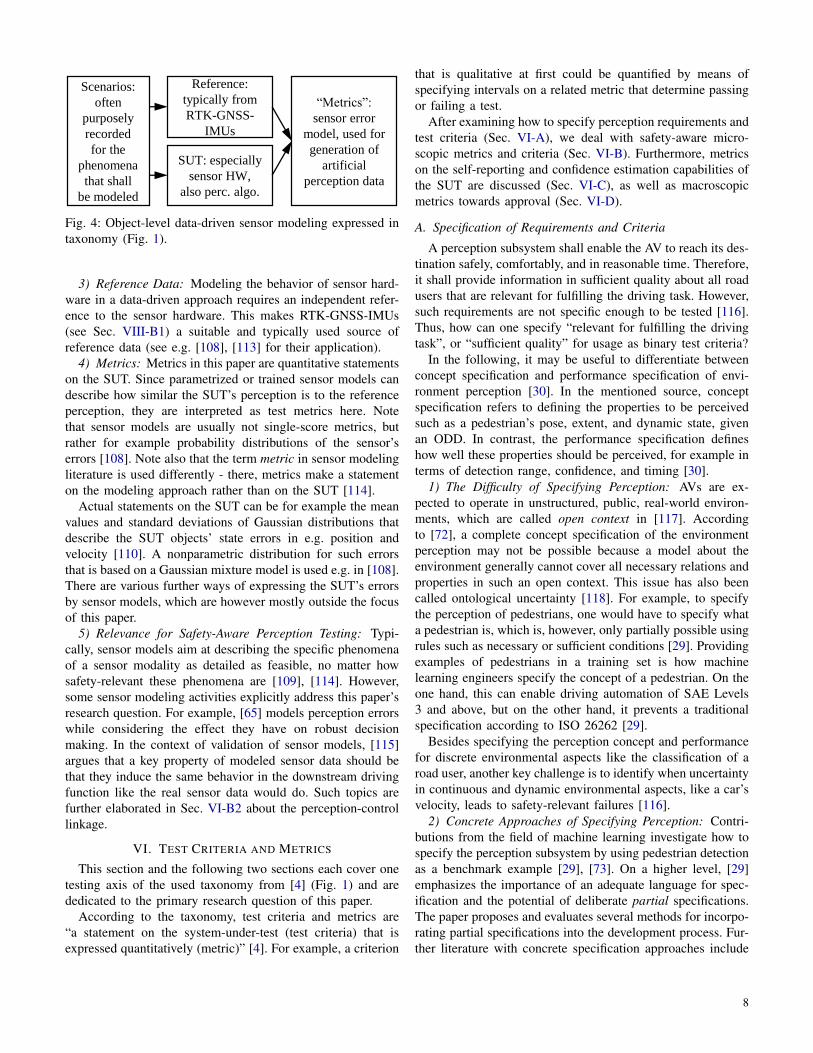
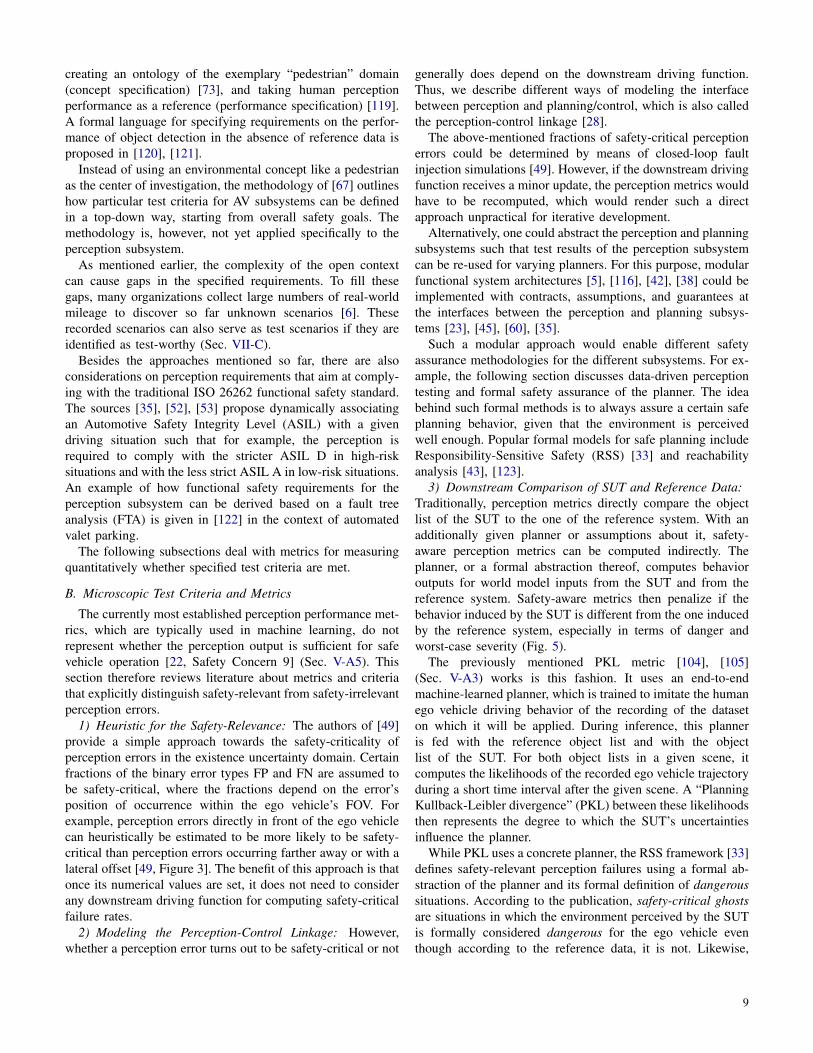
3) Downstream Comparison of SUT and Reference Data:Traditionally, perception metrics directly compare the objectlist of the SUT to the one of the reference system. With anadditionally given planner or assumptions about it, safety-aware perception metrics can be computed indirectly. Theplanner, or a formal abstraction thereof, computes behavioroutputs for world model inputs from the SUT and from thereference system. Safety-aware metrics then penalize if thebehavior induced by the SUT is different from the one inducedby the reference system, especially in terms of danger andworst-case severity (Fig. 5).
The previously mentioned PKL metric [104], [105](Sec. V-A3) works is this fashion. It uses an end-to-endmachine-learned planner, which is trained to imitate the humanego vehicle driving behavior of the recording of the dataseton which it will be applied. During inference, this planneris fed with the reference object list and with the objectlist of the SUT. For both object lists in a given scene, itcomputes the likelihoods of the recorded ego vehicle trajectoryduring a short time interval after the given scene. A “PlanningKullback-Leibler divergence” (PKL) between these likelihoodsthen represents the degree to which the SUT’s uncertaintiesinfluence the planner.
While PKL uses a concrete planner, the RSS framework [33]defines safety-relevant perception failures using a formal ab-straction of the planner and its formal definition of dangeroussituations. According to the publication, safety-critical ghostsare situations in which the environment perceived by the SUTis formally considered dangerous for the ego vehicle eventhough according to the reference data, it is not. Likewise,
9
Scenario Reference Perception System
(Layers 1 and 2)
Perception Subsystem Under Test
Metrics & Test Criteria
Layer 1:
Information
Reception
Layer 2:
Information
Processing
Layer 0:
Information
Access (Ref.)
Layer 0:
Information
Access (SUT)
Layer 3:
Situational
Understanding
Layer 4:
Behavioral
Decision
or assumptions/abstraction thereof
Measure
danger or
worst-case
severity
Diff. between SUT and Ref. System-
Fig. 5: Safety-aware perception testing of [33] and [28] expressed in taxonomy for testing by [4] (Fig. 1), with decompositionlayers of the driving function by [5] (Fig. 2) mapped into the taxonomy. Further explanation is given in Sec. VI-B3.
safety-critical misses are situations in which the environmentperceived by the SUT is formally not considered dangerouseven though it actually is. For example, a safety-critical ghostcan be a false-positive pedestrian detection in front of theego vehicle that could cause a false and dangerous brakingmaneuver. A safety-critical miss could be a pedestrian at thesame location as a false-negative detection, which could leadto the ego vehicle hitting the pedestrian. Safety-critical ghostsand misses can not only be caused by existence uncertainties,but also by state and classification uncertainties [33] becausetheir definition is agnostic of the type of uncertainty. Thisavoids a potentially ambiguous differentiation between stateand existence uncertainties (see Sec. V-A4).
However, this concept of safety-critical perception fail-ures [33] so far seems to have been treated mostly theo-retically. For example, we are not aware of its extension toconsider multiple time steps or its practical demonstration onreal data.
Salay et al. [28] expand this concept of binary safety-critical perception failures to a potentially continuous de-scription of the risk that a perception failure can cause. Thework formalizes a concept to analyze the so-called incurredseverity that an uncertain environment perception can cause.It also requires knowledge about the planning subsystem, forexample, the planner’s policy for computing actions basedon a world model. Furthermore, for actions that can causeharm, there must be a way to assess the worst-case severityof this harm. With these assumptions, the microscopic andsafety-aware perception metric incurred severity is defined asthe difference between the SUT’s and the reference system’sinduced worst-case severities of control actions [28] (Fig. 5).
The same work [28] applies this concept in a case studydealing with classification uncertainty of road users. Forexample, if a pedestrian is correctly perceived as a pedestrian,then the worst-case incurred severity is zero. If a pedestrianis however classified as a cyclist, and if the control action forcyclists is less cautious than for pedestrians, then the incurredseverity of this misclassification is likely positive. Future worknot yet covered in [28] is to generalize the computation ofincurred severity to world models that are also subject toexistence and state uncertainty. Moreover, representative real-
world exposures (probabilities of occurrence) of scenes wouldbe needed for valid risk computations.
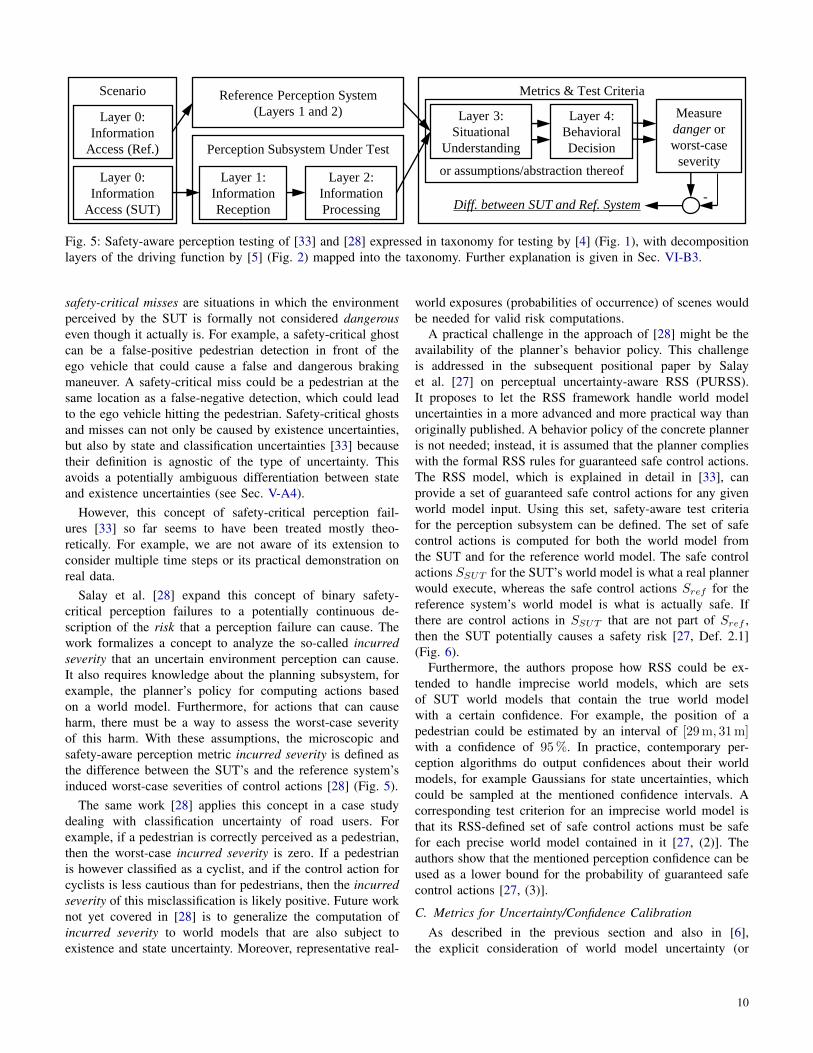
A practical challenge in the approach of [28] might be theavailability of the planner’s behavior policy. This challengeis addressed in the subsequent positional paper by Salayet al. [27] on perceptual uncertainty-aware RSS (PURSS).It proposes to let the RSS framework handle world modeluncertainties in a more advanced and more practical way thanoriginally published. A behavior policy of the concrete planneris not needed; instead, it is assumed that the planner complieswith the formal RSS rules for guaranteed safe control actions.The RSS model, which is explained in detail in [33], canprovide a set of guaranteed safe control actions for any givenworld model input. Using this set, safety-aware test criteriafor the perception subsystem can be defined. The set of safecontrol actions is computed for both the world model fromthe SUT and for the reference world model. The safe controlactions SSUT for the SUT’s world model is what a real plannerwould execute, whereas the safe control actions Sref for thereference system’s world model is what is actually safe. Ifthere are control actions in SSUT that are not part of Sref ,then the SUT potentially causes a safety risk [27, Def. 2.1](Fig. 6).
Furthermore, the authors propose how RSS could be ex-tended to handle imprecise world models, which are setsof SUT world models that contain the true world modelwith a certain confidence. For example, the position of apedestrian could be estimated by an interval of [29m, 31m]with a confidence of 95%. In practice, contemporary per-ception algorithms do output confidences about their worldmodels, for example Gaussians for state uncertainties, whichcould be sampled at the mentioned confidence intervals. Acorresponding test criterion for an imprecise world model isthat its RSS-defined set of safe control actions must be safefor each precise world model contained in it [27, (2)]. Theauthors show that the mentioned perception confidence can beused as a lower bound for the probability of guaranteed safecontrol actions [27, (3)].
C. Metrics for Uncertainty/Confidence CalibrationAs described in the previous section and also in [6],
the explicit consideration of world model uncertainty (or
10
Scenario
Reference:
world model
𝑊𝑟𝑒𝑓
SUT:
world model
𝑊𝑆𝑈𝑇
Test Criteria:
Safe actions
𝑆𝑟𝑒𝑓(𝑊𝑟𝑒𝑓)
Safe actions
𝑆𝑆𝑈𝑇(𝑊𝑆𝑈𝑇)
→ 𝑆𝑆𝑈𝑇 ⊆ 𝑆𝑟𝑒𝑓?
Fig. 6: Testing whether the SUT’s world model can inducecontrol actions that would not be safe for the reference worldmodel [27, Def. 2.1]. Figure follows taxonomy of Fig. 1.
inversely, confidence) can facilitate safety assurance, for ex-ample through runtime monitoring (more in Sec. IX-C3). Inthis context, it is crucial that the self-reported uncertaintyof the SUT correctly reflects its true uncertainty [22, SafetyConcern 5]. If this holds, then the SUT is calibrated [61],which means that it is neither over-confident nor too doubtfulof itself.
1) Types of Uncertainty: The literature on uncertainty inAD (e.g. [64]) describes that epistemic uncertainty, or modeluncertainty, constitutes how uncertain the SUT’s model ofdeep neural networks (DNNs) is in correctly describing theenvironment. In contrast, aleatoric uncertainty is caused byphysical sensor properties like finite fields of views, resolu-tions, and sensor noise. Both types are relevant for correctcalibration. Additionally, [118] proposes the concept of onto-logical uncertainty to describe the complete unawareness ofcertain aspects of the environment, even in the reference data.
2) Representations of Uncertainty: In object perception,state estimation is a regression task (continuous true value),while existence and classification estimation are classifica-tion tasks (discrete true values) [64]. State uncertainties aretypically quantified by continuous probability distributions orconfidence intervals, while existence and classification uncer-tainties are usually expressed by scalar probabilities between0 and 1.
3) Calibration Metrics: This section focuses on metricsthat only describe how well-calibrated the world model un-certainties are. In contrast, uncertainty-aware classification orregression metrics [64] are a topic of perception algorithmbenchmarking (Sec. V-A).
Multiple literature sources set up so-called calibrationcurves [61], [124], [125] for visualization and numericalanalysis. These curves plot the accuracy (or empirical fre-quency) of a prediction over the prediction’s confidence, oftenusing bins. For example, in classification tasks, one specificbin could contain all events where the detector reports aconfidence/existence probability in between 80% and 90%.If there is a pedestrian present for only 70% of all events inthat bin, then the calibration curve would be tilted off from theideal diagonal line. In regression tasks, a similar calibrationcurve can be set up by defining the accuracy as the empirical
frequency of when the estimated confidence interval containedthe true value.
Single-score calibration metrics can be computed from suchcalibration curves [64]. In classification tasks, the ExpectedCalibration Error (ECE) and the Maximum Calibration Error(MCE) [124] represent the expected and the maximum dif-ference between confidence and accuracy in such calibrationcurves, respectively. Similar metrics for regression tasks arethe calibration error [125] or the related Area Under theCalibration Error Curve (AUCE) [126].
Concrete applications of uncertainty calibration and eval-uation in 3D object detection from lidar point clouds aregiven for example in [75] and the follow-up publication [76].The latter publication explicitly uses the mentioned calibrationcurves and the ECE metric.
A further uncertainty evaluation approach that explicitlyaddresses perception systems in safety-relevant domains isprovided in [70] and subsequently [63]. The publications,which focus on out-of-distribution detection for classificationtasks, distinguish four different cases in classification results.The cases are combinations of the properties certain/uncertain(decided by a threshold), and correct/incorrect. Metrics aredefined based on the fractions of these individual cases amongall classification results. The fraction of certain, but incorrectresults is defined as the Remaining Error Rate (RER), andthe fraction of certain and correct results is defined as theRemaining Accuracy Rate (RAR).
All mentioned metrics so far assume that a precise worldmodel is available as a reference. However, also reference dataare generally uncertain and imprecise (Sec. VIII-D), whichmakes test metrics more complex.
D. Macroscopic Metrics Towards Approval
So far in this paper, the used metrics and test criteriahave been statements on the SUT in either individual scenes(microscopic metrics) or in relatively small amounts of testdata with a research purpose. While microscopic metrics andcriteria are necessary for a detailed analysis of the SUT, theyalone are not sufficient for the overall safety assurance ofAVs because their results need to be extrapolated to estimatemacroscopic [127] metrics (definition in Sec. I-C10).
1) Terminology: Safety vs. Reliability: Since the term re-liability is often used in the context of macroscopic safetymetrics [49], it is first briefly differentiated from the termsafety. The perception subsystem of an AV must enable theoverall vehicle to drive safely. Safety, however, is a propertyof the overall system and not of the perception subsystem.The perception subsystem can at best be reliable, which isgenerally different from being safe [9, Sec. 2.1] (Sec. I-C).Note that a property that includes both safety and reliabilityis dependability [128].
2) Mean Time Between Failures: The RSS publication [33]argues that for the acceptance of AVs, the overall probabilityof occurrence of safety-critical failures must be in the orderof magnitude of 10−9 per hour. This would imply a test
11
criterion of no such failures during about 109 hours of driv-ing, where safety-critical failures in their publication are thepreviously introduced safety-critical ghosts and misses. Therelated paper [66], which focuses on perception within RSS,states another large required mean time between failures of107 h for the perception subsystem. Only perception failuresthat can possibly lead to unsafe vehicle behavior should becounted in that number.
Major contributions to the macroscopic reliability assess-ment of the perception subsystem have come from Berket al., e.g. [49], [36]. The macroscopic metrics they use arethe rate of all perception failures and the rate of safety-critical perception failures, both measured in failures per hour.Safety-critical perception failures are computed by filteringall perception failures with a field-of-view-dependent safety-criticality factor between 0 and 1, as explained in Sec. VI-B1.An overall approval criterion according to [36] is that thesum of the failure rates of the perception, planning, andactuation subsystems is smaller than a given threshold rate,which is called the target level of safety. A correspondingtesting methodology to compute these macroscopic perceptionmetrics is discussed in Sec. IX-C4.
E. Conclusion of Test Criteria and Metrics
Different metrics describe different properties of the SUTlike its safety-relevant performance in a single scene, thecalibration of its self-reported uncertainties, or its statisti-cal safety impact. Specifically the representation of safety-relevance in microscopic metrics seems challenging. Thesementioned different classes of metrics are typically coupled.For example, the SUT’s statistical safety impact depends on itssafety impact in individual scenes, which in turn may dependon whether the SUT has correctly reported its uncertainty inthat scene. Thus, one challenge is to harmonize individuallydedicated metrics into an overall framework. Moreover, thespecification of test criteria is nontrivial due to the complexityof the open-world context.
VII. TEST SCENARIOS
According to the taxonomy of [4], a test scenario is “a setof specified conditions” under which a test is executed. Thefollowing subsections deal with adapting the term scenario tothe perception context (Sec. VII-A), describing test scenariosand the ODD (Sec. VII-B), generating a test scenario catalog(Sec. VII-C), executing scenarios as test cases (Sec. VII-D),and splitting scenarios into training and test sets (Sec. VII-E).Much of the literature on scenario-based testing does not yetfocus on perceptual uncertainty, which is why this section alsocites related literature with a broader focus.
A. Adapting the Term Scenario to the Perception Context
The definition of the term scenario has been discussedextensively in the context of scenario-based testing [12].According to the mentioned source, a scenario contains actors(mostly road users) whose actions influence the temporal de-velopment of scenes within the scenario. For testing purposes,
one of such actors within the scenario is the subject vehicle.So far, the focus of scenario-based testing of AVs has beenon the plan and act subsystems instead of on the perceptionsubsystem of the subject vehicle [15]. However, if only theperception subsystem is tested in an open-loop fashion, thenit typically only has the role of a passive observer of thescenario instead of an influencing actor. At this point, weexclude closed-loop testing because we are interested in theoffline test of potentially multiple perception algorithms on thesame recorded raw sensor data from the real world.
To the best of our knowledge, we are not aware of litera-ture that explicitly considers the influence that an open-loopperception subsystem may have on the temporal developmentof a scenario. Such an influence is in fact possible throughe.g. electromagnetic waves emitted by active sensors, whichcould disturb the sensors of other AVs and thus theoreti-cally influence their behavior. However, in this review, weassume for simplicity that perception-specific scenarios arescenarios whose temporal development of objective scenesis pre-determined, but where the subjective observation ofthese scenes in world models is left open. This corresponds tostatic scenarios with an additionally predetermined ego vehiclebehavior according to [129].
Furthermore, it seems that the different abstraction levelsof scenarios (functional, logical, concrete) of [130] can alsobe used for perception scenarios. A functional scenario isdescribed verbally (e.g. it rains, among other aspects), whereasa logical scenario has parameters (e.g. uniform precipitationin millimeters per hour), and a concrete scenario gives eachparameter a numerical value (e.g. 2mm/h). Generally, differ-ent logical scenario parameters are of interest for perceptiontests than for planning tests [131].
B. Description of Scenarios and ODD
Arguing whether test scenarios cover the entire ODD re-quires ways to describe scenarios and the ODD.
Current ODD description approaches are the taxonomy ofBSI PAS 1883 [132], the NHTSA framework [78, Ch. 3],and the ongoing standardization of a machine-readable ODDformat in ASAM OpenODD [133]. Furthermore, ontologiesare used to describe ODDs [59] and scenes within scenar-ios [44]. Ontologies are intended to be standardized in ASAMOpenXOntology [134] and have also been proposed to definea schema for world model data [27]. For ontology-generatedscenarios, the notion of abstract scenarios was introduced todescribe functional scenarios that are formal and machine-readable, but do not yet have a logical parameter space [131].The ontology of [44], which is used to generate traffic scenesfor scenario-based testing, organizes all scenario entities bymeans of a 5-layer-model. This model was first defined usingfour layers in [135], and has been adapted to six layersin [136] and most recently [137]. The model’s individuallayers according to the most recent and also summarizingpublication [137] are
1) Road network and traffic guidance objects2) Roadside structures
12
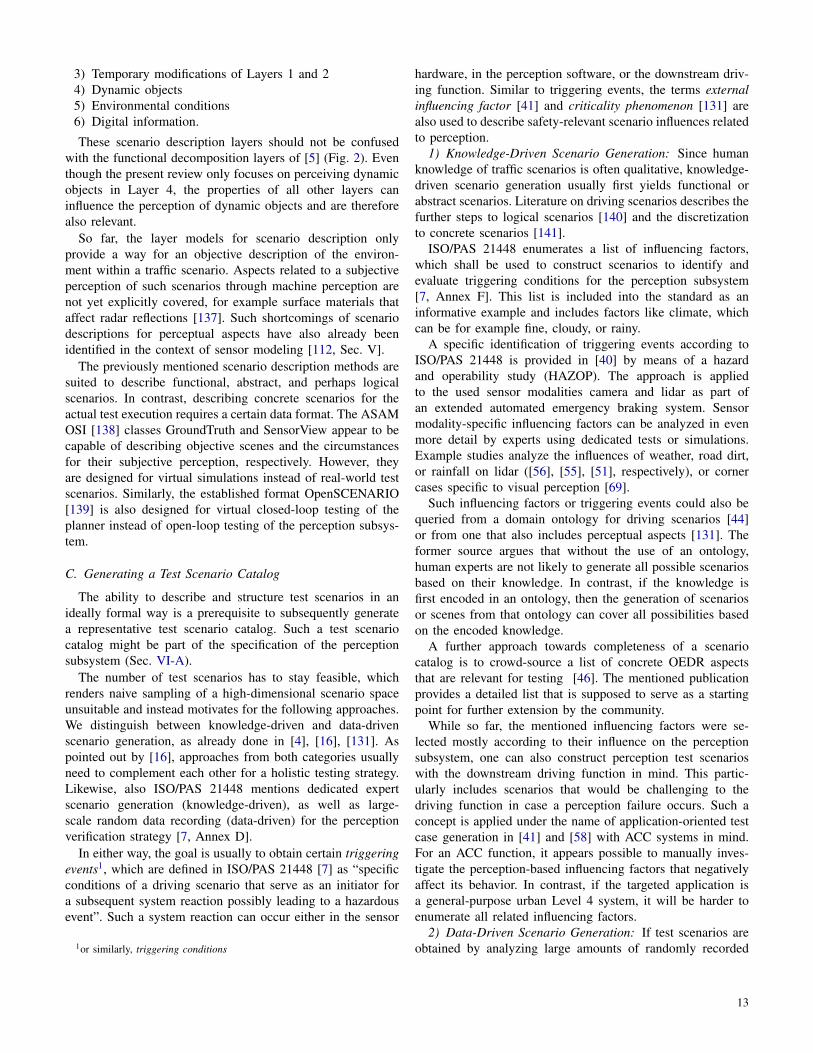
3) Temporary modifications of Layers 1 and 24) Dynamic objects5) Environmental conditions6) Digital information.
These scenario description layers should not be confusedwith the functional decomposition layers of [5] (Fig. 2). Eventhough the present review only focuses on perceiving dynamicobjects in Layer 4, the properties of all other layers caninfluence the perception of dynamic objects and are thereforealso relevant.
So far, the layer models for scenario description onlyprovide a way for an objective description of the environ-ment within a traffic scenario. Aspects related to a subjectiveperception of such scenarios through machine perception arenot yet explicitly covered, for example surface materials thataffect radar reflections [137]. Such shortcomings of scenariodescriptions for perceptual aspects have also already beenidentified in the context of sensor modeling [112, Sec. V].
The previously mentioned scenario description methods aresuited to describe functional, abstract, and perhaps logicalscenarios. In contrast, describing concrete scenarios for theactual test execution requires a certain data format. The ASAMOSI [138] classes GroundTruth and SensorView appear to becapable of describing objective scenes and the circumstancesfor their subjective perception, respectively. However, theyare designed for virtual simulations instead of real-world testscenarios. Similarly, the established format OpenSCENARIO[139] is also designed for virtual closed-loop testing of theplanner instead of open-loop testing of the perception subsys-tem.
C. Generating a Test Scenario Catalog
The ability to describe and structure test scenarios in anideally formal way is a prerequisite to subsequently generatea representative test scenario catalog. Such a test scenariocatalog might be part of the specification of the perceptionsubsystem (Sec. VI-A).
The number of test scenarios has to stay feasible, whichrenders naive sampling of a high-dimensional scenario spaceunsuitable and instead motivates for the following approaches.We distinguish between knowledge-driven and data-drivenscenario generation, as already done in [4], [16], [131]. Aspointed out by [16], approaches from both categories usuallyneed to complement each other for a holistic testing strategy.Likewise, also ISO/PAS 21448 mentions dedicated expertscenario generation (knowledge-driven), as well as large-scale random data recording (data-driven) for the perceptionverification strategy [7, Annex D].
In either way, the goal is usually to obtain certain triggeringevents1, which are defined in ISO/PAS 21448 [7] as “specificconditions of a driving scenario that serve as an initiator fora subsequent system reaction possibly leading to a hazardousevent”. Such a system reaction can occur either in the sensor
1or similarly, triggering conditions
hardware, in the perception software, or the downstream driv-ing function. Similar to triggering events, the terms externalinfluencing factor [41] and criticality phenomenon [131] arealso used to describe safety-relevant scenario influences relatedto perception.
1) Knowledge-Driven Scenario Generation: Since humanknowledge of traffic scenarios is often qualitative, knowledge-driven scenario generation usually first yields functional orabstract scenarios. Literature on driving scenarios describes thefurther steps to logical scenarios [140] and the discretizationto concrete scenarios [141].
ISO/PAS 21448 enumerates a list of influencing factors,which shall be used to construct scenarios to identify andevaluate triggering conditions for the perception subsystem[7, Annex F]. This list is included into the standard as aninformative example and includes factors like climate, whichcan be for example fine, cloudy, or rainy.
A specific identification of triggering events according toISO/PAS 21448 is provided in [40] by means of a hazardand operability study (HAZOP). The approach is appliedto the used sensor modalities camera and lidar as part ofan extended automated emergency braking system. Sensormodality-specific influencing factors can be analyzed in evenmore detail by experts using dedicated tests or simulations.Example studies analyze the influences of weather, road dirt,or rainfall on lidar ([56], [55], [51], respectively), or cornercases specific to visual perception [69].
Such influencing factors or triggering events could also bequeried from a domain ontology for driving scenarios [44]or from one that also includes perceptual aspects [131]. Theformer source argues that without the use of an ontology,human experts are not likely to generate all possible scenariosbased on their knowledge. In contrast, if the knowledge isfirst encoded in an ontology, then the generation of scenariosor scenes from that ontology can cover all possibilities basedon the encoded knowledge.
A further approach towards completeness of a scenariocatalog is to crowd-source a list of concrete OEDR aspectsthat are relevant for testing [46]. The mentioned publicationprovides a detailed list that is supposed to serve as a startingpoint for further extension by the community.
While so far, the mentioned influencing factors were se-lected mostly according to their influence on the perceptionsubsystem, one can also construct perception test scenarioswith the downstream driving function in mind. This partic-ularly includes scenarios that would be challenging to thedriving function in case a perception failure occurs. Such aconcept is applied under the name of application-oriented testcase generation in [41] and [58] with ACC systems in mind.For an ACC function, it appears possible to manually inves-tigate the perception-based influencing factors that negativelyaffect its behavior. In contrast, if the targeted application isa general-purpose urban Level 4 system, it will be harder toenumerate all related influencing factors.
2) Data-Driven Scenario Generation: If test scenarios areobtained by analyzing large amounts of randomly recorded
13
vehicle fleet data, then the abstraction level of available datais closer to concrete scenarios than to functional scenarios.However, the recorded data is initially only available in thedata schema of the recording format, which usually does notshare the same parameters like a logical scenario space. Thus,a challenge in data-driven approaches is to generalize thesnippets from the recorded data in a way that they correspondto points in a logical scenario space. This is necessary in orderto vary individual parameters such that potentially relevant,but not yet observed scenarios can also be generated. Weare not aware of scientific publications that present data-driven scenario generation in the safety context specificallyfor perception testing, and thus will refer to related literatureabout general testing, which has already been reviewed inmore detail in [16].
One example approach for a data-driven test case generationis described in [142]. In the mentioned publication, a databasesystem of relevant scenarios is described. Its input data fromvarious sources such as field operational testing, naturalisticdriving studies, accident data, or others, must first be con-verted to a common input data format of traffic recordings.Afterwards, individual snippets of the input data are affiliatedto pre-determined logical scenario types, such that each snippetcorresponds to one point in a logical scenario space. Thelogical scenario parameters can also be obtained throughunsupervised learning on the input data [143]. If the inputdata were obtained from large amounts of randomly collecteddriving data, then one can further compute statistical measuressuch as the scenario’s real-world exposure and its parame-ters’ real-world probability distributions [142]. By additionallycomputing criticality metrics on the given snippets, one couldestimate the potential severity of a section of the logicalscenario space. The exposure and severity as meta-informationon the scenario space then help to turn the obtained logicalscenarios into relevant test cases. For example, one could putmore testing efforts on scenarios with a high risk, where therisk of a scenario increases with its exposure and severity, anddecreases with its controllability [144, Appendix A].
3) Combined Scenario Generation: As pointed out by [16],knowledge-driven and data-driven approaches for scenariogeneration often complement each other in practice. For exam-ple, the previously mentioned database approach from [142]assumes that a concept for logical scenario spaces is given,potentially from expert knowledge. In turn, knowledge-drivenscenario generation can also be backed up by measurementsand data [16].
One example of a combined test case generation for theperception subsystem is given in [5]. Besides the functionaldecomposition layers (Fig. 2), the publication also proposes amethod for defining particular test cases for each of those de-composition layers. The method takes driving scenarios from adatabase such as [142], assumes an accident if there was none,and then uses a fault tree analysis (FTA) to define pass/failcriteria for the individual subsystems in a given scenario.This combined approach allows the derivation of perception-specific test scenarios from general driving scenarios.
4) Test Scenarios Specific to the SUT: In the end, it couldalso be that the test scenarios that result in the highest riskfor a given SUT are not found by only considering externalinfluencing factors from the space of all possible scenarios.Instead, the unexpected insufficiencies that the DNNs of theSUT have learned might lead to more critical behavior thanwhat a usually suspected external influence could trigger [22,Safety Concern 4]. For example, [145] identifies perceptionsubsystem inputs that lead to highly uncertain world modelsfor a given SUT by propagating uncertainties through theindividual perception components.
5) Difficulties in Covering the ODD with Scenarios:Any attempt to formally describe the ODD and to cover itsufficiently with test scenarios is generally difficult becauseof the open context problem of the real world [117]. Relatedto this, [22, Safety Concern 1] expresses that the data orscenarios used for the development and training of the per-ception subsystem are usually not a good approximation ofthe system’s ODD in the real open world. Furthermore, thereal world changes over time, which makes it necessary toiteratively update the ODD description and its coverage withtest scenarios [22, Safety Concern 2].
Moreover, in practice only a finite number of concrete testscenarios can be sampled from the infinite number of concretescenarios that could be theoretically generated from a logicalscenario. This sampling makes it generally unclear whetherthe results of two similar concrete test scenarios also hold inbetween these discrete points. In fact, DNNs used for objectdetection can show a potentially extreme non-linear behaviorwith respect to only slight input variations for example inweather conditions. This brittleness, which has been pointedout in [22, Safety Concern 6], makes it difficult to argue abouta sufficient ODD coverage with sampled test scenarios.
Nevertheless, combinatorial testing [146], which is sug-gested by ISO/PAS 21448 and already applied to computervision for AVs [147], can potentially keep the number ofdiscretized concrete tests feasible while providing certaincoverage guarantees. Furthermore, combinatorial testing thatexplicitly exploits the functional decomposition approach forAVs [5] is performed in [148] for simulated AV testing.
D. Executing Scenarios as Test Cases
We assume the execution of a test scenario to be an offlineexecution of a perception algorithm on previously recordedraw sensor data. In this way, only the sensor mounting posi-tions and sensor hardware are fixed by the recording, whereasmultiple perception algorithms can be applied.
For scenarios that correspond to snippets from existingreal-world vehicle recordings, the corresponding raw data candirectly be used for the test without having to be re-recorded.Otherwise, the raw sensor data for the test scenarios mustbe captured. Public roads offer less influence on the scenariodetails, but allow encountering many different scenarios overtime with little effort per scenario. In contrast, proving groundsallow to set up specific scenarios, which however requires
14
high efforts per scenario and may lack realism, e.g., whenreproducing precipitation.
E. Training and Test Sets of Scenarios
If the DNNs of the SUT are trained on data and scenariosthat are also used for testing, then overfitting likely takesplace during training and an unbiased testing for verifica-tion and validation purposes is not possible. Thus, it isimportant to properly separate recorded perception data intoindividual datasets for training and for testing [22, SafetyConcern 7], [82]. Furthermore, if the developers evaluate theSUT on a test set multiple times, an unintentional optimizationwith respect to the test set result might take place over multipledevelopment iterations [22].
F. Conclusion of Test Scenarios
Scenario-based approaches to minimize the overall testingeffort of AD functions also seem applicable to the percep-tion subsystem [82, Sec. 3.3.4]. An agreed-upon descriptionlanguage and data format of perception scenarios would bebeneficial for further research. Various approaches have beenproposed to obtain test scenarios, where their combinationfor a sufficient ODD coverage is an active research topic.Furthermore, it is challenging to obtain real-world recordingsof all identified test scenarios.
VIII. REFERENCE DATA
The third and final testing axis that this paper covers isthe “knowledge of an ideal result (reference)” [4]. For object-based environment perception, such an ideal result is an objectlist containing all road users that the SUT is supposed toperceive. We distinguish between the terms ground truth andreference in a way that a ground truth perfectly and objectivelydescribes the world. A reference is a subjective approximationof the ground truth in terms of data that are generated by aperception system that is superior to the SUT.
Requirements for reference systems for environment percep-tion have been analyzed in depth in the context of ADAS [34].Apart from the qualitative requirements mobility/portabilityand reporting of its own uncertainty, the paper states thequantitative requirements reliability, sufficient field-of-view,accuracy, and proper timing of the measurements. The follow-ing sections review different ways of generating reference data,where each way has its own advantages and disadvantages inthe mentioned categories. We structure the literature accordingto the position of the reference sensors, which can be mountedonly on the ego vehicle (Sec. VIII-A), also on other roadusers (Sec. VIII-B), or externally and not part of any roaduser (Sec. VIII-C). Uncertainty in reference data and anappropriate choice of the reference data source are discussedin Sec. VIII-D and Sec. VIII-E, respectively.
A. Reference Data From Ego Vehicle Sensors
The biggest advantage of reference data from sensors ofthe ego vehicle is that no external measurement equipment isneeded. Without an external perspective, however, road users
that are occluded for the sensors under test can also hardly bepresent in the reference data.
1) Reference from Sensors Under Test: Perhaps the mostcommon approach of generating reference data is to usethe raw sensor data from the SUT such that humans canlabel the reference objects and their properties. Labels in asensor-specific coordinate system, such as in a camera’s pixelspace, need to be transformed to the world model’s coordinatesystem (often in meters and defined over the ground plane) topotentially serve as a reference for it. In practice, the humanlabeling process is often at least semi-automated by offlineperception algorithms, which can go back and forth in time.Such reference data is typically used by datasets for perceptionalgorithm benchmarking such as [84]–[86].
Using only offline perception algorithms without humanintervention (as also done in e.g. [149]) dramatically reducesthe overall effort and could still result in superior data tothe SUT, but generally impairs the data quality. A standard-ization attempt for human-labeled reference data is ASAMOpenLABEL [150].
In either case, no additional sensor hardware is required,which is valid and a big advantage if the perception algorithmis the only component of interest. At the same time, it meansthat the SUT’s sensor mounting positions and sensor hardwaredo not have an independent reference, which might impedetheir rigorous assessment.
2) Separate Reference Sensors on Ego Vehicle: Additionalsensors on the ego vehicle that are not part of the SUT canpotentially also provide a reference for validating the SUT’ssensor mounting positions and hardware performance, seee.g. [149]. This approach seems to be more popular in ADASdevelopments than for AVs because AVs often already use thebest available sensors for their regular operation, and hencethere are no other sensors of higher quality left as reference.
3) k-out-of-n-vote of High-Level Fusion Inputs: The presentreview paper focuses on testing the world model that is gener-ated from fused inputs of all environment sensors. In contrast,Berk et al. [32] propose testing the object-level outputs ofindividual sensor systems before those are fused (more inSec. IX-C4). Such testing is needed for the authors’ proposedsafety assessment strategy for the perception subsystem, wherethe corresponding reference data could be generated withoutadditional sensors and without manual human effort.
If for example, a majority of fusion input systems detectsa certain road user while one input system does not, thenit can be argued that the majority of agreeing input systemsprovides the reference data for identifying a perception failurein the single disagreeing system. This idea is generalizedto a so-called k-out-of-n vote of sensor systems. It couldpotentially scale to billions of kilometers of data collectionusing large vehicle fleets with feasible effort, but its practicalimplementation on real vehicle data seems to have not yetbeen described in the available literature.
15

B. Reference Data from Other Road Users
Other road users can be either equipped with specific testequipment for the estimation of their position and state, orthey could communicate their states to the ego vehicle as partof a potential V2X-based regular operation in future.
1) RTK-GNSS-IMUs: Global navigation satellite systems(GNSS) with real-time kinematic correction (RTK) and anattached inertial measurement unit (IMU) have been popularfor generating reference data of individual road users. Pairedsystems of those can be installed both in the ego vehicle andat other road users to determine relative positions, velocities,and orientation angles. RTK-GNSS can measure the absoluteposition up to a few centimeters, but face difficulties when thesignal is affected by nearby structures such as buildings, trees,or a tunnel. IMUs work independently of the surroundings, butonly provide relative and incremental positioning information.Data fusion algorithms can combine the strengths of bothcomponents to estimate a consolidated state of the respectiveroad user.
Despite the size of the measurement hardware, also vul-nerable road users (VRUs) can wear such hardware as abackpack [151], which, however, alters their appearance toother sensors. In general, only specifically equipped road userscan provide reference data using RTK-GNSS-IMUs, whichexcludes the majority of public road users.
The accuracy of RTK corrections of GNSS signals inautomotive applications has been analyzed in more detailin [152]. Another work has specifically analyzed the accuracyof GNSS systems that are used for relative positioning of localgroups of vehicles [153]. For more information on GNSS ingeneral, we refer to the textbook [154].
2) Collaborative World Model Through V2X: If targetvehicles have the capability to accurately localize themselveswithout dedicated testing hardware, then they could communi-cate their state to a cloud-based or edge-based collective envi-ronment model [155]. The mentioned publication hypothesizeshow this could enable a mutual verification of the environmentperception of individual road users. The key difference tothe previously described RTK-GNSS-IMU approaches is thatthe publication [155] aims at the regular operation of futureproduction vehicles rather than dedicated testing activities.
The targeted crowd-sourced reference data generation fol-lows a similar idea like the previously described k-out-of-n-vote of high-level fusion inputs (Sec. VIII-A3). The differencehere is that the inputs to the vote would originate from vehiclesinstead of from sensors. However, also this approach does notseem to have been demonstrated with real-world vehicles yet.
C. Reference Data from Non-Road Users
The analyzed literature on reference data generation withsensors external to the road users includes stationary infras-tructure sensors, unmanned aerial vehicles (UAVs, or drones),and helicopters. Those data are often intended as either stand-alone naturalistic traffic data or as online enhancements ofthe AV perception. They can still serve as a reference forthe SUT if their quality is superior to the SUT according to
context-specific reference data requirements. A data qualitysuperior to the SUT on the ground can be achieved by a moreadvantageous bird’s eye perspective, by intentional overfittingof the perception algorithms to the sensor’s location, and byhuman error-checking. Humans can detect errors in referenceobject lists easier when comparing them to a raw video from abird’s eye perspective than by comparing them to a potentiallydisturbed GNSS signal or to potentially incomplete SUT rawdata.
1) Reference Data from Stationary Infrastructure Sensors:Stationary infrastructure sensors are sensors that are mountedon buildings, streetlamps, gantries, bridges, or other nearbystructures. They are used in urban locations for example inthe Ko-PER dataset [48], in the test area autonomous drivingBaden-Wurttemberg [71], and at the AIM test site [156].Infrastructure sensors at highways or motorways are usedin [157] and at the Providentia sensor system [158], wherethe latter source assesses its performance using a helicopter-based system, which is covered in Sec. VIII-C3. The projectsHDVMess and ACCorD aim at installing mobile and fixedinfrastructure sensors at various sites [159] and evaluate theirdata generation with a UAV-based reference system [160].
2) Reference Data from UAVs: Camera-based referencedata generation from a bird’s eye perspective has been in-vestigated at least since 2014 [47]. The necessary processingsteps to track ground vehicles from UAVs were later describedin more detail in [161] and [162]. UAVs are used as referencesensors for sensor modeling in [110] and for assessing infras-tructure sensors in [160]. A qualitative assessment of UAV-based reference systems in contrast to other reference systemsis given in [163]. Reference data from a UAV’s perspectivetend to suffer from less occlusions than from perspectivescloser to the ground, however, new sorts of occlusions fromtreetops or bridges occur.
3) Reference Data from Helicopters: Additionally, heli-copters have been used to record the ground traffic for verifi-cation and validation purposes of AD systems. The DLRADdataset [164] was partially recorded using a helicopter thatfollows a target vehicle with active environment perception.A previous publication from the same project [165] describeshow such a helicopter-based system can be used to validate thebehavior of ADAS. Furthermore, a helicopter-based referencedata generation is also described and used in [158] to assessa static infrastructure sensor system.
D. Uncertainty in Reference Data
Reference systems do not provide an absolute ground truth,but only have to come closer to it than the SUT does. Thishas been pointed out and quantified with respect to labelinguncertainty in [166]. Thus, the quality of the reference data(or labels) should be taken into account such that test resultsare not misleading [22, Safety Concern 8].
For automatically generated reference data from externalsensors, there might not be labeling uncertainty, but uncer-tainty in temporal synchronization of reference and SUT data,as well as uncertainty in their spatial alignment.
16
Moreover, any automatically generated reference data with-out human error-checking can suffer from unexpected inaccu-racies in the reference measurement system. Those inaccura-cies might be rare enough to not matter in small-scale R&Dtesting, but over large amounts of test scenarios or kilometers,as needed for safety assurance, the probability of encounteringrelevant reference system errors increases.
E. Choice of Reference Data Source
Different ways of generating reference data are used fordifferent aspects of perception testing, where each way hasits unique advantages. For example, human labels might bebest for testing what a perception algorithm can infer fromgiven raw data in the absence of additional data sources.Separate high-quality sensors on the ego vehicle could bethe most useful choice for benchmarking individually inferiorsensor systems. RTK-GNSS-IMUs might be best for testingthe perception of small numbers of vehicles in the absenceof high buildings. Data from an aerial perspective might bemost suitable for testing the perception performance understatic and dynamic occlusions in complex naturalistic traffic.Infrastructure test fields that spread over a large area can bebest suited for investigations that require a large field of view.Finally, reference data from the k-out-of-n-vote might have thebest potential for keeping the testing effort feasible for largeamounts of kilometers or scenarios.
F. Conclusion of Reference Data
The most appropriate choice of reference data depends onthe detailed objectives of the respective testing activity withinthe safety case ([82, Sec. 3.6.3]). In any case, the referencedata’s limitations should be considered.
IX. DISCUSSION OF REVIEW RESULTS
Sec. IX-A summarizes the particular conclusions of eachtesting axis in terms of the largest issues regarding the primaryresearch question. Intersection topics between the axes arecovered in Sec. IX-B. Finally, testing as reviewed in this paperis likely necessary, but not sufficient for safety assurance ofAVs. Therefore, Sec. IX-C places the reviewed topics into abroader context by drawing connections to related activitiesaround perceptual aspects in safety assurance.
A. Open Issues per Testing Axis
In terms of metrics and test criteria (Sec. VI), currentchallenges are the incompleteness of criteria due to the open-world context and also the consideration of a potential safetyimpact in the metrics.
Open issues about perception-specific test scenarios(Sec. VII) are a common description language and format, acombination of scenario generation approaches for sufficientODD coverage, and the difficulty of recording the identifiedtest scenarios in the real world.
The most appropriate source of reference data (Sec. VIII)depends on the investigated aspect of environment perception.
A combination of multiple such investigations into a harmo-nized methodology targeting the safety proof appears to be notyet demonstrated in the literature.
The mentioned open issues from the literature might be thereason why as of now, safety standards (Sec. IV) leave manydetails around perception testing open.
B. Open Issues Between the Testing Axes
Solutions to the individual testing axes must be able to fitinto a consolidated methodology that also considers intersec-tion topics between the axes. For example, at the intersectionof test criteria and scenarios, the criteria on the SUT’s FOVmight be relaxed if the ego vehicle drives slowly due to rainin the respective scenario. In between the axes scenarios andreference data, the fact that rain is present in the scenariomight affect some ways of reference data generation morethan others. The intersection between reference data andmetrics/criteria includes the metrics’ sensitivity to details inthe reference data. For example, a metric that penalizes falsenegatives behind occlusions produces different results depend-ing on whether the reference data contain these occludedobjects or not.
While an all-encompassing methodology that covers all ofsuch details seems to be not yet demonstrated, approachessuch as [30] or [49] already propose general ways of how thedependability of the perception subsystem could be managedand tested.
C. Further Safety Assurance Activities Regarding Perception
Testing as described in this review (see Table I) is onlyone activity out of many within an all-encompassing safetyargumentation. The following subsections intend to reveal thislarger context by drawing connections to related activities inperception dependability. We structure the approaches accord-ing to the means for attaining dependability by [128], whichhave recently been adopted to uncertainties in AD [118]. Theyconsist of prevention, removal, tolerance, and forecasting offaults or uncertainty, respectively.
1) Uncertainty Prevention: Formal verification of the per-ception subsystem could ideally prevent the occurrence ofcertain world model uncertainties. So far, we are not awareof formal verification methods that cover the entire perceptionsubsystem. Also, the review paper [15] only mentions formalverification methods for the downstream driving function.However, formal analysis and verification of DNNs for per-ception tasks is an active topic of research [167], [168].Moreover, the way in which uncertain world models affectformally verified downstream driving functions is activelybeing researched, for example in the context of RSS [27].
Another means of uncertainty prevention is the restrictionto certain ODDs [118].
2) Uncertainty Removal: Perceptual uncertainties can beremoved during development and during its use after the initialrelease. Uncertainty removal during development includessafety analysis methods such as fault tree analysis (FTA) [118],or insightful developer testing with the goal of reducing found
17

uncertainties afterwards. For example, white-box-testing of theperception subsystem can reveal uncertainties related to thephysically complex measurement principles (see e.g. [112]).Human-understandable insights into the DNNs for objectdetection are, however, difficult [22, Safety Concern 3].
Testing on simulated raw data allows the perception al-gorithm to be tested without the need for physical sensorhardware (e.g. [169] for grid mapping). For testing objectperception algorithms, a simulation environment such as [170]could produce both the raw sensor data as an input to thealgorithm under test and a ground truth object list as areference. A hybrid approach is to test the perception algorithmon recorded real data with simulated injected faults [171].
After the initial release, incremental safety assurancethrough system updates is a necessary means to remove uncer-tainties because the ODD of the AV changes continuously [22,Safety Concern 2]. Ideally, the safety argumentation shouldallow minor system updates without having to repeat majortesting efforts [6]. Agile safety cases [172] could enablethe safe deployment of such incremental updates through aDevOps-like workflow [74].
3) Uncertainty Tolerance: Runtime monitoring of the un-certainty of the produced world model can help mitigatingthe safety consequences of perception errors [173]. An RSS-compliant planner would become more cautious for uncertainworld models due to a reduced set of guaranteed safe controlactions [27] (Sec. VI-B3). Similarly, in a service-orientedarchitecture, sensor data that is monitored as too uncertainor faulty could lead to a bypass of the usual informationprocessing pipeline in favor of a safe behavior for degradedmodes [174, Fig. 3]. An overview of self-representation andmonitoring of subsystems is given in [175]. Similarly, inthe ISO 26262 context, it was proposed that the perceptionsubsystem dynamically outputs one world model for eachASIL level such that the planner can dynamically take just thatworld model that it needs to comply to the ASIL requirementof the current driving situation [35], [52], [53]. In any ofsuch applications, it is crucial to assure that the reporteduncertainties are correctly calibrated (Sec. VI-C).
Furthermore, the mentioned collaborative world modelthrough V2X (Sec. VIII-B2) can also serve as a means for un-certainty tolerance if participating cars can reduce their worldmodel uncertainties through, e.g., a cloud-based fusion [176].
4) Uncertainty Forecasting: The failure rates in a fusedworld model must be extremely low, which means that thedirect test effort for proving or forecasting it is extremely high.
One approach to overcome this so-called approval trap[177] is to test the more failure-prone world models ofindividual sensor systems before they are fused [33], [49]. Thelatter source investigates how this could be realized withoutseparately generated reference data, allowing the tests to bepotentially executed in shadow-mode by production vehicles.In this approach (Fig. 7), the reference data take the form ofa k-out-of-n-vote of object-level fusion inputs (Sec. VIII-A3).Such a mutual cross-referencing mechanism is also suggestedin Safety First for Automated Driving [82, Sec. 2.2.2.4].
Scenarios:
from fleet
data of
production
vehicles
Reference:
k-out-of-n vote
of fusion inputs
SUT:
one out of n
fusion inputs
Metrics:
(microscopic)
FPs, FNs;
(macroscopic)
rate of safety-
critical failures
of SUT
Fig. 7: Perception testing for macroscopic safety assurancewithout separately generated reference data [32], [49], ex-pressed in taxonomy (Fig. 1).
The mentioned testing approach exploits the redundancyof fusion inputs in the following way [31]. If a mean timebetween failures of for example 104 h can be demonstrated fortwo statistically independent inputs to a data fusion system,then the fusion output has a mean time between failures ofabout 108 h. Such a redundancy exploitation has also beenstated in the RSS papers [33], [66] and in literature onperception subsystem architectures [178], [39] and perceptionrequirements [35]. The actual number of necessary test kilo-meters is then computed in a statistically sound way basedon how statistically dependent the inputs to the object-levelfusion system actually are [50], [54].
Whether or not perceptual uncertainties lead to safety-critical failures on the vehicle level might require a sensi-tivity analysis of the driving function. Reachability analysis(e.g. [43], [123]) could be used to analyze in detail whetheran uncertain world model can lead to unsafe future states, asoutlined in the context of the incurred severity metric [28].An impact analysis of perceptual errors on the downstreamdriving function has also already been described in [65].
Furthermore, uncertainty forecasting for the release ar-gumentation could make use of the tests mentioned underUncertainty Removal (Sec. IX-C2) if they are validated andexecuted on separate test datasets.
X. CONCLUSION
We analyzed literature from multiple neighboring fields,attempting to provide a structured overview of safety-relevanttesting activities for the environment perception of AVs. Theseneighboring fields included, but are not limited to, AV safetyassurance, perception algorithm development, and safeguard-ing of artificial intelligence. A combined literature searchprocess that consisted of undocumented search, keyword-based search and snowballing search required large efforts,but appeared to be suitable for covering the relevant literature.
The analyzed test methods from the available literature seemto be not yet capable of demonstrating the dependability of theperception subsystem for series-production Level 4 vehicles.To overcome this issue, the provided overview can serveas a common basis for a further harmonization of primaryliterature contributions into all-encompassing novel testingmethodologies.
18
ACKNOWLEDGEMENT
The authors would like to thank their colleagues at theInstitute for Automotive Engineering and their project partnersof the project VVM, a project of the PEGASUS family, fortheir valuable feedback on the initial version of this paper.Furthermore, the authors would like to thank Robert Krajewskifor fruitful discussions.
Despite all efforts, we might have unintentionally over-looked individual literature contributions to the research ques-tion. In that case, we apologize to the corresponding authorsand are welcoming such feedback from the community.
REFERENCES
[1] SAE, “J3016: Taxonomy and definitions for terms related to drivingautomation systems for on-road motor vehicles,” 2018.
[2] K. C. J. Dietmayer, S. Reuter, and D. Nuss, Representation of FusedEnvironment Data. Cham: Springer International Publishing, 2014, pp.1–30. [Online]. Available: https://doi.org/10.1007/978-3-319-09840-125-1
[3] K. Dietmayer, “Predicting of machine perception for automated driv-ing,” in Autonomous Driving. Springer, 2016, pp. 407–424.
[4] J. E. Stellet, M. R. Zofka, J. Schumacher, T. Schamm, F. Niewels,and J. M. Zollner, “Testing of advanced driver assistance towardsautomated driving: A survey and taxonomy on existing approaches andopen questions,” in IEEE 18th Int. Conf. on Intelligent TransportationSystems. IEEE, 2015, pp. 1455–1462.
[5] C. Amersbach and H. Winner, “Functional decomposition: An approachto reduce the approval effort for highly automated driving,” in 8. TagungFahrerassistenz. Munich: Technical University of Munich, 2017.
[6] P. Koopman and M. Wagner, “Toward a framework for highly auto-mated vehicle safety validation,” in SAE Technical Paper Series. SAEInternational, Apr. 2018.
[7] ISO/PAS 21448:2019 Road vehicles — Safety of the intendedfunctionality, ISO Std., Jan. 2019. [Online]. Available: https://www.iso.org/standard/70939.html
[8] “Glossary of research project ‘VVM - Verification and ValidationMethods for Automated Vehicles Level 4 and 5’,” Internal, Nov. 2020.
[9] N. G. Leveson, Engineering a safer world: Systems thinking appliedto safety. The MIT Press, 2016.
[10] ISO 26262 Road vehicles - Functional safety, ISO Std., 2018.[11] Evaluation of measurement data — Guide to the expression ofuncer-
tainty in measurement, Joint Committee for Guides in Metrology Std.,Rev. GUM 1995 with minor corrections, 2008.
[12] S. Ulbrich, T. Menzel, A. Reschka, F. Schuldt, and M. Maurer,“Defining and substantiating the terms scene, situation, and scenariofor automated driving,” in IEEE 18th Int. Conf. on Intelligent Trans-portation Systems. IEEE, Sept. 2015.
[13] P. M. Junietz, “Microscopic and macroscopic risk metrics for thesafety validation of automated driving,” Ph.D. dissertation, TUDarmstadt, Darmstadt, 2019. [Online]. Available: http://tuprints.ulb.tu-darmstadt.de/9282/
[14] J. E. Stellet, M. Woehrle, T. Brade, A. Poddey, and W. Branz,“Validation of automated driving–a structured analysis and surveyof approaches,” in 13. Uni-DAS e.V. Workshop Fahrerassistenz undautomatisiertes Fahren, 2020.
[15] S. Riedmaier, T. Ponn, D. Ludwig, B. Schick, and F. Diermeyer,“Survey on scenario-based safety assessment of automated vehicles,”IEEE Access, vol. 8, pp. 87 456–87 477, 2020.
[16] D. Nalic, T. Mihalj, M. Baeumler, M. Lehmann, A. Eichberger, andS. Bernsteiner, “Scenario based testing of automated driving systems:A literature survey,” in FISITA Web Contress, Oct. 2020.
[17] “Pegasus method: An overview,” Online, 2019.[Online]. Available: https://www.pegasusprojekt.de/files/tmpl/Pegasus-Abschlussveranstaltung/PEGASUS-Gesamtmethode.pdf
[18] M. Borg, C. Englund, K. Wnuk, B. Duran, C. Levandowski, S. Gao,Y. Tan, H. Kaijser, H. Lonn, and J. Tornqvist, “Safely entering thedeep: A review of verification and validation for machine learning anda challenge elicitation in the automotive industry,” arXiv:1812.05389,2018.
[19] E. Marti, M. A. de Miguel, F. Garcia, and J. Perez, “A review of sensortechnologies for perception in automated driving,” IEEE IntelligentTransportation Systems Magazine, vol. 11, no. 4, pp. 94–108, 2019.
[20] F. Rosique, P. J. Navarro, C. Fernandez, and A. Padilla, “A systematicreview of perception system and simulators for autonomous vehiclesresearch,” Sensors, vol. 19, no. 3, p. 648, Feb. 2019.
[21] H. Zhu, K.-V. Yuen, L. Mihaylova, and H. Leung, “Overview ofenvironment perception for intelligent vehicles,” IEEE Transactions onIntelligent Transportation Systems, vol. 18, no. 10, pp. 2584–2601, Oct.2017.
[22] O. Willers, S. Sudholt, S. Raafatnia, and S. Abrecht, “Safety concernsand mitigation approaches regarding the use of deep learning in safety-critical perception tasks,” in Computer Safety, Reliability, and Secu-rity. SAFECOMP Workshops, A. Casimiro, F. Ortmeier, E. Schoitsch,F. Bitsch, and P. Ferreira, Eds. Cham: Springer International Publish-ing, 2020, pp. 336–350.
[23] S. Burton, L. Gauerhof, and C. Heinzemann, “Making the case forsafety of machine learning in highly automated driving,” in ComputerSafety, Reliability, and Security, S. Tonetta, E. Schoitsch, and F. Bitsch,Eds. Cham: Springer International Publishing, 2017, pp. 5–16.
[24] B. Kitchenham and S. Charters, “Guidelines for performing systematicliterature reviews in software engineering,” Evidence-Based SoftwareEngineering (EBSE) Project, Tech. Rep. v2.3, 2007.
[25] C. Wohlin, “Guidelines for snowballing in systematic literature studiesand a replication in software engineering,” in Proc. of the 18th Int.Conf. on Evaluation and Assessment in Software Engineering, 2014,pp. 1–10.
[26] F. Schalling, S. Ljungberg, and N. Mohan, “Benchmarking lidar sensorsfor development and evaluation of automotive perception,” in 4thInt. Conf. and Workshops on Recent Advances and Innovations inEngineering (ICRAIE), 2019, pp. 1–6.
[27] R. Salay, K. Czarnecki, I. Alvarez, M. S. Elli, S. Sedwards, andJ. Weast, “PURSS: Towards perceptual uncertainty aware responsibilitysensitive safety with ML,” in Proc. of the Workshop on ArtificialIntelligence Safety (SafeAI), New York, USA, 2020.
[28] R. Salay, M. Angus, and K. Czarnecki, “A safety analysis methodfor perceptual components in automated driving,” IEEE 30th Int.Symposium on Software Reliability Engineering (ISSRE), pp. 24–34,2019.
[29] R. Salay and K. Czarnecki, “Improving ML safety with partial specifi-cations,” in Computer Safety, Reliability, and Security, A. Romanovsky,E. Troubitsyna, I. Gashi, E. Schoitsch, and F. Bitsch, Eds. Cham:Springer International Publishing, 2019, pp. 288–300.
[30] K. Czarnecki and R. Salay, “Towards a framework to manageperceptual uncertainty for safe automated driving,” Lecture Notesin Computer Science, p. 439–445, 2018. [Online]. Available:http://dx.doi.org/10.1007/978-3-319-99229-7 37
[31] M. Berk, O. Schubert, H.-M. Kroll, B. Buschardt, and D. Straub,“Exploiting redundancy for reliability analysis of sensor perception inautomated driving vehicles,” IEEE Transactions on Intelligent Trans-portation Systems, 2019.
[32] ——, “Reliability assessment of safety-critical sensor information:Does one need a reference truth?” IEEE Transactions on Reliability,vol. 68, no. 4, pp. 1227–1241, Dec. 2019.
[33] S. Shalev-Shwartz, S. Shammah, and A. Shashua, “On a formal modelof safe and scalable self-driving cars,” arXiv:1708.06374, 2017, v6.
[34] M. Brahmi, K.-H. Siedersberger, A. Siegel, and M. Maurer, “Referencesystems for environmental perception: Requirements, validation andmetric-based evaluation,” in 6. Tagung Fahrerassistenzsysteme, 2013.
[35] A. Cassel, C. Bergenhem, O. M. Christensen, H.-M. Heyn,S. Leadersson-Olsson, M. Majdandzic, P. Sun, A. Thorsen, andJ. Trygvesson, “On perception safety requirements and multisensor systems for automated driving systems,” in SAE TechnicalPaper. SAE International, Apr. 2020. [Online]. Available: https://doi.org/10.4271/2020-01-0101
[36] M. Berk, “Safety assessment of environment perception in automateddriving vehicles,” Dissertation, Technical University Munich, Munich,2019.
[37] R. Salay, R. Queiroz, and K. Czarnecki, “An analysis of ISO26262: Using machine learning safely in automotive software,”arXiv:1709.02435, 2017.
[38] O. S. Tas, F. Kuhnt, J. M. Zollner, and C. Stiller, “Functional systemarchitectures towards fully automated driving,” in IEEE IntelligentVehicles Symposium (IV). IEEE, 2016, pp. 304–309.
19
[39] N. Kaprocki, G. Velikic, N. Teslic, and M. Krunic, “Multiunit auto-motive perception framework: Synergy between AI and deterministicprocessing,” in IEEE 9th Int. Conf. on Consumer Electronics (ICCE-Berlin). IEEE, Sept. 2019.
[40] H. Martin, B. Winkler, S. Grubmuller, and D. Watzenig, “Identificationof performance limitations of sensing technologies for automateddriving,” in IEEE Int. Conf. on Connected Vehicles and Expo (ICCVE),2019, pp. 1–6.
[41] J. Bai, Y. Zhan, P. Cao, L. Huang, Y. Xu, and X. Bi, “Applicationoriented identification of external influence factors on sensing forvalidation of automated driving systems,” in IEEE MTT-S InternationalWireless Symposium (IWS), 2019, pp. 1–3.
[42] S. Ulbrich, A. Reschka, J. Rieken, S. Ernst, G. Bagschik, F. Dierkes,M. Nolte, and M. Maurer, “Towards a functional system architecturefor automated vehicles,” arXiv:1703.08557, 2017.
[43] M. Althoff, “Reachability analysis and its application to the safety as-sessment of autonomous cars,” Ph.D. dissertation, Technical UniversityMunich, 2010.
[44] G. Bagschik, T. Menzel, and M. Maurer, “Ontology based scene cre-ation for the development of automated vehicles,” in IEEE IntelligentVehicles Symposium (IV). IEEE, June 2018.
[45] S. Burton, L. Gauerhof, B. B. Sethy, I. Habli, and R. Hawkins, “Confi-dence arguments for evidence of performance in machine learning forhighly automated driving functions,” in Computer Safety, Reliability,and Security, A. Romanovsky, E. Troubitsyna, I. Gashi, E. Schoitsch,and F. Bitsch, Eds. Cham: Springer International Publishing, 2019,pp. 365–377.
[46] P. Koopman and F. Fratrik, “How many operational design domains,objects, and events?” in SafeAI@AAAI, 2019.
[47] T. Kubertschak, M. Wittenzellner, and M. Maehlisch, “KamerabasiertesReferenzsystem fur Fahrerassistenzsysteme,” in Forum Bildverar-beitung, vol. 82. KIT Scientific Publishing, 2014, p. 261.
[48] E. Strigel, D. Meissner, F. Seeliger, B. Wilking, and K. Dietmayer,“The Ko-PER intersection laserscanner and video dataset,” in 17thInternational IEEE Conf. on Intelligent Transportation Systems (ITSC).IEEE, Oct. 2014.
[49] M. Berk, O. Schubert, H.-M. Kroll, B. Buschardt, and D. Straub,“Assessing the safety of environment perception in automated drivingvehicles,” SAE International Journal of Transportation Safety, vol. 8,no. 1, Apr. 2020.
[50] M. Berk, H.-M. Kroll, O. Schubert, B. Buschardt, and D. Straub,“Bayesian test design for reliability assessments of safety-relevantenvironment sensors considering dependent failures,” in SAE TechnicalPaper Series. SAE International, Mar. 2017.
[51] M. Berk, M. Dura, J. V. Rivero, O. Schubert, H.-M. Kroll, B. Buschardt,and D. Straub, “A stochastic physical simulation framework to quantifythe effect of rainfall on automotive lidar,” in SAE Technical PaperSeries. SAE International, Apr. 2019.
[52] R. Johansson and J. Nilsson, “The need for an environment perceptionblock to address all ASIL levels simultaneously,” in IEEE IntelligentVehicles Symposium (IV). IEEE, June 2016.
[53] R. Johansson, S. Alissa, S. Bengtsson, C. Bergenhem, O. Bridal,A. Cassel, D.-J. Chen, M. Gassilewski, J. Nilsson, A. Sandberg,S. Ursing, F. Warg, and A. Werneman, “A strategy for assessing safeuse of sensors in autonomous road vehicles,” in Computer Safety,Reliability, and Security, S. Tonetta, E. Schoitsch, and F. Bitsch, Eds.Cham: Springer International Publishing, 2017, pp. 149–161.
[54] F. Bock, S. Siegl, and R. German, “Mathematical test effort estimationfor dependability assessment of sensor-based driver assistance sys-tems,” in 42th Euromicro Conf. on Software Engineering and AdvancedApplications (SEAA). IEEE, Aug. 2016.
[55] J. R. V. Rivero, I. Tahiraj, O. Schubert, C. Glassl, B. Buschardt,M. Berk, and J. Chen, “Characterization and simulation of the effectof road dirt on the performance of a laser scanner,” in IEEE 20th Int.Conf. on Intelligent Transportation Systems (ITSC). IEEE, Oct. 2017.
[56] R. H. Rasshofer, M. Spies, and H. Spies, “Influences of weatherphenomena on automotive laser radar systems,” Advances in RadioScience: ARS, vol. 9, pp. 49–60, 2011.
[57] T. Fawcett, “An introduction to ROC analysis,” Pattern RecognitionLetters, vol. 27, no. 8, pp. 861–874, June 2006.
[58] P. Cao and L. Huang, “Application oriented testcase generation forvalidation of environment perception sensor in automated drivingsystems,” SAE MOBILUS, 2018.
[59] K. Czarnecki, “Operational world model ontology for automateddriving systems - Part 2: Road users, animals, other obstacles, andenvironmental conditions,” Waterloo Intelligent Systems EngineeringLab (WISE), Tech. Rep., 2018.
[60] B. Meyer, “Applying 'design by contract',” Computer, vol. 25, no. 10,pp. 40–51, Oct. 1992.
[61] C. Guo, G. Pleiss, Y. Sun, and K. Q. Weinberger, “On calibration ofmodern neural networks,” arXiv:1706.04599, 2017.
[62] R. Salay and K. Czarnecki, “Using machine learning safely in au-tomotive software: An assessment and adaption of software processrequirements in ISO 26262,” arXiv:1808.01614, 2018.
[63] A. Schwaiger, P. Sinhamahapatra, J. Gansloser, and K. Roscher,“Is uncertainty quantification in deep learning sufficient for out-of-distribution detection?” in Proc. of the Workshop on Artificial Intelli-gence Safety (AISafety), Yokohama, Japan, 2020.
[64] F. Arnez, H. Espinoza, A. Radermacher, and F. Terrier, “A comparisonof uncertainty estimation approaches in deep learning components forautonomous vehicle applications,” arXiv:2006.15172, 2020.
[65] A. Piazzoni, J. Cherian, M. Slavik, and J. Dauwels, “Modeling sensingand perception errors towards robust decision making in autonomousvehicles,” in Proc. of the 29th International Joint Conf. on ArtificialIntelligence (IJCAI), 2020.
[66] J. Weast, “Sensors, safety models and a system-level approach to safeand scalable automated vehicles,” arXiv:2009.03301, 2020.
[67] B. Klamann, M. Lippert, C. Amersbach, and H. Winner, “Definingpass-/fail-criteria for particular tests of automated driving functions,”in IEEE Intelligent Transportation Systems Conf. (ITSC). IEEE, Oct.2019.
[68] V. Aravantinos and P. Schlicht, “Making the relationship betweenuncertainty estimation and safety less uncertain,” in Design, Automation& Test in Europe Conf. & Exhibition (DATE). IEEE, Mar. 2020.
[69] J. Breitenstein, J.-A. Termohlen, D. Lipinski, and T. Fingscheidt,“Systematization of corner cases for visual perception in automateddriving,” IEEE Intelligent Vehicles Symposium (IV), 2020.
[70] M. Henne, A. Schwaiger, K. Roscher, and G. Weiss, “Benchmarkinguncertainty estimation methods for deep learning with safety-relatedmetrics,” in SafeAI@AAAI, 2020, pp. 83–90.
[71] T. Fleck, K. Daaboul, M. Weber, P. Schorner, M. Wehmer, J. Doll,S. Orf, N. Sußmann, C. Hubschneider, M. R. Zofka, F. Kuhnt,R. Kohlhaas, I. Baumgart, R. Zollner, and J. M. Zollner, “Towards largescale urban traffic reference data: Smart infrastructure in the test areaautonomous driving Baden-Wurttemberg,” in Intelligent AutonomousSystems 15, M. Strand, R. Dillmann, E. Menegatti, and S. Ghidoni,Eds. Cham: Springer International Publishing, 2019, pp. 964–982.
[72] B. Spanfelner, D. Richter, S. Ebel, U. Wilhelm, and C. Patz, “Chal-lenges in applying the ISO 26262 for driver assistance systems,” inTagung Fahrerassistenz, Munich, 2012.
[73] M. Rahimi, J. L. Guo, S. Kokaly, and M. Chechik, “Toward re-quirements specification for machine-learned components,” in IEEE27th International Requirements Engineering Conf. Workshops (REW).IEEE, Sept. 2019.
[74] K. Czarnecki, “Software engineering for automated vehicles: Address-ing the needs of cars that run on software and data,” in IEEE/ACM41st Int. Conf. on Software Engineering: Companion Proc. (ICSE-Companion). IEEE, May 2019.
[75] D. Feng, L. Rosenbaum, and K. Dietmayer, “Towards safe autonomousdriving: Capture uncertainty in the deep neural network for lidar 3Dvehicle detection,” in 21st Int. Conf. on Intelligent TransportationSystems (ITSC). IEEE, Nov. 2018.
[76] D. Feng, L. Rosenbaum, C. Glaeser, F. Timm, and K. Dietmayer,“Can we trust you? On calibration of a probabilistic object detectorfor autonomous driving,” arXiv:1909.12358, 2019.
[77] USA DOT NHTSA, “Automated driving systems 2.0: A vision forsafety,” 2017.
[78] E. Thorn, S. C. Kimmel, and M. Chaka, “A framework for automateddriving system testable cases and scenarios,” USA DOT NHTSA, Tech.Rep., 2018.
[79] UL4600 - Standard for Safety for the Evaluation of AutonomousProducts, Underwriters Laboratories Std., Rev. Voting Version, Dec.2019.
[80] P. Koopman, U. Ferrell, F. Fratrik, and M. Wagner, “A safety standardapproach for fully autonomous vehicles,” pp. 326–332, Aug. 2019.
[81] Uniform provisions concerning the approval of vehicles with regard toAutomated Lane Keeping Systems, Economic Commission for Europe,
20
Inland Transport Committee Std., Rev. ECE/TRANS/WP.29/2020/81,2020.
[82] M. Wood, P. Robbel, M. Maass, R. Tebbens, M. Meijs, M. Harb, andP. e. a. Schlicht, “Safety first for automated driving,” Online, 2019.[Online]. Available: https://newsroom.intel.com/wp-content/uploads/sites/11/2019/07/Intel-Safety-First-for-Automated-Driving.pdf
[83] “Iso/tr 4804 — road vehicles — safety and cybersecurity for automateddriving systems — design, verification and validation,” Dec. 2020.
[84] A. Geiger, P. Lenz, and R. Urtasun, “Are we ready for autonomousdriving? The KITTI vision benchmark suite,” in Conf. on ComputerVision and Pattern Recognition (CVPR), 2012. [Online]. Available:http://www.cvlibs.net/datasets/kitti/eval tracking.php
[85] H. Caesar, V. Bankiti, A. H. Lang, S. Vora, V. E. Liong, Q. Xu,A. Krishnan, Y. Pan, G. Baldan, and O. Beijbom, “nuScenes: Amultimodal dataset for autonomous driving,” arXiv:1903.11027, 2019.
[86] P. Sun, H. Kretzschmar, X. Dotiwalla, A. Chouard, V. Patnaik, P. Tsui,J. Guo, Y. Zhou, Y. Chai, B. Caine, V. Vasudevan, W. Han, J. Ngiam,H. Zhao, A. Timofeev, S. Ettinger, M. Krivokon, A. Gao, A. Joshi,Y. Zhang, J. Shlens, Z. Chen, and D. Anguelov, “Scalability in percep-tion for autonomous driving: Waymo open dataset,” arXiv:1912.04838,2019.
[87] M.-F. Chang, J. Lambert, P. Sangkloy, J. Singh, S. Bak, A. T. Hartnett,D. Wang, P. Carr, S. Lucey, D. Ramanan, and J. Hays, “Argoverse:3D tracking and forecasting with rich maps,” IEEE/CVF Conf. onComputer Vision and Pattern Recognition (CVPR), pp. 8740–8749,2019.
[88] M. Stampfle, D. Holz, and J. C. Becker, “Performance evaluation of au-tomotive sensor data fusion,” in Proc. IEEE Intelligent TransportationSystems. IEEE, 2005, pp. 50–55.
[89] H. W. Kuhn, “The hungarian method for the assignment problem,”Naval Research Logistics Quarterly, vol. 2, no. 1-2, pp. 83–97, Mar.1955.
[90] D. P. Bertsekas and D. A. Castanon, “The auction algorithm for thetransportation problem,” Annals of Operations Research, vol. 20, no. 1,pp. 67–96, Dec. 1989.
[91] K. Bernardin and R. Stiefelhagen, “Evaluating multiple object trackingperformance: the CLEAR MOT metrics,” Journal on Image and VideoProcessing, vol. 2008, p. 1, 2008.
[92] Z. Chen, C. Heckman, S. Julier, and N. Ahmed, “Weak in the NEES?:Auto-tuning kalman filters with bayesian optimization,” 21st Int. Conf.on Information Fusion (FUSION), July 2018. [Online]. Available:http://dx.doi.org/10.23919/ICIF.2018.8454982
[93] D. Schuhmacher, B.-T. Vo, and B.-N. Vo, “A consistent metric forperformance evaluation of multi-object filters,” IEEE Transactions onSignal Processing, vol. 56, no. 8, pp. 3447–3457, 2008.
[94] B. Ristic, B.-N. Vo, and D. Clark, “Performance evaluation of multi-target tracking using the OSPA metric,” in 13th Int. Conf. on Informa-tion Fusion. IEEE, 2010, pp. 1–7.
[95] X. He, R. Tharmarasa, T. Kirubarajan, and T. Thayaparan, “A trackquality based metric for evaluating performance of multitarget filters,”IEEE Transactions on Aerospace and Electronic Systems, vol. 49, no. 1,pp. 610–616, 2013.
[96] T. Vu and R. Evans, “A new performance metric for multiple targettracking based on optimal subpattern assignment,” in 17th Int. Conf.on Information Fusion (FUSION). IEEE, 2014, pp. 1–8.
[97] M. Beard, B. T. Vo, and B.-N. Vo, “OSPA (2): Using the OSPA metricto evaluate multi-target tracking performance,” in Int. Conf. on Control,Automation and Information Sciences (ICCAIS). IEEE, 2017, pp. 86–91.
[98] A. S. Rahmathullah, A. F. Garcıa-Fernandez, and L. Svensson, “Gen-eralized optimal sub-pattern assignment metric,” in 20th Int. Conf. onInformation Fusion (Fusion). IEEE, 2017, pp. 1–8.
[99] X. Shi, F. Yang, F. Tong, and H. Lian, “A comprehensive performancemetric for evaluation of multi-target tracking algorithms,” in 3rd Int.Conf. on Information Management (ICIM). IEEE, 2017, pp. 373–377.
[100] S. Reuter, B. Vo, B. Vo, and K. Dietmayer, “The labeled multi-bernoullifilter,” IEEE Transactions on Signal Processing, vol. 62, no. 12, pp.3246–3260, June 2014.
[101] K. Granstrom, M. Baum, and S. Reuter, “Extended object tracking:Introduction, overview and applications,” arXiv:1604.00970, 2016.
[102] Y. Li, C. Huang, and R. Nevatia, “Learning to associate: Hybridboostedmulti-target tracker for crowded scene,” in IEEE Conf. on ComputerVision and Pattern Recognition. IEEE, 2009, pp. 2953–2960.
[103] J. Luiten, A. Osep, P. Dendorfer, P. Torr, A. Geiger, L. Leal-Taixe, andB. Leibe, “HOTA: A higher order metric for evaluating multi-objecttracking,” International Journal of Computer Vision, oct 2020.
[104] J. Philion, A. Kar, and S. Fidler, “Learning to evaluate perceptionmodels using planner-centric metrics,” in 2020 IEEE/CVF Conferenceon Computer Vision and Pattern Recognition (CVPR). IEEE, June2020.
[105] Y. Guo, H. Caesar, O. Beijbom, J. Philion, and S. Fidler, “The efficacyof neural planning metrics: A meta-analysis of pkl on nuscenes,”arXiv:2010.09350, Oct. 2020.
[106] J. Florback, L. Tornberg, and N. Mohammadiha, “Offline object match-ing and evaluation process for verification of autonomous driving,” inIEEE 19th Int. Conf. on Intelligent Transportation Systems (ITSC), Nov.2016, pp. 107–112.
[107] D. Sondell and K. Svensson, “Matching vehicle sensors to referencesensors using machine learning methods,” Master’s thesis, ChalmersUniversity of Technology, 2018.
[108] N. Hirsenkorn, T. Hanke, A. Rauch, B. Dehlink, R. Rasshofer, andE. Biebl, “A non-parametric approach for modeling sensor behavior,”in 16th International Radar Symposium (IRS), June 2015, pp. 131–136.
[109] T. Hanke, N. Hirsenkorn, B. Dehlink, A. Rauch, R. Rasshofer, andE. Biebl, “Classification of sensor errors for the statistical simulationof environmental perception in automated driving systems,” in IEEE19th Int. Conf. on Intelligent Transportation Systems (ITSC). IEEE,2016, pp. 643–648.
[110] R. Krajewski, M. Hoss, A. Meister, F. Thomsen, J. Bock, and L. Eck-stein, “Using drones as reference sensors for neural-networks-basedmodeling of automotive perception errors,” in IEEE Intelligent VehiclesSymposium (IV), 2020.
[111] E. L. Zec, N. Mohammadiha, and A. Schliep, “Statistical sensormodelling for autonomous driving using autoregressive input-outputHMMs,” in 21st Int. Conf. on Intelligent Transportation Systems(ITSC). IEEE, Nov. 2018.
[112] M. F. Holder, C. Linnhoff, P. Rosenberger, C. Popp, and H. Winner,“Modeling and simulation of radar sensor artifacts for virtual testingof autonomous driving,” in 9. Tagung Automatisiertes Fahren, 2019.
[113] A. Schaermann, A. Rauch, N. Hirsenkorn, T. Hanke, R. Rasshofer, andE. Biebl, “Validation of vehicle environment sensor models,” in IEEEIntelligent Vehicles Symposium (IV). IEEE, 2017, pp. 405–411.
[114] P. Rosenberger, J. T. Wendler, M. F. Holder, C. Linnhoff, M. Berghofer,H. Winner, and M. Maurer, “Towards a generally accepted validationmethodology for sensor models - challenges, metrics, and first results,”Proc. of Graz Symposium Virtual Vehicle (GSVF), 2019.
[115] M. F. Holder, J. R. Thielmann, P. Rosenberger, C. Linnhoff, andH. Winner, “How to evaluate synthetic radar data? Lessons learnedfrom finding driveable space in virtual environments,” in 13. Uni-DASe.V. Workshop Fahrerassistenz und automatisiertes Fahren, 2020.
[116] R. Philipp, F. Schuldt, and F. Howar, “Functional decomposition ofautomated driving systems for the classification and evaluation ofperceptual threats,” in 13. Uni-DAS e.V. Workshop Fahrerassistenz undautomatisiertes Fahren, 2020.
[117] A. Poddey, T. Brade, J. E. Stellet, and W. Branz, “On the validation ofcomplex systems operating in open contexts,” arXiv:1902.10517, 2019.
[118] R. Gansch and A. Adee, “System theoretic view on uncertainties,” in2020 Design, Automation & Test in Europe Conference & Exhibition(DATE). IEEE, Mar. 2020.
[119] B. C. Hu, R. Salay, K. Czarnecki, M. Rahimi, G. Selim, andM. Chechik, “Towards requirements specification for machine-learnedperception based on human performance,” in IEEE 7th InternationalWorkshop on Artificial Intelligence for Requirements Engineering(AIRE). IEEE, Sept. 2020.
[120] A. Dokhanchi, H. B. Amor, J. V. Deshmukh, and G. Fainekos,“Evaluating perception systems for autonomous vehicles using qualitytemporal logic,” in Runtime Verification, C. Colombo and M. Leucker,Eds. Cham: Springer International Publishing, 2018, pp. 409–416.
[121] A. Balakrishnan, A. G. Puranic, X. Qin, A. Dokhanchi, J. V. Deshmukh,H. B. Amor, and G. Fainekos, “Specifying and evaluating quality met-rics for vision-based perception systems,” in 2019 Design, Automation& Test in Europe Conference & Exhibition (DATE). IEEE, Mar. 2019.
[122] V. Schonemann, H. Winner, G. Verhaeg, F. Tronci, and G. A. G. Padilla,“Fault tree-based derivation of safety requirements for automateddriving on the example of cooperative valet parking,” 2019.
21
[123] C. Pek, S. Manzinger, M. Koschi, and M. Althoff, “Using onlineverification to prevent autonomous vehicles from causing accidents,”Nature Machine Intelligence, vol. 2, no. 9, pp. 518–528, Sept. 2020.
[124] M. P. Naeini, G. F. Cooper, and M. Hauskrecht, “Obtaining wellcalibrated probabilities using bayesian binning,” in Proc. of the AAAIConf. on Artificial Intelligence, vol. 2015. NIH Public Access, 2015,pp. 2901–2907.
[125] V. Kuleshov, N. Fenner, and S. Ermon, “Accurate uncertainties for deeplearning using calibrated regression,” arXiv:1807.00263, 2018.
[126] F. K. Gustafsson, M. Danelljan, and T. B. Schon, “Evaluating scalablebayesian deep learning methods for robust computer vision,” in Proc.of the IEEE/CVF Conf. on Computer Vision and Pattern Recognition(CVPR) Workshops, June 2020.
[127] P. Junietz, F. Bonakdar, B. Klamann, and H. Winner, “Criticality metricfor the safety validation of automated driving using model predictivetrajectory optimization,” in 21st Int. Conf. on Intelligent TransportationSystems (ITSC). IEEE, Nov. 2018.
[128] A. Avizienis, J.-C. Laprie, B. Randell, and C. Landwehr, “Basicconcepts and taxonomy of dependable and secure computing,” IEEETransactions on Dependable and Secure Computing, vol. 1, no. 1, pp.11–33, Jan. 2004.
[129] E. Rocklage, H. Kraft, A. Karatas, and J. Seewig, “Automated scenariogeneration for regression testing of autonomous vehicles,” in IEEE 20thInt. Conf. on Intelligent Transportation Systems (ITSC). IEEE, Oct.2017.
[130] T. Menzel, G. Bagschik, and M. Maurer, “Scenarios for development,test and validation of automated vehicles,” in IEEE Intelligent VehiclesSymposium (IV). IEEE, June 2018.
[131] C. Neurohr, L. Westhofen, M. Butz, M. Bollmann, U. Eberle, andR. Galbas, “Criticality analysis for the verification and validation ofautomated vehicles,” IEEE Access, vol. 9, pp. 18 016–18 041, 2021.
[132] S. Khastgir, Operational Design Domain (ODD) taxonomy for anautomated driving system (ADS) – Specification, The British StandardsInstitution Std. PAS 1883:2020, 2020.
[133] ASAM e. V., “ASAM OpenODD,” 2020, accessed on 09/12/2020. [On-line]. Available: https://www.asam.net/project-detail/asam-openodd/
[134] ——, “ASAM OpenXOntology,” 2020, accessed on09/12/2020. [Online]. Available: https://www.asam.net/project-detail/asam-openxontology/
[135] F. Schuldt, “Ein Beitrag fur den methodischen Test von automatisiertenFahrfunktionen mit Hilfe von virtuellen Umgebungen,” Ph.D.dissertation, TU Braunschweig, Apr. 2017. [Online]. Available: https://publikationsserver.tu-braunschweig.de/receive/dbbs mods 00064747
[136] J. Bock, R. Krajewski, L. Eckstein, J. Klimke, J. Sauerbier, andA. Zlocki, “Data basis for scenario-based validation of had on high-ways,” in 27th Aachen Colloquium Automobile and Engine Technology,2018.
[137] M. Scholtes, L. Westhofen, L. R. Turner, K. Lotto, M. Schuldes,H. Weber, N. Wagener, C. Neurohr, M. Bollmann, F. Kortke, J. Hiller,M. Hoss, J. Bock, and L. Eckstein, “6-layer model for a structureddescription and categorization of urban traffic and environment,”arXiv:2012.06319, 2020.
[138] C. van Driesten and T. Schaller, “Overall approach to standardizeAD sensor interfaces: Simulation and real vehicle,” in Fahrerassis-tenzsysteme 2018, T. Bertram, Ed. Wiesbaden: Springer FachmedienWiesbaden, 2019, pp. 47–55.
[139] ASAM e. V., “ASAM OpenSCENARIO,” 2021, accessed on09/02/2021. [Online]. Available: https://www.asam.net/standards/detail/openscenario/
[140] T. Menzel, G. Bagschik, L. Isensee, A. Schomburg, and M. Maurer,“From functional to logical scenarios: Detailing a keyword-basedscenario description for execution in a simulation environment,” inIEEE Intelligent Vehicles Symposium (IV). IEEE, June 2019.
[141] C. Neurohr, L. Westhofen, T. Henning, T. de Graaff, E. Mohlmann, andE. Bode, “Fundamental considerations around scenario-based testingfor automated driving,” in IEEE Intelligent Vehicles Symposium (IV).IEEE, Oct. 2020.
[142] A. Putz, A. Zlocki, J. Bock, and L. Eckstein, “System validation ofhighly automated vehicles with a database of relevant traffic scenarios,”in 12th ITS European Congr., vol. 1, 2017, pp. 19–22.
[143] R. Krajewski, T. Moers, D. Nerger, and L. Eckstein, “Data-driven ma-neuver modeling using generative adversarial networks and variationalautoencoders for safety validation of highly automated vehicles,” in
21st International Conference on Intelligent Transportation Systems(ITSC). IEEE, Nov. 2018.
[144] Hans-Peter Schoener, “Challenging highway scenarios beyond colli-sion avoidance for autonomous vehicle certification,” ResearchGatepreprint, Nov. 2020.
[145] I. Kurzidem, A. Saad, and P. Schleiss, “A systematic approach toanalyzing perception architectures in autonomous vehicles,” in Model-Based Safety and Assessment, M. Zeller and K. Hofig, Eds. Cham:Springer International Publishing, 2020, pp. 149–162.
[146] R. Kuhn, R. Kacker, Y. Lei, and J. Hunter, “Combinatorial softwaretesting,” Computer, vol. 42, no. 7, pp. 94–96, Aug. 2009.
[147] C. Gladisch, C. Heinzemann, M. Herrmann, and M. Woehrle, “Leverag-ing combinatorial testing for safety-critical computer vision datasets,”in Proceedings of the IEEE/CVF Conference on Computer Vision andPattern Recognition (CVPR) Workshops, June 2020.
[148] N. Weber, D. Frerichs, and U. Eberle, “A simulation-based, statisticalapproach for the derivation of concrete scenarios for the release ofhighly automated driving functions,” in AmE - Automotive meetsElectronics; 11th GMM-Symposium, Dortmund, Germany, 2020, pp.1 – 6.
[149] Robosense, “RS-Reference - efficiently access massive and reliableground truth data,” Online, Dec. 2020. [Online]. Available: http://www.robosense.ai/en/rslidar/RS-Reference
[150] ASAM e. V., “ASAM OpenLABEL,” 2020, accessed on09/12/2020. [Online]. Available: https://www.asam.net/project-detail/scenario-storage-and-labelling/
[151] N. Scheiner, N. Appenrodt, J. Dickmann, and B. Sick, “Automatedground truth estimation of vulnerable road users in automotive radardata using GNSS,” in IEEE MTT-S Int. Conf. on Microwaves forIntelligent Mobility (ICMIM). IEEE, Apr. 2019.
[152] V. Ho, K. Rauf, I. Passchier, F. Rijks, and T. Witsenboer, “Accuracyassessment of RTK GNSS based positioning systems for automateddriving,” in 15th Workshop on Positioning, Navigation and Communi-cations (WPNC). IEEE, Oct. 2018.
[153] M. Tahir, S. S. Afzal, M. S. Chughtai, and K. Ali, “On the accuracy ofinter-vehicular range measurements using GNSS observables in a co-operative framework,” IEEE Transactions on Intelligent TransportationSystems, vol. 20, no. 2, pp. 682–691, Feb. 2019.
[154] J. S. Subirana, J. J. Zornoza, and M. Hernandez-Pajares, “GNSS dataprocessing. volume 1: Fundamentals and algorithms,” ESA Communi-cations ESTEC, PO Box, vol. 299, p. 2200, 2013.
[155] B. Lampe, T. Woopen, and L. Eckstein, “Collective Driving - CloudServices for Automated Vehicles in UNICARagil,” in 28th AachenColloquium, Aachen, Germany, Oct. 2019.
[156] S. Knake-Langhorst, K. Gimm, T. Frankiewicz, and F. Koster, “Testsite AIM – toolbox and enabler for applied research and developmentin traffic and mobility,” Transportation Research Procedia, vol. 14, pp.2197–2206, Dec. 2016.
[157] D. Notz, F. Becker, T. Kuhbeck, and D. Watzenig, “Extraction andassessment of naturalistic human driving trajectories from infrastructurecamera and radar sensors,” arXiv:2004.01288, 2020.
[158] A. Krammer, C. Scholler, D. Gulati, V. Lakshminarasimhan, F. Kurz,D. Rosenbaum, C. Lenz, and A. Knoll, “Providentia - a large-scalesensor system for the assistance of autonomous vehicles and itsevaluation,” arXiv:1906.06789, 2019.
[159] L. Kloeker, A. Kloeker, F. Thomsen, A. Erraji, and L. Eckstein, “Trafficdetection using modular infrastructure sensors as a data basis forhighly automated and connected driving,” 29. Aachen Colloquium -Sustainable Mobility, vol. 29, no. 2, pp. 1835–1844, 2020.
[160] L. Kloeker, C. Geller, A. Kloeker, and L. Eckstein, “High-precisiondigital traffic recording with multi-lidar infrastructure sensor setups,”arXiv:2006.12140, 2020.
[161] G. Guido, V. Gallelli, D. Rogano, and A. Vitale, “Evaluatingthe accuracy of vehicle tracking data obtained from unmannedaerial vehicles,” International Journal of Transportation Scienceand Technology, vol. 5, no. 3, pp. 136 – 151, 2016, UnmannedAerial Vehicles and Remote Sensing. [Online]. Available: http://www.sciencedirect.com/science/article/pii/S2046043016300272
[162] F. Kruber, E. S. Morales, S. Chakraborty, and M. Botsch, “Vehicle po-sition estimation with aerial imagery from unmanned aerial vehicles,”arXiv:2004.08206, 2020.
[163] R. Krajewski, J. Bock, and L. Eckstein, “Drones as a tool for thedevelopment and safety validation of highly automated driving,” inAachener Kolloquium, 2019, pp. 1449–1462.
22
[164] F. Kurz, D. Waigand, P. Pekezou-Fouopi, E. Vig, C. Henry, N. Merkle,D. Rosenbaum, V. Gstaiger, S. Azimi, S. Auer, et al., “DLRAD -a first look on the new vision and mapping benchmark dataset forautonomous driving,” International Archives of the Photogrammetry,Remote Sensing & Spatial Information Sciences, vol. 42, no. 1, 2018.
[165] F. Kurz, D. Rosenbaum, H. Runge, and P. Reinartz, “Validation ofadvanced driver assistance systems by airborne optical imagery,” Proc.of Mobil.TUM, pp. 1–11, 2015.
[166] Z. Wang, D. Feng, Y. Zhou, W. Zhan, L. Rosenbaum, F. Timm,K. Dietmayer, and M. Tomizuka, “Inferring spatial uncertainty in objectdetection,” arXiv:2003.03644, 2020.
[167] S. Wang, K. Pei, J. Whitehouse, J. Yang, and S. Jana, “Efficient formalsafety analysis of neural networks,” arXiv:1809.08098, Sept. 2018.
[168] S. A. Seshia, D. Sadigh, and S. S. Sastry, “Towards verified artificialintelligence,” arXiv:1606.08514, 2020, v4 (after first version from2016).
[169] M. Barbier, A. Renzaglia, J. Quilbeuf, L. Rummelhard, A. Paigwar,C. Laugier, A. Legay, J. Ibanez-Guzman, and O. Simonin, “Validationof perception and decision-making systems for autonomous driving viastatistical model checking,” in IEEE Intelligent Vehicles Symposium(IV), 2019, pp. 252–259.
[170] K. von Neumann-Cosel, “Virtual test drive: Simulation umfeldbasierterFahrzeugfunktionen,” Dissertation, Technical University Munich, Mu-nich, 2014.
[171] D. Rao, P. Pathrose, F. Huening, and J. Sid, “An approach for validatingsafety of perception software in autonomous driving systems,” inModel-Based Safety and Assessment, Y. Papadopoulos, K. Aslansefat,P. Katsaros, and M. Bozzano, Eds. Cham: Springer InternationalPublishing, 2019, pp. 303–316.
[172] T. Myklebust, T. Stalhane, and G. Hanssen, “Agile safety case and
DevOps for the automotive industry,” in Proc. of the 30th EuropeanSafety and Reliability Conf. and the 15th Probabilistic Safety Assess-ment and Management Conf., Aug. 2020.
[173] P. Antonante, D. I. Spivak, and L. Carlone, “Monitoring and diagnos-ability of perception systems,” arXiv:2011.07010, 2020, v3.
[174] T. Woopen, B. Lampe, T. Boddeker, L. Eckstein, A. Kampmann,B. Alrifaee, S. Kowalewski, D. Moormann, T. Stolte, I. Jatzkowski,M. Maurer, M. Mostl, R. Ernst, S. Ackermann, C. Amersbach,S. Leinen, H. Winner, D. Pullen, S. Katzenbeisser, M. Becker, C. Stiller,K. Furmans, K. Bengler, F. Diermeyer, M. Lienkamp, D. Keilhoff, H.-C. Reuss, M. Buchholz, K. Dietmayer, H. Lategahn, N. Siepenkotter,M. Elbs, E. v. Hinuber, M. Dupuis, and C. Hecker, “UNICARagil- Disruptive Modular Architectures for Agile, Automated VehicleConcepts,” in 27th Aachen Colloquium, Aachen, Germany, Oct. 2018.
[175] M. Nolte, I. Jatzkowski, S. Ernst, and M. Maurer, “Supporting safedecision making through holistic system-level representations & mon-itoring – a summary and taxonomy of self-representation concepts forautomated vehicles,” arXiv:2007.13807, 2020.
[176] B. Lampe, R. van Kempen, T. Woopen, A. Kampmann, B. Alrifaee,and L. Eckstein, “Reducing uncertainty by fusing dynamic occupancygrid maps in a cloud-based collective environment model,” in IEEEIntelligent Vehicles Symposium (IV). IEEE, Oct. 2020.
[177] H. Winner, ADAS, Quo Vadis? Cham: Springer InternationalPublishing, 2016, pp. 1557–1584. [Online]. Available: https://doi.org/10.1007/978-3-319-12352-3 62
[178] S. Grubmuller, G. Stettinger, M. A. Sotelo, and D. Watzenig, “Fault-tolerant environmental perception architecture for robust automateddriving,” in IEEE Int. Conf. on Connected Vehicles and Expo (ICCVE).IEEE, Nov. 2019.
23
![Testing Testing [Read-Only] - Czone - East Sussex](https://static.fdokumen.com/doc/165x107/6327b2a26d480576770d6757/testing-testing-read-only-czone-east-sussex.jpg)