A QUANTITATIVE EVALUATION OF EFFECTIVENESS AND EFFICACY OF COMPETITION POLICIES ACROSS COUNTRIES
56
A QUANTITATIVE EVALUATION OF EFFECTIVENESS AND EFFICACY OF COMPETITION POLICIES ACROSS COUNTRIES * Dr. Serdar DALKIR Abstract This paper proposes a quantitative, cross-sectional, framework for ex-post evaluation of competition policies from relevance, effectiveness and efficacy perspectives. The paper evaluates competition policy output effectiveness and outcome efficacy in the sample countries. The evaluation has two levels that focus on an intermediate output and a final outcome, respectively. The intermediate output is defined as “competition policy implementation, advocacy and enforcement effectiveness.” A positive link from the legal framework and resource use to competition policy implementation, advocacy and enforcement indicates an effective intermediate output. The final outcome is defined as “national competitiveness to attract foreign direct investment (FDI).” A positive link from a country’s intermediate output effectiveness to the country’s competitiveness to attract FDI is interpreted as an efficacious final outcome. These two links are quantitatively estimated through numerical indicators. Statistical results obtained are consistent with the existence of measurable implementation gaps (1) between the developing and the developed countries, and (2) between the recent European Union members or candidate(s) and the more senior E.U. members, controlling for the level of resources used in competition implementation, advocacy and enforcement. These gaps cannot be bridged merely by increasing the size of the competition agencies’ budgets. Reorganizing agencies’ spending priorities as well as developing extra-agency initiatives can be complementary means to bridge these gaps. Statistical evidence is also consistent with a positive association between competition effectiveness and policy efficacy. Efficacy may also be a function of binary variables (for example, E.U. membership); if so, efficacy can partially be increased through a binary transformation in a country’s status. Conversely, an efficacy gap may persist as long as economic and other types of conditions preclude a binary transformation. * The author thanks Dr. Michael Nicholson, Cihan Aktas, Dr. Refet Gurkaynak, Dr. David Eisenstadt, Dr. Umut Aydin, attendees of a presentation to the Turkish-American Business Forum, CUTS/CDRF, panel discussants and the audience of a CUTS/CDRF symposium, and two anonymous referees. Any errors or ommissions are the author’s responsibility.
Transcript of A QUANTITATIVE EVALUATION OF EFFECTIVENESS AND EFFICACY OF COMPETITION POLICIES ACROSS COUNTRIES

A QUANTITATIVE EVALUATION OF EFFECTIVENESS AND EFFICACY OF
COMPETITION POLICIES ACROSS COUNTRIES*
Dr. Serdar DALKIR Abstract This paper proposes a quantitative, cross-sectional, framework for ex-post evaluation of competition policies from relevance, effectiveness and efficacy perspectives. The paper evaluates competition policy output effectiveness and outcome efficacy in the sample countries. The evaluation has two levels that focus on an intermediate output and a final outcome, respectively. The intermediate output is defined as “competition policy implementation, advocacy and enforcement effectiveness.” A positive link from the legal framework and resource use to competition policy implementation, advocacy and enforcement indicates an effective intermediate output. The final outcome is defined as “national competitiveness to attract foreign direct investment (FDI).” A positive link from a country’s intermediate output effectiveness to the country’s competitiveness to attract FDI is interpreted as an efficacious final outcome. These two links are quantitatively estimated through numerical indicators. Statistical results obtained are consistent with the existence of measurable implementation gaps (1) between the developing and the developed countries, and (2) between the recent European Union members or candidate(s) and the more senior E.U. members, controlling for the level of resources used in competition implementation, advocacy and enforcement. These gaps cannot be bridged merely by increasing the size of the competition agencies’ budgets. Reorganizing agencies’ spending priorities as well as developing extra-agency initiatives can be complementary means to bridge these gaps. Statistical evidence is also consistent with a positive association between competition effectiveness and policy efficacy. Efficacy may also be a function of binary variables (for example, E.U. membership); if so, efficacy can partially be increased through a binary transformation in a country’s status. Conversely, an efficacy gap may persist as long as economic and other types of conditions preclude a binary transformation.
* The author thanks Dr. Michael Nicholson, Cihan Aktas, Dr. Refet Gurkaynak, Dr. David Eisenstadt, Dr. Umut Aydin, attendees of a presentation to the Turkish-American Business Forum, CUTS/CDRF, panel discussants and the audience of a CUTS/CDRF symposium, and two anonymous referees. Any errors or ommissions are the author’s responsibility.

2
I. INTRODUCTION, STATEMENT OF OBJECTIVES AND SUMMARY
Competition laws and a policy focus on domestic competition have spread across
many countries especially within the past two decades.1 , 2 Developments within
individual countries often paralleled, and in some cases, were influenced, by
developments within multinational bodies such as the European Union (E.U.) and by
policy assistance and/or policy advice from international organizations such as the World
Bank, the EBRD, and the OECD.3 Because of this spread in competition laws and
policies, there is an increasing need for independent evaluations of such laws and
policies.4
This paper proposes a quantitative, cross-sectional, framework for ex-post
evaluation of competition policies from relevance, effectiveness and efficacy
perspectives. The evaluation has two levels that focus on an intermediate output and a
final outcome, respectively.
The intermediate output is defined as “competition policy implementation5 and
enforcement effectiveness.” Implementation of competition policies is achieved through
1 Unless noted otherwise, “competition” as an adjective is used as a synonym for “antitrust.” 2 For example, Dutz and Vagliasindi (1999) note that during the period 1990-1996, “competition laws have been adapted in 22 of the 26 transition economies of central and eastern Europe and the former Soviet Union.” 3 The E.U., the World Bank and the EBRD offer technical assistance to their respective member countries to for strengthening competition policy definition and implementation, and policy enforcement, of their members. OECD has been dispensing policy advice to its members for introducing more rigorous competition and deregulation; see, for example, Crampton (2003), who cites OECD’s 1997 Regulatory Reform Report for the statement that “reform should be built on a foundation of competition policy.” 4 This is not to say that evaluations of antitrust policy have never been attempted by national or multinational bodies and international organizations. In fact, some multinational bodies and international organizations, such as the World Bank, have a reputation for the importance they place upon and the support they give to evaluations of past and present policy and advice. These evaluations, however, presumably reflect the national perspective, or the membership composition, of these bodies and organizations. 5“At least in this paper, the term ”implementation” is meant to include “advocacy.” As noted by a CUTS/CDRF syposium discussant (Prof. Eleanor Fox):

3
the use of a mechanism (or technology) that enforces the existing competition laws and
regulations through resource use (e.g. agency budget). For the purposes of this study, the
success of the intermediate outcome is measured by the level of domestic competition
index assigned to each country by the World Economic Forum (“the WEF index”). The
links from (a) legal infrastructure (competition laws) to implementation, and (b) from
resource use (e.g. competition agency budget) to implementation are evaluated. A
positive link is interpreted as an effective intermediate output.
The final outcome is defined as “national competitiveness to attract foreign direct
investment (FDI).” For the purposes of this study, the success of the final outcome is
measured by FDI inflows. The link from a country’s effectiveness to achieve the
intermediate output to the level of FDI inflows (in logarithmic terms) is estimated. A
positive link is interpreted as an efficacious final outcome.
Differences in countries’ competition policy effectiveness and differences in
countries’ policy efficacy have implications for policy priorities both within and across
groups of countries. For example, if a significant effectiveness gap exists between the
developing and the developed countries, it is natural to ask whether and to what extent
this gap can be explained by the amount of resources allocated to competition agencies.
This study measures differentials in competition policy effectiveness and
differentials in policy efficacy (1) between the developing and the developed countries,
(2) between the European Union members and others, and/or (3) between the recent
European Union members or candidate(s) and the more senior E.U. members. The
The successes of competition advocacy are a major factor in assessing effectiveness. For example, in Ireland, for a number of years, advocacy in getting the government to liberalize markets was more significant than enforcement actions – and probably did more good towards efficiency and competitiveness.

4
analysis begins with two primary questions: (i) “Are differences in competition policy
effectiveness between countries explained exclusively by competition agency budget and
staff numerosity as direct inputs?” and: (ii) “are the gaps in policy efficacy between
countries explained exclusively by differences in competition policy effectiveness
between countries?” Each of these primary questions is associated with a secondary
question: (i) “Which variables other than direct inputs might significantly explain
differences in competition policy effectiveness?” and: (ii) “which variables other than
competition policy effectiveness might explain the differences in policy efficacy?” The
statistical technique of multiple regression analysis is used to research these questions.
A. Competition policy implementation and enforcement effectiveness
The decision to use the WEF rating as a measure of (perceived) effectiveness is
consistent with other recent research; see, for example, Hylton and Deng (2006). When
evaluating competition policy effectiveness, two natural hypotheses to test are that
effectiveness of competition policy in a country will increase with (1) the extent of
competition laws and (2) the amount of resources allocated to competition policy
implementation and enforcement (e.g. the agency budget). This study first considers the
relationship from the extensiveness of competition laws, to implementation and
enforcement effectiveness. As explained in the Results section below, a visual inspection
of the two variables suggests that a positive relationship may exist under some
assumptions. However, the present data do not support a statistically significant
relationship between the two variables.6 The study then estimates a statistical
6 Hylton and Deng (2006) present tentative or preliminary evidence that the scope of a country’s competition law is positively associated with the perceived intensity of local competition, measured by the WEF rating. In view of the possibility of a statistical bias due to endogeneity (i.e., the scope of the law itself being influenced by the perceived intensity of competition), they also estimate instrumental variables

5
relationship from competition agency resource use, to implementation and enforcement
effectiveness. It derives an “effectiveness gap” (or “effectiveness premium”) for each
country in the sample, defined as the difference between the actual level of effectiveness
and the predicted level of effectiveness based on input use.
This study then researches whether systematic gaps in implementation
effectiveness exist between groups of countries that cannot be attributed to differences in
resource use. Its primary conclusion is that there are simultaneous gaps in the
implementation effectiveness between (1) developing versus developed countries, (2)
E.U. versus non-E.U. countries, and (3) recent E.U. members and candidates versus more
senior E.U. members. These gaps are not explained by differences in the level of
resources allocated to competition policy implementation and enforcement across
countries.
The study also researches whether implementation effectiveness is also a function
of time. If so, countries with extensive competition laws and/or relatively large
enforcement budgets but a low level of implementation effectiveness (such as the recent
E.U. members and the candidates) can expect to strengthen their implementation
effectiveness over time.
B. Policy efficacy
As noted above, the measure of policy efficacy used in this study is the sample
countries’ level of FDI competitiveness. The relevance of the existence and enforcement
of competition laws and policies on private capital’s incentives to invest and innovate is
not a priori apparent. For this reason, the direction (or the magnitude) of the relationship
regressions. Their instrumental variable regressions (which avoid the bias due to endogeneity) fail to show a statistically significant association.

6
between competition policy and competitiveness to attract FDI is not theoretically clear.
This study estimates a relationship between competition policy effectiveness and final
outcome efficacy, and derives an “efficacy gap” (or an “efficacy premium”) for each
country in the sample, defined as the difference between the actual level of efficacy and
the predicted level of efficacy based on competition policy effectiveness.7
As a measure of the efficacy of final outcome, “FDI inflows” has its weaknesses.
As noted by a panel discussant in the CUTS/CDRF symposium,8 antitrust is likely to be a
policy adopted in conjunction with many other liberalizing policies. Deregulation of
markets in which competition will work, and lowering of trade barriers, are likely to be
measures that overwhelm any effect of competition law enforcement, even if there is a
provable prositive effect of competition law enforcement on FDI competitiveneness.
Moreover, macroeconomic stability may be an important additional factor in its own right
that explains FDI inflows.9 In light of these and similar comments, this study attempts to
statistically control for the effect of such policies and factors through the use of numerical
indicators that measure the extent of economic freedoms and macroeconomic stability in
each country.10
7 Reducing the efficacy gap may require actions at the level of a country’s general governance and minimizing general risk and uncertainty for the country as a whole. For example, Nicholson (2004) observes: “the larger Western economies [...] shoulder, in general, relatively stronger rule of law, intellectual property protection, control of corruption, and other indicators of institutional maturity, which may positively interact with antitrust regimes” (p. 11). As another example, Maskus (2000) emphasizes possible complementarities between antitrust regimes and property rights, market liberalization, deregulation, and technology development policies. The maintained hypothesis of this paper is that effective antitrust implementation and effective governance in other areas contribute to efficacy in separately identifiable ways. This would imply that a significant reduction of the efficacy gap is almost certain to require a higher level of effort than ensuring effective implementation of competition laws and policies only. 8 Prof. Eleanor Fox. 9 Prof. Simon Evenett. 10 In the best-case scenario, a zero (or moderate) correlation between competition policy and other policy areas will enable one to identify the separate effect of competition policy effectiveness on outcome

7
The study concludes that a positive relationship exists between effective
implementation of competition laws and policies and an efficacious final outcome, while
statistically accounting for the effects of other policies and factors through additional
numerical indicators. Another conclusion is that efficacy may also be a function of
binary variables (for example, E.U. membership).
C. Policy implications
Results of this study have important policy implications. They suggest that the
gaps between the developed and the developing countries cannot be bridged merely by
increasing the size of the competition agencies’ budgets. Reorganizing agencies’
spending priorities as well as developing extra-agency initiatives can be complementary
means to bridge these gaps. Examples of extra-agency initiatives include civil society
organizations, ability of private parties to initiate lawsuits under the competition laws,
and ability to collect private damages from violators.
This study’s results indicate that increasing competition effectiveness is relevant
for national competitiveness. Moreover, efficacy can partially be increased through a
binary transformation in a country’s status (for example, E.U. membership). Conversely,
an efficacy gap may persist as long as economic and other types of conditions preclude a
binary transformation.
D. Organization of the paper
efficacy. In the worst-case scenario, a high (positive) correlation between competition policy effectiveness and effects of reforms in other policy areas will preclude identifying a secular relationship between competition policy effectiveness and outcome efficacy. However, since a high correlation will also imply that competition policy effectiveness is on average associated with effectiveness of other policy reforms, identifying the direct effect of competition policy will not be as important as confirming a positive overall effect, from a practical point of view.

8
The rest of the paper is organized as follows. Section II presents the paper’s
policy evaluation framework and quantitative indicators used; it also selectively surveys
existing empirical literature on the (implicit or explicit) use of FDI inflows as a measure
of policy efficacy, either generally or with specific reference to policies aiming increased
investment. Section III comments on the sample and the methodology. Section IV
presents results. Section V concludes.
II. BACKGROUND: EVALUATION FRAMEWORK AND QUANTITATIVE INDICATORS
Figure I demonstrates a schematic view of the ex-post policy evaluation framework used
in this paper. In this framework, competition laws and available resources for
enforcement are represented as inputs to an enforcement technology. Effective and
consistent use of a suitable enforcement technology is expected to result in an optimal
intermediate output. Enforcement may result in a suboptimal intermediate output if the
enforcement technology being used is not suitable for the task, compromising
effectiveness and leading to a welfare loss.11 In this framework , a suboptimal
(inefficacious) final outcome may be observed even when the competition enforcement
technology is suitable and effectively implemented. This outcome may arise if
governance in other policy areas is ineffective or policies are inadequately coordinated
across policy areas.
Measurement, or ranking of countries with respect to intermediate and final
outcomes is probably essential for a systematic evaluation of competition policy
11 Of course, an inconsistent, unpredictable and erratic use of a given technology may also result in a suboptimal outcome.
9
effectiveness and efficacy across countries. This is not a simple task, primarily because it
requires some form of quantification along the pertinent dimension.12 And, many
quantitative variables or indices that can be used for this purpose are usually imperfect
(e.g., biased due to a combination of measurement error, truncation, and endogeneity).13
A. Quantitative measures for evaluating the effectiveness of the intermediate outcome (competition implementation and enforcement) relative to the inputs
Nicholson (2004) discusses surveys and comprehensive analyses of inputs and
outputs of competition enforcement. He discusses research by Kee and Hoekman (2003),
Evenett (2002), Lapachi (2002), Dutz and Vagliasindi (2000), Fingleton et al. (1998),
Pittman (1998), Graham and Richardson (1997), Hoeckman (1997), and Jenny (1995).
As a new measure to assess the presence of competition laws across countries, he
introduces the Antitrust Law Index (ATLI), the sum of each country’s binomial scores for
the presence of particular laws.14 , 15
12 Measurement usually implies cardinality. In contrast, countries can be ranked using either a cardinal or an ordinal scale. 13 A CUTS/CDRF symposium discussant (Prof. Eleanor Fox) noted that in the United States the question is generally posed in terms of whether antitrust helps or hurts consumers; that there has been debate on this point; and that even that narrower proposition has been hard to quantify and is usually done anecdotally. 14 He notes that the countries with the highest index values do not necessarily represent the strongest antitrust laws; and that the impetus for adopting antitrust laws appears related to the imposed guidelines of supranational bodies, in particular the requirements of the European Union. He mentions Ginarte and Park (1997) and Rapp and Rozeck (1990) as examples of research on intellectual property rights which use a comparable methodology. 15 This paper researches whether a positive link exists between “extensiveness of competition laws” and the effectiveness of competition law an policy. A visual inspection of the two variables suggests that a positive relationship may exist under some additional assumptions. However, the present data do not support a statistically significant relationship between the two variables. This finding is consistent with both Nicholson (2004) and the expectations of at least one CUTS/CDRF symposium discussant (Prof. Eleanor Fox), who noted that “extensiveness” of competition laws tells us nothing about effectiveness of competition law and policy; that competition laws are commonly applied against cartels and they also are commonly applied against abuses of dominance, protecting firms without power from abusive restraints; and that even if aggregate efficiency is the only goal, a spare competition law might be more effective than an extensive one.

10
For quantification of the inputs and the intermediate outcome (i.e.,
implementation and enforcement effectiveness), this paper uses, and where possible,
supplements, the following four variables discussed and displayed by country in
Nicholson (2004): the ATLI (described above); competition agency budget size and
competition agency staff count compiled by Global Competitiveness Review (GCR); and
a domestic antitrust effectiveness rating compiled by the World Economic Forum
(WEF).16 In addition, years in which countries enacted competition laws for the first time
have been compiled from the International Competition Network, the Global Competition
Forum, and Dutz and Vagliasindi (1999).17
Nicholson (2004) also includes a “regime/institution score” determined by the
GCR Survey. This score is positively and significantly correlated with the WEF rating;18
this finding confers an independent degree of reliability upon the WEF rating, as the
comments received from symposium discussants would seem to imply.19 This positive
16 Nicholson (2004, p. 7) describes the WEF ratings as follows:
A comprehensive set of countries is covered in a survey conducted by the World Economic Forum (WEF), but is limited to a relatively subjective and simple valuation of the broad characterization of anti-monopoly policy. The WEF surveyed business leaders in 2001 to rate the effectiveness of antitrust policy in various countries, asking them to rate “antimonopoly” policy from “1=lax and not effective and promoting competition” to “7=effectively promotes competition”. The results are published in the Global Competitiveness Report 2001-2002, and replicated in Table 2.
Nicholson also includes a “regime/institution score” determined by the GCR Survey. This score is positively and significantly correlated with the WEF rating; this finding confers an independent degree of reliability upon the WEF rating. This positive and significant correlation also renders the GCR Survey largely redundant as an additional indicator; the cross-sectional variation reflected by the GCR Survey is adequately represented by the WEF rating to a reasonable degree for the purposes of this paper. 17 For most countries, the enactment or effectiveness years are from the International Competition Network or the Global Competition Forum websites although the value for Canada has been revised to reflect the initial enactment of the Canadian anti-monopoly law; the value for Poland is from Dutz and Vagliasindi (1999). 18 Within the sample, the coefficient of correlation between the GCR score and the WEF rating is 0.80 with a level of statistical significance less than 1%. While the WEF rating is defined for 48 countries in the sample, the GCR score is defined for only 25 countries, 23 of which also have a WEF rating. 19 For example, in the words of Prof. Eleanor Fox:

11
and significant correlation also renders the GCR Survey largely redundant as an
additional indicator; the cross-sectional variation reflected by the GCR Survey is
adequately represented by the WEF rating, to a statistically reasonable degree.
B. Quantitative measures to evaluate the efficacy of the final outcome relative to the intermediate outcome
This study uses countries’ levels of FDI inflows as a quantitative indicator of final
outcome (national competitiveness to attract FDI).20 , 21 Mehta and Evenett (2006) define
competitiveness as “many features of a nation’s corporate performance compared to
firms located abroad.” They emphasize “firms, not nations, compete and so properly
understood competitiveness is not a characteristic of government or state, but of the firms
How should effectiveness of competition law and policy be measured? The WEF index […] is of doubtful help. Intensive studies of the details of what an agency does and fails to do (e.g. hands off position on conduct and ventures of SOEs) is much more revealing and may be necessary. OECD, UNCTAD, and other peer reviews are very helpful; even then, these must sometimes be discounted because the reviewers may be trying to be supportive of the agency. While much more remote and subjective, the Global Competition Review[‘]s ratings of how agencies are doing is of some help – and better help than WEF because by a more expert group that understands the intricacies. Of course, in some few nations, non-governmental enforcement is also a factor in antitrust effectiveness – whether positive or negative.
Prof. Fox also asked “should not effectiveness competition law and policy be seen in terms of a nation’s own goals?” Similarly, another panel discussant (Mr. Joseph S. Hur) noted that “success” may not have an identical meaning across jurisdictions. This study takes it as a given the subjective nature of the WEF rating as an indicator of competition policy effectiveness. 20 This definition of competitiveness is more specific than that in Mehta and Everett (2006); the latter includes many features of corporate performance, such as “share of world markets, the rate of innovation, and the level of import penetration.” This paper shares the view in Mehta and Everett (2006) that competitiveness is a characteristic of firms within a juristiction. Since most FDI inflows are measured and reported on a country basis, the relevant juristiction is hypothesized as a country. This hypothesis is statistically tested in Section IV below. 21 A strand of the existing literature analyzes countries’ relative competitiveness and/or the process of competition between countries (e.g., regulatory incentives) to attract FDI. For example, Inal (2003) surveys various definitions of competition and discusses some of the quantitative indicators that are present in that literature. The analysis presented in this paper partially overlaps with that literature; the present analysis also differs from that literature because, unlike the latter, it specifically focuses on the “ambient” effect of antitrust policies (antitrust implementation and enforcement) on FDI inflows. This paper’s focus on the FDI inflows as a measure of efficacy also differs from that of the literature on the determinants of FDI.

12
within a jurisdiction.” They note “by fostering competition between domestic firms,
governments are thought by some to foster national competitiveness.”22 , 23
The direction or the magnitude of the relationship between competition policy and
FDI is not immediately clear. FDI flows have been empirically associated with
privatization;24 foreign investment flows have also been thought related to deregulation
and market liberalization.25
Complementarities in attracting FDI may exist between competition regimes and
property rights, market liberalization, deregulation, and technology development
policies.26 However, it is also recognized that in the absence of an effective competition
policy, privatization,27 deregulation or liberalization28 are not sufficient to ameliorate
welfare losses arising from anticompetitive conduct.
All else equal, investors would be attracted to market power29 and anti-liberal
protections, as long as they can benefit from these. Investors would be dispelled by
market power if they believe that the distribution of market power (across markets or
across firms in a market) can harm their interests. For example, investors may believe
that incumbent firms in a market can use their market power to exclude entrants. Such a
22 They reference U.K. and E.U. white papers on this point. 23 A panel discussant in the CUTS/CDRF symposium, Prof. Eleanor Fox, noted that “good” antitrust should improve efficiency of firms established in countries around the world that do business in the particular jurisdiction among others; that good antitrust applies equally to firms, no matter where they come from or where the goods or services come from; but competitiveness is usually used as a comparative term, to imply advantages to one country. 24 Sader (1995) and (1993). 25 Crampton (2003, p. 15) 26 Maskus (2000). 27 Crampton (2003, p.2) citing Wallensten (1999). 28 Crampton (2003, p. 18). 29 Market power is defined as the power to sustain price over the competitive level for a significant duration of time.

13
belief would tend to diminish the investors’ willingness to enter into the market.
Investors would also prefer competitive upstream and downstream markets.30 Risk
aversion may also affect the magnitude and the direction of the relation between market
power and FDI. If potential entrants are risk averse, then the likelihood of entry into a
market can be expected to increase with the degree of evenness (symmetry) of the
distribution of market power across markets and across market participants, as well as the
entrant’s degree of certainty that it will enjoy a given level of market power.
A CUTS—C-CIER briefing paper31 underlines that the observed direction of the
relationship between competition effectiveness and investment inflows can be either
positive or negative. The paper looks at two different examples: soft drinks in India and
cement markets in Zambia. The first example narrates that in the absence of adequate
competition laws or effective implementation and enforcement, foreign entry (direct
investment) can be correlated with market conditions suitable for an increase in market
concentration. (In India, foreign entry into the soft drinks market resulted in a virtual
duopoly between the two foreign entrants, Pepsi and Coca-Cola.) In this case, the FDI
inflow would appear negatively correlated with competition effectiveness (or positively
correlated with an absence thereof). The second example illustrates how well
implemented and adequately enforced competition laws can avoid an increase in the
market power, while maintaining the FDI inflow. (In Zambia, new entry by Lafarge did
not increase market concentration and possibly created cost efficiencies thanks to a
30 This is because double markups will tend to reduce sales and profits. In addition, the level of existing market power in a vertically related market may lessen the profitability of incremental market power in the market of entry, because any additional profit due to increased market power will have to be “shared” by the upstream or the downstream firm (the supplier or the distributor). 31 CUTS—C-CIER (2005).

14
timely intervention by Zambia Competition Commission.) In this case, the FDI inflow
would appear positively correlated with competition effectiveness.
Dutz and Vagliasindi (1999), Khemani (2003) and Crampton (2003) are three
examples of studies that use measures of final outcome other than FDI. These three
studies research the relationship from competition effectiveness to average firm
efficiency, national income, and R&D intensity, respectively.
Dutz and Vagliasindi (1999) define a range of competition policy implementation
criteria along enforcement, competition advocacy and institutional effectiveness
dimensions. They also provide an assessment of the effectiveness of competition policy
implementation across eighteen countries, split equally between central or eastern
European or Baltic countries and the former Soviet Union countries, using data from each
country’s competition authorities. They find a robust positive relationship between
effective competition policy implementation and expansion of more efficient private
firms.32 They stress “having a competition law on the books, or having an up-and-
running competition agency, is not a sufficient condition for effective implementation”
(p. 9).
For a cross section of countries Khemani (2003) presents visual relationships
between average industry competitiveness (alternatively, prevalence of new entry into the
industry) measured on a scale of 1-7, and per capita GDP (alternatively, GDP growth
rate). He concludes that competition in domestic markets through either inter-firm
32 On the other hand, they do not find a robust effect of competition advocacy. They comment “this is a most difficult area to implement effectively across all transition economies. It requires the competition authorities to gain expertise not only in traditional anti-trust enforcement but also in the other industry oversight (especially network infrastructure industries). It also requires sufficient resources to be spent on effective education.” (ibid.)

15
rivalry or new entrants is positively associated with higher levels (alternatively, higher
growth rates) of per capita GDP.
Crampton (2003) emphasizes that in the long run “innovation accounts for most
of the improvements in average living standards that flow from greater competition. This
applies in both developed and developing economies”; he also states that “procompetitive
reform explained more than one third of the excess R&D intensity in the U.S., Japan,
German and Sweden relative to the OECD average and provided a large positive
contribution in the U.K., Canada and Ireland. Conversely, excessive regulatory
restrictions to competition in Italy and Greece were estimated to account for one third and
two thirds, respectively, of the shortfall in R&D intensity relative to the OECD
average.”33 The specific procompetitive policies that were analyzed in the referenced
study, and whether competition policy is one of them, are not made clear in Crampton’s
remarks.
Although each of the measures of final outcome used by the three studies
discussed immediately above (namely, average firm efficiency, national income, and
R&D intensity) is suitable for evaluating the effect of competition policy implementation
on static or dynamic efficiency or national prosperity, the specific aim of the present
study is to research the relationship between competition policy implementation and
national competitiveness measured by FDI inflows. There is a large volume of literature
that discusses the determinants of FDI inflows. The remainder of this subsection presents
a selective survey of these studies, with a particular emphasis on the developing
countries.
33 He cites to para. 18 of G. Nicoletti (2002) “The Economy-wide Effects of Product Market Policies,” paper presented at the OECD-World Bank Services Experts Meeting, OECD Headquarters, Paris.

16
Goldberg (2004) selectively surveys the literature on FDI with a particular
emphasis on the financial sector. She concludes that multinationals and FDI in emerging
markets generally have important effects on the host countries, with particularly notable
effects in financial services. These effects include improved allocative efficiency,
technology transfer and diffusion, wage spillovers, institution building, altered
macroeconomic cycles, and overall economic stability. Allocative efficiency is enhanced
when foreign investors enter markets characterized with high entry barriers and reduce
monopolistic distortions. Increased competitive pressures and demonstration effects may
spur local firms to enhance technical efficiency. In financial services, a positive
association between FDI and institutional development is expected through improved
supervision and regulation, although there may be a lag due to initial conditions (e.g. the
level of preparedness of the supervising agency to evaluate the new products and the new
processes introduced by foreign entrants). The employment and growth effects of FDI
depend on the type of investment (greenfield vs. merger or acquisition), and in the case of
an acquisition, on the soundness of the acquired institution.
Singh and Jun (1995) empirically analyze various factors that influence direct
investment flows to developing countries; they examine qualitative factors. Their
findings differ between the group of countries that have historically attracted high FDI
inflows and others that have not. For the first group, they find that qualitative indices of
political risk and business operation conditions, and exports in general and manufacturing
exports in particular, are significant determinants of FDI. For the second group, they find
that sociopolitical instability measured by lost person-hours because of a labor dispute
has a negative impact on investment flows.

17
Banga (2003) addresses the effectiveness of selective government policies and
investment agreements in attracting FDI flows to developing countries, and whether FDI
from developed and developing countries respond similarly to developing countries’
policies. He examines the impact of fiscal incentives, deregulation and bilateral and
regional investment agreements, while controlling for host countries’ economic
fundamentals. He finds that while FDI originating from a developed country responds to
deregulation, FDI with a developing country origin can be attracted by fiscal incentives
and lower tariffs.
Neven and Siotis (1993) discuss the role of European competition policy in
monitoring the intervention of member states towards FDI; they find that current
subsidies to attract investment are not excessive in the presence of strong distortions in
the labor market.
To find the impact of private practices on FDI inflows, Noland (1999) reviews
documentary evidence from various countries and econometrically analyzes industry-
level FDI inflows into the United States and Japan. He concludes that general economic
conditions or specific policies facilitated by private practices are likely to discourage
FDI. Industry concentration is negatively but not robustly associated with FDI. He also
finds that for these two countries R&D expenditures are positively associated with FDI
flows.
Various OECD papers address effectiveness and efficiency of incentives in
attracting FDI. OECD (2002) advocates the use of general investment subsidies rather
than incentives available to FDI only. Charlton (2003) finds that it is difficult to assess
whether, or in what cases, the efficiency gains from competitive bidding for mobile

18
capital outweigh the costs to the international system, and surveys examples of inter-
regional and international competitive bidding for investment. OECD (2003) assesses the
degree to which developing countries compete against each other and against the most
highly developed economies in attracting FDI through incentives. It concludes that while
developing countries compete with each other, few directly compete with developed
economies; also, competition for individual investment projects seems confined to a few
sectors, e.g. car production.
Dahl (2002) examines FDI in the Southern African Development Community
(SADC) in the 1990s and considers possible incentives for FDI. He concludes that FDI
may be attracted to countries belonging to integrated regional groups; that resource-
driven investments in Southern Africa seem to be primarily driven by factors such as FDI
regimes, privatization, low cost labor and per capita GDP growth, rather than general
economic fundamentals; and that “soft parameters” such as administrative barriers and
the overall poor image of Africa may be important.34
Maskus (2000) reviews the theory and evidence on how protection of intellectual
property rights may influence FDI flows and technology transfer. He notes that strong
intellectual property rights (IPRs) can be an effective incentive for FDI inflows;
complementarities may also exist between IPRs and market liberalization, deregulation,
technology development policies, and competition regimes in attracting FDI. He advises
governments to devote attention and analysis in order for assuring that their countries will
achieve net gains from stronger or additional IPRs and licensing over time.
34 He states that most of the developing countries that were in the “top ten” with respect to FDI inflows in year 1999 fulfilled the following criteria: regional group membership, per capita income growth, foreign market access, skilled labor force, low-cost unskilled labor, high level of GDP, fiscal discipline, favorable corporate tax structure, and political stability. (p. 3)

19
FitzGerald (2002) examines whether countries’ regulatory competition in property
rights, market access rules, environmental protection, and labor standards for attracting
FDI affects the level and “quality” (e.g., technology level, degree of stability,
employment creation) of the investment they receive, and whether such competition leads
to a welfare loss for the nominal winners and losers. He concludes that for some poor
countries, regional arrangements may be more effective than international rules. He
states that the published empirical evidence is ambiguous on the existence, effect and
consequences of regulatory competition. Critically, he emphasizes that the usual measure
of FDI is “changes in equity stake that include acquisitions and exclude third-party
finance” and as such, it does not reflect capital formation by multinational corporations.35
He warns that any empirical study which posits a positive relationship between high
regulatory standards and foreign investment36 cannot exclude the possibility of a spurious
association unless it controls for per capita income or market size.37
Charlton (2003) reviews the role of investment incentives, analyzing their main
benefits and costs. He notes that regulatory competition between countries can have both
positive and negative effects on both domestic and international welfare; a negative
outcome would occur either when a government offers an incentive package such that the
35 He states: “in particular, large privatizations in developing and transition countries, and mergers in industrial countries, have distorted the published FDI figures seriously during the past decade” (p. 12). Although the empirical consequences of this proposition should be studied, they go well beyond the aims of this paper. 36 That is, a study which negates the existence of a “race to the bottom,” i.e., cutthroat regulatory competition. 37 “All regulatory standards – whether on property and competition, on environmental protection or on labor standards – tend to improve with a country’s income level. In addition, small countries are clearly in a weaker negotiating position with regard to large companies and large neighbors. Thus we would expect to see the incentive for a government to engage in regulatory competition to decline with both income and size. But income levels and market size are agreed to be the main attraction for FDI itself. So we would in fact expect to observe a statistical correlation between regulatory standards and inward FDI even if there were no causal connection” (FitzGerald 2002, p. 2; emphasis in the original).

20
value of the concessions exceed the value of the benefits to the host economy, or when it
uses inefficient incentive instruments. He concludes that since no individual government
has an incentive to unilaterally reveal the value of their incentive packages in the absence
of similar and simultaneous action by other governments, explicit international
coordination may help to improve disclosure standards.
Waldkirch (2003) uses industrial branch level data from Mexico to examine the
degree to which FDI is attracted to particular sectors in a country on the basis of available
domestic skills. He finds a direct correlation between skill differences and FDI across
sectors.
Blonigen and Wang (2004) examine whether the determinants and effects of FDI
are systematically different for less developed countries than for developed countries.
Using a semi-logarithmic functional form, they interact their exogenous variables with a
developed county dummy variable; they find that the underlying factors that determine
the location of FDI activity across countries vary systematically across the two groups of
countries. Their aggregate data support the growth effect of FDI only for the less
developed countries. They also find that FDI is more likely to crowd in (less likely to
crowd out) domestic investment in less developed countries relative to developed
countries.
III. SAMPLE OF COUNTRIES AND METHODOLOGY
The agency budget variable is available for 38 countries in Nicholson (2004). Turkish
Competition Agency (2004) and World Bank (2004) have been used to include Turkey as
the 39th country. The WEF rating is defined for 49 countries; 35 countries comprise the

21
overlap between the WEF rating and the agency budget variables. The ATLI is defined
for 52 countries; 42 countries make up the overlap between the WEF rating and the
ATLI. The FDI analysis variables are defined for 47 countries.
This paper first reviews the empirical relationships between policy effectiveness
measured by the WEF rating and the following “input” variables: the ATLI, size of the
enforcement budget, and size of the enforcement staff. The relationship between size of
the budget and effectiveness of the intermediate outcome is graphically displayed and
statistically estimated. Then, this relationship is re-estimated while controlling for
additional explanatory variables (economic development status, incidence and duration of
E.U. membership, and duration of competition laws). Lastly, the relationship from
effectiveness (measured by the WEF rating) to efficacy (measured by FDI inflows) is
graphically displayed; this relationship is also statistically estimated while controlling for
additional explanatory variables.38 Table I below displays the summary statistics for the
variables used in either analysis (between the inputs and the intermediate output, or
between the intermediate output and the final outcome).
Table I: Summary statistics of the variables used in statistical analyses
Variable N Min Max Mean
Median
Standard Dev.
Agency budget (million U.S. $)
35 0.18 307.00 24.35 5.30 54.67
Staff/National Income 35 0.01 3.00 0.62 0.39 0.69E.U. country 47 0 1 0.49 0 0.51
38 There is the question whether the WEF rating is a catchall variable that measures the efficacy of a country’s general governance, rather than reflecting the efficacy of a more narrowly defined competition (antitrust) implementation. More than one CUTS/CDRF panel discussant emphasized this possibility in their remarks. In light of their remarks, to guard against this possibility, the statistical relationship between effectiveness and efficacy is estimated while accounting for the degree of a country’s economic stability and the extent of economic freedoms in a country, as measured by a combination of numerical indicators.

22
Variable N Min Max Mean
Median
Standard Dev.
E.U. recent member or candidate
47 0 1 0.21 0 0.41
Developed country 47 0 1 0.49 0 0.51Years since legal enactment
or effectiveness 47 2.00 115.00 17.85 11.00 23.30
WEF rating 47 3.10 6.60 4.66 4.60 0.92Inflation, consumer prices
(annual %) 47 -1.07 54.4 6.55 3.59 9.38
Population, total (millions)
47 1.36 285.32 40.07 18.73 56.00
GDP per capita, PPP (constant 1995 international $)
47 2,768 32,554 14,869 13,462 8,929
Economic Freedom Index 47 46.07 82.41 66.57 67.34 8.83Venezuela (oil exporter) 47 0 1 0.02 0 0.15FDI inflows, 2001 (million
$)a 47 -3,277 124,435 11,775 3,266 22,384
aThe dependent variable in the FDI model is the logarithm of FDI inflows (2001), hence any country with a negative value of the FDI inflow variable is automatically excluded from estimation. IV. RESULTS
A. Competition policy implementation and enforcement effectiveness as a function of policy inputs and other external variables
Figure II plots the ATLI on the horizontal axis and the WEF rating on the vertical
axis. Relative sizes of data points and of the country names (relative size of the typeface)
correspond to the age of competition laws in each country. Years of enactment (or legal
effectiveness) of the laws are stated in parentheses next to the names of the countries.
This picture hints at a rough distribution of the sample countries with respect to the
historical nature of market competition in each country.39 Start at the northeast and
proceed clockwise. The northeast corner represents “competition by choice,” defined as
an effective outcome built upon strong legal foundations. The closest example is the
39 The four corners are meant to represent the four extremes of possible combinations of ATLI and WEF ratings, rather than four possible categories of countries.

23
United States. The southeast corner represents competition issues having arisen as a
“historical necessity.” The closer is a country to the southeast corner the greater the
likelihood of having seemingly strong legal foundations but lacking an effective outcome.
All of the recent E.U. members and candidate countries that are included in the sample
fall closest to this corner. The southwest corner represents “policy inertia.” The causes
and the nature of this inertia possibly differ across the countries, yet the result is similar:
a weak legal structure and a poor intermediate outcome. Finally, the northwest corner
represents “competition as a historical accident,” typified by a low ATLI value (few
competition laws) yet a competitive economy at least as measured by the WEF rating.40
Some of the closer examples are the Netherlands, the U.K., and New Zealand.
A positive relationship between competition legislation and an effective
intermediate outcome would certainly add realism to the expectation that at least some of
the countries currently with a relatively high ATLI value but a relatively low WEF rating
(i.e., countries currently closer to the southeast corner) can hope to achieve effectively
competitive markets through effective and consistent application of their competition
laws. Such a positive relationship is not apparent from Figure II. However, a positive
relationship between ATLI and the WEF rating could arise if individual (constituent)
states of the U.S., many, perhaps all, of which have independent competition laws and
enforcement mechanisms, are included in this picture. Many of these individual states
are presumably characterized by similar ATLI-WEF combinations as the federation itself;
40 E.U. countries with high WEF ratings might have benefited from effective implementation of E.U.’s antitrust laws, which are not captured in their respective ATLI values. This point applies as well to E.U. countries near the northeast corner (e.g. France) as to those near the northwest corner. I thank Jennifer M. Morrison, Esq., for pointing this out.

24
they are putatively represented as smaller marks around the data point representing the
U.S. as a whole.
Figure III depicts the relationship between direct input use measured by agency
budget size and intermediate outcome measured by the WEF rating. Figure III has
“agency budget” (U.S. dollars, in logarithms) on the horizontal axis and the WEF rating
on the vertical. The straight line represents the best semi-logarithmic fit. A positive
relationship can be observed. In addition, diminishing returns to budget size are implied
by the convexity of a semi-logarithmic relationship.
The difference between an observed and an expected WEF value (the residual) is
tentatively interpreted as an “effectiveness premium” (in the case of a positive residual)
or an “effectiveness gap” (in the case of a negative residual). According to this
interpretation, countries such as Latvia, Japan, Korea, Mexico and Turkey should be able
to achieve higher WEF ratings given their respective competition agency budgets. These
countries suffer from an effectiveness gap that is potentially attributable to relatively
inadequate enforcement technologies.41 At the other side of the spectrum, countries such
as Ireland, the U.K., and the Netherlands are performing even better than expected on the
basis of their competition budgets alone. These countries enjoy an effectiveness
premium that is potentially attributable to relatively adequate enforcement technologies.42
41 For some countries, an alternative or additional explanation may be absence of an adequate legal infrastructure. 42 The U.S. enjoys a small effectiveness premium. This may partially be thanks to private plaintiffs’ right to sue under the antitrust laws in the United States However, countering this “private enforcement” premium are the antitrust enforcement budgets of the individual states. The budget figure for the U.S. does not include these resources; see Nicholson (2004), footnote 20. The budget figure for the U.S. does include federal resources allocated for consumer protection (by the U.S. Federal Trade Commission); see ibid. footnote 19.

25
The average magnitude of the effectiveness gap is reduced by controlling for the
level of economic development (per capita income). Figure IV depicts a separate
relationship between agency budget (horizontal axis) and competition policy
effectiveness (vertical axis) for the developed and the developing countries. Countries
with a per capita income greater than ten thousand U.S. dollars are referred to as
“developed” while the rest are referred to as “developing.”43 The developed countries are
grouped in the uppermost section of Figure IV; all but two have an effectiveness rating of
five or higher (the exceptions are Slovenia and Korea). The developing countries are
grouped in the lower section; all but one have an effectiveness rating of less than five (the
exception is Chile). Each of the two lines represents the average (expected) level of
effectiveness corresponding to a given level of the agency budget for either type of
country. The higher of the two lines represents the expected level of effectiveness for a
developed country with a given agency budget. The lower line represents the expected
effectiveness level for a developing country with a given agency budget.
Within the budget sizes displayed in the figure, a secular gap of at least one point
is apparent between the expected levels of effectiveness for a developing country and a
developed country with identical agency budgets. While there seems to be a positive
relationship between agency budget and competition policy effectiveness for both types
of countries, raising the competition policy effectiveness of a developing country to the
expected level of effectiveness for a developed country with an identical agency budget
43 A member of the audience in a CUTS/CDRF symposium noted that another (more relevant?) research question is the difference between the least-developed countries and other countries. The hypothesis that competition policy effectiveness in the average least-developed country is statistically identical to competition policy effectiveness in the average less (but not the least) developed country was tested. It was found that this null hypothesis could not be rejected when controlling for other relevant variables. This point is addressed in greater technical detail in the Results section below.

26
would appear to necessitate an increase of many orders of magnitude in the developing
country’s agency budget.44 An interpretation of this effectiveness gap between the
developed and the developing countries is that the first group of countries on average are
equipped with more suitable enforcement technologies than the second group.45
Figure V depicts a similar discrepancy when the sample of countries is restricted
to E.U. members and candidates. Recent members or candidates of the Union are
grouped in the lower part of the figure; they have all have effectiveness ratings of less
than five. Other, more “senior” members are grouped in the upper part; they all have
effectiveness ratings of five or more. Each of the two lines represents the average
(expected) level of effectiveness corresponding to a given level of the agency budget for
either type of country. The lower of the two lines represents the expected level of
effectiveness for a recent member or candidate with a given agency budget. The higher
line represents the expected effectiveness level for a “senior” member with a given
agency budget.
Within the budget sizes displayed in the figure, a secular gap of more than one
point is apparent between the expected levels of effectiveness for the two types of
countries with an identical agency budget size. While there seems to be a positive
relationship between agency budget and competition policy effectiveness for both types
44 For a developing country with an agency budget of one million dollars, the expected level of effectiveness is about 4. The expected level of effectiveness for a developed country with the same budget size seems to be about 5.3. Achieving an effectiveness rating of 5.3 would appear to necessitate an agency budget of as much as one trillion dollars for the average developing country, all else the same. Although this calculation may not be very precise in a statistical sense, it does highlight the magnitude of the discrepancy between the expected levels of effectiveness between the developing and the developed countries. This example strikingly illustrates that bridging this gap does not appear as practically possible by increasing the antitrust agency’s budget only (the average GDP in the sample of developing countries is only 0.23 trillion dollars – less than a quarter of the level of antitrust budget necessary for an expected effectiveness rating of 5.3 for a developing country). 45 The suitability of the enforcement technology should be understood relative to the intial competitive conditions in a given country. I thank Dr. Umut Aydin for suggesting this point.

27
of countries, raising the competition policy effectiveness of a recent member or candidate
to the expected level of effectiveness for a “senior” member with an identical agency
budget would appear to necessitate an increase of many orders of magnitude in the
former country’s agency budget.46 An interpretation of this effectiveness gap between the
recent members or candidates and the more “senior” members is that the first group of
countries on average are equipped with less suitable enforcement technologies than the
second group.
The extensiveness of competition laws (measured by the ATLI variable) was not
found to be significantly associated with competition effectiveness (measured by the
WEF rating), and was therefore excluded from statistical estimation. The numerical
relationship between the WEF rating and the competition enforcement agency inputs is
estimated using three alternative model specifications. The first model includes only two
agency variables: logarithm of the budget – denoted as Log(budget) – and agency staff
count relative to national income.47 The second model also includes three dummy
variables indicating E.U. membership (including candidacy), whether the country is a
new E.U. member or an E.U. candidate, and whether a country is “developed, ”defined as
46 For a recent member or candidate with an agency budget of three million dollars, the expected level of effectiveness is about 4. The expected level of effectiveness for a “senior” member with the same budget size seems to be about 5.5. Achieving an effectiveness rating of 5.5 would appear to necessitate an agency budget of as much as three hundred billion dollars for the average recent member or candidate, all else the same. Again, while this calculation is probably not very precise statistically, it does highlight the magnitude of the discrepancy between the expected levels of effectiveness between the two groups of E.U. members. This example strikingly illustrates that bridging this gap does not appear to be practically possible by increasing the antitrust agency’s budget only (the average GDP in the sample of the recent E.U. members or candidates is less than one trillion dollars, or about three times the level of antitrust budget necessary for an expected effectiveness rating of 5.5 for a recent E.U. member or a candidate.) 47 National income is implicitly defined by two of the variables in Table 3 of Nicholson (2004): Agency Budget and Budget/National Income. Staff relative to national income is defined as 1000*staff/(budget/(budget/National Income)), where budget is the Agency Budget variable in Table 3 of Nicholson (2004). National income is being expressed in billions of U.S. dollars in this calculation since Nicholson (2004)’s Budget/National Income variable scales down National Income by a factor of 10–6.

28
having a per capita GDP in excess of $10,000 in year 2002. The results are displayed in
Table II below.
Table II: Parameter estimates for the WEF rating equation (the dependent variable is the WEF rating). Model Specification
Variable
Parameter estimate
Standard error
t-stat
Significance level a
WEF.1 Log(Budget) 0.18 0.08 2.39 0.02Staff/National income (GDP PPP, bn. $)
-0.39 0.21 -1.92 0.06
WEF.2
Log(Budget) 0.07 0.05 1.47 0.15
Staff/National income 0.06 0.15 0.41 0.69E.U. member or candidate 0.44 0.22 1.98 0.06Recent E.U. member or candidate
-0.90 0.33 -2.74 0.01
Developed country 0.95 0.24 3.99 0.00
WEF.3
Log(Budget) 0.02 0.05 0.43 0.67Staff/National income 0.08 0.14 0.56 0.58E.U. member or candidate 0.67 0.24 2.84 0.01Recent E.U. member or E.U. candidate
-1.01 0.31 -3.21 0.00
Developed country 0.73 0.25 2.91 0.01Log(Years) 0.25 0.12 2.10 0.04
a Rounded to the next lowest significant digit; e.g. a significance level of 0.0049 (or less) is shown as 0.00.
The first two rows of Table II (not counting the label row) display the results of
the first model specification. In this model, the WEF rating increases approximately one
and a quarter point (1.25) with every doubling of the agency budget,48 while keeping a
constant ratio of staff size to national income. This result is statistically significant at the
5% level of statistical significance. In addition, given budget size, country’s WEF rating
decreases with the number of the agency staff members relative to national income. This
result is statistically significant at the 10% level but not at the 5% level. This result does
48 The difference between the expected levels of effectiveness for a country with an agency budget of X dollars and another country with an agency budget twice as large (2X) can be calculated using the parameter estimate on the first row of Table II as 1.8 * [Log(2X) – Log(X)] = 1.8 * [Log(2) + Log(X) – Log(X)] = 1.8 * Log(2) = 1.8 * 0.69 = 1.25.

29
not mean that implementation effectiveness can be raised by reducing the competition
agency’s employment, but rather that agency staff size is correlated with other variables
that characterize countries with low implementation effectiveness.49
The next three rows of Table II display the results of the second model
specification which includes three dummy variables for developed countries, E.U.
members and candidate(s), and recent E.U. member or E.U. candidate. The average
level of effectiveness for developed countries is nearly one point above that for the
developing countries, controlling for agency size both in terms of dollars and staff.50
Given agency size, being a member of, or a candidate for, the E.U. increases the WEF
rating by a little more than 2/5ths of a point (0.44), but being a recent member or a
candidate reduces the WEF rating by nearly the same amount (–0.46 = 0.44 – 0.90). This
result is consistent with effective implementation being a function of time. When the
developed country variable and the two E.U. variables are included among the
explanatory variables for WEF, the agency variables become statistically insignificant.
49 It is natural to hypothesize that competition agency staff numerosity is significantly correlated with the agency budget. This statistical occurrence is technically known as multicollinearity of explanatory variables. Such correlation, if present, would minimize the individual statistical significance of each explanatory variable. In part as a precaution against this possibility, the agency staff is expressed relative to national income. The statistical correlation between this variable (staff relative to national income) and the budget variable is approximately -0.3 in the sample, which is not especially high. Severe multicollinearity would be indicated if explanatory variables are statistically significant jointly but not individually. Neither of the individual variables in model WEF.1 is especially insignificant. This suggests that multicollinearity between the budget and the staff variables is not a serious problem. A desirable property of the multiple regression technique is that it produces unbiased estimates of the coefficients even in the presence of multicollinearity. 50 The null hypothesis of an identical average competition policy effectiveness between the least-developed countries and the less (but not the least) developed countries was statistically tested. This was accomplished by simultaneously including in the regression model a variable for “developing country” status (defined as GDP per capita < U.S. $10,000 in 2002) and another variable for “least developed country” status (defined as GDP per capita < U.S. $2,000 in 2002). Although the first variable was (negative and) statistically significant, the second variable was (negative but) not statistically significant. Therefore, the null hypothesis of an equal average competition policy effectiveness between the least developed and the less (but not the least) developed countries could not be rejected when controlling for the other explanatory variables in regression model specification WEF.2.

30
This is because the correlation between each of the agency variables and the three
dummy variables is near, and sometimes in excess of, the correlation between the agency
variable and the dependent variable (the WEF rating).
The relationship between the WEF rating and time is tested more directly in the
third model specification. This specification includes the logarithm of years as an
additional explanatory variable.51 Years is defined as the number of years elapsed since a
country’s competition laws were enacted or became effective for the first time. This
variable has a coefficient estimate of 0.25 that is significant at the 5% level. All else
equal, a country’s WEF rating is expected to increase about one-sixth of a point (0.17)
with every doubling of years.52 Table A.1 in the Appendix displays statistical software
printouts for these three specifications.
In the first model specification in Table A.1, the R2 statistic equals 0.30. This
implies that the budget and the staff variables explain nearly one-third of the cross-
sectional variation in the WEF ratings. In the second model specification in Table A.1,
the R2 statistic equals 0.77. This implies that the agency variables, the E.U. membership
variables, and the developed country variable together explain more than three-fourths of
the cross-sectional variation in the WEF ratings. The R2 in the third specification is 0.80,
which implies that the agency variables, the years variable, the developed country
51 I thank Dr. Refet Gürkaynak for suggesting this model specification. 52 The difference between the expected levels of effectiveness for a country with Y number of years and another country with twice the number of years (2Y) since the enactment or the effective date of antitrust laws can be calculated using the parameter estimate on the last row of Table II as 0.25 * [Log(2Y) – Log(Y)] = 0.25 * [Log(2) + Log(Y) – Log(Y)] = 0.25 * Log(2) = 0.25 * 0.69 = 0.17.

31
variable, and the E.U. variables together explain nearly four-fifths of the total variation of
competition policy implementation effectiveness across countries.53
The divide between the developed and the developing countries as well as that
between the recent E.U. members or candidate(s) and the more “senior” E.U. members
may indicate gaps in policy design, implementation and enforcement that cannot be
bridged merely by allocating more resources toward the existing competition
enforcement mechanisms in the countries that are currently placed at the lower half of
each divide.
B. FDI competitiveness efficacy as a function of effectiveness and other external variables
Figure VI demonstrates the relationship between implementation effectiveness of
competition laws and policies, and the final outcome (FDI inflows relative to GDP). The
horizontal axis is the WEF rating and the vertical axis is the FDI inflows as a percentage
53 The estimation is based upon only those countries for which both the dependent and the independent variables have non-missing values. Three important sources for potential biases in regression coefficient estimates are omitted variable bias, measurement bias, and endogeneity bias. A relatively high value of the R2 statistic indicates that omitted variables are not a significant source of variation compared with the variables included in the model. The variables included in the model are relatively straightforward to measure, and are likely exogenous at least when measured on a year to year basis, as they are here. The “reasonable” values of the t statistics are also consistent with a nonexistent or an insignificant bias due to endogeneity. Additionally, non-uniform variance (heteroscedastic) residuals can result in a loss of statistical efficiency. For each of the models in Table II, a specification Chi-square statistic was computed. The statistically insignificant results of these computations indicated that if no specification errors are present, then the null hypothesis of uniform variance (homoscedastic) residuals cannot be rejected. Moreover, a non-normal distribution of the residual term can render invalid a test of statistical significance (such as the t test or the F test). Truncation of the left-hand side variable may be a source of non-normal disturbances when the dependent variable is “quasi quantitative,” as the WEF rating. However, a visual inspection of the distribution of the WEF rating does not indicate that the lower and the upper bounds (1 and 7, respectively) are constraints that are binding on the WEF rating. (That is because the WEF rating does not seem to have an abnormally high frequency -- a mass or an accumulation point -- at or near either of the two bounds.) A commonly used statistical test for determining whether the dependent variable is sampled from a normal distribution is the Kolmogorov-Smirnov test. The result of this test indicated that the WEF rating can reasonably be considered normally distributed when the threshold probability value for not accepting normality is 1% or less.

32
of GDP.54 The straight line represents the best linear fit. A positive relationship is
clearly observed. Moreover, there are no apparent diminishing returns.
In Figure VI, the difference between an observed and an expected FDI value (the
residual) is tentatively interpreted as an “efficacy premium” (in the case of a positive
residual) or an “efficacy gap” (in the case of a negative residual). According to this
interpretation, countries such as Germany, Japan, Korea, Greece and Turkey should be
able to achieve higher FDI inflows (relative to GDP) given their respective WEF ratings.
These countries suffer from an efficacy gap that is potentially attributable to relatively
ineffective governance in areas other than competition policy.55 For such a country,
competition policy implementation and enforcement can be characterized as “ahead of
the times” relative to governance effectiveness in areas other than competition policy. At
the other side of the spectrum, countries such as Ireland (an outlier), the U.K., and the
Netherlands are performing even better than expected on the basis of their WEF ratings.
These countries enjoy an efficacy premium that is potentially attributable to relatively
effective governance in areas other than competition policy.
Next, the numerical relationship between FDI inflows and the WEF rating was
estimated.56 The dependent variable is the natural logarithm of FDI inflows (2001).57
The explanatory variables are:
54 World Bank (2004) series “Gross foreign direct investment (% of GDP).” Series id: BG.KLT.DINV.GD.ZS, year 2002. 55At least for some countries an efficacy gap may be related to “politicization of antitrust enforcement.” For example, the heads of the U.S. antitrust agencies are political appointees. This effect may partially be offset by private plaintiffs’ right to sue under the antitrust laws in the United States. 56 The estimated link between antitrust effectiveness and FDI inflows would capture effectiveness of other factors (e.g. economic stability or reforms in other areas), provided that: (1) the estimation methodology does not explicitly account for those factors, and (2) antitrust effectiveness is significantly correlated with those factors and reforms. To guard against this possibility, the estimation methodology explicitly accounts for economic stability and reform variables.

33
1. competition effectiveness variable: the WEF rating,
2. economic stability and liberalization variables: a. a dummy variable indicating “high inflation,”58 , 59 b. a dummy variable indicating a high value of the Heritage Foundation’s Economic Freedom Index60
3. market size variables: a. population size (in natural logarithms)61 b. sample rank of the per capita GDP in constant 1995 dollars62
4. political block and country variables: a. a dummy variable indicating E.U. membership or candidacy b. a dummy variable indicating Venezuela (oil exporter).63
The results are displayed in Table III below. The WEF rating is significant and
positive.64 Its point estimate implies that every unit increase in the WEF rating increases
the FDI inflow by 66% (calculated as the exponential of the coefficient value 0.505).65
57 United Nations (2002) Annex Table B.1. “FDI inflows, by host region and economy,” year 2001. 58 Defined as an annual rate of change in the consumer price index in excess of 8%. Source: World Bank (2004) series “Inflation, consumer prices (annual %).” Series id: FP.CPI.TOTL.ZG, year 2001. 59 Technically, a high rate of inflation is a characteristic of economic instability (rather than stability). An alternative to defining a “high inflation” variable would have been to define a “low inflation” variable. A “low inflation” variable would have a one-to-one correspondance with the current “high inflation” variable. Specifically, for each country in the sample, either “high inflation” = 1 and “low inflation” = 0, or “high inflation” = 0 and “low inflation” = 1. The estimated coefficient of a “low inflation” variable would have been identical in absolute magnitude to the coefficient of the “high inflation” variable displayed in Table III, but with the opposite sign. The values of its t statistic and significance level would also have been identical to those of the “high inflation” variable displayed in Table III. 60 Defined as an index value in excess of the sample median. Source: The Heritage Foundation website. 61 Source: World Bank (2004) series “Population, total.” Series id: SP.POP.TOTL, year 2001. 62 Source: World Bank (2004) series “GDP per capita, PPP (constant 1995 international $).” Series id: NY.GDP.PCAP.PP.KD, year 2001. 63 The sample includes two oil exporting countries as defined in United Nations (2002) Annex Table B.1., footnote k. They are Indonesia and Venezuela. Since the FDI inflows variable has a negative value for Indonesia, the only oil exporting country that is included in the regression analysis underlying Table III is Venezuela. 64The statistical significance of the WEF variable supports the hypothesis that when measuring the relationship between competition policy effectiveness (measured by the WEF rating) and competitiveness to attract FDI, the smallest relevant collection of firms (that is, the smallest relevant jurisdiction) is not larger than a country. 65 It may be hypothesized that factors determining the WEF ratings are correlated with determinants of FDI inflows. It has been suggested that perceptions regarding a country’s general economic and political condition may influence the WEF rating of a country while simultaneously influencing the level of FDI

34
This estimate implies that the level of the WEF rating has a significant and positive
impact on the level of the FDI inflow independent of and in addition to other factors
measured by the economic stability and liberalization variables, the market size variables,
and the political block and country variables.66
Table III: Parameter estimates for the FDI inflow equation (the dependent variable is the natural logarithm of FDI inflows for year 2001). Model Specification
Variable
Parameter estimate
Standard error
t-stat
Significance level a
FDI
Competition effectiveness variable WEF rating 0.51 0.19 2.68 0.01
Economic stability and liberalization variables High inflation (CPI
inflation > 8%) -0.54 0.29 -1.84 0.08
High Economic Freedom Index (EFI > sample median)
0.29 0.23 1.26 0.22
Market size variables Logarithm of total
population 0.65 0.08 8.36 0.00
Sample rank of per capita GDP (PPP, constant 1995 dollars)
0.04 0.01 2.98 0.01
Political block and country variables E.U. member or
candidate 0.67 0.22 3.11 0.00
Venezuela (oil exporter) 1.72 0.70 2.47 0.02
inflows into the country. In this case, the estimated coefficient for the WEF rating variable in the FDI equation will be subject to an endogeneity bias. (I thank Dr. Umut Aydin for emphasizing this point.) The standard methodology to test for endogeneity is the Hausman-Wu test. See, for example, Cameron and Trivedi (2005). When implemented, a Hausman-Wu test failed to reject at the 5% level the null hypothesis that the WEF rating is exogenously determined relative to FDI inflows. The instrument set included all the variables displayed in Table III and the variable “recent E.U. member or candidate.” The first-stage R2 was 0.73 and the first-stage adjusted R2 was 0.68. The correlation between the predicted and the actual WEF ratings was 0.86. 66 In a different version of the FDI regression model, the lagged (year 2000) dependent variable was introduced as an additional explanatory variable. The coefficient of the lagged dependent variable was positive and highly significant. Even accounting for the lagged dependent variable, the WEF coefficient was estimated as 0.30 with a t statistic of 1.87, which indicated a statistical significance at the 7% level. At a 10% or lower significance level, only two other explanatory variables were found significant; they were the logarithm of the population and the E.U. variable. This version of the model had an R2 of 0.91 and and adjusted R2 of 0.88. Table A.2 in the Appendix includes the statistical software printout for this version of the FDI regression model in addition to the version displayed in Table III.

35
a Rounded to the next lowest significant digit; e.g. a significance level of 0.0049 (or less) is shown as 0.00.
Of the stability and liberalization variables, the “high inflation” variable is
negative and statistically significant at the 10% level whereas the “high EFI” variable is
positive but not statistically significant at the 10% level.67 The correlation coefficient
between “high inflation” and the WEF rating is -0.46, which is higher (in absolute
magnitude) than the correlation coefficient between “high inflation” and logarithmic FDI
inflows, -0.40. The correlation coefficient between “high EFI” and the WEF rating is
0.42, which is also higher than the correlation coefficient between “high EFI” and
logarithmic FDI inflows, 0.33. For either of the “high inflation” and “high EFI”
variables, the magnitude of the the variable’s correlation with the WEF rating relative to
the variable’s correlation with the logarithmic FDI inflows explains the moderate levels
of the t statistic and statistical significance for that variable in Table III. Despite a
moderately high correlation between either of these two variables and the WEF rating,
the WEF rating retains a relatively high t statistic and statistical significance thanks to its
relatively high correlation with the dependent variable, 0.73. These correlations indicate
that:
1. macroeconomic stability is positively associated with an effective
competition policy, it is also positively associated with FDI inflows to
an almost equal degree,
67 The Heritage Foundation website also provides data on the individual components of the composite index (EFI). These components are labeled “Regulation,” “Trade,” “Fiscal,” “Gov’t,” “Monetary,” “Investment,” “Financial,” “Property Rights,” and “Corruption.” In another version of the FDI regression model, the “high EFI” variable (reflecting a value of the composite index in excess of the sample median) was replaced jointly by “high trade” and “high financial” variables (indicating a “Trade” component index value or a “Financial” component index value in excess of the respective median value in the sample). In this version, FDI inflows were found to be negatively related to the “high trade” variable and positively related to the “high financial” variable, although neither was significant at the 10% level. This did not qualitatively affect the magnitude or the statistical significance of the WEF variable.

36
2. overall economic liberalization is positively associated with an effective
competition policy, it is associated with FDI inflows to an also positive
but lesser degree,
3. competition policy effectiveness is positively and significantly
associated with FDI inflows.
Both of the market size variables (the logarithm of the population and the sample
rank of per capita GDP, PPP in 1995 dollars) are positive and significant. The E.U.
variable and the “Venezuela (oil exporter)” variable are also positive and significant. The
positive and statistically highly significant coefficient of the E.U. variable may be due to
a high level of intra-E.U. FDI flows;68 this coefficient’s magnitude and its level of
statistical significance may also reflect the effectiveness of the E.U. superstructure as
well as any positive externalities among the member countries in attracting FDI inflows.
The R2 was 0.86, implying that the variables displayed in Table III explained 86% of the
variation in FDI inflows.69 Table A.2 in the Appendix displays the statistical software
printout.70
68 Intra-E.U. FDI flows constituted nearly a quarter of all FDI inflows to the E.U.-25 countries during years 2001 through 2004 (source: Eurostat, “Direct investment inward flows by main investing country”). 69 The adjusted R2 was 0.83. 70 The estimation is based upon only those countries for which both the dependent and the independent variables have non-missing values. Three important sources for potential biases in regression coefficient estimates are omitted variable bias, measurement bias, and endogeneity bias. A relatively high value of the R2 statistic usually indicates that omitted variables are not a significant source of variation compared with the variables included in the model. The variables included in the model are relatively straightforward to measure, and are likely exogenous at least when measured on a year-to-year basis, as they are here. The primary variable for which endogeneity may have been an issue is the WEF rating. The endogeneity of the WEF rating was tested; and the test failed to reject at the 5% level of significance the null hypothesis that the WEF rating is exogenously determined relative to FDI inflows. Additionally, non-uniform variance (heteroscedastic) residuals can result in a loss of statistical efficiency. For the model in Table III, a specification Chi-square statistic was computed. The statistically insignificant result of this computation indicated that if no specification errors are present, then the null hypothesis of uniform variance (homoscedastic) residuals cannot be rejected. The high t statistics of the coefficients are consistent with the absence of multicollinearity as a problem. Moreover, a non-normal distribution of the residual term can

37
V. CONCLUSIONS, POLICY IMPLICATIONS AND FUTURE RESEARCH
Outcome efficacy is ultimately determined by interactions between a country’s
competition policy and other institutions, contracts, and policies. For example, consider
incumbent carriers’ refusal to lease excess capacity to a new entrant in mobile
telecommunications.71 Competition authority of the host country might consider
enforcement action that would effectively force the incumbent carriers to lease their
excess capacity to the entrant on a nondiscriminatory basis. Ceteris paribus, a case could
be made that such enforcement action may reduce the level, and/or delay the timing, of
FDI entry into telecommunications infrastructure. However, if infrastructure competition
is contractually mandated by the initial agreement between the entrant and the host
government, then this kind of enforcement action can be argued as less likely to reduce or
delay FDI entry into infrastructure.72
Furthermore, the link between competition policies and outcome efficacy is
probably determined at a market level. Specifically, FDI might be attracted to market
power in the market of entry. FDI might also seek competitive conditions in markets that
are vertically related to the market of entry. Theoretically, the relative extents of the
market power effects in the market of entry and vertically related markets on the
investment incentives would depend on the nature of the vertical relationships in each
render invalid a test of statistical significance (such as the t test or the F test). The result of a Kolmogorov-Smirnoff test of normality indicated that the logarithmic FDI variable is normally distributed. 71 Turkish Competition Agency actually investigated such a case; in 2003 it decided in favor of the entrant (a consortium with foreign investment participation) and issued fines and injunctive relief. See the chapter on Turkey in CUTS (2006). 72 In the Turkish competition case mentioned above, the entrant had agreed to build its own infrastructure within five years of entry.

38
specific case. An uneven (or uncertain) distribution of market power across markets
and/or market participants may also repel risk-averse potential entrants.
The returns to effectiveness are explained largely by the qualitative variables
indicating “developed country,” “E.U. member or candidate” and “recent E.U. member or
candidate.” Effectiveness gaps between the developing versus the developed countries,
and between the recent E.U. members (and candidates) versus other E.U. members may
be interpreted as indicating a need for technical support in the design and implementation
of competition policies, and a need for increased effectiveness in the enforcement
technology, for the developing countries and the recent E.U. members and candidates.
Available statistical evidence supports the proposition that effective
implementation of existing laws is also a function of time. As a result, countries such as
recent E.U. members and E.U. candidate(s) that are currently placed close to the
southeast corner of Figure II can reasonably expect to strengthen implementation
effectiveness over time, and thus migrate toward the northeast corner in Figure II. Extra-
agency initiatives may accelerate this transformation. Examples of extra-agency
initiatives include civil society organizations, ability of private parties to initiate lawsuits
under the competition laws, and ability to collect private damages from violators.73
With respect to efficacy, statistical findings support the relevance of competition
laws, policies and effective implementation for increased welfare in the dynamic sense.74
Moreover, these findings indicate that in addition to competition policies, efficacy is also
73 The decision whether to allow private parties to sue under the antitrust laws is at the discretion of each individual country. 74 These findings can also be interpreted as supporting the conjecture that investors on average expect an unfavorable and/or uncertain distribution of market power across markets and firms.

39
a function of binary variables (for example, E.U. membership), which are not always
determined on the basis of economic criteria only.
Statistical analyses presented above have important policy implications. They
suggest that the gaps between the developed and the developing countries cannot be
bridged merely by increasing the size of the competition agencies’ budgets.
Reorganizing agencies’ spending priorities as well as developing extra-agency initiatives
can be complementary means to bridge these gaps. Increasing competition effectiveness
is relevant for national competitiveness. Moreover, efficacy can partially be increased
through a binary transformation in a country’s status (for example, E.U. membership).
Conversely, an efficacy gap may persist as long as economic and other types of
conditions preclude a binary transformation.
This study does not address the question of competition agency efficiency (e.g.
relative to the minimum cost or the time duration required to process a given type of
case). Neither does this study attempt to determine the circumstances under which a
competition agency may have the greatest effect on competitive conditions (e.g., relative
to initial competitive conditions) in a country. These are among the pertinent questions
and issues that may direct future research.
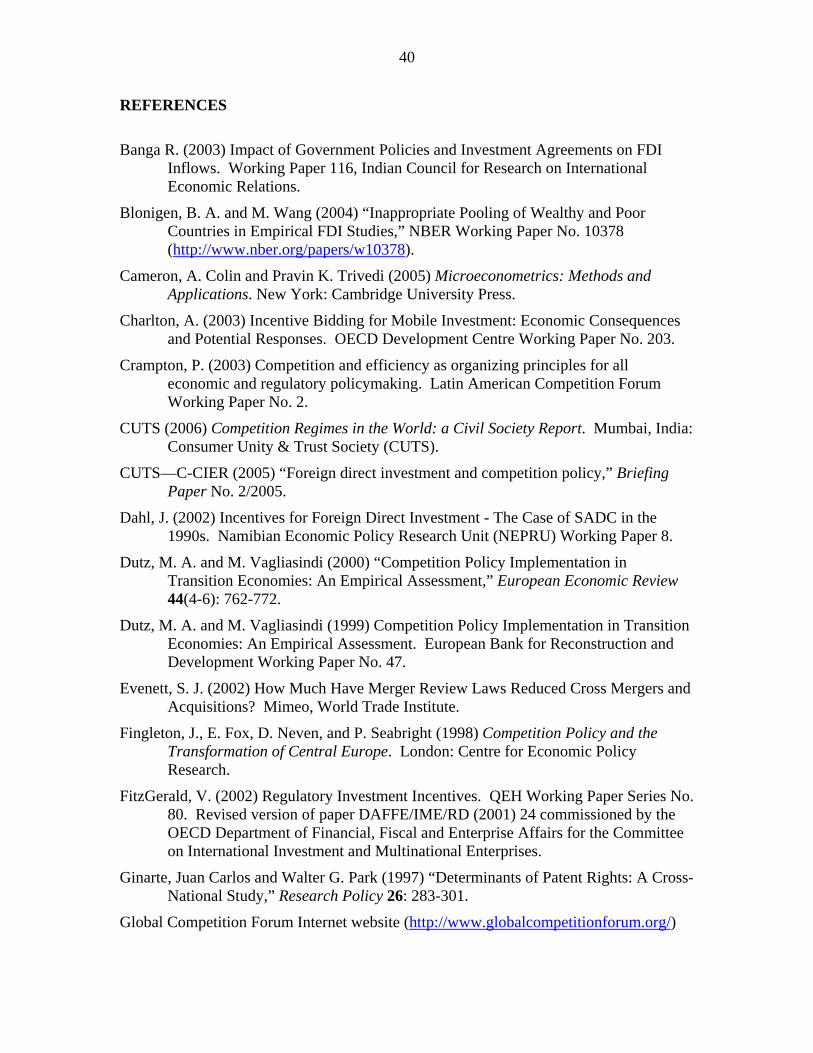
40
REFERENCES
Banga R. (2003) Impact of Government Policies and Investment Agreements on FDI Inflows. Working Paper 116, Indian Council for Research on International Economic Relations.
Blonigen, B. A. and M. Wang (2004) “Inappropriate Pooling of Wealthy and Poor Countries in Empirical FDI Studies,” NBER Working Paper No. 10378 (http://www.nber.org/papers/w10378).
Cameron, A. Colin and Pravin K. Trivedi (2005) Microeconometrics: Methods and Applications. New York: Cambridge University Press.
Charlton, A. (2003) Incentive Bidding for Mobile Investment: Economic Consequences and Potential Responses. OECD Development Centre Working Paper No. 203.
Crampton, P. (2003) Competition and efficiency as organizing principles for all economic and regulatory policymaking. Latin American Competition Forum Working Paper No. 2.
CUTS (2006) Competition Regimes in the World: a Civil Society Report. Mumbai, India: Consumer Unity & Trust Society (CUTS).
CUTS—C-CIER (2005) “Foreign direct investment and competition policy,” Briefing Paper No. 2/2005.
Dahl, J. (2002) Incentives for Foreign Direct Investment - The Case of SADC in the 1990s. Namibian Economic Policy Research Unit (NEPRU) Working Paper 8.
Dutz, M. A. and M. Vagliasindi (2000) “Competition Policy Implementation in Transition Economies: An Empirical Assessment,” European Economic Review 44(4-6): 762-772.
Dutz, M. A. and M. Vagliasindi (1999) Competition Policy Implementation in Transition Economies: An Empirical Assessment. European Bank for Reconstruction and Development Working Paper No. 47.
Evenett, S. J. (2002) How Much Have Merger Review Laws Reduced Cross Mergers and Acquisitions? Mimeo, World Trade Institute.
Fingleton, J., E. Fox, D. Neven, and P. Seabright (1998) Competition Policy and the Transformation of Central Europe. London: Centre for Economic Policy Research.
FitzGerald, V. (2002) Regulatory Investment Incentives. QEH Working Paper Series No. 80. Revised version of paper DAFFE/IME/RD (2001) 24 commissioned by the OECD Department of Financial, Fiscal and Enterprise Affairs for the Committee on International Investment and Multinational Enterprises.
Ginarte, Juan Carlos and Walter G. Park (1997) “Determinants of Patent Rights: A Cross- National Study,” Research Policy 26: 283-301.
Global Competition Forum Internet website (http://www.globalcompetitionforum.org/)

41
Goldberg, L. S. (2004) "Financial-Sector Foreign Direct Investment and Host Countries: New and Old Lessons," FRB of New York Staff Report No. 183.
Graham, E. M. and J. D. Richardson, eds. (1997) Global Competition Policy. Washington, DC: Institute for International Economics.
Hoeckman, B. (1997) “Focal Points and Multilateral Negotiations on the Contestability of Markets,” in K. E. Maskus, et al., eds., Robert M. Stern and His International Economic Legacy. Ann Arbor: University of Michigan Press.
Hylton, K. N. and F. Deng (2006) Antitrust Around the World: An Empirical Analysis of the Scope of Competition Laws and Their Effects. Boston University School of Law Working Paper Series, Law and Economics, Working Paper No. 06-47 (forthcoming, Antitrust Law Journal, 2007).
Inal, A. G. (2003) A Study into Competitiveness Indicators. REF Report, Istanbul. (http://ref.advancity.net/En/Moduller/Makaleler/MakaleForm.aspx?KodAl=0&mdId=184)
International Competition Network Internet website (http://www.internationalcompetitionnetwork.org/)
Jenny, F. (1995) “Competition and Efficiency,” in B. Hawk, ed., International Antitrust Law & Policy: Annual Proceedings of the Fordham Corporate Law Institute.
Kee, H. L. and B. Hoekman (2003) Imports, Entry, and Competition Law as Market Disciplines. CEPR Discussion Paper No. 3777.
Khemani, R. S. (2003) Some Perspectives on Competition Policy for Developing Economies. Speaking Notes for the Second Annual Meeting of the International Competition Network.
Lapachi, K. (2002) “An Examination of the Present Competition Law of Georgia Using Pittman’s Criteria,” Antitrust Bulletin 47(1): 187-215.
Maskus, K. E. (2000) Intellectual Property Rights and Foreign Direct Investment. University of Adelaide Centre for International Economic Studies Policy Discussion Paper No. 0022.
Mehta, P. S. and S. J. Evenett (2006) “Promoting Competition Around the World: A Diversity of Rationales and Approaches,” in CUTS (2006).
Neven, D. J. and G. Siotis (1993) Foreign Direct Investment in the European Community: Some Policy Issues. C.E.P.R. Discussion Paper No 798.
Nicholson, M. W. (2004) Quantifying Antitrust Regimes. Mimeo. U.S. Federal Trade Commission.
Noland, M. (1999) Competition Policy and FDI: A Solution in Search of a Problem? Institute for International Economics Working Paper 99-3.
OECD (1997) Technology and the economy: The key relationships. Paris: Organization for Economic Co-operation and Development.

42
OECD (2002) The Economics of International Investment Incentives. Article prepared by Professor Magnus Blomström, Stockholm School of Economics, NBER and CEPR.
OECD (2003) Incentives-Based Competition for FDI in Developing Countries. Findings of a joint WAIPA/OECD questionnaire. Paris: Directorate for Financial, Fiscal and Enterprise Affairs.
Pittman, R. (1998) “Competition Law in Central and Eastern Europe: Five Years Later,” Antitrust Bulletin 43(1): 179-228.
Rapp, Richard and Richard Rozek (1990) “Benefits and Costs of Intellectual Property Protection in Developing Countries,” Journal of World Trade 24: 75-102.
Sader, F. (1993) Privatization and Foreign Investment in the Developing World, 1988-92. World Bank Policy Research Working Paper WPS 1202.
Sader, F. (1995) Attracting Foreign Direct Investment into Infrastructure: Why Is It So Difficult? Foreign Investment Advisory Service Occasional Paper 12.
Singh H. and K. W. Jun (1995) Some New Evidence on Determinants of Foreign Direct Investment in Developing Countries. World Bank Policy Research Working Paper WPS 1531.
Turkish Competition Authority (2004) Year 2003 Operational Report (in Turkish). Ankara.
United Nations (2002) World Investment Report 2002. New York and Geneva.
Waldkirch, A. (2003) Vertical FDI? A Host Country Perspective. Mimeo. Oregon State University.
Wallensten S. (1999) An Empirical Analysis of Competition, Privatization and Regulation in Telecommunications Markets in Africa and Latin America. World Bank Policy Research Working Paper No. 2136.
World Bank (2004) World Development Indicators CD-ROM. Washington, D.C.: International Bank for Reconstruction and Development.

43
Figure I: Ex-post policy evaluation framework: a schematic demonstration.

44
Figure II: Four corners of the international antitrust landscape, in three dimensions
3
4
5
6
7
0 5 10 15 20 25
Legal Foundation (AT Law Index)
Imp
lem
enta
tio
n E
ffec
tive
nes
s (W
EF
Rat
ing
) U.S. (1890)
CHILE (1973)
TURKEY (1995)
FINLAND (1998)
UKRAINE (1994)
NETHERLANDS (1998)
KOREA(1980)
BELGIUM (1999)
SRI LANKA (1987)
GERMANY(1958)
U.K. (1973)NEW ZEALAND (1986)
NOR-WAY(1993)
DEN-MARK(1997)
AUS-TRALIA (1974)
CANADA (1889)
SPAIN(1989)JAPAN
(1947)
MEXICO(1993)
THAI. (1999)PERU (1991) INDO-
NESIA (2000)
COSTA RICA (1995)
JAMAICA (1993)PANAMA (1996)
CZECH (2001)
SLOVENIA (1993)
ESTONIA (2001)
ISRAEL(1988)
ITALY(1990)SWEDEN(1993)
IRELAND (2002)
ARGENTINA (1999)
FRANCE (1986)
LITHUANIA (1999)
S. AFRICA (1998)
LATVIA (1998)ROMANIA (1996)
POLAND (1995)
COMPETITIONAS "HISTORICALACCIDENT"
COMPETITION BY CHOICE
COMPETITION INERTIA
COMPETITION AS "HISTORICAL
NECESSITY"
Data source(s): Nicholson (2004); Global Comp. Forum; Dutz and Vagliasindi (1999).
SLOVAK (2001)
VENEZ.(1992)
TAI-WAN
(1992)

45
Figure III: Effectiveness as a function of budget
3
4
5
6
7
100,000 1,000,000 10,000,000 100,000,000 1,000,000,000
Agency Budget (Logarithmic scale)
Imp
lem
enta
tio
n E
ffec
tive
nes
s (
WE
F R
ati
ng
)
U.S.
Finland
Germany Netherlands
IsraelBelgium
DenmarkFrance U.K.
AustraliaCanada
Sweden New ZealandNorway
ItalySpain
Chile IrelandJapan
S. Africa
KoreaPoland
SloveniaEstonia
TURKEYMexico
PanamaJamaica
LatviaSlovakia
Romania
Cze
ch R
ep.
Indonesia
Lithuania
Argentina
Data source(s): Nicholson (2004);World Development Indicators (2004); Turk. Rek. Kur. 2003 Faal. Rap. (Turk. Comp. Auth. 2003 Oper. Report)
"Effectiveness gap"
"Effectivenesspremium"

46
Figure IV: Effectiveness gap: developed countries vs. other countries.
0
1
2
3
4
5
6
7
100,000 1,000,000 10,000,000 100,000,000 1,000,000,000
Competition Agency Budget (US Dollars, Logarithmic Scale)
Imp
lem
enta
tio
n e
ffec
tive
nes
s (W
EF
Rat
ing
)
Developed countires (GDP > $10,000/person)
Developing countires (GDP < $10,000/person)
Data sources: Nicholson (2004); World Bank (2004)

47
Figure V: Effectiveness gap: recent E.U. members and E.U. candidate(s) vs. other E.U. members
0
1
2
3
4
5
6
7
100,000 1,000,000 10,000,000 100,000,000 1,000,000,000
Competition Agency Budget (US Dollars, Logarithmic Scale)
Imp
lem
enta
tio
n e
ffec
tive
nes
s (W
EF
Rat
ing
)
Other EU members
EU recent members and candidate(s)
Data sources: Nicholson (2004); World Bank (2004)

48
Figure VI: Efficacy as a function of effectiveness
0
10
20
30
40
50
3.0 3.5 4.0 4.5 5.0 5.5 6.0 6.5 7.0
Implementation Effectiveness (WEF Rating)
Ou
tco
me
Eff
icac
y (
FD
I In
flo
ws
as
% o
f G
DP
)
Ireland
U.K.
Finland
Chile
TURKEY
Lithuania
Ind
one
sia
Cos
ta R
ica
Ro
man
ia
Czech Rep.
ArgentinaLatviaPeruVenezuelaPhilippines = Sri Lanka
Jam
aica
Th
aila
nd
Mex
ico
Pan
ama
Estonia
Slovenia
Portugal
Poland
Korea
Hungary
S. AfricaJapan
Switzerland
Spain
Italy
No
rwa
y
New
Ze
ala
nd
Sweden
Canada De
nma
rk
Israel
Australia
Belgium
France
U.S.
Netherlands
Germany
World Development Indicators (2004).Data source(s): Nicholson (2004);
RussiaUkraine Greece
"Efficacy gap"
"Efficacy premium"
49
Appendix
Table A.1: Ordinary Least Squares estimation of the effect of an increase in the agency budget and staff size on antitrust implementation effectiveness (measured by the WEF rating) Dependent Variable = WEF rating
The SAS System 17:11 Saturday, June 3, 2006 18 The REG Procedure Descriptive Statistics Uncorrected Standard Variable Sum Mean SS Variance Deviation Intercept 35.00000 1.00000 35.00000 0 0 LogBudget 543.62698 15.53220 8559.27673 3.39865 1.84354 staff_NI 21.78930 0.62255 29.78163 0.47696 0.69062 WEF 171.20000 4.89143 865.68000 0.83139 0.91181 EU 20.00000 0.57143 20.00000 0.25210 0.50210 New2EU_Candidate 9.00000 0.25714 9.00000 0.19664 0.44344 DC 20.00000 0.57143 20.00000 0.25210 0.50210 LogYears 85.54067 2.44402 241.84958 0.96431 0.98199 Descriptive Statistics Variable Label Intercept Intercept LogBudget staff_NI WEF WEF EU EU New2EU_Candidate New2EU_Candidate DC LogYears Correlation Variable Label LogBudget staff_NI WEF EU LogBudget 1.0000 -0.3186 0.4687 -0.1286 staff_NI -0.3186 1.0000 -0.4180 0.1862 WEF WEF 0.4687 -0.4180 1.0000 0.0431 EU EU -0.1286 0.1862 0.0431 1.0000 New2EU_Candidate New2EU_Candidate -0.3083 0.5833 -0.6200 0.5095 DC 0.4355 -0.3938 0.8269 0.0667 LogYears 0.5956 -0.3216 0.5496 -0.3937 Correlation New2EU_ Variable Label Candidate DC LogYears LogBudget -0.3083 0.4355 0.5956

50
staff_NI 0.5833 -0.3938 -0.3216 The SAS System 17:11 Saturday, June 3, 2006 19 The REG Procedure Correlation New2EU_ Variable Label Candidate DC LogYears WEF WEF -0.6200 0.8269 0.5496 EU EU 0.5095 0.0667 -0.3937 New2EU_Candidate New2EU_Candidate 1.0000 -0.5473 -0.4341 DC -0.5473 1.0000 0.5006 LogYears -0.4341 0.5006 1.0000 The SAS System 17:11 Saturday, June 3, 2006 20 The REG Procedure Model: MODEL1 Dependent Variable: WEF WEF Analysis of Variance Sum of Mean Source DF Squares Square F Value Pr > F Model 2 8.48032 4.24016 6.86 0.0033 Error 32 19.78710 0.61835 Corrected Total 34 28.26743 Root MSE 0.78635 R-Square 0.3000 Dependent Mean 4.89143 Adj R-Sq 0.2563 Coeff Var 16.07609 Parameter Estimates Parameter Standard Variable Label DF Estimate Error t Value Pr > |t| Intercept Intercept 1 2.26893 1.25253 1.81 0.0795 LogBudget 1 0.18467 0.07717 2.39 0.0228 staff_NI 1 -0.39486 0.20600 -1.92 0.0642

51
The SAS System 17:11 Saturday, June 3, 2006 21 The REG Procedure Model: MODEL2 Dependent Variable: WEF WEF Analysis of Variance Sum of Mean Source DF Squares Square F Value Pr > F Model 5 21.65575 4.33115 19.00 <.0001 Error 29 6.61168 0.22799 Corrected Total 34 28.26743 Root MSE 0.47748 R-Square 0.7661 Dependent Mean 4.89143 Adj R-Sq 0.7258 Coeff Var 9.76160 Parameter Estimates Parameter Standard Variable Label DF Estimate Error t Value Pr > |t| Intercept Intercept 1 3.12514 0.79338 3.94 0.0005 LogBudget 1 0.07497 0.05092 1.47 0.1517 staff_NI 1 0.06102 0.15026 0.41 0.6877 EU EU 1 0.43831 0.22103 1.98 0.0569 New2EU_Candidate New2EU_Candidate 1 -0.89705 0.32719 -2.74 0.0104 DC 1 0.95203 0.23845 3.99 0.0004

52
The SAS System 17:11 Saturday, June 3, 2006 22 The REG Procedure Model: MODEL3 Dependent Variable: WEF WEF Analysis of Variance Sum of Mean Source DF Squares Square F Value Pr > F Model 6 22.55906 3.75984 18.44 <.0001 Error 28 5.70837 0.20387 Corrected Total 34 28.26743 Root MSE 0.45152 R-Square 0.7981 Dependent Mean 4.89143 Adj R-Sq 0.7548 Coeff Var 9.23084 Parameter Estimates Parameter Standard Variable Label DF Estimate Error t Value Pr > |t| Intercept Intercept 1 3.32277 0.75610 4.39 0.0001 LogBudget 1 0.02336 0.05404 0.43 0.6688 staff_NI 1 0.07911 0.14235 0.56 0.5828 EU EU 1 0.66960 0.23613 2.84 0.0084 New2EU_Candidate New2EU_Candidate 1 -1.00939 0.31397 -3.21 0.0033 DC 1 0.72703 0.24954 2.91 0.0069 LogYears 1 0.25289 0.12014 2.10 0.0444

53
Table A.2: Ordinary Least Squares estimation of the effect of antitrust implementation effectiveness (measured by the WEF rating) on FDI inflows Dependent Variable = Logarithm of foreign direct investment inflow (2001) The SAS System 22:16 Friday, March 30, 2007 The REG Procedure Descriptive Statistics Uncorrected Variable Sum Mean SS Variance Intercept 46.00000 1.00000 46.00000 0 WEF 215.20000 4.67826 1044.98000 0.84929 highinf 9.00000 0.19565 9.00000 0.16087 LogPopTotal 765.21577 16.63513 12808 1.74333 RankGDPpercapPPP1995intldollars 1127.00000 24.50000 35719 180.16667 hiefi 23.00000 0.50000 23.00000 0.25556 EU 23.00000 0.50000 23.00000 0.25556 VZ 1.00000 0.02174 1.00000 0.02174 LogWIRFDI01 379.11430 8.24162 3234.55719 2.44540 LogWIRFDI00 390.94767 8.49886 3495.63026 3.84488 Descriptive Statistics Standard Variable Deviation Label Intercept 0 Intercept WEF 0.92157 WEF highinf 0.40109 LogPopTotal 1.32035 RankGDPpercapPPP1995intldollars 13.42262 hiefi 0.50553 EU 0.50553 EU VZ 0.14744 LogWIRFDI01 1.56378 LogWIRFDI00 1.96084 Correlation Variable Label WEF highinf LogPopTotal WEF WEF 1.0000 -0.4572 0.0725 highinf -0.4572 1.0000 0.0554 LogPopTotal 0.0725 0.0554 1.0000 RankGDPpercapPPP1995intldollars 0.8165 -0.4726 -0.0182 hiefi 0.4245 -0.3836 -0.0513 EU EU 0.2051 -0.0548 -0.2482 VZ -0.1436 0.3023 0.0439 LogWIRFDI01 0.7341 -0.4001 0.5037 LogWIRFDI00 0.7531 -0.4577 0.4223 The SAS System 22:16 Friday, March 30, 2007

54
The REG Procedure Correlation RankGDPpercap Variable Label PPP1995intldollars hiefi EU WEF WEF 0.8165 0.4245 0.2051 highinf -0.4726 -0.3836 -0.0548 LogPopTotal -0.0182 -0.0513 -0.2482 RankGDPpercapPPP1995intldollars 1.0000 0.4208 0.2604 hiefi 0.4208 1.0000 -0.1304 EU EU 0.2604 -0.1304 1.0000 VZ -0.1965 -0.1491 -0.1491 LogWIRFDI01 0.6964 0.3323 0.2012 LogWIRFDI00 0.7571 0.4304 0.1645 Correlation Variable Label VZ LogWIRFDI01 LogWIRFDI00 WEF WEF -0.1436 0.7341 0.7531 highinf 0.3023 -0.4001 -0.4577 LogPopTotal 0.0439 0.5037 0.4223 RankGDPpercapPPP1995intldollars -0.1965 0.6964 0.7571 hiefi -0.1491 0.3323 0.4304 EU EU -0.1491 0.2012 0.1645 VZ 1.0000 -0.0104 -0.0073 LogWIRFDI01 -0.0104 1.0000 0.9297 LogWIRFDI00 -0.0073 0.9297 1.0000 The SAS System 22:16 Friday, March 30, 2007 The REG Procedure Model: MODEL1 Dependent Variable: LogWIRFDI01 Analysis of Variance Sum of Mean Source DF Squares Square F Value Pr > F Model 7 94.11543 13.44506 32.08 <.0001 Error 38 15.92758 0.41915 Corrected Total 45 110.04302 Root MSE 0.64742 R-Square 0.8553 Dependent Mean 8.24162 Adj R-Sq 0.8286 Coeff Var 7.85544 Parameter Estimates Parameter Standard Variable Label DF Estimate Error t Value Intercept Intercept 1 -6.27736 1.36706 -4.59

55
WEF WEF 1 0.50513 0.18853 2.68 highinf 1 -0.53674 0.29192 -1.84 LogPopTotal 1 0.64855 0.07758 8.36 RankGDPpercapPPP1995intldollars 1 0.03893 0.01309 2.98 hiefi 1 0.28791 0.22885 1.26 EU EU 1 0.67377 0.21694 3.11 VZ 1 1.71815 0.69693 2.47 Parameter Estimates Variable Label DF Pr > |t| Intercept Intercept 1 <.0001 WEF WEF 1 0.0108 highinf 1 0.0738 LogPopTotal 1 <.0001 RankGDPpercapPPP1995intldollars 1 0.0051 hiefi 1 0.2160 EU EU 1 0.0036 VZ 1 0.0183 The SAS System 22:16 Friday, March 30, 2007 The REG Procedure Model: MODEL2 Dependent Variable: LogWIRFDI01 Analysis of Variance Sum of Mean Source DF Squares Square F Value Pr > F Model 8 99.59024 12.44878 44.07 <.0001 Error 37 10.45277 0.28251 Corrected Total 45 110.04302 Root MSE 0.53151 R-Square 0.9050 Dependent Mean 8.24162 Adj R-Sq 0.8845 Coeff Var 6.44915 Parameter Estimates Parameter Standard Variable Label DF Estimate Error t Value Intercept Intercept 1 -2.88272 1.36171 -2.12 WEF WEF 1 0.30172 0.16153 1.87 LogWIRFDI00 1 0.47480 0.10785 4.40 highinf 1 -0.15727 0.25469 -0.62 LogPopTotal 1 0.32024 0.09808 3.27 RankGDPpercapPPP1995intldollars 1 0.00784 0.01286 0.61 hiefi 1 -0.01900 0.20040 -0.09 EU EU 1 0.37390 0.19068 1.96 VZ 1 0.53229 0.63241 0.84

56
Parameter Estimates Variable Label DF Pr > |t| Intercept Intercept 1 0.0410 WEF WEF 1 0.0697 LogWIRFDI00 1 <.0001 highinf 1 0.5407 LogPopTotal 1 0.0024 RankGDPpercapPPP1995intldollars 1 0.5458 hiefi 1 0.9250 EU EU 1 0.0575 VZ 1 0.4054