
A Qualitative Study of Two-to-Four-Year Transfer Practices in ...
Upload
khangminh22Category
view
0download
0
Purdue UniversityPurdue e-Pubs
Open Access Dissertations Theses and Dissertations
Fall 2014
A qualitative study of problematic reasonings ofundergraduate electrical engineering students inContinuous Time Signals and Systems coursesFarrah FayyazPurdue University
Follow this and additional works at: https://docs.lib.purdue.edu/open_access_dissertations
Part of the Engineering Education Commons
This document has been made available through Purdue e-Pubs, a service of the Purdue University Libraries. Please contact [email protected] foradditional information.
Recommended CitationFayyaz, Farrah, "A qualitative study of problematic reasonings of undergraduate electrical engineering students in Continuous TimeSignals and Systems courses" (2014). Open Access Dissertations. 266.https://docs.lib.purdue.edu/open_access_dissertations/266
� � � � � � � � � � � � � � � � � � � � � � � � � � � � � � � � � � � � � � � � � � � � � � � � � � � � � � � � � � � � � � � � � � � � � � � � � � � � � � �� � � � � � � � � � � � � � � � � � � � � � � � � � � � � � � � � � � � � � � � � � � � � � � � � � � � � � � � � � � ! � � � � � � � � � � � � � � � � � � � � � � � �� � � � � � � � � � � � " � � # � � � � � � � � � � � � � � $ � � # � � � � � % � & � � � � � � ' � � � � � � � � � ( � � � � � � � ) � � � � � � � � � � �� � " � � � � � � � � � � � � � � *
+ , - - , . + , / / , 01 2 3 4 5 6 7 4 7 6 8 9 : 7 3 ; < = > ? @ = A 5 9 B 4 7 6 C D 9 4 E = F 6 F G E = > H F ; 9 @ G @ 4 ; 3 4 7 9 I 5 9 C 7 @ 6 C 4 5 I F G 6 F 9 9 @ 6 F G : 7 3 ; 9 F 7 E 6 FJ = F 7 6 F 3 = 3 E K 6 B 9 : 6 G F 4 5 E 4 F ; : < E 7 9 B E J = 3 @ E 9 EL M N O M - M P Q . R S M T M U . /D 3 7 V : 7 @ 9 8 9 5 9 @J = @ ; 9 5 6 4 W @ = X FY = F 6 C 4 J 4 @ ; 9 5 5 4
D 3 7 V : 7 @ 9 8 9 5 9 @Y 4 @ 6 = : 6 B = F 6
D 3 7 V : 7 @ 9 8 9 5 9 @ Z Z [ \ ] [ \ ^ Z ]

A QUALITATIVE STUDY OF PROBLEMATIC REASONINGS OF
UNDERGRADUATE ELECTRICAL ENGINEERING STUDENTS IN CONTINUOUS
TIME SIGNALS AND SYSTEMS COURSES
A Dissertation
Submitted to the Faculty
of
Purdue University
by
Farrah Fayyaz
In Partial Fulfillment of the
Requirements for the Degree
of
Doctor of Philosophy
December 2014
Purdue University
West Lafayette, Indiana

ii
To God who has given me every blessing and every ability
To my advisor for her endless support and guidance
To my father for believing in me
To my mother for our relationship which gave me strength to go through this process
To Tamania for her endless support
iii
ACKNOWLEDGEMENTS
Many thanks to
• My advisor Dr. Ruth Streveler for always being a text away, for our long meetings to
guide me on everything academic and personal, for knowing exactly how to make me
move forward in this journey, for her valuable mentorship in helping me become a better
researcher and a stronger person
• Dr. Cordelia Brown, and Dr. Monica Cardella for their valuable feedback and
suggestions throughout this study
• Dr. Mario Simoni for always being available to answer all my questions, for always
encouraging me, for assisting me in conducting this study, and for his and his wife Dr.
Tina Hudson's warm hospitality
• Dr. Maurice Aburdene for always being available to give me very valuable feedback on
my dissertation, and for his and his wife Laurie Aburdene's love, friendship, and
mentorship
• My father for always believing that I was capable of achieving a doctorate
• Tamania Javaid and her family for their love and support throughout my journey to the
United States and throughout graduate school
• Wonderful friends I found here in the US including Joi-Lynn Mondisa, Dr. Jeremi
London, The Huff Family, The Bollock Family, Dana Denick and her mom Donna
Denick, Linda Gudeman, and The Siddiqui Family
iv
• Aisha Mahmood for her friendship and books
• Fulbright for giving me an opportunity to have a life-changing learning experience
• National Science Foundation (DUE 1140995) for partially funding this study
• The staff at Rose-Hulman Institute of Technology including Susan Dayhuff, Jan A Pink,
Linda Price, Sarah Forbes, and Alan J Ward
• The faculty at Rose-Hulman Institute of Technology including Daniel J Moore, Bruce
Black, and Jianjian Song
• The following wonderful people for their feedback and suggestions on my dissertation:
Dana Denick, Dr. James Huff, Jeremi London, Joi-Lynn Mondisa, Dr. Ruth Wertz, Dr.
Deepika Sangam, Dr. Tatiana Goris, Dr. Mark Carnes, Dr. Dan Ferguson, Dr. Signe
Kastberg, Dr. Joachim Walther, Nicole Pitterson, Zachary Hass, Dr. Devlin Montfort,
Samantha Brunhaver and her husband John Brunhaver, my dissertation brother Dr. James
Cawthorne, and many others
• My neighbors Dr. Anshu Garg, Dr. Anjali Bhardwaj, and Moumita Roy for sharing their
home-cooked meals and friendship with me
• Maggie and Abby for their warm hugs and giggles, which brighten my days
• Students who volunteered in the pilot as well as the actual study
• Transcribers of the interviews I conducted for this study
• Writing lab tutors and awesome baristas and customers at Greyhouse coffee shop and
Starbucks for helping me become a better writer
• Everyone who encouraged me throughout this process
v
TABLE OF CONTENTS
Page
LIST OF FIGURES .............................................................................................................x
LIST OF TABLES ........................................................................................................... xiv
ABSTRACT .................................................................................................................... xvi
CHAPTER 1 - INTRODUCTION .......................................................................................1
1.1 Purpose ......................................................................................................................4
1.2 Research Questions ....................................................................................................5
1.3 Overview of Study Methodology and Methods.........................................................5
1.4 Rationale ....................................................................................................................6
1.5 Limitations .................................................................................................................7
1.6 Definitions of Fundamental Terms ............................................................................8
CHAPTER 2 - LITERATURE REVIEW ..........................................................................10
2.1 Signals and Systems - Course Content and Difficult Concepts ...............................12
2.1.1 Course Content .................................................................................................13
2.1.2 Problems in Learning ........................................................................................14
2.2 Pedagogical Strategies for Signals and Systems Courses........................................20
2.2.1 Signals and Systems Concept Inventory ...........................................................22
2.3 Conceptual Change and Learning Theories .............................................................27
2.3.1 Ontological Categorization ...............................................................................28
vi
Page
2.3.2 Framework Theory ...........................................................................................30
2.3.3 P-prims ..............................................................................................................32
2.3.4 Learning and Conceptual Change Theories in Mathematics ............................34
2.4 Three Studies on Problems in Learning Signals and Systems Course Content .......42
2.4.1 Learning Difficulties and Knowledge Gaps in the Course Content and Potential
Reasons behind Them ......................................................................................43
2.4.2 Difficult Questions in SSCI Post-Test ..............................................................61
2.4.3 Problems in Learning Signals and Systems Course Content across Borders ...63
2.5 Gaps in Research Conducted Thus Far in Learning Signals and Systems Courses 64
CHAPTER 3 - RESEARCH METHOD ............................................................................66
3.1 Introduction..............................................................................................................66
3.2 Why Qualitative Research .......................................................................................67
3.3 Data Collection ........................................................................................................68
3.3.1 The Design Process of the Interview Protocol ..................................................68
3.3.2 Interview Protocol .............................................................................................75
3.3.3 Clinical Interviews ............................................................................................79
3.4 Study Site .................................................................................................................86
3.5 Description of Continuous Time Signals and Systems Course Taught at Iris
University ................................................................................................................87
3.6 Participants ..............................................................................................................88
3.6.1 Sampling Strategy .............................................................................................89
3.6.2 Sample Size .......................................................................................................90

vii
Page
3.6.3 Recruitment Process .........................................................................................91
3.6.4 Sample Profile ...................................................................................................92
3.7 Data Analysis ...........................................................................................................94
3.8 Quality of the Research ...........................................................................................98
3.9 Reducing Researcher's Biases ...............................................................................102
3.10 Description of External Content Experts .............................................................103
CHAPTER 4 - RESULTS ...............................................................................................106
4.1 Introduction............................................................................................................106
4.2 Problematic Reasonings.........................................................................................108
4.2.1 Signal Representations and Operations (SRO) ...............................................111
4.2.2 Frequency Analysis (FA) ................................................................................119
4.2.3 System Analysis (SA) .....................................................................................130
4.3 Difference between Problematic Reasonings among Students with Different
Academic Statuses .................................................................................................134
4.3.1 Number of Problematic Reasonings Demonstrated by Normalized Proportion
of Individual Participants in Each Group .......................................................136
4.3.2 Normalized Proportion of Problematic Reasonings Demonstrated by a Group
Collectively ....................................................................................................139
4.4 Additional Findings ...............................................................................................142
4.4.1 Mistakes ..........................................................................................................143
4.4.2 Missing Conceptual Knowledge .....................................................................158
4.4.3 Mathematical Equations versus Graphs ..........................................................169
viii
Page
4.5 Summary ................................................................................................................171
CHAPTER 5 - DISCUSSION .........................................................................................173
5.1 Discussion of Problematic Reasonings Identified .................................................175
5.1.1 Representational Translation (LC1) ................................................................178
5.1.3 Accommodation (LC3) ...................................................................................184
5.2 Discussion of Differences in Problematic Reasonings of Students with Different
Academic Statuses .................................................................................................186
5.2.1 CTSS-Only-Dominant Problematic Reasonings ............................................187
5.2.2 CTSS-Plus-Dominant Problematic Reasonings..............................................188
5.2.3 Robust Problematic Reasonings .....................................................................191
5.3 Discussion of Problems in Learning Continuous Time Signals and Systems
Courses in Light of Problematic Reasonings ........................................................193
5.4 Why Continuous Time Signals and Systems Courses are Difficult ......................197
5.5 Implications ...........................................................................................................204
5.5.1 Implications for Instruction ............................................................................204
5.5.2 Implications for Learning ...............................................................................210
5.6 Future Work ...........................................................................................................213
REFERENCES ................................................................................................................218
APPENDICES .................................................................................................................230
Appendix A - Protocol-A (First Pilot Study) ...............................................................231
Protocol-B (First Pilot Study) ..................................................................................235
Appendix B - Protocol A (Second Pilot Study) ...........................................................240
ix
Page
Protocol B (Second Pilot Study) ..............................................................................245
Appendix C - Protocol A (Actual study) .....................................................................248
Protocol B (Actual study) ........................................................................................252
Appendix D - IRB approval letter for the pilot study ..................................................255
Appendix E - IRB approved consent form for the pilot study .....................................256
Appendix F - IRB Approval Letter for the actual study ..............................................258
Appendix G - IRB approved Consent Form for the actual study ................................259
Appendix H - Recruitment email .................................................................................262
Appendix I - Announcement script for recruitment in classes at Iris University ........263
Appendix J - Iris University's Continuous Time Signals and Systems course outline 264
Appendix K - Codebook for this study ........................................................................267
VITA ................................................................................................................................279
x
LIST OF FIGURES
Figure ............................................................................................................................. Page
Figure 2.1. Same graphical representation of a continuous time signal and a discrete time
signal on the x-axis (Fayyaz, 2009). ................................................................................. 45
Figure 2.2. Upsampling a discrete time signal by a factor of 2 (Fayyaz, 2009). .............. 46
Figure 2.3. Multiplication of a continuous time signal with an ideal impulse train results
in a continuous time signal and not a discrete time signal (Fayyaz, 2009). ..................... 47
Figure 2.4. No sophisticated mathematical model explaining the conversion of a
continuous time signal into a discrete time signal exists (Fayyaz, 2009). ........................ 47
Figure 2.5. Graphical representation of Fourier series and Fourier transform of a periodic
signal (Fayyaz, 2009). ....................................................................................................... 50
Figure 2.6. Continuous time Fourier series and discrete time Fourier transform appear as
duals of each other (Fayyaz, 2009). .................................................................................. 51
Figure 2.7. Discrete time signal obtained by sampling a continuous time signal by sample
and hold followed by multiplication with a pulse train (Fayyaz, 2009). .......................... 52
Figure 2.8. An ideal continuous time impulse train and a discrete time impulse train
appear to have identical transforms (Fayyaz, 2009). ........................................................ 54
Figure 2.9. Plot of sum of hundred thousands of harmonically related sinusoids plotted on
MATLAB (Fayyaz, 2009). ............................................................................................... 55
xi
Figure ............................................................................................................................. Page
Figure 4.1. A rectangular function. ................................................................................. 112
Figure 4.2. John's response for the area under the rectangular function. ........................ 113
Figure 4.3. Emily's response for the area under the rectangular function....................... 114
Figure 4.4. Tom's response for the area under the rectangular function. ........................ 115
Figure 4.5. Justin's response for area under the rectangular function. ............................ 116
Figure 4.6. Caleb's response for area under the rectangular function. ............................ 117
Figure 4.7. Luke's working for simplifying the equation �� = �2�� − 1. ...................... 119
Figure 4.8. An aperiodic rectangular function and its corresponding periodic rectangular
function used in a couple of questions in the protocol used for this study. .................... 120
Figure 4.9. Carl's drawing of the spectrum of the periodic rectangular function. .......... 121
Figure 4.10. John's drawing of the spectrum of the periodic rectangular function. ........ 122
Figure 4.11. Caleb's drawing of the spectrum of the periodic rectangular function. ...... 123
Figure 4.12. Emily's drawing of the spectrum of the periodic rectangular function. ..... 124
Figure 4.13. Tom's drawing of the spectrum of the given signals. ................................. 127
Figure 4.14. Two same signals given to the participants to discuss the convolution result
of the signals in the time and frequency domains. .......................................................... 131
Figure 4.15. Picture of the ac-to-dc converter given to the participants to determine if it is
a time-invariant system. .................................................................................................. 133
Figure 4.16. Normalized proportion of the number of students in each group employing a
particular problematic reasoning. .................................................................................... 138
xii
Figure ............................................................................................................................. Page
Figure 4.17. Normalized proportion of a particular problematic reasoning employed by
each group collectively. .................................................................................................. 141
Figure 4.18. Bill's working with powers of exponential functions. ................................ 145
Figure 4.19. Bill's working to find Fourier transform of t-square. ................................. 146
Figure 4.20. Luke's working to find Fourier transform of �4(�) = � − �2[�� + � − �� −�]. .................................................................................................................................... 147
Figure 4.21. Jim's working to find the Fourier transform of �3� = ���(�6� − �6) +� �3................................................................................................................................. 148
Figure 4.22. Lily's graph for t-square. ............................................................................ 148
Figure 4.23. Area under a periodic rectangular function drawn by Matt (left) and Carl
(right). ............................................................................................................................. 149
Figure 4.24. Erin's work trying to explain how the plot of area under the periodic
rectangular function will look like. ................................................................................. 150
Figure 4.25. Correct plot of �(−2� + 2) (left), plot drawn by Luke (right). ................. 150
Figure 4.26. Tom expressed an impulse train as a unit step function. ............................ 151
Figure 4.27. Lily's working of using unit step functions inside an integral. ................... 152
Figure 4.28. Plot of ���(�2� − �4) drawn by Megan. Instead of π/4, the correct value is
1/2. .................................................................................................................................. 154
Figure 4.29. Plot of ���(�2� − �4) drawn by Lily. ...................................................... 154
Figure 4.30. Plot of ���(�2� − �4) drawn by Rick. ..................................................... 155
Figure 4.31. Correct plot of �(−2� + 2) (left), Jim's plot of �(−2� + 2) (right). ........ 156
Figure 4.32. Jake's attempt to find Fourier series of �(�) = ���� + �4 + 3���(7�). .. 161

xiii
Figure ............................................................................................................................. Page
Figure 4.33. Megan's attempt to find Fourier series of �(�) = ���� + �4 + 3���(7�).......................................................................................................................................... 162
Figure 4.34. Rick's attempt to find Fourier series of �(�) = ���� + �4 + 3���(7�). .. 163
Figure 5.1. Map of Curricular priorities of typical Continuous Time Signals and Systems
courses. Note that topics that are marked 'Important to know' are all the concepts that
help students learn enduring understandings. ................................................................. 198
Figure 5.2. Topics of Continuous Time Signals and Systems course content and CTSS-
only-dominant problematic reasonings. This map shows when conceptual learning might
be affected by these problematic reasonings. ................................................................. 200
Figure 5.3. Topics of Continuous Time Signals and Systems course content and CTSS-
plus-dominant problematic reasonings. This map shows when conceptual learning might
be affected by these problematic reasonings. ................................................................. 201
Figure 5.4. Topics of Continuous Time Signals and Systems course content and robust
problematic reasonings. This map shows when conceptual learning might be affected by
these problematic reasonings. ......................................................................................... 202
xiv
LIST OF TABLES
Table .............................................................................................................................. Page
Table 2.1. Summary Analysis of Student Results on SSCI Tests ..................................... 62
Table 2.2. Summarized Results of Problems Encountered by Students in Learning Signals
and Systems Course Content across Borders .................................................................... 64
Table 3.1. Summary of Concepts Covered in Each Interview Question ........................... 79
Table 3.2. Courses Passed by Participants which Require Prior Knowledge of
Continuous-Time Signals and Systems Course Content .................................................. 93
Table 3.3. Genders of Participants .................................................................................... 94
Table 3.4. Nationalities of Participants ............................................................................. 94
Table 3.5. Credentials of Experts Consulted and the Areas in which they Assisted....... 105
Table 4.1. Problematic Reasonings Employed in Continuous Time Signals and Systems
Course Content ............................................................................................................... 110
Table 4.2. Summary of Findings Categorized under the Three Main Content Areas .... 172
Table 5.1. Summary of All Problematic Reasonings and Possible Associated Learning
Challenges ....................................................................................................................... 177
Table 5.2. Problematic Reasonings (section 4.2), Mistakes (section 4.4.1) and Missing
Knowledge (section 4.4.2) that might be Explained with Representational Translation
(LC1) as a Potential Learning Challenge ....................................................................... 180
xv
Table .............................................................................................................................. Page
Table 5.3. Explanation of Problematic Reasonings with Representational Translation
(LC1) as a Potential Learning Challenge ....................................................................... 181
Table 5.4. Problematic Reasonings (section 4.2), Mistakes (section 4.4.1) and Missing
Conceptual Knowledge (section 4.4.2) that might be Explained with Translation Between
Domains (LC2) as a Potential Learning Challenge ....................................................... 182
Table 5.5. Explanation of Problematic Reasonings with Translation Between Domains
(LC2) as a Potential Learning Challenge ....................................................................... 183
Table 5.6. Problematic Reasonings (section 4.2), Mistakes (section 4.4.1) and Missing
Conceptual Knowledge (section 4.4.2) that might be Explained with Accommodation
(LC3) as a Potential Learning Challenge ....................................................................... 185
Table 5.7. Explanation of Problematic Reasonings with Accommodation (LC3) as a
Potential Learning Challenge ......................................................................................... 186
Table 5.8. Possible Explanations Suggested by the Findings for Incorrectly Answered
Questions in SSCI Tests (section 2.4.2) .......................................................................... 196
Table 5.9. Important-to-Know Content Areas in Continuous-Time Signals and Systems
Courses where Conceptual Understanding can be Affected by the Identified Problematic
Reasonings ...................................................................................................................... 203
xvi
ABSTRACT
Fayyaz, Farrah. Ph.D., Purdue University, December 2014. A Qualitative Study of Problematic Reasonings of Undergraduate Electrical Engineering Students in Continuous Time Signals and Systems Courses. Major Professor: Ruth A. Streveler.
Continuous Time Signals and Systems is a core course in the undergraduate
electrical engineering curriculum. The topics covered in this course are difficult to learn
conceptually because a significant number of topics are abstract, disconnected from a
student's daily life, and make extensive use of mathematical modeling and formulas.
Engineering educators have put in significant effort to design effective educational
strategies for this course; however, there remained a gap in qualitative understanding of
students' reasonings associated with difficulties in conceptual learning of the course
content. This study aims to fill this gap by identifying problematic reasonings of
undergraduate electrical engineering students when they engage with the course content.
In addition, this study aims to identify and assess the differences in the problematic
reasonings employed by students of different academic statuses (students who have only
taken Continuous Time Signals and Systems course and students who have taken
subsequent courses). Looking at the differences in the problematic reasonings used by the
students of different academic statuses enables an understanding of the persistent
difficulties in learning the course content.
xvii
This study used a constructivist framework and started with the design and
validation of a sixty-minute semi-structured interview protocol. The protocol is designed
based on the difficult topics in this course identified through literature and content
experts of Continuous Time Signals and Systems courses. Once the protocol was tested,
nineteen undergraduate electrical engineering students from a teaching-intensive
Midwestern university were interviewed for this study. The participants were required to
have passed this course already. Of the nineteen participants, eight (CTSS-only group)
have only taken Continuous Time Signals and Systems course and eleven (CTSS-plus
group) have taken subsequent (up to 4) courses. Each student was interviewed
individually. Data collected from think-aloud interviews were analyzed using thematic
analysis.
Results revealed that the reasonings used by the participants that are potentially
problematic in conceptual learning of Continuous Time Signals and Systems course
content are related to content areas of Signal Representations and Operations, Frequency
Analysis, and System Analysis. The identified reasonings can be further classified under
three main learning challenges, namely i) accommodation; ii) translation of a signal to its
multiple representations in one domain; and iii) translation of a signal to its multiple
representations between domains (time and frequency). The robust problematic
reasonings are the ones exhibited equally by all nineteen students in translating a signal to
its multiple representations between domains (time and frequency).
The results of this study can provide a broader impact on future work across many
subfields within engineering including electrical, computer, mechanical, biomedical,
aeronautics, and astronautics. This study will benefit both engineering curriculum
xviii
developers to design curriculum that efficiently help students develop a conceptual
understanding of courses like Continuous Time Signals and Systems and instructors of
Continuous Time Signals and Systems courses to develop successful educational
strategies for this course. Additionally, the design of this study can be used as an example
for future work in understanding problematic concepts within engineering education.
1
CHAPTER 1 - INTRODUCTION
Various factors influence student learning in educational settings. These include
faculty (e.g., adequacy in professional knowledge, teaching style, attitude, sympathy,
language skill, etc.), students (e.g., ability, attitude, need, learning styles, working
memory capacity, motivational styles, etc.), physical situations, assessment methods,
socio-cultural factors, and misconceptions (Bahar, 2003). Misconceptions are defined as
"any aspect of an individual's conceptual understanding that resists conceptual change
and contributes to an incorrect, naive, or unproductive conceptual understanding"
(Streveler, Brown, Herman, & Montfort, 2014, p.1). Reasonings are the knowledge that
students reveal (speak or write) in response to a particular problem which might just be
limited within the context of the problem. Misconceptions can come from informal or
formal educational settings and at any stage of the students' education (Bahar, 2003). In
the literature, misconceptions are also referred to as naive beliefs (Caramazza,
McCloskey, & Green, 1981), erroneous ideas (Fisher, 1985), preconceptions (Hashweh,
1988), multiple private versions of science (McClelland, 1984), underlying sources of
error (Fisher & Lipson, 1986), personal models of reality (Klopfer, Champagne, &
Gunstone, 1983), spontaneous reasoning (Viennot, 1979), persistent pitfalls (Meyer,
1987), common sense concepts (Halloun & Hestenes, 1985), spontaneous knowledge
(Pines & West, 1986), alternative frameworks (Driver & Easley, 1978), faulty extensions
2
of productive prior knowledge (Smith, diSessa, & Roschelle, 1994), and children’s
science (Gilbert, Osborne, & Fensham, 1982).
I am situating this study in a constructivist framework that is based on two
assumptions. One, the reasonings employed by the students when they engage with a
certain concept play role in the learning of that concept, and two, the knowledge that a
student possesses may be "in-pieces" (DiSessa, 1983, 1988, 2008), which means a
particular reasoning used by a student may not be representative of the complete mental
model of that student. Based on these two assumptions, I choose the term problematic
reasoning over misconception for this study and define problematic reasoning as a
person's reasoning (purposeful effort to generate justifiable conclusions and make sense
of the problem) that has the potential to hinder conceptual understanding and cultivate
misconceptions.
Learning conceptual knowledge in engineering science is crucial to develop
competence and expertise in engineering. An essential question within the domain of
conceptual knowledge and learning is what makes some concepts difficult to learn
(Perkins, 2007; Streveler, Litzinger, Miller, & Steif, 2008). So far, this question is not
deeply explored in engineering education research (Streveler, Litzinger, Miller, & Steif,
2008). To date, the research in conceptual knowledge within engineering sciences have
been focused mainly on force, heat, and electric current (Streveler, Litzinger, Miller, &
Steif, 2008). A few key reasons that these concepts are difficult to learn are that they are
abstract, not observable directly, and are usually miscategorized by novice learners (Chi,
2005). These difficulties are also inherent in most of the Continuous Time Signals and
Systems course content.
3
Continuous Time Signals and Systems is a core course in the undergraduate
electrical and computer engineering curriculum (Nasr, Hall, & Garik, 2005; Wage &
Buck, 2001). The course content is difficult to learn conceptually because a significant
number of topics in this course are abstract, disconnected from a student's daily life, and
make extensive use of mathematical modeling and formulas (Nasr, Hall, & Garik, 2005;
Ferri et al., 2009; Han, Zhang, & Qin, 2011; Tsakalis et al., 2011). The conceptual
understanding of the content of this course is important as these concepts become
foundational knowledge for many other courses in undergraduate electrical and computer
engineering curriculum like communication, control systems, circuit design, image, and
audio processing (Oppenheim, Willsky, & Nawab, 1997).
Electrical engineering educators have put in significant effort to design effective
educational strategies for this course. These include the design of the Signals and
Systems Concept Inventory (SSCI) (Wage & Buck, 2001), use of SSCI to study difficult
concepts in Signals and Systems (Wage, Buck, & Wright, 2004), use of computer tools
and simulations (Cavicchi, 2005; Han, Zhang, & Qin, 2011), and other active learning
strategies (Ferri et al., 2009). Additionally, there had been a few quantitative studies to
assess students' performance in Signals and Systems (Huettel, 2006; Ogunfunmi, 2011).
Despite all these efforts, the course content has continued to challenge students' learning
as evidenced by well-above-average drop/failure rates (Simoni, Aburdene, & Fayyaz,
2013a, 2014). This is because there is a lack of exploratory studies on students'
understanding of this course (Nasr, 2007).
Teaching for conceptual change and development of successful learning
environments and pedagogical strategies necessitates exploration of students'
4
misconceptions and concepts that are difficult to learn (Streveler, Olds, Miller, & Nelson,
2003; Anderson, Abell, & Lederman, 2007; Streveler, Brown, Herman, & Montfort,
2014). Open-ended and theoretically-focused conceptual change research in engineering
education is most suitable for investigation of existence, importance, and interrelatedness
of a cognitive phenomenon (Streveler, Brown, Herman, & Montfort, 2014). To develop
most appropriate educational strategies for Signals and Systems there is a need for
exploratory studies on how students engage with Continuous Time Signals and Systems
course content (Nasr, Hall, & Garik, 2007). The goal of this study is to fill the gap of
qualitative analysis of students' conceptual understanding of Signals and Systems.
1.1 Purpose
The purpose of this qualitative study is to understand the problematic reasonings
used by undergraduate electrical engineering students when they attempt to access
Continuous Time Signals and Systems course content. Additionally, this study seeks to
understand how the problematic reasonings change when students progress in their
academic career in engineering. This will help to understand students' unintended
approaches in Continuous Time Signals and Systems course content that persist to
challenge learning even after students' continued use of these concepts in more contexts
and applications. The research questions guiding this study will be presented next.
5
1.2 Research Questions
This study has the following research questions:
RQ 1. What problematic reasonings do undergraduate electrical engineering students
employ when they engage with the Continuous Time Signals and Systems course
content?
RQ 2. How do these problematic reasonings differ after the students take more courses
that require prior knowledge of Continuous Time Signals and Systems course
content?
1.3 Overview of Study Methodology and Methods
As mentioned before, this study of problematic reasonings used by undergraduate
electrical engineering students while engaging with Continuous Time Signals and
Systems course content is set in a constructivist framework (Creswell, 2007). A
structured protocol was designed to explore problematic reasonings (section 3.3.1) and
one-on-one think-aloud interviews were conducted with undergraduate electrical
engineering students using the designed protocol (section 3.3.3.4). This study
acknowledges the fact that interpersonal communications plays a role in the data
collected about the conceptual understanding of any topic using clinical interviews
(Montfort, 2011; Säljö, 1999), and so focuses more on the identification of the revealed
knowledge (i.e., problematic reasonings) rather than claiming to understand what
students know (i.e. misconceptions). The topics for the questions for the protocol were
identified through existing literature (Chapter 2) and discussion with Continuous Time
Signals and Systems experts (section 3.10). The quality of the protocol was validated by
6
a) discussion with a total of ten experts in Continuous Time Signals and Systems course
content and qualitative research methods (Table 3.5) and, b) the researcher piloting the
protocol three times (section 3.3.1). In addition, to validate the protocol, the pilot studies
were also used to hone the researcher's skills as an interviewer, and making choices for
the most appropriate interview settings (section 3.3.3.4).
Nineteen undergraduate electrical engineering students from Iris University
(pseudonym for study site described in detail in section 3.4) voluntarily participated in
this study (section 3.6.3). Of the nineteen students, eight had taken only one Continuous
Time Signals and Systems course and no subsequent courses, and eleven had taken one
or more (up to four) such courses (section 3.6.4). Each student was interviewed
individually. The interviews were audio-recorded (section 3.3.3.4). Participants were
provided with a calculator, a Fourier transform table, and a related formula sheet during
the interviews, in case they needed it (section 3.3.1). The transcribed audio data collected
during interviews was analyzed using thematic analysis (section 3.7).
1.4 Rationale
The purpose of this study is to explore the problematic reasonings used by
undergraduate electrical engineering students when they engage with Continuous Time
Signals and Systems course content. There are very few exploratory studies on
engineering students' understanding of concepts similar in nature to the concepts learned
in Continuous Time Signals and Systems courses. Therefore, this study has both
theoretical and practical significance. Theoretically, this study will add to the literature on
conceptual learning in engineering and will help the engineering educators to develop an
7
in-depth understanding of the difficulties faced by students while attempting to access
similar content. Furthermore, this study will provide an understanding of the differences
of the use of problematic reasonings between students who have taken no additional
courses that require prior knowledge of the content of this course and students who have
taken the subsequent courses. This understanding will be useful for i) instructors of
engineering courses like Continuous Time Signals and Systems to develop successful
educational strategies, and ii) engineering curriculum developers to modify overall
electrical engineering curriculum to efficiently help students to develop a robust
conceptual understanding of Continuous Time Signals and Systems course content.
Moreover, the design of this study can be used as an example for future work in
understanding students' reasonings within engineering courses.
Although the focus of this study is to understand electrical engineering students'
problematic reasonings of the course content, this course is taught in various other
engineering disciplines like aeronautics, and astronautics, bio-medical, and mechanical.
Therefore, the results of this study can have broader impact beyond electrical and
computer engineering education.
1.5 Limitations
There are several limitations of this study.
1. The findings collected from a small sample of volunteer participants from a small
private teaching-intensive university may not generalize to all undergraduate
electrical engineering students. Additionally, the scope of this study is bounded
within the learning experiences of students in one country only.
8
2. Verbal protocols only reveal knowledge that participants articulate in response to a
specific question or a task, and do not reveal all the knowledge possessed by the
participants (Säljö, 1999). Therefore, the findings of this study are more
representative of what students can verbalize as compared to what they actually
know.
3. Although the choices made by the researcher for this research (protocol development,
conducting the interviews, data analysis and interpretation, etc.) are validated at all
stages with experts in the field of conceptual understanding as well as in the field of
signal analysis, the results of this study are not completely free of the researcher's
biases.
1.6 Definitions of Fundamental Terms
Following are the definitions of the fundamental terms (arranged alphabetically)
used in this study.
Concept - A concept is defined as a piece or cluster of knowledge (Streveler, Brown,
Herman, & Montfort, 2014).
Conceptual change - Conceptual change is a process of altering a person's conceptual
understanding (Streveler, Brown, Herman, & Montfort, 2014).
Conceptual understanding - Conceptual understanding of a particular topic is defined as
beliefs and framework used to acquire new knowledge or perform new applications of
old knowledge in that topic (Montfort, Brown, & Pollock, 2009).
9
Conceptual Knowledge - Conceptual knowledge is understanding of principles governing
a domain and the interrelations between units of knowledge in a domain (Rittle‐Johnson,
2006, p. 2)
Misconceptions - Misconceptions are "any aspect of an individual's conceptual
understanding that resists conceptual change and contributes to an incorrect, naive, or
unproductive conceptual understanding" (Streveler, Brown, Herman, & Montfort, 2014,
p.1).
Mistakes - Participants' incorrect responses during the interviews for which there is not
enough evidence for a problematic reasoning behind them are called mistakes (Definition
specifically created for this study and explained more in section 2.5).
Problematic Reasoning - Problematic reasoning is a reasoning that has the potential to
hinder conceptual understanding and cultivate misconceptions (Definition specifically
created for this study).
Reasoning - Reasoning is a purposeful effort to generate justifiable conclusions and make
sense of the problem (Definition specifically created for this study).
10
CHAPTER 2 - LITERATURE REVIEW
Signals and systems is a core course in the undergraduate electrical engineering
curriculum in which students learn about the fundamental concepts of signals and
systems and their analyses using various generalized mathematical tools and transforms.
Although the concepts discussed in this course are applicable to any signals or systems in
the world, signals in this course mainly characterize analog or digital signals representing
some analog physical quantities (like audio signals, radio signals, etc.), and systems in
this course mainly represent an electrical or electronic systems (like filters,
communication systems, or control systems, etc.). This chapter discusses literature on
learning Signals and Systems in particular and relevant literature on learning science and
mathematics in general.
In the first section of this chapter, I will discuss the course content of Signals and
Systems and the difficult concepts that arise out of this subject matter. I will start the
section with a discussion of the course content. I will then present the literature on what
makes this a difficult course in general followed by specific misconceptions and
conceptual difficulties identified in the course. The comparison of course content and
literature on difficult concepts presented in this section highlights the gaps in research in
conceptually understanding concepts in Signals and Systems, which supports the need for
this study discussed in last section of this chapter.
11
In the second section of this chapter, I will present various pedagogical strategies
proposed by engineering educators to improve students' learning in this course. In
addition, I will explain the development of the Signals and Systems concept inventory as
a tool to evaluate pedagogical techniques and curricular reforms in Signals and Systems.
The literature presented in this section acknowledges the numerous attempts of
engineering educators to improve students' conceptual understanding of Signals and
Systems. The literature in this section will highlight the lack of qualitative evidence to
support and validate the success of these pedagogical strategies in achieving students'
conceptual understanding. The identification of a lack of evidence to support the current
efforts in improving pedagogy of this course will highlight the need for this study that is
discussed in the last section of this chapter.
In the third section of this chapter, I will present a few conceptual change and
learning theories in science and mathematics. Although there is a pool of information
ranging over decades on conceptual change and learning, I will specifically focus on the
theories that i) other researchers have used to describe learning hurdles in Signals and
Systems (p-prims), and/or ii) have the potential to suggest an explanation for the learning
difficulties in this course.
In the fourth section, I will present the findings of the three studies that I
conducted at different times on difficulties for students taking Signals and Systems
courses. I will first present the findings of my master's thesis about identification of
learning hurdles for students taking Signals and Systems. Then I will discuss the potential
reasons for these learning hurdles in the light of the conceptual change theories presented
in the third section of this chapter. This discussion will help to illustrate the reasons for
12
the choice of theoretical framework for this study. Next, I will present the difficult
concepts identified in a quantitative analysis of continuous time SSCI post-test scores of
958 students over a period of ten years at Iris University. In the end of this section, I will
discuss the findings from a small study from my Qualitative Research Methods class on
identification of problems in learning Signals and Systems course content across borders.
The literature presented in this section will establish the researcher's understanding of
possible difficulties associated with conceptually understanding concepts in Signals and
Systems courses.
In the fifth section of this chapter, I will discuss the gaps in the literature on
learning Signals and Systems course content as evidenced by the information presented in
the previous sections. This will establish the standing of this study in the realm of the
research conducted on learning Signals and Systems course content to date.
2.1 Signals and Systems - Course Content and Difficult Concepts
Signals and systems is a core course in electrical, computer, and aerospace
engineering curricula, and typically taught in sophomore or junior year (Wage & Buck,
2001). Standard textbooks for this course are Signals and Systems (Oppenheim, Willsky,
& Nawab, 1997) and Linear Systems and Signals (Lathi, 1998), (Wage, Buck, Welch, &
Wright, 2002a, 2002b), however, engineering educators have been using various other
books as well (Kanmani, 2011). Course content mainly focuses on continuous time
signals and continuous time systems (Wage & Buck, 2001). A thorough understanding of
this course is important in the field of electrical engineering because concepts learned in
this course are pre-requisite concepts for many core courses in the undergraduate
13
electrical engineering curriculum like circuit analysis, communications, and control
systems as well as many specialized courses like digital signal processing.
2.1.1 Course Content
As mentioned in section 2.1, Signals and Systems is a core course in a typical
undergraduate electrical engineering curriculum and is a pre-requisite for many core
courses in the undergraduate electrical engineering curriculum like circuit analysis,
communications, control systems and specialized courses like digital signal processing,
etc. (Munson & Jones, 1999). The three major content areas in typical Continuous Time
Signals and Systems courses are i) Signal representation and operation, ii) Frequency
analysis, and iii) System Analysis. Signal representation and operation content area
comprises topics like representation of signals using mathematical equations and graphs,
components of signal (even, odd, etc.), types of signals, various operations on signals like
time shifting, time scaling, etc, complex signals like Dirac delta, sinc, unit step function,
etc. Frequency Analysis content area comprises of analysis of signals through Fourier
series and transform. System Analysis content area covers topics such as different types
of systems with emphasis on linear time-invariant systems, impulse response, and LTI
system analysis through convolution and Laplace transform (Evans, Karam, West, &
McClellan, 1993; Munson & Jones, 1999; Wage, Buck, Welch, & Wright, 2002).
14
2.1.2 Problems in Learning
The three major content areas in the Signals and Systems courses are Signal
properties, Fourier analysis, and system analysis (Laplace transform, and convolution)
(Evans, Karam, West, & McClellan, 1993; Munson & Jones, 1999; Wage, Buck, Welch,
& Wright, 2002). Some studies have suggested that the abstract nature and disconnection
of these concepts from daily life could make them difficult to understand. Additionally,
these concepts and their applications in the physical world are described through
mathematics, which requires students to combine advanced mathematical concepts with
their perception of physical systems (Nasr, Hall, & Garik, 2005). Consequently, a large
part of this course deals with abstract mathematical constructs. A few studies have
contended that these abstract mathematical constructs are difficult to visualize and
comprehend (Shaffer, Hamaker, & Picone, 1998; Nasr, Hall, & Garik, 2005, 2007;
Tsakalis et al., 2011). For conceptual understanding of any subject matter, students often
need to know the usefulness of what they learn and want to be sure that the information
they acquire is useful in daily life (Çetin, 2004). Nasr, Hall, and Garik (2005) have
argued that the disjointed-from-everyday-life nature of concepts in Signals and Systems
course content makes this course different from other courses in engineering, like
Electronics and Circuit Analysis.
In addition, for better understanding of this course, sophisticated mathematical
skills rather than just knowing formulas and carrying out fixed procedures to solve the
problems are deemed necessary in most of the studies. There is sufficient anecdotal
support that, these days, engineering students either lack the mathematical proficiency
required to solve any problem in physics or engineering, or fail to apply their knowledge

15
of the mathematics to any physics or engineering context (Nasr, Hall, & Garik, 2005).
Bruner (1962) argues that students can find difficulty in understanding mathematical
concepts if they cannot understand them intuitively or be able to translate intuitive ideas
into mathematics. Betz (1978) suggests that math anxiety in engineering students can
influence their understanding of math-influenced engineering concepts. Moreover, in the
university level engineering education, the gap between application-oriented expectations
of students and theory-focused lectures is claimed to have a considerable effect on the
motivation of students (Munz, Schumm, Wiesebrock, & Allgower, 2007).
There is a limited amount of work done in conceptual understanding of topics
taught in Signals and Systems courses. I have divided this literature into three categories
based on the particular course content investigated in each study. The categories are: i)
Linear-time-invariant system analysis and convolution and, ii) mathematical concepts and
thinking. The difficult concepts discussed in one category may not be uniquely attributed
to the problems in learning that particular concept, but rather a combination of more than
one category of difficult concepts.
2.1.2.1 Linear-Time-Invariant System Analysis and Convolution
The difficulties in learning system analysis and convolution identified in the
previous literature are as follows:
i. Nasr, Hall, and Garik (2007) used the concept of DiSessa's p-prims (fundamental
knowledge structure) and coordination classes (large and complex knowledge
structures composed of combination of p-prims) to explain the faulty cognitive
resources underlying the mathematical reasonings of students attempting to learn
16
continuous time (CT) linear, time-invariant (LTI) electric circuits. They were
specifically interested in finding reasons for conceptual problems in the context of
LTI circuits, as the students in aerospace engineering program at MIT are taught
Signals and Systems courses in this context. For this purpose, they interviewed 51
students enrolled in Signals and Systems course in the Department of Aeronautics at
Massachusetts Institute of Technology, in 2002-2003. Their results suggested that the
faulty reasonings of the students when engaging with topics related to superposition,
convolution, and Laplace transform are mostly because of the inappropriate
invocation of the interval matching readout strategy. In other words, they argued that
the students employ the interval matching strategy in problems where its use is
inappropriate. Readout strategies, as presented by DiSessa (1983, 2002) are part of a
large complex knowledge system called coordination class, which is an integrated
model of numerous smaller knowledge structures that result in an expert-like
understanding of a certain scientific concept. Readout strategies constitute the ways in
which a particular concept or a situation is observed or understood (DiSessa, 1983,
2002).
ii. In a follow-up study, Nasr, Hall, and Garik (2009) investigated naive reasoning of
aeronautical engineering students related to the concepts of linearity, time-invariance,
and convolution, to provide a foundation for designing effective instructional
materials for Signals and Systems courses. They suggested that their findings would
help in designing a better pedagogy for this course as the knowledge of students'
skills and pre-conceptions is necessary for effective pedagogical design (NBPTS,
2005). In addition to interval matching, symmetry invocation was also claimed to be a
17
commonly employed faulty naive reasoning. Symmetry invocation as defined by
Nasr, Hall, and Garik (2009) is students' undue bias to apply symmetry properties to
analyze all the systems including non-symmetric systems.
iii. Wage, Buck, and Hjalmarson (2006a) conducted semi-structured interviews with nine
students and they argued that in some instances the "connotations" of the daily use of
the term "filter" limits the student's understanding of the concept of scaling factor in
the concept of "filters as systems" taught in this course. According to them, students
face difficulties in connecting the concept of a scaling factor to a filter as their
perception of filters adheres to the everyday use of filter such as air filter, coffee
filter, or spam filter. The difficulty in learning a new concept or term about which the
students have prior familiarity in a different meaning is suggested in other studies and
contexts in science education as well. These include Herman, Kaczmarczyk, Loui,
and Zilles's (2008) study on computer science and computer engineering students'
misconceptions in logic design concepts, and DiSessa, Gillespie, and Esterly's (2004)
study on the K-12 students' concepts of force.
iv. Wage, Buck, and Wright (2004) have argued that students face difficulty in relating
the concepts of impulse response and complex frequency analysis (Laplace
transform) to analyze a real system (Wage, Buck, & Wright, 2004).
2.1.2.2 Mathematical Concepts and Thinking
1. Wage, Buck, and Wright (2004) have used the Signals and Systems concept inventory
(SSCI) (to be discussed in detail in section 2.2.1) to illustrate that a sound
mathematical knowledge is helpful in understanding the concepts in Signals and
18
Systems course content. Although the reliability of an SSCI as an assessment
instrument is not yet established, ever since its initial design in 2001 it has been
widely used in over twelve schools for research in understanding problems
encountered by students taking Signals and Systems courses (Wage, Buck, & Wright,
2004). Without the information about the reliability of an instrument, the consistency
of the results of any research using that particular instrument remains questionable
(Gilbert, 1989). However, in an interest to include all the discussion in the literature
about possible obstacles in conceptual understanding of Signals and Systems course
content, I am presenting the results of a study conducted using an SSCI (Wage, Buck,
& Wright, 2004) that claims that the mathematical understanding of students
contribute towards conceptual learning of concepts covered in Signals and Systems
courses.
a) The study claimed a positive correlation of the gain in SSCI scores of the students
with their grades in some prerequisite courses (calculus, differential equations,
and circuits) within the curriculum of electrical and computer engineering.
b) Wage, Buck, and Wright (2004) argued, based on students' responses in SSCI
pretests and posttests, about the presence of three persistent misconceptions in
students. Firstly, they suggested that students incorrectly believed that the real
impulse response corresponds only to systems with real poles and zeros.
Secondly, they claimed that the students incorrectly thought that the
multiplication in the time domain corresponds to multiplication in the frequency
domain as well. Thirdly, they asserted that the students falsely believed that a
frequency response with two resonant peaks have one pole in the left-half plane
19
and one in the right-half plane, that is, they mistakenly reverse the roles of the real
and imaginary axes of the pole-zero plot.
c) A few studies have suggested that the students face difficulties in understanding
the need and importance of transforms, which further confuse them to connect
alternate shapes of the same signal in different domains (Wage, Buck, & Wright,
2004; Buck & Wage, 2005; Wage, Buck, & Hjalmarson, 2006a).
2. Nasr, Hall, and Garik (2009) have argued that the students find difficulties in doing
convolution by graphical method. They suggest that while performing convolution by
graphical method, students demonstrate problems in solving long integrals,
multiplying two signals, putting appropriate limits, defining signals piece-wise, and
flipping and shifting the signal. They further claimed that the difficulty in doing
convolution was more significant when one of the two functions being convolved had
any of these characteristics: (i) did not begin at t=0, (ii) was piece-wise, (iii) was non-
causal, and (iv) had negative values over a certain interval of time (Nasr, Hall, &
Garik, 2009).
3. Nelson, Hjalmarson, and Wage (2011) used two types of in-class assessments: group
exercises and individual exams to observe students' understandings of Signals and
Systems course content. They claimed that the mathematical areas where students
exhibited significant gaps in their knowledge were i) definitions and/or evaluation of
the conditions of causality and stability of a system, ii) mathematical representation
of signals and systems as either a function or a graph, iii) different types of
independent and dependent variables together in a function, and v) impulse response.
20
2.2 Pedagogical Strategies for Signals and Systems Courses
Engineering educators have spent a great deal of effort on developing effective
ways to teach Signals and Systems courses. So (2012) collected feedback from students;
gathered quantitative data from student evaluations and grade distributions; and
concluded that "chalk-and-talk" lecturing style is a preferred way to teach this course
instead of using PowerPoint slides. Hanselman (1992) based his research on learning
styles (Felder & Silverman, 1988) of an engineering student and proposed to teach
continuous-time concepts before discrete-time concepts in this course. According to him,
teaching continuous-time concepts before discrete-time concepts will support inductive
progression of the course content, attend to the need of the students who learn through
sensing, and help both global and sequential learners.
Many engineering educators have proposed to teach this course using computer
tools like excel (Stanton, Drozdowski, & Duncan, 1993) and MATLAB (Cavicchi, 2005;
Guan, Zhang, & Zheng, 2009; Han, Zhang, & Qin, 2011) to help students bridge the gap
between the abstract nature of the concepts in this course and their real life applications.
Stanton, Drozdowski, and Duncan (1993) proposed that computer exercises using
spreadsheets are more effective than structured languages in reinforcing students'
fundamental concepts taught in signals and systems courses, specifically Fourier series
analysis, convolution of finite duration signals, and state-space solutions to linear circuits.
Cavicchi (2005) presented a set of experiments integrating concepts like sampling,
aliasing, system modeling, frequency response, discrete Fourier transform, power
spectrum, correlation, and auto-correlation in MATLAB that explain, predict, and
evaluate various measurements. He surveyed all eight students who worked on the

21
suggested lab sequence over the two years and the data from students suggested that these
labs helped all the students but high-achieving students got more out of it.
Moreover, some educators have recommended hands-on techniques to improve
students' understanding of this course. These include hardware-based signal processing
laboratory exercises to enhance students' understanding of signal processing concepts
(Huettel, 2006), and the use of inexpensive and portable LEGO MINDSTORMS NXT
platforms for signal processing experiments (Ferri et al., 2009). Huettel (2006)
recommended four hardware-based signal processing laboratory exercises to enhance
students' understanding of signal processing concepts. These four exercises covered real-
time audio effects, dual-tone multi-frequency, sampling and aliasing, and voice-
scrambler-descrambler. He piloted the lab on his students and administered an
anonymous survey at the end of semester about students' experiences in the lab. The
results of the survey illustrated a clear understanding among students about sampling and
aliasing and about real-world applications of concepts covered in this course. In addition,
the survey results showed an increase in students' level of interest in the field of signal
processing. To help students get a practical experience of the abstract and mathematical
concepts in this course, Ferri et al. (2009) proposed a set of inexpensive signal processing
experiments for undergraduate students in electrical and mechanical engineering based on
the LEGO MINDSTORMS NXT platform. The set-up of the experiments was portable,
relatively inexpensive, and rugged enough that students could perform them at home, as
well as in the classroom. These experiments highlighted basic concepts in Signals and
Systems course content like sampling, aliasing, digital filtering, frequency analysis,
system identification, and control design.
22
Additionally, Simoni (2011) has developed a hardware platform that provides
hands-on experiences to undergraduate electrical engineering students in learning
continuous-time signals and system course content. The hands-on experiences are
expected to improve students' understanding and interest in frequency domain concepts.
The hardware platform facilitates students to work with a wide variety of realistic and
personalized signals including an audio signal (through a microphone), a voltage signal,
and an ECG signal (through an instrumentation amplifier). The hardware platform can
perform various operations including multiplication, addition, filtering, and sampling on
the different input signals. The platform allows students to manipulate realistic
continuous-time systems and observe corresponding input and output signals
simultaneously in the time and frequency domains.
2.2.1 Signals and Systems Concept Inventory
A concept inventory (CI) is an assessment tool that may be administered as
pretest and posttest in a course and is often used to measure gain in conceptual
understanding of a learner (Wage & Hjalmarson, 2006b; Buck, Wage, Hjalmarson, &
Nelson, 2007). The design of any CI is based on the knowledge collected by the
developer(s) about commonly held misconceptions of students in a particular discipline
(Evans et al., 2002). The CIs use misconceptions as distractors to identify if a student is
able to recognize the correct answer out of the common misconceptions (Evans et al.,
2002). Streveler et al. (2011) have presented an efficient methodology for creating valid
and reliable concept inventories to measure students' misconceptions in engineering and
science domains. They suggest that successful concept inventory design involves aligning
23
the three corners of the assessment triangle, i.e., cognition, observation, and
interpretation. The cognition corner corresponds to the identification and validation of
important concepts (can be done through Delphi studies), the observation corner
corresponds to the development and pilot of the inventory and the interpretation corner
includes establishing the instrument reliability.
The Signals and systems concept inventory (SSCI) was initially developed in
2000 for the curriculum of this course within electrical and computer engineering (Wage
& Buck, 2001). SSCI is a 25 question multiple-choice exam devised to measure students'
understanding of basic concepts in an undergraduate Signals and Systems course (Wage
& Buck, 2001). In just a few years, SSCI was already used on over 1000 students in 12
schools (Wage, Buck, & Wright, 2004). Since the development of SSCI, investigations
have continued to analyze the results of SSCI in undergraduate courses to assess students'
performance in Signals and Systems courses from year to year, and to identify concepts
that are difficult for most of the students so that the future offerings of this course can be
improved (Ogunfunmi, 2011). There is no evidence in previous studies about the
development of the cognition or interpretation corners of the SSCIs developed so far,
which, I argue, presents a doubt in the use of SSCIs and interpretation of students'
misconceptions based on the SSCI scores. I contend that the important concepts that need
to be covered in any CI cannot be determined without the development of the cognition
corner and the results of any CI test would be doubtful if the interpretation corner is not
established (Streveler et al., 2011).
Wage and Buck (2001) initially designed the questions in the SSCI to focus on
core concepts of this course including linearity, time-invariance, impulse response,

24
convolution, Fourier analysis, Laplace transform, representations of systems with linear
differential equations, pole-zero diagrams and their relationship with impulse and
frequency responses of systems, filtering, and stability. All the questions were designed
in a way that they need minimal or no mathematical computations (Wage & Buck, 2001).
These core concepts were further divided into six categories: pre-requisite mathematical
concepts, linearity and time-invariance, convolution, transforms, filtering, and sampling
(Evans et al., 2003). Each question in SSCI had four options and the three incorrect
choices, also called distractors, were claimed to be designed to capture students' common
misconceptions in Signals and Systems course content (Wage, Buck, & Hjalmarson,
2006a). The processes used in the development of SSCI to i) design the distractors to
capture students' misconceptions, ii) gain knowledge of students' misconceptions to
design the distractors, and iii) design the questions so that no mathematical computations
are necessary are not known. There are distinct versions of the SSCI tests for continuous
time (CT) and discrete time (DT) concepts. The SSCI website (http://signals-and-
systems.org) is maintained to provide information about its ongoing study.
Validity of any instrument is an important criterion to determine the worth of the
results obtained by using that particular instrument. Validity of an instrument is usually
established by correlating the scores obtained by the instrument with some similar scores.
The validation of SSCI was initially done in 2002 (Wage, Buck, Welch, & Wright, 2002).
The cumulative GPA, Signals and Systems course grade, and other prerequisite courses
of 174 students were correlated with their SSCI scores. These students were from four
different schools, George Mason University, US Air Force Academy, the US Naval
Academy, and University of Massachusetts Dartmouth. The correlation results of SSCI
25
posttest scores and grades were found consistently significant in students across all four
campuses. In addition, analysis of variance (ANOVA) test was performed on the SSCI
scores to check for gender and racial bias. The results showed no statistically significant
correlations between males and females or between whites and under-represented
minorities, hence supporting the validity of SSCI. Buck, Wage, Hjalmarson, and Nelson
(2007) validated SSCI by the results of two different analyses. Firstly, they claimed a
statistically significant correlation between SSCI scores and the final exam scores for
questions on convolution and Fourier transform properties. Secondly, they interviewed 18
students about questions on frequency-selective filtering and convolution, and correlated
their interview responses with their SSCI scores in questions related to these concepts.
Their results suggested that students' understanding of both time-frequency relations and
convolution was well-connected to their performance in related questions in SSCI (Buck,
Wage, Hjalmarson, & Nelson, 2007).
Wage, Buck, and Hjalmarson (2006a) used SSCI to probe student's understanding
of frequency selective filtering in Signals and Systems courses. They interviewed
students and used their responses to provide insight into the conceptual models that
students employ to reason about frequency and filtering. Their results claimed that
students' major misconceptions revolved around magnitude and phase of the frequency
response and the relationships between the magnitudes of the time domain signals and
their spectra. Based on the findings of this study, Wage, Buck, and Hjalmarson (2006a)
proposed to include questions in SSCI that would probe students' understandings of
filtering and comparison of magnitudes of a signal in both the time and frequency
domains. Additionally, in the same study, Wage, Buck, and Hjalmarson (2006b) provided
26
a summary of students' SSCI pretest and posttest scores to claim gains in students'
conceptual understanding of Signals and Systems course content. Furthermore, students'
scores in SSCI pretest and posttest were used to compare interactive-engagement and
traditional lecture based approach to teach this course. It was contended that at the end of
the semester, students' gain in knowledge was 39% more than their knowledge at the start
of the semester, when taught through interactive classes, whereas, the gain in students'
knowledge through traditional lecture-based approach was only about 22% (Wage, Buck,
& Hjalmarson, 2006b).
Additionally, since its development, SSCI has been used as a tool to evaluate
Signals and Systems curriculum and pedagogical techniques. In one study, both SSCI
pre-test scores and SSCI gains were correlated with grades in several prerequisite courses
(calculus, differential equations, and circuits) within the curriculum of electrical and
computer engineering. The results demonstrated that students learned this course better
when they had adequate background and expertise in mathematics (Wage, Buck, &
Wright, 2004). SSCI was also used to show that active and cooperative learning (ACL)
instructional format facilitates students' learning of signals and systems course content
(Buck & Wage, 2005).
Padgett, Yoder, and Forbes (2011) proposed six extended applications of SSCI
that were not in the scope of the original design of SSCI. These were (i) comparison of
how differences in international educational style impact conceptual learning, (ii)
introduction of conceptual/graphical testing to international instructors, (iii)
demonstration of student outcomes for ABET assessment, (iv) comparisons of
reinforcement of concepts in follow-on electives, (v) longitudinal studies, and (vi)
27
comparison of variation of student performance with student learning style. Students'
SSCI scores were claimed to be useful for the identification of the differences in
international curricula, faculty mindset, and curriculum assessment. Additionally, SSCI
scores were argued to be useful for determining the extent to which the subject matter of
Signals and Systems was reinforced in subsequent elective courses and the improvement
in students' understanding of the fundamental concepts taught in Signals and Systems
courses over time (Padgett, Yoder, & Forbes, 2011).
SSCI has been used in many universities and some research has been done in the
past on the validation of the SSCI (discussed in the beginning of this section), not much
research is conducted in determining the reliability statistics of SSCI. The lack of this
important information introduces ambiguity in the results of any research in assessing
students' misconceptions in Signals and Systems courses using SSCI. This is a limitation
of using an SSCI as a quantitative assessment tool.
2.3 Conceptual Change and Learning Theories
Much research has been done in conceptual learning in science and mathematics
since early 1970s (Smith, DiSessa, & Roschelle, 1994). Piaget (1971), one of the early
cognitive development theorists, believed that cognitive development is an active
construction process in which children increasingly build their own knowledge according
to their biological tendencies. Vygotsky (1962) on the other hand highlighted the
importance of the role of a teacher in child's learning and suggested that learning actually
happens in the zone of proximal development. The term conceptual change was first
introduced by Thomas Kuhn (1962) to explain that the concepts embedded in a theory
28
change their meaning when theory changes. According to him, the conceptual systems of
a learner are well integrated and oppose bit-by-bit change. Therefore, science changes in
a revolutionary manner.
Learning theories can be domain general or domain specific. Domain general
theories focus on principles and mechanisms that can describe all aspects of learning, for
example, Piagetian and Vygotskian learning theories. Domain specific theories focus on
the description and explanation of conceptual changes within specific content of
knowledge. Domain specific theories compliment domain general theories and yet allow
researchers to flexibly make hypothesis about the way a specific content is structured
(and re-structured), without necessarily committing to general constraints or modules
(Vosniadou, Vamvakoussi, & Skopeliti, 2008).
In this section, I will describe three learning theories that were helpful in the past
to explain numerous misconceptions and difficulties in learning science related concepts.
I will use these theories later in this chapter to suggest some explanation for difficulties in
learning 'Signals and Systems' course content. These are i) Ontological categorization, ii)
Framework theory, iii) P-prims. In the end of this section, I will discuss conceptual
change theories in mathematics in general, and 'advanced mathematical thinking' in
particular.
2.3.1 Ontological Categorization
While Kuhn (1962) and many other philosophers of science, like Lakatos (1970)
and Laudan (1978) discussed theory of conceptual change in terms of a paradigm shift,
Chi and colleagues (1992, 1993, 1994, 1997, 2002, 2008, 2012) presented the idea of
29
conceptual change as a change in the categorical status of a concept. This theory
emphasized that assigning correct categories for novel concepts was important for
conceptual understanding. This was based on the idea that the novel concept would
automatically inherit features and attributes from its category membership and the learner
could use knowledge of the category to make many inferences about the newly learned
concept. Chi and colleagues argued that the misunderstandings would happen when the
learner would place a new concept in an incorrect category. Moreover, robust
misunderstandings would occur if the new concept is placed in an incorrect lateral or
ontological category because laterally or ontologically different categories had distinct
and mutually exclusive properties. Chi (1992, 2008) defined ontological categories as
lateral categories between different conceptual trees that do not even share any common
super-ordinate level categories.
With reference to the idea that categorization allows new concepts to inherit
categorical properties, Chi (2008) has suggested two possible mistakes within
categorization and learning: hierarchical and categorical. A hierarchical mistake claims
that a learner fails to recognize an obvious basic category of a new concept or
phenomenon and assigns it to a more general hierarchical category. A categorical mistake
claims that a learner fails to recognize the category of a new concept or phenomenon and
assigns it to an incorrect lateral or ontological category. Chi (2008) argued that the
category mistakes, unlike hierarchical mistakes, are more damaging to conceptual
understanding of new concepts because the new concept inherits all the attributes of the
erroneously assigned lateral category.
30
Category mistakes are not only claimed to be in conflict with the correct scientific
knowledge but they are also claimed to be robust, i.e. they are suggested to be persistent
and resistant to conceptual change (Chi, 1993, 2005, 2008; Chi, Slotta, & de Leeuw,
1994). Chi argues that to correct a robust misconception and overcome the barrier of
conceptual change across lateral and ontological categories, a learner must have the
knowledge about the possible categories to which a concept can belong, and be able to
confront the knowledge at the categorical level to identify if there is a category mistake.
A few category mistakes identified in the science education literature so far are force,
temperature, heat, light, electric current, and diffusion (Chi, 2008; Chi, Roscoe, Slotta,
Roy, & Chase, 2012).
2.3.2 Framework Theory
Vosniadou and Vamvakoussi (2006) presented the theory that children start to
form their knowledge frameworks from birth and keep enriching the initially formed
frameworks whenever they encounter any new knowledge. They argued that this makes a
human's knowledge system a complex integration of a person's numerous beliefs
developed by interaction with physical, social, and cultural worlds around him/her. They
argued that the assimilation of a novel knowledge into an existing knowledge system
becomes a problem when the person does not have a compatible initial framework to add
this new knowledge and is not even aware of the missing appropriate framework.
The framework theory approach suggested that when a learner encounters some
new information and has no compatible initial framework to assimilate it, misconceptions
occur. This is why, according to this theory, mathematical concepts that are contradictory
31
to the learner's prior everyday knowledge are harder to learn. Vosniadou and
Vamvakoussi (2006) argued that to learn concepts that conflict with well-acquired
everyday knowledge, the learners are needed to be actively aware of their existing
knowledge structure, and to be able to reassess their existing knowledge structures
whenever required. This ability to be actively aware of one’s knowledge corresponds
with the metacognition model of cognitive learning theory (Svinicki, 1999). Additionally,
the ability to reassess the knowledge schema corresponds to structuring and restructuring
of memory discussed in the early cognitive model of learning (Svinicki, 1999).
Vosniadou and Vamvakoussi (2006) based their framework theory on empirical
studies conducted on sixteen ninth-graders in a middle class school in the Athens area.
Students participated voluntarily in this study and they all had varying mathematics
grades in class as reported by their teacher. Each student was interviewed individually for
about an hour for this study. The questionnaire used for the interviews was developed
after conducting an experimental pilot study on a larger pool of questions related to the
concepts of rational numbers and fractions. The objective of this study was to find out if
students hold on to their prior beliefs in learning mathematics, just as they do in learning
science concepts (Vamvakoussi & Vosniadou, 2004).
The results of this study showed that the students exhibited a lack of
understanding of rational numbers. The study also claimed that students demonstrated
confusion in understanding how many numbers, either finite or infinite, fall between two
rational numbers. In addition, the study argued that the students showed weak
understanding of similarity between a fraction and a decimal number (Vosniadou &
Vamvakoussi, 2006). Vosniadou and Vamvakoussi (2006) discussed that the
32
misconceptions identified in their study could be explained based on framework theory
and claimed that the radical re-structuring of the initial belief from everyday life about
numbers is required to properly understand the concept of a rational number.
One drawback of Vosniadou and Vamvakoussi's (2006) framework theory is that
this theory implies that the initial frameworks in the mind of a person are coherent. This
can be true in some cases, but not always. A counter example is presented by DiSessa and
colleagues (DiSessa, Gillespie, & Esterly, 2004; DiSessa, 2008).
2.3.3 P-prims
While Chi talks about the category mistakes, others explore the role of reasoning
resources in student's learning processes. Reasoning resources are described as the
cognitive raw materials that constitute the knowledge used to describe and explain
thinking and reasoning. They included basic knowledge elements (Redish, 2004),
mathematical knowledge structures (Sherin, 2001a, 2001b), interpretive strategies, and
cognitive nets of smaller reasoning resources called p-prims (DiSessa & Sherin, 1998;
DiSessa, 2002).
DiSessa et al. (1982, 1983, 1988, 1993, 1994, 2008) presented a constructivist
approach to conceptual learning that was based on students' intuitive knowledge. They
dismissed the ideas that i) the students' prior knowledge conflicting with the expert's
knowledge was a misconception, and ii) conceptual change referred to correcting the
misconception. Instead, they proposed that the student's prior knowledge contradicting
with expert's knowledge was not a misconception but a more fundamental and abstract
cognitive structure called phenomenological primitive or p-prim.
33
DiSessa (1982) defined p-prims as phenomenological as they originated
automatically from interpretations of some experienced reality and primitive because they
were assumed to be self-evident and not be further reduced to smaller cognitive
structures. Any situation within their span of applicability would activate them. DiSessa
(1982) claimed that one might liken p-prims to Piagetian concrete operational
understanding. P-prims are claimed to facilitate learning if they are activated in an
appropriate situation, and improper activation of p-prims in any situation is argued to lead
to misconceptions (DiSessa, 1993, 2002; DiSessa & Sherin, 1998).
For example, in a study, students were asked to explain why weather is hot in
summer, and most of them replied that it is because the earth is closer to the sun in
summer. It was suggested that the participants invoked the p-prim connecting proximity
and intensity (closer means stronger) that is correct information but was activated
incorrectly in interpreting the hot weather in summer. Hammer (2000) argued that this p-
prim closer means stronger was not a misconception and would have helped in
knowledge empowerment if activated appropriately in a situation (Hammer, 2000).
DiSessa (2008) emphasizes that p-prims are important in everyday learning, and
are often if not always productive in everyday thinking. He claims that the inappropriate
contextual use of otherwise correct p-prims explains the robustness of the difficulty in
conceptual change (DiSessa, 2008). In contrast to the general argument that conceptual
change requires erasing the previous concept (Kuhn, 1962), DiSessa (2008) contends that
conceptual change requires corresponding p-prims to be re-contextualized and not erased.
Many such coordinated contextual changes of p-prims create normative scientific concept
(DiSessa, 1982, 2008).
34
Based on the idea that coordinated changes in the contextuality of many
corresponding p-prims create conceptual understandings, DiSessa (1983, 1988, 2008)
also argued that the knowledge structure of a learner is fragmented in contrast to the idea
of coherent naive knowledge of a learner (Kuhn, 1962; McCloskey, 1983; Carey, 1999;
Vosniadou, 2002). He called it "knowledge in pieces." According to him, the real issue in
conceptual learning is the grain size at which we describe conceptual structure instead of
coherence or "knowledge in pieces."
2.3.4 Learning and Conceptual Change Theories in Mathematics
The research in conceptual change approach in mathematics learning and teaching
started more recently. Mathematics was considered different from physical sciences, and
so for a long time, the mathematics education community was hesitant to espouse
conceptual change theories developed primarily in the context of physical sciences
(Vosniadou, 2008). Kuhn (1962) suggested that since mathematics is based on deductive
proofs and not on experiments, it must be separated from the pattern of scientific
development and change. Additionally, unlike science, new theories in mathematics
usually carried mathematics to a more general level of analysis and enabled a wider
perspective, which created possibilities for new solutions (Dauben, 1984; Corry, 1993).
However, Vosniadou (2008) contends that from a learning point of view, students'
experiences remain the same across mathematics and science. Additionally, students
develop naive mathematics from everyday experience just as they develop naive science,
which may facilitate or hinder learning. Vosniadou, (2008) uses such similarities to
35
support the argument that the conceptual change theories for science can be successfully
applied in the case of mathematics learning.
I will next present the discussion between conceptual vs. procedural knowledge
that helps to understand the learning of engineering concepts that involve mathematical
modeling and abstractions. Later, I will discuss advanced mathematical thinking skills
required for understanding such engineering concepts followed by Lesh's translational
model.
2.3.4.1 Conceptual vs. Procedural Knowledge
Numerous theories on learning acknowledge the difference between conceptual
and procedural knowledge (Bisanz & LeFevre, 1992; Anderson, 1993). Procedural
knowledge corresponds to a person's understanding to execute certain action in a
sequence to solve problems. This knowledge is specific to a specific problem and is
usually not generalizable. On the other hand, conceptual knowledge corresponds to a
person's implicit or explicit understanding of the principles within a domain and of
interrelations between units of knowledge in a domain. Conceptual knowledge is flexible,
not specific to a specific problem, and generalizable. Most studies on conceptual versus
procedural knowledge are focused on deciding which type of knowledge develops first.
Conceptual-first theories advocate that conceptual knowledge in a domain is developed
first and later used to develop procedural knowledge in that domain (Halford, 1993;
Geary, 1994; Gelman & Williams, 1998). On the contrary, procedures-first theories
advocate that the learner starts with learning procedures for solving problems in a domain
that then helps to create conceptual knowledge within that domain (Fuson, 1988;
36
Karmiloff-Smith, 1993; Siegler & Stern, 1998). Additionally, there is third model for the
development of conceptual and procedural knowledge, an iterative model, which suggests
that both types of knowledge develop iteratively, gain in one type of knowledge furthers
gain in the other type of knowledge and the cycle continues, irrespective of which comes
first (Rittle-Johnson, Siegler, & Alibali, 2001).
Vincenti (1990) claimed that one of the key epistemological features that
distinguish engineering from science is that engineers work with models and abstractions
of concepts. Steif (2004) contends that many concepts within various models and
abstractions can only be understood from the procedures of the models, which poses a
methodological concern to distinguish increase in procedural knowledge from seemingly
increase in conceptual knowledge (Steif, 2004). Additionally, it is argued that students
hold an incorrect understanding of the role of mathematics in physics. They can perform
mathematical operations correctly in the context of a mathematics problem yet remain
unable to perform the same operations in the context of a physics problem (Steinberg,
Saul, Wittmann, & Redish, 1996). Streveler, Brown, Herman, and Montfort (2014)
contend that distinguishing conceptual knowledge from procedural knowledge is
important to suggest improvement in the curriculum by identifying the most important
knowledge and ways of thinking.
2.3.4.2 Advanced Mathematical Thinking
A large amount of research has been done to observe how students learn
mathematics and many suggestions have been presented to improve learning of
mathematical concepts so that students can apply the learned mathematical knowledge

37
constructively in practical applications. The range of this research includes discourse
analysis (Jamison, 2000), talk-in-action (Chapin, O'Connor, & Anderson, 2009), virtual
reality (Roussou, 2009), inquiry communities (Jaworski, 2004), patterns (Steen, 1988),
metacognition (Schoenfeld, 1992), problem-solving (Schoenfeld, 1992), informal
learning (Civil, 1990), shift of attention (Mason, 1989), analogical reasoning (English &
Sharry, 1996), cognitive apprenticeship (Brown, Collins, & Newman, 1989), and
simulations (Snir, Smith, & Grosslight, 1993). All these theories are important and
helpful in learning mathematics. Advanced mathematical thinking theory (Dreyfus, 1991)
suggests explanations for i) students' difficulties in learning engineering concepts taught
through mathematical concepts and models, and ii) how these difficulties can be
removed.
According to Dreyfus (1991), solving a simple integral like
� ����� (�)�!"#$%�$!& involves a large variety of simultaneously interacting mental
processes like graphical visualization of each function in the integration, visualization of
the area under the graph of the product, translation of the product into a simpler function,
performing integrals, checking and generalizing the answer in different representations,
etc. He suggested that sometimes even when the students are able to perform
standardized procedures using defined formulas, as a computer would do; they lack the
skill to use their mathematical knowledge more flexibly in unknown situations. He
argued that in such situations even a slight change in the structure of the problem or
formula could block students' mental processes (Dreyfus, 1991).
Dreyfus (1991) discusses the importance of psychological processes in
mathematical learning and suggests that students learn advanced mathematical concepts
38
through reflection on mathematical activity. According to him, the reason for students’
failure to reflect on advanced mathematical concepts is the incomplete presentation of
these concepts. He says that mathematics is created from many abstractions and
assumptions but teachers and mathematicians present mathematics to students in the
refined form. This simplified presentation of otherwise complex and abstract
mathematical concepts hinders the creation of mental processes required for advanced
mathematical learning. Additionally, although abstract mathematical concepts are
powerful in obtaining generalizations in mathematical concepts, they do not have any
specified intrinsic properties, and can be understood only in terms of their relationships
with other similar or different concepts. This makes them hard to intuit. Therefore,
Dreyfus (1991) argues that understanding abstract concepts requires a mental ability to
shift attention from the concepts themselves to the structure of their properties and
relationships with other concepts. He claims that the knowledge of mathematical
concepts without sophisticated mental processing skills can enable students to apply
mathematical formulas in well-structured questions, but does not prepare them to reflect
on mathematical activities. Dreyfus (1991) emphasizes that students can only learn
advanced mathematical concepts through mental processing (like visual imagery and
metacognition) of these concepts. Additionally, little knowledge is gained about physics
concepts when they are learned through mathematics because the concepts remain very
abstract (Bruner, 1962).
Dreyfus (1991) has used a descriptive approach for this study. He has backed up
his idea based on the results of the previous empirical studies, which include a study on
school children in understanding their calculus knowledge (Selden, Mason, & Selden,
39
1989), a study on the instructional techniques leading to misconceptions in students
(Davis, 1988), and a study on improvement in mathematical knowledge of school
children using graphical tools (Ruthven, 1990). He used results from all of these studies
to prove his claim that advanced mathematical learning happens through active mental
processing and metacognition. According to Dreyfus (1991) students can only learn
advanced mathematical concepts through the conscious interaction of a large number of
mathematical and psychological processes in their minds. These processes include
representation, translation, modeling, generalizing, synthesizing, etc. I will explain some
of these processes.
Representations correspond to creating a mental representation or visualization of
a mathematical concept, such as, graphs, algebraic formulas, flow diagrams, and tables.
Understanding the representation of a concept is necessary for learning a concept,
particularly when the same concept has seemingly contradictory multiple representations.
The richer the mental representation created by a learner about a particular concept is, the
better the concept is learned. The ability to achieve a rich mental representation
corresponds to the ability of a learner to link multiple aspects of the same concept in
his/her mind, which is only possible when the learner is consciously aware of these
representations (Dreyfus, 1991). This looks like the metacognition model of learning
(Svinicki, 1999).
In addition to creating a mental representation of a concept, learning an advanced
mathematical concept requires an ability to switch mentally from one representation or
formula of a concept to its other representation or formula. This is called switching
representations or translation. For example, a trigonometric function has multiple
40
representations and properties, like frequency, amplitude, phase, graph, table, points of
extremas, and zeros. Students get overwhelmed when they encounter many
representations of the same concept and try to stick to only one mental image, which
leads to misconceptions (Dreyfus, 1991).
Moreover, learning an advanced mathematical concept requires an ability to
mentally translate the mathematical concept in different contexts. This corresponds to the
ability of a student to apply a mathematical concept to multiple problem statements. For
example, applying a second-order, linear differential equation to an electric circuit
problem requires students to translate the same quantities in the formula in the context of
the differential equation as well as in the context of the electric circuits (Dreyfus, 1991).
Furthermore, modeling refers to a mental mathematical model of a physical system.
Generalizing corresponds to the ability of a learner to relate a mathematical concept
learned in one situation and apply it to other situations by identifying commonalities
between different situations. Synthesizing corresponds to the ability to interrelate many
mathematical concepts into one single big picture (Dreyfus, 1991).
Dreyfus's (1991) advanced mathematical thinking suggests that careful instruction
is needed for learning advanced mathematical concepts and for learning mathematical
concepts that are not familiar from everyday life. Additionally, it suggests that
mathematics is learned conceptually when students take charge of their own learning,
when students are able to apply the same mathematical concepts in multiple contexts and
applications, and when students are able to reflect on their learning of mathematical
concepts.

41
2.3.4.3 Translations of a Mathematical Function
Lesh (1981) discusses that complete understanding of a mathematical concept
requires the formation of three types of mathematical knowledge structures. First is
"within-idea structures" which involve understanding the mathematical concept itself.
Within-idea knowledge structures are coordinated systems of relations, operations, or
transformations of a particular mathematical concept that distinguish it from other classes
of the same concept. The meaning of a mathematical concept is usually context-
dependent driven from its relationship with other concepts or from the system in which it
is embedded. Therefore, second type of knowledge structure required to understand a
mathematical concept is "between-concept structures" that include understanding the
meaning of a particular mathematical concept in the context in which it is used. Third is
"between-mode structures" that understand various representations of a mathematical
concept together with organized systems of translation processes linking one
representation to another. This includes ''between-system mappings" (translations) and
''within-system operations" (transformations).
Lesh's (1981) translation model proposes that a mathematical concept can be
translated in five different representations, which are real-world translations, graphics,
manipulateable models, words, and symbols. A complete understanding of any
mathematical concept requires abilities to represent the concept in multiple
representations and to make connections between the multiple representations. In a
learner's mind, as the understanding of a concept develops, the related underlying
transformation/translation networks become more and more complex. A mathematical
concept is well learned when the learner can flexibly use a variety of relevant
42
representational systems and easily switch to the most appropriate representation in a
problem solving process.
Schoenfeld (1979) suggests that learning a specific mathematical concept in
isolation leads to gap in recognizing problems where the concept can be used and
identifying relationships between various concepts and strategies. Based on this, Lesh
(1981) proposes that the fourth knowledge structure required to understand a
mathematical concept would be organized systems of processes. A system of
mathematical object may include more than sum of parts of systems of ideas (between
concept structures), systems of operations and relations (e.g., within-concept structures),
and systems of problem solving processes.
In a qualitative study conducted on fourth-grade students, it was reported that the
ability to translate a mathematical concept significantly influences mathematical learning
as well as problem-solving capabilities of students (Behr, M. J., Wachsmuth, I., Post, T.
R., & Lesh, R., 1984). It was suggested that building the translational abilities facilitates
conceptual learning and applying of mathematical concepts. A mathematical concept is
well learned when a student can (1) recognize the concept embedded in a variety of
qualitatively different representations, (2) flexibly manipulate the concept within given
representations, and (3) accurately translate the concept from one system to another.
2.4 Three Studies on Problems in Learning Signals and Systems Course Content
In this section, I will present the results of three studies on the identification of
students' difficulties in learning Signals and Systems course content.
43
2.4.1 Learning Difficulties and Knowledge Gaps in the Course Content and Potential
Reasons behind Them
In the first part of this section (2.4.1.1), I will present the findings of a study that I
conducted for my master's thesis (Fayyaz, 2009). In the second part of this section
(2.4.1.2), I will suggest an explanation for these findings based on the learning theories
discussed in section 2.3. This will illustrate some reasons for the choice of theoretical
framework for this study.
2.4.1.1 Difficulties in Learning
This study was conducted for my master's thesis (Fayyaz, 2009). I started the
study with the development of a detailed concept map of signal analysis through Fourier
techniques, in order to identify difficult concepts. I started constructing the concept map
by carefully adding all signal analysis related topics (identified through textbooks) and
concepts (identified during classroom teaching of signal analysis related topics) required
to conceptually learn signal analysis. The concept map was constructed after several
iterations. Signal analysis content experts were consulted after each iteration. There were
two purposes of the construction of the concept map, 1) Identify all the concepts and their
linking prepositions required for conceptual understanding of signal analysis, 2) Identify
difficult concepts by assessing the difficulty with which each concept was added or
linked with other concepts in the concept map. The process of constructing and reflecting
on the process of constructing the complete concept map revealed many difficult,
misleading, and incompletely explained concepts in signal analysis. Later, I used this
concept map to develop class tests and interview protocols to identify the concepts
44
leading to misconceptions and learning hurdles for students taking Signals and Systems
courses.
During this period, I was also teaching Signals and Systems, and Digital Signal
Processing courses at a private engineering school in Lahore, Pakistan. I developed
questionnaires and quizzes throughout the courses for three consecutive semesters to test
students' understanding of the difficult concepts identified during the development of the
concept map. The purpose of this exercise was to both verify the initially identified
difficult concepts and test for additional learning hurdles. After each test or questionnaire,
I conducted retrospective interviews with one or two students in each class to ask them
about the concepts with which they struggled. Students' responses in class tests were used
as a measure of difficulties in learning signal analysis, and interview responses were used
to support the data collected in the class tests.
The problems identified in this study can be coded in seven categories: i)
Difference between continuous and discrete domain, ii) discrete frequency, iii) units of
Fourier series and Fourier transform, iv) periodic/aperiodic or finite/infinite duration
signals?, v) sampling, vi) aliasing and folding, and vii) abstract mathematical concepts.
The difficult concept discussed in one category may not be uniquely attributed to the
problems in learning that particular concept, but rather a combination of more than one
category of difficult concepts. The details of the problems identified within each category
are given below.
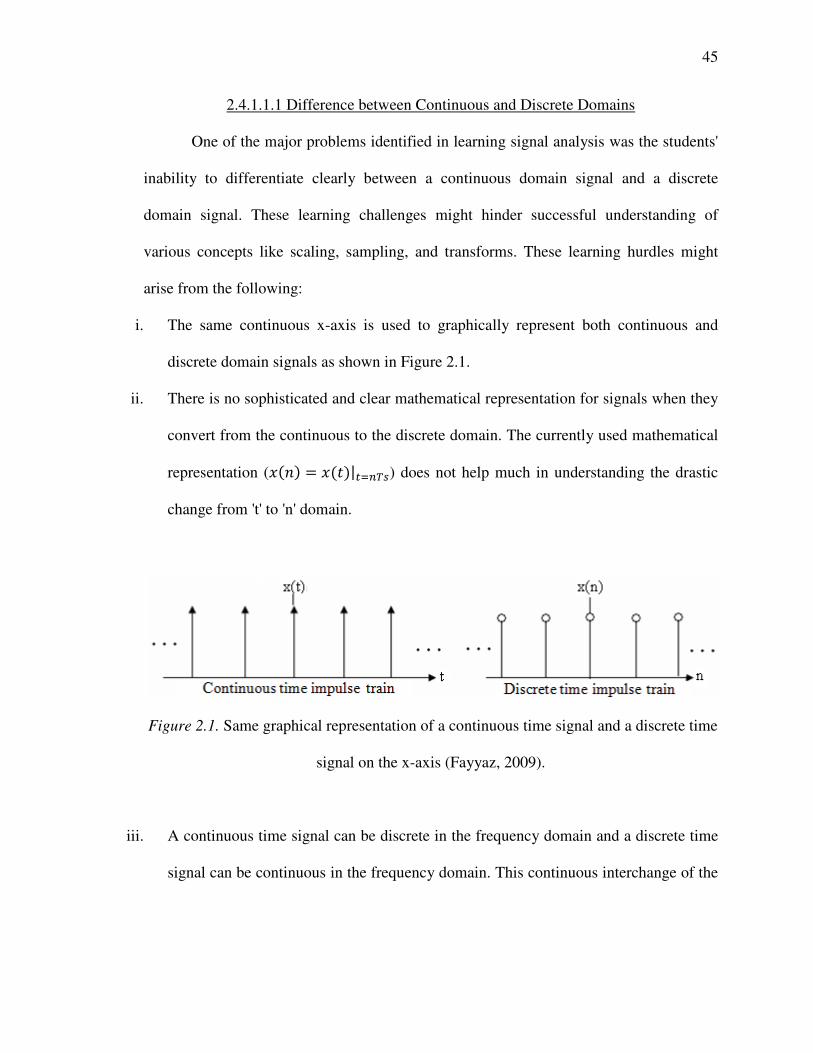
45
2.4.1.1.1 Difference between Continuous and Discrete Domains
One of the major problems identified in learning signal analysis was the students'
inability to differentiate clearly between a continuous domain signal and a discrete
domain signal. These learning challenges might hinder successful understanding of
various concepts like scaling, sampling, and transforms. These learning hurdles might
arise from the following:
i. The same continuous x-axis is used to graphically represent both continuous and
discrete domain signals as shown in Figure 2.1.
ii. There is no sophisticated and clear mathematical representation for signals when they
convert from the continuous to the discrete domain. The currently used mathematical
representation (�(�) = '�(�)|$)*+,) does not help much in understanding the drastic
change from 't' to 'n' domain.
Figure 2.1. Same graphical representation of a continuous time signal and a discrete time
signal on the x-axis (Fayyaz, 2009).
iii. A continuous time signal can be discrete in the frequency domain and a discrete time
signal can be continuous in the frequency domain. This continuous interchange of the
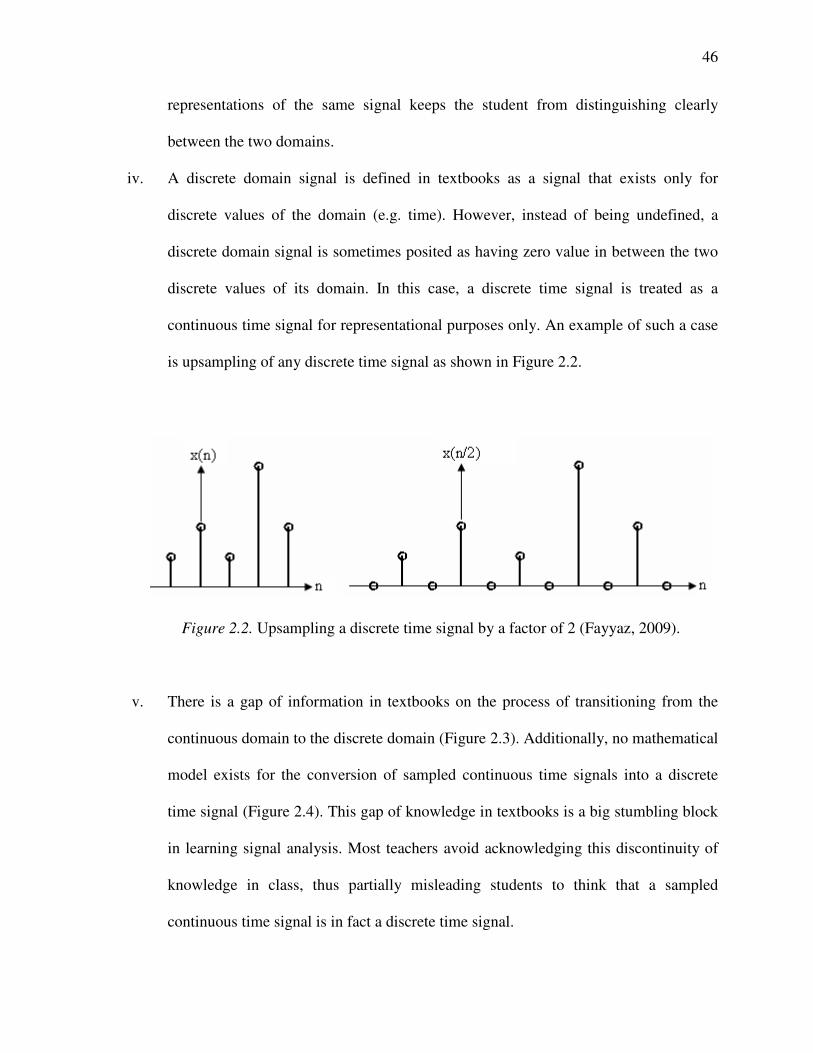
46
representations of the same signal keeps the student from distinguishing clearly
between the two domains.
iv. A discrete domain signal is defined in textbooks as a signal that exists only for
discrete values of the domain (e.g. time). However, instead of being undefined, a
discrete domain signal is sometimes posited as having zero value in between the two
discrete values of its domain. In this case, a discrete time signal is treated as a
continuous time signal for representational purposes only. An example of such a case
is upsampling of any discrete time signal as shown in Figure 2.2.
Figure 2.2. Upsampling a discrete time signal by a factor of 2 (Fayyaz, 2009).
v. There is a gap of information in textbooks on the process of transitioning from the
continuous domain to the discrete domain (Figure 2.3). Additionally, no mathematical
model exists for the conversion of sampled continuous time signals into a discrete
time signal (Figure 2.4). This gap of knowledge in textbooks is a big stumbling block
in learning signal analysis. Most teachers avoid acknowledging this discontinuity of
knowledge in class, thus partially misleading students to think that a sampled
continuous time signal is in fact a discrete time signal.
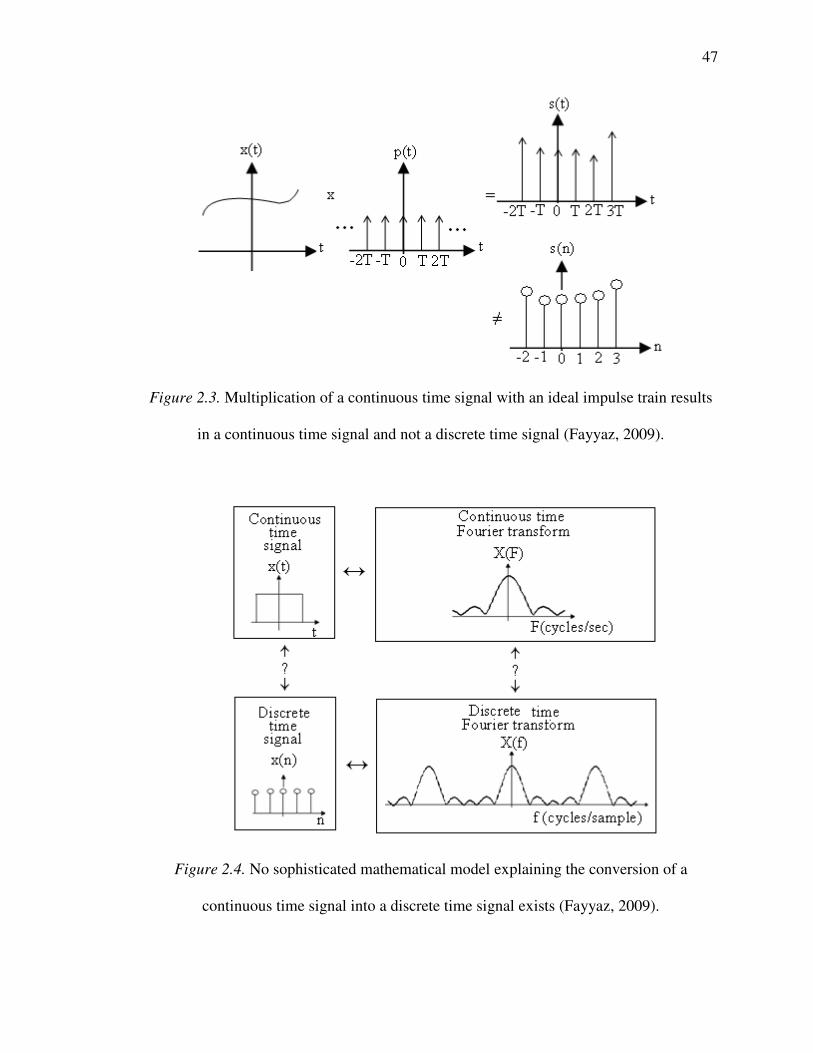
47
Figure 2.3. Multiplication of a continuous time signal with an ideal impulse train results
in a continuous time signal and not a discrete time signal (Fayyaz, 2009).
Figure 2.4. No sophisticated mathematical model explaining the conversion of a
continuous time signal into a discrete time signal exists (Fayyaz, 2009).
48
2.4.1.1.2 Frequency of Discrete Time Signals
The conceptual understanding of the frequency of discrete time signals including
the finiteness (modulo 2π) and periodicity of the frequency was another challenge found
in learning discrete time signal analysis. This learning hurdle might emerge from the
following:
i. The concept of a discrete time signal is introduced in Digital signal processing course
by simply multiplying a continuous time signal with an impulse train. At this point,
without a conceptual explanation, the quality of the frequencies of the resulting
spectrum is changed from cycles per second to cycles per sample. This frequency
(sometimes called as discrete frequency), f (units: cycles/sample) of the discrete time
signals is explained in textbooks simply as the scaled version of the frequency, F
(cycles/sec) of the continuous time signals (f = F/FS, where FS is the sampling
frequency in samples/sec). None of the description and mathematical equations in
textbooks helps to explain how the frequency of a discrete time signal becomes finite
(modulo 2π). This creates confusion in connecting the concepts of finiteness and
periodicity to the frequency of discrete time signals.
ii. A periodic signal is generally understood as a signal that repeats itself for all values
of its domain. Therefore, the concept of periodicity yet finiteness of the frequency of
discrete time signals create confusion in conceptually understanding the frequency of
discrete time signals.
iii. The units of frequency of a discrete time signal is cycles/sample, which in general is
written as Hz. This is the same as the generally used unit of continuous frequency,
cycles/sec. This use of the same units for two different frequencies is confusing to

49
understand the difference between the frequency spectra of discrete-time vs.
continuous-time signals.
iv. The discrete frequency, in case of discrete time Fourier transform, is a continuous
function of frequency. This mix-up of a discrete entity being continuous in domain
inhibits the clear understanding of discrete frequency.
2.4.1.1.3 Units of Fourier Series and Fourier Transform
A clear understanding of the units of Fourier series and Fourier transform are
important for conceptual understanding of different types of Fourier analysis, but are
often not foregrounded in teaching material and classroom practices. One consequence of
the lack of attention is the recognition of the difference between the quality of Fourier
series and Fourier transform as stated in textbooks as a periodic signal can also have a
Fourier transform, which is just a scaled version of its Fourier series. Whereas, in fact,
Fourier transform is a function that is continuous within the frequency domain and
Fourier series is a discrete within the frequency domain and representing a signal through
Fourier transform instead of Fourier series is representing a signal that is continuous
within its domain instead of discrete (Figure 2.5). The conceptual understanding of the
existence of a difference in the nature of the spectrum demands the discussion of the
difference in the units of Fourier series (e.g., Volts) and Fourier transform (e.g.,
Volts/Hz) as seen in Figure 2.5.
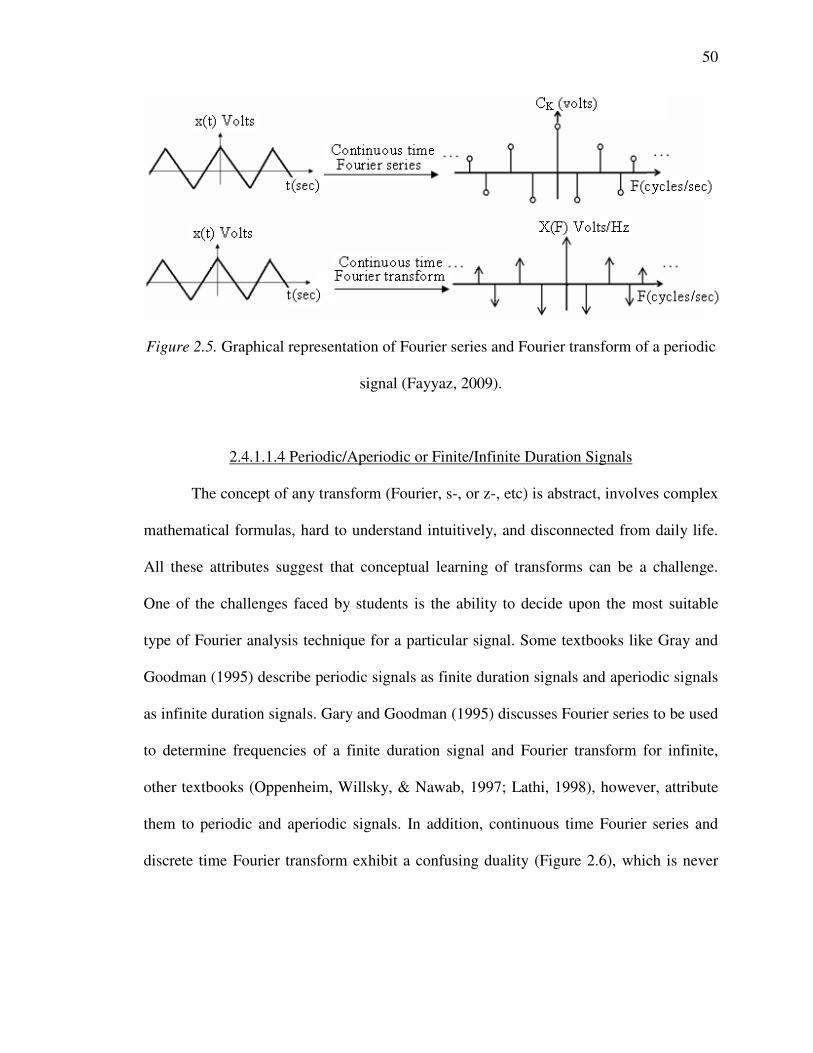
50
Figure 2.5. Graphical representation of Fourier series and Fourier transform of a periodic
signal (Fayyaz, 2009).
2.4.1.1.4 Periodic/Aperiodic or Finite/Infinite Duration Signals
The concept of any transform (Fourier, s-, or z-, etc) is abstract, involves complex
mathematical formulas, hard to understand intuitively, and disconnected from daily life.
All these attributes suggest that conceptual learning of transforms can be a challenge.
One of the challenges faced by students is the ability to decide upon the most suitable
type of Fourier analysis technique for a particular signal. Some textbooks like Gray and
Goodman (1995) describe periodic signals as finite duration signals and aperiodic signals
as infinite duration signals. Gary and Goodman (1995) discusses Fourier series to be used
to determine frequencies of a finite duration signal and Fourier transform for infinite,
other textbooks (Oppenheim, Willsky, & Nawab, 1997; Lathi, 1998), however, attribute
them to periodic and aperiodic signals. In addition, continuous time Fourier series and
discrete time Fourier transform exhibit a confusing duality (Figure 2.6), which is never
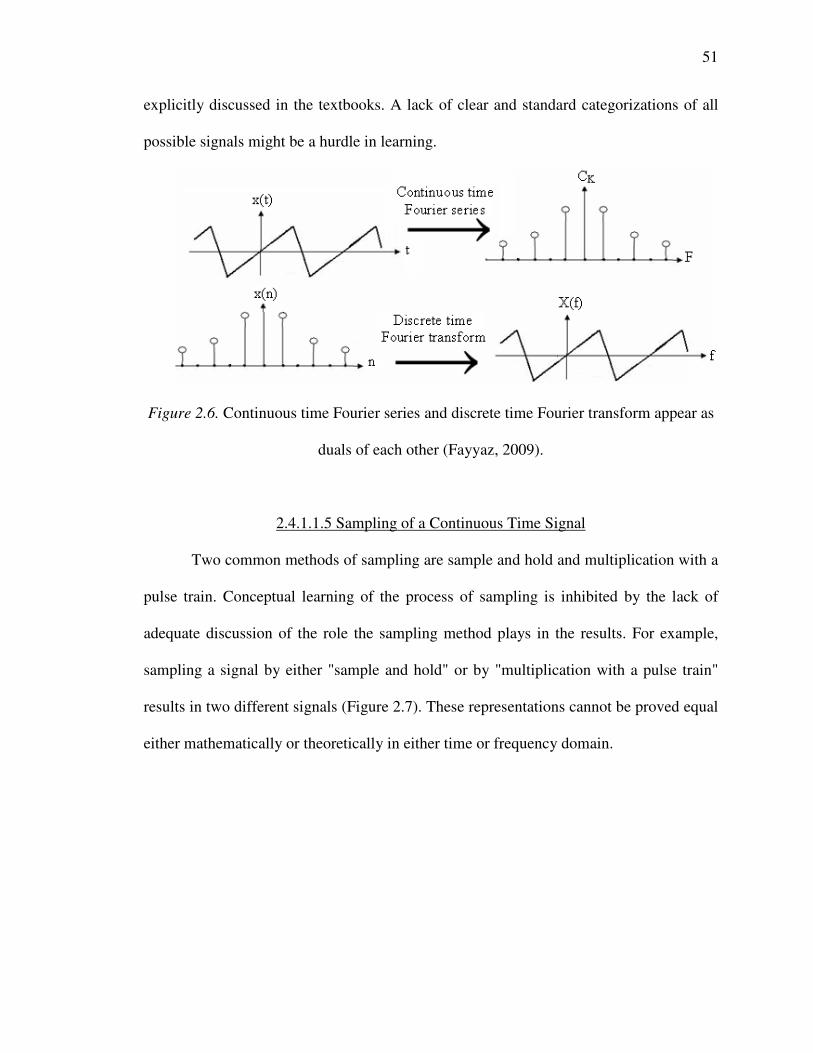
51
explicitly discussed in the textbooks. A lack of clear and standard categorizations of all
possible signals might be a hurdle in learning.
Figure 2.6. Continuous time Fourier series and discrete time Fourier transform appear as
duals of each other (Fayyaz, 2009).
2.4.1.1.5 Sampling of a Continuous Time Signal
Two common methods of sampling are sample and hold and multiplication with a
pulse train. Conceptual learning of the process of sampling is inhibited by the lack of
adequate discussion of the role the sampling method plays in the results. For example,
sampling a signal by either "sample and hold" or by "multiplication with a pulse train"
results in two different signals (Figure 2.7). These representations cannot be proved equal
either mathematically or theoretically in either time or frequency domain.
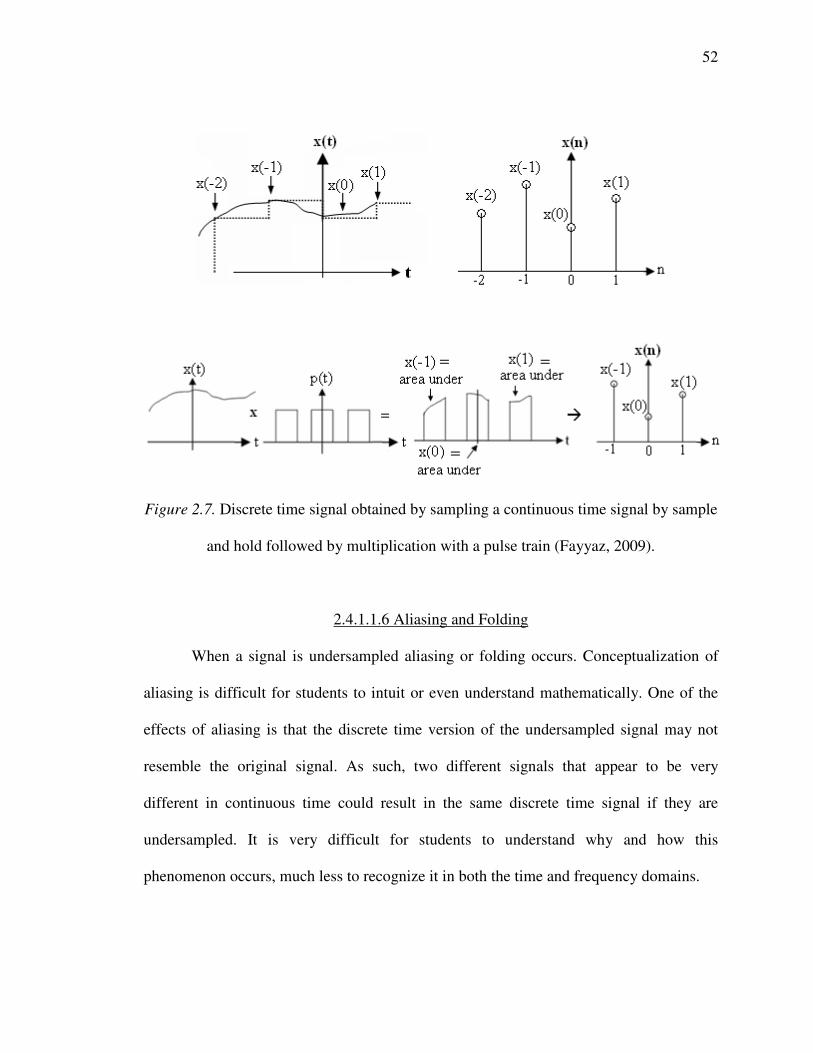
52
Figure 2.7. Discrete time signal obtained by sampling a continuous time signal by sample
and hold followed by multiplication with a pulse train (Fayyaz, 2009).
2.4.1.1.6 Aliasing and Folding
When a signal is undersampled aliasing or folding occurs. Conceptualization of
aliasing is difficult for students to intuit or even understand mathematically. One of the
effects of aliasing is that the discrete time version of the undersampled signal may not
resemble the original signal. As such, two different signals that appear to be very
different in continuous time could result in the same discrete time signal if they are
undersampled. It is very difficult for students to understand why and how this
phenomenon occurs, much less to recognize it in both the time and frequency domains.
53
The concept of folding is another difficult concept for students. Students struggle
because it involves understanding two difficult phenomena, phase inversion and aliasing,
simultaneously. The concept of folding is easier to understand in the context of rotating
objects like fans when the concept of phase can be related to the direction of rotation, but
is harder to intuit in the context of angle of sinusoidal signals in the time domain.
2.4.1.1.7 Abstract Mathematical Concepts
While learning signal analysis, students continuously struggle with the intuitive as
well as mathematical or scientific understanding of abstract mathematical concepts like s-
, and z-domains, complex numbers, infinity, Dirac delta function, Kronecker delta
function, complex exponentials, and Euler's identity. A few examples are:
i. A clear understanding of the difference between Dirac delta function and
Kronecker delta function and more importantly, to decide which delta function
should be used in a particular situation remains a difficult concept. The fact that
these two deceptively similar looking delta functions also have deceptively
similar looking transforms (Figure 2.8) further misleads students to treat both
delta functions as discrete signals. The lack of a clear presentation of continuous
and discrete domain signals as well as continuous and discrete frequency as
already discussed above further manifests misconceptions in this situation.
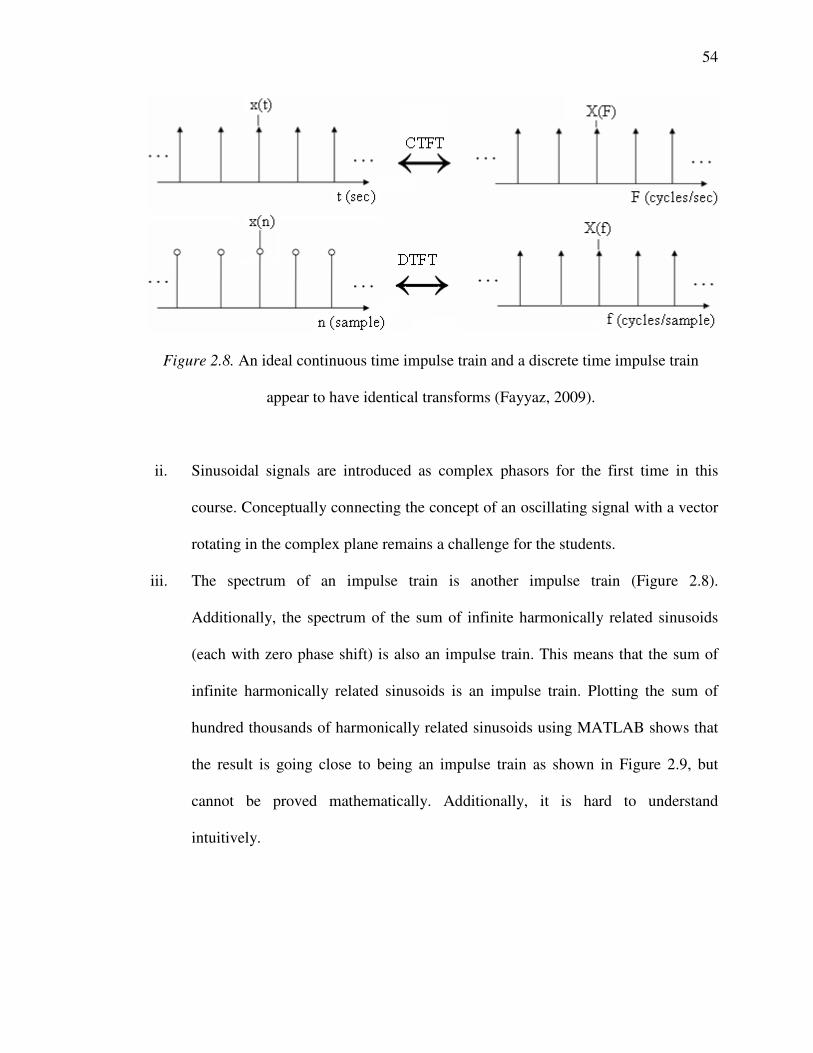
54
Figure 2.8. An ideal continuous time impulse train and a discrete time impulse train
appear to have identical transforms (Fayyaz, 2009).
ii. Sinusoidal signals are introduced as complex phasors for the first time in this
course. Conceptually connecting the concept of an oscillating signal with a vector
rotating in the complex plane remains a challenge for the students.
iii. The spectrum of an impulse train is another impulse train (Figure 2.8).
Additionally, the spectrum of the sum of infinite harmonically related sinusoids
(each with zero phase shift) is also an impulse train. This means that the sum of
infinite harmonically related sinusoids is an impulse train. Plotting the sum of
hundred thousands of harmonically related sinusoids using MATLAB shows that
the result is going close to being an impulse train as shown in Figure 2.9, but
cannot be proved mathematically. Additionally, it is hard to understand
intuitively.
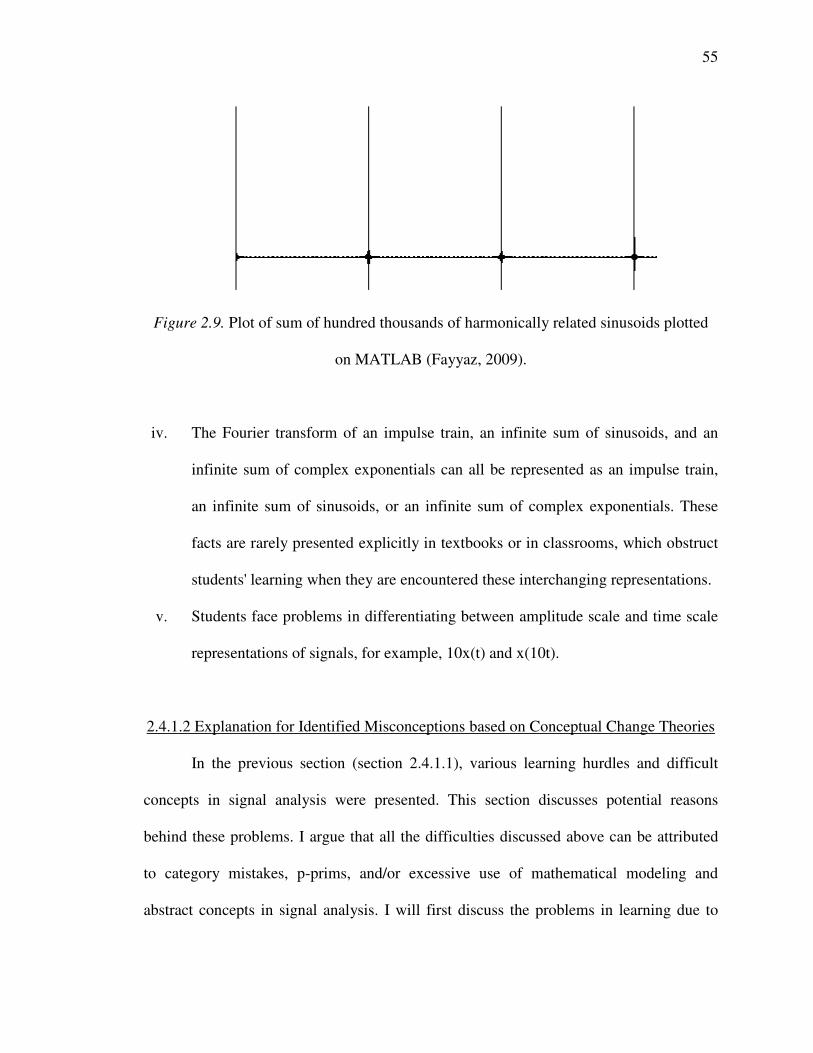
55
Figure 2.9. Plot of sum of hundred thousands of harmonically related sinusoids plotted
on MATLAB (Fayyaz, 2009).
iv. The Fourier transform of an impulse train, an infinite sum of sinusoids, and an
infinite sum of complex exponentials can all be represented as an impulse train,
an infinite sum of sinusoids, or an infinite sum of complex exponentials. These
facts are rarely presented explicitly in textbooks or in classrooms, which obstruct
students' learning when they are encountered these interchanging representations.
v. Students face problems in differentiating between amplitude scale and time scale
representations of signals, for example, 10x(t) and x(10t).
2.4.1.2 Explanation for Identified Misconceptions based on Conceptual Change Theories
In the previous section (section 2.4.1.1), various learning hurdles and difficult
concepts in signal analysis were presented. This section discusses potential reasons
behind these problems. I argue that all the difficulties discussed above can be attributed
to category mistakes, p-prims, and/or excessive use of mathematical modeling and
abstract concepts in signal analysis. I will first discuss the problems in learning due to
56
category mistakes, then I will discuss problems in learning due to certain p-prims, and in
the end of this section, I will discuss some learning hurdles due to excessive use of
mathematical modeling and abstract concepts.
2.4.1.2.1 Category Mistakes
Some learning hurdles in signal analysis might be due to the obscure
characterization of various ontological categories, like discrete and continuous domain,
discrete and continuous frequency, taxonomy of signals, and real and complex signals.
The description of these ontological categories and the misconceptions ascribed to them
follows.
A continuous within its domain function and a discrete within its domain function
are two mutually exclusive categories. However, the misrepresentation of concepts of
signals within each domain (section 2.4.1.1.1) misleads students to confuse
characteristics of continuous within their domain signals with discrete within their
domain signals. This confusion is a category mistake. Explicit definition and
categorization of the two types of signals might help to overcome many learning hurdles
in signal analysis. For example, if students are clear about all the characteristics of the
signals that are continuous within their domain and signals that are discrete within their
domain, understanding the difference between Kronecker delta function and Dirac delta
function will be a matter of mostly knowing their category membership.
Moreover, clearly categorizing the types of signals that are continuous within
their domain and signals that are discrete within their domain might help students to
57
overcome the hurdle of deciding about the appropriate Fourier analysis technique for a
particular signal (section 2.4.1.1.4).
Additionally, the frequency of a continuous time signal and the frequency of a
discrete time signal are two separate categories despite their seemingly similar
characteristics (section 2.4.1.1.2). The clear distinction of the concepts and units within
these two categories might help students to understand the different frequencies better.
Furthermore, the proper understanding of the domain and the range of the frequency of
continuous- and discrete-domain signals might help to rectify the common confusion that
frequency of a discrete signal implies frequency, which is discrete within its domain
(section 2.4.1.1.4). Additionally, the clear understanding of continuous- and discrete-
domain signals and their classifications discussed earlier might support better
understanding of the two frequencies.
Explicitly discussing the category membership of real and complex functions in
this course might decrease confusion in understanding various functions. For example,
sinusoidal signals are expressed as complex phasors in this course (section 2.4.1.1.7),
which misleads students to consider sinusoidal signals as complex functions.
2.4.1.2.2 P-Prims
In addition to category mistakes, some of the learning hurdles in signal analysis
could be due to the influence of naive knowledge structure, i.e., phenomenological
primitives, of a student. A step towards improvement of students' understanding of signal
analysis is the identification of the misconceptions that might be explained with the
related p-prims and design instruction that can help to reveal and confront the appropriate
58
p-prims. Some of the misconceptions that might be ascribed to the p-prims are discussed
below.
Although the category mistake accounts for the tendency among students to treat
a discrete time signal as a continuous time signal as discussed earlier, this bias could also
be contributed from the p-prim concept of time in the minds of students. The p-prim that
time is a continuous entity in everyday life may hinder the ability of students to
understand various phenomena of discrete time signals, aliasing, and undersampling
(sections 2.4.1.1.1 and 2.4.1.1.6). The inclination of students to treat the discrete domain
as the continuous domain contradicts the framework theory claim that students tend to
adhere to the concept of discreteness and natural numbers (Vosniadou & Verschaffel,
2004). I argue that this is because, for a novice, it is easier to think of discreteness in the
context of counting and harder to think of discreteness in the context of time. This
contradiction clearly supports DiSessa's (1988, 2008) claim of knowledge-in-pieces. In
my opinion, the conceptual understanding of the discrete domain might improve if the
students are able to replace the p-prim of continuous time from everyday life and
confront the p-prim of counting in the context of time.
A few p-prims contribute to the hurdles in the conceptual understanding of the
discrete frequency. One is the electric current as an example of a periodic signal, and the
other is the concept of the unit Hz as cycles/sec. Before the introduction of the discrete
frequency in this course, finiteness was never attributed to periodic signals. The
definition of periodicity is not explicitly revised at this point either. Therefore, students
may tend to connect the concept of periodic signals with the never-stopping sinusoidal
electric signal they see in their daily lives. The activation of this p-prim in the context of
59
discrete frequency might create a misconception in understanding of discrete frequency
as a finite (modulo 2π) function (section 2.4.1.1.2). Additionally, although Hz is used as a
unit for both continuous and discrete frequencies (section 2.4.1.1.4); students may
associate the concept of Hz only with cycles per seconds. The p-prim that Hz is
cycles/sec only creates hindrance in associating Hz as cycles/sample.
As discussed earlier, the learning of the discrete domain signals might get easier if
students can confront their basic knowledge of natural numbers in the context of time. A
few similar instances exist in learning signal analysis where students fail to appeal to
their intuition (p-prim). Firstly, despite having prior understanding of the use of
logarithms, which is also a type of transform, to solve certain kind of mathematical
problems, students do not connect the concept of Fourier transform with logarithm.
Secondly, the concept of complex phasors (section 2.4.1.1.7) might be better understood
if students try not to connect it with the p-prim of counting, but rather connect it with the
intuition of possible differences in the length and orientation of sticks in any given plane
(Pickering, 2006).
2.4.1.2.3 Advanced Mathematical Thinking
Even if the students successfully understand different categories of signals (Figure
2.10), frequencies (Figure 2.11), domains of signals, and are able to acknowledge
relevant p-prims, there are still threats to their conceptual understanding of some
concepts in this course. These threats are due to the high cognitive demand of advanced
mathematical thinking (section 2.4.1.1.7) and various incomplete and misleading
instructional steps, mathematical models, and equations in several concepts in signal
60
analysis. These concepts include graphical representations of discrete and continuous
time and frequency axes (section 2.4.1.1.1), conversion of a sampled continuous time
signal into a discrete time signal (sections 2.4.1.1.2 and 2.4.1.1.5), sampling (sections
2.4.1.1.1 and 2.4.1.1.5), definition and units of frequencies of continuous time and
discrete time signals (sections 2.4.1.1.1, 2.4.1.1.2, and 2.4.1.1.3), relation between
Fourier series and Fourier transform of a periodic signal (section 2.4.1.1.3), and abstract
mathematical models (section 2.4.1.1.7). I argue that the incomplete mathematical
models and equations are a result of more-than-necessary use of mathematics to simplify
and explain otherwise complex processes in signal analysis. Bertrand Russell (1962)
summarizes this phenomenon well when he states that physics is not mathematical
because we know so much about the physical world, but because we know so little that
we can only discover its mathematical properties. Furthermore, Dreyfus (1991) contends
that mathematics is created through trial and error, partially correct and partially incorrect
statements, and intuitive formulations with loose terms and imprecision, but is only
taught in a polished form. This is why even when the students are able to perform
standardized procedures using defined formulas, they lack the skill to flexibly use their
knowledge of mathematics in unknown situations and even a slight change in the
structure of a problem and/or formula can completely block their mental processes
(Dreyfus, 1991). Based on this, I suggest that without addressing the gaps of knowledge
that originate because of the use of mathematics alone to explain complex scholarship of
'Continuous-Time Signals and Systems' related topics, conceptual understanding of the
subject is hard to achieve.
61
Additionally, in signal analysis, many concepts are abstract (section 2.4.1.1.7)
which might make heavy cognitive demand from students. One example is a Dirac delta
function. Even if students can characterize this function as a continuous function, its
infinite height may continuously poses problems in learning this course content. The
reason is that although abstract concepts are powerful in obtaining generalizations in
mathematical concepts, they do not have very specific independent properties of their
own. Abstract concepts are explained usually in context with their relationships with
other similar or different concepts. Hence, understanding concepts that use abstract
concepts in a certain context sometimes requires a mental ability to shift attention from
the independent properties of the abstract concept itself to the structure of the properties
and relationships of the abstract concept within the given context. Dreyfus (1991)
suggests that learning an abstract concept gets more difficult because of the fact that it is
difficult to make a visual image of an abstract concept in mind.
2.4.2 Difficult Questions in SSCI Post-Test
For the design of the questions for the protocol of this study, I analyzed
continuous-time SSCI scores of undergraduate electrical engineering students at Iris
University collected over ten years. The continuous-time SSCI v3.02 scores of 670
students and continuous-time SSCI v4.0 scores of 288 students were evaluated. It was
found that majority of the students consistently answered a few questions and concepts
incorrectly. The summary of the findings is shown in Table 2.1.
The table shows that the students face difficulty in understanding the concept that
multiplication in the time domain corresponds to convolution in the frequency domain.
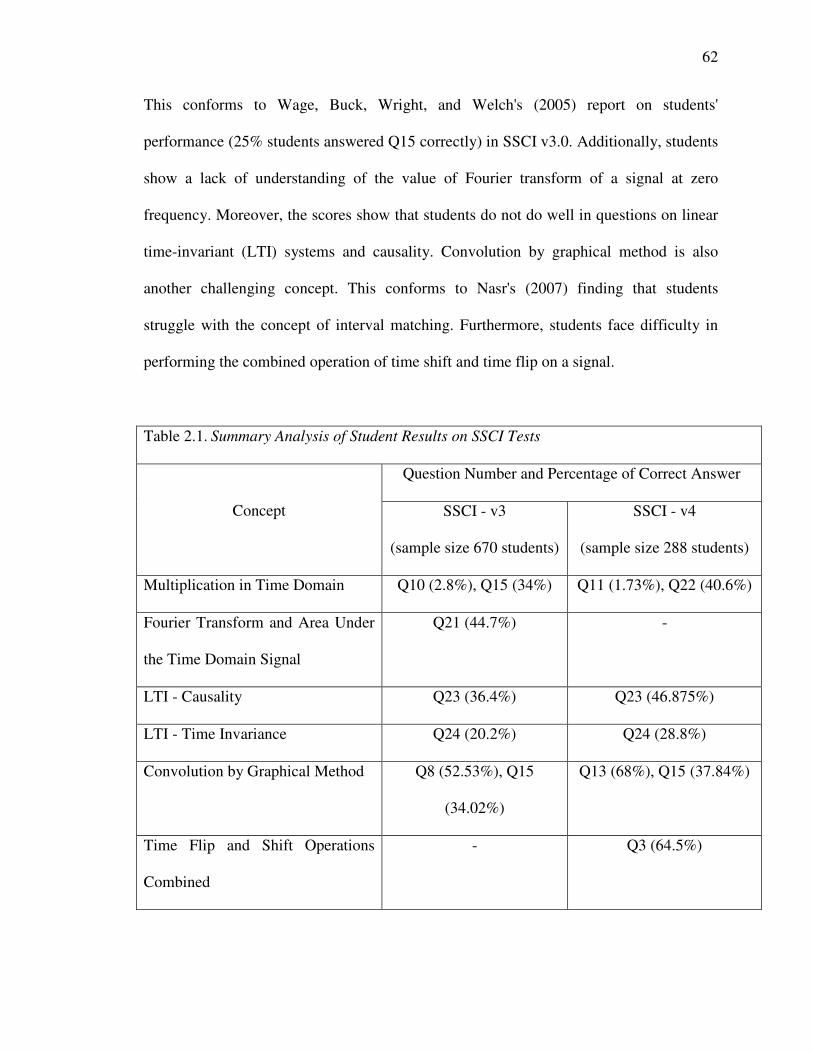
62
This conforms to Wage, Buck, Wright, and Welch's (2005) report on students'
performance (25% students answered Q15 correctly) in SSCI v3.0. Additionally, students
show a lack of understanding of the value of Fourier transform of a signal at zero
frequency. Moreover, the scores show that students do not do well in questions on linear
time-invariant (LTI) systems and causality. Convolution by graphical method is also
another challenging concept. This conforms to Nasr's (2007) finding that students
struggle with the concept of interval matching. Furthermore, students face difficulty in
performing the combined operation of time shift and time flip on a signal.
Table 2.1. Summary Analysis of Student Results on SSCI Tests
Concept
Question Number and Percentage of Correct Answer
SSCI - v3
(sample size 670 students)
SSCI - v4
(sample size 288 students)
Multiplication in Time Domain Q10 (2.8%), Q15 (34%) Q11 (1.73%), Q22 (40.6%)
Fourier Transform and Area Under
the Time Domain Signal
Q21 (44.7%) -
LTI - Causality Q23 (36.4%) Q23 (46.875%)
LTI - Time Invariance Q24 (20.2%) Q24 (28.8%)
Convolution by Graphical Method Q8 (52.53%), Q15
(34.02%)
Q13 (68%), Q15 (37.84%)
Time Flip and Shift Operations
Combined
- Q3 (64.5%)
63
2.4.3 Problems in Learning Signals and Systems Course Content across Borders
For my class project in Qualitative Research Methods course, I conducted a small
study on the identification of problems in learning Signals and Systems course content
across borders. For this study, I prepared questionnaires and sent them to a friend in
Pakistan who was teaching this course at that time. Three undergraduate electrical
engineering students in Pakistan wrote the answers to those questions and my friend
scanned and emailed them to me. I conducted semi-structured interviews with three
graduate students at a large research-intensive Midwestern university in the US where
engineering has a strong presence, using the same questionnaire. I transcribed the
interviews and compared the answers of all six students.
The results showed some similarities between the experiences of students across
borders in learning Signals and Systems course content. All the participants reported that
they were only able to learn the concepts superficially in this course. They attributed the
reason for lack of conceptual understanding to the disconnection of the concepts from
real life. Additionally, the participants revealed that even when they understood a certain
concept; they were unable to place it in a bigger picture. One example of such a concept
is convolution. They proposed that including more real life examples in this course might
have helped them understand the course better. Furthermore, the participants mentioned
that use of MATLAB was helpful in this course. The participants from both the countries
said that this course was taught to them more like a mathematical course than an
engineering course. Most of the participants from both the countries said that Fourier
analysis is the most difficult topic in Signals and Systems course content whereas
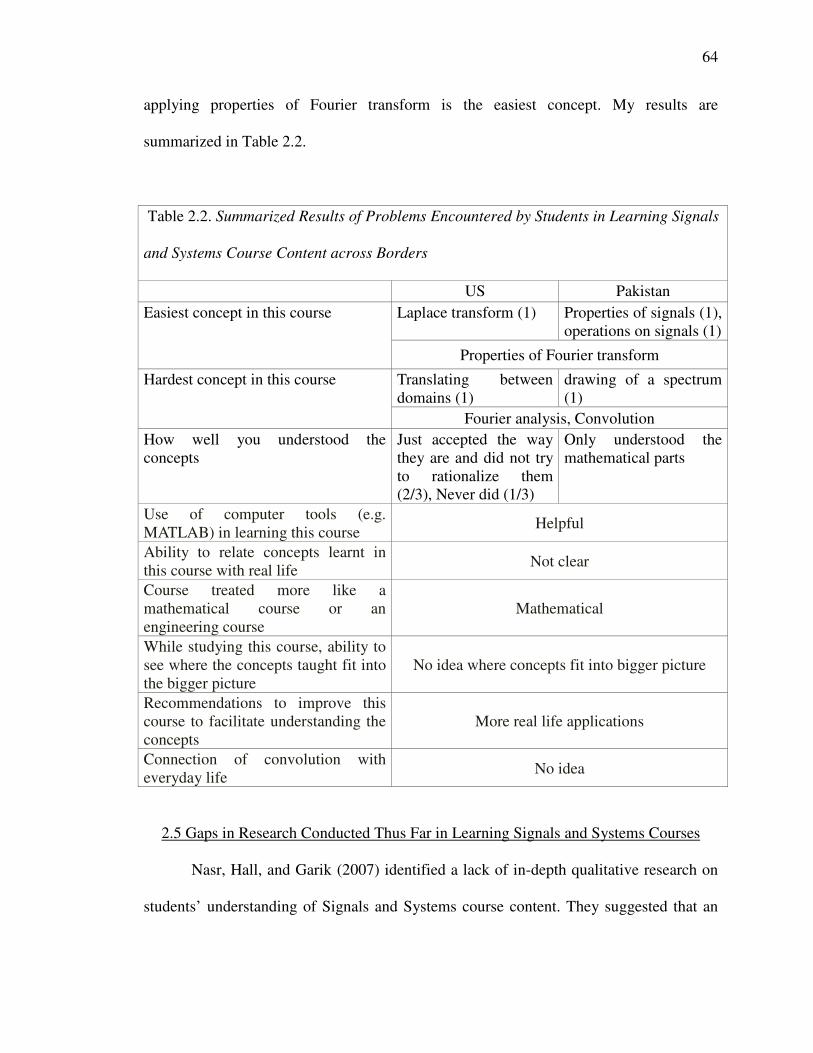
64
applying properties of Fourier transform is the easiest concept. My results are
summarized in Table 2.2.
Table 2.2. Summarized Results of Problems Encountered by Students in Learning Signals
and Systems Course Content across Borders
US Pakistan
Easiest concept in this course Laplace transform (1) Properties of signals (1), operations on signals (1)
Properties of Fourier transform
Hardest concept in this course Translating between domains (1)
drawing of a spectrum (1)
Fourier analysis, Convolution
How well you understood the concepts
Just accepted the way they are and did not try to rationalize them (2/3), Never did (1/3)
Only understood the mathematical parts
Use of computer tools (e.g. MATLAB) in learning this course
Helpful
Ability to relate concepts learnt in this course with real life
Not clear
Course treated more like a mathematical course or an engineering course
Mathematical
While studying this course, ability to see where the concepts taught fit into the bigger picture
No idea where concepts fit into bigger picture
Recommendations to improve this course to facilitate understanding the concepts
More real life applications
Connection of convolution with everyday life
No idea
2.5 Gaps in Research Conducted Thus Far in Learning Signals and Systems Courses
Nasr, Hall, and Garik (2007) identified a lack of in-depth qualitative research on
students’ understanding of Signals and Systems course content. They suggested that an
65
effective pedagogical strategy could not be designed for this course without identifying
the reasons behind students' faulty reasonings when they engage with Continuous Time
Signals and Systems course content. To get a better understanding of students' faulty
reasonings, they interviewed aerospace engineering students to identify faulty reasonings
in concepts related to LTI electric circuits. However, Signals and Systems courses for
electrical engineering students include additional important concepts, like, Fourier
analysis, Laplace transform, etc. There is still a lack of 1) qualitative studies on the
explanation for students' difficulties when they engage with the course content, 2)
evidence on how students actually attempt to learn these concepts, and 3) understanding
of cognitive resources that come into play when students access the course content for the
first time. Additionally, there is inadequate research on how students learn the abstract
concepts in this course.
Furthermore, there is a scarcity of research in learning of mathematical concepts
related to Signals and Systems course content. The gaps in literature in conceptually
learning concepts using extensive mathematical models and formulas include i) how
mathematical formulas and modeling play a role in learning various engineering
concepts, ii) whether learning theories explaining mathematical understanding also
explain understanding engineering concepts through mathematics, and iii) how students
engage with the abstract mathematical concepts like complex numbers.
This study investigates the above-mentioned gaps in the research in difficult
concepts encountered by students while learning Signals and Systems course content. The
findings of this study will facilitate the design of instructional strategies that help students
to overcome their difficulties in learning the course content.
66
CHAPTER 3 - RESEARCH METHOD
3.1 Introduction
Learning conceptual knowledge in engineering science is crucial for developing
competence and expertise in engineering (Streveler, Litzinger, Miller, & Steif, 2008).
Signals and Systems is a core course in the undergraduate electrical and computer
engineering curriculum (Wage & Buck, 2001; Nasr, Hall, & Garik, 2005). This course is
difficult to learn conceptually because a significant number of topics in this course are
abstract, are disconnected from a student's daily life, and make extensive use of the
mathematical modeling and formulas (Nasr, Hall, & Garik, 2005; Ferri et al., 2009; Han,
Zhang, & Qin, 2011; Tsakalis et al., 2011). The conceptual understanding of the content
of this course is important, as these concepts become foundational knowledge for many
other courses like communication, control systems, circuit design, image, and audio
processing (Oppenheim, Willsky, & Nawab, 1997).
Despite many efforts to improve the learning experiences of Continuous Time
Signals and Systems courses (Wage & Buck, 2001; Wage, Buck, & Wright, 2004;
Cavicchi, 2005; Ferri et al., 2009; Han, Zhang, & Qin, 2011), the abstract nature of the
concepts and their disconnection from daily lives have continued to pose difficulties in
conceptual learning (Nasr, Hall, & Garik, 2007). This necessitates qualitative studies on
how students engage with Continuous Time Signals and Systems course content (Nasr,
67
Hall, & Garik, 2007) and what mistakes students make while trying to solve a related
problem. The goal of this study is to fill the gap of qualitative research in understanding
how undergraduate electrical engineering students engage with Continuous Time Signals
and Systems course content by identifying their problematic reasonings. The research
methods and rationale used to collect, analyze, and interpret data for this qualitative study
is explained in this chapter.
3.2 Why Qualitative Research
Qualitative research is a method of inquiry that seeks to understand a social
phenomenon within the context of the participants' perspectives and experiences. A
qualitative study relies on the understanding of the views of the participants by typically
asking broad and general questions to the participants (as opposed to specific and narrow
questions in a quantitative study), and conducts inquiry in a subjective but unbiased
manner (as opposed to objective in a quantitative study) (Creswell, 2002). Although
literature may provide some information about the phenomenon of the study, a qualitative
study focuses to learn from the participants through exploration (Creswell, 2002).
The purpose of this study is to understand the problematic reasonings employed
by undergraduate electrical engineering students while learning and engaging with
Continuous Time Signals and Systems course content. A qualitative research is most
suitable for this study as the solution for the research problem requires both the
exploration (how students conceptualize course content, what are the problematic
reasonings employed by the students) as well as an understanding (because of its
complexity) of the process of conceptually learning Signals and Systems course content.
68
3.3 Data Collection
Clinical interviews were conducted using semi-structured protocols for data
collection for this study. Individual think-aloud interviews of the participants were audio-
recorded. The details of the process of the protocol development, the protocol itself,
process of conducting interviews, and various other choices made for this study are
described in this section.
3.3.1 The Design Process of the Interview Protocol
This section will explain the process of the design of the protocol. The details of
the protocol itself are presented in section 3.3.2. Eight questions were designed for this
study and were divided into two protocols with four questions in each. The questions in
the protocol were similar to textbooks or exam problems in typical Continuous Time
Signals and Systems courses and were carefully designed to ensure that only very basic
knowledge of Continuous Time Signals and Systems course content is required to answer
each question correctly and completely. The questions in the protocol were related to
signals and systems analysis in general, Fourier analysis, and convolution (details in
section 3.3.2). There were a few reasons to use two protocols:
1. To increase the variety of the questions and topics for a one-hour interview
A larger variety of questions and topics was preferred to increase the opportunity
to identify conceptual problems that pervade in multiple contexts.
2. To increase the perceptual cues given to any participant
In conceptual change interviews, asking a number of isomorphic problems that
share the same solution strategy and conceptual knowledge but present different
69
perceptual cues is recommended because such problems help to identify the degree to
which students' access of conceptual knowledge is based on specific surface features
of a problem (Streveler, Brown, Herman, & Montfort, 2014).
3. To ask different set of questions to the participants to reduce the possibility of a
response guided by the sequence and types of the questions asked
During conceptual change interviews, students often tend to solve a problem with
the methodology they used in solving the most recent problem. This tendency to solve
problems in a sequence with the same methodology can affect the revelation of true
conceptual knowledge of the participant. This can be helped if participants are asked
to solve a similar problem at a different time during the interview, because then they
use different strategies and reasoning to solve the problem (Herman, Loui,
Kaczmarczyk, & Zilles, 2012).
No rule was made about which participant will be interviewed under which
protocol. The participants were interviewed based on their preferred available time and
the two protocols were given to the participants alternately. Nineteen students
participated in this study. Ten participants were interviewed under one protocol
(Appendix C-Protocol B) and nine were interviewed under the other (Appendix C-
Protocol A).
70
The questions in the protocol were designed based on:
1. The importance of a particular concept for students to know. Important concepts in
the course were determined from consulting the literature (Chapter 2) and discussion
with content experts (Table 3.5).
2. The degree to which undergraduate electrical engineering students understand a
particular concept in Continuous-Time Signals and Systems course content. This was
determined through i) literature, ii) analysis of ten-year long data of the Signals and
Systems Concept Inventory scores of students at Iris University (section 2.4.2), and
iii) discussion with content experts (section 3.10)
3. The strength of a question to obtain students' problematic reasonings related to the
important concepts. The strength of each question was established through analysis of
data collected from pilot interviews (sections 3.3.1.1, 3.3.1.2, and 3.3.1.3). To obtain
rich verbal data, the questions in the protocol were carefully checked (through pilot
interviews) to be neither too easy nor too difficult for students. Too difficult or too
easy questions have the potential to hinder the ability of a student to talk through the
process of problem solving as they can get stuck at difficult questions and may
answer too easy questions too quickly without putting a lot of thinking in the
problem-solving process (Sherin, 2001b).
Before the finalization of the protocol for the actual study, it was piloted, revised,
and updated three times to ensure congruence between the research questions and each
component of the proposed methodology. This was achieved by carefully analyzing
multiple aspects of i) the interview settings (for example, resources that should be made
available to the participants during the interview, time taken to answer each question,
71
etc.), and ii) the quality of the data collected (for example, richness of verbal data
collected for each question, clarity with which the participants understood each question,
data provided to the participant for each question, etc.). The data collected from each
pilot study was analyzed and the protocol was revised before the next pilot study.
Existing literature, as well as experts in research in conceptual understanding in
engineering education and/or 'Continuous-Time Signals and Systems' courses (section
3.10), were consulted at each developmental stage of the protocol to validate the changes
made in the protocol. The details of each pilot study are presented next.
3.3.1.1 First Pilot Study
In the first stage of the pilot interviews, each protocol (Appendix A) was designed
to last ninety minutes. During the interview, to ensure that the participants' responses
were not affected by the concepts or formulas they could not recall, they were allowed to
use textbooks or any resource (internet, etc.) with course related information. To
accomplish this, I took with me a couple of standard textbooks and my laptop for the use
of the participants during the interviews. Making these resources available was aligned
with the goal of the study, which is to identify students' reasonings when they engage
with the course content. Additionally, the participants were given questions on papers as
worksheets and they worked on the solution on those worksheets with pen or pencil.
These worksheets were collected back from the participants at the end of the interview
and were later used together with interview transcripts for data analysis purposes. Six
electrical engineering students from two large engineering schools voluntarily
participated in the first pilot study. Of the six participants, two were graduate students

72
and four were undergraduate students. The interviews were audio recorded and later
transcribed verbatim. The data collected from the first stage of the pilot interviews was
thoroughly analyzed to ensure that the questions in the protocol are well designed and
aligned with the aim of the study. The protocol was revised (some questions were omitted
and some were edited) after the analysis of the data obtained from the first stage of the
pilot interviews. A few observations made after the first stage of the pilot interviews
include:
i. The designed protocols were lengthy and each interview session took longer than
ninety minutes. Additionally, it was observed that ninety minutes were too long to
keep the participant interested and focused.
ii. The responses of the participants did not differ much before or after consultation
from the textbooks or internet. Additionally, the time taken to respond to each
question was drastically increased when participants used textbooks or any related
material.
iii. Some questions were answered correctly by most of the participants so those
questions were deemed ineffective for the purpose of the identification of
problematic reasonings that lead to incorrect responses.
iv. It was a big challenge to make the participants think aloud. Thinking aloud is not
a natural way of thinking for all and it was not natural for any of the participants.
They either remained in the silent mode during the interview, forgetting that they
were supposed to think aloud, or kept requesting to think quietly so they could
think with concentration and report their thoughts later. Another challenge, in my
opinion, ties to some of the learning difficulties already identified in learning
73
mathematics related topics. Students generally access mathematics related content
in a procedural manner rather than conceptual and they find it difficult to reflect
on a procedure already well learned (now a habit).
v. In some instances, the participants used phrases like "this equation" or "that
graph" and it was observed during data analysis later that audio data did not
capture what the participants were referring to.
3.3.1.2 Second Pilot Study
Based on my experiences in the first pilot study, some changes (discussed
throughout in this section) were made in the protocol (Appendix B), as well as in the
interview settings for the second pilot study. These changes are described in this section.
For the design of the protocol, the questions that were deemed ineffective (either
too easy or too hard) to gather knowledge of the participants' conceptual understanding in
the first stage of the pilot interviews were omitted from the protocol. Moreover, the
wordings of each question were adjusted according to the clarity that the participants
demanded to answer each question in the first pilot.
For the second pilot study, the length of the interview was decreased to one hour
to ensure active involvement of the participants throughout the interview. Additionally, I
decided to not provide textbooks or internet access during the interviews after noticing in
the first pilot study that the participants were i) taking too long to consult textbooks or
internet during the interview, ii) not thinking aloud during the consultation, and iii) not
responding very differently before or after consulting textbooks. However, a Fourier
transform table and related formulas were still given to the participants so they can
74
quickly access or recall the most commonly used Fourier transform pairs or formulas
during the interview. The questions in the protocol were also verified to make sure that
the response of each question only required basic conceptual knowledge of Continuous-
Time Signals and Systems course content and not stipulate any memorization from the
textbook. Additionally, although the protocol questions were designed in a way that they
did not need any computation, calculator was given to the participants to save the time on
calculating if they wanted to calculate anything.
In addition, the participants in the second stage of the pilot study were given
questions on Microsoft Surface Pro instead of pages given to the participants in the first
stage of the pilot interviews. The participants were asked to work on the tablet and click
on the screen every time they had to talk about a particular graph or equation. The screen
of the tablet was recorded using Camtasia Studio in addition to audio recording of the
interviews to record richer details from the interviews.
In the second stage, the pilot interviews were conducted at Iris University (study
site discussed in detail in section 3.4) to make sure that within the target population the
designed protocol is well aligned with the aim of the study. Four undergraduate electrical
engineering students participated in this pilot study. One major difficulty that continued
to exist even in the second pilot study was to make the participants think out loud and
provide rich verbal data.
3.3.1.3 Third Pilot Study
The challenge that continued in the second pilot study was that the participants
were still not very comfortable with verbalizing their thoughts. Therefore, the questions
75
in the interview protocol were further rephrased and revised for the third pilot study.
These revisions were made based on the occurrences identified during the analysis of the
data collected from the second pilot stage where the i) participants asked for further
clarification or showed confusion, or ii) the researcher had to prompt the participants to
provide additional details on their responses.
In the third stage, the protocol was piloted in an interview with one graduate
student at a large Midwestern engineering school. A Fourier transform table, a formula
sheet, and a calculator were provided to the participants as prior interviews proved this
useful to the participants. This time the participant was not given the tablet and it was
observed that when working with papers and pens the participant was more comfortable
in verbalizing their thoughts. This observation prompted me to assume that one of the
reasons for the lack of the verbal data collected from the second stage of the pilot
interviews was limited writing space on the tablet's screen, which might have affected
participants' comfort level of verbalizing their thoughts. Therefore, to capture detailed
data in the actual study, I decided to video record the surface of the top of the desk where
the participants worked instead of using the tablets to record the work surface. The need
to use video data did not arise during analysis of the transcripts of the audio data
collected for the actual study. Therefore, the video data recorded for the actual study was
not used for the data analysis purposes.
3.3.2 Interview Protocol
Eight questions were designed for this study and were divided into two protocols
with four questions in each (Appendix C). This section discusses the concepts covered in
76
each question and objective behind the design of each question designed for this study.
Table 3.1 summarizes the concepts covered in each question.
The first question was mainly centered on the concept of convolution. The
participants were asked to i) perform the convolution of the two signals in the time
domain, ii) perform the convolution of the two signals in the frequency domain, iii) find
the relation between the result of convolution and the two given signals being convolved,
and iv) find the relation between Fourier transforms of convolution result and the two
given signals being convolved. The participants were given an option to use either graphs
or equations only to perform the convolution. The two signals given in this question were
an impulse train and a triangular function, which are very common signals in Continuous
Time Signals and Systems courses. These two signals were specifically chosen to trigger
instant recollection of the related concepts because of their high initial familiarity to the
participants. Additionally, an impulse train was chosen because calculations with an
impulse function do not take very long. This question was designed to i) understand how
students perform the process of convolution, ii) explore how students understand the
process of convolution for different domains, and iii) understand how students engage
with an impulse train in particular and an impulse function in general.
The second question was about the relationship between the integral of an
aperiodic signal and its corresponding periodic signal. This question was designed to
understand how students conceptualize the graphical representation of the integral of a
signal, and how students relate the properties (like area) of a periodic signal and its
corresponding aperiodic signal.
77
The third question was centered on the concept of Fourier analysis of a signal. For
this question, four different signals (an impulse function, a constant, a Fourier series, and
a rectangular function) were given to the participants and they were asked to provide an
explanation for the frequencies present in these four signals. The participants were
expected to have a high initial familiarity, and hence quick recollection of related
concepts and high confidence, with all four signals. Fourier transforms of these signals
were also available in the Fourier transform table provided to the participants during the
interview. Additionally, the participants were asked to explain the change in the
frequency of an aperiodic signal after making the signal periodic. An aperiodic and a
periodic rectangular function were given as examples for this question. The overall aim
of the third question was to understand how students conceptualize the mathematical
equations given in the Fourier transform table and obtained from the Fourier analysis
procedure in the context of the frequency components of a signal.
The fourth question was centered on the concept of linearity and time-invariance
of systems. Participants were asked to describe their understanding about time-invariance
and linearity of a system and use their knowledge to find time-invariance and linearity of
the two given systems. The information about one system was given in the form of the
mathematical equations and the information about the second system was given in the
form of the graphs. This question was designed to explore how students understand the
concepts of linearity and time-invariance of a system and apply their knowledge to
different systems and representations. Due to an oversight on my part, one part of this
question (Q4.b) had incomplete information. I gave the mathematical equation for the
impulse response of the system instead of input and output signals. Later during the
78
discussion with one of the content experts (section 3.10), we realized that this is
incomplete information to determine linearity and time-invariance of the system. The
analysis method specifically for this question is discussed in section 3.7 in detail.
The fifth question (Q1 in Protocol B, Appendix C) was centered on the concepts
of Fourier series and Fourier transform. In this question, the participants were given
signals in the form of mathematical equations. All the signals were represented as
sinusoids or exponentials or combination of sinusoids or exponentials. The purpose of
this question was to see how students understand frequencies of signals that are already in
the form of sinusoids or exponentials.
The sixth question (Q2 in Protocol B, Appendix C) was centered on the concepts
of time shift, time scale, and phase shift. Participants were given two signals expressed in
mathematical equations and they were asked to scale and shift those signals together in
time. Of the two signals, one was a phase shifted sinusoidal signal. The purpose of this
question was to understand students' i) reasonings behind performing the combined
operations of time shift and time scale on a signal and ii) perception of the difference
between phase shift and time shift of a signal.
The seventh question (Q3 in Protocol B, Appendix C) was centered on the
concept of Fourier transform and the conditions for the existence of Fourier transform. In
this question, students were given a signal that did not satisfy the sufficient conditions of
the existence of Fourier transform and some altered forms of the same signal that
satisfied the condition. The purpose of this question was to understand students'
reasonings as they find the Fourier transforms of the signals.
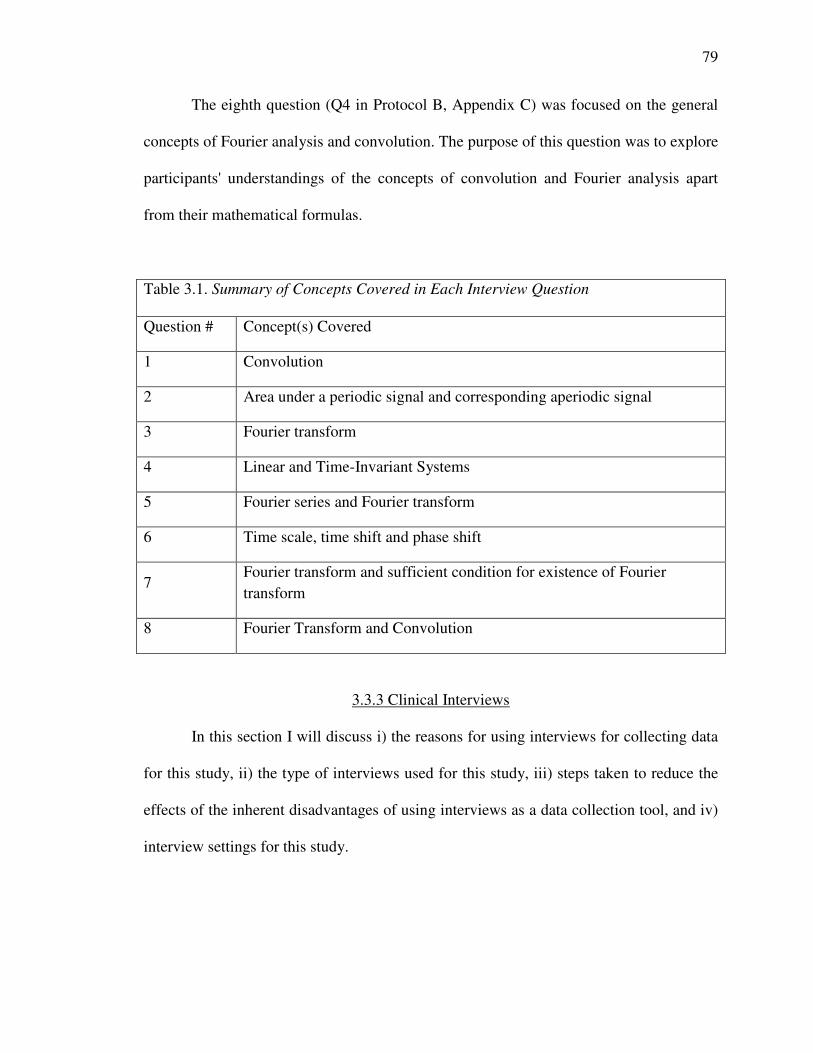
79
The eighth question (Q4 in Protocol B, Appendix C) was focused on the general
concepts of Fourier analysis and convolution. The purpose of this question was to explore
participants' understandings of the concepts of convolution and Fourier analysis apart
from their mathematical formulas.
Table 3.1. Summary of Concepts Covered in Each Interview Question
Question # Concept(s) Covered
1 Convolution
2 Area under a periodic signal and corresponding aperiodic signal
3 Fourier transform
4 Linear and Time-Invariant Systems
5 Fourier series and Fourier transform
6 Time scale, time shift and phase shift
7 Fourier transform and sufficient condition for existence of Fourier
transform
8 Fourier Transform and Convolution
3.3.3 Clinical Interviews
In this section I will discuss i) the reasons for using interviews for collecting data
for this study, ii) the type of interviews used for this study, iii) steps taken to reduce the
effects of the inherent disadvantages of using interviews as a data collection tool, and iv)
interview settings for this study.
80
3.3.3.1 Why Clinical Interviews
A few major categories of qualitative data collection are observations, interviews,
documents, and audiovisual materials. A qualitative interview is chosen when a
researcher wants to ask open-ended questions to the participants to get their voice on their
experiences unconstrained by any bias of the researcher or the existing literature.
Additionally, interviews give some flexibility to the researcher to control the type of
information received in the interview, which helps to collect the data that cannot be
directly observed (Creswell, 2002). Clinical interviews help to explore an individual's
unique mental processes and expose hidden structures in an individual's thinking
(Seidman, 1998). Throughout the history of conceptual change research, clinical
interviews are considered most consistent with the assumptions of cognitive
constructivism (Ginsburg, 1997) and are used extensively as the primary means of
accessing students' understandings (McDermott & Shaffer, 1992). The goal of this study
is to uncover the reasonings employed by students in their responses that lead to
difficulties in solving problems related to Continuous Time Signals and Systems courses
and clinical interviews are the most appropriate method to flexibly achieve this goal
(Nasr, 2007).
3.3.3.2 Type of Clinical Interview Chosen
One of the derivatives of the clinical interview method is verbal reporting. The
theoretical basis of this method lies in the cognitive model of information processing
(Ericsson & Simon, 1980). Verbal reporting method is classified into two main categories
based on the temporal relation of verbal reporting and cognition. These are concurrent
81
(think-aloud) and retrospective. Concurrent reports are the ones in which the participants
verbalize their thoughts while performing a task (Ericsson & Simon, 1980). Verbal
reporting while solving a task particularly facilitates researchers to investigate thinking
processes of the participants while solving mathematics related tasks that otherwise only
generate right and wrong answers (Ginsburg, Jacobs, & Lopez, 1998). Retrospective
reports are the ones in which the participants verbalize their thinking after completion of
the task (Ericsson & Simon, 1984). Some studies also discuss a third type of verbal
protocols called predictive reports. In predictive reports, the participants verbally talk
about their potential performance before performing the task (Ginsburg, Jacobs, & Lopez,
1998).
This study employed clinical interviews exploiting both concurrent and
retrospective verbal reporting techniques. At first, the participants were asked questions
related to the topics taught in Continuous-Time Signals and Systems courses and they
talked out aloud while concurrently trying to solve the given problems. Once the
participants had solved a particular problem, if needed, the interviewee asked them
questions in retrospect for any clarification or further understanding of their responses,
for example, among all possible ways to answer a particular question why the participant
chose the method he/she used to solve the given problem, etc.
3.3.3.3 Disadvantages of Clinical Interviews and Measures Taken to Minimize Them
Collecting data through interviews has disadvantages too. I took some measures
to take care of the disadvantages of the interviewing technique used. The disadvantages
and measures taken to minimize their effects include:
82
i. Disadvantage: The data collected by the interviews is a participant's perspective only
(Creswell, 2002).
To alleviate this problem, this study makes sure to capture data that represents the
conceptual difficulties among a broad population. This is achieved by using a
relatively larger sample size and piloting the protocol thrice. In the three pilot studies,
I thoroughly analyzed the data collected at the end of each study before the next to
ensure that the identified problems in learning are representative of a larger
population. Additionally, discussions with content experts (experts in conceptual
learning as well as experts in Continuous-Time Signals and Systems course content
described in section 3.10) were done at each stage for the validity of the protocol used
for this study.
ii. Disadvantage: Interviews only measure participants' conscious and stated knowledge
of their cognitive processes (Garner, 1987).
To alleviate the effect of this disadvantage, the data collected from the pilot
interviews for this study was carefully reviewed to identify the questions and
concepts where the participants' responses were not very clear or the participants were
unable to give a detailed response. The questions in the protocol and their language
were constantly revised and rephrased in the three pilot stages of the development of
the protocol so that the questions sound familiar to the participants and they
appropriately understand the intent of the question.
iii. Disadvantage: Interviews include the possibility of the influence of the presence of
the interviewer on the response of the participant (Orne, 1969; Adair, 1984; Ericsson
& Simon, 1984; Shaochun, Zendi, & Xuhui, 2007).
83
To make the participants comfortable with their responses during the interview, they
were told in the beginning of the interviews that they will not be judged based on any
right or wrong answer and the aim of the study is just to understand their thought
processes. In addition, the participants were ensured before the interview that any
faculty in their university will never know about how they responded during the
interview and their identities will be protected. Furthermore, no faculty member was
present at the time of the interview to ensure participants' comfort in the interview
settings.
iv. Disadvantage: Data collected by the interviews necessitates a very accurate
interpretation (Davison, Robins, & Johnson, 1983; Jaspers, 2009).
To ensure correct interpretation of the data collected for this study, the researcher's
interpretation was validated by multiple discussions with the content experts
(discussed in section 3.10) so that the researcher's bias is minimized and multiple
lenses are incorporated to look at the data.
v. Disadvantage: In the analysis of the data collected through interviews, the researcher
has to be very careful about correct interpretation of the silences in the data (Boren &
Ramey, 2000; Benbunan-Fich, 2001).
This study mainly looked at the reasonings used by the participants when they talked
through the process of solving the questions given to them during the interviews and
silences were not considered as data for this study.
vi. Disadvantage: Interview necessitates proper recording and careful transcription
(Creswell, 2002).
84
To ensure noise-free recording, the interviews were conducted in a quiet room on
campus. This also provided uninterrupted attention of the participants. Additionally,
this study used good quality audio and video recorders, and used the services of
professional transcribers for transcription of the audio data. The audio-recorded data
was transcribed verbatim for data analysis purposes. Furthermore, the work surface of
the participants' desk was video recorded to make sure that all the responses were
captured completely (video data, however, was not used for this study because the
need for additional information did not come up in the recorded audio data).
vii. Disadvantage: The abundance or dearth of language data collected from interviews
can be the greatest asset or liability of interviews as data collection methodology
(Pressley & Afflerbach, 1995).
Pilot studies for this study were specially focused to ensure that the interview
questions are phrased very clearly and prompted rich language data. Additionally, the
participants were provided with calculator, a Fourier transform table, and related
formulas so that the cognitive load on them is reduced and their responses are not
constricted by the need to have additional resources to answer a particular question.
3.3.3.4 Interview Settings
The interviews were conducted in a quiet office at Iris University (study site
described in section 3.4). Only the researcher and the participant were present in the
office at the time of interview. The main interview questions were the questions from the
pre-designed protocol (Appendix C); however, the discussions were kept flexible to
follow up on the response of the participant, if needed.
85
IRB approval was not initially sought for the first pilot study because publishing
the data was not the original intent to conduct the pilot study. I wanted to use those
interviews just as practice to hone my interviewing skills and improve the protocol for the
actual study. The participants were explicitly told about the initial intent of the
interviews. The interviews were successfully completed and useful data was collected
from the interviews. The richness of the data prompted a need to present the findings to
the engineering education community, so decision was made to apply for retroactive IRB
approval. For this purpose, I contacted the participants again and explained the situation
to them and asked if they were willing to sign the consent form (Appendix E) given IRB
approves the study. All six participants agreed and after that, I applied for the retroactive
IRB approval, which was approved (Appendix D). All the interviews for the pilot studies
later and the actual study were conducted after the IRB approval. (Appendix F). All the
participants of the subsequent pilot studies and the actual study signed an informed
consent form (Appendix G) before the start of the interview. The consent form had
details of: i) the purpose of the study, ii) the expectations from the participants; iii) the
expected length (in time) of one interview; iv) potential benefits of participation, v)
incentives to participate; vi) securing confidentiality of the participants' names and their
data; and vi) the rights of the participants to opt out of the study. Additionally, the
participants were offered the summary of the results when the study is completed. Two
participants showed interest and a summary will be sent to them once the results are
published. To encourage participation and to compensate the participants for their time
and support (Wolcott, 2002), each participant was given a $20 (as per IRB's
86
recommended amount) check request form redeemable from the Business Office of Iris
University.
3.3.3.5 Length (in time) of One Interview Session
The interview protocol for the actual study was designed to take no longer than
one hour. However, there is always a chance a discussion can take longer than the
allocated time. At the beginning of the interviews, participants were informed that if the
discussion went past the allocated time, it would be at their discretion to stay. A one-hour
long interview was considered reasonable to make sure that a participant does not get
bored or tired towards the end of the interview. This was decided based on my
observation from the ninety-minute pilot interviews that the keenness of the participants
reduced after an hour of participation. The time taken by the participants during pilot
interviews to answer each question was carefully monitored to design a protocol that was
expected to finish in an hour. The minimum time taken by any participant in the actual
study was 32 minutes and the maximum time taken by any participant was 1 hour 43
minutes. The median of time taken by all the nineteen participants of the actual study was
1 hour 9 minutes.
3.4 Study Site
For qualitative research, participants and sites are chosen to best achieve the
central phenomenon of the study. For this reason, standard practice is purposeful
sampling of the participants as well as the site (Creswell, 2002). This study was
conducted in a teaching-intensive Midwestern university, which, to preserve anonymity,
87
will be referred to as Iris University. Iris University has been among the list of top US
undergraduate engineering colleges for the many consecutive years now. In an annual
survey conducted by U.S. News and World Report for its 2013 college guidebook, Iris
University was highly rated by America's engineering deans and senior faculty members,
and was ranked on top for five engineering areas including electrical engineering. The
minimum requirement to apply for the admission in any program in Iris University is that
the applicants must be in the top 25% of their high school graduating class. Based on the
above-mentioned facts about Iris University, it was considered a very suitable site for this
study because it can be assumed that any random volunteer participant from this
university has a good academic background and their problems in learning Continuous
Time Signals and Systems course content are not influenced by their poor academic
backgrounds. This fact strengthens the practical implications of the results obtained from
this study, as the problematic reasonings identified in this study are representative of the
problematic thinking processes of high-achieving students.
3.5 Description of Continuous Time Signals and Systems Course Taught at Iris
University
At Iris University, Continuous Time Signals and Systems is a four credit-hour
course, taught in a 10-week quarter system, which includes three 50-minute lectures and
one 160-minute laboratory session per week. The topics covered in Continuous Time
Signals and Systems course at Iris University include continuous time signal modeling,
Fourier series and Fourier transforms, response of systems to periodic and aperiodic
continuous time signals, filter design, and sampling. The course typically ends with
88
sampling theory (course outline is presented in Appendix J). The lab content consists of
various hands-on application-oriented activities that provide students with personal
experiences with Continuous Time Signals and Systems course content. These include
simultaneously observing their ECG signal in the time domain and its spectrum in the
frequency domain. The pre-requisite courses for Continuous Time Signals and Systems
course at Iris University include one year of physics (three quarters with four 50-minute
lectures and one 3-hour lab per week for each quarter) and one year of Calculus (three
quarters with five 50-minute lectures per week for each quarter). This means that at Iris
University students get 6000 minutes of physics and 7500 minutes of calculus instruction
as a pre-requisite. In schools with the semester system, students typically take two
semesters (sixteen weeks with three lecture hours or 5760 minutes of instruction per
semester) each of calculus and physics (data provided by a faculty member at Iris
University). Additionally, two courses of differential equations and two courses of AC
and DC circuit analysis are pre-requisite courses for Continuous Time Signals and
Systems at Iris University. Students at Iris University typically take Continuous Time
Signals and Systems course in the Fall or Winter quarter of the third year of
undergraduate electrical engineering program while all math and physics courses are
typically completed by the Winter quarter of the second year.
3.6 Participants
This study focuses on the undergraduate electrical engineering students'
problematic reasonings when they engage with Continuous Time Signals and Systems
course content. The target population for this study was undergraduate electrical
89
engineering students who have already taken Continuous Time Signals and Systems
course. I intended to identify problematic reasonings that pervade the conceptions of
high-achievers, so I limited the target population to students who have passed the
Continuous Time Signals and Systems course. This course, at Iris University, is offered
to electrical engineering undergraduate students in the start of junior year, so the target
population of this study was undergraduate electrical engineering students who were
either in their junior year or higher. This section discusses the selection of sampling
method and the sample size for this study.
3.6.1 Sampling Strategy
Participants for this study were selected using stratified purposeful sampling
strategy. Stratified purposeful sampling lays out the characteristics of particular
subgroups of interest and facilitates comparisons between subgroups. Stratified sampling
can be used only when enough information about the sample population is known to
classify the samples. Stratified purposeful sampling extends credibility to a research
study (Patton, 2001).
From the target population, this study aimed to recruit two different groups of
students based on their academic statuses. One group, called the CTSS-only group,
comprised of students who have only taken one Continuous Time Signals and Systems
course and no subsequent courses. The second group, called the CTSS-plus group,
consisted of students who have also taken one or more courses that require prior
knowledge of Continuous Time Signals and Systems course content. The courses at Iris
University that require prior knowledge of Continuous-Time Signals and Systems course

90
content are Communication Systems, Linear Control Systems, Electromagnetic Waves,
and Discrete-Time Signals and Systems. This criterion of sample selection and division
of participants in groups of different academic levels was intended to identify the
difference in the problematic reasonings employed by students with different levels of
knowledge and exposure to applications of Continuous Time Signals and Systems course
content. Additionally, this criterion helps to identify robust problematic reasonings that
persist even when a student continues to apply these concepts in related courses and
applications (Montfort, Brown, & Pollock, 2009).
3.6.2 Sample Size
Qualitative research has no standard rules for sample size. Various factors like
research questions, purpose of the inquiry, credibility criteria, available time, and
resources collectively contribute to determine the appropriate sample size (Patton, 2001).
Even the sample size of one, if selected purposefully can be sufficient in some cases for
in-depth analysis (Patton, 2001; Creswell, 2002). Mason (2010) suggests that the "sample
size in the majority of qualitative studies should generally follow the concept of
saturation when the collection of new data does not shed any further light on the issue
under investigation" (p. 8). He examined 560 doctoral theses to determine the appropriate
sample size for qualitative interview-based research and reported a mean sample size of
31 interviews and standard deviation of 19 interviews. However, heterogeneity of the
population might require a larger sample size (Mason, 2010).
The participants of this study are undergraduate electrical engineering students
from the same university (homogeneous population). There was no gender preference for
91
the selection of the participants for this study for two reasons. First, Iris University is a
small school and restricting the participation based on the gender could have posed
difficulties in finding the desired number of participants. Secondly, the scope of this
study does not account for gender specific learning differences.
I decided to recruit twenty students for this study based on the i) general trends in
the sample size for similar qualitative studies, ii) number of questions I wanted to ask
each participant during the interview, and iii) length of one interview session. Nineteen
students volunteered to participate in the study. Therefore, the sample size of this study
became nineteen.
3.6.3 Recruitment Process
The participants were recruited to participate in this study through:
1. A "call for participation" email sent from secretary of the Department of Electrical
and Computer Engineering at Iris University to all the junior and senior students in
the Department of Electrical and Computer Engineering at Iris University (Appendix
H).
2. Class announcements made by the researcher in a few classes (digital systems,
discrete-time signals and systems, principles of design, and software defined radio).
These classes were chosen over other classes in which the enrolled students were
expected to have passed Continuous Time Signals and Systems course because these
classes were meeting on the day the researcher planned to make the announcements
(recruitment Script is in Appendix I).
92
3. Requesting electrical engineering faculty at Iris University to encourage students in
their classes to participate in this study
The students were told to directly contact the researcher for consent to participate.
The faculty at Iris University had no knowledge of the participants of this study.
3.6.4 Sample Profile
Of the nineteen students who participated in this study, eight (CTSS-only group)
had taken only one Continuous Time Signals and Systems course and no subsequent
courses, and eleven (CTSS-plus group) had taken one or more (up to four) such courses.
The subsequent courses taken and passed by the participants at the time of participation
are shown in Table 3.2. Pseudonyms are assigned to the participants to protect their
privacy.
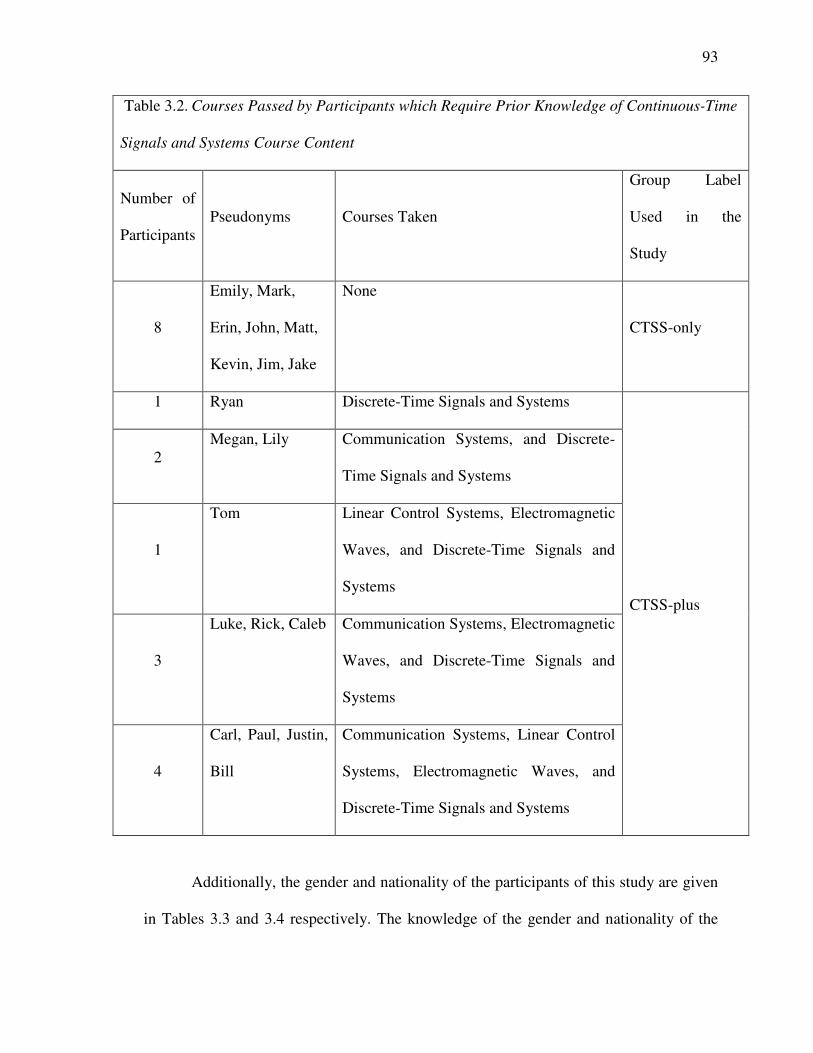
93
Table 3.2. Courses Passed by Participants which Require Prior Knowledge of Continuous-Time
Signals and Systems Course Content
Number of
Participants Pseudonyms Courses Taken
Group Label
Used in the
Study
8
Emily, Mark,
Erin, John, Matt,
Kevin, Jim, Jake
None
CTSS-only
1 Ryan Discrete-Time Signals and Systems
CTSS-plus
2 Megan, Lily Communication Systems, and Discrete-
Time Signals and Systems
1
Tom Linear Control Systems, Electromagnetic
Waves, and Discrete-Time Signals and
Systems
3
Luke, Rick, Caleb Communication Systems, Electromagnetic
Waves, and Discrete-Time Signals and
Systems
4
Carl, Paul, Justin,
Bill
Communication Systems, Linear Control
Systems, Electromagnetic Waves, and
Discrete-Time Signals and Systems
Additionally, the gender and nationality of the participants of this study are given
in Tables 3.3 and 3.4 respectively. The knowledge of the gender and nationality of the
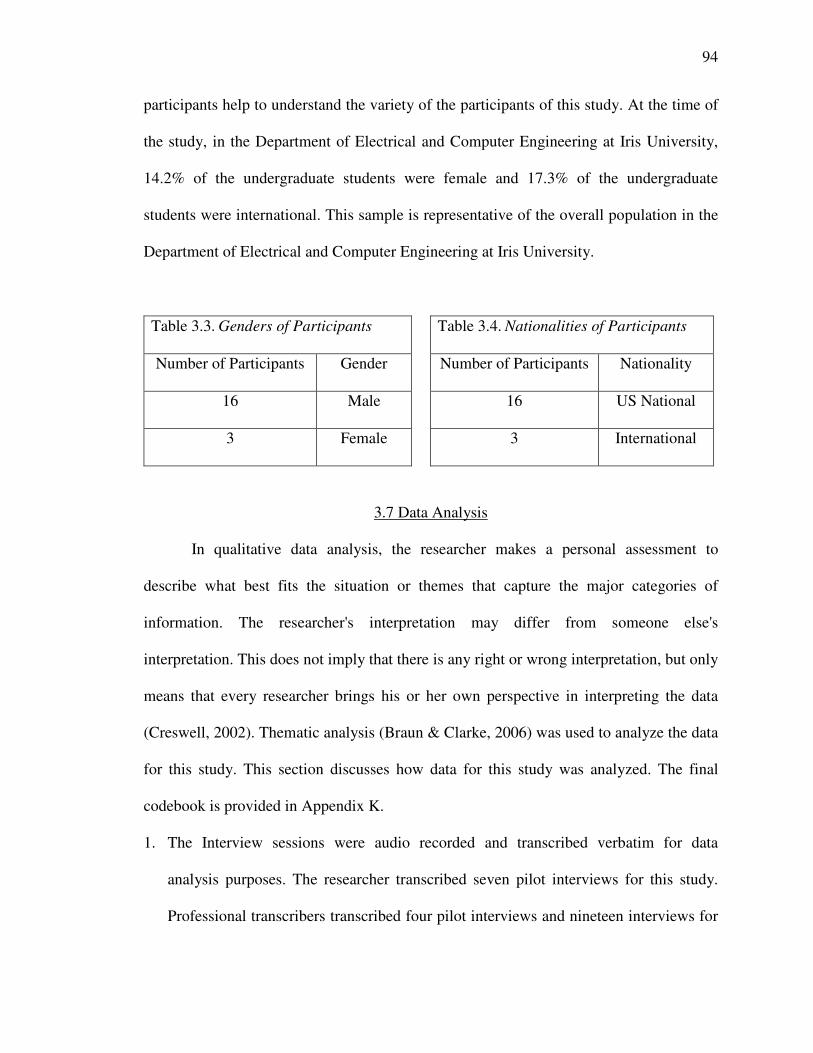
94
participants help to understand the variety of the participants of this study. At the time of
the study, in the Department of Electrical and Computer Engineering at Iris University,
14.2% of the undergraduate students were female and 17.3% of the undergraduate
students were international. This sample is representative of the overall population in the
Department of Electrical and Computer Engineering at Iris University.
Table 3.3. Genders of Participants
Number of Participants Gender
16 Male
3 Female
Table 3.4. Nationalities of Participants
Number of Participants Nationality
16 US National
3 International
3.7 Data Analysis
In qualitative data analysis, the researcher makes a personal assessment to
describe what best fits the situation or themes that capture the major categories of
information. The researcher's interpretation may differ from someone else's
interpretation. This does not imply that there is any right or wrong interpretation, but only
means that every researcher brings his or her own perspective in interpreting the data
(Creswell, 2002). Thematic analysis (Braun & Clarke, 2006) was used to analyze the data
for this study. This section discusses how data for this study was analyzed. The final
codebook is provided in Appendix K.
1. The Interview sessions were audio recorded and transcribed verbatim for data
analysis purposes. The researcher transcribed seven pilot interviews for this study.
Professional transcribers transcribed four pilot interviews and nineteen interviews for
95
the actual study. The transcripts were reviewed against the recorded audio to check
for accuracy. Moreover, the work surface of the participant's desk was video recorded
to ensure all responses are captured completely. However, the video data was not
analyzed for this study.
2. Before the start of the data analysis, solutions of the interview questions were made
by the researcher and double-checked by consultation with a faculty member at Iris
University who has been teaching Continuous Time Signals and Systems courses for
eight years. Most of the questions in the protocol could be solved by a variety of
approaches and the questions were phrased in a way that the participants had
flexibility to choose any approach (intuitive, mathematical equations, graphs, etc.) to
answer a particular question. The researcher and the faculty member also discussed
and agreed upon multiple possible approaches to solve each question.
3. The transcriptions were thoroughly read and all the problematic reasonings, mistakes,
and demonstrations of missing conceptual knowledge were separately collected in an
excel sheet. For this study,
a. A reasoning is defined as the participant's purposeful effort to generate
justifiable conclusions and make sense of the problem.
b. A problematic reasoning is defined as a reasoning that has the potential to
hinder conceptual understanding and cultivate misconceptions. For example,
participants' thought processes behind their choices for their actions, spoken
aloud by them, while incorrectly solving a mathematical equation.
c. A mistake is defined as the incorrect response of the participant without
enough evidence of the reasoning employed behind it. For example, a
96
participant's incorrect attempt to solve a mathematical equation without
explaining the thought processes behind the steps taken.
d. Missing conceptual knowledge is defined as the knowledge that was not
evident in the participants' responses and the use of which could have helped
the participant to successfully solve the problem at hand. This was identified
by the instances where the participants were asked to explain something and
they either just said that they didn't know (different from when they said they
did not know because they did not remember or could not recall), or they also
explained what they did not know, or they were stuck at some question and
kept brainstorming but could not figure out the certain type of knowledge that
could have helped them to get out of that stuck situation.
4. Keeping the context together with the problematic reasonings, mistakes, and
demonstrations of missing conceptual knowledge collected from the data helped in
multiple iterations of coding and recoding of the data (Braun & Clarke, 2006). It also
facilitated in understanding the variety of possible topic areas in Continuous Time
Signals and Systems course content where conceptual learning could be influenced by
one particular problematic reasoning (section 4.2), mistake (section 4.4.1), or missing
conceptual knowledge (section 4.4.2).
5. Since the focus of this study is to identify problematic reasonings, a response was not
considered as a problematic reasoning, a mistake, or the demonstration of some
missing conceptual knowledge if
a. The participants self-corrected themselves either in the same question or later
during the interview in any other question or context.
97
b. The participant did not answer a particular question at all for reasons such as
"I do not remember how we did this in the class," etc. because this study
focuses only on the problematic reasonings and not on measuring the retention
of Continuous Time Signals and Systems course content.
6. A response or statement was considered a problematic reasoning, a mistake, or the
demonstration of some missing conceptual knowledge if the participants made an
incorrect statement in the given context and never self-corrected themselves in the
same question or later during the interview in any other question or context. In
addition, one question in the protocol (Q4.2) had incomplete information due to
oversight on my behalf (details discussed in section 3.3.2). The response of the
participants for that question was analyzed based on whether the participants were
able to identify that some data was missing in the question or not.
7. Once all the problematic reasonings, mistakes, and occurrences of missing conceptual
knowledge from all the interviews were collected together, similar statements either
made by the same participant in different questions or made by different participants
were grouped together to understand them collectively. This grouping also helped to
identify if a particular problematic reasoning originated from one question (context)
or more. This information helped to identify prevalent problematic reasonings.
8. At this stage, different content experts (section 3.10) were consulted to establish the
difference between mistakes and problematic reasonings identified and to identify
common thinking patterns of the participants.
9. In the first round of coding, the incorrect statements were grouped under the name of
the topic associated with them. For example, an incorrect statement that originated in
98
a question related to Fourier series was categorized under Fourier analysis. I started
exploring thoughts of the participants associated with each incorrect statement in the
second stage and moved the incorrect statements around the thoughts or actions of the
participants behind each statements. For example, if a particular incorrect statement
was about wrong graphical translation of a signal, it was placed under the category of
graphical challenges. Subsequent cycles of coding were about further exploring the
thoughts and incorrect statements and narrowing down the focus to get the actual
problematic reasoning behind the undesired responses (codebook is given in
Appendix-K).
10. A problematic reasoning, mistake, or missing conceptual knowledge was attributed to
the participants' preference to use mathematical equations over other options if the
participant failed to answer the question correctly because of relying on just
mathematical formulas when clearly an additional (and at some instances only) use of
intuitive or graphical approach would have been helpful.
11. Discussions were made with content analysis experts in all stages from second stage
onwards to validate the understanding of participants' reasonings from the evidence
collected from the data.
3.8 Quality of the Research
Qualitative researchers use different terms to describe research quality like
accuracy, credibility (Creswell, 20012), authenticity, trustworthiness (Lincoln & Guba,
1985), etc., and use different strategies and terms to validate their choices and decisions,
like member checking, auditing (Creswell, 2002), etc. I will mainly use the Qualifying
99
Qualitative Research Quality (Q3) typology presented by Walther, Sochacka, and Kellam
(2013) for interpretive research in engineering education to explain how I established the
quality of this research. This typology includes theoretical, procedural, communicative,
pragmatic validation, and process reliability.
As per Q3 typology, validity of an engineering education research can be
described as the "agreement of the results of the measured quantity" (Sirohi & Krishna,
1983, p. 39), "extent to which the research findings appropriately reflect properties of the
social setting investigated" (Walther, Sochacka, & Kellam, 2013, p. 636), and "process
character of the framework" (Walther, Sochaka, & Kellam, 2013, p. 637). Additionally,
the reliability of an engineering education research can be described as "the repeatability
of a measuring process" (Sirohi & Krishna, 1983, p. 40), "an attempt to mitigate the
effect of random influences on the research process" (Walther, Sochaka, & Kellam, 2013,
p. 637), and "an accessible way of conceptualizing research quality without assuming the
positivist stance of the intellectual traditions from which these terms originated"
(Walther, Sochaka, & Kellam, 2013, p. 637).
Theoretical validation focuses on whether the "concepts and relationships of the
theory appropriately correspond to the social reality under investigation?" (Walther,
Sochaka, & Kellam, 2013, p. 640). For theoretical validation of this study, stratified
purposeful sampling strategy was used for participant selection. Additionally, the sample
for this study is chosen to best represent the research topic and to ensure effective and
efficient saturation of categories, with optimal quality data. Furthermore, methodological
coherence (Morse, Barrett, Mayan, Olson, & Spiers, 2002) was ensured in this study by
matching the research question with appropriate method of data collection (interviews),
100
and matching data collection method with the most appropriate data analysis method
(thematic analysis) for this study. Content experts were consulted to ensure
methodological coherence and sample appropriateness for this study.
Procedural validation focuses on "which features of the research design improve
the fit between reality and the theory generated?" (Walther, Sochaka, & Kellam, 2013, p.
640). For procedural validation of this study, content experts were consulted for protocol
development, and data analysis. Additionally, to reduce the risk of the misinterpretation
of the data, analysis was done in iterations. Content experts (to be discussed in section
3.10) were consulted at each iteration and the process is documented in the form of dated
copies of revised versions of the data analysis document. Additionally, the researcher
made sure to bracket her bias with piloting the process of developing the protocol and
conducting the interviews. Furthermore, researcher's biases were checked by continuous
discussion with content experts at each stage of protocol development, data collection,
and data analysis.
Communicative validation focuses on whether "the knowledge is socially
constructed within the relevant communication community?" (Walther, Sochaka, &
Kellam, 2013, p. 640). For communicative validation of this study, the method and
findings at different stages are presented in four different workshops (Simoni, Aburdene,
& Fayyaz, 2013b, 2013c, 2013d, 2014) over a period of one year. In these workshops, we
opened discussions on protocol development, methods of data collection and data
analysis for this study with the participants of the workshops. These workshop
presentations provided external auditing for this study. Furthermore, publications are
planned from the findings of this study to further open this work for discussion among
101
related communities. In addition, interactions with experts (section 3.10) at all stages of
the study contributed to communicative validation too.
Pragmatic validation focuses on whether "concepts and knowledge claims
withstand exposure to the reality investigated?" (Walther, Sochaka, & Kellam, 2013, p.
640). For pragmatic validation of this study, the protocol was piloted in three
developmental stages and with students in three different engineering universities.
Additionally, we intend to present our research results to a variety of communities
including educators, education researchers, engineering educators, and engineering
education researchers, and electrical engineering students. The extent to which our results
resonate with people in these different communities will validate pragmatic validity of
this study.
Process reliability focuses on "how can the research process be made as
independent as possible from random influences?" (Walther, Sochaka, & Kellam, 2013,
p. 640). For process reliability of this study, the protocol was piloted in three
developmental stages and with students in three different engineering universities to
ensure that the data obtained from the protocol is as independent of random factors as
possible. The data after each pilot stage was thoroughly analyzed to improve reliability of
the protocol, interviewing skills of the researcher, and the process of data analysis before
the subsequent stage. Content experts were consulted at each pilot stage. The pilot studies
and the actual study were IRB approved and adhered to the standard methods for data
collection, data coding, and data analysis.
102
3.9 Reducing Researcher's Biases
Qualitative researchers do not typically use the word "bias," as qualitative
research is interpretive. However, it is important for the researchers to reflect on their role
in the study based on their personal experiences, interests, and values that shape various
steps of the research study (Creswell, 2002). Following are my prior experiences with the
learning and teaching of this course, and the details of the steps taken throughout the
study to reduce the biased influences of the prior experiences on my decisions.
I have taught Signals and Systems courses numerous times in Pakistan and have a
fair understanding of the concepts covered in this course, which might pose a challenge
to appreciate, understand, and interpret the problems faced by the students when they
attempt to learn this course. Furthermore, before I started this study, based on my prior
teaching experience, I had some pre-notions about the common mistakes students make
when they access the course's content. For this reason, I remained very careful in
designing and conducting the interviews not to let any personal bias influence the design
of the interview protocol or discussions during the interviews. Moreover, I was careful to
hide my excitement or disappointment on receiving any expected responses during the
interviews. Additionally, while understanding participants' conceptual knowledge and
thinking processes, I stayed very mindful to detach my identity as a teacher of this course
and stay in the role of a qualitative researcher.
To maintain complete awareness of my decisions and reduce the influence of my
biases throughout the study, in addition to constant reflection, I consulted experts in
engineering and/or engineering education (section 3.10) during all the stages of the study,
which include developing the protocol, conducting the interviews, and analyzing the data.
103
Furthermore, the design of this study and preliminary results at different stages were
discussed in various workshops and presentations to invite discussions and suggestions
from content experts.
3.10 Description of External Content Experts
To establish the validity of this study, experts from the fields of qualitative
research, STEM education, and/or Signal Processing were consulted at various stages.
The summary of the content experts' profiles and areas in which they assisted the study is
given in Table 3.5.
While there is no standard rule for sample size in qualitative research, sample size
decisions generally follows the concept of saturation (Mason, 2010). I followed the same
concept of saturation to determine the appropriate number of content experts for this
study. I consulted several experts who helped shed light on the problem under
investigation at each stage of this study. After consulting with ten experts comprised of
seven experts in Continuous Time Signals and Systems course content and seven experts
in qualitative research methods, it became clear that I had reached the stage of
satisfactory communicative and procedural validation and consulting with more experts
would not add any more insight to the coding of the data. I then discontinued further
consultation.
Primarily, for this study, a specific person was considered an expert in a particular
field if that person had extensive teaching and research experience in that particular area.
Three senior faculty members (1, 2, and 3 in Table 3.5) with (teaching and
research) expertise in Signal Processing were consulted for protocol development, data
104
analysis, and inter-rater reliability for this study. Furthermore, an expert in mathematics
education research (4 in Table 3.5) was consulted at the data analysis stage to discuss the
themes identified in the data that involved mathematical thinking. Additionally, to
establish the quality of the qualitative methods employed in this study, two faculty
members (5 and 6 in Table 3.5) with expertise in qualitative research in engineering
education were consulted at various stages of protocol development, data collection, and
data analysis.
Secondarily, I also consulted the experts who were recent graduates and students
in the PhD program in electrical engineering or engineering education who had a master's
degree in electrical engineering as well as teaching experience in electrical engineering
related subjects (7, 8, 9, and 10 in Table 3.5). I considered them experts because of the
combination (knowledge of signal analysis and knowledge of qualitative research in
engineering education) of their academic and research training.
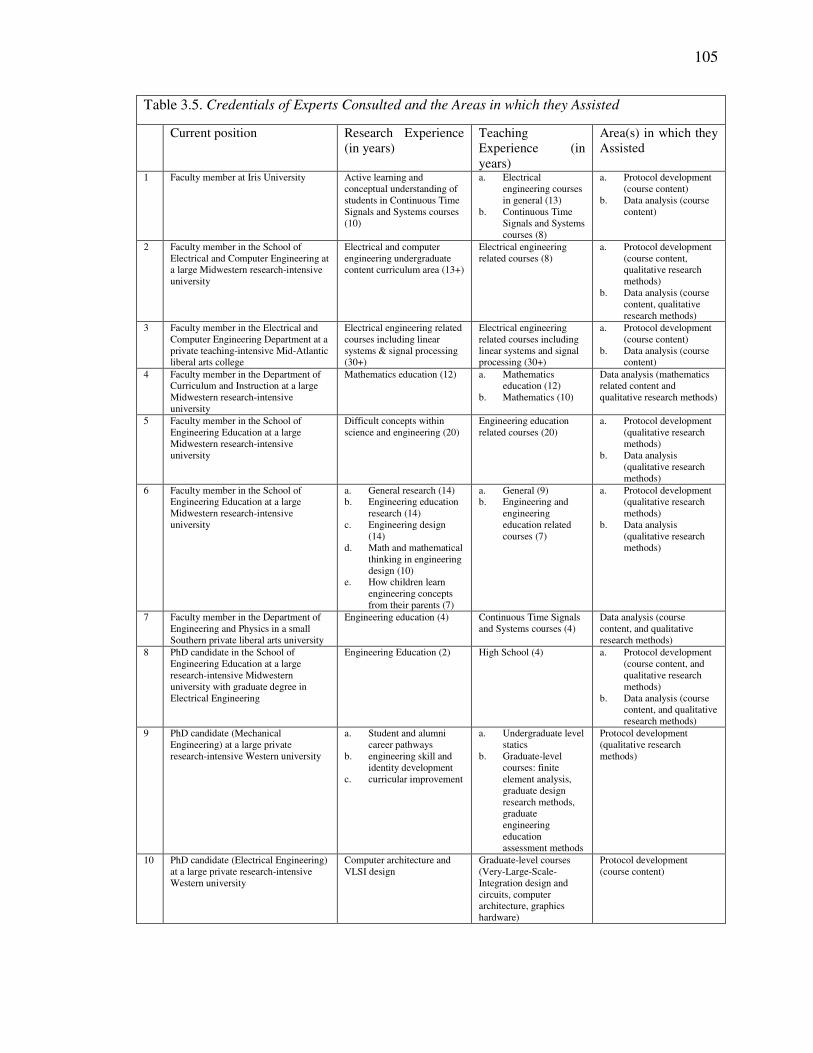
105
Table 3.5. Credentials of Experts Consulted and the Areas in which they Assisted
Current position Research Experience (in years)
Teaching Experience (in years)
Area(s) in which they Assisted
1 Faculty member at Iris University Active learning and conceptual understanding of students in Continuous Time Signals and Systems courses (10)
a. Electrical engineering courses in general (13)
b. Continuous Time Signals and Systems courses (8)
a. Protocol development (course content)
b. Data analysis (course content)
2 Faculty member in the School of Electrical and Computer Engineering at a large Midwestern research-intensive university
Electrical and computer engineering undergraduate content curriculum area (13+)
Electrical engineering related courses (8)
a. Protocol development (course content, qualitative research methods)
b. Data analysis (course content, qualitative research methods)
3 Faculty member in the Electrical and Computer Engineering Department at a private teaching-intensive Mid-Atlantic liberal arts college
Electrical engineering related courses including linear systems & signal processing (30+)
Electrical engineering related courses including linear systems and signal processing (30+)
a. Protocol development (course content)
b. Data analysis (course content)
4 Faculty member in the Department of Curriculum and Instruction at a large Midwestern research-intensive university
Mathematics education (12) a. Mathematics education (12)
b. Mathematics (10)
Data analysis (mathematics related content and qualitative research methods)
5 Faculty member in the School of Engineering Education at a large Midwestern research-intensive university
Difficult concepts within science and engineering (20)
Engineering education related courses (20)
a. Protocol development (qualitative research methods)
b. Data analysis (qualitative research methods)
6 Faculty member in the School of Engineering Education at a large Midwestern research-intensive university
a. General research (14) b. Engineering education
research (14) c. Engineering design
(14) d. Math and mathematical
thinking in engineering design (10)
e. How children learn engineering concepts from their parents (7)
a. General (9) b. Engineering and
engineering education related courses (7)
a. Protocol development (qualitative research methods)
b. Data analysis (qualitative research methods)
7 Faculty member in the Department of Engineering and Physics in a small Southern private liberal arts university
Engineering education (4) Continuous Time Signals and Systems courses (4)
Data analysis (course content, and qualitative research methods)
8 PhD candidate in the School of Engineering Education at a large research-intensive Midwestern university with graduate degree in Electrical Engineering
Engineering Education (2) High School (4) a. Protocol development (course content, and qualitative research methods)
b. Data analysis (course content, and qualitative research methods)
9 PhD candidate (Mechanical Engineering) at a large private research-intensive Western university
a. Student and alumni career pathways
b. engineering skill and identity development
c. curricular improvement
a. Undergraduate level statics
b. Graduate-level courses: finite element analysis, graduate design research methods, graduate engineering education assessment methods
Protocol development (qualitative research methods)
10 PhD candidate (Electrical Engineering) at a large private research-intensive Western university
Computer architecture and VLSI design
Graduate-level courses (Very-Large-Scale-Integration design and circuits, computer architecture, graphics hardware)
Protocol development (course content)
106
CHAPTER 4 - RESULTS
4.1 Introduction
This chapter is divided into three sections. The first section presents the findings
of this study that answer the first research question, "What problematic reasonings do
undergraduate electrical engineering students employ when they engage with Continuous
Time Signals and Systems course content?" As mentioned earlier (sections 1.6, and 3.7),
for this study, a reasoning is defined as a person's purposeful effort to generate justifiable
conclusions and make sense of the problem, and a problematic reasoning is defined as a
reasoning that has the potential to hinder conceptual understanding and cultivate
misconceptions (definitions created specifically for the study). Moreover, a
misconception is defined as any aspect of an individual's conceptual beliefs and
frameworks that resists conceptual change and contributes to incorrect, naive, or
unproductive conceptual understanding (Streveler, Brown, Herman, & Montfort, 2014).
The second section of this chapter presents the differences in problematic
reasonings between students who have taken only one Continuous Time Signals and
Systems course and no other course that require prior knowledge of the course content
and students who have taken such subsequent courses. This will answer the second
research question of this study; "How do these problematic reasonings differ after the
107
students take more courses that require prior knowledge of Continuous Time Signals and
Systems course content?"
The third section of this chapter presents some additional findings from student
responses that go beyond strictly answering the two research questions. Although the aim
of this study was to identify students' problematic reasonings, there were some
noteworthy instances in the data where the participants gave incorrect, inappropriate, or
incomplete responses and were not very clear in describing their thoughts behind their
responses. The prevalent themes of such instances were deemed important to mention for
conceptual learning and effective teaching of this course. For this study, these findings
are labeled as mistakes and missing conceptual knowledge. A mistake is defined as the
incorrect response of the participant without enough evidence of the reasoning employed
behind it (definition created for the study). In addition, missing conceptual knowledge is
defined as the knowledge that was not evident in the participants' responses but the use of
which could have helped the participant to successfully solve the problem at hand
(definition created for the study). This chapter concludes with the summary of all the
findings presented throughout the chapter.
To protect the privacy of the participants, pseudonyms are used in the
presentation of the data throughout this chapter. As mentioned in Chapter 3 (section
3.6.1), participants are grouped according to the courses they had taken at the time of the
study. These groups are the CTSS-only (students who have taken no subsequent courses
after Continuous Time Signals and Systems course) and the CTSS-plus (students who
have taken and passed subsequent courses). Table 3.2 can be referred to for the details of
the academic profiles of the participants.
108
4.2 Problematic Reasonings
As discussed in section 2.1.1, content of a typical Continuous Time Signals and
Systems course can be categorized into three main content areas:
1. Signal representations and operations (SRO): Includes topics like mathematical and
graphical representation of signals, components of signal (even, odd, etc.), types of
signals, various operations on signals like time shifting, time scaling, etc., complex
signals like Dirac delta, sinc, unit step function, etc.
2. Frequency Analysis (FA): Includes analysis of signals through Fourier series and
transform.
3. System Analysis (SA): Includes topics like discussion of types of systems with
emphasis on linear time-invariant systems, impulse response, and LTI system analysis
through convolution and Laplace transform
The collected data from the conducted interviews suggests the following
problematic reasonings (in no particular order) of the undergraduate electrical
engineering students when engaging with the Continuous Time Signals and Systems
course content. Explanations for these problematic reasonings will be discussed later in
this section. These problematic reasonings are further categorized (in no specific order)
according to their related content areas, shown in Table 4.1.
1. Any property of a signal is limited within the duration of the signal itself.
2. δ(t) and δ(ω) are functions like x(t) which varies according to whatever value t takes
on.
3. The product of any function and an impulse function is a constant.
4. A periodic signal in the time domain is also periodic in the frequency domain.
109
5. Signal representation in the time domain is same representation in the frequency
domain.
6. A constant in the frequency domain means no frequency as it has no ω in it.
7. Phase shift means shifting the phase plot of a signal in the frequency domain
8. Convolution and multiplication are interchangeable.
9. Concept of time-invariance of a system is interchangeable with the literal meaning of
time invariance.
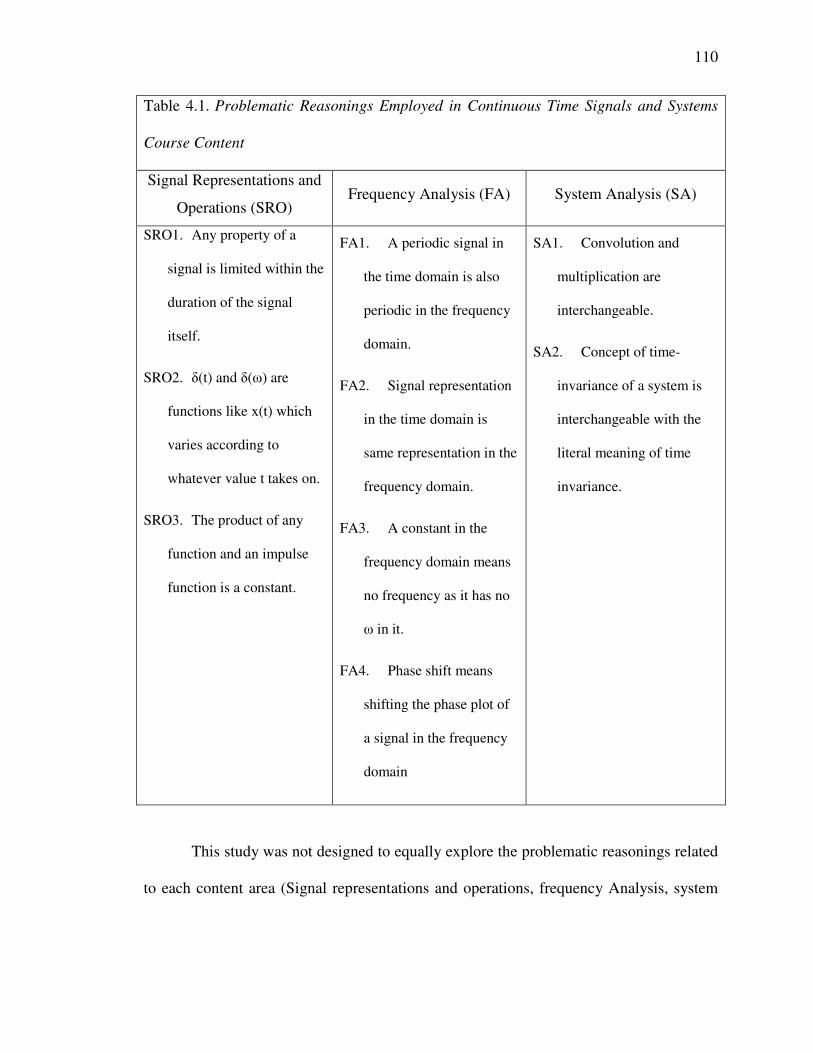
110
Table 4.1. Problematic Reasonings Employed in Continuous Time Signals and Systems
Course Content
Signal Representations and
Operations (SRO) Frequency Analysis (FA) System Analysis (SA)
SRO1. Any property of a
signal is limited within the
duration of the signal
itself.
SRO2. δ(t) and δ(ω) are
functions like x(t) which
varies according to
whatever value t takes on.
SRO3. The product of any
function and an impulse
function is a constant.
FA1. A periodic signal in
the time domain is also
periodic in the frequency
domain.
FA2. Signal representation
in the time domain is
same representation in the
frequency domain.
FA3. A constant in the
frequency domain means
no frequency as it has no
ω in it.
FA4. Phase shift means
shifting the phase plot of
a signal in the frequency
domain
SA1. Convolution and
multiplication are
interchangeable.
SA2. Concept of time-
invariance of a system is
interchangeable with the
literal meaning of time
invariance.
This study was not designed to equally explore the problematic reasonings related
to each content area (Signal representations and operations, frequency Analysis, system
111
analysis). Therefore, the difference in the number of the problematic reasonings in each
category does not imply any comparison of a content area being more difficult to learn
than the others are. The details of all the problematic reasonings as per their content area
and the data suggesting the presence of these problematic reasonings is presented below.
4.2.1 Signal Representations and Operations (SRO)
The explanation of the problematic reasonings related to 'Signal Representations
and operations' content area and the examples from the data collected for this study
suggesting the presence of these problematic reasonings are presented in this section.
4.2.1.1 Any Property of a Signal is Limited within the Duration of the Signal Itself
(SRO1)
The data recommends that the students think that any property of a signal is
limited within the duration of the signal. A few examples from the data supporting this
reasoning are presented below:
The participants were asked to find and draw the integral s1(t) of a rectangular
function v1(t) shown in Figure 4.1. The correct limits on x-axis for area under the integral
of the rectangular function are from � = −1 to ∞. Irrespective of the different responses
given by the participants, they chose the same time limits on the x-axes of the plots of the
signal v1(t) and its integral s1(t). Some responses of the participants are as follows:
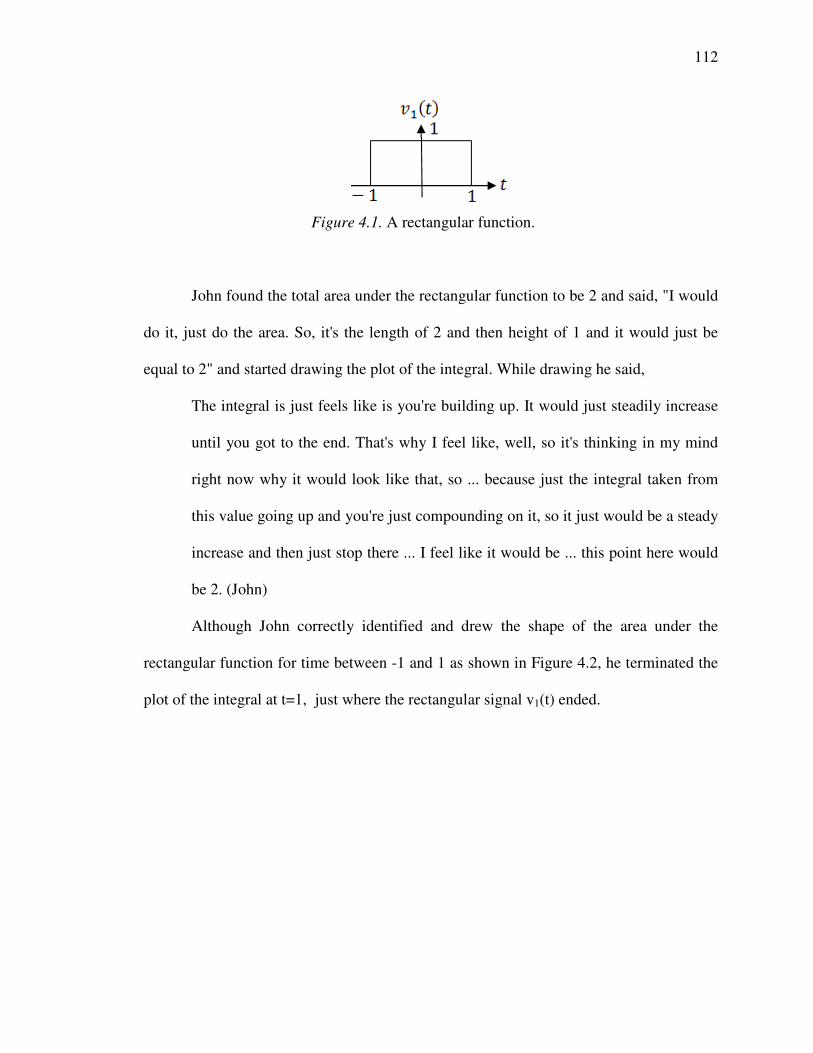
112
Figure 4.1. A rectangular function.
John found the total area under the rectangular function to be 2 and said, "I would
do it, just do the area. So, it's the length of 2 and then height of 1 and it would just be
equal to 2" and started drawing the plot of the integral. While drawing he said,
The integral is just feels like is you're building up. It would just steadily increase
until you got to the end. That's why I feel like, well, so it's thinking in my mind
right now why it would look like that, so ... because just the integral taken from
this value going up and you're just compounding on it, so it just would be a steady
increase and then just stop there ... I feel like it would be ... this point here would
be 2. (John)
Although John correctly identified and drew the shape of the area under the
rectangular function for time between -1 and 1 as shown in Figure 4.2, he terminated the
plot of the integral at t=1, just where the rectangular signal v1(t) ended.

113
Figure 4.2. John's response for the area under the rectangular function.
Additionally, Emily (Figure 4.3), Tom (Figure 4.4), and Justin (Figure 4.5) drew
similar plots for the area and limited their plots within the time limits of the actual
rectangular function. Their responses are as follows:
So I have my rectangle function, and it goes from negative one to one. Amplitude
of one. So my integral since it's a signal would go from negative infinity to
infinity, but because it's a rectangle function it's only there from negative one to
one. And then it would be rect(t/2), and then centered about one d(t), but since it's
only on it would be negative one to one. One d(t) and then t integrated from
negative one to one, so that would be two, would be my answer, and then I guess I
would just plot a straight line across that two. (Emily)
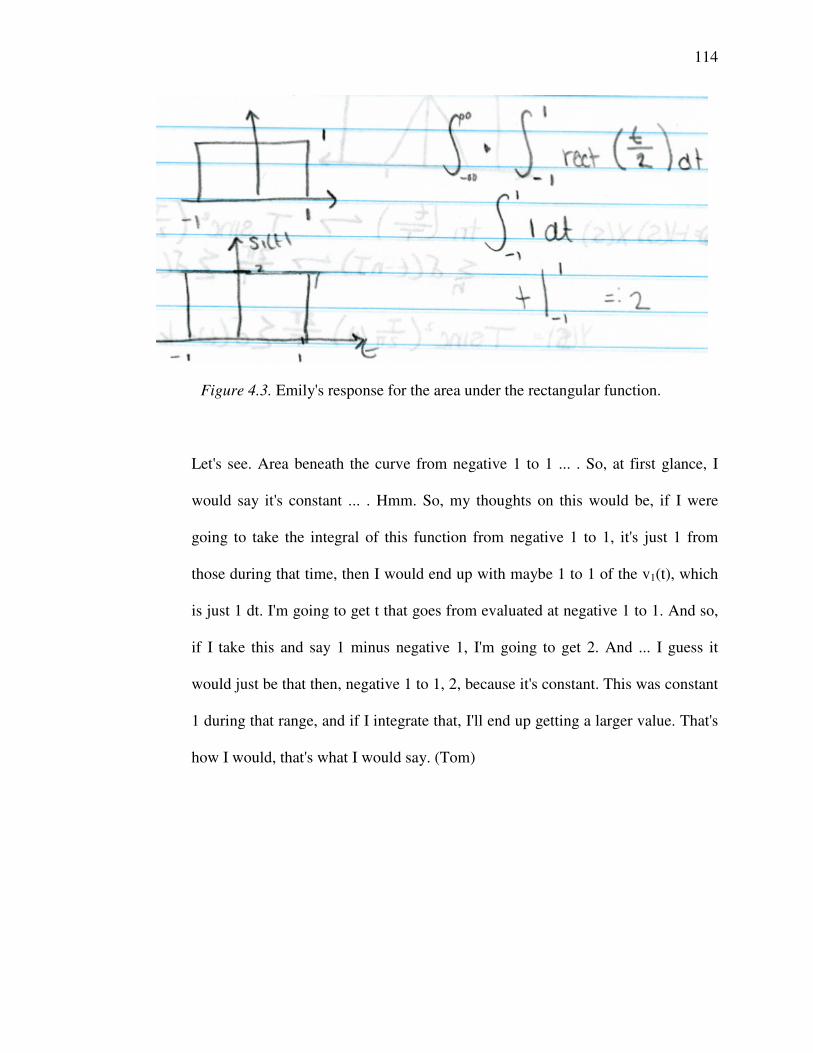
114
Figure 4.3. Emily's response for the area under the rectangular function.
Let's see. Area beneath the curve from negative 1 to 1 ... . So, at first glance, I
would say it's constant ... . Hmm. So, my thoughts on this would be, if I were
going to take the integral of this function from negative 1 to 1, it's just 1 from
those during that time, then I would end up with maybe 1 to 1 of the v1(t), which
is just 1 dt. I'm going to get t that goes from evaluated at negative 1 to 1. And so,
if I take this and say 1 minus negative 1, I'm going to get 2. And ... I guess it
would just be that then, negative 1 to 1, 2, because it's constant. This was constant
1 during that range, and if I integrate that, I'll end up getting a larger value. That's
how I would, that's what I would say. (Tom)
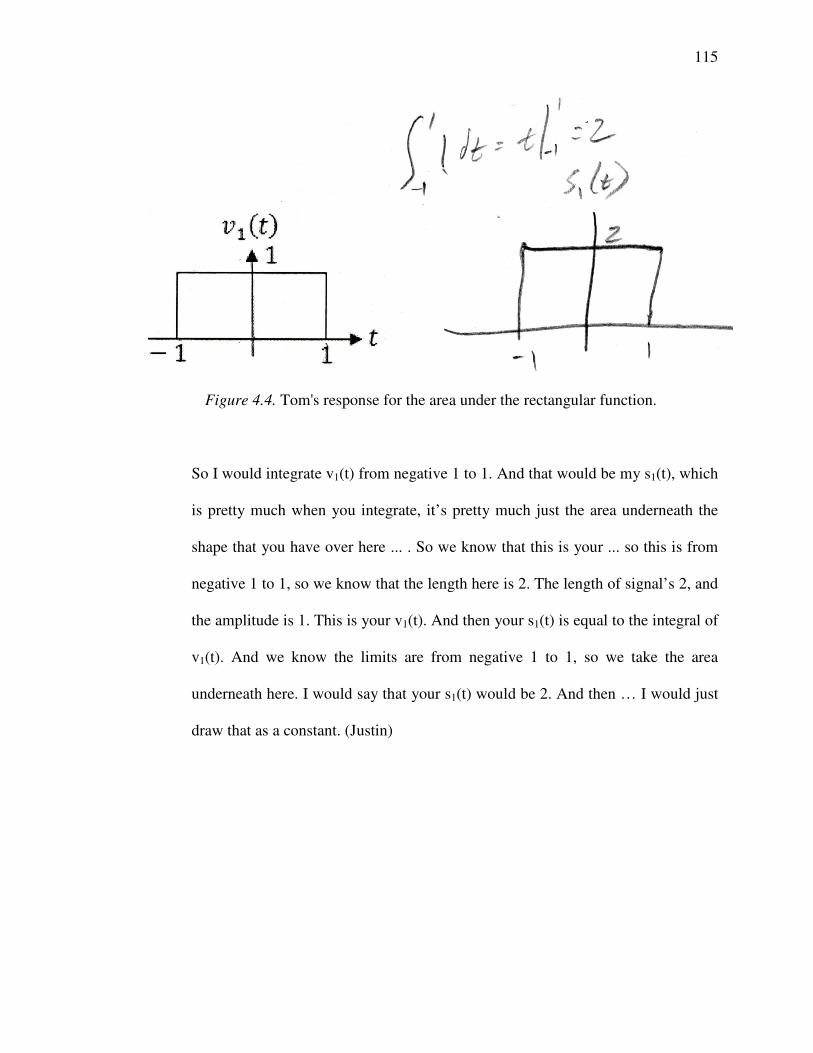
115
Figure 4.4. Tom's response for the area under the rectangular function.
So I would integrate v1(t) from negative 1 to 1. And that would be my s1(t), which
is pretty much when you integrate, it’s pretty much just the area underneath the
shape that you have over here ... . So we know that this is your ... so this is from
negative 1 to 1, so we know that the length here is 2. The length of signal’s 2, and
the amplitude is 1. This is your v1(t). And then your s1(t) is equal to the integral of
v1(t). And we know the limits are from negative 1 to 1, so we take the area
underneath here. I would say that your s1(t) would be 2. And then … I would just
draw that as a constant. (Justin)
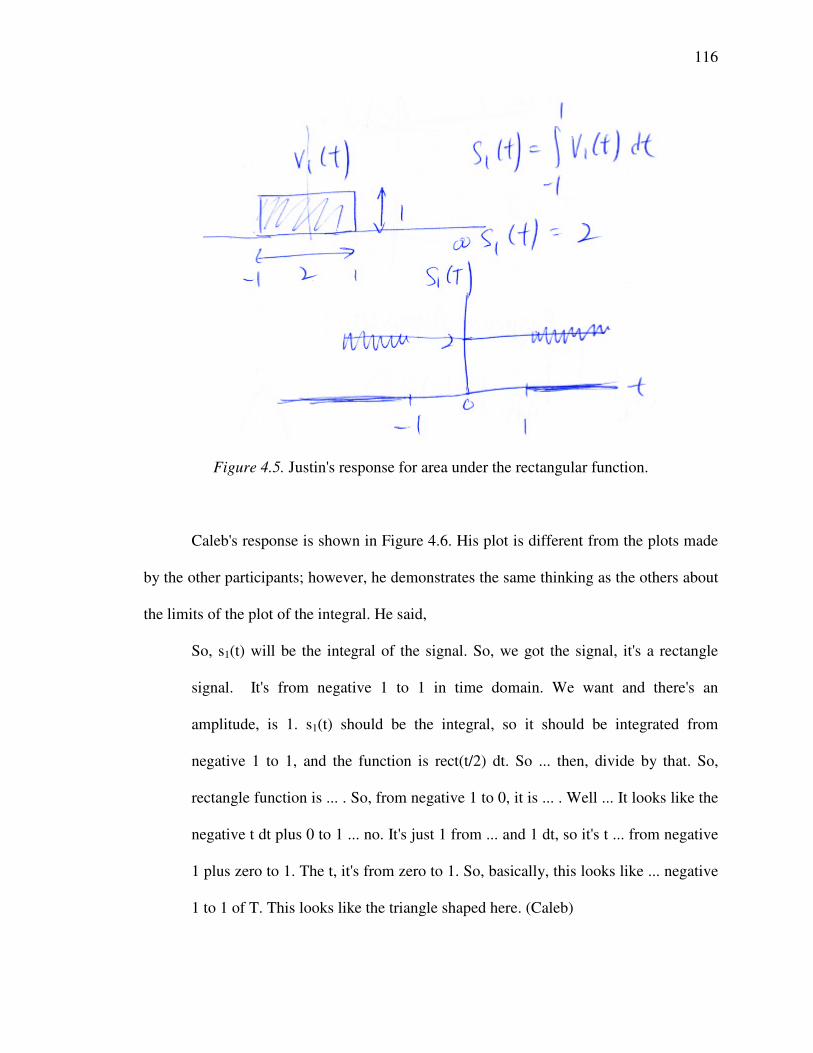
116
Figure 4.5. Justin's response for area under the rectangular function.
Caleb's response is shown in Figure 4.6. His plot is different from the plots made
by the other participants; however, he demonstrates the same thinking as the others about
the limits of the plot of the integral. He said,
So, s1(t) will be the integral of the signal. So, we got the signal, it's a rectangle
signal. It's from negative 1 to 1 in time domain. We want and there's an
amplitude, is 1. s1(t) should be the integral, so it should be integrated from
negative 1 to 1, and the function is rect(t/2) dt. So ... then, divide by that. So,
rectangle function is ... . So, from negative 1 to 0, it is ... . Well ... It looks like the
negative t dt plus 0 to 1 ... no. It's just 1 from ... and 1 dt, so it's t ... from negative
1 plus zero to 1. The t, it's from zero to 1. So, basically, this looks like ... negative
1 to 1 of T. This looks like the triangle shaped here. (Caleb)
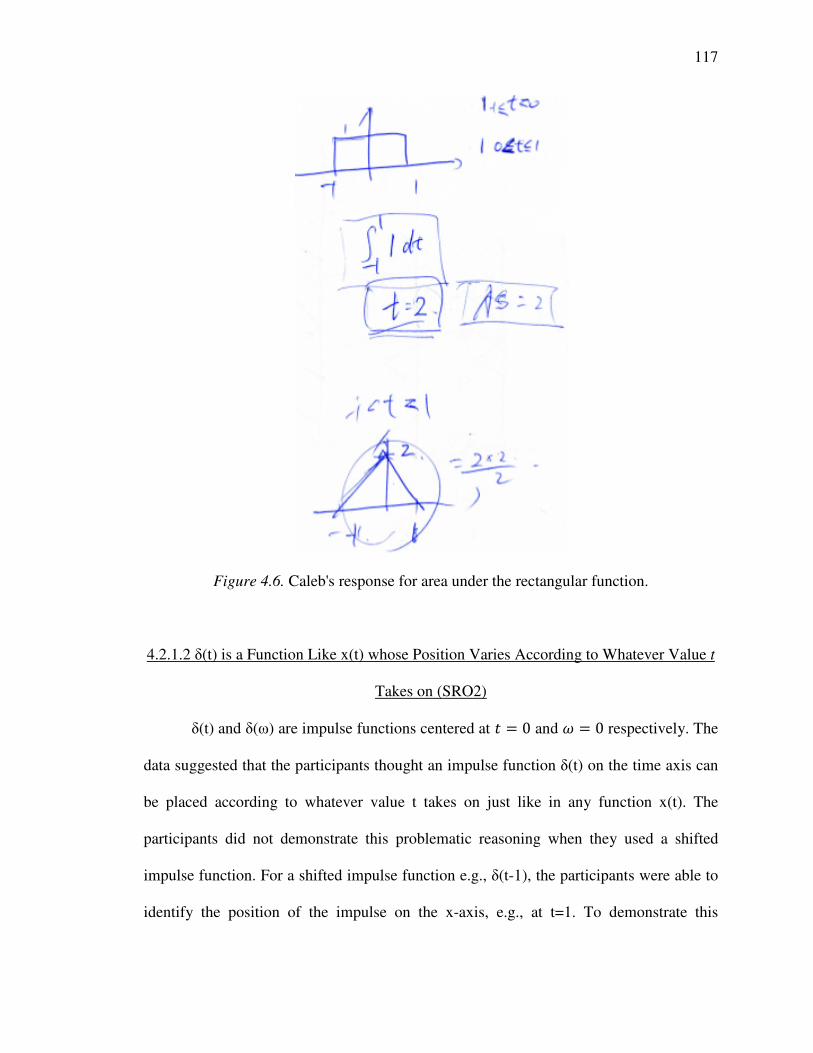
117
Figure 4.6. Caleb's response for area under the rectangular function.
4.2.1.2 δ(t) is a Function Like x(t) whose Position Varies According to Whatever Value t
Takes on (SRO2)
δ(t) and δ(ω) are impulse functions centered at � = 0 and � = 0 respectively. The
data suggested that the participants thought an impulse function δ(t) on the time axis can
be placed according to whatever value t takes on just like in any function x(t). The
participants did not demonstrate this problematic reasoning when they used a shifted
impulse function. For a shifted impulse function e.g., δ(t-1), the participants were able to
identify the position of the impulse on the x-axis, e.g., at t=1. To demonstrate this
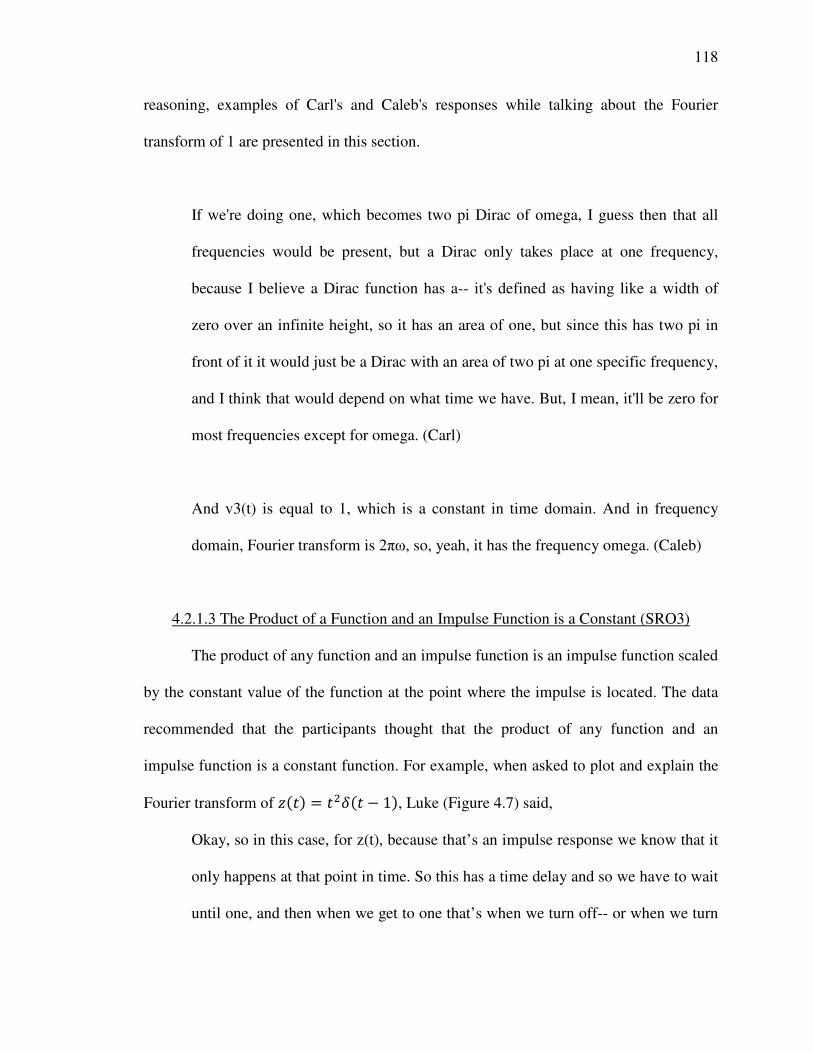
118
reasoning, examples of Carl's and Caleb's responses while talking about the Fourier
transform of 1 are presented in this section.
If we're doing one, which becomes two pi Dirac of omega, I guess then that all
frequencies would be present, but a Dirac only takes place at one frequency,
because I believe a Dirac function has a-- it's defined as having like a width of
zero over an infinite height, so it has an area of one, but since this has two pi in
front of it it would just be a Dirac with an area of two pi at one specific frequency,
and I think that would depend on what time we have. But, I mean, it'll be zero for
most frequencies except for omega. (Carl)
And v3(t) is equal to 1, which is a constant in time domain. And in frequency
domain, Fourier transform is 2πω, so, yeah, it has the frequency omega. (Caleb)
4.2.1.3 The Product of a Function and an Impulse Function is a Constant (SRO3)
The product of any function and an impulse function is an impulse function scaled
by the constant value of the function at the point where the impulse is located. The data
recommended that the participants thought that the product of any function and an
impulse function is a constant function. For example, when asked to plot and explain the
Fourier transform of �(�) = �.�(� − 1), Luke (Figure 4.7) said,
Okay, so in this case, for z(t), because that’s an impulse response we know that it
only happens at that point in time. So this has a time delay and so we have to wait
until one, and then when we get to one that’s when we turn off-- or when we turn
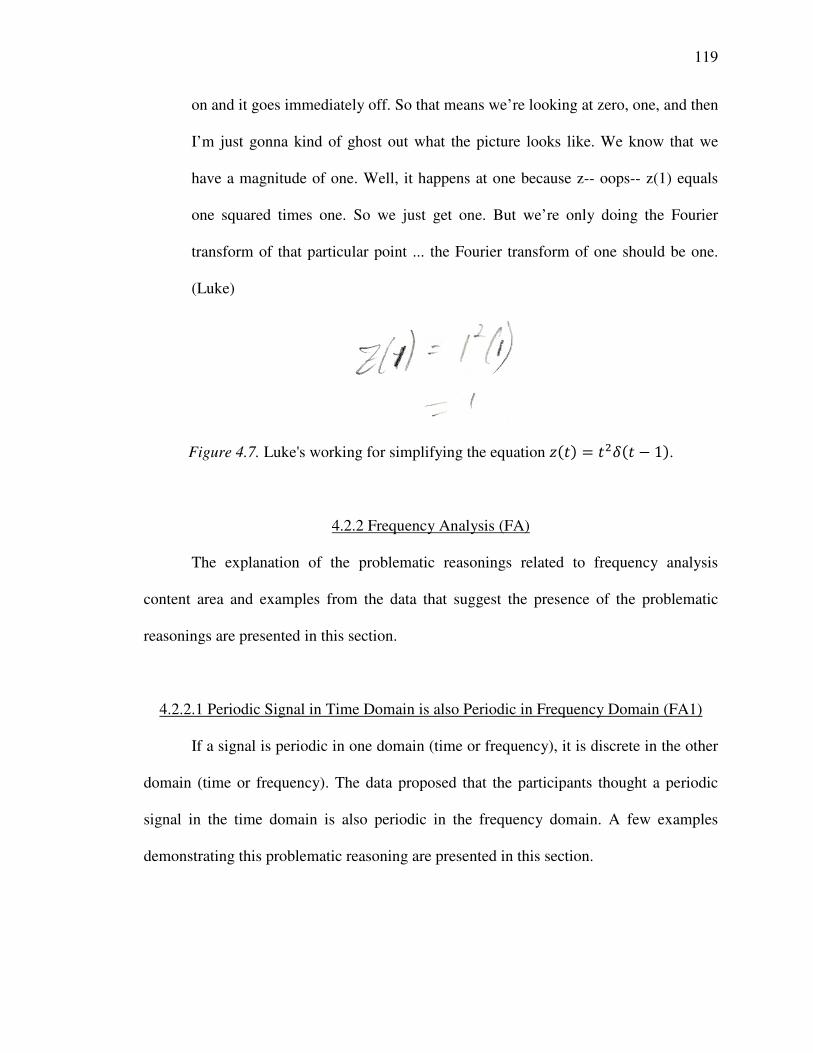
119
on and it goes immediately off. So that means we’re looking at zero, one, and then
I’m just gonna kind of ghost out what the picture looks like. We know that we
have a magnitude of one. Well, it happens at one because z-- oops-- z(1) equals
one squared times one. So we just get one. But we’re only doing the Fourier
transform of that particular point ... the Fourier transform of one should be one.
(Luke)
Figure 4.7. Luke's working for simplifying the equation �(�) = �.�(� − 1).
4.2.2 Frequency Analysis (FA)
The explanation of the problematic reasonings related to frequency analysis
content area and examples from the data that suggest the presence of the problematic
reasonings are presented in this section.
4.2.2.1 Periodic Signal in Time Domain is also Periodic in Frequency Domain (FA1)
If a signal is periodic in one domain (time or frequency), it is discrete in the other
domain (time or frequency). The data proposed that the participants thought a periodic
signal in the time domain is also periodic in the frequency domain. A few examples
demonstrating this problematic reasoning are presented in this section.
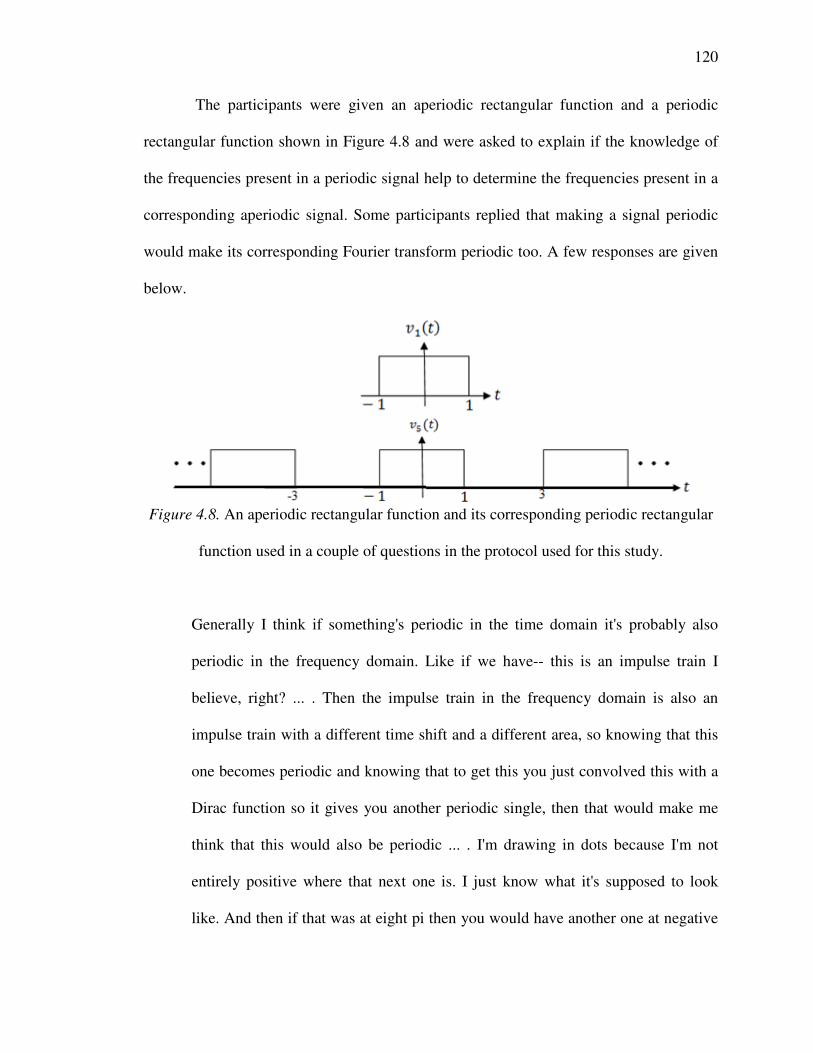
120
The participants were given an aperiodic rectangular function and a periodic
rectangular function shown in Figure 4.8 and were asked to explain if the knowledge of
the frequencies present in a periodic signal help to determine the frequencies present in a
corresponding aperiodic signal. Some participants replied that making a signal periodic
would make its corresponding Fourier transform periodic too. A few responses are given
below.
Figure 4.8. An aperiodic rectangular function and its corresponding periodic rectangular
function used in a couple of questions in the protocol used for this study.
Generally I think if something's periodic in the time domain it's probably also
periodic in the frequency domain. Like if we have-- this is an impulse train I
believe, right? ... . Then the impulse train in the frequency domain is also an
impulse train with a different time shift and a different area, so knowing that this
one becomes periodic and knowing that to get this you just convolved this with a
Dirac function so it gives you another periodic single, then that would make me
think that this would also be periodic ... . I'm drawing in dots because I'm not
entirely positive where that next one is. I just know what it's supposed to look
like. And then if that was at eight pi then you would have another one at negative
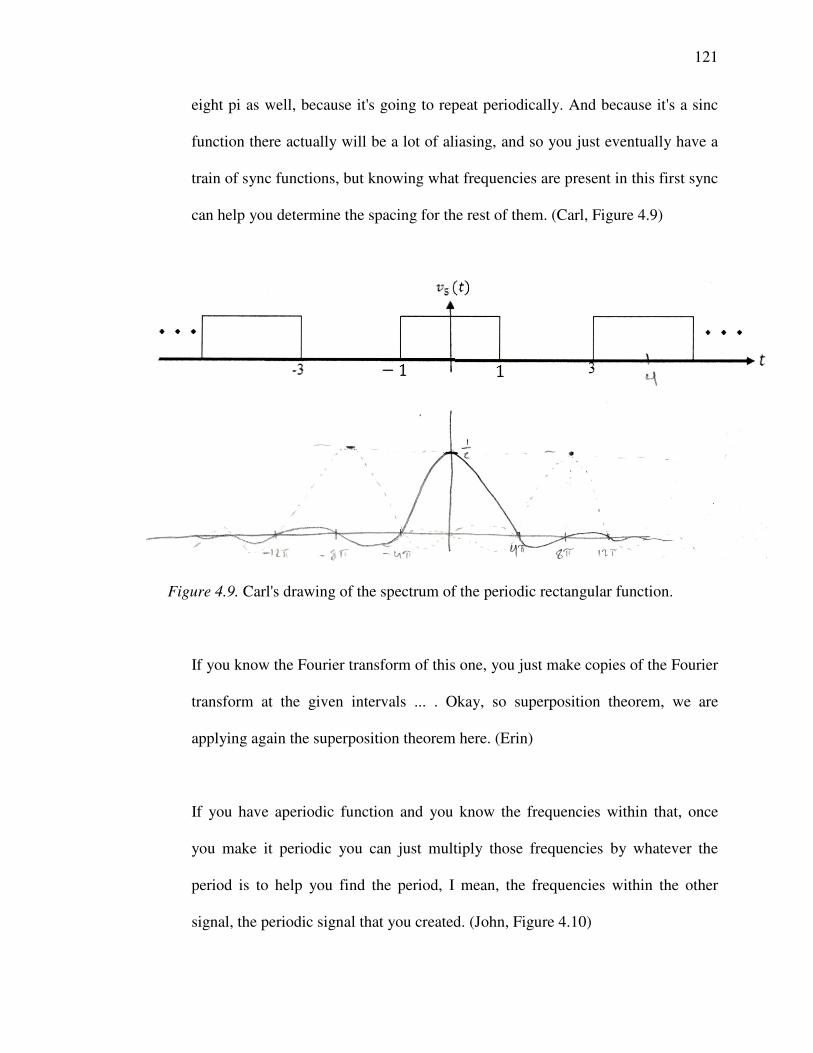
121
eight pi as well, because it's going to repeat periodically. And because it's a sinc
function there actually will be a lot of aliasing, and so you just eventually have a
train of sync functions, but knowing what frequencies are present in this first sync
can help you determine the spacing for the rest of them. (Carl, Figure 4.9)
Figure 4.9. Carl's drawing of the spectrum of the periodic rectangular function.
If you know the Fourier transform of this one, you just make copies of the Fourier
transform at the given intervals ... . Okay, so superposition theorem, we are
applying again the superposition theorem here. (Erin)
If you have aperiodic function and you know the frequencies within that, once
you make it periodic you can just multiply those frequencies by whatever the
period is to help you find the period, I mean, the frequencies within the other
signal, the periodic signal that you created. (John, Figure 4.10)
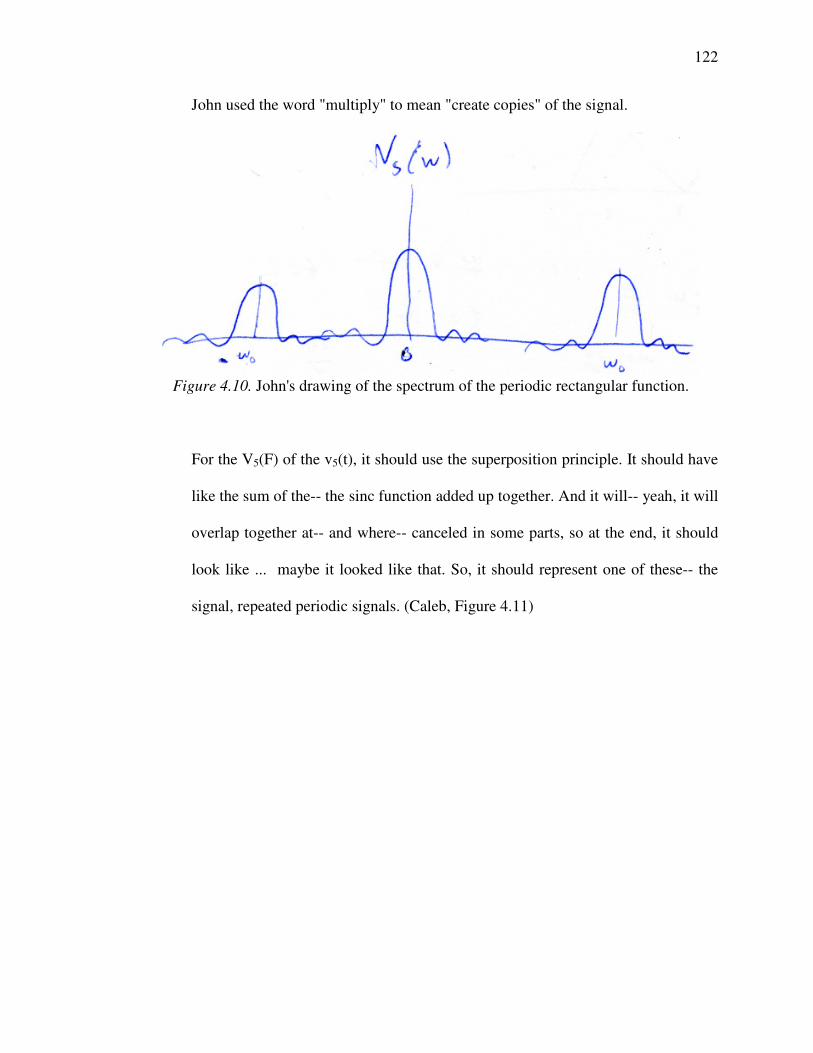
122
John used the word "multiply" to mean "create copies" of the signal.
Figure 4.10. John's drawing of the spectrum of the periodic rectangular function.
For the V5(F) of the v5(t), it should use the superposition principle. It should have
like the sum of the-- the sinc function added up together. And it will-- yeah, it will
overlap together at-- and where-- canceled in some parts, so at the end, it should
look like ... maybe it looked like that. So, it should represent one of these-- the
signal, repeated periodic signals. (Caleb, Figure 4.11)
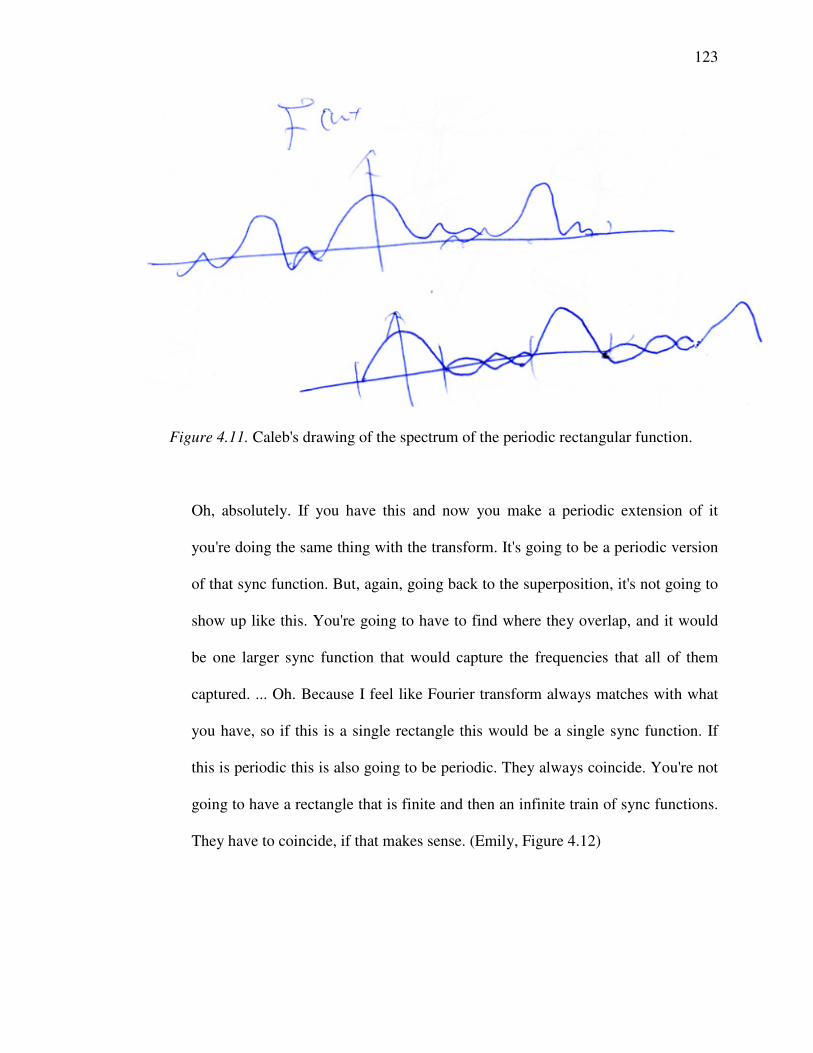
123
Figure 4.11. Caleb's drawing of the spectrum of the periodic rectangular function.
Oh, absolutely. If you have this and now you make a periodic extension of it
you're doing the same thing with the transform. It's going to be a periodic version
of that sync function. But, again, going back to the superposition, it's not going to
show up like this. You're going to have to find where they overlap, and it would
be one larger sync function that would capture the frequencies that all of them
captured. ... Oh. Because I feel like Fourier transform always matches with what
you have, so if this is a single rectangle this would be a single sync function. If
this is periodic this is also going to be periodic. They always coincide. You're not
going to have a rectangle that is finite and then an infinite train of sync functions.
They have to coincide, if that makes sense. (Emily, Figure 4.12)
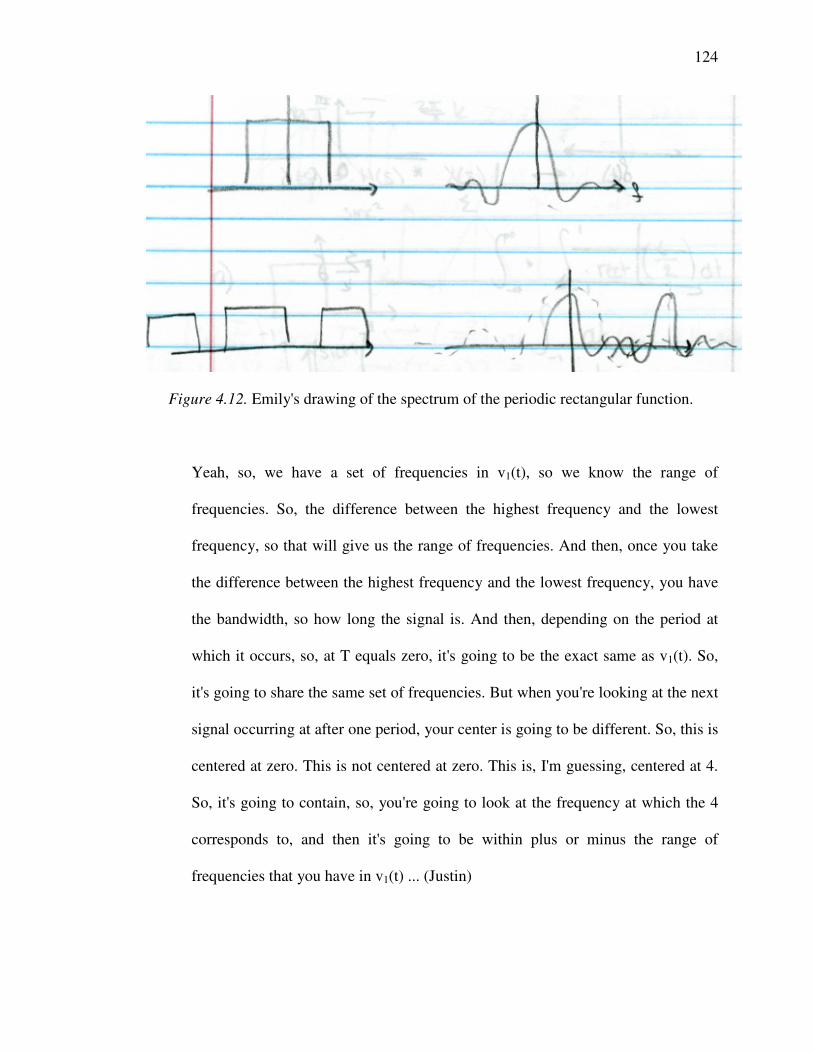
124
Figure 4.12. Emily's drawing of the spectrum of the periodic rectangular function.
Yeah, so, we have a set of frequencies in v1(t), so we know the range of
frequencies. So, the difference between the highest frequency and the lowest
frequency, so that will give us the range of frequencies. And then, once you take
the difference between the highest frequency and the lowest frequency, you have
the bandwidth, so how long the signal is. And then, depending on the period at
which it occurs, so, at T equals zero, it's going to be the exact same as v1(t). So,
it's going to share the same set of frequencies. But when you're looking at the next
signal occurring at after one period, your center is going to be different. So, this is
centered at zero. This is not centered at zero. This is, I'm guessing, centered at 4.
So, it's going to contain, so, you're going to look at the frequency at which the 4
corresponds to, and then it's going to be within plus or minus the range of
frequencies that you have in v1(t) ... (Justin)
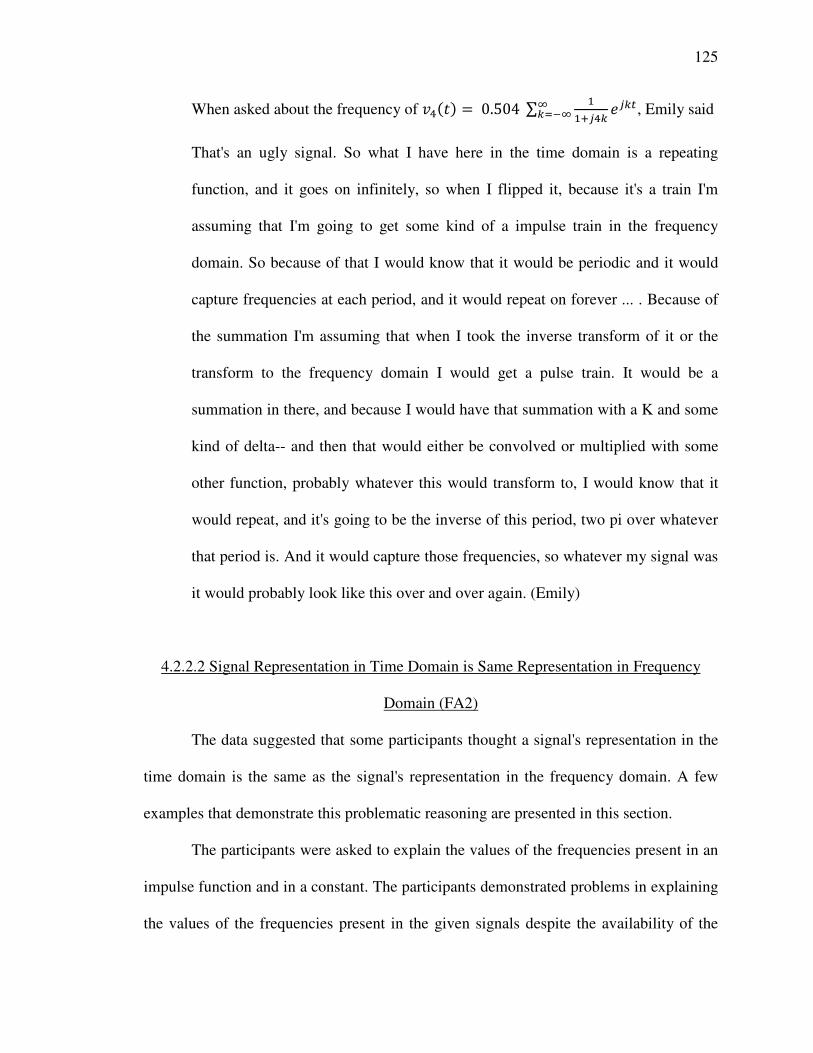
125
When asked about the frequency of �/(�) = 0.504 ∑ 334"/5 �"5$&5)!& , Emily said
That's an ugly signal. So what I have here in the time domain is a repeating
function, and it goes on infinitely, so when I flipped it, because it's a train I'm
assuming that I'm going to get some kind of a impulse train in the frequency
domain. So because of that I would know that it would be periodic and it would
capture frequencies at each period, and it would repeat on forever ... . Because of
the summation I'm assuming that when I took the inverse transform of it or the
transform to the frequency domain I would get a pulse train. It would be a
summation in there, and because I would have that summation with a K and some
kind of delta-- and then that would either be convolved or multiplied with some
other function, probably whatever this would transform to, I would know that it
would repeat, and it's going to be the inverse of this period, two pi over whatever
that period is. And it would capture those frequencies, so whatever my signal was
it would probably look like this over and over again. (Emily)
4.2.2.2 Signal Representation in Time Domain is Same Representation in Frequency
Domain (FA2)
The data suggested that some participants thought a signal's representation in the
time domain is the same as the signal's representation in the frequency domain. A few
examples that demonstrate this problematic reasoning are presented in this section.
The participants were asked to explain the values of the frequencies present in an
impulse function and in a constant. The participants demonstrated problems in explaining
the values of the frequencies present in the given signals despite the availability of the
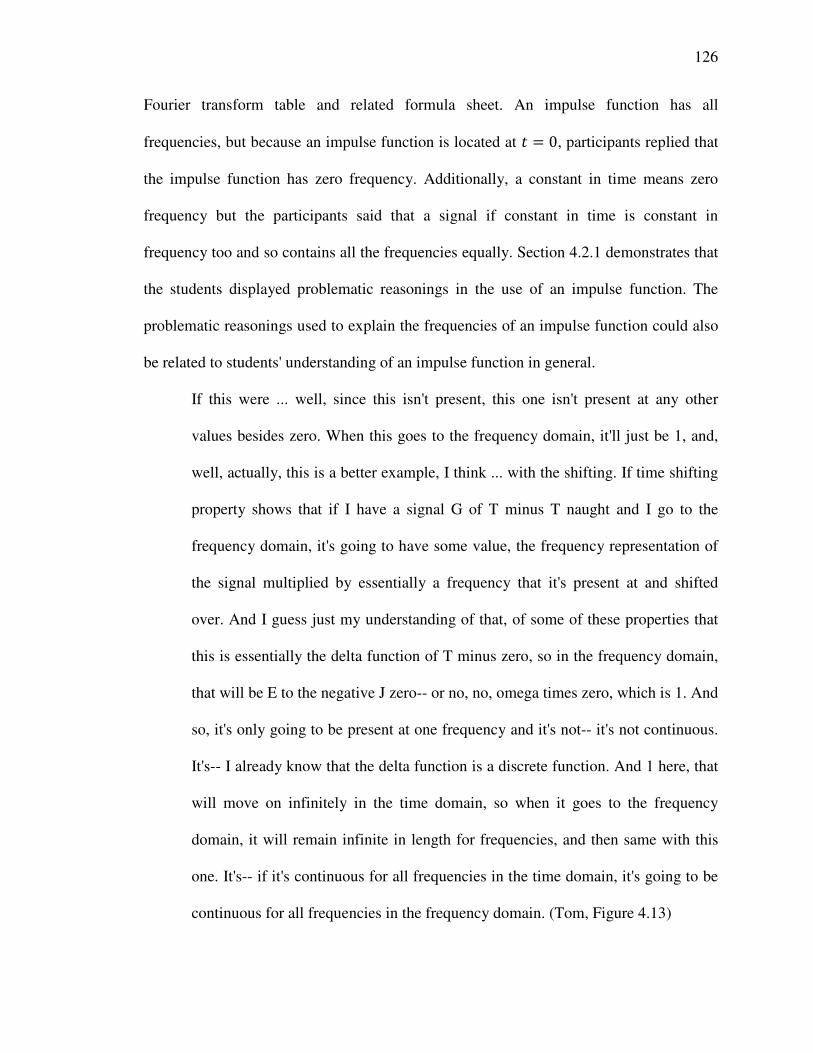
126
Fourier transform table and related formula sheet. An impulse function has all
frequencies, but because an impulse function is located at � = 0, participants replied that
the impulse function has zero frequency. Additionally, a constant in time means zero
frequency but the participants said that a signal if constant in time is constant in
frequency too and so contains all the frequencies equally. Section 4.2.1 demonstrates that
the students displayed problematic reasonings in the use of an impulse function. The
problematic reasonings used to explain the frequencies of an impulse function could also
be related to students' understanding of an impulse function in general.
If this were ... well, since this isn't present, this one isn't present at any other
values besides zero. When this goes to the frequency domain, it'll just be 1, and,
well, actually, this is a better example, I think ... with the shifting. If time shifting
property shows that if I have a signal G of T minus T naught and I go to the
frequency domain, it's going to have some value, the frequency representation of
the signal multiplied by essentially a frequency that it's present at and shifted
over. And I guess just my understanding of that, of some of these properties that
this is essentially the delta function of T minus zero, so in the frequency domain,
that will be E to the negative J zero-- or no, no, omega times zero, which is 1. And
so, it's only going to be present at one frequency and it's not-- it's not continuous.
It's-- I already know that the delta function is a discrete function. And 1 here, that
will move on infinitely in the time domain, so when it goes to the frequency
domain, it will remain infinite in length for frequencies, and then same with this
one. It's-- if it's continuous for all frequencies in the time domain, it's going to be
continuous for all frequencies in the frequency domain. (Tom, Figure 4.13)
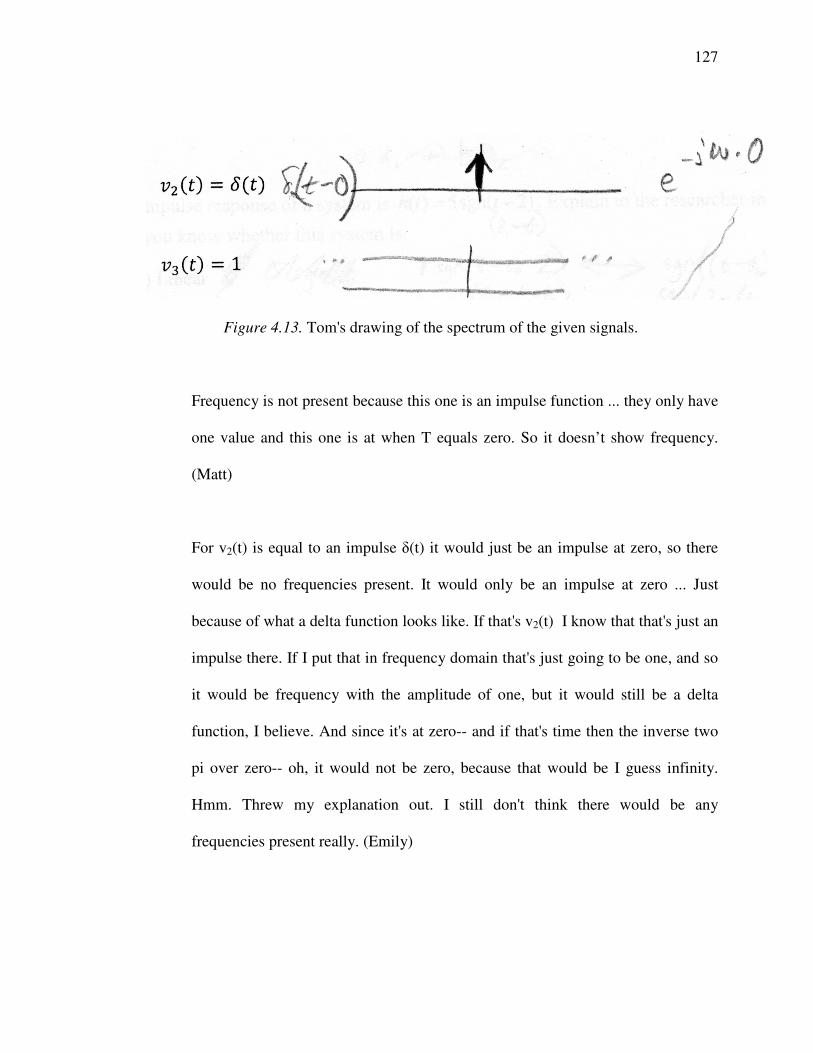
127
Figure 4.13. Tom's drawing of the spectrum of the given signals.
Frequency is not present because this one is an impulse function ... they only have
one value and this one is at when T equals zero. So it doesn’t show frequency.
(Matt)
For v2(t) is equal to an impulse δ(t) it would just be an impulse at zero, so there
would be no frequencies present. It would only be an impulse at zero ... Just
because of what a delta function looks like. If that's v2(t) I know that that's just an
impulse there. If I put that in frequency domain that's just going to be one, and so
it would be frequency with the amplitude of one, but it would still be a delta
function, I believe. And since it's at zero-- and if that's time then the inverse two
pi over zero-- oh, it would not be zero, because that would be I guess infinity.
Hmm. Threw my explanation out. I still don't think there would be any
frequencies present really. (Emily)

128
Additionally, in a question Luke while trying to find Fourier transform of
�(�) = �.�(� − 1) said that �(1) = 1 and that "Fourier transform of one should be one."
Furthermore, in response to a question to find Fourier transform and Fourier
series of �/(�) = �!"67[�(� + �) − �(� − �)], Jake found that the Fourier transform of
�/(�) is a sinusoidal signal and said that "the Fourier series should have same graph as
the Fourier transform-- because this signal is periodic". Lily did the same thing. She
looked at this question and said "I was thinking it was already a Fourier transform" and
then she drew this function as Fourier transform of this function.
4.2.2.3 A Constant in Frequency Domain Means No Frequency (FA3)
A constant in the frequency means all frequencies present equally. The data
suggested the participants utilized the problematic reasonings when explaining what
frequencies were represented by a constant in the frequency domain and thought that no
ω means no frequency. The participants were asked to explain the frequency components
of an impulse function and were given the Fourier transform table too. They identified
the Fourier transform of an impulse function from the Fourier transform table but had
trouble with explaining what the constant means in the frequency domain, as the constant
representation does not have a variable ω in it.
So, v2(t) is equal to δ(t), which is an impulse in time domain, and for the Fourier
in the frequency domain, it's just 1. So, I don't think there is a frequency
represented in this signal ... Because there's just no omega in the frequency
domain, just a 1. (Caleb)
129
4.2.2.4 Phase Shift Means Shifting Phase Plot of Signal in Frequency Domain (FA4)
Phase shift is time shift in time domain calculated in terms of angle. The data
recommended that the participants interchanged the concept of time shift in the time
domain with the concept of phase shift in the frequency domain. A few examples that
demonstrate this problematic reasoning are presented in this section.
The participants were given the signal ℎ(�) = sin(<. � −</) and were asked to
explain the concept of the time shift and the phase shift using ℎ(�) as an example.
Following are some of the responses:
And then for a phase shift ... in the frequency domain, it would look just like the
time shift does in the time domain. (Jim)
A time shift is a phase shift in frequency, which is, again, shifting it over. But
that’s in the frequency domain. (Megan)
So, a phase shift would be when the signal would be shifted on the frequency
axis, so we'd get frequency, and then, if the frequency ... or if the frequency of
this is ... So, if it's-- the frequency is pi over 2, then the frequency shift would just
shift it either higher or lower. (Lily)
The phase shift would happen almost exactly the same with respect to time shift,
what happens in the frequency domain, so it's just a different domain of time. It's
the same, the same idea of the system, but because of the new angle being
130
introduced, the phase has changed, whether it's in the future or if in the past or
delayed, so coming later ... what we would be doing is kind of shifting this signal
just along where now our x-axis is in frequency, so it's in hertz or in radians, and
we're looking at that going back and forth. (Luke)
Megan while trying to find Fourier transform of �/(�) = �!"67[�(� + �) −�(� − �)] said,
I'm pretty sure it's just a phase shift in the frequency domain ... because now I've
got the time delay. So looking at them one at a time, I should have one E to the J
pi minus J pi, possibly. So from there, I can then draw that at least. I'm still trying
to draw. I've got 1 to the E to J pi, so that's going to be a 1, but it's phase shifted
over to pi. So that's a delay in the time domain. It's a frequency shift. It's a shift in
the frequency domain. So if I'm shifting it over pi, it should just start at pi. I'm not
sure what else it could possibly do there.
4.2.3 System Analysis (SA)
The explanation of the problematic reasonings related to System Analysis content
area and examples from the data collected that suggest the presence of each problematic
reasoning are presented in this section.
4.2.3.1 Convolution and Multiplication are Interchangeable (SA1)
The data suggested that the participants interchanged the concept of convolution
with multiplication and illustrated two different reasons behind this incorrect interchange.
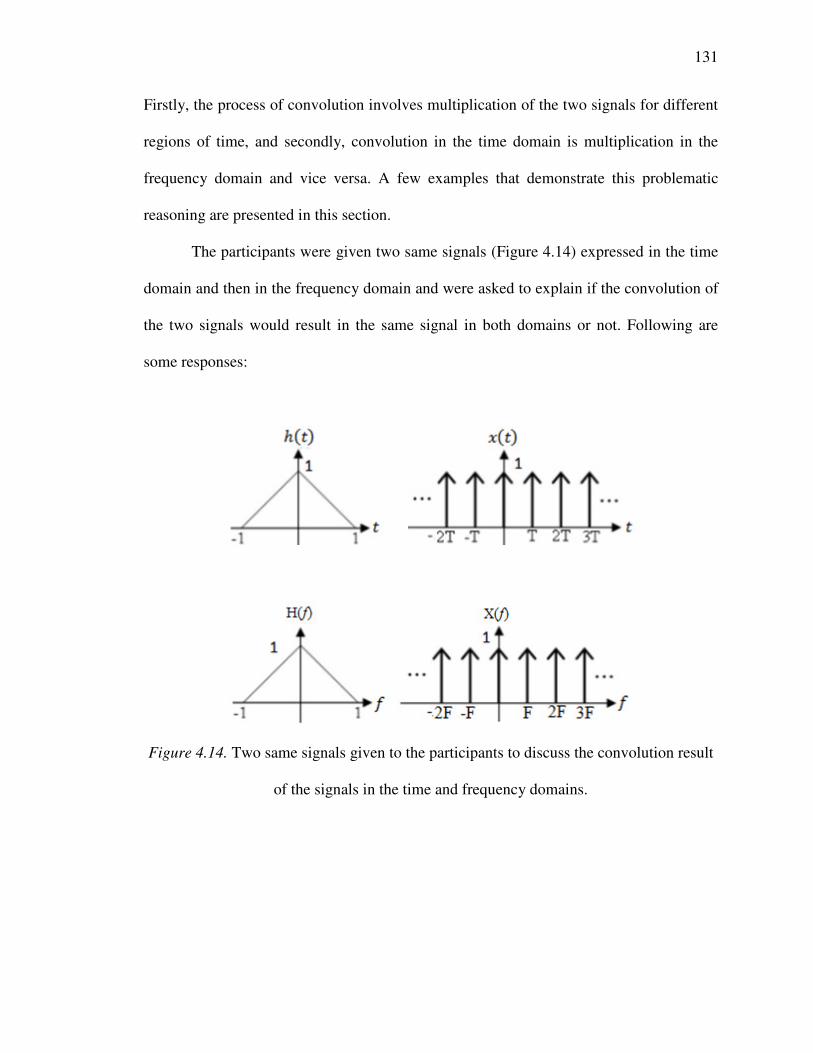
131
Firstly, the process of convolution involves multiplication of the two signals for different
regions of time, and secondly, convolution in the time domain is multiplication in the
frequency domain and vice versa. A few examples that demonstrate this problematic
reasoning are presented in this section.
The participants were given two same signals (Figure 4.14) expressed in the time
domain and then in the frequency domain and were asked to explain if the convolution of
the two signals would result in the same signal in both domains or not. Following are
some responses:
Figure 4.14. Two same signals given to the participants to discuss the convolution result
of the signals in the time and frequency domains.
132
Because it's in the frequency domain, so the convolution is basically, is H(f) times
X(f). So, simply multiply these two, and you only got the one shaped at the origin,
so there's no others at the rest. So, it's just one of these triangles. (Caleb)
Yes, the plot would be very different, because they're already in frequency
domain ... it's multiplication in time. (Emily)
So instead of looking at this in a time domain, we’re looking at it in the frequency
domain ... the way I remembered it was convolution in the time domain is
multiplication in the frequency domain ... The first thing I thought of was, you
know, they’re going to be the same. But that’s because I didn’t really read the-- I
just saw the shapes ... So we know that they’re inversely proportional for
frequency and time. Well, we know now that we can just multiply this. Your H
signal with your X signal. So it’s not going to look like what we did for part a ...
So one’s multiplication, one’s convolution, so that would produce a different
output. (Justin)
Yeah, I think it will change ... Because the Fourier transform is changed from
time domain to the frequency domain. I think h(t) will give the range of the y(t) ...
So it’s from -1 to 1 ... y(t) would be from -1 to 1 too ... Because there’s a filter so
it will filter out the parts that doesn’t include in that. (Matt)
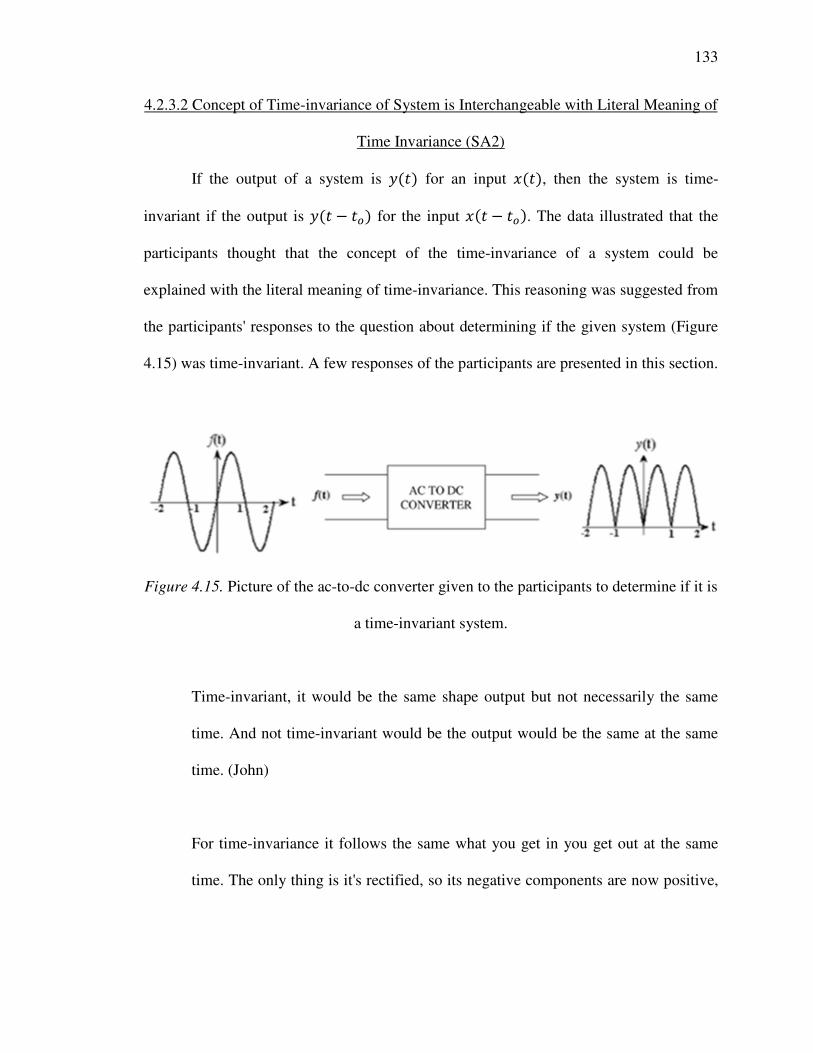
133
4.2.3.2 Concept of Time-invariance of System is Interchangeable with Literal Meaning of
Time Invariance (SA2)
If the output of a system is =(�) for an input �(�), then the system is time-
invariant if the output is =(� − �>) for the input �(� − �>). The data illustrated that the
participants thought that the concept of the time-invariance of a system could be
explained with the literal meaning of time-invariance. This reasoning was suggested from
the participants' responses to the question about determining if the given system (Figure
4.15) was time-invariant. A few responses of the participants are presented in this section.
Figure 4.15. Picture of the ac-to-dc converter given to the participants to determine if it is
a time-invariant system.
Time-invariant, it would be the same shape output but not necessarily the same
time. And not time-invariant would be the output would be the same at the same
time. (John)
For time-invariance it follows the same what you get in you get out at the same
time. The only thing is it's rectified, so its negative components are now positive,
134
but it follows the same period. It's not shifted at all. It's not changed. It hasn't
moved back. So here it's easier to see that it would be time-invariant. (Emily)
It doesn’t get affected by the time inside the converter so it can be time invariant.
(Matt)
I think if I remember correctly the rule for time-invariance if you're looking at an
equation is since T is not being multiplied by anything it's time-invariant ...
Because the system that comes out is still periodic then that would lead me to
believe it's time-invariant. (Carl)
4.3 Difference between Problematic Reasonings among Students with Different
Academic Statuses
This section presents the answer to the second research question of the study,
"How the problematic reasonings differ after the students take more courses that require
prior knowledge of Continuous Time Signals and Systems course content?" Nineteen
participants (Table 3.2) were interviewed for this study. Of the nineteen participants,
eight participants belonged to CTSS-only group (had taken only one Continuous Time
Signals and Systems course) and eleven participants belonged to CTSS-plus group (had
taken related courses subsequent to Continuous Time Signals and Systems).
The comparisons given in Figures 4.16 and 4.17 are based on the number of
participants in each group using a certain problematic reasoning (section 4.3.1) and the
number of problematic reasonings demonstrated by each group (section 4.3.2)
135
respectively. The two different comparisons show how that the number of problematic
reasonings per group and the number of students per group that demonstrate a particular
problematic reasoning are distributed. This is important because if one group represents
ten problematic reasonings and only one person in that group is using that particular
reasoning, then the use of reasoning may not be a representative of the whole group.
Rather than comparing the number of the problematic reasonings employed with
the number of participants in each group employing that particular reasoning, I am
comparing the number of the problematic reasonings employed with the normalized
(standardized) proportion of participants in each group demonstrating a particular
reasoning. There are two reasons for this choice. First, if all the participants were given
an equal chance to demonstrate a particular problematic reasoning, and all demonstrated
that particular problematic reasoning, the number of problematic reasonings
demonstrated by the CTSS-plus group would have been more as the number of students
in this group is higher. Second, for questions related to topics similar to the ones in
Continuous Time Signals and Systems courses, there is always more than one way to
solve a particular problem. If only participants from one group employed a certain
problematic reasoning, there is no certainty that the other participants would not have
employed the same problematic reasoning, if they had chosen to solve the same question
in the same way. While comparing the differences in the reasonings employed by each
group, I acknowledge that not all the participants got an equal chance to reveal a
particular reasoning, as everyone preferred their own choice of methods to respond to the
problems. In both cases, I normalize the number of students so that the results indicated
would match the results if the number of students in each group were the same. Figure
136
4.16 is the number of students displaying a particular reasoning in each group (section
4.3.1) and Figure 4.17 is the difference in number of problematic reasonings displayed by
each group (section 4.3.2).
4.3.1 Number of Problematic Reasonings Demonstrated by Normalized Proportion of
Individual Participants in Each Group
Figure 4.16 shows the normalized proportion of students from each group that
demonstrated a particular problematic reasoning (section 4.2). Figure shows that the
problematic reasonings demonstrated more in the participants from the CTSS-only group
are:
1) Convolution and multiplication are interchangeable (SA1)
2) Concept of time-invariance of a system is interchangeable with the literal meaning of
time invariance (SA2)
Figure 4.16 shows that the problematic reasonings used more often by the
participants in the CTSS-plus group are:
1) δ(t) or δ(ω) are functions like x(t) which varies according to whatever value t takes on
(SRO2)
2) The product of any function and an impulse function is a constant (SRO3)
3) A constant in the frequency domain means no frequency as it has no ω in it (FA3)
4) Phase shift means shifting the phase plot of a signal in the frequency domain (FA4)
Figure 4.16 shows the problematic reasonings demonstrated almost equally (at
least 40% or more often) by both groups are:
1) Any property of a signal is limited within the duration of the signal itself (SRO1)
137
2) A periodic signal in the time domain is also periodic in the frequency domain (FA1)
3) Signal representation in the time domain is the same representation in the frequency
domain (FA2)
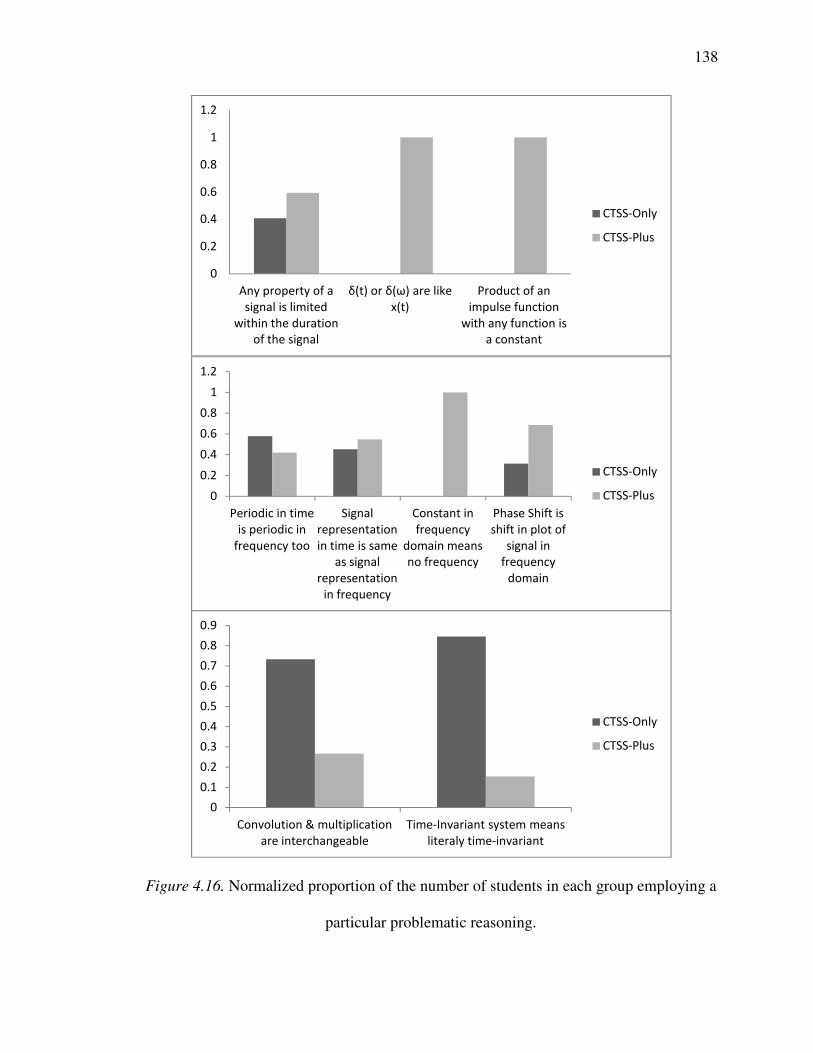
138
Figure 4.16. Normalized proportion of the number of students in each group employing a
particular problematic reasoning.
0
0.2
0.4
0.6
0.8
1
1.2
Any property of a
signal is limited
within the duration
of the signal
δ(t) or δ(ω) are like
x(t)
Product of an
impulse function
with any function is
a constant
CTSS-Only
CTSS-Plus
0
0.2
0.4
0.6
0.8
1
1.2
Periodic in time
is periodic in
frequency too
Signal
representation
in time is same
as signal
representation
in frequency
Constant in
frequency
domain means
no frequency
Phase Shift is
shift in plot of
signal in
frequency
domain
CTSS-Only
CTSS-Plus
0
0.1
0.2
0.3
0.4
0.5
0.6
0.7
0.8
0.9
Convolution & multiplication
are interchangeable
Time-Invariant system means
literaly time-invariant
CTSS-Only
CTSS-Plus
139
4.3.2 Normalized Proportion of Problematic Reasonings Demonstrated by a Group
Collectively
This section presents the normalized proportion of the number of problematic
reasonings (presented in section 4.2) demonstrated by the CTSS-plus (Table 3.2) and
CTSS-only (Table 3.2) groups. Figure 4.17 demonstrates the proportion graphically. The
discussion of these proportions will be presented in section 5.2. Figure 4.17 shows that
the normalized proportion of the number of problematic reasonings demonstrated more
often by the participants from the CTSS-only group are:
1) Convolution and multiplication are interchangeable (SA1)
2) Concept of time-invariance of a system is interchangeable with the literal meaning of
time invariance (SA2)
Figure 4.17 shows that the normalized proportion of number of problematic
reasonings used more often by the participants in the CTSS-plus group are:
1) δ(t) or δ(ω) are functions like x(t) which varies according to whatever value t takes on
(SRO2)
2) The product of any function and an impulse function is a constant (SRO3)
3) A constant in the frequency domain means no frequency as it has no ω in it. (FA3)
4) Phase shift means shifting the phase plot of a signal in the frequency domain (FA4)
140
Figure 4.17 shows that the normalized proportion of the number of problematic
reasonings demonstrated almost equally (at least 40% or more often) by both groups are:
1) Any property of a signal is limited within the duration of the signal itself (SRO1)
2) A periodic signal in the time domain is also periodic in the frequency domain (FA1)
3) Signal representation in the time domain is same representation in the frequency
domain (FA2)

141
Figure 4.17. Normalized proportion of a particular problematic reasoning employed by
each group collectively.
0
0.2
0.4
0.6
0.8
1
1.2
Any property of a signal
is limited within the
duration of the signal
δ(t) or δ(ω) are like x(t) Product of an impulse
function with any
function is a constant
CTSS-Only
CTSS-Plus
0
0.2
0.4
0.6
0.8
1
1.2
Periodic in time is
periodic in
frequency too
Signal
representation in
time is same as
signal
representation in
frequency
Constant in
frequency domain
means no
frequency
Phase Shift is shift
in plot of signal in
frequency domain
CTSS-Only
CTSS-Plus
0
0.1
0.2
0.3
0.4
0.5
0.6
0.7
0.8
Convolution & multiplication are
interchangeable
Time-Invariant system means literaly
time-invariant
CTSS-Only
CTSS-Plus
142
The data represented in Figures 4.16 and 4.17 are almost similar. This shows that
the problematic reasonings that are more prevalent in one group (Figure 4.17) are
prevalent among the participants of that group as well (Figure 4.16).
4.4 Additional Findings
The aim of this study was to identify students' reasonings that can cause
difficulties in conceptually learning topics taught in Continuous Time Signals and
Systems courses. These reasonings are presented in section 4.2. These responses were
labeled problematic reasonings because i) they led the participants to give incorrect,
inappropriate, or incomplete responses during the interviews, and ii) the participants were
very clear in describing their thoughts behind these responses. However, there were
several instances in the collected data where the participants' responses were incorrect,
inappropriate, or incomplete but they did not explain their reasonings. These responses
are labeled as mistakes (section 4.4.1) or missing conceptual knowledge (section 4.4.2)
based on the distinction given later in this section. I am presenting the prevalent mistakes
and missing conceptual knowledge from the data as 'additional findings' because in my
opinion prevalence makes them attention worthy for both the instructors and learners of
these courses.
Additionally, the data suggested that in general the participants preferred to solve
a question using mathematical equations as compared to solve by making graphs. I argue
that understanding this general trend is important for design of effective instruction for
this course. The details and examples from data demonstrating this trend are presented in
section 4.4.3.
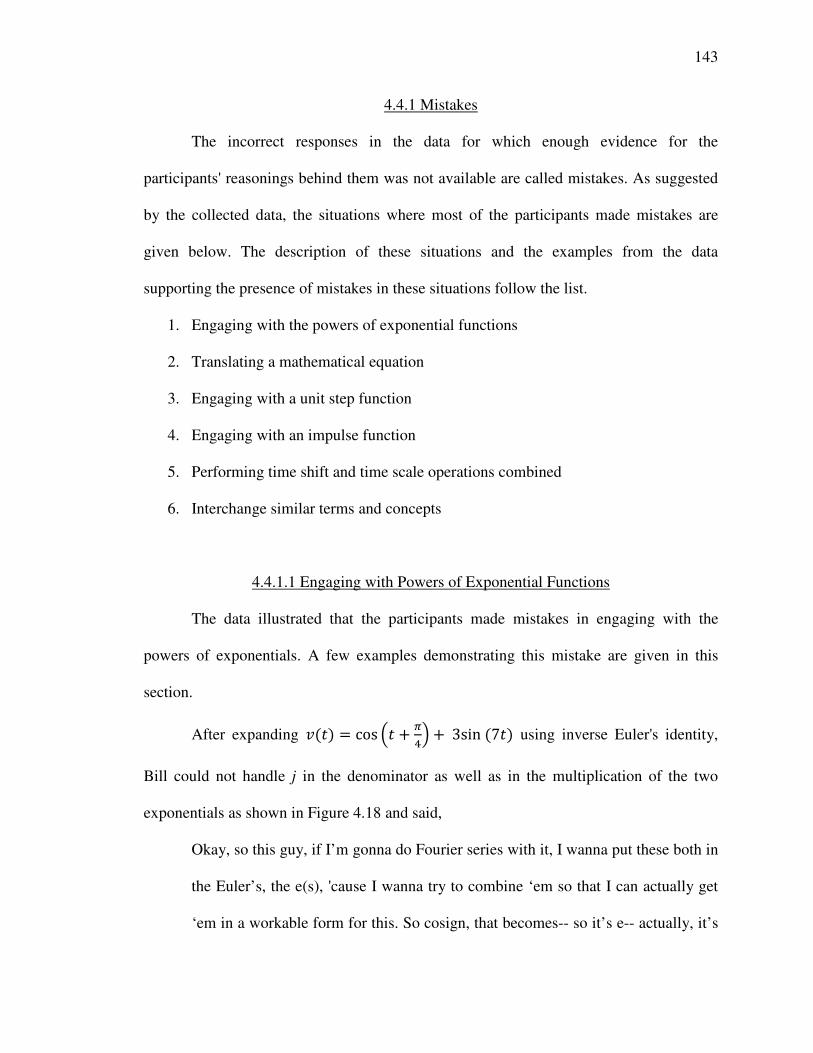
143
4.4.1 Mistakes
The incorrect responses in the data for which enough evidence for the
participants' reasonings behind them was not available are called mistakes. As suggested
by the collected data, the situations where most of the participants made mistakes are
given below. The description of these situations and the examples from the data
supporting the presence of mistakes in these situations follow the list.
1. Engaging with the powers of exponential functions
2. Translating a mathematical equation
3. Engaging with a unit step function
4. Engaging with an impulse function
5. Performing time shift and time scale operations combined
6. Interchange similar terms and concepts
4.4.1.1 Engaging with Powers of Exponential Functions
The data illustrated that the participants made mistakes in engaging with the
powers of exponentials. A few examples demonstrating this mistake are given in this
section.
After expanding �(�) = cos A� + </B + 3sin(7�) using inverse Euler's identity,
Bill could not handle j in the denominator as well as in the multiplication of the two
exponentials as shown in Figure 4.18 and said,
Okay, so this guy, if I’m gonna do Fourier series with it, I wanna put these both in
the Euler’s, the e(s), 'cause I wanna try to combine ‘em so that I can actually get
‘em in a workable form for this. So cosign, that becomes-- so it’s e-- actually, it’s

144
on the back here. Just to make sure I’m not doing it wrong. Well, I thought it was
on the back. Nope it’s not. Okay, from what I remember-- I’m trying to
remember what I do with the pi over 4. All right-- man, I don’t know what I’m
drawing <inaudible> here. Sometimes I just need to-- all right. So cosign, I know,
it’s e j positive plus e to the negative j, all over 2. So then the t, since it’s just one,
that’s why you just have j. The cosign of pi/ 4, I’m pretty sure it just goes back to,
like-- even looking at this table I think it’s just the shift. So it’d just be like e to
the j pi over 4 on the outside. That’s the part I’m struggling with right there. I
don’t quite remember what you do with the pi over 4. But then for the sign, it’s 3
and then it’s times all of the e to the ... Caught that. E to the j 7-- well, I guess--
what I need. I’m thinking now do any of the t still? I’m kinda just like dropping it.
But-- or would it change? I’m gonna assume later I’m gonna need the t but I’ll
finish this. And then so sign is e to the minus j 7 all over 2 j. From there I’m
gonna try to combine ‘em. Solve the point of putting in this form so that you can
kinda reduce ‘em all down together. Yeah, so you have-- trying to think of the t.
Right now, yeah, right now I’m just-- I’m thinking, when I put it in, 'cause it’s on
one-- I’m trying to get it so I can use this form for the Fourier series. And the a of
k is my omega 2 and then I wanna find the phase. So I wanna get it into a form
that I can multiply these through and then actually take the integral. J of k, omega
naught t. I--yeah, I’m ma leave it like this. This is fine. And then I’m gonna-- so
I’m gonna try to simplify a little bit how-- well, I mean, I guess this one, when I
pull this out, you coulda left that in-- 2 <inaudible>. J of 1 plus pi over 4. 'cause
they just add. And this coulda been e to the j negative 1 plus pi over 4. This is
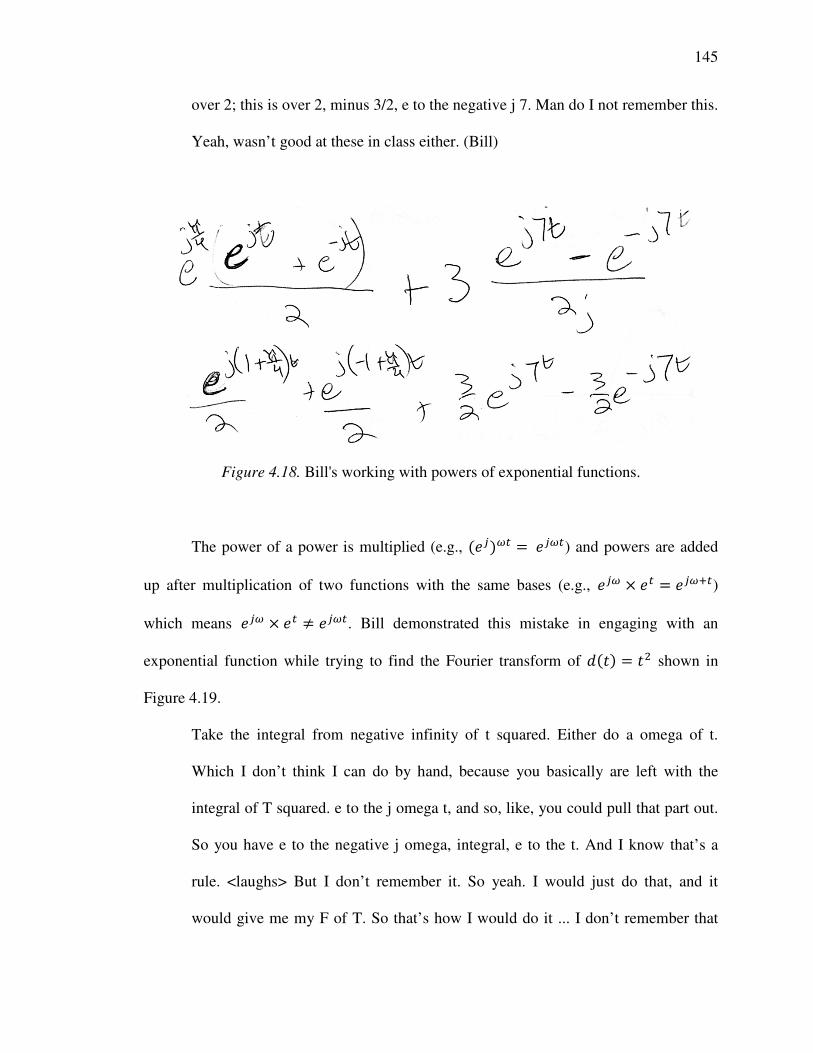
145
over 2; this is over 2, minus 3/2, e to the negative j 7. Man do I not remember this.
Yeah, wasn’t good at these in class either. (Bill)
Figure 4.18. Bill's working with powers of exponential functions.
The power of a power is multiplied (e.g., (�")#$ =�"#$) and powers are added
up after multiplication of two functions with the same bases (e.g., �"# × �$ = �"#4$) which means �"# × �$ ≠ �"#$. Bill demonstrated this mistake in engaging with an
exponential function while trying to find the Fourier transform of %(�) = �. shown in
Figure 4.19.
Take the integral from negative infinity of t squared. Either do a omega of t.
Which I don’t think I can do by hand, because you basically are left with the
integral of T squared. e to the j omega t, and so, like, you could pull that part out.
So you have e to the negative j omega, integral, e to the t. And I know that’s a
rule. <laughs> But I don’t remember it. So yeah. I would just do that, and it
would give me my F of T. So that’s how I would do it ... I don’t remember that
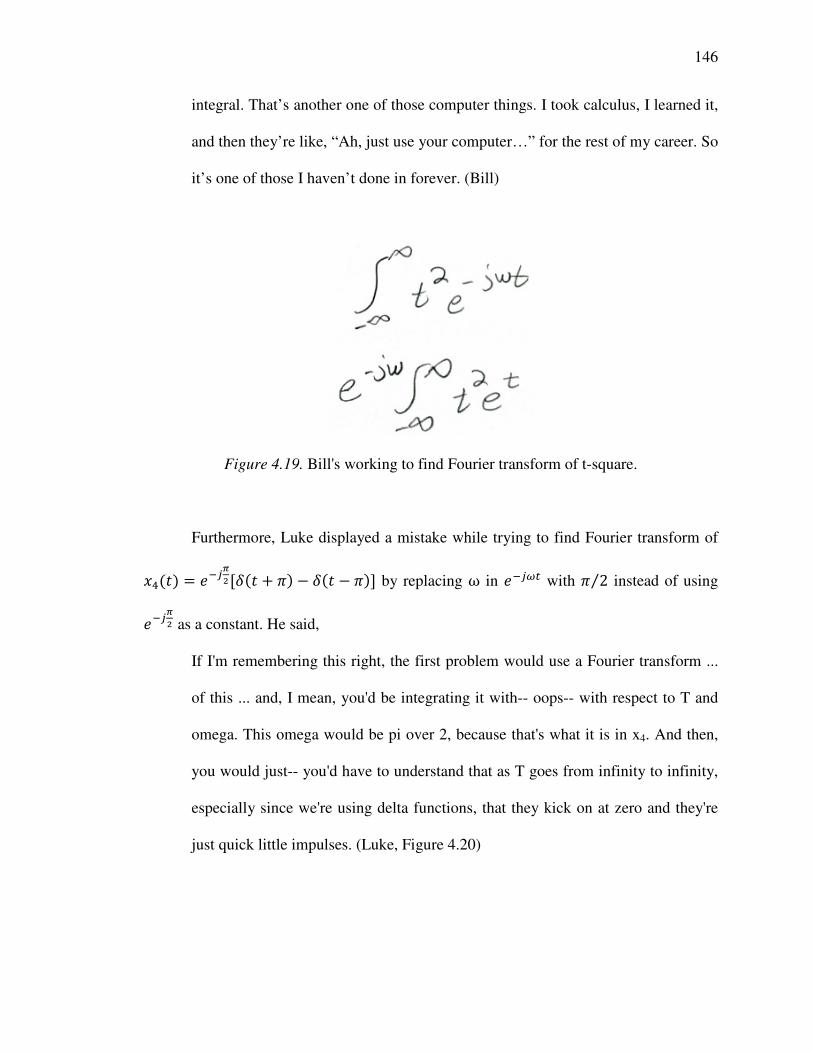
146
integral. That’s another one of those computer things. I took calculus, I learned it,
and then they’re like, “Ah, just use your computer…” for the rest of my career. So
it’s one of those I haven’t done in forever. (Bill)
Figure 4.19. Bill's working to find Fourier transform of t-square.
Furthermore, Luke displayed a mistake while trying to find Fourier transform of
�/(�) = �!"67[�(� + �) − �(� − �)] by replacing ω in �!"#$ with � 2⁄ instead of using
�!"67 as a constant. He said,
If I'm remembering this right, the first problem would use a Fourier transform ...
of this ... and, I mean, you'd be integrating it with-- oops-- with respect to T and
omega. This omega would be pi over 2, because that's what it is in x4. And then,
you would just-- you'd have to understand that as T goes from infinity to infinity,
especially since we're using delta functions, that they kick on at zero and they're
just quick little impulses. (Luke, Figure 4.20)
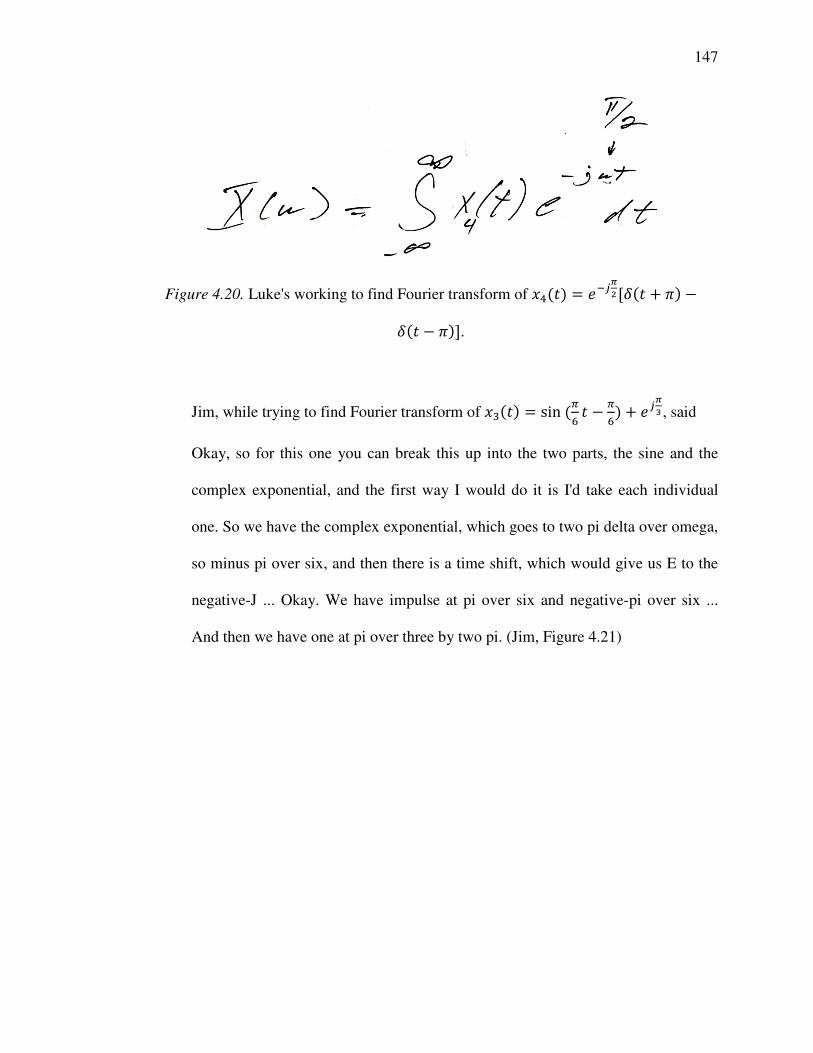
147
Figure 4.20. Luke's working to find Fourier transform of �/(�) = �!"67[�(� + �) −�(� − �)].
Jim, while trying to find Fourier transform of �G(�) = sin(<H � −<H) + �"6I , said
Okay, so for this one you can break this up into the two parts, the sine and the
complex exponential, and the first way I would do it is I'd take each individual
one. So we have the complex exponential, which goes to two pi delta over omega,
so minus pi over six, and then there is a time shift, which would give us E to the
negative-J ... Okay. We have impulse at pi over six and negative-pi over six ...
And then we have one at pi over three by two pi. (Jim, Figure 4.21)
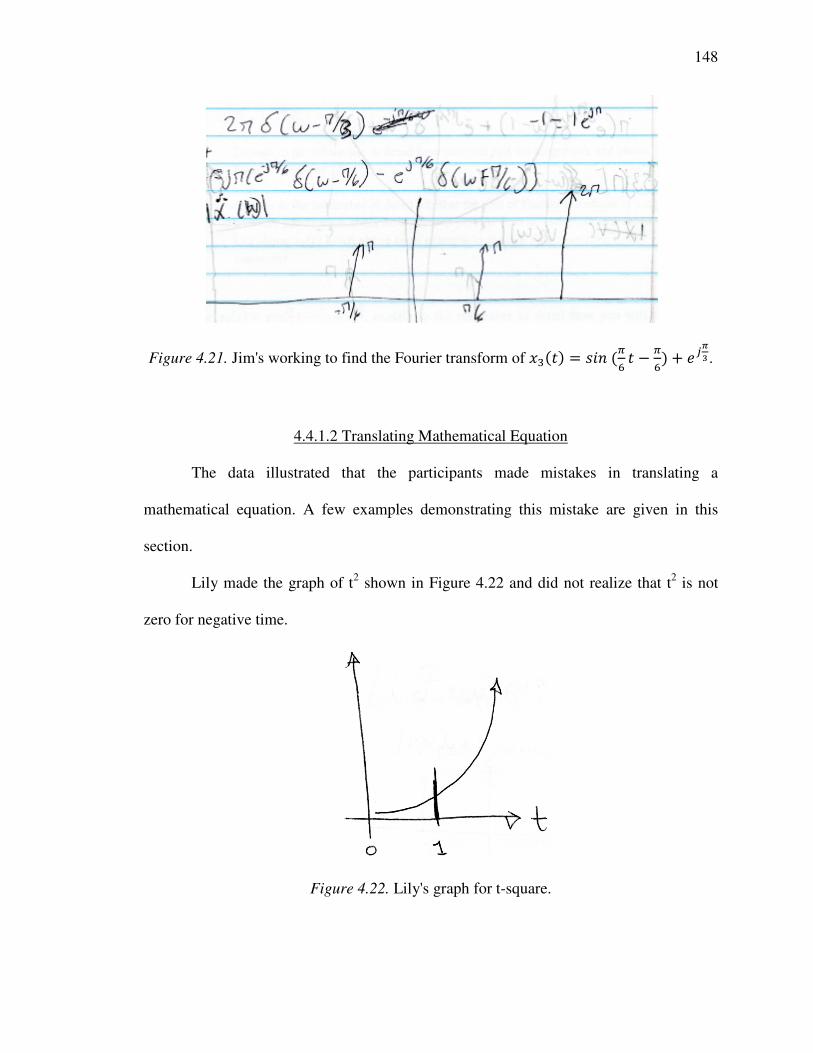
148
Figure 4.21. Jim's working to find the Fourier transform of �G(�) = ���(<H � −<H) + �"6I .
4.4.1.2 Translating Mathematical Equation
The data illustrated that the participants made mistakes in translating a
mathematical equation. A few examples demonstrating this mistake are given in this
section.
Lily made the graph of t2 shown in Figure 4.22 and did not realize that t2 is not
zero for negative time.
Figure 4.22. Lily's graph for t-square.

149
Furthermore, the participants were asked to plot the integral of a rectangular
function (Figure 4.8) and explain if the plot of the area of the rectangular function helps
in determining the plot of area under a periodic rectangular function (Figure 4.8). The
correct response was that the area of each rectangle in the periodic signal would be added
up with the areas of the rectangles before that and the plot of area of a periodic
rectangular function will not be periodic. The plots of the area under the periodic
rectangular function drawn by Carl and Matt are shown in Figure 4.23.
Figure 4.23. Area under a periodic rectangular function drawn by Matt (left) and Carl
(right).
Erin correctly identified how he can use the plot of area under the aperiodic
rectangular function to plot the area under the periodic rectangular function, but he failed
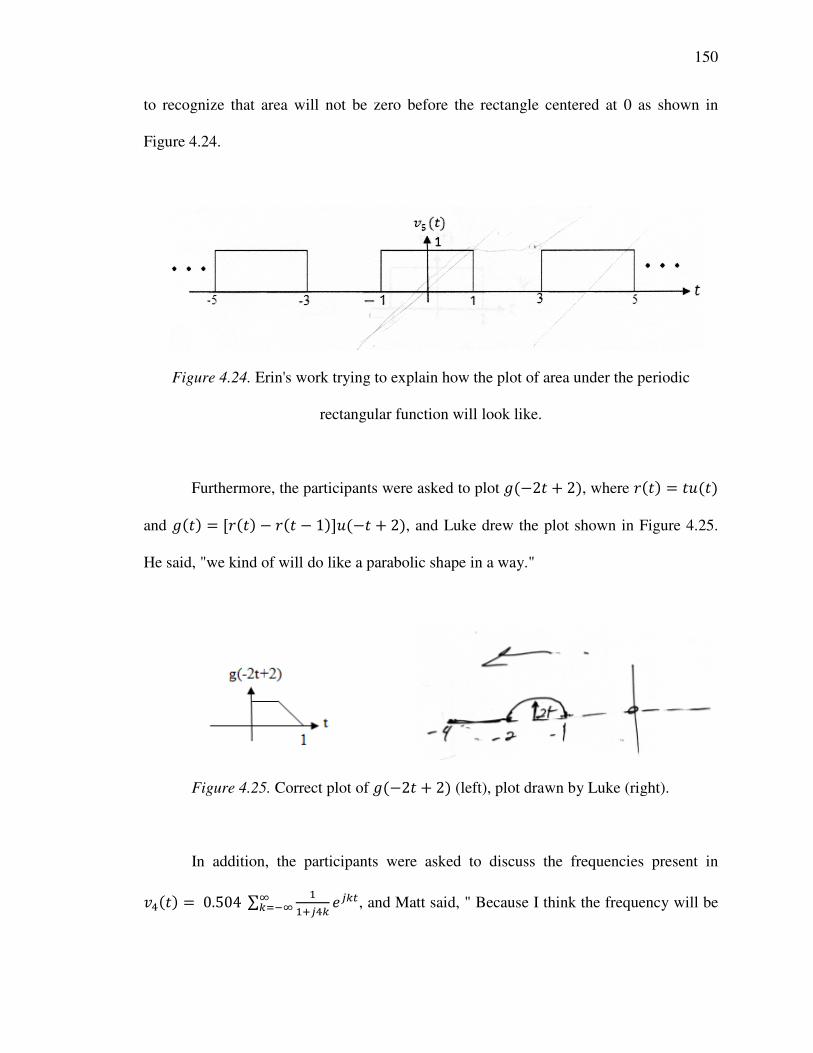
150
to recognize that area will not be zero before the rectangle centered at 0 as shown in
Figure 4.24.
Figure 4.24. Erin's work trying to explain how the plot of area under the periodic
rectangular function will look like.
Furthermore, the participants were asked to plot �(−2� + 2), where J(�) = � (�) and �(�) = [J(�) − J(� − 1)] (−� + 2), and Luke drew the plot shown in Figure 4.25.
He said, "we kind of will do like a parabolic shape in a way."
Figure 4.25. Correct plot of �(−2� + 2) (left), plot drawn by Luke (right).
In addition, the participants were asked to discuss the frequencies present in
�/(�) = 0.504∑ 334"/5 �"5$&5)!& , and Matt said, " Because I think the frequency will be
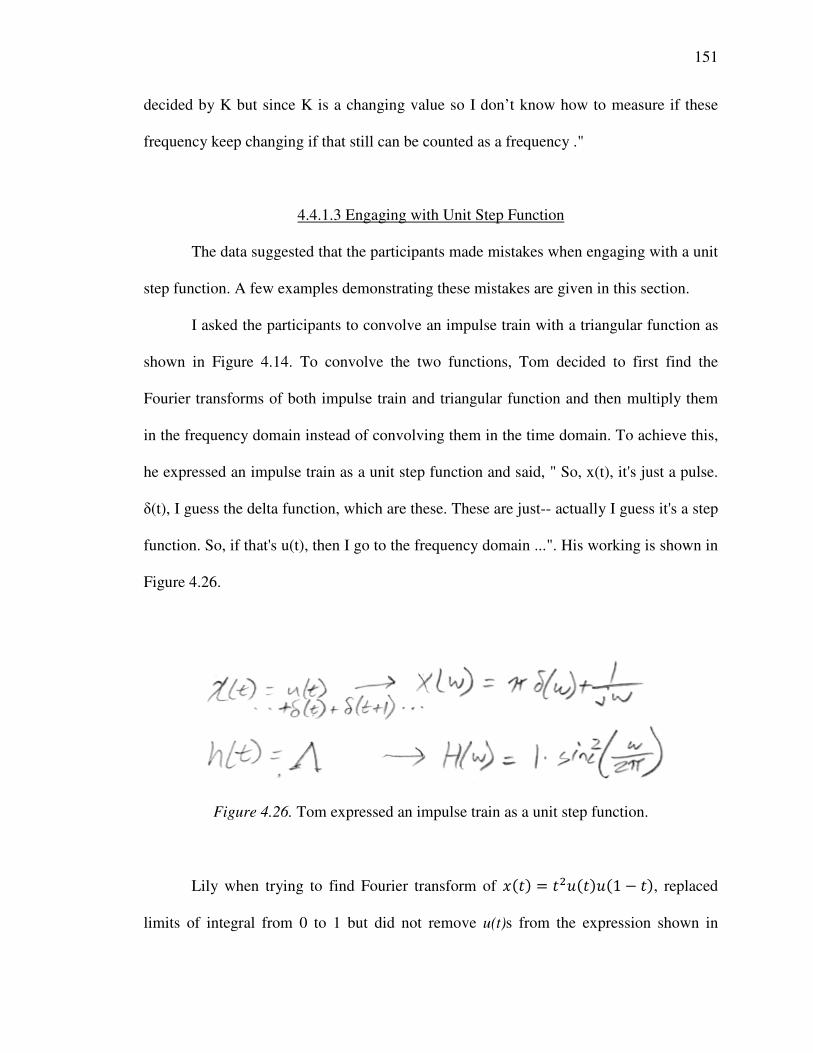
151
decided by K but since K is a changing value so I don’t know how to measure if these
frequency keep changing if that still can be counted as a frequency ."
4.4.1.3 Engaging with Unit Step Function
The data suggested that the participants made mistakes when engaging with a unit
step function. A few examples demonstrating these mistakes are given in this section.
I asked the participants to convolve an impulse train with a triangular function as
shown in Figure 4.14. To convolve the two functions, Tom decided to first find the
Fourier transforms of both impulse train and triangular function and then multiply them
in the frequency domain instead of convolving them in the time domain. To achieve this,
he expressed an impulse train as a unit step function and said, " So, x(t), it's just a pulse.
δ(t), I guess the delta function, which are these. These are just-- actually I guess it's a step
function. So, if that's u(t), then I go to the frequency domain ...". His working is shown in
Figure 4.26.
Figure 4.26. Tom expressed an impulse train as a unit step function.
Lily when trying to find Fourier transform of �(�) = �. (�) (1 − �), replaced
limits of integral from 0 to 1 but did not remove u(t)s from the expression shown in
152
Figure 4.27. Because of unit step functions still in the integral she later could not solve
the integral.
Figure 4.27. Lily's working of using unit step functions inside an integral.
4.4.1.4 Engaging with Impulse Function
The collected data demonstrated that the participants made mistakes when
engaging with an impulse function. A few examples demonstrating these mistakes are
given in this section. The participants were asked to explain the Fourier transform of
%(�) = �. and then Fourier transform of �(�) = �.�(� − 1). A few responses are:
The delta just moves the t2 functions. So whatever you had for t2 it would be
moved to-- that’s what it is in frequency ... That and the time domain the delta
goes to and the frequency domain a constant. And it’s got the shift, though. It’s
got a shift of one and it’s a constant times whatever the t2 is. So it should be the
transform of t2, shifted by one and then multiplied by a constant. (Megan)
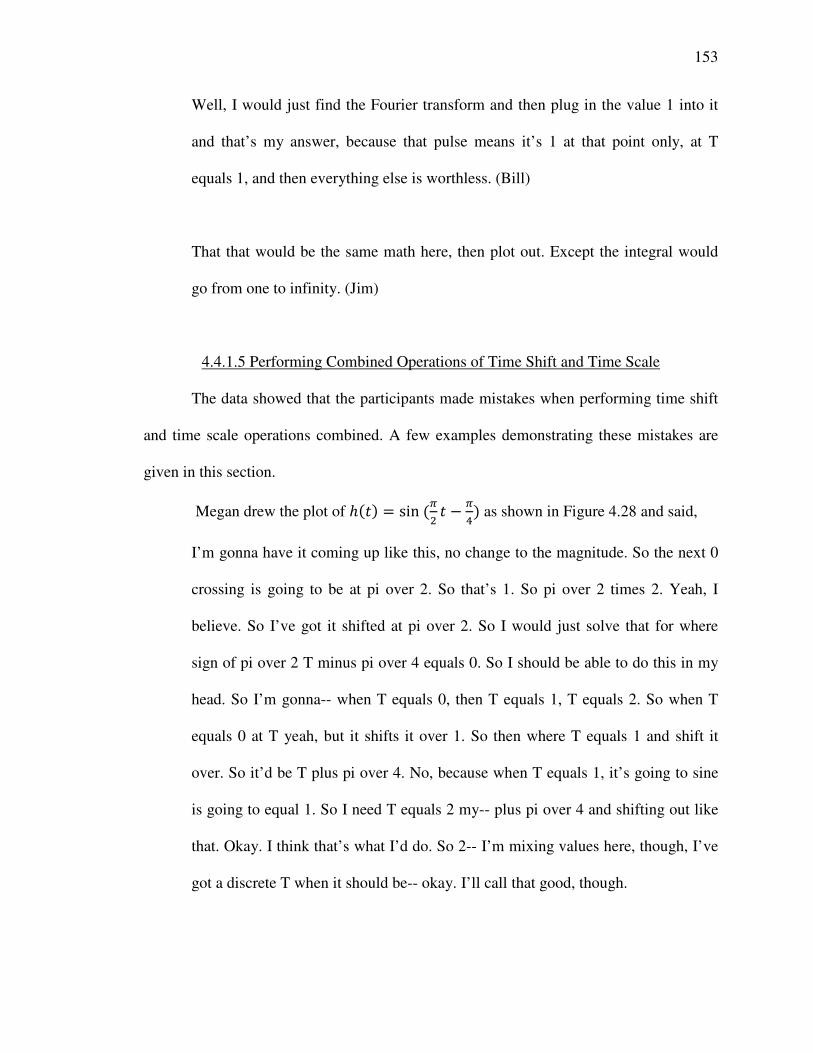
153
Well, I would just find the Fourier transform and then plug in the value 1 into it
and that’s my answer, because that pulse means it’s 1 at that point only, at T
equals 1, and then everything else is worthless. (Bill)
That that would be the same math here, then plot out. Except the integral would
go from one to infinity. (Jim)
4.4.1.5 Performing Combined Operations of Time Shift and Time Scale
The data showed that the participants made mistakes when performing time shift
and time scale operations combined. A few examples demonstrating these mistakes are
given in this section.
Megan drew the plot of ℎ(�) = sin(<. � −</) as shown in Figure 4.28 and said,
I’m gonna have it coming up like this, no change to the magnitude. So the next 0
crossing is going to be at pi over 2. So that’s 1. So pi over 2 times 2. Yeah, I
believe. So I’ve got it shifted at pi over 2. So I would just solve that for where
sign of pi over 2 T minus pi over 4 equals 0. So I should be able to do this in my
head. So I’m gonna-- when T equals 0, then T equals 1, T equals 2. So when T
equals 0 at T yeah, but it shifts it over 1. So then where T equals 1 and shift it
over. So it’d be T plus pi over 4. No, because when T equals 1, it’s going to sine
is going to equal 1. So I need T equals 2 my-- plus pi over 4 and shifting out like
that. Okay. I think that’s what I’d do. So 2-- I’m mixing values here, though, I’ve
got a discrete T when it should be-- okay. I’ll call that good, though.
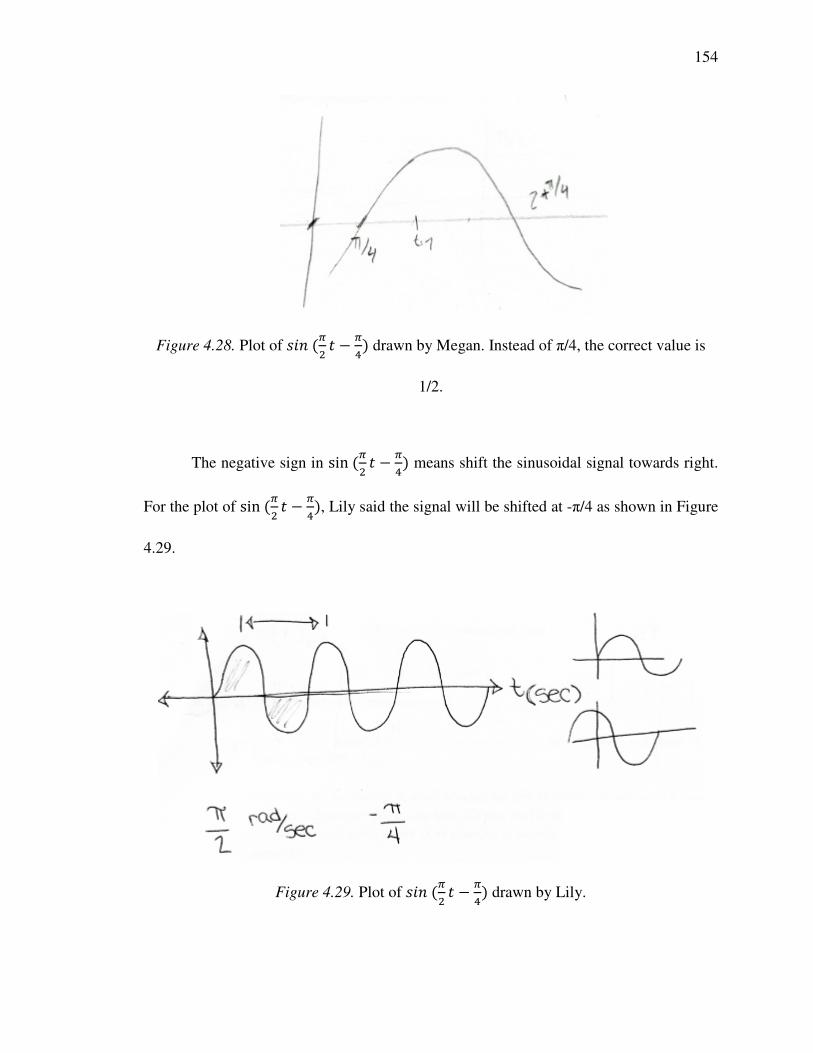
154
Figure 4.28. Plot of ���(<. � −</) drawn by Megan. Instead of π/4, the correct value is
1/2.
The negative sign in sin(<. � −</) means shift the sinusoidal signal towards right.
For the plot of sin(<. � −</), Lily said the signal will be shifted at -π/4 as shown in Figure
4.29.
Figure 4.29. Plot of ���(<. � −</) drawn by Lily.
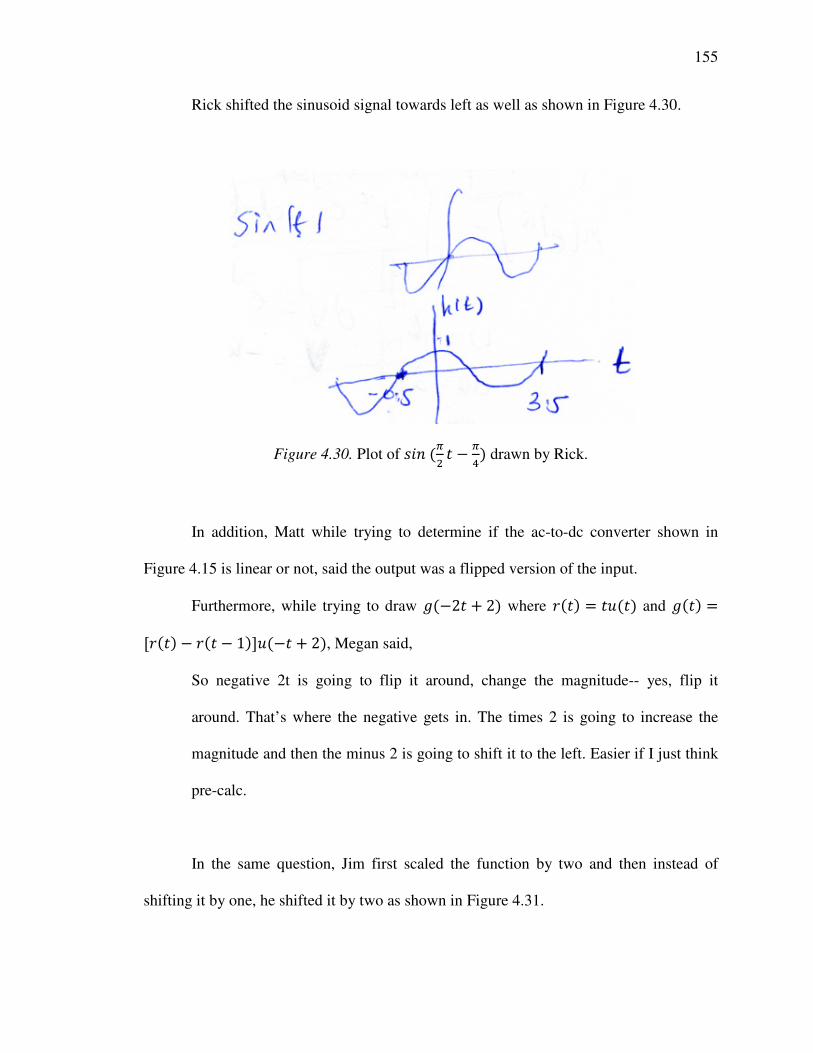
155
Rick shifted the sinusoid signal towards left as well as shown in Figure 4.30.
Figure 4.30. Plot of ���(<. � −</) drawn by Rick.
In addition, Matt while trying to determine if the ac-to-dc converter shown in
Figure 4.15 is linear or not, said the output was a flipped version of the input.
Furthermore, while trying to draw �(−2� + 2) where J(�) = � (�) and �(�) =[J(�) − J(� − 1)] (−� + 2), Megan said,
So negative 2t is going to flip it around, change the magnitude-- yes, flip it
around. That’s where the negative gets in. The times 2 is going to increase the
magnitude and then the minus 2 is going to shift it to the left. Easier if I just think
pre-calc.
In the same question, Jim first scaled the function by two and then instead of
shifting it by one, he shifted it by two as shown in Figure 4.31.
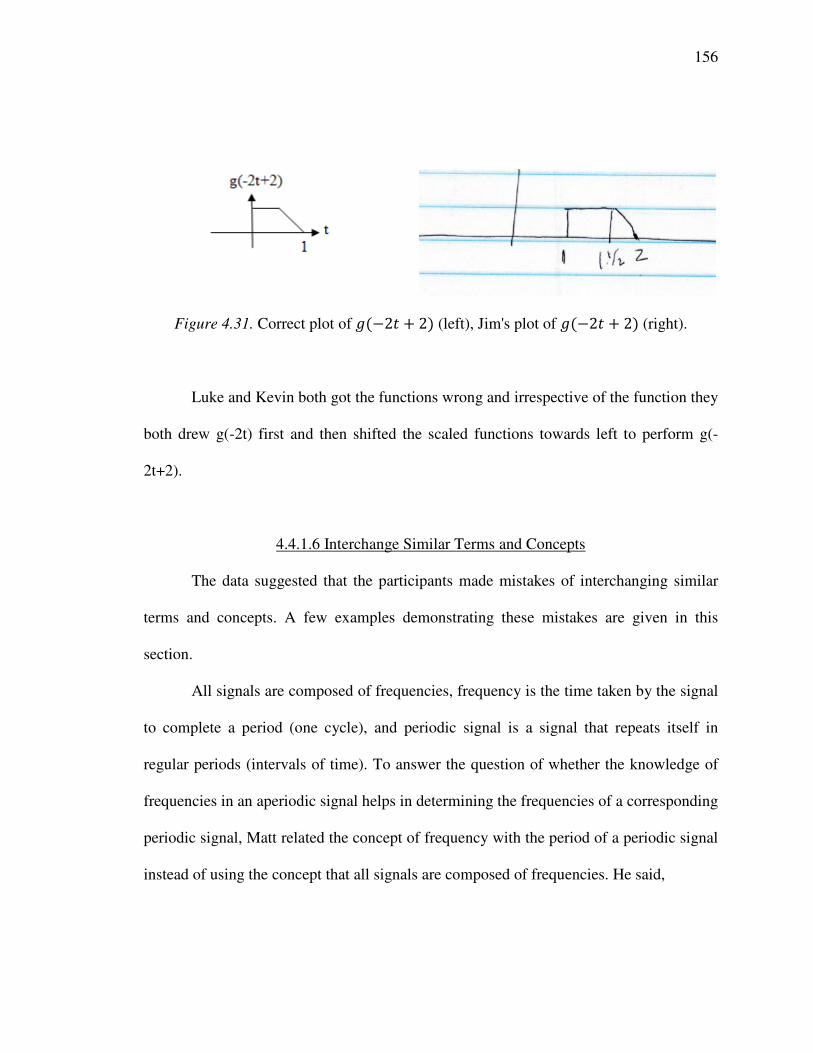
156
Figure 4.31. Correct plot of �(−2� + 2) (left), Jim's plot of �(−2� + 2) (right).
Luke and Kevin both got the functions wrong and irrespective of the function they
both drew g(-2t) first and then shifted the scaled functions towards left to perform g(-
2t+2).
4.4.1.6 Interchange Similar Terms and Concepts
The data suggested that the participants made mistakes of interchanging similar
terms and concepts. A few examples demonstrating these mistakes are given in this
section.
All signals are composed of frequencies, frequency is the time taken by the signal
to complete a period (one cycle), and periodic signal is a signal that repeats itself in
regular periods (intervals of time). To answer the question of whether the knowledge of
frequencies in an aperiodic signal helps in determining the frequencies of a corresponding
periodic signal, Matt related the concept of frequency with the period of a periodic signal
instead of using the concept that all signals are composed of frequencies. He said,

157
"I don't think its helpful because one is periodic, the other is not periodic; they
cannot be compared ... the way how you repeat it is actually the frequency of this
one ... So if it’s not periodic it doesn’t have a frequency. But the periodic will
have one so they cannot be compared and it doesn’t help to get a frequency off the
periodic function"
Moreover, to plot the area (and nothing related to Fourier series or transform)
under a periodic signal with the help of the area under its corresponding aperiodic signal
shown in Figure 4.8, the participants used the formula of Fourier series coefficient Ao
(Fourier series being completely unrelated in this question) instead of simple integration .
Matt said,
"Oh since this one’s a periodic, the graph of s1(t) is a straight line. So this one’s
supposed to be a straight line too because it’s kind of like say a series graph so we
only focus on one period of it. So I think we don’t actually need to care about the
others. We just need to probably make a comment and say this one is a series."
Emily said,
"If this is periodic it would be the same thing as s1(t) but just repeated, so again if
I did the integration I would only pick one area. So whether I did it from negative
five to negative three or negative one to one, I would still get the same answer of
the amplitude of two, so then I would just go from one to negative one up twice,
and then three to five up two and go on forever."
158
4.4.2 Missing Conceptual Knowledge
This study is based on a constructivist framework and had no objective to analyze
the data from a post-positivist perspective. However, there were many examples in the
data where I speculated that solving the problem at hand with the use of some relevant
conceptual knowledge would have made the participants' approaches more successful.
For the scope of this study, I am calling missing conceptual knowledge as the knowledge
that was not evident in the participants' responses. This section presents examples of
missing conceptual knowledge identified from the collected data. As the examples in this
section will demonstrate, this lack of knowledge was evidenced from 1) the participants'
confrontation about the lack of their knowledge when they were prompted to explain
their responses, or 2) the responses that suggested failure to appeal to some useful
knowledge to correctly answer the given question. The list of the missing conceptual
knowledge illustrated in the data is given below. The details of each along with the
examples from the collected data follow.
1. Difference in the use of graphical representations of discrete and continuous
impulse functions
2. Conceptual understanding of Fourier Analysis
3. Ability to translate a function from one representation to another
4.4.2.1 Difference in Use of Graphical Representations of Discrete and Continuous
Impulse Functions
The data suggested that the participants lacked the knowledge of the difference in
the use of the graphical representations of the discrete and continuous impulse functions.
159
During the interviews whenever the participants used any one type, I asked them to
explain their choice to use that particular representation of the impulse function.
Following are some examples from the responses received:
I don’t know. It’s kind of hard to explain when you use them. This one’s--
supposedly goes up to infinity, and then the value given here is the area of it. And
then this one has a certain height. These are used any time you have the delta
function, and these are when you have a constant, I guess. (Lily)
Jake said, "I don’t know. I sometimes use this, sometimes use this one."
Rick said, "Yeah, just to show that impulse is the infinitely high, right, so just to
show that, we put an arrow. And if you have just value, you put a lollipop thing."
Jim said, "These would also change to bubbles if we're doing the Fourier series,
because the impulses we use would've transformed to-- and the bubbles we use with a
series because the bubble is a height, but the impulse is an area."
"I don’t-- I didn’t-- I just picked one. I didn’t actually put much thought into it. I
always forget that impulses are arrows and then discreet time is circles. So I
guess, in this case, it would be an arrow because these are impulses. I picked
circle just kinda arbitrarily. That was-- there was no thought into that. I think it
was just habit of putting a bulb" (Bill)
160
Paul said, "Think that’s just personal preference."
Mark said, "I'm not sure. I just-- yeah, so ... I guess it was-- yeah. I don't know. I
guess here, I would probably ... I'd probably do this for this one. But, yeah, I don't know."
4.4.2.2 Conceptual Understanding of Fourier Analysis
The responses of the students revealed that the participants leaned towards
performing Fourier analysis using either commonly used Fourier transform pairs given in
the Fourier transform table or through integration. The collected data suggested that the
participants displayed lack of acumen in Fourier analysis of a signal when they were
encountered with a signal, which was not easy to analyze through any of these two
preferred methods. Some missing knowledge related to Fourier analysis as illustrated by
the data is:
1. Ability to recognize that a function originally expressed in the form of sinusoids
or exponentials is already expressed in the form of Fourier series or transform
2. Knowledge of the units of Fourier series and transform
3. Ability to identify that the Fourier transform of a signal may not exist
4. Ability to identify that Fourier series of an aperiodic signal does not exist
The description of the above-mentioned missing knowledge related to Fourier
analysis and examples from the collected data are presented below.
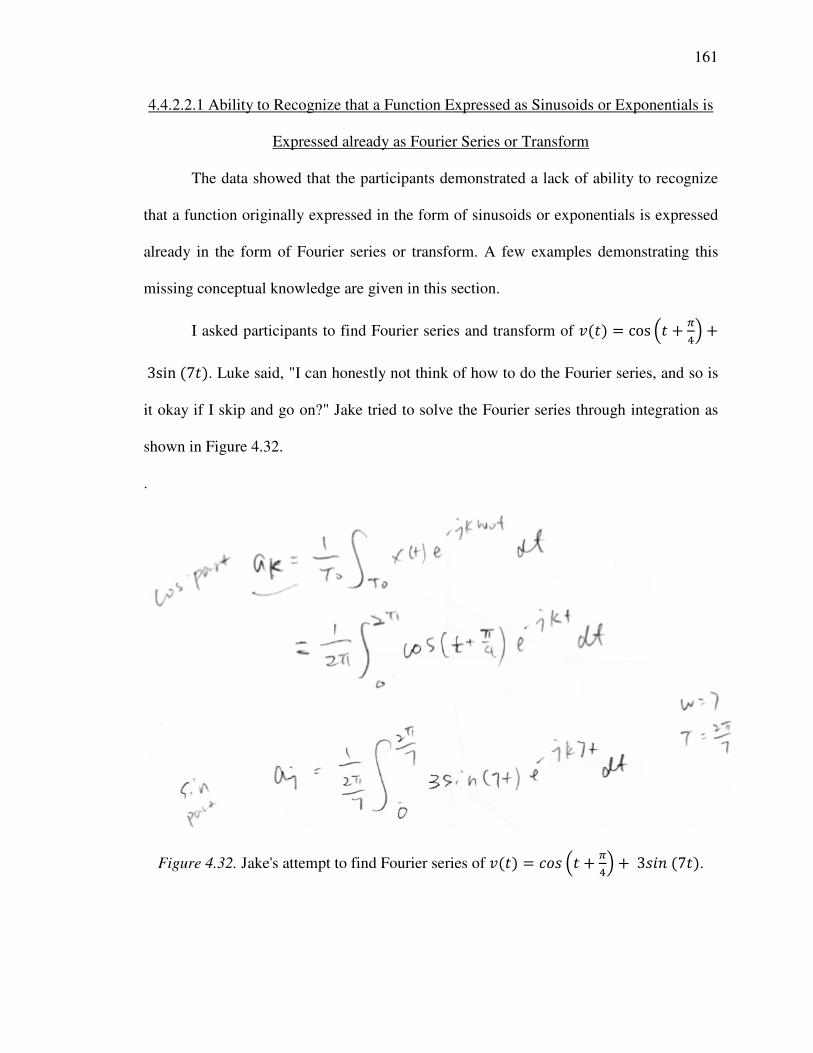
161
4.4.2.2.1 Ability to Recognize that a Function Expressed as Sinusoids or Exponentials is
Expressed already as Fourier Series or Transform
The data showed that the participants demonstrated a lack of ability to recognize
that a function originally expressed in the form of sinusoids or exponentials is expressed
already in the form of Fourier series or transform. A few examples demonstrating this
missing conceptual knowledge are given in this section.
I asked participants to find Fourier series and transform of �(�) = cos A� + </B +
3sin(7�). Luke said, "I can honestly not think of how to do the Fourier series, and so is
it okay if I skip and go on?" Jake tried to solve the Fourier series through integration as
shown in Figure 4.32.
.
Figure 4.32. Jake's attempt to find Fourier series of �(�) = ��� A� + </B + 3���(7�).
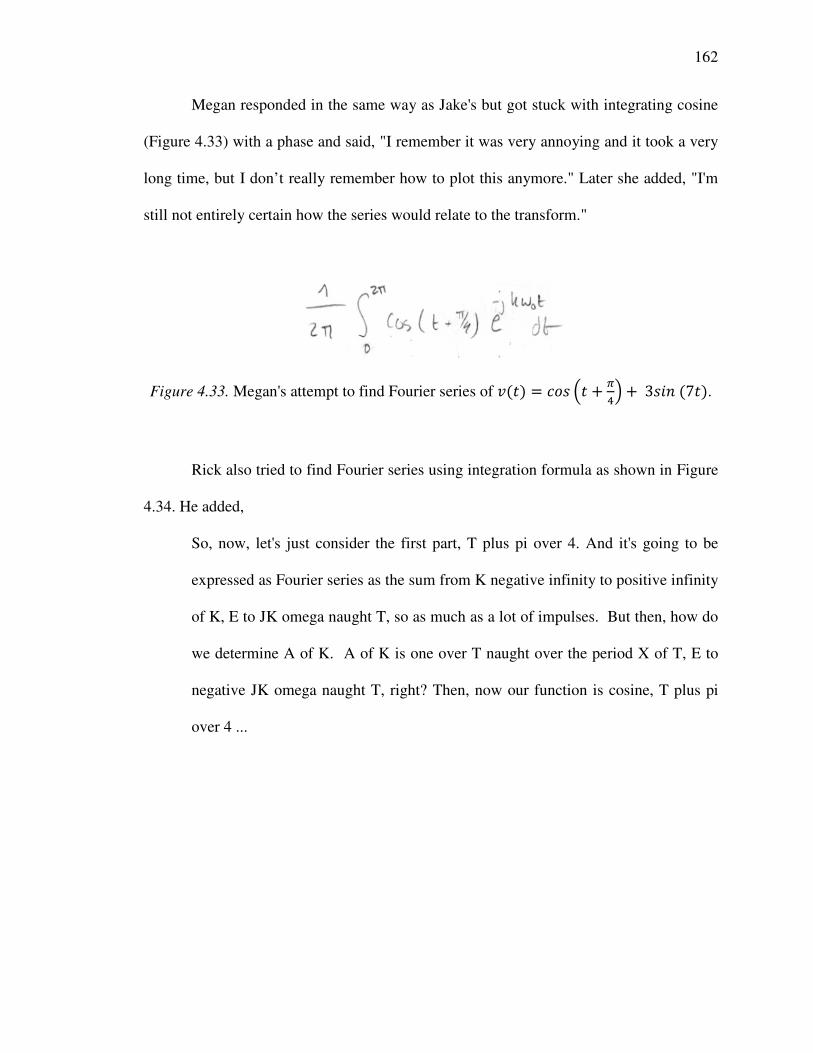
162
Megan responded in the same way as Jake's but got stuck with integrating cosine
(Figure 4.33) with a phase and said, "I remember it was very annoying and it took a very
long time, but I don’t really remember how to plot this anymore." Later she added, "I'm
still not entirely certain how the series would relate to the transform."
Figure 4.33. Megan's attempt to find Fourier series of �(�) = ��� A� + </B + 3���(7�).
Rick also tried to find Fourier series using integration formula as shown in Figure
4.34. He added,
So, now, let's just consider the first part, T plus pi over 4. And it's going to be
expressed as Fourier series as the sum from K negative infinity to positive infinity
of K, E to JK omega naught T, so as much as a lot of impulses. But then, how do
we determine A of K. A of K is one over T naught over the period X of T, E to
negative JK omega naught T, right? Then, now our function is cosine, T plus pi
over 4 ...
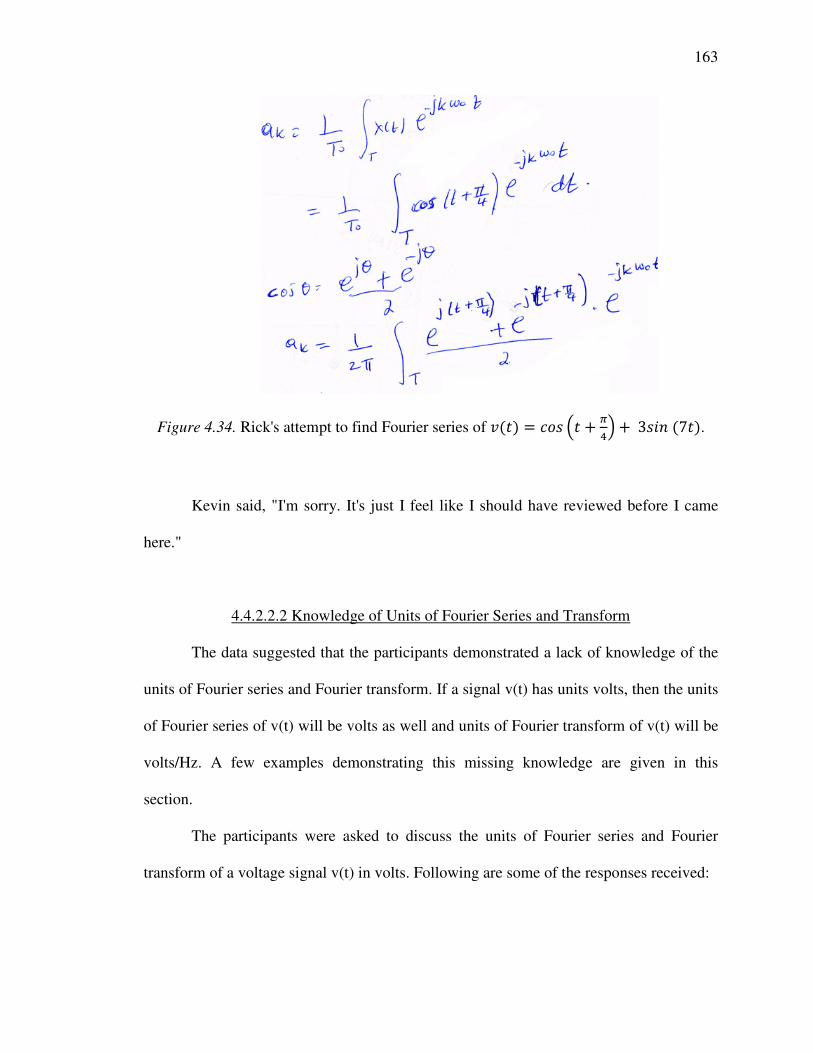
163
Figure 4.34. Rick's attempt to find Fourier series of �(�) = ��� A� + </B + 3���(7�).
Kevin said, "I'm sorry. It's just I feel like I should have reviewed before I came
here."
4.4.2.2.2 Knowledge of Units of Fourier Series and Transform
The data suggested that the participants demonstrated a lack of knowledge of the
units of Fourier series and Fourier transform. If a signal v(t) has units volts, then the units
of Fourier series of v(t) will be volts as well and units of Fourier transform of v(t) will be
volts/Hz. A few examples demonstrating this missing knowledge are given in this
section.
The participants were asked to discuss the units of Fourier series and Fourier
transform of a voltage signal v(t) in volts. Following are some of the responses received:
164
I’ve always found I get my units mixed up. There’s been, actually in this class
too, plenty of times on the test I get the numbers right and then I don’t know what
units to put on it. I don’t quite remember-- I know they’re different. I know
there’s not, like, your Fourier series, I think, is just volts. And then the Fourier
transform is something else. Like, it’s volts square or it’s something different. But
to look at you and say, like, I’m sure of it? I’m not ... Because the Fourier series is
still in time domain so you haven’t done anything to it. It’s just still-- if this is
volts, then the Fourier series is volts because you’re just looking at the actual
equation, the v(t). But when you take the Fourier transform, you move to the
frequency and I would just assume it’s not the same as just volts. (Bill)
This is unit less ... Because if it has-- this is a complex number, and the units here,
they cancel out, because you cannot calculate something, E to-- when you find the
natural frequency, natural what is the exponent of a number. It should be unit less.
(Rick)
Kevin said, "I think it's just a magnitude. So units of the magnitude as in unit
less?"
For the Fourier transform I think of-- the Fourier transform of v(t) should have
same units as the v(t) ... Because we know that e of j, omega-nought t, because
this part is imaginary so I think it shouldn’t have any unit for it ... Because I don’t
think we can have imaginary volts. (Jake)
165
I guess if, like, taking a step back it’s voltage times time. The Fourier transform
goes between the time domain and the frequency domain. In the frequency
domain, it doesn’t have time, <laughs> because it’s not in the time domain. So a
unit of anything times time doesn’t really make sense. Because this is probably
just supposed to be a really simple question and then I move on from it. The graph
of the Fourier transform shows essentially the magnitude of the signal, whatever
the signal is, at that specific frequency. This being omega. That would be omega.
So I guess in that sense it would make sense that it would just be volts again,
because it’s still just the magnitude of the signal given a specific parameter. And
the same logic would go for the Fourier series as well. It would just be volts.
(Ryan)
4.4.2.2.3 Ability to Identify that Fourier Transform of a Signal may not Exist
The data showed that the participants demonstrated a lack of ability to identify
that Fourier transform of a signal might not exist. A few examples demonstrating this
missing knowledge are given in this section.
During the interviews, nine participants were asked to explain the steps to find
and plot the Fourier transform of %(�) = �.. No one could identify conceptually that
Fourier transform of d(t) would not exist and they all suggested they would find the
Fourier transform through integration. Rick and Luke even solved the whole integration,
found infinity in the answer, but still failed to reach to the right conclusion. Their
responses to infinity were:
166
Positive infinity ... I must have made some mistake, because it's kind of zero.
Okay, if I put positive infinity, right, this would be zero. This would be also zero.
This would be zero. Okay? Minus negative infinity, put zero, zero. I don't want
this. It's positive infinity. You get it to positive infinity here ... I'm checking my
math, if I make any mistakes. (Rick)
But I don’t want to say that omega is just zero, but if it was zero then that makes
this little term one and so then we’re looking at t-squared throughout infinite time,
which kind of blows up. So I feel like there’s another way to really-- to look at it
better. (Luke)
4.4.2.2.4 Ability to Identify that Fourier Series of Aperiodic Signal does not Exist
The data showed that the participants demonstrated a lack of ability to identify
that Fourier series of an aperiodic signal does not exist. A few examples demonstrating
this missing knowledge are given in this section.
An aperiodic signal was shown to ten participants and they were asked to explain
the Fourier series of the signal. No participant was able to tell that the Fourier series
would not exist. Following are some of the responses received:
I'm thinking of like you can take your data, like certain points from that, and build
up a more and more and more exact approach to it. And so, this, the Fourier
transform, tries to find not, you know, the precise to the, you know, millionth
decimal, but like the good, general statement of, you know, this is what, excuse
167
me, this is what the like first initial terms and the Fourier transform-- or the
Fourier series are, sum up to. (Luke)
That’s another that was like I can’t remember which direction it goes but they are
the same signal but off by a constant that-- I feel like it’s either 2 pi or 1 over 2 pi,
one of the two. But it’s the same signal just scaled ... That isn’t the only
difference. I-- the transform is continuous and the series is discontinuous. So the
scaling that I was referring to happens at whole number-- all of the points where
there is a series is just they scaled value of that same point on the continuous
transform. But it’s-- doesn’t have points for the whole transform. (Ryan)
4.4.2.3 Ability to Translate a Function from One Representation to Another
The data suggested that the participants demonstrated a lack of ability to translate
a function from one representation to another. A few examples demonstrating this
missing knowledge are given in this section.
When talking about the relation of the bandwidth of a rectangular function with
its width in time, Justin said,
I’ve always had a little trouble kind of visualizing, seeing the relationship. But I
think through a lot of practice, a lot of work, I think it’s just ingrained. It’s like a
concept. So I’m not able to visually see how they’re related, but maybe that’s just
how I think about the problems ... I forget what the time-- oh, do have this. I think
it’s a sinc square. Yeah. It’s a sinc square. Okay. So I don’t really know what a
sinc square looks like, though. <laughs> I mean, I guess it’s just a sinc square. I
168
guess looking at an easier example, so I think a rectangular pulse is easier to look
at.
Emily while convolving a triangular function with an impulse train said, "I like to
do things graphically and see them. I think that's easier." And she could not solve
graphically and said, "I misdrew that ... And then I would be stumped for a while and
look at it, because I would do the Laplace transforms and do it that way and do H(S)
times X(S), which would actually be just impulses." And she solved the problem
correctly with the use of Laplace transform.
Ryan while explaining a problem said, "The mathematical explanation is
sufficient for me to understand it so I never really looked into it more, I guess."
While trying to find Fourier transform of �G(�) = sin(<H � −<H) + �"6I Jake said,
So basically “j” is useless ... because every component occurs at different
frequency. So the “j” don’t really matter here ... Because for the magnitude we
will take the magnitude. So “j” is gone. We only need this part." And when asked
to give an example where j will matter, he said, "It will be-- for example, if it’s j
sine omega plus cosine omega ... then if we take the magnitude we need to do
this, and so square each part and take the square root. In this case, the “j” matters
because for this case the omega is continuous of other from negative infinity to
infinity. For this case it only occurs at specific frequency.
Matt responded, "Yeah, if I can have the-- actually by math way of these two
functions that would be easier for me". At a different instance, Matt also said, "...when
169
we do the math it’s really-- I think it’s hard to just get the idea from the mathematical
function."
Lily when finding the Fourier transform of t2 said, "So, then, ideally I would just
put that into a Maple or solving thing and then find this"
Well, if this was an honest homework problem, I would be putting this into Maple
to check it, because I'm sorry, calculus is not something I do anymore really.
(Megan)
4.4.3 Mathematical Equations versus Graphs
The data showed that the students preferred to solve a problem using
mathematical equations thinking that any problem is always easiest to solve using
mathematical equations. Participants belonging to the CTSS-only group demonstrated
this perception more often than the participants belonging to the CTSS-plus group did. In
some questions, this perception led the participants to be stuck in lengthy calculations and
stopped them from making conceptual decisions (outside the scope of mathematical
equations) in intermediate steps that could have helped them in successfully solving that
particular question. A few examples are:
Participants were asked to convolve an impulse train with a triangular function
shown in Figure 4.14. A few responses are:
If I’m going to plot y(t) I will try to transfer h(t) and x(t) to actually function so I
can just use the math methods to get y(t) and plot them out and plot the y(t) ...
170
actually by math way of these two functions that would be easier for me ... If we
can have a math to describe these two functions. (Matt)
When we were starting to learn Fourier transforms, the convolution rule was
taught to us that, okay, if we had y(t) as equal to x(t) convoluted with h(t), you do
that in the frequency domain and Y(ω) is going to be equal to X(ω) times H(ω).
And if we can figure out the X(ω) and H(ω), it's a lot easier to multiply than to
convolute, because this involves that with whatever we put in there. And this just
involves multiplying two signals. And a lot of the times, if you don't have
something-- if we don't have anything as complex as this where we have multiple
functions based on omega, then it may be easier to revert back to the time domain
with simple signals. But when I did this, I started confusing myself and talking in
circles. (Tom)
Erin said, "I would probably do it mathematically and find the actual equation for
what I have to use to plot that." Erin was able to solve the problem correctly through
mathematical equations.
For length of a triangular function in the time domain, Emily said,
See, I never really think of it that way, to be honest. I don't look at a signal and
then-- I would just do the Fourier transform, but I feel like that's been a lot more
memorization and just doing problems over and over. I honestly don't ever look at
171
a signal and go "Oh." I mean, if I saw the triangle it would be like "Oh, that's a
sync squared," but I don't convert them in my head.
4.5 Summary
The findings of this study were presented in this chapter as problematic
reasonings (section 4.2), mistakes (section 4.4.1), and missing conceptual knowledge
(section 4.4.2). These findings are summarized in Table 4.2. The problematic reasonings
in section 4.2 were categorized under three main content areas of Continuous Time
Signals and Systems course content. The mistakes and missing conceptual knowledge are
categorized into the same three content areas in Table 4.2.

172
Table 4.2. Summary of Findings Categorized under the Three Main Content Areas
Problematic Reasonings Mistakes
Missing Conceptual Knowledge
Sig
nal
s R
epre
sen
tati
on
s an
d O
per
atio
ns 1. Any property of a signal is
limited within the duration of the signal itself.
2. δ(t) or δ(ω) are functions like x(t) which varies according to whatever value t takes on. (CTSS-plus)
3. The product of any function and an impulse function is a constant. (CTSS-plus)
1. Engaging with the powers of exponential functions
2. Translating a mathematical equation
3. Engaging with a unit step function
4. Engaging with an impulse function
5. Performing time shift and time scale operations combined
6. Interchange similar terms and concepts
1. Difference in the use of graphical representations of the discrete and continuous impulse functions
2. Ability to translate a function from one representation to another
Fre
qu
ency
An
aly
sis
1. A periodic signal in the time domain is also periodic in the frequency domain.
2. Signal representation in the time domain is same representation in the frequency domain.
3. A constant in the frequency domain means no frequency as it has no ω in it. (CTSS-plus)
4. Phase shift means shifting the phase plot of a signal in the frequency domain. (CTSS-plus)
1. Interchange similar terms and concepts
1. Conceptual understanding of Fourier Analysis
Sy
stem
A
nal
ysi
s
1. Convolution and multiplication are interchangeable. (CTSS-only)
2. Concept of time-invariance of a system is interchangeable with the literal meaning of time invariance. (CTSS-only)
none seen none seen
Note.
(a) The mistake "Interchange similar terms and concepts" is placed under two content areas; Signals representations and operations, and frequency analysis because they were demonstrated in both these content areas. (b) CTSS-only and CTSS-plus in the table represent the group that demonstrated that particular problematic reasoning more.
173
CHAPTER 5 - DISCUSSION
Conceptual understanding of Continuous Time Signals and Systems course
content has been a challenge for undergraduate electrical engineering students despite
many efforts to improve pedagogy of this course (section 2.2). The lack of the knowledge
of the reasons behind the difficulties in learning the topics in this course has hindered the
design of successful pedagogical methods and promotion of conceptual learning (section
2.5). The findings of this study (Chapter 4) suggest some reasons behind the difficulties
in conceptually understanding Continuous Time Signals and Systems course content and
the differences in the problematic reasonings of students with different academic statuses
further highlights the robustness of some problematic reasonings. In my opinion, it will
be important to understand the findings of this study based on potential learning
challenges connected with each problematic reasoning, mistake, and missing knowledge
presented in the previous chapter. The understanding of the potential learning challenges
might help to understand the bigger picture of difficulties associated with the findings of
this study.
Chi (2008) discusses two kinds of learning; enriching (Carey, 1991) and
conceptual change (Vosniadou & Verschaffel, 2004; Chi, 2008). The enriching kind of
learning occurs when a learner learns something that was missing or adds something that
was incomplete in his or her prior knowledge structure. The enriching kind of learning
enriches the prior knowledge structure of the learner. The awareness of the missing
174
conceptual knowledge identified in this study is important for the design of the pedagogy
of Continuous Time Signals and Systems courses to ensure enriching kind of learning of
the course content. The conceptual change kind of learning occurs when the learner
changes/replaces his or her prior concepts that were in conflict with the actual to-be-
learned concepts that are correct by some normative standard. The knowledge of the
mistakes and problematic reasonings identified in this study is important to promote the
conceptual change kind of learning of Continuous Time Signals and Systems course
content. The knowledge of the problematic reasonings that are present equally in the
CTSS-only and CTSS-plus groups is critically important for the effective instructional
design of Continuous Time Signals and Systems courses. Despite the limitations of
clinical interviews (discussed in section 3.3.3.3), clinical interviews are very well
recognized to explore thinking patterns of a person. For conceptual understanding related
studies, the knowledge of thinking patterns gathered from interviews related to concepts
that the students struggle with gives way to understanding potential underlying
misconceptions (Montfort, Brown, & Findley, 2007). Therefore, the knowledge of
problematic reasonings identified in this study is particularly useful because this gives an
opportunity to repair thinking patterns that can potentially lead to misconceptions. The
discussion of the problematic reasonings identified in this study is presented in this
chapter in three parts. First, the problematic reasonings are explained with the help of
possible learning challenges associated with them. In the second section, the findings of
this study are compared with the difficulties in learning Continuous Time Signals and
Systems courses identified in the prior literature (Chapter 2). In the last section of this
175
chapter, implications on the instruction and learning of this course and the directions for
future research are presented.
5.1 Discussion of Problematic Reasonings Identified
In the previous chapter, I grouped the problematic reasonings identified in this
study as per the topics covered in the course (Table 4.1). For the sake of discussion in this
chapter, I am regrouping the findings of this study according to my interpretation of the
learning challenges associated with each problematic reasoning presented in Chapter 4
(section 4.2). These three learning challenges are:
LC1. Representational Translation
This learning challenge relates to the ability of a learner to translate a concept or a
function from one representation to the other in the same domain (time or frequency).
LC2. Translation between Domains
This learning challenge relates to the ability of a learner to translate a concept or a
function from one domain (time or frequency) to the other.
LC3. Accommodation
This learning challenge relates to the ability of a learner to alter their existing
schema to learn a new concept.
This is not a unique interpretation or grouping of these findings, but it is a helpful
step to start understanding the bigger picture of the learning challenges faced by the
undergraduate electrical engineering students when they attempt to learn Continuous
Time Signals and Systems course content. The list of the problematic reasonings (section
4.2) associated with each learning challenge is given in Table 5.1. These learning

176
challenges along with the problematic reasonings associated with them will be discussed
in detail later in this section.
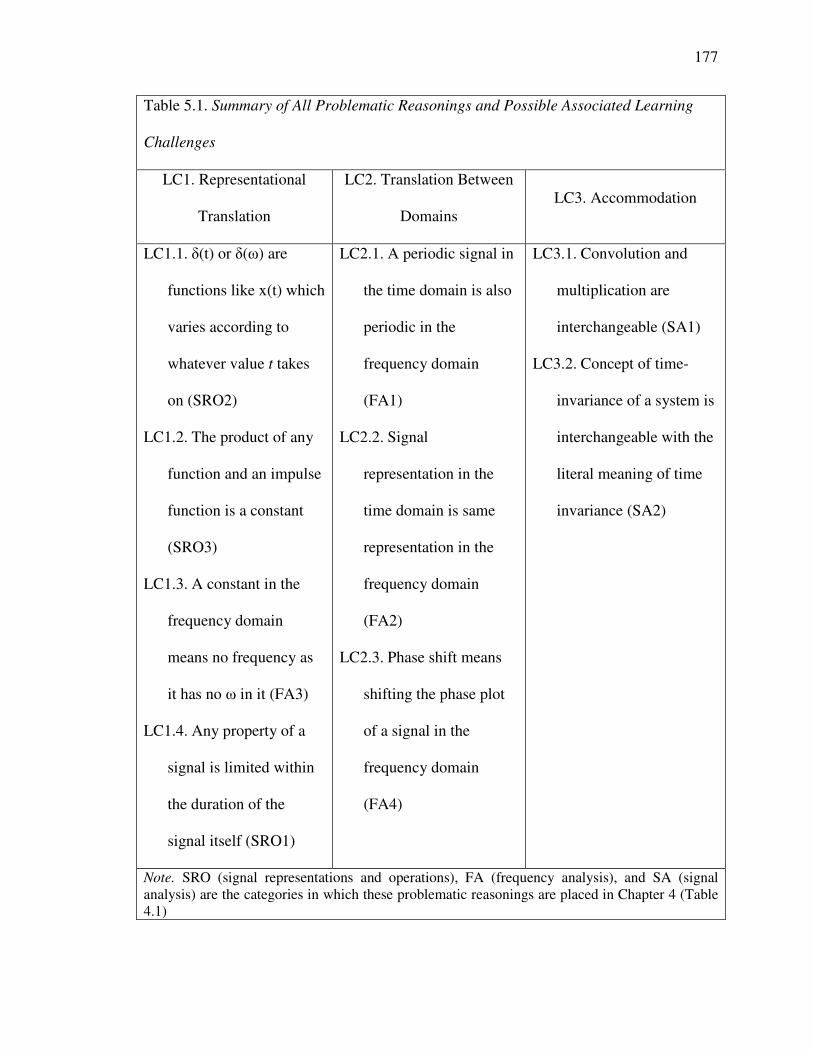
177
Table 5.1. Summary of All Problematic Reasonings and Possible Associated Learning
Challenges
LC1. Representational
Translation
LC2. Translation Between
Domains LC3. Accommodation
LC1.1. δ(t) or δ(ω) are
functions like x(t) which
varies according to
whatever value t takes
on (SRO2)
LC1.2. The product of any
function and an impulse
function is a constant
(SRO3)
LC1.3. A constant in the
frequency domain
means no frequency as
it has no ω in it (FA3)
LC1.4. Any property of a
signal is limited within
the duration of the
signal itself (SRO1)
LC2.1. A periodic signal in
the time domain is also
periodic in the
frequency domain
(FA1)
LC2.2. Signal
representation in the
time domain is same
representation in the
frequency domain
(FA2)
LC2.3. Phase shift means
shifting the phase plot
of a signal in the
frequency domain
(FA4)
LC3.1. Convolution and
multiplication are
interchangeable (SA1)
LC3.2. Concept of time-
invariance of a system is
interchangeable with the
literal meaning of time
invariance (SA2)
Note. SRO (signal representations and operations), FA (frequency analysis), and SA (signal analysis) are the categories in which these problematic reasonings are placed in Chapter 4 (Table 4.1)
178
5.1.1 Representational Translation (LC1)
The learning challenge that might be associated with the four problematic
reasonings shown in Table 5.1 is the inability of the student to translate a concept or
function from one representation to the other. The following learning theories might
suggest an explanation to this learning challenge. As discussed in Chapter 2, conceptual
understanding of an advanced mathematical operation requires a variety of
simultaneously interacting mental processes like multiple visualization of the functions
involved in the operation, translation of the functions into simpler and sometimes
alternative forms, generalizing answer in multiple representations (Dreyfus, 1991). Piaget
(1971) calls it a vertical décalage, which refers to the proficiency of understanding a
concept at different stages of intellectual functioning. Furthermore, Lesh's (1981)
translation model suggests that the development of deep understanding of mathematical
ideas requires an ability to represent mathematical ideas in multiple ways and an ability
to make connections between these multiple ways. Additionally, Redish and Smith
(2008) highlight that for an engineer conceptual knowledge is the ability to not only
understand mathematics (syntax) but also to combine the mathematical knowledge with
the knowledge of what the math is talking about in a tightly integrated way using the
meaning of the symbols.
The summary of the subset of the problematic reasonings, mistakes, and missing
knowledge identified in this study that might be a result of this learning challenge are
given in Table 5.2. Furthermore, this learning challenge might also help to explain why
students prefer to use mathematical equations to solve the problems related to Continuous
Time Signals and Systems courses (section 4.4.3). Some possible explanations of the

179
difficulties associated with the problematic reasonings assigned to this category are given
in Table 5.3.
5.1.2 Translation between Domains (LC2)
The learning challenge suggested behind the problematic reasonings assigned to
this category is the inability to translate a concept from one domain to the other. The
"domain" here specifically means either the time or the frequency domain. This learning
challenge involves simultaneous mental processing of more than one representations of
one function in two different domains. The difficult aspect of this kind of learning
challenge is that almost all functions have dissimilar representations for the frequency
and time domains and the process of successfully looking beyond the seemingly
dissimilar representations demands advanced mental processing skills. The summary of
all the problematic reasonings, mistakes, and missing knowledge identified in this study
that can be explained with this learning challenge are given in Table 5.4. Additionally,
the possible explanations of the learning challenges associated with the problematic
reasonings assigned to this category are given in Table 5.5.

180
Table 5.2. Problematic Reasonings (section 4.2), Mistakes (section 4.4.1) and Missing
Knowledge (section 4.4.2) that might be Explained with Representational Translation
(LC1) as a Potential Learning Challenge
Pro
ble
mat
ic R
easo
nin
gs 1. δ(t) or δ(ω) are functions like x(t) which varies according to whatever value t
takes on
2. The product of any function and an impulse function is a constant
3. A constant in the frequency domain means no frequency as it has no ω in it
4. Any property of a signal is limited within the duration of the signal itself
Mis
tak
es
1. Engaging with the powers of exponential functions
2. Translating a mathematical equation
3. Engaging with a unit step function
4. Engaging with an impulse function
5. Performing time shift and time scale operations combined
Mis
sin
g C
on
cep
tual
Kn
ow
led
ge
1. Difference in the use of graphical representations of discrete and continuous
impulse functions
2. Conceptual understanding of Fourier Analysis
a. Ability to recognize that a function originally expressed in the form
of sinusoids or exponentials is already expressed in the form of
Fourier series or transform
3. Ability to translate a function from one representation to another
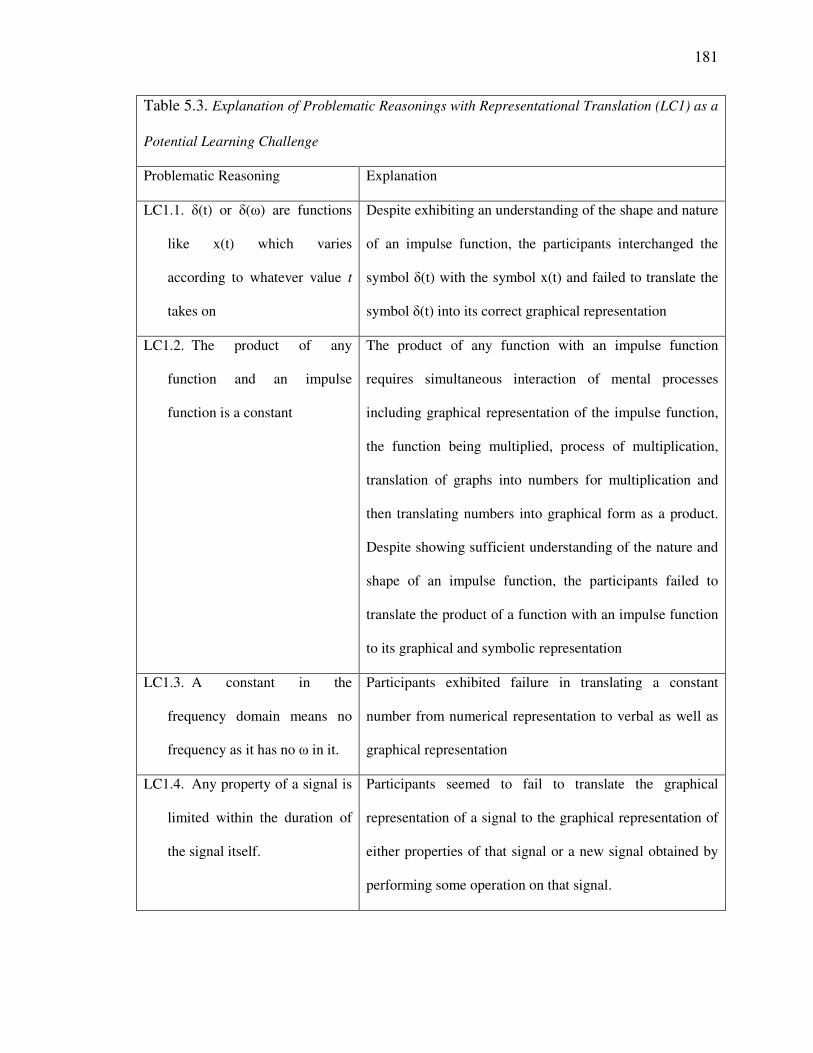
181
Table 5.3. Explanation of Problematic Reasonings with Representational Translation (LC1) as a
Potential Learning Challenge
Problematic Reasoning Explanation
LC1.1. δ(t) or δ(ω) are functions
like x(t) which varies
according to whatever value t
takes on
Despite exhibiting an understanding of the shape and nature
of an impulse function, the participants interchanged the
symbol δ(t) with the symbol x(t) and failed to translate the
symbol δ(t) into its correct graphical representation
LC1.2. The product of any
function and an impulse
function is a constant
The product of any function with an impulse function
requires simultaneous interaction of mental processes
including graphical representation of the impulse function,
the function being multiplied, process of multiplication,
translation of graphs into numbers for multiplication and
then translating numbers into graphical form as a product.
Despite showing sufficient understanding of the nature and
shape of an impulse function, the participants failed to
translate the product of a function with an impulse function
to its graphical and symbolic representation
LC1.3. A constant in the
frequency domain means no
frequency as it has no ω in it.
Participants exhibited failure in translating a constant
number from numerical representation to verbal as well as
graphical representation
LC1.4. Any property of a signal is
limited within the duration of
the signal itself.
Participants seemed to fail to translate the graphical
representation of a signal to the graphical representation of
either properties of that signal or a new signal obtained by
performing some operation on that signal.
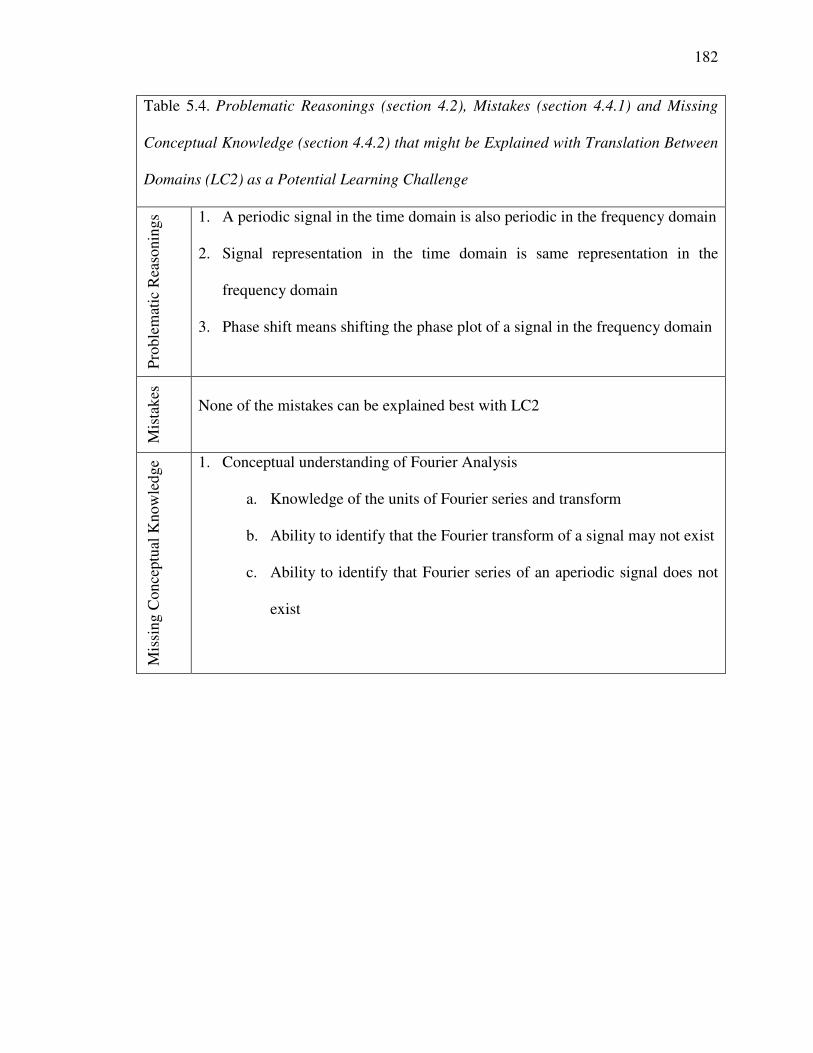
182
Table 5.4. Problematic Reasonings (section 4.2), Mistakes (section 4.4.1) and Missing
Conceptual Knowledge (section 4.4.2) that might be Explained with Translation Between
Domains (LC2) as a Potential Learning Challenge
Pro
ble
mat
ic R
easo
nin
gs 1. A periodic signal in the time domain is also periodic in the frequency domain
2. Signal representation in the time domain is same representation in the
frequency domain
3. Phase shift means shifting the phase plot of a signal in the frequency domain
Mis
tak
es
None of the mistakes can be explained best with LC2
Mis
sin
g C
on
cep
tual
Kn
ow
led
ge 1. Conceptual understanding of Fourier Analysis
a. Knowledge of the units of Fourier series and transform
b. Ability to identify that the Fourier transform of a signal may not exist
c. Ability to identify that Fourier series of an aperiodic signal does not
exist
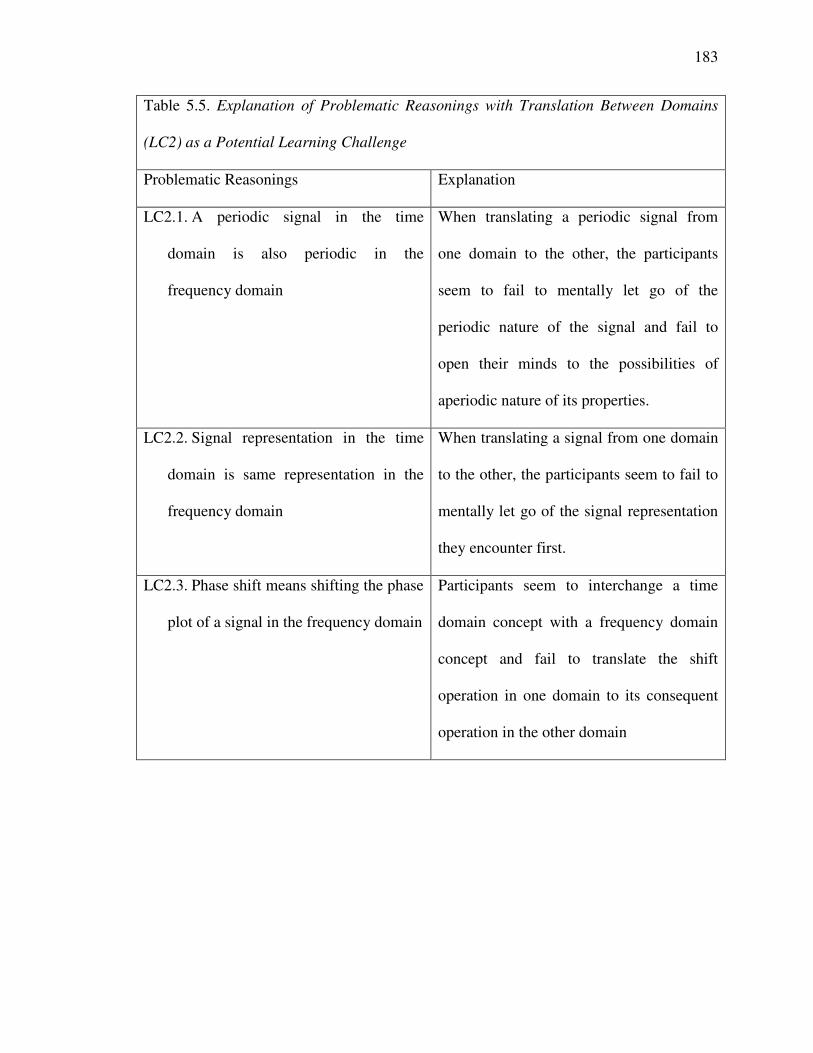
183
Table 5.5. Explanation of Problematic Reasonings with Translation Between Domains
(LC2) as a Potential Learning Challenge
Problematic Reasonings Explanation
LC2.1. A periodic signal in the time
domain is also periodic in the
frequency domain
When translating a periodic signal from
one domain to the other, the participants
seem to fail to mentally let go of the
periodic nature of the signal and fail to
open their minds to the possibilities of
aperiodic nature of its properties.
LC2.2. Signal representation in the time
domain is same representation in the
frequency domain
When translating a signal from one domain
to the other, the participants seem to fail to
mentally let go of the signal representation
they encounter first.
LC2.3. Phase shift means shifting the phase
plot of a signal in the frequency domain
Participants seem to interchange a time
domain concept with a frequency domain
concept and fail to translate the shift
operation in one domain to its consequent
operation in the other domain

184
5.1.3 Accommodation (LC3)
The problematic reasonings assigned to this category seem to come from the
challenge of accommodation of the newly learned knowledge. Accommodation is the
term introduced by Piaget (1971) which refers to the adaptation process of a learner while
altering an existing schema (cognitive framework or concept that helps organize and
interpret information) because of the newly learned information. For example, a child
may have an existing schema for table. Table has four legs, so the child may
automatically believe that any furniture item with four legs is a table. When the child
learns that chair also have four legs, he/she will undergo a process of accommodation in
which his/her existing schema for tables will change and he/she will also develop a new
schema for chairs. Accommodation is specifically challenging when the new information
conflicts with the existing schemas.
The summary of the problematic reasonings, mistakes, and missing knowledge
identified in this study that can be explained with this learning challenge are given in
Table 5.6. Additionally, some possible explanations of the learning challenges associated
with the problematic reasonings assigned to this category are given in Table 5.7.
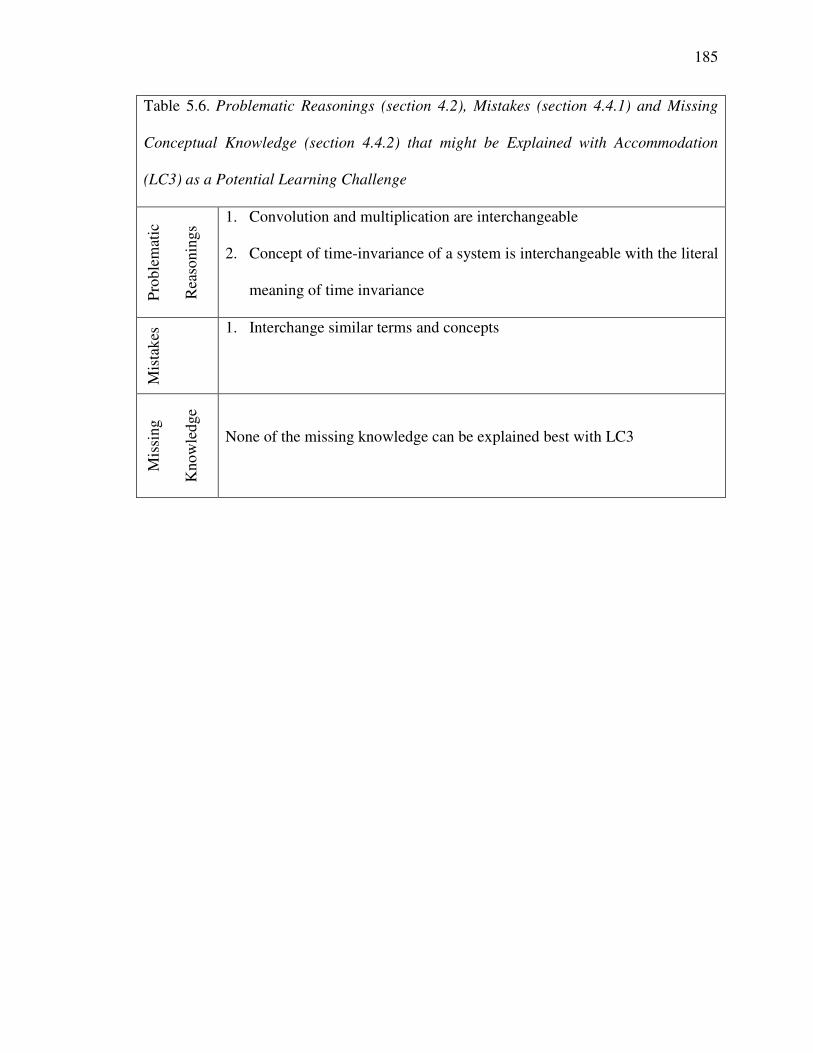
185
Table 5.6. Problematic Reasonings (section 4.2), Mistakes (section 4.4.1) and Missing
Conceptual Knowledge (section 4.4.2) that might be Explained with Accommodation
(LC3) as a Potential Learning Challenge
Pro
ble
mat
ic
Rea
son
ing
s
1. Convolution and multiplication are interchangeable
2. Concept of time-invariance of a system is interchangeable with the literal
meaning of time invariance
Mis
tak
es 1. Interchange similar terms and concepts
Mis
sin
g
Kn
ow
led
ge
None of the missing knowledge can be explained best with LC3
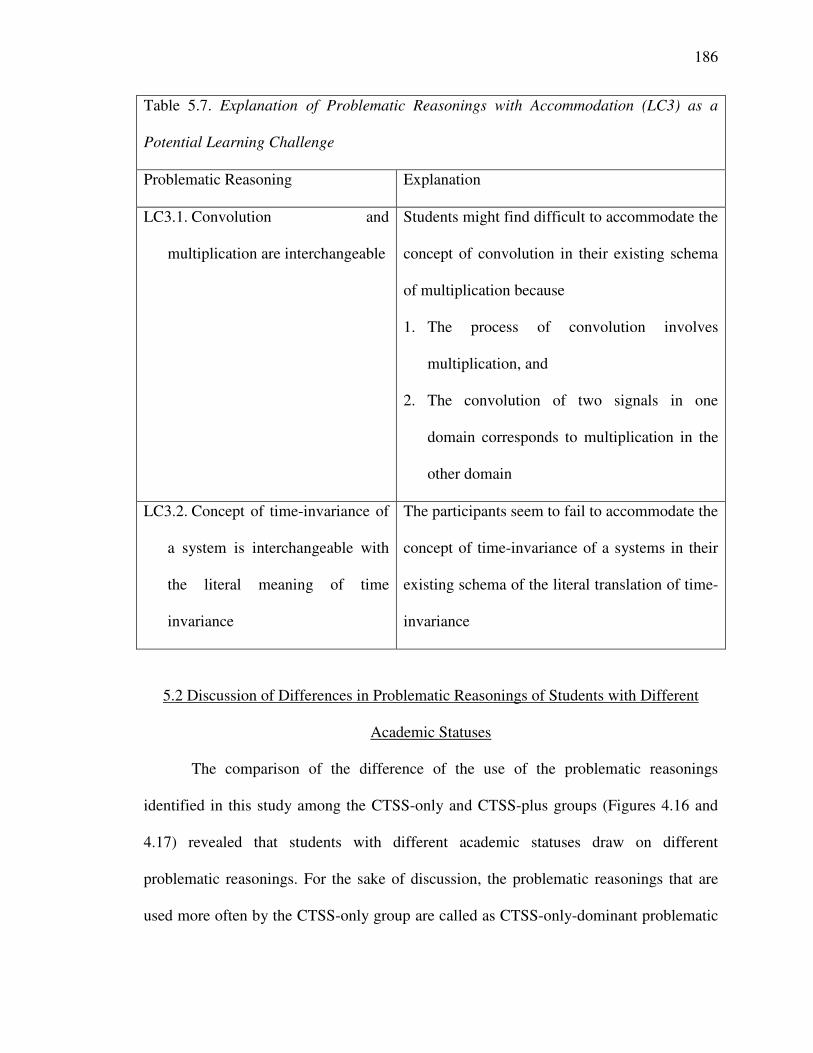
186
Table 5.7. Explanation of Problematic Reasonings with Accommodation (LC3) as a
Potential Learning Challenge
Problematic Reasoning Explanation
LC3.1. Convolution and
multiplication are interchangeable
Students might find difficult to accommodate the
concept of convolution in their existing schema
of multiplication because
1. The process of convolution involves
multiplication, and
2. The convolution of two signals in one
domain corresponds to multiplication in the
other domain
LC3.2. Concept of time-invariance of
a system is interchangeable with
the literal meaning of time
invariance
The participants seem to fail to accommodate the
concept of time-invariance of a systems in their
existing schema of the literal translation of time-
invariance
5.2 Discussion of Differences in Problematic Reasonings of Students with Different
Academic Statuses
The comparison of the difference of the use of the problematic reasonings
identified in this study among the CTSS-only and CTSS-plus groups (Figures 4.16 and
4.17) revealed that students with different academic statuses draw on different
problematic reasonings. For the sake of discussion, the problematic reasonings that are
used more often by the CTSS-only group are called as CTSS-only-dominant problematic
187
reasonings, the problematic reasonings that are used more often by the CTSS-plus group
are called as CTSS-plus-dominant problematic reasonings, and the problematic
reasonings employed almost equally by both groups are called as robust problematic
reasonings. This section discusses the differences and the possible reasons behind the
differences in problematic reasonings employed by students with different academic
statuses.
5.2.1 CTSS-Only-Dominant Problematic Reasonings
The problematic reasonings that are employed more often by the participants
belonging to the CTSS-only group are:
1) Convolution and multiplication are interchangeable (LC3.1)
2) Concept of time-invariance of a system is interchangeable with the literal meaning of
time invariance (LC3.1)
Both these problematic reasonings are described in section 5.1 as related to the
accommodation of the newly introduced concepts. The fact that these problematic
reasonings are not prevalent in the CTSS-plus group implies that the students reach
equilibration stage of these concepts as they continue to use the content of Continuous
Time Signals and Systems courses in advanced courses. Such problematic reasonings are
easy to repair and may only require more practice on students' behalf to overcome this
learning challenge. There is also evidence in the data collected from the participants of
the CTSS-plus group that repetition and practice helped the participants to overcome
these learning challenges. For example, Tom, who had taken three courses that require
188
prior knowledge of Continuous Time Signals and Systems course content (Table 3.2),
said about convolution,
From, so, this is a 1231 concept, which is dynamical systems of convolution.
That's when we were first introduced to that, and I kind of struggled with grasping
that concept. But it made more sense to me in discrete time, which is why I
mentioned that earlier ... I guess repetition makes me understand it. (Tom)
5.2.2 CTSS-Plus-Dominant Problematic Reasonings
The problematic reasonings employed more often by the participants belonging to
the CTSS-plus group are:
1) δ(t) or δ(ω) are functions like x(t) which varies according to whatever value t takes on
(LC1.1)
2) The product of any function and an impulse function is a constant (LC1.2)
3) A constant in the frequency domain means no frequency as it has no ω in it (LC1.3)
4) Phase shift means shifting the phase plot of a signal in the frequency domain (LC2.3)
Most of the problematic reasonings used dominantly by the CTSS-plus group
belong to the learning challenge of representational translation. There can be numerous
possible explanations for these problematic reasonings prevalent only in students from
the CTSS-plus group. It seems counter-intuitive but studies have shown that students can
get more confused after more coursework on a concept (Chi & Roscoe, 2002; Limón &
Mason, 2002; Mayer, 2002; Montfort, Brown, & Pollock, 2009). Conceptual change
requires revision of beliefs and when students try to reevaluate their knowledge of the
1 Course code is replaced by 123 to protect privacy of the institution
189
subject matter, their confidence in their knowledge decreases as they start questioning the
facts on which they based their foundational knowledge. Additionally, recently learned
concepts can inhibit the recollection of previously learned concepts, a phenomenon called
retroactive interference (Wohldmann, Healy, & Bourne, 2008).
Exact reasons for the presence of these problematic reasonings in this course's
content can be explored by conducting a longitudinal study of how conceptual
understanding of undergraduate electrical engineering students evolve as they progress
through the electrical engineering curriculum. However, there is some evidence in the
collected data that speaks for the presence of retroactive interference of the concepts that
students learned after taking Continuous Time Signals and Systems course. A few
examples are:
Fourier transform has integration but Fourier series has summation and while I am
thinking of summation I started thinking about equations with summations in
them and I was thinking x of lambda h of t minus lambda which is definitely
discrete time convolution and totally not what we are doing. (Ryan)
Additionally, when Ryan was explaining the units of Fourier series and Fourier
transform, he and I had this conversation:
Ryan: The only thing that comes to mind for both of these is volts squared.
Me: Volts squared?
Ryan: Mm-hm.
Me: And why is that?
Ryan: Because of a lab I had for a different class ...

190
Carl when talking about finding integral of a periodic signal using superposition
said,
That's not superposition, is it? Because I cannot remember for the life of me what
that is. I remember using it in another class. I'll come back to that one here in a
little bit. I'll just make a note. (Carl)
Furthermore, there is evidence in the interview data (mostly from the members of
the CTSS-plus group) collected for the study that students are relying on computers for
even solving trivial problems in this course. The undue use of computer programs to
reach to a conclusion readily might be a reason for the lack of the ability to translate a
signal from one representation to the other and might be hindering the development of
metacognition skills of the students. For Continuous Time Signals and Systems courses at
Iris University, students are not allowed to use Maple or similar programs for problem
solving and home works are not accepted in the form of Maple worksheets. The fact that
the students are still using Maple when they get out of the class further suggests a
resistance to learning this material on the behalf of students. I will present some evidence
of the students' preference of the use of computers over reasoning to solve a problem
from the collected data here:
While trying to find Fourier series of �(�) = cos A� + </B + 3sin(7�) Bill said
To be honest, at this point, I’d be plugging this into a computer program to let
them do that for me and help out. (Bill)

191
Well, if this was an honest homework problem, I would be putting this into Maple
to check it, because I'm sorry, calculus is not something I do anymore really. But I
think you can calculate that one by doing integral of that times that plus the
integral of that, sine times that. I'm thinking derivatives, aren't I? Anyway, the
point is, put this into Maple, I'm going to get something that is going to be a sine.
(Megan)
Additionally, Luke while trying to convolve an impulse train with a rectangle
said, "I would probably use my experience and MATLAB." Furthermore, while trying to
find Fourier transform of t2, Lily said, "So, then, ideally I would just put that into a Maple
or solving thing and then find this."
5.2.3 Robust Problematic Reasonings
The problematic reasonings that are exhibited almost equally by the participants
in both groups are:
1) Any property of a signal is limited within the duration of the signal itself (LC1.4)
2) A periodic signal in the time domain is also periodic in the frequency domain (LC2.1)
3) Signal representation in the time domain is same representation in the frequency
domain (LC2.2)
The word "robust" for these problematic reasonings is borrowed from the term
"robust misconceptions." The term robust misconception is used in thousands of
conceptual change studies starting from Novak (1977) until today (Richey & Nokes-
Malach, 2014). Robust misconceptions are conceptions that are incompatible with the
192
standard scientific conceptions and are difficult to revise which makes a conceptual
change hard to achieve (Chi, 2008). Therefore, "radical conceptual change" is required to
build conceptual understanding in the presence of robust misconceptions (Carey, 1985); a
term used in the literature to emphasize the revision of overall belief system. On the same
lines, these problematic reasonings are problematic because these are incompatible with
the standard correct reasonings. Moreover, the fact that these problematic reasonings are
present almost equally in students from both groups speaks for the difficulty to revise
these problematic reasonings, hence robustness.
Of the three robust problematic reasonings, two might be explained with the
learning challenge of translation between domains. The ability to successfully translate
between domains requires multiple aspects of mental processing at the same time, which
includes simultaneous processing of two or more entirely different representations of the
same signal, placing them in two entirely different domains, and answering related
questions all at the same time. The acquisition of this skill demands careful attention to
instructional methods as this kind of skill falls under the highest levels of revised Bloom's
taxonomy. Carefully designed hands-on application-oriented activities that provide
personal experiences with the Continuous Time Signals and Systems courses along with
related prompts for metacognition (Simoni, Fayyaz, & Streveler, 2014) seem like a good
pedagogical strategy for repairing these robust problematic reasonings.
193
5.3 Discussion of Problems in Learning Continuous Time Signals and Systems Courses
in Light of Problematic Reasonings
There are a few quantitative studies conducted in the past to identify the problems
in learning Continuous Time Signals and Systems course content among undergraduate
electrical engineering students. The motivation of this study was to understand the
reasons behind the problems in learning this course. In this section, I will discuss how the
findings of this study might suggest an explanation for the reasons behind some of the
previously identified problems in learning content of this course.
Previous studies on learning Continuous Time Signals and Systems courses have
shown that students face difficulty in connecting dissimilar shapes of the same signal in
different domains (Wage, Buck, & Wright, 2004; Buck & Wage, 2005; Wage, Buck, &
Hjalmarson, 2006a). Of the nine problematic reasonings identified in this study (Table
5.1), seven relate to the translation of a function and three of the seven specifically relate
to the translation between domains. These problematic reasonings extend some possible
explanations for the difficulties faced by the students when engaging with the problems
related to connecting dissimilar shapes of the same signal in different domains.
Moreover, studies in the past have contended that Continuous Time Signals and
Systems course content are difficult to learn conceptually because of the extensive use of
the mathematical modeling and formulas involved in this course (Nasr, Hall, & Garik,
2005; Ferri et al., 2009; Han, Zhang, & Qin, 2011; Tsakalis et al., 2011). The findings of
this study suggest that the poor grades in this course might not be due to extensive
mathematics or students' lack of mathematics proficiency, but due to students' inability to
process at the highest level of Bloom's taxonomy of learning which requires a
194
simultaneous processing of a combination of mathematical concepts and Continuous
Time Signals and Systems related concepts. Additionally this also suggests an
explanation for the results of the correlation of students' grades in the pre-requisite
mathematics courses and Continuous Time Signals and Systems courses, which showed
that even the students with grades of As and Bs in the pre-requisite mathematics courses
could not perform well in Continuous Time Signals and Systems courses (Simoni,
Fayyaz, & Streveler, 2014).
Many previous studies contend that Continuous Time Signals and Systems
courses are difficult to learn because large part of these courses deals with abstract
mathematical concepts that are difficult to visualize and hard to make sense of (Shaffer,
Hamaker, & Picone, 1998; Nasr, Hall, & Garik, 2005, 2007; Tsakalis et al., 2011). The
seven problematic reasonings (Table 5.1) identified in the study that involve translation
of the signal might suggest an explanation for the difficulty in visualization of some of
the mathematical concepts in these courses.
Furthermore, as discussed in Chapter 2, past studies have suggested that students
face difficulties in performing convolution by graphical method and these difficulties
might be explained with p-prims of the students (Nasr, Hall, & Garik, 2007, 2009). Two
problematic reasonings (a. interchange of multiplication and convolution and, b. any
property of a signal is limited within the property of the signal itself) identified in this
study might extend further explanation for Nasr, Hall, and Garik's (2007, 2009)
justification behind students' difficulties in performing convolution by graphical method.
In addition, Wage, Buck, and Wright (2004) claimed that students think that
multiplication in the time domain is multiplication in the frequency domain as well
195
(Wage, Buck, & Wright, 2004). Two problematic reasonings from this study (a. Students'
attempt to interchange multiplication and convolution, and b. Signal's representation is
the same in both the time and frequency domains) might extend an explanation for why
students would think that multiplication in the time domain is multiplication in the
frequency domain.
In addition, as discussed in Chapter 2, Nelson, Hjalmarson, and Wage (2011)
observed that students exhibited significant gaps in their knowledge of i) definitions
and/or evaluation of the conditions of causality and stability of a system, ii) mathematical
representation of signals and systems as either a function or a graph, iii) working with
different types of independent and dependent variables together in a function, and v)
understanding a system in terms of a signal (impulse response). Except for the gap in the
knowledge of causality and stability of a system because the protocol used for the study
had no related questions, the problematic reasonings identified in this study suggest
explanations for the gaps in the knowledge identified by Nelson, Hjalmarson, and Wage
(2011).
Table 5.8 shows a summary of the concepts involved in the consistently
incorrectly answered questions in SSCI tests obtained from the analysis of scores of the
students (Table 2.1) along with the possible difficulties suggested from the findings of
this study.

196
Table 5.8. Possible Explanations Suggested by the Findings for Incorrectly Answered
Questions in SSCI Tests (section 2.4.2)
Concept Covered in the Incorrectly
Answered Question
Problematic Reasonings that might
Account for the Incorrect Response
Multiplication in the time domain Convolution and multiplication are
interchangeable (LC3.1)
Convolution by graphical method Convolution and multiplication are
interchangeable (LC3.1)
Time Invariance
Concept of time-invariance of a system is
interchangeable with the literal meaning of
time invariance (LC3.2)
Fourier transform at ω=0 and area under
the time domain signal
Signal representation in the time domain is
same representation in the frequency
domain*
Time flip and shift operations combined Evidence available in the mistakes of
students presented in section 4.4.1.5
LTI causality _**
Note.
* It was noted that the most incorrect response was that students were thinking that the value of
F(ω) for ω=0 is the value of f(t) at t=0 which aligns with the given problematic reasoning
** There was no question in the protocol that prompted participants to talk about this concept
197
5.4 Why Continuous Time Signals and Systems Courses are Difficult
Continuous Time Signals and Systems courses are considered particularly hard
among other courses in the electrical engineering curriculum. This is evident from the
results of the quantitative analysis of withdrawal and failure rates of almost 860
undergraduate electrical engineering students over a period of ten years, conducted by
Simoni, Fayyaz, and Streveler (2014). The results showed that the withdrawal and failure
rates in Continuous Time Signals and Systems and Electromagnetics courses were
approximately three times higher than in other required courses in electrical and
computer engineering curriculum at Rose-Hulman Institute of Technology.
The problematic reasonings identified in this study suggest explanations for
students' struggles in understanding this course. I will use the knowledge of the
problematic reasonings gained from this study and the course content map shown in
Figure 5.1 to illustrate why this course might be so hard. I made this map to design a
Continuous Time Signals and Systems course for a class project. In Figure 5.1,
"Important to know" topics are the ones without conceptual understanding of which the
proficiency of the students in this course would be incomplete. Furthermore, "enduring
understandings" are the topics that the students should get the thorough understanding of
and retain even after they have forgotten many other details covered in this course
(Wiggins & McTighe, 2005). To keep the discussion focused on the conceptual learning
of basic concepts, "worth-being-familiar-with" topics in Continuous Time Signals and
Systems course content are not shown in Figure 5.1.
An important observation in the complete map of the topics covered in typical
Continuous Time Signals and Systems courses is that the "important to know" topics are
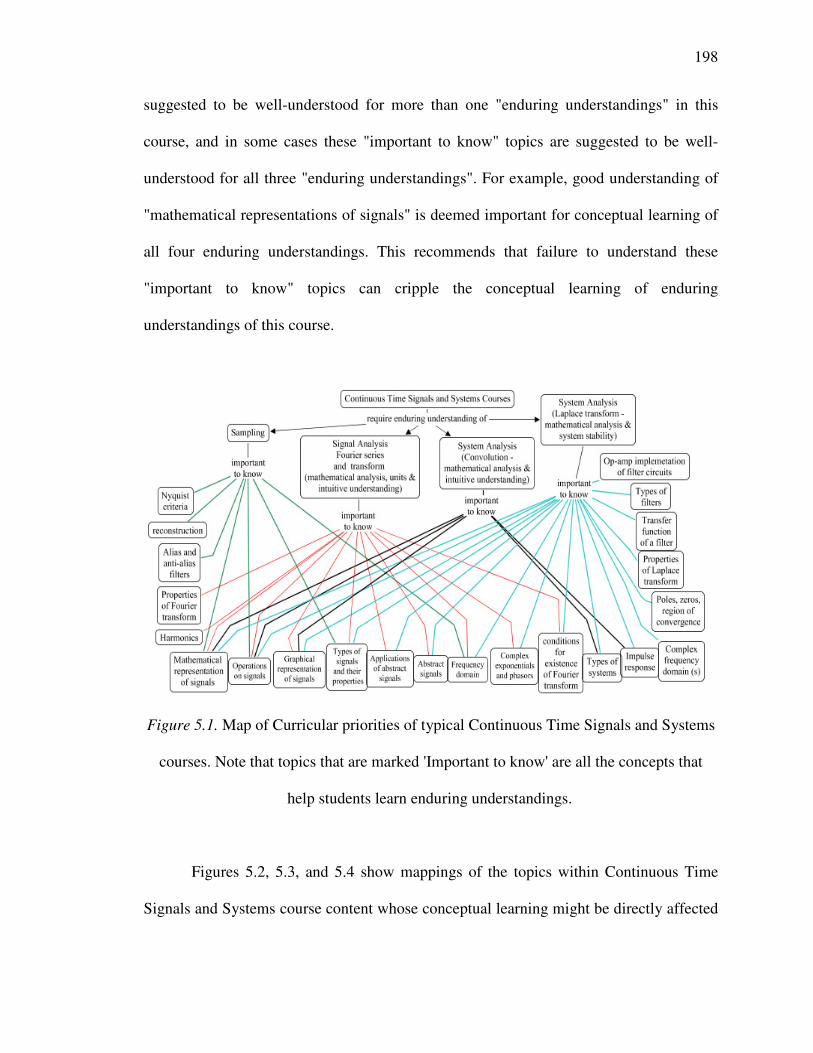
198
suggested to be well-understood for more than one "enduring understandings" in this
course, and in some cases these "important to know" topics are suggested to be well-
understood for all three "enduring understandings". For example, good understanding of
"mathematical representations of signals" is deemed important for conceptual learning of
all four enduring understandings. This recommends that failure to understand these
"important to know" topics can cripple the conceptual learning of enduring
understandings of this course.
Figure 5.1. Map of Curricular priorities of typical Continuous Time Signals and Systems
courses. Note that topics that are marked 'Important to know' are all the concepts that
help students learn enduring understandings.
Figures 5.2, 5.3, and 5.4 show mappings of the topics within Continuous Time
Signals and Systems course content whose conceptual learning might be directly affected
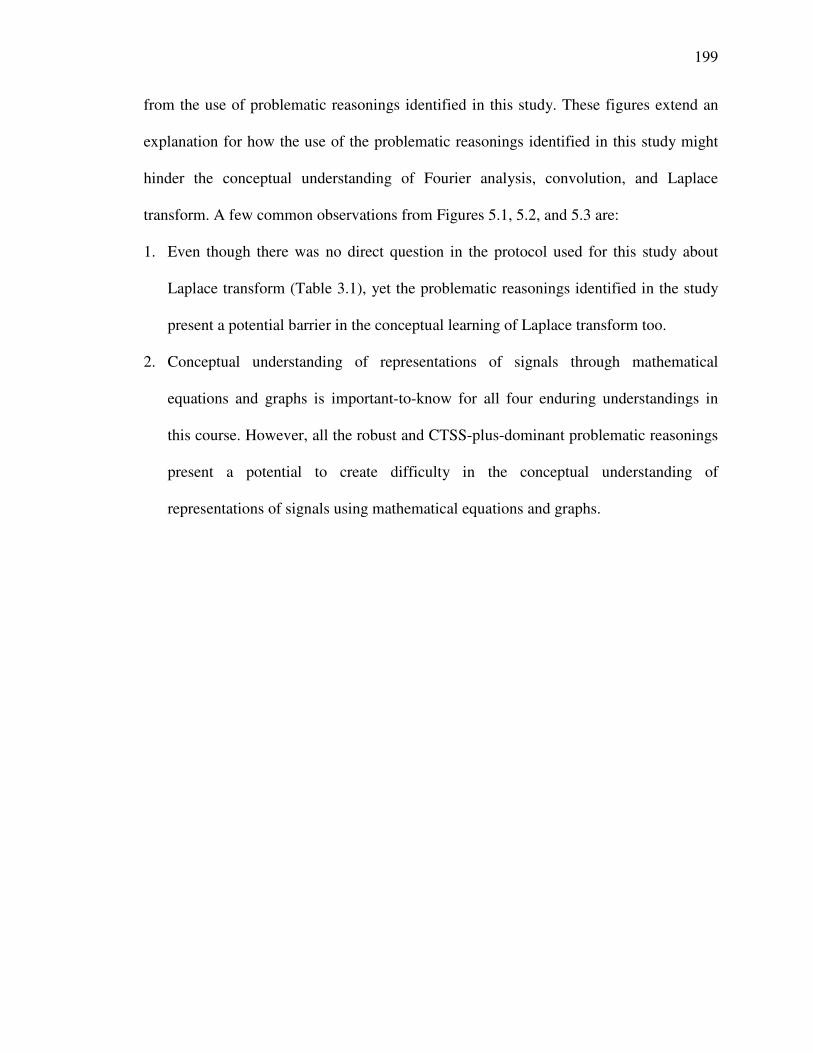
199
from the use of problematic reasonings identified in this study. These figures extend an
explanation for how the use of the problematic reasonings identified in this study might
hinder the conceptual understanding of Fourier analysis, convolution, and Laplace
transform. A few common observations from Figures 5.1, 5.2, and 5.3 are:
1. Even though there was no direct question in the protocol used for this study about
Laplace transform (Table 3.1), yet the problematic reasonings identified in the study
present a potential barrier in the conceptual learning of Laplace transform too.
2. Conceptual understanding of representations of signals through mathematical
equations and graphs is important-to-know for all four enduring understandings in
this course. However, all the robust and CTSS-plus-dominant problematic reasonings
present a potential to create difficulty in the conceptual understanding of
representations of signals using mathematical equations and graphs.
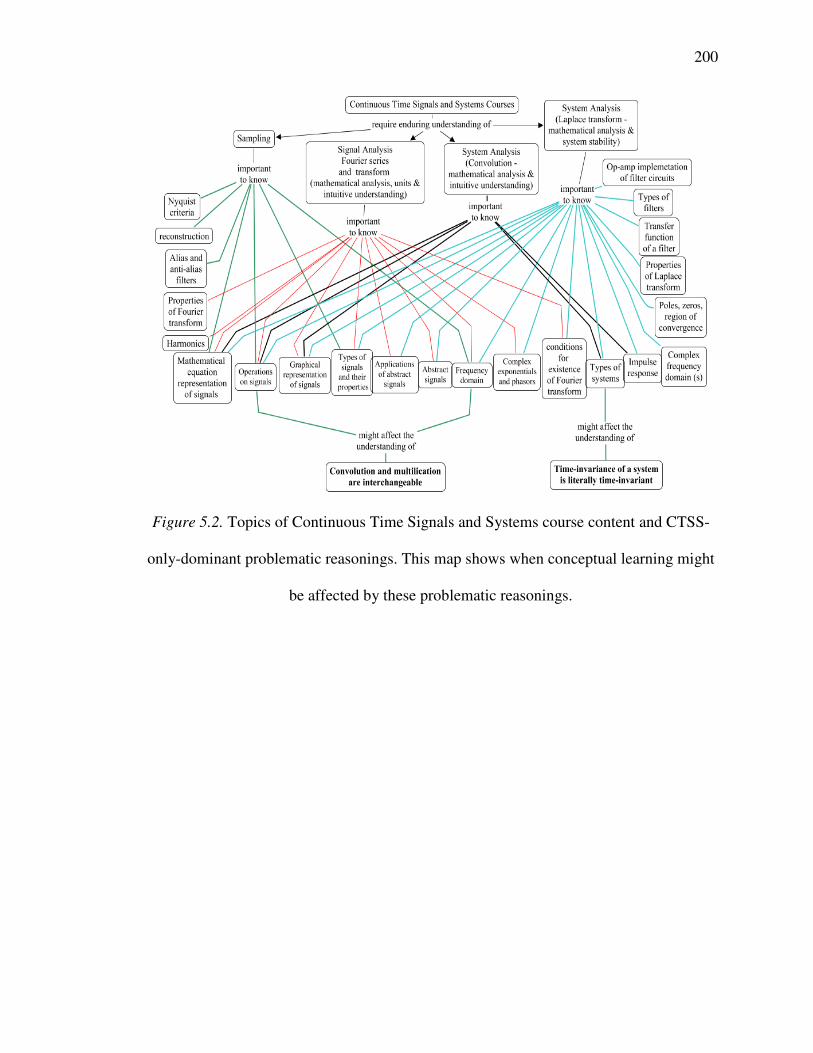
200
Figure 5.2. Topics of Continuous Time Signals and Systems course content and CTSS-
only-dominant problematic reasonings. This map shows when conceptual learning might
be affected by these problematic reasonings.
201
Figure 5.3. Topics of Continuous Time Signals and Systems course content and CTSS-
plus-dominant problematic reasonings. This map shows when conceptual learning might
be affected by these problematic reasonings.
3. Figure 5.2 shows that CTSS-only-dominant reasonings do not demonstrate a potential
to affect understanding of many topics together. This might be a reason they do not
persist and are easy to fix.
4. Figure 5.4 shows that the robust problematic reasonings illustrate a potential to affect
the understanding of maximum number of topics in this course. Their widespread
prevalence suggests an explanation for them being robust.
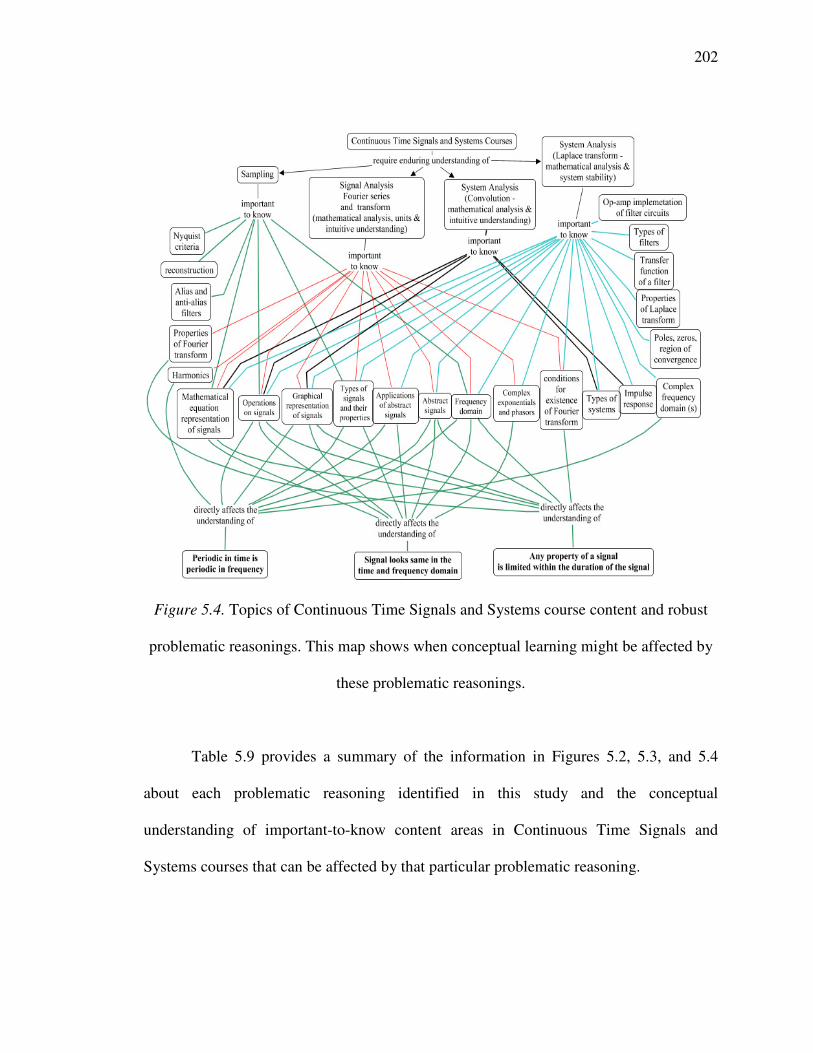
202
Figure 5.4. Topics of Continuous Time Signals and Systems course content and robust
problematic reasonings. This map shows when conceptual learning might be affected by
these problematic reasonings.
Table 5.9 provides a summary of the information in Figures 5.2, 5.3, and 5.4
about each problematic reasoning identified in this study and the conceptual
understanding of important-to-know content areas in Continuous Time Signals and
Systems courses that can be affected by that particular problematic reasoning.
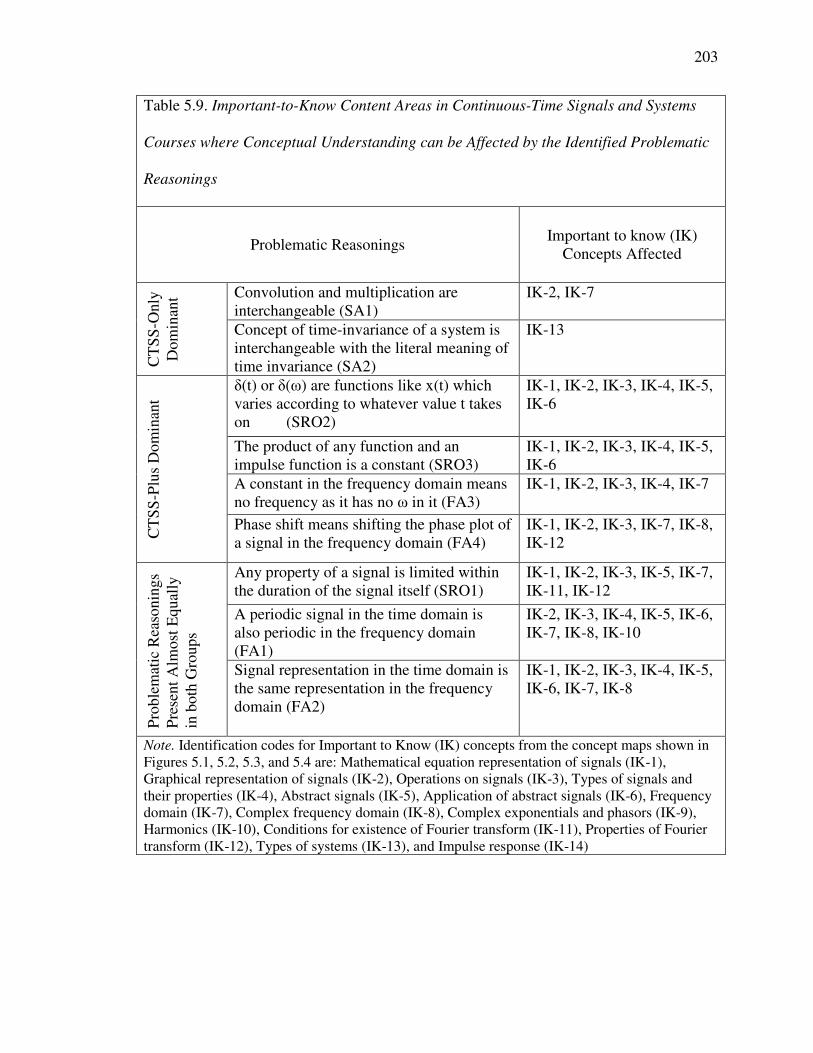
203
Table 5.9. Important-to-Know Content Areas in Continuous-Time Signals and Systems
Courses where Conceptual Understanding can be Affected by the Identified Problematic
Reasonings
Problematic Reasonings Important to know (IK)
Concepts Affected
CT
SS
-On
ly
Do
min
ant Convolution and multiplication are
interchangeable (SA1) IK-2, IK-7
Concept of time-invariance of a system is interchangeable with the literal meaning of time invariance (SA2)
IK-13
CT
SS
-Plu
s D
om
inan
t
δ(t) or δ(ω) are functions like x(t) which varies according to whatever value t takes on (SRO2)
IK-1, IK-2, IK-3, IK-4, IK-5, IK-6
The product of any function and an impulse function is a constant (SRO3)
IK-1, IK-2, IK-3, IK-4, IK-5, IK-6
A constant in the frequency domain means no frequency as it has no ω in it (FA3)
IK-1, IK-2, IK-3, IK-4, IK-7
Phase shift means shifting the phase plot of a signal in the frequency domain (FA4)
IK-1, IK-2, IK-3, IK-7, IK-8, IK-12
Pro
ble
mat
ic R
easo
nin
gs
Pre
sen
t A
lmo
st E
qu
ally
in
bo
th G
rou
ps
Any property of a signal is limited within the duration of the signal itself (SRO1)
IK-1, IK-2, IK-3, IK-5, IK-7, IK-11, IK-12
A periodic signal in the time domain is also periodic in the frequency domain (FA1)
IK-2, IK-3, IK-4, IK-5, IK-6, IK-7, IK-8, IK-10
Signal representation in the time domain is the same representation in the frequency domain (FA2)
IK-1, IK-2, IK-3, IK-4, IK-5, IK-6, IK-7, IK-8
Note. Identification codes for Important to Know (IK) concepts from the concept maps shown in Figures 5.1, 5.2, 5.3, and 5.4 are: Mathematical equation representation of signals (IK-1), Graphical representation of signals (IK-2), Operations on signals (IK-3), Types of signals and their properties (IK-4), Abstract signals (IK-5), Application of abstract signals (IK-6), Frequency domain (IK-7), Complex frequency domain (IK-8), Complex exponentials and phasors (IK-9), Harmonics (IK-10), Conditions for existence of Fourier transform (IK-11), Properties of Fourier transform (IK-12), Types of systems (IK-13), and Impulse response (IK-14)
204
5.5 Implications
Learning Continuous Time Signals and Systems course content is challenging.
Many topics in the course content have multiple representations and all the multiple
representations are used interchangeably. Moreover, many concepts are abstract which
adds to the challenge of learning. Additionally, conceptually learning only one
representation of a concept that has more than one representation does not solve the
problem of learning as the use of different representations help in different problems.
This in turn influences the confidence of the learners as well, as they stay confused and
continue to question their understanding every time they encounter a seemingly well-
learned (in one isolated situation) concept in a new situation. Furthermore, as
demonstrated in the findings of this study, the problematic reasonings used by the
students when they access content of Continuous Time Signals and Systems courses are
intricately intertwined with multiple topics in these courses, which further begs for
conscious teaching and learning of the topics covered in these courses. Following are my
suggestions to facilitate conceptual learning and teaching of these courses.
5.5.1 Implications for Instruction
1. Learning of Continuous Time Signals and Systems courses will improve if the
instructors make sure that the students understand where each individual course
content fits in the bigger picture (enduring understandings, Figure 5.1) of the whole
course and in the whole electrical engineering curricula. For example, when I taught
this course, I used to make little concept maps on the white board in the classroom
both at the start of the course and at the intermediate stages during the semester
205
whenever I introduced a new concept to help my students understand the bigger
picture (Fayyaz, 2009). For instance, I used to teach Laplace transform after Fourier
transform and at the beginning of the introduction of Laplace transform; I used to
make a content map in the class involving my students to connect Laplace transform
with the course content already covered at that point. This also helped to give a heads
up to the students about the differences and similarities between Fourier and Laplace
transforms through the concepts already covered or to-be covered in the course.
Doing the same exercise in the class for the next topic, which in my case used to be
application of Laplace transform in system analysis, the previous conceptual
connections were reiterated and misunderstandings were discussed before the start of
a new topic. In my opinion, helping the students to make connections between the
topics covered in the whole course and later in the courses that require prior
knowledge of Continuous Time Signals and Systems course content empowers
students for conceptual learning of the course content and "makes the game worth
playing" for them (Perkins, 2010).
2. There should be labs in this course that are well-aligned with the course content to
further nudge students' understanding of the course content. One such example is the
lab instruction model at the Rose-Hulman Institute of Technology for this course
(Simoni, Aburdene, & Fayyaz, 2013b, 2013c, 2013d, 2014). At Rose-Hulman
Institute of Technology, the instructor of the course conducts the labs himself making
sure that the concepts covered in the classroom are highlighted in the labs and same
terms are used in the labs as are discussed in the classroom. I contend that this helps
to rectify the problem of interchanging terms suggested in this study. Additionally, at
206
Rose-Hulman Institute of Technology, hands-on application-oriented activities are
designed for lab work that provide personal experiences to students with signals like
their own ECG, speech, and hearing. The experience of applying new knowledge
(Garfield, 1995), engaging in solving real-world problems (Merrill, 2002), and
knowing that new knowledge is useful in the daily life (Çetin, 2004) promote
conceptual learning. Moreover, reflection prompts are given to the students in each
lab session that encourage them to connect theoretical knowledge covered in the
classroom with their real-world personalized experiences in the labs. These
reflections are graded which further pushes the students to reflect and learn. For
learning mathematics related topics, reflection empowers learners to separate
themselves from the action of doing mathematics and think on the processes under
study (Wheatley, 1992). I argue that lab activities with real life applications aligned
with the course content and reflections help to rectify the difficulty faced by the
students in translation of the signals suggested in this study. Furthermore, studies
have shown, in general, bridging the gap between theory-focused lectures and
application-oriented expectations of undergraduate engineering students increase the
motivation of a student (Munz, Schumm, Wiesebrock, & Allgower, 2007).
3. Instructors need to give careful attention to the hard parts (Perkins, 2010) of these
courses. The hard parts of these courses include, i) multiple representations of the
same function, ii) multiple approaches available to solve a question, iii) different skill
sets needed to solve a question after making small changes in the question. Instructors
need to give examples of different representations and skill sets in the class as much
as possible to make the minds of the students engaged in all possible situations.
207
Studies have shown that the students learn better and are more motivated to struggle
with their learning when they work cooperatively in small groups to solve problems
and learn to argue convincingly for their approach among conflicting ideas and
methods (Garfield, 1995). I argue that for teaching Continuous Time Signals and
Systems courses, facilitating group discussions in the classroom would help to
explore multiple representations and methods for any given situation as different
students will attempt to look at the given question differently which will provide
opportunities for other students to open their minds to the possibilities of multiple
solutions and representations. Additionally, class discussions will help to pinpoint and
fix problems in the reasonings employed by the students when they engage with the
course content. Furthermore, students always find difficulty in understanding the
concepts that they cannot understand intuitively from the mathematical expression or
vice versa (Bruner, 1962; Ashcraft, 2002). Facilitating students to reflect intuitively
(through well-designed homework, class discussions, etc.) on the concepts taught in
these courses will help them better understand the course content.
4. I recently learned about the use of Licht's model of teaching electrical energy,
voltage, and current (Licht, 1991) for teaching related courses like ac circuits within
undergraduate electrical engineering curriculum (Pitterson & Streveler, 2014). This
model provides an alternative framework to effectively teach courses with abstract
and complex scientific concepts like alternating current. I argue that this model seems
effective for teaching Continuous Time Signals and Systems courses because of the
abstract nature of the topics covered in this course. This model divides instruction of
a concept or a topic into five stages of instruction. I will discuss these stages briefly to
208
explain the instruction model and I will use the example of teaching Fourier
transform to explain how this model might work for the overall instruction of
Continuous Time Signals and Systems courses.
Stage 1 is a phenomenological orientation of the concept. This includes
introduction of the general overview of the concept and an overall intersection of the
macro, micro, and symbolic forms of that concept. For teaching the concept of the
Fourier transform at stage 1, the instructor will introduce the term, its definition, and
possible relations of this newly introduced term with the previous knowledge of the
students. This stage provides students to discuss and exchange ideas on their beliefs
on signals and its frequency components, which will prepare students for a more in-
depth explanation of the topic. At this stage the instructor would make sure that the
students' understandings about the signal consisting of different frequency
components is clearly established.
Stage 2 introduces the qualitative macroscopic approach to the concept. This
includes introduction of more specific information about the particular concept but
without any micro level details. This stage helps students to connect their prior
knowledge with the newly introduced knowledge. For teaching the concept of the
Fourier transform at stage 2, the instructor at this stage would introduce the terms like
complex exponentials and Eigenvectors at the macro level. This stage would enable
students to understand the bigger picture of Fourier transform and the related terms.
Stage 3 introduces a qualitative microscopic approach. This includes introduction
of the microscopic details of the concept expecting that the students at this stage are
ready to switch between macroscopic and microscopic details of that concept. For

209
teaching the concept of the Fourier transform at stage 3, the instructor would use
visual representations and simulations to facilitate students to assimilate the abstract
concept of frequency domain and frequency. This is very useful because students do
not have a prior concept of frequency domain at this point and understanding the
representations help to understand the importance of this concept.
Stage 4 introduces the quantitative macroscopic approach of the new concept.
This means introduce mathematical equations and formulas related to the new
concept at this stage. For teaching the concept of the Fourier transform at stage 4, the
instructor would introduce the mathematical formulas of Fourier transform at this
stage after they are sure that the students have sufficient qualitative understanding of
the newly introduced concept at both macroscopic and microscopic levels.
Stage 5 introduces a quantitative microscopic approach. This includes providing
students with opportunities to explore and verify the relationships between various
mathematical symbols and variables introduced in the previous stage and the details
of the concept itself. For teaching the concept of the Fourier transform at stage 5, the
instructor would give multiple problems to students to facilitate them to explore and
verify the relationship of signals and their frequencies with mathematical equations.
In order to ensure students completely understand the fundamental underlying
relationship among signals, Fourier transform formulas, and frequencies, the
instruction at this stage would highlight the microscopic level of equations enabling
students to fully understand how variables are related as well develop the ability to
derive equations from textual information. At this stage, the instruction on the use of
mathematical equations and quantitative approaches to learning Fourier transform
210
should go beyond the rote learning and application of the formulas. At this stage,
students must be prepared to understand when a formula or approach is more
appropriate to use and what relationship each formula represents.
5.5.2 Implications for Learning
Garfield (1995) argued that students learn better if they are engaged in, and
motivated to struggle with their own learning. He asserted that working cooperatively in
small groups to solve problems and learning to argue convincingly for their approach
among conflicting ideas and methods is helpful for students (Garfield, 1995). For
learning topics such as those in Continuous Time Signals and Systems course content,
this seems like a good strategy because this might help students to reflect on their choices
for problem-solving strategies when choosing among multiple interchangeable and
conflicting methods and signal representations presented in these courses.
Additionally, for learning abstract concepts that involve mathematics, it is
important for the learners to separate themselves from the action of doing mathematics
(learning mathematical formulas and equations) and reflect on the results and the
processes. This does not suggest it is not important to be able to solve a problem in
Continuous Time Signals and Systems courses, but recommends that being able to reflect
on the action of solving a problem is equally important for students. I argue that this
ability must be the enduring understanding for all the topics related to Continuous Time
Signals and Systems courses. Once this ability is developed, I contend that students can
solve, explain, and apply any problem related to these courses whenever they have the
related mathematical formulas and sometime even without.
211
Nasr (2007) conducted a study on understanding faulty reasonings of
undergraduate aeronautical engineering students in Signals and Systems courses. His
study was mainly focused on students' concepts related to system analysis. This study is
focused on understanding undergraduate electrical engineering students' problematic
reasonings in Signals and Systems courses. This study was focused on both signals and
systems analysis and most of the findings are related to signal analysis. Nasr (2007)
reported that students used faulty reasonings in problems related to concepts of linearity,
time-invariance, convolution (specifically with the introduction of new symbol, τ),
Laplace transform (specifically with the region of convergence), and Bounded-input-
bounded-output stability of a system. This study also shows that students exhibit the use
of problematic reasonings in problems related to convolution and time-invariance of the
system. Participants of this study did not show problematic reasonings in finding linearity
of the system. In this study, students' concepts related to Laplace transform and Bounded-
Input-Bounded-Output stability of a system were not checked. Nasr (2007) suggests
students use the reasoning resources based on the features of the given structure of
problem or input-output pairs and are able to solve the problems related to system
analysis correctly sometimes even with the lack of correct knowledge. Some of the
frequently invoked resources are interval matching readout strategy and symmetry (Nasr,
2007). A student using a problematic reasoning and still correctly answering the given
question was not observed in this study. The structure of questions being asked for this
study can be a reason for the absence of this observation. This study suggests that
students showed problems in solving questions related to convolution because they mixed
up the operation of convolution with the operation of multiplication and showed
212
problems in solving questions related to time-invariance because they mixed up the
concept of time-invariance with the literal meaning of time-invariance.
Lesh, Post, and Behr (1987) interviewed fourth to eighth graders to investigate
their understanding of applied mathematics, proportional reasoning, and rational
numbers. They observed that the participants exhibited lack of understanding of the
representations and translations of mathematical concepts. The results of this study show
that students struggle with translation of signals from one representation to the other
within a domain and between domains. Although this study is focused on undergraduate
electrical engineering students' (not fourth to eighth graders') understanding of Signals
and Systems (not mathematics) related topics, the results are consistent with the Lesh,
Post, and Behr's (1987) findings. This suggests that may be students struggle in Signals
and Systems courses because the skills required to understand the course content are not
well acquired in the earlier classes. Learning the skills to translate and represent a
mathematical concept in all five forms (graph, equation, symbol, real world,
manipulative) suggested by Lesh, Post, and Behr (1987) will be a good preparation to
excel in courses like Signals and Systems.
Dreyfus (1991) suggests that reflection on one's mathematical experiences is
important in learning advanced mathematical processes. He proposes that an ability to
check the solution through an alternative method is important for meaningful learning
and students should consciously practice to understand representations and abstractions
of advanced mathematical concepts. According to Dreyfus (1991), students can only
learn advanced mathematical concepts through the conscious interaction of a large
number of mathematical and psychological processes in their minds. These processes
213
include representation, translation, modeling, generalizing, and synthesizing. Dreyfus's
(1991) study is focused on high school and college students' understanding of Calculus
related topics. The main findings of this study are not that the participants could not solve
a particular problem due to their inability to perform calculus related operations but lack
of abilities to translate between different representations of the same signal led to
incorrect solutions. This suggest that although students might have learned to perform
calculus related operations like integration, lack of ability to translate the given function
(signals) hold students from solving Signals and Systems related problems. Developing
an ability to reflect on the mathematical processes and verifying the answer from more
than one method might help students to excel in courses like Signals and Systems. In
Signals and Systems courses, students must attempt to challenge themselves to do
multiple translations of the same concept and make connections between them with
mathematical reasoning.
5.6 Future Work
The promotion of the 'conceptual change kind of learning' involves discussion of
several critical issues including (i) In what ways is knowledge misunderstood, (ii) Why
misunderstood knowledge is difficult to change, (iii) What comprises a change in prior
knowledge, and (iv) how can the instruction be designed to promote conceptual change
(Chi, 2008). This study is a step towards understanding the ways in which the knowledge
is misunderstood. There are yet many areas to be explored before we can completely
ensure conceptual learning of Continuous Time Signals and Systems course content. In
this section, I will discuss some research opportunities that are created as a result of the
214
knowledge unraveled in this study. Future research on learning Continuous Time Signals
and Systems courses may include:
1. For this study, the analysis of the collected data was focused on the problematic
reasonings of students, and what an incorrect response looks like in Continuous Time
Signals and Systems courses. A future study (from the same collected data) that will
complement this study and will help to better understand students' understanding of
this course will be to look at what unproblematic reasonings of students look like
when they engage with the same content. The data will be analyzed in the similar way
it was done for this study except that this time except that the focus will be shifted
from incorrect to correct responses and centered on what reasonings students use
when they correctly solve the given problem. The results from this study will bring
forward students' successful approaches to engage with Continuous Time Signals and
Systems course content and will help in designing effective pedagogy for the
students. A comparison of problematic and unproblematic reasonings might suggest a
way to efficient fix-up of the problematic reasonings.
2. The data analysis for this study mainly focused on the identification of the
problematic reasonings employed by students within Continuous Time Signals and
Systems courses. An important area for future work from similar kind of data
collected is to capture the problem solving strategies of students in Continuous Time
Signals and Systems courses. These include studies like,
a. Investigate how the students talk through the process (for example, linear,
negotiated, etc) of problem solving within Continuous Time Signals and
Systems courses.
215
b. Explore how the problem-solving approaches of the students who correctly
solve a problem differ from the approaches of the students who incorrectly
solve the same problem.
c. Explore the resources (for example, Fourier Transform table, calculator,
computer, etc.) that the students rely on to solve a particular problem in
Continuous Time Signals and Systems courses, how they make use of these
resources, and how the use of these resources influence the problem solving
strategies of the students.
3. An important area for the research in conceptual understanding of any concept is to
find what makes that concept hard to understand (Perkins, 2007). Perkins (2007)
suggests that the answer can be achieved by the identification of distinct patterns of
how a student constructs meanings and concepts. Montfort (2011) puts forward a
similar approach of answering this question. He recommends finding same student's
correct and incorrect responses (understanding), identifying the connection between
the incorrect and correct responses, and exploiting the connection to answer why a
particular topic is difficult to understand for that particular student. The knowledge of
what a student understands better empowers an educator to better teach any concept
with the knowledge of i) potential areas to build analogies on, ii) to create references
for learning, and iii) recognize how a student switches from one version of
understanding to another in the course of problem solving, communicating, or
learning.
4. Future research in continuation of this study will be establishing generalizability of
the findings of this study (Montfort, Brown, & Pollock, 2009). Generalizability of the
216
findings of this study will help to address some methodological concerns that arise
from the findings of any similar qualitative research on conceptual understanding.
These include participant's ability to describe his/her reasonings accurately, influence
of the communication skills of a participant to display his/her conceptual
understanding, influence of the presence of the researcher on the participants'
responses. A few ways to achieve this are to
a) Investigate the differences in the use of the problematic reasonings among
undergraduate electrical engineering students in different places (universities,
countries, etc.)
b) Investigate the difference in the use of problematic reasonings among students
with different grades in Continuous Time Signals and Systems courses (Montfort,
Brown, & Pollock, 2009)
c) Explore factors that play a role in the inculcation of the use of particular
reasonings among different students in different places (Montfort, Brown, &
Pollock, 2009), and
d) Develop a test (or revise SSCI) for quantitative analysis of conceptual
understanding of undergraduate electrical engineering students within Continuous
Time Signals and Systems course content
5. Another important area for further research in conceptual learning of Continuous
Time Signals and Systems courses is a longitudinal study to explore how conceptual
knowledge of undergraduate electrical engineering students of topics covered in
Continuous Time Signals and Systems courses evolves as they move forward in
electrical engineering program.
217
6. For students who have taken one year of calculus and analytic geometry in high
school, Iris University provides an intensive five-week fast track calculus course in
which students review differential and integral calculus, cover all of multivariable
calculus, and become familiar with the computer implementation of mathematics.
Upon successful completion of Fast-Track Calculus, the student receives 15 hours of
academic credit, and is able to enter Sophomore-level mathematics courses as a
freshman. In the future, it will be interesting to explore the difference in the
understanding of Continuous Time Signals and Systems course content between
students with a non-traditional mathematical training and those without.

REFERENCES
218
REFERENCES
Adair, J. G. (1984). The Hawthorne effect: A reconsideration of the methodological artifact. Journal of Applied Psychology, 69(2), 334-345. doi:10.1037/0021-9010.69.2.334.
Anderson, C. W. (2007). Perspectives on science learning. In S. Abell & N. Lederman (Eds.), Handbook of research on science education (pp. 3-30). Mahwah, NJ: Lawrence Erlbaum Associates.
Anderson, J. R. (1993). Problem solving and learning. American Psychologist, 48(1), 35. doi:10.1037/0003-066X.48.1.35
Bahar, M. (2003). Misconceptions in biology education and conceptual change strategies. Educational Sciences: Theory & Practice, 3(1), 55-64.
Behr, M. J., Wachsmuth, I., Post, T. R., & Lesh, R. (1984). Order and equivalence of rational numbers: A clinical teaching experiment. Journal for Research in
Mathematics Education, 15(5), 323-341. doi:10.2307/748423. Benbunan-Fich, R. (2001). Using protocol analysis to evaluate the usability of a
commercial web site. Information & Management, 39(2), 151-163. Betz, N. E. (1978). Prevalence, distribution, and correlates of math anxiety in college
students. Journal of Counseling Psychology, 25(5), 441-448. doi:10.1037/0022-0167.25.5.441.
Bisanz, J., & LeFevre, J. A. (1992). Understanding elementary mathematics. In J. I. D. Campbell (Ed.), The nature and origins of mathematical skills (pp 113-136). North Holland, Amsterdam: Elsevier Science Publisher.
Boren, T., & Ramey, J. (2000). Thinking aloud: Reconciling theory and practice. IEEE
Transactions on Professional Communication, 43(3), 261-278. doi:10.1109/47.867942.
Braun, V., & Clarke, V. (2006). Using thematic analysis in psychology. Qualitative
Research in Psychology, 3(2), 77-101. doi:10.1191/1478088706qp063oa. Bruner, J. S. (1962). On knowing: Essays for the left hand. Cambridge, Massachusetts:
Harvard University Press. Buck, J. R., & Wage, K. E. (2005). Active and cooperative learning in signal processing
courses. In IEEE Signal Processing Magazine, (pp. 76-81). Piscataway, NJ: IEEE. doi:10.1109/MSP.2005.1406489.
Buck, J. R., Wage, K. E., Hjalmarson, M. A., & Nelson, J. K. (2007). Comparing student understanding of signals and systems using a concept inventory, a traditional exam and interviews. In 37th Annual Frontiers In Education Conference - Global
Engineering: Knowledge Without Borders, Opportunities Without Passports (pp. S1G-1,S1G-6). Piscataway, NJ: IEEE. doi:10.1109/FIE.2007.4418043.

219
Caramazza, A., McCloskey, M., & Green, B. (1981). Naive beliefs in “sophisticated” subjects: Misconceptions about trajectories of objects. Cognition, 9(2), 117-123. doi:10.1016/0010-0277(81)90007-X.
Carey, S. (1985). Conceptual change in childhood: Cambridge, MA: MIT Press. Carey, S. (1999). Knowledge acquisition: Enrichment or conceptual change. In E.
Margolis & S. Laurence (Eds.), Concepts: core readings (pp. 459-487). Cambridge, MA: MIT Press.
Cavicchi, T. J. (2005). Experimentation and analysis: SigLab/MATLAB data acquisition experiments for signals and systems. IEEE Transactions on Education, 48(3), 540-550. doi:10.1109/TE.2005.852595.
Chapin, S. H., O'Connor, C., & Anderson, N. C. (2009). Classroom discussions: Using
math talk to help students learn, grades K-6 (2nd ed.). Sausalito, CA: Math Solutions Publications.
Çetin, Y. (2004). Teaching logarithm by guided discovery learning and real life
applications (Unpublished master's Thesis). Middle East Technical University, Ankara, Turkey.
Chi, M. T. H., & Roscoe, R. D. (2002). The processes and challenges of conceptual change. In M. Limón & L. Mason (Eds.), Reconsidering conceptual change:
Issues in theory and practice (pp. 3-27). Hingham, MA: Kluwer Academic Publishers.
Chi, M. T. H. (1992). Conceptual change within and across ontological categories: Examples from learning and discovery in science. In R. Giere (Ed.), Cognitive
models of science: Minnesota studies in the philosophy of science (pp. 129-186). Minneapolis: University of Minnesota Press.
Chi, M. T. H. (1993). Barriers to conceptual change in learning science concepts: A theoretical conjecture. In Proceedings, Fifteenth Annual Conference of the
Cognitive Science Society (pp. 312-317). Hillsdale, NJ: Lawrence Erlbaum Assoiates.
Chi, M. T. H. (1997). Creativity: Shifting across ontological categories flexibly. In T. B. Ward, S. M. Smith, R. A. Finke & J. Vaid (Eds.), Conceptual structures and
processes: Emergence, discovery and change (pp. 209-234). Washington, DC: American Psychological Association.
Chi, M. T. H. (2005). Commonsense conceptions of emergent processes: Why some misconceptions are robust. Journal of the Learning Sciences, 14(2), 161-199. doi:10.1207/s15327809jls1402_1.
Chi, M. T. H. (2008). Three types of conceptual change: Belief revision, mental model transformation, and categorical shift. In S. Vosniadou (Ed.), International
handbook of research on conceptual change (pp. 61-82). New York, NY: Routledge
Chi, M. T. H., Roscoe, R. D., Slotta, J. D., Roy, M., & Chase, C. C. (2012). Misconceived causal explanations for emergent processes. Cognitive Science, 36(1), 1-61. doi: 10.1111/j.1551-6709.2011.01207.x.
Chi, M. T. H., Slotta, J. D., & De Leeuw, N. (1994). From things to processes: A theory of conceptual change for learning science concepts. Learning and Instruction,
4(1), 27-43. doi:10.1016/0959-4752(94)90017-5.
220
Civil, M. (1990). "You only do math in math": A look at four prospective teachers' views about mathematics. For the Learning of Mathematics, 10(1), 7-9.
Collins, A., Brown, J. S., & Newman, S. E. (1989). Cognitive apprenticeship: Teaching the crafts of reading, writing, and mathematics. In L. Resnick (Ed.), Knowing,
learning, and instruction: Essays in honor of Robert Glaser (pp. 487). Hillsdale, NJ: Lawrence Erlbaum Associates.
Corry, L. (1993). Kuhnian issues, scientific revolutions and the history of mathematics. Studies In History and Philosophy of Science Part A, 24(1), 95-117.
Creswell, J. W. (2002). Educational research: Planning, conducting, and evaluating
quantitative and qualitative research. Upper Saddle River, NJ: Merrill Prentice Hall.
Creswell, J. W. (2007). Qualitative inquiry & research design: Choosing among five
approaches (2nd ed.). Thousand Oaks, CA: Sage Publications. Dauben, J. (1984). Conceptual revolutions and the history of mathematics: two studies in
the growth of knowledge. In E. Mendelsohn (Ed.), Transformation and tradition
in the sciences: Essays in honour of I. Bernard Cohen (pp. 81-103). New York, NY: Cambridge University Press.
Davis, R. B. (1988). Is ‘Percent’a number? Journal of Mathematical Behavior, 7(3), 299-302.
Davison, G. C., Robins, C., & Johnson, M. K. (1983). Articulated thoughts during simulated situations: A paradigm for studying cognition in emotion and behavior. Cognitive Therapy and Research, 7(1), 17-40. doi:10.1007/BF01173421.
DiSessa, A. A. (1982). Unlearning Aristotelian physics: A study of knowledge-based learning. Cognitive Science, 6(1), 37-75. doi:10.1207/s15516709cog0601_2.
DiSessa, A. A. (1983). Phenomenology and the evolution of intuition. In D. Gentner & A. Stevens (Eds.), Mental models (pp. 15-34). Hillsdale, NJ: Lawrence Erlbaum
DiSessa, A. A. (1988). Knowledge in pieces. In G. Forman & P. B. Pufall (Eds.), Constructivism in the computer age (pp. 49-70). Hillsdale, NJ: Lawrence Erlbaum Associates.
DiSessa, A. A. (1993). Toward an epistemology of physics. Cognition and Instruction,
10(2-3), 105-225. doi:10.1080/07370008.1985.9649008. DiSessa, A. A. (2002). Why “conceptual ecology” is a good idea. In M. Limón & L.
Mason (Eds.) Reconsidering conceptual change: Issues in theory and practice (pp. 28-60). Hingham, MA: Kluwer Academic Publishers.
DiSessa, A. A. (2008). A bird’s-eye view of the “pieces” vs.“coherence” controversy (from the “pieces” side of the fence). In S. Vosniadou (Ed.), International
handbook of research on conceptual change (pp. 35-60). New York, NY: Routledge.
DiSessa, A. A., Gillespie, N. M., & Esterly, J. B. (2004). Coherence versus fragmentation in the development of the concept of force. Cognitive Science, 28(6), 843-900. doi:10.1207/s15516709cog2806_1.
DiSessa, A. A., & Sherin, B. L. (1998). What changes in conceptual change? International Journal of Science Education, 20(10), 1155-1191. doi:10.1080/0950069980201002.
221
Dreyfus, T. (1991). Advanced mathematical thinking processes. In D. Tall (Ed.), Advanced mathematical thinking (pp. 25-41). Dordrecht, Netherlands: Kluwer Academic Publishers.
Driver, R., & Easley, J. (1978). Pupils and paradigms: A review of literature related to concept development in adolescent science students. Studies in Science
Education, 5, 61-84. doi:10.1080/03057267808559857. English, L. D., & Sharry, P. V. (1996). Analogical reasoning and the development of
algebraic abstraction. Educational Studies in Mathematics, 30(2), 135-157. doi:10.1007/BF00302627.
Ericsson, K. A., & Simon, H. A. (1980). Verbal reports as data. Psychological Review,
87(3), 215-251. doi:10.1037/0033-295X.87.3.215. Ericsson, K. A., & Simon, H. A. (1984). Protocol analysis: Verbal reports as data.
Cambridge, MA: MIT press. Evans, B. L., Karam, L. J., West, K. A., & McClellan, J. H. (1993). Learning signals and
systems with Mathematica. IEEE Transactions on Education, 36(1), 72-78. doi:10.1109/13.204820.
Evans, D. L., Gray, G. L., Krause, S., Martin, J., Midkiff, C., Notaros, B. M., . . . Wage, K. (2003, November). Progress on concept inventory assessment tools. Panel presented at the 33rd Annual Frontiers in Education Conference. Boulder, CO.
Evans, D., Midkiff, C., Miller, R., Morgan, J., Krause, S., Martin, J., . . . Wage, K. (2002, November). Tools for assessing conceptual understanding in the engineering sciences. Panel presented at 32nd Annual Frontiers in Education Conference. Boston, MA.
Fayyaz, F. (2009). Identification of problems in signal analysis using concept mapping
(Unpublished master's thesis). University of Engineering and Technology, Lahore, Pakistan.
Felder, R. M., & Silverman, L. K. (1988). Learning and teaching styles in engineering education. Engineering Education, 78(7), 674-681.
Ferri, B. H., Ahmed, S., Michaels, J. E., Dean, E., Garyet, C., & Shearman, S. (2009). Signal processing experiments with the LEGO MINDSTORMS NXT kit for use in signals and systems courses. In American Control Conference (pp. 3787-3792). Piscataway, NJ: IEEE. doi:10.1109/ACC.2009.5160602.
Fisher, K. M. (1985). A misconception in biology: Amino acids and translation. Journal
of Research in Science Teaching, 22(1), 53-62. doi:10.1002/tea.3660220105. Fisher, K. M., & Lipson, J. I. (1986). Twenty questions about student errors. Journal of
Research in Science Teaching, 23(9), 783-803. doi:10.1002/tea.3660230904. Fuson, K. C. (1988). Children's counting and concepts of number. New York, NY:
Springer-Verlag Publishing. Garfield, J. (1995). How students learn statistics. International Statistical Review/Revue
Internationale de Statistique, 63, 25-34. doi:10.2307/1403775. Garner, R. (1987). Metacognition and reading comprehension. Norwood, NJ: Ablex
Publishing. Geary, D. C. (1994). Children's mathematical development: Research and practical
applications. Washington, DC, US: American Psychological Association.
222
Gelman, R., & Williams, E. M. (1998). Enabling constraints for cognitive development and learning: Domain specificity and epigenesis. In W. Damon, D. Kuhn & R. S. Siegler (Eds.), Handbook of child psychology: Vol. 2. Cognition, perception and
language (5th ed., pp. 575-630). New York, NY: Wiley. Gilbert, J. K., Osborne, R. J., & Fensham, P. J. (1982). Children's science and its
consequences for teaching. Science Education, 66(4), 623-633. doi:10.1002/sce.3730660412.
Gilbert, S. (1989). Principles of educational and psychological measurement and
evaluation (3rd ed.). Belmont, CA: Wadsworth Publishing Company. Ginsburg, H. P. (1997). Entering the child's mind: The clinical interview in psychological
research and practice. New York, NY: Cambridge University Press. Ginsburg, H. P., Jacobs, S. F., & Lopez, L. S. (1998). The teacher's guide to flexible
interviewing in the classroom. Don Mills, Ontarion: Allyn & Bacon. Gray, R. M., & Goodman, J. W. (1995). Fourier Transforms: An introduction for
engineers. Norwell, MA: Kluwer Academic. Guan, X. H., Zhang, M. M., & Zheng, Y. (2009). Matlab simulation in signals & systems
using Matlab at different levels. In First International Workshop on Education
Technology and Computer Science (pp. 952-955). Piscataway, NJ: IEEE. doi:10.1109/ETCS.2009.476.
Halford, G. (1993). Children's understanding: The development of mental models. Hillsdale, NJ: Lawrence Erlbaum Associates.
Halloun, I. A., & Hestenes, D. (1985). The initial knowledge state of college physics students. American Journal of Physics, 53(11), 1043-1055. doi:10.1119/1.14030.
Hammer, D. (2000). Student resources for learning introductory physics. American
Journal of Physics, 68(S1), S52-S59. doi:10.1119/1.19520. Han, B., Zhang, C., & Qin, X. (2011). Based on Matlab signals and systems course
project-driven teaching method research. In IEEE 3rd International Conference
on Communication Software and Networks (pp. 466-469). Piscataway, NJ: IEEE. doi:10.1109/ICCSN.2011.6013873.
Hanselman, D. C. (1992). Signals and linear systems: A teaching approach based on learning styles concepts. IEEE Transactions on Education, 35(4), 383-386. doi:10.1109/13.168714.
Hashweh, M. (1988). Descriptive studies of students' conceptions in science. Journal of
Research in Science Teaching, 25(2), 121-134. doi:10.1002/tea.3660250204. Herman, G. L., Kaczmarczyk, L., Loui, M. C., & Zilles, C. (2008, September). Proof by
incomplete enumeration and other logical misconceptions. In Proceedings, Fourth
International Workshop on Computing Education Research (pp. 59-70). New York, NY: ACM. doi:10.1145/1404520.1404527.
Huettel, L. G. (2006). A DSP hardware-based laboratory for signals and systems. In Proceedings, 4th Digital Signal Processing Workshop, 12th - Signal Processing
Education Workshop (pp. 456-459). Piscataway, NJ: IEEE. doi:10.1109/DSPWS.2006.265466.
Jamison, R. E. (2000). Learning the language of mathematics. Language and Learning
across the Disciplines, 4(1), 45-54.
223
Jaspers, M. W. (2009). A comparison of usability methods for testing interactive health technologies: methodological aspects and empirical evidence. International
Journal of Medical Informatics, 78(5), 340-353. doi:10.1016/j.ijmedinf.2008.10.002.
Jaworski, B. (2004). Grappling with complexity: Co-learning in inquiry communities in mathematics teaching development. In Proceedings, 28th Conference of the
International Group for the Psychology of Mathematics Education (pp. 17-36). Berlin, Germany: IGPME.
Kanmani, B. (2011). Introducing signals and systems concepts through analog signal processing first. In Proceedings, IEEE Digital Signal Processing Workshop and
IEEE Signal Processing Education Workshop (DSP/SPE) (pp. 84-89). Piscataway, NJ: IEEE. doi:10.1109/DSP-SPE.2011.5739191.
Karmiloff-Smith, A. (1993). Self-organization and cognitive change. In M. Johnson (Ed.), Brain development and cognition: A Reader (pp. 592-618). Oxford, MA: Blackwell Publishers.
Klopfer, L. E., Champagne, A. B., & Gunstone, R. F. (1983). Naive knowledge and science learning. Research in Science & Technological Education, 1(2), 173-183. doi:10.1080/0263514830010205.
Kuhn, T. (1962). The structure of scientific revolutions. Chicago, IL: University of Chicago Press.
Lakatos, I. (1970). Falsification and the methodology of scientific research programmes. In I. Lakatos & A. Musgrave (Eds.), Criticism and the growth of knowledge (pp. 91-195). London: Cambridge University Press.
Lathi, B. P. (1998). Signal processing and linear systems. Berkeley, CA: Cambridge Press.
Laudan, L. (1978). Progress and its problems: Towards a theory of scientific growth. Berkeley, CA: University of California Press.
Lesh, R. (1981). Applied mathematical problem solving. Educational Studies in
Mathematics, 12(2), 235-264. Lesh, R., Post, T., & Behr, M. (1987). Representations and translations among
representations in mathematics learning and problem solving. In C. Janvier (Ed.), Problems of Representation in the Teaching and Learning of Mathematics (pp.33–40). Hillsdale, NJ: Lawrence Erlbaum Associates.
Limón, M., & Mason, L. (2002). Reconsidering conceptual change: Issues in theory and
practice. New York, NY: Springer. Lincoln, Y. S., & Guba, E. G. (1985). Establishing trustworthiness. In Y. S. Lincoln & E.
G. Guba (Eds.), Naturalistic inquiry (pp. 289-331). Newbury Park, CA: Sage Publications.
Licht, P. (1991). Teaching electrical energy, voltage and current: An alternative approach. Journal of Physics Education, 26(5), 272 - 277.
Mason, J. (1989). Mathematical abstraction as the result of a delicate shift of attention. For the learning of mathematics, 9(2), 2-8.
224
Mason, M. (2010). Sample size and saturation in PhD studies using qualitative interviews. In Proceedings, Forum Qualitative Sozialforschung/Forum:
Qualitative Social Research, 11(3). Retrieved from http://www.qualitative-research.net/index.php/fqs/article/view/1428/3028
Mayer, R. E. (2002). Understanding conceptual change: A commentary. In M. Limón & L. Mason (Eds.), Reconsidering conceptual change: Issues in theory and practice (pp. 101-111). New York, NY: Springer.
McClelland, J. (1984). Alternative frameworks: Interpretation of evidence. European
Journal of Science Education, 6(1), 1-6. doi:10.1080/0140528840060102. McCloskey, M. (1983). Naive theories of motion. In D. Gentner & A. Stevens (Eds.),
Mental models (pp. 299-324). Hillsdale, NJ: Larence Erlbaum Associates. McDermott, L. C., & Shaffer, P. S. (1992). Research as a guide for curriculum
development: An example from introductory electricity. Part I: Investigation of student understanding. American Journal of Physics, 60(11), 994-1003. doi:10.1119/1.17003.
Merrill, M. D. (2002). First principles of instruction. Educational Technology Research
and Development, 50(3), 43-59. doi:10.1007/BF02505024. Meyer, E. F. (1987). Thermodynamics of "mixing" of ideal gases: A persistent pitfall.
Journal of Chemical Education, 64(8), 676. doi:10.1021/ed064p676. Montfort, D. B. (2011). Conceptual and epistemological undercurrents of learning as a
process of change (Unpublished doctoral dissertation). Washington State University, Pullman, WA.
Montfort, D. B., Brown, S., & Findley, K. (2007). Using interviews to identify student misconceptions in dynamics. In Proceedings, 37th Annual Frontiers in Education
Conference - Global engineering: knowledge without borders, opportunities
without passports. Piscataway, NJ: IEEE. doi:10.1109/FIE.2007.4417947. Montfort, D. B., Brown, S., & Pollock, D. (2009). An investigation of students'
conceptual understanding in related sophomore to graduate‐level engineering and mechanics courses. Journal of Engineering Education, 98(2), 111-129. doi:10.1002/j.2168-9830.2009.tb01011.x.
Morse, J. M., Barrett, M., Mayan, M., Olson, K., & Spiers, J. (2002). Verification strategies for establishing reliability and validity in qualitative research. International Journal of Qualitative Methods, 1(2), 13-22. Retrieved from http://ejournals.library.ualberta.ca/index.php/IJQM/article/view/4603/3756
Munson Jr, D. C., & Jones, D. L. (1999). Analog signal processing first. In Proceedings, IEEE International Conference on Acoustics, Speech, and Signal Processing (pp. 2025 - 2028). Piscataway, NJ: IEEE. doi:10.1109/ICASSP.1999.758326.
Munz, U., Schumm, P., Wiesebrock, A., & Allgower, F. (2007). Motivation and learning progress through educational games. IEEE Transactions on Industrial
Electronics, 54(6), 3141-3144. doi:10.1109/TIE.2007.907030. Nasr, R. (2007). A cognitive systems analysis of engineering students' mathematical
reasoning in signals and systems (Doctoral dissertation). Retrieved from Dissertations and Theses. (Accession Order No. AAI3259866).
225
Nasr, R., Hall, S. R., & Garik, P. (2005). Student misconceptions in signals and systems and their origins - Part II. In Proceedings, 35th Annual Frontiers in Education
Conference (pp. T4E,19-22). Piscataway, NJ: IEEE. doi:10.1109/FIE.2005.1611980.
Nasr, R., Hall, S. R., & Garik, P. (2007). Student understanding in signals and systems: The role of interval matching in student reasoning. In Proceedings, American
Society for Engineering Education Annual Conference. Washington, DC: ASEE Nasr, R., Hall, S. R., & Garik, P. (2009). Understanding naive reasonings in signals and
systems: A foundation for designing effective instructional material. In Proceedings, IEEE 13th Digital Signal Processing Workshop and 5th IEEE Signal
Processing Education Workshop, DSP/SPE 2009 (pp. 720 - 725). Piscataway, NJ: IEEE. doi:10.1109/DSP.2009.4786016.
National Board for Professional Teaching Standards (NBPTS). (2005). Five core
propositions. Retrieved from http://www.nbpts.org/five-core-propositions Nelson, J. K., Hjalmarson, M. A., & Wage, K. E. (2011). Using in-class assessment to
inform signals and systems instruction. In Proceedings, IEEE Digital Signal
Processing Workshop and IEEE Signal Processing Education Workshop (DSP/SPE) (pp. 192-197). Piscataway, NJ: IEEE. doi:10.1109/DSP-SPE.2011.5739210.
Ogunfunmi, T. (2011). Analysis of assessment using signals, systems concept inventory
for systems courses. In Proceedings 2011 IEEE International Symposium on Circuits and Systems (pp. 595-598). Piscataway, NJ: IEEE. doi:10.1109/ISCAS.2011.5937635.
Oppenheim, A. V., Willsky, A. S., & Nawab, S. H. (1997). Signals and systems (2nd ed.). Englewood Cliffs, NJ. Prentice Hall.
Orne, M. T. (1969). Demand characteristics and the concept of quasi-controls. New York, NY: Academic Press.
Padgett, W. T., Yoder, M. A., & Forbes, S. A. (2011). Extending the usefulness of the Signals and Systems Concept Inventory (SSCI). In Proceedings, IEEE Digital
Signal Processing Workshop and IEEE Signal Processing Education Workshop
(DSP/SPE) (pp. 204-209). Piscataway, NJ: IEEE. doi:10.1109/DSP-SPE.2011.5739212.
Patton, M. Q. (2001). Qualitative research and evaluation methods (3rd ed.). Thousand Oaks, CA: SAGE Publications.
Perkins, D. N. (2007). Theories of difficulty. In N. J. Entwistle & P. D. Tomlinson, (Eds.), British Journal of Educational Psychology Monograph Series II, Number 4 – Student learning and university teaching (pp. 31-48). Leicester: British Psychological Society.
Piaget, J. (1971). The child's conception of the world. Chicago, IL, University of Chicago Press.
Pickering, A. (2006). Concepts and the mangle of practice constructing quaternions. In R. Hersh (Ed.), 18 Unconventional Essays on the Nature of Mathematics (pp. 250-288). New York, NY: Springer.
226
Pines, A. L., & West, L. H. (1986). Conceptual understanding and science learning: An interpretation of research within a sources‐of‐knowledge framework. Science
Education, 70(5), 583-604. doi:10.1002/sce.3730700510. Pressley, M., & Afflerbach, P. (1995). Verbal protocols of reading: The nature of
constructively responsive reading. Hillsdale, NJ: Erlbaum. Redish, E. F. (2004). A theoretical framework for physics education research: Modeling
student thinking. In E. Redish & M. Vicentini (Eds.), In Proceedings, Enrico
Fermi Summer School, Course CLVI (Italian Physical Society) (pp. 1-63). Retrieved from http://mapmf.pmfst.hr/~luketin/Physics_education/Redish_teor.pdf
Richey, J. E., & Nokes-Malach, T. J. (2014). Comparing four instructional techniques for promoting robust knowledge. Educational Psychology Review, 1-38. doi:10.1007/s10648-014-9268-0.
Rittle-Johnson, B., Siegler, R. S., & Alibali, M. W. (2001). Developing conceptual understanding and procedural skill in mathematics: An iterative process. Journal
of Educational Psychology, 93(2), 346-362. doi:10.1037/0022-0663.93.2.346. Rittle‐Johnson, B. (2006). Promoting transfer: Effects of self‐explanation and direct
instruction. Child Development, 77(1), 1-15. doi:10.1111/j.1467-8624.2006.00852.x.
Roussou, M. (2009). A VR playground for learning abstract mathematics concepts. In Proceedings, IEEE Computer Graphics and Applications (pp. 82-85). Piscataway, NJ: IEEE. doi:10.1109/MCG.2009.1.
Ruthven, K. (1990). The influence of graphic calculator use on translation from graphic to symbolic forms. Educational Studies in Mathematics, 21(5), 431-450. doi:10.1007/BF00398862.
Säljö, R. (1999). Concepts, cognition and discourse: From mental structures to discursive tools. In W. Schnotz, S. Vosniadou & M. Carretero (Eds.), New perspectives on
conceptual change (pp. 81-90). Netherlands, Pergamon Press. Schoenfeld, A. H. (1979). Explicit heuristic training as a variable in problem-solving
performance. Journal for Research in Mathematics Education, 10(3), 173-187. Schoenfeld, A. H. (1992). Learning to think mathematically: Problem solving,
metacognition, and sense making in mathematics. In D. A. Grouws (Ed.), Handbook of research on mathematics teaching and learning, A project of the National Council of Teachers of Mathematics (pp. 334–370). New York, NY: Macmillan.
Seidman, I. (1998). Interviewing as qualitative research: A guide for researchers in
education and the social sciences (2nd ed.). New York, NY: Teachers College Press.
Selden, J., Mason, A., & Selden, A. (1989). Can average calculus students solve nonroutine problems? Journal of Mathematical Behavior, 8(1), 45-50.
Shaffer, J., Hamaker, J., & Picone, J. (1998). Visualization of signal processing concepts. In Proceedings, IEEE International Conference on Acoustics Speech and Signal
Processing (pp. 1853-1856). Piscataway, NJ: IEEE. doi:10.1109/ICASSP.1998.681824.
227
Shaochun, X., Zendi, C., & Xuhui, C. (2007). Empirical evaluation of the dialog-based protocol and think-aloud protocol. In Proceedings, Canadian Conference on
Electrical and Computer Engineering (pp. 1227-1230). Piscataway, NJ: IEEE. doi:10.1109/CCECE.2007.313.
Sherin, B. L. (2001a). A comparison of programming languages and algebraic notation as expressive languages for physics. International Journal of Computers for
Mathematical Learning, 6(1), 1-61. doi:10.1023/A:1011434026437. Sherin, B. L. (2001b). How students understand physics equations. Cognition and
Instruction, 19(4), 479-541. doi:10.1207/S1532690XCI1904_3. Siegler, R. S., & Stern, E. (1998). Conscious and unconscious strategy discoveries: A
microgenetic analysis. Journal of Experimental Psychology: General, 127(4), 377-397. doi:10.1037/0096-3445.127.4.377.
Simoni, M. (2011). Work in progress-A hardware platform for a continuous-time signals and systems course. In Proceedings, Frontiers in Education Conference (pp. S4G-1-2). Piscataway, NJ: IEEE. doi:10.1109/FIE.2011.6142947.
Simoni, M., Aburdene, M. F., & Fayyaz, F. (2013a). Analog-circuit-based activities to improve introductory Continuous-Time Signals and Systems courses. In Proceedings, American Society for Engineering Education Annual conference. Washington, DC: ASEE.
Simoni, M., Aburdene, M., and Fayyaz F., (2013b, June). Hands-on activities for Continuous-Time Signals and Systems. Three-day workshop conducted at Rose-
Hulman Institute of Technology. Terre Haute, IN. Simoni, M., Aburdene, M., and Fayyaz F., (2013c, October). Why are Continuous-Time
Signals and Systems courses so difficult? How can we make them more accessible? Pre-conferene workshop conducted at IEEE Frontiers in Education
Conference (pp. 6-8) at Oklahoma City, OK. Piscataway, NJ: IEEE. doi:10.1109/FIE.2013.6684928.
Simoni, M., Aburdene, M., and Fayyaz F., (2013d, October). Why are Continuous-Time Signals and Systems courses so difficult? How can we make them more accessible? Workshop conducted at IEEE Frontiers in Education Conference (pp. 761-763) at Oklahoma City, OK. Piscataway, NJ: IEEE. doi:10.1109/FIE.2013.6684773.
Simoni, M., Aburdene, M., and Fayyaz F., (2014, June). Hands-on activities for Continuous-Time Signals and Systems. Three-day workshop conducted at Rose-
Hulman Institute of Technology, Terre Haute, IN. Retrieved from http://www.rose-hulman.edu/ctssworkshop.aspx
Simoni, M., Fayyaz, F., & Streveler, R. A. (2014). Data mining to help determine sources of difficulty in an introductory Continuous-Time Signals and Systems course. In Proceedings, American Society for Engineering Education Annual Conference.
Washington, DC: ASEE. Sirohi, R. S., & Krishna, H. R. (1983). Mechanical measurements. New York, NY:
Wiley. Smith III, J. P., Disessa, A. A., & Roschelle, J. (1994). Misconceptions reconceived: A
constructivist analysis of knowledge in transition. Journal of the Learning
Sciences, 3(2), 115-163. doi:10.1207/s15327809jls0302_1.
228
Snir, J., Smith, C., & Grosslight, L. (1993). Conceptually enhanced simulations: A computer tool for science teaching. Journal of Science Education and
Technology, 2(2), 373-388. doi:10.1007/BF00694526. So, S. (2012). Refined ‘chalk-and-talk’of lecture content: Teaching Signals and Systems
at the Griffith School of Engineering. In Proceedings, 23rd Annual Conference
for the Australasian Association for Engineering Education (AAEE) - The
Profession of Engineering Education: Advancing Teaching, Research and
Careers. Barton, Australian Capital Territory (ACT), Australia: AAEE. Stanton, B. J., Drozdowski, M. J., & Duncan, T. S. (1993). Using spreadsheets in student
exercises for signal and linear system analysis. IEEE Transactions on Education,
36(1), 62-68. doi:10.1109/13.204818. Steen, L. A. (1988). The science of patterns. Science, 240(4852), 611-616.
doi:10.1126/science.240.4852.611. Steif, P. S. (2004). An articulation of the concepts and skills which underlie engineering
statics. In Proceedings, 34th Annual Frontiers in Education Conference (pp F1F, 5-10). Piscataway, NJ: IEEE. doi:10.1109/FIE.2004.1408579.
Steinberg, R., Saul, J., Wittmann, M., & Redish, E. (1996, September). Student
difficulties with math in physics: Why can’t students apply what they learn in
math class. Paper presented at the 113th American Association of Phyics Teachers (AAPT) National Meeting, College Park, MD. Abstract retrieved from http://www.physics.umd.edu/perg/papers/redish/talks/aapt96m.htm
Streveler, R. A., Litzinger, T. A., Miller, R. L., & Steif, P. S. (2008). Learning conceptual knowledge in the engineering sciences: Overview and future research directions. Journal of Engineering Education, 97(3), 279-294. doi:10.1002/j.2168-9830.2008.tb00979.x.
Streveler, R.A., Brown, S., Herman, G.L., & Montfort, D. (2014). Conceptual change and misconceptions in engineering education: Curriculum, measurement, and theory-focused approaches. In A. Johri and B. Olds (Eds.), Cambridge handbook of
engineering education research (pp. 83-102). New York, NY: Cambridge University Press.
Streveler, R. A., Miller, R. L., Santiago-Román, A. I., Nelson, M. A., Geist, M. R., & Olds, B. M. (2011). Rigorous methodology for concept inventory development: Using the 'assessment triangle' to develop and test the thermal and transport science concept inventory (TTCI). International Journal of Engineering
Education, 27(5), 968-984. Streveler, R. A., Olds, B. M., Miller, R. L., & Nelson, M. A. (2003). Using a Delphi
study to identify the most difficult concepts for students to master in thermal and transport science. In Proceedings, American Society for Engineering Education
Annual Conference. Washington, DC: ASEE. Svinicki, M. D. (1999). New directions in learning and motivation. New Directions for
Teaching and Learning, 80, 5-27. doi:10.1002/tl.8001. Tsakalis, K., Thiagarajan, J., Duman, T., Reisslein, M., Zhou, G. T., XiaoLi, M., &
Spanias, P (2011). Work in progress - Modules and laboratories for a pathways course in signals and systems. In Proceedings, Frontiers in Education Conference (pp. T2G-1- T2G-2). Piscataway, NJ: IEEE. doi:10.1109/FIE.2011.6143007.
229
Vamvakoussi, X., & Vosniadou, S. (2004). Understanding the structure of the set of rational numbers: A conceptual change approach. Learning and Instruction,
14(5), 453-467. doi:10.1016/j.learninstruc.2004.06.013. Viennot, L. (1979). Spontaneous reasoning in elementary dynamics. European Journal of
Science Education, 1(2), 205-221. doi:10.1080/0140528790010209. Vincenti, W. G. (1990). What engineers know and how they know it: Analytical studies
from aeronautical history. Baltimore, MD: The John Hopkins University Press. Vosniadou, S. (2002). On the nature of naïve physics. In M. Limón & L. Mason (Eds.),
Reconsidering conceptual change: Issues in theory and practice (pp. 61-76). Dordrecht, Netherlands: Kluwer Academic Publishers.
Vosniadou, S. & Verschaffel, L (2004). Extending the conceptual change approach to mathematics learning and teaching. Learning and Instruction, 14(5), 445-451. doi:10.1016/j.learninstruc.2004.06.014.
Vosniadou, S. (2008). International handbook of research on conceptual change. New York, NY: Routledge.
Vosniadou, S., & Vamvakoussi, X. (2006). Examining mathematics learning from a conceptual change point of view: Implications for the design of learning environments. In L. Verschaffel, F. Dochy, M. Boekaerts & S. Vosniadou (Eds.), Instructional psychology: Past, present and future trends. Sixteen essays in
honour of Erik De Corte (pp. 55-70). Oxford, UK: Elsevier. Vosniadou, S., Vamvakoussi, X., & Skopeliti, I. (2008). The framework theory approach
to the problem of conceptual change. In S. Vosniadou (Ed.), International
handbook of research on conceptual change (pp. 3-34). New York, NY: Routledge.
Vygotsky, L. S. (1962). Thought and language. (E. Hanfmann & G. Vakar, Trans.) Cambridge, MA: MIT Press. (Original work published in 1934)
Wage, K. E., & Buck, J. R. (2001). Development of the Signals and Systems Concept Inventory (SSCI) assessment instrument. In proceedings, 31st Annual Frontiers in
Education Conference (pp. F2A-F22). Piscataway, NJ: IEEE. doi: 10.1109/FIE.2001.963690.
Wage, K. E., Buck, J. R., Welch, T. B., & Wright, C. H. G. (2002). Testing and validation of the signals and systems concept inventory. In Proceedings, IEEE
10th Digital Signal Processing Workshop, and the 2nd Signal Processing
Education Workshop (pp 151- 156). Piscataway, NJ: IEEE. Wage, K. E., Buck, J. R., & Hjalmarson, M. A. (2006a). Analyzing misconceptions
using the signals and systems concept inventory and student interviews. In Proceedings, Fouth IEEE Digital Signal Processing Education Workshop (pp.
123-128). Piscataway, NJ: IEEE. Wage, K. E., Buck, J. R., & Hjalmarson, M. A. (2006b). The signals and systems concept
inventory. In Proceedings, National STEM Assessment Conference (pp. 307-313). Open Water Media.
Wage, K. E., Buck, J. R., Welch, T. B., & Wright, C. H. G. (2002a). The continuous-time signals and systems concept inventory. In proceedings, IEEE Conference on
Acoustics, Speech, and Signal Processing (pp.IV-4112 -IV-4115). Piscataway, NJ: IEEE.
230
Wage, K. E., Buck, J. R., Welch, T. B., & Wright, C. H. G. (2002b). The signals and systems concept inventory. In Proceedings, American Society for Engineering
Education Annual Conference. Washington, DC: ASEE. Wage, K. E., Buck, J. R., & Wright, C. H. G. (2004). Obstacles in signals and systems
conceptual learning. In Proceedings, 3rd IEEE Digital Signal Processing
Workshop (pp. 58-62). Piscataway, NJ: IEEE. Wage, K. E., Buck, J. R., Wright, C. H. G., & Welch, T. B. (2005). The signals and
systems concept inventory. IEEE Transactions on Education, 48(3), 448-461. doi:10.1109/TE.2005.849746.
Walther, J., Sochacka, N. W., & Kellam, N. N. (2013). Quality in interpretive engineering education research: Reflections on an example study. Journal of
Engineering Education, 102(4), 626-659. doi:10.1002/jee.20029. Wheatley, G. H. (1992). The role of reflection in mathematics learning. Educational
Studies in Mathematics, 23(5), 529-541. doi:10.1007/BF00571471. Wohldmann, E. L., Healy, A. F., & Bourne Jr, L. E. (2008). A mental practice superiority
effect: less retroactive interference and more transfer than physical practice. Journal of Experimental Psychology: Learning, Memory, and Cognition, 34(4), 823-833. doi:10.1037/0278-7393.34.4.823.
Wolcott, H. F. (2002). Sneaky kid and its aftermath: Ethics and intimacy in fieldwork. Walnut Creek, CA: Altamira Press.

APPENDICES
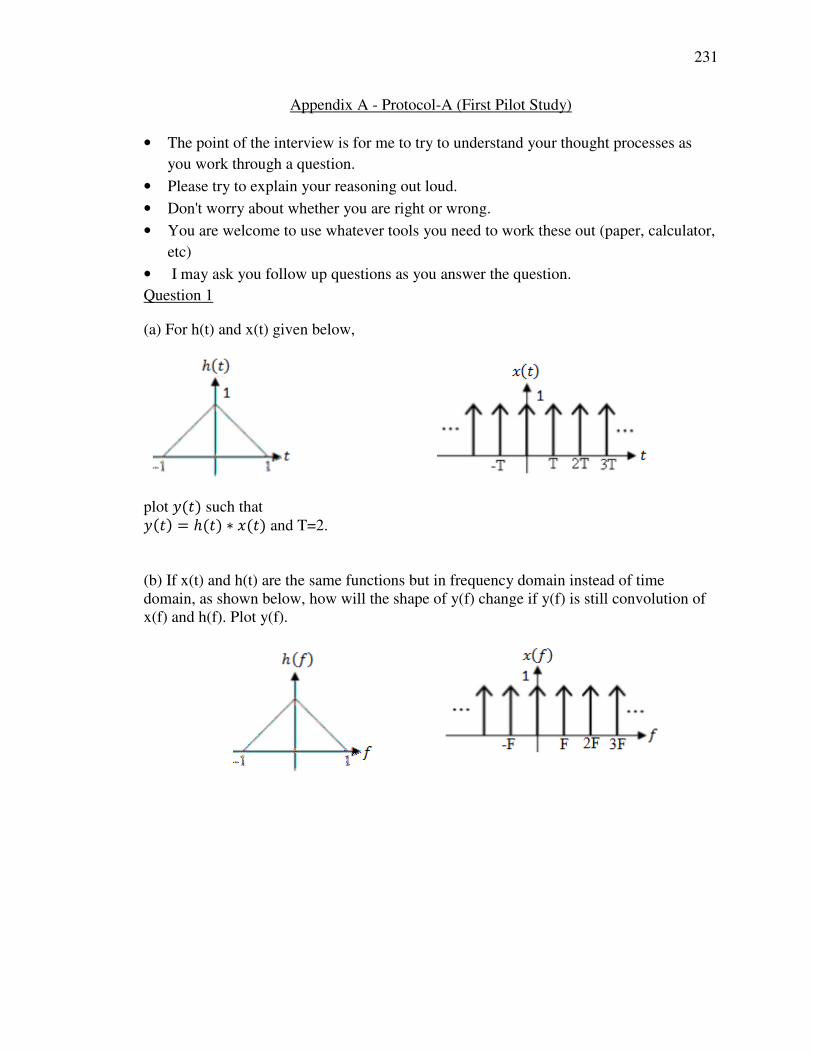
231
Appendix A - Protocol-A (First Pilot Study)
• The point of the interview is for me to try to understand your thought processes as
you work through a question.
• Please try to explain your reasoning out loud.
• Don't worry about whether you are right or wrong.
• You are welcome to use whatever tools you need to work these out (paper, calculator,
etc)
• I may ask you follow up questions as you answer the question.
Question 1
(a) For h(t) and x(t) given below,
plot =(�) such that =(�) = ℎ(�) ∗ �(�) and T=2. (b) If x(t) and h(t) are the same functions but in frequency domain instead of time domain, as shown below, how will the shape of y(f) change if y(f) is still convolution of x(f) and h(f). Plot y(f).
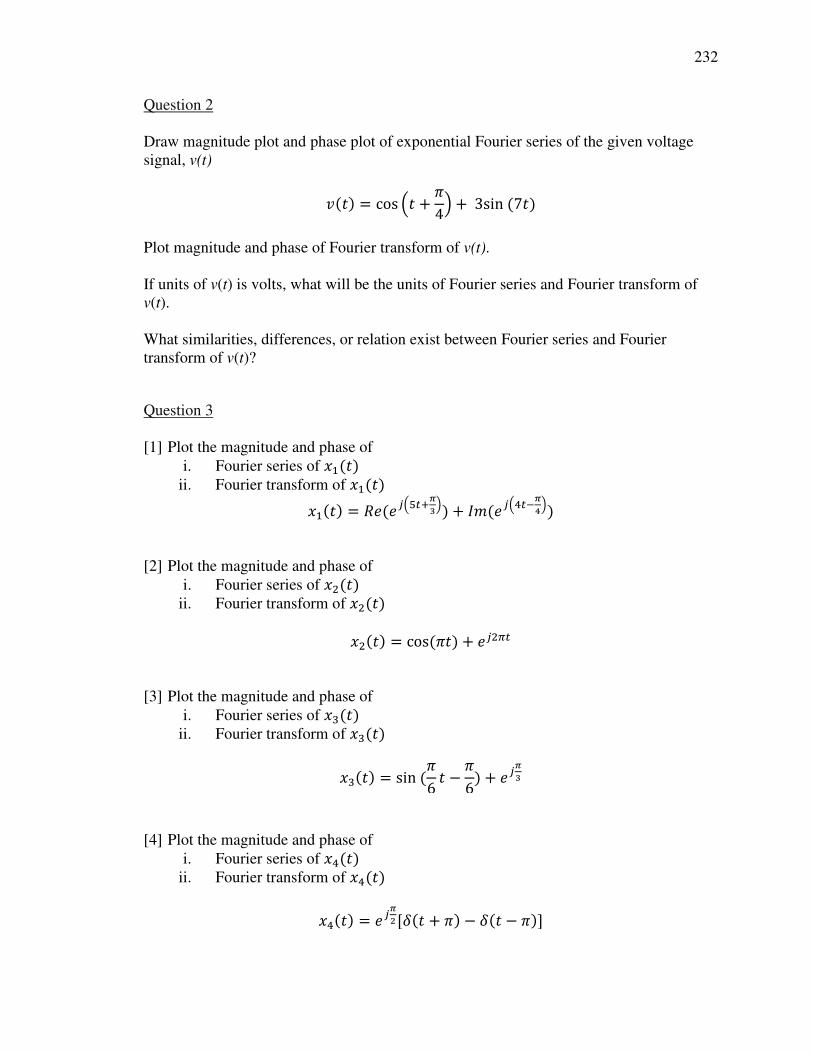
232
Question 2 Draw magnitude plot and phase plot of exponential Fourier series of the given voltage signal, v(t)
�(�) = cos A� + �4B + 3sin(7�)
Plot magnitude and phase of Fourier transform of v(t). If units of v(t) is volts, what will be the units of Fourier series and Fourier transform of v(t). What similarities, differences, or relation exist between Fourier series and Fourier transform of v(t)?
Question 3 [1] Plot the magnitude and phase of
i. Fourier series of �3(�) ii. Fourier transform of �3(�)
�3(�) = L�(�"AM$46IB) + NO(�"A/$!6
PB) [2] Plot the magnitude and phase of
i. Fourier series of �.(�) ii. Fourier transform of �.(�)
�.(�) = cos(��) + �".<$ [3] Plot the magnitude and phase of
i. Fourier series of �G(�) ii. Fourier transform of �G(�)
�G(�) = sin(�6 � −�6) + �"6I
[4] Plot the magnitude and phase of
i. Fourier series of �/(�) ii. Fourier transform of �/(�)
�/(�) = �"67[�(� + �) − �(� − �)]
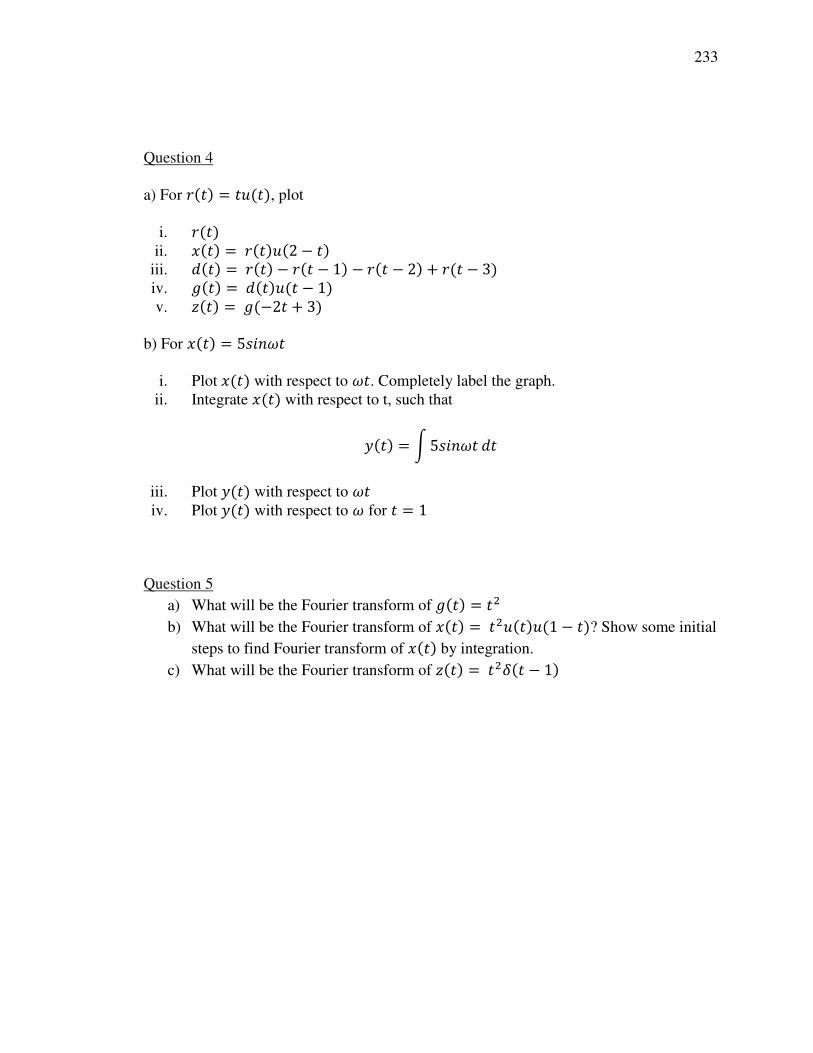
233
Question 4 a) For J(�) = � (�), plot
i. J(�) ii. �(�) = J(�) (2 − �)
iii. %(�) = J(�) − J(� − 1) − J(� − 2) + J(� − 3) iv. �(�) = %(�) (� − 1) v. �(�) = �(−2� + 3)
b) For �(�) = 5�����
i. Plot �(�) with respect to ��. Completely label the graph. ii. Integrate �(�) with respect to t, such that
=(�) = Q5����� %� iii. Plot =(�) with respect to �� iv. Plot =(�) with respect to � for � = 1
Question 5
a) What will be the Fourier transform of �(�) = �.
b) What will be the Fourier transform of �(�) = �. (�) (1 − �)? Show some initial
steps to find Fourier transform of �(�) by integration.
c) What will be the Fourier transform of �(�) = �.�(� − 1)
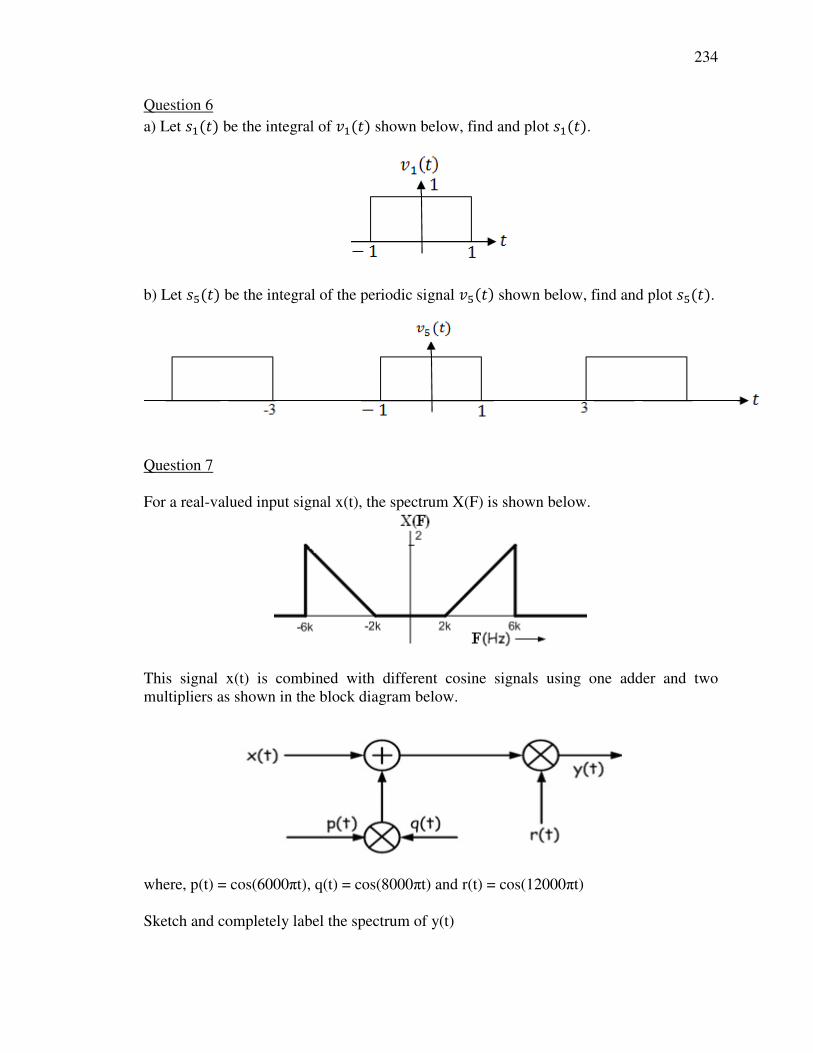
234
Question 6
a) Let �3(�) be the integral of �3(�) shown below, find and plot �3(�).
b) Let �M(�) be the integral of the periodic signal �M(�) shown below, find and plot �M(�).
Question 7 For a real-valued input signal x(t), the spectrum X(F) is shown below.
This signal x(t) is combined with different cosine signals using one adder and two multipliers as shown in the block diagram below.
where, p(t) = cos(6000πt), q(t) = cos(8000πt) and r(t) = cos(12000πt) Sketch and completely label the spectrum of y(t)
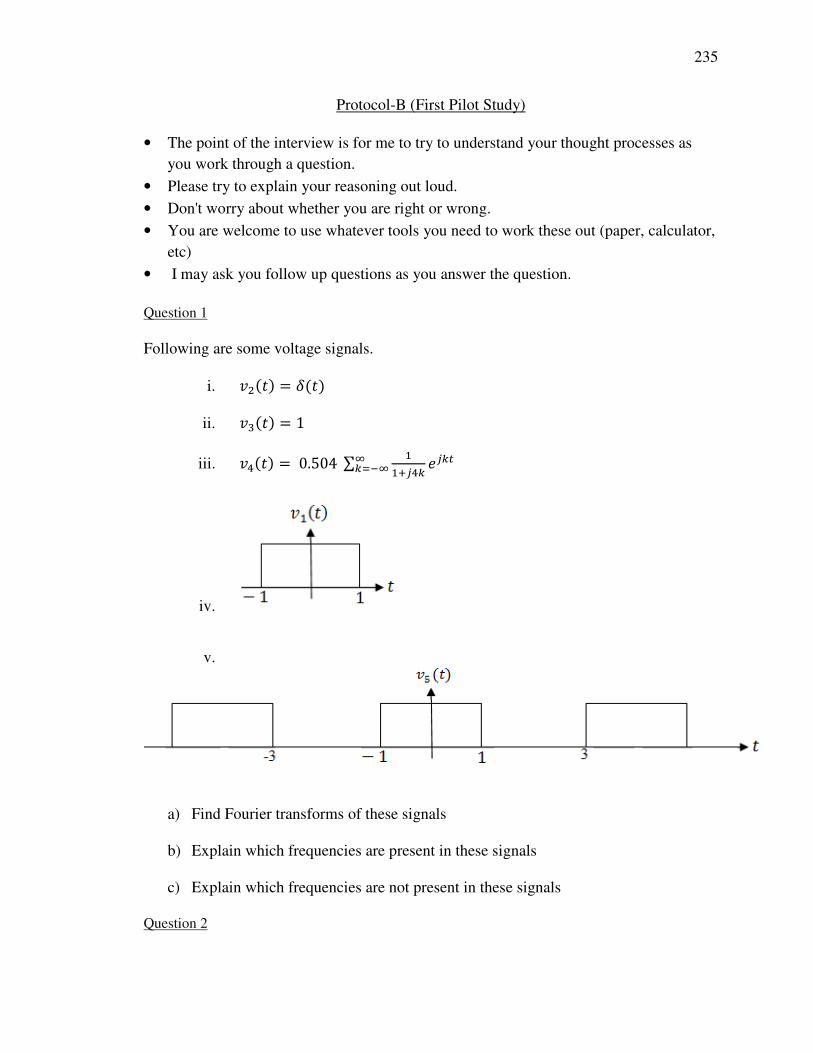
235
Protocol-B (First Pilot Study)
• The point of the interview is for me to try to understand your thought processes as
you work through a question.
• Please try to explain your reasoning out loud.
• Don't worry about whether you are right or wrong.
• You are welcome to use whatever tools you need to work these out (paper, calculator,
etc)
• I may ask you follow up questions as you answer the question.
Question 1
Following are some voltage signals.
i. �.(�) = �(�)
ii. �G(�) = 1
iii. �/(�) = 0.504∑ 334"/5 �"5$&5)!&
iv.
v.
a) Find Fourier transforms of these signals
b) Explain which frequencies are present in these signals
c) Explain which frequencies are not present in these signals Question 2
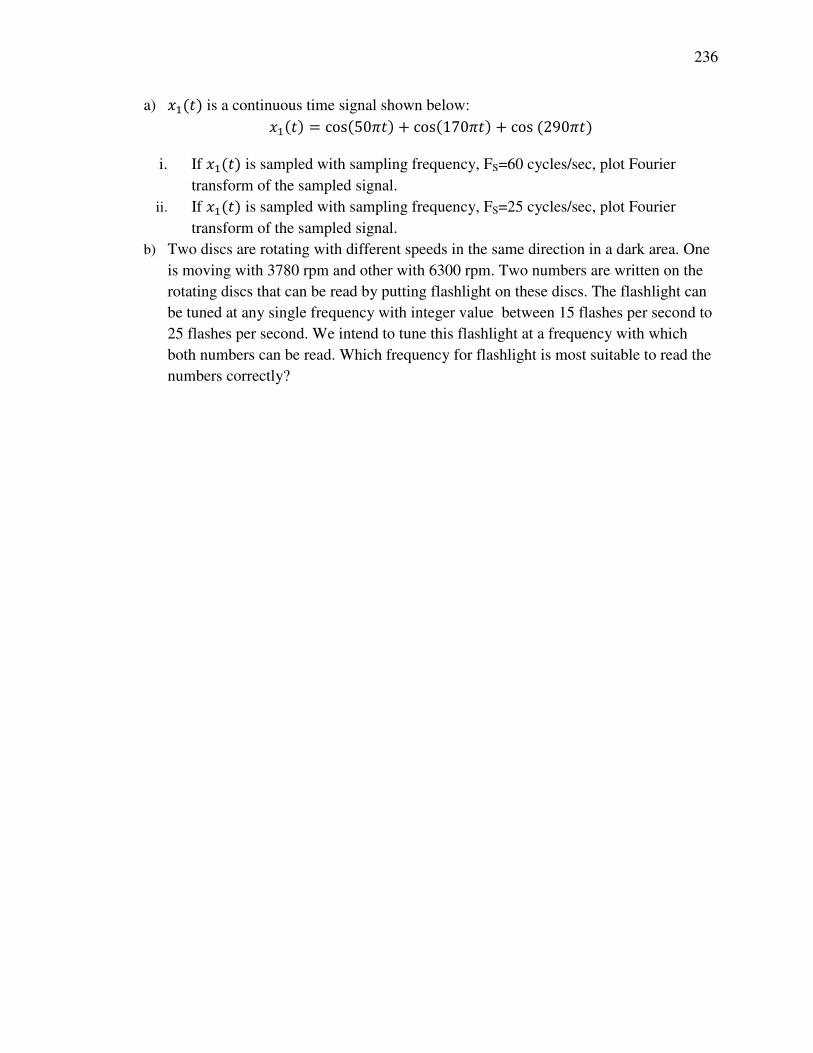
236
a) �3(�) is a continuous time signal shown below:
�3(�) = cos(50��) + cos(170��) + cos(290��) i. If �3(�) is sampled with sampling frequency, FS=60 cycles/sec, plot Fourier
transform of the sampled signal.
ii. If �3(�) is sampled with sampling frequency, FS=25 cycles/sec, plot Fourier
transform of the sampled signal.
b) Two discs are rotating with different speeds in the same direction in a dark area. One
is moving with 3780 rpm and other with 6300 rpm. Two numbers are written on the
rotating discs that can be read by putting flashlight on these discs. The flashlight can
be tuned at any single frequency with integer value between 15 flashes per second to
25 flashes per second. We intend to tune this flashlight at a frequency with which
both numbers can be read. Which frequency for flashlight is most suitable to read the
numbers correctly?

237
Question 3 a) Let y(t) be the output of a multiplier as shown below. Fourier transforms of s(t) and y(t) are shown below as S(jω) and Y(jω) respectively. A and B are unknown constants. Plot the Fourier transform of x(t).
b) If s(t) is the impulse response of an LTI system and input to the system is x(t), such that S(jω) and Y(jω) are shown below. Plot the Fourier transform of x(t)
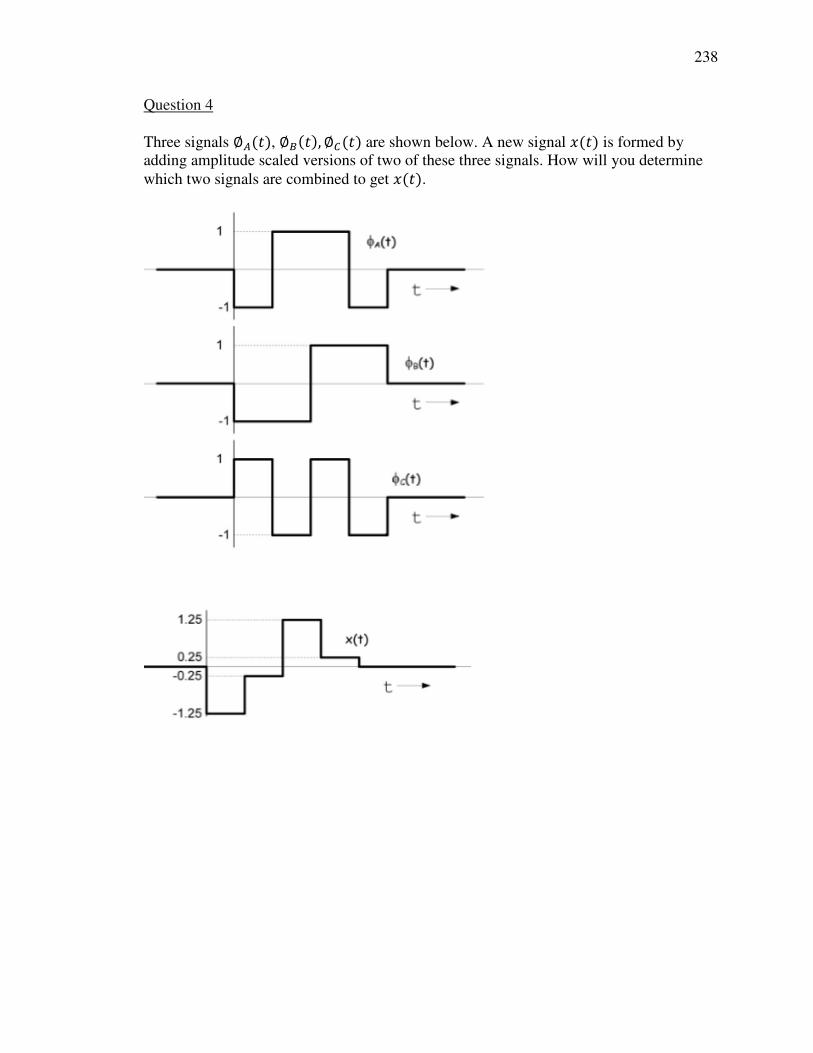
238
Question 4 Three signals ∅T(�), ∅U(�), ∅W(�) are shown below. A new signal �(�) is formed by adding amplitude scaled versions of two of these three signals. How will you determine which two signals are combined to get �(�).

239
Question 5
a) Explain why do most of the systems in signal processing are LTI systems.
b) The impulse response of a system is ( ) 5 sgn( 2)h t t= − , explain whether this system is
i. linear
ii. time-invariant
iii. LTI
c) The system in the diagram shown below is used to convert an ac voltage signal to dc
voltage signal. The input f(t) and output y(t) of the system are shown below. Explain
whether this system
i. linear
ii. time-invariant
iii. LTI
Question 6
Two signals x(t) and g(t) are shown below such that =(�) = �(�) ∗ �(�), find area under
=(�) without solving convolution integral.
What will be Y(0) (Fourier transform of =(�) evaluated at 0 frequency)
240
Appendix B - Protocol A (Second Pilot Study)
My name is Farrah Fayyaz and I am a doctoral candidate in the School of Engineering Education at Purdue University. Thank you for agreeing to participate in our study on identification of persistently difficult concepts in learning Signals and Systems courses among undergraduate electrical engineering students. We will review the study procedures and what your participation entails before you begin the study. First, I need you to complete a consent form. I would like to explain the purpose and procedures of the study and give you an opportunity to ask questions. Dr. .................i is a key personnel in this project. However, neither the key personnel nor any other faculty at your school will have any information about your participation or have access to any identifiable data collected through this study.
Farrah Fayyaz reviews each section of the consent form.
Are there any questions?
Please sign and date the consent form if you are still willing to participate in this study. Let me explain the full procedure to you. The point of the interview is for me to try to understand your thought processes as you work through a question. Please try to explain your reasoning out loud. Do not worry about whether you are right or wrong. You are welcome to use calculator, if needed. I may ask you follow up questions as you answer the question. You will write your responses with pen on this tablet (Microsoft Surface Pro). If you are not comfortable with using it, we can spend first five minutes in familiarizing with it. I will give you a $20 voucher at the end of the interview that you can redeem with the business office secretary. The $20 compensation is for the complete interview. If the interview takes longer than an hour and you are still willing to give extra time and complete the interview, you will not get extra money.
Please put the pen on the tablet while referring to anything. If you are not doing so, I will
keep reminding you. Don't get nervous about that.
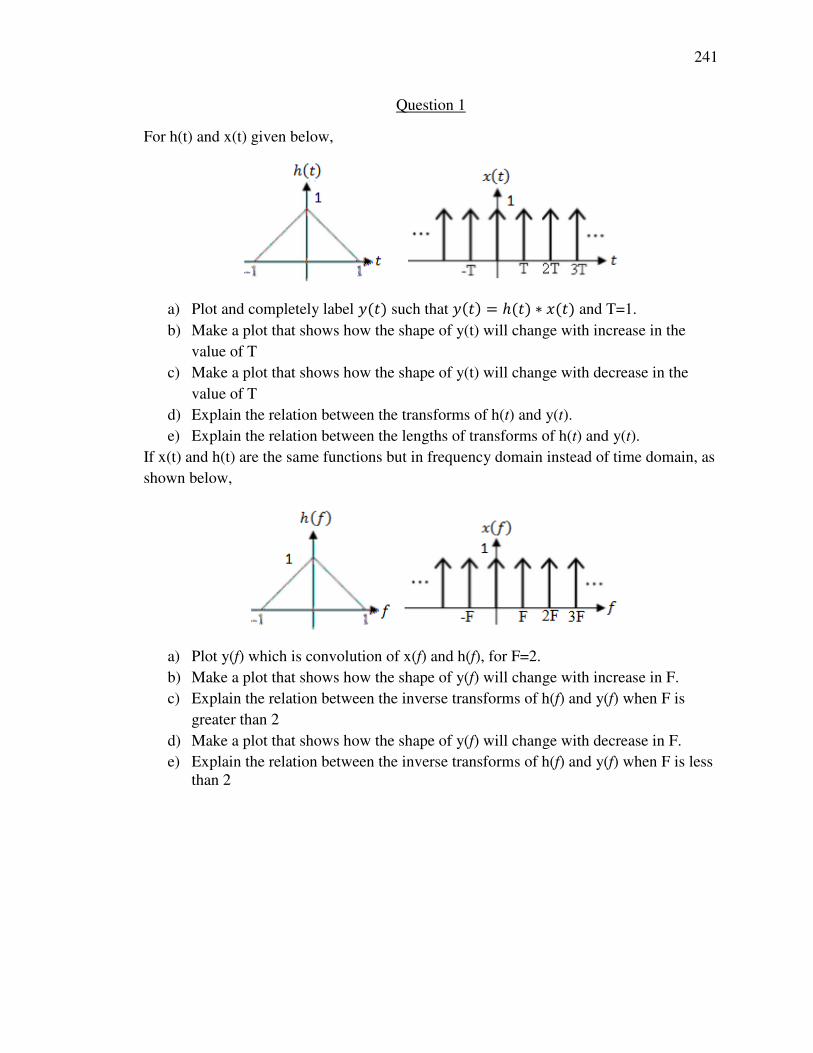
241
Question 1
For h(t) and x(t) given below,
a) Plot and completely label =(�) such that =(�) = ℎ(�) ∗ �(�) and T=1.
b) Make a plot that shows how the shape of y(t) will change with increase in the
value of T
c) Make a plot that shows how the shape of y(t) will change with decrease in the
value of T
d) Explain the relation between the transforms of h(t) and y(t).
e) Explain the relation between the lengths of transforms of h(t) and y(t).
If x(t) and h(t) are the same functions but in frequency domain instead of time domain, as
shown below,
a) Plot y(f) which is convolution of x(f) and h(f), for F=2.
b) Make a plot that shows how the shape of y(f) will change with increase in F.
c) Explain the relation between the inverse transforms of h(f) and y(f) when F is
greater than 2
d) Make a plot that shows how the shape of y(f) will change with decrease in F.
e) Explain the relation between the inverse transforms of h(f) and y(f) when F is less than 2
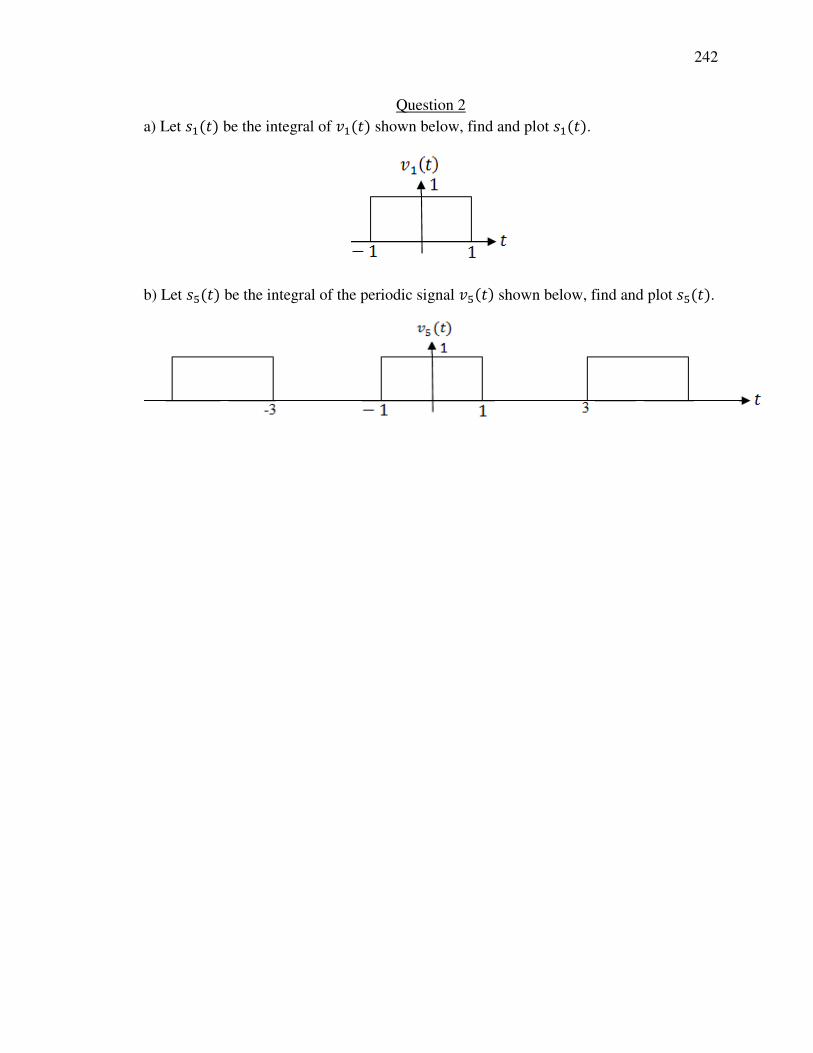
242
Question 2
a) Let �3(�) be the integral of �3(�) shown below, find and plot �3(�).
b) Let �M(�) be the integral of the periodic signal �M(�) shown below, find and plot �M(�).
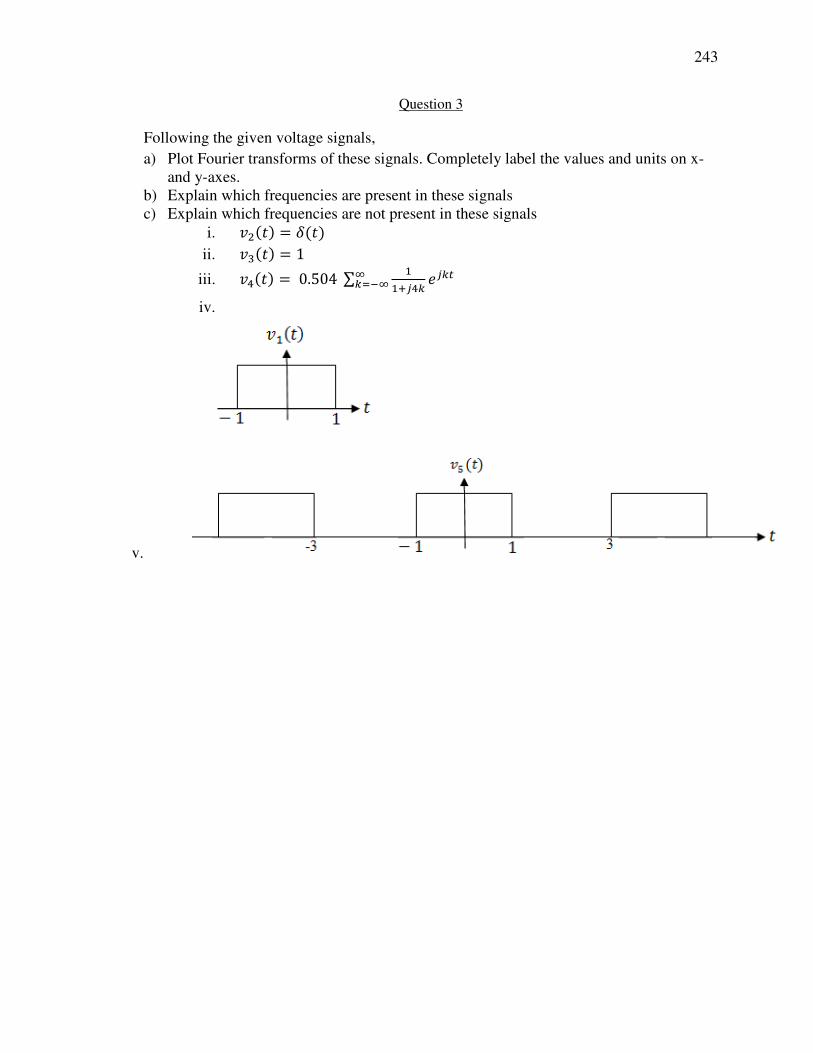
243
Question 3
Following the given voltage signals,
a) Plot Fourier transforms of these signals. Completely label the values and units on x- and y-axes.
b) Explain which frequencies are present in these signals c) Explain which frequencies are not present in these signals
i. �.(�) = �(�) ii. �G(�) = 1
iii. �/(�) = 0.504∑ 334"/5 �"5$&5)!&
iv.
v.
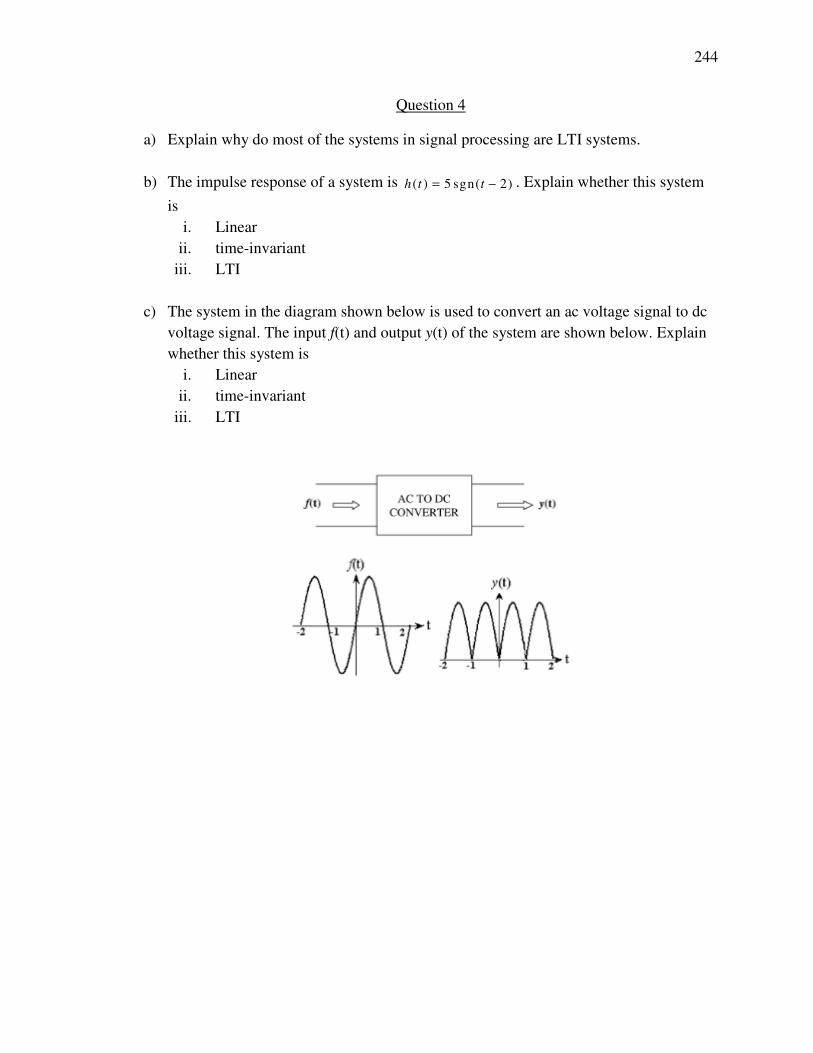
244
Question 4
a) Explain why do most of the systems in signal processing are LTI systems.
b) The impulse response of a system is ( ) 5 sgn( 2)h t t= − . Explain whether this system
is
i. Linear
ii. time-invariant
iii. LTI
c) The system in the diagram shown below is used to convert an ac voltage signal to dc
voltage signal. The input f(t) and output y(t) of the system are shown below. Explain
whether this system is
i. Linear
ii. time-invariant
iii. LTI

245
Protocol B (Second Pilot Study)
Question 1
a) For �(�) = cos A� + </B + 3sin(7�),
i. Plot the magnitude and phase of Fourier series of �(�) ii. Plot the magnitude and phase of Fourier transform of �(�)
iii. If units of v(t) is volts, what will be the units of Fourier series and Fourier
transform of v(t).
iv. Explain what similarities, differences, and relation exist between Fourier
series and Fourier transform of v(t)?
b) For �3(�) = L�(�"AM$46IB) + NO(�"A/$!6
PB), plot the magnitude and phase of Fourier
series of �3(�) c) For �.(�) = cos(��) + �".<$, plot the magnitude and phase of Fourier transform of
�.(�) d) For �G(�) = sin(<H � −
<H) + �"6I , plot the magnitude and phase of Fourier series of
�G(�) e) For �/(�) = �"67[�(� + �) − �(� − �)], plot the magnitude and phase of
i. Fourier series of �/(�) ii. Fourier transform of �/(�)
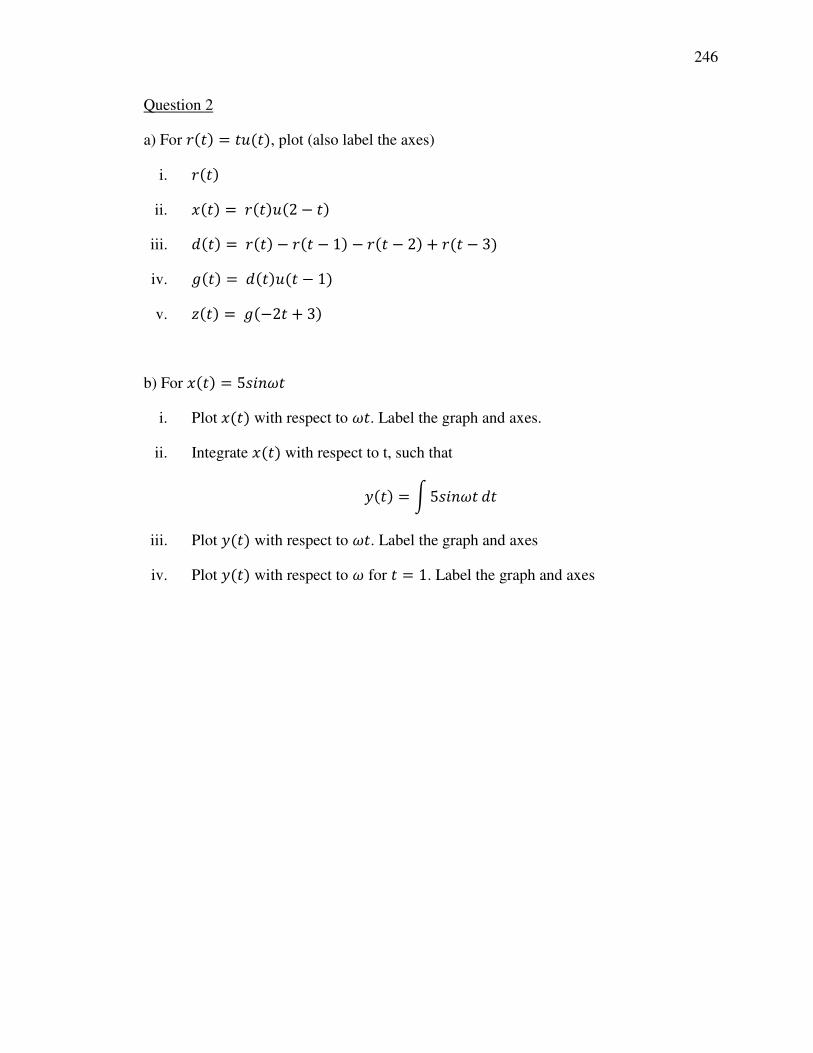
246
Question 2
a) For J(�) = � (�), plot (also label the axes)
i. J(�) ii. �(�) = J(�) (2 − �)
iii. %(�) = J(�) − J(� − 1) − J(� − 2) + J(� − 3) iv. �(�) = %(�) (� − 1) v. �(�) = �(−2� + 3)
b) For �(�) = 5����� i. Plot �(�) with respect to ��. Label the graph and axes.
ii. Integrate �(�) with respect to t, such that
=(�) = Q5����� %�
iii. Plot =(�) with respect to ��. Label the graph and axes
iv. Plot =(�) with respect to � for � = 1. Label the graph and axes
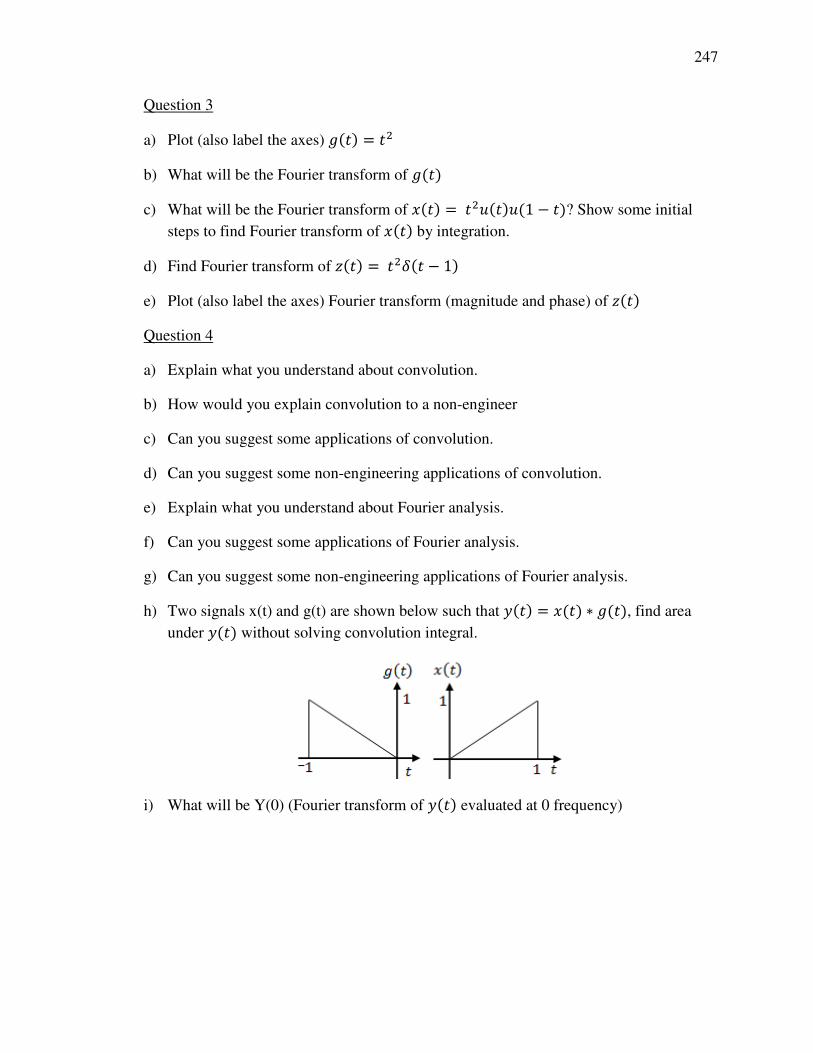
247
Question 3
a) Plot (also label the axes) �(�) = �.
b) What will be the Fourier transform of �(�) c) What will be the Fourier transform of �(�) = �. (�) (1 − �)? Show some initial
steps to find Fourier transform of �(�) by integration.
d) Find Fourier transform of �(�) = �.�(� − 1) e) Plot (also label the axes) Fourier transform (magnitude and phase) of �(�) Question 4
a) Explain what you understand about convolution.
b) How would you explain convolution to a non-engineer
c) Can you suggest some applications of convolution.
d) Can you suggest some non-engineering applications of convolution.
e) Explain what you understand about Fourier analysis.
f) Can you suggest some applications of Fourier analysis.
g) Can you suggest some non-engineering applications of Fourier analysis.
h) Two signals x(t) and g(t) are shown below such that =(�) = �(�) ∗ �(�), find area
under =(�) without solving convolution integral.
i) What will be Y(0) (Fourier transform of =(�) evaluated at 0 frequency)
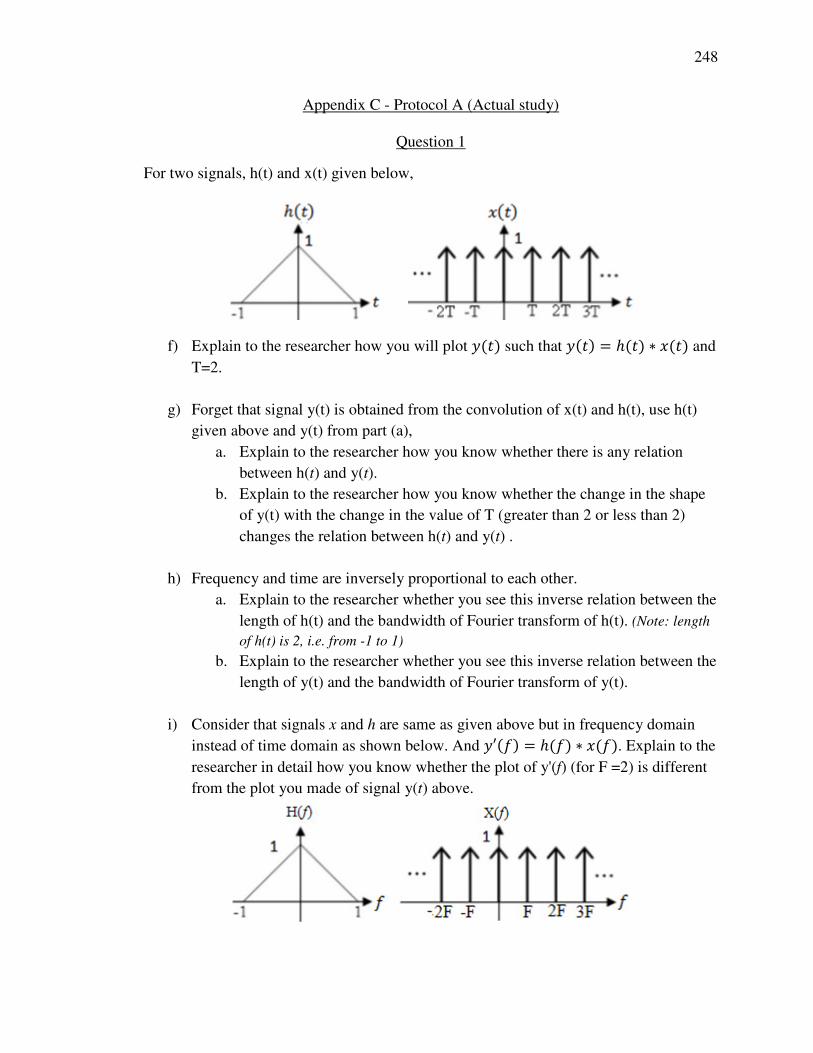
248
Appendix C - Protocol A (Actual study)
Question 1
For two signals, h(t) and x(t) given below,
f) Explain to the researcher how you will plot =(�) such that =(�) = ℎ(�) ∗ �(�) and
T=2.
g) Forget that signal y(t) is obtained from the convolution of x(t) and h(t), use h(t)
given above and y(t) from part (a),
a. Explain to the researcher how you know whether there is any relation
between h(t) and y(t).
b. Explain to the researcher how you know whether the change in the shape
of y(t) with the change in the value of T (greater than 2 or less than 2)
changes the relation between h(t) and y(t) .
h) Frequency and time are inversely proportional to each other.
a. Explain to the researcher whether you see this inverse relation between the
length of h(t) and the bandwidth of Fourier transform of h(t). (Note: length
of h(t) is 2, i.e. from -1 to 1)
b. Explain to the researcher whether you see this inverse relation between the
length of y(t) and the bandwidth of Fourier transform of y(t).
i) Consider that signals x and h are same as given above but in frequency domain
instead of time domain as shown below. And =′(Y) = ℎ(Y) ∗ �(Y). Explain to the
researcher in detail how you know whether the plot of y'(f) (for F =2) is different
from the plot you made of signal y(t) above.
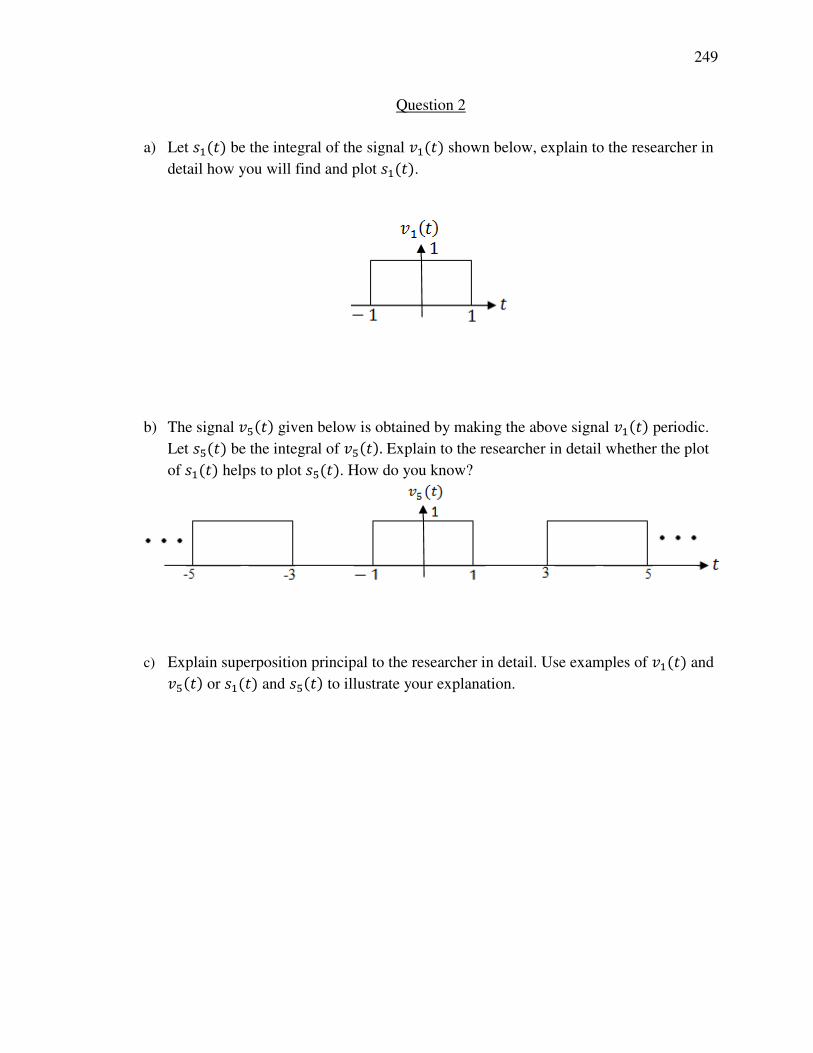
249
Question 2
a) Let �3(�) be the integral of the signal �3(�) shown below, explain to the researcher in
detail how you will find and plot �3(�).
b) The signal �M(�) given below is obtained by making the above signal �3(�) periodic.
Let �M(�) be the integral of �M(�). Explain to the researcher in detail whether the plot
of �3(�) helps to plot �M(�). How do you know?
c) Explain superposition principal to the researcher in detail. Use examples of �3(�) and
�M(�) or �3(�) and �M(�) to illustrate your explanation.
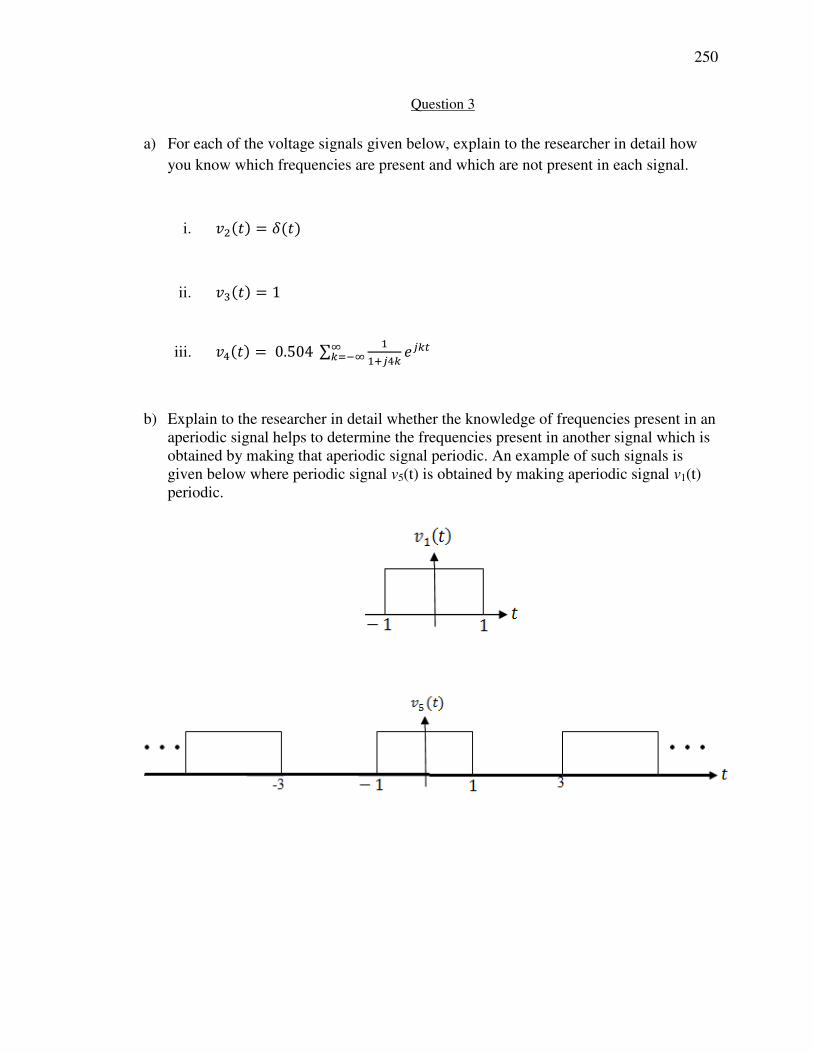
250
Question 3
a) For each of the voltage signals given below, explain to the researcher in detail how
you know which frequencies are present and which are not present in each signal.
i. �.(�) = �(�)
ii. �G(�) = 1
iii. �/(�) = 0.504∑ 334"/5 �"5$&5)!&
b) Explain to the researcher in detail whether the knowledge of frequencies present in an
aperiodic signal helps to determine the frequencies present in another signal which is obtained by making that aperiodic signal periodic. An example of such signals is given below where periodic signal v5(t) is obtained by making aperiodic signal v1(t) periodic.
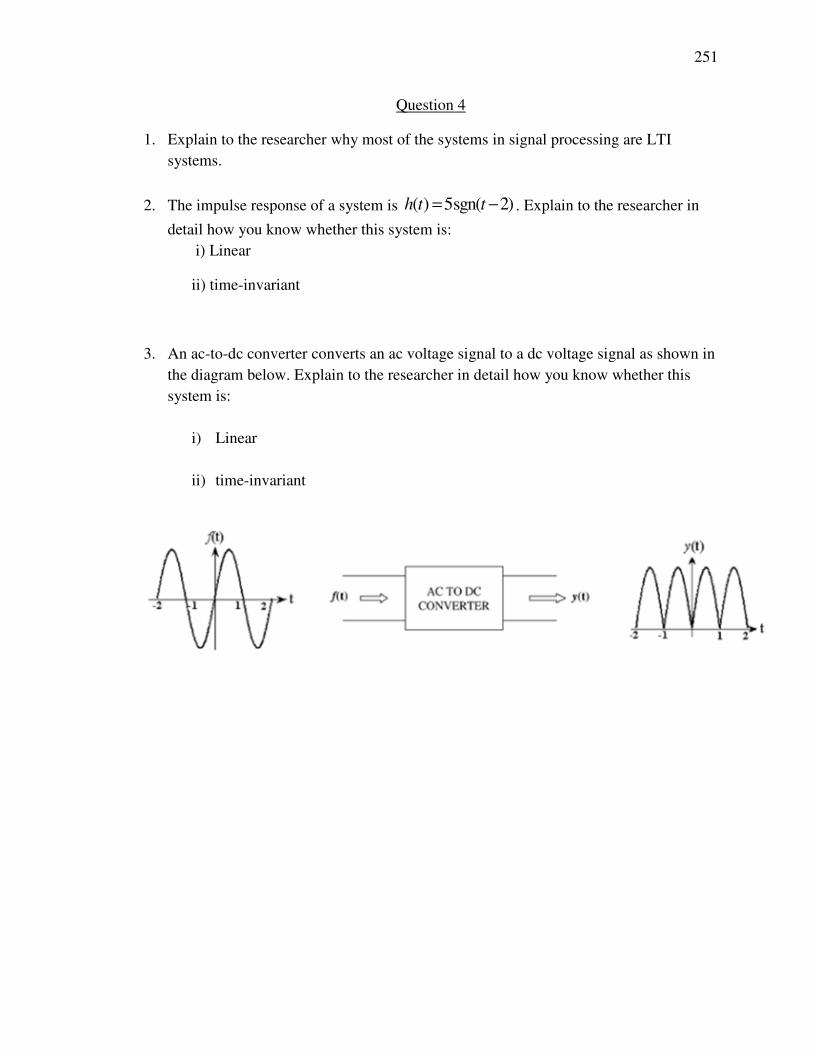
251
Question 4
1. Explain to the researcher why most of the systems in signal processing are LTI
systems.
2. The impulse response of a system is ( ) 5sgn( 2)h t t= − . Explain to the researcher in
detail how you know whether this system is:
i) Linear
ii) time-invariant
3. An ac-to-dc converter converts an ac voltage signal to a dc voltage signal as shown in
the diagram below. Explain to the researcher in detail how you know whether this
system is:
i) Linear
ii) time-invariant
252
Protocol B (Actual study)
Question 1
[1] For �/(�) = �!"67[�(� + �) − �(� − �)]
a. Explain to the researcher in detail how you will plot the magnitude and phase
of Fourier transform of �/(�).
b. Explain to the researcher in detail whether the plot of Fourier transform of a
signal provides information about how you will plot the Fourier series of the
same signal. Use signal �/(�) given above as an example to explain your
reasoning to the researcher.
[2] For �G(�) = sin(<H � −<H) + �"6I , explain to the researcher in detail how you will plot
the magnitude and phase of Fourier transform of �G(�).
[3] For �(�) = cos A� + </B + 3sin(7�)
i. Explain to the researcher in detail how you will plot the magnitude and phase
of Fourier series of �(�).
ii. Explain to the researcher in detail whether the plot of Fourier series of a signal
provides information about how you will plot the Fourier transform of the
same signal. Use signal �(�)given above as an example to explain your
reasoning to the researcher.
iii. If units of v(t) is volts, explain to the researcher what will be the
a. Units of Fourier series of v(t). How do you know?
b. Units of Fourier transform of v(t). How do you know?
253
Question 2
a) For J(�) = � (�) and �(�) = [J(�) − J(� − 1)] (−� + 2), describe to the researcher
in detail how you will plot �(−2� + 2).
b) Explain to the researcher in detail how you will plot ℎ(�) where ℎ(�) = sin(<. � −</).
As you plot, also describe as much as possible about how you will label x-axis.
c) Explain the concept of 'time shift' to the researcher. Use the example of the plot of
ℎ(�) you made above to explain this concept.
d) Explain the concept of 'phase shift' to the researcher. Use the example of the plot of
ℎ(�) you made above to explain this concept.
e) Describe to the researcher in detail how you know whether there is any relation
between the concept of phase shift and the concept of phase difference.
Question 3
a) Explain to the researcher how you will plot signal %(�) such that %(�) = �..
b) Explain to the researcher how you go about finding Fourier transform of any given
signal. Use the example of signal %(�) to explain your answer.
c) Explain to the researcher whether you will modify your procedure to find Fourier
transform of a signal described above if instead of signal %(�) you have signal �(�) such that �(�) = �. (�) (1 − �).
d) Explain to the researcher how you will plot Fourier transform of signal �(�) such that
�(�) = �.�(� − 1).
254
Question 4
a) Explain the concept of convolution to the researcher assuming the researcher is a
first-year engineering student.
b) Assume the researcher is a non-engineer. Explain how you will help the researcher to
identify problems or situations where a non-engineer can apply the concept of
convolution.
c) Explain the concept of Fourier analysis to the researcher in detail assuming the
researcher is a first-year engineering student.
d) Describe whether you will modify your explanation of the concept of Fourier analysis
for best understanding of the researcher if the researcher is not an engineer.
e) For any given signal =(�), explain to the researcher how you know whether there is
any relation between area under the signal, i.e., � =(�)%�&!& and Fourier transform of
the signal evaluated at zero frequency, i.e., Y(0).
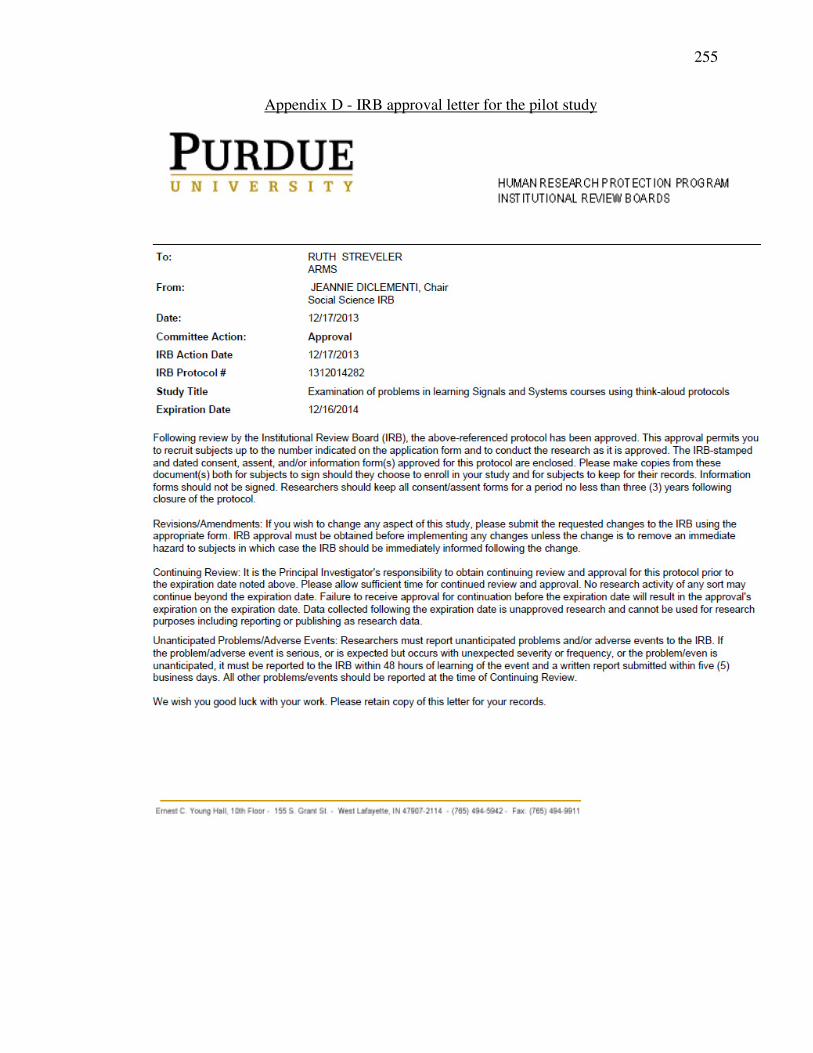
255
Appendix D - IRB approval letter for the pilot study

256
Appendix E - IRB approved consent form for the pilot study
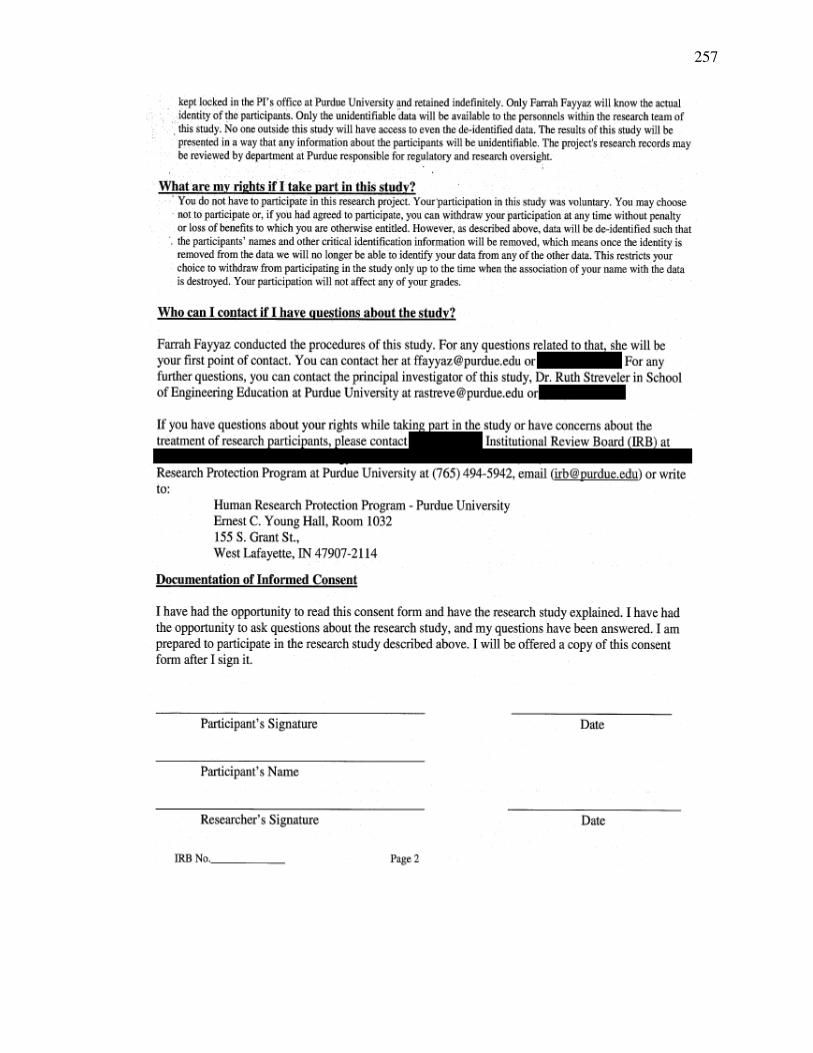
257
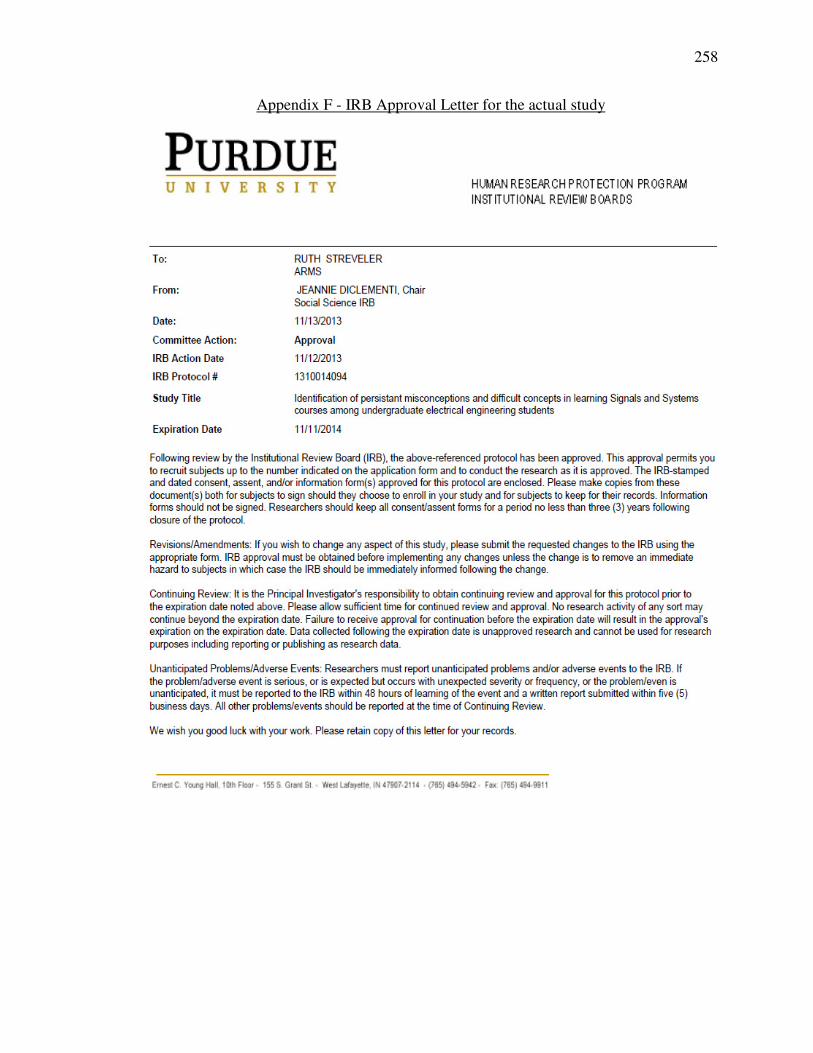
258
Appendix F - IRB Approval Letter for the actual study
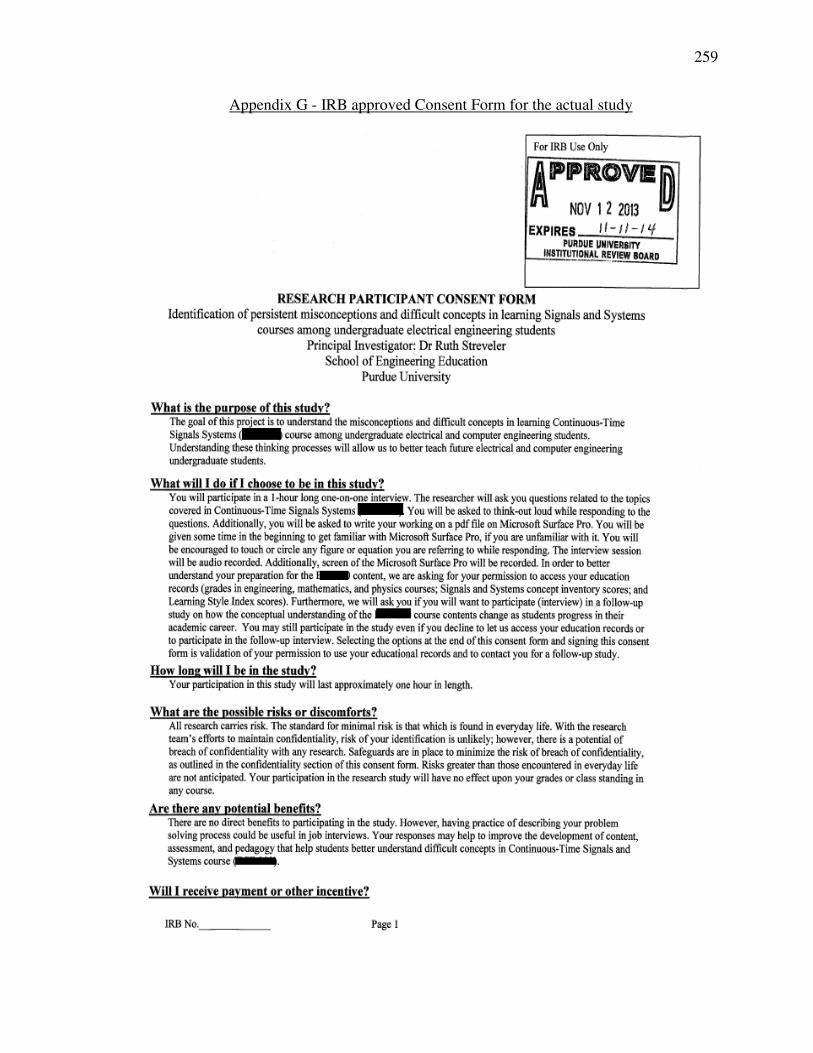
259
Appendix G - IRB approved Consent Form for the actual study
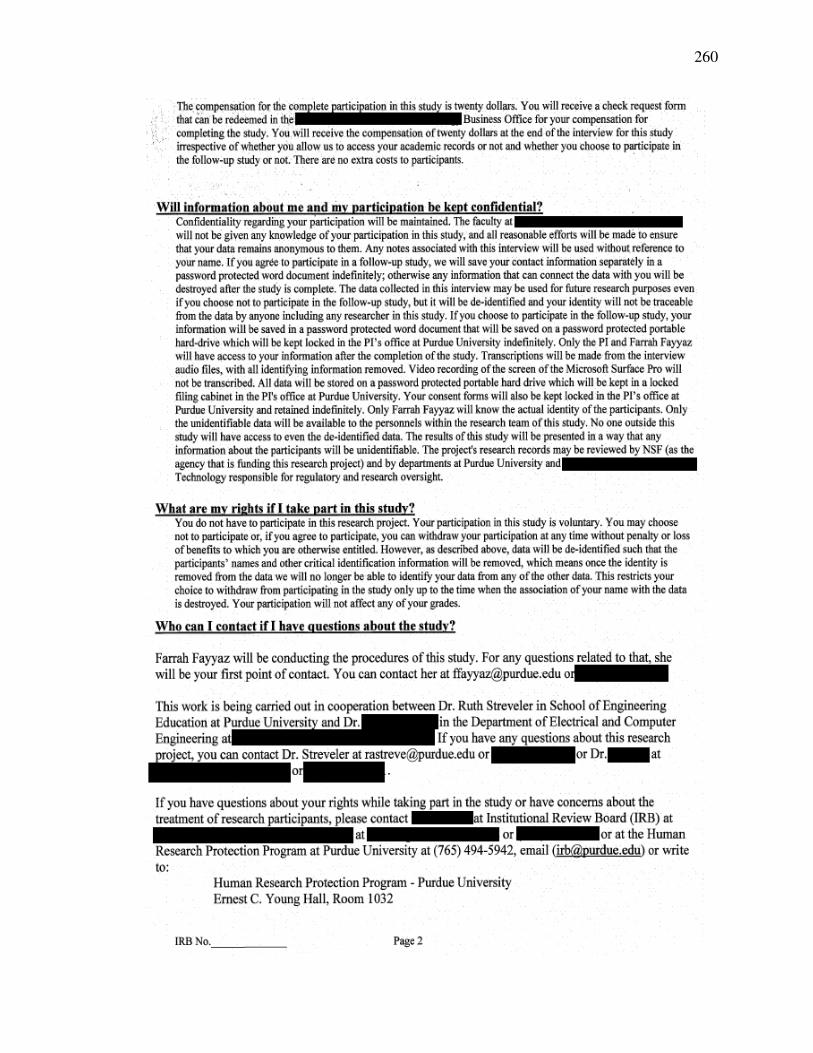
260

261

262
Appendix H - Recruitment email
Subject: Would You Like to Participate in an Engineering Education Research Project and Earn $20? I, Farrah Fayyaz, am working under directions of Dr......................................................................................................................................................................................................................................................... in collaboration with Dr........................................on an NSF-sponsored project to research how students think about concepts in Continuous-Time Signals and Systems (ECE 000) and we need your help. Here are the specifics: WHO? We are looking for undergraduate electrical and computer engineering students who have passed Continuous-Time Signals and Systems (ECE 000)
WHAT? Get paid to participate in an interview about engineering concepts. Your responses are confidential! Your participation is strictly voluntary. Participation will consist of participating in a 1-hour one-on-one interview. Your participation will not affect your grades in any of your classes WHAT’S THE PAYMENT? Participants will receive $20 for their time at the end of their interview. WHEN? Interviews will be scheduled according to participants' availability (including weekends), starting March 10, 2014 till March 16, 2014. PLACE? ................................................................................. HOW DO I SIGN UP? Please email Farrah Fayyaz ([email protected]) to participate and include:
• Name, email and phone number • Your willingness to give us permission to access your academic records (grades in
physics, engineering, and mathematics courses; score in Signals and Systems concept inventory; Learning Style Index scores) so we can better understand your preparation for the ECE.... content. Please note that you can participate in the study even if you choose to not allow us to access your academic records.
• Preferred days/times for your availability FOR ANY FURTHER QUESTIONS/CONCERNS If you have any questions or concerns about the study please email Dr .................................................... or Farrah Fayyaz ([email protected] or ................
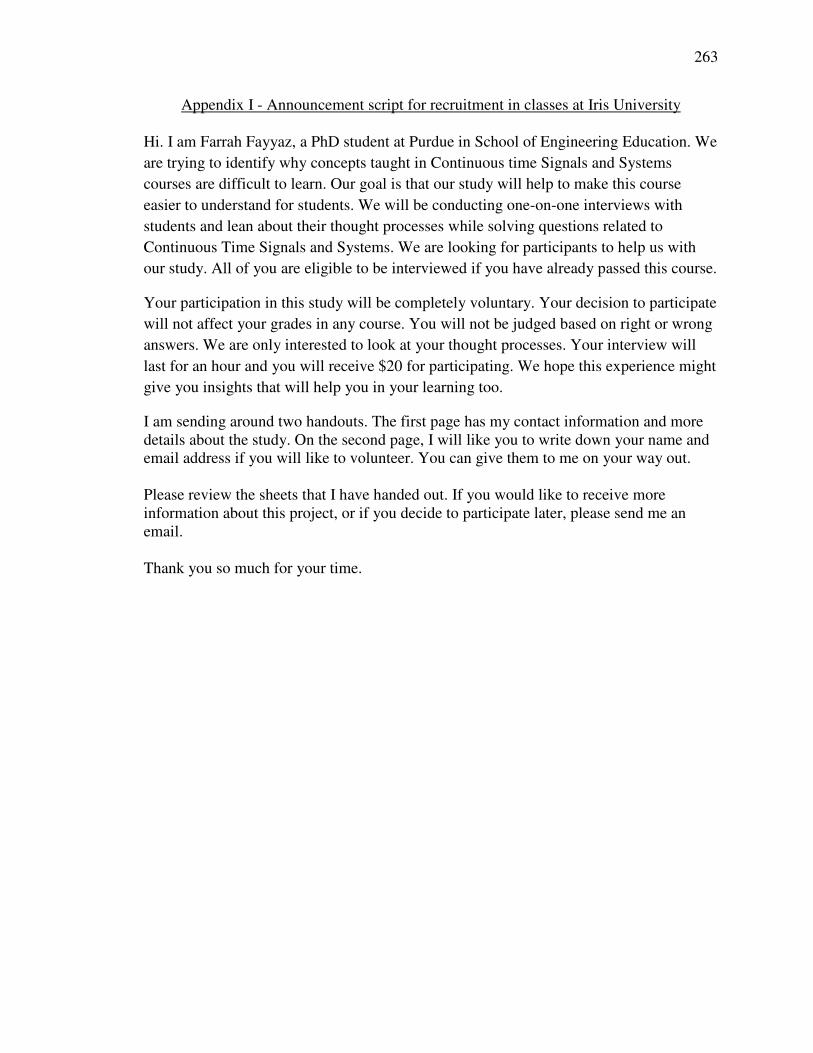
263
Appendix I - Announcement script for recruitment in classes at Iris University
Hi. I am Farrah Fayyaz, a PhD student at Purdue in School of Engineering Education. We
are trying to identify why concepts taught in Continuous time Signals and Systems
courses are difficult to learn. Our goal is that our study will help to make this course
easier to understand for students. We will be conducting one-on-one interviews with
students and lean about their thought processes while solving questions related to
Continuous Time Signals and Systems. We are looking for participants to help us with
our study. All of you are eligible to be interviewed if you have already passed this course.
Your participation in this study will be completely voluntary. Your decision to participate
will not affect your grades in any course. You will not be judged based on right or wrong
answers. We are only interested to look at your thought processes. Your interview will
last for an hour and you will receive $20 for participating. We hope this experience might
give you insights that will help you in your learning too.
I am sending around two handouts. The first page has my contact information and more details about the study. On the second page, I will like you to write down your name and email address if you will like to volunteer. You can give them to me on your way out. Please review the sheets that I have handed out. If you would like to receive more information about this project, or if you decide to participate later, please send me an email. Thank you so much for your time.
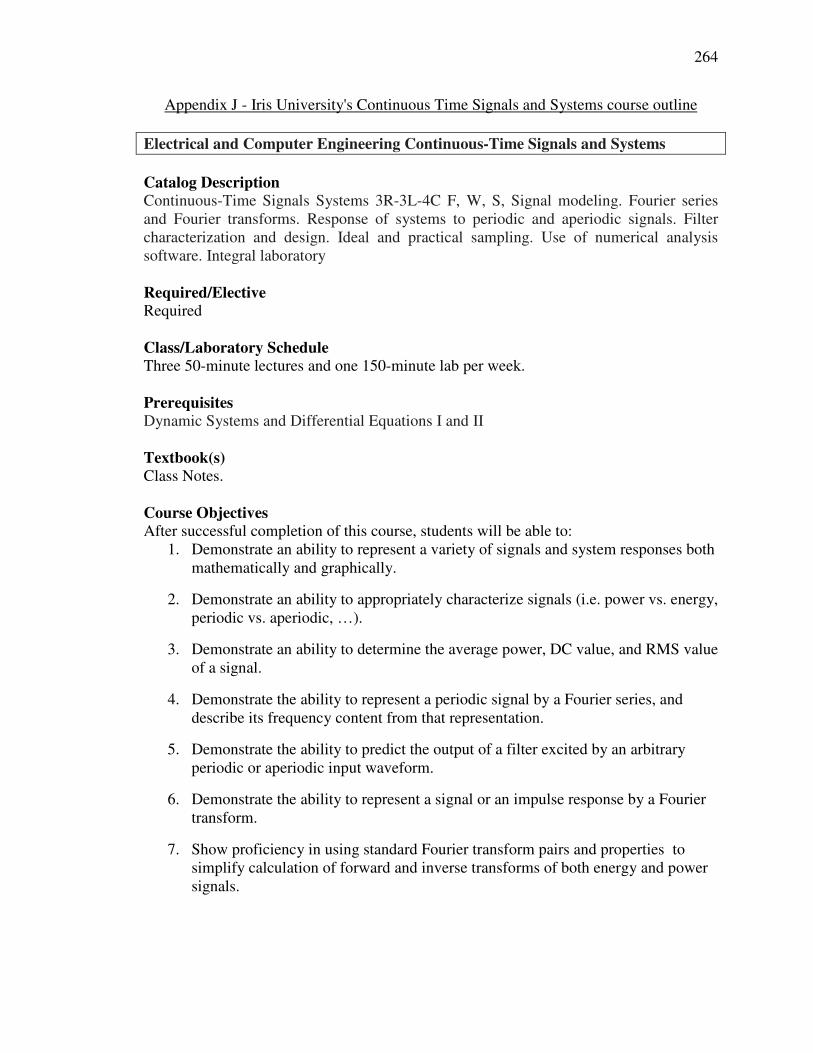
264
Appendix J - Iris University's Continuous Time Signals and Systems course outline
Electrical and Computer Engineering Continuous-Time Signals and Systems
Catalog Description Continuous-Time Signals Systems 3R-3L-4C F, W, S, Signal modeling. Fourier series and Fourier transforms. Response of systems to periodic and aperiodic signals. Filter characterization and design. Ideal and practical sampling. Use of numerical analysis software. Integral laboratory Required/Elective
Required Class/Laboratory Schedule
Three 50-minute lectures and one 150-minute lab per week. Prerequisites
Dynamic Systems and Differential Equations I and II Textbook(s)
Class Notes. Course Objectives
After successful completion of this course, students will be able to: 1. Demonstrate an ability to represent a variety of signals and system responses both
mathematically and graphically.
2. Demonstrate an ability to appropriately characterize signals (i.e. power vs. energy, periodic vs. aperiodic, …).
3. Demonstrate an ability to determine the average power, DC value, and RMS value of a signal.
4. Demonstrate the ability to represent a periodic signal by a Fourier series, and describe its frequency content from that representation.
5. Demonstrate the ability to predict the output of a filter excited by an arbitrary periodic or aperiodic input waveform.
6. Demonstrate the ability to represent a signal or an impulse response by a Fourier transform.
7. Show proficiency in using standard Fourier transform pairs and properties to simplify calculation of forward and inverse transforms of both energy and power signals.

265
8. Be able to classify filters as lowpass, highpass, bandpass, or bandstop. Interpret lowpass and bandpass filter specifications, and understand the concept of distortion.
9. Find and sketch the time and frequency domain representation of a signal after sampling.
10. Perform time and frequency domain measurements in the laboratory and be able to describe the relationship between them
Course Topics 1. Complex numbers and complex exponentials
2. Periodicity and the fundamental period for summed periodic signals
3. Finding and understanding the Fourier Series of periodic signals
4. Finding and understanding the Fourier Transform for various aperiodic signals
5. Using the Fourier Series and Transforms to determine the output of a system for any arbitrary periodic or aperiodic input
6. Characteristics of ideal and real filters.
7. Transfer functions of real filters in the Laplace and Fourier Domain.
8. Relationship of pole-zero plots to a filter’s transfer function in the frequency domain.
9. Basic filter types and functions (Butterworth, Chebychev, and Bessel)(highpass, bandpass, lowpass).
10. Using circuit analysis techniques to derive the transfer function of a filter.
11. Op-amp implementations of 1st and 2nd order circuits and how to cascade these circuits to produce higher order filters.
12. Impulse sampling, pulse sampling, and ZOH sampling.
13. Nyquist criteria.
14. Recovering a sampled signal, including the impulse response of the recovery filter.
15. Aliasing and anti-aliasing filters.
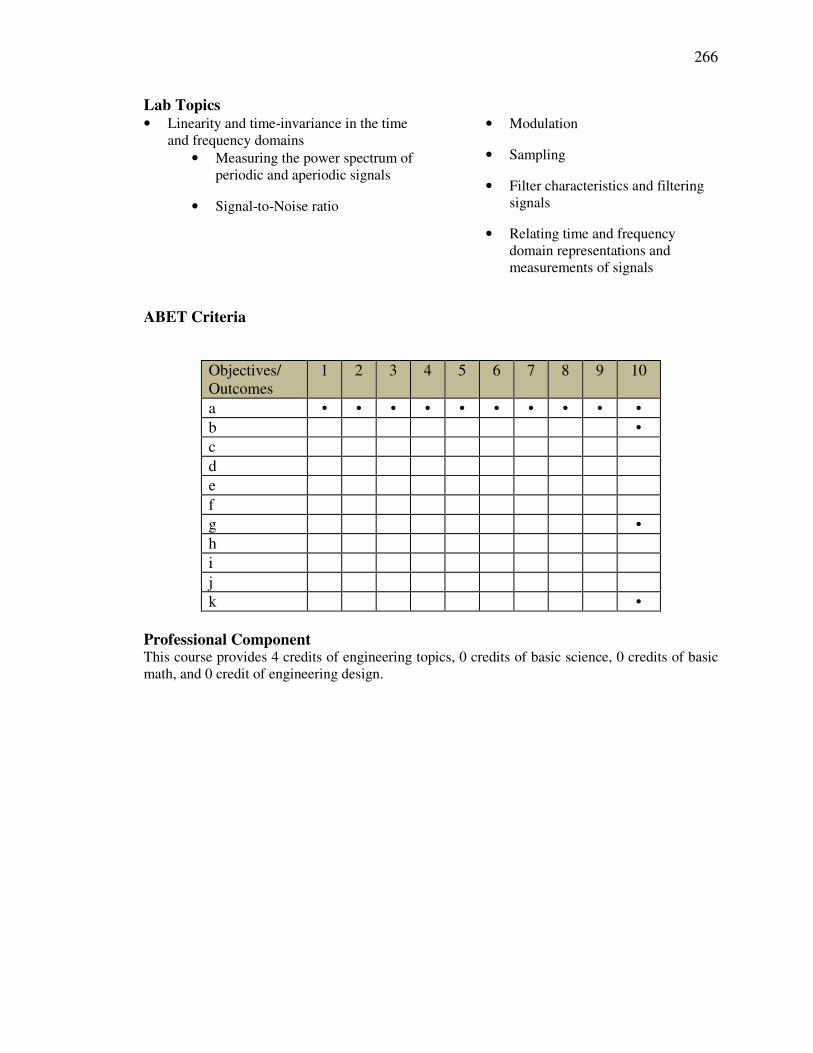
266
Lab Topics • Linearity and time-invariance in the time
and frequency domains
• Measuring the power spectrum of periodic and aperiodic signals
• Signal-to-Noise ratio
• Modulation
• Sampling
• Filter characteristics and filtering signals
• Relating time and frequency domain representations and measurements of signals
ABET Criteria
Objectives/ Outcomes
1 2 3 4 5 6 7 8 9 10
a • • • • • • • • • •
b •
c
d
e
f
g •
h
i
j
k •
Professional Component This course provides 4 credits of engineering topics, 0 credits of basic science, 0 credits of basic math, and 0 credit of engineering design.
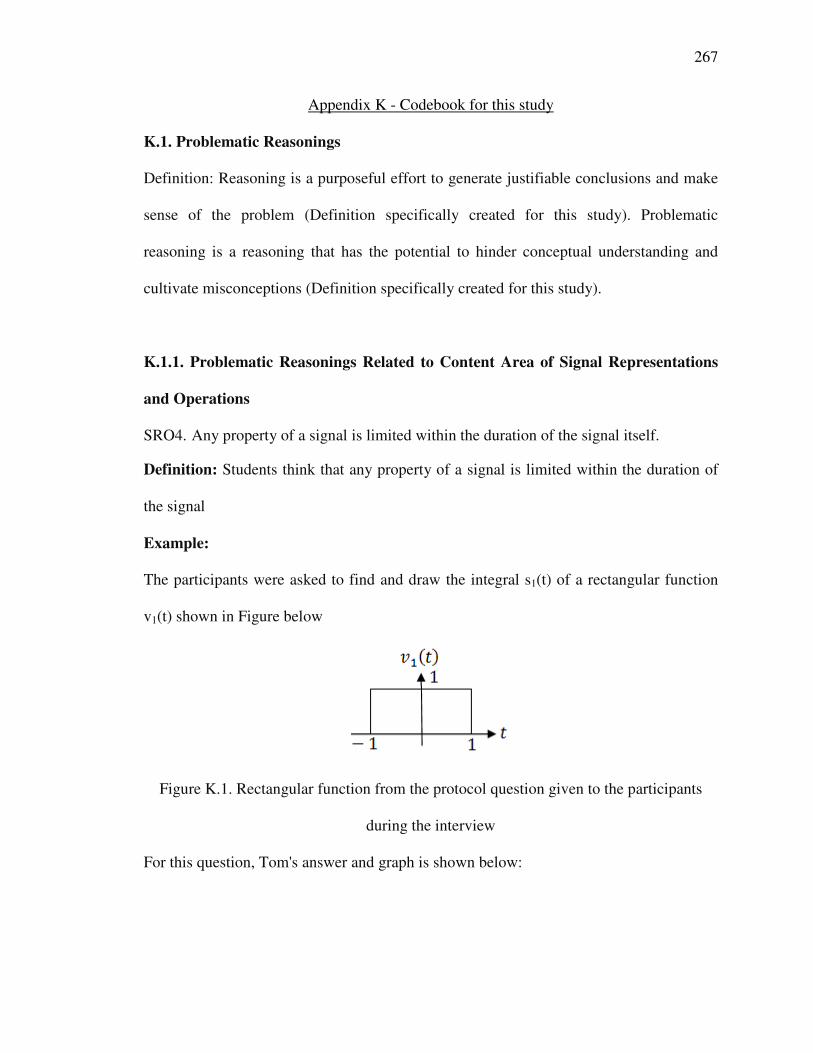
267
Appendix K - Codebook for this study
K.1. Problematic Reasonings
Definition: Reasoning is a purposeful effort to generate justifiable conclusions and make
sense of the problem (Definition specifically created for this study). Problematic
reasoning is a reasoning that has the potential to hinder conceptual understanding and
cultivate misconceptions (Definition specifically created for this study).
K.1.1. Problematic Reasonings Related to Content Area of Signal Representations
and Operations
SRO4. Any property of a signal is limited within the duration of the signal itself.
Definition: Students think that any property of a signal is limited within the duration of
the signal
Example:
The participants were asked to find and draw the integral s1(t) of a rectangular function
v1(t) shown in Figure below
Figure K.1. Rectangular function from the protocol question given to the participants
during the interview
For this question, Tom's answer and graph is shown below:
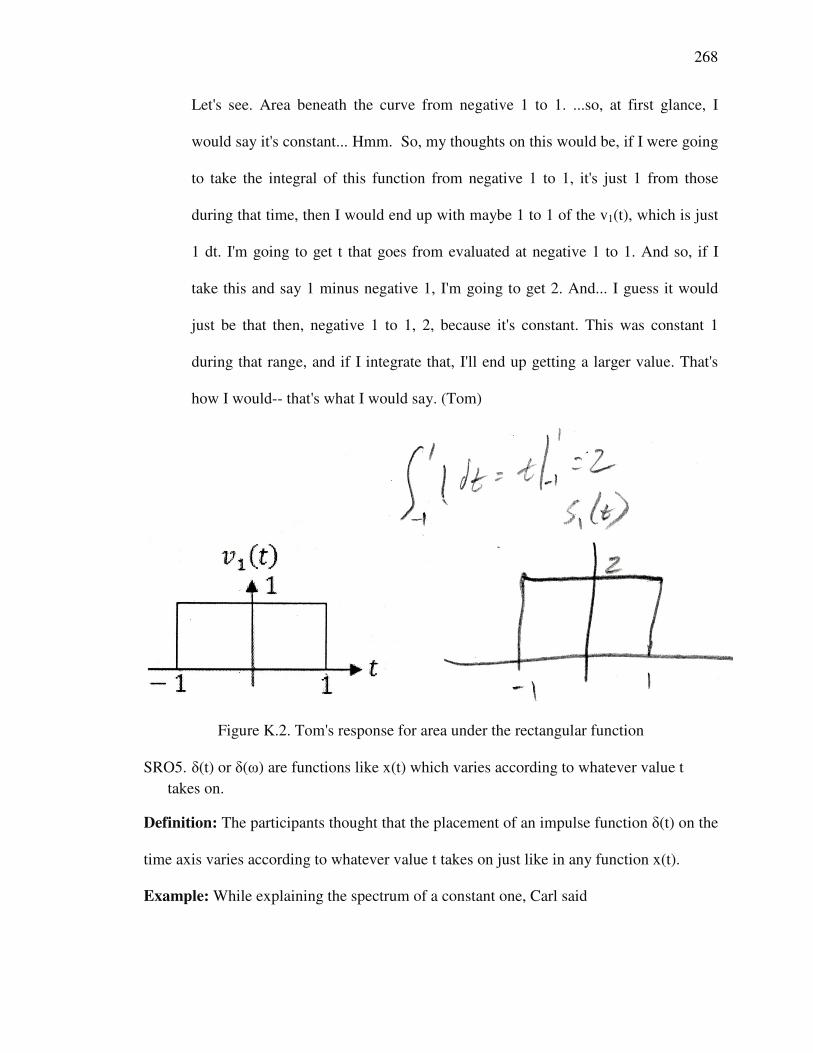
268
Let's see. Area beneath the curve from negative 1 to 1. ...so, at first glance, I
would say it's constant... Hmm. So, my thoughts on this would be, if I were going
to take the integral of this function from negative 1 to 1, it's just 1 from those
during that time, then I would end up with maybe 1 to 1 of the v1(t), which is just
1 dt. I'm going to get t that goes from evaluated at negative 1 to 1. And so, if I
take this and say 1 minus negative 1, I'm going to get 2. And... I guess it would
just be that then, negative 1 to 1, 2, because it's constant. This was constant 1
during that range, and if I integrate that, I'll end up getting a larger value. That's
how I would-- that's what I would say. (Tom)
Figure K.2. Tom's response for area under the rectangular function
SRO5. δ(t) or δ(ω) are functions like x(t) which varies according to whatever value t
takes on.
Definition: The participants thought that the placement of an impulse function δ(t) on the
time axis varies according to whatever value t takes on just like in any function x(t).
Example: While explaining the spectrum of a constant one, Carl said
269
If we're doing one, which becomes two pi Dirac of omega, I guess then that all
frequencies would be present, but a Dirac only takes place at one frequency, because I
believe a Dirac function has a-- it's defined as having like a width of zero over an infinite
height, so it has an area of one, but since this has two pi in front of it it would just be a
Dirac with an area of two pi at one specific frequency, and I think that would depend on
what time we have. But, I mean, it'll be zero for most frequencies except for omega.
(Carl)
SRO6. The product of any function and an impulse function is a constant.
Definition: The participants thought that the product of any function and an impulse
function is a constant function
Example: When asked to plot and explain the Fourier transform of �(�) = �.�(� − 1) Luke said,
Okay, so in this case, for z(t), because that’s an impulse response we know that it only
happens at that point in time. So this has a time delay and so we have to wait until one,
and then when we get to one that’s when we turn off-- or when we turn on and it goes
immediately off. So that means we’re looking at zero, one, and then I’m just gonna kind
of ghost out what the picture looks like. We know that we have a magnitude of one. Well,
it happens at one because z-- oops-- z(1) equals one squared times one. So we just get
one. But we’re only doing the Fourier transform of that particular point... the Fourier
transform of one should be one. (Luke)
K.1.2. Problematic Reasonings Related to Content Area of Frequency Analysis
FA1. A periodic signal in the time domain is also periodic in the frequency domain.
270
Definition: The data showed that the participants thought that a periodic signal in the
time domain is also periodic in the frequency domain.
Example: The participants were given an aperiodic rectangular function and a periodic
rectangular function and were asked to explain if the knowledge of the frequencies
present in a periodic signal help to determine the frequencies present in a corresponding
aperiodic signal is. Carl said,
Generally I think if something's periodic in the time domain it's probably also
periodic in the frequency domain. Like if we have-- this is an impulse train I believe,
right?... Then the impulse train in the frequency domain is also an impulse train with
a different time shift and a different area, so knowing that this one becomes periodic
and knowing that to get this you just convolved this with a Dirac function so it gives
you another periodic single, then that would make me think that this would also be
periodic... I'm drawing in dots because I'm not entirely positive where that next one
is. I just know what it's supposed to look like. And then if that was at eight pi then
you would have another one at negative eight pi as well, because it's going to repeat
periodically. And because it's a sinc function there actually will be a lot of aliasing,
and so you just eventually have a train of sync functions, but knowing what
frequencies are present in this first sync can help you determine the spacing for the
rest of them. (Carl)
FA2. Signal representation in the time domain is same representation in the frequency
domain.
Definition: The data showed that the participants thought that the signal representation in
the time domain is the same as the signal representation in the frequency domain.
271
Example: In a question Luke while trying to find Fourier transform of �(�) =�.�(� − 1) said that �(1) = 1 and so "Fourier transform of one should be one."
FA3. A constant in the frequency domain means no frequency as it has no ω in it.
Definition: The data showed that the participants employed problematic reasonings in
explaining what frequencies were represented by a constant in the frequency domain and
thought no ω means no frequency.
Example: Caleb while telling about out the frequency components of an impulse
function said, So, v2(t) is equal to δ(t), which is an impulse in time domain, and for the
Fourier in the frequency domain, it's just 1. So, I don't think there is a frequency
represented in this signal... Because there's just no omega in the frequency domain, just a
1. (Caleb)
FA4. Phase shift means shifting the phase plot of a signal in the frequency domain
Definition: The data shows that the participants interchanged the concept of time shift in
the time domain with the concept of phase shift in the frequency domain.
Example: The participants were given the signal ℎ(�) = sin(<. � −</) and were asked to
explain the concept of the time shift and the phase shift using ℎ(�) as an example. Jim
said, "And then for a phase shift... in the frequency domain, it would look just like the
time shift does in the time domain."
K.1.3. Problematic Reasonings Related to Content Area of System Analysis
SA1. Convolution and multiplication are interchangeable.
Definition: The data showed that the participants interchanged the concept of
convolution with multiplication.
272
Example: The participants were given two same signals expressed separately in the
frequency domain and in the time domain and were asked to explain if the resultant
signals from convolution of these signals separately in the time domain (ℎ(�) ∗ �(�)) and
in the frequency domain (ℎ(Y) ∗ �(Y)) will be the same or not. Matt said, "Yeah, I think
it will change... Because the Fourier transform is changed from time domain to the
frequency domain. I think h(t) will give the range of the y(t)... So it’s from -1 to 1... y(t)
would be from -1 to 1 too... Because there’s a filter so it will filter out the parts that
doesn’t include in that. "
SA2. Concept of time-invariance of a system is interchangeable with the literal
meaning of time invariance.
Definition: The data showed that the participants thought that the concept of the time-
invariance of a system could be explained with the literal meaning of time-invariance.
Example: The participants were asked to explain whether given systems were time-
invariant or not. John said, "Time-invariant, it would be the same shape output but not
necessarily the same time. And not time-invariant would be the output would be the same
at the same time."
K.2. Mistakes
The incorrect responses of the participants for which there is not enough evidence
for reasonings behind them are called mistakes (Definition specifically created for this
study).
Mistake1. Engaging with the powers of exponential functions
Definition: The data showed that the participants made mistakes in dealing with the
powers of exponentials.
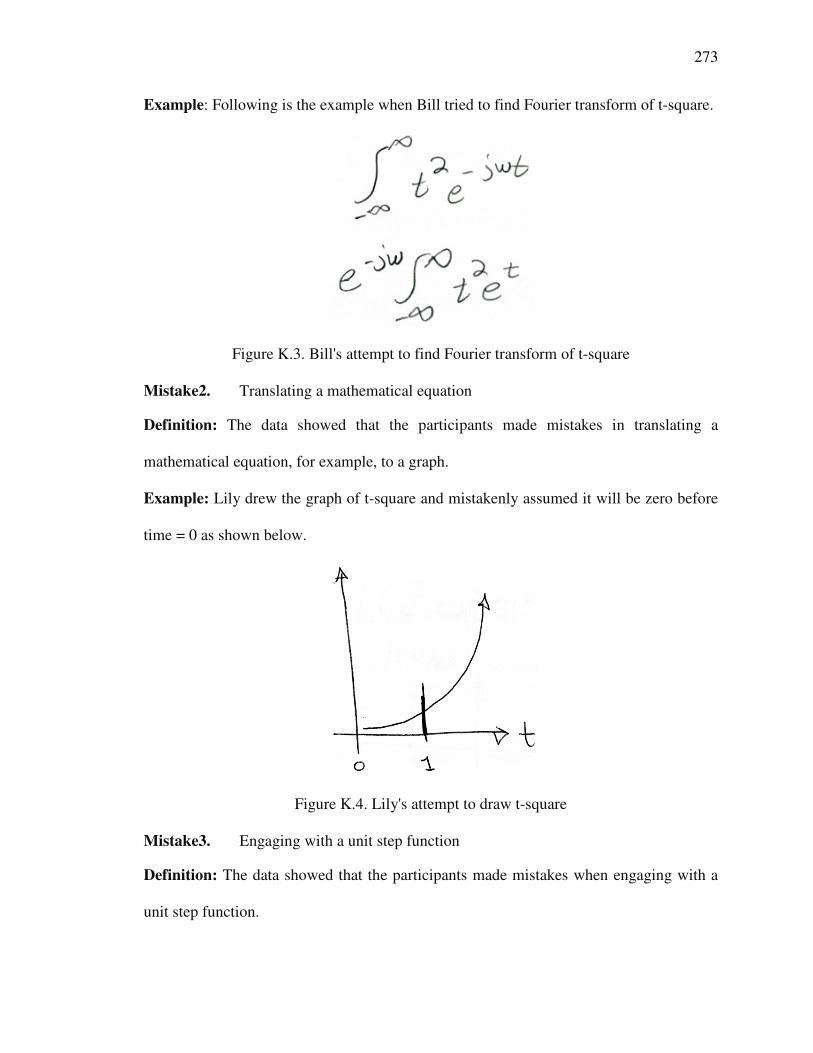
273
Example: Following is the example when Bill tried to find Fourier transform of t-square.
Figure K.3. Bill's attempt to find Fourier transform of t-square
Mistake2. Translating a mathematical equation
Definition: The data showed that the participants made mistakes in translating a
mathematical equation, for example, to a graph.
Example: Lily drew the graph of t-square and mistakenly assumed it will be zero before
time = 0 as shown below.
Figure K.4. Lily's attempt to draw t-square
Mistake3. Engaging with a unit step function
Definition: The data showed that the participants made mistakes when engaging with a
unit step function.
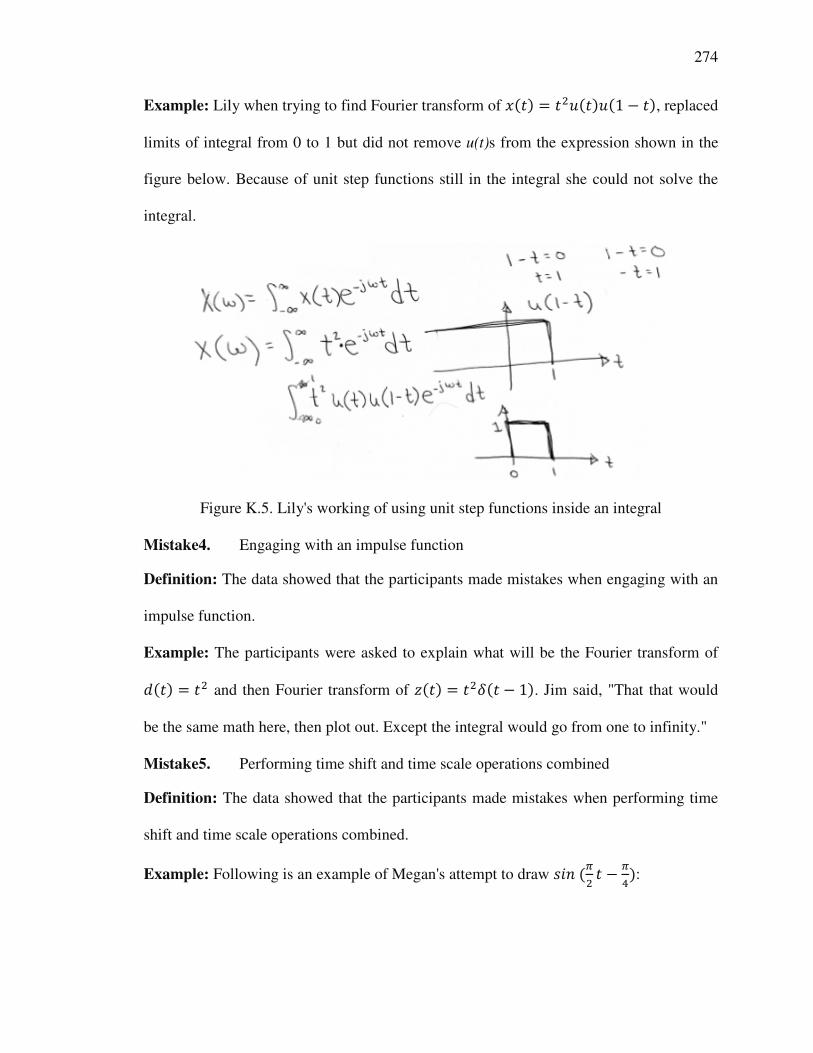
274
Example: Lily when trying to find Fourier transform of �(�) = �. (�) (1 − �), replaced
limits of integral from 0 to 1 but did not remove u(t)s from the expression shown in the
figure below. Because of unit step functions still in the integral she could not solve the
integral.
Figure K.5. Lily's working of using unit step functions inside an integral
Mistake4. Engaging with an impulse function
Definition: The data showed that the participants made mistakes when engaging with an
impulse function.
Example: The participants were asked to explain what will be the Fourier transform of
%(�) = �. and then Fourier transform of �(�) = �.�(� − 1). Jim said, "That that would
be the same math here, then plot out. Except the integral would go from one to infinity."
Mistake5. Performing time shift and time scale operations combined
Definition: The data showed that the participants made mistakes when performing time
shift and time scale operations combined.
Example: Following is an example of Megan's attempt to draw ���(<. � −</):
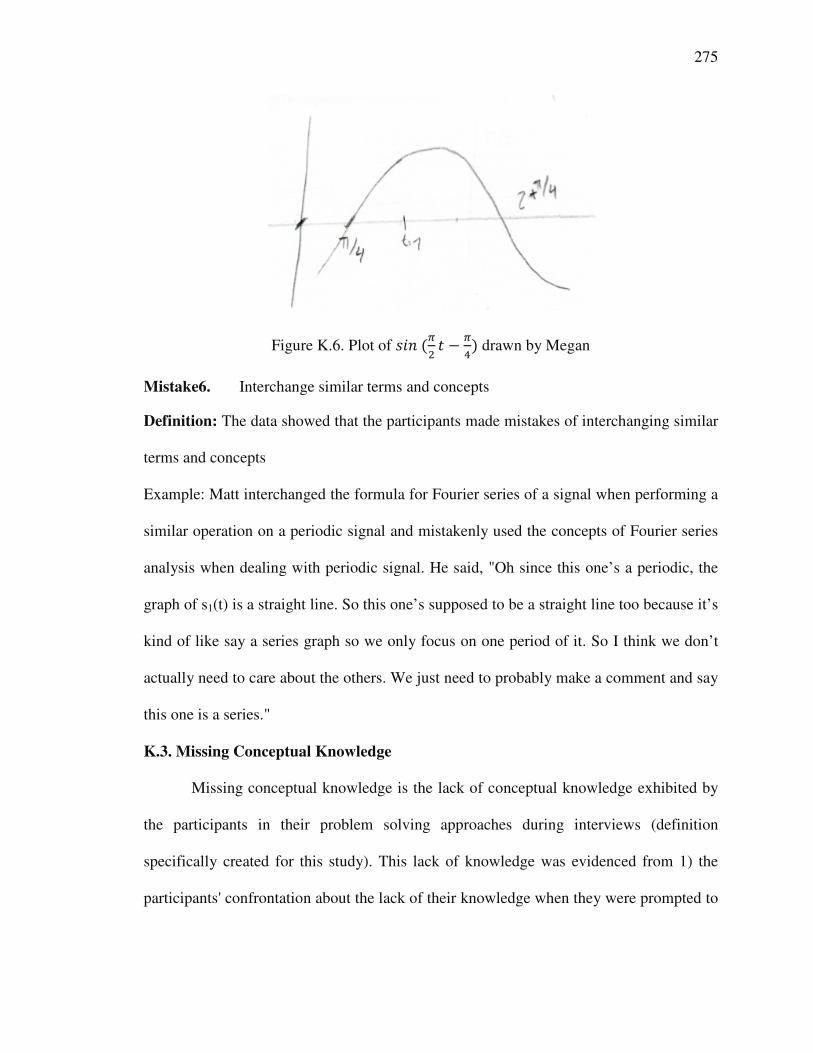
275
Figure K.6. Plot of ���(<. � −</) drawn by Megan
Mistake6. Interchange similar terms and concepts
Definition: The data showed that the participants made mistakes of interchanging similar
terms and concepts
Example: Matt interchanged the formula for Fourier series of a signal when performing a
similar operation on a periodic signal and mistakenly used the concepts of Fourier series
analysis when dealing with periodic signal. He said, "Oh since this one’s a periodic, the
graph of s1(t) is a straight line. So this one’s supposed to be a straight line too because it’s
kind of like say a series graph so we only focus on one period of it. So I think we don’t
actually need to care about the others. We just need to probably make a comment and say
this one is a series."
K.3. Missing Conceptual Knowledge
Missing conceptual knowledge is the lack of conceptual knowledge exhibited by
the participants in their problem solving approaches during interviews (definition
specifically created for this study). This lack of knowledge was evidenced from 1) the
participants' confrontation about the lack of their knowledge when they were prompted to
276
explain their responses, or 2) the responses that showed failure to appeal to some useful
knowledge to correctly answer the given question.
4. Difference in the use of graphical representations of discrete and continuous impulse
functions
Definition: The data shows that the participants lacked the knowledge of the difference
in the use of the graphical representations of the discrete and continuous impulse
functions.
Example: During the interview, Jake drew an impulse and I asked him to explain why he
chose to use that particular representation of the impulse function. He said, "I don’t
know. I sometimes use this, sometimes use this one."
5. Conceptual understanding of Fourier Analysis
Definition: The responses of the students revealed that the participants leaned towards
solving questions related to Fourier analysis using either commonly used Fourier
transform pairs given in Fourier transform table or through integration and displayed lack
of acumen in Fourier analysis if they were encountered with question, which was not
easy to answer through any of these two preferred methods.
Example 1: Ability to recognize that a function originally expressed in the form of
sinusoids or exponentials is already expressed in the form of Fourier series or transform.
The participants were asked to find Fourier series and transform of �(�) = cos A� + </B +
3sin(7�). Luke said, "I can honestly not think of how to do the Fourier series, and so is
it okay if I skip and go on?"
Example 2: The data showed that the participants demonstrated a lack of knowledge of
the units of Fourier series and Fourier transform.
277
The participants were asked to discuss if the units of a signal v(t) is volts, what will be
the units of Fourier series and Fourier transform of that signal. Kevin said, "I think it's
just a magnitude. So units of the magnitude as in unit less?"
Example 3: The data showed that the participants demonstrated a lack of ability to
identify that Fourier transform of a signal may not exist
During the interviews, the participants were asked to explain how they will find and plot
Fourier transform of %(�) = �.. Luke solved the whole integration and found infinity in
the answer and said, " But I don’t want to say that omega is just zero, but if it was zero
then that makes this little term one and so then we’re looking at t-squared throughout
infinite time, which kind of blows up. So I feel like there’s another way to really-- to look
at it better."
Example 4: Ability to identify that Fourier series of an aperiodic signal does not exist
The data showed that the participants demonstrated a lack of ability to identify that
Fourier series of an aperiodic signal does not exist. A aperiodic signal was shown to the
participants and they were asked to explain what the Fourier series of that signal will be.
Luke said, "I'm thinking of like you can take your data, like certain points from that, and
build up a more and more and more exact approach to it. And so, this, the Fourier
transform, tries to find not, you know, the precise to the, you know, millionth decimal,
but like the good, general statement of, you know, this is what, excuse me, this is what
the like first initial terms and the Fourier transform-- or the Fourier series are, sum up to."
6. Ability to translate a function from one representation to another
Definition: The data showed that the participants demonstrated a lack of ability to
translate a function from one representation to another.

278
Example: Ryan while explaining a problem said, "The mathematical explanation is
sufficient for me to understand it so I never really looked into it more, I guess."

VITA
279
VITA
Farrah Fayyaz received her B.S. and M.S. degrees in Electrical Engineering at the
University of Engineering and Technology, Lahore in 2000 and 2009 respectively. She
taught undergraduate Electrical Engineering courses in Pakistan for almost nine years
before starting her Ph.D. in Engineering Education at Purdue University in 2011. She will
be returning to Pakistan in December 2014 as a faculty member, following the
completion of her degree.
She received a Fulbright Fellowship for her PhD (2011-2015) and a Ross
Fellowship from Purdue for the academic year 2011-2012. Her future research plans
include cross-cultural studies on conceptual understanding of undergraduate electrical
engineering students.
Copyright © 2022 FDOKUMEN