A Protocol for mtGenome Analysis on Large Sample Numbers
8
Author Proof Copy 127 BIOINFORMATICS AND BIOLOGY INSIGHTS 2014:8 Open Access: Full open access to this and thousands of other papers at http://www.la-press.com. Bioinformatics and Biology Insights Introduction In the past 25 years, human populations have been targeted in several studies by anthropologists, linguists, geneticists, and others who aim to understand the evolutionary factors involved in the formation of sociobiological populations. Clas- sical genetics and polymorphism studies helped to reconstruct part of the history of world populations. 1–6 Mitochondrial DNA (mtDNA) offers several advan- tages for evolutionary and population genetics compared with nuclear DNA, 7,8 such as (i) high number of copies per cell (up to 1000 copies in nervous system-specialized cells, an important feature for rescuing ancestral DNA from degraded samples), (ii) small genome size (16,659 bp), (iii) maternal haploid heritage (passing from mother to progeny without any recombination), and (iv) high mutation rate that allows the tracking of changes over short periods of time, such as the process of human settlement. 1–7,9 However, most works have been limited to investigating the hypervariable regions (HVS), which do not represent all the variability of mtDNA. Currently, to address this problem, researchers have employed, among other strategies, full mitochondrial genome sequencing with modern high-throughput sequencing technology. 10–13 Sanger sequencing still presents several advantages, such as high quality and large extension of the generated sequences. However, Sanger sequencing has high costs and demands a large amount of time for full genome sequencing A Protocol for mtGenome Analysis on Large Sample Numbers Igor G. Hamoy 1,2,‡ , André M. Ribeiro-dos-Santos 1,‡ , Luiz Alvarez 3 , Silvanira Barbosa 1 , Artur Silva 1 , Sidney Santos 1,4 , Leonor Gusmão 1,3 and Ândrea Ribeiro-dos-Santos 1,4, * 1 Instituto de Ciências Biológicas, Universidade Federal do Pará, Belém, PA, Brazil. 2 Universidade Federal Rural da Amazônia, Campus de Capanema, PA, Brazil. 3 Institute of Molecular Pathology and Immunology of the University of Porto, Universidade do Porto. Porto, Portugal. 4 Núcleo de Pesquisa em Oncologia, Universidade Federal do Pará, Belém, PA, Brazil. ‡ Authors with equal contribution. *Corresponding author. ABSTRACT: e mitochondrial genome is widely studied in a variety of fields, such as population, forensic, and human and medical genetics. Most studies have been limited to a small portion of the sequence that, although highly diverse, does not describe the total variability. e arrival of modern high-through- put sequencing technologies has made it possible to investigate larger sequences in a shorter amount of time as well as in a more affordable fashion. is work aims to describe a protocol for sequencing and analyzing the complete mitochondrial genome with the Ion PGM™ platform. To evaluate the protocol, the mitochondrial genome was sequenced to approximately 210 Mbp, with high-quality sequences distributed between 12 samples that had an average coverage of 1023× per sample. Several variant callers were compared to improve the protocol outcome. e results suggest that it is possible to run up to 120 samples per run without any loss of any significant quality. erefore, this protocol is an efficient and accurate tool for full mitochondrial genome analysis. KEYWORDS: next-generation sequencing, mitochondrial DNA, analysis protocol, polymorphism, population genetics CITATION: Hamoy et al. A Protocol for mtGenome Analysis on Large Sample Numbers. Bioinformatics and Biology Insights 2014:8 127–134 doi: 10.4137/BBI.S14623. RECEIVED: January 31, 2014. RESUBMITTED: March 9, 2014. ACCEPTED FOR PUBLICATION: March 10, 2014. ACADEMIC EDITOR: JT Efird, Associate Editor TYPE: Original Research FUNDING: This work was part of the Rede de Pesquisa em Genômica Populacional Humana. Financial support: PROPESP/UFPA -FADESP, CAPES, Governo do Pará FAPESPA, CNPq and IPATIMUP. Igor Guerreiro Hamoy is supported by Pós-Doc Junior (PDJ) fellowship from CNPq/Brazil (162605/2011–0), Ândrea Ribeiro-dos-Santos by CNPq/Produtividade, and Sidney Santos by CNPq/Produtividade. The funders had no role in study design, data collection and analysis, decision to publish, or preparation of the manuscript. COMPETING INTERESTS: Authors disclose no potential conflicts of interest. COPYRIGHT: © the authors, publisher and licensee Libertas Academica Limited. This is an open-access article distributed under the terms of the Creative Commons CC-BY-NC 3.0 License. CORRESPONDENCE: [email protected]/[email protected] This paper was subject to independent, expert peer review by a minimum of two blind peer reviewers. All editorial decisions were made by the independent academic editor. All authors have provided signed confirmation of their compliance with ethical and legal obligations including (but not limited to) use of any copyrighted material, compliance with ICMJE authorship and competing interests disclosure guidelines and, where applicable, compliance with legal and ethical guidelines on human and animal research participants.
Transcript of A Protocol for mtGenome Analysis on Large Sample Numbers

Author Proof Copy
127Bioinformatics and Biology insights 2014:8
Open Access: Full open access to this and thousands of other papers at http://www.la-press.com.
Bioinformatics and Biology Insights
IntroductionIn the past 25 years, human populations have been targeted in several studies by anthropologists, linguists, geneticists, and others who aim to understand the evolutionary factors involved in the formation of sociobiological populations. Clas-sical genetics and polymorphism studies helped to reconstruct part of the history of world populations.1–6
Mitochondrial DNA (mtDNA) offers several advan-tages for evolutionary and population genetics compared with nuclear DNA,7,8 such as (i) high number of copies per cell (up to 1000 copies in nervous system-specialized cells, an important feature for rescuing ancestral DNA from degraded samples), (ii) small genome size (16,659 bp), (iii) maternal
haploid heritage (passing from mother to progeny without any recombination), and (iv) high mutation rate that allows the tracking of changes over short periods of time, such as the process of human settlement.1–7,9 However, most works have been limited to investigating the hypervariable regions (HVS), which do not represent all the variability of mtDNA. Currently, to address this problem, researchers have employed, among other strategies, full mitochondrial genome sequencing with modern high-throughput sequencing technology.10–13
Sanger sequencing still presents several advantages, such as high quality and large extension of the generated sequences. However, Sanger sequencing has high costs and demands a large amount of time for full genome sequencing
A Protocol for mtGenome Analysis on Large Sample Numbers
igor g. hamoy1,2,‡, andré m. ribeiro-dos-santos1,‡, luiz alvarez3, silvanira Barbosa1, artur silva1, sidney santos1,4, leonor gusmão1,3 and Ândrea ribeiro-dos-santos1,4,*1Instituto de Ciências Biológicas, Universidade Federal do Pará, Belém, PA, Brazil. 2Universidade Federal Rural da Amazônia, Campus de Capanema, PA, Brazil. 3Institute of Molecular Pathology and Immunology of the University of Porto, Universidade do Porto. Porto, Portugal. 4Núcleo de Pesquisa em Oncologia, Universidade Federal do Pará, Belém, PA, Brazil. ‡Authors with equal contribution. *Corresponding author.
AbstrAct: The mitochondrial genome is widely studied in a variety of fields, such as population, forensic, and human and medical genetics. Most studies have been limited to a small portion of the sequence that, although highly diverse, does not describe the total variability. The arrival of modern high-through-put sequencing technologies has made it possible to investigate larger sequences in a shorter amount of time as well as in a more affordable fashion. This work aims to describe a protocol for sequencing and analyzing the complete mitochondrial genome with the Ion PGM™ platform. To evaluate the protocol, the mitochondrial genome was sequenced to approximately 210 Mbp, with high-quality sequences distributed between 12 samples that had an average coverage of 1023× per sample. Several variant callers were compared to improve the protocol outcome. The results suggest that it is possible to run up to 120 samples per run without any loss of any significant quality. Therefore, this protocol is an efficient and accurate tool for full mitochondrial genome analysis.
Keywords: next-generation sequencing, mitochondrial DNA, analysis protocol, polymorphism, population genetics
CitAtioN: hamoy et al. a Protocol for mtgenome analysis on large sample numbers. Bioinformatics and Biology Insights 2014:8 127–134 doi: 10.4137/BBi.s14623.
ReCeived: January 31, 2014. ReSubmitted: march 9, 2014. ACCePted foR PubLiCAtioN: march 10, 2014.
ACAdemiC editoR: JT Efird, Associate Editor
tYPe: original research
fuNdiNG: this work was part of the rede de Pesquisa em genômica Populacional humana. financial support: ProPEsP/UfPa -fadEsP, caPEs, governo do Pará faPEsPa, cnPq and iPatimUP. igor guerreiro hamoy is supported by Pós-doc Junior (PdJ) fellowship from cnPq/Brazil (162605/2011–0), Ândrea ribeiro-dos-santos by cnPq/Produtividade, and sidney santos by cnPq/Produtividade. the funders had no role in study design, data collection and analysis, decision to publish, or preparation of the manuscript.
ComPetiNG iNteReStS: Authors disclose no potential conflicts of interest.
CoPYRiGht: © the authors, publisher and licensee libertas academica limited. this is an open-access article distributed under the terms of the creative commons cc-By-nc 3.0 license.
CoRReSPoNdeNCe: [email protected]/[email protected]
this paper was subject to independent, expert peer review by a minimum of two blind peer reviewers. all editorial decisions were made by the independent academic editor. all authors have provided signed confirmation of their compliance with ethical and legal obligations including (but not limited to) use of any copyrighted material, compliance with ICMJE authorship and competing interests disclosure guidelines and, where applicable, compliance with legal and ethical guidelines on human and animal research participants.

Author Proof Copy
Hamoy et al
128 Bioinformatics and Biology insights 2014:8
(even for small genomes such as the mitochondrial). New benchtop sequencing platforms, such as MiSeq (Illumina, San Diego, CA, USA) and Ion Personal Genome Machine™ (Ion PGM™ – Life Technologies, Foster City, CA, USA),14 have allowed access to sequencing data in a small operating time. These technologies have added a separate chapter in the study of population genetics.10,11 However, they are not widely employed, particularly the new technologies, such as Ion PGM™ (Life Technologies).
Considering cost, quality, throughput, and operating time, the new benchtop sequencing technologies are good alternatives to full mitochondrial genome sequencing for forensic, medical, and population studies. Therefore, this work proposes a standard protocol for sequencing and ana-lyzing the complete mitochondrial genome with Ion PGM™ (Life Technologies).
This new protocol includes a mtDNA library preparation and a bioinformatics analysis workflow. Unlike the manufac-turer’s protocol, this protocol performs all the analyses on an external Linux workstation to avoid consuming sequencer time and enables the use of other third party software for analy-sis. This study aimed to address, among others, the follow-ing goals: to (i) provide a standard mitochondrial preparation and analysis protocol with Ion PGM™ (Life Technologies), (ii) evaluate the efficiency of the variant discovery tools, and (iii) estimate the best software to obtain high-quality results.
Material and Methodssample preparation. This study was composed of 12
DNA samples obtained by oral swab and peripheral blood from anonymous, unrelated Portuguese individuals. All of the samples were collected according to the ethical principles of the Declaration of Helsinki with written informed consent. The total DNA from the oral swab samples was extracted using Chelex 50 resin (Bio-Rad, Hercules, CA, USA) and from peripheral blood using the PureLink™ Genomic DNA Kit (Invitrogen, Foster City, CA, USA). The samples were later quantified with a Qubit 2.0 Fluorometer (Invitrogen) and were diluted to 10 ng/µL.
mtdNA amplification. mtDNA was amplified with the primers developed by Torroni et al.15 and Ramos et al.9 (Table 1). A total of 12 overlapping amplicons with length between 1270 and 1870 bp were produced to cover the complete mitochon-drial genome for each sample. The PCR product was visualized in a 2% agarose electrophoresis gel (Fig. 1), purified using an Invisorb Fragment CleanUp Kit (Invitek, Hayward, CA, USA) and quantified with a Qubit 2.0 Fluorometer (Invitrogen) using the Quant-iT dsDNA HS Assay Kit (Invitrogen).
IoN PGM™ barcode library construction. The barcode library construction was performed following the protocol “Preparing Long Amplicon Libraries” (Life Technologies) and using the Ion Xpress™ Plus Fragment Library Kit (Life Tech-nologies). A pool of 96 ng of DNA for all of the samples was produced using 8 ng from each. The enzyme Ion Shear Plus
Enzyme Mix II (Life Technologies) fragmented the sequences. The product was later purified with the Agencourt AMPure XP Reagent (Beckman Coulter, Passadena, CA, USA), which was added to the Ion P1 and Ion Express Barcode X adapters (Ion Xpress™ Barcode Adapters Kit, Life Technologies) and was hen purified again. A total of 200 base-pair fragments were selected using E-Gel SizeSelect Agarose Gels (Invitrogen). The results were quantified with a Qubit 2.0 Fluorometer (Invitrogen) to confirm the presence of DNA, which were amplified using a Ion Plus Fragment Library Kit (Life Technologies) and purified again to produce the mtDNA libraries for each sample.
The libraries were gathered into a pool of the same con-centrations to perform emulsion PCR and enrichment follow-ing the Ion Xpress™ Template Kit v2.0 (Life Technologies) protocol. The result was deposited into an Ion 316 Chip Kit (Life Technologies) following the Ion PGM™ 200 Sequenc-ing Kit (Life Technologies) protocol and inserted into an Ion Personal Genome Machine™ System (Life Technologies) for sequencing. The detailed protocol of all procedures is described in the Supplementary Protocol.
bioinformatic analysis workflow. The reads discrimi-nated by barcode (1–12, corresponding to the samples) were transferred to a Linux workstation (24 GB of RAM and CPU 3.0 GHz with eight cores) for analysis. The reads were converted into FASTQ format using sff_extract (http://bioinf.comav.upv.es/sff_extract/). Read quality was evaluated using FastQC (http://www.bioinformatics.babraham.ac.uk /projects/ fastqc/), and low-quality reads were filtered and trimmed using fastx_tools (http://hannonlab.cshl.edu/fastx_toolkit/).
The reads were aligned to the revised Cambridge Reference Sequence (rCRS)16 using two strategies. The first employed the licensed platform CLC Genomics Workbench 4.9 (CLC Bio, Cambridge, MA, USA) and the second used the open source software Torrent Mapping Alignment Program (TMAP) v.0.3.7 (https://github.com/iontorrent/TMAP) employed in Torrent Suite (Life Technologies). The CLC Genomics Work-bench (CLC Bio) has a friendly graphical user interface and a complete analysis platform, among many other features. Con-versely, TMAP only has a command line interface but offers compatibility with many common bioinformatics tools.
Both strategies produced Binary Sequence Alignment Map (BAM) format alignments that were processed, indexed, sorted, and analyzed by the tools included in the SAMtools 0.1.1717 and GATK 2.718 packages.
Variant calling. Three strategies were employed for vari-ant calling: the first used the CLC Genomics Workbench 4.9 (CLC Bio) on the CLC alignments, the second used SAMtools on the TMAP alignments, and the third used the GATK variant analysis workflow on the TMAP alignments. The complete bioinformatics workflow is described in detail in the Supplementary Bioinformatics Protocol.
The Single Nucleotide Polymorphism (SNP)s were clas-sified as transitions and transversions, and as synonymous and non-synonymous according to the MITOMAP19 database.

Author Proof Copy
A protocol for mtGenome analysis
129Bioinformatics and Biology insights 2014:8
table 1. Primers applied to complete mitochondrial genome amplification.
fRAGmeNt fRAGmeNt LeNGth (bP) NAme SequeNCe (5’-3’)
mtt1 1822 fW 14898forb tagccatgcactactcaccaga
rV 151revb ggatgaggcaggaatcaaagac
mtt2 1758 fW 16488fora ctgtatccgacatctggttcct
rV 1677reva gtttagctcagagcggtcaagt
mtt3a 1397 fW 1404fora acttaagggtcgaaggtggatt
rV 2801revb taatgcaggtttggtagttta
mtt3B 1301 fW 2646forb ggttcagctgtctcttacttt
rV 3947revb tcgatgttgaagcctgagacta
mtt4a 1837 fW 3734forb aagtcaccctagccatcattcta
rV 5571revb aagtattgcaacttactgagg
mtt4B 1271 fW 5468forb cacgctactcctacctatctc
rV 6739revb gatatcatagctcagaccatacc
mtt5a 1489 fW 6511forb ctgctggcatcactatactacta
rV 8000revb caacgtcaaggagtcgcaggt
mtt5B 1507 fW 7713forb tcctaacactcacaacaaaac
rV 9220revb gattggtgggtcattatgtgttg
mtt6 1738 fW 8910fora cttaccacaaggcacacctaca
rV 10648revb ggcacaatattggctaagaggg
mtt7 1866 fW 10360forb gtctggcctatgagtgactaca
rV 12226revb cagttcttgtgagctttctcgg
mtt8 1853 fW 11977forb ctccctctacatatttaccacaac
rV 13830revb aagtcctaggaaagtgacagcga
mtt9 1872 fW 13477fora gcaggaatacctttcctcacag
rV 15349reva gtgcaagaataggaggtggagt
figure 1. Pcr product visualization. agarose electrophoresis gel (2%) for the visualization of Pcr products.
The pN/pS ratio was calculated from these results accord-ing to the equation pN/pS = (NSY/N)/(SYN/S), where NSY is the number of non-synonymous mutations observed, N is the number of non-synonymous mutation sites, SYN is the
number of synonymous mutations observed, and S is the number of synonymous mutation sites.
To validate our results, two individuals’ HVS regions were sequenced by Sanger sequencing and compared to our results. To estimate the protocol potential sample size and minimum coverage, the reads of both individuals were ran-domly sampled at several rates (2.5, 5, 10, 25, and 50% of the reads) with 100 repetitions each and were compared to the Sanger results. Furthermore, the variants of each repeti-tion were compared among their sampling to infer variant calling coherence.
statistical analysis. Statistical analyses and data plotting were performed in R v3.0 (http://www.r-project.org/) statisti-cal package with the aid of ggplot2 v0.9.820 package.
results and discussionA single Ion 316 Chip Kit (Life Technologies) run produced 1,341,502 reads and approximately 210 Mbp of sequence dis-tributed across 12 samples (Table 2). All of the barcode reads were correctly identified, with less than a 1% loss, and were uniformly distributed among the samples, corresponding to

Author Proof Copy
Hamoy et al
130 Bioinformatics and Biology insights 2014:8
8% (approximately 100,000 reads), which is more than that has been reported in previous works10,11 (Table 2). The reads demonstrated an overall good quality (QV $ 20) until their 250th base, confirming the protocol quality (Fig. 2).
Both alignment strategies yielded similar total mapped reads and coverage. Although less user friendly than CLC, TMAP is recommended because it is faster, license free, and easily compatible with other bioinformatics software. TMAP aligned 98.45% of the reads with average coverage of 1023× for all samples. Schönberg et al.10 who studied 149 individual mitochondrial genome sequences, obtained an average cover-age of only 97.69×, and Gunnarsdóttir et al.11 who studied 109 individuals, obtained an average coverage of only 54.6×, confirming the quality of our approach. To visualize our results, the mean coverages of consecutive 100-bp windows of the mitochondrial genome are plotted in Figure 3. On aver-age, no window displayed coverage below 500×, although a single sample presented low coverage, likely because of either an unknown deletion or machine error.
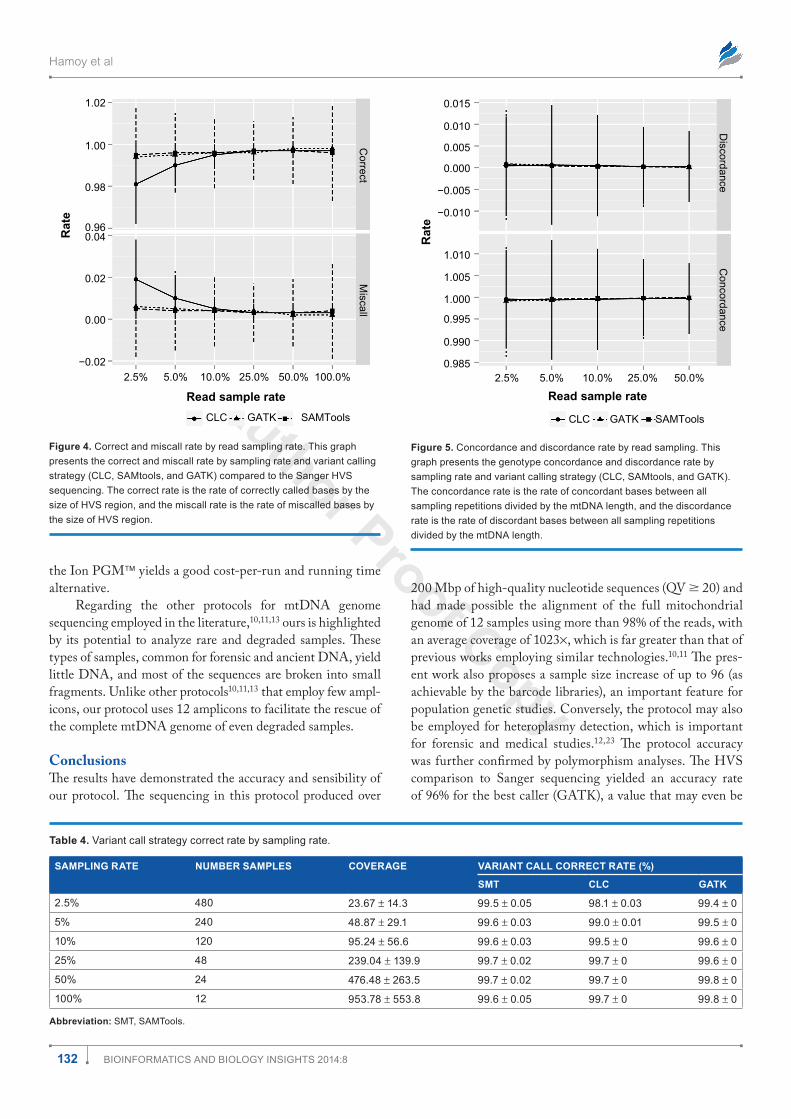
To infer the best variant calling strategy and sample size, the results were compared to HVS Sanger sequencing (Table 3). The CLC variant caller is based only on coverage and quality, and is fast and efficient for high-coverage data (.20×).21,22 Conversely, GATK and SAMtools compute the Bayesian genotype likelihood to infer the most prob-able genotype. This strategy has produced consistent results and consider several samples during genotype imputation that correct low-coverage data (,10×).21,22 Overall, all three strategies presented more than 99% correct rates (rate of cor-rectly called bases by the size of HVS region) (Fig. 4) above the 10% sampling rate, suggesting that, theoretically, up to
120 samples could be sequenced in a single run with a mean coverage of 95.24×, which is similar to previous works.10,11 Unfortunately, commercial barcode libraries have, at most, 96 different tags. Conversely, medical studies are interested in mitochondrial heteroplasmy, and as suggested by Holland et al.23 and Wong.12 Next-Generation Sequencing (NGS) may allow the detection of low heteroplasmy levels but demands high-coverage values. Therefore, the number of samples must be adjusted according to the study goals.
01000
2000
3000
4000
5000
6000
7000
80009000
10000
11000
12000
13000
14000
15000
16000
500
1000
150020002500
Position
Mea
n c
ove
rag
e (l
og
10)
figure 3. mtdna sequencing coverage per sample. this graph represents a polar plot, the coverage (log10 scale) for each 100-bp mitochondrial genome window for each of the samples, and the grey highlighted areas in the graph represent the amplicon overlap.
30
20
10
Qu
alit
y
Position
0
350–369
300–349
250–299
200–249
150–199
90–99
100–149
80–89
70–79
60–69
50–59
45–49
40–44
35–39
30–34
25–29
15–19
20–24
10–14
987654321
figure 2. sequenced sample quality distributions per read position. the following plot displays the distribution of qualities per read position obtained by the fastQc software. in the graph, the thick line represents the median quality obtained in the respective read position, and the box represents the quality obtained between the first and third quartiles.
table 2. number of reads and mapped reads per sample.
SAmPLe ReAdS %** mAPPed ReAdS
%***
1 93919 6.90% 92514 98.50%
2 107553 7.93% 105924 98.49%
3 122484 8.98% 120948 98.75%
4 117671 8.65% 116229 98.77%
5 127574 9.41% 125987 98.76%
6 112323 8.23% 110579 98.45%
7 109611 8.05% 108008 98.54%
8 98925 7.24% 97173 98.23%
9 88552 6.50% 87384 98.68%
10 125664 9.22% 123710 98.45%
11 145192 10.58% 142533 98.17%
12 107743 7.93% 106295 98.66%
none* 5339 0.39% 4218 79.00%
total 1362550 100.0% 1341502 98.46%
Note: *“none” correspond to all reads that were mislabeled to any sample. **this column is relative to the total of reads obtained. ***this column is relative to each sample reads total.

Author Proof Copy
A protocol for mtGenome analysis
131Bioinformatics and Biology insights 2014:8
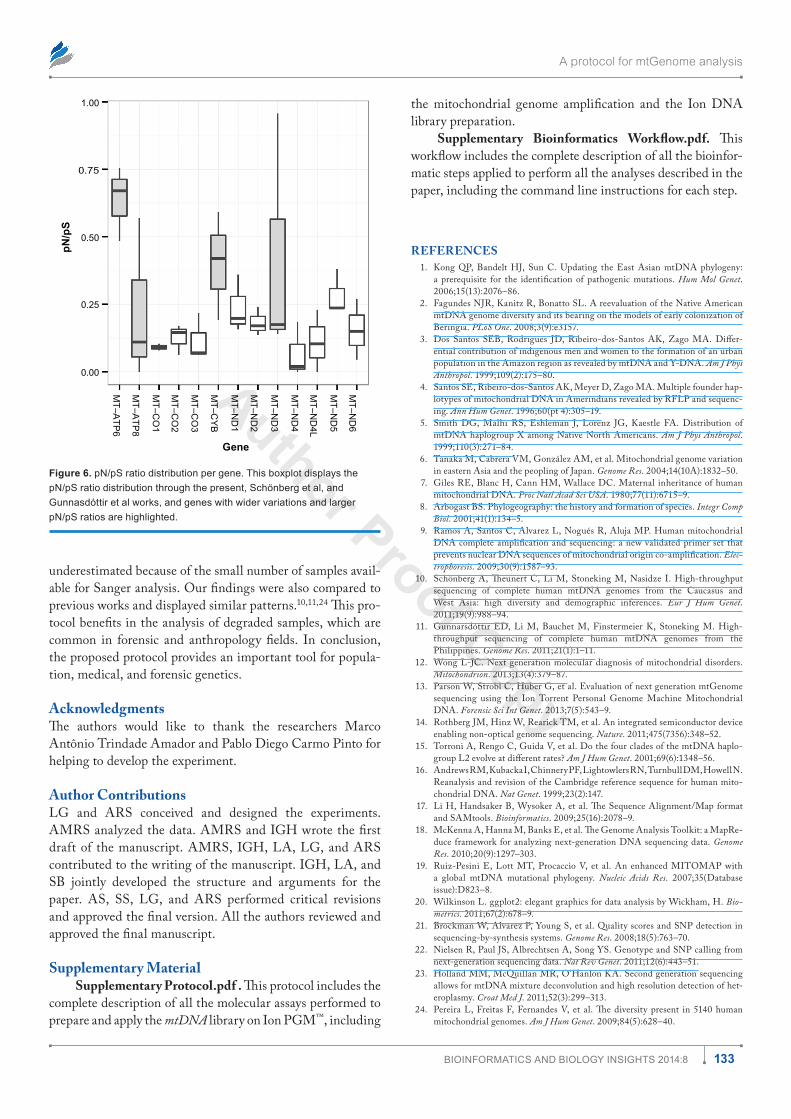
the rates were lower than one, but it is important to highlight that the genes ATP6 (0.484), CYB (0.592), and ND3 (0.957) yielded values farthest from the average (0.226). Compared with the distribution of the pN/pS values from the present work, Gunnarsdóttir et al.11 and Schönberg et al.10 observed the widest divergence at ND3, CYB, and ATP8 genes, whereas higher values were observed at ATP6 gene (Fig. 6), suggesting a lighter selective pressure as described previously.10,11
To achieve similar results with Sanger sequencing, it would be necessary to perform 12 sequencing reactions per sample, totaling 144 reactions (considering that each ampl-icon can be sequenced by a single reaction). Each reaction costs approximately $20 and takes approximately 40 minutes to complete; therefore, a similar experiment would cost approxi-mately $2880 and take four days to complete. High-throughput platforms, such as HiSeq (Illumina) and SOLiD (Life Technologies), have a low cost (approximately $0.10/Mbp), but library preparation is complex and the run takes approxi-mately one week or more to complete; each run costs approxi-mately $10,000.25–28 Conversely, benchtop platforms, such as MiSeq (Illumina), are good alternatives that cost only $1/Mb, with a running time of 27 hours and an average output of 1.5 GB/run. The Ion PGM™ platform has an average cost of $2/Mb and an output of 200 Mbp/run (Ion 316 Chip Kit), but it compensates for this higher cost and limited yield with a running time of only three hours and a small instrument cost (compared with other next-generation platforms). Therefore,
table 3. number of variable sites, transitions, transversions, insertions, deletion, synonimous, non-synonimous and pn/ps ratio per mtdna region.
ReGioN / GeNe vARiAbLe Site tRS tRv iNS deL SYN NSY pN/pS*
control region 75 62 4 7 2 - - -
12s rrna 13 10 1 1 1 - - -
16s rrna 20 13 1 3 3 - - -
trnas 12 9 0 3 0 - - -
mt-atP6 11 10 0 1 0 5 5 0.484
mt-atP8 3 3 0 0 0 3 0 0.000
mt-co1 27 20 1 0 6 17 4 0.104
mt-co2 9 7 1 0 1 7 1 0.062
mt-co3 12 8 0 1 3 7 1 0.062
mt-cyB 23 20 1 0 2 9 12 0.592
mt-nd1 15 10 2 2 1 9 3 0.157
mt-nd2 18 13 0 4 1 10 3 0.136
mt-nd3 9 6 0 3 0 2 4 0.957
mt-nd4 27 20 0 3 4 20 0 0.000
mt-nd4l 8 6 0 0 2 6 0 0.000
mt-nd5 34 25 4 1 4 19 10 0.236
mt-nd6 8 7 0 1 0 5 2 0.150
total 324 249 15 30 30 119 45 -
Note: *mean pn/ps ratio: 0.226.Abbreviations: trs, transitions; trV, transversions; ins, insertion; dEl, deletion; syn, synonimous; nsy, non-synonimous.
Variant calling sampling sensibility was evaluated by measuring the rate of genotype concordance between repeti-tions of each sampling. All the strategies and samplings were consistent with a 99% concordance rate (Fig. 5) above a 10% sampling rate.
A total of 324 polymorphic sites were observed among all samples, of which 249 were transitions, 15 were transversions, 30 were insertions, and 30 were deletions (Table 4), similar to findings by Gunnarsdóttir et al.11 and Schönberg et al.10 However, Schönberg et al identified 855 variant sites, likely because of the different number of individuals and popula-tions investigated (147 individuals from five populations from West Asia). The relative numbers of mutations per classifica-tion were similar among all the works (0.93 ± 0.02). Regard-ing the ratio of transitions to transversions, coding regions presented higher values (17.0) than the control or hypervari-able regions (15.5), as previously described.10,11,24 The tRNA regions contained 12 variants, an elevated number considering Gunnarsdóttir et al.11 detected only 14 among their samples, but in accordance with the number observed by Schönberg et al.10 (39). These variants in tRNA regions are potential tar-gets for future studies.
Among the 13 protein-coding regions, 119 synonymous mutation sites and 45 non-synonymous mutation sites were observed (Table 4). The pN/pS ratio was similar to previous works10,11 (P = 0.19 and 0.66, respectively). Likewise, the pN/pS ratio varies significantly among the regions (P = 0.002). All
Author Proof Copy
Hamoy et al
132 Bioinformatics and Biology insights 2014:8
200 Mbp of high-quality nucleotide sequences (QV $ 20) and had made possible the alignment of the full mitochondrial genome of 12 samples using more than 98% of the reads, with an average coverage of 1023×, which is far greater than that of previous works employing similar technologies.10,11 The pres-ent work also proposes a sample size increase of up to 96 (as achievable by the barcode libraries), an important feature for population genetic studies. Conversely, the protocol may also be employed for heteroplasmy detection, which is important for forensic and medical studies.12,23 The protocol accuracy was further confirmed by polymorphism analyses. The HVS comparison to Sanger sequencing yielded an accuracy rate of 96% for the best caller (GATK), a value that may even be
table 4. Variant call strategy correct rate by sampling rate.
SAmPLiNG RAte NumbeR SAmPLeS CoveRAGe vARiANt CALL CoRReCt RAte (%)
Smt CLC GAtK
2.5% 480 23.67 ± 14.3 99.5 ± 0.05 98.1 ± 0.03 99.4 ± 0
5% 240 48.87 ± 29.1 99.6 ± 0.03 99.0 ± 0.01 99.5 ± 0
10% 120 95.24 ± 56.6 99.6 ± 0.03 99.5 ± 0 99.6 ± 0
25% 48 239.04 ± 139.9 99.7 ± 0.02 99.7 ± 0 99.6 ± 0
50% 24 476.48 ± 263.5 99.7 ± 0.02 99.7 ± 0 99.8 ± 0
100% 12 953.78 ± 553.8 99.6 ± 0.05 99.7 ± 0 99.8 ± 0
Abbreviation: smt, samtools.
0.015
0.010
0.005
0.000
−0.005
−0.010
1.010
Rat
e
1.005
1.000
0.995
0.990
0.9852.5%
CLC GATK SAMTools
Concordance
Discordance
5.0% 10.0% 25.0% 50.0%
Read sample rate
figure 5. concordance and discordance rate by read sampling. this graph presents the genotype concordance and discordance rate by sampling rate and variant calling strategy (clc, samtools, and gatK). the concordance rate is the rate of concordant bases between all sampling repetitions divided by the mtdna length, and the discordance rate is the rate of discordant bases between all sampling repetitions divided by the mtdna length.
1.02
1.00
0.98
0.960.04R
ate
0.02
0.00
2.5% 5.0%
CLC GATK SAMTools
10.0%
Read sample rate
25.0% 100.0%
Correct
Miscall
50.0%−0.02
figure 4. correct and miscall rate by read sampling rate. this graph presents the correct and miscall rate by sampling rate and variant calling strategy (clc, samtools, and gatK) compared to the sanger hVs sequencing. the correct rate is the rate of correctly called bases by the size of hVs region, and the miscall rate is the rate of miscalled bases by the size of hVs region.
the Ion PGM™ yields a good cost-per-run and running time alternative.
Regarding the other protocols for mtDNA genome sequencing employed in the literature,10,11,13 ours is highlighted by its potential to analyze rare and degraded samples. These types of samples, common for forensic and ancient DNA, yield little DNA, and most of the sequences are broken into small fragments. Unlike other protocols10,11,13 that employ few ampl-icons, our protocol uses 12 amplicons to facilitate the rescue of the complete mtDNA genome of even degraded samples.
conclusionsThe results have demonstrated the accuracy and sensibility of our protocol. The sequencing in this protocol produced over
Author Proof Copy
A protocol for mtGenome analysis
133Bioinformatics and Biology insights 2014:8
underestimated because of the small number of samples avail-able for Sanger analysis. Our findings were also compared to previous works and displayed similar patterns.10,11,24 This pro-tocol benefits in the analysis of degraded samples, which are common in forensic and anthropology fields. In conclusion, the proposed protocol provides an important tool for popula-tion, medical, and forensic genetics.
AcknowledgmentsThe authors would like to thank the researchers Marco Antônio Trindade Amador and Pablo Diego Carmo Pinto for helping to develop the experiment.
Author contributionsLG and ARS conceived and designed the experiments. AMRS analyzed the data. AMRS and IGH wrote the first draft of the manuscript. AMRS, IGH, LA, LG, and ARS contributed to the writing of the manuscript. IGH, LA, and SB jointly developed the structure and arguments for the paper. AS, SS, LG, and ARS performed critical revisions and approved the final version. All the authors reviewed and approved the final manuscript.
supplementary Materialsupplementary Protocol.pdf . This protocol includes the
complete description of all the molecular assays performed to prepare and apply the mtDNA library on Ion PGM™, including
the mitochondrial genome amplification and the Ion DNA library preparation.
supplementary bioinformatics workflow.pdf. This workflow includes the complete description of all the bioinfor-matic steps applied to perform all the analyses described in the paper, including the command line instructions for each step.
refereNces 1. Kong QP, Bandelt HJ, Sun C. Updating the East Asian mtDNA phylogeny:
a prerequisite for the identification of pathogenic mutations. Hum Mol Genet. 2006;15(13):2076–86.
2. Fagundes NJR, Kanitz R, Bonatto SL. A reevaluation of the Native American mtDNA genome diversity and its bearing on the models of early colonization of Beringia. PLoS One. 2008;3(9):e3157.
3. Dos Santos SEB, Rodrigues JD, Ribeiro-dos-Santos AK, Zago MA. Differ-ential contribution of indigenous men and women to the formation of an urban population in the Amazon region as revealed by mtDNA and Y-DNA. Am J Phys Anthropol. 1999;109(2):175–80.
4. Santos SE, Ribeiro-dos-Santos AK, Meyer D, Zago MA. Multiple founder hap-lotypes of mitochondrial DNA in Amerindians revealed by RFLP and sequenc-ing. Ann Hum Genet. 1996;60(pt 4):305–19.
5. Smith DG, Malhi RS, Eshleman J, Lorenz JG, Kaestle FA. Distribution of mtDNA haplogroup X among Native North Americans. Am J Phys Anthropol. 1999;110(3):271–84.
6. Tanaka M, Cabrera VM, González AM, et al. Mitochondrial genome variation in eastern Asia and the peopling of Japan. Genome Res. 2004;14(10A):1832–50.
7. Giles RE, Blanc H, Cann HM, Wallace DC. Maternal inheritance of human mitochondrial DNA. Proc Natl Acad Sci USA. 1980;77(11):6715–9.
8. Arbogast BS. Phylogeography: the history and formation of species. Integr Comp Biol. 2001;41(1):134–5.
9. Ramos A, Santos C, Alvarez L, Nogués R, Aluja MP. Human mitochondrial DNA complete amplification and sequencing: a new validated primer set that prevents nuclear DNA sequences of mitochondrial origin co-amplification. Elec-trophoresis. 2009;30(9):1587–93.
10. Schönberg A, Theunert C, Li M, Stoneking M, Nasidze I. High-throughput sequencing of complete human mtDNA genomes from the Caucasus and West Asia: high diversity and demographic inferences. Eur J Hum Genet. 2011;19(9):988–94.
11. Gunnarsdóttir ED, Li M, Bauchet M, Finstermeier K, Stoneking M. High-throughput sequencing of complete human mtDNA genomes from the Philippines. Genome Res. 2011;21(1):1–11.
12. Wong L-JC. Next generation molecular diagnosis of mitochondrial disorders. Mitochondrion. 2013;13(4):379–87.
13. Parson W, Strobl C, Huber G, et al. Evaluation of next generation mtGenome sequencing using the Ion Torrent Personal Genome Machine Mitochondrial DNA. Forensic Sci Int Genet. 2013;7(5):543–9.
14. Rothberg JM, Hinz W, Rearick TM, et al. An integrated semiconductor device enabling non-optical genome sequencing. Nature. 2011;475(7356):348–52.
15. Torroni A, Rengo C, Guida V, et al. Do the four clades of the mtDNA haplo-group L2 evolve at different rates? Am J Hum Genet. 2001;69(6):1348–56.
16. Andrews RM, Kubacka I, Chinnery PF, Lightowlers RN, Turnbull DM, Howell N. Reanalysis and revision of the Cambridge reference sequence for human mito-chondrial DNA. Nat Genet. 1999;23(2):147.
17. Li H, Handsaker B, Wysoker A, et al. The Sequence Alignment/Map format and SAMtools. Bioinformatics. 2009;25(16):2078–9.
18. McKenna A, Hanna M, Banks E, et al. The Genome Analysis Toolkit: a MapRe-duce framework for analyzing next-generation DNA sequencing data. Genome Res. 2010;20(9):1297–303.
19. Ruiz-Pesini E, Lott MT, Procaccio V, et al. An enhanced MITOMAP with a global mtDNA mutational phylogeny. Nucleic Acids Res. 2007;35(Database issue):D823–8.
20. Wilkinson L. ggplot2: elegant graphics for data analysis by Wickham, H. Bio-metrics. 2011;67(2):678–9.
21. Brockman W, Alvarez P, Young S, et al. Quality scores and SNP detection in sequencing-by-synthesis systems. Genome Res. 2008;18(5):763–70.
22. Nielsen R, Paul JS, Albrechtsen A, Song YS. Genotype and SNP calling from next-generation sequencing data. Nat Rev Genet. 2011;12(6):443–51.
23. Holland MM, McQuillan MR, O’Hanlon KA. Second generation sequencing allows for mtDNA mixture deconvolution and high resolution detection of het-eroplasmy. Croat Med J. 2011;52(3):299–313.
24. Pereira L, Freitas F, Fernandes V, et al. The diversity present in 5140 human mitochondrial genomes. Am J Hum Genet. 2009;84(5):628–40.
1.00
0.75
0.50
0.25
pN
/pS
0.00
GeneM
T–N
D6
MT
–ND
5
MT
–ND
4L
MT
–ND
4
MT
–ND
3
MT
–ND
2
MT
–ND
1
MT
–CY
B
MT
–CO
3
MT
–CO
2
MT
–CO
1
MT
–AT
P8
MT
–AT
P6
figure 6. pn/ps ratio distribution per gene. this boxplot displays the pn/ps ratio distribution through the present, schönberg et al, and gunnasdóttir et al works, and genes with wider variations and larger pn/ps ratios are highlighted.

Author Proof Copy
Hamoy et al
134 Bioinformatics and Biology insights 2014:8
25. Li X, Buckton AJ, Wilkinson SL, et al. Towards clinical molecular diagnosis of inherited cardiac conditions: a comparison of bench-top genome DNA sequenc-ers. PLoS One. 2013;8(7):e67744.
26. Koshimizu E, Miyatake S, Okamoto N, et al. Performance comparison of bench-top next generation sequencers using microdroplet PCR-based enrichment for targeted sequencing in patients with autism spectrum disorder. PLoS One. 2013;8(9):e74167.
27. Frey KG, Herrera-Galeano JE, Redden CL, et al. Comparison of three next-generation sequencing platforms for metagenomic sequencing and identification of pathogens in blood. BMC Genomics. 2014;15(1):96.
28. Metzker ML. Sequencing technologies—the next generation. Nat Rev Genet. 2010;11(1):31–46.