A Power Line Inspector Device - DigitalCommons@UMaine
124
The University of Maine The University of Maine DigitalCommons@UMaine DigitalCommons@UMaine Honors College 5-2013 A Power Line Inspector Device A Power Line Inspector Device Brendan Gates University of Maine - Main Follow this and additional works at: https://digitalcommons.library.umaine.edu/honors Part of the Electrical and Electronics Commons, Electronic Devices and Semiconductor Manufacturing Commons, Other Electrical and Computer Engineering Commons, and the Power and Energy Commons Recommended Citation Recommended Citation Gates, Brendan, "A Power Line Inspector Device" (2013). Honors College. 104. https://digitalcommons.library.umaine.edu/honors/104 This Honors Thesis is brought to you for free and open access by DigitalCommons@UMaine. It has been accepted for inclusion in Honors College by an authorized administrator of DigitalCommons@UMaine. For more information, please contact [email protected].
-
Upload
khangminh22 -
Category
Documents
-
view
6 -
download
0
Transcript of A Power Line Inspector Device - DigitalCommons@UMaine
The University of Maine The University of Maine
DigitalCommons@UMaine DigitalCommons@UMaine
Honors College
5-2013
A Power Line Inspector Device A Power Line Inspector Device
Brendan Gates University of Maine - Main
Follow this and additional works at: https://digitalcommons.library.umaine.edu/honors
Part of the Electrical and Electronics Commons, Electronic Devices and Semiconductor Manufacturing
Commons, Other Electrical and Computer Engineering Commons, and the Power and Energy Commons
Recommended Citation Recommended Citation Gates, Brendan, "A Power Line Inspector Device" (2013). Honors College. 104. https://digitalcommons.library.umaine.edu/honors/104
This Honors Thesis is brought to you for free and open access by DigitalCommons@UMaine. It has been accepted for inclusion in Honors College by an authorized administrator of DigitalCommons@UMaine. For more information, please contact [email protected].
A POWER LINE INSPECTION DEVICE
by
Brendan Gates
A Thesis Submitted in Partial Fulfillment
of the Requirements for a Degree with Honors
(Electrical Engineering Technology)
The Honors College
University of Maine
May 2013
Advisory Committee:
Scott Dunning, Director of School of Engineering Technology, Co-Advisor
Mohsen Shahinpoor, Chair of Mechanical Engineering Department, Co-Advisor
David Gross, Interim Dean of the Honors College
Nathan Weise, Professor of Electrical Engineering
John Allen, Professor of Electrical Engineering Technology

Abstract:
The goal of this project is to create a functional power line inspection device
which could replace the old inspection method of using helicopters. This microchip
based robotic device is able to ride along a conductor and send video feed, encoder
readouts, and temperature measurements to the user. The user operating system consists
of an LCD screen, two potentiometers for motor control, and a screen to display video
feed. Achieved specifications include a battery lifetime of 1 hour and 45 minutes,
distance measurements within 1 inch, and temperature accuracy within 2 °C. This thesis
includes a brief discussion on previous methods and robots, theory of operation, design
summaries, and a compilation of the final results.

iii
Dedication:
To my parents and wonderful family that have supported me throughout my life.

iv
Acknowledgements:
I would like to thank Jesse Sawin for all his help partnering with me in this project, Scott
Dunning and Mohsen Shahinpoor for advising me, Alec Johnston for parts and
troubleshooting help, and Kurt Strauch for assistance in the development of PCBs. I
would also like to thank the many faculty members and students who helped Jesse and I
along the way.

v
Table of Contents
I. Introduction ..................................................................................................................... 1
II. Background Information ................................................................................................ 3
A. Inspection and Maintenance ........................................................................................ 3
B. Previous Works and Robots ....................................................................................... 15
i. Helicopter Inspection .............................................................................................. 15
ii. Inspection Devices ................................................................................................ 17
III. Project Objectives and Scope ...................................................................................... 29
IV. Project Execution ........................................................................................................ 30
A. General Discussion of Project Design History .......................................................... 30
B. Technical Discussion of Project ................................................................................. 33
i. Theory of Operation ............................................................................................... 33
ii. Problem resolutions ............................................................................................... 43
iii. Testing .................................................................................................................. 47
C. Cost and Schedule Performance ................................................................................. 49
V. Design Results.............................................................................................................. 51
VI. Bibliography ............................................................................................................... 53
VII. Appendix A ............................................................................................................... 59
A. Drawings .................................................................................................................... 59
B. Source Code ............................................................................................................... 63
C. Test Data .................................................................................................................... 72
D. Calculations and Analysis .......................................................................................... 77
E. Printed Circuit Board Design & Construction Procedures ......................................... 82
F. Photographs ................................................................................................................ 85
G. Equipment Manuals and Data Sheets ......................................................................... 89
VIII. Appendix B ............................................................................................................ 107
A. Original Project Specification .................................................................................. 107
B. Schedule ................................................................................................................... 108
C. Correspondence: Advisor Meeting Log ................................................................... 111
D. Summary of Expenses .............................................................................................. 116
vi
List of Figures & Tables
Figure 1: Vortex Damper .................................................................................................... 4
Figure 2: Air Flow Spoiler .................................................................................................. 5
Figure 3: Detuning Pendulum ............................................................................................. 5
Figure 4: Compression Splice ............................................................................................. 6
Figure 5: Automatic Wedge Splice ..................................................................................... 7
Figure 6: Formed Wire Splice ............................................................................................. 7
Figure 7: Hydro Quebec’s LineScout ............................................................................... 18
Figure 8: LineScout Breakdown ....................................................................................... 19
Figure 9: LineScout Obstacle Avoidance ......................................................................... 19
Figure 10: Hydro Quebec’s LineROVer ........................................................................... 21
Figure 11: EPRI’s TI ......................................................................................................... 22
Figure 12: TI’s Obstacle Avoidance ................................................................................. 23
Figure 13: HIBOT’s EXPLINER...................................................................................... 24
Figure 14: EXPLINER’s Obstacle Avoidance ................................................................. 25
Figure 15: Semnan University’s MoboLab....................................................................... 26
Figure 16: MoboLab’s Obstacle Avoidance ..................................................................... 27
Figure 17: Universidad Politéchnica de Madrid’s ROBTET ............................................ 28
Figure 18: Initial Sketches ................................................................................................ 30
Figure 19: Conceptual Design .......................................................................................... 31
Figure 20: H-Bridge Operation ......................................................................................... 34
Figure 21: NJM2670 Schematic ....................................................................................... 35
Figure 22: Magnetic Encoder............................................................................................ 37
Figure 23: Thermistor Voltage Divider ............................................................................ 38
Figure 24: Buck Converter Schematic .............................................................................. 40
Figure 25: Buck Converter Curves ................................................................................... 41
Figure 26: Step Down Converter Circuit .......................................................................... 42
Figure 27: LCD Screen ..................................................................................................... 43
Figure 28: MOSFET, Pull-up, and Pull-down .................................................................. 44
Figure 29: Completed Prototype ....................................................................................... 51
Table 1: Helicopter Inspection Costs ................................................................................ 16
Table 2: Distance Measurement Testing 2-25-13 ............................................................. 72
Table 3: Temperature Measurement Testing 2-26-13 ...................................................... 72
Table 4: Battery Discharge Measurements ....................................................................... 73
Table 5: Drive Motor Speed ............................................................................................. 77
Table 6: Slide Motor Speed .............................................................................................. 78
Table 7: Encoder Calibration Readings ............................................................................ 79
Table 8: Thermistor Calibration Readings ........................................................................ 79
Table 9: Battery Loading Requirements ........................................................................... 81

1
I. Introduction
As power lines are relied on more and more to power schools, hospitals, and places of
business, catching the problem areas before failure becomes much more important. One
way to find these problem areas is by conducting a thorough inspection of a given
transmission line. A big driving factor of power line inspection is government policy.
After the blackout in the Northeast United States in 2003, The Energy Policy Act of 2005
led the Federal Energy Regulatory Commission to designate the North American Electric
Reliability Corporation (NERC) as the electric reliability organization for the US. NERC
standards set prior to this were only followed on a voluntary basis, but they are now
mandatory in the US and increase the need for reliability and therefore for inspection.
(31, North American Electric Reliability Corporation, 2007) This inspection not only
includes the physical conductor but also the vegetation growing nearby. The utilities are
expected to provide a more reliable distribution of power, in an attempt to prevent
another blackout from occurring. This reliability is created through redundancies and
inspecting crucial lines.
This project came about from an article read in the IEEE Spectrum Automation Blog
on Hydro Quebec’s robotic device called the LineScout. (13, Guizzo, 2011) Their robot
was a project started after the ’98 ice storm, originally an ice breaking robot, that lead to
an inspection and maintenance robot. This article sparked the idea of creating an
inexpensive inspection robot to ride on the conductors which my senior project partner,
Jesse Sawin, and I began to develop. Several designs and papers were found on the
subject including other companies that have worked on similar devices to the LineScout,
detailed in section Bii. The advantages and disadvantages of each design were reviewed.

2
A simple device was created that can ride on a power line and keep track of distance and
temperature measurements with a battery lifetime of about an hour and three quarters.
This document details research on inspection and maintenance of conductors and the
various devices and methods followed by the design, construction, and operation of the
robot that was developed by Jesse and myself.
3
II. Background Information
A. Inspection and Maintenance
Inspection and preemptive maintenance of power lines can prevent unnecessary
losses of revenue due to breaks of the power line. These breaks are caused by natural
forces such as wind and ice, and manmade forces such as automobile crashes and various
chemical contaminations. There are many different techniques that are used to look for
discrepancies in the conductor, splices, and other components on the line. This section
will detail the problems faced, inspection techniques, and a brief overview of
maintenance methods that are used.
i. The Source of the Damages
There are several forces that act on a power line. Mark Burns detailed these
forces in his 2003 Conference Paper, Distribution Line Hazards that Affect Reliability
and Conductor Repairs and Solutions to Avoid Future Damage. (6) In this paper he
suggests that there are two major forces on the line, natural and manmade. The natural
forces are composed mostly of wind, ice, snow, and the combination of the three. These
natural forces create conductor motions defined as Aeolian Vibration, Galloping, and
Wind Sway.
Aeolian Vibration is a high frequency, low amplitude vibration of the conductor
at 30-150 Hz. It is caused by smooth parallel winds that create vertical motion of the
conductor though vortex shedding. The result of this movement is a bending stress at
restraints causing abrasion and fatigue over time.
Galloping is a low frequency high amplitude sinusoidal vibration at 1-3 Hz.
Galloping amplitudes are measured in feet as opposed to Aeolian Vibration being

4
measured in inches. It is caused by steady 15-40 mph winds on lines that have buildup of
ice or snow. The result is immediate damage to support hardware and also tensile failure
over time due to abrasion and fatigue.
Wind Sway is a term referring to general swaying of the conductors caused by gusts
of wind. This causes abrasions at supports and restraints. The abrasion caused is related
to the looseness of the connections at supports; as they get looser, the damage accelerates.
These forces cause abrasion, fatigue breakages at supports, and tensile breakages.
The primary focus is on abrasion, and also corrosion, which can be caused by chemical
plants nearby, salting of the roads, or coastal power lines that are contaminated by the
salty ocean mists and breezes. Full on breakages require maintenance and don’t need to
be inspected. There are some mechanical solutions to minimize the types of line
movements mentioned above. Proper design and maintenance is important in addressing
the issues that come about from the motion of the conductor. In the paper mentioned
above Burns detailed a few techniques used to lessen the effects of Aeolian Vibration,
Galloping, and Wind Sway.
Aeolian Vibration solutions incorporate reducing line tension and installing dampers;
mechanical devices which dampen vibrations of the line. These devices generally consist
of two opposing masses which minimize vibrations.
Figure 1: Vortex Damper
(35, Preformed Line Products, 2010)

5
Galloping Solutions include increasing line tension to reduce amplitude and
installing Air Flow Spoilers, Detuning Pendulums, or Dampers. Air Flow Spoilers are
helically formed rods wrapped several times around the conductor to disturb the
aerodynamic lift of the conductor. Detuning Pendulums consist of a single mass secured
to a conductor.
Figure 2: Air Flow Spoiler
(35, Preformed Line Products, 2010)
Figure 3: Detuning Pendulum
(14, Havard, 1984) © 1984 IEEE
Wind Sway solutions try to reduce motion at the insulator, which can be done by
using formed wire ties on a pin insulator to create a solid connection at the pole.
As you may notice intuitively, the tensioning and reduction of tension of the lines
have opposite effects on Aeolian Vibration and Galloping. Tensioning a galloping line
too tight may cause Aeolian Vibration and vice versa. Dampers are a good method to
reduce vibrations. One must keep in mind that, like any other component connected to

6
the line, dampers can be a problem area when not installed correctly. Locations of
repairs and maintenance of power lines are also important to look at because they can be
weak points on the line.
ii. Connections
Splices, Dampers, and various connections to the line are likely weak spots on the
line and most affected by the abrasion and corrosion. In another of Mark Burn’s papers,
Reliability of the Conductor System in Today's Environment and the Importance of
Maintaining Its Integrity (7), he details issues caused by improper installation splices,
corrosion, and damages due to environmental exposure. Burns states that many failures
are caused by splices becoming more resistive and creating “hot spots” due to bad
installations, corrosion, faults, or other damage.
When fixing breaks in lines or tying two lines together there are several types of
connectors that can be used. These connectors include compression splices, automatic
wedge splices, formed wire connections, and bolted components.
Compression splices consist of a pressed fit metal sleeve that is filled with an oxide
inhibitor to prevent corrosion. A press and die is used to install the splice.
Figure 4: Compression Splice
(http://www.cnyauctions.com/nationalgrid/inventory/59-68-606.JPG)
7
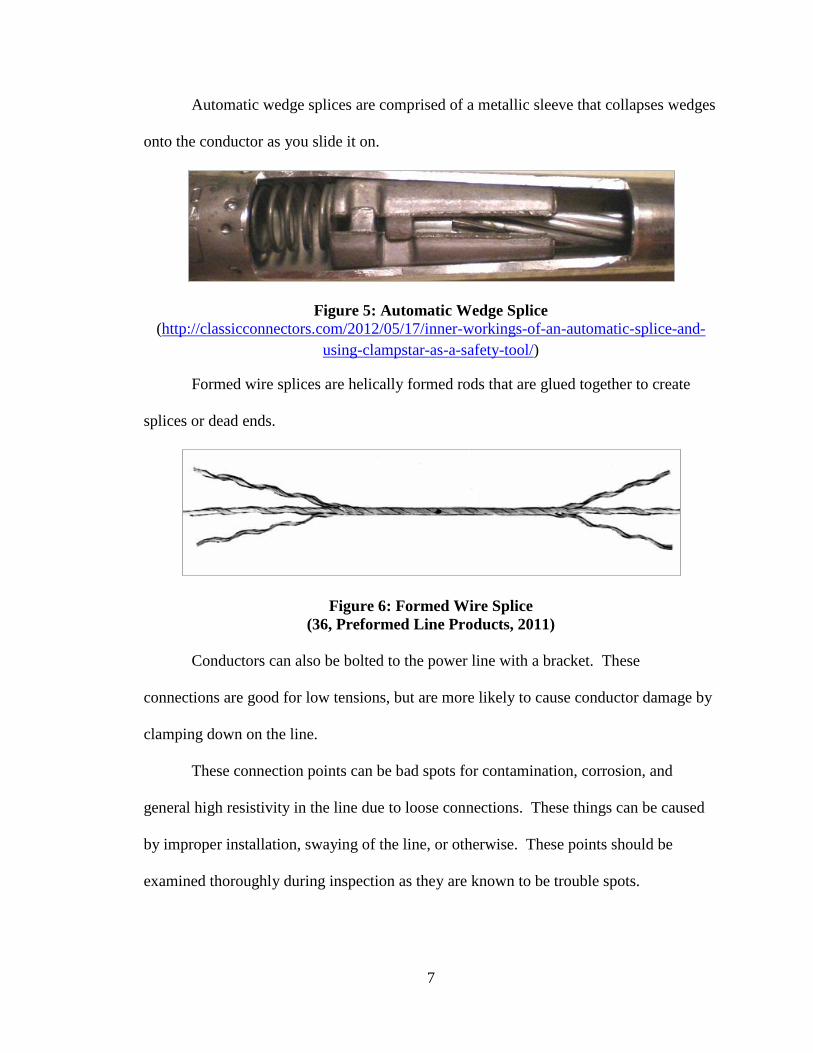
Automatic wedge splices are comprised of a metallic sleeve that collapses wedges
onto the conductor as you slide it on.
Figure 5: Automatic Wedge Splice
(http://classicconnectors.com/2012/05/17/inner-workings-of-an-automatic-splice-and-
using-clampstar-as-a-safety-tool/)
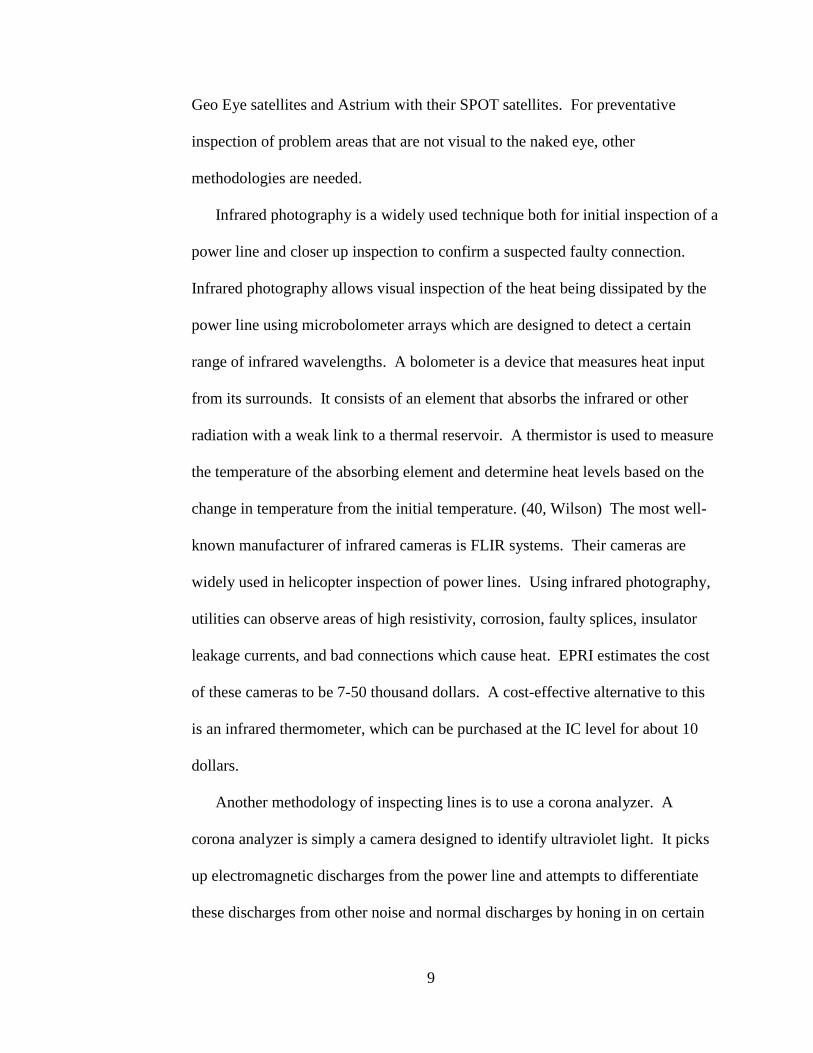
Formed wire splices are helically formed rods that are glued together to create
splices or dead ends.
Figure 6: Formed Wire Splice
(36, Preformed Line Products, 2011)
Conductors can also be bolted to the power line with a bracket. These
connections are good for low tensions, but are more likely to cause conductor damage by
clamping down on the line.
These connection points can be bad spots for contamination, corrosion, and
general high resistivity in the line due to loose connections. These things can be caused
by improper installation, swaying of the line, or otherwise. These points should be
examined thoroughly during inspection as they are known to be trouble spots.

8
iii. Inspection Methods
There are many techniques that can be used to inspect the conductor and
components on the power line. EPRI’s paper, Future of Overhead Transmission Lines
(10), details the many types of sensing technologies available, current uses of these
sensors, and possible future uses as they are developed further. Initial detection
techniques usually involve some sort of visual inspection. The visual inspection often
includes either infrared image sensing to find “hot spots” or ultraviolet image sensing to
analyze corona discharges alongside traditional photography or videography.
Visual inspection of the lines is important. Many problems are found by
linemen or other power company workers simply noticing something wrong while
going from place to place. It is good to keep an eye out for any fraying in the line
abrasion, or other damaging of connections or components so they can be
replaced or analyzed further. EPRI suggests the possibility of using image
analysis comparisons by storing images in a database and placing cameras at key
locations. These cameras may be fixed cameras, pan/tilt cameras, movable
cameras on a line robot, mounted on a UAV, or even satellite imaging systems.
This type of imaging is good for finding fraying, damaged insulators,
encroachment of right of ways, and any other visible problems, but is less
effective at finding potential failure points such as high resistive areas that cannot
be seen with the bare eye. As higher resolution cameras become available,
satellite imaging becomes much more viable for right of way inspection for
bushes, trees, avian nests, and other obstructions. There are several satellite
imaging companies that provide these services, including Digital Globe with their
9
Geo Eye satellites and Astrium with their SPOT satellites. For preventative
inspection of problem areas that are not visual to the naked eye, other
methodologies are needed.
Infrared photography is a widely used technique both for initial inspection of a
power line and closer up inspection to confirm a suspected faulty connection.
Infrared photography allows visual inspection of the heat being dissipated by the
power line using microbolometer arrays which are designed to detect a certain
range of infrared wavelengths. A bolometer is a device that measures heat input
from its surrounds. It consists of an element that absorbs the infrared or other
radiation with a weak link to a thermal reservoir. A thermistor is used to measure
the temperature of the absorbing element and determine heat levels based on the
change in temperature from the initial temperature. (40, Wilson) The most well-
known manufacturer of infrared cameras is FLIR systems. Their cameras are
widely used in helicopter inspection of power lines. Using infrared photography,
utilities can observe areas of high resistivity, corrosion, faulty splices, insulator
leakage currents, and bad connections which cause heat. EPRI estimates the cost
of these cameras to be 7-50 thousand dollars. A cost-effective alternative to this
is an infrared thermometer, which can be purchased at the IC level for about 10
dollars.
Another methodology of inspecting lines is to use a corona analyzer. A
corona analyzer is simply a camera designed to identify ultraviolet light. It picks
up electromagnetic discharges from the power line and attempts to differentiate
these discharges from other noise and normal discharges by honing in on certain

10
frequencies. CCD imaging arrays are used to do this by filtering light to only
look at a small band of the UV spectrum of about 250-280 nm creating a solar-
blind for daylight detection. (10, EPRI, 2008) These devices often include
sensitivity controls and software to count photon events. The major
manufacturers of these devices are Ofil Systems, the makers of DayCore, and
UViRCO Technologies, the makers of COROCAM. These devices are often used
to perform infrared, corona, and visual helicopter inspections.
Another method that is used with helicopter inspection is LIDAR. LIDAR
stands for Light Detection and Ranging. It works similar to RADAR; light is
transmitted, reflected off the surroundings, and received back. The time between
transmission and reception determines the distance to the object. Large systems
scan back and forth with an array of light, using GPS to record locations of
violations. One product that is commercially available is Leica GeoSystem’s
ALS-40. This device has a range of 20,000 feet at 40 kHz with a 75 degree field
of view. A simple example of LIDAR is a rangefinder. These have been used for
finding the distance to a golf ball, locations of targets for warfare, or even to focus
a camera on a particular location. They locate the distance of an object by
sending and receiving pulses using a single beam of light. A rangefinder mounted
to a cable climbing robot could take ground clearance measurements very easily
with minimal cost. The larger systems like the ALS-40 are used to check for right
of way encroachment along the conductor while mounted to a helicopter but are
expensive.

11
Phase metering can also be an effective and inexpensive way to determine
where a bad connection may be in a power line. As utilities already keep track of
system loading and try to keep relatively equal phase loading, reviewing phase
loading over time can show any abnormal values that may be caused by faulty
joints. Once suspected, the line section can be inspected more thoroughly using
other methods.
Another method of detection is the placement of sensors directly on the line
and connecting to them remotely. Some sensors that may be used include power,
vibration, acoustic, strain, tilt, magnetostrictive, and ultrasonic sensors. Similar to
looking at phase metering, by measuring currents and voltages on particular
places on the line and looking at the changes, problem areas can be identified.
Vibration and acoustic sensors can be used to identify any outside tampering and
birds nesting on towers. Strain and tilt sensors can identify problems with the
structural integrity of towers. Magnetostrictive and ultrasonic sensors can detect
the structural integrity of materials by sending sound waves through a material,
receiving the corresponding signal, and comparing the results to the reception
from a new solid material. Although Magnetostrictive and ultrasonic sensors can
detect corrosion and physical damage in a conductor or structure, they must be
attached to the material and are limited in distance. They may work well as
wireless sensors but aren’t very practical on a cable climbing robot or helicopter.
Once a joint is suspected to be faulty there are many techniques of confirming the failure
which include infrared photography, measuring the resistivity of connection, using

12
EMAT imaging on the suspected failure, and taking X-ray images of the joint. (3,
Avidar, 1993)
Infrared photography, as mentioned above, is a good method for finding “hot
spots”. These inspections may be performed from a bucket truck or by other
means.
Measuring resistivity of a connection also shows problem areas based on joint
connectivity. This could be integrated into a cable climbing robot to test cable
splices and other components and is used with Hydro Quebec’s LineScout, but
requires two physical connection points.
EMAT’s, or Electromagnetic Acoustic Transducers, are good sensors for
inspecting suspected faulty connections. They operate similarly to ultrasonic
sensors but eliminate the need for a physical connection. By injecting signals into
the material and reading the waves that bounce back, flaws, inconsistencies,
corrosion, and broken strands inside connectors can be determined. This is done
using the principles of magnetics by placing a wire near a conducting material and
driving current through that wire to produce eddy currents in the nearby material.
A static magnetic field, created by a magnetic configuration on the sensor,
combined with these eddy currents will create Lorentz forces which can be
measured by the receiving unit. (10, EPRI, 2008) The big advantage of EMAT is
its contactless operation and the ability to create guided waves at various
frequencies. These sensors can be used for inspecting towers, broken strands in
transmission lines, and other components. As these sensors and the equipment

13
required to operate them become smaller and cheaper the possibility of mounting
them on a cable climbing robot will become more viable.
Another product that could be integrated into a cable climbing robot is a
Radio Frequency Interference “Sniffer”. This “Sniffer” picks up on partial
discharges from power components. The discharges are sensed as radio
frequency interference in the MHz range. Handheld “Sniffers” and locators are
available from Radar Engineers in Portland, Oregon. These devices utilize
antennas and signal processors to find the source of the interference, operating in
similar to metal detectors.
X-ray imaging was used for direct inspection early on. By taking x-ray films,
breaks and incongruities can be determined. Use has diminished greatly since the
1980’s due to health risks of exposure to radiation and the high cost of operation.
New developments allow robotic inspection from devices riding along the line, or UAV’s
flying near the line to find faulty connections. These devices can utilize the various
sensing technologies mentioned above among others. Once a faulty connection is found,
maintenance must be performed to prevent breakage of the line.
iv. Repairs
There are two basic ways to repair a faulty connection. The first is to install a
new splice. The other option is to install a shunt over the faulty connection.
A splice connection requires a physical disconnect of the line or failed spice. A
failed splice will likely require two new splices with a line section in between them.
Installing a shunt is often a good option when turning off the line section is a
problem, as it can be done on a live line with hot sticks. It bypasses the bad line section,

14
providing the path of least resistance, while maintaining and sometimes enhancing the
structural integrity of the connection.
As repairs are something that follows inspection, no further detail is included.
15
B. Previous Works and Robots
i. Helicopter Inspection
Helicopter inspection is a very costly task that can be replaced by robotic
methods. In order to have an understanding of the task that was to be accomplished by
the inspection device, it was necessary to first have an understanding of helicopter
inspection. As previously mentioned, infrared inspection of power lines is often done
using helicopters with a camera system mounted to the aircraft. They record video and
inspect the line while riding above it in a helicopter. They look for high resistance or
“hot spots” and examine them more closely when observed. Mike Marshall, an ABB
engineer, wrote a paper called Aerial Infrared Line Inspection (20) in 1999 which details
the helicopter inspection process. In this paper Marshall details how often inspection is
necessary, loading impacts, and costs of inspection.
The time between inspections varies greatly and depends on how thorough an
inspection you are willing to make. Marshall suggests the inspections should be done
every 3-4 years at light load conditions, as is generally accepted. At light load conditions
only critical and severe problems will show up, which cuts down on inspection time. The
interval of time between inspections depends on the type and reliability of the power line,
and also the opportunity cost versus doing nothing. The NERC reliability requirements
also play into the decisions which must be made by the local utility.
The loading of the line impacts how hot the problem spots get and how visible
they are to the inspection equipment. At full load all problems spots are visible, while at
light loading only the critical and severe problems show up. Severe problems can be
identified on a line section with very minimal current loading as the high resistance

16
causes a large emission of heat by the line. Lines with more loading also tend to have
more problems than under-loaded lines. Some lines will require more frequent
inspections than others that may require very rare inspections or not be found cost
effective to inspect.
The cost of helicopter inspections is dependent on the type of line, loading,
location, weather, and many other factors. To make good documentation of hot spots
with videos and photos inspection can take an extended period of time. Turns in lines
also cause inspections to be more costly due to time spent maneuvering the helicopter.
For this reason, distribution and sub-transmission lines are much more costly to inspect
than transmission lines. Due to costs, only lines of high importance are inspected,
generally transmission lines. The costs of inspection include a helicopter, pilot, camera
man, and camera and other equipment involved. In 1999, Mike Marshall estimated costs
to be as shown in Table 1 below. The payback is found to be every 3-5 years. These
costs are what have motivated the move to create robots and other devices to inspect the
lines which take much less fuel and effort.
Table 1: Helicopter Inspection Costs
Line Type $ per mile #miles per day
Transmission 17.33 300
Rural Subtransmission 26.00 200
Urban Subtransmission 34.67 150
Rural Distribution 29.71 175
Eliminating the costs of a helicopter and pilot can reduce the cost of this effort
greatly. A more recent cost estimate received by Avant Media Group is 1000 dollars per
hour moving along at 40 knots (46 mph). This would put the cost at about 22 dollars per
mile which is comparable to Marshall’s price for transmission lines plus an increase for

17
the rise in fuel prices. This estimate did not include a camera man or a spotter which
would be provided by the utility company. While inspecting, spotters will look for other
problems that can be noted such as mechanical problems and tree conditions. These are
also important for an inspection robot to be looking for. The next section will explore the
different robots and designs that have been developed.
ii. Inspection Devices
Due to the high costs of helicopter inspection, many have thought about solutions that
can replace the task. These solutions include various types of cable-climbing robots and
UAV’s. UAV’s provide reduced costs and closer up imaging, but have their limitations.
They have a limited payload depending on the size of the UAV and are also limited by
the weather as are helicopters. They are often manned from the ground and provide a
good solution for reduced costs. It was decided to build a robot that rides on the cables,
so this section is focused on cable robots. A joint paper out of the University of
Canterbury called Cable-Climbing Robots for Power Transmission Lines Inspection (29,
Nayerloo, 2009) gives a great overview of problems faced, symptoms and detection
methods, and various mechanisms designed over the last 20 years.
Inspection devices are generally looking for cracks in insulators and corrosion or
fretting in conductors. There are various methodologies to detect these, most commonly
infrared inspection, corona analysis, and visual inspection. The cable climbing robots not
only have to inspect the power line, but they also have many obstacles in their way. They
must make it past insulators, dampers, splices, spacers, and even the occasional aircraft
warning sphere. The robots also need a means of communication and control, whether
manually controlled or autonomous. Detection of these obstacles can also be important,

18
although it can be as simple as having camera feedback when manually controlled. The
following is a synopsis of various devices and their attempts to overcome these obstacles
that they are faced with.
a. LineScout
The first robot to discuss is the one that started this project, Hydro Quebec’s
LineScout. The LineScout is a large robot capable of surpassing large obstacles, running
for about 5 hours at a time, and allows user control from distances of up to 5 km. It was
created after extensive research and an in-depth design.
Figure 7: Hydro Quebec’s LineScout
(33, Pouliot, 2012) © 2011 Wiley Periodicals, Inc.
The LineScout performs visual inspections of the power line and also is capable
of measuring resistance across splices. It can also loosen and tighten bolts and make
temporary repairs to broken conductor strands. To perform inspection and maintenance,
there are three cameras mounted on the robot. Two small cameras are mounted on the
gripper arms and a third is mounted between the wheels of the robot with an adjustable
pan and tilt.

19
Figure 8: LineScout Breakdown
(33, Pouliot, 2012) © 2011 Wiley Periodicals, Inc.
The LineScout’s obstacle avoidance scheme requires it to be a rather large robot,
but is very functional for various types of obstacles. The avoidance scheme seen below
involves a slide, clamps, and actuators to remove the drive pulleys from the conductor.
By sliding the clamps over and grabbing the line, the robot is able to release its pulleys
and slide over to the other side of the obstacle, seen below.
Figure 9: LineScout Obstacle Avoidance
(24, Montambault, 2006) © 2006 IEEE

20
The LineScout also has a good telecommunications design with a 5 km wireless
control range. It uses two radio-frequency transceivers to accomplish this range, leaving
only the antenna outside of the circuitry’s electromagnetic interference shielding.
Electronic protection was also incorporated in the antenna circuit. Video feed, controls,
and sensor data is communicated over the radio connection. The electronics include
optical encoder feedback for speed based motors, and potentiometer readouts for motors
that require more precise movements. The LineScout has shielded fans to maintain
temperature of the circuitry using thermal switches. The LineScout also uses an infrared
thermometer to monitor conductor temperature and GPS locating for mapping of problem
areas. The control station receives the information from its transceiver, displays the
video feed, and provides information and controls using a PC with a LabVIEW Digital
Interface. It also has two joysticks for control of various motors. Their software is
designed such that you can switch between modes to control different motors. Generally
one joystick would control the upper camera and the other the speed of the drive motors.
The LineScout has undergone intensive testing for electromagnetic discharge, run
time, and various other functionalities. Its lithium ion batteries allow 5 hours of run time,
and it is constructed for conductor diameters of 12-60 mm and power lines up to 735 kV
and 1000 A. The weight and size of the robot are a couple possible disadvantages of this
robot with a length of 1.37 m and weight of 100 kg. Overall it is a very well designed
inspection and maintenance robot for transmission lines. (24, Montambault, 2006)
b. LineROVer
Hydro Quebec also made a robot called the LineROVer. This device is more similar
to the simple lightweight device that is detailed in this thesis. The LineROVer’s main

21
purpose was as a de-icing robot, a need which became more apparent to us here in the
northeast section of North America after the ice storm of ’98.
Figure 10: Hydro Quebec’s LineROVer
(26, Montambault, 2010)
Ice on wires can cause faults due to conductors getting too close to each other, hardware
failure, and support failure. Using three drive wheels, fixed steel blades, and a pressure
stabilizing back wheel, the LineROVer is very effective at removing ice from the lines.
The LineROVer also has both a pan and tilt camera and an infrared camera. An Ohmstik
sensor was also added to the LineROVer to take measurements across splices. It is not
designed for obstacle avoidance, but has good remote control range of 1 km. It is
designed to pass over conductor splices and is adaptable to most conductor sizes. The
LineROVer is very robust with batteries designed to last for 45 minutes of deicing and
recharge in 1 hour from a small generator. They are looking at using the device for
cleaning conductors as well. The LineROVer is a great de-icing ROV and is fairly
lightweight for its purpose at about 50 lbs. (23, Montambault, 2003)

22
c. TI
TI is an inspection robot that is under development from EPRI, the Electric Power
Research Institute. Its purpose slightly differs from that of Hydro Quebec’s robots.
Instead of inspecting existing lines or acting as an ice breaker, TI is being designed to be
an autonomous part of a new smart grid in helping to relay data from sensors and looking
for high risk vegetation and right of way encroachment along with the inspection of the
conductor and line components. To do this TI, seen below, is equipped with an HD
camera, LIDAR sensor, and is also to have an electromagnetic interference antenna that
will detect corona discharges from failing components or conductors. It has GPS to keep
track of its position and speed and sensors to monitor the weather.
Figure 11: EPRI’s TI
(http://www.youtube.com/watch?v=nWOfQeiWylM&feature=watch-vrec)
EPRI took a different approach to obstacle avoidance by using diverter cables and
proximity sensors to detect the diverter and release the wheel locking mechanism seen
below. The locking system with pulleys on either side makes for a very stable connection
to the conductor, and as long as all the sensors are functioning properly this design works
quite well.

23
Figure 12: TI’s Obstacle Avoidance
(http://www.youtube.com/watch?v=nWOfQeiWylM&feature=watch-vrec)
As a part of a new smart grid that is to be developed, the diverter cables would be
installed along with new sensors. EPRI’s design integrates a RF sensor reader antenna
and data collection module to the robot along with a communications to the data
collection center. The idea is that sensors would be installed in areas that were known for
problems, and the robot would be one means of collecting the data alongside satellites,
cell towers, ground patrols, and any other means possible. For example, vibration
sensors would be installed in the windy areas, lighting sensors where lightning frequently
strikes, and leakage current sensors where there is salt contamination or other chemical
contamination to the lines. The sensor data could all be relayed back to the data
collection center, and maintenance groups would be alerted as needed.
As an autonomous robot, TI is designed to incorporate energy harvesting. EPRI’s
initial idea of running the robot completely off of solar has been modified to include
charging off the power line by making contact with the shield wire. This is a very
interesting concept that would allow robots to be completely autonomous if implemented
correctly. EPRI is working with AEP, American Electric Power, to test TI and the rest of

24
their system on a new 138 kV transmission line after extensive testing on their test loop
in Lenox, Massachusetts. The robot is designed to withstand 765 kV lines. (11, Electric
Power Research Institute, 2012)
d. EXPLINER
EXPLINER, seen below, is a robot developed by HiBot Corporation in Tokyo,
Japan. It performs visual inspections of conductors, spacers, and other components on the
power line with on board cameras. The focus of HiBot’s design was to create a robot that
could surpass certain obstacles which include spacers and suspension clamps.
Figure 13: HIBOT’s EXPLINER
(15, HIBOT)
The design of the EXPLINER was created in an attempt to limit weight and make
a stable mobile platform. Using a counterweight connected to mobile linkages, the
robot’s center of mass can be easily shifted in any direction. By shifting the
counterweight all the way to one side or the other, the majority of the robot’s weight can
be transferred to one motion unit or the other which allows the other motion unit to be
removed from the power line.

25
Figure 14: EXPLINER’s Obstacle Avoidance
(9, Debenest, 2008) © 2008 IEEE
A semi-automatic control system was designed for the EXPLINER. This system
automates obstacle avoidance and transfers to and from access cables but allows for
direct control of speed and cameras. The control unit consists of a tablet, switches,
joysticks, a wireless module complete with antenna, and batteries in a weather proof case.
The control unit communicates to the robot using TCP/IP protocol over wireless LAN to
allow control of the robot, display video feed, and display current robot configurations
using the encoder data.
Although the EXPLINER lacks the various sensors of TI, its obstacle avoidance
design is very capable on 2 and 4 conductor bundles. The battery life of the robot is
approximately 6 hours with a wireless range of 200 m. It is a very capable design with
the ability to climb up to a 30 degree incline. (9, Debenest, 2008)

26
e. Other Notable Robots
1. MoboLab
MoboLab is a robot that was designed out of Semnan University in Semnan, Iran.
This robotic design played a part in the initial design of the robot, so it’s worth noting.
The design of MoboLab was an attempt to create a robot that can quickly travel on a
conductor and traverse obstacles while having simplicity in control and low energy
consumption which resulted in the model seen below. This robot performs visual
inspection with a camera controlled by the user.
Figure 15: Semnan University’s MoboLab
(30, Nayyerloo, 2007) © 2007 InTech
MoboLab uses power screw systems to move its 3 arms and 3 grippers about the
slide and avoid obstacles. Using its three arms, Mobolab can easily release one arm
without compromising the stability of the robot. By moving one arm down out of the
way at a time, advancing, and reattaching the arm many obstacles can be traversed

27
relatively quickly. Testing of a scaled model resulted in a 35 second time required to
traverse an obstacle and a 30 cm/sec speed on the line.
Figure 16: MoboLab’s Obstacle Avoidance
(30, Nayyerloo, 2007) © 2007 InTech
The MoboLab model is very capable with the ability to climb an 18% grade and
carry a 1 kg payload. The model weighed 14 kg and was about 3 feet long. The control
system used an AVR microcontroller to communicate via RS232 with a computer. Using
a GUI a user can easily control each motor, watch video feed, or take images of the

28
conductor. Controls are sent from the AVR to a relay board which operates the motors.
(30, Nayyerloo, 2007)
2. ROBTET
ROBTET is a maintenance robot that was designed out of the Universidad
Politéchnica de Madrid in collaboration with Iberdrolla and Cobra and was in use in
2002. The ROBTET system consisted of an autonomous truck, a 10 kW electric
generator, hydraulic pump unit, and robotic arms from Kraft TeleRobotics. Kraft is a
company out of Kansas which has been involved in many similar ventures, including
maintenance robots with EPRI and Hydro Quebec. This was one of the early attempts to
integrate robotics into the utility industry using robotic arms mounted to an insulated
boom truck. ROBTET is rated for power lines up to 69 kV, and rather unique as a
completely tele-operated unit. The control system utilizes a vision system and haptic
joysticks which allow the operator to receive force feedback from the robotic arms.
Figure 17: Universidad Politéchnica de Madrid’s ROBTET
(2, Aracil, 2007)

29
III. Project Objectives and Scope
The goal of this is project was to create a working prototype of a power line
inspection robot. It would inspect the line by recording temperature, distance, and
sending back video feed to visually inspect for flaws in the conductor, insulators and
other components along the line. Design parameters were set to measure distance within
15% accuracy and temperature within 10 °C for at least 15 minutes. A camera was to be
implemented for visual inspection and an encoder would be used to measure the length of
conductor between the fixed poles.
Advanced goals for this project would be to further refine the initial design
parameters and allow control of the robot wirelessly from the ground at a distance of 40
feet, or the height of a pole. These specifications included distance measurement within
5% accuracy, temperature measurement within 2 °C, and 30 minutes of continuous
runtime. The details of these specifications can be found in the project specification in
Appendix B section A.
30
IV. Project Execution
A. General Discussion of Project Design History
As previously mentioned, this project came about from an article read in the IEEE
Spectrum Automation Blog on Hydro Quebec’s robotic device called the LineScout.
This article sparked the idea of creating an inexpensive inspection robot to ride on the
conductors. A block diagram of the electrical system was drawn up as seen in Appendix
A section Aiii and initial project specifications were agreed upon. After reviewing
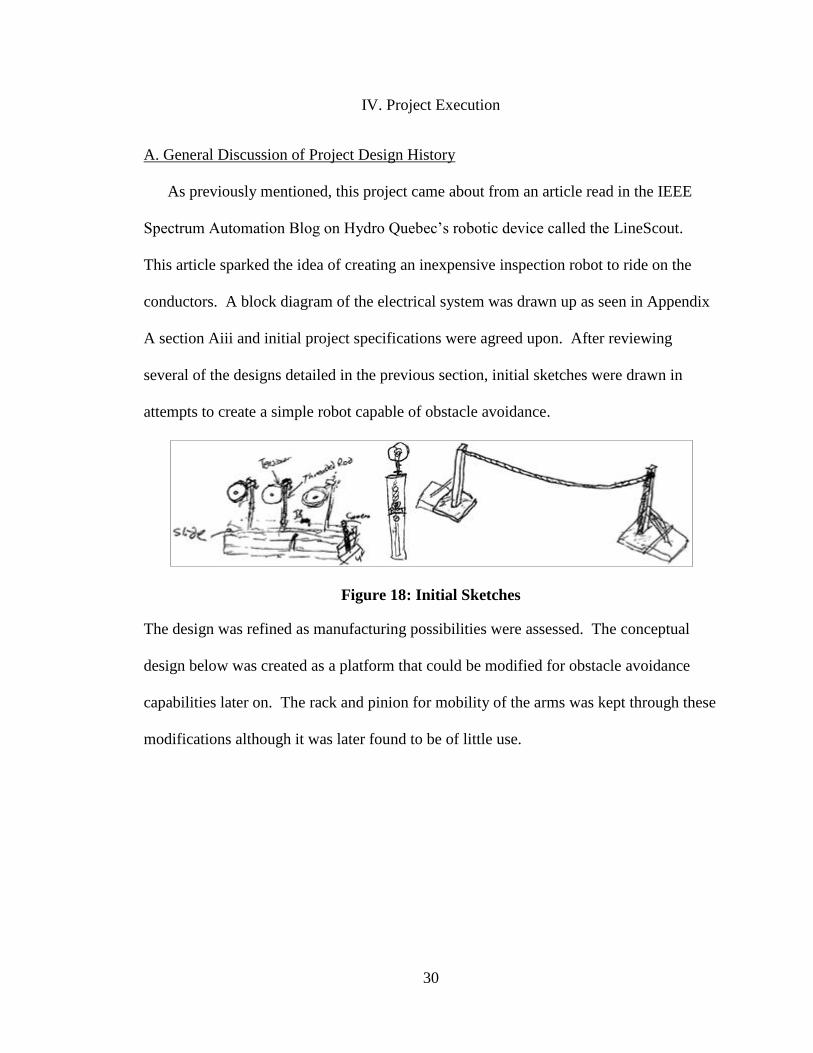
several of the designs detailed in the previous section, initial sketches were drawn in
attempts to create a simple robot capable of obstacle avoidance.
Figure 18: Initial Sketches
The design was refined as manufacturing possibilities were assessed. The conceptual
design below was created as a platform that could be modified for obstacle avoidance
capabilities later on. The rack and pinion for mobility of the arms was kept through these
modifications although it was later found to be of little use.

31
Figure 19: Conceptual Design
Throughout this design process parts were specified for the mechanical construction
along with the motors to run the drive pulleys. These parts can be seen in a labeled view
in Appendix A Section Aii. Construction of the mechanics began and the electrical
circuits were discussed. From the initial block diagram the electrical circuitry was
expanded upon in creating a communications diagram as seen in Appendix A Section
Aiv. Using this diagram, the major electrical components were selected beginning with
the PIC microcontroller. The initial selection was a PIC 32 microcontroller but
connection difficulties, detailed later on, brought about the use of a PIC 18. An infrared
thermometer was selected for temperature measurement as it was a cheap non-contact
sensor that met the required accuracies. Batteries were selected and ordered based on the
power requirements of each component. Next, the motor control design began. PID
control was accessed but needs only required speed control; PWM control with H-
Bridges to reverse direction was the selected method. Next, the power requirements of
each component were accessed and buck converters were selected to efficiently provide
four different voltage levels to the circuit. Communication difficulties with the infrared
thermometer lead to the use of a thermistor in contact with the conductor, and testing of

32
encoder inputs, thermistor operation, and batteries was performed. A working prototype
of the robot was completed.
Despite a successful project, several problems were encountered during the design
process that altered the direction of the project. Early on, wireless communication and
infrared thermometers were researched extensively. A PIC 32 was selected for its
Ethernet capabilities and TCP/IP library. This chip was only available in a surface mount
style and required a break-out board. Due to soldering problems, a more familiar PIC 18
was used, temporarily sacrificing the wireless features. Another problem was the
operation of the h-bridges for motor control using a PWM input signal from the PIC 18.
The motors did not operate correctly and required extra circuitry. Serial communication
with the IR thermometer was more challenging than originally thought and a thermistor
was used as a temporary replacement due to time constraints. A few problems occurred
during the testing stages of the project. The first run on the line showed that the drive
motors were drawing more current than intended causing the buck converter chip to
overheat; a replacement was found and a heat sink was mounted. Lastly, the battery
holders purchased for this project had connection problems and required soldering to
ensure solid connections.

33
B. Technical Discussion of Project
In the electrical design of the power line inspection device the overall goals included
the selection of a microcontroller, motor control, distance measurements taken from an
encoder, temperature measurements, battery selection, voltage regulation, and
communication to a display. The selection of the components and some of the theory
behind how they work are included in the following section followed by the solutions to
problems faced and the testing and verification of specifications.
i. Theory of Operation
a. Microcontroller
The PIC microcontroller is the brains of both the robot and the control board of
this device. Why might one use a microcontroller? The answer is often cost, size, or
low power consumption among many things. These three reasons fit along with the
familiarity with PIC chips from microcontroller class. Although a small CPU may
greatly simplify communication and processing, a microcontroller takes up much less
space than a CPU and doesn’t require external ROM, RAM, or I/O ports that would
be required with a microprocessor. Another advantage is the ability to easily
configure external connections. In the selection of PIC microcontrollers, the
availability of many I/O pins was stressed along with available analog pins and an
onboard analog to digital converter. The PIC 18 and PIC 32 microcontrollers from
Microchip fit the requirements.
b. H-Bridge
The H-Bridge chips are the basis of the robot’s motor control system. They allow
control of dc gear motors using a 5V signal voltage and the ability to run them in both

34
forward and reverse. H-Bridge operation is a fairly basic concept. By creating an H
with switches and placing a motor or other load along the center line, the polarity of
the power to the device can easily be reversed. The operation is comparable to a
DPDT Switch wired as below. Consider position A on the DPDT switch being the
same as S1 and S4 being closed and position B being the same as S2 and S4 being
closed. The two positions allow a reversal of polarities of the motor power supply,
allowing the rotor to be turned in either forward or reverse depending on the switch
operation. The H-Bridge also allows the motor to be brought to a complete stop,
bringing each side of the motor to the same potential by closing both S1 and S3 or S2
and S4. One thing to notice is the ability to short the power supply with the H-
Bridge. S1 and S2 or S3 and S4 should not be closed simultaneously.
Figure 20: H-Bridge Operation
Perhaps the most important part of the H-Bridge operation is the ability to control
the switches. The actual circuitry uses transistors to switch the voltage on and off to
the motor. Older style NJM2670 dual h-bridge IC’s from New Japan Radio were
used. These integrated circuits use Bipolar Junction Transistors along with some

35
logic circuitry to replace switches 1-4 as seen below. The logic circuitry, represented
by empty boxes, allows an enable pin to act as a safety and safe operation of the
transistors so they do not short the battery.
Figure 21: NJM2670 Schematic
One problem with this design, which has since been corrected using MOSFETs, is
that the output current through a BJT is dependent on the input current into the base.
This problem was found in the initial attempts of motor control and the solution is
detailed in the following section.
Motor controller code was designed to control the speed of the motors in both
forward and reverse using potentiometer inputs. The potentiometer inputs were wired
through the flat wire to the robot PIC chip which reads the voltage through the
onboard ADC and outputs a PWM signal to the H-Bridge chip. Code was designed to

36
cycle through a while loop, reading the potentiometer voltage and outputting the
corresponding PWM outputs to turn the motor in forward or reverse based on that
voltage. PWM, or Pulse Width Modulation, allows us to vary the speed of the motor
using the voltage input of the potentiometer to change a Duty Ratio. The Duty Ratio
represents the time the signal is high during the period of the square wave; DR =
Ton/Period. By varying the time the motor is on using the Duty Ratio with a small
period, the motor is turned on and off smoothly. In the code, a Cycle_Time variable
which represents the period of the square wave is set to 255 cycles. The
potentiometer input from the onboard ADC sets a T_On variable (0-255). As the
code cycles, a count is incremented and compared to the T_On variable to determine
the output, whether the motor should be turned on or off. When the count reaches
255 the counter is reset. Within this loop the T_On variable is continuously updated
from the ADC to change the Duty Ratio. The fully commented code for the Robot
PIC microcontroller can be seen in Appendix A Section B.
c. Encoder
The magnetic encoder that was ordered with the motors consists of a magnetized
rotor and a two channel Hall Effect sensor. The Hall Effect sensor, seen on the left
side of the figure below, recognizes the magnetic changes in polarity in the rotor and
outputs a signal.

37
Figure 22: Magnetic Encoder
For example, each magnetic South Pole would give a positive signal, and each
North Pole would give a negative signal or zero. This results in a pulse signal which
can be used to determine distance, speed, and acceleration given the number of
changes of poles in one rotation of the motor. By using two overlapping sensors and
comparing rising and fall edges the direction of rotation can be determined based on
which sensor receives a pulse first.
This pulse signal was read from the microcontroller. Original code attempted to
read the encoder counts in the same while loop that operated motor control, but the
cycle wasn’t fast enough, so Timer3 was used as a counter and a calibration was
performed. More details are included in section iv.
d. Thermistor
A thermistor is a resistor that is sensitive to temperature. There are two
classifications of thermistors, PTC and NTC. A PTC type thermistor increases
resistance at a particular temperature to act as a switch, while an NTC thermistor
changes resistance across a broad range of temperatures decreasing in resistance as
Hall Effect Sensor
Magnetized Rotor
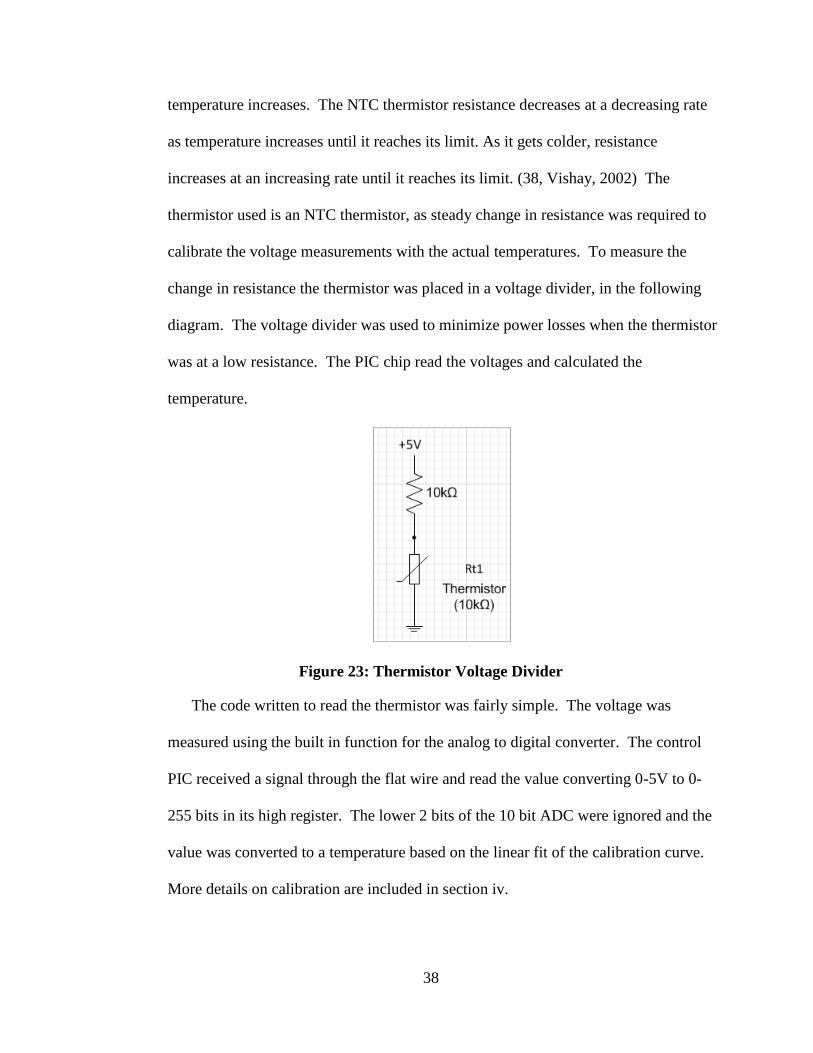
38
temperature increases. The NTC thermistor resistance decreases at a decreasing rate
as temperature increases until it reaches its limit. As it gets colder, resistance
increases at an increasing rate until it reaches its limit. (38, Vishay, 2002) The
thermistor used is an NTC thermistor, as steady change in resistance was required to
calibrate the voltage measurements with the actual temperatures. To measure the
change in resistance the thermistor was placed in a voltage divider, in the following
diagram. The voltage divider was used to minimize power losses when the thermistor
was at a low resistance. The PIC chip read the voltages and calculated the
temperature.
Figure 23: Thermistor Voltage Divider
The code written to read the thermistor was fairly simple. The voltage was
measured using the built in function for the analog to digital converter. The control
PIC received a signal through the flat wire and read the value converting 0-5V to 0-
255 bits in its high register. The lower 2 bits of the 10 bit ADC were ignored and the
value was converted to a temperature based on the linear fit of the calibration curve.
More details on calibration are included in section iv.

39
e. Battery
To select batteries it was decided that weight and longevity were most important,
along with the ability to recharge, and a low cost. All major components were
considered, and power losses were added up. This resulted in an approximate
2.75Ah, 12V power rating. To make up for wire losses, losses across resistors, and
other passive component losses, the calculated power loss was doubled and a set of
batteries with a lifetime of about an hour or so with a voltage above 12V researched.
Ultrafire 18650 batteries satisfied all the criteria. These Lithium batteries were
rechargeable, measured 3.7V each and had a 4900 mA hour rating. Using four
batteries in series gave the robot a 14.8V supply to be stepped down for the various
components of the circuit.
f. Switch Mode DC-DC Converter (Buck)
DC-DC converters allow an efficient conversion from one DC voltage to another,
88% efficient with the TL2575, as opposed to other much less efficient methods such
as voltage dividers. When the circuitry was designed, it was decided to use a battery
voltage higher than the electronics and motors required. To power the loads of
various voltages, several step-down converters or buck converters were needed.

40
Figure 24: Buck Converter Schematic
A buck converter operates based on Pulse Width Modulation control of a
transistor applied to qA in the above diagram. Like the PWM control of the motor,
the buck converter varies voltage based on changing the Duty Ratio (D) of a square
wave input. With a buck converter, however, the output voltage needs to be
relatively stable; with minimal oscillation. To maintain a stable voltage, an inductor
and capacitor are used to store energy and a diode blocks current to ground when
voltage is applied and allows current flow from the inductor when the transistor is off.
An output voltage is attained; . The analysis of the buck
converter circuit and relationships between the voltages and currents can be seen
below.
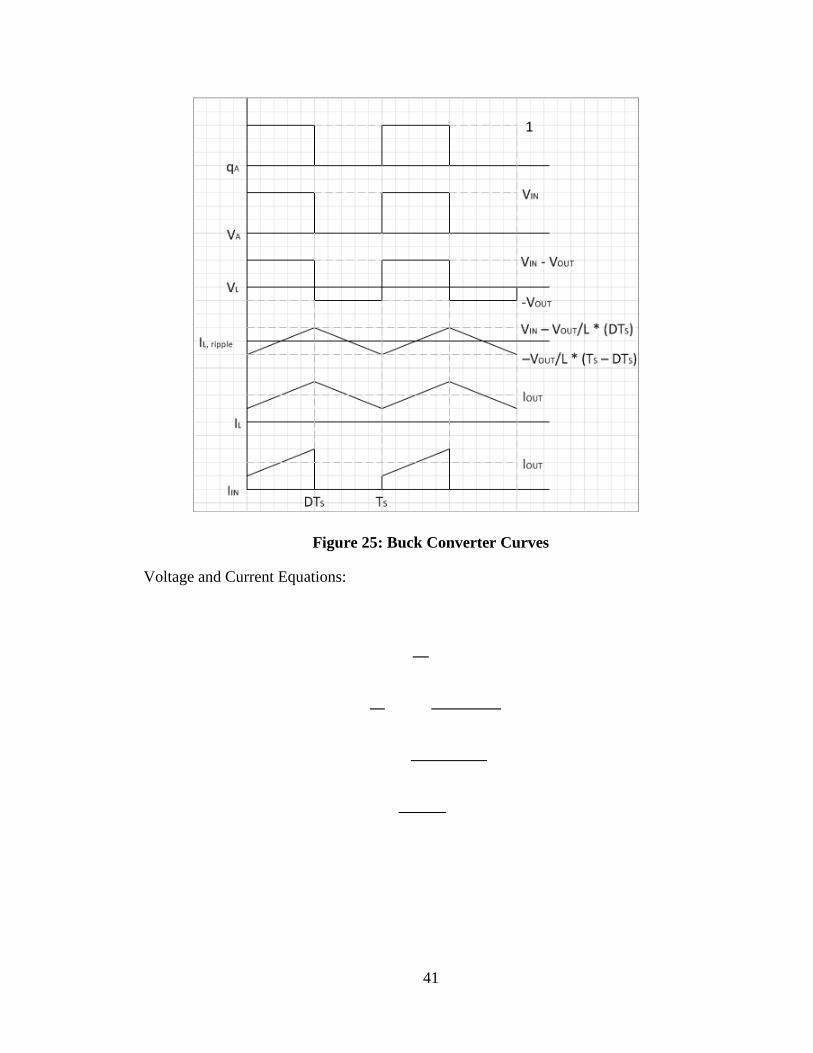
41
Figure 25: Buck Converter Curves
Voltage and Current Equations:

42
To establish the qA signal in the above diagrams, Texas Instruments TL2575 IC’s
were used. The TL2575 converter chips are designed as closed loop control chips to
maintain a voltage set point of 3.3V, 5V, 12V, or an adjustable voltage based on two
resistors connected in a voltage divider configuration. The recommended inductors,
capacitors, and diodes were used as seen below.
Figure 26: Step Down Converter Circuit
g. LCD Screen
The LCD screen that was used operates using simple commands from a serial
interface. It has 8 pins to send and receive data, an enable pin to send commands,
register select pin, and read/write pin. Using the instruction set from the datasheet,
seen in Appendix A Section G, display of distance and temperature data was
achieved. The code that was written to display the data consists of LCD commands
and text displays that are stored in ROM, two functions that execute commands and
display data, and various “FOR” loops to send characters to the screen one by one.
The code for display is cycled through in a while loop that runs continuously after
startup. Outside of the while loop, the display variables are written to the screen;

43
distance, inches, temperature, degC. Inside the “WHILE” loop the screen is
commanded to scroll to the display points where the numbers are display and write
the updated distance and temperature measurements. The control PIC code can be
seen in Appendix A Section B.
Figure 27: LCD Screen
ii. Problem resolutions
a. Microcontroller (PIC 32)
The first electrical problem encountered was connecting to the PIC 32
microcontroller; which happened to be the only Ethernet compatible PIC chip
available. This chip was only available as a surface mount, so it required a breakout
board in order to be placed on a breadboard. Initial attempts to solder a TQFP
package chip to a breakout board using a soldering iron resulted in damaged traces
and no connection. The proper way to solder this chip would have been with solder
paste and an oven. Due to this problem, a PIC 18 was used as a replacement because
of its mounting style, familiarity, and availability. It was intended to use the PIC 32
later on to incorporate the wireless feature, and a pre-made breakout board with the
mounted chip was ordered.
44
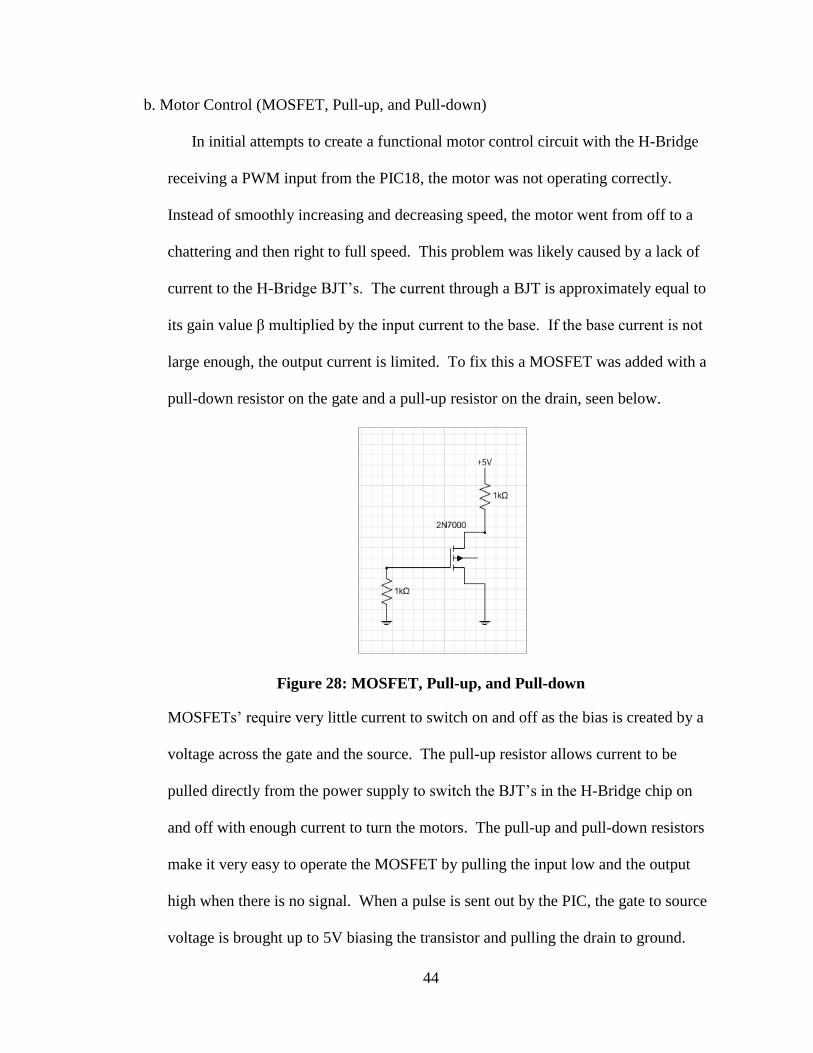
b. Motor Control (MOSFET, Pull-up, and Pull-down)
In initial attempts to create a functional motor control circuit with the H-Bridge
receiving a PWM input from the PIC18, the motor was not operating correctly.
Instead of smoothly increasing and decreasing speed, the motor went from off to a
chattering and then right to full speed. This problem was likely caused by a lack of
current to the H-Bridge BJT’s. The current through a BJT is approximately equal to
its gain value β multiplied by the input current to the base. If the base current is not
large enough, the output current is limited. To fix this a MOSFET was added with a
pull-down resistor on the gate and a pull-up resistor on the drain, seen below.
Figure 28: MOSFET, Pull-up, and Pull-down
MOSFETs’ require very little current to switch on and off as the bias is created by a
voltage across the gate and the source. The pull-up resistor allows current to be
pulled directly from the power supply to switch the BJT’s in the H-Bridge chip on
and off with enough current to turn the motors. The pull-up and pull-down resistors
make it very easy to operate the MOSFET by pulling the input low and the output
high when there is no signal. When a pulse is sent out by the PIC, the gate to source
voltage is brought up to 5V biasing the transistor and pulling the drain to ground.
45
Although theoretically all that would be necessary is a pull-up resistor to allow more
current and help the microcontroller bring the voltage high, when a pull-up was used
in the circuit it didn’t function. The added isolation and easy switching from the
MOSFET which was suggested by a classmate, Alec Johnston, functioned properly.
c. Buck Converter Driver Overheating
Initial Buck Converter selection involved the use of several TL2575 control chips.
These chips were designed to achieve a desired voltage output out of a buck converter
by acting as both the transistor switch and the control of that switch in the buck
converter. The current limit of 1A was too small for the two drive motors. This
current wasn’t exceeded but approached the chip’s limit. This became apparent in
initial battery testing as the buck converter heated up excessively. As the current was
still below an amp, an attempt was made to solve the problem by mounting a heat-
sink on the chip. Further battery testing showed that after significant run time the
chip was still heating up and failing to operate correctly so a 3A converter was
ordered. The 3A converter was tested with the robot and ran smoothly with a heat
sink.
d. Encoder Code
As mentioned previously, an attempt was made to read the encoders in the same
loop as the motor control code by incrementing a counter each time a pulse was
received. The issue with this was that the cycle time of the loop was too slow and
wouldn’t count all of the encoder counts. To solve this, the Timer 3 register was
used.

46
e. Thermometer
The original device that was to be used for temperature measurements was a
Melexis IR thermometer. Since the robot was intended to be moving at all times, a
temperature probe with zero contact was the most desirable. An issue arose from the
communication with this thermometer. To read the temperature, serial
communication was required between the PIC 18 and the sensor. This
communication was in the form of a SMBus configuration. In this configuration
there are two shared data wires (SCL and SDA), a master device, and a number of
slave devices. The SCL wire is a clock signal that the devices use to synchronize
timing with each other. The SDA wire is a data wire on which all information is
passed back and forth between the master and slave devices. In order to do this, the
master first pulls the SDA wire to ground. Next it sends the address of the slave
device it is trying to get information from along with a read/write bit. If there is a
slave device that has this address, it is then supposed to pull the data wire low to
acknowledge that it is there. After this acknowledge, the master would send the
internal register location to read or write to, or wait to read data from the slave.
Following this the master would send data to the slave device and send a stop
sequence which is represented by an extended high signal. This type of serial
communication is called I2C. The PIC 18 microcontroller had little documentation on
the I2C communication in C, so this was a challenging programming problem. Much
time was spent on this, but due to time constraints and the lack of information
available on the topic, the IR thermometer was replaced with a 10 kΩ thermistor.
The PIC 32 has a built in I2C module which will allow easy communication with the

47
IR thermometer if used later on. The thermistor had a very simple operation, as
detailed in the previous section, and was easily read as an analog voltage input to the
PIC 18. Another problem that was faced was that the thermistor responded slowly to
change in temperature; an alternative was sought out. An attempt was made to use a
spare temperature probe from a multi-meter. Using this probe would have drawn too
much current and thusly reduced the battery lifetime, so the slower acting thermistor
became a temporary solution for the project until a faster acting thermistor was
ordered.
f. Battery Packs
In initial testing of the batteries, the connections of the battery packs were found
to be faulty. To solve this, the springs and connection wired to the rivets were
soldered. Loose connections continue to be a problem due to poor quality springs,
but are much simpler to fix. New, higher quality battery packs will be investigated.
g. Motor Couplings
Initial testing showed the motor couplings were failing. The original couplings
were ¼” nylon spacers with set screws to join the motor shaft and the threaded rod
shaft of the pulley assembly. When on the line, these couplings began to bend under
the load. The nylon couplings were replaced with steel threaded rod couplings, which
were bored and fitted with a set screw to attach the motor shafts. This allowed for a
secure motor coupling.
iii. Testing
The testing portion of this project came down to the required specifications;
distance measurements within 5% accuracy, temperature readings within 2 degrees

48
Celsius, and 30 minutes of battery lifetime. To achieve these specifications and prove
the robot’s functionality, calibrations of the encoder and thermistor were performed
and the batteries were tested for a full discharge cycle.
a. Encoder Calibration
The encoders that were ordered with the motors had two hall sensor outputs
which combined provide 64 counts per encoder revolution (48 CPR on slide motors).
As only one hall sensor output was used, initial attempts to calculate a distance based
on a 64 CPR encoder signal failed. If both sensor outputs were used together, the
conversion to distance could be calculated as follows.
Instead of using this calculation a calibration was performed by testing various
distances, measuring with a tape measure, and recording their corresponding number
of counts. The data was plotted and a linear fit was performed in excel; see Appendix
A Section Dii. The calibrated display was tested with several distances to prove its
accuracy.
b. Thermistor Calibration
The calibration of the thermistor was similar to that of the encoder. Since no
curves were available documenting the operation of the thermistor that was donated
to us by Alec Johnston, a calibration was performed. The thermistor was placed in
water baths of varying temperatures and connected in a voltage divider. Voltage
measurements and temperature measurements were recorded using a multimeter, and
a linear fit was performed; see Appendix A Section Diii. Although an exponential fit
would be more accurate, this fit performed within the range of error that was

49
specified; 2 degrees Celsius. The calibrated display was tested with various
temperatures to assure accuracy.
c. Battery Testing
Battery discharge testing was performed to find the battery lifetime of the device.
The inspection robot was steered back and forth on a 10 ft length of conductor that
was mounted on a test stand until the motors no longer turned. Battery voltages were
recorded each minute through the control board using a multimeter and a discharge
curve was generated. Although there were slight disruptions in the curve as batteries
were temporarily disconnected due to loose connections, the discharge curve fits a
standard curve for a lithium ion battery. There were also disruptions caused by
coupling failure. The robot ran for 1 hour and 45 minutes as seen in Appendix A
Section Ciii.
C. Cost and Schedule Performance
Compared to a typical EET capstone project the power line inspection device was
on the expensive side, however, compared to inspection robots currently in industry this
project was relatively inexpensive. For approximately $840.00, the project demonstrated
that a working prototype of a power line inspection robot could be created with a small
budget and be built using mostly parts from hardware stores. This price included tools
and equipment needed to execute portions of the project, as well as spare components.
An official budget was not created for this project, but care was taken in ordering parts
and components at the lowest price, while still obtaining all the requirements needed. If

50
this project were to be rebuilt on a new budget, the price could be reduced greatly by only
ordering necessary components.
Scheduling initially was set with large goals. Creating a detailed timeline for the
project was a fairly difficult thing to do as this project was a first and many items had not
been previously attempted. By planning extra time for most scheduled items, the project
followed the timeline fairly closely. A few items, such as the infrared thermometer and
some of the mechanics took longer than intended, pushing back the project schedule
slightly. Overall, the project’s goals were met by the time of presentation at the end of
the fall semester.

51
V. Design Results
The completion of this project showed the robot’s ability to meet three out of four
of the scope’s advanced specifications, and subsequently all of the basic specifications.
The robot, seen below, was able to record distance to the nearest inch, temperature within
2 °C, and run for 1 hour and 45 minutes.
Figure 29: Completed Prototype
The only advanced item that was not accomplished was wireless control; instead a
tethered control box was used for robot operation. Early on in the project, attempts to
incorporate wireless control into the prototype using the PIC 32 were pushed back, and
became too difficult to achieve within time constraints. Wireless communication remains
as one of the future improvements to this project. Final touches done on the project

52
include the manufacturing of printed circuit boards for the robot and control circuitry
along with the removal of the slide and replacement of the thermistor, seen in the above
figure, with a faster acting thermistor. Manufacturing procedures can be seen in
Appendix A Section E.
There are several improvements that could be done to the device. Wireless
control of the prototype would include the PIC 32, an Ethernet data layer chip, and a
router. A laptop would send and receive data to and from the PIC 32. The second
improvement on the list is obstacle avoidance. This would allow the robot continuous
travel past insulators, splices and other line components that impede on straight line
travel. Plans to accomplish this include replacing existing tensioners with linear
actuators and adding in two motors to remove the pulleys from the line. A drawing of
obstacle avoidance operation can be seen in Appendix A Section Aviii. Another future
improvement is an infrared thermometer to allow non-contact temperature readings. The
original plans with the project were to include this device, but due to complications in
communication, a thermistor was used in its place. Another feature to be added is pan and
tilt control of the camera. By having this additional control, the user could view the other
conductors and more of the conductor. The magnetic encoders that were used should be
replaced by optical encoders to eliminate the possibility of magnetic interference from the
power line. Additional features that could be added include a range finder, wireless
current sensor, and an inductive charging coil along with upgrades of existing equipment.

53
VI. Bibliography
1) Anaheim Automation. (2011). Magnetic encoder guide. Retrieved, 2013, from
http://www.anaheimautomation.com/manuals/forms/magnetic-encoder-guide.php
2) Aracil, R., & Ferre, M. (2007). Telerobotics for aerial live power line maintenance. In
M. Ferre, M. Buss, R. Aracil, C. Melchiorri & C. Balaguer (Eds.), Advances in
telerobotics (pp. 459–469) Springer Berlin Heidelberg.
3) Avidar, B. (1993). Electronic airborne inspection method for overhead transmission
power-lines. Proceedings from ESMO-93., Sixth International Conference on
Transmission and Distribution Construction and Live Line Maintenance, 1993, 89-
93.
4) Bouchard, S. (2010). LineScout robot climbs on live power lines to inspect them.
Message posted to http://spectrum.ieee.org/automaton/robotics/industrial-
robots/linescout-robot-climbs-on-live-power-lines-to-inspect-them
5) Boylestad, R. L., & Nashelsky, L. (2009). In Anthony V. (Ed.), Electronic devices and
circuit theory (Tenth ed.). Upper Saddle River, New Jersey: Pearson Education, Inc.
6) Burns, M. R. (2003). Distribution line hazards that affect reliability and the conductor
repairs and solutions to avoid future damage. Rural Electric Power Conference,
2003, C1-1-C1-13.

54
7) Burns, M. R. (2006). Reliability of the conductor system in Today~s environment and
the importance of maintaining its integrity. Rural Electric Power Conference, 2006
IEEE, 1-8.
8) Cormon.Overhead line corrosion detector. Unpublished manuscript.
9) Debenest, P., Guarnieri, M., Takita, K., Fukushima, E. F., Hirose, S., Tamura, K., . . .
Shiga, F. (2008). Expliner - robot for inspection of transmission lines. ICRA 2008.
IEEE International Conference on Robotics and Automation, 2008, 3978-3984.
10) Electric Power Research Institute. (2008). Future inspection of
Overhead Transmission lines. Unpublished manuscript.
11) Electric Power Research Institute. (2012). Overhead transmission line robot.
Retrieved, 2013, from http://transsensorsrobots.epri.com/overhead-transmission-
line-robot.html
12) Elizondo, D., Gentile, T., Candia, H., & Bell, G. (2010). Overview of robotic
applications for energized transmission line work — technologies, field projects and
future developments. 2010 1st International Conference on Applied Robotics for the
Power Industry (CARPI), 1-7.
13) Guizzo, E. (2011). Watch this robot crawl on a high-voltage power line. Message
posted to http://spectrum.ieee.org/automaton/robotics/industrial-robots/expliner-
robot-inspects-high-voltage-lines

55
14) Havard, D. G., & Pohlman, J. C. (1984). Five years' field trials of detuning
pendulums for galloping control. IEEE Transactions on Power Apparatus and
Systems, PAS-103(2), 318-327.
15) HiBot.EXPLINER robot for inspection of very-high voltage transmission lines.
Unpublished manuscript.
16) Holtberg, P.EPACT2005 summary. Retrieved 2, 2013, from
http://www.eia.gov/oiaf/aeo/otheranalysis/aeo_2006analysispapers/epa2005_summa
ry.html
17) IEEE guide for collecting and managing transmission line inspection and
maintenance data (2011).
18) IEEE guide for maintenance methods on energized power-lines (1988).
19) Lee, J., Jung, N., & Cho, B. (2011). Development of transmission line sleeve
inspection robot. World Academy of Science, Engineering and Technology, (58),
195-199.
20) Marshall, M. (1999). Aerial infrared line inspection. Rural Electric Power
Conference, 1999, A3/1-A3/2.
21) Mazidi, M. A., McKinlay, R. D., & Causey, D. (2008). In Anthony V. (Ed.), PIC
microcontroller and embedded systems using assembly and C for PIC 18. Upper
Saddle River, New Jersy: Pearson Education, Inc.

56
22) Mohan, N. (2012). In Syre D. (Ed.), Power electronics A first course. Hobokey, NJ:
John Wiley & Sons, Inc.
23) Montambault, S., & Pouliot, N. (2003). The HQ LineROVer: Contributing to
innovation in transmission line maintenance. 2003 IEEE ESMO. 2003 IEEE 10th
International Conference on Transmission and Distribution Construction, Operation
and Live-Line Maintenance, 2003, 33-40.
24) Montambault, S., & Pouliot, N. (2006). LineScout technology: Development of an
inspection robot capable of clearing obstacles while operating on a live line. IEEE
11th International Conference on, Transmission & Distribution Construction,
Operation and Live-Line Maintenance, 2006. ESMO 2006.
25) Montambault, S., & Pouliot, N. (2010). About the future of power line robotics.
Applied Robotics for the Power Industry (CARPI), 2010 1st International
Conference on, 1-6.
26) Montambault, S. (2010). LineROVer remotely operated vehicle for work on live
overhead lines. Unpublished manuscript.
27) Montambault, S. (2010). LineScout A robot for inspecting live transmission lines.
Unpublished manuscript.
28) Montambault, S., & Pouliot, N. (2007). 6th international conference on field and
service robotics. Design and Validation of a Mobile Robot for Power Line Inspection
and Maintenance, Chamontix, France. (1)

57
29) Nayyerloo, M., Chen, X. Q., Wang, W. H., & Chase, G. (2009). Cable-climbing
robots for power line inspection. In X. Chen (Ed.), Mobile robots – state of the art in
land, sea, air, and collaborative missions (pp. 63-84). Vienna: I-Tech Education and
Publishing.
30) Nayyerloo, M., Mohammad, S., Yeganehparast, M., Barati, A., & Foumani, M. S.
(2007). Mechanical implementation and Simulation of MoboLab, A mobile robot
for Inspection of power transmission lines. International Journal of Advanced
Robotic Systems, 4(3), 381.
31) North American Electric Reliability Corperation. (2007). Milestones: NERC
RELIABILITY STANDARDS. Retrieved 2013 from
http://www.nerc.com/files/StandardsMilestones.pdf
32) PERGAM-SUISSE AG. (2010). Airborne power line inspection service. Unpublished
manuscript.
33) Pouliot, N., & Montambault, S. (2012). Field-oriented developments for LineScout
technology and its deployment on large water crossing transmission lines. Journal of
Field Robotics, 29(1), 25-46.
34) Preformed Line Products. (2010). Air flow spoiler. Unpublished manuscript.
35) Preformed Line Products. (2010). Transmission line repair manual. Unpublished
manuscript.
58
36) Preformed Line Products. (2011). Overhead distribution line repair manual.
Unpublished manuscript.
37) Van Dyke, P., & Laneville, A. (2008). Galloping of a single conductor covered with a
D-section on a high-voltage overhead test line. Journal of Wind Engineering and
Industrial Aerodynamics, 96(6–7), 1141-1151.
38) Vinogradov, S. (2013). Magnetoscrictive sensor-based guided waves. Retrieved 2,
2013, from http://www.swri.org/4org/d18/nde/mss.htm
39) Vishay. (2002). NTC and PTC thermistors. Retrieved February 22, 2013, from
http://www.vishay.com/docs/33016/engnote.pdf
40) Wilson, G., & Austermann, J.What is a bolometer? Retrieved, 2013, from
http://www.astro.umass.edu/~wilson/CDL/bolometer.html

59
VII. Appendix A
A. Drawings
i. Conceptual Design
ii. Mechanical Detail

60
iii. Block Diagram
iv. Communications Block Diagram
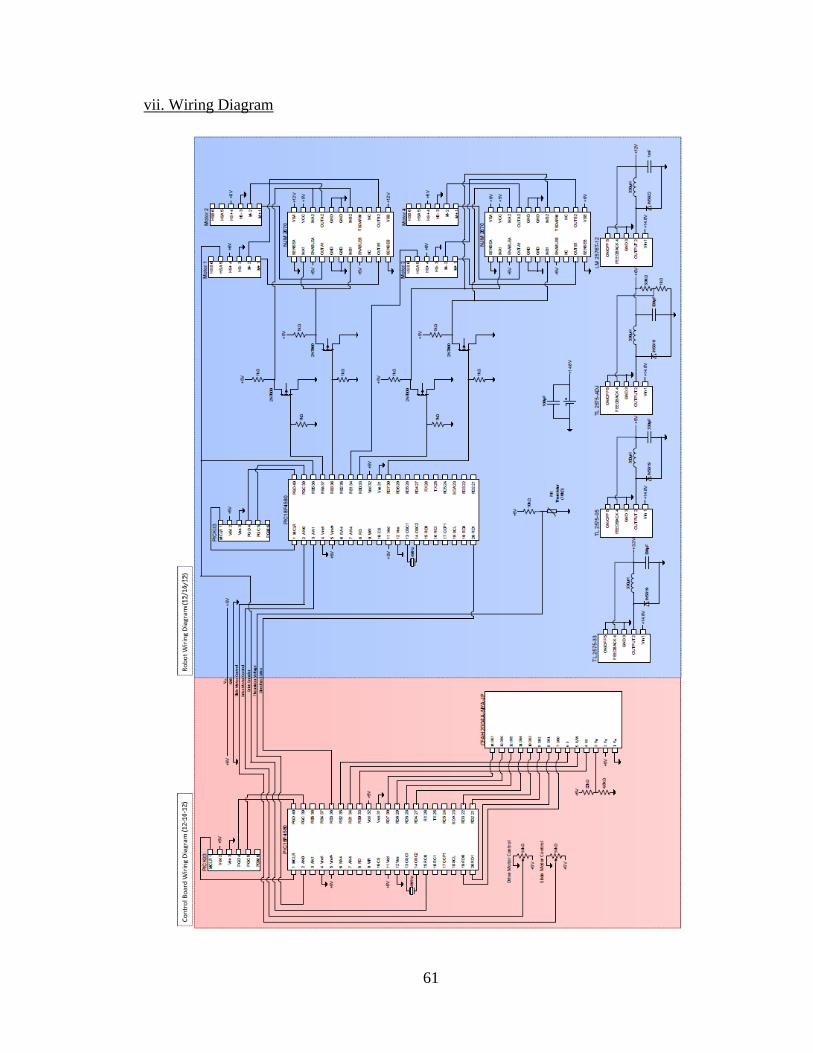
61
vii. Wiring Diagram
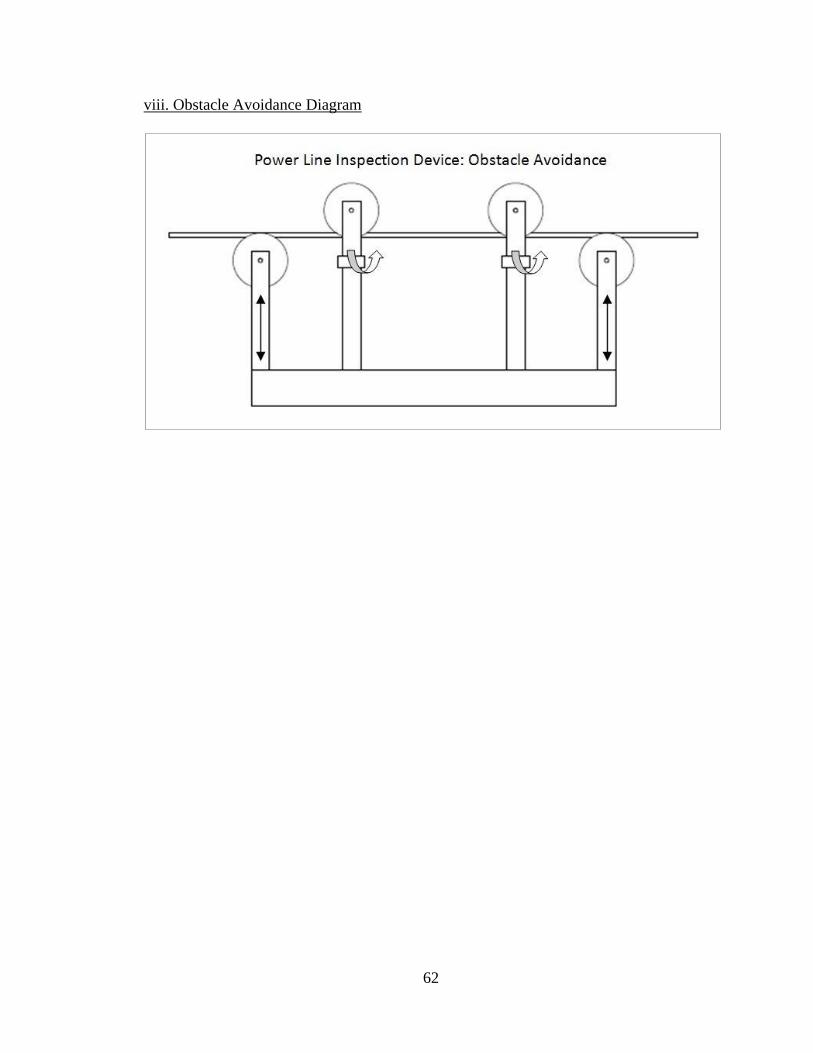
62
viii. Obstacle Avoidance Diagram

63
B. Source Code
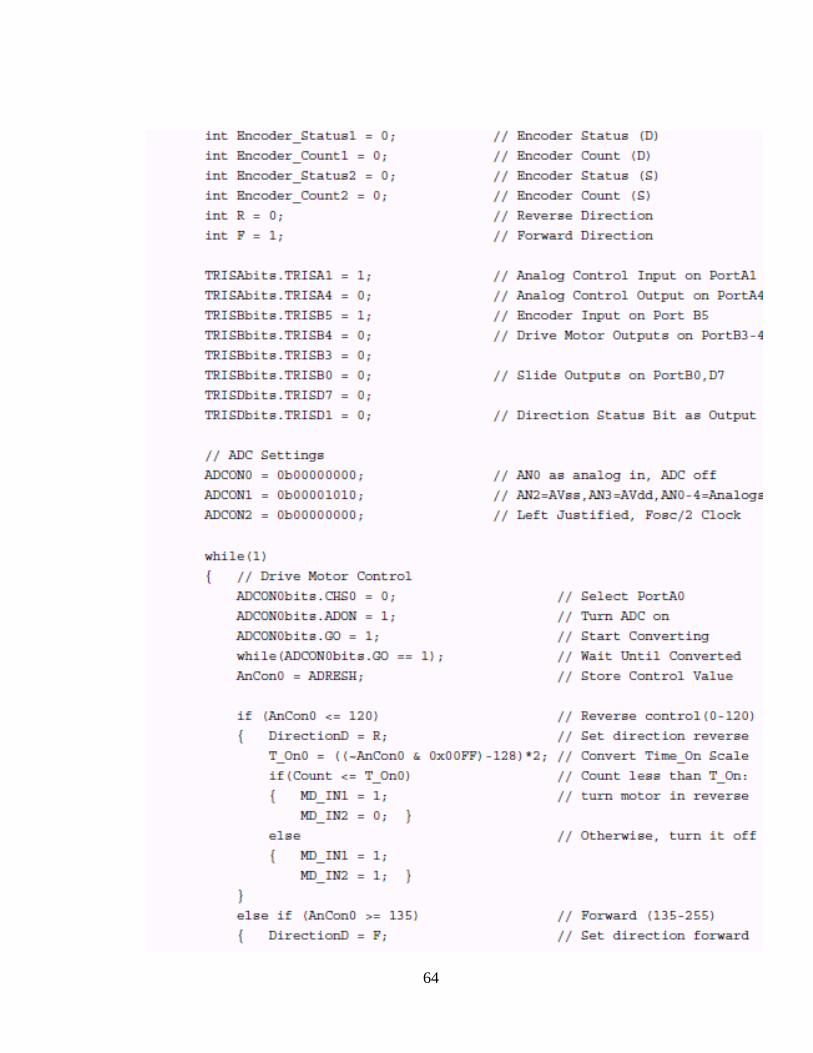
64

65

66
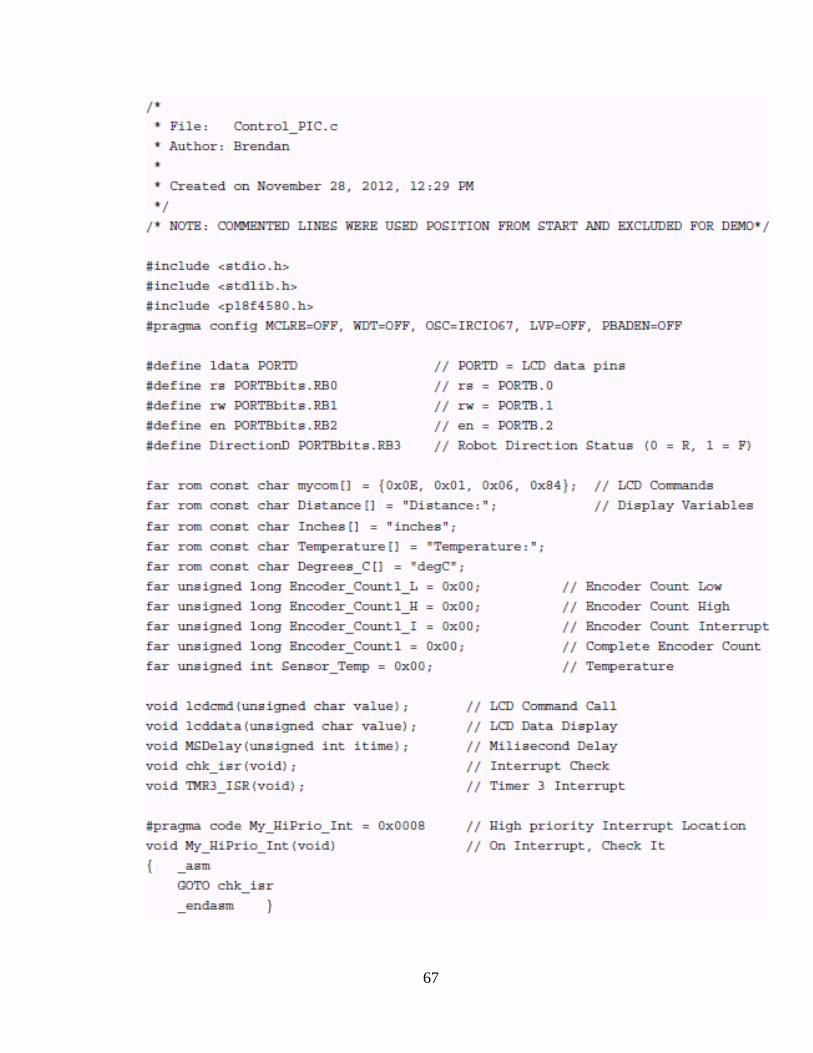
67

68

69

70

71

72
C. Test Data
i. Distance Measurement
Table 2: Distance Measurement Testing 2-25-13
Tape Measure Measurement
(Inches)
Distance Readout
(Inches) Accuracy
4 3 75.00%
5 5 100.00%
9 9 100.00%
13 12 92.31%
15.5 16 96.77%
20.5 21 97.56%
30.5 30 98.36%
45 45 100.00%
66 66 100.00%
96 96 100.00%
Average Accuracy: 96.00%
ii. Temperature Measurement
Table 3: Temperature Measurement Testing 2-26-13
Multimeter Probe Measurement
(°C)
Temperature
Measurement(°C) Accuracy
6 7 83.33%
15 15 100.00%
18 18 100.00%
32 33 96.88%
23 23 100.00%
37 39 94.59%
42 44 95.24%
47 49 95.74%
52 52 100.00%
64 62 96.88%
65 67 96.92%
Average Accuracy: 97.63%

73
iii. Battery Discharge
Table 4: Battery Discharge Measurements
Time(min) Voltage(V) Comments
0 15.4
1 15.1
2 14.87 Turned off due to
3 15.2 mechanical failure
4 14.95
5 14.7
6 14.7
7 14.67 Turned off due to
8 15.6 mechanical failure
9 15.5
10 15.3
11 15.2
12 15.1
13 15
14 15
15 14.95
16 14.85
17 14.65
18 14.65
19 14.7
20 14.65
21 14.6
22 14.6
23 14.6 Some small stops due to tensioner rubber
24 14.5 12V Buck Converter beginning to heat up
25 14.4
26 14.5
27 14.3
28 14.46
29 14.3
30 14.3
31 14.2
32 14.1
33 14.1
34 14.1
35 14.1
36 14

74
37 14.1
38 14
39 14
40 13.9
41 14.1
42 14
43 13.8
44 13.8
45 13.8
46 13.8
47 13.4
48 13.13
49 12.9
50 12.85
51 12.85 Stopped Briefly, turned batteries and restarted
52 12.6
53 12.6
54 12.4
55 12.6
56 12.8
57 12.5
58 12
59 12.6
60 12.1
61 12.2
62 13.9
63 13.6
64 13.5
65 13.4
66 13.3
67 13.3
68 13
69 13.1
70 12.74
71 13.4
72 12.8
73 12.68
74 11.9
75 12.4
76 11.6
77 11.2

75
78 10.45
79 9.29
80 8.22
81 6.25 No Movement
82 13.52 Stopped Briefly, turned batteries and restarted
83 13.3
84 13.3
85 13.15
86 12.96
87 13
88 12.95
89 12.8
90 12.8
91 12.84
92 12.66
93 12.67
94 12.4
95 12.1
96 11.71
97 11.49
98 10.94
99 10
100 9.23
101 8.6
101.3 7.2 No Movement, Voltage Declining
102 6.13
103 4.9 LCD Dimming
104 3.7 LCD Gone
105 4.5 Turned batteries to test connection
106 3.6
107 3.35 Stopped robot due to component and battery heating
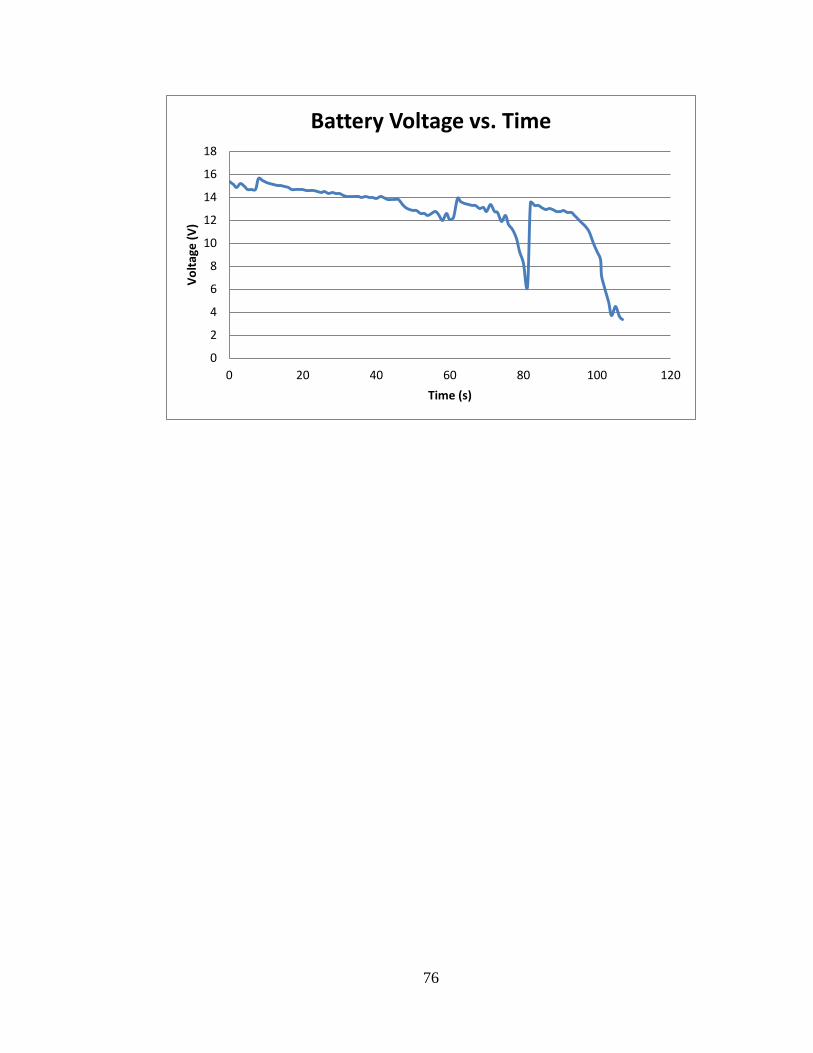
76
0
2
4
6
8
10
12
14
16
18
0 20 40 60 80 100 120
Vo
ltag
e (
V)
Time (s)
Battery Voltage vs. Time

77
D. Calculations and Analysis
i. Motor Calculations
Table 5: Drive Motor Speed
Speed(mph)
Pulley
Diameter(in) Circumference(in)
Motor
Speed(rpm)
0.1 3 18.84 5.605095541
0.2 3 18.84 11.21019108
0.3 3 18.84 16.81528662
0.4 3 18.84 22.42038217
0.5 3 18.84 28.02547771
0.6 3 18.84 33.63057325
0.7 3 18.84 39.23566879
0.8 3 18.84 44.84076433
0.9 3 18.84 50.44585987
1 3 18.84 56.05095541
1.1 3 18.84 61.65605096
1.2 3 18.84 67.2611465
1.3 3 18.84 72.86624204
1.4 3 18.84 78.47133758
1.5 3 18.84 84.07643312
1.6 3 18.84 89.68152866
1.7 3 18.84 95.2866242
1.8 3 18.84 100.8917197
1.9 3 18.84 106.4968153
2 3 18.84 112.1019108
0
20
40
60
80
100
120
0 0.5 1 1.5 2 2.5
Mo
tor
Spe
ed
(rp
m)
Robot Speed (mph)
Robot Speed v. Motor Speed
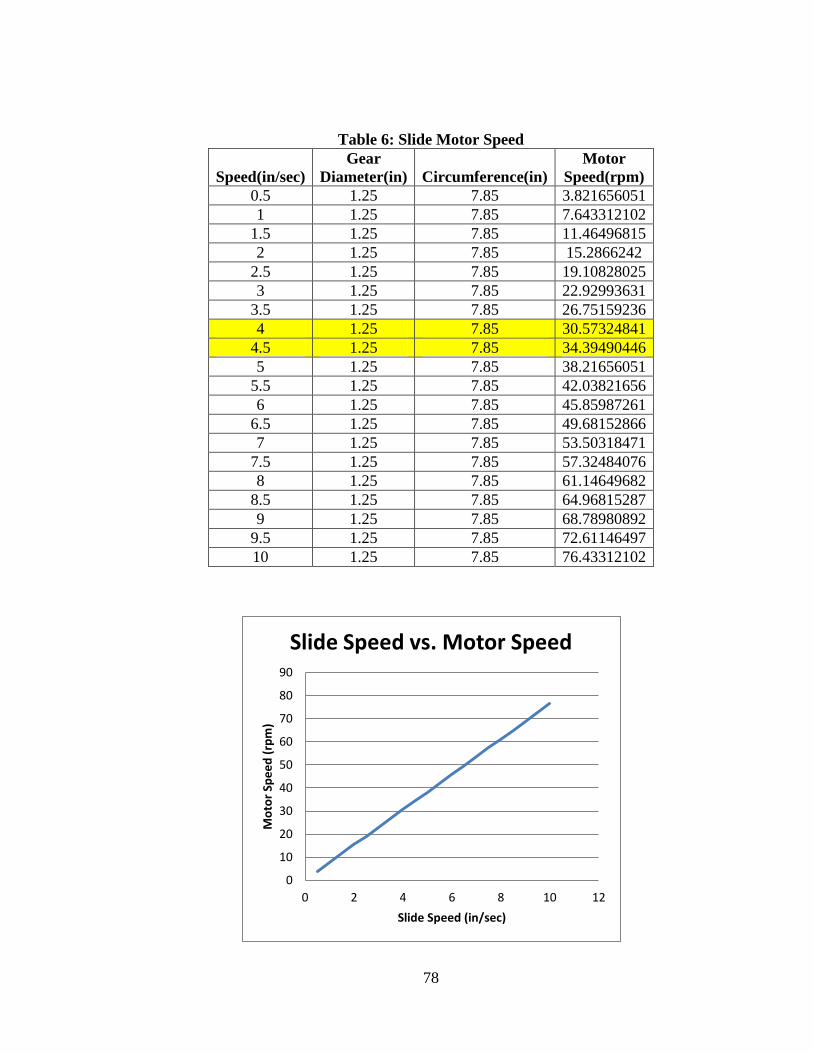
78
Table 6: Slide Motor Speed
Speed(in/sec)
Gear
Diameter(in) Circumference(in)
Motor
Speed(rpm)
0.5 1.25 7.85 3.821656051
1 1.25 7.85 7.643312102
1.5 1.25 7.85 11.46496815
2 1.25 7.85 15.2866242
2.5 1.25 7.85 19.10828025
3 1.25 7.85 22.92993631
3.5 1.25 7.85 26.75159236
4 1.25 7.85 30.57324841
4.5 1.25 7.85 34.39490446
5 1.25 7.85 38.21656051
5.5 1.25 7.85 42.03821656
6 1.25 7.85 45.85987261
6.5 1.25 7.85 49.68152866
7 1.25 7.85 53.50318471
7.5 1.25 7.85 57.32484076
8 1.25 7.85 61.14649682
8.5 1.25 7.85 64.96815287
9 1.25 7.85 68.78980892
9.5 1.25 7.85 72.61146497
10 1.25 7.85 76.43312102
0
10
20
30
40
50
60
70
80
90
0 2 4 6 8 10 12
Mo
tor
Spe
ed
(rp
m)
Slide Speed (in/sec)
Slide Speed vs. Motor Speed

79
ii. Encoder Calibration
Table 7: Encoder Calibration Readings
iii. Thermistor Calibration
y = 0.0039x - 0.4332
0
20
40
60
80
100
0 5000 10000 15000 20000 25000
Dis
tan
ce(i
n)
Encoder Counts
Distance vs. Encoder Counts
Counts Distance(in)
0 0
632 2
1686 6
1766 6.5
2455 9
4074 15.75
4293 16
4622 18
6453 24.5
6759 25.35
6763 26
7350 28
8928 35
10015 38
12274 47.5
13209 51.25
13522 53
15415 59.75
17014 66.5
20471 79
Table 8: Thermistor Calibration Readings
Voltage(V)
Digital
Counts Temperature(C)
3.394 173 8
3.41 173 9
3.277 166 11
3.285 167 11
3.139 160 14
2.983 151 16
2.848 144 19
2.796 141 20
2.772 141 20
2.59 131 23
2.442 124 27
2.223 112 30

80
y = -22.299x + 82.269 0
10
20
30
40
50
60
70
80
0 1 2 3 4
Tem
pe
ratu
re (
C)
Voltage (V)
Voltage vs. Temperature
y = -0.4355x + 81.681 0
10
20
30
40
50
60
70
80
0 50 100 150 200
Tem
pe
ratu
re (
C)
Digital Counts
Digital Counts vs. Temperature
2.136 109 33
1.948 98 36
1.875 95 38
1.677 86 42
1.673 84 42
1.494 75 46
1.33 67 51
1.085 54 54
1.152 58 56
1.025 51 60
0.9443 47 63
0.912 45 65
0.879 43 67
0.748 37 73
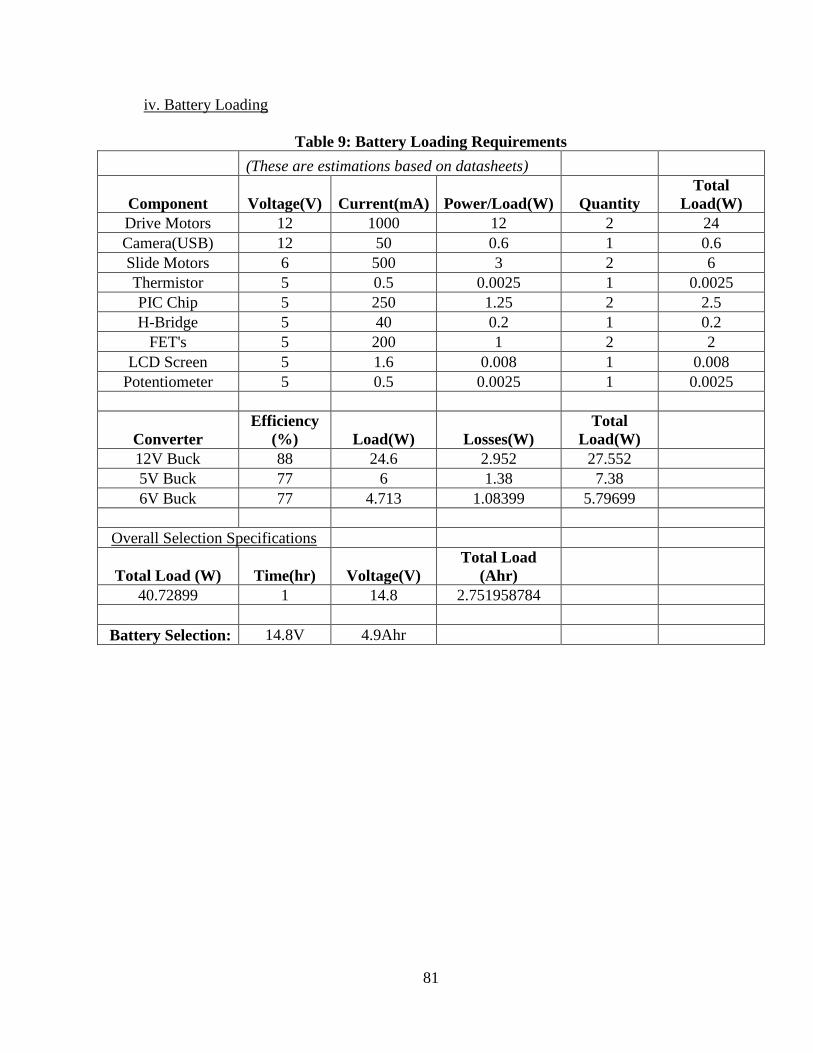
81
iv. Battery Loading
Table 9: Battery Loading Requirements
(These are estimations based on datasheets)
Component Voltage(V) Current(mA) Power/Load(W) Quantity
Total
Load(W)
Drive Motors 12 1000 12 2 24
Camera(USB) 12 50 0.6 1 0.6
Slide Motors 6 500 3 2 6
Thermistor 5 0.5 0.0025 1 0.0025
PIC Chip 5 250 1.25 2 2.5
H-Bridge 5 40 0.2 1 0.2
FET's 5 200 1 2 2
LCD Screen 5 1.6 0.008 1 0.008
Potentiometer 5 0.5 0.0025 1 0.0025
Converter
Efficiency
(%) Load(W) Losses(W)
Total
Load(W)
12V Buck 88 24.6 2.952 27.552
5V Buck 77 6 1.38 7.38
6V Buck 77 4.713 1.08399 5.79699
Overall Selection Specifications
Total Load (W) Time(hr) Voltage(V)
Total Load
(Ahr)
40.72899 1 14.8 2.751958784
Battery Selection: 14.8V 4.9Ahr

82
E. Printed Circuit Board Design & Construction Procedures
i. PCB Design Procedure (Altium Designer)
1. Create new project with schematic, PCB, schematic library and PCB library
2. Create footprints for each component in the PCB library using Component
Wizard
3. Create schematics for each component in the schematic library and link the
schematic with its corresponding footprint.
4. Place schematics in the schematic document and connect the pins.
(Use Vcc and GND labels to simplify voltage connections)
5. Update PCB document with component footprints.
6. Draw a Keep Out layer to represent the physical circuit board dimensions and
place the components inside it.
7. Set up the trace, pad, via and through-hole rules and select auto-route.
8. Select design rule check and fix any bad connections or unconnected
components
9. Export Gerber Files (Top Layer, Bottom Layer, Keep Out Layer)
10. Export NC Drill Files and save the export files seen in the project outputs
folder
ii. PCB Manufacturing Procedure (LPFK S63)
1. Create project in CircuitPro software and select material & ProConduct plating
2. Import Gerber & NC Drill files and label (Top Layer, Bottom Layer, Board
Outline, Plated Holes, Unplated Holes)
3. Place fiducials on each corner (be careful not to place too close to the board
outline)
4. Calculate necessary drill bits (select double pads, contour routing, and check
contour routing bit size)
5. Place drill bits and confirm locations on the software
6. Start production wizard and place board

83
7. After the bottom layer is milled, flip the board and manually locate fiducials if
necessary
8. After the top layer is milled remove the board, place protective material on both
sides of the board but not covering the fiducial holes
9. Apply ProConduct paste until all holes are filled
10. Place the board on the table with felt and porous board underneath and
vacuum the ProConduct Paste through
11. Repeat steps 9 and 10 for the opposite side
12. Cure the paste in the oven for 30 minutes at 375 degrees F
iii. Conformal Coating Procedure (LPFK ProMask)
1. Import top and bottom layers to Circuit CAM and remove all traces, pours, and
holes that are to be coated
2. Print out on clear plastic sheeting
3. Mix paint and curing agent (ProMask Comp A and Comp B) and use paint
roller to apply coating
4. Dry coating in oven at 176 degrees F for 10 minutes or until it is completely
dry
5. Place printout over circuit board and expose to UV Light for 30 Seconds
6. Repeat step 5 for the other side of the board
7. Mix Developer packet with 1000mL of 104-122 deg. F water in bath and take
the epoxy off the PCB pads with a brush or scrubbing pad
8. Mix Conditioner solution with Developer solution and 5000mL of water for
disposal
9. Clean thoroughly, inspect, and remove excess copper with a razor blade
iii. Tips
1. Double check trace size requirements for the required voltage and current.
2. Don’t use through holes to make connections between layers; place a separate
via to avoid bad connections

84
2. Ensure the coating is completely dry before exposing to UV light to avoid
patches of copper
3. Be careful to make sure holes are larger than leads and the machine has the
correct bits to drill the holes
4. Clean off the air permeable pad between millings of each side of the board

85
F. Photographs
i. Fall Semester Prototype
ii. Robot Board

86
iii. Control Board
iv. Distance Measurement

87
v. Temperature Measurement
v. Robot PCB

88
v. Control PCB

89
G. Equipment Manuals and Data Sheets
1. Drive Motors - http://www.pololu.com/catalog/product/1447
2. Slide Motors - http://www.pololu.com/catalog/product/2288
3. PIC 18F4580 - http://ww1.microchip.com/downloads/en/devicedoc/39637c.pdf
4. PIC 32MX795F512H -
http://www.microchip.com/wwwproducts/Devices.aspx?dDocName=en545655#2
5. IR Thermometer(MLX90614)-
http://www.sparkfun.com/datasheets/Sensors/Temperature/MLX90614_rev001.pd
f
6. Camera(CM-26N/P)- http://www.sparkfun.com/datasheets/Sensors/Imaging/CM-
26N.pdf
7. Thermistor(USP10982)-
http://media.digikey.com/pdf/Data%20Sheets/U.S.Sensors/USP10982.pdf
8. Dual H-Bridge IC(NJM2670)-
http://www.datasheetcatalog.org/datasheet/newjapanradio/be10021.pdf
9. 3A Buck Converter IC(lm2576)- http://www.ti.com/lit/ds/symlink/lm2576.pdf
10. 1A Buck Converter IC(tl2575)- http://www.ti.com/lit/ds/symlink/tl2575-05.pdf
11. 2N7000 MOSFET - http://www.fairchildsemi.com/ds/2N/2N7000.pdf
12. 1N5819 Diode - http://www.diodes.com/datasheets/ds23001.pdf
13. 1N5822 Diode - http://www.datasheetcatalog.org/datasheet/vishay/1n5820.pdf
14. 100 µH Inductor -
http://docs-europe.electrocomponents.com/webdocs/082f/0900766b8082f8e2.pdf
15. 330 µH Inductor - http://www.smae.de/uploads/tsl1112.pdf
16. LCD Screen(CFAH2004A-NYA-JP)-
https://engineering.purdue.edu/ece477/Webs/F04-
Grp11/index_files/Documents/20x4LCD.pdf

90
1. Drive Motors
131:1 Metal Gearmotor 37Dx57L mm with 64 CPR Encoder
Pololu item #: 1447
Price
break
Unit price
(US$)
1 39.95
10 35.96
Quantity: 1
backorders
allowed
This 2.71" × 1.45" × 1.45" gearmotor is a powerful 12V brushed DC motor with a
131.25:1 metal gearbox and an integrated quadrature encoder that provides a resolution
of 64 counts per revolution of the motor shaft, which corresponds to 8400 counts per
revolution of the gearbox’s output shaft. These units have a 0.61"-long, 6 mm-diameter
D-shaped output shaft. This gearmotor is also available without an encoder.
Key specs at 12 V: 80 RPM and 300 mA free-run, 250 oz-in (18 kg-cm) and 5 A stall.

91
2. Slide Motors
172:1 Metal Gearmotor 25Dx56L mm with 48 CPR Encoder
Pololu item #: 2288
Price break Unit price (US$)
1 34.95
10 31.46
Quantity: 1
backorders
allowed
This cylindrical, 2.69″ × 0.98″ × 0.98″ brushed DC gearmotor with a 171.79:1 metal
gearbox is a lower-current alternative to our 25D mm HP gearmotors. It has an integrated
48 CPR quadrature encoder on the motor shaft, which corresponds to 8246 counts per
revolution of the gearbox’s output shaft. These units have a 0.315"-long, 4 mm-diameter
D-shaped output shaft. This gearmotor is also available without an encoder.
Key specs at 6 V: 33 RPM and 80 mA free-run, 170 oz-in (12.2 kg-cm) and 2.2 A stall.

92
3. PIC18F4580
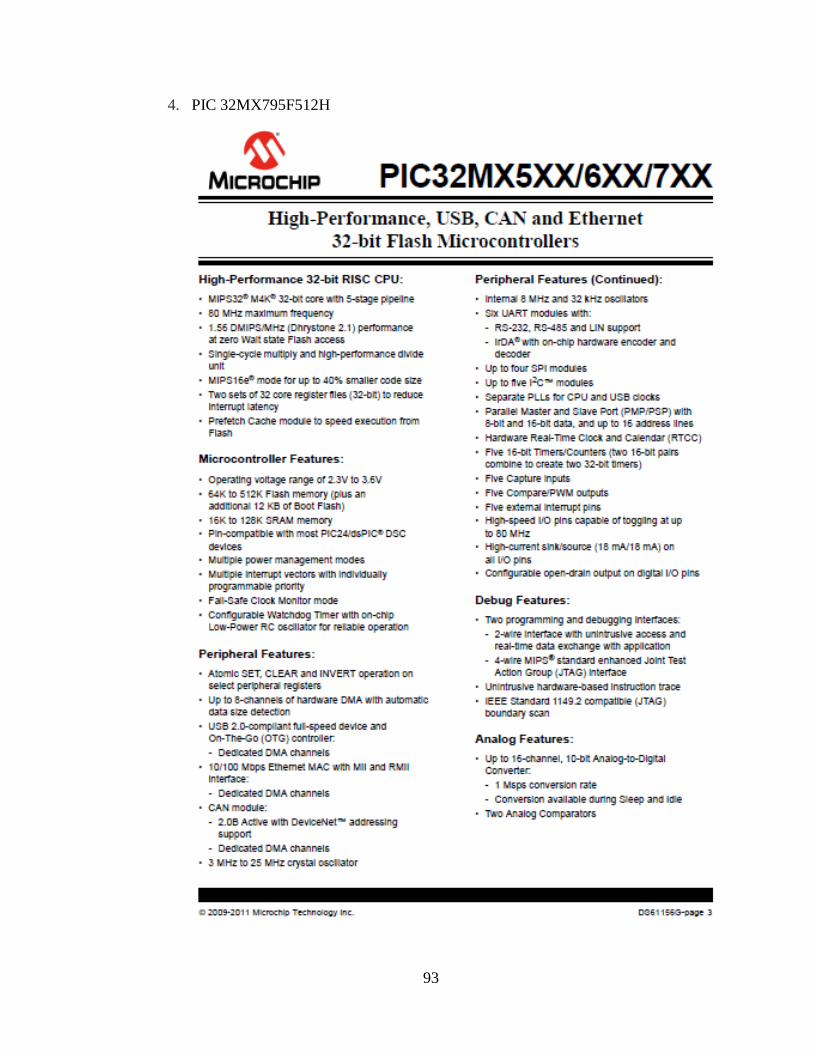
93
4. PIC 32MX795F512H

94
5. IR Thermometer(MLX90614)

95
6. Camera(CM-26N/P)

96
7. Thermistor(USP10982)
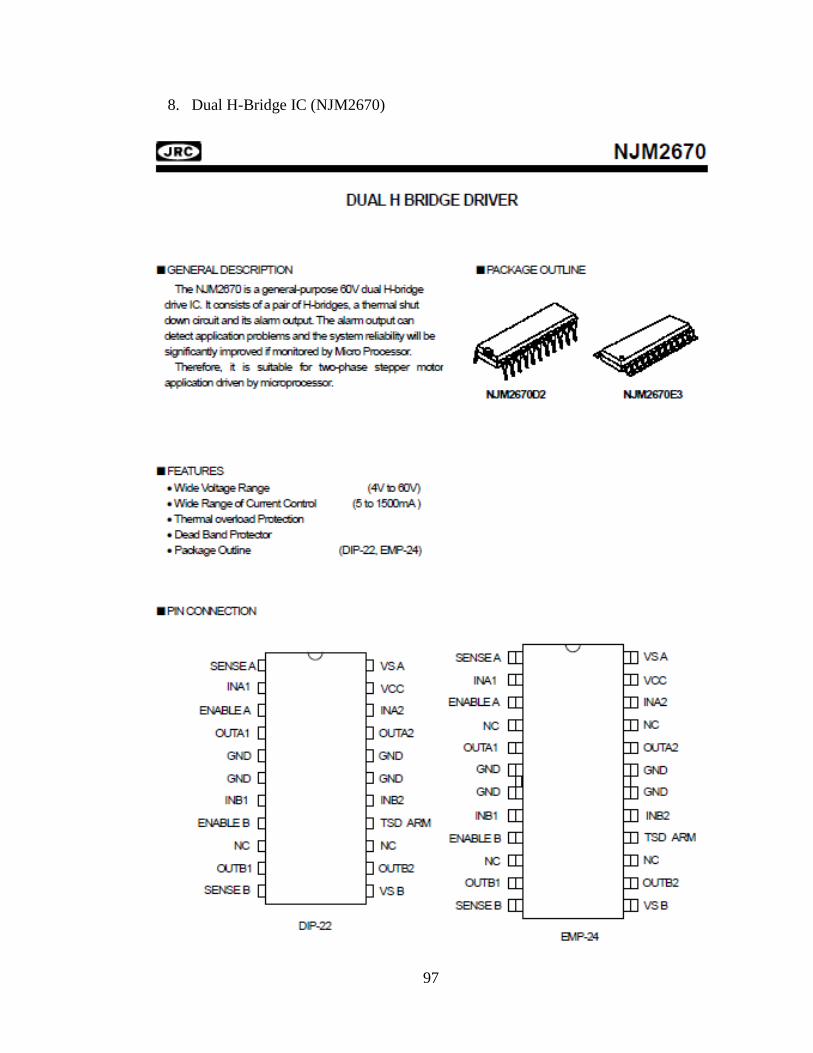
97
8. Dual H-Bridge IC (NJM2670)
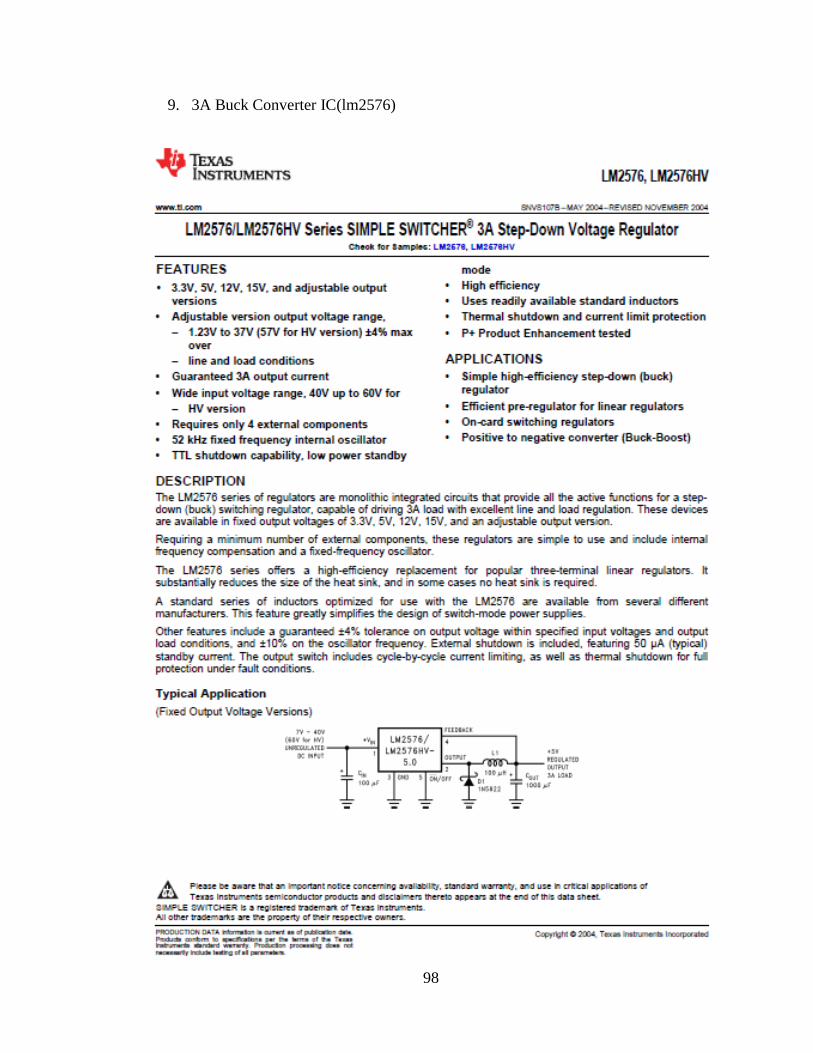
98
9. 3A Buck Converter IC(lm2576)
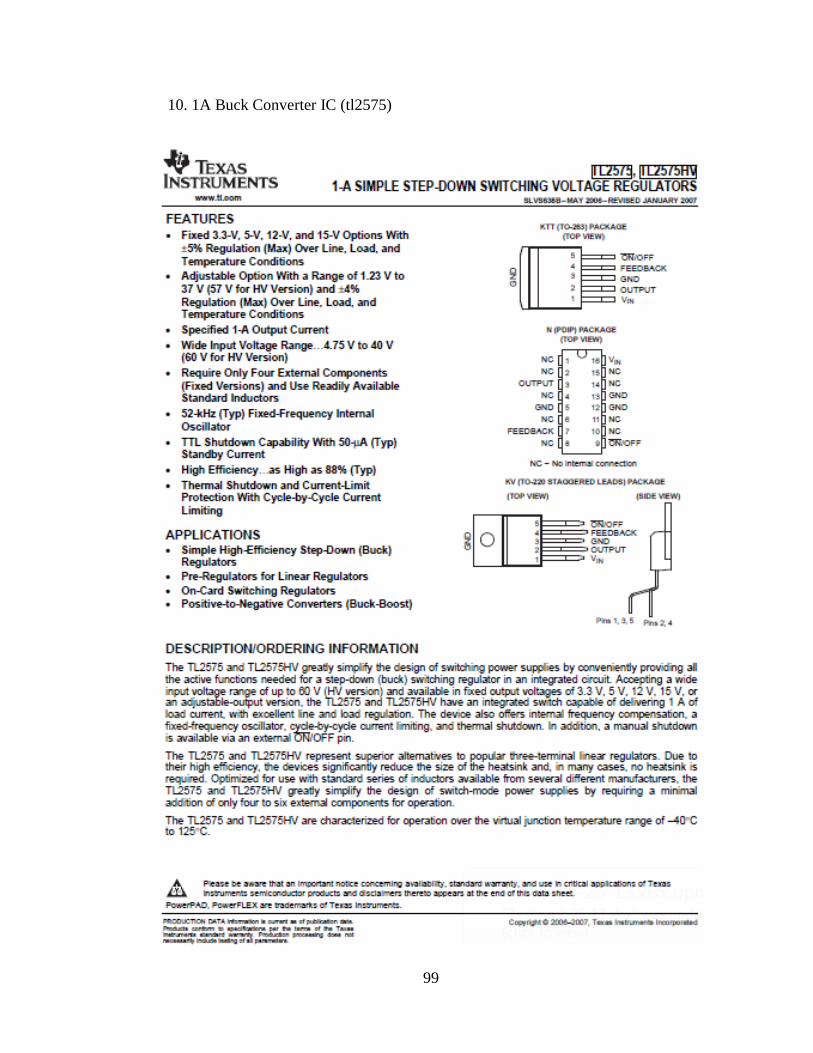
99
10. 1A Buck Converter IC (tl2575)
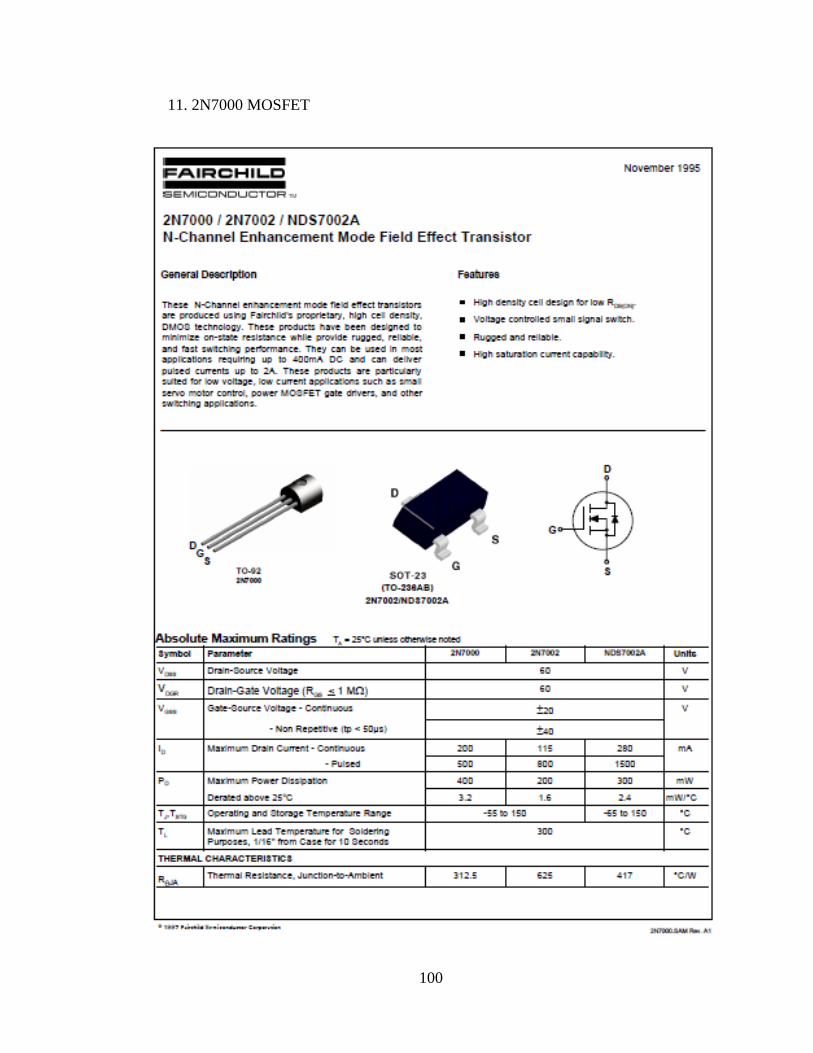
100
11. 2N7000 MOSFET

101
12. 1N5819 Diode
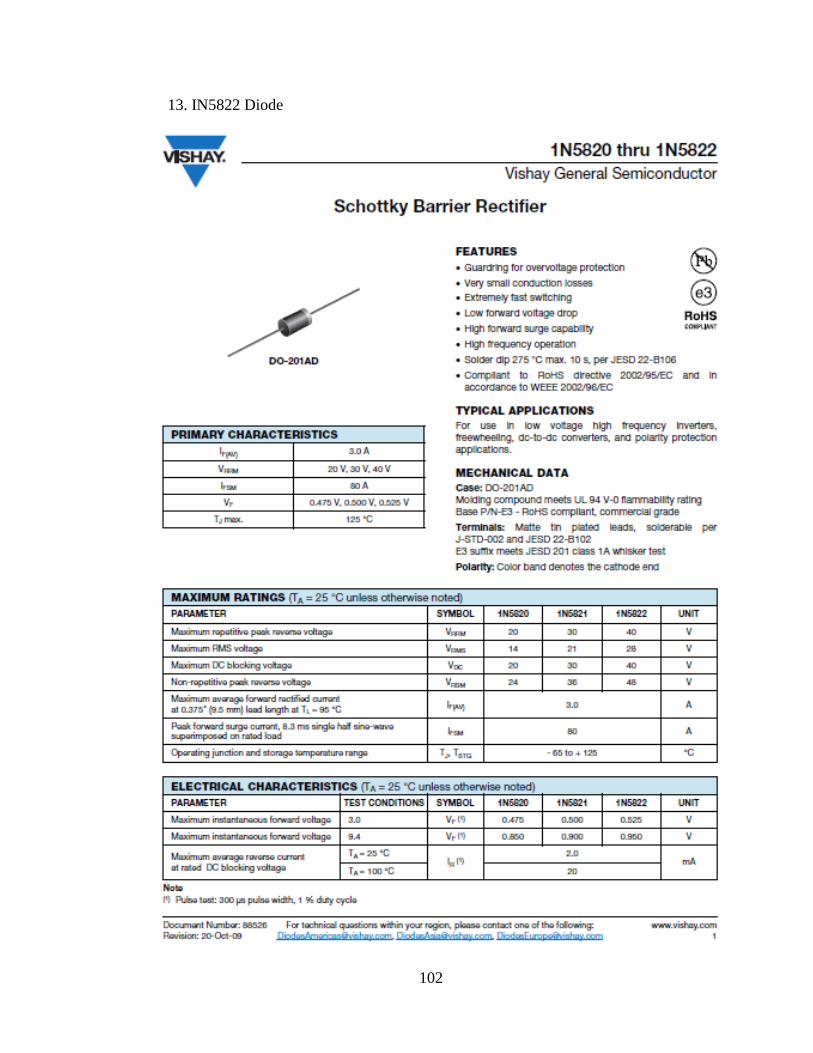
102
13. IN5822 Diode

103
14. 100 µH Inductor

104
15. 330 µH Inductor
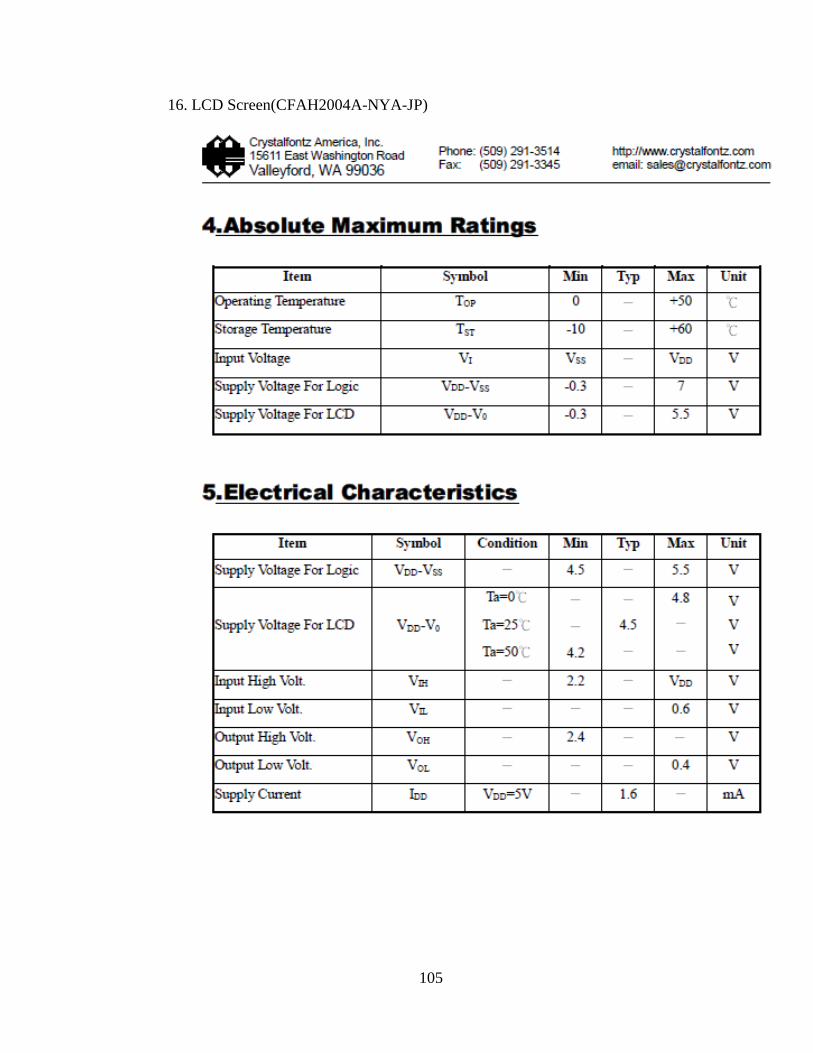
105
16. LCD Screen(CFAH2004A-NYA-JP)
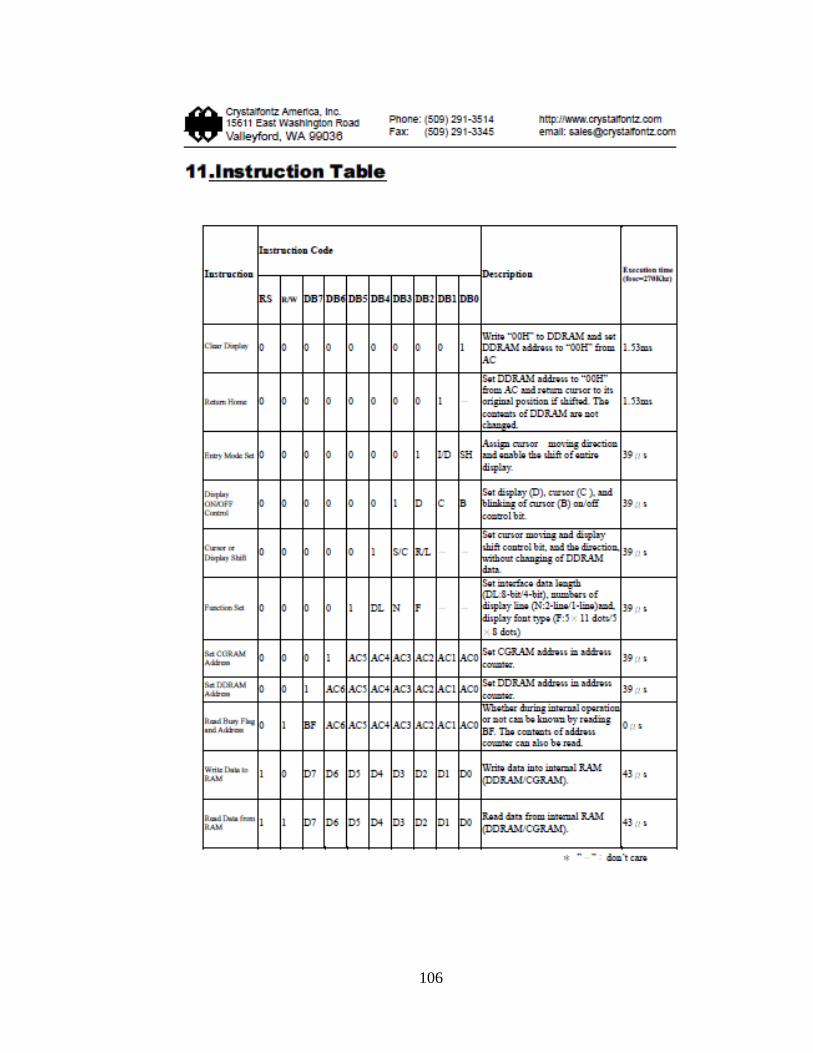
106
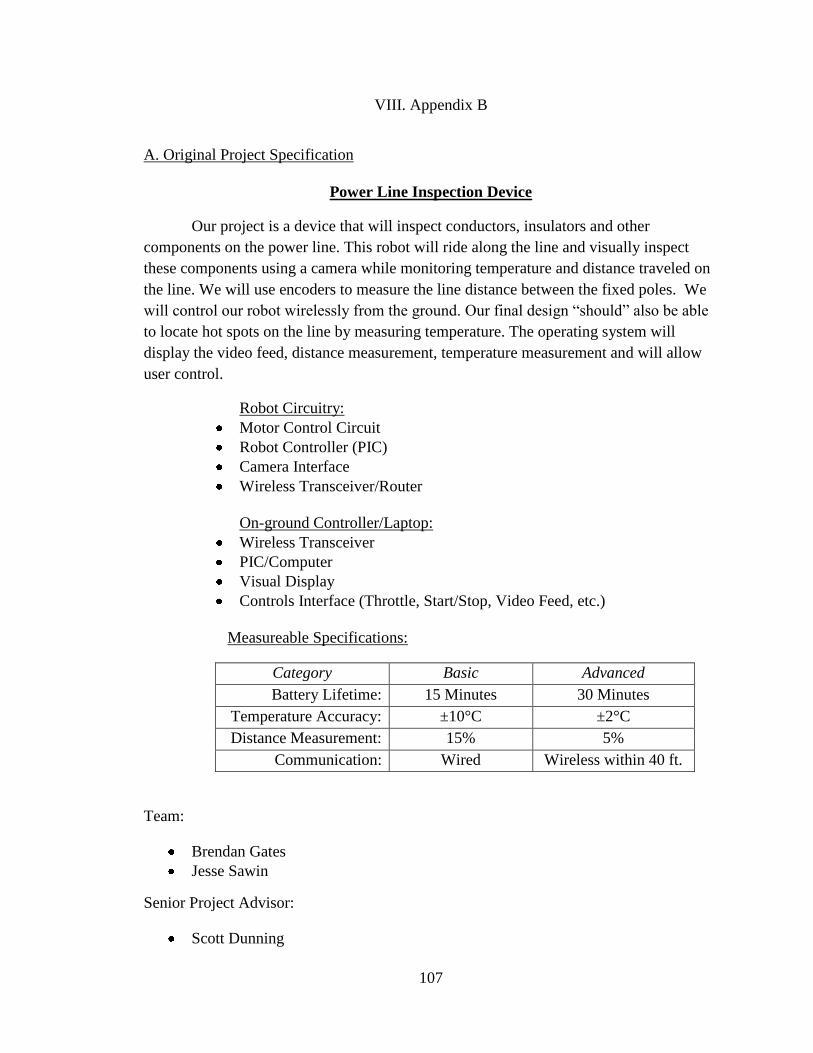
107
VIII. Appendix B
A. Original Project Specification
Power Line Inspection Device
Our project is a device that will inspect conductors, insulators and other
components on the power line. This robot will ride along the line and visually inspect
these components using a camera while monitoring temperature and distance traveled on
the line. We will use encoders to measure the line distance between the fixed poles. We
will control our robot wirelessly from the ground. Our final design “should” also be able
to locate hot spots on the line by measuring temperature. The operating system will
display the video feed, distance measurement, temperature measurement and will allow
user control.
Robot Circuitry:
Motor Control Circuit
Robot Controller (PIC)
Camera Interface
Wireless Transceiver/Router
On-ground Controller/Laptop:
Wireless Transceiver
PIC/Computer
Visual Display
Controls Interface (Throttle, Start/Stop, Video Feed, etc.)
Measureable Specifications:
Category Basic Advanced
Battery Lifetime: 15 Minutes 30 Minutes
Temperature Accuracy: ±10°C ±2°C
Distance Measurement: 15% 5%
Communication: Wired Wireless within 40 ft.
Team:
Brendan Gates
Jesse Sawin
Senior Project Advisor:
Scott Dunning

108
B. Schedule
Task Name Duration Start Finish Resource
Names Notes
Senior Project Schedule 241 days Fri 6/1/12 Fri 5/3/13 Brendan/ Jesse
I. First Summer meeting 1 day Sat 6/9/12 Sat 6/9/12 Brendan/Jesse
A. Part Specifications 1 wk Sat 6/9/12 Thu
6/14/12 Brendan/Jesse
i. Motors 1 wk Sat 6/9/12 Thu
6/14/12 Brendan
ii. Pulleys 1 wk Sat 6/9/12 Thu
6/14/12 Jesse
iii. Gearing 1 wk Sat 6/9/12 Thu
6/14/12 Jesse
iv. Stock 1 wk Sat 6/9/12 Thu
6/14/12 Jesse
B. Preliminary
Conceptual Design 33 days Sat 6/9/12
Tue
7/24/12 Brendan/Jesse
i. Motor/Component
Research 33 days Sat 6/9/12
Tue
7/24/12 Brendan
ii. Project CAD
Drawing 33 days Sat 6/9/12
Tue
7/24/12 Brendan/Jesse
iii. Gearing
Research 33 days Sat 6/9/12
Tue
7/24/12 Jesse
II. Second Summer
Meeting 1 day
Tue
7/24/12
Tue
7/24/12 Brendan/Jesse
A. Part Ordering 2 wks Tue
7/24/12
Mon
8/6/12 Brendan/Jesse
i. Pulleys 1 day Wed
7/25/12
Wed
7/25/12 Jesse
ii. Gearing 1 day Wed
7/25/12
Wed
7/25/12 Jesse
iii. Members 1 day Sat
7/28/12 Sat 7/28/12 Jesse
iv. Main Assembly
Stock 1 day
Sat
8/11/12 Sat 8/11/12 Jesse
v. Infrared
Thermometer 6 days
Tue
8/21/12
Tue
8/28/12 Brendan
vi. Motors 6 days Tue
8/21/12
Tue
8/28/12 Brendan
B. Secondary Design 29 days Tue
7/24/12 Sat 9/1/12
i. Final Conceptual
Design 1 day
Tue
7/24/12
Tue
7/24/12 Brendan/Jesse

109
ii. Preliminary
Mechanical Construction 24 days
Wed
8/1/12 Sat 9/1/12 Jesse
III. Fall Semester 75 days Sat 9/1/12 Fri
12/14/12 Brendan/ Jesse
A. Part Ordering 71 days Sat 9/1/12 Fri 12/7/12 Brendan/ Jesse
i. Threaded Rod 1 day Sat 9/8/12 Sat 9/8/12 Jesse
ii. Motor Caps 7 days Sat 9/8/12 Sun
9/16/12 Jesse
iii. Break-Out Board 4 days Tue
9/11/12 Fri 9/14/12 Brendan
iv. Spring 1 day Tue
9/11/12
Tue
9/11/12 Jesse
v. Miscellaneous
Tensioner Components 1.2 wks
Thu
9/13/12
Thu
9/20/12 Jesse
vi. Motor Control
Components 6 days
Tue
10/2/12
Tue
10/9/12 TBD
vii. Wireless
Components 3 days
Tue
10/2/12
Thu
10/4/12 TBD
TBD 2nd
Semester
B. Electrical Design 70 days Sat 9/1/12 Thu
12/6/12 Brendan/Jesse
i. Motor Control
Circuit Design 23 days
Tue
9/18/12
Thu
10/18/12 Brendan/ Jesse
ii. Voltage
Regulation 11 days
Tue
10/23/12
Tue
11/6/12 Brendan/ Jesse
iii. Wireless
Specifications & Setup 31 days
Thu
10/11/12
Thu
11/22/12 Brendan/ Jesse
TBD 2nd
Semester
iv. Programming 46 days Tue
10/2/12
Tue
12/4/12 Brendan
v. Motor Control 11 days Tue
10/2/12
Tue
10/16/12 Brendan
vi. Encoder and IR
Thermometer Input 29 days
Thu
10/18/12
Tue
11/27/12 Brendan
Used
Thermistor
vii. Camera Input 16 days Thu
11/1/12
Thu
11/22/12 Brendan
viii. Data
Communication 19 days
Tue
11/6/12
Fri
11/30/12 Brendan
ix. Testing &
Tweaking 26 days
Sat
11/10/12
Fri
12/14/12 Brendan/ Jesse
C. Mechanical Work 76 days Sat 9/1/12 Fri
12/14/12
i. Secondary
Mechanical Construction 66 days Sat 9/1/12
Fri
11/30/12 Jesse
D. CAD Drawings 70 days Sat 9/1/12 Thu
12/6/12

110
i. Conceptual CAD
Drawing Completion 4 days Sat 9/1/12
Wed
9/5/12 Brendan
ii. As Built
Mechanical Drawing (3D) 37 days
Tue
10/2/12
Wed
11/21/12 Brendan TBD
IV. Spring Semester 68 days Mon
1/14/13
Wed
4/17/13 Brendan/Jesse
A. PCB 33 days Mon
1/14/13
Wed
2/27/13 Brendan/Jesse
B. Layout/Design 20 days Mon
1/14/13 Fri 2/8/13 Brendan/Jesse
C. Populating and
Soldering 19 days
Mon
2/25/13
Thu
3/21/13 Brendan/Jesse
D. Paper 33 days Mon
1/14/13
Wed
2/27/13 Brendan/Jesse
E. Presentation Slide
Show 29 days Fri 3/1/13
Wed
4/10/13 Brendan/Jesse
F. Robot Upgrades 34 days Fri 3/1/13 Wed
4/17/13 Brendan/Jesse
G. Wireless
Communication Brendan
H. Obstacle
Avoidance Jesse
I. Drawings 68 days Mon
1/14/13
Wed
4/17/13 Brendan/Jesse
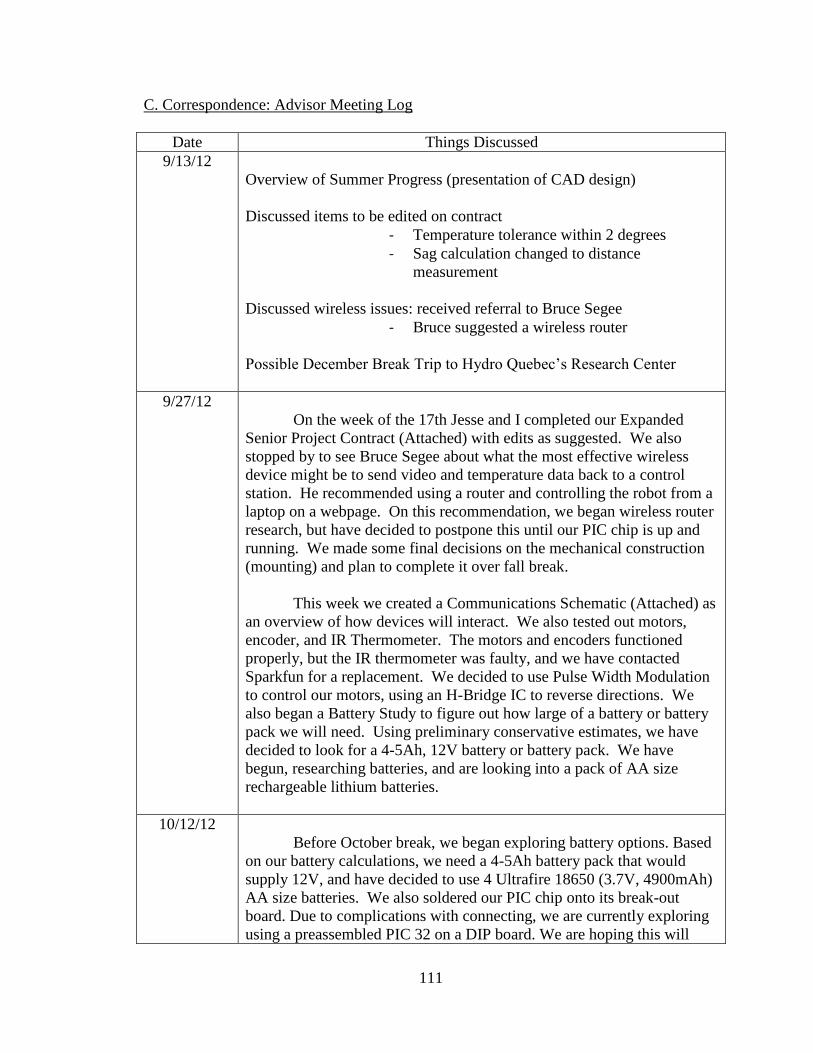
111
C. Correspondence: Advisor Meeting Log
Date Things Discussed
9/13/12
Overview of Summer Progress (presentation of CAD design)
Discussed items to be edited on contract
- Temperature tolerance within 2 degrees
- Sag calculation changed to distance
measurement
Discussed wireless issues: received referral to Bruce Segee
- Bruce suggested a wireless router
Possible December Break Trip to Hydro Quebec’s Research Center
9/27/12
On the week of the 17th Jesse and I completed our Expanded
Senior Project Contract (Attached) with edits as suggested. We also
stopped by to see Bruce Segee about what the most effective wireless
device might be to send video and temperature data back to a control
station. He recommended using a router and controlling the robot from a
laptop on a webpage. On this recommendation, we began wireless router
research, but have decided to postpone this until our PIC chip is up and
running. We made some final decisions on the mechanical construction
(mounting) and plan to complete it over fall break.
This week we created a Communications Schematic (Attached) as
an overview of how devices will interact. We also tested out motors,
encoder, and IR Thermometer. The motors and encoders functioned
properly, but the IR thermometer was faulty, and we have contacted
Sparkfun for a replacement. We decided to use Pulse Width Modulation
to control our motors, using an H-Bridge IC to reverse directions. We
also began a Battery Study to figure out how large of a battery or battery
pack we will need. Using preliminary conservative estimates, we have
decided to look for a 4-5Ah, 12V battery or battery pack. We have
begun, researching batteries, and are looking into a pack of AA size
rechargeable lithium batteries.
10/12/12
Before October break, we began exploring battery options. Based
on our battery calculations, we need a 4-5Ah battery pack that would
supply 12V, and have decided to use 4 Ultrafire 18650 (3.7V, 4900mAh)
AA size batteries. We also soldered our PIC chip onto its break-out
board. Due to complications with connecting, we are currently exploring
using a preassembled PIC 32 on a DIP board. We are hoping this will
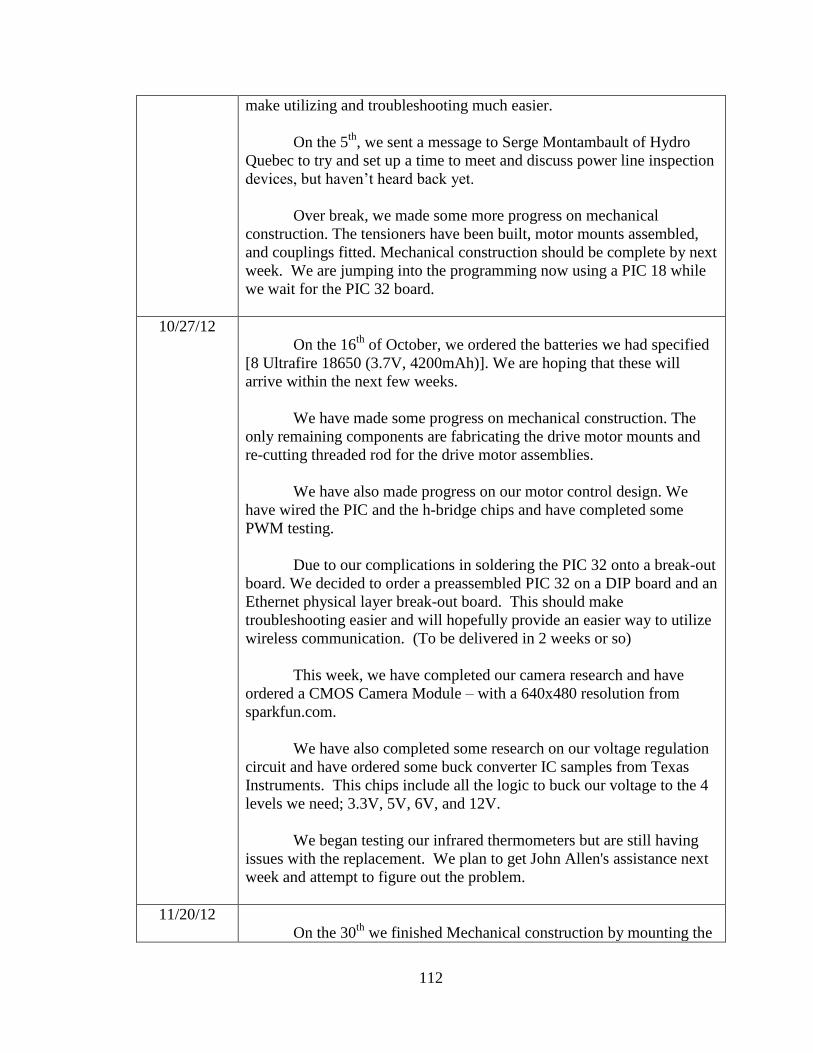
112
make utilizing and troubleshooting much easier.
On the 5th
, we sent a message to Serge Montambault of Hydro
Quebec to try and set up a time to meet and discuss power line inspection
devices, but haven’t heard back yet.
Over break, we made some more progress on mechanical
construction. The tensioners have been built, motor mounts assembled,
and couplings fitted. Mechanical construction should be complete by next
week. We are jumping into the programming now using a PIC 18 while
we wait for the PIC 32 board.
10/27/12
On the 16th
of October, we ordered the batteries we had specified
[8 Ultrafire 18650 (3.7V, 4200mAh)]. We are hoping that these will
arrive within the next few weeks.
We have made some progress on mechanical construction. The
only remaining components are fabricating the drive motor mounts and
re-cutting threaded rod for the drive motor assemblies.
We have also made progress on our motor control design. We
have wired the PIC and the h-bridge chips and have completed some
PWM testing.
Due to our complications in soldering the PIC 32 onto a break-out
board. We decided to order a preassembled PIC 32 on a DIP board and an
Ethernet physical layer break-out board. This should make
troubleshooting easier and will hopefully provide an easier way to utilize
wireless communication. (To be delivered in 2 weeks or so)
This week, we have completed our camera research and have
ordered a CMOS Camera Module – with a 640x480 resolution from
sparkfun.com.
We have also completed some research on our voltage regulation
circuit and have ordered some buck converter IC samples from Texas
Instruments. This chips include all the logic to buck our voltage to the 4
levels we need; 3.3V, 5V, 6V, and 12V.
We began testing our infrared thermometers but are still having
issues with the replacement. We plan to get John Allen's assistance next
week and attempt to figure out the problem.
11/20/12
On the 30th
we finished Mechanical construction by mounting the

113
drive motors. We also designed buck converter circuits to obtain our four
voltage levels (3.3V, 5V, 6V and 12V) and ordered parts. We decided
this would allow us to achieve our voltage levels with the most
efficiency. We began router research and programming PWM control on
the PIC chip.
November 1st, we tested the IR thermometer once again and had
no success. Since then we have contacted both the manufacturer and the
distributer. Both sources provided some guidance in communication with
the thermometer, but we ordered an evaluation board from sparkfun.com
just in case.
On the 5th
, we received an e-mail from Hydro-Quebec telling us
that they cannot schedule a meeting of the type we wanted. We have not
pursued this any further. We built our buck converter circuits and
confirmed their operation to output 3.3V, 5V, 6V, and 12V
We received our batteries and chargers and confirmed their
operation. Their size was misleading; they were much larger than the AA
package we had intended so we ordered new battery packs to fit the larger
size. Temporarily we connected four of the batteries and shrink wrapped
them to achieve the 14.8 volts we needed for our buck converter inputs.
We also mounted the drive motors on the robot.
On the 7th
, we finished assembly of our test stand by spanning the
conductor between ends. We realized that ballast would be required on
either end to ensure the robot doesn’t fall so we purchased several cement
blocks to hold the ends down.
On the 9th
, we rewired the breadboard to take off the outer rails so
it would fit inside the robot. We followed up with Melexis about the IR
Thermometers and later heard back that they needed to be wired and
programmed in a SMBus configuration.
On the 13th
, we began to wire and write code for our
potentiometer control circuit. This is how we want to control the both the
slide and drive motors of the robot. We also began drawing a schematic
of our breadboard for aid in troubleshooting.
On the 14th
, we were having trouble with the potentiometer
control. Internally the PIC was not switching fast enough so we
supplemented this control circuit with external transistors using pull-up
and pull-down resistors to correct the problem.
This past weekend, we soldered the motor leads on all four motors
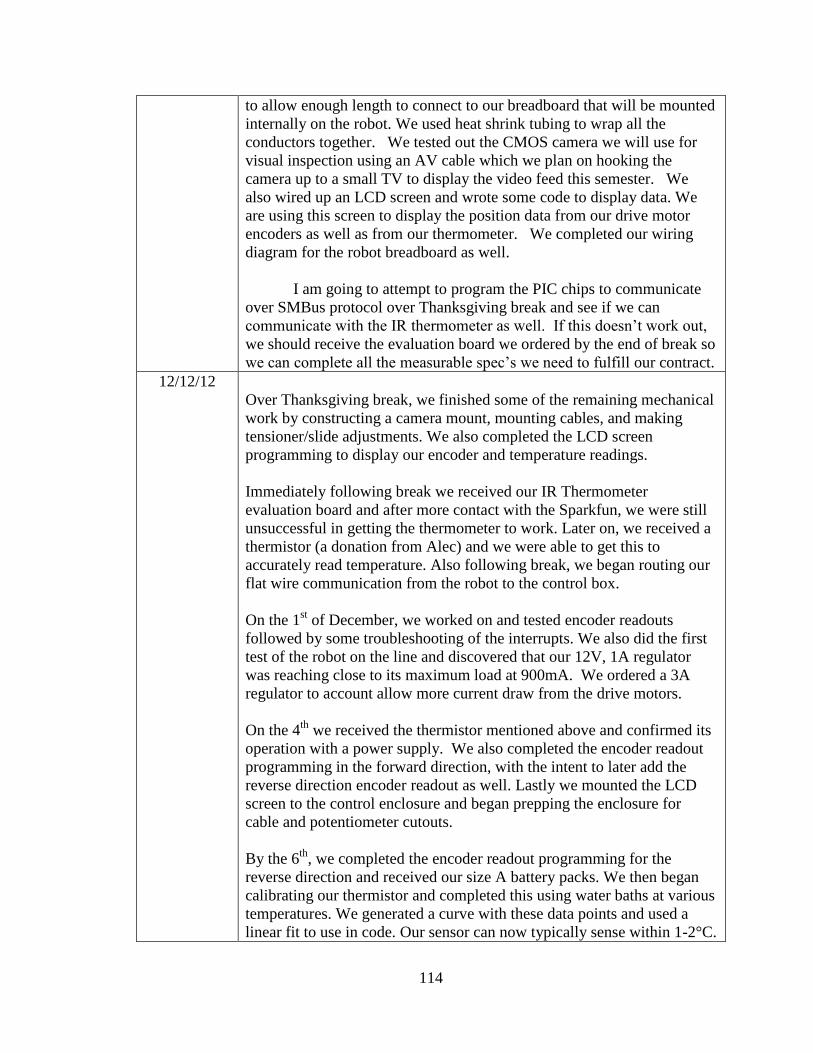
114
to allow enough length to connect to our breadboard that will be mounted
internally on the robot. We used heat shrink tubing to wrap all the
conductors together. We tested out the CMOS camera we will use for
visual inspection using an AV cable which we plan on hooking the
camera up to a small TV to display the video feed this semester. We
also wired up an LCD screen and wrote some code to display data. We
are using this screen to display the position data from our drive motor
encoders as well as from our thermometer. We completed our wiring
diagram for the robot breadboard as well.
I am going to attempt to program the PIC chips to communicate
over SMBus protocol over Thanksgiving break and see if we can
communicate with the IR thermometer as well. If this doesn’t work out,
we should receive the evaluation board we ordered by the end of break so
we can complete all the measurable spec’s we need to fulfill our contract.
12/12/12
Over Thanksgiving break, we finished some of the remaining mechanical
work by constructing a camera mount, mounting cables, and making
tensioner/slide adjustments. We also completed the LCD screen
programming to display our encoder and temperature readings.
Immediately following break we received our IR Thermometer
evaluation board and after more contact with the Sparkfun, we were still
unsuccessful in getting the thermometer to work. Later on, we received a
thermistor (a donation from Alec) and we were able to get this to
accurately read temperature. Also following break, we began routing our
flat wire communication from the robot to the control box.
On the 1st of December, we worked on and tested encoder readouts
followed by some troubleshooting of the interrupts. We also did the first
test of the robot on the line and discovered that our 12V, 1A regulator
was reaching close to its maximum load at 900mA. We ordered a 3A
regulator to account allow more current draw from the drive motors.
On the 4th
we received the thermistor mentioned above and confirmed its
operation with a power supply. We also completed the encoder readout
programming in the forward direction, with the intent to later add the
reverse direction encoder readout as well. Lastly we mounted the LCD
screen to the control enclosure and began prepping the enclosure for
cable and potentiometer cutouts.
By the 6th
, we completed the encoder readout programming for the
reverse direction and received our size A battery packs. We then began
calibrating our thermistor and completed this using water baths at various
temperatures. We generated a curve with these data points and used a
linear fit to use in code. Our sensor can now typically sense within 1-2°C.

115
We also purchased a half-sized breadboard to place in our control box
and got all off the components swapped onto it and finished construction
of the control box by mounting the potentiometers.
On the 7th
, we decided to try one of our multimeter test probe thermistors
to use instead of the bulkier thermistor we received. The problem we had
with the larger thermistor was that the high resistance of it made it very
slow in reaching its set point and displaying temperature. Since our test
probe was very fast acting we decided to try another test probe. We
discovered that the test probes only change about an ohm, so our output
voltage would need to be amplified. After a discussion with John, we
decided that amplifying would draw too much current so we stuck with
the original thermistor. So we mounted the thermistor we had on the
center of the robot using some thin-wall aquarium tubing donated by
Travis and Eric.
Over the weekend of the 8th
and 9th
, we began prepping the entire project
for a presentation on Monday (12/10). We replaced our 12V regulator
with the 3A version we ordered, the chip still seemed to heat up
significantly so we mounted it to heat sink. We re-calibrated our
thermistor to ensure an accurate reading and to include more data points
on our curve. We also calibrated our distance measurement once again
and got accuracy within one inch. Our last minute mechanical work
consisted of mounting a power switch and some more cable routing. On
Saturday we tested the battery lifetime of one battery pack on the motors,
we barely cleared our 15 minute C spec by lasting 22 seconds over that
mark. Sunday, we decided to hook up both of our battery packs in
parallel to increase battery life. The battery packs were prone to
connection failure, but we were able to confirm a battery lifetime of 1
hour and 47 minutes, and generate a decent battery curve. We
encountered a few mechanical issues and had to adjust the batteries once
or twice to ensure contact during the test.
Before our presentation on the 10th
, we re-taped our motor pulleys with 3
strips to ensure better traction with the line and made sure our batteries
were operable prior to the presentation. At noon we gave our
demonstration to John and Jude and were able to meet our A specs for:
battery lifetime, temperature accuracy, and distance accuracy. We did not
meet A spec on wireless communication as we had not planned to
complete this until next semester.
On the 11th
and 12th
, we began cleaning up or documentation and
prepping our project binder. We also took pictures and videos to give
some visual aspects to our documentation.
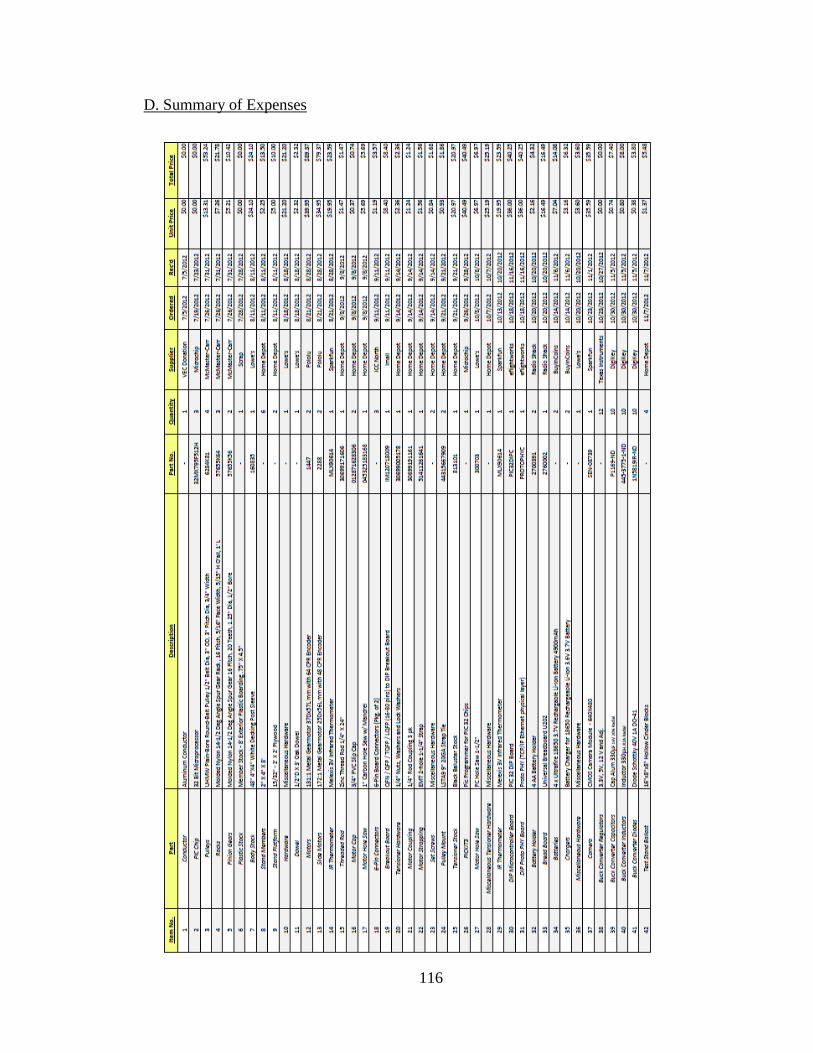
116
D. Summary of Expenses

117