A nudge-based intervention to reduce problematic ... - OSF
48
NUDGE-BASED INTERVENTION 1 A nudge-based intervention to reduce problematic smartphone use 1 Jay A. Olson 1 , Dasha A. Sandra 2 , Denis Chmoulevitch 3 , Amir Raz 1,4 , and Samuel P. L. Veissière 1 1 Department of Psychiatry, McGill University, Montreal, QC, Canada 2 Integrated Program in Neuroscience, McGill University, Montreal, QC, Canada 3 Department of Psychology, McGill University, Montreal, QC, Canada 4 Institute for Interdisciplinary Behavioral and Brain Sciences, Chapman University, Irvine, CA, USA Author Note This research was supported by the Canada First Research Excellence Fund, awarded to the Healthy Brains for Healthy Lives initiative (#3c-KM-10) at McGill University. JO acknowledges funding from le Fonds de recherche du Québec — Santé (FRQS). JO, DS, DC, AR, and SV declare that they have no conflict of interest. All datasets are available at https://osf.io/5mqnp/. Pre-registrations are available at https://osf.io/wmvje and https://osf.io/3p7rz and have been copied in the Appendix. 1 Preprint (2021-12-29). Corresponding author: J. A. Olson ([email protected]).
-
Upload
khangminh22 -
Category
Documents
-
view
0 -
download
0
Transcript of A nudge-based intervention to reduce problematic ... - OSF
NUDGE-BASED INTERVENTION 1
A nudge-based intervention
to reduce problematic smartphone use1
Jay A. Olson1, Dasha A. Sandra2, Denis Chmoulevitch3, Amir Raz1,4, and Samuel P. L. Veissière1
1Department of Psychiatry, McGill University, Montreal, QC, Canada
2Integrated Program in Neuroscience, McGill University, Montreal, QC, Canada
3Department of Psychology, McGill University, Montreal, QC, Canada
4Institute for Interdisciplinary Behavioral and Brain Sciences, Chapman University, Irvine, CA,
USA
Author Note
This research was supported by the Canada First Research Excellence Fund, awarded to the
Healthy Brains for Healthy Lives initiative (#3c-KM-10) at McGill University. JO acknowledges
funding from le Fonds de recherche du Québec — Santé (FRQS). JO, DS, DC, AR, and SV declare
that they have no conflict of interest. All datasets are available at https://osf.io/5mqnp/.
Pre-registrations are available at https://osf.io/wmvje and https://osf.io/3p7rz and have been copied
in the Appendix.
1 Preprint (2021-12-29). Corresponding author: J. A. Olson ([email protected]).
NUDGE-BASED INTERVENTION 2
Abstract
Problematic smartphone use is rising across the world. We tested an intervention with ten strategies
that nudge users to reduce their smartphone use, for example by disabling non-essential
notifications. Participants first completed baseline measures of smartphone use, well-being, and
cognition, before choosing which intervention strategies to follow for two to six weeks. Study 1
(N = 51) used a pre–post design while Study 2 (N = 70) compared the intervention to a control
group who monitored their screen time. Study 1 found reductions in problematic smartphone use,
screen time, and depressive symptoms after two weeks. Study 2 found that the intervention reduced
problematic smartphone use, lowered screen time, and improved sleep quality compared to the
control group. This intervention, which takes 10 min to begin implementing, returned problematic
smartphone use scores to normal levels for at least six weeks. These results demonstrate that
various strategies can be combined while maintaining feasibility and efficacy.
Keywords: problematic smartphone use, smartphone addiction, depression, screen time,
intervention, nudges
NUDGE-BASED INTERVENTION 3
Introduction
Around half of the global population owns a smartphone and this number continues to rise
(Newzoo, 2021; O’Dea, 2021). Screen time is similarly increasing: young adults across the world
now spend 2 to 3 h per day on social media alone (GlobalWebIndex, 2021). Accordingly, there
have been growing concerns about problematic smartphone use, in which compulsive patterns of
use impair daily functioning (Busch & McCarthy, 2021). A recent meta-analysis of 24 countries
found that problematic smartphone use has been increasing across the world for the past decade
(Olson et al., 2022), despite the growing availability of technological interventions such as screen
time tracking aiming to reduce it (Deloitte, 2019).
Problematic smartphone use has been associated with various negative effects, such as
cognitive impairments across the domains of driving, work, and education (Wilmer et al., 2017).
Using a phone while driving slows reaction time, increases erratic behaviour, and can cause
collisions (Caird et al., 2014; National Center for Statistics and Analysis, 2020; Perlman et al.,
2019). In work-related contexts, receiving notifications can impair task performance as much as
writing a text message or talking on the phone (Stothart et al., 2015). Even the mere presence of
one’s smartphone can reduce performance on working memory tasks (Ward et al., 2017).
Problematic smartphone use and social networking site use also negatively correlate with university
grades (Kirschner & Karpinski, 2010; Li et al., 2015), though the effect sizes may be small
(Bjerre-Nielsen et al., 2020).
The evidence is mixed regarding the relationship between problematic smartphone use and
various aspects of well-being. Some studies have found that smartphone use at night is associated
with later bedtimes and lower sleep quality (Demirci et al., 2015; Lemola et al., 2014); others have
argued that these correlations are present but weak (Orben & Przybylski, 2020; Przybylski, 2019).
There is even less agreement about the relationship between phone use and depression.
Country-wide smartphone ownership has coincided with increases in depression and anxiety among
teenagers and young adults (Twenge, Cooper, et al., 2019). Cross-sectional surveys show negative
NUDGE-BASED INTERVENTION 4
correlations between screen time and well-being (Sarris et al., 2020; Twenge et al., 2018), and
laboratory studies have found correlations between problematic smartphone use and depression
(Elhai et al., 2017). These links may be strongest when phones are used for passive social media
consumption (e.g., scrolling through feeds without interaction) rather than to actively socialise
(Elhai et al., 2017; Escobar-Viera et al., 2018). In contrast, other researchers have argued that these
correlations may be inflated by flexible definitions of well-being (Orben & Przybylski, 2019a,
2019b), screen time (Kaye et al., 2020), and problematic smartphone use (Connolly et al., 2021).
Evidence is also mixed regarding the effectiveness of behavioural interventions targeting
problematic smartphone use to reduce depression. One study found that limiting social networking
site use to 10 min per platform per day reduced depression (Hunt et al., 2018); another intervention
also reduced screen time but found no such effect (Holte & Ferraro, 2020). Researchers continue to
debate the nature and magnitude of the link between smartphone use and specific aspects of
well-being (Twenge et al., 2020).
Perhaps the simplest argument for reducing smartphone use is that many people would
rather spend their time doing something else (Deloitte, 2018; Lukoff et al., 2018). Nearly half of
smartphone users in developed countries consider themselves to be over-using their phones
(Deloitte, 2019). Problematic smartphone use may have negative consequences because it replaces
or interferes with activities that increase well-being, such as sleeping, exercising, or (in-person)
socialising (Kushlev & Leitao, 2020). Indeed, adolescents worldwide are doing less of these
healthy activities than in the past (Guthold et al., 2018; Keyes et al., 2015; Sarris et al., 2020;
Twenge, Spitzberg, et al., 2019), likely in part due to technology use (Oberle et al., 2020).
Intervention approaches
Perhaps the most popular attempt to reduce problematic smartphone use is screen time
monitoring (Zimmermann, 2021), which is now built in to most smartphones. Still, only a minority
of smartphone owners report using it (Deloitte, 2019), and screen time notifications alone may be
ineffective at reducing screen time or phone checking behaviour (Loid et al., 2020; Zimmermann,
NUDGE-BASED INTERVENTION 5
2021). Some researchers have also argued that “fighting tech with tech” may pose a conflict of
interest, since phone manufacturers or app designers may be financially motivated to maximise
rather than reduce engagement (Rezaee & Pedret, 2018). In addition to monitoring, over 100 apps
claim to help with reducing screen time (Bychkov & Young, 2018). Most of these do not rely on
psychological theories or mechanisms (Velthoven et al., 2018) and only a handful have been
formally tested (Mac Cárthaigh, 2020). Some of the more effective ones can reduce social media
use (Okeke et al., 2018) or screen time (Busch & McCarthy, 2021; Kim et al., 2019), but one survey
found that most people are not willing to use additional technology to help them do so; they would
rather have more control over the process (Hiniker et al., 2015).
Other approaches have focused on monetary incentives and self-control, such as limiting
daily time spent on social networking sites (Allcott et al., 2021; Collis & Eggers, 2019; Hunt et al.,
2018; Okeke et al., 2018). Such restrictions can reduce screen time and depressive symptoms (Hunt
et al., 2018) as well as improve well-being during the study period (Allcott et al., 2020). These
approaches, while effective, may be less feasible for some populations in the long term. Participants
tend to stop their restrictions at the end of the intervention period (Hunt et al., 2018), and others say
they would need to be paid over $1,000 to deactivate their Facebook account for one year (Corrigan
et al., 2018; Mosquera et al., 2019). People generally struggle to regulate their smartphone use (Ko
et al., 2015) yet still over-estimate their level of self-control while doing so (Allcott et al., 2020).
These issues are exacerbated by technological design decisions: many apps use psychological
factors such as motivation and reward schedules to intentionally promote habitual use (Chen et al.,
2019; Eyal, 2014; Fogg, 2009; Oulasvirta et al., 2011). Smartphones and their interfaces are also
designed to be easy to use with little friction, which results in appealing products but also habitual
behaviour (Anderson & Wood, 2020). These various factors may help explain why, in one survey,
only half of Americans trying to reduce their phone use reported successfully doing so (Deloitte,
2018).
NUDGE-BASED INTERVENTION 6
Combined interventions
Although various studies have tested individual strategies for reducing smartphone use, few
have attempted to combine them (e.g., Throuvala et al., 2020; Myers et al., 2021) and almost none
have used a more customised approach. Allowing people to “mix and match” various strategies
based on their lifestyle may have several advantages over one-size-fits-all approaches. Because they
are based on personal preference, the strategies may achieve higher compliance or efficacy over the
long term. Accordingly, we sought to develop a personalised and combined behavioural
intervention to reduce screen time and problematic smartphone use.
Our intervention focuses on nudges (Thaler & Sunstein, 2008), small changes to phone
settings or usage. Changing the smartphone display to greyscale, for example, can reduce screen
time, problematic smartphone use, and anxiety (Holte et al., 2021; Holte & Ferraro, 2020). The
effectiveness of such nudges can be explained by the Fogg Behaviour Model, which posits that
habitual behaviours result from the combination of motivation, ability, and prompts (Fogg, 2019).
Habitual smartphone use, for example, may result from a prompt such as a social media notification,
the ease (ability) of picking up the phone and scrolling through a feed, and the motivation to pass
time when bored (Oulasvirta et al., 2011). Crucially, many smartphone apps draw from this model
to intentionally promote habitual use (Eyal, 2014; Fogg, 2009), so reversing the same principles
may help reduce usage (cf. Fogg, 2019; Eyal, 2019). For example, reducing notifications (prompts),
keeping the phone out of reach at night (ability), and making the phone less aesthetically pleasing
with the greyscale setting (motivation) can all reduce phone usage and improve various aspects of
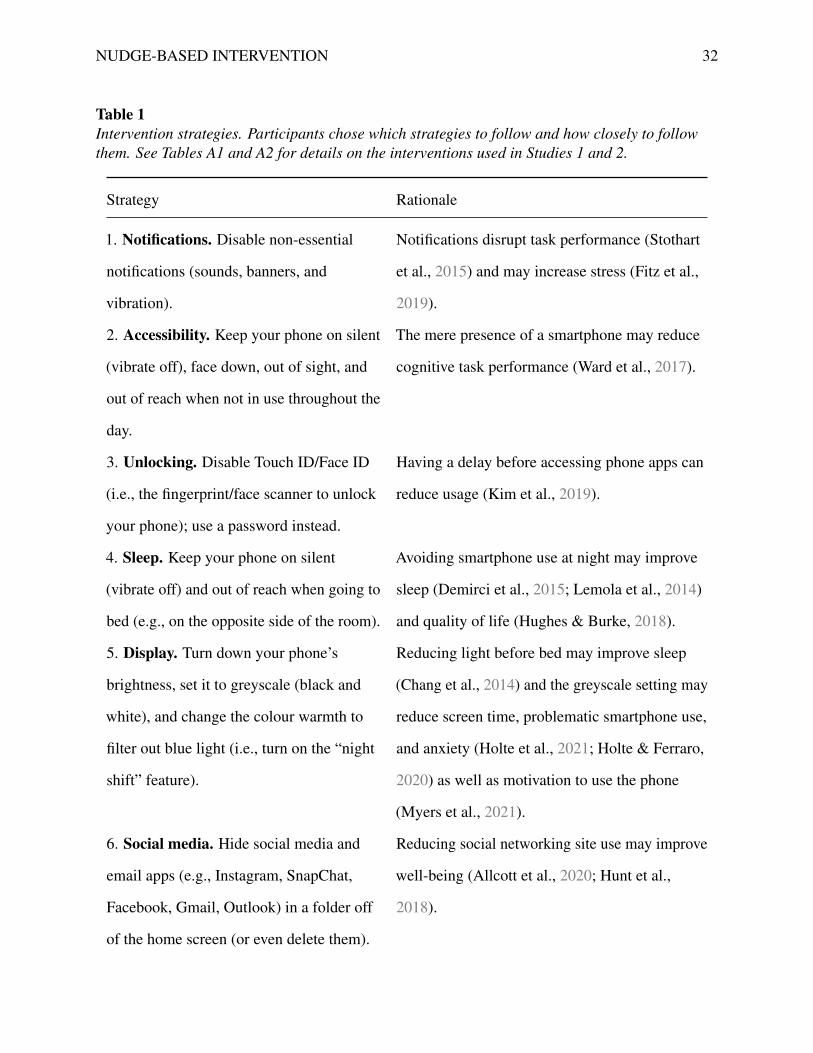
well-being (Fitz et al., 2019; Holte et al., 2021; Hughes & Burke, 2018). Table 1 shows the ten
components of the intervention.
We tested this combined intervention on university students across two pre-registered
studies. First, we tested the feasibility and initial efficacy using a pre–post design over two weeks.
Given the results of studies testing similar individual strategies, we hypothesised that the combined
intervention would reduce screen time, problematic smartphone use, and depressive symptoms as
NUDGE-BASED INTERVENTION 7
well as improve sleep quality and cognition (sustained attention and working memory). Second, we
compared our intervention to an active control group who only enabled screen time monitoring. We
had confirmatory assessments two weeks later and exploratory assessments six weeks later. We
hypothesised that at least some participants would follow the intervention beyond the main study
period and continue to experience its positive effects. Combined, these studies demonstrate the
preliminary feasibility and efficacy of a multi-faceted nudge-based intervention to reduce
problematic smartphone use.
Methods
Study 1
Participants
We recruited a convenience sample of 51 participants (36 women) from social media
advertisements and from the psychology participant pool at McGill University. Most were students
and all were between 18 and 34 years old (M = 21.7, SD = 2.8). To be eligible, participants needed
an iPhone with iOS version 12 (or later) which includes built-in screen time tracking. We included
only participants with normal or corrected-to-normal vision who were not taking any medication
and had no history of neurological or psychiatric issues. Participants received $20 or course credit.
The protocols for both studies were approved by the McGill University Research Ethics Board II
(#451-0518) and followed the Declaration of Helsinki.
We were interested in detecting medium effect sizes, so we posted weekly experiment slots
until we reached 50 participants with complete data. This sample size gave us 80% power to detect
small-to-medium effects of d = 0.36 for our directional confirmatory tests.
Procedure
Baseline measures. After completing an online screening for eligibility, participants were
asked if they had screen time tracking enabled on their phone. Those who did scheduled a lab visit;
NUDGE-BASED INTERVENTION 8
those who did not were asked to enable it and schedule a visit one week later. This procedure gave
one week of baseline tracking before the intervention began, allowing us to disentangle the effects
of the intervention from the effects of enabling the tracking. At the lab, the experimenter obtained
informed consent and then asked the participants to silence their phone and place it in the corner of
the room to reduce distractions (Ward et al., 2017). Participants then completed baseline measures
of cognition, depression, problematic smartphone use, sleep, mood, and personality.
Intervention. The experimenter explained that the study was testing the feasibility of a
behavioural intervention to reduce smartphone use. The experimenter led the participants through
each strategy, asked if they would like to follow it, and if so, guided them through the
implementation. Participants chose the extent to which they followed each strategy, for example
ranging from disabling only sounds to disabling any visual notifications. The participants were
asked to follow the intervention for two weeks. To increase compliance, we offered participants an
additional $20 incentive to follow the strategies, which we provided at the end of the study period.
Finally, the participants took a screenshot of the screen time summary on their phone and emailed it
to the experimenter as the baseline measurement (i.e., for the week prior to the study). They also
completed this procedure the following week at home; we did not analyse this at-home data
because we expected lower compliance and more variability in the reporting since participants
could send the screenshots at any time. We present the at-home data in figures for completeness.
Post measurements. Two weeks after the first visit (13 to 15 days later), participants
returned to the lab to complete the same measures except for the personality questionnaires. The
experimenter then debriefed and compensated the participants.
Measures
Sustained Attention to Response Task (SART). Participants first completed the SART,
which measures sustained attention and response inhibition (Robertson et al., 1997). Participants
pressed a key when they saw any digit except for “3” while the computer recorded errors of
omission and commission.

NUDGE-BASED INTERVENTION 9
Operation Span Task (OSpan). The OSpan measures working memory capacity
(Unsworth et al., 2005) and is affected by the presence of a smartphone (Ward et al., 2017).
Participants remembered sequences of letters while completing simple math problems.
Beck Depression Inventory II (BDI-II). The BDI assesses the severity of depressive
symptoms such as sadness and loss of pleasure over the previous two weeks (Beck et al., 1996). An
example item ranges from “I do not feel sad” (0 points) to “I am so sad or unhappy that I can’t
stand it” (3 points). Total scores range from from 0 to 63, with 14 being the cut-off for mild
depression. The scale’s internal consistency for college students is high (α = .93) (Beck et al.,
1996) and was similar in our samples (Study 1: α = .93, Study 2: α = .88).
Smartphone Addiction Scale — Short Version (SAS-SV). The SAS-SV is the most
common measure of problematic smartphone use (Olson et al., 2022) and asks about disturbances
in daily life and withdrawal symptoms related to phones (Kwon et al., 2013). We used the 10-item
version of this scale with minor edits for clarity from a previous study (Olson et al., 2020). An
example item is: “I have a hard time concentrating in class, while doing assignments, or while
working, due to smartphone use.” Each item uses a Likert scale ranging from 1 (Strongly disagree)
to 6 (Strongly agree), for a total score between 10 and 60. The scale usually has high internal
consistency (α = .91) (Kwon et al., 2013); it was slightly lower in our samples (Study 1: α = .82,
Study 2: α = .78) but was similar to another sample from the same university (.83) (Olson et al.,
2020). This and the subsequent non-trait questionnaires asked about the previous two weeks to stay
consistent with the intervention period and the BDI.
Sleep Quality Scale (SQS). The SQS measures sleep quality with one item: “Rate your
sleep quality from 0 to 10, with 0 being the worst possible sleep, and 10 being the best.” The
measure correlates well with longer sleep questionnaires (Cappelleri et al., 2009).
International Positive and Negative Affect Scale — Short Form (PANAS). The
PANAS measures positive and negative affect as independent dimensions (Thompson, 2007).
Participants rate 10 items (e.g., Interested, Hostile) on 5-point scales ranging from 1 (Never) to 5
(Always). The scale usually has acceptable reliability (α of .75 for positive affect and .76 for
NUDGE-BASED INTERVENTION 10
negative), which was similar in our sample for positive (Study 1: α = .66, Study 2: α = .80) and
negative affect (Study 1: α = .82, Study 2: α = .75).
Trait-level measures. Finally, participants completed the Big Five Inventory (BFI) for
basic personality traits (John et al., 1991) and the Internal Control Index (ICI) which measures how
much control they feel they have over their lives (Duttweiler, 1984).
Analysis
The design and analysis were pre-registered (see Appendix); all pre-registered tests are
labelled as confirmatory and the rest as exploratory. We conducted 6 directional paired-samples t
tests, predicting that participants would: (1) report lower problematic smartphone use (SAS-SV),
(2) use their phone less (screen time), (3) reduce depression (BDI-II), (4) improve sleep quality
(SQS), (5) increase working memory capacity (OSpan), and (6) make fewer attentional errors
(SART). We used a Type I error rate of .05 with no family-wise error control. We included all
participants regardless of how much of the intervention they followed, in order to better assess
feasibility and promote external generalisability (Heintzelman & Kushlev, 2020). One participant
missed one week of screen time reporting and so was excluded from the test of screen time.
Study 2
Participants
Using the same procedure as in Study 1, we recruited 82 participants. Based on the
pre-registration, we excluded 12 of them: 7 dropped out (6 control and 1 intervention; 4 during the
pandemic), 1 updated his phone which deleted all screen time data, and 4 did not follow most of the
intervention. Because we were interested in testing efficacy for Study 2, we included only
participants who followed at least 5 strategies of the intervention. The final sample included 70
participants (54 women, aged 18 to 33, M = 20.7, SD = 2.6).
NUDGE-BASED INTERVENTION 11
Procedure
Participants completed two lab visits over two weeks, with the same tasks and
questionnaires as in Study 1. We excluded the SART, given the lack of effect in the previous study.
After the baseline measurements, participants were randomly assigned to an experimental condition.
Consistent with Study 1, the experimenter explained that we were testing the feasibility of a
smartphone use reduction intervention. Both groups then enabled screen time tracking. The control
group was told that the tracking was the intervention; they were not aware that they were in the
control group. We chose screen time tracking as the control since it is perhaps the most popular
smartphone reduction intervention (Zimmermann, 2021) and is feasible to implement. The
intervention participants were additionally led through the ten strategies that resembled those of
Study 1 with minor changes based on new research (see Table A2).
Both groups were told that they were in the intervention condition and they were not aware
what the other condition entailed. We could not plausibly obscure our main research question (i.e.,
testing whether the intervention would reduce smartphone use) with a convincing cover story for
both groups, since it could be easily inferred from the intervention strategies. However, giving both
groups similar expectations was intended to reduce differences between them due to social
desirability or demand characteristics (Olson & Raz, 2021).
Two weeks later, participants returned to the lab to complete the same measures and a
questionnaire assessing the feasibility of the intervention. The final 11 participants completed their
second visit online after the university closed due to the COVID-19 pandemic (which meant they
could not complete the OSpan task). We also asked participants how they spent any additional free
time; two raters later categorised their responses and a third resolved discrepancies.
We gave participants $20 and told them that the intervention period was now complete. We
suggested that they continue to follow the intervention as much as is feasible but they would not be
compensated for doing so. Another four weeks later, participants completed online questionnaires

NUDGE-BASED INTERVENTION 12
to assess compliance after the main study period. All participants then reported compliance and the
last half of the sample (N = 44) re-completed all of the questionnaire measures (e.g., depression) to
monitor improvements over a longer period. We only assessed the last half of the sample due to
menial procedural delays as the pandemic approached. Participants received an additional $20 for
completing the follow-up measures.
Measures
Our confirmatory outcomes were all of the measures that showed effects in Study 1: screen
time, problematic smartphone use, depression, and working memory. Our exploratory outcomes did
not previously show effects: sleep quality, positive affect, and negative affect.
Analysis
The design and analysis were pre-registered (see Appendix). We used mixed-effect linear
regression to predict each measure given the condition (control or intervention), time (baseline or
two weeks later), and the interaction, with a random intercept for each participant. We did
confirmatory tests of the interactions for the primary outcomes and exploratory tests for the
secondary outcomes. We used a Type I error rate of .05 and directional tests, predicting that
intervention participants would show larger improvements on each measure. We deviated from our
pre-registered sample size (N = 70 rather than 80) when the university closed due to the pandemic.
Based on the pre-registration, we excluded two additional participants from only the test of
screen time: one had an extreme score (z > 4) and one sent the screen time data too late. For the
OSpan test, an additional five participants were excluded due to technical errors during the task.
Results
Compliance. In Study 1, participants reported following an average of 7.5 out of the 10
strategies by week 2 (SD = 1.49). In Study 2, with a slightly modified intervention, participants
initially agreed to follow 8.8 (1.37) of the strategies; two weeks later, they reported successfully
NUDGE-BASED INTERVENTION 13
following 7.28 (1.4) of them. After these two weeks, we told participants that the main study period
had ended but to continue to follow the intervention as much as is feasible. At six weeks,
participants continued to follow most of the strategies (M = 5.55, SD = 2.27). Participants were
most likely to comply with reducing notifications and least likely to keep their screen on greyscale
(Study 1) or to leave their phone at home (Study 2). See Tables A1 and A2 for individual
compliance rates.
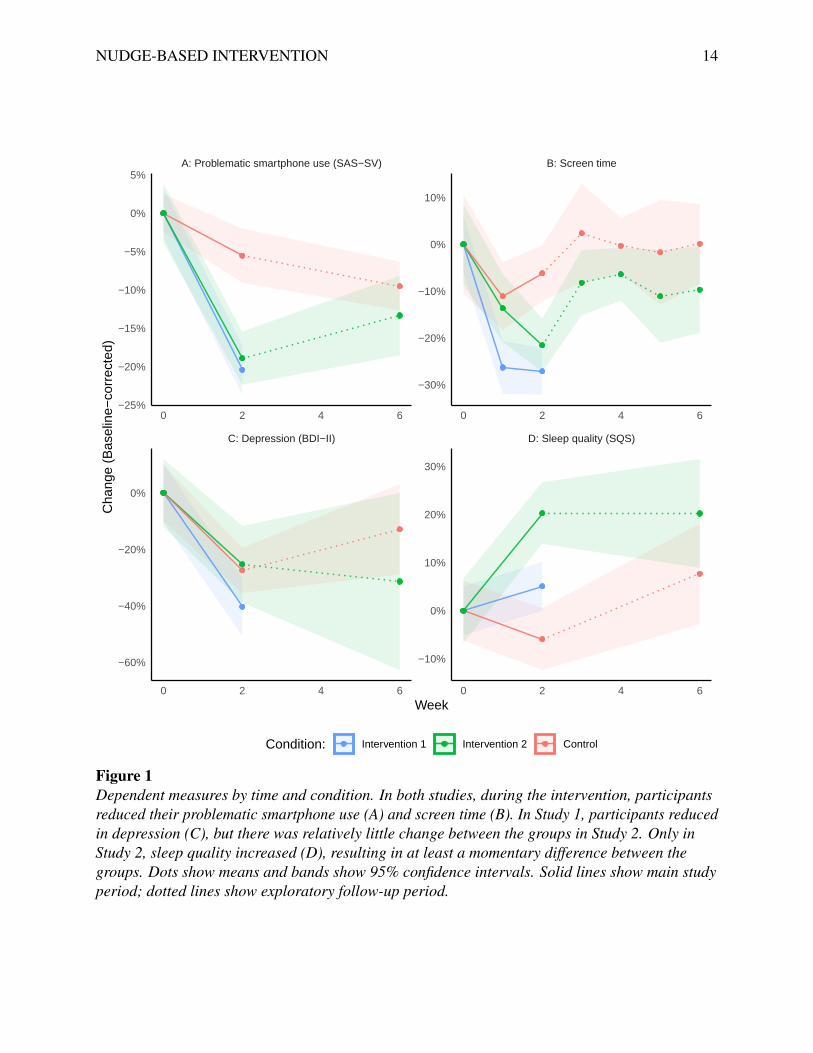
Problematic smartphone use. The intervention reduced problematic smartphone use. In
Study 1, participants initially scored 35.29 on the Smartphone Addiction Scale (Short Version),
which ranges from 10 to 60. Based on the scale authors’ original cut-offs of 31 for men and 33 for
women (Kwon et al., 2013), 67% would be considered at a high risk of smartphone addiction.
During the intervention, participants dropped to a score of 28.08 (t(50) =−6.85,
d =−0.96 [−1.21,−0.69], p < .001; Figure 1a), putting only 35% above the high-risk threshold
and thereby returning them to a more normal range for samples in North America (Olson et al.,
2022). Study 2 showed similar reductions; the intervention group dropped by 5.84 points while the
control group dropped by only 1.9. See Table 2 for regression models and Tables A3 and A4 for
descriptive statistics.
Screen time. The intervention also reduced screen time. In Study 1, daily usage dropped
from 4.67 h to 3.4 h, for a difference of 1.27 h per day at week 2 (t(49) =−6.18,
d =−0.87 [−1.22,−0.45], p < .001; Figure 1b). In Study 2, daily screen time dropped by an
average of 0.33 h in the control group and 0.87 h in the intervention group. The largest proportion
of screen time was spent on social networking, consistent with other studies (Panova et al., 2019).
This amount increased by 0.13 h per day in the control group and decreased by 0.23 h in the
intervention group.
Depression. There were inconsistent results for depression. In Study 1, participants began
with a depression score of 11.57, with 33% in the range of at least mild depression (Figure 1c).
During the intervention, their depression scores decreased to 6.9, with only 14% at the clinical
cut-off (t(50) =−4.25, d =−0.59 [−0.92,−0.12], p < .001). Study 2, however, found no
NUDGE-BASED INTERVENTION 14
C: Depression (BDI−II) D: Sleep quality (SQS)
A: Problematic smartphone use (SAS−SV) B: Screen time
0 2 4 6 0 2 4 6
0 2 4 6 0 2 4 6
−30%
−20%
−10%
0%
10%
−10%
0%
10%
20%
30%
−25%
−20%
−15%
−10%
−5%
0%
5%
−60%
−40%
−20%
0%
Week
Cha
nge
(Bas
elin
e−co
rrec
ted)
Condition: Intervention 1 Intervention 2 Control
Figure 1Dependent measures by time and condition. In both studies, during the intervention, participantsreduced their problematic smartphone use (A) and screen time (B). In Study 1, participants reducedin depression (C), but there was relatively little change between the groups in Study 2. Only inStudy 2, sleep quality increased (D), resulting in at least a momentary difference between thegroups. Dots show means and bands show 95% confidence intervals. Solid lines show main studyperiod; dotted lines show exploratory follow-up period.
NUDGE-BASED INTERVENTION 15
difference in depression between the groups; both appeared to show similar reductions.
Cognition. In Study 1, working memory improved (t(50) = 1.95, d = 0.27 [−0.01,0.53],
p = .029), but both groups showed similar changes in Study 2. We did not see any changes in
sustained attention errors, which we only tested in Study 1 (t(50) = 1.12, d = 0.16 [−0.11,0.43],
p = .866).
Sleep quality. The rest of the measures were exploratory. Study 1 found little change in
sleep quality, which went from 6.61 to 6.94 out of 10 (t(50) = 1.07, d = 0.15 [−0.14,0.43],
p = .144; Figure 1d). In Study 2, the control group showed no increase (−0.35 points) while the
intervention group showed an increase of 1.19 points. This improvement would be considered
clinically significant (Zisapel & Nir, 2003) and persisted for at least six weeks while the gap
between the groups diminished.
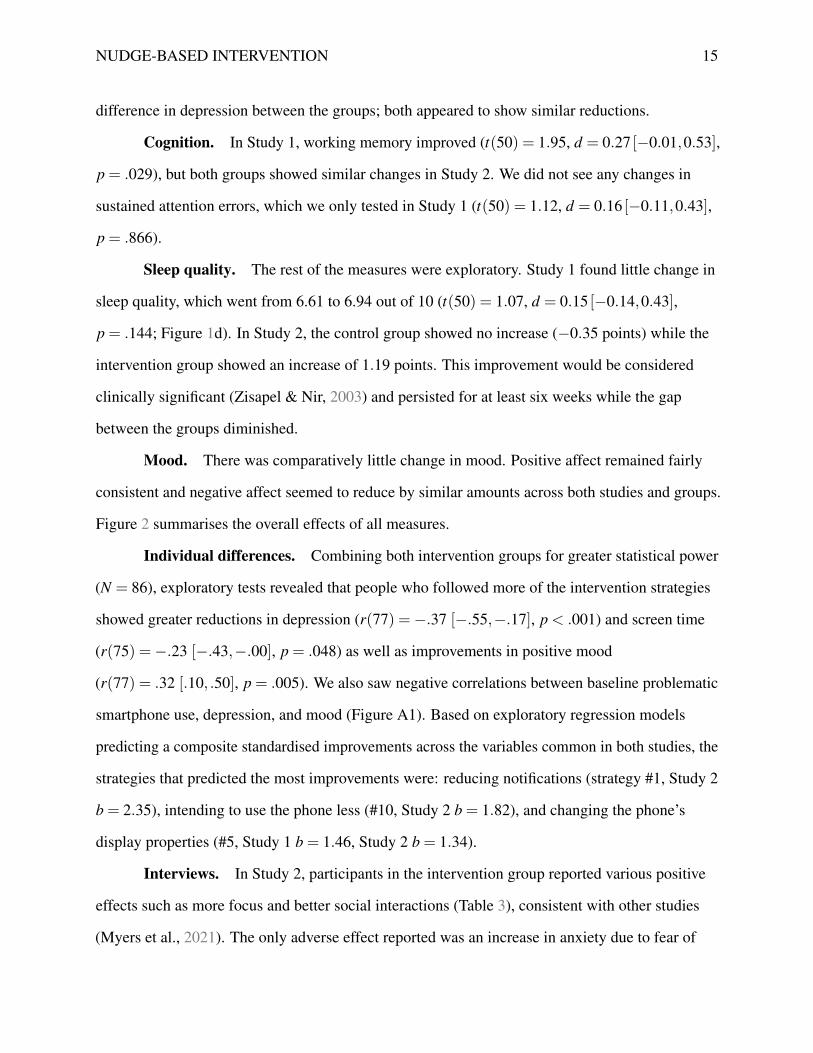
Mood. There was comparatively little change in mood. Positive affect remained fairly
consistent and negative affect seemed to reduce by similar amounts across both studies and groups.
Figure 2 summarises the overall effects of all measures.
Individual differences. Combining both intervention groups for greater statistical power
(N = 86), exploratory tests revealed that people who followed more of the intervention strategies
showed greater reductions in depression (r(77) =−.37 [−.55,−.17], p < .001) and screen time
(r(75) =−.23 [−.43,−.00], p = .048) as well as improvements in positive mood
(r(77) = .32 [.10, .50], p = .005). We also saw negative correlations between baseline problematic
smartphone use, depression, and mood (Figure A1). Based on exploratory regression models
predicting a composite standardised improvements across the variables common in both studies, the
strategies that predicted the most improvements were: reducing notifications (strategy #1, Study 2
b = 2.35), intending to use the phone less (#10, Study 2 b = 1.82), and changing the phone’s
display properties (#5, Study 1 b = 1.46, Study 2 b = 1.34).
Interviews. In Study 2, participants in the intervention group reported various positive
effects such as more focus and better social interactions (Table 3), consistent with other studies
(Myers et al., 2021). The only adverse effect reported was an increase in anxiety due to fear of
NUDGE-BASED INTERVENTION 16
−0.96
−0.94
−0.94
−0.12
Intervention 1Intervention 2
CombinedControl
−0.87
−0.77
−0.83
−0.05
−0.52
−0.58
−0.55
−0.52
−0.59
−0.42
−0.52
−0.39
−0.23
0.29
−0.02
−0.10
0.15
0.65
0.33
−0.34
0.27
0.78
0.40
0.32
Working memory (OSpan):
Sleep quality (SQS):
Positive mood (PANAS):
Depression (BDI−II):
Negative mood (PANAS):
Screen time:
Problematic smartphone use (SAS−SV):
−1.0 −0.5 0.0 0.5 1.0Cohen's d
Figure 2Effect sizes across studies between the baseline and two weeks later. Error bars show bootstrapped95% confidence intervals.

NUDGE-BASED INTERVENTION 17
missing out on conversations (cf. Hunt et al., 2018; Myers et al., 2021). The control group reported
fewer effects, whether positive or negative.
We also asked participants how they spent any additional free time, in case they simply
replaced phone use with computer use. Intervention participants commonly reported spending more
time on studying or work (51%), enjoyable activities such as hobbies or cooking (26%), or
interacting with friends and family (21%). More rarely, participants spent time on household chores
(13%), computer use (13%), exercise (5%), or sleep (5%). These results support the idea that the
link between problematic smartphone use and well-being may be due in part to a reduction in these
healthy activities (Kushlev & Leitao, 2020); it is unclear whether some of our quantitative results
may have been indirect effects of having more time to study, do hobbies, or exercise.
Discussion
As problematic smartphone use rises across the world (Olson et al., 2022), there will be a
growing need for feasible and effective approaches to reduce it. We developed a behavioural
intervention to reduce phone use without relying on additional technology or considerable
self-control. The intervention, which takes around 10 min to explain and begin implementing,
reduced screen time, returned problematic smartphone use to normal levels, and improved sleep
quality. These improvements were larger than those from screen time monitoring alone, and several
of them appeared to persist for at least six weeks. Some of our effect sizes were larger than those
seen in studies of individual strategies. For example, our intervention group reduced their
problematic smartphone use scores by 5.8 points, larger than when changing the display to
greyscale (2.6 points; Holte et al., 2021), leaving the phone outside the bedroom (1.6 points;
Hughes & Burke, 2018), or batching notifications (< 1 point between groups; Fitz et al., 2019).
The causal effects on depression were less clear. Both screen time monitoring and the full
intervention appeared to show similar reductions in depressive symptoms
(b =−0.27 [−0.49,−0.05]; Figure 2) and negative affect (b =−0.43 [−0.70,−0.16]; Table 1). It
NUDGE-BASED INTERVENTION 18
is thus difficult to tell whether these reductions were caused by the intervention, screen time
tracking, or incidental aspects of the study itself such as demand characteristics or observation
effects. Still, participants who followed the intervention more closely showed larger reductions in
depressive symptoms, and these symptoms positively correlated with both screen time and
problematic smartphone use (Figure A1). It is possible, for example, that closely following the
intervention reduced depressive symptoms, or simply that people with more malleable depressive
symptoms were more likely to comply with the intervention strategies. Our results are consistent
with studies suggesting that there may be a link between well-being and smartphone use, though
this link may be weaker than was previously believed (Coyne et al., 2020; Orben & Przybylski,
2019a).
Strengths and limitations
Overall, our results demonstrate that combining different behavioural strategies can form a
feasible and efficacious intervention to reduce smartphone use. Such an intervention could be
useful to reach a larger population than those who would be willing to apply any specific strategy.
For example, switching the screen to greyscale can have several benefits (Holte et al., 2021; Holte
& Ferraro, 2020), but this strategy showed some of the lowest compliance rates (e.g., 38% in Study
1; Table A1). Combining intervention strategies in a more flexible approach could allow for easier
recruiting of larger samples and may improve long-term compliance. Indeed, participants in Study 2
continued to follow most of the intervention strategies for at least four weeks beyond the main study
period (Table A2). Further, many of the intervention strategies are “set and forget” — the phone
settings, for example, only need to be changed once — which may make them more sustainable
rather than relying solely on consistent self-control. Finally, because the intervention is based on
general behavioural principles (Fogg, 2019), the strategies could be adapted for future technologies.
The flexibility of the intervention also presented limitations. Because the intervention used
a combination of strategies, and additionally participants chose which ones to follow, it is difficult
to determine their mechanisms or relative effectiveness. We have previously argued that
NUDGE-BASED INTERVENTION 19
intervention development could involve an initial “shotgun” approach to first determine whether the
intervention as a whole is potentially feasible and efficacious before attempting to determine its key
components and underlying mechanisms (Olson et al., 2021). Future studies could assess
compliance in real-world or clinical settings and test additional demographic characteristics to
better predict who may benefit from which components of the intervention. These studies could
also help determine which strategies are best for people already following particular guidelines,
such as those with notifications disabled.
Another potential issue related to the pre-existing differences between conditions in Study 2.
The intervention and control groups differed in their initial scores for screen time and problematic
smartphone use (Table A4) even though they were randomised after the baseline measures.
Although we controlled for these differences in our regression model, our effect sizes for the
measures may have been either under- or over-estimated. For example, people in the intervention
group who began with lower smartphone use may have had less room to improve, reducing the
effect size; or, they may have found their habitual behaviours easier to change, increasing the effect
size. Future studies with larger sample sizes or blocked designs could reduce these issues.
Implications
Our results may be useful for phone manufacturers and app developers interested in
improving digital well-being. Screen time tracking alone — though commonly included in
smartphones — had little effect on phone behaviour six weeks later (Figure 1b), consistent with
other studies (Loid et al., 2020). To effectively reduce screen time, several of our intervention
strategies could be adapted for future operating systems. Apple’s app store has recently started
disclosing privacy ratings of various apps; a similar approach for digital well-being could also be
useful. For example, apps could be penalised for giving too many notifications that participants end
up blocking or ignoring. Reducing notifications could be made easier; for example, there could be a
setting to silence all notifications while the phone is sitting face down on a table, or non-essential
notifications could be hidden by default until the phone is unlocked. Another setting could allow
NUDGE-BASED INTERVENTION 20
the phone to unlock slightly slower in order to add a small amount of friction to phone checking. Of
course, these may make phones less accessible, less attractive, or harder to use — and likely less
profitable. Given recent criticisms of technology companies and their role in well-being (e.g.,
Hemphill & Banerjee, 2021), part of a long-term profitable approach may involve preventive and
proactive maintenance of healthy digital habits to maintain public trust. Still, technology companies
promoting digital well-being remain in the tenuous position of being both a partial cause of and
solution for problematic smartphone use (Rezaee & Pedret, 2018).
Technology alone, however, cannot offer a complete solution. We agree with researchers
and ethicists who argue that reducing problematic smartphone use should ultimately result from
re-establishing healthy habits, a broader philosophy of technology use, and cooperation with
technology companies (Heitmayer & Lahlou, 2020; Newport, 2019). Newport (2019, p. 28), who
argues for “digital minimalism”, states that:
What all of us who struggle with these issues need [. . . ] is a philosophy of technology
use, something that covers from the ground up which digital tools we allow into our
life, for what reasons, and under what constraints. In the absence of this introspection,
we’ll be left struggling in a whirlwind of addictive and appealing cyber-trinkets, vainly
hoping that the right mix of ad hoc hacks will save us.
Until our habits are rewired and such a philosophy of technology gains traction, we hope that our
particular mix of strategies can at least serve as a stopgap. These strategies will be particularly
important following recent global increases in remote work and online schooling, blurring the line
between personal and professional uses of technology. Feasible behavioural interventions could
help people use technology in ways that are beneficial to them while minimising negative effects.
With half of the population owning a smartphone, and many of them trying to reduce their screen
time, even small changes to phone habits could free an immeasurable amount of collective time
across the globe.
NUDGE-BASED INTERVENTION 21
Data transparency
Anonymised data sets are available (https://osf.io/5mqnp/).
Informed consent
All procedures followed were in accordance with the ethical standards of the responsible
committee on human experimentation (institutional and national) and with the Helsinki Declaration
of 1975, as revised in 2000. Informed consent was obtained from all patients for being included in
the study.
References
Allcott, H., Braghieri, L., Eichmeyer, S., & Gentzkow, M. (2020). The welfare effects of social
media. American Economic Review, 110(3), 629–676. https://doi.org/10.1257/aer.20190658
Allcott, H., Gentzkow, M., & Song, L. (2021). Digital addiction. National Bureau of Economic
Research.
Anderson, I. A., & Wood, W. (2020). Habits and the electronic herd: The psychology behind social
media’s successes and failures. Consumer Psychology Review, 4(1), 83–99.
https://doi.org/10.1002/arcp.1063
Beck, A. T., Steer, R. A., & Brown, G. K. (1996). Beck Depression Inventory (BDI-II). Pearson.
Bjerre-Nielsen, A., Andersen, A., Minor, K., & Lassen, D. D. (2020). The negative effect of
smartphone use on academic performance may be overestimated: Evidence from a 2-year panel
study. Psychological Science, 095679762095661. https://doi.org/10.1177/0956797620956613
Busch, P. A., & McCarthy, S. (2021). Antecedents and consequences of problematic smartphone
use: A systematic literature review of an emerging research area. 114, 106414.
https://doi.org/10.1016/j.chb.2020.106414
NUDGE-BASED INTERVENTION 22
Bychkov, D., & Young, S. D. (2018). Facing up to nomophobia: A systematic review of mobile
phone apps that reduce smartphone usage. In Studies in big data (pp. 161–171). Springer
Singapore. https://doi.org/10.1007/978-981-10-8476-8_8
Caird, J. K., Johnston, K. A., Willness, C. R., Asbridge, M., & Steel, P. (2014). A meta-analysis of
the effects of texting on driving. Accident Analysis & Prevention, 71, 311–318.
https://doi.org/10.1016/j.aap.2014.06.005
Cappelleri, J. C., Bushmakin, A. G., McDermott, A. M., Sadosky, A. B., Petrie, C. D., & Martin, S.
(2009). Psychometric properties of a single-item scale to assess sleep quality among individuals
with fibromyalgia. Health and Quality of Life Outcomes, 7(1), 54.
https://doi.org/10.1186/1477-7525-7-54
Chang, A.-M., Aeschbach, D., Duffy, J. F., & Czeisler, C. A. (2014). Evening use of light-emitting
eReaders negatively affects sleep, circadian timing, and next-morning alertness. Proceedings of
the National Academy of Sciences, 112(4), 1232–1237.
https://doi.org/10.1073/pnas.1418490112
Chen, C., Zhang, K. Z. K., Gong, X., & Lee, M. (2019). Dual mechanisms of reinforcement reward
and habit in driving smartphone addiction. 29(6), 1551–1570.
https://doi.org/10.1108/intr-11-2018-0489
Collis, A., & Eggers, F. (2019). Effects of restricting social media usage. SSRN.
Connolly, T., Atherton, G., Cross, L., Piovesan, A., & Kaye, L. K. (2021). The wild west of
measurement: Exploring problematic technology use cut off scores and their relation to
psychosocial and behavioural outcomes in adolescence. 125, 106965.
https://doi.org/10.1016/j.chb.2021.106965
Corrigan, J. R., Alhabash, S., Rousu, M., & Cash, S. B. (2018). How much is social media worth?
Estimating the value of Facebook by paying users to stop using it. PLOS ONE, 13(12),
NUDGE-BASED INTERVENTION 23
e0207101. https://doi.org/10.1371/journal.pone.0207101
Coyne, S. M., Rogers, A. A., Zurcher, J. D., Stockdale, L., & Booth, M. (2020). Does time spent
using social media impact mental health?: An eight year longitudinal study. Computers in
Human Behavior, 104, 106160. https://doi.org/10.1016/j.chb.2019.106160
Deloitte. (2018). 2018 global mobile consumer survey: US edition.
https://www2.deloitte.com/content/dam/Deloitte/us/Documents/technology-media-
telecommunications/us-tmt-global-mobile-consumer-survey-exec-summary-2018.pdf
Deloitte. (2019). Deloitte’s 2019 global mobile consumer survey.
https://www2.deloitte.com/us/en/insights/industry/telecommunications/global-mobile-
consumer-survey-2019.html
Demirci, K., Akgönül, M., & Akpinar, A. (2015). Relationship of smartphone use severity with
sleep quality, depression, and anxiety in university students. Journal of Behavioral Addictions,
4(2), 85–92. https://doi.org/10.1556/2006.4.2015.010
Duttweiler, P. C. (1984). The Internal Control Index: A newly developed measure of locus of
control. Educational and Psychological Measurement, 44(2), 209–221.
https://doi.org/10.1177/0013164484442004
Elhai, J. D., Dvorak, R. D., Levine, J. C., & Hall, B. J. (2017). Problematic smartphone use: A
conceptual overview and systematic review of relations with anxiety and depression
psychopathology. Journal of Affective Disorders, 207, 251–259.
https://doi.org/10.1016/j.jad.2016.08.030
Escobar-Viera, C. G., Shensa, A., Bowman, N. D., Sidani, J. E., Knight, J., James, A. E., &
Primack, B. A. (2018). Passive and active social media use and depressive symptoms among
United States adults. Cyberpsychology, Behavior, and Social Networking, 21(7), 437–443.
https://doi.org/10.1089/cyber.2017.0668
NUDGE-BASED INTERVENTION 24
Eyal, N. (2014). Hooked: How to build habit-forming products. Penguin UK.
Eyal, N. (2019). Indistractable: How to control your attention and choose your life. Nir and Far.
Fitz, N., Kushlev, K., Jagannathan, R., Lewis, T., Paliwal, D., & Ariely, D. (2019). Batching
smartphone notifications can improve well-being. Computers in Human Behavior, 101, 84–94.
https://doi.org/10.1016/j.chb.2019.07.016
Fogg, B. (2009). A behavior model for persuasive design.
https://doi.org/10.1145/1541948.1541999
Fogg, B. J. (2019). Tiny habits: The small changes that change everything. Houghton Mifflin
Harcourt.
GlobalWebIndex. (2021). Social. GlobalWebIndex’s Flagship Report on the Latest Trends in Social
Media. https://www.gwi.com/reports/social
Guthold, R., Stevens, G. A., Riley, L. M., & Bull, F. C. (2018). Worldwide trends in insufficient
physical activity from 2001 to 2016: A pooled analysis of 358 population-based surveys with
1.9 million participants. The Lancet Global Health, 6(10), e1077–e1086.
https://doi.org/10.1016/s2214-109x(18)30357-7
Heintzelman, S. J., & Kushlev, K. (2020). Emphasizing scientific rigor in the development, testing,
and implementation of positive psychological interventions. The Journal of Positive Psychology,
1–6. https://doi.org/10.1080/17439760.2020.1789701
Heitmayer, M., & Lahlou, S. (2020). Why are smartphones disruptive? An empirical study of
smartphone use in real-life contexts. Computers in Human Behavior, 106637.
https://doi.org/10.1016/j.chb.2020.106637
Hemphill, T. A., & Banerjee, S. (2021). Facebook and self-regulation: Efficacious proposals—or
’smoke-and-mirrors’? Technology in Society, 101797.
NUDGE-BASED INTERVENTION 25
Hiniker, A., Sobel, K., Suh, H., Sung, Y.-C., Lee, C. P., & Kientz, J. A. (2015). Texting while
parenting. Proceedings of the 33rd Annual ACM Conference on Human Factors in Computing
Systems — CHI ’15. https://doi.org/10.1145/2702123.2702199
Holte, A. J., & Ferraro, F. R. (2020). True colors: Grayscale setting reduces screen time in college
students. The Social Science Journal, 1–17. https://doi.org/10.1080/03623319.2020.1737461
Holte, A. J., Giesen, D. T., & Ferraro, F. R. (2021). Color me calm: Grayscale phone setting
reduces anxiety and problematic smartphone use. https://doi.org/10.1007/s12144-021-02020-y
Hughes, N., & Burke, J. (2018). Sleeping with the frenemy: How restricting “bedroom use” of
smartphones impacts happiness and wellbeing. Computers in Human Behavior, 85, 236–244.
https://doi.org/https://doi.org/10.1016/j.chb.2018.03.047
Hunt, M. G., Marx, R., Lipson, C., & Young, J. (2018). No more FOMO: Limiting social media
decreases loneliness and depression. Journal of Social and Clinical Psychology, 37(10),
751–768. https://doi.org/10.1521/jscp.2018.37.10.751
John, O. P., Donahue, E. M., & Kentle, R. L. (1991). Big Five Inventory. American Psychological
Association (APA). https://doi.org/10.1037/t07550-000
Kaye, L. K., Orben, A., Ellis, D. A., Hunter, S. C., & Houghton, S. (2020). The conceptual and
methodological mayhem of ’screen time’. International Journal of Environmental Research and
Public Health, 17(10), 3661. https://doi.org/10.3390/ijerph17103661
Keyes, K. M., Maslowsky, J., Hamilton, A., & Schulenberg, J. (2015). The great sleep recession:
Changes in sleep duration among US adolescents, 1991-2012. PEDIATRICS, 135(3), 460–468.
https://doi.org/10.1542/peds.2014-2707
Kim, J., Park, J., Lee, H., Ko, M., & Lee, U. (2019, May). LocknType: Lockout task intervention for
discouraging smartphone app use. https://doi.org/10.1145/3290605.3300927
NUDGE-BASED INTERVENTION 26
Kirschner, P. A., & Karpinski, A. C. (2010). Facebook and academic performance. Computers in
Human Behavior, 26(6), 1237–1245. https://doi.org/10.1016/j.chb.2010.03.024
Ko, M., Yang, S., Lee, J., Heizmann, C., Jeong, J., Lee, U., Shin, D., Yatani, K., Song, J., & Chung,
K.-M. (2015, February). NUGU: A group-based intervention app for improving self-regulation
of limiting smartphone use. https://doi.org/10.1145/2675133.2675244
Kushlev, K., Hunter, J. F., Proulx, J., Pressman, S. D., & Dunn, E. (2019). Smartphones reduce
smiles between strangers. Computers in Human Behavior, 91, 12–16.
https://doi.org/10.1016/j.chb.2018.09.023
Kushlev, K., & Leitao, M. R. (2020). The effects of smartphones on well-being: Theoretical
integration and research agenda. Current Opinion in Psychology, 36, 77–82.
https://doi.org/10.1016/j.copsyc.2020.05.001
Kwon, M., Kim, D.-J., Cho, H., & Yang, S. (2013). The smartphone addiction scale: Development
and validation of a short version for adolescents. PLOS ONE, 8(12), e83558.
https://doi.org/10.1371/journal.pone.0083558
Lemola, S., Perkinson-Gloor, N., Brand, S., Dewald-Kaufmann, J. F., & Grob, A. (2014).
Adolescents’ electronic media use at night, sleep disturbance, and depressive symptoms in the
smartphone age. Journal of Youth and Adolescence, 44(2), 405–418.
https://doi.org/10.1007/s10964-014-0176-x
Li, J., Lepp, A., & Barkley, J. E. (2015). Locus of control and cell phone use: Implications for sleep
quality, academic performance, and subjective well-being. Computers in Human Behavior, 52,
450–457. https://doi.org/10.1016/j.chb.2015.06.021
Loid, K., Täht, K., & Rozgonjuk, D. (2020). Do pop-up notifications regarding smartphone use
decrease screen time, phone checking behavior, and self-reported problematic smartphone use?
Evidence from a two-month experimental study. Computers in Human Behavior, 102, 22–30.
NUDGE-BASED INTERVENTION 27
https://doi.org/10.1016/j.chb.2019.08.007
Lukoff, K., Yu, C., Kientz, J., & Hiniker, A. (2018). What makes smartphone use meaningful or
meaningless? Proceedings of the ACM on Interactive, Mobile, Wearable and Ubiquitous
Technologies, 2(1), 1–26. https://doi.org/10.1145/3191754
Mac Cárthaigh, S. (2020). The effectiveness of interventions to reduce excessive mobile device
usage among adolescents: A systematic review. Neurology, Psychiatry and Brain Research, 35,
29–37. https://doi.org/10.1016/j.npbr.2019.11.002
Mosquera, R., Odunowo, M., McNamara, T., Guo, X., & Petrie, R. (2019). The economic effects of
Facebook. Experimental Economics, 23(2), 575–602.
https://doi.org/10.1007/s10683-019-09625-y
Myers, E., Drees, E. T., & Cain, J. (2021). Student experiences with an intervention utilizing the
salience principle to reduce psychological attraction to smartphones. 8717.
https://doi.org/10.5688/ajpe8717
National Center for Statistics and Analysis. (2020). Distracted driving 2018. National Highway
Traffic Safety Administration.
https://crashstats.nhtsa.dot.gov/Api/Public/ViewPublication/812926
Newport, C. (2019). Digital minimalism: Choosing a focused life in a noisy world. Portfolio.
Newzoo. (2021). Global mobile market report. https://newzoo.com/insights/trend-reports/newzoo-
global-mobile-market-report-2021-free-version/
Oberle, E., Ji, X. R., Kerai, S., Guhn, M., Schonert-Reichl, K. A., & Gadermann, A. M. (2020).
Screen time and extracurricular activities as risk and protective factors for mental health in
adolescence: A population-level study. Preventive Medicine, 141, 106291.
https://doi.org/10.1016/j.ypmed.2020.106291

NUDGE-BASED INTERVENTION 28
O’Dea, S. (2021). Number of smartphone users worldwide from 2016 to 2021. Statista.
https://www.statista.com/statistics/330695/number-of-smartphone-users-worldwide/
Okeke, F., Sobolev, M., Dell, N., & Estrin, D. (2018, September). Good vibrations.
https://doi.org/10.1145/3229434.3229463
Olson, J. A., Lifshitz, M., Raz, A., & Veissière, S. P. L. (2021). Super placebos: A feasibility study
combining contextual factors to promote placebo effects. Frontiers in Psychiatry.
https://doi.org/10.3389/fpsyt.2021.644825
Olson, J. A., & Raz, A. (2021). Applying insights from magic to improve deception in research:
The Swiss cheese model. Journal of Experimental Social Psychology, 92, 104053.
https://doi.org/10.1016/j.jesp.2020.104053
Olson, J. A., Sandra, D. A., S. Colucci, Bikaii, A. A., Chmoulevitch, D., Nahas, J., Raz, A., &
Veissière, S. P. L. (2022). Smartphone addiction is increasing across the world: A meta-analysis
of 24 countries. Computers in Human Behavior, 129, 107138.
https://doi.org/10.1016/j.chb.2021.107138
Olson, J. A., Stendel, M., & Veissière, S. (2020). Hypnotised by your phone? Smartphone
addiction correlates with hypnotisability. Frontiers in Psychiatry, 11.
https://doi.org/10.3389/fpsyt.2020.00578
Orben, A., & Przybylski, A. K. (2019a). The association between adolescent well-being and digital
technology use. Nature Human Behaviour, 3(2), 173–182.
https://doi.org/10.1038/s41562-018-0506-1
Orben, A., & Przybylski, A. K. (2020). Teenage sleep and technology engagement across the week.
PeerJ, 8, e8427. https://doi.org/10.7717/peerj.8427

NUDGE-BASED INTERVENTION 29
Orben, A., & Przybylski, A. K. (2019b). Screens, teens, and psychological well-being: Evidence
from three time-use-diary studies. Psychological Science, 30(5), 682–696.
https://doi.org/10.1177/0956797619830329
Oulasvirta, A., Rattenbury, T., Ma, L., & Raita, E. (2011). Habits make smartphone use more
pervasive. Personal and Ubiquitous Computing, 16(1), 105–114.
https://doi.org/10.1007/s00779-011-0412-2
Panova, T., Carbonell, X., Chamarro, A., & Puerta-Cortés, D. X. (2019). Specific smartphone uses
and how they relate to anxiety and depression in university students: A cross-cultural
perspective. Behaviour & Information Technology, 39(9), 944–956.
https://doi.org/10.1080/0144929x.2019.1633405
Perlman, D., Samost, A., Domel, A. G., Mehler, B., Dobres, J., & Reimer, B. (2019). The relative
impact of smartwatch and smartphone use while driving on workload, attention, and driving
performance. Applied Ergonomics, 75, 8–16. https://doi.org/10.1016/j.apergo.2018.09.001
Przybylski, A. K. (2019). Digital screen time and pediatric sleep: Evidence from a preregistered
cohort study. The Journal of Pediatrics, 205, 218–223.e1.
https://doi.org/10.1016/j.jpeds.2018.09.054
Rezaee, F., & Pedret, A. (2018). A critical review of silicon valley solutions for smartphone
addiction. Idealogy, 3(3), 189–196.
Robertson, I. H., Manly, T., Andrade, J., Baddeley, B. T., & Yiend, J. (1997). "Oops!": Performance
correlates of everyday attentional failures in traumatic brain injured and normal subjects.
Neuropsychologia, 35(6), 747–758. https://doi.org/10.1016/s0028-3932(97)00015-8
Sarris, J., Thomson, R., Hargraves, F., Eaton, M., Manincor, M. de, Veronese, N., Solmi, M.,
Stubbs, B., Yung, A. R., & Firth, J. (2020). Multiple lifestyle factors and depressed mood: A
cross-sectional and longitudinal analysis of the UK biobank (n0.167em=0.167em84,860). BMC
NUDGE-BASED INTERVENTION 30
Medicine, 18(1). https://doi.org/10.1186/s12916-020-01813-5
Stothart, C., Mitchum, A., & Yehnert, C. (2015). The attentional cost of receiving a cell phone
notification. Journal of Experimental Psychology: Human Perception and Performance, 41(4),
893–897. https://doi.org/10.1037/xhp0000100
Thaler, R. H., & Sunstein, C. R. (2008). Nudge: Improving Decisions About Health, Wealth, and
Happiness. Yale University Press.
Thompson, E. R. (2007). Development and validation of an internationally reliable short-form of
the Positive and Negative Affect Schedule (PANAS). Journal of Cross-Cultural Psychology,
38(2), 227–242. https://doi.org/10.1177/0022022106297301
Throuvala, M. A., Griffiths, M. D., Rennoldson, M., & Kuss, D. J. (2020). Mind over matter:
Testing the efficacy of an online randomized controlled trial to reduce distraction from
smartphone use. International Journal of Environmental Research and Public Health, 17(13),
4842. https://doi.org/10.3390/ijerph17134842
Twenge, J. M., Blake, A. B., Haidt, J., & Campbell, W. K. (2020). Commentary: Screens, teens,
and psychological well-being: Evidence from three time-use-diary studies. Frontiers in
Psychology, 11. https://doi.org/10.3389/fpsyg.2020.00181
Twenge, J. M., Cooper, A. B., Joiner, T. E., Duffy, M. E., & Binau, S. G. (2019). Age, period, and
cohort trends in mood disorder indicators and suicide-related outcomes in a nationally
representative dataset, 20052017. Journal of Abnormal Psychology, 128(3), 185–199.
https://doi.org/10.1037/abn0000410
Twenge, J. M., Martin, G. N., & Campbell, W. K. (2018). Decreases in psychological well-being
among American adolescents after 2012 and links to screen time during the rise of smartphone
technology. Emotion, 18(6), 765–780. https://doi.org/10.1037/emo0000403
NUDGE-BASED INTERVENTION 31
Twenge, J. M., Spitzberg, B. H., & Campbell, W. K. (2019). Less in-person social interaction with
peers among U.S. adolescents in the 21st century and links to loneliness. Journal of Social and
Personal Relationships, 36(6), 1892–1913. https://doi.org/10.1177/0265407519836170
Unsworth, N., Heitz, R. P., Schrock, J. C., & Engle, R. W. (2005). An automated version of the
operation span task. Behavior Research Methods, 37(3), 498–505.
https://doi.org/10.3758/bf03192720
Veissière, S. P. L., & Stendel, M. (2018). Hypernatural monitoring: A social rehearsal account of
smartphone addiction. Frontiers in Psychology, 9, 141.
Velthoven, M. H. van, Powell, J., & Powell, G. (2018). Problematic smartphone use: Digital
approaches to an emerging public health problem. DIGITAL HEALTH, 4, 205520761875916.
https://doi.org/10.1177/2055207618759167
Ward, A. F., Duke, K., Gneezy, A., & Bos, M. W. (2017). Brain drain: The mere presence of one’s
own smartphone reduces available cognitive capacity. Journal of the Association for Consumer
Research, 2(2), 140–154. https://doi.org/10.1086/691462
Wilmer, H. H., Sherman, L. E., & Chein, J. M. (2017). Smartphones and cognition: A review of
research exploring the links between mobile technology habits and cognitive functioning.
Frontiers in Psychology, 8, 1–16. https://doi.org/10.3389/fpsyg.2017.00605
Zimmermann, L. (2021). "Your screen-time app is keeping track": Consumers are happy to monitor
but unlikely to reduce smartphone usage. 000–000. https://doi.org/10.1086/714365
Zisapel, N., & Nir, T. (2003). Determination of the minimal clinically significant difference on a
patient visual analog sleep quality scale. Journal of Sleep Research, 12(4), 291–298.
https://doi.org/10.1046/j.0962-1105.2003.00365.x
NUDGE-BASED INTERVENTION 32
Table 1Intervention strategies. Participants chose which strategies to follow and how closely to followthem. See Tables A1 and A2 for details on the interventions used in Studies 1 and 2.
Strategy Rationale
1. Notifications. Disable non-essential
notifications (sounds, banners, and
vibration).
Notifications disrupt task performance (Stothart
et al., 2015) and may increase stress (Fitz et al.,
2019).
2. Accessibility. Keep your phone on silent
(vibrate off), face down, out of sight, and
out of reach when not in use throughout the
day.
The mere presence of a smartphone may reduce
cognitive task performance (Ward et al., 2017).
3. Unlocking. Disable Touch ID/Face ID
(i.e., the fingerprint/face scanner to unlock
your phone); use a password instead.
Having a delay before accessing phone apps can
reduce usage (Kim et al., 2019).
4. Sleep. Keep your phone on silent
(vibrate off) and out of reach when going to
bed (e.g., on the opposite side of the room).
Avoiding smartphone use at night may improve
sleep (Demirci et al., 2015; Lemola et al., 2014)
and quality of life (Hughes & Burke, 2018).
5. Display. Turn down your phone’s
brightness, set it to greyscale (black and
white), and change the colour warmth to
filter out blue light (i.e., turn on the “night
shift” feature).
Reducing light before bed may improve sleep
(Chang et al., 2014) and the greyscale setting may
reduce screen time, problematic smartphone use,
and anxiety (Holte et al., 2021; Holte & Ferraro,
2020) as well as motivation to use the phone
(Myers et al., 2021).
6. Social media. Hide social media and
email apps (e.g., Instagram, SnapChat,
Facebook, Gmail, Outlook) in a folder off
of the home screen (or even delete them).
Reducing social networking site use may improve
well-being (Allcott et al., 2020; Hunt et al.,
2018).

NUDGE-BASED INTERVENTION 33
Strategy Rationale
7. Computers. If you can do the task on a
computer, try to keep it on the computer
(e.g. social media, web search, or e-mail).
Social networking site use primarily occurs on
smartphones and may be more likely to produce
habitual use compared to computers (Oulasvirta
et al., 2011).
8. Relationships. Let your family, friends,
or colleagues know that you will be
replying less often unless they call you
directly.
Reducing the expectation of immediate replies
could reduce the motivation to use the phone
(Myers et al., 2021; Veissière & Stendel, 2018).
9. Presence. Leave your phone at home
when you do not need it (e.g., when getting
groceries or going to the gym).
Not having a phone accessible will prevent it
from interfering with other activities (Kushlev &
Leitao, 2020) such as social interactions (Kushlev
et al., 2019).
10. General. Overall, use your phone as
little as possible.
Limiting smartphone use through will-power can
increase well-being (Hunt et al., 2018).
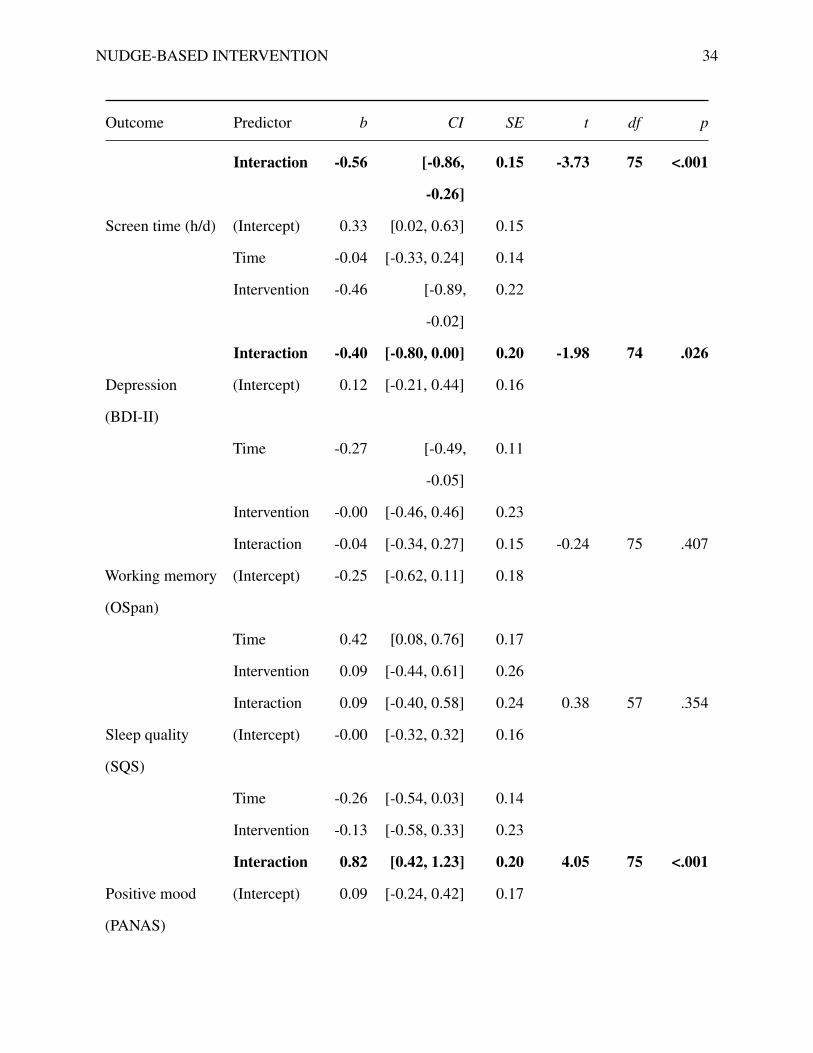
Table 2Regression results for Study 2 comparing weeks 0 and 2. Only the interactions were tested in orderto isolate the differences between the groups while reducing experiment-wise Type I error. The firstfour measures (screen time to working memory) were confirmatory; the rest were exploratory. Alleffects were in the predicted direction.
Outcome Predictor b CI SE t df p
Problematic
smartphone use
(SAS-SV)
(Intercept) 0.31 [0.00, 0.61] 0.15
Time -0.11 [-0.32, 0.11] 0.11
Intervention -0.28 [-0.70, 0.15] 0.22
NUDGE-BASED INTERVENTION 34
Outcome Predictor b CI SE t df p
Interaction -0.56 [-0.86,
-0.26]
0.15 -3.73 75 <.001
Screen time (h/d) (Intercept) 0.33 [0.02, 0.63] 0.15
Time -0.04 [-0.33, 0.24] 0.14
Intervention -0.46 [-0.89,
-0.02]
0.22
Interaction -0.40 [-0.80, 0.00] 0.20 -1.98 74 .026
Depression
(BDI-II)
(Intercept) 0.12 [-0.21, 0.44] 0.16
Time -0.27 [-0.49,
-0.05]
0.11
Intervention -0.00 [-0.46, 0.46] 0.23
Interaction -0.04 [-0.34, 0.27] 0.15 -0.24 75 .407
Working memory
(OSpan)
(Intercept) -0.25 [-0.62, 0.11] 0.18
Time 0.42 [0.08, 0.76] 0.17
Intervention 0.09 [-0.44, 0.61] 0.26
Interaction 0.09 [-0.40, 0.58] 0.24 0.38 57 .354
Sleep quality
(SQS)
(Intercept) -0.00 [-0.32, 0.32] 0.16
Time -0.26 [-0.54, 0.03] 0.14
Intervention -0.13 [-0.58, 0.33] 0.23
Interaction 0.82 [0.42, 1.23] 0.20 4.05 75 <.001
Positive mood
(PANAS)
(Intercept) 0.09 [-0.24, 0.42] 0.17

NUDGE-BASED INTERVENTION 35
Outcome Predictor b CI SE t df p
Time -0.03 [-0.31, 0.25] 0.14
Intervention -0.26 [-0.72, 0.21] 0.23
Interaction 0.28 [-0.11, 0.68] 0.20 1.43 76 .078
Negative mood
(PANAS)
(Intercept) 0.38 [0.07, 0.70] 0.16
Time -0.43 [-0.70,
-0.16]
0.13
Intervention -0.33 [-0.78, 0.11] 0.22
Interaction -0.10 [-0.48, 0.28] 0.19 -0.53 75 .300
Table 3Categories of effects reported during the interview on week 2 of Study 2. The intervention groupreported more effects.
Reported effect Control Intervention Example intervention quote
More focus 6% 23% “I was able to concentrate on
work for prolonged periods of
time”
Less anxiety 0% 21% “I definitely feel less
depressed/stressed/anxious
because I do not feel the stress
of missing one of the texts from
my friends anymore nor the
need to respond immediately”
Concerned when using phone 9% 15% “It leaves a bad taste in my
mouth after wasting so much
time on my phone”
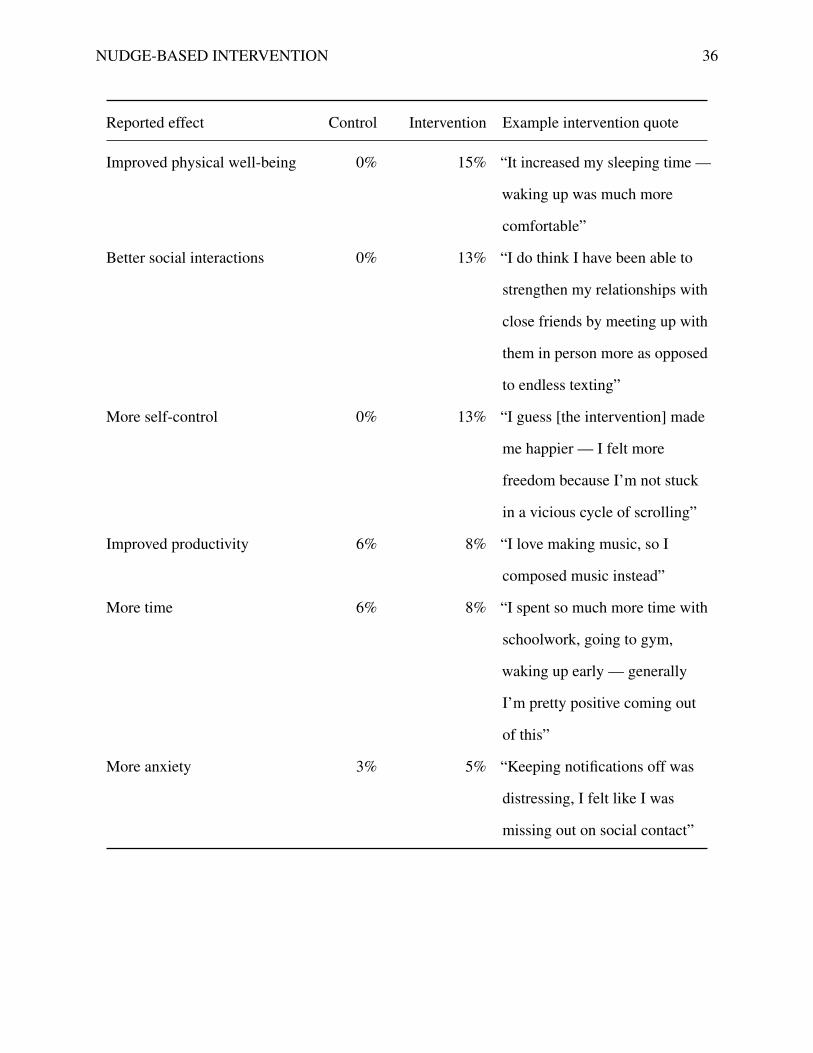
NUDGE-BASED INTERVENTION 36
Reported effect Control Intervention Example intervention quote
Improved physical well-being 0% 15% “It increased my sleeping time —
waking up was much more
comfortable”
Better social interactions 0% 13% “I do think I have been able to
strengthen my relationships with
close friends by meeting up with
them in person more as opposed
to endless texting”
More self-control 0% 13% “I guess [the intervention] made
me happier — I felt more
freedom because I’m not stuck
in a vicious cycle of scrolling”
Improved productivity 6% 8% “I love making music, so I
composed music instead”
More time 6% 8% “I spent so much more time with
schoolwork, going to gym,
waking up early — generally
I’m pretty positive coming out
of this”
More anxiety 3% 5% “Keeping notifications off was
distressing, I felt like I was
missing out on social contact”
NUDGE-BASED INTERVENTION 37
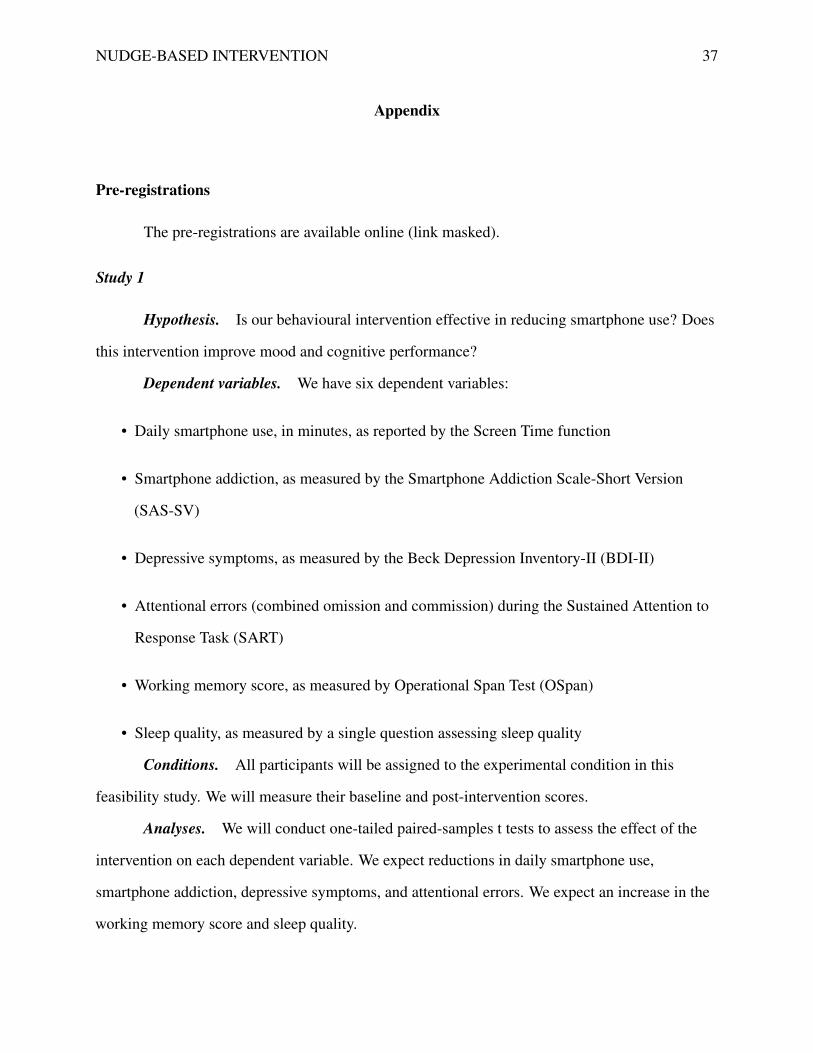
Appendix
Pre-registrations
The pre-registrations are available online (link masked).
Study 1
Hypothesis. Is our behavioural intervention effective in reducing smartphone use? Does
this intervention improve mood and cognitive performance?
Dependent variables. We have six dependent variables:
• Daily smartphone use, in minutes, as reported by the Screen Time function
• Smartphone addiction, as measured by the Smartphone Addiction Scale-Short Version
(SAS-SV)
• Depressive symptoms, as measured by the Beck Depression Inventory-II (BDI-II)
• Attentional errors (combined omission and commission) during the Sustained Attention to
Response Task (SART)
• Working memory score, as measured by Operational Span Test (OSpan)
• Sleep quality, as measured by a single question assessing sleep quality
Conditions. All participants will be assigned to the experimental condition in this
feasibility study. We will measure their baseline and post-intervention scores.
Analyses. We will conduct one-tailed paired-samples t tests to assess the effect of the
intervention on each dependent variable. We expect reductions in daily smartphone use,
smartphone addiction, depressive symptoms, and attentional errors. We expect an increase in the
working memory score and sleep quality.
NUDGE-BASED INTERVENTION 38
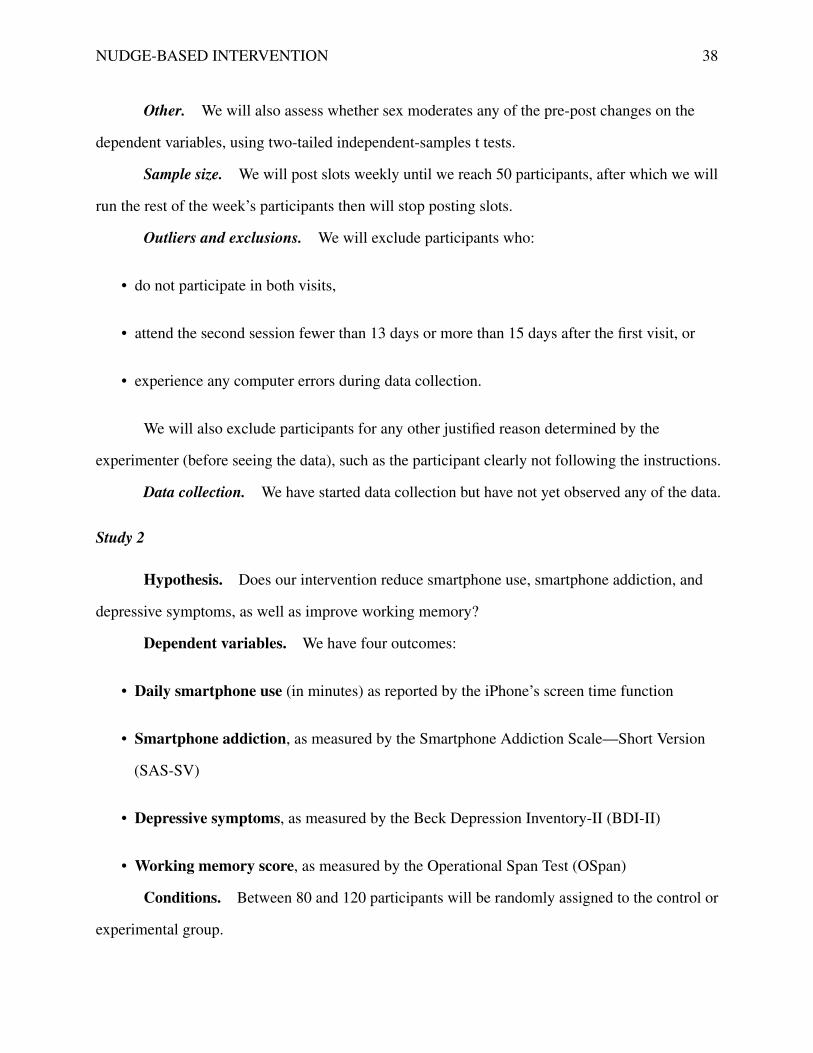
Other. We will also assess whether sex moderates any of the pre-post changes on the
dependent variables, using two-tailed independent-samples t tests.
Sample size. We will post slots weekly until we reach 50 participants, after which we will
run the rest of the week’s participants then will stop posting slots.
Outliers and exclusions. We will exclude participants who:
• do not participate in both visits,
• attend the second session fewer than 13 days or more than 15 days after the first visit, or
• experience any computer errors during data collection.
We will also exclude participants for any other justified reason determined by the
experimenter (before seeing the data), such as the participant clearly not following the instructions.
Data collection. We have started data collection but have not yet observed any of the data.
Study 2
Hypothesis. Does our intervention reduce smartphone use, smartphone addiction, and
depressive symptoms, as well as improve working memory?
Dependent variables. We have four outcomes:
• Daily smartphone use (in minutes) as reported by the iPhone’s screen time function
• Smartphone addiction, as measured by the Smartphone Addiction Scale—Short Version
(SAS-SV)
• Depressive symptoms, as measured by the Beck Depression Inventory-II (BDI-II)
• Working memory score, as measured by the Operational Span Test (OSpan)
Conditions. Between 80 and 120 participants will be randomly assigned to the control or
experimental group.

NUDGE-BASED INTERVENTION 39
Analyses. We will use mixed-effect linear regression. In separate forced-entry regressions,
we will predict each measure given the condition (experimental or control), time (baseline or two
weeks later), and the interaction, with the participant as a random factor. We will only test the
interaction, predicting that we will see larger improvements in the experimental group (directional
test).
If we compute p values (depending on the journal), we will use an alpha of .05 with no
family-wise Type I error control.
Other. We will conduct various exploratory analyses, such as comparing how sex may
moderate these changes.
Sample size. We plan to run between 80 and 120 participants.
We will continue to post weekly experiment slots until 31 Mar 2020 to reach a minimum
sample size of 80 full observations. If we reach this number prior to the end date, we will continue
running participants up to a maximum of 120 observations. We will consider an observation to be
full (and thus to contribute to our sample size) if the participant has no missing data on the
smartphone addiction or depression measures and has no other exclusions (see below).
Outliers and exclusions. We will exclude participants who:
• do not participate in both lab sessions,
• attend the second session fewer than 13 days or more than 15 days after the first session,
• do not have full data sets on the smartphone addiction or depression measures (e.g., due to
computer or experimenter error),
• are excluded for any other justified reason determined by the experimenter before seeing the
data (e.g., participant clearly not following the instructions),
• report following fewer than 5 of the 10 intervention guidelines when assessed at the second
session (for guidelines including several components we will count each component as a
NUDGE-BASED INTERVENTION 40
fraction of the overall guideline), or
• have an extreme difference score (absolute z score greater than 3) within the condition on any
of the main measures and provide a reason for the difference when asked at the end of the
study whether any external events may have affected their outcomes. If the reason could
plausibly affect the other variables (e.g., having a steep increase in depression and being
stressed during the exam period), we will exclude the participant altogether, otherwise (e.g.,
if the participant’s screen time tracking function malfunctions and shows high numbers) we
will exclude the participant only from analyses using that measure.
For other missing data, we will exclude the participant from the specific analyses in which
the missing data would be used. For small amounts of missing data (e.g., one day of screen time
tracking lost), we may use multiple imputation or similar methods to fill in the values.
Data collection. We have started data collection but have not yet observed any of the data.
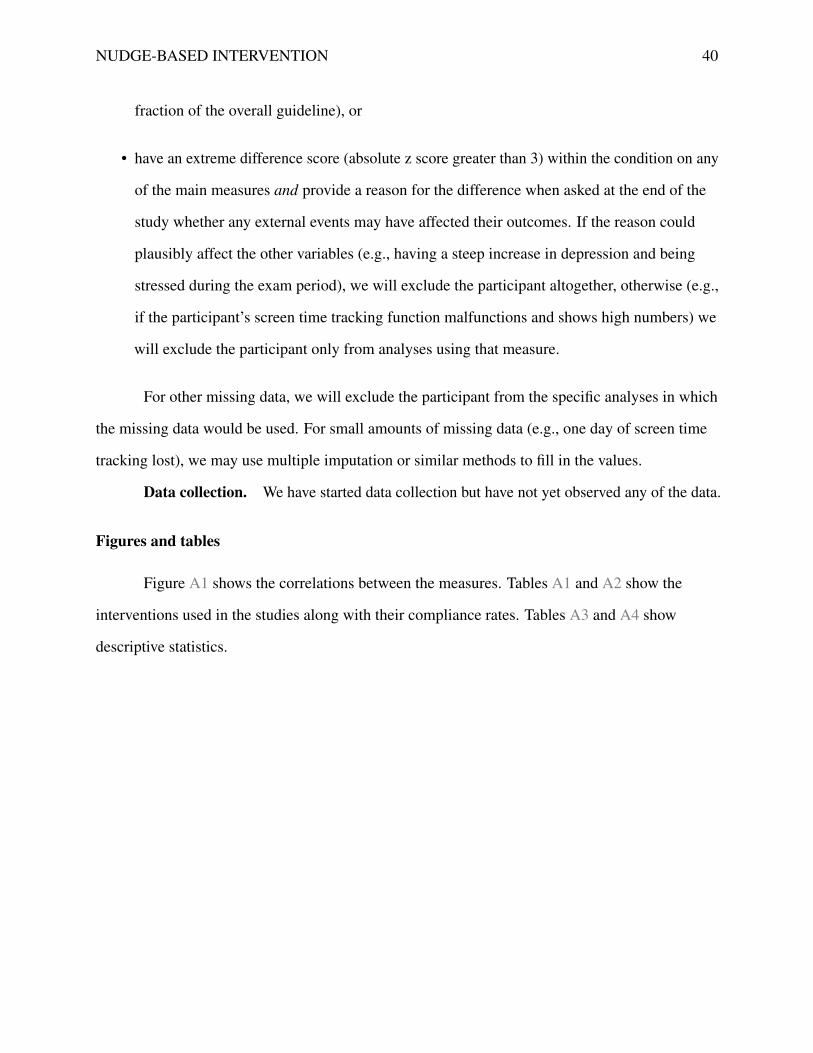
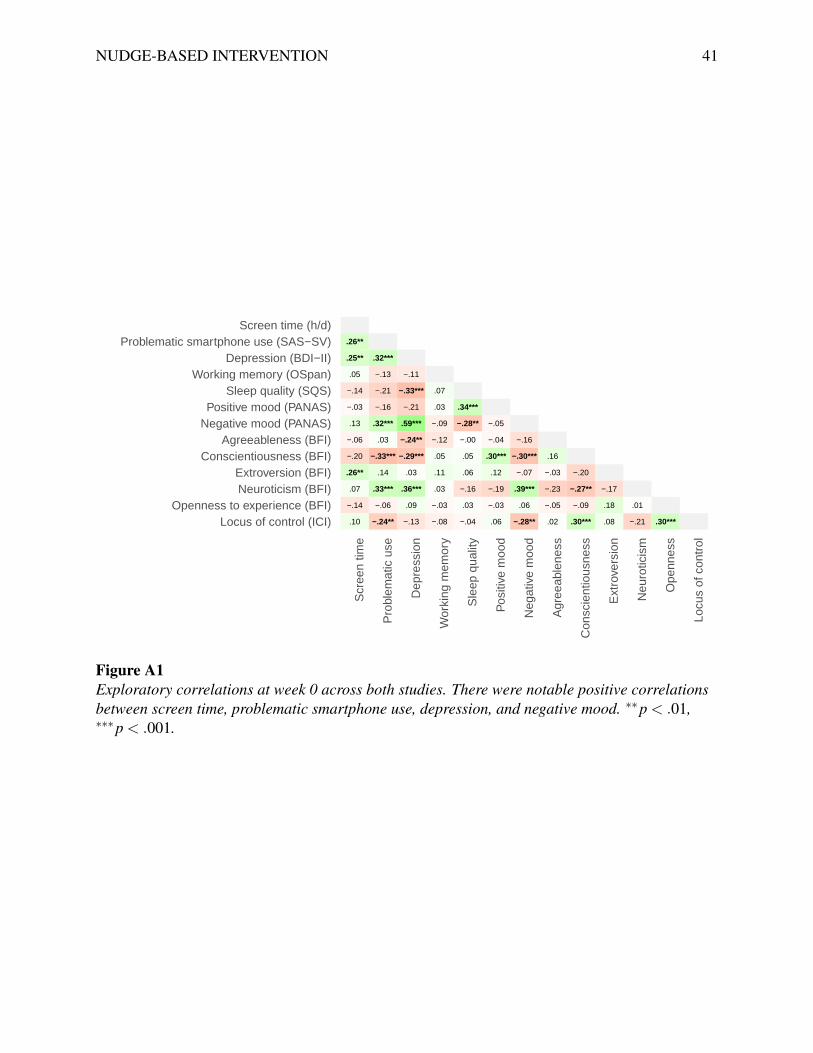
Figures and tables
Figure A1 shows the correlations between the measures. Tables A1 and A2 show the
interventions used in the studies along with their compliance rates. Tables A3 and A4 show
descriptive statistics.
NUDGE-BASED INTERVENTION 41
.26**
.25** .32***
.05 −.13 −.11
−.14 −.21 −.33*** .07
−.03 −.16 −.21 .03 .34***
.13 .32*** .59*** −.09 −.28** −.05
−.06 .03 −.24** −.12 −.00 −.04 −.16
−.20 −.33*** −.29*** .05 .05 .30*** −.30*** .16
.26** .14 .03 .11 .06 .12 −.07 −.03 −.20
.07 .33*** .36*** .03 −.16 −.19 .39*** −.23 −.27** −.17
−.14 −.06 .09 −.03 .03 −.03 .06 −.05 −.09 .18 .01
.10 −.24** −.13 −.08 −.04 .06 −.28** .02 .30*** .08 −.21 .30***Locus of control (ICI)Openness to experience (BFI)
Neuroticism (BFI)Extroversion (BFI)
Conscientiousness (BFI)Agreeableness (BFI)
Negative mood (PANAS)Positive mood (PANAS)
Sleep quality (SQS)Working memory (OSpan)
Depression (BDI−II)Problematic smartphone use (SAS−SV)
Screen time (h/d)
Scr
een
time
Pro
blem
atic
use
Dep
ress
ion
Wor
king
mem
ory
Sle
ep q
ualit
y
Pos
itive
moo
d
Neg
ativ
e m
ood
Agr
eeab
lene
ss
Con
scie
ntio
usne
ss
Ext
rove
rsio
n
Neu
rotic
ism
Ope
nnes
s
Locu
s of
con
trol
Figure A1Exploratory correlations at week 0 across both studies. There were notable positive correlationsbetween screen time, problematic smartphone use, depression, and negative mood. ∗∗p < .01,∗∗∗p < .001.
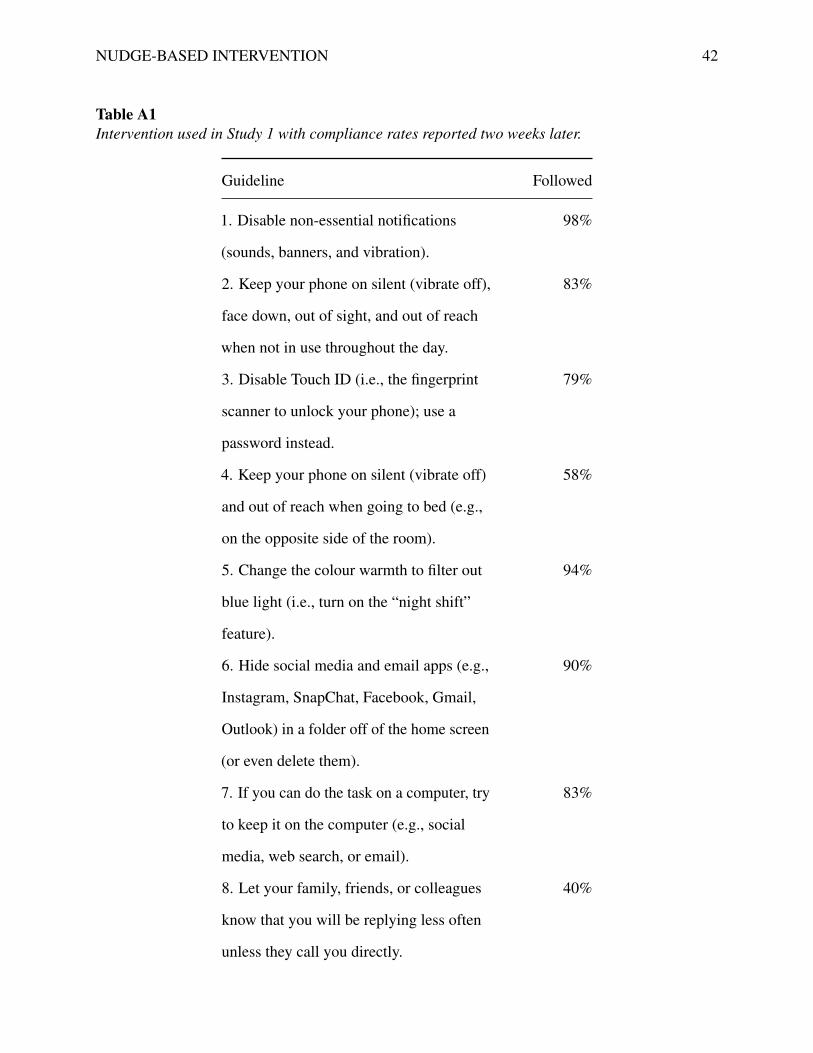
NUDGE-BASED INTERVENTION 42
Table A1Intervention used in Study 1 with compliance rates reported two weeks later.
Guideline Followed
1. Disable non-essential notifications
(sounds, banners, and vibration).
98%
2. Keep your phone on silent (vibrate off),
face down, out of sight, and out of reach
when not in use throughout the day.
83%
3. Disable Touch ID (i.e., the fingerprint
scanner to unlock your phone); use a
password instead.
79%
4. Keep your phone on silent (vibrate off)
and out of reach when going to bed (e.g.,
on the opposite side of the room).
58%
5. Change the colour warmth to filter out
blue light (i.e., turn on the “night shift”
feature).
94%
6. Hide social media and email apps (e.g.,
Instagram, SnapChat, Facebook, Gmail,
Outlook) in a folder off of the home screen
(or even delete them).
90%
7. If you can do the task on a computer, try
to keep it on the computer (e.g., social
media, web search, or email).
83%
8. Let your family, friends, or colleagues
know that you will be replying less often
unless they call you directly.
40%
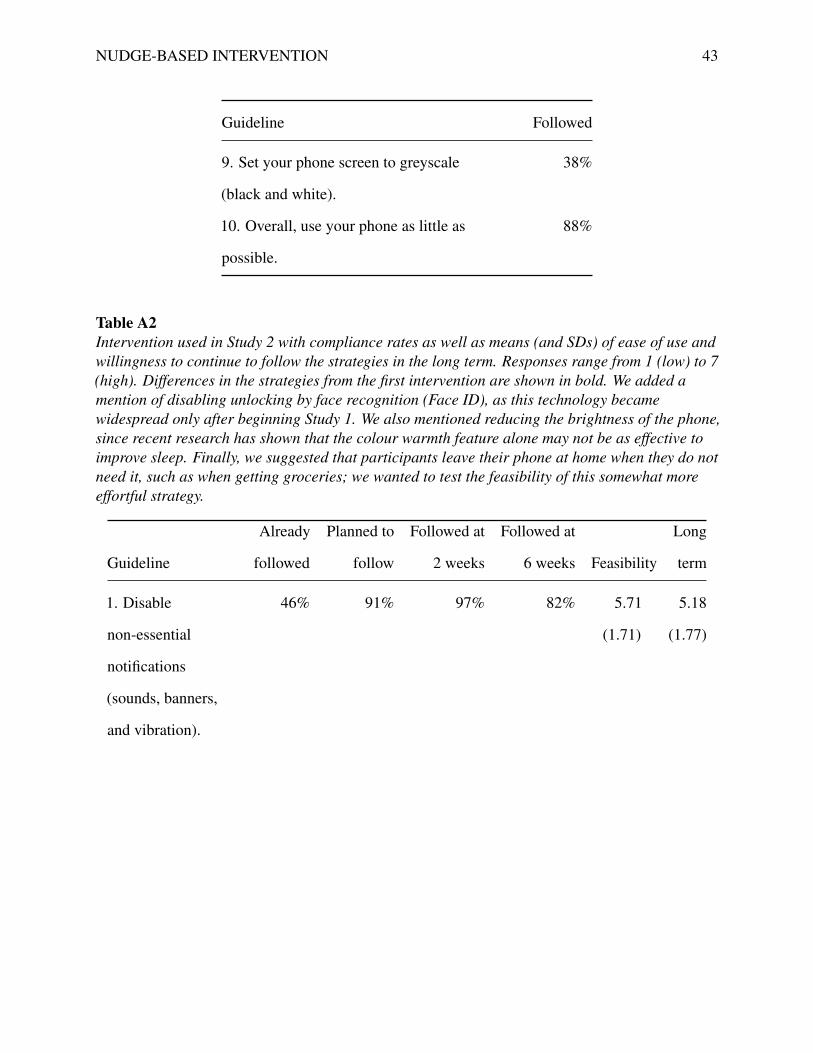
NUDGE-BASED INTERVENTION 43
Guideline Followed
9. Set your phone screen to greyscale
(black and white).
38%
10. Overall, use your phone as little as
possible.
88%
Table A2Intervention used in Study 2 with compliance rates as well as means (and SDs) of ease of use andwillingness to continue to follow the strategies in the long term. Responses range from 1 (low) to 7(high). Differences in the strategies from the first intervention are shown in bold. We added amention of disabling unlocking by face recognition (Face ID), as this technology becamewidespread only after beginning Study 1. We also mentioned reducing the brightness of the phone,since recent research has shown that the colour warmth feature alone may not be as effective toimprove sleep. Finally, we suggested that participants leave their phone at home when they do notneed it, such as when getting groceries; we wanted to test the feasibility of this somewhat moreeffortful strategy.
Guideline
Already
followed
Planned to
follow
Followed at
2 weeks
Followed at
6 weeks Feasibility
Long
term
1. Disable
non-essential
notifications
(sounds, banners,
and vibration).
46% 91% 97% 82% 5.71
(1.71)
5.18
(1.77)
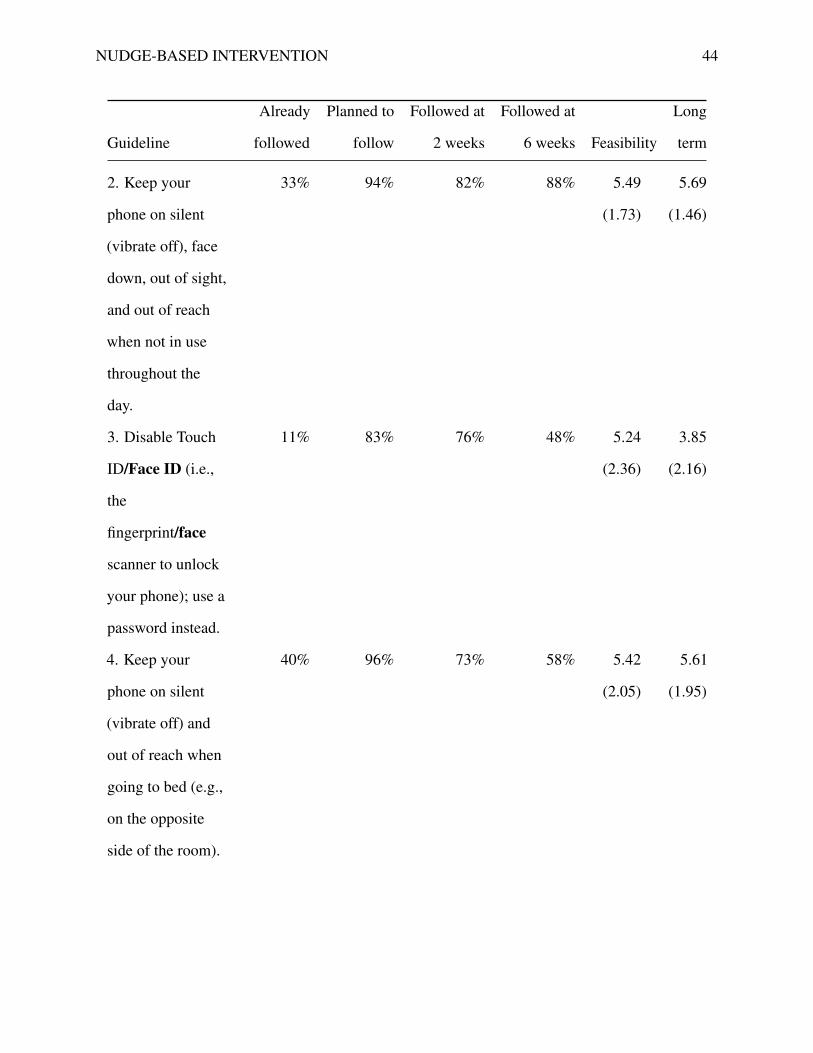
NUDGE-BASED INTERVENTION 44
Guideline
Already
followed
Planned to
follow
Followed at
2 weeks
Followed at
6 weeks Feasibility
Long
term
2. Keep your
phone on silent
(vibrate off), face
down, out of sight,
and out of reach
when not in use
throughout the
day.
33% 94% 82% 88% 5.49
(1.73)
5.69
(1.46)
3. Disable Touch
ID/Face ID (i.e.,
the
fingerprint/face
scanner to unlock
your phone); use a
password instead.
11% 83% 76% 48% 5.24
(2.36)
3.85
(2.16)
4. Keep your
phone on silent
(vibrate off) and
out of reach when
going to bed (e.g.,
on the opposite
side of the room).
40% 96% 73% 58% 5.42
(2.05)
5.61
(1.95)
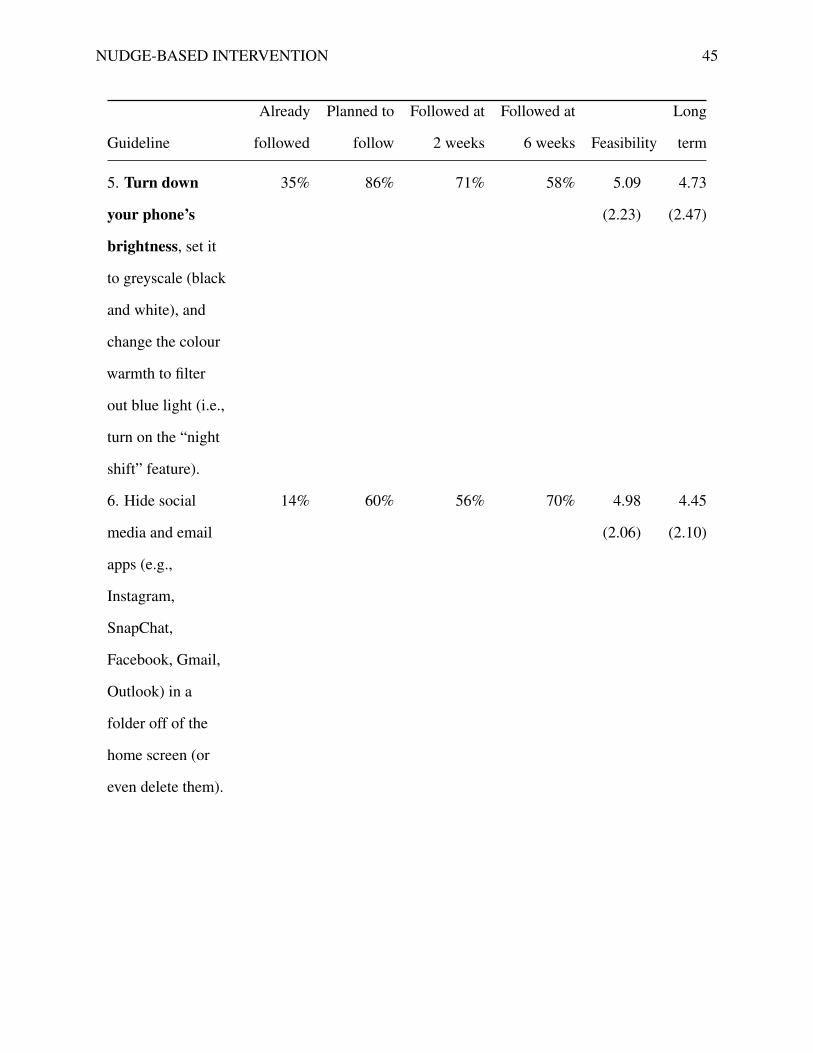
NUDGE-BASED INTERVENTION 45
Guideline
Already
followed
Planned to
follow
Followed at
2 weeks
Followed at
6 weeks Feasibility
Long
term
5. Turn down
your phone’s
brightness, set it
to greyscale (black
and white), and
change the colour
warmth to filter
out blue light (i.e.,
turn on the “night
shift” feature).
35% 86% 71% 58% 5.09
(2.23)
4.73
(2.47)
6. Hide social
media and email
apps (e.g.,
Instagram,
SnapChat,
Facebook, Gmail,
Outlook) in a
folder off of the
home screen (or
even delete them).
14% 60% 56% 70% 4.98
(2.06)
4.45
(2.10)
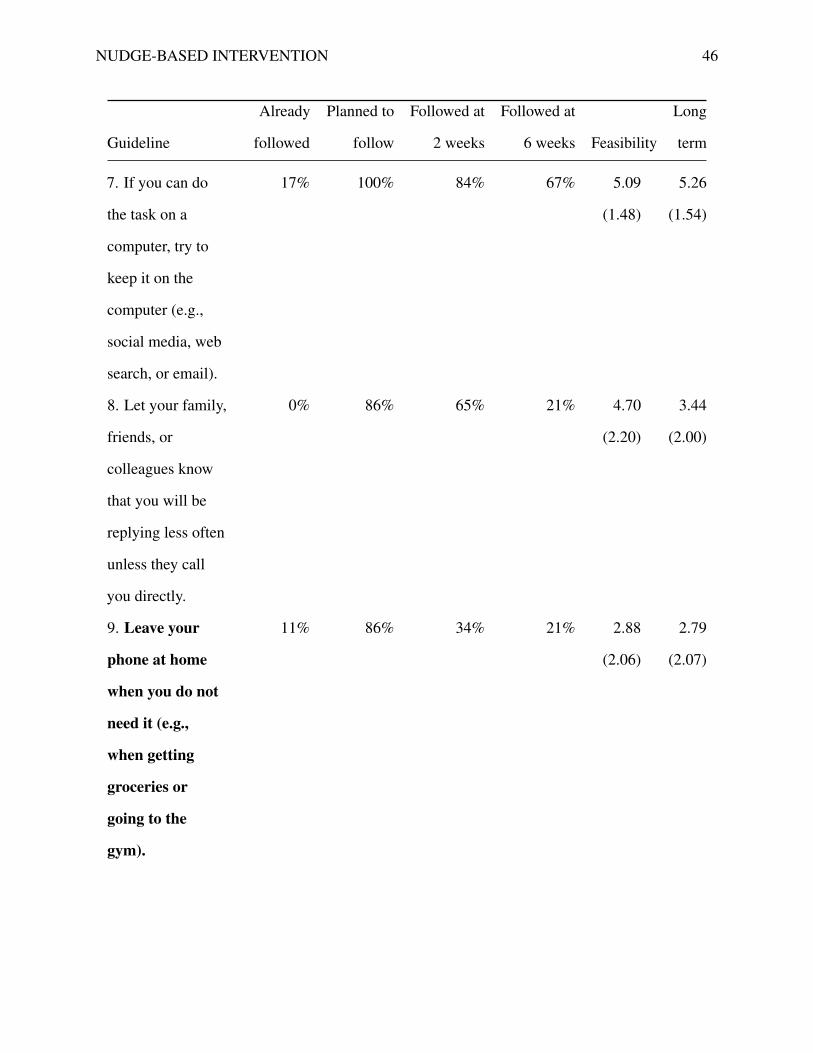
NUDGE-BASED INTERVENTION 46
Guideline
Already
followed
Planned to
follow
Followed at
2 weeks
Followed at
6 weeks Feasibility
Long
term
7. If you can do
the task on a
computer, try to
keep it on the
computer (e.g.,
social media, web
search, or email).
17% 100% 84% 67% 5.09
(1.48)
5.26
(1.54)
8. Let your family,
friends, or
colleagues know
that you will be
replying less often
unless they call
you directly.
0% 86% 65% 21% 4.70
(2.20)
3.44
(2.00)
9. Leave your
phone at home
when you do not
need it (e.g.,
when getting
groceries or
going to the
gym).
11% 86% 34% 21% 2.88
(2.06)
2.79
(2.07)

NUDGE-BASED INTERVENTION 47
Guideline
Already
followed
Planned to
follow
Followed at
2 weeks
Followed at
6 weeks Feasibility
Long
term
10. Overall, use
your phone as
little as possible.
0% 100% 90% 42% 4.79
(1.55)
5.41
(1.26)
Table A3Means (and SDs) of measures across weeks in Study 1.
Measure Intervention week 0 Intervention week 2
Screen time (h/d) 4.67 (2.09) 3.40 (1.99)
Problematic smartphone use
(SAS-SV)
35.29 (8.84) 28.08 (9.00)
Depression (BDI-II) 11.57 (9.51) 6.90 (7.04)
Working memory (OSpan) 46.69 (18.28) 50.59 (17.62)
Sustained attention errors (SART) 16.33 (9.83) 17.82 (12.72)
Sleep quality (SQS) 6.61 (1.72) 6.94 (1.59)
Positive mood (PANAS) 17.69 (3.30) 16.96 (3.05)
Negative mood (PANAS) 11.33 (4.30) 9.63 (3.58)
Table A4Means (and SDs) of measures across conditions and weeks in Study 2.
Measure
Control week
0
Control week
2
Intervention
week 0
Intervention
week 2
Screen time (h/d) 5.28 (2.19) 5.34 (2.49) 4.05 (1.59) 3.14 (1.46)
Problematic
smartphone use
(SAS-SV)
34.21 (8.39) 32.61 (7.35) 30.86 (7.80) 25.16 (7.23)
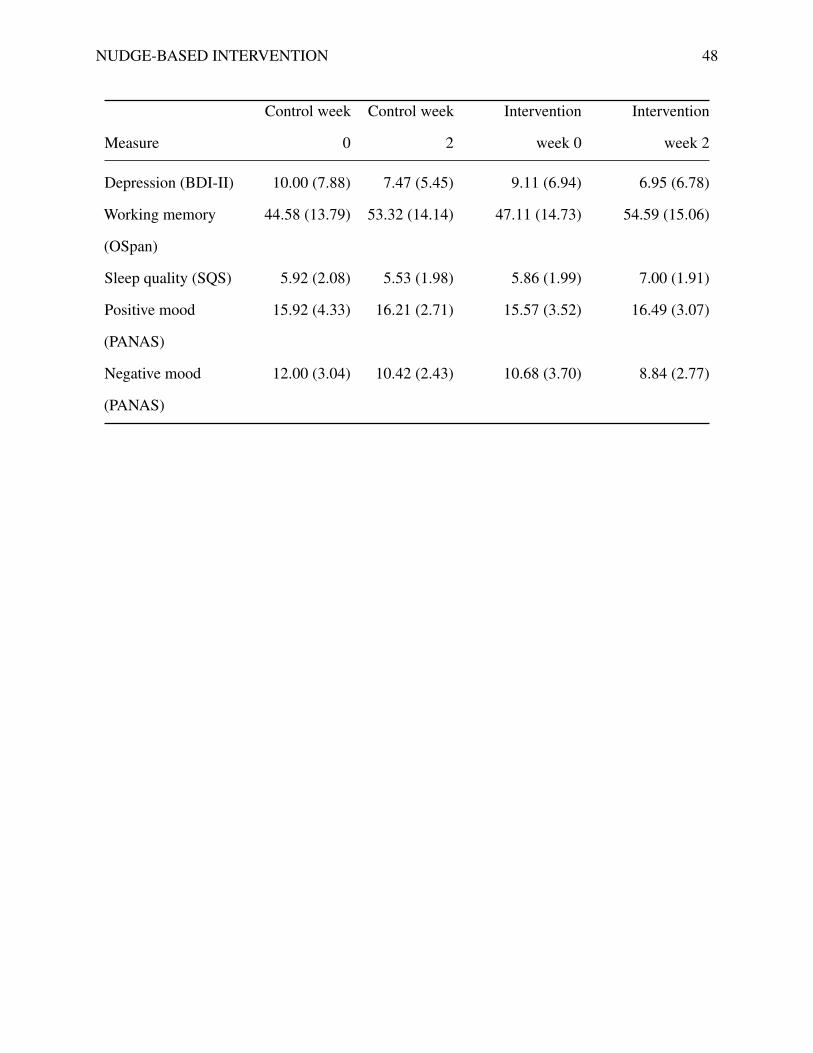
NUDGE-BASED INTERVENTION 48
Measure
Control week
0
Control week
2
Intervention
week 0
Intervention
week 2
Depression (BDI-II) 10.00 (7.88) 7.47 (5.45) 9.11 (6.94) 6.95 (6.78)
Working memory
(OSpan)
44.58 (13.79) 53.32 (14.14) 47.11 (14.73) 54.59 (15.06)
Sleep quality (SQS) 5.92 (2.08) 5.53 (1.98) 5.86 (1.99) 7.00 (1.91)
Positive mood
(PANAS)
15.92 (4.33) 16.21 (2.71) 15.57 (3.52) 16.49 (3.07)
Negative mood
(PANAS)
12.00 (3.04) 10.42 (2.43) 10.68 (3.70) 8.84 (2.77)