A Multi Response Optimization of Machining Parameters For Surface Roughness & MRR In High Speed CNC...
13
[Saini, 3(9): September, 2014] ISSN: 2277-9655 Scientific Journal Impact Factor: 3.449 (ISRA), Impact Factor: 2.114 http: // www.ijesrt.com (C)International Journal of Engineering Sciences & Research Technology [333] IJESRT INTERNATIONAL JOURNAL OF ENGINEERING SCIENCES & RESEARCH TECHNOLOGY A Multi Response Optimization of Machining Parameters For Surface Roughness & MRR In High Speed CNC Turning of EN-24 Alloy Steel Using Response Surface Methodology Puneet Saini *, Shanti Parkash *M.tech Mechanical Engg. Student, Haryana Engg. College, Jagadhri, Haryana, India Assistant Professor Mechanical Engg. Haryana Engg. College, Jagadhri, Haryana, India [email protected] Abstracts In Manufacturing sector Turning is the most common process used to remove material from cylindrical workpiece & produce smooth surface finish on the workpiece. In turning process Material removal rate & Surface roughness are the important performance characteristics to be considered which is affected by several factors such as spindle speed, cutting tool material, feed rate, depth of cut, Nose radius cutting tool, coolant and work material characterstics. Alloy Steel EN-24 is a medium carbon steel which is used in manufacturing of aircraft Automotive & axles components, Heavy duty Gears, Shafts, Spindles, Studs, collets, Pins, bolts, sprockets, couplings, pinions & pinion arbors. In this research Response surface methodology (RSM) was applied to determine the optimum machining parameters leading to minimum surface roughness maximum MRR in turning process. In this research spindle speed, depth of cut & feed rate are considered to be main parameters for turning on Alloy Steel. Through multi response optimization the optimum value of the surface roughness (Ra) comes out to be 1.46389 μm for MRR is 403.458 mm3/sec. It is also concluded that feed rate & depth of cut are the major significant factor affecting surface roughness & MRR. Keywords: En-24 Alloy Steel, Turning Process, Surface Roughness, MRR, Anova, Response Surface Methodology. Introduction Increasing productivity & Quality of product are considered to main challenging task for manufacturing industries. In manufacturing industries machining processes suffers various problems regarding optimum value of machining parameters for better surface finish & material removal rate. The work material selected for the present study is Alloy Steel EN-24 (Medium Carbon Steel) used in manufacturing of aircraft Automotive & axles components, Heavy duty Gears, Shafts, Spindles, Studs, collets, Pins, bolts, sprockets, couplings & pinion arbors . In this research spindle speed, depth of cut and feed rate are considered to be main parameters for turning on Alloy Steel. Methodology In this research Design Expert version 6.0.8 software with Box–Behnken approach was used to develop the experimental plan for multi response optimization. RSM was introduced by G.E.P.BOX and K.B.WILSON in 1951. It is a collection of mathematical and statistical technique that is useful for modeling and analysis of problems in which a response of interest is influenced by several variables and objective is to optimize this response. This experiment contains main three factors each at three levels. therefore total number of runs requirement is seventeen including five replications of centre point. The same software was also used to analyse the collected Result data. Desirability is an objective function that ranges from zero outside of the limits to one at goal. The numerical optimization finds a point that maximizes the desirability function. Flow Process Chart
Transcript of A Multi Response Optimization of Machining Parameters For Surface Roughness & MRR In High Speed CNC...

[Saini, 3(9): September, 2014] ISSN: 2277-9655 Scientific Journal Impact Factor: 3.449
(ISRA), Impact Factor: 2.114
http: // www.ijesrt.com (C)International Journal of Engineering Sciences & Research Technology [333]
IJESRT INTERNATIONAL JOURNAL OF ENGINEERING SCIENCES & RESEARCH
TECHNOLOGY
A Multi Response Optimization of Machining Parameters For Surface Roughness & MRR
In High Speed CNC Turning of EN-24 Alloy Steel Using Response Surface Methodology
Puneet Saini *, Shanti Parkash
*M.tech Mechanical Engg. Student, Haryana Engg. College, Jagadhri, Haryana, India
Assistant Professor Mechanical Engg. Haryana Engg. College, Jagadhri, Haryana, India
Abstracts In Manufacturing sector Turning is the most common process used to remove material from cylindrical
workpiece & produce smooth surface finish on the workpiece. In turning process Material removal rate & Surface
roughness are the important performance characteristics to be considered which is affected by several factors such as
spindle speed, cutting tool material, feed rate, depth of cut, Nose radius cutting tool, coolant and work material
characterstics. Alloy Steel EN-24 is a medium carbon steel which is used in manufacturing of aircraft Automotive &
axles components, Heavy duty Gears, Shafts, Spindles, Studs, collets, Pins, bolts, sprockets, couplings, pinions &
pinion arbors. In this research Response surface methodology (RSM) was applied to determine the optimum
machining parameters leading to minimum surface roughness maximum MRR in turning process. In this research
spindle speed, depth of cut & feed rate are considered to be main parameters for turning on Alloy Steel. Through multi
response optimization the optimum value of the surface roughness (Ra) comes out to be 1.46389 µm for MRR is
403.458 mm3/sec. It is also concluded that feed rate & depth of cut are the major significant factor affecting surface
roughness & MRR.
Keywords: En-24 Alloy Steel, Turning Process, Surface Roughness, MRR, Anova, Response Surface Methodology.
Introduction
Increasing productivity & Quality of
product are considered to main challenging task for
manufacturing industries. In manufacturing
industries machining processes suffers various
problems regarding optimum value of machining
parameters for better surface finish & material
removal rate. The work material selected for the
present study is Alloy Steel EN-24 (Medium Carbon
Steel) used in manufacturing of aircraft Automotive &
axles components, Heavy duty Gears, Shafts,
Spindles, Studs, collets, Pins, bolts, sprockets,
couplings & pinion arbors . In this research spindle
speed, depth of cut and feed rate are considered to be
main parameters for turning on Alloy Steel.
Methodology
In this research Design Expert version 6.0.8
software with Box–Behnken approach was used to
develop the experimental plan for multi response
optimization. RSM was introduced by G.E.P.BOX and
K.B.WILSON in 1951. It is a collection of
mathematical and statistical technique that is useful for
modeling and analysis of problems in which a
response of interest is influenced by several variables
and objective is to optimize this response. This
experiment contains main three factors each at three
levels. therefore total number of runs requirement is
seventeen including five replications of centre point.
The same software was also used to analyse the
collected Result data. Desirability is an objective
function that ranges from zero outside of the limits to
one at goal. The numerical optimization finds a point
that maximizes the desirability function.
Flow Process Chart

[Saini, 3(9): September, 2014] ISSN: 2277-9655 Scientific Journal Impact Factor: 3.449
(ISRA), Impact Factor: 2.114
http: // www.ijesrt.com (C)International Journal of Engineering Sciences & Research Technology [334]
Experimental Setup
Work material
In this research, EN-24 alloy steel which is a
medium carbon steel (Bars having diameter 34 mm
and length 60 mm) is used as work piece for turning
operation. It is used in manufacturing of aircraft
Automotive & axles components, Heavy duty Gears,
Shafts, Spindles, Studs, collets, Pins, bolts, sprockets,
couplings & pinion arbors .
Chemical Composition of EN-24
Metal Percentage
Fe 95.748
C 0.403
Si 0.185
Mn 0.606
S 0.019
P 0.0134
Cr 1.140
Mo 0.257
Ni 1.360
Cutting Tool
The Coated Tungsten Carbide Turning Insert
(CNMG120408) is used
Tool material- Tungsten carbide
Tool Make- WIDIA
Tool Coating Material- TiN coating
C – Shape 80o diamond
N – clearance angleM – tolerance
G – insert type (pin type/top clamp)
Figure 1: WIDIA Tool Bit for turning with geometry
Experimental Machine
The experiments were conducted in R&D polytechnic
Ludhiana. in CNC turning centre. EN-24 alloy steel
(bars having diameter 34 mm and length 60mm) is
used as work material for turning process in dry
condition.
Figure 2: Stallion 100 HS CNC Lathe Machine for
turning
Process variables & range
The working ranges of parameters for subsequent
design of experiment based on Response Surface
Methodology have been selected. In this experimental
work, spindle speed, DOC and feed rate have been
considered as main process variables. The process
variables with their units (and notations) are listed in
Table 1
Table 1: Process variables & working Range
Factors Units Level-
1
Level-
2
Level-
3
Spindle
speed(N)
Rpm 2400 2800 3200
Feed (F) mm/rev 0.1 0.2 0.3
Depth of
cut
(DOC)
mm 0.5 1.00 1.50
[Saini, 3(9): September, 2014] ISSN: 2277-9655 Scientific Journal Impact Factor: 3.449
(ISRA), Impact Factor: 2.114
http: // www.ijesrt.com (C)International Journal of Engineering Sciences & Research Technology [335]
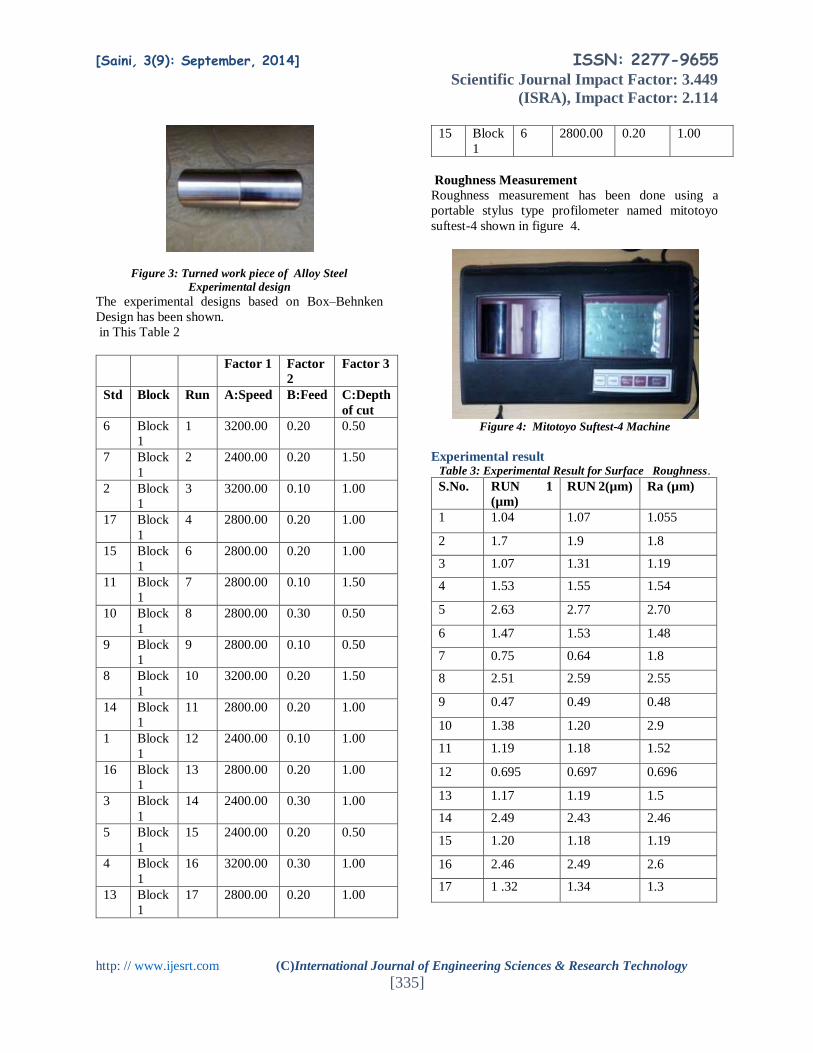
Figure 3: Turned work piece of Alloy Steel
Experimental design
The experimental designs based on Box–Behnken
Design has been shown.
in This Table 2
Factor 1 Factor
2
Factor 3
Std Block Run A:Speed B:Feed C:Depth
of cut
6 Block
1
1 3200.00 0.20 0.50
7 Block
1
2 2400.00 0.20 1.50
2 Block
1
3 3200.00 0.10 1.00
17 Block
1
4 2800.00 0.20 1.00
15 Block
1
6 2800.00 0.20 1.00
11 Block
1
7 2800.00 0.10 1.50
10 Block
1
8 2800.00 0.30 0.50
9 Block
1
9 2800.00 0.10 0.50
8 Block
1
10 3200.00 0.20 1.50
14 Block
1
11 2800.00 0.20 1.00
1 Block
1
12 2400.00 0.10 1.00
16 Block
1
13 2800.00 0.20 1.00
3 Block
1
14 2400.00 0.30 1.00
5 Block
1
15 2400.00 0.20 0.50
4 Block
1
16 3200.00 0.30 1.00
13 Block
1
17 2800.00 0.20 1.00
15 Block
1
6 2800.00 0.20 1.00
Roughness Measurement
Roughness measurement has been done using a
portable stylus type profilometer named mitotoyo
suftest-4 shown in figure 4.
Figure 4: Mitotoyo Suftest-4 Machine
Experimental result Table 3: Experimental Result for Surface Roughness.
S.No. RUN 1
(µm)
RUN 2(µm) Ra (µm)
1 1.04 1.07 1.055
2 1.7 1.9 1.8
3 1.07 1.31 1.19
4 1.53 1.55 1.54
5 2.63 2.77 2.70
6 1.47 1.53 1.48
7 0.75 0.64 1.8
8 2.51 2.59 2.55
9 0.47 0.49 0.48
10 1.38 1.20 2.9
11 1.19 1.18 1.52
12 0.695 0.697 0.696
13 1.17 1.19 1.5
14 2.49 2.43 2.46
15 1.20 1.18 1.19
16 2.46 2.49 2.6
17 1 .32 1.34 1.3

[Saini, 3(9): September, 2014] ISSN: 2277-9655 Scientific Journal Impact Factor: 3.449
(ISRA), Impact Factor: 2.114
http: // www.ijesrt.com (C)International Journal of Engineering Sciences & Research Technology [336]
Table 4: Results of main experiments for MRR & average surface roughness values Ra
Factor I Factor II Factor III Response I Response II
Std Block Run A:Speed B:Feed C:Depth of cut Ra (µm) MRR
mm3/sec
6 Block 1 1 3200 0.2 0.50 1.055 152.86
7 Block 1 2 2400 0.2 1.50 1.8 413.15
2 Block 1 3 3200 0.1 1.00 1.19 280.25
17 Block 1 4 2800 0.2 1.00 1.54 350.31
12 Block 1 5 2800 0.3 1.50 2.7 618.74
15 Block 1 6 2800 0.2 1.00 1.48 407.64
11 Block 1 7 2800 0.1 1.50 1.8 305.73
10 Block 1 8 2800 0.3 0.50 2.55 222.93
9 Block 1 9 2800 0.1 0.50 0.48 127.38
8 Block 1 10 3200 0.2 1.50 2.9 621.02
14 Block 1 11 2800 0.2 1.00 1.52 407.64
1 Block 1 12 2400 0.1 1.00 0.696 209.38
16 Block 1 13 2800 0.2 1.00 1.5 389.24
3 Block 1 14 2400 0.3 1.00 2.46 382.17
5 Block 1 15 2400 0.2 0.50 1.19 152.86
4 Block 1 16 3200 0.3 1.00 2.6 541.40
13 Block 1 17 2800 0.2 1.00 1.3 467.09
ANOVA For Ra
ANOVA is performed using the Design-Expert 6.0.8. software. ANOVA for response Ra is given in Table 5
Table 5: ANOVA for Ra
Source Total Sum of
Squares
DF Mean
Square
Total F
Value
P- value
Prob> F
Remarks
Model 8.08 7 1.15 46.29 < 0.0001 Significant
A 0.32 1 0.32 12.81 0.0059 Significant
B 4.72 1 4.72 189.15 < 0.0001 Significant
C 1.93 1 1.93 77.19 < 0.0001 Significant
B2 0.19 1 0.19 7.51 0.0229 Significant
C2 0.19 1 0.19 7.49 0.0230 Significant
AC 0.38 1 0.38 15.29 0.0036 Significant
BC 0.34 1 0.34 13.72 0.0049 Significant
Residual 0.22 9 0.025
Lack of Fit 0.19 5 0.037 4.02 0.1012 Insignificant
Pure Error 0.037 4 9.320E-003
Core Total 8.31 16
Std. Dev. 0.16 C.V. 9.34
R-Squared 0.9730 Pred R-Squared 0.8084

[Saini, 3(9): September, 2014] ISSN: 2277-9655 Scientific Journal Impact Factor: 3.449
(ISRA), Impact Factor: 2.114
http: // www.ijesrt.com (C)International Journal of Engineering Sciences & Research Technology [337]
Mean 1.69 PRESS 1.59
Adj R-Squared 0.9520
Adeq Precision 23.233
ANOVA For MRR
ANOVA is performed using the Design-Expert 6.0.8. software. ANOVA for response MRR is given in Table 6
Table 6: ANOVA for MRR
Source Total Sum of
Squares
DF Mean
Square
Total F
Value
P- value
Remarks
Model 3.602E+005 6 60031.42
32.44 < 0.0001
Significant
A 23985.98 1 23985.98 12.96 < 0.0048 Significant
B 88742.63 1 88742.63 47.95 < 0.0001 Significant
C 2.121E+005 1 2.121E+005 114.60 < 0.0001 Significant
C2 12736.11 1 12736.11 6.88 0.0255 Significant
AC 10802.48 1 10802.48 5.84 0.0363 Significant
BC 11822.21 1 11822.21 6.39 0.0300 Significant
Residual 1850.35 10 1850.74
Lack of Fit 11400.77 6 1900.13 1.07 0.4970 Insignificant
Pure Error 7106.58 4 1776.65
Core Total 3.787E+005 16
Std. Dev 43.02 C.V. 12.09
R-Squared 0.9511 Pred R-Squared 0.8665
Mean 355.87 PRESS 50544.49
Adj R-Squared 0.9218
Adeq Precision 19.427
Regression Models.
The regression equations for the response
characteristics as a function of input process
parameters are given below in both coaded and actual
factors.. The insignificant coeffiecients (investigated
from ANOVA) are omitted from the total equations. &
The developed statistical model for Surface roughness
and Material removal rate is
Surface Roughness =1.49 + 0.20 * A + 0.77* B + 0.49
* C + 0.21 * A2 + 0.21 * B2 + 0.37 * C2 + 0.31 *A * C
-0.29 * B * C
Surface Roughness = 2.41360 -1.04406E-003 * speed
+ 5.10632 * feed -3.85399 * depth of cut + 21.05921
* feed2 + 0.84137 * depth of cut2 +1.54375E-003
*speed *depth of cut -5.85000*feed *depth of cut.
Material Removal Rate = +381.67 + 54.76 * A +
105.32 * B +162.83 * C – 54.84 * C2 + 51.97 *A* C
+ 54.36 * B * C.
Material Removal Rate = +187.73542 -0.12295 *
speed -34.07500 * feed- 180.65361* depth of cut -
219.34944 * depth of cut2 + 0.25984 * speed * depth
of cut +1087.30000 * feed * depth of cut

[Saini, 3(9): September, 2014] ISSN: 2277-9655 Scientific Journal Impact Factor: 3.449
(ISRA), Impact Factor: 2.114
http: // www.ijesrt.com (C)International Journal of Engineering Sciences & Research Technology [338]
Figure 5: Effect of (A) speed, (B) feed, (C) depth of cut on Ra.
Figure 6: Effect of (A) speed, (B) feed, (C) depth of cut on MRR

[Saini, 3(9): September, 2014] ISSN: 2277-9655 Scientific Journal Impact Factor: 3.449
(ISRA), Impact Factor: 2.114
http: // www.ijesrt.com (C)International Journal of Engineering Sciences & Research Technology [339]
Figure 7: (a) Contour plot (b) response surface (c) Interaction plot at feed of 0.20mm. And (d) Contour plot (e) response
surface (f) Interaction plot at speed of 2800 rpm (g) Normal probability plot of residuals (h) Actual Vs Predicted values (i)
Residual Vs Run
Figure 7: a-b-c shows the contour plot, 3D response
surface and Interaction Graph for the response MRR
in terms of speed and depth of cut at a feed of
0.20mm.Contour plot plays a very important role in
the study of response surface method. with generating
contour plot using Design of expert software for the
response surface analysis, it is simple to characterize
the shape of surface and locate the optimum with
reasonable precision. By the examination of the
contour plot and response surface, it is observed that
SR increases from 1.37 to 2.46 with increase in speed
from 2400RPM to 3200RPM with increase of depth of
cut from 0.5mm to 1.5mm at a feed 0.20mm.
Figure 7: d-e-f shows the contour plot, 3D response
surface and Interaction Graph for the response MRR
in tergure 7: g-h-i displays the normal probability plot
of residuals and predicted versus actual plots for Ra. It
is observed that the residuals generally fall on the
straight line implying that errors are normal
distributed. The outlier points are then verified by
checking for any points lying outside the red lines. It
is evident from the fig.7(i), all points lie inside the red
lines, which indicates that the model fit well.

[Saini, 3(9): September, 2014] ISSN: 2277-9655 Scientific Journal Impact Factor: 3.449
(ISRA), Impact Factor: 2.114
http: // www.ijesrt.com (C)International Journal of Engineering Sciences & Research Technology [340]
Figure 8: Estimated (a) contour (b) response surface (c) Interaction plot at a feed = 0.20mm, and (d) contour (e) response
surface (f) Interaction plot at the speed of 2800RPM, (g) Normal probability plot residuals (h) Actual Vs Predicted values (i)
Residual Vs Run
Figure 8: a-b-c shows the contour plot, 3D response
surface and Interaction Graph for the response MRR
in terms of speed and depth of cut at a feed =
0.20mm.Contour plot plays a very important role in
the study of response surface. with generating contour
plot by Design of expert software for the response
surface method, it is simple to characterize the shape
of surface and locate the optimum with reasonable
precision. By the examination of the contour plot and
response surface, it is observed that MRR increases
from 233.746 mm3/sec to 523.856 mm3/sec with
increase in speed from 2400RPM to 3200RPM with
increase of depth of cut from 0.5mm to 1.5mm at a
feed 0.20mm.
Figure 8: d-e-f shows the contour plot, 3D response
surface and Interaction Graph for the response MRR
in terms of feed and depth of cut at a speed of
2800RPM.
Figure 8: g-h-i displays the normal probability plot of
residuals and predicted versus actual plots for Ra. It is
observed that the residuals generally fall on the
straight line implying that errors are normal
distributed. The outlier points are then verified by
checking for any points lying outside the red lines. It
is evident from the fig. 8(i), all points lie inside the red
lines, which ensures easily that the model fit well.
[Saini, 3(9): September, 2014] ISSN: 2277-9655 Scientific Journal Impact Factor: 3.449
(ISRA), Impact Factor: 2.114
http: // www.ijesrt.com (C)International Journal of Engineering Sciences & Research Technology [341]
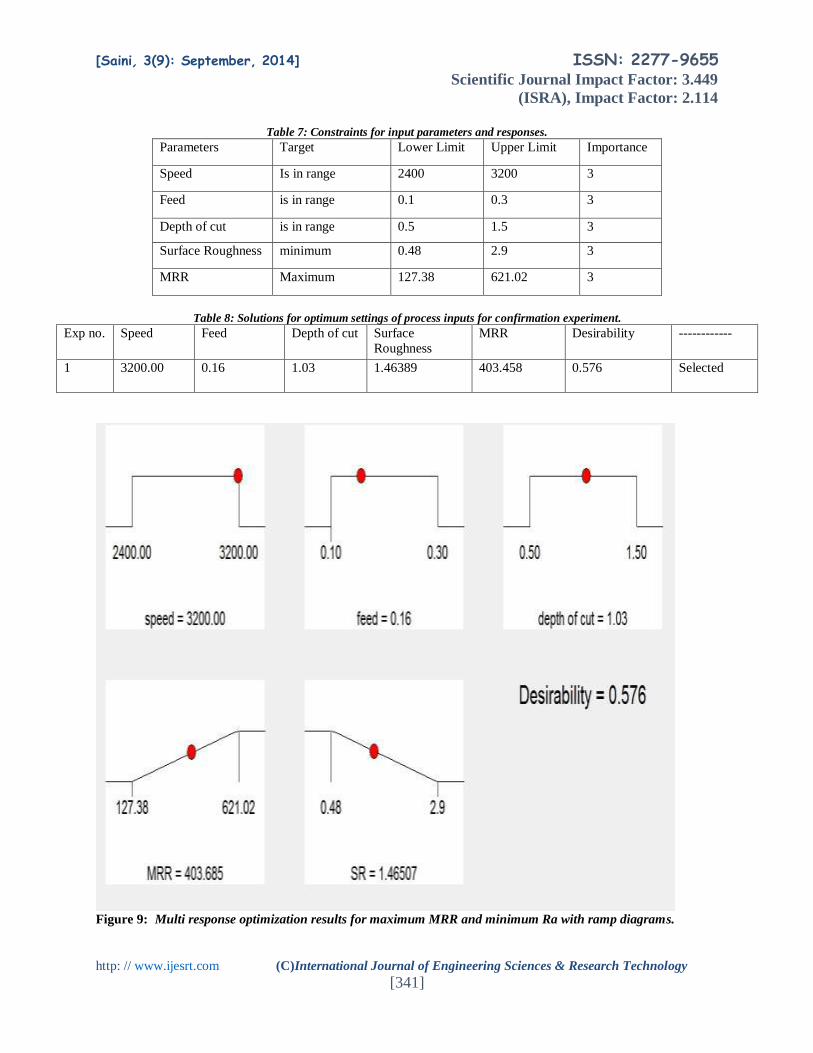
Table 7: Constraints for input parameters and responses.
Parameters Target Lower Limit Upper Limit Importance
Speed Is in range 2400 3200 3
Feed is in range 0.1 0.3 3
Depth of cut is in range 0.5 1.5 3
Surface Roughness minimum 0.48 2.9 3
MRR Maximum 127.38 621.02 3
Table 8: Solutions for optimum settings of process inputs for confirmation experiment.
Exp no. Speed Feed Depth of cut Surface
Roughness
MRR Desirability ------------
1 3200.00 0.16 1.03 1.46389 403.458 0.576 Selected
Figure 9: Multi response optimization results for maximum MRR and minimum Ra with ramp diagrams.

[Saini, 3(9): September, 2014] ISSN: 2277-9655 Scientific Journal Impact Factor: 3.449
(ISRA), Impact Factor: 2.114
http: // www.ijesrt.com (C)International Journal of Engineering Sciences & Research Technology [342]
Figure10: Multi response optimization results for maximum MRR and minimum Ra with histograms results for maximum
MRR and minimum Ra with histograms
Figure 11: Contour plot for results of overall desirability functions ( At speed = 3200 RPM, feed rate 0.16mm, depth of cut
1.03mm)
Once the optimal level of the process inputs is
selected, the final step is to predict and verifying the
improvement of the performance characteristics using
the optimal level of the machining parameters.
Experiments performed to machine and verify the
Turning at the above optimal input parametric setting
for MRR and surface roughness were compared with
optimal response values. The observed MRR and
surface roughness of the experimental results are
403.458 mm3/sec and 1.46389 µm respectively. Table
10 shows the error percentage for experimental
validation of the developed models for the responses
with optimal parametric setting during Turning of
Alloy Steel EN-24. From the analysis of Table10, it
can be observed that the calculated error is small. The
error between experimental and predicted values for
surface roughness and MRR lies within 5.48% and
1.04% respectively. Obviously, this confirms the
excellent reproducibility for the experimental
conclusions.

[Saini, 3(9): September, 2014] ISSN: 2277-9655 Scientific Journal Impact Factor: 3.449
(ISRA), Impact Factor: 2.114
http: // www.ijesrt.com (C)International Journal of Engineering Sciences & Research Technology [343]
Table 9: Multi-optical parametric settings for surface roughness and MRR
Parameters Units Optical parameter
setting
Speed RPM 3200
Feed mm/rev 0.16
Depth of cut mm3/sec 1.03
Table 10: Main Experimental validation of developed models with optimal parameter settings.
Responses Predicted Experimental Error
Surface roughness 1.46 1.54 5.48%
MRR 403.45 407.64 1.04%
Conclusion In this study, the surface roughness and MRR
in the surface finishing process of EN24 alloy steel
were modeled and analyzed through RSM. Spindle
speed, feed and depth of cut have been employed to
carry out the experimental study. Summarizing the
main features, the following conclusion can be drawn.
1. Analysied with ANOVA the experimental
results showed that the feed rate (the most
significant factor) contributed 56.80 %,
where as the depth of cut and spindle speed
contribution was 23.22 % and 4 % for Ra.
2. The experimental results with ANOVA
analysis showed that the Depth of cut (the
most significant factor) contributed 56 %,
where as the feed rate and spindle speed
contribution was 23.43 % and 6.33 % for
MRR.
3. The predicted values of R2 are 0.8084 for
surface roughness and 0.8665 for MRR are
reasonably well.Its value greater than 70%
and closest to one is the best value for fit
the model.
4. The error between experimental and
predicted values at the optimal combination
of parameter setting for Ra and MRR lie with
in 5.48 % and 1.03 % respectively.
Obviosly,this confirms excellent
reproducibility of the experimental
conclusions.
5. From the multi response optimization, we
obtain the optimal combination of parameters
settings are speed of 3200 rpm, feed rate 0.16
mm/rev. and depth of cut 1.03 mm for
achieving the required minimum surface
roughness and maximum MRR.
Scope for future work In this present research only three parameters
have been studied in accordance with their effects.
View of future scope, the further researches can be
carried out as:
To study the effects of tool geometry like Nose Radius,
Rake Angle on the surface roughness and MRR.
1. To analyses the effect of cutting forces
exerted and tool wear rate during the cutting
operation.
2. To study the other output factors like power
consumption, tool life, etc. can be studied.
3. To study effect of response variables with
different cutting tools.
To study and compare the differences in performance
characteristics on same work sample after heat
treatment.
References 1. Adeel Suhail H., Ismail N., Wong S.V. and
Jali N.A. Abdul l (2010),“Optimization of
cutting parameters based on surface
roughness and assistance of work piece
surface temperature in turning process”
American journal of engineering and applied
science, vol. 3, pp. 102-108.
2. Bhateja Ashish ,Bhardwaj Jyoti, Singh
Maninder and Kumar Pal Sandeep (2013),
“Optimization of Different Performance
Parameters i.e. Surface Roughness, Tool
Wear Rate & Material Removal Rate with the
Selection of Various Process Parameters

[Saini, 3(9): September, 2014] ISSN: 2277-9655 Scientific Journal Impact Factor: 3.449
(ISRA), Impact Factor: 2.114
http: // www.ijesrt.com (C)International Journal of Engineering Sciences & Research Technology [344]
Such as Speed Rate, Feed Rate, Specimen
Wear , Depth Of Cut in CNC Turning of
EN24 Alloy Steel” The International Journal
of Engineering And Science (IJES), Volume
2, Issue 1,Pages- 103-113
3. Babu V. Suresh, Kumar S. Sriram, Mural
R.V. and Rao M. (2011) ), “Investigation and
validation of optimal cutting parameters for
least surface roughness in EN24 with
response surface method”, International
Journal of Engineering, Science and
Technology, Vol. 3, No. 6, 2011, pp. 146-160.
4. Dave H. K., Patel L. S., Ravala H. K. (2012),
“Effect of machining conditions on MRR and
surface roughness during CNC turning of
different materials using TiN coated cutting
tools – A Taguchi approach” International
Journal of Industrial Engineering
Computations,science direct.
5. Das S. R, Dhupal D, Kumar A, (2012),
“Experimental Study & Modeling of Surface
Roughness in Turning of Hardened AISI 4340
Steel Using Coated Carbide Inserted”
International Journal of Automotive
Engineering Vol. 3, Number 1, Pages 284-
292.
6. Das S.R., Behera R.K., Kumar A,(2013)
“Experimental Investigation on Tool Wear,
Surface Roughness and Material Removal
Rate during Dry Turning of AISI 52100
Steel” Journal Of Harmonized Research in
Engineering ISSN 2347 – 7393,1(1),05-15
7. Fnides B. (2011), “Application of response
surface methodology for determining cutting
force model in turning hardened AISI H11
hotwork tool steel”, Sadhna,Vol.36, Par, , pp.
109–123.
8. Gupta Vishal, Gupta Arun K., Dhingra
Ashwani K.(2012), “Development of Surface
Roughness Model Using Response Surface
Methodology’’ International J ournal of
Engineering Sciences, vol. 01, Isue
02,ISSN:2277-9698.
9. Hassan Kamal ,Kumar Anish , Garg M.P.
(2012) , “Experimental investigation of
Material removal rate in CNC turning using
Taguchi method ’’, International Journal of
E of Engineering Research and Applications
,Vol. 2, pp.1581-1590.
10. Jakhale prashant p, jadhav b. R. (2013),
“Optimization of surface roughness of alloy
Steel by changing operational parameters
and Insert geometry in the turning process”,
Int. J. Adv. Engg. Res. Studies, II-IV, July-
Sept. 2013, pp. 17-21.
11. Kahraman Funda (2009) , “The use of
response surface methodology for prediction
and analysis of surface roughness of AISI
4140 steel”, Original scientific article/Izvirni
znanstveni ~lanek ISSN 1580-2949
12. Kirby Daniel E., Zhang Zhe , Joseph C.
(2005) , “Optimizing surface finish in turning
operation using the Taguchi parameter
design method”, Int J Adv Manuf Technol
,30: 1021–1029 Springer-Verlag London
Limited .
13. Korat Mahendra, Agarwal Neeraj (2012),
“Optimization of Different Machining
Parameters of En24 Alloy Steel In CNC
Turning by Use of Taguchi Method”,
International Journal of Engineering
Research and Applications (IJERA) ISSN:
2248-9622 Vol. 2, Issue 5, pp.160-164.
14. Kumar Raman, Singh Rai Jaspreet, Singh
Virk Navneet,(2013) “Analysis the effects of
Process Parameters in En24 Alloy steel
during CNC Turning by using MADM”
International Journal of Innovative Research
in Science, Engineering and TechnologyVol.
2, Issue 7, ISSN: 2319-8753
15. Krishankant, Taneja Jatin , Bector Mohit ,
Kumar Rajesh (2012) , “Application of
Taguchi Method for Optimizing Turning
Process by the effects of Machining
parameters”, International Journal of
Engineering and Advanced Technology,
Volume-2, pp. 2249 – 8958
16. Mallampati Mahesh and Das Chitranjan
(2012), “Optimization Of Cutting
Parameters As Speed, Feed & Depth Of Cut
Based On Surface Roughness In Turning
Process Using Genetic Algorithm And
Particle Swarm Optimization” ,International
Journal of Engineering Research &
Technology ,Vol. 1 Issue 7.
17. M. Adinarayana, g. Prasanthi, g. Krishnaiah
(2014), “ Parametric analysis and multi
objective optimization of cutting parameters
in turning operation of aisi 4340 alloy steel
with cvd cutting tool”, International journal
of research in engineering and technology,
Vol. 3, Issue 02, pp. 449-456.
18. Murthy T. Sreenivasa , Suresh R.K.,
Krishnaiah G. , Reddy V. Diwakar (2013), “
Optimization of process parameters in dry
turning operation of EN 41B alloy steels with
cermet tool based on the Taguchi method” ,

[Saini, 3(9): September, 2014] ISSN: 2277-9655 Scientific Journal Impact Factor: 3.449
(ISRA), Impact Factor: 2.114
http: // www.ijesrt.com (C)International Journal of Engineering Sciences & Research Technology [345]
International Journal of Engineering
Research and Applications, Vol. 3, pp.1144-
1148
19. Noordin M.Y. ,Venkatesh V.C. ,Sharif S.,
Abdullah A. (2004) , “Application of
response surface methodology in describing
the performance of coated carbide tools when
turning AISI 1045 steel” ,Journal of
Materials Processing Technology ,Vol.45 pp.
46–58.
20. Palanikumar K., Karunamoorthy L,
Karthikeyan R. and Latha
B(2006),“Optimization of machining
parameters in turning GFRP composites
using a carbide (K10) tool based on the
taguchi method with fuzzy logics” Metals
And Materials International, vol. 12, pp.483-
491.
21. Prasad M. V. R. D., Janardhana G. Ranga,
Rao
D.Hanumantha(2009)“Experimentalinvestig
ation to study the influence of process
parameters in dry machining” , ARPN
Journal of Engineering and Applied
Sciences, VOL. 4,pp. 1819-6608.
22. Pawan Kumar, Anish Kumar, Balinder Singh
(2013), “Optimization of Process
Parameters in Surface Grinding Using
Response Surface Methodology”,
International Journal of Research in
Mechanical Engineering & Technolog
IJRMET Vol. 3, Issue 2, May - Oct 2013 pp.
245-252.
23. Rahul Davis, Jitendra Singh Madhukar,
Vikash Singh Rana, Prince Singh (2012),
“Optimization of Cutting Parameters in Dry
Turning Operation of EN24 Steel”,
International Journal of Emerging
Technology and Advanced Engineering
Website: Vol. 2, Issue 10, Oct. 2012, pp. 559-
563.
24. Sahoo P. (2011), “ Optimization of turning
parameters for surface roughness using RSM
and GA” ,Advancs in production engineering
& management,vol. 6,no. 3,197-208..
25. V. Suresh Babu1, S. Sriram Kumar, R. V.
Murali and M. Madhava Rao (2011),
“Investigation and validation of optimal
cutting parameters for least
surfaceroughness in EN24 with response
surface method”, International Journal of
Engineering, Science and Technology,Vol. 3,
No. 6, 2011, pp. 146-160.
26. Yadav Ashish , Bangar Ajay , Sharma Rajan
, Pal Deepak (2012), “ Optimization of
Turning Process Parameters for Their Effect
on En 8 Material Work piece Hardness by
Using Taguchi Parametric Optimization
Method ” ,International Jou rnal of
Mechanical and Industrial Engineering
(IJMIE), Volume-1, ISSN No. 2231 –6477.
27. http://en.wikipedia.org/wiki/Box-
Behnken_design,Date: April 18, 201
28. http://www.itl.nist.gov/div898/handbook/pri/
section3/pri336.htm,Date:April18, 2012.