
A mixed-methods investigation of the extent to which routinely ...
362
A mixed-methods investigation of the extent to which routinely collected information can help evaluate the implementation of screening and brief alcohol interventions in primary health care. Amy Jane O’Donnell A thesis submitted in partial fulfilment of the requirements for the degree of Doctor of Philosophy Institute of Health and Society, Faculty of Medical Sciences Newcastle University February 2014
-
Upload
khangminh22 -
Category
Documents
-
view
0 -
download
0
Transcript of A mixed-methods investigation of the extent to which routinely ...

A mixed-methods investigation of the extent to which
routinely collected information can help evaluate the
implementation of screening and brief alcohol
interventions in primary health care.
Amy Jane O’Donnell
A thesis submitted in partial fulfilment of the requirements
for the degree of Doctor of Philosophy
Institute of Health and Society, Faculty of Medical Sciences
Newcastle University
February 2014

i
Abstract
Background: UK health policy has sought to encourage alcohol screening and brief
intervention (ASBI) delivery in primary care, including via pay-for-performance (P4P)
schemes. To measure the impact of such policies, a range of data exist, including
General Practitioner (GP) Read codes, which record all clinical activity. However,
previous studies have highlighted the difficulties of using Read code data for
evaluation purposes, with concerns around the distorting effect of P4P on healthcare
recording. Against this background, this research investigated whether Read code data
can be used to provide a meaningful measure of ASBI implementation in primary care.
Methods: Sequential mixed methods design, comprising: (1) systematic literature
review to identify what factors influence the recording of routine clinical data by UK
primary care physicians; (2) analysis of ASBI Read code data from 16 GP practices in
North East England; (3) 14 GP interviews to explore the barriers and facilitators
affecting their ASBI recording.
Results: (1) Multiple factors shape primary care physicians’ recording of routine data,
including structural influencers (such as the design and resourcing of the coding
system), and psychosocial factors (including patient characteristics and physicians’
perspectives on their role as care-givers). (2) 287 Read codes exist to record alcohol-
related activity however only a small minority are used regularly, generally relating to
the identification of alcohol use disorders. Whilst many unused Read codes are
associated with relatively rare alcohol conditions, a significant number relate to
duplicate or outmoded terminology. Overall, practices associated with higher recorded
rates of key ASBI service indicators were signed up to P4P schemes. (3) GP interviews
suggested that across all practices, nurse-administered ASBI components were most
likely to be provided and coded consistently, with GP-delivery and recording activity
far more ad hoc.
Conclusion: Whilst routine data may be a valid indicator of more successfully
embedded ASBI activity in UK primary healthcare following the introduction of P4P
schemes, measuring the impact on delivery at GP level remains challenging due to the
deficiency of the available Read code data across a number of quality dimensions.

ii
Publications and presentations arising from this thesis
O’Donnell A, Anderson P, Newbury-Birch D, Schulte B, Schmidt C, Reimer J & Kaner E.
“The impact of brief alcohol interventions in primary healthcare: A systematic review
of reviews”. Alcohol and Alcoholism. 2014. 49 (1): 66-78 (published) (see Appendix P)
O’Donnell A. & Kaner E. “Chapter 35: Screening of High Risk Drinkers”, In Alcohol:
Science, Policy and Public Health, Boyle, Boffetta, Zatonski, Lowenfels, Brawley, Burns
and Rehm (Eds). 2013. Oxford University Press, Oxford (published)
Kaner E. & O’Donnell A. “Chapter 36: Brief intervention: does it work?” In Alcohol:
Science, Policy and Public Health, Boyle, Boffetta, Zatonski, Lowenfels, Brawley, Burns
and Rehm (Eds). 2013. Oxford University Press, Oxford (published)
O’Donnell A, Haighton K, Chappel D, Shevills C & Kaner E. “Can routine data help
evaluate the implementation of a brief alcohol intervention in primary health care?”
36th Annual Scientific Meeting of the Research Society on Alcoholism. 22nd to 26th June
2013. Orlando, USA (poster presentation, abstract published in Alcoholism: Clinical and
Experimental Research 2013; 35(S6): 149A)
O’Donnell A, Haighton C, Chappel D, Shevills C & Kaner E. “Can routine data help
evaluate the implementation of a brief alcohol intervention in primary health care? A
mixed-methods study to evaluate the delivery of screening and brief interventions for
alcohol”. European General Practice Research Network Meeting. 16th to 18th May
2013, Kusadasi, Turkey (plenary presentation, abstract published in European Journal
of General Practice, 2013; 19:165).
O'Donnell A, Haighton K, Chappel D, Shevills C & Kaner E.“Can routine data help assess
the delivery of alcohol interventions?” Medical Research Council (MRC) Early career
Researchers in the Population Health Sciences Workshop. 24th to 25th February 2011,
Southampton, UK. (oral presentation)
O'Donnell A, Haighton K, Chappel D, Shevills C & Kaner E, “Can routine data help
assess the delivery of alcohol interventions?” Symposium for PhD Students
Researching Substance Misuse. 11th July 2011, Oxford Brookes University, Oxford, UK.
(oral presentation)

iii
Acknowledgements
It would not have been possible to write this doctoral thesis without the help and
support of my friends, family and colleagues, only some of whom it is possible to
acknowledge here.
First and foremost, I’d like to express my gratitude to my supervisory team, Professor
Eileen Kaner, Dr Katie Haighton, Dr David Chappel and Colin Shevills. Thanks to their
involvement, I have benefitted from an enviable package of skills, knowledge and
expertise throughout my research journey. In particular, it has been a privilege to work
with Professor Kaner, who has undoubtedly helped to keep me at the cutting edge of
the fast-moving field of screening and brief alcohol intervention. I’d also like to thank
my assessors, Dr Dorothy Newbury-Birch and Professor Martin White, for providing a
much-needed prod in the right direction on more than one occasion, and to
acknowledge the support of the ESRC and Fuse (a UKCRC Centre of Excellence in Public
Health), in both a financial and academic capacity.
Next, I would like to thank the General Practitioners, Practice Managers and other staff
who gave up their time to speak to me during what has undoubtedly been a
challenging period in UK primary healthcare. Without their help, I could not have
accessed any data or gained such invaluable experience of the complex, fast-paced,
moveable feast that is the modern general practice. My appreciation also to Dr Anna
Christie and Dr Fiona Pearson for guiding me through the minefield of aggregrated
routine data, whilst you were both also engaged in your own doctoral journeys.
On a more personal note, I would like to express my gratitude to my friends and family
who have endured my company over the past four years. In particular, to my doctoral
student peers at the Institute of Health and Society, to my colleagues on the alcohol
research team, and most of all, to Dr Stephanie O’Neil, who has fuelled this experience
with caffeine, music and laughter. Apologies to my children, Tim and Sam, for a less
than successful juggling act of study, work and motherhood, I am looking forward to
spending weekends with you both in the very near future. Finally, this thesis is
dedicated to my husband, Martin Brummitt, without whose unwavering patience,
support and keen eye for detail, could never have been completed.

iv
Table of Contents
Chapter 1 Introduction and background to the research .................................... 1
1.1 Risky drinking: a global concern ...................................................................... 1 1.1.1 ....Social, economic and health impacts of alcohol consumption ............................................... 1
1.1.2 ....Recent changes in global alcohol consumption trends ........................................................... 4
1.1.3 ....The scale and impact of risky drinking in the United Kingdom ............................................... 5
1.2 Preventing and treating hazardous and harmful alcohol consumption ......... 7 1.2.1 ....Tackling alcohol-related harm in the UK ................................................................................. 7
1.2.2 ....The ‘triangle’ of treatment options ....................................................................................... 10
1.2.3 ....Screening patients for risky drinking ..................................................................................... 12
1.2.4 ....Brief alcohol interventions .................................................................................................... 16
1.3 Screening and brief alcohol intervention: from knowledge to practice ....... 19 1.3.1 ....Barriers to implementing brief alcohol interventions in routine primary healthcare ........... 19
1.3.2 ....Incentivising screening and brief alcohol intervention implementation in primary healthcare23
1.4 Using routine data to assess the implementation of screening and brief alcohol interventions in primary health care ........................................................... 26 1.4.1 ....Capturing routine data in primary healthcare ...................................................................... 27
1.4.2 ....Routine sources of alcohol data ............................................................................................ 30
1.4.3 ....Advantages of using routine data in research and evaluation ............................................. 32
1.4.4 ....Challenges associated with using routine health data sets for research .............................. 34
1.5 Rationale for the research ............................................................................. 37
1.6 Aims and objectives ....................................................................................... 39
1.7 Structure of the thesis ................................................................................... 39
Chapter 2 Paying for performance? A review and critique of the rise of quality management initiatives in UK healthcare ............................................................. 41
2.1 Introduction ................................................................................................... 41
2.2 The changing face of the NHS: 1979-2012 .................................................... 41 2.2.1 ....Thatcher’s NHS and The Patients’ Charter: 1979-1997 ........................................................ 42
2.2.2 ....‘New’ Labour and the Health Service: 1997-2010 ................................................................. 45
2.2.3 ....‘Clinicians in the driving seat’: NHS under the Coalition Government .................................. 49
2.3 Impact of quality improvement initiatives on the UK health service ........... 51 2.3.1 ....Positive effects on service quality and patient outcomes ..................................................... 52
2.3.2 ....Questionable impacts on health outcomes and health inequalities ..................................... 53
2.3.3 ....The perverse and unintended consequences of management-by-targets ............................ 54
2.4 Incentivising quality and the role of the GP .................................................. 55 2.4.1 ....Extrinsic motivation ‘crowding out’ intrinsic professional drivers ........................................ 55
2.4.2 ....‘Gaming’ the system for financial reward ............................................................................. 56
2.4.3 ....Professional boundaries and maintaining ‘hierarchies of appropriateness’ ......................... 57
2.5 Challenge of performance managing the UK public sector .......................... 58
2.6 Summary ........................................................................................................ 59
Chapter 3 Research methodology .................................................................... 61
3.1 Introduction ................................................................................................... 61

v
3.2 The role and importance of a research paradigm ......................................... 61 3.2.1 ....The importance of an explicit theoretical paradigm ............................................................. 62
3.2.2 ....Mixed methods: conflict resolution for the paradigm wars? ................................................ 63
3.3 Description of and justification for mixed-methods approach ..................... 65 3.3.1 ....Overview of study design ...................................................................................................... 65
3.3.2 ....Justification and purpose ...................................................................................................... 66
3.4 Rationale for a Critical Realist paradigm ....................................................... 68 3.4.1 ....Overview of critical realism ................................................................................................... 68
3.4.2 ....Value and relevance of a critical realist approach to the study ............................................ 69
3.4.3 ....Implications for epistemology, ontology, methodology and axiology .................................. 69
3.5 Operationalising the mixed-methods research process ............................... 71 3.5.1 ....Summary of the sequential, explanatory mixed-methods research design .......................... 71
3.5.2 ....Sequence of study components ............................................................................................ 72
3.5.3 ....Prioritization of data from individual research components ................................................ 73
3.5.4 ....Approach to mixed-methods data integration and interpretation ....................................... 73
3.6 Summary ........................................................................................................ 75
Chapter 4 What factors influence primary care physicians’ recording of routine data? A systematic review and critical interpretive synthesis of the literature ...... 76
4.1 Introduction ................................................................................................... 76
4.2 Method .......................................................................................................... 76 4.2.1 ....Rationale, aim and objectives ............................................................................................... 76
4.2.2 ....Criteria for considering studies for this review ..................................................................... 77
4.2.3 ....Inclusion and exclusion criteria ............................................................................................. 80
4.2.4 ....Search strategy for identification of studies ......................................................................... 81
4.2.5 ....Data collection and analysis ................................................................................................. 82
4.2.6 ....Critical Interpretive Synthesis of data ................................................................................... 83
4.3 Description of included studies ..................................................................... 87
4.4 Methodological quality of included studies .................................................. 88 4.4.1 ....Quality of included quantitative papers ............................................................................... 89
4.4.2 ....Quality of included qualitative studies .................................................................................. 90
4.5 Critical Interpretive Synthesis .....................................................................100 4.5.1 ....Synthesis 1: Narrative synthesis of findings from quantitative studies .............................. 100
4.5.2 ....Synthesis 2: Thematic analysis of qualitative data ............................................................. 112
4.5.3 ....Synthesis 3: Mixed methods synthesis of quantitative and qualitative findings ................ 115
4.6 Strengths and limitations of the review ......................................................119
4.7 Summary and discussion .............................................................................121
Chapter 5 A descriptive and comparative analysis of the use of Read Code data to record screening and brief alcohol interventions in routine general practice ...... 124
5.1 Introduction .................................................................................................124
5.2 Method ........................................................................................................124 5.2.1 ....Rationale, aims and objectives ........................................................................................... 124
5.2.2 ....Sample and strategy ........................................................................................................... 125
5.2.3 ....Ethical approval .................................................................................................................. 128
5.2.4 ....Recruitment ........................................................................................................................ 128
5.2.5 ....Description of study sample ................................................................................................ 130
5.2.6 ....Characteristics of the case study practice ........................................................................... 137

vi
5.2.7 ....Data management .............................................................................................................. 137
5.2.8 ....Data collection and analysis ............................................................................................... 138
5.3 Results .........................................................................................................144 5.3.1 ....Q1: What alcohol-related Read codes are available to UK General Practitioners? ............ 144
5.3.2 ....Q2: How frequently are available alcohol-related Read codes used in routine primary health care? A single GP practice case study .............................................................................................. 148
5.3.3 ....Q3: Are there significant differences in the rates of alcohol screening and brief intervention Read coding at individual GP practice level? ................................................................................... 150
5.4 Strengths and limitations ............................................................................166
5.5 Summary and discussion .............................................................................169
Chapter 6 General Practitioners’ perspectives on what shapes their recording of screening and brief alcohol interventions ........................................................... 173
6.1 Introduction .................................................................................................173
6.2 Method ........................................................................................................173 6.2.1 ....Rationale, aims and objectives ........................................................................................... 173
6.2.2 ....Sampling, recruitment and participants ............................................................................. 174
6.2.3 ....Ethics and consent .............................................................................................................. 176
6.2.4 ....Data management .............................................................................................................. 177
6.2.5 ....Data collection and analysis ............................................................................................... 177
6.3 Results .........................................................................................................178 6.3.1 ....Characteristics of the recruited sample .............................................................................. 178
6.3.2 ....Overview of the interviews ................................................................................................. 181
6.3.3 ....Theme 1: The design and functionality of GP practice IT systems ...................................... 182
6.3.4 ....Theme 2: Coding as a reflection of the hierarchy of incentive schemes ............................. 186
6.3.5 ....Theme 3: Individual coding practices and local-level screening processes – a synergistic relationship ...................................................................................................................................... 190
6.3.6 ....Theme 4: The acceptability and feasibility of brief alcohol interventions ........................... 195
6.3.7 ....Theme 5: The role of the GP within the patient-centred consultation ................................ 197
6.4 Strengths and limitations ............................................................................201
6.5 Summary and discussion .............................................................................205
Chapter 7 Discussion and conclusion ............................................................. 208
7.1 Introduction .................................................................................................208
7.2 Mixed methods data integration ................................................................208 7.2.1 ....Emerging meta-inferences from the research .................................................................... 208
7.2.2 ....Explaining discordance and ‘filling in the gaps’ .................................................................. 212
7.3 Interpretation of the findings ......................................................................214 7.3.1 ....Dimension 1: The completeness of screening and brief alcohol intervention Read code data216
7.3.2 ....Dimension 2: The accuracy of recorded alcohol intervention data ..................................... 217
7.3.3 ....Dimension 3: The currency and accessibility of alcohol screening and intervention data .. 218
7.3.4 ....Dimension 4: The relevancy of screening and brief alcohol intervention Read code data . 219
7.3.5 ....Approach to the extraction and analysis of alcohol-related Read code data in this thesis 220
7.4 Strengths and limitations of the research ...................................................222
7.5 Recommendations .......................................................................................223 7.5.1 ....Fostering a GP-friendly approach to screening and brief alcohol interventions ................. 223
7.5.2 ....Improving the design of the alcohol-related GP Read code system .................................... 224
7.5.3 ....Re-thinking the role of enhanced services in stimulating alcohol activity .......................... 225

vii
7.6 Areas for future research ............................................................................226
7.7 Concluding remarks .....................................................................................227
Appendices ..................................................................................................... 229
Appendix A: Systematic review search terms ........................................................230
Appendix B: Quality assessment tool for quantitative data ..................................231
Appendix C: Quality assessment tool for qualitative data .....................................235
Appendix D: Quality assessment tables .................................................................239
Appendix E: Letter to practice managers to participate in the study ....................256
Appendix F: Project flyer ........................................................................................257
Appendix G: Study information sheet for GP practices .........................................258
Appendix H: Confidentiality agreement between researcher and GP Practice ....262
Appendix I: Full list of alcohol-related Read codes ................................................263
Appendix J: Full list of zero-incidence Read codes ................................................270
Appendix K: Full Read code analysis tables for all variables .................................276
Appendix L: Interview consent form ......................................................................285
Appendix M: GP Interview Participant Information sheet ....................................286
Appendix N: Interview topic guide .........................................................................290
Appendix 0: Mixed methods matrix: case-by-case key data trends ......................293
Appendix P: The impact of brief alcohol interventions in primary healthcare: A systematic review of reviews .................................................................................295
References ..................................................................................................... 309
List of Tables
Table 1: Alcohol-related NHS hospital admissions in England based on primary and
secondary diagnoses: 2002-03 to 2011-12 ....................................................................... 6
Table 2: Alcohol Users Disorders Identification Test (AUDIT) ........................................ 15
Table 3: Key milestones in the development of the performance management regime
under New Labour (348) ................................................................................................. 48
Table 4: Summary of key characteristics of included studies ......................................... 92
Table 5: Statistically significant influencing factors ...................................................... 109
Table 6: Summary of systems, structure and environment influencing factors........... 117
Table 7: Summary of psycho-social influencing factors ................................................ 118
Table 8: Stratified purposive sample scheme for quantitative research phase ........... 127
Table 9: Recruited research sample .............................................................................. 130
Table 10: Age profile of sample practices 2010-2011 by gender (M = male; F = female)
(%) ................................................................................................................................. 134
Table 11: Mid-2009 synthetic estimate of the percentage within the total population of
abstainers, lower risk, increasing risk, high risk and binge drinkers in local authority
populations aged 16 yrs+ .............................................................................................. 135
Table 12: Key characteristics of sample practices ........................................................ 136
viii
Table 13: Mid-2009 synthetic estimate of the percentage within the total population of
abstainers, lower risk, increasing risk, high risk and binge drinkers in local authority
populations aged 16 yrs+ .............................................................................................. 137
Table 14: Alcohol Read Code queries ........................................................................... 141
Table 15: Main categories of all alcohol-related Read codes ....................................... 146
Table 16: Alcohol consumption Read codes ................................................................. 147
Table 17: Top ten highest incidence alcohol-related Read codes between 2007-2011
....................................................................................................................................... 149
Table 18: Recorded rates of alcohol screening, delivery of brief advice / intervention
and specialist referrals by practice and gender ............................................................ 152
Table 19: Purposive sample scheme ............................................................................. 176
Table 20: Summary characteristics of qualitative interview participants .................... 179
Table 21: Key characteristics of individual interview participants ............................... 180
List of Figures
Figure 1: The range of alcohol treatments and interventions ........................................ 11
Figure 2: Conceptual Model for Considering the Determinants of Diffusion,
Dissemination, and Implementation of Innovations in Health Service Delivery and
Organization (215) .......................................................................................................... 22
Figure 3: Alcohol Primary Care Pathway (with Read codes) (273) ................................. 32
Figure 4: Visual representation of the mixed-methods research design ....................... 72
Figure 5: Example of a mixed methods matrix based on Miles and Huberman (512) ... 74
Figure 6: Process of synthesising multi-method evidence (based on Harden & Thomas,
2005 (517)) ...................................................................................................................... 84
Figure 7: PRISMA (Preferred Reporting Items for Systematic Reviews and Meta-
Analyses) flow diagram of systematic review (546) ....................................................... 88
Figure 8: Fishbone diagram of factors influencing the recording of routine data by PCPs
....................................................................................................................................... 119
Figure 9: Research sample design ................................................................................. 127
Figure 10: Study sample by Primary Care Trust ............................................................ 132
Figure 11: Deprivation rank of study sample practices by IMD quintile ...................... 133
Figure 12: Enhanced service for alcohol status of study sample .................................. 136
Figure 13: Example table of aggregated Read Code counts extracted from general
practice systems ............................................................................................................ 142
Figure 14: Visual basic Wilson Score Add-on for Excel ................................................. 143
Figure 15: Top ten high incidence alcohol-related Read codes between 2007-2011 .. 149
Figure 16: Rates of recorded hazardous and harmful level alcohol consumption 2010-
2011 by individual practice and gender ........................................................................ 154
Figure 17: Rates (%) of recorded hazardous and harmful level alcohol consumption
2010-2011 by enhanced service status and gender ..................................................... 155
Figure 18: Rate (%) of recorded hazardous and harmful level alcohol consumption
2010-2011 by size / type of practice and gender ......................................................... 156

ix
Figure 19: Rates of short screening tool (FAST or AUDIT-C) 2010-2011 by gender and
individual practice ......................................................................................................... 157
Figure 20: Rates of full AUDIT screening tool 2010-2011 by gender and individual
practice .......................................................................................................................... 158
Figure 21: Rates (%) of recorded delivery of short screening test (FAST or AUDIT-C) for
alcohol use disorders 2010-2011 by enhanced service status and gender .................. 159
Figure 22: Rates (%) of recorded delivery of full AUDIT screening test for alcohol use
disorders 2010-2011 by enhanced service status and gender ..................................... 160
Figure 23: Rates (%) of recorded delivery of short screening test (FAST or AUDIT-C) for
alcohol use disorders 2010-2011 by size / type of practice and gender ...................... 161
Figure 24: Rates (%) of recorded delivery of full AUDIT screening test for alcohol use
disorders 2010-2011 by size / type of practice ............................................................. 161
Figure 25: Rates (%) of recorded delivery of brief advice, brief intervention and /or
extended intervention for alcohol 2010-2011 by individual practice and gender
including lower and upper confidence intervals .......................................................... 163
Figure 26: Rates (%) of recorded delivery of brief advice, brief intervention and /or
extended intervention for alcohol 2010-2011 by enhanced service for alcohol and
gender including lower and upper confidence intervals .............................................. 164
Figure 27: Rates (%) of recorded delivery of brief advice, brief intervention and /or
extended intervention for alcohol 2010-2011 by size / type of practice and gender
including lower and upper confidence intervals .......................................................... 164

1
Chapter 1 Introduction and background to the research
1.1 Risky drinking: a global concern
1.1.1 Social, economic and health impacts of alcohol consumption
Alcohol is a significant risk to public health (1), and globally represents the fifth leading
cause of morbidity and premature death after high blood pressure, tobacco smoking,
household air pollution from solid fuels and a diet low in fruits (2). An intoxicant,
affecting a wide range of structures and processes, alcohol consumption is causally
related to over 230 International Classification of Disease Version 10 (ICD-10), disease
codes (3, 4). This includes both those diseases in which alcohol consumption is a
necessary cause (such as alcohol-use disorders, alcoholic liver disease, and alcohol-
induced pancreatitis), plus those in which alcohol plays a contributory role (such as
diabetes, cardiovascular disease, and accidental and intentional injury) (5-7),
particularly in terms of its carcinogenic effects (8).
According to Rehm et al (3), health and well-being is affected by two different
dimensions of alcohol consumption. First, the average volume of alcohol consumption,
which has been linked to more than 60 disease conditions, including mental and
behavioural disorders, gastrointestinal conditions, cancers, cardiovascular diseases,
immunological disorders, lung diseases, skeletal and muscular diseases, reproductive
disorders and pre-natal harm (9, 10). Second, patterns of drinking, in particular
episodes of heavy drinking, linked mainly to two categories of disease outcome, acute
effects of alcohol such as accidental and intentional injuries, and cardiovascular
outcomes (11). However the socio-economic context in which alcohol is consumed,
and the demographic characteristics of individual drinkers themselves, also influence
outcomes. For example, the proportional impact of alcohol is larger in younger age
groups, mainly due to the increased risk of alcohol-related injuries, and globally,
alcohol-attributable mortality rates for men are about 5.2 times those for women (4).
Further, epidemiological data confirm that the disease burden is greatest in socio-
economically deprived and / or marginalised people, with rates of alcohol-attributable
mortality higher in developing than in developed countries, relative to the volume of
alcohol consumed per head (4). Recent evidence also suggests that the presence of
other people during consumption may enhance some of the subjective and

2
behavioural effects of alcohol, in particular, drinking in the presence of another
intoxicated individual (12).
Whilst the vast majority of the health effects of alcohol consumption are negative,
with a clear and quantifiable dose–response adverse relationship (4), some evidence
suggests there may be positive effects of light regular drinking on both ischaemic
cardiovascular diseases and diabetes mellitus (3, 13), resulting in the so-called ‘J-
shaped’ curve (14). It is important to emphasise, however, that available
epidemiological data demonstrate these beneficial effects apply only to men over 40
years, and post-menopausal women (15, 16). Moreover, given that the category of
non-drinkers includes both lifetime abstainers and ex-drinkers, there is also some
evidence to suggest that the observed protective effect may be due to the fact that
some drinkers quit drinking as a result of health reasons and are therefore more
vulnerable for mortality over the longer term, thus contributing to the higher risk
observed in abstainers compared to moderate drinkers(17, 18), (the so-called ‘sick-
quitter’ hypothesis) (19). In addition, the degree of heterogeneity in effect size leads
others to dispute the causality of a cardio-protective quality of light regular drinking,
given the unknown confounding effect of other heart disease risk factors, such as
education, income, physical activity or smoking (13, 14, 20). Finally, irrespective of
these concerns, it remains the case that any such potential protective properties are
far outweighed by the detrimental effects of alcohol on disease and injury overall (21).
Further, although the aforementioned alcohol-related health impacts are indeed
substantial, there are additional wider social and economic consequences, which
extend beyond the individual drinker to their families, local communities and indeed
society as a whole. Alcohol consumption, especially heavy episodic drinking, is
associated with fewer years in formal education (22), and ultimately educational
underachievement (23, 24). In the workplace, it increases the risk of unemployment,
absenteeism and presenteeism, and can lead to disciplinary problems and low
productivity (25, 26). Heavy alcohol consumption is also associated with family
disruption (27), child abuse and neglect (28), with homicide, crime, and drink driving
fatalities (29-31), and is a contributory factor for risky sexual behaviour, sexually
transmitted diseases and HIV infection (32, 33).

3
The key question would seem, therefore, is there a ‘risk-free’ level at which alcohol can
be consumed? Here, however the research literature diverges, with varied evidence
available about what constitutes lower-risk alcohol consumption (27, 34), including
those who suggest that in fact there is no safe limit as far as alcohol consumption and
cancer risk is concerned (35). Alcohol consumption at a dependent level (with
dependence defined as repetitive problems, affecting three or more areas of life,
including a strong desire or compulsion to use alcohol, inability to control use,
withdrawal from and tolerance to alcohol (5)) is widely accepted as being associated
with major physiological consequences and life impairment (36). Further, Rehm et al
have demonstrated that heavy (though not necessarily dependent) use – defined as
drinking in excess of 60 grammes of alcohol per day for men, and 40 grammes for
women – is responsible for the majority of alcohol-related mortality and morbidity
(37). In addition, as implied earlier, the pattern in which alcohol is consumed, is also an
influencing factor (38) (for example, drinking 10 drinks on 3 days a week is more
harmful than 5 drinks 6 days a week (39)).
Finally, it is also the case that what constitutes lower-risk alcohol consumption will
vary for different population groups. Currently in the UK, government guidance is that
adult men should not regularly drink more than 3-4 units of alcohol a day, and adult
women should not regularly drink more than 2-3 units a day (where one unit = 8 g (10
ml) of pure alcohol). Further, after an episode of heavy drinking (defined as consuming
more than double the daily unit guidelines for alcohol in one session), it is also
advisable to refrain from drinking for 48 hours to allow tissues to recover (40).
However a recent report of the House of Commons Science and Technology
Committee has highlighted the need for clearer, evidence-based guidelines for specific
population groups such as younger and older people, and pregnant women (16). For
example, research published by the Royal College of Psychiatrists in 2011, suggested
that a ‘safe limit’ for older people would be substantially lower than younger adults at
11 units per week for men aged 65 and over, or seven units per week for women (41).
However, whilst there is a recognised continuum of both alcohol consumption and
harm (42, 43), the damaging effects of alcohol consumption are evident at much lower
levels than heavy or dependent level use, with any alcohol consumption over 10g per
day associated with higher overall mortality (27). In fact, a recent modelling exercise

4
conducted with UK consumption data by Nicholls et al, suggested that a reduction to
no more than 5g a day would provide the optimum level of reduced chronic diseased
mortality in England (34). Importantly, epidemiological data have shown that the
majority of alcohol-related problems that occur in a population are not due to the
most problematic drinkers, generally individuals with alcohol dependence, but to a
much larger group of hazardous and harmful drinkers: this is known as the
preventative paradox (44-47). Hazardous drinking is consumption at a level, or in such
a pattern, that increases an individual’s risk of physical or psychological consequences
(48), whilst harmful drinking is defined by the presence of these consequences (49).
The paradox comes from the fact that whilst dependent drinkers experience the most
alcohol-related harm compared to other types of drinkers on an individual basis,
society as a whole incurs more damage from a larger group whose members each
experience less severe problems themselves, at least for the majority of their drinking
careers (50). Against such evidence, the simple ‘take home’ message is probably that
abstinence represents the most effective approach to minimising risk. If adults choose
to drink however, less is better, and limiting consumption to no more than 20g of
alcohol per day will keep the lifetime risk of dying from an alcohol-related condition to
less than one in a hundred (51).
1.1.2 Recent changes in global alcohol consumption trends
Whilst drinking alcohol has been a long-standing practice in human societies (26), with
archaeological evidence showing the existence of fermented beverages as long as
12,000 years ago (52), the past thirty years has witnessed some significant changes in
global consumption patterns. In particular, although the amount of alcohol consumed
overall has remained relatively stable over the past few decades, there has been an
increase in higher-risk drinking behaviours. These include an increased prevalence of
both drinking at hazardous levels, and heavy episodic drinking, described by Room as
the consumption of five or more drinks (or more precisely, 60g of alcohol (53)) on a
single occasion (54)), especially amongst young people (4). A number of factors have
been suggested as contributing to these increases in consumption amongst younger
drinkers, including the relative affordability, availability and accessibility of alcohol
(55), alongside changing social norms relating to the perceived acceptability of certain
drinking behaviours (56). These trends have profound consequences for public health,

5
both in terms of the short-term increased risk of morbidity and mortality from alcohol-
related accidents and injuries, but also in respect of the longer term implications for
the development of problematic drinking practices in later life (52). This trend in
alcohol consumption patterns is also significant for health service provision as
empirical evidence shows that the preventive paradox is most pronounced in
populations where heavy episodic drinking (commonly known as binge drinking) is a
common component of hazardous or harmful drinking (57, 58).
At the same time, it is important to emphasise the fact that there is considerable
variation in the burden of alcohol-related disease experienced by different countries.
High abstainer rates in Islamic countries, and in the Near East, mean that there are
relatively low levels of alcohol-attributable harm (27). Conversely, excessive drinking
presents a significant risk to public health in more developed countries [8, 9], and
Europe, in particular, has the highest impact of alcohol, accounting for 6.5% of deaths,
and 11.6% of DALYs (Disability Adjusted Life Years) in 2004 (27). Within Europe overall
per capita consumption of alcohol is relatively stable, however, again, this conceals
significant variation between countries (26, 27), even between those with relatively
similar genetic backgrounds and cultures (34). Although average alcohol consumption
has indeed fallen in a number of European countries since the 1970s (Italy, France,
Spain for example) (59), it has risen in others (such as Finland, Iceland and Ireland)
(26).
1.1.3 The scale and impact of risky drinking in the United Kingdom
In the UK, whilst the average alcohol consumption (as measured by annual sales) is
slightly lower than the overall European average (10.2 litres in comparison to 10.7
litres per person) (60), recent decades have witnessed a rise in more problematic
patterns of alcohol consumption overall (21), alongside increased levels of drinking
amongst new sections of the population (women, middle- and older- age groups, and
younger adolescents (aged 11-13) (61)). In 1986, for example, the UK had a similar
drinking culture to other Northern European countries such as Sweden, and broadly
similar liver disease death rates. The most recent World Health Organisation (WHO)
liver death rate for Sweden, however, was 5.3, whereas in the UK it had more than
doubled from 4.9 to 11.4 (59). In England, despite a long-term downward trend in the

6
proportion of adults who reported drinking in the previous week, almost a quarter of
men and around one in five women continue to drink above recommended levels (62).
Further, there is significant variation at a regional level in terms of the level and
pattern of alcohol consumption. In the North East of England, for example, 2009
synthetic alcohol estimate data suggest that 30.1% of drinkers aged 16 and over
reported heavy episodic alcohol consumption (‘binge’ drinking), compared with just
14.3% in London (63). Further, the North East also shows a higher prevalence of
hazardous or dependent alcohol consumption, and higher rates of alcohol related
death and poor health, compared with the rest of England (64-66). The problem of
heavy episodic drinking has worsened in recent years in the North East, especially for
female drinkers (64).
The harmful effects of excessive alcohol consumption on the physical, psychological
and social health of individuals, families and communities, and the rising costs to the
NHS, the economy, the criminal justice system and social care have been well-
documented (67-70). For individuals, as discussed earlier, the health risks associated
with harmful alcohol use are manifold. Balakrishnan et al estimate that alcohol
consumption was responsible for 31,000 deaths in the UK in 2005 (representing 5% of
all deaths), and for 10% of all disability adjusted life years in 2002 (male: 15%; female:
4%) alone (71). As Table 1 demonstrates, the number of hospital admissions
attributable to alcohol was over 1.22 million in 2011/12, a 139% increase since
2002/03 (72).
Table 1: Alcohol-related NHS hospital admissions in England based on primary and secondary diagnoses: 2002-03 to 2011-12
1
2002- 2003
2003- 2004
2004- 2005
2005- 2006
2006- 2007
2007- 2008
2008- 2009
2009- 2010
2010- 2011
2011- 2012
Acute 63,500 69,400 75,400 83,900 85,300 88,100 90,500 94,200 96,100 94,300
Chronic 363,800 403,700 456,200 524,000 579,900 630,800 698,400 785,400 880,200 919,200
Mental & behav. disorders
83,400 97,000 113,000 128,100 136,900 144,700 156,500 177,400 192,000 206,800
Total 510,700 570,100 644,700 736,000 802,000 863,500 945,400 1,056,900 1,168,300 1,220,300
1 Lifestyle Statistics. Statistics on Alcohol: England, 2013. London: Health and Social Care Information
Centre, 2013.

7
However, the consequences of the UK’s problematic relationship with alcohol also
carry a tangible financial price tag. In England, estimates for the annual cost of alcohol-
related harm range from £20 billion to £55 billion (73, 74). Again, there are regional
variations, but conservative estimates put the annual cost of alcohol consumption to
the North East in the region of £950 million to £1 billion alone (75). This of course
includes costs to the health service: the latest government figures suggest that the
overall annual cost of alcohol-related harm to the NHS is approximately £2.9 billion at
2008/9 prices (76, 77). However more recent research using 2006–07 data, has
estimated that £3.3 billion of total NHS costs (over £43 billion) were due to alcohol-
related ill health (78).
There are also wider costs incurred by society as a result of excessive alcohol
consumption, such as the impact of heavy drinking on crime, and in particular the
strong link between heavy drinking and violent crime including domestic violence (73).
Indeed, the 2008/9 British Crime Survey (79) reported victims believed the offender(s)
to be under the influence of alcohol in nearly half (47%) of all violent incidents. The
Prime Ministers Strategy Unit (PMSU) estimated the overall annual cost of crime and
antisocial behaviour linked to alcohol to be about £7.5 billion (73) (figure since revised
upwards to £8 billion taking into account rises in the Retail Price Index (RPI)) (77). In
addition, there are costs to businesses due to alcohol-related employer absence: a
report by the Cabinet Office estimated that sickness absence because of alcohol
among both alcohol-dependent and non-alcohol dependent employees was around 17
million working days per year (80). Based on Chartered Institute of Personnel and
Development survey data (81), the National Institute for Health and Clinical Excellence
(NICE) calculate that employee absenteeism costs related to alcohol-use disorders are
£1.7 billion (77). There are also less immediately tangible costs associated with
presenteeism with employees underperforming but in work as a result of heavy
drinking (82).
1.2 Preventing and treating hazardous and harmful alcohol consumption
1.2.1 Tackling alcohol-related harm in the UK
Growing recognition of both the harmful effects of alcohol consumption, and the rising
associated costs (83), have ensured that responding to alcohol-related harm has
become a major public health priority in recent years, both internationally and within

8
the UK (84). Indeed whilst not a new concern for Governments (see the work of the
Temperance League movement in Victorian England for example (85)), the period from
the late 1990s onwards has seen an increased focus on addressing the health, social
and financial impacts of drinking. The Labour Government of 1997-2010 introduced an
“unprecedented” proliferation of laws, regulations, guidance documents and policy
statements on alcohol (86). In part, these policy directives focussed on tackling the
health-related consequences of alcohol consumption, for example in the 1998
publication, Saving Lives: Our Healthier Nation (87), and subsequently in The NHS Plan
(88) and Choosing Health (89). However, there was also a strong preoccupation with
addressing alcohol-related crime and disorder on the part of the new Labour
government, arguably the main driving force behind the reformed licensing laws in
2003 (90).
The publication of the Labour administration’s Alcohol Harm Reduction Strategy for
England in 2004 (73) can be seen as a milestone in the development of national
alcohol policy, marking the first concerted (if not entirely successful) attempt to bring
together government interventions to prevent, minimise and manage alcohol-related
harm (91). In addition to a focus on improving treatment for harmful and dependent
drinkers, this reflected a stronger emphasis on the importance of prevention and
public health measures on the part of the Government, evidenced by commitments: to
improve education and communication around ‘alcohol misuse’; to tackle alcohol-
related crime; and to work more effectively with the alcohol industry itself.
Importantly, under the thematic area of improving health and treatment services, the
findings of the Alcohol Needs Assessment Research Project were published (92),
alongside various guidance documents on the provision of effective alcohol treatment
services (67, 93, 94). Importantly, the Alcohol Needs Assessment Research Project
found extremely low levels of identification, treatment and referral of patients with
alcohol use disorders by GPs in primary care, despite higher levels of awareness of
alcohol-related problems in comparison to previous studies (92). Further, the project
highlighted considerable regional variation in the levels of alcohol related need, and in
turn, availability of specialist agencies to provide appropriate care (92). In particular,
the study determined that despite the fact that the North East of England
demonstrated some of the highest rates of people with alcohol-use disorders, it was

9
particularly poorly served in terms of alcohol treatment agencies, resulting in the
highest regional Prevalence Service Utilisation Ratio (PSUR) in England, with only one
in 102 (1%) of alcohol dependent people accessing treatment in a year (92).
Three years later, the Labour Government published their revised Strategy: Safe.
Sensible. Social, which sought to “build on the foundations laid and lessons learned
since 2004” (91). In doing so, the Strategy focused on three key areas. First, it aimed to
ensure more effective use of the laws and licensing powers which had been previously
introduced to tackle alcohol-fuelled crime and disorder, protect young people and
bear down on irresponsibly managed premises. Secondly, it sought to “sharpen the
focus” on the minority of drinkers who cause or experience the most harm to
themselves, their communities and their families (specifically, young people under 18
who drink alcohol, 18 to 24-year-old binge drinkers, and harmful drinkers (95)). Third,
the Strategy emphasised the need for a joined-up approach, whereby the various
groups / agencies involved (police, local authorities, prison and probation staff, the
NHS, voluntary organisations, the alcohol industry, the wider business community, the
media and local communities) would work together to shape an environment that
actively promotes sensible drinking. This new requirement for local actors to produce
area specific strategies was an important development in the alcohol policy
framework, particularly as it was underpinned by a Public Sector Agreement (PSA 25),
meaning there was now “a delivery plan and focussed targets around reducing harms
caused by drugs and alcohol” (86).
However, despite Labour’s increasing focus on alcohol, the approaches outlined above
were strongly criticised. A 2010 report from the House of Commons Health Committee
went so far as describing the continued alcohol-related problems as reflective of a
“failure of will and competence” (68). For example, commentators argued that the
complex nature of the policy framework governing alcohol at both the national and
local level had resulted in conflicting and diverse agendas. A study by the Alcohol
Education and Research Council focussed on the example of the inherent
contradictions present in Labour policies around the night-time economy, where a
local level desire to market urban centres as cultural and leisure zones, the need to
promote liberal licensing legislation and the concern to tackle potential public order
issues, all conspired to work against each other (86). Further, a “stark discrepancy” (96)

10
was highlighted between the findings of research on effective methods of alcohol
control, and the policy measures actually introduced under Labour. In particular, it was
argued that the need to foster good relations with the alcohol industry resulted in an
undue focus on the responsibility of the individual consumer, through policing and
enforcement activity (86).
More recently, following their election in 2010, the Coalition Government announced
their intention to review alcohol taxation and pricing (97), along with changes to
licensing legislation as part of the 2011 Policing Reform and Social Responsibility Act
(98). When published in 2012, the UK Government Alcohol Strategy (99), appeared to
deliver on early promises to strengthen supply-side controls, comprising greater
powers for licensing authorities and the introduction of minimum unit pricing, a
potential landmark in British policy (100). In addition, the Strategy proposed
consultation on the limited introduction of a ‘public health objective’ for local
authorities, a review of alcohol consumption guidelines and greater enforcement of
the Responsibility Deal adopted in 2011 by the alcohol industry (101). At the same
time, although there was initially relatively positive feedback (102), concern was
expressed that the strategy represented an essentially individualistic approach to
tackling alcohol-related harm, in particular in relation to its failure to acknowledge the
wider impact of excessive drinking on children and families; its focus on crime rather
than health (100); and despite assurances around the Responsibility Deal, the
perceived continued influence of the alcohol industry on UK policy formulation (103).
The failure to progress the implementation of minimum unit pricing since 2012, has
done little to allay such fears, raising concern that there remains a lack of political will
to introduce population level interventions to tackle excessive drinking, in spite of
significant evidence in favour of such measures (68, 96, 104)
1.2.2 The ‘triangle’ of treatment options
A range of interventions exist for the prevention and treatment of heavy drinking at
present, from health promoting interventions aimed at tackling hazardous and harmful
drinking, to more intensive and specialist treatment for severely dependent drinking
(105). Figure 1 below illustrates the main alcohol treatments and interventions
currently available to policy makers and health practitioners. As the scale indicates,
dependent level alcohol consumption represents a much smaller proportion of the

11
drinking population in comparison to hazardous and harmful drinkers. Thus, according
to the aforementioned preventative paradox (46), it has been argued that the greatest
impact in addressing alcohol-related harm at a population level is likely to be achieved
by focussing on this larger group of hazardous and harmful drinkers. However, it needs
to be acknowledged that individual drinkers may move between categories of alcohol
problem over time, and the boundaries between categories are not clear-cut. Further,
it is also important to acknowledge more recent evidence from Rehm et al which
demonstrates the significant contribution of heavy drinking to alcohol-related
mortality (77% of all deaths). As such, and given the dose-response relationship of
alcohol consumption and related harms, Rehm suggests that greater health gains can
be achieved with a 10% reduction from a dependent drinker than from a 10%
reduction from a hazardous or harmful drinker (37)
Figure 1: The range of alcohol treatments and interventions
(Adapted from the 2008 NAO report Reducing Alcohol Harm (105))
In recognition of the high prevalence of hazardous and harmful level drinking, recent
policy approaches have included a strong emphasis on public health measures aimed
at raising awareness of the negative impacts of alcohol at population level. Examples
include school based interventions aimed at reducing drug and alcohol use in children;
community-based programmes (such as increased enforcement of licensing); mass
media campaigns highlighting the harmful effects of excessive alcohol consumption
(106); and family and individual level interventions (107). However, whilst
acknowledging a general lack of robust evaluation data on many of these intervention
approaches, what little evidence is available suggests that public and school-based

12
education and information programmes do not consistently lead to sustained changes
in drinking behaviour (108-111), and in fact, are likely to be ineffective if pursued in
isolation from other preventative measures (112). In contrast, there appears to be
stronger scientific support for both the better regulation of alcohol marketing,
particularly in relation to its effects on adolescent drinking (113), and for measures to
reduce the relative affordability of alcohol through taxation and minimum pricing (114,
115).
Within the multi-stranded approach described above the health sector itself has a
clear role to play in delivering specialist, intensive treatment for severe and
moderately dependent drinkers [30]. However, generalist health settings also offer a
prime opportunity for effective preventative work, with primary care seen as an ideal
context for the early detection and secondary prevention of alcohol-related problems,
due to its high contact-exposure to the population [54], and the frequency with which
excessive drinkers present to primary healthcare practitioners [55]. In particular,
screening and brief intervention (SBI) for alcohol has emerged as a cost-effective
preventative approach (116), which is relevant and practicable for delivery in primary
care settings (93), where patients tend to present with less acute symptoms, return
regularly for follow-up appointments (117) and often build long-term relationships
with their GP (118).
1.2.3 Screening patients for risky drinking
Screening and brief alcohol intervention comprises two key elements. First, an
essential pre-requisite of any intervention, is the process of screening a patient to help
identify those individuals drinking in a potentially hazardous or harmful way. Screening
is defined as tests done among apparently well people to identify those at an
increased risk of a disease or disorder (119). Those identified are sometimes then
offered a subsequent diagnostic test or procedure, or, in some instances, a treatment
or preventive medication. Thus, screening is not the same as diagnostic testing, which
establishes the actual presence of a disorder. Rather, screening is often used to
indicate if early stage risk or harm is present, and act as a precursor to preventive
intervention to avoid the development of more serious future problems (120).
There is a wide range of alcohol screening tests and approaches available to
practitioners, which vary in their degree of accuracy, intrusiveness, and acceptability to

13
practitioners and patients (121). These tests include a number of biomedical markers
of alcohol use such as mean corpuscular volume, gamma-glutamyl transferase (GGT),
carbohydrate deficient transferrin (CDT), and the ratio of aspartate aminotransferase
(AST) to alanine aminotransferase (ALT). However such biomedical markers generally
only identify those patients with long-term use in whom secondary symptoms have
already occurred, and thus perform significantly better in clinical populations as
opposed to community settings where high sensitivity is required (122). In addition,
certain laboratory tests can pick up pathologies unrelated to alcohol (such as liver
disease due to obesity) and they can be affected by several medications (123). Further,
urine, blood, and breath tests are all relatively unreliable indicators of different levels
of alcohol use, particularly early stage problems, since alcohol is metabolized quickly
and is unlikely to be detected in body fluids (124). As a result, biomedical markers have
a relatively limited role to play in the detection of hazardous and harmful drinking in
primary healthcare settings. However, there is some support for their use as a
supplementary screening measure (125), or for monitoring following intervention
(126).
As an alternative to the biomedical markers described above, educated guessing based
on clinical experience may identify some users, but this approach is heavily dependent
on the practitioner’s attitudes and experience. Structured interviewing, although
arguably a more consistent approach, is both time-intensive to deliver, and requires a
level of training and monitoring that is impractical in most clinical settings. Therefore
the most effective method for detecting high-risk drinkers has been found to be via a
validated, standardised questionnaire-based screening tool, generally designed to be
administered face-to-face, patient-to-provider. Importantly, their standardization
permits uniformity in administration and scoring across interviewers with diverse
experience, training, and treatment philosophies. In addition, questionnaire-based
screening is less costly than laboratory analysis; and is far less intrusive and more
acceptable to patients. Crucially, in medical practice, standardized questionnaires have
been found to have a greater sensitivity and specificity than biomedical markers (121).
A number of questionnaire screening tools exist, and for practitioners selecting an
appropriate screening instrument, it is vital to choose a test that will both accurately
detect alcohol problems and be practical to deliver (127). Screening test
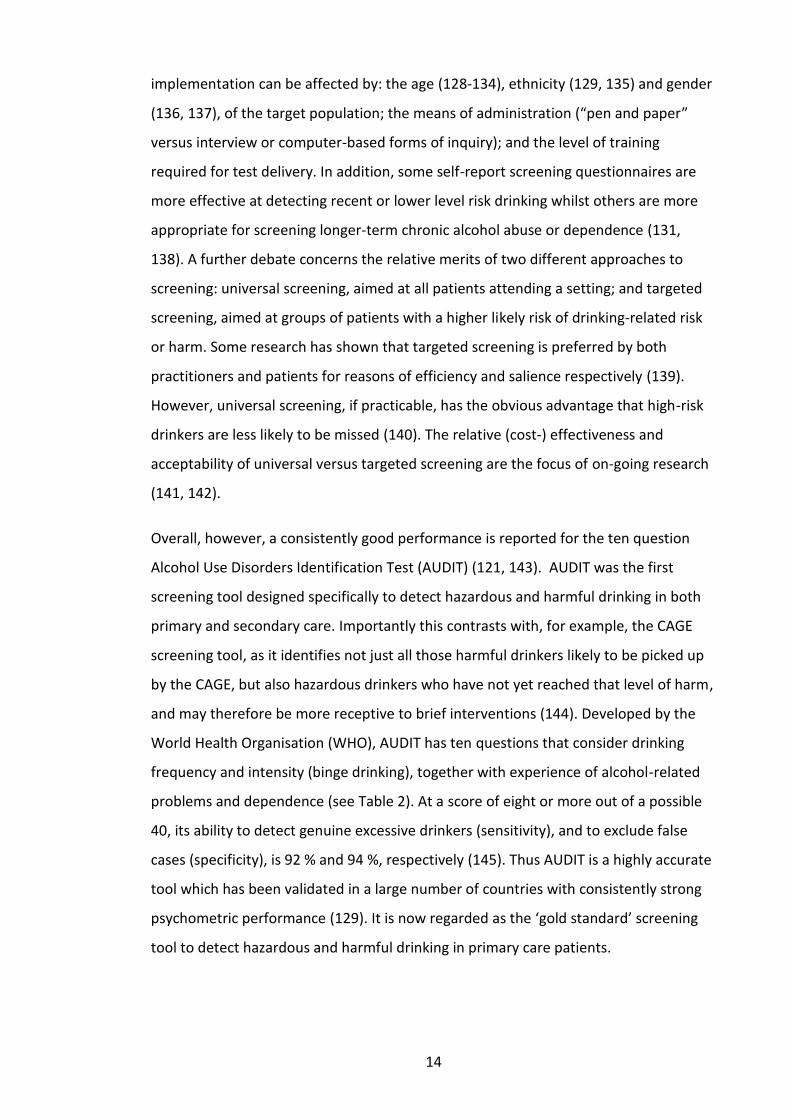
14
implementation can be affected by: the age (128-134), ethnicity (129, 135) and gender
(136, 137), of the target population; the means of administration (“pen and paper”
versus interview or computer-based forms of inquiry); and the level of training
required for test delivery. In addition, some self-report screening questionnaires are
more effective at detecting recent or lower level risk drinking whilst others are more
appropriate for screening longer-term chronic alcohol abuse or dependence (131,
138). A further debate concerns the relative merits of two different approaches to
screening: universal screening, aimed at all patients attending a setting; and targeted
screening, aimed at groups of patients with a higher likely risk of drinking-related risk
or harm. Some research has shown that targeted screening is preferred by both
practitioners and patients for reasons of efficiency and salience respectively (139).
However, universal screening, if practicable, has the obvious advantage that high-risk
drinkers are less likely to be missed (140). The relative (cost-) effectiveness and
acceptability of universal versus targeted screening are the focus of on-going research
(141, 142).
Overall, however, a consistently good performance is reported for the ten question
Alcohol Use Disorders Identification Test (AUDIT) (121, 143). AUDIT was the first
screening tool designed specifically to detect hazardous and harmful drinking in both
primary and secondary care. Importantly this contrasts with, for example, the CAGE
screening tool, as it identifies not just all those harmful drinkers likely to be picked up
by the CAGE, but also hazardous drinkers who have not yet reached that level of harm,
and may therefore be more receptive to brief interventions (144). Developed by the
World Health Organisation (WHO), AUDIT has ten questions that consider drinking
frequency and intensity (binge drinking), together with experience of alcohol-related
problems and dependence (see Table 2). At a score of eight or more out of a possible
40, its ability to detect genuine excessive drinkers (sensitivity), and to exclude false
cases (specificity), is 92 % and 94 %, respectively (145). Thus AUDIT is a highly accurate
tool which has been validated in a large number of countries with consistently strong
psychometric performance (129). It is now regarded as the ‘gold standard’ screening
tool to detect hazardous and harmful drinking in primary care patients.

15
Table 2: Alcohol Users Disorders Identification Test (AUDIT)2
Questions Scoring System Your Score* 0 1 2 3 4
1. How often do you have a drink that contains alcohol?
Never Monthly or less
2-4 times per month
2-3 times per week
4+ times per week
2. How many standard alcoholic drinks do you haveon a typical day when you are drinking?
1-2 3-4 5-6 7-9 10+
3. How often do you have 6 ormore standard drinks on oneoccasion?
Never Less than monthly
Monthly Weekly Daily or almost daily
4. How often in the last year have you found you werenot able to stop drinkingonce you had started?
Never Less than monthly
Monthly Weekly Daily or almost daily
5. How often in the last year have you failed to do what was expected of you becauseof drinking?
Never Less than monthly
Monthly Weekly Daily or almost daily
6. How often in the last year have you needed an alcoholic drink in themorning to get you going?
Never Less than monthly
Monthly Weekly Daily or almost daily
7. How often in the last year have you had a feeling of guilt or regret after drinking?
Never Less than monthly
Monthly Weekly Daily or almost daily
8. How often in the last year have you not been able to remember what happened when drinking the night before?
Never Less than monthly
Monthly Weekly Daily or almost daily
9. Have you or someone elsebeen injured as a result of your drinking?
No Yes, but not in the last year
Yes, during the last year
10. Has a relative/friend /doctor/health worker been concerned about yourdrinking or advised you to cut down?
No Yes, but not in the last year
Yes, during the last year
*0-7 = sensible drinking; 8-15 = hazardous drinking; 16-19 = harmful drinking; 20+ = possible dependence
Nevertheless, at ten items, AUDIT may be considered to be too lengthy for use in
regular screening activity. Further, in primary care, approximately four out of every
five patients tend to screen negative for hazardous and harmful drinking. Thus
practitioners need a more time-effective detection method and so several shorter
versions of AUDIT have been developed, including:
AUDIT-C – the first three (consumption) items of the full AUDIT. A score
of five plus indicates hazardous or harmful drinking (146).
2 143. Saunders JB, Aasland OG, Babor TF, de la Fuente JR, Grant M. Development of the Alcohol Use
Disorders Identification Test (AUDIT): WHO Collaborative Project on Early Detection of Persons with Harmful Alcohol Consumption II. Addiction. 1993;88:791-804.

16
AUDIT-PC – the first two (consumption) questions of AUDIT, plus items
four, five and ten which focus on alcohol-related problems and possible
dependence. A score of five plus indicates hazardous or harmful
drinking (147).
Fast Alcohol Screening Test (FAST) – a two-stage screening procedure
based on four of the original AUDIT items. Item three is asked first and
classifies over half of respondents as either non-hazardous or hazardous
drinkers. Only those not classified at the first stage go on to the second
stage, consisting of AUDIT items five, eight, and ten. A response other
than ‘never’ to any of these three items classifies the respondent as a
hazardous drinker (148).
Single Alcohol Screening Questionnaire (SASQ) – “When was the last
time you had more than ‘x’ drinks in one day?” (where x = five for men
and four for women (USA values), eight for men and six for women (UK
values)). Possible responses are: never; over 12 months; three–12
months; within three months: the last response suggests hazardous or
harmful drinking (149).
These short instruments are quicker to administer than AUDIT, but are generally less
accurate than the longer tool, and do not all clearly differentiate between hazardous,
harmful and dependent drinking. Nevertheless, a recent review reported that these
shorter tools have relatively good psychometric properties, with AUDIT-C in particular
nearly as accurate as the full version (150). Thus, a pragmatic approach for
practitioners may be to use AUDIT-C as a pre-screening tool to quickly filter out
negative cases; administering the remaining seven AUDIT questions to the smaller pool
of cases to provide an accurate and differential assessment of alcohol-related risk or
harm (121).
1.2.4 Brief alcohol interventions
The second key component of screening and brief alcohol intervention concerns the
delivery of a brief preventative intervention. Originating in the field of smoking
cessation (151), these interventions aim to detect alcohol problems at an early stage,
when they are most amenable to adjustment, to promote positive behaviour change
(152), and thus avoid the development of more serious future problems in an

17
individual (120). Grounded in social cognitive theory (153), brief alcohol intervention is
concerned with supporting positive behaviour change in individuals to help reduce risk
or harm linked to drinking. Brief intervention draws on a fundamentally social concept
of learning and behaviour (154) and operates from the perspective that all activity
results from a dynamic and reciprocal interaction between an individual, his or her
actions and the physical and social environment. Thus, drinking behaviour is influenced
not only by an individual’s attitudes towards alcohol, their knowledge about its risks,
and perceptions of its reinforcing effects; but also by the attitudes of family members
and friends towards drinking, and the patterns of use within social groups (50).
Brief intervention comprises two broad modalities. First, simple structured advice in
the form of personalised feedback on how to address problematic drinking behaviour
and/or avoid its adverse consequences, which are typically short in duration (5-10
minutes). Second, extended brief intervention, using counselling techniques such as
motivational interviewing, which are generally around 20 to 30 minutes in length
(155). Further, brief interventions have been delivered either in a single appointment
or a series of related sessions which can last between five and 60 minutes overall.
Whilst brief interventions for non-treatment seeking populations (that is, those whose
risk is opportunistically identified, and who are not consciously seeking help for
alcohol-related problems) tend not to exceed five sessions in total, those aimed at
more problematic drinkers can involve more sessions and include a wider variety of
counselling techniques (including cognitive behavioural therapy, motivational
enhancement therapy and motivational interviewing) (50).
However, whilst the content and delivery style of brief intervention may vary, at their
core, all modalities are designed to promote awareness of the negative effects of
drinking and to motivate change (68). Thus, important components of brief alcohol
interventions include drawing out individuals’ beliefs and attitudes about drinking,
their self-efficacy or sense of personal confidence about changing their drinking, and a
view about how their drinking sits in relation to other people’s drinking behaviour
(normative comparison) (50). These core elements of brief alcohol intervention are
based upon ‘FRAMES’ principles (156):

18
Feedback: provide feedback on the individual’s risk from their drinking
Responsibility: be clear that the individual is responsible for change
Advice: provide advice on risk reduction or gives explicit direction to change
Menu: provide a variety of options or strategies for behaviour change
Empathy: deliver advice or counselling using empathy and avoid judgment
Self-efficacy: encourage optimism about the scope for behaviour change
From the first study of the effects of opportunistic brief intervention carried out in
Malmo, Sweden in the early 1980s (157), over three decades of research has been
undertaken both locally and internationally to develop these simple technologies to
assist with the identification of individuals at risk from their alcohol consumption, and
the delivery of short, cost-effective interventions in community and health care
settings. Across a series of systematic reviews, covering a total of 56 unique primary
healthcare-based randomised controlled trials, it has been consistently reported that
brief alcohol interventions are effective at reducing hazardous and harmful drinking in
primary healthcare (158-176). Weekly alcohol consumption is the most commonly
reported outcome, and meta-analysis by Kaner et al. showed that compared with
control conditions, brief intervention reduced the quantity of alcohol drunk by an
average 38 g per week (95% CI (confidence interval): 23-54g) (159). This is slightly less
than the overall effect size found more recently by Jonas et al (160), which suggested
that brief intervention compared to controls in primary healthcare reduced alcohol
consumption by 49g per week for adults aged 18-64 (95% CI: 33-66g) (although this
latter review suggests effects may be lesser in older adults aged 65 and over (23g: 95%
CI 8-38g) and for young adults / college students aged 18-30 (23g: 95% CI 10-36g)).
Other positive outcomes reported in previous studies include a reduction in alcohol-
related problems (177), and reduced health-care utilization (178) and mortality
outcomes (165). Importantly, delivery by a range of practitioners in primary healthcare
settings has beneficial effects (179), although findings of one review suggests that the
effect-sizes are greater if delivered by doctors (180).

19
1.3 Screening and brief alcohol intervention: from knowledge to practice
1.3.1 Barriers to implementing brief alcohol interventions in routine primary
healthcare
Whilst there have been successive attempts to encourage the routinized delivery of
brief alcohol interventions in day-to-day practice, most efforts have demonstrated
limited success (181-185), and approaches to care remain inconsistent. In the UK,
recent attitudinal survey data suggest that whilst GPs see both preventative medicine
and alcohol as increasingly high priority public health areas, and generally view
primary health care as an appropriate setting to raise and discuss alcohol, particularly
as part of a broader healthy lifestyle focus (186), most are not routinely asking patients
about their drinking (187), resulting in sporadic provision of alcohol care (105). Further,
even where primary care practitioners are raising the topic of alcohol consumption
within consultations, recent data suggests a strong reliance on the use of simple
quantity questions as a means of screening patients as opposed to using a validated
questionnaire such as AUDIT (188). This is problematic for a range of reasons, not least
as evidence suggests patients both struggle to translate standard drink measures into
their actual consumption reports; and that they may actually underestimate their
overall consumption regardless (189).
Some of the barriers to the provision of brief alcohol interventions identified to date
concern the socio-cultural, interactional and attitudinal factors that influence their
delivery by individual primary healthcare practitioners (190, 191). For example, there is
evidence to suggest that many GPs remain unconvinced that patients will take such
advice to change their drinking behaviour, particularly those patients drinking at heavy
or dependent levels (192-194). Practitioners are also concerned that they might offend
patients by discussing alcohol or at least view alcohol as a ‘delicate’ subject to raise in
the standard consultation situation (191, 194), which potentially risks jeopardising the
patient-doctor relationship (195, 196). This ‘role insecurity’ (197) also relates to the
impact that practitioners’ own drinking practices may have on intervention delivery,
alongside confusion about what advice they should actually be delivering on lower risk
drinking (186).
In addition, there are also a series of structural and organisational factors that
influence alcohol intervention delivery. Lack of training or suitable intervention

20
materials (194, 198), inadequate financial incentives (199, 200), unsupportive specialist
alcohol service provision (117, 193), and everyday time pressures (193, 201), have all
been identified by GPs and other health practitioners as barriers to their successful
engagement in and delivery of brief interventions for alcohol (184, 187, 190, 199, 202-
206). In the UK, for example, a recent House of Commons (HoC) report drew particular
attention to the “dire state” of alcohol treatment service as a “ significant disincentive
for primary care services to detect alcohol related issues at an early stage” (68).
Moreover, these barriers are often interrelated. Thus GPs’ discussions around alcohol
are shaped by both the practical challenge of incorporating discussions about alcohol
within the pressured, time-limited consultation process, and their own (and the
patient’s) complex social, cultural and moral beliefs about what constitutes ‘normal’
versus ‘problematic’ drinking (190, 207, 208).
The complex set of barriers discussed above highlight a fundamental challenge for
evidence-based medicine: how to bridge the knowledge-to-practice gap (209). Indeed,
many of the obstacles to routine delivery of alcohol interventions are reflective of
some of the common themes emerging from the growing field of implementation
science. Linton (210) has described implementation as:
“…all activities that occur between making an adoption commitment
and the time that an innovation either becomes part of the
organizational routine, ceases to be new, or is abandoned (…) [and
the] behaviour of organizational members over time evolves from
avoidance or non‐use, through unenthusiastic or compliant use, to
skilled or consistent use.”
Despite Linton’s implication above, however, implementation need not necessarily be
concerned with innovation. Implementation may comprise more conservative goals,
such as the standardization and regulation of (best) practices, as is often the case in
medicine and health care (211). Moreover, it is important to emphasise the fact that
implementation never refers to a single, easily-defined entity that is to be
implemented. Whenever some new way of thinking, acting, or organising is introduced
into a social system of any kind, it evolves as a multi-faceted, and essentially organic
package of both material and cognitive practices (212) .
Various theories have been developed in recent years to support our better
understanding of this complex process of implementation. These have included

21
theories focussed on understanding the behaviour of the individual health
professional, such as psychological theories of intention, and in particular, the Theory
of Planned Behaviour (213). However, it has been argued that such an essentially
individualistic approach to implementation fails to take into account the issue that
“there are always social factors that promote or constrain particular expressions of
agency” (211). Alternative approaches, such as Everett Roger's classic Diffusion of
Innovations theory (214), Normalization Process Theory, and May’s emerging General
Theory of Implementation, therefore represent attempts to integrate the structural
properties of social systems into our understanding of the implementation process
(212).
Greenhalgh et al’s (215) review of the diffusion of service innovations represents a
particularly comprehensive approach to amalgamating the multiple elements involved
in implementation. The emerging theory draws heavily on Roger’s seminal work in this
field (214), but also takes in a multi-disciplinary evidence-base (encompassing
sociology, psychology, anthropology, political science, ecology organisation and
management theory), in order to develop a unifying conceptual model to aide
consideration of the determinants of diffusion, dissemination and implementation of
innovations in health service delivery and organisation. Figure 2 overleaf, is their
graphical representation of the theoretical model developed.

22
Figure 2: Conceptual Model for Considering the Determinants of Diffusion, Dissemination, and Implementation of Innovations in Health Service Delivery and Organization (215)
According to the above model, therefore, the rate and scale of implementation is
influenced by a multifarious collection of interrelated factors. These include key
attributes of the innovation itself, indeed Rogers himself found that innovation
characteristics explain 49-87% of the variance in rate of adoption (214). Such attributes
include: whether an innovation is perceived to deliver a clear unambiguous and
observable (relative) advantage to users over existing practice (214, 216, 217); the
degree of flexibility and experimentation it tolerates (214, 217); the extent to which
the innovation is simple (as opposed to complex) (218); and whether it is compatible
with adopters’ values, norms, and perceived needs (218-220). At the same time, the
model acknowledges that “people are not passive recipients of innovations” (215):
individuals may be psychologically pre-disposed toward trying out and using new
practices or systems (214); and may also attach disparate and even conflicting
“meanings” to initiatives (221). Further, their involvement in the process of
implementation itself can be influential, such as whether they have been involved in
the initial decision to introduce an innovation (214), or have had their concerns about
the impact of the innovation addressed at key stages of the adoption process (222).

23
Moreover, the process of successful diffusion and dissemination of an initiative is also
subject to multiple influencers. These may include: the structure, quality and type of
social networks to which potential adopters belong (214, 223, 224); the extent to
which relations between new and current users of the innovation are homophilic (i.e.
share common characteristics) (223); and the influence of expert opinion leaders on
take-up (225), such as through the use of innovation champions (226). Further, the
system itself, or as Greenhalgh describes it the “structural determinants of
innovativeness”, also has bearing on adoption rates. Systems which are large, mature,
functionally differentiated and well-resourced, with decentralised decision-making, a
flexible organisational structure, and top management support (227), are generally
more amenable to successful innovation implementation. Whilst these structural
determinants may interact in a complex and unpredictable way (215), system
characteristics, in particular, the extent to which it demonstrates ‘readiness’ for
change (214, 228) can impact heavily on the extent to which an innovation becomes
‘routinised’ once adopted. Finally, there are also external influencers that can impact
on the success of innovation, including the role played by inter-organisational
(sometimes informal) networks (223), “intentional spread strategies” such as quality
improvement initiatives (217), and the impact of political directives on practice, such
as the provision of a dedicated funding stream (229, 230).
1.3.2 Incentivising screening and brief alcohol intervention implementation
in primary healthcare
As part of the UK governments’ continued focus on addressing alcohol-related risk and
harm, the key role played by screening and brief alcohol intervention has been
recognised at both a national and regional level. Receiving its first mention in Labour’s
Safe, Sensible, Social, (73), the more recent 2012 Alcohol Strategy again emphasises
the current Governments commitment (on paper at least) to maximise potential
opportunities for their delivery in suitable settings (99). However, whilst most
comprehensive theories of implementation emphasise the complex and interrelated
factors that may potentially influence practitioners’ adoption of new services or
practices, empirical evidence would suggest approaches in UK healthcare have been
much more simplistic. Focussing now on attempts by governments to encourage the
routine delivery of screening and brief alcohol intervention in primary health care, for
example, there have arguably been two main mechanisms employed to date.

24
First, and importantly, screening and brief intervention in primary care has been
endorsed in a series of health and social care policy statements and guidelines in the
UK. Current NICE guidance on the prevention of alcohol use disorders recommends the
prioritisation of resources for screening and brief alcohol interventions by health
service commissioners, alongside their routine delivery (in adults and older
adolescents) by trained professionals in primary healthcare and other appropriate
settings (231): a message reiterated in the more recent 2012 Government Alcohol
Strategy (232). Further, from April 2013, the Department of Health has included
alcohol screening and related brief advice within the NHS Health Check for adults aged
between 40 and 75 [86].
There have also been regional level policy attempts to accelerate the rate of
implementation of alcohol screening and brief intervention in primary healthcare. In
the North East of England, for example, building on the recommendations of the North
East Alcohol Misuse Statement of Priorities (65), the 2007 health strategy Better
Health, Fairer Health, outlined the region’s policy approach to tackling the rising costs
of alcohol-related harm. In particular, this strategy responded to evidence from the
2004 Alcohol Needs Assessment Research Project, suggesting a large regional gap
between the need for alcohol treatment and actual access to treatment (92) (although
subsequent data suggests significant improvements in service provision since 2004,
and even that the initially identified low treatment rates may have been more related
to inadequate data than inadequate services per se (233)). Thus, key elements
included a commitment to expand services “to deliver ready availability of brief
interventions”, and a commitment to having the “highest per capita availability of brief
interventions in the country” by 2010 (234). Further, it resulted in the establishment of
a regional office for alcohol, BALANCE (the North East Office for Alcohol). Funded by
the twelve Local Authorities across the North East of England, BALANCE is the first
regional Office of its kind to tackle alcohol-related issues in a cross-cutting way (235).
Its remit includes a commitment to: raise the profile of alcohol-related issues;
coordinate good practice across the region and push for appropriate changes in laws,
regulations and pricing policy based on existing evidence and new research.
Second, there have also been initiatives targeting what might be described as
practitioners’ extrinsic motivations (236), through the introduction of a dedicated (yet

25
time-limited) funding stream in the form of enhanced services (financial incentives) to
encourage the delivery of screening and brief intervention for alcohol. Following the
Alcohol Harm Reduction Strategy for England (2004), alcohol-focused Local Enhanced
Services (LES) were set up across the country with local general practices. Financed by
the relevant Primary Care Trust (PCT), the alcohol LES was a package targeted at
meeting the needs of the local population, most often involving screening existing
patient lists and delivering Brief Advice. Not all PCTs introduced such services, and
payment packages were agreed locally, with sign-up by individual practices themselves
done on a voluntary basis. As such, provision at either national or even regional level
was far from uniform. For example, in the three former PCT areas that encompassed
NHS South of Tyne (i.e. Gateshead, South Tyneside and Sunderland), addressing
alcohol misuse was a stated Local Enhanced Service (LES) area and GP practices were
paid for both screening patients, and delivering interventions and / or specialist
referrals as required (237). However, no comparable local level service was introduced
in the former NHS North of Tyne area (i.e. Newcastle, North Tyneside and
Northumberland located in the north of the same North East region).
Building on the approach behind the local-level alcohol Enhanced Service, in April
2008, NHS Employers and the General Practitioners Committee (GPC) of the British
Medical Association (BMA) agreed five new clinical Directed Enhanced Services (DES);
including a DES specification for alcohol (238). Again, such services were introduced
on a voluntary, time-limited, albeit now available on a national level basis. Under the
alcohol DES, practices would be financially rewarded by their PCT for screening all
newly registered patients aged 16 and over; with the recommendation that practices
should then deliver brief advice to patients identified as drinking at increasing and
higher risk levels. Again, a PCT Alcohol Service Framework was established to support
this delivery [50, 88]. Initially planned to last for a two year period, the national alcohol
enhanced service has been repeatedly renewed, and was recently extended yet again
to continue until March 31st 2014 (239).
Since April 2013, arrangements for both national and local enhanced services have
altered as a result of the major restructuring of primary healthcare in England (240).
Responsibility for the national level Directed Enhanced Service for alcohol contracts
previously managed locally by PCTs has transferred to NHS England, to be

26
commissioned by the relevant NHS England Area Team (for the former NHS North of
Tyne and South of Tyne and Wear organisational areas, this relates to the Cumbria,
Northumberland and Tyne and Wear Area Team (241)) (242). Local Enhanced Services
for alcohol come under the new public health responsibilities of English Local
Authorities (242). However NHS England retains overall contractual responsibility for
primary care, and Clinical Commissioning Groups have been charged with managing
transitional arrangements during an interim period lasting to 2014 (243).
There have also been (albeit to date unsuccessful) attempts at incorporating screening
and brief alcohol intervention into the Quality and Outcomes Framework (QOF) which
may yet bear fruit (QOF: a voluntary incentive scheme for GPs in the UK which
financially rewards practices for their performance against a pre-determined set of key
service indicators). This step was recommended in the 2010 House of Commons Health
Committee report on alcohol (68) and the 2012 Alcohol Strategy also included a
commitment to revisit the potential to support GPs through the incorporation of
alcohol into the QOF (232). However, some areas (including Hammersmith and Fulham
Council in London) did introduce a local version of the Quality and Outcomes
Framework named QOF+, whereby practices were incentivised to screen patients with
cardiovascular conditions, mental health conditions and patients on the cardiovascular
disease risk register for alcohol use disorders (244). QOF+ was introduced in July 2008,
and recent research by Hamilton et al suggested that the initiative was delivered
successfully, leading to a statistically significant increase in the proportion of patients
with cardiovascular and mental health conditions being screened for problem alcohol
use (from 4.8% prior to the introduction of QOF+ to 65.7% afterwards) (245). However
the programme ended in March 2011, when funding was withdrawn.
1.4 Using routine data to assess the implementation of screening and brief
alcohol interventions in primary health care
In determining the impact of the various policy endorsements and incentivisation
schemes at encouraging implementation (delivery) of screening and brief alcohol
intervention in primary care, a range of routine data exist, much of which remains
relatively untapped in research (246). Key features of routine data include: their
regular and continuing collection; the use of standard terminology and definitions; and
some degree of obligation to collect them universally (i.e. through systems which

27
cover all relevant patients) (247). Importantly, routine data should be collected
irrespective of the procedure or outcome. As such, it is data whose primary reason for
collection is administrative i.e. to manage the day-to-day running of health services,
not specifically for the purposes of research (248).
Routine data includes not only administrative data sets, but also disease and health
technology registers, adverse event reporting systems, and regular health-related
surveys (247-249), and may be collected at the national or regional level. Examples
include Hospital Episode Statistics (250), a data warehouse containing details of all
admissions to NHS hospitals in England, alongside specific commissioning-focussed
datasets, such as the ‘Better Care Better Value’ indicator sets (251), and those
captured under the Secondary Uses Service Programme to support purposes other
than clinical care such as healthcare planning, commissioning services, public health
and national policy development (252).
1.4.1 Capturing routine data in primary healthcare
As the entry point to the health care system for most users, and accountable for
addressing a large majority of personal health care needs (253), primary health care
offers a prime opportunity to collect a wide-range of routine data. In particular, as a
highly computerised sector of the NHS (254), and given it’s near universal population
coverage (255), general practice performs a central role in routine data collection.
According to the DH, there are four key purposes for the capture of routine data within
general practice (256). First, routine data is gathered to directly support clinical
practice, facilitating the optimal care of both individual patients and that of the
practice population as a whole. Second, routine data can also perform various non-
clinical functions, and in particular, help practices to meet their administrative, legal,
and contractual obligations. For example the Quality and Outcomes Framework
requires that certain data items are captured and recorded to demonstrate an
individual practice’s achievements in clinical areas (257). Third, routine data can
support additional purposes such as clinical governance, professional development,
commissioning and healthcare planning. Fourth and finally, there may be ‘emerging
needs’ driving the collection of routine data, such as the need to share health records
across providers, or to facilitate further control on the part of patients over their own
health records (256).

28
Whilst a modern general practice continually receives large volumes of information
from a wide range of sources and in a variety of different formats, such as x-rays,
hospital letters, and summary data on Lloyd George record (256), a significant
proportion of this data is collected by clinicians as part of the everyday patient
consultation (258). Indeed, a range of literature underlines the central role GPs now
play in the collection of routine primary care data in the UK (259). Importantly, GPs
provide the majority of primary health care provision in the UK; they are generally the
first point of contact for patients, and also act as gatekeepers to facilitate access to
secondary care services (260). Further, the capture of routine data as part of the
consultation encounter is effectively mandated, with current Department of Health
guidelines ‘encouraging’ clinicians to “add at least one clinical code per encounter”
(256).
However, although traditionally the main function of information systems in general
practice has been to provide information for GPs and other members of the clinical
team for day-to-day clinical care, changes to GPs’ contractual arrangements in 2004,
including the introduction of financial incentives tied to the achievement of clinical and
other performance targets (255, 260), mean that general practices are increasingly
required to record detailed information on clinical management in order to qualify for
payment (254). As a result, although there is some evidence to suggest that in practice
much routine coding is carried out by nursing staff in primary care, such recording
activity is generally directed and delegated by GPs, meaning nurses have little
discretion over when or whether to record (261).
The major general practice clinical computer systems currently used in the UK include
EMIS (Egton Medical Information System), SystmOne and Vision (262). As Lusignan
writes, GP systems record data in two ways. First, via date-stamped ‘coded’ (or
structured) data, where the data entrant selects the most appropriate clinical term to
represent the main purpose of the consultation event (whether this refers to a
presenting complaint, a diagnosis, procedure or administrative term), with additional
clinical terms added as necessary. Second, most systems also allow the entry of ‘free
text’ or narrative as part of the record of the patient encounter (263). For example,
such narrative free text may be used to qualify any clinical term, and thus place the
coded information within the overarching context of the patient’s ‘story’ (256). The

29
key advantage of structured data, however, is the potential it offers for simplicity and
consistency, and thus enhanced accessibility of the resultant information. Importantly,
coded data facilitates the “simple” representation of often complex information, that
allows it to be processed within the general practice system (263). Further, in selecting
the most appropriate code, clinicians generally use a list of options, potentially via the
use of a keyword search, or through the use of a standardised data template. Thus,
coded data also perform a vital function in helping to rationalise the multiple ways in
which clinical concepts can be represented in healthcare.
Since the 1980s, the UK primary care sector has mainly used Read codes for the
purposes of recording structured data. Named after their inventor, Dr James Read
(264), Read codes are a hierarchically-arranged controlled standard clinical vocabulary
(265) which support detailed clinical encoding of multiple patient phenomena,
including demographic details, clinical signs, symptoms and observations; laboratory
tests and results; diagnoses; and administrative items. There are currently two Read
code versions of differing complexity: READ version 2, commonly known as 5-Byte
READ due to its five character code structure, released in 1991; and READ version 3
(Clinical Terms Version 3 or 'CTV3'), devised during the 1990s in an attempt to address
some technical limitations of the earlier designs. Today, whilst the NHS in England has
committed to a strategic move to a further coding system, SNOMED CT (Systematised
Nomenclature for Medicine—Clinical Terms) (266), 5-Byte Read and Clinical Terms V3
remain the most commonly used Read code systems in UK general practice (266).
Together, Clinical Terms V3, 5-Byte Read codes and SNOMED CT comprise the standard
national code set for UK primary care, with each set of codes updated on a biannual
basis by the UK Terminology Centre. It should be noted that at present, however, there
is no provision to ‘retire’ defunct Read codes; rather, the lexicon continually expands
as new codes are added to the system. There are attempts to rationalise the available
codes however: in the case of Clinical Terms V3 for example, each concept is assigned
an appropriate ‘status’, either current, optional, redundant or extinct (267). Current
status is given to all mainstream, clinically useful concepts, suitable for recording
clinical data. Optional status is given to concepts which are mainly derived from
incorporation of earlier versions and are not considered clinically intuitive (but which
may still be used). Redundant status is assigned in circumstances where more than one
30
code is found to exist for the same concept. However as no codes are actually deleted,
the resulting Read code lexicon is sizeable to say the least. By way of illustration, the
October Clinical Terms V3 2010 release contained 298,102 discrete concept codes of
which 55,829 were marked as inactive, and 58,130 were pharmaceutical products or
devices. Further, additional Read codes may also be devised for use within individual
or groups of general practices. These codes are not part of the standard national code
set (Read, CVT3, SNOMED) but are generated at a more local level by a particular
supplier, health community or practice. In particular, it has been observed that “local
codes are usually generated to fill a perceived gap in the national set or meet some
peculiarly intrinsically local requirement” (256).
1.4.2 Routine sources of alcohol data
Whilst there is an existing system to collect data on the delivery of alcohol treatment
services in the form of the National Drug Treatment Monitoring System, this only
gathers data on specialist alcohol treatments (Tier 3 and 4 services) so cannot be used
to determine activity within primary care settings (classed as Tier 2 services). Other
potential sources of performance data for the measurement of screening and brief
alcohol intervention in primary care include hospital admission episode data for
alcohol-attributable conditions. Hospital Episode Data has been collected in the UK
since 1989-90 and aims to collect a detailed record for each 'episode' of admitted
patient care delivered in England, either by NHS hospitals or delivered in the
independent sector but commissioned by the NHS (268). Such data include alcohol-
attributable mortality and hospital admissions (i.e. admissions relating to those
conditions which are significantly (>20%) attributable to alcohol (269)). These data are
considered to be sensitive to prevention interventions (i.e. eventually alcohol-
attributable admissions would fall if screening and brief alcohol interventions were
successful), therefore it has been argued that improved prevention and treatment
interventions would have a direct impact on the rate of alcohol admissions to hospital
(270, 271).
Indeed, under the previous Labour Government, alcohol-related admissions data was
used to evidence progress towards their Public Service Agreement performance
indicator (PSA 25) ‘to reduce the harm caused by alcohol and drugs’ [132]. More
recently, such data was included within the current administration’s Public Health

31
Outcomes Framework under Health improvement Objective 2: People are helped to
live healthy lifestyles, make healthy choices and reduce health inequalities; although
this looks likely to be an indicator which estimates alcohol related admissions based on
primary diagnoses only, a much narrower measure than previously (272). At the same
time, however, it should be emphasised that reductions in alcohol-attributable
hospital admissions is likely to be a longer-term measure of intervention effect (77),
and therefore may not be appropriate for assessing impact in the shorter-term.
Since 2004, the introduction of payment by incentives for delivery of a range of
Enhanced Services by GPs has provided additional sources of data on screening and
brief alcohol interventions in primary care that crucially offers the promise of more
immediacy over hospital admissions and thus may help to assess their implementation.
As already detailed, the delivery of the current alcohol Directed Enhanced Service is
supported by an alcohol Primary Care Service Framework, which covers the
recommended screening and brief alcohol intervention process, and provides a suite
of supportive resources and tools [116]. Importantly, it also specifies the types of data
that service providers should collect to demonstrate service effectiveness and
performance. Thus, general practices must provide an annual audit of:
the number of newly registered patients aged 16 and over within the
financial year who have had the short standard case-finding test (FAST
or AUDIT-C);
the number of newly registered patients aged 16 and over who have
screened positive using a short case-finding test (as above) during the
financial year, who then undergo a fuller assessment using a validated
tool (AUDIT) to determine Hazardous, Harmful or likely dependent
drinking;
the number of Hazardous or Harmful drinkers who have received a brief
intervention to help them reduce their alcohol-related risk;
the number of patients scoring 20+ on AUDIT who have been referred
for specialist advice for dependent drinking.
This data should be recorded using the appropriate new GP Read codes associated
with the identification and management of risky drinking in primary care, which were
introduced in 2008 to support the delivery of Enhanced Services for alcohol. The

32
diagram below shows how these Read codes map onto the alcohol care pathways
advised by the UK Department of Health (note that this diagram and associated Read
codes were produced by the Department of Health and include a misleading error; in
that, an AUDIT score of 16-19 not 16-20 should prompt Extended Brief Intervention).
Figure 3: Alcohol Primary Care Pathway (with Read codes) (273)
To date, such Read code data has generally been reported manually on a local basis by
practices, although the UK Government recently announced that the automated
calculating quality reporting service (CQRS) would replace the manual systems for
calculating and reporting performance data for many general practice services,
including some enhanced services such as that for alcohol, in the near future (239).
However, research (188) suggests that general practice level screening data is
reasonably comprehensive, at least for new patients, with Read code data available for
76% of newly registered adults patients.
1.4.3 Advantages of using routine data in research and evaluation
Whilst gathered primarily to support the day-to-day delivery of healthcare services, it
is also the case that such data offer a range of potential secondary uses. In particular, it
has been argued that the routine data generated in primary care settings can aid

33
health-care decision making, support professional self-evaluation (274) and as already
suggested, inform research to determine whether certain interventions are being
implemented successfully to relevant patients (248) or to highlight variations in
measured performance between different providers (275). Indeed, as part of the
increased focus on improving efficiency, evidence-based practice and patient
outcomes in the NHS (276), measurement of progress remains heavily dependent on
the availability of meaningful, accessible and cost-effective data (277). In theory, such
data could represent a valuable potential information source to help understand the
implementation of screening and brief alcohol interventions in routine primary health
care.
Importantly, such data possess a number of key advantages as an information source
for researchers. First, as such data is by definition collected as part of the routine
management and delivery of healthcare services, it represents a cost-effective and
relatively unobtrusive means of gathering information (248). This is particularly the
case when compared with direct observation or the introduction of behavioural
measures, both of which are complex and costly to use (274) and introduce the
possibility of the ‘Hawthorne Effect’ (278), whereby the act of participating in research
can influence clinical practice. Second, routine health data offer an especially
comprehensive information source: they are readily available in multiple settings; and
provide a rich source of information about large numbers of patients (275), in many
cases, providing details of a patient’s diagnoses, management and health outcomes
over the full life course (254). In addition, in theory at least, such data sets are
generally comparable throughout the NHS, meaning practitioners, commissioners and
researchers can compare care across locations (248).
Finally, it has been argued that the trend towards increasingly computerised medical
records has been driven in part at least, by an expectation that such systems will
support the improvement of the ‘quality’ of care (279). A systematic review reported
that the main benefits of computerised information systems were increased
adherence to guidelines, enhanced surveillance and monitoring, and decreased
medication efforts (280). This point was reiterated in another systematic review, which
found a number of studies suggesting the positive association between electronic
health records and the completeness and accuracy of routine medical records (281).

34
Importantly, a further study also confirmed the likelihood of higher quality records in
paperless practices, in addition to highlighting the positive impact on record legibility
of electronic versus paper-based versions (282).
1.4.4 Challenges associated with using routine health data sets for research
At the same time, previous research has highlighted the difficulties of using clinical
records such as Read Code data for research purposes (263, 283, 284). This is
potentially unsurprising, given that the different needs and priorities of clinical users as
opposed to the research community will inform the degree of care or consistency with
which routine data is recorded in day-to-day practice (285). On this basis, van der Lei
and others have proposed that data should “be used only for the purposes for which
they were collected” (286). In particular, the logic underpinning arguments around the
potential of routine data to support the monitoring and evaluation of healthcare value
rely on a fundamental assumption: that “it is possible to make attributions of causality
between the services provided and the observed quality measures” (275). A range of
evidence suggests this assumption may be flawed in a number of respects. Drawing on
Weiskopf and Weng’s three fundamental dimensions of data quality – completeness,
correctness (or accuracy), and currency (or timeliness) (285) – as a starting point, the
following section explores these issues in more depth.
First, there is the question of the extent to which routine data in primary care settings
can be considered ‘complete’. On a superficial level, the concept of completeness
appears relatively simple: for data to be ‘complete’ there is an assumption that every
real world instance of a concept has been recorded. For some, therefore,
completeness is closely aligned to the concept of sensitivity (287). Thus for ‘complete’
data on the diagnosis of an alcohol use disorder, every patient known to have an
alcohol use disorder in a given population (e.g. practice registered list) would have that
fact recorded. However the problem in this scenario is how to determine first what is
meant by “known to have”, second, how to define and code the different levels of
alcohol use disorders in patients, and even how to determine when the identification
and coding of a patient’s alcohol use status is “necessary” and / or relevant to their
needs.

35
Further, the absence of important clinical details in data gathered for primarily
administrative purposes, and their low sensitivity for capturing certain dimensions of
service delivery (288), particularly in relation to management and treatment of chronic
conditions, also impacts on record ‘completeness’. For example, the findings of a
review by Hrisos et al (274) on valid proxy measures of clinical behaviour suggested
that the completeness of medical records varied according to the type of clinical
behaviour or action that was being measured. Records were more likely to be
thorough for actions relating to physical examination, blood pressure measurements,
laboratory tests, and screening services than for actions relating to the provision of a
wide range of counselling services, including alcohol counselling (274). Next, it is also
the case that unless screening is carried out on a universal basis, for various reasons,
patients may not actively ‘present’ for alcohol use screening, despite (or potentially
because of) the presence of relevant symptoms (as is the case in other areas of
healthcare (289)). Finally, assessing data ‘completeness’ in relation to alcohol
consumption is of course further complicated by the fact that there is no true
comparable ‘gold standard’ of data: our best prevalence data are derived from local
area synthetic estimates generated from statistical models combining national survey
and local area level data (290).
Second, there is the question of data correctness or accuracy. For some, this dimension
is analogous with the measure of positive predictive value (the proportion of positive
data that are true positives (291)). However, correctness relates not just to the
question of whether we can say that the information contained in routine medical
records is ‘true’ (and thus in part linked to completeness), but also to whether the data
itself has been recorded correctly. In this respect, it is important to be aware that
information recorded on GP systems is seldom homogeneous (292). Routine data in
primary care is the result of “the collective action of teams made up of individuals with
different roles. Diagnostic, prescribing, administrative, and clinical management
information… may each depend on different groupings of people, working in different
contexts, and carrying out different actions” (256). Such factors can combine to
compromise the reliability of routine data, further compounded by the fact that
multiple individuals may be involved in data collection and recording over time (288).
36
In addition, as already described in section 1.4.1, a given piece of information may be
recorded in several different ways. It may be coded or written in free text, which may
contain acronyms or abbreviations. Coding may be based on using national, local or
even practice level recording guidelines and / or codes themselves. Although some
local Read codes are created by suppliers and are essential to support normal system
functions, others have been developed to augment or in some cases duplicate existing
Read codes. Such codes cannot be rendered fully interoperable (i.e. cannot be
understood if transferred to other supplier systems) (293), and undermine the
consistency of patient health records. This is a particularly salient point with regards to
the recording of alcohol interventions, as evidence suggests that despite efforts by
various organisations (particularly at a local level), there remains confusion around the
recording of screening and brief alcohol intervention delivery due to successive
changes in terminology and Read coding for the alcohol DES (294).
Third, data quality is also affected by its currency or timeliness. For example, whether
there is a time-lag between the capture and the publication or availability of routine
data (289). As already mentioned (section 1.4.3), one key advantage of primary care
Read code data is generally considered to be its immediacy in comparison to other
routine data sets. However, and linked to the above issues of ensuring accurate and
homogenous coding practices, there is possibly more doubt over the extent to which
such data are actually available, whether that concerns accessibility from a researchers
perspective, or that of the practitioner themselves. In general, structured data (e.g.
coded information) will be more rapidly available than free text; however as already
highlighted, inconsistent coding and the use of practice-based euphemisms may
reduce accessibility. Further, the architecture of the computerised practice record also
impacts on the ease with which information can be accessed. Not all systems facilitate
effective data linkage and in particular, the lack of a reliable unique identifier for
patients makes linkage with other systems challenging (263).
Underlying all three dimensions of data quality is the issue of relevancy. That is, GPs
and their practice teams are most likely to record information if they believe it to be
important or relevant to a given situation or context at the time of recording. In
particular, there is strong evidence that payments to GPs can distort coding practice,
with research in this field emphasising the potential for manipulation (or gaming) of

37
these administrative data items to improve the apparent performance of provider
organizations by physicians and other health care workers (295-297). As Lusignan
writes “when GPs receive payments for specific diagnoses (pneumonia but not upper
respiratory tract infection), interventions (for prescribing, but not for advice or wait-
and-see) or performances (home visits, but not for nurse-led clinic) it is likely that GP
records will report antibiotics-treated pneumonia in a home visit, rather than common
cold that was advised by the nurse to wait-and-see” (263). Such recording behaviour
throws into question the extent to which practice records can be taken as a proxy
measure of effective treatment (92, 187, 190, 202, 298).
Finally, as increasingly digitalised health records provide an ever-more accessible
resource for researchers, it is essential to frame these concerns around the quality and
validity of routine data sets within a broader ethical context. Above all, it must be
acknowledged that using private medical data for purposes other than the immediate
health needs of the individual patient arguably represents a breach of confidentiality
(289). Whether such a breach of confidentiality is justified, is a subject for continued
debate, and as Foster and Young highlight, often rests somewhat uncomfortably on
conventional and morally simplistic assumptions of research as a process which
implicitly ‘benefits’ the public ‘other’ (299). This can be a dangerous assumption. After
all, not all research is ‘good’ research (objective, independent, beneficent), and the use
(or misuse) of routine health data can result in some real and damaging consequences
for patients that extend well beyond their initial interaction with the health system.
For example, allowing insurance companies access to certain types of medical data
could seriously jeopardise a patient’s financial status, affecting their ability to access
credit or to secure health insurance (300).
1.5 Rationale for the research
On the basis that there is now robust evidence to support the wider implementation of
screening and brief alcohol intervention implementation in UK primary care settings
(301, 302), the research agenda has arguably now moved on to examining the question
of whether initiatives introduced to date, to accelerate the pace of adoption, including
the introduction of financial incentives, have actually been successful. Routine data
sets, and in particular GP Read code data potentially represent a timely, cost-effective
and comprehensive source of information to support the evaluation of such initiatives

38
(188), and crucially, the collection of such data are inherently embedded within their
actual delivery (303).
At the same time, however, previous research confirms the sizeable challenges
associated with using clinical records such as Read Code data for such secondary
purposes. Further, given the acknowledged complexity of the implementation process
itself, it remains questionable as to whether such routine data can accurately reflect
the multifaceted dimensions of intervention adoption (304), not least, as the literature
confirms the multiple and interrelated factors that influence individual physicians
adoption and use of the various healthcare systems that support the collection of
routine data in the first place. For example, a systematic review of barriers to the
acceptance of electronic medical records (EMRs) by physicians revealed a wide range
of possible barriers to implementation, including primary barriers such as financial,
technical and time constraints; alongside secondary barriers related to psychological,
social and change process issues (305).
In the case of screening for alcohol use disorders, for example, whilst recent research
suggests high rates of newly registered adult patients (76% nationally) are currently
being screened for an alcohol use disorder in English general practice settings (188), it
is important to emphasise that there remain some unanswered questions about the
screening process itself which this fails to answer. Importantly, whilst the study by
Khadjesari et al was based on analysis of The Health Improvement Network (THIN)
data, and therefore represents a robust and broadly representative sample of 382,609
patients drawn from over 500 general practices, the fact that the information is only
disaggregated at regional level, and measurement is strongly reliant on pre-
determined quantitative Read codes, represent key limitations. For example, although
the study found significantly higher rates of recorded screening in certain regions,
including the North East of England, it was unable to determine the extent to which
financial incentives, particularly local level incentives, might have influenced such
differences (188). In addition, there was notable discrepancy between the levels of
alcohol consumption recorded in the GP data available to the researchers when
compared with general population survey estimates, suggesting that practitioners may
be under-recording alcohol use disorders and over-recording incidences of non-

39
drinking patients (188), but little insight as to what might actually be driving such a
trend.
1.6 Aims and objectives
Against this background, the doctoral research presented in this thesis is concerned
with the question of whether routinely collected data represents a sufficiently
accurate research tool to study the implementation of screening and brief alcohol
intervention delivery in primary health care. The issues of ensuring effective
knowledge translation, i.e. how successfully evidence-based policy translates into real-
life practice, and of performance management, i.e. how these activities can most
meaningfully be measured and assessed, formed the crux of the rationale for this
research. Building on this research question, the study sought to deliver the following
substantive objectives:
1. To conduct a systematic literature review, of both qualitative and
quantitative research, to identify which factors influence the recording
of routine practice data by Primary Care Physicians (PCPs) in the UK;
2. To quantitatively compare and contrast the delivery of screening and
brief alcohol interventions for alcohol across a sample of general
practices and former primary care trust areas (PCTs) in North East of
England using routinely collected electronic General Practitioner (GP)
Read Code data;
3. To qualitatively understand the barriers and facilitators impacting on
GPs recording and delivery of screening and brief alcohol interventions
in primary care settings;
4. To draw on data from both the qualitative and quantitative phases in
order to triangulate the overall findings and return to the original
research question of whether we can use routinely collected data to
monitor and evaluate alcohol screening and brief interventions.
1.7 Structure of the thesis
The remainder of the thesis is presented in six chapters, the content of which is
outlined below.

40
Chapter 2 presents the historical and political context to the research through an
exploration of the rise of Total Quality Management in UK healthcare, highlighting the
growth in measurement and monitoring in the NHS over the past three decades,
alongside increased use of financial incentives to stimulate improvements in care.
Chapter 3 introduces the overall research strategy, including providing a justification
for the mixed-methods research design, alongside an overview of the research
paradigm: critical realism. It then describes the sequence of research phases and
summarises the approach to data integration.
Chapters 4, 5 and 6 present the methodology, method and findings from the three
core components of the doctoral study. Namely, a systematic literature review to
identify what factors influence the recording of routine clinical data by Primary Care
Physicians (PCPs) in the UK (Chapter 4); secondary analysis of alcohol Read code data
extracted directly from a sample of GP practices based in the North East of England
(Chapter 5); and semi-structured interviews with General Practitioners to explore the
barriers and facilitators impacting on their recording of screening and brief
interventions for alcohol in primary care settings (Chapter 6).
Finally, Chapter 7 provides a mixed-methods synthesis of the findings from this
research, and the strengths and limitations of the approach taken are acknowledged.
The thesis concludes by identifying recommendations for policy, practice and future
research.

41
Chapter 2 Paying for performance? A review and critique of the
rise of quality management initiatives in UK healthcare
2.1 Introduction
The UK government has introduced a range of measures to foster the mainstreaming
of screening and brief alcohol intervention in primary healthcare settings in recent
years. In particular, this has included a strong focus on the use of financial incentives to
encourage the successful implementation of screening and brief alcohol intervention
in routine general practice (238). This example of paying for ‘performance’ in public
services is far from isolated, particularly within the UK health sector. Indeed recent
decades have witnessed a steady increase in the use of private sector-style tools and
techniques in the organisation and management of the National Health Service and its
constituent parts, ensuring an eventful ride for those at the forefront of delivering and
commissioning healthcare services. (306).
In order to understand the context in which alcohol screening and brief intervention is
currently delivered, it is important to understand these developments. As such, this
chapter explores the rising phenomenon of ‘performativity’ within UK healthcare,
highlighting the growth in measurement and monitoring in the NHS over the past
three decades, alongside increased use of financial incentives to stimulate
improvements in care. In particular, it focuses on the period from the late 1970s
onwards, which encompasses a series of significant changes in the culture,
management and organisation of the NHS which are particularly pertinent to the
historical, political and theoretical context of this study.
2.2 The changing face of the NHS: 1979-2012
The UK National Health Service (NHS) has undergone over six decades of development
and restructuring since its establishment in 1948. Originally set up as a relatively
simple tripartite system (307), comprising hospital services; self-employed family
doctors, dentists, opticians and pharmacists; and local authority health services, it has
evolved through a number of organisational permutations over its sixty year history.
One key change during that period has been the gradual blurring of public-private
boundaries in the ownership and delivery of health services in the UK. Today’s NHS,
although still essentially true to its original aim of being a service provided to all

42
without payment, no longer necessarily provides such services through a fully publicly-
owned infrastructure (307). A market-based approach to provision, comprising both
private practices and the involvement of public-private partnerships in a widening
range of activities, makes for a far more complex organisation than its forbears could
have envisaged.
At the same time however, it is important to stress the long-standing nature of many
of the issues that continue to challenge the NHS. Indeed, Rivett’s authoritative account
of the history of the NHS, makes this point succinctly: “The fundamental questions that
tested Bevan and his colleagues - how best to organise and manage the service, how to
fund it adequately, how to balance the often conflicting demands and expectations of
patients, staff and taxpayers, how to ensure finite resources are targeted where they
are most needed - continue to exist” (307). Above all, fulfilling the ever-expanding
financial needs of the UK health service has always been a challenge, with demand
perennially outstripping resources.
Substantial increases in the number and types of available medical technologies in
recent decades, combined with an ageing population exhibiting an increased
prevalence of chronic diseases and multi-morbidities (308, 309), have resulted in
escalating healthcare costs to governments (in 2010 the UK devoted more than twice
the share of its gross domestic product (GDP) to public plus private healthcare
spending as it did in 1960 (310)). Set against successive financial challenges, from the
oil crisis of 1974 to the more recent global economic downturn, such rising costs have
tested the organisation’s growth and development throughout its lifetime. This first
section considers some common characteristics of the key policy responses UK
government’s have introduced in an effort to tackle these challenges.
2.2.1 Thatcher’s NHS and The Patients’ Charter: 1979-1997
1979 proved a watershed election for Britain in many respects. Importantly, under
Britain’s first female Prime Minister, the newly elected Conservative government was
to launch what many commentators regarded as a ‘revolution’ (311) in Britain’s public
sector. Undoubtedly, economic factors played a strong role in driving this period of
reform: indeed Pollitt and Bouckaert have described the reforms as ‘born’ out of the
global economic recession experienced during the 1970s, with governments under

43
increased pressure to make more efficient use of limited financial resources (312, cited
in 313). However, although it was initially galvanised by the need to arrest processes of
relative economic decline, public sector reform also had political and social drivers. In
particular they were fuelled by ‘New Right’ ideology (314), where the notion of ‘rights’
to universal welfare provision, along with the rationale of ‘intervention’ by
government in economic and social affairs were being increasingly questioned (315).
Certainly, during the late 1960s and 1970s, the public had become progressively more
dissatisfied with the cumbersome administrative hierarchy of public sector service
delivery, and the perceived inflexibility that came from a focus upon impartiality and
uniformity (316). For many policy makers, it seemed as though the only way to
respond to these challenges was to focus on making the public sector more efficient,
economical and effective (317). In response to demands for greater quality and
accountability, and in pursuit of cost efficiency and reduced government expenditure,
market principles were now applied to the provision of public services.
Collectively, this prolonged phase of public sector reform has come to be known as
New Public Management (NPM) (318, 319) and is characterised by a series of core
doctrinal components, closely linked to strategic management (including: explicit
standards and measures of performance; a shift to greater competition in the public
sector (320, 321); an emphasis on private-sector styles of management practice; and
parsimony in resource use (319, 322). Finally, commentators generally agree on the
key contribution of economic theory to New Public Management. As Hughes states, it
is “heavily overlaid with both the language and practice of management by accounting,
with the emphasis on explicit standards, measurement of performance and output.”
(323).
Of course management through targets and incentives was not a new phenomenon for
the NHS. In primary care for example, the incentive-based approach to healthcare
provision and improvement was introduced as far back as the 1950s in response to the
Royal Commission on doctors’ pay (the new GPs' Charter, which clarified the
performance-based financial awards scheme). We also see beginnings of target-
orientated delivery from that period on, and a stronger focus on ‘better’ management
(see in particular, the Cogwheel Report of 1967, resulting in the organisation of

44
medical work into specialities amongst other changes (324)). However, the need to
tackle the enormous financial pressures of the NHS (Thatcher’s “bottomless financial
pit” (325)), led to some particularly radical changes in policy and practice from the late
1970s onwards (326, 327). In health, a series of initiatives were introduced aimed at
maximising cost-efficiency so that services could be improved and extended without
adding to the overall bill (327). This period also saw the publication of the first
‘performance indicators’ on the NHS, covering clinical services, finance, manpower and
estate management (327) and the introduction of competitive-tendering for some
non-clinical services. The publication of the 1983 Griffiths Report (328) marked a
distinct change in the organisational culture of the NHS. Engaged by Margaret
Thatcher to produce a report on the management of the National Health Service
(NHS), businessman Sir Ernest Roy Griffiths (8 July 1926 – 28 March 1994)
recommended the establishment of a Health Services Supervisory Board, a full-time
NHS Management Board and the introduction of general managers throughout the
NHS. These changes have been described by some as a managerial ‘revolution’ which
represented a significant challenge to the previous relative autonomy of the medical
profession (327).
Further large scale NHS reform was introduced to the UK later that decade, triggered
by the publication of the ‘Working for Patients’ White Paper in 1989 (329). This led to a
series of reforms to create a ‘quasi-market’ in healthcare (330-332) and represents a
further shift not only in the culture of the NHS as an organisation, but in the role of the
GP within it as well (although Le Grand et al argue that the impacts on patients
themselves were rather more limited) (333, 334). Crucially, this period saw the
introduction of the ‘purchaser-provider’ split in the NHS, aimed at stimulating
competition between providers which would in turn (theoretically) lead to gains in
quality and efficiency (332, 334). As well as establishing a purchasing role for health
authorities (the ‘population focussed’ arm), this also attempted to introduce a similar
role for general practices through GP fundholders (the ‘patient-focused’
element)(332). Subsequent government publications (335, 336) sought to build on this
move towards a more consumer-led healthcare service, with both increased choice for
patients (e.g. over GP or treatment), and a greater role for the private sector.

45
The reforms of the late 1980s and early 1990s also involved a clear emphasis on
promoting quality and efficiency through more explicit performance management of
the public sector (337). The Citizen’s Charter (1991) was billed as John Major’s (the
then Prime Minister) ‘big idea’ and set out six principles for public services:
consultation of users and customers; increased information to enable citizens to find
out what services are available; more and better choice; greater accessibility; greater
responsiveness when things go wrong; and importantly, clear published standards. In
conjunction with the publication of regular performance league tables, the Citizen’s
Charter represented an extension of the New Public Management reforms that had
characterised the Thatcher period. Although it conferred no legal entitlement, by being
clear about the quality of services that users could expect, the Citizen’s Charter sought
to strengthen the accountability of service providers to users. The ‘Charter’ concept
proliferated across a number of departmental spheres, including the NHS, through the
Patient’s Charter (338). This set out a series of explicit ‘rights’ for patients, in addition
to nine charter standards setting out key service specifications: a shift in power from
providers to consumers that as Klein comments was symbolic of “a new rhetoric and a
new set of expectations in the NHS” (326).
2.2.2 ‘New’ Labour and the Health Service: 1997-2010
In 1997, after 18 years in opposition, the Labour Party was elected to Government
under the banner of ‘New’ Labour. Central to this rebranding was the ideological
repositioning of the Party in the centre ground of the British political landscape via
Labour’s introduction of the so-called ‘Third Way’, which sought to unite previously
polarised individualist and collectivist stances by synthesising right-wing economic with
left-wing social policies (339, in 340). For many commentators however, this ‘Third
Way’ was in many respects simply an extension of the Conservative-initiated New
Public Management programme (341), through the Modernisation Agenda (see 342),
and in particular, the notion of Best Value (312-314, 343), which promoted continuous
improvement in local government through the greater use of competitive tendering,
alongside new performance management, inspection, and audit routines. Indeed,
despite ‘New’ Labour’s emphasis on the language of ‘partnership’ and ‘joined-up
government’, commentators have remarked on the ideological continuity in this
respect (344).

46
In health, certainly, some core characteristics of the previous regime were retained.
Labour’s 10 year vision for the NHS was set out in a White Paper: The New NHS –
Modern, Dependable (345). Importantly, the purchaser-provider split was retained and
overall responsibility for commissioning health services remained with health
authorities (346). However, there were also some important changes. In the main,
these entailed the abolition of GP fund-holding and the creation of primary care
groups (PCGs), which would take the place of all previous fund-holding and primary-
care led commissioning schemes. As Smith et al observe, PCGs were always intended
as transitional bodies, and were eventually replaced (from 2000 on) by Primary Care
Trusts (PCTs) (346). PCTs were new statutory bodies that would combine the
management of local primary and community services with a much extended role in
commissioning of health services (346): a development enshrined in law with the
publication of the Department of Health’s (DoH) Shifting the Balance of Power (347). In
2007, Labour launched its ‘world class commissioning’ programme, designed to
improve the performance of PCTs further (although doubts were expressed over the
ability of PCTs to successfully respond to this challenge in several areas of core
competencies (348)).
In the latter years of the Labour administration however, there was a pronounced shift
in emphasis in health back to a market-driven system reminiscent of its Conservative
predecessors (332). The reforms introduced from 2002 onwards therefore focussed on
increased choice, diversity and competition in hospital services; for example by
providing more rights for patients over hospital provider, and through the introduction
of NHS foundation trusts (332, 349, 350). Further, although PCTs were given statutory
responsibility for purchasing, the reforms also delivered a variation on the GP fund-
holding theme through ‘practice-based commissioning’, with the aim of introducing
increased competition in primary and community healthcare services (332).
Importantly, the Labour administration also took a resolute step towards a pay-for-
performance based healthcare system with the introduction of a new GP contract in
2004. Prior to this point, most GPs in England had been employed under a nationally
negotiated General Medical Services (GMS) contract, with the payment mechanism
driven by claim and patient list-size (capitation) (351). The 2004 contract introduced a
new annually re-defined baseline payment, driven by a combination of: practice list
47
profile; agreed service level categorisation and quality marker target attainment, with
payment tailored to reflect the specific needs of differing practice populations. This
latter element involved the launch of the Quality and Outcomes Framework (QOF), a
voluntary “system of financial incentives that reward practices for providing high-
quality care” (255, 352).
The revised contractual arrangements also enabled GPs to provide a range of
‘enhanced services’ to their patients, which would also be rewarded with financial
incentives. These additional voluntary enhanced services comprised (taken from The
King’s Fund briefing on General Practice in England (255)):
Directed Enhanced Services (DES). Services or activities provided by GP
practices that have been negotiated nationally – for example, providing
extended opening hours, improving treatment of heart failure. Practices
are not contractually obliged to provide these services but most do and
payment is at a nationally agreed rate;
National Enhanced Services (NES). Services that a PCT, using national
specifications, can choose to commission from a practice – for example,
minor injury services and enhanced care for the homeless. Again,
payment is at nationally agreed rates; and
Local Enhanced Services (LES). Locally developed services designed to
meet local health needs – for example, enhanced medical care of
asylum seekers, and specific services for people with learning
disabilities; these are commissioned by PCTs and fees for these services
are locally negotiated.
The previously piloted Personal Medical Services contract was also adopted as a
permanent arrangement in 2004, with the aim of enabling individual contracts with
practices that are appropriate to the needs of local populations (353), along with the
introduction of two further contracts: Alternative Provider Medical Services (APMS)
and Primary Care Trust Medical Services (PCTMS) (255).
Alongside these developments in the organisation and payment structure of primary
healthcare, the change in Government also brought with it a new centrally managed
performance ‘framework’ for public services such as the NHS (345, 354). Indeed a key

48
element of Labour’s Modernising Government drive was a focus on delivering ‘high
quality’ public services achieved through prescriptive targets and rigorous
performance monitoring (348). Importantly therefore, the publication of Modern
public services for Britain introduced Public Service Agreements (PSAs) that would tie
department’s budgets to their performance targets (355). The introduction of two new
institutions: The National Institute for Health and Clinical Excellence (NICE) and the
Council for Health Improvement (CHIMP), would support this centralist approach to
performance management by monitoring and enforcing performance standards (345).
In particular, the creation of NICE in April 1999, was designed to make more effective
use of limited NHS resources through a markedly evidence-based approach to clinical
‘best’ practice (356), and in particular, the provision of clinical guidelines,
recommendations on audit methods to enable the monitoring of clinical performance;
and appraisals of the clinical- and cost-effectiveness of new and existing health
technologies (357). The following table summarises some key milestones in the
development of Labour’s performance management regime for the NHS.
Table 3: Key milestones in the development of the performance management regime under New Labour (348)
Year Milestone
1997 Performance Assessment Framework The framework compiled and published performance reporting by health authorities and (for some measures) acute trusts across six themes: health improvement, fair access, the effective delivery of appropriate health care, efficiency, patient/carer experience, and health outcomes.
1998 Public Service Agreements (PSAs) These were first introduced alongside the Comprehensive Spending Review. The first health PSAs included challenging, outcome-focused public health targets, together with a dozen others, including some on reducing waiting lists and waiting times.
2000 NHS Plan This included more than 100 new targets, ranging from commitments to invest in equipment and infrastructure, to increasing staff numbers and establishing maximum waiting times for treatments. The Department of Health put hospital chief executives under strong pressure to meet these targets as part of the broader performance management system (Harrison and Appleby 2005; National Audit Office 2001).
2000 Star-ratings system Under this system, trusts were given a single summary score, between 0 and 3, according to their performance. Results were made public, and intended to hold the system to account through a process of ‘naming and shaming’, under which chief executives of zero-rated trusts were at risk of losing their jobs (Bevan 2006). Full responsibility for collating and publishing these shifted to the regulator in 2002.
2004 Further targets More targets were introduced between 2000 and 2004, including targets to: reduce inequalities in life expectancy and infant mortality; establish a maximum 18-week wait from referral to treatment for hospital care, and to halve rates of MRSA.
2007 Vital signs These were introduced in the NHS Operating Framework for 2008/09, dividing performance priorities for the service into three tiers: national ‘must dos’, national ‘must dos’ for which delivery is to be determined locally, and options for other issues from which local areas can select priorities.

49
The continued focus on targets was further emphasised in ‘Excellence and Fairness’,
which focused on the introduction of clear national standards and targets to ‘drive up’
performance (358), supported by increased devolution of incentive setting and
greater diversity in provision. The publication of the Health Act 2009, conferred a legal
duty on the part of commissioners and providers of NHS services to ‘have regard to’
the new NHS Constitution, which included rights to choice of GP, to access care and to
a patient’s own health records (359). Underpinning many of these developments,
substantial funding was provided to primary health care services, in the form of
investment in information technology systems, and the creation of a major new
database to support the collection of data from practice computer systems (352, 360).
This vision of a more responsive, accountable and flexible NHS continues to shape
policy today (361-366).
2.2.3 ‘Clinicians in the driving seat’: NHS under the Coalition Government
The May 2010 election resulted in the end of Labour’s longest serving administration
with the formation of the Conservative-Liberal Coalition. Directly on gaining office, the
new Government pronounced the end of “big government” and the failure of
“centralisation and top-down control” with the publication of their joint programme
for Government (367). There was also a clear message that tackling the public debt
was the most urgent issue facing the UK, along with a warning that tackling this would
undoubtedly result in some “difficult decisions” being made (367).
The publication of their first budget the following month confirmed the new
Government’s determination to introduce austerity measures, with the introduction of
what some have described as a ‘regressive’ (368) budget which included a £40bn
package of emergency tax increases, welfare cuts and Whitehall spending restraint
designed to slash the budget deficit by the end of the parliament (369). Whilst the
government confirmed that NHS spending would be ring-fenced, it would nevertheless
experience zero real-terms growth, with the Quality, Innovation, Productivity and
Prevention (QIPP) programme introduced to help achieve productivity savings worth
£20 billion by 2015 (370, 371). The central guiding tenets of more decentralised and
cost-efficient NHS have arguably guided health policy decision-making ever since.

50
The 2010 White Paper, Equality and excellence: Liberating the NHS (372) announced
plans for transformational reforms of the organisation and delivery of healthcare,
aimed at hastening progress towards what they described as a truly ‘patient-led’ NHS
(372). ‘Accountability’ and ‘autonomy’, and by virtue of that, greater devolution in
decision making (less ‘political micromanagement’) were strong emphases in the
Coalition White Paper. Importantly, and as subsequently enshrined in law with the
publication of the Health and Social Care Act 2012, this would involve the abolition of
primary care trusts in England from April 2013 (240).
This had two key impacts on the structure and organisation of the NHS, particularly at
a local level. First, it heralded the introduction of GP-based commissioning, whereby
groups of GP practices would work in consortia to commission the majority of NHS
services for their patients, and supported by a new NHS Commissioning Board, thus
removing this role from primary care trusts (372). In some respects, it could be argued
that this built on Labour’s practice-based commissioning approach, and before it, the
conservative-initiated total purchasing pilots. Clinical commissioning groups (CCGs)
now control around two thirds of the NHS budget, and are responsible not only for
commissioning secondary and community care services for their local populations, but
also have a legal duty to support quality improvement in general practice (373).
Second, under what the White Paper described as a move toward great “local
democratic legitimacy” (372), primary care trust responsibilities for public health
improvement and behaviour change would be transferred from PCTs to local
authorities in April 2013. Each local authority has taken on the function of joining up
the commissioning of local NHS services, social care and health improvement, and a
new executive agency of the Department of Health, Public Health England, supports
the system and provides overall national-level leadership (371).
Next, and importantly, in the context of this research, the White Paper stressed that
there would be a new focus on ‘outcomes’ as opposed to ‘process’ and / or top-down
targets that lacked clinical credibility or a sound evidence-base (372). As such,
Labour’s PSA performance regime of departmental responsibility would be replaced
with a series of separate frameworks for outcomes (374). This included the
introduction of a new NHS Outcomes Framework, covering what were described as the
three main domains of quality: the effectiveness; safety and overall experience of the

51
care received by patients (375), alongside Outcomes Frameworks for Public Health
(376), and for Social Care (377). The Department of Health also announced their
intention to renegotiate the 2004 GP contract, with the particular aim of improving
access to primary care in disadvantaged areas, and in particular, via a substantial
reduction in the size of the Quality and Outcomes Framework (378, 379). At the same
time, despite the government’s focus on abolishing target-driven care, recent reports
from The King’s Fund have highlighted the fact that data demonstrating progress
against most NHS targets is still collected (371). Further, performance management of
providers has essentially continued under this Government, with the NHS Commission
Board playing a strong role in this respect as a ‘quasi regulator’ of local commissioners
(380).
2.3 Impact of quality improvement initiatives on the UK health service
Despite some differences in emphases and specific policy tools, the previous section
thus identifies some broadly homogenous influencers shaping the design and delivery
of UK health care over the past three decades. In addition to a shift towards a more
market-based approach to healthcare (319, 322), a key departure from the ‘old’ style
public administration paradigm of service delivery has been an escalating interest in
the measurement and comparison of service quality and service outcomes within
government (381, 382). This emphasis on ‘performativity’ has drawn on management
tools and principles generally originating from outside the public sector, and in
particular Total Quality Management and Business Process Re-engineering (382).
Bevan and Hood have described such governance by targets as a form of ‘homeostatic
control’ (306), whereby measurable targets are specified in advance, a system exists to
monitor progress against that specification, and there are appropriate feedback
mechanisms, including some level of public accountability. As already described, the
Labour government of 1997-2010 in particular, introduced a strong emphasis on the
use of prescriptive targets and rigorous performance monitoring as part of its
modernisation agenda (348). Despite recent indications on the part of the Coalition
government of their intent to move away from an emphasis on process and towards
more ‘outcomes’ focussed targets (375), the underlying theme of an accountable and
responsible NHS remains. The following section considers the impacts of this broadly
shared approach on the health service itself.

52
2.3.1 Positive effects on service quality and patient outcomes
For the proponents of New Public Management, this period of change has led to some
positive developments in both the NHS, and other key spheres of the public sector.
There is some evidence to support this view. A review of literature examining the
impact of these types of quality-focused improvements on the UK public sector by
Hodgson et al, found that the introduction of various forms of target setting and
quality-focussed operational change strategies (benchmarking, business-process-
reengineering, performance-related pay, audit procedures) had resulted in beneficial
effects (383). In particular, the review cites a number of studies which found such
changes led to tangible and positive impacts on public sector staff in terms of
increased motivation, recruitment and retention in addition to speedier and more
responsive services for the public (see for example 384, 385). Other studies highlight
the beneficial effects arising from increased investment in public services by Labour
during this period (386, cited in 387). Bouvaird and Halachmi focus on the positive
impacts of Best Value in particular in this respect (381).
More specifically, in healthcare, a 2010 report from The King’s Fund (348) concluded
that despite criticisms of the use of targets and strong performance management in
the Labour Government, there had been tangible and positive impacts on patients
during this period. In particular, they cite the example of reduced hospital waiting
times, warning that “any future government needs to be aware of all of the potential
consequences for patients of removing or reducing the number of targets” (348).
Campbell et al have also suggested that the introduction of the Quality and Outcomes
Framework in primary care improved intermediate outcomes, and in particular the
control and management of diabetes-related conditions (388). A further review of the
effects of QOF on services by Van Herck et al, also suggests that impacts were overall,
positive (389).
In addition, as already highlighted, the introduction of pay-for-performance also
resulted in further investment in primary health care infrastructure, such as increased
numbers of nursing and administrative staff, the establishment of chronic-disease
clinics and increased computerisation (293, 352), which in turn, helped consolidate
evidence-based methods for care (390). There is also some evidence to suggest that
inequalities of care between the most and least deprived areas narrowed as a result of

53
QOF (360), with positive impacts equitable across socio-economic groups (391, 392).
Thus, potentially as a result of such improvements, analysis by Grosso suggests that
despite a general downward trend across Europe for public satisfaction in their
healthcare system since the 1970s, this was less evident in the UK in comparison to
similar countries as a result of these successive health reforms (393).
2.3.2 Questionable impacts on health outcomes and health inequalities
At the same time, it has also been argued that many of the benefits outlined above are
at best, partial and contested (394), and in fact, may have resulted in some unintended
and harmful consequences for UK healthcare provision. Crucially, a number of
commentators have pointed toward the lack of reliable data on impacts, seemingly
disproving the functionalist perspective on New Public Management described in the
previous section (395, 396). This includes a recent Cochrane review which found poor
evidence that financial incentives in primary care had improved patients’ wellbeing
(397), a finding echoed in both Downing et al’s study examining the link between
observed health in practice populations and their QOF scores (398), and in Sermuga et
al.’s examination of the effect of pay-for-performance on hypertension outcomes
(399).
Further, even where data are suggestive of improvements in health-related outcomes,
it is important to recognise that a common criticism of pay-for-performance
programmes is that they merely promote better recording of care rather than better
care itself (400-402). So, financial incentives may have simply served to stimulate
changes in clinical recording: any observed improvements in performance are more
the results of differential (or even, inaccurate) recording of care, as opposed to ‘real’
improvements in quality of service (403) (although one study by Steel et al suggests
this was not the case (404)). For example, whilst official sources reported reduced
waiting times in emergency departments in 2002/03, there were strong discrepancies
between government rates and the figures quoted in independent patient surveys
(306). Thus, as Sheldon writes “evaluations are usually tautological in the sense that
the yardsticks used to evaluate the impact of performance assessment are the same
potentially imperfect instruments used in the assessment itself” (405).

54
Finally, there is also the issue of the extent to which the introduction of fiscal quality
stimulants, and in particular the QOF, have been responsible for any identified
improvements in care, or whether such improvements would have taken place
regardless. For example, research by Campbell et al found evidence that the 2004
contract had resulted in only a modest acceleration in improvement in relation to
diabetes and asthma care, but suggested that such improvements were already taking
place prior to its introduction (400, 406). Certainly it is worth noting that an
assessment of GPs’ performance during the first year of implementation of the 2004
new contract found that practitioners achieved 98% of the available points for clinical
indicators (407). This was significantly above the levels anticipated (75%), with the
result that the average family practitioner saw their gross income increase by around
£23,000 (407).
2.3.3 The perverse and unintended consequences of management-by-targets
Concern has also been raised in relation to the ways in which the adoption of overly
narrow or ill-conceived targets in the public sector have sometimes skewed
performance in less desirable directions; particularly from proponents of the ‘public
value’ school of thought (408). In health, for example, the use of targets (in particular
the distorting effects of incentivising process as opposed to outcomes) has been
criticised for leading to harmful – if mostly unintended – results, and for contributing
to what has been described as a regime of “targets and terror” within the NHS (348).
Such impacts have included: distortions in clinical priorities; undermining professional
autonomy and local leadership; encouraging ‘silo-based’ rather than integrated
approaches to providing care; and promoting a focus on process rather than outcomes
(348). In primary care, there were reports under Labour that the introduction of the
target for GPs in England to see their patients within 48 hours resulted in many areas
preventing patients booking appointments more than two days in advance (409).
The findings of a recent King’s Fund report highlight the ways in which the pressures to
deliver results in the form of nationally prescribed targets, has detracted from NHS
managers ability to actually meet the needs of their patients (348). The report called
for more support for NHS managers to enable them to “deliver targets in ways that do
not undermine the ultimate purpose of service provision” (348). This concern was
echoed in research by McDonald et al, which cautioned against the potential for pay-

55
for-performance to reduce primary health care to a set of biomedical tasks, dubbing
this almost mechanistic, production-line approach to clinical practice as ‘Fordist’ (410).
In addition, concerns have been voiced as to whether certain areas – both clinical and
geographic – are neglected where financial incentives are lacking (411). In particular, it
has been suggested that despite the fact that QOF has encouraged greater consistency
in care across localities, the possibility of excluding hard-to-reach patients via
exception reporting may have the effect of limiting its impact on health inequalities
(412). Further, Heath et al have drawn attention to the fact that three quarters of the
population do not have any of the diseases listed in the quality and outcomes
framework (413).
2.4 Incentivising quality and the role of the GP
Whilst the above section identifies a range of impacts of New Public Management at a
systematic level, there have been profound consequences for individual practitioners
working within the NHS, and above all, for UK general practitioners. In particular, the
introduction of an explicit pay-for-performance scheme with the launch of the Quality
and Outcomes Framework in 2004 (351), has changed the structure of primary care
away from a traditional professional bureaucracy, where there was implicit trust in
clinicians, and towards a distinctly private-sector ‘managerialist’ delivery model (400,
411), informed by strong business discourse (414), and in which the clinical autonomy
of health professionals is diminished through increased use of surveillance techniques
(410, 415). However, the extent to which such measures have been effective (and
indeed acceptable or appropriate) in terms of changing clinician behaviour, and in
turn, improving the quality of primary care provision, remains questionable.
2.4.1 Extrinsic motivation ‘crowding out’ intrinsic professional drivers
The use of financial incentives (as part of a wider set of contracted mechanisms) as
“positive reinforcers” (236) to stimulate desired behaviours (generally more effort, and
higher performance) is essentially based on economic agency theory (416). However,
there is substantial evidence to indicate that extrinsic motivation (contingent rewards)
can in reality conflict with intrinsic motivation (an individual’s desire to perform a task
for its own sake) (236, 417), particularly when it comes to professionals working in the
healthcare sector (418). Indeed, some commentators have argued that management
by incentives neglects, or even ‘crowds out’ key elements of a physician’s ‘professional

56
repertoire’ such as emotion, morality and trust, much of which stimulated their desire
to work in the health sector in the first place (419). Further, the extent to which
centralised monitoring systems can – and indeed should – ever replace the quality
check of trustworthy professionals has also been questioned (405).
GPs themselves have focused in particular on the way in which the Quality and
Outcomes Framework has encouraged clinicians to direct their efforts towards
incentivised population-based service goals at the expense of a more holistic, patient-
centred approach (393, 420, 421), a shift that could also be characterised as shifting
general practice away from the bio-psychosocial to the biomedical model (410)
(Stewart suggests that a consultation cannot be patient-centred if it is disease or
technology-centred (422)). An observational study by Chew-Graham et al appears to
confirm this perception, finding evidence that the requirements of the QOF agenda,
did indeed appear to ‘crowd out’ opportunities to discuss non-incentivised patient
concerns (423). Further, and despite the increases in salary already identified (407),
the perception that QOF has led to an almost ‘tick-box’ rather than ‘generalist’
approach to patient care appears to have reduced job satisfaction for doctors (420).
2.4.2 ‘Gaming’ the system for financial reward
However, whilst such perverse impacts are in the main unintended, there is some
evidence to suggest the existence of a practice known as ‘gaming’ in healthcare,
whereby some clinicians may purposefully manipulate delivery and recording of care
to boost financial reward. This could either refer to instances where care is recorded,
but not delivered (or at least not to the required standard), or where performance is
reduced in areas which are not incentivised or where it already exceeds requirements
(306). Le Grand has employed the concepts of ‘knights’ (whose strong public service
ethos overrides any consideration of concealing or manipulating performance) versus
‘knaves’ (who may either reactively or deliberately engineer data to provide a false
picture of performance ) to describe health providers’ possible motivations for, and
opportunities to, ‘game’ the system (424). In primary care, Le Grand argues that the
perverse nature of financial incentives can turn GP ‘knights’ into ‘knaves’ by rewarding
certain outcomes over others and thus effectively encouraging ‘gaming’ behaviour
(424).

57
There are several reported examples of such ‘gaming’ in primary healthcare. For
example, the GP contract which introduced the Quality and Outcomes Framework
included provision to allow GPs to exclude patients from eligibility for specific
indicators in the performance calculations, known as ‘exception reports’. Critics have
argued that this has allowed practitioners to increase their income by inappropriately
excluding patients for whom they have missed targets (352). However, it should also
be stressed that the evidence on this issue is far from clear-cut. A review conducted by
the Audit Commission of PCT reporting arrangements for QOF concluded that there
was no real evidence to suggest any systematic gaming by GPs (425). However it
remains a serious concern for policy makers, not least as the effectiveness of
governance-through-targets relies on the assumption that the ‘knights’ substantially
outnumber the ‘knaves’, and that the system does not influence a significant shift from
the former category to the latter (306, 424).
2.4.3 Professional boundaries and maintaining ‘hierarchies of
appropriateness’
At the same time, it is also important to stress that other research highlights examples
of clinician’s deliberately circumventing the QOF process to ensure adequate time is
available to discuss the patient’s concerns (426), suggesting overall, the initiative has
not damaged internal motivations of clinicians or crowded out their core values (410).
Further, it is also the case, that in reality, a significant proportion of the routine ‘tick-
box’ elements of care are now delegated to either nursing staff (for example via nurse-
led disease clinics), or where possible, newly employed healthcare assistants (for
example taking blood samples or blood pressure) following the introduction of the
Quality and Outcomes Framework (410). As such, far from representing a shift in
professional roles, it has been argued that QOF instead served to reconstruct
traditional professional boundaries and clinical hierarchies (393), in which GPs make
the difficult, more complex decisions, and remain resistant to standardisation and
protocols (410, 420, 427, 428) and nursing staff deal with the straightforward,
everyday task-(and template-) based work (akin to Charles-Jones et al.’s ‘hierarchies of
appropriateness’ (429)).

58
2.5 Challenge of performance managing the UK public sector
It could be argued that transferring the aforementioned focus on targets and
‘performativity’ from the private to the public sector will always be fraught with
difficulties, considering the increasingly pressurised environment in which public
sector employees must work which limits their potential to innovate and thus
‘perform’. Budgetary constraints and heavy workloads mean that public sector workers
benefit from very little ‘organisational slack’, particularly at more junior levels, with
few routes by which ‘bottom up’ innovators can secure resources to invest in their
innovation (430, cited in 431). In addition, there is a lack of incentives to support
innovation within the public sector, as Kamarck emphasises, financial ‘rewards’ are
more likely to accrue to the state or at the least, the organisation, not to the individual
themselves (cited in 431). As such, change can only ever be evolutionary as opposed
to revolutionary, an approach fundamentally at odds with certain quality management
tools such as Business Process Re-engineering (382).
Further, as Bevan and Hood highlight, performance indicators are only valid on an
assumption of ‘synecdoche’ (taking a part to stand for the whole) (306). In this respect,
it must be acknowledged that public sector workers work within an authorising as
opposed to a market environment, with a complex web of stakeholders (313, 432),
further exacerbated by the bureaucratic nature of public organisations (433). This
stakeholder model of decision-making creates a far more complex – and far less
deterministic - structure and strategic process than in the relatively simple
accountability model found in modern private sector organisations (313). Thus, in the
case of healthcare for example, the link between actions and outcomes is much less
direct than in most production processes, being “modified or confounded by other
activities, patient case mix, and other non-health care factors” (405). This point is
illustrated in research by Giuffrida et al (434) which investigated the impact of factors
outside the control of primary care on performance indicators proposed as measures
of the quality of primary care. Their study showed that hospital admission rates in a
number of key areas of health (asthma, diabetes, and epilepsy) were all substantially
influenced by factors outside the control of the primary care team, and in particular,
by the socio-economic characteristics of their population and the supply of secondary
care resources.

59
Finally, it is also important to acknowledge the fact that the public to which such
organisations are accountable has changed significantly in recent years. Simply put,
people now expect more from their public services, expecting them to not only be
accessible at all times (the ‘24/7 society’), but also to be increasingly personalised
(431). These rising expectations that have in part been shaped by peoples’ experiences
as private sector ‘consumers’ where technological advances have enabled mass
communication, quicker response times and communication with institutions using
telephone, text message and online (435). Of course, it could be argued that such
rising expectations have been a key factor driving change in the UK public sector. For in
contrast to the centralised and highly bureaucratic post-war models of public
administration, which relied on the positioning of ‘Joe Public’ as inarticulate and
deferential to the experts in power, modern systems depend on a more informed, and
more demanding citizenship (436).
However, this development has profound consequences for governments. As Aucoin
and Neintzman have written, it means that they must now govern in a context “where
there are greater demands for accountability for performance on the part of a better
educated and less deferential citizenry, more assertive and well-organised interest
groups and social movements, and more aggressive and intrusive mass media
operating in a highly competitive information-seeking and processing environment”
(437). This creates particular challenges for the public sector as public perception can
be entirely at odds with the reality of provision, so that even increasing investment
and improving performance will not necessarily deliver ‘customer-based’ strategic
goals: the so-called ‘delivery paradox’. Finally, to add to such challenges, organisations
are tasked with meeting these higher public expectations in increasingly challenging
economic times, when growth in public expenditure is slowing.
2.6 Summary
This chapter has summarised some of the major developments in the culture,
management and organisation of the NHS which have taken place over the past three
decades. In doing so, it has sought to situate the research within the wider socio-
political and historical debates that continue to shape the delivery of UK primary
healthcare. As the chapter has shown, neoliberal ideology, as manifested in New Public
Management, now informs much of government thinking around the provision of

60
health services in the UK (438). In particular, primary healthcare has been undergoing
a “sustained, if quiet, revolution” since the 1990s (350), marked by the constant
modification and re-modification of the commissioning arrangements, and by the
changed and developing role of the GP within the sector. As previously discussed
(section 2.3.3), it has been argued that these developments have resulted in some
perverse and unintended consequences for the delivery of primary healthcare in the
UK, distorting clinical priorities, undermining professional autonomy, and promoting a
focus on process rather than outcomes (348). Finally, and importantly, such
developments also inform our understanding of the focus topic of this study - the
usefulness of routine data to evaluate the (financially incentivised) implementation of
alcohol interventions in primary health care - and in particular, the possible factors
influencing GPs’ recording of such data.

61
Chapter 3 Research methodology
3.1 Introduction
The purpose of this chapter is first to introduce the overall research methodology,
including a justification for the mixed-methods research design, alongside an overview
of the research paradigm: critical realism. It then describes the sequence of research
phases and summarises the approach to data integration. The actual methods (or
instruments) employed in the delivery of the research study itself are described fully in
the results chapters (4, 5 and 6).
3.2 The role and importance of a research paradigm
A research paradigm can be viewed as an “accepted model or pattern” (439) that
provides an organising structure and set of assumptions to help ground both
explanations of the nature of the (social) world and about the knowability of this world
(440, 441). For some theorists, this belief system model is more accurately viewed as
“epistemological stances…concentrating on one’s worldviews about issues within the
philosophy of knowledge” (442). Harrits proposes that a research paradigm can also
refer to a common research practice (443) (akin to Kuhn’s research “communities”
(444)), where members of a particular scientific speciality share a consensus view on
which questions are most meaningful and which procedures are most appropriate for
answering those questions (442). Linked to this version, a further group of theorists
focus on the development of paradigmatic case studies which act as exemplar research
designs, an approach particularly evident in mixed methods studies, such as in the
work of Cresswell, Hanson et al (445, 446).
Of course, these two broad versions of research paradigms are far from mutually
exclusive. Indeed, Morgan suggests that it may be more helpful to view these
paradigm versions as “nested” within one another (442). According to Guba, therefore,
a fully developed research paradigm can be characterised through its: ontology (what
is reality?); epistemology (how do you know something?); and methodology (how do
you go about finding out?) (447). These three key characteristics create a holistic view
of how knowledge is viewed; how we see ourselves in relation to this knowledge and,
in directing the methodological strategies we use to discover it (440). In contrast, the

62
research methods (or instruments) themselves, can be defined as procedures and
activities for selecting, collecting, organising and analysing data (448).
3.2.1 The importance of an explicit theoretical paradigm
Since the mid-twentieth century, Western science has been largely dominated by two
broad theoretical paradigms, namely positivist and interpretivist approaches (449,
450). Positivism holds that there is an absolute, singular reality, which can be
measured, studied and understood, without being influenced by pre-existing values
(451). Traditionally, positivism is associated with the natural sciences and in particular,
with quantitative research methodologies. Alternatively, interpretivism (along with
constructivist and critical theory paradigms, generally associated with social science
and qualitative research methodologies) contends that this ‘scientific’ model is ill-
suited to the study of social phenomena, where the goal is less explanation, and more
understanding of complex and often changing entities (451, 452). Crucially,
interpretivists assert that there is no such thing as a single objective reality (440),
rather there are multiple constructed realities, because different people are likely to
experience the world in differing ways (453), including of course the researcher
themselves (452).
There is an acknowledged tendency amongst health services researchers to adopt a
standard research methodology without considering the philosophical assumptions on
which they are based (454) or to utilise a generic and poorly defined methodological
strategy (described by Appleton and King as a ‘pick and mix’ approach (455)). Alise and
Teddlie assert that these weaknesses are particularly evident amongst researchers
reporting empirical studies, with both positivists and constructivists often working
within implicit research paradigms “because they assume that readers of a particular
journal (especially in ‘‘pure’’ traditional disciplines) are already familiar with that
orientation” (456). Further, as Kuhn emphasised, the longstanding dominance of
positivism in science, has served to “normalise” this research paradigm (444), with the
resultant lack of theoretical challengers meaning that researchers often lack
awareness of the belief systems and methodological practices that inform their work
(442).
63
However, such implicit paradigms are arguably naïve constructs, for as Gramsci writes
“everyone is a philosopher, though in his own way and unconsciously, since even in the
slightest manifestation of any intellectual activity whatever, in ‘language’ there is
contained a specific conception of the world” (cited in 457). Thus, any research study
reflects a worldview of at least the three philosophical layers described above:
ontological beliefs; epistemological assumptions and methodological choices (458).
Further, these layers are intrinsically inter-related: particular ontological beliefs lead us
to make particular epistemological assumptions; which in turn lead us to choose
certain methodologies over others.
3.2.2 Mixed methods: conflict resolution for the paradigm wars?
Determining an appropriate and meaningful theoretical paradigm is far from a case of
making a simple choice between positivism and interpretivism however. Alongside
their acknowledged dominance in Western thought, there has also been a “long-
lasting, circular, and remarkably unproductive debate”(440) concerning the advantages
and disadvantages of these alternative worldviews in research, sometimes described
as the ‘‘paradigm wars’’(459). The strengths of positivist (and generally quantitative)
approaches include their capacity to operationalize and measure a specific construct;
to conduct between group comparisons; to examine the strength of association
between variables of interest; and to test research hypotheses (460). However, a key
limitation is that the resultant data can be divorced from its original ecological ‘real-
world’ context (461), a phenomenon referred to as decontextualization (462). In
contrast, whilst the interpretivist (generally qualitative) approach delivers a more fully
contextualized, rich detailed account of human experiences (463), sample sizes are
generally small, with data collection ceasing at the point of saturation, limiting the
generalizability of the results (464). Thus, in selecting one philosophical orientation
over another, a researcher is implicitly making a choice to prioritise both certain types
of knowledge, and particular modes of knowledge construction.
At the same time, it is also the case that presenting the choice as an ‘either/or’
scenario may lead to the creation of inflated and misleading distinctions between the
two paradigmatic orientations. For example, qualitative research has been accused of
‘covert’ positivism through its emphasis on the importance of empirical, data-
grounded knowledge (451); and researchers housed within both paradigms place great

64
emphasis on the need to minimise confirmation bias and maximise the internal and
external validity of the results (465). As Guba and Lincoln have discussed, therefore, it
is simply not sensible to separate paradigms into “airtight categories” (442), due to the
considerable overlap, and necessary ‘permeability’ between paradigmatic boundaries
(466). It could therefore be argued that mixed-methods represent an attractive middle
ground, sitting both between these two extremes, and offering a pragmatic response
to the on-going and circular so-called “paradigm wars” (440, 443). Mixed methods
research has been defined by Burke Johnson and Onwuegbuzie as “the class of
research where the researcher mixes or combines quantitative and qualitative research
techniques, methods, approaches, concepts or language into a single study” (467). As
such, it has been referred to as the third major research paradigm (468), offering a
multi-dimensional approach to knowledge theory and practice that includes both
quantitative and qualitative methodologies. However, its benefits relate to more than
merely paradigmatic conflict resolution.
In particular, the use of mixed methods to triangulate data (i.e. seeking convergence
and corroboration of results from different methods studying the same phenomenon
(468)) has been much discussed in the literature over the past sixty years (469-471).
Thus, mixed-methods approaches have also been credited with their capacity to ‘add-
value’ in terms of delivering richer, more nuanced data through complementarity
(472); and to help initiate, expand or even reframe the research question by exploring
contradictions in results from alternative modes of inquiry (472, 473). Importantly, a
number of proponents of mixed-methods research approaches cite the particular
value of these approaches in answering complex and multi-faceted research questions
(the “wicked problems” of public health (474)). As Burke Johnson and Onwuegbuzie
write “today’s research is becoming increasingly inter-disciplinary, complex and
dynamic…taking a non-purist or compatibilist or mixed position allows researchers to
mix and match design components that offer the best chance of answering their
specific research questions” (467).
At the same time, it would be simplistic to represent mixed methods as a conflict-free
option. In epistemological terms, for example, it has been argued that the fundamental
paradigmatic incompatibility (475) of positivism and interpretivism, renders their
combination a “violation” of basic philosophical principles (442). Indeed, Max Weber

65
was strongly critical of the naïve assumption that “simply because positions differ from
one another, a “mid-point” synthesis that steers a line among them is somehow more
objective and less partisan” (476). Further within the mixed-methods community itself,
there is marked disparity in how this research paradigm is both operationalized (what
is mixed; when, where and why the mixing is carried out (468)), and indeed defined
(from Thomas’ ‘blended’ research (477), to Johnson and Christensen’s broader ‘mixed’
research term, which of course implies more than just mixing methods (478)). Within
the health services research community, for example, O’Cathain et al have highlighted
a lack of transparency around mixed-methods research design and approach to data
integration in particular (479).
In electing to employ mixed-methods to answer a particular question, it is therefore
essential to address these questions of function, process and crucially, philosophy in
justifying and clarifying the research approach. The next section of this chapter looks in
turn, therefore, at: the justification for using a mixed-methods approach to the
research; the overarching theoretical framework that informs this research; and finally,
how this translates on an operational level in terms of the research process itself.
3.3 Description of and justification for mixed-methods approach
3.3.1 Overview of study design
The intent of this three-phase, sequential mixed-methods study was to investigate the
usefulness of routinely collected medical information in evaluating the implementation
of screening and brief alcohol interventions in primary health care. In the first phase, a
systematic review and critical interpretive synthesis sought to identify factors which
have been reported as influencing the recording of routine practice data by Primary
Care Physicians (PCPs). Second, quantitative research methods were used to
numerically describe, compare and contrast the information that GPs have used to
record their delivery of screening and brief interventions in routine general practice
settings across a sample of general practices in North East of England. More
specifically, this phase examined GPs’ use of electronic Read codes to record
structured data on their case finding activities to identify potential problem drinkers,
and to evidence their delivery of interventions to help address risky drinking. In the
third and final phase, qualitative interviews with GPs, with subjects drawn from both
participating and non-participating practices in the previous phase of the study, were

66
carried out to verify the influencing factors identified in the systematic review, probe
significant results from the quantitative phase and explore the barriers and facilitators
impacting on individual alcohol Read coding behaviour. In doing so, the study aimed to
develop a robust, comprehensive and contextualised picture of the phenomenon
under investigation.
3.3.2 Justification and purpose
A mixed-methods approach (471) was selected for three main reasons. First and
foremost, the application of different methods allowed the study to answer different
dimensions of the overarching research question, and so lead to a more in-depth,
contextualised and therefore ‘authentic’ understanding of the phenomenon under
investigation. Thus, the primary purpose of using mixed methods was enhanced causal
explanation through what is probably best described as data ‘triangulation’. Campbell
and Fiske introduced the idea of triangulation (which they termed “multiple
operationalism”) whereby multiple methods are employed primarily as a construct
validation technique (480); a concept extended further by Webb, Campbell, Schwartz
and Sechrest (470); and in turn, by Cook through “critical multiplism” (481). There
remains divergence on the definition and application of triangulation as a research
concept, in particular, whether ‘true’ triangulation is possible in sequential mixed
methods research designs (473). However this study resisted alignment with either
conjunctive or disjunctive conceptions of triangulation, but alternatively adopted
Mathison’s holistic model (482), thereby seeking to bring together both convergent
and discordant data under a more comprehensive explanatory framework (483).
Second, by using mixed-methods, the study sought to address the acknowledged
weaknesses of single method research designs. For example, using a structured
questionnaire falls into the quantitative and therefore positivist research tradition, in
its aim to objectively quantify trends. However, respondents may not interpret the
questions in the same way as the survey authors, their responses may be subject to
social desirability (where rather than reflecting an individuals own values or beliefs,
respondents provide answers they assume deliver a positive representation of self
(484)), and the analysis may leave little room for the incorporation or interpretation of
the “unwanted noise”, such as additional annotated notations, or contextual data
surrounding non-responders, in the survey process (450). Thus it is questionable as to

67
the extent to which the analysed survey data adequately explains the depth and
complexity of the phenomenon under investigation. At the same time, however,
qualitative approaches are arguably limited in their ability to assess links and / or
associations between observations, cases or constructs (461); and result in the
creation of essentially subjective and potentially idiosyncratic realities that has little or
no generalisability beyond the study sample (467).
In the case of this research, therefore, determining the usefulness of routine alcohol
data demanded an understanding of not merely the measurable trends that could be
observed in purely statistical terms, but of the social, cultural, political and behavioural
factors that shape how, when and where an individual clinician records such data
(including a critical consideration of the quality of the data itself). For as Coiera
suggests, medical informatics is necessarily a hybrid “sociotechnical” field of research
(485). Quantitative analysis of Read code data would therefore allow the strength of
the association between key variables of interest to be tested (enhanced service for
alcohol status, NHS organisational area, size/type of practice, and individual practice
level) and crude rates of alcohol screening and brief intervention recording. Whereas
gathering additional qualitative data via semi-structured interviews with GPs based in
the participant practices would support the development of a more fully
contextualized, in-depth narrative of how and why primary care practitioners use
routine data to record alcohol interventions through an exploration of their complex
individual, social and cultural reasoning processes (445, 486, 487).
Third, through the use of a sequential study design, there was also a deliberative
developmental logic to the use of mixed-methods, whereby the findings from one
research phase informed the next at a variety of levels. As Greene et al describe,
strong development-led mixed-methods designs use dissimilar methods of equal
status to examine the same or similar phenomena (473). In this study, data from a
systematic review to identify which factors influence the recording of routine practice
data by Primary Care Physicians (PCPs) (Phase 1), and the trends identified from
descriptive analysis of routine alcohol Read code data, informed both the development
of the topic guide utilised in the GP interviews in Phase 3, and the identification of
suitable interview participants.

68
3.4 Rationale for a Critical Realist paradigm
3.4.1 Overview of critical realism
Emerging as a response to the “crisis” of positivism (488), critical realism was originally
proposed by Roy Bhaskar as a philosophy of science (489), and as an argument for the
careful application of the scientific method to the study of society (490). Essentially,
critical realism is a realist theory that has been used to explain and ground claims of
knowledge, truth, progress and reality in both natural and social science research
(491). However, it differs from traditional realism in a number of respects. Unlike strict
empiricists or linguistic realists, the world is composed not only of “events, states of
affairs, experiences, impressions, and discourses, but also of underlying structures,
powers and tendencies that exist, whether or not detected or known through
experience and / or discourse” (476). However, the different levels (experiences and
events) may be ‘out-of-synch’ (492) with each other, and even though the underlying
level may possess particular capabilities or a predisposition towards certain outcomes,
these may not actually be realised (476).
For critical realists therefore, in contrast to positivist accounts of causality (493),
science is not merely a straightforward deductive process of identifying constant
causative relationships, but one that aims to explore the wider contextual factors (pre-
existing institutional, organisational and social conditions) that combine to influence
the course of events (476). As scientists, Bhaskar wants us to ask “what must be true in
order [for the scientific activity] to be possible?”(489). Thus, structure and agency are
linked, in that both individual (self) and situated (social) activity take place within a
wider and deeper relational context (494). However they are not inseparable, indeed a
key concern is to investigate their interplay over time, “how pre-existing structure may
constrain action and how action reproduces or transforms existing structures” (490).
This is a generative model of causation: how mechanisms interact with context to
produce different outcomes, akin to Pawson and Tilley’s middle-range theory of
‘context-mechanism-observation’ (495). Further, and importantly, context here is not a
static construct, such outcome patterns only reflect the researchers current
understanding of mechanisms and contexts shaping the phenomenon under
investigation (495).

69
3.4.2 Value and relevance of a critical realist approach to the study
It has been argued that critical realism is a particularly ‘suitable’ theoretical paradigm
for mixed-methods research. Indeed, as a research approach, it rejects methodological
individualism as “naïve and reductionist” (491) and unable to account for the complex
and changing nature of causation at play in the ‘real world’ (489, 496). Further, in
contrast to pragmatism, critical realism challenges the view that mixed-methods
represents an a-philosophical, “over-harmonistic middle-class” and middle-ground
ideology (497). Rather, critical realism offers the opportunity to engage with and
challenge the “extremities” that create the possibility of a certain understanding of the
middle ground (476). Against positivism, critical realism contends that individuals are
not reducible to mere “social dupes” (498), unconsciously manipulated by structural
forces, and criticises positivists’ tendency to focus on observable events with little
reference to the influence of prior theoretical frameworks on such observations (499).
At the same time, critical realism resists the epistemological, ontological and ethical
relativism of interpretivism (491), and in particular, its failure to take account of the
underlying social structures or networks which may enable or constrain individual
behaviour (499). Rather, critical realism is underpinned by ‘retroduction’, wherein
researchers are required to move from the “level of observations and lived experience
to postulate about the underlying structures and mechanisms that account for the
phenomena involved” (499).
3.4.3 Implications for epistemology, ontology, methodology and axiology
A key attribute of critical realism is a commitment to epistemological pluralism or
‘opportunism’ (476), which is in turn tied to a central belief that ontological concerns
have priority over epistemological ones. Otherwise, by settling epistemological
questions in advance of ontological questions, one effectively limits “what is, to what
can be known, given X epistemology” (494). The priority of ontology coupled with
epistemological opportunism also affects the choice of methodology for scientific
enquiry, in that it promotes methodological pluralism. Importantly, with critical
realism, assumptions of a conflict (or incommensurability) between alternative
paradigms of inquiry are rejected: the question (or object) of inquiry is the starting
point in determining the methodological decision-making process. Thus, in Wight's
words, “differing object domains will require differing methods and any attempt to
70
specify methodological structures in advance of ontological considerations can only be
arbitrary” (494).
For this study, therefore, various methods employed were selected for their potential
to access the different structures, experiences and events shaping the recording of
alcohol-related data in routine primary care practice (Bhaskar’s stratified ontology
(492)). Thus, quantitative methods were employed to help identify any underlying
causal (structural) mechanisms that might explain patterns of association between key
variables (such as financial incentives) and outcomes of interest (such as recorded
rates of intervention delivery) (500). Alternatively , qualitative methods would help
“illuminate complex concepts and relationships that are unlikely to be captured by
predetermined response categories or standardised quantitative measures” (499).
Indeed, given the ‘wicked’ nature of many of the questions posed by public health
researchers (1), there is growing recognition of the value of qualitative methods in
supporting our understanding of both the complexity of interventions themselves, and
the complexity of the social contexts in which such interventions are tested (2-4). As
Morse comments “Qualitative research is . . .essential to the knowledge development
of the health care disciplines” (5). This role is now formally recognised by the UK
Medical Research Council framework for the development and evaluation of complex
interventions (6). As such, semi-structured interviews with GPs would inform the
understanding of how individual practitioners’ values, experiences and perspectives
can interact with these underlying causal mechanisms to determine their delivery and
recording of screening and brief alcohol interventions (9).
However it was also vital that such a critical realist-led study was grounded within an
in-depth historical understanding of the social and political context in which the
research took place (501). Thus, in the case of the research question under
investigation (whether routine data can be used to evaluate the implementation of
alcohol interventions in primary health care), a critical realist approach demanded an
understanding of not just how individuals interact within a specific context, but
additionally, the underlying generative mechanisms that have shaped that context. As
Orlikowski writes “technology embodies and hence is an instantiation of some of the
rules and resources constituting the structure of an organisation” (502). The way in
which actors (or agents, i.e. the developers and users) interact with structure (the

71
technology) over time becomes the focus of investigation. Thus, information systems
are recognised as not merely “passive instruments but become ‘actors’ in the
essentially social world of clinicians and patients” (503, cited in 504).
3.5 Operationalising the mixed-methods research process
3.5.1 Summary of the sequential, explanatory mixed-methods research design
A range of mixed-methods research designs are reported in the literature. However
there are arguably two main factors which determine the approach selected (445,
505, 506): first, the priority, weight or emphasis of different study methods (i.e.
whether each research component (method) is assigned the same status as another);
and second, the time orientation informing the process of data collection itself (i.e.
whether data are collected in parallel or at different, successive time points). Cresswell
et al have grouped the potential combinations of these two factors into six most
frequently used models, which include three concurrent (in which all research
components are conducted simultaneously), and three sequential designs (in which
one research component is conducted after another) (445).
Amongst these various designs, the equal-weight sequential explanatory mixed-
methods design is particularly popular among researchers (507), and generally implies
collecting and analysing first quantitative, and then qualitative data in two consecutive
phases within one study. The rationale for this approach is that the quantitative data
and their subsequent analysis provide a general understanding of the research
problem, whereas the qualitative data and their analysis refine and explain those
statistical results by exploring participants’ views in more depth (445, 505). In theory at
least, it represents a more straightforward, if often more time-consuming, approach to
mixed-methods in comparison to concurrent models of research (508).
For this study, an equal-weight, sequential explanatory mixed-methods design was
selected. This overarching sequential study design is summarised in the figure below
(4), which highlights the equal weighting of the quantitative and qualitative data within
the analysis and interpretation of results, and the multi-level data integration that
occurred throughout the research process. The issues of sequence, prioritisation,
integration and interpretation of data are explored in more depth in the sections to
follow.

72
Figure 4: Visual representation of the mixed-methods research design
3.5.2 Sequence of study components
First, the findings of the systematic review to identify which factors influence the
recording of routine practice data by Primary Care Physicians (PCPs) (Phase 1) were
used to both contextualise the study on a macro level, as well as to inform the
development of the topic guide utilised in the semi-structured GP interviews in Phase
3. Next, quantitative methods were employed to compare and contrast the delivery of
screening and brief alcohol interventions for alcohol across a sample of general
practices in North East of England using routinely collected electronic GP Read Code
data (Phase 2), with the subsequent qualitative interviews (Phase 3) used to probe
significant results emerging from the descriptive statistical analysis. In addition, a
purposeful nested sampling approach allowed the quantitative phase to inform
recruitment of the interview participants in the qualitative component of the research,
by highlighting “information-rich cases” of GPs’ use of routine data to record alcohol
screening and brief interventions that would benefit from further investigation (509).
Specifically, the study employed stratified purposeful sampling in order to ensure that
one or two interview cases were recruited that exemplified the key traits and degree
of variation relevant to understanding the target phenomenon (510). The nested
sampling strategy also informed the recruitment of the case study general practice,
using convenience sampling. This case study would facilitate the in-depth investigation
of the range of available alcohol Read codes in primary health care, as well as helping

73
to inform understanding of the extent to which these available Read codes are actually
used in day-to-day practice by clinicians.
3.5.3 Prioritization of data from individual research components
As well as specifying the sequential research process, it is also necessary to consider
the issue of how the data arising from the three individual study phases would be
prioritised. Priority refers to the weight or attention assigned by the researcher to
each component of the research throughout the data collection and analysis process.
Generally speaking, in the sequential explanatory design, priority is given to the
quantitative approach because the quantitative data collection comes first in the
sequence of data collection, and moreover it often represents the major aspect of the
mixed-methods data collection process. However, it is by no means a straightforward
decision to make, and this common prioritisation is far from prescriptive. Cresswell et
al suggest that choices should be based on: the specific interests of the researcher; the
target audience for the findings; and the focus of the research itself (445). As the aim
of this research was to determine the usefulness of routine data to assess GPs’ delivery
of screening and brief alcohol interventions, the results from both the quantitative
phase (in which the data itself would be analysed) and the qualitative phase (which
explored GPs’ own perspectives on their use of such data) were seen as carrying equal
status in contributing to the overall research findings.
3.5.4 Approach to mixed-methods data integration and interpretation
Referring back to Burke Johnson and Onwuegbuzie’s definition of mixed-methods
research, using this approach must entail some level of ‘mixing’ or ‘combining’ data
(467). As such, a key element of fully mixed-methods research is effective data
integration. Indeed, without an explicit and well-considered framework for data
integration, it has been argued that many so-called mixed methods studies remain
unable to “transcend the forced dichotomy of quantitative and qualitative methods
and data”(440), and continue to present results as separate, disconnected data sets.
Alternatively, ‘true’ integration relies on examining phenomena from multiple
perspectives in order to gain a more rich and comprehensive understanding (511).
In this study, data integration took place at three broad levels. First, as emphasised
above, a key function of the sequential research design was to integrate the findings

74
from one phase of the research directly within the following phase: thus the
development and refinement of the research as it progressed was directly supported
by mixed-methods data integration. In particular, findings from Phases 1 and 2 (a
systematic review of factors influencing recording of routine data by PCPs and
secondary data analysis of alcohol Read code data) informed the content and direction
of the semi-structured interviews conducted in Phase 3 with North East GPs; as well as
the selection of the GP participants themselves.
Second, data integration took place at the analysis stage, where both convergent and
discordant data gained from each phase of the research were blended in order to
generate a more comprehensive explanatory framework of the phenomenon under
investigation (483). In terms of how this was operationalized within the research
process, as both qualitative and quantitative data were available on a number of GP
case study practices, the use of a mixed methods matrix (originally developed by Miles
and Huberman (512)) was felt to be of value. Within a mixed methods matrix, the rows
represent the cases for which there is both qualitative and quantitative data, and the
columns display different data collected on each case (see Figure 5). This allows
researchers to pay attention to surprises and paradoxes between types of data on a
single case and then look for patterns across all cases (513) in a qualitative cross-case
analysis (512). Therefore, results from each phase were summarised and displayed in a
matrix once individual-level, single-method analysis had been carried out. This allowed
the identification of both meta-inferences, i.e. overarching converging messages from
all individual component inferences, at the same time as helping to highlight areas of
divergence and discrepancy.
Figure 5: Example of a mixed methods matrix based on Miles and Huberman (512)

75
Third and finally, mixed-methods data integration occurred at the interpretation stage
of the study. Specifically, the discussion section of this thesis sought to explore the
emerging themes in more depth, and in turn, to situate these meta-inferences within
the broader published literature in the field. As such, the conclusion sought to use fully
integrated quantitative and qualitative data to answer to overarching research
question: can routine data help evaluate the implementation of alcohol screening and
brief intervention?
3.6 Summary
This chapter has presented a justification and rationale for employing a mixed-
methods approach to this research study. Specifically, the application of mixed-
methods seeks: to support the development of a more in-depth contextualised
understanding of the phenomenon under investigation; to address the acknowledged
weaknesses of single method research designs; and to support the on-going
development of the actual study results. In terms of how this translates on an
operational level for the research process itself, an equal weight sequential
explanatory mixed-methods design was selected, incorporating elements of data
integration throughout the study at multiple levels. Finally, the process and broad
methodological approach are informed by a critical realist approach, reflecting the
need to understand not just how individuals interact within a specific context, but
additionally, the underlying generative mechanisms that have shaped that context.
The following three chapters 4, 5 and 6, present the methods (or instruments)
employed in the delivery of the research study itself, alongside the results from each
respective research component.

76
Chapter 4 What factors influence primary care physicians’
recording of routine data? A systematic review and critical
interpretive synthesis of the literature
4.1 Introduction
This chapter presents a systematic review of the literature to identify factors that have
been reported to influence the recording of routine clinical data by primary care
physicians in the UK. It begins with an overview of the aims and objectives of the
review; the search strategy (including inclusion and exclusion criteria); and the
approach to data collection, analysis and quality assessment. Next, it details the review
process itself and describes the eligible studies, before going on to summarise the
methodological quality of eligible papers. The chapter then presents a critical
interpretive synthesis of the findings of the included papers; and concludes with an
assessment of the overall synthesis product and a brief consideration of its
implications for the wider thesis.
4.2 Method
4.2.1 Rationale, aim and objectives
Systematic reviews perform a vital role in supporting evidence based health care and
medicine (514), helping to “identify, evaluate and summarise the findings of all
relevant individual studies, thereby making the available evidence more accessible to
decision-makers” (515). Importantly, in addition to providing a robust yet easily
digestible source of information on a particular topic, systematic reviews also help to
demonstrate where knowledge is lacking (516). In this sense, Harden and Thomas
(2005) argue that systematic reviews can be conceptualised as akin to primary
research: they require rigorous and highly focussed data collection methods; resultant
data is subject to thorough analysis and quality assessment; and the findings aim to
produce “new knowledge by bringing the results of many studies together” (517).
The primary aim of this review was to identify what factors influence the recording of
all routine (i.e. as opposed to alcohol-related) clinical or practice data by primary care
physicians in the UK. In doing so, it sought to fulfil three broad objectives:

77
To identify, evaluate and summarise the findings of all relevant
individual studies (516); at the same time as helping to demonstrate key
knowledge gaps in the subject field (518).
To draw on the evidence generated to help inform a better conceptual
understanding of the factors influencing how, when and why primary
care physicians record their delivery of screening and brief alcohol
interventions.
To use the findings to aid the design of the topic guide to be used in
qualitative interviews with General Practitioners that would be
conducted as part of the study (see Chapter 6 for results from this phase
of the research).
The interpretivist approach inferred in the second objective was deliberate. Although
traditionally, systematic reviews have been used to answer questions of effectiveness
(‘what works?’), the past decade has seen a rise in what could be described as a more
‘theory-driven’ application of the method, in particular, realist synthesis, which seeks
to “unpack the relationships between context, mechanism and outcomes” (519) and
Greenhalgh’s (2005) meta-narrative technique (520). In the context of this research,
interpretation as opposed to merely aggregation was a crucial element of the review in
order to support the development of a theory of primary care physician recording
practices that could be explored and ‘tested’ in subsequent phases of the research.
The synthesis method adopted – Critical Interpretive Synthesis – is described in more
depth below (521).
4.2.2 Criteria for considering studies for this review
Studies
An initial scoping exercise, comprising key word searches (physician, primary care,
routine data, electronic health records, audit, attitudes and evaluation) in MEDLINE
and Google Scholar, suggested that a range of study designs could potentially be
relevant for inclusion in the review (259, 263, 284, 291, 305, 522-526). However, given
the behavioural and attitudinal focus of this review, it was considered that the study
types most likely to yield data of relevance were: (1) trials to identify effective
mechanisms to improve routine data recording by primary care physicians; and (2)
descriptive and / or observational studies that examined physicians’ views and

78
experiences of recording routine data, including research examining the use and
adoption of electronic and paper-based patient records in primary health care settings.
In addition, it was anticipated that some studies of the financing and organisation of
primary health care may include discussion of recording practices and / or behaviour,
and would therefore prove relevant to the review. Therefore, the review also
considered studies which investigate the presence and organisation of quality
monitoring mechanisms; and / or implementation studies that include some
examination of physician routine data recording practices in primary health care.
The inclusion of a range of study designs was subject to the proviso that the relative
strengths and weaknesses of individual research designs were recognised to prevent
over-interpretation of the findings. Further, on-going studies were included only if
preliminary data were obtainable and appraised. The incorporation of recognised
quality assessment tools (see following sections and appendices) into the design and
delivery of the review helped to ensure this.
For this review, all electronically stored patient-specific data, collected on a regular
and universal basis as part of the process of delivering healthcare within primary care
settings, was included as falling within the definition of routine data. Some of these
data are collected on behalf of provider organisations, specifically for central returns
or contracting (such as for the former Primary Care Trusts); while other data are
collected by healthcare professionals or clinical teams to inform the delivery of care to
individual patients (249). Data sources include: General Medical Services (GMS) data;
Royal College General Practice (RCGP) Weekly Returns Service data; General Practice
Research Database (GPRD); National Database for Primary Care Groups and Trusts;
General Household Survey, Primary Care Information Service (PRIMIS); Morbidity,
Information Query and Export Syntax (MIQUEST); Practice based disease registers;
Practice based health promotion data; Prescribing Analysis and Cost (PACT) data ;
Quality Management and Analysis System (QMAS); and The Health Improvement
Network (THIN) (254).
Participants
Primary care physicians are medically qualified physicians who provide primary health
care. This includes general practitioners, family doctors, family physicians, family

79
practitioners and other physicians working in general practice settings who fulfil
primary health care tasks. The review focussed on physicians as opposed to other
primary health care workers such as nursing staff due to the key role they play in
directing and delegating recording activity within primary care settings (261).
Setting
Any UK primary health care setting was acceptable for inclusion. For the purposes of
this review, primary health care was defined as all immediately accessible, integrated
general health care which covers a broad range of presenting problems, and which can
be accessed by a wide range of patients on demand, and not as the result of a referral
for specialist care (177). Such provision should be delivered by clinicians who are
accountable for addressing a large majority of personal health care needs, developing
a sustained and continuous relationship with patients, and practice in the context of
family and community (527). In the UK National Health Service, therefore, the main
provider of primary health care is general practice.
This review limited its remit to UK primary care settings only due to the unique history,
culture, organisation, and funding arrangements of the UK National Health Service
(NHS). Funded directly by the government through general taxation, the UK NHS is a
highly centralised version of only a handful of single-payer health systems around the
world and is relatively unique in a number of important respects. Importantly, unlike
restricted single-payer systems like Medicare in the USA or Australia’s Medicare which
uses a system of top-ups for certain services, all those ordinarily resident in the UK are
entitled to health care that is largely free at point of access, with the exceptions of
prescription charges, dental care and optician services (260, 528). Further, in contrast
to single-payer systems like those of Canada and Norway, the majority of physicians
and nurses are government employees (528).
Publication date
The review initially considered studies published between January 2000 and March
2011. Searches were updated in January 2014 to include the period April 2011 to
December 2013. This period encompasses a series of key developments, in UK health
policy, linked to performance monitoring and recording health interventions, including
the growth in centralised performance management and use of financial incentives in

80
primary health care. In particular, this covers: the launch of the NHS Plan in 2000,
along with the star-ratings system for former Primary Care Trusts the same year (88);
key changes to GPs contractual arrangements in 2004 such as via the Quality and
Outcomes Framework (QOF) (529); and the introduction of the ‘Vital Signs’
performance indicators in 2007 as part of the new NHS Operating Framework (530).
Outcome measures
It was anticipated that the studies included in the review would report a wide variety
of outcomes due to the heterogeneous nature of the target material. However, key
outcome measures of interest included:
Any objective measure of written or electronic clinical or administrative
recording behaviour using either:
- standardised patient (an individual who is trained to act as a real
patient in order to simulate a set of symptoms or problems);
- trained observer (such as a researcher);
- video or audio recording.
Any objective measure of general clinical performance or process
outcome such as:
- number of tests ordered or decision to prescribe a particular
drug;
- patient health outcomes (e.g. blood pressure, length of hospital
stay).
Any subjective measure of primary care physicians’ knowledge,
attitudes or satisfaction with clinical and administrative health records.
4.2.3 Inclusion and exclusion criteria
Inclusion criteria
Studies reporting data on UK based primary care physicians;
Studies published between January 2000 and December 2013;
Peer-reviewed studies available in the public domain.
Exclusion criteria
Studies that only include data on non-UK primary care physicians;

81
Studies published before January 2000;
Grey or unpublished literature that has not been subject to peer-review
as a means of quality controlling the resultant evidence.
Studies not reported in English.
4.2.4 Search strategy for identification of studies
Electronic searches
A search strategy was designed with the help of an information specialist to locate
relevant studies of interest in this review (see Appendix A for full details). As detailed
above, the review elected to limit its search to published, peer-reviewed material that
was readily available in the public domain. Although it is acknowledged that the
decision to exclude grey literature such as theses, conference abstracts, unpublished
studies and reports carried with it the risk of publication bias, it was felt that this
approach offered a more reliable way of accessing relevant data that had already been
subject to a level of quality control via peer review.
The following databases were searched by AOD (Amy O’Donnell): MEDLINE; PsycINFO;
EMBASE; and Scopus. This selection of databases included two high performing
medical databases (MEDLINE and EMBASE) (531), a database specifically focussed on
behavioural sciences (PsycINFO), and finally Scopus, which covers additional open
access sources and various scientific websites (532). Further, evidence suggests that
searching three or more databases is likely to achieve optimal coverage of potential
records (533, 534). In addition, the reference lists of located papers were scanned for
additional relevant material using a 360 degree citation process; and reference lists
already held by reviewers were searched.
Search terms
Search terms were agreed following a scoping search carried out in collaboration with
the review team information specialist. The search has been split into three core
concepts:
Set 1: Participants:
Primary care physicians (for example: GP; general practitioners; doctors; primary
health care practitioners; family physicians).

82
Set 2: Influencing Factors
Any behavioural or attitudinal factors that influence the recording of routine clinical
and administrative health data.
Set 3: Routine health data
Read codes; electronic medical records; electronic patient records; patient records.
Specific search terms used according to the requirements of individual databases are
presented as Appendix A.
4.2.5 Data collection and analysis
Screening
The title and abstract of all records identified by electronic searches were retrieved
and screened for relevance and downloaded to a bibliographic software programme
(EndNote X7). Any duplicate records were removed, along with any non-UK-based
studies, using a series of Endnote searches. Next, all titles and abstracts were screened
in order to assess which studies met the inclusion criteria. An initial list of potential
studies for inclusion was then reviewed by a second reviewer, with any outstanding
discrepancies and / or queries resolved through referral to a third party as necessary.
The Cochrane Group emphasise the importance of involving two reviewers in the final
selection of studies (535), as this limits the potential for relevant material to be
discarded (536). Finally, full text copies of all potentially relevant papers were retrieved
for in-depth review by two independent reviewers (AOD and KH (Katie Haighton)),
according to the inclusion and exclusion criteria, in order to determine eligibility.
Quality / risk-of-bias assessment
Although the quality of studies was not stipulated as an inclusion or exclusion criterion
for this review, it was nevertheless viewed as an important element of the review
process in order to inform some sort of ‘measure’ of the robustness of the available
evidence in this subject area, or as Khan et al describe it “to guide interpretation of
findings, help determine the strength of inferences, and guide recommendations for
future research and clinical practice” (537).

83
According to Verhagen et al, methodological quality assessment involves some level of
evaluation of internal validity (the degree to which a study’s design, conduct and
analysis have minimised biases) and external validity (the extent to which the results of
a study can be generalised outside the experimental situation)(538). For this review,
the methodological quality of included studies was assessed by a single reviewer (AOD)
using one of two method-appropriate tools. First, for quantitative studies, the
component-based tool developed by the Effective Public Health Practice Project,
Canada (539), was used (see Appendix B), which possesses a relatively high degree of
inter-rater reliability in comparison to alternative tools (540, 541). Second, qualitative
research studies were assessed using the Critical Review Form for Qualitative Studies
(542) originally developed by the McMaster University Occupational Therapy Evidence-
Based Practice Research Group and revised by Letts et al., 2007 (see Appendix C). A
second reviewer (KH) assessed a random sample of twenty per cent of all papers in
order to independently verify the findings of this process.
4.2.6 Critical Interpretive Synthesis of data
Critical Interpretive Synthesis (CIS) was used to analyse and synthesise data, with a
deliberate focus on the interpretive function of this approach (521). Although this
included an element of aggregation (that is, identifying those findings that recur most
frequently across included studies (543)), the primary function of synthesis here was
interpretation. As Harden writes: “rather than pooling findings from studies, key
concepts are translated within and across studies, and the synthesis product is a new
interpretation” (544). Thus, in contrast to merely aggregating review findings,
emerging themes were used as a “jumping-off point” (543), to allow influencing factors
to be linked together in ways not necessarily addressed in the primary research
reports.
Critical Interpretative Synthesis as opposed to meta-analysis was selected as the mode
of reporting results for two main reasons. Firstly, as reported above, the studies
selected for inclusion in the review were highly heterogeneous in both design and
methods. This diversity had been anticipated in the findings of the initial scoping
search conducted in the early stages of the review, the findings of which suggested
that it would not be possible (or potentially appropriate) to pool findings from the
available evidence. CIS offered a more relevant method of critically analysing a

84
complex body of literature which also incorporated the transparent, structured and
accountable means of identifying and accessing literature offered by more traditional
systematic review approaches (545).
Secondly, and importantly, the stated goal of this phase of the research was not to
produce an overall pooled estimate of effect size in terms of which interventions work
best to improve recording practices in primary care physicians (what one might see as
a more ‘typical’ style of review (544)). Rather, the review sought to identify which
factors influence physician’s recording practices in order to build a better conceptual
understanding of which contexts are more or less supportive of effective recording.
Thus, rather than seeing this as a limitation of the review, it was felt that, as Harden
argues, integrating multiple methods evidence would actually serve to “enhance its
utility and impact” (544).
This interpretive approach to data synthesis comprised three separate syntheses: 1. A
narrative synthesis of the results recorded in quantitative papers; 2. thematic analysis
of qualitative data presented in qualitative or mixed methods papers; and 3. a mixed
methods synthesis using Critical Interpretive Synthesis of both quantitative and
qualitative findings (517). The process of synthesis is represented in diagrammatical
form in Figure 6 below, with further detail provided in the next section.
Figure 6: Process of synthesising multi-method evidence (based on Harden & Thomas, 2005 (517))
Focused review question What factors influence the recording of
routine clinical or practice data by Primary Care Physicians (PCPs) in the UK?
Synthesis 1: Quantitative studies 1. Application of inclusion criteria
2. Quality assessment3. Data extraction
4. Quantitative synthesis
Synthesis 2: Qualitative findings 1. Application of inclusion criteria
2. Quality assessment3. Data extraction
4. Qualitative synthesis
Synthesis 3: Mixed methods synthesis Critical Interpretive Synthesis of quantitative
and qualitative findings
85
Data extraction of eligible studies
Data was extracted from all included papers in tabular form using a tailored data
extraction pro-forma in Excel. This was carried out by one review author (AOD), using a
checklist based on criteria developed by EPOC (The Cochrane Effective Practice and
Organisation of Care Group) (546) and modified for the purposes of this review. As
above, a random sample of twenty per cent of all papers was also reviewed by a
second reviewer (KH) in order to independently verify the findings of the data
extraction process. Data were extracted on: aim, design, and study methods; setting,
participants and sample size; data source and outcome measures; results; conclusions
and key limitations of the research (see Table 4 further in this section). Data was also
collected on the quality of the papers and reported in the extraction tables, based on
method-appropriate quality assessment tools (summarised in Section 4.4). Drawing on
the extracted and quality assessed data, narrative synthesis and thematic analysis was
employed for the quantitative and qualitative data respectively to combine and
organise the findings, described in more detail below.
Synthesis 1: Narrative synthesis of findings from trials and other quantitative studies
In the first synthesis, key data from all included quantitative studies was extracted,
including summary statistics as available. Results were presented as a narrative
synthesis, whereby statistically significant relationships between a particular
intervention or identified influencing factor were grouped together on a thematic
basis, and placed into one of three categories: positive (facilitating); negative (barrier);
or no relationship.
Narrative synthesis as opposed to meta-analysis was selected as the means of
combining and presenting data for two main reasons. First, the scoping exercise
carried out at the start of the review had suggested that the heterogeneity of the
populations, interventions and outcome measures of the evidence base was likely to
be substantial, therefore pooling results would not be appropriate. Second, and
importantly, the stated goal of this phase of the research was not to produce an
overall pooled estimate of effect size in terms of which interventions work best to
improve recording practices in primary care physicians (what one might see as a more
‘typical’ style of review (544)). Rather, the review sought to identify which factors

86
influence physician’s recording practices in order to build a better conceptual
understanding of which contexts are more or less supportive of effective recording.
Synthesis 2: Thematic analysis of qualitative data
Next, in the second synthesis, the results and conclusions sections of all eligible papers
comprising an identifiable qualitative element (including relevant elements of mixed
methods papers) were entered verbatim into NVivo software designed for qualitative
data analysis and line-by-line coding of the findings of primary studies was carried out.
These codes were linked and organised to allow the construction of a predominantly
descriptive hierarchical framework (517), based on key emergent themes, concepts
and categories of influencers.
The initial coding themes drew on the work of Boonstra and Broekhuis as a starting
point, whose systematic review sought to identify, categorise and analyse barriers
perceived by physicians to the adoption of Electronic Medical Records and thus bore
some useful similarities to the topic under consideration (305). New themes were
added as appropriate in order to more accurately capture the on-going interpretation
of the qualitative data (451, 547). Along with the synthesis of quantitative data (1)
described above, this phase was most akin to Element 2 described by Rodger’s et al,
where they develop a “preliminary synthesis” (548).
Synthesis 3: Mixed methods synthesis of qualitative and quantitative findings
Finally, in Synthesis 3, relationships within and between studies were explored in order
to formulate a new interpretation that integrated these findings into what might be
described as a typology of influencing factors. The individual synthesis mentioned
above were re-grouped (or ‘clustered’ (548)) into barriers versus facilitators of robust
recording practices by primary care physicians. This phase also helped identify
instances in which certain factors worked in divergent ways (i.e. acted as both
facilitators AND barriers to recording); alongside examples of which combinations of
factors worked together to produce varying effects.
This allowed the review to ‘go beyond’ the content of the original research, described
as the “defining characteristic” of the synthesis process, akin to the ‘third order
interpretations’ employed in meta-ethnography based on the ‘lines-of-argument’

87
synthesis developed by Noblit and Hare (517, 549). Dixon-Woods et al conceptualise
this approach as a “synthesising argument” which “ integrates evidence from across
the studies in the review into a coherent theoretical framework comprising a network
of constructs and the relationships between them” (521). This process may require
what they described as “synthetic constructs” in which the primary evidence is
transformed into new interpretations. This interpretivist approach was a crucial
component of the review in supporting the development of a theory on primary care
physician recording practices which could be ‘tested’ in subsequent phases of the
research.
4.3 Description of included studies
The search strategy identified 2,405 potentially eligible papers, the titles and abstracts
of which were screened against the eligibility criteria. The eligibility of the full text of a
total of eighty-one papers was assessed independently by two reviewers (AOD and
KH), with any disagreements resolved by discussion with an external party (Eileen
Kaner (EK)). Fifty-nine papers were excluded at this stage. The main reasons for
exclusion were: no clear influencing factor was identified (53); the paper did not report
any UK data (7); the paper did not focus on primary care physicians (7); and the paper
was not reported in English (2). As a result, a total of twenty papers, based on nineteen
different studies (282, 550-568), were deemed to fulfil the inclusion criteria. For all
eligible studies, data was extracted on the type of behaviour targeted or overarching
aim of the study; the study design and individual methods employed; setting,
participants and sample size; source of study data; outcome measure(s) used (if
appropriate); and results, including an assessment of the overall quality of the paper.
The study selection process is shown overleaf as a flow diagram in Figure 7.

88
Figure 7: PRISMA (Preferred Reporting Items for Systematic Reviews and Meta-Analyses) flow diagram of systematic review (546)
Of the nineteen studies covered by the twenty eligible papers: the majority (fifteen
studies in sixteen papers) reported on research that was purely quantitative in design
(550, 551, 553-557, 559-564, 566-568); three were described as mixed-methods
studies (282, 552, 565); and one paper was fully based on a qualitative study (558).
4.4 Methodological quality of included studies
The agreement between the reviewers in quality assessing the 20% sample of eligible
papers (four papers) was analysed with a kappa statistic for multiple-raters, which
resulted in a value of k = 0.824. Assessed this way, the strength of agreement was
considered to be 'very good'. At the same time, it is also important to stress that the
reporting style of some included papers made evaluation of the methodological quality
Titles and abstracts identified through database searching
n = 10,789
Additional records identified through other sources
n = 13
Records after duplicates removed n = 9,820
Titles and abstracts screened n = 2,775
Records excluded n = 2,691
Papers included in Critical Interpretive Synthesis
n = 20
Full text articles assessed for eligibility
n = 89 (inc. additional 5 from reference searching)
n =
Articles excluded n = 69
No identified influencing factors n = 53
No UK data reported n = 7
Not focussed on Primary Care Physicians
n = 7 Foreign language
n = 2
Ide
nti
fica
tio
n
Scre
en
ing
Elig
ibili
ty
Incl
ud
ed
Non-UK records excluded n = 7, 045

89
of the study challenging (540). For example, a number of quantitative papers did not
explicitly state the research design (552, 554, 556, 557, 562); and none of the four
papers with a qualitative element made their theoretical perspective explicit (282, 552,
558, 565). Where it was not possible to draw a firm conclusion in relation to particular
quality assessment criteria employed by the selected tools, it is simply reported as
“can’t tell” in the quality assessment tables (see Appendix D). With this in mind, the
main findings are described below, organised by overall methodological approach.
4.4.1 Quality of included quantitative papers
Looking first at the internal validity of the eligible papers, there was marked variation
in the quality of study design. Of the eighteen studies with an identifiable quantitative
element, including three mixed methods studies (282, 552, 565): two were described
as Randomised Controlled Trials (RCTs) (559, 563); one study (reported in two papers)
described itself as a Randomised Crossover Trial (550, 569); six were broadly
longitudinal in design and / or utilised interrupted time series methods (553, 554, 557,
562, 566, 568); two termed themselves data ‘audits’ or ‘evaluations’ (552, 560); a
further two were cross-sectional studies (282, 556) ; two could be defined as cohort
studies (555, 564); one study employed visual techniques (567) and a final study was
described as a prospective uncontrolled intervention study (561).
In relation to selection bias, only one study was rated as strong in this respect (552),
with the remainder judged potentially unrepresentative of the target population for a
number of reasons. In particular, participants were often drawn from practices signed
up to various data improvement networks so unrepresentative of the wider practice
population (553, 554, 557, 564). Sample sizes varied significantly, from relatively small-
scale studies involving ten to twenty GP practices (551, 556, 559-561, 565, 567); to
studies based on sizeable national patient datasets (553, 562, 566, 568). Finally,
looking at the quality of data collection and analysis in the eligible papers, none of the
included studies used what could be described as validated data collection tools. Few
studies controlled for confounders and no study reported that participants were
‘blinded’ to the research question; a recognised cornerstone of internal validity,
although usually more applicable to the quality assessment of randomised control
trials. Only six studies reported on withdrawals and drop-outs from the study (282,
551, 552, 559, 563, 564).

90
Focussing next on external validity, seven studies considered local populations such as
general practitioners based in Norfolk (551), London (556, 560), and Trent (282); and
patients and general practitioners based in Leicestershire (555), North Staffordshire
(561) and Greater Manchester (563) practices. Two studies considered regional
populations of general practices (552, 559); and the remaining five studies considered
national samples of patient data, drawn from a range of general practice databases
(553, 554, 557, 562, 564). For the nine studies that sampled participants: three studies
used random selection (282, 552, 563); two studies used a convenience sample (551,
564) and five studies did not explicitly specify their sampling strategy (555, 556, 559,
560, 567). One study drew participants from both a national database and a purposive
selection of general practices (565). Again, the remainder were based on national GP
databases (553, 554, 557, 562, 566, 568).
Overall, of the fifteen fully quantitative studies, the majority (eleven) were categorised
as weak (550, 551, 553, 555-557, 560-562, 564, 567) in methodological quality, one
was categorised as moderate (568) and a further two strong (559, 563). The
quantitative element of a further three mixed methods papers was moderate (282,
552) or weak (565).
4.4.2 Quality of included qualitative studies
Four papers reported on studies with an identifiable qualitative element, including one
interview-based study (558) and three mixed methods papers (282, 552, 565). All
papers stated the purpose of the study but generally lacked detail on the actual
research design or did not identify a particular theoretical perspective. Whilst the
evidence available would suggest all three pieces of research were generally
phenomenological in approach, this was not always explicit, and overall, the papers
were located at the low-inference end of the qualitative research spectrum. Sampling
approaches varied. One study employed a purposeful sampling strategy, with
additional interviews carried out until data saturation was achieved (558). Two mixed
methods studies used a random stratified sample, although it was unclear as to
whether sampling had been carried out until redundancy in data was reached (282,
552). The final mixed methods study employed essentially convenience sampling to
identify suitable participants (565).

91
In terms of the papers’ description of their respective data collection procedures, all
detailed the study site and participants, but were less precise with regards to possible
issues of research bias, or the potential impact of the researcher-participant
relationship on the research process. Two of the four papers explained the approach
taken to data analysis (thematic analysis, using the constant comparative approach
(282, 558)). Finally, all papers provided generally credible findings based on the
evidence reported, although the transferability of the findings was limited, mainly due
to small or unrepresentative sampling. Overall, the quality of the four papers with a
qualitative component were categorised as strong (558) and moderate (282, 552, 565).

92
Table 4: Summary of key characteristics of included studies
Citation Setting Participants &
Sample Methods Results Quality
(Assessment tool)
Brown et ala (2003) “Randomised
crossover trial comparing the performance of Clinical Terms Version 3 and Read Code 5 byte set coding schemes in general practice” (551) and Brown et al
b (2003) “A
methodology for the functional comparison of coding schemes in primary care” (550)
Setting: UK primary care (Norfolk)
Participants: GPs
Sample: 10
Randomised crossover trial in which clinicians coded patient records using both coding schemes after being randomised in pairs to use alternate combinations of one scheme before the other.
Exact matches were more common with Clinical Terms (70% (95% confidence interval 67% to 73%)) than with Read Codes (50% (47% to 53%)) (P < 0.001); and this difference was significant for each of the 10 participants individually.
The pooled proportion with exact and identical matches by paired participants was greater for Clinical Terms (0.58 (0.55 to 0.61)) than Read Codes (0.36 (0.33 to 0.39)) (P < 0.001).
The time taken to code with Clinical Terms (30 seconds per term) was not significantly longer than that for Read Codes.
Weak (EPHPP)
Campbell et al (2002) “Quality assessment for three common conditions in primary care: validity and reliability of review criteria developed by expert panels for angina, asthma and type 2 diabetes” (552)
Setting: UK primary care (covering 3 English NHS regions)
Participants: General practice staff
Sample: 60 practices
Mixed methods study comprising analysis of quantitative audit data, a postal questionnaire data and semi-structured interviews
54%, 59%, and 70% of relevant criteria rated valid by the expert panels for angina, asthma, and type 2 diabetes respectively were found to be usable, valid, reliable, and acceptable for assessing quality of care.
General practitioners and practice nurses agreed with panellists that these criteria were valid but not that they should always be recorded in the medical record.
Weak (EPHPP)/ Moderate (Critical Review Form)
Carey et al (2009) “Blood pressure recording bias during a period when the Quality and Outcomes Framework was introduced” (553)
Setting: UK primary care
Participants: National sample of patient data
Sample size: 3,164, 189 BP measurements from 236 467 patients, with the ischaemic heart disease, stroke and hypertension diagnoses from 2000 to 2005.
Longitudinal study which examined blood pressure data from 2000-2005 to produce: (1) histograms of SBP recording distribution, pre- and post-QOF periods; (2) crude calculations of ‘expected’ value for each BP integer increment; (3) examination of degree to which the level of SBP influenced the likelihood of achieving DBP of 90 or less & whether there was any change in this influence over time; (4) assessment of treatment for hypertension through Read code searches for 1st 3 months of 2005; (5) examination of variation between practices in 2004–05, by classifying them according to the degree to which they tended to record just under the 150mmHg threshold.
Over this period, recorded systolic BP (SBP) fell: 36% had SBP 4150mmHg in 2000–2001, and only 19% in 2004–2005.
There was a trend towards recording systolic values just below the 150 cut-off. In 2000–2001, 2.3% of patients had 148–149 recorded and 1.8% had 151–152. In 2004–2005, the figures were 4.2 and 1.3%, respectively.
By smoothing the distribution, estimated that the true percentage of patients with SBP 4150mmHg in 2004–2005 was 23%, rather than the 19% recorded.
Moreover, patients with a recorded SBP¼148–149 were more likely to have a recorded diastolic BPp90 (93%) than patients with SBP 151–152 (78%).
However, patients just below the 150mmHg cut-off received more antihypertensive treatment than those just above it (odds ratio¼1.20, 95% confidence interval 1.01–1.41).
Weak (EPHPP)
92

93
Citation Setting Participants &
Sample Methods Results Quality
(Assessment tool)
Coleman et al (2007) Distributing questionnaires about smoking to patients: impact on general practitioners' recording of stop--smoking advice (555)
Setting: UK primary care (Leicestershire)
Participants: Patients, GPs
Sample size: 32 GPs and 6775 patients
Controlled before-and-after study in which researchers: (1) distributed questionnaires on smoking behaviour to patients in surgeries; (2) obtained medical records for these patients & for a comparator group who had not received the questionnaire; and (3) compared documenting of stop smoking advice in patient's medical records between 2 groups.
Discussion of smoking was recorded in 8.0% (220/2739) of medical records when questionnaires were distributed versus 4.6% (116/2537) where these were not.
After controlling for relevant potential confounders (inc. age, gender), odds ratio for recording of information in the presence of questionnaire distribution (versus none) was 1.78 (95% CI, 1.36 to 2.34).
Weak (EPHPP)
Coleman et al (2007) “Impact of contractual financial incentives on the ascertainment and management of smoking in primary care” (554)
Setting: UK primary care (national)
Participants: GPs, patient data
Sample: 32 GPs
Longitudinal study which analysed data from patients aged 15–75 years including annual incidence of recording smoking status / advice to stop smoking and prescriptions for nicotine addiction in current smokers, for each year from 1990 to 2004.
Smoking status recording increased temporarily 1993–4 & then rose gradually from 2000.
This rise was more marked from 2003, with an 88% increase between the first quarters of 2003 & 2004. Latter ¼ was just before introduction of new GP contract & higher rates of recording smoking status were sustained for subsequent year.
In smokers, there was a broadly similar pattern for the proportion recorded as having received brief cessation advice.
However, while there was a sharp rise in nicotine addiction treatment prescriptions for 2000+, no comparable acceleration 2003+ was apparent.
Moderate (EPHPP)
Dalton et al (2010) “Implementation of the NHS Health Checks programme: baseline assessment of risk factor recording in an urban culturally diverse setting” (556)
Setting: UK primary care (NW London)
Participants: General practices
Sample size: 14
Cross sectional study which analysed data extracted from electronic medical records in 14 general practices between December 2008 and January 2009. The completeness of blood pressure, smoking, body mass index (BMI) and cholesterol recording was examined by practice and patient characteristics.
Recording of blood pressure [85.6% (practice interquartile range = 10.1)] and smoking status [95.8% (2.6)] was very high.
Recording of BMI [72.8% (23.4)] and cholesterol [55.6% (25.3)] was considerably lower.
Large differences in recording between practices (range for cholesterol: 33.6–78.0%), though these were largely explained by patient characteristics.
Hypertensive patients [adjusted odds ratio (AOR) = 36.3, 95% confidence interval (CI) 21.0–62.9], women [AOR = 2.88 (95% CI 2.64–3.15)] and older patients [AOR = 2.75 (95% CI 2.28–3.32) for 65–74 against 35–44 years had better recording of blood pressure as well as BMI and cholesterol.
Recording of blood pressure [AOR = 1.38 (95% CI 1.09–1.75)] and cholesterol [AOR = 1.47 (95% CI 1.30–1.66)] was significantly higher among South Asian patients.
Weak (EPHPP)
93

94
Citation Setting Participants &
Sample Methods Results Quality
(Assessment tool)
Lusignan et al (2002) “Does Feedback Improve the Quality of Computerized Medical Records in Primary Care?” (557)
Setting: UK primary care (national)
Participants: General practices
Sample size: 500+ general practices
Longitudinal study which examined data markers used since 1992 to determine whether the feedback of “useful” data quality markers led to a statistically significant improvement.
Three quality markers improved significantly over the period of the study at the 5% level. These were (1) the use of highly specific “lower-level” Read Codes (p=0.004) and the linkage of (2) repeat prescriptions (p=0.03) and (3) acute prescriptions (p=0.04) to diagnosis.
Clinicians who fall below the target level for linkage of repeat prescriptions to diagnosis receive more detailed feedback; the effect of this was also statistically significant (p<0.01.)
Weak (EPHPP)
Lusignan et al (2003) “Managers See the Problems Associated with Coding Clinical Data as a Technical Issue whilst Clinicians also See Cultural Barriers” (558)
Setting: UK primary care (South Thames Primary Care Research Network area)
Participants: GPs, nurses & practice managers
Sample size: 15
Qualitative Research involving semi-structured interviews
For clinicians the recording of structured data within a consultation is not a neutral activity, they are highly aware of diagnostic uncertainty and sensitive to the potential impact of both a correct and incorrect diagnostic label on their relationship with their patient.
Clinicians accept that data has to be coded if they are to demonstrate that appropriate evidence based care has been provided to populations; but alongside this they require free-text as a more powerful reminder of the individual human encounter.
Managers felt they could encourage clinicians to code data for re-use as part of population data or as quality target indicators rather than as an enabler of the next consultation.
Strong ((Critical Review Form)
Lusignan et al (2004) An educational intervention to improve data recording in the management of ischaemic heart disease in primary care (564)
Setting: UK primary care (England, 8 PCTs)
Participants: General practices
Sample: 87 practices (based on practice population of 600 000)
Before and after study of impact of Primary Care Data Quality (PCDQ) Programme on key data measures of quality of ischaemic heart disease care recording in 87 general practices. PCDQ intervention comprised 1 hour didactic introductory meeting with practice representatives; collection, analysis and presentation of key data using MIQUEST at baseline and thereafter at 6 monthly data quality workshops of 2-3 hours involving a GP, nurse and practice manager from each practice.
Recorded prevalence of ischaemic heart disease increased by about 10 % (from 29 to 32 per 1000 patients).
Nearly 10 000 (50%) additional patients with ischaemic heart disease were recorded as being given advice to stop smoking, a further 2000 (10%) had their smoking habit recorded and their cholesterol measured and nearly 1000 (5%) had their aspirin status recorded.
Concluded that an educational approach, focused on a narrow clinical area where there are interventions of known effectiveness that GPs can make, appears to result in a modest but clinically significant increase in the identification of cases of ischaemic heart disease and in data recording on these patients in primary care.
Weak (EHPP)
94

95
Citation Setting Participants &
Sample Methods Results Quality
(Assessment tool)
Hippisley-Cox (2003) “The electronic patient record in primary care - regression or progression? A cross sectional study” (282)
Setting: UK primary care (Trent region)
Participants: GPs
Sample: 53
Cross sectional study which reviewed of medical records and conducted interviews with general practitioners.
Compared with paper based records, more paperless records were fully understandable (89.2% v 69.9%, P=0.0001) and fully legible (100% v 64.3%, P < 0.0001).
Paperless records were significantly more likely to have at least one diagnosis recorded (48.2% v 33.2%, P=0.05), to record that advice had been given (23.7% vs 10.7%, P=0.017), and, when a referral had been made, were more likely to contain details of the specialty (77.4% v 59.5%, P=0.03).
When a prescription had been issued, paperless records were more likely to specify the drug dose (86.6% v 66.2%, P=0.005).
Paperless records also contained significantly more words, abbreviations, and symbols (P < 0.01 for all).
At doctor interview, there was no difference between the groups for the proportion of patients or consultations that could be recalled. Doctors using paperless records were able to recall more advice given to patients (38.6% v 26.8%, P=0.03).
Moderate (EPHPP) / Moderate (Critical Review Form)
Holt (2010) “Automated electronic reminders to facilitate primary cardiovascular disease prevention: randomised controlled trial” (559)
Setting: UK primary care (West Midlands)
Participants: General practices
Sample: 19
Randomised Control Trial of the E-Nudge system. Four groups of patients aged 50+ were identified on the basis of estimated cardiovascular risk and adequacy of risk factor data in general practice computers. The E-Nudge intervention involved screen messages to highlight individuals at raised risk and prompt users to complete risk profiles where necessary.
Intervention led to an increase in the proportion of patients with sufficient data who were identifiably at risk, with a difference of 1.94% compared to the control group (95% confidence interval [CI] = 1.38 to 2.50, P<0.001).
Corresponding reduction occurred in the proportion potentially at risk but requiring further data for a risk estimation (difference = –3.68%, 95% CI = –4.53 to –2.84, P<0.001).
No significant difference was observed in the incidence of cardiovascular events (rate ratio = 0.96, 95% CI = 0.85 to 1.10, P = 0.59).
Strong (EPHPP)
95

96
96
Citation Setting Participants &
Sample Methods Results Quality
(Assessment tool)
Kontopantelis (2012) “Recorded quality of primary care for patients with diabetes in England before and after the introduction of a financial incentive study: a longitudinal observational study” (568)
Setting: UK primary care (national)
Participants: General practices
Sample: 148 (covering 653 500 patients inc. 23780 diabetes patients in regression analyses)
Longitudinal observational study. Quantified annually recorded quality of care as measured by 17 QOF diabetes indicators using Interrupted Time Series Design
Recorded quality of care improved for all subgroups in the pre-incentive period.
In year 1, composite quality improved over-and above this pre-incentive trend by 14.2% (13.7–14.6%).
By year 3, the improvement above trend was smaller, but still statistically significant, at 7.3% (6.7–8.0%).
After 3 years, recorded levels of care varied significantly for patient gender, age, years of previous care, no. of co-morbid conditions and practice diabetes prevalence.
Financial incentives were associated with improvements in recorded quality of diabetes care, mostly related to the documentation of recommended aspects of clinical assessment as opposed to patient outcomes.
Moderate (EPHPP)
Kumarapeli (2006) “Ethnicity recording in general practice computer systems” (560)
Setting: UK (London) primary care.
Participants: General practices
Sample size: 16 practices covering 117 out of 158 patients.
Audit and evaluation which assessed the effect of the Individual Patient Registration Profile Project (IPRP) intervention on ethnicity recording levels.
Baseline recording of ethnicity data was poor (<1% of practice population). Median level of ethnicity recording after the study was 46.85% (IQR 12.85%); minimum/maximum levels were 14.01/74.77%, respectively.
Ethnicity recording generally increased with age: from 46.74% (17 709/37 888) for patients 40+ to 54.94% (6349/11 556 for patients over 65 (with high levels for young adults).
More codes were recorded for females than males (medians: M - 57.15 (IQR 3.9%); F - 46.03% (IQR 7.6%).
Ethnicity recording was primarily carried out using ‘9S...’ (68.37%) and ‘9i...’ codes (28.18%).
Commonest recorded category was ‘White’ (60.88%, 34 013/55 871). Black/Black British’ recorded for 22.99% (12 844/55 871) & ‘Mixed’, ‘Asian/Asian British’ 3% of ethnicity codes. ‘Chinese or other’ ethnic group more likely to have ethnicity recorded using the 9i hierarchy / local EMIS codes.
Mixed use of hierarchies and use of non-specific codes made it difficult to identify individuals in specific high-risk groups.
Most practices used full range of hierarchies & proportions of people in each ethnic category was not statistically different from 2001 census.
Weak (EPHPP)

97
Citation Setting Participants &
Sample Methods Results Quality
(Assessment tool)
Kumarapeli (2013) “Using the computer in the clinical consultation; setting the stage, reviewing, recording, and taking actions: multi-channel video study” (567)
Setting: UK primary care (SE London)
Participants: General practices
Sample: 16 GPs based in 11 general practices covering 163 real-life consultations (101 female patients; 62 male patients)
Multi-channel video study using tailored toolkit (ALFA: Activity Log File Aggregation) to classify and quantify patient-doctor consultations using four EPR brands. This included a visual study of the consultation room and coding of interactions between clinician, patient, and computer.
Patients looked at the computer twice as much (47.6 s vs 20.6 s, p<0.001) when it was within their gaze. A quarter of consultations were interrupted (27.6%, n=45); and in half the clinician left the room (12.3%, n=20).
The core consultation takes about 87% of the total session time; 5% of time is spent preconsultation, reading the record and calling the patient in; and 8% of time is spent post-consultation, largely entering notes. Consultations with more than one person and where prescribing took place were longer (R2 adj=22.5%, p<0.001).
The core consultation can be divided into 61% of direct clinician–patient interaction, of which 15% is examination, 25% computer use with no patient involvement, and 14% simultaneous clinician–computer–patient interplay. The proportions of computer use are similar between consultations (mean=40.6%, SD=13.7%).
There was more data coding in problem-orientated EPR systems, though clinicians often used vague codes.
Weak (EPHPP)
Porcheret (2004) “Data Quality of General Practice Electronic Health Records: The Impact of a Program of Assessments, Feedback and Training” (561)
Setting: UK primary care (North Staffordshire).
Participants: GP practices
Sample size: 7 (covering 59,337 patients
Cohort study (described as prospective uncontrolled intervention study) which involved a combination of feedback sessions, training and other agreed strategies to improve data quality in participant practices.
On repeat assessments all practices improved or maintained their levels of coding and over time rates increased to levels comparable with, or above, MSGP4 rates.
Weak (EPHPP)
97

98
Citation Setting Participants &
Sample Methods Results Quality
(Assessment tool)
Rait (2009) “Recent trends in the incidence of recorded depression in primary care” (562)
Setting: UK primary care
Participants: All adults aged 16 and over, and registered with acceptable General Practices
Sample Size: 298 practices, with 2 982 registered patients aged 16 years and over
Longitudinal study in which annual incidence rates were calculated using data from 298 UK general practices between 1996 and 2006, adjusted for year of diagnosis, gender, age and deprivation.
Incidence of recorded diagnoses fell from 22.5/1000 PYAR in 1996 to 14.0/1000 PYAR in 2006 (IRR = 0.64, 95% CI 0.57–0.71). Females were more than twice as likely to have a diagnosis recorded than males; people aged 25-44 had the highest rate of diagnosed depression; and people in most deprived group had nearly twice the rate of depression diagnosis compared with the least deprived group.
Incidence of recorded depressive symptoms rose threefold from the baseline of 5.11/1000 PYAR in 1996 to 15.5/1000 PYAR in 2006. Females had symptoms recorded twice as often as males; 25-44 age group had highest rate of depression symptoms, compared with those in aged 16-24; most deprived group had depressive symptoms recorded nearly twice as often as least deprived group.
Overall, results demonstrate a fall in the recorded incidence of diagnosed depression but an increase in recorded depressive symptoms, although the combined incidence rates varied little over time.
Weak (EPHPP)
Taggar (2012) “The impact of the Quality and Outcomes Framework (QOF) on the recording of smoking targets in primary care medical records: cross-sectional analyses from The Health Improvement Network (THIN) database (566)
Setting: UK primary care (national)
Participants: GP practices
Sample: 446 covering 6 million + patients
Cross-sectional analyses using THIN data to calculate annual proportions of i) patients who had a record of smoking status made in the previous 27 months and ii) current smokers recorded as receiving cessation advice in the previous 15 months were calculated. Multivariate logistic regression was used to investigate individual-level characteristics associated with the recording of smoking status and cessation advice.
Rapid increases in recording smoking status and advice occurred around the introduction of QOF in 2004. Subsequently, compliance to targets has been sustained, although rates of increase have slowed.
By 2008 64.5% of patients aged 15+ had smoking status documented in the previous 27 months and 50.5% of current smokers had cessation advice recorded in the last 15 months.
Adjusted odds ratios show pre and post- QOF, those with chronic medical conditions, greater social deprivation and women were more likely to have a recent recording of smoking status or cessation advice.
Post-QOF, the strongest characteristic associated with recording activities was the presence of co-morbidity.
Moderate (EPHPP)
98

99
Citation Setting Participants &
Sample Methods Results Quality
(Assessment tool)
Thapar (2002) “A pragmatic randomised controlled trial of a prompt and reminder card in the care of people with epilepsy” (563)
Setting: UK primary care
Participants: GP practices
Sample: People with active epilepsy (n = 1275) from 82 practices.
Pragmatic cluster randomised controlled trial in which practices were randomly categorised as ‘control’, ‘doctor-held card’ (card in patient records), or ‘patient-held card’ practices.
Compared with control practices, recording of seizure frequency was significantly increased in doctor-held card practices (57.4% versus 42.8%, P = 0.003) but not in patient-held card practices (44.6% versus 42.8%).
No differences were found in the proportion of seizure-free patients (doctor-held card [56.0%] versus control [51.5%]; patient-held card [58.1%] versus control [51.5%]) or in the proportion on monotherapy.
Patients in both intervention groups reported more medication-related side-effects and patients in doctor-held card practices were less satisfied with information provision about epilepsy.
Participating GPs found the card useful. The doctor-held card was retrieved and completed more often than the patient-held card.
Strong (EPHPP)
Woodman (2012) “A simple approach to improve recording of concerns about child maltreatment in primary care records: developing a quality improvement intervention” (565)
Setting: UK primary care(North East, East Midlands, East England & South East)
Participants: GP practices
Sample: 11 study practices plus 442 practices in The Health Improvement Network (THIN)
Development of a quality improvement intervention via 4 phase mixed methods approach including clinical audit, a descriptive survey, telephone interviews, a workshop, database analyses and consensus development.
The rate of children with at least one maltreatment-related code was 8.4/1000 child years (11 study practices, 2009–2010), and 8.0/1000 child years (THIN, 2009–2010).
Of 25 patients with known maltreatment, six had no maltreatment-related codes recorded, but all had relevant free text, scanned documents, or codes.
When stating their reasons for undercoding maltreatment concerns, GPs cited damage to the patient relationship, uncertainty about which codes to use, and having concerns about recording information on other family members in the child’s records.
Consensus recommendations are to record the code ‘child is cause for concern’ as a red flag whenever maltreatment is considered, and to use a list of codes arranged around four clinical concepts, with an option for a templated short data entry form.
Weak (EPHPP) Moderate (Critical Review Form)
99

100
4.5 Critical Interpretive Synthesis
4.5.1 Synthesis 1: Narrative synthesis of findings from quantitative studies
There was substantial clinical heterogeneity of the populations studied, and variable
outcome measures employed, which made it inappropriate to combine results through
meta-analysis (cited in 541, 570). Of the 18 studies with a quantitative element
(including three mixed methods studies, and reported in 19 papers, see Tables 4 and
5), there was considerable variation in the area of clinical focus (including smoking
cessation management; angina, asthma and diabetes; blood pressure recording;
cardiovascular events; epilepsy; child maltreatment; and depression); and outcome
measures employed also ranged widely (from simple recording of clinical events to
measures to determine coding accuracy). The results of the narrative synthesis are
summarised in Table 5, with a descriptive narrative detailing the findings in more
depth presented below.
Interventions which appear to influence practitioner coding behaviour
Use of prompts and reminders
Three papers found statistically significant evidence to suggest that prompts and
reminders, in both electronic and paper form, can positively influence the recording of
routine data (559, 560, 563). First, the Individual Patient Registration Profile Project
(IPRP) intervention to improve ethnicity recording in general practice computer
systems found that limiting GP computer systems to display only a preferred list of
codes can both help improve data quality and rates of ethnicity data recording (560).
At the start of the intervention, baseline recording of ethnicity data in participant
practices was poor (<1% of practice population); whereas median level of ethnicity
recording after the study was 46.85% (IQR 12.85%); with rates varying from minimum
to maximum range of 14% to 75%, respectively.
Second, an RCT carried out by Holt et al tested the effects of a system of electronic
reminders (the 'e-Nudge') on cardiovascular events and the adequacy of data for
cardiovascular risk estimation (559). They found that the e-Nudge had a positive
impact on the adequacy of risk factor information recorded by clinicians. Specifically,
the intervention led to an increase in the proportion of patients with sufficient data
who were identifiably at risk, with a difference of 1.94% compared to the control

101
group (95% confidence interval [CI] = 1.38 to 2.50, P<0.001) (559). A corresponding
reduction occurred in the proportion potentially at risk but requiring further data for a
risk estimation (difference = –3.68%, 95% CI = –4.53 to –2.84, P<0.001).
Finally, Thapar’s pragmatic RCT of a prompt and reminder card for the care of people
with epilepsy also demonstrated the positive impact of prompts on the recording of
clinical information (563). In this study, practices were either allocated to the ‘control’
group, to the ‘doctor-held card’ group (where the card was inserted into the patients’
records) or to the ‘patient-held card’ group (where the patient held the card). In terms
of the intervention’s impact on recording practices, results seemed to favour the
doctor-held card. For example, compared with control practices, recording of seizure
frequency was significantly increased in doctor-held card practices (57.4% versus
42.8%, p = 0.003) but not in patient-held card practices (44.6% versus 42.8%, p = 0.49).
The card retrieval and completion rate was also higher for patients in the doctor-held
card group than for patients in the patient-held card group (91.5% versus 43.4%; and
56.4% versus 49% respectively).
At the same time, however, alongside such positive effects, there was also evidence
that there may be unintended consequences of using coding ‘prompts’ in general
practice. In relation to Thapar’s study (563), for example, although participating GPs
found the card useful, the impact on patient relevant outcomes (seizure frequency)
was marginal. Further, patients in both intervention groups reported more medication-
related side-effects, and patients in doctor-held card practices in particular were less
satisfied with information provision about epilepsy. The authors concluded therefore
that whilst a doctor-held prompt and reminder was effective in improving the
recording of key clinical information for people with epilepsy, it did not improve
outcomes, and may actually have resulted in less patient-centred care (563).
Further, there was inconclusive evidence as to whether patient-delivered ‘prompts’
were as effective as system-based or doctor-held prompts in stimulating clinicians to
code in consultations. On the one hand, a study by Coleman et al found that the
distribution of questionnaires about smoking to patients had a positive impact on
general practitioners' recording practices, with discussion of smoking recorded in 8.0%
(220/2739) of medical records when questionnaires were distributed, versus 4.6%

102
(116/2537) where these were not (odds ratio 1.78 (95% CI, 1.36 to 2.34)) (555).
However, results from Thapar’s RCT of a prompt and reminder card in the care of
people with epilepsy, suggest that patient-delivered prompts were generally less
effective than ‘prompt’-based interventions delivered via doctors themselves (563).
Training and feedback
In terms of whether technology-focussed training and feedback can help to improve
the quality of data recorded in consultations, the evidence from three papers appears
‘cautiously’ positive. Porcheret et al investigated the impact of a programme of
repeated assessments, feedback, and training on the quality of coded clinical data in
general practice (561). They found that on repeat assessments, all participating
practices improved or maintained their levels of coding, and over time rates increased
to levels comparable with, or above, National Study of Morbidity Statistics from
General Practice (MSGP4) rates. However it is important to stress that the practices
that participated in the study were able to provide time and resources for feedback
and training sessions. Therefore, the authors conceded that whilst the programme
may be generalizable to other practices, it required a trained support team to
implement it that had clear implications for cost and resources (561).
In addition, similarly positive results emerged from a before and after study by
Lusignan et al examining the impact of the Primary Care Data Quality (PCDG)
programme on recording of ischaemic heart disease in English general practices (564).
They found that the intervention (comprising a one hour didactic introductory meeting
with practice representatives; the collection, analysis and presentation of key data
using MIQUEST at baseline and thereafter at 6 monthly data quality workshops of 2-3
hours involving a GP, nurse and practice manager from each practice) led to an
increase in the recorded prevalence of ischaemic heart disease by about 10 % (from 29
to 32 per 1000 patients). However, participant practices volunteered to take part in
the research, and were all actively seeking tools to help them raise standards (indeed
most already had higher baseline levels of data recording than the researchers found
in previous studies), therefore the results may not be generalizable to standard
general practices.

103
Finally, a further study by Lusignan et al, offered a more measured verdict on the
impact of feedback on recording practices. This study examined the impact of
feedback of data quality markers within the MediPlus database to see whether this led
to a more rapid improvement in data quality than that generally occurring in primary
care (557). They found that three quality markers improved significantly over the
period of the study at the 5% level. These were the use of highly specific “lower-level”
Read Codes (p=0.004); and the linkage of repeat prescriptions (p=0.03) and acute
prescriptions (p=0.04) to diagnosis. However for the remainder of the data quality
markers measured (see Table 5 for details), there was no significant improvement over
the same period. The authors concluded, therefore, that feedback alone, whilst
potentially a low cost tool, was not a reliable mechanism to ensure improved data
quality, thus more research into what data quality markers should be fed back, how
and by whom was needed (557).
Technical characteristics of the recording system
Different clinical coding schemes
The relative advantages of one coding scheme over another were reported in a small-
scale RCT (which led to two linked papers (550, 551)). Thus Brown et al compared the
accuracy and consistency of alternative clinical coding schemes (Read Version 3,
Clinical Terms Version 3 versus the earlier of this coding scheme, Version 2, 5-Byte
Read) in coding electronic patient records. It found that in both respects, Clinical Terms
Version 3 outperformed Read Codes 5 byte. Exact matches were more common with
Clinical Terms (70% (95% confidence interval 67% to 73%)) than with Read Codes (50%
(47% to 53%))(P < 0.001); and the pooled proportion with exact and identical matches
by paired participants was greater for Clinical Terms (0.58 (0.55 to 0.61)), than Read
Codes (0.36 (0.33 to 0.39)) (P < 0.001).
A study by Kumarapeli and Lusignan, which analysed GP consultation data recorded via
their multi-channel video and data capture toolkit (ALFA: Activity Log File Aggregation),
also suggested that certain coding schemes may be associated with increased (and / or
more rapid) coding activity in comparison to others (567). They found that the
consultations that used EMIS-LV and EMIS-PCS systems had the least number of codes
recorded (1.5 codes, SD 1.5 per consultation), compared with 2.9 codes recorded in

104
Vision and Synergy (p=0.001). Consultations with PCS had the shortest mean duration
for entering coded data (mean 5.6 s, SD 3.4 s). Both LV and Vision took significantly
longer to code (LV: mean 9.0s, SD 6.1s; Vision: mean 8.8s, SD 3.9s; T tests comparing
LV and Vision with PCS: p<0.001). Part of the reason for the faster coded data entry
among the PCS users (mean 1.8 s, SD 0.8 s) was the ‘auto suggestion’ feature where
the computer suggested a coded term during free-text entry. In the other three
systems it took nearly 3 s (LV 2.8 s, Vision 2.8s, Synergy 3.0 s) to navigate to the coding
screen prior to commencing the coding process.
Kumarapeli and Lusignan highlighted the particular example of blood pressure
recording, which varied significantly between brands (p=0.032). Synergy was the
fastest (mean duration - 9.7 s, SD 3.4 s), and Vision and LV were the next fastest, with
similar mean durations for data recoding (mean 10.6 s for both; LV: SD 2.7 s, Vision: SD
2.4 s). As the authors emphasised however, there were some key differences in the
process required by individual coding schemes. For example, LV required the data
entry page or form to be opened using the keyboard; and Vision users either used an
icon or had menu led access. In contrast, although the auto-suggestion feature offered
in PCS recognizes the clinician’s attempt to record BP values and automatically initiates
presenting the blood pressure recording interface, the delay between the text
recognition and interface presentation lengthened the actual coding time (mean 14 s,
SD 3.7 s).
Electronic versus paper-based patient records
A cross sectional study by Hippisley-Cox et al examined both whether paperless
medical records contained less information than paper-based medical records, and
whether that information was harder to retrieve (282). They found no evidence to
suggest either that paperless records were truncated or that they contained more local
abbreviations than electronic versions; or that the absence of writing decreased
subsequent recall. Conversely, paperless records compared favourably with manual
records, potentially suggesting that electronic patient records stimulate more detailed
and consistent coding. Importantly, compared with paper-based records, more
paperless records were fully understandable (89.2% v 69.9%, P=0.0001) and fully
legible (100% v 64.3%, P < 0.0001); and also contained more clinical detail. For
example, paperless records were significantly more likely to have at least one diagnosis

105
recorded (48.2% v 33.2%, P=0.05), to record that advice had been given (23.7% vs
10.7%, P=0.017), and, when a referral had been made, were more likely to contain
details of the specialty (77.4% v 59.5%, P=0.03).
Number of available Read codes
Work by Woodman et al to develop a quality improvement intervention to address
poor recording of child maltreatment in primary care records (565) determined the
existence of 350 maltreatment-related Read codes, of which only 82 were recorded
more than once in the 11 general practices surveyed, or more than ten times in the
THIN data analysed as part of the study. The study also found that although the overall
concepts of maltreatment remained relatively constant across the data extracted from
the practices and THIN, the specific Read codes actually used varied somewhat.
Impact of financial incentives on coding
Coleman et al looked at the impact of a new payment made to general practitioners
for their health promotion activity on the ascertainment and management of smoking
in primary care between 1990 and 2004 (554). This study found that the recording of
smoking status increased temporarily during 1993 to 1994, then rose gradually from
2000, with a more marked increased from 2003. An 88% increase between the first
quarters of 2003 and 2004 coincided with the introduction of the new GP contract,
which included clear financial incentives to record the smoking status of key categories
of patients. Crucially, this also appeared to have translated into an increase in smoking
cessation activities, as there was a broadly similar pattern for the proportion of
smokers recorded as having received brief cessation advice. However, while there was
a sharp rise in nicotine addiction treatment prescriptions from 2000, no comparable
acceleration from 2003 was apparent (558).
A further paper by Tagger et al (566) examined the impact of the Quality and
Outcomes Framework on the recording of smoking targets in primary care using THIN
data. The study found that overall, a greater proportion of patients had a record of
smoking status and cessation advice following the introduction of financial incentives.
Pre-incentives, in 2002, 29.6% of women and 21.5% of men had their smoking status
recorded, and 12.5% of female and 10.1% of male smokers had a record of cessation
advice. In contrast, in 2008, four years after the introduction of incentives, 70.4% of

106
women and 58.6% of men had their smoking status recorded, and 57.1% of female and
44.6% of male smokers had a record of cessation advice.
In addition, Carey et al examined the impact of the introduction of Quality and
Outcomes Framework (QOF) targets on blood pressure (BP) recording over the period
2000 to 2005 (553). This study found that during this period recorded systolic BP (SBP)
fell (36% had SBP 150mmHg in 2000–2001 compared with only 19% in 2004–2005).
However, this coincided with a trend towards recording systolic values just below,
rather than just above the 150 cut-off (in 2000–2001, 2.3% of patients had 148–149
recorded and 1.8% had 151–152; whereas in 2004–2005, the figures were 4.2 and
1.3%, respectively). By smoothing the distribution, the authors estimated that the true
percentage of patients with SBP 4150mmHg in 2004–2005 was 23%, rather than the
19% recorded. Moreover, patients with a recorded SBP 148–149 were more likely to
have a recorded diastolic BP90 (93%) than patients with SBP 151–152 (78%); and
patients just below the 150mmHg cut-off received more antihypertensive treatment
than those just above it (odds ratio 1.20, 95% confidence interval 1.01–1.41). Overall,
the study concluded that whilst blood pressure levels in UK primary care continued to
fall through the introduction of QOF, this fall was exaggerated due to values being
clustered just below the QOF target (although importantly, there was no evidence of
adverse effects of this on clinical management) (553).
Next, research by Kontopantelis et al (568) into the recorded quality of diabetes
recording in primary care following the introduction of financial incentives, found that
recorded quality of care across the 148 study practices increased for all individual
indicators between 2000/1 and 2006/7, with absolute improvements ranging from
4.2% (control of HbA1c levels ≤10%) to 85.5% (providing smoking cessation advice).
Further, recorded QOF care as measured by the composite quality of care score
increased from 46.5% in 2000/1 to 81.0% in 2006/7, with scores increasing for all
subgroups.
Impact of patient demographics on practitioner coding
Dalton et al’s examination of risk factor recording found that differences in recording
between practices could be explained by individual patient socio-demographic
characteristics (556). Focussing on levels of cardiovascular disease (CVD) risk factor

107
recording, in regression analysis, Dalton et al found that women (AOR = 2.88 (95% CI
2.64–3.15)) and older patients (AOR = 2.75 (95% CI 2.28–3.32) for 65–74 against 35–44
years of age) had better recording of blood pressure, as well as body mass index (BMI)
and cholesterol. Further, recording of blood pressure (AOR = 1.38 (95% CI 1.09–1.75))
and cholesterol (AOR = 1.47 (95% CI 1.30–1.66)) was significantly higher among South
Asian patients (556).
Kumarapeli et al also looked at the variation in recording of patient socio-demographic
characteristics in general practice computer systems, focussing in particular on
ethnicity recording (560). The original study was concerned with whether the
Individual Patient Registration Profile Project (IPRP) intervention, essentially a tailored
data template, improved the recording of ethnicity and other patient characteristics in
participating practices. In addition to the results relating to the impact of the
intervention itself (which were positive - see previous section), the study also found
that ethnicity recording generally increased with age from 46.74% (17 709/37 888) for
patients 40+ to 54.94% (6349/11 556) for patients over 65; and that more codes were
recorded for females than males (medians were 57.15 (IQR 3.9%) and 46.03% (IQR
7.6%) respectively) (560).
Results from a third paper suggest that patients with a history of particular conditions
were more likely to have certain factors coded than other patients. A cross-sectional
study by Dalton et al examined the baseline levels of CVD risk factor recording in
general practices located in Ealing, North West London, focussing on the completeness
of blood pressure, smoking, BMI and cholesterol recording in electronic patient
records (556). Dalton et al found that although the recording of blood pressure (85.6%
(practice interquartile range = 10.1)) and smoking status (95.8% (2.6)) was very high in
all practices, the recording of BMI (72.8% (23.4)) and cholesterol (55.6% (25.3)) was
considerably lower. Crucially, there were large differences in recording between
practices (range for cholesterol: 33.6–78.0%), which were largely explained by patient
characteristics. In regression analysis, hypertensive patients (adjusted odds ratio
(AOR) = 36.3, 95% confidence interval (CI) 21.0–62.9), had better recording of blood
pressure as well as BMI and cholesterol.

108
Finally, the findings from research by Taggar et al into the impact of the Quality and
Outcomes Framework on the recording of smoking targets in primary care also
suggested an association between certain patient characteristics and increased odds of
coded smoking (566). For example, there was a greater recording of smoking status
and cessation advice with advancing Townsend score (greater deprivation), and this
was most apparent post introduction of financial incentives. In 2008, 67.8% and 53.0%
of patients had smoking status and cessation advice recorded in the most deprived
quintile, respectively, compared with 26.5% and 11.9% in 2002. Multivariate analyses
for 2008 showed that patients with greater deprivation were 35% more likely to have
smoking status recorded (OR 1.35, 95% CI 1.21-1.49, p<0.001) and 20% more likely to
have cessation advice recorded (OR 1.20, 95% CI 1.10-1.30, p<0.001), than those less
deprived.
However, this contrasts with the results of the Kontopantelis study of diabetes
recording, which found that recorded care (as measured by key practice covariates) did
not vary significantly by area deprivation before or after the introduction of the
incentive scheme (47.5% in least deprived quartile versus 49.0% in the most deprived
quartile in 2000/01, compared with 81.8% in least deprived quartile versus 81.5% in
the most deprived quartile in 2006/07) (568).
The following table summarises the results of the included quantitative papers
organised by identified influencing factor, and whether this was positive, negative or
no influence.

109
Table 5: Statistically significant influencing factors
Factor Positive Negative No influence
10
9
INTE
RV
ENTI
ON
S IN
FLU
ENC
ING
CO
DIN
G B
EHA
VIO
UR
Feedback and training (Lusignan et al, 2002) (557)
3 quality markers improved significantly over the study period at 5% level: (1) use of highly specific “lower-level” Read Codes (p=0.004); and the (2) linkage of repeat prescriptions (p=0.03); and (3) acute prescriptions (p=0.04) to diagnosis
No data No data
Feedback and training (Porcheret, 2004) (561)
Programme of repeat assessments led to practices improving or maintaining their levels of coding in relation to (1) % of consultations assigned a Read coded problem title and stratified by primary care centre consultation; (2) % patients prescribed a selected drug or drug types with relevant morbidity code.
No data No data
Feedback and training (Lusignan et al, 2004) (564)
PCDQ intervention involving initial training and ongoing 2-3 hrs data quality workshops led to increase in recorded prevalence of ischaemic heart disease by about 10 % (29-32 per 1000 patients).
No data No data
Prompts and reminders (Holt, 2010) (559)
Intervention led to an increase in the proportion of patients with sufficient data who were identifiably at risk, with difference of 1.94% compared to the control group (95% confidence interval [CI] = 1.38 to 2.50, P<0.001).
Corresponding reduction occurred in the proportion potentially at risk but requiring further data for a risk estimation (difference = –3.68%, 95% CI = –4.53 to –2.84, P<0.001).
No significant difference was observed in the incidence of cardiovascular events (rate ratio = 0.96, 95% CI = 0.85 to 1.10, P = 0.59).
Prompts and reminders (Thapar, 2002) (563)
Compared with control practices, recording of seizure frequency was significantly increased in doctor-held card practices (57.4% versus 42.8%, P = 0.003) but not in patient-held card practices (44.6% versus 42.8%).
Patients in both intervention groups reported more medication-related side-effects and patients in doctor-held card practices were less satisfied with information provision about epilepsy.
No differences found in the proportion of seizure-free patients (doctor-held card [56.0%] versus control [51.5%]; patient-held card [58.1%] versus control
Prompts and reminders (Coleman et al, 2007) (555)
Discussion of smoking was recorded in 8.0% (220/2739) of medical records when questionnaires were distributed versus 4.6% (116/2537) where these were not
After controlling for potential confounders (inc. age, gender), odds ratio for recording of information in the presence of questionnaire distribution (versus none) was 1.78 (95% CI, 1.36 to 2.34).
No data No data
TEC
HN
ICA
L C
HA
RA
CTE
RIS
TIC
SS O
F
THE
CO
DIN
G S
YSTE
M
Coding scheme (Brown et al, 2003) (551)
Exact matches more common with Clinical Terms (70% (95% confidence interval 67% to 73%)) than with Read Codes (50% (47% to 53%)) (P < 0.001)
Pooled proportion with exact and identical matches by paired participants was greater for Clinical Terms (0.58 (0.55 to 0.61)) than Read Codes (0.36 (0.33 to 0.39)) (P < 0.001).
No data Time taken to code with Clinical Terms (30 seconds per term) not significantly longer than that for Read Codes.
Coding scheme (Kumarapeli & Lusignan, 2012) (567)
Consultations using Vision and Synergy had most number of codes record (2.9 codes per consultation (p=0.001)).
Consultations with PCS had the shortest mean duration for entering coded data (mean 5.6 s, SD 3.4 s)
EMIS-LV and EMIS-PCS systems had the least number of codes recorded (1.5 codes, SD 1.5 per consultation).
LV and Vision took significantly longer to code (LV: mean 9.0 s, SD 6.1 s; Vision: mean 8.8 s, SD 3.9 s; t tests comparing LV and Vision with PCS, p<0.001).
No data

110
Factor Positive Negative No influence
11
0
Electronic records (Hippisley-Cox, 2003) (282)
Compared with paper based records, paperless records were fully understandable (89.2% v 69.9%, P=0.0001) and fully legible (100% v 64.3%, P < 0.0001)
Paperless records significantly more likely to have at least one diagnosis recorded (48.2% v 33.2%, P=0.05), to record advice given (23.7% vs 10.7%, P=0.017) & when a referral had been made, more likely to contain details of the specialty (77.4% v 59.5%, P=0.03)
When a prescription had been issued, paperless records were more likely to specify the drug dose (86.6% v 66.2%, P=0.005)
Paperless records also contained significantly more words, abbreviations, and symbols (P < 0.01 for all)
No data No data
Number of Read Codes (Woodman et al, 2012) (565)
No data 350 maltreatment-related Read codes existed of which only 82 were recorded more than once in the 11 general practices surveyed, or more than ten times in the THIN data analysed as part of the study.
Whilst overall concepts of maltreatment remained relatively constant across practices and THIN, the specific Read codes actually used varied.
No data
FIN
AN
CIA
L IN
CEN
TIV
ES
Financial incentives (Carey et al, 2009) (553)
There was a trend towards recording systolic values just below, rather than just above the 150 cut-off. In 2000–2001, 2.3% of patients had 148–149 recorded and 1.8% had 151–152. In 2004–2005, the figures were 4.2 and 1.3%, respectively
Recorded systolic BP (SBP) fell: 36% had SBP 4150mmHg in 2000–2001, and only 19% in 2004–2005.
By smoothing the distribution, estimated that the true % of patients with SBP 4150mmHg in 2004–2005 was 23%, rather than the 19% recorded
No data
Financial incentives (Coleman et al, 2007) (554)
Smoking status recording increased temporarily 1993–4 and then rose gradually from 2000
Rise was more marked from 2003, with an 88% increase between the first quarters of 2003 and 2004.
In smokers, there was a broadly similar pattern for the proportion recorded as having received brief cessation advice.
No data While there was a sharp rise in nicotine addiction treatment prescriptions for 2000+, no comparable acceleration from 2003 was apparent.
Financial incentives (Tagger et al, 2012) (564)
Greater proportion of patients had a record of smoking status/cessation advice post- introduction of financial incentives.
Pre-incentives, in 2002, 29.6% of women and 21.5% of men had their smoking status recorded, and 12.5% of female and 10.1% of male smokers had a record of cessation advice.
In 2008, four years after the introduction of incentives, 70.4% of women and 58.6% of men had their smoking status recorded, and 57.1% of female and 44.6% of male smokers had a record of cessation advice.
No data No data

111
Factor Positive Negative No influence
11
1
Financial incentives (Kontopantelis et al, 2012) (568)
Recorded quality of care across the 148 study practices increased for all individual indicators between 2000/1 and 2006/7, with absolute improvements ranging from 4.2% (control of HbA1c levels ≤10%) to 85.5% (providing smoking cessation advice).
Recorded QOF care as measured by the composite quality of care score increased from 46.5% in 2000/1 to 81.0% in 2006/7.
No data
PA
TIEN
T D
EMO
GR
AP
HIC
S
Gender, age and ethnicity (Dalton et al, 2010) (556)
In regression analysis, hypertensive patients [adjusted odds ratio (AOR) = 36.3, 95% confidence interval (CI) 21.0–62.9], women [AOR = 2.88 (95% CI 2.64–3.15)] and older patients [AOR = 2.75 (95% CI 2.28–3.32) for 65–74 against 35–44 years of age] had better recording of blood pressure as well as BMI and cholesterol
Recording of blood pressure [AOR = 1.38 (95% CI 1.09–1.75)] and cholesterol [AOR = 1.47 (95% CI 1.30–1.66)] was significantly higher among South Asian patients.
No data No data
Gender and ethnicity (Kumarapeli, 2006) (560)
More codes were recorded for females than males; the medians were 57.15 (IQR 3.9%) and 46.03% (IQR 7.6%), respectively
Overall, commonest recorded ONS ethnic category was ‘White’ (60.88%, 34 013/55 871). Black or Black British’ recorded for 22.99% (12 844/55 871) & ‘Mixed’, ‘Asian or Asian British’ about 3% of ethnicity codes. ‘Chinese or other’ ethnic group more likely to have ethnicity recorded using 9i hierarchy/local EMIS codes.
No data Despite inter-practice variation in rate of ethnicity recording most practices used full range of hierarchies & proportions of people in each ethnic category was not statistically different from 2001 census.
Gender, age and socio-economic status (Rait, 2009) (562)
Females were more than twice as likely to have a diagnosis recorded than males; people in the 25 to 44 age group had the highest rate of diagnosed depression; and people in the most deprived group had nearly twice the rate of depression diagnosis compared with the least deprived group.
No data No data
Socio-economic status (Tagger et al, 2012) (564)
In 2008, 67.8% and 53.0% of patients had smoking status and cessation advice recorded in the most deprived quintile, respectively, compared with 26.5% and 11.9% in 2002.
In 2008, patients with greater deprivation were 35% more likely to have smoking status recorded (OR 1.35, 95% CI 1.21-1.49, p<0.001) and 20% more likely to have cessation advice recorded (OR 1.20, 95% CI 1.10-1.30, p<0.001), than those least deprived.
No data No data
Socio-economic status (Kontopantelis, 2012) (566).
No data. No data. Recorded care did not vary significantly by area deprivation before or after the introduction of financial incentives.
47.5% in least deprived quartile versus 49.0% in the most deprived quartile in 2000/01, compared with 81.8% in least deprived quartile versus 81.5% in the most deprived quartile in 2006/07)

112
4.5.2 Synthesis 2: Thematic analysis of qualitative data
Technology
The first factor identified in the included studies concerned the impact that the clinical
coding scheme itself can have on practitioner recording practices, with a number of
papers focussing on the inherent limitations of existing systems. In Lusignan et al’s
qualitative study of the barriers to recording structured information in computerised
medical records (558), he emphasised the potential for the sheer volume of available
Read codes to undermine recording practices: to put it more simply, there are too
many options. “Long and complex picking lists” led to clinicians simply not coding “for
fear of assigning the wrong diagnostic label” or to view ‘free text’ as a pragmatic
alternative to rigid coding (558). Lusignan et al found that this was particularly the case
when dealing with complex or emerging diagnoses.
The broader concern of whether the essentially biomedical model imposed through
existing coding schemes is able to reflect the complex social interaction of real-life
clinical consultations, also emerged in the qualitative literature. The same study by
Lusignan et al determined that for clinicians at least, the recording of structured data
within a consultation was not viewed as a “neutral activity, they are highly aware of
diagnostic uncertainty and sensitive to the potential impact of both a correct and
incorrect diagnostic label on their relationship with their patient” (558). He found that
although clinicians accepted the need to code certain data in order to demonstrate
that the appropriate quality of care had been provided, there was a perceived
mismatch with the broader ‘holistic’ needs of the individual clinical encounter, and the
challenges of capturing emerging diagnoses or labelling patients with potentially
stigmatising conditions. This theme was echoed in Woodman et al’s research around
the development of a quality improvement intervention for child maltreatment
recording in primary care (565). Interviews with GPs exploring disincentives to coding
cases, highlighted concerns for the potentially harmful impact this might have on both
children and parents, including perceived legal barriers to recording third-party
information about parent risk factors , or maltreatment of a sibling, in a child’s records.
In addition, a general lack of IT skills, combined with inadequate training, was
highlighted in two papers (552, 558), as a further barrier to the effective use of coding

113
systems. Lusignan’s research into the barriers to recording structured information in
computerised medical records highlighted the negative impact of poor keyboard skills
on the part of clinical staff (558). As he emphasises, computerization has only
happened relatively recently, with a gradual transition from written to computer
records alongside a steadily increasing proportion of structured data. Whilst incentives
could serve to improve data quality in areas; a lack of IT skills and skilled personnel
may still mean that some primary care professionals who want to record data cannot
(558). Interviews conducted by Campbell et al as part of their study into recording of
angina, asthma and type 2 diabetes also suggested that inadequate or inconsistent
information technology and insufficient computer training contributed to poor coding
performance (552).
At the same time, results of a mixed-methods study by Hippisley-Cox et al, suggested
that the constraints of computer entry (such as keyboard skills) did not lead to any
“impoverishment of clinical records” in practices that had moved to Electronic Patient
Records (282). Nor did the interviews with GPs carried out as part of this research
determine any significant difference in recall of a patient or consultation between
practices using paper-based as opposed to electronic records, although overall, recall
rates were low in both types of practice (see Chapter 6). The researchers suggest that
such low levels of specific recall suggests that “the doctor-patient relationship may not
be as personal as many suppose” (282).
Finally, under this broader theme of ‘technology’ Lusignan et al’s examination of the
barriers to recording structured information in computerised medical records found
that templates helped to structure data entry, alongside memory joggers such as lists
of codes (558). Coding templates were highlighted as a “structured means of entering
data” along with lists of key codes and so forth (558). At the same time, however,
Campbell et al stressed that poor data recording templates could also have the
opposite effect on recording practices, resulting in poor data coding performance
(552).
Resources
The second influencing factor arising from the qualitative literature concerned the
impact of available resources on recording practices. For example, the study by

114
Campbell et al discussed the “trade-off” clinicians feel they are making between, on
the one hand, the time it takes to record data, and on the other, time spent with
patients (552). They suggested that this was particularly the case in relation to dealing
with lifestyle issues with patients, such as smoking and weight-management (552). At
the same time, Lusignan et al’s 2003 study of the barriers to clinical coding found that
the need to report progress towards targets or to demonstrate that appropriate
evidence based care had been provided to populations was a positive influencer for
both clinicians and practice managers: in this study, money is described as a “powerful
motivator to change” (558).
Patient-related factors
Third, and finally, a series of patient-related factors were suggested as impacting on
recording. Evidence from one study suggested that clinicians may record the provision
of preventative care less consistently than other areas of primary healthcare. Campbell
et al investigated the acceptability, validity and reliability of review criteria developed
by RAND Corporation expert panels to measure quality of care around angina, asthma
and type 2 diabetes (552). The study found a number of examples where doctors and
nurses felt confident that necessary care had been provided but had not been
recorded. In particular, it found that criteria relating to preventive care and the
recording of related symptoms were less frequently met than criteria for procedures
and investigations.
In addition, the challenge of successfully integrating the clinical coding process within a
‘patient-centred’ consultation was also explored in several of the papers reviewed.
This was emphasised in Lusignan et al’s 2003 study (558), which examined the barriers
to recording structured information in computerised medical records from the
perspective of both clinicians and practice managers. A key finding was that clinicians
often viewed coding as a barrier to an effective consultation process (558). Linked to
this theme, Lusignan et al also found that clinicians were particularly concerned that
the meaning and interpretation of coding within the consultation could cause anxiety
on the part of the patient (558). In particular, using a classification scheme that applied
what were described as “diagnostic labels” could be damaging to the doctor-patient
relationship, whether these labels were correct or not. In response, Lusignan reported

115
that “the pragmatic solution that clinician’s have come up with to avoid this problem is
to avoid coding data in the consultation!” (558)
An additional study by Rait et al reinforces Lusignan’s suggestion that clinicians may
sometimes be reluctant to formalise potentially stigmatising health conditions through
coding (562). Rait used electronic patient data from The Health Improvement Network
(THIN) to look at the incidence and socio-demographic variation in GP-recorded
depression diagnoses and depressive symptoms between 1996 and 2006. Overall, the
study found that whilst instances of recorded depression diagnoses fell, there was a
threefold rise in incidence of recorded depressive symptoms, suggesting that the way
that GPs choose to record depression changed over this time period. Although the
categorisation by GPs reflected what is known about depression (with diagnoses being
more commonly recorded for women and in areas of greater deprivation), the overall
number of depression diagnoses was lower than that reported in studies on GP
attendees using active case-finding. The authors felt this suggested that GPs may often
choose not to use formal psychiatric criteria to define people’s illnesses.
4.5.3 Synthesis 3: Mixed methods synthesis of quantitative and qualitative
findings
In the final synthesis, relationships within and between studies were explored in order
to formulate a new interpretation that integrated these findings into what is described
here as a ‘typology’ of influencing factors. Findings from the individual syntheses of
quantitative and qualitative material were “clustered” (548) into barriers versus
facilitators of robust recording practices by primary care physicians. This phase also
helped identify instances in which certain factors worked in divergent ways (i.e. acted
as both facilitators and barriers to recording); alongside examples of which
combinations of factors worked together to produce varying effects. A critical
consideration and synthesis of the evidence base in its entirety produced two broad
spheres of influence on PCPs recording of routine data. These are summarised in Table
6, and described in depth below.
The influence of systems, structure and environment on coding
A significant body of evidence focused on what could broadly be described as
‘technological influencers’ of recording practices. For example, both the clinical coding

116
scheme itself (550, 551, 567), and the introduction of data prompts and coding
templates can positively influence the accuracy and consistency of routine data
recording (558-560, 563), particularly as clinicians emphasise the challenge of
navigating the excessive number of available Read codes (558, 565). Crucially, clinical
notions need to be represented as coded concepts that are both ‘user friendly’ and
easily retrievable in order for information technology to be fully adopted (550, 551).
However, it is also the case that the design of coding templates and prompts must be
mindful of the need to put patient-centred care first in order to be effective (563).
The way in which systems are resourced can also impact on routine data recording. In
particular, there is strong evidence that the use of financial incentives, such as through
the Quality and Outcomes Framework, can stimulate increased recording rates of key
data in primary health care (566, 568). However it is also important to emphasise that
there can be ‘unintended’ effects of such incentive systems, which result in the
distortion of routine data recording (553). Overall, despite some concerns voiced
around the challenges of integrating diverse record types in general practice, there is
robust evidence that the introduction of an electronic system of patient records leads
to more accurate and consistent coding on the part of PCPs (282). However, lack of
that vital resource, time, is cited by clinicians as a barrier to coding within the
pressurised consultation context (552).
Third, there is some evidence that the delivery of targeted training and feedback
around coding can improve the quality of recorded data (557, 561), although this is by
no means a reliable mechanism, and implies a level of available resources that not all
practices will have access to. In addition, lack of general IT skills, such as keyboard
skills, potentially results in lower rates of coding on the part of some individual
clinicians (552, 558).

117
Table 6: Summary of systems, structure and environment influencing factors
Barriers Facilitators
Tech
no
logy
Data prompts can lead to less patient-
centred care (563); and patient-held
versions are less effective (555)
Badly designed coding templates can lead
to poor data recording (552)
Excessive number of available codes can
undermine routine data recording (558,
565)
Displaying only a preferred list of codes can
improve the quality and rates of routine
data recording (558, 560)
Prompting clinicians to record key
information can have positive impact on
adequacy of recorded data (558, 559, 563)
Clinical coding scheme can positive
influence the accuracy and consistency of
routine data recording (550, 551, 567)
Equ
ipm
ent
&
reso
urc
es
Financial incentives can ‘distort’ coding
(553, 571)
Lack of time to code within consultation
(552, 571)
Paper-held records contain less detail and
less consistent data (282)
Financial incentives can stimulate increased
recording rates of key data (553, 554, 558)
Electronic patient records improves detail
and consistency of coding (282)
Edu
cati
on
&
Trai
nin
g
Lack of IT skills (552, 558)
Training and feedback can improve the
quality of recorded data (557, 561, 564)
Psycho-social influencers: how doctors respond to the needs and characteristics of the
patient through coding
In addition to the structural and systematic factors identified above, there are a series
of psycho-social influencers that can affect the recording of routine data by physicians
(summarised below in Table 7). First, a number of articles suggest that the behaviour
and characteristics of patients themselves can impact on physician recording practices.
For example, findings from two of the studies reviewed imply that the presenting
health condition can influence what a physician records (552, 556). In particular, the
provision of preventative care appears to be less well recorded than other conditions
(552). Finally, patients with related pre-existing conditions are more likely to have
certain data recorded (556); and three further studies suggest that patients with
certain socio-demographic characteristics are more likely to have particular conditions
coded than others (556, 560, 566), although the evidence around this factor is by no
means conclusive (568).
Second, physicians’ perspectives on their roles as care-givers, and by implication, their
responsibilities towards patients can influence what routine data they record in a

118
variety of respects (as might be expected, these factors were predominately
highlighted in the qualitative literature). For primary care physicians who are strongly
committed to the concept of a ‘patient-centred’ consultation process, coding activity
that detracts from that focus is viewed negatively (558). This is partly related to the
time pressures highlighted previously, but also to concern about assigning certain
codes to patients that could potentially have a stigmatising effect (562, 565).
Moreover, the literature points towards what might be described as a ‘culture-clash’
between the essentially rigid biomedical coding system and the more complex psycho-
social narrative of the consultation process, that physicians must continually attempt
to resolve (558, 565). This problematic interface between the ‘human’ and the
‘technical’ shapes how PCPs record routine data in everyday practice.
Table 7: Summary of psycho-social influencing factors
Barriers Facilitators
Infl
uen
ce o
f th
e p
atie
nt
Younger patients, men and certain ethnic
groups tend to have less data recorded
(556, 560)
Provision of preventative care less well
recorded than other conditions (552)
Challenge of coding complex and / or
developing conditions (558, 565).
Older patients, women and certain ethnic
groups tend to have more data recorded
(556, 560)
Patients with related pre-existing conditions
are more likely to have certain data
recorded (556)
Ro
le o
f th
e d
oct
or Concern for a patient-centred consultation
(558)
Concerns about stigmatising patients (562,
565)
Mismatch of biomedical coding system with
psycho-social consultation process (558)
Figure 8 overleaf combines both spheres of influence into an overarching typology of
influencing factors.

119
Figure 8: Fishbone diagram of factors influencing the recording of routine data by PCPs
4.6 Strengths and limitations of the review
There are a number of process-related issues connected to the review strategy that
should be acknowledged. For example, the review limited its search to published,
peer-reviewed material that was readily available in the public domain. The decision to
exclude grey literature is of course acknowledged to carry the risk of publication bias,
in that studies that show statistically significant, “positive” results are more likely to be
published than those that do not, potentially leading to exaggerated intervention
effect sizes (572). However, it was felt that this approach offered a more reliable way
of accessing relevant data that had already been subject to a level of quality control via
peer review. In addition, the fact that only a small sample of papers were quality
assessed by a second reviewer (n=4, 25%), is a further limitation. If adequate time and
resources had been available, it would of course been preferable to double-quality
check all included papers. However it should also be stressed that nevertheless, the
strength of agreement between the reviewers in quality assessing this sample of
eligible papers was rated as ‘very good’ (k = 0.824).
120
A number of broader methodological criticisms need to be acknowledged in relation to
the data synthesis adopted in this review. For example, there are identified
disadvantages of using narrative synthesis in combining quantitative data. Most
critically, in comparison to meta-analysis, this approach does not provide an effect
size, and artefact variance such as sampling and measurement errors could not be
accounted for. At the same time, however, it must be stressed that the clinical
heterogeneity of the populations studied, and variable outcome measures employed,
made it inappropriate to combine results (cited in 541, 570). Of the 18 studies with a
quantitative element (reported in 19 papers), there was substantial variation in the
area of clinical focus (including smoking cessation management; angina, asthma and
diabetes; blood pressure recording; cardiovascular events; epilepsy and depression);
and the outcome measures employed also ranged widely (from simple recording of
clinical events to measures to determine coding accuracy). Rather than viewing the
use of narrative synthesis of the quantitative findings as a weakness of the review,
however, as Rodgers et al conclude, it was felt that the incorporation of additional
contextual data above and beyond simple effect size calculations, would in fact add
further meaning and value to the findings in comparison with traditional meta-analysis
(548).
There are also debates as to the appropriateness of synthesising qualitative research
findings. Critics argue that a key advantage of qualitative, in comparison to
quantitative research, is its ability to deliver rich data on a particular set of
participants, for a particular time and context: the findings are essentially not
generalizable (573). In seeking to bring such data together within a thematic synthesis,
therefore, “reviewers are open to the charge that they de-contextualise findings and
wrongly assume that these are commensurable” (574). At the same time, as detailed
earlier in this chapter, the qualitative research carried out in the selected papers was
generally done at the basic, low-inference descriptive level. As such, the data was not
suitable for synthesis methods reliant on highly interpretive findings, and thus in some
respects, more “comparable in interpretive depth to the descriptive findings” of the
quantitative evidence reviewed (543).
Finally, it is important to acknowledge that the more interpretive approach employed
in mixed-methods data synthesis (based on Critical Interpretive Synthesis), is a

121
subjective and potentially idiosyncratic process, detached from traditional review
approaches which simply present research findings as originally reported. In the case
of this review, it must be stressed however that the methodological heterogeneity and
varied research focus of the included evidence base made the assimilation of data
highly challenging using conventional means. As Voil et al highlight, the assimilation of
data in the absence of a common metric or language can be highly challenging, and
that focussing on the qualitative versus quantitative binary can result in the creation of
“false distinctions” between essentially comparable sources of evidence (543). In such
a situation, Critical Interpretive Synthesis helped provide a meaningful, theory-driven
approach to synthesising mixed-methods data, helping to blur the line between the
different methods and methodologies employed by included studies, and thus foster a
sense of a comparable body of evidence on the subject.
Further, whilst there was undoubtedly a high level of within-topic diversity in terms of
the individual study methods and outcome measures employed, it is important to
emphasise that the mixed-methods synthesis demonstrated notable similarity in the
overarching themes evident across the evidence base as a whole. Moreover,
integrating evidence from varied study types helped offer multiple perspectives on the
phenomenon under investigation. For example, in the case of influencing factors that
appear to work in divergent ways, qualitative data can more easily show how different
contexts can influence direction, whereas “the same variable operating in opposing
ways in quantitative studies will yield a statistically non-significant main effect” (543).
4.7 Summary and discussion
The findings from this review suggest a range of factors can influence primary care
physicians’ recording of routine data. A number of these concern system and
structure, such as the design and delivery of the coding scheme itself, and the way in
which recording practices are resourced in both financial and temporal terms.
However it is also apparent that psycho-social factors can affect the adoption and use
of even the best designed systems.
Thus, the coding of primary care consultations is a socially, behaviourally and techno-
structurally situated activity. Further, and importantly, it is the complex interface
between these broad spheres of influence that shapes the quality and significance of

122
the resultant data over time. This framework of coding influencers shares some strong
commonalities with Greenhalgh and Stone’s work examining the impact of information
technology programmes on healthcare settings (575), which links Gidden’s
structuration theory (576) with actor-network theory (577). Their resulting theoretical
model links together structure, human agency and technologies in a recursive
relationship, which constantly evolves in complex and unpredictable ways (578).
One particular area of interest within the context of this research concerns the
influence of financial incentives on clinicians’ recording practices. As this review
indicates, however, the relationship is far from straightforward. Overall, it would
appear that pay-for-performance initiatives may stimulate increased rates of coding in
the associated areas of care (553, 554, 558), suggesting incentives could represent an
effective means of influencing clinician behaviour. However, the findings from this
review and other comparable evidence, also underline medical professionals’ strong
resistance to ‘standardisation’ initiatives, and highlight the mechanisms they often
employ to negotiate, circumvent or even disregard the recording process (558). This is
particularly the case if there is a perceived lack of evidence to support incentivised
practices (427), or where there is a sense that coding detracts from their primary
focus, the patient-centred consultation (558). As such, in primary care at least,
electronic primary care recording systems are not necessarily the large-scale
oppressive Foucauldian instruments of surveillance they possibly represent in other
spheres of governance (579).
Given the fundamentally symbiotic relationship between the effective performance-
management of primary health care and the availability of accurate, meaningful
practice data, these findings have profound implications for policy and practice (415,
420). Importantly, they suggest that policy makers and service commissioners seeking
to design recording systems that enable the effective monitoring and delivery of
primary health care must treat their development as the ‘complex intervention’
electronic patient records truly are (580). As emphasised in actor-network analyses of
this field, electronic records (and in turn, coding systems), are not merely empty
vessels to be filled with data, but rather often play a transformative, ‘actant’ role in the
system (581). Further, there is a need to work in close proximity to the context and

123
users of such systems in order to ensure technology is sufficiently flexible and
sophisticated to meet their needs (575, 582, 583).
Finally, the results of this review lend weight to calls for more contextualised and
theoretically-grounded accounts of physicians’ attitudes towards using electronic
patient records (518). Subsequent phases of this research will provide an opportunity
to further examine this typology of influencing factors using the example of routine
data on alcohol interventions in primary health care, analogous to Greenhalgh’s
recursive research tradition of studying not technologies and contexts in isolation, but
‘technologies-in-use’ (578). In particular, it will explore whether there are any key gaps
in the literature-based model that might affect recording practices, such as policy-level
influencers, or the provision of local-level alcohol services. As such, it will help to
“unpack the relationships between context, mechanism and outcomes” (519), and thus
better inform our understanding of whether current primary care recording
environments are likely to result in meaningful routine data sets for alcohol.

124
Chapter 5 A descriptive and comparative analysis of the use of
Read Code data to record screening and brief alcohol
interventions in routine general practice
5.1 Introduction
This chapter presents a descriptive analysis of alcohol Read code data extracted
directly from a sample of GP practices based in the North East of England. First, it
describes the aims and objectives of this phase; summarises the key characteristics of
the study sample and presents the findings from the analysis of Read code data. It then
considers the strengths and limitations of this component of the study, and discusses
the main messages emerging from the results.
5.2 Method
5.2.1 Rationale, aims and objectives
The usefulness of Read code data as a source of information about alcohol
intervention delivery is strongly reliant on the completeness and consistency of the
recorded data itself. As the previous chapter (4) has highlighted, a range of inter-
related factors influence general practitioners’ recording of routine data, including
technical and psycho-social influencers, all of which may impact on the validity of the
resultant data. In particular, how recording processes are structured (for example, the
choice of clinical coding system, whether data prompts and / or templates are used,
and the volume of available Read codes), and incentivised (mainly through financial
incentives) can all shape how, why and when certain data is recorded, including which
codes are actually used by GPs in routine practice.
The primary objective of the quantitative phase of the research was to compare and
contrast the delivery of screening and brief alcohol interventions for alcohol across a
sample of general practices and former primary care trust areas (PCTs) in North East of
England using routinely collected electronic General Practitioner (GP) Read Code data.
In doing so, the research sought to deliver the following secondary objectives:
1. To identify and categorize the full range of Read codes currently available to
general practitioners to record alcohol intervention (including prevention,
treatment and diagnoses) in general practice.

125
2. To investigate which Read codes were used most frequently to record alcohol
treatment and diagnoses in general practice.
3. To explore whether there were significant differences in rates of routine
recording of alcohol screening and brief interventions and patient alcohol
consumption levels between: individual practices; Enhanced Service for alcohol
status; NHS organisational area; and size of practice.
Screening and brief interventions for alcohol have been financially incentivised at two
key levels in recent years. First, practices could voluntarily sign up to delivery of the
national Directed Enhanced Service (DES) for alcohol, whereby participating practices
were paid £2.33 for each newly registered patient aged 16 and over who had received
screening using either FAST or AUDIT-C (584). Second, where available, practices could
also sign up to Local Enhanced Service schemes (LES), such as the one offered by NHS
South of Tyne and Wear (237). In this case, participating practices based in NHS South
of Tyne and Wear received additional payments for screening and providing eligible
patients with brief advice (£8.00); and for referring eligible patients to community
detox programmes (£80.00).
Onsite extraction of alcohol-related Read code data was selected as the primary mode
of quantitative data collection as opposed to using centralised databases of general
practice data such as The Health Improvement Network (THIN) (585) or QRESEARCH
(586). Crucially, onsite collection would allow analysis at individual practice level which
would not be possible using standard general practice databases. Further, general
practices that contribute to databases such as THIN undergo assessment to ensure
they are using their computer systems correctly, and thus they may not be
representative of ‘standard’ practices (587). In combination with the qualitative
interview data gathered from GPs based at the participant practices, this would inform
a better understanding of the delivery contexts that potentially influence alcohol
screening and brief intervention recording practices in primary health care.
5.2.2 Sample and strategy
The target population in this study was general practices based in the NHS North of
Tyne and NHS South of Tyne and Wear organisational areas (encompassing the former
Newcastle PCT, North Tyneside PCT, and Northumberland Care Trust; and Gateshead

126
PCT, South Tyneside PCT, and Sunderland Teaching PCT respectively). As such, this
would allow the comparison of alcohol screening and brief intervention Read coding in
an area in which a Local Enhanced Service specification for alcohol had been launched
(South of Tyne and Wear (237)) and one where only the voluntary national level
Directed Enhanced Service for alcohol was available (588). In other words, it would
compare recording rates in those practices receiving various levels of financial
incentives, and subject to the various recording systems introduced as part of that
process, with those practices not receiving any additional funding for alcohol screening
and interventions. In addition, the sample would include practices based in two former
PCT areas identified in the North East Public Health strategy Better Health, Fairer
Health (234) for accelerated alcohol screening and brief intervention implementation
(Newcastle PCT and North Tyneside PCT), and thus potentially subject to additional
policy-level influences on routine intervention delivery which could in turn impact on
recording practices.
A sequential, mixed-methods research design, in which the quantitative phase
informed subsequent qualitative interviews and the identification of a case study
practice, was employed, using nested samples in two broad phases described below:
First, stratified purposive sampling was used to identify potential
practices based on three key variables: NHS organisational location;
enhanced service for alcohol status (either national and / or local
schemes); and practice size. According to the North East Primary Care
Services Agency, as at April 2010 there were a total of 214 practices in
the selected geographical areas (589). The proposed sample size at the
outset of recruitment was twenty general practices, representing
approximately 9-10% of GP practices based in the target PCT areas (i.e.
20 out of 214 practices). The limited sample size reflected the
exploratory nature of the study (10% is recommended in a number of
texts on adequate samples for efficacy studies, small-scale trials and
other similar pilot research (590-592)). The key concerns for
determining an adequate sample size were therefore that the
characteristics (key variables) of the participating practices were
representative of the characteristics of the overall study population (GP

127
practices in the target NHS organisational areas) in order to provide an
adequate indicator of alcohol-intervention recording trends in the
target localities.
Second, a single general practice was identified from within the wider
sample for the purpose of an in-depth case study. Given that this
element of the quantitative phase would involve a particularly time-
consuming data extraction process, the use of a convenience sampling
approach was proposed to identify an eligible practice that was willing
and able to accommodate the requirements of the study.
Figure 9 and Table 8 below illustrates the planned sample design and stratified sample
scheme for the research. Additional details of the qualitative sampling strategy are
provided in the following chapter of this thesis (Chapter 6).
Figure 9: Research sample design
Table 8: Stratified purposive sample scheme for quantitative research phase
NHS Organisation
Smaller than average
practice size (≤ 6,499)
Larger than average
practice size (≥6,500)
Multi-site practice group
Enhanced Service
No Enhanced Service
Enhanced Service
No Enhanced Service
Enhanced Service
No Enhanced Service
North of Tyne 2 2 2 2 1 1
South of Tyne and Wear
2 2 2 1 1 1
Quantitative sample of 20 general practices selected based on stratified purposive sampling across 3 key
dimensions
Qualitative sub-sample of between eight and twelve General Practitioners using
theory-based sampling
In-depth case study of Read Code usage in a single general practice using a
convenience sample

128
Specific inclusion and exclusion criterion for research participants in both elements of
the quantitative phase are described below.
Inclusion criteria:
GP practice of any model (i.e. multi-partner, sole practices, salaried
practices, Darzi-units)
Based within either NHS South of Tyne and Wear or NHS North of Tyne;
and
Willing to participate in the project.
Exclusion criteria:
Located outside either NHS South of Tyne and Wear or NHS North of
Tyne and Wear.
5.2.3 Ethical approval
The research was reviewed by Newcastle and North Tyneside Research Ethics
Committee 1 (10/HO906/47), and granted full ethical approval on 16th September
2010. An NHS Research Passport to enable the study to commence recruitment was
obtained in February 2011.
5.2.4 Recruitment
GP practices were identified and subsequently contacted using a range of channels, as
described below, in three broad rounds of recruitment carried out between March
2011 and April 2012.
Round 1: March to August 2011
In the first round of recruitment, potential participants were identified from publicly
available lists available via the NHS choices website (www.nhs.uk) and the North East
Primary Care Services Agency (www.nefhsa.nhs.uk), and lists of research active
practices provided by contacts within the Research and Development departments of
relevant Primary Care Trusts. At this stage, a strictly purposive approach to
recruitment was adopted, whereby only practices that were identified as ‘fitting’ the
sample scheme were targeted. An initial letter or email correspondence (where email
addresses were available) was sent to Practice Managers (Appendix E), inviting them to

129
participate in the study. This correspondence included a project ‘flyer’ (Appendix F),
which offered a brief introduction to the research, and explained why their
involvement was required and what participation would involve. The flyer was
produced and designed on the advice of PCT contacts who suggested this was the most
effective means of making initial contact with busy practice managers and clinicians.
Based on the response to this initial email or postal contact, a full Project Information
Sheet was available for their perusal (see Appendix G), which included more detail on
the data to be collected, and the manner in which the research would be conducted.
Practice Managers also received a copy of a confidentiality agreement at that stage
(Appendix H) between practices and the researcher, which outlined the conditions of
access to practice data that the researcher would adhere to throughout the study. In
total, sixty-three practices were emailed or written to at this point (March to August
2011), with follow-up calls made where named contacts were available. This round
yielded only a small number of interested practices (five), with many practices
responding that time demands or existing research commitments prevented their
participation in the research.
Round 2: September to December 2011
In the second round, the search was broadened to include an additional ninety
potential practices, using publicly available lists available via the NHS choices website
(www.nhs.uk/Service-Search/GP/LocationSearch/4) and the North East Primary Care
Services Agency (www.nefhsa.nhs.uk) to identify potential practices, and matching the
sample scheme requirements as far as it was possible. The first round had underlined
the importance of identifying personal email addresses for practice managers:
requests in writing almost always resulted in non-response; whereas all successes thus
far had resulted from personal email contacts. A database of potential email contacts
for all ninety practices was therefore produced using online searches for Freedom of
Information requests for practice manager email addresses. Again, follow-up calls
were made to boost the response rate, targeting practices that filled identified gaps in
the sample. Again, this round delivered limited success, with a further six practices
recruited between September and December 2011.

130
Round 3: January to April 2012
In the final round of recruitment, the search strategy focussed on filling the gaps in the
sample base: working with former PCTs to contact practices signed up to enhanced
services; additionally targeting practices not listed on PCT Local Enhanced Service lists
to address an identified shortfall in practices not signed up to an enhanced service;
and returning to practices that had expressed an interest earlier in the research but did
not fulfil a sample requirement (for example, practices that had signed up to an
enhanced service when practices not signed up were actually required). A further
forty-nine practices were contacted at this point (January to April 2012). This markedly
pragmatic approach to recruitment was viewed as essential in order to make up the
shortfall in the sample needed. Five practices agreed to participate at this stage,
making sixteen practices in total.
5.2.5 Description of study sample
A total of sixteen GP practices were recruited to the study, as presented in Table 9
below. This section explores the key characteristics of the study sample, namely:
practice size (by number of registered patients); geographic location; deprivation
ranking; age profile; alcohol consumption rates; and other relevant contextual data
gathered during the course of the fieldwork.
Table 9: Recruited research sample
NHS Organisation
Smaller than average
practice size (≤ 6,499)
Larger than average
practice size (≥6,500)
Multi-site practice group
Enhanced Service
No Enhanced Service
Enhanced Service
No Enhanced Service
Enhanced Service
No Enhanced Service
North of Tyne 2 1 2 2 1 1
South of Tyne and Wear
5 0 2 0 0 0
Size of participant practices
Half (n=8; 50%) of the study practices were classed as ‘smaller than average’ single site
practices in terms of the number of registered patients (range: 596 to 6,261). Just over
37% (n=6) were classed as ‘larger than average’ single site practices (range: 7,540 to
16,430 registered patients). The remainder (n=2; 12.5%) were classed as multiple-site
practices, with the total number of patients able to use the various practice sites
131
ranging from 6,759 to 16,497. Overall, the mean number of registered patients for the
study practices was 6,667 patients, which compares well with the national average
practice list size of 6,487 patients (593).
Additional contextual data on the recruited sample
Additional data gathered during the course of the fieldwork highlighted a range of
further variables of interest. For example, two study practices in the North of Tyne
area (NOTW1 and NOTW8) had opened relatively recently (in 2009 and 2011
respectively) as a result of Lord Darzi’s review of the NHS which recommended
improving access to primary care through the introduction of additional GP-led health
centres (polyclinics - so-called ‘Darzi practices’)(594). In these instances, all GPs were
salaried and the practice as a whole subject to additional performance measures
above and beyond the standard Quality and Outcomes Framework or Enhanced
Service requirements. In addition, around a third of practices (n=6; 37%) identified
themselves as teaching practices (NOTW3, NOTW4, NOTW9, SOTW1, SOTW7) and one
practice stated explicitly that they were ‘research active’ (SOTW2). Finally, five
practices (31%) had either what might be described as a ‘local opinion leader’ in the
alcohol prevention field within the senior team (SOTW1) or had been involved in
alcohol-related research or initiatives in the past (NOTW2, NOTW3, NOTW5 and
NOTW9). Importantly, this factor often appeared to have led to the development of
Read Codes and coding templates specifically tailored to the practice concerned.
However, it is also worth noting that the longer term impacts on individual practice
approach to delivering or recording alcohol screening and brief intervention varied
considerably, for example, where research funding had ended or where particular
personnel had moved on.
Geographic location of practices
Whilst recruitment was achieved in all six target PCT areas, there was a higher
representation of Sunderland, North Tyneside and Newcastle PCTs within the sample
(at 25%, 25% and 19% respectively), compared with Gateshead, Northumberland and
South Tyneside (13%, 12% and 6%). Practices based in the overall North of Tyne NHS
organisational area were also over-represented in comparison to South of Tyne and

132
Wear, (at 56% versus 44% respectively). The geographic breakdown of the sample is
illustrated in Figure 10 below.
Figure 10: Study sample by Primary Care Trust
Deprivation ranking of practice sample
The postcode of each participating practice was mapped against English Indices of
Deprivation data (595) in order to provide a proxy measure of deprivation. As shown in
Figure 11, this would suggest that practices in the North of Tyne organisational area
were generally based in less deprived localities in comparison with the South of Tyne
and Wear-based sample.
Newcastle 19%
North Tyneside 25%
Northumberland 12%
Gateshead 13%
South Tyneside 6%
Sunderland 25%

133
Figure 11: Deprivation rank of study sample practices by IMD quintile
Age profile of sample patient population
The age profile of the participant GP practices for 2010-2011 is presented to follow, by
gender, and compared to England population estimates using Office for National
Statistics Mid-2011 Population Estimates (596). As evident from Table 10, overall, the
age profile of most practices compared with that of England as a whole. The main
exception was practice ID SOTW2, whose age profile was noticeably older than that of
the sample as a whole, with more patients aged between 25 and 34 than in other
recruited practices. This was a smaller than average practice, based in a relatively
deprived part of Sunderland.
It is important to emphasise the fact that the age profile of practices was based on the
total number of registered patients at the time point surveyed (2010-2011) and
therefore may not accurately reflect the age profile of the community in which the
practice was located.
2725
7603
17416
12659
19557
16039
3004
744
22737
810
2939
694
3324
9185
2834
12979
NHS North of Tyne Practices
3rd
4th
5th
2n
1st
NHS South of Tyne and Wear Practices
IMD
Qu
inti
les
(1st
= m
ost
de
pri
verd
)

134
Table 10: Age profile of sample practices 2010-2011 by gender (M = male; F = female) (%)
0-16 17-24 25-34 35-44 45-54 55-64 65-74 75+
PRACTICE ID M F M F M F M F M F M F M F M F
NOTW1 29 25 11 16 22 25 17 16 10 9 6 6 3 2 1 2
NOTW2 20 18 10 9 12 12 14 15 16 14 13 12 9 10 7 10
NOTW3 19 17 9 8 15 15 13 13 14 15 14 13 9 9 7 10
NOTW4 17 18 9 10 10 10 13 13 15 15 16 15 12 11 8 7
NOTW5 15 15 10 9 11 10 14 13 18 16 14 13 10 12 9 13
NOTW6 20 17 8 7 9 8 11 13 17 16 15 14 11 13 10 12
NOTW7 21 19 10 9 11 12 14 14 16 14 12 12 8 9 7 10
NOTW8 26 26 20 21 15 19 14 15 11 9 8 6 4 2 2 2
NOTW9 19 16 14 14 14 13 14 13 15 14 11 11 7 7 7 10
SOTW1 16 17 11 11 20 21 15 13 15 14 12 11 7 7 5 8
SOTW2 8 8 34 47 26 22 16 9 9 7 4 4 1 2 1 1
SOTW3 28 24 16 14 17 14 12 15 13 11 6 8 4 6 4 8
SOTW4 25 23 12 11 15 15 15 15 13 13 12 12 6 5 2 4
SOTW5 19 16 12 9 12 11 14 14 15 16 12 13 9 10 6 10
SOTW6 22 19 10 11 15 15 14 13 16 15 11 10 7 8 5 9
SOTW7 16 15 8 7 11 11 13 12 14 13 15 15 12 14 9 12
ENGLAND 21 19 11 10 14 13 14 14 14 14 12 12 8 9 6 9
Alcohol consumption rates in sample practice Local Authority areas
The following table (11) presents mid-2009 synthetic estimates of different levels of
alcohol consumption at population level by relevant Local Authority (LA) organisational
areas (i.e. the LA areas in which the sample practices were based), for the North East
Government Office region, and for England as a whole (597). Synthetic alcohol
consumption prevalence estimates are derived from a statistical model which models
the probability of abstaining or being a lower, increasing or higher risk drinker (of the
drinking population only) using a combination of individual level (age, sex, ethnicity),
area level (Index of Multiple Deprivation) and alcohol-specific hospital admission data
(290).
As the data shows, whilst synthetic estimates of lower, increasing and higher risk
drinking rates were generally comparable both between different LA areas, and in
relation to regional and national rates; clear differences emerged at either end of the
consumption spectrum. Overall the North East had a lower rate of abstainers than
nationally (14.6% as opposed to 16.5%) alongside significantly higher rates of binge
drinking amongst those adults that drink (30.1% for the North East compared with
20.1% for England). Generally speaking, these consumption trends were reflected

135
across the respective practice LA areas, although Newcastle LA was notable in having
both a higher prevalence of alcohol abstainers, and of both higher risk and binge
drinking adults.
Table 11: Mid-2009 synthetic estimate of the percentage within the total population of abstainers, lower risk, increasing risk, high risk and binge drinkers in local authority populations aged 16 yrs+
Area
Abstainers3 Lower risk drinking4 Increasing risk drinking5 Higher risk drinking6 Binge Drinkers7 %
po
pu
lati
on
age
d 1
6 y
ears
+
Low
er 9
5%
CI
Up
per
95
% C
I
% d
rin
kin
g p
op
ula
tio
n a
ged
16
+
Low
er 9
5%
CI
Up
per
95
% C
I
% d
rin
kin
g p
op
ula
tio
n a
ged
16
+
Low
er 9
5%
CI
Up
per
95
% C
I
% d
rin
kin
g p
op
ula
tio
n a
ged
16
+
Low
er 9
5%
CI
Up
per
95
% C
I
% d
rin
kin
g p
op
ula
tio
n a
ged
16
+
Low
er 9
5%
CI
Up
per
95
% C
I
Newcastle 17 12 21 73 51 85 20 11 38 8 3 23 34 31 37
N. Tyneside 14 9 18 74 51 86 20 11 37 7 2 21 30 27 33
North’land 14 9 17 73 51 86 20 11 39 7 2 21 30 27 32
Gateshead 15 9 19 74 53 87 19 11 36 7 3 22 30 27 34
S. Tyneside 15.5 10.3 19.9 74.5 52.7 86.8 19.0 10.4 36.6 6.5 2.4 21.2 28.7 25.6 32.1
Sund’land 14.2 9.3 18.5 74.2 52.6 86.2 19.2 10.7 37.0 6.6 2.4 21.6 29.8 27.2 32.5
North East 14.6 9.6 18.7 73.7 51.9 85.9 19.6 10.9 37.6 6.7 2.4 21.7 30.1 26.2 34.4
England 16.5 11.1 20.6 73.3 51.1 86.4 20.0 10.8 38.5 6.7 2.4 21.8 20.1 19.4 20.8
Enhanced service for alcohol status
Seventy-five per cent (n = 12) of the practices in the study sample were signed up to an
enhanced service for alcohol at either the national or local level. Within the practices
based in the South of Tyne and Wear NHS organisational area, coverage was 100%,
with all practices signed up to both the national Directed Enhanced Service for Alcohol
introduced in 2008, and a Local Enhanced Service introduced in 2009-10 (n = 7).
Despite the lack of a local-level enhanced service for alcohol in place in the north of
the sample area, the majority of practices were signed up to the national service (56%)
(n = 5), and these were spread across all PCT areas involved (one in Newcastle PCT;
two in both Northumberland and North Tyneside PCTs respectively) (see Figure 12).
3 Proportion (%) of adults aged 16+ who report in abstaining from drinking alcohol. 4 Proportion (%) of adults aged 16+ (not including abstainers) aged 16 years and over who report engaging in lower
risk drinking, defined as consumption of less than 22 units of alcohol per week for males, and less than 15 units of alcohol.
5 Proportion (%) of adults aged 16+ (not including abstainers) who report engaging in increasing risk drinking, defined as consumption of between 22 and 50 units of alcohol per week for males, and between 15 and 35 units of alcohol per week for females.
6 Proportion (%) of adults aged 16+ (not including abstainers) who report engaging in higher risk drinking, defined as more than 50 units of alcohol per week for males, and more than 35 units of alcohol per week for females.
7 Proportion (%) of adults aged 16+ who consume at least twice the daily recommended amount of alcohol in a single drinking session (that is, 8 or more units for men and 6 or more units for women).

136
Figure 12: Enhanced service for alcohol status of study sample
Summary of all sample practice characteristics
The following table (12) summarises the aforementioned practice characteristics.
Table 12: Key characteristics of sample practices
Enhanced Service for
Alcohol Status
Size of Practice North of Tyne
Practices
South of Tyne & Wear
Practices
Index of Multiple Deprivation
PRACTICE ID D
ES
LES
No
. re
gist
ere
d
pat
ien
ts
Larg
er
than
av
era
ge
Smal
ler
than
av
era
ge
Mu
lti-
site
Ne
wca
stle
No
rth
Tyn
esi
de
No
rth
um
ber
lan
d
Gat
esh
ead
Sou
th T
yne
sid
e
Sun
de
rlan
d
Sco
re
Ran
k (1
=mo
st)
Qu
inti
le
(1st
= m
ost
)
NOTW1 0 0 1372 0 1 0 1 0 0 0 0 0 47.25 2725 1st
NOTW2 0 0 16497 0 0 1 0 1 0 0 0 0 31.38 7603 2nd
NOTW3 1 0 9826 1 0 0 0 1 0 0 0 0 15.9 17416 3rd
NOTW4 1 0 2950 0 1 0 0 1 0 0 0 21.81 12659 2nd
NOTW5 0 0 7651 1 0 0 0 1 0 0 0 0 13.73 19557 4th
NOTW6 1 0 6759 0 0 1 0 0 1 0 0 0 17.48 16039 3rd
NOTW7 0 0 8019 1 0 0 1 0 0 0 0 0 45.97 3004 1st
NOTW8 1 0 596 0 1 0 1 0 0 0 0 0 60.92 744 1st
NOTW9 1 0 8793 1 0 0 0 1 0 0 0 0 10.99 22737 4th
SOTW1 1 1 4890 0 1 0 0 0 0 1 0 0 60.15 810 1st
SOTW2 1 1 1230 0 1 0 0 0 0 0 0 1 46.21 2939 1st
SOTW3 1 1 3017 0 1 0 0 0 0 0 0 1 61.61 694 1st
SOTW4 1 1 4834 0 1 0 0 0 0 0 0 1 44.59 3324 1st
SOTW5 1 1 6261 0 1 0 0 0 0 0 0 1 27.88 9185 2nd
SOTW6 1 1 7540 1 0 0 0 0 0 0 1 0 46.66 2834 1st
SOTW7 1 1 16430 1 0 0 0 0 0 1 0 0 21.36 12979 3rd
TOTALS 12 7 106665 6 8 2 3 4 2 2 1 4 - -
% 75 44 - 38 50 13 19 25 13 13 6 25 - -
North of TyneSouth of Tyne &
WearAll Practices
No Enhanced Service 4 0 4
Enhanced Serice 5 7 12
0%
10%
20%
30%
40%
50%
60%
70%
80%
90%
100%

137
5.2.6 Characteristics of the case study practice
The recruited case study practice was based in a relatively deprived part of Gateshead,
within the NHS South of Tyne and Wear organisational area (ranked in the first (most
deprived) quintile according to the Index of Multiple Deprivation (598)). The practice
was signed up to both the national Directed Enhanced Service for alcohol, in addition
to the Local Enhanced Service. With a patient population of 4,890, it is classed as
smaller than average in relation to the standard GP practice. The practice is also
research-active, and notably, the practice team included a GP that could be described
as a ‘local alcohol champion’. In comparison with England as a whole, the related local
authority area alcohol consumption compared with trends evident across with the
wider North East region, demonstrating a relatively lower rate of abstainers, and
higher prevalence of binge drinkers than nationally (see Table 13 below).
Table 13: Mid-2009 synthetic estimate of the percentage within the total population of abstainers, lower risk, increasing risk, high risk and binge drinkers in local authority populations aged 16 yrs+
Local Authority Area
Abstainers8 Lower risk
drinking9
Increasing risk drinking
10
Higher risk drinking
11
Binge Drinkers
12
% p
op
ula
tio
n
aged
16
yea
rs+
Low
er 9
5%
CI
Up
per
95
% C
I
% d
rin
kin
g p
op
ula
tio
n a
ged
16
+
Low
er 9
5%
CI
Up
per
95
% C
I
% d
rin
kin
g
po
pu
lati
on
age
d
16
+
Low
er 9
5%
CI
Up
per
95
% C
I
% d
rin
kin
g p
op
ula
tio
n a
ged
16
+
Low
er 9
5%
CI
Up
per
95
% C
I
% d
rin
kin
g p
op
ula
tio
n a
ged
16
+
Low
er 9
5%
CI
Up
per
95
% C
I
Gateshead 14.6 9.4 18.9 74.3 52.5 86.5 19.0 10.5 36.3 6.7 2.5 22.2 30.2 27.1 33.5
North East 14.6 9.6 18.7 73.7 51.9 85.9 19.6 10.9 37.6 6.7 2.4 21.7 30.1 26.2 34.4
England 16.5 11.1 20.6 73.3 51.1 86.4 20.0 10.8 38.5 6.7 2.4 21.8 20.1 19.4 20.8
5.2.7 Data management
All Read Code data were extracted in-situ at the relevant GP practice, with the
researcher working alongside practice managers or data administrators to run a series
of Read Code queries (see Table 14 for details) derived primarily from Department of
Health recommended coding for screening and brief alcohol interventions (273). The
data were anonymised and aggregated before they were transferred from the
8 Proportion (%) of adults aged 16+ who report in abstaining from drinking alcohol. 9 Proportion (%) of adults aged 16+ (not including abstainers) aged 16 years and over who report engaging in lower
risk drinking, defined as consumption of less than 22 units of alcohol per week for males, and less than 15 units of alcohol.
10 Proportion (%) of adults aged 16+ (not including abstainers) who report engaging in increasing risk drinking, defined as consumption of between 22 and 50 units of alcohol per week for males, and between 15 and 35 units of alcohol per week for females.
11 Proportion (%) of adults aged 16+ (not including abstainers) who report engaging in higher risk drinking, defined as more than 50 units of alcohol per week for males, and more than 35 units of alcohol per week for females.
12 Proportion (%) of adults who consume at least twice the daily recommended amount of alcohol in a single drinking session (that is, 8 or more units for men and 6 or more units for women).

138
research site onto University computers via an encrypted, password protected USB
stick; therefore no sensitive or personal data left any of the participant NHS sites.
Microsoft Excel was used for data management purposes, and for the generation of
basic descriptive statistics, rates of recording (percentages, %), and confidence
intervals (CI); with tests for heterogeneity between key variables carried out in Stata
(599). Storage on University computers was password protected and only accessed by
the Chief Investigator (AOD). This stringent approach to data security was detailed in a
tailored confidentiality agreement between the researcher and the participant
practice, which was signed by both parties prior to data extraction taking place (see
Appendix H).
5.2.8 Data collection and analysis
(1) Identifying the range of alcohol Read Codes available to General Practitioners
The first element of the quantitative research phase comprised the identification and
categorisation of the full range of Read Codes currently available to general
practitioners to record alcohol-related clinical services in general practice settings.
EMIS (an acronym which stands for Egton Medical Information Systems) was searched
in order to generate a comprehensive list of alcohol Read Codes that could potentially
be used to record treatment of alcohol use disorders and / or interventions for alcohol
by practitioners. EMIS was selected as the initial means of identifying the appropriate
Read codes as it is the dominant GP computer system in the UK at present (it is used
by 53% of all GP practices in the UK (600)).
The process of identifying alcohol-related Read codes utilised a series of search
features within EMIS (specifically: alcohol; alcohol consumption; and alcohol
screening); alongside World Health Organisation ICD-10 codes for alcohol (5) (F10:
Mental and behavioural disorders due to use of alcohol). An additional list of alcohol-
related Read Codes published in 2008 was identified via an online search of deposited
papers in the UK Parliament (601). The two initial lists of Read codes were merged in
Excel, duplicates were deleted, and a number of unique codes added to the generally
available Read code lexicon by the case study practice were also removed. The
resultant list of alcohol-related Read Codes was grouped and categorised using the
related more detailed textual descriptors. Importantly, this information informed

139
subsequent work to establish which Read Codes are used most frequently to record
alcohol treatment and diagnoses in general practice (see section (2) Case study:
frequency of alcohol Read Code use).
(2) Case study: frequency of alcohol Read Code use
Next, a case study of a single GP practice based in NHS South of Tyne and Wear was
undertaken in order to explore which alcohol-related Read Codes are currently used
most frequently in general practice settings. First, using the comprehensive list of
alcohol Read Codes developed in part 1 (above), patient records were searched using
each individual Read Code in order to identify the number of occasions it had been
used to record alcohol-related treatment and diagnoses over the period 2007-2011
inclusive. Crucially, this covered the introduction and implementation of the national
alcohol Directed Enhanced Service and alcohol LES for South of Tyne and Wear.
Next, tables were generated, resulting in aggregated numbers of instances on which
individual codes had been used, presented by age using standard Korner Bands, and
gender (see Figure 13 for an example output). Finally, the aggregated data was
analysed to identify: zero incidence Read Codes by year; most frequently used Read
Codes by year; and the proportion of all available alcohol Read Codes in most frequent
use.
(3) Differences in rates of recording of routine alcohol screening and brief intervention
data
Finally, descriptive statistics were used to compare and contrast recording rates
between GP practices in relation to the delivery of screening and brief interventions
for alcohol (the incomplete, basic and heterogeneous nature of the data meant it was
inappropriate to conduct inferential statistical tests). This component of the research
sought to identify differences in recorded rates of clinical activity relating to the
identification, treatment and management of alcohol-use disorders. Alcohol-use
disorders cover a wide range of mental health problems as recognised within the
international disease classification systems (ICD-10, DSM-IV) (5). These include
hazardous and harmful drinking and alcohol dependence (602). Therefore, the key
coding areas of interest were as follows:

140
1. Alcohol Consumption: As the population of interest comprised patients
identified as drinking above recommended limits, it was important to identify
the rates of recorded excessive alcohol consumption (hazardous or harmful
level drinking over recommended limits ) in practices. Hazardous drinking was
defined as drinking over the recommended weekly limit of alcohol (21 units for
men and 14 units for women); harmful drinking was defined as drinking over
the recommended weekly limit of alcohol and experiencing health problems
directly related to alcohol. This would provide a crude indicator of the
population that could potentially benefit from screening and brief intervention
for alcohol.
2. Screening for alcohol use: Next, the study was interested in determining the
rates of recorded delivery of one of three pre-determined screening tests for
alcohol use; namely, FAST (148), AUDIT-C (603) and the full AUDIT (143, 604).
Due to overlap and variations in coding practices, coded instances of
administration of AUDIT-C and FAST were aggregated into a single over-arching
‘brief screening test’ category, with rates of recorded delivery of the full AUDIT
presented separately.
3. Brief advice or interventions for hazardous or harmful alcohol use: Third, the
research sought to identify the rates of patients that had scored positively on
one of the above screening tests and as a result, had either received: brief
advice for alcohol (around 5 minutes in length, also sometimes coded as a brief
intervention for alcohol) or an extended brief intervention (up to four sessions
of 20 to 40 minutes length).
4. Referral to specialist treatment: Finally, the study wanted to establish the rates
of patient referrals to specialist alcohol treatment, such as detoxification
and/or psychosocial interventions, in order to reduce or cease their drinking.
The extent to which practitioners were coding instances of referral to
community detox was of particular interest as a new financial incentive had
been introduced in the South of Tyne and Wear area during the course of the
research (237).
A set of Read code search strategies were developed for the interrogation of general
practice systems, drawing on the intelligence gathered in the previous elements of the

141
quantitative phase, alongside guidance published by the Department of Health (273)
and Haringey Drug and Alcohol Action Team (294) on the optimal recording of alcohol
screening and brief intervention activity. However it is acknowledged that some
practices may have recorded the core concepts outlined above (1-4) using alternative
Read codes. This set of Read code queries was further piloted and refined at one of the
participant practices prior to full roll-out of this element of the research. This pilot
phase also offered an opportunity to gather informal observational data that informed
subsequent revisions to the overall research approach and in particular, more effective
working practices with practice staff. Two separate sets of Read codes were developed
for use in either EMIS (605) or SystmOne (606) clinical computing systems, as these
emerged as the main software used in UK GP practices (600, 607). Importantly, both
systems were also recommended by the GP Systems of Choice scheme through which
the NHS funded the provision of GP clinical IT systems in England (608). The Read Code
queries conducted at each participating practice are detailed below.
Table 14: Alcohol Read Code queries
Description SystmOne 5 byte (EMIS, Vision, Torex)
Q: Number of patients drinking at hazardous levels between 2006-2011
1 Male weekly unit consumption (upper limit 49; lower limit 22) Ub171 136..
2 Female weekly unit consumption (upper limit 35; lower limit 15) Ub171 136..
Q: Number of patients drinking at harmful levels between 2006-2011
3 Male weekly unit consumption (upper limit 99; lower limit 50) Ub171 136..
4 Female weekly unit consumption (upper limit 99; lower limit 36) Ub171 136..
Q: Number of patients drinking at hazardous levels between 2010-2011
5 Male weekly unit consumption (upper limit 49; lower limit 22) Ub171 136..
6 Female weekly unit consumption (upper limit 35; lower limit 15) Ub171 136..
Q: Number of patients drinking at harmful levels between 2010-2011
7 Male weekly unit consumption (upper limit 99; lower limit 50) Ub171 136..
8 Female weekly unit consumption (upper limit 99; lower limit 36) Ub171 136..
Q: Number of patients screened with FAST or AUDIT-C between 2010-2011
9 FAST Screenings XaNO9 9k16
10 AUDIT C Screenings XaORP 9k17

142
Q: Number of patients with a positive FAST or Audit-C score between 2010-2011
11 No of positive FAST screenings (upper limit 16; lower limit 3) XaNO9 .388u
12 No. of positive AUDIT-C screenings (upper limit 12; lower limit 5) XaORP 9k17
Q: Number of patients given full AUDIT assessment between 2010-2011
13 No. of full AUDIT conducted XM0aD 9k15/.38D3
Q: Number of patients given brief advice/intervention/extended intervention between 2010-2011
14 Brief advice XaFvp 8CAM
15 Brief intervention XaPPv 9K1A
16 Extended intervention XaPPy 9K1B
Q: Number of patients with a full AUDIT score of 20 or more referred to specialist alcohol treatment services between 2010-2011
17 Referred to specialist alcohol treatment services Xa0RR 8HkG
18 Referred to community detox 8BA8 8BA8
Simple count data for the above queries were extracted from practice computers. In
order to maintain patient confidentiality, data were extracted in aggregated form as
tables showing total counts by Korner band age groups and by gender for the specified
time period. The figure below (relating to a query on number of male patients
recorded as drinking at hazardous or harmful levels) illustrates the typical table format
of data extracted from practice systems.
Figure 13: Example table of aggregated Read Code counts extracted from general practice systems
The aggregated count data were transferred into Excel for data management and
analysis purposes. Analysis of the resultant data involved the following:
Q1 (25.1.2012) . BASE IS PRACTICE POPULATION
------------------------------------------------------------------------------
|Age groups |0-4 5-16 17-24 25-34 35-44 45-54 55-64 65-74 75-84 85-89 90+ |
|------------------------------------------------------------------------------|
|Males 0 0 90 65 63 143 161 106 48 15 6 |
|------------------------------------------------------------------------------|
|Base 236 548 590 573 593 618 459 307 196 55 27 |
|------------------------------------------------------------------------------|
|Percent 0% 0% 15% 11% 11% 23% 35% 35% 24% 27% 22% |
|------------------------------------------------------------------------------|
|Females 0 0 0 0 0 0 0 0 0 0 0 |
|------------------------------------------------------------------------------|
|Base 233 523 647 615 619 643 515 336 300 98 62 |
|------------------------------------------------------------------------------|
|Percent 0% 0% 0% 0% 0% 0% 0% 0% 0% 0% 0% |
|------------------------------------------------------------------------------|
|Total males : 697 Base : 4202 Percent : 17% |
|------------------------------------------------------------------------------|
|Total females : 0 Base : 4591 Percent : 0% |
|------------------------------------------------------------------------------|
|Total both sexes : 697 Base : 8793 Percent : 8% |
------------------------------------------------------------------------------

143
a. Rates (proportions) were calculated for each variable by dividing the
aggregated counts (the numerator) by the patient population for each practice
(the denominator population). In statistical terms, these populations were
‘open’: patients may have entered or left the population during the specified
time period (through ageing, migration, birth, death, and so forth), each
contributing different periods at risk (609).
b. 95 % confidence intervals for rates (proportions) were determined using the
binomial distribution and calculated using the Wilson Score method (610). The
Wilson Score method is the preferred method of the Association of Public
Health Observatories (609) and has been evaluated and recommended by
Newcombe and Altman (611, 612). Importantly, this method can be used with
any data values, including small samples, and, unlike some methods, it does not
fail to give an interval when the numerator count, and therefore the
proportion, is zero (609). The calculations were carried out in Excel using an
‘add-on’ function programmed with visual basic as detailed in Figure 14.
Figure 14: Visual basic Wilson Score Add-on for Excel
Option Compare Database Option Explicit Function WilsonCI(dNumerator As Double, dDenominator As Double, _ dZ As Double, iUpper As Integer) As Double Dim dPartA As Double, dPartB As Double, dPartC As Double, dProportion As Double Dim dPtB1 As Double, dPtB2 As Double ' This function implements the Wilson method for calculating ' a confidence interval for a proportion. It takes 4 arguments. ' dNumerator and dDenominator have their obvious meanings. ' dZ is the value expressed as ' Z ' 1-a/2 ' This is the 1-a/2 percentile of a standard normal distribution. ' For a = 95% it will be 1.96 ' iUpper indicates if the upper (value - 1) or lower (value - 0) ' confidence interval is required. If dDenominator = 0 Then Exit Function dProportion = dNumerator / dDenominator dPartA = dProportion + ((1 / (2 * dDenominator)) * (dZ ^ 2)) dPtB1 = ((dProportion * (1 - dProportion)) / dDenominator) dPtB2 = (dZ ^ 2 / (4 * (dDenominator ^ 2))) dPartB = dZ * Sqr(dPtB1 + dPtB2) dPartC = 1 + ((1 / dDenominator) * (dZ ^ 2))

144
If iUpper = 1 Then WilsonCI = (dPartA + dPartB) / dPartC Else WilsonCI = (dPartA - dPartB) / dPartC End If End Function
c. Heterogeneity between key variables (sex; individual practices; enhanced
service for alcohol status; NHS organisation; and size / type of practice) was
tested using the Cochrane Q test (613). Statistical analyses were performed
using Stata 12.0 (StataCorp, College Station, Texas), with the metan macros
used for meta-analytic procedures. P values <0.05 were considered statistically
significant.
(4) Field notes
In addition, a research journal and field notes also contributed to the data gathered as
part of the research. These notes detailed observations made during the fieldwork
process using a brief pro-forma and to record any additional data obtained outside of
the formal Read Code searches. In particular, these more informal observations,
generally based on unstructured conversations with practice managers and other
administrative practice staff, provided a rich source of data that could complement the
qualitative GP interview findings in the following phase of the research.
5.3 Results
5.3.1 Q1: What alcohol-related Read codes are available to UK General
Practitioners?
A total of 287 unique alcohol-related Read Codes were identified once locally
generated, practice-specific codes had been eliminated (see Appendix I for full list).
This comprehensive list of codes was analysed to determine: the main categories of
alcohol-related Read codes; any areas of duplication in available Read codes; and
finally any Read codes which the associated textual accompanier suggest were out-
dated. These findings are presented to follow.
Main categories of alcohol-related GP Read codes
The textual identifiers accompanying each of the 287 codes were reviewed and
grouped according to overarching coding categories: the identification and treatment

145
of alcohol use disorders; the acute physical or psychological consequences of alcohol;
and the social consequences of excessive drinking.
The largest volume of the available Read Codes at just over half (n = 147, 52%) were
associated with the identification, treatment and management of alcohol use
disorders. Within this group, however, there were clear sub-categories of Read Codes.
First, there were a series of codes relating to the recording of a patient’s alcohol
consumption (n = 51, 18%) or the categorisation of their drinking ‘type’ (n = 34, 12%).
The remainder codes related to the administration of screening tests (both
questionnaire-based and biomedical) (n = 37, 13%); the delivery of brief or extended
interventions, or the distribution of information and advice (including alcohol-related
‘lifestyle’ guidance) (n = 10, 4%); referring patients from or to specialist treatment
services (n = 13, 5%); and finally, there were a small number of purely administrative
codes concerned with enhanced service management (n=2, 1%).
An additional 135 (47%) Read codes concerned the more acute clinical consequences
of alcohol abuse, including alcohol-related poisoning and toxic effects (n = 68, 24%);
physical and psychological conditions and disorders (n = 59, 21%); and the impacts of
alcohol use on foetal and maternal health (n = 8, 3%). A final small number of Read
codes covered what might be described as the social consequences of alcohol misuse
(n = 6, 2%), including codes for a personal or family ‘history’ of alcohol abuse. This data
is summarised in the following table (15).

146
Table 15: Main categories of all alcohol-related Read codes
Read Code Category Count %
Identification and treatment of AUDs 147 52
Alcohol consumption pattern 51 18
Screening test administered (self-report questionnaire or biomedical) 37 13
Alcohol Use Disorder identified 34 12
Referral to / from specialist treatment services 13 5
Delivery of brief advice / intervention or an extended intervention 10 4
Enhanced service administration 2 1
Acute physical / psychological consequences 135 47
Alcohol-related poisoning / toxicity 68 24
Alcohol-related physical / psychological conditions 59 21
Foetal / Maternal Health 8 3
Social Consequences 6 2
Total 287 100
Areas of duplicate alcohol-related Read codes
The GP Read code system is a dynamic entity, and updated regularly to reflect changes
in clinical practice. However, due to the need to ensure continuity in data aggregation
over time (265), old codes are not deleted; but rather when newer codes supersede
previous versions, the overall Read code lexicon is simply augmented to include all
potential Read codes. Currently two versions, Version 2 (v2) and Version 3 (CTV3 or
v3), are actively maintained by the NHS UK Terminology Centre (UKTC). As such, there
are potentially areas of Read coding where there is considerable duplication, and
where outmoded Read codes continue to be available that have since been
superseded by updated and more appropriate terminology.
Given the previous phase of research (a systematic review of factors influencing GP
recording practices, see Chapter 4) had determined that the sheer volume of available
Read codes impacted negatively on the accuracy and consistency of clinician coding
practices, it was important to determine the extent to which excessive and duplicate
Read coding could potentially affect GPs‘ recording of alcohol treatment and
diagnoses. Thus, in the next stage of analysis, additional textual identifiers were
considered to ascertain any notable areas of duplication in the available alcohol-
related Read codes. As detailed in the table below (16), the main area of duplication
that emerged concerned those Read codes concerned with classifying a patient’s
alcohol consumption level. For patients classed as lower risk, increasing risk and higher
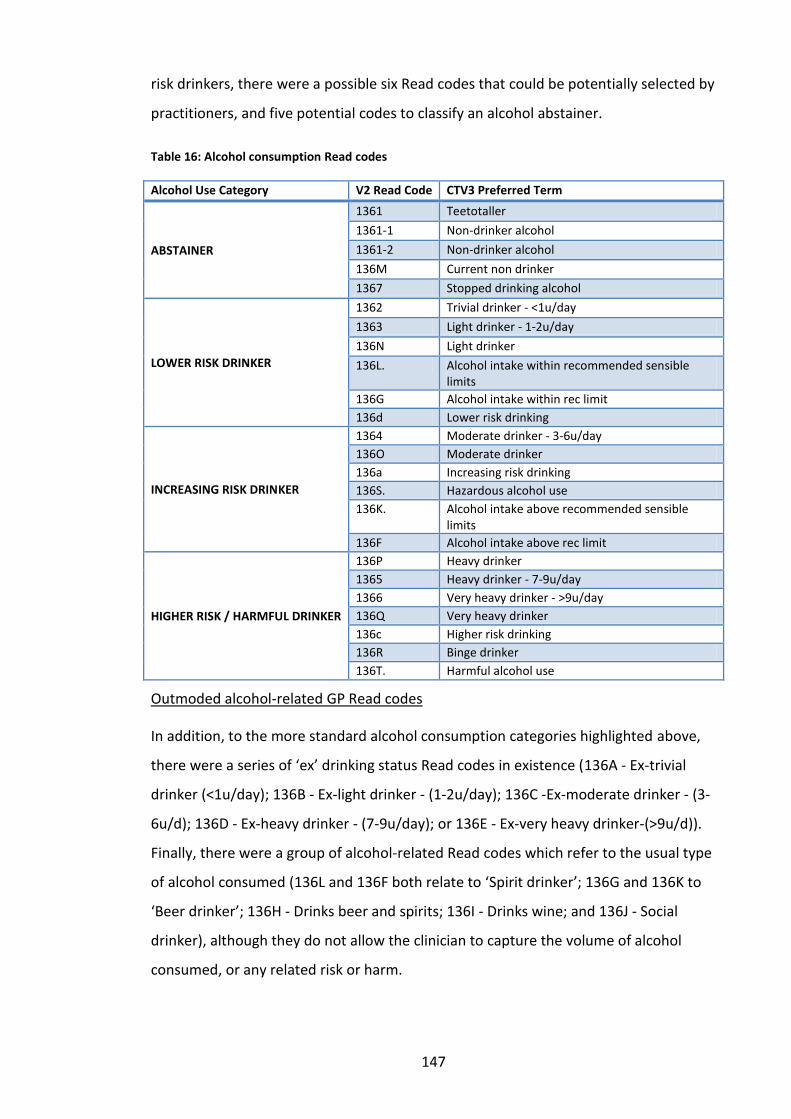
147
risk drinkers, there were a possible six Read codes that could be potentially selected by
practitioners, and five potential codes to classify an alcohol abstainer.
Table 16: Alcohol consumption Read codes
Alcohol Use Category V2 Read Code CTV3 Preferred Term
ABSTAINER
1361 Teetotaller
1361-1 Non-drinker alcohol
1361-2 Non-drinker alcohol
136M Current non drinker
1367 Stopped drinking alcohol
LOWER RISK DRINKER
1362 Trivial drinker - <1u/day
1363 Light drinker - 1-2u/day
136N Light drinker
136L. Alcohol intake within recommended sensible limits
136G Alcohol intake within rec limit
136d Lower risk drinking
INCREASING RISK DRINKER
1364 Moderate drinker - 3-6u/day
136O Moderate drinker
136a Increasing risk drinking
136S. Hazardous alcohol use
136K. Alcohol intake above recommended sensible limits
136F Alcohol intake above rec limit
HIGHER RISK / HARMFUL DRINKER
136P Heavy drinker
1365 Heavy drinker - 7-9u/day
1366 Very heavy drinker - >9u/day
136Q Very heavy drinker
136c Higher risk drinking
136R Binge drinker
136T. Harmful alcohol use
Outmoded alcohol-related GP Read codes
In addition, to the more standard alcohol consumption categories highlighted above,
there were a series of ‘ex’ drinking status Read codes in existence (136A - Ex-trivial
drinker (<1u/day); 136B - Ex-light drinker - (1-2u/day); 136C -Ex-moderate drinker - (3-
6u/d); 136D - Ex-heavy drinker - (7-9u/day); or 136E - Ex-very heavy drinker-(>9u/d)).
Finally, there were a group of alcohol-related Read codes which refer to the usual type
of alcohol consumed (136L and 136F both relate to ‘Spirit drinker’; 136G and 136K to
‘Beer drinker’; 136H - Drinks beer and spirits; 136I - Drinks wine; and 136J - Social
drinker), although they do not allow the clinician to capture the volume of alcohol
consumed, or any related risk or harm.

148
5.3.2 Q2: How frequently are available alcohol-related Read codes used in
routine primary health care? A single GP practice case study
The primary objective of the case study was to investigate, in detail, which Read codes
were used most frequently to record alcohol treatment and diagnoses in general
practice. Secondary objectives were to identify which alcohol-related Read codes were
unused during the surveyed period, and to identify any areas of duplication in alcohol-
related Read codes. In addition, the case study offered an opportunity to pilot the set
of alcohol-related Read code queries developed for use in the subsequent element of
the quantitative research; and finally, to gather additional contextual data about the
process of routine Read coding in GP practices that could inform the remainder of the
research.
As detailed in section 5.2.8, practice electronic records were searched using the
comprehensive list of alcohol-related Read Codes developed in the previous element
of this research phase (see Appendix I) in order to identify the number of occasions
each Read code had been used over the periods 2007 to 2011 inclusive.
High incidence Read Codes between 2007-2011
All the top ten highest incidence Read codes fell within the broad category of the
identification and treatment of alcohol use disorders (AUD). As illustrated in both the
table (17) and line graph (15), throughout the period surveyed, Read code 136.0, which
relates to a patient’s alcohol consumption (usually with the addition of relevant weekly
units consumed recorded in the electronic patient records), was by far the most
frequently used code. The recorded rate of use of 136.0 was relatively consistent
throughout the surveyed period, ranging from 34.5% (n = 1,707) in 2007, to its peak
usage in 2010, at 39.4% (n = 1947). This was followed by relatively high rates of use of
Read code 8CAM (Patient advised about alcohol), although this increased noticeably
from 15.4% (n = 764) in 2007 to around 25% (n = 1238-1272) during the period 2008 to
2011 inclusive.
Use of the new Read Codes established as part of the introduction of the Directed
Enhanced Service for alcohol increased from 2008 onwards. For example, rates of
recording of Read Code 388u (FAST alcohol screening test), increased from 0.8% (n =
38) in 2008, to 7.5% (n = 373) in 2011. There were also small increases for Read Code

149
9k17 (Alcohol screen – AUDIT-C completed: 0.0% (n = 0) in 2008 to 0.4% (n = 21) in
2011); 9k1A (BI for excessive alcohol consumption completed: 0.0% (n = 0) in 2008 to
0.6% (n = 31) in 2011); and 9k15 (Alcohol screen – AUDIT completed: 0.0% (n = 0) in
2008 to 0.2% (n = 11) in 2011).
The table (17) and figure (15) below illustrate the top ten most frequently used
alcohol-related Read codes in the case study practice during the surveyed period
Table 17: Top ten highest incidence alcohol-related Read codes between 2007-2011
2007 2008 2009 2010 2011
V2 Read Code (Preferred Term)
% No. % No, % No. % No. % No.
136.0 (Alcohol consumption) 34.5 1707 38.7 1914 38.8 1919 39.4 1947 36.3 1796
8CAM (Patient advised about alcohol) 15.4 764 25.7 1272 25.5 1259 25.2 1248 25.0 1238
388u (Fast alcohol screening test) 0.0 0 0.8 38 7.3 362 7.4 365 7.5 373
E23 (Alcohol dependence syndrome) 0.6 30 1.3 64 1.4 69 1.3 62 1.4 67
6792.0 (Health ed. – alcohol) 0.8 39 0.4 22 0.5 23 0.1 3 0.5 23
E23-2 (Alcohol problem drinking) 0.2 12 0.4 19 0.5 25 0.5 25 0.5 27
9k17 (Alcohol screen - AUDIT C completed)
0.0 0 0.0 1 0.2 9 0.2 10 0.4 21
E250 (Alcohol abuse – nondependent) 0.1 7 0.2 11 0.1 6 0.1 5 0.1 7
9k1A (BI for excessive alc. consumption completed)
0.0 0 0.0 0 0.0 0 0.0 2 0.6 31
9k15 (Alcohol screen - AUDIT completed) 0.0 0 0.0 1 0.2 8 0.1 4 0.2 11
Figure 15: Top ten high incidence alcohol-related Read codes between 2007-2011
0.0
5.0
10.0
15.0
20.0
25.0
30.0
35.0
40.0
45.0
2007 2008 2009 2010 2011
Rat
es
(%)
136 (alcohol consumption)
8CAM (patient advised about alcohol)
388u (FAST screening test)
E23 (alcohol dependence syndrome)
6792 (health ed - alcohol)
E23-2 (alcohol problem drinking)
9k17 (AUDIT-C screening test)
E250 (alcohol abuse - nondependent)
9k1A (brief intervention completed)
9k15 (AUDIT screening test)

150
Overall, of the forty Read codes that had been used during the surveyed period (2007-
2011), the majority related to the identification and treatment of alcohol use disorders
(82.5%, n = 33), with a smaller number relating to acute physical or psychological
effects of alcohol dependence such as mental or behavioural disorders due to alcohol
or seizures due to alcohol withdrawal (17.5%, n = 7).
Zero incidence Read codes between 2007-2011
The remaining 247 Read codes (86% of available codes) were not used at all during the
period 2007-2011 (see Appendix J for full list of Read codes). Over half of these (n =
129, 52%) related to acute physical or psychological consequences of harmful alcohol
use, many of which, would of course occur relatively rarely in a standard patient
population. However, a further 113 Read codes (45.75%) were related to the
identification and treatment of AUDs. A number of these included the out-dated Read
codes identified in section 5.3.1 (for example, 136L / 136F both relate to ‘Spirit
drinker’; 136G / 136K ‘Beer drinker’; 136J ‘Social drinker’). The full list of zero incidence
codes is provided in Appendix J.
5.3.3 Q3: Are there significant differences in the rates of alcohol screening
and brief intervention Read coding at individual GP practice level?
The following section presents the findings from the analysis of Read code data
extracted from the sixteen North East based GP practices. The aim of this final element
of the quantitative research was to explore whether there were significant differences
in rates of routine recording of alcohol screening and brief interventions and patient
alcohol consumption levels between different types of GP practice.
Recorded rates of screening and brief interventions for alcohol
The Read codes of interest concerned the following coding categories: the recording of
individual patients’ alcohol consumption; recorded screening for alcohol use disorders
using validated self-report questionnaire tools; the delivery of alcohol interventions via
any modality (i.e. recorded as either advice, brief or extended intervention); and
recorded referral to either specialist services or into community detox. Table 18
presents the extracted Read code data in aggregated form, with more detailed results
to follow by coding category.

151
Differences in recording rates are reported by both individual practice and between
key variables of interest, namely enhanced service for alcohol status, and by size / type
of practice. For enhanced service status, practices were divided into three categories:
(1) those which had not signed up to either a local or national level enhanced service
(all of these were based in the North of Tyne); (2) those signed up to only the DES
(again, all based in North of Tyne); and (3) those practices which had signed up to both
the LES and DES for alcohol (all of which were based in the South of Tyne and Wear).
Analysis was also carried out to compare recording rates between different NHS
organisational areas (i.e. whether practices were based in the NHS North of Tyne or
NHS South of Tyne and Wear areas). In reality, however, given that all practices in NHS
South of Tyne and Wear were signed up to both national and local Enhanced Service
for alcohol schemes, results are presented by DES / LES status only (i.e. the recording
rates at NHS organisational level mirrored enhanced service status).
Finally, recording rates were calculated by dividing the aggregated Read code counts
by the total registered patient population for each practice. Thus, rates were
determined by the number of patients both registered at a GP practice during the
surveyed period who were also screened and / or advised or referred about their
alcohol consumption. As such, it is important to note that women’s tendency to
present more frequently in primary health care, could potentially affect results (471,
614).

152
Table 18: Recorded rates of alcohol screening, delivery of brief advice / intervention and specialist referrals by practice and gender
15
2
Rate (%)
Base
Hazardous and Harmful Drinking Short Screen Full Audit Brief Advice
Brief Intervention
Extended Intervention
Specialist Referrals
Community Detox
Practice M F M F M F M F M F M F M F M F M F
NH
S N
ort
h o
f Ty
ne
NOTW1 690 682 2.5 0.3 2.2 0.0 0.0 0.0 0.0 0.0 0.0 0.0 0.0 0.0 0.0 0.0 0.0 0.0
NOTW2 8076 8421 4.3 1.5 0.0 0.0 0.6 0.1 0.6 0.3 0.0 0.0 0.0 0.0 0.0 0.0 0.0 0.0
NOTW3 4944 4882 8.1 7.8 0.0 0.0 0.4 0.2 4.6 6.3 0.2 0.2 0.0 0.0 0.0 0.0 0.0 0.0
NOTW4 1552 1539 1.0 0.7 4.9 5.1 0.0 0.0 0.0 0.0 0.0 0.0 0.0 0.0 0.0 0.0 0.0 0.0
NOTW5 3813 3838 5.7 2.5 0.0 0.0 0.0 0.0 11.4 7.3 0.1 0.0 0.0 0.0 0.0 0.0 0.0 0.1
NOTW6 3291 3468 3.0 1.6 0.0 0.0 0.0 0.0 0.0 0.0 0.0 0.0 0.0 0.0 0.0 0.0 0.0 0.0
NOTW7 3870 4149 4.6 2.1 0.0 0.0 0.0 0.0 12.8 7.1 0.0 0.0 0.0 0.0 0.0 0.0 0.0 0.0
NOTW8 284 312 2.8 1.3 54.6 57.7 7.0 3.5 0.0 0.0 9.9 6.1 0.0 0.0 0.7 0.0 0.0 0.0
NOTW9 4202 4591 13.0 4.2 6.6 8.0 10.5 12.4 9.8 13.5 12.4 11.6 0.0 0.0 0.0 0.0 0.1 0.0
NH
S So
uth
of
Tyn
e an
d W
ear SOTW1 2577 2313 12.5 3.6 7.0 7.1 0.0 0.0 24.7 22.9 0.0 0.0 0.0 0.0 0.0 0.0 0.0 0.0
SOTW2 712 518 30.6 42.3 25.8 34.9 0.7 1.0 16.7 19.3 0.3 0.0 0.0 0.0 0.1 0.0 0.1 0.0
SOTW3 1465 1552 19.9 19.2 16.3 14.8 1.1 0.4 10.7 8.0 0.3 0.1 0.0 0.0 0.1 0.0 0.0 0.0
SOTW4 2444 2390 18.2 22.9 0.0 0.0 0.0 0.0 8.8 10.3 0.0 0.0 0.0 0.0 0.1 0.1 0.0 0.0
SOTW5 2935 3326 0.4 0.4 4.1 4.2 0.0 0.0 0.7 0.1 0.0 0.0 0.0 0.0 0.1 0.1 0.0 0.0
SOTW6 3633 3907 6.4 2.9 2.3 0.9 1.9 0.6 6.9 4.8 1.8 0.1 0.1 0.1 0.3 0.2 0.1 0.0
SOTW7 8078 8352 9.1 4.3 0.1 0.1 7.4 9.6 7.0 3.8 1.1 0.4 0.0 0.0 0.1 0.0 0.0 0.0

153
Recorded rates of hazardous and harmful level alcohol consumption
The first area of alcohol Read coding examined concerned the rate of patients
recorded by participant practices as drinking above recommended limits (either at
hazardous or harmful levels). This data could have been recorded on a variety of
occasions. Primarily, however, practices reported that alcohol consumption would be
collected in three main ways: as part of the standard data set captured at the point of
a new patient registration; during an annual health review carried out by a nurse
practitioner; or more opportunistically during the course of a standard GP
consultation.
Variation by practice
At practice level, the rate of recorded hazardous and harmful alcohol consumption
ranged considerably, between 0.41% and 30.62% for males, and between 0.29% and
42.28% for females. The heterogeneity between individual practices was significant
(males: p < 0.001; females: p < 0.001). As shown in figure 16 to follow, those practices
with the highest rates of recorded hazardous or harmful alcohol use were classed as
smaller than average in terms of patient population, were all based in Sunderland PCT
in relatively deprived areas, and were all signed up to both the national and local
enhanced service for alcohol.

154
Figure 16: Rates of recorded hazardous and harmful level alcohol consumption 2010-2011 by individual practice and gender
Variation by enhanced service status
The variation by enhanced service status referred to above was more clearly evident
when recording rates were compared between those practices signed up to an
enhanced service and those not in receipt of financial incentives (see figure 17). Rates
of recorded hazardous and harmful alcohol consumption ranged from 4.61% males
(95% CI: 4.30-4.95) / 0.35% females (95% CI: 0.27-0.45) in practices with no enhanced
service; to 7.45% males (95% CI: 7.03-7.89) / 4.34% females (95% CI: 4.02-4.68) in
those signed up to the DES only; and were highest in practices signed up to both LES
and DES, at 10.33% males (95% CI: 9.93-10.74)/ 7.28 females (95% CI: 6.95-7.63). The
difference between these groups of practices was significant (males: p < 0.001;
females: p < 0.001).
0.00
5.00
10.00
15.00
20.00
25.00
30.00
35.00
40.00
45.00
50.00
NO
TW1
NO
TW2
NO
TW3
NO
TW4
NO
TW5
NO
TW6
NO
TW7
NO
TW8
NO
TW9
SOTW
1
SOTW
2
SOTW
3
SOTW
4
SOTW
5
SOTW
6
SOTW
7
Rat
e (
%)
Practice
Proportion (%) Male
Proportion (%) Female
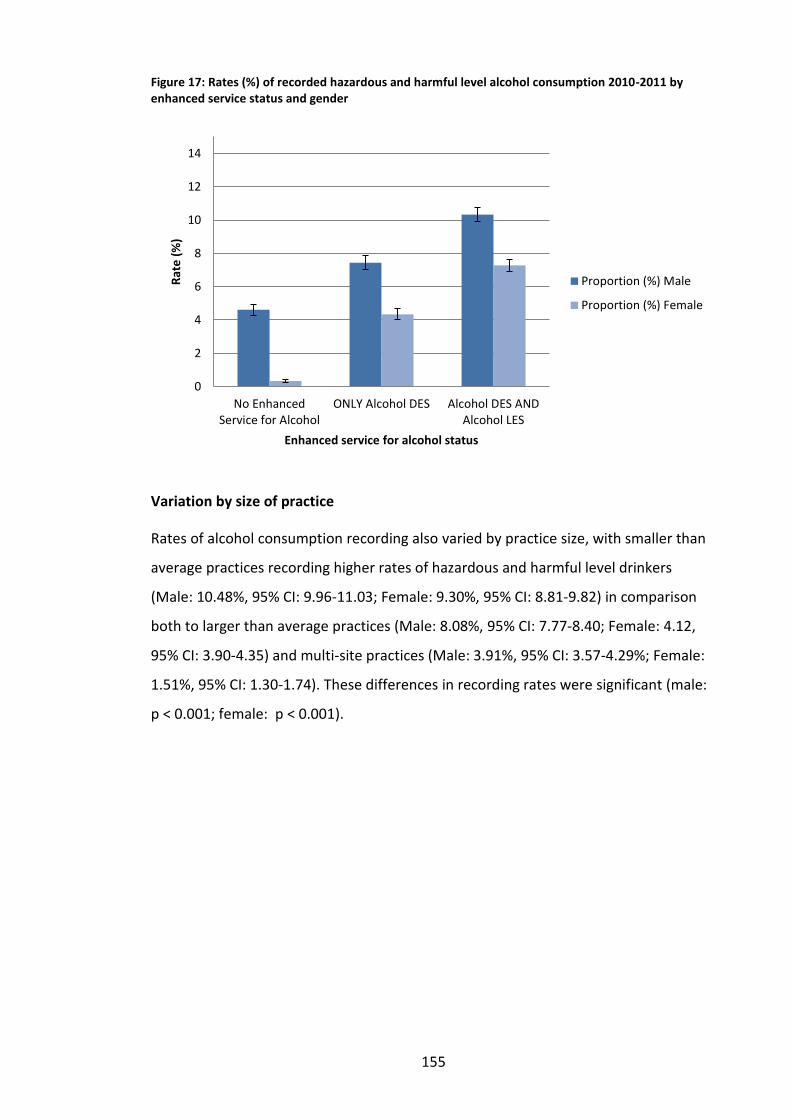
155
Figure 17: Rates (%) of recorded hazardous and harmful level alcohol consumption 2010-2011 by enhanced service status and gender
Variation by size of practice
Rates of alcohol consumption recording also varied by practice size, with smaller than
average practices recording higher rates of hazardous and harmful level drinkers
(Male: 10.48%, 95% CI: 9.96-11.03; Female: 9.30%, 95% CI: 8.81-9.82) in comparison
both to larger than average practices (Male: 8.08%, 95% CI: 7.77-8.40; Female: 4.12,
95% CI: 3.90-4.35) and multi-site practices (Male: 3.91%, 95% CI: 3.57-4.29%; Female:
1.51%, 95% CI: 1.30-1.74). These differences in recording rates were significant (male:
p < 0.001; female: p < 0.001).
0
2
4
6
8
10
12
14
No EnhancedService for Alcohol
ONLY Alcohol DES Alcohol DES ANDAlcohol LES
Rat
e (
%)
Enhanced service for alcohol status
Proportion (%) Male
Proportion (%) Female

156
Figure 18: Rate (%) of recorded hazardous and harmful level alcohol consumption 2010-2011 by size / type of practice and gender
Recorded rates of screening for alcohol use disorders
The next area of alcohol-related Read coding examined was the recorded rate of
delivery of a screening test for alcohol use disorders using a validated self-report
questionnaire tool. For the purposes of this research, GP systems were searched for
recorded delivery of either the brief or full versions of the DH recommended screening
tests (specifically AUDIT-C, FAST, or the full AUDIT) (615). Again, these data could have
been recorded in a number of situations, primarily when a new patient registered at
the practice (as required by both national and local level enhanced service for alcohol
schemes), or during the course of a standard GP consultation. Note that data for
recording rates of brief versions of the recommended screening tests represent a
combined value for both recorded incidence of FAST and / or AUDIT-C delivery.
Variation by practice
There was a significant variation at practice level in terms of the recorded rate of both
the brief and full versions of the alcohol use disorder screening tests (AUDIT-C and
FAST combined, and the full AUDIT). As Figure 19 illustrates, use of AUDIT-C and FAST
0
2
4
6
8
10
12
14
Larger than average Smaller than average Multi-site
Rat
e (
%)
Size / type of practice
Proportion (%) Male
Proportion (%) Female

157
combined ranged from 0.00% to 54.58% for males, and between 0.00% and 57.69% for
females, and this heterogeneity was significant (males: p < 0.001; females: p < 0.001).
Practices with the highest rates of screening tool delivery included a recently opened
‘Darzi’ practice (NOTW8), and two Sunderland-based practices (SOTW2 and SOTW3),
which were located in relatively deprived areas. In contrast, those practices reporting
very low rates of brief screening tool delivery were mostly based in the North of Tyne
organisational area, and included three practices (NOTW3, NOTW5 and NOTW7) that
reported zero recordings of AUDIT-C or FAST delivery during 2010-2011. Notably, two
of these practices were not signed up to the national enhanced service for alcohol.
However NOTW3 did report DES status, and interestingly was a practice that reported
having participated in alcohol-related research in the past.
Figure 19: Rates of short screening tool (FAST or AUDIT-C) 2010-2011 by gender and individual practice
The rate of recorded delivery of the full AUDIT also ranged substantially, between
0.00% and 10.47% (males), and between 0.00% and 12.37% (females), and this
heterogeneity was significant (males: p < 0.001; females: p < 0.001). Again, NOTW8 (a
‘Darzi’ practice), showed higher rates of delivery of the full AUDIT test; alongside
0.00
10.00
20.00
30.00
40.00
50.00
60.00
70.00
NO
TW1
NO
TW2
NO
TW3
NO
TW4
NO
TW5
NO
TW6
NO
TW7
NO
TW8
NO
TW9
SOTW
1
SOTW
2
SOTW
3
SOTW
4
SOTW
5
SOTW
6
SOTW
7
Rat
es
(%)
Practice
Proportion (%) Male
Proportion (%) Female

158
NOTW9 and SOTW7 (both larger than average practices which had previously
participated in alcohol-related research). Overall, recorded rates of delivery were
higher in the South of Tyne and Wear, with the majority of practices in the North of
Tyne area having recorded zero incidence of full AUDIT delivery during the time period
surveyed (NOTW1, NOW4, NOTW5, NOTW6 and NOTW7).
Figure 20: Rates of full AUDIT screening tool 2010-2011 by gender and individual practice
Variation by enhanced service for alcohol status
Looking at differences in recorded rates of the delivery of a brief screening test (either
AUDIT-C or FAST) for alcohol according to enhanced service for alcohol status, again,
there was significant variation. Rates were lowest in practices with no enhanced
service (0.097% males (95% CI: 0.06-0.16) / 0.01% females (95% CI: 0.00-0.03)). Rates
were higher in practices signed up to both LES and DES (3.73% males (95% CI: 3.48-
3.99)/ 3.40% females (95% CI: 3.17-3.64)); and were highest of all in practices signed
up to the DES only at 3.58% males (95% CI: 3.29-3.90) / 4.24% females (95% CI: 3.93-
4.58). The difference between these groups of practices was significant (males: p <
0.001; females: p < 0.001).
0
2
4
6
8
10
12
14
16
Rat
e (
%)
Practice
Proportion (%) Male
Proportion (%) Female

159
Figure 21: Rates (%) of recorded delivery of short screening test (FAST or AUDIT-C) for alcohol use disorders 2010-2011 by enhanced service status and gender
For recorded delivery of the full AUDIT, there was also significant heterogeneity
(males: p < 0.001; females: p < 0.001). Again, practices not signed up to an enhanced
service had the lowest recorded rates (males: 0.28%, 95% CI: 0.21-0.37; females:
0.06%, 95% CI: 0.04-0.12). However those signed up to both enhanced services had
lower recorded rates (males: 3.13%, 95% CI: 2.90-3.37; females: 3.75%, 95% CI: 3.51-
4.01) in comparison to practices signed up to only the national DES (all of which were
based in the North of Tyne) (males: 3.36%, 95% CI: 3.07-3.66; females: 3.99%, 95% CI:
3.51-4.01).
0
1
2
3
4
5
6
7
8
9
10
No Enhanced Servicefor Alcohol
ONLY Alcohol DES Alcohol DES ANDAlcohol LES
Rat
e (
%)
Enhanced service for alcohol status
Proportion (%) Male
Proportion (%) Female

160
Figure 22: Rates (%) of recorded delivery of full AUDIT screening test for alcohol use disorders 2010-2011 by enhanced service status and gender
Variation by size of practice
Finally, smaller than average practices had higher rates of recorded brief screening
tests for alcohol (AUDIT-C or FAST) (males: 7.65%, 95% CI: 7.20-8.13; females: 7.69,
95% CI: 7.24-8.17) in comparison to larger than average practices (males: 1.30, 95% CI:
1.17-1.43; females: 1.40, 95% CI: 1.27-1.54). Rates were very low in multi-site practices
(males: 0.02%, 95% CI: 0.00-0.06; females: 0.01, 95% CI: 0.00-0.05). This difference was
significant (males: p < 0.001; females: p < 0.001).
0
1
2
3
4
5
6
7
8
9
10
No Enhanced Servicefor Alcohol
ONLY Alcohol DES Alcohol DES ANDAlcohol LES
Rat
e (
%)
Enhanced service for alcohol status
Proportion (%) Male
Proportion (%) Female

161
Figure 23: Rates (%) of recorded delivery of short screening test (FAST or AUDIT-C) for alcohol use disorders 2010-2011 by size / type of practice and gender
However, larger than average practices had higher rates of recorded delivery of the full
AUDIT in comparison with other types of practices (males: 3.93%, 95% CI: 3.71-4.16;
females: 4.73%, 95% CI: 4.50-4.98), as opposed to lower recorded rates in smaller than
average practices (males : 0.32%, 95% CI: 0.24-0.44; females: 0.17, 95% CI: 0.12-0.26)
and in multi-site practices (males: 0.40, 95% CI: 0.30-0.54; females: 0.09, 95% CI: 0.05-
0.17). Again, this heterogeneity was significant (males: p < 0.001; females: p < 0.001).
Figure 24: Rates (%) of recorded delivery of full AUDIT screening test for alcohol use disorders 2010-2011 by size / type of practice
0
1
2
3
4
5
6
7
8
9
Larger than average Smaller than average Multi-site
Rat
e (
%)
Size / type of practice
Proportion (%) Male
Proportion (%) Female
0
1
2
3
4
5
6
Larger than average Smaller than average Multi-site
Rat
e (
%)
Size / type of practice
Proportion (%) Male
Proportion (%) Female

162
Read coding rates of any mode of alcohol intervention or advice
Read code data were extracted separately on the recorded rate of delivery of brief
advice, brief intervention or an extended intervention for alcohol.
Initial analysis indicated clear recording preference between practices signed up to the
different levels of enhanced service schemes. Rates of recorded delivery of brief advice
for alcohol consumption was highest in practices signed up to both a local and national
enhanced service (males: 8.99% (95% CI: 8.62-9.38); females: 6.74% (95% CI: 6.42-
7.08)) in comparison with either practices not signed up to an enhanced service
(males: 5.95% (95% CI: 5.60-6.32); females: 3.50% (95% CI: 3.23-3.79)), or those only
signed up to the national DES (males: 4.48% (95% CI: 4.15-4.83); females: 6.25% (95%
CI: 5.87-6.66)). This heterogeneity was significant (p < 0.001).
In contrast, rates of recorded delivery of a brief intervention for alcohol were highest
in practices signed up to only the national enhanced service (males: 3.90% (95% CI:
3.59-4.23); females: 3.81% (95% CI: 3.51-4.13)) in comparison with either practices not
signed up to an enhanced service (males: 0.03% (95% CI: 0.01-0.07); females: 0.02
(95% CI: 0.01-0.05)), or those signed up to both enhanced service schemes (males:
0.74% (95% CI: 0.64-0.86); females: 0.17% (95% CI: 0.13-0.24)). Only two of the sample
practices had recorded the delivery of an extended intervention for alcohol. As a
result, the crude rate of recorded delivery of a brief intervention for alcohol use
ranged between just 0.00% and 0.06% (males); and 0.00% and 0.08% (females) and the
heterogeneity between individual practices was not significant (males: p = 1.000;
females: p = 1.000).
In order to capture the total volume of brief advice or interventions for alcohol
currently delivered within the sample practices, counts of recorded delivery of either
Brief Advice, a Brief Intervention or an Extended Intervention were combined, with the
resultant recording rates presented to follow.
Variation by individual practice
Rates of recording of any mode of brief intervention or advice varied between
practices (male: 0.00-24.68; female: 0.00-25.11), and this heterogeneity was significant
(male: p < 0.001; female: p < 0.001). Overall, recorded delivery of brief intervention or

163
advice was highest in practices based in the South of Tyne and Wear area: two
practices in the North of Tyne area (NOTW1 and NOTW4) did not record any such
intervention during the surveyed time period. However, paradoxically, two of out
three practices reporting relatively high recording rates in North of Tyne (NOTW5 and
NOTW7) were not signed up to the alcohol DES.
Figure 25: Rates (%) of recorded delivery of brief advice, brief intervention and /or extended intervention for alcohol 2010-2011 by individual practice and gender including lower and upper confidence intervals
Variation by enhanced service for alcohol status
However, when all instances of recorded brief intervention were combined, rates were
highest in practices signed up to an enhanced service for alcohol. Interestingly, the
combined intervention activity was highest for male patients in practices signed up to
both a local and national enhanced service (9.74%, 95% CI: 9.36-10.14) but for female
patients, more activity had been recorded in practices signed up to the national
enhanced service only (10.06%, 95% CI: 9.59-10.55). As in other alcohol-related Read
coding areas, rates of recording of any type of intervention activity were lowest in
practices not signed up to either enhanced service (male - 5.98%, 95% CI: 5.63-6.35;
female – 3.52%, 95% CI: 3.25-3.80). The heterogeneity between enhanced service
status groups was significant (male: p < 0.001; female: p < 0.001).
0
5
10
15
20
25
30
NO
TW1
NO
TW2
NO
TW5
NO
TW7
NO
TW3
NO
TW4
NO
TW6
NO
TW8
NO
TW9
SOTW
1
SOTW
2
SOTW
3
SOTW
4
SOTW
5
SOTW
6
SOTW
7
Rat
e (
%)
Practice
Proportion (%) Male
Proportion (%) Female

164
Figure 26: Rates (%) of recorded delivery of brief advice, brief intervention and /or extended intervention for alcohol 2010-2011 by enhanced service for alcohol and gender including lower and upper confidence intervals
Variation by size of practice
The highest rates of intervention recording were found in larger than average practices
(male – 10.78%, 95% CI: 10.43-11.15; females – 8.72%, 95% CI: 8.40-9.04); and low in
practices based across multiple sites (male – 0.43%, 95% CI: 0.33-0.57; female – 0.20%,
95% CI: 0.14-0.30). This heterogeneity was significant (male - p < 0.001; female - p <
0.001).
Figure 27: Rates (%) of recorded delivery of brief advice, brief intervention and /or extended intervention for alcohol 2010-2011 by size / type of practice and gender including lower and upper confidence intervals
0
5
10
15
20
25
No Enhanced Servicefor Alcohol
ONLY Alcohol DES Alcohol DES ANDAlcohol LES
Rat
e (
%)
Enhanced service for alcohol status
Proportion (%) Male
Proportion (%) Female
0
2
4
6
8
10
12
14
Larger than average Smaller thanaverage
Multi-site
Rat
e (
%)
Size/type of practice
Proportion (%) Male
Proportion (%) Female

165
Recorded rates of referral to specialist services for alcohol
The final area of analysis concerned the recorded rates of patient referrals to either
specialist services for alcohol or to community detox programmes. The extent to which
practitioners were coding instances of referral to Community detox was of particular
interest as a new element of the Local Enhanced Service had been introduced in the
South of Tyne and Wear area during the course of the research which could have
potentially influenced delivery rates (2). These results are presented narratively,
however, as a very small incidence of referrals were recorded in any of the participant
practices. The full data extracted is presented in Appendix L.
Variation by individual practice
The rate of recorded referral to either specialist services for alcohol or community
detox ranged between 0.00% and 0.70% (males) and 0.00% and 0.15% (females); and
0.00% and 0.14% (males) and 0.00% and 0.15% (females) respectively. However the
heterogeneity between individual practices was not significant in either case (specialist
services - males: p = 0.192; females: p = 0.695; community detox – males: p = 0.999; females:
p = 1.000).
Variation by enhanced service for alcohol status
Only practices signed up to an enhanced service for alcohol had recorded any patient
referrals to specialist alcohol services (DES only – males: 0.03% (95% CI: 0.01-0.07);
females: 0.01% (95% CI: 0.00-0.05); and DES plus LES – males: 0.11% (95% CI: 0.07-
0.16); females 0.07% (95% CI: 0.04-0.11)). The heterogeneity between different
enhanced service statuses was significant (males: p < 0.001; females: p = 0.001).
Heterogeneity was also significant between different NHS organisational areas (males:
p < 0.001; females: p = 0.001).
For referral to community detox, all practices had recorded similarly low levels of
activity (no enhanced service – males: 0.01% (95% CI: 0.00-0.03); females: 0.01% (95%
CI: 0.00-0.04); only DES – males: 0.01% (95% CI: 0.00-0.05); females: 0.01% (95% CI:
0.00-0.04); and both DES and LES – males: 0.01% (95% CI: 0.00-0.04); females: 0.01%
(95% CI: 0.00-0.04)). Heterogeneity was not significant, either in terms of enhanced
service status (males: p = 1.000; females: p = 1.000) or NHS organisational area (males:
p = 0.712; females: p = 0.712).

166
Variation by size of practice
Finally, there was heterogeneity with regards to the rates of recorded referrals to
specialist alcohol services between practices of varying sizes and types (male: p =
<0.000; female: p = 0.010). Crude rates in all groups were low however, and neither of
the groups of multi-site practices had recorded delivery of any specialist referrals
during the study period. Rates of referrals to community detox were also very low
(again, neither of the multi-site practices had recorded delivery), however the
difference was not significant in statistical terms (male: p = 0.352; female: p = 0.351).
5.4 Strengths and limitations
In considering the implications of these results for policy and practice, it is important
to first acknowledge any limitations. In particular, given the quantitative design of this
phase of the research, consideration must be given to the external validity of the
recruited sample. For although the purposive sampling approach employed sought to
engage a group of practices broadly illustrative of the key variables of interest
(enhanced service for alcohol status, NHS organisational area and size/type of
practice), it is nevertheless the case that sample selection was not randomised and
thus the potential for self-selection must be recognised.
As previously described, recruitment was a challenging, protracted process,
complicated by the fact that there is no national database of practices signed up to the
Directed Enhanced Service. However, whilst even former PCTs did not seem to have
access to a comprehensive list of Local Enhanced Service for alcohol practices, Trust-
level intelligence suggested that universal coverage of the LES was achieved during the
recruitment period in two out of the three former PCT areas concerned, meaning that
the potential sample base became increasingly restricted. In total, it took 13 months to
engage the 16 participant practices, and whilst most variables of interest were covered
in this sample, it was not possible to recruit a practice not signed up to an enhanced
service for alcohol in the South of Tyne and Wear NHS organisational area.
There are several factors that could have acted as a barrier to research participation
for GP practices. For example, the sensitive nature of the research, which involved the
scrutiny of practice records relating to their financial reimbursement claims, could
have made some GPs’ less likely to participate, particularly given alcohol is already

167
viewed as a ‘delicate’ topic for discussion (191, 194). In addition, time pressures were
commonly reported as a key reason for non-participation, reflecting the experiences of
other researchers working in primary health care settings (616, 617). At the same time,
there are also factors that could have made certain types of practices more likely than
others to participate. For instance, previous research suggests that an interest in
improving quality of care in the focus research area increases participation rates (618),
and that GPs working in practices that deliver more preventive services are also more
likely to participate in studies overall (619).
Certainly, it would seem likely that practices that were more engaged with the alcohol
prevention agenda, had greater awareness of the importance of Read coding (and in
turn, had better developed alcohol Read coding systems in place) or identified
themselves as ‘research-active’, were more inclined to agree to participate in the
study. Thus, more overtly (‘measurably’) high performing practices around alcohol
screening and brief intervention provision could have been more motivated to
participate in the research than moderately performing ones (617), thus limiting the
generalizability of the data (620). This was particularly the case for the case study
practice, which was signed up to both national and local level enhanced services for
alcohol, and benefitted from having a local opinion leader in the alcohol field within
the senior partners, potentially making it atypical.
Next, looking at the Read code data itself, there are further limitations that need to be
recognised in terms of the ‘validity’ and ‘reliability’ of the measures employed (both of
which must be in place to enable useful comparisons of sets of data to take place
(291)). Measures of validity tell us whether an item measures what it is supposed to,
that is, whether a measurement is true. Thus Neal et al's definition of record validity
states that “medical records…are valid when all those events that constitute a medical
record are correctly recorded and all the entries in the record truly signify an event”
(621). So, for example, in the case of this study, a measure of validity would be judged
on the basis of whether the presence of a Read code for hazardous alcohol
consumption in the clinical database truly means that the patient is drinking at risky
levels. And conversely, the non-presence of a Read code representing the delivery of
brief advice or intervention, would imply that no such activity had taken place. In this
respect, however it must be stressed in the absence of corroborating observational

168
data (such as the use of audio or video taping of consultations), it was only possible to
assess the rates of alcohol screening and brief intervention delivered through what
was formally coded. Therefore it is possible that these data were not an accurate (or
‘valid’) record of the care that was actually given (622). Further, searches were limited
to Read coded as opposed to free text data, and to only the set of pre-determined
Read Codes developed for the query set, thus practices routinely using alternative
codes or care recorded in free text would not have been picked up.
In addition, looking at the ‘reliability’ of the extracted data sets (here meaning the
consistency or reproducibility of the search process), there are also limitations that
further limit the degree of validity that is possible. These relate firstly to issues
experienced with the process of data collection during the fieldwork that could
potentially have compromised the consistency of the extracted data. In total, three
different GP clinical systems were used across the practice sample (EMIS LV, EMIS PCS
and SystmOne), each of which employed different data structures, data definitions and
search mechanisms. Further, different practices had often developed additional Read
codes tailored to the (perceived) needs of the individual practice context. Thus,
although system-specific query sets had been developed for the research, the process
of extracting and analysing data nevertheless remained challenging. In most cases, the
data extraction process was strongly reliant on the skills and attitudes of the assisting
staff member at the practice. These varied considerably and in particular, difficulties
were encountered in accessing some systems because the staff concerned were not
available, trained or particularly cooperative. Finally, it needs to be acknowledged that
the data collection process took place over the period of approximately one year.
Whilst the same time periods of data were searched in all practices, given the fast
changing nature of primary health care policy during the fieldwork, it is possible that
the approach to electronic patient recordkeeping may have changed over the year,
including the potential for some retrospective coding in order to meet contractual
obligations relating to enhanced service payments.
At the same time, despite the limitations outlined above, it is also important to
emphasise some key strengths of the research approach employed. Importantly, as
previously described, all Read code data was extracted onsite as opposed to using a
centralised database of general practice data such as THIN (585) or QRESEARCH (586).

169
This facilitated analysis at identifiable individual practice level, which would not be
possible using a standard general practice database. As such, it was possible to gather
additional contextual data to inform analysis (such as Enhanced Service Status, size /
type of practice, knowledge and awareness of screening and brief alcohol intervention)
that would not have been available if a centralised database was used.
Additionally, this ‘in-situ’ approach to data collection afforded an opportunity to gain
valuable understanding of how primary care IT systems are used in everyday practice.
Informal exchanges with practice managers and clinical system administrators during
the course of data extraction sessions served to reveal considerable variation in
attitudes towards alcohol work as part of the overall practice workload, approaches to
Read coding and the electronic patient record, and individual practice orientations
towards financial incentive systems. In combination with the qualitative interview data
gathered from GPs based at the participant practices, such information would help
inform a more contextualised understanding of alcohol screening and brief
intervention recording in primary health care (see Greenhalgh et al on ‘technologies-
in-use’ (578)).
In addition to informing the overall findings of the research, the ‘situated’ approach to
quantitative data collection also played a valuable developmental role in this mixed-
methods sequential study. Importantly, it helped to establish positive relationships
with local practices that were instrumental in securing GP participation in the
qualitative interview phase of the research. The results also informed the development
of the interview schedule used with GP interviewees, suggesting additional themes for
discussion, and ensuring the interviewer was sufficiently knowledgeable about routine
Read coding practices to interpret participants’ responses.
5.5 Summary and discussion
This chapter has explored how alcohol-related Read codes are used in routine general
practice in order to determine their value as an information source on alcohol
screening and brief intervention delivery. The results suggest three key findings of
significance for this research.
First, the case study has helped illuminate the sheer volume of possible Read codes
that are available to GPs. The results suggest that a minimum of 287 Read codes exist

170
for the recording of alcohol-related findings and procedures in primary care settings.
However, the implications from this research are that only a small minority of these
are in regular use, and that these generally relate to the identification, treatment and
management of alcohol use disorders. Overall, between 2007 and 2011, only a small
proportion of available Read Codes were actually used by clinicians in the case study
practice (13.94%, n = 40), with none of the remainder recorded on a single occasion
over that five year period (86.06%, n = 247). Further, whilst many unused Read Codes
are associated with relatively rare alcohol-related conditions, analysis showed that a
significant number of little used alcohol-use disorder related codes relate to duplicate,
outmoded and unhelpful drinking terminology. This situation is potentially problematic
as previous research by Lusignan et al tells us that the excessive number of Read codes
can lead to inaccurate coding practices, which in turn reduces the validity of the
resultant data (558).
The second significant finding relates to how these codes are actually used in day-to-
day practice. Importantly, the findings from the case study would suggest that Read
codes relating to patient alcohol consumption (136.0) are used much more frequently
than codes relating to the delivery of an alcohol use disorder screening test (such as
388u for FAST or 9k17 for AUDIT-C). Indeed all participant general practices in the
wider study sample captured relatively large quantities of data on patients’ alcohol
consumption, whilst recorded rates of screening and brief alcohol intervention delivery
were relatively low. This echoes findings from previous research highlighting GPs’
reliance on the use of consumption as a means of screening patients as opposed to
using a validated questionnaire such as AUDIT (188).
However, whilst it is encouraging to see that most practices are asking patients about
their alcohol consumption, this is an unreliable means of detecting risky drinking. For
example, across the sample, consumption was generally recorded as the number of
standard units of alcohol an individual patient reported drinking on a weekly basis. This
reflects previous guidance from the Royal College of Physicians (623) which
recommended that men should drink no more than 21 units of alcohol, and women 14
units of alcohol per week. However it is important to stress that this has since been
superseded by the current Department of Health advice which now offers daily rather
than weekly drinking guidelines, recommending that men should not regularly drink

171
more than 3–4 units of alcohol a day and women should not regularly drink more than
2–3 units a day (624). Further, as already emphasised in Chapter 1, evidence suggests
patients both struggle to translate standard drink measures into their actual
consumption reports; and that they may actually underestimate their overall
consumption (189). In comparison, both the full AUDIT, and its briefer alternatives,
offer a highly specific and sensitive screening test which has been specifically designed
to counter variations in both practitioner’s attitudes and experience, and the potential
for misinterpretation by patients (121).
The final finding of significance concerns what this research tells us about the practice
variables that seem to be associated with higher rates of recorded screening and brief
alcohol intervention activity. Overall, the data would suggest that being signed up to
both a national and local enhanced service for alcohol seems to be the strongest
determinant of higher rates of recorded screening and brief alcohol intervention
activity in general practices. In contrast, practices not signed up to either Enhanced
Service demonstrated the lowest rates of recording across all measured indicators of
service. As a result, given that a local enhanced service was only available to practices
in the NHS South of Tyne and Wear organisational area, there was also a clear
geographic differential, with higher rates of recording in the south compared with the
north of the sample. On this basis, policy makers and commissioners would be advised
to consider whether existing national level pay-for-performance arrangements are
sufficiently persuasive, particularly in relation to the weight this finding lends to
continued campaigns to include alcohol within the Quality and Outcomes Framework.
At the same time, however, it is also important to acknowledge the limitations of the
Read Code data collected here, both in terms of their validity (that is, whether
presence (or absence) of an alcohol-related Read Code represents a true measure of
service delivery), and moreover, what the data signify about the quality of the service
delivered. Further, it is also important to highlight that the available data reveal little
about whether it is the particular features of the local enhanced service available in
the South of Tyne and Wear that stimulate increased rates of activity, or the combined
influence of signing up for two sets of financial incentives, or indeed, whether there
are additional features of the higher ‘recorders’ that the quantitative phase was
unable to detect. The next phase of research, qualitative interviews with GPs, will

172
therefore explore any additional factors that might be influencing individual
physician’s recording of alcohol screening and brief interventions, and thus help inform
a more nuanced understanding of which contexts support more robust recording
practices.

173
Chapter 6 General Practitioners’ perspectives on what shapes
their recording of screening and brief alcohol interventions
6.1 Introduction
This chapter presents the findings of qualitative research conducted with a sample of
GPs based in the NHS North of Tyne and South of Tyne and Wear organisational areas
in North East England. First, it describes the aims and objectives of this phase; outlines
the sampling and recruitment strategy; and summarises the approach employed to
data analysis. It then presents the characteristics of the recruited study sample,
followed by the major themes that emerged from analysis of the interview data.
Finally, the chapter considers the strengths and limitations of this component of the
research, and discusses the key implications of the results.
6.2 Method
6.2.1 Rationale, aims and objectives
The primary aim of this third phase of the research was to understand the barriers and
facilitators impacting on GPs’ recording of their delivery of screening and brief alcohol
interventions in routine primary care. In doing so, it would deliver the following
objectives:
To explore the feasibility and acceptability of the Read code system to
General Practitioners;
To identify any contextual issues that might affect GPs’ use of routine
data to record screening and brief alcohol interventions, in particular
the introduction of financial incentives; and
To investigate GPs’ perspectives on the validity of Read code data as a
useful measure of performance of alcohol-related care.
Semi-structured interviews were selected as the method of qualitative data collection
in this doctoral study for several reasons. First, in comparison to unstructured or more
narrative approaches, the ‘structured’ nature of the interviews provided an
opportunity to co-create meaning with interviewees around a set of pre-determined
focus questions of interest: in this case, helping to reconstruct participants’
perceptions of events and experiences related to the recording and delivery of

174
screening and brief alcohol interventions (625, 626). Further, from a logistical
perspective, semi-structured interviews represented a relevant research approach,
given both the ethical and time constraints of conducting fieldwork in busy general
practice settings. Importantly, unlike less structured methods, this method lent itself
to being scheduled in advance at a designated time and location outside of everyday
events (625).
At the same time, the iterative nature of the qualitative research process, in which
preliminary data analysis coincided with data collection, would allow questions to be
developed to reflect emerging findings in the topic of interest, or for questions that
proved ineffective at eliciting the necessary information to be dropped and new ones
added (625). Furthermore, although organised around a set of predetermined open-
ended questions, semi-structured interviews would allow for the emergence of
additional questions based on the direction that the dialogue between interviewer and
interviewee took. Such digressions can be very productive, as they enable the
interview to follow the interviewee’s interest and knowledge, and thus acquire
unanticipated and novel data on the focus topic (627).
GPs were selected as interview subjects as opposed to other practice staff such as
nurses, in recognition of the vital role they play in relation to the recording and
delivery of screening and brief alcohol interventions. Whilst nursing staff are also
involved in the routine delivery and coding of alcohol screening tests in particular
(202), and practice managers strongly influence the overall recording culture of a
practice (558), the way in which most primary care is financed and organised places
GPs in a unique position in terms of directing, delegating and delivering both the
coding and alcohol-related clinical activity itself (261).
6.2.2 Sampling, recruitment and participants
For this study, a purposeful sampling strategy was employed (using Patton’s broad
definition of the term) in order to access ‘information-rich’ cases (628) of GPs’ use of
routine data to record alcohol screening and brief interventions (509). As such, the
overarching sample of interviewees was relatively homogenous as a professional group
of participants, and importantly, shared critical similarities related to the research
question (629). In order to achieve maximum variation of participant perspectives,
175
however, the sampling approach built on both the findings of previous phases of the
research and the overarching theoretical framework of the research (630), with
participants thus selected on the basis of their potential to represent key relational
and conceptual constructs of interest (631-633).
Specifically, interview participants were recruited to represent both different practice
settings (geographically and in terms of Enhanced Service for alcohol status), and GPs’
professional identities (either salaried or partner). Salaried GPs have fixed salary,
contracted duties and hours and generally work under direction of the employing GP
partners, or in some instances, practice management. In contrast, GP Partners benefit
from a share of the practice profits, including those derived from participation in
financial incentives schemes, and generally have more opportunity to be involved in
the overall development of the practice (634).
The rationale behind these units of interest was essentially two-fold. First, previous
literature examined as part of the systematic literature review (Chapter 4) had
underlined the strong influence of structure and environment on GP recording of
routine data, in particular, the impact of financial incentives (553, 554, 558); and the
role of technology, such as the use of coding prompts and data templates in general
practice (558-560, 563). Further, in the specific example of routine alcohol screening
and brief intervention recording, secondary data analysis of GP Read code data
conducted in the quantitative phase of the research (Chapter 5) suggested that higher
rates of screening and brief alcohol intervention recording were evident in practices
receiving financial incentives for alcohol work. It was therefore of particular interest to
interview GPs subject to alternative salary arrangements, based at contrasting
practices in relation to the use of financial incentives for alcohol, and located within
varying organisational contexts with corresponding differences in technological
systems and processes; and thereby help ensure cross-case comparability (451, 635).
For recruitment purposes, the target population was General Practitioners (GPs)
working in primary care settings and based in either NHS North of Tyne or NHS South
of Tyne and Wear organisational areas (encompassing the former: Newcastle PCT;
North Tyneside PCT; Northumberland Care Trust; Gateshead PCT; South Tyneside PCT;
and Sunderland Teaching PCT at the time of recruitment). This component of the study

176
was primarily interested in interviewing GP representatives drawn from the 16 general
practices that had been recruited to the study during the previous research phase
(secondary analysis of GP Read code data, see Chapter 5 for details) in order to explore
in more depth any contextual factors that might shape recording rates. For these
practices, potential interview subjects were generally nominated by the respective
Practice Managers based in each practice; or had ‘volunteered’ their involvement
during the previous phase of fieldwork. However, in recognition of the potential for
the ‘Hawthorne Effect’ (278), whereby the act of participating in research, for
whatever reason, can influence clinical practice, and in turn, research findings (636) as
a result of the “psychological stimulus of being singled out and made to feel important”
(637), GP participants were also sought from outside the original sample.
The sampling framework itself, as illustrated in Table 19 below, was developed to
ensure that at least one interview subject was recruited with the characteristics from
each of the 8 cells (a - h). In addition, the sample also aimed to include an identified
local alcohol ‘champion’, a GP Registrar and an Academic GP.
Table 19: Purposive sample scheme
Enhanced Service for Alcohol No Enhanced Service for Alcohol
Salaried GP Partner Salaried GP Partner
NHS North of Tyne a b c d
NHS South of Tyne & Wear e f g h
6.2.3 Ethics and consent
Eligible participants were first contacted via telephone or email, at which point the
study was explained in more detail and they were provided with an opportunity to ask
questions. With all potential participants, it was explained that participation in the
study was entirely voluntary and that a decision to not participate would not have any
effect upon their legal rights. It was also explicitly stated that participants could
withdraw consent at any time, without giving reason, and that this would also have no
effect upon their legal rights. Once a GP had indicated their willingness to participate
in the research, an interview was arranged, at a time and location convenient to them.

177
Generally, interviews either took place in the respective GPs consulting room, or over
the telephone. At the interview appointment itself, participants were asked to give
written informed consent for an audio-recorded interview (Appendix M). To give
informed consent, potential participants needed to be fully aware as to what
participation involved, therefore a tailored Participant Information Sheet for GPs was
provided, and clinicians were given the opportunity to ask questions (Appendix N). On
average, interviews lasted between thirty and forty minutes. All interviews were
recorded using digital recording equipment.
6.2.4 Data management
After consent, each participant was allocated a unique identification number. Audio
recordings of interviews and any related data was identified by this identification
number and not by a personal identifier. All anonymised data was kept on a password
protected drive. Audio recordings were transcribed verbatim, with any potentially
identifying details removed at that point. This included the removal of all direct
identifiers connected to the data, along with any indirect identifiers that could
potentially result in a breach of confidentiality (such as geographical information,
personal information on an individual patient or practice setting). In the transcripts of
the textual data, any direct and indirect identifiers were either removed or replaced
with pseudonyms or vaguer descriptors prior to write-up. An anonymisation log (table)
of all replacements, aggregations or removals made was created to ensure consistency
and accuracy, with unedited versions to be retained for the purposes of archival
preservation. The audio recordings were permanently deleted once the transcription
process was completed. All data analysis was based on the anonymised transcripts:
direct quotations from the interviews are used in this thesis, however they are
presented according to role and corresponding practice ID (e.g. GPX (NHS AREA)).
6.2.5 Data collection and analysis
An initial outline interview guide was developed as part of the NHS ethics process at
the start of the project. Statistical data gathered in the previous phase of the research
and key findings from the systematic review were used to further inform the
development of the interview guide. In addition, based on advice from contacts in the
primary care sector relating to the limited interview time available with GPs, the topic

178
guide was further refined until the most concise form of the interview questions was
achieved. The final version of the interview topic guide is presented in Appendix N.
Transcriptions were then analysed in accordance with the principles of thematic
analysis, using Framework Analysis to aid data management. Framework Analysis is
deemed to be an appropriate approach for qualitative health research where the
objectives are closely linked to quantitative investigation (638). As such, the gathered
data were sifted, charted and sorted in accordance with key issues and themes.
According to Ritchie and Spencer, this involves a five step process: 1. familiarisation; 2.
identifying a thematic framework; 3. indexing; 4. charting; and 5. mapping and
interpretation (639).
Using a small section of the data, an initial coding framework was developed, based on
the themes emerging from the data. In identifying key themes that might inform the
framework, Ryan and Bernard’s advice to look for a range of evidence in the interview
data, such as repetitions, transitions, linguistic connectors, theory-related material and
missing data (547) was followed. During analysis, a process of constant modification
and re-modification of the original coding framework occurred as new themes
emerged and / or other themes became redundant, thus enhancing the credibility of
the thematic framework and interpretation (640, 641). This process continued until a
final framework was developed and the whole data set was coded and analysed (642).
NVivo Qualitative Research software (version 9.2), which is fully compatible with a
Framework Analysis approach (643), was employed to support this process. Finally, in
order to stimulate a reflective approach to the interview process, and to further inform
framework development, a fieldwork diary was kept throughout the data collection
phase and incorporated into the analysis.
6.3 Results
6.3.1 Characteristics of the recruited sample
Fourteen GPs agreed to participate in the interviews, as detailed in Tables 20 and 21
below. Ten of these GPs were drawn from practices that had participated in the
previous phase of the research study, with four additional interviews conducted with
GPs external to the original quantitative sample. Participants were evenly split along
gender lines (seven male and seven female participants), and in terms of their

179
employment status (seven were partners, six were salaried GPs and one participant
was a GP Registrar). The sample also included one GP who could be described as a
‘local alcohol champion’, and one ‘Academic’ GP. The length of time spent in general
practice varied between interview participants. However overall, the recruited sample
could be described as relatively experienced. In total, half of the interviewees reported
having over 15 year’s clinical experience, either based at their current practice or
elsewhere (seven participants), with the remainder reporting practicing medicine for
between five and 15 years (three participants), and less than five 5 years (four
participants). The two tables below present a summary of the combined sample
characteristics, alongside information on the key sample variables of each GP
participant.
Table 20: Summary characteristics of qualitative interview participants
N (14) %
Gender Male 7 50
Female 7 50
Experience in practice >5 years 4 29
5-15 years 3 21
>15 years 7 50
Employment status Partner 7 50
Salaried GP 6 43
Registrar 1 7
Location North of Tyne NHS 7 50
Newcastle PCT 3 21
North Tyneside PCT 3 21
Northumberland PCT 1 7
South of Tyne and Wear NHS 7 50
Gateshead PCT 4 29
South Tyneside PCT 0 0
Sunderland PCT 3 21
Enhanced service status No Enhanced Service 3 21
Directed Enhanced Service 4 29
Directed Enhanced Service & Local Enhanced Service 7 50
Practice IMD Quintile 1st (most deprived) 5 36
2nd
3 21
3rd
2 14
4th
4 29
5th (least deprived) 0 0

180
Table 21: Key characteristics of individual interview participants
ID NHS Area Gender Enhanced Service Professional Status
GP1 North of Tyne female No Enhanced Service for Alcohol Salaried
GP2 North of Tyne Male Directed Enhanced Service for Alcohol
Partner
GP3 North of Tyne female No Enhanced Service for Alcohol Partner
GP4 North of Tyne female Directed Enhanced Service for Alcohol
Salaried
GP5 North of Tyne female Directed Enhanced Service for Alcohol
Partner
GP6 North of Tyne male No Enhanced Service for Alcohol Partner (Academic GP)
GP7 South of Tyne and Wear
male Directed and Local Enhanced Service for Alcohol
Partner (Local Opinion Leader)
GP8 South of Tyne and Wear
male Directed and Local Enhanced Service for Alcohol
Salaried
GP9 South of Tyne and Wear
female Directed and Local Enhanced Service for Alcohol
Salaried
GP10 South of Tyne and Wear
male Directed and Local Enhanced Service for Alcohol
Salaried (Registrar)
GP11 South of Tyne and Wear
male Directed and Local Enhanced Service for Alcohol
Partner
GP12 South of Tyne and Wear
female Directed and Local Enhanced Service for Alcohol
Partner
GP13 South of Tyne and Wear
female Directed and Local Enhanced Service for Alcohol
Salaried
GP14 North of Tyne male Directed Enhanced Service for Alcohol
Partner
As the table above shows (Table 21), an even representation of practices from each
NHS organisation area of interest was achieved (seven in both the North of Tyne and
South of Tyne and Wear NHS areas). However, at Primary Care Trust (PCT) level, it was
not possible to recruit any GP participants based in the former South Tyneside PCT
area, and only one Northumberland-based GP. Practices were also varied in terms of
the socio-demographic characteristics of the local patient population, although overall,
the recruited practices tended to cover more as opposed to less deprived populations.
Further, practices ranged in size, funding arrangements and length of establishment.
For example, a number were relatively newly established practices, including a walk-in
centre and a ‘Darzi’ polyclinic (594). A further practice was unusual in that it was
funded via the local hospital. One had come about following a merger of two smaller
practices five years earlier.

181
6.3.2 Overview of the interviews
The semi-structured interviews explored a range of topics related to participants’
experiences of delivering and recording alcohol-related activity. The first set of
questions sought to elicit GPs’ perspectives on the process of delivering screening and
brief alcohol interventions, focussing on the feasibility, acceptability and effectiveness
of tackling risky drinking in routine primary healthcare. In particular, practice-level
approaches to case identification were examined, such as targeted versus universal
screening approaches, and the use of validated screening questionnaires as opposed
to alternative and / or more informal methods. The roles played by different practice
staff in this delivery process, from nurses and healthcare assistants to GPs themselves,
were also explored.
Next, the interviews explored participants’ views on, and experiences of, using Read
codes to record their delivery of screening and brief alcohol interventions. In
particular, questions aimed to identify the key barriers and facilitators affecting the
recording of alcohol-related activity, including the impact of financial incentives, as
well as highlighting which aspects of screening and brief alcohol interventions GPs
found more or less straightforward to codify. Participants were also asked for their
views on the use of Read codes more generally as a means of capturing patient-related
information, as well as the role played by narrative free text and computer coding
templates with their wider recording repertoire. Finally, GPs’ perspectives on the value
and validity of using Read code data to document patient care were investigated,
including their views on the extent to which Read Code and other routine data offered
a useful source of information on the quality of primary healthcare being delivered.
Analysis of the resultant data from the GP interviews suggested the existence of five
overarching and closely inter-related themes. The first three themes concerned a
series of structural influencers on GPs’ recording practices. First, participants
highlighted the ways in which certain elements of the design and functionality of
practice IT and Read code systems shaped their coding behaviours. Second,
interviewees framed coding behaviour, and in particular, which types of coding areas
were most prioritised by physicians, as closely associated with the perceived hierarchy
of different financial incentive schemes. Third, GPs suggested the existence of a strong
synergy between practice-level processes for screening patients for risky drinking, and

182
the process of coding such activity employed by individual clinicians. Next, in addition
to these structural influencers, a further two clear themes emerged in the analysis.
Interviews demonstrated the impact that GPs’ views on both the acceptability and
feasibility of delivering brief alcohol interventions in routine care could have on their
Read coding of such activity. Finally, the way in which individual clinicians’
conceptualised the role of the general practitioner, and in turn, how that role shaped
the doctor-patient relationship, emerged as a strong influencer on coding practices.
These five themes are explored in more depth below.
6.3.3 Theme 1: The design and functionality of GP practice IT systems
Interviewees described a practice culture in which both the clinical and administrative
processes were highly technologized. Electronic Read coding represented the normal
process of routine data capture for the majority of GPs, with clinical encounters
computerised as standard practice. As such, the use of Lloyd George paper records was
purely historical and at the very least, interviewees described their practice as “paper
light” (GP6, male, no enhanced service). Yet, despite the routinized and near-universal
adoption of electronic patient records, accounts suggested that training and guidance
to support their use was relatively minimal. The more experienced GP interviewees
described being given an initial round of training when the Read code system was first
launched in the late 1980s. However more commonly, interviewees emphasised the
role played by individual GPs with a particular interest in health informatics in taking
responsibility for the development of practice IT systems, and in particular, the
creation of tailored coding templates. Interviewees also mentioned receiving
communications from practice managers about which Read codes to use, in particular,
relating to data to support the Quality and Outcomes Framework, on a regular basis.
Generally, however, it appeared that coding skills were acquired more informally and
experientially through individual GPs’ daily use of the coding systems. As such, the
utility, accessibility and perceived relevance of the Read code system – in short, how
‘user-friendly’ clinicians found the system - strongly influenced GP coding practices.
This was evidenced in three key common interview sub-themes: navigating the
complex Read code system; the challenge of coding developing diagnoses and / or
unexplained conditions; and GPs’ aversion to the use of electronic coding templates.

183
First, a number of GP interviewees emphasised the difficulty of locating the correct
Read code in everyday practice. In part, this concerned the challenge of navigating the
sheer volume of available Read codes, as one interviewee commented “…the trouble
with Read codes, is there’s so many” (GP6, male, no enhanced service). The high
number of possible Read code options available to clinicians delivered a clear time-
burden when managing the search process itself. However, more commonly, GP
interviewees talked about navigational barriers in terms of the negative impact of
multiple code options on how confident they felt about selecting the ‘right’ code to
use in particular situations. As one interviewee commented, whilst discussing their
experience of the process of choosing the correct alcohol screening Read code:
“…you are never quite sure whether it is that one that you have to
use…if they took away everything that they didn’t want us to use from
the entire system, it will be very helpful. But they leave the things on
that we shouldn’t be using, I don’t know what for.”
GP4, female, directed enhanced service
Indeed, for many GPs, the detection and selection of the appropriate code was
described as almost a ‘wildcard’ process. There was limited awareness that particular
Read codes were more or less appropriate to use in particular circumstances, with GPs
often relying on using the keyword search facility of their clinical IT system to locate a
suitable code. Focusing on alcohol intervention coding in particular, this ‘wildcard’
approach seemed evident across GPs from different types of practices, irrespective of
their Enhanced Service status. The quote below describes this type of inconsistent
Read coding practice well:
“I might well record something like, ‘Discussed alcohol.’ Or ‘Advice
about alcohol.’ Or something like that. I’d have to admit it wouldn’t be
systematic in using the same code for the same thing every time. You
know we use SystmOne, so I’d right click in the box and see what came
up. You know type in alcohol, see what came up under that rubric and
pick one.”
GP6, male, no enhanced service
At the same time, it was also evident that the lack of confidence on the part of some
GP interviewees around selecting the correct Read code resulted in a tendency to
avoid formalising care through coding entirely. In these situations, individual level

184
anxiety about choosing the right Read code meant clinicians simply used the less
structured (and as previously discussed in Chapter 1, less accessible) alternative of
narrative free text to record elements of the patient consultation. For these
interviewees, there was a strong sense of the possible implications of selecting a
particular Read code for the practice, given their use as proxy measures of care for the
purpose of clinical audit. As one interviewee explained:
“Obviously data quality is important, so you’ve got to be careful if
you’ve got a Read Code and you want to use it in a particular way. And
you put something that makes sense in the English language, but then
somebody’s reserved that code for something else, and you shouldn’t
have used it and you’ve got all these ones all over the place that you
shouldn’t touch. And sometimes I think perhaps it’s better to put things
in free text if you’re not sure.”
GP8, male, directed and local enhanced service
Second, in addition to this general challenge of navigating the high volume of Read
codes, interviewees also talked about some particular conditions and diagnoses they
found difficult to translate into code. Indeed, despite the fact that many interviewees
highlighted the excessive number of codes as a barrier to accurate coding, it was also
clear that in many instances the Read code lexicon lacked application to some
common general practice situations. For example, many interviewees reported finding
unexplained or developing conditions particularly challenging to Read code:
“The whole area of medically unexplained symptoms or functional
illness, which is a huge area of our practice, is a little bit, there’s a kind
of dearth of appropriate codes. That’s why I say multiple symptoms or
vague symptoms, might be something that I might use there, well as a
sort of holding code until either an organic diagnosis is made or it is
apparent that it…But I don’t think there is a code for medically
unexplained symptoms.”
GP6, male, no enhanced service
Against these accounts of the challenge of coding developing diagnoses, interviews
nevertheless suggested that GPs felt a keen sense of responsibility to code every
consultation, or at least to Read code what was described as the primary presenting
‘problem’, in addition to any actual diagnoses or tests. Coding the formal (or
‘quantifiable’) diagnosis appeared to be an approach learned early on in GP practice.

185
As one respondent said “It’s drilled into you, erm, you’ve got to have the problem, the
main presenting problem.” (GP7, male, directed and local enhanced service).
Connected to this issue, a number of GPs suggested that they found it more
straightforward to record units of alcohol consumption as opposed to using the Read
codes associated with the delivery of alcohol screening and brief alcohol interventions.
As the following quote implies, the fact that alcohol consumption involves the
recording of a fixed numeric value, appeared to enhance its ‘code-able’ properties for
a GP:
“…if I am going to code it properly, I would put the alcohol units
…because one, there’s a figure, one it’s recorded and then two, it’s
always on the summary screen so I know for next time how much this
person is drinking….and I think for that one, at least it’s clear, and it’s
consistent as well.”
GP9, female, directed and local enhanced service
GP participants also highlighted the issues experienced in using system Read code
templates in routine practice. In theory, Read codes templates represent an effective
means of speeding up data entry, ensuring that all appropriate information about a
patient is obtained and facilitating consistent recording of that patient information
across a practice. However, whilst two interviewees talked positively about the impact
of IT system templates on recording practices (GP3, female, no enhanced service, and
GP7, male, directed and local enhanced service), the more general view on templates
was far more critical. Further, even those who described templates in relatively benign
terms, did so from the perspective of the nurse rather than the clinician as their
primary user (“The nurses are much better at doing templates than doctors are, so it’s
usually done properly when the nurse does it and a bit ad hoc when the GPs do it”
(GP5, female, directed enhanced service)).
There were some specific criticisms made of the alcohol screening and intervention
templates in use at some GP practices, particularly in comparison to those used to
record tobacco interventions. As a result, one interviewee admitted sometimes
avoiding using that template entirely (GP2, male, directed enhanced service). Another
GP also expressed frustration at the existing alcohol intervention template design:

186
“They’re a bit of a scrawl, a bit of a mess. They certainly don’t fit well
into what the nurses like, which is just a very linear thing that you go
through. They probably might appeal more to nurses, but not – you
have to fill in every last bit of it ...it’s a little bit buggy. Some of them, I
can’t, I have to minimise the task bar in order to click out of it when
I’ve finished and that sort of thing. So it’s a bit clumsy to use.”
They continued:
“Doctors, by their very nature, do not like templates…You know, it’s
just a cultural thing. We feel hemmed in, I think.”
GP8, male, directed and local enhanced service
6.3.4 Theme 2: Coding as a reflection of the hierarchy of incentive schemes
Alongside the technological factors described above, it was also clear that the way in
which screening and brief alcohol interventions were resourced also affected coding.
In particular, financial incentives were positioned as driving not only the direction of
care provided by GPs, but also how they captured such care through code. This
overarching influencer was articulated in terms of three clear sub-themes: the primacy
of the Quality and Outcomes Framework as a driver of Read coding; the strong
associative relationship between the design of individual incentive schemes and the
Read coding prioritised by practice staff; and finally, GPs’ limited belief in Read code
data as a meaningful measure of healthcare.
In some respects, this symbiotic relationship between coding and incentives is to be
expected given that practices use Read code data to evidence clinical activities in order
to trigger payment. As highlighted in Chapter 1, this data must be collected in order to
evidence performance against both the more established, universal Quality and
Outcomes Framework (257), as well as the national and local voluntary Enhanced
Service schemes for alcohol [116]. However, interviewees suggested the existence of a
definite hierarchy of coding priorities for clinicians in routine practice, with data
recording relating to the Quality and Outcomes Framework positioned as more
important than that for other types of incentives. As one interviewee commented
“…it’s one third of our income, we have to get QOF or we would go out of business.”
(GP11, female, directed and local enhanced service). This resulted in a keen awareness
of the importance of coding areas of care related to the QOF thoroughly amongst all
GPs:

187
“…you’re driven by what’s important or what you have to categorise.
Somebody smoking is QOF-related so I find a way to read-code
somebody’s smoking status. Especially if there’s a reminder at the
bottom right of the screen, so I would do that fairly comfortably and
there’s lots of different ways of recording it, you can say x light smoker,
or x heavy smoker or current 20 a day or current 17 a day or whatever
you want to put down, so I would do that erm, and, but also record
diagnoses, I’d also record symptoms and that would be generally
helpful to have that coming up on top of the screen, erm so, we do go
through the notes and highlight diagnoses that we want added later
on, and then we’d also go through the records and then pass on results
of say diabetic retinal screening so that our data entrist can record
that, but that’s QOF-driven.”
GP11, male, directed and local enhanced service
Further, and connected to the previous theme related to the impact of technology on
coding, the high priority accorded to the recording of QOF-related data also appeared
evident in both the design of the IT systems in place to support their collection, and in
the way in which administrators encouraged clinicians to code accurately. As one
respondent reported:
“We have better systems in the practice to make sure that the QOF
data is collected and there are more reminders on the screen if it’s not
done. Back office staff will chase people up and things like that for QOF
data”
GP2, male, directed enhanced service
Another GP commented:
“They keep emailing me or tasking me or sending notification in the
patient’s notes to say, “Can you Read Code this, related to your
consultation on this day?” Or, “Can you Read this for that one?” Or,
“Are you able to Read Code this based on your consultation update
that has been picked up on QOF?” or something like that. I keep
getting those on and off.”
GP4, female, directed enhanced service
Accounts of the influence of the various Enhanced Services for alcohol suggested
arrangements were very different to support coding of screening and brief alcohol
interventions. Those interviewees that worked in practices signed up to an Enhanced
Service for alcohol emphasised the importance of coding interventions accurately in

188
order to qualify for payment. However, unlike coding connected to QOF target areas,
GP interviewees implied that nursing staff were responsible for capturing the vast
majority of Read code data to evidence delivery of screening and brief alcohol
interventions. In particular, this was connected to the important role that nurses play
in gathering lifestyle data as part of standardised patient processes, such as the annual
health checks for patients with chronic conditions or registration of new patients to a
practice. One interviewee summarised this practice of coding alcohol screening tests
within a wider healthy lifestyle focus well:
“…that tends not to be done by the doctors, the AUDIT-C, that tends to
be done by our healthcare assistants and nurses who are delivering the
health promotion stuff, so everybody who comes through the
hypertension clinic, the diabetic clinic, COPD, the asthma, the just the
standard man off the street just wanting his cholesterol done, they all
get fed through that template.”
GP11, female, directed and local enhanced service
Further, it was also evident that the design of the Enhanced Services for alcohol,
particularly the national scheme, also served to prioritise the collection of certain
elements of data relating to screening and brief alcohol intervention over others.
Specifically, as practices were generally paid on the basis of the number of screening
tests coded, as opposed to their subsequent delivery and coding of brief alcohol
interventions on the basis of a patient’s screening score, the recording of intervention
data was far less systematised. In fact, in reality, many interviewees suggested they
would be more likely to use free text to record data on alcohol-related discussions in
patient consultations rather than using specific codes introduced as part of the
incentive schemes. Thus, talking about whether alcohol interventions would be coded,
one GP commented:
“No...not unless there was a particular reason for it…So if you were
saying would I record delivered brief intervention on alcohol, I
wouldn’t unless there was QOF driven reason for it or it was important
to put in their notes but er, a vaguer type of thing such as …personal
alcohol consumption heavy, for example might be a reasonable thing”
GP11, male, directed and local enhanced service
This reliance on free text to capture the delivery of interventions or advice on alcohol
was evident in all GPs interviewed. However, responses suggested that formal Read

189
coding was least consistent of all in GPs based in those practices not signed up to an
Enhanced Service for Alcohol (as one GP put it, “You’d probably find I use a different
term every time.” GP6, male, no enhanced service). It should be stressed however, that
delivery of care and the subsequent Read coding of that care were not considered
synonymous in such practices: as one interviewee commented:
“…as long as I know somebody’s drinking 50 units and I know that I’ve
talked them through it and I know that they’re coming back to see me
about it, whether I’ve coded it on the system or not, so what? The
intervention’s been done.”
GP5, female, directed enhanced service
The above quote highlights a common belief set that emerged from the interviews in
relation to the validity of Read code data as representing quality of care. Generally
speaking, for Quality and Outcomes Framework indicators at least, most clinicians
appeared to see the routine data gathered as part of the audit process as providing
only a crude measure of care. A number of interviewees were doubtful that the
essentially ‘tick-box’ nature of Read code data could adequately capture the
complexity of day-to-day care. One GP explained “it’s almost trying to analyse
something that can’t be analysed. It’s like a good piece of music. It just has to be
heard”. (GP7, male, directed and local enhanced service). Indeed, as a further
interviewee commented, using Read codes to assess quality and performance merely
served to “atomise” care:
“Because the really important things about care are, well as important
as doing the checks on a patient with diabetes, are all the other bits
that, all the stuff between that, which is the human interaction and you
know all those kind of things which are, that’s the essence of care.”
GP6, male, no enhanced service
There was also some concern about whether the Read code data gathered to evidence
progress towards QOF targets accurately measured differences in the quality of care,
in particular at individual clinician level. The following account illustrates this concern
well:
“I sat with somebody observing their consultation and once the patient
had left, they just Read Coded things like lifestyle advice regarding
smoking, lifestyle advice regarding alcohol, lifestyle advice regarding

190
diet… ‘How many do you smoke?’ ‘Okay.’ ‘Do you drink alcohol?’ ‘Okay.’
‘How many units do you think it is?’ And, ‘Well, you know, you realise
you are overweight, you need to lose weight.’… So that’s what it meant.
But you could go to some other person who would just then say, ‘Well,
have you thought about stopping smoking?’ ‘No.’ ‘How confident do
you feel on 0 to 10?’ ‘Seven.’ ‘Okay, so what is it that makes it seven
rather than five?’
You know, the same information, so the Read Codes, I don’t think
necessarily capture the content of the discussion. It is just very much a
mechanical robotic activity of just ticking the box or putting the Read
Code. There is a flashing icon on your right hand side, QOF: ‘ask
smoking’. Then you will just ask the smoking status and quickly write it
down. You are aware it is 10 minutes and you have to quickly ask this
question and hope that it doesn’t open a can of worms or something
like that.”
GP4, female, directed enhanced service
6.3.5 Theme 3: Individual coding practices and local-level screening processes
– a synergistic relationship
In addition to the impact of technology and financial resources on recording practices,
a further structural influencer concerned the way in which practice-level care
pathways supporting the delivery of screening for alcohol use disorders shaped
clinician coding behaviour. This was evidenced in terms of: first, the impact of targeted
versus universal screening approaches on coding practices, and how these approaches
were in turn professionally delineated; second, GPs’ reluctance to use validated
screening questionnaires to assess risk; and finally, a strong correlation between
formalised screening and formalised Read coding (and vice versa). These sub-themes
are discussed further below.
First, interviewees talked about a variety of situations in which the alcohol use
disorder screening process would be ‘triggered’ for an individual patient. Broadly
speaking, these fitted into what might be described as ‘targeted’ (whereby potentially
‘at risk’ patients are identified on the basis of pre-determined characteristics) versus
‘universal’ (whereby all adult patients are eligible) alcohol screening approaches. In
terms of more ‘targeted’ approaches, a number of interviewees described how
screening was incorporated within various annual health check processes such as for
the management of chronic diseases, or as part of the recently introduced NHS Health

191
Checks for adults aged 40 to 74. In these instances, the delivery of an alcohol screening
test would be automatically coded by the use of the associated electronic template.
However, most GP interviewees emphasised that nursing staff were generally
responsible for delivering such health checks, and in turn using the alcohol screening
templates. In contrast, ‘targeted’ screening as delivered by GPs, was in reality a far
more ad-hoc and far less systematic process. For example, it was evident that some
clinicians were more likely to screen an individual patient depending on their
presenting condition, and its perceived relationship with alcohol use. It was often
unclear as to whether this perceived relationship was objective and evidence-based, or
more the accumulation of what might be described as ‘learned clinical experience’.
One interviewee mentioned mental health as an example of this screening approach,
“…because alcohol is so, you know, entwined with mental health…it would be unusual
not to ask how much” (GP7, male, directed and local enhanced service). Another
interviewee expanded further on this approach:
“…depends on a present patient, erm maybe if there is a history of
depression or erm, they present that they have got concerns …or
maybe they get an abnormal liver test and that issue is raised. …I
guess as a GP mainly it is I suppose through the presentation of the
patient…. and then you take it from there.”
GP9, female, directed and local enhanced service
Some interviewees also talked about what might be termed a more ‘universal’
screening approach, whereby all patients (those aged sixteen and over) would be
screened. As might be expected, this was a more dominant theme in the interviews
held with GPs based in practices signed up to an enhanced service for alcohol, where
financial incentives supported such universal screening. However, again, the concept
of universal screening did not appear to be thoroughly embedded across all practice
staff concerned. For those practices paid on the basis of screening all newly registered
patients, nursing staff or healthcare assistants ensure that screening data was
captured consistently, supported by the associated electronic template. GPs’
translation of universal screening, however, was far less uniform. Two key factors
impacting on universal screening practices emerged here: availability of time, usually
in terms of accommodating alcohol screening against other practice priorities; and
again, a sense that it was important to tailor the screening approach to the needs of

192
the individual patient (as one respondent emphasised: “the consultation is driven by
patient need” (GP7, male, directed and local enhanced service). As a result, ‘universal’
screening appeared anything but, with delivery in practice remaining very much ‘ad
hoc’, as the following quotes illustrate:
“…we do the bit they come about, their agenda, and then there’s a
whole host of practice issues...QOF issues…and it depends on what’s
flavour of the month...how much space we’ve got left in the
consultation”
GP7, male, directed and local enhanced service
“… we certainly don’t routinely screen every consultation… its partly
just because that’s the way we’ve always done things, that its just to do
things from experience rather than reverting to tools. And I think
partly because people usually consult with other problems and alcohol
is a bi-product of the consultation. So often the screening is quite an
add-on at the end.”
GP2, male, directed enhanced service
Further, it is important to stress that alcohol ‘screening’ here often seemed to be
discussed synonymously with recording alcohol consumption (i.e. using weekly unit
consumption as opposed to the use of a validated screening tool such as AUDIT-C or
FAST, which also incorporate questions on alcohol-related risk or harm). As the quote
below suggests, an initial question on weekly alcohol consumption was almost used as
a pre-screening mechanism, whereby patients who reported drinking over
recommended limits were then subject to additional questions about whether they
had experienced any alcohol-related harm:
“I ask them whether they smoke, they drink, they use drugs, erm, but
obviously take it forward only if I feel that you know there is eh, an
alcohol use beyond or above recommended limits…. I ask them how
many units do they drink a week and if there has been any problems.”
GP4, female, directed enhanced service
In contrast, a number of GP interviewees described using screening tools as a prompt
to bring up the issue of alcohol consumption within the consultation, and in turn, to
help them to ask the ‘right’ questions. In this sense, validated screening tools were
translated less as prescriptive and absolute, and more as an aide-memoire to stimulate
discussion of a patients drinking status during the consultation (“…they certainly

193
remind you of which questions to ask and perhaps fill in some of the details that you
sometimes don’t ask” (GP2, male, directed enhanced service)). Some interviewees also
described how they sometimes ‘tailor’ the tool to meet the perceived needs of the
patient. Thus, screening is also interpreted as a flexible and adaptive process as
opposed to an approach that should be followed ‘to the letter’. The following quote
illustrates this point well, with the GP in question suggesting that screening may need
to be altered depending on the individual concerned:
“… It’s just some patients if they’re a bit cagey about their alcohol,
bringing out a piece of paper doesn’t always work. So I think it’s very
much about looking at what you’ve got in front of you, and adapting
the consultation accordingly.”
GP5, female, directed enhanced service
For some, this reluctance to ‘stick to the script’ was also related to a sense of
discomfort with the rigid, formulaic screening tool process. As one GP, talking about
their personal use of AUDIT-C, commented:
“…in terms of doing it in a systematic and structured way, that always
feels slightly clunky and I’ve always got to be very convinced that it’s
worth doing it.”
GP8, male, directed and local enhanced service
Also implicit in the above statement is a sense that the GP in question is expressing a
sense of professional entitlement to withhold screening unless they are convinced it
will be ‘worth it’. Another GP interviewee echoed this viewpoint, describing a highly
experience-led approach to screening, where practitioners are more likely to draw on
their own skills and expertise as opposed to relying on formal tools:
“So where there are issues that alcohol comes up, then you possibly use
the brief intervention screening. Probably not as often as we should I
would imagine. We probably ask more about alcohol and do our own
sort of version of brief interventions rather than use the formal
screening tool. Or I probably do but that’s because I’m not good at
using screening tools….I think it’s partly just because that’s the way
we’ve always done things, that it’s just to do things from experience
rather than reverting to tools.”
GP2, male, directed enhanced service

194
In terms of the actual coding of alcohol screening test delivery, this trend of
informalised and individualised patient assessment had profound implications.
Importantly, there was a strong link between the use of a formalised, validated tool,
and a more formalised approach to Read coding. This led to a coding ‘Catch-22’,
whereby unsystematic delivery of alcohol screening and intervention engendered
unsystematic recording practices, and vice versa. The following exchange
demonstrates this process well:
Interviewer: Thinking about when you deliver either an intervention
that’s sort of based on a formal tool or kind of any more
ad hoc activity, would you tend to record that? Would
you Read code that conversation?
Respondent: If I’d used a tool yes.
Interviewer: If you hadn’t used a tool?
Respondent: I wouldn’t Read code.
Interviewer: You wouldn’t Read code it? You’d free text?
Respondent: Yes.
GP2, male, directed enhanced service
A further structural factor influencing the recording of alcohol interventions related to
the alcohol service context in which individual practices were situated. Crucially, some
interviewees reported that a lack of specialist alcohol services in the local area
translated into a reluctance to formalise alcohol issues through Read coding. In
particular, this was a strong theme in the interviews conducted in the North of Tyne
NHS organisational area, a part of the region that has been previously identified as
lacking adequate specialist treatment services (92). For example, as one GP
commented:
“… part of the whole problem of helping people with alcohol problems
is that there’s not an adequate service. And we don’t record where
they’ve got help from or where they’re getting help from. Partly
because there isn’t a very good service……if we had very good services,
that we could refer people on to, we might code more about, you know,
offered this, offered that.”
GP3, female, no enhanced service
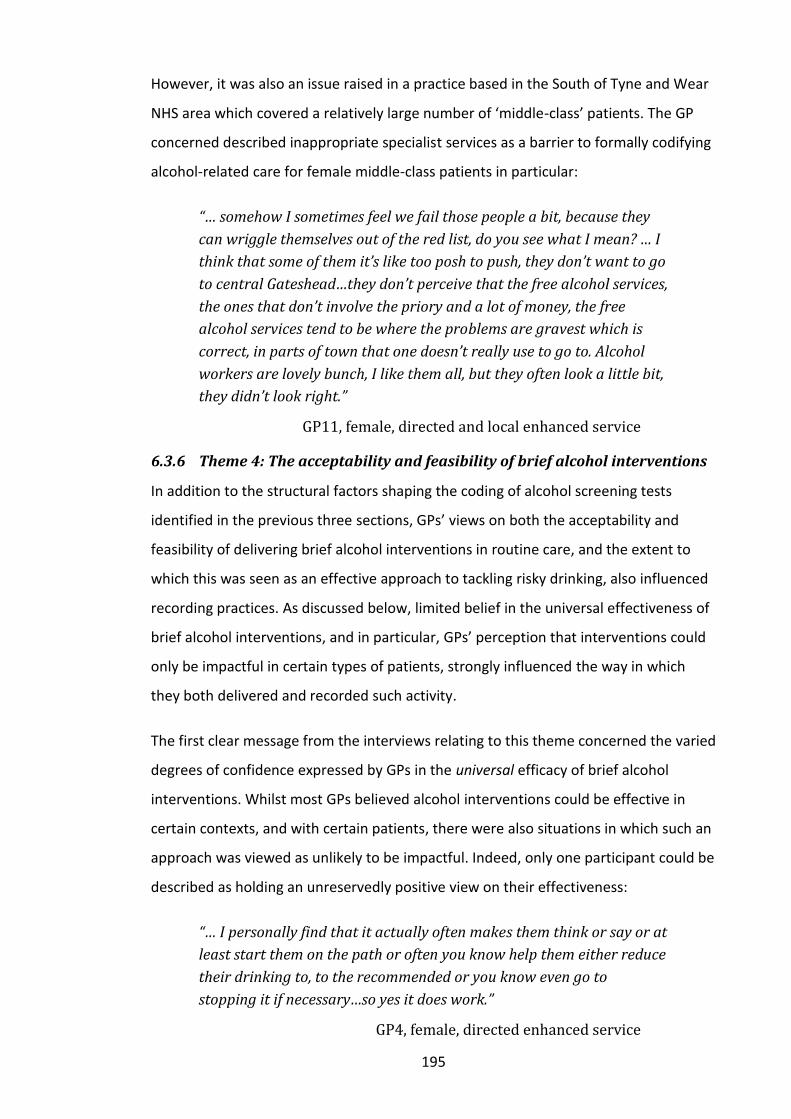
195
However, it was also an issue raised in a practice based in the South of Tyne and Wear
NHS area which covered a relatively large number of ‘middle-class’ patients. The GP
concerned described inappropriate specialist services as a barrier to formally codifying
alcohol-related care for female middle-class patients in particular:
“… somehow I sometimes feel we fail those people a bit, because they
can wriggle themselves out of the red list, do you see what I mean? … I
think that some of them it’s like too posh to push, they don’t want to go
to central Gateshead…they don’t perceive that the free alcohol services,
the ones that don’t involve the priory and a lot of money, the free
alcohol services tend to be where the problems are gravest which is
correct, in parts of town that one doesn’t really use to go to. Alcohol
workers are lovely bunch, I like them all, but they often look a little bit,
they didn’t look right.”
GP11, female, directed and local enhanced service
6.3.6 Theme 4: The acceptability and feasibility of brief alcohol interventions
In addition to the structural factors shaping the coding of alcohol screening tests
identified in the previous three sections, GPs’ views on both the acceptability and
feasibility of delivering brief alcohol interventions in routine care, and the extent to
which this was seen as an effective approach to tackling risky drinking, also influenced
recording practices. As discussed below, limited belief in the universal effectiveness of
brief alcohol interventions, and in particular, GPs’ perception that interventions could
only be impactful in certain types of patients, strongly influenced the way in which
they both delivered and recorded such activity.
The first clear message from the interviews relating to this theme concerned the varied
degrees of confidence expressed by GPs in the universal efficacy of brief alcohol
interventions. Whilst most GPs believed alcohol interventions could be effective in
certain contexts, and with certain patients, there were also situations in which such an
approach was viewed as unlikely to be impactful. Indeed, only one participant could be
described as holding an unreservedly positive view on their effectiveness:
“… I personally find that it actually often makes them think or say or at
least start them on the path or often you know help them either reduce
their drinking to, to the recommended or you know even go to
stopping it if necessary…so yes it does work.”
GP4, female, directed enhanced service

196
In contrast, most other participants questioned whether such an essentially
standardised approach could be effective in all patients. For example:
“You can feel like you’ve had a very good consultation and they’ll still
go on drinking. Or you can do something really quickly and say ‘You
know for heaven’s sake you’ve got to stop drinking.’ And they’ll come
back in three months and say ‘Do you know when you said that I was
really shocked, I’ve stopped drinking.’ And you think ‘Oh my goodness!’
It’s very hard to predict who you’re going to have an effect on.”
GP3, female, no enhanced service
Interestingly, this view was even expressed by those that could be considered fully
engaged in the alcohol agenda. The following quote is taken from an interview with a
GP who could be described as a ‘local opinion leader’ in the field, and therefore fully
aware of the evidence base supporting brief alcohol intervention:
“I’m realistic, it doesn’t work every time… that’s one of the mysteries,
you don’t quite know who it’s gonna work with, or when it’s gonna
work.”
GP7, male, directed and local enhanced service
For some interviewees, this lack of faith in the universal effectiveness of brief alcohol
interventions related to a belief that a patient needed to be ‘ready to change’ for
interventions to work. As such, GPs rationed their delivery (and in turn, recording) of
alcohol interventions to ‘changeable’ patients, with this assessment of whether a
patient was ‘ready to change’ based on an instinctive ‘gut’ reaction
(“sometimes…when you’re dealing with an individual in front of you, you get that kind
of gut feeling that it is worth spending a bit of time” (GP8, male, directed and local
enhanced service)). Several interview accounts illustrated this perspective, for
example:
“I suppose one of the key things I feel with alcohol to some extent is, I
suppose people have to be wanting to change before you can take them
too far down the road of an intervention. And so sometimes yes, they
know they’re drinking too much but they’re not that ready to change,
so going through a whole pathway doesn’t always help.”
GP2, male, directed enhanced service

197
“…I will try and explore where somebody is at in a sort of behaviour
change cycle. You know are they in a place where they’re actually
thinking about it, or is it not even on their radar, or is it just, you know
that’s what they’ve come to talk about. So that’s what I would do
next.”
GP6, male, no enhanced service
6.3.7 Theme 5: The role of the GP within the patient-centred consultation
The final theme concerned how GPs’ recording of screening and brief alcohol
interventions was affected by various sociocultural factors. In particular, the way in
which individual clinicians’ conceptualised the role of the general practitioner, and in
turn, how that role shaped the doctor-patient relationship, emerged as a strong
influencer on coding practices. This was articulated in four distinct sub-themes: first,
how alcohol work is positioned within the generalist role of the primary care physician;
second, GPs’ concern to deliver a ‘patient-centred consultation’; third, the limitations
of formal Read codes for capturing contextual data; and fourth, the potentially
stigmatising effect of formalising sensitive or uncertain diagnoses through code.
First, it is important to emphasise the fact that the majority of interviewees defined
themselves primarily as medical ‘generalists’. For interviewees with several years in
practice, this generalism was positioned as being synonymous with the role of the GP.
For example, one of the more experienced interviewees labelled the bulk of their work
as being “mainly your straightforward general practice” ( GP2, male, directed
enhanced service); and another expressed their job in terms of “mainly general
practice, with general being the operative word” (GP3, female, no enhanced service).
For less experienced GPs, however, this label of clinical generalism appeared more
connected with their on-going development as a clinician and less in terms of a fixed
role identity. For example, one interviewee described their lack of clinical specialism in
the context of “still developing, yeah, trying to figure out which area that I like” (GP9,
female, directed and local enhanced service). Importantly however, only a small
minority of interview subjects described themselves as having either a particular
interest or declared specialism in alcohol or substance-related work. Further, even in
the case of GP interviewees who might be seen as ‘local opinion leaders’ in the field,
any specialist alcohol work was nevertheless strongly situated within their wider
generalist role, as the comment below illustrates:

198
“I’m a normal GP most of the time but then I run two special clinics for
addictions, but that’s mainly opiate addiction. So the clinics aren’t just
for alcohol…I would see alcohol in my normal everyday work”
GP7, male, directed and local enhanced service, male
Next, alongside this generalist identity, interviewees also positioned their role as
overwhelmingly focused on delivering the ‘patient-centred consultation’. This was also
articulated as putting the patient’s ‘agenda’ first: as one interviewee put it “… a good
GP will always stay on the patient’s agenda” (GP12, female, directed and local
enhanced service). Further, delivery of the patient-centred consultation was thus a
necessarily individualised activity, strongly informed by a patient’s social and familial
circumstances. As the same GP continued:
“… when patients come to the doctors it’s not a hole in the wall
situation…doctors aren’t automatons and each patient is an individual.
It’s a bit different…to perhaps a lot of other countries where you go to
ER and you are basically a stranger every time you go.”
GP12, female, directed and local enhanced service
Another interviewee commented:
“… sometimes a quick social chat at the end of a consultation you learn
more about them, what motivates them, who their family is and so on
and sometimes it can really unlock doors”.
GP11, female, directed and local enhanced service
This socially-situated and patient-centred consultation delivery had distinct
implications for both what Read coding was prioritised in routine practice, and how
such Read coding was carried out. For as one interviewee explained “I don’t like codes;
you know…I’m a clinician, I love the clinical encounter… the commitment [is] to what
has gone on with the patient” (GP7, male, directed and local enhanced service).
In terms of which factors drive clinicians to formally Read code alcohol screening and
brief intervention, several interviewees framed their commitment to coding within the
wider context of supporting continuity of care: “it helps you search, and for other
people to keep track on what’s happening” (GP7, male, directed and local enhanced
service). In this sense, Read coding was seen as a preferable means of capturing
consultation information in comparison to free texting. This was particularly the case

199
in larger practices, where multiple clinicians could be caring for an individual patient.
As one interviewee explained:
“I don’t like free text, erm, at all, because I feel that, especially if you
need to, if another doctor needs to go back to a problem, it’s important
that they can actually see what went on, and having to go through free
text is just difficult.”
GP9, female, directed and local enhanced service
At the same time, many of the GP interviewees held firm beliefs on the limitations of
formal Read code data in terms of providing information about a patient’s social and
historical circumstances. In contrast, most interviewees expressed a belief that free
text allowed clinicians to capture greater depth and more complexity around the
consultation narrative. As one GP expressed it, free text “can help and inform and give
a level of sort of continuity of care by kind of explaining conversations and a bit of
background to the situation.” (GP9, female, directed and local enhanced service).
Another interviewee discussed this point at length in relation to the specific context of
providing care for people with alcohol-related problems:
“…because, you know the situation is usually so complex, in terms of
the person’s own personal and social history and what’s led them to
heavy drinking. And then all the factors that influence their
motivation to change and the constraints and so on, on that process.
You know Read coding, simple coding can’t capture all that sort of, not
by a long shot…you could perfectly well have instances in which the
codes tell you that the doctor or the nurse has done the right things in
terms of an intervention. But actually if the relationship and the trust
and the understanding of the person’s social context isn’t there, then
you don’t know the whole story.
GP6, male, no enhanced service
A small number expressed this in even stronger terms. For two respondents, Read
codes were clearly viewed as less ‘important’ to the clinical encounter than free text,
particularly for complex cases. As one respondent said, “most of the information to be
honest that I would value is free texted; if you took the free text away, I would be lost.”
(GP8, male, directed and local enhanced service).
In addition to a keen sense of the limitation of Read codes for capturing social,
contextual information, some GPs also articulated their reluctance to code certain

200
sensitive or uncertain diagnoses in electronic health records. As the quote below
suggested, this was in part to do with GPs’ concerns not to formally label ambiguous
complaints. However, some interviewees also presented such reluctance in terms of
the potentially stigmatising nature of Read coding a patient and the serious
implications such stigma could carry:
“…we’re getting a lot of undifferentiated stuff coming through as
general practitioners. And particularly before you’ve made a clear cut
diagnosis, the last thing on Earth you want to do is code somebody
with something, because it’s got implications if you make a diagnosis.
So, the for example; I’d say what is the difference between asthma and
COPD? About £200 on your holiday insurance!”
GP8, male, directed and local enhanced service
It should be stressed however, that this anxiety not to stigmatise patients through
Read coding was not shared universally. A number of interviewees strongly resisted
the idea that stigma influenced individual coding practices. Another interviewee
explained that concerns about stigma did not prevent coding, rather it led to what
might be described as ‘adaptive’ coding practices to accommodate such concerns, “if
there’s sensitive issues relating to the patient…we code those as ‘minor past’, so they
don’t appear on the front screen”. (GP5, female, directed enhanced service)
A further consequence of GPs’ concern to keep the patient at the heart of the
consultation was the manner in which it influenced the actual sequence of Read coding
within the consultation process. When asked about the actual process of coding, the
vast majority described Read coding as a retrospective activity, detached from the
business of the consultation itself. Predominantly, clinicians justified this approach in
terms of their concern to ensure that the consultation remained ‘patient-centred’. In
particular, they emphasised the importance of maintaining eye contact during the
consultation discussion. As one respondent commented:
“I just don’t like using the computer when you’re talking to the patient,
so that’s the only reason. It’s not that I’m- I could say to a patient “If
you just hang on, I’ll just enter that into the computer.” But I tend to
just out of habit do it afterwards, yes.”
GP5, female, directed enhanced service

201
One final point of interest in relation to this theme of the GP as a ‘patient-centred
generalist’ is how this contrasts with their representations of nurse-led Read coding. In
particular, interviewees portrayed nurses as responsible for the delivery of more
‘routine’ and tightly defined patient care. Thus, whereas many interviewees described
free text as often more appropriate for capturing the in-depth contextual and varied
data that would usefully inform the GP consultation, Read codes were viewed as more
suitable for nursing activity (“I think doctors probably use free text, practice nurses use
the read codes” (GP5, female, directed enhanced service)). This discussed specifically
in relation to the delivery of alcohol screening tests by nursing staff. The following
examples demonstrate this perspective well:
“…the practice nurses probably have a much more structured
approach….most of their work is chronic disease management and
they tend to be filling in screening tools. So that’s what they do all the
time, so they’re much better at it.”
GP2, male, directed enhanced service
“…if you’re wanting to record it, it works best when the doctors aren’t
doing it…all task-led work is much better done by people who aren’t
having to think out of the box about the patients work… doctors are
trained to diagnose and treat things, nurses are trained to do task
orientated work, it’s the way we think … Equally if somebody was to
come in and… even if it’s really obvious and screaming out of what
they should expect, blinkering, clinical blinkering means it often isn’t
getting picked up. So I wonder how the nurse not notice that, well she
wasn’t doing a consultation, she was doing a hypertension review so
she didn’t notice the cauliflower lesion on his left ear, as a doctor
might and not record anything they’d talked about in the previous ten
minutes but only deal with that..”
GP11, female, directed and local enhanced service
6.4 Strengths and limitations
Before considering the key findings from the interviews, and their implications for the
wider study, is important to acknowledge some limitations of this phase of the
research.
The first limitation concerns whether 14 GP interviews were sufficient to gain an
adequate understanding of the phenomenon under investigation. In this respect, a key
factor influencing the appropriate number of interviewees concerns the point at which

202
data saturation is deemed to have been achieved (644). However, decisions are often
subjective and there are few clear guidelines on how to establish whether one has in
fact achieved saturation. Romney et al represent one attempt to operationalize the
concept of saturation via the development of the ‘Cultural Consensus Model’ (CCM )
for their ethnographic work (645). CCM suggests that each ‘culture’ has a shared view
of the world, creating an overall ‘cultural consensus’. Although there may be variation
on the level of consensus around an issue, the number of views are nevertheless finite,
allowing the development of a comprehensive model of potential cultural viewpoints
through factor analysis (645). In relation to this research, analysis of the interview data
suggests a finite set of viewpoints emerged on the topic under investigation. In terms
of GPs’ views on delivering and recording alcohol screening and brief intervention
activity, there appeared to be a high level of homogeneity in viewpoints, particularly in
relation to perspectives on screening patients for alcohol use disorders, and the
barriers and drivers of alcohol-related (and wider) Read coding.
Further, looking at the recruited participants, the sampling approach was purposive
and aimed to achieve maximum variation against key variables of interest (type of GP,
enhanced service status, and geographic location). As such, there was a ‘sociological
logic’ to the systematic selection of interview subjects (646), whereby cases were
selected to facilitate the exploration of emerging theory from the previous phases of
the research that financial incentives encourage higher rates of delivery, and in turn
recording, of alcohol screening and brief intervention. Importantly, therefore, it should
be emphasised that the recruited sample included at least one GP from each of the
categories of interest, with the exception of one group: GPs based in South of Tyne
and Wear organisational area and not signed up to an enhanced service. However, as
reported in the previous chapter (5), given universal coverage of the combined
Directed and Local Enhanced Service for alcohol was achieved during the recruitment
period across South of Tyne and Wear, the potential sample base became increasingly
restricted. Thus, the majority of interviewees (eleven out of fourteen) were drawn
from practices signed up to at least a national level enhanced service for alcohol. It has
to be acknowledged, therefore, that interview accounts could have varied if it had
been possible to recruit additional GPs from practices less formally engaged in alcohol
intervention activities across the full geographic area of interest.

203
Before embarking on the interview phase of the research, it was anticipated that
concerns around ‘professional liability’ could have resulted in GPs providing more
guarded, less truthful accounts of alcohol screening and brief intervention activity,
particularly where activities connected with payment of financial incentives were
concerned. Further, given the significant challenges experienced in recruiting adequate
numbers of GPs to the study, it is postulated that such concerns could well have
negatively influenced individual and practice-level decisions around whether to
participate in the interviews. In contrast, however, it needs to be stressed that
clinicians’ accounts were frequently far more honest than expected (for example, in
relation to their confessions around not using formal screening tools, and widespread
cynicism on the impact of financial incentives as driving quality). Further, even if these
were on occasion, socially constructed accounts of screening and brief alcohol
intervention activity based on clinicians’ perceptions of how they wished to represent
themselves (as opposed to the reality), the resultant data are still valuable. As Rapley
argues, if we accept our inability to access a person’s ‘intimate interior’ through the
interview, we can start to consider its value in other terms (647). Thus all
representations, including those offered in the relative artifice of the interview
situation, are valid, for one purpose or another (648, 649). In the context of this
research, therefore, the qualitative data helped provide some insight not only in terms
of the ‘surface level’ responses to the actual questions asked, but in providing
additional insight into what clinician’s see as an acceptable public persona, and in
particular, how acceptable they feel it is to be openly ad-hoc as practitioners around
alcohol work.
Additionally, some logistical constraints of the circumstances in which the interviews
were carried out should be acknowledged. The interviews lasted between thirty
minutes and one hour 15 minutes, with an average of around 40 minutes in total. The
relatively restrictive interview timeframe had been a necessary condition of
negotiating access to this group of participants. As a result, the flow of dialogue in
some interviews was slightly more constrained and structured in style, and on a small
number of occasions, verbal and non-verbal clues suggested that further probing and /
or exploration of initial responses was not welcome or feasible. In addition, a number
of the interviews conducted in the GPs consultation room were interrupted by patient

204
or administration related calls, which further challenged the natural development of
the interview narrative. At the same time, it needs to be stressed that this was a
professional, generally highly articulate group of interview participants, who in the
main were able to quickly grasp and verbalise complex issues. Of course, this was not
always the case. For three participants for example (GP4, female, directed enhanced
service, GP9, female, directed and local enhanced service and GP10, male, directed
and local enhanced service), English was not their first language, which sometimes
represented a barrier to understanding and communicating the issues under
discussion.
Further, both telephone (two) and face-to-face (twelve) interviews were conducted as
part of this research, and this might also have implications for the emergent data. It
was necessary to conduct two of the interviews via telephone due to access challenges
(GP4, female, directed enhanced service and GP9, female, directed and local enhanced
service). This represents a potentially significant difference in delivery mode. Face-to-
face interviews are uniquely characterised by the fact that they facilitate synchronous
communication in both time and place. As such, they allow interviewers access to what
might be described as ‘social’ cues, such as voice or body language, which can help
provide additional information to a respondent’s verbal answer (650). In contrast,
although telephone interviews are of course advantageous in facilitating extended
access to participants (651), there are some notable disadvantages when compared
with face-to-face interviews. In particular, a key disadvantage of asynchronous
communication of place by telephone is the reduction in available social cues: the
interviewer does not see the interviewee, so body language in particular cannot be
used as a source of extra information (650, 652). On reflection, from a researcher’s
perspective, the telephone interviews were more demanding to conduct in
comparison with their face-to-face counterparts, particularly as technology was not
always helpful, with one interview in particular disjointed as a result of problems with
the telephone line. At the same time, it should also be noted that both telephone
interviewees were non-native English speakers, therefore it is arguable as to whether
these conversations would have ‘flowed’ as easily as others regardless of delivery
mode.

205
Finally, it is also worth highlighting the positive contribution that the experience of
conducting GP interviews within some of these somewhat challenging contexts made
to the research study. A key limitation of semi-structured interviews can be their
necessary detachment from the social, cultural and professional contexts in which they
take place. In contrast to participatory or ethnographic approaches, there is a strong
reliance on what information can be gleaned from a participants’ verbal accounts of
the phenomena under investigation, and the interview itself usually represents an
interruption of the informants natural flow of events (451). By situating the majority of
the GP interviews within the pressured and unpredictable general practice setting,
therefore, this afforded an opportunity for a more sensitive and nuanced appreciation
of the contexts in which practitioners must deliver and record alcohol interventions.
6.5 Summary and discussion
The interviews conducted with GPs in the qualitative phase of this study have served
to highlight the unsystematic and adaptive nature of both the delivery and recording
of screening and brief alcohol interventions in primary care. Indeed despite the
introduction of a series of policy endorsements in recent years, including financial
incentives, for GPs at least, the alcohol care pathway remains a somewhat inconsistent
process, with the interpretation, application and recording of screening and brief
alcohol interventions highly personalised and opportunistic.
To some extent, these findings reflect the issues identified by previous research on the
challenges GPs experience in both delivering screening and brief alcohol interventions
in routine general practice, and in using the Read code system to record such activity.
In particular, the interviews underlined the multiple factors that contribute to the
inconsistent nature of GP-led screening and brief alcohol interventions, including
physicians’ discomfort at discussing alcohol within the patient consultation (190, 201,
208, 653-657), and the way in which competing demands on limited time can lead to
the de-prioritisation of preventive care, and divergence from recommended clinical
guidelines (191, 194, 208). The interviews also support the findings of previous studies
examining GPs’ use of alcohol disorder screening tools in routine practice,
demonstrating how their delivery was often tailored to perceived patient need, with a
strong reliance on the use of weekly alcohol consumption measures to assess risk as
opposed to validated screening questionnaires (188, 658). Further, and closely echoing

206
the literature reviewed in Chapter 4, as with other areas of clinical practice in primary
care, the use of routine data to record screening and brief alcohol intervention
appeared subject to a series of structural and psychosocial influencers (659). For
example, low awareness of the correct codes amongst practitioners was in turn
exacerbated by the challenge of navigating the mammoth Read code system (552,
558). Additionally, GPs struggled with the perceived inadequacy of the essentially rigid
biomedical coding system in terms of capturing the more complex psycho-social
narrative of the consultation (558, 660).
Importantly, the interview analysis would suggest that the themes described above are
closely interrelated, resulting in a synergistic relationship between the process of
delivering screening and brief alcohol interventions, and in turn, how this activity is
Read coded. Thus, formal interventions delivered via formal, validated tools, resulted
in more formalised coding practice. Conversely, more adaptive, less systematised
interventions, whose delivery is contextualised within the broader narrative of an
individual patient’s social circumstances, were more inclined to be (informally) free
texted. Further, these coding practices were professionally situated, with nurses more
likely to record alcohol screening activity through Read codes, and GPs more
comfortable with the complexity allowed by free text data when delivering
intervention work. Additionally, however, these findings also have significant
implications for our understanding of impact of strategies employed to date to
encourage the implementation of screening and brief alcohol interventions on primary
care clinicians, and in turn, the relevancy of the systems available to measure such
impact.
First, therefore, the interviews suggest that whilst financial incentives in general were
viewed as key influencers of both clinical and coding practice, their impact on the
delivery and recording of alcohol screening and brief intervention seems to be more
ambiguous. For GPs at least, it would appear that introduction of the enhanced service
specifications for alcohol have not routinely stimulated either more consistent
recording practices or more defined intervention delivery in the way that the Quality
and Outcomes Framework appears to have done for other areas of clinical practice
(553, 554, 558). However, it is important to stress that interview accounts imply this
was not the case at overall practice level, where alcohol screening delivery and

207
recording did appear to be increasingly routinized. Nurses and healthcare assistants
seemed responsible for driving such improvement, with their work supported in
particular by the incorporation of alcohol screening questions within the various Read
code templates for new patient registration and the management of chronic
conditions. It is of course worth highlighting at this point that the national enhanced
service in particular rewards practices only for their delivery of alcohol screening tests
(238). In this way, it would appear that the emphasis of the incentive scheme, and the
development of coding templates to support its delivery, have served to construct
alcohol work as “professionally delineated” (661). Thus, nurses have taken on
responsibility for the necessarily uniform business of monitoring and managing
screening work, with clinicians positioned more as consultants, focussed on the
delivery of complex, individualised and in turn, less measureable, alcohol interventions
(410, 420, 427, 428, 661), arguably a further example of Charles-Jones et al.’s
“hierarchies of appropriateness” (429).
Next, in terms of the overarching research question, the messages emerging from the
interview analysis also cast doubt on the question of quality of the routine screening
and brief alcohol intervention data currently captured in primary care settings. GPs
confusion around the correct Read codes to use, and their occasional reluctance to
codify alcohol activity at all, would strongly suggest that not every real world instance
of screening or brief alcohol intervention delivery is being recorded at present. In
addition, these findings also illustrate the limitations of routine data for capturing
certain dimensions of service delivery (288), particularly in relation to recording less
easily quantifiable activity such as behavioural interventions (274). Further, the
interview findings also question the extent to which the data currently recorded by
GPs can be considered accurate, in particular as a result of the heterogeneous coding
practices evident in practitioners (288, 292, 293) , especially in relation to the
recording of alcohol screening and brief intervention delivery (294).

208
Chapter 7 Discussion and conclusion
7.1 Introduction
This final chapter begins with a mixed-methods integration of the key findings
identified by each phase of the study in order to identify areas of commonality and
discordance. This is followed by discussion of the implications for the research in
relation to the four key dimensions of data quality, namely: completeness; accuracy;
accessibility; and relevancy. Next, the strengths and limitations of the overall research
approach are considered, and some recommendations for policy and practice arising
from the findings outlined. The chapter concludes by highlighting potential areas for
future research and by offering some closing remarks.
7.2 Mixed methods data integration
The findings from all three phases of the research were drawn together and reviewed
to determine common themes across the study as a whole. In addition, a mixed-
methods matrix approach (512) was employed to support cross-case analysis of results
from the nine GP practices where both qualitative and quantitative data were
available. Recorded rates of hazardous or harmful level alcohol consumption, and the
delivery of screening and brief alcohol interventions by individual practice were placed
into quartiles based on the overall sample range. Interview transcripts from GP
representatives of the same practices were reviewed for statements relating to the
delivery and coding of screening and alcohol interventions. The emergent matrix is
presented in Appendix O. These processes allowed the identification of both meta-
inferences (i.e. converging messages from all individual component inferences), at the
same time as helping to highlight areas of divergence and discrepancy. The emergent
overarching themes are presented to follow.
7.2.1 Emerging meta-inferences from the research
First, being signed up to a national and / or a local enhanced service for alcohol
emerged as the strongest determinant of higher rates of recorded screening and brief
alcohol intervention activity in participating North East UK-based general practices.
Analysis of the Read code data extracted from these practices demonstrated that
recorded rates were lowest in practices with no enhanced service, and highest in
practices signed up to at least one enhanced service for alcohol, with the difference

209
between these different groups of practices statistically significant (males: p < 0.001;
females: p < 0.001 for all elements of intervention delivery). To focus on the recorded
delivery of brief screening test for alcohol use disorders for example, the data showed
that delivery of FAST or AUDIT-C was lowest in practices not signed up to an enhanced
service for alcohol (0.097% males (95% CI: 0.06-0.16) / 0.01% females (95% CI: 0.00-
0.03)); was significantly higher in practices signed up to both the local and national
schemes (3.73% males (95% CI: 3.48-3.99), 3.40% females (95% CI: 3.17-3.64)); and
was marginally higher still in practices signed up to the national scheme only (3.58%
males (95% CI: 3.29-3.90), 4.24% females (95% CI: 3.93-4.58)).
This trend was also reflected in the qualitative data, with GP interviewees working in
practices signed up to an enhanced service reporting that financial incentives were key
stimulants of coding activity connected to the delivery of screening and brief alcohol
interventions. This positive relationship was supported by the development and
implementation of electronic coding templates within practices, which served to
prompt the more systematic, accurate and consistent Read coding of interventions,
either as embedded within standard processes for registering new patients and for the
management of chronic conditions, or as stand-alone screening and brief alcohol
intervention templates. The positive impact of tailored computer templates on the
delivery and recording of screening and brief alcohol intervention was also highlighted
in Hamilton et al’s research on financial incentives for targeted alcohol work in primary
care (245).
Financial incentives also emerged as a strong positive influencer of coding activity in
several studies analysed as part of the systematic review of previous literature in this
field, which demonstrated clinicians’ keen awareness of the importance of evidencing
progress towards primary health care targets (553, 554, 558). At the same time,
however, a strong implication of the interviews was that whilst financial incentives
increased the recording of intervention activity at overall practice level, this did not
necessarily equate to an increase in recorded screening and brief alcohol intervention
activity at individual clinician level. In particular, the qualitative findings would suggest
that nurses and healthcare assistants were mostly responsible for the delivery and
coding of alcohol use disorder screening tests in primary care. Indeed, there were
multiple accounts in support of this hypothesis, with interviewees reporting that

210
nursing staff were more likely to both deliver, and in turn record, alcohol screening
activity compared to GPs.
Second, the high number of potential alcohol-related Read codes served to undermine
the accurate and consistent recording of intervention activity in primary care. Several
GP interviewees emphasised the difficulty of locating the correct Read code in
everyday practice, and in particular, participants commented that they found it
challenging and time-consuming to navigate the sheer volume of potential codes.
Moreover, the existence of multiple possible Read code options appeared to
undermine GPs’ confidence to select the correct code, which in turn resulted in a
tendency to avoid formalising care through coding entirely and to instead rely on
narrative free text to record more ambiguous elements of the patient consultation.
Again, this practice confirmed the findings of the systematic review, and in particular,
Lusignan’s 2003 research (558), which highlighted primary care clinicians’ propensity
to free text where doubt existed in relation to coding.
In addition, the results of the case study practice analysis highlighted the existence of
287 Read codes in the system for the recording of alcohol-related activity in primary
care. However, it determined that only a small minority of these codes were in regular
use (13.94%, n = 40), and that these generally related to the identification, treatment
and management of alcohol use disorders. Further, and significantly, whilst many
unused Read Codes were associated with relatively rare alcohol-related conditions, a
significant number related to duplicate, outmoded and unhelpful drinking terminology.
The continued availability of such outmoded alcohol-use terminology to GPs is highly
problematic. Whilst recent research suggests that evidence that alcohol involvement
can be considered in both categorical and continuous terms (662), it remains the case
that clear, accurate definitions of medical conditions and disorders are important for
both research and clinical practice. Crucially, the use of evidence-based and
unambiguous terminology in relation to the classification of an individuals drinking
status serves to reduce heterogeneity in the diagnostic category so that more can be
learned about treatment response (663, 664), and also reduces the potential for
stigma, an issue which is recognised as a key barrier to the delivery of alcohol
interventions in primary health care (191, 194-196).

211
Third, Read codes relating to patient alcohol consumption (136.0) were used far more
frequently than codes relating to the delivery of an alcohol screening tool (such as
388u for FAST or 9k17 for AUDIT-C) across all practices. Indeed all practices captured
relatively large quantities of data on patients’ alcohol consumption, whilst recorded
rates of screening and brief alcohol intervention delivery were comparatively low. The
findings from both the systematic literature review and analysis of GP interviews
helped provide further insight as to the possible reasons behind this trend. Interview
data suggested that GPs prioritised the coding of the presenting ‘problem’, in addition
to any formal diagnoses or tests. The importance of ensuring such patient data was
captured was learned early during their medical training. However, the design and
structure of the Read code system itself served to facilitate the detailing of the
quantifiable and essentially biomedical over the more complex and psychosocial
information. Thus, when recording screening and brief alcohol interventions, GPs
reported that they found it more straightforward (and less ambiguous) to record units
of alcohol consumption as opposed to using the standard Read codes associated with
the delivery of validated alcohol screening tools, which were viewed as a more flexible,
adaptive and thus ultimately more contestable measure of alcohol use. This finding
reflects previous research examining GPs’ use of alcohol disorder screening tools in
routine practice, demonstrating their strong preference for asking quantity–frequency
questions as opposed to using self-report screening questionnaires (188, 658).
In addition, although many interviewees highlighted the excessive number of codes as
a barrier to accurate coding, it was also clear that in many instances the Read code
lexicon lacked application to some common general practice situations. For example,
many interviewees reported finding unexplained or developing conditions particularly
challenging to Read code. A number of GPs emphasised the value of contextual data as
part of summing up the background factors impacting on an individual patient’s
relationship with alcohol. However, there was a shared sense of inadequacy around
the existing Read code system, meaning that such information was most likely to be
entered in free-text form as opposed to being formally coded. The key advantage of
structured data, however, is the potential it offers for simplicity and consistency, and
thus enhanced accessibility of the resultant information. Importantly, coded data
facilitates the “simple” representation of often complex information, that allows it to

212
be processed within the general practice system (263). Further, in selecting the most
appropriate code, clinicians generally use a list of options, potentially via the use of a
keyword search, or through the use of a standardised data template. Thus, coded data
also perform a vital function in helping to rationalise the multiple ways in which clinical
concepts can be represented in healthcare.
7.2.2 Explaining discordance and ‘filling in the gaps’
Whilst there were several common themes across the research, there were some
notable areas of dissonance across the data, including a number of divergent cases
where the quantitative data contradicted the general trend, and where the qualitative
results were probed in order to help explain the discrepancy.
At an aggregated level, there was a strong association between practices that were in
receipt of financial incentives for alcohol-related activity, and higher recorded rates of
delivery of alcohol screening tests. However, this relationship was by no means
consistent. For example, focussing first on the delivery and recording of screening
activity, both NOTW3 and some of the practices based in the South of Tyne and Wear
area were paid to screen newly registered patients for risky drinking, but in fact
demonstrated recorded rates of delivery that placed them in the lowest quartile in
comparison to the rest of the sample. Several practical factors could potentially explain
such discord in the data. For example, the rates of delivery were based on the number
of occasions on which practitioners recorded their provision of an alcohol screening
test using a pre-specified Read code. Therefore, if they had delivered the test but
either failed to record the activity, or indeed, had used an alternative Read code (such
as a practice-specific code); the analysis would not have picked this up.
The qualitative data also suggested that the GPs in these practices tended to describe
themselves as employing a relatively unstructured approach to screening. In addition,
the same GPs verbalised a clear preference for using unit alcohol consumption as a
preliminary assessment tool for possible risky drinking in their day-to-day practice. This
is problematic for a range of reasons. For example, evidence suggests patients both
struggle to translate standard drink measures into their actual consumption reports;
and that they may actually underestimate their overall consumption regardless (188,
189). In addition, a review by Mitchell et al of the clinical recognition and recording of

213
alcohol disorders by clinicians in primary and secondary care served to highlight the
considerable difficulty healthcare practitioners experience in identifying problem
drinking in clinical practice via informal means. The meta-analysis conducted as part of
their review determined that by using clinical judgement as opposed to validated
screening tools, primary care physicians only identified about four in ten of attendees
with an alcohol use disorder, and that their medical records were accurate in less than
three out of ten cases (658).
A logical response to this gap between desired and actual practice would presumably
involve further education around the added-value of screening using the AUDIT tool or
comparable. It is interesting to note, however, that a number of the GPs in practices
receiving financial incentives recorded relatively low rates of screening activity. These
individuals portrayed themselves as trained, experienced and knowledgeable in
screening and brief alcohol interventions, implying that the barrier was less to do with
awareness or expertise, and potentially more to do with the socio-cultural,
interactional and attitudinal factors that influence their delivery (190-192). These
include: continued scepticism in relation to the universal efficacy of alcohol
interventions (192-194); the perception of alcohol as a sensitive and stigmatising
discussion subject (191, 194-196); and the impact that practitioners’ own drinking
practices may have on intervention delivery (186).
Next, looking at the association between higher recorded rates of brief alcohol
intervention delivery, again, this was by no means a consistent relationship. Whilst the
accounts of single GPs cannot of course represent the entirety of views and
experiences of a complete practice, it was nevertheless clear that practices in which
recorded rates of delivery of alcohol interventions were low (i.e. placed them in the
lowest quartile) reported both a much less structured approach to the delivery of
alcohol interventions, alongside a verbalised lack of awareness as to whether certain
Read codes were more or less appropriate to use. Conversely, despite not being signed
up to an enhanced service scheme, and expressing some cynicism around the
effectiveness of brief alcohol interventions themselves, some GP recording
comparatively higher delivery rates, reported that they had benefitted from previous
training, which explained their more consistent approaches. Further, GPs in the
practices reporting the highest recorded rates of delivery were experienced and

214
interested in, and often displayed a positive orientation towards, alcohol-interventions
(NOTW9 and SOTW1).
Finally, it was also evident that the design of the enhanced service for alcohol, and in
particular the national scheme, served to prioritise the collection of certain elements
of data relating to screening and brief alcohol intervention over others. Specifically,
interviews with GP representatives of the participating practices implied that as
payments for the national scheme were made on the basis of the number of screening
tests coded as opposed to the subsequent delivery (and coding) of brief alcohol
interventions resulting from a patient’s screening test score. Thus the recording of
intervention activity was far less systematised than case finding work. This echoes the
findings of research by Coleman et al, which found that whilst the recording of
smoking status increased dramatically in 2003-04 following the introduction of
financial incentives, there was no comparable rise in nicotine addiction treatment
prescriptions from 2003 (554), as notably, such treatment is not incentivised under
Quality and Outcomes Framework (351).
In the current study, whilst aggregate rates of brief alcohol intervention delivery were
fairly comparable between groups of practices signed up to both national and local
enhanced services , and those signed up to the national scheme only, this trend masks
substantial variation at individual practice level. For example, NOTW3 and NOTW8
demonstrated recorded rates of intervention delivery in the lowest quartile, despite
both practices being signed up to the national enhanced service scheme. In addition, a
further practice in the North of Tyne area (NOTW4) did not record any such
intervention activity during the surveyed time period, despite being signed up to the
national enhanced service for alcohol.
7.3 Interpretation of the findings
With robust evidence supporting the effectiveness of screening and brief alcohol
intervention in primary health care at reducing harmful level drinking (158-176), recent
years have witnessed a justifiable focus by UK policy makers on encouraging their
routine delivery, in particular, via the introduction of financial incentives (231, 232,
238). In assessing the impact of these policy endorsements for brief alcohol
interventions on their successful implementation, electronic GP Read codes arguably

215
represent a comprehensive, cost-effective and unobtrusive source of data, that is
available on large numbers of patients and across multiple general practice settings
(188, 254, 275). This is particularly the case when compared with direct observation or
the introduction of behavioural measures, both of which are complex and costly to use
(274) and introduce the possibility of the ‘Hawthorne Effect’ (278), whereby the act of
participating in research can influence clinical practice. This doctoral study has sought
to determine the extent to which this data might provide a valid measure of alcohol
screening and brief intervention delivery by examining both the trends evident in the
alcohol-related Read code data extracted from GP practices in the North East of
England, alongside clinicians’ own perspectives on, and experiences of, using such data
in their day-to-day work.
At face-value at least, the Read code data analysed as part of this research would
suggest that such policy initiatives have been successful in encouraging an increased
focus on the identification and addressing of risky drinking in UK primary care in recent
years. Participating practices in receipt of financial incentives to support the delivery of
screening and brief alcohol interventions recorded higher rates than those not paid to
do so. In addition, this trend was also reflected in the qualitative data analysis, with GP
interviewees working in practices signed up to an enhanced service reporting that
financial incentives were key stimulants of coding activity connected to the delivery of
screening and brief alcohol interventions. Further, across all practices, relatively large
quantities of data on patients’ alcohol consumption were captured, reflecting findings
from other studies highlighting GPs’ preference for unit consumption over the use of
validated screening questionnaires (188). The disadvantages of using consumption as a
means of detecting risky drinking have been stressed, however it does potentially
evidence increased alcohol-related activity in a general sense in primary health care.
However, the validity of the trends summarised above are dependent on the quality of
the data on which they are based. In this respect, it is important to remind ourselves
that previous research confirms such data is frequently lacking in some essential
dimensions of quality – completeness, correctness (or accuracy), currency (or
timeliness) and relevancy (285) – for a whole host of logistical, technical and
interpersonal reasons (92, 187, 190, 202, 256, 263, 274, 288, 289, 292-298). To return
to the overarching research question – whether GP Read code data can help evaluate

216
the implementation of screening and brief alcohol intervention in primary health care
– it would seem appropriate therefore to begin with an exploration of the extent to
which the findings suggest alcohol-related Read codes represent an acceptable
‘quality’ measure based on these four key dimensions. This section also considers
some of the issues related to the approach employed for the extraction and analysis of
the alcohol-related Read code data in this thesis that also influences interpretation of
the results.
7.3.1 Dimension 1: The completeness of screening and brief alcohol
intervention Read code data
First, can we consider GP alcohol intervention Read code data as ‘complete’? As
already discussed, this would require us to have a degree of confidence that every real
world instance of the delivery of screening and / or brief alcohol interventions had
been recorded by the participating general practices. On this issue, the available
evidence was indicative of a fairly clear divide between the completeness of screening
data, and that of brief intervention data. The analysis of Read code data itself
suggested relatively significant quantities of screening data was captured at practice
level, particularly in those practices incentivised for their delivery. Given that the
interview data implied that nursing staff were mainly responsible for the delivery of
screening tests in primary health care, and that clinicians felt they were recording this
activity on a reasonably consistent basis, the implication would seem to be that
available screening Read code data is relatively complete, if admittedly, still
representing a fairly low level of patient coverage.
In contrast, as GPs were generally more responsible for carrying out brief alcohol
interventions, and less likely to record such activity using formal Read codes, one could
conclude that the recorded rates of interventions under-reported true levels of activity
within the surveyed practices. A number of factors appeared to contribute to this likely
under-reporting. Some concerned the design and structure of the Read code system.
For example, a lack of confidence and / or awareness around selecting the correct
Read code (from numerous competing alternatives) which in turn often resulted in
free-texting of intervention activities as opposed standardised coding. In addition, a
perceived lack of available Read codes to record psycho-social aspects of intervention
activity also appeared to give rise to under-reporting. This echoes previous research by
217
Strange and by Hrisos et al which suggests that the completeness of medical records is
highly interrelated with the type of clinical activity being recorded (288), and that
counselling services, including alcohol counselling, were less like to be recorded than
more easily quantifiable activities such as tests and diagnoses (274). However, both
the design of the enhanced service for alcohol, alongside its position within the wider
pay-for-performance delivery context, also influenced GPs’ recording behaviour.
Crucially of course, as practices were primarily incentivised to record screening
behaviour, as opposed to brief interventions, there was no tangible benefit for
practitioners to codify the latter activity. Yet what further compounded the under-
prioritisation of recording intervention data was the relatively weak position of
enhanced services for alcohol in comparison to the activities financed through the
more lucrative quality and outcomes framework.
In addition, for many GPs, the more structured, formalised intervention approach
associated with the enhanced service for alcohol was not seen as delivering a
significant advantage over their existing more ad hoc and (perceivably) more bespoke
(or patient centred) approach to alcohol-related discussions with patients.
Alternatively, GPs based in those practices not in receipt of financial incentives but
demonstrating relatively high recorded rates of delivery, described themselves as more
positively disposed toward alcohol interventions, or had worked in the past with
identified ‘local champions’ in field. The sum effect of these factors illustrates some of
the complexity inherent in the successful implementation of improvement initiatives in
primary care practice. Designated funding streams may encourage change, but as both
Rogers and subsequently Greenhalgh and others have emphasised, it is also vital that
the characteristics of the change itself deliver unambiguous benefits to the
practitioners responsible for its delivery, in both financial and clinical terms (214, 216,
217). Otherwise, expert opinion leaders may in fact stimulate higher rates of take-up
than those achieved by incentives (225, 226).
7.3.2 Dimension 2: The accuracy of recorded alcohol intervention data
Next, there is the question of data correctness or accuracy: first, whether we can say
that the alcohol intervention-related information contained in routine medical records
is ‘true’ (i.e. does it represent actual events), and second, whether the data itself has
been recorded correctly (i.e. were appropriate Read codes used).

218
In relation to the first element of correctness, and given the strong evidence for the
distorting effect of financial incentives on coding practice (295-297), it was of
particular interest to explore whether ‘gaming’ behaviour impacted on the accuracy of
screening and brief intervention data as proxy measures of treatment. However,
despite the potential financial benefits that might have been associated with recording
additional instances of screening delivery, this study did not identify any examples of
deliberate erroneous coding on the part of GPs. In reality, GP screening and
intervention activity appeared, if anything, to be routinely under-reported. Thus, one
implication of the findings may be that there is little evidence to suggest that the
practices engaged in this particular study were deliberately ‘gaming’ the system to
boost practice income derived from screening and brief alcohol intervention activity.
Or to put it another way, one could be reasonably confident that when GPs recorded a
brief alcohol intervention Read code, they believed it represented their actual delivery
of such an intervention.
However, looking at the second element of correctness, the qualitative data in
particular would strongly imply that for GPs in particular, low awareness of the correct
screening and brief alcohol intervention Read codes, combined with some resistance
to the use of electronic templates, potentially leads to their inaccurate coding on a
fairly widespread basis. Indeed, for many GPs, the detection and selection of the
appropriate code emerged as a ‘wildcard’ process, with clinicians reliant on using the
keyword search facility of their clinical IT system to locate a suitable code. Importantly,
this ‘wildcard’ approach seemed evident across GPs from different types of practices,
irrespective of their Enhanced Service status.
7.3.3 Dimension 3: The currency and accessibility of alcohol screening and
intervention data
Third, the need for data to be current, which also implies accessibility, is also a key
consideration of quality. In theory, the introduction of electronic Read code templates
to support the delivery and coding of screening and brief alcohol intervention should
be supporting the capture of more timely and accessible data in general practice
settings. Indeed, a key reported advantage of pay-for-performance in primary care has
generally been its positive impact on computerised records, particularly via the use of
templates (293, 352).

219
In this respect, the major concern arising from this study relates to GPs’ tendency to
free text brief alcohol interventions in particular, rather than using structured Read
code data. Use of free text, combined with inconsistent coding and the use of practice-
based codes, reduced the extent to which screening and brief alcohol intervention
data was accessible to this study, and of course to policy evaluators or practitioners
themselves. Some GPs appeared resistant to using Read code templates, articulating
such mechanisms as restrictive and counter-cultural. This is a key finding which
confirms previous research illustrating the socially, behaviourally and techno-
structurally situated nature of information technology adoption in general practice
(575, 578), and in particular Swinglehurst et al’s ethnographic case study of disease
template use (661). Thus, for GPs, alcohol templates are not simply organised around
alcohol use disorders, but around a particular version of those disorders, reflecting the
assumptions and requirements of those designing the template (661). As such, the
quantifiable (and essentially auditable) takes primacy, as a finite measure of care
delivery for the purposes of financial reimbursement, with the contextual narrative
detail unaccounted for, or rather absorbed within the back screen recording process of
free-text.
7.3.4 Dimension 4: The relevancy of screening and brief alcohol intervention
Read code data
Fourth, and arguably underpinning all three dimensions of data quality discussed
above, is the need for relevancy. That is, GPs and their practice teams are most likely
to record information if they believe it to be important or relevant to a given situation
or context at the time of recording. In this sense, a strong theme from both the
qualitative and systematic review phases of this research was the manner in which the
primary motivators of continuity of care and a ‘patient-centred’ consultation appeared
to result in increasingly disconnected if not outright conflicting heuristics for clinicians
where alcohol recording was concerned (665, 666), with accurate Read coding seen as
crucial for auditing purposes, but free text narrative more important where the
patient-clinician encounter was concerned. This tension has been described by some
authors as a “rational-reality gap” (667) and by Swinglehurst et al as requiring
clinicians to maintain a “dual orientation” towards coding (661).

220
There are some strong parallels between the conflicting relationship evident in GPs’
recording of screening and brief alcohol interventions, and those previously observed
between the extrinsic motivational factors used to encourage improvements in care,
and the individual clinician’s intrinsic motivation to perform a task for its own sake
(236, 417, 418). Thus, in the same way that management by incentives can neglect or
‘crowd out’ key elements of care (such as emotion, morality and trust (419)) in favour
of their achievement of population-based service goals (393, 420, 421, 423), so the
recording system de-values (or even disallows) the coding of such associated
psychosocial activity by clinicians, despite the fact that often appears to be the very
activity they find most relevant to patient care and professional practice.
However, whilst this dual orientation (661) could undoubtedly create an
uncomfortable delivery and recording context for primary care physicians, this study
suggests that its impact on the actual care delivered may be less acute. From the
narrative free-texting of alcohol intervention activity, to the persistent use of alcohol
consumption data as a screening measure, there were numerous examples of GPs
purposefully subverting the screening and brief alcohol intervention process to allow
their routine practice to more closely align with their preferred ‘patient-centred’
approach. Instead, the routine ‘tick-box’ elements of alcohol-related care, and in
particular the delivery and recording of screening tests, were devolved to nursing staff
or healthcare assistants. In this sense, the implementation of the enhanced service for
alcohol in the UK, both in terms of its care pathway, the incentive design, and the
underlying Read code system, rather than transforming practice, has potentially only
served to reconstruct traditional “hierarchies of appropriateness” (429).
7.3.5 Approach to the extraction and analysis of alcohol-related Read code
data in this thesis
Read codes
There were some limitations in the way that I dealt with Read codes in this thesis. In
addition to the original wording thought to best describe the concept at the time the
code was developed (the 'preferred term'), Read codes have an additional 2-byte term
(the ‘term code’ ) that can extend their meaning or provide alternative ways of
describing the same concept. However it does not constitute the main body of the
Read Code and should therefore be considered alternative as opposed to additional to

221
the original preferred term. For example, the Read code 1361 represents ‘Teetotaller’,
whereas the Read codes 1361-1 and 1361-2 both represent ‘Non-drinker alcohol’
through the additional ‘-1’ and ‘-2’ term codes. As I included both preferred and
synonymous codes, my precise statement of the number of alcohol-related Read codes
may have inconsistently dealt with term codes, and would not apply to both Version 2
5-byte and Ctv3.
Ontologies
There has been a long-standing use of controlled terminologies (such as Read codes) in
healthcare to enable physicians to store and communicate general medical knowledge
and patient-related information more efficiently (668). However, as such terminologies
are by definition, generally optimised for the purposes of human processing, they are
characterized by a significant amount of implicit knowledge, which limits their
interoperability across different technological systems and health contexts. The
construction of medical domain ontologies for representing such medical terminology
helps facilitate more interoperable information systems (669), and the more efficient
automation of guideline-based healthcare (670). Domain ontologies describe detailed
concepts and their relationships in a clear and unambiguous way (671, 672), and are
thus linked closely to the Semantic Web movement, “in which information is given
well-defined meaning, better enabling computers and people to work in cooperation"
(673).
In processing the alcohol Read code data that formed the basis of this doctoral
research (and in the absence of a standardized ontological framework for classifying,
evaluating and linking such data) I formed a number of informal ontologies which
grouped together (or clustered) related clinical codes into meaningful categories. For
example, codes relating to the administration of an alcohol use disorder screening test
or for the delivery of a brief preventative intervention, were grouped together to
explore instances of duplication or redundancy in the overall screening and brief
alcohol intervention Read code lexicon. Given the limitations in the treatment of Read
codes identified above, however, there is a clear need to further develop these
informal ontologies in the future, utilising more robust devices such as the Web
Ontology Language (OWL) (a family of knowledge representation languages for
authoring ontologies (674)) and Protégé (a free, open-source platform that provides a

222
suite of tools to construct domain models and knowledge-based applications with
ontologies (675)).
Codifying context
Drawing on the issues outlined above in the sections on data completeness,
correctness, currency and relevancy (7.3.1-4), there may also be scope to codify the
context in which clinical coding does, or does not take place. Some data quality
initiatives introduced in areas such as heart disease, diabetes, depression and chronic
kidney disease have resulted in higher quality coding better reflecting clinical care
(568). In other areas such as child safeguarding, this has proved more challenging (565,
676). Findings from this research may be used to support improved understanding of
which contextual factors connected to the delivery and Read coding of alcohol-related
activity are currently promoting or inhibiting the capture of good quality routine data.
7.4 Strengths and limitations of the research
The strengths and limitations of the individual phases of this study have already been
considered in the respective results chapters (4, 5 and 6). This section, therefore,
focusses on the strengths of the overarching mixed-methods research design, at the
same time as considering both the limitations inherent to this approach, as well as
reflecting on the possible implications of some of the logistical challenges experienced
during the conduct of the study.
First and foremost, employing a mixed-methods approach to the issue of whether
routine data can help evaluate the implementation of screening and brief alcohol
interventions in primary health care provided a novel means of answering this
important research question. The systematic integration of data from three inter-
related research components has delivered a richer, more nuanced and contextualised
response to the question of ‘usefulness’ (472), which is arguably more relevant to such
a complex (or ‘wicked’) public health issue (467, 474). Further, the sequential design
ensured that the findings from one research phase informed the next at a variety of
levels and importantly, this study sought to achieve transparency in relation to the
approach to data integration, in contrast to some previous research (479). Second, the
use of multiple methods also helped address some weaknesses of the individual
method study components. For example, the ‘silences’ evident in the aggregated Read

223
code data (low recorded rates of intervention delivery in particular) would have
remained unexplained without the benefit offered by the GP interviews to explore the
reasons behind these statistical trends. At the same time, the quantitative analysis of
GP Read code data has provided invaluable indicators of the association between key
variables of interest and rates of screening and brief alcohol intervention recording,
which would not have been possible with purely qualitative methods (461).
There are of course some limitations to this approach which must also be considered.
Importantly, it needs to be acknowledged that mixed-methods research, whilst
increasingly popular, remains controversial, with some arguing there is a fundamental
paradigmatic conflict between quantitative and qualitative approaches (475). Clearly,
by using mixed-methods, and for all the reasons outlined above and in Chapter 3, this
suggestion of incommensurability between the epistemological and ontological
assumptions of alternative methods is strongly resisted. Again, critical realism is
proposed as providing a sound theoretical justification to the selection of the various
methods employed. Thus, the different methods were selected for their potential to
access the different structures, experiences and events shaping the recording of
alcohol-related data in routine primary care practice (492). This is not to say that the
actual delivery of this mixed-methods doctoral study was without its challenges. In
particular, the execution of the equal-weight sequential explanatory mixed-methods
design was both time-consuming, and highly demanding in terms of the contrasting
specialist skills required by the single researcher responsible.
7.5 Recommendations
The findings of this doctoral research have several important implications for policy
and practice relating to the implementation and subsequent evaluation of screening
and brief alcohol interventions in routine primary health care in the UK.
7.5.1 Fostering a GP-friendly approach to screening and brief alcohol
interventions
Whilst GPs appear to demonstrate increased awareness of the key role they play in
helping to reduce the harmful effects of risky drinking within the wider primary health
care system, their adoption and delivery of the associated intervention tools and
techniques remains somewhat piecemeal. This study suggests two important areas for
future work.

224
First, there is a clear demand for improved GP education around the limitations and
challenges associated with using unit alcohol consumption as a means of assessing a
patient’s level of risk, alongside a reiteration of the practical, clinical and scientific
benefits of using validated screening tests instead. One key interpretation of this
research is that GPs feel more comfortable with assessing patients using a single score
in response to a single question that is more tangibly linked to the quantity of alcohol
consumed, however there are well-established limitations of using alcohol
consumption as the sole means of identifying risky drinking (188, 189, 658). As such,
whilst acknowledging the superiority of the full AUDIT and its associated briefer
versions as a highly sensitive and specific means of case-identification in primary
health care (121, 129, 143, 144), there may also be a case for encouraging the more
systematised use of the Single Alcohol Screening Questionnaire (149) by GPs as a pre-
screening tool to quickly filter out negative cases (677, 678).
Second, many GPs articulated their resistance to overly formalised, prescriptive
interventions, preferring instead what they considered to be a more adaptive and
patient-centred approach. Of course, in reality, there may be little difference between
the intervention approach GPs imagine they are resisting, and the ones they actually
deliver. As highlighted previously, brief intervention is an umbrella term, representing
a wide variety of lengths and styles of activity (68, 177). Whilst there remain some
knowledge gaps around the essential ‘active’ ingredients of brief interventions, recent
research would suggest that the provision of simple feedback and written information
about alcohol may be enough to stimulate behaviour change (679). Thus, the key
message for clinicians could well be that so long as they incorporate those elements
within their otherwise tailored interventions, they should be effective at supporting
patients to reduce their risk related to alcohol.
7.5.2 Improving the design of the alcohol-related GP Read code system
Next, the findings of this study also have profound consequences for the design,
structure and implementation of the GP Read code system and the tools supporting its
use by primary health care staff. Certain improvements are crucial in order to both
make alcohol-related Read codes more usable and meaningful for clinicians, and in
turn, to enhance their value as evaluation data for policy makers and service
commissioners.

225
First, 287 Read codes seems to be an excessive number of recording options for busy
clinicians, and this study has confirmed the findings of previous research in this area
that the volume of potential codes has a detrimental effect on GP coding practices.
Given this study has also demonstrated the high degree of duplication of alcohol-
related Read codes, and the existence of numerous out-dated codes, there must surely
be a strong case for the immediate retirement of inappropriate Read codes, combined
with some serious pruning and rationalisation of surplus coding to facilitate more
confident, accurate and meaningful recording of alcohol intervention activity in the
future. At the same time, it is also clear that GPs are consistently employing free-text
data to capture some of the more complex, psychosocial narrative around alcohol
interventions because the current Read code system is not fit for purpose. Thus, whilst
it is important to streamline the overall coding lexicon, there is also a need to consider
the introduction of additional Read codes to support the recording of social, familial
and historical factors related to a patient’s alcohol status, at the same time as
exploring the potential for the enhanced, more systemised utilisation of free text data
(680), which to date remains challenging (681).
In addition, whilst electronic templates appear to support more systematic Read
coding of alcohol screening test delivery by nursing staff, in their current format at
least, they sit uneasily with the way in which GPs conceptualise their role as clinicians,
their preferred use of IT in patient consultations, and their approach to intervention
delivery per se. Given their potential to improve the quality of GP brief alcohol
intervention data however, system designers should be encouraged to work more
closely with clinicians in designing Read code templates that are more sympathetic to
their preferred way of working, and importantly, maintain their desired focus on
patient-centred care (661).
7.5.3 Re-thinking the role of enhanced services in stimulating alcohol activity
Finally, there was a strong implication that whilst financial incentives drive practice,
and in turn coding, where GPs are concerned at least, not all incentive schemes are
created equal. In terms of both prioritising delivery, and in turn, the Read coding of
clinical activity, GPs are keenly aware of the fundamental role of activity incentivised
via the quality and outcomes framework to practice income. As result, despite often
good intentions, and set within the pressured context of routine primary health care,
226
enhanced service activities slip to the bottom of the pile against the more lucrative
QOF areas of practice. This is of course despite the fact that in England, almost a
quarter of men and around one in five women continue to drink above recommended
levels (or around a third of adults in the North East of England) (62), whereas three
quarters of the population do not have any of the diseases listed in the quality and
outcomes framework (413).
Given the radical reduction to the number of clinical indicators covered by the
forthcoming 2014/15 QOF(682), the inclusion of screening and brief alcohol
interventions in future iterations of the scheme would appear unlikely. However, if
policy makers and local commissioners are serious about encouraging GPs and other
primary health care staff to routinely deliver screening and brief alcohol interventions,
this research would lend additional support to existing calls for a more sustainable
approach to the funding of alcohol prevention activities.
7.6 Areas for future research
This study focused on the part played by UK GPs in the delivery and recording of
screening and brief alcohol interventions. However, findings from both this
investigation, and previous research in the field, have highlighted the key role of
nurses and receptionists (202, 683, 684), practice managers and increasingly
healthcare assistants, within these processes. Indeed in some cases, these individuals
may have been leading the implementation of comprehensive alcohol screening
initiatives in practices. Further research to explore their motivations and approaches
toward recording such screening activity would arguably generate a fuller
understanding of the usefulness of alcohol Read code data in its entirety. In addition,
as already acknowledged earlier in this chapter, the accounts of single GPs cannot
represent the entirety of views and experiences of a complete practice.
Next, there were some areas of discord between the results from individual study
phases that also suggest further research would be useful. For example, as the rates of
delivery were based on the number of occasions on which practitioners recorded their
provision of an alcohol screening test using a pre-specified Read code, if they had
delivered the test but used an alternative Read code (such as a practice-specific code),
the analysis would not have picked this up. Further interrogation of practice IT systems

227
using a wider set of GP Read code queries would potentially help to identify some
possible ‘missing’ cases of screening activity.
In addition, the variation identified in the recorded rates of alcohol interventions at
individual practice level was only partially explained by the interview findings, and the
qualitative data implied that interventions were under-reported in general. Future
research could potentially employ alternative methods, such as the video-taping of
consultation activity and the examination of intervention-related narrative free-text
data, to facilitate increased understanding of the GPs’ approach to addressing risky
drinking in routine practice. The systematic review conducted by Mitchell et al on
clinical recognition and recording of alcohol disorders by clinicians in primary care
found that studies which had videotaped or observed consultations determined that
alcohol-related discussions were often superficial and yielded little information
regarding patients’ drinking practices (658). However, none of the studies covered
were based in the UK, and the most recent was published in 1997 (685-687).
Finally, this study has served to underline the continued challenges associated with
using routine Read code data to evaluate the implementation of screening and brief
alcohol interventions in primary health care, despite their numerous advantages over
alternative means of assessment, such as direct observation or the introduction of
behavioural measures (274, 278). The recommendations made in the previous section
highlighted the need for: sympathetic coding templates to facilitate more seamless
intervention data capture; the rationalisation of the existing alcohol-related Read code
system; and the introduction of mechanisms to support more systematic free-text data
mining in order to enhance their usefulness as an information source. However, such
improvements will require further research to advance our understanding of these
evolving areas of health informatics, and to enable the development of
implementation strategies that incorporate more meaningful mechanisms of ongoing
evaluation and feedback in the future.
7.7 Concluding remarks
This concluding chapter has presented the main findings from a mixed-methods
investigation into the question of whether routinely collected data can help evaluate
the implementation of screening and brief alcohol interventions in primary health

228
care. It has determined that the quality of the available alcohol Read code data is
deficient across a number of key dimensions of quality. Overall, the data is suggestive
of a degree of success in the various policy initiatives introduced in recent years to
stimulate increased alcohol prevention activity in UK primary health care, and in
particular, the use of financial incentives. However, the question of the adequacy of
the available Read code data to support the evaluation of screening and brief alcohol
intervention activity delivered by the practices participating in this study arguably goes
well beyond the utility of the current GP Read code system. The findings from this
research have served to highlight some deeper, structural factors that shape GPs
delivery and recording of interventions that also warrant further consideration in
developing more appropriate evaluation measures in the future.

229
Appendices

230
23
0
Appendix A: Systematic review search terms
CONCEPT MEDLINE* EMBASE* PsycINFO* SCOPUS* / OTHER DATABASES
Participants Physician/
Keywords: doctor$; “medical practitioner$”; GP$; pediatrician$; obstetrician$; “medical personnel; clinician$”.
Physician/
Key words: GP$; Pediatrician$; Obstetrician$; “Medical personnel”; Clinician$; “General Practitioner$”; “Family Physician$”; “Primary Care Physician$”.
Physicians/
Keywords: GP$; “Medical Practitioner$”; Clinician$; “Primary Care Physician$”.
Keywords: “associate physician*”; clinician*; doctor*; “family physician*”; “general Practitioner*”; GP*; gynaecologist*; “medical doctor*”; “medical personnel”; “medical practitioner*”; obstetrician*; “occupational health physician*”; paediatrician*; physician*; “primary care physician*”.
Focus of study
Attitude/; Health Services Administration/; Quality of Health Care/
Keywords: “clinical audit$”; “health care economic$”; “health care policy”; “Health Care Service$”; “program$ evaluation$”; “process assessment$”; “health care quality”; “health care evaluation$”; “clinical governance”; “quality indicator$”; “case management”; “health care delivery”.
Health Personnel Attitude/; Health Care Quality/
Keywords: “patient care management”; quality of health care”; “attitude to computer$”; “computer attitude$”; “case management”; “health care delivery”; “clinical audit$”.
Health Personnel Attitudes/; Health Care Administration/
Keywords: “computer attitude$”; “health attitude$”; “attitude to computer$”; “computer attitude$”; “attitude to health”; “health care quality”; “quality of health care”; “health care evaluation”; “patient care management”.
Keywords: “attitude* of health personnel”; “attitude* to computer*”; “attitude* to health”; “case management”; “clinical audit*”; “clinical governance”; “computer attitude*”; “health care delivery”; “health care economic*”; *health care evaluation*; *health care personnel attitude*”; “health care policy”; “health care service*”; “health service* research*; “healthcare evaluation”; “organisation and administration”; “patient care management”; “process assessment$”; “program evaluation”; “quality assurance”; “quality indicator*”; “quality of care research”; “quality of health care”; “health care quality”.
*Health Records
Medical records/
Key words: electronic health record$; forms and record$ control; medical data storage; medical record$; medical transcription$; patient record$; data processing; patient history; medical archive$; “read code$”; “read coding”.
Medical Record/ Read Coding/
Keywords: “read code$”
Medical Records/
Keywords: “electronic health record$”; “forms and record$ control”; “medical data storage”; “medical record$”; “medical transcription$”; “patient record$”; “medical record linkage”; “medical record$ system$”, computerized”; “health record$”; “medical archive$”; “read code$”; “read coding”.
Record*; “read code*”; “read coding”; “physician* practice pattern*”; “client record*”; “data collection”; “data processing”; record*; “electronic health record*”; “form* and record* control”; “health record*”; “hospital administration”; “hospital record”; “medical archive”; “medical data storage”; “medical record linkage”; “medical record*”; “medical transcription*”; “patient history”; “patient record”.
*MeSH, EMTREE, APA Thesaurus subject headings are presented underlined/

231
Appendix B: Quality assessment tool for quantitative data

232

233

234

235
Appendix C: Quality assessment tool for qualitative data
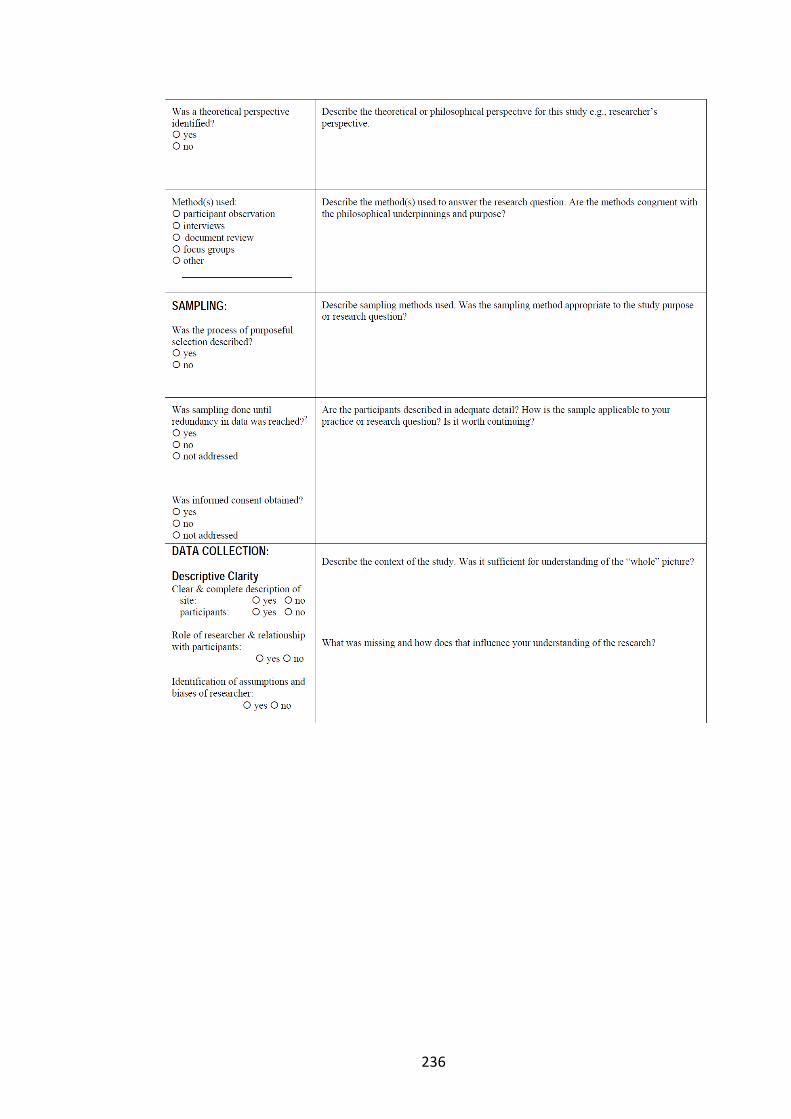
236

237
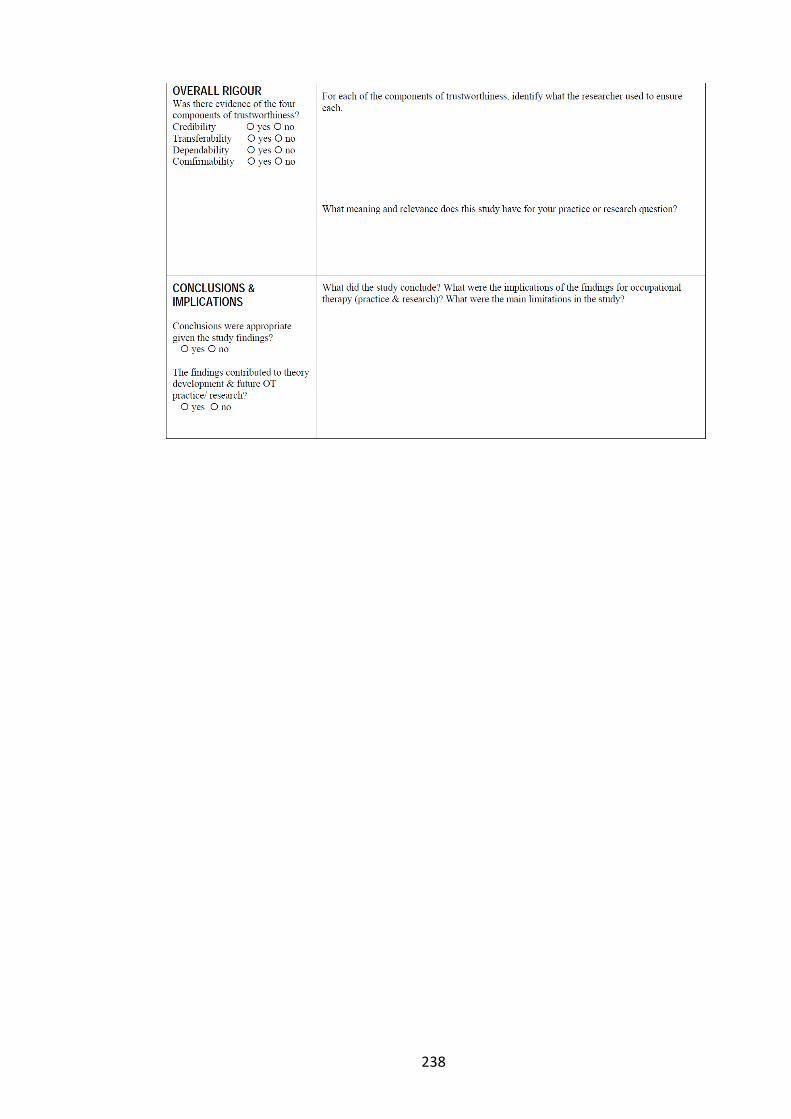
238

239
Appendix D: Quality assessment tables
Table D1: Quality of quantitative studies (selection bias, study design, confounders)
CITATION
(A) Selection Bias (B) Study Design ( C) Confounders
Are
th
e in
div
idu
als
sele
cted
to
par
tici
pat
e in
th
e st
ud
y lik
ely
to
be
rep
rese
nta
tive
of
the
targ
et p
op
ula
tio
n?
Wh
at %
of
sele
cted
ind
ivid
ual
s ag
ree
d t
o
par
tici
pat
e?
Rat
e se
ctio
n
Ind
icat
e th
e st
ud
y d
esig
n
Was
th
e st
ud
y d
escr
ibed
as
ran
do
mis
ed?
Was
th
e m
eth
od
of
ran
do
mis
atio
n d
esc
rib
ed?
Was
th
e m
eth
od
ap
pro
pri
ate?
Rat
e se
ctio
n
Wer
e th
ere
imp
ort
ant
dif
fere
nce
s b
etw
een
gro
up
s p
rio
r to
th
e in
terv
enti
on
?
If Y
ES, i
nd
icat
e th
e %
of
rele
van
t co
nfo
un
der
s
that
wer
e co
ntr
olle
d?
Rat
e se
ctio
n
Brown et al (a) (2003) “Randomised crossover trial comparing the performance of Clinical Terms Version 3 and Read Code 5 byte set coding schemes in general practice” and Brown et al (b) (2003) “A methodology for the functional comparison of coding schemes in primary care”
3 4 3 1 Yes Yes Yes 1 3 4 3
Campbell et al (2002) “Quality assessment for three common conditions in primary care: validity and reliability of review criteria developed by expert panels for angina, asthma and type 2 diabetes”
1 1 1 7 yes yes Yes 3 1 2 2
Carey et al (2009) “Blood pressure recording bias during a period when the Quality and Outcomes Framework was introduced”
1 4 2 7 no N/A N/A 3 3 n/a 3
Coleman et al (2007) Distributing questionnaires about smoking to patients: impact on general practitioners' recording of stop--smoking advice
4 4 3 3 No N/A N/A 3 3 n/a 3
Coleman et al (2007) “Impact of contractual financial incentives on the ascertainment and management of smoking in primary care”
2 4 2 7 no N/A N/A 3 1 1 1
Dalton et al (2010) “Implementation of the NHS Health Checks programme: baseline assessment of risk factor recording in an urban culturally diverse setting”
2 4 3 7 no N/A N/A 3 1 1 1
Lusignan et al (2002) “Does Feedback Improve the Quality of Computerized Medical Records in Primary Care?”
2 4 2 7 No N/A N/A 3 3 4 3
Lusignan et al (2004) An educational intervention to improve data recording in the management of ischaemic heart disease in primary care
3 4 3 5 No N/A N/A 3 2 n/a 3
Hippisley-Cox (2003) “The electronic patient record in primary care - regression or progression? A cross sectional study”
2 3 2 7 No N/A N/A 3 1 1 1
Holt (2010) “Automated electronic reminders to facilitate primary cardiovascular disease prevention: randomised controlled trial”
2 3 2 1 Yes Yes Yes 1 2 n/a 2

240
Kontopantelis (2012) “Recorded quality of primary care for patients with diabetes in England before and after the introduction of a financial incentive study: a longitudinal observational study”
1 4 2 6 No N/A N/A 2 N/A n/a n/a
Kumarapeli (2006) “Ethnicity recording in general practice computer systems”
3 4 3 7 No N/A N/A 3 N/A n/a 3
Kumarapeli (2013) “Using the computer in the clinical consultation; setting the stage, reviewing, recording, and taking actions: multi-channel video study”
3 1 3 7 No N/A N/A 3 N/A n/a 3
Porcheret (2004) “Data Quality of General Practice Electronic Health Records: The Impact of a Program of Assessments, Feedback and Training”
3 1 3 5 No N/A N/A 3 3 4 3
Rait (2009) “Recent trends in the incidence of recorded depression in primary care”
2 4 2 7 No N/A N/A 3 N/A n/a 3
Taggar (2012) “The impact of the Quality and Outcomes Framework (QOF) on the recording of smoking targets in primary care medical records: cross-sectional analyses from The Health Improvement Network (THIN) database
1 4 2 6 No N/A N/A 2 N/A n/a n/a
Thapar (2002) “A pragmatic randomised controlled trial of a prompt and reminder card in the care of people with epilepsy”
1 3 2 1 Yes Yes Yes 1 1 1 1
Woodman (2012) “A simple approach to improve recording of concerns about child matreatment in primary care records: developing a quality improvement intervention”
2 1 2 7 No N/A N/A 3 N/A n/a n/a

241
Table D2: Quality of quantitative studies (blinding, data collection, withdrawals)
CITATION
(D) Blinding ( E) Data Collection Methods
(F) Withdrawals and Drop-Outs
Was
(w
ere)
th
e o
utc
om
e as
sess
or(
s) a
war
e o
f th
e
inte
rven
tio
n o
r ex
po
sure
sta
tus
of
par
tici
pan
ts?
Wer
e th
e st
ud
y p
arti
cip
ants
aw
are
of
the
rese
arch
qu
esti
on
?
Rat
e se
ctio
n
Wer
e d
ata
colle
ctio
n t
oo
ls s
ho
wn
to
be
valid
?
Wer
e d
ata
colle
ctio
n t
oo
ls s
ho
wn
to
be
relia
ble
?
Rat
e se
ctio
n
Wer
e w
ith
dra
wal
s an
d d
rop
-ou
ts r
epo
rted
in
term
s o
f n
um
ber
s an
d /
or
reas
on
s p
er g
rou
p?
Ind
icat
e th
e %
of
par
tici
pan
ts c
om
ple
tin
g th
e
stu
dy
Rat
e se
ctio
n
Brown et al (a) (2003) “Randomised crossover trial comparing the performance of Clinical Terms Version 3 and Read Code 5 byte set coding schemes in general practice” and Brown et al (b) (2003) “A methodology for the functional comparison of coding schemes in primary care”
3 1 2 3 3 3 1 1 1
Campbell et al (2002) “Quality assessment for three common conditions in primary care: validity and reliability of review criteria developed by expert panels for angina, asthma and type 2 diabetes”
N/A 1 3 3 3 3 1 1 1
Carey et al (2009) “Blood pressure recording bias during a period when the Quality and Outcomes Framework was introduced”
N/A N/A N/A 3 3 3 4 5 4
Coleman et al (2007) Distributing questionnaires about smoking to patients: impact on general practitioners' recording of stop--smoking advice
N/A 1 3 3 3 3 4 2 4
Coleman et al (2007) “Impact of contractual financial incentives on the ascertainment and management of smoking in primary care”
N/A N/A N/A 3 3 3 4 5 4
Dalton et al (2010) “Implementation of the NHS Health Checks programme: baseline assessment of risk factor recording in an urban culturally diverse setting”
N/A N/A N/A 3 3 3 4 5 4
Lusignan et al (2002) “Does Feedback Improve the Quality of Computerized Medical Records in Primary Care?”
3 2 3 3 3 3 4 5 4
Lusignan et al (2004) An educational intervention to improve data recording in the management of ischaemic heart disease in primary care
N/A N/A N/A 3 3 3 1 1 1
Hippisley-Cox (2003) “The electronic patient record in primary care - regression or progression? A cross sectional study”
N/A N/A N/A 3 3 3 1 1 1
Holt (2010) “Automated electronic reminders to facilitate primary cardiovascular disease prevention: randomised controlled trial”
1 2 2 3 3 3 1 1 1

242
Kontopantelis (2012) “Recorded quality of primary care for patients with diabetes in England before and after the introduction of a financial incentive study: a longitudinal observational study”
N/A N/A N/A 1 1 1 3 1 2
Kumarapeli (2006) “Ethnicity recording in general practice computer systems”
N/A N/A N/A 3 3 3 3 1 2
Kumarapeli (2013) “Using the computer in the clinical consultation; setting the stage, reviewing, recording, and taking actions: multi-channel video study”
N/A N/A N/A 1 1 1 3 4 3
Porcheret (2004) “Data Quality of General Practice Electronic Health Records: The Impact of a Program of Assessments, Feedback and Training”
N/A N/A N/A 3 3 3 3 4 3
Rait (2009) “Recent trends in the incidence of recorded depression in primary care”
N/A N/A N/A 3 3 3 4 5 4
Taggar (2012) “The impact of the Quality and Outcomes Framework (QOF) on the recording of smoking targets in primary care medical records: cross-sectional analyses from The Health Improvement Network (THIN) database
N/A N/A N/A 1 1 1 3 1 2
Thapar (2002) “A pragmatic randomised controlled trial of a prompt and reminder card in the care of people with epilepsy”
2 2 1 3 3 3 1 1 1
Woodman (2012) “A simple approach to improve recording of concerns about child matreatment in primary care records: developing a quality improvement intervention”
N/A N/A N/A 3 3 3 3 1 2

243
Table D3: Quality of quantitative studies (intervention integrity, analyses)
CITATION
(G) Intervention Integrity
(H) Analyses
Wh
at %
of
par
tici
pan
ts r
ecei
ved
th
e al
loca
ted
in
terv
enti
on
or
exp
osu
re o
f in
tere
st?
Was
th
e co
nsi
sten
cy o
f th
e in
terv
enti
on
mea
sure
d?
Is it
like
ly t
hat
su
bje
cts
rece
ived
an
un
inte
nd
ed
inte
rven
tio
n (
con
tam
inat
ion
or
co-i
nte
rven
tio
n)
that
may
infl
uen
ce t
he
resu
lts?
In
dic
ate
the
un
it o
f al
loca
tio
n
Ind
icat
e th
e u
nit
of
anal
ysis
Are
th
e st
atis
tica
l met
ho
ds
app
rop
riat
e fo
r th
e
stu
dy
des
ign
?
Is t
he
anal
ysis
per
form
ed b
y in
terv
enti
on
al
loca
tio
n s
tatu
s (i
e in
ten
tio
n t
o t
reat
) ra
ther
than
th
e ac
tual
inte
rven
tio
n r
ecei
ved
?
Brown et al (a) (2003) “Randomised crossover trial comparing the performance of Clinical Terms Version 3 and Read Code 5 byte set coding schemes in general practice” and Brown et al (b) (2003) “A methodology for the functional comparison of coding schemes in primary care”
1 1 3 individual individual 1 1
Campbell et al (2002) “Quality assessment for three common conditions in primary care: validity and reliability of review criteria developed by expert panels for angina, asthma and type 2 diabetes”
1 3 3 N/A individual 1 N/A
Carey et al (2009) “Blood pressure recording bias during a period when the Quality and Outcomes Framework was introduced”
N/A N/A N/A N/A individual 1 N/A
Coleman et al (2007) Distributing questionnaires about smoking to patients: impact on general practitioners' recording of stop--smoking advice
1 3 3 N/A individual 1 N/A
Coleman et al (2007) “Impact of contractual financial incentives on the ascertainment and management of smoking in primary care”
N/A N/A N/A N/A individual 1 N/A
Dalton et al (2010) “Implementation of the NHS Health Checks programme: baseline assessment of risk factor recording in an urban culturally diverse setting”
N/A N/A N/A N/A individual & practice
1 N/A
Lusignan et al (2002) “Does Feedback Improve the Quality of Computerized Medical Records in Primary Care?”
N/A N/A N/A N/A individual 1 N/A
Lusignan et al (2004) An educational intervention to improve data recording in the management of ischaemic heart disease in primary care
1 1 1 practice individual practice
1 N/A
Hippisley-Cox (2003) “The electronic patient record in primary care - regression or progression? A cross sectional study”
1 3 3 N/A individual GP
1 N/A
Holt (2010) “Automated electronic reminders to facilitate primary cardiovascular disease prevention: randomised controlled trial”
1 1 3 N/A individual 1 N/A
Kontopantelis (2012) “Recorded quality of primary care for patients with diabetes in England before and after the introduction of a financial incentive study: a longitudinal observational study”
N/A N/A N/A individual individual 1 N/A

244
Kumarapeli (2006) “Ethnicity recording in general practice computer systems”
1 3 3 N/A individual patient
1 N/A
Kumarapeli (2013) “Using the computer in the clinical consultation; setting the stage, reviewing, recording, and taking actions: multi-channel video study”
N/A N/A N/A Consultation Consultation 1 N/A
Porcheret (2004) “Data Quality of General Practice Electronic Health Records: The Impact of a Program of Assessments, Feedback and Training”
1 1 1 N/A indivudal patient & practice
1 N/A
Rait (2009) “Recent trends in the incidence of recorded depression in primary care”
N/A N/A N/A N/A individual patient
1 N/A
Taggar (2012) “The impact of the Quality and Outcomes Framework (QOF) on the recording of smoking targets in primary care medical records: cross-sectional analyses from The Health Improvement Network (THIN) database
N/A N/A N/A individual Individual 1 N/A
Thapar (2002) “A pragmatic randomised controlled trial of a prompt and reminder card in the care of people with epilepsy”
1 3 3 practice individual patient
1 1
Woodman (2012) “A simple approach to improve recording of concerns about child matreatment in primary care records: developing a quality improvement intervention”
N/A N/A N/A practice practice 1 N/A

245
Table D4: Quality of quantitative studies (section ratings, overall rating)
CITATION
Section Ratings OVERALL RATING
Sele
ctio
n B
ias
Stu
dy
Des
ign
Co
nfo
un
der
s
Blin
din
g
Dat
a C
olle
ctio
n M
eth
od
Wit
hd
raw
als
and
Dro
p-
ou
ts
Brown et al (a) (2003) “Randomised crossover trial comparing the performance of Clinical Terms Version 3 and Read Code 5 byte set coding schemes in general practice” and Brown et al (b) (2003) “A methodology for the functional comparison of coding schemes in primary care”
3 1 3 2 3 1 Weak
Campbell et al (2002) “Quality assessment for three common conditions in primary care: validity and reliability of review criteria developed by expert panels for angina, asthma and type 2 diabetes”
1 3 2 3 3 1 Weak
Carey et al (2009) “Blood pressure recording bias during a period when the Quality and Outcomes Framework was introduced”
2 3 3 N/A 3 4 Weak
Coleman et al (2007) Distributing questionnaires about smoking to patients: impact on general practitioners' recording of stop--smoking advice
3 3 3 3 3 4 Weak
Coleman et al (2007) “Impact of contractual financial incentives on the ascertainment and management of smoking in primary care”
2 3 1 N/A 3 4 Weak
Dalton et al (2010) “Implementation of the NHS Health Checks programme: baseline assessment of risk factor recording in an urban culturally diverse setting”
3 3 1 N/A 3 4 Weak
Lusignan et al (2002) “Does Feedback Improve the Quality of Computerized Medical Records in Primary Care?”
2 3 3 3 3 4 Weak
Lusignan et al (2004) An educational intervention to improve data recording in the management of ischaemic heart disease in primary care
3 3 3 N/A 3 1 Weak
Hippisley-Cox (2003) “The electronic patient record in primary care - regression or progression? A cross sectional study”
2 3 1 N/A 3 1 Weak
Holt (2010) “Automated electronic reminders to facilitate primary cardiovascular disease prevention: randomised controlled trial”
2 1 2 2 3 1 Strong
Kontopantelis (2012) “Recorded quality of primary care for patients with diabetes in England before and after the introduction of a financial incentive study: a longitudinal observational study”
2 2 N/A N/A 1 2 Moderate
Kumarapeli (2006) “Ethnicity recording in general practice computer systems”
3 3 3 N/A 3 2 Weak
Kumarapeli (2013) “Using the computer in the clinical consultation; setting the stage, reviewing, recording, and taking actions: multi-channel video study”
3 3 N/A N/A 1 3 Weak

246
Porcheret (2004) “Data Quality of General Practice Electronic Health Records: The Impact of a Program of Assessments, Feedback and Training”
3 3 3 N/A 3 3 Weak
Rait (2009) “Recent trends in the incidence of recorded depression in primary care”
2 3 3 N/A 3 4 Weak
Taggar (2012) “The impact of the Quality and Outcomes Framework (QOF) on the recording of smoking targets in primary care medical records: cross-sectional analyses from The Health Improvement Network (THIN) database
2 2 N/A 1 2 Moderate
Thapar (2002) “A pragmatic randomised controlled trial of a prompt and reminder card in the care of people with epilepsy”
2 1 1 1 3 1 Strong
Woodman (2012) “A simple approach to improve recording of concerns about child matreatment in primary care records: developing a quality improvement intervention”
2 3 N/A N/A 3 2 Weak

247
24
7
Table D5: Quality of qualtitative studies (study purpose, literature)
Citation
Study Purpose Literature
Clear research
question?
Outline the purpose of the study and / or research questions
Relevant background
literature reviewed?
Clear / compelling need for research? How does the study apply to your research question?
Campbell et al (2002) “Quality assessment for three common conditions in primary care: validity and reliability of review criteria developed by expert panels for angina, asthma and type 2 diabetes”
Yes To field test the reliability, validity, and acceptability of review criteria for angina, asthma, and type 2 diabetes which had been developed by expert panels using a systematic process to combine evidence with expert opinion.
Yes Clear need - to support development of best practice measure of care (valid, reliable & transparent)
Extent to which quality focus in health care improves recording practices
Lusignan et al (2003) “Managers See the Problems Associated with Coding Clinical Data as a Technical Issue whilst Clinicians also See Cultural Barriers”
Yes To examine the barriers to recording structured information in computerised medical records; and to explore whether managers and clinicians had different perspectives in how these barriers should be overcome.
Yes Refers to findings from previous PCRN study which contrasting views on barriers to clinicial coding between practice managers and clinicians. This study wanted to build on that subject in more depth.
Includes investigation of clinician recording barriers - relates directly to my review question
Hippisley-Cox (2003) “The electronic patient record in primary care - regression or progression? A cross sectional study”
Yes To determine whether paperless medical records contained less infomaion than paper baed medical records and whether that information was harder to retrieve
Yes Yes Relevant in terms of whether EPR encourage better data recording by physicians
Woodman (2012) “A simple approach to improve recording of concerns about child matreatment in primary care records: developing a quality improvement intervention”
Yes To determine how the recording of child maltreatment concerns can be improved
Yes Highlights fact that despite child maltreatment being relatively common, many affected children fail to reach the threshhold for investigation and there is a lack of information on how often English GPs report child maltreatment.
Investigation focusses on development of an intervention to improve GP recording of child maltreatment

248
24
8
Table D6: Quality of qualtitative studies (study design)
Citation
Study Design
Design? Design appropriate for the study question?
Theoretical perspective identified?
Theoretical or philosophical perspective
Methods Method(s) used to answer the research question.
Campbell et al (2002) “Quality assessment for three common conditions in primary care: validity and reliability of review criteria developed by expert panels for angina, asthma and type 2 diabetes”
Mixed methods Yes - allowed rounded picture of recording practice to be built up - although not much information to explain why particular methods chosen
No - very much policy focussed
not clear Statistical analysis of audit data, questionnaire and semi-structured interviews
Methods appropriate for research question but no explicit theoretical perspective so unable to make judgement in this respect
Lusignan et al (2003) “Managers See the Problems Associated with Coding Clinical Data as a Technical Issue whilst Clinicians also See Cultural Barriers”
Not stated but presume Phenomenology
Yes - research question focusses on exploring views on / experience of recording from individual perspective of clinician / manager
No N/A Semi-structured interviews
Yes
Hippisley-Cox (2003) “The electronic patient record in primary care - regression or progression? A cross sectional study”
Not stated but presume Phenomenology
Yes No Can't tell Interviews Methods appropriate for research question but no explicit theoretical perspective so unable to make judgement in this respect
Woodman (2012) “A simple approach to improve recording of concerns about child matreatment in primary care records: developing a quality improvement intervention”
Mixed methods Yes No No clear Telephone interviews, a GP workshop and a consensus development meeting
Yes

249
24
9
Table D7: Quality of qualtitative studies (sampling)
Citation
Sampling
Process of purposeful selection
described?
Describe sampling methods used Was sampling done until redundancy in data was reached?
Are the participants described in adequate detail?
Was informed consent
obtained?
Campbell et al (2002) “Quality assessment for three common conditions in primary care: validity and reliability of review criteria developed by expert panels for angina, asthma and type 2 diabetes”
No - mixed methods so random, stratified sampling approach adopted
Multi-level randomised, stratified sampling to identify 60 GP practices from 2 health authorities each in 3 english regions. 20 patients selected per practice - using random numbers - with appropriate diagnosis & also taking commonly prescribed medication. Interviews with 3 reps per practice
Not addressed Yes - and relevant to my review
Not addressed
Lusignan et al (2003) “Managers See the Problems Associated with Coding Clinical Data as a Technical Issue whilst Clinicians also See Cultural Barriers”
Yes Purposeful sample frame was developed taking into account different primary care professions, age of interviews, single handed v group practices, diff computer systems, non-coders v coding enthusiasts - seems appropriate to question given it was looking at exploring diffs between mgrs / clinicians in more depth
Yes - additional interviews were conducted until thematic saturation was achieved
Sample frame provided which details key characteristics of participants. Includes GPs therefore relevant to my review question
Yes
Hippisley-Cox (2003) “The electronic patient record in primary care - regression or progression? A cross sectional study”
Yes Randomised using number tables, based on key characteristics of interest
Not addressed No - little detail provided yes
Woodman (2012) “A simple approach to improve recording of concerns about child matreatment in primary care records: developing a quality improvement intervention”
Yes Convenience sample of GPs with known interest in either child protection or coding.
Not addressed Minimal detail - but information provided suggests relevancy
Not addressed

250
25
0
Table D8: Quality of qualtitative studies (data collection)
Citation
Data Collection
Site description?
Participant description?
Role of researcher & relationship
with participants?
Identification of assumptions and biases of
researcher description?
Describe the context of the study. Was it sufficient for understand of the "whole"
picture?
What was missing and how does that
influence your understanding of
the research?
Procedural rigour used?
Do the resarchers provide adequate information about data
collection procedures?
Campbell et al (2002) “Quality assessment for three common conditions in primary care: validity and reliability of review criteria developed by expert panels for angina, asthma and type 2 diabetes”
Yes Yes No No Yes - focus on issue of developing meaningful measures of quality of care. Involved detailed multifactorial quality assessment of a nationally representative sample of 60 randomly selected practices in England.
Nothing key missing
Yes Reasonable amount of detail. (1) Data abstracted for up to 20 patients per condition per practice using standardised forms - took on average 20 minutes per patient. (2) Questionnaire asking respondents to rate validity of various criteria sent to a nurse and doctor in 59 practices (with 1 practice used as a pilot); and (3) 1 researcher visited 59 practices (1 used as pilot) to conduct semi-structured interviews with staff. No mention of fieldnotes taken, access, flexibility etc
Lusignan et al (2003) “Managers See the Problems Associated with Coding Clinical Data as a Technical Issue whilst Clinicians also See Cultural Barriers”
Yes Yes Not much detail provided on this
No Yes - explains both development of computerised practice in UK (including need to demonstrate meeting standards etc with clinical data); issues around recording standardised (Read Code) v free text data; and findings from previous research study which highlighted different views on barriers to coding between clinicians and practice managers
No information on practice context itself - socio-economic context, PCT policy / practice influencers etc
Yes Interviews took place in the interviewees’ primary care location, where possible, so the interviewee could show the researcher the Read Coding interface that they used. Following the 1st interview, interviewee was asked to code two problems on their clinical system. Interviews were conducted by one researcher. Structure of the interviews evolved as early interviews were analysed.

251
25
1
Hippisley-Cox (2003) “The electronic patient record in primary care - regression or progression? A cross sectional study”
Yes yes Not addressed Not addressed Yes Yes Yes
Woodman (2012) “A simple approach to improve recording of concerns about child matreatment in primary care records: developing a quality improvement intervention”
Yes Yes Not addressed Not addressed Yes Nothing key missing
Yes Yes. Practice and GP characteristics were captured using an online questionaire; recording practices were explored through short, structured telephone interviews and the half-day workshop comprised GP presentations and a free-ranging discussion. Confirms that no patient identifiable data was accessed by the research team / or left the practice.

252
25
2
Table D9: Quality of qualtitative studies (data analyses)
Citation
Data Analyses
Data Analyses
were inductive?
Findings consistent
with & reflective of
data?
Describe method(s) of data analysis.
What were the findings?
Decision trail developed?
Process of describing the
data was described
adequately?
Describe the descisions re:
transformation of data to codes /
themes.
Did a meaningful picture of the phenomenon under study
emerge?
How were concepts under study clarified and refined,
and relationships made clear?
Campbell et al (2002) “Quality assessment for three common conditions in primary care: validity and reliability of review criteria developed by expert panels for angina, asthma and type 2 diabetes”
not addressed
difficult to tell
Not explained Not addressed Not addressed Not addressed Yes - to limited extent
No conceptual model mentioned / tested etc
Lusignan et al (2003) “Managers See the Problems Associated with Coding Clinical Data as a Technical Issue whilst Clinicians also See Cultural Barriers”
Yes Yes Thematic analysis
Yes - eg of paper analysis carried out plus informatics experts interviews in order to triangulate data
Yes Explains process of thematic analysis & tools employed. Also supported by expert panel input
Yes Confirmed that clinicians/managers have different views on barriers to coding and underlined mismatch between goals of clinical consultation v audit
Hippisley-Cox (2003) “The electronic patient record in primary care - regression or progression? A cross sectional study”
yes yes Yes yes yes Yes yes n/a
Woodman (2012) “A simple approach to improve recording of concerns about child matreatment in primary care records: developing a quality improvement intervention”
not addressed
difficult to tell
Not explained Not addressed Not addressed Not addressed Yes No conceptual model mentioned / tested etc

253
25
3
Table D10: Quality of qualtitative studies (overall rigour)
Citation
Overall Rigour
Credability? Identify what the research used to
ensure this
Transferability? Identify what the research used to
ensure this
Dependability? Identify what the research
used to ensure this
Confirmability? Identify what the research
used to ensure this
What meaning and relevance does this study have for your practice or
research question?
Campbell et al (2002) “Quality assessment for three common conditions in primary care: validity and reliability of review criteria developed by expert panels for angina, asthma and type 2 diabetes”
Yes Mixed methods design allowed for in depth investigation into quality measurement, further supported by randomised, stratified sample design.
Mixed Limited extent - results may be condition specific (i.e. angina etc) rather than transferable to other more rare conditions
Not clear Not enough information
No Not enough information provided
Illustrates operational problems associated with using certain quality measures - underlining need fr tesing prior to use in field. Shows that even though practitioners agree that measures of care are valid - quality can remain variable. Demonstrates impact of varied levels of computerisation on quality audit.
Lusignan et al (2003) “Managers See the Problems Associated with Coding Clinical Data as a Technical Issue whilst Clinicians also See Cultural Barriers”
Yes Gathered range of perspectives on subject (clinicians and management staff) plus employed external expert panel to ensure findings credible
Yes - mostly Describes purposeful sample frame in detail and types of participants interviewed HOWEVER more information on practice context would have been helpful
Yes Triangulation of data / multiple perspectives
Yes - to limited extent
Again - data triangulation - although more information on interviewee / interviewer interaction etc would have been useful
Underlines issue of different perspectives of management v clinical staff

254
25
4
Hippisley-Cox (2003) “The electronic patient record in primary care - regression or progression? A cross sectional study”
yes Not clear Yes Triangulation of data / multiple perspectives
yes Again - data triangulation - although more information on interviewee / interviewer interaction etc would have been useful
Study supports other evidence that electronic records do not reduce quality / depth of recorded information, and in fact support improved data capture.
Woodman (2012) “A simple approach to improve recording of concerns about child matreatment in primary care records: developing a quality improvement intervention”
Yes Mixed methods design supported development of in-depth, tailored quality improvement intervention.
Not clear Limited extent - results may be subject / participant specific (i.e. child maltreatment management by interested / experienced GPs etc) rather than transferable more generally
Yes Triangulation of data / multiple perspectives
Yes Again - data triangulation - although more information on interviewee / interviewer interaction etc would have been useful
Illustrates range of barriers to coding senstive areas of clinical practice - such as the potential harm for the child or parents having seen documented concerns, any legal consquences of recording child harm.

255
25
5
Table D11: Quality of qualtitative studies (conclusion, overall assessment)
Citation
Conclusion & Implications Overall assessment
Appropriate conclusions?
Findings contributed to future practice / research/theory?
What did the study conclude? Weak / Moderate /
Strong
Campbell et al (2002) “Quality assessment for three common conditions in primary care: validity and reliability of review criteria developed by expert panels for angina, asthma and type 2 diabetes”
Yes Yes 54%, 59%, and 70% of relevant criteria rated valid by the expert panels for angina, asthma, and type 2 diabetes, respectively, were found to be usable, valid, reliable, and acceptable for measuring quality of care. General practitioners and practice nurses agreed with panellists that these criteria were valid but not that they should always be recorded in the medical record. onclusion: Quality measures derived using expert panels need field testing before they can be considered valid, reliable, and acceptable for use in quality assessment. These findings provide additional evidence that the RAND panel method develops valid and reliable review criteria for assessing clinical quality of care. Main limitations were: fact some review criteria were out of date; problems that medical records don't full reflect quality of care / not ideal proxy measure
Moderate
Lusignan et al (2003) “Managers See the Problems Associated with Coding Clinical Data as a Technical Issue whilst Clinicians also See Cultural Barriers”
Yes Yes Primary care consultation is a complex social interaction, and coding of the medical diagnosis in itself imposes the bio-medical model, carries assumptions about certainty, and is perceived by clinicians to potentially jeopardise their relationships with their patient. Further research to elicit patients’ views may help clarify the magnitude of this barrier. Demonstrates conflict between audit v consultation data needs. Main limitations included - study population not representative (high % teaching practices)
Strong
Hippisley-Cox (2003) “The electronic patient record in primary care - regression or progression? A cross sectional study”
Yes Yes Study found no evidence to support the hypotheses that paperless records would be truncated and contain more local abbreviations; and that the absence of writing would decrease subsequent recall. Conversely it found that the paperless records compared favourably with manual records. Main limitations included - descriptive nature of study, and potentially unrepresentative study sample.
Moderate
Woodman (2012) “A simple approach to improve recording of concerns about child matreatment in primary care records: developing a quality improvement intervention”
Yes Yes GPs under-record maltreatment-related concerns in children’s electronicmedical records. As failure to use codesmakes it impossible to search or audit these cases, an approach designed to be simple and feasible to implement in UK general practice was recommended. Main limitations included - the small size and unrepresentative nature of the study sample.
Moderate
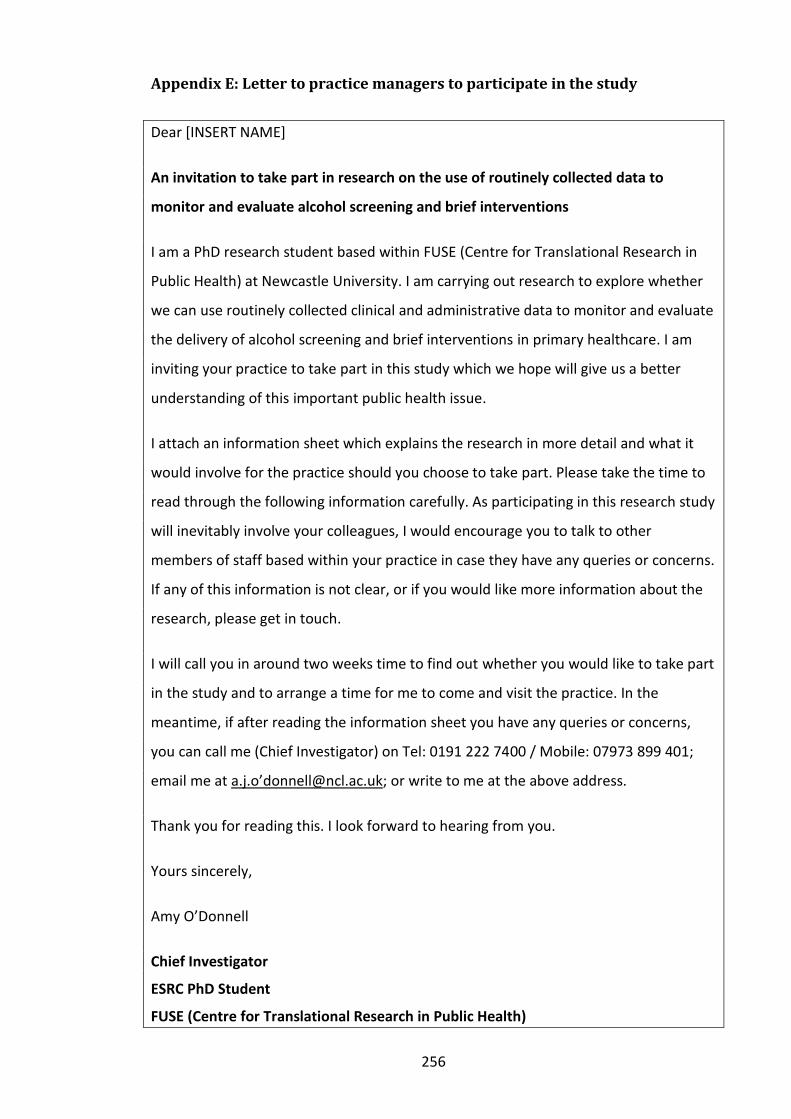
256
Appendix E: Letter to practice managers to participate in the study
Dear [INSERT NAME]
An invitation to take part in research on the use of routinely collected data to
monitor and evaluate alcohol screening and brief interventions
I am a PhD research student based within FUSE (Centre for Translational Research in
Public Health) at Newcastle University. I am carrying out research to explore whether
we can use routinely collected clinical and administrative data to monitor and evaluate
the delivery of alcohol screening and brief interventions in primary healthcare. I am
inviting your practice to take part in this study which we hope will give us a better
understanding of this important public health issue.
I attach an information sheet which explains the research in more detail and what it
would involve for the practice should you choose to take part. Please take the time to
read through the following information carefully. As participating in this research study
will inevitably involve your colleagues, I would encourage you to talk to other
members of staff based within your practice in case they have any queries or concerns.
If any of this information is not clear, or if you would like more information about the
research, please get in touch.
I will call you in around two weeks time to find out whether you would like to take part
in the study and to arrange a time for me to come and visit the practice. In the
meantime, if after reading the information sheet you have any queries or concerns,
you can call me (Chief Investigator) on Tel: 0191 222 7400 / Mobile: 07973 899 401;
email me at a.j.o’[email protected]; or write to me at the above address.
Thank you for reading this. I look forward to hearing from you.
Yours sincerely,
Amy O’Donnell
Chief Investigator
ESRC PhD Student
FUSE (Centre for Translational Research in Public Health)

257
Appendix F: Project flyer

258
Appendix G: Study information sheet for GP practices
Practice Information Sheet
Your practice is being invited to take part in a research study. Before you decide
whether to take part in the research, it is important for you to understand why the
research is being done and what your participation in the study will involve. Please
take time to read the following information carefully. I would encourage you to talk to
other members of staff based within your practice about the study if you wish. Part 1
explains the purpose of the study and what will happen to you if you take part. Part 2
gives you more detailed information about the conduct of the study. I will go through
this information sheet with you, so please feel free to ask me questions if there is
anything you are unsure about. This should take 10-15 minutes.
Part 1: About the research
What is the purpose of the study?
This research will look at the use of routinely collected medical data to monitor and
evaluate the delivery of Screening & Brief Interventions (SBIs) for alcohol in primary
healthcare. This reflects a key public health priority to respond to alcohol misuse and
alcohol-related harm; and in particular, growing support for SBIs for alcohol as a cost-
effective preventative approach. The research will draw on a range of newly available
medical data to investigate the delivery of SBIs for alcohol in 20 general practices
based across six primary care trusts in North East England: Newcastle; North Tyneside,
Northumberland; Gateshead; South Tyneside and Sunderland. Key new data sources
include new Read Codes associated with the identification and management of risky
drinking in primary care and Hospital Episode Statistics (HES) data. This data analysis
will be followed by one-to-one interviews with General Practitioners about their
experiences of delivering and recording SBIs for alcohol in real-life primary care
settings.
Why have I been invited?
Your practice has been invited to take part in this study because you are a GP practice
based in one of our target PCT areas. You and your staff will have first hand experience
of delivering SBIs for alcohol in primary healthcare.

259
Do I have to take part?
Taking part in the research is entirely voluntary: it is up to you to decide whether to
join the study. If you agree to participate, confidentiality would be discussed and the
potential implications for staff working at the practice. I will then ask you to sign a
confidentiality agreemen. Individual GPs that take part in the research will also have
opportunity to discuss the research, ask questions and sign a consent form before I
interview them. Your practice is free to withdraw at any time, without providing a
reason and without your legal rights being affected.
What will happen if I take part?
What the researcher will do:
Collect data on the recording of alcohol SBIs that take place at your practice over a twelve month period;
Seek consent from GPs based at your practice to take part in a one-to-one interview;
Maintain informal contact with practice staff including receptionists, IT staff, nurses and the practice manager.
To undertake the research the researcher will request access to the following
personnel, records and/or practice facilities:
Anonymised Read Code and performance data relating to the delivery and management of alcohol SBIs;
Conduct a single one-to-one interview with a GP based at your practice.
What the practice personnel will be asked to do:
Assist with the extraction of and / or provide baseline data on excessive alcohol consumption recorded in the practice population over a 12 month period, alcohol SBI recording practices, and service provision of SBIs. This is likely to include:
o Number and percentage of patients drinking at hazardous (i.e. those drinking >recommended units per week) and harmful (i.e. those drinking over medically recommended levels & showing evidence of alcohol-related problems) levels in the practice population seen in the last 12 months;
o No. of patients who have been screened using, FAST or Audit-C in the last 12 months;
o No. of patients with a positive FAST or Audit-C score and full AUDIT assessment in last 12 months;
o No. of patients given brief advice in the last 12 months; and

260
o No. of patients with a full AUDIT score of 20 or more who have been referred to specialist alcohol treatment services in the last 12 months.
One nominated GP will be asked to take part in a single one-2-one interview towards the end of the 12 month period focusing on their experiences of delivery and recording alcohol interventions.
What are the possible disadvantages and risks of taking part?
No risks are envisaged for you as a result of taking part in this study. The only possible
disadvantage is that you and the other staff at your practice will be giving up some of
your time to take part in the research.
What are the possible benefits of taking part?
Taking part in this research will offer staff members an opportunity to share their
views on this important subject and to know that their views are valued.
Part 2: Conduct of the research
What will happen if I don’t want to carry on with the study?
You can withdraw from the study at any time. Information we have already collected
with your consent will be retained and used in the study. Withdrawal from the study
will not affect your legal rights.
What if there is a problem?
If you have a concern about any aspect of the study, you should contact me and I will
do my best to answer your questions. Contact details are provided at the end of this
information sheet. If you remain unhappy and wish to complain formally, you can do
this via the Research and Development Manager of the appropriate NHS organisation.
Will my taking part in this study be kept confidential?
Yes. I will follow ethical and legal practice and all information about you will be
handled in confidence. The interview data will be kept confidential and reported
anonymously. Any direct quotation will be attributed to general job title only (e.g.
“Service Manager A”). The information collected will be stored securely in locked
university offices, computers will be password protected. The interviews will be
recorded and transcribed. In line with the Newcastle University’s code of conduct for
research, the interview transcripts will be destroyed ten years after publication of the
study’s findings.

261
What will happen to the results of the research study?
This research will be used as a Doctoral Degree project (PhD) and will be submitted to
examiners at Newcastle University. Research papers and conference presentations will
also be produced. Participants will receive a summary of the findings after the final
report has been disseminated.
Who are the researchers and who is funding the research?
The research forms the basis of a PhD studentship funded by the Economic and Social
Research Council (www.esrc.org.uk) based within FUSE (the Centre for Translational
Research in Public Health). Amy O’Donnell will be the Chief Investigator on this
research study and will be supervised by a group of experienced academics and
practitioners based at Newcastle University, the North East Public Health Observatory
and BALANCE (the regional alcohol office).
Who has reviewed this study?
The research has been reviewed [INSERT NAME] Research Ethics Committee,
independent of the University, to protect your interests.
How can I get further information?
If you would like any further information, please do not hesitate to contact me:
Amy O’Donnell, FUSE (The Centre for Translational Research in Public Health) Institute of Health and Society, Newcastle University Room 3.77 Baddiley-Clark Building Richardson Road, Newcastle Upon Tyne NE2 4AX
Tel: 0191 222 7400 Email: a.j.o’[email protected]
Thank you for taking the time to read this information sheet

262
Appendix H: Confidentiality agreement between researcher and GP Practice
Name of Researcher:
Amy O’Donnell
GP Practice:
Project Title: Can routine data help assess the delivery of alcohol screening and brief interventions?
Conditions of Access
I, the undersigned, acknowledge, understand and agree to adhere to the following conditions
of access:
I will maintain the privacy and confidentiality of all accessible project data and understand that unauthorised disclosure of personal/confidential data is an invasion of privacy and may result in disciplinary, civil, and/or criminal actions against me.
I will not disclose data or information to anyone other than those to whom I am authorised to do so.
I will access data only for the purposes for which I am authorised explicitly. On no occasion will I use project data, including personal or confidential information, for my personal interest or advantage, or for any other business purposes.
I will comply at all times with the practice’s data security policies and confidentiality code of conduct.
I am aware that the references to personal, confidential and sensitive information in these documents are for my information, and are not intended to replace my obligations under the Data Protection Act 1998.
I understand that where I have been given access to confidential information I am under a duty of confidence and would be liable under common law for any inappropriate breach of confidence in terms of disclosure to third parties and also for invasion of privacy if I were to access more information than that for which I have been given approval or for which consent is in place.
Should my work in relation to the project discontinue for any reason, I understand that I will continue to be bound by this signed Confidentiality Agreement.
_______________________ ________________ ________
Name of Researcher Signature Date
________________________ ________________ ________
Name of Practice Manager Signature Date
Contact details for further information
Amy O’Donnell Tel: 0191 222 7400 FUSE (The Centre for Translational Research in Public Health) Email: a.j.o’[email protected] Institute of Health and Society, Newcastle University Room 3.77 Baddiley-Clark Building, Richardson Road, Newcastle Upon Tyne NE2 4AX

263
Appendix I: Full list of alcohol-related Read codes13
Code Preferred term
1361 Teetotaller
1362 Trivial drinker - <1u/day
1363 Light drinker - 1-2u/day
1364 Moderate drinker - 3-6u/day
1365 Heavy drinker - 7-9u/day
1366 Very heavy2 drinker - >9u/day
1367 Stopped drinking alcohol
1368 Alcohol consumption unknown
2577 O/E - breath - alcohol smell
6892 Alcohol consumption screening
136.. Alcohol intake
1361-1 Non-drinker alcohol
1361-2 Non-drinker alcohol
136A Ex-trivial drinker (<1u/day)
136a Increasing risk drinking
136B Ex-light drinker - (1-2u/day)
136b Feels should cut down drinking
136C Ex-moderate drinker - (3-6u/d)
136c Higher risk drinking
136D Ex-heavy drinker - (7-9u/day)
136d Lower risk drinking
136E Ex-very heavy drinker-(>9u/d)
136F Alcohol intake above rec limit
136F Spirit drinker
136G Alcohol intake within rec limt
136G Beer drinker
136H Drinks beer and spirits
136I Drinks wine
136J Social drinker
136K Beer drinker
136K. Alcohol intake above recommended sensible limits
136L Spirit drinker
136L. Alcohol intake within recommended sensible limits
136M Current non drinker
136N Light drinker
136O Moderate drinker
136P Heavy drinker
136Q Very heavy drinker
136R Binge drinker
136V. Alcohol units per week
136X Alcohol units consumed on heaviest drinking day
136Y Drinks in morning to get rid of hangover
136Z. Alcohol consumption NOS
68S.. Alcohol consumption screening
81A7 Alcohol consumption screening test declined
13
Note that one code (DAVIEOC1) was subsequently removed from this list as it was identified as a locally-generated Read code.

264
E250. Drunkenness NOS
E250. Hangover from alcohol
E250-4 Intoxication - alcohol
ZV113 [V]Personal history of alcoholism
ZV4KC [V] Alcohol use
1282 Alcoholic in the family
1282 Alcoholic offspring
1282 Family history of alcoholism
1369 Suspect alcohol abuse - denied
1462 H/O: alcoholism
6792 Health education - alcohol
12X0. Family history of alcohol misuse
136S. Hazardous alcohol use
136T. Harmful alcohol use
136W. Alcohol abuse
13Y8. Alcoholics anonymous
13ZY. Disqualified from driving due to excess alcohol
1B1c. Alcohol induced hallucinations
1D19. Pain in lymph nodes after alcohol consumption
388u. Fast alcohol screening test
38D2. Single alcohol screening questionnaire
38D3. Alcohol use disorders identification test
38D4. Alcohol use disorder identification test consumption questionnaire
38D5. Alcohol use disorder identification test Piccinelli consumption questionnaire
4191-1 Breath alcohol level
63C7. Maternal alcohol abuse
66e.. Alcohol disorder monitoring
66e0. Alcohol abuse monitoring
67A5. Pregnancy alcohol advice
67H0. Lifestyle advice regarding alcohol
7P221 Delivery of rehabilitation for alcohol addiction
8BA8. Alcohol detoxification
8CAM. Patient advised about alcohol
8CAv. Advised to contact primary care alcohol worker
8CE1. Alcohol leaflet given
8G32. Aversion therapy - alcoholism
8H35. Admitted to alcohol detoxification centre
8H7p. Referral to community alcohol team
8HHe. Referral to community drug and alcohol team
8HkG. Referral to specialist alcohol treatment service
8HkJ. Referral to alcohol brief intervention service
8IA7. Alcohol consumption screening test declined
918b. Carer of a person with alcohol misuse
9EQ H0/RTS-police:venesect alc
9k1.. Alcohol misuse - enhanced services administration
9k10 Community detoxification registered
9k11. Alcohol consumption counselling
9k12. Alcohol misuse - enhanced service completed
9k13. Alcohol questionnaire completed
9k14. Alcohol counselling by other agencies
9k15. Alcohol screen - alcohol use disorder identification test completed
9k16. Alcohol screen - fast alcohol screening test completed

265
9k17. Alcohol screen - alcohol use disorder identification test consumption questions completed
9k18. Alcohol screen - alcohol use disorder identification test Piccinelli consumption questions completed
9k19. Alcohol assessment declined - enhanced services administration
9k19-1 Alcohol assessment declined
9k1A. Brief intervention for excessive alcohol consumption completed
9k1B. Extended intervention for excessive alcohol consumption completed
9NN2. Under care of community alcohol team
C1505 Alcohol-induced pseudo-Cushing's syndrome
E01. Alcoholic psychoses
E010 Alcohol withdrawal delirium
E010. Delirium tremens
E011 Alcohol amnestic syndrome
E011. Korsakov psychosis
E0110 Korsakov psychosis
E0111 Korsakov's alcoholic psychosis with peripheral neuritis
E011z Alcohol amnestic syndrome NOS
E012. Alcoholic dementia NOS
E012. Other alcoholic dementia
E0120 Chronic alcoholic brain syndrome
E013. Alcohol withdrawal hallucinosis
E014. Pathological alcohol intoxication
E015. Alcoholic paranoia
E01y. Other alcoholic psychosis
E01y0 Alcohol withdrawal syndrome
E01yz Other alcoholic psychosis NOS
E01z. Alcoholic psychosis NOS
E23 Alcohol dependence syndrome
E23. Chronic alcoholism
E230. Acute alcoholic intoxication in alcoholism
E2300 Acute alcoholic intoxication, unspecified, in alcoholism
E2301 Continuous acute alcoholic intoxication in alcoholism
E230-1 Alcohol dep+acute alcohol intox
E2302 Episodic acute alcoholic intoxication in alcoholism
E2303 Acute alcoholic intoxication in remission, in alcoholism
E230z Acute alcoholic intoxication in alcoholism NOS
E231. Chronic alcoholism
E2310 Unspecified chronic alcoholism
E2311 Continuous chronic alcoholism
E2312 Episodic chronic alcoholism
E2313 Chronic alcoholism in remission
E231z Chronic alcoholism NOS
E23-2 Alcohol problem drinking
E23z. Alcohol dependence syndrome NOS
E250. Inebriety NOS
E250. Nondependent alcohol abuse
E2500 Nondependent alcohol abuse, unspecified
E2501 Nondependent alcohol abuse, continuous
E2502 Nondependent alcohol abuse, episodic
E2503 Nondependent alcohol abuse in remission
E250z Nondependent alcohol abuse NOS
Eu10. [X]Mental and behavioural disorders due to use of alcohol
Eu100 [X]Mental and behavioural disorders due to use of alcohol: acute intoxication

266
Eu101 [X]Mental and behavioural disorders due to use of alcohol: harmful use
Eu102 [X]Mental and behavioural disorders due to use of alcohol: dependence syndrome
Eu102-1 Alcohol addiction
Eu103 [X]Mental and behavioural disorders due to use of alcohol: withdrawal state
Eu104 [X]Mental and behavioural disorders due to use of alcohol: withdrawal state with delirium
Eu105 [X]Mental and behavioural disorders due to use of alcohol: psychotic disorder
Eu106 [X]Mental and behavioural disorders due to use of alcohol: amnesic syndrome
Eu106-1 [X] Korsakov's alcohol induced
Eu107 [X]Mental and behavioural disorders due to use of alcohol: residual and late-onset psychotic disorder
Eu107-2 [X] Chronic alcohol brain syndr
Eu108 [X]Alcohol withdrawal-induced seizure
Eu10y [X]Mental and behavioural disorders due to use of alcohol: other mental and behavioural disorders
Eu10z [X]Mental and behavioural disorders due to use of alcohol: unspecified mental and behavioural disorder
F11x0 Alcoholic encephalopathy
F1440 Alcoholic cerebellar degeneration
F25B. Alcohol-induced epilepsy
F375. Alcohol-related polyneuropathy
F3941 Alcoholic myopathy
G555. Alcohol-induced heart muscle disease
G8523 Oesophageal varices in alcoholic cirrhosis of the liver
HO/0 Ho/Rts-Police: Venesect Alcohol
J153. Alcoholic gastritis
J610. Alcoholic fatty liver
J611. Acute alcoholic hepatitis
J612. Alcoholic cirrhosis of liver
J612. Florid cirrhosis
J612. Portal cirrhosis
J6120 Alcoholic fibrosis and sclerosis of liver
J613. Alcoholic liver damage unspecified
J6130 Alcoholic hepatic failure
J615. Portal cirrhosis
J615z Cirrhosis of liver NOS
J615z Cryptogenic cirrhosis
J615z Fibrosis of liver
J615z Macronodular cirrhosis
J617. Alcoholic hepatitis
J6170 Chronic alcoholic hepatitis
J6710 Alcohol-induced chronic pancreatitis
L254-1 Suspect fetal alcohol damage
L2553 Maternal care for (suspected) damage to fetus from alcohol
PK80. Fetal alcohol syndrome
PK83. Fetus and newborn affected by maternal use of alcohol
Q0071 Fetal alcohol syndrome
Q0071 Fetus or neonate affected by placental or breast transfer of alcohol
R103. [D]Alcohol blood level excessive
SLH3. Alcohol deterrent poisoning
SM0.. Alcohol causing toxic effect
SM00. Ethyl alcohol causing toxic effect
SM001 Denatured alcohol causing toxic effect
SM002 Grain alcohol causing toxic effect

267
SM00z Ethyl alcohol causing toxic effect NOS
SM01. Methyl alcohol causing toxic effect
SM011 Wood alcohol causing toxic effect
SM01z Methyl alcohol causing toxic effect NOS
SM02. Isopropyl alcohol causing toxic effect
SM022 Rubbing alcohol causing toxic effect
SM02z Isopropyl alcohol causing toxic effect NOS
SM030 Amyl alcohol causing toxic effect
SM031 Butyl alcohol causing toxic effect
SM032 Propyl alcohol causing toxic effect
SM0y. Other alcohol causing toxic effect
SM0z. Alcohol causing toxic effect NOS
SyuG0 [X]Toxic effect of other alcohols
T90.. Accidental poisoning by alcohol, NEC
T900. Accidental poisoning by alcoholic beverages
T901. Accidental poisoning by other ethyl alcohol and its products
T9010 Accidental poisoning by denatured alcohol
T9012 Accidental poisoning by grain alcohol NOS
T901z Accidental poisoning by ethyl alcohol NOS
T902. Accidental poisoning by methyl alcohol
T9021 Accidental poisoning by wood alcohol
T902z Accidental poisoning by methyl alcohol NOS
T903. Accidental poisoning by isopropyl alcohol
T9032 Accidental poisoning by rubbing alcohol substitute
T9033 Accidental poisoning by secondary propyl alcohol
T903z Accidental poisoning by isopropyl alcohol NOS
T90y. Accidental poisoning by other alcohols
T90z. Accidental poisoning by alcohol NOS
TJH3. Adverse reaction to alcohol deterrents
U1A9. [X]Accidental poisoning by and exposure to alcohol
U1A90 [X]Accidental poisoning by and exposure to alcohol, occurrence at home
U1A91 [X]Accidental poisoning by and exposure to alcohol, occurrence in residential institution
U1A92 [X]Accidental poisoning by and exposure to alcohol, occurrence at school, other institution and public administrative area
U1A93 [X]Accidental poisoning by and exposure to alcohol, occurrence at sports and athletics area
U1A94 [X]Accidental poisoning by and exposure to alcohol, occurrence on street and highway
U1A95 [X]Accidental poisoning by and exposure to alcohol, occurrence at trade and service area
U1A96 [X]Accidental poisoning by and exposure to alcohol, occurrence at industrial and construction area
U1A97 [X]Accidental poisoning by and exposure to alcohol, occurrence on farm
U1A9y [X]Accidental poisoning by and exposure to alcohol, occurrence at other specified place
U1A9z [X]Accidental poisoning by and exposure to alcohol, occurrence at unspecified place
U209. [X]Intentional self poisoning by and exposure to alcohol
U2090 [X]Intentional self poisoning by and exposure to alcohol, occurrence at home
U2091 [X]Intentional self poisoning by and exposure to alcohol, occurrence in residential institution
U2092 [X]Intentional self poisoning by and exposure to alcohol, occurrence at school, other institution and public administrative area
U2093 [X]Intentional self poisoning by and exposure to alcohol, occurrence at sports and athletics area
U2094 [X]Intentional self poisoning by and exposure to alcohol, occurrence on street and highway
U2095 [X]Intentional self poisoning by and exposure to alcohol, occurrence at trade and service area

268
U2096 [X]Intentional self poisoning by and exposure to alcohol, occurrence at industrial and construction area
U2097 [X]Intentional self poisoning by and exposure to alcohol, occurrence on farm
U209y [X]Intentional self poisoning by and exposure to alcohol, occurrence at other specified place
U209z [X]Intentional self poisoning by and exposure to alcohol, occurrence at unspecified place
U409. [X]Poisoning by and exposure to alcohol, undetermined intent
U4090 [X]Poisoning by and exposure to alcohol, occurrence at home, undetermined intent
U4091 [X]Poisoning by and exposure to alcohol, occurrence in residential institution, undetermined intent
U4092 [X]Poisoning by and exposure to alcohol, occurrence at school, other institution and public administrative area, undetermined intent
U4093 [X]Poisoning by and exposure to alcohol, occurrence at sports and athletics area, undetermined intent
U4094 [X]Poisoning by and exposure to alcohol, occurrence on street and highway, undetermined intent
U4095 [X]Poisoning by and exposure to alcohol, occurrence at trade and service area, undetermined intent
U4096 [X]Poisoning by and exposure to alcohol, occurrence at industrial and construction area, undetermined intent
U4097 [X]Poisoning by and exposure to alcohol, occurrence on farm, undetermined intent
U409y [X]Poisoning by and exposure to alcohol, occurrence at other specified place, undetermined intent
U409z [X]Poisoning by and exposure to alcohol, occurrence at unspecified place, undetermined intent
U60H3 [X]Alcohol deterrents causing adverse effects in therapeutic use
U60H3-1 [X] Adv react alcoh deterrents
U80.. [X]Evidence of alcohol involvement determined by blood alcohol level
U800. [X]Evidence of alcohol involvement determined by blood alcohol level of less than 20 mg/100 ml
U801. [X]Evidence of alcohol involvement determined by blood alcohol level of 20-39 mg/100 ml
U802. [X]Evidence of alcohol involvement determined by blood alcohol level of 40-59 mg/100 ml
U803. [X]Evidence of alcohol involvement determined by blood alcohol level of 60-79 mg/100 ml
U804. [X]Evidence of alcohol involvement determined by blood alcohol level of 80-99 mg/100 ml
U805. [X]Evidence of alcohol involvement determined by blood alcohol level of 100-119 mg/100 ml
U806. [X]Evidence of alcohol involvement determined by blood alcohol level of 120-199 mg/100 ml
U807. [X]Evidence of alcohol involvement determined by blood alcohol level of 200-239 mg/100 ml
U808. [X]Evidence of alcohol involvement determined by blood alcohol level of 240 mg/100 ml or more
U80z. [X]Evidence of alcohol involvement determined by presence of alcohol in blood, level not specified
U81.. [X]Evidence of alcohol involvement determined by level of intoxication
U810. [X]Evidence of alcohol involvement determined by level of intoxication, mild alcohol intoxication
U811. [X]Evidence of alcohol involvement determined by level of intoxication, moderate alcohol intoxication
U812. [X]Evidence of alcohol involvement determined by level of intoxication, severe alcohol intoxication
U813. [X]Evidence of alcohol involvement determined by level of intoxication, very severe alcohol intoxication
U814. [X]Evidence of alcohol involvement determined by level of intoxication, alcohol involvement, not otherwise specified
ZV1A0 [V]Family history of alcohol abuse
ZV57A [V]Alcohol rehabilitation
ZV6D6 Alcohol abuse counselling and surveillance
ZV704-1 Medicolegal blood alcohol

269
ZV70L [V]Blood-alcohol and blood-drug test
ZV791 [V]Screening for alcoholism

270
Appendix J: Full list of zero-incidence Read codes14
Code Preferred term
1282 Alcoholic in the family
1282 Alcoholic offspring
1282 Family history of alcoholism
1364 Moderate drinker - 3-6u/day
1365 Heavy drinker - 7-9u/day
1366 Very heavy drinker - >9u/day
1367 Stopped drinking alcohol
1368 Alcohol consumption unknown
1369 Suspect alcohol abuse - denied
1462 H/O: alcoholism
2577 O/E - breath - alcohol smell
6892 Alcohol consumption screen
12X0 Family history of alcohol abuse
1361-1 Non-drinker alcohol
1361-2 Non-drinker alcohol
136A Ex-trivial drinker (<1u/day)
136a Increasing risk drinking
136B Ex-light drinker - (1-2u/day)
136b Feels should cut down drinking
136C Ex-moderate drinker - (3-6u/d)
136c Higher risk drinking
136D Ex-heavy drinker - (7-9u/day)
136d Lower risk drinking
136E Ex-very heavy drinker-(>9u/d)
136F Alcohol intake above rec limit
136F Spirit drinker
136G Alcohol intake within rec limt
136G Beer drinker
136H Drinks beer and spirits
136I Drinks wine
136J Social drinker
136K Alcohol intake above rec limit
136K Beer drinker
136L Spirit drinker
136N Light drinker
136O Moderate drinker
136P Heavy drinker
136Q Very heavy drinker
136V Alcohol units per week
14 Note that one code (PC0077) was subsequently removed from this list as it was identified as
a non-Read code.

271
136X Alcohol units consumed on heaviest drinking day
136Y Drinks in morning to get rid of hangover
13Y8 Alcoholics anonymous
13ZY Disqualified from driving due to excessive alcohol
1D19. Pain in lymph nodes after alcohol consumption
38D2 Single alcohol screening test
38D3. Alcohol use disorders identification test
38D4. Alcohol use disorder identification test consumption questionnaire
38D5. Alcohol use disorder identification test Piccinelli consumption questionnaire
4191-1 Breath alcohol level
63B7 Apgar at 10 minutes = 6
63C7 Maternal alcohol abuse
66e Alcohol disorder monitoring
66eO Alcohol abuse monitoring
67A5 Pregnancy alcohl advice
7P221 Delivery of rehabilitation for alcohol addiction
81A7 Alcohol consumtion screening test declined
8CAv. Advised to contact primary care alcohol worker
8G32 Aversion therapy - alcohol
8H35 Admitted to alcohol detoxification centre
8HHe. Referral to community drug and alcohol team
8HkJ. Referral to alcohol brief intervention service
8IA7. Alcohol consumption screening test declined
918b. Carer of a person with alcohol misuse
9EQ H0/RTS-police:venesect alc
9k1 Alcohol misuse - enhanced services administration
9K1 D750 form photo card driving licence
9k10 Community detoxification registered
9k11 Alcohol consumption counselling
9k14 Alcohol counselling by other agencies
9k16 Alcohol screen - fast alcohol screening test completed
9k18 Alcohol screen - AUDIT PC completed
9k19 Alcohol assessment declined - enhanced services admin
9k19-1 Alcohol assessment declined
9k1B Extended intervention for excessive alcohol consumptn complt
9kl Alcohol misuse - enhanced services administration
9NN2 Under care of community alcohol team
C1505 Alcohol-induced pseudo-Cushing's syndrome
E01. Alcoholic psychoses
E010 Alcohol withdrawal delirium
E011 Alcohol amnestic syndrome
E0110 Korsakov psychosis
E0111 Korsakov's alcoholic psychosis with peripheral neuritis
E011z Alcohol amnestic syndrome NOS
E012. Alcoholic dementia NOS

272
E0120 Chronic alcoholic brain syndrome
E014 Pathological alcohol intoxication
E015. Alcoholic paranoia
E01y. Other alcoholic psychosis
E01yz Other alcoholic psychosis NOS
E01z. Alcoholic psychosis NOS
E230. Acute alcoholic intoxication in alcoholism
E2300 Acute alcoholic intoxication, unspecified, in alcoholism
E2301 Continuous acute alcoholic intoxication in alcoholism
E230-1 Alcohol dep+acute alcohol intox
E2302 Episodic acute alcoholic intoxication in alcoholism
E2303 Acute alcoholic intoxication in remission, in alcoholism
E230z Acute alcoholic intoxication in alcoholism NOS
E231. Chronic alcoholism
E2310 Unspecified chronic alcoholism
E2311 Continuous chronic alcoholism
E2312 Episodic chronic alcoholism
E2313 Chronic alcohol. - in remission
E231z Chronic alcoholism NOS
E2500 Alcohol abuse - unspecified
E2500 Nondependent alcohol abuse, unspecified
E2501 Alcohol abuse - continuous
E2501 Nondependent alcohol abuse, continuous
E2502 Nondependent alcohol abuse, episodic
E2503 Alcohol abuse - in remission
E2503 Nondependent alcohol abuse in remission
E250z Nondependent alcohol abuse NOS
Eu10 Mental and behavioural disorders due to use of alcohol
Eu100 [X] Mental & behav dis due to use alcohol: acute intoxication
Eu100 Mental & behv dis due to use of alcohol: acute intoxication
Eu101 [X] Mental & behav dis due to use alcohol: harmful use
Eu101 Mental & behv dis due to use of alcohol: harmful use
Eu103 [X] Mental & behav dis due to use alcohol: withdrawal state
Eu104 [X] Mental & behav dis due to use alcohol: withdrawl state with delirium
Eu106 [X] Mental & behav dis due to use alcohol: amnesic syndrome
Eu106-1
[X] Korsakov's alcohol induced
Eu107 [X] Mental & behav dis due to use alcohol: resid & late-onset psychot dis
Eu107-2
[X] Chronic alcohol brain syndr
Eu10y [X] Mental & behav dis due to use alcohol: oth men & behav dis
Eu10z [X]Mental and behavioural disorders due to use of alcohol: unspecified mental and behavioural disorder
F11x0 Alcoholic encephalopathy
F1440 Alcoholic cerebellar degeneration
F25B. Alcohol-induced epilepsy

273
F375. Alcohol-related polyneuropathy
F3941 Alcoholic myopathy
G555. Alcohol-induced heart muscle disease
G8523 Oesophageal varices in alcohol cirrhosis of the liver
HO/0 Ho/Rts-Police: Venesect Alcohol
J153. Alcoholic gastritis
J610. Alcoholic fatty liver
J611. Acute alcoholic hepatitis
J612. Alcoholic cirrhosis of liver
J612. Florid cirrhosis
J612. Portal cirrhosis
J6120 Alcoholic fibrosis and sclerosis of liver
J613. Alcoholic liver damage unspecified
J6130 Alcoholic hepatic failure
J615. Portal cirrhosis
J615z Cryptogenic cirrhosis
J615z Fibrosis of liver
J617. Alcoholic hepatitis
J6170 Chronic alcoholic hepatitis
J6710 Alcohol-induced chronic pancreatitis
L254-1 Suspect fetal alcohol damage
L2553 Maternal care for (suspected) damage to fetus from alcohol
PK80 Fetal alcohol syndrome
PK83 Fetus and newborn affected by maternal use of alcohol
Q0071 Fetus/neonate affected by placental/breast transfer alcohol
Q0071-1
Fetal alcohol syndrome
R103 [D] Alcohol blood excess
SLH3 Alcohol deterrent poisoning
SM0 Alcohol - toxic effect
SM00 Ethyl alcohol - toxic effect
SM001 Denatured alcohol causing toxic effect
SM002 Grain alcohol - toxic effect
SM00z Ethyl alcohol causing toxic effect NOS
SM01 Methyl alcohol causing toxic effect
SM011 Wood alcohol - toxic effect
SM02. Isopropyl alcohol causing toxic effect
SM022 Rubbing alcohl cuasing toxic effect
SM02z Isopropyl alcohol causing toxic effect NOS
SM030 Amyl alcohol - toxic effect
SM031 Butyl alcohol - toxic effect
SM032 Propyl alcohol causing toxic effect
SM0y Other alcohol - toxic effect
SM0z Alcohol - toxic effect NOS
SyuG0 [X]Toxic effect of other alcohols

274
T90 Accidental poisoning by alcohl NEC
T900. Accidental poisoning by alcoholic beverages
T901. Accidental poisoning by other ethyl alcohol and its products
T9010 Accidental poisoning by denatured alcohol
T9012 Accidental poisoning by grain alcohol NOS
T901z Accidental poisoning by ethyl alcohol NOS
T902 Accidental poisoning by methyl alcohol
T9021 Accidental poisoning by wood alcohol
T902z Accidental poisoning by methyl alcohol NOS
T903 Accidental poisoning by isopropyl alcohol
T9032 Accidental poisoning by rubbing alcohol substitute
T9033 Accidental poisoning by secondary propyl alcohol
T903z Accidental poisoning by isopropyl alcohol NOS
T90y. Accidental poisoning by other alcohols
T90z Accidental poisoning by alcohol NOS
TJH3 Adverse reaction to alcohol deterrents
U1A9 [X] Accident poisoning/exposure to alcohol
U1A90 [X] Accident poison/exposure to alcohol at home
U1A91 [X] Accid poison/expos to alcohol at res institut
U1A92 [X] Acc poison/expos alcohol school/pub admin area
U1A93 [X] Accid pois/expos alcohol in sport/athletic area
U1A94 [X] Accid poison/expos to alcohol in street/highway
U1A95 [X] Accid poison/expos to alcohol trade/service area
U1A96 [X] Accid pois/expos alcohol indust/construct area
U1A97 [X] Accident poison/exposure to alcohol on farm
U1A9y [X] Accid pois/expos to alcohl other spec place
U1A9z [X] Accid poison/expos to alcohol unspecif place
U209 [X] Intent self poison/exposure to alcohol
U2090 [X] Int self poison/exposure to alcohol at home
U2091 [X] Intent self poison alcohol at res institut
U2092 [X] Int self poison alcohol school/pub admin area
U2093 [X] Int self poison alcohol in sport/athletic area
U2094 [X] Intent self poison alcohol in street/highway
U2095 [X] Intent self pois alcohol trade/service area
U2096 [X] Int self pois alcohol indust/construct area
U2097 [X] Int self poison/exposure to alcohol on farm
U209y [X] Int self poison alcohol other spec place
U209z [X] Intent self poison alcohol unspecif place
U409 [X] Poisoning/exposure, ? Intent, to alcohol
U4090 [X] Poison/exposure ?intent, to alcohol at home
U4091 [X] Pois/expos ?intent to alcohol at res institut
U4092 [X] Pois/exp ?intent alcohol school/pub admin area
U4093 [X] Pois/exp ?intent alcohol in sport/athletic area
U4094 [X] Pois/expos ?intent to alcohol in street/highway
U4095 [X] Pois/expos ?intent to alcohol trade/service area

275
U4096 [X] Poison/exposure ?intent, alcohol indust/construct area
U4097 [X] Poison/exposure ?intent, to alcohol on farm
U409y [X] Pois/exp ?intent to alcohol other spec place
U409z [X] Pois/expos ?intent to alcohol unspecif place
U60H3 [X] Alcohol deterrents caus adverse effects in therapeut use
U60H3-1
[X] Adv react alcoh deterrents
U80 [X] Evidence of alcohl involv determin by blood alcohl level
U800. [X]Evidence of alcohol involvement determined by blood alcohol level of less than 20 mg/100 ml
U801. [X]Evidence of alcohol involvement determined by blood alcohol level of 20-39 mg/100 ml
U802. [X]Evidence of alcohol involvement determined by blood alcohol level of 40-59 mg/100 ml
U803. [X]Evidence of alcohol involvement determined by blood alcohol level of 60-79 mg/100 ml
U804. [X]Evidence of alcohol involvement determined by blood alcohol level of 80-99 mg/100 ml
U805. [X]Evidence of alcohol involvement determined by blood alcohol level of 100-119 mg/100 ml
U806. [X]Evidence of alcohol involvement determined by blood alcohol level of 120-199 mg/100 ml
U807. [X]Evidence of alcohol involvement determined by blood alcohol level of 200-239 mg/100 ml
U808. [X]Evidence of alcohol involvement determined by blood alcohol level of 240 mg/100 ml or more
U80z. [X]Evidence of alcohol involvement determined by presence of alcohol in blood, level not specified
U81 [X] Evid of alcohol involv determind by level of intoxication
U810. [X]Evidence of alcohol involvement determined by level of intoxication, mild alcohol intoxication
U811. [X]Evidence of alcohol involvement determined by level of intoxication, moderate alcohol intoxication
U812. [X]Evidence of alcohol involvement determined by level of intoxication, severe alcohol intoxication
U813. [X]Evidence of alcohol involvement determined by level of intoxication, very severe alcohol intoxication
U814. [X]Evidence of alcohol involvement determined by level of intoxication, alcohol involvement, not otherwise specified
ZV113 [V]Personal history of alcoholism
ZV1A0 Family history of alcohol abuse
Zv4KC Alcohol use
ZV57A Alcohol rehabilitation
ZV704-1
Medicolegal blood alcohol
ZV70L [V]Blood-alcohol and blood-drug test
ZV791 Alcoholism screening

276
Appendix K: Full Read code analysis tables for all variables
Table K1: Rates (%) of recorded hazardous and harmful level alcohol consumption 2010-2011 by individual practice, enhanced service status, size of practice and gender including lower (LCI) and upper (UCI) confidence intervals
Male Female
Ind
ivid
ua
l Pra
ctic
e
Base Count Rate LCI UCI Base Count Rate LCI UCI
NOTW1 690 17 2.46 1.54 3.91 682 2 0.29 0.08 1.06
NOTW2 8076 348 4.31 3.89 4.77 8421 125 1.48 1.25 1.77
NOTW3 4944 399 8.07 7.34 8.86 4882 380 7.78 7.06 8.57
NOTW4 1552 15 0.97 0.59 1.59 1539 11 0.71 0.40 1.28
NOTW5 3813 218 5.72 5.02 6.50 3838 96 2.50 2.05 3.04
NOTW6 3291 97. 2.95 2.42 3.58 3468 54 1.56 1.20 2.03
NOTW7 3870 176 4.55 3.94 5.25 4149 86 2.07 1.68 2.55
NOTW8 284 8 2.82 1.43 5.46 312 4 1.28 0.50 3.25
NOTW9 4202 5440 12.95 11.96 14.00 4591 193 4.20 3.66 4.82
SOTW1 2577 321 12.46 11.24 13.79 2313 83 3.59 2.90 4.43
SOTW2 712 218 30.62 27.34 34.10 518 219 42.28 38.10 46.57
SOTW3 1465 292 19.93 17.97 22.05 1552 298 19.20 17.32 21.24
SOTW4 2444 444 18.17 16.69 19.75 2390 548 22.93 21.29 24.66
SOTW5 2935 12 0.41 0.23 0.71 3326 13 0.39 0.23 0.67
SOTW6 3633 234 6.44 5.69 7.29 3907 115 2.94 2.46 3.52
SOTW7 8078 735 9.10 8.49 9.75 8352 355 4.25 3.84 4.70
Enh
ance
d
serv
ice
stat
us
None 16449 759 4.61 4.30 4.95 17090 59 0.35 0.27 0.45
Only DES 14273 1063 7.45 7.03 7.89 14792 642 4.34 4.02 4.68
DES & LES 21844 2256 10.33 9.93 10.74 22358 1628 7.28 6.95 7.63
Size
/ t
ype
of
pra
ctic
e Larger than average 28540 2306 8.08 7.77 8.40 29719 1225 4.12 3.90 4.35
Smaller than average
12659 1327 10.48 9.96 11.03 12632 1175 9.30 8.81 9.82
Multi-site 11367 445 3.91 3.57 4.29 11889 179 1.51 1.30 1.74

277
Table K2: Rates (%) of recorded delivery of short screening test (FAST or AUDIT-C) for alcohol use disorders 2010-2011 by individual practice and gender including lower and upper confidence intervals
Male Female
Practice Base Count Rate LCI UCI Base Count Rate LCI UCI
NOTW1 690 15 2.17 1.32 3.56 682 0 0.00 0.00 0.56
NOTW2 8076 1 0.01 0.00 0.07 8421 1 0.01 0.00 0.07
NOTW3 4944 0 0.00 0.00 0.08 4882 0 0.00 0.00 0.08
NOTW4 1552 76 4.90 3.93 6.09 1539 78 5.07 4.08 6.28
NOTW5 3813 0 0.00 0.00 0.10 3838 0 0.00 0.00 0.10
NOTW6 3291 1 0.03 0.01 0.17 3468 0 0.00 0.00 0.11
NOTW7 3870 0 0.00 0.00 0.10 4149 0 0.00 0.00 0.09
NOTW8 284 155 54.58 48.76 60.27 312 180 57.69 52.15 63.05
NOTW9 4202 279 6.64 5.93 7.43 4591 369 8.04 7.29 8.86
SOTW1 2577 180 6.98 6.06 8.03 2313 165 7.13 6.15 8.26
SOTW2 712 184 25.84 22.76 29.18 518 181 34.94 30.96 39.15
SOTW3 1465 238 16.25 14.45 18.22 1552 230 14.82 13.14 16.67
SOTW4 2444 0 0.00 0.00 0.16 2390 0 0.00 0.00 0.16
SOTW5 2935 121 4.12 3.46 4.90 3326 138 4.15 3.52 4.88
SOTW6 3633 85 2.34 1.90 2.88 3907 36 0.92 0.67 1.27
SOTW7 8078 6 0.07 0.03 0.16 8352 10 0.12 0.07 0.22
Table K3: Rates (%) of recorded delivery of short screening test (FAST or AUDIT-C) for alcohol use disorders 2010-2011 by enhanced service status and gender including lower and upper confidence intervals
Male Female
Enhanced service Base Count Rate LCI UCI Base Count Rate LCI UCI
None 16449 16 0.097 0.06 0.16 17090 1 0.01 0.00 0.03
Only DES 14273 511 3.58 3.288 3.90 14792 627 4.24 3.93 4.58
DES & LES 21844 814 3.73 3.48 3.99 22358 760 3.40 3.17 3.64
Table K4: Rates (%) of recorded delivery of short screening test (FAST or AUDIT-C) for alcohol use disorders 2010-2011 by size / type of practice and gender including lower and upper confidence intervals
Male Female
Size of practice Base Count Rate LCI UCI Base Count Rate LCI UCI
Larger than average 28540 370 1.30 1.17 1.43 29719 415 1.40 1.27 1.54
Smaller than average 12659 969 7.65 7.20 8.13 12632 972 7.69 7.24 8.17
Multi-site 11367 2 0.02 0.00 0.06 11889 1 0.01 0.00 0.05

278
Table K5: Rates (%) of recorded delivery of full AUDIT screening test for alcohol use disorders 2010-2011 by individual practice, enhanced service for alcohol status, size/type of practice and gender
Male Female
Ind
ivid
ua
l Pra
ctic
e
Base Count Rate LCI UCI Base Count Rate LCI UCI
NOTW1 690 0 0.00 0.00 0.55 682 0 0.00 0.00 0.56
NOTW2 8076 46 0.57 0.43 0.76 8421 11 0.13 0.07 0.23
NOTW3 4944 19 0.38 0.25 0.60 4882 11 0.23 0.13 0.40
NOTW4 1552 0 0.00 0.00 0.25 1539 0 0.00 0.00 0.25
NOTW5 3813 0 0.00 0.00 0.10 3838 0 0.00 0.00 0.10
NOTW6 3291 0 0.00 0.00 0.12 3468 0 0.00 0.00 0.11
NOTW7 3870 0 0.00 0.00 0.10 4149 0 0.00 0.00 0.09
NOTW8 284 20 7.04 4.60 10.63 312 11 3.53 1.98 6.20
NOTW9 4202 440 10.47 9.58 11.43 4591 568 12.37 11.45 13.36
SOTW1 2577 0 0.00 0.00 0.15 2313 0 0.00 0.00 0.17
SOTW2 712 5 0.70 0.30 1.63 518 5 0.97 0.41 2.24
SOTW3 1465 16 1.09 0.67 1.77 1552 6 0.39 0.18 0.84
SOTW4 2444 0 0.00 0.00 0.16 2390 0 0.00 0.00 0.16
SOTW5 2935 0 0.00 0.00 0.13 3326 0 0.00 0.00 0.12
SOTW6 3633 68 1.87 1.48 2.37 3907 25 0.64 0.43 0.94
SOTW7 8078 594 7.35 6.80 7.94 8352 802 9.60 8.99 10.25
Enh
ance
d
serv
ice
None 16449 46 0.28 0.21 0.37 17090 11 0.06 0.04 0.12
Only DES 14273 479 3.36 3.07 3.66 14792 590 3.99 3.69 4.32
DES & LES 21844 683 3.13 2.90 3.37 22358 838 3.75 3.51 4.01
Size
/ t
ype
of
pra
ctic
e
Larger than average
28540 1121 3.93 3.71 4.16 29719 1406 4.73 4.50 4.98
Smaller than average
12659 41 0.32 0.24 0.44 12632 22 0.17 0.12 0.26
Multi-site 11367 46 0.40 0.30 0.54 11889 11 0.09 0.05 0.17

279
Table K6: Rates (%) of recorded delivery of brief advice for alcohol 2010-2011 by individual practice and gender including lower and upper confidence intervals
Male Female
Practice Base Count Rate LCI UCI Base Count Rate LCI UCI
NOTW1 690 0 0.00 0.00 0.55 682 0 0.00 0.00 0.56
NOTW2 8076 46 0.57 0.43 0.76 8421 22 0.26 0.17 0.40
NOTW3 4944 227 4.59 4.04 5.21 4882 306 6.27 5.62 6.98
NOTW4 1552 0 0.00 0.00 0.25 1539 0 0.00 0.00 0.25
NOTW5 3813 436 11.43 10.46 12.48 3838 280 7.30 6.51 8.16
NOTW6 3291 1 0.03 0.01 0.17 3468 0 0.00 0.00 0.11
NOTW7 3870 497 12.84 11.83 13.93 4149 296 7.13 6.39 7.96
NOTW8 284 0 0.00 0.00 1.33 312 0 0.00 0.00 1.22
NOTW9 4202 411 9.78 8.92 10.72 4591 619 13.48 12.53 14.50
SOTW1 2577 636 24.68 23.05 26.38 2313 529 22.87 21.20 24.63
SOTW2 712 119 16.71 14.15 19.63 518 100 19.31 16.14 22.92
SOTW3 1465 156 10.65 9.17 12.33 1552 124 7.99 6.74 9.44
SOTW4 2444 216 8.84 7.78 10.03 2390 247 10.33 9.18 11.62
SOTW5 2935 20 0.68 0.44 1.05 3326 0.09 0.03 0.26
SOTW6 3633 250 6.88 6.10 7.75 3907 186 4.76 4.14 5.47
SOTW7 8078 567 7.02 6.48 7.60 8352 318 3.81 3.42 4.24
Table K7: Rates (%) of recorded delivery of brief advice for alcohol 2010-2011 by enhanced service status and gender including lower and upper confidence intervals
Male Female
Enhanced service Base Count Rate LCI UCI Base Count Rate LCI UCI
None 16449 979 5.95 5.60 6.32 17090 598 3.50 3.23 3.79
Only DES 14273 639 4.48 4.15 4.83 14792 925 6.25 5.87 6.66
DES & LES 21844 1964 8.99 8.62 9.38 22358 1507 6.74 6.42 7.08
Table K8: Rates (%) of recorded delivery of brief advice for alcohol 2010-2011 by size/type of practice, and gender including lower and upper confidence intervals
Male Female
Size/type of practice Base Count Rate LCI UCI Base Count Rate LCI UCI
Larger than average 28540 2388 8.37 8.05 8.69 29719 2005 6.75 6.47 7.04
Smaller than average 12659 1147 9.06 8.57 9.57 12632 1003 7.94 7.48 8.42
Multi-site 11367 47 0.41 0.31 0.55 11889 22 0.19 0.12 0.28

280
Table K9: Rates (%) of recorded delivery of brief intervention for alcohol 2010-2011 by individual practice and gender including lower and upper confidence intervals
Male Female
Practice Base Count Rate LCI UCI Base Count Rate LCI UCI
NOTW1 690 0 0.00 0.00 0.55 682 0 0.00 0.00 0.56
NOTW2 8076 2 0.02 0.01 0.09 8421 2 0.02 0.01 0.09
NOTW3 4944 9 0.18 0.10 0.35 4882 10 0.20 0.11 0.38
NOTW4 1552 0 0.00 0.00 0.25 1539 0 0.00 0.00 0.25
NOTW5 3813 3 0.08 0.03 0.23 3838 1 0.03 0.00 0.15
NOTW6 3291 0 0.00 0.00 0.12 3468 0 0.00 0.00 0.11
NOTW7 3870 0 0.00 0.00 0.10 4149 0 0.00 0.00 0.09
NOTW8 284 28 9.86 6.91 13.88 312 19 6.09 3.93 9.31
NOTW9 4202 519 12.35 11.39 13.38 4591 534 11.63 10.74 12.59
SOTW1 2577 0 0.00 0.00 0.15 2313 0 0.00 0.00 0.17
SOTW2 712 2 0.28 0.08 1.02 518 0 0.00 0.00 0.74
SOTW3 1465 4 0.27 0.11 0.70 1552 1 0.06 0.01 0.36
SOTW4 2444 0 0.00 0.00 0.16 2390 0 0.00 0.00 0.16
SOTW5 2935 0 0.00 0.00 0.13 3326 0 0.00 0.00 0.12
SOTW6 3633 67 1.84 1.45 2.34 3907 3 0.08 0.03 0.23
SOTW7 8078 89 1.10 0.90 1.35 8352 35 0.42 0.30 0.58
Table K10: Rates (%) of recorded delivery of brief intervention for alcohol 2010-2011 by enhanced service status and gender including lower and upper confidence intervals
Male Female
Enhanced service Base Count Rate LCI UCI Base Count Rate LCI UCI
None 16449 5 0.03 0.01 0.07 17090 3 0.02 0.01 0.05
Only DES 14273 556 3.90 3.59 4.23 14792 563 3.81 3.51 4.13
DES & LES 21844 162 0.74 0.64 0.86 22358 39 0.17 0.13 0.24
Table K11: Rates (%) of recorded delivery of brief intervention for alcohol 2010-2011 by size / type of practice and gender including lower and upper confidence intervals
Male Female
Size/type of practice Base Count Rate LCI UCI Base Count Rate LCI UCI
Larger than average 28540 687 2.41 2.24 2.59 29719 583 1.96 1.81 2.13
Smaller than average 12659 34 0.27 0.19 0.38 12632 20 0.16 0.10 0.24
Multi-site 11367 2 0.02 0.00 0.06 11889 2 0.02 0.00 0.06

281
Table K12: Rates (%) of recorded delivery of extended intervention for alcohol 2010-2011 by individual practice and gender including lower and upper confidence intervals
Male Female
Practice Base Count Rate LCI UCI Base Count Rate LCI UCI
NOTW1 690 0 0.00 0.00 0.55 682 0 0.00 0.00 0.56
NOTW2 8076 0 0.00 0.00 0.05 8421 0 0.00 0.00 0.05
NOTW3 4944 1 0.02 0.00 0.11 4882 0 0.00 0.00 0.08
NOTW4 1552 0 0.00 0.00 0.25 1539 0 0.00 0.00 0.25
NOTW5 3813 0 0.00 0.00 0.10 3838 0 0.00 0.00 0.10
NOTW6 3291 0 0.00 0.00 0.12 3468 0 0.00 0.00 0.11
NOTW7 3870 0 0.00 0.00 0.10 4149 0 0.00 0.00 0.09
NOTW8 284 0 0.00 0.00 1.33 312 0 0.00 0.00 1.22
NOTW9 4202 0 0.00 0.00 0.09 4591 0 0.00 0.00 0.08
SOTW1 2577 0 0.00 0.00 0.15 2313 0 0.00 0.00 0.17
SOTW2 712 0 0.00 0.00 0.54 518 0 0.00 0.00 0.74
SOTW3 1465 0 0.00 0.00 0.26 1552 0 0.00 0.00 0.25
SOTW4 2444 0 0.00 0.00 0.16 2390 0 0.00 0.00 0.16
SOTW5 2935 0 0.00 0.00 0.13 3326 0 0.00 0.00 0.12
SOTW6 3633 2 0.06 0.02 0.20 3907 3 0.08 0.03 0.23
SOTW7 8078 0 0.00 0.00 0.05 8352 0 0.00 0.00 0.05
Table K13: Rates (%) of recorded delivery of extended intervention for alcohol 2010-2011 by enhanced service status and gender, including lower and upper confidence intervals
Male Female
Enhanced service Base Count Rate LCI UCI Base Count Rate LCI UCI
None 16449 0 0.00 0.00 0.02 17090 0 0.00 0.00 0.02
Only DES 14273 1 0.01 0.00 0.04 14792 0 0.00 0.00 0.03
DES & LES 21844 2 0.01 0.00 0.03 22358 3 0.01 0.00 0.04
Table K14: Rates (%) of recorded delivery of extended intervention for alcohol 2010-2011 by enhanced service status and gender, including lower and upper confidence intervals
Male Female
Size /type of practice Base Count Rate LCI UCI Base Count Rate LCI UCI
Larger than average 28540 3 0.01 0.00 0.03 29719 3 0.01 0.00 0.03
Smaller than average 12659 0 0.00 0.00 0.03 12632 0 0.00 0.00 0.03
Multi-site 11367 0 0.00 0.00 0.03 11889 0 0.00 0.00 0.03

282
Table K15: Rates (%) of recorded delivery of brief advice, brief intervention and /or extended intervention for alcohol 2010-2011 by individual practice and gender including lower and upper confidence intervals
Male Female
Practice Base Count Rate LCI UCI Base Count Rate LCI UCI
NOTW1 690 0 0.00 0.00 0.55 682 0 0.00 0.00 0.56
NOTW2 8076 48 0.59 0.45 0.79 8421 24 0.29 0.19 0.42
NOTW3 4944 237 6.22 5.49 7.03 4882 316 8.23 7.41 9.15
NOTW4 1552 0 0.00 0.00 0.10 1539 0 0.00 0.00 0.09
NOTW5 3813 439 8.88 8.12 9.70 3838 281 5.76 5.14 6.44
NOTW6 3291 1 0.06 0.01 0.36 3468 0 0.00 0.00 0.25
NOTW7 3870 497 15.10 13.92 16.37 4149 296 8.54 7.65 9.51
NOTW8 284 28 9.86 6.91 13.88 312 19 6.09 3.93 9.31
NOTW9 4202 930 22.13 20.90 23.41 4591 1153 25.11 23.88 26.39
SOTW1 2577 636 24.68 23.05 26.38 2313 529 22.87 21.20 24.63
SOTW2 712 121 16.99 14.41 19.93 518 100 19.31 16.14 22.92
SOTW3 1465 160 10.92 9.43 12.62 1552 125 8.05 6.80 9.51
SOTW4 2444 216 8.84 7.78 10.03 2390 247 10.33 9.18 11.62
SOTW5 2935 20 0.68 0.44 1.05 3326 3 0.09 0.03 0.26
SOTW6 3633 319 8.78 7.90 9.75 3907 192 4.91 4.28 5.64
SOTW7 8078 656 8.12 7.54 8.74 8352 353 4.23 3.82 4.68
Table K16: Rates (%) of recorded delivery of brief advice, brief intervention and /or extended intervention for alcohol 2010-2011 by enhanced service for alcohol and gender including lower and upper confidence intervals
Male Female
Enhanced service Base Count Rate LCI UCI Base Count Rate LCI UCI
None 16449 984 5.98 5.63 6.35 17090 601 3.52 3.25 3.80
Only DES 14273 1196 8.38 7.94 8.85 14792 1488 10.06 9.59 10.55
DES & LES 21844 2128 9.74 9.36 10.14 22358 1549 6.93 6.60 7.27
Table K17: Rates (%) of recorded delivery of brief advice, brief intervention and /or extended intervention for alcohol 2010-2011 by size / type of practice and gender including lower and upper confidence intervals
Male Female
Base Count Rate LCI UCI Base Count Rate LCI UCI
Larger than average 28540 3078 10.78 10.43 11.15 29719 2591 8.72
8.40
9.04
Smaller than average 12659 1181 9.33 8.83 9.85 12632 1023 8.10
7.64
8.59
Multi-site 11367 49 0.43 0.33 0.57 11889 24 0.20
0.14
0.30
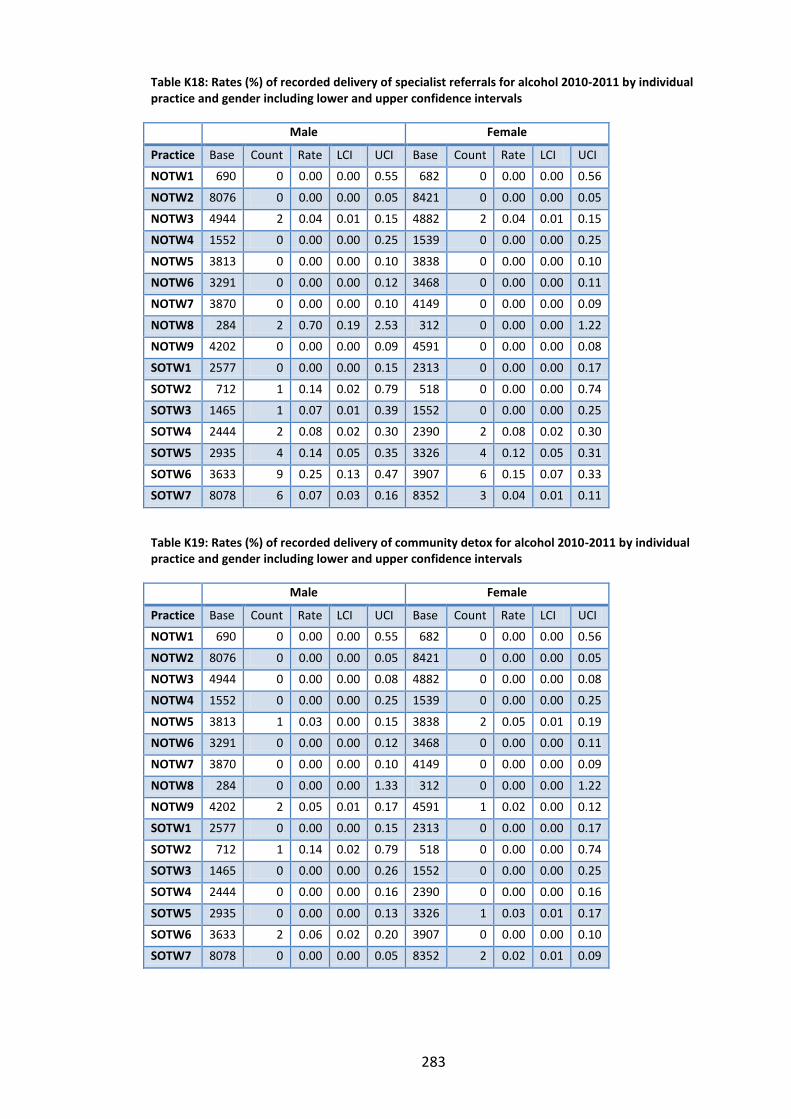
283
Table K18: Rates (%) of recorded delivery of specialist referrals for alcohol 2010-2011 by individual practice and gender including lower and upper confidence intervals
Male Female
Practice Base Count Rate LCI UCI Base Count Rate LCI UCI
NOTW1 690 0 0.00 0.00 0.55 682 0 0.00 0.00 0.56
NOTW2 8076 0 0.00 0.00 0.05 8421 0 0.00 0.00 0.05
NOTW3 4944 2 0.04 0.01 0.15 4882 2 0.04 0.01 0.15
NOTW4 1552 0 0.00 0.00 0.25 1539 0 0.00 0.00 0.25
NOTW5 3813 0 0.00 0.00 0.10 3838 0 0.00 0.00 0.10
NOTW6 3291 0 0.00 0.00 0.12 3468 0 0.00 0.00 0.11
NOTW7 3870 0 0.00 0.00 0.10 4149 0 0.00 0.00 0.09
NOTW8 284 2 0.70 0.19 2.53 312 0 0.00 0.00 1.22
NOTW9 4202 0 0.00 0.00 0.09 4591 0 0.00 0.00 0.08
SOTW1 2577 0 0.00 0.00 0.15 2313 0 0.00 0.00 0.17
SOTW2 712 1 0.14 0.02 0.79 518 0 0.00 0.00 0.74
SOTW3 1465 1 0.07 0.01 0.39 1552 0 0.00 0.00 0.25
SOTW4 2444 2 0.08 0.02 0.30 2390 2 0.08 0.02 0.30
SOTW5 2935 4 0.14 0.05 0.35 3326 4 0.12 0.05 0.31
SOTW6 3633 9 0.25 0.13 0.47 3907 6 0.15 0.07 0.33
SOTW7 8078 6 0.07 0.03 0.16 8352 3 0.04 0.01 0.11
Table K19: Rates (%) of recorded delivery of community detox for alcohol 2010-2011 by individual practice and gender including lower and upper confidence intervals
Male Female
Practice Base Count Rate LCI UCI Base Count Rate LCI UCI
NOTW1 690 0 0.00 0.00 0.55 682 0 0.00 0.00 0.56
NOTW2 8076 0 0.00 0.00 0.05 8421 0 0.00 0.00 0.05
NOTW3 4944 0 0.00 0.00 0.08 4882 0 0.00 0.00 0.08
NOTW4 1552 0 0.00 0.00 0.25 1539 0 0.00 0.00 0.25
NOTW5 3813 1 0.03 0.00 0.15 3838 2 0.05 0.01 0.19
NOTW6 3291 0 0.00 0.00 0.12 3468 0 0.00 0.00 0.11
NOTW7 3870 0 0.00 0.00 0.10 4149 0 0.00 0.00 0.09
NOTW8 284 0 0.00 0.00 1.33 312 0 0.00 0.00 1.22
NOTW9 4202 2 0.05 0.01 0.17 4591 1 0.02 0.00 0.12
SOTW1 2577 0 0.00 0.00 0.15 2313 0 0.00 0.00 0.17
SOTW2 712 1 0.14 0.02 0.79 518 0 0.00 0.00 0.74
SOTW3 1465 0 0.00 0.00 0.26 1552 0 0.00 0.00 0.25
SOTW4 2444 0 0.00 0.00 0.16 2390 0 0.00 0.00 0.16
SOTW5 2935 0 0.00 0.00 0.13 3326 1 0.03 0.01 0.17
SOTW6 3633 2 0.06 0.02 0.20 3907 0 0.00 0.00 0.10
SOTW7 8078 0 0.00 0.00 0.05 8352 2 0.02 0.01 0.09

284
Table K20: Rates (%) of recorded delivery of specialist referrals for alcohol 2010-2011 by enhanced service status and gender including lower and upper confidence intervals
Male Female
Enhanced service Base Count Rate LCI UCI Base Count Rate LCI UCI
None 16449 0 0.00 0.00 0.02 17090 0 0.00 0.00 0.02
Only DES 14273 4 0.03 0.01 0.07 14792 2 0.01 0.00 0.05
DES & LES 21844 23 0.11 0.07 0.16 22358 15 0.07 0.04 0.11
Table K21: Rates (%) of recorded delivery of community detox for alcohol 2010-2011 by enhanced service status and gender including lower and upper confidence intervals
Male Female
Enhanced service Base Count Rate LCI UCI Base Count Rate LCI UCI
None 16449 1 0.01 0.00 0.03 17090 2 0.01 0.00 0.04
Only DES 14273 2 0.01 0.00 0.05 14792 1 0.01 0.00 0.04
DES & LES 21844 3 0.01 0.00 0.04 22358 3 0.01 0.00 0.04
Table K22: Rates (%) of recorded delivery of specialist referrals for alcohol 2010-2011 by size/type of practice and gender including lower and upper confidence intervals
Male Female
Base Count Rate LCI UCI Base Count Rate LCI UCI
Larger than average 28540 17 0.06 0.04 0.10 29719 11 0.04 0.02 0.07
Smaller than average 12659 10 0.08 0.04 0.15 12632 6 0.05 0.02 0.10
Multi-site 11367 0 0.00 0.00 0.03 11889 0 0.00 0.00 0.03
Table K23: Rates (%) of recorded delivery of community detox for alcohol 2010-2011 by size/type of practice and gender including lower and upper confidence intervals
Male Female
Base Count Rate LCI UCI Base Count Rate LCI UCI
Larger than average 28540 5 0.02 0.01 0.04 29719 5 0.02 0.01 0.04
Smaller than average 12659 1 0.01 0.00 0.04 12632 1 0.01 0.00 0.04
Multi-site 11367 0 0.00 0.00 0.03 11889 0 0.00 0.00 0.03

285
Appendix L: Interview consent form
Please tick the appropriate boxes:
I have read and understood the project information sheet dated 01/01/2012.
I have been given the opportunity to consider the information, ask questions, and
have had these answered satisfactorily.
I understand that my taking part is voluntary; I can withdraw from the study at
any time, without giving reason and without my legal rights being affected. I
understand that if I withdraw, that information already collected with my consent
will be retained and used in the study.
I understand that my personal details will not be revealed to people outside the
project.
I understand that the confidentiality of the information collected will be
maintained, it will be stored securely in locked university offices and computer
files will be password protected.
I understand that, during the course of the study, should any unprofessional, or
unethical, or unsafe practices be identified, the researcher has a duty to inform
the relevant authorities.
I consent to the use of audio taping, with the possible use of anonymous direct
quotes in the study report.
I have read and understood the information and I agree to take part in this study.
________________________ ________________ ________
Name of Participant Signature Date
Amy O’Donnell ________________ ________
Name of Researcher Signature Date
Contact details for further information: Amy O’Donnell FUSE (The Centre for Translational Research in Public Health) Institute of Health and Society Newcastle University Room 3.77 Baddiley-Clark Building Richardson Road Newcastle upon Tyne NE2 4AX
Tel: 0191 222 5425 Email: a.j.o’[email protected]

286
Appendix M: GP Interview Participant Information sheet
You are being invited to take part in a research study. Before you decide it is important
for you to understand why the research is being done and what your participation in
the study will involve. Please take time to read the following information carefully. Talk
to others about the study if you wish. Part 1 explains the purpose of the study and
what will happen to you if you take part. Part 2 gives you more detailed information
about the conduct of the study. I will go through this information sheet with you,
please feel free to ask me questions if there is anything you are unsure about or if you
would like further information. This should take 5-10 minutes.
Part 1: About the research
What is the purpose of the study?
This research will look at the use of routinely collected medical data to monitor and
evaluate the delivery of Screening and Brief Interventions (SBI) for alcohol in primary
healthcare. This reflects a key public health priority to respond to alcohol misuse and
alcohol-related harm; and in particular, growing support for SBIs for alcohol as a cost-
effective preventative approach. The research will draw on a range of newly available
medical data to investigate the delivery of SBIs for alcohol in 20 general practices
based across six primary care trusts in North East England: Newcastle; North Tyneside,
Northumberland; Gateshead; South Tyneside and Sunderland. Key new data sources
include new Read Codes associated with the identification and management of risky
drinking in primary care and Hospital Episode Statistics (HES) data. This data analysis
will be followed by one-to-one interviews with General Practitioners about their
experiences of delivering and recording SBIs for alcohol in real-life primary care
settings.
Why have I been invited?
You have been invited to take part in this study because as a practicing GP, you have
firsthand experience of delivering SBIs for alcohol in primary healthcare. I am
particularly interested hearing your views on using Read Codes to record alcohol
interventions and any benefits and / or challenges that might present.

287
Do I have to take part?
Taking part in the research is entirely voluntary: it is up to you to decide whether to
join the study. If you agree to participate, confidentiality would be discussed and I will
then ask you to sign a consent form. You are free to withdraw at any time, without
providing a reason and without your legal rights being affected.
What will happen if I take part?
If you decide to take part, a single (one-to-one) interview will take place at a time, date
and location convenient for you. I will conduct the interview in either a face-to-face
situation or over the telephone, depending on your preference, and it will last no
longer than 30 minutes. Once completed, your involvement in the research will end.
There is no longer term follow up. The interview will be audio-recorded but none of
your personal details will be identified. The recording will then be transcribed so that I
can analyse the results.
What are the possible disadvantages and risks of taking part?
No risks are envisaged for you as a result of taking part in this study. The only possible
disadvantage is that you are giving up some of your time to take part in the interview. I
also acknowledge that you might find talking about your work behavior uncomfortable
but must stress the confidential nature of our discussions and your right to withdraw
from the study at any point.
What are the possible benefits of taking part?
Taking part in this interview will offer you the opportunity to share your views on this
subject and to know that your views are being listened to and are valued.
Part 2: Conduct of the research
What will happen if I don’t want to carry on with the study?
You can withdraw from the study at any time. Information we have already collected
with your consent will be retained and used in the study. Withdrawal from the study
will not affect your legal rights.

288
What if there is a problem?
If you have a concern about any aspect of the study, you should contact me and I will
do my best to answer your questions. Contact details are provided at the end of this
information sheet. If you remain unhappy and wish to complain formally, you can do
this via the Research and Development Manager of the appropriate NHS organisation.
Will my taking part in this study be kept confidential?
Yes. I will follow ethical and legal practice and all information about you will be
handled in confidence. The interview data will be kept confidential and reported
anonymously. Any direct quotation will be attributed to general job title only (e.g. “GP
A”). The information collected will be stored securely in locked university offices,
computers will be password protected. The interviews will be recorded and
transcribed. In line with the Newcastle University’s code of conduct for research, the
interview transcripts will be destroyed ten years after publication of the study’s
findings.
What will happen to the results of the research study?
This research will be used as a Doctoral Degree project (PhD) and will be submitted to
examiners at Newcastle University. Research papers and conference presentations will
also be produced. Participants will receive a summary of the findings after the final
report has been disseminated.
Who are the researchers and who is funding the research?
The research forms the basis of a PhD studentship funded by the Economic and Social
Research Council (www.esrc.org.uk) based within FUSE (the Centre for Translational
Research in Public Health). Amy O’Donnell will be the Chief Investigator on this
research study and will be supervised by a group of experienced academics and
practitioners based at Newcastle University, the North East Public Health Observatory
and BALANCE (the regional alcohol office).
Who has reviewed this study?
The study has full NHS Research Ethics Approval and the support of the R&D Team at
the PCT.

289
How can I get further information?
If you would like any further information, please do not hesitate to contact me:
Amy O’Donnell FUSE (The Centre for Translational Research in Public Health) Institute of Health and Society, Newcastle University Room 3.77 Baddiley-Clark Building, Richardson Road, Newcastle Upon Tyne NE2 4AX
Tel: 0191 222 5425 Email: a.j.o’[email protected]
Thank you for taking the time to read this information sheet

290
Appendix N: Interview topic guide
Notes to Interviewer
Introduce myself and thank participant for agreeing to talk to me; provide them
with the research information sheet.
Explain that I am a PhD research student based at Newcastle University looking at
the question of whether we can use routinely collected medical data to monitor
and evaluate the delivery of Screening & Brief Interventions (SBIs) for alcohol in
primary healthcare. They have been invited to take part in this study because as a
practicing GP, they have first-hand experience of delivering SBIs for alcohol in
primary healthcare. I am particularly interested in hearing their views on using
Read Codes to record alcohol interventions and more generally and to hear about
any benefits and / or challenges that using Read Codes in practice might present.
Advise participant that the interview should last approximately 30-45 minutes.
They will not be identified in the report; however I would prefer to record the
interview as this helps us to capture exactly what is said. Check that they are
comfortable with that.
Ensure the consent form is signed and ask if they have any questions before I start.
Section 1: Background, roles and responsibilities
I would like to start by finding out some background information about this practice and your role within it.
Q1. First, could you tell me a bit about this practice? Prompts: Local area, size, history /
recent notable changes, strengths / challenges.
Q2. What is your role within this practice? Prompt: how long have you been based here; what
are your particular interests / specialisms / responsibilities; experience of using electronic
v paper recording.
Section 2: Delivering SBIs for alcohol
This next set of questions focus on your experience of delivering and recording alcohol SBIs.
Q3. How long have you been involved in delivering alcohol SBIs?
Q4. Could you describe the process of delivering alcohol SBIs here at this practice? Prompt:
talk through process e.g. how do you identify potential patient; what happens next
/process of delivery?
Q5. How would you describe SBIs in terms of ease of delivery? Prompt: straightforward;
challenging; etc? Probe for specific examples.
Q6. Do you think alcohol SBIs ‘work’? What evidence do you have? Prompt: own experience;
patient outcomes; research evidence?
Q7. Do you have experience of using Read Codes to record SBIs for alcohol?
Q8. What drives you to record SBIs using Read Codes? Prompts: potential drivers include
providing record of treatment; financial incentives (DES/LES) etc.

291
Q9. Are there any aspects of alcohol SBIs that you find difficult to record? Prompts:
reluctance to formalise alcohol issues; difficulty in using coding templates; concern about
stigmatising patients; codes don’t match reality of intervention / procedure.
Section 3: Using GP Read Codes
Now I’d now like to explore your experience of and views on, using Read Codes in general.
Q10. Do you use Read Codes to record most aspects of patient consultations?
o What do / don’t you record? Prompt: e.g. preventative care & symptoms
versus measures relating to investigations / procedures; concerns about
stigmatising / labelling patients etc; need to record care to trigger QOF /
enhanced service payments etc.
o When might you prefer to use free text? Probe for examples.
Q11. Do you find it easy to incorporate the use of Read Codes into the consultation process?
Prompts: time pressures; issues with using computers; barrier to effective patient
consultation.
Q12. Is it straightforward to locate the correct Read Code in consultations? Are some
symptoms / types of treatment and care more difficult to code than others? Prompts:
volume of available Read Codes; mismatch between codes and more complex symptoms
/ treatments etc.
Q13. What support or guidance have you received on using Read Codes? How useful has
this support been? Prompt: any specific training; provision of templates / coding
reminders; advice from clinical or administrative colleagues; information from PCT / NHS
etc?
Q14. How important do you feel it is to use accurate and comprehensive Read Codes to
record patient care? Prompts: helps provide good quality clinical record; supports
continuity of care.
Section 4: Measuring and evaluating performance in healthcare
One of the reasons you might record alcohol SBIs and other aspects of care using Read Codes is to provide evidence of delivery in order to trigger practice payments and / or to meet local or national level healthcare targets.
Q15. How useful is Read Code and / or other routine data as a source of information on the
quality and delivery of healthcare services? Prompts: e.g. value to individual
practitioners, as a practice, for the PCT?; what’s missing from the picture – i.e. what
doesn’t the data tell you?
Q16. Could we measure ‘quality’ of service more effectively / usefully? Prompts: by
demonstrating outcomes v meeting delivery targets.
End of interview
That completes my questions. Before we finish:
Do you have any questions? Is there anything you would like to add? Is there
anything you feel we didn’t talk about that is relevant?
Finally:

292
Thank participant for their time. Remind them how material will be used:
o Once we have completed our interviews with GPs, the findings will be
analysed to identify key issues / research themes. This data will inform
a Doctoral Degree project (PhD) and will be submitted to examiners at
Newcastle University. Research papers and conference presentations
will also be produced. Participants will receive a summary of the
findings after the final report has been disseminated.
o All quotes / opinions will be anonymised – any direct quotation will be
attributed to general job title only (e.g. “GP 1”).
o Ensure I have the consent form.

293
293
Appendix 0: Mixed methods matrix: case-by-case key data trends
STUDY CASE CHARACTERISTICS QUANTITATIVE DATA15
QUALITATIVE DATA
Practice GP Haz./Harm.
Drinking Short
Screen Full Audit
All Interventions
ID Enhanced
Service / Size ID Type M F M F M F M F Delivering / Coding Screening Delivering / Coding Interventions
NOTW1 None / Smaller than average (Walk-in centre)
GP1 Salaried Q1 Q1 Q1 Q1 Q1 Q1 Q1 Q1 Practice template in development
Preference for consumption overvalidated screening tool
Nurse-led screening more structured
No awareness of correct screening codes
No experience of delivering alcoholinterventions
No awareness of correct Read codes
No sense of stigma around recordingsensitive items
NOTW3 DES / Larger than average
GP2 Partner Q2 Q2 Q1 Q1 Q1 Q1 Q1 Q2 Nurse-led more structured screeningapproach
GP-led unstructured screening approach
Trained / experienced in interventions
Viewed interventions as mostly effective
No sense of stigma when coding sensitive items
Patient context is free-texted
NOTW5 None / Larger than average
GP3 Partner Q2 Q1 Q1 Q1 Q1 Q1 Q2 Q2 Nurse-led more structured screeningapproach in various health checks
GP-led unstructured screening approach
Practice template used
Previous training in brief interventions
Patient context is free-texted
Viewed interventions as not always effective
Inadequate specialist services deterrent to interventions
Read coding low priority
NOTW8 DES / Smaller than average (Darzi practice)
GP4 Salaried Q1 Q1 Q4 Q4 Q3 Q2 Q1 Q1 Practice template used
Nurse-led more structured screening in various health checks
Preference for consumption overvalidated screening tool
Unstructured approach to interventions but some experience
Views interventions as effective
Low awareness of correct coding
Patient context is free texted
NOTW9 DES / Larger than average
GP5 Partner Q3 Q1 Q1 Q1 Q4 Q4 Q2 Q3 Practice template used
Nurse-led more structured screening in various health checks
Preference for consumption overvalidated screening tool
Interest and experience in interventions
Read coding low priority
Lack of specialist services as deterrent to interventions
Patient-context free-texted
Awareness of stigma potential when
15 Recorded rates of alcohol-related clinical activity have been grouped into quartiles, where Q1 represents the lowest recorded rates and Q4 the highest recorded rates

294
294
STUDY CASE CHARACTERISTICS QUANTITATIVE DATA15
QUALITATIVE DATA
Practice GP Haz./Harm.
Drinking Short
Screen Full Audit
All Interventions
ID Enhanced
Service / Size ID Type M F M F M F M F Delivering / Coding Screening Delivering / Coding Interventions
coding sensitive items
SOTW1 LES/DES / Smaller than average
GP7 Partner (Local opinion leader)
Q3 Q1 Q1 Q1 Q1 Q1 Q4 Q4 Preference for consumption overvalidated screening tool
Nurse-led structured screening within various health checks
Practice template used
Experienced and knowledgeable about alcohol interventions
Viewed interventions as effective
SOTW4 LES/DES/ Smaller than average
GP8 Salaried Q4 Q4 Q1 Q1 Q1 Q1 Q2 Q2 Preference for consumption overvalidated screening tool
Unstructured approach to screening
Low awareness of correct codes for screening
Low awareness of alcohol template
Unstructured approach to intervention delivery
Trained and experienced in alcohol interventions but limited belief in effectiveness
Patient context is free-texted
Awareness of stigma potential when coding sensitive items
SOTW5 LES/DES/ Smaller than average
GP9 Salaried Q1 Q1 Q1 Q1 Q1 Q1 Q1 Q1 Nurse-driven screening more structured in comparison to GP approach
Preference for consumption overvalidated screening tool
Limited experience / unstructuredapproach to delivering
Low awareness of appropriate Read codes for interventions
Some awareness of stigma around Read coding sensitive information
Low awareness of appropriate intervention codes
SOTW7 LES/DES/ Larger than average
GP10 Salaried (Registrar)
Q2 Q1 Q1 Q1 Q3 Q4 Q2 Q1 Limited experience of screening
Preference for consumption overvalidated screening tool
Limited awareness of appropriate codingfor screening
No experience of delivering interventions
SOTW7 LES/DES/ Larger than average
GP12 Partner Q2 Q1 Q1 Q1 Q3 Q4 Q2 Q1 Nurse-led structured screening in various health checks
Practice template used
Inadequate alcohol services isdisincentive to intervene

295
Appendix P: The impact of brief alcohol interventions in primary healthcare:
A systematic review of reviews

The Impact of Brief Alcohol Interventions in Primary Healthcare: A Systematic Review of Reviews
Amy O’Donnell1, Peter Anderson1,2, Dorothy Newbury-Birch1, Bernd Schulte3, Christiane Schmidt3, Jens Reimer3
and Eileen Kaner1,*
1Institute of Health and Society, Newcastle University, Newcastle upon Tyne, UK, 2Faculty of Health, Medicine and Life Sciences, Maastricht University,Maastricht, Netherlands and 3Centre for Interdisciplinary Addiction Research, University of Hamburg, Hamburg, Germany
*Corresponding author: Institute of Health and Society, Newcastle University, Newcastle upon Tyne NE2 4AX, UK. Tel.: +44-191-222-7884;Fax: +44-191-222-6043; E-mail: [email protected]
(Received 5 February 2013; first review notified 25 February 2013; in revised form 20 October 2013; accepted 21 October 2013)
Abstract — Aims: The aim of the study was to assess the cumulative evidence on the effectiveness of brief alcohol interventions inprimary healthcare in order to highlight key knowledge gaps for further research. Methods: An overview of systematic reviews andmeta-analyses of the effectiveness of brief alcohol intervention in primary healthcare published between 2002 and 2012. Findings:Twenty-four systematic reviews met the eligibility criteria (covering a total of 56 randomized controlled trials reported across 80papers). Across the included studies, it was consistently reported that brief intervention was effective for addressing hazardous andharmful drinking in primary healthcare, particularly in middle-aged, male drinkers. Evidence gaps included: brief intervention effective-ness in key groups (women, older and younger drinkers, minority ethnic groups, dependent/co-morbid drinkers and those living in tran-sitional and developing countries); and the optimum brief intervention length and frequency to maintain longer-term effectiveness.Conclusion: This overview highlights the large volume of primarily positive evidence supporting brief alcohol intervention effects aswell as some unanswered questions with regards to the effectiveness of brief alcohol intervention across different cultural settings and inspecific population groups, and in respect of the optimum content of brief interventions that might benefit from further research.
INTRODUCTION
A range of interventions exist for the prevention and treatmentof alcohol-related risk and harm, from health-promoting inputaiming at reducing hazardous and harmful drinking, to moreintensive and specialist treatment for severely dependentdrinking. Primary healthcare is seen as an ideal context for theearly detection and secondary prevention of alcohol-relatedproblems, due to its high contact-exposure to the population(Lock et al., 2009), and the frequency with which higher-riskdrinkers present (Anderson, 1985).In particular, screening and brief intervention for alcohol
has emerged as a cost-effective preventative approach(Hutubessy et al., 2003), which is relevant and practicable fordelivery in primary healthcare (Raistrick et al., 2006), wherepatients tend to present with less acute conditions, return regu-larly for follow-up appointments (Bernstein et al., 2009) andbuild long-term relationships with their GP (Lock, 2004).These interventions are typically short in duration (5–25 min),designed to promote awareness of the negative effects ofdrinking and to motivate positive behaviour change (HoCHealth Committee, 2010).Despite considerable efforts over the years to persuade prac-
titioners to adopt brief interventions in practice, most have yetto do so. Indeed, there is an international literature on barriersto brief alcohol intervention (Heather, 1996; Kaner et al.,1999; Babor and Higgins-Biddle, 2000; Aalto et al., 2003;Aira et al., 2003; Wilson et al., 2011), the majority focussingon primary healthcare. These barriers include: lack of time,training and resources; a belief that patients will not takeadvice to change drinking behaviour; and a fear amongst prac-titioners of offending patients by discussing alcohol. It hastherefore been argued that today’s challenge is more abouthow to encourage the uptake and use of brief alcohol interven-tion in routine practice (Anderson et al. 2004; Nilsen et al.,2006; Johnson et al., 2010; Kaner, 2010a; Gual and Sabadini
2011), and less about financing additional research on its ef-fectiveness. It would seem timely, therefore, to evaluate theextent to which the primary healthcare brief alcohol interven-tion evidence base is now saturated, or whether there are anyremaining knowledge gaps requiring further investigation.This paper reports on the EU co-funded research BISTAIRS
(brief interventions in the treatment of alcohol use disorders inrelevant settings) project, which aims to intensify the imple-mentation of brief alcohol intervention by identifying, system-atizing and extending evidence-based good practice acrossEurope. Given the existence of several reviews in this field, andthe overarching BISTAIRS timescale, the first phase of theproject comprised a systematic overview of published reviewsto provide a structured, comprehensive summary of the evi-dence base on the effectiveness of brief alcohol intervention inprimary healthcare.The focus on effectiveness (how an intervention performs in
real world conditions) as opposed to efficacy (how an inter-vention performs under optimal or ideal world conditions) isdeliberate. There is a well-established literature on the distinc-tion between efficacy and effectiveness trials (Flay, 1986), al-though the terms explanatory or pragmatic trials aresometimes also used (Thorpe et al., 2009). However, placingtrials into one category or other is challenging since there iswide agreement that they actually sit on a continuum fromoptimized to naturalistic conditions (Gartlehner et al., 2006).Moreover, efficacy must be demonstrated before effectivenessis assessed and the latter is a necessary pre-condition for widerdissemination (Flay et al., 2005). The US Society forPrevention Research (Flay et al., 2004, 2005) has outlined thatefficacy testing requires at least two rigorous trials involving:tightly defined populations; psychometrically sound measuresand data collection procedures; rigorous statistical analysis;consistent positive effects (without adverse effects); and atleast one significant long-term follow-up. This requirementhas been comprehensively established in a field where over 60
Alcohol and Alcoholism Vol. 49, No. 1, pp. 66–78, 2014 doi: 10.1093/alcalc/agt170Advance Access Publication 13 November 2013
© The Author 2013. Published by Oxford University Press on behalf of the Medical Council on Alcohol.This is an Open Access article distributed under the terms of the Creative Commons Attribution Non-Commercial License (http://creativecommons.org/licenses/by-nc/3.0/), which permits non-commercial re-use, distribution, and reproduction in any medium, provided the original work is properlycited. For commercial re-use, please contact [email protected]
at University of N
ewcastle on February 5, 2014
http://alcalc.oxfordjournals.org/D
ownloaded from
296

high-quality brief intervention trials have been reported inpeer-reviewed journals, with over half based in primaryhealthcare (Kaner, 2010b).This paper focuses on effectiveness, adding clinical breadth
to methodological rigour by: extending the range of patientsand delivery agents in trials; specifying details of necessarytraining and technical support; clarifying the nature of com-parison or control conditions; assessing intervention fidelity;and conducting unbiased (generally intention to treat) ana-lyses, which also considers effects on different sub-groups ofpatients and differing outcome exposures (Flay et al., 2005;Thorpe et al., 2009). To add to the brief alcohol interventionliterature, we synthesize the findings from a rapidly growingnumber of systematic reviews to answer four questions: (a)does the cumulative evidence base continue to show that briefalcohol intervention is effective when delivered in primaryhealthcare settings? (b) is brief alcohol intervention equally ef-fective across different countries and different healthcaresystems? (c) is the brief alcohol intervention evidence base ap-plicable across different population groups? and (d) what is theoptimum length, frequency and content of brief alcohol inter-vention, and for how long is it effective?
METHODS
Standard systematic reviewing methods were tailored to identifyexisting reviews rather than primary research (CRD, 2001).Reporting was carried out according to PRISMA statementguidelines (Moher et al., 2009) (see Supplementary material,Appendix 1 for full details). The review team comprised inter-national experts in the field of brief alcohol interventions (EK,PA) and in systematic reviewing methods (DNB).One author (AO) searched MEDLINE, EMBASE, PsycInfo,
The Cochrane Database, The Database of Abstracts of Reviewsof Reviews and the Alcohol and Alcohol Problems ScienceDatabase between July and August 2012 using appropriateMeSH terms. The search was split into three core concepts: (a)setting: general practice, general practitioners, physician, familypractice, primary health care, community health services andfamily physician; (b) intervention: alcohol, brief intervention,early intervention, alcohol therapy, counselling and interven-tion; and (c) study design: systematic review, review andmeta-analysis (full details of database-specific search terms areavailable upon request from the corresponding author).Reference lists of selected reviews and relevant websites, in-cluding the National Institute for Health and Care Excellenceand the World Health Organisation, were also searched and ap-propriate experts contacted in order to identify unpublishedreviews. The title and abstract of all records were screened by asingle reviewer (AO), with full text copies of potentially rele-vant papers retrieved for in-depth review against the inclusioncriteria. Any queries were resolved through discussion with thewider review team (AO, DNB, EK, PA).Full systematic reviews and meta-analyses of studies exam-
ining the effectiveness of brief alcohol intervention in com-parison to control conditions in primary healthcare settingsand published between 2002 and 2012 were eligible for inclu-sion. Primary healthcare was operationalized to include all im-mediately accessible general healthcare facilities but notemergency settings. Brief intervention was defined as a singlesession and/or up to a maximum of five sessions of
engagement with a patient, and the provision of informationand advice designed to achieve a reduction in risky alcoholconsumption or alcohol-related problems. Primary outcomesof interest included changes in self- or other reports of drink-ing quantity and/or frequency, drinking intensity and drinkingwithin recommended limits.The methodological quality of eligible studies was assessed
independently by two reviewers (AO and DNB) using theRevised Amstar tool (R-AMSTAR) (Kung et al., 2010). Datawere extracted on: healthcare setting; characteristics of thetarget population; authors’ conclusions; and any identifiedevidence gaps. Data were extracted against a data abstractiontemplate by one author (AO) and checked by another (DNB)with reference to the full article text. Extracted data alsoincluded inclusion/exclusion criteria, reported analyses andanalysis type. No statistical analyses or meta-analyses wereconducted. Instead, the existing analyses reported in the arti-cles reviewed were extracted systematically, with the findingsreported in a structured narrative synthesis.
RESULTS
Twenty-four individual systematic reviews met the eligibilitycriteria (see Figure 1) (Chang, 2002; Moyer et al., 2002; Beichet al. 2003; Berglund et al. 2003; Huibers et al., 2003;Ballesteros et al., 2004a,b;Cuijpers et al., 2004;Whitlock et al.,2004; Bertholet et al., 2005; Littlejohn, 2006; Gordonet al., 2007; Kaner et al., 2007; Parkes et al., 2008; Solberget al., 2008; Peltzer, 2009; Jackson et al., 2010; Latimer et al.,2010; Saitz, 2010; Bray et al., 2011; Gilinsky et al., 2011;Sullivan et al., 2011; Jonas et al., 2012; Babor et al., 2013).Establishing the precise number of unique trials covered by thisevidence base is challenging due to the slightly different em-phases of some reviews. Nevertheless, we identified 56 primaryhealthcare trials reported across 80 separate publications.The mean R-AMSTAR score for the 24 included reviews
was 29 (median 30.5; range 13–44). These numeric scorestranslated into grades as follows: 13–20 = D; 21–28 = C; 29–36 = B; and 37–44 = A. Using R-AMSTAR scoring, fivereviews were categorized as an ‘A’ grade publication (Huiberset al., 2003; Bertholet et al., 2005; Kaner et al., 2007; Sullivanet al., 2011; Jonas et al., 2012), eight were categorized as ‘B’(Beich et al., 2003; Ballesteros et al., 2004a,b; Jackson et al.,2010; Latimer et al., 2010; Bray et al., 2011; Gilinsky et al.,2011; Babor et al., 2013), seven as ‘C’ (Cuijpers et al., 2004;Whitlock et al., 2004; Littlejohn, 2006; Gordon et al., 2007;Parkes et al., 2008; Solberg et al., 2008; Saitz, 2010) and fouras ‘D’ (Chang, 2002; Moyer et al., 2002; Berglund et al.,2003; Peltzer, 2009). Table 1 and the following sections reportthe key findings against each focus review question, with add-itional characteristics of the included reviews available inSupplementary material, Appendix 2.
Question 1: is brief alcohol intervention effective whendelivered in primary healthcare settings?
Across the eligible reviews, it is consistently reported thatbrief alcohol interventions are effective at reducing hazardousand harmful drinking in primary healthcare (Moyer et al.,2002; Beich et al., 2003; Berglund et al., 2003; Ballesteroset al., 2004a,b; Cuijpers et al., 2004; Whitlock et al., 2004;
Review of reviews of BI effectiveness in primary care 67
at University of N
ewcastle on February 5, 2014
http://alcalc.oxfordjournals.org/D
ownloaded from
297

Bertholet et al., 2005; Littlejohn, 2006; Gordon et al., 2007;Kaner et al., 2007; Solberg et al., 2008; Peltzer, 2009; Jacksonet al., 2010; Latimer et al., 2010; Saitz, 2010; Bray et al.,2011; Gilinsky et al., 2011; Jonas et al., 2012). Whilst theoverall evidence base suggests that brief alcohol interventionsare effective in such settings, some individual trials havereported a null finding. Indeed a large UK trial (SIPS), notincluded in the reviews due to recency, has reported improve-ments in hazardous and harmful drinking in patients receivingsimple feedback and a patient information leaflet (the controlcondition) as well as in those receiving 5 min of structuredadvice, and those receiving a further 20 min brief lifestylecounselling (Kaner et al. 2013). This null finding (no signifi-cant difference between the three conditions) accords withthree systematic reviews focussing on control conditions only,which found consistently reduced drinking in these groupsover time (Jenkins et al. 2009; Bernstein et al. 2010;McCambridge and Kypri 2011). Thus the mere fact of enrol-ment in a brief intervention trial may be associated with posi-tive behaviour change due to a general ‘Hawthorn Effect’,whereby increased attention or scrutiny influences drinking,or volunteering in itself means that the individual has started achange process. Screening or assessment reactivity (a simpleresponse to screening procedures or measurement of drinking
behaviour) could also explain these reduced drinking trends.Lastly, regression to the mean is a real possibility in this field,since heavy drinking can spontaneously fall over time.Nevertheless, the cumulative (pooled) analyses reported insuccessive systematic reviews reveal positive brief interven-tion effects over and above those seen in control conditionswho typically received assessment only, treatment as usual orwritten advice.Weekly alcohol consumption was the most commonly
reported outcome, and meta-analysis by Kaner et al. (2007)showed that compared with control conditions, brief interven-tion reduced the quantity of alcohol drunk by 38 g per week(95% CI (confidence interval): 23–54 g). This is slightly lessthan the overall effect size found by Jonas et al. (2012), whichsuggested that brief intervention compared with controls inprimary healthcare reduced alcohol consumption by 49 g perweek for adults aged 18–64 (95% CI: 33–66 g). However, thelatter review also found average weekly reductions of 23 g (95%CI 8–38 g) for older adults aged 65 and over, and 23 g (95% CI10–36 g) for young adults/college students aged 18–30 follow-ing brief alcohol intervention.Delivery by a range of practitioners in primary healthcare
settings has beneficial effects (Huibers et al., 2003), althoughfindings of one review suggest that the effect sizes are greater
Fig. 1. Flow chart showing the number of potentially relevant references identified by searches and number meeting inclusion criteria and included in thenarrative review of systematic reviews.
68 O’Donnell et al.
at University of N
ewcastle on February 5, 2014
http://alcalc.oxfordjournals.org/D
ownloaded from
298

Table 1. Summary of authors’ conclusions and identified evidence gaps
StudyQ1: Is alcohol BI for alcohol effective whendelivered in primary health care settings?
Q2: Is alcohol BI equally effective acrossdifferent countries/health care systems?
Q3: Is the alcohol BI evidence baseapplicable to all population groups?
Q4: What is the optimum length/frequency/content of alcohol BI and howlong is it effective?
Babor et al. (2013) (inpress)
Consistently reported that BI was clinically andcost-effective for non-treatment seekingpopulations.
Majority of evidence has limited or noLAMIC (low and middle incomecountries) applicability.Whilst there is some evidence to suggestthat alcohol BI equality effective in HIC(high income countries) and LAMIC,however context-specific health issues maynot be adequately addressed solely by HICresearch findings.Therefore more culturally-specific researchneeded in LAMIC.
Brief intervention in primary health careappears to be most impactful innon-treatment seeking populations.Inconclusive findings on alcohol BI inantenatal settings.
Question not addressed in this review
Ballesteros et al. (2004a) Results suggest BI equally effective in bothmen and women.
Question not addressed in this review Results support the equality of BI outcomesfor reducing hazardous alcoholconsumption in both men and women.
Question not addressed in this review
Ballesteros et al. (2004b) Although indicating smaller effect sizes thanprevious meta-analyses, results support themoderate efficacy of BIs.
Question not addressed in this review BI appears to have greater efficacy whenapplied in general screening programs tonon-treatment seeking populations.
Suggested more research needed toestablish whether extended BI moreefficacious than BI.Also, identified need for furthernaturalistic studies on long-term BIefficacy.
Beich et al. (2003) Results suggests alcohol BI effective, though atlower levels than reported previously(pooled absolute risk reduction from BI was10.5% (95% CI 7.1–13.9%) A randomeffects model yielded a similar result: 10%(6–14%). The pooled number needed to treat(NNT) was 10 (7 to 14)).
Question not addressed in this review Question not addressed in this review Question not addressed in this review
Berglund et al. (2003) Majority (18 of 25 RCTs) showed BI had asignificant positive effect in health caresettings (primary care and hospital settings).Some evidence for positive impact onnumber of hospital days/incidence of newinjuries and need for hospital care.
Question not addressed in this review (Limited) evidence suggests alcohol BIequally effective in men and women.However notes that most studiesconducted with populations consisting ofmiddle-aged male heavy drinkers.Lack of evidence on treatment ofhomeless patients and for patients withpsychiatric co-morbidity.Although some studies includeddependent patients, review excluded anystudies focused on this group of patientsonly.
However, uncertainty/limited evidence onlonger-term effect sizes of alcohol BI(past 2 years).Review excluded studies that comparedBI with extended BI but highlightedlack of evidence on design of optimalBI.
Bertholet et al. (2005) Alcohol BI effective in reducing alcoholconsumption at 6 and 12 months (adjustedintention-to-treat analysis showed a meanpooled difference of −38 g/week in favour ofthe BI group).Limited evidence on impact on reduction ofhealth care utilization.
Question not addressed in this review BI was concluded to be beneficial in menand women in a primary care context.
Lack of evidence of alcohol BI onmorbidity, mortality and quality of lifemeasures.More research needed to identify whichcomponents of BI present evidence ofefficacy in primary health care.
Continued
Review
ofreview
sof
BIeffectiveness
inprim
arycare
69
at University of Newcastle on February 5, 2014 http://alcalc.oxfordjournals.org/ Downloaded from
299

Table 1. Continued
StudyQ1: Is alcohol BI for alcohol effective whendelivered in primary health care settings?
Q2: Is alcohol BI equally effective acrossdifferent countries/health care systems?
Q3: Is the alcohol BI evidence baseapplicable to all population groups?
Q4: What is the optimum length/frequency/content of alcohol BI and howlong is it effective?
Bray et al. (2011) Alcohol BI has a small, negative effect onemergency department utilization. Howeverno significant effect was found for outpatientor in patient health care utilization.
Question not addressed in this review Question not addressed in this review Question not addressed in this review
Chang (2002) Findings suggest that alcohol BI do not appearto be consistently helpful to womendrinkers.
Question not addressed in this review Mixed/inconsistent evidence for alcohol BIeffectiveness in both genders. However,pregnant women were found to reducetheir drinking in two of the studiesreviewed; thus pregnancy may provide apowerful incentive to reduce alcoholdrinking.
Question not addressed in this review
Cuijpers et al. (2004) Findings suggest positive impact of alcohol BIon reducing mortality (although limiteddetailed/verified data available from alcoholBI trials on mortality rates between pre-testand follow-up).Pooled relative risk (RR) of dying in BIcompared to control conditions was 0.47 forthe four studies (95% CI: 0.25, 0.89). Thepooled RR of all 32 studies was comparable(RR = 0.57; 95% CI: 0.38, 0.84).
Meta-analysis of mortality only includedUSA, UK and Australian data.
Acknowledged fact that study populationsdiffered considerably, althoughsensitivity analyses suggestedcomparable outcomes.
Acknowledges variation in content ofincluded interventions but emphasizesthat multiple sensitivity analysesexcluding particular studies/sets ofstudies, all resulted in comparable BIoutcomes.
Gilinsky et al. (2011) There was some evidence from a small numberof studies that singe session face to face briefinterventions resulted in positive effects onthe maintenance of alcohol abstinenceduring pregnancy.Women choosing abstinence as theirdrinking goals and heavier drinking womenwho participated with a partner were morelikely to be abstinent at follow up.However more intensive interventions maybe required to encourage women whocontinue to drink during pregnancy toreduce their consumption.
Question not addressed in this review Identified lack of high quality evidence foreffectiveness of alcohol BI in pregnantwomen.Overall, there was insufficient evidenceto determine whether such interventionsdelivered during the antenatal period areeffective at helping women to reducealcohol consumption during pregnancy.
Question not addressed in this review
Gordon et al. (2007) Although alcohol and dietary interventionsappeared to be economically favourable(cost-effective), it is difficult to drawconclusions because of the variety in studyoutcomes.Generally, the costs of the behaviouralinterventions reviewed were low relative tothose for other healthcare interventions suchas pharmaceutical management.The behavioural interventions aimed atpopulations with high-risk factors fordisease were more cost-effective than thoseaimed at healthy individuals.
Question not addressed in this review Noted tendency to omit cultural minoritiesin studies across multiple behaviouralintention cost effectiveness studies.General lack of evidence (across multiplebehavioural intention areas) of costeffectiveness for disadvantagedpopulations.
Question not addressed in this review
70O’D
onnelletal.
at University of Newcastle on February 5, 2014 http://alcalc.oxfordjournals.org/ Downloaded from
300

Huibers et al. (2003) Not possible to draw an overall conclusionconcerning the effectiveness of‘psychosocial interventions by generalpractitioners’ since studies were notcomparable in numerous aspects(intervention, outcome, population).In relation to alcohol, review found thatGP-delivered BI seem no more effective thanother, more simple interventions or whendelivered by a nurse practitioner.
Question not addressed in this review Question not addressed in this review Question not addressed in this review
Jackson et al. (2010) Evidence found for the positive impact ofalcohol BI on alcohol consumption,mortality, morbidity, alcohol-relatedinjuries, alcohol-related socialconsequences, and healthcare resource use.Further, alcohol BI were shown to beeffective in both men and women.
Question not addressed in this review Study populations made up primarily ofadults therefore limited evidenceidentified for the effectiveness of briefinterventions in young people.Participants were mainly Caucasian inorigin and ethnicity of study populationswas poorly reported in general.Although socioeconomic status was notshown to influence the effectiveness ofBI, there was limited evidence in thisarea.Limited evidence (only one review) ofBI effectiveness in patients with dualdiagnosis of psychiatric condition andalcohol misuse Relationship between thelevel of alcohol dependence and theeffectiveness of brief interventions wasunclear.
Limited evidence suggests that even verybrief interventions may be effective inreducing negative alcohol-relatedoutcomes.The benefit arising from increasedexposure or the incorporation ofmotivational interviewing principleswas unclear.Due to the extensive heterogeneity/lackof reported detail in the characteristicsof the brief interventions evaluated, it isdifficult to define the effectivecomponents of brief interventions.
Jonas (2012) Overall, evidence supports the effectiveness ofbehavioural interventions for improvingseveral intermediate outcomes for adults,older adults, and young adults/collegestudents (average reduction of 3.6 drinks perweek for adults compared with control, 11%increase in the % of adults achievingrecommended drinking limits over 12months).
Question not addressed in this review Limited data on effectiveness for pregnantwomen in terms of consumption;insufficient evidence with regards toreduction in heavy drinking episodes orwith pregnant women, particular at 6months+.Insufficient evidence on effectiveness inreducing heavy drinking episodes forolder adults; on drinking withinrecommended limits for college agestudents; or on mean consumption,heavy drinking episodes or drinkingwithin recommended limits foradolescents.Ethnicity data generally not reported forparticipants and low rates of non-Whiteparticipants except for two includedtrials (one conducted in Thailand, 100%Thai) and one in urban academic practice(80–82% non-white).Not clear whether findings applicable topeople with comorbid medical orpsychiatric conditions.
Brief multi-contact interventions have thebest evidence of effectiveness acrosspopulations, outcomes, and havefollow-up data over several years.However, differences between controland intervention groups not statisticallysignificant past 48 months; and ingeneral, insufficient evidence oneffectiveness 6 months +.Insufficient evidence to draw firmconclusions on required intensity ofintervention, including which specificcomponents needed to be included.
Continued
Review
ofreview
sof
BIeffectiveness
inprim
arycare
71
at University of Newcastle on February 5, 2014 http://alcalc.oxfordjournals.org/ Downloaded from
301
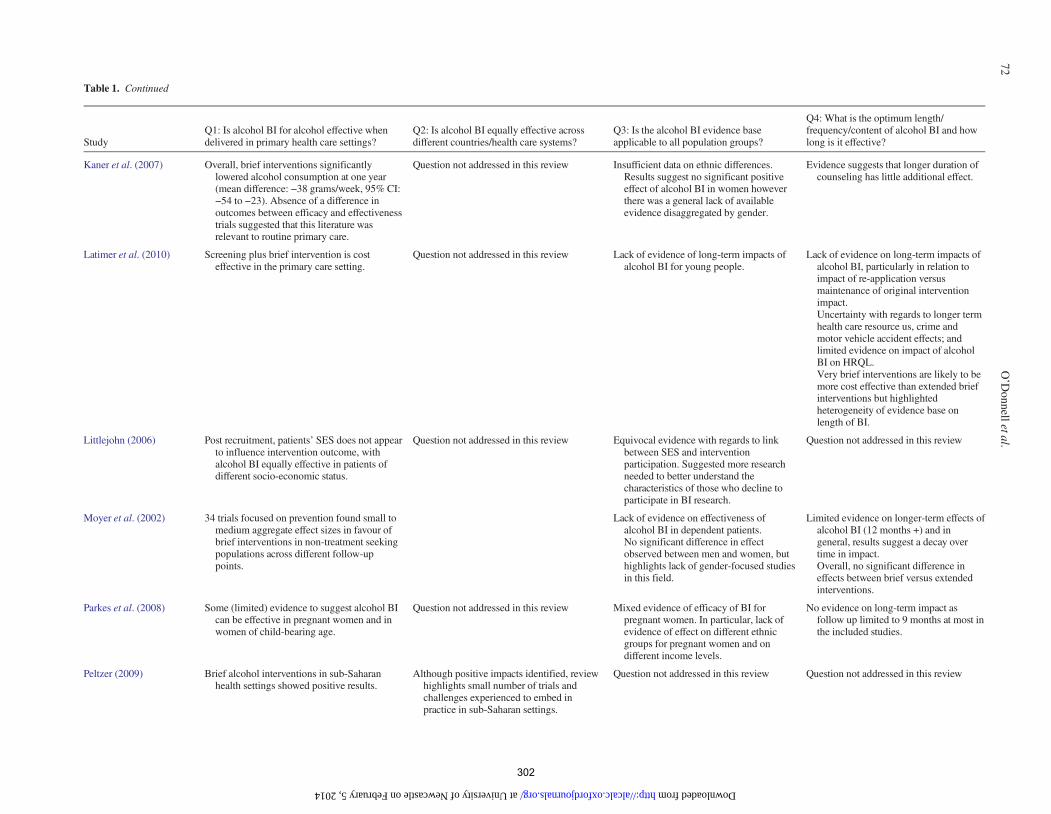
Table 1. Continued
StudyQ1: Is alcohol BI for alcohol effective whendelivered in primary health care settings?
Q2: Is alcohol BI equally effective acrossdifferent countries/health care systems?
Q3: Is the alcohol BI evidence baseapplicable to all population groups?
Q4: What is the optimum length/frequency/content of alcohol BI and howlong is it effective?
Kaner et al. (2007) Overall, brief interventions significantlylowered alcohol consumption at one year(mean difference: −38 grams/week, 95% CI:−54 to −23). Absence of a difference inoutcomes between efficacy and effectivenesstrials suggested that this literature wasrelevant to routine primary care.
Question not addressed in this review Insufficient data on ethnic differences.Results suggest no significant positiveeffect of alcohol BI in women howeverthere was a general lack of availableevidence disaggregated by gender.
Evidence suggests that longer duration ofcounseling has little additional effect.
Latimer et al. (2010) Screening plus brief intervention is costeffective in the primary care setting.
Question not addressed in this review Lack of evidence of long-term impacts ofalcohol BI for young people.
Lack of evidence on long-term impacts ofalcohol BI, particularly in relation toimpact of re-application versusmaintenance of original interventionimpact.Uncertainty with regards to longer termhealth care resource us, crime andmotor vehicle accident effects; andlimited evidence on impact of alcoholBI on HRQL.Very brief interventions are likely to bemore cost effective than extended briefinterventions but highlightedheterogeneity of evidence base onlength of BI.
Littlejohn (2006) Post recruitment, patients’ SES does not appearto influence intervention outcome, withalcohol BI equally effective in patients ofdifferent socio-economic status.
Question not addressed in this review Equivocal evidence with regards to linkbetween SES and interventionparticipation. Suggested more researchneeded to better understand thecharacteristics of those who decline toparticipate in BI research.
Question not addressed in this review
Moyer et al. (2002) 34 trials focused on prevention found small tomedium aggregate effect sizes in favour ofbrief interventions in non-treatment seekingpopulations across different follow-uppoints.
Lack of evidence on effectiveness ofalcohol BI in dependent patients.No significant difference in effectobserved between men and women, buthighlights lack of gender-focused studiesin this field.
Limited evidence on longer-term effects ofalcohol BI (12 months +) and ingeneral, results suggest a decay overtime in impact.Overall, no significant difference ineffects between brief versus extendedinterventions.
Parkes et al. (2008) Some (limited) evidence to suggest alcohol BIcan be effective in pregnant women and inwomen of child-bearing age.
Question not addressed in this review Mixed evidence of efficacy of BI forpregnant women. In particular, lack ofevidence of effect on different ethnicgroups for pregnant women and ondifferent income levels.
No evidence on long-term impact asfollow up limited to 9 months at most inthe included studies.
Peltzer (2009) Brief alcohol interventions in sub-Saharanhealth settings showed positive results.
Although positive impacts identified, reviewhighlights small number of trials andchallenges experienced to embed inpractice in sub-Saharan settings.
Question not addressed in this review Question not addressed in this review
72O’D
onnelletal.
at University of Newcastle on February 5, 2014 http://alcalc.oxfordjournals.org/ Downloaded from
302

Saitz (2010) Alcohol screening and BI has efficacy inprimary care for patients with unhealthy butnot dependent alcohol use.
Question not addressed in this review Lack of evidence to support efficacy ofalcohol BI in very heavy or dependentdrinkers. Further, small sample sizes andother study design factors limitgeneralizability of findings.
Question not addressed in this review
Solberg et al. (2008) Brief screening and counselling for alcoholmisuse in primary care is both moreeffective/cost-effective than most othereffective preventative services.Sparse data on efficacy in preventingalcohol-attributable morbidity and mortality.
Question not addressed in this review Highlights fact that dependent drinkersexcluded or lack of disaggregated data onefficacy/adherence for dependent asopposed to non-dependent drinkers.
Limited evidence of long-termeffectiveness (12 months +) and nostudies at 5 years +
Sullivan et al. (2011) Review offers preliminary support for thebenefit of brief interventions for unhealthyalcohol use by non-physicians, either aloneor in combination with physicians. There isevidence that non-physician-basedinterventions are as effective asphysician-based interventions and whenadded to physician-based interventions cansignificantly improve drinking outcomes.However, summary effect size observed fornon-physician interventions of 1.7 fewerstandard drinks per week is smaller than thatobserved for other clinician-basedinterventions in primary care settings (2.7fewer standard drinks per week but withinthe 95% CI [1.6–3.9 standard drinks] of thatresult).
Question not addressed in this review Question not addressed in this review Question not addressed in this review
Whitlock et al. (2004) Alcohol BI in primary health care settingsreduced risky and harmful alcohol use forseveral alcohol outcomes (at 6–12 months,brief counseling interventions (with up to 15min contact and at least 1 follow-up) reducedthe average number of drinks per week by13–34% more than controls. The proportionof participants drinking at ‘safe’ levels was10–19% greater than controls).
Question not addressed in this review No consistent differences found betweenmen and women.Some evidence to suggest alcohol BIeffective in older populations incomparison with younger adults.Low or non-reported non-whiteparticipation
Results suggested brief, multi-contactinterventions more effective than verybrief or brief single-contactinterventions.Lack of evidence to determinerelationship between interventioneffects and specific BI components.Although all interventions that showedsignificant improvements in outcomesincluded at least 2 out of 3 key elements(feedback, advice and goal setting).Mixed/limited data on long-termmortality and morbidity benefits,especially for groups other than males,with less severe drinkers and withlow-intensity interventions.One study reported maintenance ofimproved drinking at 4 years follow-up.
Review
ofreview
sof
BIeffectiveness
inprim
arycare
73
at University of Newcastle on February 5, 2014 http://alcalc.oxfordjournals.org/ Downloaded from
303

if delivered by doctors (Sullivan et al., 2011). Finally, whilstavailable evidence remains limited, results from onemeta-analysis found indications of the effectiveness of briefalcohol intervention on mortality outcomes, estimating a re-duction in problem drinkers of about 23–36% (Cuijpers et al.,2004).
Question 2: is brief alcohol intervention equally effectiveacross different countries and different health care systems?
There is a geographic bias, with the majority of previous re-search conducted in high-income regions, and in particular,English and Nordic speaking countries. Out of the 24 eligiblereviews, fewer than half included data from studies basedoutside Europe and/or the developed world (ten reviews:Moyer et al., 2002; Berglund et al., 2003; Cuijpers et al.,2004; Whitlock et al., 2004; Bertholet et al., 2005; Peltzer,2009; Latimer et al., 2010; Saitz, 2010; Jonas et al., 2012;Babor et al. 2013). As the review of reviews by Babor et al(2013) emphasizes, research findings from developed coun-tries may not be generalizable to developing and transitionalcountries on a number of grounds. In addition to structural andpolitical differences, there are known differences in drinkingpatterns and abstention rates between lower and higher incomecountries, and health consequences vary. Although the behav-ioural theory that underpins the design and delivery of briefintervention is likely to be ‘universally’ effective (Andersonet al., 2009), and certainly Jonas et al. (2012) found similar ef-fectiveness for brief alcohol intervention both within andoutside the USA, a need remains for further culturally-specificresearch in countries outside the USA and Western Europe inorder to demonstrate this conclusively (Peltzer, 2009).It is also worth mentioning that half the included reviews (12
reviews: Beich et al., 2003; Whitlock et al., 2004; Littlejohn,2006; Gordon et al., 2007; Parkes et al., 2008; Peltzer, 2009;Latimer et al., 2010; Saitz, 2010; Bray et al., 2011; Gilinskyet al., 2011; Sullivan et al., 2011; Jonas et al., 2012) were basedexclusively on studies published in the English language. Giventhe resulting potential for publication bias (authors are morelikely to publish significant results in English-language journals(Egger et al., 1997)), this suggests a need for increased linguis-tic (alongside geographic) diversity in future systematic reviewsin this field (Babor et al., 2013).
Question 3: is the brief alcohol intervention evidence baseapplicable across different population groups?
Although overall the evidence implies that brief alcohol inter-vention is equally effective in men and women (Ballesteroset al., 2004a; Whitlock et al., 2004; Bertholet et al., 2005),most studies to date have either focussed on male drinkers ornot reported the data disaggregated by sex (Moyer et al., 2002;Berglund et al., 2003; Kaner et al., 2007). One review sug-gested that brief alcohol intervention may not be consistentlyhelpful to women, or at least the results are more equivocal(Chang, 2002); and there is an identified lack of high-qualityevidence on its effectiveness in pregnant women drinkers(Parkes et al., 2008; Gilinsky et al., 2011; Jonas et al., 2012;Babor et al., 2013). Whilst one review indicated that preg-nancy itself may provide a powerful incentive to reducealcohol drinking (Chang, 2002), another found insufficientevidence to determine the effectiveness of brief interventiondelivered during the antenatal period, suggesting that more
intensive interventions may be required to encourage womenwho continue to drink during pregnancy to successfullyreduce their consumption (Gilinsky et al. 2011).Further, whilst brief intervention appears to improve
alcohol-related outcomes for adults aged eighteen and over,evidence on effectiveness at either end of the age spectrum isless conclusive. Previous research (predominantly conductedin US college settings) suggests that effects appear less long-lived for young adults and college-age students, and there isinsufficient evidence of brief alcohol intervention effective-ness in both adolescents (Kaner et al. 2007; Jackson et al.2010; Latimer et al. 2010) and older adults (Kaner et al. 2007;Jonas et al. 2012), with only one review showing effect inadults aged 65 and over (Whitlock et al. 2004)).There was limited consideration of the impact of socio-
economic status on the effectiveness of brief alcohol interventionin the majority of the included reviews, with a general acknow-ledgment of the lack of evidence for disadvantaged populationsin those that did (Littlejohn, 2006; Gordon et al., 2007; Jacksonet al., 2010). Further, a number of reviews noted the tendencyfor studies either to omit ethnic minorities (Gordon et al., 2007)or to be poorly reported where non-White participants wereincluded (Whitlock et al., 2004; Kaner et al., 2007; Jacksonet al., 2010; Jonas et al., 2012).Finally, a number of reviews suggest that brief alcohol inter-
vention was most impactful in non-treatment seeking, non-dependent patient populations (Moyer et al., 2002; Ballesteroset al., 2004b; Babor et al., 2013). However, other reviewshighlight the equivocal nature of the existing evidence base(Jackson et al., 2010), and/or emphasize the exclusion or lackof disaggregated data in primary studies for dependent versusnon-dependent patients (Berglund et al., 2003; Solberg et al.,2008). There was also a lack of conclusive evidence on the useof brief alcohol intervention in patients with co-morbidmedical or psychiatric conditions (Berglund et al., 2003;Jackson et al., 2010; Jonas et al., 2012).
Question 4: what is the optimum length, frequency andcontent of brief alcohol intervention, and for how long is iteffective?
Evidence also points towards a need for greater understandingof the temporal limits of brief alcohol intervention impact.Research shows that effect sizes are largest at the earliestfollow-up points, with decay in intervention effects over time.This overview found limited information on the longer-termeffectiveness of brief alcohol intervention past 48 monthspost-intervention (Moyer et al., 2002; Latimer et al., 2010;Jonas et al., 2012). In addition, although recent evidence sug-gests that greater effect sizes may be achieved with brief multi-contact interventions (each contact up to 15 min), comparedwith very brief (up to 5 min) and brief (>5 min, up to 15 min)single-contact interventions (Jonas et al., 2012), it is importantto note that the 2007 Cochrane Review found that longer(more intensive) brief interventions offered no significant add-itional benefit over shorter input (Kaner et al., 2007).Few reviews considered the impact of the actual content of
interventions on their effectiveness (Berglund et al., 2003;Cuijpers et al., 2004; Whitlock et al., 2004; Jonas et al.,2012). In general, these reviews highlighted a lack of availableevidence on this issue, mainly due to the heterogeneity of theincluded studies. Whitlock et al. (2004) reported that all
74 O’Donnell et al.
at University of N
ewcastle on February 5, 2014
http://alcalc.oxfordjournals.org/D
ownloaded from
304

interventions demonstrating statistically significant improve-ments in alcohol outcomes included at least two of the follow-ing three elements—feedback, advice and goal-setting—butadded that, given that the most effective interventions weremulti-contact, inevitably these also comprised additional as-sistance and follow-up. Further, as Beich et al. (2003) high-lights, conversations about alcohol can take place in differentways in primary healthcare settings, thus the effectiveness ofbrief intervention may be as much down to the well-established ‘helping relationship’ between patient and practi-tioner as the frequency or content of contact per se.
DISCUSSION
This review of systematic reviews supports the effectiveness ofbrief intervention at reducing alcohol-related problems across56 trials and a wide range of patients in primary healthcare.However, it highlights knowledge gaps regarding the effect-iveness of brief alcohol intervention with pregnant women,with older and younger drinkers, with those from ethnic mi-nority groups, and in transitional and low income countries.There is also a need to determine the optimum length, fre-quency and necessary content of brief intervention required tomaintain longer-term effects.Further, although the general consensus is that brief alcohol
interventions are ill-suited to the needs of dependent drinkers,who require more specialist and intensive support (Saitz, 2010),it is inevitable that routinely screening patients for excessivealcohol use in primary healthcare—an essential precursor tointervention—will identify those at the dependence end of thespectrum. Whilst primary healthcare practitioners clearly havean important role to play in terms of ‘signposting’ alcohol-dependent patients to more specialist treatment, they are alsopresented with a prime opportunity to deliver an interventionthemselves at that point. Along with pharmacotherapy, model-ling work by Rehm and Roerecke (2013) suggests that briefintervention in hospital settings is most effective at reducingmortality in alcohol-dependent patients. However, at present,comparable modelling data for this group of drinkers in primaryhealthcare settings are not available due to lack of alcohol con-sumption or diagnosis information (Purshouse et al., 2013).With fewer than 10% of people affected by alcohol dependencecurrently receiving treatment (Alonso et al., 2004), there maybe considerable value in furthering our understanding of theextent to which brief interventions delivered in primary health-care work in dependent drinkers. Given the dose–response rela-tionship of alcohol consumption and related harms, greaterhealth gains can be achieved with a 10% reduction from a de-pendent drinker than from a 10% reduction from a hazardous orharmful drinker (Rehm and Roerecke, 2013).Yet even in populations and settings where brief alcohol
intervention is known to be effective, there remain unansweredquestions about which ‘active ingredients’make for successfulinterventions (Kaner, 2010a). Research in primary healthcaresettings shows that most control groups report a decrease inalcohol consumption, suggesting the possibility of either re-gression to the mean (in which extreme measures of behaviourtend to shift to less extreme positions over time), or thatscreening or assessment reactivity affects outcomes (i.e.assessments of alcohol use themselves contain a therapeuticelement) (Bertholet et al., 2005; Jonas et al., 2012). Findings
from three recent reviews appear to support this latterexplanation (Jenkins et al., 2009; Bernstein et al., 2010;McCambridge and Kypri, 2011) and most recently, the resultsof the SIPS alcohol screening and brief intervention researchprogramme also suggest that their trial control condition, con-sisting of simple feedback and written information aboutalcohol, may have contained active factors of behaviourchange (Kaner et al., 2013).
Further, as Mitchie et al. (2012) acknowledge, the issue oftreatment fidelity presents an additional obstacle to our under-standing of brief alcohol intervention effectiveness. For avariety of reasons, busy physicians dealing with alcohol inroutine practice settings may deviate from guidelines and pro-tocols of care (Moriarty et al., 2012), as happens in other areasof clinical practice (Dew et al., 2010). Thus, even when practi-tioners can be persuaded to engage in brief alcohol interven-tion, it is not possible to establish conclusively the causalchain between interventions as designed, and their subsequentoutcomes (an issue that further complicates questions aroundwhich intervention components have most impact on alcohol-related outcomes (McCambridge, 2013)).These evidence gaps are not merely an academic concern.
Given that the demand for healthcare is always likely to out-strip supply, determining the essential intervention elements isvital in order to inform the design, commissioning and deliv-ery of more cost-effective measures to address alcohol-relatedharm (McCambridge, 2013). Thus there is a need for furtherresearch in the aforementioned areas where genuine knowl-edge gaps exist. Moreover, available research indicates thatsignificant public health gains could be achieved if even thebasic elements of brief alcohol intervention were main-streamed in primary healthcare. Whilst acknowledging the in-adequacy of the existing implementation evidence base,previous studies highlight the positive role of alcohol-specific,multi-component, and ideally, practitioner-tailored trainingprogrammes in routinising brief alcohol intervention delivery(Anderson et al., 2004; Nilsen et al., 2006). However, work-load demands remain a fundamental barrier to mainstreamadoption, irrespective of individual knowledge levels and atti-tudes (Johnson et al., 2010). On this basis, current researchwould suggest that time-pressed clinicians should focus on thefollowing three ‘easy’ wins.
Short and simple is still effective
First, busy practitioners need to be reassured that there islittle evidence to suggest that longer or more intensive inputprovides additional benefit over shorter, simpler input (Moyeret al., 2002; Kaner et al., 2007). Although one review foundgreater effect sizes associated with brief multi-contact interven-tions compared with other intensities (Jonas et al., 2012),overall, there appears no significant advantage of extended briefintervention in reducing alcohol consumption (Kaner et al.,2007, 2013). Even a single, 5-min session of structured briefadvice on alcohol using a recognized, evidence-based resourcebased on FRAMES principles (Feedback, Responsibility,Advice, Menu, Empathy and Self-efficacy) is still likely to beeffective.
Use the most active ingredients
Second, given the weak relationship between duration of coun-selling and outcome, it may be the case that the structure and
Review of reviews of BI effectiveness in primary care 75
at University of N
ewcastle on February 5, 2014
http://alcalc.oxfordjournals.org/D
ownloaded from
305
content of brief interventions has more influence on patients’drinking than the total length of delivery (Kaner et al., 2009).Whilst there remains an identified knowledge gap around themost ‘active ingredients’ of brief alcohol intervention, onemust acknowledge some important developments in this fieldin recent years, not as yet reflected in published systematicreviews. Mitchie et al. (2012) sought to identify which specificbehaviour change techniques (BCTs) led to improved out-comes for brief alcohol interventions (42 BCTs reviewed intotal, although not all associated with brief alcohol interven-tion). They concluded that prompting self-recording ofalcohol intake was associated with greater effect sizes frombrief intervention, and called for further research to extend anddevelop this approach. A systematic review by McCambridgeand Kypri (2011) also found that answering questions ondrinking, including consumption, in brief alcohol interventiontrials appeared to alter subsequent self-reported behaviour innon-intervention control groups. On this basis, asking thesimple question ‘how much do you drink?’ may be enough totrigger a positive behaviour change.
Target the ‘right’ patients
Finally, whilst there is a recognized need for further evidenceon the effectiveness of brief alcohol intervention in certaingroups of patients (pregnant women, younger and older drin-kers), given the large number of trials showing consistentlypositive outcomes in middle-aged men, at the very least, prac-titioners should target their efforts in this direction. Indeed, astwo-thirds of all alcohol-attributable deaths in the 20- to64-year-old EU population occur in those aged 45–64, Rehmet al. (2011) have argued tackling harmful use in this agegroup would be most effective in helping to rapidly reducealcohol’s health burden to society overall.There are several limitations associated with this review of
reviews, including some inherent weaknesses with this meth-odological approach in general. First, although there is a rangeof published reviews on brief alcohol intervention effective-ness, some questions of interest were only partially addressedby the available evidence base. For example, there werelimited data available on the effectiveness of brief alcoholintervention in different models of primary healthcare systems,beyond the broad comparison on geographic grounds. Second,in basing our conclusions on the findings of previous system-atic reviews, this review is necessarily limited by individualauthors’ decisions regarding the exclusion/inclusion of par-ticular studies, further confounded by the fact that the standardof reporting, analysis and interpretation, whilst generally high,varied across the included papers. Third, our reliance on previ-ous systematic reviews limits the immediacy of our findings asthe most recent primary research is not included. Whilst ourdiscussion sought to supplement the findings with the resultsfrom more recent primary studies, this approach was unsys-tematic. Fourth, we did not verify the information reported inthe reviews by consulting individual studies, which may haveintroduced bias (e.g. resulting from inaccurate reporting offindings (Smith et al., 2011)). However, the overlap in results,and broad agreement in responses to the questions posed bythis review of reviews, suggests that our representation of theevidence is likely to limit potential bias.
CONCLUSION
Despite the limitations identified above, this paper illuminatessome commonalities across the existing evidence base. Thereremain unanswered questions around the effectiveness of briefalcohol intervention across different settings, different popula-tion groups, about the optimum intervention content, and thelongevity of intervention effects. However, available evidencesuggests that time-pressed clinicians looking for maximumimpact with minimal input should direct their efforts to the de-livery of short, simple interventions which focus on promptingindividuals to record their alcohol intake, and that these arelikely to be most effective in middle-aged, male drinkers.
SUPPLEMENTARYMATERIAL
Supplementary material is available at Alcohol andAlcoholism online.
Acknowledgements — We thank Dr Ruth McGovern, Institute of Health and Society, forproofing this publication.
Funding— This work was supported by the health programme of the European Union aspart of the BISTAIRS research project (Agreement number 2011_1204). The soleresponsibility lies with the author and the Executive Agency is not responsible for anyuse that may be made of the information contained therein. For further information, visitthe project website at www.bistairs.eu. Funding to pay the Open Access publicationcharges for this article was provided by the Institute of Health & Society, NewcastleUniversity, England.
Conflict of interest statement. None declared.
REFERENCES
Aalto M, Pekuri P, Seppa K. (2003) Obstacles to carrying out briefintervention for heavy drinkers in primary health care: a focusgroup study. Drug Alcohol Rev 22:169–73.
Aira M, Kauhanen J, Larivaara P et al. (2003) Factors influencinginquiry about patients’ alcohol consumption by primary healthcare physicians: qualitative semi-structured interview study. FamPract 20:270–5.
Alonso J, Angermeyer M, Bernert S et al. ESEMeD/MHEDEA 2000Investigators. (2004) Use of mental health services in Europe:results from the European study of the Epidemiology of MentalDisorders (ESMeD) project. Acta Psychiatr Scand 109:47–54.
Anderson P. (1985) Managing alcohol problems in general practice.Br Med J 290:1873–5.
Anderson P, Laurant M, Kaner E et al. (2004) Engaging general prac-titioners in the management of hazardous and harmful alcoholconsumption: results of a meta-analysis. J Stud Alcohol 65:191–9.
Anderson P, Chisholm D, Fuhr D. (2009) Effectiveness and cost-effectiveness of policies and programmes to reduce the harmcaused by alcohol. Lancet 373:2234–46.
Babor TF, Higgins-Biddle J. (2000) Alcohol screening and briefintervention: dissemination strategies for medical practice andpublic health. Addiction 95:677–86.
Babor T, Kaner E, Nilsen P et al. (2013) Rapid Review of CurrentEvidence for Health Promotion Actions for Hazardous andHarmful Alcohol Use, with Specific Reference to Low- andMiddle-Income Countries: WHOMainstreaming Health PromotionProject. Geneva: World Health Organization (in press).
Ballesteros J, Gonzalez-Pinto A, Querejeta I et al. (2004a) Brief inter-ventions for hazardous drinkers delivered in primary care areequally effective in men and women. Addiction 99:103–8.
Ballesteros JA, Duffy JC, Querejeta I et al. (2004b) Efficacy of briefinterventions for hazardous drinkers in primary care: systematicreview and meta-analysis. Alcohol Clin Exp Res 28:608–18.
76 O’Donnell et al.
at University of N
ewcastle on February 5, 2014
http://alcalc.oxfordjournals.org/D
ownloaded from
306

Beich A, Thorsen T, Rollnick S. (2003) Screening in brief interven-tion trials targeting excessive drinkers in general practice: system-atic review and meta-analysis. Br Med J (Clin Res Ed)327:536–42.
Berglund M, Thelander S, Jonsson E. (2003) Treating alcohol anddrug abuse: an evidence-based review. Alcohol Clin Exp Res27:1645–56.
Bernstein E, Topp D, Shaw E et al. (2009) A preliminary report ofknowledge translation: lessons from taking screening and briefintervention techniques from the research setting into regionalsystems of care. Acad Emerg Med 16:1225–33.
Bernstein J, Bernstein E, Heeren T. (2010) Mechanisms of change incontrol group drinking in clinical trials of brief alcohol interven-tion: implications for bias towards the null. Drug Alcohol Rev29:498–507.
Bertholet N, Daeppen J-B, Wietlisbach V et al. (2005) Brief alcoholintervention in primary care: systematic review and meta-analysis.Arch Intern Med 165:986–95.
Bray JW, Cowell AJ, Hinde JM. (2011) A systematic review andmeta-analysis of health care utilization outcomes in alcoholscreening and brief intervention trials.Med Care 49:287–94.
Chang G. (2002) Brief interventions for problem drinking andwomen. J Subst Abuse Treat 23:1–7.
CRD. (2001) Undertaking Systematic Reviews of Research onEffectiveness: CRD’s Guidance for Those Carrying Out or Com-missioning Reviews. York: Centre for Reviews and Dissemination.
Cuijpers P, Riper H, Lemmers L. (2004) The effects on mortality ofbrief interventions for problem drinking: a meta-analysis.Addiction 99:839–45.
Dew K, Stubbe M, Macdonald L et al. (2010) The (non) use of priori-tisation protocols by surgeons. Sociol Health Illn 32:545–62.
Egger M, Zellweger-Zähner T, Schneider M et al. (1997) Languagebias in randomised controlled trials published in English andGerman. Lancet 350:326–9.
Flay B. (1986) Efficacy and effectiveness trials (and other phases ofresearch) in the development of health promotion programs. PrevMed 14:451–74.
Flay B, Biglan A, Boruch R et al. (2004) Standards of Evidence:Criteria for Efficacy, Effectiveness and Dissemination. FallsChurch, VA: Society for Prevention Research.
Flay B, Biglan A, Boruch R et al. (2005) Standards of evidence: cri-teria for efficacy, effectiveness and dissemination. Prev Sci6:151–75.
Gartlehner G, Hansen R, Nissman D et al. (2006) A simple and validtool distinguished efficacy from effectiveness studies. J ClinEpidemiol 59:1040–8.
Gilinsky A, Swanson V, Power K. (2011) Interventions deliveredduring antenatal care to reduce alcohol consumption during preg-nancy: A systematic review. Addict Res Theory 19:235–50.
Gordon L, Graves N, Hawkes A et al. (2007) A review of the cost-effectiveness of face-to-face behavioural interventions forsmoking, physical activity, diet and alcohol. Chronic Illn3:101–29.
Gual A, Sabadini MdA. (2011) Implementing alcohol disorders treat-ment throughout the community. Curr Opin Psychiatry 24:203–7.
Heather N. (1996) The public health and brief interventions for exces-sive alcohol consumption: the British experience. Addict Behav21:857–68.
HoC Health Committee. (2010) Alcohol: First Report of Session2009–10. London: The Stationery Office.
Huibers M, Beurskens A, Bleijenberg G et al. (2003) TheEffectiveness of Psychosocial Interventions Delivered by GeneralPractitioners. London: Cochrane database of systematic reviews.
Hutubessy R, Chisholm D, Edejer T. (2003) Generalised Cost-Effectiveness Analysis for National-Level Priority Setting in theHealth Sector. Cost Effectiveness and Resource Allocation.Geneva: World Health Organisation.
Jackson R, Johnson M, Campbell F et al. (2010) Screening and BriefInterventions for Prevention and Early Identification of AlcoholUse Disorders in Adults and Young People. Sheffield: Universityof Sheffield, School of Health and Related Research (ScHARR)Public Health Collaborating Centre.
Jenkins RJ, McAlaney J, McCambridge J. (2009) Change over timein alcohol consumption in control groups in brief intervention
studies: systematic review and meta-regression study. DrugAlcohol Depend 100:107–14.
Johnson M, Jackson R, Guillaume L et al. (2010) Barriers and facili-tators to implementing screening and brief intervention foralcohol misuse: a systematic review of qualitative evidence.J Public health Res 33:412–21.
Jonas D, Garbutt J, Brown J et al. (2012) Screening, BehavioralCounseling, and Referral in Primary Care to Reduce AlcoholMisuse. Rockville, MD: Agency for Healthcare Research andQuality.
Kaner E. (2010a) Brief alcohol intervention: time for translational re-search. Addiction 105:960–1.
Kaner E. (2010b) NICE work if you can get it: development of na-tional guidance incorporating screening and brief intervention toprevent hazardous and harmful drinking in England. DrugAlcohol Rev 29:589–95.
Kaner E, Heather N, McAvoy B et al. (1999) Intervention for exces-sive alcohol consumption in primary health care: attitudes andpractices of English general practitioners. Alcohol Alcohol 34:559–66.
Kaner E, Beyer F, Dickinson H et al. (2007) Effectiveness of BriefAlcohol Interventions in Primary Care Populations. London:Cochrane Database of Systematic Reviews.
Kaner E, Dickinson H, Beyer F et al. (2009) The effectiveness ofbrief alcohol interventions in primary care settings: a systematicreview. Drug Alcohol Rev 28:301–23.
Kaner E, Bland M, Cassidy P et al. (2013) Effectiveness of screeningand brief alcohol intervention in primary care (SIPS trial): pragmaticcluster randomised controlled trial. Br Med J 346:1–14.
Kung J, Chiappelli F, Cajulis O et al. (2010) From systematic reviewsto clinical recommendations for evidence-based health care: valid-ation of revised assessment of multiple systematic reviews(R-AMSTAR) for grading of clinical relevance. Open Dent J4:84–91.
Latimer N, Guillaume L, Goyder E et al. (2010) Prevention and EarlyIdentification of Alcohol Use Disorders in Adults and YoungPeople: Screening and Brief Interventions, Cost EffectivenessReview. Sheffield: University of Sheffield, School of Health andRelated Research (ScHARR) Public Health Collaborating Centre.
Littlejohn C. (2006) Does socio-economic status influence the accept-ability of, attendance for, and outcome of, screening and brief inter-ventions for alcohol misuse: a review. Alcohol Alcohol 41:540–5.
Lock C. (2004) Screening and brief alcohol interventions: what, why,who, where and when? A review of the literature. J Subst Abuse9:91–101.
Lock C, Wilson G, Kaner E et al. (2009) A Survey of GeneralPractitioners’ Knowledge, Attitudes and Practices Regarding thePrevention and Management of Alcohol-Related Problems: AnUpdate of a World Health Organisation Survey Ten Years on.London: Alcohol Education and Research Council.
McCambridge J. (2013) Brief intervention content matters. DrugAlcohol Rev 32:339–41.
McCambridge J, Kypri K. (2011) Can simply answering researchquestions change behaviour? Systematic review and meta analysesof brief alcohol intervention trials. PLoS One 6:23748.
Mitchie S, Whittington C, Hamoudi Z et al. (2012) Identification ofbehaviour change techniques to reduce excessive alcohol con-sumption. Addiction 107:1431–40.
Moher D, Liberati A, Tetzlaff J et al., PRISMA Group. (2009)Preferred reporting items for systematic reviews and meta-analyses: the PRISMA statement. Ann Intern Med 151:1–4.
Moriarty H, Stubbe M, Chen L et al. (2012) Challenges to alcoholand other drug discussions in the general practice consultation.Fam Pract 29:213–22.
Moyer A, Finney JW, Swearingen CE et al. (2002) Brief interven-tions for alcohol problems: a meta-analytic review of controlledinvestigations in treatment-seeking and non-treatment-seekingpopulations. Addiction 97:279–92.
Nilsen P, Aalto M, Bendtsen P et al. (2006) Effectiveness of strategiesto implement brief alcohol intervention in primary healthcare: asystematic review. Scand J Prim Health 24:5–15.
Parkes T, Poole N, Salmon A et al. (2008) Double Exposure: A BetterPractices Review on Alcohol Interventions during Pregnancy.Vancouver: British Columbia Centre of Excellence for Women’sHealth.
Review of reviews of BI effectiveness in primary care 77
at University of N
ewcastle on February 5, 2014
http://alcalc.oxfordjournals.org/D
ownloaded from
307

Peltzer K. (2009) Brief intervention of alcohol problems inSub-Saharan Africa: a review. J Psychol Africa 19:415–22.
Purshouse R, Brennan A, Rafia R et al. (2013) Modelling the cost-effectiveness of alcohol screening and brief interventions inprimary care in England. Alcohol Alcohol 48:180–8.
Raistrick D, Heather N, Godfrey C. (2006) Review of the Effectivenessof Treatment for Alcohol Problems. London: NHS: NationalTreatment Agency for Substance Misuse.
Rehm J, Roerecke M. (2013) Reduction of drinking in problem drin-kers and all-cause mortality. Alcohol Alcohol 48:509–13.
Rehm J, Zatonksi W, Taylor B et al. (2011) Epidemiology andalcohol policy in Europe. Addiction 106:11–9.
Saitz R. (2010) Alcohol screening and brief intervention in primarycare: absence of evidence for efficacy in people with dependanceor very heavy drinking. Drug Alcohol Rev 29:631–40.
Smith V, Devane D, Begley C et al. (2011) Methodology in conduct-ing a systematic review of systematic reviews of healthcare inter-ventions. BMC Med Res Methodol 11:1–6.
Solberg LI, Maciosek MV, Edwards NM. (2008) Primary care inter-vention to reduce alcohol misuse: ranking its health impact andcost effectiveness. Am J Prev Med 34:143–52.
Sullivan L, Tetrault J, Braithwaite S et al. (2011) A meta-analysis ofthe efficacy of nonphysician brief interventions for unhealthyalcohol use: implications for the patient-centered medical home.Am J Addiction 20:343–56.
Thorpe K, Zwarenstein M, Oxman A et al. (2009) A pragmatic-ex-planatory continuum indicator summary (PRECIS): a tool to helptrial designers. J Clin Epidemiol 62:464–75.
Whitlock EP, Polen MR, Green CA et al. (2004) Behavioral counsel-ing interventions in primary care to reduce risky/harmful alcoholuse by adults: a summary of the evidence for the U.S. PreventiveServices Task Force. Ann Intern Med 140:557–68.
Wilson G, Lock C, Heather N et al. (2011) Intervention against ex-cessive alcohol consumption in primary health care: a survey ofGPs’ attitudes and practices in England ten years on. AlcoholAlcohol 46:570–7.
78 O’Donnell et al.
at University of N
ewcastle on February 5, 2014
http://alcalc.oxfordjournals.org/D
ownloaded from
308

309
References
1. Rehm J, Room R, Monteiro M, et al. Alcohol as a risk factor for global burden ofdisease. European Addiction Research. 2003;9:157-64.
2. Lim S, Vos T, Flaxman A, et al. A comparative risk assessment of burden ofdisease and injury attributable to 67 risk factors and risk factor clusters in 21regions, 1990–2010: a systematic analysis for the Global Burden of DiseaseStudy 2010. The Lancet. 2012;380:2224-60.
3. Rehm J, Room R, Graham K, Monteiro M, Gmel G, Sempos C. The relationshipof average volume of alcohol consumption and patterns of drinking to burdenof disease—an overview. Addiction. 2003;98:1209-28.
4. Rehm J, Mathers C, Popova S, Thavorncharoensap M, Teerawattananon Y,Patra J. Global burden of disease and injury and economic cost attributable toalcohol use and alcohol-use disorders. The Lancet. 2009;373 2223-33.
5. World Health Organisation. International Statistical Classification of Diseasesand Related Health Problems. 10th Revision. Version for 2007. Geneva: WorldHealth Organisation, 2007.
6. World Health Organisation. Reducing risks, promoting healthy life. Geneva: TheWorld Health Organisation, 2002.
7. Rothman K, Greenland S, Lash T. Modern epidemiology (3rd edn). Philadelphia:Lippincott Williams & Wilkins; 2008.
8. Poschl G, Seitz H. Alcohol and Cancer. Alcohol and Alcoholism. 2004;39(3):155-65.
9. English DR, Holman CDJ, Milne E, Winter MJ, Hulse GK, Codde G, et al. TheQuantification of Drug-caused Morbidity and Mortality in Australia 1995.Canberra: Commonwealth Department of Human Services and Health, 1995.
10. Anderson P, Baumberg B. Alcohol in Europe. A public health perspective.London: Institute of Alcohol Studies, 2006.
11. Rehm J, Rehn N, Room R, Monteiro M, Gmel G, Jernigan D, et al. The globaldistribution of average volume of alcohol consumption and patterns ofdrinking. European Addiction Research. 2003;9(4):147-56.
12. Kirkpatrick M, Wit H. In the company of others: social factors alter acutealcohol effects. Psychopharmacology. 2013;230(2):215-26.
13. Puddey I, Rakic V, Dimmitt S, Beilin L. Influence of pattern of drinking oncardivascular disease and cardiovascular risk factors. Addiction. 1999;94:649-63.
14. Roerecke M, Rehm J. The cardioprotective association of average alcoholconsumption and ischaemic heart disease: a systematic review and meta-analysis. Addiction. 2012;107(7):1246-60.
15. Rehm J, Sempos C. Alcohol consumption and all-cause mortality. Addiction.1995;90:471-80.
16. Comittee HSaT. Alcohol Guidelines: Eleventh Report of Session 2010–12.London: House of Commons, 2012.

310
17. Shaper AG. Alcohol and mortality: a review of prospective studies. Britishjournal of addiction. 1990;85(7):837-47.
18. Shaper AG, Wannamethee SG. The J-shaped curve and changes in drinkinghabit. Novartis Foundation symposium. 1998;216:173-88.
19. Gmel G, Gutjahr E, Rehm J. How stable is the risk curve between alcohol andall-cause mortality and what factors influence the shape? A precision-weightedhierarchical meta-analysis. European journal of epidemiology. 2003;18(7):631-42.
20. Fuchs F, Chambless L. Is the cardioprotective effect of alcohol real? Alcohol.2007;41(pp. 399-402).
21. Rehm J, Room R, Monteiro M, Gmel G, Graham K, Rehn T, et al. Alcohol. In:WHO, editor. Comparative quantification of health risks: Global and regionalburden of disease due to selected major risk factors. Geneva: WHO; 2004.
22. Lye J, Hirschberg J. Alcohol consumption and human capital: a retrospectivestudy of the literature. Journal of Economic Surveys. 2010;24(2):309-38.
23. Carrell S, Hoekstra M, West J. Does drinking impair college performance?Evidence from a regression discontinuity approach. Journal of PublicEconomics. 2011;94(1-2):54-62.
24. Wolaver A. Does drinking affect grades more for women? Gender differences inthe effects of heavy episodic drinking in college. The American Economist.2007;51:72-88.
25. Anderson P, Møller L, Galea G. Alcohol in the European Union Consumption,harm and policy approaches. Copenhagen, Denmark: WHO Regional Office forEurope, 2012.
26. OECD. Harmful Use of Alcohol: Trends and Policy Conclusions. Paris:Organisation for Economic Co-operation and Development, 2013.
27. Rehm J, Zatonksi W, Taylor B, Anderson P. Epidemiology and alcohol policy inEurope. Addiction. 2011;106(Supplement 1):11-9.
28. Laslett A-M, Room R, Dietze P, Ferris J. Alcohol's involvement in recurrent childabuse and neglect cases. Addiction. 2012;107(10):1786-93.
29. Navarro HJ, Doran CM, Shakeshaft AP. Measuring costs of alcohol harm toothers: A review of the literature. Drug and Alcohol Dependence. 2011;114(2-3):87-99.
30. Taylor B, Rehm J. The Relationship Between Alcohol Consumption and FatalMotor Vehicle Injury: High Risk at Low Alcohol Levels. Alcoholism: Clinical andExperimental Research. 2012;36(10):1827-34.
31. Taylor B, Irving HM, Kanteres F, Room R, Borges G, Cherpitel C, et al. The moreyou drink, the harder you fall: A systematic review and meta-analysis of howacute alcohol consumption and injury or collision risk increase together. Drugand Alcohol Dependence. 2010;110(1–2):108-16.
32. Standerwick K, al. e. Binge drinking, sexual behaviour and sexually transmittedinfection in the UK. International Journal of STD and AIDS. 2007;18:810-3.

311
33. Aicken CRH, Nardone A, Mercer CH. Alcohol misuse, sexual risk behaviour andadverse sexual health outcomes: evidence from Britain's national probabilitysexual behaviour surveys. Journal of Public Health. 2011;33(2):262-71.
34. Nichols M, Scarborough P, Allender S, Rayner M. What is the optimal level ofpopulation alcohol consumption for chronic disease prevention in England?Modelling the impact of changes in average consumption levels. BMJ Open.2012;2(3).
35. WCRF/AICR. World Cancer Research Fund and American Institute for CancerResearch. Food, Nutrition, Physical Activity and the Prevention of Cancer: aGlobal Perspective. Washington DC: AICR, 2007.
36. Schuckit MA. Alcohol-use disorders. The Lancet.373(9662):492-501.
37. Rehm J, Roerecke M. Reduction of drinking in problem drinkers and all-causemortality. Alcohol and alcoholism (Oxford, Oxfordshire). 2013;48(4):509-13.
38. Rehm J, Marmet S, Anderson P, Gual A, Kraus L, Nutt D, et al. DefiningSubstance Use Disorders: Do We Really Need More Than Heavy Use? Alcoholand Alcoholism. 2013.
39. Rehm J, Greenfield T, Kerr W. Patterns of drinking and mortality from differentdiseases - an overview. Contemporary Drug Problems. 2006;33:205-35.
40. Centre. NI. Statistics on Alcohol: England, 2012. London: NHS InformationCentre, 2012.
41. Psychiatrists RCo. Our invisible addicts. London: Royal College of Psychiatrists,2011.
42. Anderson P. Effectiveness of general practitioner interventions for patientswith harmful alcohol consumption. British Journal of General Practice.1993;43:386-9.
43. Anderson P. Alcohol and risk of physical harm. In: Holder HD, Edwards G,editors. Alcohol and Public Policy: Evidence and Issues. Oxford Oxford Medical Publications; 1995. p. 82-113.
44. Drummond C, Oyefeso A, Phillips T, Cheeta S, Deluca P, Perryman K, et al.Alcohol needs assessment research project (ANARP): The 2004 national needsassessment for England. London: Department of Health, 2004.
45. Rose G. Sick Individuals and Sick Populations. International Journal ofEpidemiology. 1985;14(1):32-8.
46. Kreitman N. Alcohol consumption and the preventive paradox. British Journalof Addictions. 1986;81:353-63.
47. Saunders B. Alcohol and other drugs: the prevention paradoxes. CommunityHealth Studies. 1989;8:150-5.
48. Edwards G, Arif A, Hodgson R. Nomenclature and classification of drug andalcohol related problems: A WHO memorandum. Bulletin of the World HealthOrganization. 1981;59:225-42.
49. World Health Organisation. International classification of diseases. 10threvision ed. Geneva1992.

312
50. Kaner A, O'Donnell A. Chapter 40: Brief intervention: does it work? In: Boyle B, Zatonski, Lowenfels, Brawley, Burns and Rehm,, editor. Alcohol, Science, Policy and Public Health. Oxford: Oxford University Press; 2013.
51. National Health and Medical Research Council. Australian guidelines to reduce health risks from drinking alcohol. Canberra: National Health and Medical Research Council, 2009.
52. Patrick CH. Alcohol, Culture and Society. Durham. North Carolina: Duke University Press; 1952.
53. World Health Organisation. Heavy episodic drinkers among drinkers Geneva: World Health Organisation; 2013 [cited 2013 26th October]. Available from: http://www.who.int/gho/alcohol/consumption_patterns/heavy_episodic_drinkers_text/en/.
54. Room R. Drinking patterns in large U.S. cities: A comparison of San Francisco and national samples. Quarterly Journal of Studies on Alcohol. 1972;Suppl 6:28-57.
55. Rabinovich L, Hunt P, Staetsky L, Goshev S, Nolte E, Pedersen J, et al. Further study on the affordability of alcoholic beverages in the EU: A focus on excise duty pass-through, on- and off-trade sales, price promotions and statutory regulations. Santa Monica, CA: RAND Corporation, 2012.
56. Seaman P, Ikegwuonu T. Drinking to belong - Understanding young adults' alcohol use within social networks. York: Joseph Rowntree Foundation, 2010.
57. Poikolainen K, Paljarvi T, Makela P. Alcohol and the preventive paradox: serious harms and drinking patterns. Addiction. 2007;102(4):571-8.
58. Rossow I, Romelsjo A. The extent of the 'prevention paradox' in alcohol problems as a function of population drinking patterns. Addiction. 2006;101(1):84-90.
59. Sheron N, Hawkey C, Gilmore I. Projections of alcohol deaths—a wake-up call. The Lancet. 2011;377:1297 - 9.
60. OECD. Health at a Glance: Europe 2012. Paris: Organisation for Economic Co-operation and Development, 2012.
61. Smith L, Foxcroft D. Drinking in the UK: An exploration of trends. York: Joseph Rowntree Foundation, 2009.
62. National Statistics. Statistics on Alcohol: England, 2013. London: Health and Social Care Information Centre, 2013.
63. NWPHO. Topography of Drinking Behaviours in England: Synthetic estimates of numbers and proportions of abstainers, lower risk, increasing risk and higher risk drinkers in local authorities in England. Liverpool: North West Public Health Observatory, 2011.
64. NEPHO. Alcohol and Health in North East England. Stockton on Tees: North East Public Health Observatory, 2006.
65. North East Regional Alcohol Advisory Group. North East Alcohol Misuse: statement of priorities. Newcastle: Government Office for the North East, 2007.
66. BALANCE. North East Big Drink Debate Results. Darlington: BALANCE, 2009.

313
67. Department of Health. Alcohol Misuse Interventions: Guidance on developing alocal programme of improvement. London: NHS National Treatment Agency forSubstance Abuse, 2005.
68. HoC Health Committee. Alcohol: First Report of Session 2009-10. In: House ofCommons, editor.: London: The Stationery Office Limited; 2010.
69. Prime Minister's Strategy Unit. Strategy Unit Alcohol Harm Reduction Project:Interim Analytical Report. London: Cabinet Office, 2003.
70. NHS Confederation. Too much of the hard stuff: what alcohol costs the NHS.London: The NHS Conferedation in association with the Royal College ofPhysicians, 2010.
71. Balakrishnan R, Allender S, Scarborough P, Webster P, Rayner M. The burden ofalcohol-related ill health in the United Kingdom. Journal of Public Health.2009;31(3):366-73.
72. Lifestyle Statistics. Statistics on Alcohol: England, 2013. London: Health andSocial Care Information Centre, 2013.
73. Cabinet Office. Alcohol Harm Reduction Strategy for England. London: PrimeMinister's Strategy Unit, 2004.
74. Lister G. Evaluating social marketing for health – the need for consensus. .London: Proceedings of the National Social Marketing Centre, 2007.
75. North Tyneside Strategic Partnership. The North Tyneside Alcohol HarmReduction Strategy 2008-2011: Evidence Based Review. North Tyneside: NorthTyneside Strategic Partnership, 2008.
76. Department of Health. The cost of alcohol harm to the NHS in England: Anupdate to the Cabinet Office (2003) study. London: Health ImprovementAnalytical Team, Department of Health, 2008.
77. NICE. Alcohol-use disorders: preventing harmful drinking. Costing Report.Implementing NICE guidance. London: National Institute for Health and ClinicalExcellence, 2010.
78. Scarborough P, Bhatnagar P, Wickramasinghe KK, Allender S, Foster C, RaynerM. The economic burden of ill health due to diet, physical inactivity, smoking,alcohol and obesity in the UK: an update to 2006–07 NHS costs. Journal ofPublic Health. 2011;33(4):527-35.
79. Office H. Crime in England and Wales 2008/09. Findings from the British crimesurvey and police recorded crime. London: Home Office, 2009.
80. Office C. Alcohol misuse: how much does it cost? London: Cabinet Office, 2003.
81. Development CIoP. Annual survey report absence management. London:Chartered Institute of Personnel Development, 2009.
82. British Medical Association Board of Science. Alcohol misuse: tackling the UKepidemic. London: British Medical Association, 2008.
83. World Health Organisation. Global Health Risks: Mortality and burden ofdisease attributable to selected major risk. Geneva: World Health Organisation,2009.

314
84. World Health Organisation. Global status report on alcohol and health. Geneva: World Health Organisation, 2011.
85. Kneale J, French S. Mapping alcohol: Health, policy and the geographies of problem drinking in Britain. Drugs: Education, Prevention, and Policy. 2008;15(3):233-49.
86. Alcohol Education and Research Council. The Orientation and Integration of Local and National Alcohol Policy in England and Wales. London: Alcohol Education and Research Council, 2009.
87. Department of Health. Saving Lives: Our Healther Nation. London: Department of Health, 1998.
88. Department of Health. The NHS Plan. A Plan for Investment. A Plan for Reform. London: Department of Health, 2000.
89. Department of Health. Choosing Health: Making Health Choices Easier. London: Department of Health, 2004.
90. Great Britain. Licensing Act 2003, Chapter 17. London: HMSO, 2003.
91. Dept. of Health, Home Office, Skills. DfEa, Dept. for Culture MaS. Safe. Sensible.Social. The next steps in the National Alcohol Strategy. London: HM Government, 2007.
92. Department of Health. Alcohol Needs Assessment Research Project (ANARP): The 2004 national alcohol needs assessment for England. London: Department of Health, 2004.
93. Raistrick D, Heather N, Godfrey C. Review of the effectiveness of treatment for alcohol problems. London: NHS: National Treatment Agency for Substance Misuse 2006.
94. Department of Health. Models of care for alcohol misusers (MoCAM). London: NHS National Treatment Agency for Substance Misuse, Department of Health, 2006.
95. Department of Health, Home Office, Skills. DfEa, Department for Culture MaS. Safe. Sensible.Social. The next steps in the National Alcohol Strategy. London: HM Government, 2007.
96. Room R, Babor T, Rehm J. Alcohol and Public Health. The Lancet. 2005;365:519-30.
97. HM Treasury. Review of alcohol taxation and pricing London: HM Treasury; 2010 [cited 2010 31st August]. Available from: http://www.hm-treasury.gov.uk/alcohol_taxation.htm.
98. Govermment H. Policing Reform and Social Responsibility Act. London: The Stationery Office, 2011.
99. Goverment H. The Government's Alcohol Strategy. London: HM Government, 2012.
100. Ward S. The Government's Alcohol Strategy: A view from both ends of the world. Drugs: Education, Prevention & Policy. 2012;19(5):368-9.

315
101. Nicholls J. The Government Alcohol Strategy 2012: Alcohol policy at a turning point? Drugs: Education, Prevention & Policy. 2012;19(5):355-9.
102. Anderson P. The UK government's alcohol strategy. Drugs: Education, Prevention & Policy. 2012;19(5):360-1.
103. McCambridge J. A user's guide to the 2012 Alcohol Strategy for England and Wales: A commentary on the commentaries. Drugs: Education, Prevention & Policy. 2012;19(5):377-8.
104. Scally G. Crunch time for the government on alcohol pricing in England. British Medical Journal. 2013;346:1-2.
105. NAO. Reducing Alcohol Harm: health services in England for alcohol misuse. London: National Audit Office, 2008.
106. Department of Health. Change4Life launches its first alcohol campaign London: Department of Health; 2012 [cited 2013 25th October]. Available from: https://www.gov.uk/government/news/change4life-launches-its-first-alcohol-campaign.
107. I&DeA. Valuing Health: developing a business case for health improvement. London: Improvement and Development Agency, 2009.
108. Foxcroft D, al. e. Longer-term primary preventation for alcohol misuse in young people: a systematic review. Addiction. 2003;93:397-411.
109. Foxcroft D, Tsertsvadze A. Universal school-based prevention programs for alcohol misuse in young people. Cochrane Database of Systematic Reviews, 2011.
110. Foxcroft D, Tsertsvadze A. Universal multicomponent prevention programs for alcohol misuse in young people. Cochrane Database of Systematic Reviews, 2011.
111. Babor T, al. e. Alcohol: no ordinary commodity. Research and public policy (2nd ed). Oxford: Oxford University Press; 2010.
112. Anderson P. Information and education. In: Anderson P, Moller L, Galea G, editors. Alcohol in the European Union: Consumption, harm and policy approaches. Copenhagen, Denmark: World Health Organisation Regional Office for Europe; 2012.
113. Science Group of the European Alcohol and Health Forum. Does marketing communication impact on the volume and patterns of consumption of alcoholic beverages, especially by young people? - a review of longitudinal studies. Brussels: European Commission, 2009.
114. Bruun Kea. Alcohol control policies in public health perspective. Helsinki: Finnish Foundation for Alcohol Studies, 1975.
115. Wagenaar A, Salois M, Komro K. Effects of beverage alcohol price and tax levels on drinking: a meta-analysis of 1003 estimates from 112 studies. Addiction. 2009;104:179-90.
116. Hutubessy R, Chisholm D, Edejer T-T, WHO-CHOICE. Generalised cost-effectiveness analysis for national-level priority setting in the health sector.

316
Cost effectiveness and resource allocation. Geneva: World Health Organisation, 2003.
117. Bernstein E, Topp D, Shaw E, Girard C, Pressman K, Woolcock E, et al. A Preliminary Report of Knowledge Translation: Lessons From Taking Screening and Brief Intervention Techniques From the Research Setting into Regional Systems of Care. Academic Emergency Medicine. 2009;16(11):1225-33.
118. Lock C. Screening and brief alcohol interventions: What, why, who, where and when? A review of the literature. Journal of Substance Abuse. 2004;9(2):91-101.
119. Grimes DA, Schulz KF. Uses and abuses of screening tests. The Lancet. 2002;359(9309):881-4.
120. Babor T, Higgins-Biddle J. Brief Intervenation for Hazardous and Harmful Drinking: A Manual for Use in Primary Care. World Health Organization: Department of Mental Health and Substance Dependence, 2001.
121. O'Donnell A, Kaner A. Chapter 39: Screening of High Risk Drinkers. In: Boyle B, Zatonski, Lowenfels, Brawley, Burns and Rehm,, editor. Alcohol, Science, Policy and Public Health. Oxford: Oxford University Press; 2013.
122. Koch H, Meerkerk G-J, Zaat JOM, Ham MF, Scholten RJPM, Assendelft WJJ. Accuracy of carbohydrate-deficient transferrin in the detection of excessive alcohol consumption: a systematic review. Alcohol & Alcoholism. 2004;39(2):75-85.
123. Scouller K, Conigrave KM, Macaskill P, Irwig L, Whitfield JB. Should we use carbohydrate-deficient transferrin instead of gamma-glutamyltransferase for detecting problem drinkers? A systematic review and metaanalysis. Clinical Chemistry. 2000;46(12):1894-902.
124. Wallace P. Patients with alcohol problems - simple questioning is the key to effective identification and management. British Journal of General Practice. 2001;51(464):172 - 3.
125. Kapoor A, Kraemer KL, Smith KJ, Roberts MS, Saitz R. Cost-effectiveness of screening for unhealthy alcohol use with % carbohydrate deficient transferrin: results from a literature-based decision analytic computer model. Alcohol Clin Exp Res. 2009;33(8):1440-9.
126. Hoeksema HL, de Bock GH. The value of laboratory tests for the screening and recognition of alcohol abuse in primary care patients. Journal of Family Practice. 1993;37(3):268-76.
127. Allen JP, Wilson VB. Assessing Alcohol Problems. A Guide for Clinicians and Researchers. Second Edition. Bethseda, Maryland: National Institute on Alcohol Abuse and Alcoholism; 2003.
128. Clements R. A Critical Evaluation of Several Alcohol Screening Instruments Using the CIDI-SAM as a Criterion Measure. Alcoholism: Clinical & Experimental Research. 1998;22(5):985-93.
129. Reinert DF, Allen JP. The Alcohol Use Disorders Identification Test: An Update of Research Findings. Alcoholism: Clinical & Experimental Research. 2007;31(2):185-99.

317
130. Dhalla S, Kopec JA. The CAGE questionnaire for alcohol misuse: a review of reliability and validity studies. Clinical & Investigative Medicine - Medecine Clinique et Experimentale. 2007;30(1):33-41.
131. Berner MM, Kriston L, Bentele M, Harter M. The alcohol use disorders identification test for detecting at-risk drinking: a systematic review and meta-analysis. Journal of Studies on Alcohol & Drugs. 2007;68(3):461-73.
132. Cook RL, Chung T, Kelly TM, Clark DB. Alcohol Screening in Young Persons Attending a Sexually Transmitted Disease Clinic. Comparison of AUDIT, CRAFFT and CAGE Instruments. Journal of General Internal Medicine. 2005;20:1-6.
133. Sindelar-Manning H, Lewander W, Chun T, Barnett N, Spirito A. Emergency Department Detection of Adolescents With a History of Alcohol Abuse and Alcohol Problems. Pediatric Emergency Care. 2008;24(1):457-61.
134. O'Connell H, Chin A-V, Hamilton F, Cunningham C, Walsh JB, Coakley D, et al. A systematic review of the utility of self-report alcohol screening instruments in the elderly. International Journal of Geriatric Psychiatry. 2004;19(11):1074-86.
135. Aertgeerts B, Buntinx F, Kester A. The value of the CAGE in screening for alcohol abuse and alcohol dependence in general clinical populations: a diagnostic meta-analysis. Journal of Clinical Epidemiology. 2004;57(1):30-9.
136. Burns E, Gray R, Smith LA. Brief screening questionnaires to identify problem drinking during pregnancy: a systematic review. Addiction. 2010;105(4):601-14.
137. Bradley KA, Boyd-Wickizer J, Powell SA, Burman ML. Alcohol Screening Questionnaires in Women: A Critical Review. Journal of the American Medical Association. 1998;280(2.):166-71.
138. Fiellin DA, Reid MC, O'Connor PG. Screening for alcohol problems in primary care: a systematic review. Archives of Internal Medicine. 2000;160(13):1977-89.
139. Hutchings D, Cassidy P, Dallolio E, Pearson P, Heather N, Kaner E. Implementing screening and brief alcohol interventions in primary care: views from both sides of the consultation. Primary Care Research and Development. 2006;7:221-9.
140. Reinholdz H, Fornazar R, Bendtsen P, Spak F. Comparison of systematic versus targeted screening for detection of risky drinking in primary care. Alcohol and alcoholism (Oxford, Oxfordshire). 2013;48(2):172-9.
141. Purshouse R, Brennan A, Rafia R, Latimer N, Archer R, Angus C, et al. Modelling the Cost-Effectiveness of Alcohol Screening and Brief Interventions in Primary Care in England. Alcohol and Alcoholism. 2013;48(2):180-8.
142. Tariq L, van den Berg M, Hoogenveen RT, van Baal PH. Cost-effectiveness of an opportunistic screening programme and brief intervention for excessive alcohol use in primary care. PloS one. 2009;4(5):5696.
143. Saunders JB, Aasland OG, Babor TF, de la Fuente JR, Grant M. Development of the Alcohol Use Disorders Identification Test (AUDIT): WHO Collaborative Project on Early Detection of Persons with Harmful Alcohol Consumption II. Addiction. 1993;88:791-804.

318
144. McCusker MT, Basquille J, Khwaja M, Murray‐Lyon IM, Catalan J. Hazardous and harmful drinking: a comparison of the AUDIT and CAGE screening questionnaires. QJM. 2002;95(9):591-5.
145. Saunders JB, Aasland OG, Babor TF, De La Fuente JR, Grant M. Development of the Alcohol Use Disorders Identification Test (AUDIT): WHO Collaborative Project on Early Detection of Persons with Harmful Alcohol Consumption II. Addiction. 1993;88(6):791-804.
146. Bush K, Kivlahan DR, McDonell MB, Fihn SD, Bradley KA, for the Ambulatory Care Quality Improvement P. The audit alcohol consumption questions (audit-c): An effective brief screening test for problem drinking. Archives of Internal Medicine. 1998;158(16):1789-95.
147. Aertgeerts B, Buntinx F, Ansoms S, Fevery J. Questionnaires are better than laboratory tests to screen for current alcohol abuse or dependence in a male inpatient population. Acta Clinica Belgica. 2002;57:241-9.
148. Hodgson RJ, Alwyn T, John B, Thom B, Smith A. The FAST Alcohol Screening Test. Alcohol & Alcoholism. 2002;37:61-6.
149. Canagasaby A, Vinson DC. Screening for hazardous or harmful drinking using one or two quantity-frequency questions. Alcohol and Alcoholism. 2005;40(3):208-13.
150. Kriston L, Holzel L, Weiser A-K, Berner MM, Harter M. Meta-analysis: are 3 questions enough to detect unhealthy alcohol use? Annals of Internal Medicine. 2008;149(12):879-88.
151. Russell M, Wilson C, Taylor C, Baker C. Effect of general practitioners' advice against smoking. British Medical Journal. 1979;283:231-4.
152. Winett RA. A framework for health promotion and disease prevention programs. American Psychologist. 1995;50(5):341-50.
153. Kaner EFS, Newbury-Birch D, Heather N. Brief Intervention. In: Miller PM, editor. Evidence-Based Addiction Treatment. Burlington: Academic Press; 2009. p. 189-213.
154. Bandura A. Social foundations of thought and action: A social cognitive theory. Englewood Cliffs, New Jersey: Prentice Hall; 1986.
155. National Institute for Health and Clinical Excellence. Alcohol-use disorders - preventing the development of hazardous and harmful drinking. http://guidanceniceorguk/PH24. 2010.
156. Miller W, Sanchez V. Motivating young adults for treatment and lifestyle change. Notre Dame, IN: University of Notre Dame Press; 1993 1993///. 55-580 p.
157. Kristenson H, Ohlin H, Hulten-Nosslin M-B, Trell E, Hood B. Identification and intervention of heavy drinking in middle-aged men: results and follow up of 24-60 months of long-term study with randomised controls. Alcohol: Clinical and Experimental Research. 1983;7:203-10.

319
158. Solberg LI, Maciosek MV, Edwards NM. Primary Care Intervention to Reduce Alcohol Misuse: Ranking Its Health Impact and Cost Effectiveness. American Journal of Preventive Medicine. 2008;34(2):143-52.
159. Kaner E, Beyer F, Dickinson H, Pienaar E, Campbell F, Schlesinger C, et al. Effectiveness of brief alcohol interventions in primary care populations. London: Cochrane Database of Systematic Reviews, 2007.
160. Jonas D, Garbutt J, Brown J, Amick H, Brownley K, Council C, et al. Screening, Behavioral Counseling, and Referral in Primary Care To Reduce Alcohol Misuse. Rockville, MD: Agency for Healthcare Research and Quality, 2012.
161. Jackson R, Johnson M, Campbell F, Messina J, Guillaume L, Meier P, et al. Screening and Brief Interventions for Prevention and Early Identification of Alcohol Use Disorders in Adults and Young People. Sheffield: University of Sheffield, School of Health and Related Research (ScHARR) Public Health Collaborating Centre, 2010.
162. Gordon L, Graves N, Hawkes A, Eakin E. A review of the cost-effectiveness of face-to-face behavioural interventions for smoking, physical activity, diet and alcohol. Chronic Illness. 2007;3:101-29.
163. Berglund M, Thelander S, Jonsson E. Treating alcohol and drug abuse: an evidence-based review. Alcoholism: Clinical & Experimental Research. 2003;27(10):1645-56.
164. Bertholet N, Daeppen J-B, Wietlisbach V, Fleming M, Burnand B. Brief alcohol intervention in primary care: systematic review and meta-analysis. Archives of Internal Medicine. 2005;165:986-95.
165. Cuijpers P, Riper H, Lemmers L. The effects on mortality of brief interventions for problem drinking: a meta-analysis. Addiction. 2004;99(7):839-45.
166. Moyer A, Finney JW, Swearingen CE, Vergun P. Brief interventions for alcohol problems: a meta-analytic review of controlled investigations in treatment-seeking and non-treatment-seeking populations. Addiction. 2002;97(3):279-92.
167. Latimer N, Guillaume L, Goyder E, Chilcott J, Payne N. Prevention and Early Identification of Alcohol Use Disorders in Adults and Young People: Screening and Brief Interventions, Cost Effectiveness Review Sheffield: University of Sheffield, School of Health and Related Research (ScHARR) Public Health Collaborating Centre, 2010.
168. Saitz R. Alcohol screening and brief intervention in primary care: Absence of evidence for efficacy in people with dependance or very heavy drinking. Drug and Alcohol Review. 2010;29:631-40.
169. Peltzer K. Brief intervention of alcohol problems in Sub-saharan Africa: A review. Journal of Psychology in Africa. 2009;19(3):415-22.
170. Whitlock EP, Polen MR, Green CA, Orleans T, Klein J. Behavioral Counseling Interventions in Primary Care to Reduce Risky/ Harmful Alcohol Use by Adults: A Summary of the Evidence for the U.S. Preventive Services Task Force. Annals of Internal Medicine. 2004;140(7):557-68.

320
171. Beich A, Thorsen T, Rollnick S. Screening in brief intervention trials targeting excessive drinkers in general practice: systematic review and meta-analysis. BMJ (Clinical research ed). 2003;327(7414):536-42.
172. Bray JW, Cowell AJ, Hinde JM. A systematic review and meta-analysis of health care utilization outcomes in alcohol screening and brief intervention trials. Med Care. 2011;49(3):287-94.
173. Gilinsky A, Swanson V, Power K. Interventions delivered during antenatal care to reduce alcohol consumption during pregnancy: A systematic review. Addiction Research and Theory. 2011;19(3):235-50.
174. Littlejohn C. Does socio-economic status influence the acceptibility of, attendance for, and outcome of, screening and brief interventions for alcohol misuse: a review. Alcohol & Alcoholism. 2006;41(5):540-5.
175. Ballesteros J, Gonzalez-Pinto A, Querejeta I, Arino J. Brief interventions for hazardous drinkers delivered in primary care are equally effective in men and women. Addiction. 2004a;99(1):103-8.
176. Ballesteros JA, Duffy JC, Querejeta I, Arino J, Gonzalez-Pinto A. Efficacy of brief interventions for hazardous drinkers in primary care: systematic review and meta-analysis. Alcoholism, Clinical & Experimental Research. 2004;28(4):608-18.
177. Kaner E, Beyer F, Dickinson H, Pienaar E, Campbell F, Schlesinger C, et al. Effectiveness of brief alcohol interventions in primary care populations. Cochrane Database of Systematic Reviews. 2007;Issue 2:CD004148.DOI:10.1002/14651858.CD4148.pub3.
178. Bray JW, Zarkin GA, Davis KL, Mitra D, Higgins-Biddle JC, Babor TF. The effect of screening and brief intervention for risky drinking on health care utilization in managed care organizations. Med Care. 2007;45(2):177-82.
179. Huibers M, Beurskens A, Bleijenberg G, van Schayck C. The effectiveness of psychosocial interventions delivered by general practitioners. Review. London: Cochrane database of systematic reviews, 2003.
180. Sullivan L, Tetrault J, Braithwaite S, Turner B, Fiellin DA. A Meta-analysis of the Efficacy of Nonphysician Brief Interventions for Unhealthy Alcohol Use: Implications for the Patient-Centered Medical Home. The American Journal on Addictions. 2011;20:343-56.
181. van Beurden I, Anderson P, Akkermans R, Grol R, Wensing M, Laurant M. Involvement of general practitioners in managing alcohol problems: a randomized controlled trial of a tailored improvement programme. Addiction. 2012;107(pp. 1601-1611).
182. Sepppanen K, Aalto M, Seppa K. Institutionalization of Brief Alcohol Intervention in Primary Health Care - The Finnish Case. Alcoholism, Clinical & Experimental Research. 2-12;36(8):1456-61.
183. Anderson P, Kaner E, Wutzke S, Funk M, Heather N, Wensing M, et al. Attitudes and managing alcohol problems in general practice: an interaction analysis based on findings from a WHO Collaborative Study. Alcohol & Alcoholism. 2004;39(4):351-6.

321
184. Nilsen P, Aalto M, Bendtsen P, Seppa K. Effectiveness of strategies to implement brief alcohol intervention in primary healthcare: A systematic review. Scandinavian Journal of Primary Health Care. 2006;24:5-15.
185. Funk M, Wutzke S, Kaner E, Anderson P, Pas L, McCormick R, et al. A multi country controlled trial of strategies to promote dissemination and implementation of brief alcohol intervention in primary health care: Findings of a WHO Collaborative Study. . Journal of Studies on Alcohol. 2005;66:379-88.
186. Hutchings D, Cassidy P, Dallolio E, Pearson P, Heather N, Kaner E. Implementing screening and brief alcohol interventions in primary care : views from both sides of the consultation. Primary Health Care Research and Development. 2006;7(3):pp. 221-9.
187. Lock C, Wilson G, Kaner E, Cassidy P, Christie M, Heather N. A survey of general practitioners' knowledge, attitudes and practices regarding the prevention and management of alcohol-related problems: an update of a World Health Organisation survey ten years on. London: Alcohol Education and Research Council, 2009.
188. Khadjesari Z, Marston L, Petersen I, Nazareth I, Walters K. Alcohol consumption screening of newly-registered patients in primary care: a cross-sectional analysis. British Journal of General Practice. 2013;63(615):706-12.
189. Boniface S, Shelton N. How is alcohol consumption affected if we account for under-reporting? A hypothetical scenario. European journal of public health. 2013.
190. Rapley T, May C, Kaner E. Still a difficult business? Negotiating alcohol-related problems in general practice consultations. Social Science and Medicine 2006(63):2418-28.
191. Moriarty H, Stubbe M, Chen L, Tester R, Macdonald L, Dowell A, et al. Challenges to alcohol and other drug discussions in the general practice consultation. Family Practice. 2012;29:213-22.
192. Thom B, Tellez C. A difficult business: detecting and managing alcohol problems in general practice. British Joural of Addiction. 1986;81:405-18.
193. Kaner E, Heather N, McAvoy B, Lock C, Gilvarry E. Intervention for Excessive Alcohol Consumption in Primary Heath Care: Attitudes and Practices of English General Practitioners. Alcohol & Alcoholism. 1999;34(4):559-66.
194. Aira M, Kauhanen J, Larivaara P, Rautio P. Factors influencing inquiry about patients' alcohol consumption by primary health care physicians: qualitative semi-structured interview study. Family Practice. 2003;20(3):270-5.
195. Tam M, Zwar N, Markham R. Australian general practitioner perceptions of the detection and screening of at-risk drinking, and the role of the AUDIT-C: a qualitative study. BMC Family Practice. 2013;13(121).
196. May C, Rapley T, Kaner E. Clinical reasoning, clinical trials and risky drinkers in everyday primary care: a qualitative study of British general practitioners. . Addiction Research and Theory. 2006;14(4):387-97.
197. Shaw S, Cartwright A, Spratley T, Harwin J. Responding to Drinking Problems. Baltimore: University Park Press; 1978.

322
198. Aalto M, Pekuri P, Seppa K. Primary health care nurses' and physicians' attitudes, knowledge and beliefs regarding brief intervention for heavy drinkers. Addiction. 2001;96:305-11.
199. Johnson M, Jackson R, Guillaume L, Meier P, Goyder E. Barriers and facilitators to implementing screening and brief intervention for alcohol misuse: a systematic review of qualitative evidence. Journal of Public Health. 2010;33(3):412-21.
200. Kersnick J, Poplas Susic T, Kolsek M, Svab I. What May Stimulate General Practitioners to Undertake Screening and Brief Intervention for Excess Alcohol Consumption in Slovenia? A Focus Group Study. Journal of International Medical Research. 2009;37(pp. 1561-1569).
201. Beich A, Gannik D, Malterud K. Screening and brief intervention for excessive alcohol use: qualitative interview study of the experiences of general practitioners. British Medical Journal. 2002;325(870).
202. Lock C, Kaner E, Lamont S, Bond S. A qualitative study of nurses' attitudes and practices regarding brief -alcohol intervention in primary health care. Journal of Advanced Nursing. 2002;39(4):333-42.
203. HoC Public Accounts Committee. Reducing Alcohol Harm: health services in England for alcohol misuse. London: The Stationery Office Ltd: House of Commons, 2009.
204. Gual A, Sabadini MdA. Implementing alcohol disorders treatment throughout the community. Current Opinion in Psychiatry. 2011;24(203-207).
205. Anderson P, Laurant M, Kaner E, Wensing M, Grol R. Engaging General Pracitioners in the Management of Hazardous and Harmful Alcohol Consumption: Results of a Meta-Analysis. Journal of Studies on Alcohol. 2004;65 191-9.
206. Kaner E. Brief alcohol intervention: Time for translational research. Addiction. 2010;105:960-1.
207. Amaral M, Ronzani T, Souza-Formigoni. Process evaluation of the implementation of a screening and brief intervention program for alcohol risk in primary health care: An experience in Brazil. Drug and Alcohol Review. 2010;29:162-8.
208. Nygaard P, Aasland O. Barriers to Implementing Screening and Brief Interventions in General Practice: Findings from a Qualitative Study in Norway. Alcohol and Alcoholism. 2011;46(1):52-60.
209. Carlfyord S, Lindberg M, Bendsten P, Nilsen P, Andersson A. Key factors influencing adoption of an innovation in primary health care: a qualitative study based on implementation theory. BMC Family Practice. 2010;11(60):1-11.
210. Linton JD. Implementation research: state of the art and future directions. Technovation. 2002;22(2):65‐79.
211. May C, Finch T. Implementation, embedding, and integration: an outline of Normalization Process Theory. Sociology. 2009;43(3):535 - 54.
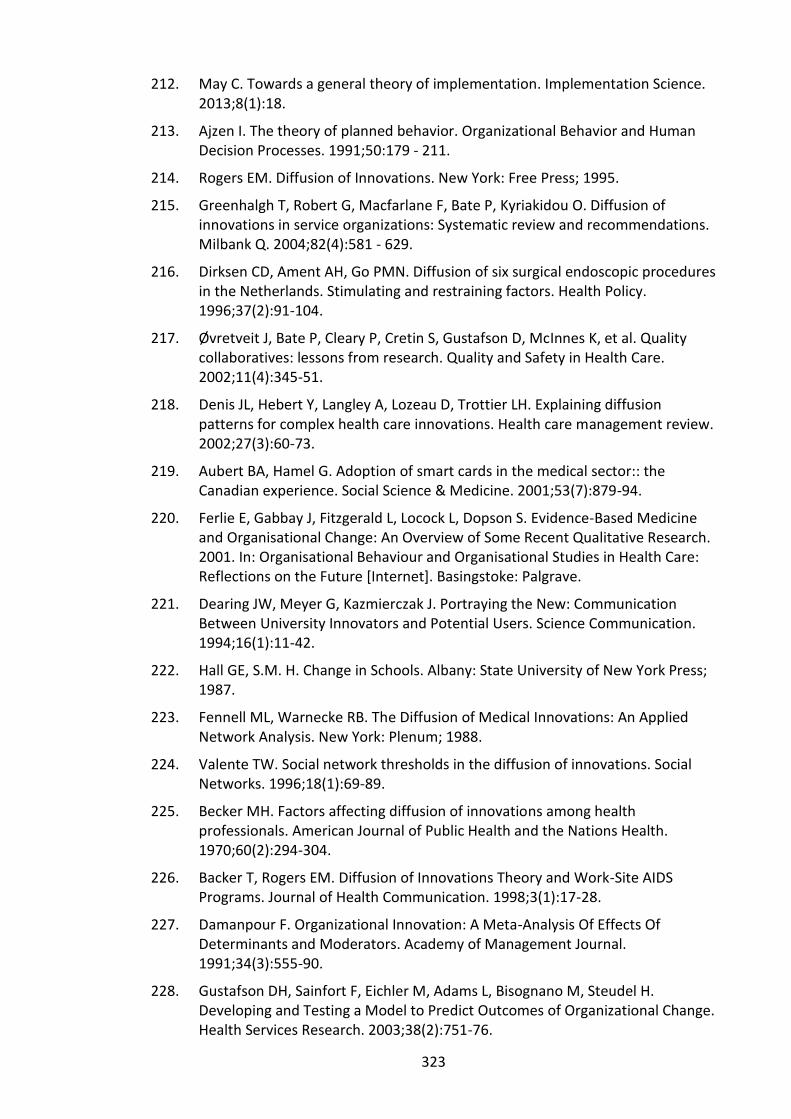
323
212. May C. Towards a general theory of implementation. Implementation Science. 2013;8(1):18.
213. Ajzen I. The theory of planned behavior. Organizational Behavior and Human Decision Processes. 1991;50:179 ‐ 211.
214. Rogers EM. Diffusion of Innovations. New York: Free Press; 1995.
215. Greenhalgh T, Robert G, Macfarlane F, Bate P, Kyriakidou O. Diffusion of innovations in service organizations: Systematic review and recommendations. Milbank Q. 2004;82(4):581 - 629.
216. Dirksen CD, Ament AH, Go PMN. Diffusion of six surgical endoscopic procedures in the Netherlands. Stimulating and restraining factors. Health Policy. 1996;37(2):91-104.
217. Øvretveit J, Bate P, Cleary P, Cretin S, Gustafson D, McInnes K, et al. Quality collaboratives: lessons from research. Quality and Safety in Health Care. 2002;11(4):345-51.
218. Denis JL, Hebert Y, Langley A, Lozeau D, Trottier LH. Explaining diffusion patterns for complex health care innovations. Health care management review. 2002;27(3):60-73.
219. Aubert BA, Hamel G. Adoption of smart cards in the medical sector:: the Canadian experience. Social Science & Medicine. 2001;53(7):879-94.
220. Ferlie E, Gabbay J, Fitzgerald L, Locock L, Dopson S. Evidence-Based Medicine and Organisational Change: An Overview of Some Recent Qualitative Research. 2001. In: Organisational Behaviour and Organisational Studies in Health Care: Reflections on the Future [Internet]. Basingstoke: Palgrave.
221. Dearing JW, Meyer G, Kazmierczak J. Portraying the New: Communication Between University Innovators and Potential Users. Science Communication. 1994;16(1):11-42.
222. Hall GE, S.M. H. Change in Schools. Albany: State University of New York Press; 1987.
223. Fennell ML, Warnecke RB. The Diffusion of Medical Innovations: An Applied Network Analysis. New York: Plenum; 1988.
224. Valente TW. Social network thresholds in the diffusion of innovations. Social Networks. 1996;18(1):69-89.
225. Becker MH. Factors affecting diffusion of innovations among health professionals. American Journal of Public Health and the Nations Health. 1970;60(2):294-304.
226. Backer T, Rogers EM. Diffusion of Innovations Theory and Work-Site AIDS Programs. Journal of Health Communication. 1998;3(1):17-28.
227. Damanpour F. Organizational Innovation: A Meta-Analysis Of Effects Of Determinants and Moderators. Academy of Management Journal. 1991;34(3):555-90.
228. Gustafson DH, Sainfort F, Eichler M, Adams L, Bisognano M, Steudel H. Developing and Testing a Model to Predict Outcomes of Organizational Change. Health Services Research. 2003;38(2):751-76.

324
229. Exworthy M, Berney L, Powell M. 'How great expectations in Westminster may be dashed locally': the local implementation of national policy on health inequalities. Policy & Politics. 2002;30(1):79-96.
230. Fitzgerald L, Ferlie E, Wood M, Hawkins C. Interlocking Interactions, the Diffusion of Innovations in Health Care. Human Relations. 2002;55(12):1429-49.
231. NICE. Alcohol-use disorders: preventing the development of hazardous and harmful drinking: NICE public health guidance 24. London: National Institute for Health and Clinical Excellence, 2010 June 2010. Report No.
232. Home Office. The Government's Alcohol Strategy. London: HM Government, 2012.
233. NEPHO. Specialist Alcohol Treatment in the North East. Stockon-on-Tees: North East Public Health Observatory, 2009.
234. National Health Service. Better Health, Fairer Health: A Strategy for 21st Century Health and Well-being in the North East of England. Newcastle upon Tyne: DoH & NHS Public Health North East, 2008.
235. BALANCE. About Balance Darlington: BALANCE; 2008 [cited 2010 29th July]. Available from: www.balancenortheast.co.uk.
236. Benabou R, Tirole J. Intrinsic and extrinsic motivation. Review of Economic Studies. 2003;70:489-520.
237. NHS South of Tyne and Wear. Local Enhanced Service for Alcohol: Service Level Agreement. Gateshead: NHS South of Tyne and Wear, 2010.
238. NHS Employers. Clinical Directed Enhanced Service (DES) Guidance for GMS contract 2008/9. London NHS Employers and British Medical Association (BMA), 2008.
239. National Health Service. 2013/14 general medical services (GMS) contract: Guidance and audit requirements for new and amended services London: NHS England & NHS Employers,, 2013.
240. Government HM. Health and Social Care Act. London: The Stationary Office; 2012.
241. England N. Cumbria, Northumberland, Tyne and Wear area team London: NHS England; 2013 [cited 2013 28th October]. Available from: http://www.england.nhs.uk/north/north/cntw-at/.
242. NHS England. Primary medical care functions delegated to clinical commissioning groups: Guidance. London: NHS, 2013.
243. British Medical Association, NHS Employers. 2013/14 Enhanced services: Frequently asked questions (FAQs). London: NHS Employers, 2013.
244. Millett C, Majeed A, Huckvale C, Car J. Going local: devolving national pay for performance programmes. BMJ. 2011;342.
245. Hamilton FL, Laverty AA, Gluvajic D, Huckvale K, Car J, Majeed A, et al. Effect of financial incentives on delivery of alcohol screening and brief intervention (ASBI) in primary care: longitudinal study. Journal of Public Health. 2013.

325
246. Observatories AoPH. Indications of Public Health in the English Regions. York: Association of Public Health Observatories, 2007.
247. Stevens A, Raftery J, Roderic P. Can health technologies be assessed using routine data? International Journal of Technology Assessment in Health Care. 2005;21(1):96-103.
248. McKee M. Routine data: a resource for clinical audit? Quality in Health Care. 1993;2:104-11.
249. Williams J, Cheung W, Cohen D, Hutchings H, Longo M. Can randomised trials rely on existing electronic data? A feasibility study to explore the value of routine data in health technology assessment. Health Technology Assessment. 2003;7.
250. Department of Health. Hospital Episode Statistics [cited 2011 11th July]. Available from: www.hesonline.nhs.uk.
251. National Health Service. Better Care, Better Value Indicators [cited 2012 11th July]. Available from: www.productivity.nhs.uk.
252. National Health Service. Secondary Uses Service [cited 2012 11th July]. Available from: www.connectingforhealth.nhs.uk/systemsandservices/sus). .
253. Donaldson M, Yordy K, Vanselow N. Defining primary care: An interim report. Washington DC: Institute of Medicine, 1994.
254. Gnani S, Majeed A. A user's guide to data collected in primary care in England. London: Eastern Region Public Health Observatory on behalf of the Association of Public Health Observatories, 2006.
255. Gregory S. General practice in England: An overview. London: The King's Fund,, 2009.
256. Department of Health, Royal College of General Practitioners, British Medical Association. The Good Practice Guidelines for GP electronic patient records v4. London: Department of Health, 2011.
257. Department of Health. Quality and Outcomes Framework London [cited 2012 13th July]. Available from: www.qof.ic.nhs.uk/index.asp.
258. Pemberton J, Buehring A, Stonehouse G, Simpson L, Purves I. Issues and trends in computerisation within UK primary health care. Logistics Information Management. 2003;16(3/4):181 - 90.
259. Majeed A, Car J, Sheikh A. Accuracy and completeness of electronic patient records in primary care. Family Practice. 2008;25(4):213-4.
260. Boyle S. The UK Health Care System. New York: The Commonwealth Fund,, 2008.
261. McDonald R, Roland M. Pay for performance in primary care in England and California: comparison of unintended consequences. Annals of Family Medicine. 2009;7(2):121-7.
262. Williams T, van Staa T, Puri S, Eaton S. Recent advances in the utility and use of the General Practice Research Database as an example of a UK Primary Care Data resource. Therapeutic Advances in Drug Safety. 2012;3(2):89-99.

326
263. de Lusignan S, van Weel C. The use of routinely collected computer data for research in primary care: opportunities and challenges. Family Practice. 2006;23(2):253-63.
264. Chisholm J. The Read clinical classification. British Medical Journal. 1990;300(6732):1092.
265. Robinson D, Schulz E, Brown P, Price C. Updating the Read Codes: User-interactive Maintenance of a Dynamic Clinical Vocabulary. Journal of the American Medical Informatics Association. 1997;4(6):465-72.
266. UK Terminology Centre. Why migrate to SNOMED CT? . London: NHS, 2011.
267. UK Terminology Centre. Read Codes Clinical Terms Version 3: Introduction and Overview. London: NHS, 2008.
268. Health & Social Care Information Centre. Hospital Episode Statistics 2013 [cited 2013 27th October]. Available from: http://www.hscic.gov.uk/hes.
269. Jones L, Bellis MA, Dedman D, Sumnall H, Tocque K. Alcohol-attributable fractions for England. Liverpool: Centre for Public Health, Liverpool John Moores University on behalf of Department of Health, 2008.
270. D'Onofrio G, Degutis L. Preventive care in the emergency department: Screening and brief intervention for alcohol problems in the emergency department: a systematic review. Academic Emergency Medicine. 2002;9(6):627-38.
271. Gentilello L, Rivara F, Donovan D, Jurkovich G, Daranciang E, Dunn C, et al. Alcohol interventions in a trauma center as a means of reducing the risk of injury recurrence. Annals of Surgery. 1999;230(4):473-80.
272. Health Do. Improving outcomes and supporting transparency. Part 1: A public health outcomes framework for England, 2013-2016. London: Department of Health,, 2012.
273. Department of Health. Alcohol Care Pathways. London: Department of Health, 2009.
274. Hrisos S, Eccles M, Francis J, Dickinson H, Kaner E, Beyer F, et al. Are there valid proxy measures of clinical behaviour? A systematic review. Implementation Science. 2009;4(No. 37).
275. Powell A, Davies H, Thomson R. Using routine comparative data to assess the quality of health care: understanding and avoiding common pitfalls. Quality and Safety in Health Care. 2003;12:122-8.
276. Audit Commission. Improving data quality in the NHS: Annual report on the PbR assurance programme. In: Audit Commission, editor. London2010.
277. British Medical Association, NHS Employers. Quality and Outcomes Framework guidance for GMS contract 2009/10. In: NHS, editor. London: The NHS Confederation (Employers); 2009.
278. Roethlisberger F, Dickson W. Management and the Worker. Cambridge, Mass.: Harvard University Press; 1939.

327
279. Shachak A, Hadas-Dayagi M, Ziv A, Reis S. Primary care physicians' use of an electronic medical record system: a cognitive task analysis. Journal of General Internal Medicine. 2009;24(3):341-8.
280. Chaudhry B, Wang J, Wu S, Maglione M, Mojica W, Roth E, et al. Systematic review: impact of health information technology on quality, efficiency, and costs of medical care. Annals of Internal Medicine. 2006;144(10):742-57.
281. Hayrinen K, Saranto K, Nykanen P. Definition, structure, content, use and impacts of electronic health records. A review of the research literature. International Journal of Medical Informatics. 2008;77:291-304.
282. Hippisley-Cox J, Pringle M, Cater R, Wynn A, Hammersley V, Coupland C, et al. The electronic patient record in primary care--regression or progression? A cross sectional study.[Erratum appears in BMJ. 2003 Aug 30;327(7413):483]. BMJ. 2003;326(7404):1439-43.
283. Terry AL, Chevendra V, Thind A, Stewart M, Marshall JN, Cejic S. Using your electronic medical record for research: a primer for avoiding pitfalls. Family Practice. 2010;25:121-6.
284. Gray J, Orr D, Majeed A. Use of Read codes in diabetes management in a south London primary care group: implications for establishing disease registers. British Medical Journal. 2003;326:1-4.
285. Weiskopf NG, Weng C. Methods and dimensions of electronic health record data quality assessment: enabling reuse for clinical research. Journal of the American Medical Informatics Association. 2013;20(1):144-51.
286. van der Lei J. Use and abuse of computer-stored medical records. Methods of Information in Medicine. 1991;30:79-80.
287. W. H, Wagner M. Accuracy of data in computer-based patient records. Journal of the American Medical Informatics Association. 1997;4:342-55.
288. Strange K, Zyzanski S, Fedirko Smith T, al. e. How valid are medical records and patient questionnaires for physician profiling and health services research? A comparison with direct observation of patient visits. Med Care. 1998;Vol. 38(pp. 851-867).
289. Kane R, Wellings K, Free C, Goodrich J. Uses of routine data sets in the evaluation of health promotion interventions: opportunities and limitations. Health Education. 2000;100(1):33-41
290. NWPHO. Local Alcohol Profiles for England 2012: User Guide. Liverpool: North West Public Health Observatory, 2012.
291. Hassey A, Gerrett D, Wilson A. Information in practice: A survey of validity and utility of electronic patient records in a general practice. BMJ. 2001;322(June):1401-5.
292. Waize Tai T, Anandarajah S, Dhoul N, De Lusignan S. Variation in clinical coding lists in UK general practice: a barrier to consistent data entry? Informatics in Primary Care. 2007;15:143-50.
293. Crosson J, Ohman-Strickland P, Campbell S, Phillips R, Roland M, Kontopantlis E, et al. A comparison of chronic illness care quality in US and UK family medicine

328
practices prior to pay-for-performance performance initiatives. Family Practice. 2009(pp.510-516).
294. Pechey L. Improving the Delivery of the Alcohol Direct Enhanced Service: A Step-By-Step Guide for Commissioners, Primary Care Practitioners and Practice Managers. London: Haringey Drug and Alcohol Action Team, Public Health Directorate and Department of Health, 2011.
295. Prytherch D, Briggs J, Weaver P, Schmidt P, Smith G. Measuring clinical performance using routinely collected clinical data. Medical Informatics and the Internet in Medicine. 2005;30(2):151-6.
296. Lilford R, Mohammed M, Spiegelhalter D, Thomson R. Use and misuse of process and outcome data in managing performance of acute medical care: avoiding institutional stigma. The Lancet. 2004;363:1147–54.
297. Powell P. On the unintended consequences of publishing performance data in the public sector. International Journal of Public Administration. 1995;18:277-310.
298. Hutchings D, Cassidy P, Dallolio E, Pearson P, Heather N, Kaner E. Implementing screening and brief interventions in primary care: views from both sides of the consultation. Primary Health Care Research & Development. 2006;7:221-9.
299. Foster V, Young A. The use of routinely collected patient data for research: A critical review. Health:. 2012;16(4):448-63.
300. Cayton H, Denegri S. Is what's mine my own? Journal of Health Service Research and Policy. 2003;8(1):33-5.
301. Coulton S, Drummond C, Deluca P, Kaner E, Newbury-Birch D, Perryman K, et al. The utility of different screening methods to detect hazardous drinking and alcohol use disorders in the Screening and Intervention Programme for Sensible drinking (SIPS) programme. Addiction Science and Clinical Practice. 2012;7(suppl 1):83.
302. O’Donnell A, Anderson P, Newbury-Birch D, Schulte B, Schmidt C, Reimer J, et al. The impact of brief alcohol interventions in primary healthcare: A systematic review of reviews Alcohol and Alcoholism. 2014;49(1):66-78.
303. Finch T, May C, Mair F, Mort M, Gask L. Integrating service development with evaluation in telehealthcare: an ethnographic study. British Medical Journal. 2003;327(7425):1205‐9.
304. Finch T, Mair F, O'Donnell C, Murray E, May C. From theory to 'measurement' in complex interventions: Methodological lessons from the development of an e-health normalisation instrument. BMC Med Res Methodol. 2012;12:69.
305. Boonstra A, Broekhuis M. Barriers to the acceptance of electronic medical records by physicians from systematic review to taxonomy and interventions. BMC Health Services Research. 2010;10(231).
306. Bevan G, Hood C. WHAT’S MEASURED IS WHAT MATTERS: TARGETS AND GAMING IN THE ENGLISH PUBLIC HEALTH CARE SYSTEM. Public Administration. 2006;84(3):517-38.

329
307. Rivett G. National Health Service History London2010 [cited 2010 21st June]. Available from: www.nhshistory.net.
308. Rechel B, Grundy E, Robine J-M, Cylus J, Mackenbach JP, Knai C, et al. Ageing in the European Union. The Lancet.381(9874):1312-22.
309. Lehnert T, Heider D, Leicht H, Heinrich S, Corrieri S, Luppa M, et al. Review: Health Care Utilization and Costs of Elderly Persons With Multiple Chronic Conditions. Medical Care Research and Review. 2011;68(4):387-420.
310. Appleby C. Rises in healthcare spending: where will it end? BMJ. 2012;345.
311. Alldritt C, Masters J, Gerritsen S, Kippin H. A Brief History of Public Service Reform. London: 2020 Public Services Trust, 2009.
312. Pollitt C, Bouckaert G. Public management reform - a comparative analysis. New York: Oxford University Press; 1999.
313. Anderson HV, Lawrie G. Examining Opportunties for Improving Public Sector Governance through better Strategic Management. Maidenhead: 2GC Active Management, 2002.
314. Tolofari S. New Public Management and Education. Policy Futures in Education. 2005;3(1).
315. Farnham D, Horton S. Managing the new public services. Basingstoke: Macmillan; 1993.
316. Burns D, Hambleton R, Hoggett P. The Politics of Decentralisation, Revitalising Local Democracy. 1994.
317. Lapsley I. New Public Management: The Cruellist Invention of the Human Spirit? ABACUS: A Journal of Accounting, Finance and Business Studies. 2009;45(1):1-21.
318. Hood C. Contemporary management. Public Policy and Administration. 1995;10(2):104-17.
319. Hood C. A Public Management for All Seasons? Public Administration. 1991;69(Spring):3-19.
320. Boden R, Cox D, Nedeva M. The Appliance of Science? New Public Management and Strategic Change. Technology Analysis & Strategic Management. 2006;18(2):125-41.
321. Richards S. Devolving Public Management, Centralising Public Policy. Oxford Review of Economic Policy. 1994;10(3).
322. Boyne GA. Public and Private Management: what's the difference? Journal of Management Studies. 2002;39(1):97-122.
323. Hughes OE. Public Management & Administration (3rd ed.). Basingstoke: Palgrave Macmillan; 2003.
324. Ministry of Health. First report of the joint working party on the organisation of medical work in hospitals. London: HMSO, 1967.
325. Thatcher M. The Downing Street Years. London: Harper Collins; 1993.
326. Klein R. The New Politics of the NHS (third edition). London: Longman; 1995.

330
327. BRI Inquiry Secretariat. Reforming the NHS: policy changes and their impact on professional and managerial organisation and cultyre 1984-1995: Background Paper. Bristol: Bristol Royal Infirmary, 2000.
328. Griffiths R. NHS Management Inquiry. Report to the Secretary of State for Social Services. London: Department for Health and Social Security, 1983.
329. Secretary of State for Health. Working for Patients. London: HMSO; 1989.
330. Exworthy M, Powell M, Mohan J. The NHS: quasi-market, quasi-hierarchy or quasi-network? Public Money and Management. 1999;19(4):15-22.
331. Ferlie E. The Creation and Evolustion of Quasi Markets in the Public Sector: early evidence from the National Health Service. Policy and Politics. 1994;22(2):105-12.
332. Lewis R, Smith J, Harrison A. From quasi-market to market in the National Health Service in England: what does this mean for the purchasing of health services? Journal of Health Service Research and Policy. 2009;14(1):44-51.
333. Le Grand J, Mays M, Mulligan JA. Learning from the NHS Internal Market. A review of the evidence. London: The Kings Fund, 1998.
334. Le Grand J. Competition, Cooperation, Or Control? Tales from the British National Health Service. Health Affairs. 1999(May / June):27- 39.
335. Secretary of State for Health. The NHS: A Service with Ambitions. London: HMSO; 1996.
336. Secretary of State for Health. The Health of the Nation: A Strategy for Health in England. London: HMSO; 1992.
337. Klein R. Why Britain is Reorganising its National Health Service - Yet Again. Health Affairs. 1998(July / August):111-25.
338. Secretary of State for Health. The Patient's Charter. London: Department of Health, 1991.
339. Secretary of State for Health. The New NHS: Modern, Dependable. London: HMSO; 1997.
340. Greener I. The Three Moments of New Labour's Health Policy Discourse. Policy and Politics. 2004;32(3):303-16.
341. Powell M. New Labour and the "new" UK NHS. Critical Public Health. 1998;8(2):167-73.
342. Blair T. The Third Way: new politics for the new century. London: Fabian Society, 1998.
343. Alford J. The implications of 'publicness' for strategic management theory. In: Johnson G, Scholes K, editors. Exploring Public Sector Strategy. London: Prentice Hall; 2001.
344. Worrall L, Mather K, Seifert R. Solving the Labour Problem Among Professional Workers in the UK Public Sector: Organisation Change and Performance Management. Public Organisation Review [Internet]. 2009; (accessed online 22nd November 2009:

331
http://www.springerlink.com/content/573qxu5154vu44g2/fulltext.pdf?page=1.
345. Department of Health. The New NHS - Modern, Dependable. London: Department of Health, 1997.
346. Smith J, Mays N, Dixon J, Goodwin N, Lewis R, McClelland S, et al. A review of the effectiveness of primary care-led commissioning and its place in the NHS. London: The Health Foundation, 2004.
347. Department of Health. Shifting the Balance of Power. London: Department of Health, 2001.
348. Thorlby R, Maybin J. A high-performing NHS?: A review of progress 1997-2010. London: The King's Fund, 2010.
349. Department of Health. Health reform in England - update and next steps. London: Department of Health, 2005.
350. Lewis R, Dixon J. The Future of Primary Care: Meeting the challenges of the new NHS market. London: King's Fund, 2005.
351. NHS Employers. Investing in General Practice. London: NHS Employers / General Medical Services, 2003.
352. Doran T, Fullwood C, Gravelle H, Reeves D, Kontopantlis E, Hiroeh U, et al. Pay-for-Performance Programs in Family Practices in the United Kingdom. The New England Journal of Medicine. 2006;355(4):375-84.
353. Department of Health. Sustaining Innovation Through New Personal Medical Services (PMS) Arrangements. London: Department of Health, 2003.
354. Greener I, Mills N, Powell M, Doheny S. How did consumerism get into the NHS? An empirical examination of choice and responsiveness in NHS policy documents London: Birkbeck College, 2006 Contract No.: Working Paper No: 29
355. H.M. Treasury. Modern Public Services for Britain: Investing in Reform. London: HMSO, 1998.
356. NICE. NICE, A Guide to Our Work. London: National Institute for Health and Clinical Excellence 1999.
357. Syrett K. Nice Work? Rationing, Review and the ‘Legitimacy Problem’ in the New NHS. Medical Law Review. 2002;10(1):1-27.
358. Cabinet Office. Excellence and fairness: Achieving world class public services. London: Cabinet Office, 2008.
359. Department of Health. NHS Constitution: The NHS belongs to us. London: Department of Health, 2009.
360. Doran T, Fullwood C, Kontopantlis E, Reeves D. Effect of financial incentives on inequalities in the delivery of primary clinical care in England: analysis of clinical activity indicators for the quality and outcomes framework. The Lancet. 2008;372:728-36.
361. Secretary of State for Health. Delivering the NHS Plan: Next Steps on Investment and Reform. London: HMSO; 2002.

332
362. Department of Health. Patient choice becomes a reality across the NHS. London: Department of Health; 2006.
363. Department of Health. Choosing Health: Making healthy choices easier. London: Department of Health; 2004.
364. Department of Health. Building on the Best: Choice, Responsiveness and Equity in the NHS. London: Department of Health; 2003.
365. Secretary of State for Health. The NHS Plan: A Plan for Investment, A Plan for Reform. London: HMSO; 2000.
366. Department of Health, Department for Local Communities and Government, Department for Education and Skills. The Case for User Choice in Public Services. London: Public Administration Select Committee into Choice, Voice and Public Services, 2005.
367. Cabinet Office. The Coalition: our programme for government. London: HM Government, 2010.
368. Browne J, Levell P. The distributional effect of tax and benefit reforms to be introduced between June 2010 and April 2014: a revised assessment. London: Institute for Fiscal Studies, 2010.
369. Elliott L, Wintour P. Budget 2010: Pain now, more pain later in austerity plan London: Guardian Newspapers; 2010 [cited 2010 22nd June]. Available from: http://www.guardian.co.uk/uk/2010/jun/22/budget-2010-vat-austerity-plan.
370. Department of Health. Quality, Innovation, Productivity and Prevention London: Department of Health; 2011 [cited 2013 15th November]. Available from: http://www.improvement.nhs.uk/Default.aspx?alias=www.improvement.nhs.uk/qipp.
371. Gregory S, Dixon A, Ham C. Health policy under the coalition government: A mid-term assessment. London: The King's Fund, 2012.
372. Department of Health. Equality and excellence: Liberating the NHS. London: Department of Health - The Stationery Office Ltd, 2010.
373. Naylor C, Curry N, Holder H, Ross S, Marshall L, Tait E. Clinical commissioning groups: Supporting improvement in general practice? London: The King's Fund and the Nuffield Trust; 2013.
374. HM Treasury. The Spending Review framework. London: The Stationery Office, 2010.
375. Department of Health. Liberating the NHS: Transparency in outcomes - a framework for the NHS. A consultation on proposals. London: Department of Health, 2010.
376. Department of Health. Improving outcomes and supporting transparency. Part 1A: A public health outcomes framework for England, 2013-2016. London: Department of Health, 2013.
377. Department of Health. The Adult Social Care Outcomes Framework 2013/14. London: Department of Health, 2012.

333
378. Department of Health. The Mandate: A mandate from the government to the NHS Commissioning Board: April 2013 to march 2015. London: Department of Health, 2012.
379. Ham C. London: The King's Fund. 2013. [cited 2013].
380. Department of Health. Consulation of Strengthening the NHS Constitution. London: Department of Health, 2012.
381. Bovaird T, Halachmi. Learning from international approaches to Best Value. Policy and Politics. 2001;29(4):451-63.
382. Powell A, Rushmer R, Davies H. A systematic narrative of quality improvement models in health care. Edinburgh: Social Dimensions of Health Institute at The Universities of Dundee and St Andrews / NHS Quality Improvement Scotland, 2009.
383. Hodgson L, Farrell C, Connolly M. Improving UK Public Services: A Review of the Evidence. Public Administration. 2007;85(2):355-82.
384. Holloway J, Francis G, Hinton M. A vehicle for change?: A case study of performance improvement in the “new” public sector. International Journal of Public Sector Management. 1999;12(4):351 - 65.
385. Longbottom D. Benchmarking in the UK: an empirical study of practitioners and academics. Benchmarking: An International Journal. 2000;7(2):98 - 117.
386. Bichard M. Why isn't public service reform delivering? London: Solace Foundation, 2005.
387. Evans M. Gordon Brown and public management reform - a project in search of a 'big idea'? Policy Studies. 2009;Vol. 30(No. 1):33-51.
388. Campbell S, Reeves D, Kontopantlis E, Sibbald B, Roland M. Effects of pay for performance on the quality of primary care in England. New England Journal of Medicine. 2009;361:368-78.
389. Van Herck P, De Smedt D, Annemans L, Remmen R, Rosenthal M, Sermeus W. Systematic review: Effects, design choices, and context of pay-for-performance in health care. BMC Health Services Research. 2010;10(247):1-13.
390. Roland M, Campbell S, Bailey N, Whalley D, Sibbald B. Financial incentives to improve the quality of primary care in the UK: predicting the consequences of change. Primary Care Research and Development. 2006;7:18-26.
391. Crawley D, Ng A, Mainous 111 A, Majeed A, Millettt C. Impact of pay for performance on quality of chronic disease management by social class group in England. Journal of the Royal Society of Medicine. 2009;102:103-7.
392. Ashworth M, Seed P, Armstrong D, Durbaba S, Jones R. The relationship between social deprivation and the quality of primary care: a national survey using indicators from the UK Quality and Outcomes Framework. The Lancet. 2007;372:728-36.
393. Grosso A. Did the UK's Performance-Focused Health Reforms Work? A Difference in Differences Analysis of Citizen Perceptions. 11th Annual Public Management Research Conference 2-4th June; Maxwell School, Syracuse University, New York2011

334
394. Pollitt C, Bouckaert G. Public Management Reform: A Comparative Analysis 2nd ed. Oxford: Oxford University Press; 2004.
395. Grol RP, Bosch M, Hulscher M, Eccles M, Wensing M. Planning and studying improvement in patient care: the use of theoretical perspectives. Milbank Q. 2007;85(1):93 - 138.
396. Shortell S, Bennett C, Byck G. Assessing the Impact of Continuous Quality Improvement on Clinical Practice: What It Will Take to Accelerate Progress. The Milbank Quarterly. 1998;76:593-624.
397. Scott A, Sivey P, Ait Ouakrim D, Willenberg L, Naccarella L, Furler J, et al. The effect of financial incentives on the quality of health care provided by primary care physicians. Ottawa, Canada: Cochrane Database of Systematic Reviews 2011.
398. Downing A, Rudge G, Cheng Y, Tu Y, Keen J, M. G. Do the UK government's new Quality and Outcomes Framework (QOF) scores adequately measure primary care performance? A cross-sectional survey of routine healthcare data. BMC Health Services Research. 2007;7(166).
399. Sermuga B, Ross-Degnan D, Avery A, Elliott R, Majumdar S, Zhang F, et al. Effect of pay for performance on the management and outcomes of hypertension in the United Kingdom: interrupted time series study. British Medical Journal. 2011;342:1-7.
400. Campbell S, Reeves D, Kontopantlis E, Middleton E, Sibbald B, Roland M. Quality of Primary Care in England with the Introduction of Pay for Performance. The New England Journal of Medicine. 2007;357(2):181-90.
401. Coleman T. Do financial incentives for delivery health promotion counselling work? Analysis of smoking cessation acitivities stimulated by the quality and outcomes framework. BMC Public Health. 2010;10(167):1-6.
402. Wilkinson E, McColl A, Exworthy M, Roderick P, Smith H, Moore M, et al. Reactions to the use of evidence-based performance indicators in primary care: a qualitative study. Quality in Health Care. 2000;9:166-74.
403. Ashworth M, Kordowicz M. Quality and Outcomes Framework: smoke and mirrors? Quality in Primary Care. 2010;18:127-31.
404. Steel N, Maisey S, Clark A, Fleetcroft R, Howe A. Quality of clinical primary care and targeted incentive payments: an observational study. British Medical Journal. 2007;57:449-54.
405. Sheldon T. The healthcare quality measurement industry: time to slow the juggernaut? Quality and Safety in Health Care. 2005;14:3-4.
406. Gravelle H, Sutton M, Ma A. Doctor behaviour under a pay for performance contract: evidence from the quality and outcomes framework. York: University of York, 2007.
407. Mannion R, Davies H. Payment for performance in health care. British Medical Journal. 2008;336:306-8.
408. Coats D, Passmore E. Public Value: The Next Steps in Public Service Reform. London: The Work Foundation, 2008.

335
409. Timmons N. Blair Bemused Over GP Waiting Times. Financial Times. 2005 April 30th.
410. McDonald R, Harrison S, Checkland K, Campbell S, Roland M. Impact of financial incentives on clinical autonomy and internal motivation in primary care: ethnographic study. British Medical Journal. 2007;10(1136):1-6.
411. Checkland K, Marshall M, Harrison S. Re-thinking accountability: trust versus confidence in medical practice. Quality & Safety in Health Care. 2004;13:130-5.
412. Gillam S, Siriwardena A, Steel N. Pay-for-Performance in the United Kingdom: Impact of the Quality and Outcomes Framework - A Systematic Review. Annals of Family Medicine. 2012;10(5):462-8.
413. Heath I, Hippisley-Cox J, Smeeth L. Measuring performance and missing the point? British Medical Journal. 2007;335:1075-6.
414. Cohen L, Musson G. Entrepeneurial identities: reflections from two case studies. Organization. 2000;71(1):31-48.
415. Grant S, Huby G, Watkins F, Checkland K, McDonald R, Davies H, et al. The impact of pay-for-performance on professional boundaries in UK general practice: an ethnographic study. Sociology of Health & Illness. 2009;31(2):229-45.
416. Milgrom P, Roberts P. Economics, Organisation, and Management. Englewood Cliffs, New Jersey: Prentice Hall; 1992.
417. Herzog L. Higher and lower virtues in commerical society: Adam Smith and motivation crowding out. Politics, Philosophy and Economics. 2011;10(4):370-95.
418. Georgellis Y, Iossa E, Tabvuma V. Crowding Out Intrinsic Motivation in the Public Sector. Journal of Public Administration Research and Theory. 2010;21:473-93.
419. Harrison S, Smith C. Trust and moral motivation: redundant resources in health and social care. Policy & Politics. 2004;32(3):371-86.
420. Maisey S, Steel N, Marsh R, Gillam S, Fleetcroft R, Howe A. Effects of payment for performance in primary care: qualitative interview study. Journal of health services research & policy. 2008;13(3):133-9.
421. Steel N, Maisey S, Clark A, Fleetcroft R, Howe A. Quality of clinical primary care and targeted incentive payments: an observational study. Br J Gen Pract. 2007;57:449-554.
422. Stewart M. Towards a global definition of patient centred care - the patient should be the judge of patient centred care. British Medical Journal 2001;322(7284):444-5.
423. Chew-Graham C, Hunter C, Langer S, Stenhoff A, Drinkwater J, Guthrie E, et al. How QOF is shaping primary care review consultations: a longitudinal qualitative study. BMC Family Practice. 2013;14(103):1-7.
424. Le Grand J. Motivation, Agency and Public Policy. Oxford: Oxford University Press; 2003.

336
425. Audit Commission. Paying GPs to improve quality. London: Audit Commission, 2011.
426. Campbell SM, McDonald R, Lester H. The Experience of Pay for Performance in English Family Practice: A Qualitative Study. The Annals of Family Medicine. 2008;6(3):228-34.
427. McGlynn EA. Intended and unintended consequences - What should we really worry about? Med Care. 2007;45(1):3-5.
428. Davies H, Powell A, Rushmer R. Healthcare professionals' views on clinician engagement in quality improvement: A literature review. London: The Health Foundation, 2007.
429. Charles-Jones H, Latimer J, May C. Transforming general practice: the redistribution of medical work in primary care. Sociology of Health & Illness. 2003;25(1):71-92.
430. Mulgan G, Albury D. Innovation in the Public Sector. London: Strategy Unit, Cabinet Office, 2003.
431. Lekhi R. Public Service Innovation - A Research Report for The Work Foundation's Knowledge Economy Programme. London: The Work Foundation, 2007.
432. Collier N, Fishwick F, Johnson G. The process of strategy development in the public sector. In: Johnson G, Scholes K, editors. Exploring Public Sector Strategy. London: Prentice Hall; 2001.
433. Boyne GA. Public and Private Management: what's the difference? Journal of Management Studies. 2002;39(1):pp. 97-122.
434. Giuffrida A, Gravelle H, Roland M. Measuring quality of care with routine data: avoiding confusion between performance indicators and health outcomes. British Medical Journal. 1999;319:94-8.
435. The Work Foundation. "World-Class Public Services: Engaging Citizens and Staff". London: The Work Foundation supported by Adobe, 2008.
436. Mahdon M. Public Value and Health. London: The Work Foundation, 2006.
437. Aucoin P, Neintzman R. The Dialectics of Accountability for Performance in Public Management Reform. Administrative Science Quarterly. 2000;55:45-55.
438. Hunter D. To Market! To Market! London: Centre for Health and the Public Interest, 2013.
439. Kuhn T. The structure of scientific resolutions (1st edition). Chicago: University of Chicago Press; 1962.
440. Feilzer M. Doing Mixed Methods Research Pragmatically: Implications for the Rediscovery of Pragmatism as a Research Paradigm. Journal of Mixed Methods Research. 2010;4(1):6-16.
441. Denscombe M. Communities of practice: A research paradigm for the mixed-methods approach. Journal of Mixed Methods Research. 2008;2(3):270-83.

337
442. Morgan D. Paradigms Lost and Pragmatism Regained: Methodological Implications of Combining Qualitative and Qualitative Methods. Journal of Mixed Methods Research. 2007;1(1):48-76.
443. Harrits G. More than Method?: A Discussion of Paradigm Differences within Mixed Methods Research. Journal of Mixed Methods Research. 2011;5(2):150-66.
444. Kuhn T. The structure of scientific revolutions (3rd edition). Chicago: University of Chicago Press; 1996.
445. Cresswell J, Plano-Clark V, Guttman M, Hanson W. Advanced mixed methods research designs. 2003. In: Handbook of mixed methods in social and behavioural research [Internet]. Thousand Oaks, CA.: Sage.
446. Hanson W, Plano-Clark V, Petska K, Cresswell J. Mixed-methods research designs in counseling psychology. Journal of Counseling Psychology. 2005;52(2):224-35.
447. Guba E, editor. The Paradigm Dialog. London: Sage Publications; 1990.
448. Blakie N. Designing social research (2nd edition). Cambridge, England Polity Press; 2010.
449. Teddlie C, Tashakkori A. Foundations of mixed methods research. Thousand Oaks, CA: Sage; 2009.
450. Hughes J, Sharrock W. Theory and methods in sociology. Basingstoke, UK: Palgrave Macmillan; 2007.
451. Bryman A. Social Research Methods (Third Edition). Oxford: Oxford University Press; 2008.
452. Weber M. The Theory of Social and Economic Organization, trans. A.M. Henderson and T. Parsons. New York: Free Press; 1947.
453. Lincoln Y, Guba E. Paradigmatic controversies, contradictions and emerging confluences. 2000. In: Handbook of qualitative research (2nd edition) [Internet]. Thousand Oaks, CA.: Sage.
454. Appleton J, King L. Journeying from the philosophical contemplation of constructivism to the methodological pragmatics and health services research. Journal of Advanced Nursing. 2002;40(6):641-8.
455. Appleton J, King L. Constructivism: a naturalistic methodology for nursing inquiry. Advances in Nursing Science. 1997;20:13-22.
456. Alise M, Teddlie C. A Continuation of the Paradigm Wars? Prevalence Rates of Methodological Approaches Across the Social/Behavioral Sciences. Journal of Mixed Methods Research. 2010;4(2):103–26.
457. Collier A. Critical Realism: An Introduction to the Philosophy of Roy Bhaskar. London: Verso; 1994.
458. Rowland G. Archetypes of system design. Systems Practice. 1995;8(3):277-89.
459. Labinger J, Collins H. The one culture: A converstation about science. Chicago: University of Chicago Press; 2001.

338
460. González Castro F, Kellison J, Boyd S, Kopak A. A Methodology for Conducting Integrative Mixed Methods Research and Data Analyses. Journal of Mixed Methods Research. 2010;4(4):342-60.
461. Castro F, Kellison J, Boyd S, Kopak A. A methodology for Conducting Integrative Mixed Methods Research and Data Analyses. Journal of Mixed Methods Research. 2010;4:342-60.
462. Viruel-Fuentes E. Beyond acculturation: Immigration, discrimination, and health research among Mexicans in the United States. Social Science & Medicine. 2007;65:1524-35.
463. Guba E, Lincoln Y. Competing paradigms in qualitative research. In: Denzin N, Lincoln Y, editors. Handbook of qualitative research. Thousand Oaks, CA.: Sage; 1995.
464. Dreher M. Qualitative research methods from the reviewer's perspective. In: Denzin N, Lincoln Y, editors. Handbook of qualitative research. Thousand Oaks, CA: Sage; 1994.
465. Sandelowski M. The problem of rigor in qualitative research. Advances in Nursing Science. 1986;8(3):27-37.
466. Guba E, Lincoln Y. Paradigmatic controversies, contradictions, and emerging confluences. In: Denzin N, Lincoln Y, editors. Handbook of qualitative research 3rd ed. Thousand Oaks, CA: Sage; 2005 p. 191-215.
467. Burke Johnson R, Onwuegbuzie A. Mixed Methods Research: A Research Paradigm Whose Time Has Come. Educational Researcher. 2004;33(7):14-26.
468. Burke Johnson R, Onwuegbuzie A, Turner L. Towards a Definition of Mixed Methods Research. Journal of Mixed Methods Research. 2007;1(2):112-33.
469. Campbell D, Fiske D. Convergent and discriminant validation by the multitrait-multimethod matrix. Psychological Bulletin. 1958;56:81-105.
470. Webb E, Campbell D, Schwartz R, Sechrest L. Unobtrusive measures. Chicago: Rand McNally; 1966.
471. Payment by Results- Papers to Be Presented at a Pera Conference.
472. Rossman G, Wilson B. Numbers and words: combining quantitative and qualitative methods in a single large-scale evaluation study. Evaluation Review. 1985;9:627-43.
473. Greene J, Caracelli V, Graham W. Toward a conceptual framework for mixed-method evaluation designs. Educational Evaluation and Policy Analysis. 1989;11:255-74.
474. Rittel H, Webber M. Dilemmas in a General Theory of Planning. Policy Sciences. 1973;4:155-69.
475. Tashakkori A, Teddlie C. Major issues and controversies in the use of mixed methods in the social and behavioural sciences. In: Tashakkori A, Teddlie C, editors. Handbook of mixed methods in social and behavioural research. Thousand Oaks, CA: Sage; 2003. p. 3-50.
476. Patomaki H, Wight C. After Postpositivism? The Promises of Critical Realism. International Studies Quarterly. 2000;44:213-37.

339
477. Thomas R. Blending qualitative and quantitative research methods in theses and dissertations. Thousand Oaks, CA: Corwin; 2003.
478. Johnson R, Christensen L. Educational research: Quantitative, qualitative, and mixed approaches. Boston, MA: Allyn & Bacon.; 2004.
479. O'Cathain A, Murphy E, Nicholl J. The quality of mixed methods studies in health services research. Journal of Health Service Research and Policy. 2008;13(2):92-8.
480. Campbell D, Fiske D. Convergent and discriminant validation by the multitrait-multimethod matrix. Psychological Bulletin. 1959;56:81-105.
481. Cook T. Postpositivist critical multiplism. In: Shotland R, Mark M, editors. Social science and social policy. Beverly Hills, CA.: Sage; 1985.
482. Mathison S. Why triangulate? Educational Researcher. 1988;17:13-7.
483. Howe K. Mixed Methods, Triangulation, and Causal Explanation. Journal of Mixed Methods Research. 2012;6(2):89-96.
484. Phillips DL, Clancy KJ. Some Effects of "Social Desirability" in Survey Studies. American Journal of Sociology. 1972;77(5):921-40.
485. Coiera E. Four rules for the reinvention of health care. British Medical Journal. 2004;328:1197-9.
486. Gelo O, Braakman D, Benetka G. Qualitative and quantitative research: beyond the debate. Integrative Psychological and Behavioural Science. 2008;42:266-90.
487. Plano-Clark V, Huddleston-Cases C, Churchill S, Green S, Garrett A. Mixed methods approaches in family science research. Journal of Family Issues. 2008;29:1543-66.
488. Bhaskar R. Philosophy and the Idea of Freedom. Oxford: Blackwell; 1991.
489. Bhaskar R. The Possibility of Naturalism. Hemel Hempstead: Harvester Wheatsheaf; 1979.
490. Dobson P. The Philosophy of Critical Realism - An Opportunity for Information Systems Research. Information Systems Frontiers. 2001;3(2):199-210.
491. Connelly J. Critical realism and health promotion: effective practice needs an effective theory. Health Education Research. 2001;16(2):115-20.
492. Bhaskar R. A Realist Theory of Science. Sussex: Harvester Press; 1978.
493. Pratten S. Critical Realism and Causality: Tracing the Aristotelian Legacy. Journal for the Theory of Social Behaviour. 2009;39(2):189-218.
494. Wight C. Agents, structures and international relations: politics as ontology. Cambridge: Cambridge University Press; 2006.
495. Pawson R, Tilley N. Realistic Evaluation. London: Sage Publications; 1997.
496. Byrne D. Complexity in the Social Sciences. London: Routledge; 1998.
497. Mills CW. Sociology and Pragmatism. New York: Oxford University Press; 1966.
498. Garfinkel H. Studies in Ethnomethodology. Englewood Cliffs, NJ.: Prentice-Hall; 1967.

340
499. McEvoy P, Richards D. A critical realist rationale for using a combination of quantitative and qualitative methods. Journal of Research in Nursing. 2006;11(1):66-78.
500. Olsen WK, Morgan J. A Critical Epistemology of Analytical Statistics: Addressing the Sceptical Realist. Journal for the Theory of Social Behaviour. 2995;35(3):255-84.
501. Connelly J. Evaluating complex public health interventions: theory, methods and scope of realist enquiry. Journal of Evaluation in Clinical Practice. 2007;13:935-41.
502. Orlikowski W. The duality of technology: Rethinking the concept of technology in organizations. Organization Science. 1992;3(3):398-427.
503. Ventres W, Kooienga S, Vuckovic N, Marlin R, Nygren P, Stewart V. Physicians, patients, and the electronic health record: An ethnographic analysis. Annals of Family Medicine. 2006;4:124-31.
504. Scott P, Briggs J. A Pragmatist Argument for Mixed Methodology in Medical Informatics. Journal of Mixed Methods Research. 2009;3(3):223-41.
505. Tashakkori A, Teddlie C. Mixed methodology: Combining qualitative and quantitative approaches. Thousand Oaks, CA.: Sage; 1998.
506. Onwuegbuzie AJ, Leech N. Sampling Designs in Qualitative Research: Making the Sampling Process more Public. The Qualitative Report. 2007;12(2):238-54.
507. Lopez-Fernandez O, Molina-Azorin J. The use of mixed methods research in the field of behavioural sciences. Qual Quant. 2011;45(6):1459-72.
508. Ivankova NV, Creswell JW, Stick SL. Using Mixed-Methods Sequential Explanatory Design: From Theory to Practice. Field Methods. 2006;18(1):3-20.
509. Patton M. Qualitative Research and Evaluation Methods. Thousand Oaks: SAGE; 2002.
510. Sandelowski M. Combining Qualitative and Quantitative Sampling, Data Collection and Analysis Techniques in Mixed-Method Studies. Research in Nursing & Health. 2000;23:246-55.
511. Jick T. Mixing qualitative and quantitative methods: Triangulation in action. Administrative Science Quarterly. 1979;24:602-11.
512. Miles M, Huberman A. Qualitative data analysis: an expanded sourcebook. Beverley Hills, CA.: Sage; 1994.
513. Wendler M. Triangulation using a meta-matrix. Journal of Advanced Nursing. 2001;35:521-5.
514. Sackett D, Rosenberg W, Gray J, Haynes R, Richardson W. Evidence based medicine: what it is and what it isn't. BMJ. 1996;312(71).
515. Centre for Reviews and Dissemination. Systematic Reviews: CRD's guidance for undertaking reviews in health care. York: Centre for Reviews and Dissemination, University of York, 2009.
516. Petticrew M, Roberts H. Systematic reviews in the social sciences: a practical guide. Malden, MA.: Blackwell Publishing; 2006.

341
517. Harden A, Thomas J. Methodological Issues in Combining Diverse Study Types in Systematic Reviews. International Journal of Social Research Methodology. 2005;8(3):257-71.
518. Greenhalgh T, Potts H, Wong G, Bark P, Swinglehurst D. Tensions and Paradoxes in Electronic Patient Record Research: A Systematic Literature Review Using the Meta-Narrative Method. The Milbank Quarterly. 2009;87(4):729-88.
519. Greenhalgh T, Wong G, Westhorp G, Pawson R. Protocol - realist and meta-narrative evidence synthesis: Evolving Standards (RAMESES). BMC Medical Research Methodology. 2011;11(115).
520. Greenhalgh T, Robert G, Macfarlane F, Bate P, Kyriakidou O, Peacock R. Storylines of research in diffusion of innovation: a meta-narrative approach to systematic review. Social Science & Medicine. 2005;61:417-30.
521. Dixon-Woods M, Cavers D, Agarwak S, Annandale E, Arthur A, Harvey J, et al. Conducting a critical interpretive synthesis of the literature on access to healthcare by vulnerable groups. BMC Medical Research Methodology. 2006;6(35).
522. de Lusignan S. Using routinely collected GP data for quality improvement and research. BCS HI L&SE Specialist Groups2006.
523. de Lusignan S. Using routinely collected patient data with and without consent: trust and professionalism. Informatics in Primary Care. 2008;Vol. 16:251-4.
524. de Lusignan S, Metsemakers J, Houwink P, Gunnarsdottir V, Van der Lei J. Routinely collected general practice data: goldmines for research? Informatics in Primary Care. 2006;Vol. 14:203-9.
525. Baillie L, Burwood D, Owen D. Electronic patient records of diagnosis and risk factor monitoring in coronary heart disease: a project to investigate and feedback completeness and consistency in a group of general practices. Primary Health Care Research & Development. 2005;6:300-10.
526. Christensen T, Grimsmo A. Instant availability of patient records, but diminished availability of patient information: a multi-method study of GP's use of electronic patient records. BMC Medical Informatics & Decision Making. 2008;8:12.
527. Committee on the Future of Primary Care DoHCS. Defining Primary Care: An Interim Report. Washington DC: The National Academies Press; 1994.
528. Tanner M. The Grass is Not Always Greener. A Look at National Health Care Systems Around the World. Washington D.C.: CATO Institute, 2008.
529. British Medical Association, NHS Employers. Investing in General Practice - The New General Medical Services Contract. London: BMA & NHS Employers, 2003.
530. Department of Health. The Operating Framework for the NHS in England 2008/09. London: Department of Health, 2007.
531. Royle P, Milne R. Literature searching for randomized controlled trials used in Cochrane reviews: rapid versus exhaustive searches. International Journal of Technology Assessment in Health Care. 2003;19:591-603.

342
532. Sampson M, McGowan J, Cogo E, Horsley T. Managing database overlap in systematic reviews using Batch Citation Matcher: case studies using Scopus. Journal of the Medical Library Association. 2006;94(4):461-3.
533. Beyer F, Wright K. Comprehensive searching for systematic reviews: a comparison of database performance. York: Centre for Reviews and Dissemination, University of York, 2011.
534. Crumley E, Wiebe N, Cramer K, Klassen T, Hartling L. Which resources should be used to identify RCT/CCTs for systematic reviews: a systematic review. BMC Medical Research Methodology. 2005;5(1):24.
535. Higgins JPT, Green S, editors. Cochrane Handbook for Systematic Reviews of Interventions Version 5.1.0 [updated March 2011]. Available from www.cochrane-handbook.org: The Cochrane Collaboration; 2011.
536. Edwards P, Clarke M, DiGuiseppi C, Pratap S, Roberts I, Wentz R. Identification of randomized controlled trials in systematic reviews: accuracy and reliability of screening records. Statistics in Medicine. 2002;21(11):1635-40.
537. Khan KS, ter Reit G, Popay Jea. Stage II: conducting the review, phase 5: study quality assessment. In: Khan KS, ter Reit G, al GJe, editors. Undertaking Systematic Reviews of Research Effectiveness: CRD's Guidance for Those Carrying Out or Commissioning Reviews. 1-20. CRD Report 4. York: NHS Centre for Reviews and Dissemination, University of York; 2001.
538. A.P. V, de Vet HC, de Bie RAea. The art of quality assessment of RCTs included in systematic reviews. Journal of Clinical Epidemiology. 2001;54:651-4.
539. National Collaborating Centre for Methods and Tools. Quality Assessment Tool for Quantitative Studies Method Hamilton ON: McMaster University; 2008 [updated April 2010; cited 2011 April]. Available from: http://www.nccmt.ca/registry/view/eng/15.html.
540. Armijo-Olivio S, Stiles CR, Hagen NA, Biondo PD, Cummings GG. Assessment of study quality for systematic reviews: a comparison of the Cochrane Collaboration Risk of Bias Tool and the Effective Public Health Practice Project Quality Assessment Tool: methodological research. Journal of Evaluation in Clinical Practice. 2010(No. doi: 10.1111/j.1365-2753.2010.01516.x).
541. Thomas BH, Ciliska D, Dobbins M, Micucci S. A process for systematically reviewing the literature: providing the research evidence for public health nursing interventions. Worldviews on Evidence-Based Nursing. 2004;1(3):176-84.
542. Letts L, Wilkins S, Law M, Stewart D, Bosch J, Westmorland M. Critical Review Form - Qualitative Studies (Version 2.0). Hamilton, Ontario: McMaster University, 2007.
543. Voils CI, Sandelowski M, Barroso J, Hasselblad V. Making Sense of Qualitative and Quantitative Findings in Mixed Research Synthesis Studies. Field Methods. 2008;20(3):3-25.
544. Harden A. Mixed-Methods Systematic Reviews: Intergrating Quantitative and Qualitative Findings. London: The National Center for the Dissemination of Disability Research (NCDDR), 2010.

343
545. Thomas J, Harden A, Oakley A, Oliver S, Sutcliffe K, Rees R, et al. Integrating qualitative research with trials in systematic reviews: An example from public health. BMJ. 2004;328:1010-2.
546. Moher D, Liberati A, Tetzlaff J, Altman D, PRISMA Group. Preferred Reporting Items for Systematic Reviews and Meta-Analyses: The PRISMA Statement. Annals of Internal Medicine. 2009;151(4):1-4.
547. Ryan GW, Bernard HR. Techniques to Identify Themes. Field Methods. 2003;15:85-109.
548. Rodgers M, Sowden A, Petticrew M, Arai L, Roberts H, Britten N, et al. Testing Methodological Guidance on the Conduct of Narrative Synthesis in Systematic Reviews: Effectiveness of Interventions to Promote Smoke Alarm Ownership and Function. Evaluation. 2009;15(1):49-74.
549. Campbell R, Pound P, Pope C, Britten N, Pill R, Morgan M, et al. Evaluating meta-ethnography: a synthesis of qualitative research on lay experiences of diabetes and diabetes care. Social Science & Medicine. 2003;56(pp. 671-684).
550. Brown PJB, Warmington V, Laurence M, Prevost AT. A methodology for the functional comparison of coding schemes in primary care. Informatics in Primary Care. 2003;11(3):145-8.
551. Brown PJB, Warmington V, Laurence M, Prevost AT. Randomised crossover trial comparing the performance of Clinical Terms Version 3 and Read Codes 5 byte set coding schemes in general practice. BMJ. 2003;326(7399):1127.
552. Campbell SM, Hann M, Hacker J, Durie A, Thapar A, Roland MO. Quality assessment for three common conditions in primary care: Validity and reliability of review criteria developed by expert panels for angina, asthma and type 2 diabetes. Quality and Safety in Health Care. 2002;11 (2):125-30.
553. Carey IM, Nightingale CM, DeWilde S, Harris T, Whincup PH, Cook DG. Blood pressure recording bias during a period when the Quality and Outcomes Framework was introduced. Journal of Human Hypertension. 2009;23(11):764-70.
554. Coleman T, Lewis S, Hubbard R, Smith C. Impact of contractual financial incentives on the ascertainment and management of smoking in primary care. Addiction. 2007;102(5):803-8.
555. Coleman T, Wilson A, Barrett S, Wynne A, Lewis S. Distributing questionnaires about smoking to patients: impact on general practitioners' recording of smoking advice. BMC Health Services Research. 2007;7:153.
556. Dalton ARH, Bottle A, Okoro C, Majeed A, Millett C. Implementation of the NHS Health Checks programme: Baseline assessment of risk factor recording in an urban culturally diverse setting. Family Practice. 2010;28(1):34-40.
557. de Lusignan S, Stephens PN, Adal N, Majeed A. Does feedback improve the quality of computerized medical records in primary care? Journal of the American Medical Informatics Association. 2002;9 (4):395-401.
558. de Lusignan S, Wells SE, Hague NJ, Thiru K. Managers see the problems associated with coding clinical data as a technical issue whilst clinicians also see cultural barriers. Methods of Information in Medicine. 2003;42(4):416-22.
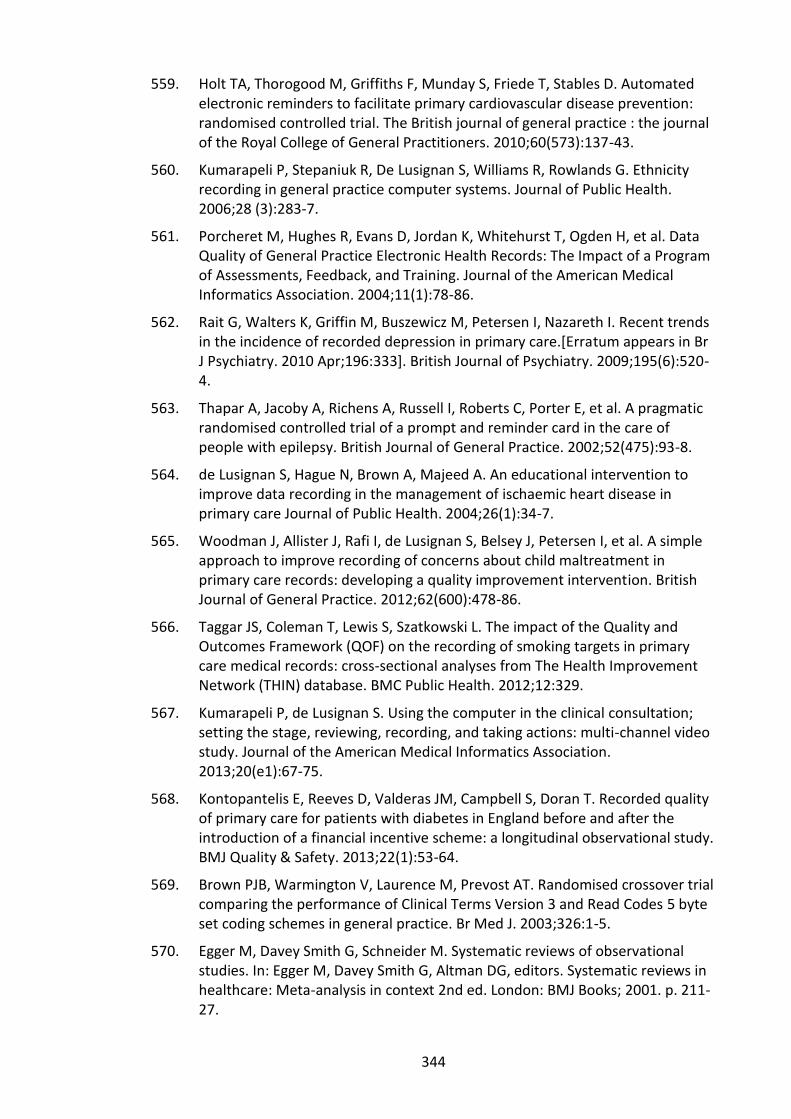
344
559. Holt TA, Thorogood M, Griffiths F, Munday S, Friede T, Stables D. Automated electronic reminders to facilitate primary cardiovascular disease prevention: randomised controlled trial. The British journal of general practice : the journal of the Royal College of General Practitioners. 2010;60(573):137-43.
560. Kumarapeli P, Stepaniuk R, De Lusignan S, Williams R, Rowlands G. Ethnicity recording in general practice computer systems. Journal of Public Health. 2006;28 (3):283-7.
561. Porcheret M, Hughes R, Evans D, Jordan K, Whitehurst T, Ogden H, et al. Data Quality of General Practice Electronic Health Records: The Impact of a Program of Assessments, Feedback, and Training. Journal of the American Medical Informatics Association. 2004;11(1):78-86.
562. Rait G, Walters K, Griffin M, Buszewicz M, Petersen I, Nazareth I. Recent trends in the incidence of recorded depression in primary care.[Erratum appears in Br J Psychiatry. 2010 Apr;196:333]. British Journal of Psychiatry. 2009;195(6):520-4.
563. Thapar A, Jacoby A, Richens A, Russell I, Roberts C, Porter E, et al. A pragmatic randomised controlled trial of a prompt and reminder card in the care of people with epilepsy. British Journal of General Practice. 2002;52(475):93-8.
564. de Lusignan S, Hague N, Brown A, Majeed A. An educational intervention to improve data recording in the management of ischaemic heart disease in primary care Journal of Public Health. 2004;26(1):34-7.
565. Woodman J, Allister J, Rafi I, de Lusignan S, Belsey J, Petersen I, et al. A simple approach to improve recording of concerns about child maltreatment in primary care records: developing a quality improvement intervention. British Journal of General Practice. 2012;62(600):478-86.
566. Taggar JS, Coleman T, Lewis S, Szatkowski L. The impact of the Quality and Outcomes Framework (QOF) on the recording of smoking targets in primary care medical records: cross-sectional analyses from The Health Improvement Network (THIN) database. BMC Public Health. 2012;12:329.
567. Kumarapeli P, de Lusignan S. Using the computer in the clinical consultation; setting the stage, reviewing, recording, and taking actions: multi-channel video study. Journal of the American Medical Informatics Association. 2013;20(e1):67-75.
568. Kontopantelis E, Reeves D, Valderas JM, Campbell S, Doran T. Recorded quality of primary care for patients with diabetes in England before and after the introduction of a financial incentive scheme: a longitudinal observational study. BMJ Quality & Safety. 2013;22(1):53-64.
569. Brown PJB, Warmington V, Laurence M, Prevost AT. Randomised crossover trial comparing the performance of Clinical Terms Version 3 and Read Codes 5 byte set coding schemes in general practice. Br Med J. 2003;326:1-5.
570. Egger M, Davey Smith G, Schneider M. Systematic reviews of observational studies. In: Egger M, Davey Smith G, Altman DG, editors. Systematic reviews in healthcare: Meta-analysis in context 2nd ed. London: BMJ Books; 2001. p. 211-27.

345
571. de Lusignan S. The barriers to clinical coding in general practice: A literature review. Medical Informatics and the Internet in Medicine. 2005;30(2):89-97.
572. McAuley L, Pham B, Tugwell P, Moher D. Does the inclusion of grey literature influence estimates of intervention effectiveness reported in meta-analyses? The Lancet. 2000;356(9237):1228-31.
573. Sandelowski M, Barosso J. Handbook for Synthesising Qualitative Research. New York: Springer; 2007.
574. Thomas J, Harden A. Methods for the thematic synthesis of qualitative resarch in systematic reviews. BMC Medical Research Methodology. 2008;8(45).
575. Lehoux P, Sicotte C, Denis JL, Berg M, Lacroix A. The theory of use behind telemedicine: how compatible with physicians' clinical routines? Soc Sci Med. 2002;54(6):889 - 904.
576. Giddens A. The constitution of society: Outline of the theory of structure. Berkley, CA.: University of California Press; 1984.
577. Latour B. Reassembling the social: An introduction to actor-network-theory. Oxford: Oxford University Press; 1992.
578. Greenhalgh T, Stones R. Theorising big IT programmes in healthcare: strong structuration theory meets actor-network theory. Soc Sci Med. 2010;70(9):1285 - 94.
579. Timmons S. A failed panoptican: surveillance of nursing practice via new technology. New Technology, Work and Employment. 2003;18:143-53.
580. Shekelle P, Goldzweig C. Costs and benefits of health information technology: an updated systematic review. London: Health Foundation on behalf of the Southern California Evidence-based Practice Centre, RAND Corporation, 2009.
581. Berg M, Aarts J, van de Lei J. ICT in healthcare: Sociotechnical approaches. Methods of Information in Medicine. 2003;42:297-301.
582. Hartswood M, Proctor R, Rouncefield M, Slack R. Making a case in medical work: implications for the electronic medical record. Computer Supported Cooperative Work. 2003;12(3):241-66.
583. Holroyd-Leduc JM, Lorenzetti D, Straus SE, Sykes L, Quan H. The impact of the electronic medical record on structure, process, and outcomes within primary care: a systematic review of the evidence. Journal of the American Medical Informatics Association : JAMIA. 2011;18(6):732-7.
584. Association BM, Service NH. Clinical directed enhanced services (DESs) for GMS contract 2008/09. London: BMA & NHS Employers, 2009.
585. THIN (The Health Improvement Network). http://www.thin-uk.com/ London2013 [5/4/2013].
586. QRESEARCH. http://www.qresearch.org/SitePages/Home.aspx 2013 [5/4/2013].
587. Szatkowski L, Lewis S, McNeill A, Huang Y, Coleman T. Can data from primary care medical records be used to monitor national smoking prevalence? Journal of Epidemiology and Community Health. 2012;66(9):791-5.

346
588. National Health Service. NHS Health Check Minimum Data Set (MDS): Standard Specification. London: NHS, 2009 July. Report No.: Contract No.: Draft Version No: 1.4.
589. NEFHSA. North East Primary Care Services Agency 2010 [cited 2010 17 April]. Available from: www.nefhsa.nhs.uk.
590. Hertzog M. Considerations in Determining Sample Size for Pilot Studies. Research in Nursing & Health. 2008;31:180-91.
591. Hulley S, Cummings T, Browner W, S. C, Hulley D, Hearst N. Designing clinical research: An epidemiological approach. Philadelphia: Lippincott, Williams & Wilkins; 2001.
592. Lackey N, Wingate A. The pilot study: One key to research success. 1998. In: Advanced design in nursing research [Internet]. Thousand Oaks, CA.: Sage.
593. Technical Steering Committee. Average Practice List Sizes in the UK. London: NHS: The Health and Social Care Information Centre., 2008.
594. Department of Health. High Quality Care For All: NHS Next Stage Review Final Report. London: Department of Health, 2008.
595. DCLG. The English Indices of Deprivation 2010. London: Department for Communities and Local Government, 2011.
596. ONS. Mid-2011 Population Estimates: Quinary age groups for health areas in England and Wales; estimated resident population; based London: Office for National Statistics, 2012.
597. NWPHO. Local Alcohol Profiles for England: North West Public Health Observatory; 2012 [cited 2012 26th November]. Available from: http://www.lape.org.uk/.
598. Department for Communities and Local Government. The English Indices of Deprivation 2010. London: HMSO, 2011.
599. Stata v12. http://stata.com/ 2013 [5/4/2013].
600. Gold S. NHS Connecting for Health's biggest 20 suppliers, 2010-11. The Guardian. 2011.
601. Parliament U. Alcohol related Read codes. In: Health Do, editor. London: UK Parliament; 2008.
602. NICE. Alcohol-use disorders: Diagnosis and clinical management of alcohol-related physical complications (NICE clinical guideline 100). London: National Institute for Health and Clinical Excellence, 2010 June 2010. Report No.
603. Bush K, Kivlahan D, McDonell MB, Fihn SD, Bradley KA. The AUDIT Alcohol Consumption Questions (AUDIT-C). Archives of Internal Medicine. 1998;158(16):1789-95.
604. Babor T, Higgins-Biddle J, Saunders J, Monteiro M. AUDIT: The Alcohol Use Disorders Identification Test Guidelines for Use in Primary Care (2nd edition). Geneva, Switzerland: World Health Organisation: Department of Mental Health and Substance Dependence, 2001 Contract No.: WHO/MSD/MSB/01.6a/MSB/01.6a.

347
605. EMIS. Egton Medical Information Systems Ltd (EMIS) http://www.emis-online.com/2013.
606. TPP. SystmOne: one patient record. http://www.tpp-uk.com/systmone-overview/2013.
607. TPP. http://www.tpp-uk.com/deployment-statistics/ Hosforth: TPP; 2012.
608. National Health Service. http://www.connectingforhealth.nhs.uk/systemsandservices/gpsupport/gpsoc London: National Health Service; 2010 [cited 2013 18th April].
609. Eayres D. Commonly used public health statistics and their confidence intervals. York: National Centre for Health Outcomes Development, 2008.
610. Wilson EB. Probable inference, the law of succession and statistical inference. Journal of the American Statistical Association. 1927;22:209-12.
611. Newcombe RG. Two-sided confidence intervals for the single proportion: comparison of seven methods. Statistical Medicine. 1998;17:857-72.
612. Newcombe RG, Altman DG. Proportions and their differences. In: Altman DG et al. (eds), editor. Statistics with confidence (2nd edn). London: BMJ Books; 2000. p. 46-8.
613. Patil KD. Cochran's Q Test: exact distribution. Journal of the American Statistical Association. 1975;70(186-189).
614. Noone J, Stephens C. Men, masculine identities, and health care utilisation. Sociology of Health and Illness. 2008;30(5):711–25.
615. National Health Service. Primary Care Service Framework: Alcohol Services in Primary Care. London: National Health Service, 2010.
616. Ross S, Grant A, Counsell C, Gillespie W, Russell I, Prescott R. Barriers to Participation in Randomised Controlled Trials: A Systematic Review. Journal of Clinical Epidemiology. 1999;52(12):1143-56.
617. Down L, Metcalfe C, Avery K, Noble S, Lane JA, Neal DE, et al. Factors distinguishing general practitioners who more readily participated in a large randomized trial were identified. Journal of Clinical Epidemiology. 2009;62(1):67-73.
618. Ellis SD, Bertoni AG, Bonds DE, Clinch CR, Balasubramanyam A, Blackwell C, et al. Value of recruitment strategies used in a primary care practice-based trial. Contemporary Clinical Trials. 2007;28(3):258-67.
619. Hammersley VS, Hippisley-Cox J, Wilson A, Pringle M. A comparison of research general practices and their patients with other practices - A cross-sectional survey in trent. British Journal of General Practice. 2002;52(479):463-8.
620. Peat J, Barton B, Elliott E. Statistics Workbook for Evidence-based Health Care. BMJ, editor. Chichester: Wiley-Blackwell; 2008.
621. Neal R, Heywood P, Morley S. Real world data: retrieval and validation of consultation data from four general practices. Family Practice. 1996;13(455-461).

348
622. Dresselhaus T, Peabody J, Lee M, Wang M, Luck J. Measuring Compliance with Preventative Care Guidelines: Standardised Patients, Clinical Vignettes, and the Medical Record. Journal of General Internal Medicine. 2000;15:782-8.
623. Physicians RCo. The medical consequences of alcohol abuse, a great and growing evil. London: Tavistock Publications Ltd . 1987.
624. Department of Health. Sensible Drinking: The Report of an Inter-Departmental Working Group . London: Department of Health, 1995.
625. DiCicco-Bloom B, Crabtree BF. The qualitative research interview. Medical Education. 2006;40(4):314-21.
626. Miller W, Crabtree B. Depth interviewing. 2nd edn. In: Miller W, Crabtree B, editors. Doing Qualitative Research. Thousand Oaks, California: SAGE; 1999. p. 89-107.
627. Johnson J. In-depth interviewing. . In: Gubrium J, Holstein J, editors. Handbook of Qualitative Research. Thousand Oaks, California.: Sage; 2002. p. 103-19.
628. Miles M, Huberman A. Qualitative Data Analysis. London: Sage; 1994.
629. McCracken G. The Long Interview. Newbury Park, California: Sage; 1988.
630. Curtisa S, Geslerb W, Smitha G, Washburn S. Approaches to sampling and case selection in qualitative research: examples in the geography of health Social Science & Medicine. 2000;50(1000):1001-14.
631. Rapley T. Sampling strategies in qualitative research. In: Flick U, editor. The SAGE Handbook of Analyzing Qualitative Data. London: Sage; 2013.
632. Patton M. Qualitative Research and Evaluation Methods (2nd Edition). Thousand oaks, CA: Sage; 2001.
633. Koerber A, McMichael L. Qualitative Sampling Methods: A Primer for Technical Communicators. Journal of Business and Technical Communication. 2008;22(4):454-73.
634. Torjesen I. Salaried GPs versus partners. British Medical Journal [Internet]. 2010.
635. Yin R. Case study research: Design and methods: Vol. 5. Thousand Oaks, CA.: Sage; 2003.
636. Franke RH, Kaul JD. The Hawthorne experiments: First statistical interpretation. Am Sociol Rev. 1978;43:623 - 43.
637. McCarney R, Warner J, Iliffe S, van Haselen R, Griffin M, Fisher P. The Hawthorne Effect: a randomised, controlled trial. BMC Medical Research Methodology. 2007;7(1):30.
638. Pope C, Ziebland S, Mays N. Analysing qualitative data. BMJ. 2000;320(7227):114-6.
639. Ritchie J, Spencer L. Qualitative data analysis for applied policy research. In: Bryman A, Burgess RG, editors. Analyzing qualitative data: Taylor & Francis; 1994. p. 173-94.
349
640. Elliott R, Fischer C, Rennie D. Evolving guidelines for publication of qualitative research studies in psychology and related fields. British Journal of Clinical Psychology. 1999;38(3):215-29.
641. Barbour R. The Newfound Credibility of Qualitative Research? Tales of Technical Essentialism and Co-Option. Qualitative Health Research. 2003;13(7):1019-27.
642. King N. Using templates in the thematic analysis of text. In: Cassell C, Symon G, editors. Essential Guide to Qualitative Methods in Organizational Research. London: SAGE; 2004.
643. NatCen. Framework method of analysis now supported by NVivo 9 software London: National Centre for Social Research; 2011 [cited 2011 28th September]. Available from: http://www.natcen.ac.uk/media-centre/press-releases/2011-press-releases/framework-method-of-analysis-now-supported-by-nvivo-9-software-.
644. Glaser B, Strauss A. The Discovery of Grounded Theory: Strategies for Qualitative Research. Chicago: Aldine; 1967.
645. Romney A, Batchelder W, Weller S. Culture as consensus: A theory of culture and informant accuracy. American Anthropologist. 1986;88(3):13-38.
646. Brannen J, Nilsen A. Comparative biographies in case-based cross-national research: methodological considerations. Sociology. 2011;45(4):603-19.
647. Rapley T. Interviews In: Seale C, Gobo G, Gubrium J, Silverman D, editors. Qualitative Research Practice. London, Thousand Oaks and New Delhi: Sage Publications; 2004.
648. Becker H. Telling About Society. Chicago: University of Chicago Press; 2007.
649. Baker S, Edwards R. How many qualitative interviews is enough? Expert voices and early career reflections on sampling and cases in qualitative research. Southampton: NCRM, University of Southampton, 2012.
650. Opdenakker R. Advantages and Disadvantages of Four Interview Techniques in Qualitative Research. Forum: Qualitative Social Research [Internet]. 2006; 7 (4).
651. Sturges J, Hanrahan K. Comparing Telephone and Face-to-Face Qualitative Interviewing: a Research Note. Qualitative Research. 2004;4:107-18.
652. Cresswell J. Qualitative Inquiry and Research Design; Choosing Among Five Traditions. London, New Delhi, Thousand Oaks: Sage Publications; 1998.
653. Kaner E, Rapley T, May C. Seeing through the glass darkly? A qualitative exploration of general practitioners’ drinking behaviour and their alcohol intervention practices. Family Practice 2006;23:481-7.
654. Aira M, Kauhanen J, Larivaara P, Rautio P. Differences in brief interventions on excessive drinking and smoking by primary care physicians: qualitative study. Preventive Medicine. 2004;38(4):473-8.
655. Aalto M, Pekuri P, Seppa K. Obstacles to carrying out brief intervention for heavy drinkers in primary health care: a focus group study. Drug and Alcohol Review. 2003;22:169-73.

350
656. Volk RJ, Steinbauer J, Cantor S. Patient factors influencing variation in use of preventative interventions for alcohol abuse by primary care physicians. Journal of Studies on Alcohol. 1996;57:203-9.
657. Kaner E, Heather N, Brodie J, Lock C, McAvoy B. Patient and practitioner characteristics predict brief alcohol intervention in primary health care. British Journal of General Practice. 2001;51:822-7.
658. Mitchell AJ, Meader N, Bird V, Rizzo M. Clinical recognition and recording of alcohol disorders by clinicians in primary and secondary care: meta-analysis. The British Journal of Psychiatry. 2012;201(2):93-100.
659. Yarbrough AK, Smith TB. Technology acceptance among physicians - A new take on TAM. Med Care Res Rev. 2007;64(6):650 - 72.
660. Aspy CB, Mold JW, Thompson DM, Blondell RD, Landers PS, Reilly KE, et al. Integrating screening and interventions for unhealthy behaviors into primary care practices. Am J Prev Med. 2008;35(5 Suppl):373-80.
661. Swinglehurst D, Greenhalgh T, Roberts C. Computer templates in chronic disease management: ethnographic case study in general practice. BMJ Open. 2012;2(6).
662. Jackson KM, Bucholz KK, Wood PK, Steinley D, Grant JD, Sher KJ. Towards the characterization and validation of alcohol use disorder subtypes: integrating consumption and symptom data. Psychological medicine. 2014;44(1):143-59.
663. Babor TF, Dolinsky ZS, Meyer RE, Hesselbrock M, Hofmann M, Tennen H. Types of alcoholics: concurrent and predictive validity of some common classification schemes. British journal of addiction. 1992;87(10):1415-31.
664. Babor TF, Hofmann M, DelBoca FK, Hesselbrock V, Meyer RE, Dolinsky ZS, et al. Types of alcoholics, I. Evidence for an empirically derived typology based on indicators of vulnerability and severity. Archives of general psychiatry. 1992;49(8):599-608.
665. Haidet P, Paterniti DA. "Building" a history rather than "taking" one: a perspective on information sharing during the medical interview. Arch Intern Med. 2003;163(10):1134-40.
666. May C, Rapley T, Moreira T, Finch T, Heaven B. Technogovernance: Evidence, subjectivity, and the clinical encounter in primary care medicine. Social Science & Medicine. 2006;62(4):1022-30.
667. Heeks R, Mundy D, Salazer A. 1999. Manchester: Institute for Development Policy and Management, Why health care information systems succeed or fail.
668. World Health Organisation. Manual of the International Classification of Diseases, Injuries and causes of Death. Geneva, Switzerland: WHO, 1977.
669. Cimino JJ, Zhu X. The Practical Impact of Ontotologies on Biomedical Informatics. Methods of Information in Medicine. 2006;45(Suppl 1):S124-35.
670. Musen MA, Tu SW, Das AK, Shahar Y. EON: A component-based approach to automation of protocol-directed therapy. Journal of the American Medical Informatics Association. 1996;3:367-88.

351
671. Chandrasekaran B, Josephson JR, Benjamins VR. What are onotologies and why do we need them? IEEE Intelligent Systems. 1999;14(1):20-6.
672. Gruber TR. A translation approach to portable ontologies. Knowledge Acquisition. 1993;5(2):199-220.
673. Berners-Lee T, Hendler J, Lassila O. The Semantic Web. Scientific American. 2001;May:35-43.
674. OWL Working Group. OWL 2 Web Ontology Language Document Overview (Second Edition) W3C Recommendation. Manchester: W3C OWL Working Group, 2012.
675. Gennari J, Musen MA, Fergerson RW, Grosso WE, Crubezy M, Eriksson H, et al. The evolution of Protege: an environment for knowledge-based systems development. International Journal of Human-Computer Studies. 2003;58(1):89-123.
676. Woodman J, Freemantle N, Allister J, de Lusignan S, Gilbert R, Petersen I. Variation in recorded child maltreatment concerns in UK primary care records: a cohort study using The Health Improvement Network (THIN) database. PloS one. 2012;7(11).
677. Seale JP, Boltri JM, Shellenberger S, Velasquez MM, Cornelius M, Guyinn M, et al. Primary care validation of a single screening question for drinkers. J Stud Alcohol. 2006;67(5):778-84.
678. Smith PJ, Schmidt S, Allensworth-Davies D, Saitz R. Primary Care Validation of a Single-Question Alcohol Screening Test. Journal of General Internal Medicine. 2009;24(7):783-8.
679. Kaner E, Bland M, Cassidy P, Coulton S, Dale V, Deluca P, et al. Effectiveness of screening and brief alcohol intervention in primary care (SIPS trial): pragmatic cluster randomised controlled trial. Br Med J. 2013;346(e8501).
680. Jensen P, Jensen L, Brunak S. Mining electronic health records: towards better research applications and clinical care. Nat Rev Genet. 2012;13(6):395-405.
681. Meystre SM, Savova GK, Kipper-Schuler KC, Hurdle JF. Extracting information from textual documents in the electronic health record: a review of recent research. Yearbook of medical informatics. 2008:128-44.
682. British Medical Association, NHS Employers. Summary of changes to the GMS (General Medical Services) contract in England for 2014/15. Available from: http://www.nhsemployers.org/SiteCollectionDocuments/Summary%20of%202014-15%20GMS%20deal%20FINAL.pdf: BMA & NHS Employers, 2013.
683. Lock C, Kaner E. Implementation of brief alcohol interventions by nurses in primary care: do non-clinical factors influence practice? . Family Practice. 2004;Vol. 21(No. 3):pp. 270-75.
684. Lock C, Kaner E, Heather N, Gilvarry E, McAvoy B. Changes in receptionists' attitudes towards involvement in a general practice-based trial of screening and brief intervention. British Journal of General Practice. 2000;Vol. 59:pp. 111-5.

352
685. Wenrich M, Paauw D, Carline J, Curtis J, Ramsey P. Do primary care physicians screen patients about alcohol intake using the CAGE questions? Journal of General Internal Medicine. 1995;10:631-4.
686. Larsson U, Saljo R, Aronsson K. Patient-doctor communication on smoking and drinking: lifestyles in medical consultations. Social Science & Medicine. 1987;25:1129-37.
687. Lawner K, Doot M, Gausas J, Doot J, See C. Implementation of CAGE alcohol screening in a primary care practice. Family Medicine. 1997;29:332-5.