Projecting small area statistics with an Australian spatial microsimulation model (SpatialMSM)
Upload
khangminh22Category
view
0download
0
Give to AgEcon Search
The World’s Largest Open Access Agricultural & Applied Economics Digital Library
This document is discoverable and free to researchers across the globe due to the work of AgEcon Search.
Help ensure our sustainability.
AgEcon Search http://ageconsearch.umn.edu
Papers downloaded from AgEcon Search may be used for non-commercial purposes and personal study only. No other use, including posting to another Internet site, is permitted without permission from the copyright owner (not AgEcon Search), or as allowed under the provisions of Fair Use, U.S. Copyright Act, Title 17 U.S.C.
A Microsimulation Model for the Agricultural Land Rental Market in Ireland
Jason Loughrey1, Thia Hennessy2
1. Rural Economy and Development Programme, Teagasc
2. Department of Food Business and Development, Cork University
Business School
*Corresponding Author: Jason Loughrey, Teagasc REDP, Athenry, Co.
Galway, Ireland. [email protected]
Paper prepared for presentation at the 165. EAAE Seminar ‘Agricultural Land Markets –
Recent Developments, Efficiency and Regulation’
Humboldt-Universität zu Berlin, Germany, April 4-5, 2019
Copyright 2019 by Jason Loughrey and Thia Hennessy. All rights reserved.
Readers may make verbatim copies of this document for non-commercial purposes by any means, provided that this copyright notice appears on all
such copies.
2
Abstract
Agricultural land rental markets contribute towards structural change in the
farming sector by offering farmers the opportunity to adjust their farm size without committing to a transfer of land ownership. In Irish agriculture, the
share of agricultural land being rented is however, among the lowest in Europe. Many Irish farmers continue to produce output and remain in
agricultural employment despite persistently negative market returns. This implies that land-use decisions are not solely influenced by market returns.
In this paper, we utilize Teagasc National Farm survey data to analyse the agricultural land rental market in Ireland with a newly developed
microsimulation model. This model is compared to an equilibrium model of
the land rental market. The microsimulation model has a number of advantages over the equilibrium model in addressing path dependency, the
interaction between landowners and tenants and the farm size concentration. The model requires some further refinement in simulating the variability of
land rental prices between contracts.
Keywords: Microsimulation, Agricultural Land Rental Market, Sealed-Bid
Auction, Price Determination, Farm Size Concentration.
JEL code: C15, D31, Q12, Q15
3
1 Introduction
In this paper, we analyse the agricultural land rental market in Ireland with a newly developed Agent-based micro-simulation model (ABMM). The
agricultural land market in Ireland is studied closely as significant policy
changes occur including reforms to the taxation system at the national level (Geoghegan et al 2017) and reforms to the Common Agricultural Policy at an
EU level (O’Neill and Hanrahan 2012). Farm succession and inheritance are given much attention due to their important contributions towards land
mobility and generational renewal (Duesberg et al 2017 and Leonard et al 2017).
Microsimulation modelling is increasingly applied to agricultural economics
research (Ramilan et al 2011; O’Donoghue 2013 and Loughrey et al 2016). In our ABM model, we attempt to address the question of how an increase in
profit maximization behaviour could affect the agricultural land rental market
in Ireland. ABM models have previously been used to develop simulated agricultural land market auctions (Balmann 1997, Happe et al 2006 and
Arsenault et al 2012).
We compare the results of the ABM model with those derived from a standard equilibrium model based largely on the methods outlined in
(Hennessy et al 2009). ABM models can account for “the emergence of structures at the macro or societal level from individual action” (Gilbert
2007). In economics, the empirical validation of agent-based models has made ‘substantial advances’ but more research is required in advancing
hypothesis testing (Fagiolo et al 2019).
In our case, the ABM modelling approach provides flexibility around the
determination of prices where there is bilateral trading between landowners and tenants. We find that the equilibrium modelling approach can perform
well in modelling the impact of farm subsidies on land rental prices and in illustrating the gains from trading in the agricultural land rental market but is
limited by the assumption of one single market clearing price.
Our ABM model is based on Teagasc National Farm survey data, which forms
the Irish component of the FADN database. Similar to Viaggi et al (2013), the farm profits (including subsidies) determine the formation of bid prices
(of potential tenants) and asking prices (of landowners). A fictitious market agent mediates between land owners and potential tenants in establishing
the price for each parcel of rented land. In this model, the market operates through sealed bids with each market participant making a maximum of one
4
bid per available land parcel. For each available parcel, the bidder with the
highest bid gains access to the land through a rental agreement with the landowner. It is assumed that the landowner makes decisions with reference
to a reservation price, below which the landowner will not release land to the
market. All bids and reservation prices are attributed to farm profitability.
In the ABM model, limits are placed on the extent to which farms can acquire additional land and no farm exits are permitted. It is assumed that these
limits can be enforced by a central authority with a role similar to the SAFER (Sociétés d’Aménagement Foncier et d’Établissement Rural) organisation in
France (See, for example, Boinon 2003 and Piet et al 2012). The model is used to calculate the farm size concentration at the end of the auction
period. Previous research by Freeman et al (2009) used an agent-based modelling approach to analyse the evolution of the farm size distribution in
Canada between 1960 and 2000, finding among other things that farms with
an initial land holding greater than the mean were significantly more likely to survive and grow relative to the smaller farms with an initial holding size
below the mean.
The results from our ABM model show that an increase in profit maximisation behaviour leads to a substantial transfer of agricultural land from the cattle
and sheep sectors and towards the more profitable dairy sector. In this model, we show that when agricultural land is transferred solely on the basis
of profit maximization, the farm size concentration can increase significantly. This occurs in the absence of countervailing forces such as an influx of new
entrants, who may contribute differently to the extent of concentration.
Loughrey and Donnellan (2017) identified Ireland as having a relatively low inequality and concentration of farmland size in comparison to other EU
member states. Piet (2016) explains however, that farms in excess of 50 hectares operate more than 50 per cent of the total agricultural land area in
Ireland.
In the next section, we outline some of the literature relating to the spatial dimension of agricultural land markets and the simulation of farmland
auctions. We follow this with a theory section, a description of the data sources and the methodology used to develop the ABM model. This is
followed with results and finally by the conclusion.
5
2 Literature
There is a growing economic literature on the spatial dimension of agricultural land markets (including simulation modelling). In the following,
we describe some of the relevant economic literature including the literature
concerned with simulation modelling of agricultural land markets.
Patton and McErlean (2003) identify spatial autocorrelation in the agricultural land market in Northern Ireland and conclude that agricultural land prices
are not solely determined ‘by the inherent characteristics of the land, but tend to reflect also the average local price per acre’. This lagged spatial
dependence is attributed to ‘the circularity of price setting’ whereby ‘property owners, prospective buyers, real estate agencies, tax assessors and others
base their estimates of values of agricultural land on observed sales in the vicinity’. The spatial dimension can also play an important role in influencing
the extent to which farm subsidies influence land market prices. For
instance, Graubner (2018) provides a formal analysis of spatial competition in agricultural land rental markets and concludes that the land subsidy is
only fully transferred to land rental prices where the importance of space is low or non-existent.
In developing a simulation model of the land market in Chile, Berger (2001)
highlights the typically local nature of supply and demand for agricultural land and the importance of competition between neighbours in shaping the
agricultural land market. Berger (2001) concludes that ‘in rural areas, where many farms with a high marginal productivity attempt to expand their
acreage, this can lead to excessive land prices that may even prevent the
realisation of economies of scale. Ignoring these spatial dynamics by assuming perfect land allocation among farms is not always an adequate
representation of reality’. Storm et al (2014) explain the advantage of agent-based models in recognizing ‘the importance of land immobility, the location
of farms in space, and the interdependence of farms via competition on the spatial land market’.
Agent-based models of land markets are quite commonly applied to both
rural and urban settings. For instance, Filatova et al (2009) outline a model of the urban land market where the ‘centralized equilibrium price
determination mechanism’ is replaced by ‘decentralized bilateral agent
trading dispersed in time and space’. This modelling of ‘bilateral agent trading’ is evident in the farmland simulation models of Balmann (1997) and
Arsenault et al (2012). Polhill et al (2007) outline a neat method for the negotiation of selling price based on the weighted sum of the farm
6
profitability of the purchaser, the profitability of the land parcel for sale and
an exogenous interest rate.
A number of land simulation models have included the role of market power
in price determination including Arsenault et al (2012) and Filatova et al (2009). In these models, the relative market power of buyers and sellers is
attributed to the number of agents in either category. A similar approach was applied in the econometric models outlined in Cotteleer et al (2008).
Freeman et al (2009) accounted for the impact of farm income variability and risk aversion in influencing the bidding price. Some land market simulation
models are based on one period of time where the focus is placed on the static impact of policy changes e.g. Viaggi et al (2013). A number of other
models have a multi-period setting including Balmann (1997) and Bert et al (2015).
3 Theory
We begin this section by describing the theoretical background to the ABM
model. We begin with the understanding that the farm size of each farm may be comprised of rented land or owned land. We formalise according to Ciaian
and Swinnen (2006), the land decision-making problem of a profit-maximizing individual farm in the following:
( ) ( ) ( ) (1)
where p is the price of farm output, r is the rental price of land, t represents
transaction costs, is the amount of land rented-in by the
farmer, is the amount of land rented-out by the farmer, is the
amount of land owned by the farmer.
In the ABM model, we do not assume that the initial state of the land market
is perfectly competitive. This means that participation in the agricultural land market can bring about improvements in farm household welfare, relative to
the initial state. We assume that the same production function applies to both land rented and land owned and that total farm size equals the sum of
land rented-in and owned minus land rented-out.
(2)
7
By behaving according to the profit maximization motive, farm operators
with a marginal value product of land higher than the marginal cost of land (r+t) will tend to rent-in additional land.
In the sealed-bid auction setting of this model, potential tenants compete for
rented land and this competition ensures that the rental costs approach the value of the marginal product of the land.
( ( )
( )) ( ) (3)
It is assumed that a market agent or auctioneer coordinates between landowners and potential tenants. This market agent collects all available
information on sealed bids and reservation prices and identifies the highest bidder for each land parcel available on the market and mediates between
landowners and tenants in finalising the agreed rental price. An important assumption in this model is that each farmer makes only one sealed bid for
each parcel of land.
For the individual tenant farmer, the marginal product of the land equals the rental price plus transaction costs plus a surplus to the tenant farmer. This
surplus allows the tenant farm operator to earn a profit from renting-in additional land. A tenant farmer may achieve a surplus from renting-in
additional land where the marginal value product of the land exceeds the market rate for the rented plot of agricultural land.
( )
( ) ( ) (4)
In addition, we add a second derivative to account for diminishing returns.
We estimate additional costs associated with expanding the land area by 20 hectares or more. It is assumed that increasing the land area beyond this
threshold will necessitate additional building costs and further costs associated with operating and maintaining those buildings and potential
interest expenses associated with the purchase of livestock.
On the supply side, farms will tend to rent-out land where the marginal value
product of the land is lower than the marginal cost of land. For the supply side of the market, the transaction costs are subtracted from the rental
income. The assumed competition between landowners reduces rental costs
so that they approach the value of the marginal product of the land. As in the case of tenant farmers, landowners may achieve a surplus where the
market rate exceeds the willingness to accept, which is based on the
8
marginal product of the land under the current ownership. The marginal
product of the land can vary according to the farmers’ management ability.
( )
( ) ( ) (5)
There are a number of constraints in the ABM model. In this model, farms may not always expand to the point where the marginal product and
marginal costs of the land are equal. It is assumed that a central authority closes the auction when the share of rented land in a region reaches 30 per
cent of the utilizable agricultural area in that region. In the ABM model, we exclude the option of farm exit so that farms with very low or negative
returns remain active in farming. In the equilibrium model, farm exits are permitted and the number of remaining farms can reduce significantly.
Within each land market group, we make the strong assumption that land parcels are homogenous and that differences in gross margins are due to
variability in farm management.
4 Methodology
In this section, we provide details on the methods applied in the ABM model. Similar to Viaggi et al (2013), we simulate transactions in the land market
assuming that farms seek to maximize total farm profit under the further assumption that land can be reallocated among a group of farms within a
particular region or local area.
∑ ( ) (6)
subject to
∑ (7)
Where is the total farm profit in the region, represents the profit
function of farm i, represents the land available in farm i and x represent
other factors affecting farm profitability. In the ABM model, the term represents the land, which is unavailable to the market as all farms retain some hectares for their own farming activities.
In the ABM model, there is a constraint so that no farm is simulated to fall below ten hectares in land area. The land which is potentially available to the
market is therefore constrained to be the Utilizable Agricultural Area (UAA)
of each farm in the sample minus 10. The land available to the market
9
equals zero for the case of a farm with an initial farm size, which is less than
10 hectares.
( ) (8)
This can be contrasted with the equilibrium model, where the available land
equals the total utilizable agricultural area of the region i.e. ∑ ∑ .
Farm exits are permitted in the equilibrium model and all farmland can potentially form part of a transaction.
Demand
In the ABM model, we place limits on the degree of participation in the market. The model stipulates that no dairy or livestock farm can participate
in the land rental market when farm size exceeds 120 hectares. For tillage farms, the model stipulates that no farm can participate in the land rental
market when farm size exceeds 200 hectares. The higher threshold for the tillage sector is due to the greater land intensity on tillage farms.
These thresholds are designed in order to remain within the scope of the family farm model i.e. where the majority of the farm labour is due to the
farm operator and other family members. While we do not explicitly account
for the relationship between farmland size and economic returns, our preliminary analysis suggests that the current average farmland sizes of Irish
dairy and particularly livestock farms are below the optimal levels from a microeconomic perspective.
The individual demands for additional agricultural land can be therefore
described in the following:
Dairy and Livestock ( ) (9)
Tillage ( ) (10)
We attempt to simulate land transfers based on a scenario where profit maximisation is the only motive. It can be noted that other non-pecuniary
motivations influence land-use decisions (Howley et al 2015).
In order to carry out the simulations, we first divide the sample of Teagasc
National Farm survey farms into six groups based on two soil quality categories (good and medium soils) and three regional categories. We
exclude the farms with poor soils due to the low sample size. In forming
10
regional categories, we distinguish between the Border Midlands and West
NUTS 2 region, the combination of the South-West and Mid-West NUTS 3 regions and the third regional category is due to the NUTS 3 South-East and
Eastern regions.
We estimate the adjusted gross profit per hectare for each individual farm in each of the six regional groups. This adjusted gross profit per hectare is the
gross revenue per hectare plus an adjustment for direct payments minus variable costs and family labour costs and is described in equation 11. The
adjusted gross profit per hectare represents the shadow price of land and the potential demand from each farm for an additional unit of rented agricultural
land.
As in the case of Balmann (1997) and Freeman et al (2009), the marginal
value product of land is based on the expected gross margin of each individual farm. We do not account for the influence of the riskiness of the
farm returns in the formation of bid prices.
The maximum willingness to pay or bid price from each potential tenant
farmer is influenced by the direct payments and the extent to which these payments are capitalised into the bids of each potential tenant. Previous
research has not given much attention to the capitalisation of direct
payments into the formation of bid prices. Viaggi et al (2013) is among the few exceptions. The complexity and uncertainty around the estimation of
capitalisation rates is a likely contributor.
In the baseline scenario, we assume that 50 per cent of direct payments are
included in the value of each bid. This does not necessarily translate into a capitalisation of direct payments of 50 per cent given the interactions with
the supply side of the market.1
The bid price or maximum willingness to pay from each tenant is therefore
given in the following:
∑( )
(11)
Where is the maximum willingness to pay equal to the gross profit
per hectare. The notation p represents prices, q the quantity of agricultural
output, VC represents variable costs, FLC represents family labour costs, which includes the estimated labour costs associated with the farm operator
1 O’Neill and Hanrahan (2016) estimate that the average capitalisation of direct payments is approximately 21 per cent for cattle
farms, 41 per cent for dairy and 50 per cent for tillage farms. On sheep farms, the capitalization is not statistically significant but
the average capitalization is 35 per cent.
11
and other family members. The notation c represents the capitalisation rate
and represents the value of the direct payments per hectare.
In the ABM model, it is assumed that the variable costs per hectare increase when the acquired land exceeds 20 hectares. For dairy farms, the assumed
increase is €200 per hectare and for livestock farms, the assumed increase is €100 per hectare. These adjustments are made to account for additional
building costs, electricity and interest costs associated with the purchase of livestock. More precise estimates of these additional costs are required, but
revisions are unlikely to greatly alter the results.
Within each of the six land markets, each farm is ranked according to their
respective gross profits. In the ABM model, all farms with a size greater or
equal to 12 hectares are ranked. The farm with the lowest gross profit offers their land for leasing to a potential tenant. The market agent collects the bids
and allocates parcels to the farm in the market with the highest adjusted gross profit per hectare. Farms exit the market if they reach the thresholds
outlined in equations (9) and (10).
Microsimulation Model
It is assumed that each farm has the same strategy i.e. rent-in land at the
cheapest possible price or alternatively let-out land at the highest possible bid price. In this sealed-bid auction, the most profitable farms will seek to
rent-in parcels at the lowest possible price from the farms with the lowest profitability. At the same time, the farms with relatively low profitability will
seek to let-out land to the highest bidder i.e. from the farm with the highest gross profit.
The simulation process begins by transferring agricultural land from the least
profitable farm to the most profitable in an iterative process. In this process, we assume that land is transferred in a parcel size of two hectares. As
described in (9) and (10) the model is constrained so that farms exit the land rental market after reaching a certain threshold.
In this simulation model, the land rental market closes at the point where the rental share in the region reaches 30 per cent. This would bring the
rental share closer to that witnessed in many Western European countries (Loughrey et al 2019). It should be noted however, that the rental share in
Ireland is unlikely to reach to the levels reported in EU member states such as Germany and France given that landowners and farmers are largely the
same population.
12
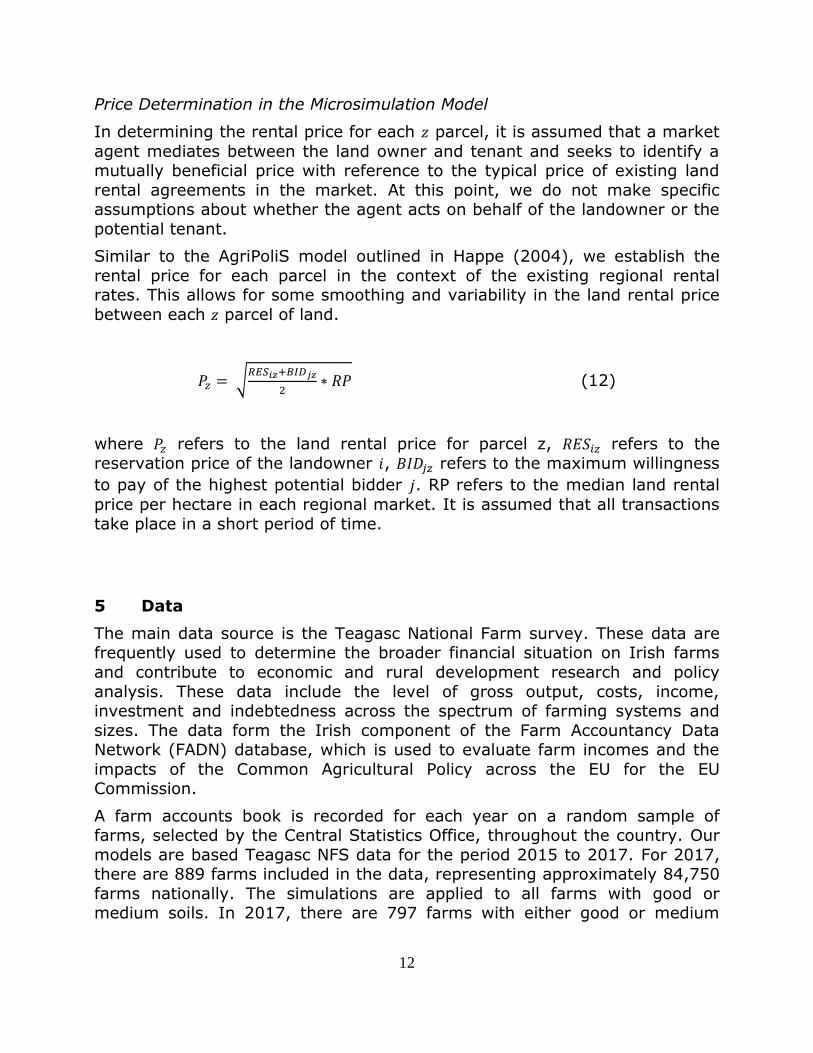
Price Determination in the Microsimulation Model
In determining the rental price for each parcel, it is assumed that a market
agent mediates between the land owner and tenant and seeks to identify a mutually beneficial price with reference to the typical price of existing land
rental agreements in the market. At this point, we do not make specific assumptions about whether the agent acts on behalf of the landowner or the
potential tenant.
Similar to the AgriPoliS model outlined in Happe (2004), we establish the
rental price for each parcel in the context of the existing regional rental rates. This allows for some smoothing and variability in the land rental price
between each parcel of land.
√
(12)
where refers to the land rental price for parcel z, refers to the
reservation price of the landowner , refers to the maximum willingness
to pay of the highest potential bidder . RP refers to the median land rental
price per hectare in each regional market. It is assumed that all transactions
take place in a short period of time.
5 Data
The main data source is the Teagasc National Farm survey. These data are frequently used to determine the broader financial situation on Irish farms
and contribute to economic and rural development research and policy
analysis. These data include the level of gross output, costs, income, investment and indebtedness across the spectrum of farming systems and
sizes. The data form the Irish component of the Farm Accountancy Data Network (FADN) database, which is used to evaluate farm incomes and the
impacts of the Common Agricultural Policy across the EU for the EU Commission.
A farm accounts book is recorded for each year on a random sample of farms, selected by the Central Statistics Office, throughout the country. Our
models are based Teagasc NFS data for the period 2015 to 2017. For 2017, there are 889 farms included in the data, representing approximately 84,750
farms nationally. The simulations are applied to all farms with good or medium soils. In 2017, there are 797 farms with either good or medium
13
soils, representing approximately 78,150 farms nationally and these 797
farms form the sample for this study.
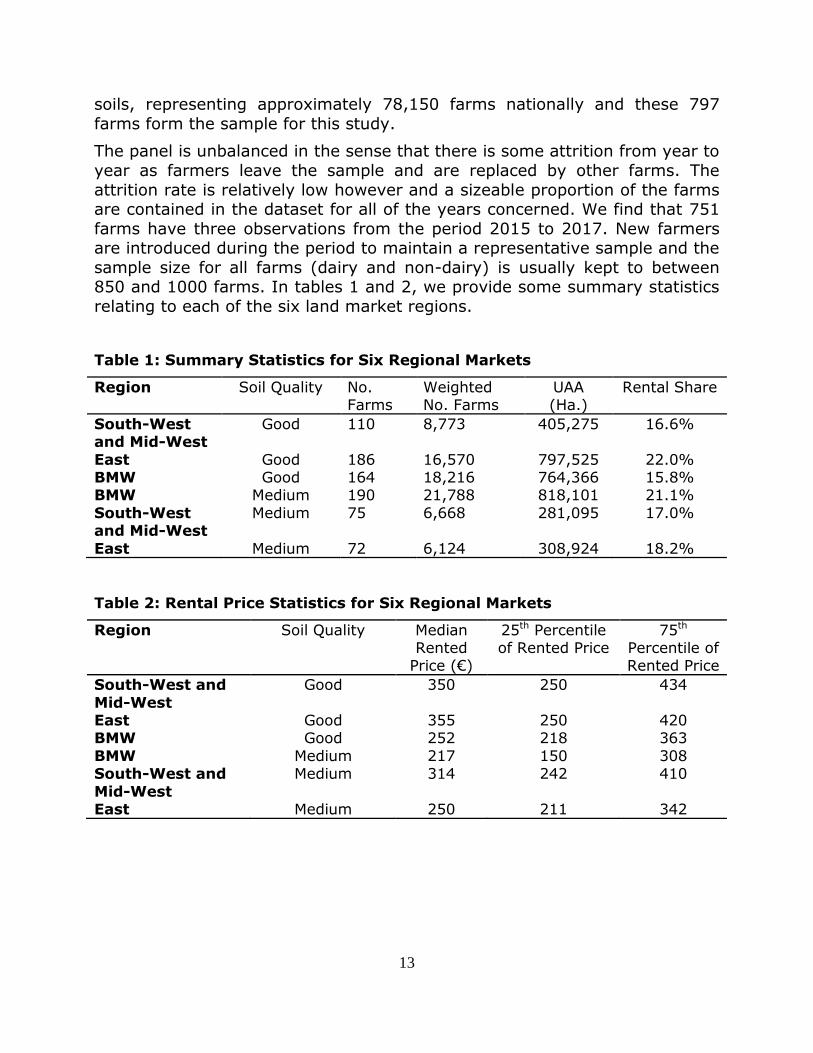
The panel is unbalanced in the sense that there is some attrition from year to
year as farmers leave the sample and are replaced by other farms. The
attrition rate is relatively low however and a sizeable proportion of the farms are contained in the dataset for all of the years concerned. We find that 751
farms have three observations from the period 2015 to 2017. New farmers are introduced during the period to maintain a representative sample and the
sample size for all farms (dairy and non-dairy) is usually kept to between 850 and 1000 farms. In tables 1 and 2, we provide some summary statistics
relating to each of the six land market regions.
Table 1: Summary Statistics for Six Regional Markets
Region Soil Quality No. Farms
Weighted No. Farms
UAA (Ha.)
Rental Share
South-West and Mid-West
Good 110 8,773 405,275 16.6%
East Good 186 16,570 797,525 22.0% BMW Good 164 18,216 764,366 15.8% BMW Medium 190 21,788 818,101 21.1%
South-West and Mid-West
Medium 75 6,668 281,095 17.0%
East Medium 72 6,124 308,924 18.2%
Table 2: Rental Price Statistics for Six Regional Markets
Region Soil Quality Median Rented
Price (€)
25th Percentile of Rented Price
75th Percentile of Rented Price
South-West and
Mid-West
Good 350 250 434
East Good 355 250 420 BMW Good 252 218 363
BMW Medium 217 150 308 South-West and
Mid-West
Medium 314 242 410
East Medium 250 211 342
14
6 Results
In this section, we detail the results from our simulations. We display the simulation results showing the change in the farm size distribution and the
extent of land transfer from the livestock sectors to the dairy sector. We pay
particular attention to the determinantion of prices in the microsimulation model and the equilibrium model. We conclude that the microsimulation
model requires further refinement to address the question of price determination.
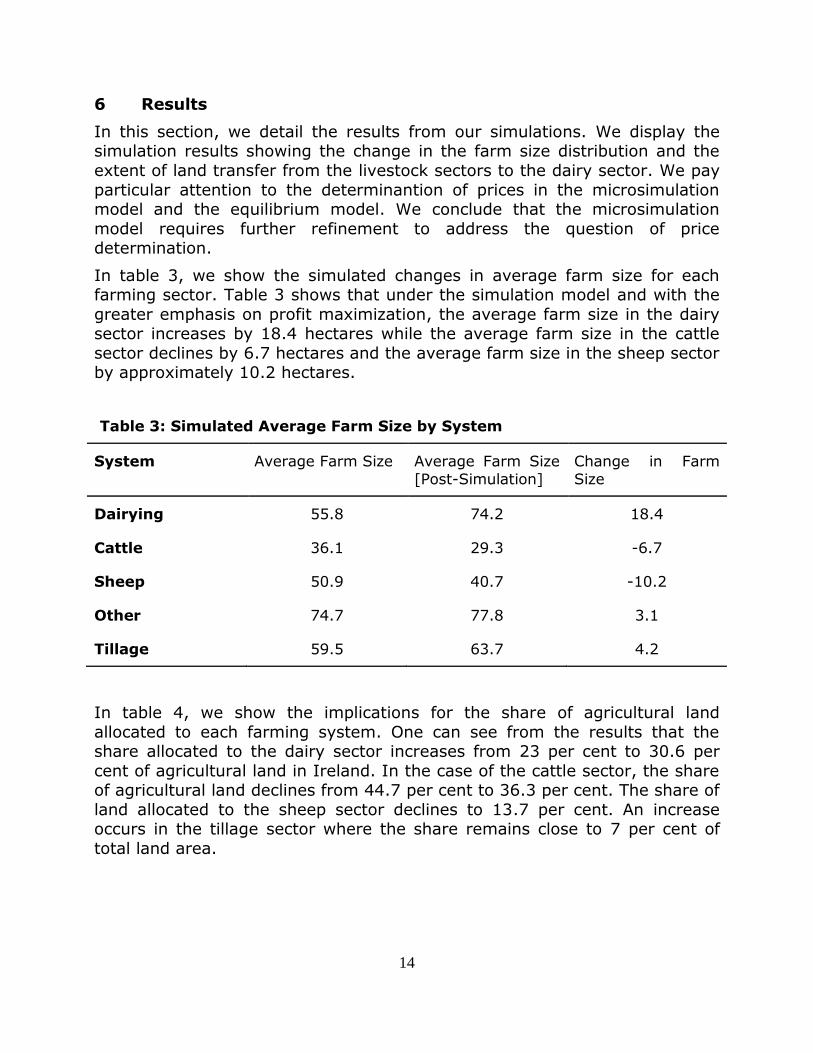
In table 3, we show the simulated changes in average farm size for each farming sector. Table 3 shows that under the simulation model and with the
greater emphasis on profit maximization, the average farm size in the dairy sector increases by 18.4 hectares while the average farm size in the cattle
sector declines by 6.7 hectares and the average farm size in the sheep sector by approximately 10.2 hectares.
Table 3: Simulated Average Farm Size by System
System Average Farm Size Average Farm Size
[Post-Simulation]
Change in Farm
Size
Dairying 55.8 74.2 18.4
Cattle 36.1 29.3 -6.7
Sheep 50.9 40.7 -10.2
Other 74.7 77.8 3.1
Tillage 59.5 63.7 4.2
In table 4, we show the implications for the share of agricultural land
allocated to each farming system. One can see from the results that the share allocated to the dairy sector increases from 23 per cent to 30.6 per
cent of agricultural land in Ireland. In the case of the cattle sector, the share of agricultural land declines from 44.7 per cent to 36.3 per cent. The share of
land allocated to the sheep sector declines to 13.7 per cent. An increase occurs in the tillage sector where the share remains close to 7 per cent of
total land area.
15
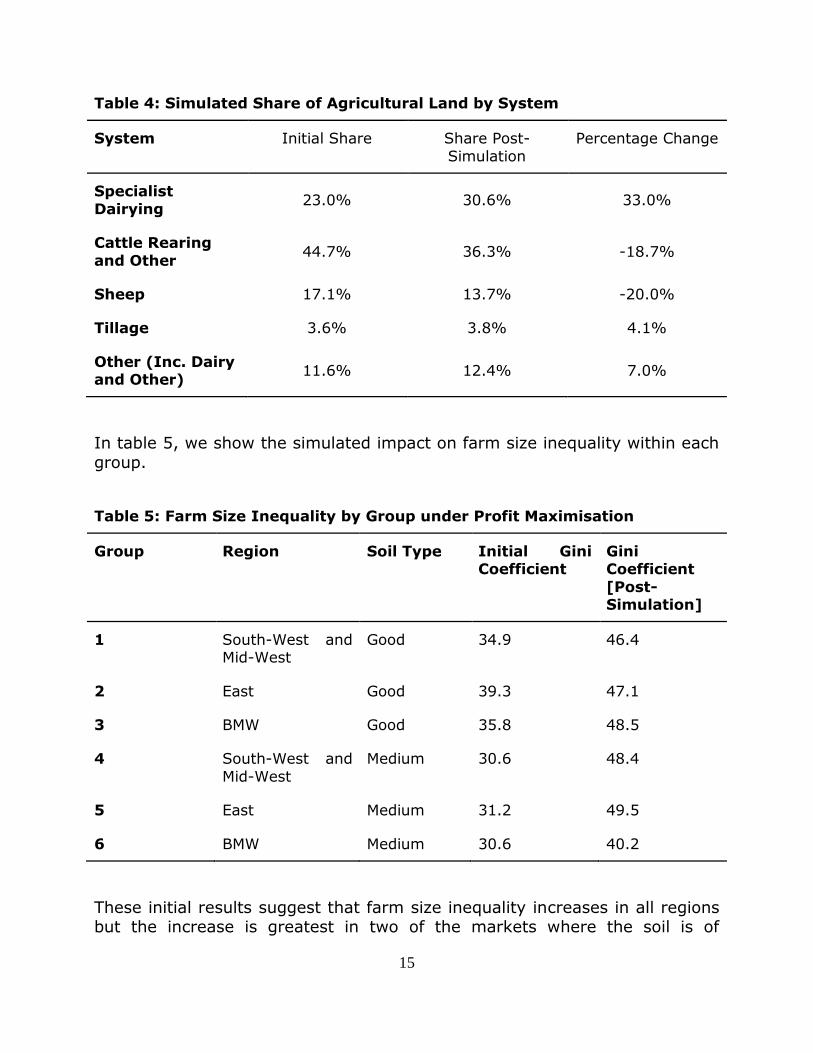
Table 4: Simulated Share of Agricultural Land by System
System Initial Share Share Post-
Simulation
Percentage Change
Specialist
Dairying 23.0% 30.6% 33.0%
Cattle Rearing
and Other 44.7% 36.3% -18.7%
Sheep 17.1% 13.7% -20.0%
Tillage 3.6% 3.8% 4.1%
Other (Inc. Dairy and Other)
11.6% 12.4% 7.0%
In table 5, we show the simulated impact on farm size inequality within each
group.
Table 5: Farm Size Inequality by Group under Profit Maximisation
Group Region Soil Type Initial Gini Coefficient
Gini Coefficient
[Post-Simulation]
1 South-West and Mid-West
Good 34.9 46.4
2 East Good 39.3 47.1
3 BMW Good 35.8 48.5
4 South-West and
Mid-West
Medium 30.6 48.4
5 East Medium 31.2 49.5
6 BMW Medium 30.6 40.2
These initial results suggest that farm size inequality increases in all regions but the increase is greatest in two of the markets where the soil is of
16
medium quality. In these markets, the initial inequality is lower relative to
other markets. In the BMW region with medium quality soils, the expansion of the land area is largely concentrated among initially medium sized farms
and this limits the increase in farm size inequality.
The change in the farm size distribution can be decomposed to account for the effect of re-ranking on the farm size distribution (See, For Example,
O'Neill et al 2017). One can then identify the extent to which the rise in inequality can be attributed to the initially large farms expanding further and
whether or not the small but highly profitable farms could affect the results.
Results for Price Determination
The ABM model provides for some variability in land prices between
individual transactions. In this way, the ABM model differs from the equilibrium model, where there is an assumption of one market clearing
price for all transactions within a given regional market. The ABM model provides for this variability in prices through the application of Eq. 12. While
ensuring some variability in land rental prices between transactions, the method does not fully replicate the existing variability of land rental prices.
This is partly due to the relatively small sample size of transactions between
farmers.
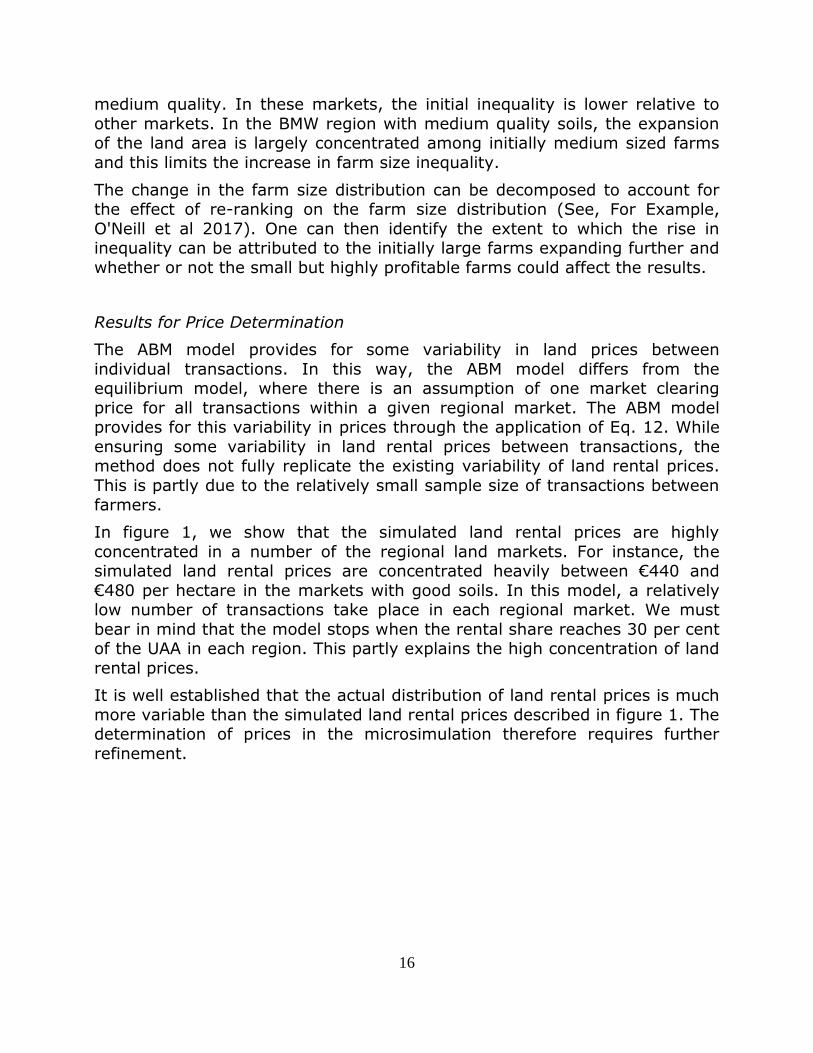
In figure 1, we show that the simulated land rental prices are highly
concentrated in a number of the regional land markets. For instance, the simulated land rental prices are concentrated heavily between €440 and
€480 per hectare in the markets with good soils. In this model, a relatively low number of transactions take place in each regional market. We must
bear in mind that the model stops when the rental share reaches 30 per cent of the UAA in each region. This partly explains the high concentration of land
rental prices.
It is well established that the actual distribution of land rental prices is much
more variable than the simulated land rental prices described in figure 1. The determination of prices in the microsimulation therefore requires further
refinement.
17
Figure 1: Distribution of Land Rental Prices in Microsimulation Model
Source: Authors calculations using the ABM model and Teagasc NFS data 2015-2017
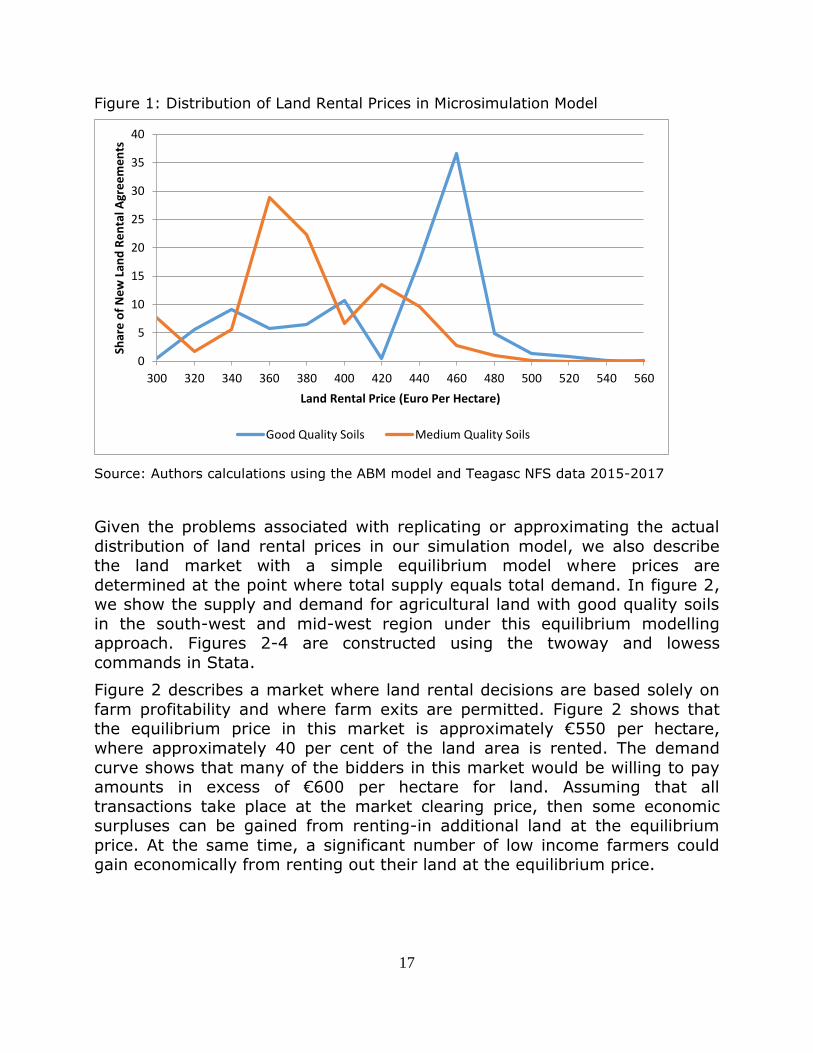
Given the problems associated with replicating or approximating the actual
distribution of land rental prices in our simulation model, we also describe the land market with a simple equilibrium model where prices are
determined at the point where total supply equals total demand. In figure 2, we show the supply and demand for agricultural land with good quality soils
in the south-west and mid-west region under this equilibrium modelling approach. Figures 2-4 are constructed using the twoway and lowess
commands in Stata.
Figure 2 describes a market where land rental decisions are based solely on
farm profitability and where farm exits are permitted. Figure 2 shows that the equilibrium price in this market is approximately €550 per hectare,
where approximately 40 per cent of the land area is rented. The demand
curve shows that many of the bidders in this market would be willing to pay amounts in excess of €600 per hectare for land. Assuming that all
transactions take place at the market clearing price, then some economic surpluses can be gained from renting-in additional land at the equilibrium
price. At the same time, a significant number of low income farmers could gain economically from renting out their land at the equilibrium price.
0
5
10
15
20
25
30
35
40
300 320 340 360 380 400 420 440 460 480 500 520 540 560
Shar
e o
f N
ew
Lan
d R
en
tal A
gre
em
en
ts
Land Rental Price (Euro Per Hectare)
Good Quality Soils Medium Quality Soils
18
Figure 2: Market for Good Agricultural Land in South-West and Mid-West Region
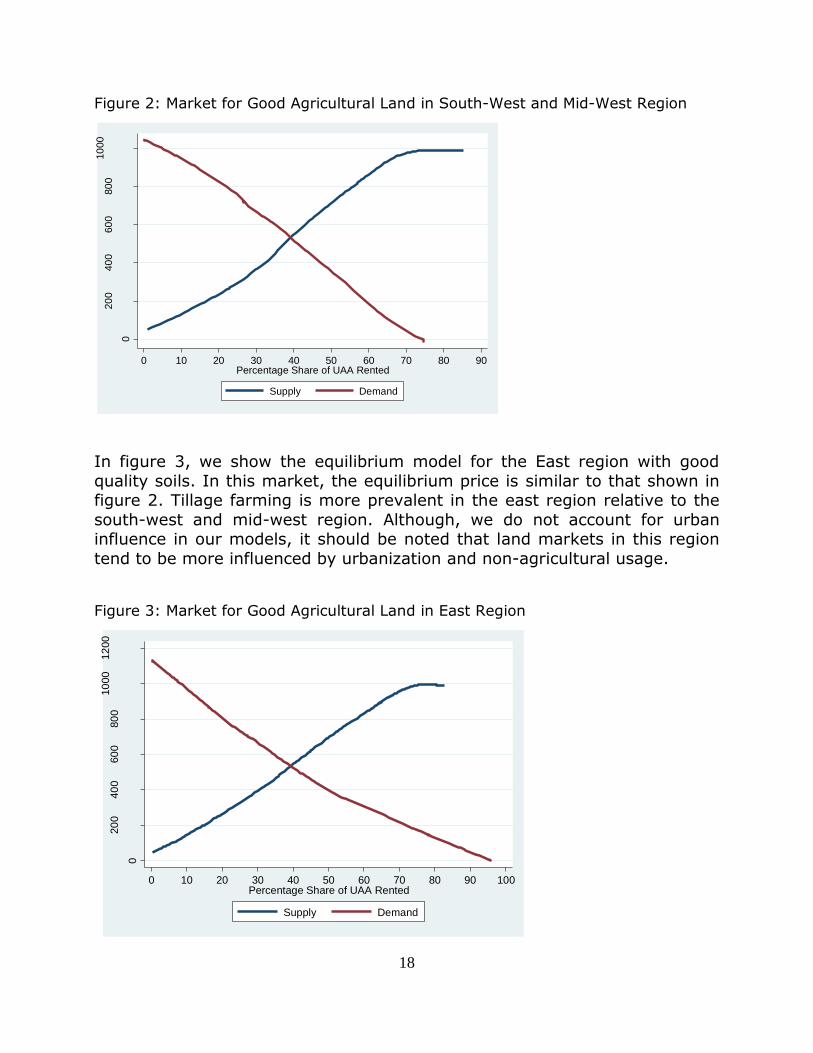
In figure 3, we show the equilibrium model for the East region with good
quality soils. In this market, the equilibrium price is similar to that shown in figure 2. Tillage farming is more prevalent in the east region relative to the
south-west and mid-west region. Although, we do not account for urban influence in our models, it should be noted that land markets in this region
tend to be more influenced by urbanization and non-agricultural usage.
Figure 3: Market for Good Agricultural Land in East Region
0
20
040
060
080
010
00
Euro
Pri
ce P
er
He
cta
re
0 10 20 30 40 50 60 70 80 90Percentage Share of UAA Rented
Supply Demand
0
20
040
060
080
010
00
12
00
Euro
Pri
ce P
er
He
cta
re
0 10 20 30 40 50 60 70 80 90 100Percentage Share of UAA Rented
Supply Demand
19
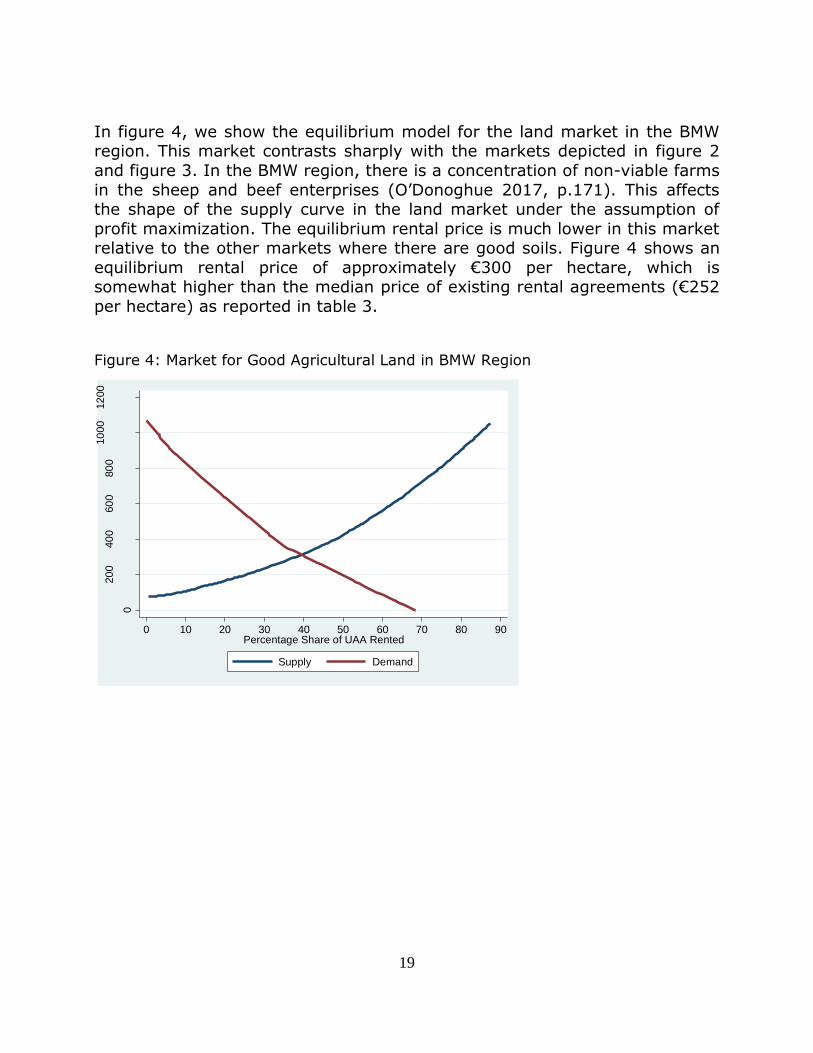
In figure 4, we show the equilibrium model for the land market in the BMW region. This market contrasts sharply with the markets depicted in figure 2
and figure 3. In the BMW region, there is a concentration of non-viable farms
in the sheep and beef enterprises (O’Donoghue 2017, p.171). This affects the shape of the supply curve in the land market under the assumption of
profit maximization. The equilibrium rental price is much lower in this market relative to the other markets where there are good soils. Figure 4 shows an
equilibrium rental price of approximately €300 per hectare, which is somewhat higher than the median price of existing rental agreements (€252
per hectare) as reported in table 3.
Figure 4: Market for Good Agricultural Land in BMW Region
0
20
040
060
080
010
00
12
00
Euro
Pri
ce P
er
He
cta
re
0 10 20 30 40 50 60 70 80 90Percentage Share of UAA Rented
Supply Demand
20
7 Conclusion
In this paper, we have introduced a new agent-based microsimulation model
to analyse the agricultural land rental market in Ireland. The model requires
some refinement to deal with the question of price determination but provides a number of valuable insights. The findings from the
microsimulation model indicate that a greater emphasis on profit maximization behaviour in the land rental market would be likely to lead to
significant increases in farm size concentration and inequality.
This increase in farm size inequality would be likely to occur in the absence
of countervailing factors such as may arise from an influx of highly-trained new entrant farmers into the land market or through targeted reforms to the
system of farm subsidies. The model results also confirm the expectation that an increase in profit maximisation behaviour leads to a significant
transfer of agricultural land from the cattle and sheep sectors and towards the more profitable dairy sector. The results point to a small increase in land
area for the tillage sector, which can be partly attributed to relatively lower labour costs and lower building costs associated with expansion of the land
area.
In addition to the microsimulation model, we display results based on an equilibrium model, where prices are determined by the total supply and total
demand for agricultural land and with the assumption of one single market clearing price in each regional market. This model assumes the presence of a
central auctioneer organising the operation of the market. Under this equilibrium model of price determination, our results confirm sharp
differences between the land markets in the south and east regions and the largely disadvantaged BMW region in Ireland. It appears plausible that
agricultural market returns are the dominant factor in influencing the demand for agricultural land rental in many parts of Ireland but other
considerations must play an important role on the supply side of the market and this motivates further research into the topic.
The microsimulation model and the equilibrium model can both be refined to account for the assumptions regarding transaction costs and the costs
associated with fragmentation. Future work could account for the distinction
between one year land rental agreements and longer term leasing agreements as well as the question of land sales.
21
8 References
Arsenault, A., Nolan, J., Schoney, R., and Gilchrist, D. (2012). Outstanding in
the field: Evaluating auction markets for farmland using multi-agent
simulation. Journal of Artificial Societies and Social Simulation, 15(1), 11.
Balmann, A. (1997) Farm-based modelling of regional structural change: A
cellular automata approach. European review of agricultural economics, 24(1), 85-108.
Berger, T. (2001). Agent‐based spatial models applied to agriculture: a
simulation tool for technology diffusion, resource use changes and policy
analysis. Agricultural economics, 25(2‐3), 245-260.
Bert, F., North, M., Rovere, S., Tatara, E., Macal, C., and Podestá, G. (2015). Simulating agricultural land rental markets by combining agent-based
models with traditional economics concepts: The case of the Argentine Pampas. Environmental Modelling & Software, 71, 97-110.
Boinon, J. P. (2003). Land policy in France and its consequence for the farmers. ZEMEDELSKA EKONOMIKA-PRAHA-, 49(4), 166-172.
Cotteleer, G., Gardebroek, C., and Luijt, J. (2008). Market power in a GIS-based hedonic price model of local farmland markets. Land
Economics, 84(4), 573-592.
Duesberg, S., Bogue, P., and Renwick, A. (2017). Retirement farming or sustainable growth–land transfer choices for farmers without a
successor. Land Use Policy, 61, 526-535.
Fagiolo G., Guerini M., Lamperti F., Moneta A., and Roventini A. (2019)
Validation of Agent-Based Models in Economics and Finance. In: Beisbart C., Saam N. (eds) Computer Simulation Validation. Simulation Foundations,
Methods and Applications. Springer, Cham
Freeman, T., Nolan, J., and Schoney, R. (2009). An Agent‐Based Simulation
Model of Structural Change in Canadian Prairie Agriculture, 1960–
2000. Canadian Journal of Agricultural Economics/Revue canadienne d'agroeconomie, 57(4), 537-554.
Geoghegan, C., Kinsella, A., and O’Donoghue, C. (2017). Institutional drivers of land mobility: The impact of CAP rules and tax policy on land mobility
incentives in Ireland. Agricultural Finance Review, 77(3), 376-392.
Gilbert, N. (2007). Agent-based Models. Quantitative Applications in the
Social Sciences, vol. 153 (7). SAGE Publications, p. 112
Graubner, M. (2017). Lost in space? The effect of direct payments on land
rental prices. European Review of Agricultural Economics, 45(2), 143-171.
22
Happe, K., Balmann, A., and Kellermann, K. (2004). The Agricultural Policy
Simulator (Agripolis) An Agent-Based Model To Study Structural Change In Agriculture (Version 1.0) (No. 918-2016-72618).
Happe, K., Kellermann, K., and Balmann, A. (2006). Agent-based analysis of
agricultural policies: an illustration of the agricultural policy simulator AgriPoliS, its adaptation and behavior. Ecology and Society, 11(1).
Hennessy, T., Shrestha, S., Shalloo, L., and Wallace, M (2009) The inefficiencies of regionalised milk quota trade. Journal of Agricultural
Economics, 60(2), 334-347.
Howley, P., Buckley, C., Donoghue, C. O', and Ryan, M. (2015). Explaining
the economic ‘irrationality’of farmers' land use behaviour: The role of productivist attitudes and non-pecuniary benefits. Ecological Economics, 109,
186-193.
Leonard, B., Kinsella, A., O’Donoghue, C., Farrell, M., and Mahon, M. (2017).
Policy drivers of farm succession and inheritance. Land use policy, 61, 147-159.
Loughrey, J., Thorne, F., and Hennessy, T. (2016) A Microsimulation Model for Risk in Irish Tillage Farming. International Journal of Microsimulation,
9(2), 41-76.
Loughrey, J., and Donnellan, T. (2017). Inequality and Concentration in Farmland Size: A Regional Analysis for Western Europe, The XV EAAE
Congress, “Towards Sustainable Agri-food Systems: Balancing Between Markets and Society, 29th August - 1st September, Parma, Italy.
Loughrey J., Donnellan, T., and Hanrahan K. (2019). The Agricultural Land Market in the EU and the Case for Better Data Provision, Eurochoices.
O’Donoghue, C. (2013). Modelling farm viability. In Spatial Microsimulation for Rural Policy Analysis (pp. 177-191). Springer, Berlin, Heidelberg.
O’Donoghue, C. (2017). Spatial Microsimulation of Farm Income. In Farm-Level Microsimulation Modelling (pp. 147-175). Palgrave Macmillan, Cham.
O’Neill, S., and Hanrahan, K. (2012). Decoupling of agricultural support payments: The impact on land market participation decisions. European
Review of Agricultural Economics, 39(4), 639–659.
O'Neill, S., and Hanrahan, K. (2016). The capitalization of coupled and
decoupled CAP payments into land rental rates. Agricultural Economics,
47(3), 285-294.
O'Neill, S., Loughrey, J., Hynes, S., O'Donoghue, C., and Hanrahan, K.
(2017). The redistributive impact of EU farm payment reforms in the UK and Ireland, The XV EAAE Congress, “Towards Sustainable Agri-food Systems:
23
Balancing Between Markets and Society, 29th August - 1st September,
Parma, Italy.
Patton, M., and McErlean, S. (2003). Spatial effects within the agricultural
land market in Northern Ireland. Journal of Agricultural Economics, 54(1),
35-54.
Piet, L., Latruffe, L., Le Mouël, C., and Desjeux, Y. (2012). How do
agricultural policies influence farm size inequality? The example of France. European Review of Agricultural Economics, 39(1), 5-28.
Piet, L. (2016). Recent trends in the distribution of farm sizes in the EU, 149th EAAE Seminar ‘Structural change in agri-food chains: new relations
between farm sector, food industry and retail sector’, Rennes, France, October 27-28, 2016
Polhill, J. G., Parker, D. C., and Gotts, N. M. (2008). Effects of land markets on competition between innovators and imitators in land use: results from
FEARLUS-ELMM. In Social simulation: Technologies, advances and new discoveries (pp. 81-97). IGI Global.
Ramilan T., Scrimgeour F., and Marsh, D. (2011). Analysis of environmental and economic efficiency using a farm population micro-simulation model.
Mathematics and Computers in Simulation, 81(7), 1344-1352.
Storm, H., Mittenzwei, K., and Heckelei, T. (2014). Direct payments, spatial competition, and farm survival in Norway. American Journal of Agricultural
Economics, 97(4), 1192-1205.
Viaggi, D., Bartolini, F., Puddu, M., and Raggi, M. (2013). Farm/Household-
Level Simulation Results of Testing Policy and Other Scenarios, Factor Markets Working Paper No. 54
Copyright © 2022 FDOKUMEN