A methodology for priority setting with application to software development process
15
Theory and Methodology A methodology for priority setting with application to software development process Mindy Lee, Hoang Pham * , Xuemei Zhang Department of Industrial and Systems Engineering, Rutgers University, P.O. Box 909, Piscataway, NJ 08855, USA Received 13 May 1996; accepted 22 July 1998 Abstract In this paper we briefly review the basic ideas behind the Analytic Hierarchy Process (AHP). Based on these ideas, we introduce the concept of comparison interval and propose a methodology based on stochastic optimization to achieve global consistency and to accommodate the fuzzy nature of the comparison process. We also discuss systems with feedback. For systems with inter-component dependence, we review the super-matrix technique. For systems with intra- component dependence, we propose a systematic approximation scheme to compute the weight vector for priority setting. Applications of software development process and a numerical example are given to illustrate our methodology and results. Ó 1999 Elsevier Science B.V. All rights reserved. Keywords: Analytic hierarchy process; Software development process; Pairwise comparison method; Stochastic optimization; Priority setting 1. Introduction The Analytic Hierarchy Process (AHP) is a methodology originally used for decision-making by structuring and analyzing a multi-variable complex system. AHP has been applied in a vari- ety of areas since it was first developed by Saaty [1] in the 1970s. In the AHP, the relevant issues in decision making problem is constructed into a hi- erarchical structure and a series of pairwise com- parison is carried out to achieve a preference order. When doing pairwise comparison, decision maker (DM) specifies his/her preference of one factor to another and the global preference order is estabulished by combining all the comparisons. This paper extends the AHP methodology by incorporating the following two factors: (a) un- certainty of preference comparison process and (b) dependence of components and elements of the hierarchy. DM usually find that it is more confi- dent to give interval judgments than fixed value judgments. This is because usually he/she is unable to explicit about his/her preferences due to the fuzzy nature of the comparison process. By using the concept of comparison interval, we introduce a methodology based on stochastic optimization to European Journal of Operational Research 118 (1999) 375–389 www.elsevier.com/locate/orms * Corresponding author. Tel.: +1-908-445-5471; fax: +1-908- 445-5467; e-mail: [email protected] 0377-2217/99/$ – see front matter Ó 1999 Elsevier Science B.V. All rights reserved. PII: S 0 3 7 7 - 2 2 1 7 ( 9 8 ) 0 0 3 2 0 - 8
-
Upload
independent -
Category
Documents
-
view
0 -
download
0
Transcript of A methodology for priority setting with application to software development process

Theory and Methodology
A methodology for priority setting with application to softwaredevelopment process
Mindy Lee, Hoang Pham *, Xuemei Zhang
Department of Industrial and Systems Engineering, Rutgers University, P.O. Box 909, Piscataway, NJ 08855, USA
Received 13 May 1996; accepted 22 July 1998
Abstract
In this paper we brie¯y review the basic ideas behind the Analytic Hierarchy Process (AHP). Based on these ideas, we
introduce the concept of comparison interval and propose a methodology based on stochastic optimization to achieve
global consistency and to accommodate the fuzzy nature of the comparison process. We also discuss systems with
feedback. For systems with inter-component dependence, we review the super-matrix technique. For systems with intra-
component dependence, we propose a systematic approximation scheme to compute the weight vector for priority
setting. Applications of software development process and a numerical example are given to illustrate our methodology
and results. Ó 1999 Elsevier Science B.V. All rights reserved.
Keywords: Analytic hierarchy process; Software development process; Pairwise comparison method; Stochastic
optimization; Priority setting
1. Introduction
The Analytic Hierarchy Process (AHP) is amethodology originally used for decision-makingby structuring and analyzing a multi-variablecomplex system. AHP has been applied in a vari-ety of areas since it was ®rst developed by Saaty [1]in the 1970s. In the AHP, the relevant issues indecision making problem is constructed into a hi-erarchical structure and a series of pairwise com-parison is carried out to achieve a preference
order. When doing pairwise comparison, decisionmaker (DM) speci®es his/her preference of onefactor to another and the global preference order isestabulished by combining all the comparisons.
This paper extends the AHP methodology byincorporating the following two factors: (a) un-certainty of preference comparison process and (b)dependence of components and elements of thehierarchy. DM usually ®nd that it is more con®-dent to give interval judgments than ®xed valuejudgments. This is because usually he/she is unableto explicit about his/her preferences due to thefuzzy nature of the comparison process. By usingthe concept of comparison interval, we introduce amethodology based on stochastic optimization to
European Journal of Operational Research 118 (1999) 375±389www.elsevier.com/locate/orms
* Corresponding author. Tel.: +1-908-445-5471; fax: +1-908-
445-5467; e-mail: [email protected]
0377-2217/99/$ ± see front matter Ó 1999 Elsevier Science B.V. All rights reserved.
PII: S 0 3 7 7 - 2 2 1 7 ( 9 8 ) 0 0 3 2 0 - 8

achieve global consistency and to accommodatethe uncertainty of the comparison process. Thispaper also capture another practical feature ofdecision making process, which is dependence. Inreal application, many times we due systems withfeedback, that is there are interdependence amongthe components in a system. Both inter-compo-nent dependence and intra-component dependenceare discussed. We review the super-matrix tech-nique and conjecture that the ®nal weight vector ina system with feedback can be approximated by anexpansion in terms of the length of the impactpaths.
This paper contains four sections. In Section 2,we brie¯y discuss the basic ideas of the AHP. InSection 3, we modify AHP by introducing theconcept of comparison interval and propose astochastic optimization method to achieve consis-tency in the comparison process. In Section 4, wediscuss the generalizations of the plain hierarchyprocess to systems with feedback, i.e. systems inwhich there are both inter-component and intra-component dependence. In Section 5, we illustrateour methodology by choosing the design phase inthe software development process as an example.
2. Basics of the analytic hierarchy process
The AHP is a comprehensive mathematicalframework for priority setting in a complex sys-tem. According to Saaty's original proposal, acomplex system is decomposed into subsystemsand represented in the hierarchical form. The ele-ment at the highest level is called the goal. Theelements at each level are the criteria of the ele-ments at the level below. The elements at thebottom level are called the alternatives. In thisway, AHP organizes the basic rationality of thepriority setting process by breaking down a multi-element complex system into its smaller constitu-ent parts called components (or levels). The processsetting can be divided into three phases which aresystem structuring, pairwise comparison and pri-orities synthesis.
The principle of comparative judgment calls forsetting up a matrix to carry out the pairwisecomparisons of the relative importance of the el-
ements in a component with respect to the criteria,elements in a dominating component at a higherlevel in the hierarchy. This matrix, denoted by C inour notation, is called the pairwise comparisonmatrix. Let the pairwise comparison matrix be
C �
1 c1;2 � � � c1;N
c2;1 1 � � � c2;N
� � � � � � � � � � � �cN ;1 � � � � � � 1
0BBB@1CCCA; �1�
where N is the number of elements in the compo-nent. The entry ci;j > 0 measures the relative im-portance of the impact on the criterion fromelement i against that from element j. There aresome obvious properties of C [1], among which theconsistency is the most important one. When I
matrix C satis®es the following equation, it is saidto be consistent.
ci;j � ci;kck;j for any k: �2�It is straightforward to show that when C is
consistent, the weight vector W, which gives therelative priorities of the elements, is identical toany one of the columns of C within a normaliza-tion factor. One can further show that W is thedominant eigenvector (i.e. eigenvector of the ei-genvalue with the largest amplitude) of the matrix,namely
C �W � NW: �3�Since the relative importance of the elements de-pends only on the relative amplitudes of thecomponents of the vector W, we may normalize W
by requiringXi
Wi � 1: �4�
Generally, a vector is said to be normalized if itsatis®es the above equation.
In fact the fuzzy nature of the comparisonprocess dictates that inconsistency cannot becompletely eliminated. It has been argued [1,2] thateven when C is not consistent, the weight vector W
is still determined by the dominant eigenvector ofC, namely
C �W � kmaxW; �5�
376 M. Lee et al. / European Journal of Operational Research 118 (1999) 375±389

where kmax is the largest eigenvalue of the matrixC. It can be shown that kmax P N for any positivereciprocal matrix [3,4]. The equality is reachedonly when the matrix is consistent. To measure theconsistency of the matrix C, we de®ne the consis-tency index (C.I.) as follows:
C:I: � !�C� � kmax ÿ NN ÿ 1
: �6�In practice, we consider the consistency of C is
acceptable if the consistency index ratio C:R: �!�C�=!�Crandom� is less than 0.1.!�Crandom� is theaverage consistency index of a random reciprocalmatrix of the same dimension.
Finally, we want to state a theorem [4] that we®nd useful in computing the dominating eigen-vector of a reciprocal matrix.
Theorem. Let W0 be a nonzero vector of dimensionN. The dominant eigenvector of a positive reciprocalmatrix C of dimension N is given by
limk!1
Ck �W0: �7�
3. Comparison interval and consistency
As we mentioned in Section 1, DM may ®nd itdi�cult to specify a point estimate when making apairwise comparison. To overcome this di�culty,and furthermore to accommodate the fuzzy natureof the comparison process, we propose the solu-tion of using conperison intervals instead of pointestimate of scale one to nine. Secondly, we mini-mize the consistency index !(C) as a function ofthe comparison matrix C under the constraint thatits elements ci;j 2 Ii;j, where Ii;j � �cmin
i;j ; cmaxi;j � is the
preference intervals. Speci®cally, let the compari-son matrix be
C �
1 c1;2 � � � c1;N
c2;1 1 � � � c2;N
� � � � � � � � � � � �cN ;1 � � � � � � 1
0BBBBB@
1CCCCCA: �8�
In literature, Saaty and Vargas [5] discussedways of deriving local priorities from the above
comparison interval matrix. They pointed out thatthe eigenvector in Eq. (3) is a nonlinear function ofthe comparison matrix elements and thereforethere is no simple methods for determining boundsand the amount of computation is intractable evenwhen the numbers ci;j is restricted to the nine in-tegers.
Arbel [6] interpreted the interval judgementIi;j � �li;j; ui;j� in terms of linear constraints on thelocal priorities, where li;j; ui;j are the lower andupper bounds of the preference intervals. Theypointed out that any local priority vector w ��w1; . . . ;wn� must satisfy the constraints lijwj6wi6 uijwj. In other words, the ith subelement is atleast lij but no more than uij times as important asthe jth subelement.
Salo and H�am�al�ainen [7] investigated how ap-proximate preference statements can be incorpo-rated into the AHP. They proposed a method toallow DM to start by articulate his/her preferencesabout those aspects that he/she feels most certainabout. Their method leads to an iterative processwhere the weight intervals can be re®ned by theDM based on his/her earlier judgements.
Zahir [8] presented how to incorporate un-avoidable uncertainty into the decision judgementsexpressed in terms of the relative weights in thepairwise comparison matrices in AHP. An algo-rithm was also developed for computing intervalsfor the alternatives.
Here we propose a stochastic model to deter-mine the weight priorities. This method bases onan iterative search in the space of C. It is simple forDM to perform the pairwise comparisons. And theconsistency index can be calculated interatively. Aslong as the comparison intervals are given, thecomparison matrix with any reasonable consis-tency index can be obtained easily with the help ofa PC. In the following part of this section, themodel is presented in details.
Let Ii;j � �cmini;j ; c
maxi;j � be a subinterval of
�1=emax; emax�. The parameter emax measures thepossible maximal relative importance of one ele-ment compared to another. Since in principle therecould be elements with vanishing priorities, thevalue of emax should be in®nity. In practice, theexact value of emax does not a�ect the priorityvector and the consistency index as long as it is
M. Lee et al. / European Journal of Operational Research 118 (1999) 375±389 377

large enough. The only thing it a�ects is the con-sistency index ratio since the entries of the randomreciprocal matrices are bounded by �1=emax; emax�.The emax can be any reasonable scale value. In allof our calculations, we choose it to be emax� 20.This is because compared with 9, 20 is a reason-ably large scale value to integrate di�erence levelsof preference. And one usually ®nd di�cult toperform comparison by using scale number be-yond 20. Obviously we maintain local consistencyby requiring reciprocal relation ci;j � 1=cj;i to besatis®ed. To facilitate this, we set
cmini;j �
1
cmaxj;i
; �9�
cmaxi;j �
1
cminj;i
: �10�
Note that the number of independent variables ofthe function !�C� is N�N ÿ 1�=2. Before we pro-ceed to discuss the minimization of the consistencyindex, we remark that by allowing the entries ofthe comparison matrix to be intervals, we have infact generated an ensemble of comparison matriceswith elements in the respective intervals. The taskof minimizing the consistency index is simply tochoose the comparison matrix with the consistencysmaller enough consistency index from this en-semble. There are various methods we can use toperform this task. One can certainly analyze indetail the extremal properties of !�C�. But this willbe much too complicated, especially when the di-mension N of the matrix is large. In our situation,we do not really want to know very precisely theextremal properties of !�C�. All we need is to ®nda matrix C in the given range with a consistencyindex that is small enough. Therefore we can takea much simpler approach.
The method we propose is based on iterativestochastic search in the space of C. The idea is thefollowing. To start, we generate the initial com-parison matrix C0 randomly such that its elementsc�0�i;j 2 Ii;j and c�0�j;i � 1=c�0�i;j for all i; j. Next we iter-atively modify the comparison matrix randomlyand compute its consistency index !�Cn� until itconverges, where Cn is the matrix generated in thenth step of the iteration. Speci®cally, in each step
of the iteration, we propose a new matrix by thefollowing operations. We ®rst modify the elementsin the upper triangle of the matrix, i.e.
for i < j; ci;j � c�n�i;j � ei;jhi;j; �11�where ei;j � eli;j; e > 0 is very small compared to 1,li;j is the length of the interval Ii;j given by li;j �cmax
i;j ÿ cmini;j and hi;j is a random number with a
uniform distribution in [ÿ1, 1]. By doing this, wemodify ci;j by adding or substracting a randomsmall value and continue the serch. Next, we checkwhether the modi®ed elements are all in their re-spective ranges. If not, we bounce them back intothe ranges. The operations involved are:
c�n�1�i;j � ci;j if ci;j 2 Ii;j;
c�n�1�i;j � 2cmin
i;j ÿ ci;j if ci;j < cmini;j ;
c�n�1�i;j � 2cmax
i;j ÿ ci;j if ci;j > cmaxi;j :
8>><>>: �12�
Finally, we generate the lower triangle using thereciprocal relation, i.e.
if i > j; c�n�1�j;i � 1
c�n�1�i;j
: �13�
The above iteration manifestly preserves thereciprocal relation and keeps the matrix elementsin their respective range Ii;j. Now it should bestraightforward to compute !�Cn� using the the-orem stated in Section 2, and then ®nd the com-parison matrix with a small enough consistencyindex. The value of e a�ects the convergence of theiteration. A small enough e 6� 0 will always pro-duce a convergent result although the number ofiteration steps needed may be large. Our experi-ence with the calculation indicates that for a typ-ical N from 3 to 16, it is su�cient to takee � 0:0005. The number of iteration steps beforethe consistency index converges is about 104. Thecomputation can easily be handled by a personalcomputer. Once the result converges, it isstraightforward to calculate the consistency indexratio C:R: � !�Cn�=�!�emax�, where �!�e max� is theaverage consistency index of the reciprocal matri-ces of dimension N with entries drawn uniformlyfrom the interval �1=emax; emax�.
To demonstrate the e�ectiveness of our pro-posed method, we consider the following example.
378 M. Lee et al. / European Journal of Operational Research 118 (1999) 375±389

Imagine we are in the process of purchasing anautomobile. There are various factors we have toconsider, such as price, performance, safety fea-tures, dealer service, etc. To be concrete, let usfocus only on the driving performance that dif-ferent cars can provide. The cars under consider-ation are various four door sedans made byToyota, Nissan, Honda, and Mazda. After sur-veying a number of people, we obtain the com-parison intervals listed in Table 1. In this case, thedimension of the matrix N� 4. As mentionedabove, we use emax � 20. The average consistencyindex of a 4-dimensional random reciprocal matrixwith entries in the interval �1=emax; emax� can becalculated to be �!4�20� � 0:416: In Fig. 1, weshow the consistency index as a function of thenumber of iteration steps. We can clearly see that
the consistency index converges in about 1400steps. The resultant comparison matrix has anacceptable consistency index of 0.0272 since it isless than 10% of �!4�20� � 0:416. Table 2 showsthe resultant comparison matrix and the prioritiesof the elements. As indicated by the results,Maxima stands out as the option with the highestpriority, i.e. the best subjective performance. Thisis also consistent with the expert opinions pub-lished in the Motor Trend magazine [9].
Before concluding this section, we remark thatas long as the comparison intervals are reasonablygiven, then the optimal comparison matrix is un-ique, and our method always converges to theoptimal comparison matrix, as our computationshows. Furthermore, we may add more ¯exibilityto the above approach. For example, we may al-low the comparison matrix to be a random recip-rocal matrix distributed around the resultantoptimal comparison matrix. Then all of the rele-vant results must be weighted by the distributionand we may talk about the system only on theaverage.
To summarize, we have proposed to introducethe concept of comparison interval to achieveconsistency and to accommodate the fuzzy natureof the comparison process. Based on stochasticminimization, we have devised and implemented anumerical method to compute the comparisonmatrix with the consistency index as a function ofthe iterative steps. Reasonable comparison matrixcan be obtained according to the requirement ofthe practical problem.
Table 1
Performance Toyota Camry Nissan Maxima Honda Accord Mazda 626
Toyota Camry [1.0, 1.0] [0.22, 0.40] [2.5, 4.0] [3.5, 4.8]
Nissan Maxima [2.5, 4.5] [1.0, 1.0] [3.0, 4.5] [4.0, 6.0]
Honda Accord [0.25, 0.40] [0.22, 0.33] [1.0, 1.0] [3.0, 5.0]
Mazda 626 [0.21, 0.29] [0.16, 0.25] [0.20, 0.33] [1.0, 1.0]
Fig. 1. The consistency index as a function of the iteration steps
in the stochastic minimization.
Table 2
Performance Toyota Camry Nissan Maxima Honda Accord Mazda 626 Priority
Toyota Camry 1.000 0.400 2.500 4.243 0.274
Nissan Maxima 2.500 1.000 3.536 6.000 0.515
Honda Accord 0.400 0.283 1.000 3.000 0.146
Mazda 626 0.236 0.167 0.330 1.000 0.065
M. Lee et al. / European Journal of Operational Research 118 (1999) 375±389 379
4. Systems with feedback
In this section, dependence of the hierarchycomponents are considered by using the super-matrix technique. A general form of matrix ispresented to deal with dependency between com-ponents of any length. This sequential procedure isused to determine the weight priorities.
In last section, we have been focusing on sys-tems with a strictly tree-like priority structure, i.e.systems where the impact propagates only in onedirection from one level to another and there is noimpact among the elements in the same level.Obviously a methodology of priority setting ap-plicable only to these systems is limited in realworld practice. In many applications, the impactsmay propagate in both directions, i.e. the alter-natives may a�ect the priority setting of their cri-teria. Furthermore the alternatives in the samelevel may a�ect each other. These systems arecalled systems with feedback [1]. As we canimagine, the impact relations in a real situationcan be very complex. Strictly speaking, pairwisecomparison may not be a sensible tool for prioritysetting in the sense that the comparison processitself depends on the priorities of the elements, i.e.the entries of the pairwise comparison matrix haveto be functions of the priorities of the elements inthe system. We are therefore facing two very dif-®cult problems. First, we need to ®nd out the formof these functions which is almost impossiblewithout a large amount of real data. Secondly,even if we manage to ®gure out these functions, weare still facing with a nonlinear eigenvalue prob-lem, which is not an easy task either. Obviouslymore work should be done in this area. However,the problem is not completely hopeless. Undercertain assumptions, we have at most the combi-nation of the following two situations.
(1) The hierarchical structure still exists. Thereis inter-component dependence but no intra-com-ponent dependence. In this case, the so-called su-per-matrix technique [1] may be used to take intoaccount the impacts along all of the paths so thatthe ®nal priorities can be calculated.
(2) There is intra-component dependence. Theinter-component impacts travel only in one direc-tion and do not form close loops. In this case, we
may expand the solution order by order de®ned bythe length of the impact paths taken into account.This technique enables us to focus on some givenpaths so that pairwise comparison may still be areasonable tool. The ®nal priorities can then besynthesized from the pairwise comparisons.
In the following sections, we are going to dis-cuss these two cases in more details.
4.1. Inter-component feedback and the super-matrixtechnique
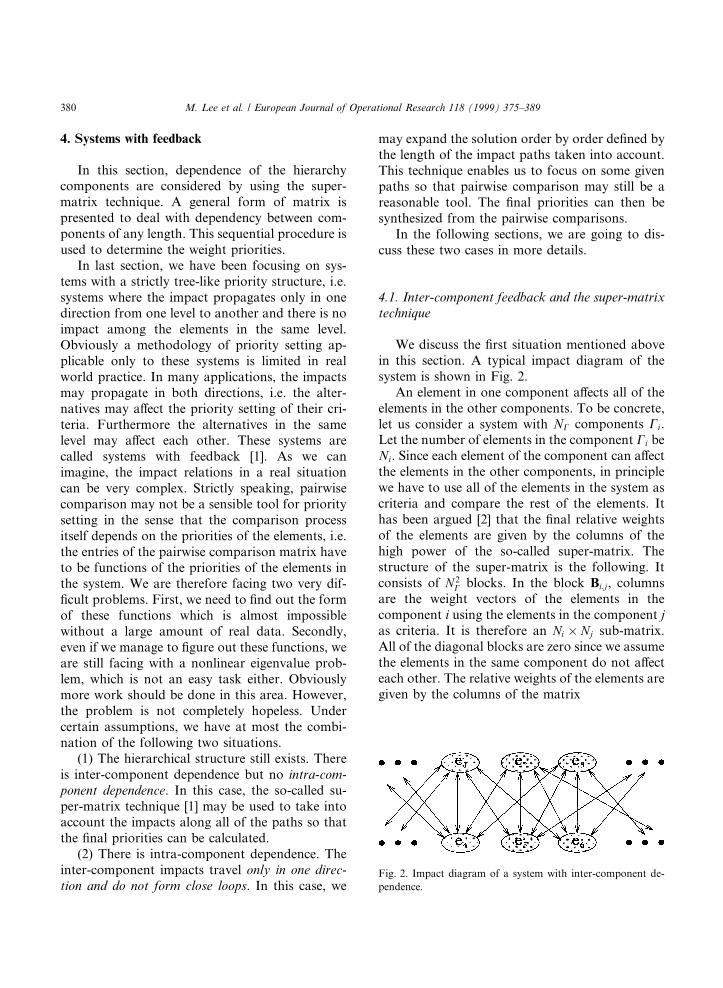
We discuss the ®rst situation mentioned abovein this section. A typical impact diagram of thesystem is shown in Fig. 2.
An element in one component a�ects all of theelements in the other components. To be concrete,let us consider a system with NC components Ci.Let the number of elements in the component Ci beNi. Since each element of the component can a�ectthe elements in the other components, in principlewe have to use all of the elements in the system ascriteria and compare the rest of the elements. Ithas been argued [2] that the ®nal relative weightsof the elements are given by the columns of thehigh power of the so-called super-matrix. Thestructure of the super-matrix is the following. Itconsists of N 2
C blocks. In the block Bi;j, columnsare the weight vectors of the elements in thecomponent i using the elements in the component jas criteria. It is therefore an Ni � Nj sub-matrix.All of the diagonal blocks are zero since we assumethe elements in the same component do not a�ecteach other. The relative weights of the elements aregiven by the columns of the matrix
Fig. 2. Impact diagram of a system with inter-component de-
pendence.
380 M. Lee et al. / European Journal of Operational Research 118 (1999) 375±389

S�1� � limk!1
S�2k�1�; �14�
where S is the super-matrix
S �
B1;1 B1;2 � � � B1;NC
B2;1 B2;2 � � � B2;NC
� � � � � � � � � � � �BNC;1 � � � � � � BNC ;NC
0BBB@1CCCA: �15�
4.2. Iterative method for intra-component depen-dence
For simplicity yet without loss of generality, weconsider a system consisting of one criterion andone component of N elements. The elements in thesystem a�ect each other, as shown in Fig. 3.
As mentioned at the beginning of the section, itis nontrivial to apply the pairwise comparisonmethod in this case. Here we only brie¯y describeand generalize an approach proposed by Saaty andTakizawa [10]. The approach is based on an orderby order approximation of the solution by con-sidering impact paths of increasing lengths. To thelowest order, when we consider the impact paths oflength 1, such as the paths e1 ! e0; e2 ! e0; e3 !e0; and e4 ! e0 in the ®gure, the process is identicalto the usual analytic hierarchy process, which is toconstruct the pairwise comparison matrix ignoringthe interdependence among the elements. To thislowest order, the weight vector W is approximatedby the dominant eigenvector W�1� of the compar-ison matrix. To take into account the interdepen-dence among the elements, we have to consider
longer impact paths. For the impact paths oflength 2, like the paths e1 ! e2 ! e0; e3 ! e2 !e0; and e4 ! e2 ! e0 in the ®gure, for example, wecan encode the interdependence among the ele-ments in a stochastic matrix called the interde-pendence matrix W�2�. The jth column of thematrix contains impact information along thepaths with element j as the intermediate element.In constructing the column, we ®rst construct thepairwise comparison matrix C�j� in the set S�j� ofthe starting points of the paths as if its elements areindependent. In the comparison process, it is im-portant to keep in mind that only the impacts alongthe paths under consideration are taken into ac-count. Secondly, we assign a number w�2�j 2 �0; 1� tothe intermediate element j to measure its contri-bution along the paths. Then the jth column of theinterdependence matrix W�2� is given by
W�2�i;j �
w�2�j if i � j;
�1ÿ w�2�j �V�j�i if i 6� j and i 2 S�j�;
0 otherwise;
8><>:�16�
where V�j� is the normalized dominant eigenvectorof C�j�. To the second order, when the paths, oflengths not greater than 2 are taken into account,the weight vector for the elements is given by
W �W�2� �W�1�: �17�Generally, for the impact paths of length n, such asthe one shown in Fig. 4, the interdependenceamong the elements can be encoded in a rank ninterdependence tensor W�n� with componentsgiven by
W�n�i;jnÿ1;jnÿ2;...;j1
�w�c�V�c�i if i 6� j1; j2; . . . ; jnÿ1 and i 2 S�c�;
wjl if i � jl;
0 otherwise;
8><>:�18�
where S�c� is the set of the starting points of thepath c; w�c� � 1ÿPnÿ1
l�1 wjl; and wjl is the weightmeasuring the importance of the intermediate el-ement jl along the path. If the number of elementsin the set S�c� is zero, the interdependence tensor isde®ned by
Fig. 3. Impact diagram of a system with intra-component de-
pendence.
M. Lee et al. / European Journal of Operational Research 118 (1999) 375±389 381

W�n�i;jnÿ1;jnÿ2;...;j1
�1 if i � jnÿ1;
0 otherwise:
(�19�
We can argue, or more appropriately, we conjec-ture that to the nth order, the approximatedweight vector is given by
Wi �X
j1;j2;...;jnÿ1
W�n�i;jnÿ1;jnÿ2;...;j1
W�nÿ1�jnÿ1;jnÿ2;...;j1
� � �W�2�j2;j1
W�1�j1: �20�
It is easy to verify that this conjecture gives thecorrect results when it is applied to a systemwithout feedback. As we can see, the process ofincluding the interdependence quickly becomesvery complicated. To take into account the lowestorder e�ects of the interdependence among theelements, we only consider all of the paths oflength up to 2, and assume that the longer pathsdo not substantially a�ect the ®nal results.
For systems with more than one component, wemay use the process outlined above in each com-ponent and then synthesize the weights of the el-ements component by component. In a morecomplicated situation when there is interdepen-dence among the elements in the same componentas well as di�erent components, we need to com-bine the approach proposed in this section withthat of 4.1 to obtain the ®nal weight vector.
5. Application of generalized AHP to softwaredevelopment process
In this section, we discuss the details of apply-ing the generalized AHP to the software develop-ment process.
Software has a life cycle, which goes throughthe periods of initiation, growth, maturity, andphase-out. The development of software takesplace through a number of phases or stages. Thereare several ways to structure software life cycleinto phases according to di�erent activities duringsoftware development. After analyzing the soft-ware development process, we construct the soft-ware life cycle into ®ve phases: analysis, design,coding, testing, and operation. The developmentphases overlap and feed information to each other.Each phase can be decomposed further to showthe detailed activities under that phase. Recently,we performed a survey on software developmentand environmental factors involved in this process[11]. The results show that analysis, design, codingand testing take, respectively, about 25%, 18%,36%, and 21% of the whole software developmente�orts. We developed the hierarchy structure forevery phase. Even though the design phase is notthe one taking the longest time, it is the one withmost complex structure of its activities. Also theoutput of design phase have signi®cant impacts onthe coding and testing phase. Therefore, in thispaper, we will use the design phase to illustrate ourproposed methodology.
Fig. 5 shows details of the hierarchy structureof the design phase [12]. For convenience, we labelthe activities in design phase by e0 to e27. As we cansee from this ®gure, the structure is primarily ahierarchical structure. Fig. 6 shows the impactrelationships in this phase. The impacts propagatefrom the dominating components only. However,there are intra-component dependence in the sys-tem. Therefore, it is appropriate to combine theplain AHP approach and the iterative approxi-mation method discussed in Section 4.2. In the
Fig. 4. An impact path of length n in a system with inter-component dependence.
382 M. Lee et al. / European Journal of Operational Research 118 (1999) 375±389

Fig
.5.
Dia
gra
mo
fel
emen
tn
um
ber
ass
ign
men
t.
M. Lee et al. / European Journal of Operational Research 118 (1999) 375±389 383

following, we ®rst present the data on all of thepairwise comparisons in this phase. Then, we im-plement the ideas of AHP and its generalizationsin C programs. The priorities of the elements in thedesign phase will be presented as results from ourcomputation.
Fig. 6 is the impact diagram of the elements inthe design phase. As we can see from the diagram,there is no bi-directional impact path between anytwo components. The ideas and techniques dis-cussed in Section 4.2 are su�cient to handle thepriority setting in this case. The data below showtwo categories of information. First, for thosecomponents with no intra-component dependence,we list the comparison intervals. Second, for thosecomponents with intra-component dependence, inaddition to the comparison intervals (which en-code the information of the pairwise comparisonalong impact paths of length 1), we also list theinformation from the pairwise comparison alongimpact paths of length 2. This information consistsof the weight of the intermediate element and thecomparison intervals of the rest of the elementscontribute to the impact of the paths. The inter-dependence matrix W�2� introduced in Section 4.2is also given because it enters the synthesis of the®nal priorities.
In the following, we will present the data,starting from the top to bottom and from left toright in the ®gure. In generating the comparison
data, we have consulted several software engineerwho have been working on the software develop-ment process for many years. The data were givenbased on the relative importance of the activities inthe design phase for software products of di�erentsizes. Our computation results show that all of theconsistency indices are of the order of 10ÿ10. Sincethese are very small numbers, we are not going tolist them here. The format of the tables is the fol-lowing. For comparison matrices, the elements inthe upper-left corner are the criteria. The entries ofthese tables are the comparison intervals and theactual matrix elements from our consistency indexminimization program. For those componentswith intra-component dependence, we furtherpresent tables containing the interdependencematrix and the ®nal weights of the elements.
Obviously the ®nal weights of e1 and e2 are:w1� 0.278, w2� 0.722.
e0 e1 e2 Priority
e1 [1.0, 1.0] 1.000 [0.3, 0.5] 0.385 0.278e2 [2.0, 3.0] 2.597 [1.0, 1.0] 1.000 0.722
Fig. 6. Impact diagram of the design phase of software development.
e1 e3 e4 Priority
e3 [1.0, 1.0] 1.000 [2.0, 3.0] 0.390 0.719e4 [0.3, 0.5] 2.563 [1.0, 1.0] 1.000 0.281
384 M. Lee et al. / European Journal of Operational Research 118 (1999) 375±389

The ®nal weights of the elements e3 and e4 are:
w3 � 0:278� 0:804 � 0:224;
w4 � 0:278� 0:196 � 0:054:
The ®nal weights of the elements e5 and e6 are:
w5 � 0:224� 0:631 � 0:141;
w6 � 0:224� 0:369 � 0:083:
The ®nal weights of the elements e7, e8, e9, and e10
are:
w7 � 0:141� 0:206 � 0:029;
w8 � 0:141� 0:338 � 0:048;
w9 � 0:141� 0:206 � 0:029;
w10 � 0:141� 0:249 � 0:035:
The ®nal weights of the elements e11 and e12 are:
w11 � 0:083� 0:501 � 0:042;
w12 � 0:083� 0:499 � 0:041:
The interdependence matrix and length-2 relativepriorities are given by the table below.
e3 e5 e6 Priority
e5 [1.0, 1.0] 1.000 [1.0, 2.0] 1.169 0.539e6 [0.5, 1.0] 0.856 [1.0, 1.0] 1.000 0.461
e6 e5 e6 Priority
e5 1.000 0.200 0.631e6 0.000 0.800 0.369
e5 e7 e8 e9 e10 Priority
e7 [1.0, 1.0]
1.000
[0.5, 0.7]
0.609
[1.0, 1.0]
1.000
[0.7, 1.0]
0.827
0.206
e8 [1.5, 2.0]
1.642
[1.0, 1.0]
1.000
[1.5, 1.8]
1.642
[1.2, 1.7]
0.358
0.338
e9 [1.0, 1.0]
1.000
[0.6, 0.7]
0.609
[1.0, 1.0]
1.000
[0.7, 1.0]
0.827
0.206
e10 [1.0, 1.5]
1.209
[0.6, 0.8]
0.737
[1.0, 1.4]
1.210
[1.0, 1.0]
1.000
0.249
e6 e11 e12 Priority
e11 [1.0, 1.0]1.000
[1.0, 1.0]1.000
0.501
e12 [1.0, 1.0]1.000
[1.0, 1.0]1.000
0.499
e2 e13 e14 e15 e16 e17 Priority
e13 [1.0, 1.0]
1.000
[1.5, 1.8]
1.762
[1.5, 2.0]
1.762
[1.0, 2.0]
1.454
[3.0, 3.5]
3.415
0.321
e14 [0.6, 0.7]
0.568
[1.0, 1.0]
1.000
[1.0, 1.0]
1.000
[0.7, 1.0]
0.825
[1.5, 2.0]
1.938
0.182
e15 [0.5, 0.7]
0.568
[1.0, 1.0]
1.000
[1.0, 1.0]
1.000
[0.7, 1.0]
0.825
1.5, 2.0]
1.938
0.182
e16 [0.5, 1.0]
0.688
[1.0, 1.5]
1.212
[1.0, 1.5]
1.212
[1.0, 1.0]
1.000
[1.8, 2.4]
2.348
0.221
e17 [0.28, 0.33]
0.293
[0.5, 0.7]
0.516
[0.5, 0.7]
0.516
[0.4, 0.7]
0.426
[1.0, 1.0]
1.000
0.094
e17 e13 e14 e16 Priority
e13 [1.0, 1.0]1.000
[1.5, 2.5]2.001
[2.0, 2.5]2.231
0.513
e14 [0.4, 0.7]0.500
[1.0, 1.0]1.000
[1.0, 1.5]1.115
0.257
e16 [0.4, 0.5]0.448
[0.7, 1.0]0.897
[1.0, 1.0]1.000
0.230
e4 e3 e4 Priority
e3 1.000 0.300 0.804e4 0.000 0.700 0.196
e2 e13 e14 e15 e16 e17 Priority
e13 1.000 0.150 0.300 0.250 0.154 0.473e14 0.000 0.850 0.000 0.000 0.077 0.162e15 0.000 0.000 0.700 0.000 0.000 0.128e16 0.000 0.000 0.000 0.750 0.069 0.172e17 0.000 0.000 0.000 0.000 0.700 0.066
M. Lee et al. / European Journal of Operational Research 118 (1999) 375±389 385

The ®nal weights of the elements e13, e14, e15, e16,and e17 are:
w13 � 0:722� 0:473 � 0:341;
w14 � 0:722� 0:162 � 0:117;
w15 � 0:722� 0:128 � 0:092;
w16 � 0:722� 0:172 � 0:124;
w17 � 0:722� 0:066 � 0:048:
The ®nal weights of the elements e18 and e19 are:
w18 � 0:341� 0:800 � 0:273;
w19 � 0:341� 0:200 � 0:068:
The ®nal weights of the elements e20, e21, e22, ande23 are:
w20 � 0:068� 0:285 � 0:019;
w21 � 0:068� 0:285 � 0:019;
w22 � 0:068� 0:216 � 0:015;
w23 � 0:068� 0:214 � 0:015:
The ®nal weights of the elements e24, e25, e26, ande27 are:
w24 � 0:019� 0:285 � 0:005;
w25 � 0:019� 0:187 � 0:004;
w26 � 0:019� 0:186 � 0:004;
w27 � 0:019� 0:343 � 0:007:
The ®nal weights of the elements e28 and e29 are;
w28 � 0:092� 0:501 � 0:046;
w29 � 0:092� 0:499 � 0:046:
The overall priorities of the activities in thedesign phase are summarized in Fig. 7. At the topmost level, we see that the weight of detailed de-sign is roughly two to three times that of systemarchitecture design. This is consistent with ourintuition because there are more activities underdetailed design and more resources are needed forthese activities. Here we want to emphasize thatour methodology not only provides qualitativeinformation consistent with intuition, but alsoprovides quantitative information which is veryinstrumental in resource allocation. In the nextlevel, we see that our results again are consistentwith intuition. In system architecture design, theresource allocated to system structure is aboutfour times that of system architecture document.
e13 e18 e19 Priority
e18 [1.0, 1.0]1.000
[4.0, 4.0]4.0
0.800
e19 [0.25, 0.25]0.250
[1.0, 1.0]1.000
0.200
e19 e20 e21 e22 e23 Priority
e20 [1.0, 1.0]
1.000
[1.0, 1.0]
1.000
[1.0, 1.5]
1.316
[1.0, 1.5]
1.327
0.285
e21 [1.0, 1.0]
1.000
[1.0, 1.0]
1.000
[1.0, 1.5]
1.316
[1.0, 1.5]
1.327
0.285
e22 [0.7, 1.0]
0.760
[0.7, 1.0]
0.760
[1.0, 1.0]
1.000
[1.0, 1.2]
1.009
0.216
e23 [0.7, 1.0]
0.753
[0.7, 1.0]
0.753
[0.8, 1.0]
0.991
[1.0, 1.0]
1.000
0.214
e15 e28 e29 Priority
e28 [1.0, 1.0]1.000
[1.0, 1.0]1.000
0.501
e29 [1.0, 1.0]1.000
[1.0, 1.0]1.000
0.499
e21 e24 e25 e26 e27 Priority
e24 [1.0, 1.0]
1.000
[1.2, 1.8]
1.522
[1.5, 2.0]
1.533
[0.7, 1.0]
1.327
0.285
e25 [0.6, 0.8]
0.957
[1.0, 1.0]
1.000
[1.0, 1.0]
1.000
[0.5, 0.7]
0.545
0.187
e26 [0.5, 0.7]
0.652
[0.1, 1.0]
1.000
[1.0, 1.0]
1.000
[0.5, 0.7]
0.541
0.186
e27 [1.0, 1.5]
1.205
[1.5, 2.0]
1.834
[1.5, 2.0]
1.848
[1.0, 1.0]
1.000
0.343
386 M. Lee et al. / European Journal of Operational Research 118 (1999) 375±389

Fig
.7
.F
ina
l(r
ela
tive)
wei
gh
td
iagra
m.
Th
en
um
ber
so
nth
eto
pare
the
®n
al
wei
gh
ts,
the
nu
mb
ers
at
the
bo
tto
m(i
nth
ep
are
nth
eses
)are
the
rela
tive
wei
gh
ts.
M. Lee et al. / European Journal of Operational Research 118 (1999) 375±389 387
This should be evident from the amount of activ-ities involved in system structure. Similarly, indetailed design, almost half of the resources shouldbe allocated to program structure since it is themajor activity at this level. To improve the designprogress, we need to focus more on detailed de-sign, especially on program structure. Other ac-tivities are also important. Resources allocated tothese activities should also be proportional to their®nal weights.
The methodology discussed above applies toother phases in the software development process.The same procedure can be used to analyze theimpacts among the activities, to decompose thesystem into components, and to construct theweight diagrams. Weight diagrams are very in-formative and useful in planning the softwaredevelopment process. In the design phase, forexample, software developers can plan theirschedules according to the relative weights withinthe design time frame. The weight diagram isuseful in identifying the most important activitieswhile conducting multiple tasks. For instance,su�cient time and e�ort should be spent onspeci®cation analysis before conducting systemdecomposition. Since the relative weight of systemdecomposition is about 37% and that of speci®-cation analysis is about 63%, software developersshould spend roughly twice as much time ande�ort on the latter. If the right amount of timeand e�ort is spent on each of the activities, thedevelopment process can be made smoother,more e�cient, and better outcome can beachieved.
Furthermore, the activity weight diagram is auseful tool to the management of the developmentprocess, especially to its non-technical personnel.It provides a high-level blueprint of the softwaredevelopment process. It is useful to management inplanning the project schedule, allocating resources,and estimating the cost, etc.
Our methodology provides an e�ective way inquantitative resource allocation to enhance thesoftware development process. By setting up thehierarchy tree diagram, analyzing the activities toobtain the impact diagram, doing pairwise com-parisons, and using our proposed method, we cancalculate the relative weights of the elements in the
same component and obtain the ®nal weights of allthe elements in the system.
6. Conclusions
Summarizing this paper, we have discussedbasic ideas of the analytic hierarchy process and itsvarious generalizations. We have introduced theconcept of comparison interval to achieve consis-tency and to accommodate the fuzzy nature of thecomparison process. We have devised and imple-mented a stochastic method to use the comparisonintervals as input to minimize the consistency in-dex. We have discussed the super-matrix techniqueand proposed an iterative approximation methodto deal with interdependence.
Acknowledgements
The authors thank the valuable suggestions andconstructive criticism of two anonymous referees.This work was partially supported by the FAAWilliam J. Hughes Technical Center on SoftwareReliability Project.
References
[1] T.L. Saaty, The Analytic Hierarchy Process, McGraw-
Hill, New York, 1980.
[2] P.T. Harker, L.G. Vargas, The theory of ratio scale
estimation: Saaty's analytic hierarchy process, Manage-
ment Science 33 (11) (1987).
[3] F.R. Gantmacher, Application of the Theory of Matrices,
Interscience, New York, 1960.
[4] T.L. Saaty, Axiomatic foundation of the analytic hierar-
chy process, Management Science 32 (7) (1986).
[5] T.L. Saaty, L.G. Vargas, Uncertainty and rank order in
the analytic hierarchy process, European Journal of
Operational Research 32 (1987) 107±117.
[6] A. Arbel, Approximate articulation of preference and
piority deviation, European Journal of Operational Re-
search 43 (1989) 317±326.
[7] A. Salo, R.P. H�am�al�ainen, Processing interval judgements
in the analytic hierarchy process, in: Goicoechea, Duck-
stein, Zionts (Eds.), Multicriteria Decision Making: Pro-
ceedings of IX International Conference on MCDM,
Springer, Berlin, 1991, pp. 359±372.
388 M. Lee et al. / European Journal of Operational Research 118 (1999) 375±389

[8] M. Zahir, Incorporating the uncertainty of decision
judgments in AHP, European Journal of Operational
Research 53 (1991) 206±216.
[9] Editors of Motor Trend, Motor Trend 1995 Import Car of
the Year ± Nissan Maxima, Motor Trend, February 1995.
[10] T.L. Saaty, M. Takizawa, Dependence and independence:
From linear hierarchies to nonlinear networks, European
Journal of Operational Research 26 (1986) 229±237.
[11] H. Pham, X. Zhang, Study of environmental factors and
software reliability, Industrial Engineering Working Pa-
per, Rutgers University, 1998.
[12] M. Lee, H. Pham, The concept of comparison interval to
priority setting with application to software development
process, IE Working Paper, Rutgers University, 1996.
M. Lee et al. / European Journal of Operational Research 118 (1999) 375±389 389