
A Method for Measuring Wide Range Performance of Boolean ...
230
EERO SORMUNEN A Method for Measuring Wide Range Performance of Boolean Queries in Full-Text Databases U n i v e r s i t y o f T a m p e r e T a m p e r e 2 0 0 0
-
Upload
khangminh22 -
Category
Documents
-
view
2 -
download
0
Transcript of A Method for Measuring Wide Range Performance of Boolean ...

EERO SORMUNEN
A Method for Measuring Wide Range Performanceof Boolean Queries in Full-Text Databases
U n i v e r s i t y o f T a m p e r eT a m p e r e 2 0 0 0

A Method for Measuring Wide Range Performanceof Boolean Queries in Full-Text Databases
A c t a U n i v e r s i t a t i s T a m p e r e n s i s 7 48

Distribution
University of TampereSales OfficeP.O. Box 61733101 TampereFinland
Cover design byJuha Siro
Printed dissertationActa Universitatis Tamperensis 748ISBN 951-44-4820-0ISSN 1455-1616
Tampereen yliopistopaino Oy Juvenes PrintTampere 2000
Tel. +358 3 215 6055Fax +358 3 215 [email protected]://granum.uta.fi
ACADEMIC DISSERTATIONUniversity of Tampere, Department of Information Studies
Electronic dissertationActa Electronica Universitatis Tamperensis 34ISBN 951-44-4732-8ISSN 1456-954Xhttp://acta.uta.fi

EERO SORMUNEN
ACADEMIC DISSERTATIONTo be presented, with the permission of
the Faculty of Social Sciences of the University of Tampere,
for public discussion in Paavo Koli Auditorium of the
University of Tampere, Kehruukoulunkatu 1,
on May 13th, 2000, at 12 o’clock.
A Method for Measuring Wide Range Performanceof Boolean Queries in Full-Text Databases
U n i v e r s i t y o f T a m p e r eT a m p e r e 2 0 0 0

5
ABSTRACT
A new laboratory-based method for the evaluation of Boolean queries in free-textsearching of full-text databases is proposed. The method is based on a controlled formulationof inclusive query plans, on an automatic conversion of query plans into a set of elementaryqueries, and on composing optimal queries at varying operational levels by combiningappropriate sub-sets of elementary queries. The method is based on the idea of reverseengineering, and exploits full relevance data of documents to find the query performingoptimally within given operational constraints.
The proposed method offers several advantages. The method makes good use of theexpertise of experienced searchers in the query formulation process while avoidinguncontrolled human biases. Inclusive query plans are comprehensive representations of querytuning space available in each individual search topic. Query tuning space defines the limitswithin which query exhaustivity and query extent are free to change in search for theoptimally performing query.
An heuristic algorithm for composing the optimal queries was developed by elaboratingthe original idea proposed by Harter (1990) and by applying standard algorithms for the Zero-One Knapsack Problem of physical objects. The algorithm offers an efficient technique to findthe optimal sub-set of elementary queries from any finite set of available elementary queries.The characteristics of Boolean queries can be investigated over a wide operational range bycomposing the optimal queries at standard recall levels R0.1…R1.0 or at selected DCV levels(e.g. 2, 5, 10,…500 documents).
A case experiment focusing on the mechanism of falling effectiveness of free-textsearching in large full-text databases is reported. A unique feature of the case experiment wasthat not only were the effects of the size but also the effects of the density of relevantdocuments, evaluated. In high recall searching, a major finding was that retrieval performancewas dominated by documents where important concepts were expressed implicitly. These leastretrievable documents compel the reduction of the exhaustivity of queries, and this leads tosteeply falling precision at the highest recall level R1.0. The findings gave empirical support forthe hypothesis of falling recall in large full-text databases introduced by Blair & Maron (1985)as a conclusion from the well known Stairs study. In high precision searching, the studyrevealed among other things, that increasing exhaustivity is a tool that can be used to increasethe share of highly relevant documents in query results. Another interesting finding was thatBoolean AND operator seems to be competitive with proximity operators in high precisionsearching. Further, it was shown that, in high precision searching, the relative effectivenessachieved in large databases is greatly influenced by the density of relevant documents.
From the methodological viewpoint, the case experiment demonstrated how theperformance of a Boolean IR system can be measured across a wide operational range.Second, the case showed how to study the relations between measured performance and thestructural characteristics of Boolean queries optimised for different retrieval goals. Third, therationale of structural changes in optimal queries could be logically explained by analysing thecharacteristics of relevant documents available in the database. Further, the case studyexemplified the dynamic nature of the method from the experimental design viewpoint.
Validity, reliability, and efficiency issues were considered in the evaluation of the methoditself. Empirical tests showed that the proposed method has a firm basis when applied toappropriate problems of the intended application domain.

6
PREFACE
This thesis was the most extensive enterprise of my academic career. The active stage of
the work lasted some four years, but the basis was already created in the FREETEXT project
in the early nineties. Basically, the licentiate thesis completed in the FREETEXT project was
a preliminary study for the doctoral thesis published here. The first version of the proposed
evaluation method was demonstrated, and the test collection was created at that time.
Personally, I have not been in a position to apply and benefit from any grants during the
past years. However, the work has received financial support from various sources. First of
all, the Department of Information Studies at the University of Tampere has supported the
work in many ways, e.g. by allocating some resources for software development and
experimentation. The local employment office and the Technology Research Center of
Finland have also funded the work of research assistants.
Many people have contributed to my work, and frankly speaking, I have been totally
dependent on these contributions. Heikki Keskustalo played a central role in designing and
implementing the optimisation algorithm. Heikki also helped several times to solve the
technical problems in the test environment. Juha Laaksonen worked as the designer and
programmer of the IR Game, a Web application that turned out to be a very useful tool in
testing the performance of the optimisation algorithm.
I have benefitted from the excellent work of several research assistants. The first to be
mentioned are Kari Sandholm, Erkka Leppänen, and Jussi Koivisto. Kari carried out most of
the optimisations and data gathering. Erkka developed a library of tables and SQL queries
helping in the analysis of results. He also did a pioneering work by challenging the
optimisation algorithm using the IR Game as his only weapon. Jussi did more pioneer work by
making a facet analysis for more than one thousand news articles. A valuable data set was
created.
Several students of the Department have collaborated in this work as test persons.
Especially, I would liked to thank Heikki Eloranta, Marja Räsänen, and Pekka Salosaari for
their enthusiastic concentration of the facet selection test. Similarly, Perttu Makkonen, Mikko
Sola, and Mikael Vakkari made a contribution as control searchers in the interactive query
optimisation test.

7
The early work on the Finnish test collection in the Information Retrieval Laboratory
should not be forgotten since it created the backbone for this and many other IR studies at the
Department of Information Studies. Markku Ylinen and Hannele Vihermaa from Alma Media
(the newspapers Aamulehti and Kauppalehti at that time) as well as Irmeli Toivanen from the
newspaper Keskisuomalainen helped us to provide the news articles for the collection. Pirjo
Valpas worked on the inclusive query plans for the test collection, and subsequent tests have
shown that her work was of a high quality. Ulla Saikkonen, Markku Juusola, Merja Lehti, and
Juha Riihioja conducted the relevance judgements at a high level of consistency.
The FIRE group has provided me with a stimulating basis to test my research ideas and
reporting. Thanks for the comments and encouragement. Especially, I am grateful to Jaana
Kekäläinen, who has also been an active user of the test collection. Jaana contributed by
developing the recall base estimates of the test collection, the ideas on how to apply query
facets in experiments, and the proper use of statistical tests.
I have been honoured to receive constructive comments from highly appreciated foreign
researchers. Nick Belkin (Rutgers University, U.S.), Peter Ingwersen (Royal School of Library
and Information Science, Denmark), and, especially, Giorgio Brajnik (University of Udine,
Italy), and Paul Solomon (University of North Carolina at Chapel Hill) did a lot of work in
commenting on my early version of the text. Professors William Hersh (Oregon Health
Sciences University, U.S.) and Stephen Robertson (Microsoft Research and City University,
UK) were the pre-reviewers of my dissertation and their comments helped me to improve
some important details in my text. I was very impressed of the enthusiasm of these mentors.
I also thank Virginia Mattila for her work in correcting and improving my language.
Professor Kalervo Järvelin has been my supervisor in three studies: the theses for the
master's, licentiate's, and doctor's degree. The total length of my theses is about 500 pages.
This means that during the last twelve years, Kal has read and commented thousands of pages
I have composed in a more or less finished form. That is quite an impressive effort knowing
the high quality feedback. I have enjoyed a myriad of ideas how to improve my work. Kal is at
his best in developing innovative solutions to any problems faced in formulating research
questions, selecting data and methods, making analysis, and reporting.
I would also thank all colleagues at the department of the encouraging atmosphere and
support. My main job has been to work as acting professor, and I have been involved in
several research projects, educational development work, and teaching. All the people in these

8
co-operative activities have shown remarkable patience when I have failed to take complete
care of my duties. I am especially grateful to Mirja Björk and Leena Lahti who have helped
me to become aware of the current issues requiring my attention.
Last but not least, I want to thank my family - Seija, Annakaisa, Ville, and Emilia - for
their patience and encouragement. This time has been hard for us all. I have been working six
days a week for a long period. I believe this will not be the scenario for the future.
Tampere 28 April 2000
Eero Sormunen

9
CONTENTS
ABSTRACT ................................................................................................................................................... 5
PREFACE ...................................................................................................................................................... 6
CONTENTS ................................................................................................................................................... 9
LIST OF SYMBOLS................................................................................................................................... 13
1 INTRODUCTION ................................................................................................................................... 15
1.1 METHODOLOGICAL PROBLEMS IN BOOLEAN IR EXPERIMENTS ............................................................. 16
1.2 HARTER’S IDEA: THE MOST RATIONAL PATH ........................................................................................ 18
1.3 METHODS AND TECHNIQUES IN IR EVALUATION .................................................................................. 21
1.4 RESEARCH PROBLEMS.......................................................................................................................... 22
1.5 THE STRUCTURE OF THE DISSERTATION ............................................................................................... 23
2 OUTLINE OF THE EVALUATION METHOD.................................................................................. 25
2.1 THE THEORETICAL FRAMEWORK .......................................................................................................... 25
2.1.1 The Boolean IR model................................................................................................................. 25
2.1.2 Other approaches to the study of Boolean queries ..................................................................... 28
2.1.3 An outline for the procedure of the method ................................................................................ 30
2.2 CONTROLLING THE QUERY FORMULATION PROCESS ............................................................................. 31
2.2.1 Query formulation models .......................................................................................................... 31
2.2.2 Strategies for free-text searching ................................................................................................ 33
2.2.3 Inclusive query plans .................................................................................................................. 36
2.3 ELEMENTARY QUERIES ........................................................................................................................ 40
2.4 RECALL BASE ESTIMATION ................................................................................................................... 40
2.4.1 Pooling method by TREC............................................................................................................ 41
2.4.2 Candidate sets and sampling by Blair ........................................................................................ 41
2.4.3 Pre-selection method................................................................................................................... 42
2.4.4 Extensive queries with basic facets ............................................................................................. 43
2.4.5 Summary of recall base estimation ............................................................................................. 45
2.5 OPTIMAL COMBINATION OF ELEMENTARY QUERIES .............................................................................. 45
2.5.1 All combinations and optimal paths............................................................................................ 46
2.5.2 The Zero-One Knapsack Problem............................................................................................... 47
2.5.3 An heuristic algorithm for query optimisation............................................................................ 49
2.5.4 Evaluation of heuristic algorithms.............................................................................................. 53
2.6 SELECTING STANDARD POINTS OF OPERATION...................................................................................... 54

10
2.7 THE DOMAIN OF THE METHOD.............................................................................................................. 55
3 THE TEST ENVIRONMENT AND DATA COLLECTION METHODS ......................................... 59
3.1 THE TEST DATABASE AND RETRIEVAL SYSTEMS ................................................................................... 59
3.2 SEARCH TOPICS AND INITIAL QUERY PLANS.......................................................................................... 60
3.3 RELEVANCE ASSESSMENTS AND RECALL BASE ESTIMATES ................................................................... 63
3.4 FINAL INCLUSIVE QUERY PLANS ........................................................................................................... 64
3.4.1 Closing the hunt for new relevant documents ............................................................................. 66
3.4.2 Query plan characteristics.......................................................................................................... 69
3.4.3 Search topic characteristics....................................................................................................... 71
3.5 QUERY OPTIMISATION.......................................................................................................................... 72
3.5.1 Elementary queries ..................................................................................................................... 72
3.5.2 Optimisation algorithm............................................................................................................... 76
3.6 DATA COLLECTION AND ANALYSIS ....................................................................................................... 77
3.6.1 Precision at fixed DCVs.............................................................................................................. 77
3.6.2 Precision at fixed recall levels .................................................................................................... 79
3.7 EVALUATION OF THE TEST COLLECTION .............................................................................................. 80
3.7.1 Analysis of search topics............................................................................................................. 80
3.7.2 Analysis of query plans on the basis of known relevant documents............................................ 82
3.8 SUMMARY OF THE TEST COLLECTION AND DATA COLLECTION.............................................................. 84
4 A CASE EXPERIMENT: FREE-TEXT SEARCHING IN LARGE FULL-TEXT DATABASES .. 87
4.1 INTRODUCTION .................................................................................................................................... 87
4.2 FRAMEWORK AND RESEARCH PROBLEMS ............................................................................................. 90
4.2.1 Large full-text databases............................................................................................................. 90
4.2.2 Full-text indexing ........................................................................................................................ 90
4.2.3 Query tuning ............................................................................................................................... 91
4.2.4 Research problems...................................................................................................................... 92
4.2.4.1 Effectiveness differences......................................................................................................................94
4.2.4.2 Changes in optimal query structures ....................................................................................................95
4.2.4.3 Research hypotheses ............................................................................................................................97
4.3 METHODS AND DATA ........................................................................................................................... 98
4.3.1 The test collection and query optimisation ................................................................................. 98
4.3.2 Data collection and analysis..................................................................................................... 100
4.4 FINDINGS ........................................................................................................................................... 101
4.4.1 Effectiveness in high recall searching....................................................................................... 103
4.4.2 Query tuning in high recall searching ...................................................................................... 105
4.4.2.1 Query exhaustivity changes................................................................................................................105
4.4.2.2 Query extent changes .........................................................................................................................109
4.4.3 Effectiveness in high precision searching ................................................................................. 110

11
4.4.4 Query tuning in high precision searching................................................................................. 114
4.4.4.1 Query exhaustivity changes................................................................................................................115
4.4.4.2 Query extent changes .........................................................................................................................116
4.5 WHAT DID WE LEARN? ....................................................................................................................... 119
4.5.1 The questions to be answered ................................................................................................... 120
4.5.2 Analysis of findings in high recall searching ............................................................................ 121
4.5.2.1 Implicit facets and the fall of exhaustivity..........................................................................................121
4.5.2.2 Conjunctions and falling recall ..........................................................................................................125
4.5.2.3 Query expansion.................................................................................................................................126
4.5.2.4 The limits of Boolean queries in high recall searching ......................................................................128
4.5.3 Analysis of findings in high precision searching ...................................................................... 131
4.5.3.1 Proportional exhaustivity and implicit expressions in top documents ...............................................131
4.5.3.2 Recall in the “best” terms queries ......................................................................................................132
4.5.3.3 Capability of retrieving highly relevant documents............................................................................134
4.5.3.4 AND vs. proximity operators in querying highly relevant documents ...............................................138
4.5.3.5 Limits of Boolean queries in high precision searching ......................................................................143
4.5.4 The comparison of high recall and high precision searching................................................... 145
4.5.4.1 Differences in performance ................................................................................................................145
4.5.4.2 Differences in query structures...........................................................................................................146
4.6 CONCLUSIONS AND DISCUSSION......................................................................................................... 147
5 EVALUATION OF THE EVALUATION METHOD ........................................................................ 153
5.1 INTRODUCTION .................................................................................................................................. 153
5.1.1 Inclusive query planning........................................................................................................... 153
5.1.2 Query optimisation.................................................................................................................... 154
5.1.3 Questions to be evaluated ......................................................................................................... 158
5.1.4 Setting goals for the evaluation ................................................................................................ 160
5.2 DATA AND METHODS IN RELIABILITY AND VALIDITY TESTS ................................................................ 161
5.2.1 The facet selection test .............................................................................................................. 161
5.2.2 Verification test for the optimisation algorithm........................................................................ 163
5.2.3 Interactive query optimisation test............................................................................................ 164
5.2.3.1 The IR Game ......................................................................................................................................164
5.2.3.2 Test procedure....................................................................................................................................166
5.3 RESULTS OF THE EMPIRICAL TESTS..................................................................................................... 169
5.3.1 Exhaustivity of query plans (Question V.1)............................................................................... 169
5.3.2 Consistency of facet selection (Question R.1) ........................................................................... 171
5.3.3 Comprehensiveness of facet representation by query terms (Question V.2) ............................. 176
5.3.4 Effects of query term grouping (Question V.3) ......................................................................... 180
5.3.5 Reliability of the optimisation algorithm (Question R.2) .......................................................... 182
5.3.6 Validity of query structures (Question V.4)............................................................................... 185
5.4 EFFICIENCY OF THE METHOD.............................................................................................................. 186

12
5.4.1 Efficiency of inclusive query planning (Question E.1).............................................................. 187
5.4.2 Efficiency of recall base estimation (Question E.2) .................................................................. 188
5.4.3 Computational efficiency of the optimisation algorithm (Question E.3).................................. 189
5.5 SUMMARY OF THE RELIABILITY, VALIDITY, AND EFFICIENCY EVALUATION......................................... 193
6 CONCLUSIONS..................................................................................................................................... 195
6.1 THE DOMAIN OF THE METHOD............................................................................................................ 195
6.2 PROCEDURE OF THE METHOD ............................................................................................................. 198
6.3 JUSTIFICATION OF THE METHOD ......................................................................................................... 200
6.3.1 Appropriateness of the method ................................................................................................. 201
6.3.2 Validity, reliability, and efficiency of the procedure................................................................. 203
6.4 FINAL REMARKS................................................................................................................................. 204
REFERENCES .......................................................................................................................................... 208
APPENDIXES 1-4 ..................................................................................................................................... 217

13
LIST OF SYMBOLS
Logic connectives and Boolean operators:
∨ , OR Disjunction
∧ , AND Conjunction¬ , ANDNOT Negation
Set operations:
∪ Union
∩ Intersection
- Difference
[A] Facet A
Br Broadness of a topic
C Capacity of the knapsack
C Complexity of a topic
CCNF Complete conjunctive normal form
CNF Conjunctive normal form
DCV, DCVj Document cut-off value, Fixed document cut-off value j
DNF Disjunctive normal form
EEF Explicitly expressed facets
EQ, eqi Elementary query, Elementary query i
EXH Query Exhaustivity
F1…F5 Facet of an inclusive query plan ranked 1…5
FE Facet extent
FPC Futility point criterion
ki Database size ratio for topic i
nij Number of documents retrieved by query j in topic i
p Probability
P Precision
PAR Paragraph operator
PC Prediction criterion
PDF Proportional document frequency
PE Proportional exhaustivity

14
pj Profit of item j (the knapsack problem)
PQE Proportional Query Extent
QE Query Extent
Qextra(i) Set of extra non-relevant documents in the large databases for topic i
qi Query i
Qi, Qi+ Sets of non-relevant documents for topic i in the small database and in
the large databases, respectively: |Qi+| ≈ ki x |Qi|
R, Rj Recall, Recall level j
Rel Degree of relevance
Rextra(i) Set of extra relevant documents in the large & dense database for topic i
rij Number of relevant documents retrieved by query j in topic i
Ri, Ri+ Set of relevant documents for topic i in the small/large & sparse
database, and in the large & dense database, respectively: |Ri+| ≈ ki x|Ri|
SPO Standard point of operation
Wj Weight of item j (the knapsack problem)

15
1 INTRODUCTION
Earlier research has been successful in describing how expert searchers exploit the tools
of Boolean IR systems to focus queries towards appropriate retrieval goals (see e.g. Fidel
1984, 1985, 1991, Saracevic, et al. 1988, Shute & Smith 1993). On the other hand, past
research does not tell much about the characteristics of those tools. For instance, we know that
expert users tend to tune recall and precision of queries by applying disjunction, conjunction,
and proximity operators but we do not know what the ultimate limits of these operators are
from the system point of view. Knowing the performance limits of the Boolean IR model
would be important in predicting how Boolean IR systems work in extreme situations, e.g.
how they scale up in large databases. The performance limits of the IR system also set the
upper limit for human searchers’ performance.
In this study, we seek a better understanding of the very core of the Boolean IR model,
Boolean queries. In investigating the characteristics of Boolean queries we concentrate on the
problems of matching the representations of queries and documents, and need a system-
oriented evaluation method to do this. The mainstream of the system-oriented IR evaluation
has followed the Cranfield paradigm, also called the laboratory model, or the system approach
(see e.g. Sparck Jones 1981, Harter & Hert 1997). The major focus within the mainstream of
experimental research has been on the best-match IR models, first on the vector space IR
model, and later on the probabilistic IR model (see e.g. Salton & McGill 1983, Belkin & Croft
1987). The low interest in studying the Boolean IR model can be seen not only in the low
volume of research output (see e.g. TREC reports Harman 1993a and later), but also in the
slow development of system-oriented experimental methods. Contemporary methods have
been designed for best-match IR systems because these have been the target of research.
Evaluative research of operational systems has focused on Boolean IR systems but the
contribution has been very slight on the development of methods (see Sparck Jones 1981,
Blair & Maron 1985).
For about 40 years, most of the operational IR systems in existence have been
implementations of the Boolean IR model. The mainstream of research within the Cranfield
paradigm has shared a very critical attitude towards the Boolean IR systems. A recent review
by Frants et al. (1999) presents an excellent summary of arguments used in refuting the
Boolean approach. A few attempts have been made to verify the validity of these arguments

16
empirically. The early study by Salton (1972) was an example of a study aimed to show the
competitiveness (or superiority) of the vector space IR model with (over) the Boolean IR
model. Turtle (1994) conducted a similar study comparing a Boolean and a probabilistic IR
system. The results of the recent experiments by Hersh & Hickam (1995), Lu et al. (1996),
and Paris & Tibbo (1998) have suggested that studying the overall superiority of one model
over the other may be a naive way to see this research issue. Boolean queries seem to perform
better in some situations, and best-match queries in other situations.
Both the "mystic" competitiveness of the Boolean IR model in operational applications
and the above mentioned experimental findings of its superior performance in some situations
increase motivation to study the basic characteristics of Boolean queries. As pointed out by
Paris & Tibbo (1998), we currently know that different matching mechanisms work better in
different retrieval situations, but findings are not sufficient to explain the reasons for the
differences. This study will focus on the basic characteristics of Boolean queries. However,
the goal is not to compare the Boolean and best-match IR models. The focus is solely on
Boolean queries. The development of more appropriate evaluation methods is seen as the key
to draw a more detailed picture of the effective features, and the limits of the Boolean IR
model.
1.1 Methodological problems in Boolean IR experiments
The Boolean IR model has three special features that cause methodological problems for
experimental research (Ingwersen & Willett 1995):
1. The formulation of Boolean queries requires a trained person to translate the userrequest into a query. Professional intermediaries are often used to carry out the searchon behalf of the information user.
2. The searcher has very little control over the size of the output produced by aparticular query. Without detailed knowledge of the database, the searcher will beunable to predict the number of records retrieved by a given query.
3. A Boolean query divides a database into two discrete subsets; one set for the recordsthat match the query and one set for the rest. There is no mechanism by which therecords could be ranked in order of decreasing probability of relevance.
The first feature, the necessity to use a human intermediary in query formulation, is a
potential source of validity and reliability problems. Validity is the extent to which the
observed variables really present the concepts under investigation. Reliability is the extent to

17
which the experimental results can be replicated by other experimenters (Tague-Sutcliffe
1992). It is very difficult to separate the effects of a technical IR system from those of a
human searcher. In system-oriented evaluations where, for instance, alternative indexing
methods are compared, the role of the human intermediary becomes critical.
In the well known STAIRS study, the queries were designed by two paralegals. The
searchers had a predefined goal to locate at least 75 per cent of all relevant documents. It
turned out that only less than 20 per cent of relevant documents were found. The authors
concluded that the effectiveness of full-text retrieval systems is not satisfactory in large
textual databases (Blair & Maron 1985). On the other hand, the average precision of the test
queries was as high as 79 per cent. This is an extremely high figure for precision in a
collection where the average document length was about nine pages (for comparative figures
see e.g. Tenopir 1985, Salton 1986, McKinin et al. 1991, Harman 1996). The paralegals were
obviously formulating high-precision queries although they were asked to work towards high
recall.
The STAIRS study is one of the few where the recall goal of queries was explicitly stated.
Usually, intermediaries have been given free hands. For example, Turtle (1994) asked his
intermediaries “...to produce the ‘best’ query that they could for each issue statement”.
Tenopir (1985) formulated the queries by herself without explicitly defining the precision and
recall goals. The consequence of vague and undefined query goals is that we have difficulties
in saying anything about the performance of an IR system. Performance differences based on
system differences are in danger of being overrun by individual searching styles and
behaviours as well as uncontrolled variation of resulting queries.
The latter two features of the Boolean IR model (no ranking, little control over the output
size) cause problems in measuring the performance of a Boolean system across its whole
operational range. The notion of operational range is used here to emphasise that the users of
information retrieval systems have different goals in making queries and this issue should also
be considered in designing experiments for Boolean IR systems. In some situations, the user
wants to find all relevant documents if possible and even a substantial searching effort to
achieve this goal is acceptable. In another situation, a few relevant documents may satisfy the
searcher and high precision queries are preferred to minimise the effort of browsing. Recall
can be used to characterise the different levels of the operational range.

18
With best-match systems, a typical way of measuring performance is to average precision
over all test queries at selected recall levels (see Salton & McGill 1983, 166). With Boolean
IR systems, performance is usually measured at a single recall/precision point for each query.
Recall and precision values are averaged separately over all queries. As Lancaster (1968, 132)
has shown, the distribution of recall and precision values for a large set of test queries is very
wide. It is very difficult to see how the averaged recall and precision values should or could be
interpreted. Averages are mixing queries from different operational levels (from very focused
to very broad).
1.2 Harter’s idea: the most rational path
Harter (1990) has also pointed out that pooling results for several searchers or search
topics may obscure or eliminate important relationships. He introduced an idea for an
evaluation method that should reveal more elegantly the performance of the Boolean IR model
at different operational levels. The approach is based on the concept of elementary postings
sets and Harter used it in a case study to analyse the retrieval performance of different search
term combinations and the overlap of elementary postings sets. The author used a single
search topic to illustrate how the method is applied:
1. A high recall oriented query based on two facets was designed and executed1:
Facet [Information retrieval] (information retrieval OR
online systems ORonline(w)search?)
Facet [Search process] (tactic? ORheuristic? ORtrial(1w)error ORexpert systems ORartificial intelligence ORattitudes/DE ORbehavior?/DE,ID,TI ORcognitive/de)
2. All documents matching the conjunction of facets [Information retrieval] and [Searchprocess] represented by the disjunction of all selected query terms were retrieved. Therelevance of resulting 371 documents was assessed.
1 The author stated that “the information need was for research that attempts to understand aspects of the
online search process. Theoretical treatments or models of the process and empirical studies were consideredequally useful.” The query is presented in the syntax of DIALOG retrieval service. Dialog is a trademark of TheDialog Corporation plc.
Square brackets [] are used to denote facets and other concepts. For instance, [Information retrieval] refersto a facet (or a concept) named “information retrieval”.

19
3. All conjunctions of query terms representing the facets [Information retrieval] and[Search process] (called elementary postings sets) were composed. The 24 conjunctionsand their retrieval results are presented in Table 1.1.
The maximum achievable precision across the whole relative recall range was determined
by applying a simple algorithm constructing incrementally the most rational path. The
gradually expanding union of elementary postings sets was created by adding one set after
another to the path maximising precision at each path position. The algorithm was described
by the author in the following way:
(1) To select the initial set, choose the elementary postings set that produces the highestprecision: if there is a tie, select the set that produces the highest recall. This definesthe first step of the path.
(2) Create in turn the union of each of the remaining elementary postings sets with theset defined by the current path position; finding the union takes overlap among
Table 1.1. Retrieval results for the 24 elementary postings set in the case search by Harter(1990).*
Setno
Elementary postings set No ofpostings
No ofrelevantpostings
Precision (Relative)Recall
s1s2s3s4s5
s6s7
s8s9
s10s11s12s13s14s15s16s17s18s19s20s21s22s23s24s25
information retrieval AND tactic?information retrieval AND heuristic?information retrieval AND trial(1w)errorinformation retrieval AND expert systemsinformation retrieval AND artificial
intelligenceinformation retrieval AND attitudes/DEinformation retrieval AND
behavior?/DE,ID,TIinformation retrieval AND cognitive/deonline systems AND tactic?online systems AND heuristic?online systems AND trial(1w)erroronline systems AND expert systemsonline systems AND artificial intelligenceonline systems AND attitudes/DEonline systems AND behavior?/DE,ID,TIonline systems AND cognitive/deonline(w)search? AND tactic?online(w)search? AND heuristic?online(w)search? AND trial(1w)erroronline(w)search? AND expert systemsonline(w)search? AND artificial intelligenceonline(w)search? AND attitudes/DEonline(w)search? AND behavior?/DE,ID,TIonline(w)search? AND cognitive/des1-s24/OR
817
243
4842
6356
610
21844524221
741
1579
1810
371
442
10
95
2022
322594
145431921
107
90
0,500,241,000,23
0,190,12
0,320,390,500,201,000,280,200,080,330,240,570,751,000,600,290,110,560,700,24
0,040,040,020,11
0,100,06
0,220,240,030,020,020,060,100,040,160,060,040,030,010,100,020,010,110,081,00
*) In most tables and figures, decimal points are denoted by commas "," instead of full stop "."because of insurmountable technical problems with the spreadsheet software used.

20
postings into consideration. The next step in the path is defined to be the set thatmaximizes precision. If there is a tie, select the set that increases recall the most.Find the union of this set with the set defined by the current path position to create anew path position.
(3) Repeat step 2 until the elementary postings sets have exhausted.
Precision and recall values for the 24 elementary postings sets and the respective curve for
the most rational path are presented in Figure 1.1.2 Harter did not report full-scale evaluation
results based on the most rational path idea except this single example. He developed a “blind
2 The article text obviously contains inconsistent data. The algorithm was said to construct the most rational
path by selecting elementary postings sets in the following order: s3, s18, s24, s17, s9, s1, s20, s23, s21, s10, s2,s8, s22, s16, s12, s15, s7, s13, s4, s5, s6, s14, s11, s19. However, the cumulative recall and precision figuresreconstructed in Figure 1.1 show that the algorithm did not work as described. Harter assigns all 24 elementarypostings sets to the most rational path, but only 19 of them are needed to achieve the maximum precision atappropriate levels of relative recall. In addition, some added postings sets do not make a positive contribution:
• Sets s21, s10 and s22 make a negative contribution by adding non-relevant records only. Recall doesnot increase but precision falls from a path position to the next one. Thus these sets should not be addedat all. (Continue on the next page.)
• Sets s11 and s19 that were selected last do not make any contribution. They must be subsets of set s3since they contain only relevant records (P=1,00) but are not added before set s18 that contains onenon-relevant document.
Figure 1.1. Recall and precision of the 24 elementary postings sets and the most rational path in the case search presented by Harter (1990).
0,00
0,10
0,20
0,30
0,40
0,50
0,60
0,70
0,80
0,90
1,00
0,00 0,10 0,20 0,30 0,40 0,50 0,60 0,70 0,80 0,90 1,00
Recall
Pre
cisi
on
Most rational path
Elementary postings
s3
s3 or s18
s3 or s18 or s24
s3 or s18or s24 or s17
s18s24
s17
s9
s2
s22 added
s10 addeds21 added
s1

21
search” algorithm generating all 1785 combinations of the 24 elementary postings sets. The
distributions of the 1785 postings set combinations were reported separately across recall and
precision from 0 to 100 per cent at 10 per cent intervals. He did not present the maximum
precision values as a function of recall and neither did he report any comparisons between the
incremental and the blind search algorithms in constructing the most rational paths.
Harter’s idea is an obvious contribution. If the ultimate limits and the basic characteristics
of Boolean IR systems are to be studied, the evaluation should be stretched over the whole
operational range of the system. One should compare queries designed for a particular
operational level, and not obscure the phenomena under investigation by heavy averaging.
However, the theoretical framework and operational guidelines were not sufficiently
developed for a fluent use of the method in practice in Harter's paper. To do this, we need an
appropriately defined framework for the method in the context of IR evaluation.
1.3 Methods and techniques in IR evaluation
Methods (in science) are the particular activities that are used to achieve research results.
Methods include various experimental designs, sampling procedures, measuring instruments,
and the statistical treatment of data. (Polkinghorne 1983, 5.) Bunge (1967, 8) defines a
(scientific) method as a procedure for handling a set of problems. Established methods and
techniques relate to, and are a part of the normative standards guiding scientific activities and
especially the processes of investigation (Groot 1969, 24).
The study - the description, the explanation, and the justification - of methods is called
methodology. The aim of methodology is to understand the process of scientific inquiry
(Kaplan 1964, 18,23). Groot (1969, 24) defines methodology as the study of methods of
empirical science, the actual procedures of investigation. Some authors make a distinction
between methods and techniques. In this view, methods are seen as quite general procedures
common to all or a significant part of sciences like forming concepts and hypotheses, making
observations and measurements, performing experiments, etc. Techniques differ from one
another in the scope of application, some being appropriate only in a very narrowly defined
context (Bunge 1967, 8). However, the difference between the methods and techniques of
scientific investigation is only a matter of degree (Kaplan 1964, 23).
Evaluation is an activity taking many forms in different professional and scientific
contexts. In the IR research context, evaluation is focused on the study of the extent to which

22
an information retrieval system satisfies the needs of its users (Lancaster & Warner 1993, 161-
162). Evaluation is a major force in research, development and applications related to
information retrieval (Saracevic 1995). Because of the central role of evaluation in IR, the
methods applied in evaluation have been an area of active debate. The issues of relevance and
relevance based effectiveness measures, the role of the user, the validity of the laboratory
model, etc. have been addressed (see e.g. Harter & Hert 1997).
According to Newell (1969) and Eloranta (1979, 39-40) a method can be defined as a
triple M={domain3, procedure, justification}. Applying the triplet to the IR evaluation task,
we are able to outline the key aspects of evaluation methods that should be described and
analysed:
1. The domain of a method refers to the set of tasks defined for a method. For instance,describing evaluation tasks as the domain of a method requires that we define theaims of evaluation, the characteristics of evaluated systems and other factorsrestricting the intended application area of the method.
2. The procedure of a method refers to the ordered set of operations to be applied to thetasks in the domain. For instance, the procedure of an evaluation method shouldspecify how the test queries are formulated and executed, relevance of documentsassessed, and performance measured.
3. The justification of a method should justify the application of the procedure on thetasks in the domain. Saracevic (1995) suggests that methods should be evaluated fortheir validity, reliability, appropriateness and other related criteria. Tague-Sutcliffe(1992) includes efficiency as an essential characteristic of a method that should bediscussed.
1.4 Research problems
The main goal of this study is to create an evaluation method for measuring the ultimate
performance limits of Boolean queries across a wide operational range by elaborating and
applying the ideas of elementary postings sets and the most rational path introduced by Harter
(1990). To do so, an evaluation method is proposed and demonstrated. The method is
presented and argued using the triple M={domain, procedure, justification} as a framework.
The research problems are defined in the following way:
1) The domain of the method. The problem is to define the goals for the method and tospecify an appropriate application area for the proposed method. An importantquestion to be answered is: What kind of IR evaluations is the method good for?
3 Actually Newell (1969) used term problem statement instead of domain. We prefer to use the latter.

23
Harter introduced the idea of the method but did not really apply it to any full scaleevaluation studies.
2) The procedure of the method. The ordered set of operations constituting the procedureof the method is described. Two major operations of the procedure need to beelaborated:
a) Query formulation. How the set of queries (elementary postings sets) representingthe whole operational range from high precision to high recall should becomposed from a search topic. Harter used a query plan based on two facets andall (elementary postings set) queries were conjunctions of two query terms. Noclear scenario was presented on how the search facets and the corresponding set ofquery terms were selected.
b) Algorithm for searching the most rational path. What algorithm should be used forcombining the elementary postings sets to find the optimal query for differentoperational levels? Harter used a very simple algorithm and did not evaluate howclose the resulting path was to the optimum.
3) The justification of the method. The appropriateness, validity, reliability and efficiencyof the method in conducting evaluations within the specified domain must be justified.
a) Appropriateness is verified by introducing a case experiment that yields newresults or questions the results of earlier studies. Harter mainly emphasised thepossibility of studying the overlap in elementary postings sets. This view can bebroadened.
b) Validity is confirmed by ensuring that the procedure of the method is based on anestablished interpretation of the essential variables in the observed phenomena ofthe specified domain. Harter did not discuss the potential validity problems of thismethod.
c) Reliability. The main question is, how query formulation processes could becontrolled to increase the replicability of experiments and to avoid uncontrolledhuman biases. Harter formulated the query plan by himself and did not discuss thereplicability problem.
d) Efficiency. An appropriately performing method should also be reasonable interms of resources consumed. These issues were not examined by Harter.
1.5 The structure of the dissertation
The work starts by introducing some basic concepts and an outline of the proposed
evaluation method in Chapter 2. The goal is to specify first the procedure of the method
emphasising those operations that differ from those applied in traditional IR experiments. The
description of the procedure focuses on query planning, query optimisation, and other
operations that are unique to the proposed method. Much space is devoted to theoretical and
empirical arguments justifying the implementation of the key operations. The chapter ends by
sketching the domain of the proposed method.

24
Chapter 3 describes a test collection that was used in a case experiment. This experiment
is reported in Chapter 4. The aim of the case experiment was to learn and illustrate the
pragmatic issues of applying the proposed method in a concrete experimental setting. The
experiment focused on the basic characteristics of Boolean queries in free-text searching of
small and large full-text databases. One aim of the case experiment was to justify the
appropriateness of the method: new knowledge can be gained by applying the method.
Chapter 5 discusses the other justification issues of the method: validity, reliability and
efficiency. Several empirical tests were carried out to clarify the potential validity and
reliability problems in applying the method. Chapter 6 presents the concluding remarks of the
dissertation.

25
2 OUTLINE OF THE EVALUATION METHOD
The aim of this chapter is to construct a sound theoretical framework for the method
proposed by Harter (1990) and to formulate operational guidelines for exercising it. In the
introduction, we used concepts and terminology adopted from Harter but cannot continue
without refinements and extensions. One problem is that Harter presented his ideas through
examples and did not give (formal) definitions for the concepts he was applying. For instance,
when talking about queries (query statements) he referred to sets (e.g. elementary postings
sets). Because our focus is on the Boolean IR model it is necessary that we make a distinction
between queries as logical statements and query results as sets. From now on, we talk about
elementary queries (EQ) instead of elementary postings sets. Elementary queries are atomic
query structures from which desired queries for varying recall and precision goals are
composed by disjunctions. The second column of Table 1.1 contains examples of EQs.
2.1 The theoretical framework
2.1.1 The Boolean IR model
IR models or IR techniques address the issue of comparing a query as a representation of a
request for information with representations of texts. Different techniques for comparison
(matching) of representations are in the core of IR models. However, the representations of
requests and texts are also important components of the model since different representations
allow different comparison techniques to be used. The Boolean IR model supports rich query
structures, a (simple) binary representation of texts, and an exact match technique for
comparing queries and text representations. (Belkin & Croft 1987).
A query consists of query terms and operators. Query terms are usually words, phrases, or
other character strings typical of natural language texts. Operators are special character strings
defined in the query language of an IR system, and used to create a structure for a query.
Words, phrases, or other character strings occurring in texts to be retrieved are here called
expressions. In this study, the focus is on text retrieval but the texts to be retrieved are called
documents.
The Boolean query structures are based on three logic connectives conjunction (∧),
disjunction (∨), negation (¬), and on the use of parenthesis. A query expresses the

26
combination of terms that retrieved documents have to contain (Järvelin 1995, 118-119). If we
want to generate all possible candidates for Boolean queries for a particular request and study
their performance, it is not only a question of identifying all possible query terms that might
be useful. It is as essential to generate all logically reasonable query structures (i.e. how query
terms are combined).
In a Boolean IR system, queries are implemented through set operations in the inverted
file of a database. A query term creates a document set (actually, a set of document
identification numbers) associated with that term in the inverted file. The disjunction of query
terms is implemented as the union (∪) of, the conjunction as the intersection (∩) of, and the
negation as the difference (-) of the respective document sets. One part of the implementation
is the query language that specifies commands and parameters used in executing queries (and
other operations). A set of operators is used as symbols of Boolean operations: union (e.g.
OR), intersection (e.g. AND) and difference (e.g. NOT) (Järvelin 1995, 190-192). For a
detailed presentation of implementation issues in Boolean IR systems, see Frakes & Baeza-
Yates (1992, 264-292).
The set of documents retrieved by a query is called the result set. Recall and precision are
standard performance measures used in the evaluation of retrieval systems (see e.g. Salton &
McGill 1983). These measures are based on the content of the result set. The optimality of
queries or query combinations can only be estimated by studying the contents of their result
sets. This may be a reason why logic-based concepts are often replaced by or mixed with set-
based concepts (as Harter did).
The notion of facet is very useful in representing the relationship between Boolean query
structures and requests as expressed information needs. A facet is a concept (or a family of
concepts) identified from, and defining one exclusive aspect of a request or a search topic4.
The notion of facet is widely used in the professional and research literature dealing with
query formulation (see Section 2.2). The notion of facet helps to identify query terms that play
a similar semantic role, and are interchangeable in a query or a text. Terms within a facet are
naturally combined by Boolean disjunctions. Facets themselves present the exclusive aspects
4 We prefer to use term search topic or request instead of user request. The term user request is associated
with the cases where the ultimate information user expresses a request to an intermediary. Search topic is perhapsa more accurate expression because we have adopted a system-oriented view where information needs areexpected to be well-defined (they are a sub-set of “real” user requests).

27
of desired documents. Thus facets are naturally combined by Boolean conjunction or negation.
(Harter 1986, 76-81, Järvelin 1995, 142-145).
We define that any search topic i of n identifiable facets can be represented as a query
qi= (a1∨a2∨… ∨ak) ∧ (b1∨b2∨… ∨bl) ∧ … ∧ (n1∨n2∨…∨nm),
where {a1,a2,…,ak}, {b1,b2,…,bl}, and {n1,n2,…,nm} are query terms representing facets [A],
[B] and [N] identified from the search request. Conjunction (∧) can be replaced by negation
(¬) when the exclusion of documents is appropriate. It is typical of facets (e.g. [computer])
that they can be represented in documents and in queries using different expressions (e.g.
computer, microcomputer). Further, an expression may occur in different forms as a character
string (e.g. computer, computers). For a more detailed introduction on the levels of
representation in documents and queries, see Järvelin et al. (1996).
Query qi is in a standard form (the conjunctive normal form - CNF to be defined formally
in Section 2.3). It is also possible to formulate queries by applying the Boolean connectives
differently, but we base our work on this structure. It is widely used in practice, and it clearly
shows the link between the Boolean IR model and the verbal representations of search topics.
Similar query structures are also available in advanced best match IR systems and seem to
improve their effectiveness when exploited appropriately (Kekäläinen & Järvelin 1998,
Kekäläinen 1999, Pirkola 1998, 1999).
We need two additional concepts characterising the structure of Boolean queries. Query
exhaustivity (Exh) is simply the number of facets that are exploited in a query. Query extent
(QE) measures the broadness of a query, e.g. the average number of query terms used per
facet. The structural properties, exhaustivity and extent, are illustrated in Figure 2.1. In query
qi ,
Exh i n( ) = , and
,/|)|( n)s(Ffacet-termQE(i) j
n
aj∑
=
=
where |facet-terms(Fj)| gives the number of terms selected for facet Fj. In query qi, these
numbers for facets [A], [B], and [N] are, respectively, k, l, and m.

28
The changes made in query exhaustivity and extent to achieve appropriate retrieval goals
are called here query tuning. The range within which query exhaustivity and query extent can
change sets the boundaries for query tuning. In query qi, exhaustivity may be tuned from 1 to
n, and extent from 1 to (k+l+ …+m)/n. The set of all elementary queries and their feasible
combinations composed at all available exhaustivity and extent levels form the query tuning
space. In principle, the query tuning space for a search topic i contains all conceptually
justifiable query modifications extracted from query qi.
The focus of this study is mainly on free-text searching of full-text databases although the
findings may also be exploited in other environments. Full-text databases contain the
complete texts of documents, e.g. newspaper articles, or court decisions. Bibliographic and
referral databases pointing users to another, “complete” information source, are excluded from
the definition (Tenopir & Ro 1990, 3). Full-text databases are typically full-text indexed, i.e.
the index of a database contains all character strings (“words”) of the stored documents. In our
study, free-text searching was restricted to mean Boolean querying in full-text indexed full-
text databases.
2.1.2 Other approaches to the study of Boolean queries
Frants et al. (1999) vigorously criticised the typical way of thinking about the Boolean IR
systems. For instance, they questioned the views that a trained searcher is needed in the query
formulation process and that relevance ranking is not supported in Boolean IR systems. The
authors point out that several algorithms for the automatic construction of query formulations
term ak
term a3
term a2
term a1
term bl
term b3
term b2
term b1
term nm
term n3
term n2
term n1
exte
nt
exhaustivity
∨
∨
∧ ...∧
Figure 2.1. The structural dimentions of a query for a search request containing n identifiable facets.
∧ ∨∨
∨
∨∨
∨
∨

29
in Boolean form have been published, e.g. by Frants & Shapiro (1991), Salton (1988), Smith
& Smith (1997), and French et al. (1997).
The coordination level (also called quorum level) method developed for the Cranfield 2
project, is a traditional approach to omit the trained searcher from the query formulation, to
rank output, and to measure the wide range performance of a Boolean system (Cleverdon
1967, Keen 1992a). For example, query terms are selected applying an automatic procedure
from a written search topic Small deflection theory of cylinders, breeding four queries
(assuming that word of is on the stop word list):
Level 1: small ∨ deflection ∨ theory ∨ cylindersLevel 2: (small ∧ deflection) ∨ (small ∧ theory) ∨ (small ∧ cylinders) ∨
(deflection ∧ theory) ∨ (deflection ∧ cylinders) ∨ (theory ∧ cylinders)Level 3: (small ∧ deflection ∧ theory) ∨ (small ∧ deflection ∧ cylinders)
∨ (small ∧ theory ∧ cylinders) ∨ (deflection ∧ theory ∧ cylinders)Level 4: small ∧ deflection ∧ theory ∧ cylinders
Selection of query terms from the search request and their permutation at different
coordination levels is a mechanical process replacing the cognitive effort of a human searcher
in formulating a query. The Boolean query operations are exploited in a simplified way. For
instance, the role of disjunction as a mechanism for representing the sets of synonymous or
otherwise interchangeable query terms is ignored. The method tends to produce quite
pessimistic performance curves (see e.g. Cleverdon 1967, 182). The problem is caused by
broad query terms retrieving large document sets. At each level, the conjunction retrieving the
largest set of documents dominates (decreases) the precision average. Often these query terms
or conjunctions of terms are the least focused at that level (e.g. small at level 1 or small ∧
theory at level 2). Because the coordination level method and other similar methods exploit
the Boolean IR model in an underoptimal way, it is not an adequate tool for investigating the
ultimate performance characteristics of that model.
Losee (1994, 1998) developed analytic models for the performance evaluation of text
retrieval and filtering systems. His goal is to describe current performance, predict future
performance, and understand why systems perform as they do. The drawback of this approach
is that situations where many facets and query terms are involved are very complex to model.
Typically, single term queries or very simple Boolean query structures have been modelled. In

30
the case of free-text searching in full-text databases an empirical approach was regarded as
more appropriate.
2.1.3 An outline for the procedure of the method
After defining the basic concepts we are ready to start building up the outline for the new
evaluation method. The procedure includes nine main operations, and these are discussed in
detail in the sections of this chapter (see Figure 2.2):
1. One or a group of experienced searchers analyse each search topic and design aninclusive query plan applying a specified planning strategy. Inclusive query plansyield a comprehensive query tuning space, i.e. a wide range of query exhaustivity andextent organised into an appropriate structure (see Section 2.2).
2. Documents retrieved by an extensive query are printed out for relevance judgements.Relevance judgements are obtained from independent assessors (see Section 2.4).
3. The order of facets in the inclusive query plan is determined by ranking themaccording to their measured recall power, and sub-plans are composed at differentlevels of exhaustivity (see Section 2.2).
4. Inclusive query plans are converted in an automatic procedure into elementary queries(EQ) at different levels of exhaustivity (see Section 2.3).
5. Elementary queries are executed and the result set of each EQ is recorded.
6. Standard points of operation (SPO, e.g. document cut-off values or fixed recall levels)are selected at which the performance of an IR system is to be evaluated (see Section2.6).
7. A disjunction of elementary queries providing the optimal performance at each SPOis determined by EQ result sets and their combinations using an optimisationalgorithm (see Section 2.5).
8. The value of the performance measure (e.g. precision) of the optimal query at eachSPO is calculated for each search topic and averaged over all topics.
9. The optimal EQ combinations are analysed to find query structure based explanationsfor performance variation.
These nine steps describe the ordered set of operations constituting the procedure of the
proposed method. Two operations of the procedure, namely the query formulation (steps 1 and
3) and the search for the optimal set of elementary queries (steps 6 and 7), are in the focus of
this study as stated in the introduction (research problems 2a and 2b). Other operations, the
execution of queries (step 5), the way of doing relevance assessments and recall base
estimation (step 2), and the analysis of results (steps 8 and 9), are also described. However,
the justifications of the latter operations are not discussed in detail since these operations are
applied in a standard way (as in the TREC experiments).

31
2.2 Controlling the query formulation process
Query formulation is defined here to incorporate all actions taken to construct a query as
well as all reformulations of the query in the course of a search. In this section, the main
features of query formulation as a dynamic and interactive process are discussed. The aim is to
find a solid ground for the query formulation process so that it could be controlled more
systematically in the context of the proposed method.
2.2.1 Query formulation models
Ingwersen (1996) introduced a cognitive model for IR interaction. One key component of
this model is called the Interface/Intermediary functions. These functions represent the
A search topic
1 Formulate an inclusive query plan
4 Convertthe inclusive query plan
into elementary queries (EQ)
5 Retrieve by EQs
2 Search by extensivequeries and obtain
relevance judgments
6 Selectstandard points
of operation (SPO)
7 Combine EQs to find optimal queries at each SPO
8 Average performanceacross search topics
at each SPO
9 Analyzeproperties of optimal
queries
Figure 2.2. The procedure of the proposed evaluation method as an orderedset of operations.
3 Determine the facet orderand formulate queries of
varying exhaustivity

32
cognitive structures involved in query formulation. Query formulation is a process where an
intermediary perceives and interprets a user request and translates it into a query. Two basic
transformations take place: from the linguistic level (the user request in natural language) to
the cognitive level (intermediary's knowledge structure) and back to the linguistic level
(Boolean query). The way that an intermediary interprets a user’s request depends on his/her
current cognitive structures. The cognitive structures of a person are determined by the
experiences gained through time in a social and historical context.
Query formulation is routinely taught to novice searchers (see e.g. Harter 1986, pp. 170-
203, Lancaster & Warner 1993, 129-158). Formulation practices include general, database
specific, and request dependent search strategies and heuristics. A search strategy is usually
defined as an overall plan or approach for achieving the goals of a search request. Heuristics
(often called moves) are actions taken to meet limited objectives towards the goal within a
search strategy (Harter 1986, p. 170). A large set of strategies and heuristics has been
identified in empirical studies on searching behaviours of professional searchers (Mark
Pejtersen 1989, Fidel 1991, Belkin et al. 1996, Cool et al. 1996).
Building blocks, successive facets (or fractions), pairwise facets, briefsearch, and
interactive scanning are examples of general purpose search strategies (Hawkins & Wagers
1982, Harter 1986, p. 172-180). A common feature of search strategies is that they emphasise
the analysis of concepts (facets or aspects) of a search request, and how to represent them with
expressions (query terms). Different strategies are intended to serve different goals. For
example, the building blocks strategy is aimed at high-recall searching and briefsearch
strategy for quick-and-dirty type of searching.
Heuristics are applied to formulate an initial query as well as to modify it to increase recall,
to increase precision or to adjust the size of a result set (Fidel 1985, Harter & Peters 1985,
Sormunen 1989). On the basis of a study of 47 searchers performing their job-related
searches, Fidel was able to introduce a formal decision tree representation for moves applied
by professional searchers. Of the 33 identified move types, 17 were used to reduce the size of
a set (increase precision), 13 were used to enlarge the size of a set (increase recall), and three
were used to increase both precision and recall (Fidel 1991).
Different individuals seem to apply different sets of strategies and heuristics leading to
different searching styles (Fidel 1984, Fidel 1991). Empirical findings show clear performance
differences between individual searchers. However, little evidence has been found on the

33
relationship between the characteristics of individual searchers (demographic, searching
experience, searching styles, etc.) and searching performance (Saracevic et al. 1988, Cool et
al. 1996). All searchers, regardless of their searching style, seem to encounter difficulties in
achieving satisfactory recall, because most of the applied moves are intended to increase recall
(Fidel 1991).
A logical consequence of varying searching styles is low consistency in resulting queries
when comparing one searcher with another. The average overlap in selection of query terms
(measured character-by-character) is usually around 30 per cent (Saracevic et al. 1988, p. 197-
216, Iivonen 1995a). This seems to confound all attempts to control the query formulation
process. Fortunately, the situation is not so bad. Iivonen (1995a) has examined the degree of
intersearcher concept-consistency within a group of 32 searchers who were analysing 12
requests. Search concepts reflect the meanings (the aspects of a topic) recognised by a
searcher from a request. Intersearcher concept-consistency rose up to 88 per cent. And
importantly, the consistency of experienced searchers of a specific database was well above
the average.
Nevertheless, irrespective of the ways of arriving at facets and query terms within the
Boolean model, the outcome is a set of query terms and operators which may be interpreted as
typical facet structures. Our focus is on the structured representations of search topics as
Boolean queries. There may occur slight variations in query formulations, but this does not
invalidate the base of the method. The point is that by careful design of query formulation
operations we guarantee that query plans reflect high quality professional practices.
2.2.2 Strategies for free-text searching
Traditional search strategies offer a general framework for designing controlled query
formulation processes. Most high-recall directed strategies for free-text searching are more or
less obvious modifications of the building blocks strategy. The major steps of the building
blocks strategy are
1. Identify major facets and their logical relationships with one another.
2. Identify query terms that represent each facet: words, phrases, etc.
3. Make a query by each query term within each facet and combine the query terms of afacet by disjunction (OR operation).

34
4. Combine all facet queries (formed in step 3) using conjunction or negation (AND orANDNOT operation) (Harter 1986, p. 172).5
The drawback of the building blocks strategy is that all major facets are regarded as being
of equal value, some other facets of a request are neglected, and only one query plan of fixed
exhaustivity is composed.
A modification of the building blocks strategy, called the successive facets strategy, offers
a more appropriate basis for controlled query formulation at varying exhaustivity levels. The
query plan is designed through the same four steps as in the building blocks strategy, but the
facets are designed one at a time starting from the most important one. The least important
facets are employed only if required for focusing the query, or for restricting the size of a
result set (Harter 1986, 177-180).
Figure 2.3 illustrates the steps of successive facets strategy. The critical point in this
strategy is that the searcher is supposed to rank the selected facets in some order of
importance. The names for some versions of this strategy suggest some interpretations of
importance: most specific concept first, fewest postings first, etc. (Harter 1986, p. 177,
Hawkins & Wagers 1982). A searcher is supposed to identify those facets that can be
expressed with a set of query terms with a high likelihood of retrieving all relevant documents
but as few other documents as possible.
5 Terms used in the source have been translated from set-based language to query-based language (e.g.
postings replaced with queries, etc.).
Search topic
[A][B][C]
.
.[K]
Identifiedsearch facets in order of estimatedimportance
qA = A1 OR A2 OR … OR Am
qB = B1 OR B2 OR … OR Bn
First facet (option 1)
Second facet
qK = K1 OR K2 OR … OR Kt
K’th facet
qC = C1 OR C2 OR … OR Cp
(option 2)
Third facet
(option 3)
.
.
.
Figure 2.3. Successive facets strategy (modified from Harter 1986, p. 177)
qA AND qB
qA AND qB AND qC

35
The successive facets strategy has several advantages:
1. Control of exhaustivity. The successive facets strategy guides the searcher to identifythe most meaningful facets and, in addition, to estimate the mutual importance offacets in focusing the query. This feature helps to create queries on varying levels ofquery exhaustivity.
2. Control of extent. The strategy also encourages the searcher to discover all reasonableexpressions for each facet. The completeness of facet representations helps to designtests at varying levels of query extent.
3. Tendency towards concept-consistency. In her consistency study, Iivonen (1995b)found that those professional searchers having experience in a specific databaseenvironment and achieving high concept-consistency level, tend to prefer three searchstrategies: successive facets, most specific facet first (a version of the former), andpairwise facets. This finding suggests that the successive facets strategy is tolerable ifthe consistency of queries is considered.
Fidel (1991) identified 33 online searching moves applied by professional searchers.
Eleven moves were related to controlled vocabulary, and eight to special search keys
(publication year, document type, etc.) or to selection of databases or database sections. The
remaining fourteen moves are applicable in free-text searching of a particular database (see
Table 2.1). Some moves are not really a problem of query formulation, and can be easily
solved by designing parallel tests (the rule Weight 4) or sampling procedures (the rule Cut).
The remaining moves are instances of three general rules:
1. Exhaustivity rule. Increase or decrease the exhaustivity of a query.
2. Extent (or broadness) rule. Increase or decrease the extent of a query.
3. Replace rule. Replace an existing query term with another.
The above summary suggests that the multiplicity of available search heuristics is
misleading in the context of free-text searching. Taking successive facets as an underlying
search strategy, there are only three basic options to adjust a query to meet varying retrieval
goals. Firstly, one may modify query exhaustivity by adopting or omitting facets available for
a query. On the other hand, one may choose different sets of available expressions to represent
a facet in a query. Thus, the idea of using query exhaustivity and extent as the major
constituents in the Boolean IR model is supported by professional practices. And conversely:
By studying exhaustivity and extent tuning in optimal queries we may obtain results that can
be exploited in practice.

36
2.2.3 Inclusive query plans
The successive facets strategy - as defined in the literature - offers a general framework for
designing controlled query formulation processes. However, the steps of query formulation
have to be specified and documented in the form of detailed guidelines to meet the reliability
requirements of experimentation. Another reliability problem is that professional searchers
plan queries with the expected needs of an individual information user and his/her information
Table 2.1. Moves applicable in free-text searching (based on Fidel 1991).
Name Description Comments
To reduce the size of a set
Eliminate Eliminate a term from theformulation.
Broadness rule. (From a facet, but not thelast one.)
Cut Submit only part of the retrievedanswer set, arbitrarily selected.
Sampling is a test design issue - excludedfrom human query formulation.
Intersect 1 Intersect a set with a set representinganother query component.
Exhaustivity rule. (Add a new facet.)
Weight 4 Require that free-text terms occurcloser to one another in the searchedtext.
AND -> proximity oper. is a test designissue - excluded from human queryformulation.
Negate Eliminate unwanted elements byusing the AND NOT operator.
A special case of Intersect 1; seldom used,omitted here
Narrow 3 Select a narrower concept. Replace rule.
To enlarge the size of a set
Add 1 Add synonyms and variant spellings. Broadness rule. (Increase broadness of afacet.)
Add 3 Add terms occurring in relevantcitations retrieved.
Broadness rule. (Increase broadness of afacet.)
Add 4 Add terms from database's index thathave a high number of postings.
Broadness rule. (Increase broadness of afacet.)
Cancel Eliminate restrictions previouslyimposed.
Exhaustivity rule. (Exclude a facet)
Expand 2 Group together search terms tobroaden the meaning of a set.
Broadness rule. (Increase broadness of afacet.)
Exclude Exclude from a formulation conceptspresent in most documents in adatabase.
Exhaustivity rule. (Exclude a facetrepresenting an implicit concept.)
Expand 5 Supplement a specific answer setwith sets representing broaderconcepts.
Broadness rule. (Increase broadness overall facets of a query statement.)
To increase both precision and recall
Refine Find a “better” search key. Replace rule.

37
needs in mind. They balance the effects of exhaustivity and extent of a query to meet the
expected needs of that particular user. Replicating query formulation practices as such would
not work in the evaluation context.
Our aim is to design a query formulation process that assists in formulating an inclusive
query plan that represents a comprehensive query tuning space including all appropriate levels
of query exhaustivity and extent. Although inclusive query plans are designed by following
special guidelines, their design is based on ordinary free-text searching expertise. However,
the guidelines have to be clearly presented to the searcher subjects to help them see the
difference between inclusive query planning and traditional planning for a single client.
Inclusive query plans are developed at three abstraction levels (see Järvelin et al. 1996):
1. Level of concepts. All meaningful query facets, their concepts, relations and mutualimportance are identified.
2. Level of expressions. All plausible query terms for each facet are identified andstructured into logical groups.
3. Level of character strings. A formal query for a particular retrieval system iscomposed.
The conceptual query plan represents the facet structure on the basis of identified search
concepts. According to the successive facets strategy, all K facets potentially useful in
searching should be identified. The relative mutual importance of facets in focusing the query
should also be estimated (order [A], [B], [C], …[K] in Figure 2.3). The order of facets is an
essential variable in designing tests. We may obtain quite different results about the effect of
query exhaustivity on retrieval performance if we use, for instance, facets [A]and [B] instead
of facets [C] and [K] at exhaustivity level two (see Pirkola 1999, 3/II).
At the initial stage of query planning, there is no reliable way to determine what the
optimal order of facets is. This can be decided later when recall and precision data for all
facets become available. However, professional searchers are able to make a distinction
between the major facets and minor facets already at the initial stage. There is some empirical
evidence that expert searchers identify the set of major facets quite consistently (Iivonen
1995b).
In large full-text indexed databases, there is also another problem in deciding the order of
facets. The number of retrieved records is high at the lowest levels of query exhaustivity (see
e.g. Blair & Maron 1985, Ledwith 1992). The experimenter probably cannot afford the total
cost of obtaining relevance judgements. We are running now into a vicious circle which does
not seem to have an exit at all. We are not able to make reliable recall base estimates because

38
the queries at the exhaustivity level one [A], [B], etc. retrieve so many items. Perhaps facet
[A] is retrieving all relevant documents in a focused way, but we do not know which of the
identified facets could play the role of the facet [A] without knowing all relevant documents.
We have two problems, both of which can be solved if either one of them is solved. (1) The
optimal order of facets needs to be determined to build a solid base for studying query
exhaustivity issues. (2) The problem of recall base estimates has to be solved. The second
problem is discussed in Section 2.4 and we presume here that it provides a sufficient answer.
This assumption enables us to proceed into query planning.
The design principle is illustrated with the following example. A reasonable conceptual
interpretation for a search topic “News about the decisions made by the Organization of
Petroleum Exporting Countries (OPEC) concerning oil production quotas” could be:
C.I [OPEC] AND [oil] AND [production] AND [quotas] AND [decision].
Facets may refer to individual persons, organisations, geographical areas6. They may be
general concepts referring to physical or abstract entities, action or properties. Complex
concepts are not accepted, and they have to be split into elementary concepts (e.g. [oil price] -
> [oil] and [price]). An elementary concept cannot be made more elementary by splitting
without moving outside the original context (e.g. [valtameri] - [ocean]; [valta] – in this
context [great], but usually [power, might];[meri] - [sea]).
At the level of expressions, each facet in the conceptual query plan is replaced with a
disjunction of all plausible expressions for that facet. Any character string - usually a word or
a phrase - by which the author of a document may refer to a concept covered by a particular
facet is a plausible expression within that facet. This includes expressions that are
1. synonymous query terms: expressions for the facet as a whole (equivalencerelationship)
2. narrower query terms: expressions for the narrower concepts within the facet (genericor partitive relationship)
3. associative query terms: expressions otherwise related to the facet that can be usedinstead of synonymous query terms in some search contexts (associative relationship)
6 As defined in Section 2.1.1 facet is a concept or a group of concepts representing one exclusive aspect of a
search topic. Fugman (1993, IX-XIV) defines that a concept is the entirety of true and essential statements thatcan be made about a referent and the referent is anything about which statements can be made. Concepts may beindividual (or named, e.g. [OPEC]), specific (e.g. [crude oil]) or general (e.g. [industries]). We may name andtalk about concepts by using some agreed expression (e.g. [abc]).

39
Basically, the design principles of a searching thesaurus illustrated in Kristensen (1993) and
Kekäläinen (1999, 14-20) may be applied here to cover all plausible expressions.
Various sources have to be used in gathering potential query terms: the searcher’s personal
knowledge, printed sources (dictionaries, handbooks, primary literature), records from sample
queries, etc. The thoroughness of this process is essential in achieving comprehensive
representations for all facets. However, all terms not occurring in the test database should be
rejected to avoid their biases in measuring the extent of resulting queries.
At the string level, query terms are translated into the syntax of the target retrieval system.
For example, if query terms are truncated manually, a systematic way of doing this has to be
adopted. As mentioned earlier, inclusive query planning is an interactive process. All
decisions made at the level of expressions have to be verified by executing test queries (string
level representations of the query plan). Thus, the process of query planning is interactive.
The query plan is now nearly completed. The only thing that has to be done is to decide the
order of facets in the query plan. This is done by first making a query with each facet (the
disjunction of query terms of a facet). The output of these queries reveals what documents are
found by a particular facet. By comparing the results with the relevance data (see Section 2.4),
it is possible to rank the facets according to the number of retrieved relevant documents. If
there are several facets retrieving the same number of relevant documents, the precision of
results is used as the second criterion of ranking.
If we assume that the facets in the conceptual plan C.I were (by accident) in the order of
decreasing recall, our example of the inclusive query plan (on the level of expressions, a
simplified version) gets the following form:
E.I.1 (OPEC OR Organization of Petroleum Exporting Countries) AND(oil OR petroleum OR crude oil) AND(production OR pumping OR overproduction) AND(quota OR ceiling OR production quota) AND(decision OR agreement OR agree)
E.I.2 (OPEC OR Organization of Petroleum Exporting Countries) AND(oil OR petroleum OR crude oil) AND(production OR pumping OR overproduction) AND(quota OR ceiling OR production quota)
E.I.3 (OPEC OR Organization of Petroleum Exporting Countries) AND(oil OR petroleum OR crude oil) AND(production OR pumping OR overproduction)
E.I.4 (OPEC OR Organization of Petroleum Exporting Countries) AND(oil OR petroleum OR crude oil)

40
E.I.5 (OPEC OR Organization of Petroleum Exporting Countries)
Sub-plans E.I.1…5 represent the original query plan on all available levels of exhaustivity
from one to n (here from 1 to 5).
2.3 Elementary queries
Harter (1990) did not give any formal definitions for the query structures he was using in
his sample search. However, his query plan (as all queries based on the building blocks
strategy) was in a standard Boolean query structure called conjunctive normal form (CNF). All
sub-plans E.I.1 - E.I.5 are in CNF. Query term combinations like (OPEC OR Organization of
Petroleum Exporting Countries), (oil OR petroleum OR crude oil), etc. are elementary
disjunctions. A query is in CNF, if it is a conjunction of a finite number of elementary
disjunctions (for definitions, see Arnold 1962, 102-107).
The conjunctive normal form has become a popular scheme for professional searchers to
write query plans. By using CNF as a model, the “conceptual structure” of the query is easy to
manage and also to explain to IR-ignorant clients. The drawback of CNF is that facets obscure
the effects of individual query terms or their conjunctions. In the CNF structure, it is difficult
to check for example, whether a query plan contains any degenerative or inefficient query
terms.
Any Boolean statement in CNF can be transformed into disjunctive normal form (DNF)
that displays explicitly the elementary conjunctions of a query plan. A query is in the
disjunctive normal form, if it is a disjunction of a finite number of elementary conjunctions
(Arnold 1962, 107). For instance, if (A∨B) ∧ (C∨D∨E) is a query in CNF, and (A∧C) ∨
(A∧D) ∨ (A∧E) ∨ (B∧C) ∨ (B∧D) ∨ (B∧E) is the same query in DNF. Elementary
conjunctions give a solid base for producing atomic query structures (elementary queries -
EQ) mentioned earlier. Harter’s sample queries (elementary postings sets as he called them)
presented in Table 1.1 are also elementary conjunctions of his DNF query plan.
2.4 Recall base estimation
Recall base estimation induces remarkable methodological problems in large test
collections. Assessing all documents against all search requests is too laborious and too
expensive to be applied. Blair (1996) argued that much of the variance in recall evaluations
may be explained by weak efforts in trying to find unretrieved, relevant documents. He

41
criticised the experimenters with operational systems in particular for their omissions in
estimating the number of non-retrieved, relevant documents. A typical routine is to use the
pooling method by making a union of all documents retrieved by alternative queries without
any extra effort (see e.g. Tenopir 1985). If the recall base is not estimated with care, one may
wonder at what operational levels the results of an experiment may hold.
2.4.1 Pooling method by TREC
The Text REtrieval Conference (TREC) adopted a more advanced pooling method
originally introduced by Sparck Jones and van Rijsbergen (1976) for recall base estimations in
large test collections. In this form, the pooling method requires that various participating IR
systems and research groups are involved. In TREC-1, each research group constructed a set
of 200 ranked documents for each test topic. The documents in the union set of top 100
document sets were assessed for relevance, resulting in an average of 1462 judged documents
for each topic. Only little overlap was observed among the document sets generated by the
sixteen participating groups using 25 different IR systems (Harman 1993b). The pooling
method is convincing, but the recall base estimate still depends on the quality and variability
of the efforts of each group. It is not very appropriate in its original form for a single
evaluation project having limited resources.
2.4.2 Candidate sets and sampling by Blair
Blair (1990, 91-93, and 1996) outlined a model for recall base estimation that can be
applied in experiments with single Boolean IR systems. The scope of the original query is
expanded systematically by generating semantically close queries by making logical
modifications to the original query in CNF (e.g. A∧B∧C). The original query is modified by
using the so-called complete conjunctive normal form (CCNF) representation. In our example,
the CCNF representations are A∧B∧C (the original query), A∧B∧¬C, A∧¬B∧C, ¬A∧B∧C,
A∧¬B∧¬C, ¬A∧B∧¬C, and ¬A∧¬B∧C (excluding ¬A∧¬B∧¬C), where A, B and C are single
query terms or primary disjunctions. The logical modification method produces result sets
(called candidate sets) not intersecting with the original result set.
The disjunction of all CCNF queries retrieves the same documents as the disjunction of
primary disjunctions A, B and C (i.e. A∨B∨C). The problem is that usually the number of
documents in some candidate sets is so enormous that they have to be excluded from the
estimation process. The exclusion of a CCNF element is a semantic decision, and the

42
foundation of such a decision is not explicitly explained by Blair. One possibility is to use
sampling for large candidate sets. The first problem with sampling is that while it helps to
estimate the number of relevant documents it does not to really identify them. The second
problem is that sampling in a sparse space of relevant documents is unreliable (Tague-
Sutcliffe 1992).
2.4.3 Pre-selection method
An approach emphasising the role of a professional searcher in estimating the number of
relevant documents in a large test collection has been applied by Frisch & Kluck (1997) and
Kluck (1998), and called the method of pre-selection 7. The idea is to conduct
“… an exhaustive Boolean search (= a query) within the database to get a set ofdocuments which is on one hand comprehensive enough to contain all possibly relevantdocuments and on the other hand restricted enough to contain not too much noise.”
The pre-selection method is based on a profound knowledge of the documents inside the
database including knowledge of the subject area, a long time of contributing to the input of
the database, participation in the selection of the documents for the database, and retrieval
experience with the test collection or with the database where the documents originated
(Kluck 1998).
The method proposed by Kluck and others offers an interesting frame for hunting relevant
documents from a test database since it has a common basis with our idea of query planning:
an expert searcher designing comprehensive queries. Unfortunately, the sources do not give a
detailed description what “an exhaustive Boolean search” means. Thus, we must first try to
make that notion more exact and concrete. Another problem is that the pre-selection method
was developed for surrogate databases (patent and literature references, project descriptions)
where comprehensive conceptual indexing and classification are applied, but only abstracts
were available for free-text searching. We have to apply the idea to full-text databases and
free-text searching. Instead of exhaustive searches we prefer to use term extensive queries
since exhaustivity refers to the number of facets. However, both words refer to a query that is
designed to retrieve as many relevant documents as possible (= a high recall query)
7 The authors refer to Krause, J. & Womser-Hacker, C. Das Deutsche Patentinformationsystem.
Entwicklungstendenzen, Retrievaltest und Bewertungen. Heymanns, Köln, 1990 as the original source where theapproach has been documented. The term pre-selection sounds somewhat confusing but the term is used becausethe German source (Frisch & Kluck 1997) did not give arguments for finding a better translation.

43
2.4.4 Extensive queries with basic facets
Two basic principles in formulating inclusive query plans are that an attempt is made to
identify all query facets, and that all identified query facets are presented by the disjunction of
all plausible query terms (see Section 2.2.3). Inclusive means here that the designer of the
query plans is not making compromises that are typical for real search situations (balancing
query extent and exhaustivity before executing the query to meet the anticipated needs of a
particular client). This offers a good starting point for outlining a systematic way to design
extensive queries for recall base estimation.
The extent of facets in inclusive query plans is high but a decision has to be made: which
facet or facets to include in the extensive query. Because of the high extent of facets, some of
them may retrieve very large document sets and cannot be used alone as extensive queries. If
combined as a conjunct with another facet, a risk of rejecting relevant documents increases.
Some facets may also be weak in retrieving all relevant documents (implicit - non-searchable
expressions may have been used in the documents).
Facets are not equal as query tools. Harter (1990) identified “single-meaning” and “multi-
meaning” facets and demonstrated their differences in terms of retrieval performance. A
single-meaning facet defines a concept (e.g. information retrieval). Multi-meaning facets
define aspects or ways of thinking about the other query facets (e.g. cognitive and behavioural
issues). He demonstrated that the query terms for single-meaning facets retrieve more
overlapping document sets than those for multi-meaning facets. This means that a larger
number of query terms has to be used to achieve high recall in multi-meaning facets. Harter
also identified a strong negative correlation between result set size and precision and
suggested that added query terms lead to a diminishing returns effect. On the average, they
will increase recall but at the expense of precision.
Harter explained that the distinction between single-meaning and multi-meaning facets is
analogous to a distinction made by Fidel (1986) introducing the concepts single-meaning term
and common term. Fidel (1986, 1991) observed that professional searchers feel comfortable in
selecting free-text query terms when they can identify “single-meaning” terms for a concept (=
a query facet). A single-meaning term “... usually occurs in a particular context, it is uniquely
defined, and it is specific to the concept it presents” and that a common term “... usually
occurs in more than one context, or it has a broad and fuzzy meaning”. Fidel made a

44
contribution by showing that the rating of query facets for their potential effectiveness in free-
text searching is a routine decision made by expert searchers.
The findings above suggest that it is possible to identify for each well-defined search topic
a set of single-meaning facets that are more capable than other facets in focusing an extensive
query designed for recall base estimation. These facets are called here the set of basic facets.
Other facets identified from a search request are called auxiliary facets. They can be used to
narrow the scope of a query and serve in generating more exhaustive query versions, i.e. to
achieve high-precision goals. Typically, the occurrences of an auxiliary facet cannot be
covered adequately without using common terms as defined by Fidel (1991).
Three general criteria are defined for the identification of basic facets:
1. High likelihood of explicit occurrences. It is highly probable that all documents thatrefer to a concept within a basic facet contain at least one explicit expression for thatfacet.
2. High predictability of expressions. The occurrences of a basic facet can be representedby a limited number of explicit expressions.
3. High focusing capability. An appropriately focused query cannot be formulatedwithout expressions referring to all basic facets.
The first criterion states that if, for instance, an article is about a person, it is very probable
that his/her name will be mentioned. The second criterion implies that if a facet fulfils the first
criterion, the searcher should be able to identify all occurrences of that facet and express them
by query terms. While the first two criteria attempt to ensure that inclusive query plans
retrieve as many relevant documents as possible, the third criterion is trying to keep the total
number of retrieved documents as small as possible (for the sake of research economy).
Individual concepts (e.g. named persons and organisations) and specific concepts (bicycle,
perch, natural gas, etc.) are good candidates for basic facets. General concepts8 (e.g. politics,
action, opinions) do not meet the criteria. In our sample query plan (see Section 2.2.3),
[OPEC] and [oil] are good candidates for basic facets. Thus, E.I.4 could be an appropriate
extensive query for probing relevant documents (see Section 2.2.3):
(OPEC OR Organization of Petroleum Exporting Countries) AND(oil OR petroleum OR crude oil)
If document frequencies in a particular collection are relatively small for facet [OPEC],
8 Individual, specific, and general concepts: see definitions in Fugmann (1993).

45
query plan E.I.5 could be selected instead as the extensive query. On the border line, there
may be difficulties in deciding whether or not a facet meets the criteria of basic facets. In these
cases, the facet should be named an auxiliary one. The cost of this rule in terms of research
economy may be high, because the exclusion of a facet may increase the total number of
retrieved records dramatically.
Blair (1990, 104-106) demonstrated the risk of missing relevant documents if the
exhaustivity of queries is increased. Because of this risk, the reliability of recall base estimates
may be increased by setting a limit for the number of basic facets that should not be exceeded
without well-founded reasons (e.g. Exh ≤ 2).
2.4.5 Summary of recall base estimation
The proposed method leads to high recall Boolean formulations ensuring that semantic
decisions and logical modifications in recall base estimation have a solid ground. However,
the proposed method would not, as Blair has said of his method,
give a "true" value for recall, but it would probably give a reasonable maximumvalue for recall that might be good enough to compare between different retrievalsystems - something we have not had so far. (Blair 1996).
Credible recall base estimates are one cornerstone of an evaluation method, especially in
measuring the high recall performance of an IR system. At this stage, the reliability of the
proposed method for recall base estimation is only a hypothesis that requires empirical
verification (see Section 3.3).
The reliability of recall base estimates can be increased if pooling can be used. This
should be done when possible. When evaluating Boolean IR systems the other methods used
in the pool should be as different as possible. For instance, best-match systems exploiting
different weighting schemes and query formulation strategies are obviously good candidates
in the pool complementing extensive Boolean queries.
2.5 Optimal combination of elementary queries
An optimal query leads to the maximum performance of an IR system under defined
conditions. Here, we are looking for a combination of elementary queries, which is regarded
to approximate an optimal query. Some earlier studies on this topic have considered the
logical variants of a query in CNF. The optimal form of a query has been searched for by
creating CCNF representations for the original queries and by evaluating the combinations of
elements in CCNF representation. Heine and Tague (1991) experimented with descriptor

46
searching (Medical Subject Headings - MeSH). Losee (1994) introduced an approach for
determining the quality (optimality) of Boolean queries.
The analytical CCNF approach has obvious limitations. If one studies the variants of a
single conjunct (e.g. A∧B∧C) only very simple queries can be examined. If more complicated
queries in CNF are accepted (e.g. A∧B∧(C∨D∨E)), the primary disjuncts (here C∨D∨E) are
seen as undividable entities. Thus one cannot evaluate the effect of query extent tuning. In our
case, this would limit too much the possibility of studying query tuning.
2.5.1 All combinations and optimal paths
Harter (1990) used two algorithms to study the optimal combinations of elementary
queries. The first one created all possible combinations of elementary queries, and the second
one built the most rational path as introduced in Section 1.2. The full set of EQ combinations
was used to calculate the distribution of queries across ten fixed precision and recall intervals
and to study overlap in result sets of different query term conjunctions. Only the most rational
path algorithm was used to produce traditional performance data (i.e. precision of optimal
queries as a function of recall).
Generating all possible combinations of elementary queries is a brute force (or a blind
search) approach. If the number of query terms (or synonymous groups) for facet N is n, then
the number of different disjunctions of 1…n query terms is 2n - 1 (the empty set is ignored).
Each of these disjunctions can form a conjunction with any of the disjunctions originating
from other query facets. In the case presented by Harter (see Section 1.2), seven different
disjunctions could be generated from facet A (23 - 1 = 7) and 255 for facet B (28 - 1 = 255).
Thus the total number of possible query combinations from the elementary queries was 7 x
255 = 1,785 (Harter 1990).
If we use our own example (see Section 2.3) where the query plan contained five facets
and five query terms per facet, the number of possible queries at exhaustivity level 5 is (25 - 1)
x (25 - 1) x (25 - 1) x (25 - 1) x (25 - 1) = 31 x 31 x 31 x 31 x 31 = 28,629,151. If the average
number of query terms is increased by one to six, then the number of possible queries
increases to 0.99 x 10⁹. We are obviously facing the risk of combinatorial explosion since we
do not know the upper limit of query exhaustivity and query extent in inclusive query plans.
The size of the query tuning space can be determined by taking a sum of the possible queries
across all available exhaustivity levels.
Harter (1990) could apply brute force approach in his small scale example, but he also

47
introduced an heuristic algorithm that created incrementally an estimate for the optimal
combinations of elementary queries (the most rational path). Harter’s incremental algorithm
(see Section 1.2 and Figure 1.1) was a simple loop that started from the elementary query with
highest precision and added new EQs one by one checking that precision was maximised
(locally) at each path position. Harter clearly realised the importance of overlap in result sets
and the complexity of the optimisation problem. However, he did not take advantage of any
formally defined methods developed in linear programming and other fields of operations
research.
Harter pointed out that “…the present algorithm suffers from the defect that, once
selected, an elementary postings set is never removed.” This problem is very basic and it is
easy to present examples where the proposed algorithm does not find an optimally performing
combination. For instance, if we have two elementary queries retrieving documents (those two
marked in bold being relevant)
eq1: {1,2}eq2: {1,3,4,5,6} (1)
the most rational path is eq1 -> eq2, and recall and precision (R=0,5;P=0,5) ->
(R=1,0;P=0,3). The algorithm did not find the optimum since eq2 alone achieves higher
precision (R=1,0;P=0,4).
Harter’s metaphor of building a path of queries is not very refined. It suggests that optimal
query combinations of low recall levels are always sub-sets of optimal query combinations of
higher recall levels. Arguments supporting this view are hardly available. It is more fruitful to
search for the optimal combinations of elementary queries independently at different
operational levels. From the evaluative viewpoint it is useful to select a set of standard points
of operation (SPO) that supports the application of standard measures of performance, for
instance, precision at fixed recall or document cut-off values (see Harman 1996, Salton &
McGill 1983).
2.5.2 The Zero-One Knapsack Problem
The problem of finding an optimal set of elementary queries for a set of SPOs resembles a
traditional integer programming case called the Knapsack Problem or Cargo Loading
Problem. The problem is to fill a container with a set of items so that the value of the cargo is
maximised, and the weight limit for the cargo is not exceeded (Chvátal 1983, p. 201). The

48
special case where each item is selected once only (like EQs in our combination problem), is
called the 0-1 (also Zero-One or Binary) Knapsack Problem.
The 0-1 Knapsack Problem is (Martello & Toth 1990, p. 13):
Given a set of n items and a knapsack, with
pj = profit of item j,
wj= weight of item j,
c = capacity of the knapsack,
select a subset of items so as to
maximise = z p xj j
j=1
n
∑ (2.1)
subject to w x cj j
j
n
≤=
∑1
, (2.2)
where = 1, if item is selected0, otherwise x j
j
(2.3)
0-1 Knapsack Problem is NP-hard. Blind search algorithms for finding the optimal
solution may lead to running times that grow exponentially with the input size (here n).
However, efficient approximation algorithms have been developed to find a feasible lower
bound for the optimal solution value. (Martello & Toth 1990, pp. 13 - 80).
Usually approximations are based on assumptions
pj , wj , and c are positive integers, (3.1)
w cj
j 1
n
> =
∑ , (3.2)
wj ≤ c for j ∈ N = {1, ..., n} (3.3)
and on sorting the items in the order of decreasing efficiency (called here an efficiency
list).
p1/w1 ≥ p2/w2 ≥ ... ≥ pn/wn (4)

49
By replacing pj by ri (relevant documents retrieved by eqi), wj by ni (total number of
documents retrieved by eqi) and c by DCV (document cut-off value) in (2.1), (2.2) and (2.3),
the query optimisation problem could be represented as follows:
Select a set of EQs so as to
maximise =z r xi i
i
n
=∑
1
(5.1)
subject to n x DCVi i
i
n
j≤=∑
1
(5.2)
where if is selected
otherwise
and selected document cut - off value.
=
xeq
DCV
i
i
j
1
0
,
,=
(5.3)
The above definition of the optimisation problem is in its maximisation version. The
number of relevant documents is maximised while the total number of retrieved documents is
restricted by the given DCVj. In the minimisation version of the problem, the goal is to
minimise the total number of documents while requiring that the number of relevant
documents has to exceed some minimum value. The query optimisation in the minimisation
version is the following:
Select a set of EQs so as to
minimise =z n xi ii
n
=∑
1
(6.1)
subject to r x Ri ii
n
j≥=∑
1
(6.2)
. level recall achieve torequired documents of no and
otherwise ,0
selected is if ,1 where
=
jR
eqx
j
ii
=
(6.3)
2.5.3 An heuristic algorithm for query optimisation
Unfortunately, the well-known optimisation algorithms designed for physical entities
would not work with EQs. Physical entities are combined using arithmetic sum but query sets
are combined by union. Different EQs tend to overlap and retrieve at least some joint
documents (for examples, see Harter 1990). This means that, in a disjunction of elementary
queries, the profit pi and the weight ri of the elementary query eqi have dynamically changing

50
effective values that depend on the other EQs selected. The basic overlap types are illustrated
in Figure 2.4. The effect of overlap in a combination of several query sets is hard to predict.
Since tested and documented optimisation algorithms for Boolean sets were not
available, a simple heuristic procedure for an incremental construction of the optimal sets was
designed. The maximisation version of the algorithm contains seven steps:
1. Remove all elementary queries eqi
a) retrieving more documents than the upper limit for the number of documents (i.e. ni >
residual document cut-off value DCV', starting from DCV' = DCV j) or
b) retrieving no relevant documents (ri=0).
2. Stop, if no elementary queries eqi are available.
3. Calculate the efficiency list using precision values ri/ni for remaining m elementary queries
and sort elementary queries in descending efficiency order. In the case of equal values, use
the number of relevant documents (ri) retrieved as the second sorting criterion.
4. Move eq1 at the top of the efficiency list to the optimal query list.
5. Remove all documents retrieved by eq1 from the query sets of remaining elementary
queries eq2, ..., eqm.
6. Calculate the new value for free space DCV'.
7. Continue from step one.
The efficiency list ri/ni is recalculated and sorted after eq1 has been moved to the optimal
query list. The relative rank of a single eqi may change a lot in this process. EQs having type b
and especially type c overlap with the selected eq1 tend to drop, and those EQs with type a and
especially type d overlap tend to advance on the efficiency list. The advantage of this
incremental procedure is that all EQs not retrieving unique relevant documents are quickly
eliminated from the process.
The basic algorithm (like Harter’s algorithm) favours narrowly formulated EQs retrieving
a few relevant documents with high precision at the expense of broader queries retrieving
many relevant documents with medium precision. This tendency sometimes leads to non-
optimal combinations because, in a particular overlap case, a few high precision EQs selected
first from the top of the efficiency list may reduce the available free space DCV´ enough to
keep out the broader EQ. These failures can be eliminated by running the optimisation in an
alternative mode differing only in step four of the first iteration round: eqi retrieving the

51
largest set of relevant documents is selected from the efficiency list instead of eq1. The
alternative mode is called the largest first mode and the basic one as the precision first mode.
To give an example, let us assume a set of five elementary queries retrieving documents
(listed in the efficiency list order, bold denoting relevant documents):
eq1: {1}
eq2: {3, 4, 6} (6)
eq3: {2, 3, 5, 6, 7}
eq4: {1, 3, 6, 8}
eq5: {1, 6, 7, 8}
The resulting combinations of EQs are presented in Table 2.2. Blind search, where all 31
different combinations are formed, is conducted here to control the quality of optimisation
results. The table displays the set and the order of EQs selected to the optimal query for both
approximation modes and all appropriate DCVs. One can see that in all cases the best
optimisation result is as good as the one found by blind search.
Type d overlap (see Figure 2.4) may cause problems for the algorithm. For example, if
four EQs retrieve documents
Figure 2.4. Types of overlap in result sets of elementary queries: a) no overlap, b)symmetric overlap, c) relevant documents overlap, and d) non-relevant documentsoverlap.
���������������������������������������������������������������������������������������������������������������������������������������������������������������������������������������������������������������������������������
R NR������������������������������������������������������������������������������������������������������������������������������������������������������������������������������������R NR
��������������������������������������������������������������������������������������������������������������������������������������������������������������������������������������������������������
RN
RN
R
������������������������������������������������������������������������������������������������������������������������������������������������������������������������������������R NR
��������������������������������������������������������������������������������������������������������������������������������������������������������������������������������R
��������������������������������������������������������������������������������������������������������������������������������������������������������������������������������������������������������
RN
R
a)��������������������������������������������������������������������������������������������������������������������������������������������������������������������������������
b)
c) d)
��������������������������������������������������������������������������������������������������������������������������������������������������������������������������������R NR

52
eq1: {1, 2, 6}
eq2: {3, 7} (7)
eq3: {4, 7}
eq4: {5, 7},
the optimisation operation with DCV = 4 selects elementary query eq1 only, and results in
two relevant documents (1, 2). If any other EQ were selected first, the total number of relevant
documents would be three (3, 4, 5). An argument against this failure example is that it cannot
be very common since it is against the inverse relationship principle of recall and precision.
The largest result set achieves higher precision than the smaller ones.
The proposed algorithm suffers from the same defect as that of Harter’s (1990): once
selected, an EQ is never removed. This problem has been discussed in the context of the
traditional 0-1 Knapsack Problem, since solving it is the key to the whole optimisation
problem. The initial solution is formed just by picking the first k items from the efficiency list
(4) that do not yet exceed the capacity c of the knapsack (the first k+1 would do that). If the
initial solution does not use the whole capacity c, the optimum is searched for by algorithms
examining the effect of replacing item j within the present solution with item x that is outside
the present solution (see Chvátal 1983).
The idea of an algorithm replacing one selected EQ with another does not sound
promising because the target is not stable (the “profits” ri and “weights” ni are dynamically
changing). We do not have an initial solution of the k “most efficient” items but rather an
incrementally improved initial solution. Thus a very simple solution is presented here. The
algorithm may be executed by selecting the first EQ differently. For instance, running the
algorithm five times and starting each time with a different top five EQ on the initial
efficiency list. Applying this in both the largest first and the precision first modes, means ten
Table 2.2. An example of the combinations of elementary queries in (5) using a) blind search(optimal set), b) “precision first” approximation and c) “largest first” optimisation.
DCV Optimal set Rel Tot Precision first Rel Tot Largest first Rel Tot1 eq1 1 1 eq1 1 1 eq1 1 12 eq1 1 1 eq1 1 1 eq1 1 13 eq2 2 3 eq1 1 1 eq2 2 34 eq1,eq2 3 4 eq1,eq2 3 4 eq2, eq1 3 45 eq1,eq2 3 4 eq1,eq2 3 4 eq3 3 56 eq1,eq3 4 6 eq1,eq2 3 4 eq3,eq1 4 67 eq1,eq2,eq3 5 7 eq1,eq2,eq3 5 7 eq3,eq1,eq2 5 7

53
different attempts to find the optimal combination. The idea of changing the EQ selected first
is an heuristic attempt to reject some sub-optimal situations. Moreover, it is one way to collect
empirical data about possible defects in the original algorithm proposed by Harter (1990).
When the number of EQs is some tens or some hundreds, the probability of problems
from the odd overlap/no overlap situations is smaller. This is based on the assumption that the
probability of a document being retrieved by more than one elementary query increases as the
number of EQs increases. One may expect that, in a large group of result sets, a wider
spectrum of different types and different degrees of overlap take place. Then the probability of
meeting a sub-optimal dead end as in (6) is not so great.
2.5.4 Evaluation of heuristic algorithms
The proposed optimisation operation is a heuristic algorithm aiming at giving a good
starting point in solving a combinatorial optimisation problem (i.e. 0-1 Knapsack Problem in
combining Boolean sets). Heuristic algorithms are usually evaluated for their computational
efficiency and for their performance in searching for the optimum. Because of the
straightforward nature of the proposed algorithm performance is seen more important and is
considered more thoroughly.
The performance of heuristic algorithms has been evaluated using (1) empirical testing, or
analytical approaches namely (2) worst-case analysis, and (3) probabilistic analysis (Martello
& Toth 1990, 9). Empirical testing is based on creating a large set of problem solutions and
comparing it with the approximated set. The empirical approach is expensive in use of
computer time when applied to large data sets and provides only statistical evidence about the
performance of the heuristic for those problem instances that were not run (Fisher 1980).
Worst-case analysis concentrate on revealing the maximum amount that the heuristic
solution will deviate from the optimum for any problem instance within a class of problems
studied. The worst case analysis can exemplify when and why the heuristic algorithm will
perform worst. On the other hand, the results are not predictive of average performance.
Probabilistic analysis predicts how the heuristic will perform for a typical problem instance.
Its major limitation is that one has to be able to specify the density function for the problem
data. In addition, probabilistic analysis is not applicable to problem instances of any finite size
(Fisher 1980).
Martello & Toth (1990, 9) suggest that besides the empirical (experimental) evaluation, it
is useful to provide a theoretical measure of performance through worst-case analysis.

54
Unfortunately, the present formal theory base for the 0-1 Knapsack Problem of Boolean sets is
too weak to apply this analytical approach. Through empirical evaluation it is possible to get
some statistical evidence about the generality of optimisation errors in a particular data set and
examples of situations where errors may occur. The evaluation of the proposed algorithm is
further discussed with some test data in Section 5.3.5.
2.6 Selecting standard points of operation
Applying document cut-off values to Boolean output is more complicated than to ranked
output. Although the proposed method may produce output over a wide operational range, it is
unrealistic to expect an unbroken chain of measuring points stretching from 1 to N retrieved
documents. If the number of elementary queries is low, gaps are likely to appear in some parts
of the operational range. The most extreme situation is that a simple request leads basically to
a single term query. On the other hand, single term queries are seldom important from the
experimentation point of view, and may be overlooked without any loss of generality.
Two basic options are available for selecting standard points of operation. Either one uses
1. fixed DCVs for all test topics or
2. fixed Rjs, were DCVs are topic dependent (proportional to the number of known
relevant documents).
Along with the TREC experiment it has become common to compute precision on a set of
fixed DCVs for each topic (e.g. 5, 10, 15, 20, 30, 100, 200, 500 and 1000 documents) and to
average these values over all test topics (see Harman 1996). One obvious problem with fixed
DCVs is that if the number of relevant documents varies in a wide range from one request to
another, fixed DCVs will conceal potential differences in the system’s performance. Hull
(1993) suggests that precision is an appropriate measure at low DCVs because this measure
seems to follow user preferences. Low, fixed DCVs are probably most suitable in studying the
system’s performance in high precision directed searching.
The traditional approach, averaging precision values at fixed recall levels requires that the
0-1 Knapsack Problem (see Formulas 5.1, 5.2, and 5.3) is solved in its minimisation version.
The goal is to minimise the number of retrieved documents while retrieving at least 10, 20 ...
100 per cent of relevant documents available in the database. Precision values at the fixed
levels of recall are based on interpolation (Salton & McGill 1983, 166-167). The output from
Boolean queries provides a more coarsely distributed set of measuring points emphasising the
role of interpolation.

55
2.7 The domain of the method
The evaluation method proposed in this chapter is motivated by the view that a trained
searcher is needed in the query formulation process even when conducting system-oriented
experiments in Boolean IR environments. The trained searcher is not needed to replicate
everyday searching behaviour but rather to play a defined role in the controlled query
formulation process. The steps of the query formulation process are defined explicitly to
minimise the uncontrolled variation in inclusive query plans. Inclusive query planning can be
done by a panel of searchers, see Section 5.3.2.
Despite all this trouble in systematising the query formulation operation, it is not possible
to guarantee that two individuals could formulate identical inclusive query plans. However,
minor differences in the inclusive query plans are not a critical issue in applying the method
when the goal is not to measure the performance using an absolute scale (e.g. the highest
possible precision for Boolean queries at recall level 1.0). In typical evaluations, the goal is to
compare one system with another (e.g. performance differences between small and large
databases or between differently indexed databases). Then it is only required that the inclusive
query plans give a convincing and acceptable basis for estimating the lower bound of the
optimal performance in a particular retrieval situation.
Harter (1990) pointed out that traditional experimental methods have not been very
appropriate in studying some very basic phenomena in Boolean queries. For instance, the
hypothesis that recall and precision are inversely related has been very difficult to test.
Cleverdon (1972) showed that testing this hypothesis requires that data points represent a
series of subqueries for a particular topic “in the logical order of expected decreasing
precision”. Averaging a pool of topics using a single query per topic would obviously mask
the details of the phenomenon.
The proposed method is designed especially for experiments where the performance of
Boolean queries is investigated over a wide operational range. The designer of an experiment
has access to all structures of the inclusive query plans. Because of this possibility, it is easy to
study, for instance, the effects of query extent and exhaustivity on retrieval performance.
Moreover, the proposed method helps in carrying out experiments more economically than in
traditionally designed experiments of this type. In the traditional design, one should select first
a set of m exhaustivity levels and a set of n extent levels, and process mxn test queries. The
number of test queries is enormous if query extent tuning includes the possibility that the

56
extent of separate facets changes independently. In principle, the number of test queries equals
the size of the query tuning space if the experimental design is not simplified (see Section
2.5.1). Thus, research questions of a particular type are easy for the proposed method while
they may be impossible to carry out as a traditional experiment.
One might also use the method to study the interaction between query structures and the
characteristics of a database or the set of query features exploited. For instance, it is easy to
investigate how optimal query structures change when the size of the database or the average
length of documents in the database grows. A similar approach might be taken to compare, for
example, how the use of different proximity operations instead of the AND operation reflect
on the retrieval performance and on the optimal query structures. The advantage of the method
is that it does not require the use of structurally identical test queries in the comparisons of
operations as the traditional approaches do (see e.g. Tenopir & Ro, 172-176).
Comparative evaluations between the Boolean and best match IR systems are an obvious
application domain for the proposed method. As pointed out by Paris & Tibbo (1998), it may
not be relevant to study the overall superiority of one IR model over the other but rather to
concentrate on revealing in which situations one approach leads to better results than the
other. The proposed method supports performance evaluation at different parts of the
operational range. For instance, the effectiveness of different IR models in high recall oriented
and high precision oriented searching could be compared. The possibility to compare "top
documents" and the least retrievable documents ("tail documents") in the Boolean IR system,
too, opens interesting prospects: What kind of relevant documents are typically retrieved or
not retrieved by the Boolean IR system? Are there systematic differences between Boolean
queries and, for instance, probabilistic queries?
The domain of questions that can be appropriately studied by the proposed method is
different from those studied by the traditional methods for laboratory-based or operational IR
experiments. Robertson (1996) has called the type of methods optimising queries on the basis
of complete relevance data as retrospective. Most experimental methods, like those applied in
TREC, are predictive. An important question in all IR experiments is how the results gained
by a method relate to realistic search situations. This is especially important in a retrospective
method since the use of complete relevance data is an obvious source of doubts and questions
on the possibility of making any conclusions about "real" searching.

57
The domain of the proposed method is limited to research questions concerning the
Boolean IR model seen as a technical system matching a Boolean query and a text document.
The method helps to find a query estimating optimal performance under given constraints (e.g.
database, standard point of operation, query operator) within the query tuning space (gained
from the inclusive query plan). Thus, the results give an estimate for the theoretically possible
maximum performance of the technical Boolean IR system. This performance level cannot be
exceed by any user searching under the same constraints and within the specified query tuning
space (assuming a reliably performing optimisation process).
In a realistic search situation, the measured performance of a user may be much lower
than achieved in the optimised queries. This is obvious because the optimally performing
query for a given individual topic and search situation can not be predicted on the basis of
information available to the user, and the user cannot try all queries of the huge query tuning
space to find the optimal one. What the user may predict is the type of queries that may be
worth trying in a given situation, or what types of query changes may be relevant when
changing from one search situation to another (e.g. from a small database to a large one). This
is the area where the experiments based on the proposed method could make a contribution.
The findings help to identify general strategies how to take full advantage of the technical IR
system in different search situations.
The findings based on the proposed method are not directly comparable to the findings of
predictive experiments in terms of measured performance. However, assuming that the query
tuning space is realistic, the results of a retrospective experiment may support or challenge the
findings of a predictive experiment. For instance, a predictive experiment may reveal that the
users of a Boolean IR system achieve a higher level of effectiveness in a setting A than in a
setting B. This finding is supported by a retrospective experiment if a similar (smaller or
larger) difference is observed in the effectiveness of optimal queries. The performance
difference observed in the predictive experiment could be expected to be based, at least
partially, on the properties of the technical IR system.
If a retrospective study comes up with results contradicting with those of a predictive
study (the optimal queries perform better in the setting B), one may doubt that the
performance difference observed in the predictive test was not based on the system limits but
rather on the ability of users to conduct effective queries in varying settings. Obviously, the
users were not exploiting the capacity of the IR system as fully in the setting B as in the

58
setting A. If a logical reason for the under-utilisation of the system in the setting B can be
revealed (e.g. too high query exhaustivity) the users may learn new query formulation
strategies. If a new predictive experiment were made the relative effectiveness of the systems
A and B could turn out to be different from the original predictive study. The usefulness of a
retrospective method is dependent on how tangible and applicable the findings on the
technical IR system, and on the underlying IR model are from the user viewpoint.
The domain of the proposed method also has its limitations. It is quite obvious that the
method is not very appropriate for studying searching performance related to “real”
information needs and uses. The method shares the limitations of the Cranfield paradigm
except that it does not exclude the experienced searcher from the query formulation process. It
is designed for experiments applying stable and topical requests and it is also assumed that all
the relevant documents of a test collection are known. However, in the domain of system-
oriented evaluation methods the proposed method opens avenues for studying Boolean queries
and IR systems. New research questions may be addressed, and new kinds of experiments
conducted in an efficient manner.

59
3 THE TEST ENVIRONMENT AND DATA
COLLECTION METHODS
This chapter will give a description of a test collection that was designed for the case
experiment applying the evaluation method proposed in Chapter 2. The case experiment
demonstrating the use of the method and exploiting the test collection is reported in Chapter 4.
A separate chapter for the test collection is justified by the vital role of the test collection in
the evaluation method, and by the need to describe the construction process in detail. The
separate chapter for the test collection also emphasises the fact that the test collection can be
used for different types of experiments. The case experiment of Chapter 4 is only one example
of the research problems that can be handled by the method and by the test collection.
The issues of the test collection to be discussed are the following:
1. the characteristics of the document collection and the IR systems used
2. the characteristics of the search topics
3. the principles applied in recall base estimation and relevance assessments
4. the characteristics of the elementary queries
5. the implementation of the optimisation algorithm
6. the methods of data collection and analysis
The test collection was originally designed in the FREETEXT project (see Sormunen
1994) applying approaches introduced in TREC (Harman 1993b).
3.1 The test database and retrieval systems
The test database constructed for the experiment contained about 54,000 newspaper
articles from three Finnish newspapers published in 1988-1992. One subset of articles (some
25,000) was from the foreign affairs section of Aamulehti (Tampere, Finland), another (some
13,000) from all sections of Keskisuomalainen (Jyväskylä, Finland), and the third (some
16,000) from all sections of Kauppalehti (Helsinki, Finland). The first two are leading general
newspapers in their provinces, and Kauppalehti is the leading national newspaper on business
and economics. The whole database contained some 12.5 million words. The average article
length was 202 words (202, 207, and 199 in sub-collections), the median length was 162
words (147, 190, and 157) and the standard deviation was 155 words (164, 135, and 161).

60
At the time of the FREETEXT project, the test environment provided the TOPIC retrieval
system. Recently, the database has been implemented for the TRIP (replacing TOPIC) and for
the INQUERY retrieval systems9. In this study, the main part of the data is based on TOPIC
queries. Some modified query plans have been executed using the TRIP database version. The
INQUERY version of the database has been used in other studies (Järvelin et al. 1996,
Kristensen 1996, and Kekäläinen & Järvelin 1998, Kekäläinen 1999), and their results were
used in controlling the reliability of recall base estimates.
Both TOPIC and TRIP allow ordinary Boolean searching including proximity operations
based on paragraph, sentence and phrase structures. INQUERY (versions 1.6 and 3.1) allows
ordinary Boolean as well as probabilistic retrieval in various forms. The TOPIC and TRIP
database indices contained all word occurrences in their inflected forms. For INQUERY
database, a morphological analysis was performed by TWOL software10 to return the inflected
word forms into the basic form, and to split compound words into their components.
3.2 Search topics and initial query plans
The test environment provides a collection of 35 search topics for which the following
documentation is available:
1. the original verbal topics (see Appendix 1)
2. inclusive query plans
3. relevance assessments for each article retrieved by a pool of extensive Boolean andprobabilistic queries.
The inclusive query planning was performed by an experienced searcher working as a
search analyst for three months on the FREETEXT project. She was given the written search
topics, and detailed written instructions for this work. For the basic concepts and procedures
applied in query planning, see Section 2.2.3.
In thirteen out of 35 topics, the search analyst introduced two or more separate query
plans (such as different suggestions to represent the query). Two query plans were regarded as
separate if their basic facets were not identical. The extensive versions of the separate query
plans were executed and records printed for relevance assessors. However, only one of the
separate query plans per topic was selected for the experiment - the one that retrieved the
largest share of relevant documents in its extensive form.
9 TOPIC provided by Verity, Inc., TRIP by TRIP Systems International (owned by Fulcrum), and INQUERY by Information
Retrieval Laboratory, University of Massachusetts.

61
In Finnish full-text databases, the difference between basic and inflected form indices is
remarkable. A traditional database index (like those in TOPIC and TRIP databases) often got
tens (in theory, thousands) of inflected forms for each single word. The Finnish language is
rich in compound words and this constitutes an extra problem in query planning. The head
(the genus component) of a compound word is usually the most important part from the
retrieval point of view (Alkula & Honkela 1992).
In the case of a traditional database index, the searcher has to imagine all possible
prefixed parts of a compound word to cover all words referring to narrower concepts than the
original one. For example, retrieving documents on different branches of the forest industry
requires that the searcher recognise compound words “metsäteollisuus ” (forest industry),
“selluteollisuus” (pulp industry), “paperiteollisuus” (paper industry), “kartonkiteollisuus”
(cardboard industry), and many others.
Recognition of alternative query terms for all facets was a critical task in the query
formulation process. In databases with traditional inflected word form indices, this stage is
especially demanding since general terms like “teollisuus” (industry) do not retrieve articles
containing only specific terms like “metsäteollisuus” (forest industry). Recognition was based
on defined guidelines and on the use of three different sources: the search analyst’s personal
knowledge, printed sources (dictionaries), and analysis of sample query results.
The easiest way to perceive the process of inclusive query planning is to study a sample
plan for search topic no. 2 presented in Appendix 2. The conceptual query plan contains three
facets [South America], [debt], and [crisis]. Subplans I.1-3 represent the query plan at the
exhaustivity levels from three to one. The underlined facets were selected as basic facets by
the search analyst. The basic facets were applied in the extensive queries used in recall base
development. Appendix 2 also contains the lists of identified expressions for each facet (as
execution ready string representations in the original plans, but as basic form words or phrases
in the English translations).
At an early stage of the project, it was realised that the TOPIC retrieval system was not
able to handle the largest sets of EQ generated from the inclusive query plans in its automatic
batch mode process. It was decided to sort closely related terms within facets into disjunctive
sets called synonymous groups. Grouping of query terms was also reasonable because it made
the optimisation process more efficient since the size of the query tuning space is reduced.
10 TWOL provided by Lingsoft, Inc., Helsinki, Finland performs morphological analysis of words in several languages, including

62
And further, interest focused more on the role of different query term categories rather than on
the role of individual query terms. Thesaural relationships provided a general purpose
framework for grouping criteria (see ISO 1986). For instance, the query terms for the facet
[South America], were organised into three synonymous groups:
s=2: (South America or Latin America or Latino Countries)
s=3: (Argentina or Bolivia or Brasil or … eight more)
s=4: (Peru).
Query terms in sets 3 and 4 are obviously narrower than those in set one (whole-part
relationship). The query term peru was separated from the other country names since it
retrieves many false drops. The truncated string peru# matches Peru and perulainen
(Peruvian) correctly, but unfortunately also other words like perua (to cancel), peruna
(potato), perus (elemental, basic), perusta (foundation, basis), and perustella (justify). The
division of terms into different groups was supposed to minimise the disturbing variation
caused by the ‘badly behaving’ terms.
Query terms and synonymous groups for the facet [debt] illustrate how general concepts
were represented as synonymous groups (see Appendix 2). Sets 6, 7 and 8 represent the facet
at the highest hierarchical level, but do not form a synonymous group since all of them
retrieve a large set of documents and match many inappropriate expressions. Set 9 contains a
group of terms that are narrower than the first three. The terms in set 10 do not directly
represent the facet [debt] but are associated with it (mainly processes of debt handling). Query
terms in the form of verbs comprise set 11 (Note the large number of alternative truncated root
word forms per query term). The last set (s=12) contains the expressions of set 11 in the form
of verbal nouns (a characteristic feature of Finnish).
The sample illustrates the comprehensiveness of the inclusive query plans. It depends on
the characteristics of a facet what expression types are applied (e.g. verbs or verbal nouns).
The query plans were designed for a database index where words were stored in their inflected
forms and for a retrieval system supporting only right hand truncation. The set and appearance
of the query terms as well as their organisation into synonymous groups would have been
different for a database index with morphologically treated expressions (basic word forms,
compound words split into components).
Finnish, Swedish, German, and English.

63
Appendix 2 also lists the elementary queries for the sample inclusive query plan. Using
the selected grouping of query terms (3 for [South America], 7 for [debt], and 5 for [crisis]),
105 EQs were generated at exhaustivity level 3, 21 EQs at the level 2, and 3 at level 1,
respectively.
3.3 Relevance assessments and recall base estimates
Extensive Boolean queries were used to retrieve documents for relevance assessors, i.e.
the disjunction of all separate query plans in their minimum exhaustivity (only basic facets
applied)/ maximum extent versions. The relevance criteria for articles were defined in the
context of an imaginary journalist intending to write an article on the topic. The assessors
were asked to estimate the value of articles for the imaginary journalist in that task context. A
four point scale of relevance was used:
0 - totally off target1 - marginally relevant, refers to the topic but does not convey more information than
the topic description itself2 - relevant, contains some new facts about the topic3 - highly relevant, contains valuable information, the article’s main focus is on the
topic.
Relevant and highly relevant articles (levels 2 and 3) were counted as relevant ones if not
otherwise mentioned.
Most documents were judged by two persons independently. If the assessments differed by
one point (e.g. two against three), the value was selected alternately from the first and the
second assessor. If the difference was two or three points, the researcher analysed the article
and made the final decision. The parallel assessments were identical in 73 percent of articles,
differed by one point in 21 percent, and by more than one point in 6 percent of articles.
Slightly over 5,000 articles were judged in the FREETEXT experiment. Of these 1,206
were regarded as relevant or highly relevant (Sormunen 1994). In two experiments on the
INQUERY system, sets of 30 and 34 topics were used in Boolean and probabilistic queries
(Kristensen 1996, Kekäläinen & Järvelin 1998, Kekäläinen 1999). Both studies were about
query expansion and a large set of test queries were used per topic. In the first one, Boolean
and probabilistic queries were compared on different query extent and exhaustivity levels. In
the second one, eight different structures of probabilistic queries were tested on five query
extent levels. In the third study, probabilistic queries included 13 query structures (based on

64
different operators available in the INQUERY query language), 5 expansion levels, and 2
exhaustivity levels - 110 different query versions per search topic.
The first study, (Kristensen 1996), judged the relevance of over 3,000 new articles
containing 7911 new relevant or highly relevant articles. In the second and third studies
(Kekäläinen & Järvelin 1998, Kekäläinen 1999), 6,900 new items were assessed and 36 new
relevant or highly relevant documents were found. The density of relevant articles in the
newly found document sets declined from the original 24 % to 2.6 % and 0.5 % in the
successive experiments. Kekäläinen (1999, 98) observed that most of the new relevant
documents were retrieved below DCV30, and only a minor share after DCV40.
The recall failures identified were analysed to find out why the original query plans
designed for the FREETEXT Project had missed those 115 relevant documents. It turned out
that most recall failures were caused by quite simple errors in inclusive query plans. The
search analyst had not identified all query terms needed to fully cover a particular facet or had
selected too many basic facets. The TOPIC retrieval system supported neither left hand
truncation in querying or in index browsing, nor fuzzy pattern matching of index words (as
e.g.TRIP does) and this functional restriction affected the query design process.
Nineteen relevant documents contained implicit expressions that were difficult from the
searching view point. Either it was difficult to find a searchable word combination matching
the basic facets used in the query plans or the remaining facets were retrieving thousands of
documents. The results showed that implicit expressions are a key problem in applying the
idea of extensive queries with basic facets in recall base estimates. Non-Boolean methods
were needed to retrieve complementary document sets for making reliable recall base
estimates.
3.4 Final inclusive query plans
Some redesign work was done for the present study to eliminate the effects of query plan
flaws. Major changes were made to four query plans (restructuring the plan but using the
originally identified facets). Other changes were restricted within a single query facet per
topic. In five query plans, one basic facet was changed to an auxiliary facet. In seven topics,
11 Actually, there were more than one hundred relevant documents that had not been found in the
FREETEXT Project but some of these were because of technical errors in executing the queries, not in theinclusive query plans. It also turned out that two search topics (numbers 25 and 26) were ambiguously formulatedcausing inconsistency in relevance assessments. The topic descriptions were clarified and all retrieved documents

65
one or more missed query terms were added to one facet of the inclusive query plans. The
redesigned query plans for the present experiment retrieved about 2,450 new articles that were
assessed for relevance. Of these 26 were found relevant or highly relevant. After three
experiments and redesigning of original queries, the relevance corpus was 17,338 articles (486
per topic), of which 1,278 (7.5 % of all assessed) were considered relevant or highly relevant.
The evolution of the recall base estimates is summarised in Table 3.1.
Table 3.1. Evolution of recall base estimates in a sequence of experiments. The numberof relevant documents missed by the original inclusive query plans but retrieved byprobabilistic queries are presented in three last columns.
Error categoryExperiment Newdocuments
assessed
No. of newrelevant
documents12
Density ofrelevant
documents Queryterm
missing
Toomanybasic
facets
Implicitexpressionsin relevantdocuments
1. Original queryplans
5,018 1,206 24.1%
2. Kristensen 1996 ca.3,000
79 2.6% 33 33 13
3. Kekäläinen &Järvelin 1998 +Kekäläinen 1999
ca.6,900
36 0.5% 9 21 6
4. Redesignedquery plans
ca.2,450
26 1.1%
Total 17,337 1,278 7.4% 42 54 19
Although the tools for developing the recall base were not adequate at the time of
inclusive query planning, a high quality result was achieved: 89 % of relevant documents were
found. All queries used to discover all relevant documents were based on an extensive
representation of query facets by alternative query terms, on varying levels of exhaustivity, on
varying query structures and matching techniques. In the author’s understanding, the
combination of efforts can be regarded as a very exceptional activity. The recall base is well-
founded at least to the degree commonplace in IR experiments.
were reassessed. Because of more strict relevance criteria the size of the recall base was reduced by 65documents.
12 The sum of the cell values is not equal to the bottom line value because of two reformulated andreassessed topics (nos 25 and 26). Some duplicates were also removed.

66
3.4.1 Closing the hunt for new relevant documents
After the redesign work, 26 relevant articles (2.0% of the recall base) were still not
retrieved by the broadest Boolean queries of minimal exhaustivity (=using basic facets) and
maximal extent. The main problem was implicit expressions used in referring to very basic
concepts (regarded as basic facets by the query designer). Those expressions were difficult to
cover by any concrete query terms.
Because the share of new relevant documents had fallen dramatically in the last retrieval
attempts, it was decided that, from now on, all non-assessed documents would be considered
non-relevant. A similar assumption of non-relevance was adopted in TREC (Harman 1996).
After this decision it was natural to modify the inclusive query plans so that they covered all
exhaustivity levels from 1 to N, where N is the number of facets in the inclusive query plan.
The order in which the facets were to be applied was now determined (see Section 2.2.3).
The facet order was based on the comparison of document sets retrieved by the individual
facets of the topic. Each facet query was composed as the disjunction of all query terms
available for that facet in the inclusive query plan. The facets were ranked applying two
sorting criteria: (1) descending recall, and, in case of ties, (2) descending precision. This way
of defining the order of facets guarantees that it is possible to maximise recall at all
exhaustivity levels in an economic way. Other options, like testing all facet combinations at
each exhaustivity level would have increased the amount of work dramatically. Human-based
facet order selections would have required the contribution of several parallel assessors, and
also a decision on how to combine inconsistent selections.
Table 3.2 summarises the data concerning relevance judgements and recall base estimates
for individual search topics and for the whole collection. Columns “Relevant Docs Used”
contains the number of relevant articles retrieved by the disjunction of all query terms
associated with the first facets, i.e. retrieved by the extensive queries at the exhaustivity level
1. These articles constitute the recall base for the case experiment reported in Chapter 4.
Columns “Known Relevant Docs” list all relevant articles that are known (identified in
parallel experiments). In six out of 35 search topics (nos. 15,23,25,27,30,31) at least one
article was not retrieved by the redesigned queries. It turned out that in these eight articles the
first facet of the inclusive query plan was not explicitly expressed, i.e. that aspect was not
expressed with one searchable word or phrase. Changing the order of facets would not have
helped since the sorting criteria had already minimised this problem.

67
Table 3.2. Summary of documents assessed for relevance in the test collection.
Topic Relevant Docs Used Known Relevant Docs Missed Missed-% Non-relevants Allno Rel=3 Rel=2 Rel=2-3 Rel=3 Rel=2 Rel=2-3 Rel=1-2 Rel=1-2 Rel=1 Rel=0 Rel=0-1 assessed
1 14 18 32 14 18 32 0 0,00 % 22 341 363 395
2 11 42 53 11 42 53 0 0,00 % 28 644 672 725
3 10 9 19 10 9 19 0 0,00 % 4 580 584 603
4 7 1 8 7 1 8 0 0,00 % 8 708 716 724
5 19 20 39 19 20 39 0 0,00 % 15 8 23 62
6 17 30 47 17 30 47 0 0,00 % 83 529 612 659
7 15 72 87 15 72 87 0 0,00 % 58 543 601 688
8 39 26 65 39 26 65 0 0,00 % 18 820 838 903
9 6 23 29 6 23 29 0 0,00 % 43 159 202 231
10 7 16 23 7 16 23 0 0,00 % 14 257 271 294
11 46 55 101 46 55 101 0 0,00 % 46 272 318 419
12 13 16 29 13 16 29 0 0,00 % 25 273 298 327
13 1 12 13 1 12 13 0 0,00 % 6 486 492 505
14 18 17 35 18 17 35 0 0,00 % 76 254 330 365
15 17 36 53 17 37 54 1 1,85 % 30 507 537 591
16 11 5 16 11 5 16 0 0,00 % 19 11 30 46
17 6 39 45 6 39 45 0 0,00 % 23 332 355 400
18 8 38 46 8 38 46 0 0,00 % 16 326 342 388
19 18 38 56 18 38 56 0 0,00 % 25 119 144 200
20 1 13 14 1 13 14 0 0,00 % 12 426 438 452
21 2 15 17 2 15 17 0 0,00 % 16 338 354 371
22 10 26 36 10 26 36 0 0,00 % 29 321 350 386
23 25 6 31 26 8 34 3 8,82 % 34 341 375 409
24 9 14 23 9 14 23 0 0,00 % 20 390 410 433
25 3 10 13 3 11 14 1 7,14 % 76 733 809 823
26 3 32 35 3 32 35 0 0,00 % 87 978 1065 1100
27 17 73 90 17 74 91 1 1,10 % 49 352 401 492
28 5 11 16 5 11 16 0 0,00 % 8 459 467 483
29 13 12 25 13 12 25 0 0,00 % 20 773 793 818
30 13 13 26 13 14 27 1 3,70 % 8 666 674 701
31 28 29 57 28 30 58 1 1,72 % 16 502 518 576
32 22 28 50 22 28 50 0 0,00 % 31 514 545 595
33 6 16 22 6 16 22 0 0,00 % 15 498 513 535
34 2 4 6 2 4 6 0 0,00 % 8 239 247 253
35 2 11 13 2 11 13 0 0,00 % 14 358 372 385
Sum 444 826 1270 445 833 1278 8 1002 15057 16059 17337
Ave 12,7 23,6 36,3 12,7 23,8 36,5 0,2 0,6 % 28,6 430,2 458,8 495,3
Min 1 1 6 1 1 6 0 0,0 % 4 8 23 46
Med 11 17 31 11 17 32 0 0,0 % 20 390 410 452
Max 46 73 101 46 74 101 3 8,8 % 87 978 1065 1100
StDev 10,2 17,4 23,4 10,3 17,4 23,5 0,6 2,0 % 22,7 220,5 226,4 228,4

68
Table 3.3 Summary of query plans including the average number of query terms per facet (broadness),
the average number of facets per topic (complexity), and the maximum number of EQs that can be
generated from a query plan. Basic facets shaded.
Topic no Facet 1 Facet 2 Facet 3 Facet 4 Facet 5 Sum Broadness Complexity Max EQs1 1 3 2 42 11 59 11,8 5 2772
2 15 28 29 72 24,0 3 121803 10 27 4 62 103 25,8 4 669604 2 10 22 34 11,3 3 4405 3 32 35 17,5 2 96
6 5 23 2 3 33 8,3 4 6907 1 11 2 34 48 12,0 4 7488 1 5 41 15 7 69 13,8 5 21525
9 3 3 31 20 31 88 17,6 5 17298010 2 3 31 12 5 53 10,6 5 1116011 10 3 26 7 46 11,5 4 546012 5 24 7 36 12,0 3 84013 4 6 27 8 45 11,3 4 518414 1 2 25 8 36 9,0 4 40015 5 13 5 28 51 12,8 4 910016 3 20 23 11,5 2 6017 2 15 26 20 63 15,8 4 1560018 5 14 20 39 13,0 3 140019 7 26 10 43 14,3 3 182020 7 11 22 40 13,3 3 169421 6 55 31 92 30,7 3 1023022 2 10 58 19 89 22,3 4 2204023 9 39 29 77 25,7 3 1017924 14 18 41 73 24,3 3 1033225 43 18 3 30 94 23,5 4 6966026 31 28 45 3 14 121 24,2 5 164052027 19 20 19 23 81 20,3 4 16606028 9 12 13 8 24 66 13,2 5 26956829 74 21 37 37 169 42,3 4 212742630 15 29 4 20 31 99 19,8 5 107880031 45 49 30 124 41,3 3 6615032 5 58 6 6 75 18,8 4 1044033 3 2 3 1 19 28 5,6 5 34234 3 13 39 32 87 21,8 4 4867235 2 2 31 4 39 9,8 4 496
Sum 372 653 721 442 142 2330 620 134 5862024
Ave 10,6 18,7 21,8 19,2 17,8 66,6 17,7 3,8 167486,4Min 1 2 2 1 5 23 6 2 60Med 5 15 25 19 17 63 14 4 10230Max 74 58 58 62 31 169 42 5 2127426
St Dev 15,4 14,8 15,0 15,3 10,2 32,2 9 1 471154

69
The group of eight relevant articles was removed from the recall bases used in recall
calculations. Thus, recall values were based on 1,270 relevant articles. This is a conscious
simplification. It would have been easy to include all relevant articles by just including
exhaustivity level one queries composed from the other facets. Would this have increased the
reliability and credibility of experimental results? It could be argued that after including the
eight missing relevant documents it is still highly probable that some new relevant articles
could be found by some retrieval methods. On the other hand, relevance assessments are never
fully consistent. Thus the efforts to find the “right” treatment for a small set of articles less
than one per cent in the recall base appears pointless. How could this tiny set of excluded
relevant articles change the results of an experiment? This depends on the research problem
that the experiment is intended to answer. In this case, the reliability of recall base estimates is
bound to be high since they are based on extensive efforts: inclusive query planning and
parallel probabilistic queries. The exclusion cannot cause any significant distortion in general
performance characteristics of the Boolean IR system in which we were interested13.
3.4.2 Query plan characteristics
The summary of the final inclusive query plans is presented in Table 3.3. The number of
query terms is given for each topic and facet. The shaded cells indicate the basic facets that
were applied in extensive queries (exploring the sets of relevant documents). The total number
of facets in the 35 inclusive query plans was 134. The average number of facets per query plan
was 3.8 ranging from 2 to 5. In total, 2,330 query terms were identified for the 134 facets
yielding an average of 67 terms per query plan and 18 terms per facet. The number of terms
per query plan ranged from 23 to 169, and the number of terms per facet from 1 to 74.
The order of facets is not random and this can be seen from the distribution of query
terms. The median of query terms per facet is only 5 for the first facets and varies between 15
and 25 for the other facets. This reflects the fact that facets based on proper name query terms
tend to be more effective than other facets, both in recall and in precision. Only in two search
topics (nos. 25 and 29), was the broadest facet ranked first.
13 The excluded relevant documents were only omitted in the optimisation process of queries to en able the
measurement of retrieval performance over a comparable operational range (recall R=0.1…1.0). In the caseswhen, for instance, the characteristics of relevant documents were analysed, all relevant documents were treated.

70
Table 3.4 Facet document frequencies of the inclusive query plans, i.e., the number
of documents retrieved by the disjunction of query terms representing a facet.
Topic no Facet 1 Facet 2 Facet 3 Facet 4 Facet 5 DF/facet1 4068 2095 3269 34189 12241 111722 1464 5111 8904 51603 172 8289 10862 36889 140534 3603 78 27555 104125 61 23529 117956 479 14286 5574 9651 74987 1238 1486 9458 30846 107578 3315 3504 4567 15607 8220 70439 110 2326 14098 23145 28034 13543
10 956 281 7676 3580 2541 300711 361 18485 644 7488 674512 275 14079 6463 693913 146 2335 5263 29650 934914 1246 252 7340 25547 859615 4686 11133 78 21429 933216 47 2296 117217 436 1259 15202 17674 864318 382 14868 14483 991119 477 18303 14253 1101120 359 22772 7856 1032921 837 2710 16817 678822 590 836 40664 11415 1337623 74 10809 20937 1060724 290 14550 30719 1518625 1526 2487 8875 15550 711026 2956 11440 7993 13147 16291 1036527 609 2570 23477 1726 709628 2295 18036 281 2281 16604 789929 3797 7149 6724 15844 837930 5150 15412 5994 10841 28057 1309131 817 6501 19675 899832 1699 15224 5336 16272 963333 299 3893 7430 12527 9431 671634 84 784 40208 23015 1602335 816 1535 12834 1609 4199
Sum 45720 280703 411509 379922 121419 321928Ave 1306 8020 12470 16518 15177 9198Min 47 78 78 1609 2541 1172Med 609 5111 8875 15607 14266 9332Max 5150 23529 40664 36889 28057 16023
St Dev 1467 7201 10323 10282 9135 3286

71
Table 3.4 contains document frequencies for each facet (= number of articles retrieved by the
disjunction of query terms within a facet). The average document frequency per facet is about
9,400, ranging from 47 to 40,664 articles. This means that the broadest facets retrieve nearly
the whole database while some facets are really focused. On average, the facets ranked first
were more focused (median about 600 articles) than those ranked second (median about 5100
articles), and the remaining facets (median from 8,800 to 15,600).
None of the first facets was the largest within a topic in terms of document frequencies. In
some cases, the large number of search terms in the first facet lead to high document
frequencies (e.g. topics nos. 26 and 29) but sometimes a single search term could do this (e.g.
topics nos. 1 and 8). Some names of countries and places retrieved unfocused sets of articles.
This suggests that low query extent measured as the average number of query terms per facet
does not always predict focused querying.
3.4.3 Search topic characteristics
Search topic characteristics are a potentially important variable in explaining performance
differences and optimal query structures in Boolean IR systems, but categorising them seems
to be a hard task. Saracevic et al. (1988) used five aspects, namely (1) domain, (2) clarity, (3)
specificity, (4) complexity, and (5) presupposition. Most aspects were rated by independent
judges but the variation of assessments was great. Iivonen (1995a) used a typology based on
two of these dimensions: complexity and specificity. She also adopted the same definition for
these properties as Saracevic et al. (1988). Complexity means “the number of search concepts,
their modifiers and/or constraints”, and specificity “the hierarchical level in the meaning of
terms and ultimately the whole topic”.
For the sake of clarity, we prefer to use measures based on query facets rather than
concepts. Complexity is defined to refer to the number of facets in a topic. Specificity is
replaced by its antonym broadness and defined across query facets as the average number of
expressions required to fully cover the references to query facets. In free-text searching
experiments, it is rational to relate measuring of topic properties to the defined environment.
For example, in measuring broadness (or specificity) only those expressions actually occurring
in the database index should be taken into consideration.
Both complexity and broadness can be measured from inclusive query plans. Measuring
broadness may be based on counting the number of query terms representing a facet. Another
way to measure topic broadness is to use document frequencies instead of the number of
72
disjunctive query terms. The former is a conceptually justified, query statement oriented
measure while the latter is a statistically justified, database specific measure. The number of
facets in an inclusive query plan is a straightforward measure for the complexity of a search
topic.
Table 3.3 lists complexity and broadness data for all search topics. The complexity and
broadness of search topics in the test collection are important variables since they set limits
for two structural characteristics of Boolean queries: query extent and query exhaustivity.
Complexity ranges from 2 to 5 (median 4). Thus query exhaustivity may be tuned from 1 to
2…5 depending on the complexity of a search topic. Broadness ranges from 6 to 42 (median
14) and query extent may vary from 1 to 6…42 depending on the broadness of the facets in a
search topic.
3.5 Query optimisation
3.5.1 Elementary queries
As pointed out in Section 2.3, composing elementary queries (EQ) from single query
terms might lead to a combinatorial explosion in searching for the optimally performing EQ
set. This can be verified using the inclusive query plans as an example (see Table 3.3). For
instance, taking the median number of query terms per facet over the five ranked facet levels,
the number of EQs at the highest exhaustivity level is 5x15x25x19x17=605,625. The number
of EQs based on single query terms ranges from 60 (for topic no. 16) to 2,127,426 (topic no.
29).
The total number of potential combinations that would have had to be evaluated in the
blind search for the optimally performing EQ set is intractable in size (for the explanations of
the formulas see Section 2.5.1): (25-1) x (215-1) x (225-1) x (219-1) x (217-1) = 31 x 32,767 x
33,554,431 x 524,287 x 131,071 = 2.3x10²³ (using the medians of search terms per facet in
Table 3.3).

73
Table 3.5 Summary of query plans: number of query term groups for facets 1-5 and
the number of elementary queries at exhaustivity levels form 1 to N.
Topic Number of query term groups Number of elementary queries no F1 F2 F3 F4 F5 Sum Ave E=1 E=2 E=3 E=4 E=5 Sum Ave1 1 1 1 6 5 14 2,8 1 1 1 6 30 39 82 3 7 5 15 5,0 3 21 105 129 433 2 6 11 19 6,3 2 12 132 146 494 1 3 4 8 2,7 1 3 12 16 55 1 5 6 3,0 1 5 6 36 1 5 1 2 9 2,3 1 5 5 10 21 57 1 5 1 5 12 3,0 1 5 5 25 36 98 1 1 5 2 2 11 2,2 1 1 5 10 20 37 79 1 2 9 5 5 22 4,4 1 2 18 90 450 561 11210 1 2 5 5 2 15 3,0 1 2 10 50 100 163 3311 3 1 3 4 11 2,8 3 3 9 36 51 1312 1 4 3 8 2,7 1 4 12 17 613 1 2 4 3 10 2,5 1 2 8 24 35 914 1 5 4 10 3,3 1 5 20 26 915 2 4 5 11 22 5,5 2 8 40 440 490 12316 1 5 6 3,0 1 5 6 317 1 2 3 5 11 2,8 1 2 6 30 39 1018 2 5 2 6 15 3,8 2 10 20 120 152 3819 1 6 2 9 3,0 1 6 12 19 620 1 3 3 7 2,3 1 3 9 13 421 2 4 5 11 3,7 2 8 40 50 1722 1 2 14 4 21 5,3 1 2 28 112 143 3623 2 6 5 13 4,3 2 12 60 74 2524 2 3 9 14 4,7 2 6 54 62 2125 5 4 1 4 14 3,5 5 20 20 80 125 3126 2 3 3 1 3 12 2,4 2 6 18 18 54 98 2027 3 5 3 7 18 4,5 3 15 45 315 378 9528 2 2 2 2 3 11 2,2 2 4 8 16 48 78 1629 4 4 8 4 20 5,0 4 16 128 512 660 16530 5 5 1 4 4 19 3,8 5 25 25 100 400 555 11131 6 6 5 17 5,7 6 36 180 222 7432 2 6 1 2 11 2,8 2 12 12 24 50 1333 1 1 2 7 1 12 2,4 1 1 2 14 14 32 634 1 3 6 4 14 3,5 1 3 18 72 94 2435 1 2 3 6 12 3,0 1 2 6 36 45 11
Sum 66 130 139 99 25 459 123 66 273 1073 2140 1116 4668 1156Ave 2 4 4 5 3 13 4 2 8 33 97 140 133 33Min 1 1 1 1 1 6 2 1 1 1 6 14 6 3Max 6 7 14 11 5 22 6 6 36 180 512 450 660 165Med 1 4 3 4 3 12 3 1 5 18 36 51 51 16
St dev 1,3 1,7 3,1 2,2 1,5 4,4 1,1 1,3 7,9 42,9 140,1 178,7 175,4 40,6

74
Grouping of closely related query terms dramatically reduced the number of resulting
elementary queries (Table 3.5). After grouping, the average number of elementary queries was
119 (median 51) per topic ranging from 6 to 561. Based on the medians, the set of all possible
EQ combinations was reduced to (21-1) x (24-1) x (23-1) x (24-1) x (23-1) = 1 x 15 x 7 x 15 x 7
= 11,025. Typically, few elementary queries resulted from simple search topics focusing on
named persons or organisations. For instance, in topic no. 16 (Bankruptcy of the P.T.A
company), 6 EQs and 32 potential combinations were generated. High EQ quantities were
resulting from complex and broad search topics focusing on general topics like topic no. 30
(Business hours in retail trade…) yielding 555 EQs and 216,255 potential combinations.
The number of potential EQ combinations also varies a lot over the exhaustivity levels
within a single search topic. For instance, in topic no. 9 the number of potential EQ
combinations is 1, 3, 1,533, 47,523, and 1,473,213 at exhaustivity levels Exh=1, 2, 3, 4, 5,
respectively. This means that very few EQs combinations are available in simple and narrow
search topics. In terms of statistics one may expect that in these situations the performance of
a system is measured in very few points increasing the variance of results.
EQs were generated from the inclusive query plans, and executed in an automatic
procedure programmed on top of TOPIC. In the case experiment, the elementary queries of
Figure 3.1. The distribution of retrieved articles in 42 elementary queries of a sample request (no. 1).
0
10
20
30
40
50
60
70
80
90
100
Num
ber
of a
rtic
les
retr
ieve
d
Non-Relevant
Relevant
EQ42 EQ15 EQ16EQ27EQ21
Elementary query
number of known relevant documents
EQ7EQ32EQ8 EQ9

75
the redesigned queries were executed manually in TRIP. After a checking and pre-treatment
stage, accession numbers retrieved by each EQ were conveyed to the optimisation process.
A distribution of articles retrieved by the EQs of a sample topic is presented in Figure 3.1.
The example shows the tendency that some EQs had a narrow focus and they retrieved only
relevant articles but not many of them (EQ nos. 15, 16, 21, 27). On the other hand, a single
EQ may retrieve nearly all relevant articles but also many non-relevant ones (no. 42). Some
EQs retrieved nothing or non-relevant documents only (see six column slots on the right).
Figure 3.2 illustrates the effectiveness of the sample EQs in terms of recall and precision. The
EQs having the black square symbol are obviously good candidates for optimally working
queries. On the basis of this graph, we may conclude that at recall levels 0.1, 0.2 and 0.3 the
EQs nos. 15/16, 27, and 21, respectively, are working optimally and achieve 100 per cent
precision. On the higher recall levels, the optimum is probably achieved by some combination
of EQs. However, that can not be inferred from this graph (due to the overlap of document
sets retrieved).
Figure 3.2. P/R-values of 42 elementary queries generated from a sample request (no. 1).
0,0
0,2
0,4
0,6
0,8
1,0
0,0 0,2 0,4 0,6 0,8 1,0
Recall
Pre
cisi
on
EQ42
EQ21
EQ32EQ8EQ38
EQ7
EQ9
EQ27EQ15EQ16

76
3.5.2 Optimisation algorithm
The first version of the optimisation algorithm was designed and implemented14 for the
FREETEXT Project. An advanced version of the algorithm was programmed in C for Unix
for the present study. The application was extended by implementing both maximisation and
minimisation versions of the algorithm. Standard performance measures were now exploited:
the same fixed DCVs (2, 5, 10, …500 documents) and fixed recall levels (R=0.1 …1.0) as in
TREC. At each SPO, the optimisation operation (called optimisation lap) was executed ten
times starting each round from a different EQ (if available): five different runs in the largest
first mode and five in the precision first mode. Another major change was that optimisation
was now done separately for different exhaustivity levels to yield optimal queries that are
closer to CNF.
The implemented algorithm produces a set of candidate combinations. For instance, a
query plan of five exhaustivity levels may lead to 5 x 10 = 50 candidates at a particular SPO.
Very often more than one optimal query was found to be retrieving an equal number of
relevant and non-relevant documents. The one to be named the optimal query was selected by
applying the following sorting criteria in this order:
1. the smallest number of EQs
2. the lowest exhaustivity
3. the lowest starting number of an EQ where an optimisation round started
4. precision first mode before largest first mode.
The first criterion implies that the optimal query should not contain any redundant EQs
that do not retrieve unique relevant documents. These EQs do not affect the effectiveness
measures but they could bias query extent measures. The first and the second criteria together
drive the optimal queries to be as simple as possible (minimise query extent and exhaustivity).
The third and the fourth criteria indicate that the basic idea of the “most rational path” by
Harter (1990) and especially the first version of the optimisation algorithm by Sormunen
(1994) are acting as the bottom line in the evaluation of the optimisation algorithm. If a
complex operation is not needed, a simple one in preferable.
14 An application on the PC DBMS software Open Access III by Software Products Int., Inc.

77
3.6 Data collection and analysis
In best-match IR systems supporting relevance ranking, precision and recall can be
calculated after each individual document (Salton & McGill 1983, 166). There is usually no
clear distinction between retrieved and non-retrieved documents. Rather one may suppose that
the whole database is presented as a ranked list. Precision calculations at fixed DCVs do not
require any interpolation. For fixed recall levels, the distance of interpolation is very short, at
least if the size of the recall base is more than ten documents. See the example by Salton &
McGill (1983, 166).
In Boolean IR systems, retrieved and not retrieved documents form distinct sets. A typical
assumption is that relevant documents are randomly distributed within result sets, and only
one precision and one recall figure is calculated for the whole result set. One exception is
Turtle (1994) who treated Boolean result sets as ranked output. He argued that this
interpretation is appropriate since novelty is an essential relevance criterion in his research
environment. The traditional approach was applied in this study. In the test database
consisting of three differently profiled sub-databases, the position of relevant documents is
highly sensitive to uncontrolled variables like the subject area of the search topic (e.g. relevant
articles dealing with economics are mainly located in Kauppalehti sub-collection). In this
study, all calculations are based on complete result sets.
3.6.1 Precision at fixed DCVs
In the proposed method, the result set of an optimal query i at a particular fixed DCVj is
supposed to contain as many relevant documents as possible, but the total number of
documents should not exceed DCVj. The number of documents may equal the DCVj but may
also be lower. Several DCVs may also share the same optimal query. For instance, let us
assume that the optimisation algorithm has only found two queries:
q1 retrieving 1 relevant and 1 non relevant documents, and
q2 retrieving 7 relevant and 13 non relevant documents.
Query q1 is applied at DCVj = {2,5,10,15}, and q2 at DCVj = {20,30,50,…}. The idea of
DCVs is to measure how many relevant documents the user is able to find by browsing a fixed
number of documents (=DCVj). Precision can be used as the measure of effectiveness but
there are three different ways to calculate it.
Traditionally, precision has been computed directly from the result set using the formula

78
Pij(set) =rij/nij, (8)
where rij and nij are the number of relevant and all documents for the optimal query i at
DCVj, respectively. Considering the idea of fixed DCVs, it is more appropriate to calculate
precision by reflecting the number of relevant documents to DCVj instead of nij. Thus we
define a new measure, DCV precision that is computed by the formula
Pij(DCVj) =rij/ DCVj, (9)
where DCVj is the document cut-off value at which the query qi has been optimised.
Figure 3.3 illustrates the difference between Pij(set) and Pij(DCV). Black squares symbolise
Pij(set) and white triangles symbolise Pij(DCV)s.
At low DCVs, i.e. DCVj ∈ {2,5,10,15,20,30} the uncontrollable size of the Boolean
result sets causes problems. It may happen that none of the EQs that pass the DCVj limit
Figure 3.3. Interpolation of precision values for queries optimised for fixed document cut-off values.
0,30
0,87
0,650,70
0,50
1,001,00
0,72
0
0,1
0,2
0,3
0,4
0,5
0,6
0,7
0,8
0,9
1
0 5 10 15 20 25 30
Document cut-off value (DCV)
Pre
cisi
on
P(DCV) P(set)
DCV REL TOT P(set) P(DCV) P(used) 2 - - - - 1,00 5 - - - - 1,0010 3 6 0,50 0,30 1,0015 13 13 1,00 0,86 0,8620 13 13 1,00 0,65 0,7230 21 29 0,72 0,70 0,70
2
P(used)

79
retrieve relevant documents. Another special situation is that optimal queries at low DCVs are
not very effective, i.e. Pij(DCV) < Pik(DCV), where DCVj < DCVk,. In the case presented in
Figure 3.3, no optimal queries was found at DCV2 and DCV5, and the one found for DCV10 is
obviously not very effective. To avoid these anomalies we make here an assumption that the
user is always willing to browse the result set up to DCV30. If we assume that relevant
documents are randomly distributed within result sets, a valid precision actually used in
comparisons at DCVj is
Pij(used) = max {Pij(DCVj), Pik(set)}, (10)
where k>j, and k,j ∈ {2,5,10,15,20,30}. From now on, precision in the context of fixed
DCVs refers to Pij(used) unless otherwise specified. At DCVs higher than 30, Pij(DCVj) is
always applied.
3.6.2 Precision at fixed recall levels
Precision at fixed recall levels is a system-oriented measure, and points out how
effectively the IR system retrieves a specified share of known relevant documents. The
F i g u re 3 .4 . In terp ola tion of p recision va lu es for q u eries
op tim ised for fixed reca ll levels (R = 0 ,1 … 1 ,0 ) .
0,0
0,1
0,2
0,3
0,4
0,5
0,6
0,7
0,8
0,9
1,0
0,00 0,10 0,20 0,30 0,40 0,50 0,60 0,70 0,80 0,90 1,00
R e c a l l
Pr
ec
isio
n
M e a sur e d I n t e rp o la t e dP (s e t ) P (u s ed )

80
optimal query is supposed to retrieve at least as many relevant documents as the particular
recall level requires, and at the same time maximise precision. Thus the optimal query i at
recall level Rj retrieves rij relevant documents, so that rij ≥ j x R1,0 and rij/nij ≥ rik/nik for k ≥ j,
where R1,0 is the number of relevant documents known for the search topic, and j,k∈ {0.1, 0.2,
…, 1.0}. We have again the same problem that the number relevant documents retrieved by
the query optimised for a particular recall level does not equal to the number of required
relevant documents (= j x R1,0) but very often exceeds it. A single query may be optimal for
several recall levels as seen in Figure 3.4. In this case we may apply the traditional set based
precision computed by formula (8) assuming that relevant documents are randomly
distributed in result sets.
3.7 Evaluation of the test collection
In this section, the appropriateness of the test collection from the experimental design
viewpoint is discussed. First, the possibility of statistical dependencies in test collection
variables is analysed. Next, the inclusiveness of the query plans is examined.
3.7.1 Analysis of search topics
Table 3.6 shows the results of a statistical analysis made on the search topics aiming to
reveal hidden relations between query and search topic variables. Hidden correlation between
the test collection variables (e.g. complex search topics tend to be broad, and the least
complex ones tend to be narrow) may lead to false interpretations of the experimental results.
The search topics were classified into three complexity categories (C=2-3, C=4, and C=5), and
into two broadness categories (Br≤14 and Br>14). Data were also collected about the average
document frequencies and recall base sizes associated with different categories of search
topics. The aim was to find answers to the following questions:
1. Are the search topic sets in three complexity categories similar to each other in terms of
a) search topic broadness
b) average document frequencies per facet in the inclusive query plans
c) the average number of relevant documents known per query?
2. Are the search topic sets in two broadness categories similar to each other in terms of
a) search topic complexity
b) average document frequencies per facet in the inclusive query plans
c) the average number of relevant documents known per query?

81
Average broadness values in three complexity groups ranged between 14.6 and 19.9
(medians between 13.5 and 15.9). The Kruskal-Wallis one-way analysis of variance by ranks
(see Siegel & Castellan 1988, 206-215) was used to test whether the observed variation could
be expected among random samples from a same population or merely predict population
differences. The null hypothesis could not be rejected (p<0.5) and the search topics in all three
complexity categories seemed to have similar broadness distributions.
Average complexity of search topics in two broadness categories are quite close to each
other (3.7 vs. 3.9). Since complexity data contain a lot of ties (possible values 2, 3, 4, and 5)
two different statistical tests were applied: the Wilcoxon-Mann-Whitney test and the Chi-
Square test for two independent samples (see Siegel & Castellan 1988, 111-123, 128-136).
Both tests showed that the null hypothesis could not be rejected. Both broad and narrow
search topics seemed to have similar complexity distributions. We could conclude that there
did not seem to exist any correlation between the complexity and broadness of search topics.
This means that the exhaustivity of queries can be tuned without topic broadness based biases.
Similarly, query extent can be tuned without interference from topic complexity restrictions.
The analysis of average document frequencies per facet in the inclusive query plans
showed that the search topic sets of varying complexity are similar in this respect. On the
other hand, the average document frequencies per facet correlated with search topic
broadness. It is no surprise that inclusive query plans containing a larger number of search
terms per facet retrieve a large number of articles. However, this test was necessary to ensure
that this correlation is statistically significant. We also gained some support for the idea that
the number of terms per facet is an appropriate measure of query broadness.
Table 3.6 A comparison of properties in search topic subsets of varying complexity
and broadness (Ave=average; Med=median). Statistical tests: H 0 (property X does not
differ significantly in different search topic categories) can be rejected when p<0,05.
Search topic No. of Complexity Broadness Doc. frequency Recall basecategories topics Ave Med Ave Med Ave Med Ave Med
Complexity C=2-3 12 19,9 15,9 9026 10120 33 17C=4 15 17,7 15,8 9386 8643 42 22C=5 8 14,6 13,5 9105 9132 31 28
p <0,5 *) >0,99 *) <0,9 *)
Broadness Br≤≤≤≤14 17 3,9 4,0 7710 7899 45 42Br>14 18 3,7 4,0 10603 10486 30 26
p <0,5 **) 0,0073 ***) <0,2776 ***)

82
The last test dealt with the potential correlation between the complexity and broadness of
a search topic and the number of known relevant articles for that search topic. This correlation
might be an issue in measuring performance at fixed DCVs (document cut-off values) (see
Hull 1993). Although the averages and medians for the known relevant documents differed
from one search topic category to another (averages ranged from 30 to 45 and medians from
26 to 42), the differences were not statistically significant.
Data samples were quite small, especially in the complexity categories. This means that
the probability of making the type II error (i.e. we fail to reject the null hypothesis H0 when,
in fact, it is false) in statistical inference is quite high (Siegel & Castellan 1988, 9-11). The
likelihood of the type II error is high when the difference in the mean values of property X in
the search topic subsets compared is small. The significance tests tell us only that there did not
seem to be strong uncontrolled biases in our search topic collection (which is a relative issue,
but needs to be tested to avoid trivial mistakes). We may assume that our search topic
collection is balanced enough since search topic complexity and broadness were not used as
key concepts in formulating hypotheses for our experiments (see Chapter 4). They merely
gave the ultimate boundaries within which the exhaustivity and extent of queries may vary.
3.7.2 Analysis of query plans on the basis of known relevant documents
The texts of all relevant articles of a sample of 18 search topics were analysed to identify
all searchable expressions for all facets of the inclusive query plans. The aims were (1) to test
how comprehensively the inclusive query plans contained searchable expressions for the
facets, (2) to find out the prevalence of implicit, not searchable expressions in news texts, (3)
to study the capability of individual query terms to retrieve relevant documents, and (4) to
collect word occurrence data for comparing documents retrieved at different operational levels
(e.g. in high precision and high recall searching).
The sample contained three search topics from each of the complexity/broadness
combinations: 3 search topics x 3 complexity categories (C=2-3, C=4 and C=5) x 2 broadness
categories (Br≤14 and Br>14) = 18 search topics. The sample contained 648 documents. The
average number of relevant documents per topic was about the same in the sample as in the
whole collection (34 vs. 36 articles). Each article was read by a research assistant and all
searchable expression (nouns, verbs or adjectives, single words, compound words or phrases)
were marked using a different colour for each facet. The occurrences of different expressions
were counted and this data fed into a database.

83
Appendix 3 presents the basic results of the facet analysis. For each facet of a query plan
the following data is given:
1. W/Qp: How many of the expressions referring to a facet in relevant documents are
covered by the query plan terms of that facet?
2. W/New: How many new unique expressions referring to a facet but not matching the
query plan terms have been found?
3. W/All: The sum of W/Qp and W/New, all unique expressions referring to a facet in
relevant documents.
4. W/Qp-%: The percentage of available expressions representing a facet covered by
the query plans.
5. W/New-%: The percentage of available expressions representing a facet not covered
by the query plans.
6. RecallBase: All relevant documents known for a topic.
7. RetbyPlan: The number of documents retrieved by a facet using query plan terms.
8. RetbyAll: The number of documents that were retrieved by a facet if all identified
expressions had been exploited in query plans.
9. NRet: The number of relevant documents that were not retrieved by a facet because
of missing query plan terms.
Figure 3.5. Average share of relevant documents containing a) at least one query plan word (QPlanWord), b) at least one searchable expression (OtherExpr), or c) only an
implicit expression (ImplExpr) for query plan facets no 1-5. (18 search topics).
99,4 %93,8 %
86,2 %78,7 %
89,2 %
11,8 %17,2 %
0,5 %
5,4 %
4,1 %
2,0 %
1,9 %
0,2 %
5,4 %4,3 %
0 %
10 %
20 %
30 %
40 %
50 %
60 %
70 %
80 %
90 %
100 %
F1 (18 topics) F2 (18 topics) F3 (17 topics) F4 (12 topics) F5 (6 topics)
Facet number
Sh
are
of
rele
van
t d
ocu
men
ts
ImplExpr
OtherExpr
QPlanWord

84
10. UnRet: The number of relevant documents that were unretrievable by a facet
because the facet was expressed implicitly in the document.
The numbers in Appendix 3 were averaged over each facet level (F1…F5). A facet in a
query plan was typically referred to by 20-40 different expressions in the relevant
documents15. Of these 65-76 % (14-26 expressions) were covered by the query plan terms.
This result indicates that the search analyst was able to exploit about two out of three
expressions available for each query facet in the relevant documents. Thus, one out of three
potential query terms was missing from the query plans called inclusive requiring further
analysis.
How do the missing terms affect the usefulness of the test collection in evaluation? This
issue can be discussed by taking a look at Figure 3.5 and the NRet and UnRet columns in
Appendix 3 showing for each facet the shares of relevant documents retrieved a) by the query
plan terms, b) by only new expressions found in the facet analysis, and c) by no means since
that particular aspect had been expressed implicitly. The column of the first facet indicates
that nearly all except four relevant documents have been retrieved (as was already shown in
Table 3.2). All four documents contained only an implicit expression for the first facet. The
role of implicit expressions was larger and also the role of missed query terms also became
observable in facets F1-F5.
We may conclude that the query plans can be called inclusive since the effect of missed
query terms is minimal in terms of missed relevant documents. From the perspective of
performance measuring missed query terms do have an effect as some additional relevant
documents contained implicit expressions.
3.8 Summary of the test collection and data collection
The basic issues of designing and constructing an appropriate test environment for the
proposed evaluation method have been outlined above. The reported results give a tangible
image of the key aspects of the proposed method and of the consequences of using it in
designing test collections and measuring performance. The main differences compared to the
traditional experiments with Boolean IR systems are:
1. Inclusive query planning is a major effort in creating a test collection. Each inclusive
15 These numbers are not directly comparable to the number of terms in the inclusive query plans given in
Table 3.3. A truncated query term may match several expressions, for instance, to all compound words having thequery term as the prefix part.

85
query plan is a rich representation of a search topic in terms of query exhaustivity andextent. It forms a flexible and comprehensive base on which different types ofexperiments dealing with varying query contents and structures can be designed. Thisbase can be exploited not only in Boolean but also in best match IR experiments.
2. Extensive Boolean queries (supplemented with parallel probabilistic queries) yield aneffective model to discover relevant documents in a test collection, and to developreliable recall base estimates.
3. Elementary queries present the whole spectrum of atomic queries available forexperimentation, and the optimisation algorithm shows how to find ideallyperforming queries under given constraints. The performance of Boolean queries canbe measured at standard points of operation (SPO) similar to the methods applied forbest match queries.
4. A detailed description was given of the characteristics of the test collection. Thedescription was based on the inclusive query plans, on reliable recall base estimatesand on the facet analysis of all relevant documents in a representative sample of 18search topics.
5. Inclusive query plans provide data that can be used to categorise search topics. Thisopens up new opportunities to design more refined experiments taking into accountsearch topic characteristics.
A case experiment applying the proposed evaluation method and exploiting the developed
environment is described in the next chapter.


87
4 A CASE EXPERIMENT: FREE-TEXT
SEARCHING IN LARGE FULL-TEXT DATABASES
4.1 Introduction
A new method for the evaluation of the wide range performance of Boolean IR systems
was introduced in Chapter 2. The case experiment reported here will elucidate the potential
uses of the proposed method. The focus is on clarifying the types of research questions that
can be effectively solved by the method, and on explicating the operational pragmatics of the
method.
The experiment was inspired by the STAIRS study, where the investigators drew strong
conclusions doubting the effectiveness and suitability of free-text searching in large full-text
databases (Blair & Maron 1985). Unfortunately, Blair and Maron could not base their
conclusions on firm empirical data, as pointed out by Salton (1986). Later, Blair and Maron
tried to clarify the problems of free-text searching in large full-text databases, and constructed
analytical justifications supporting their original conclusions (Blair 1986, 1990; and 1996;
Blair & Maron 1990).
Blair and Maron based their justifications mainly on three concepts. Prediction criterion
(PC) refers to the fact that the searcher is required to predict one or more words used to index
desired documents (without seeing the text). The searcher typically has difficulties in
discovering the set of words leading to retrieval of all relevant documents but not the non-
relevant ones. Futility point criterion (FPC) illustrates the searcher’s tendency not to display
any results until the number of records falls below some personally perceived limit. In large
databases, it is common that query terms retrieve large document sets, and the futility point is
repeatedly exceeded. Thirdly, the searcher’s trust in the original query terms and tendency of
exploiting conjunctive query elements in the case of output overload was called the anchoring
effect (Blair 1990, 9-13, 17).
Blair and Maron argued that in a large, full-text indexed database, the pressure to fulfil
both PC and FPC with the searcher’s tendency of anchoring lead to narrowly focused queries
resulting in low recall. They also demonstrated the deterioration of recall in queries containing
conjunctions using examples based on probability calculations (Blair & Maron 1985; Blair

88
1990, 104-106). Blair (1990, 106) gives the following example of the risk of missing relevant
documents because of Boolean conjunctions. By assuming four probabilities
1. P(SW1) = 0.6 = probability searcher uses term W1 in a query
2. P(SW2) = 0.5 = probability searcher uses term W2 in a query
3. P(DW1) = 0.7 = probability W1 appears in a relevant document
4. P(DW2) = 0.6 = probability W2 appears in a relevant document
one may estimate achieved recall as the joint probability of searcher selecting W1 and W2 and a
relevant document containing W1 and W2: P(SW1) x P(DW1) x P(SW2) x P(DW2) = 0.6 x 0.7 x
0.5 x 0.6 = 0.126. Obviously, typical recall is very low if the given assumptions hold for
typical search situations.
The above hypotheses by Blair and Maron were potential explanations for the low
recall/high precision figures of the STAIRS study. The authors also suggested that the size of
a database might be a crucial variable in evaluating IR system performance. However, the
empirical results did not permit the general conclusion that free-text searching is an
inadequate technique in large full-text databases, because:
1. As with most evaluations of Boolean IR systems, the STAIRS study was not able toseparate clearly the performance of the searchers from that of the technical IR system.Thus, we do not know how comprehensively the searchers were taking advantage ofthe capabilities of the technical IR system (more generally, the Boolean IR model).
2. No data about the characteristics of queries from the original STAIRS study or fromany other study were published to support the hypothesis. Basically, we know verylittle about the relation between the characteristics of queries (such as exhaustivity)and the performance of an IR system.
3. The authors did not make any distinctions between different search situations, e.g.search request or database characteristics.
In the present study, we try to draw a detailed picture of system performance and optimal
query structures in search situations typical of large databases. Our point is not to reconstruct
the STAIRS study but rather to demonstrate the ultimate system limits of the Boolean IR
model under the pressure of larger and larger document collections. We assume an ideally
performing user and, at least in principle, exclude all user-based effectiveness limits. Thus, the
results should show the performance limits of Boolean queries in one type of a collection
indexed in a particular way. The user of the system, no matter how skilful, should not be able
to exceed the effectiveness of queries optimised from the system viewpoint.

89
Blair and Maron did not address the problems of high precision searching, i.e. the
situation when the user is only interested in finding some relevant (probably highly relevant)
documents. Then the goal of the IR system is to retrieve some relevant documents, and at the
same time reject the mass of non-relevant documents as effectively as possible. The proposed
method is capable of evaluations in both situations: high recall searching and high precision
searching.
Quite many researchers of operational full-text databases have taken a different standpoint
from Blair and Maron, and have been more concerned about the low precision of full-text
searching. Several studies have shown that recall tends to be higher and precision lower in
full-text databases than in their bibliographical counterparts (Tenopir 1985, McKinin et al.
1991). Increasing query exhaustivity and decreasing query extent are structural moves that can
be used to focus a query. Similarly, replacing a query term with a more specific one (in a
statistical or semantic sense) is a move serving the goal of higher precision (see e.g. Harter &
Peters 1985). Proximity operators have been seen as a special precision tool for full-text
searching to reduce precision errors typical with long documents (Ledwith 1992, Tenopir &
Ro 1990). Professional searchers apply these moves routinely (Fidel 1991).
The effects of query exhaustivity and extent on the performance of Boolean queries in
high precision searching has not been studied extensively. Several experiments have been
conducted to compare the performance of proximity operators and traditional AND operators
in Boolean queries (Tenopir & Shu 1989, Love & Garson 1985, Keen 1992b). The main
contribution of these studies has been that precision can be increased by replacing AND
operators by proximity operators. The results are quite self-evident because of frozen query
structures. An earlier study (Sormunen 1994) yielded preliminary results suggesting that
queries should be optimised separately for AND and proximity operators to make a valid
comparison.
In this case study, we are interested in Boolean queries designed for high recall and in
high precision searching of large, full-text databases. The hypotheses by Blair and Maron give
us a point of comparison for high recall searching, and the experiments on proximity operators
another for high precision searching. However, we will exclude the study of proximity
operators as such in the present study. The core of the Boolean queries, queries structured by
the traditional OR and AND operators, are in the main focus. Proximity searching is included
to get a reference point for traditional Boolean queries in high precision searching.

90
4.2 Framework and research problems
4.2.1 Large full-text databases
Full-text databases contain the complete texts of documents, e.g. newspaper articles, or
court verdicts. Large implies that the number of documents in a database is clearly greater
than in some typical or standard test databases. For example, traditional test collections
contained only several hundred or a few thousand documents while operational full-text
databases or those used in the TREC collection contain several hundred thousand documents.
In this study, largeness is seen as a relative issue. We are not interested in experimenting with
large databases as such, but rather to demonstrate how Boolean queries are able to scale up
along with the growth of a database.
The number of documents is not the only interesting issue in the growth of databases. The
density (or generality) of relevant documents is another. Generality is measured as the
percentage of documents in a database that are relevant to a given query (Losee 1998, 82). We
are discussing here two extreme cases:
1. the density of relevant documents will remain about the same in the large database, i.e.the volumes of both relevant and non-relevant documents increase similarly or
2. the density of relevant documents is lower in the large database, i.e. the number ofnon-relevant documents increases alone.
We call these two extreme types of large databases the large & dense database (density
constant) and the large & sparse database (density declining). Surprisingly, the density issues
of large databases have not been much discussed in the research literature. One exception is
the article by Ledwith (1992) discussing the differences of searching in traditional test
collections and large operational databases. No evaluation results on the effects of database
density have been reported so far.
4.2.2 Full-text indexing
The characteristics of indexing like exhaustivity, specificity, correctness, consistency, and
applied indexing devices (links, role indicators, weights or pre-combination) are a complex set
of factors affecting the performance of a Boolean IR system (Soergel 1994). Of these
characteristics, exhaustivity and specificity are the most relevant when the effectiveness of
free-text searching is discussed. Hersh (1996, 76-77) suggests that exhaustivity measures the
completeness of indexing and specificity refers to the precision of the indexing vocabulary.

91
Alternatively, Soergel (1994) points out that exhaustivity is the extent to which the concepts
relevant to a document are covered in indexing, and that specificity refers to the generic level
at which the concepts to be represented are expressed.
The indexing of full-text databases is regarded as both exhaustive and specific. In theory,
high exhaustivity of indexing should lead to a tendency for high recall and low precision, and
high specificity of indexing to a tendency for low recall and high precision (Soergel 1994).
The results of empirical studies have shown that queries in full-text indexes tend to provide
higher recall but lower precision than other indexing methods (Tenopir 1985, McKinin et al.
1991). This suggests that high exhaustivity of indexing is the dominating characteristic of full-
text indexes when the effectiveness of free-text searching is considered.
The analytical reasoning by Soergel (1994) about the relationship of indexing
characteristics and retrieval performance obviously originates from the context of traditional
classification and thesaurus-based indexing. It does not pay attention to the differences
between controlled index languages and natural languages. For instance, the vocabulary of
natural language contains synonymous and homonymous expressions. A text may contain
several redundant expressions for a single concept or a concept may be expressed sometimes
implicitly. Homonyms and implicit expressions16 affect traditional indexing like errors. A
homonymous word works like an erroneously assigned index term and an implicit expression
like an omitted index term (for a general introduction to indexing based recall and precision
failures, see Lancaster 1968, 133-150).
4.2.3 Query tuning
The changes made in query exhaustivity and extent to achieve appropriate retrieval goals
are called here query tuning. Figure 2.1 (see Section 2.1) illustrated the two dimensions of
query tuning. The exhaustivity (Exh) of a query can be tuned from one to n, where n equals
the complexity of a search request. Facet extent (FE) can be tuned from one to k in facet [A]
(to l and m in facet [B] and in facet [N], respectively) where k, l, and m are limited by the
broadness of facets [A], [B] and [N]. Query extent (QE) is the average facet extent across all
16 Implicit expression is a somewhat confusing term since one may ask how something that is not expressed
can be called an expression. The term implicit expression was adopted since then it is convenient to talk about adocument that does not contain a searchable expression. This included the cases when a competent reader of atext comprehends that a particular concept (e.g. a type of crime) is discussed but that the concept is not directlymentioned or is expressed by non-searchable expressions.

92
facets of a query. Increasing (or decreasing) extent and exhaustivity tend to have opposite
effects on recall and precision.
In some situations proportional measures are more appropriate. Proportional exhaustivity
(PE) is the percentage of available facets actually exploited in a query. This measure is
appropriate, for example, in treating query structure data originated from different sets of
search topics. Proportional facet extent (PFE) is the percentage of available expressions of a
facet actually exploited in a query and proportional query extent (PQE) is the averaged
proportional facet extent across all facets of the query. PQE is a useful measure when the
exhaustivities of comparable queries or the sets of search topics are different.
Structural query measures are obviously insensitive to some query modifications that may
affect retrieval performance. For example, if a query term is replaced with a narrower or
broader term, resulting recall and precision may change but query extent does not change.
However, it is expected that such modifications do not hide the effect of structural factors.
The effect of query term changes may be controlled by counting document frequencies (df) for
all facets of the optimal queries. This measure correlates with the query extent figures (see
Section 3.4.2) but, on the other hand, gives a chance to collect complementary data to learn
about the dynamics of query structures and query term changes.
4.2.4 Research problems
Query tuning is used to achieve an optimally performing query in a particular situation. If
the Boolean IR model was working ideally, query tuning could maintain the level of
effectiveness in tightened search situations (e.g. the declining density of relevant documents).
However, both exhaustivity and facet extent tuning have their limits. The facets represented in
a search request fix the upper limit in query exhaustivity tuning. The availability of “well-
behaving” expressions for search facets is another factor limiting the area of extent tuning.
It is useful to separate high recall and high precision oriented searching when considering
retrieval performance in large databases. The aim of high recall searching is to retrieve all
relevant documents, and to reject as many non-relevant ones as possible. System performance
in high recall searching is most straightforward to evaluate by measuring precision at the
highest recall levels (e.g. R0.8…R1.0). In high precision searching, the query is supposed to
retrieve as many relevant documents as possible within a limited result set. A user-based view
on high precision searching can be demonstrated by measuring precision at low document cut-

93
off values (e.g. DCV2…DCV30). Another option, the use of low recall levels (e.g. R0.1…R0.3) is a
system view on high precision searching.
In Section 4.2.1, the large & dense database was defined to contain the same density, and
the large & sparse database a lower density, of relevant documents as the small database. To
simplify the situation from the retrieval viewpoint, we define three databases created from
finite number of documents using a set of n test topics:
smalldb = ( )i 1
n
i iR Q=
∪! (4.1)
large&densedb = ( )R Qii
n
i+
=
+∪1! (4.2)
large&sparsedb = ( )R Qi ii
n
∪ +
=1! (4.3)
where Ri ⊆ Ri+ are the sets of relevant documents for topic i, and |Ri
+| ≈ ki x|Ri|Qi ⊆ Qi
+ are the sets of non-relevant documents for topic i, and |Qi+| ≈ ki x |Qi|
|Qi|>>|Ri|, and size ratio ki ∈ N={2,3,…m}.17
In other words, the sets of relevant documents Ri are the same in the small and in the large
& sparse database. Similarly, both large databases contain the same sets of non-relevant
documents Qi+. For each topic, this includes the set of extra non-relevant documents
iiiextra QQQ −= +)( (4.4)
that do not exist in the small database. The large & dense database contains for each topic
a set of extra relevant documents
iiiextra RRR −= +)( (4.5)
that are unique to that database. This simplification makes designing experiments easy. If
Ri and Qi are randomly selected subsets of Ri+ and Qi
+, respectively, one can be sure that the
characteristics of documents are similar in the small and in the large databases, and do not
cause any biases in comparisons.
Analysing the databases defined above, it is easy see what the basic differences in
querying of the small and large databases are (if an equal performance level is striven for):
17 We make an assumption that sets Ri for i=1-n (and Ri
+,Qi,, Qi+, respectively), are mutually exclusive and
do not contain any joint documents. There may occur cases when Ri ∩ Qi ≠ 0 but the simplifying assumptiondoes not invalidate formulas 4.1-4.3 since each topic i is treated individually in the experiment.

94
1. In high recall searching, the user is interested in finding all or nearly all relevant
documents. This goal necessitates that the IR system reject a larger number of non-
relevant documents (≈ |Qextra(i)|) in the large databases than in the small one, and retrieve,
a) in the large & dense database an equal share but a larger number of relevant
documents, and
b) in the large & sparse database, an equal share and number of relevant documents when
compared to the small database.
2. In high precision searching the user is expecting to find some relevant documents with
minimum browsing effort. This goal requires that the IR system reject a larger number of
non-relevant documents (≈ |Qextra(i)|) in the large databases than in the small one, and
retrieve
a) in the large & dense database a smaller share but an equal number of relevant
documents, and
b) in the large & sparse database, an equal share and number of relevant documents when
compared to the small database.
4.2.4.1 Effectiveness differences
The need to reject the extra non-relevant documents is a characteristic of querying in large
databases. In the large & sparse database, the tendency of falling effectiveness seems to be
quite straightforward. A query designed for a small database will retrieve the same relevant
documents but also extra non-relevant documents matching the original query term
combinations. The only means of improving precision is to increase the exhaustivity, or to
decrease the extent of queries. Adding facets and removing disjunctive query terms tend to
decrease recall. Thus, effectiveness is predicted to fall both in high precision as well as in high
recall searching.
The situation in the large & dense database is more complex. Since the density of relevant
documents remains constant, the matching system is only required to retrieve an equal share
of relevant documents, and to reject an equal share of non-relevant documents as in the small
database. This fact suggests that the performance level should not fall. However, there are
arguments for the opposite view. If the number of relevant documents increases considerably,
some documents in Rextra(i) may contain unique expressions, and may not be retrieved by the
original queries used in the small database. In high recall searching, the query extent of

95
queries designed for the small database has to be increased to maintain recall. Increasing the
extent of queries tends to decrease precision predicting falling effectiveness.
In high precision searching of the large & dense database the effectiveness may not fall at
all. For instance, we may assume that for a particular search request the large & dense
database contains 50 relevant documents (= Ri+) and the small one 10 relevant documents (=
Ri). The database size ratio ki for these requests is 5. If the optimal query in the small database
has retrieved 5 of the relevant documents at DCV=10, the system operates at recall level 0.5.
To achieve the same precision, the optimal query in the large & dense database has likewise to
retrieve 5 relevant documents but is required to operate only at the recall level 0.1. Because
many combinations of five relevant documents (out of 50) are available, new combinations of
query terms may be used to seek a more focused result set than in the small database. It is
expected that higher precision may be achieved in the large & dense database.
4.2.4.2 Changes in optimal query structures
Increasing exhaustivity can be seen as the major precision device and increasing query
extent the major recall device in optimal query tuning (Fidel 1991). By definition, optimal
queries do not contain query terms which do not retrieve any unique relevant documents.
Thus, reducing extent could not help in improving precision without recall losses. Similarly, it
is hard to see how reduced exhaustivity could improve recall without precision losses because
there are no extraneous conjuncts in optimal queries.
Queries working optimally in one database probably do not work optimally in another,
and the new optimum is achieved by balancing exhaustivity and query extent changes (for
instance, to increase extent to achieve a particular recall level and, at the same time, increase
exhaustivity to improve precision). Predicting simultaneous changes in exhaustivity and query
extent is more difficult in high precision searching since more options are available for both
query extent and exhaustivity tuning, and different sets of relevant documents satisfy the
recall goal. In high recall searching, the situation is simpler. When full recall is required, all
relevant documents have to be retrieved, and the limits of query tuning are easier to predict.
In high recall searching of the large & dense database, the IR system has to retrieve a
larger set of documents to achieve the same recall level as in the small database. This requires
that query extent be increased if we assume that some new relevant documents in Rextra(i) may
contain unique expressions for the query facets that do not occur in the relevant documents of
the small database. On the other hand, when the aim is to retrieve all relevant documents, the

96
role of implicit expressions may become essential. Some documents in Rextra(i) may present
some query facet only implicitly, and that facet has to be removed to retrieve those
documents. It is predicted that the precision of optimal queries and the average exhaustivity
will be lower and the average query extent higher in the large & dense database than in the
small database at the highest recall levels.
In high recall searching of the large & sparse database, the main problem for query tuning
is to find a structure that decreases the precision of queries at a particular recall level as little
as possible (rejects most documents in Qextra(i)). In general, increasing query exhaustivity is
expected to work as the major tool in focusing the queries since query extent cannot be
lowered in order to retrieve the same relevant documents as in the small database. Thus, it is
likely that the average exhaustivity of optimal queries is higher in the large & sparse database
than in the small one, but there is no clear pressure for increasing query extent. It is thus
predicted that, at high recall levels, the exhaustivity of optimal queries is higher in large &
sparse databases than in the small one. The query extent should remain about the same.
In high precision searching of the large & dense database, the system operates at a lower
recall level but has to reject ki times more non-relevant documents from the set Qextra(i) than in
the small database. It is very likely that the average exhaustivity of queries is higher than in
the small database. Because more relevant documents are available in the large & dense
database, each query term (used in the optimal small database queries) may retrieve some
additional relevant documents from the set Rextra(i). This means that only the most focused query
terms are needed in optimal queries of the large & dense database to retrieve the same number
or even more relevant documents than in the small database. Thus, the exhaustivity of optimal
queries is expected be higher but query extent lower in the large & dense database.
In high precision searching of the large & sparse database, the system has to reject a ki
times larger number of non-relevant documents from the set Qextra(i) and to press the total
number of retrieved documents below the required DCVj. Obviously, this should lead to
higher average exhaustivity of optimal queries. Another probable move in reducing the result
set is to remove some of the broadest query terms from the query. It is suggested that a new
optimum (at a lower level of precision) is achieved by queries having higher exhaustivity and
lower average query extent.

97
4.2.4.3 Research hypotheses
Twelve hypotheses were formulated concerning effectiveness, exhaustivity and extent of
optimal queries in large databases. Six of the hypotheses were for high recall searching and
another six for high precision searching.
1. In high recall searching of a large & dense database containing the same proportions ofrelevant documents as the small database:
a) The average precision of optimal queries should be lower in the large & densedatabase than in the small one.
b) The average exhaustivity of optimal queries should be lower in the large & densedatabase.
c) The average proportional query extent18 of optimal queries should be higher in thelarge & dense database.
2. In high recall searching of a large & sparse database containing the same set ofrelevant documents as the small database:
a) The average precision of optimal queries should be lower at high recall levels in thelarge & sparse database than in the small one.
b) The average exhaustivity of optimal queries should be higher in the large & sparsedatabase.
c) The average proportional query extent of optimal queries should be about the samein both the small and the large & sparse databases.
3. In high precision searching of a large & dense database containing the sameproportions of relevant documents as the small database:
a) The average precision of optimal queries measured at low DCV levels should behigher in the large & dense database than in the small one.
b) The average exhaustivity of optimal queries should be higher in the large & densedatabase.
c) The average proportional query extent of optimal queries should be lower in thelarge & dense database.
4. In high precision searching of a large & sparse database containing the same sets ofrelevant documents as the small database:
a) The average precision of optimal queries measured at low DCV levels should belower in the large & sparse database than in the small one.
b) The average exhaustivity of optimal queries should be higher in the large & sparsedatabase.
c) The average proportional query extent of optimal queries should be lower in thelarge & sparse database.
18 Proportional query extent is a more appropriate measure here than query extent (see Section 4.3.3) since
the exhaustivity of the comparable queries is expected to vary.

98
The summary of hypotheses is presented in Table 4.1.
4.3 Methods and data
Comprehensive descriptions of the evaluation method and the test collection were
presented in Chapters 2 and 3. This section contains only some information specific to the
case experiment.
4.3.1 The test collection and query optimisation
Experimental designs for comparing optimal queries in the small and large databases were
quite straightforward after the relevance data had been collected and combined with the EQ
result sets. The original queries in the document database were executed only once. The
original document database had the role of the large & dense database. Other databases, the
Table 4.2. The characteristics of the actual experimental setting (large & dense database) and twoemulated settings (small and large & sparse databases).
Database property Largedatabase
Small“database”
Sparse“database”
Number of documents (about) 54000 11000 52800Average number of relevantdocuments per request
36 8 8
Average density of relevantdocuments
0.63x10⁻³ 0.72x10⁻³ 0.15x10⁻³
Table 4.1. Summary of hypotheses. The predicted changes in effectiveness of free-text searchingand in the structural characteristics of optimal queries in large&dense and large&sparsedatabases compared to a small database. Volume indicators: relevant documents: ; non-relevant documents:
Large & dense database Large & sparse database
FeatureGoal
Effect-iveness
Exhaust-ivity
Facetextent
Effect-iveness
Exhaust-ivity
Facetextent
Highrecallsearching H 1a H 1b H 1c H 2a H 2b
≈H 2c
Highprecisionsearching H 3a H 3b H 3c H 4a H 4b H 4c
������������
������������������������������������������
Small database����������
��������������

99
small database and the large &
sparse database, were created
through sampling from EQ result
sets. The summary of database
characteristics is presented in Table
4.2.
The result sets for the
elementary queries of the small
database were constructed by taking
a systematic sample (about one out
of five documents) out of the result
sets retrieved by EQs in the
document database. The basic
sample consisted of documents
having an id-number ending with 1
or 2. Other id-number endings were
applied if the sample set for a
particular search topic contained less
than three relevant documents. This
was the case with seven search
topics.
The large & sparse database was
created by deleting approximately 80
% of the relevant documents from
the original EQ result sets. Relevant
documents having id-numbers
ending with 3,4, … 9, or 0 were deleted. Exceptions were the same as with the small database.
As a result of this process, the EQ result sets of the small database contained the same
relevant documents as those of the large & sparse database. A similar sampling technique has
been used in the VLC Track of TREC (Hawking 1999).
A summary of the contents of the emulated small and large & sparse databases are
presented in Table 4.3 including the number of relevant documents available for each search
Table 4.3. Number of relevant documents in the small
and in the large & sparse databases. (Ri -> emulated dbs;
Ri+-> large & dense db; k=size ratio) Topic no Rel=3 Rel=2 Ri Ri+ k
1 3 3 6 32 5,32 0 7 7 53 7,63 1 2 3 19 6,34 2 1 3 8 2,75 3 3 6 39 6,56 2 9 11 47 4,37 3 11 14 87 6,28 8 5 13 65 5,09 1 7 8 29 3,610 0 5 5 23 4,611 11 19 30 101 3,412 1 4 5 29 5,813 1 4 5 13 2,614 5 3 8 35 4,415 6 6 12 53 4,416 2 2 4 16 4,017 2 14 16 45 2,818 4 11 15 46 3,119 4 7 11 56 5,120 1 4 5 14 2,821 0 4 4 17 4,322 1 4 5 36 7,223 8 1 9 31 3,424 2 3 5 23 4,625 1 3 4 13 3,326 1 5 6 35 5,827 3 17 20 90 4,528 1 3 4 16 4,029 3 4 7 25 3,630 2 3 5 26 5,231 6 7 13 57 4,432 5 4 9 50 5,633 1 3 4 22 5,534 1 2 3 6 2,035 0 4 4 13 3,3
Sum 95 194 289 1270Ave 2,7 5,5 8,3 36,3 4,5Med 2 4 6 31 4,4

100
topic (recall bases Ri), respective figures for the large & dense database (Ri+) and the size
factor ki.
All 35 search topics available for the original document collection were used in the case
experiment. Optimisation of queries was performed separately for all three database types
applying the procedure described in Section 3.7.
4.3.2 Data collection and analysis
Performance data was collected by measuring precision at recall levels R=0.1, 0.2, … 1.0
and at DCV= 2, 5, 10, 15, 20, 30, 50, 100, 200, 500 for each topic, database, and optimisation
lap. The total number of optimisations (optimisation laps) was remarkable: 35 topics x (10 Ris
+ 10 DCVs) x 3 databases x 10 alternative starting EQs x 4 exhaustivity levels (median) =
84,000 queries. Performance data were collected for optimal queries at 35 x (10 + 10) x 3 x 4
= 8,400 standard points of operation (SPO). However, high recall searching was studied at
recall level 0.8-1.0 and high precision searching at DCV=5-20. Precision at recall levels
R=0.1-0.3 was used as a comparative data set for high precision searching.
Exhaustivity data for the optimised queries was quite simple to collect since optimisation
was done separately for each exhaustivity level. For instance, if four facets were identified
from the search topic, the optimal query was searched combining first EQs of exhaustivity
level one for all SPOs, then for exhaustivity level two, and so on. When the optimal query was
found, query exhaustivity value could be recorded automatically. As mentioned earlier, in the
case of ties in precision figures, the query of the smallest exhaustivity was named the optimal
one.
Query extent data is more complex to collect since it requires a lot of manual checking
and calculations. That is why the extent figures were calculated only for key SPOs of interest.
For fixed recall levels query extent figures were determined R0.8; R0.9, R1.0 (high recall
searching). For fixed DCVs, extent calculations were made for DCV5, DCV10, and DCV20 (high
precision searching). Facet extent data were also collected for R0.1; R0.2, R0.3 for characterising
the system viewpoint in high precision searching.
Document frequency data were averaged across all facets of the optimal query giving a
figure that was analogous to query extent. Similarly, the analogous figure for proportional
query extent was determined by calculating the percentage of documents retrieved by the
terms of a particular facet in the optimal query and averaging these percentages across all
facets in the optimal query. Document frequency data was used to identify the potential shifts

101
in query terms that cannot be perceived from the query extent data (e.g. a query term is
replaced by a broader or a narrower one).
The sensitivity of results to changes in search topic characteristics was also analysed. The
search topics were grouped into subsets according to the number of known relevant
documents, topic complexity, and topic broadness. The aim of the sensitivity analysis was to
reveal how the observed phenomena held for the different subsets of the test collection,
especially, for different search topics.
The characteristics of top and tail documents were also analysed. Those documents that
were retrieved by queries optimised for high precision searching were called top documents.
Two sets of top documents were formed: one for optimal queries at DCV10 and another for
R0.2. Similarly, those relevant documents retrieved only by queries optimised at high recall
levels (R0.8 … R1.0), but not at any lower recall levels, were called tail documents. The set of
tail documents also contained the relevant documents (8 in total) that were excluded from the
experiment because they were not retrieved by the first facet, i.e. at exhaustivity level one
(see Table 3.2, in Section 3.4.1).
Statistical significance tests were applied to all major results. All results were based on
matched pairs and the Wilcoxon signed rank test was used (see Siegel & Castellan 1988, 87-
95). If the null hypothesis could be rejected at the significance level α=0.05 (p<0.05), the
observation was considered statistically significant.
4.4 Findings
Tables 4.4-4.7 summarise the comparisons between the small, large & dense and large &
sparse databases displaying the average precision, exhaustivity, extent, and proportional
extent of optimised queries at fixed recall levels. Full series of data across recall levels
0.1…1.0 are presented except for query extent. Recall levels R0.8…R1.0 are used for examining
high recall searching phenomena. Averages are presented for both ranges when available.
Absolute and proportional differences were also computed to help in comprehending the
magnitude and direction of differences between the small and large databases.

102
Table 4.4. Average precisions of queries optimally formulated at fixed recall lecels for small, Large &
dense, and large & sparse databases. (35 test topics, p=Wilcoxon signed-rank test)Recall Small Large&dense Large&sparse L&d - Sm Diff-% p L&s - Sm Diff-% p
0.1 0,927 0,845 0,697 -0,081 -8,8 % 0,0097 -0,229 -24,7 % 0,00020.2 0,913 0,817 0,666 -0,097 -10,6 % 0,0022 -0,248 -27,1 % 0,0001
0.3 0,862 0,784 0,579 -0,078 -9,0 % 0,0401 -0,283 -32,8 % 0,00010.4 0,819 0,712 0,522 -0,107 -13,1 % 0,0148 -0,297 -36,3 % 0,00010.5 0,780 0,664 0,466 -0,116 -14,8 % 0,0025 -0,314 -40,2 % 0,00010.6 0,715 0,618 0,388 -0,097 -13,6 % 0,1010 -0,327 -45,8 % 0,0001
0.7 0,655 0,564 0,321 -0,092 -14,0 % 0,0043 -0,335 -51,0 % 0,0001
0.8 0,585 0,506 0,279 -0,079 -13,5 % 0,0126 -0,306 -52,4 % 0,0001
0.9 0,428 0,400 0,183 -0,028 -6,6 % 0,1773 -0,245 -57,2 % 0,00011,0 0,410 0,233 0,169 -0,178 -43,3 % 0,0001 -0,241 -58,8 % 0,0001
Ave 0.0-1.0 0,709 0,614 0,427 -0,095 -13,4 % -0,283 -39,8 %Ave 0.8-1.0 0,475 0,380 0,210 -0,095 -20,0 % 0,0056 -0,264 -55,7 % 0,0001
Table 4.5. Average exhaustivity of queries optimally formulated at fixed recall levels for small,
large & dense, and large & sparse databases. (35 test topics, p=Wilcoxon signed-rank test)
Recall Small Large&dense Large&sparse L&d - Sm Diff-% p L&s - Sm Diff-% p
0.1 3,20 3,69 3,46 0,49 15,2 % 0,0013 0,26 8,0 % 0,0126
0.2 3,31 3,57 3,51 0,26 7,8 % 0,0290 0,20 6,0 % 0,0973
0.3 3,31 3,63 3,54 0,31 9,5 % 0,0080 0,23 6,9 % 0,0456
0.4 3,20 3,60 3,54 0,40 12,5 % 0,0047 0,34 10,7 % 0,0030
0.5 3,23 3,49 3,46 0,26 8,0 % 0,0293 0,23 7,1 % 0,02090.6 3,14 3,54 3,29 0,40 12,7 % 0,0029 0,14 4,5 % 0,1317
0.7 3,03 3,17 3,17 0,14 4,7 % 0,1655 0,14 4,7 % 0,0588
0.8 2,69 2,97 2,80 0,29 10,6 % 0,0542 0,11 4,3 % 0,1797
0.9 2,20 2,57 2,34 0,37 16,9 % 0,0183 0,14 6,5 % 0,1025
1,0 2,17 1,74 2,29 -0,43 -19,7 % 0,0245 0,11 5,3 % 0,1797
Ave 0.0-1.0 2,95 3,20 3,14 0,25 8,4 % 0,19 6,5 %Ave 0.8-1.0 2,35 2,43 2,48 0,08 3,2 % 0,6207 0,12 5,3 % 0,3591
Table 4.6. Average extent of queries optimally formulated at fixed recall levels 0.8,…,1.0 for small, large & dense and large & sparse databases. (35 test topics, p=Wilcoxon signed-rank test)
Recall Small Large&dense Large&sparse L&d - Sm Diff-% p L&s - Sm Diff-% p
0.8 8,24 10,66 8,38 2,42 29,4 % 0,0012 0,15 1,8 % 0,3807
0.9 7,42 10,45 7,94 3,03 40,9 % 0,0104 0,52 7,0 % 0,3758
1,0 7,68 9,63 7,93 1,94 25,3 % 0,0660 0,25 3,2 % 0,2583Ave 0.8-1.0 7,78 10,25 8,08 2,47 31,9 % 0,0021 0,30 4,0 % 0,2294
Table 4.7. Average proportional extent of queries optimally formulated at fixed recall levels 0.8, …, 1.0 for small, large & dense and large & sparse databases. (35 test topics, p=Wilcoxon signed-rank test)
Recall Small Large&dense Large&sparse L&d - Sm Diff-% p L&s - Sm Diff-% p
0.8 0,66 0,72 0,67 0,05 7,9 % 0,0008 0,00 0,7 % 0,2113
0.9 0,66 0,72 0,67 0,06 8,5 % 0,1499 0,01 1,4 % 0,6874
1,0 0,68 0,78 0,68 0,11 15,8 % 0,0099 0,00 0,1 % 0,6417Ave 0.8-1.0 0,67 0,74 0,67 0,07 10,7 % 0,0151 0,00 0,7 % 0,5373

103
4.4.1 Effectiveness in high recall searching
The average precision of optimal queries across the highest recall levels was 0.475 in the
small database while remaining to 0.380 in the large & dense database and to 0.210 in the
large & sparse database. The difference between the small database and both large databases
is quite clear across the whole operational range (Figure 4.1). At the highest recall levels, the
average precision of optimal queries was 20 percent lower in the large & dense and 56 percent
lower in the large & sparse databases than in the small one. The results sustained hypotheses
1a and 2a since the null hypothesis could be rejected at the highest recall levels. The only
exception was recall level R0.9 in the large & dense database. Although the average precision
was lower than in the small database, the difference was not statistically significant.
Precision curves for the small and both types of large databases have a quite similar shape
but a different vertical position up to the recall level R0.8. The difference in precision between
the small and the large & dense database is fairly steadily around 10 percent units (in the
window of 0.08 … 0.12). The difference in precision is larger between the small and the large
& sparse databases but also quite firmly around 30 percent units (in the window of 0.23 …
0.34).
Precision of queries in the small and large & sparse databases fall steeply between R0.8 and
R0.9 but level off after R0.9. In the large & dense database, precision sinks dramatically after R0.9.
This phase shift makes the average precision difference between the small and large & dense
Figure 4.1. Average precision at fixed recall levels in optimal queries for small, large & dense and large & sparse databases (35 test requests).
0,00
0,10
0,20
0,30
0,40
0,50
0,60
0,70
0,80
0,90
1,00
0,0 0,2 0,4 0,6 0,8 1,0
Recall
Pre
cisi
on Small
Large & dense
Large & sparse

104
database tiny at R0.9 and ruins the possibilities to reject the null hypotheses at that point. A
possible reason for the different shape of precision curves at high recall levels may have
something to do with the sizes of the recall bases.
The effect of small recall base sizes on the precision curved is illustrated in Figure 4.2.
The search topics were grouped into three sets according to recall base sizes Ri: Rb=3-4;
Rb=5-9; Rb=10 or more (see Table 4.3, column Ri). The idea is that with group Rb=3-4 (and
Rb=5-9) all relevant documents have to be retrieved already at level R0.8 (at level R0.9 for
Rb=5-9, respectively)19. In the small and large & sparse databases, retrieving the last or the
very last relevant documents causes a dramatic drop in the precision curves between levels
R0.7 and R0.8 in the topic group Rb=3-4, and between levels R0.8 and R0.9 in the group Rb=5-9.
At least 25 out of 35 search topics reached the bottom of precision values already at level R0.9
in the small database (and also in the large & sparse database). Excluding all search topics
19 Let us assume that we know 4 relevant documents for search topic A, 8 for search topic B, and 10 for
search topic C. The size differences in recall bases means that all relevant documents have to be found already atR0.8 in search topic A, at R0.9 in search topic B, but not until R1.0 in search topic C. This is because, in search topicA, retrieving 3 relevant documents raises recall only onto 0.750. Similarly, in search topic B, retrieving 7relevant documents gives only recall 0.875. In search topic C, 9 relevant documents elevates recall up to 0.900,and the problem of the least retrievable document affects precision only at R1.0. The phenomenon can be called aphase shift in performance data.
Figure 4.2. Average precision of optimal queries in the large & dense database; search topics of varying recall base sizes (k x 3...4, k x 5...9, and k x 10...
documents; 9, 16, 10 search topics, respectively).
0,000
0,100
0,200
0,300
0,400
0,500
0,600
0,700
0,800
0,900
1,000
0,0 0,2 0,4 0,6 0,8 1,0
Recall
Pre
cisi
on
Small/Ri=3...4
Large & dense/Ri=k x 3...4
Small/Ri=5...9
Large & dense/Ri=k x 5...9
Small/Ri=10...
Large & dense/Ri>k x 10…

105
providing a recall base smaller that 10 documents would have solved the problem of phase
shift but, unfortunately, this was not possible in our case.
In the large & dense database, all search topics except two provide a larger recall base
than 9 documents and the average number of relevant documents per topic is about 36 (see
Table 4.3, column Ri+). A large recall base seemed to help in maintaining a relatively high but
slightly declining precision up to recall level R0.9. The dramatic drop took place after that, and
the slope was steepest in the search topics of largest recall bases. The average precision for
each recall base group is higher in the small database but the shift in curves makes them
nearly collide at R0.9 making the difference statistically non-significant. The observed changes
in curve slopes emphasise that very few least retrievable (relevant) documents20 may dominate
the achieved precision at the highest recall levels and that recall base size may be an important
variable to control in IR experiments.
4.4.2 Query tuning in high recall searching
The preceding section illustrated the effectiveness differences between the small and large
databases. Now we are aware that, on the average, it is not possible to achieve as high
precision at high recall levels in the large databases as in the small one. The analysis of
optimal query structures helps to understand what kind of query tuning takes place and reveal
the ultimate limits of the Boolean IR model in adapting to changes in the operational
environment.
4.4.2.1 Query exhaustivity changes
Table 4.5 and Figure 4.3 contain a comparison of exhaustivities in queries optimised for
the small and large databases. In general, exhaustivity in both types of large databases is
higher than in the small one. The average query exhaustivity across all recall levels R0.1…R1.0 is
2.95 for the small, 3.20 for the large & dense, and 3.14 for the large & sparse database. Query
exhaustivity is highest in the large & dense database except at the highest recall level R1.0.
Hypothesis 1b stating that exhaustivity of optimal queries should be lower in the large &
dense database than in the small one was supported but only at the recall level R1.0. The
difference is clear (0.43) and statistically significant. Hypothesis 1b could not be verified at
the recall levels R0.8 and R0.9. On the contrary, exhaustivity was higher in the large & dense
20 From now on, term least retrievable document is used for those relevant documents that are not retrieved
by any optimal query below recall levels R0.8.

106
database than in the small one at R0.9, and at all recall levels below that. The failure to verify
the hypothesis on a wider recall range suggests that the fall of query exhaustivity is caused by
a small number of least retrievable documents. The hypothesis was correct but worked over a
narrower recall range than expected.
The steep slope in query exhaustivity after recall level R0.9 was obviously connected to,
and an explanation for the drastic drop in precision of queries in the large & dense database
illustrated in Figures 4.1 and 4.2. Retrieving the last 10 percent of relevant documents (not
found by queries at R0.9) requires that a larger number of query facets (conjuncts) be removed
from the optimal queries. Finding the ultimate reason for the necessity to remove facets (e.g.
query terms missed by the query designer or implicit expressions used in documents) requires
an analysis of relevant documents and inclusive query plans.
The exhaustivity differences between the small and the large & sparse databases were
slight at highest recall levels and they were not statistically significant. Thus we could not
reject the null hypothesis and did not get support for hypothesis 2b. The minor difference in
exhaustivity (Fig 4.3) and the major difference in precision (Figure 4.1) at high recall levels,
seems to suggest that exhaustivity tuning is quite inefficient in maintaining precision in the
large & sparse database.
Figure 4.3. The exhaustivity of queries optimised for small, large & dense and large & sparse databases (35 requests).
0,00
0,50
1,00
1,50
2,00
2,50
3,00
3,50
4,00
4,50
5,00
0,0 0,2 0,4 0,6 0,8 1,0
Recall
Exh
aust
ivit
y Small
Large & dense
Large & sparse

107
Figure 4.3 illustrates a slightly different trend of the large & dense database in lowering
exhaustivity from low to high recall levels. The drop in exhaustivity from R0.1 to R1.0 is greatest
in the large & dense database being 1.95 units while only 1.17 and 1.03 units in the large &
Figure 4.4. Exhaustivity of optimal queries in requests of varying complexity in the small and large&large databases (12, 15, and 8 requests).
0,00
0,50
1,00
1,50
2,00
2,50
3,00
3,50
4,00
4,50
5,00
0,0 0,2 0,4 0,6 0,8 1,0
Recall
Exh
aust
ivit
y
Small/C=2-3
Large & dense/C=2-3
Small/C=4
Large & dense/C=4
Small/C=5
Large & dense/C=5
Figure 4.5. Query extent of optimal queries in high recall searching of the small, large&dense, and large&sparse databases (35 topics).
8,24
7,42 7,68
10,66 10,45
9,63
8,387,94 7,93
0,00
2,00
4,00
6,00
8,00
10,00
12,00
0.8 0.9 1.0
Recall level
Query exten
Small Large & dense Large & sparse

108
sparse and small databases, respectively. The difference between the large & dense database
and the other ones suggests that the larger set of relevant documents increases the possibility
of using exhaustivity tuning at low recall levels, but on the other hand, problems arise when
all relevant documents of a larger document set have to be retrieved.
The effect of search topic complexity on the exhaustivity of optimal queries is illustrated
in Figure 4.4. As one could expect the exhaustivity of optimal queries correlated strongly with
the complexity of search topics. At the highest recall levels, however, the differences in
exhaustivity became smaller. In the large & dense database, the average exhaustivity of
optimal queries for complex search topics fell even below the less complex search topics.
Combining this with the precision findings in Figure 4.2 suggests that the necessity of
removing facets to reach R1.0 is most probable in complex search topics that also have a large
recall base. Actually, the focusing advantage of additional facets in complex search topics is
lost totally when all relevant documents have to be retrieved. Exhaustivity at R1.0 is about the
same for simple and complex search topics.
Figure 4.6. Proportional query extent (PQE) of optimal queries in high recall searching of the small, large & dense, and large & sparse databases (35
search topics).
0,66 0,66 0,680,72 0,72
0,78
0,67 0,67 0,68
0,00
0,20
0,40
0,60
0,80
1,00
0.8 0.90 1.0
Recall level
Pro
po
rtio
nal
qu
ery
exte
nt
Small db Large&dense db Large&sparse db

109
4.4.2.2 Query extent changes
Table 4.6 and Figure 4.5 present the findings concerning the extent of queries optimised
for the small, the large & dense and the large & sparse databases at recall levels R0.8…R1.0. The
optimal queries in high recall searching contained about 8 terms per facet in the small and
large & sparse databases and about 10 terms in the large & dense database. The results
suggested that query extent correlated directly with the number of documents that have to be
retrieved to achieve the required recall level. The difference was statistically significant.
Query extent figures decreased slightly towards R1.0 but this result is difficult to interpret
since this change is mixed with exhaustivity changes. Facets having a low rank within an
inclusive query plan were removed from optimal queries at the highest recall levels. On the
average, these facets were broader and were presented by a larger set of terms in the inclusive
query plans (see Table 3.3). Thus, query extent is useful in telling how many query terms are
used per facet but is sensitive to exhaustivity changes. Proportional query extent is a more
appropriate measure in comparisons of queries at different exhaustivity levels. It has also the
advantage of giving the same weight to each search topic and each facet within a query plan.
Absolute query extent emphasises more broader topics and facets than narrower ones.
Figure 4.7. Proportional document frequency of optimal queries in high recall searching of the small, large & dense, and large & sparse databases (35 search
requests) .
0,690,74 0,760,76
0,810,88
0,680,75 0,75
0,00
0,20
0,40
0,60
0,80
1,00
0.8 0.9 1.0
Recall
Pro
po
rtio
nal
do
cum
ent
freq
uen
cy
Small db Large&dense db Large&sparse db

110
Table 4.7 and Figure 4.6 present proportional query extent (PQE) data for queries optimal
in three databases. The PQE figures were quite definitely within the range of 0.66…0.67 for
both the small and the large & sparse database at all recall levels R0.8 …R1.0. The average PQE
was clearly higher (0.74) in the large & dense database and increased to 0.78 at R1.0. The
differences were statistically significant between the small and the large & dense database
except at R0.9. The problem of getting statistically significant results at R0.9 may be a reflection
of the phase shift related to the difference in recall base sizes. The PQE difference between
the small and the large & sparse databases were not statistically significant. Thus both
hypothesis 1c (there is a difference) and hypothesis 2c (there is no difference) were supported.
Query extent alone may not be a reliable measure since the effect of query expansion
(retrieve more relevant documents by adding new query terms to a facet) can also be achieved
by replacing a query term with a broader one. Query extent does not change, but the new
query may retrieve more relevant documents. One way to investigate the possibility of “extent
neutral” query term chances in optimal queries is to check the corresponding document
frequencies - DF (the number of documents retrieved)21.
Figure 4.7 presents proportional document frequencies (PDF) which were computed in a
way similar to the calculation of proportional query extent presented in Figure 4.6. The figures
look quite similar in shape. One small difference is that PDFs increase more clearly towards
R1.0 than PQEs. In the small and the large & sparse databases, the difference between R0.8 and
R1.0 was 0.01 units for PQE and 0.06 units for PDF. In the large & dense database, the
differences were 0.07 and 0.12 units, respectively. This could be an indication that query
expansion needed to retrieve the very last relevant documents was based on terms broader
than terms used at lower recall levels.
4.4.3 Effectiveness in high precision searching
Tables 4.8-4.11 summarise the results concerning high precision searching in the small
and large databases: performance, exhaustivity and extent data for optimal queries. Precision
and exhaustivity data is presented as full series across document cut-off values DCV2…DCV500.
21 In this study, document frequency is a fictive measure in the case of the small and the large & sparse
databases. Document frequencies are measured by querying in the document database (the large & densedatabase). The corresponding figures for the other databases are reflections: “How many documents wereretrieved if the query optimised for the small (or the large & sparse) database were executed in the large & densedatabase?” Proportional document frequencies (PDF) would have been another way to compare queries indatabases of different sizes, but our approach was simpler to implement and yields equally valid comparisons.

111
However, the actual region of interest for high precision searching extends only up to
DCV30, and query extent was only collected for DCV5, DCV10 and DCV20. DCV2 was redundant
Table 4.8. Average precision of queries optimally formulated at fixed DCVs for small, large & dense and
large & sparse databases. (35 test topics, p=Wilcoxon signed-rank test)
DCV Small Large&dense Large&sparse L&d - Sm Diff-% p L&s - Sm Diff-% p
2 0,851 0,849 0,621 -0,002 -0,3 % 0,9519 -0,231 -27,1 % 0,00015 0,658 0,810 0,472 0,151 23,0 % 0,0002 -0,186 -28,3 % 0,0001
10 0,530 0,760 0,349 0,230 43,5 % 0,0001 -0,181 -34,2 % 0,000115 0,430 0,703 0,293 0,273 63,5 % 0,0001 -0,137 -31,8 % 0,000120 0,353 0,654 0,243 0,301 85,4 % 0,0001 -0,110 -31,2 % 0,000130 0,247 0,550 0,184 0,304 123,2 % 0,0001 -0,063 -25,5 % 0,000150 0,154 0,449 0,134 0,295 191,8 % 0,0001 -0,019 -12,6 % 0,0001
100 0,081 0,306 0,075 0,225 277,5 % 0,0001 -0,007 -8,1 % 0,0001200 0,041 0,171 0,039 0,130 318,5 % 0,0001 -0,002 -5,6 % 0,0001500 0,017 0,071 0,016 0,054 326,5 % 0,0001 0,000 -2,4 % 0,0001
Ave 5-20 0,493 0,732 0,339 0,239 48,5 % 0,0001 -0,153 -31,1 % 0,0001
Table 4.9. Average exhaustivity of queries optimally formulated at fixed DCVs for small, large & dense and
large & sparse databases. (35 test topics, p=Wilcoxon signed-rank test)
DCV Small Large&dense Large&sparse L&d - Sm Diff-% p L&s - Sm Diff-% p2 3,37 3,43 3,49 0,06 1,7 % 0,6267 0,11 3,4 % 0,30465 3,49 3,66 3,57 0,17 4,9 % 0,0578 0,09 2,5 % 0,3657
10 2,97 3,69 3,57 0,71 24,0 % 0,0001 0,60 20,2 % 0,000215 2,83 3,74 3,37 0,91 32,3 % 0,0001 0,54 19,2 % 0,000120 2,71 3,69 3,31 0,97 35,8 % 0,0001 0,60 22,1 % 0,000130 2,60 3,60 3,11 1,00 38,5 % 0,0001 0,51 19,8 % 0,000650 2,51 3,29 2,97 0,77 30,7 % 0,0001 0,46 18,2 % 0,0015
100 2,34 2,71 2,69 0,37 15,9 % 0,0303 0,34 14,6 % 0,0057200 2,23 2,37 2,57 0,14 6,4 % 0,3024 0,34 15,4 % 0,0164500 2,11 2,11 2,46 0,00 0,0 % 0,6547 0,34 16,2 % 0,0164
Ave 5-20 3,00 3,69 3,46 0,69 23,1 % 0,0001 0,46 15,2 % 0,0001
Table 4.10. Average extent of queries optimally formulated at fixed DCV levels 5, 10 and 20 for small, large & dense and large & sparse databases. (35 test topics, p=Wilcoxon signed-rank
DCV Small Large&dense Large&sparse L&d - Sm Diff-% p L&s - Sm Diff-% p5 6,66 6,82 5,84 0,16 2,4 % 0,1273 -0,82 -12,3 % 0,0210
10 8,26 8,42 6,83 0,16 1,9 % 0,8737 -1,43 -17,3 % 0,038620 7,81 10,07 8,01 2,25 28,8 % 0,0104 0,20 2,5 % 0,6970
Ave 5,10.20 7,58 8,44 6,89 0,86 11,1 % 0,0577 -0,68 -9,0 % 0,1849
Table 4.11. Average proportional extent of queries optimally formulated at fixed DCV levels 5, 10 and 20 for small, large & dense and large & sparse databases. (35 test topics, p=Wilcoxon signed-rank
DCV Small Large&dense Large&sparse L&d - Sm Diff-% p L&s - Sm Diff-% p5 0,59 0,57 0,56 -0,02 -4,0 % 0,6808 -0,03 -5,9 % 0,0999
10 0,67 0,64 0,60 -0,03 -4,7 % 0,3131 -0,08 -11,3 % 0,017520 0,70 0,72 0,64 0,02 2,3 % 0,8957 -0,06 -8,4 % 0,0397
Ave 5,10.20 0,65 0,64 0,60 -0,01 -2,1 % 0,4761 -0,06 -8,5 % 0,0051

112
and worthless since data for most search topics were interpolated22 from the level DCV5, or
even from DCV10. Some comparative data is also given using fixed recall levels R0.1…R0.3.
The average precision of optimal queries was highest in the large & dense database at all
document cut-off values from DCV5 to DCV20 (Table 4.8, Figure 4.8). It rose 23-85 % above
precision achieved in the small database and the difference was statistically significant.
Hypothesis 3a was supported. Figure 4.1 gave a totally different view on high precision
searching. Precision measured at low recall levels R0.1…R0.3 were in the large & dense
database about ten percent lower than in the small one. There is nothing contradictory in this
difference. The point is that fixed recall levels gave a system view and DCVs emphasised the
user view. At the document cut-off values DCV5…DCV20, the IR system was operating in the
small database at recall levels R0.7…R1.0 and in the large & dense one at R0.1…R0.5 (just compare
precision levels achieved in Tables 4.4. and 4.8 ). Correspondingly, the operational range of
the large & sparse database for DCV5…DCV20 seemed to match recall levels R0.5…R0.8.
22 The best result sets of Boolean queries in high precision searching are typically larger than two or five
documents. In our query plans, synonymous query terms were grouped into undividable disjunctions restrictingthe options to reduce the extent of optimal queries below a certain limit. If single terms from all facets had beenavailable, very low extent and high exhaustivity could have been possible in optimal queries retrieving only someand only relevant documents..
Figure 4.8. Average precision of optimal queries at fixed DCVs in high precision searching of small and large databases (35 test requests).
0,0
0,1
0,2
0,3
0,4
0,5
0,6
0,7
0,8
0,9
1,0
0 5 10 15 20 25 30
Document Cut-off Value (DCV)
Pre
cisi
on Small
Large & dense
Large & sparse

113
The average precision of queries in the large & sparse database was clearly lowest of all at
the lowest DCVs. Precision in the large & sparse database was about thirty percent lower than
in the small database at DCV5…DCV20. The difference is statistically significant at all DCVs
and hypothesis 4a was supported. Effectiveness difference is about the same as seen in Figure
4.1 for recall levels R0.1…R0.3.
The size of a recall base is a variable that has to be controlled in experiments where
DCVs are used as standard points of operation. Figure 4.9 gives an example of precision
differences in the small and large & dense databases when search topics were grouped
according to recall base sizes. In both databases, clearly higher precision averages are
achieved in search topic groups providing larger recall bases.
The effect of different recall base sizes is a potential source of error in the interpretation
of results. Precision of queries correlates strongly with the size of the recall base at high
DCVs (see Table 4.8). In each search topic, precision approaches the value calculated by the
formula Ri/DCVj, and equals that value when the last relevant documents have been retrieved.
For instance, our data show that already at DCV200, and especially at DCV500 measured
precision values are very close to the values given by the formula Ri/DCVj. The average recall
base size is 8.3 for the small and large & sparse databases, and 36.3 for the large & dense one.
At DCV200 (and at DCV500) the formula gives precision estimates 8.3/200=0.041
Figure 4.9. Average precision at fixed DCVs in optimal queries for the small and large & dense databases; comparison of varying recall base sizes (9,16,
and 10 topics).
0,00
0,10
0,20
0,30
0,40
0,50
0,60
0,70
0,80
0,90
1,00
0 5 10 15 20 25 30
Document Cut-off Value (DCV)
Pre
cisi
on
Small/Ri=3-4
Large & dense/Ri=k x 3-4
Small/Ri=5...9
Large & dense/Ri=k x 5...9
Small/Ri=10...
Large & dense/Ri>k x 10…

114
(8.3/500=0.017) for the small and the large & sparse databases, and 36.3/200=0.181
(36.3/500=0.073) for the large & dense database. The corresponding precision figures
measured were 0.041 (0.017) for the small database, and 0.171 (0.071) for the large & dense
database (see Table 4.8).
This phenomenon makes the use of DCVs more problematic in cases when matched pairs
of search topics cannot be used, for instance, when the effect of search topic characteristics on
retrieval performance is evaluated. It is also hard to see any use for DCVs being clearly larger
than the average recall base sizes. At that operational range, the differences in precision do not
reflect system differences, but rather recall base size differences (or performance differences
in search topics providing largest recall bases).
4.4.4 Query tuning in high precision searching
Above it was seen that, in high precision searching, high effectiveness can also be
achieved in large databases if the total number of relevant documents is higher than in the
small database. The analysis of optimal query structures is presented here in a similar way as
earlier for high recall searching. However, the situation is now more complex because
different sets of relevant documents satisfy performance requirements at a particular SPO.
Figure 4.10. Exhaustivity of optimal queries in high-precision searching of small and large databases (35 topics).
0,00
0,50
1,00
1,50
2,00
2,50
3,00
3,50
4,00
4,50
5,00
0 5 10 15 20 25 30
Document Cut-off Value (DCV)
Exh
aust
ivit
y Small
Large & dense
Large & sparse

115
Thus one tool (say exhaustivity tuning) may be replaced by another (e.g. by query extent
tuning or by query term changes).
4.4.4.1 Query exhaustivity changes
The exhaustivity of optimal queries averaged over DCV5 … DCV20 was systematically
higher in the large databases than in the small one; about 23 % in the large & dense database
and about 15 % in the large & sparse database (Table 4.9, Figure 4.10). Starting from nearly
equal exhaustivity at DCV5 in all databases the curves diverged. The difference is statistically
significant above DCV5, and hypotheses 3b and 4b were supported. The comparison of
exhaustivities achieved at the low recall levels (Figure 4.3) shows that the situation is the
same from the system viewpoint.
The comparison of query exhaustivity (Figure 4.10) and precision figures (Figure 4.8)
reveals that in high precision searching of two databases containing an equal density of
relevant documents, the optimal queries in the large database result in higher precision than
queries optimised for a small database. The obvious reason for better performance is in the
larger set of relevant documents and alternative query terms. A given number of relevant
documents can be retrieved by a more exhaustive query statement meaning that precision
tends to increase. In the large & sparse database, higher exhaustivity does not help much.
Result sets that are equal in size (do not exceed a particular DCV) contain fewer relevant
documents than those in the small database.
The relative exhaustivity of optimal queries was very close to the maximum in the large &
dense database. The average complexity of search topics was 3.8 (see Table 3.3), and the
exhaustivity of optimal queries varied between 3.66 and 3.74 within DCV5 … DCV20 (relative
exhaustivity = 96-98%). The flat exhaustivity curve for the large & dense database suggests
that query tuning is not based on exhaustivity within high precision searching. The reserve of
exhaustivity tuning had been used at higher levels than DCV20. In the large & sparse database
the exhaustivity of optimal queries was also high but could be increased still within the region
of high precision searching. In the small database exhaustivity had the clearest role in query
tuning.
As pointed out above, the region of DCV5 … DCV20 means from the system viewpoint
different operational range in different databases: R0.7…R1.0 in the small database, R0.2…R0.5 in
the large & dense database, and R0.5…R0.8 in the large & sparse database. The differences in
exhaustivity changes within DCV5 … DCV20 are easy to understand by keeping in mind the

116
differences in operational ranges and comparing exhaustivities in Figures 4.3 and 4.10. The
exhaustivity curves of optimal queries did not change much from R0.2 to R0.5 explaining the
stability in the large & dense database. The exhaustivity of queries in the large & sparse
database declined from R0.5 to R0.8 as it also did from DCV10 to DCV20. In the small database,
the exhaustivity first declined and then levelled off as it also did between R0.7 and R1.0.
4.4.4.2 Query extent changes
Table 4.10 and Figure 4.11 present the average extent of optimal queries in high recall
searching of different databases. The optimal queries contained, on the average, 8.4 query
terms per facet in the large & dense, 7.6 in the small and 6.9 in the large & sparse databases.
Query extent decreased in both large databases towards lower DCVs. The clear downward
trend is easy to interpret. This reflects the fact that query exhaustivity stayed quite firmly at
the same level across the lowest DCVs, especially in the large & dense database. Query tuning
was based on query extent changes. In the small database, exhaustivity increased down to
DCV5 and the changes in query extent were more difficult to interpret.
Table 4.11 and Figure 4.12 show the proportional query extent (PQE) averages for
optimal queries in high precision searching. In the small and large & dense databases, PQE
averages are close to each other. Hypotheses 3c stated that PQE should be lower in the large
Figure 4.11. The average extent of queries optimised for the small, large & dense and large & sparse database (35 topics).
6,66
8,267,81
6,82
8,42
10,07
5,84
6,83
8,01
0,00
2,00
4,00
6,00
8,00
10,00
12,00
5 10 20
Document cut-off value (DCV)
Que
ry e
xten
t
Small Large & dense Large & sparse

117
& dense database. The measured difference is as predicted at DCV5 and DCV10 but,
unfortunately, the results are not statistically significant. On the other hand, hypothesis 4c
could be verified since averaged PQE values were lower in the large & sparse database than in
the small one. The results were statistically significant at DCV10 and DCV20 (p<0.05) but
received only weak statistical support at DCV5 (p<0.1).
The trend in PQE figures from DCV20 to DCV5 declined in all databases. Query terms were
removed to make the result sets smaller. The decline of PQE is steepest in the large & dense
database reflecting the fact that exhaustivity tuning cannot be used for focusing the query.
PQE also declined in the large & sparse database towards the smallest DCVs, but less than in
the large & dense one (-0.15 vs. -0.08 terms). There was more space for exhaustivity tuning.
In the small database, PQE declined (-0.11 terms from DCV20 to DCV5) but at the same time a
notable increase in exhaustivity occurred (+0.78 terms while only –0.03 and +0.26 terms in
the large & dense and large & sparse databases, respectively).
Figure 4.13 presents proportional documents frequencies for optimal queries at DCV5 …
DCV20. The PDF figures of both large databases follow the trends of PQE in Figure 4.12. In
the small database, PDF values were clearly highest at all DCV levels, and declined steadily
towards lower DCVs. This result suggests that our failure to gain support for hypothesis 3c
may reflect the importance of “extent neutral” query term changes in the small database. On
the average, optimal queries for high precision searching contained less terms and narrower
terms in the large databases than in the small database.
We have no full series of query facet data across all recall levels without gaps (extent data
for R0.4…R0.7 is not available). Thus, it is only partially possible to make a similar comparison
of DCV-based and recall level based extent figures as was done for the precision and
exhaustivity results. The valid operational range for comparing PQE figures of queries in the
large & dense database was R0.2…R0.5 meaning that DCV5 and DCV10 match approximately
R0.2 and R0.3 in this database. In the small database, DCV10 matches approximately to R0.8 …
R0.9 (based on the precision correspondence in Tables 4.4 and 4.8).

118
Figure 4.14 presents the PQE figures measured at recall levels R0.1…R0.3. Corresponding
figures for recall levels R0.8…R1.0 were already presented in Table 4.7 and Figure 4.6. In the
Figure 4.12. Proportional query extent (PQE) of optimal queries in high precision searching of small and large databases (35 search requests).
0,59
0,67 0,70
0,57
0,64
0,72
0,560,60
0,64
0,00
0,20
0,40
0,60
0,80
1,00
5 10 20
Document cut-off value (DVC)
Pro
po
rtio
nal
qu
ery
exte
nt
Small db Large&dense db Large&sparse db
Figure 4.13. Proportional document frequencies per facet in queries optimised for high precision searching in small and large databases (35
search requests).
0,57
0,670,74
0,53
0,640,69
0,530,61 0,64
0,00
0,20
0,40
0,60
0,80
1,00
5 10 20
Document cut-off value
Pro
po
rtio
nal
do
cum
ent
freq
uen
cy
Small db Large&dense db Large&sparse db

119
small database, the PQE values are close to each other (0.67 vs. 0.66) at DCV10 and R0.8 …
R0.9 (see Figures 4.6 and 4.12). In the large & dense database, the figures are also quite close
(0.57/0.64 vs. 0.60/0.66) at DCV5/DCV10 and R0.2/R0.3 (see Figures 4.14 and 4.12). A larger
share of query terms per facet is applied at all recall levels in the large & dense database than
in the small one. The difference in the operational level explains why the order was the
opposite at the lowest DCVs.
4.5 What did we learn?
The purpose of the case experiment was to serve as an exemplification of potential uses of
the proposed method, to help in learning how to apply the method in practice, and, of course,
to find answers to the given research problems. When a new methodological approach is
launched, a myriad of open questions arises even in a single case experiment about the
findings themselves, as well as about their validity and reliability. The most important issues
concerning the concrete findings of the case experiment are discussed in this section. The
critical questions about the method itself are mainly in the focus of the next chapter.
Figure 4.14. Proportional query extent at low recall levels in queries optimised for the small and large databases (35 topics).
0,520,55 0,540,53
0,600,66
0,490,53
0,57
0,00
0,20
0,40
0,60
0,80
1,00
0.1 0.2 0.3
Recall level
Pro
po
rtio
nal
fac
et e
xten
t
Small db Large & dense db Large & sparse db

120
4.5.1 The questions to be answered
Our starting point in the case experiment was the theses by Blair and Maron (1985) about
the ineffectiveness of free-text searching in large full-text databases and their analytical
justifications constructed to support this view (Blair 1986 and 1990, Blair & Maron 1990).
We considered the ideas by Blair and Maron interesting hypotheses about the difficulties of
achieving full recall in high recall searching. For high precision searching, we took
experiments on proximity operators as a point of comparison (Tenopir & Shu 1989, Love &
Garson 1985).
The hypotheses of Blair and Maron were based on a mixture of user-related and system-
related assumptions. We concentrated on system-related issues: system performance and
optimal query structures assuming ideal user performance. The earlier experiments on
proximity operators (as all traditional experiments on Boolean IR systems) were based on
measuring query effectiveness at a single average point of operation. We broadened the
evaluation over a wider operational range and the performance of optimised queries at
standard points of operation (SPOs): high recall levels R0.8-R1.0 in high recall searching, and
low documents cut-off values DCV5-DCV20 in high precision searching. The notion of
database size was revised by taking the density of relevant documents in the collection as one
research variable. Twelve research hypotheses were formulated; six for high recall searching,
and six for high precision searching.
In the sections to follow, the major findings of the experiment are considered in detail.
The results of the facet analysis of 18 search topics (see Section 3.7.2) were exploited in two
ways. First, the characteristics of the small recall base (the relevant documents in the small
and large & sparse database) and the large recall base (the relevant documents in the large &
dense database) were compared. The advantage of this analysis was that it provided data about
the retrieval-related properties of all relevant documents independently of the optimisation
process. Second, the results of the facet analysis were applied to the relevant top documents
(retrieved in high precision searching) and relevant tail documents (retrieved only in high
recall searching). The latter analysis helped in revealing the differences in document sets
retrieved by queries optimised under differently defined goals. Both lines of analysis were
used to collect more evidence for interpreting the results of the experiment, and to find the
rationale behind the structures of optimal queries.

121
The discussion is divided into three sections. In the next two sections, the issues of high
recall and high precision searching are addressed. The third Section 4.5.4 gives a comparison
of results between high recall and high precision searching. The chapter is closed by pointing
out the main contributions of the experiment and discussing the methodological issues found
problematic in the experiment.
4.5.2 Analysis of findings in high recall searching
It was found that in high recall searching it was not possible to achieve as high
performance in the large databases as in the small one. The low density of relevant documents
in a database was an additional burden predicting lower performance. Precision was about 56
% lower in the large & sparse database than in the small one at the highest recall levels. The
optimal queries in the large & dense database performed better but still the average precision
was about 20 % lower than in the small database for recall levels R0.8-R1.0 (see Table 4.4).
An interesting performance problem was revealed at the highest recall level R1.0 in the
large & dense database (see Figure 4.1). The steep decline in precision after R0.9 seemed to be
correlated with the number of relevant documents to be retrieved (see Figure 4.2) and the
exhaustivity drop in optimal queries (see Figure 4.3), especially, in complex search topics (see
Figure 4.4). The decline in precision and exhaustivity was assumed to be caused by the
implicit expressions in the least retrievable documents.
4.5.2.1 Implicit facets and the fall of exhaustivity
The analysis of top and tail documents supported the view that implicit expressions have a
key role in declining performance at the highest recall levels. Table 4.12 presents the summary
of facet analysis of all relevant documents known for a sample of 18 search topics. The
analysis shows that the occurrence of implicit expressions is facet dependent. Query facets
were ranked according to their recall power, and thus the frequency of implicit expressions
seemed to correlate inversely with the facet ranks. For facets ranked first, a searchable
expression was found in nearly all relevant documents while even more than 20 percent of
documents could contain implicit expressions for facets having a low rank (see for example,
facets 4 and 5 in the small recall base R).

122
The role of implicit expressions becomes more tangible when the occurrences of implicit
expressions in relevant top documents and in relevant tail documents are compared. The share
of implicit expressions in two top document sets (“TopDCV10” and “TopR20”) and one tail
Figure 4.15. Share of query facet related expressions implicit in "Top20", "TopDCV10" and "TailR80" documents retrieved by optimal queries in the
small and large databases (a sample of 18 search topics).
6,7 %
0,9 %
3,4 %3,2 %
0,8 %1,8 %
26,0 %
21,9 %
26,0 %
11,7 %
8,3 %
11,7 %
0 %
5 %
10 %
15 %
20 %
25 %
30 %
Small db Large & dense db Large & sparse db
Database
Th
e sh
are
of
rele
van
t d
ocu
men
ts
TopDCV10 TopR20 TailR80 All rel docs
Figure 4.16. Average of maximum recall achievable in queries of increasing exhaustivity in the small and large recall bases. A sample of 18
search topics.
0,9960,949
0,856
0,7310,694
0,9860,925
0,818
0,669
0,527
0,00
0,10
0,20
0,30
0,40
0,50
0,60
0,70
0,80
0,90
1,00
F1 (18 search topics) F1*F2 (18) F1*F2*F3 (17) F1*F2*F3*F4 (12) F1*F2*F3*F4*F5 (5)
Exhaustivity
Rec
all
Large recall base R+ Small recall base R

123
document set (“TailR80”) are presented in Figure 4.1523. The share of implicit expressions
was clearly higher in the tail documents. The difference between top and tail documents is
greatest in the large & dense database containing the largest set of relevant documents. In the
large & dense database, implicit expressions are 24-27 times more common in the tail
documents than in the top documents. The difference is smaller in the other databases: only 4-
8 times more common in the small database, and 8-14 times more common in the large &
sparse database.
One interesting detail is that the share of implicit expressions is smaller in the large recall
base R+ than in the small recall base R (see Table 4.12, and Figure 4.16). The relation is the
same for all facet levels. This was contrary to expectations. The findings of the experiment
suggested that the role of implicit expressions was important in the steep decline of precision,
especially, in the large & dense database. The point is that relative figures are misleading
when all relevant documents have to be retrieved. It is more appropriate to study the number
of query facets affected by the implicit expressions than their generality as such.
The number of documents “contaminated” by implicit expressions over five facet ranks
was presented in Table 4.12, column “Implicit”. For all facets (except for the first facet) the
number of “contaminated” documents is clearly greater in the large recall base (3.5 times
greater, on the average) than in the small one. The consequence of the larger number of
affected documents can be seen in Table 4.13 presenting the number of explicitly expressed
facets (EEF) in all relevant documents for the large and small recall bases. The average
number of explicitly expressed facets per search topic is 1.6 for the large recall base and 2.2
for the small one. These figures explain definitely why the exhaustivity of optimal queries at
R1.0 was falling so low, and leading to clearly lower precision in the large & dense database
than in the small one.
Implicit expressions also have a key role in explaining the low average precision of
optimal queries in the large & sparse database. It was a surprise that all 24 relevant tail
documents in the sample of 18 search topics were exactly the same for both the small and the
large & sparse database. Exactly the same least retrievable documents governed the query
23 The share of implicit expressions was calculated in the following way: For each document and query plan
facet pair, it was checked whether or not a searchable expression could be identified. If not even a singlesearchable expression was available, the expression for the facet in that document was classified as “implicit”.Thus, if a set of 10 relevant tail documents was retrieved for a search topic providing a 5 facet query plan, 5 x 10= 50 potential cases of a facet to occur were analysed. For instance, if a searchable expression was not identifiedin 5 of these cases, the share of implicit expressions was 10 %.

124
tuning process. This explains why the exhaustivity and extent of optimal queries were so close
to each other in high recall searching of these databases (see Figures 4.3, and 4.5). The few
documents containing implicit expressions forced the exhaustivity of queries down in both
databases. Because the large & sparse database contained a large additional set of non-
relevant documents (Qextra(i)) the average precision of optimal queries was dramatically lower
than in the small database (see Figure 4.1). Only minor query changes were possible to find a
new balance between query extent and exhaustivity for maintaining precision.
The analysis of implicit expressions helped in comprehending the observed differences
between the large databases in high recall searching. The average precision of optimal queries
was clearly higher in the large & dense database than in the large & sparse one up to recall
level R0.9, but fell radically at R1.0. One reason for the difference is that higher exhaustivity
could be maintained in the large & dense database until at R1.0 it fell drastically (see Figure
4.3). In the large & sparse database, the effect of implicit expressions appeared earlier
(because of the smaller recall base) and the average exhaustivity fell close to that of the small
database queries already at R0.6 (difference only +0.11…+0.14, see Table 4.5).
Table 4.13. The number of explicitly expressed facets (EEF) in the large recall base (R+) and in the small recall base ( R ) (a sample of 18 search topics).
TOPIC No No of EEF(Ri+) No of EEF(Ri) Complexity EEF-% (Ri+) EEF-% (Ri)1 1 3 5 20 % 60 %2 1 2 3 33 % 67 %3 3 4 4 75 % 100 %4 2 3 3 67 % 100 %5 1 2 2 50 % 100 %6 1 1 4 25 % 25 %7 1 1 4 25 % 25 %8 1 3 5 20 % 60 %9 3 3 5 60 % 60 %10 1 2 5 20 % 40 %12 3 3 3 100 % 100 %13 1 1 4 25 % 25 %19 2 2 3 67 % 67 %23 1 1 3 33 % 33 %25 0 0 4 0 % 0 %26 2 2 5 40 % 40 %30 2 3 5 40 % 60 %32 2 3 4 50 % 75 %
Average 1,6 2,2 3,9 42 % 58 %Min 0 0 2 0 % 0 %Max 3 4 5 100 % 100 %
Median 1 2 4 37 % 60 %

125
4.5.2.2 Conjunctions and falling recall
The above data gave the upper limit for the probability P(DWi) that term Wi appears in a
relevant document as introduced by Blair and Maron (see Section 4.1). In Table 4.12 (column
“%-Explicit”), it was seen that, on the average, only about 81.9-99.8 % of relevant documents
in the large recall base, and about 76.1-99.2 % of relevant documents in the small recall base
contained at least one searchable expression for a selected query facet. A rough (and over-
optimistic) estimate for the highest achievable recall as a function of query exhaustivity24 can
be calculated by taking the product of explicitness ratios (%-Explicit values) over facets.
However, a more accurate estimate was used here by first calculating recall for each search
topic at all appropriate exhaustivity levels and then averaging recall values for each
exhaustivity level over the search topics.
Figure 4.16 gives the estimates for the highest achievable recall in queries at five levels of
exhaustivity. The calculations are based on the assumption of fixed facet order as applied in
the inclusive query planning. It was seen already in Chapter 3 (see Table 3.2) that sometimes
full recall was not possible even though single facet queries were used (see F1). If the
exhaustivity level is raised in all search topics, the upper limit for recall falls close to 90 % in
conjunctions of two query facets, close to 80 % in conjunctions of three query facets, and so
forth. The estimates for the maximum achievable recall at different exhaustivity levels were
higher in the large recall base than in the small one, similarly to the maximum recall averages
for individual facets in Table 4.12.
The estimates for the upper limit of recall calculated above were based on the assumption
that the same number of conjunctions is used in each search topic. However, we get a different
answer if asking at each exhaustivity level: “For how many search topics is full recall
possible?” The answer is presented in Figure 4.17. In the set of 18 search topics, for which the
facet analysis of all relevant documents was made, full recall was not at all possible in one
search topic. At exhaustivity level one, full recall could be achieved in 94 % (17/18) of topics
both in the large, and in the small recall base. At exhaustivity level two, full recall was
possible in 67 % (12/18) of topics in the small recall base but only in 44 % (8/18) of topics in
the large recall base. At higher exhaustivity levels, full recall was possible much more often in
the small recall base than in the large one (17 % vs. 45 % of search topics).
24 In the terminology of Blair and Maron: as a function of the number of conjunctions.

126
The above results gave empirical support to the idea of declining recall as a function of
increasing query exhaustivity suggested by Blair and Maron (1985, 1990). If exhaustivity is
increased to improve precision in a large database, full recall is less probable. And further, if
recall bases become larger the probability of missing relevant document still increases. This is
because the average number of explicitly expressed facets (EEF) declines in larger sets of
relevant documents. This is a new observation not discussed by Blair and Maron.
4.5.2.3 Query expansion
The average query extent and proportional query extent were higher for the large & dense
database than for the other databases. This seemed to indicate that a larger number of query
terms is needed per facet to retrieve a larger set of relevant documents. The average QE and
PQE values of optimal queries increased notably at higher recall levels only in the large &
dense database, indicating that query expansion had a role in query tuning in full recall
searching. In the small and large & sparse databases, the QE and PQE figures were quite close
to each other and did not change much at the highest recall levels. This is obvious, because all
relevant documents were found in most search topics already at R0.8 and R0.9 (see Figure 4.2).
A general rule in query tuning seems to be that exhaustivity changes are much more
remarkable than query extent changes in high recall searching. However, when improving
recall, e.g. from R0.2 to R0.8, query expansion has an essential role. See Section 4.5.4.2.
Figure 4.17Effect of implicit expressions: the share of search topics wherefull recall can be achieved as a function of query exhaustivity in the small
and large recall bases. A sample of 18 search topics.
94 %
44 %
18 %
0 % 0 %
94 %
67 %
47 %
8 %
0 %0 %
10 %
20 %
30 %
40 %
50 %
60 %
70 %
80 %
90 %
100 %
F1 (18 search topics) F1*F2 (18) F1*F2*F3 (17) F1*F2*F3*F4 (12) F1*F2*F3*F4*F5 (5)
Exhaustivity
Th
e sh
are
of
sear
ch t
op
ics
Large recall base R+ Small recall base R

127
One special feature of the relevant tail documents can be seen from Figure 4.18. The
maximum recall achieved by a single query term25 was calculated for top and tail documents
from the facet analysis data of relevant documents. In all databases, the “best” query term of a
facet retrieved a smaller share of relevant documents in the set of tail documents than in the
sets of top documents. On the average, the “best” query term retrieved about 56 % of the
relevant tail document in the large & dense database, and about 65 % in the other databases.
This indicates that the number of required query terms in retrieving all relevant documents is
higher in the case of a larger recall base, and supports the finding that the extent of optimal
queries was higher in the large & dense database (see Figures 4.5 and 4.6).
The effect of additional facets on recall was analysed further by formulating “best term”
queries of increasing exhaustivity. The results are presented in Figure 4.19. In all databases,
and both in top and tail documents, a single facet query retrieved about 88-95% of relevant
documents. Differences became more notable at higher exhaustivity levels. Recall fell fastest
in the tail documents and especially in the large & dense database. The average recall within
the tail documents of the large & dense database fell below 50 % already at exhaustivity level
Figure 4.18. Recall of "best term", single facet queries averaged over facets 1-5 in the top and tail documents of the small and large databases (a sample
of 18 search topics).
72,8 %
84,9 % 85,6 %90,7 %
84,9 %
94,7 %
64,5 %
56,1 %
64,5 %
0 %
10 %
20 %
30 %
40 %
50 %
60 %
70 %
80 %
90 %
100 %
Small db Large & dense db Large & sparse db
Database
Rec
all
TopDCV10 TopR20 TailR80

128
2, and below 15 % at exhaustivity level 4. In the small and large & sparse database, recall
stayed about 0.12-0.17 units higher at exhaustivity levels 2-4. The conclusion is that, in high
recall searching, query expansion is more urgently needed in the case of large & dense
database, i.e. when larger recall bases are involved.
4.5.2.4 The limits of Boolean queries in high recall searching
To sum up, the deterioration of recall in queries containing conjunctions as outlined by
Blair and Maron seems to have an empirical foundation. Moreover, what is important, the
phenomenon seems to be most notable in large databases and in search topics with large recall
bases. The results show that implicit expressions are a major obstacle in achieving high recall
in query statements of high exhaustivity. We have also shown that the problem of achieving
full recall becomes more serious in large recall bases. We have only discussed document
(text) based limits for the highest achievable recall from the retrieval system viewpoint. From
the user perspective, additional open questions remain: Is the searcher able to discover all
25 Single query term includes truncation because the index of the document database contained words in
inflected forms. Thus a query term includes all expressions for a facet starting with the same character string
Figure 4.19. Recall of "best" term queries in the sets of top and tail documents averaged at different exhaustivity levels (1-5 facets applied).
0,78
0,59
0,49
0,41
0,80
0,66
0,57
0,45
0,93
0,71 0,69
0,51
0,63
0,50
0,26
0,00
0,46
0,35
0,140,10
0,63
0,50
0,26
0,00
0,91
0,960,94
0,88
0,93
0,00
0,10
0,20
0,30
0,40
0,50
0,60
0,70
0,80
0,90
1,00
F1 (18 topics) F1*F2 (18) F1*F2*F3 (17) F1*F2*F3*F4 (12) F1*F2*F3*F4*F5 (5)
Conjunctions
Rec
all
Small db/TopDCV10 Large & dense db/TopDCV10Large & sparse db/TopDCV10 Small db/TailR80Large & dense db/TailR80 Large & sparse db/TailR80

129
unique expressions occurring in the documents? Is the precision of full recall queries high
enough for the user?
The major advantage of the Boolean query is that it supports the representation of
different semantic aspects or dimensions of an information need. The dimensions of the need
are presented as query facets arranged into a sequence of conjunctions. The power of query
facet structures goes beyond the Boolean IR model. Similarly, facet-based, conjunctive query
structures have been shown also to increase precision in probabilistic queries, especially in the
context of query expansion (Kekäläinen & Järvelin 1998) and dictionary-based cross-lingual
IR (Pirkola 1998). However, in the Boolean IR model, conjunctive structures have a more
central role in maintaining precision, since term weighting, relevance ranking or similar
precision tools are not available.
The experiment indicated that, when full recall is required, the possibility of using
conjunctions to focus the Boolean query is very limited because documents contain implicit
expressions. On the average, the exhaustivity of full recall queries is very low and sometimes
even an extensive single facet query is too narrow to retrieve all relevant documents. In some
search topics all relevant documents of the large recall base contained at least one explicit
expression for the first 2 or 3 top ranked facets (e.g. topics no. 3, 4, 9, 12, 19, 26, 30, 32 in
Table 4.13). Thus, the possibility of using exhaustivity tuning in full recall queries depends on
the search topic characteristics.
From the user perspective, the most problematic situations are topics where the set of
required query terms is large (broad facets) and the number of documents retrieved by the top
ranked facets is large. The easy cases can be identified by comparing the number of query
terms in top ranked facets of the inclusive query plans (see Table 3.3), and corresponding
document frequencies (see Table 3.4). We may assume that, say, a set of query terms less than
5 could be easy to recognise per facet and a result set of less than 200 documents is
convenient to browse.26 Comparing the first facets, only 5 out of the 35 search topics are easy
cases for the user (topic numbers 5, 9, 13, 16, and 34). When considering the conjunction of
two first facets, only in 6 out of 35 search topics, does the inclusive query plan contain less
than 5 query terms for both facets (topic numbers 1, 9, 10, 14, 33, and 35; no limits for
document frequencies applied here).
(including compound words).

130
All the above mentioned topics concerned named persons, organisations and places, i.e.
they led to proper name queries. In these cases, especially when the names are single meaning
words and the number of documents discussing that person, organisation or place is limited,
the size of a database or the size of the recall base is not a definite obstacle to achieve full
recall. Unfortunately, the median of query terms for the first facet was 5, and 15 for the second
facet (see Table 3.3). Although not all alternative terms for a facet are necessarily needed to
retrieve all relevant documents, the user is in difficulties since the set of required query terms
cannot be known in advance without seeing all relevant documents. This means that the
probability P(SWi) that the searcher uses/recognises (the required) term Wi in a query is quite
likely to remain well below 1 (see the arguments by Blair and Maron in Section 4.1). The high
proportional query extent required (see Figure 4.6) at the highest recall levels suggests that
most query terms of the inclusive query plans are needed.
It is worth considering the interpretation of the precision figures for both large databases
from the user viewpoint to gain a more profound understanding of retrieval problems in high
recall searching. The average precision of queries optimised for the large & dense database at
R1.0 was 0.233, and 0.169 for queries optimised for the large & sparse database. The median of
relevant documents per search topic was 31 in the large & dense database, and 6 in the large &
sparse one (see Table 4.3). Using the average precision values for both databases the estimate
for the number of browsed documents in a full recall query is 133 for the large & dense
database and 36 for the large & sparse database.
Which of the systems performed better? This question may appear irrelevant because the
number of relevant documents was different in the databases compared. This is not the case
since the figures demonstrate how differences in the density of relevant documents affect the
performance of a system. From the user perspective, the burden of searching in full recall
queries increases if the number of relevant documents to be retrieved increases.
The conclusion is that the aim of full recall in very large databases, like Web search
indexes, is appropriate only in highly verificative information needs which can be represented
by specific, “high recall” query terms, and for which only a small number of relevant
documents is available. The larger the recall base is, the less focused the queries are since the
exhaustivity of queries must be reduced to compensate the recall losses caused by the implicit
26 The assumptions are arbitrary and have no empirical basis. They are merely used to clarify the ideas
presented.

131
expressions. Our document collection was relatively small (about 54,000 articles), and the
average precision fell close to or below 20 % at the highest recall levels even though we
excluded 8 eight least retrievable relevant documents from the experiment. In very large
document databases, the precision of optimal queries is likely to be lower, making the burden
of the user unmanageable in typical information needs. The concerns addressed by Blair and
Maron (1985, 1990) and Blair (1986, 1990) seem to be justifiable, but the seriousness of the
full recall problem obviously varies from one search topic to another. Search topic
characteristics, e.g. the broadness and ambiguity of the key facets, and the size of the recall
base, affect the burden of the user in high recall searching.
4.5.3 Analysis of findings in high precision searching
As pointed out in Section 4.2.4, the aim of high precision searching is that the query
retrieves as many relevant documents as possible within a limited result set. The user expects
that some relevant documents are found with limited browsing effort. We may also assume
that the user prefers to see highly relevant rather than less relevant documents. It was observed
that optimal queries for the large & dense database provided the highest precision using
DCV5…DCV20 as the standard points of operation (see Figure 4.8). High precision was
associated with search topics with larger recall bases (see Figure 4.9). The results supported
the view that a larger recall base permitted higher exhaustivity (see Figure 4.10), and queries
were more focused. It was suggested that higher exhaustivity was possible because a smaller
share of relevant documents from the larger recall base was needed to achieve a particular
performance level.
4.5.3.1 Proportional exhaustivity and implicit expressions in top documents
The results of the facet analysis of top documents supported the view presented above.
Figure 4.15 illustrated the difference of top and tail documents retrieved by the optimal
queries in the small and large databases. Very few of the top documents (less than 1 %) in the
large & dense database contained implicit expressions, and the average proportional
exhaustivity of optimal queries raised very high (96-98 %)27. In the large & sparse database,
about 3.4 % of the “TopDCV10” documents contained implicit expressions, and the average
27 The average complexity of search topics was 3.8 (see Table 3.3), and the average proportional
exhaustivity is calculated by dividing the average exhaustivity of optimal queries at DCV5…DCV20 presented inTable 4.9 by this figure.

132
proportional exhaustivity fell to 87-94 %. In the small database, the percentage of implicit
expressions was 6.7%, and the average proportional exhaustivity ranged from 71 % to 92 %.
The above comparison suggests quite clearly that the occurrence of implicit expressions
also sets the upper limit for exhaustivity in high precision searching. In the large & dense
database providing largest recall bases, the precision of optimal queries could be increased by
taking full advantage of the complexity of search topics. From a larger set of relevant
documents it was possible to find a larger set of documents that did not contain any implicit
expressions for query plan facets.
The small and large & sparse databases have identical recall bases but the number of
relevant top documents is greater in the small one (higher precision was achieved there). The
extra set of non-relevant documents (Qextra(i)) to be rejected explains why exhaustivity was
higher in the optimal queries of the large & sparse database. Relevant documents filtered out
were mainly those that contained implicit expressions for some low rank query facets.
4.5.3.2 Recall in the “best” terms queries
In the sample of 18 search topics, the “best” single query term retrieves, on the average, a
larger share of relevant “TopDCV10” documents than that in the tail documents (see Figure
4.18). The top documents are more homogeneous than the tail documents if the overlap of
expressions is used as a similarity measure. This finding may indicate that the information
contents of top documents may also overlap. If this assumption holds, the top documents do
not represent well the spectrum of information available in the database about the search
topics but rather the dominating documents of that spectrum, e.g. articles by a journalist who
has written most of the material on the topic and using similar terminology. However, further
discussion of this hypothesis is left here as a potential problem for future studies.
The “best” query term (averaged over all facets) retrieved 73 % of the relevant top
“DCV10” documents in the small database, 85 % in the large & dense database, and 86 % in
the large & sparse database. First of all, the percentages suggest that the pressure to use more
disjunctive query terms than just the “best” one, was faced in the small database. This was
seen in the optimal queries since the proportional query extent (PQE) was highest in the small
database at DCV5 and DCV10 (Figure 4.12). The optimal queries for the small database
retrieved a higher proportion of relevant documents than queries in the large databases. The
documents filtered out in the high precision searching of the large databases contained some
unique expressions. Excluding a particular set of query terms helped in increasing precision,

133
i.e. the exclusion helped to reject a larger set of documents in Qextra(i) per missed relevant
document than any other set of query terms for the same facet.
The above figures characterised recall achieved by the “best” query terms within the top
documents and averaged over all query facets. Figure 4.19 presented the average recall for
actual “best” term queries of increasing exhaustivity. The highest recall within top documents
was achieved in the large & sparse database, the second highest in the large & dense one, and
the lowest in the small database. When interpreting the curves it is advisable to remember that
the number of relevant TopDCV10 documents was greatest in the large & dense database,
second largest in the small database, and smallest in the large & sparse database.
Figure 4.20 presents what these figures mean from the user viewpoint: the number of
relevant documents retrieved by “best” term queries at varying exhaustivity levels28. For
instance, when the first facet only is applied, the “best” query term retrieves, on the average,
8.4 relevant documents in the large & dense database, 4.3 relevant documents in the small
database, and only 3.0 relevant documents in the large & sparse database. The difference in
the number of retrieved relevant documents emphasises the potential of exhaustivity tuning in
the large & dense database. “Best” term queries at all exhaustivity levels retrieved nearly
twice as many relevant documents in the large & dense database as corresponding queries in
the small database. If only the “best” terms were used, the maximum exhaustivity could have
been applied in the large & dense database, and still more relevant documents were retrieved
than by single facet queries in the small database (4.3 vs. 5.3-7.2 documents). The
performance optimum in the small database was achieved by increasing query extent, but the
volume advantage of the large & dense database was big enough for focused queries rejecting
the pressure of non-relevant documents in Qextra(i).
The volume difference between the small and the large & sparse databases in the “best”
term queries within the top relevant documents was relatively small and decreased when query
exhaustivity increased. However, the difference between databases was more substantial in
optimised queries since the average exhaustivity of queries was higher in the large & sparse
database (to reject as many non-relevant documents from the Qextra(i) as possible, see Figure
4.10), and the extent of queries lower than in the small database (see Figure 4.11 and 4.12).
28 The number of relevant documents retrieved by the “best” term queries is calculated by multiplying the
number of relevant top DCV10 documents at each exhaustivity level (see Appendix 4) by the correspondingrecall value.

134
4.5.3.3 Capability of retrieving highly relevant documents
Finding highly relevant documents is an appropriate sub-goal for high precision searching.
In the test collection the relevance of documents was judged on a four point scale (see Section
3.3 and Table 3.2). Documents were judged as highly relevant (Rel=3), relevant (Rel=2),
probably relevant (Rel=1), or non-relevant (Rel=0). A dichotomous definition of relevance
was used in the optimisation process in the way that is typical in laboratory type
experimentation. Documents judged as relevant (level 2) and as highly relevant (level 3) were
considered “relevant” in the experiment reported above. However, it is an interesting question
whether or not the Boolean queries optimised for high precision searching have any effect on
the average degree of relevance within retrieved documents.
The role of highly relevant documents (Rel=3) is, of course, important. Another
interesting issue is the treatment of documents of low relevance degree (Rel=1). According to
the relevance definitions, a document judged “probably relevant” refers to the theme of the
search topic but does not convey more information than the topic description itself (see
Section 3.3). Thus documents judged to be probably relevant may contain the same words as
the highly relevant ones but they do not give the user additional information about the topic.
From the user perspective, it is useful if the IR system is capable of distinguishing between
marginally relevant (Rel=1) and “usefully” relevant documents (Rel>1).
Figure 4.20. Number of relevant documents retrieved within the TOPDCV10 documents by the "best" query term per search topic as a
function of query exhaustivity (F1…F5) in the small and large databases. A sample of 18 search topics.
4,33,7
2,82,4 2,7
8,4
7,2
5,75,3
5,9
3,0 2,92,3 2,4 2,4
0
1
2
3
4
5
6
7
8
9
F1 (18 search topics) F1*F2 (18) F1*F3*F3 (17) F1*F3*F4*F4*F5 (12) F1*F3*F4*F5 (5)
Conjunctions
Num
ber
of r
elev
ant d
ocum
ents
Small db Large & dense db Large & sparse db

135
The distribution of top documents across relevance degrees 0-3 was calculated for all 35
search topics. Figure 4.2129 presents the average portions of documents at different relevance
levels in the TopDCV10 document sets of different databases. The total number of
TopDCV10 documents exceeded the expected maximum (10x35=350) in the large & dense
database. This was because in some search topics the maximum precision was achieved in
optimal queries at DCV15 or DCV20 and these queries were also applied at DCV10 (see Section
3.6.1). From the average precision figures (see Figure 4.830) it was already seen that, at
DCV10, the joint share of relevant and highly relevant documents was highest for queries in
the large & dense database, and lowest for those in the large & sparse database. This explains
the differences in the total heights of Rel=3 and Rel=2 columns.
The optimisation algorithm did not make any distinction between relevant and highly
relevant documents. However, the role of highly relevant documents is more perceivable in
the top documents of the large & dense database. The ratio of highly relevant (Rel=3) and
relevant (Rel=2) TopDCV10 documents (calculated from the percentages of Figure 4.21) was
0.58 (= 22.4%/38.3%) in the small database, 0.98 in the large & dense database, and 0.72 in
29 The total number of known Rel=3 documents was 444 (Rel=2: 826) in the large & dense database, and 95
(194) in the small and large & sparse databases.30 The values of average precision are not exactly the same in Figure 4.8 (at DCV10) and Figure 4.21. In the
former case, precision was calculated first for each search topic and then averaged over all search topics. In thelatter case, percentages were calculated from total sums of retrieved documents at each relevance level.
Figure 4.21. The relevance distribution of TopDCV10 documents in the small and large databases. All 35 search topics included.
22,4 %
38,2 %
19,5 %
38,3 %
39,0 %
27,1 %
15,3 %
9,9 %
24,4 %
24,0 %12,9 %
28,9 %
0 %
10 %
20 %
30 %
40 %
50 %
60 %
70 %
80 %
90 %
100 %
Small db Large & dense db Large & sparse db
Databases
Dis
trib
uti
on
of
rele
van
t d
ocu
men
ts
Rel=0
Rel=1
Rel=2
Rel=3
(313) (403) (266)

136
the large & sparse one. The share of relevant (Rel=2) documents is about the same in the
TopDCV10 documents of the small and large & dense databases (38 % vs. 39 %) but the
share of highly relevant documents (Rel=3) is clearly grater in the large & dense database (22
% vs. 38 %). This difference supports the view that higher query exhaustivity in the large
databases favours retrieval of highly relevant documents. Very few relevant TopDCV10
documents of the large & dense database suffered from implicit expressions (see Figure 4.15)
allowing higher exhaustivity with minimum recall losses. The figures suggest that under
particular conditions (a complex search topic and a large recall base) exhaustivity tuning helps
in focusing the query on highly relevant documents.
In the TopDCV10 documents of the large & sparse database, the most notable feature
might be the quite even distribution of documents over the four relevance categories. When
compared with the small database, the share of relevant (Rel=3) top documents was less than
3 percent units lower (22.4 % -> 19.5 %), and only less than 5 percent units higher in the non-
relevant documents (Rel=0) (24.0 % -> 28.9 %). The advantage of the small database is more
than +11 percent units in the relevant (Rel=2), and more than -9 percent units in the probably
relevant TopDCV10 documents (Rel=1). The finding suggests that in the large & sparse
database it may be difficult to formulate queries that are capable of distinguishing between
relevance degrees. The higher exhaustivity of optimal queries did not help to reject the mass
of low relevance documents lurking in Qextra(i).
Figure 4.22 illustrates how the optimal queries for high precision searching succeeded in
rejecting the mass of low relevance documents. The column “all relevant” reveals that about
44% of the 2,280 documents providing some relevance were considered “probably relevant”.
Queries optimised at DCV10 succeeded to reduce the concentration of probably relevant
documents about 33 percent units (44% -> 11%) in the large & dense database, about 24 %
(44% -> 20%) in the small database, and about 10 % (44% -> 34%) in the large & sparse
database. Only minor filtering took place in the large & sparse database.
Figure 4.23 presents the distribution of relevant and highly relevant documents in the
subsets of relevant tail and top documents. The major difference between TopDCV10 and
TopR20 documents was that the latter set contained a clearly greater share of highly relevant
documents in the small database queries. This is logical because the number of documents in
the TopR20 set of the small database is clearly smaller than that in the TopDCV10 set (see
Appendix 4). Once again, the change supports the view that optimal queries for high precision

137
searching tend to increase the concentration of highly relevant documents. The corresponding
concentration change is smaller in the large & sparse database which was an anticipated result
on the basis of earlier findings (see Figure 4.21).
The sets TopDCV10 and TopR20 contained a larger share of highly relevant documents
than the TailR80 set. The share of highly relevant tail documents was close to 22 % for all
three databases. It may be more appropriate to compare this baseline with the TopR20
Figure 4.22. The comparison of relevance distribution in TopDCV10 documents of the small and large databases and in all documents judged at
least probably relevant (only rel=0 excluded). 35 search topics.
29,4 %
43,9 %
27,5 %19,5 %
50,4 %
44,7 %
38,1 %
36,5 %
20,2 %11,4 %
34,4 %43,9 %
0 %
10 %
20 %
30 %
40 %
50 %
60 %
70 %
80 %
90 %
100 %
Small db Large & dense db Large & sparse db All relevant
Database
Dis
trib
uti
on
of
rele
van
t d
ocu
men
ts
Rel=1
Rel=2
Rel=3
(2280)(238) (351) (189)
Figure 4.23. Distribution of highly relevant (Rel=3) and relevant (Rel=2) documents within top and tail documents. 35 search topics.
63,2 %50,5 %
58,1 %
77,1 % 77,8 % 77,1 %
51,9 % 50,3 % 55,4 %
0 %
10 %
20 %
30 %
40 %
50 %
60 %
70 %
80 %
90 %
100 %
Small db Large &dense db
Large &sparse db
Small db Large &dense db
Large &sparse db
Small db Large &dense db
Large &sparse db
Databases & document sets
Dis
trib
uti
on
of
rele
van
t d
ocu
men
ts
Rel=2
Rel=3
TopDCV10 TailR80 TopR20

138
documents since both are based on the same recall bases. In the TopR20 sets, the
concentration of highly relevant documents rose to nearly 50%, being lowest in the large &
sparse database (about 44%). The shift of 22 - 28 percent units (increase of 100 - 127 %) in
the concentration of highly relevant documents from tail to top documents is notable. This
phenomenon must be contrasted with the common notion that the Boolean IR model does not
support relevance ranking. Within a single query relevance ranking is excluded by definition
but not from a more general viewpoint. Exhaustivity tuning is the major feature that can be
used as a relevance ranking tool in Boolean queries.
4.5.3.4 AND vs. proximity operators in querying highly relevant documents
A supplementary experiment was performed to compare the relevance degree
distributions in top documents retrieved by queries optimised for AND operators and for
proximity operators. An answer was sought to the question: Are plain Boolean operators (here
AND) as effective as proximity operators in retrieving highly relevant documents in high
precision searching.
The PAR operator was used, requiring that connected terms occur within the same text
paragraph of a document. PAR operators were applied since Sormunen (1994) showed that the
other option, the sentence operator, performed less effectively at least with this document
collection. Queries were optimised at two relevance levels accepting either both relevant and
highly relevant documents or only the highly relevant documents31.
In traditional proximity operator experiments, the performance comparisons have been
based on a set of fixed queries where AND operators have been replaced by the proximity
ones. All results have shown that proximity operators help in increasing precision at the cost
of recall (Love & Garson 1985, Tenopir & Shu 1989). For instance, Tenopir & Shu (1989)
evaluated the performance of the AND operator and the paragraph operator queries in a full-
text database of magazine articles. They measured a clear increase in the average precision
(49.3 % - > 64.3 %), and a clear decline in relative recall (100 % -> 52.1 %) when replacing
AND operators by paragraph operators.
31 The experiment with the proximity operators was originally designed to be a separate study and the
optimisations were made only in the large&dense database. 25 search topics were used when optimising queriesagainst the set of relevant and highly relevant documents, and 20 search topics when exploiting highly relevantdocuments, only. 5 topics were excluded because their recall bases for highly relevant documents were eitherempty or very small (1-2 documents).

139
Basically, the traditional comparisons only show how much precision increases32 and
recall decreases if AND operators are replaced by proximity operators. What remains to be
ascertained is the highest possible performance level for a system when applying different
operators, and how should the queries be formulated when applying different types of
operators. The optimal structure of queries is determined separately in the optimisation
process for both operator types. This helps in finding a more refined picture of proximity
searching in relation to plain Boolean searching.
The precision of optimal queries applying the Boolean AND operator and applying the
PAR proximity operator are presented in Figure 4.24. The results show that at the very lowest
levels of operation, DCV2 and DCV5, the advantage of PAR queries ranges from 0.066 to
0.102 when optimising at relevance levels Rel=2-3, and, respectively, from 0.072 to 0.116
when maximising the number of highly relevant (Rel=3) documents. At DCV10, the advantage
of PAR queries is lost and no significant or systematic trend in difference may be seen
between the precision curves at higher DCVs. Surprisingly, the operational area where the
PAR operator makes a clear contribution seemed to be very narrow. If the user is willing and
able to browse at least ten documents, on the average, (s)he should not observe any
remarkable difference in the query results.
32 Precision may also decrease if an inappropriately tight proximity operator is applied.
Figure 4.24. Average precision of AND and PAR queries in high precision searching (relevance level Rel=2-3, 25 search topics; relevance level Rel=3,
20 topics).
0,818
0,680
0,535
0,752
0,793
0,7200,648
0,530
0,613
0,895
0,5850,545
0,666
0,728
0,463
0,564
0,2780,3380,3800,423
0,2780,318
0,370
0,427
0,00
0,10
0,20
0,30
0,40
0,50
0,60
0,70
0,80
0,90
1,00
0 5 10 15 20 25 30
Document Cut-off Value (DCV)
Pre
cisi
on
AND/Rel=2-3
PAR/Rel=2-3
AND/Rel=3
PAR/Rel=3

140
In our experiment, the queries were free to change towards the optimally performing
structure. Figure 4.25 illustrates the differences in the average exhaustivity of the optimal
AND and PAR queries. At the very lowest DCV levels, the average exhaustivity of AND
queries is slightly higher by 0.05 to 0.30 units. At DCV10 and above, the average exhaustivity
of optimal AND queries is clearly higher than in optimal PAR queries. The difference stays
quite constantly between 0.60 and 0.75 units. The exhaustivity difference suggests that at
DCV10 and above exhaustivity tuning in AND queries is capable of maintaining precision of
queries at about the same level as in the PAR queries. At DCV10 and DCV15 the proportional
exhaustivity reached the maximum (very close to 100 %) and exhaustivity tuning cannot be
used to increase precision. This is possible in PAR queries, and the average exhaustivity
increased down to DCV2.
Figure 4.26 presents the corresponding changes and differences in proportional query
extent. A fairly systematic trend was observed. The average PQE was slightly but consistently
higher in the optimal PAR queries than in the corresponding AND queries. Thus more query
terms are applied in the paragraph queries per facet. Obviously, the maximum performance of
the PAR queries is achieved by reducing exhaustivity when appropriate, and increasing query
extent when appropriate, if we use corresponding AND queries as a baseline.
Figure 4.25. Exhaustivity of high-precision queries exploiting AND and PAR operators (relevance level Rel=2-3, 25 search topics; relevance level
Rel=3, 20 topics).
3,603,40
3,503,75 3,75 3,70
3,60
2,953,153,203,253,45
3,30
3,603,653,703,70
3,703,75
3,50
3,20 3,10 3,052,85
0,00
0,50
1,00
1,50
2,00
2,50
3,00
3,50
4,00
4,50
5,00
0 5 10 15 20 25 30
Document Cut-off Value (DCV)
Exh
aust
ivit
y
AND/Rel=2-3
PAR/Rel=2-3
AND/Rel=3
PAR/Rel=3

141
Combining the results from the two figures above suggests that query exhaustivity tuning
and operator changes have a similar effect on query results. In high precision searching,
instead of increasing the exhaustivity of AND queries, one may apply proximity operators and
formulate, e.g. PAR queries at a lower exhaustivity level. The availability of different query
formulation tactics for high precision searching is obviously an advantage of the Boolean IR
system. The most obvious case for applying proximity operators are simple search topics (only
two or three searchable facets available) where the exhaustivity of queries cannot be
increased. In simple search topics, the average precision of optimal PAR queries for high
precision searching should exceed that of AND queries. Correspondingly, in complex search
topics, optimal AND queries should be competitive since exhaustivity tuning can be
effectively exploited. However, we leave the further analysis of this phenomenon for future
research, and revert to the main track of this section, considering whether AND queries are as
effective as PAR queries in retrieving highly relevant documents in high precision searching.
Relevance degree distributions in TopDCV10 documents in optimal AND and PAR
queries are presented in Figure 4.27. The share of highly relevant documents was slightly
greater in the PAR queries than in the AND queries, 35 % vs. 31 % when using Rel=2-3
Figure 4.26. Proportional query extent of queries optimised for PAR and AND-operators using relevant (Rel=2-3; 25 topics) and highly relevant
documents (Rel=3; 20 topics).
0,620,67
0,720,65
0,730,77
0,570,64 0,66
0,590,65
0,73
0,00
0,20
0,40
0,60
0,80
1,00
5 10 20
Document cut-off value (DCV)
Pro
po
rtio
nal
qu
ery
exte
nt
AND2-3 PAR2-3 AND3 PAR3

142
documents, and 55 % vs. 53 % when using only the highly relevant documents as the
optimisation criteria.33
The total number of TopDCV10 documents was greater in the AND queries than in the
PAR queries (236 vs. 291, and 179 vs. 200). This was mainly because in the AND queries, the
data for DCV10 was more often interpolated from levels DCV15 and DCV20 than in the PAR
queries (in 4 vs. 9 search topics for Rel=2-3 optimised, and 3 vs. 6 for Rel=3, respectively).
On the average, the most precise PAR query for a search topic retrieves a smaller set of
documents than the corresponding AND query. The large number of search topics where
interpolation was needed is obviously a reflection of grouping the synonymous query terms in
the inclusive query plans. However, the same groups were used for both.
Figure 4.28 presents the average number of documents retrieved at each relevance level
per search topic. This way of examining the result sets reveals that, on the average, the user
sees 3.0 – 3.2 (or 4.2) highly relevant documents within the ten first documents if the queries
are optimised for relevance levels Rel=2-3 (and for Rel=3, respectively). The difference is
quite small (about 7 % higher in PAR queries when optimising with Rel=2-3), or then there is
33 The average precision in Figure 4.24 does not match with the percentages in Figure 4.27 since the optimal
query did not always retrieve exactly 10 documents. For example, if we assume that only 8 documents wereretrieved including 6 relevant documents, precision used in Figure 4 is 6/10=0.60 while 6/8 in Figure 4.27 (forprecision calculations at fixed DCVs, see Section 3.6.1).
Figure 4.27. Distribution of retrieved documents over relevance levels in queries optimised at DCV10 using AND and PAR operators at two relevance
levels. 20 (Rel=3) and 25 search topics (Rel=2-3).
35,0 % 31,0 %
55,3 % 52,7 %
43,6 %40,4 %
21,8 % 23,1 %
13,0 %
13,2 %13,0 % 13,3 %
8,4 %15,4 %
9,9 % 10,9 %
0 %
10 %
20 %
30 %
40 %
50 %
60 %
70 %
80 %
90 %
100 %
PAR/Rel=2-3 AND/Rel=2-3 PAR/Rel=3 AND/Rel=3
Optimisation category
Dis
trib
uti
on
of
rele
van
t d
ocu
men
ts
Rel=0
Rel=1
Rel=2
Rel=3
(236) (291) (179) (200)

143
no difference (optimising with the highly relevant documents). The portion of non-relevant
documents is also slightly larger for the AND queries. Based on this data it is not possible to
conclude that queries exploiting proximity operators were more effective in retrieving highly
relevant documents than plain Boolean queries. The capability of focusing the query to favour
highly relevant documents is mostly associated to the high exhaustivity of queries.
4.5.3.5 Limits of Boolean queries in high precision searching
One of the major findings of the experiment concerning high precision searching was that
the number of relevant documents correlated with precision achieved at low DCVs. Higher
precision was achieved in the large database containing an equal density of relevant
documents than the small database. The important point is that the larger set of non-relevant
documents, i.e. the size of the database, was not a problem as such. A larger share of relevant
documents can be rejected, if at the same time a large set of relevant documents is available.
The data revealed that when a larger set of relevant documents is available, the exhaustivity of
queries can be increased to exploit the larger set of documents not contaminated by implicit
expressions.
Figure 4.28 The number of retrieved documents in queries optimised at DCV10 using AND and PAR operators at two relevance level. 20 (Rel=3) and
25 search topics (Rel=2-3).
3,2 3,0
4,2 4,2
3,6 3,81,9 2,1
1,1 1,2
1,1 1,0
0,81,4
0,8 0,9
0
1
2
3
4
5
6
7
8
9
10
PAR/Rel=2-3 AND/Rel=2-3 PAR/Rel=3 AND/Rel=3
Optimisation category
Th
e d
istr
ibu
tio
n o
f re
leva
nt
do
cum
ents
Rel=0
Rel=1
Rel=2
Rel=3

144
Another important issue was that the exhaustivity of queries correlated with the likelihood
of retrieving highly relevant documents. This finding strongly suggests that Boolean
conjunction is a relevance ranking tool to increase not only precision, but also the
concentration of highly relevant documents. The plain Boolean conjunction (AND operator)
was also shown to be competitive with proximity searching (PAR operator) both in increasing
precision and in favouring highly relevant documents.
As was seen in the large & sparse database, the limits of Boolean queries in high precision
searching are obvious when the density of relevant documents is very small. The average
precision of queries is low and the distribution of retrieved documents is quite flat across
different relevance levels. The results predict that, after a certain point in the growth and
dilution of a document collection, query tuning loses its power. At that query saturation point,
the content and structure of the optimal query is frozen since query exhaustivity is maximised,
query extent decreased to one, and query terms cannot be changed to more focused ones. It
may be worth considering the phenomenon of query saturation using an example.
It could be assumed that for any specified information need, only a restricted number of
highly relevant documents is available. On the other hand, there is no practical upper limit for
non-relevant and marginally relevant (topical but not pertinent) documents in growing
collections (e.g. web-based documents). In all information needs (excluding very specific
proper name topics), it is logical to expect that the point of query saturation is achieved sooner
or later. For instance, assume that the optimal query at DCV10 retrieves one relevant and nine
non-relevant documents. All queries retrieving two or more relevant documents have a
precision less than 0.10. Obviously, the combination of terms used in the optimal query is
very rare within the relevant documents, however, it is the best discriminator between the
relevant and non-relevant documents. Now, if the collection grows further, we can anticipate
that the ratio of relevant/non-relevant documents within the new retrieved documents
matching the frozen optimal query will decline further (the number of non-relevant documents
increases by endlessly while the increase of the relevant ones levels off).
From the user perspective, the major problem is how to find that particular query term
combination having the highest discrimination power to separate some relevant documents
into a small result set. It is often easy to predict what expressions are typically used to
represent a concept (here facet), but more difficult to know what expressions are more typical

145
in relevant than in non-relevant documents (as pointed out by Blair and Maron 1985). And
even further, the user has to guess the right combination of query terms.
The point of query saturation could probably be moved upwards by combining the
advantages of different matching methods. Our results showed that the capability of Boolean
queries in high recall searching is based on exhaustivity tuning favouring those documents
that contain explicit expressions for all query plan facets. The vector space and probabilistic
IR models both base their relevance ranking on term weighting schemes that exploit inverse
documents frequencies (idf) and term frequencies (tf). Query exhaustivity tuning and term
weighting have obviously a similar goal in maintaining precision of queries, but they take
advantage of different characteristics of a document as potential indicators of relevance. Thus,
structured probabilistic queries could be of use in moving the query saturation point upwards.
The results by Kekäläinen & Järvelin (1998) and Kekäläinen (1999) support this view.
One of the major findings was that the basic conjunctive operator, Boolean AND, is quite
competitive with the best proximity operator PAR in high precision searching. However, the
result is quite tentative since we have only analysed average performance of optimal queries.
Behind the averages, one could find a more versatile spectrum of varying performance. For
instance, topic complexity is a potential variable the role of which should be investigated.
4.5.4 The comparison of high recall and high precision searching
One of the aims of the evaluation method proposed in this study was to support the
evaluation of Boolean IR systems at different operational regions. The results introduced
above have clarified some differences in Boolean queries optimised for high recall and high
precision searching. The findings have been treated separately and next we compare the
observations concerning these two regions.
4.5.4.1 Differences in performance
The difference in performance between high precision and high recall searching is quite
sensitive to figures used. For instance, if the precision averages across all high recall SPOs
(R0.8…R1.0) and all high precision SPOs (DCV5…DCV20) are compared, the difference is not
noticeable in the small database (0.018 -> 1.8%) and also quite small in the large & sparse
database (0.129 -> 12.9%). Small recall bases are obvious reasons for the disappearance of
differences. The precision of optimal queries fell steeply from DCV5 to DCV20 and went under

146
the respective average precision at R0.8…R1.0. If we compare precision differences between
DCV5 (or R0.1) and R1.0 we get a more realistic view of performance differences.
Figure 4.29 illustrates the decline of precision from high precision searching to full recall
searching. The fall of precision is always more substantial in the large databases; small db: 38
- 56 %, large & dense db: 71 - 72 %, and large & sparse db: 64 - 76 %, depending whether
DCV5 or R0.1 is used as the referent in high precision searching. This finding can be seen as an
empirical verification the law of inverse relationship between recall and precision. It may be
daring to say but the above results may be the first, appropriately obtained verification for the
law of inverse relationship between recall and precision in Boolean queries since the Cranfield
studies (Cleverdon 1967). The coordination level approach was applied by Cleverdon, but
later experiments have been based on a single query per search topic.
4.5.4.2 Differences in query structures
The comparison of average exhaustivities in full recall searching and high precision
searching (Tables 4.5. and 4.9, SPOs R1.0 and DCV5) reveals that exhaustivity is clearly higher
in high precision searching. The exhaustivity drop is greatest in the large & dense database
(3.66 – 1.74 = 1.92, minus 52 %) while quite equally less in the large & sparse database (3.57
– 2.29 = 1.28, minus 36 %), and in the small database (3.49 – 2.17 = 1.32, minus 38 % ). This
indicates again the importance of recall base size in exhaustivity tuning. In high precision
Figure 4.29. Decline of precision in queries optimised for high precision searching (SPO=DCV5 and R0.1) and high recall searching (SPO=R1.0) in
the small and large databases. (35 search topics).
0,845
0,6970,658
0,810
0,4720,410
0,233
0,169
0,927
0,00
0,10
0,20
0,30
0,40
0,50
0,60
0,70
0,80
0,90
1,00
Small db Large & dense db Large & sparse db
Database
Pre
cisi
on
R0.1 DCV5 R1.0
-38%
-71%
-64%
-56%
-72%
-76%

147
searching, the average exhaustivities of optimal queries are quite close to each other but a
more substantial exhaustivity drop is needed to retrieve all documents of a larger recall base.
The increase of proportional query extent of optimal queries from DCV5 to R1.0 was
greatest in the large & dense database (0.78 - 0.57 = 0.21, plus 38 %), second largest in the
large & sparse database (0.68 - 0.56 = 0.12, plus 22 %), and slightly less in the small database
(0.68 - 0. 59 = 0.09, plus 15 %) (see Tables 4.7 and 4.11). The figures suggest that query
expansion in conjunction with exhaustivity reduction are major tools in full recall queries,
especially, in large recall bases.
Figure 4.30 summarises the changes in the structures of optimal queries across the whole
operational range by presenting the change of exhaustivity as a function of proportional query
extent. The figures demonstrate that facet extent is the major query tuning tool in high
precision searching while exhaustivity tuning has the major role in high recall searching. This
was especially clear in the large & dense database. The changes in the small and large &
sparse database are quite small at the highest recall levels revealing the effect of small recall
bases on query tuning. Only slight changes can be seen from the averages when most search
topics have achieved full recall already at R0.8 or R0.9.
4.6 Conclusions and discussion
The purpose of this experiment was to elucidate the potential uses of the proposed
evaluation method for Boolean IR systems, and to explicate the operational practices of the
method. The case helps in comprehending the types of research questions that can be treated
by the method. We also try to show the advantages of the method, and also warn about its
limitations. This is done by first describing the main contributions of the case experiment. In
the previous sections we have discussed the concrete results of the case experiment which are,
of course, an essential contribution. The focus is now raised to a more general level to address
the methodological contributions of the case experiment in the light of earlier research.
First of all, our experiment demonstrated how the performance of a Boolean IR system
can be measured across a wide operational range. Traditional studies have presented the
results of an experiment by separately averaging recall and precision across a set of test topics
using one query per topic (see e.g. Lancaster 1969, Blair & Maron 1985, Tenopir 1985,
McKinin et al. 1991, Hersh & Hickman 1995, Lu et al. 1996). The results are presented as a
pair of average precision and recall for systems X and Y. The reader is left into a state of

148
uncertainty as to how the systems differ in high precision oriented searching or high recall
oriented searching.
Turtle (1994) introduced an approach to treat the result set of a Boolean query as a ranked
list. He suggested that novelty is an important relevance criteria for many information users,
and thus, the inverted chronological order of documents can be used in the same way as
ordinary relevance ranked lists. However, the idea of comparing relevance ranking to
chronological ordering has not received general acceptance since the approach seems to
favour systems exploiting ordinary, content-based ranking (see e.g. Lu et al. 1996). In
addition, Turtle himself admitted that precision values at the highest recall levels were not
meaningful. Single queries with fairly small result sets were used, and precision was estimated
at the highest recall levels by assuming that all non-retrieved documents are sorted by date
(inverted chronological order) and inserted in the ranks below the retrieved set.
Turtle seemed to trust the precision figures measured at the lowest levels, but a disclaim
must be expressed about them. Precision calculations were based on a single query per topic.
The searchers were asked to "… produce the 'best' query that they could…" (Turtle 1994). The
query was not necessarily designed for high precision searching, and neither for high recall
Figure 4.30. Exhaustivity of the optimal queries as a function of proportional query extent in high recall and high precision searching of the
small and large databases (35 search topics).
1,00
1,50
2,00
2,50
3,00
3,50
4,00
0,40 0,50 0,60 0,70 0,80 0,90
Proportional Query Extent (PQE)
Exh
aust
ivity
Small db/R80-100
L&d db/R80-R100
L&s/R80-R100
Small db/R10-R30
L&d db/R10-R30
L&s db/R10-R30
Small db/DCV5-20
L&d db/DCV5-20
L&s db/DCV5-20

149
searching. Rather, the searches had to imagine some balanced, "average" goal for their query.
In partial match systems, a single query may serve both high precision and high recall goals.
In Boolean querying, this is definitely an inappropriate assumption.
The proposed evaluation method is also superior compared to the coordination level
method introduced by Cleverdon (1967), and other corresponding approaches based on
mechanical construction of queries (see e.g. Frants et al. 1991, Salton 1988, and Smith &
Smith 1997). Excluding the human searcher totally from the retrieval process as an intelligent
actor goes against the principle that the use of Boolean operations requires conceptual
decisions. The idea of disjunctive and conjunctive query operations is related to the
conceptual structures in texts and in expressed information needs. The exclusion of the human
searcher from the query formulation process makes the plausibility of findings derived from
coordination level experiments questionable no matter how system-oriented the research
problems may be. Even in a system-oriented experiment, the role of a human searcher should
be taken into account, at least indirectly, to maintain a sense of reality.
Second, we were able to show how to estimate the optimal performance of a Boolean
system in a given situation. The approach was system-oriented, i.e. we were probing the limits
of a system by idealising user performance by exploiting relevance data. As far as the author
knows, this was the first time that this type of query optimisation has been done for Boolean
queries. Earlier studies on the optimal form of a query (see e.g. Heine & Tague 1991, and
Losee 1994) have discussed the issue as a question of Boolean logic, and how to treat queries
as Complete Conjunctive Normal Form representations. The original idea of optimal queries
came from Harter (1990), but he only came up with an informal and preliminary description
of the method lacking proper empirical evidence of its usefulness.
The research problems of the case study were connected to the size and density of full-text
databases, but optimal performance can be studied by applying the method in any similar
context. In principle, any comparison based on different ways to index a database or formulate
a query can be evaluated by using inclusive query plans and optimal queries derived from
them. Similarly, any change in database properties like changing from one document type to
another, is appropriate issues for evaluation.
One obvious application area is the comparison of different matching algorithms.
Traditionally, Boolean and best match systems have been compared by two sets of documents.
The documents retrieved by the Boolean query and an equal number of document from the top

150
of the ranked output of the partial match IR system (see e.g. Salton 1972, Lu et al. 1996). The
proposed way to measure precision of Boolean queries across the standard recall levels is, of
course, a long step forward in experimental methodology.
Third, we showed how to study the relations between measured performance and the
structural characteristics of queries optimised for different retrieval goals. Very few studies
have been concerned with query structures. Most of them have focused on partial match IR
systems and on expanding queries without exploiting facet structures (for a literature review,
see Kekäläinen 1999). The studies of Kristensen & Järvelin (1990), Kristensen (1993), and
Järvelin et al. (1996) have reported the effect of thesaurus-based query expansion (increasing
query extent at a given exhaustivity level) on the average recall and precision in Boolean
queries. A typical observation has been that relative recall increased substantially, and
precision decreased somewhat. The latest experiments of Kekäläinen & Järvelin (1998) and
Kekäläinen (1999) took into account, among other things, query exhaustivity (called
complexity) and query extent (called coverage plus broadness) but dealt with probabilistic
queries.
As far as the author is aware, no similar empirical studies have been published penetrating
the relationship of query structures and retrieval performance in Boolean searching. Soergel
(1994) addressed the issue but only from the analytical viewpoint. The case experiment was
especially successful in revealing the role of query exhaustivity both in high recall and high
precision searching. The forced reduction of exhaustivity at the highest recall levels, and the
possibility of increasing exhaustivity at the lowest DCVs was shown to be a common factor in
explaining differences in the average precision levels achieved in different databases. The
connection of precision and query extent were not so self-evident since query extent changes
seemed to be mixed with query term specificity changes.
Fourth, we could demonstrate that the rationale of structured changes in optimal queries
could be explained logically by analysing the characteristics of relevant documents in the
database. The results of the facet analysis of all relevant documents in the sample of 18 search
topics and relevant top and tail documents of all 35 search topics revealed that the phenomena
of exhaustivity and extent tuning were based on measurable characteristics of documents.
Especially two findings: (1) the role of implicit expressions in setting the boundaries for
exhaustivity tuning, and (2) the number of relevant documents to be retrieved setting the
requirements for extent tuning brought new knowledge about the dynamics of Boolean

151
queries. In addition, the findings based on the facet analysis of documents did not only
provide new insight into the phenomena investigated but also evidence about the validity of
the proposed method in evaluating query structures.
Fifth, the case study exemplifies the dynamic nature of the proposed method in
experimental design. The designer of an experiment is not obliged to list all queries that are
used in a test run. Rather, inclusive query plans are constructed to give the ultimate
boundaries for exhaustivity and extent tuning. The query to be observed is born in a (re-
engineering) process exploiting relevance data to optimise performance within defined
constraints. The structure and the content can be measured from the resulting optimal queries.
In a traditional experimental design, all potential structures have to be generated in advance.
The enormous size of the query tuning space tends to restrict the share of potentially available
query structures that can be examined in the traditional approach. This research economic
limitation can be avoided in the proposed method.


153
5 EVALUATION OF THE EVALUATION METHOD
5.1 Introduction
Methods of evaluation should themselves be evaluated in regard to appropriateness,
validity and reliability (Saracevic 1995). Tague-Sutcliffe (1992) has also emphasised the
importance of efficiency in experimental procedures. The appropriateness of a method can be
verified by showing that it helps to achieve new results or question the results of earlier
studies (Saracevic 1995). Validity is the extent to which the observed variables really
represent the concepts under investigation, reliability the extent to which the experimental
results can be replicated by other experimenters, and efficiency the extent to which an
experiment is effective, i.e. valid and reliable, relative to the resources consumed. (Tague-
Sutcliffe 1992.)
The appropriateness of the proposed method was justified in the case experiment reported
in Chapter 4. The case study made a contribution by gaining new knowledge about Boolean
queries in high precision and high recall searching. Validity, reliability, and efficiency are
complex issues to evaluate. The evaluation task has to be divided into subtasks to make the
process manageable. The main concerns should, of course, be directed at those operations of
the procedure of the proposed method that are unique or at least not generally applied. Two
operations are especially important in this respect: the formulation of inclusive query plans,
and the optimisation of queries. The former operation is quite intellectual in nature, while the
query optimisation is a technical (but heuristic) operation exploiting the inclusive query plan.
5.1.1 Inclusive query planning
As was pointed out in Section 2.2, query formulation is a quite well known process. An
obvious reliability problem observed in field studies is the low consistency of queries
designed by different searchers (e.g. Saracevic et al. 1988). However, Iivonen (1995a) showed
that although consistency measured character-by-character is low, concept-consistency is
typically quite high, especially, between experienced searchers of a particular database. Earlier
in this study, it was suggested that uncontrolled or undefined query design goals might
increase the risk of inconsistency. By fixing the goal, and by specifying the query planning
task, the consistency of inclusive query plans should be high enough for experimental
purposes (see Section 2.2.3).

154
The inclusive query plan for a particular search topic represents the query tuning space
from which the optimal set of elementary queries (EQs) is derived. If the query designer fails
to identify a searchable facet, exhaustivity tuning is limited by one unit. If a query term for an
selected facet is omitted, extent tuning is limited by one unit. Both types of failures reduce the
size of the query tuning space, and may also affect recall base estimates. A complete query
tuning space may be an unrealistic goal, and even defining it may be a ambiguous task.
However, it is fair to require that most searchable facets, and most query terms for all selected
facets be identified. This should be enough to guarantee comparative results in replicated
experiments.
Higher standards for validity and reliability usually lead to lower efficiency, i.e. increase
the cost of an experiment. Designing experimental procedures requires that these contradicting
goals be balanced in an appropriate way (Tague-Sutcliffe 1992). For instance, query terms
within a facet were organised into synonymous groups to make the process more
straightforward. Unfortunately, this treatment may induce validity problems since the number
of available query term combinations is restricted in advance. This affects query extent values
in optimal queries. Thus, without synonymous groups the problem may emerge in
experimental efficiency, and when applying the groups the validity of results may be
questioned. In an unfortunate case, contradicting goals between validity/reliability and
efficiency either render a procedure useless, or at least restrict its application domain.
Other potential efficiency problems of inclusive query planning are associated with the
efforts of thoroughly composing query plans, and of obtaining relevance assessments. For
instance, the requirement on the comprehensive representation of facets by disjunctive query
terms, or on the reliability of facet selection may necessitate the exploitation of teamwork
approaches in query planning. The proposed method is based on well-established recall base
estimates meaning higher costs in terms of time and money.
5.1.2 Query optimisation
The critical reliability issues of the query optimisation operation are mainly associated
with the performance of the optimisation algorithm. The evaluation of a product like a
computer program can be divided into two subtasks: verification and validation. Verification
refers to the test of the correspondence between a product and its specifications as intended by
the designer. Verification is supposed to answer the question whether or not the
implementation has been made according to the specifications. Validation is an assessment of

155
the degree to which the product actually serves the needs of the end-user. (Mark Pejtersen &
Rasmussen 1997.)
In our case, the aim of verification is to guarantee that the optimisation algorithm is
correctly implemented. Validation, in the field of heuristic algorithms called performance
evaluation, is a more complex task than verification. The aim is to investigate how good the
algorithm is in estimating the optimal solution. As seen in Section 2.5.3, empirical testing was
the most appropriate way to evaluate the algorithm in this particular situation (probabilistic
and worst case analysis could not be applied). The idea of empirical testing is that a large set
of problem solutions, i.e. candidates for optimal queries, are created and compared to the one
found by the algorithm. Empirical testing is typically expensive when applied to large data
sets, and gives only statistical evidence about the performance of the algorithm for those
problem instances that were not run (Fisher 1980).
One validity problem in the optimisation operation is that the algorithm was slightly
simplified to make the implementation task easier. Queries produced by the optimisation
algorithm are not necessarily in the conjunctive normal form (CNF). The effect of the
simplification can be seen in the following example using an imaginary inclusive query plan
of two facets [A] and [B]: (A1 OR A2) AND (B1 OR B2 OR B3). Six elementary queries are
generated from this query plan: eq1 = A1 AND B1, eq2 = A1 AND B2, eq3 = A1 AND B3, eq4 = A2
AND B1, eq5 = A2 AND B2, and eq6 = A2 AND B3.
The simplified algorithm accepts query structures like Q1 = eq1 OR eq5 = (A1 AND B1) OR
(A2 AND B2), where the algorithm exploited both query terms of facet [A], and two query terms
from facet [B] but not in all combinations. A typical human searcher exploiting these four
query terms would have used a query in CNF form Q2 = (A1 OR A2) AND (B1 OR B2) = eq1 OR
eq2 OR eq4 OR eq5 (i.e. four EQs selected instead of two). Query exhaustivity and extent
figures are equal for both queries Q1 and Q2 but the queries may retrieve different document
sets. It is obvious that precision figures tend to be higher in the optimised queries than in
corresponding queries in the "natural" CNF form. The extent figures of optimal queries are not
fully comparable with the queries formulated by a real searcher.
The limitation of the optimisation algorithm described above is an example of a very
fundamental efficiency problem. An optimisation algorithm capable of yielding queries in the
standard Conjunctive Normal Form would have required much more effort in interdisciplinary
theoretical work and software development than was possible in this study. The problem was

156
circumvented by simplifying the operation. The efficiency problem was turned into a validity
problem.
Another potential efficiency problem for the optimisation operation is how sensitive the
algorithm is to a radical expansion in the query tuning space (in the terminology of heuristic
algorithms: the problem of increasing search space). This question is associated with the need
to use query term grouping to limit the size of the search space. Again, the goals of efficiency
and validity are contradictory, and they have to be balanced somehow.
The proposed method is retrospective. Queries are optimised on the basis of complete
relevance data, i.e., the same test collection is used to optimise queries and measure
performance. Most experiments, like those in TREC, are predictive. System parameters are
tuned in a training collection and performance measured in another collection. Robertson
(1996) has warned (in his letter to the editor) of methodological problems associated with the
retrospective approach. The letter was written as a response to an article by Shaw (1995).
Shaw (1995) published the results of an evaluation study on relevance weights in
probabilistic retrieval. In this retrospective study, one set of test queries included all terms of
the collection, and Shaw was able to show that the equations for relevance weights proposed
by the author helped in retrieving all relevant documents at high precision (P1.0 > 0.99)
exceeding the performance of equations proposed by Robertson and Sparck Jones (1976).
Robertson (1996) argued that a retrospective test conducted as Shaw did it will
overestimate the optimum. Advantage could be taken of any property of the test set, including
those that are not even in principle predictable. For instance, if a typographical error occurs
only in a relevant document, this property helps to improve performance. The problems
associated with overfitted queries to achieve “perfect performance” are decreasing the
plausibility of the results. It is not clear how the findings – essentially based on unpredictable
properties of a test set – could be applied in real searching.
The optimisation operation of the proposed method in the present thesis shares the general
limitations of the retrospective approach but not the flaws identified by Robertson (1996) in
the study by Shaw (1995). The major differences are:
1. The origin of query terms. Shaw included all terms occurring in the collection to each
query and any term (character string) occurring only in relevant documents received a
high weight no matter what meaning it might bear. In the proposed method, all query
terms are derived from inclusive query plans. The set of query terms is not based on

157
the set of relevant documents. On the contrary, candidate terms were collected from
multiple sources of which some were external to the test collection. However, (1) only
those candidates that occurred in the database (in relevant or non-relevant documents)
were accepted, and (2) each of them had to be logically associated with the test topic.
2. The structure of queries. Shaw used unstructured queries where any arbitrary
combination of terms occurring in a relevant document could receive high weights and
improve the score of that document. In the proposed method, each query term is
associated with a facet and facets are applied in a defined order. Only those documents
are retrieved that contain at least one query term for each of the n top ranked facets at
the selected level of query exhaustivity n.
3. The plausibility of queries. Shaw applied queries of unrealistically high exhaustivity
(all terms occurring in the collection). Our approach has been to conduct optimisation
separately for different exhaustivity levels. Thus, optimised queries closely simulate
the building blocks type of query formulation routinely used by real users in Boolean
environments (a minor difference exists, see Section 5.3.6).
4. The goal of optimisation. Shaw attempted to show that if term relevance weights are
computed accurately in a probabilistic IR system, all relevant documents and only
relevant documents can be retrieved. Our main focus is on comparing the relative
effectiveness of two experimental IR settings by optimising their performance within
the given query tuning space, and to reveal the statistical relations between
performance and query structures.
The four constraints of optimisation above limit the risk of overfitting. Only two
questions still sound unpredictable:
1. Which of the query terms represented in the inclusive query plan for a particular facet
occur (if occur) in the relevant documents.
2. How many of the n query plan facets ranked first are covered by the expressions
occurring in the relevant documents.
The same problem of unpredictability is also faced by the searcher in realistic search
situation. The user can never be sure, in advance, how the terms appropriate for representing
the facets of a query plan occur in relevant (and non-relevant) documents. The role of the
optimisation operation is to identify the set of facets and associated query terms that perform
optimally within the given query tuning space.

158
Actually, the nature of unpredictability faced here is totally different from that described
by Robertson (1996) using typographical error as an example. Here unpredictability is just a
variation in two independent variables while that from the typographical errors was an
indication of uncontrolled variables questioning the validity of findings based on the
optimisation. We cannot predict which query terms will or would be included into the
optimal query and do not need to care what query term instances from the inclusive query
plan are selected to represent a facet. We are interested in how the extent and exhaustivity of
optimal queries change when a change is made in the operational environment.
The level of performance is typically much higher in retrospective tests than in predictive
tests or in searches made by real users in operational settings – unrealistic in some sense.
However, the performance gap is not detrimental if the problem of overfitting is avoided in
the experimental design (as described above) and the findings are not generalised beyond the
appropriate application domain (the matching of search topic and document representations).
The use of a training collection and a separate test collection is another technique to
eliminate the risk of overfitting. This was not done because the above arguments suggest that
the benefit of creating and applying a new collection would might be minimal. The level of
performance would have dropped somewhat but this is not an important issue since the aim
was to study performance differences.
The proposed method does not exclude the possibility to use a separate training collection
to determine the sets of optimal queries for each search topic. However, one obvious problem
in this approach is that of measuring performance at the highest recall levels since it may not
be possible to retrieve all relevant documents in a separate test collection.
5.1.3 Questions to be evaluated
Above, some examples were given of the potential reliability, validity and efficiency
problems in exploiting the proposed method. The questions that were selected for an
evaluative analysis are summarised in Table 5.1. The list of questions is by no means a
comprehensive one. All questions that are commonly shared by all experiments (sample sizes,
etc.) and typical laboratory oriented IR evaluation (e.g. reliability or validity of recall base
estimates) were ignored.
Question R.1. The consistent selection of facets in inclusive query planning is an essential
reliability requirement. If expert query designers do not have a common basis in identifying
facets, especially basic facets, different experiments cannot yield comparative results. The

159
process of determining the order of facets was not seen as an important reliability issue since
it was derived by mechanically calculating the maximum achievable recall for each facet. The
consistent selection of basic facets selected is important from the recall base estimation
viewpoint. Extensive queries used to retrieve documents for relevance assessments are based
on basic facets. However, as suggested in Section 2.4.5, recall base estimation should be
based on extensive pooling, and different approaches, e.g. probabilistic queries, should be
used to discover all potentially relevant documents.
Question R.2. The consideration of the optimisation operation raises reliability issues
including the correctness of the implementation (verification problem) and the performance of
the heuristic algorithm in its intended task. Major faults in the heuristic algorithm would
effectively ruin the whole method.
Questions V.1 and V.2. The exhaustivity of query plans (the number of facets) and the
comprehensiveness of the set of disjunctive query terms representing a facet are two main
dimensions of inclusive query plans that set boundaries for the query tuning space. The
validity of results concerning query exhaustivity and extent are essentially dependent on these
dimensions.
Question V.3. Organising disjunctive query terms into synonymous groups is used to
simplify inclusive query plans to make the optimisation process more manageable. It does not
affect the boundaries of the query tuning space but reduces the number of disjunctive query
term combinations available. This treatment could possibly increase the extent values, and
Table 5.1 Potential reliability, validity, and efficiency problems in the special procedures of theproposed evaluation method.
Procedure Reliability Validity EfficiencyInclusivequeryplanning
R.1Are query facetsidentifiedconsistently?
V.1Are inclusive query plansexhaustive enough?V.2Are potential query termsidentified comprehensively?V.3Do synonymous groups inducebiases in precision and queryextent of optimal queries?
E.1Does query planning causemajor extra costs?E.2Does the volume ofrequired relevanceassessments increasesignificantly?
Queryoptimisation
R.2Is the optimisationalgorithm reliable infinding the optimalcombination of EQs?
V.4Are the structures ofautomatically optimised queriessimilar to those formulated by ahuman searcher?
E.3Is query term groupingneeded to keepoptimisation acomputationally efficientprocess?

160
lower the precision values of optimal queries. As a reflection, grouping could also skew the
measured values of query exhaustivity.
Question V.4. The present implementation of the optimisation algorithm allows query
structures that are different from the traditional CNF. As a result, an optimised query of
particular extent and exhaustivity tends to give higher precision than the corresponding CNF
type query composed by a human searcher. The question is whether this simplification causes
biases to the measured query structures, especially the extent of optimal queries.
Question E.1. Inclusive query planning consists of exhaustive tasks obviously more
demanding and time consuming than a typical query design process in traditional experiments.
If a high standard of experimental reliability is applied, the operation requires that several
query designers be involved. Does this ruin the efficiency of the proposed method?
Question E.2. Reliable recall base estimates have been emphasised as an essential
cornerstone of the proposed method. The proposed method comprises the idea of extensive
queries used to generate enough documents for relevance judges. In addition, pooling was
recommended as an alternative aid in recall base estimation, and this put resource pressures
both on query planning and on relevance assessments. Can the extra costs be afforded by
small research groups not having collaborative support resources like those in TREC?
Question E.3. The efficiency of the optimisation operation is dependent on the number of
elementary queries available. One method to reduce the number of EQs is query term
grouping. On a more general level, it is useful to address the effect of expanding search spaces
on the effectiveness of the optimisation algorithm.
5.1.4 Setting goals for the evaluation
Nine reliability, validity, and efficiency questions concerning the two main operations of
the proposed method (inclusive query planning and query optimisation), were formulated
above. All questions are such that no definite answer can be found by empirical testing. Some
questions can be analysed empirically only in a restricted context (the empirical test is too
complex to execute, e.g. R.1), and some questions are too broad to be thoroughly analysed as
a sub-task of a single study (e.g. E.3). Thus, it is reasonable to consider the set of reliability,
validity, and efficiency questions mainly in the frame of the case experiment.
It may be typical of innovative methodological processes that the main focus is first on
developing and refining the procedure of the method through experimentation, and to justify
the appropriateness of the method. Interest in the systematic analysis of validity, reliability and

161
efficiency issues emerges later. At the early stage of development it is also difficult to
comprehend and define the potential problems in these issues without concrete experiences in
applying the method. This was the case, at least, in this study.
The drawback of this late interest on the validity, reliability and efficiency issues is that
some designs in the case experiment do not support the evaluation of the method well. For
instance, the inclusive query planning was not evaluated as a process before its
implementation. Thus, it had to be tested afterwards.
5.2 Data and methods in reliability and validity tests
Several empirical tests were designed to investigate the potential reliability and validity
problems formulated above as six questions. The applied tests, the facet selection test, the
verification tests for the optimisation algorithm, and the interactive query optimisation test are
described in this section. Efficiency questions were approached analytically by addressing the
potential sources of low experimental efficiency.
The facet selection test was designed to study the consistency of facet selection (Question
R.1), and the exhaustivity of inclusive query plans (Question V.1). Question V.2 concerning
the comprehensiveness of the set of disjunctive query terms representing a facet was
approached by comparing the set of query terms selected for inclusive query plans of the test
collection to the set of expressions identified in the facet analysis of relevant documents. The
facet analysis procedure and its preliminary results were already presented in Section 3.7.2
(see also, Appendix 3). This analysis was enhanced by analysing the effects of missing query
terms as a part of the interactive query optimisation test.
Reliability testing of the optimisation algorithm (Question R.2) consisted of two parts:
verification and validation. Verification was made by an optimisation test based on blind
search, and validation on the interactive query optimisation test. The interactive query
optimisation test was also used to examine the validity effects of synonymous groups
(Question V.3), and query structures yielded by the optimisation algorithm (Question V.4).
5.2.1 The facet selection test
Three subjects having good knowledge of text retrieval and indexing (advanced Master’s
students) were asked to make a facet identification test. They were given and asked to read the
same query planning instructions as the search analyst designing the inclusive query plans.
The conceptual query planning process of two sample topics was introduced to the test

162
persons, and were asked to make conceptual query plans by themselves for three other search
topics as an exercise. The subjects were encouraged to make sample queries in the test
collection to find out the query characteristics of candidate facets. The results and perceived
problems were discussed to guarantee that the subjects had understood the goals and the
process in inclusive query planning (the phase of conceptual planning, at least).
In the actual facet identification test, the subjects were given 14 search topics (Topic
Numbers 6, 7, 11, 12, 14, 15, 16, 19, 20, 25, 26, 28, 33, and 34, see Appendix 1). They were
then asked to analyse the search topics (in the given order), and to compose a conceptual
query plan for each topic including the selection of major facets. No exact time limit was
given for individual query plans but the subjects were guided to record the time they needed to
complete each query plan. The total planning time was 166, 220, and 157 minutes, and the
median of planning time per topic was 11, 15, and 9 minutes for the test person 1, 2, and 3
respectively. Test person 1 quite consistently used less time than test person 2 (11 vs. 15
minutes per topic) but opposite examples were also observed. Test person 3 used about as
much time as test person 2 for the first eight topics (8 – 25 vs. 10 – 30 minutes per topic) but
clearly less in the six last topics (4 - 7 vs. 10 – 20).
The output of the test, three series of conceptual query plans, was analysed to find out
how consistently different query designers identify query facets, and, especially, major facets.
The procedure of classifying facets and calculating consistency of facet selection was adapted
from Iivonen (1995a). Facets are conjunctive concepts identified from search topic
descriptions, and query designers may use different expressions to denote a facet. For
instance, the following types of different expressions were interpreted to refer to the same
facet:
1. Different inflectional forms of a word (including singular and plural).
2. Synonymous expressions (including abbreviations and ellipses, e.g. [Bush] and[George Bush].
3. Expressions referring to broader or narrower concepts (e.g. [automotive industry] and[car industry]).
4. Expressions referring to concepts that are complementary or can replace each otherwithin a facet (e.g. [statistics] and [forecasts]).
Complex facets were split into elementary facets. For instance, two query plans
[Germany] AND [reunion], and [Germany’s reunion] were considered conceptually identical

163
both containing two facets. This was because both query plans lead to identical string level
queries if the query design rules are followed.
The formula for calculating consistency of facet selection by query designer 1 in relation to
query designer 2 was
where T1 is the set of facets selected by query designer 1, and T2 the set of facets by query
designer 2. Likewise, consistency of facet selection by query designer 2 in relation to query
designer 1 was calculated by
Pairwise consistency between two persons is the average of CT1,2 and CT2,1. A personal
consistency figure for a person within a group can be determined by calculating the average of
the person’s pairwise consistencies with all other members of the group. An overall
consistency index for the whole group can be calculated by averaging all pairwise
consistencies (see Iivonen 1995b, 1995c, 72-73).
In our case of three query designers, consistency was first calculated between all pairs,
and the overall consistency by averaging the pairwise consistencies. Another comparison was
made by comparing the consistency of the original query designer with the whole test group.
5.2.2 Verification test for the optimisation algorithm
The implementation of the optimisation algorithm was verified by running test
optimisations using small sets of elementary queries selected from 12 search topics of the test
collection. Two optimisation runs were performed per topic, one using a small DCV value and
another with large DCV (1 x and 2 x recall base). The optimisation results returned by the
algorithm were compared with a manually constructed complete set of EQ combinations (a
result of a "blind search"). The first version (used in Sormunen 1994), and second versions of
the algorithm were coded by different programmers using different tools. The operation of
both versions were compared in a test using the complete sets of EQs from ten search topics
optimised at all standard DCVs (DCV2…DCV500). This test was conducted to expose trivial
coding errors in the implementation.
,||
||
1
212,1 T
TTCT
∩=
.||
||
2
211,2 T
TTCT
∩=

164
5.2.3 Interactive query optimisation test
The idea of an interactive query optimisation test was to replace the automatic
optimisation operation by an expert searcher, and compare the achieved performance levels as
well as query structures. A special WWW-based tool, the IR Game was used in the test.
5.2.3.1 The IR Game
The IR Game was developed for rapid analysis of query results applied both in
experimental research and in training of searchers (Sormunen et al. 1998). When interfaced to
a laboratory test collection, the tool offers immediate performance feedback at the level of
individual queries in the form of recall-precision curves, and a visualisation of actual query
results. The searcher is able to study, in a convenient and effortless way, the effects of any
query changes. The performance data for all queries are stored automatically, and the
precision of optimal queries at a particular recall level can be checked easily.
The IR Game is based on a plug-in architecture, meaning that the different components of
the tool (e.g. databases, dictionaries, and stemming methods) can easily be replaced with
other corresponding components in order to modify the application for research purposes. The
main components of the IR Game are (the parts in bold face used in the interactive query
optimisation test):
1) IR test collections
a) A Finnish test collection containing about 54,000 newspaper articles with 35 testtopics and about 17,000 relevance judgements.
b) An English database (a subset of TREC) containing about 514,000 documents withcorresponding TREC test topics and relevance judgements.
c) A database of newspaper photographs, with captions in English or Finnish.
2) Text retrieval systems
a) TRIPb) InQuery (Version 3.1).
c) InQuery application programs for computing the recall-precision information on thebasis of search results.
3) Translation dictionaries
4) Morphological analysis programs

165
Figure 5.1 Query formulation page of the IR Game.
Figure 5.2. Performance evaluation page of the IR Game.

166
The use of the IR Game is quite straightforward and intuitive. After selecting the topic,
the database, and the IR system to be used, the user enters the query formulation page (Figure
5.1). (S)he types in the query using the query language of the target IR system (here the TRIP
search language). The query is sent to the target system after the user has clicked the "Submit
query" button. The query is processed by the IR system, the recall-precision figures are
computed, and the corresponding graph is immediately and automatically presented to the user
(Figure 5.2).
For Boolean queries, the IR Game displays the resulting recall and precision values as a
highlighted dot, which can be compared with the highest precision values achieved in earlier
queries, and presented over the whole recall range R0.0…R1.0 as a stepped curve. Thus, the user
sees immediately after executing a query whether or not any progress has been made in terms
of recall and precision. If the precision of a query exceeds the stepped curve, the query
statement is automatically assigned to the "Hall of Fame", and the P/R value is updated to the
stepped precision curve. Actually, any precision curve can be presented in the background of
the R/P graph. For instance, the two thin curves in Figure 5.2 illustrate the performance of
best structured and unstructured probabilistic queries for this sample topic in another
experiment (Kekäläinen&Järvelin 1998, Kekäläinen 1999).
5.2.3.2 Test procedure
A sample of 18 search topics, the same set as in the document facet analysis, was selected
for the interactive optimisation test. An experienced searcher having a good knowledge of the
Boolean retrieval system TRIP, and the test database was recruited as the test searcher. The
optimisation was done only at standard recall levels R0.0 … R1.0 since this restriction made it
possible to increase the number of searcher's optimisation attempts. Parallel DCV-based
optimisations had hardly generated substantially new information.
The optimisation test was carried out in four series. Three different versions of inclusive
query plans, and one different technique to combine EQs were used:
Test set 1) Optimisation with synonymous word groups in CNF queries (denoted“SynGrCNF”). The synonymous groups used were the same as in the automaticoptimisation. Only queries in Conjunctive Normal Form (CNF) were accepted. The aimof this test series was to challenge the optimisation algorithm. The results are used forQuestions V.3 and V.4.
Test set 2) Optimisation with synonymous word groups (denoted "SynGr"). The approachwas the same as in test set 1 but the resulting queries did not need to be in CNF. This

167
was exactly the output form the optimisation algorithm produced. The results are usedfor Questions R.2 and V.4.
Test set 3) Optimisation with ungrouped words (denoted “WORDS”). The synonymousgroups of the inclusive query plans were unpacked, and any disjunctive combination ofquery terms could be used. The aim of this test series was to investigate the effect ofquery term groupings on achieved precision and on query structures. The results areused for Questions V.2 and V.3.
Test set 4) Optimisation including missed words (denoted "WORDS+"). The set ofexpressions identified in the facet analysis of relevant documents was made available.The aim was to investigate the effect of query terms missing from the inclusive queryplans on the average precision and proportional extent of queries. The results are usedfor Question V.2.
The same basic data were gathered on the interactively optimised queries as on the
automatically optimised queries in the case experiment. The only exception was that extent
data was collected across all recall levels since this time data gathering was much easier.
Three other searchers were recruited as a group of control searchers making parallel
queries. The aim was to test the overall capability of the test searcher to find optimal queries.
The test searcher should in most cases achieve the same or better results than the control
searchers. The control searchers were given 10 search topics; three different search topics for
each control searcher, and one topic for all of them. Search topics were selected so that
complex and simple as well as broad and narrow topics were equally represented in the
control set. Only search topics of group simple & narrow were excluded. The number of EQs
is small for this topic group, and a comparison hardly revealed any differences between the
searchers. The control searchers were working only with inclusive query plans containing
synonymous groups, and formulating queries in CNF form (test set 1, described above).
Concentrating on a single test set was meant to improve their chances to "compete" with the
test searcher.
All searchers were given written instructions, and a short demonstration of the test
procedure. All searchers were also training the test procedure using a sample search topic (not
a member of the set of 18 topics). The instructions guided the searchers to take into account
the fixed facet order, the rules for forming disjunctions of query terms within facets, and term
truncation rules (the last one needed only in Test set 4). The searchers were also advised to
start from the lowest exhaustivity level (i.e. one) to find first the best query formulation at the
highest recall level R1.0, and then continue to exhaustivity levels two, three, and so forth. The
strategy of increasing exhaustivity helps in making the process more economical since the

168
really useless query term combinations originating from the top facets are identified as early
as possible.
A separate work space of the IR Game was created for each searcher and each test set.
Thus, the searchers could directly compare only their own query results. The use of the IR
Game was made convenient and the risk of misspelling in query formulation was minimised
by giving the inclusive query plans to the searchers on paper and as a text file. The whole
query plan as an executable query statement and any parts of it could be copied and pasted
into the query window of the IR Game. Thus, the searchers could easily make query changes
and quickly check their effects on performance. The syntactical correctness of queries stored
in the "Hall of Fame" was checked later and only very few queries were deleted because of
errors.
In principle, the test searcher had no time limits in his work. The test searcher was
working for a period of 1.5 months to generate a competing set of optimal queries for a
sample of 18 search topics. The control searchers were working about ten hours each, i.e. two
and a half hours per topic, on the average. The much shorter working period of the control
searchers might be seen to favour the test searcher. However, he was working with four
different test sets (opposed to one by control searchers) and 18 search topics (opposed to 4 by
the control searchers). In fact, test set 1 is the simplest of the sets to perform since the
optimisation is based on the use of synonymous groups.
The comparison of optimisation results achieved by the test searcher and the control
searchers is presented in Table 5.2. It turned out that the optimised queries made by the test
searcher yielded the highest precision at 56 out of 110 measuring points (about 51 %).
Correspondingly, control searcher no. 3 had achieved higher precision than the test searcher in
6 cases (5.5 %). In all other cases (about 44 %) the results achieved by the test searcher and
the control searchers were equal. The results show that the overall performance of the test
searcher was at a high level, and that no clear failures could be observed in the detailed
inspection of optimisation results. We may thus assume that the results of the interactive
optimisation test are reflecting a high standard of professional searching expertise.

169
5.3 Results of the empirical tests
The results of the above described empirical reliability and validity tests are reported in
this section. The efficiency issues are discussed in Section 5.4.
5.3.1 Exhaustivity of query plans (Question V.1)
If a searchable facet is omitted the optimal queries are biased by the reduced range for
exhaustivity tuning. The number of searchable facets is obviously a search topic dependent
issue, and can be measured by a human judge. There is no standard method to verify that all
searchable facets have been taken into account in inclusive query plans. Thus we can only
compare the exhaustivity of original query plans with query plans composed by a test group. It
is also possible to use the results of earlier studies on query formulation practices in
operational environments. The validity of the exhaustivity tuning range yielded by the
inclusive query planning operation, and applied in the case study results cannot be questioned,
if inclusive query plans provide at least a reasonable range for query tuning.
The number of basic and auxiliary facets selected by the query designers in the facet
selection test is presented in Table 5.3. It turned out that query designers (QD1-3) selected, on
the average, quite equally 31-33 basic facets but the number of auxiliary facets ranged from 10
to 16. Query designer 1 selected fewer searchable facets than the others (41 vs. 46/49). The
average number of facets per search topic was 3.2. All query designers of the facet selection
test selected fewer facets than the original query designer (OQD) of the test collection (2.9-3.5
vs. 3.9). The differences indicate that, in addition to differences in personal ways of
Table 5.2 Number of "best" queries by different searchers maximising
precision at the 11 standard recall levels in interactive query optimisation(S=Test Searcher; C=Control Searcher, 10 search topics)
Topic no P(S) > P(C) P(S) = P(C) P(S) < P(C) Control searcher1 9 2 0 C12 3 7 1 C38 10 1 0 C29 5 6 0 C2
10 5 5 1 C313 0 11 0 C219 8 3 0 C123 3 4 4 C326 10 1 0 C132 3 8 0 C1+C2+C3
Total 56 48 6Percentage 50,9 % 43,6 % 5,5 %

170
interpreting search topics, broader experience in the inclusive query planning may affect the
resulting exhaustivity of query plans. QDs 1-3 were working for a couple of days for the
project while the OQD did inclusive query planning for about three months.
Possibly the differences in the definition of design goals also affected the query designers’
performance. Although the query designers QD1-3 were asked to apply the guidelines for
inclusive query planning they were also aware that the designed query plans were to be used
for measuring the consistency of selected facets. It was therefore probably easier to omit facets
that were not self-evident selections. The original designer of inclusive query plans was in the
opposite social situation. Her goal was to design exhaustive query plans supporting query
tuning over a wide exhaustivity range.
The results indicate that the exhaustivity of inclusive query plans designed for the test
collection was higher than in query plans composed in the facet selection test. The average
exhaustivity of queries designed by experienced searchers measured in some earlier studies
has also been lower than in the inclusive query plans of the present study. For instance,
Iivonen (1995c, 289) reported that experienced searchers applied, on the average, 2.7 concepts
Table 5.3. The number of selected facets by different query designers (QD), andthe original query designer (OQD) of the test collection in 14 search topics.
No of basic facets No of other facets Total no of facetsTopic QD1 QD2 QD3 Aver QD1 QD2 QD3 Aver QD1 QD2 QD3 Aver OQD
6 1 2 2 1,7 1 1 1 1,0 2 3 3 2,7 47 2 3 2 2,3 1 1 1 1,0 3 4 3 3,3 4
11 2 3 3 2,7 1 2 2 1,7 3 5 5 4,3 412 3 2 3 2,7 1 1 1 1,0 4 3 4 3,7 314 2 2 2 2,0 1 1 1 1,0 3 3 3 3,0 415 3 3 2 2,7 1 1 1 1,0 4 4 3 3,7 416 2 2 1 1,7 0 1 1 0,7 2 3 2 2,3 219 2 2 2 2,0 1 0 1 0,7 3 2 3 2,7 320 2 2 2 2,0 1 1 0 0,7 3 3 2 2,7 325 3 3 3 3,0 0 1 1 0,7 3 4 4 3,7 426 2 2 2 2,0 1 1 1 1,0 3 3 3 3,0 528 3 3 3 3,0 0 3 1 1,3 3 6 4 4,3 533 2 2 2 2,0 1 1 2 1,3 3 3 4 3,3 534 2 2 2 2,0 0 1 1 0,7 2 3 3 2,7 4
Average 2,2 2,4 2,2 2,3 0,7 1,1 1,1 1,0 2,9 3,5 3,3 3,2 3,9Median 2,0 2,0 2,0 2,0 1,0 1,0 1,0 1,0 3,0 3,0 3,0 3,2 4,0StDev 0,6 0,5 0,6 0,5 0,5 0,7 0,5 0,3 0,6 1,0 0,8 0,6 0,9Min 1,0 2,0 1,0 1,7 0,0 0,0 0,0 0,7 2,0 2,0 2,0 2,3 2,0

171
per query34. Lancaster & Fayen (1973, 193-195) have referred to empirical results where over
80 % of queries were based on 2 or 3 facets. Similarly, Convey (1989, 57) cited another study
where a group experienced Medline users were applying, on the average, 2.5 facets per search
topic.
The findings support the view that inclusive query planning produces relatively
exhaustive query plans. On the other hand, the results emphasise that special attention should
be paid to the query design instructions and to training the query designers. If this part of the
experiment is disregarded, query designers easily replicate common practices of query
formulation. The conscious or unconscious rejection of minor query facets may lead to biases
in exhaustivity tuning.
5.3.2 Consistency of facet selection (Question R.1)
The findings above dealt with the number of facets selected, i.e. exhaustivity of query
plans. An equal number of facets selected by two query designers does not guarantee that
query plans are similar. In fact, facets selected by different persons may refer to quite different
aspects of a search topic. Replicated experiments on identical or supplementary research
problems cannot yield comparative results if consistency is low in query plans. As with query
plan exhaustivity, there is no fixed standard regarding how the consistency of query plans
should be measured and interpreted to guarantee the reliability of experiments. However, it is
important to know at least roughly the consistency limits of the operation.
Table 5.4 presents the findings concerning the overall consistency of query designers
QD1-3 in the facet selection test, and their consistency with respect to the original query
designer. Column “QD1-3” indicates that the average consistency of three query designers in
selecting facets was 86 %. Consistency for individual search topics ranged from 71% to
100%. The relatively narrow interval in consistency variation for individual search topics is an
encouraging result. Because the number of identified searchable aspects per search topic is
small (typically 2-5) the risk of low consistency figures is obvious if there is no shared basis
of reasoning between different query designers35. The results suggest that experienced
34 The concept of “search concept” has not been defined explicitly enough in the earlier studies of interest
(e.g. Iivonen 1995a-c, and Saracevic et al. 1988) so that the equivalence of “search concepts” and “query facets”could be guaranteed. However, it is assumed that, 2.7 search concepts in Iivonen (1995a) means 2.7 or fewerfacets in our terminology.
35 The problem of the small number of instances selected can be easily characterised by an example: If querydesigner X formulates a query plan [A] AND [B], and query designer Y a query plan [A] AND [C] AND [D],consistency between these designs is (1/2 + 1/3)/2 = 0.42 (for consistency calculation formulas, see Section5.2.1).

172
searchers have a shared basis in conceptual query planning, and no distinctly deviant
interpretations were observed in the test. However, the test set was small and cannot alone
verify the reliability of the operation of conceptual query planning. Earlier studies support our
results reporting similar or slightly lower consistency figures. For instance, Iivonen (1995a,
1995c) reported 87.6 %, and Saracevic et al. (1988) reported 78 % consistency in search
concept selection.
Three columns “QD1/OQD”…“QD3/OQD” of Table 5.4 present consistency data of facet
selections between each of the query designers QD1-3 and the original query designer OQD,
and column “QD1-3/OQD” the average of these figures. The results show that consistency is
lower (80%) between the group and the original query designer than within the group. This is
not surprising because the original query designer was selecting a larger number of facets per
search topic than the subjects in the facet selection test (3.9 vs. 2.9-3.5, see Table 5.2). An
interesting result is that the values of average consistency between each member of the group
QD1-3 and the original query designer are quite close to each other. The fewer facets selected
by query designer QD1 (2.9 facets per topic) overlapped well with the larger set of facets
selected by the original query designer OQD (3.9 facets per topic), i.e. they were often a sub-
Table 5.4. Consistency between query designers QD1-QD3 and between QD1-3 and
the original query designer (OQD) in 14 search topics. The number of joint facets selected by three or two QDs.
Consistency (all facets) No of joint facets TOPIC QD1-3 QD1/OQD QD2/OQD QD2/OQD QD1-3/OQD for 3 QDs for 2 QDs
6 0,78 0,75 0,58 0,58 0,64 2 27 0,92 0,88 1,00 0,88 0,92 2 3
11 0,87 0,88 0,90 0,90 0,89 3 412 0,83 0,75 0,88 0,75 0,79 3 314 1,00 0,88 0,88 0,88 0,88 3 315 1,00 0,75 0,75 0,75 0,75 4 416 0,89 1,00 0,83 0,83 0,89 2 319 0,89 0,67 0,83 0,67 0,72 2 320 0,89 0,67 0,67 0,83 0,72 2 325 0,83 0,80 0,68 0,90 0,79 3 326 0,78 0,90 0,90 0,90 0,90 2 328 0,71 0,80 0,80 0,80 0,80 2 333 0,92 0,88 0,88 0,75 0,83 3 334 0,78 0,75 0,58 0,88 0,74 2 2
Average 0,86 0,81 0,80 0,81 0,80 2,50 3,00Median 0,88 0,80 0,83 0,83 0,80 2 3StDev 0,08 0,09 0,13 0,10 0,08 0,65 0,55Min 0,71 0,67 0,58 0,58 0,64 2 2

173
set of the larger set. This finding suggests that the number of facets selected by different
subjects may vary but the core facets overlap.
Another view on the overlap of core facets is presented in the two last columns of Table
5.4. The second last column displays the number of facets selected jointly by all query
designers QD1-3. The number of facets per search topic jointly selected by all three query
designers ranged from 2 to 4, with a mean of 2.5 and a median of 2. The last column reveals
that the number of facets selected by at least two query designers ranged also between 2 and 4,
but with a mean of 3.0 and a median of 3.
An important detail in the data above was that at least two facets were jointly selected by
all query designers in all search topics. If the number of jointly selected facets is compared to
the complexity of a search topic (see Table 3.3) there does not seem to be any correlation, i.e.
2-3 facets were identified consistently no matter how many searchable aspects could be
identified from the search topic description. The sample is small for any generalisations but it
indicates that in a defined and restricted conceptual space (a written search topic description)
facet selections have a predictable core area.
The concept of the “basic facet” was introduced as a part of the idea of inclusive query
planning (see Section 2.4.4). Above, the jointly selected facets by different subjects were
called “core facets”. What is the relation between these concepts? This is an important issue,
since if these concepts overlap heavily it gives a chance to define the conceptual analysis stage
of inclusive query planning as a standard operation performed by a group of query designers.
This would strengthen the reliability of the operation since it would not be so sensitive to
personal selections in query planning. To discuss this issue further, the results concerning the
selection of basic facets have to be introduced.
Query designers QD1-3 were also asked in the facet selection test to mark the facets that
they considered basic facets (according to the definition in Section 2.4.4). In Table 5.3 it was
seen that 70 % of the selected facets were marked “basic”, and that the average number of
basic facets selected was 2.3. The consistency results based on basic facets are presented in
Table 5.5. The main observation is that the average consistency is slightly higher for the basic
facets than for all facets (86 % vs. 89 %). The average number of jointly selected basic facets
by all three query designers was 1.8 (median 2) ranging from 1 to 2 per search topic. The
respective figures for jointly selected facets by two query designers were: a mean of 2.3, a
median of 2, and a range from 2 to 3 basic facets per search topic.

174
Another view of the
above data is obtained if
the set of jointly selected
facets is compared to the
union of facets selected by
any of the query designers
QD1-3. Figure 5.3
presents the percentages of
basic facets (auxiliary
facets) jointly selected by
a group of two or three
QDs within the whole set
of basic facets (auxiliary
facets, respectively).36 The
diagram emphasises the
distinct consistency
difference between basic and auxiliary facets. More than two thirds (69 %) of all suggested
basic facets were selected by all three query designers QD1-3. Nearly all basic facets (92 %)
got at least two “votes”. Actually, 3 out of 36 basic facets suggested were selected by only one
query designer. Within the auxiliary facets, only less than one half of selections (43 %) were
made by more than one query designer.37
36 The number of basic facets (auxiliary facets) was calculated by taking a union of facets named basic
(auxiliary, respectively) by at least one query designer. Thus, some facets belong to both groups if one QD hasmade a different decision than the others. The number of jointly selected basic facets was calculated by taking aunion of facets named “basic” by three (or two) query designers. In the case of auxiliary facets, the number ofjointly selected facets also includes those facets where some query designers have selected it as “basic” and some“auxiliary”. This way of calculating the percentages of jointly selected auxiliary facets raises the figuressomewhat.
37 No comparison was made between the group QD1-3 and the original query designer in selection of basicfacets. The reason was that the OQD developed her inclusive query plans over a rather long period of time. Theset of basic facets was reduced in this process under the pressures to ensure the reliability of recall base estimates.The total number of facets did not change much but there was a systematic shift from basic facets tosupplementary facets.
Table 5.5. Consistency between query designers QD1-QD3 in selecting basic facets in 14 search topics. The number of joint basic facets selected by three or two QDs.
Consistency (basic facets) No of joint facets TOPIC QD1 QD2 QD3 QD1-3 for 3 QDs for 2 QDs
6 0,75 0,75 1,00 0,83 1 27 1,00 0,67 1,00 0,89 2 2
11 0,75 0,67 0,50 0,64 1 212 0,83 1,00 0,83 0,89 2 314 1,00 1,00 1,00 1,00 2 215 1,00 0,83 0,83 0,89 2 316 0,75 0,75 1,00 0,83 1 219 1,00 1,00 1,00 1,00 2 220 1,00 1,00 1,00 1,00 2 225 1,00 1,00 1,00 1,00 3 326 0,75 0,50 0,75 0,67 1 228 0,83 0,83 0,83 0,83 2 333 1,00 1,00 1,00 1,00 2 234 1,00 1,00 1,00 1,00 2 2
Average 0,90 0,86 0,91 0,89 1,79 2,29Median 1,00 0,92 1,00 0,89 2 2StDev 0,12 0,17 0,15 0,12 0,58 0,47Min 0,75 0,50 0,50 0,64 1 2

175
The findings support the idea that inclusive query plans could be designed by a group of
query designers to reduce the risk of biases from the variation of individual searching styles.
For instance, a group of three query designers could produce their conceptual query plans and
the selection of basic facets could be based on the voting principle. The selection of basic
facets seems to be a straightforward process, but the selection of auxiliary facets is more
problematic. Less consistency was observed in the selection of auxiliary facets meaning that,
at least in some cases, the selected facets did not create a sound, conceptually reasoned
Figure 5.3. Percentage of jointly selected basic and auxiliary facets by three or two query designers (QDs) in the facet selection test of 14 search topics.
69 %
92 %
30 %
43 %
0 %
10 %
20 %
30 %
40 %
50 %
60 %
70 %
80 %
90 %
100 %
Joint facets/3 QDs Joint facets/2 QDs
Degree of agreement
Per
cen
tag
e o
f fa
cets
Basic facets Auxiliary facets
Figure 5.4. Average precision of interactively optimised queries in 18 search topics: a) original query plan words (WORDS) applied, b) original and
supplementary words (WORDS+) applied.
0,980,95
0,91
0,83
0,740,70
0,640,60
0,50
0,25
0,47
0,550,62
0,660,70
0,75
0,84
0,950,89
1,00
0,27
1,00
0,00
0,10
0,20
0,30
0,40
0,50
0,60
0,70
0,80
0,90
1,00
0,0 0,1 0,2 0,3 0,4 0,5 0,6 0,7 0,8 0,9 1,0
Recall
Pre
cisi
on
WORDS
WORDS+

176
conjunction. A mechanical solution would be to accept all other than basic facets as auxiliary
facets and assume that ambiguous or illogical conjunctions are so rare that they do not disturb
experiments. A more elegant way would be to check the conceptual rationale of query plans in
a meeting of original query designers or independent QDs.
5.3.3 Comprehensiveness of facet representation by query terms (Question V.2)
The results of the facet analysis of all relevant documents in the 18 sample search topics
were used to investigate the comprehensiveness of facet representations in inclusive query
plans. The summary of the results was introduced in Section 3.7.2. It turned out that the
original query designer had identified about two thirds of the available expressions in the
relevant documents referring to selected query facets (see Appendix 3). However, the effect of
the missed query terms was regarded as marginal since their occurrences in documents mostly
overlapped with other expressions already covered by the query plans. On the level of a
particular facet rank, the effect of missing query terms was small on recall remaining clearly
smaller than the effect of implicit expressions (see Figure 3.5).
The results of the interactive query optimisation test can be used to estimate the effect of
missing query terms on the standard performance curves, as well as on query exhaustivity and
extent. This can be done by comparing the results of test sets 3 (“WORDS”) and 4
(“WORDS+”). In test set 3, the synonymous groups used in the inclusive query plans were
decomposed, and any disjunctive combinations of query terms could be used within a facet
(see Section 5.2.3.2). The only difference in the test set 4 is that new expressions identified in
the facet analysis of relevant documents were made available. Thus, the comparison of the
results from these test sets should reveal the effects of missed query terms on precision, query
exhaustivity and query extent.
Figure 5.4 illustrates the difference of precision in interactively optimised queries when
applying only query plan terms (WORDS) and also when applying supplementary terms
(WORDS+) identified in the facets analysis of relevant documents. The precision of
interactively optimised queries averaged over recall levels R0.0-R1.0 was 70 % for WORDS, and
74 % for WORDS+. Thus, the effort to identify the last one third of expressions in inclusive
query planning would have helped to achieve an advantage of 4 %. Figure 5.5 presents the
average exhaustivity of interactively optimised WORDS and WORDS+ queries. The
exhaustivity averaged over the whole recall range is 2.9 % higher for queries exploiting

177
supplementary words. Figure 5.638 gives the corresponding figures for proportional query
extent (PQE). The average PQE is 1.7 % higher (PQE difference 0.004) in optimal queries
exploiting supplementary words. The effect of supplementary words is observable from R0.1 to
R0.4, at the region where the precision advantage was also greatest.
The main conclusion of the results presented in Figures 5.4-5.6 is that the average
precision, exhaustivity and proportional extent of interactively optimised queries are slightly
higher when all available query terms are exploited in query planning. Corresponding curves
have taken quite similar shapes. The curves are quite close to each other at both ends of the
operational range, suggesting that missing terms have only a marginal effect on system
performance in high recall and high precision searching.
38 PQE values are calculated here in relation to the total number of expressions identified for a facet in the
facet analysis of all relevant documents in the sample of 18 search topics. Thus, these PQE vales are notcomparable with the PQEs presented in the case experiment discussed in Chapter 4. There PQE values werecalculated in relation to the total number of query terms assigned to a facet in the inclusive query plans.
Figure 5.5 Average exhaustivity of interactively optimised queries in 18 search topics: a) original query plan words (WORDS) applied, and b)
original and suppelementary words(WORDS+) applied.
3,613,39
3,22
2,72
1,78
3,72 3,72 3,83
2,67
1,61
3,003,17
3,333,563,56
3,833,78 3,67
3,83
3,67 3,67 3,72
0,00
0,50
1,00
1,50
2,00
2,50
3,00
3,50
4,00
4,50
0,0 0,1 0,2 0,3 0,4 0,5 0,6 0,7 0,8 0,9 1,0
Recall
Exh
aust
ivit
y
WORDS
WORDS+

178
The benefit of the extra effort to take into account all possible expressions is questionable
in a comparative evaluation like that reported in Chapter 4. On the average, missing terms
punish all systems, methods, etc, to be evaluated equally and should not cause biases in the
results. A share of expressions are ellipses (e.g. “President” instead of “President George
Bush”, or “City” instead of the “City of Tampere”), or connotative expressions like
metaphors. Usually complete expressions giving the literal or factual basis for the reader also
occur in the text. In our data, one third of expressions omitted did not seem to impair the
validity of the experiment. However, from the methodological viewpoint it is necessary to
consider the issue further: Where is the limit for the comprehensiveness of facet
representations if the compromise presented above is acceptable? For instance, are inclusive
query plans containing only one third of the available query terms still acceptable? What
means can an experimenter apply to be sure that the comprehensiveness problem in a
particular experiment is solved satisfactorily?
These questions are difficult to answer since facets are different (broad, narrow, specific,
etc.) and the definite requirement of taking into account all available expressions for a facet
ruins the efficiency of the inclusive query planning operation. A rational solution to the
problem of setting the goal for the comprehensiveness of facet representations is to analyse its
potential interactions with the research variables. For instance, in the case study reported in
Figure 5.6. Average proportional query extent of interactively optimised queries in 18 search topics: a) original query plan words (WORDS) applied,
and b) original and suppelementary words(WORDS+) applied.
0,2910,2570,2180,2270,261
0,221 0,207 0,204 0,201 0,217 0,2290,222 0,2150,250 0,2770,245
0,243 0,222 0,224 0,226 0,221 0,231
0,000
0,100
0,200
0,300
0,400
0,500
0,600
0,700
0,800
0,900
1,000
0,0 0,1 0,2 0,3 0,4 0,5 0,6 0,7 0,8 0,9 1,0
Recall
Pro
po
rtio
nal
qu
ery
exte
nt
WORDS
WORDS+

179
Chapter 4, the role of implicit expressions was essential in explaining the observed retrieval
phenomena. Terms missing from the inclusive query plans have a similar effect on retrieval
phenomena as the implicit expressions in documents. Thus, it is important that the effect of
missing query terms on retrieval performance be made clearly smaller than that of implicit
expressions (see Figure 3.5).
A pragmatic answer to the comprehensiveness problem is that the guidelines for inclusive
query planning define the procedure of query term discovery unambiguously. Basically, the
process of selecting query terms is quite straightforward and not very demanding in terms of
interpretation. The process can be supported by different tools: dictionaries and reference
books for checking synonyms and related terms, index browsing tools including n-gram type
character string matching for checking word form variants, morphological analysers to
identify compound words, and the IR system it self to allow database probing by sample
queries. A major problem in the inclusive query planning process for this study was that no
appropriate tools were available for checking all compound words having a specified head,
e.g. sokeri (sugar) -> ruokosokeri (cane sugar), raakasokeri (raw sugar), hedelmäsokeri (fruit
sugar, fructose). Many of the “effective” query terms missed in the present test collection were
missed because of this problem.
Figure 5.7. Average precision of interactively optimised queries in 18 search topics: a) original query plan word groups (SynGrCNF) applied, b)
ungrouped words (WORDS) applied.
0,47
0,870,82
0,750,71
0,660,61
0,560,53
0,480,42
0,24
0,550,62
0,660,70
0,75
0,840,89
0,951,00
0,25
0,00
0,10
0,20
0,30
0,40
0,50
0,60
0,70
0,80
0,90
1,00
0,0 0,1 0,2 0,3 0,4 0,5 0,6 0,7 0,8 0,9 1,0
Recall
Pre
cisi
on
SynGrCNF
WORDS

180
5.3.4 Effects of query term grouping (Question V.3)
Synonymous expressions within facets were organised into disjunctive query term groups
that were treated undivided like single query terms (see Section 2.3 and Section 3.5.1). This
was done to keep the experiment simpler to conduct in the given environment (within limits
of the TOPIC retrieval software). The proposed method does not require term grouping but it
is a useful approach in some cases. Unfortunately, synonymous groups are a potential validity
risk by simplifying the query tuning space. All queries containing any subset of query terms in
synonymous groups are excluded from the optimisation process.
Figure 5.7 presents the average precision curves for 18 search topics in interactively
optimised queries exploiting a) synonymous groups from the original inclusive query plans
(denoted “SynGrCNF”), and b) the same but ungrouped, freely combinable words (denoted
“Words”). As could be expected, the option of excluding some inefficient words from the
query helped in increasing precision. On the average, queries based on freely combinable
words achieved a precision advantage of 0.09 corresponding to an improvement of 15.6 %. At
low recall levels R0.0 - R0.3, the precision advantage stays between 0.13 to 0.14 while nearly
negligible at the highest recall levels. The results suggest that organising query terms into
synonymous groups reduces precision in high precision searching. However, this does not
Figure 5.8. Average exhaustivity of interactively optimised queries in 18 search topics: a) original query plan word groups (SynGrCNF) applied, b)
ungrouped words (WORDS) applied.
3,61
2,67
1,61
3,83
3,223,33
3,673,67
3,783,78 3,72
2,89
3,00
3,723,72
3,83
3,56 3,56
2,67
1,61
3,333,17
0,00
0,50
1,00
1,50
2,00
2,50
3,00
3,50
4,00
4,50
0,0 0,1 0,2 0,3 0,4 0,5 0,6 0,7 0,8 0,9 1,0
Recall
Exh
aust
ivit
y
SynGrCNF
WORDS

181
necessarily invalidate the results. One situation where problems could arise would be a
comparison of query extent between high precision and high recall searching.
Figure 5.8 demonstrates that query term grouping did not affect the average exhaustivity
of optimal queries. The average query exhaustivity is only 0.01 higher for queries based on
freely combinable words, and the difference in exhaustivity curves was hardly perceptible.
The similarity of the curves suggests that the effects of query term grouping are restricted to
query extent changes. This is good news since it makes the prediction of validity risks much
more straightforward.
The difference in proportional query extent is characterised in Figure 5.939. The average
PQE of the “SynGrCNF” queries was 0.466 while remaining to 0.230 in the “WORDS”
queries. The difference is quite remarkable, being quite steadily above the mean difference at
low recall levels R0.1 - R0.4 (ranging from 0.25 to 0.31), and below the mean difference at high
recall levels R0.5 – R1.0 (ranging from 0.18 to 0.24). On the average, half of the query terms (51
%) in the synonymous groups were useless since they were removed in the word-by-word
39 PQE values are calculated here in relation to the total number of expressions identified for a facet in the
facet analysis of all relevant documents in the sample of 18 search topics. Thus, these PQE vales are notcomparable to the PQEs presented in the case experiment discussed in Chapter 4. There PQE values werecalculated in relation to the total number of query terms assigned to a facet in the inclusive query plans.
Figure 5.9. Average proportional query extent of interactively optimised queries in 18 search topics: original query plan word groups (SynGrCNF)
applied, b) ungrouped words (WORDS) applied.
0,507
0,439
0,261
0,4170,4610,4400,435
0,4730,4850,4700,4750,520
0,2010,2040,2070,221
0,291
0,2570,2290,2180,2270,217
0,000
0,100
0,200
0,300
0,400
0,500
0,600
0,700
0,800
0,900
1,000
0,0 0,1 0,2 0,3 0,4 0,5 0,6 0,7 0,8 0,9 1,0
Recall
Pro
po
rtio
nal
qu
ery
exte
nt
SynGrCNF
WORDS

182
optimisation. The results emphasise that the measured PQE values in the case experiment (see
Section 4.4.2.2 and Section 4.4.4.2) were unrealistically high (about 0.7-0.8 in high recall
searching). This was not only because word-by-word optimisation omitted useless query terms
but also because PQE values were calculated in relation to the total number of terms
representing a facet in inclusive query plans.
To sum up, synonymous groups can be used to increase the efficiency of experimentation
but the comparability of performance and query extent data can be questioned, especially in
studying differences between high precision and high recall searching. Synonymous groups
are also a validity risk within high precision searching since changes in optimal queries are
heavily based on extent tuning at that operational range.
5.3.5 Reliability of the optimisation algorithm (Question R.2)
Is the optimisation algorithm reliable in finding the optimal combination of EQs? At the
verification stage, no faults in operations were identified when the optimisation results were
compared to the results of the “blind search” optimisation. In the comparison of outputs from
two versions of the algorithm, the versions produced identical optimisation results except in
three cases, where errors were identified in the optimisation results of the earlier version. The
errors originated from the manual operations needed in the operation of the first version.
Figure 5.10. Average precision of optimised queries in 17 search topics. Optimisation made a) automatically by the optimisation algorithm (AutOpt), b) interactively in CNF
(IntOptCNF), and c) interactively in the same form as in AutOpt (IntOpt).
0,820,77
0,720,67
0,630,58
0,52
0,45
0,890,89
0,26
0,840,84
0,490,54
0,57
0,67
0,76
0,24
0,43
0,500,55
0,580,62
0,680,72
0,770,83
0,00
0,10
0,20
0,30
0,40
0,50
0,60
0,70
0,80
0,90
1,00
0,0 0,1 0,2 0,3 0,4 0,5 0,6 0,7 0,8 0,9 1,0
Recall
Pre
cisi
on
AutOpt
SynGrCNF
SynGr

183
Interactive query optimisation test set 2 (“SynGr”) was designed for testing the
performance of the optimisation algorithm. Queries formulated in test set 1 were in
Conjunctive Normal Form (CNF) but queries formulated in test set 2 corresponded exactly to
the query structures produced by the automatic optimisation algorithm. Because queries in
test set 2 are complex to compose manually the main effort was put into test set 1. After test
set 1 had been completed, the queries of test set 2 were formulated using optimal queries from
the test set 1 as a starting point. SynGr queries did not perform much better than SynGrCNF
queries. The precision difference between the two types of interactively generated optimal
queries was nearly unnoticeable (0.005).
Figure 5.10 presents precision curves for the interactively optimised queries “SynGrCNF”
and“SynGr”, as well as for the automatically optimised queries “AutOpt” averaged across 17
search topics40. From now on, the results of the set “SynGr” are used as a reference for
interactively optimised queries unless otherwise stated. The average precision over recall
levels R0.0 – R1.0 was 0.62 for the interactively optimised queries, and 0.65 for the automatically
optimised queries. The difference was quite small (0.03) for the benefit of the automatic
operation. One exception is the lowest recall level R0.0 where the interactive optimisation
procedure achieved a slightly higher average precision. The reason is that the optimisation
algorithm was not designed to optimise queries below R0.1. Thus all precision values at R0.0
were interpolated values from R0.1. The test searcher found some optimal queries between R0.0 -
R0.1, and improved precision at the very lowest recall level.
On the average, interactive query optimisation could not exceed the performance of the
automatic optimisation algorithm. However, a more precise analysis of optimisation results
revealed that automatic optimisation did not find always the optimal EQ combination. In total,
the test consisted of 198 optimisation cases (11 recall levels x 18 search topics). Table 5.6
sums up the results of the detailed analysis of the optimisation test.
40 One search topic was excluded from this comparison because the data for the original EQs were slightly
corrupted.

184
The automatic optimisation operation was better or performed equally well in 92 % of the
198 optimisation events. In 16 cases out of 198 optimisation events (8 %), the interactive
optimisation procedure yielded better performance than the optimisation algorithm. In 6 cases
dealing with a single search topic (no. 12), the original data had been corrupted and an equal
performance was not possible. Another 3 cases of failure were caused by the restriction in the
optimisation algorithm discussed above (the algorithm does not optimise queries below recall
level R0.1). Differences in parsing the text strings in the indexing process between TOPIC and
TRIP retrieval systems caused 3 of the failures (character “-“ was interpreted as a character by
TRIP and as a character string separator by TOPIC).
The analysis revealed that 4 of the failure cases (2.0 %) really questioned the performance
of the optimisation algorithm. These cases concerned one search topic (no. 26). Partially
different EQ sets were combined by the different operations, but the reason for this was hard
to find manually because of the large number of EQs available. The cases mentioned might be
examples of suboptimal performance of the optimisation algorithm. Whether or not this is the
case, the test gives indicative verification, at least, that suboptimal performance is very rare.
However, the test did not give any evidence to refute the suspicion that in some special cases
the algorithm could perform poorly since we were not able to make an analytical worst-case
analysis. A heuristic procedure is open to errors in some situations. That is the price to be paid
for avoiding expensive blind search approaches, or the massive use of human resources (for
instance, extensive experiments using the IR Game).
Table 5.6. Summary of results from the detailed analysis of the performance test of the optimisationalgorithm.
Result category No %Automatic optimisation better 98 49.6Equal result 84 42.4Interactive optimisation better
1. 6 cases: data corrupted in original material (one topic)2. 3 cases: recall level 0.0 (3 topics)3. 3 cases: different indexing in TOPIC and TRIP (3 topics)4. 4 cases: unknown (one topic)
16 8.1(3.0)(1.5)(1.5)(2.0)
Total 198 100

185
5.3.6 Validity of query structures (Question V.4)
Are the structures of automatically optimised queries similar to those composed by a
human searcher? Actually, the problem was that the optimisation algorithm did not
necessarily generate queries in Conjunctive Normal Form (CNF) and a concern was
expressed whether this could reflect as biases on measured query structures. The issue can
be treated by comparing the measured structures of the original optimised queries and
interactively optimised queries in test sets 1 and 2. In the background it is good to
remember the differences in precision curves of corresponding queries (see Figure 5.10).
Figure 5.11 introduces the average exhaustivity curves for the three sets of optimised
queries. On the average, the exhaustivity was 0.7 % higher in the automatically optimised
queries than in the interactively optimised queries. The average difference is small but in the
mid-recall range from R0.3 to R0.8 the exhaustivities vary quite a lot. The curves intersect each
other more than once and there does not seem to be any systematic tendency making some
difference between the curves.
Figure 5.12 presents the comparison of average proportional query extent figures. On the
average automatic optimisation yielded the highest PQE values but comparisons are difficult
to make since extent data for automatically optimised queries is available only for six recall
Figure 5.11. Average exhaustivcity of optimised queries in 17 search topics. Optimisation made a) automatically by the optimisation algorithm (AutOpt), b)
interactively in CNF (SynGrCNF), and c) interactively in the same form as in AutOpt (SynGr).
3,88 3,76 3,71
3,353,12
2,65
3,764,00 4,00
3,88
3,50
3,82 3,823,76
3,65
1,59
3,71
3,823,82
3,71 3,653,35
3,24
2,88 2,65
1,59
3,75 3,75
3,88
3,25
2,88
2,63
1,38
0,00
0,50
1,00
1,50
2,00
2,50
3,00
3,50
4,00
4,50
0,0 0,1 0,2 0,3 0,4 0,5 0,6 0,7 0,8 0,9 1,0
Recall
Exh
aust
ivit
y AutOpt
SynGrCNF
SynGr

186
levels. The shape of PQE curves is similar, and differences, as in the earlier figures, are small
at the lowest and highest recall levels and increase towards mid range.
The above comparison of query structures in differently optimised queries does not
indicate any special validity problem in queries optimised by the simple operation used so far.
However, this is not to say that it is useless to develop more elaborated optimisation
algorithms capable of generating optimal queries in CNF. The major problem obviously is the
interpretation of query extent and PQE results. Both the simplification of the optimisation
algorithm, and the grouping of synonymous query terms increased query extent values
artificially.
5.4 Efficiency of the method
Tague-Sutcliffe (1992) defined efficiency to be the extent to which an experiment is
effective (i.e. valid and reliable) relative to resources consumed. Efficiency issues emphasise
research economic criteria in the evaluation of a method. A valid and reliable method is not
very useful if the required resources are not on the same scale as expected output from the
experiment. For instance, in large collaborative research enterprises higher costs can be
Figure 5.12. The average PQE of optimised queries in 17 search topics. Optimisation made a) automatically by the optimisation algorithm (AutOpt), b) interactively in CNF
(SynGrCNF), and c) interactively in the same form as in AutOpt (SynGr).
0,530,55 0,55
0,60 0,59 0,60
0,65 0,630,64
0,84
0,690,66
0,58 0,60
0,54 0,55
0,81
0,85
0,600,58
0,660,64
0,560,560,530,540,510,53
0,00
0,10
0,20
0,30
0,40
0,50
0,60
0,70
0,80
0,90
1,00
0 0,1 0,2 0,3 0,4 0,5 0,6 0,7 0,8 0,9 1
Recall
Pro
po
rtio
nal
qu
ery
exte
nt
AutOpt
SynGrCNF
SynGr

187
afforded than in small scale experiments. The economics of a new method can also be
analysed by comparing it with methods currently used for corresponding experiments.
Efficiency issues are quite different when a method is applied to create experimental facilities
for a whole research programme as a single investment, and when a method is in routine
experimental use. For instance, higher costs are acceptable when a method yields a test
collection that can be exploited later in different types of experiments.
5.4.1 Efficiency of inclusive query planning (Question E.1)
In a typical IR experiment, not much attention is paid to the query formulation process.
Professional or novice searchers have been used in most experiments on operational IR
systems. The searchers have had quite free hands in designing queries (see Turtle 1994, Lu et
al. 1996, Paris & Tibbo 1998). In some cases, the researcher has composed the test queries by
herself (e.g. Tenopir 1985). Blair & Maron (1985) set general recall goals for the searchers but
did not control or analyse the resulting queries. It may take 30 minutes or an hour to complete
a typical search. A group of searchers may be used for each search topic but the cost of the
total process is not very high. What is the output of the process? A set of queries reflecting
average user and system performance in a given situation is generated. The queries are usually
designed for a single study, and can only be exploited for this.
Inclusive query planning is an investment that is made to create a test collection that can
be exploited in different types of system-oriented experiments. Higher costs can be afforded
than in a single experiment. In our case, the original inclusive query plans for 35 search topics
required about three months of design work but this included all the false steps necessary to
understand and to develop all routines. Through the explicit and straightforward guidelines of
the task, and with better tools the process could be accelerated. It is realistic to estimate that,
on the average, an inclusive query plan can be completed in 5-8 hours (per searcher). The
variation in required time is considerable. A simple and narrow search topic can be processed
in an hour, but a complex and broad topic may require an effort of days. The total cost of an
inclusive query plan per search topic can be estimated to be about 5-8 hours x no of
simultaneous searchers x average hourly wages.
A rough idea of the costs can be derived from the above estimates, but what is the benefit
of this investment? As pointed out in Section 3.8, an inclusive query plan is a comprehensive
conceptual representation of a search topic. It can be used for a large number of purposes. The
experiment on Boolean queries demonstrated in this study is only one of these. The conceptual

188
structures of inclusive query plans can also be exploited in experiments on best match IR
systems. Actually, this has been demonstrated in Järvelin et al. (1996). Nor is it necessary to
use any optimisation operation in applying the query plans. Traditional experimental designs
can also be applied to study, for instance, the issues of query expansion or query structures.
An experimenter may also benefit indirectly from inclusive query plans. For instance,
inclusive query planning can be applied to improve recall base estimates, and make the hunt
for relevant documents more effective (discussed further in Section 5.4.2). The comprehensive
conceptual representation can be used to categorise search topics to increase the analytical
depth of experiments. Inclusive query plans are also a reference that can be used in user-
oriented studies to analyse user generated queries.
It is easy to give an answer to the efficiency question E.1 (see Table 5.1) by comparing the
list of potential uses and the cost estimates presented above. The extra cost of the proposed
query planning approach is low in relation to the expected profits. Of course, this conclusion
presupposes that the potential uses of the inclusive query plans match the goals and research
problems of an experimenter.
5.4.2 Efficiency of recall base estimation (Question E.2)
Reliable methods for discovering the set of relevant documents are required in studying
high recall performance of an IR system. Reliable recall base estimates are also an advantage
in high precision oriented experiments. In the case study, it was demonstrated that the number
of relevant documents is an important variable that should be controlled – also when operating
at the high precision end of an IR system (see Section 4.4.3). Requirements for reliable recall
base estimates tend to increase costs. The number of examined documents is usually the main
variable in the cumulation of costs. Other cost components are more or less fixed by the
rigorous reliability and validity requirements (e.g. what items are used in assessments, how
thorough the process of judging is, how many judges are used).
Inclusive query planning and the use of extensive queries applying basic facets may sound
like an expensive process but actually it can be used to improve the efficiency of recall base
estimation. A clear weakness of the pooling method as implemented in TREC is that it trusts
on the larger number of participants (research groups) using a wide spectrum of matching
algorithms so exclusively. For instance, in TREC5, the average number of documents in the
pool for a search topic was 2,671 of which 4.1 % (110 documents) were judged relevant

189
(Voorhees & Harman 1997). The process is expensive because so many non-relevant
documents have to be judged to find a relevant one.
In our test collection, the share of relevant documents was 7.4 % of all documents judged.
The share of relevant documents in our set of documents judged was clearly higher,
suggesting that our approach helps in reducing the costs of relevance assessments. This does
not illustrate the whole potential for cost reductions. The extensive queries based on the
original inclusive query plans retrieved 89 % of the presently known relevant documents.
About 24 % of the 5,018 judged documents were relevant (see Table 3.1). Supplementary
probabilistic queries retrieved about 9,900 new documents but these increased the number of
relevant documents by only 10 %. These queries were designed for a query expansion study
(Kekäläinen 1999), and were by no means optimised for the cost-effective recall base
development. However, the experience pushed forward an idea that a conscious use of
Boolean and probabilistic queries in search for relevant documents could increase the
effectiveness of the process, and make the pooling idea also work for single research groups
having limited resources.
Substantial cost reductions are possible by allocating resources on inclusive query
planning made by expert searchers, and by combining most remote and extensive Boolean and
probabilistic query types. The power of the Boolean IR model is in the predictability of the
exact match processing of queries and in query structures supporting the representation of
conceptually justified statements. Probabilistic queries are useful in complementing Boolean
queries in retrieving documents containing implicit expressions for some query facets. Further
research is needed to find the query types that best complement each other.
The answer to the efficiency question E.2 (see Table 5.1) is "no". If the required reliability
level of a recall base is fixed, the proposed method for collecting the pool of documents for
relevance judgements seems to reduce the total number of documents judged. However, the
effective search strategies for recall base estimation need more research since, for instance, the
capability of structured probabilistic queries was not really studied here.
5.4.3 Computational efficiency of the optimisation algorithm (Question E.3)
The case experiment demonstrated that the efficiency of the algorithm was not a problem
with the present data. The estimated number of optimisation laps for the 35 search topics and
three databases was about 84,000 in the case experiment (see Section 4.3.2), and these
optimisations took some two weeks to run. However, these figures do not say much about the

190
efficiency in large query tuning spaces since query terms were organised into semantically and
statistically homogeneous groups. The groups substantially reduced the number of EQs and
also the load of the optimisation algorithm. Although the computational efficiency of the
optimisation algorithm was not a major concern in this study, it is necessary to analyse the
potential efficiency problems as a function of the size of the input.
The running time of an algorithm can be estimated either by benchmarking or by
analysing its operations. We selected the latter option since the basic operations of the
optimisation algorithm are quite straightforward to analyse, and standard tests were not
available for benchmarking. Determining a precise formula for the running time T(n) of a
program, i.e. the number of time units taken on any input of size n, is a difficult, if not
impossible, task. So called “Big-Oh” notation O(f(n)) is used to estimate the upper bound on
T(n), where f(n) is some function of n categorising the growth rate of the running time. For
instance, O(1) denotes a constant running time, or at least that it is independent of the size of
the input. O(1) as well as logarithmic O(log n), linear O(n), and close to linear O(n log n)
growth rates are seen as easy cases while, e.g. quadratic O(n2), cubic O(n3), or exponential
O(2n) predict efficiency problems. (Aho & Ullman 1992, 85-95).
The optimisation algorithm operates mainly with three tables. (The described data
structures and operations of the optimisation algorithm are simplified here. Only those
features that are needed to illustrate the efficiency risks are mentioned.) The input data
describing the contents of the EQ result sets is organised into the basic table EQ(EQ_NO,
DOC_ID, REL), where EQ_NO is the identification number for an elementary query (EQ),
DOC_ID is the identification number for a document retrieved by the EQ, and REL is the
relevance degree of the document, respectively. The basic table contains one line for each
document retrieved by a particular EQ. To be able to compare the properties of the available
EQs (see Section 2.5.3), the algorithm calculates a sum table EQ_SUM(EQ_NO,
NO_OF_RELS, NO_OF_NRELS, PREC), where NO_OF_RELS and NO_OF_NRELS are the
numbers of relevant and non-relevant documents retrieved by an EQ, and PREC the
corresponding precision. The data associated with the EQs creating the optimal query are
accumulated in the output table OPT(EQ_NO, DOC_ID, REL). The content of the basic table
is gradually emptied, the sum table is recalculated and resorted accordingly, and the
optimisation result is accumulated the output table.

191
The optimisation algorithm comprises four major operations on the three tables described
above following each other in a loop:
1. The sum table is calculated/recalculated from the basic table at the beginning of each loop.
2. The lines of the sum table are sorted in order of descending precision (to create theefficiency list, see Section 2.5.3).
3. The EQ matching the selection rules is assigned to the optimal query and correspondinglines from the basic table are added to the output table.
4. The lines containing the same DOC_IDs as were associated with the selected EQ aredeleted from the basic table.
The running time of the first operation belongs to the O(n) category since it increases linearly
as a function of the number of EQs treated. The table has to be scanned through once to create
the sum table. The efficiency of the second operation, sorting, is more sensitive to the size of
the input. According to Aho & Ullman (1992, 111-112), the running time of merge sort is of
type O(n log n). The running time of the third operation is only dependent on the number of
lines moved into the output table (always << n, if n is large), i.e. of type O(1). The fourth
operation is similar to the first one, and the growth rate of the running time is a linear function
of the input size. Applying the summation rule (see Aho & Ullman 1992, 98-99) we may say
that the upper bound on the running time of a loop of the optimisation algorithm T(n) =
T1(n)+T2(n)+T3(n)+T4(n) ≈ O(n)+O(n log n)+O(1)+O(n) ≈ O(n log n).
The maximum number of sequential loops executed during an optimisation lap equals the
size of the recall base of a search topic because, after each sorting, an EQ containing at least
one relevant document is moved into the output table. Thus, the maximum of the total running
time could be Ttot(n) ≈ R x O(n log n), where R is the size of the recall base. However, applying
the "constants do not matter" rule by Aho & Ullman (1992, 100) R can be removed from the
"Big-Oh" formula. The size of the recall base is not dependent on the input size n. The
conclusion is that the running time of the optimisation algorithm should be manageable if the
number of EQs is finite.
From the practical viewpoint, a further question can be raised: How large sets of EQs may
appear? The column “Max EQs” in Table 3.3 indicates that the number of EQs generated
from the inclusive query plans at the highest exhaustivity level ranged from 60 to 2.1x10⁶ in
the test collection of the case experiment if the synonymous query terms had not been
grouped. In theory, the highest number of sorted EQs could have been in the order of millions.

192
In practice, only those EQs that have retrieved relevant documents are sorted. It is quite likely
that most of the EQs in the largest query tuning spaces do not retrieve any relevant documents.
In the largest query tuning spaces, the exhaustivity of the EQs is high, and the extent of
facets in the underlying inclusive query plans is also high. On the other hand, the number of
relevant documents per search topic is always limited (in the order of tens or, perhaps,
hundreds) and it is not dependent on the size of the query tuning space. Under these
circumstances one may predict that:
1. The number of unique expressions occurring in a typical relevant document is limited
for each query facet. There is no reason to believe that the number of unique
expressions strongly correlates with the broadness of facets. This should mean that in a
larger query tuning space a smaller share of the available EQs retrieves relevant
documents.
2. Harter (1990) made the observation that documents retrieved by query terms assigned
to broad, multi-meaning facets seldom overlapped. This means that, in an absolutely
extreme case, each relevant document is retrieved only by one, and unique EQ, and that
the maximum number EQs processed does not exceed the number of relevant
documents known for a search topic!
3. The high exhaustivity of EQs means smaller average result sets, and again increases the
probability of empty result sets, especially because the extent of queries is reduced to
the minimum.
To get a rough idea of how large a share of the generated EQs have to be really processed,
a calculation was made using the search topic no. 29, generating the largest EQ set as an
example. For Exh=4, the number of EQs without grouping was 2.1x10⁶ (see Table 3.3), and
512 when synonymous groups were applied (see Table 3.6). 126 of the 512 EQs retrieved at
least one relevant document, i.e. about 25% of all EQs were really processed by the
optimisation algorithm. The average number of relevant documents retrieved by a processed
EQ was as low as 1.8. When individual query terms are applied, each of the 512 EQs is split,
on the average, into 4,100 elementary conjunctions. (This estimate was derived by dividing
the number of EQs generated without synonymous grouping by the number of EQs generated
when synonymous groups were applied, i.e. 2,100,000/512=4,101.) The question is, how many of the
4,100 combinations of four query terms really occur in the 1.8 relevant documents? The point
is that while the number of EQs generated may rise quite high in complex and broad search

193
topics, various opposing factors slow down the growth in the number of EQs actually
processed.
Thus we may conclude that a sufficient answer could be found to Question E.3 (see Table
5.1). The case experiment showed that the algorithm worked with an acceptable efficiency
with a realistic data set. Larger search spaces are quite likely to be composed in future
experiments but the requirements for the computational power do not seem to be too difficult
to solve.
5.5 Summary of the reliability, validity, and efficiency evaluation
The validity, reliability, and efficiency issues of the proposed evaluation method were
addressed in this chapter. The main focus was on the two operations unique to the procedure
of the proposed method: inclusive query planning and automatic query optimisation. Nine
critical questions were formulated (see Table 5.1), and answered. The answers were based on
extensive empirical tests like the facet selection test, and the interactive query optimisation
test, as well as on logical argumentation like the analysis of costs associated with the
operations of inclusive query planning and recall base estimation.
The results showed that the potential query tuning space can be represented
comprehensively by applying the inclusive query planning operation. Resulting query plans
were highly exhaustive (Question V.1), and the selected facets were covered by alternative
query terms well enough for studying query extent tuning (Question V.2). The facet selection
test demonstrated that experienced query designers are quite consistent in naming the basic
facets of a given search topic (Question R.1). The observed consistency in the selection of
basic facets and the good coverage of alternative query terms in inclusive query plans
strengthen the basis of extensive queries as a tool of recall base estimation. Potential problems
were pointed out in the way of organising query terms into synonymous groups within facets
(Question V.3). Term grouping makes the optimisation process simpler but, unfortunately, it
induces a validity risk making the interpretation of query extent results difficult. The main
conclusion from the above results is that the inclusive query planning operation is well
established and does not suffer from any major reliability or validity risks when applied
appropriately.
The interactive query optimisation test gave convincing results of the reliability of the
automatic query optimisation algorithm, and of the validity of resulting query structures. The
performance of the automatic algorithm could be exceeded by the test searcher only in very

194
few cases (Question R.2). It was also shown that the straightforward way of combining EQs
did not cause biases in the structures of the optimised queries (Question V.4).
The inclusive query planning operation was shown to be effective in terms of research
economy. The cost of providing a test collection with inclusive query plans was considered
low in relation to the benefits achieved. The query plans produced can be used to conduct
different types of experiments (Question E.1). The results also suggested that inclusive query
planning and especially extensive queries can be used to reduce the cost of recall base
estimation (Question E.2). The computational efficiency of the optimisation algorithm was
analysed (Question E.3), and a clear conclusion could be drawn that the algorithm can handle
all conceivable sizes of input. The algorithm was shown to be efficient enough to run the case
experiment – a realistic situation to apply the algorithm.

195
6 CONCLUSIONS
The research problems of this thesis were introduced in Section 1.4. The main goal was
to design, demonstrate and evaluate a new evaluation method for measuring the ultimate
performance limits of Boolean queries across a wide operational range by developing
further the ideas introduced by Harter (1990). Three research problems were formulated by
applying the framework proposed by Newell (1969) for defining a method as a triple
M={domain, procedure, justification}:
1. Domain of the method. The problem was to define the goals of the method andspecify its appropriate application area.
2. Procedure of the method. The problem was to define the ordered set of operationsconstituting the procedure of the method. Two major operations specific for theproposed method needed especially to be elaborated: how query tuning spaces arecreated, and how queries are optimised.
3. Justification of the method. The problem was to justify the appropriateness,validity, reliability and efficiency of the method in conducting evaluations.
The work on the research problems has been reported in the preceding chapters. This
chapter sums up the answers to the research problems, discusses the contribution of the
method in the light of research literature, and outlines some needs for further research.
6.1 The domain of the method
The proposed method was expected to serve in the system-oriented, wide range
performance evaluation of Boolean IR systems. The method was developed and
demonstrated in the context of full-text indexed full-text databases but there is no reason to
doubt the applicability of the method to Boolean queries in other types of databases, too,
e.g. in bibliographic or manually indexed image databases. Because the proposed method is
designed for system-oriented experiments it shares many of the presuppositions and
restrictions typical of the Cranfield paradigm. The focus is on the matching process, i.e.
comparing queries with the representations of documents. The basic unit of observation is
a query based on a well-defined search topic. All relevant documents are expected be
known in the test database. These restrictions obviously exclude from the domain of the
method user-oriented research problems, e.g. studies on interactive search processes.

196
The potential application area of the method has already been discussed in Section 2.7,
and further in Section 4.6 by elaborating the lessons learned in the case experiment. Two
unique characteristics of the method help to comprehend its potential:
1. Performance can be measured at any selected point across the whole operational range,and different standard points of operations (SPO) may be applied (fixed recall levels,and DCVs).
2. Queries under consideration estimate optimal performance at each SPO, and querystructures are free to change within the defined query tuning space in search of theoptimum.
The domain of the method can be characterised by illustrating the kinds of research
variables that can be appropriately studied by applying the method. Experiments are
designed to reveal how a change in the value of an independent variable affects the value
of dependent variables while the value of control variables is held constant, or in some
cases either neutralised or randomised (Fidel & Soergel 1983). In the proposed method,
query precision, exhaustivity and extent are used as dependent variables. The standard
points of operation (SPO) are used as the control variable. Independent variables may relate
to:
1. documents (e.g. type, length, degree of relevance),
2. databases (e.g. size, density),
3. database indexes (e.g. type of indexing, normalisation of words)
4. search topics (e.g. complexity, broadness, type), or
5. matching operations (e.g. different operators).
Figure 6.1 illustrates a typical experimental setting. Comparing the figure to the
comprehensive framework of online bibliographic retrieval proposed by Fidel & Soergel
(1983) reveals that important categories of variables are excluded here, e.g. the setting
(organisational context), the user (of information) and the searcher.
In a comparative evaluation, one independent variable is given two or more values (e.g.
two differently indexed databases are used) keeping other (left hand side) variables
constant. At each SPO, the optimal queries are searched in the optimisation operation from
the query tuning space by applying both (all) values of the independent variable. The
effects of the change in the independent variable are revealed by analysing the performance
and other characteristics of the optimal queries.

197
The goal of the proposed method is to help in "measuring the ultimate performance
limits of Boolean queries" (see Section 1.4). In our case, especially, the comprehensiveness
and integrity of the query tuning space (based on the quality of inclusive query planning)
sets the fundamental limits for the possibility of measuring the ultimate performance limits.
When talking about the ultimate performance limits, we do not refer to universal, generally
applicable performance limits of Boolean queries. Rather, ultimate limits refer to a
particular context characterised by particular document types, a particular database
implementation, a particular type of indexing, and a particular set of inclusive query plans
(query tuning spaces). In this particular context, one retrieval technique or setting is
compared to another. In that comparison, it is necessary that the query tuning spaces for
both systems compared be equally comprehensive and solid, and that the method is capable
of measuring both systems at their ultimate performance levels in that particular context.
The method is designed for comparative evaluations, and is not qualified without questions
for determining the ultimate performance limits of Boolean queries in general, e.g. in terms
of literal precision values. The inclusive query plans are to guarantee that no observable
difference in the performance of systems is missed because of any easily avoidable
shortcomings in the queries.
eq1
eq2
eq3
eq4
eq5
eq6
eq7
eq8
eq9
.
.
.
.
.
eqn
Optimisation operation inthe Boolean query tuning space
Control variables- standard points of operation- inclusive query plans
Independentvariables;properties of - documents- databases- database indexes- search topics- query operators
Dependentvariables;query properties - precision- exhaustivity- extent- types of keys
Figure 6.1. A characterisation of the domain of the proposed evaluation methodthrough a model of a typical experimental setting.
EQs

198
The core domain of the method has been defined above. However, it is appropriate to
consider additional uses of the method in conjunction with other methods. For instance, the
comparison of Boolean and probabilistic IR systems can be designed by using the same test
collection (including database, search topics, inclusive query plans, and relevance data),
and by applying the proposed method to generate the optimal Boolean queries. Optimal
probabilistic queries have to be composed by some other method that is not discussed.
There may occur some validity problems in the comparison but this approach could be
useful in revealing typical cases, e.g. in what kind of search topics either of the systems
tend to process better. Similarly, the optimal queries can be used as a point of reference in
user-oriented studies. The comparison could help in estimating how close the real user is
able to approach the optimum, and in which kinds of search topics the user has the worst
problems.
The domain of the proposed method including the goal has been described above. This
is the answer to the first research problem: the domain of the method (see Section 1.4).
6.2 Procedure of the method
The procedure of the method was described as the ordered set of operations in Chapter
2 including the flow chart in Figure 2.2. The procedure consists of 9 operations at three
operational stages:
STAGE I. QUERY FORMULATION
1. Formulate an inclusive query plan for each given search topic. The inclusive queryplan of a search topic is a comprehensive representation of the query tuning spaceavailable for that topic. (see Section 2.2.3).
2. Conduct extensive queries and obtain relevance judgements. The goal of extensivequeries is to gain reliable recall base estimates. (see Section 2.4).
3. Determine the order of facets. The facet order of inclusive query plans isdetermined by ranking the facets according to their measured recall power, i.e. theircapability to retrieve relevant documents. (see Section 2.2.3).
STAGE II. QUERY OPTIMISATION
4. Convert the inclusive query plans into elementary queries (EQ). Inclusive queryplans in the conjunctive normal form (CNF) at different exhaustivity levels aretransformed into the disjunctive normal form (DNF) where the elementaryconjunctions create the set of elementary queries. (see Section 2.3).
5. Execute elementary queries. All elementary queries are executed to find the set ofrelevant and non-relevant documents associated with each EQ.

199
6. Select standard points of operation (SPO). Both fixed recall levels R0.1,…,R1.0 andfixed document cut-off values, e.g. DCV2, DCV5,…,DCV500 may be used as SPOs.(see Section 2.6).
7. Find the optimal combination of elementary queries (i.e. optimal queries) for eachSPO. An optimisation algorithm is used to compose the combinations of EQsperforming optimally at each selected SPO.
STAGE III. EVALUATION
8. Measure precision at each SPO. Precision can be used as a performance measure.Precision is averaged over all search topics at each SPO.
9. Analyse the characteristics of optimal queries. The optimal queries are analysed toexplain the changes in the performance of an IR system.
The goal of the query formulation stage is to create the comprehensive and solid
representation of the available query tuning space consistently for each search topic. The
human component of searching is heavily involved at this stage: an expert query designer
composes the inclusive query plans. The development of the inclusive query planning
operation was based on a thorough analysis and elaboration of earlier research concerning
query planning strategies and resulting query statements (see e.g. Fidel 1991, Iivonen
1995a-c).
The concept of inclusive query planning is a major contribution of this thesis. The
development of the new approach was necessary because the seminal idea by Harter (1990)
did not give a clear scenario of how query planning should be made. The traditional
approach in query formulation using professional searchers to replicate their routine query
formulation practices (see e.g. Blair & Maron 1985, Hersh & Hickam 1995, or Turtle 1994)
was likewise not valid since it does not support the measurement of performance across a
wide operational range. An additional innovation was the use of extensive queries derived
from the inclusive query plans. Extensive queries are a technique to increase the reliability
of recall base estimates as well as decreasing the costs of obtaining relevance data.
The query optimisation stage aims to find the optimal query from the query tuning
space at each SPO. The operations at this stage are quite technical (e.g. CNF/DNF –
conversion), but also raise some challenging problems (e.g. performance of the
optimisation algorithm). The main contribution at this stage was the innovation to adapt the
heuristic algorithms developed for the 0-1 Knapsack Problem of physical objects into the
problem of finding the optimal combination of Boolean query sets. Harter (1990)
introduced two ideas: blind search and the iterative process of creating the most rational

200
path. However, the approach by Harter missed one necessary component of the operation to
make it work in practice: the use of the standard points of operation as optimisation
constraints. The analytical approaches (e.g. Heine & Tague 1991, Losee 1994, and Losee
1998) for the optimisation of Boolean queries still lack empirical verification, and it is
unclear in what kinds of environments they are applicable. The proposed optimisation
operation and the analytical approaches can be seen as complementary research strategies
rather than competing ones.
The object of the evaluation stage is to collect and analyse data needed in the
evaluation of Boolean queries resulting from the two or more settings compared. The
processes of data collection and analysis introduced (see Section 3.6 and Section 3.7) do
not contain radically new ideas but rather show the way how to modify the present
practices to meet the requirements of the new types of data. For instance, the interpolation
of precision data at selected DCVs (see Section 3.6.1) required new practices. Similar
practices have been developed for the experiments based on the coordination level
approach, but the available sources do not discuss these issues in detail (see Cleverdon
1967, Keen 1992).
The characteristic of the test collection including search topics (see Section 3.7.1),
inclusive query plans, and known relevant documents (see Section 3.7.2) were discussed at
a level of details that has been exceptional in earlier research publications. This was done
to emphasise the importance of knowing the characteristics of the test collection in making
controlled experiments by the proposed or other methods. The ways of presenting the data
concerning the performance and structures of optimal queries were shown in Section 4.4.
The conclusion from this section is that an acceptable answer was formulated to the
second research problem: the procedure of the method (see Section 1.4). Sufficient
approaches were developed for both the query formulation and query optimisation
operations of the proposed method. The operational pragmatics of the method were
introduced in detail in Chapter 4 so that experienced researchers should be able to replicate
the case experiment and apply the procedure in any appropriate evaluations.
6.3 Justification of the method
The domain including the goals, and the procedure of the proposed method were
described above. The proposed method has the ambitious goal of being able to plausibly
measure the performance of Boolean queries across a wide operational range, something

201
that has not been possible by the traditional methods. The power of the method is based on
a unique procedure containing new innovative operations. The final step in defining the
method is to assure that the method is appropriate in achieving new research results or
questioning the old ones within the defined domain. In addition, the operations of the
method have to be valid, reliable and efficient before the method is well established.
6.3.1 Appropriateness of the method
The case experiment reported in Chapter 4 was intended to be the major effort to show
the appropriateness of the method in practice. The results of the case experiment are not
summarised here but, rather, the reasons why the proposed method is capable of gaining
new results, or to question old results, are discussed. The starting point is the suggested
domain of the method, and the list of potential research variables listed in Section 6.1.1.
Although these variables are related to quite basic elements of the Boolean IR system, it is
quite obvious that the domain has not been well covered in the past research. One reason
for the present situation may be that traditional evaluation methods are not quite
appropriate in studying the problems of the domain defined.
Two basic approaches have been applied to study the effects of the left-hand side
variables listed in Figure 6.1 on the query variables. The first of the traditional
experimental designs is that a group of searchers is asked to make queries: a single query
per search topic per person. The drawback of this approach is that the researcher has no
control over the query formulation process. Recall and precision values are separately
averaged over the searchers and search topics. Averaging a pool of queries (arbitrarily
distributed over the operational range) tends to mask the effects of independent variables as
pointed out by Cleverdon (1972). This may explain why, for example, an extensive study
by Saracevic et al. (1988) considering among other things the effects of search topic and
query variables on retrieval performance achieved so few conclusive results.
Another traditional approach is to design a controlled experiment based on fixed query
structures or fixed contents. For instance, the performance of queries exploiting either the
full texts, abstracts, titles, or index terms of documents were compared by Tenopir (1985)
using identical (in the three first cases), or identically structured queries (the last one, index
terms). Similarly, the experiments on proximity operators have been based on identical
query structures where only the conjunctive operators have been changed (see Tenopir &
Shu 1989 and Kristensen 1993). Studies on the performance effects of database indexes

202
composed from differently normalised words (e.g. Alkula & Honkela 1992), or studies on
query expansion in Boolean queries (Kristensen 1993) have been based on identical facet
structures. Only the sets of disjunctive query terms within facets have changed from one
setting to another.
Although the above studies were more focused and controlled experiments than the
field studies like that of Saracaevic et al. (1988), they, too, have not solved the “single
query per search topic” problem. It is hard to get a clear picture of the relations between
variables since query results from different operational levels are merged in averaging.
Another methodological problem is that the potential effect of query exhaustivity has not
been taken into account. Different retrieval techniques or database implementations may
achieve optimal performance at different exhaustivity levels. This may ruin the findings
based on the use of fixed query structures or limit their application area, as was shown in
Section 4.5.3.4 in the case of proximity operator studies. Our study showed that query
content and query structure interact, and that both factors should be taken into account in
designing experiments.
One solution to this problem is to design a series of queries at different exhaustivity
levels. Experiments designed this way have been carried out by Kekäläinen & Järvelin
(1998) and Kekäläinen (1999) but only in probabilistic IR systems. They evaluated the
effects of query exhaustivity, query expansion and query structures on the performance of
probabilistic queries. If this approach were applied to Boolean queries, the drawback would
be that the number of test queries becomes easily unmanageable in studying queries in a
large and fine-grained query tuning space. Basically, the traditional approach requires that
all queries of the query tuning space are formulated and executed (see the example of
2.3x10²³ different queries in Section 3.5.1). The question is how fine, and dynamically
changing details of queries can be studied. However, the efficiency advantage of the
proposed method can be fully exploited only if all processes concerning the EQs were
automated.
The main conclusion of the above appropriateness analysis is that, within the defined
domain, the proposed method offers clear advantages over traditional evaluation methods.
First, the proposed method is able to acquire new information about the phenomena
observed and challenge present findings because it is more accurate. The method is more
accurate since it does not miss information in the averaging process as happens in

203
experiments exploiting only a single query per search topic. Queries are optimised, and
averaging across the search topics takes place at standard points of operation. Second, the
method is economical in experiments where a complex query tuning space is studied. The
query tuning space contains all potential candidates for optimal queries, but data are
collected only on those queries that turn out to be optimal at a particular SPO. This means
that research problems dealing with more complex query tuning spaces can be managed
than in the traditional experimental design.
6.3.2 Validity, reliability, and efficiency of the procedure
The validity, reliability, and efficiency issues of the proposed method were discussed in
detail in Chapter 5. Those operations that replicate standard experimental practices (e.g. in
TREC, see Tague-Sutcliffe 1992, Harman 1993a) were omitted, and the focus was on the
two unique operations: inclusive query planning and query optimisation. This section will
summarise the main findings of the analysis.
Two validity concerns were defined for both operations. The first validity concern in
the inclusive query plans was: Is the exhaustivity of query plans high enough to avoid
biases in exhaustivity tuning? (see Section 5.3.1). The other potential validity problem was
the comprehensiveness of facet representations by disjunctive query terms (see Section
5.3.3). This is necessary in avoiding biases in extent tuning. Both concerns could be
rejected in empirical tests. The validity risks of the query optimisation operation were
related to the effects of query term grouping (see Section 5.3.4), and to the structural
characteristics of the optimal queries (see Section 5.3.4). Both risks are associated with the
present implementation of the optimisation algorithm and the test collection. Query term
grouping was shown to reflect unfavourably on the query extent measures. However, this
finding did not ruin the basis of the proposed method since the problems were associated
only with the test collection used in the case study, not the defined procedure of the
method.
Two reliability issues were discussed and tested. First, the consistency of the facet
selection in inclusive query planning was analysed. A high level of consistency was
achieved in applying the query planning guidelines in a facet selection task (see Section
5.3.2). Next, the reliability of the optimisation algorithm was evaluated in a verification
test and a validation test. The tests suggested that suboptimal performance of the algorithm
is very rare. The results suggest that the procedure of the proposed method can also be

204
justified to meet the reliability requirements of good experimental practices within the
defined domain.
Three efficiency issues were raised: the efficiency of inclusive query planning, the
efficiency of recall base estimates, and the efficiency of the optimisation algorithm. The
costs of inclusive query planning were estimated to exceed the costs of query planning in
traditional experiments. However, the total costs were regarded as low in relation to the
expected profits if full advantage is taken from the collection of inclusive query plans (see
Section 5.4.1). The analysis of recall base estimation costs suggested that the exhaustive
queries based on the inclusive query plans could reduce the total number of assessed
documents and minimise costs (see Section 5.4.2). The third question, computational
efficiency of the optimisation algorithm was regarded as a minor concern in this study.
However, it was pointed out that the case experiment showed at least that the algorithm
worked fast enough in a realistic experimental situation (see Section 5.4.3). The efficiency
analysis showed that the procedure of the method performs efficiently enough to run
experiments in the defined domain.
The conclusion from Section 6.3 is that an appropriate answer could be found to the
third research problem: the justification of the method (see Section 1.4). It was shown that
new results can be gained by applying the method (appropriateness), and that the unique
operations of the procedure are performing at a level of validity, reliability, and efficiency
high enough for comparative evaluations.
6.4 Final remarks
The dominating role of the Boolean IR systems in operational applications has lasted
for about 40 years but this era seems to be nearing its end. The growth of WWW based
search services has started the triumphal march of best-match IR systems both in public
and in-house applications. Although conventional Boolean IR systems are gradually giving
way to best-match systems, there is no reason to say that this study came too late because
the contribution of the present work goes beyond the core domain, i.e. the Boolean IR
system.
Earlier research has seen the Boolean and best match IR systems as competing and
mutually exclusive technologies (Ingwersen & Willet 1995). As pointed out in the
introduction of this thesis, a major concern has been to show the superiority of best-match
IR systems over Boolean systems (see Salton 1972, Turtle 1994, Frants et al. 1999). The

205
results of some recent studies comparing Boolean and best-match IR systems have shown
that Boolean queries are superior in some situations but the reasons for the better
performance are not clear (Hersh & Hickam 1995, Lu et al. 1996, and Paris & Tibbo 1998).
One potential explanation for the competitiveness of the Boolean IR model is the rich
query structures available, a feature that is in the focus of the proposed evaluation method.
Some probabilistic IR systems like INQUERY support query operators similar to the
Boolean OR and AND operators. The positive effects of query structuring on retrieval
performance have been shown, for instance, by Kekäläinen (1999) and Pirkola (1999). A
general conclusion from the recent studies could be that the operational text retrieval
systems of the future should support both a “bag of words” type of querying with relevance
ranking, and Boolean type structured querying with and without relevance ranking.
However, it is not clear yet what the best way to integrate the best match and Boolean
technologies is. Thus, the question is how the proposed method could help in solving the
problems of integrated text retrieval systems. This requires that both types of matching
mechanisms can be experimented with.
The proposed method yielded to two major innovations: the idea of inclusive query
planning, and the idea of query optimisation. The former innovation is more generally
applicable as it can be used both in Boolean as well as in best match IR experiments. In
fact, it was applied in a query expansion study by Järvelin et al. (1996). The query
optimisation operation in the proposed form is more or less restricted to the Boolean IR
model since it presumes that the query results are distinct sets. The inclusive query
planning idea is easier to exploit since its outcome, the representation of the available
query tuning space, can also be exploited in experiments on best-match IR systems.
It is typical of the Cranfield style experiments that the test queries are automatically or
manually extracted from the text describing a search topic. Human intervention in the form
of conceptual query planning has been a rare strategy. The mechanical approach in treating
the search topics will not be as plausible an approach in the future as in the past since the
role of query structures is becoming more crucial. Of course, the selection of facets from a
written search topic can be automated, and the expansion of query terms within facets as
well but, obviously, this is not wise as the only experimental strategy. It is much more
effective to adopt a double strategy. The traditional approach is efficient in showing what it
is possible to achieve in text retrieval by automatic means, assuming only a minor

206
involvement by the human searcher. A complementary strategy based on studying the
query tuning space composed in the form of inclusive query plans could be used to design
new types of experiments, and to give a point of reference for the performance of fully
automated approaches.
Similarly to the present study, the performance limits of the best match IR system
could be investigated by using the inclusive query plans (and elementary queries produced
of them). The problem is how to find the optimal queries for each SPO from the query
tuning space. It is quite clear that the optimisation algorithm developed for the Boolean IR
system cannot be applied directly. The behaviour of the relevance ranking mechanism
would be difficult to predict in the incremental construction process of a query statement.
A more promising approach is to replace the optimisation algorithm by a human searcher
exploiting IR game type tools (see Section 5.2.3.1). However, more methodological
research is needed to guarantee comparable settings in search for the optimal structured
(Boolean or best match) and unstructured (“a bag of words”) queries.
After describing the possible avenues of extending the application area of the
developed operations into the study of other IR models it is worth asking: Is it still
reasonable to study Boolean queries? The answer is “yes” but maybe it is more important
to study query structures that are similar to those applied in traditional Boolean IR systems.
If we share the view that query structures will be an important theme of future research, the
natural environment for experimenting with these phenomena is a Boolean one. The effects
of query exhaustivity and extent can be analysed easily since there are fewer intervening
variables to control (e.g. as in the INQUERY system version 3.1, where the relevance
ranking operations cannot be excluded). There are some phenomena in Boolean queries
that are not well understood but could possibly be applied in future systems. For instance,
the observation that the increased exhaustivity of queries seemed to be associated with the
higher average relevance degree of documents in high precision searching should be
studied more thoroughly (see Section 4.5.3.4).
One of the most interesting challenges for the system-oriented research is related to the
differences in IR systems in treating different types of relevant documents. We do not have
a clear picture of the typical characteristics of the least retrievable documents (see Section
4.4.1), and whether or not these sets are the same or different for the Boolean and
probabilistic queries. This could be easily studied by analysing the TailR80 documents of

207
the present study and corresponding probabilistic queries (see Section 4.3.2). Similarly, one
could draw a profile of the top documents that are easiest to retrieve by the different access
methods compared. If there is a strong overlap between search results the access methods
could replace each other. If the overlap is small this would encourage the development of
combined access methods to improve performance. The ideas of polypresentation of
Ingwersen (1996) and the empirical results of the effects of multiple query representations
of Belkin et al. (1995) encourage continuing this research line. Obviously, the proposed
method could make a clear contribution in solving such research problems.

208
REFERENCES
Aho, A.V. & Ullman, J.D. (1992) Foundations of Computer Science. New York: Computer
science Press.
Alkula, R. & Honkela, T. (1992). Tekstin tallennus- ja hakumenetelmien kehittäminen suomen
kielen tulkintaohjelmien avulla. [Linguistic processing and retrieval techniques in Finnish
fulltext databases.] Espoo: Technical Research Centre of Finland. VTT Publications 765.
[in Finnish, English abstract]
Arnold, B.H. (1962). Logic and Boolean algebra. Eaglewood Cliffs: Prentice-Hall.
Belkin, N.J. & Croft, W.B. (1987). Retrieval Techniques. In: Williams, M.E., Annual Review
of Information Science and Technology 22(), 109-145, New York: Elsevier&ASIS.
Belkin, N.J., Cool, C., Koenemann, J., Ng, K.B. & Park, S. (1996). Using Relevance
Feedback and Ranking in Interactive Searching. In: Harman, D., ed. (1996), TREC-4.
Proceedings of the Fourth Text Retrieval Conference. Washington, GPO.
Belkin, N.J., Kantor, P., Fox, E.A. & Shaw, J.A. (1995). Combining the evidence of multiple
query representations for information retrieval. Information Processing & Management
31(3), 431-448.
Blair, D.C. (1986). Full Text Retrieval: Evaluation and Implications. International Journal of
Classification 13(1), 18 - 23.
Blair, D.C. (1990). Language and representation in information retrieval. Amsterdam:
Elsevier Science.
Blair, D.C. (1996). STAIRS Redux: Thoughts on the STAIRS Evaluation, Ten Years after.
Journal of the American Society for Information Science 47(1), 4-22.
Blair, D.C. & Maron, M.E. (1985). An evaluation of retrieval effectiveness for a full-text
document retrieval system. Communications of the ACM (28)3, 289-299.
Blair, D.C. & Maron, M.E. (1990). Full-text information retrieval: Further analysis and clarifi-
cation. Information Processing and Management 26(3), 437-447.
Bunge, M. (1967). Scientific Research I. Heidelberg: Springer-Verlag.
Chvátal, V. (1983). Linear Programming. New York: W.H. Freeman.

209
Cleverdon, C.W. (1967). The Cranfield tests on index language devices. Aslib Proceedings
19(6), 173-193.
Cleverdon, C.W. (1972). On the inverse relationship of recall and precision. Journal of
Documentation 28(), 195-201.
Convey, J. (1989). Online information retrieval. An introductory manual to principles and
practice. London: Clive Bingley.
Cool, C., Park, S., Belkin, N., Koenemann, J. & Ng, K.B. (1996). Information Seeking
Behaviour in New Searching Environments. In: Ingwersen, P. & Pors, N.O. (Eds.),
Proceedings of Second International Conference on Conceptions of Library and
Information Science: Integration in Perspective. Copenhagen, Oct 13-16, 1996. pp. 403-
416.
Eloranta, K.T. (1979). Menetelmäeksperttiyden analyysi menetelmäkoulutuksen
suunnittelun perustana. [A proposal of rational analysis of methodological expertise for a
basis in the planning of methodological education]. Doctoral Dissertation, University of
Tampere, Faculty of Education. ISSN 0355-6352, no. 15. [in Finnish, English abstract]
Fidel, R. (1984). Online searching styles: A case-study-based model of searching behaviour.
Journal of the American Society for Information Science 35(July), 211-221.
Fidel, R. (1985). Moves in online searching. Online Review 9(1), 61-74.
Fidel, R. (1986). Towards Expert Systems for the Selection of Search Keys. Journal of the
American Society for Information Science 37(1), 37-44.
Fidel, R. (1991). Searcher’s Selection of Search Keys: I. The Selection Routine. II. Controlled
Vocabulary of Free-Text Searching. III. Searching Styles. Journal of the American Society
for Information Science 42(7), 490-500, 501-514, 515-527.
Fidel, R. & Soergel, D. (1983). Factors Affecting Online Bibliographic Retrieval. A
Conceptual Framework for Research. Journal of the American Society for Information
Science 34(3), 163-180.
Fischer, M.L. (1980). Worst-case analysis of heuristic algorithms. Management Science 26(1),
1-17.
Frakes, W.B. & Baeza-Yates, R., Eds. (1992). Information Retrieval Data Structures &
Algorithms. New Jersey: Prentice Hall.

210
Frants, V.I. & Shapiro, J. (1991). Algorithm for Automatic Construction of Query
Formulations in Boolean Form. Journal of the American Society for Information Science
42(1), 16-26.
Frants, V.I., Shapiro, J., Taksa, I. & Voiskunskii, V.G. (1999). Boolean Search: Current State
and Perspectives. Journal of the American Society for Information Science 50(1), 86-95.
French, J.C., Brown, D.E. & Kim, N-H. (1997). A Classification Approach to Boolean Query
Reformulation. Journal of the American Society for Information Science 48(8), 694-706.
Frisch, E. & Kluck, M. (1997). Pretest zum Projekt German Indexing and Retrieval
Testdatabase (GIRT) unter Anwendung der Retrievalsysteme Messenger un free WAISsf.
Bonn: Informations Zentrum Sozialwissenschaften, IZ-Arbeistbericht Nr. 10.
Fugman, R. (1993). Subject Analysis and Indexing. Frankfurt/Main: Indeks Verlag.
de Groot, A.D. (1969). Methodology. Foundations of inference and research in the behavioral
sciences. The Hague: Mouton.
Harman, D. (1993a). The First Text Retrieval Conference (TREC-1). Gaithersburg: National
Institute of Standards and Technology. (NIST Special Publication 500-207).
Harman, D. (1993b). Overview of the First Text Retrieval Conference (TREC-1). In: Harman,
D. (Ed.). The First Text Retrieval Conference (TREC-1). Gaithersburg: National Institute of
Standards and Technology. (NIST Special Publication 500-207).
Harman, D. (1996). The Fourth Text Retrieval Conference (TREC-4). Gaithersburg: National
Institute of Standards and Technology. (NIST Special Publication 500-236).
Harter, S.P. (1986). Online Information retrieval. Orlando: Academic Press.
Harter, S.P. (1990). Search Term Combinations and Retrieval Overlap: A Proposed
Methodology and Case Study. Journal of the American Society for Information Science
41(2), 132-146.
Harter, S.P. & Hert, C.A. (1997). Evaluation of Information Retrieval Systems: Approaches,
Issues, and Methods. In: Williams, M.E. (Ed.), Annual Review of Information Science and
Technology (ARIST) 32(), 3-94. Medford: ASIS & Information Today.
Harter, S.P. & Peters, A.R. (1985). Heuristics for online information retrieval: a typology and
preliminary listing. Online Review 9(5), 407-424.
Hawking, D. (1999). Overview of TREC-7 Very Large Collection Track. The Seventh Text
Retrieval Conference (TREC-7). Gaithersburg: National Institute of Standards and

211
Technology. (NIST Special Publication 500- 242). URL: http://trec.nist.gov/pubs/trec7/
t7_proceedings.html.
Hawkins, D.T. & Wagers, R. (1982). Online Bibliographic Search Strategy Development.
Online, 1982 May, p. 12-19.
Heine, M.H. & Tague, J.M. (1991). An Investigation of the Optimization of Search Logic for
the MEDLINE Database. Journal of the American Society for Information Science 42(4),
267-278.
Hersh, W.R. (1996). Information retrieval : a health care perspective. New York, Springer.
Hersh, W.R. & Hickam, D.H. (1995). An Evaluation of Interactive Boolean and Natural
Language Searching with Online Medical Textbook. Journal of the American Society for
Information Science 48(7), 478-489.
Hull, D. (1993). Using Statistical Testing in the Evaluation of Retrieval Experiments. In:
ACM-SIGIR '93, pp. 329 - 338. Pittsburgh: ACM.
Hull, D. (1996). Stemming Algorithms: A Case Study for Detailed Evaluation. Journal of the
American Society for Information Science 47(1), 70-84.
Iivonen, M. (1995a). Consistency in the selection of search concepts and search terms.
Information Processing & Management 31(2), 173-190.
Iivonen, M. (1995b). Searchers and Searchers: Differences Between the Most and Least
Consistent Searchers. In: SIGIR'95. Proceedings of the 18th annual international
ACM-SIGIR conference on research and development in information retrieval, Seattle,
WA, July 9 - July 13, p.149-157. Seattle: ACM.
Iivonen, M. (1995c). Hakulausekkeiden muotoilun yhdenmukaisuus onlineviitehaussa.
[Consistency in the formulation of query statements in online bibliographic retrieval.]
Tampere: Acta Universitatis Tamperensis, Ser A, Vol. 443.
Ingwersen, P. (1996). Cognitive perspectives of information retrieval interaction: Elements of
a cognitive IR theory. Journal of Documentation 32(1), 3-50.
Ingwersen, P. & Willett, P. (1995). An Introduction to Algorithmic and Cognitive Approaches
for Information Retrieval. Libri 45(), 160-177.
ISO (1986). ISO 2788 Documentation - Guidelines for the establishment and development of
monolingual thesauri. International Organization for Standardization, 32 p.

212
Järvelin, K. (1995). Tekstitiedonhaku tietokannoista. [Text retrieval in databases. - in Finnish]
Espoo, Suomen ATK-kustannus.
Järvelin, K., Kristensen, J., Niemi, T., Sormunen, E., & Keskustalo, H. (1996). A Deductive
Data Model for Query Expansion. In: Proceedings of the 19th International Conference on
Research and Development in Information Retrieval (ACM SIGIR '96), Zürich,
Switzerland, August 18-22, 1996.
Kaplan, A. (1964). The conduct of inquiry : methodology for behavioral science. Scranton
(Pa.), Chandler.
Keen, E.M. (1992a). Presenting results of experimental retrieval comparisons. Information
Processing & Management 28(4), 491-502.
Keen, E.M. (1992b). Some aspects of proximity searching in text retrieval systems. Journal of
Information Science 18( ), 89-98.
Kekäläinen, J. (1999). The Effects of Query Complexity, Expansion and Structure on
Retrieval Performance in Probabilistic Text Retrieval. Doctoral Thesis. Tampere:
University of Tampere. (Acta Universitatis Tamperensis 678).
Kekäläinen, J. & Järvelin, K. (1998). The impact of query structure and query expansion on
retrieval performance. In: Croft, W. B. & et al. (Eds.), Proceedings of the 21th Annual
International ACM SIGIR Conference on Research and Development in Information
Retrieval (ACM SIGIR '98), Melbourne, Australia, August 23-28, 1998. P. 130-137. New
York, NY: ACM Press.
Kluck, M. (1998). German Indexing and Retrieval Test Database (GIRT). Some Results of the
Pretest. In: Dunlop, M. (Ed.), IRSG 98. Discovering new worlds of IR. 25-27 March 1998 in
Grenoble, France. Proceedings available at URL: http://
www.ewic.org.uk/ewic/workshop/view.cfm/IRSG-98
Kristensen, J. (1993). Expanding end-users' query statements for Free text searching with a
search-aid Thesaurus. Information Processing & Management 29(6): 733-744.
Kristensen, J. (1996). Concept-based query expansion in a probabilistic IR system. In:
Ingwersen, P. & Pors, N.O. (Eds.) Proceedings of the Second International Conference on
Conceptions of Library and Information Science: Integration in Perspective, October 13-16
1996, p. 281-291. Copenhagen: The Royal School of Librarianship.

213
Lancaster, F.W. (1968). Information Retrieval Systems: Characteristics, Testing, and
Evaluation. New York: John Wiley.
Lancaster, F.W. (1969). MEDLARS: Report on the Evaluation of Its Operating Efficiency.
American Documentation 20(2), 641-664.
Lancaster, F.W. & Fayen, E.G. (1973). Information Retrieval On-Line. Los Angeles: Melville.
Lancaster, F.W. & Warner, A.J. (1993). Information Retrieval Today. Arlington: Information
Resources Press.
Ledwith, R. (1992). On the difficulties of applying the results of information retrieval research
to aid in the searching of large scientific databases. Information Processing and
Management 28(4), 451-455.
Love, R. & Garson, L. (1985). Precision in Searching the Full-Text Database: ACS Journals
Online. Proceedings of the 6th National Online Meeting, p. 273-282. New York: Learned
Information.
Losee, R.M. (1994). Upper bounds for retrieval performance and their use measuring
performance and generating optimal Boolean queries: Can it get any better than this?
Information Processing and Management 30(2), 193-203.
Losee, R.M. (1998). Text Retrieval and Filtering. Analytical Models of Performance.
Massachusetts, Kluwer Academic Press.
Lu, X.A., Holt, J.D., & Miller, D.J. (1996). Boolean Systems Revisited: Its Performance and
its Behavior. In Harman, D. (Ed.). The Fourth Text Retrieval Conference (TREC-4).
Gaithersburg, National Institute of Standards and Technology. (NIST Special Publication
500-236).
Mark Pejtersen, A. (1989). The Book House. Modelling User’s Needs and Search Strategies
as a Basis for System Design. Roskilde: Riso National Laboratory, Riso-M-2794.
Mark Pejtersen, A. & Rasmussen, J. (1997). Effectiveness testing of complex systems. In:
Salvendy, G. (Ed.), Handbook of Human Factors and Ergonomics. New York: Wiley.
Martello, S. & Toth, P. (1990). Knapsack Problems. Algorithms and Computer
Implementations. Guildford: John Wiley & Sons.
McKinin, E.J., Sievert, M.E., Johnson, E.D., & Mitchell, J.A. (1991). The Medline Full-Text
Project. Journal of the American Society for Information Science 42(4), 297-307.

214
Newell, A. (1969). Heuristic programming: Ill-structured problems. In: Arofonsky, J. (Ed.).
Progress in Operations Research, Vol III, 360-414. New York.
Paris, L.A.H. & Tibbo, H.R. (1998). Freestyle vs. Boolean: A comparison of partial and exact
match retrieval systems. Information Processing & Management 34(2/3), 175-190.
Pirkola, A. (1998). The effects of query structure and dictionary setups in dictionary-based
cross-language information retrieval. In: Croft, W. B. et al. (Eds.), Proceedings of the 21th
Annual International ACM SIGIR Conference on Research and Development in
Information Retrieval (ACM SIGIR '98), Melbourne, Australia, August 23-28, 1998. P. 55-
63. New York, NY: ACM Press.
Pirkola, A. (1999). Studies on linguistic problems and methods in text retrieval: the effects of
anaphor and ellipsis resolution in proximity searching, and translation and query
structuring methods in cross-language retrieval. Doctoral Thesis. Tampere: University of
Tampere. (Acta Universitatis Tamperensis 672.)
Polkinghorne, D. (1983). Methodology for the human sciences. Systems of inquiry. Albany:
State University of New York.
Robertson, S.E. (1996). Letter to the Editor. Information Processing and Management 32(5),
635 - 636.
Robertson, S.E. & Sparck Jones K. (1976). Relevance weighting of search terms. Journal of
the American Society for Information Science 27(3), 129 – 146.
Salton, G. (1972). A new comparison between conventional indexing (MEDLARS) and
automatic text processing (SMART). Journal of the American Society for Information
Science 23(March-April), 75-84.
Salton, G. (1986). Another look at automatic text-retrieval systems. Communications of the
ACM 29(7), 648-656.
Salton, G. (1988). A simple blueprint for automatic Boolean query processing. Information
Processing & Management 24(3), 269-280.
Salton, G. & McGill, M.J. (1983). Introduction to Modern Information Retrieval. Singapore:
McGraw-Hill.
Saracevic, T. (1995). Evaluation of evaluation in information retrieval. In: Fox, E.A. et al.
(Eds.), SIGIR ’95 - Proceedings of the 18th Annual International ACM SIGIR Conference

215
on Research and Development in Information Retrieval. Washington July 9 - 13, 1995. (A
special issue of the SIGIR Forum). 138-146.
Saracevic, T., Kantor. P. et al. (1988). A Study of Information Seeking and Retrieving. I
Background and Methodology. II. Users, Questions, and Effectiveness. III. Searchers, Sear-
ches, and Overlap. Journal of the American Society for Information Science 39(3), pp. 161-
176, 177-196 and 197-216.
Shaw, W.M. (1995). Term-relevance computations and perfect retrieval performance.
Information Processing and Management 31(4), 491- 498.
Shute, S.J. & Smith, P.J. (1993). Knowledge-based search tactics. Information Processing and
Management 29(1), 29-45.
Siegel, S. & Castellan, N.J. (1988). Nonparametric statistics for the behavioral Sciences.
Singapore: McGraw-Hill.
Smith, M.P. & Smith, M. (1997). The use of genetic programming to build Boolean queries
for text retrieval through relevance feedback. Journal of Information Science 23(6), 423-
431.
Soergel, D. (1994). Indexing and Retrieval Performance: The Logical Evidence. Journal of
the American Society for Information Science 45(8), 589-599.
Sormunen, E. (1989). An analysis of online searching knowledge for intermediary systems.
Espoo: Technical Research Centre of Finland. (Research Reports 630).
Sormunen, E. (1994). The effectiveness of free-text searching in full-text databases containing
newspaper articles and abstracts. Espoo: Technical Research Centre of Finland. (Research
Publications 790). [in Finnish, English abstract]
Sormunen, E., Laaksonen, J., Keskustalo, H., Kekäläinen, J., Kemppainen, H., Laitinen, H.,
Pirkola, A., Järvelin, K. (1998). The IR Game - A Tool for Rapid Query Analysis in Cross-
Language IR Experiments. PRICAI '98 Workshop on Cross Language Issues in Artificial
Intelligence. Singapore, Nov 22-24, 1998, p. 22-32.
Sparck-Jones, K. (1981). Information retrieval experiment. London: Butterworths.
Sparck Jones, K. & van Rijsbergen, C.J. (1976). Information retrieval test collections. Journal
of Documentation 32(1), 59-75.
Tague-Sutcliffe, J. (1992). The pragmatics of information retrieval experimentation, revisited.
Information Processing & Management 28(4), 467-490.

216
Tenopir, C. (1985). Full Text Database Retrieval Performance. Online Review 9(2), 149-164.
Tenopir, C. & Ro, J.S. (1990). Full text databases. New York: Greenwood.
Tenopir, C. & Shu, M.E. (1989). Magazines in full text: uses and search strategies. Online
Review 13 (2), 107-118.
Turtle, H. (1994). Natural Language vs. Boolean Query Evaluation: A Comparison of
Retrieval Performance. In Croft, W.B & van Rijsbergen, C.J. (Eds.) Proceedings of the
Seventeenth Annual International ACM-SIGIR Conference on Research and Development
in Information Retrieval. London: Springer-Verlag. pp. 212-220.
Voorhees, E. & Harman, D. (Eds.) (1997). The Fifth Text REtrieval Conference (TREC-5).
Gaithersburg: National Institute of Standards and Technology. (NIST Special Publication
500-238)

217
APPENDIXES 1-4

Appendix 4 1/2
Appendix 1. Search topics
(Translated from Finnish).
1. The Bush – Gorbachev Summit in Helsinki in September 1990. The issues of thenegotiations, and resolutions and agreements.
2. The South-American debt crisis. How did the debt problems arise? What kinds ofsolutions have been proposed?
3. Dumping charges against the Finnish forest industry in the U.S.. What happened to theFinnish paper exporters ? The content of the dumping charges, the result of the trial.
4. The proposal for an amalgamation between the city and the rural community ofJyväskylä. Supporters' and opponents' opinions and reasons are wanted. Calculation ofthe economic effects (economic incentives, subsidies, among other things).
5. Forecasts made by Sixten Korkman. “What did Korkman really say?”6. Repeal of the Warsaw Pact. Anything about the process, the attitudes of different
governments, decisions, etc.7. The economic boycott against Lithuania by the Soviet Union in spring 1990. What
actions were linked to the boycott, and how did these manifest in Lithuania?8. Annihilation of Iraqi mass destruction weapons. According to the armistice agreement
of the war of Persian Gulf Iraq must surrender chemical, biological, and nuclearweapons and their production engineering. The UN is responsible for the inventory andannihilation of the weapons. Has the commission succeeded?
9. The decisions of OPEC concerning oil price and output.10. Revolts in Bucharest against opposition by miners whom President Iliescu called in to
help the government. Background information about incidents, victims, andconsequences.
11. The UN peace protection operation for Namibian independence. Information about thepreparations, events linked to the operation, and the action of the UNTAG troops andthe Finnish battalion.
12. The role of the parliament in EU decision-making. What is of interest is the role of theEuropean Parliament in relation to the EU Commission and other official organs. Whatkinds of changes to the present situation have been called for, and who has been askingfor them? How does democratic control function in EU?
13. Carl Bildt and Nordic co-operation. Bildt's statements concerning Nordic co-operation.What has Bildt said in particular about the co-operation between Finland and Sweden?
14. News about the activities of the Council of Presidents in Yugoslavia. Especiallyinformation about the sessions and decisions made.
15. The 2 + 4 negotiations between East and West Germany and the four allied [the UnitedStates, the UK, France, and the Soviet Union] concerning the reunification of Germany.What were the most essential problems to settle? What particular conflicts came up?What is essential in the treaty?
16. Bankruptcy of the P.T.A company. Anything about the issue: background information,reasons, and consequences.
17. The profitability of VALMET in the production of tractors and vehicles. Forestmachinery / tractors / engines, transportation vehicles, and rail carriages (Transtech,among others) are included in the branch. Partnerships in car and truck industry are notof interest.
18. Background information about businesses made by the Valio company.19. The profitability of airlines FINNAIR (including Finaviation and Karair), SAS
(including (Linjeflyg), and LUFTHANSA.

Appendix 4 2/2
20. Dismissals in Tampella. Look for information about dismissals in various companies ofthe Tampella-consortium.
21. The investments of KERA and KTM (Ministry for Trade and Industry) in the touristtrade. Information about loans and subsidies (here = investments) granted. Especiallygeneral reviews are valuable.
22. An overview of natural gas acquisition by Neste. What has Neste achieved in naturalgas acquisition (fields and import contracts), delivery (building a network), andmarketing?
23. Processing and storage of nuclear waste produced in nuclear power plants. Examples ofproblems, risks, and accidents.
24. The spread of AIDS in the EU countries. How serious is the AIDS epidemic in thesecountries? Information about contagion, campaigns and other activities to stop thespread of infection.
25. The effects of removal of the food import restriction on the Finnish food processingindustry. Briefings, estimates, opinions, and other background information.
26. Economic trends and cyclic fluctuation in house building in Finland: especiallystatistics, prognoses, and estimates.
27. The exhaust gas emissions of road traffic in Finland and abroad. The development ofemissions and future expectations (among others, the influence of legislation). What isthe influence of catalysers on emission levels? The technology of catalysers is not ofinterest.
28. The investments of the automobile industry of Japan in Europe, and the productional co-operation with the European car manufacturers. In which countries have Japaneseautomobile factories been planned, set up, and extended?
29. The environmental investments of the forest industry, especially investments in sewagetreatment in the chemical forest industry. Both investments in sewage treatment plantsand the utilisation of processes friendlier to the environment.
30. Business hours in the retail trade. Discussion about the liberation of business hours inretail is wanted. Especially interest in the attitudes and actions of the businessorganisations and trade unions.
31. Packages as an environment protection issue. Especially interest in development andtesting of recycling systems, legislation concerning recycling in different countries.
32. Finnish-Estonian joint ventures. To what extent, in which branches, and in which formshave Finns started joint ventures with Estonians? Summaries, experiences of successand failures, examples of practical organisations /arrangements.
33. Esko Aho and Finland's application for EU membership. Aho's opinions, attitude, andactivities regarding the application. Comments on his actions.
34. Kauko Juhantalo's speeches and activities for nuclear power. Juhantalo’s grounds /justification for a 5th nuclear power plant. How did Juhantalo promote the decision fornuclear power?
35. The initiatives, interpellations, proposals, and voting behaviour of the Greens in theFinnish Parliament. Both the party and the individual MPs are of interest

Appendix 4 1/8
Appendix 2. A sample inclusive query plan.English translations are shaded. For query term translations only basic word forms
without truncation are presented. String level representations are not directly translatable.Translated query terms may not be reasonable for searching in English document collections.
Haku 02 (VELKA)Etelä_Amerikan velkakriisi. Miten velkaantumisongelma on kehittynyt? Miten ongelmaa
on pyritty ratkaisemaan?
Topic no. 2 (Debt)The South-American debt crisis. How did the debt problems arise? What kinds of
solutions have been proposed?
Käsitteellinen hakusuunnitelmaI.1 [Etelä-Amerikka] and [velka] and [kriisi]I.2 [Etelä-Amerikka] and [velka]I.3 [Etelä-Amerikka]
Conceptual query planI.1 [South America] and [debt] and [crisis]I.2 [South America] and [debt]I.3 [South America]
Fasettien esitystason kuvaukset[Etelä-Amerikka]s=2:
f etelä# amerik# or latinalai# amerik# or lattarimaa# or lattarimai#<253> <- dokumenttifrekvenssi
s=3:f argentiin# or bolivia# or brasili# or chile# or eduador# or guayan# or kolumbia#
or paraqua# or surinam# or urugua# or venezuela#<1300>
s=4:f peru#<15550>
s=5:f s=2 to 4<16547>
[velka]s=6:
f vela# or velka# or velko# or veloi#<2064>

Appendix 4 2/8
s=7:f laina# or laino#<2496>
s=8:f luoto# or luotto#<1548>
s=9:f kehitysmaaluot# or ulkomaanvel# or kehitysluot# or lisäluot# or lisälain# or
hätälain#<280>
s=10:f velanhoid# or velanhoit# or velkaratkaisu# or luottomarkkin# or lainanhoi# or
velanot# or luottokelpoisuu# or luotottaj# or takaisinmaks# or maksuvaikeu# orlainauks# or lainaus# or lainoituks# or lainoitus#
<506>
s=11:f luotota# or luototta# or luototi# or luototti# or luototet# or lainoita# or lainoitta#
or lainoiti# or lainoitet# or lainat# or lainaa# or lainasi# or lainaisi# or lainann# orvelkaannu# or velkaantu# or velo# or velko#
<2119>
s=12:f velkomin# or velkaantumin# or luotottamin# or lainaamin#<67>
s=13:f s=6 to 12<5111>
[kriisi]s=14:
f kriisi# or kriise# or ongelm# or kiertee# or kiertei# or kierre# or louku# orloukku#
<7872>
s=15:f talouskriis# or velkakriis# or velkaongelm# or velkaantumisongelm# or
velkakier# or velkaantumiskier# or lainakier# or velkalouk# or luottokriis#<253>
s=16:f taloudell# ahdink# or taloudell# ahding# or velkakurjuu# or velkapomm# or
velkasuo* or velkadraam* or velkasäk# or velkataak# or velkaiek# or velkaies#<185>

Appendix 4 3/8
s=17:f s=15 to 16<417>
s=18:f dollarivelkataak#<1>
s=19:f ylivelkaan# or lykät# or lykkää# or lykkäsi# or lykkäisi# or lykänn# or
ann#anteeksi or ant#anteeksi#<1059>
s=20:f anteeksiantami# or lykkäämi# or ylivelkaantumi#<202>
s=21:f s=14 to 20<8904>
Facets as string level representations (translated only on the level ofexpressions)
[South America]s=2:
f south america or latin america or latino countries<253> <- document frequency for s=2
s=3:f argentina or bolivia or brazil or chile or colombia or ecuador or guayana or
guiana or paraguay or suriname or uruguay or venezuela<1300>
s=4:f peru
<15550>
s=5:f s=2 to 4
<16547>
[debt]s=6:
f debt<2064>
s=7:f loan

Appendix 4 4/8
<2496>
s=8:f credit
<1548>
s=9:f credit to developing country or foreign debt or development credit or additional
credit or additional loan or emergency loan<280>
s=10:f debt handling or debt solution or credit market or loan handling or debt raising or
creditworthiness or credit grantor or repayment or financial difficulty or lending orborrowing or financing<506>
s=11:f allow credit or lend or borrow or get into debt or demand payment
<2119>
s=12:f demanding payment or getting into debt or allowing credit or lending or
borrowing<67>
s=13:f s=6 to 12
<5111>
[crisis]s=14:
f crisis or problem or spiral or trap<7872>
s=15:f economical crisis or debt crisis or debt problem or debt spiral or loan spiral or
debt trap or credit crisis<253>
s=16:f embarrassment or debt misery or debt bomb or debt swamp or debt drama or
sack of debt or burden of debt or debt yoke<185>
s=17:f s=15 to 16
<417>

Appendix 4 5/8
s=18:f burden of dollar debt
<1>
s=19:f delay or remit
<1059>
s=20:f remitting or delaying
<202>
s=21:f s=14 to 20
<8904>
Elementaariset lausekkeetElementary queries
Osasuunnitelma I.1 (tyhj= 3): 105 elementtiäSubplan I.1 (Exhaustivity=3): 105 EQs
ELNO 1 s=2 and s=6 and s=14ELNO 2 s=2 and s=6 and s=17ELNO 3 s=2 and s=6 and s=18ELNO 4 s=2 and s=6 and s=19ELNO 5 s=2 and s=6 and s=20ELNO 6 s=2 and s=7 and s=14ELNO 7 s=2 and s=7 and s=17ELNO 8 s=2 and s=7 and s=18ELNO 9 s=2 and s=7 and s=19ELNO 10 s=2 and s=7 and s=20ELNO 11 s=2 and s=8 and s=14ELNO 12 s=2 and s=8 and s=17ELNO 13 s=2 and s=8 and s=18ELNO 14 s=2 and s=8 and s=19ELNO 15 s=2 and s=8 and s=20ELNO 16 s=2 and s=9 and s=14ELNO 17 s=2 and s=9 and s=17ELNO 18 s=2 and s=9 and s=18ELNO 19 s=2 and s=9 and s=19ELNO 20 s=2 and s=9 and s=20ELNO 21 s=2 and s=10 and s=14ELNO 22 s=2 and s=10 and s=17ELNO 23 s=2 and s=10 and s=18ELNO 24 s=2 and s=10 and s=19ELNO 25 s=2 and s=10 and s=20ELNO 26 s=2 and s=11 and s=14ELNO 27 s=2 and s=11 and s=17
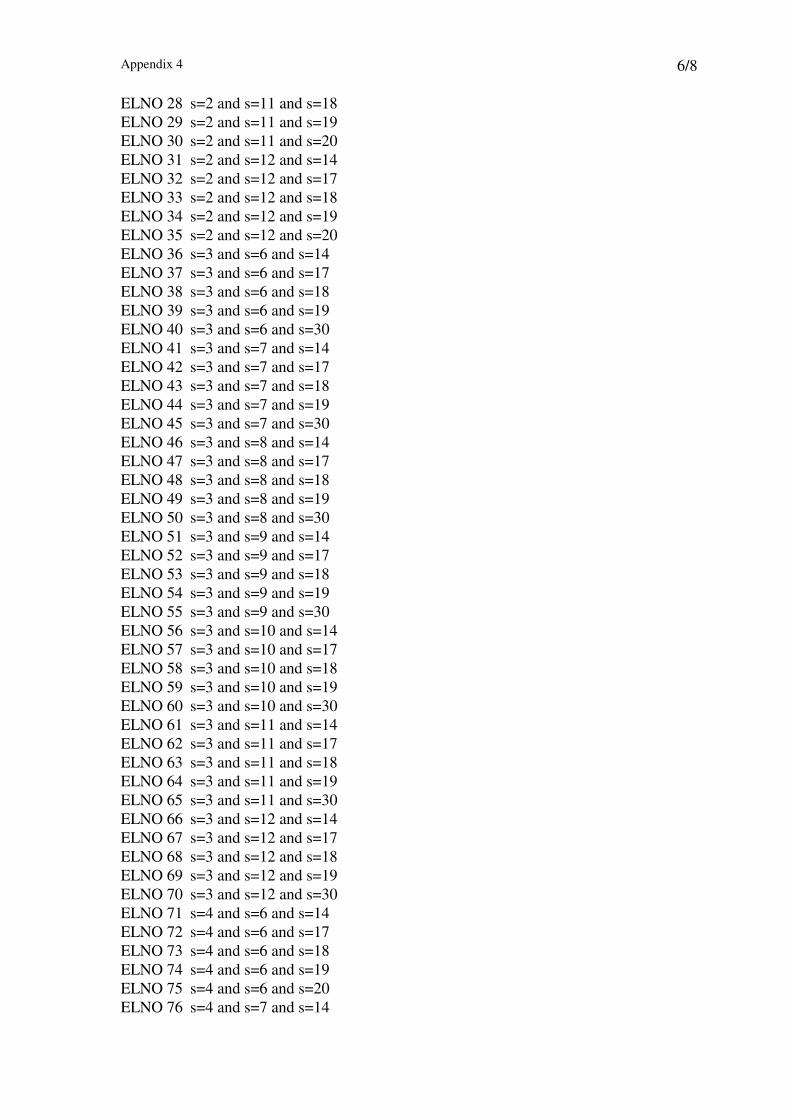
Appendix 4 6/8
ELNO 28 s=2 and s=11 and s=18ELNO 29 s=2 and s=11 and s=19ELNO 30 s=2 and s=11 and s=20ELNO 31 s=2 and s=12 and s=14ELNO 32 s=2 and s=12 and s=17ELNO 33 s=2 and s=12 and s=18ELNO 34 s=2 and s=12 and s=19ELNO 35 s=2 and s=12 and s=20ELNO 36 s=3 and s=6 and s=14ELNO 37 s=3 and s=6 and s=17ELNO 38 s=3 and s=6 and s=18ELNO 39 s=3 and s=6 and s=19ELNO 40 s=3 and s=6 and s=30ELNO 41 s=3 and s=7 and s=14ELNO 42 s=3 and s=7 and s=17ELNO 43 s=3 and s=7 and s=18ELNO 44 s=3 and s=7 and s=19ELNO 45 s=3 and s=7 and s=30ELNO 46 s=3 and s=8 and s=14ELNO 47 s=3 and s=8 and s=17ELNO 48 s=3 and s=8 and s=18ELNO 49 s=3 and s=8 and s=19ELNO 50 s=3 and s=8 and s=30ELNO 51 s=3 and s=9 and s=14ELNO 52 s=3 and s=9 and s=17ELNO 53 s=3 and s=9 and s=18ELNO 54 s=3 and s=9 and s=19ELNO 55 s=3 and s=9 and s=30ELNO 56 s=3 and s=10 and s=14ELNO 57 s=3 and s=10 and s=17ELNO 58 s=3 and s=10 and s=18ELNO 59 s=3 and s=10 and s=19ELNO 60 s=3 and s=10 and s=30ELNO 61 s=3 and s=11 and s=14ELNO 62 s=3 and s=11 and s=17ELNO 63 s=3 and s=11 and s=18ELNO 64 s=3 and s=11 and s=19ELNO 65 s=3 and s=11 and s=30ELNO 66 s=3 and s=12 and s=14ELNO 67 s=3 and s=12 and s=17ELNO 68 s=3 and s=12 and s=18ELNO 69 s=3 and s=12 and s=19ELNO 70 s=3 and s=12 and s=30ELNO 71 s=4 and s=6 and s=14ELNO 72 s=4 and s=6 and s=17ELNO 73 s=4 and s=6 and s=18ELNO 74 s=4 and s=6 and s=19ELNO 75 s=4 and s=6 and s=20ELNO 76 s=4 and s=7 and s=14

Appendix 4 7/8
ELNO 77 s=4 and s=7 and s=17ELNO 78 s=4 and s=7 and s=18ELNO 79 s=4 and s=7 and s=19ELNO 80 s=4 and s=7 and s=20ELNO 81 s=4 and s=8 and s=14ELNO 82 s=4 and s=8 and s=17ELNO 83 s=4 and s=8 and s=18ELNO 84 s=4 and s=8 and s=19ELNO 85 s=4 and s=8 and s=20ELNO 86 s=4 and s=9 and s=14ELNO 87 s=4 and s=9 and s=17ELNO 88 s=4 and s=9 and s=18ELNO 89 s=4 and s=9 and s=19ELNO 90 s=4 and s=9 and s=20ELNO 91 s=4 and s=10 and s=14ELNO 92 s=4 and s=10 and s=17ELNO 93 s=4 and s=10 and s=18ELNO 94 s=4 and s=10 and s=19ELNO 95 s=4 and s=10 and s=20ELNO 96 s=4 and s=11 and s=14ELNO 97 s=4 and s=11 and s=17ELNO 98 s=4 and s=11 and s=18ELNO 99 s=4 and s=11 and s=19ELNO 100 s=4 and s=11 and s=20ELNO 101 s=4 and s=12 and s=14ELNO 102 s=4 and s=12 and s=17ELNO 103 s=4 and s=12 and s=18ELNO 104 s=4 and s=12 and s=19ELNO 105 s=4 and s=12 and s=20
Osasuunnitelma I.2 (tyhj= 2): 21 elementtiäSubplan I.2 (Exhaustivity=2): 21 EQs
ELNO 106 s=2 and s=6ELNO 107 s=2 and s=7ELNO 108 s=2 and s=8ELNO 109 s=2 and s=9ELNO 110 s=2 and s=10ELNO 111 s=2 and s=11ELNO 112 s=2 and s=12ELNO 113 s=3 and s=6ELNO 114 s=3 and s=7ELNO 115 s=3 and s=8ELNO 116 s=3 and s=9ELNO 117 s=3 and s=10ELNO 118 s=3 and s=11ELNO 119 s=3 and s=12ELNO 120 s=4 and s=6ELNO 121 s=4 and s=7

Appendix 4 8/8
ELNO 122 s=4 and s=8ELNO 123 s=4 and s=9ELNO 124 s=4 and s=10ELNO 125 s=4 and s=11ELNO 126 s=4 and s=12
Osasuunnitelma I.3 (tyhj= 1): 3 elementtiäSubplan I.3 (Exhaustivity=1): 3 EQs
ELNO 127 s=2ELNO 128 s=3ELNO129 s=4

Appendix 4 1/2
Appendix 3. Words identified from the relevant
documents and covered by the query plans
Cont....
Results are based on the facet analysis of all relevant documents in a smaple of 18 search topics. (W/Qp=words in query plans, W/New=new words found, Rels=known relevant documents, RetbyPlan=retrievable by query plans, RetbyAll=retrievable by all words, Nret=not retrieved by query plans, Unret=not retrievable/implicit expressions).Topic no Fac et no Faset name W/ Qp W/ New W/ All W/ Qp-% W/ New-% RecBase RetbyPlan RetbyAll NRet UnRet
1 1 helsinki 3 1 4 75 % 25 % 32 32 32 0 0
1 2 bush 4 2 6 67 % 33 % 32 31 31 0 1
1 3 gorbatshov 3 3 6 50 % 50 % 32 31 31 0 1
1 4 asia 40 24 64 63 % 38 % 32 30 31 1 1
1 5 tapaaminen 15 3 18 83 % 17 % 32 30 30 0 2
2 1 etelä-amerikka 24 7 31 77 % 23 % 53 53 53 0 0
2 2 velka 61 11 72 85 % 15 % 53 46 51 5 2
2 3 kriisi 32 12 44 73 % 27 % 53 39 40 1 13
3 1 polkumyynti 11 0 11 100 % 0 % 19 19 19 0 0
3 2 metsäteollisuus 40 4 44 91 % 9 % 19 19 19 0 0
3 3 USA 2 1 3 67 % 33 % 19 19 19 0 0
3 4 jupakka 46 12 58 79 % 21 % 19 18 18 0 1
4 1 jyväskylä 5 0 5 100 % 0 % 8 8 8 0 0
4 2 kuntaliitos 8 12 20 40 % 60 % 8 8 8 0 0
4 3 edut & haitat 5 8 13 38 % 62 % 8 4 6 2 2
5 1 Sixten Korkman 4 0 4 100 % 0 % 39 39 39 0 0
5 2 ennuste 23 8 31 74 % 26 % 39 31 32 1 7
6 1 Varsovan liitto 3 0 3 100 % 0 % 47 47 47 0 0
6 2 purkaminen 20 13 33 61 % 39 % 47 45 45 0 2
6 3 sotilaallinen 17 1 18 94 % 6 % 47 40 40 0 7
6 4 rakenne 3 3 6 50 % 50 % 47 12 15 3 32
7 1 Liettua 14 2 16 88 % 13 % 87 87 87 0 0
7 2 saarto 12 9 21 57 % 43 % 87 78 82 4 5
7 3 Neuvostoliitto 3 1 4 75 % 25 % 87 81 81 0 6
7 4 julistaminen 34 6 40 85 % 15 % 87 80 84 4 3
8 1 Irak 14 3 17 82 % 18 % 65 65 65 0 0
8 2 YK 18 1 19 95 % 5 % 65 64 64 0 1
8 3 joukkotuhoase 69 24 93 74 % 26 % 65 63 63 0 2
8 4 hävittäminen 40 13 53 75 % 25 % 65 60 60 0 5
8 5 komissio 13 13 26 50 % 50 % 65 55 57 2 8
9 1 OPEC 9 4 13 69 % 31 % 29 29 29 0 0
9 2 öljy 40 5 45 89 % 11 % 29 29 29 0 0
9 3 hinta 38 23 61 62 % 38 % 29 27 29 2 0
9 4 määrä 24 8 32 75 % 25 % 29 26 27 1 2
9 5 päätös 14 8 22 64 % 36 % 29 21 23 2 6
10 1 Romania 7 0 7 100 % 0 % 23 23 23 0 0
10 2 kaivosmiehet 3 1 4 75 % 25 % 23 21 21 0 2
10 3 väkivalta 24 3 27 89 % 11 % 23 22 22 0 1
10 4 mielenosoitukset 7 3 10 70 % 30 % 23 21 22 1 1
10 5 oppositio 9 0 9 100 % 0 % 23 17 17 0 6

Appendix 4 2/2
12 1 EY:n parlamentti 4 4 8 50 % 50 % 17 17 17 0 0
12 2 päätöksenteko 18 11 29 62 % 38 % 17 17 17 0 0
12 3 muut toimielimet 8 7 15 53 % 47 % 17 15 17 2 0
13 1 Bildt 3 0 3 100 % 0 % 13 13 13 0 0
13 2 Pohjoismaat 4 1 5 80 % 20 % 13 11 11 0 2
13 3 lausunto 12 7 19 63 % 37 % 13 11 13 2 0
13 4 yhteistyö 2 3 5 40 % 60 % 13 8 8 0 5
19 1 lentoyhtiö 23 42 65 35 % 65 % 56 56 56 0 0
19 2 tulos 40 15 55 73 % 27 % 56 55 56 1 0
19 3 talous 16 5 21 76 % 24 % 56 38 39 1 17
23 1 ydinjäte 12 15 27 44 % 56 % 34 31 34 3 0
23 2 käsittely 45 9 54 83 % 17 % 34 30 30 0 4
23 3 ongelmat 27 11 38 71 % 29 % 34 18 19 1 15
25 1 elintarviketeollisuus 34 48 82 41 % 59 % 14 13 13 0 1
25 2 tuonti 10 0 10 100 % 0 % 14 12 12 0 2
25 3 Suomi 4 2 6 67 % 33 % 14 13 13 0 1
25 4 rajoitus 13 3 16 81 % 19 % 14 7 7 0 7
26 1 asunto 48 20 68 71 % 29 % 35 35 35 0 0
26 2 tuotanto 35 28 63 56 % 44 % 35 34 35 1 0
26 3 suhdanne 46 5 51 90 % 10 % 35 33 33 0 2
26 4 Suomi 4 3 7 57 % 43 % 35 21 24 3 11
26 5 tilasto 6 9 15 40 % 60 % 35 22 27 5 8
30 1 aukiolo 28 11 39 72 % 28 % 27 27 27 0 0
30 2 kauppa 41 32 73 56 % 44 % 27 27 27 0 0
30 3 sunnuntai 10 5 15 67 % 33 % 27 25 25 0 2
30 4 järjestö 17 16 33 52 % 48 % 27 21 22 1 5
30 5 määräykset 27 6 33 82 % 18 % 27 21 22 1 5
32 1 Viro 11 6 17 65 % 35 % 50 50 50 0 0
32 2 yritys 46 93 139 33 % 67 % 50 50 50 0 0
32 3 yhteisomistus 16 4 20 80 % 20 % 50 46 47 1 3
32 4 Suomi 18 19 37 49 % 51 % 50 43 47 4 3
F1/Total 18 se a rc h top ic s 257 163 420 61 % 39 % 36 644 647 3 1
F2/Total 18 se a rc h top ic s 468 255 723 65 % 35 % 36 608 620 12 28
F3/Total 17 se a rc h top ic s 332 122 454 73 % 27 % 36 525 537 12 72
F4/Total 12 se a rc h top ic s 248 113 361 69 % 31 % 37 347 365 18 76
F5/Total 6 se a rc h top ic s 84 39 123 68 % 32 % 35 166 176 10 10
F1/ Ave 18 se a rc h top ic s 14,3 9,1 23,3 76 % 24 % 36 35,8 35,9 0,17 0,06
F2/ Ave 18 se a rc h top ic s 26,0 14,2 40,2 71 % 29 % 36 33,8 34,4 0,67 1,56
F3/ Ave 17 se a rc h top ic s 19,5 7,2 26,7 70 % 30 % 36 30,9 31,6 0,71 4,24
F4/ Ave 12 se a rc h top ic s 20,7 9,4 30,1 65 % 35 % 37 28,9 30,4 1,50 6,33
F5/ Ave 6 se a rc h top ic s 14,0 6,5 20,5 70 % 30 % 35 27,7 29,3 1,67 1,67
F1-F5/ Ave 14 se a rc h top ic s 18,9 9,3 28,2 70 % 30 % 36 31,4 32,3 0,94 2,77

Appendix 4 1/1
Appendix 4. Relevant documents where a facet is
represented at least by one query plan expressionThe number and proportion of relevant documents where a facet is represented at least by
one query plan expression (QpW) or other expression (NewW), or contains only unsearchable
expressions (ImplE). The sample of 18 search topics. (NewWU = documents containing
searchable but not query plan expressions).
All relevant docs Relevant docs in TopDCV10 Relevant docs in TopR20 Relevant docs in TailR80a) The small database.Facet QpW NewW NewWU ImplE Total QpW NewW NewWU ImplE Total QpW NewWNewWU ImplE Total QpW NewW NewWU ImplE Total
1 126 32 1 1 128 85 21 0 0 85 39 9 0 0 39 23 6 0 1 242 119 40 1 8 128 84 29 1 0 85 39 13 0 0 39 16 7 1 7 243 105 31 1 17 123 70 27 1 9 80 34 11 0 1 35 20 4 0 3 234 64 35 6 22 92 50 26 2 7 59 23 10 3 3 29 7 3 2 10 195 31 5 1 12 44 25 5 1 7 33 12 2 0 1 13 5 0 0 5 10
Average 89 29 2 12 103 63 22 1 5 68 29 9 1 1 31 14 4 1 5 20b) The large&dense databaseFacet QpW NewW NewWU ImplE Total QpW NewW NewWU ImplE Total QpW NewWNewWU ImplE Total QpW NewW NewWU ImplE Total
1 647 148 0 1 648 162 35 0 0 162 158 39 0 0 158 124 26 0 1 1252 608 196 12 28 648 161 48 0 1 162 158 54 0 0 158 100 30 2 23 1253 524 122 12 73 609 140 44 4 3 147 141 37 1 5 147 77 20 6 35 1184 342 178 19 80 441 108 53 3 1 112 106 53 3 0 109 45 24 7 36 885 171 51 9 31 211 65 11 0 1 66 52 12 0 0 52 27 10 4 15 46
Average 458 139 10 43 511 127 38 1 1 130 123 39 1 1 125 75 22 4 22 100c) The large&sparse databaseFacet QpW NewW NewWU ImplE Total QpW NewW NewWU ImplE Total QpW NewWNewWU ImplE Total QpW NewW NewWU ImplE Total
1 126 32 1 1 128 56 13 0 0 56 41 10 0 0 41 23 6 0 1 242 119 40 1 8 128 56 21 0 0 56 41 15 0 0 41 16 7 1 7 243 105 31 1 17 123 50 22 1 3 54 39 15 0 0 39 20 4 0 3 234 64 35 6 22 92 41 20 1 0 42 28 14 0 2 30 7 3 2 10 195 31 5 1 12 44 19 4 0 5 24 12 1 0 1 13 5 0 0 5 10
Average 89 29 2 12 103 44 16 0 2 46 32 11 0 1 33 14 4 1 5 20