A Method for Distributed Pipeline Burst and Leakage Detection in Wireless Sensor Networks Using...
12
A Method for Distributed Pipeline Burst and Leakage Detection in Wireless Sensor Networks Using Transform Analysis Sidra Rashid 1 , Saad Qaisar 1 , Husnain Saeed 1 , Emad Felemban 2 1 School of Electrical Engineering and Computer Science, National University of Sciences and Technology (NUST) , H-12 Islamabad, Pakistan 2 Department of Computer and Information System Umm-Al-Qura University, KSA Correspondence should be addressed to Sidra Rashid; [email protected], Saad Qaisar; [email protected],Husnain Saeed; [email protected] Abstract Bursts and leakages have turned out to be one of the most frequent malfunctions in liquid pipeline distribution systems. In recent years, the issue has gained a lot of attention in research community due to associated financial costs, environmental hazards, health and safety considerations. Wireless Sensor Network (WSN) based leakage detection and localization can provide exceptional level of operational efficiency and safety assurance, providing operators a reliable and real-time parametric view of the entire instrumented pipeline network. In this paper, we propose a transient pressure wave based technique coupled with wavelet analysis to achieve reliable detection and localization of abrupt bursts and leakages. The presented technique uses the information carried in the transient pressure signal. A specific pattern was induced on the pressure trace for the leak within the pipeline. Wavelet analysis is used to detect local singularities in the pressure trace due to the presence of a leak alongwith time and frequency resolution. The proposed algorithm is distributed in nature customized to run on low power sensor nodes. The algorithm is deployed in field on a custom pipeline test bed and performance results are documented for various testing scenarios. A comparison of proposed wavelet technique with other widely used Fourier and impulse response methods has been carried out. The technique provides more than 90% accuracy in a number of deployment scenarios for high noise generating long pipeline networks. I. I NTRODUCTION According to World Bank’s estimate, water loss volume amounts to 48.6 billion m 3 /year worldwide, with a financial loss of approximately 14.6 billion US dollars per year. Almost twenty percent of the US water supply are lost through leaking pipes [1]. There exist variety of commercial leakage detection techniques ranging from physical inspection to using high performance sensing nodes. Among these techniques, acoustics phenomenon is most widely used, acoustic waves generated due to leakage are recorded using sensors and transducers, though the technique is rendered in-effective if leak is not abrupt or small enough. There is a variety os sensors and transducers used for multiple applications [2], [3], [4]. The performance level of a leak detection system can be established by a series of factors. Some of the criteria that are usually used to evaluate the performance of leak detection systems are the ability to determine location of the leak, the detection speed and the ability to estimate the size of the leak. In Table. I, we summarize most important features of each detection technique and performance evaluation criterion. All these methods require human intervention, are time consuming and not customized for energy constrained field deployed wireless sensor devices. An automated, non-invasive, rapid and easily deployable method is desirable to embed in wireless sensor network for long range pipeline networks. To decrease false alarm rate effectively and promote detection and location precision, we propose a distributed signal processing technique which employs discrete wavelet transform to extract inflection points of negative pressure wave (NPW), where distributed decision making reduces the base station work load. As a matter of fact, in frequency domain, the faults are pinpointed without losing signal information in frequency domain. However, its applications to unsteady signals neglects the basic assumption of steadiness and can fail in some cases [5]. To realize the benefits of analysis in both the frequency and time domains and to improve the effectiveness of the methodology, wavelet analysis has been used. Since the faults in the pipeline network introduce particular patterns in pressure signals obtained from transients , the problem of leak detection is to investigate the signal trend over a period of time. Therefore, the performance of different types of wavelets is explored for the valuable information corresponding to abrupt transitions which are em- bedded in pressure signals, in the presence of noise. The major contributions of this paper are; We propose and implement a complete wireless sensor system for leakage detection based on wireless sensor network paradigm. Most of the efforts in this area are simulation based, as found in recent literature [6]. A distributed sensing algorithm is integrated with self- designed wireless sensor node and wireless communication, based on a high rate pressure data that ensures long term on-line operation with respect to safety requirements. The evaluation of the proposed system is done on realistic data obtained gathered from experimentation on field deployed
-
Upload
independent -
Category
Documents
-
view
3 -
download
0
Transcript of A Method for Distributed Pipeline Burst and Leakage Detection in Wireless Sensor Networks Using...

A Method for Distributed Pipeline Burst andLeakage Detection in Wireless Sensor Networks
Using Transform AnalysisSidra Rashid 1, Saad Qaisar 1, Husnain Saeed 1 , Emad Felemban 2
1 School of Electrical Engineering and Computer Science, National University of Sciences and Technology (NUST), H-12 Islamabad, Pakistan
2 Department of Computer and Information System Umm-Al-Qura University, KSA
Correspondence should be addressed to Sidra Rashid; [email protected],Saad Qaisar; [email protected],Husnain Saeed; [email protected]
Abstract
Bursts and leakages have turned out to be one of the most frequent malfunctions in liquid pipeline distribution systems.In recent years, the issue has gained a lot of attention in research community due to associated financial costs, environmentalhazards, health and safety considerations. Wireless Sensor Network (WSN) based leakage detection and localization can provideexceptional level of operational efficiency and safety assurance, providing operators a reliable and real-time parametric viewof the entire instrumented pipeline network. In this paper, we propose a transient pressure wave based technique coupled withwavelet analysis to achieve reliable detection and localization of abrupt bursts and leakages. The presented technique uses theinformation carried in the transient pressure signal. A specific pattern was induced on the pressure trace for the leak within thepipeline. Wavelet analysis is used to detect local singularities in the pressure trace due to the presence of a leak alongwith timeand frequency resolution. The proposed algorithm is distributed in nature customized to run on low power sensor nodes. Thealgorithm is deployed in field on a custom pipeline test bed and performance results are documented for various testing scenarios.A comparison of proposed wavelet technique with other widely used Fourier and impulse response methods has been carried out.The technique provides more than 90% accuracy in a number of deployment scenarios for high noise generating long pipelinenetworks.
I. INTRODUCTION
According to World Bank’s estimate, water loss volumeamounts to 48.6 billion m3/year worldwide, with a financialloss of approximately 14.6 billion US dollars per year. Almosttwenty percent of the US water supply are lost throughleaking pipes [1]. There exist variety of commercial leakagedetection techniques ranging from physical inspection to usinghigh performance sensing nodes. Among these techniques,acoustics phenomenon is most widely used, acoustic wavesgenerated due to leakage are recorded using sensors andtransducers, though the technique is rendered in-effective ifleak is not abrupt or small enough. There is a variety ossensors and transducers used for multiple applications [2], [3],[4]. The performance level of a leak detection system can beestablished by a series of factors. Some of the criteria thatare usually used to evaluate the performance of leak detectionsystems are the ability to determine location of the leak, thedetection speed and the ability to estimate the size of the leak.In Table. I, we summarize most important features of eachdetection technique and performance evaluation criterion. Allthese methods require human intervention, are time consumingand not customized for energy constrained field deployedwireless sensor devices.
An automated, non-invasive, rapid and easily deployablemethod is desirable to embed in wireless sensor networkfor long range pipeline networks. To decrease false alarmrate effectively and promote detection and location precision,
we propose a distributed signal processing technique whichemploys discrete wavelet transform to extract inflection pointsof negative pressure wave (NPW), where distributed decisionmaking reduces the base station work load. As a matter offact, in frequency domain, the faults are pinpointed withoutlosing signal information in frequency domain. However, itsapplications to unsteady signals neglects the basic assumptionof steadiness and can fail in some cases [5]. To realize thebenefits of analysis in both the frequency and time domainsand to improve the effectiveness of the methodology, waveletanalysis has been used. Since the faults in the pipeline networkintroduce particular patterns in pressure signals obtained fromtransients , the problem of leak detection is to investigate thesignal trend over a period of time. Therefore, the performanceof different types of wavelets is explored for the valuableinformation corresponding to abrupt transitions which are em-bedded in pressure signals, in the presence of noise. The majorcontributions of this paper are; We propose and implement acomplete wireless sensor system for leakage detection basedon wireless sensor network paradigm. Most of the efforts inthis area are simulation based, as found in recent literature[6]. A distributed sensing algorithm is integrated with self-designed wireless sensor node and wireless communication,based on a high rate pressure data that ensures long termon-line operation with respect to safety requirements. Theevaluation of the proposed system is done on realistic dataobtained gathered from experimentation on field deployed

TABLE I: Leakage Detection TechniquesAbbreviations: yes (Y), no (N), slow (S), medium (M), fast (F) and high (H).
Aco
ustic lo
gg
ing
[28
]
Op
tica
l[21
]
Ca
ble
Se
nsin
g[2
2]
GP
R[2
4]
Va
po
r S
am
plin
g[2
5]
So
il m
on
ito
rin
g a
nd
tra
ce
r
ga
s[2
6]
Gu
ide
d W
ave
Me
tho
d[2
3]
Ultra
so
nic
Flo
w
[27]
Cost
Detection Rate
Parameters
H H HH MHH H
F F F F FS S M
Y Y YYYN N NLeak size estimation
test bed along with systematic analysis of error sources andfalse positives in the results. The developed system is capableof detecting leakages on its own, thereby informing centralcontrol about the locality and intensity of the anomaly usingcommunication protocols for sensor nodes. A comparison withthe state-of-the art techniques is also provided.
A brief summary on state-of-the-art methods for leakagedetection and the background on the basis of signal processingand wavelet applications for stated problem is discussed insection II. Successively, an algorithm based on the NegativePressure Wave (NPW) and wavelets phenomenon for leakagedetection and localization in pipelines is proposed. Finally, anexperimental validation of the proposed system is presentedand working of experimental setup, practical considerations,simulations and all the aspects that must be taken into accountfor the spatial localization of the leak are addressed. Thispaper provides a complete picture of the developed monitoringsystem known as REMONG for burst and leakage detectionextendingon works in [7] and [8].
II. PRESSURE-BASED LEAKAGE DETECTIONTECHNIQUES
Various pressure based techniques exist for detection andlocalization of leaks. Fig. 1 provides a nature based classi-
Pressure-Based Leakage
Detection Techniques
Transient Damping
Method (TDM)
Inverse Transient Analysis
(ITA)
Impulse Response
Analysis(IRA)
Pressure Peak Method
(PPM)
Time Domain
Reflectrometry (TDR)
Transform Analysis
Method(TAM)
Peak Sequencing Method
(PSM)
Frequency Domain Techniques
Time Domain Techniques
Fig. 1: Signal processing approaches for leakage detection.
fication of such techniques. Some of them are elaborated asfollows :
Leak reflection method (LRM) uses information of transientwave to identify leakage. LRM methods are so far used only insingle pipeline and laminar flow networks [9], [10], [11] and[12]. Impulse Response Analysis (IRA) converts reflectionsto sharp impulses with well-defined time delays. Impulseresponse is useful in mechanical pipeline systems where sharpreflections are not produced [15] [16]. Transient DampingMethod (TDM) [17] [18] [19] can be easily implemented,although this approach is less expensive. In a practical system,noise is a major concern which must be filtered out for suchtechniques [20]. Time Domain Reflectrometry (TDR) requiresbattery powered system including TDR instrument to mea-sure reflectrometry coefficient which is the ratio between theamplitude of the signal reflected and TDR response[21] [22].This method reduces the inspection time to a certain amountas compared to other traditional methods due to its highsensitivity to impedance variations. One factor which shouldbe taken care of is the rusting between the interconnectionsof the pipeline, which may lead to errors for leakage locationestimation . TDR techniques are good for a single pipelinesystem where small leak gives rise to high pressure wavewhich can be investigated in laboratory experiments [23]. Themethods described above belong to time domain transientmodeling.
Analysis of the signal in time domain requires system tran-sient response at multiple locations while in frequency domainonly one transient response is enough to study the behavioralchanges and detection of anomalies. Frequency domain anal-ysis is direct and less computationally intensive [17]. Severalresearches analyzing transient signals in frequency domain forleakage detection are as follows: Mpesha et al.(2001) proposedpresence of leak or anomalies revealed by amplitude peaks infrequency response diagram of pressure signals. These peakshave comparatively lower amplitude than leak free system.The change in amplitude of peaks shows pressure drop due topresence of leak [24]. Lee et al. (2005a) introduced inverseresonant and peak-sequencing method (PSM) which is basedon the fact that leak produces sinusoid patterns on peaks ofFRDs (Frequency Response Diagram). Although friction alsocauses attenuation. It has a smooth distinguishable pattern inleak induced signals which does not affect this approach much[24]. Some performance parameters like inspection rangedetection and detectable leakage sizes have been comparedin Table. II. Most recently, In [6], a detection method hasbeen presented to detect the bursts in pipelines. In this study,statistical analysis and hydraulic modeling are used to pinpointleakages and bursts which are applicable to detection of localleakages in small scale distribution systems in which the leaksare often masked by flow variations. The measurement errorsfrom field observations and potential bad data are neglected inthis study, which are very important in real time monitoringnetworks.
Most of the approaches described previously utilized thesupervisory control and data acquisition (SCADA) field mon-
itoring data to calibrate system parameters representing leak-age/burst and are based on simulations.
In this paper, we present an alternative leakage and burstidentification method, with the advantages of computationallyefficient detection algorithm and its distributed implementa-tion in WSN. The proposed algorithm is based on wavelettransform (WT) which decomposes a signal into its frequencycomponents just as Fourier transform but provides a globalrepresentation of signal. WT was developed to overcome theshortcomings of the Short Time Fourier Transform (STFT).STFT provides constant resolution on all frequency levelswhile WT uses multi-resolution technique, which analyzesdifferent signal frequencies with different resolution [9]. Thewavelet transform, at high frequencies, gives good time reso-lution and poor frequency resolution, while at low frequencies,the wavelet transform gives good frequency resolution andpoor time resolution. CWT cannot be used effectively unlessdiscretized [25]. This algoritm is successfully integrated inwireless sensor network for pipeline health monitoring. Theresults show that the proposed method is useful for pinpointingthe pipeline bursts and leakages in real-time.
III. DISTRIBUTED BURSTS AND LEAKAGE DETECTION INWIRELESS SENSING NETWORK
For long range oil/water distribution networks, environmentmonitoring upto several kilometers and burst/leakage detectionis made possible by Wireless Sensor Networks (WSNs). Ingeneral, there are two types of data processing in WSN. Oneis the centralized processing, which collects all data to acentral node for processing. These systems have high cost,centralized control and proprietary network protocol. Central-ized approach is similiar to SCADA (Supervisory Control andData Acquisition ) which is used to monitor real time datain industries. However, centralized approach in WSNs hashigh data rate and node density as compared to SCADA [26].For reliable detection of bursts and leakages, it is requiredto distribute the cardinal control of base station among thewireless sensor network nodes. Second type is the node leveldistributed processing, which collects raw data on sensor nodesfor local decisions and global decision is taken by high tiernodes based on these local decisions.
It can be noticed that when the number of sensing nodes
TABLE II: Efficiency ranges of various leak detection method-ologies using pressure transients [12]
MethodologyInspection
Range
Detectable
leak sizeReference
LRM
ITA
IRA
TDM
FRM
135m
5936m
20,000m
37.2m
2000m
0.04 l/s
3 l/s
10 l/s
0.01 l/s
4.73 l/s
Jo¨nsson
(2003)
Covaset al.
(2005b)
Liou (1998)
Wang et al.
(2002)
Lee et al.
(2005a)
are smaller, the total energy of the centralized and distributednetwork increases linearly and slightly differ to each other.However, the increase in number of sensing nodes results inremarkable increase in the consumed energy. This trend is dueto the fact that when a large number of nodes start computationand communication with base station , it consumes much moreenergy than a few nodes transmitting the local decisions tobase station.
Transmitted Wave Transmitted Wave
Dia
me
ter
Leak Point
Pressure Sensor
Fig. 2: Architecture of our test pipeline system.
0 500 1000 1500 2000 2500 3000 3500 4000 4500220
240
260
280
300
Time
Pres
sure
No leak
0 500 1000 1500 2000 2500 3000 3500 4000 4500220
240
260
280
300
Time
Pres
sure
Presence of leak
Fig. 3: Pressure evolution of leakage along the pipeline as afunction of time; a)Pressure profile in the absence of leak, b)Pressure profile in the presence of a 3.5 inches leak size
Most algorithms for sensor networks proposed in litera-ture are meant to be executed by the sensor nodes duringthe detection. Wireless Distributed Computing (WDC) offersrobustness, increased performance and operational efficiency.The goals are to reduce per-node and network resource require-ments and to speed up bursts and leakage detection process.Major steps involved in WDC are real-time critical data cap-ture, processing and dissemination. There are many advantagesof using distributed computing in WSN as compared to wirednetworks with LAN. If a node fails in wired network, thecomplete system is destroyed while in WSNs the system canrely on other sensor nodes. In order to increase the efficiencyof local decisions at a particular location, additional sensornodes can be included in sensor network wihout the cost ofwires and system reconfiguration.
Leakages and bursts introduce transition in pressure wavetravelling along fluid inside the pipeline which is absent inthe intact system. These transient travels along the lengthof pipeline. Fig. 2 shows that a leakage point generates twotransient waves equal in magnitude but in opposite direction.

Cluster Head 1 Cluster Head 2
Sensors Interface
Software Interface
Error Correction
Data Direction
Block A
Block B
Discrete Messages in Wireless Channel
Sensors Interface
Sensor data acquisition
Noise Removal
Burst and Leakage event
detection
Base station
Fig. 4: Distributed processing architectural layout
Due to high pressure in the fluids, the leakage causes someattenuation in the transient signal thereby causing a negativepressure wave (NPW) [27]. This scenario has been shown inFig. 3. In this figure, pressure signals are plotted with presenceand absence of leakages. The pressure profile of leak signalin Fig. 3 (b) refers to comparatively large leak size of 3.5inches which can be identified by visual inspection while incase of small and slow leakages it is not possible to visuallyidentify the leak. Slow and small leakages are challenging toidentify thus an algorithm is needed which can identify smallleakages with precision. The position of disturbance indicatesthe arrival time of leak reflected signals and can be used tomeasure the time for transient signal to travel from its source[28].
The behavior of NPW can be sensed by wireless sensornodes across several zones of the pipeline network. A linearand hierarchical infrastructure layout is required for WSNnode deployment, in which adjacent sensors nodes are groupedto form node communities. Once the features of negative pres-sure waves are acquired, they are transmitted to cluster headsover several hops and kilometers to be transmitted by longhaul transmission protocol. Important parameters consideredfor deployment of WSN in pipeline infrastructures includecoverage distance, number of hops, number of nodes, samplingand energy harvesting rates. NPW related information can betransmitted over a number of cluster nodes depending uponthe size of the network until fusion center is reached. Thedata aggregated at this level is sent for inference to base station(highest tier node), where alarm is generated for warning. Withthe increase in number of nodes in network, error debuggingand fault tolerance becomes complex due to high transmissionrate of data packets.
We consider a 1−D wireless sensor network, where sixsensor nodes are placed over the pipeline distribution systemdepending upon the communication range. Each node takes
about 100 ms to sending or receieve a message containingNPW features and transmission or reception takes 10−20 ms.The communication range is less than 100 meter in indoor en-vironment and around 100 to 200 meters in outdoor with 1mWpower. The location of the kth sensor node in the network isdk=kd,k={1,2,3,...,n} where dk shows the distance of kthnodeand k is the identity number for the node. Distributed leakageand burst detection approach includes single-node processingand multi-node collaboration for event detection. The detectionalgorithm is divided into three tasks, which are shown withdifferent shapes in the Fig. 4. There are two main blocks in thisfigure. Block ‘A’ shows the data collection and local inferencemodule whereas block ‘B’ shows the global inference module.There are six nodes in this network. Four of them are endnodes designated as n1 , n2 , n3 , n4 and two are clusterhead nodes. Waspmote has been used as sensor node in thenetwork [29]. All these sensor nodes have a number of sensorslike temperature, pressure and humidity sensors etc. Someof the features of waspmote are Microcontroller: AT mega1281, Frequency: 8MHz, SRAM: 8Kb, EEPROM: 4KB, Flash:128Kb. In order to check the validity of sensor reading, wecross-check data in a predefined offline dictionary to seperatethe garbage data. This way readings from the pressure sensorsare obtained alongwith the battery status of node. The dataacquisition is performed by nodes n1 , n2 , n3 and n4.
Practical pipeline distribution systems face some seriousissues like noise due to the presence of multiple commu-nication devices in the environment. In order to clean theraw data, we compute moving average filter, which eliminatesthe noise sparks. This reduces the chance for false alarm ofevent detection. The cluster heads perform noise removal andleakage/burst detection algorithm. For the local trending ateach sensor node, we capture the temporal pattern of pressuremeasurements. Leakage and burst detection algorithm utilizescollaboration of neighboring wireless sensor nodes to reach

a consensus for leakage presence. The local decision of thenodes is matched with a number of neighbouring nodes in thenetwork. To identify the leakage in the pipeline, behaviour ofthe sensor data is analyzed and the decision on the cluster headnode is send to base station after consensus, where wavelettransform and NPW algorithm are performed. The decisionof performing noise removal on the cluster heads is taken toreduce the time required for the transmission of noisy data.For this purpose we consider the testing problem where theobservation at the kth sensor node is given by:
O0 = pk (1)
O1 = pk + η (2)
In Eq.1 and 2, O0 and O1 show observation of signal on thesensor nodes, with and without the presence of noise whichis shown by η.
If noise removal is not performed on the sensing nodes thenaccording to Eq. 2 the required transmission time will be morethan observation in Eq. 1 which is noise free. So instead oftransmitting the scrap to next hierarical level in network it isbetter to remove it on the cluster nodes. If the moving averagefilter is implemented for noise removal and ‘N’ is the lengthof the weighted moving window therefore order of the filter isO(N). A symmetric weighted moving average filter of windowlength 2n + 1 is given by Eq. 3:
mt =
n∑j=−n
bjyt n < t < N − n (3)
where bj shows weights and yt shows pressure signalsamples. Leakage and burst detection algorithm involves signaldownsampling, coefficients multiplication and upsampling.If the ‘d’-level decomposition is performed, it will includeupsampling, downsampling, signal splitting, signal groupingfor all these levels including inverse transform computation.Thus this part of computing has O(Nd+1) order and consumesmore energy than noise removal and data collection. Thus, itis implemented on base station which has large resources thannetwork nodes.
IV. PROPOSED PRESSURE-BASED LEAKAGEDETECTION SYSTEM
A. Data Collection and Communication Module
The custom built leakage detection system caters aspectsfrom reliable sensing to wireless transfer of events and sensingdata in a secure fashion whilst utilizing an indigenouslydeveloped power efficient sensor board. For communication,our system utilizes ZigBee modules that can be connected to astandard UART connector. A latest ZigBee standard complianttransceiver can provide an outdoor range of 3200 m (2 miles),indoor range of 90 m (300 ft), transmit power of +18 dBmand receiver sensitivity of -102 dBm.A touchscreen color LCDinterface is provided for user input to set tunable parametersand display them for user interaction. The LCD is 2.4”
Fig. 5: The sensor board microcontroller with peripherals andinterfaces for data collection and communication
diagonal in size, has 240 x 320 pixels with white LED back-light and can operate in the range of -75 to +70 C. For pipelineorientation monitoring, a precision accelerometer is embeddedon the board. The board is powered by a rechargeable battery.A 2-cell 7.4 V Lithium polymer battery pack is used withthe high capacity of 13,500 mAh. The wireless sensor dataaggregator board is designed in such a way that it minimizescurrent leakages in circuitry. This board is capable of workingunder high industrial temperature range (-40 to 85 C), with theLCD operation till -75 degree. The major component of thisboard is micro-controller, to which several integrated circuitcomponents and interfaces are connected through differentprotocols as mentioned in Fig. 5
A 32-bit micro-controller based on the high-performanceRISC core operating at a frequency of up to 160 MHz isused in board design. It incorporates high-speed embeddedmemories and an extensive range of enhanced I/Os and periph-erals. The board is characterized with low power monitoringwith a set of power-saving modes including the sleep andhibernate for transceiver. There is an interface for applicationspecific sensors, we have used digital pressure and temperaturesensors which are specially designed for oil and gas industryto measure pressure and temperature of the pipeline fluid. Thesensor power requirements are kept at 5 V, 25 mA (max).These sensors can communicate using RS-485, RS-23 or SPI
Fig. 6: Linear Infrastructure monitoring using an aggregatorcluster head for WSN
interfaces.For pipeline infrastructure monitoring, a linear and hier-
archical layout is required for sensor node deployment inwhole network (Fig. 6). The sensory information of severalzones of the pipeline is monitored and transmitted to clusterheads over several hops and kilometers. There are someimportant parameters to be considered for deployment ofWSN in pipeline networks including number of hops, coveragedistance, number of nodes, sampling and energy harvestingrates. In the linear pipeline monitoring topology, gateway orend nodes cannot communicate with other nodes more thanone or two hops away. When the node wants to establishcommunication and transfer packets with each other, it willsend out broadcasts asking for the RSSI of other nodes inits vicinity, and a table will be formed with RSSI of theneighboring nodes. In sensor network, whenever a sensor nodeis awake, it collects pressure data and calculates local decisionfrom this information.
B. Signal Processing and Decision Making ModuleWhen a leakage takes place, pressure inside and outside
the pipeline would be different which results in a negativepressure wave(NPW) propagating at a particular velocity. Thelocation of leakage can be predicted if the time delay betweenNPW and the normal pressure waves inside the pipeline isknown. The layout of the pipeline system has been shown inFig. 2. The location of leakage can be found by the followingequation:
X = (L+ v.∆t)/2 (4)
X: the distance between leakage point and pressure transducer;L: the distances between two pressure transducers;v: negative pressure wave propagating velocity in liquidmedium piping system of m/s;t: time difference of the pressure wave getting to both pressuretransducers on the pipeline [30]
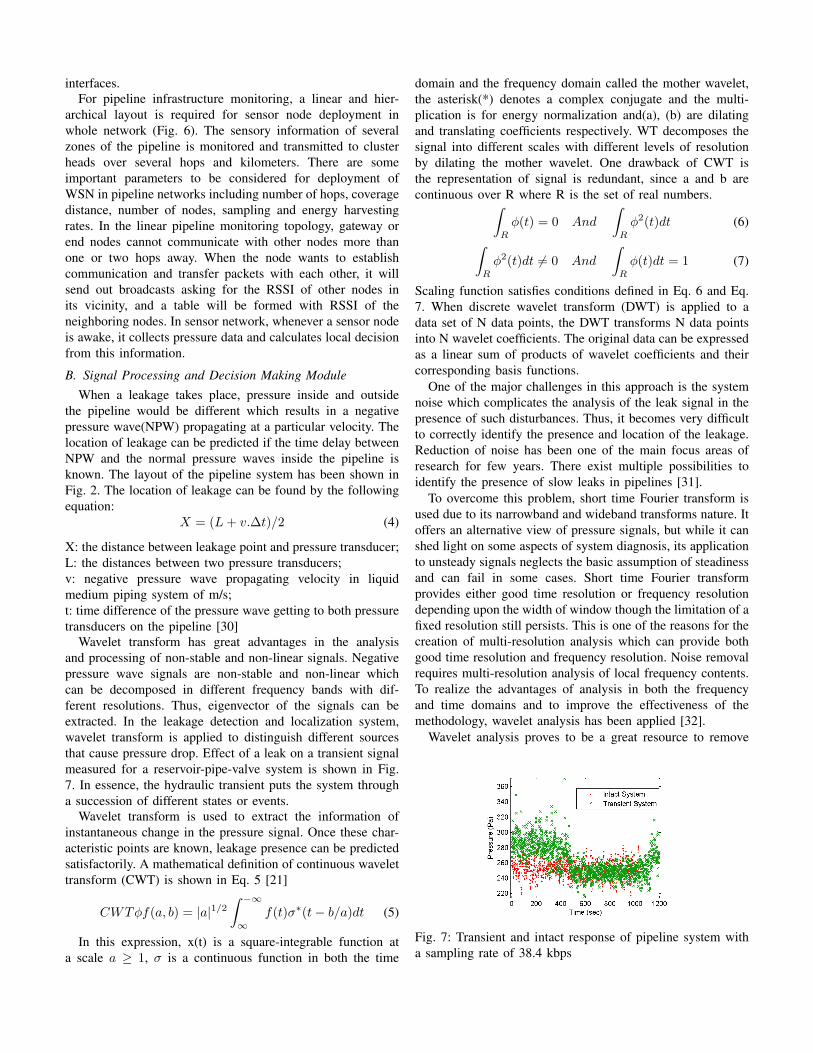
Wavelet transform has great advantages in the analysisand processing of non-stable and non-linear signals. Negativepressure wave signals are non-stable and non-linear whichcan be decomposed in different frequency bands with dif-ferent resolutions. Thus, eigenvector of the signals can beextracted. In the leakage detection and localization system,wavelet transform is applied to distinguish different sourcesthat cause pressure drop. Effect of a leak on a transient signalmeasured for a reservoir-pipe-valve system is shown in Fig.7. In essence, the hydraulic transient puts the system througha succession of different states or events.
Wavelet transform is used to extract the information ofinstantaneous change in the pressure signal. Once these char-acteristic points are known, leakage presence can be predictedsatisfactorily. A mathematical definition of continuous wavelettransform (CWT) is shown in Eq. 5 [21]
CWTφf(a, b) = |a|1/2∫ −∞∞
f(t)σ∗(t− b/a)dt (5)
In this expression, x(t) is a square-integrable function ata scale a ≥ 1, σ is a continuous function in both the time
domain and the frequency domain called the mother wavelet,the asterisk(*) denotes a complex conjugate and the multi-plication is for energy normalization and(a), (b) are dilatingand translating coefficients respectively. WT decomposes thesignal into different scales with different levels of resolutionby dilating the mother wavelet. One drawback of CWT isthe representation of signal is redundant, since a and b arecontinuous over R where R is the set of real numbers.∫
R
φ(t) = 0 And
∫R
φ2(t)dt (6)∫R
φ2(t)dt 6= 0 And
∫R
φ(t)dt = 1 (7)
Scaling function satisfies conditions defined in Eq. 6 and Eq.7. When discrete wavelet transform (DWT) is applied to adata set of N data points, the DWT transforms N data pointsinto N wavelet coefficients. The original data can be expressedas a linear sum of products of wavelet coefficients and theircorresponding basis functions.
One of the major challenges in this approach is the systemnoise which complicates the analysis of the leak signal in thepresence of such disturbances. Thus, it becomes very difficultto correctly identify the presence and location of the leakage.Reduction of noise has been one of the main focus areas ofresearch for few years. There exist multiple possibilities toidentify the presence of slow leaks in pipelines [31].
To overcome this problem, short time Fourier transform isused due to its narrowband and wideband transforms nature. Itoffers an alternative view of pressure signals, but while it canshed light on some aspects of system diagnosis, its applicationto unsteady signals neglects the basic assumption of steadinessand can fail in some cases. Short time Fourier transformprovides either good time resolution or frequency resolutiondepending upon the width of window though the limitation of afixed resolution still persists. This is one of the reasons for thecreation of multi-resolution analysis which can provide bothgood time resolution and frequency resolution. Noise removalrequires multi-resolution analysis of local frequency contents.To realize the advantages of analysis in both the frequencyand time domains and to improve the effectiveness of themethodology, wavelet analysis has been applied [32].
Wavelet analysis proves to be a great resource to remove
Fig. 7: Transient and intact response of pipeline system witha sampling rate of 38.4 kbps

Fig. 8: Original pressure signal , wavelet denoised signal and wavelet compressed signal with a sampling rate 0f 38.4 kbps
signal noise as well as provide insight into frequency contentof the signal. First of all, a data object is transformed into thewavelet domain. Then, some coefficients are selected and zero-filled or shrunk/truncated by a certain criterion. At the end, theshrunken or processed coefficients are inversely transformedto the original domain, this is the denoised data. The pressuredata signal of NPW is transformed to wavelets and thenwavelet compression and denoising is performed respectivelyfollowed by the event detection algorithm. Denoising is theproblem of signal recovery from noisy data. The de-noisingobjective is to suppress the noise part of the signal and torecover original signal. All steps for using wavelets are shownin Fig. 9. In this figure, ‘x’ is the original signal and ‘e’ isnoise.
The denoising procedure proceeds in three steps:1) Decompose: Choose a wavelet; choose a level N. Com-
pute the wavelet decomposition of the signal s at levelN.
1) Threshold detail coefficients: For each level from 1 to N,select a threshold and apply soft thresholding to the detailcoefficients.
1) Reconstruct: Compute wavelet reconstruction base on theoriginal approximation coefficients of level N.
A wavelet function is a small oscillatory wave which containsboth the analysis and the window function. Discrete wavelettransform uses filter banks for the analysis and synthesis ofa signal. The filter banks contain wavelet filters and extractthe frequency content of the signal in various sub-bands. Fig.8 shows the pressure signal taken from the pipeline test bedin an intact state and compares its response in presence ofa leak. This pressure signal is then denoised using waveletpacket transform. Wavelet compression is based on the conceptthat regular signal components can be approximated usingsmall number of approximation coefficients and some detailcoefficients.
The compression procedure proceeds in three steps: decom-
Wavelet
Transform
Inverse
Transform
Truncate
Coefficients
y x e Wy v Hv 1x W
Fig. 9: Block diagram of discrete wavelet transform
d1
d2
d3
d4
d5
a5
s
Decomposition level 5: s=a5+d1+d2+d3+d4+d5
Fig. 10: Wavelet packet decomposition tree
pose, threshold detail coefficients and reconstruction same asdenoising. The only difference with the de-noising procedureis found in threshold i.e step 2 where compression selects thelargest absolute value coefficient. The wavelet packet methodis a generalization of wavelet decomposition that offers a richmulti-resolution analysis. Wavelet packet atoms are waveformsindexed by position and scale for a given orthogonal waveletfunction. Fig. 10 shows level-5 decomposition where ‘a5’ isthe coefficient signal, ‘s’ is the original signal and ‘d1’ to‘d5’ are all decomposition levels for practical signal recordedfrom pipeline test-bed. All these decomposition levels andcoefficient signal are added to obtain original signal. Thewavelet packets can be used for numerous expansions of agiven signal. We select the most suitable decomposition ofsignal with respect to entropy.
A single decomposition using wavelet packets generatesa large number of basis. The generic step splits the ap-proximation coefficients into two parts. After splitting, weobtain a vector of approximation coefficients and a vector ofdetail coefficients, both at a coarser scale. The information
h
g
↓2
↓2
h
g
↓2
↓2
↑2
↑2
h‘
g‘
↑2
↑2
h‘
g‘
Original Signal
Level 1Decomposition
Level 2Decomposition
Level 1Reconstruction
Level 2Reconstruction
Reconstructed Signal
A٥
A1
A2
D2
A2'
D2'
A1'
D1'
A٥
Down Sample by 2 Down Sample by 2 Up Sample by 2 Up Sample by 2
0-fs/2
0-fs/4 0-fs/8
Fig. 11: Level-2 decomposition and reconstruction of wavelet
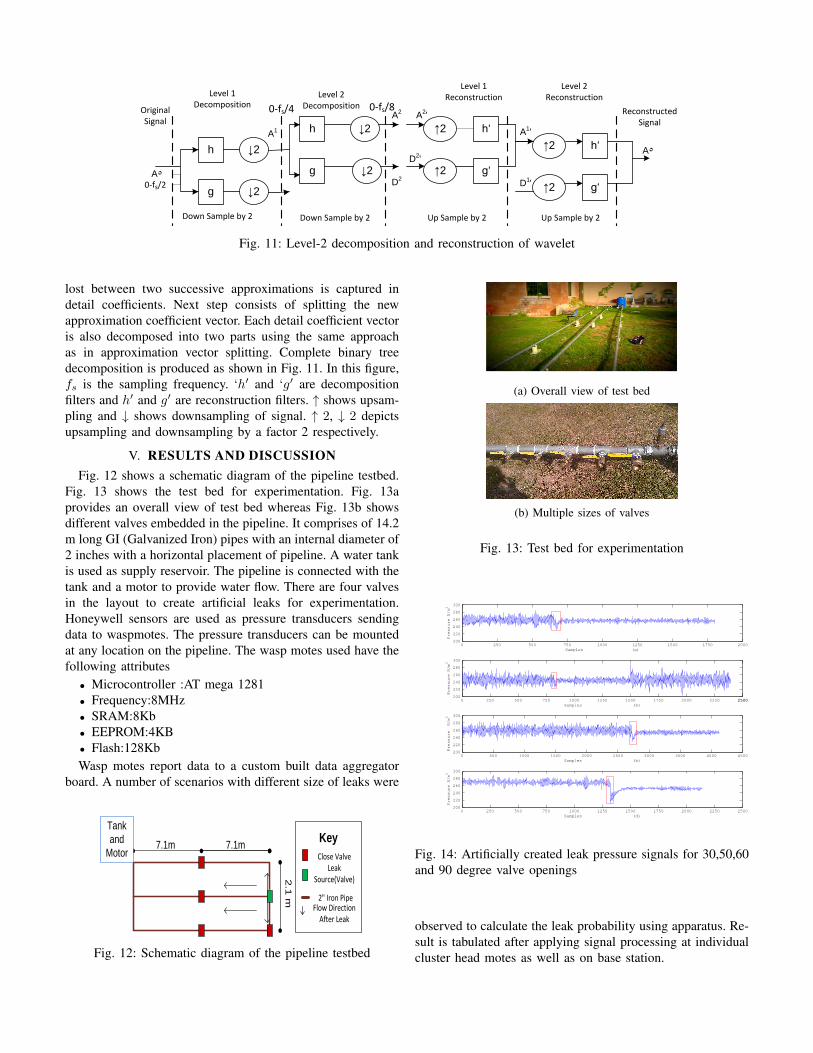
lost between two successive approximations is captured indetail coefficients. Next step consists of splitting the newapproximation coefficient vector. Each detail coefficient vectoris also decomposed into two parts using the same approachas in approximation vector splitting. Complete binary treedecomposition is produced as shown in Fig. 11. In this figure,fs is the sampling frequency. ‘h′ and ‘g′ are decompositionfilters and h′ and g′ are reconstruction filters. ↑ shows upsam-pling and ↓ shows downsampling of signal. ↑ 2, ↓ 2 depictsupsampling and downsampling by a factor 2 respectively.
V. RESULTS AND DISCUSSIONFig. 12 shows a schematic diagram of the pipeline testbed.
Fig. 13 shows the test bed for experimentation. Fig. 13aprovides an overall view of test bed whereas Fig. 13b showsdifferent valves embedded in the pipeline. It comprises of 14.2m long GI (Galvanized Iron) pipes with an internal diameter of2 inches with a horizontal placement of pipeline. A water tankis used as supply reservoir. The pipeline is connected with thetank and a motor to provide water flow. There are four valvesin the layout to create artificial leaks for experimentation.Honeywell sensors are used as pressure transducers sendingdata to waspmotes. The pressure transducers can be mountedat any location on the pipeline. The wasp motes used have thefollowing attributes• Microcontroller :AT mega 1281• Frequency:8MHz• SRAM:8Kb• EEPROM:4KB• Flash:128KbWasp motes report data to a custom built data aggregator
board. A number of scenarios with different size of leaks were
7.1m
2.1
m
7.1m
Tank
and
Motor
Close ValveLeak
Source(Valve)
2" Iron PipeFlow Direction
After Leak
Key
Fig. 12: Schematic diagram of the pipeline testbed
(a) Overall view of test bed
(b) Multiple sizes of valves
Fig. 13: Test bed for experimentation
0 250 500 750 1000 1250 1500 1750 2000200
220
240
260
280
300
Samples (a)
Pressure N/m2
0 500 1000 1500 2000 2500 3000 3500 4000 4500200
220
240
260
280
300
Samples (b)
Pressure N/m2
0 250 500 750 1000 1250 1500 1750 2000 2250 2500200
220
240
260
280
300
Samples (d)
Pressure N/m2
0 250 500 750 1000 1250 1500 1750 2000 2250 25002500200
220
240
260
280
300
Samples (b)
Pressure N/m2
Fig. 14: Artificially created leak pressure signals for 30,50,60and 90 degree valve openings
observed to calculate the leak probability using apparatus. Re-sult is tabulated after applying signal processing at individualcluster head motes as well as on base station.

1 2 3 4 5 6 7 80.92
0.93
0.94
0.95
0.96
0.97
0.98
0.99
1
Instances
Spe
cific
ity
DaubechiesHaarSymlet
(a) Specificity of distributed leak detectionalgorithm
1 2 3 4 5 6 7 80.92
0.93
0.94
0.95
0.96
0.97
0.98
0.99
1
Instances
Sen
sitiv
ity
DaubechiesHaarsymlet
(b) Sensitivity of distributed leak detectionalgorithm
1 2 3 4 5 6 7 80.92
0.93
0.94
0.95
0.96
0.97
0.98
0.99
1
Instances
Pos
itive
Pre
dict
ive
Val
ue
DaubechiesHaarSymlet
(c) Positive prediction value of distributedleak detection algorithm
1 2 3 4 5 6 7 80.92
0.93
0.94
0.95
0.96
0.97
0.98
0.99
1
Instances
Neg
ativ
e P
redi
ctiv
e V
alue
DaubechiesHaarSymlet
(d) Negative prediction value of distributedleak detection algorithm
1 2 3 4 5 6 7 80.91
0.92
0.93
0.94
0.95
0.96
0.97
0.98
0.99
1
Instances
Acc
urac
y
Daubechieshaar_AccuracySymlet
(e) Accuracy of distributed leak detectionalgorithm
0 2 4 6 8 10 12 14 1515−5
−4
−3
−2
−1
0
1
2
3
4
5
6
7
8
9
1010
Decomposition levels of Wavelet
Dau
bech
ies
Wav
elet
Par
amet
ers
MeanSNRStandard Deviation
(f) Trade off between signal to noise ratioand decomposition levels
Fig. 15: Performance parameters of distributed leakage detection algorithm under different scenarios
We evaluated detection accuracy using four experiments inpipeline setup. Valve 3 is opened at 30 degree, 50 degree,60 degree and 90 degree accurately using digital compass asshown in Fig. 14. The red colored window shows the presenceof leak and the signal part which needs to be focused on foraccurately finding samples where leak occurs. Once samplesare correctly identified using the time information, we can findthe location of leak in the pipeline network. System’s naturalresponse is also recorded to make comparison.
The trace set obtained by this experimental setup containsfour pressure transient signals. We have used five wasp motesto make wireless mesh network in a tree topology. There aretwo cluster head nodes and one base station. All traces are an-alyzed with both wavelet transform analysis for three differentwavelet types like haar, symlet and daubechies wavelets. Noiseremoval has been performed on network nodes and leakagedetection algorithm has been performed on base station. Waspmotes pass the noise free critical pressure information to othercluster head nodes and consequently an alarm is generated onthe base station as a leak detection warning.
Here, we present the results from experimental evaluationof distributed leakage detection algorithm. Some statisticalmeasures are evaluated for the performance of said technique.Sensitivity measures the proportion of correctly identifiedsamples for event detection whereas specificity measures thequantity of false events which are correctly identified, these
two measures are closely related. In Fig. 15 some performancemeasures has been plotted. In this figure the x-axis showsinstances. From 1-4 on x-axis, wavelet denoising alongwith30%, 50%, 75%, 90% opening of two inches valve hasbeen used to detect leakage and corresponding performanceparameter is plotted. Similarly, from 4-8 on x-axis, waveletcompression alongwith 30%, 50%, 75%, 90% opening of twoinches valve has been used to detect leakage. The experimenthas been repeated ten to twenty times and the average of theresults obtained are plotted for each instance. In Fig 15(a),specificity of detection algorithm has been shown with threedifferent types of wavelets. Specificity for the daubechies andsymlet is much higher than haar wavelets due to comparativelycomplex decomposition in both wavelets. Daubechies waveletsare the most popular wavelets. These are also called Maxflatwavelets as their frequency responses have maximum flatnessat frequencies 0 and π.
The optimum wavelet decomposition level can be chosenby estimating the SNR in wireless transmission system [33].Further it can be made adaptive. The results of simulationfor different level of daubechies wavelet decomposition areshown in Fig. 15 (f) . It can be clearly seen that eight leveldecomposition shows much better performance than the two,four or six level wavelet analysis for leakage detection. Foreighth level, mean value of decomposition signal reducessignificantly and as a result, the SNR performance is increased.

0 0.5 1 1.5 2
x 104
750
800
850
900
950
1000
1050
Time (seconds)
Pre
ssu
re (
Pa
)
(a) Pressure profile of burst
0 0.5 1 1.5 2
x 104
800
850
900
950
1000
1050
1100
Time (seconds)
Pre
ssu
re (
Pa
)
(b) Pressure profile of slow leakage
Fig. 16: Pressure signature of leakage and burst pipeline as afunction of time
In wireless communications, two level decomposition has notbeen so effective in it’s SNR performance. Through extensivesimulation results, we find SNR of six level decompositionshowing better performance in reducing noise. Thus, sixlevel wavelet decomposition is considered to be best waveletdecomposition for de-noising in our case.
To differentiate between bursts and leakages, another traceset is acquired. The test bed for varying leakage size is shownin Fig. 13b. This figure shows five valves of different sizes,which are embedded in the pipeline structure at two differentpositions. The sizes of valves are 0.25 inches, 0.5 inches, 0.75inches, 1.0 inches and 1.5 inches. Different sized valves havebeen selected not only to create different sizes of leakages butalso create samples for bursts. This trace set is used to evaluatethe proposed algorithm for bursts and leakages detection. The
0 10 20 30 40 50
80
82
84
86
88
90
92
94
96
98
Leakage sizes (inches)
Perc
enta
ge A
ccura
cy
0.25 0.5 0.75 1.0 1.5
Fig. 17: Accuracy of algorithm for bursts and leakages ofdifferent sizes
small sizes of valves are used to model bursts whereas largesizes of valves are used for slow leakages. In Figure. 16, it canbe noticed that burst (Fig. 16a) and leakage (Fig. 16b) profilesobtained from the test bed are quite different. The burst sampleis collected by opening the smallest size valve i.e 0.25 incheswhereas the leakage sample is collected by opening 1.5 inchesvalve. Theses traces are collected over a time span of thirtyfive seconds each at 500-700 Hz frequency. A high samplingfrequency of pressure measurements is required because theNPW speed can be as high as several meters per second butdue to sensor node memory constraint, we keep it to be 500-700 Hz. Burst shows a rapid transition and it regains its normalresponse when the valve is closed, whereas a leakage signalmakes a clear profile and takes time to come back to normalflow. Our algorithm caters for both bursts and leakages. Wehave collected fifty samples for each leakage size using fivevalves. The average accuracy of detection algorithm usingdaubechies wavelet has been plotted in Fig. 17. The size ofindividual valve can be discretized further to generate a varietyof leakage size and bursts. It can be observed in this figure thatthere is an incresing trend of accuracy of algorithm with theincrease in the leakage size. There is a dip in range 0.5-1.0inches leakage size, the reason can be communication erroramong sensor nodes or small data set. However, the curvefollows ±4% bounds of linearly increasing curve which isacceptable range. With the increase in the number of samplesof each leakage size, the accuracy curve will follow the linearfashion.
False alarms can be generated when the pressure/volumein the pipeline decreases due to change in flow through pumpand maintenance operations. In order to avoid this type of falsealarm, we created an offline dictionary that contains featuresfor normal flow and patterns with change in pump readings.This way, the proposed method can avoid false positives.
The choice of wavelet depends upon the shape and theirability to analyze the signal in a particular application. Simi-larly, sensitivity and positive prediction values undergo samebehaviour as speficity but in case of negative prediction value,symlet performs better than daubechies in some scenarios.One of the reason for this deviation is the practical proof ofconcept. Accuracy percentage shows how much the leakagedetection result is close to the expected values as found bythe signal. It can be seen in the accuaracy plot that for allthe eight scenarios of wavelet compression and denoising,performance is better using daubechies wavelets. For scenario3, haar wavelet performs better than symlet and daubechiesusing wavelet denoising. Three level wavelet decompositionhas been used in this case because signal noise has beenremoved already on the wasp motes using low pass filter.
From the above discussion and practical results for dis-tributed leakage detection as shown in Fig. 15, daubechieswavelet gives best results in our case, with maximum achiev-able accuracy in leakage detection as compared to other typesof wavelets and transforms. The accuracy of leak detectiongrows as we move on to scenario axis. As mentioned before,scenario 4-8 belongs to wavelet compression. Thus daubechies

0 5 10 15 20 2510
1.67
101.7
101.73
101.76
Number of sensing nodes
Sem
ilog
( N
etw
ork
ener
gy in
db)
DistributedCentralized
Fig. 18: Energy of network vs. number of sensing nodes
wavelet provides better accuracy performance in leakage de-tection by removing noise due to its optimum decomposition,denoising and compression property while rest of the waveletsproduce quite satisfactory results. Wavelet transform is pref-fered to short time Fourier transform because wavelet trans-form provides multi-resolution in frequency domain. Multi-resolution transform allows comprehensive analysis of signalat different levels in frequency domain.
Wavelets provide multiresolution analysis of frequencycomponents of the signal. Through the results, we have shownpractically that wavelet transform can play an effective roleto detect leakage from the noisy pressure signal for wirelesssensor network data. Moreover, it is interesting to note thatfor lower noise densities, single level of DWT decompositionis sufficient; while for higher noise densities, second level ofDWT decomposition is required and so on. Wirelessly de-ployed sensor nodes may have higher possibility for presenceof noise which can corrupt the signal. Wavelets not only reducenoise but at each decomposition level apply a filter bank andmakes the leak event easily detectable with accuracy.
The choice of decomposition levels of wavelets depend uponthe signal to noise ratio. Single level wavelet decompositionis sufficient for less corrupted signal, while for signals cor-rupted with higher noise densities, a second level of waveletdecomposition is required and so on. SNR, mean and standarddeviation are plotted for a number of decomposition level ofwavelets in Fig. 15. Optimum level of wavelet decompositionshows better performance in noisy signal transmission inwireless communications.
NPW has been considered by many researches for leakagedetection, it may not be all that could determine leak accu-rately. Wavelet transform helps to indicate the presence of aleak by providing insight to mutiple signal frequencies withtime information. When the algorithm is integrated in sensornodes for distributed event detection in WSN, the energyconsumed in the network is far less than when all readings aresent to base station in a centralized network. As we discussedin section I, most of the methods addressed in literatureare SCADA based, we see that distributed event detectionconsumes less energy resources. If we compare the total
energies of the centralized and distributed network, Fig. 18shows a trade-off between number of the sensor nodes used inthe network and the energy consumed during communication.These results are obtained in real time scenarios, where threebattery powered sensor nodes, two cluster heads and one basestation is used for leakage and bursts detection. This energyis consumed for communication between sensor nodes forconsensus on event reporting and on-mote processing involvedin algorithm. For large number of nodes, energy is calculatedusing the simulation tools.
Furthermore, final real world deployment of system achievesan overall accuracy of 90% against multiple scenarios of slowand fast bursts/leakages detection, an improvement of 10%percent over the proof-of-concept. With the increase in sizeof leakage/bursts, the accuracy of the proposed algorithmincreases and follows ±4% bounds of linearly increasingcurve. It is found that daubechies and symlet wavelets performvery well than haar wavelets due to comparatively complex de-composition in both wavelets. The higher decomposition levelsare more accurate specifically to leak detection application. Ithas been noticed that eight level decomposition shows muchbetter performance than low level wavelet analysis for leakagedetection. For eighth level wavelet decomposition, the signal tonoise ratio is higher than its low level decomposition. Throughextensive experimentation results, we found that SNR of sixlevel decomposition shows satisfactory performance for de-noising in our system considering the memory constraint ofwireless sensor nodes. All these findings prove the validityand effectiveness of our proposed monitoring system.
VI. CONCLUSION
In this paper, we described how leakage and bursts detectionin WSNs come with several different techniques, each with itsspecifications. The overall dominating factor is the trade offbetween energy efficiency and leakage/burst event detectionaccuracy. Systems that operate distributedly pave the way to-wards deployments that can provide both highly accurate eventdetection as well as save redundant wireless communication.
Our leak/burst detection and localization technique com-bines wavelet transform and optimal filtration coupled withdistributed processing of our leak detection algorithm in WSN.Very few efforts exist in this regard. The results are veryencouraging and we were able to achieve detection accuracyup to 90 percent under different deployment scenarios. Theleakage detection algorithm has been implemented in a dis-tributed manner in WSNs to support the above statement.The proposed method has the desirable features of distributedcomputing and efficient leak detection. The Wavelet transformproves to be an analytical tool for feature extraction foranalysis and adjustment of noisy signals in WSNs. It can beseen that proposed leakage detection algorithm demonstratedoutstanding performance in terms of distance range, accuracyand detection time.
The algorithm and results presented in this paper are basedon sets of experiments where slow and fast bursts/leakages
are emulated above ground using manual valves. The re-sults indicate that the proposed techniques hold promise.The next program of tests will include leakage localization,its size estimation and its distance calculation from sourcealong with more realistic emulation of underground pipelinebursts/leakages and comparison of acoustic and pressure tran-sient detection methods. In addition, we are also working onextending the proposed leakage/burst detection scheme to largenumber of nodes and to improve the performance, we willfocus on unsupervised learning of WSN.
VII. ACKNOWLEDGEMENT
This research was supported by King Abdul Aziz Cityfor Science and Technology (KACST) Saudi Arabia grants:NPST-11-INF1688−10 & NPST-10-ELE1238-10 and NationalICTRDF Pakistan grant SAHSE-11.
REFERENCES
[1] J. Thornton, R. Sturm, and G. Kunkel , Water Loss Control, 2nd ed,2008[2] Andrey Somov, Alexander Baranov and Denis Spirjakin (2014). A wire-
less sensoractuator system for hazardous gases detection and control, J.Sensors and Actuators , Elsevier, A 210, 157-164.
[3] Tariq AL-Kadi, Ziyad AL-Tuwaijri and Abdullah AL-Omran (2013).Wireless Sensor Networks for Leakage Detection in UndergroundPipelines: A Survey Paper , The 5th International Symposium on Ap-plication of Ad hoc and Sensor Networks , Elsevier, Procedia ComputerScience 21, 491-498.
[4] Dalius Misiunas (2004). Burst Detection and Location in Pipelines andPipe Networks with application in water distribution systems , Departmentof Industrial Electrical Engineering and Automation, Lund University,Sweden.
[5] Ferrante, M., and Brunone, B. (2003). Pipe system diagnosis and leakdetection by unsteady-state tests. 2 Wavelet analysis. Advances in WaterResources, 26(1), 107-116.
[6] Kang, D. , and Lansey, K. (2014). Novel approach to detecting pipebursts in water distribution networks, J. Water Resources Planning andManagement , ASCE, 140(1), 121-127.
[7] Husnain Saeed, Salman Ali, Sidra Rashid, Saad Qaisar, and E. Felemban,Reliable monitoring of oil and gas pipelines using wireless sensor network(wsn) Remong IEEE 9th International System of Systems EngineeringConference, 2014.
[8] Sidra Rashid, Saad qaisar, Husnain saeed, and Emad felemban , Per-formance analysis of leak detection algorithm in long range pipelinenetworks using transform analysis, IEEE Conference on Systems, Processand Control (ICSPC), 10-15, 2013.
[9] Brunone, B., and Ferrante, M. (2001). Detecting leaks in pressurised pipesby means of transients, J. of Hydraulic Research, IAHR, 39(5), 539-547.
[10] Ferrante, M., Brunone, B., and Meniconi, S. (2009). Leak detection inbranched pipe systems coupling wavelet analysis and a Lagrangian model,J. of Water Supply: Research and Technology AQUA, IWA, 58(2), 95-106.
[11] Ferrante, M., Brunone, B., and Meniconi, (1999). On leak detectionin single pipes using unsteady-state tests, Proceedings of the IASTED,International Conference on Modeling and Simulation, Philadelphia, PA,USA.
[12] R. Puust , Z. Kapelan , D. A. Savic , (2010). A review of methods forleakage management in pipe networks, J. of Urban Water, 7(1), 2545.
[13] Jonsson, L., Leak detection in pipelines using hydraulic transients,in Proc 5th Int Conf on Hydraulic Engineering Software, Hydrosoft94, editors Blain, W.R. and Katsifarakis, K.L. Computational MechanicsPublications, Southampton, 1994, 343-352.
[14] Wang, X., Lambert, M., Simpson, A., Liggett, J., and Vtkovsk, J. (2002).Leak Detection in Pipelines using the Damping of Fluid Transients. J.Hydraul. Eng., 128(7), 697-711.
[15] M.F. Ghazali, S.B.M. Beck, J.D. Shuck smith, J.B, Boxall, W.J.Staszewski (2012), Comparative study of instantaneous frequency basedmethods for Leak detection in pipeline networks, J. Mechanical Systemsand Signal Processing, vol. 29, 187-200.
[16] C.P. Liou (1999), Pipeline leak detection by impulse response extraction,J. Fluids Eng, 120(4) , 833-838.
[17] Andrea Cataldo, Giuseppe Cannazza, Egidio De, Benedetto, and NicolaGiaquinto (2012), A New Method forDetecting Leaks in UndergroundWater Pipelines, IEEE Sensors Journal, 12(6), 1660-1667.
[18] Robert X. Gao Ruqiang Yan , [16] Wavelets,Theory and Applicationsfor Manufacturing
[19] Lee, P.J., Vitkovsky, J.P., Lambert, M.F., Simpson, A.R., Liggett, J.A(2005), Frequency Domain Analysis for Detecting Pipeline Leaks, J.Hydraulic Engineering, 131 (7), 596-604.
[20] P.J. Lee, M.F.Lambert, A.R.(2007) Leak location in single pipelinesusing transient reflections, Australian Journal of Water Resources, 11(1),53-66.
[21] Liggett, J. and Chen, L. (1994). Inverse Transient Analysis in PipeNetworks. J. Hydraul. Eng., 120(8), 934-955.
[22] Sang Hyun Kim, M.ASCE1 (2005), Extensive Development of LeakDetection Algorithm by Impulse Response Method, Journal of HydraulicEngineering, 131(3), 201-208.
[23] Z.K. Peng, Peter W. Tsea and F.L. Chub (2005) A comparison studyof improved HilbertHuang transform and wavelet transform: Applicationto fault diagnosis for rolling bearing, J. Mechanical Systems and SignalProcessing, 19(5), 974-988.
[24] Andrew F. Colombo a, Pedro Leeb, Bryan W. Karney (2009) A selectiveliterature review of transient-based leak detection methods, Journal ofHydro-environmentResearch , 2(4), 212-227.
[25] Mpesha, W., Gassman, S.L., Chaudhry, M.H. (2001) Leak detection inpipes by Frequency response method, Journal of Hydraulic Engineering,ASCE 127(2), 134-147.
[26] Jim C.P.Liou. Pipeline Variable Uncertainties And Their Effects onLeak Detectability. In American Petroleum Institute (API) 1149, November1993.
[27] Li Yi-bo,Sun Li-ying, Leakage Detection and Location for Long RangeOil Pipeline Using Negative Pressure Wave Technique ,IEEE ICIEA 2009.
[28] A. Apostoloudia, E. Douka (2007), Timefrequency analysis of transientDispersive wave, J. Applied Acoustics , 68(3), 296-309.
[29] http://www.libelium.com/development/waspmote[30] Su Weijun, Lian Xiaoqin, Yu Chongchong, Shi Qinxia, Cao Zhiguo
(2003). Application of the negative pressure wave theory in the leak-detecting system of transporting-oil pipe. J. Control and Automation, 43-44.
[31] Yingjun Sang, Jinzhu Zhang, and Xiuhe Lu (2006), Signal Processingbased on Wavelet Transform in Pipeline Leakage Detection and Location. Proceedings of the Sixth International Conference on Intelligent SystemsDesign and Applications.
[32] Marco Ferrante, Bruno Brunone, M.ASCE, and Silvia Meniconi (2007)Wavelets for the Analysis of Transient Pressure Signals for Leak Detection.Journal of Hydraulic Engineering, 133(11), 1276-1282.
[33] Omar, S.F., Salman Yussof (2011),Finding the Optimum Level of WaveletDecomposition for Reducing Noise in Wireless Communication , Australian
Journal of Basic and Applied Sciences , 7(11), 1212-1217.