A Mathematical Framework For Enterprise Architecture Representation And Design
34
Enterprise Architecture Representation, Design, and Measurement -- Revised 4/6/02; submitted 10/2/2001 Paper A Mathematical Framework for Enterprise Information Architecture Representation, Design, and Measurement Ambrose Goicoechea, Ph.D. Software Engineering Center (W098) MITRE Corporation Reston, Virginia 22033, USA Phone: 703-883-6272 [email protected] 1
-
Upload
independent -
Category
Documents
-
view
2 -
download
0
Transcript of A Mathematical Framework For Enterprise Architecture Representation And Design
Enterprise Architecture Representation, Design, and Measurement -- Revised4/6/02; submitted 10/2/2001
Paper
A Mathematical Framework for EnterpriseInformation Architecture Representation, Design,
and Measurement
Ambrose Goicoechea, Ph.D.Software Engineering Center (W098)
MITRE CorporationReston, Virginia 22033, USA
Phone: [email protected]
1

Enterprise Architecture Representation, Design, and Measurement -- Revised4/6/02; submitted 10/2/2001
Accepted for publication in the International Journal of Information Technology and Decision Making; submitted on August 2001 and revised on April 2002.
Table of Contents
Abstract.................................................................3Introduction...............................................................3Problem Statement and Purpose of this Paper................................5Multiple Architectural Views...............................................5Business Process Architectural View......................................6Business Systems Architectural View......................................7Data Architectural View..................................................8Applications Architectural View..........................................9Technology Architectural View...........................................10
Mathematical Representation...............................................12Integrated Architectural Design Views...................................12Illustrative Example....................................................15Attribute Tradeoff Analysis.............................................17Pareto Efficient Design Frontier........................................17
Conclusions...............................................................20Acknowledgements..........................................................20References................................................................21
2

Enterprise Architecture Representation, Design, and Measurement -- Revised4/6/02; submitted 10/2/2001
3
Enterprise Architecture Representation, Design, and Measurement -- Revised4/6/02; submitted 10/2/2001
A Mathematical Framework for Enterprise InformationArchitecture Representation, Design, and Measurement
Ambrose Goicoechea, Software Engineering Center (W098), MITRE Corporation, Phone: 703-883-6272, [email protected]
AbstractThis paper presents a new mathematical framework for therepresentation and measurement of enterprise informationarchitectures, also known as simply enterprise architectures (EA). Settheory is used to represent an EA as an 8-tuple consisting of a set ofrequirements, a set of business processes, a set of business systems,a set of data elements, a set of applications, a set of technologies,a set of constraints and business rules, and a set of metrics andtheir values. A set of "EA core components" is identified and a setof metrics are defined on that domain of core components with valuesin the set of real numbers between zero and one. The paper also showsthat the Business Process Architectural View, the Business SystemsArchitectural View, the Data Architectural View, the ApplicationsView, and the Technology View are all subsets of the same efficientdesign point in the resource space. Issues involved in performingattribute tradeoff analysis are also discussed. Metric values arecomputed for three enterprise architectures in an illustrativenumerical example.
Key Words: Enterprise Architecture, EA, enterprise informationarchitecture, metrics, measurement, design, representation, businessprocesses, business systems, architectural views, multiple criteriadecision making, MCDM, Pareto analysis, efficient frontier.
IntroductionThe decade and era of Enterprise Architectures (EA) is just beginningand already architects and engineers in DoD, the Federal Agencies,industry and business sectors are becoming painfully aware of thevariety and magnitude of challenges in the design and assessment ofthese architectures. Enterprise architectures are characterized bylarge-scale, legacy-rich, business-process-driven, organizationallyintensive, and geographically distributed systems that must meet avast array of functional and performance requirements while observingsignificant build time and funding constraints. The problem is oftenexacerbated by the existence of multiple legacy sub-systems that
4
Enterprise Architecture Representation, Design, and Measurement -- Revised4/6/02; submitted 10/2/2001
perform critical functions on a round-the-clock, continuous basis(i.e., 24x7) and cannot be simply "turned off" and replaced with newarchitecture components weeks or months later. Also, in the last 3-5years the General Accounting Office (GAO) and other overseeingorganizations are providing recommendations and guidelines for the useof business processes and business systems that must be identified anddefined at the outset of the design effort. We believe that existingEA frameworks, although rich in text and graphical representation,lack in formal representation, with little or no theoretical basis,thus limiting their applicability and usefulness across domains. As aresult, the "traditional" frameworks for large-scale architecturedesign and assessment and the "lessons learned" in several fields inthe 80's and 90's, including software architecture design, oftenrequire costly and repetitive effort.
BackgroundCurrently MITRE provides oversight to several enterprise
architecture modernization programs in U.S. Treasury and Federalagencies that are envisioned to extend over the next 10-15 years.Business, industry, and government publications show a clear andmarked trend towards both business and technical solutions thataddress the entire enterprise, not just a part of it. In fact, thesebusiness process and business systems drive these architecture designefforts, it is now recognized. MITRE's Center for EnterpriseManagement (CEM) has been involved for the last three years in thedesign and assessment of enterprise architectures in the Federalagencies through its support and oversight of the work conducted byprime contractors. Key to MITRE's role in providing sound projectengineering support and independent program oversight is its abilityto capture from its internal community of engineers and scientists theinsight and experience gained across multiple projects in variousformats including white papers, papers published in refereed journals,and textbooks while leveraging on new, emerging business paradigms andtechnologies.
There are no published works to date on mathematicalrepresentations of enterprise architectures, to this author'sknowledge. It is envisioned, however, that this paper willstimulate and further other mathematical and engineeringtreatments of enterprise architectures. Several non-mathematical definitions and representations ofenterprise architectures are available in the publishedliterature. Spewak (1992) states “…there are threearchitectures: a data architecture, an applications architecture,and a technology architecture. Architectures in this context arelike blueprints, drawings, or models …”. Finneran (2001) definesan EA " … as a business association, consisting of a recognizedset of interacting business functions, able to operate as anindependent, stand-alone entity. There are enterprises within
5
Enterprise Architecture Representation, Design, and Measurement -- Revised4/6/02; submitted 10/2/2001
enterprises. For instance, a business unit within the overallcorporate entity may be considered an enterprise as long as itcould be operated independently…" Still earlier Zachman (1987)pioneered EA work and has described the EA framework as a"simple, logical structure of descriptive representations foridentifying models that are the basis for designing theenterprise and for building the enterprise's systems". There isa vast body of literature on software metrics (Fenton,1993;Woodcock, 1989) but none of these metrics have been applied toenterprise architectures.In Circular A-130, the Office of Management and Budget (OMB) hasdefined an EA as "the explicit description and documentation ofthe current and desired relationships among business andmanagement processes and information technology. It describes the"current architecture" and "target architecture" to include therules and standards and systems life cycle information tooptimize and maintain the environment which the agency wishes tocreate and maintain by managing its IT portfolio…" In thecreation of an EA, Circular A-130 adds, agencies must identifyand document:
(i) Business Processes - Agencies must identifythe work performed to support its
mission, vision and performance goals. Agenciesmust also document change
agents, such as legislation or new technologiesthat will drive changes in the EA.
(ii) Information Flow and Relationships -Agencies must analyze the information
utilized by the agency in its business processes,identifying the information used
and the movement of the information. Theseinformation flows indicate where the
information is needed and how the information isshared to support mission
functions.
(iii) Applications - Agencies must identify,define, and organize the activities that capture, manipulate, and manage the businessinformation to support business processes. The EA also describes the logicaldependencies and relationships among business activities.
6
Enterprise Architecture Representation, Design, and Measurement -- Revised4/6/02; submitted 10/2/2001
(iv) Data Descriptions and Relationships -Agencies must identify how data is created, maintained, accessed, and used. At ahigh level, agencies must define the data and describe the relationships among dataelements used in the agency's information systems.
(v) Technology Infrastructure - Agencies mustdescribe and identify the functional characteristics, capabilities, andinterconnections of the hardware, software, and telecommunications.
Problem Statement and Purpose of this PaperThere are a myriad of challenges to the task of defining,designing, and meauring architectures:
Architectures of large-scale systems (e.g., C4ISR, other)are functionally complex, the design evolves over longtime frames (years), and are difficult to assess due tochanging requirements, complex business processes, largenumber of distributed systems, emerging new technologiesand business paradigms.
It is not clear today how to best proceed with theidentification, representation, and measurement ofcritical EA components, including business processes,business systems, data model, and infrastructure.
A major challenge facing the design and assessment ofarchitectures for very-large systems today is the non-availability of a full body of concepts, modeling andsimulation tools, and established design principles.
Current frameworks for EAs are composed of multiplerepresentations (mostly textual and graphic) and somemodels that are combined in an ad- hoc manner.Integration is not really achieved. For example, processand system models are as difficult as ever to combine.
An alternative approach to EAs is to develop a singleunifying representation of architectural elements thatare used across the different components of an EA.
7
Enterprise Architecture Representation, Design, and Measurement -- Revised4/6/02; submitted 10/2/2001
A main objective of this paper is to identify and select a“central core” of Enterprise Architecture (EA) components, todevelop a set of concepts and basis for interrelationships amongthese components (EA Representation), and to develop a set ofMetrics that cut across multiple architectural views that can beused to conduct Attribute Tradeoff Analysis (EA Measurement).
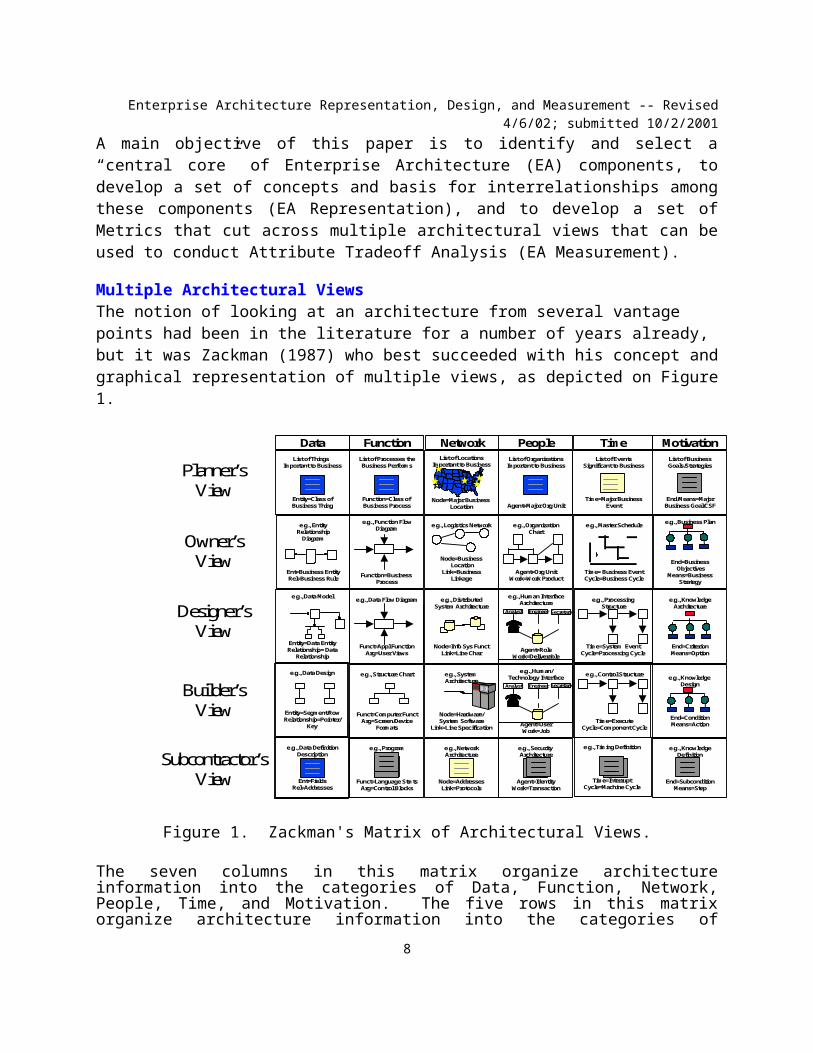
Multiple Architectural ViewsThe notion of looking at an architecture from several vantage points had been in the literature for a number of years already, but it was Zackman (1987) who best succeeded with his concept andgraphical representation of multiple views, as depicted on Figure1.
Figure 1. Zackman's Matrix of Architectural Views.
The seven columns in this matrix organize architectureinformation into the categories of Data, Function, Network,People, Time, and Motivation. The five rows in this matrixorganize architecture information into the categories of
8
List of LocationsImportant to Business
Node=Major Business Location
Data Function Network People Time MotivationList of Things
Important to Business
Entity=Class ofBusiness Thing
List of Processes theBusiness Performs
Function=Class of Business Process
List of OrganizationsImportant to Business
Agent=Major Org Unit
List of EventsSignificant to Business
Time=Major BusinessEvent
List of BusinessGoals/Strategies
End/Means=MajorBusiness Goal/CSF
e.g., EntityRelationshipDiagram
Ent=Business EntityRel=Business Rule
e.g., Function FlowDiagram
Function=Business Process
e.g., Data Model
Entity=Data EntityRelationship= Data
Relationship
e.g., Structure Chart
Funct=Computer FunctArg=Screen/Device
Formats
e.g., System Architecture
Node=Hardware/System Software
Link=Line Specification
e.g., Logistics Network
Node=Business Location
Link=BusinessLinkage
e.g., Program
Funct=Language StmtsArg=Control Blocks
e.g., NetworkArchitecture
Node=AddressesLink=Protocols
e.g., OrganizationChart
Agent=Org UnitWork=Work Product
e.g., Business Plan
End=Business Objectives
Means=BusinessStrategy
e.g., Human InterfaceArchitecture
Agent=RoleWork=Deliverable
e.g., Security Architecture
Agent=IdentityWork=Transaction
e.g., Processing Structure
Time=System EventCycle=Processing Cycle
e.g., Control Structure
Time=ExecuteCycle=Component Cycle
e.g., Timing Definition
Time=InterruptCycle=Machine Cycle
e.g., KnowledgeArchitecture
End=CriterionMeans=Option
e.g., Knowledge Design
End=ConditionMeans=Action
e.g., KnowledgeDefinition
End=SubconditionMeans=Step
e.g., Data DefinitionDescription
Ent=FieldsRel=Addresses
e.g., Data Design
Entity=Segment/RowRelationship=Pointer/
Key
e.g., Data Flow Diagram
Funct=Appl FunctionArg=User Views
Analyst EngineerSecretary
e.g., Human/Technology Interface
Agent=UserWork=Job
Analyst Engineer
e.g., Master Schedule
Time= Business EventCycle=Business Cycle
e.g., DistributedSystem Architecture
Node=Info Sys FunctLink=Line Char
Secretary
Planner’sView
Owner’sView
Designer’sView
Builder’sView
Subcontractor’sView

Enterprise Architecture Representation, Design, and Measurement -- Revised4/6/02; submitted 10/2/2001
Planners's View, Owner's View, Designer's View, Builder's View,and Subcontractor's View.
This paper addresses the architectural content of the top three rows in Zackman's matrix and proposes a mathematical representation of five architectural views:
Business Process Architectural ViewBusiness Systems Architectural ViewData Architectural ViewApplications Architectural View, andInfrastructure Architectural View.
Business Process Architectural ViewTypically, an organization may have hundreds of business processes already in place or that is considering to streamline in the planning phase, and each business process will be made up of 5-10 business process activities. Shown on Figure 2 is one such business process, Determine Eligibility of Applicant for Service X1, consisting of four activities: Activity 1.5.1 through Activity 1.5.4.
This paper proposes that asenterprise architecturescontinue to evolve inpurpose and content, therewill be types of businessprocesses that will beconsidered basic across allor most enterprisearchitectures and that assuch will server as"building blocks" of aportion of the architecturethat we are calling theBusiness Process
9
Business Process: Determine Applicant’s Eligibility for Service X Customer
contacts Company ABC
Company ABC
contacts customer
Initiate pre-
submission contact Understand customer situationIdentify appropriat
e product(s)Determine eligibilit
yNotify
applicant of
eligibility
Activity 1.5.1
Activity 1.5.2
Activity 1.5.3
Activity 1.5.4
Enterprise Architecture Representation, Design, and Measurement -- Revised4/6/02; submitted 10/2/2001
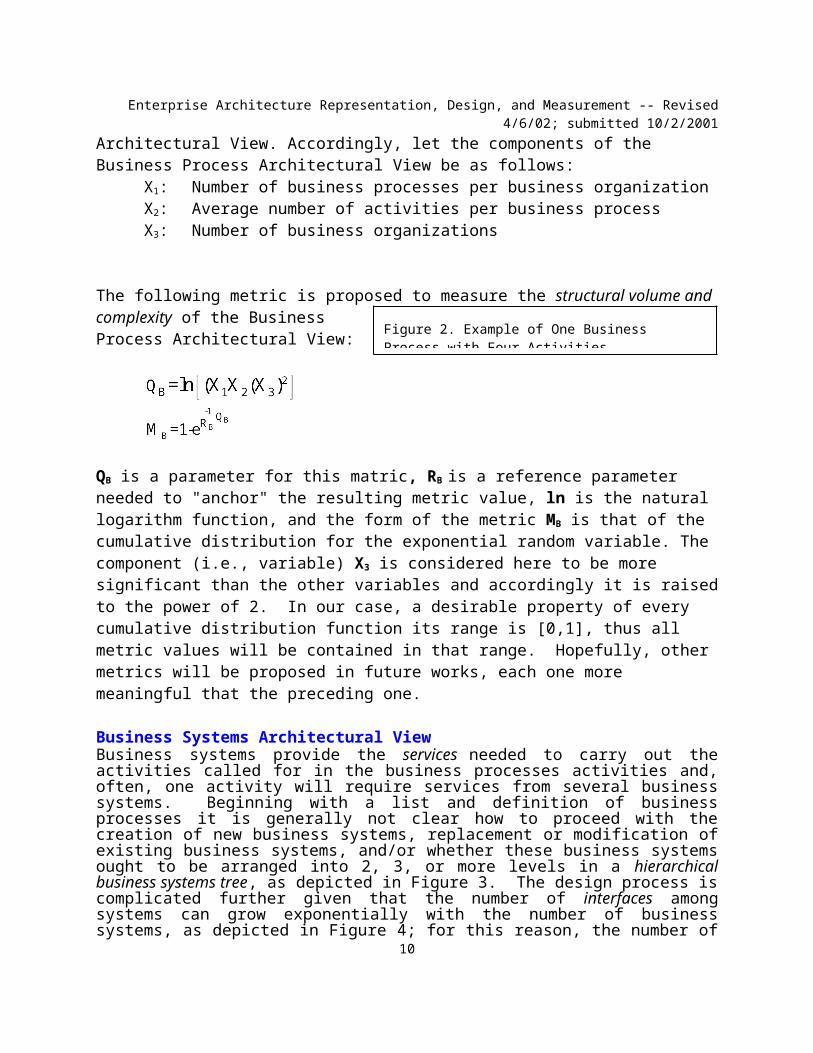
Architectural View. Accordingly, let the components of the Business Process Architectural View be as follows:
X1: Number of business processes per business organizationX2: Average number of activities per business processX3: Number of business organizations
The following metric is proposed to measure the structural volume and complexity of the BusinessProcess Architectural View:
QB is a parameter for this matric, RB is a reference parameter needed to "anchor" the resulting metric value, ln is the natural logarithm function, and the form of the metric MB is that of the cumulative distribution for the exponential random variable. The component (i.e., variable) X3 is considered here to be more significant than the other variables and accordingly it is raisedto the power of 2. In our case, a desirable property of every cumulative distribution function its range is [0,1], thus all metric values will be contained in that range. Hopefully, other metrics will be proposed in future works, each one more meaningful that the preceding one.
Business Systems Architectural ViewBusiness systems provide the services needed to carry out theactivities called for in the business processes activities and,often, one activity will require services from several businesssystems. Beginning with a list and definition of businessprocesses it is generally not clear how to proceed with thecreation of new business systems, replacement or modification ofexisting business systems, and/or whether these business systemsought to be arranged into 2, 3, or more levels in a hierarchicalbusiness systems tree, as depicted in Figure 3. The design process iscomplicated further given that the number of interfaces amongsystems can grow exponentially with the number of businesssystems, as depicted in Figure 4; for this reason, the number of
10
Figure 2. Example of One Business Process with Four Activities

Enterprise Architecture Representation, Design, and Measurement -- Revised4/6/02; submitted 10/2/2001
business systems proposed ought to be large and varied enough toprovide the services needed and not larger as to make possible amanageable set of interfaces. Let the components of the BusinessSystems Architectural View be as follows:
Y1: Number of levels ofdecomposition in thehierarchical tree ofbusiness systems;Y2: Number of businesssystems at Level 1;Y3: Number of businesssystems at Level 2;Y4: Number of businesssystems at Level 3;Y5: Number of interfacetypes;Y6: Number of interfacesat Level 1;Y7: Number of interfacesat Level 2;Y8: Number of interfaces at Level 3;
The following metric isproposed to measure structural volume and complexityof the Business SystemsArchitectural View:
11
S8
S2
S4
S3 S6
S1
SCSBSA
S7
S5
S9
Level (N-1)
Level N
S8
S2
S4
S3 S6
S1
SCSBSA
S7
S5
S9
Level n-1
Level n
Figure 3. A Hierarchical Tree of BusinessSystems
Figure 4. Interfaces of Business Systems within and across Hierarchical Levels
Enterprise Architecture Representation, Design, and Measurement -- Revised4/6/02; submitted 10/2/2001
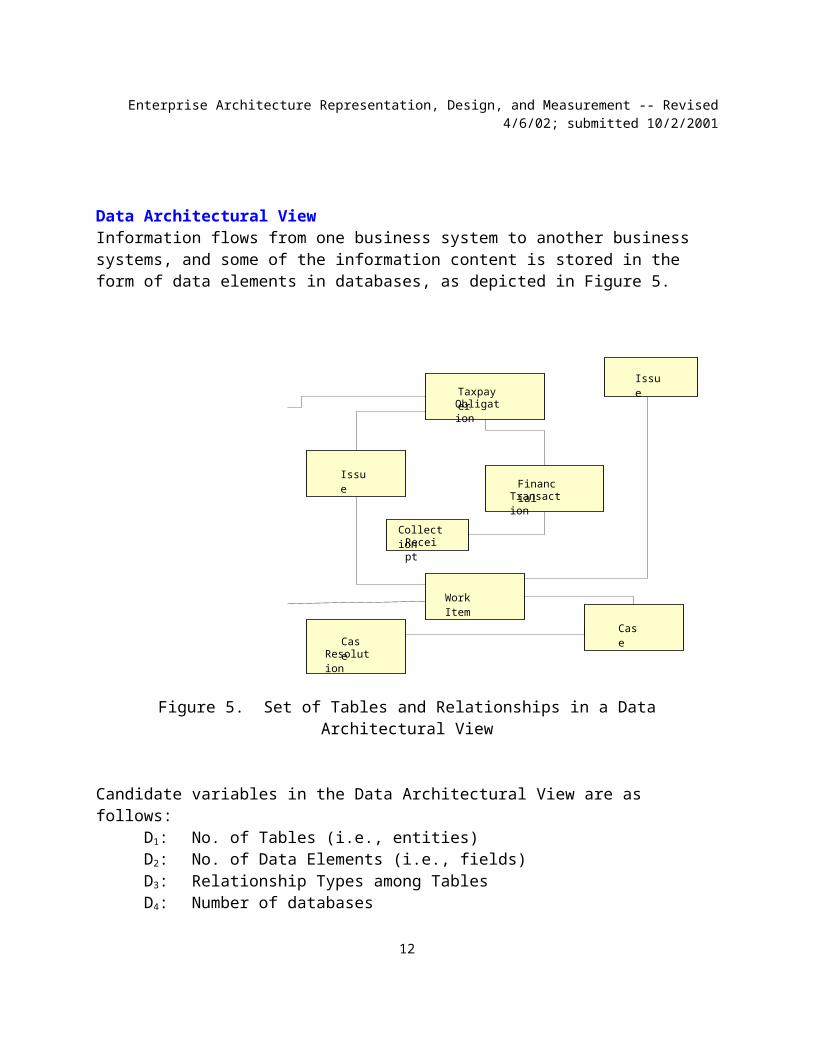
Data Architectural ViewInformation flows from one business system to another business systems, and some of the information content is stored in the form of data elements in databases, as depicted in Figure 5.
Figure 5. Set of Tables and Relationships in a DataArchitectural View
Candidate variables in the Data Architectural View are as follows:
D1: No. of Tables (i.e., entities)D2: No. of Data Elements (i.e., fields)D3: Relationship Types among TablesD4: Number of databases
12
FinancialTransact
ion
IssueTaxpay
erObligation
Issue
CollectionReceipt
Work Item
CaseCas
eResolution

Enterprise Architecture Representation, Design, and Measurement -- Revised4/6/02; submitted 10/2/2001
The following metric is proposed to measure the structural volume and complexity of the Data Architectural View:
It is reasoned here that the variable D3 is more significant thanthe other variables and accordingly it is raised to the power of 2. Multiple databases are discouraged in this metric and accordingly D4 is placed in the denominator (i.e., raised to the power of -1).
Applications Architectural ViewApplications are software implementations of the services (i.e., functionality) provided by the various business systems. Typically, a business system will house several applications. Figure 6 depicts an example of a set of applications that implement common infrastructure services, business applications, and thin mission applications specific to a particular domain (i.e., banking, weather analysis and forecasting).
Figure 6. An Applications Architectural View
13
High-Level Services: Business and Non-Business functionality across
the enterpriseEnterprise Common Services
Generic Applications
Common Business
Applications
Thin Business
Applications
Low-Level Services: Resource manager primitives, custom
primitives
Enterprise Architecture Representation, Design, and Measurement -- Revised4/6/02; submitted 10/2/2001
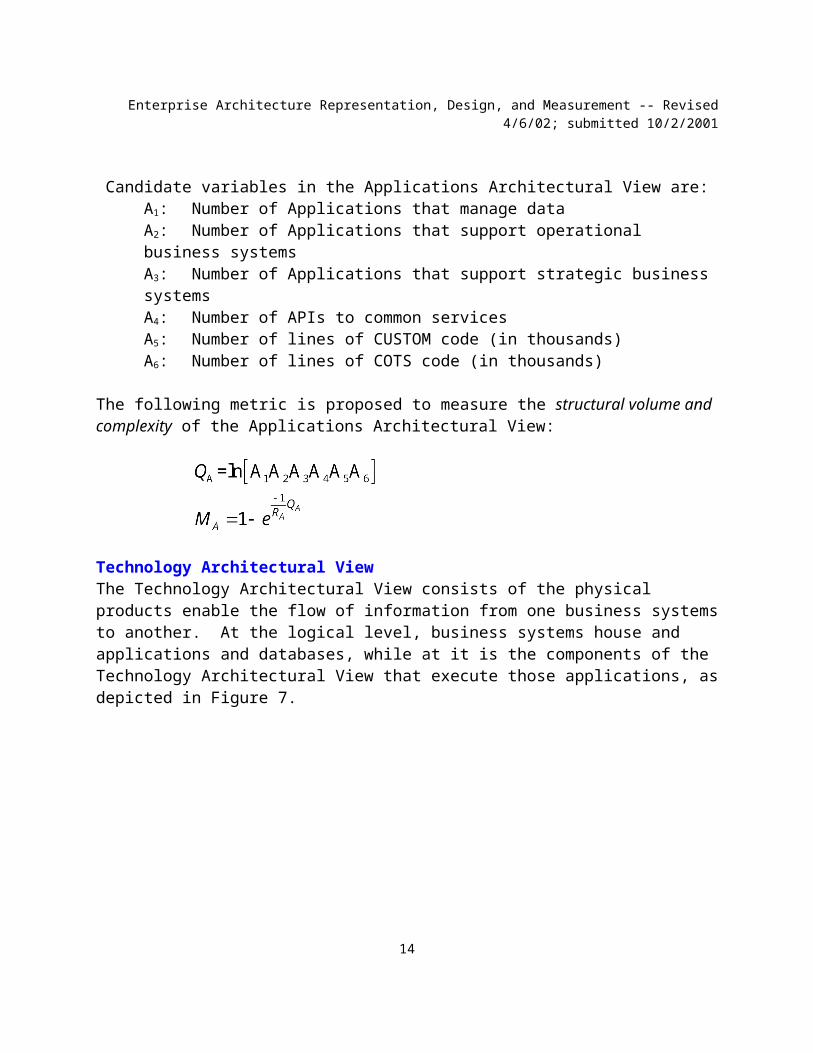
Candidate variables in the Applications Architectural View are: A1: Number of Applications that manage dataA2: Number of Applications that support operational business systemsA3: Number of Applications that support strategic business systemsA4: Number of APIs to common servicesA5: Number of lines of CUSTOM code (in thousands)A6: Number of lines of COTS code (in thousands)
The following metric is proposed to measure the structural volume and complexity of the Applications Architectural View:
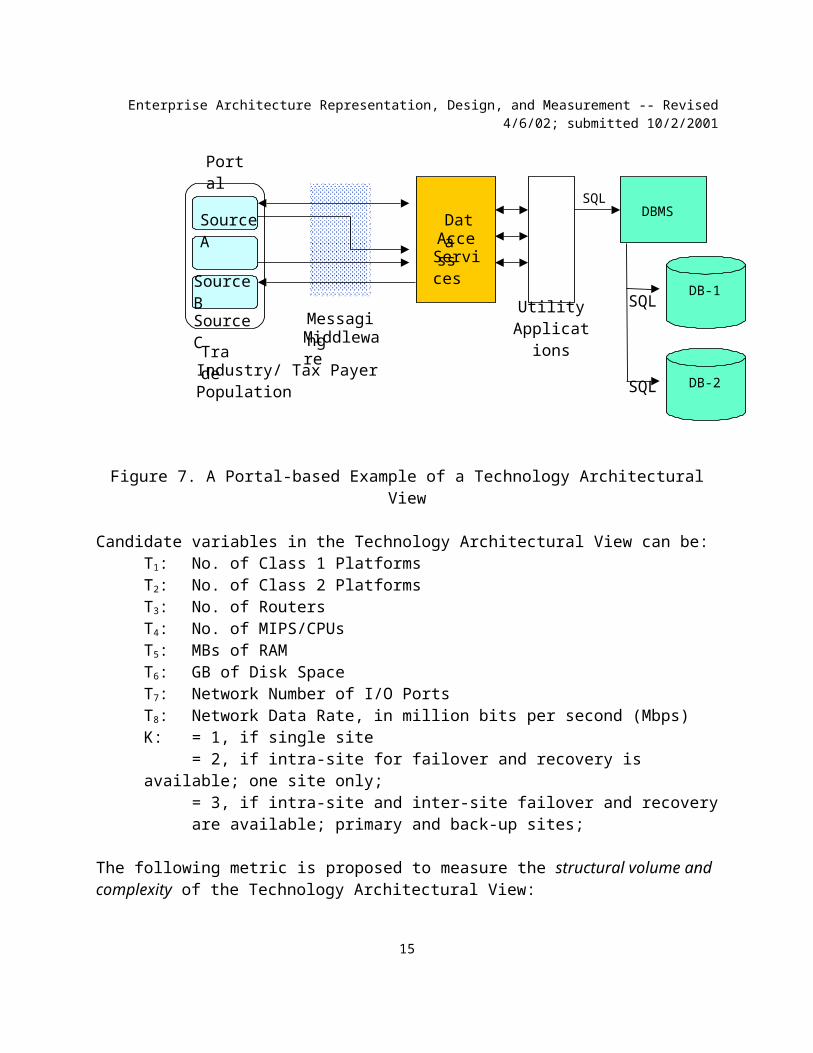
Technology Architectural ViewThe Technology Architectural View consists of the physical products enable the flow of information from one business systemsto another. At the logical level, business systems house and applications and databases, while at it is the components of the Technology Architectural View that execute those applications, asdepicted in Figure 7.
14
Enterprise Architecture Representation, Design, and Measurement -- Revised4/6/02; submitted 10/2/2001
Figure 7. A Portal-based Example of a Technology ArchitecturalView
Candidate variables in the Technology Architectural View can be:T1: No. of Class 1 Platforms T2: No. of Class 2 PlatformsT3: No. of RoutersT4: No. of MIPS/CPUsT5: MBs of RAMT6: GB of Disk SpaceT7: Network Number of I/O PortsT8: Network Data Rate, in million bits per second (Mbps)K: = 1, if single site
= 2, if intra-site for failover and recovery is available; one site only;
= 3, if intra-site and inter-site failover and recoveryare available; primary and back-up sites;
The following metric is proposed to measure the structural volume and complexity of the Technology Architectural View:
15
TradeIndustry/ Tax Payer Population
Source C
Source B
Source A
MessagingMiddleware
DataAccessServices
SQL
SQL
SQL
DB-2
DB-1
DBMS
Utility Applications
Portal

Enterprise Architecture Representation, Design, and Measurement -- Revised4/6/02; submitted 10/2/2001
`
Mathematical RepresentationHaving presented salient features of the four architectural views, this paper defines an Enterprise Architecture (EA) as an 8-tuple:
where:
Each member of the sets above would be defined in sufficient detail as to constitute a recipe with instructions for the instantiation of the Enterprise Architecture by any design team. That is, each and every business process would be spelled out in
16
Enterprise Architecture Representation, Design, and Measurement -- Revised4/6/02; submitted 10/2/2001
detail with all activities that make up each business process; each business system would be described in terms of services it provides and the business processes these services support; each data table would be described in terms of data element content and how it relates to other data tables, and so on. Additionally, the set of constraints would document guidelines and rules for the distribution of processing resources across organizational, geographical, business, and marketing boundaries,as well as instructions on how to interface the various architectural components (i.e., metadata on Data Architectural View and the structural integration of the enterprise architecture).
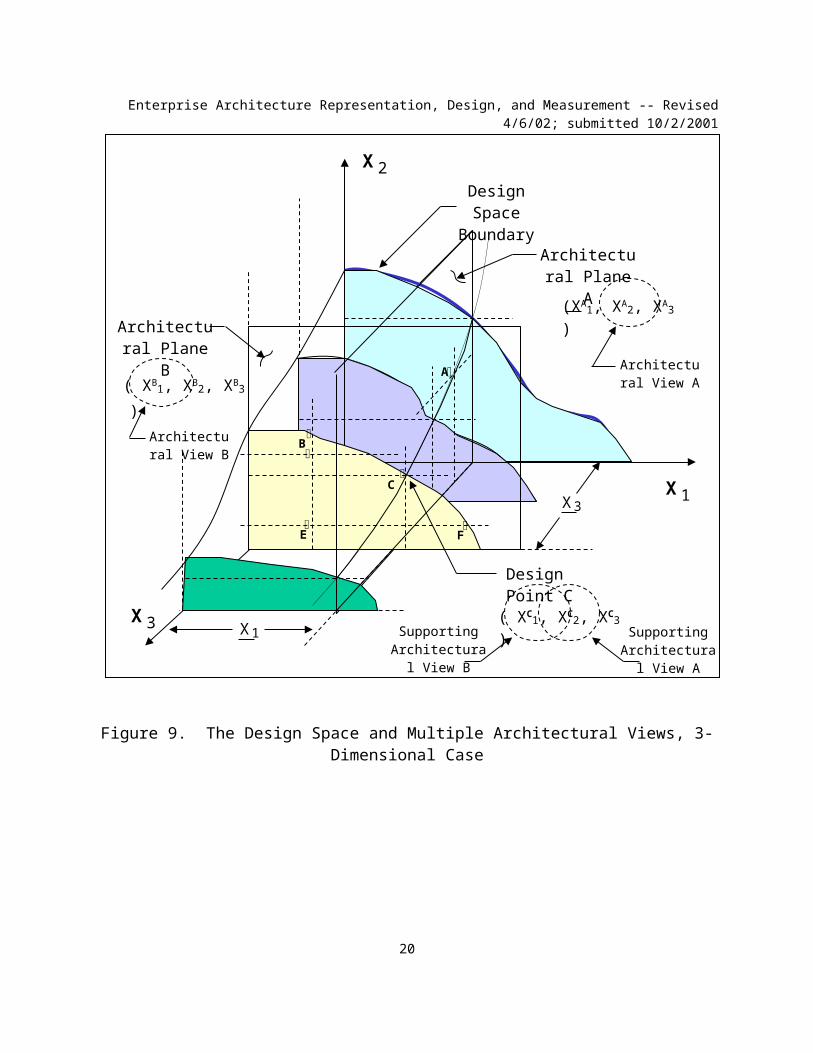
Integrated Architectural Design ViewsInitially, at the conceptual design phase, the design space {X1,X2, X3,…t1, t2, t3,…tw} is very large but lacking definition, andas the design evolves into the logical design phase and thephysical design phase thereafter the design space becomes smallerbut by then the design components (i.e., design components) arebetter/well defined, as depicted in Figure 8. At each phase ofthe life cycle, however, all five architectural views exist(i.e., Business Process Architectural View, Business SystemsArchitectural View, Data Architectural View, ApplicationsArchitectural View, and Technology Architectural View), so thateach architectural view is represents a subset of the decisionspace itself. The representation of the architectural views indecision space is shown on Figure 9 for an illustrative decisionspace made up of only three design variables, {X(X1, X2, X3)}.The design space itself is bounded and defined by a set ofconstraints and relationships among these three design variablesthat we are calling the design space boundary. Architectural Plane A,
, is noted in Figure 9, is a “cut” of the design spacesuch that this cut is parallel to the X2-X3 plane and a distance
from such plane; Architectural Plane B, also representsa cut of the design space such that this cut is parallel to theX1-X2 plane and a distance from such plane. Next, we let
17
Enterprise Architecture Representation, Design, and Measurement -- Revised4/6/02; submitted 10/2/2001
, be the architectural design view A in thearchitectural plane A and on the design space boundary itself,and design point B, , be the architectural designview B in the architectural plane B and on the design spaceboundary itself. Furthermore, let design point C, , atthe intersection of architectural plane A, architectural plane B,and the design space boundary; this point is called a reconciledarchitectural design because at this design point the architecturaldesign view A and the architectural design view B support eachother, i.e. the two architectural views belong to a single pointin the design space boundary. Thus, we have explained here thecomposition of the various architectural views in terms of basic,core architectural components, and we have shown that each viewis a subset of an architectural design point in the design spaceboundary. Furthermore, these views are said to support eachother when they identify subsets of resources of one and only onepoint in the design space boundary.Engineering perspective: During the conceptual phase EngineeringTeam A produces Architectural Design View A (e.g., BusinessSystems View A) and Engineering Team B produces Architectural DesignView B (e.g., Data Architectural View B), two distinct points inthe design space boundary. Next, as the design progresses andnears the Logical Design Phase, the two architectural designviews get closer and closer to each other. Ultimately, as thedesign progresses and arrives at the Physical Design Phase, thetwo architectural design views should belong to a one and onlyone point in the design space boundary.
18

Enterprise Architecture Representation, Design, and Measurement -- Revised4/6/02; submitted 10/2/2001
Figure 8. Architectural Views and Decision Space over the SystemLife Cycle
19
ConceptualDesign
PhysicalDesign
LogicalDesign
Life Cycle Tim e
Business Process ViewBusiness System s ViewData View
Technology View
Decision Space(Resource Allocation
Space)Applications View
Enterprise Architecture Representation, Design, and Measurement -- Revised4/6/02; submitted 10/2/2001
Figure 9. The Design Space and Multiple Architectural Views, 3-Dimensional Case
20
X 2
X 3
X 1
Architectural Plane
AArchitectural Plane
B
X1
X3
(XA1, XA2, XA3 )
E
A
B
F
Design Space
Boundary
C
Design Point C( XC1, XC2, XC3 )Supporting
Architectural View B
Supporting Architectural View A
Architectural View A( XB1, XB2, XB3
)Architectural View B
Enterprise Architecture Representation, Design, and Measurement -- Revised4/6/02; submitted 10/2/2001
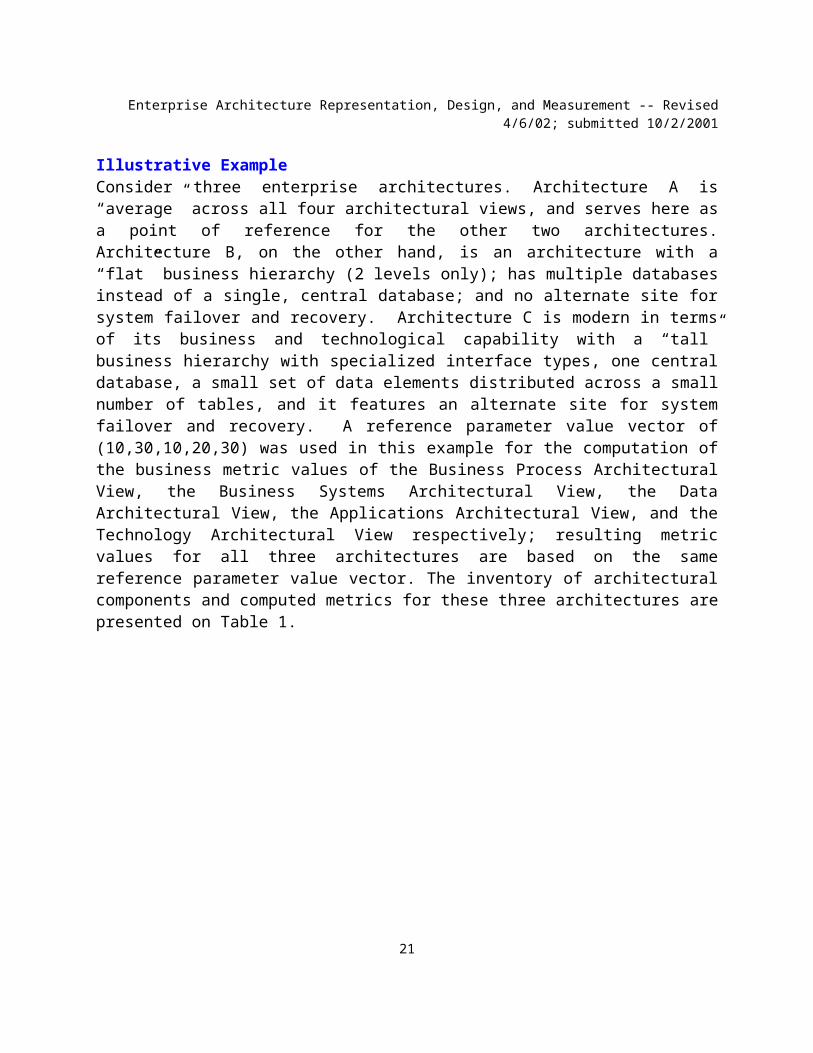
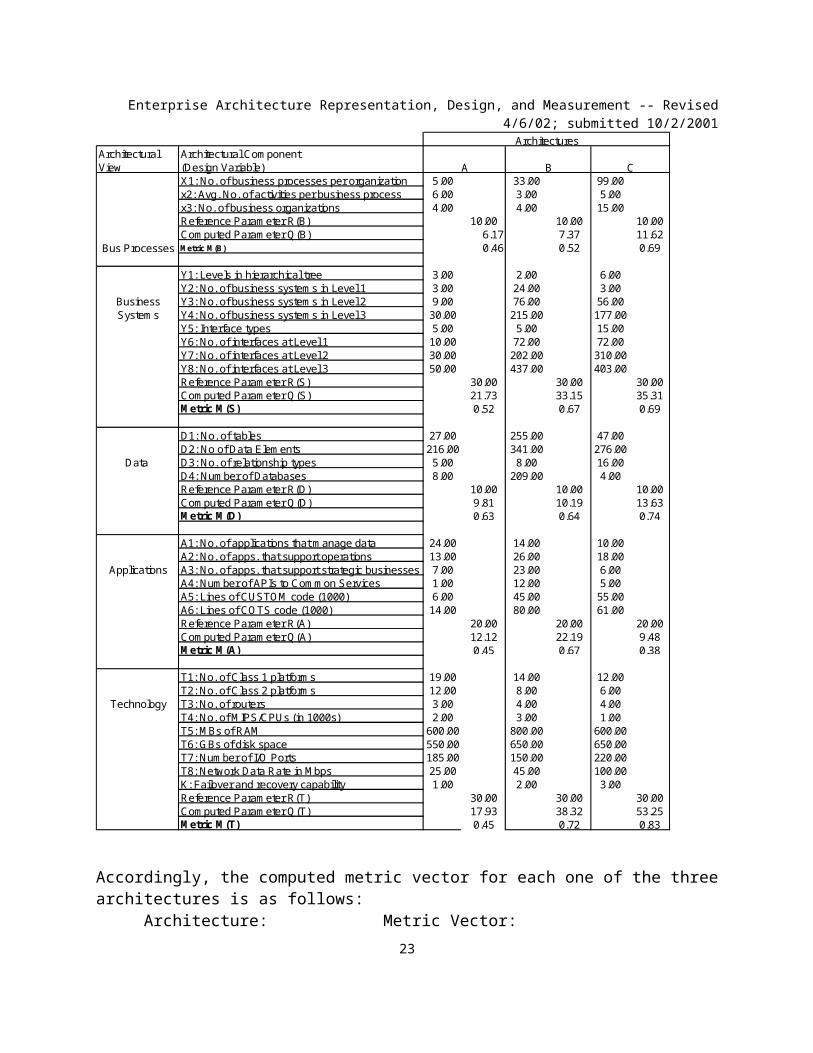
Illustrative ExampleConsider three enterprise architectures. Architecture A is“average” across all four architectural views, and serves here asa point of reference for the other two architectures.Architecture B, on the other hand, is an architecture with a“flat” business hierarchy (2 levels only); has multiple databasesinstead of a single, central database; and no alternate site forsystem failover and recovery. Architecture C is modern in termsof its business and technological capability with a “tall”business hierarchy with specialized interface types, one centraldatabase, a small set of data elements distributed across a smallnumber of tables, and it features an alternate site for systemfailover and recovery. A reference parameter value vector of(10,30,10,20,30) was used in this example for the computation ofthe business metric values of the Business Process ArchitecturalView, the Business Systems Architectural View, the DataArchitectural View, the Applications Architectural View, and theTechnology Architectural View respectively; resulting metricvalues for all three architectures are based on the samereference parameter value vector. The inventory of architecturalcomponents and computed metrics for these three architectures arepresented on Table 1.
21
Enterprise Architecture Representation, Design, and Measurement -- Revised4/6/02; submitted 10/2/2001
Table1. Computation of Metrics for Three Architectures in Illustrative Example
22
Enterprise Architecture Representation, Design, and Measurement -- Revised4/6/02; submitted 10/2/2001
Accordingly, the computed metric vector for each one of the threearchitectures is as follows:
Architecture: Metric Vector:23
Architectural Architectural Com ponentView (Design Variable)
X1: No. of business processes per organization 5.00 33.00 99.00x2: Avg. No. of activities per business process 6.00 3.00 5.00x3: No. of business organizations 4.00 4.00 15.00Reference Param eter R(B) 10.00 10.00 10.00Com puted Param eter Q(B) 6.17 7.37 11.62M etric M (B) 0.46 0.52 0.69
Y1: Levels in hierarchical tree 3.00 2.00 6.00Y2: No. of business system s in Level 1 3.00 24.00 3.00
Business Y3: No. of business system s in Level 2 9.00 76.00 56.00System s Y4: No. of business system s in Level 3 30.00 215.00 177.00
Y5: Interface types 5.00 5.00 15.00Y6: No. of interfaces at Level 1 10.00 72.00 72.00Y7: No. of interfaces at Level 2 30.00 202.00 310.00Y8: No. of interfaces at Level 3 50.00 437.00 403.00Reference Param eter R(S) 30.00 30.00 30.00Com puted Param eter Q(S) 21.73 33.15 35.31M etric M (S) 0.52 0.67 0.69
D1: No. of tables 27.00 255.00 47.00D2: No of Data Elem ents 216.00 341.00 276.00
Data D3: No. of relationship types 5.00 8.00 16.00D4: Num ber of Databases 8.00 209.00 4.00Reference Param eter R(D) 10.00 10.00 10.00Com puted Param eter Q(D) 9.81 10.19 13.63M etric M (D) 0.63 0.64 0.74
A1: No. of applications that m anage data 24.00 14.00 10.00A2: No. of apps. that support operations 13.00 26.00 18.00
Applications A3: No. of apps. that support strategic businesses 7.00 23.00 6.00A4: Num ber of APIs to Com m on Services 1.00 12.00 5.00A5: Lines of CUSTOM code (1000) 6.00 45.00 55.00A6: Lines of CO TS code (1000) 14.00 80.00 61.00Reference Param eter R(A) 20.00 20.00 20.00Com puted Param eter Q(A) 12.12 22.19 9.48M etric M (A) 0.45 0.67 0.38
T1: No. of Class 1 platform s 19.00 14.00 12.00T2: No. of Class 2 platform s 12.00 8.00 6.00
Technology T3: No. of routers 3.00 4.00 4.00T4: No. of M IPS/CPUs (in 1000s) 2.00 3.00 1.00T5: M Bs of RAM 600.00 800.00 600.00T6: GBs of disk space 550.00 650.00 650.00T7: Num ber of I/O Ports 185.00 150.00 220.00T8: Network Data Rate in M bps 25.00 45.00 100.00K: Failover and recovery capability 1.00 2.00 3.00Reference Param eter R(T) 30.00 30.00 30.00Com puted Param eter Q(T) 17.93 38.32 53.25M etric M (T) 0.45 0.72 0.83
Bus Processes
Architectures
A B C

Enterprise Architecture Representation, Design, and Measurement -- Revised4/6/02; submitted 10/2/2001
A (0.46, 0.52, 0.63, 0.45, 0.45)B (0.52, 0.67, 0.64, 0.67, 0.72)C (0.69, 0.69, 0.74, 0.38, 0.83)
The greater structural complexity of Architecture C compared tothat of Architecture A is now reflected in the greater metricvalues of Architecture C compared to those for Architecture A,for example, with the exception of 0.38 for the ApplicationsArchitectural View of Architecture C which is smaller than 0.45,the metric value for the same view in Architecture A. Granted,in this paper we have explored but an initial set of metrics, andthese remain to be applied to real-life architectures, and assuch the metric values in this example may not be verymeaningful. It is apparent from this example, however, thatarchitecture designers and practitioners may want to adopt a setof reference parameters (i.e., a reference value vector), a scaleof measurement (i.e., the cumulative exponential distribution, inour example), and a set of "standards for an architecturerepository". These steps would help greatly not only towardsarchitecture representation, but also towards architectureassessment and comparison across different domains, i.e.,Department of Defense, banking industry, transportation industry,other.
Attribute Tradeoff AnalysisNow that we have related and reconciled the architectural viewsand proposed a set of metrics to reflect on the structuralcomplexity of these views, another question to ask is: "aremetric values tradable and how does one go about determining theimpact of a desired increase on one metric value on the othermetric values?" Here we define an attribute as a single-value orvector-value characteristic or property of an architecture.Examples of single-value attributes are query response time (inseconds), yearly maintenance cost (in dollars), whether aparticular architecture is interoperable with anotherarchitecture (Yes/No), etc. Examples of multiple-valueattributes are system reliability (reliability for each
24

Enterprise Architecture Representation, Design, and Measurement -- Revised4/6/02; submitted 10/2/2001
architectural component and overall system reliability), andstructural data complexity (i.e., the vector (D1, D2, D3, D4, MD)).
Pareto Efficient Design FrontierTraditionally, over the last 50 years, many engineering designproblems would consider one criterion primarily only, e.g.,design a low-cost car for urban transportation; design a navalvessel for maximum troops payload over a fixed distance; design adatabase to allow very fast query responses, and so forth. Then,over the last 15-20 years a body of research literature hasaddressed design and decision problems characterized by multiplecriteria, e.g., initial capital cost of a corporate database,performance (large transaction volume processing, fast queryresponses, fast server recovery times, etc.), compatibility withlegacy systems, training, low maintenance costs, scalability, andso on, also known as multiple-criteria decision making (MCDM)(Goicoechea, 2000; Goicoechea et al., 1990, 1982). However, ithas been only in the last 5-10 years that MCDM methods have foundapplication in engineering design and business investmentdecision making. Central to MCDM theory is the principle of Paretooptimality:
Given a design problem characterized by a set of resourcesXi, for i = 1,2,3,…n, X (i.e., the design space), and a setof attributes S = {(A1, A2, A3,…AJ)} so that each attributeAj is a function of the Xi, then there is a Pareto solutionSP SPP if and only if an increase in one attribute value ispossible by decreasing one or more of the other attributevalues.
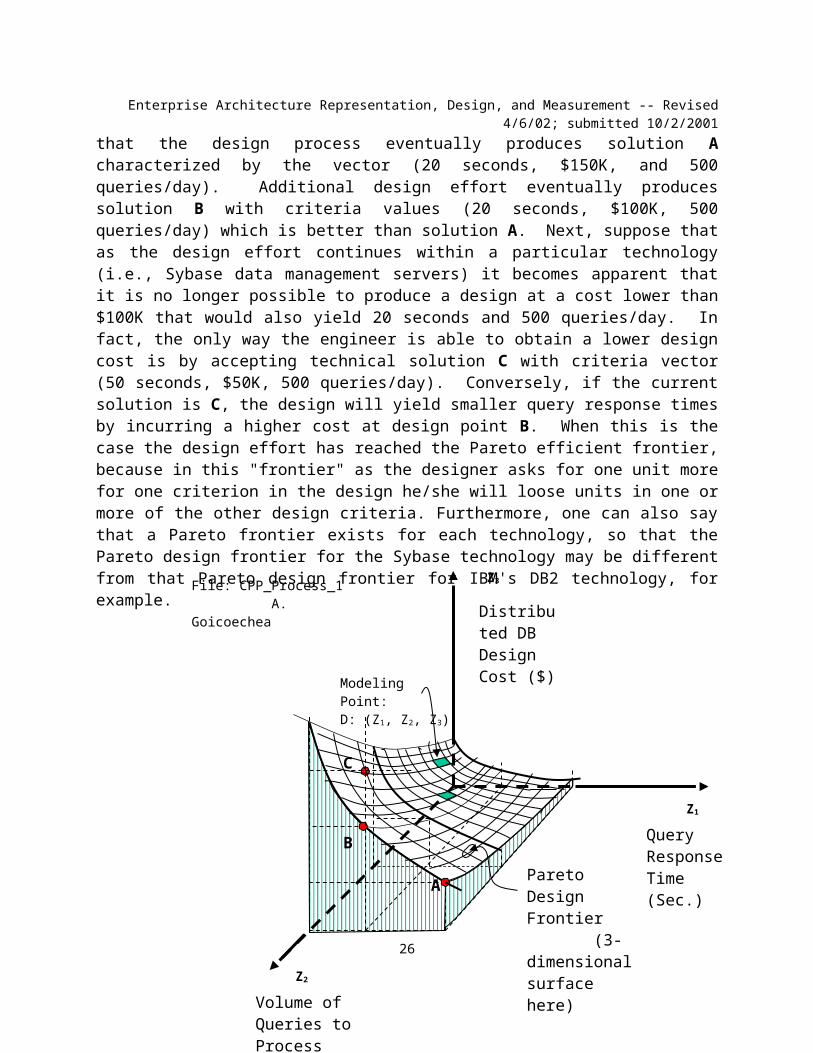
This principle is illustrated in Figure 10. A problem indatabase design is shown with design attributes A1, A2, and A3,for query response time (performance), cost, and volume ofqueries to be processed, respectively. Initially, the engineersstrives to arrive at a design that maximizes system performance(small query response times), maximizes volume of queries to beprocessed, and minimizes design costs in dollars. Let us say
25
Enterprise Architecture Representation, Design, and Measurement -- Revised4/6/02; submitted 10/2/2001
that the design process eventually produces solution Acharacterized by the vector (20 seconds, $150K, and 500queries/day). Additional design effort eventually producessolution B with criteria values (20 seconds, $100K, 500queries/day) which is better than solution A. Next, suppose thatas the design effort continues within a particular technology(i.e., Sybase data management servers) it becomes apparent thatit is no longer possible to produce a design at a cost lower than$100K that would also yield 20 seconds and 500 queries/day. Infact, the only way the engineer is able to obtain a lower designcost is by accepting technical solution C with criteria vector(50 seconds, $50K, 500 queries/day). Conversely, if the currentsolution is C, the design will yield smaller query response timesby incurring a higher cost at design point B. When this is thecase the design effort has reached the Pareto efficient frontier,because in this "frontier" as the designer asks for one unit morefor one criterion in the design he/she will loose units in one ormore of the other design criteria. Furthermore, one can also saythat a Pareto frontier exists for each technology, so that thePareto design frontier for the Sybase technology may be differentfrom that Pareto design frontier for IBM's DB2 technology, forexample.
26
Z1
Query Response Time (Sec.)
Z2
Volume of Queries to Process
Z3
Distributed DB Design Cost ($)
B
A
C
Pareto Design Frontier (3-dimensional surface here)
File: CPP_Process_1 A. Goicoechea
Modeling Point:D: (Z1, Z2, Z3)

Enterprise Architecture Representation, Design, and Measurement -- Revised4/6/02; submitted 10/2/2001
Now, how to evolve the design as to be able "to ride" the Paretodesign frontier, is a non-trivial matter, understandably so, asdepicted in Figure 11. Most often the designer does not know a-priori what the Pareto design frontier looks like, and must relyon benchmarking documentation that a vendor may make availablefor a specific set of design parameters, that may or may notrelate closely to the architecture and set of operatingrequirements at hand. Consequently, the designer or group ofdesigners must conduct testing of the architecture for a varietyof test cases, baseline configurations, and workload scenarios sothat each test produces one point in the Pareto frontier ofinterest, and together these test points eventually characterizeand determine the actual Pareto design frontier. Key in thispursuit is the term baseline configuration of architecturalcomponents, i.e., resource composition of the architecture.Design point A, for example, entails a particular baselineconfiguration, while design point B entails a different baselineconfiguration. These two configurations must be different insome specific manner, be it in the number of CPUs available forprocessing, the type of database management system (DBMS) beingemployed, the choice of transaction monitoring product, or other
27
Figure10. Pareto Design Frontier,an Example

Enterprise Architecture Representation, Design, and Measurement -- Revised4/6/02; submitted 10/2/2001
combination of core architectural components. It is then throughthe testing of a set of baseline configurations that produces thetest results that make possible the determination of the Paretodesign frontier. In reality, one is able to say, each baselineconfiguration is an architecture, and so it is the testing of aset of architectures that produces the Pareto design frontier fora particular set of technologies.
ConclusionsIn the course of exploring opportunities for enterprise architecture representation, design, and measurement some insightwas gained and several issues became apparent:
It was shown that the each of the five architecturalviews is really a subset of the same design solution (i.e.,the design space). Initially in the design, during the
28
Design process involving
vendor product evaluation, trial-and-error,
benchmarking, testing,
integration, etc.
Design A
Design B
Pareto Design Frontier
Figure 11. The Design Process on the Pareto Design Frontier
Enterprise Architecture Representation, Design, and Measurement -- Revised4/6/02; submitted 10/2/2001
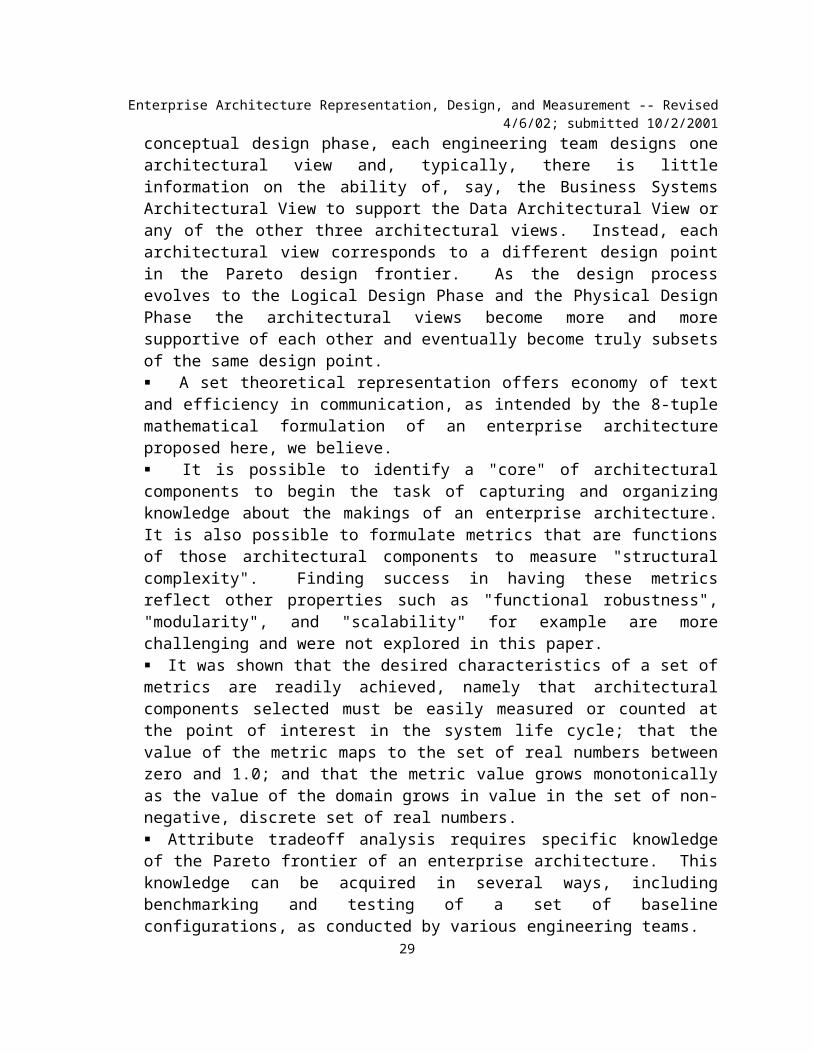
conceptual design phase, each engineering team designs onearchitectural view and, typically, there is littleinformation on the ability of, say, the Business SystemsArchitectural View to support the Data Architectural View orany of the other three architectural views. Instead, eacharchitectural view corresponds to a different design pointin the Pareto design frontier. As the design processevolves to the Logical Design Phase and the Physical DesignPhase the architectural views become more and moresupportive of each other and eventually become truly subsetsof the same design point. A set theoretical representation offers economy of textand efficiency in communication, as intended by the 8-tuplemathematical formulation of an enterprise architectureproposed here, we believe. It is possible to identify a "core" of architecturalcomponents to begin the task of capturing and organizingknowledge about the makings of an enterprise architecture.It is also possible to formulate metrics that are functionsof those architectural components to measure "structuralcomplexity". Finding success in having these metricsreflect other properties such as "functional robustness","modularity", and "scalability" for example are morechallenging and were not explored in this paper. It was shown that the desired characteristics of a set ofmetrics are readily achieved, namely that architecturalcomponents selected must be easily measured or counted atthe point of interest in the system life cycle; that thevalue of the metric maps to the set of real numbers betweenzero and 1.0; and that the metric value grows monotonicallyas the value of the domain grows in value in the set of non-negative, discrete set of real numbers. Attribute tradeoff analysis requires specific knowledgeof the Pareto frontier of an enterprise architecture. Thisknowledge can be acquired in several ways, includingbenchmarking and testing of a set of baselineconfigurations, as conducted by various engineering teams.
29
Enterprise Architecture Representation, Design, and Measurement -- Revised4/6/02; submitted 10/2/2001
The need exists for a variety of proposals forarchitectural representations, this paper being just onesuch representation, that can be forwarded to architecturalworking groups (AWG) in a multitude of domains in DoD,universities, and industries in the private sector so as tocontribute to the shaping of "standards" includingarchitecture attributes, their definition and valuemeasurement, i.e., metric forms and scales. The need exists for "architecture repositories" that usethe same set of standards to organize, store, and retrieveknowledge (i.e., metadata) of enterprise architectures.
AcknowledgementsThe author is grateful to …[to be completed]
30
Enterprise Architecture Representation, Design, and Measurement -- Revised4/6/02; submitted 10/2/2001
ReferencesOMB Circular A-130, Management of Federal Information Resources, 30 November 2000, www.whitehouse.gov/omb/circulars
Spewak, S.H., and S.C. Hill, Enterprise Architecture Planning: Developing a Blueprint for Data, Application, and Technology, Wiley-QED Publications, 212-850-6354, Library of Congress No. 92-20028, 2000.
Finneran, T., Enterprise Architecture: What And Why? Data Administration Newsletter, www.tdan.com.
Zachman, J.A., "A Framework for Information Systems Architecture", IBM Systems Journal 26, No. 3, 1987.
Enterprise Life Cycle (ELC): Quick Reference Guide, Computer Sciences Corporation, CSC publication PRIME-PPMT-C2T1-006, New Carrollton, MD, 2002
Kazman, R., M. Klein, M. Barbacci, H. Lipson, and J. Carriere, "The Architecture Tradeoff Analysis Method", Technical Report CMU/SEI-98-tr-008, July 1998.
Joint C4ISR Architecture Framework Planning/Analysis System (JCAPS), http://www.if.afrl.af.mil/programs/jcaps/ .
Barry W. Boehm, “A Spiral Model for Software Development and Enhancement,” Computer, 21, no. 5, pp. 61-72, May 1988.
[Enterprise Architecture: What And Why? T. Finneran, Data Administration Newsletter, URL: www.tdan.com
Ali Bahrami, Deborah Sadowski, Soheila Bahrami, “Enterprise Architecture for Business Process Simulation”, Proceedings of the1998 Winter Simulation Conference, 2, pp. 1409-1413, December 1998.
31
Enterprise Architecture Representation, Design, and Measurement -- Revised4/6/02; submitted 10/2/2001
G. Wood and H. Krallmann, “Tools for Analysis and Simulation: Bonapart®”, proubis GmbH whitepaper, http://www.proubis.de/ .
Federal Enterprise Architectural Framework, v. 1.1, Chief Information Officer Council, September 1999.
A Practical Guide to Federal Enterprise Architecture, v. 1.0, Chief InformationOfficer Council, February 2001.
Stallings, W., The Business Guide to Local Area Networks, Howard W. Sams &Company, a division on Macmillan, 1990.
Woodcock, J., and M. Loomes, Software Engineering Mathematics, Addison-Wesley, 1989.
Fenton, N., Software Metrics, Chapman Hall, 1993.
Goicoechea, A., Enterprise Information Architectures: Planning, Design, and Assessment, book to be published by Wiley Publishers in 2003. Already published! See Enterprise Architectures and Digital Administration, Planning, Design, and Assessment”With World Scientific, ISBN-13, 978-981-270-027-8, printed in Singapore, 2007
You can also purchase this book in Amazon.com along with other books of mine:https://www.amazon.com/s/ref=nb_sb_noss/175-6224306-0442604?url=search-alias%3Dstripbooks&field-keywords=ambrose+goikoetxea(just “click” to read some pages of it)
32
Enterprise Architecture Representation, Design, and Measurement -- Revised4/6/02; submitted 10/2/2001
Goicoechea, A., "Requirements Blueprint and Multiple Criteria forDistributed Database Design", Proceedings of the International Council on Systems Engineering (INCOSE), Mid-Atlantic Regional Conference, Reston, Virginia April 6-8, 2000.
Goicoechea, A., Distributed Database Design, DII COE Compliance, and Performance-Cost Tradeoff Analysis, working paper, Software Engineering Center, W098, MITRE, 4 April 2000.
Goicoechea, A., and Philip Sebastian, Backup Failover Architecture Study of Top Secret Collateral for Defense Message System (DMS), white paper, Software Engineering Center, W098, MITRE, 6 February 2000.
Goicoechea, A. "Why a Technical Reference Model (TRM) in the IRS Enterprise Architecture?:Support for e-Services", MITRE white paper, Software Engineering Center, W098, MITRE, 10 May 2001.
Goicoechea, A. "COE Engineering and DoD Policy: Metadata, Architecture, and Knowledge Paradigms", working paper, Software Engineering Center, W098, MITRE, 1 September 1999.
Goicoechea, A. "MQSeries Message Middleware Implementation, Use, and Performance and U.S. Customs Service, Powerpoint briefing, Software Engineering Center, W098, MITRE, 5 April 2000.
Goicoechea, A., System Capacity and Performance Planning, Global Transportation Network (GTN), Lockheed Martin Corporation Report for USTRANSCOM, 20 November 1998.
Goicoechea, A., L. Duckstein, and S. Zionts (editors), Multiple Criteria Decision Making at the Interface of Business, Industry, and Government, Proceedings of the IX-th International Conferenceon MCDM, Fairfax, Virginia, August 5-8, 1992.
33
Enterprise Architecture Representation, Design, and Measurement -- Revised4/6/02; submitted 10/2/2001
Goicoechea, A., Experimental Evaluation of Decision Support Systems (DSS) and Their Use in Situations Involving Multiple Criteria and Uncertainty, STATCOM Report 90-5, prepared for the U.S. Army Corps of Engineers, October 24, 1990.
Goicoechea, A., D.R. Hansen, and L. Duckstein, Multi-objective Decision Analysis with Engineering and Business Applications, John Wiley and Sons Publishers, 560 pages, New York, 1982.
34