
A-level ECONOMICS 7136/1 - Mark Scheme - AQA
22
A-level ECONOMICS 7136/1 PAPER 1 Markets and market failure Mark scheme June 2019 Version 1.0 Final *196A71361/MS*
-
Upload
khangminh22 -
Category
Documents
-
view
0 -
download
0
Transcript of A-level ECONOMICS 7136/1 - Mark Scheme - AQA

A-levelECONOMICS 7136/1 PAPER 1 Markets and market failure
Mark scheme
June 2019
Version 1.0 Final
*196A71361/MS*

MARK SCHEME – A-LEVEL ECONOMICS – 7136/1 – JUNE 2019
2
Mark schemes are prepared by the Lead Assessment Writer and considered, together with the relevant questions, by a panel of subject teachers. This mark scheme includes any amendments made at the standardisation events which all associates participate in and is the scheme which was used by them in this examination. The standardisation process ensures that the mark scheme covers the students’ responses to questions and that every associate understands and applies it in the same correct way. As preparation for standardisation each associate analyses a number of students’ scripts. Alternative answers not already covered by the mark scheme are discussed and legislated for. If, after the standardisation process, associates encounter unusual answers which have not been raised they are required to refer these to the Lead Examiner.
It must be stressed that a mark scheme is a working document, in many cases further developed and expanded on the basis of students’ reactions to a particular paper. Assumptions about future mark schemes on the basis of one year’s document should be avoided; whilst the guiding principles of assessment remain constant, details will change, depending on the content of a particular examination paper.
Further copies of this mark scheme are available from aqa.org.uk
Copyright © 2019 AQA and its licensors. All rights reserved. AQA retains the copyright on all its publications. However, registered schools/colleges for AQA are permitted to copy material from this booklet for their own internal use, with the following important exception: AQA cannot give permission to schools/colleges to photocopy any material that is acknowledged to a third party even for internal use within the centre.

MARK SCHEME – A-LEVEL ECONOMICS – 7136/1 – JUNE 2019
3
Level of response marking instructions Level of response mark schemes are broken down into levels, each of which has a descriptor. The descriptor for the level shows the average performance for the level. There are marks in each level.
Before you apply the mark scheme to a student’s answer read through the answer and annotate it (as instructed) to show the qualities that are being looked for. You can then apply the mark scheme.
Step 1 Determine a level
Start at the lowest level of the mark scheme and use it as a ladder to see whether the answer meets the descriptor for that level. The descriptor for the level indicates the different qualities that might be seen in the student’s answer for that level. If it meets the lowest level then go to the next one and decide if it meets this level, and so on, until you have a match between the level descriptor and the answer. With practice and familiarity you will find that for better answers you will be able to quickly skip through the lower levels of the mark scheme.
When assigning a level you should look at the overall quality of the answer and not look to pick holes in small and specific parts of the answer where the student has not performed quite as well as the rest. If the answer covers different aspects of different levels of the mark scheme you should use a best fit approach for defining the level and then use the variability of the response to help decide the mark within the level, i.e. if the response is predominantly level 3 with a small amount of level 4 material it would be placed in level 3 but be awarded a mark near the top of the level because of the level 4 content.
Step 2 Determine a mark
Once you have assigned a level you need to decide on the mark. The descriptors on how to allocate marks can help with this. The exemplar materials used during standardisation will help. There will be an answer in the standardising materials which will correspond with each level of the mark scheme. This answer will have been awarded a mark by the Lead Examiner. You can compare the student’s answer with the example to determine if it is the same standard, better or worse than the example. You can then use this to allocate a mark for the answer based on the Lead Examiner’s mark on the example.
You may well need to read back through the answer as you apply the mark scheme to clarify points and assure yourself that the level and the mark are appropriate.
Indicative content in the mark scheme is provided as a guide for examiners. It is not intended to be exhaustive and you must credit other valid points. Students do not have to cover all of the points mentioned in the Indicative content to reach the highest level of the mark scheme.
An answer which contains nothing of relevance to the question must be awarded no marks.
MARK SCHEME – A-LEVEL ECONOMICS – 7136/1 – JUNE 2019
4
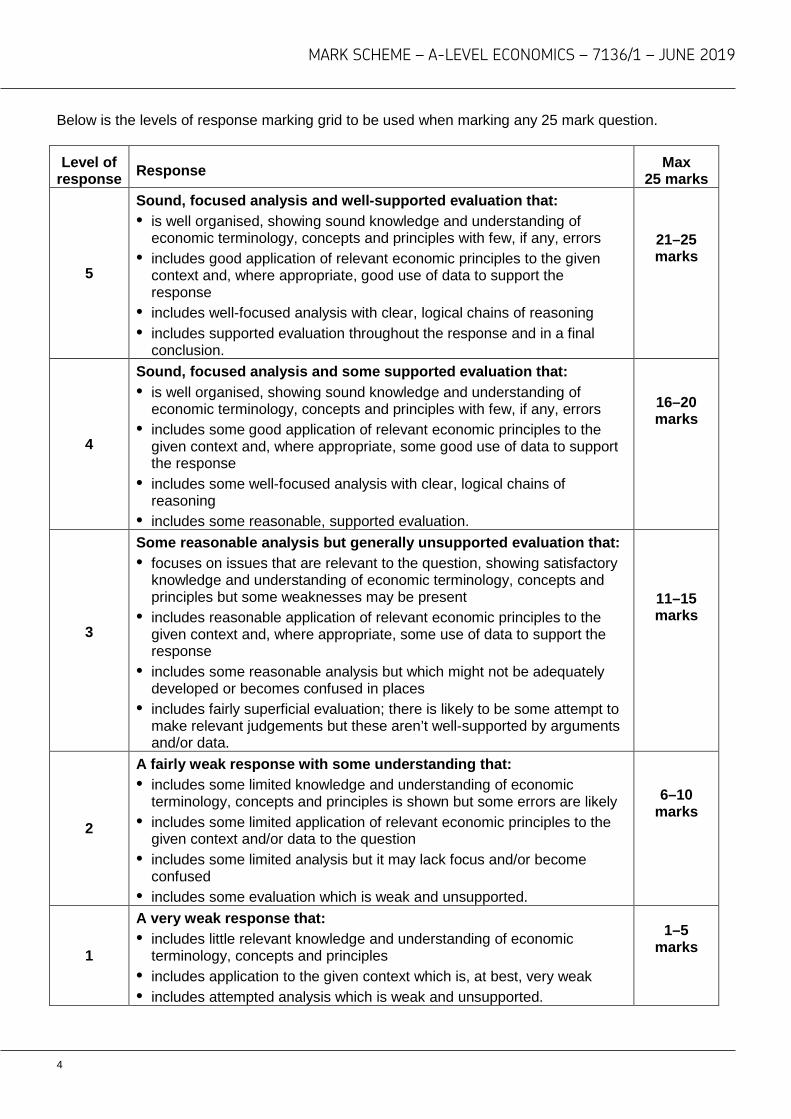
Below is the levels of response marking grid to be used when marking any 25 mark question.
Level of response Response Max
25 marks
5
Sound, focused analysis and well-supported evaluation that: • is well organised, showing sound knowledge and understanding of
economic terminology, concepts and principles with few, if any, errors• includes good application of relevant economic principles to the given
context and, where appropriate, good use of data to support theresponse
• includes well-focused analysis with clear, logical chains of reasoning• includes supported evaluation throughout the response and in a final
conclusion.
21–25 marks
4
Sound, focused analysis and some supported evaluation that: • is well organised, showing sound knowledge and understanding of
economic terminology, concepts and principles with few, if any, errors• includes some good application of relevant economic principles to the
given context and, where appropriate, some good use of data to supportthe response
• includes some well-focused analysis with clear, logical chains ofreasoning
• includes some reasonable, supported evaluation.
16–20 marks
3
Some reasonable analysis but generally unsupported evaluation that: • focuses on issues that are relevant to the question, showing satisfactory
knowledge and understanding of economic terminology, concepts andprinciples but some weaknesses may be present
• includes reasonable application of relevant economic principles to thegiven context and, where appropriate, some use of data to support theresponse
• includes some reasonable analysis but which might not be adequatelydeveloped or becomes confused in places
• includes fairly superficial evaluation; there is likely to be some attempt tomake relevant judgements but these aren’t well-supported by argumentsand/or data.
11–15 marks
2
A fairly weak response with some understanding that: • includes some limited knowledge and understanding of economic
terminology, concepts and principles is shown but some errors are likely• includes some limited application of relevant economic principles to the
given context and/or data to the question• includes some limited analysis but it may lack focus and/or become
confused• includes some evaluation which is weak and unsupported.
6–10 marks
1
A very weak response that: • includes little relevant knowledge and understanding of economic
terminology, concepts and principles• includes application to the given context which is, at best, very weak• includes attempted analysis which is weak and unsupported.
1–5 marks

MARK SCHEME – A-LEVEL ECONOMICS – 7136/1 – JUNE 2019
5
Context 1
Total for this context: 40 marks
0 1 Using the data in Extract A (Figure 1), calculate the percentage change in the price of construction sand between January 2014 and January 2018. Give your answer correct to one decimal place.
[2 marks]
Response: Marks
For the correct answer to one decimal place with the % sign 2 marks
For the correct answer but not to one decimal place and/or without the % sign OR For the correct method but the wrong answer, to one decimal place and with the % sign
1 mark
Calculation: Jan 2014 Index: 110 Jan 2018 Index: 127 % change: (127-110)/110 X 100 = 15.45%
Correct answer: 15.5%
Tolerance: Answers in the range 14% to 17% are acceptable.
Whole numbers e.g. 15% without the ‘point zero’ should be allowed.
MAXIMUM FOR QUESTION 01: 2 MARKS

MARK SCHEME – A-LEVEL ECONOMICS – 7136/1 – JUNE 2019
6
0 2
Explain how the data in Extract A (Figures 1 and 2) show that expansion in the global sand market is leading to prices of construction sand rising in real terms.
[4 marks] Response: Marks
• includes evidence that shows how the expansion in the global sand market is leading to prices rising in real terms
• clearly explains how this data is evidence that the expansion in the global sand market is leading to prices rising in real terms.
4 marks
• includes evidence that shows how the expansion in the global sand market is leading to prices rising / in real terms
• unclear explanation of how this data is evidence that the expansion in the global sand market is leading to prices rising / in real terms.
3 marks
• includes some limited evidence that shows how the expansion in the global sand market is leading to prices rising / in real terms
• limited explanation of how this data is evidence that the expansion in the global sand market is leading to prices rising / in real terms.
2 marks
• includes evidence that does not clearly show how the expansion in the global sand market is leading to prices rising / in real terms
• no explanation of how this data is evidence that the expansion in the global sand market is leading to prices rising / in real terms.
1 mark
Relevant issues include: • explanation of the concept of real terms • explanation of what is meant by ‘expansion’ in the global sand market • explanation of the link between global demand for sand and rising prices • between 2010 and 2015, global demand for sand rose from 180 million tons to 244 million tons
(an increase of 36% in 5 years), and is forecast to rise to 406 million tons by 2025 • construction sand prices have risen from an index of 100 in 2010 to an index of 127 in 2018, by
around 13% in real terms (27% in nominal terms) over the period • CPI has increased from an index of 100 in 2010 to an index of 114 in 2018 (14%) • since 2015 construction sand prices have continued to rise in line with forecasts of Figure 2
MAXIMUM FOR QUESTION 02: 4 MARKS

MARK SCHEME – A-LEVEL ECONOMICS – 7136/1 – JUNE 2019
7
0 3
Extract B (line 18) states that the global trade in sand has been ‘made possible by cheaper transportation’. With the help of a diagram, explain how cheaper transportation and a construction boom in East Asia have led to growth in the market for sand.
[9 marks]
Level of response
Response: Max 9 marks
3
• is well organised and develops one or more of the key issues that are relevant to the question
• shows sound knowledge and understanding of relevant economic terminology, concepts and principles
• includes good application of relevant economic principles and/or good use of data to support the response
• includes well-focused analysis with a clear, logical chain of reasoning
• includes a relevant diagram that will, at the top of this level, be accurate and used appropriately.
7–9 marks
2
• includes one or more issues that are relevant to the question • shows reasonable knowledge and understanding of economic
terminology, concepts and principles but some weaknesses may be present
• includes reasonable application of relevant economic principles and/or data to the question
• includes some reasonable analysis but it might not be adequately developed and may be confused in places
• may include a relevant diagram.
4–6 marks
1
• is very brief and/or lacks coherence • shows some limited knowledge and understanding of economic
terminology, concepts and principles but some errors are likely • demonstrates very limited ability to apply relevant economic
principles and/or data to the question • may include some very limited analysis but the analysis lacks focus
and/or becomes confused • may include a relevant diagram but the diagram is not used and/or
is inaccurate in some respects.
1–3 marks

MARK SCHEME – A-LEVEL ECONOMICS – 7136/1 – JUNE 2019
8
Suggested diagram
A supply and demand diagram is expected, showing a shift right in the supply curve and a shift right in the demand curve, resulting in higher levels of output.
Two separate diagrams are acceptable. Other relevant diagrams, such as cost curve diagrams, may be rewarded as part of a logical explanation. Relevant issues include: • explanation of cheaper transportation • explanation of construction boom • explanation of derived demand • how cheaper transportation shifts the supply curve out • how construction booms trigger greater demand for sand (via land reclamation in Singapore’s
case, or as an ingredient in cement and other building materials) • how cheaper shipping (for example) can create new opportunities for trade between countries • explanation of how cheaper shipping, by itself, would create excess supply at the original
equilibrium price, thus resulting in lower prices and some additional demand • explanation of how a construction boom, by itself, would create excess demand at the original
equilibrium price, thus resulting in higher prices and some additional supply • analysis of how the combination of demand and supply shifts may enable the sector to grow
without prices rising • reference to extracts including Figure 2, Chinese construction statistics, the export of Australian
sand to Dubai and ‘megacities’.
MAXIMUM FOR QUESTION 03: 9 MARKS

MARK SCHEME – A-LEVEL ECONOMICS – 7136/1 – JUNE 2019
9
0 4
Extract C (lines 14–15) states that ‘Rising prices will eventually also force builders in developing countries to explore alternatives to sand’. Use the extracts and your knowledge of economics to assess the view that the increasing scarcity of sand is a problem best solved by market forces, rather than through government intervention.
[25 marks] Areas for discussion include: • explanation of market forces and government intervention • acknowledgement of recent rapid growth in the sand market • discussion of the increasingly global market for sand, with the commodity being transported vast
distances by sea • explanation of how the market might respond to challenges via the price mechanism (incentives,
signalling, rationing) o price of sand rising leading to recycling and reduction in use o substitutes becoming more available
• ability of the market/government response to cope with future developments, including rising sea levels and the expected construction needs of rapidly developing countries
• discussion of problems created by the sand industry o externalities from degradation of environment o externalities from transport of sand o tragedy of the commons o disappearance of Indonesian islands o sand dredging damaging biodiversity o vulnerability to extreme weather
• discussion of benefits of the sand industry o restoring coasts of low-lying islands such as Kiribati
• discussion of possible policies at the national level o regulations o taxation o permits and quotas o price regulation
• discussion of problems with the above policies, referencing the organised criminal networks in India, black markets, etc.
• explanation of how international agreement may be necessary given the global nature of the problem
• discussion of how such international agreements are slow to achieve and often fail to address problems identified
• market failure arguments • government failure arguments. The use of relevant diagrams to support the analysis should be taken into account when assessing the quality of the student’s response to the question. Use the level mark scheme on page 4 to award students marks for this question.
MAXIMUM FOR QUESTION 04: 25 MARKS

MARK SCHEME – A-LEVEL ECONOMICS – 7136/1 – JUNE 2019
10
Context 2
Total for this context: 40 marks
0 5
Using the data in Extract D (Figure 3), calculate the amount of government funding per £ of passenger income in the UK rail industry for the year 2015–16. Give your answer correct to the nearest penny.
[2 marks] Calculation: £6697 million/ £9160 million: 0.731114… £0.73 or 73p (to nearest penny) Response Max 2 marks
For the correct answer to the nearest penny 2 marks
For the correct answer incorrectly rounded and/or without units OR For the correct method but the wrong answer, to the nearest penny and with the correct units
1 mark
MAXIMUM FOR QUESTION 05: 2 MARKS

MARK SCHEME – A-LEVEL ECONOMICS – 7136/1 – JUNE 2019
11
0 6
Explain how the data in Extract D (Figure 4) show that in the UK, between 2004 and 2017, changes in the demand for rail travel contributed to changes in the price of rail travel.
[4 marks] Response Max 4 marks
• includes evidence that changes in the demand for rail travel have contributed to changes in the price of rail travel
• clearly explains how this data is evidence that changes in the demand for rail travel have contributed to changes in the price of rail travel
4 marks
• includes evidence that changes in the demand for rail travel have contributed to changes in the price of rail travel
• unclear explanation of how this data is evidence that changes in the demand for rail travel have contributed to changes in the price of rail travel
3 marks
• includes some limited evidence that changes in the demand for rail travel have contributed to changes in the price of rail travel
• limited explanation of how this data is evidence that changes in the demand for rail travel have contributed to changes in the price of rail travel
2 marks
• includes evidence that does not clearly show that changes in the demand for rail travel have contributed to changes in the price of rail travel
• no explanation of how this data is evidence that changes in the demand for rail travel have contributed to changes in the price of rail travel
1 mark
Relevant issues include: • explanation of demand for rail travel • explanation of the link between passenger kilometres travelled and the demand for rail travel • explanation of the link between changes in the demand for rail travel and changes in the price of
rail travel • explanation of how rail companies have an incentive to raise prices when demand is rising • identifying that the data shows rail fares have risen from an index of 100 in 2004 to 169 in 2017
(69%) • identification that the number of passenger km has risen from an index of 100 in 2004 to 161 in
2017 (61%) showing an increase in the demand for rail travel Some candidates may point out that prices have increased by around 24% in real terms rather than consider the increase in nominal terms, which is acceptable.
MAXIMUM FOR QUESTION 06: 4 MARKS

MARK SCHEME – A-LEVEL ECONOMICS – 7136/1 – JUNE 2019
12
0 7
Extract E (lines 10–11) describes the British railway sector as a ‘natural monopoly’, which was split up into ‘no less than 100 pieces’ when it was privatised.
With the help of a diagram, explain why breaking up a natural monopoly in rail may affect long-run average costs.
[9 marks]
Level of response Response: Max 9 marks
Level 3
• is well organised and develops one or more of the key issues that are relevant to the question
• shows sound knowledge and understanding of relevant economic terminology, concepts and principles
• includes good application of relevant economic principles and/or good use of data to support the response
• includes well-focused analysis with a clear, logical chain of reasoning
• includes a relevant diagram that will, at the top of this level, be accurate and used appropriately.
7–9 marks
Level 2
• includes one or more issues that are relevant to the question • shows reasonable knowledge and understanding of economic
terminology, concepts and principles but some weaknesses may be present
• includes reasonable application of relevant economic principles and/or data to the question
• includes some reasonable analysis but it might not be adequately developed and may be confused in places
• may include a relevant diagram.
4–6 marks
Level 1
• is very brief and/or lacks coherence • shows some limited knowledge and understanding of economic
terminology, concepts and principles but some errors are likely • demonstrates very limited ability to apply relevant economic
principles and/or data to the question • may include some very limited analysis but the analysis lacks focus
and/or becomes confused • may include a relevant diagram but the diagram is not used and/or
is inaccurate in some respects.
1–3 marks

MARK SCHEME – A-LEVEL ECONOMICS – 7136/1 – JUNE 2019
13
A natural monopoly diagram is expected, showing constantly declining LRAC in the rail sector. In addition, two or more SRAC curves contained within the LRAC envelope could be used to illustrate the different cost profiles of the sector, though these are not essential. One SRAC to show where the opportunities for economies of scale aren’t adequately exploited and the other showing where the industry is operating as a monopoly, exploiting more fully the potential economies of scale. Relevant issues include: • explain what is meant by long-run average costs • explanation of the characteristics of natural monopoly, and why railways can be considered a
natural monopoly (huge network, large capital costs, etc) • explanation of minimum efficient scale relative to the size of the market • how automation and technological progress boost labour productivity within industries and
markets • provide examples of economies of scale that might be available to firms operating in the railway
sector • reference to the fact that costs are 40% higher in the UK than the rest of Europe • explanation of the higher long run average costs that are likely to flow from fragmenting the
railways into numerous smaller parts • explain the franchise model and how this encourages short-term priorities at the expense of long-
run average cost reductions • explain that the profit motive forces firms to cut costs in order to maximise profit – this could be
via a reduction in X-inefficiency.
MAXIMUM FOR QUESTION 07: 9 MARKS

MARK SCHEME – A-LEVEL ECONOMICS – 7136/1 – JUNE 2019
14
0 8
Extract F (lines 9–10) suggests that ‘the British public really don't care about who runs the trains; what they care about is reliability, comfort and price’. Use the extracts and your knowledge of economics to evaluate the case for renationalising railways in the UK.
[25 marks] Areas for discussion include: • what is meant by renationalisation • explanation of natural monopoly • arguments in favour of renationalisation o simpler consumer offering, less baffling ticketing options, more consistent service o economies of scale, e.g. purchasing of rolling stock, marketing o greater consideration of externalities, e.g. safety o necessary for making much-needed investment in new tracks and technology, although
government currently subsidising network rail so perhaps little impact here o no great upfront cost as nationalisation occurs when franchises come to an end o successful state-run railways across much of Europe o current situation appears to nationalise the risks, but privatise the rewards (East Coast mainline) o the relative success enjoyed by the East Coast mainline when run by the state o current situation isn’t true competition anyway as consumers rarely have a choice of suppliers
for a given journey • arguments against renationalisation o passenger numbers have expanded enormously since privatisation, with UK rail being used
very intensively o recent increase in investment under private hands o big improvements have occurred in safety, innovation and comfort o no excessive profits being made consistently by rail firms, with small profit margins being the
norm o many current concerns about railways (e.g. overcrowding, punctuality) are unlikely to be
resolved by a change of ownership • market failure arguments • government failure arguments.
Use the level mark scheme on page 4 to award students marks for this question.
MAXIMUM FOR QUESTION 08: 25 MARKS

MARK SCHEME – A-LEVEL ECONOMICS – 7136/1 – JUNE 2019
15
Section B
Below is the levels of response marking grid which should be used to mark the 15 mark questions
Level of response Response Max 15 marks
3 A good response provides an answer that: • is well organised and develops a selection of the key issues that
are relevant to the question • shows sound knowledge and understanding of economic
terminology, concepts and principles with few, if any, errors • includes good application of relevant economic principles to the
given context and, where appropriate, good use of data to support the response
• includes well-focused analysis with clear, logical chains of reasoning.
11–15 marks
2 A reasonable response provides an answer that: • focuses on issues that are relevant to the question • shows satisfactory knowledge and understanding of economic
terminology, concepts and principles but some weaknesses may be present
• includes reasonable application of relevant economic principles to the given context and, where appropriate, some use of data to support the response
• includes some reasonable analysis but which might not be adequately developed or becomes confused in places.
6–10 marks
1 A weak response provides an answer that: • has identified one or more relevant issues • has some limited knowledge and understanding of economic
terminology, concepts and principles but some errors are likely • has very limited application of relevant economic principles to the
given context and/or data to the question • might have some limited analysis but it may lack focus and/or
become confused.
1–5 marks

MARK SCHEME – A-LEVEL ECONOMICS – 7136/1 – JUNE 2019
16
Section B Essay 1 Total for this essay: 40 marks 0 9
Explain how rules of thumb and irrationality can affect consumers’ demand for goods and services.
[15 marks] Areas for discussion include: • explanation of the traditional assumption that economic agents are rational utility maximisers • explanation of the behavioural assumption that for a number of reasons consumers act irrationally • explanation of ‘rules of thumb’ which economic agents use to make decisions in practice • why people use rules of thumb rather than attempting to consider all costs and benefits at every
decision • computational problems • examples of how firms can exploit such rules of thumb in their marketing • explanation of biases to which consumers may be vulnerable e.g. availability bias, anchoring • bounded rationality and bounded self-control • emotional factors; social norms
The use of relevant diagrams to support the analysis should be taken into account when assessing the quality of the student’s response to the question. Use the level mark scheme on page 15 to award students marks for this question.
MAXIMUM FOR QUESTION 09: 15 MARKS

MARK SCHEME – A-LEVEL ECONOMICS – 7136/1 – JUNE 2019
17
1 0
Using examples to illustrate your answer, assess the usefulness of behavioural economic theory compared to traditional economic policies in helping governments to correct market failures
[25 marks] Areas for discussion include: • discussion of the field of behavioural economics, and how it differs from conventional economic
analysis • discussion of how governments are now beginning to use behavioural economics to achieve
policy aims, not least in the UK where the Cabinet Office Behavioural Insights Team (Nudge Unit) has been at the forefront of international work in this field
• the types of policy which can be labelled as behavioural economics policies • advantages of behavioural economics policies o relatively simple and low-cost o allows people freedom of choice without coercion o development of policies is based on trials, so is based on evidence o may be able to overcome weaknesses in consumer behaviour theory including irrationality and
inconsistency • disadvantages of behavioural economics policies o can be considered manipulative and unethical o may well change people’s choices but these choices may not reflect people’s true preferences o based on relatively weak evidence, which may not be consistent over time o may not be as effective as traditional policies
• examples from the work of the Nudge Unit and analysis of whether their policies have been successful
• the types of traditional economic policy, including indirect taxes and subsidies, maximum and minimum prices
• advantages and disadvantages of traditional policies • discussion of what usefulness means in this context, including the cost of the intervention and its
effectiveness • consideration of different types of market failure • government failure arguments
The use of relevant diagrams to support the analysis should be taken into account when assessing the quality of the student’s response to the question. Use the level mark scheme on page 4 to award students marks for this question.
MAXIMUM FOR QUESTION 10: 25 MARKS

MARK SCHEME – A-LEVEL ECONOMICS – 7136/1 – JUNE 2019
18
Essay 2 Total for this essay: 40 marks 1 1
Explain the factors a profit-maximising firm will take into account when deciding whether to shut down or to carry on operating, both in the short run and in the long run.
[15 marks] Areas for discussion include: • definitions of short run and long run • definition of normal profit, awareness that it should be considered a cost and why it is required to
remain in business in the long run • explanation of profit maximisation • explanation of what is meant by loss, in other words total costs exceeding total revenues • explanation of why this is likely to be problematic in the short run (e.g. cash-flow problems) and
long run • analysis of breakeven point for a firm and the need for average revenue to cover average total
costs at the profit-maximising point in the long run • analysis of the need for average revenue to cover average variable costs at the profit-maximising
point in the short run, to avoid the firm shutting down • explanation of why a loss-making firm is able to carry on as long as it is covering its variable costs • the availability of options for continuing if running operations at a loss, e.g. the existence of
affordable credit or investment, or previously retained earnings • analysis of barriers to exit such as sunk costs • application to perfectly and/or imperfectly competitive markets • impact of business cycles on a firm’s profit – cycles may be caused by booms and recessions, or
by seasons. • firms may consider long-run profits rather than short-run profits and continue despite making
losses • in the short run the firm may be investing heavily in capital, R & D or marketing, which may lead to
short-run losses but long-run profits • in the short run the firm may be pursuing strategies to increase market share, and gain monopoly
power in the long run • use of examples, including those mentioned in the quote, to illustrate why a firm may to continue
to produce in the short run, despite making losses The use of relevant diagrams to support the analysis should be taken into account when assessing the quality of the student’s response to the question. Use the level mark scheme on page 15 to award students marks for this question.
MAXIMUM FOR QUESTION 11: 15 MARKS

MARK SCHEME – A-LEVEL ECONOMICS – 7136/1 – JUNE 2019
19
1 2
Discuss the validity of the traditional economic assumption that the main objective of firms is to maximise profits.
[25 marks] Areas for discussion include: • what is meant by ‘firm’ • explanation of profit, drawing a distinction between normal and abnormal profit • explanation of profit maximisation • why profit is usually an important objective o reward to enterprise o source of finance for investment o signalling corporate health to shareholders
• how firms in perfectly competitive sectors have little choice but to pursue profit-maximisation but firms with monopoly power have greater flexibility
• how ownership of the firm affects behaviour and performance • how the divorce of ownership from control and the principal-agent problem affect behaviour and
performance • revenue maximisation and sales maximisation as alternative objectives • limitations to the feasibility of pursuing profit maximisation, for example the difficulty many firms
face in calculating marginal revenue and marginal cost • discussion of profit satisficing rather than maximising • sales growth as a goal in itself, or as a short-term means to a long-term goal of profit
maximisation • non-financial objectives such as environmental goals and corporate social responsibility • whether the assumption of profit-maximisation is any more or less valid than in the past • examples of firms which have/have not pursued the aim of profit maximisation.
The use of relevant diagrams to support the analysis should be taken into account when assessing the quality of the student’s response to the question.
Use the level mark scheme on page 4 to award students marks for this question.
MAXIMUM FOR QUESTION 12: 25 MARKS

MARK SCHEME – A-LEVEL ECONOMICS – 7136/1 – JUNE 2019
20
Essay 3 Total for this essay: 40 marks 1 3
Explain how the impact of a minimum price for a good or service is affected by its price elasticity of demand and its price elasticity of supply.
[15 marks] Areas for discussion include: • explanation of minimum prices and why they might be introduced by a government regulator • definition and explanation of PED and PES • use of formulae and/or calculations to illustrate elasticity • explanation of the determinants of PED and PES • analysis of how the impact of a minimum price will vary according to PED. This is likely to lead to
a greater proportionate change in quantity if demand is elastic rather than inelastic • analysis of how the impact of a minimum price will vary according to PES. This is likely to lead to
a greater proportionate change in quantity if supply is elastic rather than inelastic • how excess supply is affected by PED and PES and what this might mean for the market • analysis of how the impact of a minimum price will vary if a market has both elastic PED and
elastic PES compared to an inelastic PED and PES • analysis of how the impact of a minimum price will depend on whether the price is supported by
intervention buying • use of examples of the above situations.
The use of relevant diagrams to support the analysis should be taken into account when assessing the quality of the student’s response to the question. Use the level mark scheme on page 15 to award students marks for this question.
MAXIMUM FOR QUESTION 13: 15 MARKS

MARK SCHEME – A-LEVEL ECONOMICS – 7136/1 – JUNE 2019
21
1 4
Discuss the view that a national minimum wage is beneficial for an economy. [25 marks]
Areas for discussion include: • discussion of national minimum wages including why they have been introduced • discussion of the distinction between the NMW and National Living Wage in the UK • analysis of how a national minimum wage works in an otherwise competitive market, and the
consequent theoretical impact • analysis of how a national minimum wage works in a monopsonistic labour market, and the
consequent theoretical impact • arguments for a NMW o prevents exploitation o reduces in-work poverty and inequality o incentivises firms to invest in labour productivity-enhancing capital o boosts motivation amongst workers leading to enhanced productivity o can remove the ability of immigrants to undercut existing workers’ wages, which brings costs
and benefits • arguments against a NMW o can create unemployment by setting a wage higher than the marginal revenue product of some
workers o unemployment may be concentrated amongst low-skilled workers from disadvantaged
backgrounds thus reinforcing existing inequality o certain sectors affected more than others (e.g. careworkers, hospitality, retail). Higher wage
costs may lead to falling profits and business failure o where firms pass on higher labour costs to consumers via product prices, this may be
regressive o administrative costs of introducing and uprating the minimum wage, along with policing and
prosecuting firms that break the rules • labour market flexibility and supply-side considerations • impact on the economy as a whole e.g. cost-push inflation, international competitiveness • evidence from the UK or elsewhere about the impact on the labour market and wider economy • consideration of the level or ‘bite’ of the NMW • market failure arguments • government failure arguments. The use of relevant diagrams to support the analysis should be taken into account when assessing the quality of the student’s response to the question. Use the level mark scheme on page 4 to award student marks for this question.
MAXIMUM FOR QUESTION 14: 25 MARKS

MARK SCHEME – A-LEVEL ECONOMICS – 7136/1 – JUNE 2019
22
Key to Annotations
Annotation Meaning/Use ? Unclear
AN Analysis APP Application BOD Benefit of the doubt
X Cross/Incorrect EVAL Evaluation
Highlight Highlight On Page Comment On Page Comment
IR Irrelevant KU Knowledge and Understanding
NAQ Not answered the question REP-BIG Repeat
SEEN Reviewed but no marks awarded Tick Correct point