A Land Between: Sicily's places in the Emergence of Medieval Hilltop Settlements (Slides from an...
30
A Land Between: Sicily’s Place in the Emergence of Medieval Hilltop Settlements By: Scott Kirk M.A. University of New Mexico T05S003 : Comparative Perspectives on Early Urbanism in Europe and Beyond
Transcript of A Land Between: Sicily's places in the Emergence of Medieval Hilltop Settlements (Slides from an...

A Land Between:Sicily’s Place in the Emergence of
Medieval Hilltop Settlements
By: Scott Kirk M.A.
University of New Mexico
T05S003 : Comparative Perspectives on Early Urbanism in Europe and Beyond

Research Questions
– What is the nature of Urban Development in Sicily ?
• Can it be accurately represented in the Middle Ages by the appearance of castles?
– What kind of roles do castles play within the community and intercommunally?
• How are they represented spatially?

Out of the Roman World and into the Medieval:Collapse or Transformation?
• Medieval landscape overlies the Roman one
– Over half of Medieval Settlements located on Roman ones

Urban Development
• Arabs enter a depopulated landscape
– Large, low-lying Roman population centers supposed to be abandoned
– Population moved to more easily defensive hilltop sites
• Contradiction
– Many Roman sites in Sicily were hilltop
• Reoccupied or Repopulated?

Incastellamento
• “The reorganization of European settlement in the ninth to eleventh centuries around hilltop fortifications, or castles, which impose feudal dominance on dependent villages…” (Boone 2009: 19; Toubert 1973; 1990).
• “The Emergence of Private fortifications from within villages in the 10th Century” (Creighton 2012: 144; Francovich and Hodges 2003).
• “The ratcheting up of lordly control over landscape and populace for reasons of social control and economic intensification” (Creighton 2012: 45; Wickham 1981: 165-6).

The Nature of Urbanism in Sicily
• Relationship to Roman Settlement linked to Trade
– Medieval Sites springing up on established trade routes
– Suggests Sicily’s economy may be wealth-based, as opposed to staple-based

Methodology
• Research Questions answered using satellite Data and GIS– 1 Arc Second Digital Elevation model of
Sicily from ASTER GDEM (A product of METI and NASA)
– Modern urban centers as proxy for medieval centers
• Database constructed for Castles
– Dates typically Earliest possible
– Represents a large sample
– Sample is unbiased

Settlements

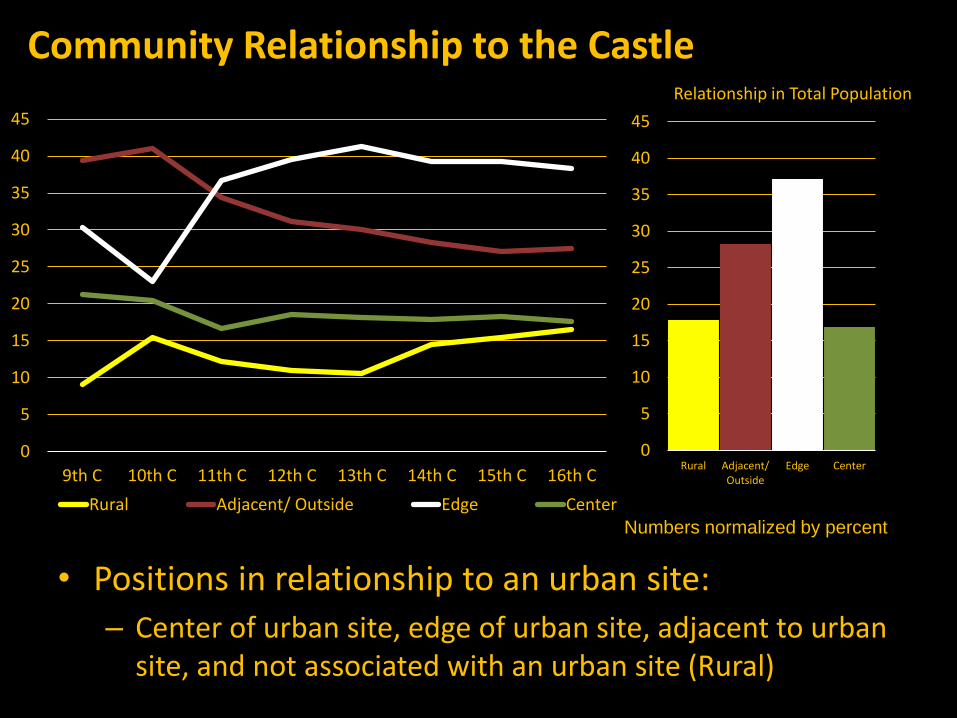
• Positions in relationship to an urban site:
– Center of urban site, edge of urban site, adjacent to urban site, and not associated with an urban site (Rural)
0
5
10
15
20
25
30
35
40
45
9th C 10th C 11th C 12th C 13th C 14th C 15th C 16th C
Community Relationship to the Castle
Rural Adjacent/ Outside Edge Center
0
5
10
15
20
25
30
35
40
45
Rural Adjacent/Outside
Edge Center
Relationship in Total Population
Numbers normalized by percent

Reason for Being on the Edge of the Community
• Positions in relationship to an urban site:
– Center of urban site, edge of urban site, adjacent to urban site, and not associated with an urban site (Rural)
0
5
10
15
20
25
30
35
40
45
9th C 10th C 11th C 12th C 13th C 14th C 15th C 16th C
Community Relationship to the Castle
Rural Adjacent/ Outside Edge Center
0
5
10
15
20
25
30
35
40
45
Rural Adjacent/Outside
Edge Center
Relationship in Total Population
Numbers normalized by percent

0
5
10
15
20
25
30
35
40
45
9th C 10th C 11th C 12th C 13th C 14th C 15th C 16th C
Characteristic Surroundings
Defensive Position Trade Route
Seaside Other
0
5
10
15
20
25
30
35
40
45
Total Population
Normalized by percent

Defensive Capabilities of the Natural Landscape
• Defensibility: “The degree to which a place is capable of protecting itself or withstanding attack.” (Borgstede and Mathieu 2007)
– Quantitatively, it presents a problem.
• Slope V. Prominence

0
5
10
15
20
25
30
35
40
45
9th C 10th C 11th C 12th C 13th C 14th C 15th C 16th C
Castle Prominence
<80m 80-159m 160-239m
240-319m 320-479m >480m
0
5
10
15
20
25
30
35
40
45
Total Population
A Cochran’s test of linear trend was run on the total population with a clear trend
towards lower prominence (χ2=115.716; p=<.001; departure= 324.284; df=4)
Results normalized by percent


0
5
10
15
20
25
30
35
40
9th C 10th C 11th C 12th C 13th C 14th C 15th C 16th C
Per
cen
tage
of
Cas
tles
Average Slope Around a Castle
None (0-8°) Low (8.01-16°)
Medium (16.01-24°) High (24.01-32°)
Severe (32.01-90°)
0
5
10
15
20
25
30
35
40
Total Population
Normalized by percent
0
10
20
30
40
50
60
70
80
90
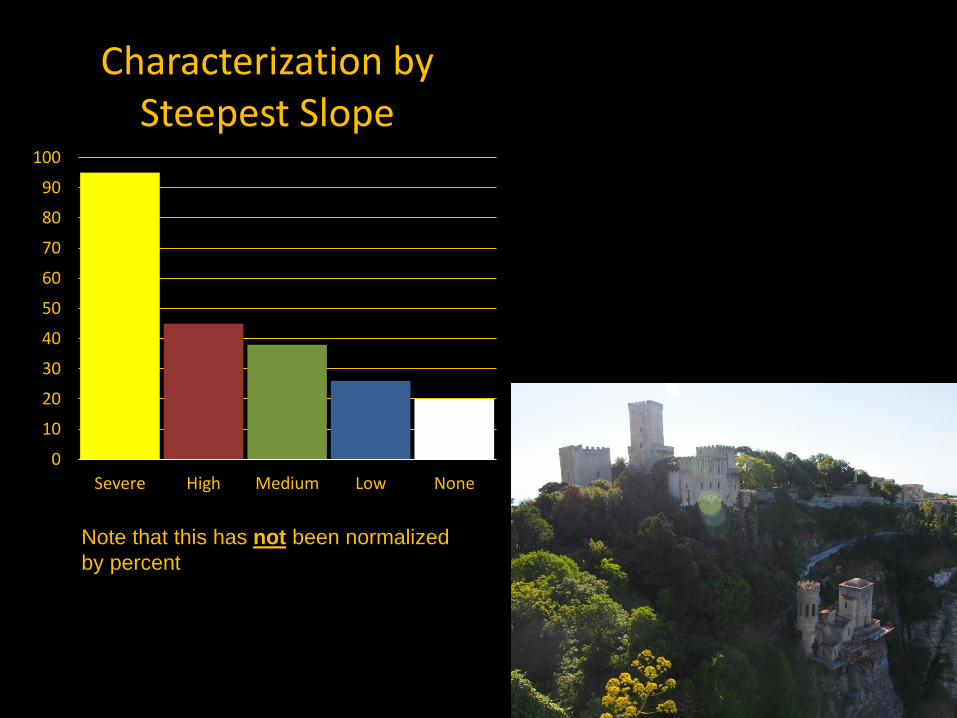
100
Severe High Medium Low None
Characterization by Steepest Slope
Note that this has not been normalized
by percent

Proximity to other Castles
• In Spain castles believed to be about a days walk from one another
– This is 15 km
– Implies castles are not entities on to themselves
• Testing this theory in Sicily
– Use a 15 km buffer to represent a days walk
– 30 km buffer to show a days ride on horseback

Castle Proximity
• Results 15km ANOVA
– F value= 55.50525 - F Crit= 2.015698 -p value= 9.19E-71
• Results 30 km ANOVA
– F value= 124.1718 - F crit= 2.015698 -p value= 6.54E-144
15 K Proximity Castles Only 30 K Proximity Castles Only
Groups Count Average Variance Mode Groups Count Average Variance Mode
9th C 51 0.98 1.26 0 9th C 51 3.25 3.03 5
10th C 60 1.23 1.27 1 10th C 60 3.93 3.55 4
11th C 135 3.23 4.76 4 11th C 135 10.73 16.30 9
12th C 190 4.91 6.70 4 12th C 190 16.52 36.73 18
13th C 228 5.93 10.71 5 13th C 228 19.64 57.53 19
14th C 273 6.92 14.92 5 14th C 273 22.98 73.12 26
15th C 277 7.07 18.08 5 15th C 277 22.85 74.60 20
16th C 288 7.24 18.15 5 16th C 288 22.60 73.42 25


Conclusions
• Castles can be used as a proxy for understanding urban development in Sicily
– Likely continuity between the Roman and Medieval eras• Castles signal a reinvestment in urban development
– State owned by the 13th Century• Early on part of the reestablishment of trade
• Indicative of a wealth based economic system

Special Thanks To
• Northern Illinois University Sicilian Archaeological Field School
• University of New Mexico GPSA