
A Knowledge Economy Programme Report
88
Knowledge Workers and Knowledge Work A Knowledge Economy Programme Report Prepared by Ian Brinkley, Rebecca Fauth, Michelle Mahdon and Sotiria Theodoropoulou
Transcript of A Knowledge Economy Programme Report
Knowledge Workers and Knowledge Work
A Knowledge Economy Programme Report
Prepared by Ian Brinkley, Rebecca Fauth, Michelle Mahdon and Sotiria Theodoropoulou
Knowledge Workers and Knowledge Work 2
Contents
Acknowledgements
This report has drawn on some of the initial research work and discussions from The Work Foundation’s three year Knowledge Economy Programme, to be completed in April 2009. However the views set out here are entirely those of The Work Foundation and do not represent those of the sponsoring organisations. We would like to thank Alana McVerry and Sezis Okut for their contributions to this paper.
Acknowledgements 2
List of Figures and Tables 3
Executive summary 4
1. The knowledge economy and knowledge work: A review of the existing
definitions and measures 9
2. Redefining knowledge work and knowledge workers 19
3. Knowledge work across industries and regions 41
4. The changing nature of work roles and the returns to knowledge 49
5. The job characteristics of knowledge workers 54
6. Organisational culture in the knowledge economy: preferences
and reality 61
7. Conclusion and recommendations 68
Appendix A. Work-related tasks and activities by factor 76
Appendix B: Sample demographic and background characteristics 82
Appendix C: Description of organisational variables 83
Appendix D: Composition of workforce in the distribution and repairs and
in the hotels and restaurants sectors 84
References 85
Knowledge Workers and Knowledge Work 3
List of Figures and Tables
Figure 1: The 30-30-40 knowledge economy workforce 5Figure 1.1: Growth of knowledge based service industries in Europe and UK 1970-2005 10Figure 1.2: Shares of graduates and workers with only basic schooling in UK workforce, 1970-2006 14Figure 2.1: What work tasks are most common across the workforce? 23Figure 2.2: Number of different computer uses and how often computers are used each week 28Figure 2.3: Share of workers that frequently perform at least one specialist computer task 29Figure 2.4: Importance of ‘teach others’ task for different clusters 31Figure 2.5: Perceived complexity of tasks performed by surveyed workers 32Figure 2.6: The 30-30-40 knowledge workforce 34Figure 2.7: Share of women in jobs by knowledge content 36Figure 2.8: Share of jobs in the top three occupational groups by knowledge content 38Figure 2.9: Share of graduates by knowledge intensity of the job 39Figure 3.1: Share of jobs in knowledge industries by knowledge intensity 42Figure 3.2: Composition of the knowledge-intensive services sector 43Figure 3.3: Workforce composition in the health and welfare industry by worker cluster 44Figure 3.4: Employment in knowledge intensive and more traditional services compared 45Figure 3.5: Composition of the manufacturing sector 46Figure 3.6: Regional composition of the workforce 47Figure 4.1: Percentage earning more than median wages by worker cluster 53Figure 5.1: Percentage of workers in the same job for more than 10 years by worker cluster 56Figure 5.2: Percentage of workers working day shifts by worker cluster 57Figure 5.3: Percentage of workers doing weekend work at least once/month by worker cluster 58Figure 5.4: Percentage of workers with flexibility in choosing work schedule by worker cluster 59Figure 6.1: Percentage prefer innovative firms by worker cluster 67
Table 2.1: Task factors with sample items 22Table 2.2: Number of methods used to acquire new information and learn new tasks 30Table 2.3: Prevalence of methods used for sharing and capturing knowledge 32Table 3.1: Regional concentration of knowledge workers in the UK 47Table 4.1: Job-skills/experience match by worker cluster 52Table 4.2: Shares of women and men earning above the median wage 53Table 6.1: Perceived organisational characteristics by worker cluster 63Table 6.2: Preferred organisational characteristics 64
Knowledge Workers and Knowledge Work 4
Executive summary
The purpose of this report is to provide a portrait of work and the workforce in the knowledge economy. We wanted to find out who the knowledge workers are, what they do in their jobs, where they are employed and what employment structures, job characteristics and organisational structures look like in the knowledge economy.
Knowledge work and knowledge workers are terms often used but seldom defined. When knowledge work is defined it is usually by broad measures such by job title or by education level. At best this gives us a partial and simplistic view of knowledge work in the UK.
This report takes a new approach. In a large and unique survey, we have asked people what they actually do at work and how often they perform particular tasks. We have used that information to assess the knowledge content of their jobs. The key test was the cognitive complexity required for each task – the use of high level ‘tacit’ knowledge that resides in people’s minds rather than being written down (or codified) in manuals, guides, lists and procedures.
We then grouped the workforce into seven distinct clusters of jobs ranging from ‘expert thinkers, innovators and leaders’ (the most knowledge intensive groups) to ‘assistants and clerks’ (the least knowledge intensive)1. We describe the two highest knowledge groups as our ‘core’ knowledge worker.
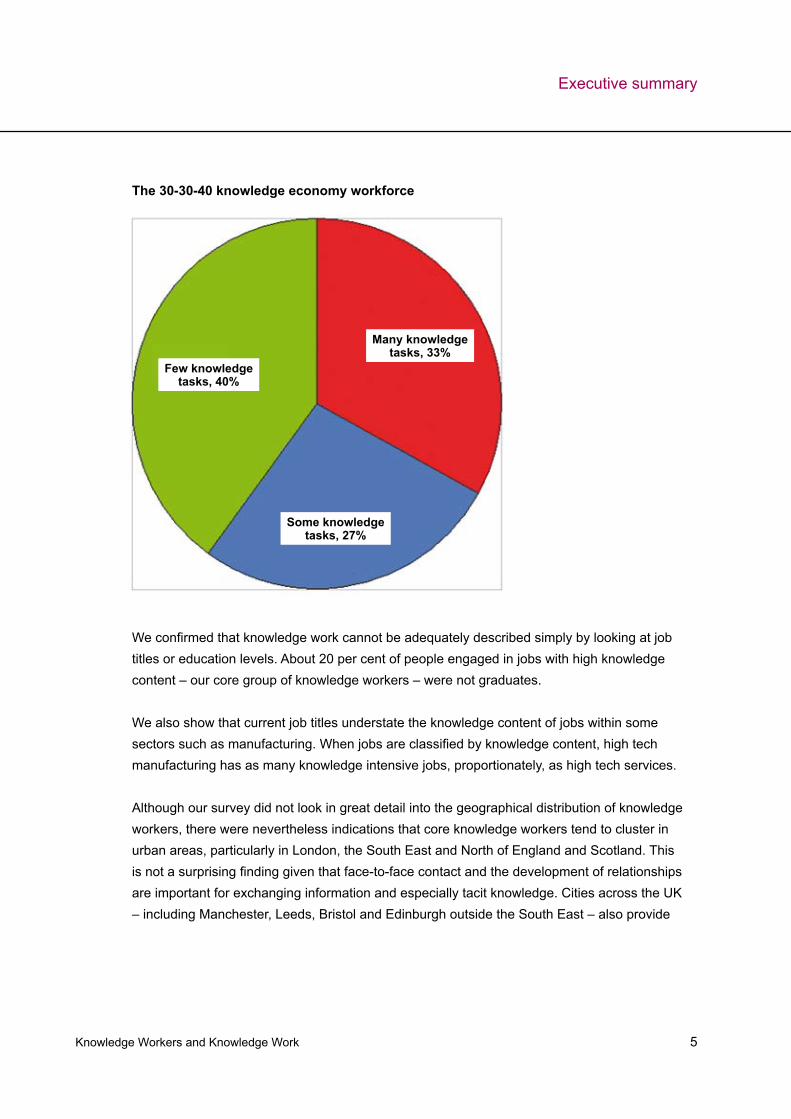
With this measure we estimated that we have a 30-30-40 workforce – 30 per cent in jobs with high knowledge content, 30 per cent in jobs with some knowledge content, and 40 per cent in jobs with less knowledge content.
Within our 30 per cent ‘core’ knowledge worker group, the highest group of all (‘leaders and innovators’) constituted just 11 per cent of the workforce. These high intensity knowledge jobs combined high level cognitive activity with high level management tasks.
These high knowledge intensive jobs are, we suspect, what some of the more excitable accounts of knowledge work we have in mind. The reality is that even after 40 years uninterrupted growth in knowledge based industries and occupations, such jobs account for only one in ten of those in work today.
1 These groupings are described in more detail on page 24
Knowledge Workers and Knowledge Work 5
We confirmed that knowledge work cannot be adequately described simply by looking at job titles or education levels. About 20 per cent of people engaged in jobs with high knowledge content – our core group of knowledge workers – were not graduates.
We also show that current job titles understate the knowledge content of jobs within some sectors such as manufacturing. When jobs are classified by knowledge content, high tech manufacturing has as many knowledge intensive jobs, proportionately, as high tech services.
Although our survey did not look in great detail into the geographical distribution of knowledge workers, there were nevertheless indications that core knowledge workers tend to cluster in urban areas, particularly in London, the South East and North of England and Scotland. This is not a surprising finding given that face-to-face contact and the development of relationships are important for exchanging information and especially tacit knowledge. Cities across the UK – including Manchester, Leeds, Bristol and Edinburgh outside the South East – also provide
Executive summary
The 30-30-40 knowledge economy workforce
Few knowledge tasks, 40%
Many knowledge tasks, 33%
Some knowledge tasks, 27%
Knowledge Workers and Knowledge Work 6
businesses with access to wider markets and to specialist skills. This result resonates with the insights of our Ideopolis programme on the growing importance of cities in world economies.
Our results confirm high economic returns to knowledge – the vast majority of those in the most knowledge intensive jobs enjoyed pay well above the median. But this was not true for those in jobs with some knowledge content – such as care and welfare work.
The most knowledge intensive jobs were almost equally likely to be held by men and women, but those jobs with some knowledge content – such as care and welfare workers, information handlers, and sellers and servers – were overwhelmingly female. Woman have benefitted from the growth of knowledge work, but the growth of more knowledge intensive work has not, of itself, overcome the gender pay gap.
Some people have speculated that the growth of knowledge work is weakening the attachment to permanent and long term employment relations. We find no evidence for this. Those in the most knowledge intensive jobs are no more likely to be in temporary jobs than those in the least knowledge intensive jobs and job tenures are also very similar.
Knowledge workers are not spear-heading radical changes in the way we work. As expected, they do have more flexibility at work than those in less knowledge intensive jobs, but the differences were not overwhelming. The reality is that less than 50 per cent of all workers and less than 60 per cent of knowledge workers said they have some flexibility in their work schedule, and only a very small minority said they can freely determine their own hours.
Perhaps not surprising, attachment to the standard nine to five day is still a central feature of the labour market for both knowledge workers and non-knowledge workers alike. Knowledge workers were far more likely to do occasional work at home, although over 60 per cent said they did no home-working. Weekend working is relatively common across the workforce, but was much less prevalent among knowledge workers.
We found two big labour market mismatches. The first was between the skills that people said they had and the demands their current job made of them. The second was between the organisational culture people perceived they actually worked in and the organisational culture they would like to work in.
Executive summary
Knowledge Workers and Knowledge Work 7
Significant minorities of workers reported their current jobs under-used their skills. The gap was less marked for knowledge workers, but nonetheless significant. About 36 per cent of knowledge workers said they were in jobs that under-used their skills compared with over 44 per cent of those in jobs with some or little knowledge content.
Taken at face value, employers are not making the most of knowledge worker skills despite such workers representing a substantial investment in human capital within the organisation. However, these mismatches are even worse for jobs with low knowledge content – suggesting a more general problem with labour utilisation rather than a particular difficulty with knowledge work.
Some have expressed concern that the economy is producing too many graduates for the available jobs that require graduate skills, forcing more graduates to accept lower pay jobs and worsening the prospects for non-graduates.
We found mixed evidence. About 20 per cent of graduates were in low knowledge content jobs. This is potentially worrying. However, the average job tenure for graduates in such jobs was much lower than for non-graduates – suggesting graduates spend less time in these jobs. Moreover, about 44 per cent of graduates in low knowledge content jobs reported that their job duties corresponded well with their current skills.
Taken with the evidence on returns from knowledge and our previous work on labour market polarisation2, the overall picture does not strongly support the idea that the UK is producing too many graduates. The situation may be worse for those who entered the labour market more recently, but we found little variation in these responses by age.
The vast majority of people in work think their organisation is characterised by formal rules and policies, but very few say this is the sort of organisation they really want to work for. The mismatch is even greater for knowledge workers: 65 per cent said their organisations were rule and policy bound, but only 5 per cent expressed a preference for such organisations.
There is a much better match when it comes to characteristics such as loyalty and mutual trust for both knowledge and non-knowledge workers. About 50 per cent of all workers said this was a predominant characteristic of their organisation, and over 60 per cent said it was their preferred organisational characteristic.
2 Fauth and Brinkley (2006) Polarisation and labour market efficiency, The Work Foundation
Executive summary
Knowledge Workers and Knowledge Work 8
Knowledge workers are more likely to work for organisations that they think are innovative or achievement orientated – not in itself a surprising result. What is surprising is that neither feature seems to appeal to them very much. For example, 50 per cent of knowledge workers said their organisation’s predominant feature was innovation, development and being at the cutting edge, but only 24 per cent preferred this type of organisation.
Some of the differences in how people characterised their organisation can be partly explained by whether the organisation was in a public based industry (education, health, public administration) or in a private market based industry. But such differences between a public and private based organisational culture did not explain preferences. It seems people reject rule bound cultures and value loyalty and trust regardless of whether they work in the public or private based sectors.
The gap between reality and organisational preference was wider in the public sector than in the private sector. Public service workers were more likely to say they worked in a rules bound organisation, which is predictable; but they also said they were less likely to be characterised by mutual rust and loyalty than in the private sector.
These are the first set of findings from our knowledge working survey. We will be publishing a second set of findings later in 2009 that look more closely at how knowledge work can be regarded as ‘good work’ and how it relates to health and well-being at work.
Executive summary
Knowledge Workers and Knowledge Work 9
The purpose of this report is to provide a portrait of the work and the workforce in the knowledge economy. We want to find out who the knowledge workers are, what they do in their jobs, where they are employed and what employment structures, job characteristics and organisational structures look like in the knowledge economy.
The term ‘knowledge economy’ is often used but seldom defined. Essentially, it refers to a transformed economy where investment in ‘knowledge based’ assets such as R&D, design, software, and human and organisational capital has become the dominant form of investment compared with investment in physical assets – machines, equipment, buildings and vehicles. Thus, the term ‘knowledge economy’ captures the subsequently changed industrial structure, ways of working, and the basis on which organisations compete and excel.
The presence and use of knowledge-based assets in the economy is of course not new – knowledge based institutions such as universities go back centuries. However, in the late 1970s and early 1980s three major economic and social forces combined to trigger the radical change in economic structures that expanded the use of knowledge based assets and brought them to the centre of economic activity across the OECD:
The introduction of increasingly powerful and relatively cheap general purpose • information and communication technologies has not only been eliminating the physical and geographical barriers of sharing information and ideas, but also expanding the possibilities of generating new knowledge. Globalisation has been acting as an accelerator by opening up both markets of global • scale and an endless variety of niche markets as well as speeding up the spread and adaption of new technologies and ideas.The rising standards of living in the advanced industrialised economies have, over the • years, created well-educated and demanding consumers with a voracious appetite for the high value added services that the knowledge economy can characteristically supply.
These changes are universal – they affect all industrial sectors, all sizes of firms, the public sector as much as the private sector. And they are global – we have yet to find an advanced industrial economy where these changes are not taking place.
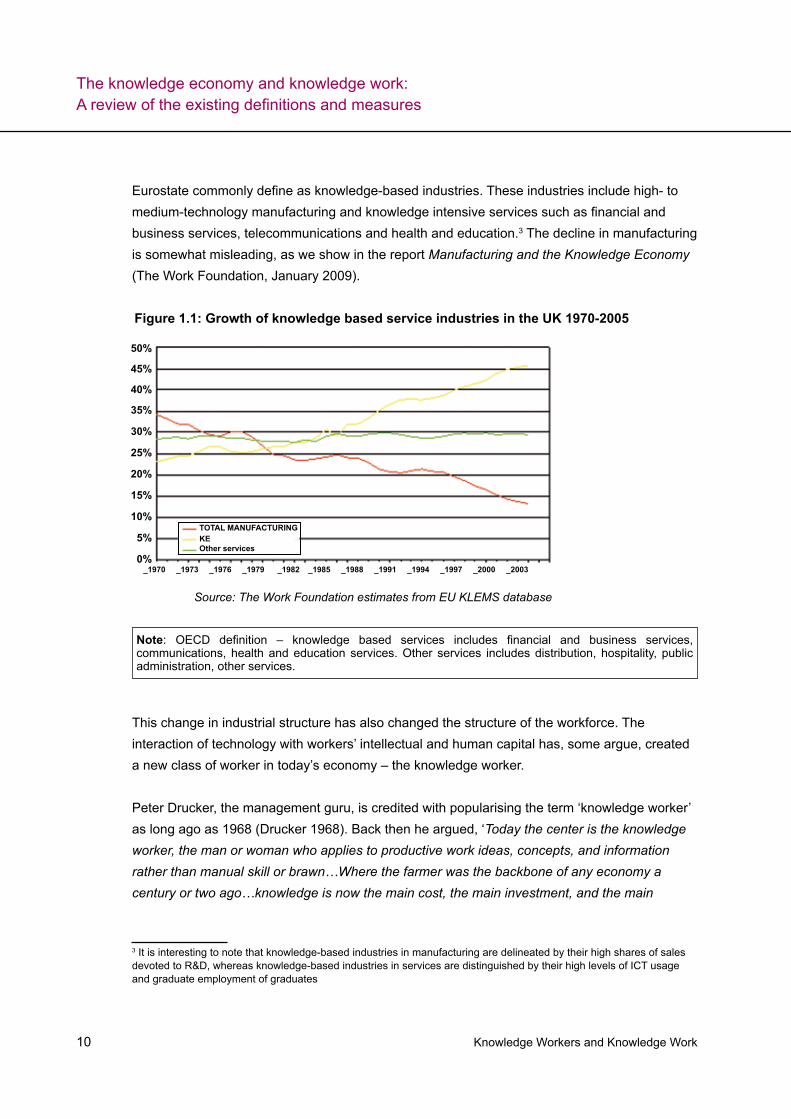
The graphs below illustrate the growth of the knowledge economy in Europe by showing the evolution of the share in value added, in the EU and the UK, of the sectors that the OECD and
1. The knowledge economy and knowledge work: A review of the existing definitions and measures
Introduction
Knowledge Workers and Knowledge Work 10
Eurostate commonly define as knowledge-based industries. These industries include high- to medium-technology manufacturing and knowledge intensive services such as financial and business services, telecommunications and health and education.3 The decline in manufacturing is somewhat misleading, as we show in the report Manufacturing and the Knowledge Economy (The Work Foundation, January 2009).
This change in industrial structure has also changed the structure of the workforce. The interaction of technology with workers’ intellectual and human capital has, some argue, created a new class of worker in today’s economy – the knowledge worker.
Peter Drucker, the management guru, is credited with popularising the term ‘knowledge worker’ as long ago as 1968 (Drucker 1968). Back then he argued, ‘Today the center is the knowledge worker, the man or woman who applies to productive work ideas, concepts, and information rather than manual skill or brawn…Where the farmer was the backbone of any economy a century or two ago…knowledge is now the main cost, the main investment, and the main
3 It is interesting to note that knowledge-based industries in manufacturing are delineated by their high shares of sales devoted to R&D, whereas knowledge-based industries in services are distinguished by their high levels of ICT usage and graduate employment of graduates
The knowledge economy and knowledge work: A review of the existing definitions and measures
The knowledge economy and knowledge work: A review of the existing definitions and measures
Figure 1.1: Growth of knowledge based service industries in the UK 1970-2005
50%
45%
40%
35%
30%
25%
20%
15%
10%
5%
0%_1997
KETOTAL MANUFACTURING
Other services
Note: OECD definition – knowledge based services includes financial and business services, communications, health and education services. Other services includes distribution, hospitality, public administration, other services.
Source: The Work Foundation estimates from EU KLEMS database
_1970 _1973 _1976 _1979 _1982 _1985 _1988 _1991 _1994 _2003_2000
Knowledge Workers and Knowledge Work 11
Defining
knowledge and
knowledge
workers
The knowledge economy and knowledge work: A review of the existing definitions and measures
product of the advanced economy and the livelihood of the largest group in the population’ (p. 264). Even in its nascent form, the very term ‘knowledge worker’ hints at a shift in nature of some jobs where knowledge – not physical capital – is increasingly becoming the core currency on the job market.
Forty years on, and we seem little closer to pinning down the terms ‘knowledge worker’ or ‘knowledge work.’ There are no official agreed definitions and no standardised measures. As with the term ‘knowledge economy’, the term ‘knowledge worker’ is used frequently and indiscriminately. It encompasses anybody from a relatively small number of professional and technical specialists to a sizeable chunk of the workforce.
The following section reviews the diverse, but surprisingly sparse, literature on the definitions and measurement of knowledge work and knowledge workers, including the definition used by The Work Foundation thus far. In reviewing this literature, we highlight the important features that a data-driven account of knowledge work and knowledge workers should reflect and the shortcomings of previous attempts at providing such an account. Moreover, this review frames our own method of deriving a better definition of knowledge work within the existing literature. In later sections of this report we will use our newly developed definition of knowledge work to explore the consequences of the knowledge economy in the structure of employment, job characteristics organisational culture and good work.
Definitions of knowledgeOne of the central problems in defining knowledge work has been the difficulty of defining knowledge itself and distinguishing knowledge from information. Indeed, the terms ‘information worker’ and ‘knowledge worker’ can be used interchangeably. There is a vast literature in which the concept of management of knowledge is hard to distinguish from the management of information. For example, the general conclusion from one meta-analysis is that much of what is described as knowledge management is really either management of information or a description of organisational changes that improved information sharing (Wilson 2002).
We argued in The Work Foundation’s Knowledge Economy Programme interim report (Brinkley 2008) that what distinguishes knowledge from information is the way in which knowledge empowers actors with the capacity for intellectual or physical activity. Knowledge is a matter of cognitive capability and enables actors to do and reflect. Information, by contrast, is passive and meaningless to those without suitable knowledge. Knowledge provides the means by which information is interpreted and brought to life.
Knowledge Workers and Knowledge Work 12
An alternative distinction is between ‘tacit’ and ‘codified’ knowledge (see Lundavall and Johnson 1994 and OECD 1996: 12). The latter can be written down, for example, in manuals, guides, instructions and statements and is easily reproduced. Tacit knowledge, however, resides with the individual in the form of expertise and experience that often cannot be written down and is expensive to transfer to others. In many respects, codified knowledge and information are indistinguishable. The significant difference is, therefore, between tacit knowledge and information.
Conceptual definitions of knowledge workEven with these distinctions in mind, knowledge work remains an elusive concept. Definitions and descriptions of knowledge work have ranged from the theoretical to the anecdotal and are very infrequently based on a robust assessment of data on workers and what they actually do. When data are used, usually proxy measures for highly skilled labour are employed. Depending what resource we look to for evidence, we might come away thinking that nearly everyone in the workforce today is a knowledge worker or that almost no one is, with the exception of a select few.
Several experts have outlined conceptual definitions of knowledge work. For example, Drucker (1999) focused on the differences between ‘manual worker productivity’ and ‘knowledge worker productivity.’ The key enablers of the latter include abstractly defined tasks (vs. clearly defined, delineated tasks), flexible application of knowledge, workers’ autonomy, continuous innovation and learning into job roles, assessment based on quality (not just quantity) of output and perceiving workers as organisational assets. While this general outline is useful, Drucker did not take the additional useful step of specifying the occupations that fit into the knowledge worker category. One could argue that he simply outlined a more modern conception of a good job where workers are viewed as more than what they produce.
Robert Reich (1992) was a bit more explicit in outlining what he terms as the ‘symbolic analysts’, the workers who engage in non-standardised problem solving using a range of analytic tools often abstract in nature. The keys to these workers’ success include creativity and innovation and incorporate occupations ranging from lawyers to bankers to researchers to consultants.
Another US-based researcher took a fairly divisive stance on knowledge work by declaring that, ‘all knowledge work is intellectual work. Thus, a job that is not intellectual enough will not contribute to knowledge work. Such jobs should not be allowed in a knowledge organisation’ (Amar 2002). The paper argued further that knowledge organisations should only have jobs
The knowledge economy and knowledge work: A review of the existing definitions and measures
The knowledge economy and knowledge work: A review of the existing definitions and measures
Knowledge Workers and Knowledge Work 13
The knowledge economy and knowledge work: A review of the existing definitions and measures
that involve at least 50 per cent intellectual content (eg, analysis, decision making, creativity). In turn, the author suggested that knowledge organisations should do away entirely with traditional manual jobs that require only physical skills.
It is hard to know whether this should be taken literally or if the argument is that knowledge-intensive tasks should be shared by all workers. After all, even in knowledge organisations, knowledge workers need to be supported, offices need to be cleaned and machinery serviced and so on. This definition would also appear to rule out high-tech manufacturing, including some of the most R&D intensive companies in the world.
Data-driven definitions of knowledge workMoving on to more data-driven definitions of knowledge work, some analysts have tried to describe knowledge workers as all those who work in particular organisations or in particular sectors or institutions – sometimes under the dubious impression that knowledge workers make up the overwhelming majority of workers in such industries. However, in practice, organisations in these industries need to deploy a wide range of complementary jobs with varying degrees of intellectual content.
Another class of proxies that economists often use for distinguishing knowledge workers is based on the investment expenditures in activities such as education and research and development. In line with this approach, one of the definitions of knowledge workers that The Work Foundation (TWF) has been using so far for their research is university graduates as a proxy for highly-skilled workers and investment in human capital.
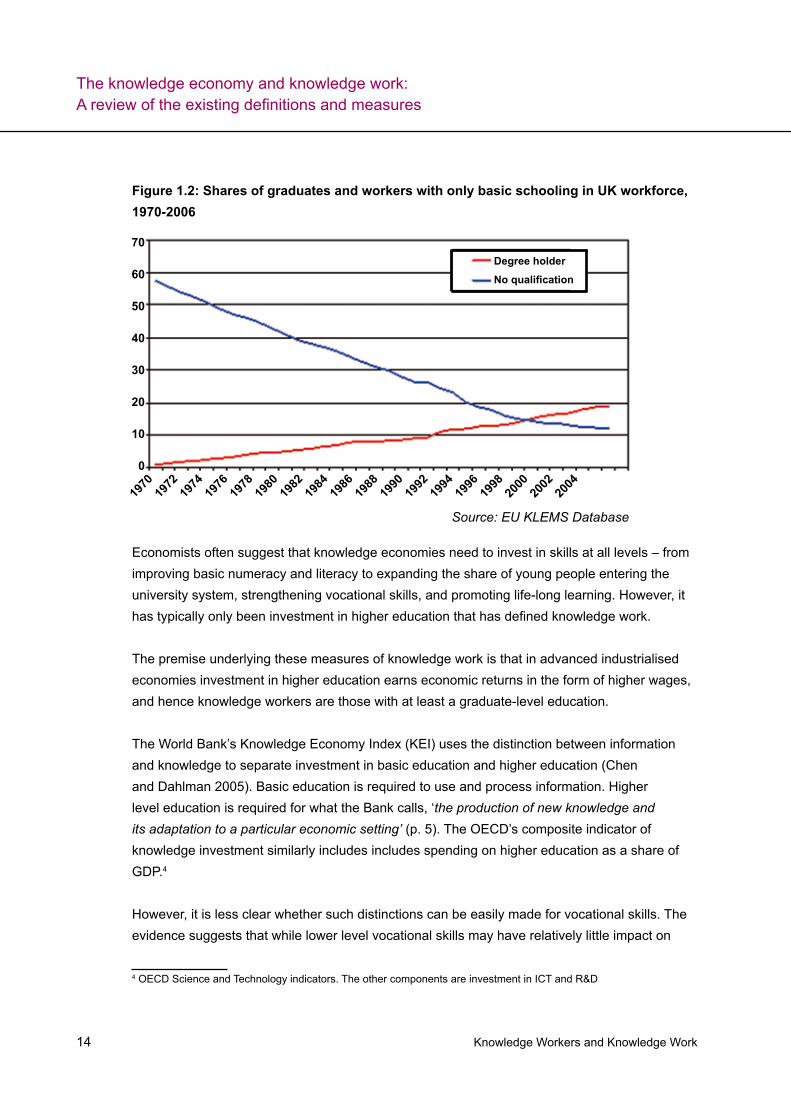
There has been a strong association between the rise of employment in knowledge intensive industries and the employment of graduates in the workforce. There has also been a major shift in the share of the workforce with some form of qualification across all sectors of the economy. As Figure 1.2 below shows, in 1970, for example, less than 10 per cent of the workforce had a degree and 60 per cent of people in work had had only basic schooling. By 2005 the share of graduates had increased to around 19 per cent, while the share of people with no qualifications had fallen to 12 per cent. The latest figures show that graduate employment accounted for just under 23 per cent of workers in the UK.
Knowledge Workers and Knowledge Work 14
Figure 1.2: Shares of graduates and workers with only basic schooling in UK workforce, 1970-2006
70
60
50
40
30
20
10
0
1970
1972
1974
1976
1978
1980
1982
1984
1986
1988
1990
1992
1994
1996
1998
2000
2002
2004
Degree holder
No qualification
Source: EU KLEMS Database
Economists often suggest that knowledge economies need to invest in skills at all levels – from improving basic numeracy and literacy to expanding the share of young people entering the university system, strengthening vocational skills, and promoting life-long learning. However, it has typically only been investment in higher education that has defined knowledge work.
The premise underlying these measures of knowledge work is that in advanced industrialised economies investment in higher education earns economic returns in the form of higher wages, and hence knowledge workers are those with at least a graduate-level education.
The World Bank’s Knowledge Economy Index (KEI) uses the distinction between information and knowledge to separate investment in basic education and higher education (Chen and Dahlman 2005). Basic education is required to use and process information. Higher level education is required for what the Bank calls, ‘the production of new knowledge and its adaptation to a particular economic setting’ (p. 5). The OECD’s composite indicator of knowledge investment similarly includes includes spending on higher education as a share of GDP.4
However, it is less clear whether such distinctions can be easily made for vocational skills. The evidence suggests that while lower level vocational skills may have relatively little impact on
4 OECD Science and Technology indicators. The other components are investment in ICT and R&D
The knowledge economy and knowledge work: A review of the existing definitions and measures
The knowledge economy and knowledge work: A review of the existing definitions and measures
Knowledge Workers and Knowledge Work 15
The knowledge economy and knowledge work: A review of the existing definitions and measures
wages, higher level vocational skills undoubtedly offer an economic return even if it is not as significant as from higher education. And it would be hard to argue that the more sophisticated vocational skills – for example, in diagnostic work – are not also engaged in the production and adaptation of new knowledge.
Other proxies for knowledge work and workers have focused more narrowly on the link between investment in scientific and technical skills and technological innovation. The narrowest measure is the share of workers in R&D: typically, these more specialist types of knowledge workers account for between 1 and 1.5 per cent of the workforce across the major OECD economies even using the wider OECD definition that includes support technicians. A wider measure is the share of workers with a science, technology, engineering or mathematics degree (STEM graduates). Both can be used as a proxy for the ability of an economy to generate and absorb technological innovations.5
Job-content definitions of knowledge workA final approach to defining knowledge work has been to look at the sort of jobs that people do. Here we see a very wide variety of examples. Suff and Reilly (2005) provide a useful summary of some of the approaches adopted. Most studies give examples of managerial professional and associate professional workers and often concentrate on particular groups. For example, a 2007 report on ‘enterprise knowledge workers’ was based on a sample survey of senior business executives and managers (Economist Intelligence Unit 2007).
Broader measures of knowledge workers have been based on occupational classifications within the official statistics. One of the more widely used measures adopted by The Work Foundation has been to group together the three top occupational groups of managers, professionals and associate professionals. These are jobs that, at least traditionally, require a certain level of educational and/or vocational training and are the least likely to be affected by technological advances and competition from low-wage manufacturing imports. Using this broad stroke definition, 42.5 per cent of the workforce would be classified as a knowledge worker in 2007.
This broad classification has the virtue of providing readily available statistics on the extent and growth of knowledge work. But it is also clear that some of the classifications do not work well. The job title ‘manager’ is applied to a much wider range of jobs in the UK than elsewhere in Europe, likely including many relatively low paid, basic supervisory roles (European Foundation for the Improvement of Living and Working Conditions 2007). The category ‘managers,
5 Also referred to as HRST (human resources in science or technology)
Knowledge Workers and Knowledge Work 16
legislators and senior officials’ accounts for about 15 per cent of the UK and the US work forces, but less than 10 per cent in Germany, France, Italy and Spain, according to estimates by the ILO (all figures 2007 or latest available). Moreover, other job categories are also likely to include people undertaking similar tasks to those within the top three occupational groups.
More sophisticated approaches by researchers in Australia, the US and the UK have regrouped the existing statistical occupational codes (Webster 1999; Autor, Levy, and Murnane 2003; Elias and Purcell 2004).
The Australian research was primarily interested in trying to measure the production of intangible ‘intellectual’ assets, and so regrouped occupations according to whether they were associated with the production of such assets (Webster 1999). A further distinction was made between workers that directly produce intangible assets for others including teachers, sales and marketing workers, consultants, researchers and financial advisors. These workers also include those who acquire and use skills, knowledge and talent to make a contribution to the goodwill or efficiency of their firms including medical staff, scientists, managers and engineers.
The US researchers were interested in the impact of computerisation on the workforce (Autor, Levy, and Murnane 2003). Notably, they wished to assess whether computers were more substitutable for routine than non-routine forms of work. To do so, the researchers took the existing statistical occupational codes and recategorised jobs into five groups based on the degree of computer substitution and adherence to strict rules – both proxies for more routine forms of work. The groups included:
Expert thinking1. : includes solving problems outside of rules based solutions, with computers assisting but not substituting. As well as high level research and creative work, this might also include the mechanic who is able to identify a solution to a problem that computer based diagnostics could not.
Complex communication2. : includes interacting with other people to acquire or convey information and persuading others of their implications, with computers assisting but unlikely to replace – examples might include some managers, teachers and salespeople.
Routine cognitive3. : includes mental tasks closely described by rules such as routine form processing and filling, often vulnerable to computerisation.
The knowledge economy and knowledge work: A review of the existing definitions and measures
The knowledge economy and knowledge work: A review of the existing definitions and measures
Knowledge Workers and Knowledge Work 17
The knowledge economy and knowledge work: A review of the existing definitions and measures
Routine manual4. : includes physical tasks closely described by rules, such as assembly line work and packaging, that may be replaced by machines.
Non-routine manual5. : includes physical tasks hard to define by rules because they require fine optical or muscle control such as truck-driving and cleaning, and unlikely to be either assisted or replaced by computers.
This delineation recognises the importance of workers’ inputs and serves as a useful guide for understanding the types of job roles that are unaffected or even enhanced by mass computerisation relative to the jobs that have become less relevant to the economy. From this, we can argue that knowledge work goes beyond basic processing of information and cannot be based on strict adherence to rules; in other words, it can be assisted and enhanced, but not replaced, by computers. Thus, expert thinking, complex communication and analytical reasoning – defined by the authors as making effective oral and written arguments – help define knowledge work, as opposed to the routine cognitive along with routine and non-routine manual categories.
Finally, UK research focuses on the links between occupations and graduate qualifications (Elias and Purcell 2004). Over time, the researchers have assessed the average educational attainment of workers in each of the minor occupational groups (ie, 371 occupations in total), accounting for workers’ age given the increase in degree holders over time. Based on this analysis, five umbrella groups of occupations based on educational qualifications were created:
Traditional graduate occupations: includes professions that historically have required an 1. undergraduate degree (eg, solicitors, scientists, doctors, teachers).
Modern graduate occupations: includes newer professions that graduates have been 2. entering since the 1960s (eg, chief executives, software professionals, writers).
New graduate occupations: includes occupations where entry-level has recently shifted 3. to incorporate degree holders (eg, marketing and sales managers, physiotherapists, welfare officers, park rangers).
Niche graduate occupations: includes jobs where majority of entry-level workers are not 4. graduates, but there is a growing number of specialists who do come in with degrees (eg, sports managers, hotel managers, nurses, retail managers).
Knowledge Workers and Knowledge Work 18
Non-graduate jobs: includes professions where a graduate degree is not required and 5. most employees do not have degrees.
Similar to the US approach, this methodology directly incorporates the changing nature of the labour market to analyse how occupations shift over time. These three categorisations get us closer to what knowledge work might be, but they are still constrained by the existing occupational codes. In all three studies, there was a strong overlap between the sort of jobs that were classified as producing intellectual assets or associated with expert thinking and complex communication skills or affiliated with graduate workers and the top three occupational codes.
At one level this is reassuring: it suggests the top three occupational codes are capturing many ‘knowledge work’ jobs and so serve as a reasonable proxy. At the same time, it is important to keep in mind that they are proxy measures nonetheless and hence only give us a partial picture of knowledge work in today’s economy.
To sum up, what is missing from all of these attempts at defining knowledge work is a thorough analysis of workers themselves and what they do at work. Moreover, different definitions provide fairly divergent estimations of the size of the knowledge workforce in the UK. For example, graduate employment in the UK in 2008 was just over 20 per cent of the workforce, while the top three occupations (managers, professionals, associate professional and technical) account for over 40 per cent. As we describe in more detail later in this report, the aim of the present study is to focus directly on a large sample of UK workers to better understand the key tasks and activities that make up their daily working life and develop a more robust measure of knowledge work within the economy.
The knowledge economy and knowledge work: A review of the existing definitions and measures
Knowledge Workers and Knowledge Work 19
This section develops our definition of knowledge work and knowledge workers. We do that in three stages:
First, we discuss the technical aspects of our survey and its analysis, and how we • reclassify the workforce into task-based ‘clusters’ on the basis of the distinguishing features in the jobs they do.
Secondly, we identify the different sorts of knowledge content within each of our • clusters, allowing us to identify these task-based characteristics that distinguish knowledge work.
Thirdly, we use our new definition of knowledge work to provide a cross-sectional • picture of the UK’s workforce today and how the new definition measures up against previous definitions.
6 We performed our analysis in several steps. We started off by conducting a survey of, among others, the tasks that people employed in the knowledge economy frequently do at work. We presented our survey respondents with a list of 186 tasks and asked them to rate how frequently they perform each of them. We then analysed this survey information along two lines. On the one hand, and to make our data more easily manageable, we identified groups of tasks, (eg data analysis, administrative tasks, people management, maintenance moving and repairing) that were frequently performed together by the same survey participants. On the other hand, we identified groups of workers depending on how frequently they performed particular groups of tasks. In addition, our survey provided information on the use of technology, the methods of sharing and acquiring knowledge and the complexity of the tasks that the participants perform at work. The survey information allowed us to come up with a fresh taxonomy of both the types of tasks that characterise work in the knowledge economy and the different groups of workers within the labour force. In what follows, we present some important details on the methods we used and then discuss our results regarding the definition of work in the knowledge economy.
6 Readers who are not interested in the specific technical details of our methodology can largely omit reading this sub-section in full without losing track of our analysis
2. Redefining knowledge work and knowledge workers
Research
design6
Knowledge Workers and Knowledge Work 20
Our surveyOur knowledge workers’ survey was designed in four phases.
First, we conducted an extensive literature review of existing sources on job and task analysis, job content and job design. From this review, we compiled an initial list of approximately 125 work-related tasks or activities featuring manual tasks, cognitive tasks, social tasks and technical tasks, to name a few.
Second, we conducted qualitative case studies of workers in two knowledge-based organisations. For these case studies, we conducted focus groups and interviews with more than 40 workers employed in a range of jobs within the organisations.
Third, we collated the evidence to finalise our list of tasks and activities for a pilot version of the survey. The initial survey included 138 work-related tasks and activities as well as additional items on workers’ background and job characteristics, features of job quality and working conditions and work-related outcomes. The pilot survey was distributed to 200 workers who participated in an online panel. Participants were required to work at least 20 hours per week in one job, although they could have more than one job.
Finally, based on the evidence from the pilot study, we revised our survey further, incorporating more work-related tasks and activities and deleting the tasks that did not appear to distinguish workers. Our final survey comprised 186 work-related tasks and activities. The full list of the 186 work-related tasks and activities is provided in Appendix A.
The survey was sent out to 2,011 online panel respondents. All participants had to be working in at least one job for a minimum of 20 hours per week for at least 3 months. Descriptive statistics for the sample are found in Appendix B. With a few exceptions, our sample demographics were comparable to those found in the 2007 Labour Force Survey (LFS) data. Our sample included slightly more workers in the managers and senior officials along with administrative and secretarial occupational categories than LFS estimates, and slightly fewer skilled tradespeople and workers in elementary occupations. We captured a range of demographic and background information about respondents as well as both general and specific characteristics of their jobs. Appendix C provides a summary of these variables. The respondents indicated the frequency with which they engaged in each of the tasks on a 4-point scale ranging from 1=never to 4=often.
Redefining knowledge work and knowledge workers
Knowledge Workers and Knowledge Work 21
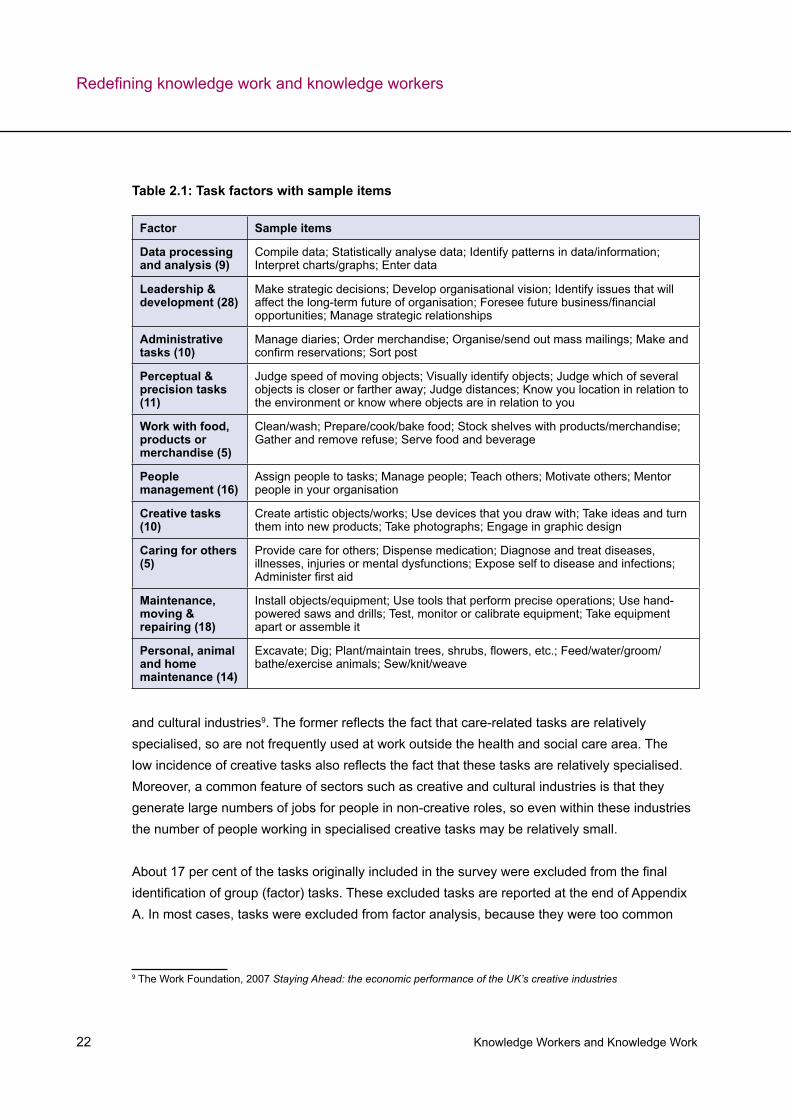
Exploring work tasks in the knowledge economy: Factor analysisTo help make our data analysis more manageable, we ran an exploratory factor analysis (EFA).7 Our ultimate goal is to classify the respondents of our survey into groups depending on the tasks they perform most frequently. Given that the list of tasks on whose frequency we asked them to report was a long one, exploratory factor analysis helped us to shorten it by grouping the tasks into 10 groups. For that purpose, this technique used the responses of our survey participants on how frequently they perform each of the tasks to group these tasks into a few distinct groups (‘factors’). The factors with sample tasks are detailed below with the figures in brackets detailing the number of tasks from the original list that were included in the relevant group (see Table 2.1 on the next page).
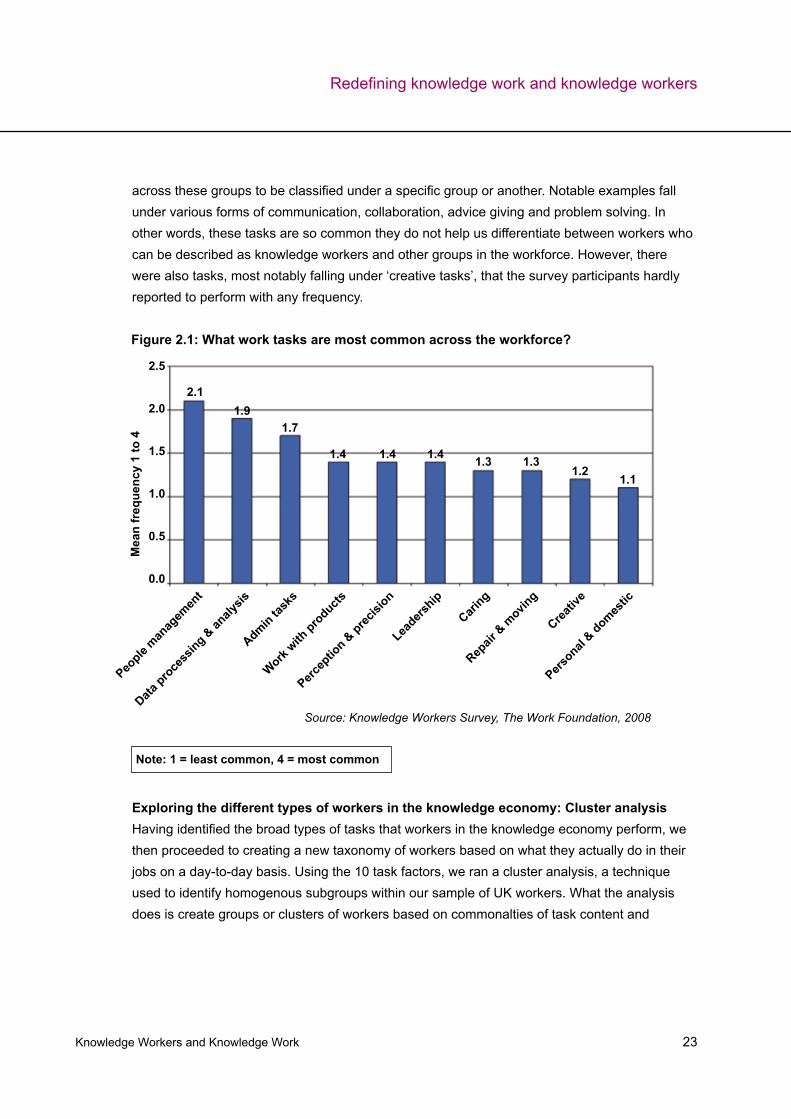
Each of the 10 factors was created by computing the mean of the relevant items. Figure 2.1 below displays the average factor scores across the full sample, that is, the average frequency with which the tasks classified under each of the factors (groups) were performed in our sample of workers. A score of one means the task is not very common across the sample – either because it is rarely performed or because it tends to be confined to a specialist group of workers. A score of four means it is very widely performed across the sample of workers. So for example, people management tasks, data and analytical tasks, and administrative tasks are the most frequently performed. In contrast, personal and domestic tasks, creative tasks and caring tasks are the least frequently performed across the sample as a whole.
The high frequency of people management tasks and of data manipulation and analysis underlines the emphasis of the knowledge economy in tacit knowledge that resides with individuals and in information. The high prevalence of these tasks is consistent with the importance of investment in both human capital and in software and computerised databases in the UK economy.8 Data processing and analysis tasks are quite wide-ranging, spanning from specialist analysis to mere data entering.
On the other hand, the relatively low incidence of care and creative tasks might seem surprising given the large numbers employed in care-based industries and occupations and in the creative
7 In general, factor analysis is a statistical technique used to explain variability among a set of ‘observed’ variables (ie, the 186 tasks in this case) through the creation of fewer ‘unobserved’ variables called factors or latent variables. By finding the commonalities between different sets of items, we can effectively collapse our 186 individual items into a more analysable set of factors. EFA was used in the first instance to get a sense of the number of factors comprised in the 186 items as well as to identify the items that were poor factor indicators (ie, items that do not load on any factor or load onto more than one factor). Confirmatory factor analysis (CFA) was subsequently used to validate the hypothesised factor structure and our model exhibited adequate fit. The analysis suggested that 126 of the 186 tasks in our survey could be collapsed into 10 distinct factors. The 60 excluded items tended to be very general types of tasks and activities that most workers engaged in8 HMT October 2007.Intangibles and Britain’s productivity performance
Redefining knowledge work and knowledge workers
Knowledge Workers and Knowledge Work 22
Leadership & development (28)
Make strategic decisions; Develop organisational vision; Identify issues that will affect the long-term future of organisation; Foresee future business/financial opportunities; Manage strategic relationships
Administrative tasks (10)
Manage diaries; Order merchandise; Organise/send out mass mailings; Make and confirm reservations; Sort post
Perceptual & precision tasks (11)
Judge speed of moving objects; Visually identify objects; Judge which of several objects is closer or farther away; Judge distances; Know you location in relation to the environment or know where objects are in relation to you
Work with food, products or merchandise (5)
Clean/wash; Prepare/cook/bake food; Stock shelves with products/merchandise; Gather and remove refuse; Serve food and beverage
People management (16)
Assign people to tasks; Manage people; Teach others; Motivate others; Mentor people in your organisation
Creative tasks (10)
Create artistic objects/works; Use devices that you draw with; Take ideas and turn them into new products; Take photographs; Engage in graphic design
Caring for others (5)
Provide care for others; Dispense medication; Diagnose and treat diseases, illnesses, injuries or mental dysfunctions; Expose self to disease and infections; Administer first aid
Maintenance, moving & repairing (18)
Install objects/equipment; Use tools that perform precise operations; Use hand-powered saws and drills; Test, monitor or calibrate equipment; Take equipment apart or assemble it
Personal, animal and home maintenance (14)
Excavate; Dig; Plant/maintain trees, shrubs, flowers, etc.; Feed/water/groom/bathe/exercise animals; Sew/knit/weave
and cultural industries9. The former reflects the fact that care-related tasks are relatively specialised, so are not frequently used at work outside the health and social care area. The low incidence of creative tasks also reflects the fact that these tasks are relatively specialised. Moreover, a common feature of sectors such as creative and cultural industries is that they generate large numbers of jobs for people in non-creative roles, so even within these industries the number of people working in specialised creative tasks may be relatively small.
About 17 per cent of the tasks originally included in the survey were excluded from the final identification of group (factor) tasks. These excluded tasks are reported at the end of Appendix A. In most cases, tasks were excluded from factor analysis, because they were too common
9 The Work Foundation, 2007 Staying Ahead: the economic performance of the UK’s creative industries
Table 2.1: Task factors with sample items
Factor Sample items
Data processing and analysis (9)
Compile data; Statistically analyse data; Identify patterns in data/information; Interpret charts/graphs; Enter data
Redefining knowledge work and knowledge workers
Knowledge Workers and Knowledge Work 23
across these groups to be classified under a specific group or another. Notable examples fall under various forms of communication, collaboration, advice giving and problem solving. In other words, these tasks are so common they do not help us differentiate between workers who can be described as knowledge workers and other groups in the workforce. However, there were also tasks, most notably falling under ‘creative tasks’, that the survey participants hardly reported to perform with any frequency.
Exploring the different types of workers in the knowledge economy: Cluster analysisHaving identified the broad types of tasks that workers in the knowledge economy perform, we then proceeded to creating a new taxonomy of workers based on what they actually do in their jobs on a day-to-day basis. Using the 10 task factors, we ran a cluster analysis, a technique used to identify homogenous subgroups within our sample of UK workers. What the analysis does is create groups or clusters of workers based on commonalties of task content and
Figure 2.1: What work tasks are most common across the workforce?
2.5
2.0
1.5
1.0
0.5
0.0
Mea
n fr
eque
ncy
1 to
4
People
manag
emen
t
Data pro
cess
ing & an
alysis
Admin task
s
Work with
products
Percep
tion &
precisi
on
Leaders
hip
Caring
Repair
& m
oving
Creativ
e
Personal
& domestic
2.11.9
1.7
1.4 1.4 1.4 1.3 1.31.2
1.1
Note: 1 = least common, 4 = most common
Source: Knowledge Workers Survey, The Work Foundation, 2008
Redefining knowledge work and knowledge workers
Knowledge Workers and Knowledge Work 24
frequency. Thus, our worker clusters are entirely based on workers’ reported tasks and activities on the job.10
The novelty of our results is that our taxonomy cuts across classifications of workers according to their educational attainment and occupation, that is, the proxies used in previous research for identifying knowledge workers.
Based on the task factors, 1,744 of the 2,011 (87 per cent) workers in our sample best fit into seven worker clusters. The analysis revealed that 267 workers reported very high frequencies on each of the tasks (ie, 1-2 standard deviations above the mean) and were identified as outliers. These workers were subsequently omitted from the analytic sample.11 The composition of the seven clusters is detailed below. Appendix D presents the average factor scores within each of the seven clusters.
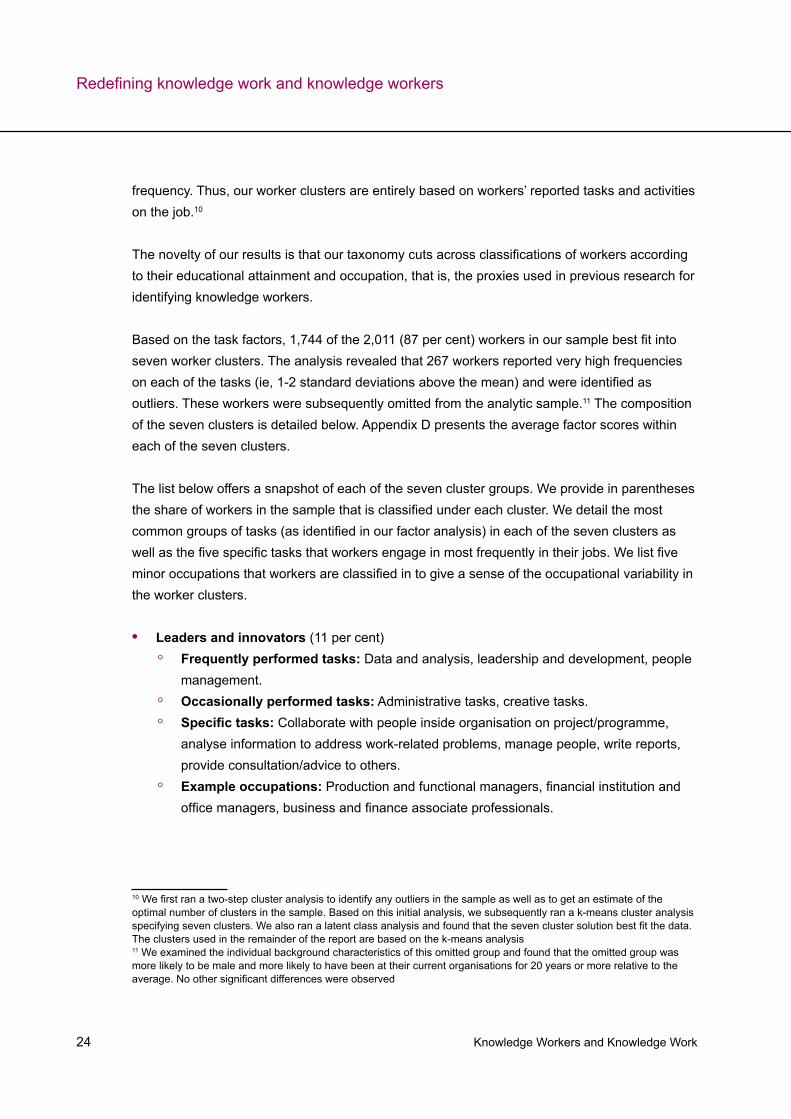
The list below offers a snapshot of each of the seven cluster groups. We provide in parentheses the share of workers in the sample that is classified under each cluster. We detail the most common groups of tasks (as identified in our factor analysis) in each of the seven clusters as well as the five specific tasks that workers engage in most frequently in their jobs. We list five minor occupations that workers are classified in to give a sense of the occupational variability in the worker clusters.
Leaders and innovators • (11 per cent)Frequently performed tasks: ◦ Data and analysis, leadership and development, people management. Occasionally performed tasks: ◦ Administrative tasks, creative tasks.Specific tasks: ◦ Collaborate with people inside organisation on project/programme, analyse information to address work-related problems, manage people, write reports, provide consultation/advice to others.Example occupations: ◦ Production and functional managers, financial institution and office managers, business and finance associate professionals.
10 We first ran a two-step cluster analysis to identify any outliers in the sample as well as to get an estimate of the optimal number of clusters in the sample. Based on this initial analysis, we subsequently ran a k-means cluster analysis specifying seven clusters. We also ran a latent class analysis and found that the seven cluster solution best fit the data. The clusters used in the remainder of the report are based on the k-means analysis11 We examined the individual background characteristics of this omitted group and found that the omitted group was more likely to be male and more likely to have been at their current organisations for 20 years or more relative to the average. No other significant differences were observed
Redefining knowledge work and knowledge workers
Knowledge Workers and Knowledge Work 25
Experts and Analysts • (22.1 per cent)Frequently performed tasks: ◦ Data and analysis, people management. Occasionally performed tasks: ◦ Leadership and development, administrative tasks.Specific tasks: ◦ Collaborate with people inside organisation on project/programme, enter data, compile data, analyse information to address work-related problems, write reports.Example occupations: ◦ ICT professionals, teaching professionals, managers and proprietors in service industries, research professionals, customer service occupations.
Information handlers • (12.8 per cent)Frequently performed tasks: ◦ Administrative tasks.Occasionally performed tasks: ◦ People management, data and analysis.Specific tasks: ◦ File (physically/electronically), sort post, manage diaries, enter data, handle complaints, settle disputes and resolve grievances.Example occupations: ◦ General administrative occupations, secretarial occupations, financial institution and office managers, managers and proprietors in service industries, financial administrative occupations.
Care and welfare workers• (7.5 per cent) Frequently performed tasks: ◦ Caring for others, people management, work with food, products or merchandise.Occasionally performed tasks: ◦ Data and analysis, administrative tasks, perceptual and precision tasks.Specific tasks: ◦ Provide care for others, administer first aid, clean/wash, dispense medications, expose self to disease/infections, write reports.Example occupations: ◦ Care associate professionals, care services, childcare services, social welfare associate professionals.
Servers and sellers• (7.0 per cent)Frequently performed tasks: ◦ Work with food, products or merchandise, people management, administrative tasks. Occasionally performed tasks: ◦ Data and analysis, perceptual and precision tasks, leadership and development.Specific tasks: ◦ Clean/wash, handle complaints, settle disputes and resolve grievances, manage people, stock shelves with products or merchandise, order merchandise.
Redefining knowledge work and knowledge workers
Knowledge Workers and Knowledge Work 26
Example occupations: ◦ Managers in distribution, storage and retailing, managers and proprietors in hospitality and leisure services, food preparation trades, elementary personal services.
Maintenance and logistics operators• (11.3 per cent) Frequently performed tasks: ◦ Perceptual and precision tasks, maintenance, moving and repairing.Occasionally performed tasks: ◦ People management, work with food, products or merchandise, data and analysis, administrative tasks.Specific tasks: ◦ Visually identify objects, know location in relation to the environment or know where objects are in relation to you, judge distances, lift heavy objects, load/unload equipment/materials/luggage.Example occupations: ◦ Protective services, security occupations, transport drivers, metal machining, fitting and instrument making trades, science and engineering technicians, construction trades.
Assistants and clerks• (28.3 per cent)Occasionally performed tasks: ◦ People management, data and analysis, work with food, products or merchandise, administrative tasks.Specific tasks: ◦ Handle complaints, settle disputes and resolve grievances, collaborate with people inside organisation on project/programme, teach others, clean/wash, coach or develop others, provide consultation/advice to others, motivate others.Example occupations: ◦ Customer service occupations, sales assistants and retail cashiers.
The assistants and clerks cluster was the least well-defined group of workers as its members tended to report engaging in all but the most general tasks relatively infrequently in their jobs. We explored the specific occupations of this group to see if we had systematically omitted relevant tasks and found this not to be the case.
To sum up, the results of our cluster analysis have allowed us to make a first attempt at classifying workers in the knowledge economy on the basis of what they do. In what follows we try to refine this classification in order to gain a better understanding of the cognitive complexity of the tasks that workers belonging to different clusters perform most frequently and the sectors in which they are employed.
Redefining knowledge work and knowledge workers
Knowledge Workers and Knowledge Work 27
Bright minds
and powerful
machines for
tasks of varying
complexity
The next stage was to gauge the cognitive complexity of the tasks that workers in different clusters mostly perform. This helped us distinguish, for example, between basic processing tasks such as data processing from higher level analytical tasks. We used three of their work characteristics for which we got information through our survey:
First, the extent to and ways in which workers in various clusters use (IT) technology.• Secondly, the type of and variability in methods of sharing and capturing knowledge and • ideas when performing new tasks. Thirdly, the perception of workers about the complexity of the tasks that they have to • perform at work.
The assumptions that underlie the selection of these three criteria are that frequent and specialist use of computing technology and frequent use of methods of sharing and garnering new knowledge involving direct human interaction will characterise clusters of workers that perform more tacit knowledge-intensive tasks. Similarly, the perceived complexity of tasks will be higher for those clusters of workers that perform more tacit-knowledge-intensive work. One of the hallmarks of the knowledge economy, and indeed one of its key enablers, is the ubiquity of computing technology. In addition to facilitating work processing and email communications, computers have sped up processing times for many work-related tasks, thereby increasing workers’ efficiency or to engage in more difficult tasks that were not possible previously.
We captured the importance of computing technology for the tasks that our survey respondents perform by asking them two questions as part of our survey. First, we enquired how often they use a computer at work. Across the full sample, workers reported using the computer 3-4 times per week on average. Secondly, we asked respondents to choose from a list of 12 tasks/activities those that they do on their computer at work.
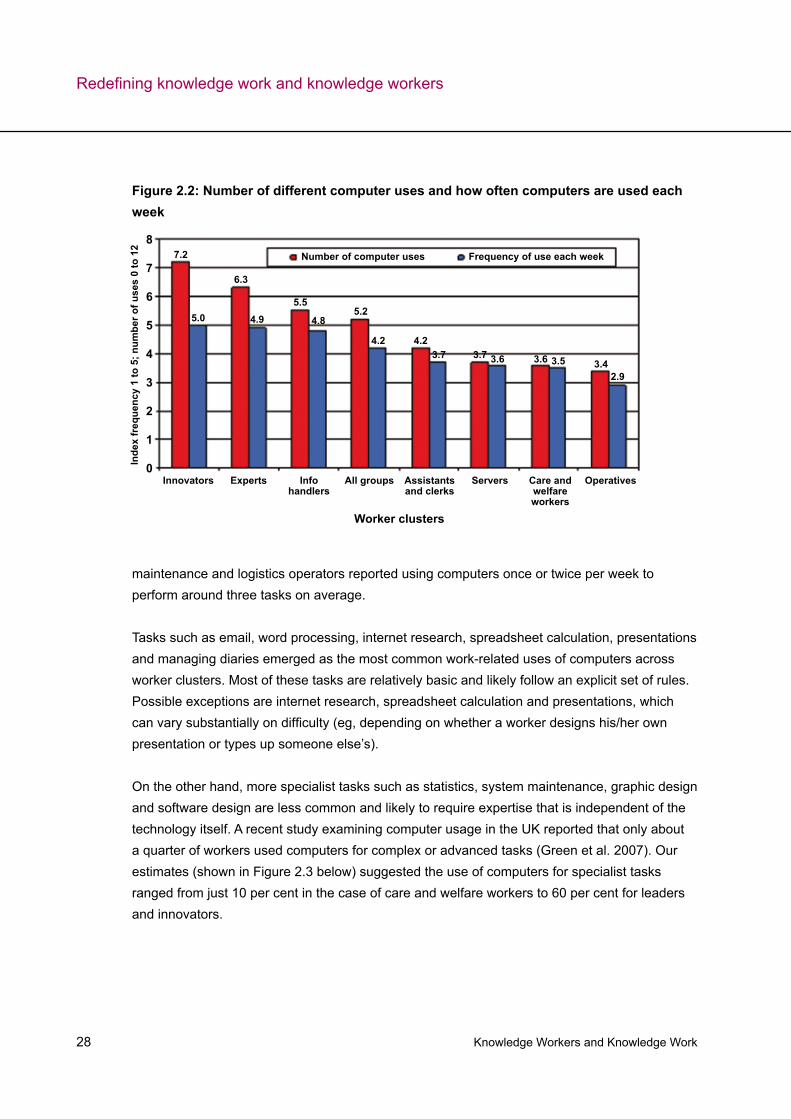
As seen in Figure 2.2 below, there was significant variation in the reported frequency of usage and variability of activities performed on computers, suggesting varying degrees of importance of information technology in workers’ jobs.
Those who used computers most frequently and for the greatest number of tasks were leaders and innovators, experts and analysts and information handlers. They used computers daily in their jobs, while performing an above average number of tasks on them. At the other extreme,
Redefining knowledge work and knowledge workers
Knowledge Workers and Knowledge Work 28
maintenance and logistics operators reported using computers once or twice per week to perform around three tasks on average.
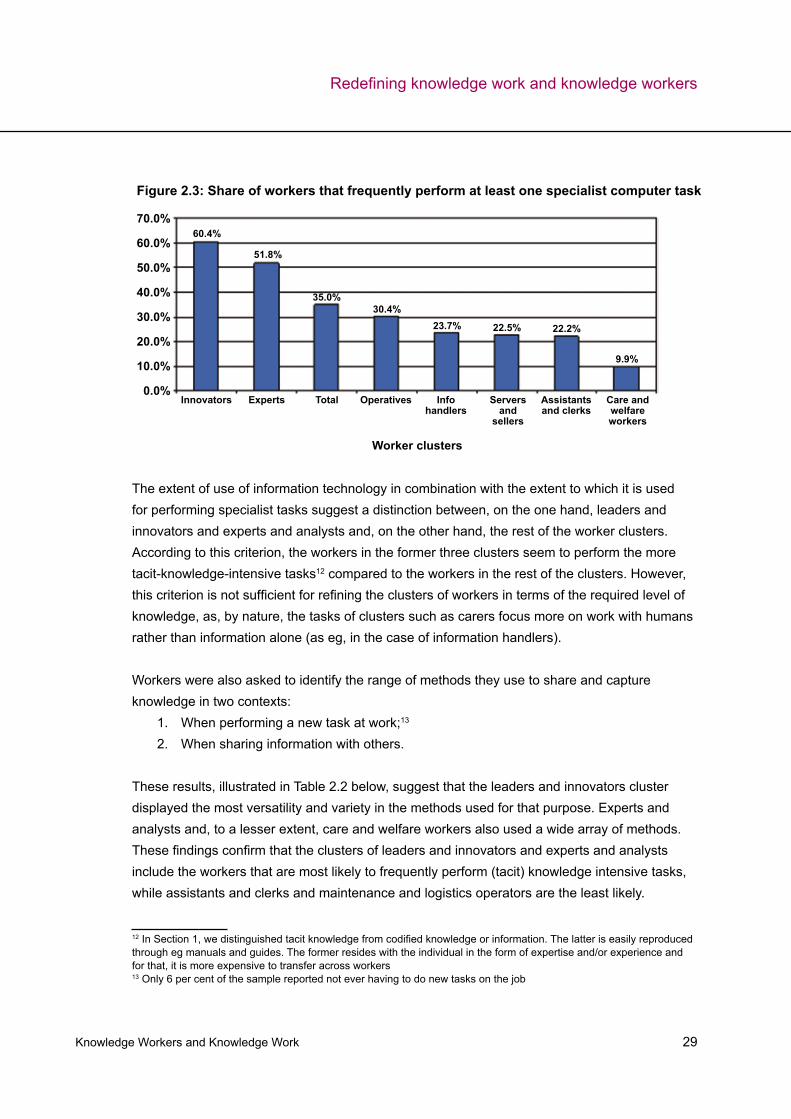
Tasks such as email, word processing, internet research, spreadsheet calculation, presentations and managing diaries emerged as the most common work-related uses of computers across worker clusters. Most of these tasks are relatively basic and likely follow an explicit set of rules. Possible exceptions are internet research, spreadsheet calculation and presentations, which can vary substantially on difficulty (eg, depending on whether a worker designs his/her own presentation or types up someone else’s). On the other hand, more specialist tasks such as statistics, system maintenance, graphic design and software design are less common and likely to require expertise that is independent of the technology itself. A recent study examining computer usage in the UK reported that only about a quarter of workers used computers for complex or advanced tasks (Green et al. 2007). Our estimates (shown in Figure 2.3 below) suggested the use of computers for specialist tasks ranged from just 10 per cent in the case of care and welfare workers to 60 per cent for leaders and innovators.
Figure 2.2: Number of different computer uses and how often computers are used each week
8
7
6
5
4
3
2
1
0Inde
x fr
eque
ncy
1 to
5; n
umbe
r of u
ses
0 to
12
Innovators Experts Info handlers
All groups Assistants and clerks
Servers Care and welfare workers
Operatives
Number of computer uses Frequency of use each week7.2
5.0
6.3
4.95.5
4.85.2
4.2 4.23.7 3.7 3.6 3.6 3.5 3.4
2.9
Worker clusters
Redefining knowledge work and knowledge workers
Knowledge Workers and Knowledge Work 29
The extent of use of information technology in combination with the extent to which it is used for performing specialist tasks suggest a distinction between, on the one hand, leaders and innovators and experts and analysts and, on the other hand, the rest of the worker clusters. According to this criterion, the workers in the former three clusters seem to perform the more tacit-knowledge-intensive tasks12 compared to the workers in the rest of the clusters. However, this criterion is not sufficient for refining the clusters of workers in terms of the required level of knowledge, as, by nature, the tasks of clusters such as carers focus more on work with humans rather than information alone (as eg, in the case of information handlers).
Workers were also asked to identify the range of methods they use to share and capture knowledge in two contexts:
When performing a new task at work;1. 13 When sharing information with others.2.
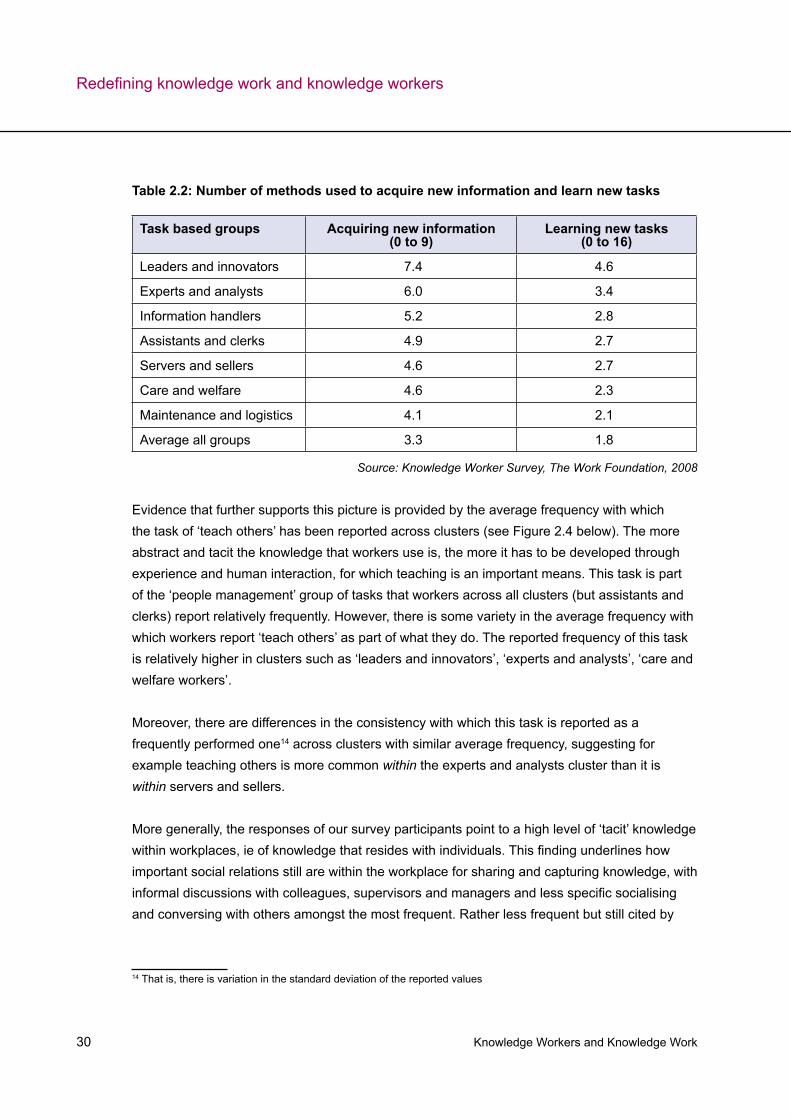
These results, illustrated in Table 2.2 below, suggest that the leaders and innovators cluster displayed the most versatility and variety in the methods used for that purpose. Experts and analysts and, to a lesser extent, care and welfare workers also used a wide array of methods. These findings confirm that the clusters of leaders and innovators and experts and analysts include the workers that are most likely to frequently perform (tacit) knowledge intensive tasks, while assistants and clerks and maintenance and logistics operators are the least likely.
12 In Section 1, we distinguished tacit knowledge from codified knowledge or information. The latter is easily reproduced through eg manuals and guides. The former resides with the individual in the form of expertise and/or experience and for that, it is more expensive to transfer across workers13 Only 6 per cent of the sample reported not ever having to do new tasks on the job
Figure 2.3: Share of workers that frequently perform at least one specialist computer task
70.0%
60.0%
50.0%
40.0%
30.0%
20.0%
10.0%
0.0%Innovators Experts Info
handlersTotal Assistants
and clerksServers
and sellers
Care and welfare workers
Operatives
60.4%
51.8%
35.0%30.4%
23.7% 22.5% 22.2%
9.9%
Worker clusters
Redefining knowledge work and knowledge workers
Knowledge Workers and Knowledge Work 30
Table 2.2: Number of methods used to acquire new information and learn new tasks
Task based groups Acquiring new information (0 to 9)
Learning new tasks (0 to 16)
Leaders and innovators 7.4 4.6
Experts and analysts 6.0 3.4
Information handlers 5.2 2.8
Assistants and clerks 4.9 2.7
Servers and sellers 4.6 2.7
Care and welfare 4.6 2.3
Maintenance and logistics 4.1 2.1
Average all groups 3.3 1.8
Source: Knowledge Worker Survey, The Work Foundation, 2008
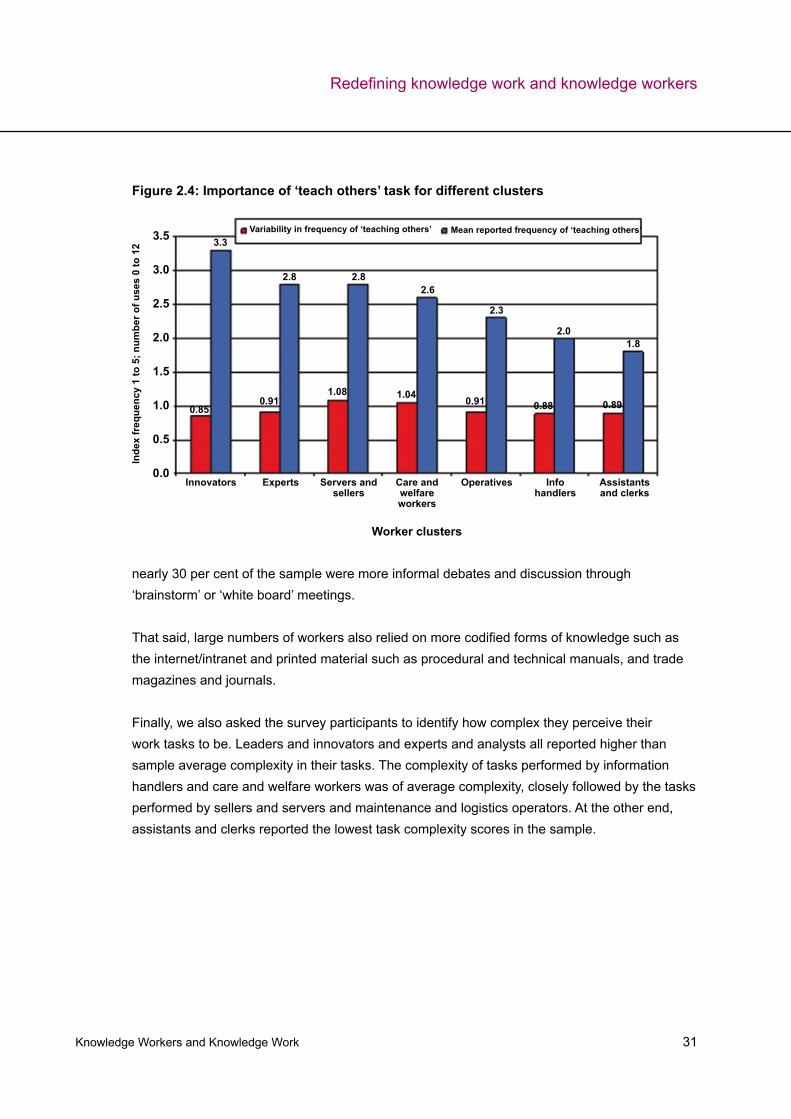
Evidence that further supports this picture is provided by the average frequency with which the task of ‘teach others’ has been reported across clusters (see Figure 2.4 below). The more abstract and tacit the knowledge that workers use is, the more it has to be developed through experience and human interaction, for which teaching is an important means. This task is part of the ‘people management’ group of tasks that workers across all clusters (but assistants and clerks) report relatively frequently. However, there is some variety in the average frequency with which workers report ‘teach others’ as part of what they do. The reported frequency of this task is relatively higher in clusters such as ‘leaders and innovators’, ‘experts and analysts’, ‘care and welfare workers’.
Moreover, there are differences in the consistency with which this task is reported as a frequently performed one14 across clusters with similar average frequency, suggesting for example teaching others is more common within the experts and analysts cluster than it is within servers and sellers.
More generally, the responses of our survey participants point to a high level of ‘tacit’ knowledge within workplaces, ie of knowledge that resides with individuals. This finding underlines how important social relations still are within the workplace for sharing and capturing knowledge, with informal discussions with colleagues, supervisors and managers and less specific socialising and conversing with others amongst the most frequent. Rather less frequent but still cited by
14 That is, there is variation in the standard deviation of the reported values
Redefining knowledge work and knowledge workers
Knowledge Workers and Knowledge Work 31
Figure 2.4: Importance of ‘teach others’ task for different clusters
3.5
3.0
2.5
2.0
1.5
1.0
0.5
0.0
Inde
x fr
eque
ncy
1 to
5; n
umbe
r of u
ses
0 to
12
Innovators Experts Info handlers
Assistants and clerks
Servers and sellers
Care and welfare workers
Operatives
Variability in frequency of ‘teaching others’ Mean reported frequency of ‘teaching others’
0.850.91
1.08 1.040.88 0.890.91
3.3
2.8 2.82.6
2.3
2.01.8
Worker clusters
nearly 30 per cent of the sample were more informal debates and discussion through ‘brainstorm’ or ‘white board’ meetings.
That said, large numbers of workers also relied on more codified forms of knowledge such as the internet/intranet and printed material such as procedural and technical manuals, and trade magazines and journals.
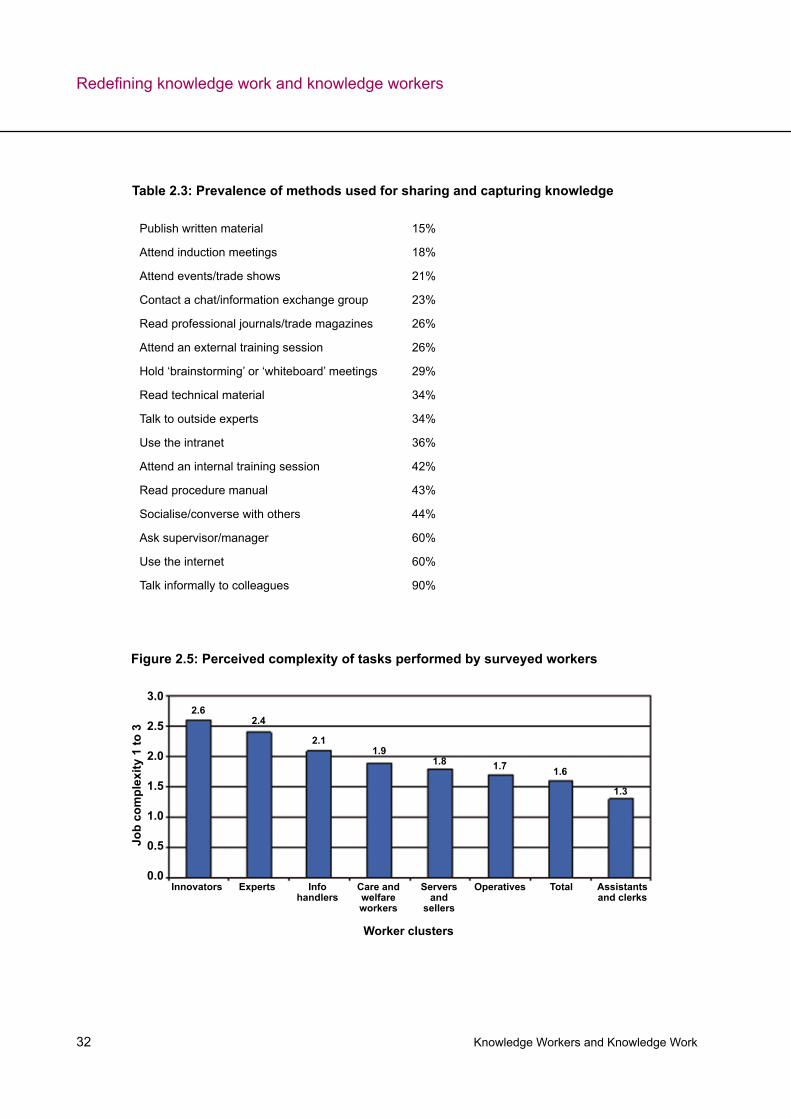
Finally, we also asked the survey participants to identify how complex they perceive their work tasks to be. Leaders and innovators and experts and analysts all reported higher than sample average complexity in their tasks. The complexity of tasks performed by information handlers and care and welfare workers was of average complexity, closely followed by the tasks performed by sellers and servers and maintenance and logistics operators. At the other end, assistants and clerks reported the lowest task complexity scores in the sample.
Redefining knowledge work and knowledge workers
Knowledge Workers and Knowledge Work 32
Publish written material 15%
Attend induction meetings 18%
Attend events/trade shows 21%
Contact a chat/information exchange group 23%
Read professional journals/trade magazines 26%
Attend an external training session 26%
Hold ‘brainstorming’ or ‘whiteboard’ meetings 29%
Read technical material 34%
Talk to outside experts 34%
Use the intranet 36%
Attend an internal training session 42%
Read procedure manual 43%
Socialise/converse with others 44%
Ask supervisor/manager 60%
Use the internet 60%
Talk informally to colleagues 90%
Table 2.3: Prevalence of methods used for sharing and capturing knowledge
Figure 2.5: Perceived complexity of tasks performed by surveyed workers
3.0
2.5
2.0
1.5
1.0
0.5
0.0
Job
com
plex
ity 1
to 3
Innovators Experts Info handlers
Total Assistants and clerks
Servers and
sellers
Care and welfare workers
Operatives
2.62.4
2.11.9
1.8 1.7 1.6
1.3
Worker clusters
Redefining knowledge work and knowledge workers
Knowledge Workers and Knowledge Work 33
Towards a
new definition
of knowledge
work
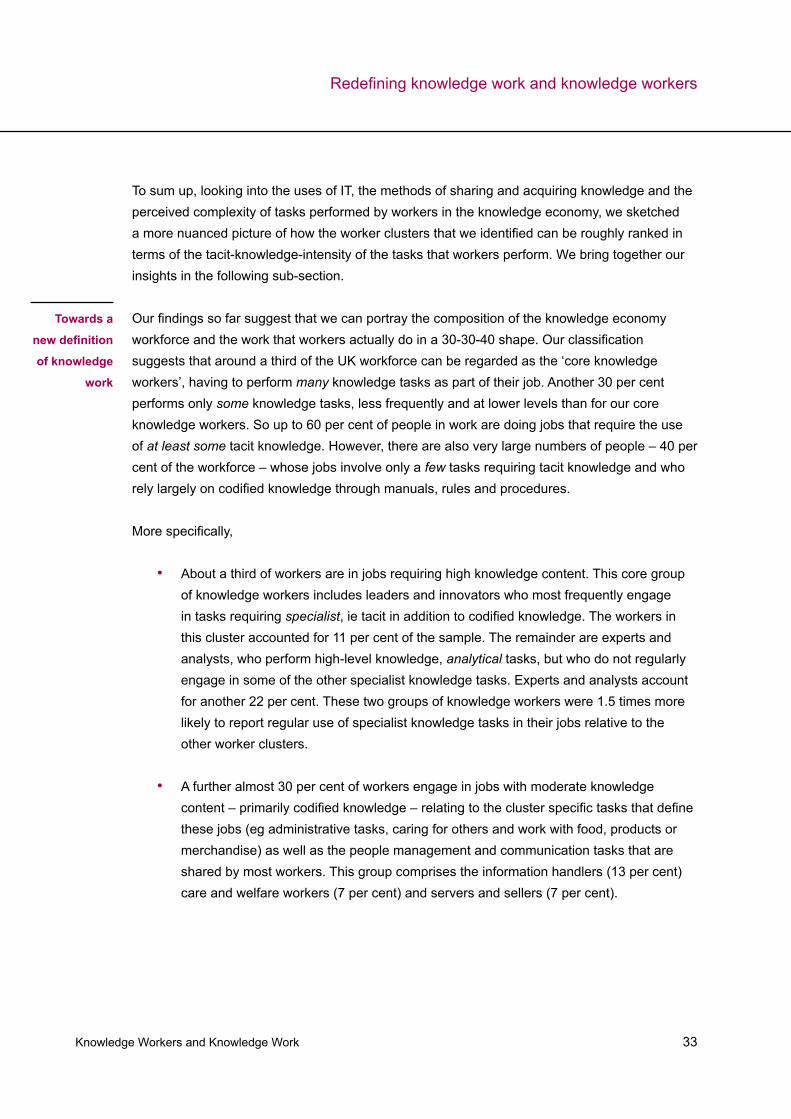
To sum up, looking into the uses of IT, the methods of sharing and acquiring knowledge and the perceived complexity of tasks performed by workers in the knowledge economy, we sketched a more nuanced picture of how the worker clusters that we identified can be roughly ranked in terms of the tacit-knowledge-intensity of the tasks that workers perform. We bring together our insights in the following sub-section.
Our findings so far suggest that we can portray the composition of the knowledge economy workforce and the work that workers actually do in a 30-30-40 shape. Our classification suggests that around a third of the UK workforce can be regarded as the ‘core knowledge workers’, having to perform many knowledge tasks as part of their job. Another 30 per cent performs only some knowledge tasks, less frequently and at lower levels than for our core knowledge workers. So up to 60 per cent of people in work are doing jobs that require the use of at least some tacit knowledge. However, there are also very large numbers of people – 40 per cent of the workforce – whose jobs involve only a few tasks requiring tacit knowledge and who rely largely on codified knowledge through manuals, rules and procedures.
More specifically,
About a third of workers are in jobs requiring high knowledge content. This core group • of knowledge workers includes leaders and innovators who most frequently engage in tasks requiring specialist, ie tacit in addition to codified knowledge. The workers in this cluster accounted for 11 per cent of the sample. The remainder are experts and analysts, who perform high-level knowledge, analytical tasks, but who do not regularly engage in some of the other specialist knowledge tasks. Experts and analysts account for another 22 per cent. These two groups of knowledge workers were 1.5 times more likely to report regular use of specialist knowledge tasks in their jobs relative to the other worker clusters.
A further almost 30 per cent of workers engage in jobs with moderate knowledge • content – primarily codified knowledge – relating to the cluster specific tasks that define these jobs (eg administrative tasks, caring for others and work with food, products or merchandise) as well as the people management and communication tasks that are shared by most workers. This group comprises the information handlers (13 per cent) care and welfare workers (7 per cent) and servers and sellers (7 per cent).
Redefining knowledge work and knowledge workers
Knowledge Workers and Knowledge Work 34
It should be emphasised at this point that the 40 per cent does not represent the ‘bargain basement’ of the UK labour market, even though the assistants and clerks category is more likely to include a high share of poor quality and low paid work. Our primary aim is to distinguish knowledge work and knowledge workers on the basis of the extent of and frequency with which they use tacit knowledge to perform their job tasks. Virtually all jobs involve some tacit knowledge, but those workers that we have classified as ‘core’ knowledge workers performed the most tacit knowledge tasks for their job and those in the 40 per cent performed the fewest
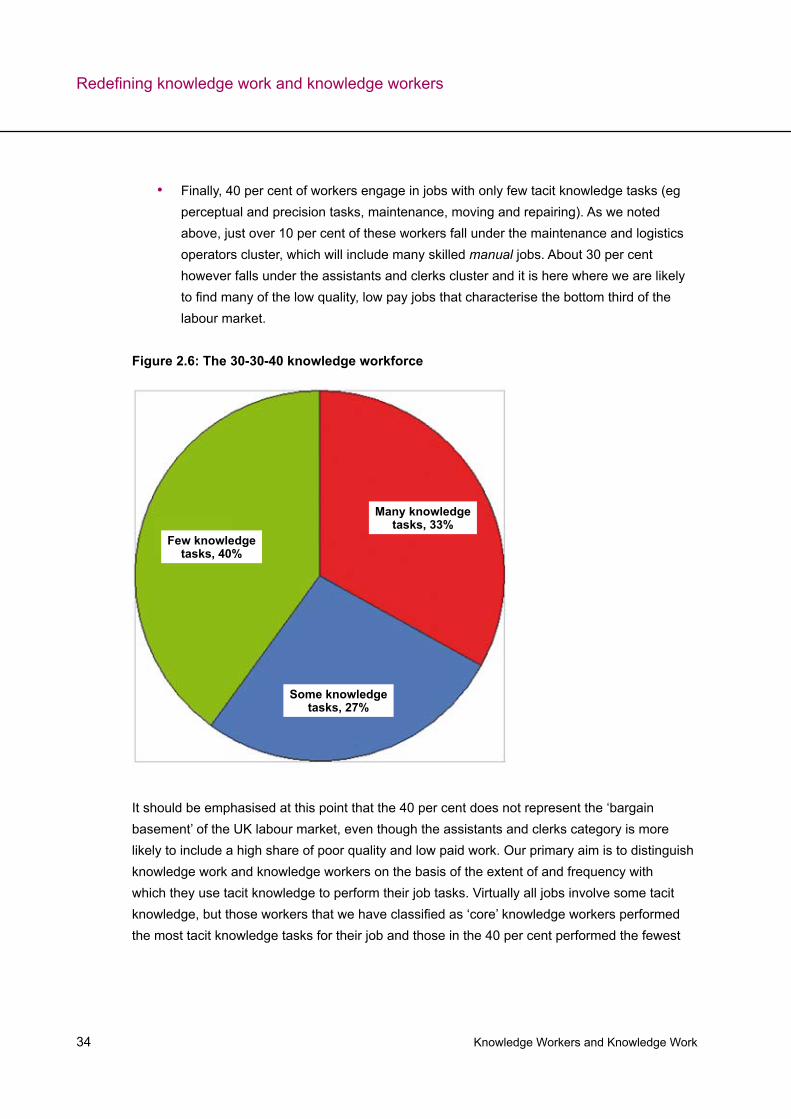
Finally, 40 per cent of workers engage in jobs with only few tacit knowledge tasks (eg • perceptual and precision tasks, maintenance, moving and repairing). As we noted above, just over 10 per cent of these workers fall under the maintenance and logistics operators cluster, which will include many skilled manual jobs. About 30 per cent however falls under the assistants and clerks cluster and it is here where we are likely to find many of the low quality, low pay jobs that characterise the bottom third of the labour market.
Figure 2.6: The 30-30-40 knowledge workforce
Few knowledge tasks, 40%
Many knowledge tasks, 33%
Some knowledge tasks, 27%
Redefining knowledge work and knowledge workers
Knowledge Workers and Knowledge Work 35
tacit knowledge tasks. We use the term ‘knowledge’ to mean explicitly ‘tacit’ knowledge rather than codified knowledge.
What is more, some of the jobs in the 40 per cent category include skilled manual jobs which might be low in tacit knowledge compared with others, but are undoubtedly rich in codified knowledge. As we report later, this acquisition of skills and codified knowledge is reflected in wages, which on average are higher than for some job groups with a higher tacit knowledge content.
Moreover, it is likely that some jobs described as skilled manual by the occupation based codes will be in the ‘core’ knowledge worker category because the individuals are undertaking a high proportion of tacit knowledge tasks in their daily work. This was recognised in the research by Autor et al. (2003) that we reported in Section 1, whereby mechanics who could diagnose complex faults and find solutions outside the standard manuals fell into the ‘expert thinking’ category. It is also strongly implied in the analysis of the modern manufacturing workforce included within the recent BERR Strategy Review and in the The Work Foundation report Knowledge Economy and Manufacturing (Brinkley 2009).
To sketch the knowledge economy workforce more accurately, we examine the general demographic and background characteristics of workers in our sample. These statistics and figures allow us to put a face to the knowledge workforce.
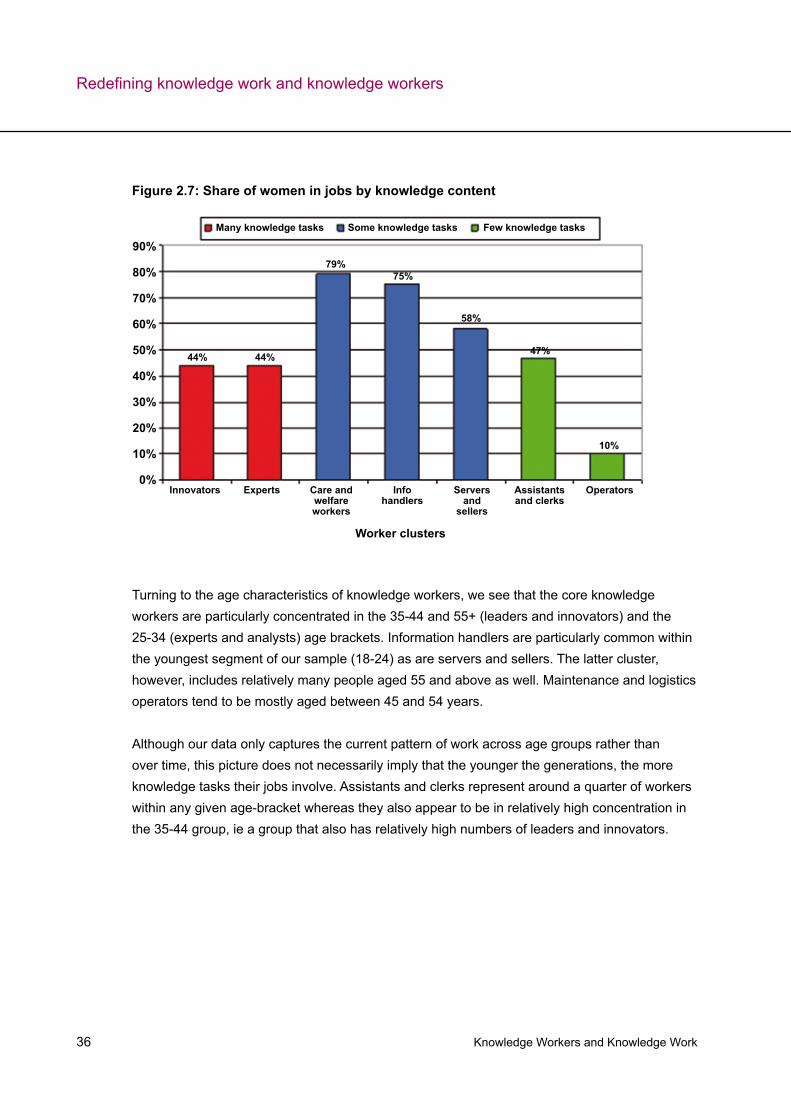
Earlier evidence from The Work Foundation suggests that the vast increases in female labour force participation over the past decade have been one of the key drivers of the knowledge economy15. Our results indicate that women indeed play a key role in the knowledge workforce. Just over 40 per cent of all workers in the core knowledge intensive jobs were women. This is however slightly less than the share of women in all jobs. Women were much more strongly concentrated within the clusters of care and welfare workers, information handlers, and servers and sellers. So while women are disproportionately concentrated in jobs involving some knowledge tasks, they are under-represented within the ‘core’ knowledge workers category.
The picture in the work clusters with few knowledge tasks is more mixed. Women accounted for just under 50 per cent of less knowledge intensive jobs, such as assistants and clerks, while in contrast, the maintenance and logistics category comprised almost exclusively of men. The latter jobs are most likely to require manual skills traditionally associated with male workers and physical strength.
15 Brinkley (2008) How Knowledge is Reshaping the Economic Life of Nations ( (Knowledge Economy Interim Report)
The
demographics
of the
knowledge
workforce:
gender and age
Redefining knowledge work and knowledge workers
Knowledge Workers and Knowledge Work 36
Turning to the age characteristics of knowledge workers, we see that the core knowledge workers are particularly concentrated in the 35-44 and 55+ (leaders and innovators) and the 25-34 (experts and analysts) age brackets. Information handlers are particularly common within the youngest segment of our sample (18-24) as are servers and sellers. The latter cluster, however, includes relatively many people aged 55 and above as well. Maintenance and logistics operators tend to be mostly aged between 45 and 54 years.
Although our data only captures the current pattern of work across age groups rather than over time, this picture does not necessarily imply that the younger the generations, the more knowledge tasks their jobs involve. Assistants and clerks represent around a quarter of workers within any given age-bracket whereas they also appear to be in relatively high concentration in the 35-44 group, ie a group that also has relatively high numbers of leaders and innovators.
Figure 2.7: Share of women in jobs by knowledge content
Many knowledge tasks
Innovators Experts Info handlers
Assistants and clerks
Serversand
sellers
Care and welfare workers
Operators
Worker clusters
Some knowledge tasks Few knowledge tasks
90%
80%
70%
60%
50%
40%
30%
20%
10%
0%
44% 44%
79%75%
58%
47%
10%
Redefining knowledge work and knowledge workers
Knowledge Workers and Knowledge Work 37
A final test for the usefulness of our new definition of knowledge work and knowledge workers is its comparison with existing proxies. As mentioned previously, two of the key proxies used to estimate the number of knowledge workers in the UK economy include:
Workers employed in the top three Standard Occupational Classification (SOC) 1. categories including managers and senior officials, professional occupations and associate professional and technical occupations.16
Workers with degrees.2.
While both of these operational definitions have some utility – and are likely to overlap with the ‘true’ estimate of knowledge workers in the economy – they are limited, primarily because they attempt to force workers into predetermined categories.
In this section we detail how our seven worker clusters align with the major SOC codes as well as educational attainment. We find that although there is a substantial overlap between our definition of core knowledge workers and these proxies, our worker clusters suggest that people outside the top three occupational classifications and people who are not graduates may be holding jobs with many knowledge tasks and vice versa. If anything, this suggests that our definition helps us understand work in the knowledge economy better.
A high share of our two core knowledge worker groups (leaders and innovators and experts and analysts) – between 70 and 85 per cent, are in the top three occupational classifications. However, significant numbers of these workers with many knowledge tasks are also found outside the top three occupational groups, especially the more numerous experts and analysts group.
Just under half of our middle knowledge task group was covered by the top three occupational group categories. This group includes significant numbers of associate professional jobs that fall within the standard occupational classification, but it is also clear that even more have been classified to other occupational groups outside the top three.
Even more interestingly, however, between 20 to 25 per cent of people in clusters characterised by few knowledge tasks are included within the top three occupational groups. Even though these shares are low compared to the other worker clusters, it is important to note that the top three occupational groups include workers whose jobs involve few tacit knowledge tasks.
16 The remaining six occupational categories include administrative and secretarial, skilled trades, personal services, sales and customer service, process, plant and machine operatives and elementary
Comparison of
new and old
proxies for
knowledge
work
Redefining knowledge work and knowledge workers
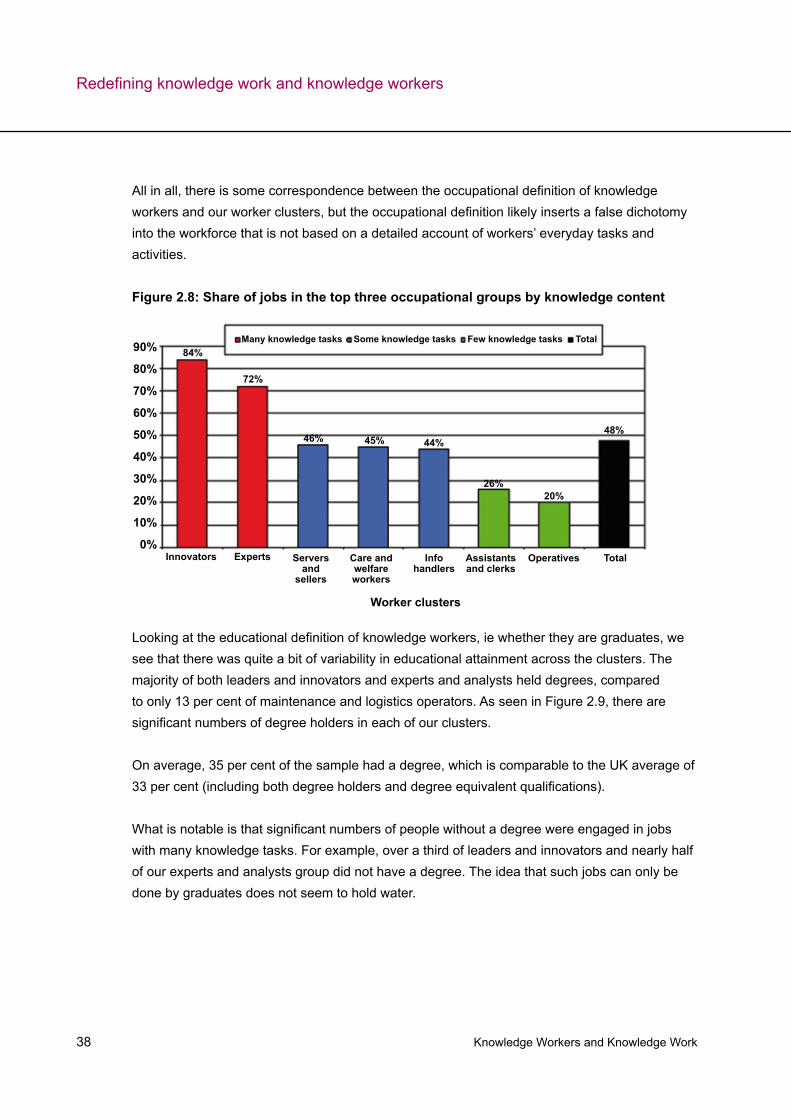
Knowledge Workers and Knowledge Work 38
All in all, there is some correspondence between the occupational definition of knowledge workers and our worker clusters, but the occupational definition likely inserts a false dichotomy into the workforce that is not based on a detailed account of workers’ everyday tasks and activities.
Looking at the educational definition of knowledge workers, ie whether they are graduates, we see that there was quite a bit of variability in educational attainment across the clusters. The majority of both leaders and innovators and experts and analysts held degrees, compared to only 13 per cent of maintenance and logistics operators. As seen in Figure 2.9, there are significant numbers of degree holders in each of our clusters.
On average, 35 per cent of the sample had a degree, which is comparable to the UK average of 33 per cent (including both degree holders and degree equivalent qualifications).
What is notable is that significant numbers of people without a degree were engaged in jobs with many knowledge tasks. For example, over a third of leaders and innovators and nearly half of our experts and analysts group did not have a degree. The idea that such jobs can only be done by graduates does not seem to hold water.
Figure 2.8: Share of jobs in the top three occupational groups by knowledge content
Innovators Experts Info handlers
TotalAssistants and clerks
Serversand
sellers
Care and welfare workers
Operatives
Worker clusters
Many knowledge tasks Some knowledge tasks Few knowledge tasks Total90%
80%
70%
60%
50%
40%
30%
20%
10%
0%
84%
72%
46% 45% 44%
26%20%
48%
Redefining knowledge work and knowledge workers
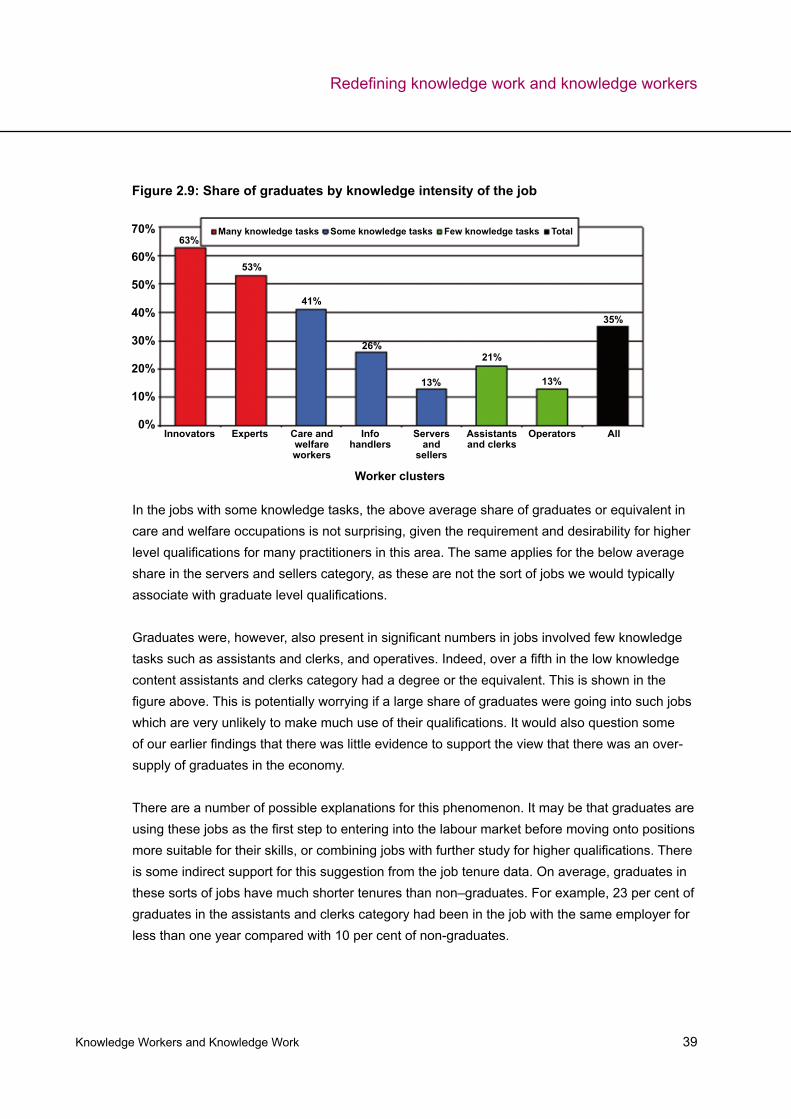
Knowledge Workers and Knowledge Work 39
In the jobs with some knowledge tasks, the above average share of graduates or equivalent in care and welfare occupations is not surprising, given the requirement and desirability for higher level qualifications for many practitioners in this area. The same applies for the below average share in the servers and sellers category, as these are not the sort of jobs we would typically associate with graduate level qualifications.
Graduates were, however, also present in significant numbers in jobs involved few knowledge tasks such as assistants and clerks, and operatives. Indeed, over a fifth in the low knowledge content assistants and clerks category had a degree or the equivalent. This is shown in the figure above. This is potentially worrying if a large share of graduates were going into such jobs which are very unlikely to make much use of their qualifications. It would also question some of our earlier findings that there was little evidence to support the view that there was an over-supply of graduates in the economy.
There are a number of possible explanations for this phenomenon. It may be that graduates are using these jobs as the first step to entering into the labour market before moving onto positions more suitable for their skills, or combining jobs with further study for higher qualifications. There is some indirect support for this suggestion from the job tenure data. On average, graduates in these sorts of jobs have much shorter tenures than non–graduates. For example, 23 per cent of graduates in the assistants and clerks category had been in the job with the same employer for less than one year compared with 10 per cent of non-graduates.
Redefining knowledge work and knowledge workers
Figure 2.9: Share of graduates by knowledge intensity of the job
Innovators Experts Info handlers
AllAssistants and clerks
Serversand
sellers
Care and welfare workers
Worker clusters
Operators
70%
60%
50%
40%
30%
20%
10%
0%
Many knowledge tasks Some knowledge tasks Few knowledge tasks Total63%
53%
41%
26%
13%
21%
13%
35%
Knowledge Workers and Knowledge Work 40
Additionally, only around 44 per cent of graduates in jobs with only few tacit knowledge tasks reported that there was a good match between their skills and the demands of their job. This finding may further suggest that these graduates are only temporarily employed in positions with few knowledge tasks.
Moreover, as our survey does not address the possibility that university degrees may not always equip their holders with the skills that are useful in the labour market, there may be a mismatch between the skills supplied and those demanded. Last but not least, It is also possible that some well-educated migrants have taken less skilled work when they first arrive in the UK.
We had argued that although some graduates were going into occupations that traditionally had not employed them in the past, the nature of some of these jobs had changed so that graduate skills had become more relevant. As we show in the next section of this report, there is some further evidence to support this suggestion.
Redefining knowledge work and knowledge workers
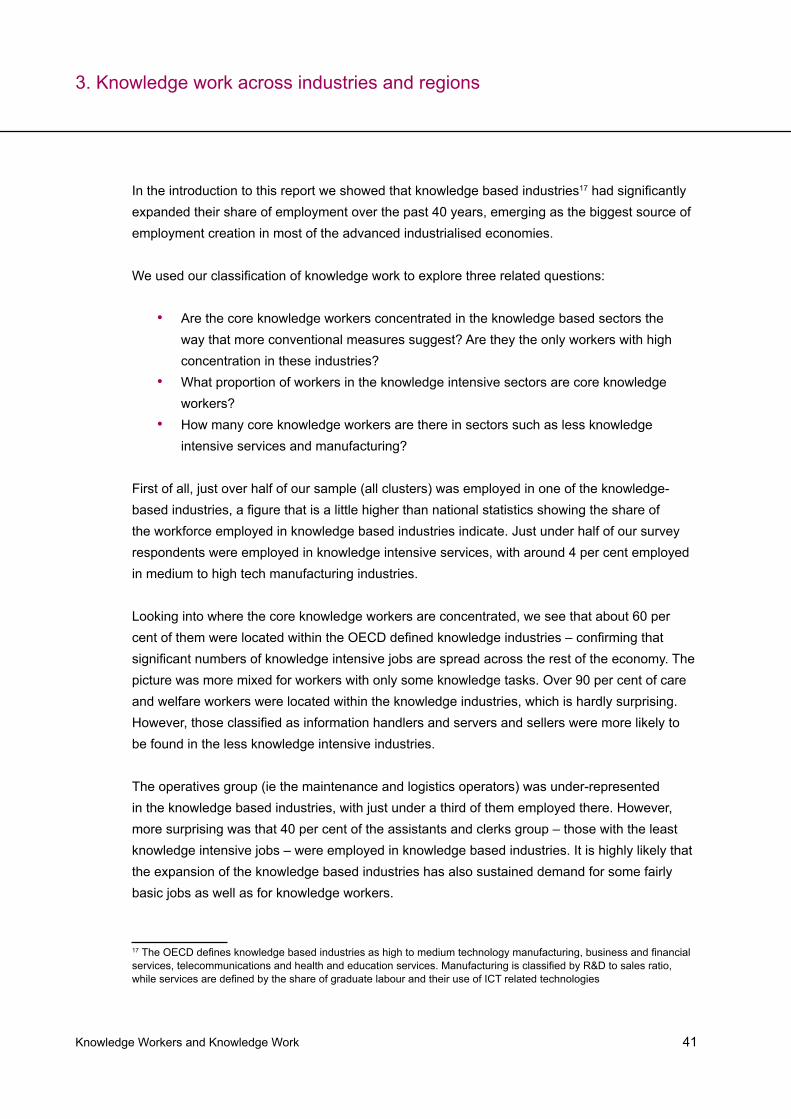
Knowledge Workers and Knowledge Work 41
In the introduction to this report we showed that knowledge based industries17 had significantly expanded their share of employment over the past 40 years, emerging as the biggest source of employment creation in most of the advanced industrialised economies.
We used our classification of knowledge work to explore three related questions:
Are the core knowledge workers concentrated in the knowledge based sectors the • way that more conventional measures suggest? Are they the only workers with high concentration in these industries?What proportion of workers in the knowledge intensive sectors are core knowledge • workers? How many core knowledge workers are there in sectors such as less knowledge • intensive services and manufacturing?
First of all, just over half of our sample (all clusters) was employed in one of the knowledge-based industries, a figure that is a little higher than national statistics showing the share of the workforce employed in knowledge based industries indicate. Just under half of our survey respondents were employed in knowledge intensive services, with around 4 per cent employed in medium to high tech manufacturing industries.
Looking into where the core knowledge workers are concentrated, we see that about 60 per cent of them were located within the OECD defined knowledge industries – confirming that significant numbers of knowledge intensive jobs are spread across the rest of the economy. The picture was more mixed for workers with only some knowledge tasks. Over 90 per cent of care and welfare workers were located within the knowledge industries, which is hardly surprising. However, those classified as information handlers and servers and sellers were more likely to be found in the less knowledge intensive industries.
The operatives group (ie the maintenance and logistics operators) was under-represented in the knowledge based industries, with just under a third of them employed there. However, more surprising was that 40 per cent of the assistants and clerks group – those with the least knowledge intensive jobs – were employed in knowledge based industries. It is highly likely that the expansion of the knowledge based industries has also sustained demand for some fairly basic jobs as well as for knowledge workers.
17 The OECD defines knowledge based industries as high to medium technology manufacturing, business and financial services, telecommunications and health and education services. Manufacturing is classified by R&D to sales ratio, while services are defined by the share of graduate labour and their use of ICT related technologies
3. Knowledge work across industries and regions
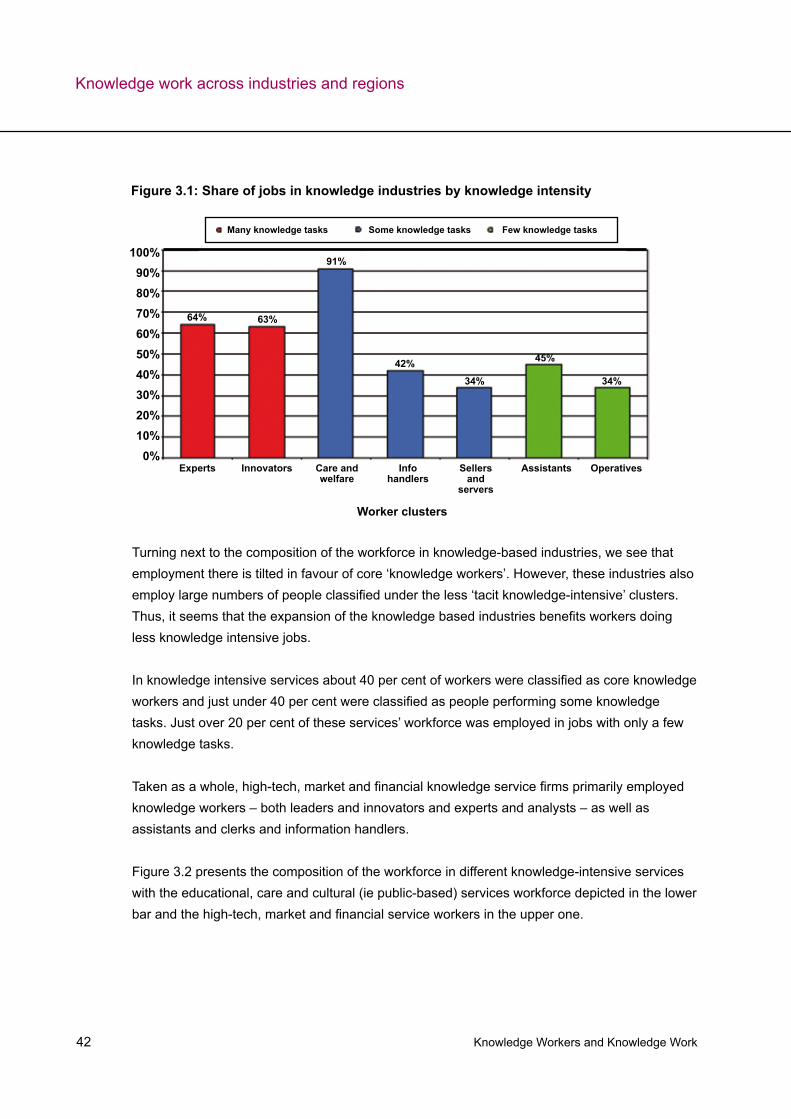
Knowledge Workers and Knowledge Work 42
Turning next to the composition of the workforce in knowledge-based industries, we see that employment there is tilted in favour of core ‘knowledge workers’. However, these industries also employ large numbers of people classified under the less ‘tacit knowledge-intensive’ clusters. Thus, it seems that the expansion of the knowledge based industries benefits workers doing less knowledge intensive jobs. In knowledge intensive services about 40 per cent of workers were classified as core knowledge workers and just under 40 per cent were classified as people performing some knowledge tasks. Just over 20 per cent of these services’ workforce was employed in jobs with only a few knowledge tasks.
Taken as a whole, high-tech, market and financial knowledge service firms primarily employed knowledge workers – both leaders and innovators and experts and analysts – as well as assistants and clerks and information handlers.
Figure 3.2 presents the composition of the workforce in different knowledge-intensive services with the educational, care and cultural (ie public-based) services workforce depicted in the lower bar and the high-tech, market and financial service workers in the upper one.
Knowledge work across industries and regions
Figure 3.1: Share of jobs in knowledge industries by knowledge intensity
InnovatorsExperts Info handlers
AssistantsSellersand
servers
Care and welfare
Operatives
Worker clusters
Many knowledge tasks Some knowledge tasks Few knowledge tasks
100%90%80%70%60%50%40%30%20%10%0%
64% 63%
91%
42%
34%
45%
34%
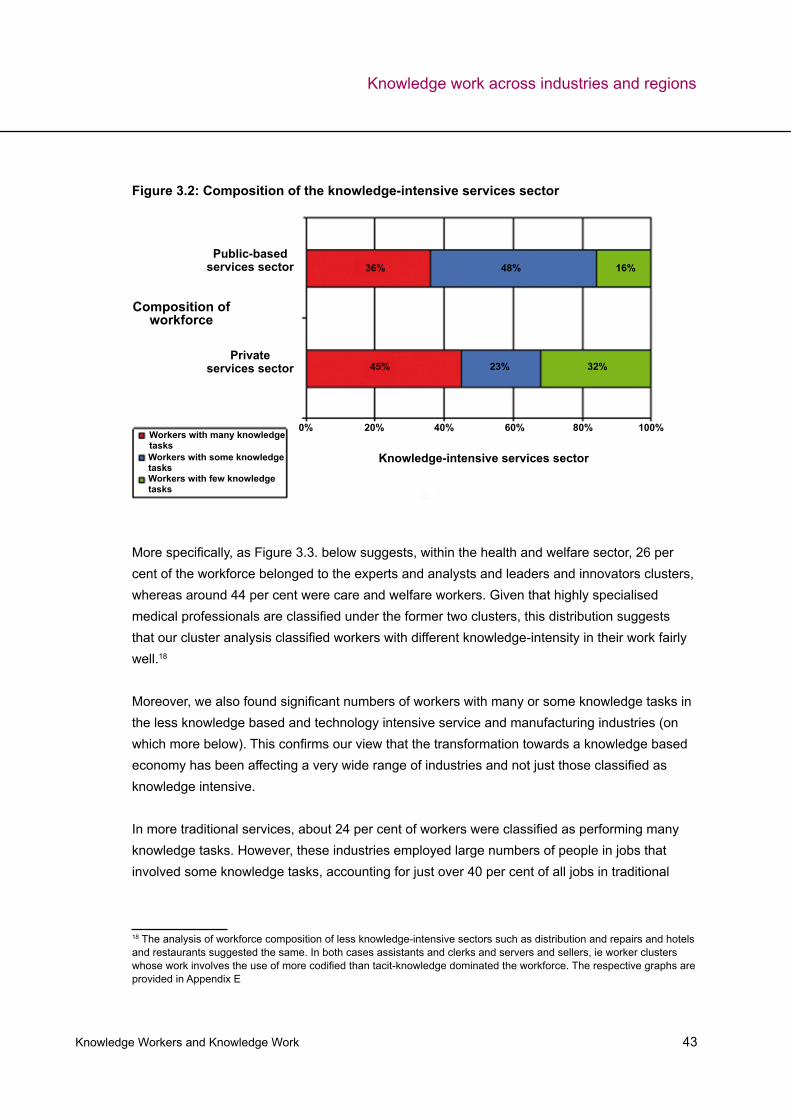
Knowledge Workers and Knowledge Work 43
More specifically, as Figure 3.3. below suggests, within the health and welfare sector, 26 per cent of the workforce belonged to the experts and analysts and leaders and innovators clusters, whereas around 44 per cent were care and welfare workers. Given that highly specialised medical professionals are classified under the former two clusters, this distribution suggests that our cluster analysis classified workers with different knowledge-intensity in their work fairly well.18
Moreover, we also found significant numbers of workers with many or some knowledge tasks in the less knowledge based and technology intensive service and manufacturing industries (on which more below). This confirms our view that the transformation towards a knowledge based economy has been affecting a very wide range of industries and not just those classified as knowledge intensive.
In more traditional services, about 24 per cent of workers were classified as performing many knowledge tasks. However, these industries employed large numbers of people in jobs that involved some knowledge tasks, accounting for just over 40 per cent of all jobs in traditional
18 The analysis of workforce composition of less knowledge-intensive sectors such as distribution and repairs and hotels and restaurants suggested the same. In both cases assistants and clerks and servers and sellers, ie worker clusters whose work involves the use of more codified than tacit-knowledge dominated the workforce. The respective graphs are provided in Appendix E
Figure 3.2: Composition of the knowledge-intensive services sector
Public-basedservices sector
Privateservices sector
Composition ofworkforce
Workers with many knowledge tasksWorkers with some knowledge tasksWorkers with few knowledge tasks
Knowledge-intensive services sector
100%0% 20% 40% 60% 80%
45%
36% 48%
23% 32%
16%
Knowledge work across industries and regions
Knowledge Workers and Knowledge Work 44
services. Workers with few knowledge tasks accounted for about a third of all employment, mainly in the assistants and clerks category.
Figure 3.4 below compares the workforce composition of the two groups of industries by knowledge intensity.
To sum up, first, growth in knowledge-intensive industries is likely to have significant effects on aggregate employment performance as it creates jobs for both the core knowledge workers and for workers with only some or a few knowledge tasks.
Secondly, the concentration of different types of knowledge workers across sectors suggests that what is driving the knowledge economy is a diverse workforce making use of different types and levels of knowledge, engaged in a variety of distinct tasks and employed in various occupations. These complementarities between different types of workers acknowledge that a well functioning economy is dependent upon all of its workers and not just the few who engage in the highest level of specialist tasks.
Figure 3.3: Workforce composition in the health and welfare industry by worker cluster
Leaders & innovatorsExperts & analystsInformation managersMaintenance & logistics operatorsCare & welfare workersServers & sellersAssistants & clerks
14.3%
5.8%43.9%
2.7%
6.7%
15.2%
11.2%
Knowledge work across industries and regions
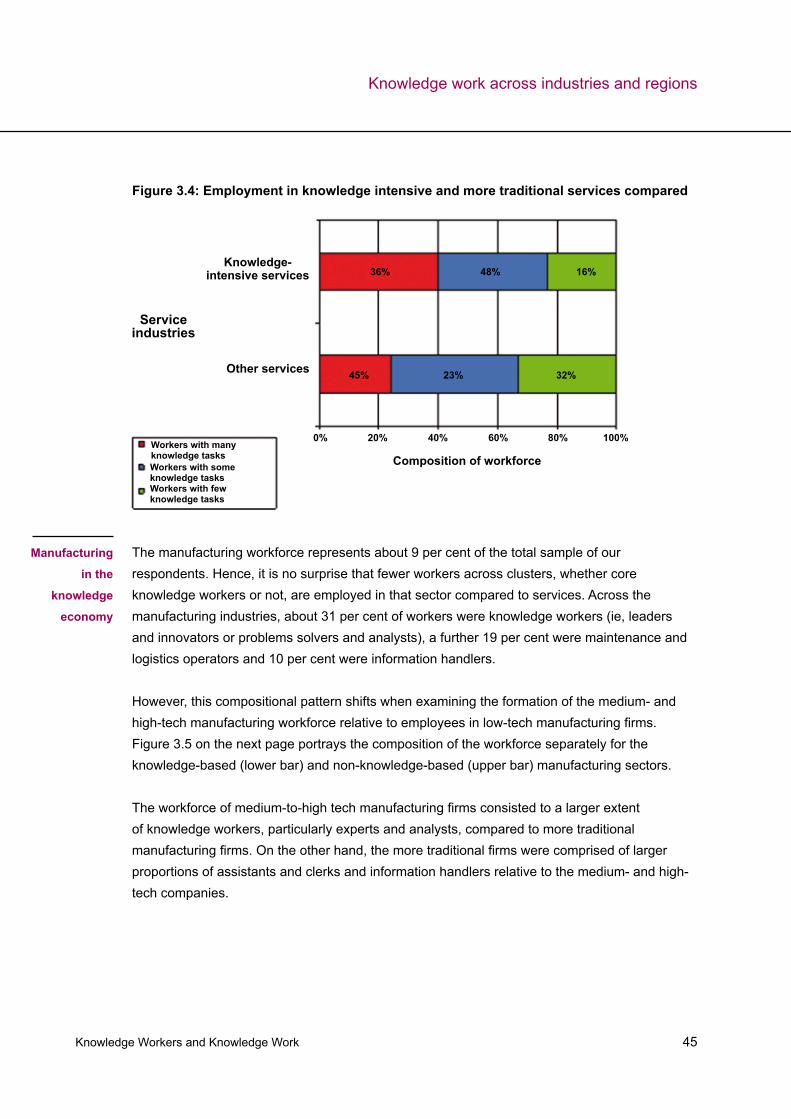
Knowledge Workers and Knowledge Work 45
The manufacturing workforce represents about 9 per cent of the total sample of our respondents. Hence, it is no surprise that fewer workers across clusters, whether core knowledge workers or not, are employed in that sector compared to services. Across the manufacturing industries, about 31 per cent of workers were knowledge workers (ie, leaders and innovators or problems solvers and analysts), a further 19 per cent were maintenance and logistics operators and 10 per cent were information handlers.
However, this compositional pattern shifts when examining the formation of the medium- and high-tech manufacturing workforce relative to employees in low-tech manufacturing firms. Figure 3.5 on the next page portrays the composition of the workforce separately for the knowledge-based (lower bar) and non-knowledge-based (upper bar) manufacturing sectors.
The workforce of medium-to-high tech manufacturing firms consisted to a larger extent of knowledge workers, particularly experts and analysts, compared to more traditional manufacturing firms. On the other hand, the more traditional firms were comprised of larger proportions of assistants and clerks and information handlers relative to the medium- and high-tech companies.
Figure 3.4: Employment in knowledge intensive and more traditional services compared
Knowledge-intensive services
Other services
Service industries
Workers with many knowledge tasksWorkers with some knowledge tasksWorkers with few knowledge tasks
Composition of workforce
100%0% 20% 40% 60% 80%
45%
36% 48%
23% 32%
16%
Manufacturing
in the
knowledge
economy
Knowledge work across industries and regions
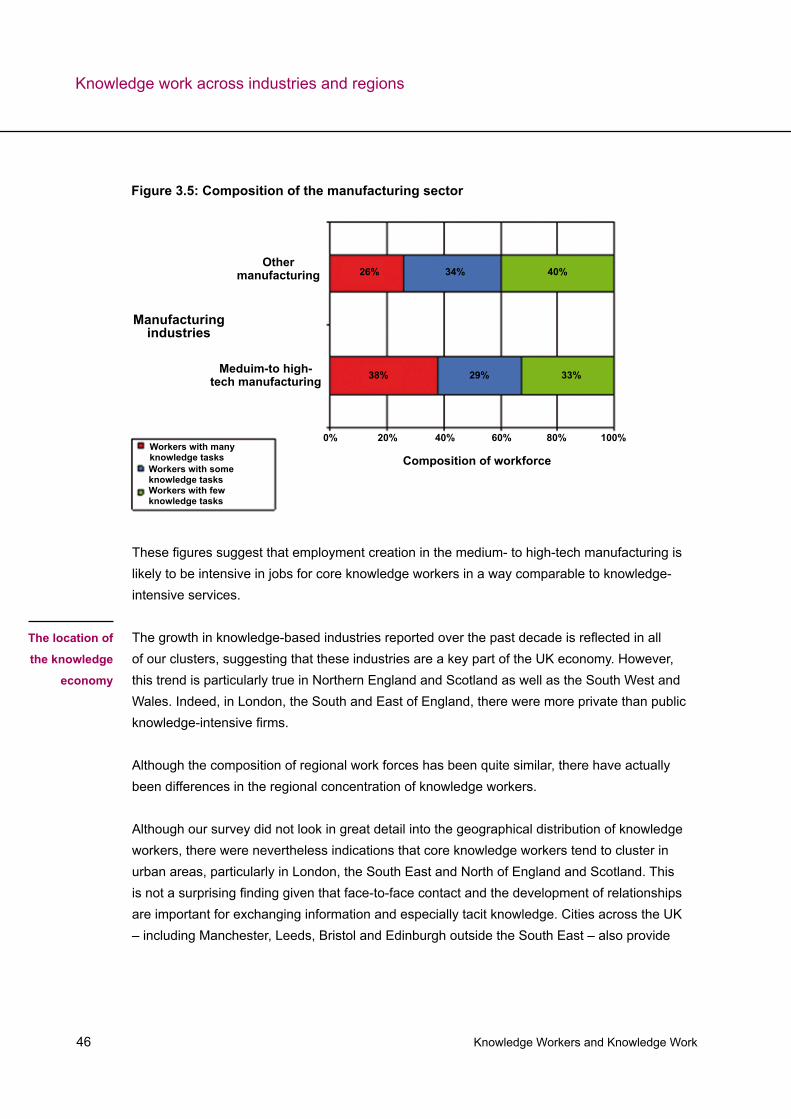
Knowledge Workers and Knowledge Work 46
These figures suggest that employment creation in the medium- to high-tech manufacturing is likely to be intensive in jobs for core knowledge workers in a way comparable to knowledge-intensive services.
The growth in knowledge-based industries reported over the past decade is reflected in all of our clusters, suggesting that these industries are a key part of the UK economy. However, this trend is particularly true in Northern England and Scotland as well as the South West and Wales. Indeed, in London, the South and East of England, there were more private than public knowledge-intensive firms.
Although the composition of regional work forces has been quite similar, there have actually been differences in the regional concentration of knowledge workers.
Although our survey did not look in great detail into the geographical distribution of knowledge workers, there were nevertheless indications that core knowledge workers tend to cluster in urban areas, particularly in London, the South East and North of England and Scotland. This is not a surprising finding given that face-to-face contact and the development of relationships are important for exchanging information and especially tacit knowledge. Cities across the UK – including Manchester, Leeds, Bristol and Edinburgh outside the South East – also provide
Knowledge work across industries and regions
The location of
the knowledge
economy
Figure 3.5: Composition of the manufacturing sector
Other manufacturing
Meduim-to high-tech manufacturing
Manufacturing industries
Workers with many knowledge tasksWorkers with some knowledge tasksWorkers with few knowledge tasks
Composition of workforce
100%0% 20% 40% 60% 80%
38%
26% 34%
29% 33%
40%
Knowledge Workers and Knowledge Work 47
businesses with access to wider markets and to specialist skills. This result resonates with the insights of our Ideopolis programme on the growing importance of cities in world economies.
On the other hand, the South West and Wales region have a relatively high concentration of workers with some knowledge tasks, while the North and Scotland have relatively more workers with few knowledge tasks.
Table 3.1: Regional concentration of knowledge workers in the UK
Workers with many knowledge tasks
Workers with some knowledge tasks
Workers with few knowledge tasks
Share of the national workforce in the region
London SE East
35.8% 33.7% 33.5% 34.1%
SW and Wales
9.4% 12.6% 10.5% 10.6%
Midlands 16.6% 16.2% 16.1% 16.3%
North and Scotland
38.3% 39.4% 40.0% 39.0%
Total 100% 100% 100% 100%
In terms of regional workforce composition, the proportion of knowledge workers was fairly comparable across regions (33-35 per cent of regional work forces) with the exception of the South West, Wales and the West, in which only 29 per cent of workers were leaders and innovators or experts and analysts. This suggests that the potential of employment expansion in different regions to create core knowledge jobs is relatively even. These findings are displayed in Figure 3.6 below.
Looking specifically within the knowledge-based industries, regional differences in knowledge work are starker. London, the South and East of England boast the highest relative percentage of knowledge workers – including both leaders and innovators and experts and analysts – with 45 per cent of the workforce in specialist knowledge jobs. The percentages in other regions range from 36 per cent in the South West, Wales and the West to 38 per cent in the North and Scotland to 40 per cent in the Midlands.
Knowledge work across industries and regions
Source: Knowledge Workers Survey, The Work Foundation, 2008
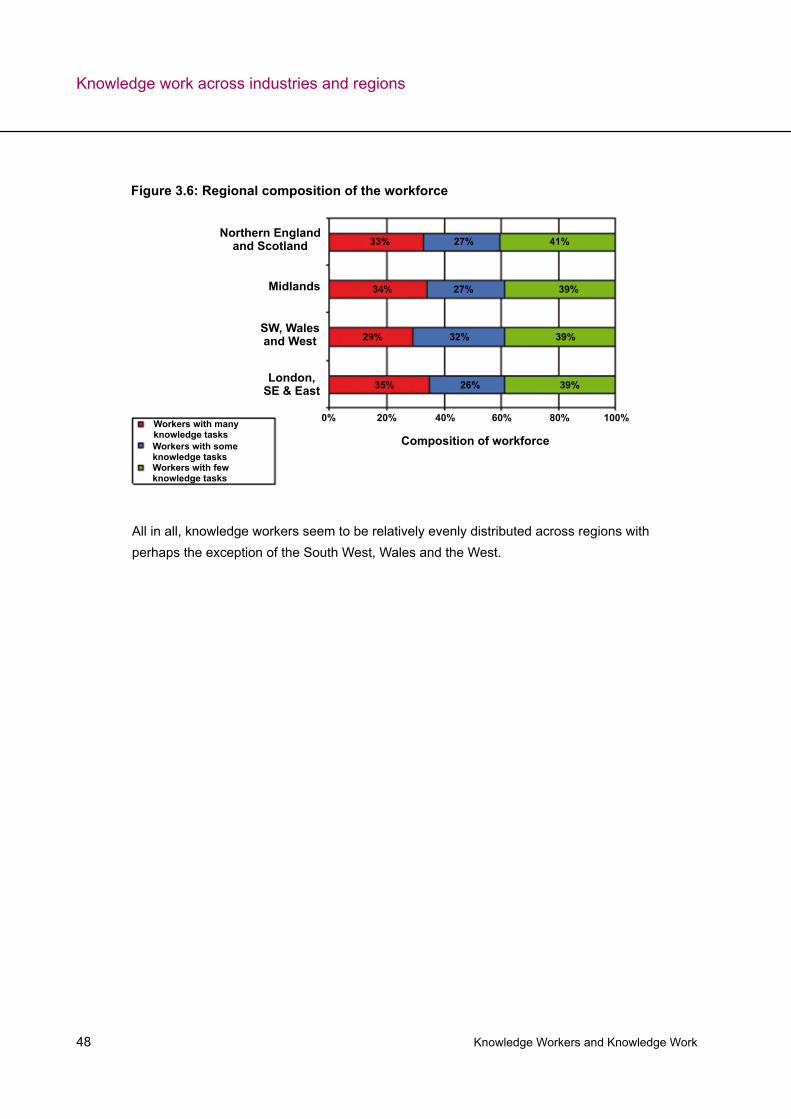
Knowledge Workers and Knowledge Work 48
All in all, knowledge workers seem to be relatively evenly distributed across regions with perhaps the exception of the South West, Wales and the West.
Knowledge work across industries and regions
Figure 3.6: Regional composition of the workforce
Northern England and Scotland
Midlands
Workers with many knowledge tasksWorkers with some knowledge tasksWorkers with few knowledge tasks
Composition of workforce
100%0% 20% 40% 60% 80%
34%
33% 27%
27% 39%
41%
SW, Wales and West
London, SE & East
29% 32% 39%
35% 26% 39%
Knowledge Workers and Knowledge Work 49
This section uses the our newly defined definition of knowledge workers and their responses to our survey to understand whether there has been any change in the nature of work roles and whether knowledge leads to higher returns to work.
One of the questions pertaining to the consequences of the knowledge economy is whether changes in technology and work organisation have altered the nature of some jobs within broad occupational groups such as administrative and clerical. Our worker survey provides some indirect evidence that the nature of work roles has been indeed changing.
About 13 per cent of our sample was classified as ‘information handlers’ and about 25 per cent had a degree. This group of workers was uniquely defined by high frequencies of administrative tasks such as organising travel, managing diaries, ordering merchandise and filing. These administrative tasks filled the days of secretarial workers in the past, and arguably did not require graduate level skills.
However, the information handlers of today also engage in tasks related to people management, data and analysis and, to a lesser extent, leadership and development. The information handlers – similar to other clusters – exhibit task overlaps with the core group of knowledge workers, hence, the need for more highly qualified people to fill these positions. These roles have been reinvented to incorporate available technology (which makes administrative tasks less time consuming) and to provide high-level support for workers in knowledge-intensive firms.
What is a manager?According to 2007 Labour Force Survey estimates, 15 per cent of the working population is employed in managerial posts – the highest percentage for any of the nine occupational groups. Among our sample, closer to 20 per cent were in management posts (using formal occupational codes). Further, tasks related to people management tasks were the most common activities workers engaged in across our sample. It seems everyone has management responsibilities, which begs the question of whether the term manager is even useful in mapping the workforce.
The term ‘manager,’ perhaps more so than any other occupational title, tells us very little about the position that someone holds within an organisation, the tasks and activities that make up their working life and the specialist knowledge required for the job. For example, people who run a small store all the way up to those who oversee a multi-million pound corporation would be classified as managers. These managers could be responsible for two workers or 10,000.
4. The changing nature of work roles and the returns to knowledge
The changing
nature of work
roles
Knowledge Workers and Knowledge Work 50
In the middle of the last century, Mills (1951) described a typology of managers that still seems accurate today:
…managers are usually split into two types: those who have to do with business decisions and those who have to do with the industrial run of the work. Both are further subdivided into various grades of importance, often according to the number of people under them; both have assigned duties and fixed requirements; both as groups have been rationalized (p. 82).
Our findings would support a further distinction between management and leadership. The leaders and innovators were able to balance their heavy load of management tasks with strategy, development, creativity, future planning and analytic tasks. Only 11 per cent of the sample regularly engaged in leadership tasks in their jobs – clearly requiring a higher level of specialisation than general managers.
Although we can distinguish managers from leaders, a few questions remain unresolved. If almost all workers have people management responsibilities, do we simply have too many managers in the UK? With so many people managing others, do staff have enough autonomy at work? Should we loosen up management hierarchies so staff have more time to specialise in tasks? Are career paths still based on the acquisition of management skills rather than specialist knowledge skills?
This evidence speaks directly to one of the key debates, namely whether the transition to a knowledge based economy has been leading to greater polarisation, with more good jobs at the top of the labour market, more bad jobs at the bottom, and fewer jobs in the middle. One argument in this debate is that the demand for jobs that require graduate level skills has been lagging supply, so that some graduates are forced into less skilled and less well paid work. This in turn reduces job opportunities for non-graduates, who would be forced into even less well paid jobs or even out of the labour market altogether.
The facts that emerge from our survey do not support this view and dovetail with the insights of our earlier research (Fauth and Brinkley 2007). We showed that over the past decade the share of well paid and low paid jobs had stabilised. This was also true for jobs taken by graduates. Moreover, aggregate wage data continued to show no significant narrowing of the wage gap between graduates and non-graduates. Nor could we find any increase in the gap in labour market outcomes between graduates and non-graduates, as measured by unemployment or employment rates.
The changing nature of work roles and the returns to knowledge
Knowledge Workers and Knowledge Work 51
All in all, these findings lend some credence to the hypothesis that the nature of work roles has been changing across the economy with perhaps the exception of the assistants and clerks. The workforce as a whole is becoming more skilled, partially as a result of technological advances, in terms of formal qualifications and acquired experience within jobs. The evidence from our survey suggests that it is increased demand for rather than excess supply of graduates that underlies the polarised employment growth across occupations.
Turning to the extent to which jobs in the knowledge economy adequately tap into workers’ skills set and experience, just under half of the respondents (48 per cent) indicated that their job duties correspond well with their extant skills. Table 4.1. shows the responses of the survey participants by worker cluster. At first glance, there does not seem to be a relatively straightforward manner in which the high knowledge content of jobs can be associated with the good fit between workers skills and their job requirements. Experts and analysts were most likely to report a good match while leaders and innovators were very close to the average in that respect, below care and welfare workers and information managers.
Still one can notice that the worker clusters with the fewest knowledge tasks along with the servers and sellers reported the weakest (below average) match between worker skills and job requirements. In the case of assistants and clerks and maintenance and logistics operators, this evidence probably suggests that jobs with few knowledge tasks do not require very job specific skills. On the other hand, the low ranking of the servers and sellers in that respect could probably be linked to the relatively high concentration of temporary, fixed-term employees in that cluster. The fact that this is also the cluster with the higher share of workers perceiving themselves as ‘overskilled’ for their job (55 per cent) further supports this suggestion.
More generally, the fact that more than 40 per cent of workers in our sample felt that their skills were underutilised at work along with the fact that many employers claim that the supply of workers does not have adequate or the right mix of skills and previous experience for the existing vacancies suggests a substantial mismatch between labour demand and labour supply in the knowledge economy.
The quality of
skills match in
the knowledge
economy
The changing nature of work roles and the returns to knowledge
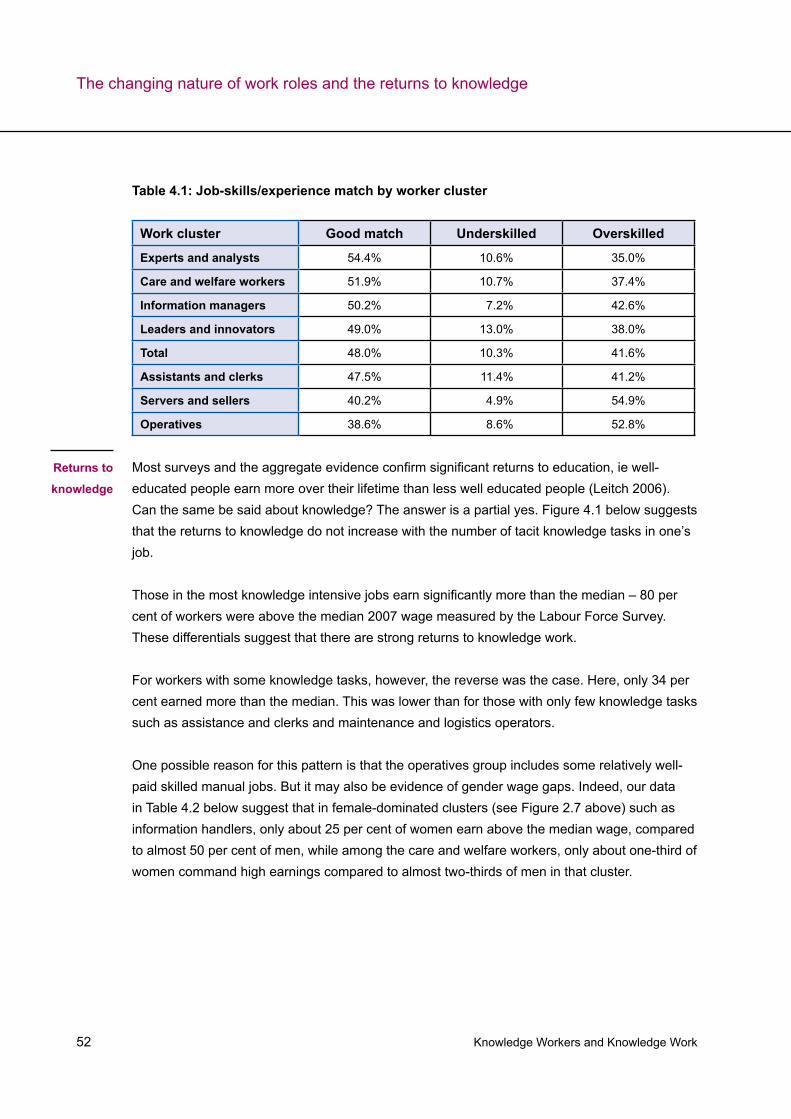
Knowledge Workers and Knowledge Work 52
Most surveys and the aggregate evidence confirm significant returns to education, ie well-educated people earn more over their lifetime than less well educated people (Leitch 2006). Can the same be said about knowledge? The answer is a partial yes. Figure 4.1 below suggests that the returns to knowledge do not increase with the number of tacit knowledge tasks in one’s job.
Those in the most knowledge intensive jobs earn significantly more than the median – 80 per cent of workers were above the median 2007 wage measured by the Labour Force Survey. These differentials suggest that there are strong returns to knowledge work.
For workers with some knowledge tasks, however, the reverse was the case. Here, only 34 per cent earned more than the median. This was lower than for those with only few knowledge tasks such as assistance and clerks and maintenance and logistics operators.
One possible reason for this pattern is that the operatives group includes some relatively well-paid skilled manual jobs. But it may also be evidence of gender wage gaps. Indeed, our data in Table 4.2 below suggest that in female-dominated clusters (see Figure 2.7 above) such as information handlers, only about 25 per cent of women earn above the median wage, compared to almost 50 per cent of men, while among the care and welfare workers, only about one-third of women command high earnings compared to almost two-thirds of men in that cluster.
The changing nature of work roles and the returns to knowledge
Table 4.1: Job-skills/experience match by worker cluster
Work cluster Good match Underskilled Overskilled
Experts and analysts 54.4% 10.6% 35.0%
Care and welfare workers 51.9% 10.7% 37.4%
Information managers 50.2% 7.2% 42.6%
Leaders and innovators 49.0% 13.0% 38.0%
Total 48.0% 10.3% 41.6%
Assistants and clerks 47.5% 11.4% 41.2%
Servers and sellers 40.2% 4.9% 54.9%
Operatives 38.6% 8.6% 52.8%
Returns to
knowledge
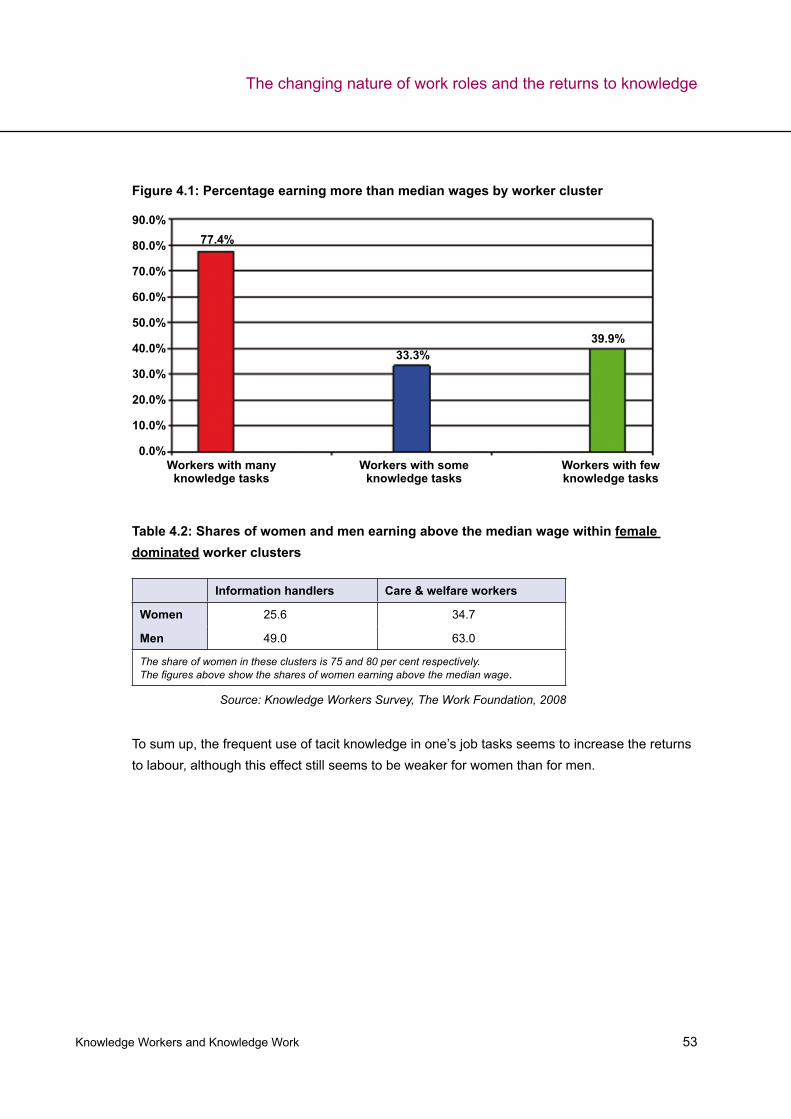
Knowledge Workers and Knowledge Work 53
Information handlers Care & welfare workers
Women 25.6 34.7
Men 49.0 63.0
The share of women in these clusters is 75 and 80 per cent respectively. The figures above show the shares of women earning above the median wage.
To sum up, the frequent use of tacit knowledge in one’s job tasks seems to increase the returns to labour, although this effect still seems to be weaker for women than for men.
The changing nature of work roles and the returns to knowledge
Figure 4.1: Percentage earning more than median wages by worker cluster
90.0%
80.0%
70.0%
60.0%
50.0%
40.0%
30.0%
20.0%
10.0%
0.0%Workers with many
knowledge tasksWorkers with some
knowledge tasksWorkers with few knowledge tasks
77.4%
33.3%39.9%
Source: Knowledge Workers Survey, The Work Foundation, 2008
Table 4.2: Shares of women and men earning above the median wage within female dominated worker clusters
Knowledge Workers and Knowledge Work 54
This section uses the results of our survey to sketch some of the general features of work in the knowledge economy. Knowledge-based work has been heralded as facilitating new forms of employment driven by enhanced bargaining power, new technologies, and generational attitude changes to work. Knowledge work is perceived as moving away from traditional 9-5 office jobs and towards less permanent, more flexible and less structured forms of employment. Other commentators have suggested that knowledge workers would open up new forms of flexibility – for example, through various forms of teleworking – so that knowledge workers would no longer be bound by the traditional 9-5 office routine. Instead they can work wherever an internet connection exists, either individually or in remote clusters. Such workers have been labelled ‘nomads’ (Kluth 2008).
These are all fascinating and beguiling possibilities, and for some individuals they are clearly a reality. However, these assertions are often made without substantial empirical evidence to back it up. According to estimates from the Labour Force Survey (for a review see Brinkley 2008) portfolio working – rare to start with – has fallen for knowledge workers over the past decade. So has self-employment (a common trend over much of the OECD). Temporary employment remains small and has not increased as a share of employment. Nor is there much to suggest that knowledge workers are turning to any significant degree to the more unusual formal working arrangements such as job shares or nine-day fortnights.
More traditional flexible working arrangements, such as part-time and flexitime, do seem to attract knowledge workers more. However, we should be careful about assuming this means knowledge workers either do not get or do not want new flexibility at work. Knowledge workers may enjoy flexibility through informal work practices – for example, they typically have high levels of autonomy in how they get their tasks done.
Given that our definition of knowledge workers cuts across occupational groups and only partly overlaps with the top three of them, we use it here to examine whether these changes in job characteristics have been occurring.
One of the most important questions is whether traditional employment relationships in organisations are still relevant in the knowledge economy (for a review see Brinkley 2008). One camp has argued that knowledge workers reject traditional employment relationships, in turn preferring ‘portfolio work’ (ie, holding several part-time jobs simultaneously) and favouring
5. The job characteristics of knowledge workers
Job
characteristics
and flexible
work
Knowledge Workers and Knowledge Work 55
more freestanding relationships as temporary employee, freelancers or self-employed workers. Yet, others have suggested that new forms of working have developed within the modern corporation. In this case, the more specialist and entrepreneurial knowledge workers are given the freedom to experiment and develop new ideas. These ‘intrapreneurs’ combine the freedom of self-employment with the security and resources of big companies.
To assess whether these changes have been taking place, we inquired about workers’ job tenure and the length of contracts in our survey. We found that neither long-term (ie beyond 10 years) nor extremely short-term tenures dominate in our sample.19 Nearly a third of workers had been in their jobs between 1-2 years, with another 40 per cent in their jobs between 2-10 years. We found that in our sample about 20 per cent of workers had been in their jobs for 10 years or more, which we have taken as one indicator of long tenure jobs.
The most striking result is that there only seems to be little association between the knowledge content of a job and the average tenure in that job. For the most knowledge intensive jobs, average tenures were in line with the overall average, average tenures for jobs with some knowledge content were somewhat below the average, and jobs with little or no knowledge content had above average tenures.20
More specifically, people in jobs with some knowledge content such as information handling and serving and selling jobs had job tenures significantly below the average, with about 12 per cent in jobs with more than 10 years tenure. A potential explanation for low tenure is age: about 25 per cent of job handlers were under 25 years old. In contrast, people in maintenance and logistics jobs with little tacit knowledge content had job tenures above average, with nearly 30 per cent in jobs lasting 10 years or more.
Permanent job contracts were the most prevalent in our sample with an average of 86 per cent of workers in our sample being on permanent contract. This estimate is lower than the UK average of 94 per cent (LFS). There was variation across our clusters in that respect, ranging from 77 per cent of information handlers to 90 per cent of leaders and innovators. However, we did not observe any straightforward association between the knowledge intensity of tasks in different clusters and share of workers holding permanent contracts.
19 Our sample excludes some part time workers, so we would expect tenures to be somewhat longer in our sample than for the workforce as a whole 20 As our survey is cross-sectional, we have to allow for the fact that tenures tend to be counter-cyclical – they fall when employment is growing and rise when employment is contracting. This is partly because new jobs, by definition, are of shorter tenure than old jobs; and partly because people are more inclined and able to move between jobs when they are plentiful. When our survey was conducted, the employment of knowledge workers defined by occupation had been increasing strongly so we might expect tenures for knowledge workers on average to be falling slightly
The job characteristics of knowledge workers
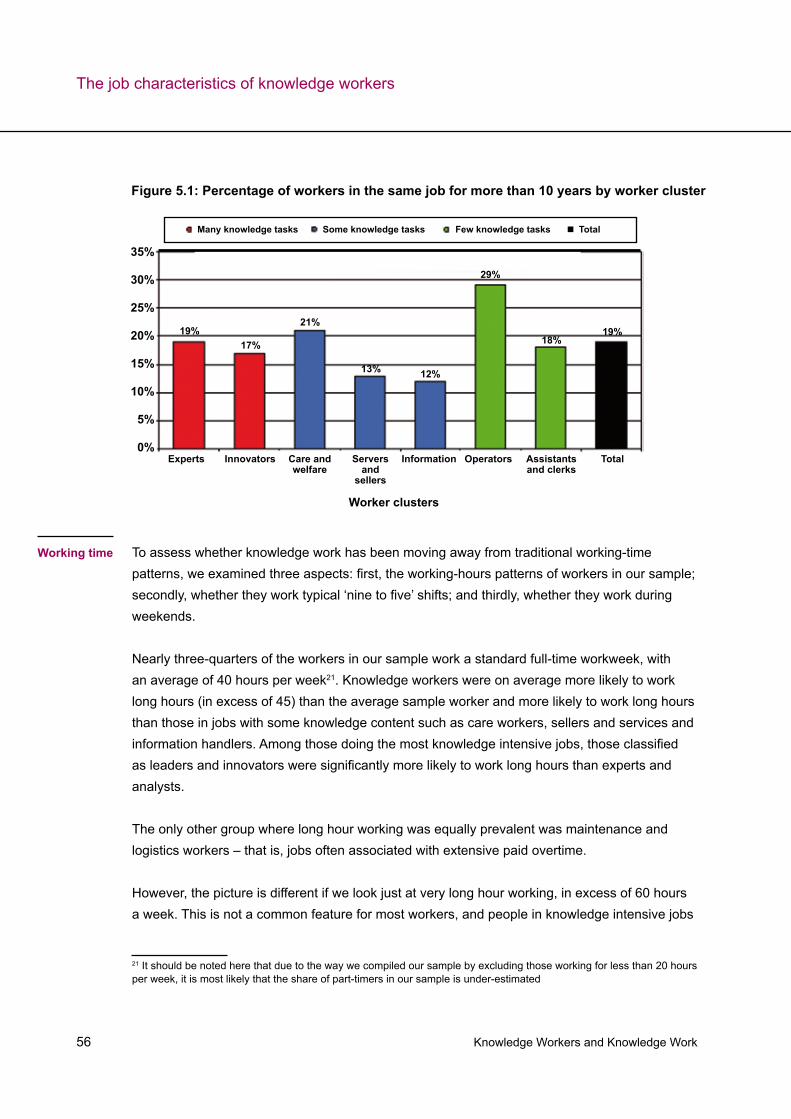
Knowledge Workers and Knowledge Work 56
To assess whether knowledge work has been moving away from traditional working-time patterns, we examined three aspects: first, the working-hours patterns of workers in our sample; secondly, whether they work typical ‘nine to five’ shifts; and thirdly, whether they work during weekends.
Nearly three-quarters of the workers in our sample work a standard full-time workweek, with an average of 40 hours per week21. Knowledge workers were on average more likely to work long hours (in excess of 45) than the average sample worker and more likely to work long hours than those in jobs with some knowledge content such as care workers, sellers and services and information handlers. Among those doing the most knowledge intensive jobs, those classified as leaders and innovators were significantly more likely to work long hours than experts and analysts.
The only other group where long hour working was equally prevalent was maintenance and logistics workers – that is, jobs often associated with extensive paid overtime.
However, the picture is different if we look just at very long hour working, in excess of 60 hours a week. This is not a common feature for most workers, and people in knowledge intensive jobs
21 It should be noted here that due to the way we compiled our sample by excluding those working for less than 20 hours per week, it is most likely that the share of part-timers in our sample is under-estimated
Working time
The job characteristics of knowledge workers
Figure 5.1: Percentage of workers in the same job for more than 10 years by worker cluster
Many knowledge tasks Some knowledge tasks Few knowledge tasks
InnovatorsExperts Information Assistants and clerks
Serversand
sellers
Care and welfare
Operators
Worker clusters
35%
30%
25%
20%
15%
10%
5%
0%
64% 63%
91%
42%
34%
45%
34%
Total
Total
19%17%
21%
13% 12%
29%
19%18%
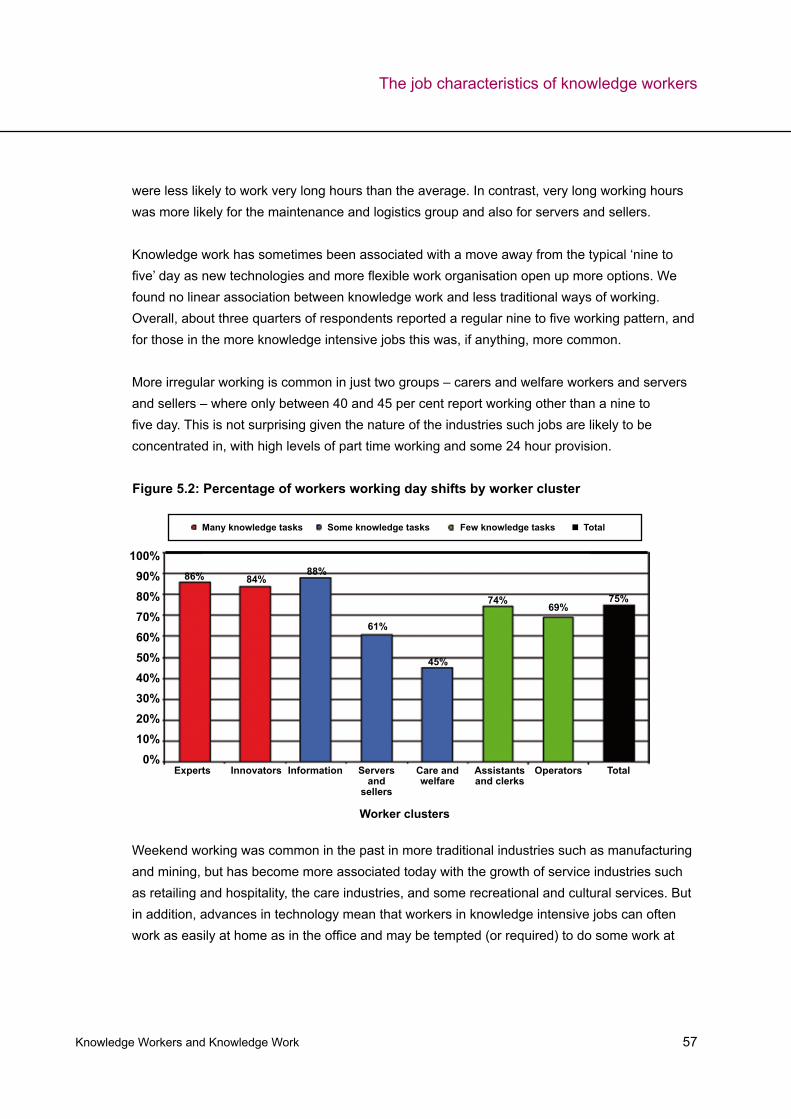
Knowledge Workers and Knowledge Work 57
were less likely to work very long hours than the average. In contrast, very long working hours was more likely for the maintenance and logistics group and also for servers and sellers.
Knowledge work has sometimes been associated with a move away from the typical ‘nine to five’ day as new technologies and more flexible work organisation open up more options. We found no linear association between knowledge work and less traditional ways of working. Overall, about three quarters of respondents reported a regular nine to five working pattern, and for those in the more knowledge intensive jobs this was, if anything, more common.
More irregular working is common in just two groups – carers and welfare workers and servers and sellers – where only between 40 and 45 per cent report working other than a nine to five day. This is not surprising given the nature of the industries such jobs are likely to be concentrated in, with high levels of part time working and some 24 hour provision.
Total
Total
Worker clusters
Figure 5.2: Percentage of workers working day shifts by worker cluster
Many knowledge tasks Some knowledge tasks Few knowledge tasks
InnovatorsExperts Information Assistants and clerks
Serversand
sellers
Care and welfare
Operators
100%90%80%70%60%50%40%30%20%10%0%
86% 84%88%
61%
45%
74%69%
75%
The job characteristics of knowledge workers
Weekend working was common in the past in more traditional industries such as manufacturing and mining, but has become more associated today with the growth of service industries such as retailing and hospitality, the care industries, and some recreational and cultural services. But in addition, advances in technology mean that workers in knowledge intensive jobs can often work as easily at home as in the office and may be tempted (or required) to do some work at
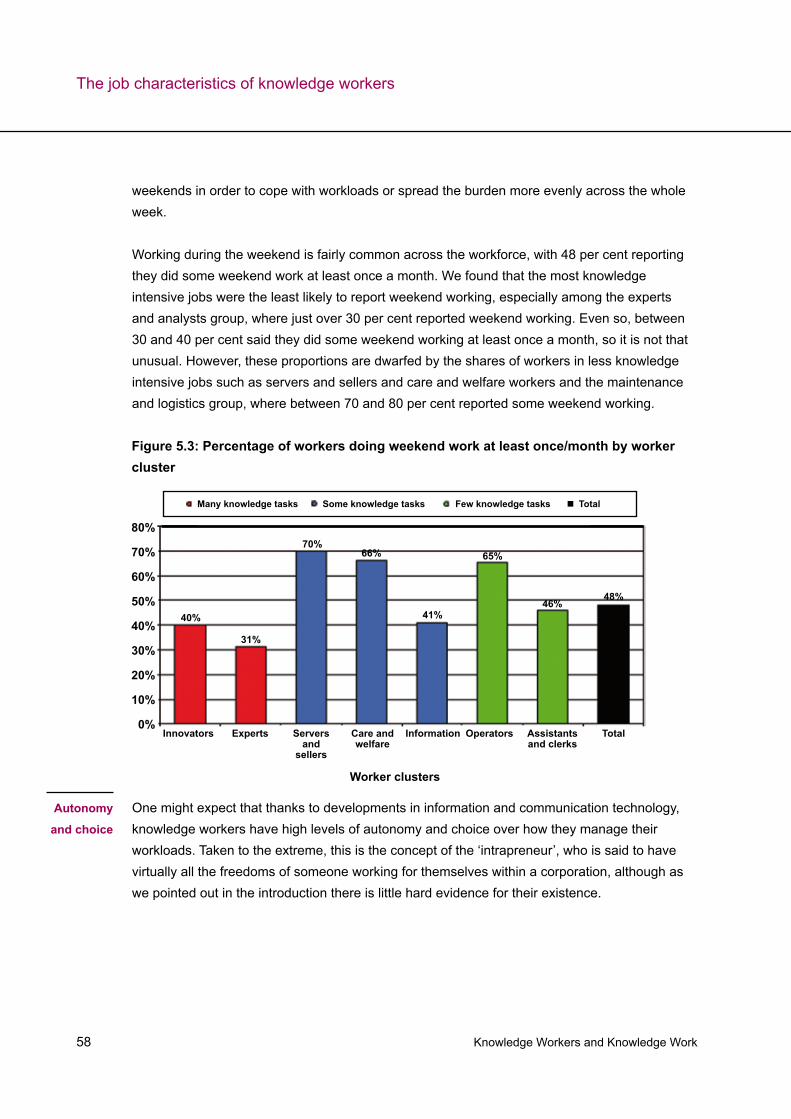
Knowledge Workers and Knowledge Work 58
weekends in order to cope with workloads or spread the burden more evenly across the whole week.
Working during the weekend is fairly common across the workforce, with 48 per cent reporting they did some weekend work at least once a month. We found that the most knowledge intensive jobs were the least likely to report weekend working, especially among the experts and analysts group, where just over 30 per cent reported weekend working. Even so, between 30 and 40 per cent said they did some weekend working at least once a month, so it is not that unusual. However, these proportions are dwarfed by the shares of workers in less knowledge intensive jobs such as servers and sellers and care and welfare workers and the maintenance and logistics group, where between 70 and 80 per cent reported some weekend working.
Autonomy
and choice
The job characteristics of knowledge workers
Worker clusters
Figure 5.3: Percentage of workers doing weekend work at least once/month by worker cluster
80%
70%
60%
50%
40%
30%
20%
10%
0%
Many knowledge tasks Some knowledge tasks Few knowledge tasks Total
Innovators Experts Information Assistants and clerks
Serversand
sellers
Care and welfare
Operators Total
40%
31%
70%66%
41%
65%
46%48%
One might expect that thanks to developments in information and communication technology, knowledge workers have high levels of autonomy and choice over how they manage their workloads. Taken to the extreme, this is the concept of the ‘intrapreneur’, who is said to have virtually all the freedoms of someone working for themselves within a corporation, although as we pointed out in the introduction there is little hard evidence for their existence.
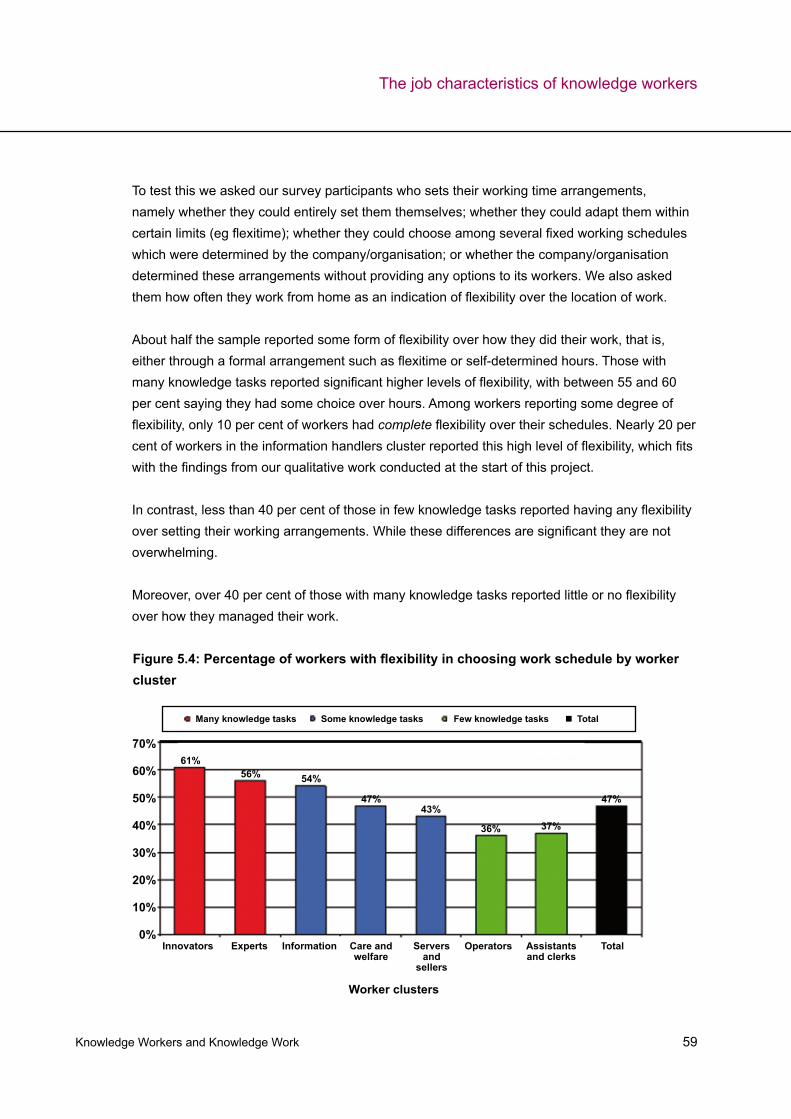
Knowledge Workers and Knowledge Work 59
To test this we asked our survey participants who sets their working time arrangements, namely whether they could entirely set them themselves; whether they could adapt them within certain limits (eg flexitime); whether they could choose among several fixed working schedules which were determined by the company/organisation; or whether the company/organisation determined these arrangements without providing any options to its workers. We also asked them how often they work from home as an indication of flexibility over the location of work.
About half the sample reported some form of flexibility over how they did their work, that is, either through a formal arrangement such as flexitime or self-determined hours. Those with many knowledge tasks reported significant higher levels of flexibility, with between 55 and 60
Figure 5.4: Percentage of workers with flexibility in choosing work schedule by worker cluster
Many knowledge tasks Some knowledge tasks Few knowledge tasks Total
Innovators Experts Information Assistants and clerks
Serversand
sellers
Care and welfare
Operators
Worker clusters
Total
70%
60%
50%
40%
30%
20%
10%
0%
61%56%
37%
54%
47%43%
36%
47%
per cent saying they had some choice over hours. Among workers reporting some degree of flexibility, only 10 per cent of workers had complete flexibility over their schedules. Nearly 20 per cent of workers in the information handlers cluster reported this high level of flexibility, which fits with the findings from our qualitative work conducted at the start of this project. In contrast, less than 40 per cent of those in few knowledge tasks reported having any flexibility over setting their working arrangements. While these differences are significant they are not overwhelming.
Moreover, over 40 per cent of those with many knowledge tasks reported little or no flexibility over how they managed their work.
The job characteristics of knowledge workers
Knowledge Workers and Knowledge Work 60
On the whole, extensive home working does not seem to be a key part of work in the knowledge economy. That is, the flexibility of knowledge employees in choosing their location of work is not as high as their flexibility in choosing their work schedules: less than a quarter of respondents reported working at home at least once a month. Again, this flexibility increased with the amount of knowledge tasks that workers in the various clusters perform frequently: approximately 40 per cent of leaders and innovators enjoyed this type of flexibility, relative to only about 15 per cent of maintenance and logistics operators and assistants and clerks, respectively.
Our findings show that those with more knowledge based jobs have greater flexibility than those in less knowledge based jobs, at least as far as choice over hours is concerned and the ability (whether willing or not) to work at home. However, it is also striking how far the standard working day with relatively fixed working arrangements still predominates in today’s labour market. Even amongst those involved in knowledge intensive jobs, a sizeable minority had little choice over working arrangements and those who could really determine their own hours are a small minority.
The job characteristics of knowledge workers
Knowledge Workers and Knowledge Work 61
The large research gaps in understanding the key characteristics of knowledge workers and knowledge work also exist at the firm level. While there is a vast literature looking at management of knowledge workers, there is little in the way of hard evidence. Further, we need a better sense not only of the predominant organisational cultures in the knowledge economy, but also the degree to which these realities mirror workers’ preferences. In this section we examine workers’ perceptions of their predominant organisation culture to assess the balance between rule bound cultures and innovative cultures, organisations defined by trust and loyalty versus those defined by achievement and competition.
For that purpose, we asked all respondents to rate their agreement to four statements describing organisational culture (Cameron and Quinn 2006):
This organisation is characterised by loyalty and mutual trust. Commitment to this 1. organisation runs high.This organisation is characterised by commitment to innovation and development. 2. There is an emphasis on being on the cutting edge.This organisation is characterised by an emphasis on achievement and goal 3. accomplishment. Aggressiveness and winning are common themes.This organisation is characterised by formal rules and policies. Maintaining a smooth-4. running organisation is important.
Table 6.1 below illustrates the share of each worker cluster within the group of workers who reported that each of the four qualities characterises their organisation and the respective shares for private and public sectors.22
The responses of our survey participants suggest several notable points.
First, the most prevalent of the four characteristics of organisations, according to their workers, is their adherence to formal rules and policies (almost 60 per cent of our respondents reported it) while the least prevalent characteristics are the emphasis on achievement and accomplishment and the commitment to innovation and development (around 37 per cent reported both).
22 The industries that we defined as private sector include agriculture, hunting and forestry, fishing, mining and quarrying, manufacturing, electricity and water supply, construction, distribution and repairs, hotels and restaurants, transport, storage and communication, financial intermediation, real estate and business activities. The public sector includes public administration, education, health and social work
6. Organisational culture in the knowledge economy: preferences and reality
Knowledge Workers and Knowledge Work 62
Interestingly, these perceptions seem to vary substantially depending on whether the respondent works in the private or the public sector. Public sector organisations are perceived to be more bound by rules and formal procedures and less committed to achievement, innovation and development than private sector organisations. Half of our respondents thought that their organisation is characterised by loyalty and mutual trust and quite notably, this feature was slightly more prevalent in the private sector than it is in the public.
Secondly, workers with many knowledge tasks in general are clearly more likely than any other group of workers to perceive their organisations as being committed to innovation and development and as emphasising achievement and accomplishment. However, there is again a sizeable difference in this perception depending on whether these core knowledge workers are employed in the private or the public sector, with the private sectors scoring higher.
To the extent that commitment to innovation and development and emphasis on achievement and accomplishment provide incentives for the use and expansion of tacit knowledge, which resides with the individual, these data suggest that public sector organisations in the UK are probably less well positioned to exploit the benefits of the knowledge economy.
On the other hand, the extent to which these ‘core’ knowledge workers perceive their organisation as being bound by formal rules and policies and characterised by loyalty and mutual trust is quite similar to that of workers with only some knowledge tasks (eg information handlers, care and welfare workers and servers and sellers).
Organisational culture in the knowledge economy: preferences and reality
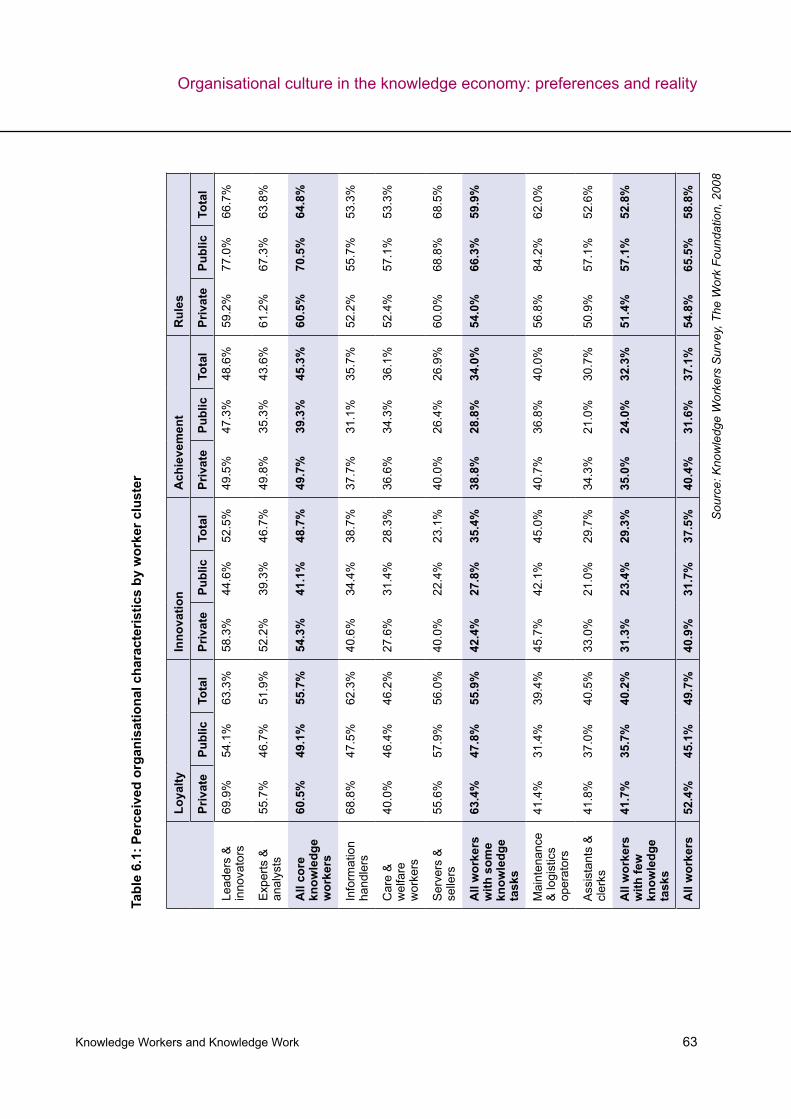
Knowledge Workers and Knowledge Work 63
Loya
ltyIn
nova
tion
Ach
ieve
men
tR
ules
Priv
ate
Publ
icTo
tal
Priv
ate
Publ
icTo
tal
Priv
ate
Publ
icTo
tal
Priv
ate
Publ
icTo
tal
Lead
ers
&
inno
vato
rs69
.9%
54.1
%63
.3%
58.3
%44
.6%
52.5
%49
.5%
47.3
%48
.6%
59.2
%77
.0%
66.7
%
Exp
erts
&
anal
ysts
55.7
%46
.7%
51.9
%52
.2%
39.3
%46
.7%
49.8
%35
.3%
43.6
%61
.2%
67.3
%63
.8%
All
core
kn
owle
dge
wor
kers
60.5
%49
.1%
55.7
%54
.3%
41.1
%48
.7%
49.7
%39
.3%
45.3
%60
.5%
70.5
%64
.8%
Info
rmat
ion
hand
lers
68.8
%47
.5%
62.3
%40
.6%
34.4
%38
.7%
37.7
%31
.1%
35.7
%52
.2%
55.7
%53
.3%
Car
e &
w
elfa
re
wor
kers
40.0
%46
.4%
46.2
%27
.6%
31.4
%28
.3%
36.6
%34
.3%
36.1
%52
.4%
57.1
%53
.3%
Ser
vers
&
selle
rs55
.6%
57.9
%56
.0%
40.0
%22
.4%
23.1
%40
.0%
26.4
%26
.9%
60.0
%68
.8%
68.5
%
All
wor
kers
w
ith s
ome
know
ledg
e ta
sks
63.4
%47
.8%
55.9
%42
.4%
27.8
%35
.4%
38.8
%28
.8%
34.0
%54
.0%
66.3
%59
.9%
Mai
nten
ance
&
logi
stic
s op
erat
ors
41.4
%31
.4%
39.4
%45
.7%
42.1
%45
.0%
40.7
%36
.8%
40.0
%56
.8%
84.2
%62
.0%
Ass
ista
nts
&
cler
ks41
.8%
37.0
%40
.5%
33.0
%21
.0%
29.7
%34
.3%
21.0
%30
.7%
50.9
%57
.1%
52.6
%
All
wor
kers
w
ith fe
w
know
ledg
e ta
sks
41.7
%35
.7%
40.2
%31
.3%
23.4
%29
.3%
35.0
%24
.0%
32.3
%51
.4%
57.1
%52
.8%
All
wor
kers
52.4
%45
.1%
49.7
%40
.9%
31.7
%37
.5%
40.4
%31
.6%
37.1
%54
.8%
65.5
%58
.8%
Sou
rce:
Kno
wle
dge
Wor
kers
Sur
vey,
The
Wor
k Fo
unda
tion,
200
8
Tabl
e 6.
1: P
erce
ived
org
anis
atio
nal c
hara
cter
istic
s by
wor
ker c
lust
er
Organisational culture in the knowledge economy: preferences and reality
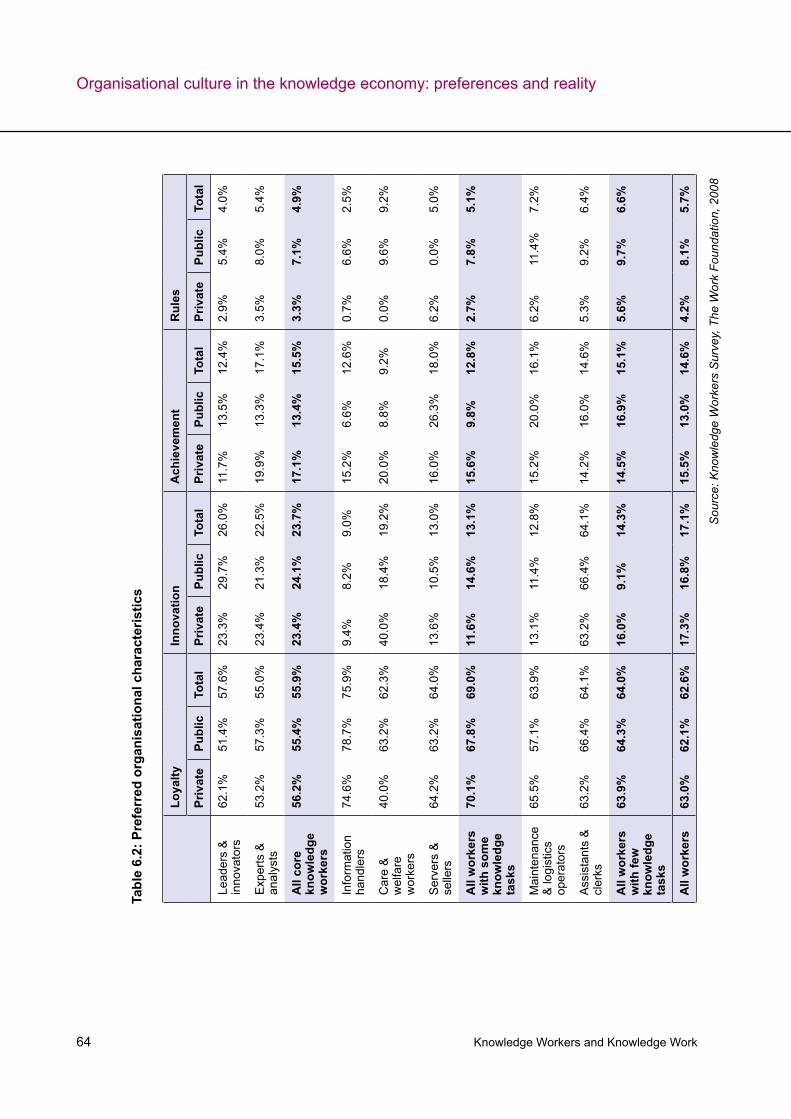
Knowledge Workers and Knowledge Work 64
Loya
ltyIn
nova
tion
Ach
ieve
men
tR
ules
Priv
ate
Publ
icTo
tal
Priv
ate
Publ
icTo
tal
Priv
ate
Publ
icTo
tal
Priv
ate
Publ
icTo
tal
Lead
ers
&
inno
vato
rs62
.1%
51.4
%57
.6%
23.3
%29
.7%
26.0
%11
.7%
13.5
%12
.4%
2.9%
5.4%
4.0%
Exp
erts
&
anal
ysts
53.2
%57
.3%
55.0
%23
.4%
21.3
%22
.5%
19.9
%13
.3%
17.1
%3.
5%8.
0%5.
4%
All
core
kn
owle
dge
wor
kers
56.2
%55
.4%
55.9
%23
.4%
24.1
%23
.7%
17.1
%13
.4%
15.5
%3.
3%7.
1%4.
9%
Info
rmat
ion
hand
lers
74.6
%78
.7%
75.9
%9.
4%8.
2%9.
0%15
.2%
6.6%
12.6
%0.
7%6.
6%2.
5%
Car
e &
w
elfa
re
wor
kers
40.0
%63
.2%
62.3
%40
.0%
18.4
%19
.2%
20.0
%8.
8%9.
2%0.
0%9.
6%9.
2%
Ser
vers
&
selle
rs64
.2%
63.2
%64
.0%
13.6
%10
.5%
13.0
%16
.0%
26.3
%18
.0%
6.2%
0.0%
5.0%
All
wor
kers
w
ith s
ome
know
ledg
e ta
sks
70.1
%67
.8%
69.0
%11
.6%
14.6
%13
.1%
15.6
%9.
8%12
.8%
2.7%
7.8%
5.1%
Mai
nten
ance
&
logi
stic
s op
erat
ors
65.5
%57
.1%
63.9
%13
.1%
11.4
%12
.8%
15.2
%20
.0%
16.1
%6.
2%11
.4%
7.2%
Ass
ista
nts
&
cler
ks63
.2%
66.4
%64
.1%
63.2
%66
.4%
64.1
%14
.2%
16.0
%14
.6%
5.3%
9.2%
6.4%
All
wor
kers
w
ith fe
w
know
ledg
e ta
sks
63.9
%64
.3%
64.0
%16
.0%
9.1%
14.3
%14
.5%
16.9
%15
.1%
5.6%
9.7%
6.6%
All
wor
kers
63.0
%62
.1%
62.6
%17
.3%
16.8
%17
.1%
15.5
%13
.0%
14.6
%4.
2%8.
1%5.
7%
Sou
rce:
Kno
wle
dge
Wor
kers
Sur
vey,
The
Wor
k Fo
unda
tion,
200
8
Tabl
e 6.
2: P
refe
rred
org
anis
atio
nal c
hara
cter
istic
s
Organisational culture in the knowledge economy: preferences and reality
Knowledge Workers and Knowledge Work 65
Another interesting result is that private sector care and welfare workers perceive their organisations being based on mutual trust and loyalty (46 per cent) and committed to innovation and development (24 per cent) to a much smaller extent than their counterparts in the public sector and when compared with other groups of workers with jobs of similar knowledge intensity, such as information handlers and servers and sellers.
We also asked workers to indicate which of the four organisational characterisations they would prefer their organisations they work at to demonstrate (see Table 6.2 above). For all workers, regardless of the knowledge intensity of their work, the strong preference was for organisations built on mutual trust and loyalty, while very few respondents stated that they preferred to work for an organisation bound by rules and procedures. Unfortunately, this latter characteristic is also the one that most workers perceive as prevalent in their organisations. Over 60 per cent of knowledge workers said their organisation was characterised by rules and regulations but less than 5 per cent said they preferred such organisations. In contrast to the perceived organisational culture characteristics, our respondents do not seem to be as divided in their preferences depending on whether they work in the private or public sector.On the other hand, only few workers overall seem to prefer innovation and development and the emphasis on achievement and accomplishment. This is still significantly less than the 50 per cent of knowledge workers who characterised their firm and organisation as innovative. Even for the knowledge worker group we labelled as ‘leaders and innovators’ only 27 per cent expressed a strong preference for innovative organisations.
Table 6.2 suggests that there are two sharp contrasts between the preferences of core knowledge workers and those of the rest. Core knowledge workers prefer relatively more to work for organisations that promote innovation and development (regardless of whether they are located in the public or private sector) and relatively less to work for organisations that emphasise loyalty and mutual trust. Moreover, the core knowledge workers are the ones that prefer the most organisations that promote achievement and accomplishment and the least organisations that are bound by formal rules and policies. However, they more or less share these preferences with workers with only few knowledge tasks and workers with only some knowledge tasks respectively.
While our results suggest some interesting insights, there are also some caveats that should be taken into account when interpreting them. This is especially true for the findings that show that
Organisational culture in the knowledge economy: preferences and reality
Knowledge Workers and Knowledge Work 66
on the one hand, UK organisations are not widely perceived to be committed to innovation and development and on the other hand, that relatively few of our respondents would prefer to work in organisations with this commitment. These caveats are associated with the way the questions in survey were asked.
Our questions on the perceived and preferred organisational characteristics did not uncover or specify the definition of innovation that each respondent may have had in mind. Innovation, sometimes categorised as ‘soft innovation’ in areas such as management and work organisation, marketing and design, is very often only incremental, ie consisting of small changes in the way things are done and without involving new technologies. However, if the predominant perception of innovation is one of exclusively radical and technologically based advances, people may underestimate the innovative character of their own organisation. It is possible, therefore, that our questions have led to responses that underestimate the commitment to innovation and development of firms.
Similarly, if organisations are considered as innovative only when they are ‘at the cutting edge’, then they can also be perceived as riskier and more likely to fold, a perception that could explain the low preference that our survey respondents expressed, even the core knowledge workers, for working in such organisations. Again, the way our question was posed may have prompted responses that understate the preferences of workers for innovative organisations.
The continued importance of rules and procedures in UK organisations combined with the adherence to traditional styles of working suggest that in many ways the knowledge economy is more about the growth of knowledge-intensive industries as a result of technology and an increasingly skilled workforce rather than a complete overhaul of the world of work.
Organisational culture in the knowledge economy: preferences and reality
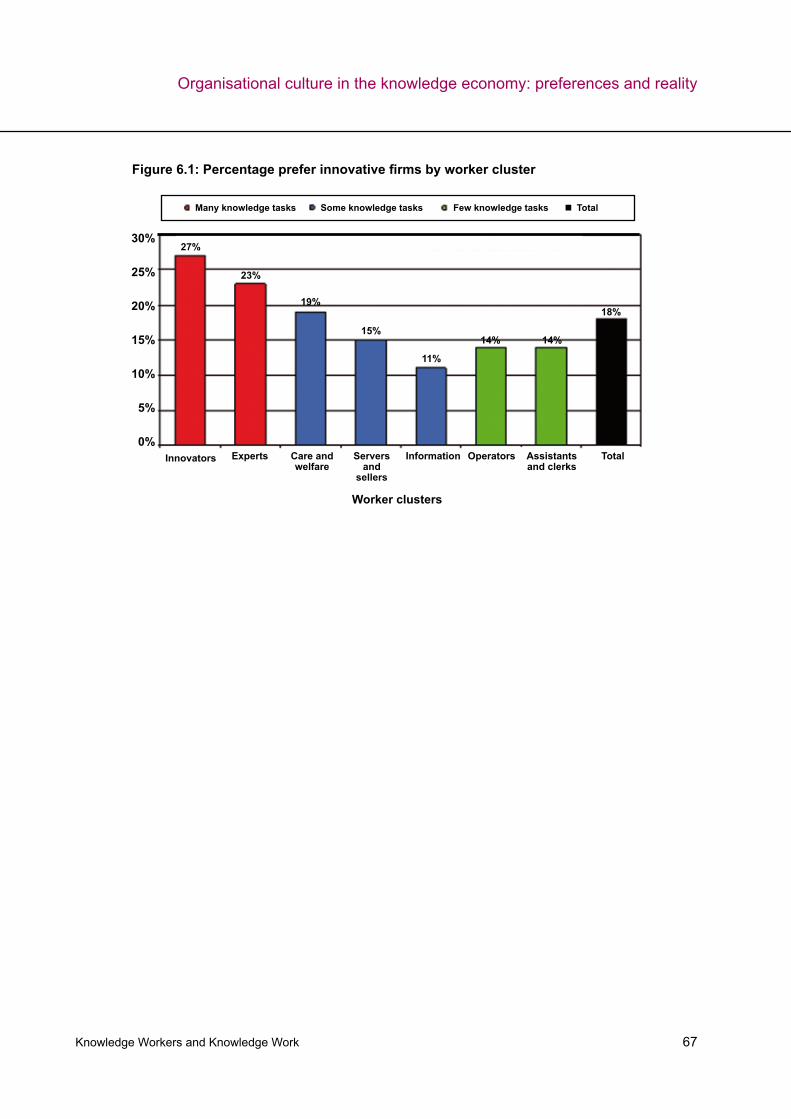
Knowledge Workers and Knowledge Work 67
Figure 6.1: Percentage prefer innovative firms by worker cluster
Many knowledge tasks Some knowledge tasks Few knowledge tasks Total
Innovators Experts Information Assistants and clerks
Serversand
sellers
Care and welfare
Operators
Worker clusters
Total
30%
25%
20%
15%
10%
5%
0%
27%
23%
19%
15%
11%
14% 14%
18%
Organisational culture in the knowledge economy: preferences and reality
Knowledge Workers and Knowledge Work 68
The purpose of this report is to provide a portrait of work and the workforce in the knowledge economy. We wanted to find out who the knowledge workers are, what they do in their jobs, where they are employed and what employment structures, job characteristics and organisational structures look like in the knowledge economy.
Knowledge work and knowledge workers are terms often used but seldom defined. When knowledge work is defined it is usually by broad measures such by job title or by education level. At best this gives us a partial and simplistic view of knowledge work in the UK.
This report takes a new approach. In a large and unique survey we have asked people what they actually do at work and how often they perform particular tasks. We have used that information to assess the knowledge content of their jobs. The key test was the cognitive complexity required for each task – the use of high level ‘tacit’ knowledge that resides in people’s minds rather than being written down (or codified) in manuals, guides, lists and procedures.
We then grouped the workforce into seven distinct clusters of jobs ranging from ‘expert thinkers, innovators and leaders’ (the most knowledge intensive groups) to ‘assistants and clerks’ (the least knowledge intensive)23. We describe the two highest knowledge groups as our ‘core’ knowledge worker.
With this measure we estimated that we have a 30-30-40 workforce – 30 per cent in jobs with high knowledge content, 40 per cent in jobs with some knowledge content, and 40 per cent in jobs with less knowledge content.
Within our 30 per cent ‘core’ knowledge worker group, the highest group of all (‘leaders and innovators’) constituted just 11 per cent of the workforce. These high intensity knowledge jobs combined high level cognitive activity with high level management tasks.
These high knowledge intensive jobs are, we suspect, what some of the more excitable accounts of knowledge work have in mind. The reality is that even after 40 years uninterrupted growth in knowledge based industries and occupations such jobs account for only one in ten of those in work today.
23 These groupings are described in more detail on page 24
7. Conclusion and recommendations

Knowledge Workers and Knowledge Work 69
We confirmed that knowledge work cannot be adequately described simply by looking at job titles or education levels. About 20 per cent of people engaged in jobs with high knowledge content – our core group of knowledge workers – were not graduates.
However, about 20 per cent of graduates were in low knowledge content jobs. This is potentially worrying. But the average job tenure for graduates in such jobs was much lower than for non-graduates – suggesting graduates spend less time in these jobs. Moreover, about over 40 per cent of graduates in low knowledge content jobs reported their job duties corresponded well with their current skills.
We also show that current job titles understate the knowledge content of jobs within some sectors such as manufacturing. When jobs are classified by knowledge content high tech manufacturing has as many knowledge intensive jobs, proportionately, as high tech services.
The 30-30-40 knowledge economy workforce
Few knowledge tasks, 40%
Many knowledge tasks, 33%
Some knowledge tasks, 27%
Conclusion and recommendations
Knowledge Workers and Knowledge Work 70
The most knowledge intensive jobs were almost equally likely to be held by men and women, but those jobs with some knowledge content – such as care and welfare workers, information handlers, and sellers and servers – were overwhelmingly female. Woman have benefitted from the growth of knowledge work, but the growth of more knowledge intensive work has not, of itself, overcome the gender pay gap.
Knowledge work and knowledge workers are often seen as at the forefront of radical workplace change. Under these types of scenarios, well-educated knowledge workers have been enabled by the new information and communication technologies to participate in the global economy and throw off the shackles of permanent long term relationships with the corporate world. This we are told will become the labour market norm in the future and companies and organisations must adjust their work practices and forge new employment relationships to cope.
We find no evidence for this. Those in the most knowledge intensive jobs are no more likely to be in temporary jobs than those in the least knowledge intensive jobs and job tenures are also very similar.
Knowledge workers are not spear-heading radical changes in the way we work. As expected, they do have more flexibility at work than those in less knowledge intensive jobs, but the differences were not overwhelming. The reality is that less than 50 per cent of all workers and less than 60 per cent of knowledge workers say they have some flexibility in their work schedule, and only a very small minority said they can freely determine their own hours.
Perhaps not surprising, attachment to the standard nine to five day is still a central feature of the labour market for both knowledge workers and non-knowledge workers alike. Knowledge workers were far more likely to do occasional work at home, although over 60 per cent said they did no home-working. Weekend working is relatively common across the workforce, but was much less prevalent among knowledge workers.
Knowledge workers enjoy more flexibility than others and have more opportunities to work at home, but the overall sense is one of conservatism rather than radicalism when it comes to the employment relationship. Knowledge workers appear to value long term relationships with their employer and remain fairly attached to the standard working day.
Organisational
implications
Conclusion and recommendations
Knowledge Workers and Knowledge Work 71
One question that flows from this analysis is why knowledge work and the growth of the knowledge based industries has not led to a greater revolution in workplace organisation. It could be that offered the chance to become ‘intrapreneurs’ or ‘nomads’ most people prefer to opt for more secure and traditional relationships with a bit more flexibility than had been previously possible. But it could also be that many organisations and workplaces have not yet caught up with the possibilities that better educated workers and new technologies offer for increased flexible working.
Our survey did not directly test out which of these propositions are closer to the truth or whether it is an amalgamation of the two. However, it is striking that in one key area – determination of hours – how few knowledge workers had full control over the hours they worked and that a very large minority said they had no control at all.
This impression of rigidity is supported by the huge discrepancy in our organisation culture question between knowledge worker preferences and reality when it came to organisations characterised by rules and procedures. The vast majority of people in work think their organisation is characterised by formal rules and policies, but very few say this is the sort of organisation they really want to work for. The mismatch is even greater for knowledge workers: 65 per cent said their organisations were rule and policy bound but only 5 per cent expressed a preference for such organisations.
There is a much better match when it comes to characteristics such as loyalty and mutual trust for both knowledge and non-knowledge workers. About 50 per cent of all workers said this was a predominant characteristic of their organisation, and over 60 per cent said it was their preferred organisational characteristic.
Knowledge workers are more likely to work for organisations that they think are innovative or achievement orientated – not in itself a surprising result. What is surprising is that neither feature seems to appeal to them very much. For example, 50 per cent of knowledge workers said their organisation’s predominant feature was innovation, development and being at the cutting edge, but only 24 per cent preferred this type of organisation.
However, this was less true for knowledge workers than others – suggesting either they were less constrained than other workers or had found a way round the rules.
Conclusion and recommendations
Knowledge Workers and Knowledge Work 72
What is surprising is that even knowledge workers did not show strong preferences for such organisational characteristics – along with other workers their strongest preference was for organisations built on mutual trust and loyalty. Our survey did not allow us to probe in more detail why innovation and achievement did not rank more highly in people’s preferences. One possibility is the balance between risk and reward for most people in the organisation – for example, the financial rewards from an ‘achievement and success’ orientated organisation might not be evenly shared. Another is that rules and regulations and trust and loyalty are seen as affecting all people in an organisation whereas characteristics such as innovation are seen as relevant only to some jobs.
There are some warning signs here for public sector organisations – they scored worse than the private sector for being rule and regulation bound (for which there can be good reasons as well as bad) but also were less likely to be perceived as organisations high in mutual trust and loyalty. Regardless of where they worked (public based or private based industries) knowledge and other workers expressed similar preferences.
We have to be careful about over-interpreting some of these results. For example, organisations must have some rules and procedures – however irksome for the individual – in order to function. In some areas they are essential for safety and probity and consistency in dealing with clients, customers, and citizens. Similarly, simple questions over skill utilisation and job demands do not tell us whether the mismatch is a serious one or could be addressed by minor changes to the job. People may also be reluctant to admit that the demands of their jobs are too much for them. Even so, the results here are consistent with some other survey findings.
Taken at face value, employers are not making the most of knowledge worker skills despite such workers representing a substantial investment in human capital within the organisation. Our survey found a significant minority of knowledge workers said they had more skills than their jobs demanded of them. However, the position was even worse for those in less knowledge jobs – so organisations who employed knowledge workers appear to be doing rather better at matching their talents to job demands than for other posts. This suggests a more general problem around issues such as job design, career development, and progression across the workforce as a whole.
All groups of workers reported their current jobs under used their skills. The gap was less marked for knowledge workers, but nonetheless significant. About 36 per cent of knowledge
Skills and the
knowledge
economy
Conclusion and recommendations
Knowledge Workers and Knowledge Work 73
workers said they were in jobs that under used their skills compared with over 44 per cent of those in jobs with some or little knowledge content.
Our results confirmed high economic returns to knowledge – the vast majority of those in the most knowledge intensive jobs enjoyed pay well above the median. But this was not true for those in jobs with some knowledge content – such as care and welfare work.
Some have expressed concern that the economy is producing too many graduates for the available jobs that require graduate skills, forcing more graduates to accept lower pay jobs than their education warrants and worsening the prospects for non-graduates.
Taken with the evidence on returns from knowledge and our previous work on labour market polarisation24, the overall picture from our survey does not strongly support the idea that the UK is producing too many graduates.
There is however undoubtedly problems for a minority of graduates in finding jobs that match their skills. The situation may also be worse for those who entered the labour market more recently, but we found little variation in the responses by age. Those under 25 with less knowledge intensive jobs were no more likely to report their skills exceeded the demands of the job than those over 25.
This survey was conducted in 2007, so pre-dates the recession. The perceptions of workers in some parts of the private sector may well be shifting, noticeably in parts of the financial services industries.
One of the biggest tests of any organisation is how to retain the trust, loyalty and commitment of the workforce at a time when some redundancies, cut-backs, and loss of earnings and promotion prospects is unavoidable. The relatively close match between perceptions and reality of organisational preferences in terms of mutual trust and loyalty that we saw pre- recession will come under strain.
So far employers have proved reluctant to lay off large numbers of people, with reported use of pay and hours flexibility and recruitment freezes as alternatives to redundancy. In the first six months of this recession, employment has fallen by less than the first six months of the previous recession. In addition, where cuts have been made they have fallen disproportionately on agency labour – partly to protect the ‘core’ permanent workforce.
24 Fauth and Brinkley (2006) Polarisation and labour market efficiency, The Work Foundation
Implications
of the
recession
Conclusion and recommendations
Knowledge Workers and Knowledge Work 74
Our wider work on the knowledge economy in previous recessions for the UK, US, and the EU shows that employment among knowledge based service industries and amongst workers in knowledge intensive jobs has been much more stable than employment in the rest of the economy. Moreover, employment expands in public based industries such as education and health. We may therefore see an opening up of more a gap between those in knowledge intensive jobs and those in less knowledge intensive jobs.
Across the economy as a whole, business investment in knowledge based intangible assets is cut back less severely than investment in physical capital. The most resilient form of investment is in human and organisational capital. We interpret this as organisations trying to make the most of the surviving workforce, restructuring and rethinking business models.
This makes it more imperative for organisations to address the widespread problem of skills underutilisation, but at the same-time the means to do so may become more constrained by the tendency to cut spending on all but the most essential. Moreover, to the extent that mismatch in skills and job demands is addressed it is more likely to be directed at those in more knowledge based occupations. These jobs are more likely to survive employment cut-backs and we expect a higher proportion of newly qualified graduates to compete for less knowledge intensive positions.
This in turn will increase pressure on the government to cut back the rate of expansion in higher and further education on the grounds that the UK has an oversupply of graduates. The recession will indeed change the balance between demand and supply for knowledge intensive labour – primarily by restricting new jobs for graduate-level entrants. As graduate unemployment rises and more graduates take any job going, the further expansion of further and higher education will look more questionable. However, it is important that the cyclical effects are separated out from the longer run needs of the knowledge based economy. The post recession economy will see continued growth in knowledge intensive service industries25 and to reduce the supply of graduate labour now would have significant repercussions for the ability of such industries to expand in the longer run. Indeed, there is a strong case to bring forward expansion in higher and further education so that young people who would otherwise be consigned to a very difficult and possibly fruitless search for work have the opportunity to study instead.
25 UKCES, 2009, Working Futures 2007-2017
Conclusion and recommendations

Knowledge Workers and Knowledge Work 75
These are the first set of findings from our knowledge working survey. We will be publishing a second set of findings later in 2009 that look more closely at how knowledge work can be regarded as ‘good work’ and how it relates to health and well-being at work.
Next steps
Conclusion and recommendations
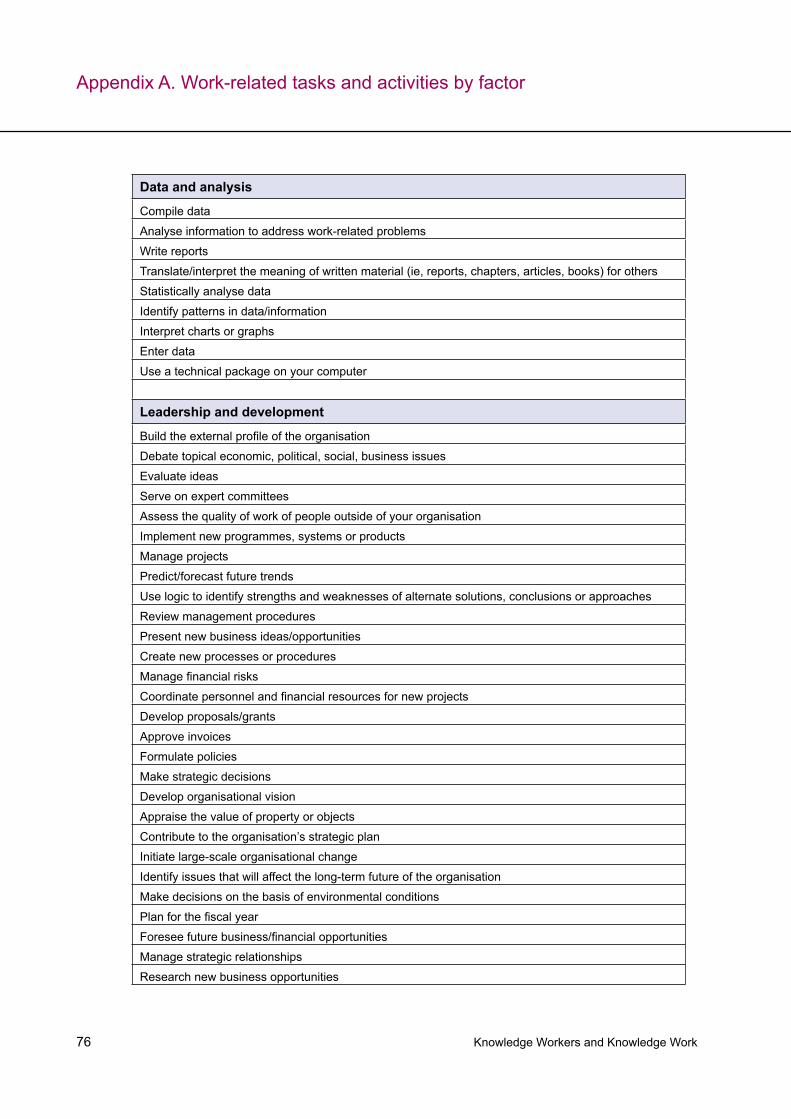
Knowledge Workers and Knowledge Work 76
Appendix A. Work-related tasks and activities by factor
Data and analysis
Compile data
Analyse information to address work-related problems
Write reports
Translate/interpret the meaning of written material (ie, reports, chapters, articles, books) for others
Statistically analyse data
Identify patterns in data/information
Interpret charts or graphs
Enter data
Use a technical package on your computer
Leadership and development
Build the external profile of the organisation
Debate topical economic, political, social, business issues
Evaluate ideas
Serve on expert committees
Assess the quality of work of people outside of your organisation
Implement new programmes, systems or products
Manage projects
Predict/forecast future trends
Use logic to identify strengths and weaknesses of alternate solutions, conclusions or approaches
Review management procedures
Present new business ideas/opportunities
Create new processes or procedures
Manage financial risks
Coordinate personnel and financial resources for new projects
Develop proposals/grants
Approve invoices
Formulate policies
Make strategic decisions
Develop organisational vision
Appraise the value of property or objects
Contribute to the organisation’s strategic plan
Initiate large-scale organisational change
Identify issues that will affect the long-term future of the organisation
Make decisions on the basis of environmental conditions
Plan for the fiscal year
Foresee future business/financial opportunities
Manage strategic relationships
Research new business opportunities
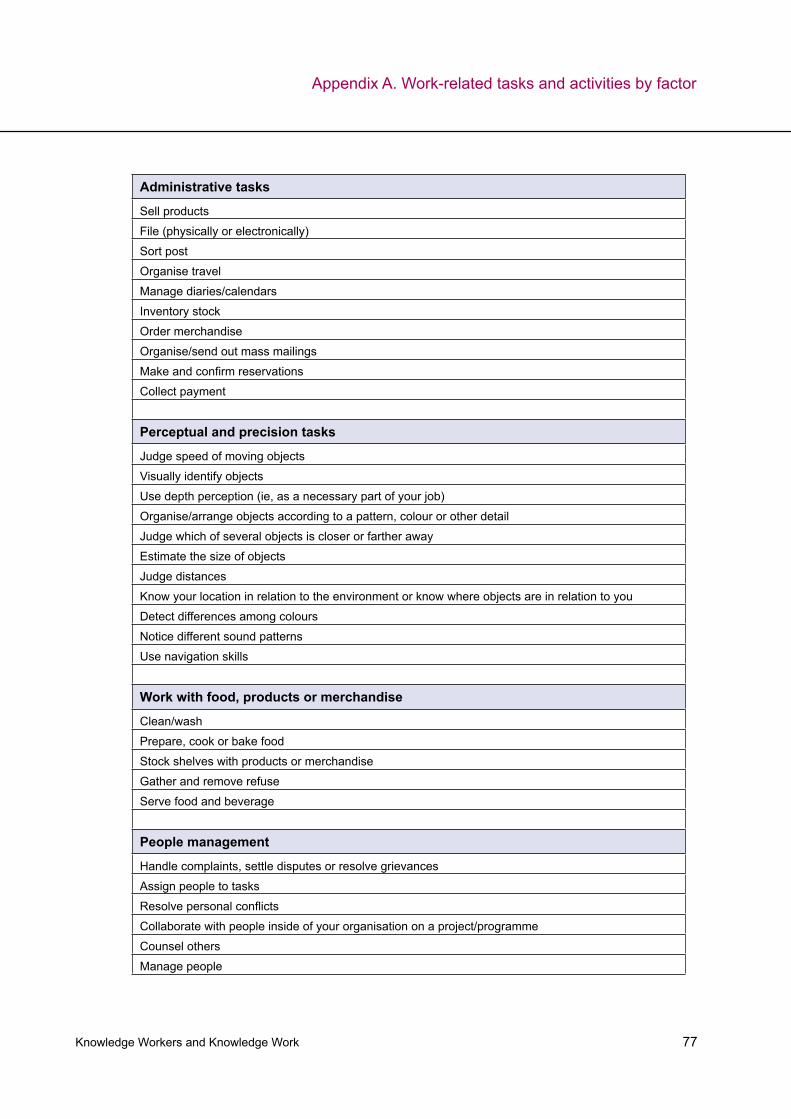
Knowledge Workers and Knowledge Work 77
Appendix A. Work-related tasks and activities by factor
Administrative tasks
Sell products
File (physically or electronically)
Sort post
Organise travel
Manage diaries/calendars
Inventory stock
Order merchandise
Organise/send out mass mailings
Make and confirm reservations
Collect payment
Perceptual and precision tasks
Judge speed of moving objects
Visually identify objects
Use depth perception (ie, as a necessary part of your job)
Organise/arrange objects according to a pattern, colour or other detail
Judge which of several objects is closer or farther away
Estimate the size of objects
Judge distances
Know your location in relation to the environment or know where objects are in relation to you
Detect differences among colours
Notice different sound patterns
Use navigation skills
Work with food, products or merchandise
Clean/wash
Prepare, cook or bake food
Stock shelves with products or merchandise
Gather and remove refuse
Serve food and beverage
People management
Handle complaints, settle disputes or resolve grievances
Assign people to tasks
Resolve personal conflicts
Collaborate with people inside of your organisation on a project/programme
Counsel others
Manage people
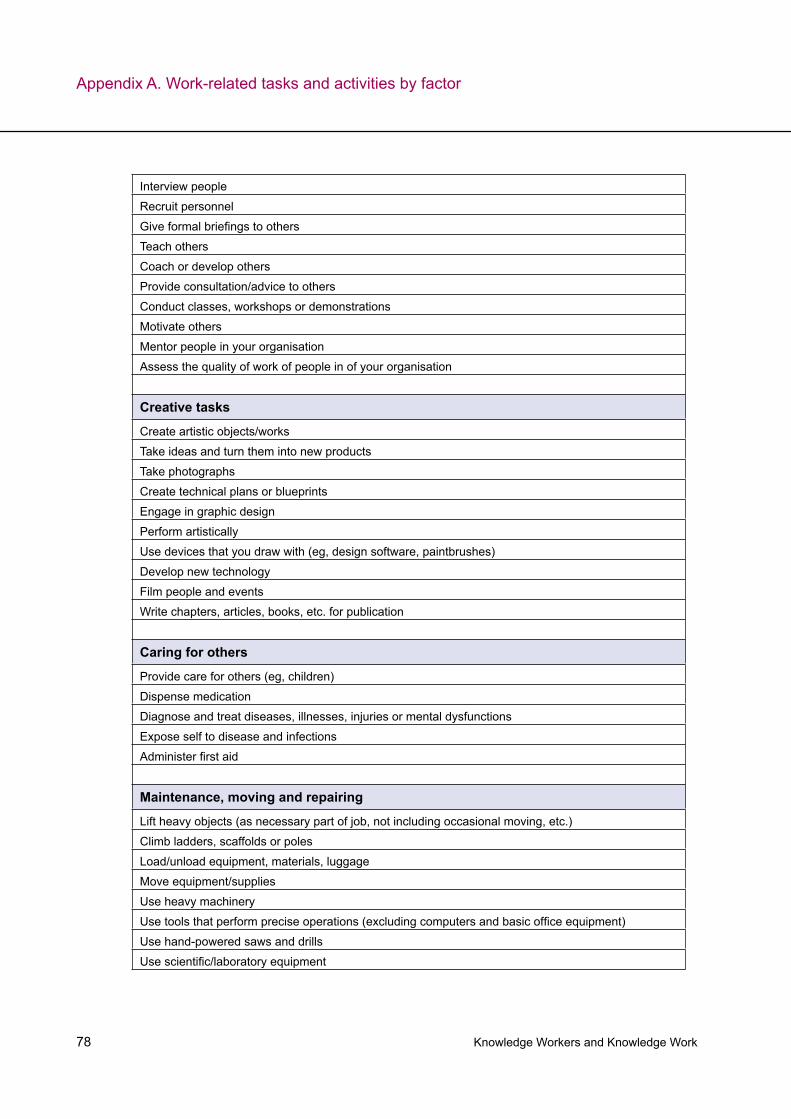
Knowledge Workers and Knowledge Work 78
Interview people
Recruit personnel
Give formal briefings to others
Teach others
Coach or develop others
Provide consultation/advice to others
Conduct classes, workshops or demonstrations
Motivate others
Mentor people in your organisation
Assess the quality of work of people in of your organisation
Creative tasks
Create artistic objects/works
Take ideas and turn them into new products
Take photographs
Create technical plans or blueprints
Engage in graphic design
Perform artistically
Use devices that you draw with (eg, design software, paintbrushes)
Develop new technology
Film people and events
Write chapters, articles, books, etc. for publication
Caring for others
Provide care for others (eg, children)
Dispense medication
Diagnose and treat diseases, illnesses, injuries or mental dysfunctions
Expose self to disease and infections
Administer first aid
Maintenance, moving and repairing
Lift heavy objects (as necessary part of job, not including occasional moving, etc.)
Climb ladders, scaffolds or poles
Load/unload equipment, materials, luggage
Move equipment/supplies
Use heavy machinery
Use tools that perform precise operations (excluding computers and basic office equipment)
Use hand-powered saws and drills
Use scientific/laboratory equipment
Appendix A. Work-related tasks and activities by factor
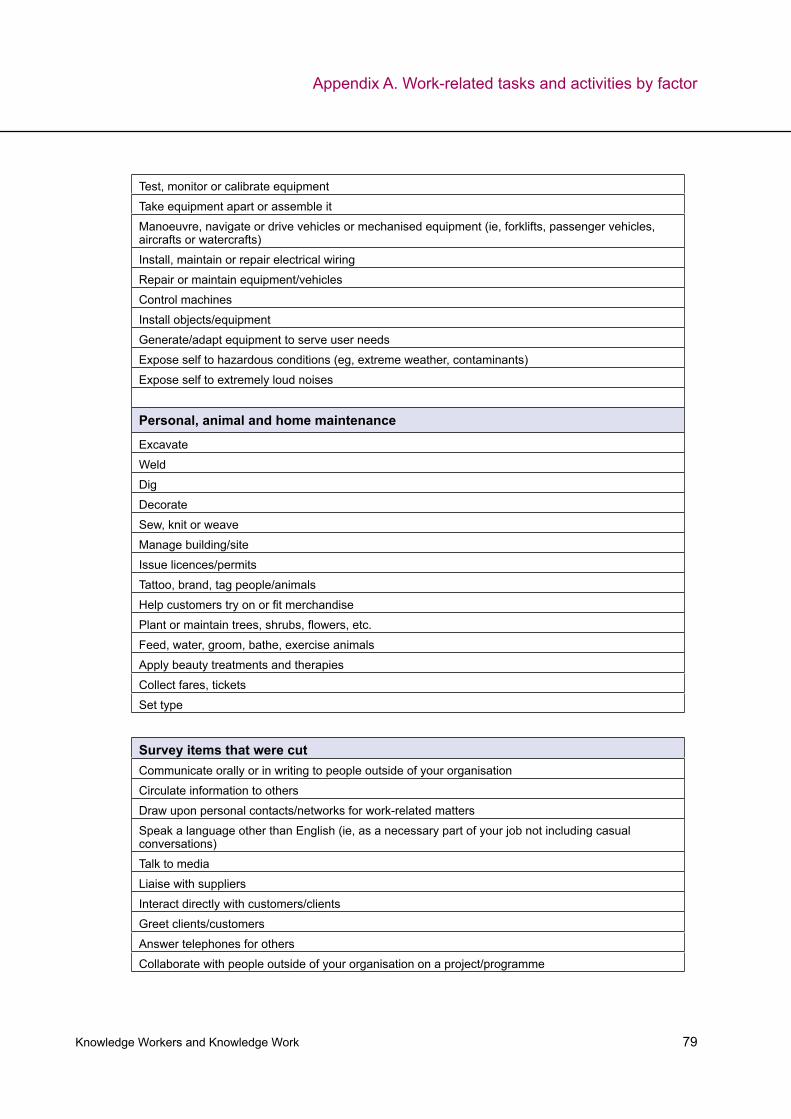
Knowledge Workers and Knowledge Work 79
Test, monitor or calibrate equipment
Take equipment apart or assemble it
Manoeuvre, navigate or drive vehicles or mechanised equipment (ie, forklifts, passenger vehicles, aircrafts or watercrafts)
Install, maintain or repair electrical wiring
Repair or maintain equipment/vehicles
Control machines
Install objects/equipment
Generate/adapt equipment to serve user needs
Expose self to hazardous conditions (eg, extreme weather, contaminants)
Expose self to extremely loud noises
Personal, animal and home maintenance
Excavate
Weld
Dig
Decorate
Sew, knit or weave
Manage building/site
Issue licences/permits
Tattoo, brand, tag people/animals
Help customers try on or fit merchandise
Plant or maintain trees, shrubs, flowers, etc.
Feed, water, groom, bathe, exercise animals
Apply beauty treatments and therapies
Collect fares, tickets
Set type
Survey items that were cutCommunicate orally or in writing to people outside of your organisation
Circulate information to others
Draw upon personal contacts/networks for work-related matters
Speak a language other than English (ie, as a necessary part of your job not including casual conversations)
Talk to media
Liaise with suppliers
Interact directly with customers/clients
Greet clients/customers
Answer telephones for others
Collaborate with people outside of your organisation on a project/programme
Appendix A. Work-related tasks and activities by factor
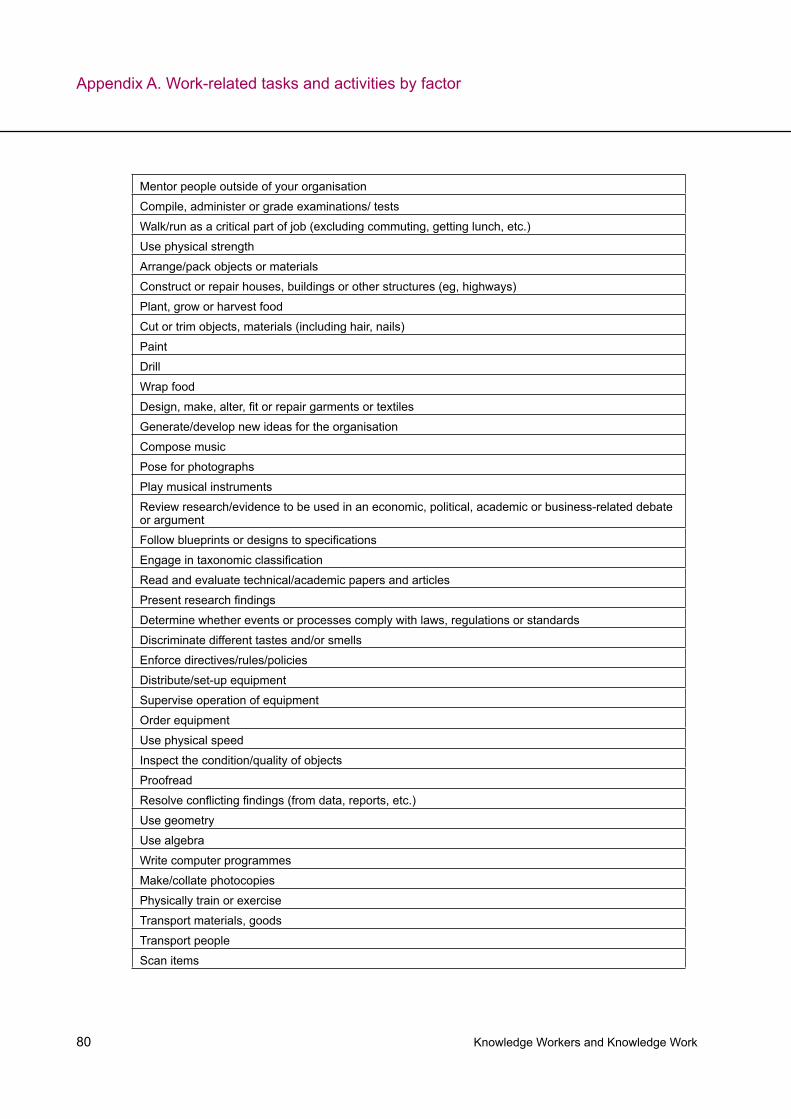
Knowledge Workers and Knowledge Work 80
Appendix A. Work-related tasks and activities by factor
Mentor people outside of your organisation
Compile, administer or grade examinations/ tests
Walk/run as a critical part of job (excluding commuting, getting lunch, etc.)
Use physical strength
Arrange/pack objects or materials
Construct or repair houses, buildings or other structures (eg, highways)
Plant, grow or harvest food
Cut or trim objects, materials (including hair, nails)
Paint
Drill
Wrap food
Design, make, alter, fit or repair garments or textiles
Generate/develop new ideas for the organisation
Compose music
Pose for photographs
Play musical instruments
Review research/evidence to be used in an economic, political, academic or business-related debate or argument
Follow blueprints or designs to specifications
Engage in taxonomic classification
Read and evaluate technical/academic papers and articles
Present research findings
Determine whether events or processes comply with laws, regulations or standards
Discriminate different tastes and/or smells
Enforce directives/rules/policies
Distribute/set-up equipment
Supervise operation of equipment
Order equipment
Use physical speed
Inspect the condition/quality of objects
Proofread
Resolve conflicting findings (from data, reports, etc.)
Use geometry
Use algebra
Write computer programmes
Make/collate photocopies
Physically train or exercise
Transport materials, goods
Transport people
Scan items
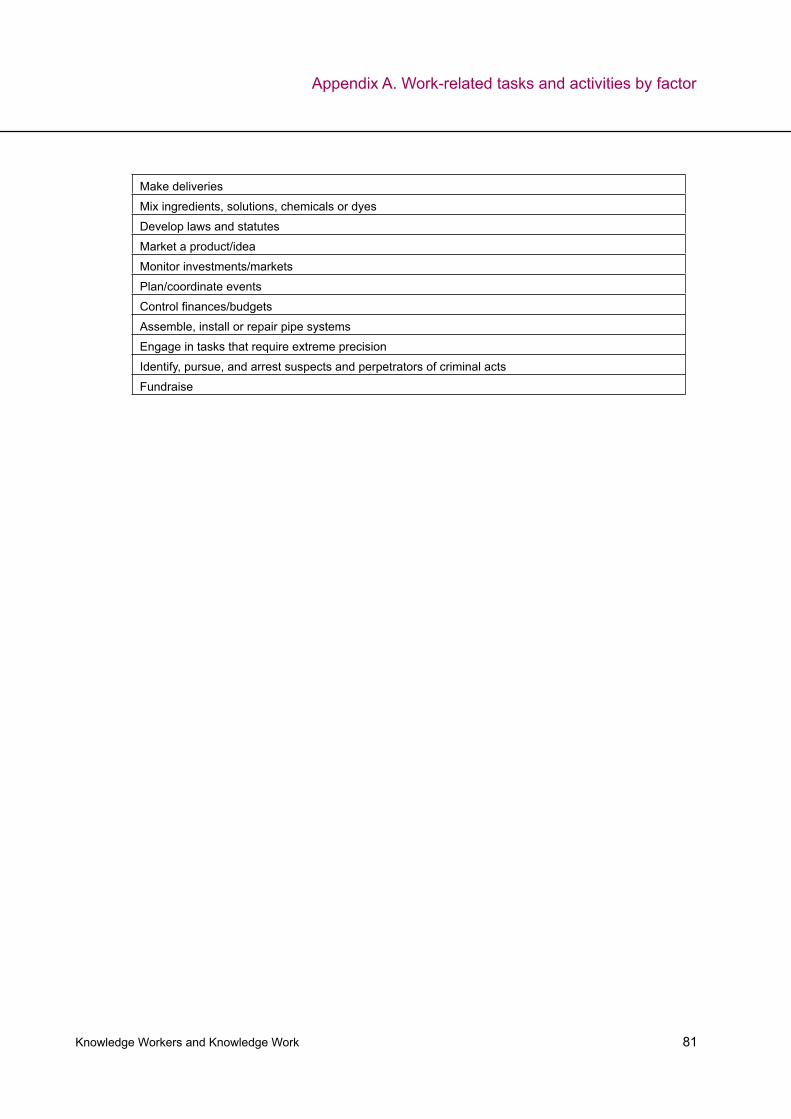
Knowledge Workers and Knowledge Work 81
Make deliveries
Mix ingredients, solutions, chemicals or dyes
Develop laws and statutes
Market a product/idea
Monitor investments/markets
Plan/coordinate events
Control finances/budgets
Assemble, install or repair pipe systems
Engage in tasks that require extreme precision
Identify, pursue, and arrest suspects and perpetrators of criminal acts
Fundraise
Appendix A. Work-related tasks and activities by factor
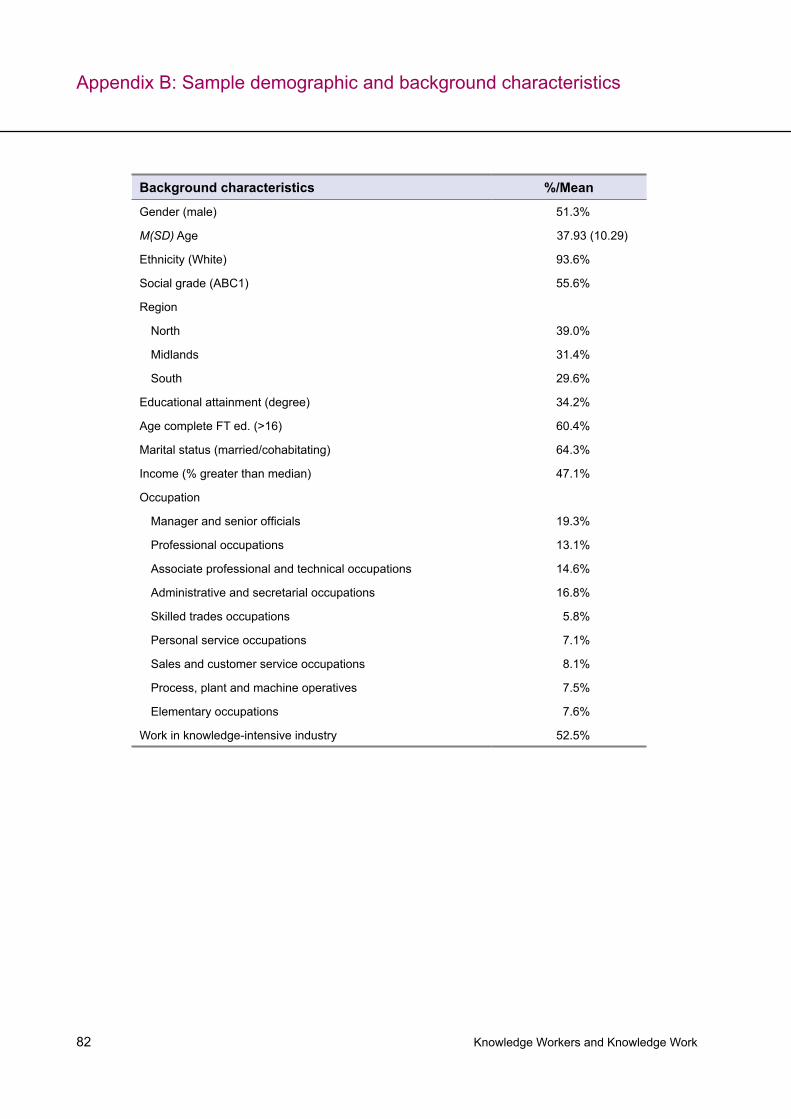
Knowledge Workers and Knowledge Work 82
Background characteristics %/Mean
Gender (male) 51.3%
M(SD) Age 37.93 (10.29)
Ethnicity (White) 93.6%
Social grade (ABC1) 55.6%
Region
North 39.0%
Midlands 31.4%
South 29.6%
Educational attainment (degree) 34.2%
Age complete FT ed. (>16) 60.4%
Marital status (married/cohabitating) 64.3%
Income (% greater than median) 47.1%
Occupation
Manager and senior officials 19.3%
Professional occupations 13.1%
Associate professional and technical occupations 14.6%
Administrative and secretarial occupations 16.8%
Skilled trades occupations 5.8%
Personal service occupations 7.1%
Sales and customer service occupations 8.1%
Process, plant and machine operatives 7.5%
Elementary occupations 7.6%
Work in knowledge-intensive industry 52.5%
Appendix B: Sample demographic and background characteristics
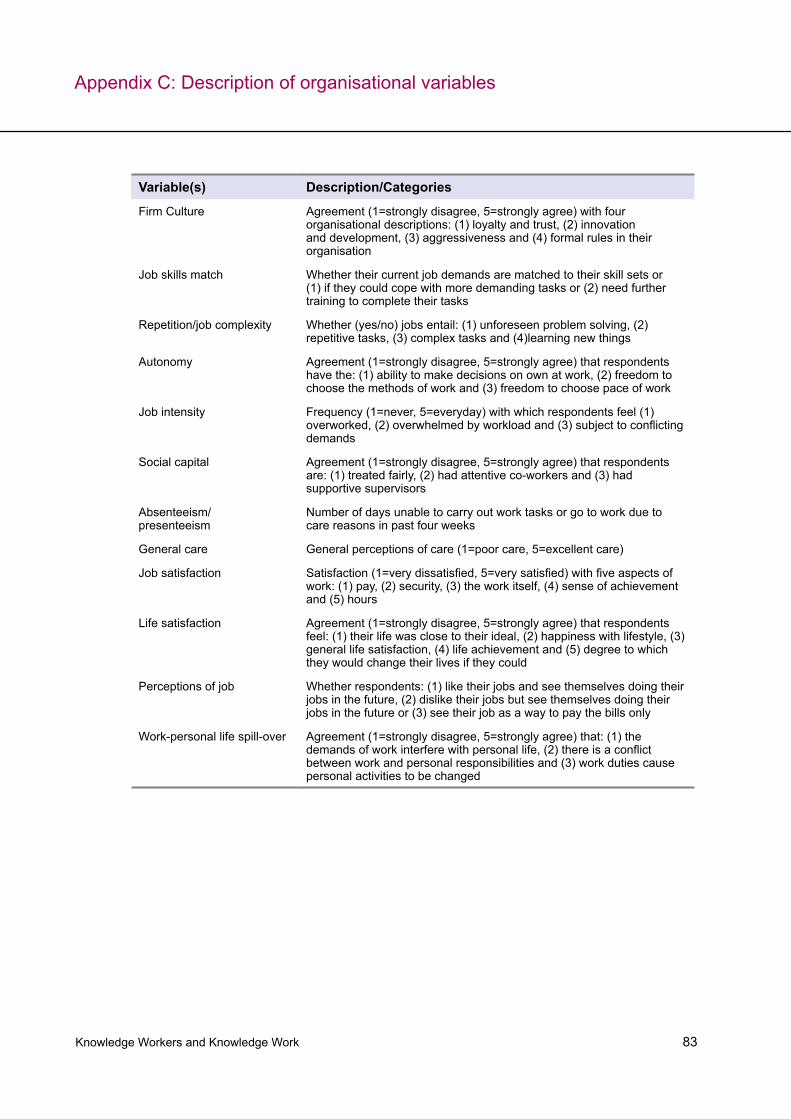
Knowledge Workers and Knowledge Work 83
Variable(s) Description/Categories
Firm Culture Agreement (1=strongly disagree, 5=strongly agree) with four organisational descriptions: (1) loyalty and trust, (2) innovation and development, (3) aggressiveness and (4) formal rules in their organisation
Job skills match Whether their current job demands are matched to their skill sets or (1) if they could cope with more demanding tasks or (2) need further training to complete their tasks
Repetition/job complexity Whether (yes/no) jobs entail: (1) unforeseen problem solving, (2) repetitive tasks, (3) complex tasks and (4)learning new things
Autonomy Agreement (1=strongly disagree, 5=strongly agree) that respondents have the: (1) ability to make decisions on own at work, (2) freedom to choose the methods of work and (3) freedom to choose pace of work
Job intensity Frequency (1=never, 5=everyday) with which respondents feel (1) overworked, (2) overwhelmed by workload and (3) subject to conflicting demands
Social capital Agreement (1=strongly disagree, 5=strongly agree) that respondents are: (1) treated fairly, (2) had attentive co-workers and (3) had supportive supervisors
Absenteeism/presenteeism
Number of days unable to carry out work tasks or go to work due to care reasons in past four weeks
General care General perceptions of care (1=poor care, 5=excellent care)
Job satisfaction Satisfaction (1=very dissatisfied, 5=very satisfied) with five aspects of work: (1) pay, (2) security, (3) the work itself, (4) sense of achievement and (5) hours
Life satisfaction Agreement (1=strongly disagree, 5=strongly agree) that respondents feel: (1) their life was close to their ideal, (2) happiness with lifestyle, (3) general life satisfaction, (4) life achievement and (5) degree to which they would change their lives if they could
Perceptions of job Whether respondents: (1) like their jobs and see themselves doing their jobs in the future, (2) dislike their jobs but see themselves doing their jobs in the future or (3) see their job as a way to pay the bills only
Work-personal life spill-over Agreement (1=strongly disagree, 5=strongly agree) that: (1) the demands of work interfere with personal life, (2) there is a conflict between work and personal responsibilities and (3) work duties cause personal activities to be changed
Appendix C: Description of organisational variables
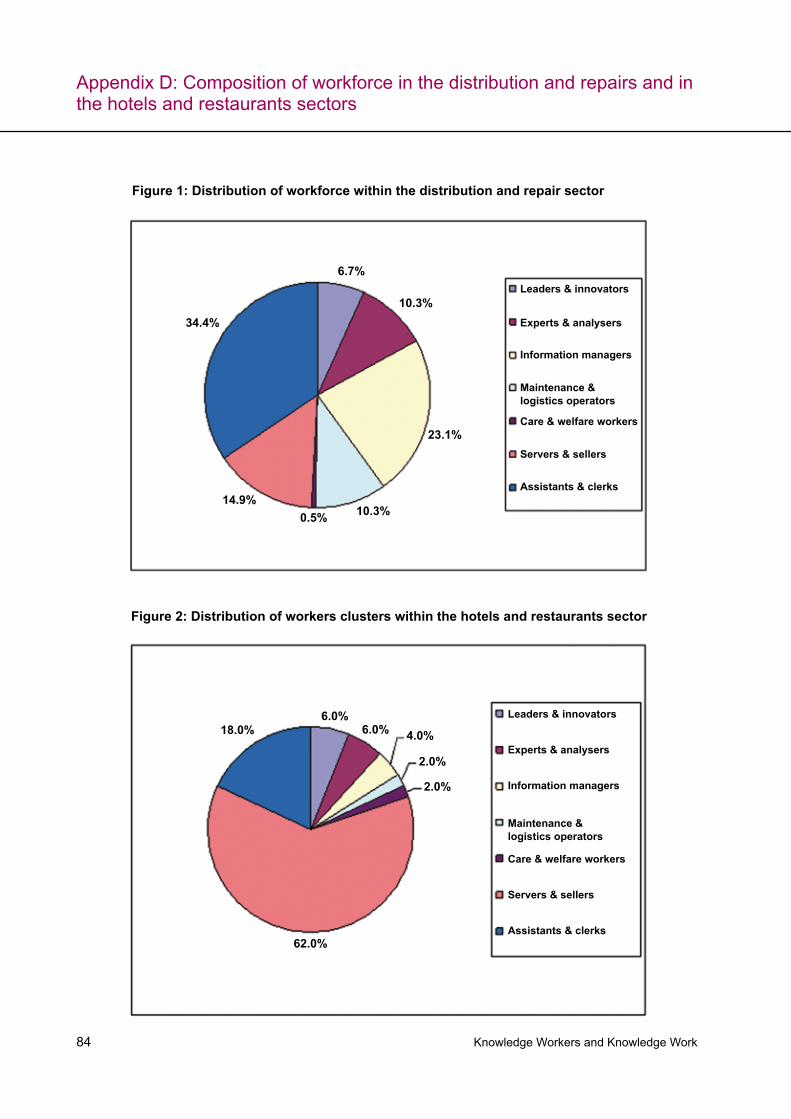
Knowledge Workers and Knowledge Work 84
Appendix D: Composition of workforce in the distribution and repairs and in the hotels and restaurants sectors
Leaders & innovators
Experts & analysers
Information managers
Maintenance & logistics operators
Care & welfare workers
Servers & sellers
Assistants & clerks
34.4%
14.9%
23.1%
10.3%
6.7%
10.3%0.5%
Leaders & innovators
Experts & analysers
Information managers
Maintenance & logistics operators
Care & welfare workers
Servers & sellers
Assistants & clerks
18.0% 6.0%
2.0%
2.0%
4.0%6.0%
62.0%
Figure 1: Distribution of workforce within the distribution and repair sector
Figure 2: Distribution of workers clusters within the hotels and restaurants sector
Knowledge Workers and Knowledge Work 85
References
Amar, A. D. 2002. Managing knowledge workers: Unleashing innovation and technology. Westport, CT: Quarum Books.Autor, David H., Frank Levy, and Richard J. Murnane. 2003. The skill content of recent technological change: An empirical exploration. Quarterly Journal of Economics 118 (4):1279-1333.Brinkley, Ian. 2008. The knowledge economy: How knowledge is reshaping the economic life of nations. London: The Work Foundation. Available at: http://www.theworkfoundation.com/research/publications/publicationdetail.aspx?oItemId=41&parentPageID=102&PubType=.Cameron, Kim S., and Robert E. Quinn. 2006. Diagnosing and changing organizational culture: Based on the competing values framework. San Francisco: Jossey-Bass.Chen, Derek H. C., and Carl J. Dahlman. 2005. The knowledge economy, the KAM methodology and Work Bank operations. Washington, DC: The Work Bank.Drucker, Peter F. 1968. The age of discontinuity: Guidelines to our changing society. London: Transaction Publishers.———. 1999. Knowledge-worker productivity: The biggest challenge. California Management Review 41 (2):79-92.Economist Intelligence Unit. 2007. Enterprise knowledge workers: Understanding risks and opportunities: Available at: http://download.sap.com/download.epd?context=5918DCA609947C45338F3F679FC1420582695BEA3821B11C5B3D5D9F42626346CCDADCBF5995D33883E01B783633D5E44FB883E57CA7E09C.Elias, Peter, and Kate Purcell. 2004. SOC (HE): A classification of occupations for studying the graduate labour market. In Researching Graduate Careers Seven Years On, Research Report No 6: Employment Studies Research Unit and Warwick Institute for Employment Research.European Foundation for the Improvement of Living and Working Conditions. 2007. Fourth European Working Conditions Survey. Luxembourg: Office for Official Publications of the European Communities.Fauth, Rebecca, and Ian Brinkley. 2006. Efficiency and labour market polarisation. London: The Work Foundation. Available at: http://www.theworkfoundation.com/research/publications/publicationdetail.aspx?oItemId=72&parentPageID=102&PubType=.Green, Francis, Alan Felstead, Duncan Gallie, and Ying Zhou. 2007. Computers and pay. In SKOPE Research Paper, No 74. Oxford: SKOPE, Department of Economics, Oxford University.Kluth, Andreas. 2008. Nomads at last. Economist, 10 April.Leitch, Sandy. 2006. Prosperity for All in the Global Economy-World Class Skills. Report. HM- Treasury. London.
Knowledge Workers and Knowledge Work 86
References
Lundvall, B. and B.Johnson. 1994. The Learning Economy. Journal of Industry Studies 1: 2Mills, C. Wright. 1951. White collar: The American middle classes. New York: Oxford University Press.OECD. 1996. The Knowledge-Based Economy. ParisReich, Robert B. 1992. The work of nations. New York: Vintage Books.Suff, P., and P. Reilly. 2005. In the know: Reward and performance management of knowledge workers. In HR Network Paper, MP47. Brighton: Institute for Employment Studies.Webster, Elizabeth. 1999. The growth of enterprise intangible investment. Melbourne: Melbourne Institute of Applied Economic and Social Research, University of Melbourne. Available at: http://www.melbourneinstitute.com/wp/wp1999n09.pdf.Wilson, T. D. 2002. The nonsense of knowledge management. Information Research 8 (1): paper no. 144. Available at: http://InformationR.net/ir/8-1/paper144.html.

All rights reserved. No part of this publication may be reproduced, stored in a retrieval system or transmitted, in any form or by any means, electronic, mechanical, photocopying, recording and/or otherwise without the prior written permission of the publishers. This publication may not be lent, resold, hired out or otherwise disposed of by way of trade in any form, binding or cover other than that in which it is published, without the prior consent of the publishers.
© The Work Foundation
Registered as a charity no: 290003
Ian Brinkley, Rebecca Fauth, Michelle Mahdon and Sotiria Theodoropoulou
First published: March 2009
The Work Foundation 21 Palmer Street London SW1H 0AD
Telephone: 020 7976 3605 Email: [email protected] Website: www.theworkfoundation.com
We provide:ResearchConsultancyLeadershipAdvocacyPartnership