A Green Oasis in a Food Desert: Increasing the Accessibility of Affordable Healthy Foods in an Urban...
38
A Green Oasis in a Food Desert: Increasing the Accessibility of Affordable Healthy Foods in an Urban Neighborhood in Hartford, CT Katherine Johns-Galvin [email protected] Central Connecticut State University New Britain, Connecticut Fall 2011 Thesis Advisor Dr. Evelyn Phillips Department of Anthropology
Transcript of A Green Oasis in a Food Desert: Increasing the Accessibility of Affordable Healthy Foods in an Urban...
!!!!!!!!!!A Green Oasis in a Food Desert:
Increasing the Accessibility of Affordable Healthy Foods in an Urban Neighborhood in Hartford, CT !!!Katherine Johns-Galvin
!!!
Central Connecticut State University
New Britain, Connecticut
!!!!
Fall 2011
!Thesis Advisor
Dr. Evelyn Phillips
Department of Anthropology
!

Johns-Galvin !2
Abstract: Over the last three decades, the United States has seen a growing problem in both ur-
ban and rural areas where access to fresh, affordable and nutritious foods has been severely di-
minished; while access to cheap, high-calorie, low-nutritional value food has increased. The pro-
liferation of convenience food, including fast-food chain restaurants, in neighborhoods around
the country coupled with a sedentary lifestyle has contributed to an epidemic of diet-related dis-
eases. The neighborhood of Frog Hollow, an urban food desert, in Hartford, Connecticut, is no
exception to this trend. This paper explores three specific topics related to urban food deserts and
food oppression - access, affordability and health - and their impact on the Frog Hollow neigh-
borhood. This is followed by an examination of nutritious and affordable food alternatives and
programs that exist in Hartford including farmers’ markets, community-supported agriculture and
community gardens. Data collection included determining the cost of a healthy food basket in
Frog Hollow versus the neighboring, wealthier community of West Hartford, as well as mapping
out the locations and types of food outlets in Frog Hollow. Through quantitative analysis of the
data, the findings presented in this paper support an argument that food oppression and food de-
sertification exist in Frog Hollow. The research showed that Frog Hollow residents shopping at
the subject bodega for their weekly grocery list are paying prices that are on average 26% higher
than those charged in the West Hartford subject supermarket. Finally, I offer suggestions for fu-
ture research to further illustrate the breadth of the food gap that exists between large urban
metro areas like Hartford and their suburban counterparts, and touch on the non-food related
community benefits of green food options.
!
Johns-Galvin !3
“Let thy food be thy medicine and thy medicine be thy food” Hippocrates (460-370B.C.) !!“You are what you eat” Victor Lindlahr (1895 – 1969) !!
Introduction
Over the last three decades, a problem has been growing in both urban and rural areas of
the United States where access to fresh, affordable and nutritious foods has been severely dimin-
ished, while access to cheap, high-calorie, low-nutritional value food has increased. Although
this is not specifically an urban issue, the research presented here is focused on an urban neigh-
borhood in Hartford, CT. The proliferation of convenience food, as well as fast-food chain
restaurants, in neighborhoods around the country coupled with a sedentary lifestyle has con-
tributed to an epidemic of diet-related diseases such as heart disease, obesity, diabetes and can-
cer. Particularly alarming is the impact this convenience food diet has on children. As former
Surgeon General Richard Carmona states, “Because of the increasing rates of obesity, unhealthy
eating habits and physical inactivity [of children], we may see the first generation that will be
less healthy and have a shorter life expectancy than their parents” (American Heart Association
2012). Dr. Francine Ratner Kaufman, president of The American Diabetes Foundation, reported a
33% increase in Type 2 diabetes (formerly referred to as ‘adult onset’ diabetes) in the pediatric
population between 1992 and 2002 alone (Kaufman 2002:217). What is the number one risk fac-
tor for Type 2 diabetes? Obesity. Risk factors for obesity include a sedentary lifestyle and diets
high in calories and refined sugars like those found in convenience foods.
Community Food Security, a concept used by the Connecticut Food Policy Council, ex-
amines the food resources of a community including: availability & affordability, community
resources such as food banks & soup kitchens, access to WIC and Food Stamp offices, accessi-
bility of food outlets and community food production (Lopez, et al 2005:1). According to a study
released by the Council in 2005, Hartford, Connecticut ranked 166 out of 169 towns in food se-

Johns-Galvin !4
curity, making it one of the least food secure towns in Connecticut. The absence of quality foods
in various communities that contribute to poor diets is also referred to as a Food Desert. The
Food, Conservation, and Energy Act of 2008 defines a food desert as an “area in the United
States with limited access to affordable and nutritious food, particularly such an area composed
of predominantly lower income neighborhoods and communities” (H.R. 6124 2008:§7527).
Based on this definition, large rural and urban populations throughout the United States reside in
food deserts. In fact, the United States Department of Agriculture (USDA) reports on their Food
Desert Locator website that in 2009 there were at least 6,500 food deserts within the United
States with a total of approximately 13.5 million people living in them.
This research will examine how a cycle of poor nutrition has been created in the
Frog Hollow neighborhood, an urban food desert, in Hartford, Connecticut and was under-
taken in an attempt to ascertain whether or not issues of food desertification and food op-
pression exist in Frog Hollow. By answering the following questions: 1) What is the cost of
a healthy food basket in Frog Hollow vs. West Hartford?, and 2) What types of food outlets
exist in Frog Hollow?, this research will support an argument that these issues do indeed
exist in Frog Hollow. The absence of large chain grocery stores and the ubiquity of fast,
high-fat, high-calorie convenience food found at neighborhood markets (bodegas), drug-
stores, liquor and convenience stores in Hartford have left a nutritional vacuum in neigh-
borhoods where access to affordable, healthy foods has been severely curtailed. Farmers’
Markets, community-supported agriculture and community gardens have grown over the
past three decades throughout Hartford’s neighborhoods to fill this gap. I argue that a re-
newed interest in community gardens and gardening, as well as expanded services at farm-
ers’ markets has reintroduced affordable, attainable healthy foods to the Frog Hollow
neighborhood and allowed the neighborhood to take the first steps towards battling food
insecurity. This research will address three topics related to urban food deserts; access, af-
fordability and health. The research is significant because it highlights the problem of food
oppression faced by a poor and predominately minority community living in a food desert
in Hartford, Connecticut and explores how this issue can be fought and overcome with the
introduction of locally grown produce at affordable prices.
Johns-Galvin !5
!Frog Hollow History and Demographics
The Frog Hollow section of Hartford is an area measuring 1.691 square miles that is
bounded by Interstate 84 to the North and West, Hamilton and Lincoln Streets to the South, and
Washington Street to the East (City-Data.com 2011). The name “Frog Hollow” was inspired by
a large population of frogs that inhabited a marsh in the late 1700s near the corner of Ward and
Broad Streets. The area has a long history as a neighborhood primarily made up of working class
citizens. Originally settled by farmers, the area did not develop as quickly as other areas of Hart-
ford for the first 200 hundred years of its inhabitation. In the mid-1800s change started as facto-
ries began to spring up in Hartford both in and along the outskirts of Frog Hollow where small
textile mills had previously been established. The neighborhood’s prime setting along the Park
River and the New York - New Haven - Hartford Railway made it an attractive location for man-
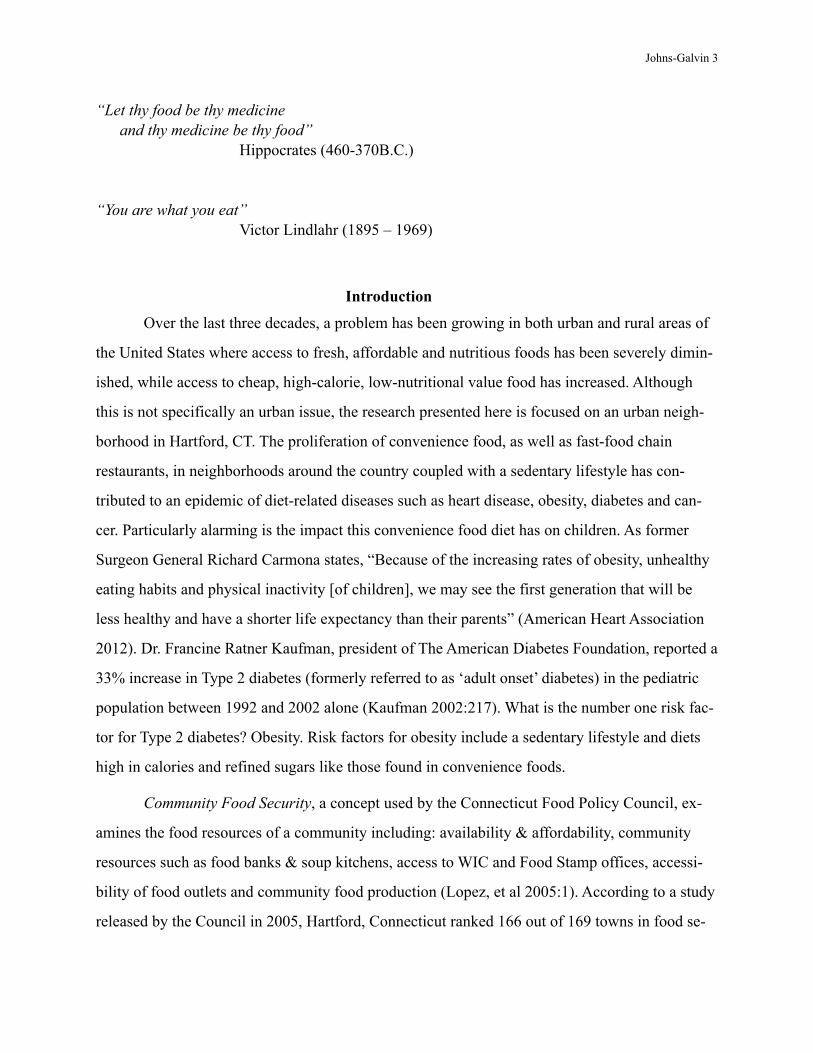
ufacturing. In 1852, the Sharps Rifle Manufacturing Company opened its factory on Rifle Road
(now Capitol Avenue). When that company moved to Bridgeport in 1870, the factory was taken
over and enlarged by the Weed Sewing Machine Company.
!!!!!!!!!!!!!!!!Figure1: The Weed Sewing Machine Company (c1889). Note the close proximity to the railroad and Park river (di-rectly behind the factory).

Johns-Galvin !6
Other factories soon followed. In 1873, Charles Billings and Christopher Spencer started
the Billings & Spencer Company which opened its facilities at the corner of Lawrence and Russ
Streets in Frog Hollow and manufactured drop-forged tools (Historic Buildings of Connecticut
2009). In 1876, Hartford Machine Screw set up in a space leased from Weed Sewing Machines
and grew steadily until 1948. In 1878, Albert Augustus Pope founded the Pope Manufacturing
Company at 436 Capitol Avenue which produced Columbia Bicycles initially, and later Pope Au-
tomobiles.
! Figure 2: Pope Mfg. Co. #2, Hartford, Conn.. (c1909)
At its peak, Pope Manufacturing occupied 18 acres of factory space and employed nearly 4,000
people (Grant 2004). The Pope Park website notes that in 1895, Albert Pope turned over 90.5
acres to the city of Hartford for the creation of Pope Park.
Companies sprang up all over Hartford in the mid- and late-1800’s representing industries
as diverse as textiles, electro-plating, engine manufacturing, machinery manufacturing, iron
works, asbestos manufacturing, and many other trade goods. By the turn of the century, Capitol
Avenue was lined with factories producing a myriad of goods. In 1889, the Hartford Board of
Trade reported that “the manufacturing establishments of Hartford employ approximately 4,979
men and 1,329 girls, disburse $3,156,600 annually in wages, and turn out an annual product of
twelve millions” (1889:155).
The boom in factory building was matched by the development of
the Frog Hollow neighborhood. The Weed Sewing Machine Company
sponsored two housing developments in Frog Hollow across from their
factory – the Columbia Street and Park Terrace Row Houses – to house
workers. Additionally, developers bought up neglected farm land in the

Johns-Galvin !7
area to build housing for factory workers. Due to the condensed area around the sprawling facto-
ries, the most common type of house built in Frog Hollow is known as the “perfect-six”. Perfect-
sixes are three-story houses with two apartments on each floor, with each house accommodating
six families. This type of housing adequately accommodated Hartford’s growing citizenry which
had swelled to 79,850 by 1900, a 50% increase over the population total from 1800.
In the early 1900s, Hartford also saw a rise in the insurance industry. Life insurance com-
panies incorporated in the 1800s began to grow as disasters such as the Great San Francisco
earthquake of 1906 pushed citizens to consider insuring their lives and property. The Hartford
Board of Trade reported in its 1907 annual meeting that “the life insurance interest located in our
city has grown to immense proportions and is of very great importance. It has become one of the
principal factors in this business community and there seems to be no limits to its
attainments” (1907:12).
Throughout the early 1900s, manufacturing industries continued to grow in Hartford. The
two world wars provided opportunities for companies to expand their production lines into the
defense industry. Between 1917 and 1918, four-fifths of Connecticut industry was involved in
defense contracting. This time period represents the heyday as well as the beginning of the de-
cline of Hartford manufacturing. Between 1905 and 1913, the Pope Manufacturing Company
moved its manufacturing operations to Westfield, MA. In 1914, they moved their office opera-
tions out of Hartford to Westfield. This shift was just one of several which closed or moved large
factories out of Hartford in the mid-1900s. In 1925, the Pratt & Whitney Aircraft Company on
Capitol Avenue in Hartford developed their first aircraft engine designed by Frederick
Rentschler, called the Wasp. By 1938, just after the start of World War II, the company had
moved out of Hartford and into West Hartford (Pratt and Whitney Measurement Systems, Inc.
2011). In 1962, the Billings and Spencer Company was acquired by the Crescent Niagara Corpo-
ration of Buffalo, New York and operations were moved out of Hartford to Jamestown, NY
shortly thereafter. In 1979, the Royal Typewriter factory on New Park Avenue was shut down,
and the manufacturing operations were moved overseas.
Johns-Galvin !8
As factories began to close their doors in Hartford those citizens who had means to leave
the city and follow the work did. Those who could not were left to endure a new culture of di-
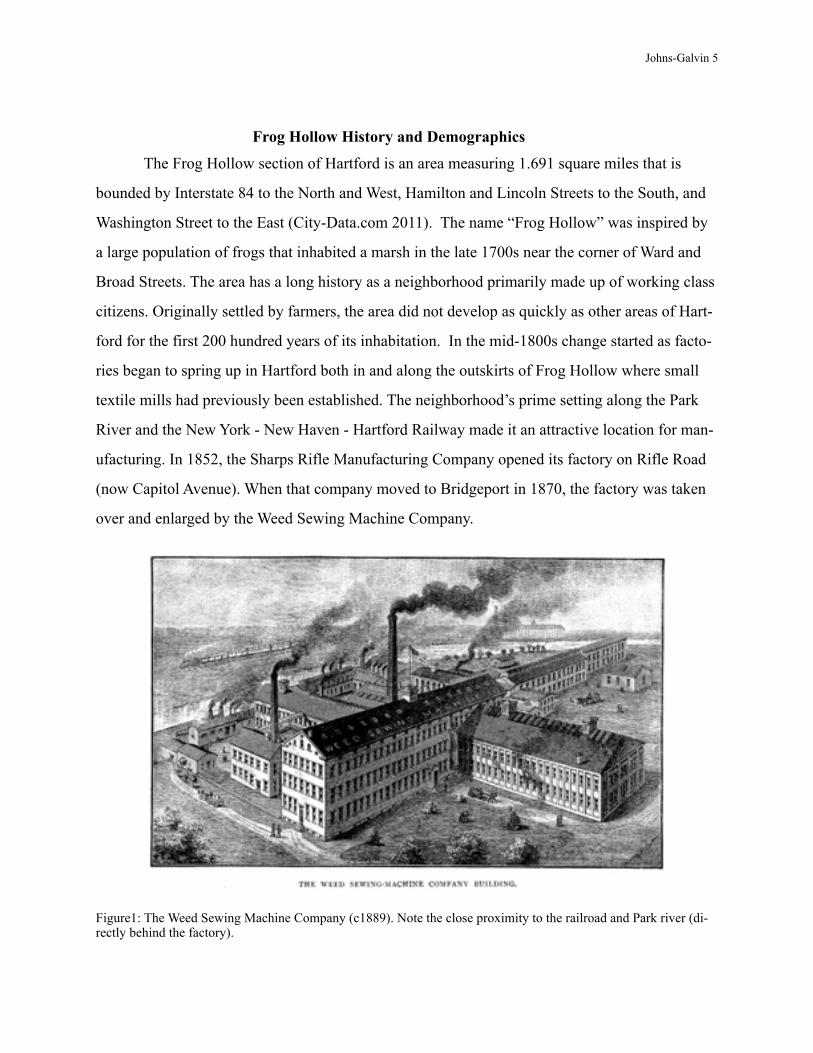
vestment. In the 1960s, a shift in the population demographics can be seen. For the first time
since census statistics were first recorded for Hartford in 1790, the population decreased. From
the 1950 to the 1960 census, the population of Hartford declined by 15,000 or 8.6% (US Bureau
of the Census 1963). This is a trend that has continued to the present. In fact, the census data
over the last 50 years show a steady decline in both the populations of Hartford and Frog Hollow.
Over the same time period, evidence of “white flight” can also be seen in the population demo-
graphics. In 1950, 99.8% of the population was classified as white on the census, by the 2000
census, whites accounted for only 11.1% of the population of Frog Hollow. In contrast, in 1960,
non-whites accounted for 0.65% of the population. By 2000, the last year neighborhood statistics
are available for, this number had climbed to 86.6%. The graph below illustrates this population
shift as white citizens left the neighborhood, and minority groups (mainly Puerto Rican) moved
in.
!
!

Johns-Galvin !9
Current Day Frog Hollow
A ride through Frog Hollow today reveals the
neighborhood’s eclectic soul. The neighborhood’s
main thoroughfare, Park Street, is lined with store-
fronts that have been added to the first floors of the
neighborhood’s iconic ‘perfect sixes’. Spanish Ameri-
can markets called ‘bodegas’, restaurants and cafés
cater to the neighborhood’s mixed heritages. There are
Greek Cafés, Caribbean Restaurants, Puerto Rican bakeries and Mexican Eateries. The area’s
strong Hispanic influence can be seen in shop names like El Mercado and Viva Mexico Spanish
Grocery.
Many of the former factory buildings have been repurposed. The Billings & Spencer
Company at the corner of Lawrence and Russ Streets is now owned by the Melville Charitable
Trust and is home to Billings Forge Community Works. According to the trust’s website, the
work of Billings Forge Community Works is “designed to replace disinvestment with investment
in Frog Hollow, create a shared sense of mission, offer education and training, and underscore
the idea that a good place to live is more than just four walls and a roof” (Melville Charitable
Trust 2010). The Billings Forge complex now includes 98 mixed income apartments, a restau-
rant and a café where residents can receive free job training, community art space, a community
garden where children from the neighborhood learn about healthy eating and a year-round week-
ly farmer’s market.
Government and city buildings are interspersed with typical signs of urban blight and di-
vestment: boarded up factory buildings, houses and storefronts line Capitol Avenue and the sur-
rounding roads.

Johns-Galvin !10
! Figure 3 - Capitol Archives and Record Storage
These signs of urban blight extend into the neighborhoods that border Frog Hollow such as Be-
hind the Rocks and Barry Square.
One such vacant storefront is the Mega Foods
supermarket on New Britain Avenue near Trinity Col-
lege which was the closest supermarket for many Frog
Hollow residents. Notably, in their 2004 Hartford Area
Food Stores Price Survey, the City of Hartford Food
Policy Commission ranked this store number one for
price competitiveness in Hartford (Hartford Food Poli-
cy Commission 2004). The Mega Foods chain of mid-
sized supermarkets had three stores in Hartford when it filed for bankruptcy in 1994, the New
Britain Avenue location closed in the Fall of 2006 (O’Connell 2007), and still sits vacant five
years later. Grocery storefronts that are nonexistent or vacated are a trend that can be seen in
poor and minority neighborhoods all over the United States. A study led by Dr. Kimberly Mor-
land of the United States Environmental Protection Agency Office of Research and Development
looked at trends across several states (Mississippi, North Carolina, Maryland, and Minnesota)
and found that there are four times more supermarkets in white neighborhoods than black neigh-
borhoods, and wealthy neighborhoods have over three times as many supermarkets as poor
neighborhoods (Morland et al 2002:23-29). A similar study found that wealthy (middle- and up-
per-income) communities in Los Angeles County have over twice as many supermarkets per

Johns-Galvin !11
capita as low-income communities, and that predominantly white communities have over three
times as many supermarkets than predominantly black communities, and almost twice as many
as predominantly Latino communities (Shaffer 2002).
The 2000 census reported that the population of Frog Hollow was 9,323 people. This rep-
resents a population decline of 22% over the 30 year period from 1970 to 2000. The 2000 popu-
lation was predominately minority with Hispanic residents making up 71.7% of the population,
Black, non-Hispanic residents at 12.7%, and Other non-Hispanic residents at 5.1%. The follow-
ing graphs depict the racial makeup of Frog Hollow vs. Hartford City.
!
!Do Food Deserts Exist in the U.S?
Currently, there is much debate about whether or not food deserts even exist in the
United States. This is partly due to the fact that there is no clear definition of the term
‘Food Desert’. The Centers for Disease Control and Prevention (CDC) acknowledge this
on their website by noting that “estimates of how much of the U.S. population is affected
can vary greatly because there is no standard definition of a food desert” (CDC 2010). By
contrast, the USDA has created an online ‘Food Desert Locator’ (http://www.ers.usda.gov/
data/fooddesert/) where users can enter any U.S. address and view food deserts by tract

Johns-Galvin !12
based on census data. The USDA borrows the definition used by the Healthy Food Financ-
ing Initiative (HFFI) to define a food desert as:
A low-income census tract where a substantial number or share of residents has low access to a supermarket or large grocery store:
• To qualify as a “low-income community,” a census tract must have either: 1) a poverty rate of 20 percent or higher, OR 2) a median family income at or below 80 percent of the area's median family income;
• To qualify as a “low-access community,” at least 500 people and/or at least 33 percent of the census tract's population must reside more than one mile from a supermarket or large grocery store (for rural census tracts, the distance is more than 10 miles). [USDA Food Desert Locator 2011]
The language in the Food, Conservation, and Energy Act of 2008 (commonly referred to as
the 2008 Farm Bill) similarly defines a food desert as an “area in the United States with
limited access to affordable and nutritious food, particularly such an area composed of pre-
dominantly lower income neighborhoods and communities” (H.R. 6124. 2008:§7527). In
his 2008 article, The Sprawl of Food Deserts, M. Nathaniel Mead defines urban food
deserts as “areas within city centers where low-income people have poor access to vegeta-
bles, fruits, and other whole foods” (Mead 2008:A335).
While most definitions focus on some aspect of income (i.e. low income) as well as
proximity to affordable and nutritious food, few also take into consideration vehicle access.
The USDA mandates that for an area to be considered a food desert, “at least 500 people
and/or at least 33 percent of the census tract's population must reside more than one mile
from a supermarket or large grocery store” (USDA ERS 2011). This definition, however,
does not take into consideration the fact that many low income people do not own cars.
Additionally, while a mile walk may not be difficult for some, for the old and infirm, a mile
walk may be nearly impossible. Seniors living on fixed incomes and unable to arrange for
transportation to a supermarket may be spending a disproportionate amount of their income
on convenience foods available at small corner markets or bodegas that are more accessible
to them.

Johns-Galvin !13
The USDA definition also does not take into consideration the availability of
healthy foods in low-income census tracts. Nor does it define the terms ‘supermarket’ or
‘large grocery store’. This represents a gap in the definition due to the fact that a measure
of access to healthy foods is a critical element of food desert classification. Many mid-size
supermarkets that exist within urban areas do not stock the freshest of fruits and vegetables
while many small grocers have started stocking fruits and vegetables from local farms.
Generalizations about supermarket size corresponding to healthy food access should be re-
placed with market data on sales of fresh fruits and vegetables in markets, as well as
farmer’s markets, located within urban and rural areas.
!What is Food Oppression?
In her 2007 article Fast Food: Oppression Through Poor Nutrition, Andrea Freeman de-
fines food oppression as:
A form of structural subordination that builds on and deepens pre-existing dispari-ties along race and class lines. Food oppression is difficult both to identify as a so-cial wrong and to redress, because it stems from a combination of market forces and government policy. Conventional wisdom holds that food consumption is a matter of private choice and free will, but blaming individuals for their own health prob-lems obscures the structural nature of food oppression. Despite substantial obstacles to change, racial and class progressives must demand accountability from those re-sponsible for the institutionalization of poor health and lower life expectancy for groups already facing multiple sites of oppression. [2007: 2245-2246]
Similarly, in their report for the FoodFirst Information and Action Network, The Right to
Food: A Resource Manual for NGOs, Rolf Künnemann and Sandra Epal-Ratjen, define op-
pression as “pushing people down to a point below the minimum human standard and/or
keeping them there”. They further define food-related oppression as coming “in two differ-
ent categories. The first category concerns acts that destroy peoples’ access to food or food-
producing resources. The second category refers to acts or omissions that keep people ex-
cluded from food or food-producing resources” (Kunnemann & Epal-Ratjen 2004:18).
Both Freeman and Künnemann & Epal-Ratjen’s definitions accurately capture the essence
of food oppression as using food to subjugate an already oppressed population. Food op-
Johns-Galvin !14
pression is more likely to occur in areas where the population is made up of predominantly
low-income and minority people. In addition, any review of food oppression must include a
look at the U.S. Government’s involvement and perpetuation of food oppression. The gov-
ernment has been a party to this type of oppression mainly through its inaction and unwill-
ingness to enact meaningful legislation towards ending food oppression.
There is a clear connection between food, politics and economics. As Jules Pretty,
from the University of Essex wrote in a 2005 report published in the journal Food Policy,
“the most political act we do on a daily basis is to eat, as our actions affect farms, land-
scapes and food businesses.” In fact, local food movements can be seen as a type of politi-
cal resistance. Because capitalism is an economic and a political force, buying locally pro-
duced foods rather than mass produced convenience foods allows low-income consumers
to use their food dollars to opt for small market rather than mass market. In the capitalist
marketplace, dollars equate to actions, and these actions can move the market. However,
the reverse is also true. Capitalism allows corporations to dictate what and how the poor
eat. Companies like Coca-Cola, Pepsi and McDonald’s routinely go into schools in poor
neighborhoods and provide funding (or “sponsorship”) for big ticket items such as play-
grounds, computer labs, A/V equipment and gymnasiums in return for becoming the
school’s preferred vendor. In other words, these companies are placing underfunded
schools in the unusual position of introducing soft drinks and fast food into school lunches
because they cannot find other ways of raising money for education (Freeman
2007:2234-2235). This is a marketing campaign aimed at creating food and drink prefer-
ences in children from a young age.
In political economic theory, this represents a conflict. There is an ongoing conflict
between low-income people and the corporate giants that conspire to control the caloric
intake of consumers. In the United States, the political system supports the growth of in-
dustry to the point of refusing to regulate corporations taking aim at low-income families in
order to sell them cheap, low-nutrition, high-calorie foods. Similar to Eric Wolf’s peasants,
low-income residents of cities are “not merely a productive organization constituted of so

Johns-Galvin !15
many hands ready to labor in the fields; it is also a unit of consumption, containing as many
mouths as there are workers” (Wolf 1966:318). In a capitalist society this equates to corpo-
rate dollars. Dollars spent by food companies to lobby government for subsidies to make
cheap food, to keep the FDA from regulating the cheap foods, and keep a steady supply of
low-income population as consumers through targeted advertising. These factors combined
with the U.S. capitalist idea of rugged individualism create an environment where low-in-
come people are often blamed and ostracized for their perceived poor food choices and re-
sulting health issues (Freeman 2007).
!Health Consequences of Life in a Food Desert
In their 2010 report published in the International Journal of Health Geographics,
Akihiko Michimi and Michael Wimberly show that a relationship exists between the dis-
tance to supermarkets, consumption of fruit and vegetables and obesity. Their research
found that “obesity prevalence increased and fruit and vegetable consumption decreased
with increasing distance to supermarkets in metropolitan areas” (Michimi and Wimberly
2010:1). Additionally, the 1999-2002 National Health and Nutrition Examination Survey
(NHANES) survey found that nationally, 16% of children ages 6-19 years are overweight,
and that obesity disproportionately affects certain minority children - African American
adolescents ages 12-19 were more likely to be overweight at 21% than non-Hispanic White
adolescents at 14% (U.S. Department of Health and Human Services 2011). Between 1999
and 2008, in the city of Hartford, the obesity rates for children ages 2-5 were 23%, and for
children ages 6-11 the obesity rates were 24% (Pachter 2009:5). Taken together, these stud-
ies are significant considering the fact that most children living in Frog Hollow are minori-
ties and live some distance from a supermarket.
Obesity in childhood can increase the risk of diseases commonly associated with
adulthood including high cholesterol, Type 2 diabetes and hypertension. The 1999-2002
NHANES survey also reported that “overweight adolescents have a 70 percent chance of
becoming overweight or obese adults, which increases to 80 percent if one or more parent

Johns-Galvin !16
is overweight or obese” (U.S. Department of Health and Human Services 2011). In 2008,
the Centers for Disease Control and Prevention (CDC) estimated that 22.6% of adults (20
years and older) in Hartford County were obese, 7.9% had been diagnosed with Diabetes,
and 22% were physically inactive. Furthermore, the leading cause of death in Connecticut
in 2008 was heart disease (Poulin and Hynes 2011:5). These diet related diseases can be
attributed in part to lack of access to healthy foods, and are ultimately a symptom of pover-
ty. In its 2011 report, The Burden of Diabetes in Connecticut, the Connecticut Department
of Public Health determined that there is a link between income level and the prevalence of
diabetes in the state. The report states that:
12.3% of Connecticut adults with annual household incomes of less than $25,000 have diabetes compared to 4.7% of Connecticut adults with annual household incomes of $75,000 or greater. The increased prevalence of diabetes among low-income persons is attributed to the decreased likelihood of low-in-come persons having adequate diets, sufficient physical activity, and access to medical care – all factors known to affect the progression of pre-diabetes to dia-betes. [Poulin and Hynes 2011:3]
These studies suggest a pattern where poor access to healthy and affordable
foods leads to overweight and obesity which can further lead to life-threatening obesity
related diseases not just in adults, but in children as well. When convenience food is
the norm at home, whether it is due to lack of time, lack of access, or lack of funds to
purchase healthy foods, the research shows that children suffer medically as much as, if
not more than, adults.
Is Frog Hollow a Food Desert?
In June 2011, First Lady Michelle Obama
joined the Surgeon General, Dr. Regina Benjamin
and U.S. Department of Agriculture Secretary, Tom
Vilsack, to unveil the Department of Agriculture’s
replacement for its then much recognized and
ridiculed Food Pyramid, MyPlate. As part of the

Johns-Galvin !17
First Lady’s call to fight childhood obesity, the Let’s Move! Campaign, MyPlate, offers
consumers an easy visual aid to the USDA’s 2010 Dietary Guidelines to Americans for
healthier, more balanced eating. The press release for the updated guidelines state that the
goals are to: “promote health, reduce the risk of chronic diseases, and reduce the preva-
lence of overweight and obesity through improved nutrition and physical activity” (USDA
2008). However, for many people living in areas such as the Frog Hollow neighborhood in
Hartford, Connecticut where there is little access to affordable healthy foods, “improved
nutrition” is not so easily achieved.
In Frog Hollow there is one mid-size, discount-type supermarket, Save-A-Lot,
which is located at the very outer-limits of the neighborhood on the boundary of the
Parkville section of Hartford. In order to keep its prices low, the supermarket reduces over-
head by limiting selection to a few exclusive brands and selling bulk items from boxes
rather than store shelves. In the city of Hartford, over 36% of households do not have ac-
cess to a vehicle (United States Bureau of the Census 2001:4). To get to the Save-A-Lot
supermarket by bus from Washington Street, on the opposite end of the neighborhood, you
would have to walk almost a half mile to a bus stop by Trinity College, take a 3 minute ride
on the 61 bus, and then walk another half mile from Broad Street to Park Street. A total of
two miles round trip walking, of which one mile would be with the added burden of carry-
ing bags of groceries.
In addition to the lack of large supermarkets to choose from, Frog Hollow residents
also have the problem of persistent poverty. In 2000, census data showed that the median
household income in Frog Hollow was $17,333, whereas the median household income for
the city of Hartford was almost $8,000 higher at $25,150. In 2000, the US Census Bureau
Poverty Threshold for a family of four was $17,463. There are 3,675 housing units in Frog
Hollow, 82.3% of them are rental units. Only 232 units are owner occupied, and the aver-
age values of these units have decreased by 57% between 1990 and 2000. The unemploy-
ment level in Frog Hollow was 16%, while Hartford’s unemployment level was 9.1%.
Based on the US Census Bureau Poverty Thresholds, over 57% of children under the age of

Johns-Galvin !18
18 and 45% of the total population of Frog Hollow live in poverty. Fifty-one percent of
adults over the age of 25 do not have a high school diploma, and half of these have not
progressed beyond the ninth grade. Forty-two percent of households in Frog Hollow re-
ceive public assistance (not including SNAP benefits). In 2008, the Connecticut State De-
partment of Education reported that of the four schools serving Frog Hollow, on average,
91% of the students were eligible for free or reduced lunch. Overall, 10% of the population
of Hartford County received Supplemental Nutrition Assistance Program (SNAP formerly
known as the Food Stamp Program) benefits in 2008 (FRAC 2011).
These facts indicate that Frog Hollow residents have been largely impacted by eco-
nomic forces such as corporate divestment. In capitalism, business follows the money, and
in urban communities like Frog Hollow, where the income levels hover somewhere around
the poverty line, there is not much incentive from a business standpoint to invest in the
area. Large, publically owned companies such as chain grocery stores that are responsible
to shareholders (in terms of making returns in the form of dividends), do not see the wis-
dom in opening stores in neighborhoods where the profit margins would be low. The mon-
ey a large company would need to invest in building a new store, or rehabilitating an exist-
ing store, plus the added ongoing costs of security in a low-income neighborhood do not
inspire companies to invest in neighborhoods with demographics like Frog Hollow’s. This
is where small vendors can step in to fill the grocery void.
!Frog Hollow’s “Green” Thumb
The bright spot in Frog Hollow’s otherwise
dismal food landscape is the introduction of fresh, lo-
cally grown produce and healthy foods made avail-
able at affordable prices. The first farmer’s market
opened in the city in 1977 (The Hartford Courant,
1980:30). Since then, several more have appeared.
The aforementioned Billings Forge complex hosts a

Johns-Galvin !19
weekly year-round farmer’s market in Frog Hollow that began in 2007. My visits to the
market revealed a pulsating, electric atmosphere where farmers, residents, friends, musi-
cians, artists and white collar workers from the neighboring insurance companies mingle.
Live music is played, and, in my experience, a sense of hope and community pervades. I
witnessed many instances where residents and neighbors stopped by the organizers’ stall at
the market to get assistance with their market vouchers or to just say hello.
The market has the added benefit of accepting Supple-
mental Nutrition Assistance Program (SNAP), Electron-
ic Benefit Transfer (EBT) cards, and Special Supple-
mental Nutrition Program for Women, Infants and Chil-
dren (WIC) benefits for payment. Additionally, thanks to
the efforts of the market’s creator, Rita Decker-Parry, a
partnership with the Wholesome Wave organization was formed in 2008 that allows the
Billings Forge Farmer’s Market to participate in the Double Value Coupon Program
(DVCP). The DVCP provides matching funds when shoppers at participating farmer’s
markets pay for locally grown fruits and vegetables with federal nutrition benefits, thereby
doubling the value of shopper’s benefits. These federal nutritional benefits include the U.S.
Department of Agriculture’s Farmers Market Nutrition Program (FMNP) checks which are
issued to seniors and participants of the WIC and SNAP programs. According to a survey
conducted by Wholesome Wave in 2010, “87% of DVCP consumers increased or greatly
increased their consumption of fresh fruits and vegetables…and over 90% of DVCP con-
sumers agreed or strongly agreed that the amount of fresh vegetables they bought at the
market made a big difference in their or their family’s diet” (Wholesome Wave 2011:2).
Farmer’s markets are not the only source for fresh local produce in Frog Hollow either.
The Knoxs Parks Foundation in Hartford has supported community gardening in the city since
the establishment of their first garden in 1972. The Community Gardens allow individuals and
families to rent garden plots ranging in size from 300-625 sq. ft. for the growing season for $25-
$30 in order to grow their own food. This is a particularly inviting option as many of the city’s

Johns-Galvin !20
residents can grow foods that represent their own ethnic
tastes and heritage. There are a total of sixteen community
gardens in Hartford, two of which are located in Frog
Hollow (Knoxs Parks Foundation 2011).
One final source of healthy produce in Hartford is
Community Supported Agriculture (CSAs). Grow Hart-
ford, a project of the non-profit Hartford Food System,
operates three organic farms within the city. Two are in Frog Hollow, and the third is in the near-
by Behind the Rocks neighborhood. The farms allow residents and community organizations
such as churches and food pantries to purchase low-cost “shares” of the farm’s output each grow-
ing season. For low-income families, the cost of a share (approx. 140lbs. of produce) is $75. For
a 12-week growing season, that amounts to about $6.25 a week for almost twelve pounds of
fresh, local, organic produce. The money from the shares is used to purchase seeds, fertilizer,
labor, etc. to keep the farm operating. Throughout the growing season, members are provided
fresh vegetables, herbs, flowers and fruits weekly.
In addition to providing healthy alternative food sources, the Grow Hartford project
also provides job training to at-risk youth from the neighborhood. Youth are hired by the
farms for a summer to work in the gardens and receive work skills training. Not only do
they learn all aspects of urban farming, they are also taught real-world skills such as mar-
keting and sales (they run a farmstand, and booths at farmers’ markets), cooking, menu
planning, resume writing and leadership.
!Methodology
To determine the cost of a healthy food basket, the United States Department of
Agriculture (USDA) Center for Nutrition Policy and Promotion 2006 Thrifty Food Plan
was used to develop a list of healthy foods for a family of four for a week. The Thrifty
Food Plan (TFP) was last updated in 2006, and is the standard used for determining food
stamp allocations. The plan incorporates the latest nutritional guidelines available at the

Johns-Galvin !21
time, the 2005 MyPyramid Food Guidance System, as well as data sets from the Federal
Government’s 2001-2002 National Health and Nutrition Examination Survey (NHANES)
and the 2001-2002 Food Price Database updated to 2006 dollars (Carlson et al 2007:2-3).
The resulting market basket is “based upon data of individuals ages 1 year old and older in
households with income at or below 130 percent of the U.S. poverty threshold, an income
level that represents the upper threshold for eligibility in the Food Stamp Program” (Carl-
son et al 2007:3).
Once the items for the healthy food basket were determined, prices were gathered
from El Mercado, a small 13,000 sq. ft. grocery store on Park Street in Frog Hollow. Item
prices for the same grocery list also were gathered at Super Stop & Shop, a larger 38,000
sq. ft. chain supermarket on Newington Avenue in the neighboring town of West Hartford
(Podsada 2010). The town of West Hartford was selected for its close proximity to Frog
Hollow, as well as its increased median household income of $79,500 (about $62,200 high-
er than that of Frog Hollow). The following table itemizes the market basket used in the
research.
Grains Vegetables Other Foods
Brown RiceOatmeal Cookies Honey Nut Cheerios Cookie Crisp cereal Special K cereal Quaker Oatmeal Multigrain Pringles Popcorn Corn Flakes White Rice Spaghetti (noodles) Frosted Flakes Saltines Ritz Crackers White Bread Tortillas
Potatoes Pringles potato chips Potato Sticks Potato Chips Broccoli (fresh) Broccoli (frozen) Carrots Squash Beets (canned) Corn Peas Beets - fresh Black Beans (canned) Red Beans (canned) Garbanzo (canned) Peas (dry) Black (dry) Red (dry)
Butter Ortega Salsa CoffeeTea Hawaiian Punch Coca-Cola Molasses SyrupBrown SugarSugar Honey Strawberry Jelly Chunky Soup Dinty Moore SoupCampbells Soup Progresso Soup Fish Sticks (frozen) Hot Wings (frozen)
Johns-Galvin !22
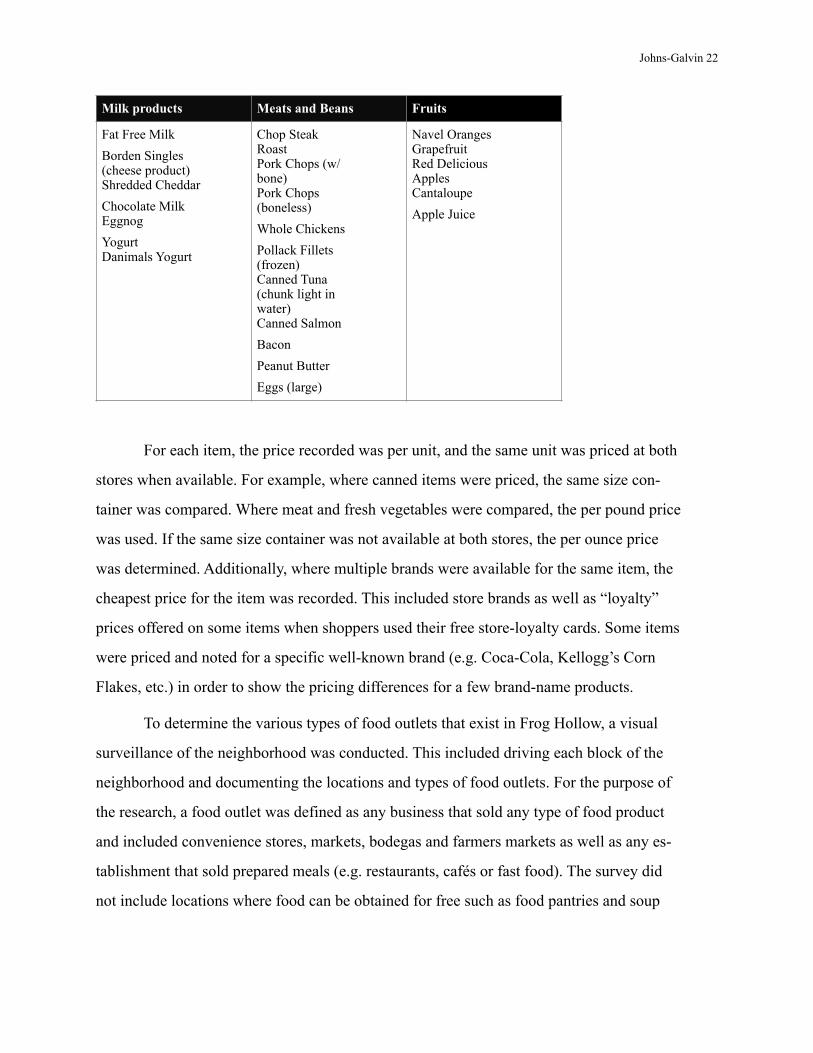
!For each item, the price recorded was per unit, and the same unit was priced at both
stores when available. For example, where canned items were priced, the same size con-
tainer was compared. Where meat and fresh vegetables were compared, the per pound price
was used. If the same size container was not available at both stores, the per ounce price
was determined. Additionally, where multiple brands were available for the same item, the
cheapest price for the item was recorded. This included store brands as well as “loyalty”
prices offered on some items when shoppers used their free store-loyalty cards. Some items
were priced and noted for a specific well-known brand (e.g. Coca-Cola, Kellogg’s Corn
Flakes, etc.) in order to show the pricing differences for a few brand-name products.
To determine the various types of food outlets that exist in Frog Hollow, a visual
surveillance of the neighborhood was conducted. This included driving each block of the
neighborhood and documenting the locations and types of food outlets. For the purpose of
the research, a food outlet was defined as any business that sold any type of food product
and included convenience stores, markets, bodegas and farmers markets as well as any es-
tablishment that sold prepared meals (e.g. restaurants, cafés or fast food). The survey did
not include locations where food can be obtained for free such as food pantries and soup
Milk products Meats and Beans Fruits
Fat Free Milk Borden Singles (cheese product) Shredded Cheddar Chocolate Milk Eggnog YogurtDanimals Yogurt
Chop Steak RoastPork Chops (w/ bone) Pork Chops (boneless) Whole Chickens Pollack Fillets (frozen) Canned Tuna (chunk light in water) Canned Salmon Bacon Peanut Butter Eggs (large)
Navel Oranges GrapefruitRed Delicious Apples Cantaloupe Apple Juice

Johns-Galvin !23
kitchens. The locations of the food outlets were then overlaid on a map of the neighbor-
hood so that an overall picture of locations and types of food outlets could be developed.
!Findings and Recommendations
The first stage of the research surveyed the Frog Hollow neighborhood in an at-
tempt to document the types and locations of food sources. The following map is the result
of this survey.
!
There are at a minimum 20 different bodegas within the 1.691 square miles comprising the
Frog Hollow neighborhood. There is one mid-size supermarket, the aforementioned Save-
a-Lot. There are two fast-food restaurants, a Subway and a McDonald’s. Both fast food
restaurants are on the outer boundaries of the neighborhood closer to Hartford’s municipal
and medical office districts. The McDonald’s restaurant is located on Washington Street
near the Hartford Hospital complex, and the Subway restaurant is located on the corner of
Broad and Capitol Streets. There are twelve restaurants and cafés, and three bakeries that
mainly cater to the various ethnic tastes within the community. There is one large drug

Johns-Galvin !24
store (Walgreens) that also sells convenience type foods. Finally, there are eleven farmers
markets, community gardens and CSA gardens in the neighborhood. As indicated on the
map, the majority of the food establishments are concentrated along the neighborhood’s
main thoroughfare, Park Street.
The second stage of the research involved pricing a healthy food basket at a Frog
Hollow market and comparing that to the price for the same food basket purchased at a su-
permarket in neighboring West Hartford. The research showed that a healthy 75-item food
basket in Frog Hollow costs $29 more than the same basket in West Hartford. Additionally,
Frog Hollow residents shopping at this bodega for their weekly grocery list are paying
prices that are on average 26% higher than those charged in the West Hartford supermarket.
Although the bodega did sell some fruit and vegetables, and their prices were gen-
erally lower than the West Hartford supermarket, the quality of the produce was also much
lower. Produce in the Frog Hollow market was discolored, wilted or overripe and generally
unappealing. Additionally, the bodega did not sell any whole grain breads and only had a
limited selection of whole grain snacks. They did, however, have an extensive selection of
meats, and offered bulk packages of meat at reduced prices perhaps suggesting that meat is
a more desirable food item to clients of this market than fresh fruits and vegetables.
Future research on this topic should incorporate price comparisons of more stores in
both low- and higher-income neighborhoods in order to complete a more comprehensive
view of the pricing differences between neighborhoods. This research would illustrate the
food gap that exists between large urban metro areas like Hartford and their suburban coun-
terparts.
!Conclusion
Food, like shelter, is a basic human need. When easy access to healthy, nutritious
and affordable foods is reserved for wealthy citizens, while low-income citizens lack the
same access, a food gap exists. This research shows that one such food gap exists in Hart-

Johns-Galvin !25
ford. Like many urban environments throughout the country, access to fresh, nutritious
foods is severely limited for those living in the low-income neighborhood of Frog Hollow.
In Frog Hollow, one mid-size supermarket has been established at the farthest
reaches of the neighborhood in the least populated section. A walk to the store from the
closest housing or bus stop will take you through a section of town that is one of the most
unsafe. In fact, while conducting this research, a purse snatching was witnessed in the pub-
lic park that sits across the street from the supermarket. The parking lot of the store is filled
with potholes, broken glass and debris. Once inside the store, a shopper has a section of
approximately 30 sq. ft. from which to select all their fresh fruits and vegetables. Compare
that to the 100-200 sq. ft. in a typical large size grocery store. There is very little shelving
in the store, and most of the grocery items are piled up on the floor in boxes for shoppers to
go through…and this is the good store. Other than this store, the grocery options for resi-
dents of Frog Hollow include, traveling to large-size supermarket in another neighborhood,
or shopping at one of the many bodegas within the community.
Both of these options present their own set of challenges however. Traveling to an-
other neighborhood is difficult if you don’t have a car. Walking or traveling by bus are oth-
er options, although getting back to Frog Hollow by foot or by bus with loaded bags of
groceries is a challenge, particularly if you have frozen items in your grocery order, or bulk
items which are generally cheaper, but heavier. On the other hand, staying in the neighbor-
hood and shopping at one of the many bodegas presents its own disadvantages due to the
fact that it is difficult to obtain the quality vegetables, fruits and whole grain foods that
make up a healthy diet.
All over the country in urban neighborhoods like Frog Hollow more and more
healthy food options are being offered in the forms of Farmer’s Markets, Community Gar-
dening and Community Supported Agriculture. All of these options give community mem-
bers choices for their food procurement. Whether they grow their own food, or support lo-
cal farmers by buying shares of seasonal crops, community members are being offered the
chance to become directly involved in how their food is produced and acquired. Opportuni-
Johns-Galvin !26
ties to meet and discuss food with local farmers and neighbors at farmer’s markets are giv-
ing residents new insight into a world of food and a myriad of food choices that perhaps
they did not realize existed. Farmer’s markets have expanded from just selling fruits and
vegetables to offering local meats, cheeses and whole grain breads, as well as other locally
made goods for the home. These “green” options do more than promote healthy food
choices, they beautify the landscape by clearing blighted vacant lots and turning them into
green gardens or markets where neighbors can come together and create community
through shared common spaces and goals.

Johns-Galvin !27
!Appendix A – Store Price Comparison
!!Food category
Description Item Size El Merca
do
Stop & Shop
S&S Notes
Cost % Diff
Grains
Whole grain breads, rice, pasta, and pastries (including whole grain flours)
- Whole wheat, multigrain, or pumpernickel breads, rolls, bagels, scones, English muffins, biscuits, tortillas, and pancakes—all with 50% or more of ounce equivalents from whole grain - Brown rice, wild rice, whole wheat pasta (e.g., macaroni, spaghetti, and noodles)—all with 50% or more of ounce equivalents from whole grain - Oatmeal cookies, granola cookies, whole wheat doughnuts, granola bars, and graham crackers—all with 50% or more of ounce equivalents from whole grain
Carolina Brown Rice
5 lbs $5.69 $4.48 27% Store brand $1.79/2lbs
Oatmeal Cookies
8.4oz $1.79 $1.00 79%
Whole grain cereals (including hot cereal mixes)
Cooked cereals (e.g., oatmeal and bulgur) with sugars, fat, and whole milk or 2% milk added; sweetened ready-to-eat cereals (e.g., frosted wheats and granola)—all with 50% or more of ounce equivalents from whole grain
Honey Nut Cheerios
12.25oz $4.79 $3.79 26%
Cookie Crisp
11.25oz $5.19 $3.99 30%
Special K 12oz $5.19 $3.99 30%
Quaker Oatmeal
18oz $4.59 $2.59 77%
Popcorn and other whole grain snacks
Popcorn, salty snacks, crackers, multigrain pretzels, and puffed
Multigrain Pringles
6.34oz $2.19 $1.99 10%

Johns-Galvin !28
grain snacks pretzels, and puffed wheat cakes—all with 50% or more of ounce equivalents from whole grain
Popcorn 3-3.3oz bags
$2.39 $1.85 29%
Non-whole grain breads, cereals, rice, pasta, pies, pastries, snacks, and flours
- White, French, potato, bran, or rye breads and rolls; muffins, English muffins, bagels, waffles, corn tortillas, taco shells, cornbread, and pancakes—all with less than 50% of ounce equivalents from whole grain - Cooked cereal (e.g., cream of wheat, grits, and oat bran); sweetened or non-sweetened ready-to-eat cereals (e.g., frosted cornflakes and puffed rice)—all with less than 50% of ounce equivalents from whole grain - Long or short white rice, sweet rice, rice noodles and pasta (e.g., macaroni, spaghetti, and noodles)—all with less than 50% of ounce equivalents from whole grain - Pies, cookies, pastries, doughnuts, shortbread; all cakes (e.g., white, yellow, shortcake, sponge, pound, and angel food); croissants; and sweet rolls—all with less than 50% of ounce equivalents from whole grain - Crackers (e.g., soda, oyster, cheese, and rice); hard or soft pretzels; and salty snacks (e.g., tortilla chips)—all with less than 50% of ounce equivalents from whole grain
Corn Flakes 12oz $3.89 $3.19 22%
White Rice 5 lbs $5.19 $4.25 22%
Spaghetti (noodles)
1 lb $1.29 $1.00 29% Store brand
Frosted Flakes
14oz $5.49 $3.79 45%
Saltines 16oz $3.39 $2.00 70%
Ritz 15.1oz $4.59 $2.50 84%
White Bread 1 lb $1.69 $1.00 69% Store brand
Tortillas 25oz $1.49 $3.15 -53%
Vegetables
Food category
Description Item Size El Merca
do
Stop & Shop
S&S Notes
Cost % Diff

Johns-Galvin !29
All potato products
- French-fried potatoes, potato chips, hash browns, potato puffs, potato patty; and potato salads and mashed pota-toes with added fat, eggs, or cheese - Boiled, baked, scal-loped, mashed, and stuffed potatoes; and potato salad, German style
Potatoes lb $0.79 $1.29 -39%
Pringles potato chips
6.41oz $2.19 $1.99 10%
Potato Sticks
7oz $2.29 $1.99 15%
Dark-green vegetables
All dark-green vegetables such as broccoli, spinach, chard, collard greens, mustard greens, and kale—with or without fat added
Broccoli (fresh)
lb $1.12 $2.99 -63%
Broccoli (frozen)
lb $3.39 $0.67 406%
Orange vegetables
- All orange vegetables such as carrots, pumpkin, winter squash, and sweet potatoes—with or without fat added - Tomato, tomato sauce, tomato puree, tomato paste, tomato soup, and tomato juice—with or without fat added
Carrots lb $0.99 $1.39 -29%
Squash lb $0.99 $1.29 -23%
Canned and dry beans, lentils, and peas (legumes)
Black Beans (canned)
29oz $2.39 $1.25 91% With loyalty card ($0.67/15.5oz)
Red Beans (canned)
29oz $2.39 $1.25 91% With loyalty card ($0.67/15.5oz)
Garbanzo (canned)
15.5oz $1.39 $1.25 11% With loyalty card ($0.67/15.5oz)
Peas (dry) lb $1.19 $0.85 40%
Black (dry) lb $2.29 $1.85 24%
Food category
Description Item Size El Merca
do
Stop & Shop
S&S Notes
Cost % Diff

Johns-Galvin !30
Red (dry) lb $2.29 $1.33 72%
Other vegetables
All other vegetables such as green beans, beets, cabbage, cauliflower, corn, eggplant, green peas, iceberg lettuce, bell pepper, snow peas, turnip, and Brussels sprouts—with or without fat added
Beets 15 oz $1.09 $0.67 63% Store brand
Corn 15 oz $1.09 $0.67 63% With loyalty card
Peas 15 oz $1.09 $0.67 63% With loyalty card
Beets - fresh lb $1.39 $1.99 -30%
Fruits
Whole fruits - Oranges, grapefruits, limes, lemons, and tangelos; melons (e.g., watermelon, cantaloupe, and honeydew); berries (e.g., strawberries, blueberries, cranberries, raspberries, and blackberries) - Fruits such as bananas, apples, cherries, peaches, pears, grapes, plums, papayas, and apricots
Navel Oranges
3 for $1.99 $3.00 -34%
Grapefruit 2 for $1.00 $3.00 -67%
Red Delicious Apples
lb $1.39 $1.79 -22%
Cantaloupe each $2.49 $3.49 -29%
Fruit juices - 100% fruit juices made from citrus fruits, melons, and berries - 100% fruit juices made from fruits other than citrus fruits, melons, and berries
Apple Juice gallon $5.99 $4.29 40%
Milk products
Whole milk, yogurt, and cream
All fluid, evaporated, condensed, and dry whole milk; regular yogurt; all fluid creams; cream substitutes; cream cheese; and dips
Yogurt 6 oz $0.72 $0.50 44%
Danimals 4-4oz pack
$3.19 $2.49 28%
Lower fat and skim milk and lowfat yogurt
All fluid, evaporated, and dry reduced-fat and skim milks; buttermilk; and lowfat or nonfat yogurts
Fat Free Milk
gallon $3.99 $3.49 14% With loyalty card
Food category
Description Item Size El Merca
do
Stop & Shop
S&S Notes
Cost % Diff

Johns-Galvin !31
All cheese (including cheese soup and sauce)
Natural, processed, and imitation cheeses; cottage cheese; cheese spreads; cheese dips; and cheese soups
Borden Singles
16 slices
$2.89 $2.99 -3% Store brand
Shredded Cheddar
8 oz $2.99 $2.50 20% Store brand
Milk drinks and milk desserts
- Milk-based drinks (e.g., malted milk, hot chocolate, eggnogs, cocoa, infant formulas, and meal-replacement drinks) with fat equivalent to that of whole milk; dairy desserts (e.g., ice cream, frozen yogurt, ice milk, custard, and puddings) having more than 6% fat by weight- Milk-based drinks made with reduced-fat or skim milk and dairy desserts having 6% or less fat by weight
Chocolate Milk
1/2 gallon
$4.19 $2.99 40%
Eggnog 32 oz $4.69 $2.29 105%
Meat and beans
Beef, pork, veal, lamb, and game
Chop Steak lb $4.99 $2.19 128%
Roast lb $3.59 $4.99 -28%
Pork Chops (w/ bone)
lb $3.99 $2.49 60% With loyalty card
Pork Chops (boneless)
lb $3.29 $4.99 -34%
Chicken, turkey, and game birds
Whole Chickens
lb $1.49 $1.29 16% With loyalty card
Fish and fish products
Pollack Fillets (frozen)
lb $3.99 $9.32 -57% With loyalty card
Canned Tuna (chunk light in water)
5 oz $1.29 $1.15 12%
Food category
Description Item Size El Merca
do
Stop & Shop
S&S Notes
Cost % Diff

Johns-Galvin !32
Canned Salmon
14.75oz $3.79 $2.59 46% With loyalty card
Bacon, sausages, and luncheon meats (including spreads)
Bacon lb $3.99 $3.33 20% Store brand
Nuts, nut butters, and seeds
Peanut Butter
18oz $3.59 $2.39 50%
Eggs and egg mixtures
Eggs (large - white)
1 dozen $1.89 $2.39 -21%
Other foods
Table fats, oils, and salad dressings
Butter, margarine, vegetable oils (e.g., corn, olive, and sunflower), butter blends, salad oils, lard, shortenings, all salad dressings
Butter lb $3.69 $3.00 23%
Gravies, sauces, condiments, and spices
Mayonnaise, pickles, relishes, salsa, soy sauce, catsup, tomato paste, and gravies and sauces
Ortega Salsa 16oz $2.89 $2.50 16%
Coffee and tea Instant, ground, and fluid coffees and teas with or without caffeine and with or without sugar or sweeteners
Coffee (Bustelo)
10oz $4.39 $3.19 38%
Lipton Tea 100 bags
$4.99 $4.19 19%
Soft drinks, sodas, fruit drinks, and ades (including rice beverages)
- Fruit drinks, cola- and pepper-type soft drinks, ginger ale, root beer, fruit punches, ades (e.g., lemonades and limeades), and other sodas containing sugar - Sugar-free or low-sugar drinks such as cola- and pepper-type soft drinks, ginger ale, root beer, fruit-flavored drinks, fruit punches, ades, and other sodas
Hawaiian Punch
gallon $3.59 $3.49 3%
Coca-Cola (2L)
2L $1.66 $1.79 -7%
Food category
Description Item Size El Merca
do
Stop & Shop
S&S Notes
Cost % Diff

Johns-Galvin !33
! !
Sugars, sweets, and candies
All types of sugars, sweeteners, and syrups (e.g., honey, jams, jellies, marmalades, preserves, icings, gelatin desserts, marshmallow, and fudge); all types of candies and chocolates; and chewing gum
Molassas 12oz $3.09 $3.99 -23%
Syrup 24oz $2.19 $2.79 -22%
Brown Sugar
2 lbs $3.49 $2.29 52%
Sugar 5 lbs $4.19 $2.99 40%
Honey 16oz $3.99 $4.79 -17%
Strawberry Jam
18oz $2.69 $2.79 -4%
Soups (ready-to-serve and condensed)
Chunky 18.6oz $2.99 $2.29 31%
Campbells 10.75oz $1.89 $1.79 6%
Progresso 19oz $2.89 $1.79 61%
Frozen or refrigerated entrées (including pizza, fish sticks, and frozen meals)
Fish Sticks 38.4 oz $7.99 $7.82 2% $4.99/24.5oz
Banquet Hot Wings
14 oz $12.19 $8.99 36%
Total $227.41 $198.37 15%
Average Price Difference 27%
Total Price Difference $29.04
Food category
Description Item Size El Merca
do
Stop & Shop
S&S Notes
Cost % Diff

Johns-Galvin !34
!Bibliography !
American Heart Association 2012 Overweight in Children. Last modified March 29, 2012. Accessed March 30, 2012.
http://www.heart.org/HEARTORG/GettingHealthy/Overweight-in-Chil-dren_UCM_304054_Article.jsp#.T3XMn4GE4fd. !
Carlson, Andrea PhD, Mark Lino, PhD, WenYen Juan, PhD, Kenneth Hanson, PhD and P. Peter Basiotis, PhD
2007 Thrifty Food Plan, 2006. Washington DC: Center for Nutrition Policy and Promotion, U.S. Department of Agriculture. !
Centers for Disease Control and Prevention (CDC) 2008 County Level Estimates. Accessed November 4, 2011. http://apps.nccd.cdc.gov/
DDT_STRS2/CountyPrevalenceData.aspx?mode=OBS. !Centers for Disease Control and Prevention (CDC)
2010 Do You Live in a Food Desert? Accessed November 21, 2011. http://www.cdc.gov/Features/FoodDeserts. !
Centers for Disease Control and Prevention (CDC) 2011 National Diabetes Surveillance System. Accessed November 21, 2011. http://apps.nc-
cd.cdc.gov/DDTSTRS/default.aspx. !City-Data.com. “Hartford, Connecticut Neighborhood Map - Income, House Prices, Occupa-
tions, Boundaries.” Accessed November 4, 2011. http://www.city-data.com/nbmaps/neigh-Hart-
ford-Connecticut.html#N5. !City of Hartford Food Policy Commission
2004 Hartford Area Food Stores Price Survey. Accessed November 15, 2011. www.hartford.-gov/government/FoodCommission/default.htm !
Colon Jr., Leonardo 1979 Produce Draws Buyers. The Hartford Courant, July 21: 17. !
Connecticut State Department of Education (CT-DOE) 2008 Connecticut Schools Participating in the National School Lunch Program Free and Re-
duced Eligibility Percentages as of October 2008. Accessed November 29, 2011. http://www.sde.ct.gov/sde/lib/sde/pdf/rfp/rfp978_oct08_fr_eligibility_percentages.pdf. !

Johns-Galvin !35
Community Data: Frog Hollow Neighborhood. Last modified August 2, 2011. Accessed No-vember 4, 2011. www.hartfordinfo.org. !
Crosskey Architects, LLC. “Projects: El Mercado.” Accessed November 29, 2011. http://www.crosskey.com/pgCommElMercado.html. !
Food Research and Action Center (FRAC) 2010 County-by-County Review of SNAP/Food Stamp Participation. Accessed November 4,
2011. http://frac.org/reports-and-resources/county-by-county-review-of-snapfood-stamp-participation-nytimes/ !
Freeman, Andrea 2007 Fast Food: Oppression Through Poor Nutrition. California Law Review 95(2221):
2221-2259 !Grant, Ellsworth
2004 The Miracle on Capital Avenue. Hog River Journal. Summer 2004. Accessed No-vember 4, 2011. http://www.hogriver.org/issues/v02n03/miracle.htm. !
Hartford Board of Trade 1889 Hartford, Conn., As a Manufacturing, Business and Commercial Center; with Brief
Sketches of its History, Attractions, Leading Industries, and Institutions. Accessed No-vember 4, 2011. www.quinnipiac.edu/abl/etext/hartford/hartford.html. !
Hartford Board of Trade 1907 Nineteenth Annual Meeting. February 20. Accessed November 15, 2011. http://ba-
bel.hathitrust.org/cgi/pt?seq=413&id=nyp.33433020609701&page=root&view=image&size=100&orient=0. !
Historic Buildings of Connecticut. “Billings & Spencer Company (1893).” Last modified July 20, 2009. Accessed November 4, 2011. http://historicbuildingsct.com/?p=1843 . !
Kaufman, Francine 2002 Type 2 Diabetes in Children and Young Adults: A “New Epidemic”. Clinical Diabetes
20(4):217-218. !Knox Parks Foundation. “Programs: Community Gardens.” Accessed December 2, 2011. http://
knoxparks.org/commgdns.html. !Kunnemann, Rolf & Sandra Epal-Ratjen
2004 The Right to Food: A Resource Manual for NGOs. FoodFirst Information and Action Network. Washington D.C.: AAAS Science and Human Rights Program. !

Johns-Galvin !36
Lopez, Rigoberto A., Jiff Martin, Sylvie Tchumtchoua and Linda T. Drake 2005 Community Food Security in Connecticut: An Evaluation and Ranking of 169 Towns.
A Joint Report by Connecticut Food Policy Council, University of Connecticut, Hartford Food System. !
Melville Charitable Trust. “Mission Related Investments: Billings Forge Community Works Programs and Projects.” Accessed November 22, 2011. http://www.melvilletrust.org/
about_us/mission_related.aspx. !Michimi, Akihiko and Michael C Wimberly
2010 Associations of Supermarket Accessibility with Obesity and Fruit and Vegetable Con-sumption in the Conterminous United States. International Journal of Health Geographics 9(49):1-14. !
Morland, Kimberly, Steve Wing, Ana Diez Roux and Charles Poole 2002 Neighborhood Characteristics Associated with the Location of Food Stores and Food
Service Places. American Journal of Preventive Medicine 22(1):23–29. !O’Connell, Jonathan
2007 Hispanic Area Market in Tax Trouble. Hartford Business Journal. March 22. !Pachter, Lee M., DO
2009 Childhood Obesity in Hartford. Connecticut Children’s Medical Center, Children’s Center for Community Research. Accessed March 30, 2012. http://www.hispanichealth.-com/hhc/publications. !
Podsada, Janice 2010 Stop & Shop Opens Second West Hartford Supermarket Friday. The Hartford Courant,
December 1. Accessed November 29, 2011. http://articles.courant.com/2010-12-01/busi-ness/hc-west-hartford-stop-and-shop-opens-20101201_1_aldi-industrial-safety-supply-price-rite. !
Pope Park. “Pope Park History.” Accessed November 4, 2011. http://www.popepark.org/histo-ry.htm. !
Poulin MPH, MT(ASCP), Stephanie M. and Margaret M. Hynes, PhD, MPH The Burden of Diabetes in Connecticut: 2010 Surveillance Report. Hartford: The Connecti-
cut Department of Public Health. !Pratt and Whitney Measurement Systems, Inc. “Pratt & Whitney History.” Accessed November
15, 2011. http://www.prattandwhitney.com/Content/History.asp. !Pretty, Jules, A.S. Ball, T. Lang and J.I.L. Morison

Johns-Galvin !37
2005 Farm costs and food miles: An assessment of the full cost of the UK weekly food bas-ket. Food Policy. 30(1):1-19. !
Shaffer, Amanda 2002 The persistence of L.A.'s grocery gap: The need for a new food policy and approach to
market development. UEP Faculty & UEPI Staff Scholarship. Accessed November 22, 2011. http://scholar.oxy.edu/uep_faculty/16. !
State of Connecticut Department of Economic and Community Development (DECP) 2000 United States Census Demographics Profiles. Hartford County Connecticut. Accessed
November 4, 2011. http://www.ct.gov/ecd/LIB/ecd/2000census/05009003.pdf. !The Hartford Courant
1980 Foundation Assists Food System. June 5: 30. !Wholesome Wave
2011 Double Value Coupon Program: A 2010 Snapshot. Bridgeport, CT. Accessed December 2, 2011. http://wholesomewave.org/wp-content/uploads/2011/07/Outcomes-for-2010-Fact-sheet-final2.pdf. !
Wolf, Eric 2008[1966] Peasantry and Its Problems. In Anthropological Theory. R. Jon McGee and
Richard L. Warms, eds. Pp. 310-323. New York: McGraw-Hill. !United States Bureau of the Census
1963 Census of Population: 1960, Vol. 1, Characteristics of the Population. Part 8, Con-necticut. U.S. Government Printing Office, Washington, D.C. !
United States Bureau of the Census 2001 Profiles of General Demographic Characteristics. 2000 Census of Population and
Housing: Connecticut. U.S. Government Printing Office, Washington, D.C. Accessed No-vember 4, 2011. http://www.ct.gov/ecd/LIB/ecd/2000census/05009003.pdf. !
United States Bureau of the Census. “State & County QuickFacts: Connecticut.” Last modified October 31, 2011. Accessed December 2, 2011. http://quickfacts.census.gov/qfd/states/
09/09003.html. !United States Department of Agriculture Economic Research Service (USDA ERS). “Food
Desert Locator.” Accessed November 21, 2011. http://www.ers.usda.gov/data/fooddesert/. !United States Department of Agriculture Economic Research Service (USDA ERS). “Food
Desert Locator Documentation.” Accessed November 4, 2011. www.ers.usda.gov/data/food-desert/documentation.html.

Johns-Galvin !38
!United States Department of Agriculture
2008 First Lady, Agriculture Secretary Launch MyPate Icon as a New Reminder to Help Consumers to Make Healthier Food Choices. Accessed October 1, 2011. www.cnpp.usda.-gov/publications/myplate/pressrelease.pdf. !
United States House of Representatives 1964 Food, Conservation, and Energy Act of 2008. H.R. 6124. 110th Congress, 2nd Session.
§7527.