
A fuzzy criticality assessment system of process equipment for optimised maintenance management
15
This article was downloaded by: [University of Bradford], [Hong-Sheng Qi] On: 09 July 2013, At: 09:04 Publisher: Taylor & Francis Informa Ltd Registered in England and Wales Registered Number: 1072954 Registered office: Mortimer House, 37-41 Mortimer Street, London W1T 3JH, UK International Journal of Computer Integrated Manufacturing Publication details, including instructions for authors and subscription information: http://www.tandfonline.com/loi/tcim20 A fuzzy criticality assessment system of process equipment for optimised maintenance management H.S. Qi a , R.N. Alzaabi a , A.S. Wood a & M. Jani a a School of Engineering, Design and Technology , University of Bradford , West Yorkshire , UK Published online: 09 Jul 2013. To cite this article: International Journal of Computer Integrated Manufacturing (2013): A fuzzy criticality assessment system of process equipment for optimised maintenance management, International Journal of Computer Integrated Manufacturing, DOI: 10.1080/0951192X.2013.814160 To link to this article: http://dx.doi.org/10.1080/0951192X.2013.814160 PLEASE SCROLL DOWN FOR ARTICLE Taylor & Francis makes every effort to ensure the accuracy of all the information (the “Content”) contained in the publications on our platform. However, Taylor & Francis, our agents, and our licensors make no representations or warranties whatsoever as to the accuracy, completeness, or suitability for any purpose of the Content. Any opinions and views expressed in this publication are the opinions and views of the authors, and are not the views of or endorsed by Taylor & Francis. The accuracy of the Content should not be relied upon and should be independently verified with primary sources of information. Taylor and Francis shall not be liable for any losses, actions, claims, proceedings, demands, costs, expenses, damages, and other liabilities whatsoever or howsoever caused arising directly or indirectly in connection with, in relation to or arising out of the use of the Content. This article may be used for research, teaching, and private study purposes. Any substantial or systematic reproduction, redistribution, reselling, loan, sub-licensing, systematic supply, or distribution in any form to anyone is expressly forbidden. Terms & Conditions of access and use can be found at http:// www.tandfonline.com/page/terms-and-conditions
Transcript of A fuzzy criticality assessment system of process equipment for optimised maintenance management

This article was downloaded by: [University of Bradford], [Hong-Sheng Qi]On: 09 July 2013, At: 09:04Publisher: Taylor & FrancisInforma Ltd Registered in England and Wales Registered Number: 1072954 Registered office: Mortimer House,37-41 Mortimer Street, London W1T 3JH, UK
International Journal of Computer IntegratedManufacturingPublication details, including instructions for authors and subscription information:http://www.tandfonline.com/loi/tcim20
A fuzzy criticality assessment system of processequipment for optimised maintenance managementH.S. Qi a , R.N. Alzaabi a , A.S. Wood a & M. Jani aa School of Engineering, Design and Technology , University of Bradford , West Yorkshire ,UKPublished online: 09 Jul 2013.
To cite this article: International Journal of Computer Integrated Manufacturing (2013): A fuzzy criticality assessment systemof process equipment for optimised maintenance management, International Journal of Computer Integrated Manufacturing,DOI: 10.1080/0951192X.2013.814160
To link to this article: http://dx.doi.org/10.1080/0951192X.2013.814160
PLEASE SCROLL DOWN FOR ARTICLE
Taylor & Francis makes every effort to ensure the accuracy of all the information (the “Content”) containedin the publications on our platform. However, Taylor & Francis, our agents, and our licensors make norepresentations or warranties whatsoever as to the accuracy, completeness, or suitability for any purpose of theContent. Any opinions and views expressed in this publication are the opinions and views of the authors, andare not the views of or endorsed by Taylor & Francis. The accuracy of the Content should not be relied upon andshould be independently verified with primary sources of information. Taylor and Francis shall not be liable forany losses, actions, claims, proceedings, demands, costs, expenses, damages, and other liabilities whatsoeveror howsoever caused arising directly or indirectly in connection with, in relation to or arising out of the use ofthe Content.
This article may be used for research, teaching, and private study purposes. Any substantial or systematicreproduction, redistribution, reselling, loan, sub-licensing, systematic supply, or distribution in anyform to anyone is expressly forbidden. Terms & Conditions of access and use can be found at http://www.tandfonline.com/page/terms-and-conditions
A fuzzy criticality assessment system of process equipment foroptimised maintenance management
H.S. Qi*, R.N. Alzaabi, A.S. Wood and M. Jani
School of Engineering, Design and Technology, University of Bradford, West Yorkshire, UK
(Received 20 June 2012; final version received 8 June 2013)
In modern chemical plants, it is essential to establish an effective maintenance strategy which will deliver financially drivenresults at optimised conditions, that is, minimum cost and time, by means of a criticality review of equipmentin maintenance. In this article, a fuzzy logic-based criticality assessment system (FCAS) for the management of alocal company’s equipment maintenance is introduced. This fuzzy system is shown to improve the conventionalcrisp criticality assessment system (CCAS). Results from case studies show that not only can the fuzzy logic-basedsystem do what the conventional crisp system does but also it can output more criticality classifications with animproved reliability and a greater number of different ratings that account for fuzziness and individual voice of thedecision-makers.
Keywords: equipment criticality assessment; maintenance management; fuzzy system; group decision-making
1. Introduction
In modern chemical plants, it is essential to establisheffective maintenance strategies. Criticality-based main-tenance (CBM) is a prioritised approach to the mainte-nance of process equipment in the chemical processindustries (CPI). In a process and hazard criticality rank-ing (PHCR) study, each equipment item is evaluated witha ‘what if it fails’ scenario. This requires personnel witha thorough knowledge of the process/equipment underreview. The PHCR value is a relative ranking in anoverall criticality hierarchy that is used to determinepriorities for maintenance programs, inspections andrepairs (Ciliberti 1998). A decision-making support sys-tem of this kind, which can achieve expert-level compe-tence in solving problems in task areas by gathering abody of knowledge about specific functions, is called aknowledge-based or expert system. More often, the twoterms, expert systems (ES) and knowledge-based system(KBS), are used synonymously (Fasanghari andMontazer 2010).
In this article, a crisp criticality assessment system(CCAS), currently used in a local chemical companybased in West Yorkshire, UK (Jani 2004), is presented,and the ambiguity and limitations of the system areidentified. To improve the system robustness, fuzzylogic is applied to the CCAS system and a fuzzy criti-cality assessment system (FCAS) is developed. Theadvantages of the new FCAS system over the existingCCAS system are illustrated using some real-life casestudies.
2. Criticality assessment systems (CAS) and expertsystems (ES) in decision-making
2.1. Criticality assessment review
Criticality assessment review of equipment provides thestructure around which a chemical plant can form its opera-tional maintenance plan. The review is to assess the processcriticality for individual equipment items, taking into con-sideration the potential impact upon the environment andhealth and safety, and the financial impact upon thebusiness in the event of equipment failure (Dekker et al.1998; Lee and Hong 2003). Normally a multi-criterionclassification of the critical equipment (MCCCE), asdefined by Felix et al. (2006), is used in a criticality reviewand assessment. Through the criticality review and assess-ment, companies can achieve
● Proper preventive maintenance for safer equipment,better equipment availability for production andlower maintenance costs
● Active planning, forecasting, scheduling and fol-low-up of most work with minimum downtimeand need for emergency repairs
● Accurate and complete recording of equipmentmaintenance activities and their associated costs(material and labour), which provides the necessarymaintenance data for maintenance managers to ana-lyse and control maintenance costs
Afefy (2010) reported that through implementation ofthe equipment criticality assessment for the plant
*Corresponding author. Email: [email protected]
International Journal of Computer Integrated Manufacturing, 2013http://dx.doi.org/10.1080/0951192X.2013.814160
© 2013 Taylor & Francis
Dow
nloa
ded
by [
Uni
vers
ity o
f B
radf
ord]
, [H
ong-
Shen
g Q
i] a
t 09:
04 0
9 Ju
ly 2
013
components, 22.17% of the annual spare parts cost aresaved as a result of the preventive maintenance.
It is worthwhile to mention that in maintenance man-agement, risk management and reliability engineering,there are different types of criticality assessment at differ-ent levels with differing aim/objectives, as pointed out byFelix et al. (2006). Accordingly different methods havebeen formulated for identifying the critical equipment of aprocess, some are centred exclusively on the effect offailure on the service and others are based on the involvedrisk (Casal et al. 1999) or safety (Hokstand et al. 1995;Cepin 2002). Braglia (2000) and Stamatis (2003) reportedusing the FMEA (failure mode and effects analysis) meth-ods to determine and prioritise maintenance activity, ratherthan to classify the equipment itself.
2.2. Criticality assessment system used at a local che-mical company
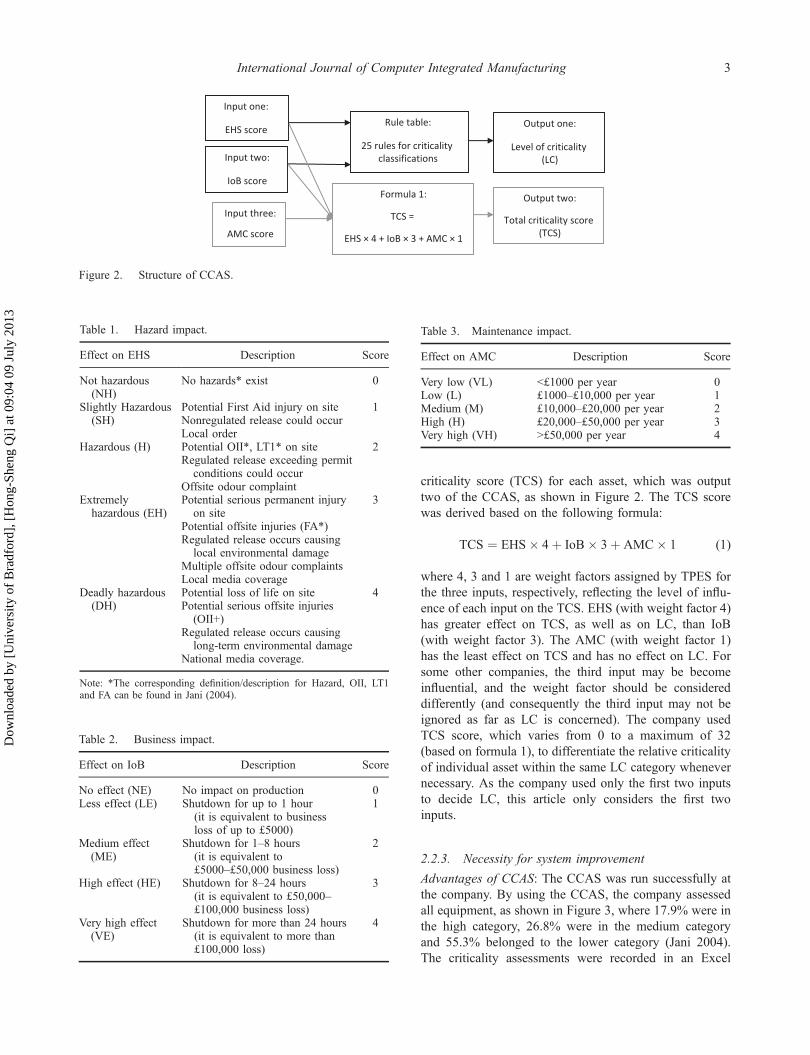
Criticality assessment review of equipment at a local che-mical company, in West Yorkshire, UK, was carried outduring 2003–2004 (Jani 2004). The review looked at allthe plant equipment in considerable detail, down to instru-ment level. The assessment process was based upon acorporate procedure as shown in Figure 1, and severaltasks were conducted through the review, such as collect-ing and reviewing equipment criticality data, which wasthe first step of the review and is detailed in this article;and concurrently building and collecting data for conse-cutive tasks, such as critical spares analysis and FMEA.The assessment method involved looking at the primaryfunction of an item and establishing the consequences ofloss of its function with three criteria/measures, that is, (1)environment, health and safety (EHS); (2) impact on busi-ness (IoB); and (3) annual maintenance cost (AMC). Thecorporate procedure was applied to all facilities, structures,systems, equipment (rotating or fixed) and components inthe plant, including electrical, mechanical and instrumen-tation. All equipment within the plant were evaluated andprocessed through the criticality assessment process based
upon site experience and team knowledge represented by a‘team of plant experts’ (TPES).
2.2.1. Team of plant experts (TPES)
The TPES was a group of staff in the company with agood mix of expertise of knowledge of the productionprocess, the environment (e.g. discharge of contents inair and waste water and other regulations), as well asmaintenance/operation of the plant. The team members,normally 8 to 10 staff at the plant site depending upon thearea of operation being considered, included the opera-tional supervisor, operator, safety/EHS representative, areaengineer, process engineer, production representative, shiftmanager, maintenance supervisor/manager/representativeand technical representative.
The potential effect of each asset on each of the threeaforementioned aspects in the case of its failure wasdetermined by TPES. The most probable failure situationassociated with each of the assets, among a number offailure scenarios, was determined by TPES in terms oflevel of impact of the failure on the company as far asmaintenance was concerned. Crisp scores (0, 1, 2, 3 or 4)were assigned by TPES to each of the assets with regardsto effect on EHS, IoB and AMC.
2.2.2. Structure of the CCAS
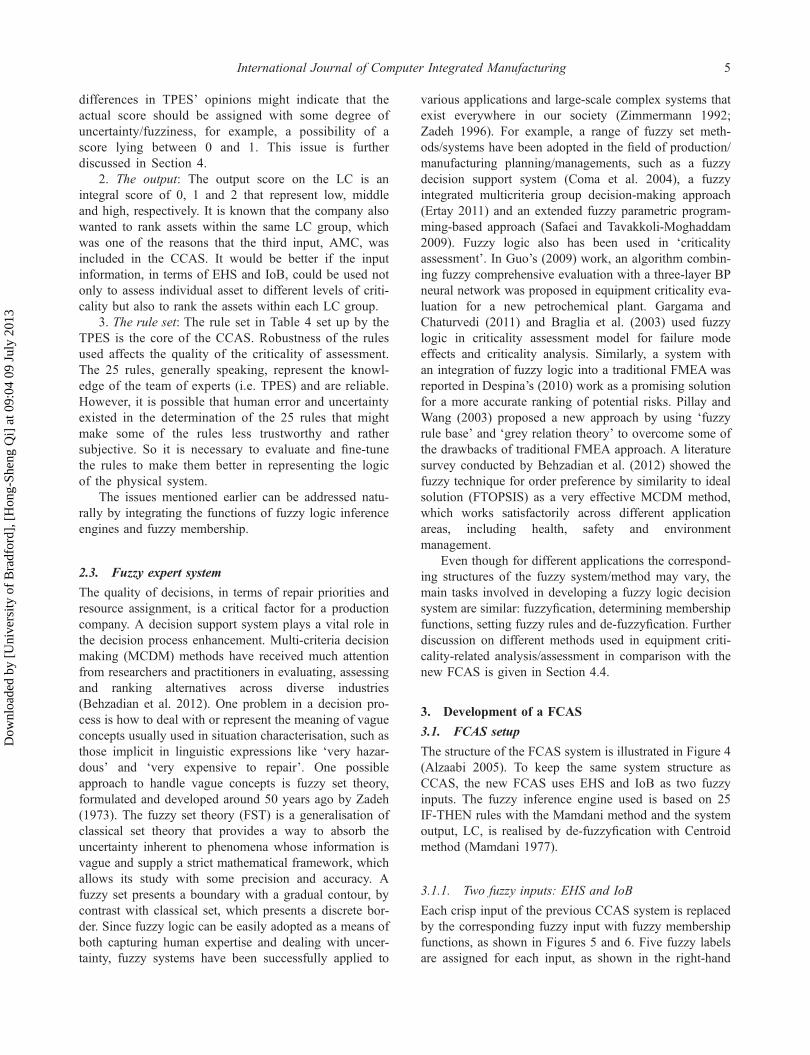
As the first step of the company’s criticality assessmentreview (as shown in Figure 1), CCAS consists of threeinput scores and two output scores, as illustrated inFigure 2. Input one is the effect on EHS. The score ofEHS for each of the assets, assigned by TPES basedupon its hazardous extent, could be 0, 1, 2, 3 or 4, asshown in Table 1. Input two is the effect on IoB. Thescore of IoB for each of the assets, assigned by TPESbased on the business loss if shutdown of whole unit forcertain time, could be 0, 1, 2, 3 or 4, as shown in Table2. Input three is the effect on AMC. The score of AMCfor each of the assets, assigned by TPES based on theequivalent cost of maintenance, could be 0, 1, 2, 3 or 4,as shown in Table 3.
Based on input one and input two, the system providedthe level of criticality (LC) as output one for each of theassets shown in Figure 2. The LC was decided using a ruletable (see Table 4) designed by TPES. The LC of each ofthe assets was classified as high (score 2) or medium(score 1) or low (score 0) according to its scores on EHSand IoB. As a result, all assets were grouped in threecategories (i.e. low, medium and high) based on the LCscore. The decision on maintenance priority for individualasset was based on the category of the asset.
Input three, that is, AMC score, did not actually haveany effect as far as the LC classification was concerned.However, it did play a role in determining the total
Review critical items of plantModify or Write PM’s
Upload data to intranet
Review critical spares
Score equipment to matrixBuild database
Review plant piping and instrument diagrams (P&ID’s)
Figure 1. Flow chart of the criticality assessment procedure(Jani 2004).
2 H.S. Qi et al.
Dow
nloa
ded
by [
Uni
vers
ity o
f B
radf
ord]
, [H
ong-
Shen
g Q
i] a
t 09:
04 0
9 Ju
ly 2
013
criticality score (TCS) for each asset, which was outputtwo of the CCAS, as shown in Figure 2. The TCS scorewas derived based on the following formula:
TCS ¼ EHS � 4þ IoB� 3þ AMC� 1 (1)
where 4, 3 and 1 are weight factors assigned by TPES forthe three inputs, respectively, reflecting the level of influ-ence of each input on the TCS. EHS (with weight factor 4)has greater effect on TCS, as well as on LC, than IoB(with weight factor 3). The AMC (with weight factor 1)has the least effect on TCS and has no effect on LC. Forsome other companies, the third input may be becomeinfluential, and the weight factor should be considereddifferently (and consequently the third input may not beignored as far as LC is concerned). The company usedTCS score, which varies from 0 to a maximum of 32(based on formula 1), to differentiate the relative criticalityof individual asset within the same LC category whenevernecessary. As the company used only the first two inputsto decide LC, this article only considers the first twoinputs.
2.2.3. Necessity for system improvement
Advantages of CCAS: The CCAS was run successfully atthe company. By using the CCAS, the company assessedall equipment, as shown in Figure 3, where 17.9% were inthe high category, 26.8% were in the medium categoryand 55.3% belonged to the lower category (Jani 2004).The criticality assessments were recorded in an Excel
Input one:
EHS scoreOutput one:
Level of criticality
(LC)
Rule table:
25 rules for criticality
classifications
Input three:
AMC score
Input two:
IoB score
Output two:
Total criticality score
(TCS)
Formula 1:
TCS =
EHS × 4 + IoB × 3 + AMC × 1
Figure 2. Structure of CCAS.
Table 1. Hazard impact.
Effect on EHS Description Score
Not hazardous(NH)
No hazards* exist 0
Slightly Hazardous(SH)
Potential First Aid injury on site 1Nonregulated release could occurLocal order
Hazardous (H) Potential OII*, LT1* on site 2Regulated release exceeding permitconditions could occur
Offsite odour complaintExtremelyhazardous (EH)
Potential serious permanent injuryon site
3
Potential offsite injuries (FA*)Regulated release occurs causinglocal environmental damage
Multiple offsite odour complaintsLocal media coverage
Deadly hazardous(DH)
Potential loss of life on site 4Potential serious offsite injuries(OII+)
Regulated release occurs causinglong-term environmental damage
National media coverage.
Note: *The corresponding definition/description for Hazard, OII, LT1and FA can be found in Jani (2004).
Table 2. Business impact.
Effect on IoB Description Score
No effect (NE) No impact on production 0Less effect (LE) Shutdown for up to 1 hour
(it is equivalent to businessloss of up to £5000)
1
Medium effect(ME)
Shutdown for 1–8 hours(it is equivalent to£5000–£50,000 business loss)
2
High effect (HE) Shutdown for 8–24 hours(it is equivalent to £50,000–£100,000 business loss)
3
Very high effect(VE)
Shutdown for more than 24 hours(it is equivalent to more than£100,000 loss)
4
Table 3. Maintenance impact.
Effect on AMC Description Score
Very low (VL) <£1000 per year 0Low (L) £1000–£10,000 per year 1Medium (M) £10,000–£20,000 per year 2High (H) £20,000–£50,000 per year 3Very high (VH) >£50,000 per year 4
International Journal of Computer Integrated Manufacturing 3
Dow
nloa
ded
by [
Uni
vers
ity o
f B
radf
ord]
, [H
ong-
Shen
g Q
i] a
t 09:
04 0
9 Ju
ly 2
013

spreadsheet, allowing easy manipulation and sorting ofdata. This spreadsheet became a control document withan appropriate change and control procedure. New equip-ment was assessed and added to the list when it wasinstalled.
The benefits of implementing CCAS at the case com-pany include
● Reducing the risk of serious failures by applyingpreventive maintenance strategy (such as FMEA)on the high LC group of assets, for example, pre-dictive/monitoring online
● Reduced costs by reduced labour requirement (aslow LC assets require less attention)
● Reduced usage of parts through unnecessarymaintenance
● Reduced planned maintenance stoppages attributedto unnecessary maintenance
● High productivity due to ‘critical assets’ improvedreliability
Using CCAS can minimise unplanned event such as
● Injury to people, both employees and the public● Damage to the environment
● Loss of process material● Damage to capital assets● Increase of operating costs
In addition, CCAS is easy to use and is easy to updatethe assessment score with new inputs of the company’sassets.
Issues for improvement: To evaluate the system per-formance, three issues have been identified:
1. The input: The input scores for EHS and IoB aresimple but have some drawbacks. For instance, whenthe TPES evaluate an individual asset, it is more likelythat they may have different views on what scores forEHS (and IoB) should be assigned. The CCAS cannotaccommodate these differences. For example, during thecritical assessment of an agitator motor, which was usedin the effluent plant to give motion to an agitator, theTPES had some differences in opinion on the EHSscore for the agitator motor. In the TPES with 10members, 5 members gave a score of 0 and the other5 gave a score of 1. In the CCAS, however, TPES hadto agree on what score (with an integer value) should beassigned. Then, eventually, everybody agreed on a scoreof 1. Such rigidity of the CCAS on input informationmight filter out some useful information, that is,
Table 4. Rule table for level of criticality (LC) score.
EHS 0 1 2 3 4
IoB
0 Low (0) Low (0) Low (0) Medium (1) High (2)1 Low (0) Low (0) Low (0) Medium (1) High (2)2 Low (0) Low (0) Medium (1) Medium (1) High (2)3 Low (0) Medium (1) Medium (1) High (2) High (2)4 Low (0) Medium (1) High (2) High (2) High (2)
350High
Medium
Low
300
250
200
150
100
50
0
Equipment
All category graph
To
ta
l
Pum
ps
Valv
es
& a
ctu
ato
rs
Inst
rum
ents
Agitato
rs
Vess
els
Conta
inm
ent
Lifting e
quip
ment
Heat exchanger
Filte
r
Boiler
Chim
ney
Figure 3. All categories critical equipment chart based on 1524 items assessed (Jani 2004).
4 H.S. Qi et al.
Dow
nloa
ded
by [
Uni
vers
ity o
f B
radf
ord]
, [H
ong-
Shen
g Q
i] a
t 09:
04 0
9 Ju
ly 2
013
differences in TPES’ opinions might indicate that theactual score should be assigned with some degree ofuncertainty/fuzziness, for example, a possibility of ascore lying between 0 and 1. This issue is furtherdiscussed in Section 4.
2. The output: The output score on the LC is anintegral score of 0, 1 and 2 that represent low, middleand high, respectively. It is known that the company alsowanted to rank assets within the same LC group, whichwas one of the reasons that the third input, AMC, wasincluded in the CCAS. It would be better if the inputinformation, in terms of EHS and IoB, could be used notonly to assess individual asset to different levels of criti-cality but also to rank the assets within each LC group.
3. The rule set: The rule set in Table 4 set up by theTPES is the core of the CCAS. Robustness of the rulesused affects the quality of the criticality of assessment.The 25 rules, generally speaking, represent the knowl-edge of the team of experts (i.e. TPES) and are reliable.However, it is possible that human error and uncertaintyexisted in the determination of the 25 rules that mightmake some of the rules less trustworthy and rathersubjective. So it is necessary to evaluate and fine-tunethe rules to make them better in representing the logicof the physical system.
The issues mentioned earlier can be addressed natu-rally by integrating the functions of fuzzy logic inferenceengines and fuzzy membership.
2.3. Fuzzy expert system
The quality of decisions, in terms of repair priorities andresource assignment, is a critical factor for a productioncompany. A decision support system plays a vital role inthe decision process enhancement. Multi-criteria decisionmaking (MCDM) methods have received much attentionfrom researchers and practitioners in evaluating, assessingand ranking alternatives across diverse industries(Behzadian et al. 2012). One problem in a decision pro-cess is how to deal with or represent the meaning of vagueconcepts usually used in situation characterisation, such asthose implicit in linguistic expressions like ‘very hazar-dous’ and ‘very expensive to repair’. One possibleapproach to handle vague concepts is fuzzy set theory,formulated and developed around 50 years ago by Zadeh(1973). The fuzzy set theory (FST) is a generalisation ofclassical set theory that provides a way to absorb theuncertainty inherent to phenomena whose information isvague and supply a strict mathematical framework, whichallows its study with some precision and accuracy. Afuzzy set presents a boundary with a gradual contour, bycontrast with classical set, which presents a discrete bor-der. Since fuzzy logic can be easily adopted as a means ofboth capturing human expertise and dealing with uncer-tainty, fuzzy systems have been successfully applied to
various applications and large-scale complex systems thatexist everywhere in our society (Zimmermann 1992;Zadeh 1996). For example, a range of fuzzy set meth-ods/systems have been adopted in the field of production/manufacturing planning/managements, such as a fuzzydecision support system (Coma et al. 2004), a fuzzyintegrated multicriteria group decision-making approach(Ertay 2011) and an extended fuzzy parametric program-ming-based approach (Safaei and Tavakkoli-Moghaddam2009). Fuzzy logic also has been used in ‘criticalityassessment’. In Guo’s (2009) work, an algorithm combin-ing fuzzy comprehensive evaluation with a three-layer BPneural network was proposed in equipment criticality eva-luation for a new petrochemical plant. Gargama andChaturvedi (2011) and Braglia et al. (2003) used fuzzylogic in criticality assessment model for failure modeeffects and criticality analysis. Similarly, a system withan integration of fuzzy logic into a traditional FMEA wasreported in Despina’s (2010) work as a promising solutionfor a more accurate ranking of potential risks. Pillay andWang (2003) proposed a new approach by using ‘fuzzyrule base’ and ‘grey relation theory’ to overcome some ofthe drawbacks of traditional FMEA approach. A literaturesurvey conducted by Behzadian et al. (2012) showed thefuzzy technique for order preference by similarity to idealsolution (FTOPSIS) as a very effective MCDM method,which works satisfactorily across different applicationareas, including health, safety and environmentmanagement.
Even though for different applications the correspond-ing structures of the fuzzy system/method may vary, themain tasks involved in developing a fuzzy logic decisionsystem are similar: fuzzyfication, determining membershipfunctions, setting fuzzy rules and de-fuzzyfication. Furtherdiscussion on different methods used in equipment criti-cality-related analysis/assessment in comparison with thenew FCAS is given in Section 4.4.
3. Development of a FCAS
3.1. FCAS setup
The structure of the FCAS system is illustrated in Figure 4(Alzaabi 2005). To keep the same system structure asCCAS, the new FCAS uses EHS and IoB as two fuzzyinputs. The fuzzy inference engine used is based on 25IF-THEN rules with the Mamdani method and the systemoutput, LC, is realised by de-fuzzyfication with Centroidmethod (Mamdani 1977).
3.1.1. Two fuzzy inputs: EHS and IoB
Each crisp input of the previous CCAS system is replacedby the corresponding fuzzy input with fuzzy membershipfunctions, as shown in Figures 5 and 6. Five fuzzy labelsare assigned for each input, as shown in the right-hand
International Journal of Computer Integrated Manufacturing 5
Dow
nloa
ded
by [
Uni
vers
ity o
f B
radf
ord]
, [H
ong-
Shen
g Q
i] a
t 09:
04 0
9 Ju
ly 2
013
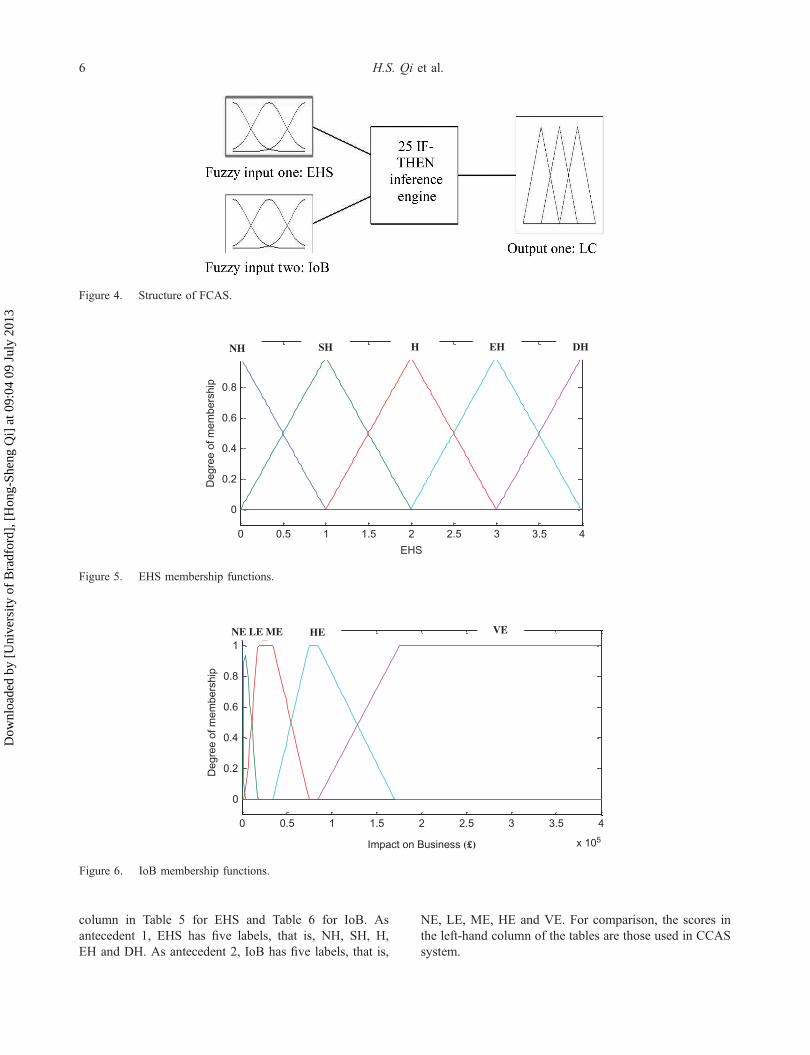
column in Table 5 for EHS and Table 6 for IoB. Asantecedent 1, EHS has five labels, that is, NH, SH, H,EH and DH. As antecedent 2, IoB has five labels, that is,
NE, LE, ME, HE and VE. For comparison, the scores inthe left-hand column of the tables are those used in CCASsystem.
0 0.5 1 1.5 2 2.5 3 3.5 4
0
0.2
0.4
0.6
0.8
EHS
Deg
ree
of m
embe
rshi
p
0 1 2 3 4NH SH H EH DH
Figure 5. EHS membership functions.
0 0.5 1 1.5 2 2.5 3 3.5 4
x 105
0
0.2
0.4
0.6
0.8
1
Impact on Business (£)
Deg
ree
of m
embe
rshi
p
01 2 3NE LE ME HE VE
Figure 6. IoB membership functions.
Figure 4. Structure of FCAS.
6 H.S. Qi et al.
Dow
nloa
ded
by [
Uni
vers
ity o
f B
radf
ord]
, [H
ong-
Shen
g Q
i] a
t 09:
04 0
9 Ju
ly 2
013
The membership function for EHS is established togive numerical meaning to each label as shown Figure 5.A triangular membership function is used. EHS isassumed within a universe of discourse U1 = {EHS / 0 ≤EHS ≤ 4}. Therefore, a limited universe of discourse tothe range of interest of application is used for EHS. Thelower boundary is zero. This makes sense because itmeans no hazardous effect on production. This also isidentical to the setup of the crisp system (CCAS).
The membership function for IoB is established togive numerical meaning to each label as shown Figure 6.A trapotropical membership function is used. IoB is
assumed within a universe of discourse U2 = {IoB / 0 ≤IoB ≤ ∞}. Therefore, an unlimited universe of discourse tothe range of interest of application is used for IoB. Thelower boundary is zero. This makes sense because it meansno effect on production or shutdown of the whole unit forzero hour and equivalent to business loss of £0. This is alsoidentical to the setup of the crisp system (CCAS).
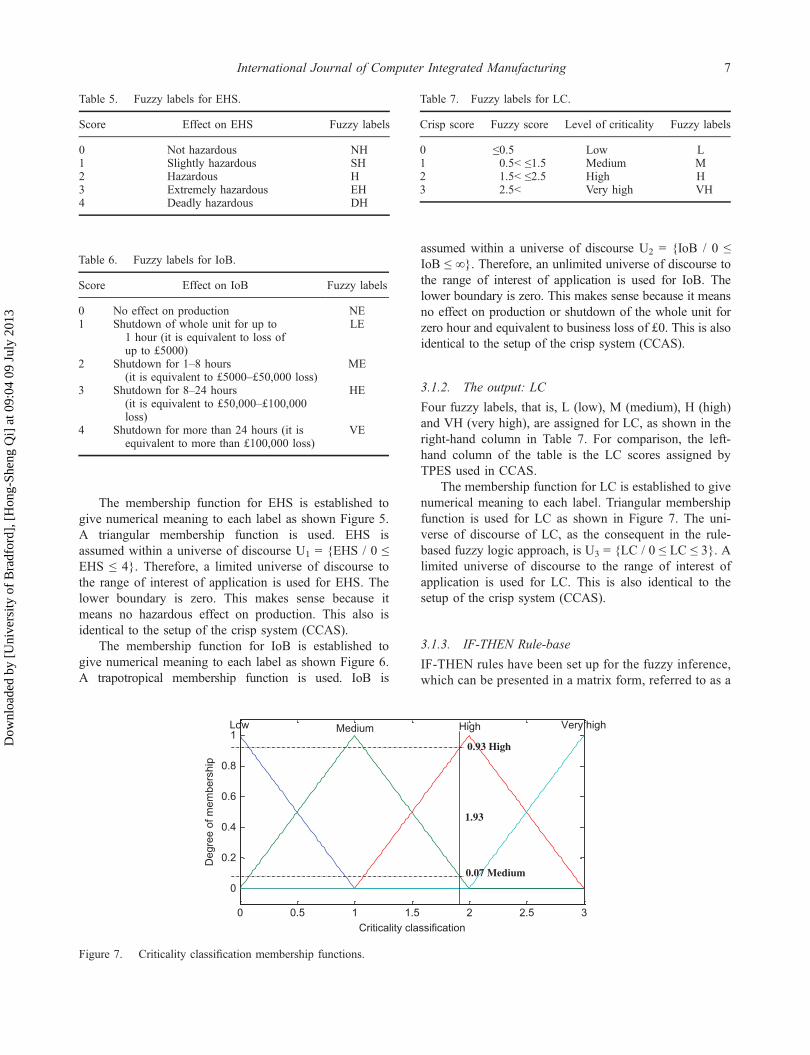
3.1.2. The output: LC
Four fuzzy labels, that is, L (low), M (medium), H (high)and VH (very high), are assigned for LC, as shown in theright-hand column in Table 7. For comparison, the left-hand column of the table is the LC scores assigned byTPES used in CCAS.
The membership function for LC is established to givenumerical meaning to each label. Triangular membershipfunction is used for LC as shown in Figure 7. The uni-verse of discourse of LC, as the consequent in the rule-based fuzzy logic approach, is U3 = {LC / 0 ≤ LC ≤ 3}. Alimited universe of discourse to the range of interest ofapplication is used for LC. This is also identical to thesetup of the crisp system (CCAS).
3.1.3. IF-THEN Rule-base
IF-THEN rules have been set up for the fuzzy inference,which can be presented in a matrix form, referred to as a
Table 5. Fuzzy labels for EHS.
Score Effect on EHS Fuzzy labels
0 Not hazardous NH1 Slightly hazardous SH2 Hazardous H3 Extremely hazardous EH4 Deadly hazardous DH
Table 6. Fuzzy labels for IoB.
Score Effect on IoB Fuzzy labels
0 No effect on production NE1 Shutdown of whole unit for up to
1 hour (it is equivalent to loss ofup to £5000)
LE
2 Shutdown for 1–8 hours(it is equivalent to £5000–£50,000 loss)
ME
3 Shutdown for 8–24 hours(it is equivalent to £50,000–£100,000loss)
HE
4 Shutdown for more than 24 hours (it isequivalent to more than £100,000 loss)
VE
Table 7. Fuzzy labels for LC.
Crisp score Fuzzy score Level of criticality Fuzzy labels
0 ≤0.5 Low L1 0.5< ≤1.5 Medium M2 1.5< ≤2.5 High H3 2.5< Very high VH
0 0.5 1 1.5 2 2.5 3
0
0.2
0.4
0.6
0.8
1
Criticality classification
Deg
ree
of m
embe
rshi
p
Low Medium High Very high
1.93
0.93 High
0.07 Medium
Figure 7. Criticality classification membership functions.
International Journal of Computer Integrated Manufacturing 7
Dow
nloa
ded
by [
Uni
vers
ity o
f B
radf
ord]
, [H
ong-
Shen
g Q
i] a
t 09:
04 0
9 Ju
ly 2
013
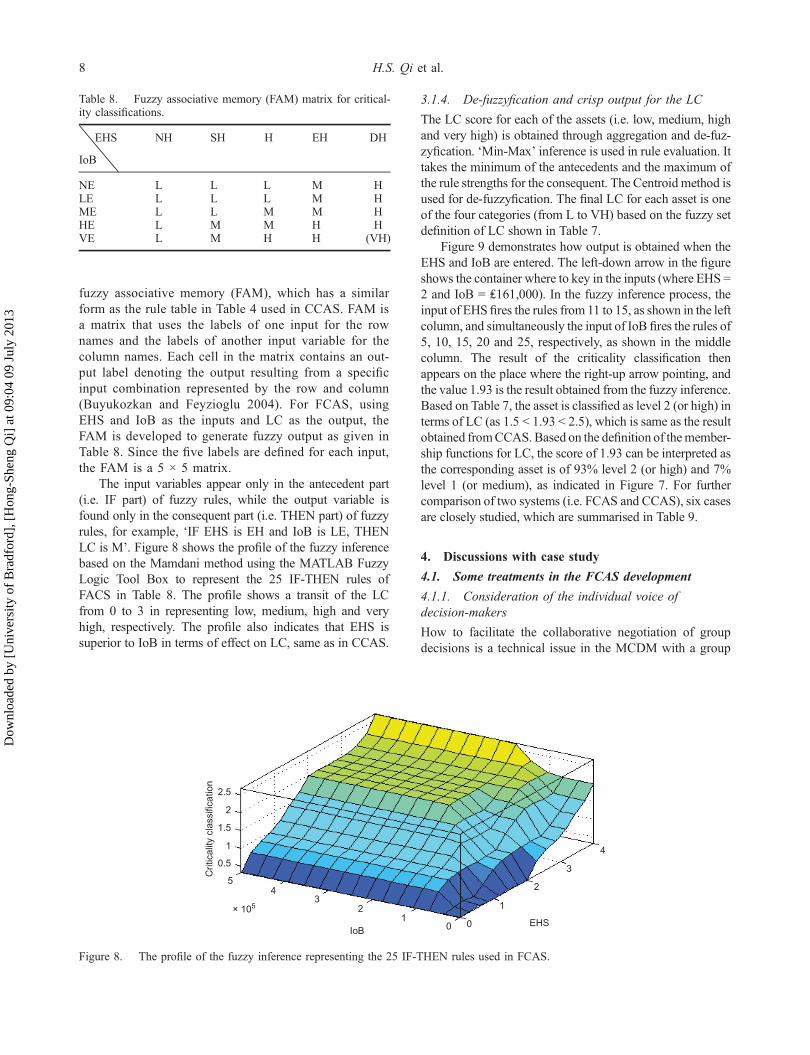
fuzzy associative memory (FAM), which has a similarform as the rule table in Table 4 used in CCAS. FAM isa matrix that uses the labels of one input for the rownames and the labels of another input variable for thecolumn names. Each cell in the matrix contains an out-put label denoting the output resulting from a specificinput combination represented by the row and column(Buyukozkan and Feyzioglu 2004). For FCAS, usingEHS and IoB as the inputs and LC as the output, theFAM is developed to generate fuzzy output as given inTable 8. Since the five labels are defined for each input,the FAM is a 5 × 5 matrix.
The input variables appear only in the antecedent part(i.e. IF part) of fuzzy rules, while the output variable isfound only in the consequent part (i.e. THEN part) of fuzzyrules, for example, ‘IF EHS is EH and IoB is LE, THENLC is M’. Figure 8 shows the profile of the fuzzy inferencebased on the Mamdani method using the MATLAB FuzzyLogic Tool Box to represent the 25 IF-THEN rules ofFACS in Table 8. The profile shows a transit of the LCfrom 0 to 3 in representing low, medium, high and veryhigh, respectively. The profile also indicates that EHS issuperior to IoB in terms of effect on LC, same as in CCAS.
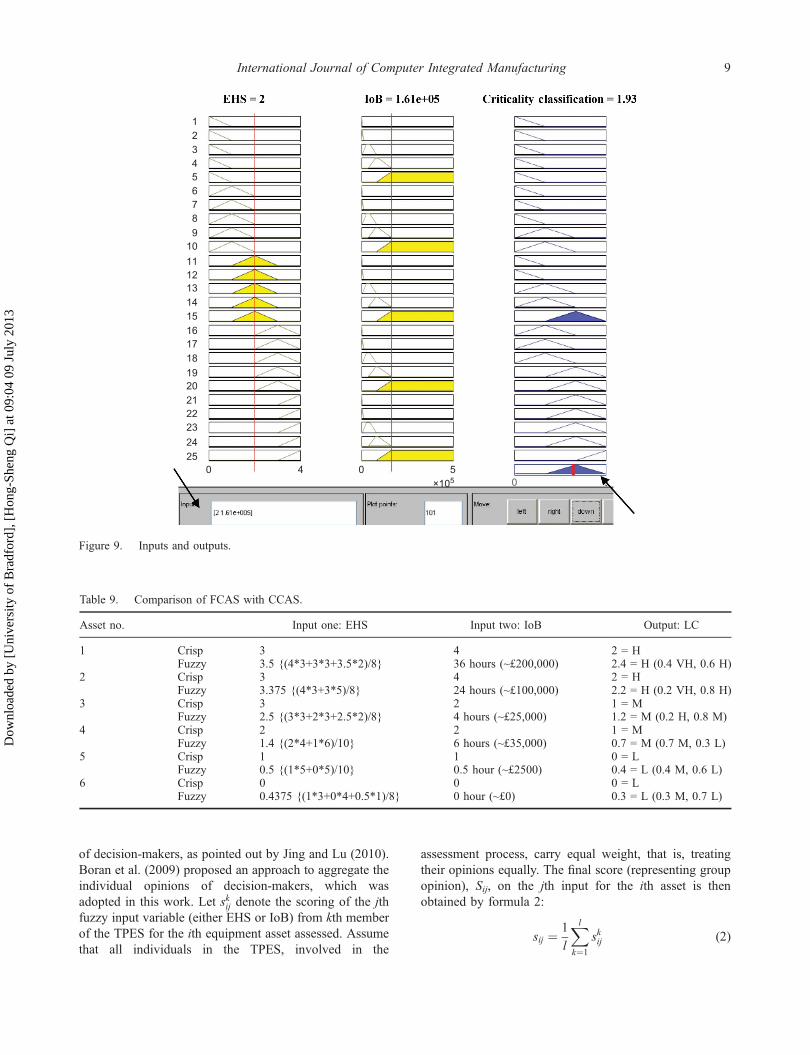
3.1.4. De-fuzzyfication and crisp output for the LC
The LC score for each of the assets (i.e. low, medium, highand very high) is obtained through aggregation and de-fuz-zyfication. ‘Min-Max’ inference is used in rule evaluation. Ittakes the minimum of the antecedents and the maximum ofthe rule strengths for the consequent. The Centroid method isused for de-fuzzyfication. The final LC for each asset is oneof the four categories (from L to VH) based on the fuzzy setdefinition of LC shown in Table 7.
Figure 9 demonstrates how output is obtained when theEHS and IoB are entered. The left-down arrow in the figureshows the container where to key in the inputs (where EHS =2 and IoB = ₤161,000). In the fuzzy inference process, theinput of EHS fires the rules from 11 to 15, as shown in the leftcolumn, and simultaneously the input of IoB fires the rules of5, 10, 15, 20 and 25, respectively, as shown in the middlecolumn. The result of the criticality classification thenappears on the place where the right-up arrow pointing, andthe value 1.93 is the result obtained from the fuzzy inference.Based on Table 7, the asset is classified as level 2 (or high) interms of LC (as 1.5 < 1.93 < 2.5), which is same as the resultobtained fromCCAS. Based on the definition of themember-ship functions for LC, the score of 1.93 can be interpreted asthe corresponding asset is of 93% level 2 (or high) and 7%level 1 (or medium), as indicated in Figure 7. For furthercomparison of two systems (i.e. FCAS and CCAS), six casesare closely studied, which are summarised in Table 9.
4. Discussions with case study
4.1. Some treatments in the FCAS development
4.1.1. Consideration of the individual voice ofdecision-makers
How to facilitate the collaborative negotiation of groupdecisions is a technical issue in the MCDM with a group
Table 8. Fuzzy associative memory (FAM) matrix for critical-ity classifications.
EHS NH SH H EH DH
IoB
NE L L L M HLE L L L M HME L L M M HHE L M M H HVE L M H H (VH)
2.5
2
1.5
1
0.5
54
× 1053
2
IoB
Crit
ical
ity c
lass
ifica
tion
EHS10 0
1
2
3
4
Figure 8. The profile of the fuzzy inference representing the 25 IF-THEN rules used in FCAS.
8 H.S. Qi et al.
Dow
nloa
ded
by [
Uni
vers
ity o
f B
radf
ord]
, [H
ong-
Shen
g Q
i] a
t 09:
04 0
9 Ju
ly 2
013
of decision-makers, as pointed out by Jing and Lu (2010).Boran et al. (2009) proposed an approach to aggregate theindividual opinions of decision-makers, which wasadopted in this work. Let skij denote the scoring of the jthfuzzy input variable (either EHS or IoB) from kth memberof the TPES for the ith equipment asset assessed. Assumethat all individuals in the TPES, involved in the
assessment process, carry equal weight, that is, treatingtheir opinions equally. The final score (representing groupopinion), Sij, on the jth input for the ith asset is thenobtained by formula 2:
sij ¼ 1
l
Xl
k¼1
skij (2)
Table 9. Comparison of FCAS with CCAS.
Asset no. Input one: EHS Input two: IoB Output: LC
1 Crisp 3 4 2 = HFuzzy 3.5 {(4*3+3*3+3.5*2)/8} 36 hours (~£200,000) 2.4 = H (0.4 VH, 0.6 H)
2 Crisp 3 4 2 = HFuzzy 3.375 {(4*3+3*5)/8} 24 hours (~£100,000) 2.2 = H (0.2 VH, 0.8 H)
3 Crisp 3 2 1 = MFuzzy 2.5 {(3*3+2*3+2.5*2)/8} 4 hours (~£25,000) 1.2 = M (0.2 H, 0.8 M)
4 Crisp 2 2 1 = MFuzzy 1.4 {(2*4+1*6)/10} 6 hours (~£35,000) 0.7 = M (0.7 M, 0.3 L)
5 Crisp 1 1 0 = LFuzzy 0.5 {(1*5+0*5)/10} 0.5 hour (~£2500) 0.4 = L (0.4 M, 0.6 L)
6 Crisp 0 0 0 = LFuzzy 0.4375 {(1*3+0*4+0.5*1)/8} 0 hour (~£0) 0.3 = L (0.3 M, 0.7 L)
123456789
10
11121314151617181920212223
2425
0 4 0 50×105
Figure 9. Inputs and outputs.
International Journal of Computer Integrated Manufacturing 9
Dow
nloa
ded
by [
Uni
vers
ity o
f B
radf
ord]
, [H
ong-
Shen
g Q
i] a
t 09:
04 0
9 Ju
ly 2
013
where l is the number of experts in the TPES, from 8 to 10in this application.
The following example, which is mentioned in Section2.2.3, is used to illustrate how to use formula 2. During thecritical assessment of an agitator motor, which was used inthe effluent plant to give motion to an agitator, the TPEShad some differences in opinion on the EHS score for theagitator motor. Among the 10 members, 5 members gave ascore of 0 and the other 5 members gave a score of 1.Based on formula 2, the group score for the agitator (asset i)in terms of EHS (j = 1):
Si1 ¼ 0�5þ 1�5ð Þ=10 ¼ 0:5
In CCAS, however, TPES had to agree on what score(with an integer value) should be assigned. Then, even-tually, everybody agreed on Si1 = 1. Such rigidity of theCCAS on input information might filter out some usefulinformation, that is, differences in TPES’ opinions mightindicate that the actual score should be assigned with somedegree of uncertainty/fuzziness.
As far as the IoB score is concerned, apart from notolerance to the difference among TPES’ opinions (thesame as on EHS score mentioned previously), the CCAStreats, for example, a loss of £5000 and a loss of£50,000 the same as they both score 2 (see Table 2).The FCAS, however, uses the actual estimated value asthe input.
4.1.2. Choosing the shapes of fuzzy sets and membershipfunctions
This is undoubtedly the most critical part of building afuzzy system since the shape of the fuzzy set determinesthe correspondence between data and the underlyingconcept. Experimental evidence, however, points to ahigh tolerance for fuzzy shape approximation in mostmodels/systems; that is, a fuzzy model will still behavewell even when the fuzzy shapes are not preciselydrawn. The conventional shape representations in engi-neering are either triangular or trapezoidal (Cox 1994).So a triangular membership function with 50% overlapis used for EHS and LC to adequately represent theirlinguistic and qualitative features with even regionfuzzy sets. For IoB, by considering its quantitativefeature (i.e. measured by hours/pounds) and its unevenfuzzy regions (e.g. 0 to 1 hour for LE and 8 to 24 hoursfor HE) a trapezoidal membership function is used. Inaddition, the general ‘Sum-to-One’ rule, defined in for-mula 3 (Cox 1994) (stated as ‘the sum of all pointsthrough the overlapping fuzzy sets should be equal toone’), is followed when setting a overlap among theneighbouring fuzzy sets for fuzzy variable IoB as wellas for EHS and LC:
Xn
a¼1
μja x½ � ¼ 1 (3)
where µja[x] is the degree of membership of the ath fuzzyset for jth fuzzy variable with the value of x, and n is thenumber of fuzzy set regions for jth fuzzy variable, n = 5for EHS and IoB, and n = 4 for LC.
4.1.3. Fuzzy rules
Twenty-four of the twenty-five rules in the rule matrix inTable 8 for FCAS are identical to the rules designed byTPES used in the CCAS (see Table 4). One new rule, thatis, ‘if EHS is DH and IoB is VE, then LC is VH’, isintroduced for the FCAS. This change helps to differenti-ate those assets with a high LC score at the high end of theranking spectrum.
4.2. Case study
The power and robustness of the FCAS can be seen bylooking and noting the differences between CCAS andFCAS, shown in Table 9, which includes critical assess-ments of six assets. Columns 3 and 4 in Table 9 are thetwo inputs, EHS and IoB. For CCAS, the two inputs areintegers. For FCAS, however, the input of IoB is the realvalue (i.e. equivalent number of hours lost and corre-sponding business loss in £) and the input of EHS is ascore based on formula 2. Column 5 includes the outputsobtained from both CCAS and FCAS. Taking the case ofasset no. 3 in Table 9 as an example, where the asset scoreon the effect of EHS is 3 and on the effect of IoB is 2 fromCCAS. Consequently, the LC of this asset scores 1, whichmeans that the asset’s criticality is medium. From theFCAS, however, by taking account the difference in opi-nion among TPES when assessing this asset, the EHSscore is 2.5 (instead of 3), which is based on 3 of the 8TPES giving a score of 3, 3 of 8 giving a score of 2 andthe remaining 2 of 8 giving a neutral score (2.5 was usedhere to represent the neutral). For IoB, 4 hours, whichrepresented the ‘shutdown the production for 4 hours andequivalent loss of £25,000’, is used as IoB input.Consequently the LC of the asset is 1.2, which can beinterpreted using the fuzzy set definition for LC as 80%medium and 20% high (see Figure 7), suggesting theasset’s criticality is predominantly medium (agreeingwith the results from CCAS).
4.3. Advantages of the fuzzy system (FCAS) over thecrisp system (CCAS)
Results of the case study show that there are severaladvantages of the new fuzzy system over the crisp system.
10 H.S. Qi et al.
Dow
nloa
ded
by [
Uni
vers
ity o
f B
radf
ord]
, [H
ong-
Shen
g Q
i] a
t 09:
04 0
9 Ju
ly 2
013
Firstly, the fuzzy system can do what the conventionalsystems offer, that is, if the crisp values from the third casediscussed previously are inputted into the FCAS, thenLC = 1 is resulted, which is identical to the result obtainedfrom CCAS. In addition, as shown in Table 9, both sys-tems derive the same results as far as the LC category isconcerned, that is, assets 1 and 2 are in the category ofhigh, assets 3 and 4 are in the category of medium andassets 5 and 6 are in the category of low.
Secondly, the fuzzy system offers a much more detailedcriticality classification than the crisp system by takingaccount of the fuzziness and greyness which exists in thereal-world production system and possible subjective/bias/imperfection of experts. It is known that the companywanted to rank assets within each LC group, which wasone of the reasons that the third criterion (AMC) wasincluded in the CCAS. By just using EHS and IoB,FCAS can not only assess individual asset to different LCbut also rank the assets within the each criticality group. Asshown in Table 9, the FCAS system ranks all six assetsbased on their fuzzy scores, that is, asset 1 is the mostcritical and asset 6 is the least critical. The conventionalCCAS is unable to distinguish difference in criticalitywithin each category, that is, criticality of asset 1 is equalto 2 (high category), asset 3 is equal to 4 (medium cate-gory) and asset 5 is equal to 6 (low category).
Thirdly, the fuzzy criticality system allows the TPESto express their difference in opinion when assessing andscoring for each asset and brings those fuzziness andvagueness into the criticality assessment process.Consequently, the fuzzy system provides the criticalityranking in terms of the company’s assets, with less bias.
4.4. Discussion
4.4.1. Comparison of FCAS with other fuzzy systems
As mentioned in Section 2.3, different types of fuzzysystem/methods are adopted by researchers and practi-tioners in evaluating, assessing and ranking alternativesacross diverse industries, and FTOPSIS continues to worksatisfactorily (Chakhar and Saad 2012; Boran et al. 2009).FFMEA was used by several researchers (Braglia et al.2003; Despina and Avram 2010; Gargama and Chaturvedi2011). The main differences of the method used in FCASin comparison with those in literature, mainly FTOPSISand FFMEA, have been identified as
1. How expert voices are used: In FCAS, experts (ordecision-makers) carry out the assessment tasks as a team,that is, 8–10 experts with diverse backgrounds. Decisionsare based on team meetings with discussion, debate andmutual influence. In the systems, such as FTOPSIS andFFMEA, experts carried out independent criticality assess-ments. They worked independently first in the assessmentprocess (with no discussion and no mutual influence).Then, with different weighting assigned based on
individual’s level of expertise and using certain rules andmathematical algorithms, the final ranking was derived asan aggregation of the experts’ independent opinions.
2. The number and the members of decision-makers: InFCAS, the number and the members of the TPES are flex-ible, that is, it can be changed from time to time, from oneplant site to another plant site if necessary. In contrast, thenumber of experts, as well as the members of the expertsinvolved, is prefixed as the main mathematics used inFTOPSIS (and FFMEA) is matrix calculus, where prede-fined and prefixed size(s) for matrix (or string) is required.
3. The number of the equipment assets being assessed:FCAS is designed and is suitable for large (or huge)numbers and differing number of items to be assessed orranked. In the case company, more than 10,000 of theplant’s equipment assets were assessed. The system alsoallows new equipment to be assessed and added into thesystem database at any required time.
4. The number of multicriteria used: In FCAS, fewercriteria are preferred, normally less than four, as fewercriteria require an inference engine with less rules and/orsimple formula, which also means less data/informationrequired for experts to make decisions in the scoring/assessing process. In the system used in literature, alarge number of criteria are normally used, which requiresmuch detailed information/data for experts in the scoring/assessing process. The lack of adequate information is oneof the main reasons causing difficulty of system imple-mentation in industrial practice (Liu et al. 2010).
In summary, the main difference in comparison withother fuzzy logic systems (or methods/approaches) is thatFCAS has an open structure in terms of the number ofequipment assets to be assessed and the number/memberof experts involved. And the TPES’ ‘voice’, or a teamvoice, is used in the assessment process. FCAS is suitablefor a large company’s initial equipment criticality analysis(or the first step of a multisteps equipment criticalityreview) in the company’s reliability cantered maintenance(RCM) framework, where a large number of equipmentassets are assessed at possible different plant sites withvaried TPES members/numbers within a certain length oftime period. Systems such as FTOPSIS and FFMEA,however, are more suitable for ranking and assessinghandful highly important/critical equipment/systemsassessed by a predefined group of experts or decision-makers and supported with adequate data/information.The fuzzy criticality analysis of this kind is normallytaken place as a subsequent step in a company’s RCMframework.
4.4.2. Necessity in applications of fuzzy systems to realproblems with real decision-makers
Criticality analysis has made some progress since itsintroduction into reliability studies in the 1960s, but
International Journal of Computer Integrated Manufacturing 11
Dow
nloa
ded
by [
Uni
vers
ity o
f B
radf
ord]
, [H
ong-
Shen
g Q
i] a
t 09:
04 0
9 Ju
ly 2
013
clearly there are still areas that could benefit from morethought, discussion and research (Moss and Woodhouse1999). The difficulty in the criticality analysis was theexistence of uncertainty: imprecision, randomness andambiguity. FST has been proven as one of the mostpromising methods for reduction of these uncertainties.The main doubt concerning the actual applicability ofFST to real industrial cases, as mentioned in Braglia’swork (Braglia et al. 2003), is due to the difficulties arisingduring the fuzzy model design, that is, in defining the(numerous) rules and membership functions required bythis methodology. Furthermore, as pointed out by Liuet al. (2010), a significant amount of fuzzy set applicationsin the literature is based on hypothetical information ortest cases. Applications of fuzzy systems to real problemwith real decision-makers are urgently needed to demon-strate the efficacy of the fuzzy systems approach for sol-ving real-world problems. Our work is attempting to doso, that is, the effectiveness of using fuzzy systemsapproach in an industrial practice is demonstrated throughstep-to-step comparison with a conventional approach anda detailed fuzzy system setup (in terms of fuzzy rules andmembership functions).
4.5. Future work
It is known that fuzzy logic is not a single method suitablefor the entire spectrum of problems encountered in uncer-tainty analyses. For addressing uncertainty, a hybridapproach was proposed in Guyonnet’s work (Guyonnetet al. 2003), which combined Monte Carlo random sam-pling of probability distribution functions with fuzzy cal-culus. Also, because the hybrid approach takes advantageof the ‘rich’ information provided by probability distribu-tions, while retaining the conservative character of fuzzycalculus, it is believed to hold value in terms of a ‘reason-able’ application of the precautionary principle. Liu et al.(2004, 2008) reported another hybrid approach, whichcombines fuzzy rule-based system with D-S theory forsafety estimation and synthesis. Guo et al. (2009) studiedan algorithm combining fuzzy comprehensive evaluationwith a three-layer BP neural network for equipment criti-cality evaluation in RCM.
To further improve the FCAS, the widely usedFTOPSIS approach will be used in the equipment criti-cality ranking for those equipment cases in Table 9. Bycomparison of the results from FTOPSIS and FCAS,issues related to enhancement of equipment criticalityassessments can be identified and addressed. In addition,the necessity of using a hybrid approach, as mentionedearlier, will be explored.
An analysis of all the results obtained from the FCASshows that some assets received fuzzy scores, eitherhigher or lower than they should be according to experts’evaluation. This observation indicates that possibly there
is room for fine-tuning some of the 25 rules, and this willbe discussed in the authors’ other paper. Furthermore,other artificial intelligent methods, such as artificial neuralnetwork (ANN) and/or genetic algorithms (GA), will bealso considered in adaptive training and fine-tuning of thefuzzy system’s setting parameters/variables, such as rules,weight factors, fuzzy set boundaries and fuzzy member-ship functions, which will improve the system’s robust-ness and reliability. It is necessary to mention that anyfuture research in this field should be both forward-look-ing and practically oriented.
5. Conclusions
CCAS is a very useful tool for the case company’s effec-tive production maintenance management. However, it isfound that the system’s flexibility and reliability can beimproved by introducing fuzzy sets into the system.Consequently, a new FCAS is developed using theMATLAB Fuzzy Logic Tool Box with a Mamdani infer-ence method. The following were found:
(1) This fuzzy system improved the existing CCAS.(2) This fuzzy system offers the possibility of much
more detailed criticality classifications than theconventional crisp system by taking into accountthe fuzziness and greyness that exists in the real-world production system and the possible bias/imperfection of experts. In addition to assessingindividual assets to different LC, FCAS can alsonaturally use the input information of EHS andIoB to rank the assets within each LC group.
(3) The fuzzy criticality system allows the TPES toexpress their difference in opinions when asses-sing and scoring for each asset and brings thosefuzziness and vagueness into the criticality assess-ment process. Consequently, the fuzzy system pro-vides the criticality ranking of the company’sassets with the possibility of less bias and higherreliability.
(4) The main difference in comparison with otherfuzzy logic systems (or methods/approaches),such as FTOPSIS and FFMEA, is that FCAS hasan open structure in terms of the number of equip-ment assets to be assessed and the number ofexperts involved. Furthermore, in FCAS, the criti-cality assessment and analysis is based on expert-team ‘voice’ rather than expert-individual voice.Consequently, FCAS is suitable for a large com-pany’s initial equipment criticality analysis (or thefirst step of a multisteps equipment criticalityreview) in the company’s RCM framework.
(5) As further work, the widely used FTOPSISapproach will be used in the equipment criticalityranking. Through comparison of the results from
12 H.S. Qi et al.
Dow
nloa
ded
by [
Uni
vers
ity o
f B
radf
ord]
, [H
ong-
Shen
g Q
i] a
t 09:
04 0
9 Ju
ly 2
013
FTOPSIS and FCAS, issues related to theenhancement of equipment criticality assessmentswill be identified and addressed. Other AI techni-ques and algorithms will be attempted for adaptivetraining and fine-tuning of the fuzzy system’ssettings.
A significant amount of fuzzy set application in theliterature is based on hypothetical information or testcases. Applications of fuzzy systems to real problemswith real decision-makers are urgently needed to demon-strate the efficacy of the fuzzy systems approach forsolving real-world problems. Any future research in thisfield should be both forward-looking and practicallyoriented.
ReferencesAfefy, H. I. 2010. “Reliability-Centered Maintenance
Methodology and Application: A Case Study.” Engineering2: 863–873.
Alzaabi, R. N. 2005. A Fuzzy Criticality Assessment System.Final Year Project Report. Bradford: University ofBradford.
Behzadian, M., S. K. Otaghsara, M. Yazdani, and J. Ignatius.2012. “A State-of the-art Survey of TOPSIS Applications.”Expert Systems with Applications 39: 13051–13069.
Boran, F. E., S. Genc, M. Kurt, and D. Akay. 2009. “A Multi-Criteria Intuitionistic Fuzzy Group Decision Making forSupplier Selection with TOPSIS Method.” Expert SystemApplication 36 (8): 11363–11368.
Braglia, M. 2000. “MAFMA: Multi-Attribute Failure ModeAnalysis.” International Journal of Quality and ReliabilityManagement 17 (9): 1017–1033.
Braglia, M., M. Frosolini, and R. Montanari. 2003. “FuzzyCriticality Assessment Model for Failure Modes andEffects Analysis.” International Journal of Quality &Reliability Management 20 (4): 503–524.
Buyukozkan, G., and O. Feyzioglu. 2004. “A Fuzzy LogicBased Decision Making Approach for New ProductDevelopment.” International Journal of ProductionEconomics 90: 27–45.
Casal, J., H. Montiel, E. Planas, and J. Vilehez. 1999. AnalisisDel Riego En Instalaciones Industrials. Barcelona:Ediciones UPC.
Cepin, M. 2002. “Optimisation of Safety Equipment OutagesImproves Safety.” Reliability Engineering and SystemSafety 77: 71–80.
Chakhar, S., and I. Saad. 2012. “Dominance-Based Rough SetApproach for Groups in Multicriteria ClassificationProblems.” Decision Support Systems 54 (1): 372–380.doi:10.1016/j.dss.2012.05.050.
Ciliberti, V. A. 1998. “Use Critically-Based Maintenance forOptimum Equipment Reliability.” Chemical EngineeringProgress 94 (7): 63–67.
Coma, O., C. Mascle, and M. Balazinski. 2004. “Application of aFuzzy Decision Support System in a Design for Assemblymethodology.” International Journal of Computer IntegratedManufacturing 17 (1): 83–94.
Cox, E. 1994. The Fuzzy Systems Handbook: A Practitioner'sGuide to Building and Maintaining Fuzzy Systems. Boston,MA: AP Professional.
Dekker, R., M. Kleijn, and P. Rooij. 1998. “A Spare Parts StockingPolicy Based on Equipment Criticality.” InternationalJournal of Production Economics 56–57: 69–77.
Despina, D., and M. Avram. 2010. “Criticality Assessment UsingFuzzy Risk Priority Numbers.” Proceedings for 2NDInternational Conference on Innovations, Recent Trends andChallenges inMechatronics, Mechanical Engineering and NewHigh-Tech Products Development (MECAHITECH’10),Bucharest, 349–356, September 23–24.
Ertay, T., A. Kahveci, and R. M. Tabanlı. 2011. “An IntegratedMulti-Criteria Group Decision-Making Approach to EfficientSupplier Selection and Clustering Using Fuzzy PreferenceRelations.” International Journal of Computer IntegratedManufacturing 24 (12): 1152–1167.
Fasanghari, M., and G. A. Montazer. 2010. “Design andImplementation of Fuzzy Expert System for Tehran StockExchange Portfolio Recommendation.” Expert System withApplications 37 (9): 6138–6147.
Felix, C., H. Leon, D. Gomez, and J. R. Cartagena. 2006.“Maintenance Strategy Based on a MulticriterionClassification of Equipments.” Reliability Engineering andSystem Safety 91 (4): 444–451.
Gao, J. J., J. F. Yang, and J. X. Kang. 2009. “CriticalityEvaluation of Petrochemical Equipment Based on FuzzyComprehensive Evaluation and a BP Neural Network.”Journal of Loss Prevention in the Process Industries 22:469–476.
Gargama, H., and S. K. Chaturvedi. 2011. “CriticalityAssessment Models for Failure Mode Effects andCriticality Analysis Using Fuzzy Logic.” IEEETransactions on Reliability 60 (1): 102–110.
Guyonnet, D., B. Bourgine, D. Dubois, H. Fargier, B. Côme, andJ. P. Chilès. 2003. “Hybrid Approach for AddressingUncertainty in Risk Assessments.” Journal ofEnvironmental Engineering 129 (1): 68–78.
Hokstand, P., P. Flotten, S. Holmstrom, F. Mekenna, and T.Onshus. 1995. “A Reliability Model for Optimisation ofTest Schemes for Fire and Gas Detectors.” ReliabilityEngineering and System Safety 47: 15–25.
Jani, M. B. 2004. Project on Critical Equipment Review. InternalIndustrial-Placement Report (School of Engineering, Designand Technology, Mechanical Engineering, August 2003–August 2004). Bradford: University of Bradford.
Jing, N., and S. C. Y. Lu. 2010. “Structure Arguments forCollaborative Negotiation of Group Decisions inManufacturing Systems Integration.” International Journalof Computer Integrated Manufacturing 23 (8–9): 720–738.
Lee, J., and Y. Hong. 2003. “A Stock Rationing Policy in a (s, S)Controlled Stochastic Production System with 2-phaseCoxian Processing Times and Lost Sales.” InternationalJournal of Production Economics 83: 299–307.
Liu, J., L. M. Lopez, J. B. Yang, and J. Wang. 2008. “LinguisticAssessment Approach for Hierarchical Safety Analysis andSynthesis.” In Intelligent Decision and Policy MakingSupport Systems, edited by D. Ruan, and F. Hardeman,ISSN: 1860-949x, 211–230. Studies in ComputationalIntelligence. Berlin: Springer.
Liu J., L. Martínez, H. Wang, R. M. Rodríguez, and V.Novozhilov. 2010. “Computing with Words in RiskAssessment.” International Journal of ComputationalIntelligence Systems 3 (4): 396–419.
International Journal of Computer Integrated Manufacturing 13
Dow
nloa
ded
by [
Uni
vers
ity o
f B
radf
ord]
, [H
ong-
Shen
g Q
i] a
t 09:
04 0
9 Ju
ly 2
013
Liu, J., J. B. Yang, J. Wang, H. S. Sii, and Y. M. Wang. 2004. “FuzzyRule-Based Evidential Reasoning Approach for Safety Analysis.”International Journal of General Systems 33 (23): 183–204.
Mamdani, E. H. 1977. “Application of Fuzzy Logic toApproximate Reasoning Using Linguistic Systems.” FuzzySets and Systems 26 (1): 1182–1191.
Moss, T. R., and J. Woodhouse. 1999. “Criticality AnalysisRevisited.” Quality and Reliability EngineeringInternational 15: 117–121.
Pillay, A., and J. Wang. 2003. “Modified Failure Mode andEffects Analysis Using Approximate Reasoning.”Reliability Engineering and System Safety 79 (1): 69–85.
Safaei, N., and R. Tavakkoli-Moghaddam. 2009. “An ExtendedFuzzy Parametric Programming-Based Approach for
Designing Cellular Manufacturing Systems UnderUncertainty and Dynamic Conditions.” International Journalof Computer Integrated Manufacturing 22 (6): 538–548.
Stamatis, D. H. 2003. Failure Mode and Effect Analysis: FMEAfrom Theory to Execution. Portland, OR: American Societyfor Quality.
Zadeh, L. A. 1973. “Outline of a New Approach to the Analysisof Complex Systems and Decision Process.” IEEETransactions of Systems, Man and Cybernetics 1: 28–44.
Zadeh, L. A. 1996. “Fuzzy Logic Computing with Words.” IEEETransactions—Fuzzy Systems 4 (2): 103–111.
Zimmermann, H. J. 1992. “Preface.” In L. Zadeh and J.Kacprzyk, Fuzzy Logic for the Management of Uncertainty.New York: John Wiley & Sons.
14 H.S. Qi et al.
Dow
nloa
ded
by [
Uni
vers
ity o
f B
radf
ord]
, [H
ong-
Shen
g Q
i] a
t 09:
04 0
9 Ju
ly 2
013