Children With Cochlear Implants Recognize Their Motherʼs Voice

A Folding Pathway-Dependent Score to RecognizeMembrane ProteinsHamid Hadi-Alijanvand1, Maryam Rouhani1, Elizabeth A. Proctor2, Nikolay V. Dokholyan2, Ali A.
Moosavi-Movahedi1*
1 Institute of Biochemistry and Biophysics, University of Tehran, Tehran, Iran, 2 Genetics Medicine, Department of Biochemistry and Biophysics, University of North
Carolina at Chapel Hill, Chapel Hill, North Carolina, United States of America
Abstract
While various approaches exist to study protein localization, it is still a challenge to predict where proteins localize. Here, weconsider a mechanistic viewpoint for membrane localization. Taking into account the steps for the folding pathway of a-helical membrane proteins and relating biophysical parameters to each of these steps, we create a score capable ofpredicting the propensity for membrane localization and call it FP3mem. This score is driven from the principal componentanalysis (PCA) of the biophysical parameters related to membrane localization. FP3mem allows us to rationalize thecolocalization of a number of channel proteins with the Cav1.2 channel by their fewer propensities for membranelocalization.
Citation: Hadi-Alijanvand H, Rouhani M, Proctor EA, Dokholyan NV, Moosavi-Movahedi AA (2011) A Folding Pathway-Dependent Score to Recognize MembraneProteins. PLoS ONE 6(3): e16778. doi:10.1371/journal.pone.0016778
Editor: Vladimir Uversky, University of South Florida College of Medicine, United States of America
Received November 21, 2010; Accepted December 29, 2010; Published March 1, 2011
This is an open-access article distributed under the terms of the Creative Commons Public Domain declaration which stipulates that, once placed in the publicdomain, this work may be freely reproduced, distributed, transmitted, modified, built upon, or otherwise used by anyone for any lawful purpose.
Funding: The authors have no support or funding to report.
Competing Interests: The authors have declared that no competing interests exist.
* E-mail: [email protected]
Introduction
Calcium influx plays a significant role in controlling a variety of
cellular functions, and is mainly carried out by voltage-gated Ca2+
channels [1,2]. Voltage-gated L-type Ca2+ channels (LTCCs) are
involved in the regulation of muscle contraction, hormone secretion,
neural excitability, gene expression and neurotransmitter release.
LTCC channels consist of four isoforms: Cav1.1, Cav1.2, Cav1.3
and Cav1.4, of which Cav1.2 and Cav1.3 are more distributed and
localize in diverse tissues [3–11]. Cav1.2 makes up at least 75–80%
of the LTCCs of the brain [12–15]. Many types of channels and
receptors correlate functionally and spatially with Cav channels.
Small conductance Ca2+- activated K+ channels (SK channels)
are a group of channels affected by Ca2+ influx and involved in
afterhyperpolarizations (AHPs) following the membrane action
potentials.[16–22]. Kohler et al. cloned these channels in 1996
and found three subtypes: KCa2.1 (SK1), KCa2.2 (SK2) and
KCa2.3 (SK3) [22]. These channels are voltage-independent but
highly sensitive to [Ca2+]i due to the C- terminal bound
calmodulin protein [16,23–28]. The channels are mainly located
in the central and peripheral nervous systems [29–33].
Interestingly, the SK channels are specifically coupled to and
activated by the Ca2+ channels, including LTCCs [16,34]. During
the depolarization periods, the LTCC channels mediate the Ca2+
influx. The subsequent binding of calcium to calmodulin leads to
the conformational change and opening of the SK channels that
causes the efflux of potassium ions. Thus, a close physical and
functional relationship exists between these two types of channels.
Lu et al. were the first who indicated the coupling of LTCC and
SK channels via cytoskeleton proteins [35]. They demonstrated
that the SK2 and Cav1.2 or Cav1.3 channels are linked via an
important component of the actin cytoskeleton, a-actinin2.
Another group of ion channels co-localized with LTCCs are the
glutamate receptors, located in postsynaptic sites of excitatory
synapses. N-methyl-D aspartate receptors (NMDARs) and a-
amino-3-hydroxy-5-methyl-4-isoxazole propionate receptors (AM-
PARs) are members of the glutamate receptor channel superfamily,
located in close proximity to the Cav1.2 channels [36–38]. Reports
indicate the involvement of both LTCCs and glutamate receptors in
the constitutive increase in synaptic transition [39–42].
Existing methods for the scaling of membrane localization
propensity use algorithms such as hidden Markov models (HMMs)
and supported vector machines (SVMs) to recognize protein
sequences that have the potential to sub-localize within the
membrane [43]. However, these methods do not consider the
causal folding pathway involved in recognition. We introduce the
Folding Pathway-based Protein Propensity for membrane
(FP3mem) score that is tightly associated with the tendency of
proteins for being a-helical plasma membrane proteins. We use
this score for interpreting the colocalization of the Cav1.2 channel
with the rat SK (rSK) channels, and with the AMPAR and
NMDAR receptors in Eubacteria and Archea taxa and in
vertebrate classes including Fishes, Amphibia, Aves and Mamma-
lia. Our data characterized the Cav1.2 as having a high propensity
for localization within the plasma membrane together with other
willing channels, which supports the hypothesis that the Cav1.2 is
an anchor for the membrane proteins in its close proximity.
Methods
The sequences of rSK1 (gi 9506831), rSK2 (gi 9506833), rSK3
(gi 31543039), Cav1.2 (gi 158186633), a-actinin (gi 1142640),
AMDAR (gi 167001419) and NMDAR (gi 11038637) were taken
from the NCBI protein database in FASTA format. Subsequently,
PLoS ONE | www.plosone.org 1 March 2011 | Volume 6 | Issue 3 | e16778

using the NCBI protein BLAST service and the Blosum62 matrix
[44], we found sequences homologous to the abovementioned
proteins from the protein non-redundant database in the Archea
(taxid 2157) and Eubacteria taxa (taxid 2), as well as vertebrate
classes including Fishes (taxid 7898), Amphibia (taxid 8292), Aves
(taxid 8782) and Mammalia (taxid 40674) (Table S1).
We calculate the thermodynamic, biophysical, and structural
parameters DCp (change in specific heat), DCp(hyd) (change in
hydration specific heat), DG(hyd) (change in Gibbs energy of
hydration), DG(oct) (change in free energy of transfer from water
to octanol), DG(wif) (change in free energy of transfer from water
to POPC interface), DDG(a-helix), GG4Br, DH(hyd) (change in
enthalpy of hydration) and kProt for the sequences obtained from
the BLAST. We consider DCp, DG(hyd) and DH(hyd) as
parameters characterizing protein properties in the water phase.
DG(oct), DG(wif) and DDG(a-helix) have a role in the transition of
proteins from the aqueous phase to the lipid phase. Finally,
DCp(hyd), GG4Br, and kProt explain the behavior of proteins in
the lipid phase.
We perform this calculation using the Hamid, Ali akbar,
Maryam Data Analyser Machine (HAMDAM) software (freely
available upon request). We calculate the hydration (hyd)
parameters DCp(hyd), DG(hyd) and DH(hyd) of each sequence
using the following equations [45–47]:
DF (hyd)~X
jDASAj|DFj(hyd)
F (hyd)~DF (hyd)=n
Where DX refers to the change in X from the native state to the
unfolded state, DF(hyd) represents each of the three parameters, j
is the residue position, ASA stands for the accessible surface area,
and n represents the total number of residues in each sequence.
We obtain DCp from the following equation [48]:
DCp~0:45(DNonpolar ASA){0:26(DPolar ASA)
In order to calculate the DG(oct) [49], DG(wif) [50,51], DDG(a-
helix) [52], GG4Br [53], and kProt [54] (all indicated with a ‘‘W’’
after the parameter name in figures), we employ the Sliding
Window Recognizer (SWR) procedure [55]. This procedure reads
the protein sequence within a window of a given number of
residues and computes the parameters for the amino acids within
that window, then slides forward one residue and repeats the
process. We choose a window of 10 residues and calculate the
parameter average for each window. Then we report the average
of averages over all windows. In the case of the DDG(a-helix)
parameter, although proline residues are considered helix
breakers, their behavior differs in membrane proteins [56], which
led us to consider this amino acid as a helix maker within this
subset of proteins. For calculation of the GG4Br parameter, the
number of GXXXG[I/V] motifs are counted in each window. We
perform Anova and PCA analysis using the free software PSPP
(http://www.gnu.org/software/pspp).
To produce alkaline phosphatase (APHO)18A3L, APHO16A5L
and APHO14A7L sequences, three peptide constructs generate
with the 18A3L, 16A5L and 14A7L amino acids compositions. In
order to consider different sequences for each of the three amino
acid compositions, we generate 2000 random sequences for each
peptide and insert them to the corresponding site in alkaline
phosphatase.
Results and Discussion
Other studies have previously pointed out the association of Cav
with SK channels in membranes [16,34,35]. Lu et al. demon-
strated the connection of these two channels via the a-actinin
protein [35]. On the other hand, the ion conductance through the
membrane and the localization within the membrane of the SK
channel was disrupted in Cav null mutant mouse. The authors
suggested that the Cav channel could act as an anchor for the SK
channel at the membrane. For integral membrane proteins
containing transmembrane region(s), an essential requirement for
functionality is localization within the membrane. Our goal is to
quantify the tendency of Cav and SK channels for localizing within
the membrane.
White and Wimley mentioned that the folding process of
membrane proteins could be divided into four steps, including
partitioning, insertion, folding, and association [49]. We consider
several biophysical parameters for each of these steps. Two
parameters (DG(oct) and DG(wif)) were previously provided for two
of these steps [49,51]. We consider other parameters related to each
step in our computation (Figure 1). As a control, we compute these
parameters for the non-membrane protein alkaline phosphatase
(APHO). We also calculate parameters for three varieties of alkaline
phosphatase: APHO18A3L, APHO16A5L and APHO14A7L.
These alkaline phosphatases localize in the E-coli inner membrane
with the aid of three inserted peptides. Each peptide is composed of
only two types of amino acids, Alanine (A) and Leucine (L). The
experimentally determined tendency of alkaline phosphatase for
localizing in the membrane is in direct correlation with the number of
leucine residues in the inserted peptides [57,58].
The partitioning stepThe ‘‘partitioning’’ step, the partitioning of proteins between lipid
and water phases in the lipid-water interface, can be described by the
DCp, DH(hyd), DG(hyd), and DG(wif) parameters. A membrane
protein should not have a stable fold before insertion into the
membrane. This property is specified by the protein heat capacity
DCp. A more positive DCp indicates lower stability, and thus a lower
propensity to be in the folded state in the water phase [55]. The DCp
of the alkaline phosphatases (the reference proteins, ‘‘Ref’’) that
contain inserted peptide is more positive than the DCp of the alkaline
phosphatase (Figure 2A), representing a difference between the
primitive forms of life (Archea and Eubacteria) and vertebrates. In
vertebrates, the DCp is lower and thus the propensity for folding in
the water phase is higher than in bacteria. Therefore, for prokaryotes,
the partitioning parameter is more favorable for membrane
localization when compared to vertebrates. Predictably, the a-actinin
homologous proteins have fewer propensities for unfolding in water
with respect to channels.
Another parameter involved in the partitioning step is the
hydration enthalpy change DH(hyd). This parameter is a scale of
the hydrophilic interaction of the unfolded state. A more negative
DH(hyd) indicates a higher tendency of the protein to be in the
unfolded state in water [45,46]. In the case of the reference
proteins, because the three types of peptides are composed solely
of leucine and alanine residues, the amount of hydrophilic
interactions is reduced (Figure 2B). The a-actinin homologous
proteins have a dramatically higher tendency for unfolding in
Mammalia than other organisms. For the rSK channel homolo-
gous proteins, the tendency of unfolding in water is higher in
vertebrates than in bacteria. This tendency indicates that
according to this partitioning parameter, in comparison to the
prokaryotic protein, the vertebrate protein is far from folded state
in water. This favors folding of the vertebrate protein in non-
A New Membrane Protein Prediction Method
PLoS ONE | www.plosone.org 2 March 2011 | Volume 6 | Issue 3 | e16778

Figure 1. Alpha helical membrane protein folding pathway. The four step-folding pathway of membrane proteins declares the critical factorsthat play a role in the folding of a-helical membrane proteins. Partitioning includes parameters involved in protein partitioning in the lipid-waterinterface. The insertion stage contains parameters required for a peptide to insert into plasma membrane. The final folding and association stagesindicate critical parameters for the membrane protein folding and packing.doi:10.1371/journal.pone.0016778.g001
Figure 2. The partitioning step parameters. The changes in parameters that describe the partitioning stage are indicated for bacteria andvertebrate proteins, A) the specific heat capacity, a measure of protein stability, B, C) the specific enthalpy and Gibbs energy of hydration,respectively. D) Free energy change of transfer from water to the POPC interface. Ref. stands for reference proteins. Error bars indicate the SEM for theparameters of each protein. The bar patterns represent Archea: wide upward diagonal, Eubacteria: dashed horizontal, Fishes: horizontal brick,Amphibia: white, Aves: wave, Mammalia: black, APHO 14A7L: black dotted white, APHO 16A5L: white grained black, APHO 18A3L: white dotted black,and APHO: gray dotted white.doi:10.1371/journal.pone.0016778.g002
A New Membrane Protein Prediction Method
PLoS ONE | www.plosone.org 3 March 2011 | Volume 6 | Issue 3 | e16778

aqueous environment. It may be presumed that there is a
discrepancy between the DCp- and DH(hyd)-derived partitioning
parameters in each group of proteins(Panels 2-A and 2-B).
However, as the DCp is generally determined by nonpolar
residues and the DH(hyd) parameter by polar residues, the
difference between the ratio of polar to nonpolar residues is the
root of this apparent dissimilarity. Each of these parameters is
weighted later.
An additional parameter affecting the partitioning step can be
the hydration free energy change DG(hyd). A membrane protein
must dehydrate before entering the plasma membrane. Since the
DG(hyd) is a scale of the propensity for hydration, the more
positive this parameter, the easier is the dehydration process
[45,59]. The propensity of rSK channel homologous proteins for
dehydration is less in vertebrates than in bacteria (Figure 2C),
indicating that the partitioning affected by this parameter happens
Figure 3. The insertion step parameters. The changes in parameters describing the insertion stage are shown for bacterial and vertebrateproteins. The vertical axes are the mean value of the corresponding parameter average for the window that slides along the protein sequence. A) Thevariation of DG(oct) is illustrated, which is a whole residue hydrophobicity scale and a sign of the protein membrane propensity. B) The alpha helixpropensity is a measure of the tendency to form alpha helix, which is characterized by DDG(a-helix). Ref. stands for the reference proteins. The errorbars indicate the SEM for the parameters of each protein. The bar patterns represent Archea: wide upward diagonal, Eubacteria: dashed horizontal,Fishes: horizontal brick, Amphibia: white, Aves: wave, Mammalia: black, APHO 14A7L: black dotted white, APHO 16A5L: white grained black, APHO18A3L: white dotted black, and APHO: gray dotted white.doi:10.1371/journal.pone.0016778.g003
A New Membrane Protein Prediction Method
PLoS ONE | www.plosone.org 4 March 2011 | Volume 6 | Issue 3 | e16778

A New Membrane Protein Prediction Method
PLoS ONE | www.plosone.org 5 March 2011 | Volume 6 | Issue 3 | e16778

more difficult in vertebrate classes than in Archea and Eubacteria.
Among all studied proteins, mammalian a-actinin homologous
proteins have the least propensity for dehydration (Figure 2C).
The last parameter that we incorporate, influencing the
partitioning of proteins between the water and lipid phases is the
DG(wif), was introduced by White et al. [51]. This parameter
represents the free energy change for the transfer of the protein in
the unfolded state from the bulk water to the lipid-water interface.
Nonpolar interactions with water and electrostatic interactions
with the lipid head groups are the important interactions taking
part in this process [49,60]. The more negative the DG(wif), the
higher is the affinity of the unfolded state to enter the interface
[61]. This parameter is small for the rSK homologous proteins in
the taxa and classes other than Mammalia (Figure 2D). Thus, the
propensity for entering the lipid-water interface is low in
mammalian rSK channels but not in the mammalian Cav
channels. However, when we consider all four parameters
involved in the partitioning step, we cannot simply conclude
which of the two types of channels is more efficient in this process.
The insertion stepThe second step in the folding of membrane proteins is the
‘‘insertion’’ of the protein into the membrane. In this step, a
protein enters the lipid phase from the lipid-water interface. Two
parameters are associated with this step: the DG(oct) and the
DDG(a-helix) [49,52,62]. In their study, the White group utilized
octanol-saturated water as the lipid-like phase and introduced the
DG(oct) parameter. More negative values of the DG(oct) correlate
with a higher tendency of the protein for transferring to the lipid
phase. For channels, this insertion parameter is more favorable in
prokaryotes than in vertebrates (Figure 3A). We infer that the
transition from the interface to the lipid phase acts as an obstacle
for vertebrate channels in the process of membrane localization.
In the interface, where the important step of insertion into the
membrane takes place, formation of disordered structures is more
probable than formation of helical structures [60,63]. Therefore,
protein structures are more likely to become a-helical after insertion
into the membrane because of the low membrane dielectric constant
[49,64,65]. Because the hydrophobic core of the membrane has a
high affinity for exposed hydrophobic groups of proteins [66], if an a-
helix is stable in the water phase it would not form hydrophobic
interactions with the membrane core. The DDG(a-helix) specifies the
propensity for the formation of a stable a-helix structure in the water
phase. More positive values of this parameter correlate with a lower
propensity for a-helix formation in water, and thus are more
favorable for the insertion of the protein into the membrane. For rSK
channel homologous proteins, this parameter decreases in Mammalia
(Figure 3B) and disturbs the insertion step.
These parameters do not have the same effects in the localization
of each evolutionary class of protein within the plasma membrane
(Figures 2 and 3). While some parameters support the membrane
localization of the homologous sequences of one protein, others
impede this process. Therefore, all parameters should be weighted
accordingly when calculating the membrane localization score.
Folding and association stepsBased on the four-step model, a protein obtains its final folded state
in the membrane and, if necessary, gains its final function by
Figure 4. The folding and association stages parameters. The changes in parameters describing the folding and association stages are shownfor bacteria and vertebrates proteins. In the A and C panels, the vertical axes are the mean value of the corresponding parameter average for thewindow that slides along the protein sequence. A) The kProt changes are shown in this panel. kProt is a factor to elucidate a-helix membrane proteintopology. B) The specific heat capacity of hydration for the channels, references and actinin is shown in this board. DCp(hyd) points out thehydrophobic patches. C) The occurrence number of the GG4Br motif in windows is defined as a scale for helix packing. Ref. stands for the referenceproteins. The error bars indicate the SEM for the parameters of each protein. The bar patterns represent Archea: wide upward diagonal, Eubacteria:dashed horizontal, Fishes: horizontal brick, Amphibia: white, Aves: wave, Mammalia: black, APHO 14A7L: black dotted white, APHO 16A5L: whitegrained black, APHO 18A3L: white dotted black, and APHO: gray dotted white.doi:10.1371/journal.pone.0016778.g004
Figure 5. The dependence of statistical descriptors to the FP3mem cut-offs. Variations of common statistical descriptors (which are used toevaluate a new predictor) in response to the FP3mem cut-off changes are depicted. Continues dark line, discontinues line, continues gray line, plusand circle symbol stand for sensitivity, specificity, PPV, accuracy and MCC parameters respectively.doi:10.1371/journal.pone.0016778.g005
A New Membrane Protein Prediction Method
PLoS ONE | www.plosone.org 6 March 2011 | Volume 6 | Issue 3 | e16778

association with other subunits. An important feature of alpha helical
membrane protein folding is protein topology, which can be either
single-span or multi-span, represented by the parameter kProt [54].
More negative kProt values correlate with higher protein tendency for
becoming multi-span. Prokaryotes show lower tendency than
vertebrates for multi-span topology (Figure 4A). In the case of rSK
channel homologous proteins, the tendency for becoming multi-span
is less in mammals than in other vertebrates. The definition of kProt
parameter is founded on the properties of membrane proteins.
Therefore, this parameter does not provide information about the
topology of non-membrane proteins including alkaline phosphatase
and a-actinin homologous proteins (Figure 4A).
Due to the low dielectric constant of the membrane, hydrogen
bond rich structures such as a-helices are more probable in
membrane proteins. In order to attain more stability and generate
a specific function, the a-helices pack together in a manner such that
a stable helix can stabilize an adjacent unstable helix [65,67,68]. The
packing of a-helices is caused by two factors: superficial hydrophobic
patches working as glue, and spatial fitting of the a-helices similar to
lock and key model. The DCp(hyd) parameter represents superficial
hydrophobic patches. A more positive DCp(hyd) indicates a more
exposed hydrophobic patch [45]. The combined surface area of
superficial hydrophobic patches, which is a scale for the association of
membrane a-helices, is high for the rSK channel homologous
proteins in comparison to the a-actinin homologous proteins
(Figure 4B). Furthermore, the surface area of superficial hydrophobic
patches, and therefore the tendency for association indicated by this
factor, decreases from prokaryote to vertebrate organisms, especially
in the rSK channel homologous proteins (Figure 4B). The second
packing factor, the spatial fitting of membrane a-helices, can be
quantified by measuring the frequency of the GXXXG[I/V] motif in
the proteins using the GG4Br parameter [53,69]. For rSK channel
homologous proteins, the frequency of the GXXXG[I/V] motif is
much higher in Mammalia as compared to other classes (Figure 4C).
We conclude that in the mammalian rSK channels, the spatial fitting
of a-helices plays a more significant role in packing than the
superficial hydrophobic patches.
The FP3mem scoreNot all parameters involved in protein localization within the
plasma membrane change in the same functional direction over
evolution (Figures 2, 3 and 4). Hence, we create a parameter that in
addition to including all significant parameters previously discussed,
is able to determine the tendency of localization of proteins within
the membrane. This parameter can also be used as a scale for the
comparison of membrane localization between proteins of interest.
In order to fulfill this purpose, all parameters that participate in
membrane localization should be weighted according to their
contributions. We use principal component analysis (PCA) to obtain
proper weights for each parameter [70]. We consider four principal
components (PC) and utilize the proposed correlation coefficients
for each parameter in each PC for constructing a factor representing
the tendency of proteins for membrane localization. We name this
factor the Folding Pathway-based Protein Propensity for mem-
Table 1. FP3mem-based statistical values for different databases.
Moller MPtopo
TMA A B C Am MPT MPT1D MPT3D MPT3Dm Alpha
F1 0.9 0.8 0.9 0.7 0.9 0.9 0.9 0.9 0.9 0.9
Specificity 0.9 0.9 0.9 0.9 0.9 0.9 0.9 0.9 0.9 0.9
PPV 0.9 0.9 0.9 0.9 0.9 0.9 0.9 0.9 0.9 0.9
Accuracy 0.9 0.8 0.9 0.8 0.9 0.9 0.9 0.9 0.9 0.9
MCC 0.8 0.7 0.8 0.6 0.8 0.8 0.8 0.8 0.8 0.8
To evaluate the FP3mem efficiency, we calculated the statistical parameters in various databases. These datasets contain information about transmembrane proteinsobtained from x-ray crystallography or other experimental methods used to verify the 3D structure. MPT is the whole MPtopo database. MPT1D and 3D are subpopulations of MPT. The m superscripts indicate that the mitochondrial proteins are omitted from the dataset.doi:10.1371/journal.pone.0016778.t001
Table 2. FP3mem-based statistical values for a prokaryoticdataset.
PSORTb 3.0
Archea Bacteria (Gram)
+ 2
F1 0.9 0.7 0.8
Specificity 0.9 0.9 0.9
PPV 0.9 0.9 0.9
Accuracy 0.9 0.8 0.9
MCC 0.8 0.6 0.7
To evaluate the FP3mem efficiency, we calculated the statistical parameters forthe PSORTb3.0 [78] trained sets. PSORTb3.0 is trained on the plasma membraneproteins of prokaryotes selected by searching the SWISSPROT sequenceannotations.doi:10.1371/journal.pone.0016778.t002
Table 3. FP3mem-based statistical values for a eukaryoticdataset.
eSLDB-TM
Human Nematode Yeast
F1 0.6 0.6 0.7
Specificity 0.9 0.9 0.9
PPV 0.8 0.9 0.9
Accuracy 0.7 0.7 0.8
MCC 0.4 0.5 0.6
To evaluate the FP3mem efficiency, we calculated the statistical parameters forthe eSLDB [79]. This database contains the whole proteome of manyeukaryotes. FP3mem identifies the transmembrane proteins of human, yeastand nematode from the database with the indicated efficiencies.doi:10.1371/journal.pone.0016778.t003
A New Membrane Protein Prediction Method
PLoS ONE | www.plosone.org 7 March 2011 | Volume 6 | Issue 3 | e16778
brane (FP3mem). The HAMDAM software calculates the FP3mem
based on the following formula:
FP3mem~
4(X9
i~1aixi)z3(
X9
i~1bixi)z2(
X9
i~1cixi)z(
X9
i~1dixi)
In this equation, the set of xi represents the nine parameters (i = 1 to
9) for the rSK and Cav1.2 channel homologous proteins. Here, a, b,
c, and d correspond to the correlation coefficients of each parameter
in PC1, PC2, PC3 and PC4 respectively. More details are supplied
in Table S2.
We calculate the FP3mem for all sequences in the TMA dataset
[71], which contains 273 transmembrane a-helix-containing
sequences from PDB structures, as well as for the sequences of a
set of human soluble proteins, documented as cell fraction, obtained
from Uniprot. These sets serve as references for membrane proteins
and non-membrane proteins, respectively. In order to define a cut-
off for FP3mem values that discriminates membrane proteins from
non-membrane proteins, we evaluate the following parameters
[72,73] over a wide range of FP3mem cut-offs (Figure 5):
TP = the fraction of membrane proteins recognized as
membrane proteins.
FN = the fraction of membrane proteins falsely recog-
nized as non-membrane proteins.
TN = the fraction of non-membrane proteins recognized
as non-membrane proteins.
FP = the fraction of non-membrane proteins falsely
recognized as membrane proteins.
Sensitivity~TP
TPzFN
Specifity~TN
TNzFP
positive prediction value (PPV)~TP
TPzFP
Accuracy~TPzTN
TPzFPzTNzFN
Matthews correlation coefficient (MCC)~
½(TP|TN){(FP|FN)�ffiffiffiffiffiffiffiffiffiffiffiffiffiffiffiffiffiffiffiffiffiffiffiffiffiffiffiffiffiffiffiffiffiffiffiffiffiffiffiffiffiffiffiffiffiffiffiffiffiffiffiffiffiffiffiffiffiffiffiffiffiffiffiffiffiffiffiffiffiffiffiffiffiffiffiffiffiffiffiffiffiffiffiffiffiffi(TPzFN)(TPzFP)(TNzFN)(TNzFP)
p
F1 score~2Sensitivity|Accuracy
SensitivityzAccuracy
Table 4. Comparison of the FP3mem efficiency with other methods.
CELLO MultiLoc Proteome Analyst pTarget woLFPSORT FP3mem
Sen Spe Sen Spe Sen Spe Sen Spe Sen Spe. Sen Spe
SP3763 plasma membrane 0.4 0.3 0.4 0.3 0.1 0.4 0.4 0.3 0.5 0.4 0.4 0.8
LOC2145 plasma membrane 0.4 0.6 0.5 0.8 0.2 0.8 0.5 0.7 0.5 0.7 0.4 0.8
The FP3mem efficiency is compared with other methods on the same datasets that are common for predicting protein membrane localization. Sen and Spe are theabbreviation of sensitivity and specificity respectively.doi:10.1371/journal.pone.0016778.t004
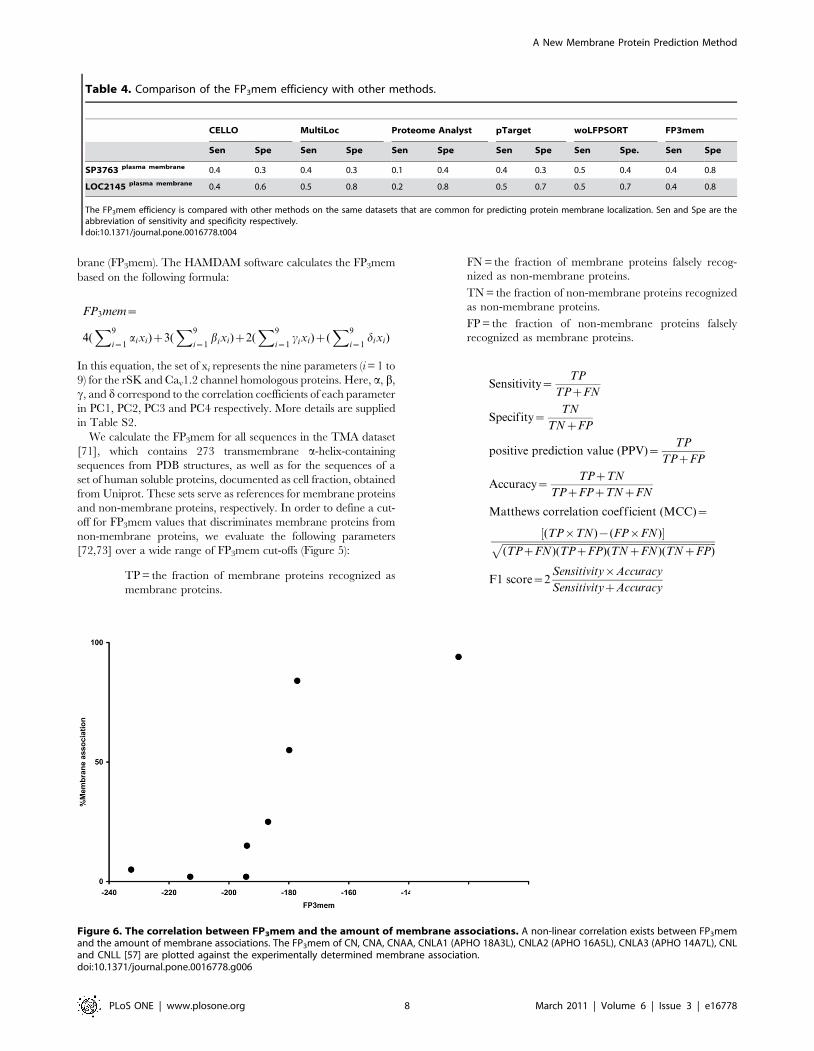
Figure 6. The correlation between FP3mem and the amount of membrane associations. A non-linear correlation exists between FP3memand the amount of membrane associations. The FP3mem of CN, CNA, CNAA, CNLA1 (APHO 18A3L), CNLA2 (APHO 16A5L), CNLA3 (APHO 14A7L), CNLand CNLL [57] are plotted against the experimentally determined membrane association.doi:10.1371/journal.pone.0016778.g006
A New Membrane Protein Prediction Method
PLoS ONE | www.plosone.org 8 March 2011 | Volume 6 | Issue 3 | e16778

Based on these results and the corresponding ROC curve (Figure
S1), we set our cut-off at FP3mem = 231, and consider the
proteins with FP3mems values higher than 231 as membrane
proteins.
In order to evaluate the FP3mem capability for discriminating
membrane proteins, we calculate the abovementioned statistical
parameters for several datasets (Table S3). One of these datasets,
the Moller dataset, includes three levels of trust to SWISSPROT
transmembrane annotation: A, B, and C [74] (Table 1). The
accuracy of FP3mem is best for the B dataset, in which membrane
localization of dataset members has been proven by experimental
evidence. If we omit mitochondrial membrane proteins from the A
dataset, in which protein structures have been determined by x-ray
crystallography, the accuracy for the A dataset increases (Table 1).
We conclude that in mitochondria, the process of membrane
localization may not be similar to the four-step membrane protein
folding process (Figure 1).
We take another dataset from the MPtopo database (Table 1).
Based on whether the protein helix bundles are determined from
three dimensional structure or by biochemical experimental methods,
Jayasinghe et al. have divided the MPtopo database into 3D and 1D
datasets respectively [75]. When we omit mitochondrial membrane
proteins from the 3D dataset, the accuracy increases. The lipid
context of mitochondrial membrane proteins is different from that of
proteins in the plasma membrane [76]. This difference may cause a
different pathway of membrane protein folding.
The last dataset that we consider is that of alpha, which is
taken from the July 9, 2010 version of the PDBTM [77]. The
non-redundant alpha dataset consists of all a-helical transmem-
brane proteins in the PDB. The calculated statistical factors are
also near to one for this dataset, which confirms the accuracy of
the FP3mem score in distinguishing a-helical transmembrane
proteins.
We calculate FP3mem for the membrane proteins used in
training the PSORTb 3.0 predictor algorithm [78] (Table 2).
FP3mem has a high efficiency in recognizing prokaryotic
membrane proteins. The eSLDB database annotates the
eukaryotic proteomes of various organisms based on their
cellular localizations [79]. We compute the FP3mem score for
a group of human, nematode (Caenorhabditis elegans), and yeast
(Sacharomyces cerevisiae) transmembrane proteins that have been
experimentally annotated (Table 3). Statistical parameters again
confirm the efficiency of FP3mem in distinguishing membrane
proteins.
There are several methods for determining the localization of
proteins in different regions of the cell, including the plasma
membrane. Some commonly used methods include CELLO,
which utilizes only the primary structure of proteins [80],
pTARGET, which utilizes the amino acid and domain compo-
sitions [81], ProteomeAnalyst, which uses the homology of the
sequences [82], WoLFPSORT, which makes use of the amino
acid composition and the sequence homology [83], and MultiLoc,
which employs signal sequences, motifs, and amino acid
compositions [84]. Teasdale compared the capacity of these
methods for determining the localization of proteins of two
datasets, LOC2145 and SP3763 [85]. We calculate the sensitivities
Figure 7. The FP3mem values of rSKs, a-actinin and Cav1.2 proteins. Columns indicate the FP3mem value for each protein over evolutionarytime. The mammalian columns are colored gray for an easier comparison. The error bars designate the SEM.doi:10.1371/journal.pone.0016778.g007
A New Membrane Protein Prediction Method
PLoS ONE | www.plosone.org 9 March 2011 | Volume 6 | Issue 3 | e16778

and specificities of FP3mem and other methods in distinguishing
the membrane proteins of these two datasets (Table 4). FP3mem
has the highest specificities as well as reasonable sensitivities.
Binary predictors encounter a common problem of disadvantaged
specificities despite good sensitivities [86]. However, FP3mem
possesses high specificities. Our method, which is based on
biophysical parameters of the membrane protein folding pathway,
in this regard outperforms the existing methods.
In order to enter membrane, proteins pass different stages. The
superiority of FP3mem with respect to other methods comes from
the fact that we relate the folding pathway stages of membrane
proteins to the representative physical parameters and do
predictions with a mechanistical viewpoint which was absent in
previous sequence-based methods.
The abovementioned databases and methods provide informa-
tion about whether a protein localizes within the plasma
membrane, but cannot resolve the membrane association (the
propensities for membrane localization) of two transmembrane
proteins. A probable reason for the co-localization of physically
interacting membrane proteins is that a protein with a high
membrane association can compensate the low membrane
association of its partner. Hence, we examine the capacity of
FP3mem in quantifying the membrane association of proteins
using the alkaline phosphatase variants whose membrane
associations were determined empirically [57,58]. The relationship
between the FP3mem and membrane association of these variants
is direct and non-linear (Figure 6). Therefore, FP3mem is not only
capable of recognizing a-helical transmembrane proteins with a
high efficiency, but also can be a scale for membrane association
propensity.
The membrane proteins co-localized with Cav channelWe use the FP3mem score to study the rSKs- a-actinin- Cav1.2
protein system in various organisms (Figure 7). The FP3mems of a-
actinin homologous proteins are similar to non-membrane
proteins in all evolutionary branches. FP3mem values are smaller
than cut-off and equivalent to zero membrane association in all
branches (Figures 5, 6). We consider rSK channel homologous
proteins as membrane proteins only in prokaryotes. However, for
Cav1.2 channel homologous proteins, in addition to prokaryotes,
Fishes and to a less degree Mammalia show higher propensities
toward localization in the membrane. This difference in the
membrane association of mammalian rSK and Cav1.2 channels
may be the reason for the observed fading of SK2 channel
presence in the plasma membrane in the absence of Cav [35]
(Figure S2). Because of their high FP3mem, we hypothesize that
the Cav1.2 channels assist in the membrane localization of SK
channels in Mammalia and Fishes.
Supporting data exist for the presence of Cav1.2 channel in
complexes containing AMPAR or NMDAR glutamate receptors
[38]. Contrary to rSK channels, none of these receptors depends
directly upon the Ca2+ influx for activation. Hence, we
hypothesize that the reason they accompany the Cav channel is
to localize within the membrane, and that this membrane
localization does not occur in the absence of Cav. In order to
test this hypothesis, we calculate FP3mem for the homologous
Figure 8. AMPAR and NMDAR co-localize with the Cav channel. Many membrane proteins co-localize with the Cav channel. The FP3memvalues of those proteins are compared with the Cav FP3mem. The FP3mem cut-off value for the plasma membrane proteins is set at 231. The averageFP3mem for the transmembrane proteins of Archea, Bacteria, and Eukaryotes are retrieved from Uniprot and presented for comparison. The error barsindicate the SEM.doi:10.1371/journal.pone.0016778.g008
A New Membrane Protein Prediction Method
PLoS ONE | www.plosone.org 10 March 2011 | Volume 6 | Issue 3 | e16778

proteins of these receptors in prokaryotes and vertebrates
(Figure 8). We observe that the FP3mem of Cav1.2 homologous
proteins is higher than the FP3mem of the AMPAR and NMDAR
homologous proteins, especially in Fishes and Mammalia. This
observation supports the proposed hypothesis that these receptors
couple the Cav1.2 channel with the aim of localizing within the
membrane.
ConclusionBy creating a score (FP3mem) encompassing the biophysical
parameters involved in the folding of a-helical transmembrane
proteins, we provide a scale for measuring the propensity of protein
sequences for localization within the plasma membrane. This
parameter distinguishes membrane proteins from non-membrane
proteins in various datasets, and powerfully competes with other
methods. Furthermore, FP3mem quantifies a protein’s propensity
for becoming an a-helical transmembrane protein. We suggest the
difference in this propensity as an underlying reason for the
colocalization of SK channels, as well as AMDAR and NMDAR
receptors, with the Cav1.2 calcium channel.
Supporting Information
Figure S1 The ROC curve. The sensitivity is plotted against 1-
specificity. The bold black filled circle is the cutoff point.
(TIF)
Figure S2 The histogram of FP3mem value for the SK2and Cav proteins in Mammalia. The vertical lines show the
FP3mem of mice SK2 and Cav 1.2.
(TIF)
Table S1 The dimension of studied protein set.(DOC)
Table S2 The PCA extracted coefficients.(DOC)
Table S3 The dimension of tested datasets.(DOC)
Acknowledgments
The support of the Research Council of the University of Tehran and Iran
National Science Foundation (INSF) is gratefully acknowledged.
Author Contributions
Conceived and designed the experiments: HH-A MR AAM-M. Performed
the experiments: HH-A MR. Analyzed the data: HH-A MR EAP NVD
AAM-M. Contributed reagents/materials/analysis tools: HH-A. Wrote the
paper: HH-A MR EAP NVD AAM-M. Designed the software used in
analysis: HH-A.
References
1. Catterall WA (2000) Structure and regulation of voltage-gated Ca2+ channels.Annu Rev Cell Dev Biol 16: 521–555.
2. Davies A, Hendrich J, Van Minh AT, Wratten J, Douglas L, et al. (2007)
Functional biology of the alpha(2)delta subunits of voltage-gated calcium
channels. Trends Pharmacol Sci 28: 220–228.
3. Dolmetsch RE, Pajvani U, Fife K, Spotts JM, Greenberg ME (2001) Signaling to
the nucleus by an L-type calcium channel-calmodulin complex through the
MAP kinase pathway. Science 294: 333–339.
4. Graef IA, Mermelstein PG, Stankunas K, Neilson JR, Deisseroth K, et al. (1999)L-type calcium channels and GSK-3 regulate the activity of NF-ATc4 in
hippocampal neurons. Nature 401: 703–708.
5. Catterall WA, Striessnig J, Snutch TP, Perez-Reyes E (2003) InternationalUnion of Pharmacology. XL. Compendium of voltage-gated ion channels:
calcium channels. Pharmacol Rev 55: 579–581.
6. Striessnig J, Hoda JC, Koschak A, Zaghetto F, Mullner C, et al. (2004) L-typeCa2+ channels in Ca2+ channelopathies. Biochem Biophys Res Commun 322:
1341–1346.
7. Platzer J, Engel J, Schrott-Fischer A, Stephan K, Bova S, et al. (2000) Congenitaldeafness and sinoatrial node dysfunction in mice lacking class D L-type Ca2+channels. Cell 102: 89–97.
8. Schulla V, Renstrom E, Feil R, Feil S, Franklin I, et al. (2003) Impaired insulinsecretion and glucose tolerance in beta cell-selective Ca(v)1.2 Ca2+ channel null
mice. EMBO J 22: 3844–3854.
9. Takahashi T, Momiyama A (1993) Different types of calcium channels mediate
central synaptic transmission. Nature 366: 156–158.
10. Yang SN, Larsson O, Branstrom R, Bertorello AM, Leibiger B, et al. (1999)
Syntaxin 1 interacts with the L(D) subtype of voltage-gated Ca(2+) channels in
pancreatic beta cells. Proc Natl Acad Sci U S A 96: 10164–10169.
11. Sinnegger-Brauns MJ, Hetzenauer A, Huber IG, Renstrom E, Wietzorrek G, et al.(2004) Isoform-specific regulation of mood behavior and pancreatic beta cell and
cardiovascular function by L-type Ca 2+ channels. J Clin Invest 113: 1430–1439.
12. Hell JW, Yokoyama CT, Wong ST, Warner C, Snutch TP, et al. (1993)Differential phosphorylation of two size forms of the neuronal class C L-type
calcium channel alpha 1 subunit. J Biol Chem 268: 19451–19457.
13. Koschak A, Obermair GJ, Pivotto F, Sinnegger-Brauns MJ, Striessnig J, et al.(2007) Molecular nature of anomalous L-type calcium channels in mouse
cerebellar granule cells. J Neurosci 27: 3855–3863.
14. Striessnig J, Koschak A, Sinnegger-Brauns MJ, Hetzenauer A, Nguyen NK,et al. (2006) Role of voltage-gated L-type Ca2+ channel isoforms for brain
function. Biochem Soc Trans 34: 903–909.
15. Yasuda R, Sabatini BL, Svoboda K (2003) Plasticity of calcium channels indendritic spines. Nat Neurosci 6: 948–955.
16. Vergara C, Latorre R, Marrion NV, Adelman JP (1998) Calcium-activated
potassium channels. Curr Opin Neurobiol 8: 321–329.
17. Stocker M (2004) Ca(2+)-activated K+ channels: molecular determinants andfunction of the SK family. Nat Rev Neurosci 5: 758–770.
18. Pedarzani P, Stocker M (2008) Molecular and cellular basis of small–and
intermediate-conductance, calcium-activated potassium channel function in thebrain. Cell Mol Life Sci 65: 3196–3217.
19. Faber ES (2009) Functions and Modulation of Neuronal SK Channels. CellBiochemistry and Biophysics 55: 127–139.
20. Joiner WJ, Wang LY, Tang MD, Kaczmarek LK (1997) hSK4, a member of a
novel subfamily of calcium-activated potassium channels. Proc Natl Acad
Sci U S A 94: 11013–11018.
21. Ishii TM, Silvia C, Hirschberg B, Bond CT, Adelman JP, et al. (1997) A human
intermediate conductance calcium-activated potassium channel. Proc Natl AcadSci U S A 94: 11651–11656.
22. Kohler M, Hirschberg B, Bond CT, Kinzie JM, Marrion NV, et al. (1996)
Small-conductance, calcium-activated potassium channels from mammalian
brain. Science 273: 1709–1714.
23. Blatz AL, Magleby KL (1986) Single apamin-blocked Ca-activated K+ channels
of small conductance in cultured rat skeletal muscle. Nature 323: 718–720.
24. Park YB (1994) Ion selectivity and gating of small conductance Ca(2+)-activatedK+ channels in cultured rat adrenal chromaffin cells. J Physiol 481(Pt 3): 555–570.
25. Hirschberg B, Maylie J, Adelman JP, Marrion NV (1998) Gating of recombinantsmall-conductance Ca-activated K+ channels by calcium. J Gen Physiol 111:
565–581.
26. Xia XM, Fakler B, Rivard A, Wayman G, Johnson-Pais T, et al. (1998)
Mechanism of calcium gating in small-conductance calcium-activated potassiumchannels. Nature 395: 503–507.
27. Schumacher MA, Rivard AF, Bachinger HP, Adelman JP (2001) Structure ofthe gating domain of a Ca2+-activated K+ channel complexed with Ca2+/
calmodulin. Nature 410: 1120–1124.
28. Keen JE, Khawaled R, Farrens DL, Neelands T, Rivard A, et al. (1999)
Domains responsible for constitutive and Ca(2+)-dependent interactions betweencalmodulin and small conductance Ca(2+)-activated potassium channels.
J Neurosci 19: 8830–8838.
29. Rimini R, Rimland JM, Terstappen GC (2000) Quantitative expression analysis
of the small conductance calcium-activated potassium channels, SK1, SK2 and
SK3, in human brain. Brain Res Mol Brain Res 85: 218–220.
30. Stocker M, Pedarzani P (2000) Differential distribution of three Ca(2+)-activatedK(+) channel subunits, SK1, SK2, and SK3, in the adult rat central nervous
system. Mol Cell Neurosci 15: 476–493.
31. Tacconi S, Carletti R, Bunnemann B, Plumpton C, Merlo Pich E, et al. (2001)
Distribution of the messenger RNA for the small conductance calcium-activated
potassium channel SK3 in the adult rat brain and correlation withimmunoreactivity. Neuroscience 102: 209–215.
32. Sailer CA, Hu H, Kaufmann WA, Trieb M, Schwarzer C, et al. (2002) Regional
differences in distribution and functional expression of small-conductance Ca2+-
activated K+ channels in rat brain. J Neurosci 22: 9698–9707.
33. Sailer CA, Kaufmann WA, Marksteiner J, Knaus HG (2004) Comparative
immunohistochemical distribution of three small-conductance Ca2+-activated
A New Membrane Protein Prediction Method
PLoS ONE | www.plosone.org 11 March 2011 | Volume 6 | Issue 3 | e16778

potassium channel subunits, SK1, SK2, and SK3 in mouse brain. Mol Cell
Neurosci 26: 458–469.34. Bowden SE, Fletcher S, Loane DJ, Marrion NV (2001) Somatic colocalization of
rat SK1 and D class (Ca(v)1.2) L-type calcium channels in rat CA1 hippocampal
pyramidal neurons. J Neurosci 21: RC175.35. Lu L, Zhang Q, Timofeyev V, Zhang Z, Young JN, et al. (2007) Molecular
coupling of a Ca2+-activated K+ channel to L-type Ca2+ channels via alpha-actinin2. Circulation Research 100: 112–120.
36. Obermair GJ, Szabo Z, Bourinet E, Flucher BE (2004) Differential targeting of
the L-type Ca2+ channel alpha 1C (CaV1.2) to synaptic and extrasynapticcompartments in hippocampal neurons. Eur J Neurosci 19: 2109–2122.
37. Hell JW, Westenbroek RE, Breeze LJ, Wang KK, Chavkin C, et al. (1996) N-methyl-D-aspartate receptor-induced proteolytic conversion of postsynaptic class
C L-type calcium channels in hippocampal neurons. Proc Natl Acad Sci U S A93: 3362–3367.
38. Dai S, Hall DD, Hell JW (2009) Supramolecular assemblies and localized
regulation of voltage-gated ion channels. Physiol Rev 89: 411–452.39. Bliss TV, Collingridge GL (1993) A synaptic model of memory: long-term
potentiation in the hippocampus. Nature 361: 31–39.40. Malenka RC, Bear MF (2004) LTP and LTD: an embarrassment of riches.
Neuron 44: 5–21.
41. Malinow R (2003) AMPA receptor trafficking and long-term potentiation. PhilosTrans R Soc Lond B Biol Sci 358: 707–714.
42. Malenka RC, Nicoll RA (1999) Long-term potentiation–a decade of progress?Science 285: 1870–1874.
43. Punta M, Forrest LR, Bigelow H, Kernytsky A, Liu J, et al. (2007) Membraneprotein prediction methods. Methods 41: 460–474.
44. Altschul SF, Madden TL, Schaffer AA, Zhang J, Zhang Z, et al. (1997) Gapped
BLAST and PSI-BLAST: a new generation of protein database searchprograms. Nucleic Acids Res 25: 3389–3402.
45. Makhatadze GI, Privalov PL (1995) Energetics of protein structure. Adv ProteinChem 47: 307–425.
46. Makhatadze GI, Privalov PL (1994) Hydration effects in protein unfolding.
Biophys Chem 51: 291–304; discussion 304–299.47. Zhou HY, Zhou YQ (2004) Quantifying the effect of burial of amino acid
residues on protein stability. Proteins-Structure Function and Genetics 54:315–322.
48. Myers JK, Pace CN, Scholtz JM (1995) Denaturant m values and heat capacitychanges: relation to changes in accessible surface areas of protein unfolding.
Protein Sci 4: 2138–2148.
49. White SH, Wimley WC (1999) Membrane protein folding and stability: physicalprinciples. Annu Rev Biophys Biomol Struct 28: 319–365.
50. White SH, Wimley WC (1999) Membrane protein folding and stability: Physicalprinciples. Annual Review of Biophysics and Biomolecular Structure 28:
319–365.
51. Hristova K, White SH (2005) An experiment-based algorithm for predicting thepartitioning of unfolded peptides into phosphatidylcholine bilayer interfaces.
Biochemistry 44: 12614–12619.52. Pace CN, Scholtz JM (1998) A helix propensity scale based on experimental
studies of peptides and proteins. Biophysical Journal 75: 422–427.53. Senes A, Gerstein M, Engelman DM (2000) Statistical analysis of amino acid
patterns in transmembrane helices: the GxxxG motif occurs frequently and in
association with beta-branched residues at neighboring positions. J Mol Biol 296:921–936.
54. Pilpel Y, Ben-Tal N, Lancet D (1999) kPROT: a knowledge-based scale for thepropensity of residue orientation in transmembrane segments. Application to
membrane protein structure prediction. Journal of Molecular Biology 294:
921–935.55. White SH (1994) Membrane protein structure: experimental approaches. New
York ; Oxford: Oxford University Press. x, 395 p.56. Li SC, Goto NK, Williams KA, Deber CM (1996) alpha-Helical, but not beta-
sheet, propensity of proline is determined by peptide environment. Proceedings
of the National Academy of Sciences of the United States of America 93:6676–6681.
57. Chen HF, Kendall DA (1995) Artificial Transmembrane Segments -Requirements for Stop Transfer and Polypeptide Orientation. Journal of
Biological Chemistry 270: 14115–14122.58. McMurry JL, Kendall DA (1999) An artificial transmembrane segment directs
SecA, SecB, and electrochemical potential-dependent translocation of a long
amino-terminal tail. J Biol Chem 274: 6776–6782.
59. Makhatadze GI, Privalov PL (1994) Hydration Effects in Protein Unfolding.
Biophysical Chemistry 51: 291–309.
60. Liang J, Adamian L, Jackups R, Jr. (2005) The membrane-water interface region
of membrane proteins: structural bias and the anti-snorkeling effect. Trends
Biochem Sci 30: 355–357.
61. Wimley WC, White SH (1996) Experimentally determined hydrophobicity scale
for proteins at membrane interfaces. Nat Struct Biol 3: 842–848.
62. White SH (2007) Membrane protein insertion: the biology-physics nexus. J Gen
Physiol 129: 363–369.
63. MacKenzie KR (2006) Folding and stability of alpha-helical integral membrane
proteins. Chemical Reviews 106: 1931–1977.
64. Booth PJ, Clarke J (2010) Membrane protein folding makes the transition.
Proceedings of the National Academy of Sciences of the United States of
America 107: 3947–3948.
65. Curnow P, Booth PJ (2009) The transition state for integral membrane protein
folding. Proceedings of the National Academy of Sciences of the United States of
America 106: 773–778.
66. Mokrab Y, Stevens TJ, Mizuguchi K (2009) Lipophobicity and the residue
environments of the transmembrane alpha-helical bundle. Proteins 74: 32–49.
67. Popot JL, Engelman DM (2000) Helical membrane protein folding, stability, and
evolution. Annu Rev Biochem 69: 881–922.
68. Engelman DM, Chen Y, Chin CN, Curran AR, Dixon AM, et al. (2003)
Membrane protein folding: beyond the two stage model. Febs Letters 555:
122–125.
69. Eilers M, Shekar SC, Shieh T, Smith SO, Fleming PJ (2000) Internal packing of
helical membrane proteins. Proceedings of the National Academy of Sciences of
the United States of America 97: 5796–5801.
70. Townend J (2002) Practical statistics for environmental and biological scientists.
Chichester: Wiley. x, 276 p.
71. Montgomerie S, Cruz JA, Shrivastava S, Arndt D, Berjanskii M, et al. (2008)
PROTEUS2: a web server for comprehensive protein structure prediction and
structure-based annotation. Nucleic Acids Res 36: W202–209.
72. Freeman TC, Jr., Wimley WC (2010) A highly accurate statistical approach for
the prediction of transmembrane beta-barrels. Bioinformatics 26: 1965–1974.
73. Van Rijsbergen CJ (1979) Information retrieval. London: Butterworth. ix, 208 p.
74. Moller S, Kriventseva EV, Apweiler R (2000) A collection of well characterised
integral membrane proteins. Bioinformatics 16: 1159–1160.
75. Jayasinghe S, Hristova K, White SH (2001) MPtopo: A database of membrane
protein topology. Protein Sci 10: 455–458.
76. Lodish HF (2003) Molecular cell biology. New York: W.H. Freeman and
Company. xxxiii, 973, 979 p.
77. Tusnady GE, Dosztanyi Z, Simon I (2005) PDB_TM: selection and membrane
localization of transmembrane proteins in the protein data bank. Nucleic Acids
Res 33: D275–278.
78. Yu NY, Wagner JR, Laird MR, Melli G, Rey S, et al. (2010) PSORTb 3.0:
improved protein subcellular localization prediction with refined localization
subcategories and predictive capabilities for all prokaryotes. Bioinformatics 26:
1608–1615.
79. Pierleoni A, Martelli PL, Fariselli P, Casadio R (2007) eSLDB: eukaryotic
subcellular localization database. Nucleic Acids Res 35: D208–212.
80. Yu CS, Chen YC, Lu CH, Hwang JK (2006) Prediction of protein subcellular
localization. Proteins 64: 643–651.
81. Guda C (2006) pTARGET: a web server for predicting protein subcellular
localization. Nucleic Acids Res 34: W210–213.
82. Szafron D, Lu P, Greiner R, Wishart DS, Poulin B, et al. (2004) Proteome
Analyst: custom predictions with explanations in a web-based tool for high-
throughput proteome annotations. Nucleic Acids Res 32: W365–371.
83. Horton P, Park KJ, Obayashi T, Fujita N, Harada H, et al. (2007) WoLF
PSORT: protein localization predictor. Nucleic Acids Res 35: W585–587.
84. Hoglund A, Donnes P, Blum T, Adolph HW, Kohlbacher O (2006) MultiLoc:
prediction of protein subcellular localization using N-terminal targeting
sequences, sequence motifs and amino acid composition. Bioinformatics 22:
1158–1165.
85. Sprenger J, Fink JL, Teasdale RD (2006) Evaluation and comparison of
mammalian subcellular localization prediction methods. BMC Bioinformatics 7
Suppl 5: S3.
86. Emanuelsson O (2002) Predicting protein subcellular localisation from amino
acid sequence information. Brief Bioinform 3: 361–376.
A New Membrane Protein Prediction Method
PLoS ONE | www.plosone.org 12 March 2011 | Volume 6 | Issue 3 | e16778
Copyright © 2022 FDOKUMEN