Querying Mediated Web Services - Department of Information ...

Available online at www.sciencedirect.com
Environmental Modelling & Software 23 (2008) 404e411www.elsevier.com/locate/envsoft
A first approach to web services for theNational Water Information System
Jonathan L. Goodall a,*, Jeffery S. Horsburgh b, Timothy L. Whiteaker c,David R. Maidment c,d, Ilya Zaslavsky e
a Department of Civil and Environmental Engineering, University of South Carolina, Columbia, SC, USAb Utah Water Research Laboratory, Utah State University, Logan, UT, USA
c Center for Research in Water Resources, University of Texas, Austin, TX, USAd Department of Civil Engineering, University of Texas, Austin, TX, USA
e Spatial Information Systems Lab, San Diego Supercomputer Center, La Jolla, CA, USA
Received 15 September 2006; received in revised form 15 January 2007; accepted 25 January 2007
Available online 25 October 2007
Abstract
A wealth of freely available hydrologic data are provided by governmental organizations including in situ observations, geospatial data sets,remote sensing products, and simulation model output. Despite having access to this information, much of the data remain underutilized in thehydrologic sciences due in part to the time required to access, obtain, and integrate data from different sources. Web services offer a means forsharing hydrologic data more openly by providing a standard protocol for machine-to-machine communication. We have used this new tech-nology to create a machine accessible interface for the National Water Information System (NWIS), an online repository of historical andreal-time streamflow, water-quality, and ground water level observations maintained by the United States Geological Survey (USGS). Theseservices provide a middle-layer of abstraction between the NWIS database and hydrologic analysis systems, allowing such analysis systemsto proxy the NWIS server for on-demand data access. We intentionally designed the services to be generic and applicable to other hydrologicdatabases, in order to provide interoperability between disparate data sources. Performance tests showed that, for time series with less than 1000observations, the web services layer added minimal overhead in terms of data response time, and development of an example client applicationfor time series visualization highlighted some of the benefits and costs of using web services for data access.� 2007 Elsevier Ltd. All rights reserved.
Keywords: Hydrology; Water resources; Interoperability; Web services; Service-oriented architecture; Cyberinfrastructure
1. Introduction and problem statement
Hydrologists and water resource managers are able to ac-cess a large and increasing quantity of data for analysis, visu-alization, and modeling of the water environment. The numberand variety of available data sources, however, make it diffi-cult to quickly locate the most appropriate resource for a par-ticular study. Furthermore, once the most appropriate data
* Corresponding author. Nicholas School of the Environmental and Earth
Science, Duke University, Box 90328, Durham, NC 22701, USA. Tel.: þ1
803 777 8184; fax: þ1 803 777 0670.
E-mail address: [email protected] (J.L. Goodall).
1364-8152/$ - see front matter � 2007 Elsevier Ltd. All rights reserved.
doi:10.1016/j.envsoft.2007.01.005
source has been identified, a considerable amount of effort isstill required to reformat the data for use in analysis, visuali-zation, or modeling software. As a result, researchers andpractitioners spend a significant amount of time on basicdata gathering and transformations, instead of scientific analy-sis and decision making.
This problem is most evident when one requires data col-lected by multiple individuals or agencies for a particular anal-ysis task. The hydrology community, for example, requiresmeteorological forcing data from the weather and climatecommunities to drive watershed and ground water models. At-mospheric science communities, however, have different datamodels and data formats than those commonly used in the

405J.L. Goodall et al. / Environmental Modelling & Software 23 (2008) 404e411
hydrologic sciences. If a hydrologist wants to make use ofweather data in an analysis, it often first requires that he or shelearn the file format or visualization tool used by that commu-nity. Therefore, interoperability of data between scientific sub-disciplines, although necessary in terms of application (i.e.rainfall leads to runoff), remains cumbersome to implement.
While it is difficult to quantify the exact cost that resultsfrom a lack of interoperability, we believe it would be signif-icantly reduced if hydrologic data were communicated be-tween systems using a standard, machine accessible protocolinstead of heterogeneous web pages (as is typically donenow). In the science community, the challenge of interopera-bility is being addressed through the recent attention in cyber-infrastructure. A blue ribbon panel of the NSF suggested thatthe agency spend $1B to develop cyberinfrastructure in thesciences, stating that a comprehensive cyberinfrastructure tosupport scientific research could profoundly change the sci-ence and engineering communities (Atkins et al., 2003). Cy-berinfrastructure plays a significant role in many geosciencesub-disciplines including ecology, atmospheric science, andhydrology (Bandaragoda et al., 2006; Green et al., 2005; Plaleet al., 2006).
Although this work is towards the eventual goal of cyberin-frastructure for the hydrologic sciences, the particular focus ofthis paper is on the communication of hydrologic time seriesusing web services. Web services provide the ability to passmessages between computers over the Internet, therefore al-lowing geographically distributed computers to more easilyshare data and computing resources. This is accomplishedthrough a set of standard protocols that facilitate how a serverdocuments its available services, how a client requests theserver to perform a process, and how services are discoveredon the web (Curbera et al., 2002). The standardization ofweb service protocols is impacting a wide variety of fieldsfrom business to science (Atkins et al., 2003; Foster, 2005;Hey and Trefethen, 2005; Stein, 2002).
Web services utilize extensible Markup Language (XML)as a common language for communicating between systems.While XML schemas have been proposed for basic communi-cation using web services (e.g. SOAP and WSDL as describedin Section 2.2), individual communities must supplement thesegeneric protocols for particular domains. XML schemas havealso been proposed for describing data in many geosciencecommunities (Atkins et al., 2003; Cox et al., 2002; Piaseckiand Bermudez, 2003; Ramachandran et al., 2004); however,less work has been done on standardizing the language usedfor requesting hydrologic data through web services. There-fore, our focus is primarily on the language for requestingtime series, instead of the language for describing a time seriesitself.
Web services have received increased attention in the geo-science literature. They are being used as the foundation fornext generation environmental models (Mineter et al., 2003),for communicating data within sensor networks (Lianget al., 2005), and for building ‘‘virtual databases’’ where thedata are distributed across multiple machines (Frehner andBrandli, 2006). Web services have been particularly popular
in bioinformatics as a tool for sharing genomic data (Pillaiet al., 2005; Stein, 2002; Sugawara and Miyazaki, 2003). De-spite this pervious work in geosciences and bioinformatics, ex-amples of web services in hydrology have been limited to date.
To investigate the application of web services for hydrology,we have prototyped a web service library for the National WaterInformation System (NWIS). NWIS is a United States GeologicalSurvey (USGS) data repository containing over 250 million real-time and historical stream discharge, water-quality, and groundwater level observations from the past 100 years (USGS, 2002)and is available over the Internet (http://waterdata.usgs.gov/nwis). The NWIS Web Services library we describe here wrapsthe logic for programmatically accessing and parsing NWISweb pages, making the NWIS data repository machine accessiblethrough a standard web service protocol. This allows water mod-elers and software designers to incorporate routines for accessingthe NWIS data repository into their own applications and, as a re-sult, reduce the data gathering and maintenance responsibilitiesfor the end user.
While this case study is limited in scope to a single datasource that contains one or more hydrologic observation time se-ries (i.e. a single fixed location where one or more variables havebeen or continue to be measured), the more long term goal is tocreate a generic standard for sharing hydrologic time series datathat can be implemented for any hydrologic observations’ data-base. Thus, in Section 3 we present a conceptual blue print fordeveloping hydrologic time series web services that is not spe-cific for NWIS. We then implement this design for NWIS, testthe performance of the web services in terms of additional re-sponse time introduced by the web services layer, and lastlypresent an example client application of the NWIS web serviceswith a discussion of the costs and benefits associated with usingthe web services library for data access.
This work is part of an ongoing effort by the Consortium ofUniversities for the Advancement of Hydrologic Science, Inc.(CUAHSI) Hydrologic Information System (HIS) group. It ismeant to document our first attempts at creating web servicesfor exposing remote hydrologic time series databases. For cur-rent efforts, the reader should visit the CUAHSI HIS website:http://www.cuahsi.org/his.
2. Background
2.1. The National Water Information System (NWIS)
The National Water Information System (NWIS) is the pri-mary database for stream discharge and ground water level ob-servations in the United States. It contains just under 1.5 millionsites, of which approximately 350,000 have water-quality fieldobservations, 24,000 have historical daily averaged streamflowobservations, 8000 are collecting real-time observations, and800,000 have ground water level observations (USGS, 2006).As of 1992, the total number of observations measured at thesesites was over 250 million and included 62.7 million chemicalobservations, 181 million daily streamflow records, 635,000flood peak discharges records, and 7.1 million ground waterlevel observations (USGS, 2002). Data in the system range
406 J.L. Goodall et al. / Environmental Modelling & Software 23 (2008) 404e411
from the late 19th century to real-time observations collectedevery day.
The NWIS database is publicly accessible over the Internetthrough NWISWeb (http://waterdata.usgs.gov/nwis) and isavailable for public and private use, free of charge. Under thecurrent NWISWeb design, a user can access any of the water-quality and quantity data by filling out a series of web formsthat isolate a portion of the database. The user can then down-load the ASCII text file resulting from the query for further anal-ysis. While this is a straightforward process, it can be timeconsuming, especially for first-time users who must learn thestructure of the website, as well as for users who must makemultiple requests to extract all data relevant for a study.
While NWISWeb is not explicitly intended for machine-to-machine communication, its design does allow one to auto-mate the process of querying hydrologic time series. Thealgorithm for extracting data from NWIS is to (1) create aUniversal Resource Locater (URL) that acts as a query onNWIS database (i.e. it describes the site, variable, and the pe-riod of interest) and (2) parse the ASCII file returned by theURL to extract a hydrologic time series. Once the web pagehas been accessed and downloaded, it can be parsed as if itwere a local text file.
Despite the ability to programmatically read NWIS using thedescribed procedure, there are a number of disadvantages withusing this approach to build robust software systems. Perhapsthe most significant disadvantage is its dependence on NWIS-Web’s interface remaining unaltered. Any changes that theNWIS administrators make to the logic for constructing URLsor for parsing web page responses will break all client applica-tions that depend on the data. Therefore, one of the primary ben-efits of creating a web service for programmatic access to NWISis to provide an intermediate layer between client applicationsthat consume NWISWeb data, and the NWISWeb server itself.As NWISWeb evolves, forthcoming changes to the interfacecould be communicated to the NWIS Web Service administra-tors so that the service could adapt to those changes and mini-mize interruptions for client applications.
The web services we have developed for the National WaterInformation System are designed to be a generic means for ac-cessing hydrologic time series data. As more earth science da-tabases become machine readable to remote users, standardswill be critical for insuring interoperability between the infor-mation and analysis systems. If the structure of web servicesfor hydrologic time series can be agreed upon and standard-ized, then it will be possible for any data provider to createand maintain web services for their own data that follow thestandards. These data providers will assume the responsibilityfor maintaining their own web services, but, because the ser-vices are standardized across providers, it will minimize theeffort required by the scientists and practitioners to integratedata from multiple sources.
2.2. Web services
Web services consist of a set of protocols that together pro-vide a mechanism for machine-to-machine communication
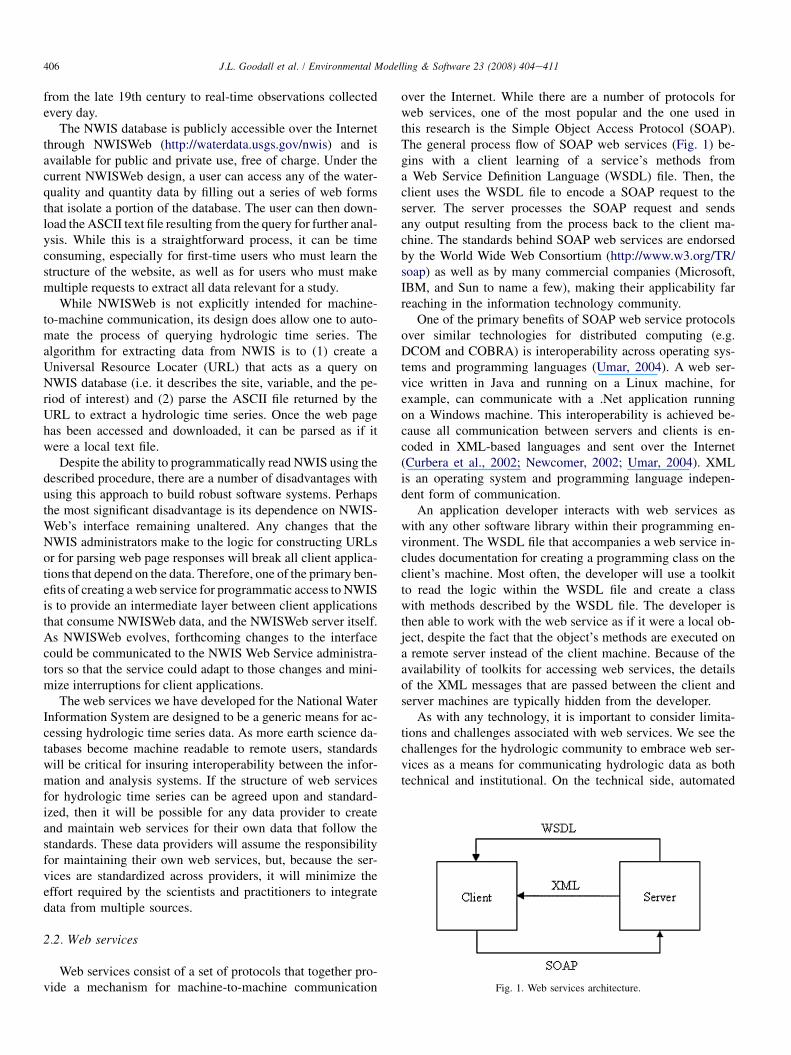
over the Internet. While there are a number of protocols forweb services, one of the most popular and the one used inthis research is the Simple Object Access Protocol (SOAP).The general process flow of SOAP web services (Fig. 1) be-gins with a client learning of a service’s methods froma Web Service Definition Language (WSDL) file. Then, theclient uses the WSDL file to encode a SOAP request to theserver. The server processes the SOAP request and sendsany output resulting from the process back to the client ma-chine. The standards behind SOAP web services are endorsedby the World Wide Web Consortium (http://www.w3.org/TR/soap) as well as by many commercial companies (Microsoft,IBM, and Sun to name a few), making their applicability farreaching in the information technology community.
One of the primary benefits of SOAP web service protocolsover similar technologies for distributed computing (e.g.DCOM and COBRA) is interoperability across operating sys-tems and programming languages (Umar, 2004). A web ser-vice written in Java and running on a Linux machine, forexample, can communicate with a .Net application runningon a Windows machine. This interoperability is achieved be-cause all communication between servers and clients is en-coded in XML-based languages and sent over the Internet(Curbera et al., 2002; Newcomer, 2002; Umar, 2004). XMLis an operating system and programming language indepen-dent form of communication.
An application developer interacts with web services aswith any other software library within their programming en-vironment. The WSDL file that accompanies a web service in-cludes documentation for creating a programming class on theclient’s machine. Most often, the developer will use a toolkitto read the logic within the WSDL file and create a classwith methods described by the WSDL file. The developer isthen able to work with the web service as if it were a local ob-ject, despite the fact that the object’s methods are executed ona remote server instead of the client machine. Because of theavailability of toolkits for accessing web services, the detailsof the XML messages that are passed between the client andserver machines are typically hidden from the developer.
As with any technology, it is important to consider limita-tions and challenges associated with web services. We see thechallenges for the hydrologic community to embrace web ser-vices as a means for communicating hydrologic data as bothtechnical and institutional. On the technical side, automated
Fig. 1. Web services architecture.

407J.L. Goodall et al. / Environmental Modelling & Software 23 (2008) 404e411
access to hydrologic databases will likely result in more de-pendence on Internet connections for on-demand data access.Furthermore, hydrologic time series can become quite large,so a web services approach that relies on XML may requirelarge bandwidths or techniques for compressing data withinXML SOAP messages. A major institutional challenge thatthe community faces is the need to standardize web servicesignatures across data providers and consumers. Standardiza-tion is required to fully capture the potential for interoperabil-ity offered by web services.
The technical challenges are, for the most part, not uniqueto the hydrologic community and are being addressed by thelarger information technology community as this technologycontinues to evolve. The political challenges (i.e. standardiza-tion), however, must be addressed by the hydrologic commu-nity because the particulars of how hydrologic information isorganized and communicated can only be described by hydrol-ogists themselves. Our hope is that, as the technology maturesand as applications are developed that demonstrate the potentialof web services and service-oriented architecture, the hydro-logic community will embrace this technology and work to-wards establishing the standards necessary for interoperability.
3. Design concepts
We considered two primary questions in our design of webservice for exposing a hydrologic time series database: (1)what methods are necessary to expose a database of hydro-logic time series variables and (2) what arguments should berequired of each method. We did not emphasize what eachmethod should return to the user because this could be definedby existing XML schemas and, as discussed in Section 1, ourfocus is on the language for requesting time series. This designeffort is a software engineering process of developing an Ap-plication Programming Interface (API) for retrieving time se-ries from a database. The web service API must be genericenough to provide a consistent interface across heterogeneoussources, but it must also be specific enough to clearly isolatesubsets of information from each source.
The basic conceptual framework for our design is based onthe idea of a spaceetimeevariable cube for referencing indi-vidual measurements according to where, when, and whatwas measured (Fig. 2). Maidment (2002) proposed this datacube concept as a means for integrating time series from het-erogeneous data providers within a relational database, but it isalso applicable to creating web services that are interoperableacross data providers. By referencing data from multiplesources within this conceptual cube, it becomes possible tosearch for relevant data across providers; that is to say, whocollected a sample is no more or less important than wherethe samples was taken, when it was measured, and what it isa measurement of.
In addition to the concept of referencing data in a spaceetimeevariable cube, we believe it is also helpful for imple-mentation purposes to consider two basic ways in which onemight use a web service. The first is as a data discovery tool(e.g. ‘‘Where has nitrogen been measured within the Neuse
River?’’), and the second is as a data delivery tool (e.g.‘‘Get me the daily streamflow time series recorded for theNeuse River near Clayton, North Carolina site.’’). One reasonfor making this distinction between data discovery and data re-trieval is that a user will likely interact with both types ofqueries very differently. Discovery services return a smallamount of data, but are generally called more frequentlythan data delivery services because users are attempting to iso-late a data set of interest. Delivery services, on the other hand,return larger data sets, but are called less frequently becauseusers will have presumably already used the discovery ser-vices to isolate a time series of interest. In designing a systemfor exposing hydrologic time series, keeping these two typesof services separate allows the system developers to maintainand implement the services in different ways. For example, toenhance performance of a mapping application, a discoveryservice may be implemented so that it accesses a local data-base of time series metadata, while a delivery service requestwould be routed to the original data source.
This paper’s primary focuses are on data delivery services be-cause we see these as being the most critical for exposing theNWIS system via web services. The NWIS web services pre-sented here were developed by wrapping the screen scrapingprocess of building URLs and parsing the returning web page.In other words e we did not have inside access to the NWIS da-tabase. Because of this, we were limited in our ability to formu-late custom search queries on the underlying database.Furthermore, based on the differences in how one might imple-ment search and retrieval based services, a search algorithmmight be implemented to read from local metadata files in orderto improve performance. In this case, the data delivery serviceswould be used to keep the local metadata files up-to-date,removing the need for searches on the remote database.
Using the concept of a spaceetimeevariable cube and not-ing that our primary focus in this paper is data delivery ser-vices, we have identified three key data delivery methodsnecessary for exposing the NWIS database: GetSiteInfo,
Fig. 2. The spaceetimeevariable data cube.

408 J.L. Goodall et al. / Environmental Modelling & Software 23 (2008) 404e411
GetVariableInfo, and GetValues. The GetSiteInfo and GetVar-iableInfo methods allow a user to learn about the individualobjects that comprise the space and variable axes of thecube (with site being a proxy for space). We did not includea method to learn about objects along the time axis (i.e. Get-TimeInfo) as we do not see any need to provide metadataabout each time step within the database. The third service,GetValues, essentially slices the cube for a particular site, vari-able, and time period of interest and returns the resulting timeseries. We only include this signature for data delivery becauseour model was the delivery of time series for a single location.Other signatures for the GetValues method, however, could beadded in the future to return data for multiple sites at once(e.g. for a given variable, a given time, and all sites within a lat-itude/longitude box). Each method is described in more detailbelow.
The GetSiteInfo method returns a site object including basicmetadata (Name, ID, Latitude, and Longitude) describing thesite. The method requires a single input parameter that iden-tifies the station according to the unique identification systemused by the USGS for each of its approximately 1.5 millionsites. Information returned from this method is in XML formatwith tags signifying the property names of each metadata attri-bute. This XML response can then be parsed or deserializedinto an object for further analysis.
The GetVariableInfo method returns a variable object in-cluding basic metadata (Name, ID, and Units) describing a par-ticular variable stored within the database. The method
requires a single input parameter that uniquely identifies a vari-able according to the convention used by the USGS. Here weare not inventing a new variable typing system, but instead areunitizing the systems native to the data resource itself. The in-formation returned by the method includes the name, units,and other basic metadata describing the variable being mea-sured. The response is encoded in XML for transmissionover the Internet.
Finally, the GetValues method returns a time series objectthat includes the values measured and the date and time ofmeasurement. To request a time series object, the user spec-ifies a site identifier, a variable identifier, a start date andtime, and an end date and time. This time window is especiallyhelpful for large time series with either a high temporal reso-lution or a long period of record. Again, the information is re-turned to the client application in an XML format (Fig. 3).
A prototype version of this service was built using Micro-soft Visual Basic .Net and is hosted by the San Diego Super-computing Center (SDSC) (http://river.sdsc.edu/NWISTS/NWIS.asmx). As this is an ongoing effort, the reader maywish to consult the CUAHSI Hydrologic Information Systemweb page (http://www.cuahsi.org/his) for the latest versionof the web services.
3.1. Key NWIS Web Service performance test
One concern of utilizing web services as an additional layerbetween client applications (analysis programs and hydrologic
Fig. 3. Example time series XML document produced by the GetValues method for the USGS site Neuse River at Clayton, NC (02087500), daily streamflow for
January 1e3, 1990.

409J.L. Goodall et al. / Environmental Modelling & Software 23 (2008) 404e411
models) and information systems is that the overhead, in termsof added response time, caused by the web service will negateany benefits derived from increased robustness and interoper-ability. Therefore, we conducted a test to quantify the addi-tional access time introduced by the web service layer. Todo this, we developed a simple client application in C#.Netthat requested time series with increasing records lengths(1, 10, 100, 1000, 10,000, and the period of record of observa-tions) from the USGS site Neuse River near Clayton, NorthCarolina (site code: 02087500). The client application re-quested data using two different methods: (1) our prototypeNWIS Web Services, and (2) programmatically accessingand parsing NWISWeb pages. To minimize the impact of var-iations in server load on both the SDSC server hosting the webservice and the NWIS web server in Reston, Virginia, eachtime series was requested 100 times using each method.
Our test showed that, for time series with records less than1000 records, there is minimal overhead imposed by the webservice approach (Fig. 4). The time required to return thetime series using the NWIS Web Service was roughly thesame as the time required for NWISWeb to create a webpage and for the client to download and parse that page (be-tween 1.5 and 2.0 s). For time series with over 1000 records,however, our test did show a performance cost associatedwith the web service approach for data access. For a time se-ries of 10,000 records, our test showed that an NWIS Web Ser-vice request takes, on average, 7.5 s whereas requesting thedata directly from NWISWeb takes 6.6 s. This performancecost increased to just over 5 s for a 32,172 observation timeseries (the period of daily streamflow record at the NeuseRiver near Clayton, North Carolina site) with the NWISWeb Service method taking 20.0 s to return the data and theNWISWeb method taking only 14.7 s.
0.0
5.0
10.0
15.0
20.0
25.0
30.0
1 10 100 1,000 10,000 31,781Number of Observations in Time Series
Req
uest T
im
e (seco
nd
s) NWIS Web Page
NWIS Web Service
Number of Observations in Time Series
NWIS Web Service Reponse Time (seconds)
NWIS Web Page Reponse Time (seconds)
1 1.9 ± 0.7 1.8 ± 0.810 1.6 ± 0.5 1.7 ± 0.3100 1.9 ± 0.7 1.8 ± 0.7
1000 2.3 ± 0.7 2.4 ± 0.610000 7.5 ± 3.8 6.6 ± 1.531781 20.0 ± 4.6 14.7 ± 2.8
Fig. 4. Average time required to retrieve data using NWIS Web Services com-
pared to NWIS web pages with error bars indicating �1 standard deviation
(n¼ 100).
Although it is difficult to isolate the exact reason for theperformance cost associated with larger time series, part ofthe reason could likely be attributed to the increase in responsememory sizes due to encoding objects in XML. An NWISWeb Service response, because it is encoded in XML, requiresroughly twice as much memory as a web page returned di-rectly from NWISWeb (Fig. 5). This suggests that for largetime series, it may be useful for future designs to offer a com-pressed version of the time series values to keep performancesimilar to the baseline NWISWeb performance levels.
3.2. NWIS Web Service client example
While the design of hydrologic time series web services isthe focus of this paper, the power of web services are most ob-vious when incorporated into client applications. Applicationsthat employ service-oriented architectures, where individualprocesses are accomplished by a set of web services distrib-uted across multiple machines, are able to make use of ge-neric, reusable components for tasks such as data access,data transformation, and data processing. Popular commercialsoftware products used by hydrologists (e.g. Matlab� and Mi-crosoft Excel) are able to utilize the web services, includingthose described here (Whiteaker et al., 2006). Having Matlab�
input data using a web service instead of a local text file, forexample, provides a means to directly couple data providersand consumers and, therefore, removes the intermediate datamanagement responsibilities from the scientist.
To illustrate the benefit of web services from a user’s pro-spective, we have modified an existing web-based applicationto be an NWIS Web Service client. The Time Series Analyst
0
0.5
1
1.5
2
2.5
Req
uest S
ize (m
eg
ab
ytes)
1 10 100 1,000 10,000 31,756Number of Observations in Time Series
NWIS Web PageNWIS Web Service
Number of Observations in Time Series
NWIS Web Service Reponse Size (megabytes)
NWIS Web PageReponse Size (megabytes)
Increase in Size Required for
NWIS Web Service (%)
1 1.0E-03 3.0E-03 33%10 2.0E-03 3.0E-03 67%
100 7.0E-03 6.0E-03 117%1000 6.6E-02 3.7E-02 178%
10000 6.5E-01 3.5E-01 187%31781 2.1E+00 9.7E-01 214%
Fig. 5. Memory requirements of NWIS Web Services responses compared to
NWIS web page responses.

410 J.L. Goodall et al. / Environmental Modelling & Software 23 (2008) 404e411
application was designed by researchers at Utah State Univer-sity to provide Internet users the ability to plot and generatesimple descriptive statistics for environmental time seriesdata (streamflow, water-quality, climate, etc.) collected in theBear River Watershed of northern Utah. In the original appli-cation (http://water.usu.edu/analyst/), the time series data arestored locally on a web server in a relational database. Theuser interacts with the Time Series Analyst via a web browserinterface to request data. Upon request, the Time Series Ana-lyst server side application queries the local database and usesthe results of the query to generate plots, descriptive statistics,and data export files.
Subsequent to the creation and release of the NWIS WebServices, a new version of the Time Series Analyst was cre-ated that ingests data via the NWIS Web Services ratherthan from a local database (http://water.usu.edu/nwisanalyst/).The user interface of the new version is essentially the same,but rather than getting the data from a local database, theNWIS version of the Time Series Analyst sends requests di-rectly to NWIS via the NWIS Web Services. This change meansthat data are requested by the Time Series Analyst and returnedby the web services in real-time (Fig. 6). They not cached as anintermediate step within a local database (Fig. 6).
Both the local database and web services approaches haveadvantages and disadvantages. The primary advantage of thelocal database approach is speed. A user request for data ispassed directly to the data repository (a local SQL Server da-tabase) and, because there is no need for network calls be-tween the data repository and the application, performanceis significantly better than the web services approach. Queriesto a local database to extract a time series only take a fractionof a second whereas the NWIS Web Service calls, as discussed
in Section 3.1, take at least 1.5 s and up to 20 s to return a timeseries.
On the other hand, the primary advantage of the web ser-vices approach is minimizing data management responsibili-ties and data redundancy for data consumers. All dataarchiving, data quality control and assurance, and data mainte-nance are done by the originating agency in the official datarepository, and any changes to the official repository are im-mediately available to all users. Better access to hydrologicdata could mean using the services ‘‘in real time’’ to visualizeremote data sets, but it could also mean the services are usedto keep local databases up-to-date as new data become avail-able. Ultimately, how the web services are put into practice,for on-demand access or for automated data harvesting, willbe determined by an organization’s needs and resources.
4. Conclusions
In this first attempt at creating web services for exposingthe National Water Information System, our goal was to pro-vide a standard, machine accessible interface to the federaldata archive that followed industry standards for web services(i.e. SOAP, WSDL). We intentionally designed the interface tobe generic so that it may be implemented as a standard proto-col for exposing any hydrologic time series database. While itis difficult to quantify the benefit of web services for data ac-cess and interoperability, our assumption is that automated ac-cess to hydrologic data through standardized interfaces willreduce the time required by scientists to incorporate datainto analysis applications.
Exactly how the web services are used by researchers isopen. We envision that in some cases, the web services may
Fig. 6. Data flow for the Time Series Analyst before and after becoming an NWIS Web Service client.

411J.L. Goodall et al. / Environmental Modelling & Software 23 (2008) 404e411
be used to keep a local achieve up-to-date, while in othercases, the web services may be used for direct data accesswithin an analysis or modeling routine. Because the NWISWeb Service presented here is built on industry standardslike SOAP and WSDL, the services can be used by any soft-ware systems able to consume web services (Matlab�, Micro-soft Excel, etc.). This makes web services an attractive optionfor distributed scientific computing.
Performance tests showed that time series from NWIS withless than 1000 observations take approximately 1.5e2 s to re-trieve. It is important to note that this response time is a resultof the NWISWeb response time e the service layer adds littleoverhead. For larger time series (<1000 observations), how-ever, the service layer does add overhead. We hypothesizethat the overhead is due to the verbosity of XML. Futurework should test this hypothesis and, if true, proposed com-pression techniques to minimize the transmission size of largetime series using web services.
This work is a first step towards creating cyberinfrastruc-ture for the hydrologic sciences through CUAHSI HydrologicInformation System. Future efforts will be directed towards re-fining the design the web services presented here and imple-menting web services for other federal data repositories.Given the increased availability of digital data and the time re-quired to access and integrate data from heterogeneous sour-ces, we believe that this is a critical need for the hydrologicsciences. If a standard can be proposed and implemented forsharing hydrologic time series using web services, it willgreatly increase the interoperability of hydrologic data and al-low scientists to more easily utilize these data sets in scientificstudies in the coming years.
Acknowledgement
This work was supported by the National Science Founda-tion (NSF) under grant #0413265.
References
Atkins, D.E., Droegemeier, K.K., Feldman, S.I., Garcia-Molina, H.,
Klein, M.L., Messerschmitt, D.G., Messina, P., Ostriker, J.P.,
Wright, M.H., 2003. Revolutionizing Science and Engineering Through
Cyberinfrastructure: Report of the National Science Foundation Blue-
Ribbon Advisory Panel on Cyberinfrastructure. Available from: http://
www.communitytechnology.org/nsf_ci_report/ (accessed 05.01.07.).
Bandaragoda, C., Tarboton, D., Maidment, D., 2006. Hydrology’s efforts to-
ward the Cyberfrontier. EOS, Transactions AGU 87 (1), 2.
Cox, S., Cuthbert, A., Lake, R., Martell, R., 2002. Geography Markup Lan-
guage (GML) 2.0 OpenGIS Implementation Specification. Available
from: http://portal.opengeospatial.org/files/?artifact_id¼11339 (accessed
05.09.06.).
Curbera, F., Duftler, M., Khalaf, R., Nagy, W., Mukhi, N., Weerawarana, S.,
2002. Unraveling the Web services Web: aintroduction to SOAP, WSDL,
and UDDI. IEEE Internet Computing 6 (2), 86e93.
Foster, I., 2005. Service-oriented science. Science 308 (5723), 814e817.
Frehner, M., Brandli, M., 2006. Virtual database: spatial analysis in a web-
based data management system for distributed ecological data. Environ-
mental Modelling & Software 21 (11), 1544e1554.
Green, J.L., Hastings, A., Arzberger, P., Ayala, F.J., Cottingham, K.L.,
Cuddington, K., Davis, F., Dunne, J.A., Fortin, M.J., Gerber, L.,
Neubert, M., 2005. Complexity in ecology and conservation: mathemati-
cal, statistical, and computational challenges. Bioscience 55 (6), 501e510.
Hey, T., Trefethen, A.E., 2005. Cyberinfrastructure for e-science. Science 308
(5723), 817e821.
Liang, S.H.L., Croitoru, A., Tao, C.V., 2005. A distributed geospatial infra-
structure for Sensor Web. Computers & Geosciences 31 (2), 221e231.
Maidment, D.R., 2002. Arc Hydro: GIS for Water Resources. ESRI Press,
Redlands, Calif, 203 pp.
Mineter, M.J., Jarvis, C.H., Dowers, S., 2003. From stand-alone programs to-
wards grid-aware services and components: a case study in agricultural
modelling with interpolated climate data. Environmental Modelling &
Software 18 (4), 379e391.
Newcomer, E., 2002. Understanding Web Services: XML, WSDL, SOAP, and
UDDI. Addison-Wesley, Boston, xxviii, 332 pp.
Piasecki, M., Bermudez, L., 2003. HYDROML: Conceptual Development of
a Hydrologic Markup Language. IAHR Congress, Thessaloniki, Greece.
Pillai, S., Silventoinen, V., Kallio, K., Senger, M., Sobhany, S., Tate, J.,
Velankar, S., Golovin, A., Henrick, K., Rice, P., Stoehr, P., Lopez, R.,
2005. SOAP-based services provided by the European Bioinformatics In-
stitute. Nucleic Acids Research 33, W25eW28.
Plale, B., Gannon, D., Brotzge, J., Droegemeier, K., Kurose, J.,
McLaughlin, D., Wilhelmson, R., Graves, S., Ramamurthy, M.,
Clark, R.D., Yalda, S., Reed, D.A., Joseph, E., Chandrasekar, V., 2006.
CASA and LEAD: adaptive cyberinfrastructure for real-time multiscale
weather forecasting. Computer 39 (11), 56e64.
Ramachandran, R., Graves, S., Conover, H., Moe, K., 2004. Earth Science
Markup Language (ESML): a solution for scientific data-application inter-
operability problem. Computers and Geosciences 30 (1), 117e124.
Stein, L., 2002. Creating a bioinformatics nation e a web-services model will
allow biological data to be fully exploited. Nature 417 (6885), 119e120.
Sugawara, H., Miyazaki, S., 2003. Biological SOAP servers and web services
provided by the public sequence data bank. Nucleic Acids Research 31
(13), 3836e3839.
Umar, A., 2004. The emerging role of the Web for enterprise applications and
ASPs. Proceedings of the IEEE 92 (9), 1420e1438.
USGS, 2002. NWISWeb: New Site for the Nation’s Water Data. Available
from: http://pubs.usgs.gov/fs/fs-128-02/ (accessed 09.09.06.).
USGS, 2006. NWISWeb Home Page. Available from: http://nwis.waterda-
ta.usgs.gov (accessed 15.09.06.).
Whiteaker, T.L., Beran, B., Goodall, J.L., Min, T., Tarboton, D., To, E., Valentine, D.,
2006. CUAHSI HIS Web Services Workbook. Available from: http://
www.cuahsi.org/his/docs/HIS-workbook-20061130.pdf (accessed 05.01.07.).
Copyright © 2022 FDOKUMEN