A Disciplinary Analysis of the Contribution of Academic Staff to PhD Completions in Australian...
22
University of Wollongong Research Online Faculty of Commerce - Papers (Archive) Faculty of Business 2007 A disciplinary analysis of the contribution of academic staff to PHD completions in Australian universities Abbas Valadkhani University of Wollongong, [email protected] Simon Ville University of Wollongong, [email protected] Research Online is the open access institutional repository for the University of Wollongong. For further information contact the UOW Library: [email protected] Publication Details is article was originally published as: Valadkhani, A, and Ville, S, Disciplinary analysis of the contribution of academic staff to PhD completions in Australian universities, International Journal of Business and Management Education, 15(1), 2007, 1-22.
Transcript of A Disciplinary Analysis of the Contribution of Academic Staff to PhD Completions in Australian...
University of WollongongResearch Online
Faculty of Commerce - Papers (Archive) Faculty of Business
2007
A disciplinary analysis of the contribution ofacademic staff to PHD completions in AustralianuniversitiesAbbas ValadkhaniUniversity of Wollongong, [email protected]
Simon VilleUniversity of Wollongong, [email protected]
Research Online is the open access institutional repository for theUniversity of Wollongong. For further information contact the UOWLibrary: [email protected]
Publication DetailsThis article was originally published as: Valadkhani, A, and Ville, S, Disciplinary analysis of the contribution of academic staff to PhDcompletions in Australian universities, International Journal of Business and Management Education, 15(1), 2007, 1-22.
A disciplinary analysis of the contribution of academic staff to PHDcompletions in Australian universities
AbstractThis paper identifies the major areas of research strengths and concentration across all Australian universities,as demonstrated by the number of PhDs and academic staff members (S) in ten broad fields of educationusing the average audited data (2001-2003). The ratio of PhD completions to S is then presented to provide atentative basis for benchmarking and productivity analysis. Inter alia, we found a very interesting relationshipbetween the number of PhD graduates (as the dependent variable) and S using a fixed-effect model with bothdiscipline-specific slope and intercept coefficients. The results provide policy implications for individualuniversities and government.
KeywordsAustralian universities, ranking, PhD completions, cross-sectional model
DisciplinesBusiness | Social and Behavioral Sciences
Publication DetailsThis article was originally published as: Valadkhani, A, and Ville, S, Disciplinary analysis of the contribution ofacademic staff to PhD completions in Australian universities, International Journal of Business andManagement Education, 15(1), 2007, 1-22.
This journal article is available at Research Online: http://ro.uow.edu.au/commpapers/357
1
A DISCIPLINARY ANALYSIS OF THE CONTRIBUTION OF
ACADEMIC STAFF TO PHD COMPLETIONS IN AUSTRALIAN
UNIVERSITIES*
ABBAS VALADKHANI
SIMON VILLE
School of Economics, University of Wollongong, NSW 2522, Australia
Abstract
This paper identifies the major areas of research strengths and concentration
across all Australian universities, as demonstrated by the number of PhDs and
academic staff members (S) in ten broad fields of education using the average
audited data (2001-2003). The ratio of PhD completions to S is then presented to
provide a tentative basis for benchmarking and productivity analysis. Inter alia,
we found a very interesting relationship between the number of PhD graduates
(as the dependent variable) and S using a fixed-effect model with both discipline-
specific slope and intercept coefficients. The results provide policy implications
for individual universities and government.
Key Words: Australian universities, ranking, PhD completions, cross-sectional model
JEL codes: A19; C23; I21; I28.
Introduction
It is well-recognised that doctoral students play a vital role in national research and
the scholarship of research, partially justifying Commonwealth government funding.
The environment for the doctorate has been shifting rapidly in recent years, a ‘sea
change’ according to one author (Park, 2005, p. 192). PhD enrolments in Australia
doubled to over 35,000 in the decade to 2003, the clientele has diversified to include
more distance, mature age, and part time students, and the types of degree have
expanded to encompass significant numbers of professional and practice-based
doctorates, new route PhDs, and PhD by publication (Gatfield, 2005; Neumann, 2002;
Park, 2005).
* We wish to acknowledge Mehryar Nooriafshar and two anonymous referees whose constructive
inputs and comments improved an earlier version of this article. The usual caveat applies.
2
Similarly, the policy field has been an active one. Governments have expressed
concern at variations in completion times and rates, and have pushed for a shift to a
generic skills-based approach to the PhD that emphasizes its role in providing
competency training ahead of disciplinary content. This homogenizing process is
consistent with a broad autonomous trend known as the commodification of
knowledge wherein discipline specific knowledge and methodology is increasingly
replaced by problem solving and knowledge management approaches (Park, 2005;
Neumann, 2002).
Guides and handbooks on doctoral research tend to bear out this generic approach
by providing advice to supervisors, students, and universities on general best practice
(Park, 2005). Disciplinary differences are rarely considered in detail in the scholarly
literature, with the focus either being on individual disciplines, mostly the medical
sciences, or comparisons of functional matters such as different supervisory styles
(Gatfield, 2005; Neumann, 2001). Such a muting of discipline-specific aspects of
doctoral studies is somewhat surprising. Academics associate very closely with their
particular discipline and it is clear in the literature on undergraduate teaching that
philosophies and practices vary considerably between disciplines.
Becher’s (1989) classic study of academic tribes and territories, for example,
examined some of these disciplinary variations, while Biglam (1973a; 1973b) helped
to provide a typology to distinguish between practices in the hard pure fields
(sciences); hard applied (technologies); soft pure (humanities and social sciences);
and soft applied (social science based professions). Neumann (2001) used these
categories to suggest disciplinary differences influence the degree of difficulty of
supervision and therefore the staff intensity required. In particular, she emphasized the
nexus between research and supervision, the extent of group-based collaborative work
(‘social-connectedness’), the balance between undergraduate and graduate teaching,
and the emphasis upon paradigmatic versus idiosyncratic methodologies and
knowledge In the hard pure and applied fields there is a closer nexus between
academic research and student supervision, relatively more time is spent on graduate
versus undergraduate teaching, and paradigms are more clear cut making research less
open-ended and speculative. In the hard pure and soft applied disciplines greater
social connectedness among academics facilitates more graduate supervision. Each of
these elements suggests that graduate supervision is less onerous in these fields
3
enabling supervisors to take on more students and see them through to a rapid and
successful completion. In a similar vein, a UK study on PhD degrees in the 1980s
found that completion times were shortest and completion rates highest in the
sciences, followed by engineering, social sciences, and arts/languages (Booth and
Satchell, 1995). Likewise, an ARC study concluded that supervision was most
onerous in the humanities since it was less ‘dovetailed with the academic’s own
research than is the case in most other disciplines’ (ARC, 1998, p. xix).
There is an ever-increasing focus in the Australian university system on
quantitative measures of research performance including postgraduate research.
However, to date this has mainly concerned assessment at an aggregate university-
wide level or within a single discipline, which is inconsistent with the most recent
policy emphasis on a holistic approach in identifying different research strengths. Put
bluntly, focusing on research performance at the institutional level ignores the varied
performance that occurs at the disciplinary level and the application of funding on this
basis serves to stifle innovation in key research areas and maintain underperforming
and outdated research areas. This provides a disincentive to focused, responsive,
innovative and diverse research in Australian universities.
The purpose of the present paper is to complement this nascent body of work with
an analysis of the recent distribution of PhD graduates among 40 Australian
universities and across 10 broad fields of education using the audited numbers of PhD
completions (in accordance with rules established by the Department of Education,
Science and Training) and analysed in both total and per academic staff terms. The
study is constructed so as to take advantage of the audited quantitative information on
research performance periodically gathered by governmental authorities. To the best
of our knowledge, the present study is the only independent (that is, non-government)
one that quantifies the relationship between the number of PhD completions and the
number of academic staff members for all Australian universities and disciplines
using consistent and audited data.
The rest of the paper is organised as follows. In the next section we explain the
methodology that we have used to formulate the relationship between PhDs and the
number of staff members active in research using a fixed-effect model. After that, we
describe the source of the data employed followed by the presentation of our

4
empirical results. The penultimate section of the paper analyses the policy
implications of the study, and the last section offers some concluding remarks.
Methodological Framework
Against the background of the preceding discussion, the present paper postulates the
number of PhD completions across various disciplines and universities as a function of
the corresponding number of academic staff members (S). That is:
ij ij ijPhD Sα β ε+= + (1)
where j (1,2,…d=10) and i (1,2,…, n=40) denote the jth discipline and the i
th university,
respectively. However, equation (1) which is described as Model (1) hereafter, does not
differentiate among various disciplines and it assumes that each extra staff member will
increase the number of PhD completions by a constant coefficient β. In order to capture
inter-disciplinary heterogeneities one can use the fixed effects model, which allows α to
vary across disciplines by estimating different intercept terms (i.e. α1, α2,… α10). This
method is also referred to as the “least squares with dummy variables” or LSDV. In this
method we subtract the within mean from each variable and then estimate OLS using the
transformed data. The following specification is thus referred to as Model (2) in this
paper:
ij j ij ijPhD Sα β ε+= + (2)
One can argue that the considerable heterogeneities among these disciplines may not
be adequately captured by a simple “intercept varying model”. Given the importance of
the slope coefficient in this relation, Model (3) allows it to change across 10 disciplines:
ij j ij ijPhD Sα β ε+= + (3)
It is also possible to specify the least restrictive model (Model 4) in which both the
intercept and the slope coefficients can differ in the estimation process for each
discipline:
ij j j ij ijPhD Sα β ε+= + (4)
However, allowing jα and jβ to take specific values for each broad field of
education entails a loss of the degree of freedom. In fact, estimating discipline-specific
coefficients involves a trade-off between the degrees of freedom lost and the resulting
gain obtained in terms of discipline specificity and the enhanced goodness-of fit
statistics. However, it is necessary to formally test each of the first three models (referred
5
to as the restricted models) against Model (4) or the unrestricted model using a Wald
type test. One can also use an information criterion such as the AIC (Akaike Information
Criterion) to choose among the rival models outlined above. As discussed later in this
paper, both approaches point to Model (3) as a more statistically accepted model.
Data and Descriptive Analysis
Forty Australian universities have been included in the analysis, all of which are
publicly funded and members of the Australian Vice-Chancellor’s Committee
(AVCC). The unpublished database used in this study was purchased from the DEST
in December 2005 as specifically detailed at the bottom of Tables 1 and 2. The data
include the number of PhD completions as well as the number of academic staff
members by institutions and across 10 consistently defined broad fields of education,
all of which we have averaged using annual observations for the period 2001-2003. In
order to minimise bias in our results, we consider only those academic staff members
who are classified as undertaking ‘research-only’ and ‘teaching-and-research’
activities. In other words, the variable that is referred to as academic staff (S) does not
include ‘teaching only’ staff.
[Tables 1 and 2 about here]
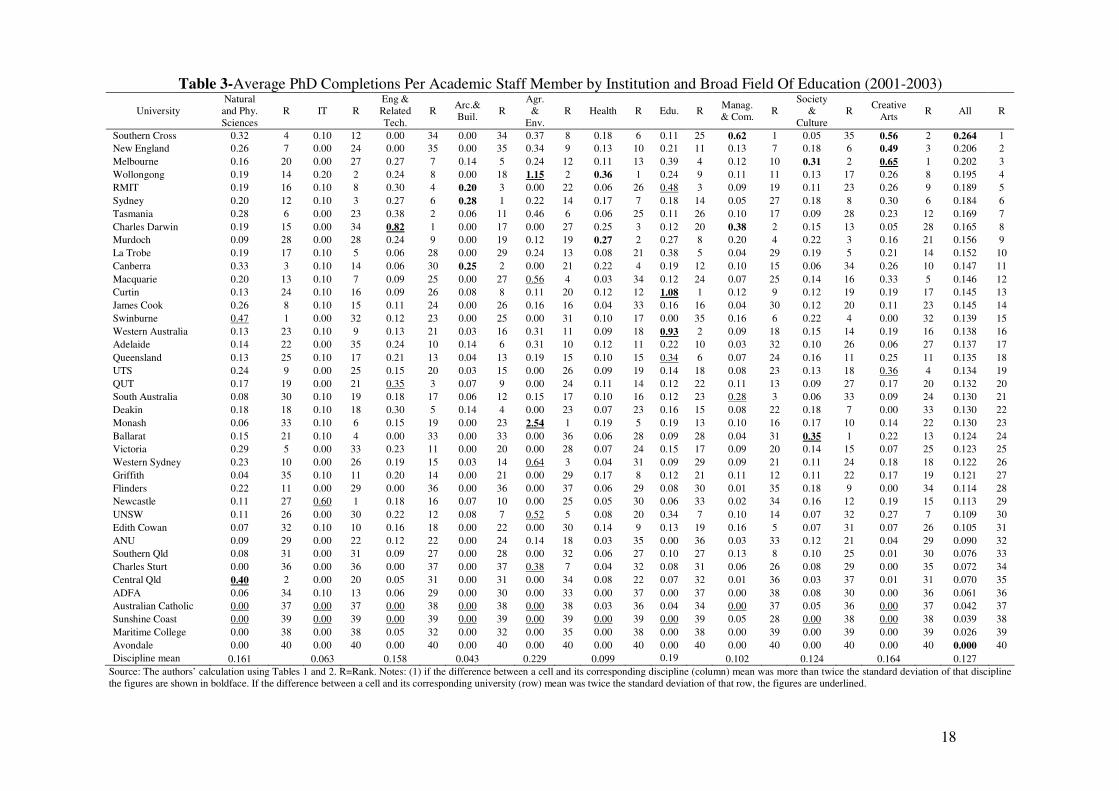
We also construct Table 3, which is a way to juxtapose Table 1 with Table 2.
Together, the three measures that we have used in this paper are: (i) the average
annual number of PhD completions (Table 1); (ii) the average annual number of
academic staff members (Table 2); and (iii) the average annual ratio of PhD
completions to the average annual number of academic staff members (Table 3). It
would be jejune to describe various individual cells in these tables without looking at
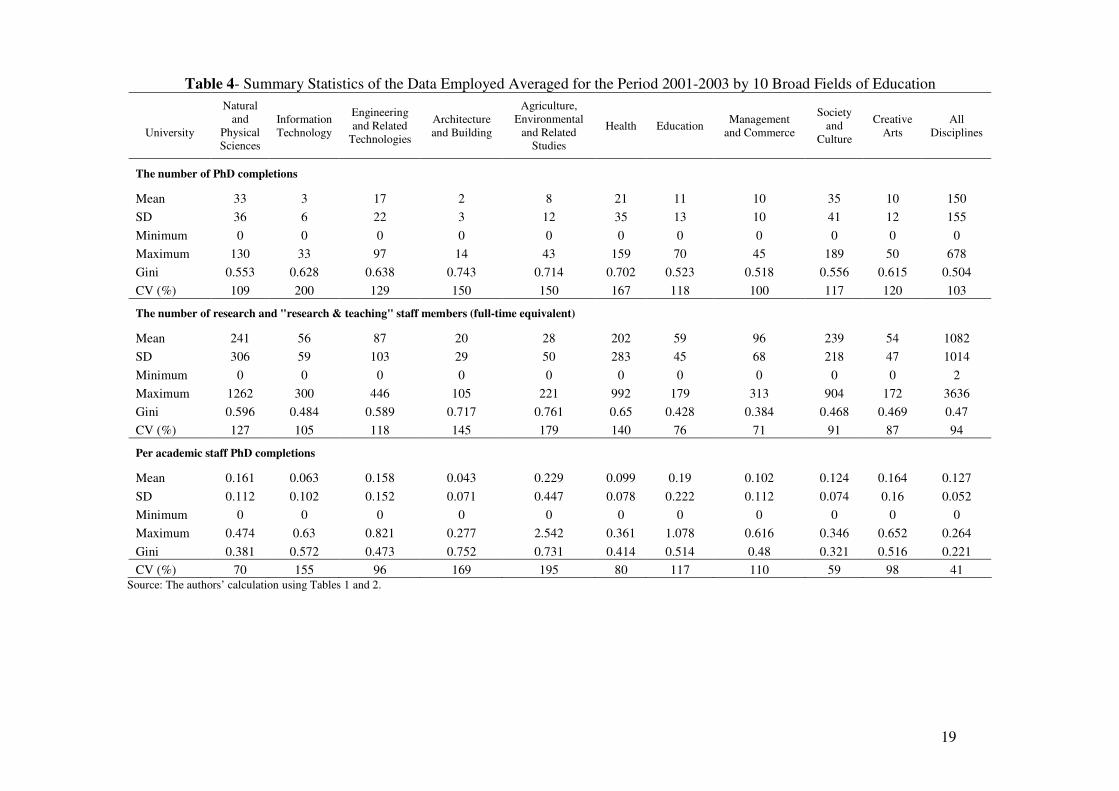
any emerging overall patterns. Table 4, therefore, presents a summary of descriptive
statistics of the annual averages for the forty universities across the 10 broad fields of
education. Sample means, maxima, minima, standard deviations, coefficient of
variation (CV) and the Gini coefficients are reported.
[Tables 3 and 4 about here]
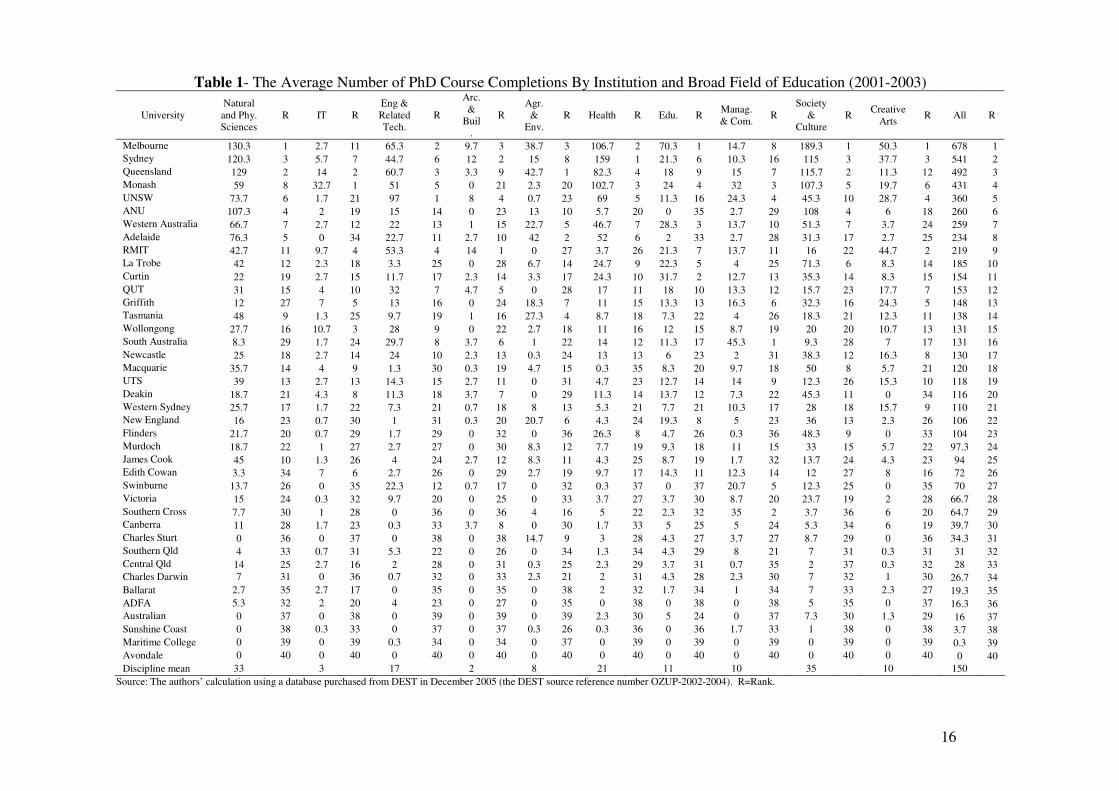
Between 2001-2003 an average of 5998 PhDs were completed per annum. Table 1
confirms what we would intuitively expect in terms of the distribution: the Group of 8
6
(Go8) universities are the leading generators of PhD scholars in Australia. Between
them they accounted for 3255 or 54 per cent of average annual PhD completions.
Whether they constitute a distinctive cluster, though, is more questionable: the leading
university, Melbourne (678), generated nearly three times as many PhDs as eighth-
placed Adelaide (234), the latter being only 17 completions above the subsequent
university. These universities provide PhD programs across the breadth of major
discipline areas, the only exceptions were the absence of PhD completions in
education and architecture/building at ANU.
At the other end of the scale, the bottom eight institutions, mostly self-grouped as
New Generation Universities, each produced less than 30 PhDs per annum, or 2 per
cent between them in total. These small aggregate numbers also reflected the limited
spread of their programs, most of these universities yielding PhDs in less than half of
the major disciplinary categories. The contrasting experiences of different universities
is confirmed by a relatively high Gini coefficient for the 40 universities as a whole of
0.504. Ranking Australian universities by these aggregate PhD statistics correlates
closely with alternative rankings of research performance based on other forms of
gross output (Ville et al. 2006: Table 5).
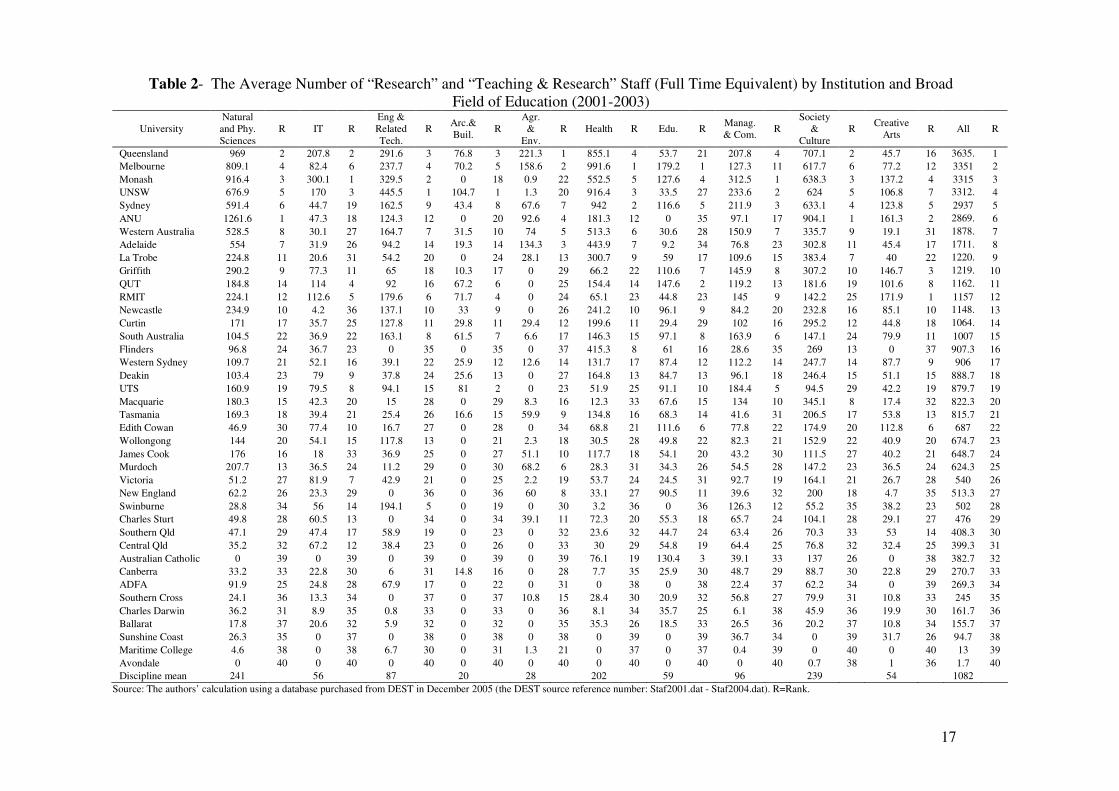
Table 2 provides evidence of the academic staff available to supervise these PhDs.
In a very similar fashion, we find the Go8 universities clustered at the very top and
with an almost identical share of supervising staff of 53 per cent, while the bottom
eight accounted for just 3 per cent and the Gini coefficient was 0.47. However, this
time the largest employer in the Go8, Queensland, is only twice that of the smallest,
Adelaide and then a significant break occurs before the 9th
largest university, La
Trobe.
Table 3 brings together the PhD data from Table 1 with the staffing data from
Table 2 to generate PhD output per staff member. Throughout Australian universities
0.127 PhDs were completed per staff member per annum. In other words, it takes on
average eight academic staff to generate one PhD per annum. Since most PhDs take 3-
4 years to complete and require a supervisory panel of at least two academic staff, this
suggests, on average, that each academic staff member is supervising one doctoral
student at any particular time. In a very similar fashion, the estimated common slope
coefficient in Table 5 shows that, averaged across all universities and disciplines, an
7
additional 10 staff will generate 1.3 extra PhD completions per annum in a consistent
manner.
[Table 5 about here]
Not surprisingly, the mean varies among universities (0-0.264) and between
disciplines (0.042-0.229). Go8 dominance in terms of size does not translate into per
capita PhD output - only Melbourne and Sydney are in the top 8, with the remaining
Go8 members scattered through from 16th
to 32nd
place in the rankings. The
university mean rankings in Table 3 progress in a fairly even and continuous fashion
except for the rapid fall off of the bottom 5 universities. In addition, the highest mean
was achieved by Southern Cross well ahead of second-placed New England. This
university was lowly ranked in Tables 1 and 2 but achieved a well above average
performance in Management & Commerce, which was also responsible for 57 per
cent of its PhD completions, thereby pushing it into first place on a per capita measure
of performance. One explanation for the high number of completions at Southern
Cross, Charles Darwin, South Australia, Murdoch etc (See Tables1 and 3) in
Management and Commerce could be due to the fact that they offer the DBA
(Doctorate of Business Administration), which is different from a conventional Ph.D
degree. At these universities that offer the DBA program, credit is given for courses
completed in an MBA program while at other universities an MBA by itself does not
even serve as an entry qualification to the Ph.D programme.
Similarly, New England achieved second place largely on the basis of being
productive in its three largest PhD areas – agriculture/environment, education, and
society & culture. Third placed Melbourne, however, looks quite different: it achieved
its high ranking while operating substantial PhD programs across all major
disciplinary areas.
We are also interested in the volatility of performance within individual
disciplines. Calculating the coefficient of variation on the results in Table 3 indicates
that the greatest intra-disciplinary volatility occurs in Agriculture & Environment;
Architecture & Building; and Information Technology. These are also the fields
generating the least PhD completions and with the most limited institutional coverage
across the university system. Those with the lowest variation were also the generators

8
of the largest numbers of PhD completions, notably the Sciences and Society &
Culture.
Table 3 can help us identify unusual or extreme cases that bear out this picture. For
example, in the field of Agriculture, Environmental and Related Studies, one
prodigious academic staff member at Monash secured 2.3 PhD completions. One way
to interpret this abnormal observation is that at Monash the supervisors were located
in related disciplines such as chemistry or agribusiness. Similar examples in
engineering and related technologies at Charles Darwin and Agriculture and the
Environment at Wollongong reflect very small staff numbers as the denominator in
deriving the mean. The smallness of these examples minimizes their impact on the
institution but will affect intra-disciplinary measures of centrality. However, some
very good results from larger disciplines and individual academic units should be
noted. These include Melbourne in the field of Creative Arts where 77.21 staff
members successfully supervised 50.33 PhD graduates ( PhD S =0.65) and Southern
Cross University in the field of Management and Commerce, mentioned above, where
57 full-time staff members produced a copious output of 35 PhD completions,
suggesting again a very high PhD S ratio (0.61).
There were also a number of cases in our database where there were no staff
members in a particular discipline but the number of PhD students was non-zero! In
order to avoid obtaining indeterminate values (i.e. a/0, where a is a positive number),
we have assumed such rare and fortuitous cases in Table 3 to be equal to zero. While
the “divide by zero” problem is definitely observed, there is also a “divide by a small
number” problem. This again can be attributed to the fact that the supervisors
involved had expertise in related disciplinary areas. These spikes or abnormal
observations, when PhD S is too high or zero or next to zero, are exceptions rather
than the rule. In the overwhelming majority of cells reported in Table 3, the number
revolves around 0.13 ranging between 0.07 to 0.23 depending on discipline and/or
university. This average range is not very large considering the multifarious
disciplines and universities.

9
Empirical Results
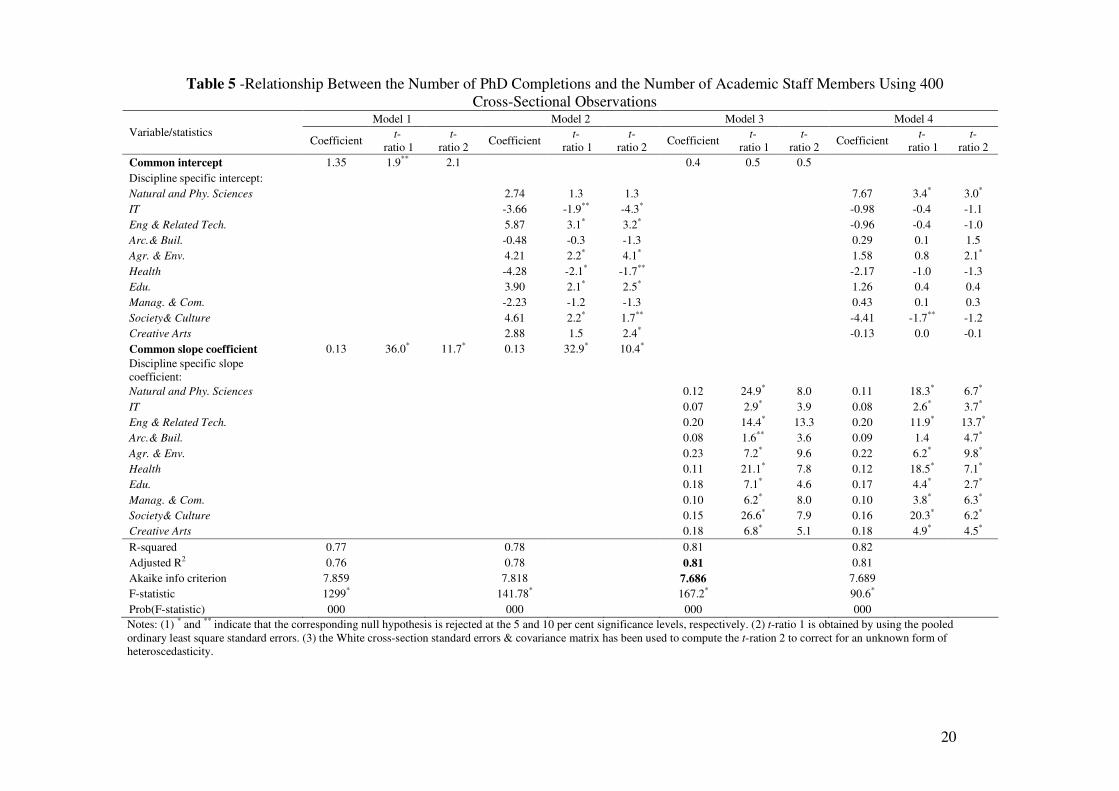
Table 5 presents the estimation results of Model (1) to Model (4) using 400
observations (10 broad fields of educations times 40 universities). The figures for PhD
and S are averaged to burnish out any particular rumbustious observation for a
discipline and/or university. Model (1) imposes a common intercept (1.35) and a
common slope coefficient (0.13). Despite varying intercept terms across ten
disciplines, the slope coefficient remains robust at 0.13 in Model (2). We have also
allowed the slope coefficients (in Model 3) and both the intercept and the slope
coefficients (in Model 4) to be discipline specific. Now the question is which model is
more statistically acceptable? Before we choose the best model, one should note that
the estimated slope coefficients in Models (3) and (4) are very similar. Thus the
results are quite robust and the choice between these two models are inconsequential.
However, based on the AIC or the adjusted R2, Model (3) is preferred to the other
three models reported in Table 5.
We have also used the Wald test as to which model performs better even if the
enhancement is quite ethereal. Using equation (4) as an unrestricted model, both
Models (1) and (2) are rejected. In the case of comparing Model (1) with Model (4),
the null hypothesis ( 1.35jα α= = and 0.13jβ β= = ) is rejected as F(20,380)=5.75
[P-value=0.000]. Comparing Model (2) and Model (4), the null hypothesis
( 0.13jβ β= = ) is also rejected as F(10,380)=7.37 [P-value=0.000]. So far both
Models (1) and (2) are rejected when compared with Model (4). However when
Model (3) is tested against Model (4) the results would be slightly different as the null
hypothesis ( 1.35jα α= = ) is marginally not rejected at 5 per cent level as
F(10,380)=1.81 [P-value=0.06]. If we rigidly stick to 1 or 5 per cent levels of
significance, the null is not rejected but at the 10 per cent we definitely reject the null.
As can be seen from Table 5, the adjusted R2 and the AIC of both Models (3) and
(4) are very comparable. However, only in Model (3) are all estimated slope
coefficients statistically significant at 10 per cent or better. Given that the size (staff or
students), overseas orientation, expert diversity, financial research orientation and
staff research orientation vary from a discipline in a particular institution to another
comparable discipline elsewhere, the adjusted R2 of 0.81 is highly encouraging. In
addition to the standard t ratios (obtained from the pooled ordinary least square
10
standard errors), we have used the White cross-section standard errors and covariance
matrix to correct an unknown form of heteroscedasticity in the residuals for each of
the four models. Even the computation of the corrected t-statistics (referred to as t-
ratio 2 in Table 5) did not reverse our conclusion in relation to the statistical
significance of the all slope coefficients. That is to say, only in Model (3) are all the
discipline-specific slope coefficients statistically significant at the 10 percent level or
better. The use of the White standard errors in computation of the t-ratio 2 made the
coefficients in Model (3) even more significant.
Therefore, we choose to continue the interpretation of our results using Model (3)
but as mentioned earlier switching to Model (4) from Model (3) does not change the
magnitudes of the estimated slope coefficients tangibly. Staff requirements for a PhD
completion vary from discipline to discipline as well as university to university. As a
rule of thumb, according to the results of the discipline-specific slope coefficients
reported in Model 3 (or 4) in Table 5, one can argue that “Agriculture, Environmental
and Related Studies”; “Engineering and Related Technologies”; “Education”; and
“Creative Arts” are the four least staff-intensive disciplines as 10 extra full-time staff
members in these four areas will lead to 2.3, 2.0, 1.8 and 1.8 PhD graduates,
respectively. On the other hand, “Information Technology”; “Architecture and
Building”; “Management and Commerce”; and “Health” are the four most staff-
intensive disciplines as 10 extra staff members will yield only 0.7; 0.8; 1.0; and 1.1
PhD completions, respectively. These results are broadly consistent with the mean
values PhD S across various disciplines in Tables 3 and 4.
These findings provide some support for the qualitative evidence in the literature
on disciplinary differences. Hard applied fields such as engineering and agriculture
are amongst the least staff intensive, which is consistent with the benefits of working
with clear paradigms and a close academic research-supervision nexus. Education’s
low staff intensity may be related to the high degree of social connectedness among
its researchers. Among the most staff intensive disciplines are applied social sciences
and professions such as management/commerce and architecture as might be
expected. Information technology does not fall into this field but perhaps may be
explained by the comparatively small number of PhDs being supervised, which may
reflect limited demand in this field more than intensity of supervision. More difficult
to explain is the fact that sciences and society & culture (humanities) both fall in the
11
middle of the results when the conceptual literature and qualitative observations
suggest that sciences should be among the least staff intensive and humanities among
the most intensive.
The slope coefficients reported in Table 5 can be used for benchmarking activities
by a particular discipline and/or university. For example, according to Table 3 the
performance of Management & Commerce in Western Australia in terms of the ratio
of PhD S is roughly 0.09, and for the whole university this ratio is 0.138. These ratios
are very close to (a) the corresponding slope coefficients reported in Table 5 [0.10
(discipline-specific coefficient for Commerce and Management) and 0.13 (the
common slope coefficient), respectively] and (b) the mean values of PhD S for all
Commerce and Management disciplines (0.102) in Australian universities and the
entire disciplines in all universities (0.127). In this case, the aggregate performance of
Western Australia or the performance of its Management and Commerce discipline is
within an acceptable range. Although comparing figures in Table 3 to the estimated
slope coefficients in Table 5 is similar to comparing the average propensity to
consume (APS) with the marginal propensity to consume (MPC), one can tentatively
make this comparison to check reliability of the estimated coefficients. In other
words, PhD S PhD S≠ ∆ ∆ but given three years averaged data, we expect these two
figures to be close to each other as APC and MPC would be almost equal in the long-
run.
Policy Implications of the Study
The present study has the great advantage of properly, in a statistical sense,
allowing for any discernible systematic variation existing in the underlying
relationship between the two variables, and distilling from that variation the marginal
discipline-specific impact of an increase in staff numbers on PhD completions.
Various discipline-specific coefficients are allowed to capture inter-disciplinary
heterogeneities. Consistent with theoretical postulates, this paper finds that the
number of PhD completions depends heavily on the number of available academic
staff members. Although the labour intensity of supervising PhD students varies from
one discipline (or university) to another, the marginal effect of an increase in the
number of academic staff members ( S∆ ) on PhD completions ( PhD∆ ), in this paper
12
is found to be in a narrow range between 0.07-0.23 with an average value mostly
around 0.12-0.13, which appear to be verisimilitude.
A number of salient points are noted from the results of this study. Most
universities in Australia provide postgraduate research training across the principal
disciplinary areas. The scale of the Go8 universities places them in the highest
(relative) grouping in terms of the size of their postgraduate training programs and
numbers of staff. However, this does not translate into leadership in terms of PhD
completions per staff member. Nor is there any consistency of pattern across
universities for individual disciplines. Size, reputation and longevity are no guarantees
of productive postgraduate training programs.
Ostensibly, these results may be interpreted as measures of performance or
productivity. However, the heterogeneous nature of output in education makes it very
difficult to draw clear conclusions about productivity even when dealing with the
same category of qualification, notably the PhD. The lower average PhD output per
academic staff member in some universities may reflect a higher quality program that
provides more assistance and guidance to graduate students. Although national
guidelines may exist for operating postgraduate training programs and universities
have to respond to various forms of audit and benchmarking, the quality and approach
of different PhD programs will in practice still vary. However, since no single
university ‘leads’ in more than one disciplinary area in terms of either per capita
output (high rank and mean) or staff input (low rank and mean), there are no obvious
overall implications for the postgraduate performance of individual universities.
Different disciplines require varying levels of supervisor input and we need also to
take account of other factors such as the provision of supporting infrastructure. Thus,
the overall cost of a PhD in science or engineering would be higher than education or
arts because of the cost of equipment. Intuitively, therefore, we might expect
discipline specific influences on average PhD output to be greater than institutional
influences and therefore a smaller variance in our results for a particular discipline
compared across universities. Surprisingly, the intra-disciplinary variance was similar
to the inter-institutional variance. It may be difficult, therefore, to appreciate why it
takes, on average, nearly twice as many academic staff to generate a PhD scholar in
the sciences at New South Wales compared with Sydney, two neighbouring Go8
universities, with similar sized faculties. While ‘natural and physical sciences’ covers
13
a range of different disciplines, the more homogeneous sector of education manifests
a greater diversity of results. Here it takes more than double the number of staff, on
average, to generate a PhD at Sydney compared with Melbourne, again despite similar
institutional characteristics. One possible explanation for this relates to the extent to
which staff members in such disciplines are involved in research activities other than
PhD supervision such as writing refereed articles or grant applications.
Our results, therefore, provide some important benchmarking and diagnostic
opportunities for universities. If the PhD S ratio for a particular university or
discipline is consistently and substantially lower (or higher) than (a) the
corresponding mean value reported in Tables 3 and 4; and/or (b) the corresponding
common slope coefficient (0.13) or the reported discipline-specific slope coefficients
in Table 5, then this may be a cause for concern. If the difference between a cell in
Table 3 and its corresponding discipline (column) mean was more than twice the
standard deviation of that discipline, the figure is shown in boldface. If the difference
between a cell and its corresponding university (row) mean was more than twice the
standard deviation of that row, the figure is underlined. Our results provide the
opportunity for individual universities to diagnose and address reasons for this high
level of variance.
These results additionally provide planning guidance for universities and
governments by calculating the marginal cost of expanding (or contracting) particular
PhD programs in terms of staffing. Thus, for example, at Tasmania, 10 new staff are
predicted to generate 2.8 new PhD completions over three years in the sciences but
only one in Management & Commerce. On a comparative intra-disciplinary level, 10
new staff will generate, on average, 5.6 additional PhD students in Creative Arts at
Southern Cross but only 1.4 at Monash. Finally, in the light of current debate about
the future of the unified national system, our results present a picture of PhD training
institutions bifurcated between those providing a full line of services across all areas
and those more akin to niche providers.
14
Concluding Remarks
This paper has analysed the extent and nature of PhD programs offered in
Australian universities, combining a disciplinary with an institutional focus. Using
triennial averages for 2001-3, obtained from audited DEST data, it finds that more
than half of PhD completions and supervising staff are to be found at the Group of 8
universities. It then focused upon PhD completions per academic staff as a possible
measure of performance, calculating the mean by discipline and institution and the
marginal change through a fixed-effect model. It was found that each 10 extra staff
members can boost the number of PhD completions by approximately 1-2 (more
precisely 0.7-2.3 with a mean of 1.3) depending on which field of study is being
examined. Given the size (staff or students), overseas orientation, expert diversity,
financial research orientation and staff research orientation vary from a discipline in a
particular institution to another comparable discipline elsewhere, this surprisingly
narrow and immutable range can be described as a useful tool in research planning
and benchmarking activities across both disciplines and universities. Cross-
institutional comparisons between universities resulted in a very similar level of
variance.
Some policy implications of this finding were noted. No individual university or
group of universities stands out in terms of per capita output of PhD completions as a
whole. It is possible to distinguish between some universities that provide a full line
of PhD services and others that are niche providers. There are some notable variations
in intra-disciplinary performance across universities, several examples of which have
been noted, which may justify closer examination by individual universities. Finally,
it should be noted that our results provide no evidence of the quality of specific PhD
programs offered by individual universities and disciplinary units. Low output per
capita may be indicative of purposefully enhancing the inputs and, by implication, the
quality of the program.
15
References
Australian Research Council (ARC) (1998), Knowing Ourselves and Others. The
Humanities in Australia into the 21st Century, Vol. 1, National Board of
Employment, Education and Training, Canberra.
Becher, T. (1989), Academic Tribes and Territories, SRHE and Open University
Press, Buckingham.
Biglan, A. (1973a), The Characteristics of Subject Matter in Different Scientific
Areas, Journal of Applied Psychology, 57, 195-203
Biglan, A. (1973b), Relationships Between Subject Matter Characteristics and the
Structure and Output of University Departments, Journal of Applied
Psychology, 57, 204-213.
Booth, A. L. and Satchell, S. E. (1995), The Hazards of Doing a PhD: An Analysis of
Completion and Withdrawal Rates of British PhD Students in the 1980s,
Journal of the Royal Statistical Society, Series A (Statistics in Society), 58, 297-
318.
Gatfield, T. (2005), An Investigation into PhD Supervisory Management Styles:
Development of a Dynamic Conceptual Model and its Managerial Implications,
Journal of Higher Education Policy and Management, 27, 311-25.
Neumann, R. (2001), Disciplinary Differences and University Teaching, Studies in
Higher Education, 26, 135-146.
Neumann, R. (2002), Diversity, Doctoral Education and Policy, Higher Education
Research and Development, 21, 67-78
Neumann, R. (2005), Doctoral Differences: Professional Doctorates and PhDs
Compared, Journal of Higher Education Policy and Management, 27, 173-188.
Park, C. (2005), New Variant PhD: the Changing Structure of the Doctorate in the
UK, Journal of Higher Education Policy and Management, 27, 189-207.
Ville, S., Valadkhani, A. and O’Brien, M. (2006), The Distribution of Research
Performance Across Australian Universities, 1992-2003, and Its Implications
for Building Diversity, Australian Economic Papers, 45(4), 343–361.
16
Table 1- The Average Number of PhD Course Completions By Institution and Broad Field of Education (2001-2003)
University
Natural
and Phy.
Sciences
R IT R
Eng &
Related
Tech.
R
Arc.
&
Buil
.
R
Agr.
&
Env.
R Health R Edu. R Manag.
& Com. R
Society
&
Culture
R Creative
Arts R All R
Melbourne 130.3 1 2.7 11 65.3 2 9.7 3 38.7 3 106.7 2 70.3 1 14.7 8 189.3 1 50.3 1 678 1
Sydney 120.3 3 5.7 7 44.7 6 12 2 15 8 159 1 21.3 6 10.3 16 115 3 37.7 3 541 2
Queensland 129 2 14 2 60.7 3 3.3 9 42.7 1 82.3 4 18 9 15 7 115.7 2 11.3 12 492 3
Monash 59 8 32.7 1 51 5 0 21 2.3 20 102.7 3 24 4 32 3 107.3 5 19.7 6 431 4
UNSW 73.7 6 1.7 21 97 1 8 4 0.7 23 69 5 11.3 16 24.3 4 45.3 10 28.7 4 360 5
ANU 107.3 4 2 19 15 14 0 23 13 10 5.7 20 0 35 2.7 29 108 4 6 18 260 6
Western Australia 66.7 7 2.7 12 22 13 1 15 22.7 5 46.7 7 28.3 3 13.7 10 51.3 7 3.7 24 259 7
Adelaide 76.3 5 0 34 22.7 11 2.7 10 42 2 52 6 2 33 2.7 28 31.3 17 2.7 25 234 8
RMIT 42.7 11 9.7 4 53.3 4 14 1 0 27 3.7 26 21.3 7 13.7 11 16 22 44.7 2 219 9
La Trobe 42 12 2.3 18 3.3 25 0 28 6.7 14 24.7 9 22.3 5 4 25 71.3 6 8.3 14 185 10
Curtin 22 19 2.7 15 11.7 17 2.3 14 3.3 17 24.3 10 31.7 2 12.7 13 35.3 14 8.3 15 154 11
QUT 31 15 4 10 32 7 4.7 5 0 28 17 11 18 10 13.3 12 15.7 23 17.7 7 153 12
Griffith 12 27 7 5 13 16 0 24 18.3 7 11 15 13.3 13 16.3 6 32.3 16 24.3 5 148 13
Tasmania 48 9 1.3 25 9.7 19 1 16 27.3 4 8.7 18 7.3 22 4 26 18.3 21 12.3 11 138 14
Wollongong 27.7 16 10.7 3 28 9 0 22 2.7 18 11 16 12 15 8.7 19 20 20 10.7 13 131 15
South Australia 8.3 29 1.7 24 29.7 8 3.7 6 1 22 14 12 11.3 17 45.3 1 9.3 28 7 17 131 16
Newcastle 25 18 2.7 14 24 10 2.3 13 0.3 24 13 13 6 23 2 31 38.3 12 16.3 8 130 17
Macquarie 35.7 14 4 9 1.3 30 0.3 19 4.7 15 0.3 35 8.3 20 9.7 18 50 8 5.7 21 120 18
UTS 39 13 2.7 13 14.3 15 2.7 11 0 31 4.7 23 12.7 14 14 9 12.3 26 15.3 10 118 19
Deakin 18.7 21 4.3 8 11.3 18 3.7 7 0 29 11.3 14 13.7 12 7.3 22 45.3 11 0 34 116 20
Western Sydney 25.7 17 1.7 22 7.3 21 0.7 18 8 13 5.3 21 7.7 21 10.3 17 28 18 15.7 9 110 21
New England 16 23 0.7 30 1 31 0.3 20 20.7 6 4.3 24 19.3 8 5 23 36 13 2.3 26 106 22
Flinders 21.7 20 0.7 29 1.7 29 0 32 0 36 26.3 8 4.7 26 0.3 36 48.3 9 0 33 104 23
Murdoch 18.7 22 1 27 2.7 27 0 30 8.3 12 7.7 19 9.3 18 11 15 33 15 5.7 22 97.3 24
James Cook 45 10 1.3 26 4 24 2.7 12 8.3 11 4.3 25 8.7 19 1.7 32 13.7 24 4.3 23 94 25
Edith Cowan 3.3 34 7 6 2.7 26 0 29 2.7 19 9.7 17 14.3 11 12.3 14 12 27 8 16 72 26
Swinburne 13.7 26 0 35 22.3 12 0.7 17 0 32 0.3 37 0 37 20.7 5 12.3 25 0 35 70 27
Victoria 15 24 0.3 32 9.7 20 0 25 0 33 3.7 27 3.7 30 8.7 20 23.7 19 2 28 66.7 28
Southern Cross 7.7 30 1 28 0 36 0 36 4 16 5 22 2.3 32 35 2 3.7 36 6 20 64.7 29
Canberra 11 28 1.7 23 0.3 33 3.7 8 0 30 1.7 33 5 25 5 24 5.3 34 6 19 39.7 30
Charles Sturt 0 36 0 37 0 38 0 38 14.7 9 3 28 4.3 27 3.7 27 8.7 29 0 36 34.3 31
Southern Qld 4 33 0.7 31 5.3 22 0 26 0 34 1.3 34 4.3 29 8 21 7 31 0.3 31 31 32
Central Qld 14 25 2.7 16 2 28 0 31 0.3 25 2.3 29 3.7 31 0.7 35 2 37 0.3 32 28 33
Charles Darwin 7 31 0 36 0.7 32 0 33 2.3 21 2 31 4.3 28 2.3 30 7 32 1 30 26.7 34
Ballarat 2.7 35 2.7 17 0 35 0 35 0 38 2 32 1.7 34 1 34 7 33 2.3 27 19.3 35
ADFA 5.3 32 2 20 4 23 0 27 0 35 0 38 0 38 0 38 5 35 0 37 16.3 36
Australian
Catholic 0 37 0 38 0 39 0 39 0 39 2.3 30 5 24 0 37 7.3 30 1.3 29 16 37
Sunshine Coast 0 38 0.3 33 0 37 0 37 0.3 26 0.3 36 0 36 1.7 33 1 38 0 38 3.7 38
Maritime College 0 39 0 39 0.3 34 0 34 0 37 0 39 0 39 0 39 0 39 0 39 0.3 39
Avondale 0 40 0 40 0 40 0 40 0 40 0 40 0 40 0 40 0 40 0 40 0 40
Discipline mean 33 3 17 2 8 21 11 10 35 10 150
Source: The authors’ calculation using a database purchased from DEST in December 2005 (the DEST source reference number OZUP-2002-2004). R=Rank.
17
Table 2- The Average Number of “Research” and “Teaching & Research” Staff (Full Time Equivalent) by Institution and Broad
Field of Education (2001-2003)
University
Natural
and Phy.
Sciences
R IT R
Eng &
Related
Tech.
R Arc.&
Buil. R
Agr.
&
Env.
R Health R Edu. R Manag.
& Com. R
Society
&
Culture
R Creative
Arts R All R
Queensland 969 2 207.8 2 291.6 3 76.8 3 221.3 1 855.1 4 53.7 21 207.8 4 707.1 2 45.7 16 3635.
7 1
Melbourne 809.1 4 82.4 6 237.7 4 70.2 5 158.6 2 991.6 1 179.2 1 127.3 11 617.7 6 77.2 12 3351 2
Monash 916.4 3 300.1 1 329.5 2 0 18 0.9 22 552.5 5 127.6 4 312.5 1 638.3 3 137.2 4 3315 3
UNSW 676.9 5 170 3 445.5 1 104.7 1 1.3 20 916.4 3 33.5 27 233.6 2 624 5 106.8 7 3312.
7 4
Sydney 591.4 6 44.7 19 162.5 9 43.4 8 67.6 7 942 2 116.6 5 211.9 3 633.1 4 123.8 5 2937 5
ANU 1261.6 1 47.3 18 124.3 12 0 20 92.6 4 181.3 12 0 35 97.1 17 904.1 1 161.3 2 2869.
7 6
Western Australia 528.5 8 30.1 27 164.7 7 31.5 10 74 5 513.3 6 30.6 28 150.9 7 335.7 9 19.1 31 1878.
3 7
Adelaide 554 7 31.9 26 94.2 14 19.3 14 134.3 3 443.9 7 9.2 34 76.8 23 302.8 11 45.4 17 1711.
7 8
La Trobe 224.8 11 20.6 31 54.2 20 0 24 28.1 13 300.7 9 59 17 109.6 15 383.4 7 40 22 1220.
3 9
Griffith 290.2 9 77.3 11 65 18 10.3 17 0 29 66.2 22 110.6 7 145.9 8 307.2 10 146.7 3 1219.
3 10
QUT 184.8 14 114 4 92 16 67.2 6 0 25 154.4 14 147.6 2 119.2 13 181.6 19 101.6 8 1162.
3 11
RMIT 224.1 12 112.6 5 179.6 6 71.7 4 0 24 65.1 23 44.8 23 145 9 142.2 25 171.9 1 1157 12
Newcastle 234.9 10 4.2 36 137.1 10 33 9 0 26 241.2 10 96.1 9 84.2 20 232.8 16 85.1 10 1148.
7 13
Curtin 171 17 35.7 25 127.8 11 29.8 11 29.4 12 199.6 11 29.4 29 102 16 295.2 12 44.8 18 1064.
7 14
South Australia 104.5 22 36.9 22 163.1 8 61.5 7 6.6 17 146.3 15 97.1 8 163.9 6 147.1 24 79.9 11 1007 15
Flinders 96.8 24 36.7 23 0 35 0 35 0 37 415.3 8 61 16 28.6 35 269 13 0 37 907.3 16
Western Sydney 109.7 21 52.1 16 39.1 22 25.9 12 12.6 14 131.7 17 87.4 12 112.2 14 247.7 14 87.7 9 906 17
Deakin 103.4 23 79 9 37.8 24 25.6 13 0 27 164.8 13 84.7 13 96.1 18 246.4 15 51.1 15 888.7 18
UTS 160.9 19 79.5 8 94.1 15 81 2 0 23 51.9 25 91.1 10 184.4 5 94.5 29 42.2 19 879.7 19
Macquarie 180.3 15 42.3 20 15 28 0 29 8.3 16 12.3 33 67.6 15 134 10 345.1 8 17.4 32 822.3 20
Tasmania 169.3 18 39.4 21 25.4 26 16.6 15 59.9 9 134.8 16 68.3 14 41.6 31 206.5 17 53.8 13 815.7 21
Edith Cowan 46.9 30 77.4 10 16.7 27 0 28 0 34 68.8 21 111.6 6 77.8 22 174.9 20 112.8 6 687 22
Wollongong 144 20 54.1 15 117.8 13 0 21 2.3 18 30.5 28 49.8 22 82.3 21 152.9 22 40.9 20 674.7 23
James Cook 176 16 18 33 36.9 25 0 27 51.1 10 117.7 18 54.1 20 43.2 30 111.5 27 40.2 21 648.7 24
Murdoch 207.7 13 36.5 24 11.2 29 0 30 68.2 6 28.3 31 34.3 26 54.5 28 147.2 23 36.5 24 624.3 25
Victoria 51.2 27 81.9 7 42.9 21 0 25 2.2 19 53.7 24 24.5 31 92.7 19 164.1 21 26.7 28 540 26
New England 62.2 26 23.3 29 0 36 0 36 60 8 33.1 27 90.5 11 39.6 32 200 18 4.7 35 513.3 27
Swinburne 28.8 34 56 14 194.1 5 0 19 0 30 3.2 36 0 36 126.3 12 55.2 35 38.2 23 502 28
Charles Sturt 49.8 28 60.5 13 0 34 0 34 39.1 11 72.3 20 55.3 18 65.7 24 104.1 28 29.1 27 476 29
Southern Qld 47.1 29 47.4 17 58.9 19 0 23 0 32 23.6 32 44.7 24 63.4 26 70.3 33 53 14 408.3 30
Central Qld 35.2 32 67.2 12 38.4 23 0 26 0 33 30 29 54.8 19 64.4 25 76.8 32 32.4 25 399.3 31
Australian Catholic 0 39 0 39 0 39 0 39 0 39 76.1 19 130.4 3 39.1 33 137 26 0 38 382.7 32
Canberra 33.2 33 22.8 30 6 31 14.8 16 0 28 7.7 35 25.9 30 48.7 29 88.7 30 22.8 29 270.7 33
ADFA 91.9 25 24.8 28 67.9 17 0 22 0 31 0 38 0 38 22.4 37 62.2 34 0 39 269.3 34
Southern Cross 24.1 36 13.3 34 0 37 0 37 10.8 15 28.4 30 20.9 32 56.8 27 79.9 31 10.8 33 245 35
Charles Darwin 36.2 31 8.9 35 0.8 33 0 33 0 36 8.1 34 35.7 25 6.1 38 45.9 36 19.9 30 161.7 36
Ballarat 17.8 37 20.6 32 5.9 32 0 32 0 35 35.3 26 18.5 33 26.5 36 20.2 37 10.8 34 155.7 37
Sunshine Coast 26.3 35 0 37 0 38 0 38 0 38 0 39 0 39 36.7 34 0 39 31.7 26 94.7 38
Maritime College 4.6 38 0 38 6.7 30 0 31 1.3 21 0 37 0 37 0.4 39 0 40 0 40 13 39
Avondale 0 40 0 40 0 40 0 40 0 40 0 40 0 40 0 40 0.7 38 1 36 1.7 40
Discipline mean 241 56 87 20 28 202 59 96 239 54 1082
Source: The authors’ calculation using a database purchased from DEST in December 2005 (the DEST source reference number: Staf2001.dat - Staf2004.dat). R=Rank.
18
Table 3-Average PhD Completions Per Academic Staff Member by Institution and Broad Field Of Education (2001-2003)
University
Natural
and Phy.
Sciences
R IT R
Eng &
Related
Tech.
R Arc.&
Buil. R
Agr.
&
Env.
R Health R Edu. R Manag.
& Com. R
Society
&
Culture
R Creative
Arts R All R
Southern Cross 0.32 4 0.10 12 0.00 34 0.00 34 0.37 8 0.18 6 0.11 25 0.62 1 0.05 35 0.56 2 0.264 1
New England 0.26 7 0.00 24 0.00 35 0.00 35 0.34 9 0.13 10 0.21 11 0.13 7 0.18 6 0.49 3 0.206 2
Melbourne 0.16 20 0.00 27 0.27 7 0.14 5 0.24 12 0.11 13 0.39 4 0.12 10 0.31 2 0.65 1 0.202 3
Wollongong 0.19 14 0.20 2 0.24 8 0.00 18 1.15 2 0.36 1 0.24 9 0.11 11 0.13 17 0.26 8 0.195 4
RMIT 0.19 16 0.10 8 0.30 4 0.20 3 0.00 22 0.06 26 0.48 3 0.09 19 0.11 23 0.26 9 0.189 5
Sydney 0.20 12 0.10 3 0.27 6 0.28 1 0.22 14 0.17 7 0.18 14 0.05 27 0.18 8 0.30 6 0.184 6
Tasmania 0.28 6 0.00 23 0.38 2 0.06 11 0.46 6 0.06 25 0.11 26 0.10 17 0.09 28 0.23 12 0.169 7
Charles Darwin 0.19 15 0.00 34 0.82 1 0.00 17 0.00 27 0.25 3 0.12 20 0.38 2 0.15 13 0.05 28 0.165 8
Murdoch 0.09 28 0.00 28 0.24 9 0.00 19 0.12 19 0.27 2 0.27 8 0.20 4 0.22 3 0.16 21 0.156 9
La Trobe 0.19 17 0.10 5 0.06 28 0.00 29 0.24 13 0.08 21 0.38 5 0.04 29 0.19 5 0.21 14 0.152 10
Canberra 0.33 3 0.10 14 0.06 30 0.25 2 0.00 21 0.22 4 0.19 12 0.10 15 0.06 34 0.26 10 0.147 11
Macquarie 0.20 13 0.10 7 0.09 25 0.00 27 0.56 4 0.03 34 0.12 24 0.07 25 0.14 16 0.33 5 0.146 12
Curtin 0.13 24 0.10 16 0.09 26 0.08 8 0.11 20 0.12 12 1.08 1 0.12 9 0.12 19 0.19 17 0.145 13
James Cook 0.26 8 0.10 15 0.11 24 0.00 26 0.16 16 0.04 33 0.16 16 0.04 30 0.12 20 0.11 23 0.145 14
Swinburne 0.47 1 0.00 32 0.12 23 0.00 25 0.00 31 0.10 17 0.00 35 0.16 6 0.22 4 0.00 32 0.139 15
Western Australia 0.13 23 0.10 9 0.13 21 0.03 16 0.31 11 0.09 18 0.93 2 0.09 18 0.15 14 0.19 16 0.138 16
Adelaide 0.14 22 0.00 35 0.24 10 0.14 6 0.31 10 0.12 11 0.22 10 0.03 32 0.10 26 0.06 27 0.137 17
Queensland 0.13 25 0.10 17 0.21 13 0.04 13 0.19 15 0.10 15 0.34 6 0.07 24 0.16 11 0.25 11 0.135 18
UTS 0.24 9 0.00 25 0.15 20 0.03 15 0.00 26 0.09 19 0.14 18 0.08 23 0.13 18 0.36 4 0.134 19
QUT 0.17 19 0.00 21 0.35 3 0.07 9 0.00 24 0.11 14 0.12 22 0.11 13 0.09 27 0.17 20 0.132 20
South Australia 0.08 30 0.10 19 0.18 17 0.06 12 0.15 17 0.10 16 0.12 23 0.28 3 0.06 33 0.09 24 0.130 21
Deakin 0.18 18 0.10 18 0.30 5 0.14 4 0.00 23 0.07 23 0.16 15 0.08 22 0.18 7 0.00 33 0.130 22
Monash 0.06 33 0.10 6 0.15 19 0.00 23 2.54 1 0.19 5 0.19 13 0.10 16 0.17 10 0.14 22 0.130 23
Ballarat 0.15 21 0.10 4 0.00 33 0.00 33 0.00 36 0.06 28 0.09 28 0.04 31 0.35 1 0.22 13 0.124 24
Victoria 0.29 5 0.00 33 0.23 11 0.00 20 0.00 28 0.07 24 0.15 17 0.09 20 0.14 15 0.07 25 0.123 25
Western Sydney 0.23 10 0.00 26 0.19 15 0.03 14 0.64 3 0.04 31 0.09 29 0.09 21 0.11 24 0.18 18 0.122 26
Griffith 0.04 35 0.10 11 0.20 14 0.00 21 0.00 29 0.17 8 0.12 21 0.11 12 0.11 22 0.17 19 0.121 27
Flinders 0.22 11 0.00 29 0.00 36 0.00 36 0.00 37 0.06 29 0.08 30 0.01 35 0.18 9 0.00 34 0.114 28
Newcastle 0.11 27 0.60 1 0.18 16 0.07 10 0.00 25 0.05 30 0.06 33 0.02 34 0.16 12 0.19 15 0.113 29
UNSW 0.11 26 0.00 30 0.22 12 0.08 7 0.52 5 0.08 20 0.34 7 0.10 14 0.07 32 0.27 7 0.109 30
Edith Cowan 0.07 32 0.10 10 0.16 18 0.00 22 0.00 30 0.14 9 0.13 19 0.16 5 0.07 31 0.07 26 0.105 31
ANU 0.09 29 0.00 22 0.12 22 0.00 24 0.14 18 0.03 35 0.00 36 0.03 33 0.12 21 0.04 29 0.090 32
Southern Qld 0.08 31 0.00 31 0.09 27 0.00 28 0.00 32 0.06 27 0.10 27 0.13 8 0.10 25 0.01 30 0.076 33
Charles Sturt 0.00 36 0.00 36 0.00 37 0.00 37 0.38 7 0.04 32 0.08 31 0.06 26 0.08 29 0.00 35 0.072 34
Central Qld 0.40 2 0.00 20 0.05 31 0.00 31 0.00 34 0.08 22 0.07 32 0.01 36 0.03 37 0.01 31 0.070 35
ADFA 0.06 34 0.10 13 0.06 29 0.00 30 0.00 33 0.00 37 0.00 37 0.00 38 0.08 30 0.00 36 0.061 36
Australian Catholic 0.00 37 0.00 37 0.00 38 0.00 38 0.00 38 0.03 36 0.04 34 0.00 37 0.05 36 0.00 37 0.042 37
Sunshine Coast 0.00 39 0.00 39 0.00 39 0.00 39 0.00 39 0.00 39 0.00 39 0.05 28 0.00 38 0.00 38 0.039 38
Maritime College 0.00 38 0.00 38 0.05 32 0.00 32 0.00 35 0.00 38 0.00 38 0.00 39 0.00 39 0.00 39 0.026 39
Avondale 0.00 40 0.00 40 0.00 40 0.00 40 0.00 40 0.00 40 0.00 40 0.00 40 0.00 40 0.00 40 0.000 40
Discipline mean 0.161 0.063 0.158 0.043 0.229 0.099 0.19
0 0.102 0.124 0.164 0.127
Source: The authors’ calculation using Tables 1 and 2. R=Rank. Notes: (1) if the difference between a cell and its corresponding discipline (column) mean was more than twice the standard deviation of that discipline
the figures are shown in boldface. If the difference between a cell and its corresponding university (row) mean was twice the standard deviation of that row, the figures are underlined.
19
Table 4- Summary Statistics of the Data Employed Averaged for the Period 2001-2003 by 10 Broad Fields of Education
University
Natural
and
Physical
Sciences
Information
Technology
Engineering
and Related
Technologies
Architecture
and Building
Agriculture,
Environmental
and Related
Studies
Health Education Management
and Commerce
Society
and
Culture
Creative
Arts
All
Disciplines
The number of PhD completions
Mean 33 3 17 2 8 21 11 10 35 10 150
SD 36 6 22 3 12 35 13 10 41 12 155
Minimum 0 0 0 0 0 0 0 0 0 0 0
Maximum 130 33 97 14 43 159 70 45 189 50 678
Gini 0.553 0.628 0.638 0.743 0.714 0.702 0.523 0.518 0.556 0.615 0.504
CV (%) 109 200 129 150 150 167 118 100 117 120 103
The number of research and "research & teaching" staff members (full-time equivalent)
Mean 241 56 87 20 28 202 59 96 239 54 1082
SD 306 59 103 29 50 283 45 68 218 47 1014
Minimum 0 0 0 0 0 0 0 0 0 0 2
Maximum 1262 300 446 105 221 992 179 313 904 172 3636
Gini 0.596 0.484 0.589 0.717 0.761 0.65 0.428 0.384 0.468 0.469 0.47
CV (%) 127 105 118 145 179 140 76 71 91 87 94
Per academic staff PhD completions
Mean 0.161 0.063 0.158 0.043 0.229 0.099 0.19 0.102 0.124 0.164 0.127
SD 0.112 0.102 0.152 0.071 0.447 0.078 0.222 0.112 0.074 0.16 0.052
Minimum 0 0 0 0 0 0 0 0 0 0 0
Maximum 0.474 0.63 0.821 0.277 2.542 0.361 1.078 0.616 0.346 0.652 0.264
Gini 0.381 0.572 0.473 0.752 0.731 0.414 0.514 0.48 0.321 0.516 0.221
CV (%) 70 155 96 169 195 80 117 110 59 98 41
Source: The authors’ calculation using Tables 1 and 2.
20
Table 5 -Relationship Between the Number of PhD Completions and the Number of Academic Staff Members Using 400
Cross-Sectional Observations
Model 1 Model 2 Model 3 Model 4
Variable/statistics Coefficient
t-
ratio 1
t-
ratio 2 Coefficient
t-
ratio 1
t-
ratio 2 Coefficient
t-
ratio 1
t-
ratio 2 Coefficient
t-
ratio 1
t-
ratio 2
Common intercept 1.35 1.9** 2.1 0.4 0.5 0.5
Discipline specific intercept:
Natural and Phy. Sciences 2.74 1.3 1.3 7.67 3.4* 3.0*
IT -3.66 -1.9** -4.3* -0.98 -0.4 -1.1
Eng & Related Tech. 5.87 3.1* 3.2* -0.96 -0.4 -1.0
Arc.& Buil. -0.48 -0.3 -1.3 0.29 0.1 1.5
Agr. & Env. 4.21 2.2* 4.1* 1.58 0.8 2.1*
Health -4.28 -2.1* -1.7** -2.17 -1.0 -1.3
Edu. 3.90 2.1* 2.5* 1.26 0.4 0.4
Manag. & Com. -2.23 -1.2 -1.3 0.43 0.1 0.3
Society& Culture 4.61 2.2* 1.7** -4.41 -1.7** -1.2
Creative Arts 2.88 1.5 2.4* -0.13 0.0 -0.1
Common slope coefficient 0.13 36.0* 11.7* 0.13 32.9* 10.4*
Discipline specific slope
coefficient:
Natural and Phy. Sciences 0.12 24.9* 8.0 0.11 18.3* 6.7*
IT 0.07 2.9* 3.9 0.08 2.6* 3.7*
Eng & Related Tech. 0.20 14.4* 13.3 0.20 11.9* 13.7*
Arc.& Buil. 0.08 1.6** 3.6 0.09 1.4 4.7*
Agr. & Env. 0.23 7.2* 9.6 0.22 6.2* 9.8*
Health 0.11 21.1* 7.8 0.12 18.5* 7.1*
Edu. 0.18 7.1* 4.6 0.17 4.4* 2.7*
Manag. & Com. 0.10 6.2* 8.0 0.10 3.8* 6.3*
Society& Culture 0.15 26.6* 7.9 0.16 20.3* 6.2*
Creative Arts 0.18 6.8* 5.1 0.18 4.9* 4.5*
R-squared 0.77 0.78 0.81 0.82
Adjusted R2 0.76 0.78 0.81 0.81
Akaike info criterion 7.859 7.818 7.686 7.689
F-statistic 1299* 141.78* 167.2* 90.6*
Prob(F-statistic) 000 000 000 000
Notes: (1) * and ** indicate that the corresponding null hypothesis is rejected at the 5 and 10 per cent significance levels, respectively. (2) t-ratio 1 is obtained by using the pooled
ordinary least square standard errors. (3) the White cross-section standard errors & covariance matrix has been used to compute the t-ration 2 to correct for an unknown form of
heteroscedasticity.