A Detailed Study to Discover the Trade between Left Atrial ...
15
Citation: Shen, P.; Ferdous, M.; Wang, X.; Li, G.; Ma, R.; Pan, X.; Zhang, H.; Zhang, G.; Luo, Z.; Kottu, L.; et al. A Detailed Study to Discover the Trade between Left Atrial Blood Flow, Expression of Calcium-Activated Potassium Channels and Valvular Atrial Fibrillation. Cells 2022, 11, 1383. https://doi.org/10.3390/ cells11091383 Academic Editors: Sebastian Clauß, Ling Xiao and Alexander E. Kalyuzhny Received: 21 November 2021 Accepted: 24 March 2022 Published: 19 April 2022 Publisher’s Note: MDPI stays neutral with regard to jurisdictional claims in published maps and institutional affil- iations. Copyright: © 2022 by the authors. Licensee MDPI, Basel, Switzerland. This article is an open access article distributed under the terms and conditions of the Creative Commons Attribution (CC BY) license (https:// creativecommons.org/licenses/by/ 4.0/). cells Article A Detailed Study to Discover the Trade between Left Atrial Blood Flow, Expression of Calcium-Activated Potassium Channels and Valvular Atrial Fibrillation Pin Shen 1,† , Misbahul Ferdous 2,† , Xiaoqi Wang 1,† , Guojian Li 3,† , Runwei Ma 1,† , Xiangbin Pan 1 , Hongming Zhang 4 , Guimin Zhang 5 , Zhiling Luo 1 , Lakshme Kottu 6 , Jiang Lu 1 , Yi Song 1 , Lin Duo 1 , Jianming Xia 1 , Enze Yang 1 , Xiang Cheng 1 , Manning Li 1 , Shaohui Jiang 1 and Yi Sun 1, * 1 Department of Cardiovascular Surgery, Fuwai Yunnan Cardiovascular Hospital, Kunming 650102, China; [email protected] (P.S.); [email protected] (X.W.); [email protected] (R.M.); [email protected] (X.P.); [email protected] (Z.L.); [email protected] (J.L.); [email protected] (Y.S.); [email protected] (L.D.); [email protected] (J.X.); [email protected] (E.Y.); [email protected] (X.C.); [email protected] (M.L.); [email protected] (S.J.) 2 National Center for Cardiovascular Diseases, Department of Cardiology, Fuwai Hospital, CAMS&PUMC, Beijing 100037, China; [email protected] 3 Department of Vascular Surgery, The Second People’s Hospital of Yunnan Province, Kunming 650021, China; [email protected] 4 Department of Engineering Mechanics, Kunming University of Science and Technology, Kunming 650500, China; [email protected] 5 Department of Cardiovascular Surgery, The Second People’s Hospital of Yunnan Province, Kunming 650021, China; [email protected] 6 Department of Experimental Cardiology, Erasmus University Medical Center, 3015 CE Rotterdam, The Netherlands; [email protected] * Correspondence: [email protected]; Tel.: +86-871-68285654 † These authors contributed equally to this work. Abstract: Background: The present study aimed to explore the correlation between calcium-activated potassium channels, left atrial flow field mechanics, valvular atrial fibrillation (VAF), and thrombosis. The process of transforming mechanical signals into biological signals has been revealed, which offers new insights into the study of VAF. Methods: Computational fluid dynamics simulations use numeric analysis and algorithms to compute flow parameters, including turbulent shear stress (TSS) and wall pressure in the left atrium (LA). Real-time PCR and western blotting were used to detect the mRNA and protein expression of IKCa2.3/3.1, ATK1, and P300 in the left atrial tissue of 90 patients. Results: In the valvular disease group, the TSS and wall ressure in the LA increased, the wall pressure increased in turn in all disease groups, mainly near the mitral valve and the posterior portion of the LA, the increase in TSS was the most significant in each group near the mitral valve, and the middle and lower part of the back of the LA and the mRNA expression and protein expression levels of IKCa2.3/3.1, AKT1, and P300 increased (p < 0.05) (n = 15). The present study was preliminarily conducted to elucidate whether there might be a certain correlation between IKCa2.3 and LA hemodynamic changes. Conclusions: The TSS and wall pressure changes in the LA are correlated with the upregulation of mRNA and protein expression of IKCa2.3/3.1, AKT1, and P300. Keywords: valvular atrial fibrillation; turbulent shear stress; IKCa2.3/3.1; thrombosis; computational model 1. Introduction Atrial fibrillation (AF) is a common arrhythmia, and it accounts for approximately 20% of all factors causing ischemic stroke [1]. Valvular atrial fibrillation (VAF) is generally rheumatic valvular disease with atrial fibrillation after cardiac valve replacement, and atrial Cells 2022, 11, 1383. https://doi.org/10.3390/cells11091383 https://www.mdpi.com/journal/cells
-
Upload
khangminh22 -
Category
Documents
-
view
2 -
download
0
Transcript of A Detailed Study to Discover the Trade between Left Atrial ...
Citation: Shen, P.; Ferdous, M.; Wang,
X.; Li, G.; Ma, R.; Pan, X.; Zhang, H.;
Zhang, G.; Luo, Z.; Kottu, L.; et al. A
Detailed Study to Discover the Trade
between Left Atrial Blood Flow,
Expression of Calcium-Activated
Potassium Channels and Valvular
Atrial Fibrillation. Cells 2022, 11, 1383.
https://doi.org/10.3390/
cells11091383
Academic Editors: Sebastian Clauß,
Ling Xiao and Alexander E.
Kalyuzhny
Received: 21 November 2021
Accepted: 24 March 2022
Published: 19 April 2022
Publisher’s Note: MDPI stays neutral
with regard to jurisdictional claims in
published maps and institutional affil-
iations.
Copyright: © 2022 by the authors.
Licensee MDPI, Basel, Switzerland.
This article is an open access article
distributed under the terms and
conditions of the Creative Commons
Attribution (CC BY) license (https://
creativecommons.org/licenses/by/
4.0/).
cells
Article
A Detailed Study to Discover the Trade between Left AtrialBlood Flow, Expression of Calcium-Activated PotassiumChannels and Valvular Atrial FibrillationPin Shen 1,† , Misbahul Ferdous 2,†, Xiaoqi Wang 1,† , Guojian Li 3,† , Runwei Ma 1,† , Xiangbin Pan 1,Hongming Zhang 4 , Guimin Zhang 5 , Zhiling Luo 1 , Lakshme Kottu 6, Jiang Lu 1 , Yi Song 1 , Lin Duo 1 ,Jianming Xia 1 , Enze Yang 1 , Xiang Cheng 1 , Manning Li 1 , Shaohui Jiang 1 and Yi Sun 1,*
1 Department of Cardiovascular Surgery, Fuwai Yunnan Cardiovascular Hospital, Kunming 650102, China;[email protected] (P.S.); [email protected] (X.W.); [email protected] (R.M.);[email protected] (X.P.); [email protected] (Z.L.); [email protected] (J.L.);[email protected] (Y.S.); [email protected] (L.D.); [email protected] (J.X.);[email protected] (E.Y.); [email protected] (X.C.); [email protected] (M.L.);[email protected] (S.J.)
2 National Center for Cardiovascular Diseases, Department of Cardiology, Fuwai Hospital, CAMS&PUMC,Beijing 100037, China; [email protected]
3 Department of Vascular Surgery, The Second People’s Hospital of Yunnan Province, Kunming 650021, China;[email protected]
4 Department of Engineering Mechanics, Kunming University of Science and Technology,Kunming 650500, China; [email protected]
5 Department of Cardiovascular Surgery, The Second People’s Hospital of Yunnan Province,Kunming 650021, China; [email protected]
6 Department of Experimental Cardiology, Erasmus University Medical Center,3015 CE Rotterdam, The Netherlands; [email protected]
* Correspondence: [email protected]; Tel.: +86-871-68285654† These authors contributed equally to this work.
Abstract: Background: The present study aimed to explore the correlation between calcium-activatedpotassium channels, left atrial flow field mechanics, valvular atrial fibrillation (VAF), and thrombosis.The process of transforming mechanical signals into biological signals has been revealed, whichoffers new insights into the study of VAF. Methods: Computational fluid dynamics simulationsuse numeric analysis and algorithms to compute flow parameters, including turbulent shear stress(TSS) and wall pressure in the left atrium (LA). Real-time PCR and western blotting were used todetect the mRNA and protein expression of IKCa2.3/3.1, ATK1, and P300 in the left atrial tissue of90 patients. Results: In the valvular disease group, the TSS and wall ressure in the LA increased,the wall pressure increased in turn in all disease groups, mainly near the mitral valve and theposterior portion of the LA, the increase in TSS was the most significant in each group near the mitralvalve, and the middle and lower part of the back of the LA and the mRNA expression and proteinexpression levels of IKCa2.3/3.1, AKT1, and P300 increased (p < 0.05) (n = 15). The present study waspreliminarily conducted to elucidate whether there might be a certain correlation between IKCa2.3and LA hemodynamic changes. Conclusions: The TSS and wall pressure changes in the LA arecorrelated with the upregulation of mRNA and protein expression of IKCa2.3/3.1, AKT1, and P300.
Keywords: valvular atrial fibrillation; turbulent shear stress; IKCa2.3/3.1; thrombosis;computational model
1. Introduction
Atrial fibrillation (AF) is a common arrhythmia, and it accounts for approximately20% of all factors causing ischemic stroke [1]. Valvular atrial fibrillation (VAF) is generallyrheumatic valvular disease with atrial fibrillation after cardiac valve replacement, and atrial
Cells 2022, 11, 1383. https://doi.org/10.3390/cells11091383 https://www.mdpi.com/journal/cells

Cells 2022, 11, 1383 2 of 15
fibrillation based on mitral valve disease. The issue of ‘Valvular AF’ (VAF) definition is ofrelevance, here we consider VAF as AF in patients with moderate-severe Mitral stenosiswith rheumatic heart disease and post valvular replacement. VAF has a higher incidence ofthrombosis [2]. Atrial cardiomyopathy refers to ‘Any complex of structural, architectural,contractile or electrophysiological changes affecting the atria with the potential to produceclinically-relevant manifestations’ [3]. Based on the changes in atrial remodeling caused byatrial fibrillation, we tried to explore this mechanism from the perspective of biomechanicalchanges. AF is widely treated with drugs that including rhythm control, heart rate control,and anticoagulation therapy, but this may lead to clinical problems, such as ventriculararrhythmia, insufficient anticoagulation, or bleeding [4,5]. TSS plays an essential rolein the study of heart valve hydrodynamics. Furthermore, changes in TSS may lead toendothelial dysfunction of cardiovascular disease and thromboembolic complications ofcardiovascular prosthesis devices [6]. Endothelial IKCas, such as IKCa2.3 and IKCa3.1, areexpressed in vascular systems [7]. IKCas channels are expressed in both atria and ventricles,but more in the atria [8]. Previous studies have shown that IKCa plays a vital role inatrial repolarization [9–11], and IKCa channel blockers effectively reduce the occurrence ofAF [10]. IKCa2.3 is regulated by shear stress [7], and IKCa3.1 acts on endothelial cells toproduce pathophysiological changes. Thus, IKCa is expected to become a new target forthe treatment of cardiovascular diseases [12,13]. However, little is known about the effectof disease-related shear stress on the function of ion channels. We hypothesize that theIKCa2.3/3.1 pathway may play a crucial role in AF. The aim of this research was to studythe TSS and wall pressure in the LA and to explore the correlation between the changes inflow field mechanics in the LA and IKCa2.3/3.1 channels.
2. Methods2.1. Patients
From April 2016 to October 2019, 75 patients with mitral valve disease, AF, and atrialseptal defects were treated in the Department of Cardiac Surgery of the First AffiliatedHospital of Kunming Medical University (Kunming, China) and Fuwai Yunnan Cardio-vascular Hospital (Kunming, China), the total number of patients enrolled for study are80, our of which 75 patients met the inclusion criteria, and 5 patients were dropped outfrom the study due to acute heart failure and chose conservative treatment. The patientswere comprised of 35 males and 40 females with an average age of 55.82 ± 9.28 years andan average weight were 65.29 ± 9.61 kg. The preoperative cardiac function was classifiedas grade I–III (NYHA standard), including 15 patients with simple mitral regurgitation(MR), 15 patients with simple mitral stenosis (MS), 15 patients with MR+AF, 15 patientswith MS+AF, and 15 patients with MS+AF+Thrombus. These clots were in the left atrialappendage. Fifteen patients in the control group had atrial septal defects, ventricularseptal defects, and other mild conditions, and they did not have the related hemodynamicchanges caused by mitral valve disease, atrial septal defect refers to adult patients whoreceived surgical treatment, but their atrial septal defect was small, and patients withoutmitral valve disease mainly include patients with aortic dissection, who needed to behospitalized for emergency surgical treatment. The hemodynamics of the left atrium ofthese patients have little change and could be used as a control group. In the control group,there were six males and nine females with an average age of 63.00 + 14.68 years and anaverage weight of 73.32 + 7.15 kg. Information on the clinical data of the subjects is shownin Table 1. All patients underwent surgical treatment. The patient inclusion criteria wereas follows: (1) preoperative physical examination, chest X-ray, electrocardiogram, andcolor Doppler echocardiography all confirmed rheumatic mitral valve disease, and patientshad surgical indications and were willing to undergo surgical treatment; (2) patients withpersistent atrial fibrillation confirmed by 24-h ambulatory electrocardiogram before op-eration (MS+AF, MR+AF group); (3) patients with thrombus confirmed by preoperativeechocardiography and intraoperative findings (MS+AF+ thrombus group); and (4) allpatients provided informed consent and signed the informed consent form, which was

Cells 2022, 11, 1383 3 of 15
authorized by the Ethics Committee of the hospital. Patients with the following conditionswere excluded: (1) NYHA IV; (2) malignant arrhythmia; (3) paroxysmal atrial fibrillation;(4) abnormal blood coagulation; (5) cardiomyopathy; (6) diabetes; (7) hyperthyroidism; (8)infection; (9) malignant tumor; and (10) other hereditary diseases or autoimmune diseases.All patients signed a written informed consent form and were reviewed by the EthicsCommittee. Tissue from all patients was obtained from the left atrial tissue (atrial septalshown in Figure 1) which separated into two parts during cardiac surgery. One was addedto TRIzol reagent for real-time PCR and the other was quickly placed in liquid nitrogen forwestern blot detection.
Table 1. Clinical data of patients.
GroupGender
Age (Years) Weight (kg)Males Females
Control 6 9 63.00 + 14.68 73.32 + 7.15MR 7 8 55.60 + 12.03 67.65 + 8.42MS 8 7 52.50 + 16.38 54.78 + 6.21
MR+AF 6 9 58.00 + 10.44 65.31 + 14.22MS+AF 5 10 59.75 + 4.27 67.84 + 9.75
MS+AF+ thrombus 9 6 53.25 + 3.30 70.87 + 9.46p-value 0.743 0.642
Cells 2022, 11, x FOR PEER REVIEW 3 of 16
color Doppler echocardiography all confirmed rheumatic mitral valve disease, and pa-tients had surgical indications and were willing to undergo surgical treatment; (2) patients with persistent atrial fibrillation confirmed by 24-h ambulatory electrocardiogram before operation (MS+AF, MR+AF group); (3) patients with thrombus confirmed by preoperative echocardiography and intraoperative findings (MS+AF+ thrombus group); and (4) all pa-tients provided informed consent and signed the informed consent form, which was au-thorized by the Ethics Committee of the hospital. Patients with the following conditions were excluded: (1) NYHA IV; (2) malignant arrhythmia; (3) paroxysmal atrial fibrillation; (4) abnormal blood coagulation; (5) cardiomyopathy; (6) diabetes; (7) hyperthyroidism; (8) infection; (9) malignant tumor; and (10) other hereditary diseases or autoimmune dis-eases. All patients signed a written informed consent form and were reviewed by the Eth-ics Committee. Tissue from all patients was obtained from the left atrial tissue (atrial sep-tal shown in Figure 1) which separated into two parts during cardiac surgery. One was added to TRIzol reagent for real-time PCR and the other was quickly placed in liquid nitrogen for western blot detection.
Figure 1. Intraoperative condition of patients undergoing mitral valve replacement.
Table 1. Clinical data of patients.
Group Gender
Age (Years) Weight (kg) Males Females
Control 6 9 63.00 + 14.68 73.32 + 7.15 MR 7 8 55.60 + 12.03 67.65 + 8.42 MS 8 7 52.50 + 16.38 54.78 + 6.21
MR+AF 6 9 58.00 + 10.44 65.31 + 14.22 MS+AF 5 10 59.75 + 4.27 67.84 + 9.75
MS+AF+ thrombus 9 6 53.25 + 3.30 70.87 + 9.46 p-value 0.743 0.642
2.2. CT Scanning and Image Processing The patients were subjected to a dual-source CT scan with a 2-mm layer thickness.
The CT image was processed by MIMICS 19. 0 for 3D reconstruction, so the 3D model of LA could be obtained. The range of the CT image parameters were analyzed in image
Figure 1. Intraoperative condition of patients undergoing mitral valve replacement.
2.2. CT Scanning and Image Processing
The patients were subjected to a dual-source CT scan with a 2-mm layer thickness.The CT image was processed by MIMICS 19. 0 for 3D reconstruction, so the 3D modelof LA could be obtained. The range of the CT image parameters were analyzed in imagesegmentation adopting 3D threshold segmentation. The threshold ranged from 273 to 502by repeatedly setting different points, 3D threshold segmentation, and 3D visual display.The elements not required for the present study were manually deleted. The featuresthat needed to be reconstructed were selected to generate the new mask using 3D regionexpansion. In addition, the unneeded vessels were eliminated by 2D and 3D editing. Thecomponents extracted from the CT images included the left superior pulmonary vein

Cells 2022, 11, 1383 4 of 15
(LSPV), right superior pulmonary vein (RSPV), left inferior pulmonary vein (LIPV), rightinferior pulmonary vein (RIPV), left atrial appendage (LAA), mitral valve (MV), and LA.
2.3. Simulation Model and Calculation Method
First, the CT image was divided into a certain number of meshes, and the segmenta-tion results were then imported into the ANSYS-FLUENT numerical simulation software.ANSYS-FLUENT was utilized to analyze the left atrial flow field and the left atrial innerwall force. After the initial conditions and boundary conditions were determined, thehemodynamic parameters were calculated according to the fluid flow’s basic physical law.The analysis results were imported into the CFD-post calculation software. The followingparameters were set: blood vessels were considered impermeable and rigid; blood flowwas considered a Newtonian fluid [14]; blood viscosity coefficient of 0.0035 kg/ms [15];and density of 1.05 × 10³ kg/m3 at normal body temperature (37 ◦C) [16].
Our previous study used Doppler ultrasound to construct a calculation method of leftventricular shear stress [17]. We can precisely detect flow field changes and shear stressin the heart by analyzing the data with such a computer [6]. The diastolic inlet and exitvelocity spectrum images of the patient’s LA were obtained using Doppler ultrasoundbefore operation. To compare the results, we applied uniform computational fluid dynamicsto apply the same boundary and physiological flow conditions to each group.
The calculation type is the transient calculation of unsteady flow. Assuming that grav-ity is not included, blood flow follows the law of conservation of mass and momentum. Thegoverning equations used in CFD are continuous equations and Navier–Stokes equationsfor three-dimensional unsteady flow [18] as follows:
ρDVDt
= −5 p + µ52 V
ρdvdt
= pF +5·p
where p is the intensity of pressure (Pa); V is the blood flow velocity vector (m/s); and ρ isthe density of the blood (kg/m3). The above two formulas are both vector formulas. Thecontinuity equation and Navier–Stokes equation were written in a rectangular coordinatesystem as follows:
∂u∂x
+∂v∂y
+∂w∂z
= 0
ρdudt
= −∂p∂x
+ ρX + µ∆u
ρdvdt
= −∂p∂y
+ ρY + µ∆v
ρdwdt
= −∂p∂z
+ ρZ + µ∆w
where ∆ is the Laplace operator; ρ is the density of the blood (kg/m3); p is the intensity ofpressure (Pa); u, v and w are the blood velocities in the directions of the X, Y and Z axes,respectively (m/s); x, y, and z are the forces in the directions of the X, Y, and Z axes (N),respectively; and µ is the viscosity coefficient (Pa·s).
2.4. Bioassay
Real-time PCR was used to detect the mRNA expression of IKCa2.3, IKCa3.4, AKT1,and P300 in the patients’ left atrial tissue (atrial septum).
During the operation, we collected atrial septum tissue. The specimen was cut up andplaced in a homogenizer followed by the addition of 1 mL of TRIzol reagent (TAKARA,Kusatsu, Japan). By grinding it into a paste on ice, the tissue suspension was obtained.After thoroughly mixing, total RNA was extracted. Reverse transcription was performed

Cells 2022, 11, 1383 5 of 15
according to the reverse transcription kit’s instructions for cDNA. According to the man-ufacturer’s protocol and then prepared for later qRT-PCR (Bio-Rad, CFX96 Real-TimeSystem, Hercules, CA, USA) using SYBR Green PCR Supermixes (Bio-Rad, Hercules, CA,USA). Moreover, the relative expression level of ribonucleic acid was calculated by the2−∆∆CT method. The primer sequences are shown in Table 2, The primers conformed toMIQE guidelines [19].
Table 2. Primer sequences for IKCa2.3, IKCa3.1, P300, AKT1, and GAPDH.
ID Forward Primer (5′–3′) Reverse Primer (5′–3′)
IKCa2.3 GACTTTCACAGACACGGACGG GCTGCACAGCAAGCTCTTCACIKCa3.1 CCAGGCTTCTTGTAGCACTCG CCCCATCACATTCCTGACCATP300 GTAGCAGCAGAGGGCAATGAG GGCCTTGGCTTAGATGATGAGAKT1 GGTCGTGGGTCTGGAAAGAGT GGCAAGGTGATCCTGGTGAAGGAPDH GGACCTGACCTGCCGTCTAG GTAGCCCAGGATGCCCTTGA
First, we split the heart tissue, extracted total protein, and then quantified the proteinby the BCA method (Wuhan Feiyi Technology Co., Ltd. Wuhan, China). We preparedSDS–PAGE gels (Bioyeartech Company, Wuhan, China), took 80 ug protein samples on thesample pores, carried out electrophoretic, and then transferred them to the membrane. Weadded the corresponding KCa2.3 antibody (Beijing Zhongshan Jinqiao Company, Beijing,China, NO: 130702), KCa3.1 antibody (Abcam, Shanghai, China, NO: GR98357-2), P300 an-tibody (abcam, China, NO: GR93557-2), AKT1 antibody (Abcam, China, NO: GR235457-2),or GAPDH antibody (Beijing Bo Osen Company, Beijing, China, NO: 29867) according to theinstructions, and diluted the corresponding antibody with 1%BSA solution. The dilutiontimes of the antibodies were 1:500, 1:500, 1:200, and 1:500, respectively, in the refrigeratorovernight. We washed the membranes with TBST for 10 min three times. After incubatingwith the second antibody, Goat Anti-Mouse IgG HRP was diluted to 1:2000 (Beijing Zhong-shan Jinqiao Company, Beijing, China, NO: 101966), and Goat Anti-rabbit IgG HRP wasdiluted to 1:1000 (Beijing Zhongshan Jinqiao Company, Beijing, China, NO: 101964). Afterthat, the TBST membrane was washed three times for 10 min each time, and the proteinbands were then exposed using ECL reagent and imaged (Thermo Company, Waltham,MA, USA). Protein bands were analyzed by IMAGEJ.
2.5. Statistical Analysis
SPSS 17.0 was used for statistical analysis, and the experimental results are expressedas the mean ± standard deviation. The data of each group were compared with thenormality test and the variance test. If the variance was uneven, the variable transformation,variance analysis, and LSD-t method were compared in pairs. p < 0.05 was consideredstatistically significant, and p < 0.01 was considered a substantial difference.
3. Results3.1. Detection of Inlet and Outlet Velocity in LA by Doppler Ultrasonography
Compared to the control group, the pulmonary vein velocity decreased in the MS+AF+thrombus group, MS+AF group, and MR+AF group, and the decrease in the MS+AF+thrombus group and MS+AF group was the most significant (p < 0.05). There was no sig-nificant difference when comparing the MS and MR groups to the control group (p > 0.05).Compared to the control group, the LAA velocity decreased in all disease groups, and thedifference was statistically significant (p < 0.05), especially in the MS+AF+ thrombus groupand MS+AF group (Table 3).

Cells 2022, 11, 1383 6 of 15
Table 3. Detection of flow velocity at each inlet and outlet by the Doppler ultrasound. Data areexpressed as the mean ± SEM of n = 15.
Control(cm/s)
(n = 15)
MR(cm/s)
(n = 15)
MS(cm/s)
(n = 15)
MR+AF(cm/s)
(n = 15)
MS+AF(cm/s)
(n = 15)
MS+AF+Thrombus(cm/s) (n = 15) p-Value
Pulmonaryvein
LSPV 41.3 ± 20.91 41.3 ± 20.13 47.36 ± 10.34 31.36 ± 4.34 18.01 ± 8.47 *,#,∆ 16.61 ± 10.19 *,#,∆ 0.031LIPV 41.5 ± 17.42 40.9 ± 18.93 47.54 ± 11.36 31.73 ± 6.19 18.27 ± 7.61 *,#,∆ 18.24 ± 16.52 *,#,∆ 0.003RSPV 45.2 ± 19.92 37.8 ± 15.52 48.83 ± 9.69 32.71 ± 8.21 19.69 ± 8.89 *,#,∆ 18.19 ± 14.90 *,#,∆ 0.024RIPV 42.2 ± 17.84 39.1 ± 17.02 46.57 ± 12.26 31.92 ± 6.78 17.69 ± 7.26 *,#,∆ 17.26 ± 16.25 *,#,∆ 0.001
LAA 56.3 ± 15.12 44 ± 4.84 34.8 ± 10.82 30.7 ± 3.36 * 18.54 ± 17.21 *,# 11.8 ± 2.16 *,#,∆ 0.019Mitralorifice 74.67 ± 16.32 78.36 ± 18.14 200.18 ± 14.89 *,# 80.17 ± 15.49 ∆ 214.67 ± 18.26 *,#,a 214.26 ± 16.78 *,#,a 0.015
* significant difference from the control group, p < 0.05; # significant difference from the MR group, p < 0.05;∆ significant difference from the MS group, p < 0.05; a significant difference from the MR+AF group, p < 0.05.
3.2. Distribution Diagram of LA Wall Pressure in Each Group
To obtain better images of the pulmonary vein and LAA, we used CFD-post rotationto rotate the image downward 80◦ during the process of making the model. Figures 2–5show the pressure distribution in the systolic and diastolic LA of each group. The colorof the legend on the left represents the decreasing wall pressure from top to bottom. Theresults demonstrated that the wall pressure increased significantly in all disease groupsin the LA, especially at the pulmonary vein entrance, LAA, near the mitral valve, andthe posterior portion of the right atrium. During the systolic and diastolic periods, thedecreasing order of wall pressure was as follows: MS+AF+ thrombus group, MS+AF group,MR+AF group, MS group, MR group, and control group. Due to the mitral valve lesion, theLA was enlarged and the congestion in the LA was significantly increased. When the mitralvalve was opened during diastole, the release of pressure in the LA was blocked, resultingin high pressure in the left atrial inner wall. When complicated with AF, the LA lost itscontractile function, and the release of tension in the LA was further blocked, increasingthe pressure of the left atrial inner wall, which was consistent with the increase of TSS.
Cells 2022, 11, x FOR PEER REVIEW 7 of 16
Figure 2. Pressure distribution of LA in the systole stage in front. The color of the legend on the left represents the decreasing wall pressure from top to bottom. (n = 15 for each group).
Figure 3. Pressure distribution of LA in the systole stage in back. The color of the legend on the left represents the decreasing wall pressure from top to bottom. (n = 15 each group).
Figure 2. Pressure distribution of LA in the systole stage in front. The color of the legend on the leftrepresents the decreasing wall pressure from top to bottom. (n = 15 for each group).

Cells 2022, 11, 1383 7 of 15
Cells 2022, 11, x FOR PEER REVIEW 7 of 16
Figure 2. Pressure distribution of LA in the systole stage in front. The color of the legend on the left represents the decreasing wall pressure from top to bottom. (n = 15 for each group).
Figure 3. Pressure distribution of LA in the systole stage in back. The color of the legend on the left represents the decreasing wall pressure from top to bottom. (n = 15 each group).
Figure 3. Pressure distribution of LA in the systole stage in back. The color of the legend on the leftrepresents the decreasing wall pressure from top to bottom. (n = 15 each group).
Cells 2022, 11, x FOR PEER REVIEW 8 of 16
Figure 4. Pressure distribution of LA in the diastole stage in front. The color of the legend on the left represents the decreasing wall pressure from top to bottom. The wall pressure increased in turn in all disease groups, mainly at the entrance of the pulmonary vein, LAA. (n = 15 each group).
Figure 5. Pressure distribution of LA in the diastole stage in back. The color of the legend on the left represents the decreasing wall pressure from top to bottom. the wall pressure increased in turn in all disease groups, mainly near the mitral valve, and the posterior portion of the LA, the de-creasing order of wall pressure was as follows: MS+AF+ thrombus group, MS+AF group, MR+AF group, MS group, MR group, and control group. (n = 15 each group).
3.3. Distribution Map of TSS in Each Group in LA Figures 6–9 show the distribution of TSS in systole and diastole in each group, and
the color of the legend on the left side of the figure represents the decrease in TSS from
Figure 4. Pressure distribution of LA in the diastole stage in front. The color of the legend on the leftrepresents the decreasing wall pressure from top to bottom. The wall pressure increased in turn in alldisease groups, mainly at the entrance of the pulmonary vein, LAA. (n = 15 each group).

Cells 2022, 11, 1383 8 of 15
Cells 2022, 11, x FOR PEER REVIEW 8 of 16
Figure 4. Pressure distribution of LA in the diastole stage in front. The color of the legend on the left represents the decreasing wall pressure from top to bottom. The wall pressure increased in turn in all disease groups, mainly at the entrance of the pulmonary vein, LAA. (n = 15 each group).
Figure 5. Pressure distribution of LA in the diastole stage in back. The color of the legend on the left represents the decreasing wall pressure from top to bottom. the wall pressure increased in turn in all disease groups, mainly near the mitral valve, and the posterior portion of the LA, the de-creasing order of wall pressure was as follows: MS+AF+ thrombus group, MS+AF group, MR+AF group, MS group, MR group, and control group. (n = 15 each group).
3.3. Distribution Map of TSS in Each Group in LA Figures 6–9 show the distribution of TSS in systole and diastole in each group, and
the color of the legend on the left side of the figure represents the decrease in TSS from
Figure 5. Pressure distribution of LA in the diastole stage in back. The color of the legend on the leftrepresents the decreasing wall pressure from top to bottom. the wall pressure increased in turn inall disease groups, mainly near the mitral valve, and the posterior portion of the LA, the decreasingorder of wall pressure was as follows: MS+AF+ thrombus group, MS+AF group, MR+AF group, MSgroup, MR group, and control group. (n = 15 each group).
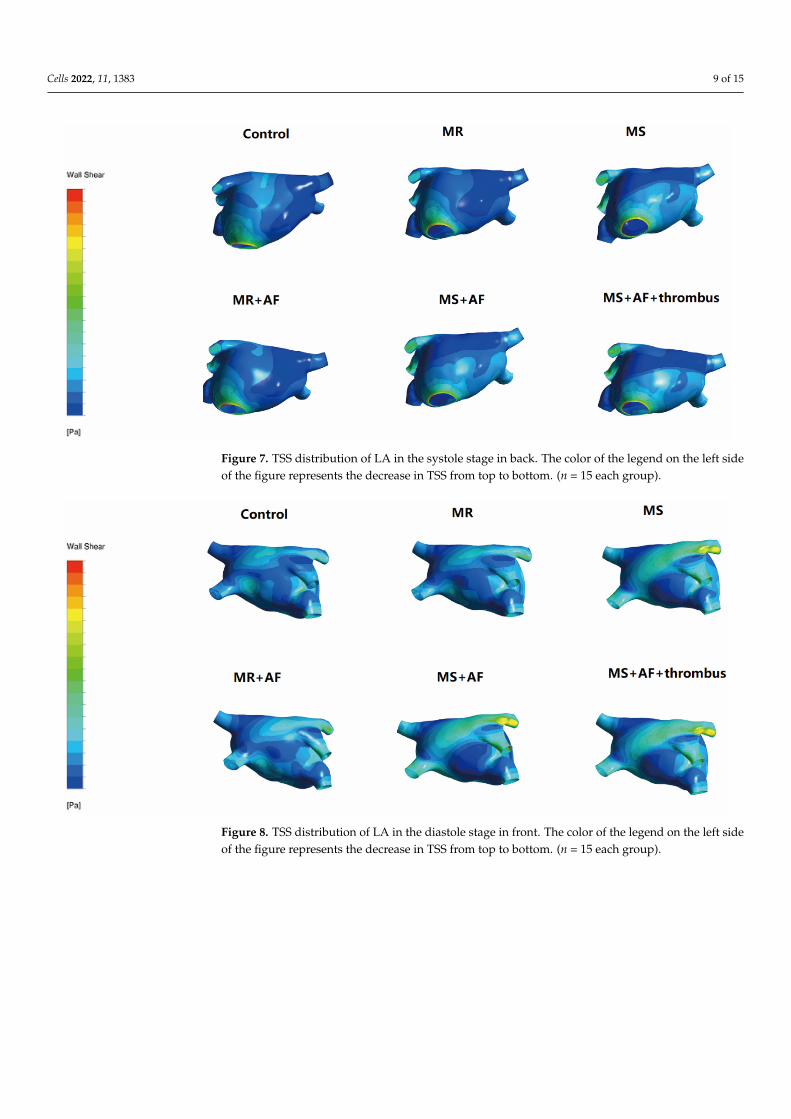
3.3. Distribution Map of TSS in Each Group in LA
Figures 6–9 show the distribution of TSS in systole and diastole in each group, andthe color of the legend on the left side of the figure represents the decrease in TSS fromtop to bottom. In the LA, the increase in TSS was the most significant in each group at theentrance of the pulmonary vein, the entry of LAA, near the mitral valve, and the middleand lower part of the back of the LA. In the systolic and diastolic phase, the TSS had thefollowing order (from high to low): MS+AF+ thrombus group, MS+AF group, MR+AFgroup, MS group, MR group, and control group.
Cells 2022, 11, x FOR PEER REVIEW 9 of 16
top to bottom. In the LA, the increase in TSS was the most significant in each group at the entrance of the pulmonary vein, the entry of LAA, near the mitral valve, and the middle and lower part of the back of the LA. In the systolic and diastolic phase, the TSS had the following order (from high to low): MS+AF+ thrombus group, MS+AF group, MR+AF group, MS group, MR group, and control group.
Figure 6. TSS distribution of LA in the systole stage in front. The color of the legend on the left side of the figure represents the decrease in TSS from top to bottom. (n = 15 each group).
Figure 7. TSS distribution of LA in the systole stage in back. The color of the legend on the left side of the figure represents the decrease in TSS from top to bottom. (n = 15 each group).
The results of LA wall pressure and TSS measurements indicated that in mitral valve disease, especially in VAF, the flow field uniformity of the LA was the worst, and the
Figure 6. TSS distribution of LA in the systole stage in front. The color of the legend on the left sideof the figure represents the decrease in TSS from top to bottom. (n = 15 each group).
Cells 2022, 11, 1383 9 of 15
Cells 2022, 11, x FOR PEER REVIEW 9 of 16
top to bottom. In the LA, the increase in TSS was the most significant in each group at the entrance of the pulmonary vein, the entry of LAA, near the mitral valve, and the middle and lower part of the back of the LA. In the systolic and diastolic phase, the TSS had the following order (from high to low): MS+AF+ thrombus group, MS+AF group, MR+AF group, MS group, MR group, and control group.
Figure 6. TSS distribution of LA in the systole stage in front. The color of the legend on the left side of the figure represents the decrease in TSS from top to bottom. (n = 15 each group).
Figure 7. TSS distribution of LA in the systole stage in back. The color of the legend on the left side of the figure represents the decrease in TSS from top to bottom. (n = 15 each group).
The results of LA wall pressure and TSS measurements indicated that in mitral valve disease, especially in VAF, the flow field uniformity of the LA was the worst, and the
Figure 7. TSS distribution of LA in the systole stage in back. The color of the legend on the left sideof the figure represents the decrease in TSS from top to bottom. (n = 15 each group).
Cells 2022, 11, x FOR PEER REVIEW 10 of 16
increase in TSS and wall pressure was the most significant. In addition, these results indi-cated that the stress site of the LA was consistent with the increase in wall pressure. Mitral valve disease’ was also highly compatible with the development of clinical disease and thrombosis. When heart valve disease occurs, the volume of the LA expands, and atrial congestion increases. Increased intra-atrial pressure, especially in VAF, and thrombosis are common in mitral stenosis with AF and occurred at the orifice of the LAA.
Figure 8. TSS distribution of LA in the diastole stage in front. The color of the legend on the left side of the figure represents the decrease in TSS from top to bottom. (n = 15 each group).
Figure 9. TSS distribution of LA in the diastole stage in back. The color of the legend on the left side of the figure represents the decrease in TSS from top to bottom. The increase in TSS was the most significant in each group near the mitral valve, and the middle and lower part of the back of
Figure 8. TSS distribution of LA in the diastole stage in front. The color of the legend on the left sideof the figure represents the decrease in TSS from top to bottom. (n = 15 each group).

Cells 2022, 11, 1383 10 of 15
Cells 2022, 11, x FOR PEER REVIEW 10 of 16
increase in TSS and wall pressure was the most significant. In addition, these results indi-cated that the stress site of the LA was consistent with the increase in wall pressure. Mitral valve disease’ was also highly compatible with the development of clinical disease and thrombosis. When heart valve disease occurs, the volume of the LA expands, and atrial congestion increases. Increased intra-atrial pressure, especially in VAF, and thrombosis are common in mitral stenosis with AF and occurred at the orifice of the LAA.
Figure 8. TSS distribution of LA in the diastole stage in front. The color of the legend on the left side of the figure represents the decrease in TSS from top to bottom. (n = 15 each group).
Figure 9. TSS distribution of LA in the diastole stage in back. The color of the legend on the left side of the figure represents the decrease in TSS from top to bottom. The increase in TSS was the most significant in each group near the mitral valve, and the middle and lower part of the back of
Figure 9. TSS distribution of LA in the diastole stage in back. The color of the legend on the left sideof the figure represents the decrease in TSS from top to bottom. The increase in TSS was the mostsignificant in each group near the mitral valve, and the middle and lower part of the back of theLA. The TSS had the following order (from high to low): MS+AF+ thrombus group, MS+AF group,MR+AF group, MS group, MR group, and control group. (n = 15 each group).
The results of LA wall pressure and TSS measurements indicated that in mitral valvedisease, especially in VAF, the flow field uniformity of the LA was the worst, and theincrease in TSS and wall pressure was the most significant. In addition, these resultsindicated that the stress site of the LA was consistent with the increase in wall pressure.Mitral valve disease’ was also highly compatible with the development of clinical diseaseand thrombosis. When heart valve disease occurs, the volume of the LA expands, and atrialcongestion increases. Increased intra-atrial pressure, especially in VAF, and thrombosis arecommon in mitral stenosis with AF and occurred at the orifice of the LAA.
3.4. Real-Time PCR
The KCNN3 and KCNN4 genes encode IKCa2.3 and 3.1, respectively. The mRNAexpression levels of IKCa2.3, IKCa3.1, AKT1, and P300 in MS+AF group was significantlydifferences with the control group (Table 4, Figure 10A). There were significant differencesamong the MS+AF+ thrombus group, MS+AF group, and control group (p < 0.01). bycomparing mRNA expression between the MS+AF and MS groups as well as between theMS+AF and MR+AF groups, we found significant difference in IKCa2.3, IKCa3.1, AKT1and P300 mRNA expression levels. The expressions of IKCa2.3 and P300 mRNA in MS+AFgroup were higher than those in MS+AF+ thrombus group (p < 0.05). Nevertheless, therewas no significant difference among the other groups. We compared the mRNA expressionof IKCa2.3, 3.1, AKT1 and P300 between the MS and MR groups, and the results showedthat there was no significant difference between these groups.

Cells 2022, 11, 1383 11 of 15
Table 4. mRNA expression levels of IKCa2.3, IKCa3.1, AKT1, and P300 in each group. After theANOVA for each group (p < 0.05), the variance for uneven group was tested using the Welch test,(p < 0.05), which means that there were statistical differences in many groups. The data are expressedas the mean ± SEM.
Group Control(n = 15)
MR(n = 15)
MS(n = 15)
MR+AF(n = 15)
MS+AF(n = 15)
MS+AF+Thrombus
(n = 15)F p Value
KCNN3 1 0.77 ± 0.51 1.19 ± 0.12 0.51 ± 0.38 2.19 ± 0.96 *,#,a 0.86 ± 0.24 b 1.635 0.225KCNN4 1 0.45 ± 0.17 1.23 ± 0.99 0.87 ± 0.64 4.00 ± 1.38 *,#,∆,a 3.20 ± 1.03 2.309 0.109
P300 1 0.74 ± 0.37 0.85 ± 0.39 0.93 ± 0.41 2.16 ± 0.38 *,#,∆,a 1.40 ± 0.22 b 11.624 0.002AKT1 1 0.69 ± 0.47 0.61 ± 0.79 0.87 ± 0.56 2.27 ± 0.99 *,#,∆,a 1.93 ± 0.45 *,#,∆,a 7.884 <0.001
* significant differences from the control group, p < 0.05; # significant differences from the MR group, p < 0.05;∆ significant differences from the MS group, p < 0.05; a significant differences from the MR+AF group, p < 0.05;b significant differences from the MS+AF group, p < 0.05.
Cells 2022, 11, x FOR PEER REVIEW 12 of 16
Figure 10. mRNA and protein expression of IKCa2.3(KCNN3), IKCa3.1(KCNN4), AKT1, and P300 in myocardial specimens. (A) Mean level of mRNA expression in all patients. (B) Mean level of protein expression in all patients. MEAN ± SEM shown as bars. * significant differences from the control group; # significant differences from the MR group; Δ significant differences from the MS group; a significant differences from the MR+AF group; b significant differences from the MS+AF group. (C) A representative set of western blot.
3.5. Western Blot We found that the protein expression of IKCa2.3/3.1, and AKT1 in each group was
significantly higher than that in the control group (Table 5, Figure 10B). We selected a representative set of Western blot (Figure 10C). The expression of IKCa2.3/3.1 and AKT1 protein in MS+AF group and MS+AF+ thrombus group was significantly different from those in other groups (p < 0.05). The protein expression of IKCa2.3/3.1 and AKT1 in MS+AF group and MS+AF+ thrombus group were significantly higher than those in other groups, and that in MS+AF+ thrombus group was lower than that in MS+AF group. There was no significant difference in the expression of IKCa2.3/3.1 protein between MS group, MR group and MR+AF group. The expression of AKT1 protein in MS group was significantly higher than that in control group (p < 0.05). Interestingly, the expression of P300 protein was very low among the groups, and there was no significant difference.
Figure 10. mRNA and protein expression of IKCa2.3(KCNN3), IKCa3.1(KCNN4), AKT1, and P300 inmyocardial specimens. (A) Mean level of mRNA expression in all patients. (B) Mean level of proteinexpression in all patients. MEAN ± SEM shown as bars. * significant differences from the controlgroup; # significant differences from the MR group; ∆ significant differences from the MS group;a significant differences from the MR+AF group; b significant differences from the MS+AF group.(C) A representative set of western blot.
3.5. Western Blot
We found that the protein expression of IKCa2.3/3.1, and AKT1 in each group wassignificantly higher than that in the control group (Table 5, Figure 10B). We selected arepresentative set of Western blot (Figure 10C). The expression of IKCa2.3/3.1 and AKT1protein in MS+AF group and MS+AF+ thrombus group was significantly different fromthose in other groups (p < 0.05). The protein expression of IKCa2.3/3.1 and AKT1 in MS+AF

Cells 2022, 11, 1383 12 of 15
group and MS+AF+ thrombus group were significantly higher than those in other groups,and that in MS+AF+ thrombus group was lower than that in MS+AF group. There wasno significant difference in the expression of IKCa2.3/3.1 protein between MS group, MRgroup and MR+AF group. The expression of AKT1 protein in MS group was significantlyhigher than that in control group (p < 0.05). Interestingly, the expression of P300 proteinwas very low among the groups, and there was no significant difference.
Table 5. Protein expression levels of IKCa2.3, IKCa3.1, AKT1, and P300 in each group. After theANOVA for each group (p < 0.05), the variance for uneven group was tested using the Welch test,(p < 0.05), which means that there were statistical differences in many groups. Data are expressed asthe mean ± SEM.
Group Control(n = 15)
MR(n = 15)
MS(n = 15)
MR+AF(n = 15)
MS+AF(n = 15)
MS+AF+Thrombus
(n = 15)F p Value
IKCa2.3 0.23 ± 0.14 0.55 ± 0.19 0.73 ± 0.44 * 0.71 ± 0.34 1.47 ± 0.75 *,#,∆,a 0.84 ± 0.21 *,# 10.620 0.042IKCa3.1 0.27 ± 0.21 0.47 ± 0.22 0.37 ± 0.29 0.58 ± 0.21 1.33 ± 0.62 *,#,∆,a 0.96 ± 0.51 *,#,∆ 15.229 <0.001
P300 0.31 ± 0.11 0.47 ± 0.34 0.81 ± 0.37 0.37 ± 0.24 0.87 ± 0.44 0.84 ± 0.76 2.623 1.334AKT1 0.32 ± 0.21 0.45 ± 0.26 0.73 ± 0.37 * 0.58 ± 0.36 1.43 ± 0.37 *,#,∆,a 1.18 ± 0.51 *,#,∆,a,b 11.711 0.001
* significant differences from the control group, p < 0.05; # significant differences from the MR group, p < 0.05;∆ significant differences from the MS group, p < 0.05; a significant differences from the MR+AF group, p < 0.05;b significant differences from the MS+AF group, p < 0.05.
4. Discussion
Computational simulation models have been widely used to study fluid-tissue in-teractions, including fluid velocity, fluid pressure, and heart TSS, in various sections ofthe mammalian heart [20]. The computational model allows accurate simulations of thefluid values in the heart of mammals and in-depth analysis, and it allows researchers toobtain accurate and reasonable experimental results. By collecting clinical data using ultra-sonic Doppler and MRI, as well as establishing the left atrial numerical simulation model,KoizumiR et al. [21] found that when AF occurs, the hemodynamics of the LA significantlychange, resulting in blood stasis. The changes in flow field mechanics in the LA may lead torelated ion channel expression changes. Takai et al. [22] showed that shear stress in the LAleads to the upregulation of IKCa2.3 and IKCa3.1, which mediates the activation of p300 inan AKT1- and IKCa-dependent manner. With the continuous advancements of computertechnology and software, high-performance computers can be used to simulate the changesof the blood flow field of the LA in the diseased state, and by analyzing the changes of theflow field in the LA, the development direction of the disease can be predicted [21,23].
In the present study, we numerically simulated the TSS and wall pressure in the LA.Compared to the control group, the TSS in the atrium at the left and right pulmonary veinentrance showed the greatest increases in the MS+AF+ thrombus, MS+AF, and MR+AFgroups. The most apparent change in TSS in the atrium among the groups was at thepulmonary vein entrance. The TSS in each group had the descending: MS+AF+ thrombusgroup, MS+AF group, MR+AF group, MS group, MR group, and control group. The leftatrial wall pressure had the descending: MS+AF+ thrombus group, MS+AF group, MR+AFgroup, MS group, MR group, and control group. The most significant increase in wallpressure was located at the pulmonary vein entrance and in the LAA, which was consistentwith the stress point of TSS in the LA. The above results indicated that the increase in theleft atrial wall pressure is highly compatible with the degree of left atrial tissue injury. Theatrial damage in the VAF group was more severe than that in the simple valvular diseasegroup. Compared to the simple valvular disease group, the TSS and wall pressure in theLA also increased, and turbulence formation was more pronounced. The abnormality andgradual increase in TSS in the left atrial flow field are fundamental causes of atrial tissueinjury and thrombosis. The atrium injury affects the entire cardiac function, resulting ina continuous increase in TSS in the LA, further deterioration of the left atrial flow field’sstability, and progressive damage to the LA, even in the whole heart. These findings

Cells 2022, 11, 1383 13 of 15
were consistent with the progression of VAF observed in the clinic. The impact of atrialcardiomyopathies on the occurrence of atrial fibrillation and atrial arrhythmia, in patientswith atrial cardiomyopathy, as a preliminary experiment to explore the biomechanicalmechanism, revealed the relationship between cardiac hemodynamic changes and atrialfibrillation. We hope to improve the experimental methods and perfect our research.
Both IKCa2.3 and IKCa3.1 channels are considered potential drug targets for cardio-cerebrovascular disease [24]. In endothelial cells, flow shear stress upregulates the ex-pression of IKCa2.3 and IKCa3.1, and it is mechanically involved in the activation of theCaMKK/AKT/P300 cascade [22]. Blood flow shear stress can cause vascular endothelialcell dysfunction, resulting in IKCa3.1 activation of platelets [25]. The present study usedreal-time PCR and Western blot to detect IKCa2.3 and IKCa3.1 channel genes and pro-teins in patients with simple mitral valve disease, patients with VAF, patients with VAFcomplicated with thrombus formation, and the control group. Compared to the controlgroup, the mRNA and protein expression levels of IKCa2.3 and IKCa3.1, AKT1, and P300in each group were significantly different from those in the control group. There weresignificant differences among the MS+AF+ thrombus group, MS+AF group, and controlgroup. There was no significant difference in the mRNA expression and protein expressionof IKCa2.3/3.1 among the groups, except there was a difference when comparing theMS and MR groups to the MS+AF groups. These results demonstrated no expression ofIKCa2.3 and IKCa3.1 channel genes and proteins in the myocardium of patients with mitralvalve disease, but IKCa2.3 and IKCa3.1 gene and protein expression were significantlyincreased in patients with atrial fibrillation, suggesting that the increased mRNA andprotein expression of IKCa2.3 and IKCa3.1 channels may be related to VAF and thrombosis.
P300 is a large histone acetyltransferase that regulates various DNA-binding tran-scription factors [26]. According to Skikama et al., P300 is necessary to develop a cardiacvalvular septal structure and coronary vascular system [27]. The gene expression of P300was the highest in the MS+AF group, indicating that P300 is involved in VAF formationof VAF and thrombus formation in the LA. P300 in the nucleus affects its expression ineach group.
AKT1 is the central node downstream of cellular signals stimulated by growth factors,cytokines, and other cells [28]. The AKT1 signaling pathway mediates insulin-dependentheart growth during postnatal growth and development of Homo sapiens [29]. There wasno significant difference in AKT1 gene expression when comparing the MS group to theMR group, and MR+AF group, but there was a significant difference among the othergroups. These findings suggested that AKT1 is involved in the development of VAF.
AF patients are in prothrombotic state with slow left atrial blood flow disorder, endo-cardial damage, increased blood coagulation factor content, enhanced coagulation activity,and hyperfunction platelet activation [30]. The primary conditions for thrombosis arehemodynamic disorder, increased TSS in the LA, and increased compressive stress in theinner wall. The secondary condition for thrombosis is endothelial dysfunction due tothe increase in TSS, which leads to endothelial cell dysfunction, resulting in upregulatedexpression of IKCa2.3, IKCa3.1, AKT1, and P300. Due to the decrease in blood flow veloc-ity in the LA and increased pressure in the LA, coagulation factors, platelets, and othersubstances are easily deposited in the LA, resulting in thrombus formation. We observedthat the expression of IKCa ion channel in patients with thrombus was lower than that inpatients with mitral valve disease and atrial fibrillation. Sicne the surface of the left atriumis covered with thrombus, the stress of blood flow on the surface of the atrium is reduced,and there is a lack of stimulation.
In conclusion, we used computer numerical simulation of TSS and wall pressure inthe LA, and we also used real-time PCR and western blot analyses to detect the mRNA andprotein expression of IKCa2.3, IKCa3.1, AKT1, and P300. The present study demonstratedthat the TSS and wall pressure in the LA change during valvular heart disease, resulting inupregulated mRNA and protein expression of IKCa2.3, IKCa3.1, AKT1, and P300. These

Cells 2022, 11, 1383 14 of 15
results suggested that IKCa channels are involved in the pathogenesis of VAF, and cancontribute to our understanding of the mechanism of VAF and thrombosis.
At present, due to the complexity of the fluid in the cardiac cavity, we can only con-struct a transient heart model, assuming that the blood is a Newtonian fluid and the bloodvessel wall is rigid. With the development of mechanical software, if the hemodynamicstudy of the heart can be calculated by the method of fluid-solid coupling and the changesof blood flow in the whole cardiac cycle analyzed, the authenticity of the model will begreatly improved.
Author Contributions: The authors declare that all data were generated in-house and that no papermill was used. Y.S. (Yi Sun) and H.Z. conceived and designed the project; X.P., J.L., Y.S. (Yi Sun)and L.D. subject to guide. P.S. and Y.S. (Yi Sun) completed the experiment. Y.S. (Yi Sun) acquisitionof the financial support. H.Z. and G.L. hydrodynamic modeling. Z.L. ultrasound. Y.S. (Yi Song)extracorporeal circulation during surgery. J.X. MIMICS drawing. E.Y. and X.C. numerical simulation.M.L. CAD modeling. S.J. image analysis. G.Z., E.Y., J.L., R.M., Y.S. (Yi Song), J.X., M.L., S.J., X.W. andX.C., acquired the data; X.P., L.K., P.S., M.F., Z.L. and G.L. analyzed and interpreted the data; andY.S. (Yi Sun), P.S., M.F., L.D. and G.L. wrote the paper. M.F., L.K., J.L. and L.D. grammar check. R.M.,M.F., L.K., Y.S. (Yi Song) and X.W. revised the manuscript, R.M., X.W., X.P. and G.Z. completed theoperation and took a specimen. All authors have read and agreed to the published version of themanuscript and are accountable for ensuring all aspects of the work.
Funding: This study was supported by the Medical Reserve Talented Person of Yunnan ProvincialHealth and Family Planning Commission (Grant Nos. H-2017017 and H-2017015), the AssociationFoundation Program of Yunnan Provincial Science and Technology Department and KunmingMedical University (Grant Nos. 2018FE001(-076) and 2018 FE001(-106)), and the National ScienceFoundation of China (Grant No. 81960072).
Institutional Review Board Statement: The study was conducted in accordance with the Declarationof Helsinki, and approved by: 1. Medical Ethics Committee of Kunming Medical University, approvalDate: 2 March 2017; 2. Ethics Committee of Fuwai Yunnan Cardiovascular Hospital (approval Code:2020-23-02, approval Date: 15 December 2020.
Informed Consent Statement: Informed consent was obtained from all subjects involved in the study.
Data Availability Statement: The datasets used or analyzed during the current study are availablefrom the corresponding author upon reasonable request.
Conflicts of Interest: The authors declare no conflict of interest.
References1. Hausler, K.G.; Landmesser, U. Left atrial appendage closure in non-valvular atrial fibrillation. Herz 2019, 44, 310–314. [CrossRef]
[PubMed]2. Lin, H.J.; Wolf, P.A.; Kelly-Hayes, M.; Beiser, A.S.; Kase, C.S.; Benjamin, E.J.; D’Agostino, R.B. Stroke severity in atrial fibrillation.
The Framingham Study. Stroke 1996, 27, 1760–1764. [CrossRef] [PubMed]3. Goette, A.; Kalman, J.M.; Aguinaga, L.; Akar, J.; Cabrera, J.A.; Chen, S.A.; Chugh, S.S.; Corradi, D.; D’Avila, A.; Dobrev, D.; et al.
EHRA/HRS/APHRS/SOLAECE expert consensus on atrial cardiomyopathies: Definition, characterization, and clinical implica-tion. Europace 2016, 18, 1455–1490. [CrossRef] [PubMed]
4. Simo-Vicens, R.; Sauter, D.R.P.; Grunnet, M.; Diness, J.G.; Bentzen, B.H. Effect of antiarrhythmic drugs on small conductancecalcium—Activated potassium channels. Eur. J. Pharmacol. 2017, 803, 118–123. [CrossRef] [PubMed]
5. Gulati, S.; Solheim, O.; Carlsen, S.M.; Oie, L.R.; Jensberg, H.; Gulati, A.M.; Madsbu, M.A.; Giannadakis, C.; Jakola, A.S.; Salvesen,O. Risk of intracranial hemorrhage (RICH) in users of oral antithrombotic drugs: Nationwide pharmacoepidemiological study.PLoS ONE 2018, 13, e0202575. [CrossRef] [PubMed]
6. Sun, Y.; Li, R.J.; Li, G.N.; Li, B.; Wang, Y.; Ma, R.W.; Yang, B.H.; Lu, S.L.; Zhang, G.M. Comparison between Doppler echocardiog-raphy and hot-film anemometry in measuring the turbulent shear stress downstream of artificial mitral valves: A methodologicalstudy. Chin. Med. J. 2013, 126, 2174–2178. [CrossRef] [PubMed]
7. Li, G.; Yang, Q.; Yang, Y.; Yang, G.; Wan, J.; Ma, Z.; Du, L.; Sun, Y.; Zetahang, G. Laminar shear stress alters endothelial KCa2.3expression in H9c2 cells partially via regulating the PI3K/Akt/p300 axis. Int. J. Mol. Med. 2019, 43, 1289–1298. [CrossRef]
8. Diness, J.G.; Skibsbye, L.; Simó-Vicens, R.; Santos, J.L.; Lundegaard, P.; Citerni, C.; Sauter, D.R.P.; Bomholtz, S.H.; Svendsen, J.H.;Olesen, S.-P.; et al. Termination of Vernakalant-Resistant Atrial Fibrillation by Inhibition of Small-Conductance Ca(2+)-ActivatedK(+) Channels in Pigs. Circ. Arrhythm. Electrophysiol. 2017, 10, 005125. [CrossRef]

Cells 2022, 11, 1383 15 of 15
9. Skibsbye, L.; Poulet, C.; Diness, J.G.; Bentzen, B.H.; Yuan, L.; Kappert, U.; Matschke, K.; Wettwer, E.; Ravens, U.; Grunnet, M.; et al.Small-conductance calcium-activated potassium (SK) channels contribute to action potential repolarization in human atria.Cardiovasc. Res. 2014, 103, 156–167. [CrossRef]
10. Diness, J.G.; Sorensen, U.S.; Nissen, J.D.; Al-Shahib, B.; Jespersen, T.; Grunnet, M.; Hansen, R.S. Inhibition of small-conductanceCa2+-activated K+ channels terminates and protects against atrial fibrillation. Circ. Arrhythm. Electrophysiol. 2010, 3, 380–390.[CrossRef]
11. Qi, X.Y.; Diness, J.G.; Brundel, B.J.; Zhou, X.B.; Naud, P.; Wu, C.T.; Huang, H.; Harada, M.; Aflaki, M.; Dobrev, D.; et al. Role ofsmall-conductance calcium-activated potassium channels in atrial electrophysiology and fibrillation in the dog. Circulation 2014,129, 430–440. [CrossRef] [PubMed]
12. Windler, R.; de Wit, C. Perspectives: The Ca2+-dependent K+-channel KCa3.1 as a therapeutic target in cardiovascular disease.Eur. Heart J. Suppl. 2014, 16, 30–32. [CrossRef]
13. Christophersen, P.; Wulff, H. Pharmacological gating modulation of small- and intermediate-conductance Ca(2+)-activated K(+)channels (KCa2.x and KCa3.1). Channels 2015, 9, 336–343. [CrossRef] [PubMed]
14. Caballero, A.D.; Lain, S. Numerical simulation of non-Newtonian blood flow dynamics in human thoracic aorta. Comput MethodsBiomech. Biomed. Eng. 2015, 18, 1200–1216. [CrossRef]
15. Sun, A.; Fan, Y.; Deng, X. Intentionally induced swirling flow may improve the hemodynamic performance of coronary bifurcationstenting. Catheter. Cardiovasc. Interv. 2012, 79, 371–377. [CrossRef]
16. Shahcheraghi, N.; Dwyer, H.A.; Cheer, A.Y.; Barakat, A.I.; Rutaganira, T. Unsteady and three-dimensional simulation of bloodflow in the human aortic arch. J. Biomech. Eng. 2002, 124, 378–387. [CrossRef]
17. Zhang, G.; Shi, Y.; Tang, H.; Zhang, E.; Guo, Z.; Fan, Y.; Pu, F.; Zeng, Z. A methodological study of measuring quantitativelyturbulent shear stree downstream of mitral stenosis in vivo using Doppler echocardiography. Sheng Wu Yi Xue Gong Cheng XueZa Zhi 2002, 19, 71–75.
18. Paul, M.C.; Larman, A. Investigation of spiral blood flow in a model of arterial stenosis. Med. Eng. Phys. 2009, 31, 1195–1203.[CrossRef]
19. Bustin, S.A.; Wittwer, C.T. MIQE: A Step Toward More Robust and Reproducible Quantitative PCR. Clin. Chem. 2017, 63,1537–1538. [CrossRef]
20. Jernigan, S.R.; Buckner, G.D.; Eischen, J.W.; Cormier, D.R. Finite element modeling of the left atrium to facilitate the design of anendoscopic atrial retractor. J. Biomech. Eng. 2007, 129, 825–837. [CrossRef]
21. Koizumi, R.; Funamoto, K.; Hayase, T.; Kanke, Y.; Shibata, M.; Shiraishi, Y.; Yambe, T. Numerical analysis of hemodynamicchanges in the left atrium due to atrial fibrillation. J. Biomech. 2015, 48, 472–478. [CrossRef] [PubMed]
22. Takai, J.; Santu, A.; Zheng, H.; Koh, S.D.; Ohta, M.; Filimban, L.M.; Lemaître, V.; Teraoka, R.; Jo, H.; Miura, H. Laminar shearstress upregulates endothelial Ca2+-activated K+ channels KCa2.3 and KCa3.1 via a Ca2+/calmodulin-dependent protein kinasekinase/Akt/p300 cascade. Am. J. Physiol. Heart Circ. Physiol. 2013, 305, 484–493. [CrossRef] [PubMed]
23. Stead, W.W.; Lin, H.S. A Vision for 21st Century Health Care and Wellness—Computational Technology for Effective Health Care—NCBIBookshelf ; National Academies Press: Washington, DC, USA, 2009.
24. Kohler, R.; Olivan-Viguera, A.; Wulff, H. Endothelial Small- and Intermediate-Conductance K Channels and Endothelium-Dependent Hyperpolarization as Drug Targets in Cardiovascular Disease. Adv. Pharmacol. 2016, 77, 65–104. [CrossRef] [PubMed]
25. Triggle, C.R.; Samuel, S.M.; Ravishankar, S.; Marei, I.; Arunachalam, G.; Ding, H. The endothelium: Influencing vascular smoothmuscle in many ways. Can. J. Physiol. Pharmacol. 2012, 90, 713–738. [CrossRef] [PubMed]
26. Zhang, H.; Yang, J.; Zhou, B.; Chen, J.; Li, J.; Li, Q.; Xiong, H.; Liu, F. NLRP3 RNAi of Injected Synoviocytes Inhibits theInflammatory Responses in Articular Cavity and Alleviates the Injury of Articular Cartilage in a Rabbit Model. J. Biomater. TissueEng. 2018, 8, 1010–1016. [CrossRef]
27. Shikama, N.; Lutz, W.; Kretzschmar, R.; Sauter, N.; Roth, J.F.; Marino, S.; Wittwer, J.; Scheidweiler, A.; Eckner, R. Essential functionof p300 acetyltransferase activity in heart, lung and small intestine formation. EMBO J. 2003, 22, 5175–5185. [CrossRef]
28. Manning, B.D.; Cantley, L.C. AKT/PKB signaling: Navigating downstream. Cell 2007, 129, 1261–1274. [CrossRef]29. Shiojima, I.; Yefremashvili, M.; Luo, Z.; Kureishi, Y.; Takahashi, A.; Tao, J.; Rosenzweig, A.; Kahn, C.R.; Abel, E.D.; Walsh, K. Akt
signaling mediates postnatal heart growth in response to insulin and nutritional status. J. Biol. Chem. 2002, 277, 37670–37677.[CrossRef]
30. Migdady, I.; Russman, A.; Buletko, A.B. Atrial Fibrillation and Ischemic Stroke: A Clinical Review. Semin. Neurol. 2021, 41,348–364. [CrossRef]