A cost-benefit analysis of transmission network reinforcement driven by generation capacity...
9
©2010 IEEE. Personal use of this material is permitted. However, permission to reprint/republish this material for advertising or promotional purposes or for creating new collective works for resale or redistribution to servers or lists, or to reuse any copyrighted component of this work in other works must be obtained from the IEEE.
-
Upload
independent -
Category
Documents
-
view
1 -
download
0
Transcript of A cost-benefit analysis of transmission network reinforcement driven by generation capacity...

©2010 IEEE. Personal use of this material is permitted. However, permission to reprint/republish this material for advertising or promotional purposes or for creating new collective works for resale or redistribution to servers or lists, or to reuse any copyrighted component of this work in other works must be obtained from the IEEE.

GM 2010, IEEE, MINNEAPOLIS 1
A cost-benefit analysis of transmission networkreinforcement driven by generation capacity
expansionAntonis Papaemmanouil,Student member, IEEE,Le Anh Tuan,member, IEEE,Goran Andersson,Fellow, IEEE,
Lina Bertling, Senior member, IEEE,and Filip Johnsson
Abstract—This paper assesses the effects of the future Euro-pean power generation system with strict CO2 emission reductiontargets on the planning of cross-border interconnection lines.Results from a techno-economic energy systems model have beenused as input to this work, regarding the development of theEuropean power generation system until the year 2050, meetingthe EU 2020 CO2 target and a 85% emissions reduction until theyear 2050. A simplified UCTE power system model was developedin order to analyze how the cross-border interconnections incontinental Europe are affected by the generation plans usingan iterative method. The paper also attempts to identify thecongestion points and proposes solutions based on nodal pricemodeling. A cost-benefit analysis (CBA) is used to evaluate theappropriate transmission planning strategy, with the costs beingthe long-term investment costs and the benefits being both theavoided environmental costs and the total congestion costs. Theeffects of new investments on the nodal prices are also studied.The results show that the profitability of the investments isinfluenced by the available production mix and the forecastedCO2 prices. The avoided congestion costs participate ratherinsignificantly in the CBA, which means that congestions arenot relieved, showing that many interconnections are insufficientfor nodal pricing market structure.
Index Terms—Future electric power systems, generation capac-ity expansion, transmission planning, CO2 emission cost-benefitanalysis.
I. I NTRODUCTION
O ften the generation capacity expansion studies do nottake into account the capacity of the transmission net-
work, which frequently becomes weaker and more vulnerableunder competitive market conditions. The coordination ofgeneration and transmission planning has turned into a verycomplicated exercise to solve based on strategic behavior,many uncertainties and political decisions. This paper dealswith the interaction between new installed production capacityand transmission investments, as a result of a cooperativework between the ”Pathways to Sustainable European EnergySystems” project (hereafter called the ”Pathways project”) at
A. Papaemmanouil and G.Andersson are with the Power SystemsLabo-ratory of Electrical and Computer Engineering, ETH Zurich (Swiss FederalInstitute of Technology), CH - 8092 Switzerland.e-mail: [papaemmanouil, andersson] @ eeh.ee.ethz.ch
L.A. Tuan and L.Bertling are with the Division of Electric Power Engi-neering, Department of Energy and Environment, Chalmers University ofTechnology, SE - 41296, Gothenburg, Sweden.e-mail: [tuan.le, lina.bertling] @ chalmers.se
F. Johnsson is with the energy and technology division at Chalmersuniversity of Technology, Gothenburg, SE - 41296 Sweden.e-mail: filip.johnsson @ chalmers.se
Chalmers University of Technology and the ”Towards futureelectricity networks” project initiated by the power systemslaboratory at ETH Zurich.
The goal is to identify common investment strategies forsupporting the power plants of the future with appropriate elec-tricity network plans building a sustainable power system.ThePathways project aims at investigating possible pathways forthe stationary energy sector which can meet strict requirementsof CO2 emission targets in line with what has been proposedby the EU. Typically, the stationary energy system (electricityand heat) contribute to at least a third of the total EuropeanCO2 emissions. Looking at the energy mix of the future, manyoptions are available. A large share of the European electricityis generated in large centralized power plants and cost efficientoptions for reducing CO2 emissions from these plants are fuelshift (coal to gas), application of CO2 capture and storageand co-firing of biomass. This is of course assuming there isa cost to emit CO2 such as from the EU Emission TradingScheme (EU-ETS). In addition, new renewable technologiessuch as biomass combined heat and power and wind powerare important CO2 mitigation technologies as is demandside efficiency measures. Another option is introduction ofpoly-generation plants for co-production of power, heat andtransportation fuels. It also seems possible to electrify thetransportation sector by use of plug-in hybrid electric vehicles(PHEVs), which may be a cost efficient way to reduce CO2
emissions from the transportation sector. Thus, the two latteroptions represent technologies which increase the interactionbetween the transportation sector and the stationary sector(heat and power).
Increased integration of the electric power system and thetransportation sector as well as an increased use of fluctuatingpower generation (most notably wind power) imposes newchallenges on the electricity network. As indicated above,acentral part of the Pathways-project is to analyze developmentpaths for the power generation sector under various constraintsand targets concerning renewable energy based power gener-ation and CO2 emissions reductions. The analysis is typicallycarried out by so called techno-economic modeling whichgives the mix of technologies until the year 2050, minimizingthe overall system cost fulfilling the targets specified.
The example in Figure 1 depicts the German productionmix as modeled by Odenberger et al. [1]. Results from suchmodels give valuable information on the overall possibilitiesfor developing the power generation system. However, the

GM 2010, IEEE, MINNEAPOLIS 2
A nomenclature list, if needed, should precede the
The goal of the project “Pathways to Sustainable European
project”) is
to investigate possible pathways for the stationary energy
sector which can meet strict requirement of CO2 emission
targets in line with what has been proposed by the EU and the
limate Change (IPCC). Typically, the
stationary energy system (electricity and heat) contribute to at
least a third of the CO2 emissions. At the same time a large
fraction of the power is produced in large centralized units
ient opportunities for reducing
CO2 emissions such as fuel shift (e.g., coal to gas), application
of CO2 capture and storage and introduction of renewable
energy technologies (e.g. wind power and biomass). Another
100
200
300
400
500
600
700
800
900
2003 2008 2013 2018 2023 2028 2033 2038 2043 2048
Electricity generation [TWh]
Contribution from present system Hydro replacements New wind power New biomass & waste
New hard coal New gas New lignite with CCS New hard coal with CCS
Hydro
Nuclear
Hard coal
Lignite
Gas
Wind
HydroReplacements
New Wind power
New Biomass & Waste
New Hard coal
New Gas
Lignite with CCS
Hard coal with CCS
Production data
Fig. 1. An example of output from the energy system model - example isthe German electricity generation: 75% Reduction in CO2 by 2050, relativeto 1990.
techno-economic modeling applied does not include any de-tailed analysis on the requirements imposed by the physicalconstraints of the electricity network. Thus, this work attemptsto consider the interactions of the network constraints on thegeneration expansion plans and identify the needs for newinvestments in transmission systems.
The paper is organized as follows: Section II presents a briefoverview of the transmission system planning methods and itsimportance in the evolution of the generation system. SectionIII discusses the proposed method used in this paper. SectionIV introduces the simplified EU 20-node system and thesnapshots in different years in the planning horizon. Section Vpresents the results. Finally, conclusions are drawn in SectionVI.
II. EFFECTS OF GENERATION SYSTEM ON TRANSMISSION
NETWORK PLANNING
Transmission system expansion planning has been per-formed with various techniques and algorithms as summarizedin [2]. In general, the objectives of transmission planningis toprovide cost-effective, safe and reliable transmission systemin a socially and environmentally responsible manner, so thatthe system loads are satisfied. The transmission planningshould also be able to manage various uncertainties in powersystems such as uncertainties in future power generation, fuelcosts, load variations, as well as time for design, approvaland construction of new high voltage transmission lines [3].Typically new transmission lines may take 7-10 years to gothrough the process of planning, permitting and construction,however one should also consider policy and terminologydifferences among the European countries that makes thecompletion of network expansion projects hard to forecast [4].Lead times considerably longer than these mentioned abovecan sometimes be encountered.
Recently, the conditions for transmission network planninghave changed due to deregulation of the energy markets.
Under regulated conditions the responsible authority fornetwork expansion has a better overview of the plannedgeneration capacity, the locations of new power plants andbased on demand forecasting the planning process can beoptimized aiming mainly to the minimization of overall costs,i.e. reliability costs or operating costs [5].
In deregulated systems generation expansion and transmis-sion planning are separated, driven by market based initia-tives. The latter implies many risks due to diversified inter-est of stakeholders, exercise of market power and lack oftransparency. The investments in transmission and generationdepend on market signals, that sometimes are inaccurateneglecting many externalities, e.g. production external costsand loop flows of transmitted power. Therefore, misleadingprice signals may force developments towards to suboptimalsystem expansion in favor of some generators over others [6].
Accordingly, transmission expansion planning based onlyeither on congestion relief or on minimization of consumercosts should be avoided in a power market. The minimizationof total congestion costs and total production costs shouldbe the objective in order to obtain the optimal solution, asclaimed by Stoft in [7]. Additionally, the problems of climatechange have been fully recognized in the EU directives withthe CO2 emission reduction targets in EU member countries.This, calls for new ways of planning both future generation andtransmission systems taking into account also the emissionsreduction targets.
In this paper, results from generation planning model con-sidering environmental constraints, are used in the evaluationof transmission planning scenarios. On the one hand, thegeneration capacity planning has already taken into accountthe CO2 emission constraints, the transmission model on theother hand generates the dispatch of power, taking into accountchanges in generation technologies, marginal costs and linescapacities using a multi-period optimal power flow model asexplained in the following.
III. PROPOSED METHODOLOGY
A. Iterative process
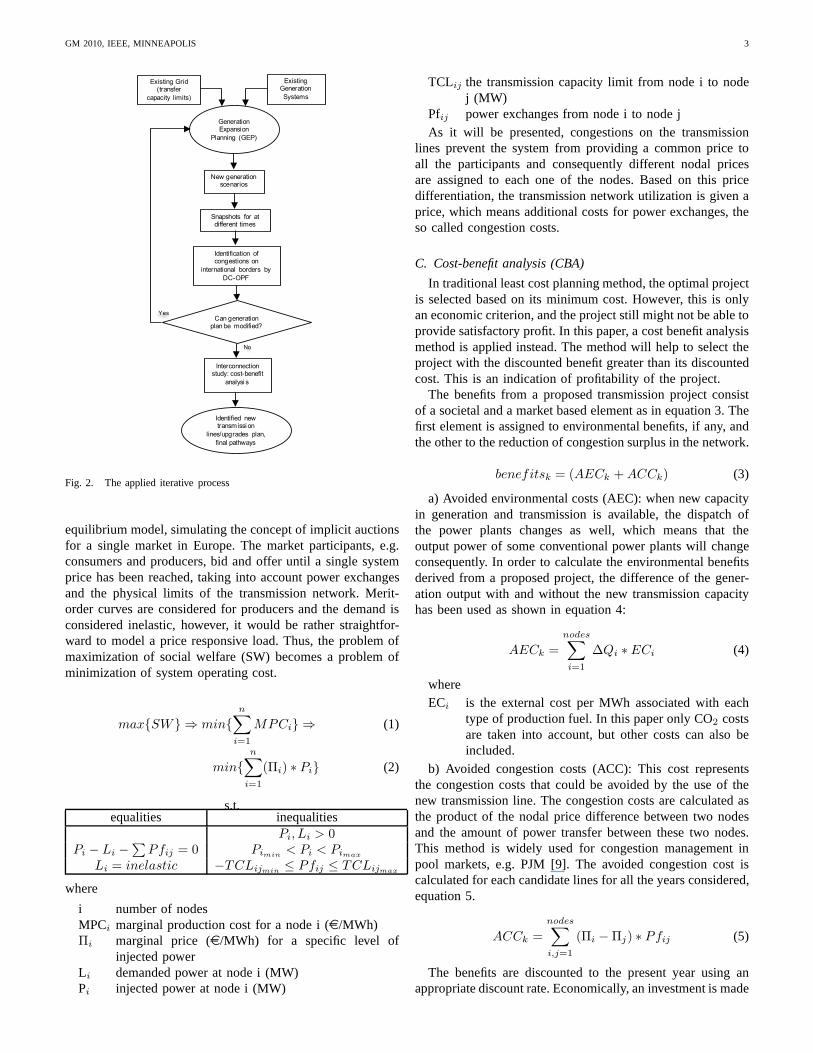
In this paper, an integrated iterative process for generationand transmission system planning is proposed. The appliedmethodology is presented in the flowchart of Figure 2.
It has been assumed that the generation capacity expansiontakes place first and a centralized entity is responsible fortheoptimization of the transmission planning based on proposedstrategies of all system stakeholders. With the generationscenarios, which were produced by the GEP, a DC-OPF runin order to identify possible bottlenecks in the network. Sincethe model used is a simplified 20-bus system model whichapproximately represents 20 EU countries, we will focus onthe interconnections between the nodes rather than on thebottlenecks within each country.
B. Optimal power flow model
A modified version of the sustainability based optimalpower flow (SOPF) [8] has been used. The model is an
GM 2010, IEEE, MINNEAPOLIS 3
Existing Grid (transfer
capacity limits)
Existing Generation
Systems
New generation scenarios
Snapshots for atdifferent times
Generation Expansion
Planning (GEP)
Yes
No
Identification of congestions on
international borders by
DC-OPF
Can generation plan be modified?
Interconnection study: cost-benefit
analysi s
Identified new transmissi on
lines/upgrades plan,
final pathways
Fig. 2. The applied iterative process
equilibrium model, simulating the concept of implicit auctionsfor a single market in Europe. The market participants, e.g.consumers and producers, bid and offer until a single systemprice has been reached, taking into account power exchangesand the physical limits of the transmission network. Merit-order curves are considered for producers and the demand isconsidered inelastic, however, it would be rather straightfor-ward to model a price responsive load. Thus, the problem ofmaximization of social welfare (SW) becomes a problem ofminimization of system operating cost.
maxSW ⇒ minn∑
i=1
MPCi ⇒ (1)
min
n∑
i=1
(Πi) ∗ Pi (2)
s.t.equalities inequalities
Pi, Li > 0Pi − Li −
∑Pfij = 0 Pimin
< Pi < Pimax
Li = inelastic −TCLijmin≤ Pfij ≤ TCLijmax
where
i number of nodesMPCi marginal production cost for a node i (e/MWh)Πi marginal price (e/MWh) for a specific level of
injected powerLi demanded power at node i (MW)Pi injected power at node i (MW)
TCLij the transmission capacity limit from node i to nodej (MW)
Pfij power exchanges from node i to node jAs it will be presented, congestions on the transmission
lines prevent the system from providing a common price toall the participants and consequently different nodal pricesare assigned to each one of the nodes. Based on this pricedifferentiation, the transmission network utilization isgiven aprice, which means additional costs for power exchanges, theso called congestion costs.
C. Cost-benefit analysis (CBA)
In traditional least cost planning method, the optimal projectis selected based on its minimum cost. However, this is onlyan economic criterion, and the project still might not be able toprovide satisfactory profit. In this paper, a cost benefit analysismethod is applied instead. The method will help to select theproject with the discounted benefit greater than its discountedcost. This is an indication of profitability of the project.
The benefits from a proposed transmission project consistof a societal and a market based element as in equation 3. Thefirst element is assigned to environmental benefits, if any, andthe other to the reduction of congestion surplus in the network.
benefitsk = (AECk +ACCk) (3)
a) Avoided environmental costs (AEC): when new capacityin generation and transmission is available, the dispatch ofthe power plants changes as well, which means that theoutput power of some conventional power plants will changeconsequently. In order to calculate the environmental benefitsderived from a proposed project, the difference of the gener-ation output with and without the new transmission capacityhas been used as shown in equation 4:
AECk =
nodes∑
i=1
∆Qi ∗ ECi (4)
whereECi is the external cost per MWh associated with each
type of production fuel. In this paper only CO2 costsare taken into account, but other costs can also beincluded.
b) Avoided congestion costs (ACC): This cost representsthe congestion costs that could be avoided by the use of thenew transmission line. The congestion costs are calculatedasthe product of the nodal price difference between two nodesand the amount of power transfer between these two nodes.This method is widely used for congestion management inpool markets, e.g. PJM [9]. The avoided congestion cost iscalculated for each candidate lines for all the years considered,equation 5.
ACCk =
nodes∑
i,j=1
(Πi −Πj) ∗ Pfij (5)
The benefits are discounted to the present year using anappropriate discount rate. Economically, an investment ismade

GM 2010, IEEE, MINNEAPOLIS 4
when the overall benefits of the investment are greater than allthe costs, i.e. initial investment and operation and maintenancecosts. In this study, a discount rate of 8% has been appliedand only aggregated investment costs are taken into account.
The costs of new investment for a double circuit 380kVoverhead line based on a European study [10], differ fromcountry to country as presented in the Table I (base case costhas been considered 401 ke/km):
TABLE ITRANSMISSION INVESTMENT COSTS380KV OVERHEAD LINE
kEuro/km Specific cost factors
Finland, Sweden 200 - 300 Flat land(fewer towers), less popu-lated
Greece, Portugal 200 - 300 Low costs (land, labour)Denmark,Norway, Spain
300 - 400 Close to base case
Belgium, Nether-lands, Italy
400 - 500 Close to base case, heavily popu-lated
France, Germany 500 - 600 Heavily populated, high labourcosts
UK(England &Wales)
600 - 800 n-2 standard applied, more tow-ers/km, high right-of-way costs,heavily populated
Austria, Switzer-land
600 - 800 High environmental issues, topog-raphy, high wind pressure limits,high labour costs
The CBA process is described in the flowchart shownin Figure 3. The ”business as usual” (BAU) case considerschanges in available generation mix, however without anytransmission network reinforcements. First of all the congestedlines are identified for the whole period k in BAU, dividedin permanent and non-permanent. The permanent congestionsare the final candidates for expansion. Due to the size ofthe system the proposed scenarios consist of more than onecandidate line.For each one of the scenarios the results arecompared with the (BAU) case in order to calculate thebenefits in every year. The process ends when all the scenarioshave been assessed and ranked.
For the assessment of the investment plans a benefit-to-cost-index (BCI) is used, described in equation 7. The average BCIfor the whole planning horizon provides a ranking represen-tation of the results.
avgBCI = (
years∑
k=1
BCI)/years (6)
BCI =benefitsk
(1 + r)k ∗ ICk
, BCI > 1 → profitable (7)
where ,
ICk is the hourly cost in year k of the transmissionline investment (IC) calculated using appropriatecapital recovery factor (CRF) taking into accountthe fixed discount rate and the number of years inthe transmission project [10]. It is assumed that thetransmission line is used whole year round.
ICk = (IC ∗ CRF )/8760 (8)
Yes
Yes
No
BEGIN
Run dc-OPF
for all years
Permanent Congestion?
scenario s = 1
Run dc-OPF for
scenario s
Compute B/C index for
scenario s and store values
Last candidate?
Identify set of
candidates
s = s +1
Last year?
k = k +1
Rank of scenarios
based on B/C
Year k = 1
No
No
Yes
Calculate congestion index
and rank congestions
Compute annual cost and
benefits of alternative
END
Fig. 3. The applied methodology for BCI calculation
CRF the capital recovery factor distributes a present valueto annuities, for a fixed discount rate r and period[11].
CRF (r, years) =r(1 + r)years
(1 + r)years − 1, years ≥ 1
(9)
A sensitivity analysis is also carried out, evaluating theprojects using different levels of CO2 prices, in order to pro-vide better information on the project ranking. As the policyissues have an impact on electricity prices and generationdispatch, it may happen that a new transmission line is nomore profitable when the environmental costs are assumedlower. Forecasts of CO2 high - low costs have been generatedfrom ELIN model [12].

GM 2010, IEEE, MINNEAPOLIS 5
IV. SIMPLIFIED UCTE MODEL
A. 20-node System
Fig. 4. Simplified 20-nodes European system
The model used in this paper is a static representationof December 2007 of the European interconnected systemconsisting of 20 nodes, as in Figure 4. Production andconsumption is assigned to each node, while six types ofproduction technologies are considered, nuclear, coal, gas,hydro, renewables and carbon capture and storage for thermalpower plants. Generation and demand are based on publicavailable data from EnTSO-E [13]. The option of carboncapture and storage (CCS) technology is added in the planningprocess after some years using the input of the ”Pathways”project. A value for the marginal cost of CCS integration hasbeen assumed according to the IEA report [14]. TheCO2
cost, different each year, is assigned to the fossil fuelledtechnologies, according to the CO2 prices (e/tonne) obtainedfrom the ELIN, i.e. corresponding to the Pathway shown infigure 1.
The economic model of the 20-bus system is composed ofsome other assumptions as well, as economic data for powerplants, e.g. marginal production costs, are not available.Ithas been assumed that renewable technologies produce at thelowest price level and then follows nuclear power plants, fossilfuels and hydro, although electricity price differences amongcountries have been taken into account and thus, this order maydiffer in some cases. For instance, hydro power in Switzerlandis cheaper than in Italy and hard coal cheaper in Germanythan in France, except for nuclear power that has the sameprice Europe-wide. Among fossil fuels only gas is consideredseparately associated with higher price than the single price ofcoal, hard coal and lignite. Price disparities and the aggregatedmerit-order curve of the system are presented in Figure 5.
Regarding transmission lines, the transfer capacities arecollected from EnTSO-E [13], equal to the net transmission
Fig. 5. Merit-order supply curves
capacities, assumed as equal for both directions. Physicaldataon the interconnections, e.g. line reactances, are obtained fromtypical values according to Table II [15], based on estimatedline lengths.
TABLE IITYPICAL VALUES FOR OVERHEAD TRANSMISSION LINES
NominalVoltage
230kV 345kV 500kV 765kV 1100kV
R (Ω/km) 0.05 0.037 0.028 0.012 0.005xL=ωL(Ω/km)
0.488 0.367 0.325 0.329 0.292
bc=ωC(mS/km)
3.371 4.518 5.2 4.978 5.544
Zc (Ω) 380 285 250 257 230SIL(MW) 140 420 1000 2280 5260
V. RESULTS
The generation case that has been applied is described in[12]. According to this case the future available generationmix until 2050 is calculated based on marginal cost effectivesolutions. In the simulations starting point is the year 2008and only the first 25 years have been used. The results areobtained by comparing the different scenario cases with theBAU scenario.
• In the so called BAU scenario increasing demand by1.06% in average and CO2 emissions reduction by 30%by 2020 are considered. Therefore, renewable technolo-gies are promoted and also carbon capture and storage(CCS) is introduced for coal fired power plants mainlyafter the year 2020, i.e after 12 simulated periods.

GM 2010, IEEE, MINNEAPOLIS 6
In Figure 8, the initial situation of the BAU case ispresented. During the total period of 25 years only someminor changes in congestions appear, and so the scenariosare based on this picture. Due to congested lines there is notacommon price for the whole system, however 3 prices zonesare obviously identified, e.g. red for expensive, blue for cheapand green for middle price zone. The most expensive nodeappears to be node 8, that corresponds to Italy. For that reasona large amount of power is transferred to the south from theneighboring nodes, influencing the direct interconnections toItaly as well as other interconnections, through the producedloop-flows.
The trilateral market coupling of Belgium, Netherlands andFrance is also very clearly recognized, as these 3 nodes belongto the same price zone and no congestions appear betweenthem. The most critical lines of the network seem to be thecross-border connections of node 6 that corresponds to Ger-many. Germany, together with France (node 3), is the majorexporter of the system, providing a large amount of powermainly to the east. Another important and active exporter ofthe system turns out to be node 14 (Slovenia), although itsproduction capability is rather limited. The strategic positionof Slovenia makes it a significant arbitrator, facilitatingtheflows form the north to Italy and to the south Eastern Europe.
According to the aforementioned observations the followingtransmission expansion scenarios have been proposed andassessed:
TABLE IIIPROPOSED TRANSMISSION INVESTMENT SCENARIOS
From To actualtran.capacity(MW)
additionaltran.capacity(MW)
Inv.costs(Me)
scenario 1 7 (CH)7 (CH)6 (DE)1 (PT)
9 (AT)8 (IT)9 (AT)2 (ES)
1200389020001300
180011102000700
500
scenario 2 6 (DE)14 (SL)6 (DE)
9 (AT)15 (HR)10 (CZ)
20009002300
100011001700
365
scenario 3 9 (AT)6 (DE)6 (DE)1 (PT)
14 (SL)5 (NL)10 (CZ)2 (ES)
650300023001300
65010001700700
400
scenario 4 6 (DE)6 (DE)1 (PT)
10 (CZ)11 (PL)2 (ES)
230012001300
17001800700
620
scenario 5 9 (AT)11 (PL)6 (DE)
14 (SL)12 (SK)9 (AT)
6505502000
8509502000
300
In Figure 6, the calculated cash flows of the five scenar-ios are presented. From the form of the curve derives thatthe avoided environmental benefits contribute more than theavoided congestion costs to the cost-benefit analysis. Duringthe first 5-6 years, while still old, inefficient technologiesare in charge, but also the integration of renewable technolo-gies increases, the avoided environmental costs thanks to theadditional transmission capacity are higher than at the endof the period when new production technologies have beeninstalled and own a higher fraction in the energy mix. It
means that through the additional transmission capacity more”green” power flows. In the middle of the period a peakappears due to the dispatch of new CCS power plants. Asthe demand increases and the dispatched generators do notchange significantly, the benefits become negative.
5 10 15 20 25−1
−0.5
0
0.5
1
1.5
2
2.5
3
3.5
4x 10⁵
Years
Cas
h flo
ws
scenario 1sceanrio 2sceanrio 3scenario 4scenario 5
Fig. 6. Cash flows of the scenarios
However, from Figure 7, all the scenarios are profitableduring the whole period. The average BCI is greater than 1 forall of them, which means that the benefits are higher than thecosts. Referring to this index the second scenario seems to bethe most profitable for the pessimistic case of high CO2 pricedevelopment, e.g. from 17 up to 32eper tonne in the year2035, although this scenario considers only three transmissionlines and it’s not the cheapest one. For the optimistic case oflower carbon dioxide prices development, e.g. from 17 up to27.5eper tonne, the index provides approximately the sameresults, despite the lower BCI values. A major difference isthat the fourth scenario is in a critical position as the benefitsturned out to be almost equal to the costs, and that the fifthscenario is not profitable any more, although in the previouscase it was more advantageous than the fourth one.
scenario 1 scenario 2 scenario 3 scenario 4 scenario 50
1
2
3
4
5
6
7
BC
I
CO2 price low CO2 price high
Fig. 7. BCI ranking for low and high CO2 prices

GM 2010, IEEE, MINNEAPOLIS 7
Fig. 8. Price zones and congested lines
VI. CONCLUSION
In this paper two models have been combined in order tostudy the effectiveness of new transmission plans, regardingenvironmental and market aspects. One was the generationexpansion model (ELIN), that calculates the optimal futuregeneration mix satisfying 30% CO2 emissions reduction by2020 and the other the modified sustainability based optimalpower flow model that considers transmission network con-straints, providing price signals under nodal pricing marketstructure.
The proposed iterative cost-benefit analysis method has beenapplied on a 20-bus simplified European ”cooper-plate” systemmodel. The results have shown that the profitability of theinvestments is influenced by the available production mixand the forecasted CO2 prices, as obtained from ELIN. Theavoided congestion costs participate rather insignificantly inthe CBA, which means that despite the additional transmissioncapacity, congestions are not relieved. Therefore, many inter-connections are insufficient for nodal pricing market structure,as exchanges between the participants are highly promotedand stronger reinforcement of the transmission lines is neededif the target is the reduction of congestion costs. Regardingenvironmental issues the proposed investments are beneficialunder both cases of CO2 price development for the period of25 years, supporting generation strategies for greenhousegasemissions mitigation, except for scenario 5 that is unprofitablefor the case of low CO2 price development.
Nevertheless, due to limited data availability, the internalbottlenecks within countries are neglected. More detailedmodels are needed for the representation of inland congestions,subject to future work.
APPENDIX ANODES - COUNTRIES
TABLE IV
Node abbr. Country1 PT Portugal2 ES Spain3 FR France4 BE Belgium5 NL Netherlands6 DE Germany7 CH Switzerland8 IT Italy9 AT Austria10 CZ Czech Republic11 PL Poland12 SK Slovakia13 HU Hungary14 SL Slovenia15 HR Croatia16 BA+ME Bosnia / Serbia17 MK F.Y.R.O.M.18 BG Bulgaria19 RO Romania20 GR Greece
ACKNOWLEDGMENT
The authors would gratefully thank Mikael Odenberger andThomas Unger for providing inputs from the ELIN model tothis work and for fruitful discussions.
The presented work is a result of the cooperation betweenthe ”Pathways to Sustainable European Energy Systems”project at Chalmers university of technology and the ”Towardsfuture electricity networks” project at the power systemslaboratory of ETH Zurich.

GM 2010, IEEE, MINNEAPOLIS 8
REFERENCES
[1] M. Odenberger, J. Kjrstad, F. Johnsson,Ramp up of CO2 capture andstorage within Europe, International Journal on Greenhouse Gas Control,2:417-438, June, 2008.
[2] G. Latorre, R. D. Cruz and J. M. Areiza,Classification of publicationsand models on transmission expansion planning, IEEE Transactions onPower Systems, Vol.18, No.2, May, 2003.
[3] J.H. Roh, M. Shahidehpour, L. Wu,Market-Based generation andtransmission planning with uncertainties, IEEE Transactions on PowerSystems, Vol.24, No.3, August, 2009.
[4] Commission of the European Communities,Priority interconnection plan,February, 2007.
[5] Lu, M. and Dong, Z.Y. and Saha, T.K.,A Framework for TransmissionPlanning in a Competitive Electricity Market, Transmission and Distri-bution Conference and Exhibition: Asia and Pacific, IEEE/PES, 2005.
[6] I. Perez-Arriaga and Luis Olmos,Compatibility of investment signalsin distribution, transmission and generation, published in Competitiveelectricity markets and sustainability, edited by FranoisLeveque, ISBN-10: 1 845542 921 4, 2006.
[7] S. Stoft, Power system economics, ISBN 0-471-15040-1, 2002.[8] A. Papaemmanouil and G. Andersson,Sustainability Based Optimal
Power Flow A New Planning Tool, Powertech, IEEE, 2009.[9] E. Bompard, P. Correia, G. Gross, M. Amelin,Congestion-Management
schemes: a comparative analysis under a unified framework, IEEEtransactions on power systems, Vol.18, No.1, February, 2003.
[10] ICF international,Unit Costs of constructing new transmission assets at380kV within the European Union, Norway and Switzerland”, preparedfor zhe DG TREN / EU, October, 2002.
[11] R. Billinton and W. Wangdee,Reliability-Based Transmission Rein-forcement Planning Associated With Large-Scale Wind Farms, IEEEtransactions on power systems, Vol.22, No.1, February, 2007.
[12] M.Odenberger,Pathways for the European electricity supply system to2050 - Implications of stringent CO2 reductions, Doctor thesis, Chalmersuniversity of technology, ISBN 978-91-7385-297-5, 2009.
[13] European Network of Transmission System Operators forElectricity,statistical database, http:www.entsoe.eu
[14] International energy agency,CO2 capture and storage, IEA energytechnology essentials, December, 2006.
[15] West Virginia University Electric Industry Restructuring ResearchGroup,Transmission Enhancement and Expansion, Interim report No.5,January, 1998.
A. Papaemmanouil received his Dipl.-Ing. degreein electrical and computer engineering from theUniversity of Patras, Greece, in September 2006,where he specialized in electric power systems. InJanuary 2007 he joined the Power Systems Labora-tory of Swiss Federal Institute of Technology (ETH),Zurich, Switzerland, where he is working towards aPhD. His research is dedicated to multi-constrainedlong-term transmission planning of electric powersystems. He is a student member of IEEE.
L.A. Tuan (S’01, M’09) received his Ph.D. in2004 in Power Systems from Chalmers Universityof Technology, Sweden, and his MSc. degree in1997 in Energy Economics from Asian Institute ofTechnology, Thailand. Currently he holds a projectleader and lecturer position at the Division of Elec-tric Power Engineering, the Department of Energyand Environment, Chalmers University of Technol-ogy, Sweden. His research interests include powersystem operation and planning, power market andderegulation issues.
G. Andersson (M’86, SM’91, F’97) obtained hisMSc and PhD degree from the University of Lundin 1975 and 1980, respectively. In 1980 he joinedASEA, now ABB, HVDC division in Ludvika, Swe-den, and in 1986 he was appointed full professorin electric power systems at the Royal Institute ofTechnology (KTH), Stockholm, Sweden. Since 2000he is a full professor in electric power systems atETH Zurich (Swiss Federal Institute of TechnologyZurich), Switzerland. His research interests are inpower system analysis, simulation and control. An-
other research interest is future energy and power systems.He is a member of the Royal Swedish Academy of Engineering Sciences
and Royal Swedish Academy of Sciences, he is Fellow of IEEE. He was therecipient of the IEEE PES Outstanding Power Educator Award 2007.
L. Bertling (S’98-M’02-SM’08) was born in Hud-dinge, Sweden, in 1973. She has a Professor Chairin Sustainable Electric Power Systems and is Headof the Division of Electric Power Engineering, atthe Department of Energy and Environment, atChalmers University of Technology, in Gothenburg,Sweden. She has been with Svenska Kraftnt, i.e.the Swedish Transmission System Operator during2007-2009, and from June 2008 as head of theR&D. She has been with KTH School of ElectricalEngineering, in Stockholm, during 1997-2009 were
she finalized her Docent degree, Associate Professor, in 2008, and the Ph.D.in 2002 both in Electric Power Systems. She was a visiting researcher withUniversity of Saskatchewan during 2000, and a postdoctoralstudent at theUniversity of Toronto, associated with Kinectrics Inc. during 2002/2003. Herresearch interests are in; transmission and distribution systems including highvoltage equipment and HVDC, and wind power systems with applicationsfor reliability assessment and modeling, and maintenance planning. She wasthe general chair of the 9th International conference on probabilistic methodsapplied to power systems (PMAPS) in Stockholm, in 2006. Dr. Bertling isa senior member of IEEE and a member of Cigr and Cired. She is the vicechair of the IEEE PES Subcommittee on Risk, Reliability, andProbabilityApplications (RRPA), and is the chair of the Swedish PE/PEL Chapter.
F. Johnsson received his doctoral degree in 1991and was appointed Professor in 2001. The researchled by Filip Johnsson comprises: Energy systemsanalysis, Fluidized bed combustion and gasificationand Oxyfuel combustion for CO2 capture. The re-search on energy systems analysis has an emphasisinfrastructural change of the energy system and thefocus is on the stationary energy system (power andheat and demand side management) in the Europeansetting. The group also holds several research con-tracts in solid fuel conversion for various fuels, such
as biomass, co-combustion and fossil fuels with CO2 capture. Filip Johnssonhas published more than 100 papers in peer reviewed journalsand internationalconference proceedings. Filip Johnsson has given talks at many institutesaround the world and he has an extensive international network in the field ofenergy systems analysis as well as in the areas of fluidized-bed and oxyfuelcombustion.