A CONSOLIDATION OF PARTICIPATORY POVERTY ... - Smeru
241
A CONSOLIDATION OF PARTICIPATORY POVERTY ASSESSMENTS IN INDONESIA The findings, views, and interpretations published in this report are those of the authors and should not be attributed to the SMERU Research Institute or any of the agencies providing financial support to SMERU. For further information, please contact SMERU, Phone: 62-21-31936336; Fax: 62-21-31930850; E-mail: [email protected]; Web: www.smeru.or.id The SMERU Research Team Report by the SMERU Research Institute and Pradipta Paramitha, with the support of JBIC (Japan Bank for International Cooperation) 0.02-07 Research Report Volume I Understanding the Voice of the Poor: Input for the Formulation of Poverty Reduction Strategy Paper
-
Upload
khangminh22 -
Category
Documents
-
view
0 -
download
0
Transcript of A CONSOLIDATION OF PARTICIPATORY POVERTY ... - Smeru

A CONSOLIDATION OF PARTICIPATORY POVERTY ASSESSMENTS IN INDONESIA
The findings, views, and interpretations published in this report are those of the authors and should not be attributed to the SMERU Research Institute or any of the agencies providing financial support to SMERU. For further information, please contact SMERU, Phone: 62-21-31936336; Fax: 62-21-31930850; E-mail: [email protected]; Web: www.smeru.or.id
The SMERU Research Team
Report by the SMERU Research Institute and Pradipta Paramitha, with the support of JBIC (Japan Bank for International Cooperation)
�����������
Research Report
Volume I Understanding the Voice of the Poor: Input for the Formulation of Poverty Reduction Strategy Paper
-%,&3UDGLSWD 3DUDPLWKD
A CONSOLIDATION OF PARTICIPATORY POVERTY ASSESSMENTS IN INDONESIA
Volume I
Understanding the Voice of the Poor: Input for the Formulation of Poverty Reduction Strategy Paper
Research Team
Widjajanti I. Suharyo (Coordinator) Syaikhu Usman
Sri Kusumastuti Rahayu Sri Budiyati
Sulton Mawardi Alma Arief
Herry Widjanarko
The SMERU Research Institute and Pradipta Paramitha Supported by Japan Bank for International Cooperation (JBIC)
December 2003

The SMERU Research Institute, December 2003 iii
ABSTRACT This study is a consolidation of Participatory Poverty Assessments (PPAs) and similar studies which were carried out in 79 locations in Indonesia. These PPA/PPA-like studies were conducted by several organizations between 1999 and 2003. The aim of this study is to enrich the understanding of poverty, by providing an analysis based upon the perspective of the poor, and provide input for the formulation of the National Poverty Reduction Strategy Paper (PRSP). The analysis in this study encompasses community perspectives of: the characteristics of poverty, the causes and problems of poverty, the solutions to poverty, the impact of poverty and the poor’s coping strategies, the role of several institutions, and the effectiveness of poverty reduction programs. The method of this study combines a content analysis of field reports from PPA/PPA-like studies and a frequency analysis. These analyses reveal general poverty issues, and differences in poverty conditions in urban and rural areas, in western and eastern Indonesia, in communities with different livelihoods, as well as between young and old, and between men and women. The results of this study reaffirm the complexity of the poverty phenomenon, which is influenced by several interrelated factors. More specifically, the results of this study indicate the subjectiveness of communities in identifying poverty as opposed to the methods of measuring poverty used by the government. This study reveals that powerlessness factors are dominant causes of poverty. In addition to material poverty, which was most frequently considered to be the cause of poverty, isolation factors also played a major role. This study also shows that there is a need to change the paradigm of the Indonesian education system, and to increase the poor’s access to education, employment opportunities, and business opportunities. Other important findings were the high dependency of the poor upon traditional social networks and the insignificant role of several poverty reduction programs in assisting the poor. Based upon this analysis, this study provides several recommendations which essentially propose that the National PRSP should be an integrated and interrelated effort to systematically eradicate the factors which hinder the poor’s access to a better life. ABSTRAK Studi ini merupakan konsolidasi Kajian Kemiskinan Partisipatoris (KKP) dan studi sejenisnya yang dilaksanakan di 79 lokasi di Indonesia. KKP tersebut dilaksanakan oleh berbagai lembaga selama tahun 1999 sampai dengan 2003. Tujuan studi ini adalah untuk memperkaya pemahaman tentang kemiskinan, dengan menyajikan analisis berdasarkan sudut pandang masyarakat miskin, dan memberikan masukan bagi penyusunan Strategi Penanggulangan Kemiskinan (SPK) Nasional. Studi ini mencakup analisis tentang pandangan masyarakat mengenai: karakteristik kemiskinan, penyebab dan persoalan kemiskinan, jalan keluar dari kemiskinan, dampak kemiskinan dan upaya masyarakat untuk mengatasinya, peranan berbagai lembaga, dan efektivitas program penanggulangan kemiskinan. Metode yang digunakan dalam studi ini adalah gabungan antara analisis isi laporan lapangan KKP/studi sejenisnya dan analisis frekuensi sederhana. Dari hasil analisis tersebut dapat dikenali isu-isu kemiskinan yang bersifat umum, dan perbedaan kondisi kemiskinan di perdesaan dan perkotaan, di kawasan barat dan timur Indonesia, di berbagai masyarakat dengan latar belakang penghidupan yang berbeda, serta antara kaum muda dan tua, dan antara laki-laki dan perempuan. Hasil studi ini menegaskan kembali kompleksitas fenomena kemiskinan, yang dipengaruhi oleh berbagai faktor yang saling terkait. Secara khusus, hasil studi ini memperlihatkan subyektivitas masyarakat dalam mengenali kemiskinan, yang berbeda dengan cara pengukuran kemiskinan yang dilakukan pemerintah. Studi ini menemukan bahwa faktor ketidakberdayaan merupakan penyebab kemiskinan yang dominan. Di samping kemiskinan materi, hal yang paling banyak dianggap sebagai penyebab kemiskinan, ternyata faktor keterisolasian juga sangat berperan. Hasil studi ini juga menunjukkan adanya kebutuhan akan perubahan paradigma sistem pendidikan, dan peningkatan akses kaum miskin terhadap pendidikan, lapangan kerja dan peluang usaha. Temuan penting lainnya adalah masih besarnya ketergantungan masyarakat miskin pada jaringan sosial tradisional dan kecilnya peranan berbagai program penanggulangan kemiskinan dalam membantu masyarakat miskin. Berdasarkan hasil analisis tersebut, studi ini menyusun beberapa rekomendasi yang pada intinya menganjurkan agar SPK Nasional disusun sebagai upaya terpadu dan saling terkait untuk secara sistematis memutus faktor-faktor yang menghambat akses masyarakat miskin terhadap penghidupan yang lebih baik.

The SMERU Research Institute, December 2003 iii
ACKNOWLEDGEMENTS We would like to express our appreciation to Mr. Shigeru Yamamura (the Indonesia-Country Representative), Mr. Takao Shimokawa (Deputy Director of the Program Division), and Mr. Kei Toyama (Deputy Director of the Social Development Division) of the Japan Bank for International Cooperation (JBIC), for giving us the opportunity to conduct this research, as well as for the support and technical guidance provided during the research process. Our appreciation is also extended to Mr. Djoharis Lubis (the Deputy VI for Poverty Reduction) of the Office of the Coordinating Ministry of People’s Welfare, who provided us with the opportunity and support to conduct this PPA consolidation study, the results of which will serve as input for the formulation of the national PRSP. Appreciation is also extended to Nilanjani Mukarjee of the World Bank; Evelyn Suleeman of Insan Hitawasana Sejahtera; Erman Rahman, Alam and Niesje Angel Manembu, consultants of the World Bank’s Initiative for Local Governance Reform; I Nyoman Komang of DFID-Jakarta; Joan Harjono (DFID consultant); and Didiet Budi Sulistyowati of LPEM-FEUI, for their assistance in providing PPA site reports as well as constructive input. Without these site reports, the completion of the PPA consolidation study would have not been possible. We would particularly like to say thank you to Devi Ariandi, the Director of the Pradipta Paramitha Foundation, who was willing to cooperate with the SMERU Research Institute in conducting this research. We would also like to thank the Bappenas Secretariat Team for Macro Planning of Poverty Reduction, the Technical Assistants and the Task Force for the Formulation of the National PRSP, the KIKIS Secretariat, and the Secretariat of the Deputy VI (Office of the Coordinating Ministry of People’s Welfare), who provided comments and suggestions during the PPA consolidation study. We realize that this report would have not been successfully completed without the input and comments from Sudarno Sumarto (SMERU Director) and Asep Suryahadi (SMERU Deputy Director for Research), and help with the data processing, which was carried out by Maemunah and Rima Prama Artha. We would also like to thank Nuning Akhmadi, Kathryn Sadler, Liza Hadiz and Justin R. Sodo, for editing this report and translating it into English, as well as Mona Sintia for the layout of the report. Finally, we would like to convey our appreciation to the participants of the Workshop on the Inception Report and Workshop on the Final Report of the PPA Consolidation for their comments and suggestions, which contributed to the refinement of the results of this PPA consolidation study.

The SMERU Research Institute, December 2003 iv
FOREWORD This volume is the first part of the Consolidation of Participatory Poverty Assessments (PPAs) in Indonesia. The results of the PPA consolidation study are reported in two volumes: Volume I : Understanding the Voice of the Poor: Input for the Formulation of Poverty
Reduction Strategy Paper Volume II : Participatory Poverty Assessment for the Regional Poverty Reduction Strategy
Paper
This PPA consolidation study was conducted with the financial support of the Japan Bank for International Cooperation (JBIC) to acquire information on poverty which was gathered from studies that were conducted with the participation of the poor. The results of this study will be used to provide input for the formulation of Indonesia’s Poverty Reduction Strategy Paper (PRSP). The objectives of the PPA as elaborated in the Interim-PRSP (I-PRSP) were to: 1) identify the problems and causes of poverty; 2) identify alternative measures and successful poverty reduction indicators; and 3) identify participatory and sustainable mechanisms for establishing information networks on poverty. In the I-PRSP it was stated that the PPA would be conducted throughout 2003. Through discussions with a number of people, including the Deputy for Poverty Reduction at the Coordinating Ministry for People’s Welfare, it became apparent that government and non-government organizations had conducted numerous PPA and PPA-like studies. Therefore, in the short period available (October-December 2003), it was considered more useful to consolidate the existing PPA studies. Considering the importance of the results of the PPAs consolidated for the formulation of the PRSP, the SMERU Research Institute and the Pradipta Paramita Foundation agreed to carry out a consolidation study of these PPAs. In line with decentralization and regional autonomy polices, the PRS would be more effective if it were designed, implemented and evaluated by local governments. Therefore, the regional PRSPs are an important part of the national PRS framework, and the PPAs at the district level are an integral part of the regional PRSP formulation for which the local governments are responsible. The problem was that there were no guidelines on how to conduct PPAs for the formulation of the regional PRSPs. For the purpose of providing guidelines on how to conduct PPAs, the PPA consolidation study also prepared an alternative guideline that would serve as a reference for PPA implementation. Indeed, this consolidation study is far from ideal; for instance, this study was unable to consolidate PPA and PPA-like reports which had no site reports. Therefore, the sample was restricted to reports that included site reports (79 villages in 69 districts and 13 provinces). Despite its limitations, this consolidation provides an analysis based on the type of community (rice-farming, dry-land farming, forest and plantation, coastal fishing, and urban informal sector and labor communities), rural and urban areas, and regions (Java, Sumatra, Kalimantan, Sulawesi, and Nusa Tenggara), as well as the age and gender dimensions. In addition, the appendices of this report present detailed data including the actual terms used by communities. Based on this PPA consolidation, it is hoped that further consolidations that include other PPA reports will be conducted and will better represent the poverty conditions of all regions.

The SMERU Research Institute, December 2003 v
Finally, we hope that this study will be useful for the formulation of the national and regional PRSPs as well as the implementation of regional PPAs, but most of all, useful for the people, that is it will provide a way to escape poverty. This study is only an initial step in the whole PPA process, therefore, we are open to any criticism and suggestions, which can be communicated through email at [email protected] or by visiting our website, www.smeru.or.id.
Jakarta, December 2003
Research Team

The SMERU Research Institute, December 2003 vi
LIST OF ABBREVIATIONS AND ACRONYMS
ADB Asian Development Bank
Babinsa Bintara Pembina Desa Non-commissioned officers stationed in villages
Bappenas Badan Perencanaan Pembangunan Nasional
National Development Planning Board
BBM Bahan Bakar Minyak Refined Fuel
BKD Badan Kredit Desa Village Credit Board
BKK Badan Kredit Kecamatan Kecamatan Credit Board
BKKBN Badan Koordinasi Keluarga Berencana
National Family Planning Coordinating Board
BKPRM Badan Koordinasi Pemuda dan Remaja Mesjid
Mosques’ Youth Coordinating Board
BP3 Badan Pembantu Penyelenggaraan Pendidikan
School Parents Association
BPD Bank Pembangunan Daerah Regional Development Bank
BPD Badan Permusyawaratan Desa Village Representative Body
BPN Badan Perwalian Nagari Nagari Representative Assembly (West Sumatra)
BPR Bank Perkreditan Rakyat People’s Credit Bank
BPS Badan Pusat Statistik Statistics Indonesia
BRI Bank Rakyat Indonesia People’s Bank of Indonesia
CRS Catholic Relief Services (name of an NGO)
CU Credit Union
DFID Britain’s Department for International Development
DKM Dewan Keluarga Mesjid Mosque Welfare Council
FADO The name of an NGO
FGD Focus Group Discussion
FKPKM Forum Komunikasi Pembangunan Kota Malang
Communication Forum for the Development of Kota Malang (name of an NGO)
GTZ Deutsche fur Technische Zusammenarbeit-GmbH
HIPPA Himpunan Petani Pemakai Air Farmers’ Irrigation Association
HIPPAM Himpunan Petani Pemakai Air Minum
Farmers’ Drinking Water Association
HKSN Hari Kesetiakawanan Sosial Nasional
National Solidarity Day

The SMERU Research Institute, December 2003 vii
IDT Inpres Desa Tertinggal Aid for Community in the Underdeveloped Villages
ILGR-WB Initiative for Local Government Reform – World Bank
IPB Institut Pertanian Bogor Bogor Agricultural Institute
I-PRSP Interim Poverty Reduction Strategy Paper
IRM Ikatan Remaja Mesjid Mosques’ Youth Organization
JBIC Japan Bank for International Cooperation
JPSBK Jaring Pengaman Sosial Bidang Kesehatan
Health Component of the Social Safety Net Scheme
KAN Kerapatan Adat Nagari Nagari Traditional Law Assembly (West Sumatra)
Kesra Kesejahteraan Rakyat People’s Welfare Programs
KIKIS Kelompok Kerja Indonesia untuk Penanggulangan Kemiskinan Struktural
The Indonesian Working Group for the Reduction of Structural Poverty (name of an NGO)
KIPP TRIBINA
Name of an NGO
KKN Kuliah Kerja Nyata Obligatory internship for advanced university students
KNPI Komite Nasional Pemuda Indonesia
The Indonesian National Youth Committee
Kopdit Koperasi Kredit Credit Cooperative
KSP Koperasi Simpan Pinjam Savings and Loans Cooperative
KUD Koperasi Unit Desa Village Credit Cooperative
KUT Kredit Usaha Tani Credit for Small Farming Business
LMD Lembaga Musyawarah Desa Village Community Assembly
LPEM Lembaga Penyelidikan Ekonomi dan Masyarakat
Institute for Economic and Social Research
LPMD Lumbung Pangan Masyarakat Desa
Village Community Food Storage
LPMK Lembaga Pemberdayaan Masyarakat Kota
Institute for the Empowerment of Urban Communities
MPA Methodology for Participatory Assessment
MUD Majelis Ulama Desa Council of Moslem Religious Leaders at Village Level
NGO Non-Government Organization
NU Nadhlatul Ulama The name of a Moslem Association
OPK Operasi Pasar Khusus Special Market Operation
P2P Pengembangan Prasarana Pedesaan
Rural Infrastructure Development
P2TPD Prakarsa Pembaharuan Tata Pemerintahan Daerah
Initiative for Local Government Reform
The SMERU Research Institute, December 2003 viii
P3A Perkumpulan Petani Pemakai Air Farmers’ Irrigation Association
P3N Petugas Pembantu Pencatat Nikah Marriage Registrar Assistant
P4K Proyek Peningkatan Pendapatan Petani –Nelayan Kecil
Rural Income Generation Project
PAM Perusahaan Air Minum Water Supply Corporation
PAN Partai Amanat Nasional National Mandate Party
PAR Participatory Action Research
PBH Pemberantasan Buta Huruf Illiteracy Elimination Programs
Perhutani Perusahaan Hutan Negara Indonesia
State Forest Enterprise
PHAST Participatory Hygiene and Sanitation Transformation
PJTKI Perusahaan Jasa Tenaga Kerja Indonesia
Association of Labor Recruitment Agencies’
PKK Pembinaan Kesejahteraan Keluarga Family Welfare Program
PLA Participatory, Learning and Action
PLKB Penyuluh Lapangan Keluarga Berencana
Family Planning Extension Worker
PLN Perusahaan Listrik Negara State electricity company
PMTAS Program Pemberian Makanan Tambahan Anak Sekolah
A nutrition program for school children
PPK Program Pengembangan Kecamatan
The World Bank’s Kecamatan Development Program
Podes Potensi Desa Village Potential Survey
Polindes Pondok Bersalin Desa Village Maternity House
Posyandu Pos Pelayanan Terpadu Integrated Health Post
PPA Participatory Poverty Assessment
PPL Petugas Penyuluh Lapangan Extension Worker
PPN Petugas Pencatat Nikah (Penghulu)
Marriage Registrar
PRA Participatory Rural Appraisal
PRSP Poverty Reduction Strategy Paper
Puskesmas Pusat Kesehatan Masyarakat Community Healthcare Center
Pustu Puskesmas Pembantu Secondary Community Healthcare Center
Raskin Beras untuk orang Miskin Rice for the Poor Program
SARAR Self-esteem, Associative Strength, Resourcefulness, Action Planning, Responsibility
Sembako Sembilan Bahan Pokok Nine basic commodities
SPP Sumbangan Penyelenggaraan Pendidikan
Educational Management Contribution

The SMERU Research Institute, December 2003 ix
SSN Social Safety Net
Susenas Survey Sosial Ekonomi Nasional National Socio-economic Survey
UBSP Usaha Bersama Simpan Pinjam Savings and Loans Group
UED-SP Unit Ekonomi Desa-Simpan Pinjam
Village-level savings and loans unit
UI Universitas Indonesia University of Indonesia
UP2K Usaha Peningkatan Pendapatan Keluarga
Family Income Enhancement Program
USAID United States Agency for International Development
WTM The name of an NGO
YASPEM The name of an NGO
YBKS The name of an NGO
YIS Name of an NGO
The SMERU Research Institute, December 2003 x
GLOSSARY
Adat The rules or customs which have existed in a community for generations; a social system that consists of cultural values, norms, laws and regulations.
Anak Alam The name of an NGO.
Antre A local initiative that involves collecting rice from all households in a neighborhood. The rice is then used for collective purposes, such as providing rice in lieu of payment to security guards or assisting the needy, particularly if someone has died.
Arisan Community rotating savings group.
Bagan A bamboo hut on stilts in coastal waters which is used by people who are fishing.
Bajaj A two-passenger pedicab with a motor scooter engine.
Bakul A middleman or small-scale trader who buys farm produce which is then sold in a local market or to a wholesaler.
Bangdes (Inpres Pembangunan Desa)
Central Government Assistance for Village Development
Banjar alat pesta A group of people who share or lend items and equipment used for parties or celebrations to each other.
Banjar kematian A community-organized group that collects funds and provides assistance for funerals.
Bank Titil A moneylender who provides micro credits usually with high interest rates and daily installments.
Banpres (Bantuan Presiden)
Special presidential aid for household groups in the form of capital or in-kind assistance.
Becak Pedicab
Bekatul Rice husks
Belis Livestock, money or valuable goods given to a bride’s family.
Bimas (Bimbingan Masyarakat)
A government program aimed at increasing rice farming productivity through an intensive transfer of applied technology to farmers.
Bundo kanduang A group of women who are respected by the community and are requested to provide advice on matters relating to adat (West Sumatra).
Cabo A local market place (Sauk Motandoi, Bolaang Mongondow).
Calo A broker. In the context of this PPA, it refers to a broker who searches for migrant workers, domestic laborers, agricultural/plantation workers and construction workers.
Camat The head of sub-district administration office.
Candak kulak Small scale trading that involves buying inexpensive goods from big markets or wholesalers and then selling them at local markets.
Carano A kind of plate to place betel and areca nuts; used in adat ceremonies.

The SMERU Research Institute, December 2003 xi
Dansos (Dana Sosial)
Capital assistance distributed to the poor by the Ministry for Social Affairs.
Dasa Wisma A government program which aims to identify a village community’s progress in improving housing conditions and their health in general. It arranges neighboring households into groups of ten to oversee one another. Groups have now developed into community rotating savings groups as well as groups that organize posyandu activities.
Deres Make an incision in order to obtain sap from a rubber tree.
Dolog A branch of the State Logistics Agency (Bulog) at the provincial level.
Dukun A traditional healer.
Forum Anak Bangsa The name of an NGO.
Hajatan A celebration for a wedding or another important event such as circumcision or first communion.
Jimpitan A local initiative that involves collecting rice from all households in a neighborhood. The rice is then used for collective purposes, such as providing rice in lieu of payment to security guards or assisting the needy, particularly if someone has died.
Jinton A type of mushroom that grows on rubber trees (West Kalimantan).
Jukung A narrow boat which carries a maximum of 3-4 passengers or a boat made from a carved-out log which is used to carry passengers.
Kabupaten Regency. An autonomous administrative area that consists of several sub-districts (kecamatan). The head of a kabupaten is called a Bupati and is elected by the local house of representatives. Several kabupaten make up a province.
Karang Taruna Village Youth Organization.
Kecamatan Sub-district. An administrative area under a kabupaten or city which is headed by a Camat.
Kelurahan Village. The lowest level administrative unit under a sub-district (kecamatan). This term is officially used for villages in urban areas, but in some regions it refers to a village in rural areas. It is headed by a Lurah.
Kematian A community-organized group that assists with matters relating to the death of a group member.
Kintal A garden around a house that is planted with various plants, which are usually consumed by the household.
Kelompencapir (Kelompok Pendengar, Pembaca dan Pemirsa)
The listeners, readers or audiences of village programs broadcast either via radio or television, or published in magazines or newspapers.
Kondektur A conductor on a public vehicle. In the context of this PPA, conductors can also provide information on job vacancies and usually assist in the recruitment of drivers, conductors or conductor assistants.
Kontak Tani A prominent farmer that leads a group of farmers and acts as a source of information on new technology and technical innovations.

The SMERU Research Institute, December 2003 xii
Kuatir (Kadikuk Naeti)
Afraid or worried about matters that are still uncertain (East Sumba, East Nusa Tenggara).
Kuli mocok Casual laborers.
Lurah Village head in urban and rural areas.
Majlis Taklim A community-organized group that gathers to read and study the Koran.
Mandor tanam A foreman that supervises planting on plantations, usually recruits farm laborers and has the authority to fire them.
Mboe mbojo Very poor people (Nusa Tenggara).
Miskin Mayilla Poor people (Nusa Tenggara).
Moco-moco Work consisting of various odd jobs (Pematang Siantar and Langkat).
Ngujur A laborer who works along the beach and is given fish in lieu of pay.
Ninik mamak Uncles from the mother’s side (mother’s brother) who are respected as family leaders and whose role it is to guard adat (West Sumatra).
Nipah A type of palm tree.
Nyakap sampan Fishermen who use other people’s fishing boats; profit is determined based on a revenue sharing system.
Ojek Motorcycle taxi.
Pa’balang A person who funds the operation of fishing boats (Bulukumba, South Sulawesi).
Paguyuban A community organization based on kinship which usually aims to preserve or maintain the close relationship among members.
Paket A An open school program that provides distant learning for primary school-level students and allows students to sit primary school examinations at the end of the program.
Paket B An open school program that provides distant learning for junior high school-level students and allows students to sit junior high school examinations at the end of the program.
Palele A middleman; fish wholesaler (East Nusa Tenggara)
Palupuh A wall made of flattened bamboo.
Parelek A local initiative that involves collecting rice from all households in a neighborhood. The rice is then used for collective purposes, such as providing rice in lieu of payment to security guards or assisting the needy, particularly if someone has died.
PDKMK (Penanggulangan Dampak Kekeringan dan Masalah Ketenagakerjaan)
A government project which aimed to reduce the impact of the long drought due to El Nino by creating labor-intensive projects.

The SMERU Research Institute, December 2003 xiii
PDMDKE (Pemberdayaan Daerah dalam Mengatasi Dampak Kekeringan Dan Masalah Ketenagakerjaan)
A project which aimed to reduce the impact of the economic crisis by introducing labor-intensive jobs and community funds.
Penendak ikan A trader who buys fish directly from fishing boats.
Pengajian A community gathering to recite verses from the Koran.
Pesanggem A forest farmers’ group that holds a concession to manage a certain area in a forest.
PKD-PWT (Padat Karya Desa Pengembangan Wilayah Terpadu)
An intensive drought relief project.
Populele Mobile merchant who buys handloom cloths from weavers (East Nusa Tenggara).
Proyekan A labor-intensive program usually for building roads or carrying out other construction work. In this PPA it refers to food for work or other labor-intensive projects.
Punggawa A wealthy person or the foreman of a fishing boat (East Nusa Tenggara).
Rencek kayu Collecting firewood from the forest.
Rentenir Moneylenders who provide loans with a very high interest rate.
RK (Rukun Kampung)
Neighborhood Village Association (have been formally replaced by RW)
RT (Rukun Tetangga)
Neighborhood Association in urban and rural areas (lowest administrative unit)
RW (Rukun Warga)
Neighborhood Association in urban and rural areas (consisting of several RTs)
Sawi A laborer or poor fisherman (East Nusa Tenggara).
Surat Miskin A letter that verifies the holder as poor and allows that person to receive special assistance.
Sapi Sistem Paron A profit-sharing system between a cattle owner and the person who raises the cattle.
Ta’ziyah A visit to another person’s home to express condolences.
Tahlilan A gathering to pray for a person who has passed away; usually three, seven, one hundred and one thousand days after their death.
Takesra (Tabungan Kesejahteraan Keluarga)
Community Welfare Savings (micro credits provided by BKKBN to the recipients of family planning programs).
Tengkulak A middleman who buys agricultural products or other home industry products from farmers or producers.
Tiwul A food made of dried cassava.
Tukang Gali A digger

The SMERU Research Institute, December 2003 xiv
UEP (Usaha Ekonomi Produktif)
A credit scheme for small/micro enterprises under the Kecamatan
Development Program
Wali Jorong/Nagari Hamlet head (West Sumatra).
Yasinan A community gathering to recite verses from Surat Yasin (the 37th chapter of the Koran which is often read if someone is terminally ill or has recently died).
Yayasan Angkatan Laut
A foundation established by the navy.
Yayasan Dana Sosial
The name of a foundation.

The SMERU Research Institute, December 2003 xv
LIST OF CONTENTS
Page ABSTRACT ii ACKNOWLEDGEMENTS iii FOREWORD iv LIST OF ABBREVIATIONS AND ACRONIMS vi GLOSSARY x LIST OF CONTENTS xv LIST OF APPENDICES xvi LIST OF TABLES xvii LIST OF FIGURES xviii LIST OF BOXES xviii SUMMARY xix CHAPTER I. INTRODUCTION 1 1.1. Background 1 1.2. Objectives 2 1.3. Report Structure 3 CHAPTER II. FRAMEWORK OF THE STUDY 5 2.1. Participatory Poverty Assessments (PPA) 5 2.2. The Characteristics and Scope of this PPA Consolidation Study 9 2.3. The Conduct of the Study and the Analytical Processes 12 CHAPTER III. WHO ARE THE POOR? 15 3.1. Poverty Characteristics from a Community Perspective 15 3.2. Welfare Categories according to Communities 22 CHAPTER IV. THE POVERTY TRAP 26 4.1. The Causes of Poverty 27 4.2. Solutions to Poverty 54 CHAPTER V. EFFORTS TO REDUCE POVERTY 60 5.1. The Impact of Poverty and the Poor’s Coping Strategies 60 5.2. Institutions and Poverty Reduction Programs 69 CHAPTER VI. CONCLUSION AND RECOMMENDATIONS 76 6.1. Conclusion and General Recommendations 76 6.2. Notes for the Four PRSP Pillars 78 REFERENCES 81 APPENDICES 85

The SMERU Research Institute, December 2003 xvi
LIST OF APPENDICES
Page Appendix 1. A Summary of the Studies Consolidated and a Comparison of PPA Methodologies 86 Appendix 2. List of the PPA Locations 91 Appendix 3. Summary of the Poverty Characteristics Analysis 93 Appendix 4. List of Expressions – Poverty Characteristics 96 Appendix 5. A Breakdown of the Population Produced through Welfare Classification Exercises in Various Participatory Poverty Assessments 105 Appendix 6. Summary of the Analysis of the Causes of Poverty 106 Appendix 7. List of Expressions – Causes of Poverty 109 Appendix 8. Summary of the Analysis of the Problems Faced by the Poor 116 Appendix 9. List of Expression – Problems Faced by the Poor 122 Appendix 10. The Responsibilities of Women in the Household based on FDGs in Various Types of Communities 128 Appendix 11. The Responsibilities of Women in the Household based on FDGs in Urban and Rural Areas, in Java and Nusa Tenggara, and with Male, Female and Mixed Groups 129 Appendix 12. The Responsibilities of Men in the Household based on FDGs in Various Types of Communities 130 Appendix 13. The Responsibilities of Men in the Household based on FGDs in Urban and Rural Areas, in Java and Nusa Tenggara, and with Male and Female Groups 131 Appendix 14. The Responsibilities of Women in the Community based on FDGs in Various Types of Communities 132 Appendix 15. The Responsibilities of Women in the Community based on FGDs in Urban and Rural Areas, and in Java and Nusa Tenggara 133 Appendix 16. The Responsibilities of Women in the Community based on FGDs with Female and Male Groups 134 Appendix 17. The Responsibilities of Men in the Community based on FGDs in Various Types of Communities 135 Appendix 18. The Responsibilities of Men in the Community based on FGDs in Urban and Rural Areas, and in Java and Nusa Tenggara 136 Appendix 19. Violence Against Women in the Past and at Present based on FGDs in Various Types of Communities 137 Appendix 20. Violence against Women at Present based on FGDs in Urban and Rural Areas, in Java and Nusa Tenggara, and with Male, Female and Mixed Groups 138 Appendix 21. Types of Assets Mentioned by the Communities 139 Appendix 22. Summary of the Analysis of the Solutions to Poverty 140 Appendix 23. List of Expressions – Soluti0ons to Poverty 144 Appendix 24. Summary of the Analysis of the Impact of Poverty 149 Appendix 25. List of Expressions - Impact of Poverty 152 Appendix 26. Summary of the Analysis of the Poor’s Coping Strategies 156 Appendix 27. List of Expressions – the Poor’s Coping Strategies 158 Appendix 28. Summary of the Analysis of the Effectiveness of Programs Mentioned in PPAs in 19 Villages 162 Appendix 29. Comments on Programs and Projects 163 Appendix 30. Summary of the Analysis of the Importance of Various Institutions 166 Appendix 31. Summary of the Analysis of the Trustworthiness/Proximity of Various Institutions 174

The SMERU Research Institute, December 2003 xvii
Appendix 32. The Trustworthiness of Various Institutions based on the Average Scores obtained in PPAs conducted by the World Bank in 5 Villages in Java 180 Appendix 33. Summary of the Analysis of the Proximity of Various Institutions 182 Appendix 34. Summary of the Analysis of the Institutions Communities can Influence based on PPAs with 43 Discussion Groups in 10 villages 190 Appendix 35. Summary of the Analysis of the Effectiveness of Various Institutions 193 Appendix 36. Summary of the Analysis of the Effectiveness of Various Institutions based on the Scores obtained in PPAs conducted by the World Bank in 9 villages 199 Appendix 37. Summary of the Analysis of the Institutions that Provided Assistance during the Economic Crisis 202 Appendix 38. Summary of the Analysis of the Institutions that Provide Information and Assistance 205 Appendix 39. Names and Types of Institutions 209 Appendix 40. List of Materials Consolidated 211
LIST OF TABLES
Page Table 2.1. Range of Locations and Types of Livelihoods 10 Table 2.2. Information Collected from PPA/PPA-Like Studies 11 Table 3.1. The Order of Characteristics of Poor Families based upon How Frequently they Came up in PPAs 16 Table 3.2. Characteristics Used as Indicators to Identify the Poor in Urban and Rural Areas 17 Table 3.3. Characteristics which are Most Often and Least Often Used as Indicators of Poverty in Western and Eastern Indonesia 18 Table 3.4. Poverty Characteristics Most Often Used in Communities with Different Livelihoods 19 Table 3.5. Poverty Characteristics Proposed by Female Discussion Groups and Male Discussion Groups 21 Table 3.6. Poverty Characteristics Used as Indicators by Groups of Young Respondents and Groups of Old Respondents 22 Table 3.7. Percentage of People in each Welfare Level based upon PPA Results in Rural and Urban Areas 23 Table 3.8. The Proportion of People in each Welfare Levels based upon PPA Results in Several Areas 23 Table 3.9. Proportion of People in each Welfare Level according to PPA Results in Communities with Different Livelihoods 24 Table 3.10. Comparing Poverty Figures from PPAs and Poverty Mapping in Several Areas 25 Table 4.1. Sequence of Factors which Cause Poverty and the Problems which the Poor Face, Based upon the Frequency that they were Mentioned in PPAs 33 Table 4.2. Male and Female Responsibilities at Home and in the Community 39 Table 4.3. Decision-Making at Home and in the Community 40 Table 4.4. Causes and Problems of Poverty – Powerlessness Factors 43 Table 4.5. Causes and Problems of Poverty – Isolation Factors 45 Table 4.6. Causes and Problems of Poverty – Material Poverty Factors 47 Table 4.7. Causes and Problems of Poverty – Physical Weakness Factors 49 Table 4.8. Causes and Problems of Poverty – Vulnerability Factors 52

The SMERU Research Institute, December 2003 xviii
Table 4.9. Causes and Problems of Poverty – Behavioral and Attitude Factors 53 Table 4.10. The Order of Solutions to Poverty based on how often they were Mentioned in PPAs 55 Table 4.11. Various Solutions to Poverty as Mentioned in Urban and Rural Areas 56 Table 4.12. Various Solutions to Poverty Frequently Mentioned in Different Regions 57 Table 4.13. Various Solutions to Poverty as Mentioned in Different Types of Communities 58 Table 5.1. The Impact of Poverty based on the Frequency with which they were Mentioned in PPAs 61 Table 5.2. The Various Impacts of Poverty in Rural and Urban Communities based on How Frequently they were Mentioned 63 Table 5.3. The Various Impacts of Poverty in Western Indonesia and Eastern Indonesia based on How Frequently they were Mentioned 64 Table 5.4. The Dominant Impacts of Poverty in Different Types of Communities based on How Frequently they were Mentioned 65 Table 5.5. The Impacts of Poverty according to Female and Male Respondents based on How Frequently they were Mentioned 65 Table 5.6. The Ten Main Coping Strategies of the Poor in the Rural and Urban Areas 68 Table 5.7. Main Coping Strategies in Different Communities 68 Table 5.8. Order of Institutions Considered Important, Close, Effective, and that Provide Information and Assistance 71 Table 5.9. The Effectiveness of Various Poverty Reduction Programs Presented in Several PPAs 72 Table 5.10. The Order of Institutions that are Considered Important and Close According to Female and Male Respondents 74
LIST OF FIGURES
Page Figure 4.1. A Diagram of the Causes of Poverty, Developed through a Discussion with a Group of Women in Lumumba Dalam, Kelurahan Ngagel – Surabaya 29 Figure 4.2 A Diagram of the Causes of Poverty, Developed through a Discussion with a Group of Men in Lumumba Dalam, Kelurahan Ngagel- Surabaya 30 Figure 4.3 A Diagram of the Causes of Poverty, Developed through a Discussion with a Group of Women in Desa Kawangu, East Sumba 31 Figure 4.4 A Diagram of the Causes of Poverty, Developed through a Discussion with a Group of Young Men in Desa Kawangu, East Sumba 32 Figure 4.5. A General Illustration of the Poverty Trap 34 Figure 4.6. Poverty Trap Illustrations in Urban and Rural Areas 35 Figure 4.7. Poverty Trap Illustrations in Western and Eastern Indonesia 35 Figure 4.8. Poverty Trap Illustrations in Different Types of Communities 36 Figure 4.9. Poverty Traps Illustrations according to Groups of Respondents 37
LIST OF BOXES
Page Box 1.1. Poverty Reduction Strategy Framework as Proposed in I-PRSP 1 Box 4.1. The Dynamics of Male and Female Roles at Home and in the Community 38 Box 4.2. Patterns of Control over Household Assets 51 Box 5.1. The Various Coping Strategies of the Poor 66

The SMERU Research Institute, December 2003 xix
SUMMARY This report is a consolidation of several Participatory Poverty Assessments (PPAs) and PPA-like studies which were carried out in Indonesia by various institutions. The objective of this study is to understand the complexity of poverty and to provide input for the formulation of the National Poverty Reduction Strategy Paper (National PRSP). This study also compares several methods used in PPA/PPA-like studies to identify their strengths and weaknesses for the purpose of developing a PPA implementation guide for formulating Regional PRSPs. This report (Volume I) analyzes poverty issues based on the various PPA/PPA-like studies consolidated. The following report (Volume II) offers an alternative implementation guide for conducting PPAs for the formulation of the Regional PRSPs. This study was conducted for three months, between October and December 2003. It consolidates PPA/PPA-like studies carried out in 79 locations (58 rural areas and 21 urban areas) in 39 districts (kabupaten and kota) throughout Indonesia. Based on the livelihood of the communities, these studies were carried out in 22 rice farming communities, 12 dry-land farming communities, 17 forest and plantation communities, 11 coastal fishing communities, 10 urban labor and informal sector communities, 7 mixed labor, informal sector and rice farming or coastal fishing communities. These studies were conducted by the World Bank (Consultations with the Poor, 1999), Insan Hitawasana Sejahtera (Micro Study for Identifying Local Proxies of Poverty Indicators, 2002 dan 2003), FKPKM (documented by KIKIS, 1999), DFID (People, Poverty and Livelihoods, 2000), and ILGR-the World Bank (Poverty Assessment at the Cluster Level, 2003). These studies were selected because they directly involved the poor and used a paticipatory approach. This study is based on an analysis of various field reports of PPA/PPA-like studies. Field reports were used as they provide detailed information on local situations, thus even though each study was conducted for different purposes, relevant information could still be obtained. Information collected from PPA/PPA-like studies included: general information on the location and community; welfare categories and the proportion of people in each category; characteristics of poverty; causes of poverty; problems faced by the poor; solutions to poverty; impact of poverty; coping strategies adopted by the poor; the poor’s perceptions of various institutions that influence their lives; effectiveness of various poverty reduction programs; and various issues relating to gender. This information was collected to address the objectives of this study, which are to:
• Identify the multidimensional aspects of poverty • Identify the causes and effects of poverty • Determine the effectiveness of efforts conducted to reduce poverty • Identify the strengths and weaknesses of methods used in various PPAs
This study is limited by the fact that it is based on the results of PPA/PPA-like studies conducted by different institutions for different purposes and using different methods. These have affected the geographical scope of this study, the scope of issues analyzed, as well as the depth of the analysis. Because this study was conducted in a relatively short period, the number of studies consolidated is also limited. Another limitation stems from the fact that this study is based on studies carried out by other institutions and thus the research team had no control over the quality of the studies being consolidated.

The SMERU Research Institute, December 2003 xx
Findings In general, this study has shown that poverty is multidimensional. Poverty is not only a condition relating to food shortages and a lack of assets, but also restlessness and limited participation in community activities. By incorporating frequency analysis, this study was able to identify a number of general poverty issues found in most regions and the differences between poverty in rural areas and urban areas. Moreover, this study also revealed differences between poverty in western Indonesia (Java and Sumatra) and eastern Indonesia (Kalimantan, Sulawesi and Nusa Tenggara), differences in poverty in various communities based on their livelihood, and differences in how the young and old, and men and women perceive poverty. Almost all of the reports that were collected provided information on the charateristics of poverty, causes of poverty, the problems faced by the poor, the impact of poverty, solutions to poverty, and the coping strategies adopted by the poor. Because information on institutions gathered through PPA/PPA-like studies varied, this analysis was limited to only covering the similar issues. Information relating to program effectiveness was quite limited and lacked depth. Therefore, this study was unable to provide an in-depth analysis of the effectiveness of various poverty reduction efforts. Who Are the Poor?
• The characteristics and criteria used to identify poor people are varied, although in general they refer to land ownership, type of work or level of income, the conditions of daily life, and relations with other members of a community. Characteristics used as references in most areas were, among others: 1) the physical condition of a house, 2) the level of education amongst children, 3) the kind of work or wage obtained, and 4) the ability to meet food needs.
• When further observed, it was discovered that although the references were the same,
the standard of poverty was different. This fact reflects the differences in living standards, culture, and the availability of local resources, all of which reflect the subjectiveness of poverty measurements adopted by each community.
• Rural communities tend to identify the poor by their ability to meet food needs and
land or livestock ownership. Urban communities on the other hand, tend to consider the type of work, level of income, level of education, health conditions, and conditions in daily life.
• Poverty characteristics used by communities in western Indonesia are slightly different
to those in eastern Indonesia. Communities in western Indonesia tend to use the type of work and level of income as references, while communities in eastern Indonesia tend to use the physical condition of a house, the ability to meet food needs, land ownership, and ability to pay for medical treatment as references.
• Looking at different communities, there is an indication that poverty among fishing
communities is more severe compared to other communities, because the characteristics expressed were even more varied and of a greater frequency. Another tendency is that difficulties in meeting food needs is a dominant reference in measuring poverty in dry-land farming communities, which reflects the high vulnerability of this community to food shortages.

The SMERU Research Institute, December 2003 xxi
• The analysis of the characteristics of poverty also indicates the differences in perspectives on poverty between the young and the old, as well as between men and women. Older respondents tend to use ownership of assets and ability to meet education and health needs as references to identify poor people. Whereas younger respondents tend to use references that are related to the type of work, education and ability to work. Female respondents tend to use characteristics relating to ownership of assets such as land and conditions in daily life. Male respondents, on the other hand, use income, ownership of various business assets and education as references. These differences are influenced by the division of labor along gender lines in the household.
• A comparison of the estimations of the proportion of poor people by the communities
involved in the PPAs and estimations from quantitative studies shows that the level of poverty in urban areas based on the communities’ estimations is far higher than that estimated in quantitative studies. On the contrary, most poverty estimates in rural communities are quite close to the results of quantitative studies.
The Poverty Trap
• The causes of poverty most frequently referred to were a lack of capital, education and skills, and employment opportunities, and a low level of income.
• Problems that were most frequently referred to were a lack of transportation facilities
and poor road conditions, as well as high education fees.
• To gain a greater understanding of the factors that cause poverty, this study uses a “poverty trap” analysis; a modification of the “deprivation trap” theory. For this purpose, a number of factors which cause poverty and the problems faced by poor communities were grouped into six factors, including powerlessness, isolation, material poverty, physical weaknesses, vulnerability, and attitude/behavior. Through this analysis, it became apparent that powerlessness factors were the most dominant.
• This analysis also revealed that there are differences between a community’s perception
of the causes of poverty and the problems they face. An analysis of the causes of poverty showed that material poverty factors were dominant. On the contrary, in the analysis of problems being faced, it was apparent that isolation factors were more dominant. This fact indicates the need for a thorough analysis in designing poverty reduction programs that provide capital. If isolation is not dealt with, capital-oriented programs will fail to free communities from poverty.
• There are some differences between urban poverty and rural poverty. Powerlessness is
the group of factors that were referred to more frequently in urban areas, while isolation and material poverty factors were mentioned more frequently in rural areas. Powerlessness in urban areas was referred to in the context of the high price of goods and unemployment. “Fate” was the powerlessness factor mentioned in rural areas, which reflects the people’s powerlessness in escaping the poverty trap that they have experienced for generations, as well as powerlessness against the lack of employment outside the agricultural sector, the low price of the goods they produce, high education costs, and lack of government assistance, particularly community education.
• In general, the illustration obtained from the poverty trap in western Indonesia was not
too different from that in eastern Indonesia, although powerlessness factors tended to be mentioned slightly more in eastern Indonesia, due to the high cost of traditional

The SMERU Research Institute, December 2003 xxii
rituals. But further observation showed that there were different patterns in the causes of poverty and problems faced due to poverty in various islands.
• There are some variations in the causes of poverty and the problems faced by
communities with different livelihoods. Land ownership and transportation problems were the factors most frequently mentioned by rice farming communities. The low price of goods produced was more frequently mentioned in dry-land farming communities and forest and plantation communities. Coastal fishing communities referred to the lack of capital, including fishing equipment, more frequently, while labor and informal sector communities mentioned a lack of employment opportunities more frequently. The poverty trap analysis showed that powerlessness factors were quite dominant in the coastal fishing communities and that isolation factors were relatively low in the urban informal sector and labor communities.
• There are differences in the experiences of young and old respondents in poverty. In
relation to the causes of poverty, younger respondents indicated that job dismissals, low level of education and high living expenses are the main causes. Older respondents, on the other hand, mentioned difficulties in managing their agricultural businesses, lack of land ownership, and no job opportunities, more frequently. In addition, younger respondents referred to health, security and government assistance issues more frequently than older respondents.
• Women and men also have different experiences in living in poverty. Women tended
to mention difficulties in managing daily life more frequently, and men tended to refer to difficulties in obtaining an income more frequently. It seems that this difference is related to the existing division of labor along gender lines that assigns the role of managing the household to women and the role of making a living to men.
• Several PPAs mentioned that there have been slight changes in the roles that men and
women play, both in the household and in the community. The role of women in providing financial support has tended to increase in urban areas, particularly among laborers and those working in the informal sector. Women’s involvement in community activities has also increased, but at the same time their involvement in decision-making at the village level has remained very low.
• Isolation factors were more prominent among male respondents because men more
often face limited access to work. On the other hand, powerlessness factors are more dominant for women.
• Analysis of ownership and control of assets revealed the vulnerability of women to
poverty if their husbands died, particularly if there were no children from the marriage.
• In order to escape poverty, a combination of external assistance and individual effort is required. In general, capital assistance, employment opportunities, hard work, an increase in education levels and skills, transportation improvements, community education, and a decrease in education fees were the factors most frequently mentioned in order to escape poverty.
• To escape poverty, the need for capital, increase in skills, decrease in education fees,
work opportunities, and control of the prices of consumer goods were more frequently referred to in urban areas than in rural areas. Solutions required to escape poverty mentioned in rural areas included hard work and improvements in transportation, in addition to God’s will. This last factor reflects the apathetic attitude of the poor which

The SMERU Research Institute, December 2003 xxiii
may be caused by their perception that there is very little chance to ever escape poverty.
• These various perceptions on how to escape poverty brought about the view that there
is a need for specific efforts in certain regions. In Nusa Tenggara, there is a specific need to increase security in order to guard against livestock theft. Rice farming communities specifically expressed the need for capital assistance, transportation improvements, and improvements in skills. Dry-land farming communities need mass education (extension work/training) and government assistance in pest control. Forest and plantation communities mentioned the need for hard work, capital assistance, and an increase in the level of education. Beside the need for capital assistance, coastal fishing communities referred to the need for hard work, and an increase of education levels and skills. Another effort quite frequently mentioned by this community was to find work in another region. Urban informal sector and labor communities need capital assistance, employment opportunities, increases in skills, reduction in education costs, and hard work.
The Impact of Poverty and Poverty Reduction Efforts
• The impacts of poverty include a failure to fulfill basic needs, limited access to an adequate income, restlessness, and the emergence of various social problems, such as crime, gambling, prostitution, and juvenile delinquency.
• The impact of poverty in urban areas is far more complex than that in rural areas. The
dominant impact of poverty in rural areas is the inability to meet food needs. In urban areas, in addition to the impacts common in rural areas, a number of social problems have also emerged.
• The impact of poverty in different communities based on livelihood indicates that
special attention is needed for coastal fishing communities, because they face problems in meeting food needs as well as difficulties in obtaining an income.
• The impact of poverty upon women is different from that upon men. Women more
frequently indicate the impact of poverty on daily life and the rise of restlessness, while men more frequently mention the impact of poverty on meeting housing needs and paying for medical treatment. These differences are related to the division of labor along gender lines in the household.
• To solve the problems they face, the poor implement a number of coping strategies in
accordance with their capabilities and the available resources. A strategy often mentioned was borrowing money or goods from a number of informal sources. Other strategies included undertaking a number of odd jobs, wives being required to “work”, utilizing the natural resources around them, or working in another region. Other strategies often mentioned were to economize by substituting certain kinds of food with less expensive food and to organize their finances. A number of strategies used by the poor indicate their high dependency on traditional social networks, their family’s economic capacity and resources, as well as the resources around them. This fact also showed the low contribution of government programs in helping the poor solve the problems they face.
• Institutional analysis also reaffirmed the major role of various informal institutions in
the lives of the poor. Among these institutions, relatives, neighbors, and prominent community figures, are considered the most important, the closest and are the best

The SMERU Research Institute, December 2003 xxiv
sources of information and assistance, even though they are considered not too effective. Informal economic institutions such as stalls, brokers, landlords, proprietors and rentenir are the institutions considered most important as well as being the closest, particularly for women. Most men considered small-scale formal economic institutions, such as savings and loans units and cooperatives, to be quite effective, but they considered these institutions to be very distant from their daily activities. Meanwhile, large-scale formal economic institutions were considered even more distant. This information indicates that economic institutions supported by the government have not touched the lives of the poor, thus they are still dependent on informal institutions.
• In the case of government institutions, the community still considered low level
institutions, such as the rukun tetangga (RT) and the rukun warga (RW), the village office and the kecamatan office as the closest, most important, most effective institutions, and the best sources of information and assistance. This was also the case for midwives who were considered to be the closest health service providers, whereas hospitals were considered distant from the lives of the people in the community. Other important information obtained was that government agricultural extension workers (PPL) were assessed as less important, more distant, and less trusted by rice farming and dry-land farming communities.
• Several community assessments on poverty reduction programs showed that non-social
safety net (non-SSN) programs were considered more important, closer, and more effective compared to social safety net (SSN) programs. However, both SSN and non-SSN programs were ranked lowly by communities, and this indicates that they are considered less important, more distant and less effective. The advantage of SSN programs, however, was more often mentioned by women than by men.
Comparison of Methods Used in Various PPAs and PPA-like Studies The five studies that were consolidated used fairly different methods, although they generally consisted of a combination of in-depth interviews, observation, and focus-group discussions (FGDs) with or without tools. After examining the methods used in each PPA report, it was concluded that attention should be given to the following issues:
• Participatory research requires a sufficiently long amount of time to allow for community involvement in the analysis process, to conduct triangulation of the information collected, and to probe all the information gathered.
• In general, FGDs that used tools provided richer and broader information.
• An important aspect of PPAs is the deep understanding and broad knowledge of the
facilitator regarding the issues and information being explored, so that she/he is able to lead discussions and obtain the information needed.
• Not all information can be obtained through FGDs, therefore in-depth interviews and
observation are required to enrich information.
• Written reports need to include the results obtained by the various tools used in FGDs as well as information on the location, the communities involved and explanations of the results of the discussions with communities.

The SMERU Research Institute, December 2003 xxv
Conclusions and Recommendations This study shows that poverty is a very complex phenomenon that is influenced by a number of interrelated factors. Thus, a poverty reduction strategy paper (PRSP) cannot be formulated based upon a collection of programs that are aimed at overcoming various elements of poverty individually. A poverty reduction strategy should be an integrated and interrelated effort to systematically eliminate the factors that hinder the poor’s access to a better standard of living. It is this strategy that is embedded in the concept of mainstreaming poverty reduction efforts. The consequence of this approach is that it is crucial to see the connection between the four pillars that were recommended in the interim PRSP.
The issues that were most frequently raised in PPAs were limited education and skills, as well as a lack of employment opportunities, a lack of access to capital and an adequate income. This reaffirmed the analyses that highlighted the gap between the education system and the existing employment and business opportunities. Therefore, it is important to reassert the strategic value of integrating the education system and the labor market as well as creating business opportunities in order to reduce poverty. The fact that these issues emerged in different forms in various PPAs, demonstrates that in order to overcome these problems, the national strategy should be complemented with local strategies. The results of this study also showed that the perceptions and interests of young people are different from that of older people. The perceptions and interests of women are also different from that of men. These differences need to be taken into account when observing the effects and benefits of policies and programs on various groups in the community, so that all groups will benefit equally from policies or programs. Furthermore, because of these differences, the representation of these groups in policymaking processes and policy implementation must be ensured so that their views and interests can be accommodated equally. The dominance of powerlessness factors as the causes of poverty and the problems faced by the poor supports the view that there is a need for social-economic policies that accommodate the interests of the poor. Providing direct aid for the poor will not be sufficient in reducing poverty. Social-economic policies that assure the fulfillment of basic needs for poor communities and access to opportunities to improve their welfare level are more crucial in reducing poverty. The gap between the analysis of the causes of poverty – that indicates the dominance of material poverty as the cause of poverty – and the analysis of the problems faced by the poor – that indicates the dominance of isolation factors – reminds us that a deep understanding of the people’s lives is required before deciding to provide capital assistance. Capital assistance per se will not help the poor escape from poverty if various obstacles particularly isolation problems are not solved. The results of the poverty trap analysis also showed that there are factors which are not too dominant, namely physical weaknesses, vulnerability, and behavior/attitude. Although these factors are not dominant on a national scale, it does not mean that they do not need to be addressed. The analysis conducted in this study is limited because it is based on how frequently a case was mentioned, and does not reveal the root of the problem. There is a possibility that factors that are not too dominant at the national level are actually a core problem at the local level. Therefore, an analysis at the local level is needed to detect core local problems that will then form the foundation for the formulation of strategies at the local level.

The SMERU Research Institute, December 2003 xxvi
The complexity of poverty problems and the large range of problems in various regions reassert the need to formulate poverty reduction strategies that are locally specific. Therefore, the National PRSP should contain strategies that can direct national social-economic policies as well as direct assistance and facilitation for the formulation and implementation of regional strategies that address local problems. Recommendations for the four pillars of PRSP: Pillar 1: Poverty is caused by a lack of employment sectors and at the same time this situation reduces job opportunities that can be accessed by the poor. The poor’s low access to job opportunities is partly due to low education, lack of information and lack of capital ownership. To break this poverty cycle, there is a need to develop a climate that is conducive for businesses that absorb the labor force of poor communities and businesses run by the poor. Pillar 2: In the PPAs, communities did not mention that there is a lack of access to decision-making processes concerning public policies. This does not mean that they already have sufficient access to this process, but reflects the fact that the poor are not aware of their rights to participate in policy making. Therefore all levels of government institutions should be open to the participation of the poor and invite communities to participate in decision-making regarding the policies that will affect their lives. At the same time, these efforts need to be accompanied by assistance and an improvement in the communities’ ability to actively participate in policy making. Pillar 3: Education is the primary means for poor people to break away from poverty as well as hope for their children to ever escape poverty. Considering that at present the highest level of education for the majority of Indonesian children is primary school, our education paradigm needs to be altered. Teaching at primary and secondary schools should be directed to practical knowledge and technical skills rather than emphasizing theory, in order to provide a foundation that will develop the relevant skills needed in life. Pillar 4: Social protection in the context of poverty reduction goes beyond the problems of the aged, the disabled, and the very poor. Vulnerability can emerge due to a loss of work and bankruptcy as a result of the economic crisis, social conflict, pest infection, and natural disasters. Social protection against these threats needs to be designed in an integrated way so that access to food, education, health services and work can be ensured.

The SMERU Research Institute, December 2003 1
I. INTRODUCTION 1.1. Background This study consolidates several Participatory Poverty Assessments (PPA) which have been carried out in Indonesia. The objectives of this study are to enrich understanding on poverty in Indonesia and to provide input to the government for the formulation of the poverty reduction strategy paper (PRSP). In the interim poverty reduction strategy paper (I-PRSP), the Indonesian government stated its commitment to re-formulate long-term strategies (2004 – 2015) for the reduction of poverty, which will be put fourth in the poverty reduction strategy paper (PRSP). The I-PRSP underlines that the full PRSP will be developed based on a combination of the theoretical analyses and empirical evidence from the community, and that the formulation of the PRSP will use a participatory approach. In addition, the I-PRSP proposed two main methods of reducing poverty including by increasing the poor’s income and decreasing their expenditure. To carry this out, the I-PRSP proposed four main strategies (pillars), including broadening opportunities, community empowerment, capacity building, and social protection (see Box 1.1.).
The understanding of the multi-dimensional aspects of poverty and the fact that there are flaws in several poverty reduction programs which have already been implemented, raise the need to involve broader stakeholders, particularly the poor, in formulating and implementing poverty reduction programs. Responding to this challenge, various participatory approaches, including Participatory Poverty Assessments (PPA), have been introduced. The World Bank induced the PPA process for the formulation of the PRSP and it has been implemented in
Box 1.1. Poverty Reduction Strategy Framework as Proposed in I-PRSP
The I-PRSP proposes two main methods to mainstream poverty reduction policies and programs in 2003-2004, including: (a) Increasing income through increasing productivity, to enable the poor to have the
management capabilities, opportunities, and protection to obtain a higher income from a variety of economic, sociocultural, and political activities; and
(b) Decreasing expenses through reducing the cost of basic necessities, by providing access to inexpensive education, health and infrastructure, which facilitates and supports socioeconomic activities.
This will be carried out through four main strategies, including: (1) Broadening opportunities, that is the government along with the private sector and society
will create new employment and business opportunities for the poor; (2) Community empowerment, that is the government, private sector and society will empower
the poor so that they are able to exercise their economic, social and political rights, control decisions that affect their lives, express their aspirations, and identify their own problems and needs;
(3) Capacity building, that is the government, the private sector and society will increase the capacity and ability of the poor so that they are capable of working more productively and protecting their interests; and
(4) Social protection, that is the government through public policies will encourage the private sector and society to provide protection and security for the poor, in particular the most disadvantaged groups (indigents, the elderly, neglected children, and the disabled) and those forced into poverty as a result of natural disasters, the negative effects of economic crises, and social conflict.
Source: I-PRSP, pp 23 – 24.

The SMERU Research Institute, December 2003 2
several countries.1 However, PPA is not just a tool for poverty analysis, but is also a means to assist the poor in understanding their capabilities and opportunities to be able to overcome their own problems. Initially, it was mainly non-government organizations (NGOs) that used various participatory approaches in assisting and facilitating the poor at the grassroots level. But, in general, the findings of participatory studies were considered as locally-specific and were thus unreliable for national level policies. Given developments, however, some poverty studies, which were carried out using participatory approaches, were able to provide different perspectives of poverty by presenting poverty analyses from the viewpoint of the poor. The World Development Report 2000/1 which embraced poverty as its theme, for example, provided an analysis based upon quantitative studies which had been enriched with the results from qualitative studies through PPAs carried out in 23 countries.2 It is widely accepted that policy formulation, particularly regarding poverty reduction strategies, should take into account the voices of the poor. However, it is not an easy task. While quantitative studies provide data with a sufficient degree of representation and a reliable methodological base, qualitative studies, including PPAs, provide information that is often considered as anecdotal and unable to be scaled up to the national level. Therefore, it is necessary to devote systematic efforts to convey the opinions of the poor obtained through PPAs at the community level to influence policy. In an effort to support the formulation of the PRSP, the SMERU Research Institute in collaboration with the Pradipta Paramitha Foundation and with the support of the Japan Bank for International Cooperation (JBIC), has carried out a study on poverty, based upon PPA/PPA-like studies carried out by a number of institutions in Indonesia. National and international institutions have carried out a number of PPA/PPA-like studies in several regions in Indonesia. These studies have different aims and are included in reports with a different emphasis.3 This study attempts to systematically consolidate the findings from PPA/PPA-like studies in order to enrich understanding on poverty in Indonesia, by providing an analysis based upon the voices of the poor. 1.2. Objectives In general, this study consolidates and analyzes findings from PPA/PPA-like studies, which have been carried out in Indonesia by several institutions. It is hoped that this analysis will enrich and deepen understanding of the characteristics and conditions of poverty in Indonesia. This study also intends to compare the methodologies used in the above studies, in order to identify their strengths and weaknesses. Based on this comparative study, PPA methods to formulate regional PRSP will be developed after taking into account the support provided by international organizations such as the World Bank, GTZ, and USAID. More specifically, the objectives of this PPA consolidation study are: 1. to identify the multi-dimensional aspects of poverty; 2. to identify the causes and effects of poverty; 3. to identify the effectiveness of poverty reduction programs, both formal and informal;
1 The World Bank has made the participatory approach in formulating PRS a prerequisite for the provision of debt relief for poor countries. As a result, several countries in Africa, such as Kenya and Uganda have taken up this approach. Countries in Asia, such as Vietnam and Cambodia, have also adopted a participatory approach in formulating poverty reduction strategies. 2 Nerayan et al. (2000) compiled the results from PPA in these 23 countries. 3 The results from several studies have been compiled in comprehensive reports, such as Mukherjee (1999) and Mukherjee, Hardjono and Carriere (2002).

The SMERU Research Institute, December 2003 3
4. to suggest effective ways to reduce poverty based upon the four main pillars contained in the I-PRSP;
5. to identify the methodological weaknesses in current PPAs; and 6. to develop PPA methods for formulating regional PRSPs. In order to attain these objectives, this study will attempt to: • Analyze the aspects, causes and effects of poverty Based on PPA/PPA-like studies, the analysis tries to answer the following questions: “Who are the poor and what difficulties do they face?” and “Why are they poor?” These questions will be answered through identifying the multi-dimensional aspects of poverty, as well as by relating the causes and effects of poverty at the national level to the four pillars of the I-PRSP. • Analyze the effectiveness of formal and informal attempts to reduce poverty By evaluating the effectiveness of formal and informal attempts to reduce poverty as reported in various PPA, this study will try to answer the following questions: “What are the poor’s coping strategies and safety nets?” and “How and to what extent do the existing anti-poverty measures assist the poor?” • Provide recommendations for effective intervention for the poor Based on the two analyses above, recommendations for effective intervention will be formulated in the framework of poverty reduction efforts in line with the pillars of the I-PRSP. • Formulate PPA methods for regional PRSPs The PPA methodology for the formulation of regional PRSPs will be developed based upon a study on PPA methodologies which tries to see how far PPA are capable of answering questions such as: “Who are the poor and what difficulties do they face?” “Why are they poor?”, “What are the poor’s coping strategies and safety nets?”, and “How and to what extent have the existing anti-poverty measures assisted the poor?” 1.3. Report Structure This report is the first of two volumes that have been prepared based on the results of the PPA consolidation study. This first volume contains a poverty analysis based upon a number of PPA/PPA-like studies which were carried out in Indonesia. This report consists of six chapters. Chapter I provides the background of the study, its general and more specific objectives, as well as the general structure of the report. Chapter II presents the framework of this study. This chapter begins with a discussion on the broad definition of PPA, the criteria for the selection of studies that were consolidated, and methodological comparison of the above studies. The following section explains the nature and scope of this study as well as its limitations. The final section of this chapter discusses the conduct of the study and the analysis, which took place between October and December 2003. Chapter III explains the ways communities identify poor people or poor families in their locality. The first section of this chapter presents the characteristics of poverty according to communities. This analysis reveals the characteristics of the poor that are considered as general references and the locally-specific characteristics, as well as variations in poverty

The SMERU Research Institute, December 2003 4
characteristics according to age or sex. The following section discusses the results from the welfare classifications, which were determined by local communities through participatory group discussions. The results of welfare classifications clearly show that communities determine poverty based on relative standards, a phenomenon that should be taken into account in formulating and implementing poverty alleviation programs. Chapter IV discusses the causes of poverty, the problems faced by the poor, and the solutions to poverty according to communities. The discussion in the first section of this chapter will illustrate several aspects of the poor’s powerlessness, isolation, material poverty, physical weaknesses, vulnerability, and behavior which contribute to impoverishment. This analysis attempts to comprehend the main causes and problems of poverty in general and the variation across different regions or different livelihoods, as well as understand the gender dimension of poverty. Furthermore, this chapter attempts to explore the factors that are necessary to lift them out of poverty, based on the viewpoints of the poor themselves. This discussion reveals a need to mainstream poverty reduction efforts. Chapter V attempts to identify the safety nets of the poor and the effectiveness of poverty reduction efforts/programs. The first section of this chapter explains the impacts of poverty and the coping mechanism of the poor. The following section discusses the poor’s perception of the institutions that affect their lives and the poverty reduction programs that they are aware of. This illustration uncovers the high dependency of poor communities on traditional social relations, which can actually perpetuate poverty, and the over exploitation of family and natural resources which could lead to impoverishment in the long term. The role of several government programs in assisting the poor is still considered very limited. Chapter VI is the final section of this report. This chapter presents a summary of the findings from this study and some recommendations for general poverty reduction policies and for the four pillars proposed by the I-PRSP.

The SMERU Research Institute, December 2003 5
II. FRAMEWORK OF THE STUDY 2.1 Participatory Poverty Assessments (PPAs) Broad Definitions of PPA The use of participatory approaches in poverty studies, particularly in rural areas, was first initiated in the late 1980s and became increasingly popular in the 1990s. This approach was developed based on the argument that “the poor know better about poverty”. Consequently, poverty reduction strategies have to take into account the experiences, priorities, reflections, and recommendations of the poor, both males and females. The key element or prerequisite of any participatory study is the involvement of the subject of the study in the planning of the study, data collection and analysis, as well as in the search for the solutions to poverty problems. In this regard, respondents (ones who give information about themselves), informants (ones who give information about others), and participants (ones who participate in focused group discussions) are the subjects of the study who know better about their own situation and the community’s situations, their problems and the solutions to the problems. Despite the popularity of studies that make use of participatory approaches, Participatory Poverty Assessment (PPA) is not a common term for Indonesian. Various institutions have carried out poverty studies that use participatory approaches such as Participatory Learning and Action (PLA), Participatory Rural Appraisal (PRA), Action Research, Participatory Action Research (PAR), Cooperative Inquiries, Participatory Rapid Appraisals, and Methodology for Participatory Assessments (MPA), but the studies are not necessarily labeled as PPA. The literature does not assign a specific definition to PPA. Most of the definitions refer mainly to the existence of an interactive process and the involvement of the poor, but not to specific data collection methods. Norton (2001), for example, states that PPA is:
…an instrument for including poor people’s views in the analysis of poverty and the formulation of strategies to reduce it through public policy….(Norton, 2001).
Whereas Nerayan et al. (1999) defines PPA as:
…an iterative, participatory research process that seeks to understand poverty from the perspective of a range of stakeholders, and to involve them directly in planning follow up action. The most important stakeholders involved in the research process are poor men and poor women (Nerayan et al.,1999).
To distinguish between the studies which use quantitative approaches – where data collection is carried out through interactions between respondents and interviewers and the data/information is gathered through questionnaires – and the studies which use participatory data collection methods, Nerayan and Nyamwaya (1996) proposed that:
The distinguished characteristics of the PPA are found in the participatory, interactive and sociological methodologies used which give “voice” to the poor and allow the exploration of issues in depth because of the open-ended nature. Participatory research embodies an approach to data collection that is two-directional –both from the researcher to the subject and to the researcher from the subject. To some extent, all persons involved in the study become the data gatherers, including the local leaders who are contacted, but most particularly the

The SMERU Research Institute, December 2003 6
village residents and the poor people themselves (Nerayan dan Nyamwaya, 1996).
Furthermore, regarding the aims of participatory studies and the role of communities and researchers in these studies, Nerayan (1996) also suggested that:
…participatory research seeks to raise people’s awareness and capacity to equipping them with new skills to analyze and solve problems. This is achieved by involving people in the development of every steps of the research process, rather than by having them follow predetermined research method imposed from the outside. As a result, the distinction between the roles of the external researchers and the “subject” – the people being studied – should become less pronounced. External expert and professional interact with community members or a project agency primarily as facilitators (Nerayan, 1996).
From the various definitions above, it can be concluded that PPA refers to a variety of studies on poverty which use participatory approaches and involve broad stakeholders, particularly the poor. Various PPA developed by Deepa Nerayan for poverty studies carried out by the World Bank in poor countries that receive loans or grants, demonstrate efforts to standardize PPA methods. This is reflected in the use of various tools and the selection of issues to be explored in the study. The methods commonly used are focus group discussions (FGDs), transects, in-depth interviews, and workshops, which are carried out using various tools developed for participatory studies. Some of the tools that are commonly used include: • Welfare classifications • Social and resource mapping • Trend analyses • Seasonal calendars • Causes and effects of poverty • Venn diagrams • Daily activities in a community • Problem prioritizing • Historic time lines • Sources of information • Case studies (male and female, rich and poor, young and old) A participatory poverty study usually combines a selection of these tools. The research team, together with the community, will then analyze the data/information obtained in the study. Data validation is done by a triangulation process that crosschecks the data through FGDs, in-depth interviews, and direct observations (when conducting transects), as well as workshops which involve all relevant stakeholders at the village level. The Studies Consolidated in this Report By definition, there are many studies that can be categorized as PPAs. However, this PPA consolidation study only includes studies on poverty which directly involve poor communities and use a participatory approach. Involvement of the poor, women and men, is the key word as this study specifically attempts to put together the views and opinions of the poor. Although this diverges from the characteristics of participatory studies, which involve a range of stakeholders as proposed by Nerayan (1999) above, this restriction is necessary for the consistency of the analysis. The consequence of this restriction is the exclusion of several poverty studies which were based upon expert analyses, including anthropological poverty

The SMERU Research Institute, December 2003 7
studies and KIKIS’ documentation (2000) of panel discussions results featuring poverty experts.4 Another criterion of the studies consolidated is the use of participatory methods. It is quite difficult to determine whether a study can be categorized as participatory. If a study uses in-depth interviews and focus group discussions, can it automatically be categorized as a “participatory” study? The definitions of PPA quoted above refer to the interactive nature of communication in data collection and the use of open-ended tools. Because it was difficult to determine what form of communication was used in data collection from the reports consolidated, this study uses a loose definition of “participatory”. Any study which used a combination of in-depth interviews and focus discussions, both those that used tools and those that used guided interviews but didn’t use questionnaires with close-ended questions, were considered participatory. Of the various materials which were collected throughout this relatively short period of study, only four studies were selected, including the World Bank study, “Consultations with the Poor” (1999) which was conducted in 12 districts; the Insan Hitawasana Sejahtera-Bappenas study, “Studi Mikro Identifikasi Indikator Proksi Kemiskinan Lokal” (Micro Study to Identify the Local Proxy Indicators of Poverty) which was carried out in 10 districts in 2002 and four districts in 2003; the DFID study, “People, Poverty and Livelihoods” (2000) in four locations; and the study conducted by ILGR-WB (Initiative for Local Governance Reform-World Bank) in nine districts (2003); in addition to a case study carried out by FKPKM (1999) as documented in a report by KIKIS. There are a few more other studies that could have been consolidated, but the limited timeframe of this study did not allow for the inclusion of these studies. 5 A Comparison of the Methodologies used in the PPA and PPA-like Studies Consolidated
The five studies consolidated in this report had different objectives and used different methods. A general illustration of the five studies is provided in Appendix 1. Regarding the method used to obtain information, the World Bank, DFID and Insan Hitawasana Sejahtera (IHS) studies applied a balanced combination of in-depth interviews and focus group discussions (FGDs), whereas the studies conducted by FKPKM and ILGR-WB mainly focused on FGDs. The studies carried out by the World Bank, FKPKM, DFID and ILGR-WB had similarities in the tools that were applied to collect information through FGDs. The FGDs conducted by IHS did not apply any tool but used open-ended discussion guidelines. The use of different methods affect the results presented in the reports. In addition, it was found that there are more important elements than the use of tools; these being the capabilities of the facilitator and the existence of a clear framework of analysis, so as to maximize the collection of information through the application of each tool. Another important finding was that in-depth interviews deepened the information obtained in FGDs. Other differences were the length of time that the research teams spent with communities and the methods used to group respondents. Of the five studies, the DFID research team spent the most time within communities, that is between seven and ten days. It seems that the length of time research teams spend with communities and the use of a sustainable livelihood analytical framework were the main factors in producing a high-quality and in-
4 Intensive panel expert discussions carried out by KIKIS were documented in seven books which discussed structural poverty from several focal points. The results of these discussions analyzed impoverishment and exposed several issues which could become important input for the formulation of the PRSP. 5 Among the studies which could have been included were: the ILGR-WB study conducted in seven other districts; a recent study by KIKIS in collaboration with several NGOs in seven locations, and several studies sponsored by DFID and ADB.

The SMERU Research Institute, December 2003 8
depth study.6 The analytical framework determined beforehand made the team more flexible in applying tools and combining several methods in gathering necessary information. This was certainly made possible due to the availability of time. Regarding the grouping of respondents, the World Bank study divided respondents into five categories: young mothers, old mothers, young fathers, old fathers and teenagers (consisting of males and females). The DFID study and the study conducted by ILGR-WB separated males and females, whereas the FKPKM study did not divide respondents according to age or sex. The IHS study divided respondents into six groups: poor men, non-poor men, poor women, non-poor women, poor children and non-poor children. But the field report from the study carried out by IHS did not include the results from discussions with each group of respondents in detail, thus the information obtained could not be separated according to the type of respondents. The classification of respondents enabled an analysis to be carried out in order to see the different perceptions of poverty conditions and problems. As will be explained in the following chapters, there are some differences in views and perceptions between males and females and between old people and young people. These variations arise because of differences in interests and experiences in their lives in poverty. Nevertheless, classification of groups according to sex does not guarantee that gender issues will be unearthed. It is not easy to explore gender issues through FGDs, thus in many cases in-depth interviews are required. A facilitator who understands gender issues well is required in order to disclose these issues successfully. A comparison of the methodologies used in the studies consolidated in this report is explained in more detail in Appendix 1. Some important lessons can be learnt from the comparison of the methodologies and report writing methods used in the above studies, including: • Ample time is required to unearth information and involve communities in PPA so that
triangulation can be conducted and sufficient information can be gathered. • The role and the capabilities of a facilitator are the most important factors in obtaining
high quality information. In order to gain an adequate understanding of issues, the research team, including the facilitator, must have sufficient knowledge of poverty and the analytical framework used in the study, and what information needs to be found, as well as being aware of local conditions which can influence community welfare.
• In general, the information obtained from focus group discussions using tools seems more comprehensive and in-depth. However, tools only provide assistance. What is more important is the facilitator’s understanding of the issues to be explored and the probing needed to obtain necessary information.
• Not all information can be obtained through discussion groups, so in-depth interviews and case studies are also required to enrich and deepen information.
• Reports require a satisfactory degree of narrative, both to illustrate the conditions at the location of the study and to explain and supplement results from the use of tools.
Findings regarding the strengths and weaknesses of the studies became input for developing the section on “PPA Methods in Formulating Regional PRS,” presented in Volume 2 of the report on the PPA Consolidation Study.
6 Mukherjee, Hardjono, dan Carriere (2000) explained in detail how the use of participatory methods and a sustainable livelihood analytical framework seem to complement each other and are able to provide added value to research on poverty.

The SMERU Research Institute, December 2003 9
2.2. The Characteristics and Scope of this PPA Consolidation Study
Characteristics of the Study and Data Sources This study is solely based on a systematic analysis of PPA/PPA-like studies carried out in 1999 and onwards. As these studies were carried out for different purposes, this consolidation was done by extracting the relevant information, using a list of key questions devised to address the objectives of this consolidation study. This method allowed for compilation and consistent analysis of the results from the above studies, so that patterns of information from specific locations could be obtained. This study tries to capture the general dimensions of poverty and the variety of poverty problems in Indonesia, and thus requires detailed information regarding poverty in each specific location. The preliminary review of several final reports from poverty studies published by the World Bank, IHS and DFID showed that the information presented in these reports was not detailed enough to be collated and re-analyzed. To allow for the results of these studies to be collated and analyzed according to the type of area or even the type of livelihood, relatively detailed data and information from each study location would be required. These data and information could only be obtained from field reports. Consequently, this study was carried out based upon field reports and field notes collected from the various institutions. Not all field notes or field reports from the studies categorized as PPA/PPA-like studies could be obtained easily. Some institutions that carried out these studies no longer had the field notes or field reports, or the notes had not been composed in a readable format. The Scope of This Study Overall, the five PPA/PPA-like studies consolidated in this report cover 79 locations (villages) across 39 districts in 13 provinces. Of these 79 locations, 58 were classified as rural areas, whereas the remainders (21) were classified as urban areas.7 These studies were spread across five regions: Java, Nusa Tenggara, Sumatra, Sulawesi and Kalimantan. Maluku and Papua, which are likely to have different poverty characteristics, were not represented at all. Of all of the locations, over half were in Java and Sumatra which can be categorized as Western Indonesia. Kalimantan was the region with the least PPA locations, with only five PPA locations and all of them were in rural areas. Although the number of locations was limited, in general, all types of communities were well represented. The distribution of locations according to the urban-rural classification and type of community livelihood are shown in Table 2.1. Village and district names are shown in Appendix 2. As the PPA/PPA-like studies consolidated were carried for different purposes and covered different issues, the information that could be obtained from each study also varied (See Table 2.2.). Only information about the characteristics of the poor and the causes of poverty were included in all of the studies. Other information which many studies provided includes the affects of poverty and the solutions to poverty. On the other hand, although almost all of the studies provided information on poverty reduction programs, the amount and depth of this information was less then adequate. This may have been caused by studies not giving special emphasis to program evaluation. Information on the community perception on poverty alleviation programs presented in several studies was only obtained through unearthing other information, for example using historic time lines, discussions about institutions and in-depth interviews.
7 Each study appeared to use different criteria in differentiating rural from urban areas. Since some reports did not present sufficient information regarding the status of an area in detail, the urban/rural classification used in this study is based on the classifications from the Indonesian Bureau of Statistics (BPS) which were updated in 1998, except for villages which have been separated and have not yet been covered in the BPS classification.

The SMERU Research Institute, December 2003 10
Table 2.1. Range of Locations and Types of Livelihoods
Type of Community
Rural (Urban) Rice-Farming
Dry-Land Farming
Forestry & Plantation
Coastal Fishing
Urban Informal Sector & Labor
Mixed
Java 19 (12) 10 (2) 1 (0) 4 (0) 3 (0) 0 (8) 1 (2)
Nusa Tenggara 8 (2)
1 (0) 5 (1) 0 (0) 1 (1) 0 (0) 1 (0)
Sumatra 12 (5)
3 (0) 3 (2) 6 (0) 0 (1) 0 (2) 0 (0)
Sulawesi 14 (2) 6 (0) 0 (0) 2 (0) 5 (0) 0 (0) 1 (2)
Kalimantan 5 (0)
0 (0) 0 (0) 5 (0) 0 (0) 0 (0) 0 (0)
Total 58 (21)
20 (2) 9 (3) 17 (0) 9 (2) 0 (10) 3 (4)
Strengths and Limitations of the Study Since the beginning of this study, the greatest challenge was how the research team would be able to draw a common pattern and conclusion from the PPA results, which are locally specific, without undermining the variety of poverty problems in Indonesia. In addition, it was necessary to ensure credibility in the method used to collate the various qualitative studies, so that the conclusions can enrich the understanding on poverty in Indonesia as well as make significant contributions to the formulation of poverty reduction strategies. Because the studies being consolidated were not been specifically designed to be collated, there are strengths and weaknesses which should be noted in interpreting and using the results of this study. The main strength of this study stems from the strengths of the studies being consolidated, which put forward the voices of the poor from various regions. Although the voices of the poor presented in this report cannot be claimed as representing the voices of all poor people across Indonesia, at least this study attempts to show poverty dimensions from the perspective of the poor – as the main beneficiaries of poverty reduction strategies, policies and programs. However, this study has limited scale and scope, since it covers limited regions and the study location did not spread evenly. Although this consolidation covers 79 locations (villages), not all information and data could be obtained from each of the 79 locations. Several analyses were based on very limited amount of data so the conclusions should be interpreted carefully. It also important to note that this study is indeed a qualitative study, and that frequency analysis was only used to assist in identifying the general issues and issues which arose in specific locations or types of communities. In addition, this study is solely based on reports composed by different institutions from different studies that were conducted for different purposes. The information unearthed in each study, the depth of information and the report presentation vary. Consequently, this study applies slightly different methods to retrieve information from various reports. Some information could be retrieved directly from several reports, whereas the explanations provided in other reports had to be interpreted. Thus, there is still a possibility that there were mistakes made in interpreting the reports and drawing conclusions, although the research team has minimized the chances by re-examining the cases which seemed peculiar.

The SMERU Research Institute, December 2003 11
The depth of analysis in this study was also limited by the depth of information presented in the reports of the studies consolidated.
Table 2.2. Information Collected from PPA/PPA-Like Studies
Issue World Bank (1999)
IHS (2002 &
2003)
FKPKM (KIKIS) (1999)
DFID (2000)
ILGR-WB (2003)
Welfare classification Yes No
Yes (but not the percentage in each group)
Yes
Yes (only a small
number stated the percentage in each group)
Characteristics of the Poor Yes Yes Yes Yes
Yes (a small number
did not) Cause of Poverty Yes Yes Yes Yes Yes
Effects of Poverty Yes Yes Yes Yes No
(A small number did)
Problems faced by the Poor Yes Yes No Yes
No (A small
number did)
Coping Strategies Yes Yes No Yes No
(A small number did)
Solutions to Poverty (What is required to overcome poverty)
Yes (+ case study) Yes Yes Yes
No (A small
number did) Programs Effectiveness
A few A few No A few No
Institutions
Institutions which are important,
trusted, help during times of crisis and those that can be
influenced
No No No
Institutions which are important,
close, useful, and those which
provide information and
assistance
Gender
Responsibility at home and in the
community, decision making at home and in the community, and violence against
women
No No Control
over Assets Control over
Assets
Another fundamental limitation is that this study did not have control over the quality of field studies consolidated. An important aspect of qualitative studies is in the conduct of the field study, particularly the capacity of the facilitators. Differing from quantitative studies conducted using questionnaires, where the quality of the data is to some extent determined by the quality of the questionnaire, the quality of qualitative studies is solely dependent upon the ability of the researchers in the field to probe and cross check (conduct triangulation) the information and data.

The SMERU Research Institute, December 2003 12
2.3. The Conduct of the Study and the Analytical Processes The Conduct of the Study This study was carried out over three months, between October and December 2003. The first month was primarily spent organizing the research team, carrying out a preliminary study on several PPA reports and PPA-like studies, as well as consulting relevant institutions to develop the study framework. At the start of the study, Bappenas had already begun to consolidate several qualitative studies to provide input for the formulation of the PRSP. Intensive consultations with Bappenas provided the research team with a picture of the consolidation problems and various materials that had already been collected by Bappenas. In addition to intensive discussions with Bappenas, the research team also consulted the Office of the Coordinating Minister for Welfare, the Technical Assistants of the Task Force and the Core Team for the formulation of the PRSP, experts from the World Bank Water and Sanitation Project, the Bogor Institute of Agriculture (Institute for Social Research), the University of Indonesia (Institute for Economic and Social Research), DFID, Insan Hitawasana Sejahtera, and KIKIS. The research team also attended several meetings with the PRSP taskforces and participated in a workshop organized by KIKIS in preparing for a PPA which was then carried out in November, 2003. At the end of October 2003, the research team organized a half-day workshop to present and discuss the study’s framework and attempt to compile PPA for the Regional PRS. As a follow up of this workshop, the research team also consulted ILGR-WB to collect reports of the PPA that have been carried out by the project and to get better understanding on the PPA process for the formulation of poverty reduction programs supported by the project in several districts. This discussion has provided invaluable input for the formulation of the 2nd volume of this report on “PPA Methods for the Regional PRSPs”. Based upon these consultations, the research team formulated the framework of the study and the analysis, in addition to collecting material in the form of reports and field notes from several institutions and individuals involved in the selected studies. As a lot of the studies identified were still on going, the collection of material and the analysis was carried out in stages. The material, which had already been collected, was analyzed first and then supplemented with the results of the analyses from other material which was collected later. Materials were collected up until the middle of December 2003 to ensure ample time for proper data processing, analysis and report writing. The interim findings from the study were presented to the Technical Assistants of the PRS Taskforces on 29 December 2003, and then presented to a larger audience at the final workshop organized on 15 January 2004. Input received during these two forums was incorporated into the analysis presented in this report. The Analytical Process As with all literary studies, the first step was to review the studies which had been collected to discern the writing style, issues covered, respondents involved in the study, and the methodology used. The preliminary findings from these reviews were used as input to compare PPA methodologies and to determine how to analyze the information presented. The following step was to obtain the relevant information and enter it into a database. This database was developed based upon general observations of the information obtained from the reports collected and the main objectives of this study. The format of the analysis was flexible and was continuously adapted to comprehend the issues covered in the studies collected. The information entered in the database included:

The SMERU Research Institute, December 2003 13
• General information on the studies and regional characteristics as well as community characteristics in the areas where the studies were conducted.
• Welfare classification according to the local community and the proportion of the population in each welfare category.
• The characteristics of poor communities based upon community perceptions. • Causes of poverty. • Impact of poverty. • Problems faced by the poor. • Coping strategies used by the poor. • Solutions to overcome poverty. • The effectiveness of programs, in particular poverty reduction programs. • The role of institutions at the village level. • Gender issues with regard to the role and responsibilities of men and women in the
household and in society, and the control of household assets. Recording the data in the database was carried out, as far as possible, in accordance with what was presented in the reports. Several reports presented information which had been obtained from different groups of respondents so data was also recorded by group of respondents. For example, the World Bank study (1999) entitled “Consultations with the Poor”, presented the results from discussions with five different groups, that is groups of young women, old women, young men, old men, and teenagers (including both males and females), and consequently the data were entered into the database according to these groups. The studies conducted by ILGR-WB and DFID only divided the respondents into two groups, that is males and females, so the information entered into the database was only in accordance with these groups. Whereas information obtained from reports which did not provide information per group of respondents, such as the results in the IHS and FKPKM studies, was included as information from mixed groups. PPA locations were divided between urban and rural areas, and according to geographical location and the livelihood of the community. In the interests of consistency and because the information about the regional conditions provided in the reports was limited, as a reference, this consolidation study uses the village/city classification established by BPS and updated in 1998. In relation to geographical location, a classification based upon islands and east/west regions was determined. Java and Sumatra were grouped as the Western Indonesia Region, whereas Kalimantan, Sulawesi and Nusa Tenggara were grouped together as the Eastern Indonesia Region. In this study, classification was also based upon the dominant livelihood of communities, that is rice-farming, dry-land farming, forest and plantation, coastal fishing, and the urban informal sector and labor communities. Classification was based upon the results of an analysis of the information presented in the reports consolidated. However, in this classification process, several areas which had a wide variety of livelihoods were found, and thus it was necessary to add a mixed category. Areas included in this category are areas where the proportion of the community working as laborers or in the informal sector is similar to those working in other types, such as rice farming, fishing, or both. These classifications based upon community livelihood patterns were chosen because they are more relevant to several sectoral policy issues. An analysis was conducted on the information which was compiled in the database, according to the following procedure: • Simplification of expressions. Several expressions which had similar meanings were
entered into one category. • Each expression was entered into the database according to the category of that
expression.

The SMERU Research Institute, December 2003 14
• An analysis was conducted by counting the frequency of expressions included in the database.
• This frequency analysis was used to assist in understanding the general patterns of information and the existence of information which arose in certain areas or certain group of respondents.
The frequency analysis was quite useful in assisting in identifying general and specific patterns in poverty issues, but to some extent the simplification had implications on the depth of the information provided. The consequences of this could not be avoided because basically poverty problems are diverse in nature and locally specific. Because of this, the use of results from the frequency analysis was restricted. In order to combine the locally-specific findings, the results from the frequency analysis were enriched with more detailed information revealed in the reports consolidated. In principle, this study attempts to provide a poverty analysis from the perspective of the poor. However, it is understood that an analytical framework capable of obtaining and comprehending, as well as relating the information to policy issues is required. In order to do so, the research team tried to place the required information in an analytical framework and compare it with the findings from other studies, both qualitative as well as quantitative studies. In order to understand the causes of poverty, this study used an analysis based upon a modification of the deprivation trap analysis created by Robert Chambers.8 Several expressions regarding the causes of poverty and the problems faced by poor communities were categorized by six main factors, which were essentially inter-related. Unlike the framework proposed by Robert Chambers, which only divided the factors causing poverty into five groups, one other factor – attitude/behavior – was added to this analysis. This addition was due to several statements concerning attitudes and behavior not being able to be fit into the five factors proposed by Robert Chambers. Thus, the causes of and problems relating to poverty were divided into six groups, including: • Powerlessness. Powerlessness is defined as the factors which have to be addressed as the
poor do not have the capabilities to influence decisions or purchasing power. For example, prices and expenses which are too high or the price of their products is determined solely by the buyers.
• Isolation. Isolation included in this analysis is not simply physical isolation, which is generally caused by poor road conditions, but also economic and social isolation caused by a lack of education and no access to credit.
• Material poverty. Material poverty can be understood directly from the physical assets owned, both in the form of land or tools of production.
• Physical weaknesses. Factors included as physical weaknesses are poor health, caused for example by an unhealthy environment, or other physical weaknesses which cause an individual to be unable to work at an optimal standard.
• Vulnerability. Vulnerability is an incapability to maintain one’s welfare level during crises, including those stemming from economic crises, environmental disasters and personal problems.
• Attitudes/Behavior. This factor covers negative attitudes and poor behavior which cause poverty, for example, gambling, alcoholism, and laziness or lack of effort.
8 In his book, Rural Development, Robert Chambers introduced the concept of deprivation which causes poverty and divided it into five concepts: material poverty, powerlessness, physical weaknesses, vulnerability and isolation. This framework was also used by Mukherjee (1999) in carrying out an analysis on poverty issues.
The SMERU Research Institute, December 2003 15
III. WHO ARE THE POOR? Identifying the poor is the first important step in poverty analysis. Calculating the number of poor people or poor families, analyzing their conditions, causes and problems of poverty, in addition to the efforts to reduce poverty can only be conducted after there has been an agreement as to who is considered poor. Because of this, each PPA always begins with a list of activities, which are aimed towards understanding the conditions and welfare levels within a community as well as identifying the people who are considered poor by the local community. This chapter discusses the results from the identification of the poor as carried out in various PPA and PPA-like studies. Unlike the various poverty measurements which are used as national indicators, such as the poverty figures calculated by Statistics Indonesia or the family welfare categories recorded by the National Family Planning Board (BKKBN), the standards used to identify the poor in PPAs are based upon local criteria determined by the local community. Thus, identification of the poor by local communities will provide an illustration of the relative poverty conditions at the local level. Aside from reflecting the multi-dimensional aspects of poverty, the various criteria used also provide an initial picture of the problems associated with poverty in each area. 3.1. Poverty Characteristics from a Community Perspective The ability and desire of a community to identify the poor varies. In most areas, communities can easily determine the criteria of those who are considered wealthy, better off, and poor or even of those who are considered very poor. In North Ampenan (NTT), where the majority of people are fishermen, for example, welfare categories can be determined from the type of fishing equipment owned. In addition, the location of one’s residence also clearly indicates their welfare level. The poor who are referred to as sawi live in houses or shacks located along the beach, the houses of wealthier people are located in housing complexes, whereas those of the rich are usually referred to as punggawa and are located along the main streets. On the other hand, for the communities in the remote area of West Kalimantan (Mempawah), identification of the poor is a very sensitive issue due to their strong communal culture. In Saham in the Mempawah district, the PPA study team reported that several individuals protested when invited to categorize the community based upon welfare levels. A special approach and explanation was required to convince the community into carrying out the categorization. Due to the variation in the attributes of poverty identified in each region, the results from the PPAs conducted in 76 locations gave rise to around 580 attributes which are considered to relate to poverty. In general, these attributes relate to an incapability to fulfill a variety of food, housing and clothing needs, deficiencies in all aspects of daily life, poor health, an uncertain employment situation and low salary, and social isolation due to limitations in participating in community social activities. In general, the variety of attributes can be categorized into 22 types or characteristics of poverty (see Appendix 3 and 4). In accordance with the multi-dimensional characteristics of poverty, most discussion groups raised more than one characteristic of poverty, and there were even some groups which mentioned 12 different types of poverty characteristics. As shown in Table 3.1., of the 22 types of characteristics above, four characteristics are most commonly used as indicators, these being the poor physical state of a house, inability to send children to school, an uncertain employment situation or a low salary, and difficulties in
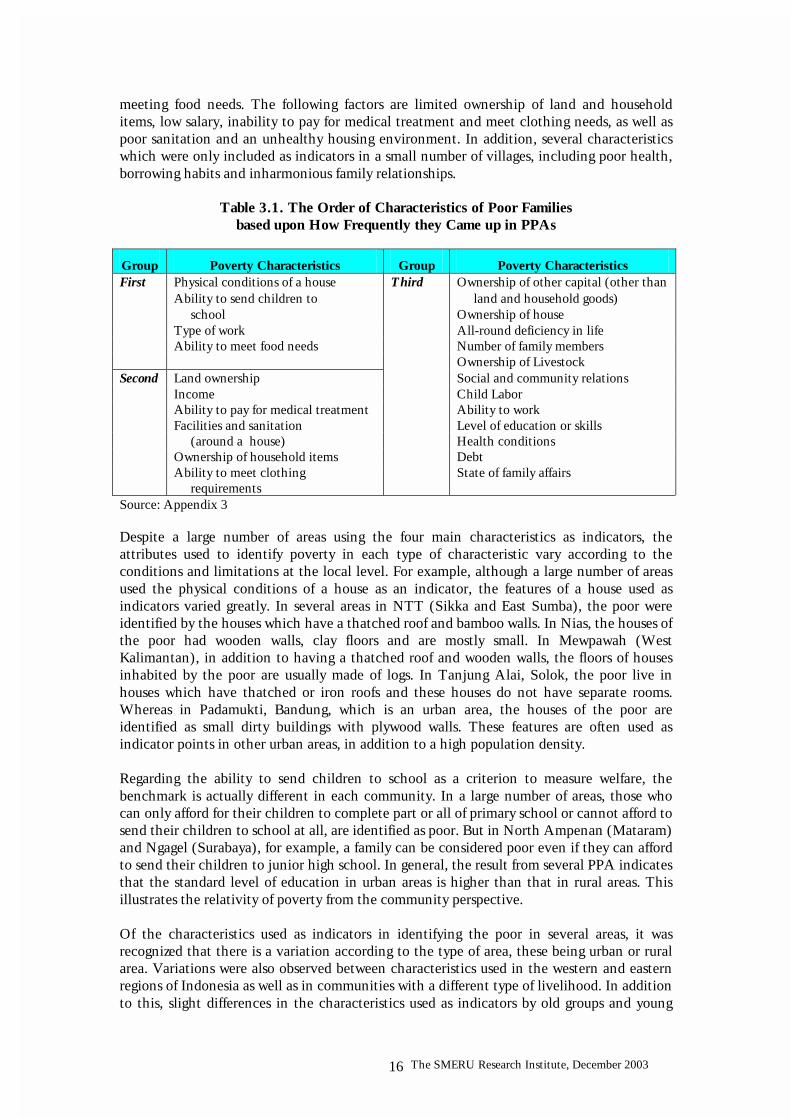
The SMERU Research Institute, December 2003 16
meeting food needs. The following factors are limited ownership of land and household items, low salary, inability to pay for medical treatment and meet clothing needs, as well as poor sanitation and an unhealthy housing environment. In addition, several characteristics which were only included as indicators in a small number of villages, including poor health, borrowing habits and inharmonious family relationships.
Table 3.1. The Order of Characteristics of Poor Families based upon How Frequently they Came up in PPAs
Group Poverty Characteristics Group Poverty Characteristics First Physical conditions of a house Third Ownership of other capital (other than Ability to send children to land and household goods) school Ownership of house Type of work All-round deficiency in life Ability to meet food needs Number of family members Ownership of Livestock Second Land ownership Social and community relations Income Child Labor Ability to pay for medical treatment Ability to work Facilities and sanitation Level of education or skills (around a house) Health conditions Ownership of household items Debt Ability to meet clothing
requirements State of family affairs
Source: Appendix 3 Despite a large number of areas using the four main characteristics as indicators, the attributes used to identify poverty in each type of characteristic vary according to the conditions and limitations at the local level. For example, although a large number of areas used the physical conditions of a house as an indicator, the features of a house used as indicators varied greatly. In several areas in NTT (Sikka and East Sumba), the poor were identified by the houses which have a thatched roof and bamboo walls. In Nias, the houses of the poor had wooden walls, clay floors and are mostly small. In Mewpawah (West Kalimantan), in addition to having a thatched roof and wooden walls, the floors of houses inhabited by the poor are usually made of logs. In Tanjung Alai, Solok, the poor live in houses which have thatched or iron roofs and these houses do not have separate rooms. Whereas in Padamukti, Bandung, which is an urban area, the houses of the poor are identified as small dirty buildings with plywood walls. These features are often used as indicator points in other urban areas, in addition to a high population density. Regarding the ability to send children to school as a criterion to measure welfare, the benchmark is actually different in each community. In a large number of areas, those who can only afford for their children to complete part or all of primary school or cannot afford to send their children to school at all, are identified as poor. But in North Ampenan (Mataram) and Ngagel (Surabaya), for example, a family can be considered poor even if they can afford to send their children to junior high school. In general, the result from several PPA indicates that the standard level of education in urban areas is higher than that in rural areas. This illustrates the relativity of poverty from the community perspective. Of the characteristics used as indicators in identifying the poor in several areas, it was recognized that there is a variation according to the type of area, these being urban or rural area. Variations were also observed between characteristics used in the western and eastern regions of Indonesia as well as in communities with a different type of livelihood. In addition to this, slight differences in the characteristics used as indicators by old groups and young

The SMERU Research Institute, December 2003 17
groups, as well as male groups and females groups, were also evident. These variations are discussed in depth in the following sections. Poverty Characteristics in Urban and Rural Areas There are some similarities and differences in the various characteristics used as indicators to identify the poor in urban and rural areas. The principal similarity was that in both rural and urban areas, the four main characteristics already mentioned above remained as the most dominant. This fact indicates that the poor, both in urban areas as well as rural areas, face similar problems in obtaining housing, education, and employment which ensure a decent standard of life, and in meeting food needs, although it seems that the level of difficulty faced is different. The type of work, for example, tends to be used as an indicator more often in urban areas, whereas in rural areas, meeting food needs is more often used as an indicator. Other than the four characteristics above, in the second group, poverty in rural areas more commonly relates to ownership of land and livestock. In urban areas, the characteristic which is more commonly used as an indicator was income, level of education or skills, health conditions, and all-round deficiency in life (Table 3.2.). This difference reflects the pattern of life in rural areas, where the level of welfare is very much determined by ownership of land and livestock. For urban communities, the level of welfare is very much determined by the type of work and the opportunity to obtain an adequate income, which are influenced by the level of education and skills.
Table 3.2. Characteristics Used as Indicators to Identify the Poor in Urban and Rural Areas
Rural Areas Urban Areas
N = 56 (%) N = 20 (%) Physical state of a house 84 Physical state of house 90 Ability to send children to school 84 Ability to send children to school 85 Ability to meet food needs 80 Type of work 85 Type of work 79 Ability to meet food needs 75 Ownership – Land 52 Income 70 Facilities & sanitation 48 Ownership – Land 45 Ability to pay for medical treatment 48 Facilities & sanitation 40 Ownership – Household goods 45 Ability to pay for medical treatment 40 Ability to meet clothing needs 41 All-round deficiency in life 40 Income 38 Ownership – Household goods 35 Ownership – Other capital 25 Ability to meet clothing needs 35 Ownership – Livestock 25 Ownership – Other Capital 35 Ownership – House 23 Ownership – House 35 Number of family members 21 Social and community relations 30 All-round deficiency in life 18 Level of education/skills 25 Child labor 14 Health conditions 25 Social-community relations 13 Number of family members 20 Ability to work 13 Child labor 15 Level of education/skills 7 Ability to work 15 Debt 5 Debt 15 Health conditions 4 Ownership – Livestock 5 State of family affairs 4 State of family affairs 5 Source: Appendix 3

The SMERU Research Institute, December 2003 18
Poverty Characteristics in Western and Eastern Indonesia The differences in the characteristics of poverty that were commonly used by the communities in western Indonesia (Sumatra and Java) and eastern Indonesia (Nusa Tenggara and Kalimantan) indicate the differences in poverty conditions in the two regions. As presented in Table 3.3., the physical condition of a house are used as an indicator in a large number of areas in eastern Indonesia, but in western Indonesia fewer areas used the physical condition of a house as an indicator of poverty. It seems that in more places in western Indonesia, the physical condition of a house cannot reflect the welfare level of the inhabitant. In several areas, although the physical conditions of a building were quite good, the inhabitant was actually lacking in everything. A similar finding was also presented in a LPEM (2003) report on an action research project in a semi-urban area in Kabupaten Bogor. In the area where LPEM conducted the research, many people had sold their land to residents of Jakarta and had used the money received to improve their houses. As a result, they no longer earned their living from agricultural activities but relied upon a combination of odd jobs in the informal sector with a low or uncertain income.
Table 3.3. Characteristics which are Most Often and Least Often Used as Indicators of Poverty in Western and Eastern Indonesia
Western Indonesia Eastern Indonesia
N = 48 (%) N = 28 (%)
Characteristics most often used as indicators
Type of work 83.9 Physical condition of a house 92.3
Ability to send children to school 79.4 Ability to meet food needs 83.7
Physical condition of a house 76.1 Ability to send children to school 83.5
Ability to meet food needs 70.0 Type of work 65.9
Income 58.9 Ability to pay for medical treatment 58.1
Ownership – Land 54.8
Characteristics least often used as indicators
Level of education/skills 14.4 Child labor 15.6
Ownership – Land 12.8 All-round deficiency 13.4
Child labor 11.7 Debt 12.9
Social and community relations 11.1 Health conditions 4.9
Health conditions 10.0 State of family affairs 4.9
Debt 6.1 Level of education/skills 2.4
Ability to work 5.0
State of family affairs 3.3
Source: Appendix 3 Another difference is that characteristics which are more often used as indicators in western Indonesia relate to the type of work and income. Whereas communities in eastern Indonesia more often used characteristics relating to an ability to meet food needs, inability to send children to school, inability to pay for medical treatment, as well as ownership of land and livestock as indicators to identify the poor. In addition, among the characteristics which are rarely used, the level of education/skills is still used more often in western Indonesia than in eastern Indonesia. This variation in poverty characteristics more or less gives an indication that there are differences in poverty conditions in the two regions which have different levels of economic development. In accordance with the fast economic development in western

The SMERU Research Institute, December 2003 19
Indonesia, the type of job and income level become a distinguishing factor between the poor and those who are better off. The opportunity to obtain a job with an adequate income will be determined more by the level of education and skills. Whereas for communities in eastern Indonesia, asset ownership and an ability to access public services, such as schools and health services, are factors which better indicate welfare levels. This is in line with the general belief regarding the underdevelopment and the severity of poverty in eastern Indonesia. Poverty Characteristics in Communities with Different Livelihoods Communities with different livelihoods use different references in identifying the poor, and this indicates that there are several poverty characteristics which are specific to certain communities. As shown in Table 3.4, in dry-land farming communities, factors such as ownership of land and livestock are among the most important characteristics of the poor. These characteristics are not so dominant in other communities. Whereas the type of work which is dominant in general, is in fact rarely used as an indicator to identify the poor in dry-land farming communities.
Table 3.4. Poverty Characteristics Most Often Used in Communities with Different Livelihoods
Rice-farming communities Dry-land farming communities Forest and plantation communities
N = 20 (%) N = 12 (%) N = 17 (%)
Physical condition of a house
90 Ability to meet food needs 92
Ability to send children to school
82
Ability to send children to school
90 Physical conditions of a house 83
Type of work 82
Type of work 90 Ability to send children to school
50
Ability to meet food needs 76
Ability to meet food needs 80 Ownership – Land 50
Physical conditions of a house 71
Facilities & sanitation 65 Ownership – Livestock 50
Ownership – Land 53
Ownership – Land 60 Ability to pay for medical
treatment 55
Coastal Fishing Communities
Urban Informal Sector and Labor Communities
Mixed Laborers, Informal Sector Workers & Other
N = 11 (%) N = 9 (%) N = 7 (%)
Physical condition of a house
100 Ability to send children to school
100
Physical condition of a house 100
Ability to send children to school
100 Type of work 89
Type of work 100
Type of work 100 Physical condition of a house 78
Ability to send children to school
86
Ability to meet food needs 73 Ability to meet food needs 78
Ability to meet food needs 71
Income 64 Income 78
Facilities & sanitation 71
Facilities & sanitation 64 All-round deficiency in life 56
Ability to pay for medical treatment
71
Ability to pay for medical treatment
64 Ownership – Land 56
Ownership – Household Goods 71
Ownership – Household Goods
64
Ownership – Land 55 Ownership – Other Capital 55
Source: Appendix 3

The SMERU Research Institute, December 2003 20
For dry-land farming communities, found mostly in Nusa Tenggara, the number of heads of livestock owned is an important characteristic not only due to environmental conditions which force them to rely on animal husbandry rather than agricultural produce, but is also due to cultural factors. The use of a large number of livestock, such as cows and pigs, in traditional marriage and burial ceremonies has resulted in them becoming more valuable and at the same time they have become social status symbols for owners. In addition, unlike other communities, the poverty characteristic most often used as an indicator by these communities is not the physical condition of a house, but the ability to meet food needs. This perhaps reflects that the primary difficulty for dry-land farming communities is in obtaining adequate food supplies, and as a result they have a relatively high level of food insecurity. It is also interesting to look at the poverty characteristics put forward by coastal fishing communities. There are three main poverty characteristics used simultaneously as indicators in all coastal fishing communities where the PPAs were conducted, these being the poor physical condition of a house, an inability to send children to school, and working as a laborer or uncertain employment. In addition, ownership of different types of fishing equipment and household goods, a low income, the environment surrounding a house, and difficulties in meeting food needs were also frequently used in identifying the poor. The large number of characteristics used as poverty indicators suggests that poverty amongst coastal fishing communities is more severe than that in other communities. Poverty Characteristics According to Female and Male Respondents The results from discussions with groups of females and groups of males indicated that there are slight differences in perspective when identifying the poor, although both groups were more inclined to use the four main characteristics as poverty indicators, these being the type of work, an ability to meet food needs, the ability to send children to school, and physical condition of a house. In addition to these four characteristics, male groups tended to use measurements related to income, ownership of a variety of assets and education levels. Whereas for female groups, the poverty characteristics proposed were inclined more towards the condition of everyday life and family conditions, such as the number of family members and whether children have to work, as well as social and community relations. The type of asset commonly used as an indicator by female groups only included land ownership. These differences in perspective seemed to be related to the different roles of men and women, both at home as well as within the village community. As will be discussed in the following chapter, to some extent, women are still more responsible for managing the household, whereas men have more of a role in seeking a living. As a result, when determining the poor, women focussed more on the conditions of a household and everyday life.

The SMERU Research Institute, December 2003 21
Table 3.5. Poverty Characteristics Proposed by Female Discussion Groups and Male Discussion Groups
Female Male
N = 22 (%) N = 24 (%) Type of work 64 Type of work 75 Ability to meet food needs 59 Ability to meet food needs 63 Ability to send children to school 59 Ability to send children to school 63 Physical condition of a house 50 Physical condition of a house 63 Ownership – Land 45 Income 50 All-round deficiency in life 41 Ownership – Land 38 Income 36 All-round deficiency in life 33 Ability to meet clothing needs 23 Ownership – House 29 Ownership – Livestock 18 Ability to pay for medical treatment 25 Ownership – House 14 Ownership – Livestock 21 Ownership – Other Capital 14 Ownership – Other Capital 21 Level of education/skills 14 Ability to meet clothing needs 17 Number of family members 14 Level of education/skills 17 Social and community relations 14 Facilities & sanitation 17 Ability to pay for medical treatment 9 Child labor 17 Debt 9 Ownership – Household Goods 17 Facilities & sanitation 5 Health conditions 13 Health conditions 5 Social and community relations 8 Ability to work 5 Number of family members 4 Child labor 5 State of family affairs 4 Ownership – Household Goods - Debt - State of family affairs - Child labor - Source: Appendix 3 Poverty Characteristics According to Groups of Old and Young Respondents Different life experiences between the young and the old appear to influence the way they identify poverty. In younger groups, the characteristic which was most often used as an indicator was the type of work, whereas in older groups, the most dominant characteristic was an ability to meet food requirements. It appeared that older groups more often tended to use measurements relating to the ownership of assets and ability to meet education and health needs. Whereas younger groups were inclined to use the level of education and issues relating to the ability to work, including health conditions. Characteristics concerning family conditions, that is families which lacked harmony, young families still living with parents, and families whose children had to work, were only apparent in discussions with younger groups and not with older groups.

The SMERU Research Institute, December 2003 22
Table 3.6. Poverty Characteristics Used as Indicators by Groups of Young Respondents and Groups of Old Respondents
Young Old
N = 32 (%) N = 22 (%) Type of work 66 Ability to meet food needs 73 Ability to send children to school 53 Ability to send children to school 68 Ability to meet food needs 50 Type of work 64 All-round deficiency in life 50 Physical condition of house 64 Income 47 Income 50 Physical condition of a house 44 Ownership – Land 45 Ownership – Land 31 All-round deficiency in life 32 Level of education/skills 28 Ownership – Livestock 27 Ownership – House 25 Ability to pay for medical treatment 23 Health conditions 16 Ability to meet clothing needs 18 Ability to meet clothing needs 13 Number of family members 18 Ability to work 13 Ownership – House 14 Ownership – Livestock 9 Ownership – Other Capital 14 Ownership – Other Capital 9 Facilities & sanitation 9 Ability to pay for medical treatment 6 Social and community relations 9 Facilities & sanitation 6 Ownership – Household Goods 9 Social and community relations 6 Level of education/skills 5 State of family affairs 6 Health conditions 5 Debt 6 Ability to work 5 Number of family members 3 Debt 5 Child labor 3 State of family affairs - Ownership – Household Goods - Child labor - Source: Appendix 3 3.2. Welfare Categories According to Communities Based upon several local characteristics and standards, communities can generally divide welfare levels into three categories, these being rich, better off and poor. Even when categorizations including more than three groups arose, it was the poor category that was mostly further broken down, and not the rich or better off categories. In addition to a poor category, in some areas there was a category which indicated a group of people who were very poor. This fourth category was combined with the poor category in this analysis. The welfare classifications carried out by communities in the PPA mostly concluded that the proportion of poor groups was relatively larger than better off and rich groups. Of the 17 locations which presented the proportion of the population in each welfare level, only in one location did the community state that 77% of the people in their village were grouped in the better off category.9 If this single case is excluded (see Table 3.7.), the proportion of poor people both in rural and urban areas appears roughly the same, that is more than half of the population. Of the 17 locations above, communities in three urban areas (kelurahan)10
9 This case arose in Saham, Mempawah. The PPA report revealed that in the beginning, it was difficult for the PPA facilitator to persuade the community to determine categories based upon welfare levels, as they did not want to differentiate between one another. However, finally, the classification was carried out successfully, and it showed the following results: poor 9%, better off 77%, and rich 14%. 10 These three locations were Semanggi (Surakarta), Padamukti (Bandung) and North Ampenan (Mataram).

The SMERU Research Institute, December 2003 23
distinguished between people who were very poor and those who were poor, and the proportion of people who were very poor was around 35%.
Table 3.7. Percentage of People in each Welfare Level based upon PPA Results in Rural and Urban Areas
Rural/Urban Rich Better off Poor
Rural (n=10) 8 34 58 Rural (n=9, excluding Saham, Mempawah1) 8 29 63 Urban (n=7) 10 25 65 Source: Appendix 5 PPAs that presented the results of the community classifications based on welfare levels are very limited in number. However, the proportion of poor people identified in different regions, or in communities with a different type of livelihood, indicates that there are similar inclinations to general perception or quantitative approaches. Table 3.8., for example, indicates that the proportion of poor people in Nusa Tenggara are higher than the proportion of poor people in Java and Sumatra. Whereas, Table 3.9. shows that the proportion of poor people in dry-land farming communities, of which most are located in Nusa Tenggara, and in coastal fishing communities is higher than in other communities. Communities with a relatively smaller proportion of poor people are the communities around forests and plantations. It appears that this phenomenon is also in compliance with the results of the poverty characteristics analysis presented in the previous section. Therefore, this finding confirms the need for greater attention on poverty reduction efforts in areas of Nusa Tenggara, or eastern Indonesia in general, as well as special attention for dry-land farming communities and coastal fishing communities. Nevertheless, in general, the proportion of poor people as calculated by communities based upon their relative measurements tends to be much larger compared with the national poverty figures calculated by Statistics Indonesia. According to the Interim Poverty Reduction Strategy Paper (I-PRSP) which quotes Statistics Indonesia, in 2002 the percentage of poor people in Indonesia was 18.2%, with the breakdown being 14.5% in urban areas and 21.1% in rural areas. If these figures from Statistics Indonesia are related to the three welfare categories above, the largest number of Indonesians will certainly be included in the better off category. This tendency appears to be different from the results of the classifications carried out by communities in PPAs. The results from several PPAs present a pyramid shape where the poor group is at the lowest level with the largest proportion, the better off category is the middle, and the small peak is the rich group.
Table 3.8. The Proportion of People in each Welfare Levels based upon PPA Results in Several Areas
Area Rich Better off Poor
Nusa Tenggara (n=4) 9 20 71
Sumatra and Kalimantan (n=4) 9 47 44
Sumatra (n=3, excluding Saham, Mempawah1) 7 37 56 Java (n=10) 9 24 57 Source: Appendix 5

The SMERU Research Institute, December 2003 24
Table 3.9. Proportion of People in each Welfare Level according to PPA Results in Communities with Different Livelihoods
Livelihood Rich Better off Poor
Rice-farming communities (n=3) 10 30 60 Dry-land farming communities (n=3) 8 18 74 Forest and plantation communities (n=4) 8 47 45 Forest and plantation communities (n=3, excluding Saham,
Mempawah1) 6 37 57
Coastal fishing communities (n=2) 7 29 64 Urban informal sector and Labor Communities (n=5) 10 25 65 Source: Appendix 5
The difference in the proportion of poor people according to PPA results compared with the figures from Statistics Indonesia above are actually not too surprising considering that there are differences in the methods of measurement between the two.11 The standards used by communities are very locally specific which draw on village standards, so that an individual or a family that is considered poor in one location may not be classified as poor in another location. The indicators used by communities were also different to the indicators used by Statistics Indonesia. As presented in the previous section, an ability to meet food needs is not the most dominant factor in identifying the poor, instead other dominant factors include the physical condition of a house, the ability to send children to school and the type of work. In addition, there are still many other characteristics and a few among them are also non-material. Whereas, food consumption is the largest component of the poverty line used by Statistics Indonesia.12 Other then the relativity of measurements used by communities, differences in proportion may be due to the fact that the villages and kelurahan chosen as PPA locations were those with a high proportion of poor people. Therefore, other than comparing average national figures calculated by Statistics Indonesia, it is necessary to compare poverty figures at the village level As poverty data calculated by Statistics Indonesia only goes down to the district/municipality level, in this analysis we have attempted to compare poverty figures from the above PPAs with the village-level poverty figures calculated by SMERU.13 The results of the two calculations are presented in Table 3.10. From the comparison of poverty figures in 10 villages, where data from the PPA results and the poverty mapping results calculated by SMERU are available, there are some interesting tendencies. Of the three PPA locations in urban areas, the PPA results were actually much higher compared with the results of the quantitative analysis conducted by SMERU. Whereas, the results from five of the seven PPAs in rural areas are still within the range of the estimations based on SMERU’s quantitative analysis or slightly higher than that of the quantitative analysis, in general are still above the average figures from the quantitative study. In the two locations in other rural areas, the PPA results for one of the villages is a lot
11 Such differences in measuring the poverty line do not only occur between experts and communities, but also occur between experts or government officials. For example, the percentage of poor people in China in 1999 was 4.6%, whereas in Indonesia it was 27.1%, but the percentage of people earning less than $1/day in China was 18.8%, whereas in Indonesia it was only 12.9% (The World Bank, 2003). 12 The food component in the poverty line is around 70%, and the remaining 30% is non-food consumption. 13 The SMERU Research Institute is currently calculating poverty figures down to the village level in all provinces of Indonesia based upon 2000 Population Census, 1999 Core and Consumption Modules of the Susenas (National Socio-economic Survey), and the 1999 Podes (Village Potential). The data are still being processed, thus data used here are interim figures.

The SMERU Research Institute, December 2003 25
higher and the other has much lower PPA results than the results from the quantitative analysis.
Table 3.10. Comparing Poverty Figures from PPAs and Poverty Mapping in Several Areas
PPA Results Poverty Rate* Village/
Kelurahan District/
Municipality Province Year Urban/ Rural Rich Better
Off Poor Range** Average
North Ampenan
Mataram NTB 1999 Urban 9 19 72 6.42 - 20.34 13.4
Semanggi Surakarta Central Java 1999 Urban 7 25 68 4.04 - 23.7 13.9 Ngagel Surabaya East Java 2000 Urban 6 20 74 1.54 - 14.04 7.8 Kuranji West Lombok NTB 2000 Rural 6 38 56 18.60 - 55.92 37.3 Kawangu East Sumba NTT 1999 Rural 5 22 73 54.63 - 87.53 71.1 Renggarasi Sikka NTT 1999 Rural 15 3 82 34.15 - 76.93 55.5 Kotobatu Tanah Datar West Sumatra 2003 Rural 5 30 65 0.86 - 8.36 4.6 Jorong Mawar Tanah Datar West Sumatra 2003 Rural 8 41 51 15.66 - 53.4 34.5 Saham Mempawah West
Kalimantan 2000 Rural 14 77 9 39.26 - 89.00 64.1
Genengsari Grobogan Central Java 1999 Rural 4 29 67 13.9 - 55.04 34.5 Notes: * Preliminary estimate calculated by SMERU based on Population Census (2000), Susenas (1999) and Podes (1999) ** The range of poverty rate (proportion of population with expenditure less than the poverty rate) with 90% level
of confidence. Source: Appendix 5 and special tabulations from SMERU.
Thus, based on the limited sample above, it can be said that there is an indication that for rural areas the poverty calculation results from PPAs are not too different from the results of SMERU’s quantitative analysis. One case where the PPA results were lower than the results from the quantitative analysis was in Saham (Mempawah – West Kalimantan). This was due to the strong communal culture as well as the community’s resistance to differentiating between the people’s level of welfare. As has been stated above, it was difficult to carry out “Welfare Classification” activities in Saham. People identified by the community as poor were those who are unable to work. Whereas in another case, Kotobatu (Tanah Datar – West Sumatra), where the PPA results were a lot higher than the results from the quantitative analysis, it appears that the data from the quantitative analysis need to be questioned, as the figures are much lower than the average poverty figures in other rural areas. For urban areas, in accordance with the high level of community welfare in the surrounding environment, poverty standards used by communities tend to be higher than the poverty line used as a standard in quantitative analysis. But whether there is a pattern in the differences between the two cannot yet be detected because the number of urban cases is very limited. Nevertheless, the considerable difference in the poverty figures from the quantitative analysis and the PPA results should be observed. Perhaps a wider and more in-depth study needs to be conducted to re-evaluate food and non-food commodity packets used as standards in measuring the poverty line in urban areas. Although in general, patterns of similarities and differences can already be seen between the results from the PPA and the qualitative analysis, these new findings are initial indications, as they are only based upon a very small number of cases. A more reliable conclusion will certainly be obtained if more data are available and they better represent the regional variations in Indonesia.

The SMERU Research Institute, December 2003 26
IV. THE POVERTY TRAP Social scientists have studied the complexity of the poverty phenomenon intensively and have produced various theories to explain why poverty continues to occur. These theories have influenced the approaches used to overcome poverty problems. Initially, poverty was seen more as a condition relating to food shortages and the result of the shortcomings of certain individuals or families. Poverty was seen as an individual problem, influenced more by cultural factors and individual attitudes which trapped people in a cycle of poverty. Given such a view, besides the provision of food aid, efforts to reduce poverty were more often carried out using individual approaches, such as awareness and education programs which aimed to change the behavior and culture that were thought to perpetuate poverty. Given its developments and in line with the understanding of the multi-dimensional nature of poverty, it was realized that poverty was not just an individual problem, but a collective problem. Poverty began to be recognized as the outcome of interactions between social, economic and political systems. Poverty was no longer considered a problem caused by food shortages or laziness. The new belief saw that poverty was more influenced by how food or economic assets were distributed between the members of a society and the incentives which were provided for work carried out by different groups in society. From a macro-economic perspective, a reduction in poverty levels was not just affected by the rate of economic growth, but was also influenced by how the products of this growth were spread across society. These ideas began with the birth of the deprivation concept which considers poverty to be a phenomenon of limited access, not only to food, but also to education, healthcare, sanitation, clean water, housing and other physical necessities. Given these theoretical developments, efforts to reduce poverty were directed more towards meeting decent living conditions for all people, by providing public facilities which could be accessed by the poor. However, these strategies were unable to fully solve poverty problems. Another theory arose that looks at the existence of factors which prevent the poor from accessing a variety of opportunities to increase their standard of living. According to this theory, poverty is the result of being unable to actively participate in the decision making which affects their life. In addition, the “structuralist” view also arose which sees poverty as the result of an exploitative pattern of interaction between groups in a society. The rise of this view inspired an opinion which believes that efforts to reduce poverty should be implemented by improving the system of governance in order to ensure political access for the poor and by transforming economic-social-political structures in working towards a fairer system. These theoretical developments have enriched the understanding of the complexity of and interdependency between various problems which trap the poor and prevent them from accessing a more decent standard of living. But these developments in thought have also triggered debate regarding the effectiveness of poverty reduction approaches and strategies. Poverty reduction strategies in the form of direct assistance for the poor, for example, has often been criticized as a strategy which does not empower people, but in fact creates dependency. In line with the development of the structuralist theory, the view that poverty reduction must be implemented through changes to the system which influences economic-social-political interactions also arose. As a result, poverty reduction has to become a part of every policy. This view is more popularly known by the term “mainstreaming poverty reduction”. However, attempting to mainstream poverty reduction is not easy. The impact of various economic, social and political policies, such as the system of protection and free trade, upon poverty and impoverishment is still frequently debated. In addition, the formulation of such policies is also influenced by various interests and lobbying power.

The SMERU Research Institute, December 2003 27
The purpose of this chapter is to provide an analysis of the causes of and problems relating to poverty from the perspective of the poor. In the PPA and PPA-like studies consolidated in this report, the poor14 discussed and analyzed the factors they considered as the causes of poverty, the problems they face, and the solutions to poverty. The results of these studies reflect the thinking patterns of the communities involved in the PPAs. This thinking is based upon their experiences in living a completely restricted life. In this regard, it needs to be noted that the results of the discussions were influenced by local culture and existing norms, as well as their knowledge and the information they possess. Although the complexity of the problems expressed may not have been different from the theories developed by poverty experts, it is hoped that the results of this analysis will enrich the understanding of poverty. Furthermore, it is hoped that the results of this analysis, which is based upon the opinions of the poor, indicate the factors that should be considered in formulating poverty reduction strategies. 4.1. The Causes of Poverty Various reports from PPA and PPA-like studies consolidated in this study demonstrate that exploring and discussing the causes of poverty with the poor is not easy. In some areas, communities could quickly state the main causes of poverty, for example floods and natural disasters which prevent them from cultivating their land, typhoons which always destroy their crops, or the mass layoffs due to the economic crisis. However, in some other areas, there is a large variation of factors which cause poverty, as the livelihoods of the members of the village community also vary considerably. In a few other locations, communities stated that poverty was predestined and was inherited from generation to generation. In these cases, further probing by a skilled facilitator was necessary in order to reveal the factors which directly and indirectly contributed to poverty. As there are limitations in the results from the discussions on the causes of poverty provided in the reports consolidated, the analysis in this section merges the results from the discussions on the causes of poverty and results from the discussions on the problems faced by the poor. Thus, it is hoped that a more comprehensive and realistic picture of poverty problems can be obtained. Results from discussions on the causes of poverty indicate that poverty can be influenced by external factors, personal or internal factors and transcendental factors or factors which are beyond the control of the poor. According to poor communities, poverty is caused by a lack of employment opportunities and a low level of education or skills, in addition to the fact that they do not possess assets in the form of money, agricultural land, fishing equipment, boats or even livestock which can be used as capital. In a few other cases, poverty also occurred as a result of natural disasters or due to government policies which caused people to lose their livelihood, such as a loss of land or loss of access to natural resources. The existing culture or traditions in a community, such as expensive traditional celebrations, are also factors which cause poverty in certain areas. Several personal factors, such as a lack of effort, gambling habits or alcoholism, as well as a husband re-marrying and abandoning his first family, also appeared in several discussions. In addition, many people also stated that poverty was “God’s will” or “their fate” which had been passed on from one generation to the next. Several studies provided an illustration of the interrelated factors that caused poverty, as shown in Figure 4.1 – 4.4. The factors which were most frequently mentioned as causes of poverty in the PPA reports consolidated were the lack of economic capital, low level of education and lack of skills (see Table 4.1.). These three factors were mentioned in more than half of the PPA locations. Other causes of poverty which were mentioned fairly often included a lack of employment 14 A few of the studies consolidated also involved non-poor communities, but in order to ensure the consistency of this analysis, the opinions of the poor have been used as far as possible.

The SMERU Research Institute, December 2003 28
opportunities, low income, ownership of only small plots of land or no land at all, lack of effort, fate, poor health, a variety of production problems relating to pests and disease, competition in accessing resources, low product prices, transportation difficulties, and government assistance which does not reach the poor. “Fate” is a factor that should receive attention as this remark reflects the existence of apathy. The poor perceive that there is no opportunity to improve their level of welfare and that only a miracle from God could change their circumstances. Several other factors which appeared in a number of PPA locations were the excessively high prices of consumer goods and basic production inputs, natural disasters, difficulties in managing businesses, layoffs, government policies which have worsened poverty, and family problems or misfortunes. Unlike the sequence of factors that cause poverty, the problems that were more frequently stated in discussions were transportation and problems relating to skills and education. The transportation problems were mainly due to a lack of transportation facilities and poor road conditions, whereas the most dominant education problem was the high cost of education. It seems that these two problems are interrelated, as generally education costs do not just refer to school fees but also to transportation costs incurred in reaching school. In many cases, the location of a school, particularly junior high schools which were located far from villages, and poor road conditions caused transportation costs to be greater than school fees. The high cost of transportation could also cause children to drop out of school. In addition to transportation and education problems, a lack of access to credit as well as a low income were also frequently mentioned in discussions on the problems faced by the poor. In addition to the high cost of medication and the lack of healthcare facilities, problems related to health which were frequently mentioned, included the high cost of contraceptives and the continual decrease in family planning participants. In addition, several problems relating to agricultural businesses also surfaced, such as inadequate irrigation, the low price of agricultural products, as well as pests and crop disease. The problems surrounding policies and the lack of government assistance most commonly raised were those which related to the lack of assistance or inappropriate targeting, as well as the lack of extension work and guidance from the government. In addition, the poor also face problems relating to a lack of employment opportunities, lack of capital, difficulties in fulfilling food and everyday needs, as well as difficulties in obtaining clean water. Problems that only appeared in a small number of PPAs included, among others, poor canals which caused floods, lack of public facilities, lack of awareness about the importance of education for children, lack of religious faith, and no electricity (Table 4.1.).15
15 As not all studies consolidated provided analysis on the causes of poverty in the form of such a diagram, an analysis on the direct cause and root problem of poverty could not be carried out. The analysis in this chapter is assisted more by an analysis based on the frequency of information at PPA locations.

The SMERU Research Institute, December 2003 29
Figure 4.1. A Diagram of the Causes of Poverty, Developed through a Discussion with a Group of Women
in Lumumba Dalam, Kelurahan Ngagel - Surabaya
Discontinue schooling
Cannot cover expenses
Income only from driving a
pedicab
Unable to fill jobs that are available
Low level of education and skills
POVERTY
Some people are lazy
Many people drink and
gamble
Influenced by the
surroundings
Often sick (many visits to the doctor,
many payments)
Unclean environment,
home in front of demolition site
Unable to migrate to
other regions
Low income
Many needs, but a low income
Many unexpected costs, such as invitations, visiting sick
people
Only father working
Mother trading but business is slow
Old, unable to sell things outside the village, young children embarrassed of
selling things outside the village
Many childre
Do not participate in
family planning
Afraid of participating in family planning
Trauma because of a neighbor’s failed
attempt with family planning
Sell things at the front of one’s house
Source: Field Report, Kelurahan Ngagel, Kecamatan Wonokromo, Kota Surabaya (DFID-2000)

The SMERU Research Institute, December 2003 30
Figure 4.2 A Diagram of the Causes of Poverty, Developed through a Discussion with a Group of Men in Lumumba Dalam, Kelurahan Ngagel- Surabaya
POVERTY
Monetary crisis
Low level of income
Too lazy to work
Difficulties in obtaining a job (office worker, factory worker)
Business does not
grow Lack of capital
Difficulties in obtaining inputs
High cost of inputs
Dependent upon Bank Cuwil/Bank
Titil (money lenders)
High prices Poor nutrition
Poor physical health
Do not have connections or
money for bribery
Lack of skills
No qualifications
Low level of education (did not
continue schooling)
Cannot cover
expenses
Source: Field Report, Kelurahan Ngagel, Kecamatan Wonokromo, Kota Surabaya (DFID, 2000)

The SMERU Research Institute, December 2003 31
Figure 4.3 A Diagram of the Causes of Poverty, Developed through a Discussion with a Group of Women in Desa Kawangu, East Sumba
POVERTY
Livestock disease
Locust, pest or rat plague
High cost of goods, low selling price for
woven cloth
Traditions, funerals and belis Thievery
No assurance of good health
Discontinue schooling
No capital
Ostracized, except from school
Worry (Kadikuk Naeti)
Difficulties
Source: Field Report, Desa Kawangu, Kecamatan Pandawai, Kabupaten Sumba Timur (World, 1999)

The SMERU Research Institute, December 2003 32
Figure 4.4 A Diagram of the Causes of Poverty, Developed through a Discussion with a Group of Young Men in Desa Kawangu, East Sumba
SIMPLE LIFESTYLE
Locust, pest or rat plague
Traditions (slaughter livestock for funerals)
Sell land
Profit sharing, works on somebody
else’s land
Gambling
No assurance of good health
Walls of house are made of
leaves
Lack of food
Children drop out of school
Alcoholism
No assurance of good health
Lack of clothing
Source: Field Report, Desa Kawangu, Kecamatan Pandawai, Kabupaten Sumba Timur (World Bank, 1999)

The SMERU Research Institute, December 2003 33
Table 4.1. Sequence of Factors which Cause Poverty and the Problems which the Poor
Face, Based upon the Frequency that they were Mentioned in PPAs
Order Cause of Poverty Order Problems Faced First Lack of/no capital
Low level of education Lack of/no skills
First Difficulties relating to transportation facilities
High cost of education Poor road conditions Unable to obtain credit Low income Low level of education/drop out of school
Second Lack of employment opportunities Low income Lack of/no land Lack of effort God’s will/fate Poor health Production problems Low produce prices Transportation difficulties Large number of family members No inheritance Lack of/trouble with government
assistance Caught up in loans Infertile/steep sloping agricultural land
Second Mismanagement/lack of assistance programs
Lack of/no capital Lack of employment opportunities Difficulties in obtaining clean water Difficulties in meeting everyday needs Poor nutrition Lack of extension work/guidance Inadequate irrigation Low product prices Family planning Pests and diseases High medical costs Lack of health services Lack of food/hunger Security problems Unemployment
Third Unemployment High cost of living High price of production inputs/basic
production materials Natural disasters Non-permanent employment Unable to manage income Family/social problems Business problems Layoffs Government policies Unable to work Problems relating to traditions or
customs Security problems Family misfortune Lack of socialization/information
Third Poor health High cost of basic commodities High cost of traditional ceremonies Housing and environment Lack of education facilities Poor harvest Lack of/poor quality of agricultural
land Caught up in loans Lack of bathing, washing and toilet
facilities Natural disasters Lack of skills Alcoholism, gambling and juvenile
delinquency Lack of participation in collective
work Remoteness Family disharmony Child labor Detrimental government policies Difficulties in developing businesses Do not own fishing equipment Lack of access to communication and
information facilities High cost of inputs Poor irrigation Lack of general facilities Lack of awareness about the
importance of education for children
Lack of religious faith No electricity
Sources: Appendices 6 and 8.

The SMERU Research Institute, December 2003 34
The variety of factors considered as causes of poverty and problems faced by the poor illustrates the complexity of the poverty in various regions in Indonesia. To assist in analyzing these problems, the causes and problems of poverty have been grouped into six categories: powerlessness, isolation, material poverty, physical weaknesses, vulnerability, and attitude and behavior. The results of this categorization are provided in Figure 4.5. In this figure, the further the point of a group of factors from the center, the larger the contribution of that group of factors to the overall problem of poverty. Figure 4.5 shows that the most dominant group was the powerlessness factors. In this context, powerlessness consists of several factors which represent the poor’s lack of control over development or the policies which influence their lives. The other groups of factors which were fairly frequently mentioned were isolation and material poverty factors, followed by vulnerability, physical weakness, and behavioral factors, respectively. As shown in Figure 4.5., there were differences between the patterns produced by the analysis of the causes of poverty and the analysis of problems faced by the poor. The analysis of the causes of poverty indicated that the poor are inclined to perceive material poverty factors as the most dominant causes of poverty, more dominant than isolation factors. Meanwhile, the analysis of the problems in fact indicated the reverse. The analysis of the most frequently mentioned problems indicated that isolation factors were more dominant than material poverty factors. The isolation factors consisted of transportation difficulties as well as limited access to a better life. This difference indicates the limitations of the poor in recognizing the interaction between the various factors which cause poverty. Material poverty, a cause that affects them directly, was more frequently indicated by the poor as a cause of poverty. But, material poverty is actually the result of a variety of other factors which are the root problems of poverty spread across the other five groups of factors. This phenomenon certainly needs to be taken into consideration in formulating poverty reduction strategies, as strategies which only focus on efforts to reduce material poverty without adequately taking into account other factors will be less effective or even ineffective.
Figure 4.5. A General Illustration of the Poverty Trap
Contributions of each group of causes and problems of poverty were different according to location (urban/rural or geographical region), livelihood of the community, and the age and sex of respondents. These differences could be observed from the shape of the poverty traps provided in Figures 4.6. – 4.9. Figure 4.6. depicts the differences in poverty trap patterns in rural and urban areas. Although the group of powerlessness factors was the dominant group of factors in both areas, differences in the magnitude of isolation, material poverty and
TotalPowerlessness
Isolation
Material Poverty
Physical Weaknesses
Vulnerability
Attitude
Causes Problems

The SMERU Research Institute, December 2003 35
behavioral factors were apparent. In rural areas, the analysis of the causes of poverty indicated that material poverty was more dominant than isolation, whereas the analysis of problems indicated that isolation problems were far more dominant than material poverty problems. In urban areas, this difference was not so obvious because there were a lot fewer isolation problems expressed in urban areas than in rural areas. The contribution of isolation factors as causes of poverty and as problems for the poor in urban areas was more consistent. Even from the behavioral aspect, it appears that behavioral factors were more frequently mentioned in urban areas than in rural areas.
Figure 4.6. Poverty Trap Illustrations in Urban and Rural Areas
The poverty traps drawn from PPAs in western and eastern Indonesia demonstrated that the poverty trap patterns in the two regions are similar (Figure 4.7.). However, the poverty traps for different types of communities’ livelihood in fact indicated bigger variations. Figure 4.8. shows that the poverty trap pattern in rice-farming communities and forest communities were similar to the general pattern of rural areas. It appears that the contribution of the material poverty and behavioral factors in dry-land farming communities tend to be larger than in other communities. This may be related to the location of dry-land farming communities, which are mostly located in Nusa Tenggara. Poverty in this region is relatively worse, and there is a drinking tradition in communities that causes more frequent behavioral problems to arise. It is apparent that powerlessness factors in coastal fishing communities tend to be more influential than in other communities. The poverty trap pattern in informal sector and labor communities was generally similar to the pattern in urban areas.
Figure 4.7. Poverty Trap Illustrations in Western and Eastern Indonesia
Rural Powerlessness
Isolation
Material Poverty
Physical Weaknesses
Vulnerability
Attitude
Causes Problems
UrbanPowerlessness
Isolation
Material Poverty
Physical Weaknesses
Vulnerability
Attitude
Causes Problems
Western IndonesiaPowerlessness
Isolation
Material Poverty
Physical Weaknesses
Vulnerability
Attitude
Causes Problems
Eastern IndonesiaPowerlessness
Isolation
Material Poverty
Physical Weaknesses
Vulnerability
Attitude
Causes Problems

The SMERU Research Institute, December 2003 36
Figure 4.8. Poverty Trap Illustrations in Different Types of Communities
The poverty traps drawn up from the results of discussions with a variety of respondents show that the pattern of factors which cause poverty based upon the perspectives of young respondents was similar to that of older respondents (Illustration 4.9.). However, there were some differences in the pattern drawn from the perceptions of female respondents and the perceptions of male respondents. Compared with male respondents, female respondents were
Dry-land Farming Community
Powerlessness
Isolation
Material Poverty
Physical Weaknesses
Vulnerability
Attitude
Causes Problems
Rice Farming Community
Powerlessness
Isolation
Material Poverty
Physical Weaknesses
Vulnerability
Attitude
Causes Problems
Forestry & Plantation Community
Powerlessness
Isolation
Material Poverty
Physical Weaknesses
Vulnerability
Attitude
Causes Problems
Mixed of Urban Labor, Informal Sector & Others
Powerlessness
Isolation
Material Poverty
Physical Weaknesses
Vulnerability
Attitude
Causes Problems
Coastal Fishing Community
Powerlessness
Isolation
Material Poverty
Physical Weaknesses
Vulnerability
Attitude
Causes Problems

The SMERU Research Institute, December 2003 37
inclined to mention factors relating to powerlessness and behavior more often. Meanwhile, male respondents tended to mention factors relating to isolation more frequently.
Figure 4.9. Poverty Traps Illustrations according to Groups of Respondents
It appears that the difference in male and female perceptions of the causes of poverty and the problems which they confront is related to the dynamics of male and female roles and responsibilities at home as well as in the community (see Box 4.1.). As is also apparent in Table 4.2. and Table 4.3., within the household, women are more responsible in organizing internal family affairs and thus they face powerlessness factors more often. Among these factors are husbands who are unemployed and thus unable to provide financial support, the high cost of consumer goods, education costs and health expenses which continuously increase, as well as debt traps. Within the village community domain, women are more often involved in social activities, although recently consultation activities in rice-farming communities have began to involve more groups of female farmers. It appears that more or less due to their limited roles, women have not really recognized the restrictions in accessing a decent job or in participating in decision-making at the community level.
FemalePowerlessness
Isolation
Material Poverty
Physical Weaknesses
Vulnerability
Attitude
Causes Problems
MalePowerlessness
Isolation
Material Poverty
Physical Weaknesses
Vulnerability
Attitude
Causes Problems
Young PeoplePowerlessness
Isolation
Material Poverty
Physical Weaknesses
Vulnerability
Attitude
Causes Problems
Old PeoplePowerlessness
Isolation
Material Poverty
Physical Weaknesses
Vulnerability
Attitude
Causes Problems

The SMERU Research Institute, December 2003 38
Box 4.1. The Dynamics of Male and Female Roles at Home and in the Community
Several PPAs carried out by the World Bank (1999) specifically tried to explore information regardingthe role of males and females, both at home and in the community, when the study was being conductedand ten years beforehand. This information shows that there been have a few changes in the roles ofmales and females in several communities, although males have remained dominant in strategicdecision-making, both at home as well as in the community. Responsibilities and Decision-Making at Home In general, the information collected in PPAs shows that the main responsibilities of women at homeare to manage household affairs and prepare food, educate children, and earn a living, respectively. Themain responsibilities of women in different areas are similar although there were somewhat differentemphases. In urban areas, the most frequently mentioned responsibilities of women were to managehousehold affairs and educate children, whereas in rural areas, particularly in rice farming communities,the main responsibility of females was to prepare food. If this is compared with the situation ten yearsago, it is apparent that the responsibility of females in educating children in rice farming communitieshas declined. But in urban areas, particularly in informal sector and labor communities, theresponsibility of females in earning a living has increased, whereas the responsibility of women whichhas tended to decline in urban areas is fetching water. The main responsibilities of males within the household are to earn a living, educate children, and assisttheir wives. But the main responsibilities of men in rural areas are different from that in urban areas. Inrural areas, the most dominant responsibility of males is to earn a living, whereas responsibilities ineducating children and assisting their wives were mostly mentioned in urban areas. However, comparedwith the arrangement ten years ago, it is apparent that there has been a decline in their responsibility toeducate children and an increase in assisting their wives. In dry-land farming communities, an increasein the responsibility to assist their wives and prepare food is also apparent, and there has also been adecline in the responsibility to earn a living and provide clothing, whereas there have been hardly anychanges in the responsibilities of males and females at home in forest communities. In line with the division of responsibilities at home, women become the decision-maker in everydayhousehold affairs (Table 4.3.). Although it seems that women make decisions on many matters, strategicdecisions such as purchasing and selling large assets (land and livestock), marrying children and payingfor a child’s schooling are still in the hands of men. Responsibilities and Decision-Making within the Community The information provided in a number of PPAs indicates that female responsibilities in the communityhave tended to increase in general. Female responsibilities which existed ten years ago, that isparticipation in PKK activities, posyandu, arisan as well pengajian, have tended to increase. In addition,there are some new female responsibilities, including participation in community consultations, LKMDcommemoration month and intensive-work programs, as well as teaching at TPA and providing food forthe PMTAS program. But this increase is not distributed equally amongst all communities. In forestcommunities, it appears that there has been no change to female responsibilities in the community. Indry-land farming communities, the female responsibilities which have increased include becoming aPKK cadre, as well as participating in collective work and NGO activities. New responsibilities includedparticipating in LKMD commemoration month and providing additional food for school children. Inrice-farming communities, new responsibilities have arisen, including participating in collective workand community consultations, whereas in informal sector and labor communities, the newresponsibilities include becoming a PKK cadre, participating in dasa wisma activities, teaching at TPAand participating in padat karya programs.

The SMERU Research Institute, December 2003 39
Table 4.2. Male and Female Responsibilities at Home and in the Community
Dominant Individual
Dominant Individual Responsibilities at Home
Males Females Responsibilities in the
Community Male Females
Earn an income XXX XXX Arisan XX XXX Build a home XX Pengajian XXX XXX Make decisions X Attend ritual celebrations XX Educate children XX XXX Contribute to celebrations X XX Provide guidance for wife X Participate in collective
work XXX XX
Provide security for family X Visit sick people X X Ensure family is happy X Village security XXX Provide clothing for family X Community service XX Fetch water X X Village meetings XX Prepare family meals X XXX LKMD activities X Take care of husband XX Head of RT/RW X Manage household affairs XXX Attend funerals XX X Manage household finances XX Family welfare program XXX Provide for other household
needs X XX Posyandu (become a cadre) XXX
Assist with wife’s work XX Assist with village needs XX Other activities X X Assist neighbors X XX Dasa Wisma X Assist people in need X Sport/aerobics XX Work as a midwife X Traditional healer X X Women’s commission X NGO/organization activist X* X Cooperatives X Provision of additional food X* Community consultation X* LKMD commemoration
month X*
Teach Koran to children X* Jimpitan X* Labor-intensive projects X* X* Traditions/Church/Mosque XX Distribute donations X Receive official visitors X* Work X* Sources: Appendices 10, 13, 14, and 17. Explanations: (XXX) mentioned in more than half of the locations; (XX) mentioned in more than 20%
of locations; (X) mentioned in less than 20% of locations; (*) a new responsibility which did not exist 10 years ago. Please see the List of Terms for the specific terms.
It seems that isolation problems, which were sensed and expressed more often by male groups in rural areas, are closely related to their role as the head of the family who must earn a living. Although earning a living is a joint responsibility, this task is still considered to be the man’s main responsibility. In order to earn a living, they have to try and find work outside of their region, and thus problems relating to transportation and low levels of education tended

The SMERU Research Institute, December 2003 40
to be more frequently mentioned by men. In addition, within the village community, men are more frequently involved in activities relating to decision-making, both at the RT/RW (neighborhood) level and the village level. Limited education and knowledge are surely felt to be restricting factors for them in actively participating in meeting forums at the village level, as well as taking official or leadership positions in organizations or groups at the local level.
Table 4.3. Decision-Making at Home and in the Community
Made by Made by Decisions at Home Males Females
Decisions in the Community Males Females
Purchase of agricultural land/rice field X
Construction of roads, bridges, mosques, and water supply systems
X
Purchase of livestock X Village, traditional or social needs X
House building X Collective work X Farming X Village meetings X Marrying children off X LKMD X
Paying children’s school fees X Village women’s program X
Giving money to relatives/family members X PKK X
Providing money to cover everyday expenses X Female kontak tani X
Determination of the price of woven cloth X Posyandu X
Providing cloth/slaughter animals for traditional ceremonies
X Dasa wisma X
Children planning to migrate X Pengajian X Permitting wife to work X Women’s commission X Organizing food/menu X Raskin (cheap rice program) X Household activities X Planning for food needs X Providing pocket money for children X
Determining how many times the family eats a day X
Selling agricultural products X Family health X Looking for loans X X Education for children X X Selling and buying household assets X X
Village contributions – voluntary X X Source: A number of the PPAs consolidated. For an explanation of the specific terms, please see the List of Terms.
The analysis based on categorizing the various causes and problems of poverty into six groups has provided a picture of the similarities and differences in the poverty issues in rural/urban areas and in communities with different livelihoods, as well as according to the perceptions of various groups of respondents. In order to deepen our understanding of the causes and problems of poverty, the factors categorized into each group need to be examined. The following section analyzes each group of factors in detail.

The SMERU Research Institute, December 2003 41
Powerlessness Factors Factors categorized into the powerlessness group are factors that reflect the lack of control or influence the poor have over the development activities and policies which influence their lives. Among the factors included in this group are those which relate to employment opportunities, expenses born by communities – both for consumption as well as for production needs, the price of products produced by a community, government assistance and policies, existing traditions, debt traps, security, and fate or God’s will. Powerlessness factors were very dominant in almost all regions, urban and rural areas , as well as all types of respondent groups – old, young, male, and female. Therefore, solving the dominant problems relating to powerlessness is a strategic element of poverty reduction efforts. Within the powerlessness factors, the most frequently mentioned cause of poverty was the lack of employment opportunities, whereas the most frequently mentioned problem was the high cost of education. In addition, factors which often arose, both in the analysis of the causes of poverty as well as in the analysis of the problems faced by the poor, were the low price of products produced by a community and the lack or mismanagement of government assistance programs. In regard to government assistance, the main issues highlighted were the lack of extension work, both for farming and other businesses, and poor targeting of assistance. The data provided in Table 4.4. indicate that the composition of powerlessness factors varies in urban and rural areas, and in communities with different livelihoods. In line with public knowledge, the most common powerlessness factors in urban areas were the lack of job opportunities and high unemployment, as well as the high price of basic necessities and the high cost of day-to-day living. Although the problems relating to a lack of job opportunities and unemployment were also often mentioned in rural areas, they were not as dominant as in urban areas. In relation to expenses, there was a tendency for problems relating to the high cost of education and medical treatment to be more frequently mentioned in urban areas than in rural areas. The problems which were more frequently raised in rural areas were problems surrounding the high price of production inputs and the low price of products produced. In addition, the “fate” factor, which tended to be more dominant in rural areas, reflects the community perception that there is only a small chance of escaping poverty. The differences between the dominant powerlessness factors in urban and rural areas indicates that there is a need for different approaches in reducing poverty in urban and rural areas. If the groups of powerlessness factors in western and eastern Indonesia are compared, it is apparent that although the lack of employment opportunities and low produce prices often arose in both areas, these two factors tended to be more dominant in eastern Indonesia. In addition, it needs to be noted that security factors and the high cost of traditional ceremonies, although rarely mentioned, tended to be a problem in eastern Indonesia. In western Indonesia, the most common factors were the high cost of living, including education and health expenses. The analysis of the different types of communities shows that there are some variations in the dominant powerlessness factors. The dominant powerlessness factors in informal sector and labor communities were more or less similar to those in urban areas, these being a lack of employment opportunities and the high cost of living. For rice farming communities, there is a lack of seasonal employment opportunities outside of the farming sector which can be taken on by farm laborers during quiet periods. Other dominant factors were the high cost of production inputs and the low price of unhulled rice and other farm produce. In dry-land farming communities, the most frequently mentioned causes of poverty were the low price of agricultural produce and the high cost of living, whereas the most frequently mentioned

The SMERU Research Institute, December 2003 42
problem in dry-land farming communities in Nusa Tenggara was the high cost of traditional ceremonies. Forest communities were somewhat different as they raised fate, the mismanagement of government assistance programs and lack of extension work more often in addition to the lack of employment opportunities. In coastal fishing communities, fate and the lack of employment opportunities were the most frequently raised factors, followed by unemployment and being caught up in loans. The dominance of “fate” as a factor in forest and coastal fishing communities reflects the severity of poverty, which has been experienced from generation to generation, and the strong perception that there is only a small chance to improve their welfare. The various causes and problems of poverty raised by old and young respondents indicated that there is a similarity in perceptions regarding the lack of job opportunities and unemployment factors as causes of poverty. Nevertheless, it was apparent that compared to older respondents, there was a tendency for young respondents to raise problems relating to the high cost of living, mismanagement of government assistance, detrimental government policies, and security more frequently, whereas older respondents were more inclined to raise problems relating to the high cost of traditional ceremonies. These differences reflect the attitudes and views of the young who are more critical of the recent developments in their region. Female and male respondents also tended to mention somewhat different powerlessness factors. In relation to employment issues, unemployment was more frequently mentioned by women, whereas the lack of employment opportunities was more frequently mentioned by men. This does not mean that more women are unemployed, but that they feel the impact of unemployment more because an unemployed husband or unemployed children increase their burden, whereas a lack of employment opportunities is felt more by men, whose main responsibility it is to earn a living. On the other hand, parallel with the role of women as managers of the household (see Table 4.2. and 4.3.), they also mentioned problems surrounding the high cost of living and being caught up in loans as causes of poverty more frequently. Isolation Factors The group of isolation factors is a collection of various physical and non-physical barriers which the poor face in accessing opportunities to improve their welfare. Factors in this group include physical and non-physical isolation. Factors relating to physical isolation include remote location and poor transportation infrastructure and facilities, whereas factors relating to non-physical isolation are made up of a low level education and skills, no access to credit, as well as a lack of access to education, health, irrigation, clean water supplies, and other public facilities. Based on the analysis of the causes of poverty mentioned by communities, these factors were not too dominant. But based upon the analysis on the problems that the poor face, issues in the group of isolation factors were very dominant. In most areas, except in urban areas and amongst informal sector and labor communities, the problems related to isolation factors are almost equal in magnitude to those caused by powerlessness factors. Therefore, isolation factors should receive substantial attention in the formulation of poverty reduction strategies, even though communities do not consider them as the cause of poverty.

The SMERU Research Institute, December 2003 43
Table 4.4. Causes and Problems of Poverty – Powerlessness Factors Type of Area Region Type of Community Respondent Groups
Total Rural Urban Western Indonesia
Eastern Indonesia
Rice- Farming
Dry-land Farming
Forestry & Plantation
Coastal Fishing
Labor & Informal Sector, &
Mixed
Female Male Young Old
(%) (%) (%) (%) (%) (%) (%) (%) (%) (%) (%) (%) (%) (%)
Causes of Poverty N = 78 56 22 49 29 22 12 17 11 16 41 40 31 20
Unemployment 19.2 17.9 22.7 14.5 20.7 13.6 - 17.6 45.5 25.0 26.8 10.0 22.6 30.0 Lack of employment opportunities 48.7 37.5 77.3 45.7 50.4 50.0 - 35.3 63.6 87.5 29.3 45.0 35.5 35.0 High cost of production inputs 17.9 23.2 4.5 16.4 13.3 40.9 16.7 5.9 9.1 6.3 12.2 20.0 - 5.0 Low produce prices 30.8 35.7 18.2 25.9 46.7 31.8 58.3 29.4 27.3 12.5 17.1 22.5 6.5 5.0 Mismanagement of government assistance 24.4 25.0 22.7 20.3 22.2 22.7 16.7 35.3 27.3 18.8 17.1 22.5 6.5 - Detrimental government policies 9.0 8.9 9.1 10.4 8.9 9.1 8.3 17.6 - 6.3 2.4 7.5 6.5 - Insecurity 5.1 7.1 - - 10.4 9.1 8.3 5.9 - - 7.3 5.0 3.2 - High cost of living 19.2 10.7 40.9 24.0 14.1 9.1 41.7 5.9 - 43.8 17.1 10.0 32.3 15.0 Caught up in loans 21.8 23.2 18.2 14.5 23.7 18.2 - 23.5 45.5 25.0 24.4 10.0 12.9 15.0
Problems related to traditions/custom 6.4 7.1 4.5 3.2 9.6 9.1 16.7 - 9.1 - 7.3 7.5 12.9 10.0
God’s will/fate 35.9 39.3 27.3 41.1 27.4 31.8 16.7 41.2 63.6 31.3 17.1 12.5 3.2 5.0
Problems Faced by the Poor N = 67 53 14 40 27 21 10 14 9 14 35 37 30 20
High medical expenses 10.4 7.5 21.4 9.3 6.3 9.5 10.0 7.1 - 21.4 11.4 8.1 16.7 - Family planning 11.9 11.3 14.3 11.4 19.4 9.5 10.0 21.4 11.1 7.1 22.9 8.1 3.3 5.0 High cost of education 32.8 28.3 50.0 30.2 20.8 38.1 10.0 35.7 22.2 42.9 25.7 32.4 20.0 15.0 High price of basic commodities 9.0 1.9 35.7 9.3 4.2 4.8 10.0 - - 28.6 17.1 2.7 16.7 15.0 Security disturbances 10.4 5.7 28.6 5.6 14.6 4.8 20.0 - 11.1 21.4 2.9 16.2 23.3 15.0 Traditional ceremonies 9.0 11.3 - 1.9 27.8 4.8 40.0 7.1 - - 11.4 13.5 13.3 25.0 Lack or mismanagement of assistance 17.9 15.1 28.6 9.4 20.8 14.3 20.0 7.1 22.2 28.6 8.6 18.9 16.7 10.0 Detrimental policies 4.5 1.9 14.3 3.7 4.2 4.8 - 7.1 11.1 - 2.9 5.4 3.3 10.0 Unemployment 10.4 1.9 42.9 11.1 2.1 9.5 - - - 35.7 20.0 8.1 26.7 25.0 Lack of employment opportunities 14.9 9.4 35.7 15.0 24.3 9.5 - 21.4 11.1 28.6 11.4 13.5 16.7 15.0 Low produce prices 13.4 13.2 14.3 7.5 36.8 14.3 20.0 14.3 22.2 - 8.6 13.5 10.0 10.0 High cost of production inputs 3.0 - 14.3 3.7 - 4.8 - - - 7.1 8.6 - 6.7 5.0 Caught up in loans 7.5 3.8 21.4 3.7 8.3 - - - 33.3 14.3 2.9 5.4 6.7 - Difficulties in fulfilling everyday needs 14.9 9.4 35.7 16.8 15.3 14.3 10.0 14.3 11.1 21.4 8.6 5.4 20.0 10.0

The SMERU Research Institute, December 2003 44
As shown in Table 4.5., out of the group of isolation factors, the most frequently mentioned causes of poverty were a low level of education and skills, and then factors relating to transportation problems. Factors relating to transportation problems arose more in rural areas, particularly within rice-farming communities. Isolation factors regarding the problems mentioned by communities varied greatly. The most frequently mentioned problems were the lack of transportation facilities, poor road conditions and no access to credit. As mentioned above, transportation problems were mentioned more often in rural areas. In urban areas, the most common problems were a lack of skills and no access to credit. Other problems which arose more frequently in rural areas were the lack of education facilities, remoteness of a location, as well as a lack of information and extension work. A lack of healthcare services, clean water, electricity and public facilities were more frequently mentioned in urban areas. A comparison of the isolation factors which arose in western and eastern Indonesia demonstrates the underdevelopment in eastern Indonesia. It is apparent from the high frequency of references to problems regarding poor road conditions and lack of education facilities, healthcare services, irrigation systems and extension work, as well as no access to credit. In western Indonesia, the most common problems were a lack of transportation facilities and lack of clean water. A comparison of the problems which were raised in different types of communities indicates that there are several specific problems in each community. In rice farming communities, the problems which often arose were the lack of transportation facilities and no access to credit. No access to credit was also very dominant in coastal fishing communities. In dry-land farming communities, the most frequently mentioned problems were the poor conditions of roads and lack of clean water. In forest communities, problems which frequently arose were the lack of transportation facilities and lack of extension work, whereas problems which often arose in informal sector and labor communities were a lack of skills and no access to credit, in addition to poor road conditions. The comparisons across respondent groups show that there was a tendency for groups of young respondents to mention problems relating to the lack of transportation facilities and lack of information and extension work more often, whereas groups of older respondents were more inclined to mention problems relating to poor road conditions and a lack of clean water. This once again reflects the differences in the focus of different age groups. From a comparison of female and male respondents, it is apparent that males were more inclined to mention problems relating to isolation. As mentioned above, it appears that this tendency is closely related to their role as the main income earner. Because in general men handle production problems, they also mentioned problems about the lack of information and extension work, lack of irrigation, and no access to loans more often, whereas groups of women raised problems relating to the poor road conditions and the lack of education facilities more frequently.
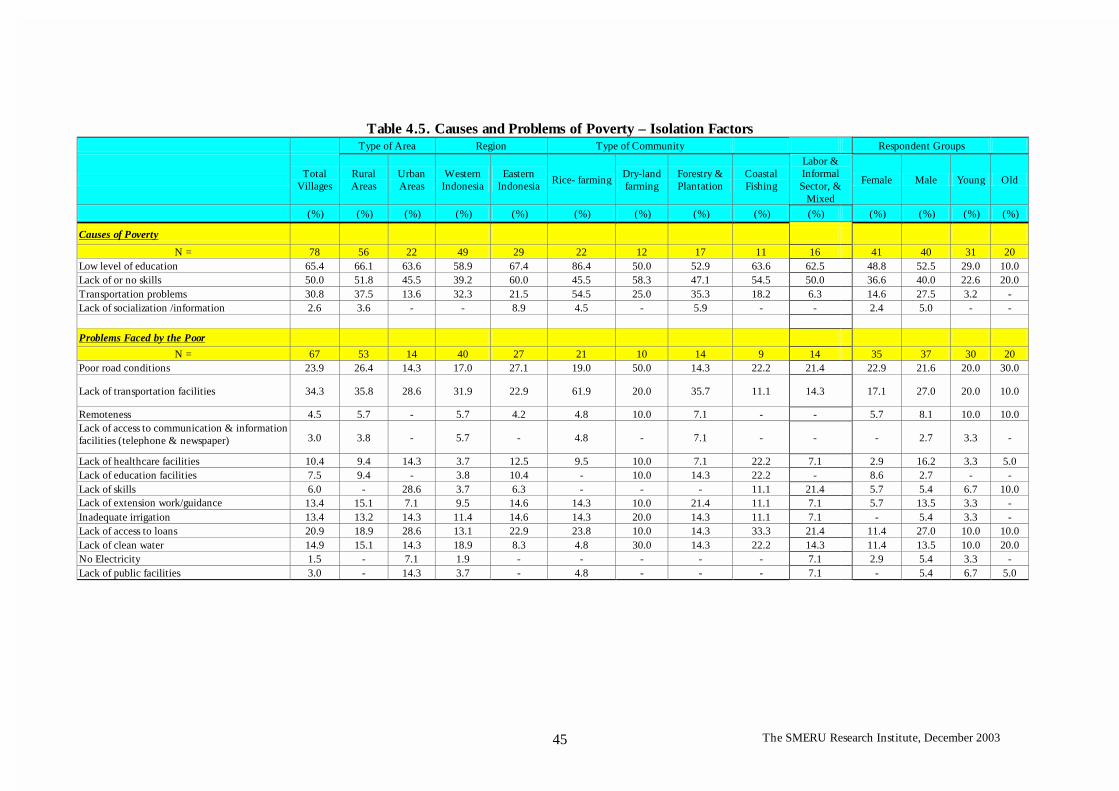
The SMERU Research Institute, December 2003 45
Table 4.5. Causes and Problems of Poverty – Isolation Factors Type of Area Region Type of Community Respondent Groups
Total Villages
Rural Areas
Urban Areas
Western Indonesia
Eastern Indonesia Rice- farming Dry-land
farming Forestry & Plantation
Coastal Fishing
Labor & Informal Sector, &
Mixed
Female Male Young Old
(%) (%) (%) (%) (%) (%) (%) (%) (%) (%) (%) (%) (%) (%)
Causes of Poverty
N = 78 56 22 49 29 22 12 17 11 16 41 40 31 20 Low level of education 65.4 66.1 63.6 58.9 67.4 86.4 50.0 52.9 63.6 62.5 48.8 52.5 29.0 10.0 Lack of or no skills 50.0 51.8 45.5 39.2 60.0 45.5 58.3 47.1 54.5 50.0 36.6 40.0 22.6 20.0 Transportation problems 30.8 37.5 13.6 32.3 21.5 54.5 25.0 35.3 18.2 6.3 14.6 27.5 3.2 - Lack of socialization /information 2.6 3.6 - - 8.9 4.5 - 5.9 - - 2.4 5.0 - -
Problems Faced by the Poor
N = 67 53 14 40 27 21 10 14 9 14 35 37 30 20 Poor road conditions 23.9 26.4 14.3 17.0 27.1 19.0 50.0 14.3 22.2 21.4 22.9 21.6 20.0 30.0
Lack of transportation facilities 34.3 35.8 28.6 31.9 22.9 61.9 20.0 35.7 11.1 14.3 17.1 27.0 20.0 10.0
Remoteness 4.5 5.7 - 5.7 4.2 4.8 10.0 7.1 - - 5.7 8.1 10.0 10.0 Lack of access to communication & information facilities (telephone & newspaper) 3.0 3.8 - 5.7 - 4.8 - 7.1 - - - 2.7 3.3 -
Lack of healthcare facilities 10.4 9.4 14.3 3.7 12.5 9.5 10.0 7.1 22.2 7.1 2.9 16.2 3.3 5.0 Lack of education facilities 7.5 9.4 - 3.8 10.4 - 10.0 14.3 22.2 - 8.6 2.7 - - Lack of skills 6.0 - 28.6 3.7 6.3 - - - 11.1 21.4 5.7 5.4 6.7 10.0 Lack of extension work/guidance 13.4 15.1 7.1 9.5 14.6 14.3 10.0 21.4 11.1 7.1 5.7 13.5 3.3 - Inadequate irrigation 13.4 13.2 14.3 11.4 14.6 14.3 20.0 14.3 11.1 7.1 - 5.4 3.3 - Lack of access to loans 20.9 18.9 28.6 13.1 22.9 23.8 10.0 14.3 33.3 21.4 11.4 27.0 10.0 10.0 Lack of clean water 14.9 15.1 14.3 18.9 8.3 4.8 30.0 14.3 22.2 14.3 11.4 13.5 10.0 20.0 No Electricity 1.5 - 7.1 1.9 - - - - - 7.1 2.9 5.4 3.3 - Lack of public facilities 3.0 - 14.3 3.7 - 4.8 - - - 7.1 - 5.4 6.7 5.0

The SMERU Research Institute, December 2003 46
Material Poverty Factors The group of material poverty factors reflects possessions and income. Factors in this group include ownership (or absence) of a variety of assets in the form of houses, land, capital, tools and inheritance, as well as income -both in the form of wages and harvest yields. The number of family members is also included in this group because it influences ownership or income per family member. After powerlessness factors, material poverty factors were the most frequently mentioned cause of poverty in various PPA locations. However, the results of the analysis of the problems the poor face indicated that material poverty is not a dominant problem. The analysis of the causes of poverty shows that the most dominant type of material poverty was the absence of economic capital. Other factors which were quite frequently mentioned included a low income, absence of agricultural land, large number of family members, agricultural land which is poor or lacks fertility, and absence of inheritance. Of the statements about problems the poor face, the most common factor to arise was the low level of income and lack of capital. Material poverty factors tended to be more frequently mentioned in urban areas than in rural areas. The absence or lack of capital, low level of income, and poor housing conditions and environment were the most frequently mentioned problems relating to material poverty in urban areas, whereas in rural areas, the causes which often arose were the absence of economic capital and the absence or lack of agricultural land. A comparison of the problems relating to material poverty mentioned in western and eastern Indonesia once again indicates that poverty conditions in eastern Indonesia are worse. The frequency of responses for almost all problems relating to material poverty factors was greater in eastern Indonesia than western Indonesia. Only the problem of a low income was more frequently mentioned in western Indonesia. Factors causing poverty found in both regions also had quite a different emphasis. Factors including limited land, small inheritance, and a large number of family members tended to be more frequently mentioned in western Indonesia than eastern Indonesia, whereas the factors which tended to be more frequently mentioned in eastern Indonesia were low income, lack of capital and infertile land. Of the causes and problems raised in various types of communities, it was apparent that in general, a lack of economic capital was the problem which was shared by all communities. This problem was very dominant in coastal fishing communities in particular. In addition to a lack of capital, limited land was more often mentioned as a cause of poverty in rice and dry-land farming communities and in forest communities, whereas for informal sector and labor communities, a low income was quite a dominant cause of poverty. In general, material poverty factors were more commonly mentioned by older respondents who specifically mentioned that a lack of capital was a cause and problem of poverty. The lack of capital factor also tended to be more frequently mentioned by male respondents compared to female respondents. Nevertheless, in general the various material poverty factors which became the cause of poverty, such as a low income, limited land ownership and infertile land, large number of family members, and no inheritance, were more commonly raised by female respondents compared to male respondents.

The SMERU Research Institute, December 2003 47
Table 4.6. Causes and Problems of Poverty – Material Poverty Factors
Type of Area Region Type of Community Respondent Groups
Total Villages
Rural Areas
Urban Areas
Western Indonesia
Eastern Indonesia
Rice- Farming
Dry-land Farming
Forestry & Plantation
Coastal Fishing
Labor & Informal Sector, &
Mixed
Female Male Young Old
(%) (%) (%) (%) (%) (%) (%) (%) (%) (%) (%) (%) (%) (%)
Causes of Poverty
N = 78 56 22 49 29 22 12 17 11 16 41 40 31 20
Low income 44.9 44.6 45.5 40.1 43.7 54.5 - 52.9 36.4 62.5 39.0 27.5 19.4 30.0
Lack/absence of agricultural land 43.6 50.0 27.3 45.5 42.2 59.1 66.7 52.9 9.1 18.8 41.5 35.0 19.4 25.0
Lack of/no capital 70.5 71.4 68.2 63.7 65.2 68.2 58.3 70.6 90.9 68.8 31.7 60.0 29.0 35.0
Large number of family members 30.8 30.4 31.8 33.2 21.5 31.8 16.7 35.3 18.2 43.8 31.7 25.0 25.8 25.0
Infertile/ steep sloping land 20.5 25.0 9.1 14.5 24.4 27.3 - 35.3 18.2 12.5 12.2 7.5 - -
No inheritance 25.6 28.6 18.2 24.0 20.7 31.8 16.7 29.4 27.3 18.8 17.1 12.5 3.2 10.0
Problems Faced by the Poor
N = 67 53 14 40 27 21 10 14 9 14 35 37 30 20
Poor harvest 7.5 9.4 - 5.7 17.4 9.5 20.0 7.1 - - 8.6 5.4 10.0 5.0
Limited land 7.5 9.4 - 9.4 4.2 9.5 20.0 7.1 - - 2.9 5.4 6.7 5.0
Lack of/no capital 16.4 9.4 42.9 15.1 16.7 9.5 30.0 - 22.2 28.6 22.9 24.3 33.3 45.0
No fishing equipment 4.5 3.8 7.1 - 10.4 - 10.0 - 22.2 - 5.7 8.1 10.0 10.0
Low income 20.9 15.1 42.9 22.4 8.3 19.0 10.0 14.3 33.3 28.6 8.6 13.5 20.0 15.0
Housing & environment 9.0 3.8 28.6 11.4 15.3 - 10.0 7.1 - 28.6 8.6 8.1 10.0 15.0

The SMERU Research Institute, December 2003 48
Physical Weaknesses Factors The group of physical weakness factors indicates the health conditions or disabilities which influence an individual’s productivity or ability to work. The causes and problems included in this group are health conditions, ability to work, lack of food or undernourishment, as well as sanitation problems which influence the level of welfare in general. Physical weakness factors were not the dominant causes or problems of poverty compared with powerlessness, isolation and material poverty. Nevertheless, these problems were still mentioned quite frequently in several areas or certain types of communities. In general, poor health conditions were more frequently mentioned as a cause of poverty compared with an inability to work. Poor health was more frequently mentioned by forest communities and there is a possibility that this problem is linked to food shortages, which were also more frequently raised by forest communities. The inability to work as a cause of poverty was only mentioned in urban areas, particularly in informal sector and labor communities. Problems relating to physical weaknesses were more frequently raised by female respondents. Parallel with their more dominant role in managing the household, women mentioned undernourishment and poor health conditions more frequently. Nevertheless, it appears that there was no difference in how men and women comprehended physical weaknesses as a cause of poverty. Differences in opinions were in fact more obvious between young groups and older groups. Young groups were more inclined to mention poor health conditions as a cause of poverty, whereas groups of older respondents were more inclined to mention the inability to work. Vulnerability Factors The group of vulnerability factors is a collection of factors which reflect instability or the disturbances that can reduce welfare levels, both those which are seasonal as well as those which are permanent. Layoffs, non-permanent employment, production problems, difficulties in managing agricultural and non-agricultural businesses, natural disasters, and family misfortune were the factors which caused poverty that were belong in this group. Among these factors, the most common causes of poverty were production problems, which seemed to be related to pests and crop diseases. Following this were natural disasters, non-permanent employment, business problems, layoffs, and family misfortune. Whereas the subsequent problems were dropping out of school and pests and crop disease, respectively. Other problems following this were natural disasters and child labor. Difficulties in managing business and poor canals, which caused flooding, were only raised in a small number of PPAs. It is apparent that vulnerability factors in rural areas were distinct from vulnerability factors in urban areas. In addition to problems in agricultural production, vulnerability factors which were thought to cause poverty in rural areas included non-permanent employment and natural disasters, whereas in urban areas, the most frequently raised vulnerability factors which were considered to cause poverty were layoffs, problems in non-agricultural businesses, and natural disasters. Of the problems raised, it was apparent that problems relating to vulnerability were more commonly mentioned in urban areas and only a few were mentioned in rural areas. This indicates that the poor in urban areas are more vulnerable. Among the problems which were frequently raised in urban areas were dropping out of school and natural disasters, specifically floods which occur on a seasonal basis. In addition, problems relating to child labor and difficulties in managing businesses were also mentioned in urban areas.

The SMERU Research Institute, December 2003 49
Table 4.7. Causes and Problems of Poverty – Physical Weakness Factors
Type of Area Region Type of Community Respondent Groups
Total Villages
Rural Areas
Urban Areas
Western Indonesia
Eastern Indonesia
Rice- Farming
Dry-land Farming
Forestry & Plantation
Coastal Fishing
Labor & Informal Sector, &
Mixed
Female Male Young Old
(%) (%) (%) (%) (%) (%) (%) (%) (%) (%) (%) (%) (%) (%)
Causes of Poverty
N = 78 56 22 49 29 22 12 17 11 16 41 40 31 20
Not healthy 33.3 35.7 27.3 32.5 32.6 40.9 16.7 41.2 18.2 37.5 24.4 22.5 16.1 10.0
Unable to work 9.0 5.4 18.2 10.8 6.7 9.1 - 5.9 - 25.0 7.3 7.5 3.2 15.0
Problems Faced by the Poor
N = 67 53 14 40 27 21 10 14 9 14 35 37 30 20
Poor health 9.0 9.4 7.1 9.4 15.3 9.5 10.0 14.3 11.1 - 11.4 2.7 6.7 5.0
Lack of food/hunger 10.4 7.5 21.4 19.1 4.2 - 10.0 21.4 - 21.4 2.9 5.4 10.0 5.0
Undernourishment 13.4 13.2 14.3 17.1 10.4 14.3 30.0 - 11.1 14.3 20.0 8.1 13.3 10.0 Lack of bathing, washing, and toilet facilities
7.5 1.9 28.6 5.6 4.2 4.8 - - 11.1 21.4 8.6 8.1 10.0 10.0

The SMERU Research Institute, December 2003 50
Of the various types of communities, the problems in agricultural production – particularly pests and crop disease as well as natural disasters, were the dominant factors in dry-land farming communities, whereas in coastal fishing communities, only natural disasters were considered as the most dominant causes of poverty. Child labor problems actually only arose in coastal fishing communities and informal sector and labor communities. Vulnerability factors mentioned by rice-farming and forest communities are similar, that is they are related to problems in agricultural production and non-permanent employment. A comparison between the perspectives of old and young respondents indicates that there are differences in emphasis concerning the vulnerability they feel. For young respondents, layoffs from work were the vulnerability factor which they considered the most dominant cause of poverty, whereas for older respondents, production problems were as equally dominant as layoff problems. In connection with the problems relating to vulnerability, dropping out of school and natural disasters were more frequently mentioned by older respondents. Through a comparison of the vulnerability factors mentioned by groups of female and male respondents, it was apparent that there were several differences which seemed to be influenced by their different roles in the household, as explained in Box 4.1. Problems relating to production, including pest and disease and business problems, were more frequently mentioned by male respondents, whereas female respondents mentioned non-permanent employment, child labor and natural disasters more often as the causes and problems of poverty. Family misfortune also tended to be more frequently mentioned by females as a cause of poverty. The high vulnerability of women to family misfortune, particularly the death of their husbands, is due to the fact that the responsibility to earn a living has remained the main responsibility of men. In addition, the pattern of control over assets, which is dominated by men, also adds to the vulnerability of women to fall into poverty if their husbands die. As explained in Box 4.2., there is a tendency that women whose husbands have died and who have no children receive an insignificant amount of wealth. Patterns of control over assets also make women more vulnerable to disharmonious family relations. This issue is mentioned in greater detail in the discussion regarding the group of behavioral factors. Attitude and Behavior Factors Factors included in the attitude and behavioral group are internal factors, that is bad habits or attitudes which tend to decrease welfare levels or hamper advancement. The causes of poverty included in this group are a lack of effort to work, inability to manage finances or squandering, and problems relating to disharmonious family relations, as well as gambling and alcoholism. The problems included in this group are a lack of awareness about personal health, a lack of awareness about the importance of education for children, disharmony at home, gambling, alcoholism, juvenile delinquency, lack of religious faith, and lack of participation in collective work with neighbors. Compared to other factors, behavioral factors were rarely mentioned as causes and problems of poverty. Nevertheless, in certain areas, particularly in urban areas and dry-land farming communities, behavioral factors were more frequently mentioned as causes of poverty compared to other communities. The attitude or behavioral factor which was most frequently raised was a lack of effort. This factor was more common in urban areas, particularly in urban informal sector and labor communities, and in dry-land farming communities. Other than a lack of effort, the problem of family disharmony also arose in informal sector and labor communities, whereas the inability to organize finances arose in dry-land farming communities. Problems relating to inharmonious families, alcoholism, gambling and juvenile delinquency, as well as a lack of participation in collective work were actually raised more

The SMERU Research Institute, December 2003 51
often in urban areas. This reflects the complexity of poverty problems in urban areas that require special attention and treatment. From the factors mentioned by the various groups of respondents, it is evident that problems relating to attitude and behavior were more frequently raised by young respondents and groups of women. This reflects that these two groups feel the impact of the various problems more.
Box 4.2. Patterns of Control over Household Assets
PPAs carried out by DFID (2002) and P2TPD (2003) revealed information regarding the control over familyassets by a husband and wife when a family was still together, in the case of divorce, and when a husband died.In several studies, it was apparent that there was an inclination for males to dominate control over large assetsand production assets. Where a family is still together, males control transportation means (bicycles,motorcycles, carts and pedicabs), a variety of agricultural tools and other production tools, rice fields and fishfarms, as well as livestock. Women usually have control over smaller farm animals, kitchen utensils, sewinginstruments, jewelry, and clothing, whereas the house, land, kiosks, money, bank accounts, radios, andtelevisions, as well as various items of household furniture such as tables, chairs, and beds, are controlledtogether. In the case of divorce, it is apparent that men continue to take control of transportation means, equipment ormachinery required for work (agricultural and fishing equipment, carpentry tools, garage tools or machinery),and livestock. Women take control over electronic goods (televisions and radios), household furniture,kitchen utensils and sewing instruments, jewelry and savings. Rice fields and plantations are divided into two.A wife usually takes control of the house as children stay living with their mother. It is unfortunate that thesestudies did not reveal information regarding who pays for the children’s needs after a divorce, and thus it isunknown who has a heavier burden after a divorce. If a husband dies, children inherit the wealth left behind by their father. As a result, almost all of the wealthwill be managed by the woman if the children stay with their mother. Nevertheless, a mother does not holdownership rights. The sale of assets usually has to be discussed with the family of their late-husband. If awoman re-marries, the rights over family assets, in the form of houses or other productive assets, must betransferred to the children. Thus, it can be said that women do not actually have full control over familyassets. In the case of women whose husbands die and who do not have children, there is a tendency for thesewomen to only receive jewelry and household furniture. The majority of them can still live in the house, but ifit is to be sold, they must consult with the family of their late-husband. If the women re-marries, the housemust be relinquished to the family of their late-husband, whereas assets in the form of rice fields, plantations,livestock, and means of transportation would be controlled by the family of their late-husbands.

The SMERU Research Institute, December 2003 52
Table 4.8. Causes and Problems of Poverty – Vulnerability Factors
Type of Area Region Type of Community Respondent Groups
Total Villages
Rural Areas
Urban Areas
Western Indonesia
Eastern Indonesia
Rice- Farming
Dry-land Farming
Forestry & Plantation
Coastal Fishing
Labor & Informal Sector, &
Mixed
Female Male Young Old
(%) (%) (%) (%) (%) (%) (%) (%) (%) (%) (%) (%) (%) (%)
Causes of Poverty
N = 78 56 22 49 29 22 12 17 11 16 41 40 31 20
Layoffs 10.3 - 36.4 14.1 - 4.5 - - - 43.8 12.2 12.5 32.3 20.0
Non-permanent employment 16.7 19.6 9.1 22.0 11.1 22.7 8.3 23.5 9.1 12.5 14.6 12.5 12.9 10.0
Production problems 30.8 37.5 13.6 27.5 40.0 27.3 58.3 35.3 27.3 12.5 19.5 27.5 12.9 20.0
Business problems 12.8 7.1 27.3 14.1 13.3 13.6 - 11.8 - 31.3 7.3 15.0 16.1 15.0
Natural disasters 17.9 17.9 18.2 11.6 34.8 9.1 8.3 17.6 54.5 12.5 9.8 7.5 9.7 5.0
Family misfortunes 5.1 3.6 9.1 8.8 - 4.5 - 5.9 - 12.5 4.9 2.5 6.5 5.0
Problems Faced by the Poor
N = 67 53 14 40 27 21 10 14 9 14 35 37 30 20
Low level of education or school drop out 17.9 15.1 28.6 20.7 17.4 4.8 30.0 21.4 11.1 28.6 11.4 13.5 16.7 25.0
Child labor 4.5 1.9 14.3 1.9 6.3 - - - 22.2 7.1 8.6 2.7 6.7 5.0
Business problems 4.5 1.9 14.3 5.6 - 9.5 - - - 7.1 - 5.4 3.3 10.0
Pests and crop disease 11.9 15.1 - 11.4 23.6 9.5 40.0 14.3 - - 14.3 18.9 23.3 20.0
Natural disasters 7.5 3.8 21.4 3.7 12.5 - 20.0 - 11.1 14.3 17.1 13.5 20.0 30.0
Irrigation 3.0 - 14.3 3.7 - 4.8 - - - 7.1 2.9 5.4 6.7 5.0
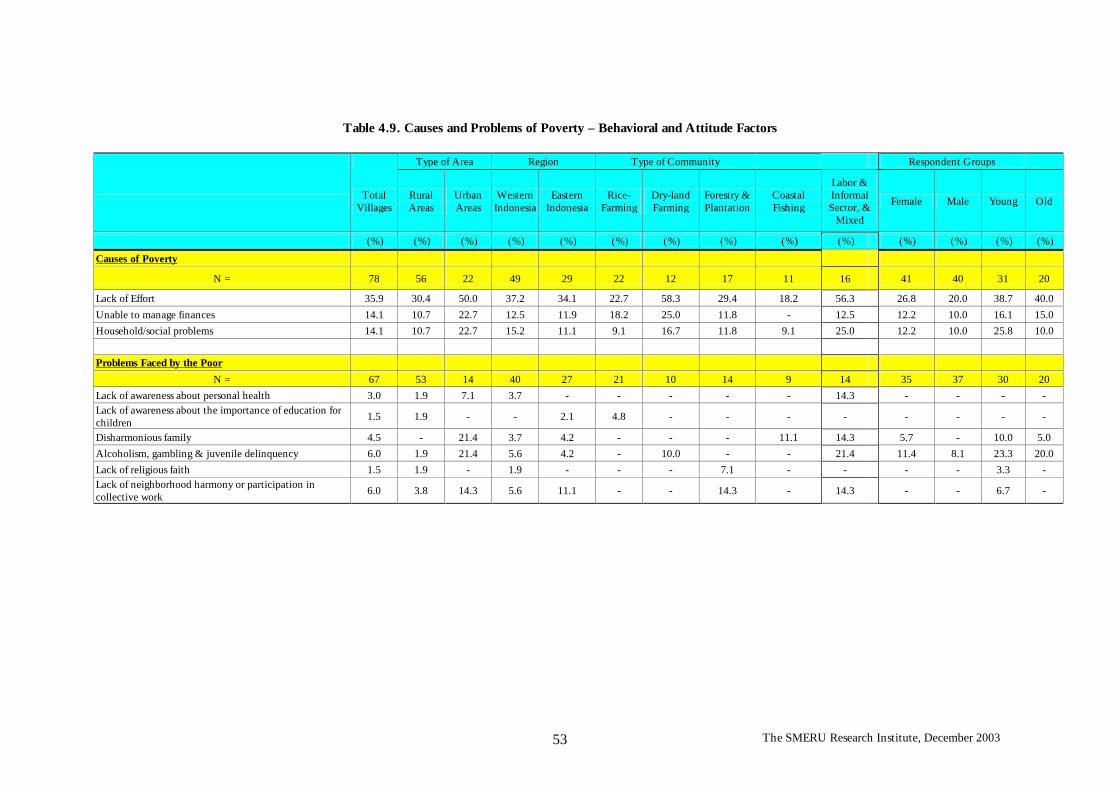
The SMERU Research Institute, December 2003 53
Table 4.9. Causes and Problems of Poverty – Behavioral and Attitude Factors
Type of Area Region Type of Community Respondent Groups
Total Villages
Rural Areas
Urban Areas
Western Indonesia
Eastern Indonesia
Rice- Farming
Dry-land Farming
Forestry & Plantation
Coastal Fishing
Labor & Informal Sector, &
Mixed
Female Male Young Old
(%) (%) (%) (%) (%) (%) (%) (%) (%) (%) (%) (%) (%) (%)
Causes of Poverty
N = 78 56 22 49 29 22 12 17 11 16 41 40 31 20
Lack of Effort 35.9 30.4 50.0 37.2 34.1 22.7 58.3 29.4 18.2 56.3 26.8 20.0 38.7 40.0
Unable to manage finances 14.1 10.7 22.7 12.5 11.9 18.2 25.0 11.8 - 12.5 12.2 10.0 16.1 15.0
Household/social problems 14.1 10.7 22.7 15.2 11.1 9.1 16.7 11.8 9.1 25.0 12.2 10.0 25.8 10.0
Problems Faced by the Poor
N = 67 53 14 40 27 21 10 14 9 14 35 37 30 20
Lack of awareness about personal health 3.0 1.9 7.1 3.7 - - - - - 14.3 - - - - Lack of awareness about the importance of education for children
1.5 1.9 - - 2.1 4.8 - - - - - - - -
Disharmonious family 4.5 - 21.4 3.7 4.2 - - - 11.1 14.3 5.7 - 10.0 5.0
Alcoholism, gambling & juvenile delinquency 6.0 1.9 21.4 5.6 4.2 - 10.0 - - 21.4 11.4 8.1 23.3 20.0
Lack of religious faith 1.5 1.9 - 1.9 - - - 7.1 - - - - 3.3 - Lack of neighborhood harmony or participation in collective work
6.0 3.8 14.3 5.6 11.1 - - 14.3 - 14.3 - - 6.7 -

The SMERU Research Institute, December 2003 54
4.2. Solutions to Poverty Other than discussing the causes of poverty and the various problems that the poor face, several PPAs also discussed the efforts required to reduce these problems and increase the welfare of the poor. The PPA carried out by the World Bank identified the efforts which could be implemented by the poor themselves and those which required external assistance. The PPA carried out by DFID and P2TPD discussed expensive and inexpensive efforts, whereas the study carried out by IHS revealed information by asking questions about what was required to exit from poverty. The results from these discussions provide an illustration of the poverty reduction efforts required based upon the perspectives of the poor. In addition to the focus group discussions with communities, the PPA carried out by the World Bank also conducted case studies through in-depth interviews to observe community welfare dynamics. The in-depth interviews with families that were previously categorized as poor but were better off at the time the study identified the factors which contributed to their increase in welfare. Somewhat different to the results of discussions with communities, which were based on desires and guesswork regarding what is required to increase their welfare, the results from these case studies provide information based on realities within communities. Both the results from discussions with communities as well as the results from case study analyses indicate that the solutions to poverty are very diverse. In general, it was evident in the 16 case studies provided in the PPA carried out by the World Bank (1999) that an increase in welfare resulted from a combination of internal factors and external intervention. In almost all cases, the internal actors were working hard by holding more than one job, economizing, saving money and gradually increasing investments from their savings. The savings and investing methods used by the poor included arisan, buying small farm animals and later livestock and land, or selling small goods, where the accumulated profits are used to buy musical instruments which can be hired out or used to open other small businesses. Other than these internal factors, it was proven that several forms of assistance and access to a job with a better salary improved the welfare of several families. No-interest loans from a foundation, for example, could be used to finalize loans with rentenir (moneylenders who charge high interest) so that part of one’s income could be saved and used to buy a boat. In another case, a family was able to improve their standing after obtaining work which was acquired through good relations with village officials. With a higher income, this family was able to open an additional business, in the form of a food stall, and send their children on to a higher level of education. Access to pawnshops, which receive woven cloth as collateral, was also a solution to paying for a variety of needs without having to become caught up in loans from rentenir. In addition, assistance from the government in building a house using credit was actually very useful in obtaining reasonable housing needs without having to borrow money from rentenir. In the case of poverty caused by blindness, a free cataract operation and assistance from the village head in paying for travel to a city resulted in a man who was blind being able to see again and farm his land. In the case of the death of a husband who used to work the family’s land, the creation of a farming group who cultivated land collectively was actually very useful. With such a farming group, the woman whose husband had died could farm the land, which would have otherwise been neglected. The results of various community discussions regarding the efforts required to overcome poverty also produced answers which were similar to the results of the case studies. As presented in Table 4.10, of the 32 types of efforts suggested by communities, individual efforts and external assistance were apparent. In addition, “God’s blessing” also arose which appeared to be closely related to the emergence of the “fate” factor as one cause of poverty.

The SMERU Research Institute, December 2003 55
The most frequently suggested solution to poverty was the provision of capital assistance. This suggestion appears to be consistent with the dominant perception amongst the poor that a lack of capital is the dominant factor which causes poverty. In addition to capital assistance, other suggestions which were frequently put forward included the need for employment opportunities, industriousness, road and transportation improvements, as well as a variety of efforts to improve human resources in the form of improving education, improving skills, extension work and guidance from the government, and a decrease in the cost of education or the provision of scholarships. The number of opinions regarding the need for efforts to develop human capabilities indicates that communities are still pinning their hopes on education and skill improvements as a way of escaping poverty. In addition, there were still many other suggestions put forward in a small number areas, including individual efforts in economize, save money and participate in collective work, or look for work in another region or even overseas as a migrant worker. Other efforts included guaranteed security and law enforcement, improvements of irrigation systems, health insurance, as well as control over the price of produce and consumer goods.
Table 4.10. The Order of Solutions to Poverty based on how often they were Mentioned in PPAs
Group Type of Effort Group Type of Effort First Capital assistance Fourth Provision of production input/equipment Second Employment opportunities Become a migrant worker Industriousness Clean water supplies Reduce alcoholism, gambling, and Skills development divorce Education improvement Assistance from children Construction/repair roads Escape the rentenir trap (transportation improvements) Work in another Government extension work and region/transmigrate services Electricity supplies Reduce education costs/provide Protect/maintain the environment scholarships Increase the role of NGOs Natural disaster management Third Guaranteed security/law enforcement Increase wages/salaries God’s blessing Provision of communication Construct/repair irrigation systems facilities Health services/insurance
Price protection and marketing assistance
Collective work or formation of community groups
Economize Save money Flood management Control over the price of consumer
goods
Sources: Appendices 22 and 23.
Table 4.11 provides an illustration of the variations in the needs mentioned in rural and urban areas. In urban areas, the need for capital assistance, skill development, decreases in the cost of education, employment opportunities and control over the price of consumer goods was more frequently mentioned than in rural areas. The need for improvements in education, government extension work and services, as well as guaranteed security and law enforcement in urban areas was relatively the same as in rural areas, whereas the need for industriousness, road improvements and God’s blessing tended to arise more in rural areas

The SMERU Research Institute, December 2003 56
compared with urban areas. In addition to these ten factors, the needs which were relatively high in rural areas were irrigation, the provision of production inputs, price protection and marketing assistance, access to natural resources, as well as a variety of internal factors, such as economizing, saving money and collective work, whereas another important effort which arose in urban areas was the need for flood management.
Table 4.11. Various Solutions to Poverty as Mentioned in Urban and Rural Areas
Rural Areas (N = 35) (%) Urban Areas (N = 18) (%)
Capital assistance 60 Capital assistance 78 Industriousness 34 Employment opportunities 56 Employment opportunities 29 Skills development 33 Skills development 29 Industriousness 28 Education improvements 26 Education improvements 28 Construct/repair roads (transportation
improvements) 26 Reduce education costs/provide scholarships 28
Government extension work and services 23 Government extension work and services 22 God’s permission 23 Flood management 22 Construct/repair irrigation systems 20 Control over the price of consumer goods 22 Reduce education costs/provide scholarships 17 Construct/repair roads (transportation
improvements) 17
Guaranteed security/law enforcement 17 Guaranteed security/law enforcement 17 Sources: Appendices 22 and 23.
In general, there are variations in the needs of the poor who live on different islands. As the there are only few samples in Kalimantan and Sulawesi, this analysis mainly focusing on the various needs put forward in the PPAs in Java, Sumatra, and Nusa Tenggara. In Java, the most frequently mentioned efforts were capital assistance, employment opportunities, industriousness, and education improvements in the form of improving formal education and decreasing education costs. In Nusa Tenggara, the need for security and law enforcement was second after capital assistance, followed by the need for employment opportunities and education improvements. The need for guaranteed security is likely to be related to the high level of livestock theft. In Sumatra, the efforts which were subsequent to capital assistance were skill development and God’s blessing. After these, efforts which were frequently mentioned included the need for extension work, industriousness, collective work and formation of community groups, as well as protection of produce prices and marketing assistance. Following these were the need for employment opportunities and improvements in formal education. The difference in frequency with which the various solutions to poverty arose reflects the difference in problems at the local level and in community perspectives regarding the factors they consider as more important. These variations can also be seen in the needs put forward in the different types of communities’ livelihood. In rice-farming communities, the three most frequently mentioned efforts were capital assistance, road improvements and skills development. The three important factors after these were health services and insurance, education improvements and construction or repair of irrigation systems. In dry-land farming communities, it was the need for government extension work and services which was frequently mentioned, most of which referred to the need for agricultural extensions and assistance in pest control. In this analysis, extensions have been included in the government services section because the government dominates them, although extension work can also be provided by non-government organizations. Furthermore, other efforts which were often mentioned in dry-land farming communities included the need for collective work or formation of community groups, capital assistance, employment opportunities and guaranteed security.

The SMERU Research Institute, December 2003 57
Table 4.12. Various Solutions to Poverty Frequently Mentioned in Different Regions
Java (N = 24) (%) Nusa Tenggara (N = 8) (%) Sumatra (N = 14) (%)
Capital assistance 75 Capital assistance 50 Capital assistance 57 Employment opportunities 54 Guaranteed security/law
enforcement 38 Skills development 36
Industriousness 38 Employment opportunities 25 God’s blessing 36 Education improvements 25 Education improvements 25 Government extension work
and services 29
Reduce education costs/provide scholarships
25 Reduce education costs/provide scholarships
25 Industriousness 29
Construct/repair roads (transportation improvements)
25 Skills development 25 Collective work/formation of community groups
29
Control over the price of consumer goods
25 Government extension work and services
25 Price protection and marketing assistance
29
Skills development 21 Access to resources 25 Employment opportunities 21 Become a migrant worker 25 Education 21 Reduce alcoholism, gambling &
divorce 25
Sulawesi (N = 3) (%) Kalimantan (N = 4) (%) Skills development 100 Capital assistance 75 Construct/repair roads (transportation improvements)
100 Industriousness 75
Repair irrigation systems/supply water
100 Employment opportunities 50
Capital assistance 67 Save money 50 Government extension work and services
67 Economize 50
Education improvements 67 Guaranteed security/law enforcement
67
Health services/insurance 67 Provision of production input/equipment
67
Sources: Appendices 22 and 23. In forest and plantation communities, the most frequently mentioned efforts were the need for industriousness and the need for capital assistance. After this, was God’s blessing and improvements in education, respectively. In poor coastal fishing communities, the need for capital assistance was the most frequently mentioned intervention, followed by working in another region, which appears to be a solution to the limited employment opportunities in the village where they live. In addition, other factors included industriousness, education improvements, skills development, access to natural resources and employment opportunities. In informal sector and labor communities, capital assistance and employment opportunities were very dominant, followed by skills development, assistance in paying school fees and industriousness. This sequence of needs reflects the relative importance of education and skills in accessing work in urban areas. It is quite interesting to note that a few of the findings from the results of this analysis are related to efforts concerning government protection policy, which so far many people have regarded as a strategy to reduce poverty, including an increase in wages and price protection. Although low incomes and low produce prices were often mentioned in the analyses of the causes and problems of poverty, the need for wage increases and price protection strategies did not arise frequently in the PPAs consolidated in this study. The need for wage increases was only raised in one location (2%), whereas the need for price protection and marketing

The SMERU Research Institute, December 2003 58
assistance only emerged in seven locations (13%). The need for employment opportunities was much more dominant than the issue of wage increases. There is a possibility this was caused by the fact that a large proportion of the respondents (particularly in poor urban communities) were unemployed or working in the informal sector or even working as laborers for a small business and could not see the possibility of demanding higher wages.
Table 4.13. Various Solutions to Poverty as Mentioned in Different Types of Communities
Rice Farming (N = 12) (%) Dry-land Farming (N = 10) (%) Forest & Plantation Communities (N = 11) (%)
Capital assistance 83 Government extension work and services
40 Capital assistance 55
Construct/repair roads (improve transportation)
67 Capital assistance 30 Industriousness 55
Skills development 50 Employment opportunities 30 God’s blessing 45 Education improvements 42 Guaranteed security/law
enforcement 30 Education improvements 27
Health services/insurance 42 Collective work/formation of community groups
30 Government extension work and services
18
Irrigation repairs/clean water supplies
42 Industriousness 30 Employment opportunities 18
Reduce education costs/provide scholarships
33 Price protection and marketing assistance
20 Price protection and marketing assistance
18
Government extension work and services
33 Save money 20 Save money 18
Employment opportunities 25 Skills development 18 Control over the price of
consumer goods 25 Repair irrigation systems/clean
water supplies 18
Provision of production input/equipment
25 Economize 18
Access to resources 18
Coastal Fishing Communities ( N = 6) (%)
Urban Informal Sector & Labor Communities
(N = 10) (%) Mixed (N = 4) (%)
Capital assistance 83 Capital assistance 90 Capital assistance 50 Work in another
region/transmigrate 50 Employment opportunities 80 Employment opportunities 50
Industriousness 33 Skills development 50 Flood management 50 Education improvements 33 Industriousness 40 Industriousness 25 Employment opportunities 33 Reduce education costs/provide
scholarships 40 Reduce education cost/provide
scholarships 25
Skills development 33 Education improvements 30 Control over the price of consumer goods
25
Access to resources 33 Guaranteed security/law enforcement
30 Electricity supplies 25
Escape the rentenir trap 20 Provision of production input/equipment
25
Control over the price of consumer goods
20
Assistance from children 20 Increase the role of NGOs 20
Sources: Appendices 22 and 23.
In relation to the need for protection of produce prices, such efforts were raised in four locations in Sumatra, and three other cases were found in Java, Sulawesi and Kalimantan.

The SMERU Research Institute, December 2003 59
The lack of suggestions regarding the need for price protection and marketing assistance may have been caused by respondents, the majority of whom were poor, not being directly concerned with issues such as the produce prices and marketing. This issue was certainly irrelevant for casual laborers who only receive a daily wage. This issue would be relevant for poor communities who own land, agricultural land or plantations whose income is influenced by the fluctuations in produce prices. But the likelihood of the poor being included in this group could be small.

The SMERU Research Institute, December 2003 60
V. EFFORTS TO REDUCE POVERTY Government and non-government organizations as well as international agencies have implemented direct and indirect efforts to reduce poverty through various policies, programs and projects. This chapter will discuss the impact of programs and projects, which are directly targeted at the poor, on the lives and livelihood of the poor. Unlike studies that were aimed at evaluating the impact of poverty reduction program or projects, the PPAs consolidated in this study did not specifically explore the impact of programs or projects in depth. The PPAs consolidated in this study contained a discussion with the poor regarding problems caused by their poverty. In addition, the poor communities also provided information on their coping strategies. This information provides an illustration of the social safety net systems the poor use and an initial indication of the effectiveness of programs and projects aimed at assisting the poor. Apart from information on the difficulties they face and the coping strategies they adopt to overcome these difficulties, several PPAs also provided information on the communities’ assessment of the institutions that play a role in their lives. In this context, institutions do not strictly refer to an organizational unit, but also include people that have a certain role in the community, such as foremen who can provide jobs, middlemen, and creditors. The PPAs consolidated in this study contained different institutional analysis. The studies conducted by the World Bank (1999), DFID (2000), and ILGR identified institutions that were considered important by the poor. In addition, the World Bank study (1999) also identified the institutions which were considered close and effective. The ILGR study, on the other hand, also added an identification of institutions which provided assistance and information to the community. This institutional analysis, combined with community assessments on some poverty alleviation programs that they are familiar with, provides a preliminary evaluation of the effectiveness of various poverty reduction programs. It should be noted that because of the limited amount and depth of information contained in the PPA reports, the evaluation of the effectiveness of programs in this analysis should be interpreted with caution. The findings from this analysis shall be compared with the findings from other studies that specifically aim to evaluate poverty alleviation programs. In addition to a description of program effectiveness, this institutional analysis also provides information on the roles and significance of various institutions in the lives of the poor. Thus the potential institutions to be used as channels to deliver assistance as well as to empower the poor can be identified. 5.1. The Impacts of Poverty and the Poor’s Coping Strategies The poverty and deprivation faced by the poor have had an impact on various aspects of their lives. Therefore, the poor have adopted various coping strategies to overcome their problems by making use of the opportunities available. This section will discuss the impact of poverty as expressed by poor communities in the various PPAs, which provides an illustration of the difficulties the poor face that varies across regions and respondent groups. Subsequently, this sub-chapter will present the coping strategies of the poor. These strategies will reveal the social safety net systems they have. This illustration also provides an initial indication of the effectiveness of various programs, provided by both the government and non-government organizations in helping the poor.

The SMERU Research Institute, December 2003 61
The Impact of Poverty The PPA reports presented a variety of impacts resulting from poverty. Poverty does not only cause a limited ability or inability to meet basic needs such as food, clothing, housing, education and health, but also causes restlessness and social isolation due to low self esteem or an inability to participate in social activities. Moreover, it was stated that poverty also causes a number of social problems, such as crime, gambling, juvenile delinquency, prostitution, and increases environmental destruction. To simplify the analysis, various statements regarding the impact of poverty were grouped in 22 categories. As shown in Table 5.1, the impacts that were most frequently expressed were those relating to the difficulties in meeting food requirements. In a number of regions it was expressed that difficulties in meeting food requirements occur in certain periods, particularly during famines. But in most PPAs, statements on the difficulties in meeting food requirements were more general, for example, the difficulties in meeting family food requirements or only being able to acquire certain food that lacks nutrition. The frequency of statements about the difficulties in meeting food needs reflects the significance of the issue of food insecurity for poor communities. Related to the various causes of poverty discussed in the previous chapter, it is clear that food insecurity can be caused by different factors. In a number of regions, insecurity can be linked to low purchasing power, while in other regions, this insecurity can be caused by a lack of food supplies due to seasons or natural disasters.
Table 5.1. The Impact of Poverty based on the Frequency with which they were Mentioned in PPAs
Group The Impacts of Poverty Group The Impacts of Poverty First Difficulties in meeting Third Increase in crime food requirements Caught up in loans Difficulties in paying education-related Second Difficulties in paying expenses school fees Social problems Difficulties in earning a living Difficulties in meeting clothing needs Low education or drop out of school Family disharmony Poor health Have to find work and settle in other
regions/countries Difficulties in paying for medical
expenses Lack of religious faith
Difficulties meeting Environmental destruction housing needs Receive fewer public services A hard life Isolation Difficulties in accessing capital Restlessness Child labor Sources: Appendices 24 and 25. Another difficulty which was frequently expressed was the difficulty in paying school fees which in turn causes children and adolescents to drop out of school and perpetuates the low level of education within poor communities. More specifically, some PPAs also revealed that poverty not only reduces the ability to pay school fees, but also the ability to purchase books and uniforms, or pay for transportation as well as other expenses related to education. The fact that a low level of education was frequently expressed as a cause of poverty shows that access to education is still an important aspect of the poverty trap. Poverty which is caused by a low level of education stems from an inability to put children through school, which in turn causes the next generation to live in poverty.
The SMERU Research Institute, December 2003 62
Other impacts that were also frequently expressed were the difficulties in obtaining an adequate income and acquiring capital. Similar to the education factor, access to work and access to capital were also quite frequently expressed when identifying the causes of poverty. The fact that access to work and capital were mentioned as causes and impacts of poverty indicates that these factors have quite dominant roles in perpetuating poverty. Besides difficulties in increasing their level of education and income, other impacts of poverty that were often stated included poor health and difficulties in paying medical expenses, social isolation, restlessness, a hard life, and the rise of child labor. In addition, although not expressed as often, some PPAs revealed that other impacts of poverty included difficulties to meet clothing needs, economic problems due to loans, family disharmony, and a variety of problems within the wider community, such as the increase of crime, the rise of various social problems, and environmental destruction. The impacts of poverty expressed in various PPAs varied based on the location of the study and type of community. Table 5.2. provides an illustration of the different impacts experienced by rural and urban communities. In general, the impact of poverty in urban areas is more complex than in rural areas. The impacts of poverty which were stated in rural areas were largely related to meeting basic needs, while those stated in urban areas also included various community problems. The increase in crime, social problems, family problems, restlessness, debt and isolation were mentioned more frequently by urban poor communities and were rarely mentioned by poor communities in rural areas. In addition, the frequency with which these factors were mentioned in urban areas was relatively higher than in rural areas. In general, the inability to fulfill food, education and health needs were the most often mentioned by the poor both in rural and urban areas, although with different intensity. The impact of poverty on education was more often mentioned by the urban poor, whereas the impact of poverty on meeting food requirements was more often mentioned in rural areas. This fact suggests that the poor in rural areas experience relatively greater food insecurity compared to the urban poor. This may be due to the poor’s pattern of meeting food requirements in rural areas where they still rely on subsistence farming or because the poor in rural areas are mostly farm laborers whose work is seasonal. In subsistence farming in Nusa Tenggara, for example a short rainy season will cause crop failure and threaten their ability to meet food requirements. With regard to education, the fact that difficulties pertaining to education were mentioned more often in urban areas does not imply that these difficulties were not experienced by those living in rural areas. This difference reflects the higher need for education in urban areas, therefore the access to higher education tends to raise more concern in urban communities. The impacts of poverty that were expressed by communities in a number of regions were also different, although in general difficulties in fulfilling food requirements was still the most dominant impact. Table 5.3, shows that the impacts of poverty expressed in PPAs carried out in western Indonesia (Java and Sumatra) are more varied than those expressed in eastern Indonesia. The rise of many social problems such as gambling, alcoholism, juvenile delinquency, a lack of religious faith, tendencies to destroy the environment as well as debt, were only expressed in western Indonesia.

The SMERU Research Institute, December 2003 63
Table 5.2. The Various Impacts of Poverty in Rural and Urban Communities based on How Frequently they were Mentioned
Rural Areas (N = 27) Urban Areas (N = 17)
(%) (%) Difficulties in fulfilling needs- food 70 Difficulties in fulfilling needs- food 65 Difficulties in paying school fees 41 Difficulties in paying school fees 59 Difficulties in earning a living 41 Difficulties in earning a living 59 Lack of education/ drop out of school 41 Lack of education/drop out of school 47 Poor health 41 A hard life 35 Difficulties in paying for medical expenses 30 Restlessness 35 Difficulties in fulfilling needs- housing 26 Poor health 29 Isolation 19 Difficulties in paying for medical expenses 29 Difficulties in accessing capital 19 Isolation 29 Child labor 19 Increase in crime 29 A hard life 15 Caught up in loans 29 Restlessness 11 Difficulties in fulfilling needs-housing 24 Increase in crime 11 Difficulties in accessing capital 24 Difficulties in fulfilling needs- clothing 11 Child labor 24 Caught up in loans 7 Social problems 24 Difficulties in paying education-related expenses 7 Family problems 24 Have to find work and settle in other regions/countries 7 Difficulties in paying education-related expenses 18 Lack of religious faith 4 Receive fewer public services 12 Environment destruction 4 Difficulties in fulfilling needs- clothing 6 Social problems - Have to find work and settle in other regions/countries 6 Family problems - Lack of religious faith 6 Receive fewer public services - Environmental destruction 6
Source: Appendix 24.
The data provided in Appendix 24 shows the difference in frequency with which the impacts of poverty were expressed in a number of regions in greater detail. In Java, the aspect of food problems, school dropouts, and the difficulties in earning a living, were in the top position, whereas another important impact felt by poor people in Sumatra included social isolation. In the case of Nusa Tenggara, besides difficulties in fulfilling food needs which was the main impact, the other impacts that were expressed were varied. Among the many impacts that were mentioned was the impact on education (dropping out of school and difficulties in paying school fees) and on health (poor health and difficulties in paying for medical expenses). Other impacts also expressed were a difficult life and inadequate housing. The poor in Sulawesi and Kalimantan also experienced these difficulties, but in addition, the increase of child labor was also mentioned as an impact in both regions. The impacts of poverty that were stated by poor communities with different livelihoods showed that every community expressed that difficulties in fulfilling food and education needs were the most dominant. However, Table 5.4. demonstrates that there are some variations in the impacts of poverty experienced by communities with different livelihoods. In general, this table shows that poverty problems in the informal sector and labor communities tend to be similar to those found in urban areas, whereas problems faced in rice-farming communities resembled the common pattern found in rural communities. But it was evident that a number of the impacts of poverty tended to be more dominant in certain types of communities. Difficulties in fulfilling food needs, for example, was a very dominant impact of poverty in forest and plantation communities and coastal fishing communities. This indicates that these communities are more vulnerable to food shortages. Difficulties in earning a living tends to be more dominant in coastal fishing communities, but was hardly mentioned in dry-land farming communities.

The SMERU Research Institute, December 2003 64
Table 5.3. The Various Impacts of Poverty in Western Indonesia and Eastern Indonesia based on How Frequently they were Mentioned
Western Indonesia (N = 31) Eastern Indonesia (N = 13) (%) (%)
Difficulties in fulfilling needs- food 71 Difficulties in fulfilling needs- food 62 Difficulties in earning a living 48 Difficulties in paying school fees 54 Lack of education/drop out of school 45 Poor health 54 Difficulties in paying school fees 45 Difficulties in earning a living 46 Poor health 29 Lack of education/drop out of school 38 Difficulties in paying for medical expenses 29 Child labor 38 Restlessness 26 Difficulties in fulfilling needs- housing 31 Caught up in loans 23 Difficulties in paying for medical expenses 31 A hard life 23 A hard life 23 Difficulties in fulfilling needs - housing 23 Difficulties in accessing capital 23 Isolation 23 Isolation 23 Increase in crime 19 Increase in crime 15 Difficulties in accessing capital 19 Difficulties in fulfilling needs- clothing 15 Social problems 13 Difficulties in paying education-related expenses 8 Difficulties in paying education-related expenses 13 Family problems 8 Child labor 13 Restlessness 8 Family problems 10 Have to find work and settle in other regions/countries 8 Difficulties in fulfilling needs- clothing 6 Receive fewer public services 8 Lack of religious faith 6 Social problems - Environmental destruction 6 Caught up in loans - Have to find work and settle in other regions/countries 6 Lack of religious faith - Receive fewer public services 3 Environmental destruction - Source: Appendix 24.
Of the impacts of poverty expressed by the different groups of respondents, it can be seen that both young and older respondents share similar perceptions (see Appendix 24). These two groups considered the difficulties in fulfilling food needs and school drop outs as the main impacts of poverty. This was also the case with the other impacts of poverty, such as an increase in crime, poor health, fulfillment of housing needs, debt, as both age groups tended to express similar experiences. A significant difference was found in the aspects of restlessness and hard life, which were expressed far more frequently by the group of older respondents. The impacts of poverty mentioned by female and male respondents showed that there are similarities in a number of aspects (Table 5.5.). Both female and male respondents considered difficulties in fulfilling food needs and school drop outs as the main impacts of poverty. Still, there are a number of differences that are quite striking. Impacts of poverty such as restlessness, a hard life, caught up in loans, and the difficulties of fulfilling clothing needs, were more frequently expressed by poor women compared to poor men. On the other side, compared to poor women, poor men more frequently mentioned difficulties in fulfilling housing needs and accessing to capital, as well as poor health as being more important impacts. This difference is related to the different roles assigned to women and men in the household and the community. The role of women is as household managers and men have the role of the breadwinner of the family, which includes the responsibility of taking care of medical expenses and providing shelter for the family.

The SMERU Research Institute, December 2003 65
Table 5.4. The Dominant Impacts of Poverty in Different Types of Communities based on How Frequently they were Mentioned
Types of Communities
No
The Impact of Poverty
Rice-Farming
Dry-land Farming
Forest and Plantation
Coastal Fishing
Mixed Laborers, Informal Sector
Workers & Other N = 9 9 10 5 11
1 Difficulties in fulfilling needs- food 66.7 55.6 80.0 80.0 63.6
2 Lack o f education/drop out of school 55.6 33.3 30.0 40.0 54.5
3 Difficulties in earning a living 55.6 11.1 50.0 80.0 54.5
4 Difficulties in paying school fees 44.4 44.4 50.0 40.0 54.5
5 Poor health 44.4 33.3 50.0 0.0 36.4
6 Difficulties in paying for medical expenses 33.3 44.4 20.0 20.0 27.3
7 Difficulties in accessing capital 33.3 22.2 20.0 0.0 18.2
8 Increase in crime 22.2 22.2 0.0 0.0 36.4
9 Caught up in loans 22.2 0.0 10.0 0.0 36.4
11 Social problems 0.0 0.0 0.0 0.0 36.4
12 Isolation 11.1 11.1 20.0 40.0 36.4
13 Restlessness 11.1 11.1 10.0 0.0 54.5
14 A hard life 11.1 33.3 10.0 0.0 45.5
15 Difficulties in fulfilling needs- housing 11.1 33.3 30.0 0.0 36.4
Source: Appendix 24.
Table 5.5. The Impacts of Poverty according to Female and Male Respondents based on How Frequently they were Mentioned
Female (N = 23) Male (N = 22)
(%) (%) Lack of education/drop out of school 57 Lack of education/drop out of school 68 Difficulties in fulfilling needs- food 52 Difficulties in fulfilling needs- food 59 Restlessness 39 Poor health 45 Increase in crime 30 Increase in crime 32 Caught up in loans 30 Difficulties in fulfilling needs- housing 32 A hard life 30 A hard life 23 Poor health 30 Difficulties in accessing capital 23 Difficulties in earning a living 22 Caught up in loans 18 Difficulties in paying for medical expenses 22 Difficulties in earning a living 18 Difficulties in fulfilling needs- clothing 17 Restlessness 14 Social problems 13 Difficulties in paying for medical expenses 14 Difficulties in fulfilling needs- housing 9 Isolation 14 Have to find work and settle in other regions/countries 9 Family problems 14 Isolation 9 Difficulties in fulfilling needs- clothing 9 Child labor 9 Have to find work an settle in other regions/countries 9 Difficulties in paying school fees 4 Child labor 9 Difficulties in accessing capital 4 Difficulties in paying school fees 9 Family problems 4 Social problems 5 Difficulties in paying education-related expenses - Difficulties in paying education-related expenses 5 Lack of religious faith - Lack of religious faith 5 Environmental destruction - Environmental destruction 5 Receive fewer public services - Receive fewer public services 5 Source: Appendix 24.

The SMERU Research Institute, December 2003 66
Box 5.1. The Various Coping Strategies of the Poor
(list based on the frequency mentioned in PPAs)
1. Make loan 2. Obtain additional works 3. Wives working to earn money 4. Utilize public natural resources 5. Work outside the region 6. Reduce/diversify food 7. Economize/manage finance 8. Help from relatives 9. Sell/pawn valuable goods/assets 10. Raise and sell farm animals 11. Send children to work 12. Saving/Arisan 13. Collective work/assistance from someone 14. Crops diversification 15. Cooperates with wealthier people 16. Reduce medical cost 17. Reduce education cost 18. Ask for ‘surat miskin’ (Detailed statements are presented in Appendix 26)
The Poor’s Coping Strategies Whilst living in inadequate conditions, the poor have to face various difficulties due to poverty and in order to survive they adopt certain coping mechanisms to make the most of their economic and social resources. The various coping strategies found in the PPAs report can be grouped into 13 types of strategies (Box. 5.1.). The most common strategy used was to borrow money/goods. Loans can be acquired from several sources which are all informal institutions. Even though the information provided does not allow us to analyze the source of loans in detail, the list shows that no formal credit institutions, such as banks or village savings and loans institutions, were mentioned (see Appendix 26). The sources that were most frequently mentioned were food stalls, neighbors, families, rich traders or landlords, rentenir (mobile credit providers), and middlemen. It is evident that the sources they choose are related to what they are going to use the money for and their accessibility to formal credit institutions. As mentioned in the previous section, the most common impacts of poverty were the difficulties in fulfilling food needs, paying school fees and medical expenses, rather than just accessing working capital. In addition, many statements emerged in the discussions on the causes and problems of poverty concerning the lack of access or inaccessibility to formal credit institutions. Therefore the poor’s dependency on traditional social relations is still very strong. Other strategies that were mentioned quite often were taking up a number of odd jobs, wives requiring to take up paid work, utilizing the natural resources around them, and working outside the region. After these, other strategies adopted were economizing or reducing their expenses. Among the most common strategies used to economize were reducing or substituting the kinds of food consumed and managing the their finances. Cutting back on education and health expenses were seldom mentioned and this fact reflects their inability to influence education and health expenses. It was interesting that very few respondents mentioned “applying for a surat miskin” - that is applying for a letter from the local authority which indicates that the person in question is poor - as a strategy used in difficult situations. This fact at least reflects the low use of public services such as concessions that can be obtained by the poor. Unfortunately, this study was unable to determine whether this fact was caused by the poor’s lack of knowledge about these services or because there were psychological barriers which caused reluctance to request these concessions. But it can be presumed that this fact is related to the poor quality of public services that the people holding surat miskin receive, a concern which was also raised in a number of PPAs. In general, the poor communities in Java and Kalimantan and rural areas, particularly in rice-farming communities, dry-land farming communities, and forest and plantation communities, stated a more diverse range of coping strategies. The urban informal sector and labor communities mentioned a more limited variation of coping strategies. A number of strategies, such as collaborating with people who are better off and working collectively were not

The SMERU Research Institute, December 2003 67
mentioned by urban poor. Because of the small number of samples, these strategies may not have appeared, but in any case, this fact reflects that there are different strategies due to the limited social resources available in the urban informal sector and labor communities. Even though borrowing money/goods is at the top of the survival strategies list, the list shows that there are a variety of coping strategies mentioned in each region. In Java, besides borrowing money/goods, the most common strategies are acquiring additional work or odd jobs, requiring wives to work for a living, economizing/managing finances, and reducing or diversifying food. A specific strategy used in Nusa Tenggara is utilizing public natural resources (gathering tubers or other forest products) in addition to raising or selling farm animals, as well as working outside the region. The utilization of public natural resources and working outside the region were quite dominant in Sulawesi, besides working collectively, wives earning a living, and acquiring additional work or numerous odd jobs. Requiring children to work was only mentioned in Sumatra and Kalimantan. These differences reflect the different natural and social resources available to the poor in these regions. The availability of natural resources in Nusa Tenggara and Sulawesi makes it possible for the poor to use these resources in difficult situations, whereas in Java there is a very limited amount of natural resources. The emergence of alternative strategies in Nusa Tenggara, such as selling farm animals, also reflects the high ownership of assets in the form of farm animals among the poor in this region. Besides the different strategies mentioned by the poor in various regions, different strategies were also found in rural and urban areas. As shown in Table 5.6, other than borrowing money/goods and obtaining additional work, the poor in rural areas rely on the utilization of public natural resources such as gathering wood or other forest products, or working on perhutani (state-owned enterprises that hold the right to manage forests) land. Requiring wives to work was in the fourth place in rural areas, but was in second place in urban areas. Requiring wives to work is a dominant strategy used by the poor in urban areas, which is consistent with the fact that the role of women in economy has increased, i.e. as an income earner, as shown in Box 4.1. In addition, the different strategies adopted by the poor in urban and in rural areas are related to food reduction and diversification. In urban areas reducing or diversifying food was in fourth place, but in rural areas it was in ninth place. Again, these differences reflect the availability of resources that can be accessed by the poor in both areas. PPAs conducted in communities with different livelihoods indicated the variations in the survival strategies expressed by the poor. As shown in Table 5.7, not all poor people use loans as their main strategy, although borrowing money/goods is one of the five most dominant strategies used in all communities. Coastal fishing communities stated borrowing money/goods as their main strategy, while in urban informal sectors and labor communities borrowing money/goods came in second place. The main strategy used by the urban informal sector and labor communities is requiring wives to earn money. In mixed communities, borrowing money/goods is in third place after requiring wives to work and having numerous odd jobs.

The SMERU Research Institute, December 2003 68
Table 5.6. The Ten Main Coping Strategies of the Poor in the Rural and Urban Areas
Rural (N = 38) (%) Urban (N = 17) (%)
Borrow money/goods 65.8 Borrow money/goods 70.6 Obtain additional work/odd jobs 50.0 Wives working to earn money 58.8 Utilizing public natural resources 34.2 Obtain additional work/odd jobs 52.9 Wives working to earn money 31.6 Reduced/diversify food 35.3 Work outside the region 28.9 Help from relatives 35.3 Raise and sell livestock 23.7 Requiring children to work 29.4 Collective work/help from someone 21.1 Work outside the region 23.5 Crop diversification 21.1 Economize/manage finances 23.5 Reduce/diversify food 18.4 Sell/pawn valuable goods/assets 23.5 Economize/manage finances 18.4 Utilize public natural resources 17.6 Source: Appendix 26.
Table 5.7. Main Coping Strategies in Different Communities
Rice-Farming Communities Dry-land Farming Communities Forest and Plantation Communities
(N = 12) (%) (N = 10) (%) (N = 11) (%) Borrow money/goods 75.0 Borrow money/goods 70.0 Borrow money/goods 63.6 Obtain additional work/numerous
odd jobs 50.0 Raise and sell livestock 60.0 Requiring wives to work 45.5
Utilizing public natural resources 41.7 Work outside the region 50.0 Collective work/help from someone
45.5
Reduce/diversify food 33.3 Obtain additional work/numerous odd jobs
40.0 Requiring children to work 45.5
Economize/manage finances 25.0 Crop diversification 30.0 Reduce/diversify food 36.4
Help from relatives 25.0 Raise and sell livestock 25.0 Crop diversification 25.0
Coastal Fishing Communities Urban Informal Sector and Labor Communities Mixed Communities of Urban Informal
Sector and Labor Communities (N = 9) (%) (N = 8) (%) (N = 5) (%)
Borrow money/goods 77.8 Requiring wives to work 75.0 Requiring wives to work 80.0 Obtain additional work/numerous
odd jobs 66.7 Borrow money/goods 62.5 Obtain additional work/numerous
odd jobs 80.0
Requiring wives to work 55.6 Obtain additional work/numerous odd jobs
62.5 Borrow money/goods 60.0
Utilize public natural resources 55.6 Reduce/diversify food 50.0 Work outside the region 40.0
Save money/participate in arisan 44.4 Sell/pawn valuable goods/assets 37.5 Work outside the region 33.3 Economize/manage finances 37.5 Sell/pawn valuable goods/assets 33.3 Requiring children to work 37.5
Source: Appendix 26.
Based on the above analysis, it can be concluded that the government has played a very limited role, or has had almost no role at all, in supporting the poor’s coping mechanism. The poor are still quite dependent on traditional social networks and the use of their own labor power, as well as the natural resources that they can access. Therefore borrowing money/goods is still the most dominant strategy used. Loan dependency has actually been the focus of discussions in many poverty studies. The fact that this is the most important strategy used to face fluctuations in income and needs uncertainty leads to the classic problem of the credit trap as the factor that perpetuates poverty, as borrowing money is only a short-term solution. The unavailability of small-scale loans that can be obtained to cover expenses (consumption and unexpected expenses) at a reasonable interest rate, causes the poor to look for any other sources of loans even though the interest rates are quite high or this situation entraps them in a lower bargaining position with lenders. It appears that various poverty reduction programs to date have not worked to overcome this classic problem. If the

The SMERU Research Institute, December 2003 69
government is unable to play a leading role in supporting the poor, then at least it should be able to ensure the poor’s access to resources that can help them survive. These include access to a number of odd jobs, work outside the regions, and the use of public natural resources, but of course by restricting it to the methods that do not damage the environment. 5.2. Institutions and Poverty Reduction Programs One important part of PPAs is the institutional analysis which is used to recognize the existence and the significance of various institutions in communities, particularly the poor. From the PPAs consolidated in this study, communities have identified over 100 institutions in total. Many of these institutions can only be found in certain regions. For the purpose of analysis, these institutions have been grouped into six major categories, namely:
a. Religious institutions; which consist of formal religious institutions, religious institutions established by the community, an individual or religious leader, and religious schools.
b. Economic institutions; which consist of large-scale formal economic institutions, small-scale formal economic institutions and informal economic institutions.
c. Social institutions; which consist of social institutions established by the community, social institutions initiated by the government, professional institutions, and individual social institutions such as the family.
d. Government institutions; which consist of institutions under the village and kecamatan (sub-district) administration, institutions at the district level or higher, schools and health services.
e. Non-government institutions; which consist of non-government organizations (NGO), mass organizations and political parties.
f. Institutions that resemble poverty reduction programs; which include Social Safety Net (SSN) programs and non-SSN programs.
The institutions in each category are listed in Appendix 36. In order to see the value of these institutions in community life, some PPAs consolidated in this study asked people to rate institutions based on the importance, the people’s level of trust in the institution, level of effectiveness, proximity to the people, and the benefits people feel they get from the assistance or information the institutions provide. In this analysis, ratings by the communities were processed into scores. The final rating was calculated by multiplying the score of the institution and the frequency of it being mentioned. Therefore institutions that were frequently mentioned and have high scores are at the top of the list. By taking the scope of the sample into consideration, this analysis only looks at the ratings based on the importance of the institutions, their proximity to the community, effectiveness and role as sources of information and support.16 An institution is considered important if it supports the daily lives of the people. Institutions that are considered important are illustrated by a bigger circle in the Venn diagram. Close institutions are institutions that are easy to contact because of their close relationship with the people and their physical proximity. In the Venn diagram, proximity is shown by closer circles. An effective institution is an institution that is assessed as doing good work in accordance to its purpose and objective, as well as producing something that benefits the community. Institutions that are served as sources of information and assistance are those that provide a lot of information and assistance needed by the community, such as information on scholarships, on institutions that can provide assistance, information on employment opportunities, or on family planning.
16 The significance of these institutions have been acquired from different PPAs.

The SMERU Research Institute, December 2003 70
In general, the order of various institutions that were mentioned in PPAs (Table 5.8.) shows that family, neighbors, relatives, and community leaders are the most important social institutions. These institutions were at the top of the list when assessed in terms of importance, proximity and their role as a source of information and assistance, although they were assessed as not being too effective. It was also found that government institutions at the sub-district level and lower (kecamatan, village, hamlet, and RT- RW) are at a relatively high rank in all aspects. Government institutions that provide health services for the community were also considered relatively important, fairly close, effective, and are sources of information and assistance. Schools are also considered as sources of information and assistance. In the case of economic institutions, informal economic institutions such as stalls, traders, middlemen and traditional creditors, are quite important to the lives of the poor. Formal economic institutions, both large-scale (banks and pawn shops) and small-scale (various village institutions that provide credit), are in fact considered quite remote from the lives of the poor, even though small-scale formal economic institutions were assessed as being fairly effective. This fact explains why there are numerous complaints about the lack of access to credit. Thus this situation causes the poor to only acquire loans from informal economic institutions. Another interesting tendency is the result of the poor’s assessment on various poverty reduction programs. In general, both SSN and non-SSN programs are ranked at the bottom in all categories, although assessments of individual programs were varied. The relatively low rank was because they were seldom mentioned and most were given a low score. This indicates that these programs rarely reach the poor. Among the programs mentioned, the scholarship program was assessed as being the most important, but it was only mentioned in one PPA location. This may have been caused by the fact that only a small number of the poor that participated in the PPAs had benefited from this program. The poverty reduction programs that were mentioned in more than three PPA locations were IDT (assistance for underdeveloped villages, based on a Presidential Instruction) and Bangdes (grants for village development, based on a Presidential Instruction), and both got low scores. Several PPAs also reported a number of comments on poverty programs. These comments were gathered from the application of other tools (other than institutional analysis) or through in-depth interviews (see Appendix 28-29). A compilation of various comments in the PPA reports in ten villages indicates that the various poverty reduction programs that have been conducted to date are ineffective. As shown in Table 5.9, most comments were made about the cheap rice assistance program, popularly known as OPK (special market operation) or Raskin (rice for the poor). From the ten PPA locations that included the poor’s comments on this program, only two locations regarded this program as effective. Four locations reported that this program is not too effective and eight locations reported that this program does not reach the target beneficiaries (was not received by the poor). One location noted that the program has been mismanaged. The poor’s assessment of the cheap rice assistance is consistent with findings in other studies. This indicates that this program needs to be closely monitored or re-evaluated.

The SMERU Research Institute, December 2003 71
Table 5.8. Order of Institutions Considered Important, Close, Effective, and that Provide Information and Assistance
Important Institutions Close Institutions Effective Institutions Institutions as Source of
Information and Assistance
1. Social-individual Government-health Government- village/kecamatan
Social-individual
2. Government- village/kecamatan
Social-individual Religious- community established
Government- village/kecamatan
3. Economic- informal Religious- leader Government- health Government- education 4. Social- community
established Government- village/kecamatan
Social- community established
Government- health
5. Government- health Religious- community established
Economic- formal, small-scale
Government-kabupaten/national
6. Social- government initiated
Economic- informal Social- government initated
Keagamaan- perorangan
7. Religious- community established
Government- education Social- individual Economic- informal
8. Government-kabupaten/national
Social- profession Religious- formal Economic- formal, large-scale
9. Economic- formal, small-scale
Government-kabupaten/national
Social- profession Social- government initiated
10. Social- profession Religious- formal Government- education Economic- formal, small-scale
11. Religious formal Social- community established
Economic- informal Religious- formal
12. Religious- school Social- government initiated
Economic- formal, large scale
Social- profession
13. Economic- formal, large-scale
Religious- school Non-government- NGO Social- community established
14. Religious- individual Economic- formal, large-scale
Program - non- SSN Program - SSN
15. Government- education Economic- formal, small-scale
Religious- individual Non-government- NGO
16. Non-government- NGO Non-government - NGO Program -SSN 17. Program - non-SSN Non-government-
political parties/mass organizations
Religious- school
18. Program - SSN Program - non-SSN Government-kabupaten/national
19. Non-government- parties/mass organizations
Program - SSN
Source: Appendix 30-38. Unlike the cheap rice assistance program, health assistance in the form of health cards (kartu sehat) was considered as an effective program by half of the sample and only a quarter of the sample considered it not too effective. However, it was also mentioned that services provided for people with health cards are unsatisfactory. On the other hand, capital assistance program that have been constantly extended by the government, were assessed as being not too effective. Besides these comments, another comment was that assistance programs lack transparency. Communities were forced to set up groups and there was a lack of business/management support for recipients of these capital assistance programs. These factors apparently caused programs to be less effective.

The SMERU Research Institute, December 2003 72
Table 5.9. The Effectiveness of Various Poverty Reduction Programs
Presented in Several PPAs N Program Effectiveness
10 Raskin 20% effective, 40% not too effective, 80% wrong target; 10% misconduct
4 Bathing, washing and toilet facilities 25% effective, 50% inappropriate location 4 Health cards 50% effective; 25% not too effective 4 Credit for farming 25% effective; 50% wrong target; 25% not transparent;
25% misconduct 4 IDT (Assistance for Underdeveloped
Villages) 25% effective; 25% not too effective
3 Road construction/repairs 33% effective
3 Capital assistance 67% effective; 33% not transparent 3 Sapi sistim paron* 100% not too effective *A profit-sharing system between a cattle owner and the person who raises the cattle. Source: Appendix 28
With a more detailed observation, a number of the institutions that are generally considered most important and most trusted by the community can be identified. These institutions are religious institutions -such as pengajian/yasinan/tahlilan, economic institutions -such as land, capital, and boat owners, and farmers or forest farming groups and fishermen groups, local government bodies -such as village heads and LKMD, health institutions - such as village midwives, and education institutions - such as schools and school committees. Even so, in a number of cases, communities assessed LKMD as untrustworthy. In rice-farming and dry-land farming communities, most institutions that were considered important were seen as trustworthy. Rice-farming communities in general still respect village institutions and apparatus, including LKMD and RT, as well as religious leaders. Rice-farming communities also considered that village apparatus, such as RT/RW have worked effectively. It is interesting to observe that rice-farming and dry-land farming communities feel that extension workers, who are considered to be the spearheads of government programs in rural areas, are unimportant and untrustworthy institutions. This may be caused by the fact that extension workers usually only work with farmers who own land or rent land, while farmers in the discussion groups were farm laborers who are paid a wage to work the land of other farmers and are not directly involved with extension workers. But the narratives of various PPA reports show that in many cases people in these farming communities stated that extension workers had never come. Banking institutions such as Bank Rakyat Indonesia (BRI) and Bank Pembangunan Desa (Rural Development Bank – BPD) are also not considered important by rice-farming communities. It seems that communities rely more on rentenir and friends or neighbors for money and trust proprietors or landlords. As in the case of extension workers, farm laborers said that they seldom have direct contact with BRI or BPD. In relation to the health sector, rice-farming and dry-land farming communities have little trust in community healthcare centers (puskesmas) and village maternity house (polindes), although they did regard these institutions as important. They have greater trust in village midwives. This may be related to affordability and accessibility. In dry-land farming communities, traditional groups and leaders, such as Nagari Traditional Law Assemblies

The SMERU Research Institute, December 2003 73
(KAN)17, wali nagari18, wali jorong19, ninik mamak20, and community and religious groups and leaders were assessed as being very important and greatly trusted. In addition, communities also trust hamlet heads, RT heads and community groups, such as the farmer groups. Slightly different from other communities, dry-land farming communities felt that police presence was very important and they put great trust in the police. These communities also considered the police as effective. This assessment is apparently related to the issue of livestock security in the sample areas, where police protection is greatly needed. Dry-land farming communities also do not trust extension workers too much, although their presence is considered important. For forest and plantation communities, the existence of informal institutions, such as shops, stalls, markets, landlords and proprietors, middlemen, cooperatives, family and even rentenir are considered important and are greatly trusted. Forest and plantation communities trust village heads, farmer groups, and in addition to PKK as forums for women’s activities. What is quite interesting is the fact that even though they live in forest environments, the people felt that the presence of perhutani (state owned enterprises that manage forest areas) or forester was not too important. In the case of health services, forest and plantation communities do not consider the presence of community healthcare centers (puskesmas), village maternity house (polindes), secondary puskesmas (pustu), village midwives, and traditional doctors as being important. They in fact consider the presence of family planning workers as being fairly important. In coastal fishing communities, almost all institutions that were considered important were also trusted. Coastal fishing communities greatly trusted religious institutions and religious leaders, stores, stalls, traditional markets, middlemen, Chinese proprietors or store owners and also trusted village apparatus, including village heads and LKMDs, hamlet heads, and RT heads. People of these communities also felt close to the village head and the LKMDs. In the health sector, as in other communities, coastal fishing communities tended to distrust puskesmas and polindes. Instead, they trusted village midwives, who they also considered effective. In the education sector, people of these communities trusted teachers, schools and school committees, which they consider do their jobs effectively. In the case of economic relations, coastal fishing communities actually do not have much trust in proprietors or boat owners, even though they have a close relationship with them. In addition, they do not have much trust in the kecamatan/camat, police and some NGOs. Urban communities did not point out many institutions that they consider important. This fact may be related to the individualistic characteristics of urban communities. Institutions that are considered important and are trusted by the urban informal sector and labor communities include BRI, arisan, PKK, families, relatives, parents, pengajian/yasinan/tahlilan groups, and schools or school committees. The results of the institutional analysis of female respondents and male respondents show that the presence of various institutions has a different significance for men and women. As presented in Table 5.10, in general, government institutions at the local level, such as the RT/RW, both men and women consider kelurahan/village apparatus, village heads, and LKMDs important and close. But for women, religious institutions that were established by communities, such as the majelis taklim (religious study groups) and pengajian groups were considered closer compared to local government institutions. In addition, social institutions
17 Nagari is an area of land belonging to a traditional community in West Sumatra. 18 A wali nagari heads a KAN. 19 A wali jorong is the head of a traditional village in West Sumatra. 20 A ninik mamak is uncles from the mother’s side (mother’s brother) who are respected as family leaders and whose role is to guard adat in West Sumatra.

The SMERU Research Institute, December 2003 74
initiated by the government, particularly PKK, were considered very close to the lives of women.
Table 5.10. The Order of Institutions that are Considered Important and Close According to Female and Male Respondents
Important Institutions Close Institutions Women (N=30) Men (N=30) Women (N = 15) Men (N=16)
1. Government - village/kecamatan
Government - village/kecamatan
Religious - community established
Government -village/kecamatan
2. Economic - informal Social - community established
Government -village/kecamatan-
Religious - community established
3. Government - health Economic - formal, small- scale
Social - government initiated
Government - health
4. Social - community established
Economic - informal Religious - leaders Social - profession
5. Social - individual Social - government established
Economic - informal Religious - leaders
6. Social - government-established
Social - profession Government - health Economic - informal
7. Economic - formal, small- scale
Religious - community established
Social - profession Social - government initiated
8. Religious - community established
Religious - formal Social - individual Government - education
9. Economic - formal, large-scale
Government - health Economic - large-scale Religious - formal
10. Government - kabupaten/national
Economic - formal, large-scale
Government - kabupaten/national
Economic - formal, large-scale
11. Religious -leaders Government - health Government - health Social - individual 12. Program - non-SSN Social - individual Religious - formal Religious - school 13. Government -
education Program - non-SSN Religious - school Economic - formal,
small-scale 14. Non-government -
NGOs Government - kabupaten/national
Non-government - NGOs
Non-government - NGOs
15. Program – SSN Religious - leader Economic – formal, small-scale
Government - kabupaten/national
16. Religious - formal Religious - school Program - non-SSN Non-government - political parties/mass organizations
17. Social - profession Non-government - NGOs
Program - SSN Program - non-SSN
18. Non-government - political parties/mass organizations
Program - SSN Non-government - political parties/mass organizations
19. Religious - school Non-government - political parties/mass organizations
Source: Appendix 30-38. In relation to economic institutions, by observing the order of important and close institutions, it is apparent that for women, informal economic institutions such as stalls, middlemen, and rentenir are more important and closer to their lives. Women consider formal economic institutions as unimportant and perceive them distant. From a male perspective, small-scale formal economic institutions, such as various institutions providing credit at the village level are actually considered fairly important, but unfortunately, these institutions are also considered distant. In general, both female and male respondents place poverty reduction programs at the bottom of the list or consider them not too important or close. Besides this, both groups feel

The SMERU Research Institute, December 2003 75
that non-SSN programs are relatively more important and closer than SSN programs. Female respondents placed SSN programs in particular in a relatively higher rank compared to what male respondents did. In fact in various discussion groups, men did not mention any SSN programs that they considered close to their lives. This indicates that women benefit more from SSN programs.

The SMERU Research Institute, December 2003 76
VI. CONCLUSION AND RECOMMENDATIONS This report is a consolidation of a number of PPAs that were carried out in Indonesia by various institutions, and thus it does not raise any new issues. Instead this report reaffirms the findings of the PPAs consolidated by identifying similarities in these studies. This report is based on community perspectives, particularly that of the poor, which were compiled from studies that used a participatory approach. It is hoped that this study will deepen our understanding of poverty in Indonesia. In many ways, the results of this study correspond to the results of other studies on poverty, both those that use quantitative methods as well as those that use qualitative methods. This correspondence clearly supports the findings of this study, whereas it is hoped that the findings that do not correspond with other studies will encourage further discussion and research. In general, this study reaffirms the multidimensional nature of poverty based on the perspectives of the people, particularly the poor. Discussions in previous chapters show that by combining content analyses of various PPA reports with frequency analyses, this study was able to identify a number of general issues found in most regions, which can therefore be considered national issues. Furthermore, this study also identifies several poverty issues specific to certain regions or types of communities. It also revealed the age and gender dimension of poverty. This concluding chapter will not repeat the findings that have been presented in previous chapters, but instead will try to combine the findings that are considered important and should be taken into account in formulating the National PRSP. This chapter also presents several recommendations based on the findings of this study. These recommendations have been divided into general recommendations and recommendations for the four pillars stated in the Interim PRSP. 6.1. Conclusion and General Recommendations
• A general conclusion, which can be drawn from this study, is that poverty is a very complex phenomenon that is influenced by a number of interrelated factors. The variety of perceptions expressed by communities when identifying the poor, the causes and problems of poverty, the impact of poverty, the solutions to poverty, as well as the various coping strategies adopted by the poor revealed the complexity of poverty. Thus, a poverty reduction strategy cannot be formulated based upon a collection of programs that are aimed at overcoming various elements of poverty individually. A poverty reduction strategy should be an integrated and interrelated effort to systematically eliminate the factors that hinder the poor’s access to a better standard of living. It is this strategy that is embedded in the concept of mainstreaming poverty reduction efforts. The consequence of this approach is that it is crucial to see the connection between the four pillars that were recommended in the interim PRSP. This idea will provide a base for the various recommendations for the four pillars of the poverty reduction strategy.
• This study showed that problems relating to limited education and skills, a lack of employment opportunities, a lack of access to capital and an adequate income are the most dominant issues. This reaffirmed the analyses that highlighted the gap between the education system and the existing employment and business opportunities. Therefore, it is important to reassert the strategic value of integrating the education system and the labor market as well as creating business opportunities in order to reduce poverty. The fact that these issues emerged in different forms in various PPAs,

The SMERU Research Institute, December 2003 77
demonstrates that in order to overcome these problems, the national strategy should complement local strategies.
• The results of this study also showed that the perceptions and the interests of young people are different from that of older people. The perceptions and the interests of women are also different from that of men. These differences do not imply that a different strategy should be adopted for each group. However, these differences need to be taken into account when observing the effects and benefits of a policy and program on various groups in the community, so that all groups will benefit equally from the policy or program. Furthermore, because of these differences, the representation of these groups in policymaking processes and policy implementation must be ensured so that their views and interests can be accommodated equally.
• The “poverty trap” analysis revealed the dominance of powerlessness factors, which reflects the significant effect of various policies and conditions that are beyond the reach of the poor. This finding supports the view that there is a need for social-economic policies that accommodate the interests of the poor. Providing direct aid for the poor will not be sufficient in reducing poverty. Social-economic policies that assure the fulfillment of basic needs for poor communities and the access to opportunities to improve their welfare level are more crucial in reducing poverty.
• The poverty trap analysis also revealed that there were limitations in community perspectives in analyzing the causes of poverty. In general, people tended to see material poverty as the cause of poverty, thus the provision of additional capital was the most frequently mentioned solution to poverty. On the contrary, the analysis that was conducted based on the problems expressed by the people showed that material poverty was not the most dominate factor. Isolation, both physical and non physical, was more dominant, however, it was rarely emphasized by communities as a cause of poverty. This case reminds us that a deep understanding of the people’s lives is required before deciding to provide capital assistance. Capital assistance per se will not help the poor escape from poverty if various obstacles particularly the isolation problems are not solved.
• The results of the poverty trap analysis also showed that there are factors which are not too dominant, namely physical weaknesses, vulnerability, and behavior/attitude. Although these factors are not dominant on a national scale, it does not mean that they do not need to be addressed. The analysis conducted in this study is limited because it is based on how frequently a case was mentioned, and does not reveal the root of the problem. There is a possibility that factors that are not too dominant at the national level are actually a core problem at the local level. Therefore, an analysis at the local level is needed to detect core local problems that will then form the foundation for the formulation of strategies at the local level.
• The complexity of poverty problems and the large range of problems in various regions reassert the need to formulate poverty reduction strategies that are locally specific. Therefore, the National PRSP should contain strategies that can direct national social-economic policies as well as direct assistance and facilitation for the formulation and implementation of regional strategies that address local problems.
6.2. Notes for the Four PRSP Pillars As stated above, the results of this study lead to the view that there is a need to build a strategy that recognizes the interdependency of the four pillars in order to systematically

The SMERU Research Institute, December 2003 78
eliminate the obstacles that limit the poor’s access to a better standard of living. Even though the findings in this study can be used as a basis for individual program evaluation and development, the recommendations below do not specifically examine these programs. Pillar 1. Increasing Opportunity From the information provided in the PPAs consolidated in this study, it was found that there is a need for employment and business opportunities for the poor in order to help them escape the poverty trap. If it is explored further, the facts revealed in this study show that the lack of employment opportunities does not only cause poverty, but furthermore, that poverty will limits access to employment opportunities. Access becomes limited due to a low level of education, lack of information and lack of money or social relations that can increase access to work. This also applies to a lack of capital. Having no assets such as land, livestock, tools and capital, and having no inheritance are factors that cause poverty. But poverty in fact also causes difficulties in accessing additional capital. Funds from a number of small-scale credit programs provided by the government and non-government organizations and funds from various large economic institutions (banks and pawnshops) have actually never reached the poor. The poor, particularly women, are still very dependent on informal credit sources which tend to be exploitative and can even exacerbate their economic condition. Another issue, that is the poor’s limited ability to access and adopt new methods and technologies to ensure they are able to compete, has also not been dealt with. This fact was reflected in the many statements regarding the lack of extension work or active extension workers. Therefore, strategies to increase employment and business opportunities should take into consideration the various factors of isolation that restrict the advancement of the poor. Among the isolation factors expressed were the lack of education and skills, physical isolation due to poor roads and inadequate transportation facilities, no access to sources of capital or credit, and the lack of extension work. By taking a number of this study’s findings into consideration, employment and business opportunities could be increased by:
• Creating a climate which is conducive to the development of businesses that will absorb the poor, both men and women.
• Ensuring and protecting access to work that can absorb the bulk of seasonal workers, including farmers, fishermen, and women.
• Improving transportation facilities and infrastructure, as well as electricity infrastructure, communication facilities and irrigation systems.
• Providing access to capital for the poor and micro-business owners, both men and women.
• Increasing the effectiveness of extension work, both in the agricultural sector and in developing other businesses.
• Distributing information on employment and business opportunities so that the poor can access them.
Pillar 2. Community Empowerment This study shows that communities have a subjective perspective of poverty, and thus poverty measurements that are used as standards by communities are different to those used by the government. In the case of poverty in rural areas, it was found that the results of measurements by communities and that from quantitative studies appeared to be quite similar. But in the case of urban areas, major differences were found. Because of these differences, planning, implementation, monitoring, and evaluation of poverty reduction programs cannot only be based on quantitative analysis, but also need to involve the communities, particularly the poor. In doing so, the program would be better able to target the beneficiaries.

The SMERU Research Institute, December 2003 79
Another important fact that was uncovered was the influence of policies that did not involve the poor in the decision-making process and that were beyond their reach. Factors relating to the causes and problems of poverty which are fairly dominant include the lack of employment opportunities and high cost of education, the low price of the poor’s produce and the high price of consumer goods, where the poor has no power over policies related to these matters. However, when identifying the causes of poverty, communities never mentioned their lack of access to the policy making process. This reflects the fact that they have not recognized their right to participate in the process. Therefore, there is a need for top-down and bottom-up efforts in community empowerment. Top-down efforts require willingness from the government and non-government organizations at all levels to be more open to participation and invite the people to participate in decision making regarding expenses that the people have to pay and other policies that influence their lives. At the same time, these efforts need to be accompanied by assistance and an improvement in the communities’ ability to actively participate in policy making. Pillar 3. Capacity Building Theoretically, education is the chief means for the poor to escape poverty and many have pinned their hopes on it. But in reality, many children have not graduated from high school or primary school, and some have not had a school education at all. Besides not being able to pay for an education, there are also indications of people not being eager to put children in school. The reason for this is caused by what the poor experience when they send their children to school. Even if children graduate from junior high school, it does not result in any significant improvement in their standard of living compared to if they had not graduated from school. All these children end up becoming unskilled workers or having numerous odd jobs and follow in the path of their parents. Based on this fact, it understandable why poor families are not too eager to send their children to school. It appears that our education system needs to be reconstructed. President Megawati Soekarnoputi once asserted, “society needs to change its paradigm concerning the future of its children, that all children need not have a university degree” (Media Indonesia, December 23, 2003). It is not only society that needs to change its paradigm, but also the government, particularly the officials responsible for the education system. The Indonesian education system prepares pupils to study up to university level. From the beginning, students are provided with theory that will prepare them for university. Schools seldom provide technical or practical knowledge as a basis for students to develop skills that will help them earn a living in their adult life. If there are cases where primary or high school graduates have successfully developed their skills into something they can use to support their lives, this is probably due to talent rather than being educated. In reality, most students attend up to the primary school level and only a few lucky ones have the opportunity to reach university level. Therefore, it can be assumed that most people who have a university degree hold it because they are fortunate and not because they are talented. In other words, they become university graduates because they are fortunate to be able to afford a university education. In relation to poverty reduction, keeping in mind that to date the majority of Indonesian children are only able to finish primary school, it appears that our education paradigm needs to be altered. Subjects in primary schools and high schools should emphasize technical and practical knowledge as a basis to develop the skills needed in life and in the community where a person lives. Therefore, it is hoped that the majority of primary and high school graduates will then possess technical skills and be able to develop them. In this system, those

The SMERU Research Institute, December 2003 80
who are able to complete university will only be those who are really talented, and not merely lucky. Aside from the need to increase quality and for a change in the direction of the education system, capacity building is also required through political education, both through formal and informal institutions. The increase in political education is expected to support efforts to empower the people by increasing their capacity to participate in public policy making. Pillar 4. Social Protection Cases that were revealed in various PPAs consolidated in this study show that there is a need for protection and insurance for the elderly and people with disabilities, which should be a permanent part of the social protection scheme. However, many factors remain as sources of vulnerability which should to be taken into account when formulating social protection programs. Vulnerability factors that arose in this study included being laid off, bankruptcy caused by the economic crises, crop destruction due to diseases or the weather, natural disasters and social conflict. Social protection against these threats needs to be integrated with the other pillars so that all people, men and women, have guaranteed access to food, education, health services and employment when they face problems relating to these factors. Other efforts which need to be taken into consideration include protection to prevent children from dropping out of school due to economic problems faced by their parents and to guarantee access to employment for people who are disabled due to accidents in the workplace. The main impact of poverty expressed by communities was the difficulties in fulfilling food requirements. In this case, the cheap rice program appears to be the right solution. However, there are two important points that should be noted about this program. First, there are a lot of opinions stating that this program does not target the right groups. Similar findings were also stated in other studies, so it appears that this program needs to be re-evaluated. Second, food aid is the kind of aid that should be provided temporarily and in cases of emergency. This sort of aid is only required in the events of disasters or food crises as part of social protection schemes, but it is not a program that will help the poor escape the poverty trap.

The SMERU Research Institute, December 2003 81
REFERENCES
Ackland, Robert et.al. (2003) Improving Data Analysis as a Means of Promoting Family Welfare in Indonesia: A Social Protection Facility (SPF) Program Conducted at Indonesia’s National Family Planning Coordinating Board (BKKBN), 19th – 30th August 2002.
Asian Development Bank. (2001) Participatory Poverty Assessment in Cambodia. Manila-
Philippines. Badan Perencanaan Pembangunan Nasional. (2003) Informasi Dasar Pengarusutamaan
Penanggulangan Kemiskinan di Daerah [Basic Information Regarding Mainstreaming Poverty Reduction in the Regions]. Jakarta.
_________________. (2003) Sistem Data dan Penentuan Sasaran (Targeting) dalam
Penanggulangan Kemiskinan [Data Systems and Targeting in Poverty Reduction]. _________________. (2003) Peta Kemiskinan di Indonesia [Poverty Mapping in Indonesia]. Biro Perencanaan & Kerja Sama Luar Negeri & GTZ-KUF. (2000) Panduan Metode dan
Proses Identifikasi Keadaan Pertanian di Wilayah Kabupaten [Guidelines on the Methods and Processes for Identifying Agricultural Conditions in the Districts]. Jakarta.
Booth, D. et al. (1998) Participation and Combined Methods in African Poverty Assessment:
Renewing the Agenda. Report Commissioned by the UK Department for International Development for the Working Group on Poverty and Social Policy, Special Program of Assistance for Africa.
Brocklesby, M.A. & Holland J. (1998) Participatory Poverty Assessment and Public Service: Key
Messages from the Poor. Swansea, Centre for Development Studies, University of Wales.
Carvalho, S. & White, H. (1997) Combining the Quantitative and Qualitative Approaches to
Poverty Measurement and Analysis: the Practice and the Potential. Washington, D.C., the World Bank.
Devarajan, S. & Go, D.S. The 123 PRSP Model. Tool Kit, Chapter 13. DFID-Kesuma. (2000) Dinamika Hubungan Antara Kelompok Tradisional, LKMD/K dan
Institusi Program Pengentasan Kemiskinan [Dynamics between Traditional Groups, LKMD/K and Institutes for Poverty Eradication Programs]. Laporan Hasil Penelitian Tahap Pertama Juli 2000. Metode Community Involvement.
___________. 2000. Dinamika Hubungan Antara Kelompok Tradisional, LKMD/K dan Institusi
Pengentasan Kemiskinan di Kamal Muara, Jakarta Utara [Dynamics between Traditional Groups, LKMD/K and Institutes for Poverty Eradication Programs in Kamal Muara, North Jakarta].
Direktorat Penyehatan Air dan Sanitasi, Ditjen PPM & PL, Departemen Kesehatan RI
Jakarta (2002) Modul Pelatihan Partisipatoris (MPAA/PHAST) Bagi Masyarakat [A Module for Participatory Training (MPAA/PHAST) for Communities]. Jakarta.

The SMERU Research Institute, December 2003 82
Driya Media. (1996) Acuan Penerapan Participatory Rural Appraisal [A Reference for the Implementation of Participatory Rural Appraisals]. Konsorsium Pengembangan Dataran Tinggi Nusa Tenggara. The Ford Foundation.
Elson, R. et.al. (2002) Vietnam Joint Staff Assessment of the International Development
Association. International Monetary Fund & the International Development Association.
Forum Nasional KIKIS. (2001) Mengembangkan Kapasitas Publik dalam Agenda
Penanggulangan Kemiskinan Struktural [Developing Public Capacity in Reducing Structural Poverty].
Insan Hitawasana Sejahtera. (2003) Proyek Pelayanan Jasa Konsultan: Pengembangan Basis
Data untuk Mendukung Program Penanggulangan Kemiskinan [Consulting Services Project: Developing Databases to Support Poverty Reduction Programs].
IRSA & the Department of Economics & Development Studies Padjadjaran University.
(2003) Regional Development in a Decentralized Era: Public Services, Poverty, and the Environment. The 5th IRSA International Conference.
Jellinek, Lea. Rustanto, B. Dr. & Susiladiharti. (2002) My Neighbour, Your Neighbour:
Governance, Poverty and Civic Engagement in Five Jakarta Communities. DFID and YPM Kesuma Multiguna.
Komite Penanggulangan Kemiskinan. (2003) Informasi Dasar Penyusunan Strategi
Penanggulangan Kemiskinan Daerah [Basic Information for the Formulation of Regional Poverty Reduction Strategies]. Jakarta.
Komite Penanggulangan Kemiskinan. (2003) Prosiding Rakernas Penanggulangan Kemiskinan
Tahun 2003 [Proceedings from the 2003 National Working Meeting on Poverty Reduction].
Laderchi, C.R. (2001) Participatory Methods in the Analysis of Poverty: A Critical Review. QEH
Working Paper number 62. Lao Cai PPA Legowo, T.A. & Takahashi, M. (2003) Regional Autonomy and Socio Economic Development in
Indonesia: A Multidimensional Analysis. Chiba, Institute of Developing Economies Japan External Trade Organization.
LPEM, FEUI. (2001) Konsultasi Penyiapan Strategi Kemiskinan [Consultations for the
Preparation of Poverty Strategies]. Buku I. Laporan Kemajuan (Interim Report). Jakarta.
McGee, R. (2000) Analysis of Participatory Poverty Assessment (PPA) and Household Survey
Findings on Poverty Trends in Uganda. McGee, R. & Brock, K. (2001) From Poverty Assessment to Policy Change: Processes, Actors
and Data. Working Paper 133. England. Institute of Development Studies.

The SMERU Research Institute, December 2003 83
McGee, R. Levene, J. & Hughes, A. (2002) Assessing Participation in Poverty Reduction Strategy Papers: A desk-based Synthesis of Experience in sub-Saharan Africa. Research Report 52. England, Institute of Development Studies.
Miles, M.B. & Huberman, A. M. (1992) Analisis Data Kualitatif [Qualitative Data Analysis].
UI-Press. Mukherjee, N. & Wijk, C.V. Sustainability Planning and Monitoring in Community Water
Supply and Sanitation: A Guide on the Methodology for Participatory Assessment (MPA) for Community-Driven Development Programs. The World Bank.
Mukherjee, N. (1999) Consultations with the Poor in Indonesia. The World Bank. Mukherjee, N. et al. (2001) People, Poverty and Livelihoods: Links for Sustainable Poverty
Reduction in Indonesia. Jakarta, the World Bank and DFID. Narayan, D. (1999) Consultations with the Poor: Process Guide for the 20 Country Study for the
World Development Report 200/01. Poverty Group, Poverty Reduction and Economic Management Network, the World Bank.
_____________. (2000) Voices of the Poor: Can Anyone Hear Us?. The World Bank, Oxford
University Press. _____________ et.al. (2000) Voices of the Poor: Crying Out for Change. the World Bank,
Oxford University Press. Narayan, D. & Nyamwaya, D. (1996) Learning from the Poor: A Participatory Poverty
Assessment in Kenya. The World Bank and ESD. Norton, A. et al. (2001) A Rough Guide to PPAs: Participatory Poverty Assessment: An
Introduction to Theory and Practice. Overseas Development Institute. Rao, V. & Woolcock, M. Integrating Qualitative and Quantitative Approaches in Program
Evaluation. Tool Kit, Chapter 8. Rietbergen-McCracken, J. & Narayan, D. (1998) Participation and Social Assessments: Tools
and Techniques. Washington, USA. Socialist Republic of Vietnam (2002) The Comprehensive Poverty Reduction and Growth
Strategy (CPRGS). ___________________. (2001) Interim Poverty Reduction Strategy Paper (I-PRSP). Soeradji, B. & Mubyarto (1998) Gerakan Penanggulangan Kemiskinan: Laporan Penelitian di
Daerah-daerah [The Poverty Reduction Movement: A Report on Research in the Regions]. Yogyakarta. Bappenas, Penerbit Aditya Media.
Srinivasan, L. (1993) Tools for Community Participation: A Manual for Training Trainers in
Participatory Techniques. UNDP. Tra Vinh PPA

The SMERU Research Institute, December 2003 84
Zaman, M. (2002) Are We Getting Lost in Exclusive Anti-Poor, Adjustment Lending Policy Cycles? A Rapid Review of Preliminary Action Aid Engagement of Poverty Reduction Strategies in Kenya, Haiti, Uganda, Vietnam, Nepal, Rwanda and Malawi.

The SMERU Research Institute, December 2003 85
APPENDICES

The SMERU Research Institute, December 2003 86
Appendix 1. A Summary of the Studies Consolidated and a Comparison of PPA Methodologies “Consultation with the Poor,” The World Bank (1999) This study was part of a cross-country study conducted in 23 countries with the purpose of providing input for the formulation of the World Development Report 2000/1 which focused on poverty. The objective of this study was to understand the variations in poverty from the perspective of the poor in communities with different social, political, and economic backgrounds. It was hoped that the results of this study would provide input to make poverty reduction strategies more effective in Indonesia. The Indonesian country study was conducted in 12 locations in West Java, Central Java, East Java, West Nusa Tenggara, and East Nusa Tenggara in May 1999. A PPA was conducted in one location in every kabupaten/kota adopting methods that were also used in PPAs carried out in other countries. Data was collected through: • Interviews with informants at the village level. • Welfare mapping and classifications. • Focus group discussions with young women, older women, young men, older men, and youths
(men and women). • In-depth interviews for case studies. Focus group discussions used various tools, such as welfare classifications, transects, the causes and effects of poverty, Venn diagrams, problem priorities and solutions, and gender roles in the household and in the community. Issues that were explored included:
1. The communities’ perception of welfare and poverty, including welfare classifications, the characteristics related to each classification and the proportion of people in each classification; the causes and effects of poverty; the likelihood of a change in welfare levels; and perceptions regarding social distance/exclusion.
2. Problem priorities according to the poor, which included: problems being faced; the connection between problems and the implications of this on strategies that could be undertaken individually and those that need external assistance; community coping strategies; and the role of programs and social safety net programs.
3. Institutional analysis to identify the institutions that exist in the lives of the people, as well as their roles in and significance for the communities.
4. Gender roles in the household and community which were revealed through the change in responsibility and decision making patterns at the household and village level, and the trends in violence against women.
“Micro Study on Identifying Proxy Indicators of Local Poverty”, I.H.S (2002 & 2003). This study was designed to identify the local proxies of poverty and was part of the study to develop a database of poverty in the regions which was conducted by Bappenas and I.H.S. The field study was conducted in two stages. The first stage was conducted between October and November 2002 in 10 kabupaten/kota. In each kabupaten/kota, the study was carried out in two villages based on topography (highland, lowland, coastal, non-coastal, urban and rural) and consultations with the local government. Data was collected at the community level through in-depth interviews and focus group discussions. Unlike the World Bank study, this study did not use the tools usually found in participatory studies, but instead utilized guidelines to facilitate interviews and discussions. Focus group discussions were conducted with poor women, women who were better off, poor men, men who were better off, and with poor and rich children (grade 5 and higher). In-depth interviews were carried out whenever needed. Despite discussions being carried out with six different groups, the field report did not include the discussion results for each group but was instead summarized results at the village level. Issues explored in this micro study included:

The SMERU Research Institute, December 2003 87
• Village characteristics, environmental conditions and the presence of facilities and infrastructure; • Community perspectives of poverty; • Problems faced by the poor; • The causes of poverty; • The poor’s survival strategies; • Community perceptions regarding the chances of escaping poverty; and • Community perceptions regarding the current and past poverty reduction programs. FKPKM (1999) This study was documented by KIKIS in a discussion report on urban poverty, where research was conducted in one village in Malang, East Jawa. This study was carried out to explore the causes and problems of poverty amongst laborers and informal sector workers in urban areas. Data was collected through focus group discussions with poor groups in the community which were selected based on the community welfare criteria established by BKKBN (the National Family Planning Coordinating Board). People were not divided into groups based on sex – men and women were gathered into one group. Issues that were addressed in discussion groups included: • Welfare classifications and the characteristics of each class. • The causes and effects of poverty. • Perceptions regarding the chances of escaping poverty. • Problems faced by the poor. “People, Poverty and Livelihood”, DFID (2000) This study, which was supported by DFID, aimed to complement the World Bank’s report, “Poverty Reduction in Indonesia: Construction of a New Strategy, 2000.” In this study, the Sustainable Livelihood framework was used to observe the dynamics of poverty and to provide input for policies based on field findings and the needs of the poor, both men and women. Poverty studies at the community level were conducted in four locations with different characteristics, namely a wet-rice farming village, a forest and plantation village, a coastal fishing village, and an urban informal sector village. The four villages were located in Kabupaten Garut (West Java), Kabupaten Mempawah (West Kalimantan), Kabupaten Lombok Barat, (West Nusa Tenggara), and Surabaya (East Java) respectively. Data and information was collected through in-depth interviews and focus group discussions using a participatory approach and similar tools to those used in the World Bank study (1999) above. Issues that were addressed in this study included: • Welfare classifications and the characteristics of each class. • The distribution of the people based on welfare and the distribution of resources as well as public
facilities and infrastructure. • The causes and effects poverty, the main cause, and the methods to reduce it. • Seasonal changes that affect the lives of the people and coping strategies adopted by the poor. • Institutions that have a role in the community and their proximity to the community. • Gather information on village history in order to understand the important events that have affected
the people’s lives. • The village’s sources of information and the community’s trust in these sources. • The daily activities in order to understand the time allocation and workload of the community. • Control over assets based on gender. In addition to exploring the issues above, this study included a livelihood analysis based on the ‘pentagon asset’. “Kajian Kemiskinan di Tingkat Kluster” (Poverty Study at the Cluster Level), P2TPD (2003)

The SMERU Research Institute, December 2003 88
Participatory Policy Analysis is one of the three components of the ILGR-WB (Initiative for Local Governance Reform-World Bank) program. The other two components are policy reform, and regulation and investment reform. Unlike other PPAs consolidated in this study, which were conducted solely for research purpose, this community level analysis is part of the preparation for the formulation of the regional PRSP. The results of this study are expected to provide direct input for the formulation of the regional poverty reduction strategy and plan. This study has directly involved government officials at the kabupaten level through implementation teams that were formed to represent the stakeholders of a kabupaten. From the 22 kabupaten that were involved in the initial stage, only 16 were expected to participate until the end, and for the purpose of this study, nine kabupaten reports were selected and consolidated. Methodology assessment at the cluster level refers to the PPA methods used by DFID and the World Bank in their Sustainable Livelihood study, which used tools during group discussions and field observations. Tools included welfare classifications, social mapping, gender analysis on the control over assets in the household, analysis of employment sources, diagrams of the causes of poverty, trend analysis, seasonal calendars, Venn diagrams to understand the significance of the institutions and their proximity to community members, and ranking and scores in order to learn about the sources of information and assistances present in the community. Unlike the World Bank and DFID studies, this PPA did not conduct in-depth interviews with poor families or conduct a poverty impact analysis. Another difference is that this study was completely carried out by the implementation team that consisted of representatives from local stakeholders, namely the local government, local parliament and NGOs.

The SMERU Research Institute, December 2003 89
A Comparison of the Methodologies used in PPAs in Addressing Questions:
World Bank IHS FKPKM DFID P2TPD 5 – 7 days 2 days (? 1 day) (10-14 days) (2 –5 days)
Who are the poor? Yes FGDs: Welfare classification
Yes FGDs Interviews
Yes FGDs: Welfare classification
Yes FGDs: Welfare classification Social mapping
Yes FGDs: Welfare classification Social mapping
Why are they poor? Yes FGDs: Causes and effects of Poverty Case studies
Yes FGDs Interviews
Yes FGDs: Causes and effects of poverty
Yes FGDs: Causes and effects of poverty
Yes FGD: Root cause of poverty
What difficulties do they face? (1) Impact of Poverty
Yes FGDs: Causes and effects of poverty
Yes FGDs Interviews
Yes FGDs: Causes and effects of poverty
Yes FGDs: Causes and effects of poverty
No (in a number of locations it arose in discussions on the causes poverty)
What difficulties do they face? (2) Problems being faced
Yes FGDs: Problem priority and solution
Yes FGDs Interviews
No Yes FGDs: Causes and effects of poverty (+) problem priority and solution Historic time lines
Partly FGDs: Trend analyses Problem priority and solution
How do they survive? (What social safety nets do they possess?)
Yes FGDs: Trend analyses In-dept interviews Case studies
Yes FGDs Interviews
No Yes Seasonal calendars Historic time lines Resource mapping Interviews Employment analyses
Partly FGDs: Seasonal calendars

The SMERU Research Institute, December 2003 90
World Bank IHS FKPKM DFID P2TPD Other information Institutional analyses:
Important, close, assist at time of crisis, can be influenced by the community Gender dimension: Responsibility and decision making in the household and in the community, and violence against women. Solutions (identification and methods to reduce poverty). Dynamics of welfare levels (Case studies). Program evaluation (a bit). Perceptions on welfare. Condition of infrastructure.
Solutions (perceptions regarding the opportunities and requirements). Program evaluation (a bit). Perceptions on welfare. Condition of infrastructure.
Solutions (perceptions regarding the opportunities and requirements).
Solutions. Migration patterns. Gender: Control of assets. Sources of information and assistance. Daily activities. Employment sources. Infrastructure. Program evaluation (a bit).
Institutional analyses: important, close, useful. Sources of information and assistance. Employment analyses. Trend analyses. Historical time lines. Gender: Control of assets.
Notes Field report: Varied between locations, some are incomplete. Methodology: In-dept interviews Case studies. FGDs with tools.
Field report: Does not include the results of FGD each group of respondent. Discussion of issues combines results of FGDs with results of interviews. Information on “the cause poverty” is not in depth (no tools used?). Good narration. Methodology: In-dept interviews. FGDs with guideline interviews, without tools.
Field report: Report is too short because only aimed to complement another study. Methodology: FGDs only, without in-depth interviews.
Field report: Good combination of FGDs with other tools. Methodology: In-dept interviews. FGDs with tools.
Field Report: Varied between locations. Most lack narration and description of the regional conditions.
Methodology: FGDs with tools. Did not optimize tools and therefore information is less detailed.

The SMERU Research Institute, December 2003 91
Appendix 2. List of the PPA Locations
Study (Year) Village Kabupaten/ Kota Province Rural/Urban
BPS (1998) Type of Community
Padamukti Bandung Urban Rice farming and labor Galih Pakuwon Garut Urban Rice farming Pegambiran Cirebon Urban Labor Harapan Jaya Bekasi
West Java
Urban Labor Semanggi Surakarta Urban Labor Genengsari Grobogan
Central Java Rural Forest
Tanjung Rejo Malang Urban Labor Banaran Ponorogo
East Java Rural Rice farming
Ampenan Utara Mataram West Nusa Tenggara
Urban Fishing
Renggarasi Sikka Rural Dry-land farming Waikanabu Rural Dry-land farming
World Bank (1999)
Kawangu Sumba Timur
East Nusa Tenggara
Rural Dry-land farming Botohilitano Urban Dry-land farming Silimabanua
Nias Urban Dry-land farming
Pematang Cengal Urban Fishing Pekubuan
Langkat Urban Fishing and labor
Kelurahan Baru Urban Labor Kelurahan Melayu
Pematang Siantar
North Sumatera
Urban Labor Bebeko Rural Forest and plantation Bedaro
Bungo Rural Forest and plantation
Lebak Bungur Rural Forest and plantation Tuo Sumay
Tebo Jambi
Rural Forest and plantation Karang Rahayu Urban Rice farming and labor Sukaraya
Bekasi West Java Urban Labor
Demangharjo Rural Rice farming Kedung Kelor
Tegal Rural Fishing
Kemejing Rural Rice farming Sumbersari
Wonosobo Central Java
Rural Rice farming Kanigoro Rural Fishing Planjan
Gunung Kidul Yogyakarta Rural Dry-land farming
Sabrang Rural Rice farming
IHS-Bappenas (2002)
Sumberrejo Jember
Rural Fishing FKPKM (1999) Purwodadi Malang
East Java Urban Labor
Kuranji West Lombok West Nusa Tenggara
Rural Fishing
Ngagel Kota Surabaya
East Java Urban Labor
Karang Sari Garut West Java Rural Rice farming
DFID (2000)
Saham Mempawah West Kalimantan
Rural Forest and plantation

The SMERU Research Institute, December 2003 92
Appendix 2. (Continued) List of the PPA Locations
Study (Year) Village Kabupaten/ Kota Province Rural/Urban
BPS (1998) Type of Community
Jorong Payo Rural Forest and plantation Jorong Mawar Rural Forest and plantation Jorong Koto Baru Rural Dry-land farming Jorong Piliang Bendang
Tanah Datar
Rural Dry-land farming Jorong Koto Baru Tanjung Alai
Rural Dry-land farming
Jorong Parik Batu Rural Rice farming West Jorong Talang East Talang
Rural Rice farming
Jorong Balai Pandan
Solok
West Sumatera
Rural Rice farming Batujaya Rural Rice farming Bangbayang Rural Rice farming Nanggerang Urban Rice farming Sukakerta
Majalengka West Java
Rural Rice farming Panyangkalan Rural Rice farming Tanrara
Gowa Rural Rice farming
Mangindara Rural Fishing Lassang Rural Rice farming Pallantikang
Takalar
Urban Rice farming and labor Pa’bumbungang Bantaeng Rural Forest and plantation Ela-Ela Rural Forest and plantation Bonto Kamase Rural Forest and plantation Benteng Palioi Rural Rice farming Mariorennu Rural Rice farming Padang loang Rural Rice farming and labor Kasimpureng Urban Dry-land farming and
labor Manjaling
Bulukumba
South Sulawesi
Rural Rice farming Toruat Rural Forest and plantation Sauk Rural Fishing Motandoi
Bolaang Mongondow
North Sulawesi
Rural Fishing Ngawi Urban Labor Kandangan Rural Rice farming and labor Mengger Rural Forest and plantation Manisharjo Rural Rice farming Girikerto Rural Forest and plantation
ILGR (2003)
Pandean
Ngawi East Java
Rural Forest and plantation Tanjung jawa Rural Forest and plantation Penda Asam
Barito Selatan Central Kalimantan Rural Forest and plantation
Seikayu Rural Forest and plantation Saka Mangkahai
Kapuas Rural Forest and plantation
Fatukoka Rural Dry-land farming Hane
South Central-Timor Rural Dry-land farming
Takari Rural Dry-land farming
IHS-Bappenas (2003)
Noelmina Kupang
East Nusa Tenggara
Rural Rice farming

The SMERU Research Institute, December 2003 93
Appendix 3. Summary of the Poverty Characteristics Analysis
Island Type of Area
Total by Village Java NTT Sumatra Sulawesi Kalimantan Rural Urban N 76 (%) 30 (%) 9 (%) 18 (%) 14 (%) 5 (%) 56 (%) 20 (%) 1 Ability to meet food needs 60 78.9 27 90.0 7 77.8 9 50.0 13 92.9 4 80.0 45 80.4 15 75.0 2 Housing
2a Physical conditions of a house 65 85.5 29 96.7 9 100.0 10 55.6 13 92.9 4 80.0 47 83.9 18 90.0 2b Ownership of house 20 26.3 8 26.7 2 22.2 6 33.3 3 21.4 1 20.0 13 23.2 7 35.0 2c Facilities and Sanitation (around a house) 35 46.1 18 60.0 0 - 4 22.2 13 92.9 0 - 27 48.2 8 40.0 3 Ability to meet clothing requirements 30 39.5 10 33.3 2 22.2 6 33.3 10 71.4 2 40.0 23 41.1 7 35.0 4 Ability to send children to school 64 84.2 26 86.7 6 66.7 13 72.2 14 100.0 5 100.0 47 83.9 17 85.0 5 Health
5a Health conditions 7 9.2 6 20.0 1 11.1 0 - 0 - 0 - 2 3.6 5 25.0 5b Ability to pay for medical treatment 35 46.1 14 46.7 3 33.3 4 22.2 13 92.9 1 20.0 27 48.2 8 40.0 6 Day-to-day life
6a All-round deficiency in life 18 23.7 11 36.7 2 22.2 5 27.8 0 - 0 - 10 17.9 8 40.0 6b Low income 35 46.1 17 56.7 3 33.3 11 61.1 2 14.3 2 40.0 21 37.5 14 70.0 6c Debt 6 7.9 2 6.7 3 33.3 1 5.6 0 - 0 - 3 5.4 3 15.0 7 Type of work 61 80.3 27 90.0 3 33.3 14 77.8 12 85.7 5 100.0 44 78.6 17 85.0 8 Ability to work 10 13.2 3 10.0 5 55.6 0 - 1 7.1 1 20.0 7 12.5 3 15.0 9 Ownership
9a Ownership – Land 38 50.0 16 53.3 5 55.6 5 27.8 8 57.1 4 80.0 29 51.8 9 45.0 9b Ownership – Farm animals 15 19.7 6 20.0 6 66.7 1 5.6 2 14.3 0 - 14 25.0 1 5.0 9c Ownership – Other capital 21 27.6 5 16.7 2 22.2 4 22.2 7 50.0 3 60.0 14 25.0 7 35.0 9d Ownership – Household items 32 42.1 13 43.3 1 11.1 6 33.3 9 64.3 3 60.0 25 44.6 7 35.0 10 Level of education or skills 9 11.8 7 23.3 0 - 1 5.6 0 - 1 20.0 4 7.1 5 25.0 11 Family 11a Number of family members 16 21.1 7 23.3 1 11.1 4 22.2 4 28.6 0 - 12 21.4 4 20.0 11b Child labor 11 14.5 2 6.7 1 11.1 3 16.7 3 21.4 2 40.0 8 14.3 3 15.0 11c State of family affairs 3 3.9 2 6.7 1 11.1 0 - 0 - 0 - 2 3.6 1 5.0 12 Social and community relations 13 17.1 5 16.7 4 44.4 1 5.6 3 21.4 0 - 7 12.5 6 30.0

The SMERU Research Institute, December 2003 94
Appendix 3. (Continued) Summary of the Poverty Characteristics Analysis
Type of Community
Rice Farming Dry-land Farming Forest & Plantation Coastal Fishing Urban Informal Sector
& Labor Mixed Laborer, Informal
Workers & Others N 20 (%) 12 (%) 17 (%) 11 (%) 9 (%) 7 (%)
1 Ability to meet food needs 16 80.0 11 91.7 13 76.5 8 72.7 7 77.8 5 71.4 2 Housing
2a Physical conditions of a house 18 90.0 10 83.3 12 70.6 11 100.0 7 77.8 7 100.0 2b Ownership of house 4 20.0 1 8.3 5 29.4 4 36.4 5 55.6 1 14.3 2c Facilities and Sanitation (around a house) 13 65.0 1 8.3 5 29.4 7 63.6 4 44.4 5 71.4 3 Ability to meet clothing requirements 9 45.0 3 25.0 6 35.3 5 45.5 4 44.4 3 42.9 4 Ability to send children to school 18 90.0 6 50.0 14 82.4 11 100.0 9 100.0 6 85.7 5 Health
5a Health conditions 2 10.0 1 8.3 0 - 0 - 3 33.3 1 14.3 5b Ability to pay for medical treatment 11 55.0 4 33.3 5 29.4 7 63.6 3 33.3 5 71.4 6 Day-to-day life
6a All-round deficiency in life 4 20.0 2 16.7 4 23.5 1 9.1 5 55.6 2 28.6 6b Low income 6 30.0 5 41.7 7 41.2 7 63.6 7 77.8 3 42.9 6c Debt 1 5.0 2 16.7 0 - 2 18.2 0 - 1 14.3 7 Type of work 18 90.0 3 25.0 14 82.4 11 100.0 8 88.9 7 100.0 8 Ability to work 2 10.0 4 33.3 1 5.9 2 18.2 1 11.1 0 - 9 Ownership
9a Ownership – Land 12 60.0 6 50.0 9 52.9 6 54.5 2 22.2 3 42.9 9b Ownership – Farm animals 4 20.0 6 50.0 3 17.6 1 9.1 0 - 1 14.3 9c Ownership – Other capital 4 20.0 1 8.3 6 35.3 6 54.5 1 11.1 3 42.9 9d Ownership – Household items 6 30.0 4 33.3 8 47.1 7 63.6 2 22.2 5 71.4 10 Level of education or skills 2 10.0 0 - 2 11.8 0 - 4 44.4 1 14.3 11 Family 11a Number of family members 6 30.0 2 16.7 2 11.8 1 9.1 3 33.3 2 28.6 11b Child labor 1 5.0 1 8.3 2 11.8 4 36.4 1 11.1 2 28.6 11c State of family affairs 0 - 1 8.3 0 - 1 9.1 1 11.1 0 - 12 Social and community relations 3 15.0 2 16.7 2 11.8 3 27.3 2 22.2 1 14.3

The SMERU Research Institute, December 2003 95
Appendix 3. (Continued) Summary of the Poverty Characteristics Analysis
Sex Age
Total by
Respondents Female Male Mixed Group Young Old Mixed Groups N 119 (%) 22 (%) 24 (%) 73 (%) 32 (%) 22 (%) 65 (%)
1 Ability to meet food needs 81 68.1 13 59.1 15 62.5 53 72.6 16 50.0 16 72.7 49 75.4 2 Housing 2a Physical conditions of a house 83 69.7 11 50.0 15 62.5 57 78.1 14 43.8 14 63.6 55 84.6 2b Ownership of house 26 21.8 3 13.6 7 29.2 16 21.9 8 25.0 3 13.6 15 23.1 2c Facilities and Sanitation (around a house) 36 30.3 1 4.5 4 16.7 31 42.5 2 6.3 2 9.1 32 49.2 3 Ability to meet clothing requirements 33 27.7 5 22.7 4 16.7 24 32.9 4 12.5 4 18.2 25 38.5 4 Ability to send children to school 86 72.3 13 59.1 15 62.5 58 79.5 17 53.1 15 68.2 54 83.1 5 Health 5a Health conditions 8 6.7 1 4.5 3 12.5 4 5.5 5 15.6 1 4.5 2 3.1 5b Ability to pay for medical treatment 36 30.3 2 9.1 6 25.0 28 38.4 2 6.3 5 22.7 29 44.6 6 Day-to-day life 6a All-round deficiency in life 33 27.7 9 40.9 8 33.3 16 21.9 16 50.0 7 31.8 10 15.4 6b Low income 52 43.7 8 36.4 12 50.0 32 43.8 15 46.9 11 50.0 26 40.0 6c Debt 7 5.9 2 9.1 0 - 5 6.8 2 6.3 1 4.5 4 6.2 7 Type of work 86 72.3 14 63.6 18 75.0 54 74.0 21 65.6 14 63.6 51 78.5 8 Ability to work 11 9.2 1 4.5 4 16.7 6 8.2 4 12.5 1 4.5 6 9.2 9 Ownership 9a Ownership – Land 51 42.9 10 45.5 9 37.5 32 43.8 10 31.3 10 45.5 31 47.7 9b Ownership – Farm animals 21 17.6 4 18.2 5 20.8 12 16.4 3 9.4 6 27.3 12 18.5 9c Ownership – Other capital 23 19.3 3 13.6 5 20.8 15 20.5 3 9.4 3 13.6 17 26.2 9d Ownership – Household items 32 26.9 0 - 4 16.7 28 38.4 0 - 2 9.1 30 46.2 10 Level of education or skills 14 11.8 3 13.6 4 16.7 7 9.6 9 28.1 1 4.5 4 6.2 11 Family
11a Number of family members 17 14.3 3 13.6 1 4.2 13 17.8 1 3.1 4 18.2 12 18.5 11b Child labor 11 9.2 1 4.5 0 - 10 13.7 1 3.1 0 - 10 15.4 11c State of family affairs 3 2.5 0 - 1 4.2 2 2.7 2 6.3 0 - 1 1.5 12 Social and community relations 13 10.9 3 13.6 2 8.3 8 11.0 2 6.3 2 9.1 9 13.8

The SMERU Research Institute, December 2003 96
Appendix 4. List of Expressions - Poverty Characteristics
1
Pemenuhan Kebutuhan Pangan
Ability to meet food needs
Beras jagung campur ubi/rumput laut
Corn mixed with cassava/seaweed
Berburu ke hutan untuk makan Hunt in the forest for food
Berburu untuk makan Hunt for food
Hanya makan pagi Only eat breakfast
Kadang 2-3x sehari Sometimes 2-3 times a day
Kadang 2x Sometimes eat twice a day
Kadang beras habis Sometimes run out of rice
Kadang makan, kadang tidak Sometimes eat, sometimes not
Kadang tidak makan Sometimes do not eat
Kebutuhan makan kurang Food needs not met
Kekurangan beras Shortage of rice
Kekurangan gizi Malnutrition
Kekurangan makan Food shortages
Kurang 2x sehari Do not eat enough, only twice a day
Kurang gizi Malnourished
Kurang makan Do not eat enough
Kurus, kurang gizi Thin, malnourished
Lauk seadanya Eat whatever protein sources are available
Makan hanya sekali Only eat once a day
Makan 1 - 2 x sehari Eat once or twice a day
Makan 2x sehari Eat twice a day
Makan 3x sehari Eat three times a day
Makan 3x sehari dengan beras dolog
Eat three times a day using rice provided by Dolog
Makan cukup Food is adequate
Makan dengan ikan dan sayur Food includes fish and vegetables
Makan dengan tiwul Food includes dried cassava
Makan hanya sayur, daging sebulan sekali
Only eat vegetables, eat meat once a month
Makan harus beli Must buy food
Makan jagung Eat corn
Makan jagung &sayur dr kebun Eat corn and vegetables from garden
Makan kadang 2 x saja sulit Sometimes eating twice a day is difficult
Makan kurang Lack of food
Makan kurang gizi Food lacks nutrients
Makan nasi jagung 1x 1 hari, siang hari makan ubi
Eat rice and corn once a day, eat cassava for lunch
Makan nasi jika ada raskin Eat rice if subsidized government rice is available
Makan nasi tanpa ikan Eat rice without fish/another source of protein
Makan pas-pasan Food is only just adequate
Makan sagam/bekatul Eat rice husks
Makan seadanya Eat whatever is available
Makan sehari-hari sering beli Food is often bought on a daily basis
Makan tidak teratur Do not eat regularly
Makan tiwul dengan sambal Eat dried cassava with chili sauce
Makan ubi kayu atau pisang rebus atau pisang bakar, makan nasi 2x seminggu, kadang ubi hutan
Eat cassava, boiled or roasted bananas, eat rice twice a week, sometimes sweet potato
Makanan sederhana Food is basic
Makanan terbatas Food is limited
Makanan tidak bergizi Food is not nutritious
Makanannya kurang Small amounts of food
Mutu makanan kurang Food is of a low quality
Nasi campur ubi Rice mixed with cassava
Nasi jagung, ikan asin, daun kelor
Rice mixed with corn, salted fish, merunggai leaves
Pagi makan sore tidak Eat in the morning but not in the afternoon
Pemenuhan kebutuhan makan sulit
Difficulties in meeting food needs
Pemenuhan kebutuhan makan terbatas
Limited ability to meet food needs
Pemenuhan makanan alakadarnya
Meet food needs with whatever is available
Persediaan makan tidak cukup Food supplies are inadequate
Rawan pangan Food insecurity
Sumber makan terkadang dari hutan
Sometimes obtain food from forests
Tambahan makanan ringan Food is supplemented with snacks
Tidak ada persediaan makan pada masa paceklik
No food supplies during drought seasons
Tidak mampu membeli sembako Unable to purchase basic food commodities

The SMERU Research Institute, December 2003 97
Appendix 4. (Continued) List of Expressions - Poverty Characteristics
2a
Kondisi Fisik Rumah Physical conditions of a house
Atap dan dinding dari daun Roof and walls are made of leaves
Atap daun kelapa Roof is made of coconut leaves
Atap ilalang Roof is made of thatched grass
Atap ilalang & seng bekas Roof is made of thatched grass and second-hand corrugated iron sheets
Atap jerami Roof is made of straw
Atap nipah Roof is made of nipa palm leaves
Atap rafiah Roof is made of raffia leaves
Atap rumbia Roof is made of sago palm leaves
Beratap nipa Roof is made of nipa palm leaves
Dinding bambu Bamboo walls
Dinding bambu atau bebak (pelepah batang pohon)
Walls are made of bamboo and the midrib of palm leaves
Dinding blabokan Walls are made of slats of wood
Dinding dan lantai bambu Bamboo walls and floor
Dinding gamacca/tripleks Plywood walls
Dinding palupuh Walls are made of palupuh
Dinding papan Walls are made of wooden planks
Dinding seng bekas Walls are made of second-hand corrugated iron sheets
Kurang layak Housing is inadequate
Lantai bambu Bamboo floor
Lantai kayu Wooden floor
Lantai papan dan tanah Floor is made of wooden planks and clay
Lantai semen Cement floor
Lantai tanah Dirt floor
Lantai tanah/papan Dirt/wooden floor
Lantai tanah/semen Dirt/cement floor
Luas 2x3 m Floor area 2x3 m
Perumahan serba kurang Housing lacks everything
Punya rumah meski sangat sederhana
Have a house although it is very simple
Rumah 5x6 m atap nipa House is 5x6 m and has a roof made of nipa palm leaves
Rumah alang-alang Grass-roofed house
Rumah atap alang-alang Grass-roofed house
Rumah atap daun House’s roof is made of leaves
Rumah atap daun, bangunan rumah dari bambu
House is made of bamboo, roof is made of leaves
Rumah atap ilalang House has a thatched grass roof
Rumah atap rendah House has a low roof
Rumah bambu Bamboo house
Rumah berbilik bambu House is made of bamboo
Rumah berkerangka & dinding bambu
House has a bamboo frame and walls
Rumah bilik kecil Small house
Rumah bocor dan memakai bedek
House is made of bamboo and roof leaks
Rumah dari bilik, kalau hujan bocor
House is made of woven bamboo, water seeps when it rains
Rumah dari daun House is made of leaves
Rumah dinding bambu House has bamboo walls
Rumah dinding bata House has brick walls
Rumah dinding ilalang House has thatched grass walls
Rumah dinding kayu House has wooden walls
Rumah gamacca 4x5 m Plywood house 4x5 m
Rumah gedek House is made of thatched-grass
Rumah gubuk House is a shack
Rumah jelek Poorly built house
Rumah kayu Wooden house
Rumah kayu dengan atap daun dan lantai kayu bulat
Wooden house with a grass roof and floor made of logs
Rumah kecil Small house
Rumah kecil tidak berkamar Small house with no rooms
Rumah kecil, tidak memiliki jendela, dinding bambu
Small house, no windows, bamboo walls
Rumah kumuh Shanty
Rumah panggung House on stilts
Rumah papan House is made of wooden planks
Rumah robek (berlubang semua) Dilapidated house (holes)
Rumah seadanya Simple house
Rumah sederhana, dihuni sekurangnya oleh 5 org anggota keluarga
House is simple and inhabited by at least five family members
Rumah semi permanen Semi-permanent house
Rumah sempit Small house
Rumah sudah mau runtuh, kecil, House is about to collapse, small
Rumah tanpa lantai House has no floor
Rumah tiang bambu House is made of bamboo branches
Rumah tidak layak huni House is not adequate for living
Rumah tidak permanen House is not permanent
Tanpa sekat ruangan No partitions
Tidak ada kamar No rooms
Tempat tinggal gubuk bambu, atap katu
House is a bamboo hut with a roof made out of katu branches
Tempat tinggal setangkep Very small house
Tempat tinggal tidak memenuhi persyaratan
Inadequate house
Ukuran rumah +/- 10 m2 terbuat dari triplek
House is about 10m2 and is made of plywood

The SMERU Research Institute, December 2003 98
Appendix 4. (Continued) List of Expressions - Poverty Characteristics
2b
Kepemilikan Rumah Ownership of House
Menempel di saudara Live with family
Menumpang di rumah orang kaya
Live with rich people
Pemenuhan kebutuhan rumah terbatas
Limited ability to meet housing needs
Pondok di kebun Hut in the field
Rumah diatas tanah sewa Living on rented land
Rumah kontrak Rental house
Rumah numpang Live in someone else’s house
Rumah sewa/menyewa Rented house
Tanah disewa untuk rumah Rent land to live on
Tidak memiliki rumah Do not own house
Tidak memiliki rumah yang layak Do not own a suitable house
Tidak mempunyai rumah sendiri/nyewa/magersari
Do not own a house/rent/become a tenant
Tidak punya rumah Do not own a house
2c
Fasilitas & Sanitasi Facilities & Sanitation (around a house)
Air bersih dari sumur umum Clean water from a public well
Air susah Difficulties in obtaining water
Kurang air bersih Lack of clean water
Lampu botol /kaleng/minyak Bottle/can/oil lamp
Lingkungan kurang bersih Unclean environment
Lingkungan rumah kurang terjaga
Environment around the house is not well maintained
Listrik dan air numpang tetangga Use neighbor's electricity and water
Listrik dan air susah Difficulties in obtaining electricity and water
Listrik numpang tetangga Use neighbor's electricity
Menggunakan kamar mandi dan jamban umum
Use public washing and toilet facilities
Menggunakan WC umum dan sungai
Use public toilet and river
Rumah kebanjiran di musim penghujan
House floods during the rainy season
Tempat kurang memadai/kotor House is inadequate/dirty
Tidak ada bak mandi,WC dan listrik
No water tank, toilet or electricity
Tidak ada kamar mandi dan WC No bathroom or toilet
Tidak ada listrik No electricity
Tidak ada listrik pakai lampu No electricity, use lamps
Tidak ada sumur/menumpang No well/use neighbor's
Tidak punya sumur/air bersih Do not have well or clean water
Tidak punya WC Do not have a toilet
Tidak punya WC (disungai) Do not have a toilet (use river)
WC darurat Non-permanent toilet
WC di luar rumah Toilet is outside house
3
Pemenuhan kebutuhan sandang
Ability to meet clothing requirements
Beli baju loakkan Buy second-hand clothes
Beli pakaian bekas Buy second-hand clothes
Beli sekali setahun Buy clothes once a year
Jumlah pakaian yang layak terbatas
Limited number of proper clothes
Membeli kredit Buy clothes using credit
Pakaian baju bekas Wear second-hand clothes
Pakaian bekas, sering tidak ditukar
Second-hand clothes, rarely replaced
Pakaian beli di pasar lokal (Cabo)
Buy clothes at the local market (Cabo)
Pakaian dari tenun Clothes are made of woven cloth
Pakaian itu-itu saja Wear the same clothes
Pakaian jelek/jorok Poor-quality/dirty clothes
Pakaian lusuh Worn-out clothes
Pakaian murah/ bekas Cheap/second-hand clothes
Pakaian sederhana Simple clothes
Pakaian sedikit Small number of clothes
Pakaian serba kurang Lack of clothing
Pakaian tidak layak Clothes are inappropriate
Pakaian terbatas/kumal Limited number of/untidy clothes
Pakaian tidak ganti Do not change clothes
Pakaian tidak rapi Clothes are untidy
Pakaian tidak terbeli Do not buy clothes
Pemenuhan kebutuhan sandang terbatas
Limited ability to meet clothing requirements
Tidak punya pakaian Do not own clothing

The SMERU Research Institute, December 2003 99
Appendix 4. (Continued) List of Expressions - Poverty Characteristics
4
Kemampuan menyekolahkan anak
Ability to send children to school
Ada yang anaknya sekolah sampai SMP
Some people have children who complete junior high school
Ada yang Buta huruf Some are illiterate
Anak ke sekolah tanpa sepatu Children go to school with bare feet
Anak putus sekolah Children drop out of school
Anak putus sekolah sampai kelas 6 SD
Children drop out of primary school
Anak sekolah sampai SD Children complete primary school
Anak sering tidak sekolah Children often do not go to school
Anak tidak tamat SD Children do not complete primary school
Anak tidak bisa disekolahkan Children cannot be sent to school
Anak tidak sekolah Children do not go to school
Anak-anak belum tentu tamat SD Not sure whether children will complete primary school
Banyak anak tidak sekolah Many children do not go to school
Banyak anak yang putus sekolah Many children drop out of school
Bayaran sekolah anak telat Pay school fees in arrear
Biaya pendidikan anak kurang Do not have enough money for children's education
Biaya sekolah anak tidak cukup Do not have enough money to send children to school
Drop out SD Drop out of primary school
Harapkan bantuan orang lain untuk sekolahkan anak
Request others to help with sending children to school
Kejar paket A Attend open school and sit formal primary school examinations (Package A)
Kekurangan biaya sekolah anak Do not have enough money for children's education
Kesulitan membayar SPP Difficulties in paying Educational Management Contribution (SPP)
Keterbatasan dalam pendidikan anak
Unable to send children to school
Menyekolahkan anak sampai SD Send children to primary school
Paling tinggi SD Highest level is primary school
Pendidikan terbengkalai Education is neglected
Pendidikan anak hanya sampai SD
Children only go to primary school
Pendidikan anak rendah Children have a low level of education
Pendidikan anak SD tidak tamat Children do not graduate from primary school
Pendidikan keluarga tidak terpenuhi
Education needs of the family are not met
Pendidikan kurang Lack of education
Pendidikan paling tinggi SLTP Highest level of education is junior high school
Pendidikan PBH Basic literacy schooling
Pendidikan SD Primary school education
Pendidikan SD/SLTP Primary and junior high school education
Pendidikan SMA Senior high school education
Pendidikan tidak lulus SD Did not complete primary school
Pergi sekolah jalan kaki Walk to school
Sarana anak sekolah belum memadai
Cannot afford to buy stationery and books for school
Sekolah SD Primary school
Sulit biaya sekolah Difficulties in paying school fees
Sulit membiayai anak sekolah Cannot pay school fees
Tidak mampu membiayai sekolah Unable to pay school fees
Tidak punya biaya Do not have the money for education
Tidak bisa bayar uang sekolah Do not have the money to pay school fees
Tidak bisa membiayai sekolah Cannot pay for education
Tidak bisa meneruskan sekolah Unable to continue schooling
Tidak bisa menyekolahkan anak Unable to send children to school
Tidak dapat membiayai sekolah anak
Cannot pay for children's education
Tidak lulus SD Do not graduate from primary school
Tidak mampu bayar sekolah Unable to pay school fees
Tidak mampu membiayai pendidikan anak
Unable to pay for children's education
Tidak mampu menyekolahkan anak
Unable to send children to school
Tidak mampu menyekolahkan anak lebih dari SMP
Unable to send children on to senior high school
Tidak mampu sekolah Cannot afford to go to school
Tidak mampu sekolahkan anak ke SMP
Unable to send children on to junior high school
Tidak pernah sekolah Have never been to school
Tidak tamat SD Do not complete primary school
Tidak tamat SD asal dapat membaca
Do not complete primary school, but are able to read
5a
Kondisi Kesehatan Health conditions Kesehatan keluarga kurang Poor family health Kesehatan kurang Poor health Kesehatan kurang terjamin Cannot afford to care for one's
health Kesehatan tidak terjamin Cannot afford to care for one's
health Kurang tahu kesehatan Lack of knowledge about
health Sering sakit Often sick

The SMERU Research Institute, December 2003 100
Appendix 4. (Continued) List of Expressions - Poverty Characteristics
5b
Kemampuan berobat Ability to pay for medical treatment
Beli obat eceran dan bebas Buy small quantities of non-prescription medicine
Berobat dengan kartu sehat Seek medical assistance using a healthcare card
Berobat ke dukun Seek medical assistance from a traditional healer
Berobat ke Posyandu Seek medical assistance at a posyandu
Berobat ke Puskesmas Seek medical assistance at a puskesmas
Bila sakit ke dukun Go to a traditional healer when sick
Bila sakit membeli obat di warung Buy medication from a stall when sick
Jika sakit berobat ke Puskesmas (dengan kartu JPS)
Seek medical assistance at a puskesmas (and use an SSN card)
Jika sakit berobat tradisional Use traditional medicine/go to traditional healers when sick
Jika sakit ke bidan Go to a village midwife when sick
Jika sakit ke pustu Go to a secondary puskesmas when sick
Kalau sakit berobat ke Polindes Seek medical assistance from a polindes when sick
Kalau sakit tidak mampu berobat Unable to seek medical assistance when sick
Mempunyai kartu berobat Possess a healthcare card
Obat meramu sendiri Concoct own medicine
Tak mampu ke Puskesmas Unable to go to a puskesmas
Tidak bisa mengobati anak sakit Unable to treat sick children
Tidak mampu berobat Unable to seek medical assistance
Tidak mampu membiayai rumah sakit
Unable to pay hospital expenses
Tidak punya uang untuk berobat ke Puskesmas
Do not have the money to seek medical assistance at a puskesmas
Tidak sanggup berobat ke rumah sakit
Unable to seek medical assistance at a hospital
6a
Hidup Kekurangan All-round deficiency in life
Anak-anak kurang jajan Children do not get enough snacks
Apa-apa kurang Short of everything
Biaya hidup tidak cukup No money to cover everyday expenses
Hanya mampu membiayai makan sehari-hari
Only able to pay for daily food
Hidup apa adanya Live on whatever can be attained
Hidup serba kekurangan Live inadequately
Hidup serba susah Live a hard life
Hidup tidak layak Live insufficiently
Kadang kekurangan uang Occasionally short of money
Kebutuhan sehari-hari kadang tidak terpenuhi
Sometimes unable to meet everyday needs
Kehidupan pas-pasan Inadequate living
Kehidupan serba kekurangan Inadequate living
Kehidupan tidak memadai Inadequate life
Kekurangan uang Lack of money
Keterbatasan dalam mencukupi kebutuhan sehari-hari
Limited ability to meet everyday needs
Kurang jajan Lack of snacks
Kurang segalanya Lack of everything
Mengkhawatirkan Apprehensive
Pemenuhan kebutuhan harian sulit
Difficulties in meeting everyday needs
Semua harus beli Must buy everything
Serba kekurangan Inadequate
Sering tidak punya uang Often do not have money
Sulit berkembang Difficulties in improving living conditions
Sulit memenuhi kebutuhan hidup Difficulties in meeting everday needs
Tidak ada uang jajan No money to buy snacks
Tidak mampu membiayai kebutuhan sehari-hari
Unable to meet everyday needs
Tidak mampu membiayai keluarga
Unable to support family
Tidak mencukupi kebutuhan sehari-hari
Cannot meet everyday needs
Tidak punya segalanya Have nothing
Uang jajan anak kecil Small amount of pocket money for children
Uang jajan dari hasil bekerja Children work for their own pocket money
Untuk membeli apapun susah Difficulties in buying anything

The SMERU Research Institute, December 2003 101
Appendix 4. (Continued) List of Expressions - Poverty Characteristics
6b
Pendapatan rendah Low income
Ekonomi kurang Low economic level
Ekonomi lemah Weak economy
Ekonomi tidak mapan Unstable financial condition
Gaji tidak mencukupi Inadequate wage
Gali lobang tutup lobang Unending indebtedness
Hasil di laut untuk bayar utang Money made from fishing is used to pay debts
Hasil kebun kurang/tidak ada Lack of/no plantation produce
Hasil panen tidak cukup Inadequate harvest yields
Kebutuhan harian selalu kurang, pengeluaran > pendapatan
Cannot cover everyday needs, expenses > income
Kehidupan sehari-hari tambal sulam
Inadequate income
Kerja kebun tidak hasil Plantation work does not produce any outcome
Kerja tidak hasil Work does not produce any income
Kondisi ekonomi parah Severe economic conditions
Pencaharian sehari-hari kurang Inadequate daily income
Pendapatan harian tidak mencukupi
Inadequate daily income
Pendapatan kecil Low income
Pendapatan kurang Insufficient income
Pendapatan Rp 5000/hari Earn Rp 5000 per day
Pendapatan Rp. 100 - 200 rb sebulan
Earn Rp. 100.000 - 200.000 per month
Pendapatan Rp 2500/hari Earn Rp 2.500 per day
Pendapatan tidak memadai Inadequate income
Pendapatan tidak mencukupi kebutuhan sehari-hari
Do not acquire enough income to meet everyday needs
Pendapatan tidak tetap Unstable income
Penghasilan hanya cukup untuk makan
Income obtained is only enough for food
Penghasilan kecil Small earnings
Penghasilan kurang Insufficient earnings
Penghasilan pas-pasan Barely enough earnings
Penghasilan rendah Low earnings
Penghasilan rendah dibawah UMR
Earnings are below the regional minimum wage
Penghasilan sangat kecil dan tidak tetap
Small and unstable earnings
Penghasilan tak cukup untuk makan
Income is too low to buy food
Penghasilan tidak cukup Inadequate income
Penghasilan tidak menentu Uncertain income
Penghasilan tidak tetap Unstable income
Sering berhutang Often borrow money
Sulit mencari uang Difficulties in earning a living
Susah cari makan Difficulties in finding food
Tidak punya penghasilan tetap Do not have a stable income
Tidak punya uang Do not have any money
Usaha tani selalu gagal Agricultural business always fails
6c Berhutang Debt
Berhutang Borrow money/goods Kebutuhan sehari-hari berhutang
Borrow money/goods to fulfill everyday needs
Pinjam tetangga bila sedang menganggur
Borrow from a neighbor if unemployed
Pinjam uang untuk beli beras Borrow money to buy rice Untuk konsumsi terkadang hutang
Sometimes borrow money/ goods for consumption
7
Jenis Pekerjaan Type of Work
Bekerja apa saja (moco-moco) Do any work (moco moco)
Bekerja mengandalkan tenaga Menial jobs
Bekerja sebagai buruh Work as a laborer
Bekerja sebagai buruh cangkul/ ngarambet
Work as a laborer who hoes land/ngarambet
Bekerja sebagai buruh tani atau nelayan
Work as a farm laborer or fisherman
Bekerja sebagai upah/buruh di sawah atau kebun orang lain
Work as a laborer in rice fields or someone else’s land
Bekerja untuk orang lain Work for other people
Bekerja/buruh serabutan Do odd jobs/a casual labor
Beternak Raise animals
Buruh Laborer
Buruh bangunan Construction laborer
Buruh bongkar muat Loading dock laborer
Buruh dengan upah harian Laborer who receives a daily wage
Buruh kasar Unskilled laborer
Buruh kerajinan Craftsman
Buruh Perhutani Perhutani laborer
Buruh tani Farm laborer
Candak kulak Candak kulak
Gembala itik Herdsman
Isteri bekerja di kebun sawit Wife works on a oil palm plantation
Isteri ikut bekerja Wife also works
Isteri tukang cuci, jual makanan Wife works as a laundress or sells food
Jasa kuda Horse rental services
Jual sayuran Vegetable seller
Jualan kue Sell cakes
Keja kuli pada orang lain Work as a coolie for other people

The SMERU Research Institute, December 2003 102
Appendix 4. (Continued) List of Expressions - Poverty Characteristics
7
Jenis Pekerjaan Type of Work
Kerja buruh Do the kind of work that laborers do
Kerja pada orang kaya Work for rich people
Kuli Coolie
Kuli (pertanian) Coolie (agriculture)
Kuli mocok Casual coolie
Kurang hubungan kerja Limited business networks
Lapangan kerja terbatas Limited employment
Malas Lazy
Mata pencaharian petani Farming as source of livelihood
Memancing Fishing
Membuat atap daun kelapa Make roofs from coconut leaves
Membuat batu bata Make bricks
Memilih biji kopi Select coffee beans
Mencari hasil hutan Collect forest products
Mencari kayu bakar Collect firewood
Mencari kerja sulit Difficulties in finding work
Menggaduh hewan Raise someone's farm animals for a share in the product
Menyadap karet Tap rubber
Minta ikan pada orang Ask for fish from other people
Nelayan Fishermen
Ngujur di tepi pantai Fish at the riverbank
Pedagang Trader
Pedagang kecil-kecilan Small-scale trader
Pekerjaan kuli sawah/buruh tani Rice field worker or farm laborer
Pekerjaan sewaktu-waktu/tidak tetap
Work temporarily
Pekerjaan tidak menentu No permanent job
Pekerjaan tidak tetap Temporary work
Pembantu mengangkat sampan Helper for carrying small boats
Pembantu Rt Domestic helper
Pemetik/pemangkas the Pick tea leaves/prune tea bushes
Pemulung Scavenger
Pendatang Migrants
Penduduk musiman (pendatang) Seasonal migrants
Penendak ikan Penendak ikan
Penganyam Weaver
Penggarap Rice field laborer
Penggembala domba Shepherd
Penghasilan tidak tentu Unstable earnings
Pengrajin tikar Mat weaver
Pesanggem Farmers who work on Perhutani land
Petani Farmer
Punya warung Stall owner
Tidak ada mata pencaharian Jobless
Tibo-tibo Peddler
Tidak ada ketrampilan No skills
Tidak memiliki pekerjaan tetap Do not have a permanent job
Tidak punya pekerjaan Have no work
Tidak punya pekerjaan tetap Have no permanent job
Tukang becak/ojek Becak/motorcycle taxi drivers
Tukang cuci Laundress
Tukang gali Digger for construction work
Usaha tidak tetap Non-permanent business
Perempuan memungut sisa panen
Women collect left overs from the harvested rice field
8
Kemampuan bekerja Ability to work
Duda Widower
Janda Widow
Jompo Elderly
Kurang tenaga Lack of strength
Sakit lumpuh Disabled
Tenaga kerja kurang Lack the energy to work
Tenaga untuk kerja kurang mampu
Lack the strength to work
Tidak bisa kerja Unable to work
Tidak produktif Unproductive
Tua Old
Umur tua Old aged
9a
Kepemilikan - Tanah Ownership- Land
Ada yang tidak memiliki tanah Some people do not own land
Lahan kebun < 50 are Farm land is less than 5,000m2
Lahan sempit Small plot of land
Memiliki tanah sedikit Own a small plot of land
Mempunyai sawah sekitar 0.5 ha dan ladang 0.6 ha yang berisi tanaman karet, bisanya tidak ada buah-buahan
Have about 0.5 ha of rice fields and 0.6 ha of dry-fields full of rubber trees, usually with no fruit
Menggarap sawah/kebun orang lain dengan bagi hasil
Work on someone’s rice field/plantation and share the profits
Menumpang di lahan orang Use someone's land
Pekarangan pinjam Use someone's garden
Pemilikan lahan sedikit Own a bit of land
Penyakap Use someone's land
Petani penggarap Landless farmer
Punya lahan Have land
Punya lahan/kebun Have agricultural land/plantation

The SMERU Research Institute, December 2003 103
Appendix 4. (Continued) List of Expressions - Poverty Characteristics
9a
Kepemilikan - Tanah Ownership- Land
Punya sedikit kebun/sawah Have a small plantation/rice field
Sawah tidak punya Have no rice fields
Sebagian lahan pinjam Do not own part of the land
Tanah hanya untuk rumah Land is used only for the house
Tanah kebun <0.5 ha Plantation is less than 0.5 ha
Tanah kebun 50 are Plantation is 5,000m2
Tanah masih menyewa Use rented land
Tanah/sawah menyewa Use rented land/rice fields
Tidak ada lahan No land
Tidak memiliki/punya sawah Do not own/have rice fields
Tidak memiliki/punya tanah Do not own/have land
Tidak memiliki tanah pertanian Do not own agricultural land
Tidak memiliki tanaman Do not own crops/plants
Tidak memiliki/punya lahan Do not have/own land
Tidak punya kebun Do not have plantation
Tidak punya lahan garapan Do not have land to work on
Tidak punya lahan/sempit Have no land or only have a small plot of land
9b
Kepemilikan - Ternak Ownership- Farm Animals
Ayam 2 ekor Two chickens
Memiliki ternak kecil/ unggas Own farm animals/fowls
Pelihara itik 10 ekor Raise 10 ducks
Punya hewan besar < 5 ekor Have less than 5 head of livestock
Punya ternak ayam Have chicken
Sapi kepunyaan orang lain Cattle owned by someone else
Tidak punya ternak sapi/babi Do not have cattle/pigs
Tidak punya ternak, hanya ayam Do not have livestock, only chickens
Ternak kecil/babi<3 ekor Less than 3 farm animals/pigs
Tidak memiliki ternak besar Do not own livestock
Tidak punya sapi, kambing Do not own cattle or goats
Tidak punya ternak Do not have farm animals
Tidak punya ternak besar Do not have livestock
Punya satu ekor Have only one animal
9c
Kepemilikan - Modal Lain Ownership- other capital
Bagan Floating lift nets
Kurang modal Lack of capital
Memiliki perahu Have a boat
Nyakap Sampan Use someone else's boat and share the profit
Perahu dayung Rowboat
Punya jukung Have a small wooden boat
Punya perahu kecil Have a small boat
Punya sepeda Have a bicycle
Sulit untuk mendapat modal usaha
Difficulties in obtaining capital for business
Tidak bermodal Have no capital
Tidak memiliki modal Do not own any capital
Tidak punya kendaraan Do have a vehicle for transportation
Tidak punya kendaraan bermotor Do not have a motor vehicle
Tidak punya mesin Do not have a tractor or other machines for farm work
Tidak punya modal Do not have any capital
Tidak punya modal untuk usaha Do not have any capital to start a business
Tidak punya perahu Do not have a boat
Tidak punya perahu, hanya punya kail
Do not have a boat, only fish hooks
Tidak punya sampan Do not have a small boat
Tidak punya uang/emas Do not have any money/gold
9d
Kepemilikan –Alat RT Ownership- Household Items
Barang yang dimiliki sedikit dan sederhana
Own a few unsophisticated items
Hanya punya meja, kursi, radio Only have a table, chairs and a radio
Masak pakai kayu Use firewood to cook
Menonton TV di tetangga Watch neighbor’s TV
Perabot RT kurang Lack household items
Perabot RT sederhana/sangat sederhana
Own plain/very plain household items
Perabot rumah sangat terbatas Very limited household items
Perabot rumah tangga seadanya Simple household items
Perabot sedikit Few items
Perabotan RT alakadarnya Have limited household items
Perabotan secukupnya Have only basic household items
Perabotan serba kurang Lack household items
Punya TV hitam putih Have a black and white TV
Tidak punya harta Have no valuables
Tidak ada barang Have no goods
Tidak ada TV Have no TV
Tidak punya TV Do not have a TV
Tidak memiliki barang apapun Do not have anything
Tidak memiliki perabot rumah tangga
Do not have household items
Tidak memiliki/punya barang Do not own/have goods
Tidak punya perabot Do not have household items
Tidak punya perabot, hanya alat masak
Do not have household items, only cooking utensils

The SMERU Research Institute, December 2003 104
Appendix 4. (Continued) List of Expressions - Poverty Characteristics
10
Tingkat pendidikan/ ketrampilan
Level of education or skill
Pendidikan kepala keluarga tidak tamat SD
The head of the household has not completed primary school
Pendidikan kurang Lack of education
Pendidikan maksimal SMP Highest level of education is junior high school
Pendidikan orang tua rendah Parents have a low level of education
Pendidikan orangtua sangat minim
Parents have very low education
Pendidikan rendah Low level of education
Pendidikan sampai SD Completed primary school
Pendidikan SD Primary school education
Pendidikan SD/SMP Primary school or junior high school education
Tidak punya keterampilan yang memadai
Do not have sufficient skills
11a
Jumlah anggota keluarga Number of family members
Anak banyak Have many children
Anggota keluarga 2-3 anak 2-3 children
Anggota keluarga banyak Many family members
Banyak anak Many children
KB dihiraukan, sehingga banyak anak
Did not adopt family planning and thus have many children
Satu rumah lebih dari satu KK More than one family living in one house
11b
Anak bekerja Child labor
Anak bekerja Children work
Anak bekerja merantau, tidak kirim uang
Children who are working and settling in other regions/ countries do not send money
Anak bekerja untuk menambah penghasilan
Children work to earn extra income
Anak jadi buruh tani Children work as farm laborers
Anak kerja membantu orang tua Children work to help parents
Anak membantu cari uang Children help to earn money
Anak membantu orang tua bekerja
Children help parents work
Anak yatim piatu Orphan
11c
Kondisi Rumah Tangga State of Family Affairs
Keluarga baru Just married
Kurang perhatian pada anak Do not pay enough attention to children
Sering terjadi pertengkaran dalam keluarga
Arguments often occur in the family
12
Hubungan Sosial - Kemasyarakatan
Social and Community Relations
Anak perempuan cepat dinikahkan
Daughters are married off very young
Hajatan hanya selamatan Ceremonies/celebrations are held in a simple way
Hajatan menyumbang Rp 2500- 5000
Contribute Rp 2.500- 5.000 to ceremonies
Hanya melaksanakan halal nikah Only hold religious ceremonies for marriages
Jika menikahkan anak meminjam uang di Palele
Borrow money from middlemen when holding wedding ceremonies for children
Kadang tidak pergi ke pesta Sometimes do not attend celebrations
Kalau hajatan hanya potong ayam & ikan laut
Only serve chicken and seafood at ceremonies
Kurang komunikasi Lack of communication
Nikah & sunatan masal Mass marriage and circumcision
Pesta alakadarnya Simple celebrations
Pesta sepi Small attendance at celebrations
Pesta tidak ada No celebrations
Sering "ketakutan" Often "scared"
Sumbangan keagamaan lebih kecil dari yang lain
Smaller contributions for religious matters
Tidak berani pinjam uang Afraid to borrow money
Tidak bisa memberi donatur walau sangat ingin
Cannot contribute, although would very much like to
Tidak dipercaya berhutang Mistrusted when trying to find credit
Tidak mampu ikut menyumbang Unable to contribute

The SMERU Research Institute, December 2003 105
Appendix 5. A Breakdown of the Population Produced through Welfare Classification Exercises in Various Participatory Poverty Assessments
Village, District Year Rural/Urban Type of
Community* Rich (%) Better off (%) Poor (%)
Ampenan Utara, Mataram 1999 Urban 1 9 19 72 Kuranji, West Lombok 2000 Rural 1 6 38 56 Kawangu, East Sumba 1999 Rural 2 5 22 73 Renggarasi, Sikka 1999 Rural 2 15 3 82 Kotobatu, Tanah Datar 2003 Rural 2 5 30 65 Jorong Mawar, Tanah Datar 2003 Rural 3 8 41 51 Jorong Payo, Tanah Datar 2003 Rural 3 7 42 51 Saham, Mempawah 2000 Rural 3 14 77 9 Padamukti, Bandung 1999 Urban 4 12 21 67 Harapan Jaya, North Bekasi 1999 Urban 5 15 28 57 Sukakerta, Majalengka 2003 Rural 6 10 15 75 Karangsari, Garut 2000 Rural 6 9 45 46 Galihpakuwon, Garut 1999 Urban 6 10 32 58 Semanggi, Surakarta 1999 Urban 5 7 25 68 Pegambiran, Cirebon 1999 Urban 5 8 29 63 Genengsari, Grobogan 1999 Rural 3 4 29 67 Ngagel, Surabaya 2000 Urban 5 6 20 74 Note: * (1) Coastal fishing; (2) Dry-land farming; (3) Forestry & plantation; (4) Mixed rice farming, and urban informal sector and labor;
(5) Urban informal sector and labor; (6) Rice farming. Sources: PPA reports for the respective villages (See the list in Appendix 40).

The SMERU Research Institute, December 2003 106
Appendix 6. Summary of the Analysis of the Causes of Poverty
Island Total by Village Western
Indonesia Eastern
Indonesia Java Nusa Tenggara Sumatra Sulawesi Kalimantan N = 78 (%) 49 29 31 (%) 9 (%) 18 (%) 15 (%) 5 (%)
Powerlessness Factors 186 238 216 247 72 232 14 156 36 200 52 347 12 240 Unemployment 15 19.2 15 21 9 29.0 2 22.2 0 - 3 20.0 1 20.0 Lack of employment opportunities 38 48.7 46 50 18 58.1 1 11.1 6 33.3 9 60.0 4 80.0 High cost of production inputs/raw materials 14 17.9 16 13 5 16.1 0 - 3 16.7 6 40.0 0 - Low produce prices 24 30.8 26 47 4 12.9 3 33.3 7 38.9 7 46.7 3 60.0 Mismanagement of government assistance 19 24.4 20 22 4 12.9 0 - 5 27.8 10 66.7 0 - Detrimental government policies 7 9.0 10 9 3 9.7 0 - 2 11.1 1 6.7 1 20.0 Insecurity 4 5.1 - 10 0 - 1 11.1 0 - 3 20.0 0 - High cost of living 15 19.2 24 14 8 25.8 2 22.2 4 22.2 0 - 1 20.0 Caught up in loans 17 21.8 15 24 9 29.0 1 11.1 0 - 6 40.0 1 20.0 Problems relating to traditions/customs 5 6.4 3 10 2 6.5 2 22.2 0 - 1 6.7 0 - God's will/fate 28 35.9 41 27 10 32.3 2 22.2 9 50.0 6 40.0 1 20.0 Isolation Factors 116 149 130 158 43 139 12 133 22 122 33 220 6 120 Low level of education 51 65.4 59 67 21 67.7 5 55.6 9 50.0 13 86.7 3 60.0 Lack of or no skills 39 50.0 39 60 14 45.2 6 66.7 6 33.3 11 73.3 2 40.0 Transportation problems 24 30.8 32 21 8 25.8 1 11.1 7 38.9 8 53.3 0 - Lack of socialization/information 2 2.6 - 9 0 - 0 - 0 - 1 6.7 1 20.0 Material Poverty Factors 184 236 221 218 82 265 12 133 32 178 48 320 10 200 Low income 35 44.9 40 44 18 58.1 1 11.1 4 22.2 9 60.0 3 60.0 Lack/absence of agricultural land 34 43.6 46 42 11 35.5 3 33.3 10 55.6 8 53.3 2 40.0 Lack of/no capital 55 70.5 64 65 24 77.4 5 55.6 9 50.0 15 100.0 2 40.0 Large number of family members 24 30.8 33 21 12 38.7 1 11.1 5 27.8 5 33.3 1 20.0 Infertile or steep sloping land 16 20.5 15 24 9 29.0 0 - 0 - 5 33.3 2 40.0 No inheritance 20 25.6 24 21 8 25.8 2 22.2 4 22.2 6 40.0 0 - Physical Weakness Factors 33 42 43 39 20 65 1 11 4 22 4 27 4 80 Not healthy 26 33.3 33 33 15 48.4 1 11.1 3 16.7 4 26.7 3 60.0 Unable to work 7 9.0 11 7 5 16.1 0 - 1 5.6 0 - 1 20.0 Vulnerability Factors 73 94 98 99 28 90 10 111 19 106 10 67 6 120 Layoffs 8 10.3 14 - 7 22.6 0 - 1 5.6 0 - 0 - Non-permanent employment 13 16.7 22 11 5 16.1 0 - 5 27.8 2 13.3 1 20.0 Production problems 24 30.8 28 40 5 16.1 6 66.7 7 38.9 5 33.3 1 20.0 Business problems 10 12.8 14 13 7 22.6 0 - 1 5.6 0 - 2 40.0 Natural disasters 14 17.9 12 35 2 6.5 4 44.4 3 16.7 3 20.0 2 40.0 Family misfortune 4 5.1 9 - 2 6.5 0 - 2 11.1 0 - 0 - Attitudes and Behavioral Factors 50 64 65 57 23 74 10 111 10 56 6 40 1 20 Lack of effort 28 35.9 37 34 11 35.5 5 55.6 7 38.9 4 26.7 1 20.0 Unable to manage finances 11 14.1 12 12 6 19.4 2 22.2 1 5.6 2 13.3 0 - Household/social problems 11 14.1 15 11 6 19.4 3 33.3 2 11.1 0 - 0 -

The SMERU Research Institute, December 2003 107
Appendix 6. (Continued) Summary of the Analysis of the Causes of Poverty
Type of Area Type of Community
Rural Urban Rice Farming Dry-land Farming Forest and Plantation Coastal Fishing Urban Informal Sector and Labor N = 56 (%) 22 (%) 22 (%) 12 (%) 17 (%) 11 (%) 16 (%)
Powerlessness Factors 132 236 54 245 54 245 22 183 37 218 32 291 41 256 Unemployment 10 17.9 5 22.7 3 13.6 0 - 3 17.6 5 45.5 4 25.0 Lack of employment opportunities 21 37.5 17 77.3 11 50.0 0 - 6 35.3 7 63.6 14 87.5 High cost of production inputs/raw materials 13 23.2 1 4.5 9 40.9 2 16.7 1 5.9 1 9.1 1 6.3 Low produce prices 20 35.7 4 18.2 7 31.8 7 58.3 5 29.4 3 27.3 2 12.5 Mismanagement of government assistance 14 25.0 5 22.7 5 22.7 2 16.7 6 35.3 3 27.3 3 18.8 Detrimental government policies 5 8.9 2 9.1 2 9.1 1 8.3 3 17.6 0 - 1 6.3 Insecurity 4 7.1 0 - 2 9.1 1 8.3 1 5.9 0 - - - High cost of living 6 10.7 9 40.9 2 9.1 5 41.7 1 5.9 0 - 7 43.8 Caught up in loans 13 23.2 4 18.2 4 18.2 0 - 4 23.5 5 45.5 4 25.0 Problems related to traditions/custom 4 7.1 1 4.5 2 9.1 2 16.7 0 - 1 9.1 - - God's will/fate 22 39.3 6 27.3 7 31.8 2 16.7 7 41.2 7 63.6 5 31.3 Isolation Factors 89 159 27 123 42 191 16 133 24 141 15 136 19 119 Low level of education 37 66.1 14 63.6 19 86.4 6 50.0 9 52.9 7 63.6 10 62.5 Lack of or no skills 29 51.8 10 45.5 10 45.5 7 58.3 8 47.1 6 54.5 8 50.0 Transportation problems 21 37.5 3 13.6 12 54.5 3 25.0 6 35.3 2 18.2 1 6.3 Lack of socialization/information 2 3.6 0 - 1 4.5 0 - 1 5.9 0 - - - Material Poverty Factors 140 250 44 200 60 273 19 158 47 276 22 200 36 225 Low income 25 44.6 10 45.5 12 54.5 0 - 9 52.9 4 36.4 10 62.5 Lack/absence of agricultural land 28 50.0 6 27.3 13 59.1 8 66.7 9 52.9 1 9.1 3 18.8 Lack of/no capital 40 71.4 15 68.2 15 68.2 7 58.3 12 70.6 10 90.9 11 68.8 Large number of family members 17 30.4 7 31.8 7 31.8 2 16.7 6 35.3 2 18.2 7 43.8 Infertile or steep sloping land 14 25.0 2 9.1 6 27.3 0 - 6 35.3 2 18.2 2 12.5 No inheritance 16 28.6 4 18.2 7 31.8 2 16.7 5 29.4 3 27.3 3 18.8 Physical Weakness Factors 23 41 10 45 11 50 2 17 8 47 2 18 10 63 Not healthy 20 35.7 6 27.3 9 40.9 2 16.7 7 41.2 2 18.2 6 37.5 Unable to work 3 5.4 4 18.2 2 9.1 0 - 1 5.9 0 - 4 25.0 Vulnerability Factors 48 86 25 114 18 82 9 75 16 94 10 91 20 125 Layoffs 0 - 8 36.4 1 4.5 0 - 0 - 0 - 7 43.8 Non-permanent employment 11 19.6 2 9.1 5 22.7 1 8.3 4 23.5 1 9.1 2 12.5 Production problems 21 37.5 3 13.6 6 27.3 7 58.3 6 35.3 3 27.3 2 12.5 Business problems 4 7.1 6 27.3 3 13.6 0 - 2 11.8 0 - 5 31.3 Natural disasters 10 17.9 4 18.2 2 9.1 1 8.3 3 17.6 6 54.5 2 12.5 Family misfortune 2 3.6 2 9.1 1 4.5 0 - 1 5.9 0 - 2 12.5 Attitudes and Behavioral Factors 29 52 21 95 11 50 12 100 9 53 3 27 15 94 Lack of effort 17 30.4 11 50.0 5 22.7 7 58.3 5 29.4 2 18.2 9 56.3 Unable to manage finances 6 10.7 5 22.7 4 18.2 3 25.0 2 11.8 0 - 2 12.5 Household/social problems 6 10.7 5 22.7 2 9.1 2 16.7 2 11.8 1 9.1 4 25.0

The SMERU Research Institute, December 2003 108
Appendix 6. (Continued) Summary of the Analysis of the Causes of Poverty
Sex Age Total by Respondent
Female Male Mixed Group Young Old Mixed Group N = 137 (%) 41 (%) 40 (%) 56 (%) 31 (%) 20 (%) 86 (%)
Powerlessness Factors 238 174 73 178 69 173 96 171 44 142 24 120 170 198 Unemployment 22 16.1 11 26.8 4 10.0 7 12.5 7 22.6 6 30.0 9 10.5 Lack of employment opportunities 53 38.7 12 29.3 18 45.0 23 41.1 11 35.5 7 35.0 35 40.7 High cost of production inputs/raw materials 17 12.4 5 12.2 8 20.0 4 7.1 0 - 1 5.0 16 18.6 Low produce prices 27 19.7 7 17.1 9 22.5 11 19.6 2 6.5 1 5.0 24 27.9 Mismanagement of government assistance 23 16.8 7 17.1 9 22.5 7 12.5 2 6.5 0 - 21 24.4 Detrimental government policies 8 5.8 1 2.4 3 7.5 4 7.1 2 6.5 0 - 6 7.0 Insecurity 6 4.4 3 7.3 2 5.0 1 1.8 1 3.2 0 - 5 5.8 High cost of living 21 15.3 7 17.1 4 10.0 10 17.9 10 32.3 3 15.0 8 9.3 Caught up in loans 22 16.1 10 24.4 4 10.0 8 14.3 4 12.9 3 15.0 15 17.4 Problems relating to traditions/customs 9 6.6 3 7.3 3 7.5 3 5.4 4 12.9 2 10.0 3 3.5 God's will/fate 30 21.9 7 17.1 5 12.5 18 32.1 1 3.2 1 5.0 28 32.6 Isolation Factors 150 109 42 102 50 125 58 104 17 55 6 30 127 148 Low level of education 69 50.4 20 48.8 21 52.5 28 50.0 9 29.0 2 10.0 58 67.4 Lack of or no skills 49 35.8 15 36.6 16 40.0 18 32.1 7 22.6 4 20.0 38 44.2 Transportation problems 29 21.2 6 14.6 11 27.5 12 21.4 1 3.2 0 - 28 32.6 Lack of socialization/information 3 2.2 1 2.4 2 5.0 0 - 0 - 0 - 3 3.5 Material Poverty 232 169 71 173 67 168 94 168 30 97 25 125 177 206 Low income 44 32.1 16 39.0 11 27.5 17 30.4 6 19.4 6 30.0 32 37.2 Lack/absence of agricultural land 49 35.8 17 41.5 14 35.0 18 32.1 6 19.4 5 25.0 38 44.2 Lack of/no capital 65 47.4 13 31.7 24 60.0 28 50.0 9 29.0 7 35.0 49 57.0 Large number of family members 36 26.3 13 31.7 10 25.0 13 23.2 8 25.8 5 25.0 23 26.7 Infertile or steep sloping land 16 11.7 5 12.2 3 7.5 8 14.3 0 - 0 - 16 18.6 No inheritance 22 16.1 7 17.1 5 12.5 10 17.9 1 3.2 2 10.0 19 22.1 Physical Weakness Factors 42 31 13 32 12 30 17 30 6 19 5 25 31 36 Not healthy 33 24.1 10 24.4 9 22.5 14 25.0 5 16.1 2 10.0 26 30.2 Unable to work 9 6.6 3 7.3 3 7.5 3 5.4 1 3.2 3 15.0 5 5.8 Vulnerability Factors 101 74 28 68 31 78 42 75 28 90 15 75 58 67 Layoffs 16 11.7 5 12.2 5 12.5 6 10.7 10 32.3 4 20.0 2 2.3 Non-permanent employment 18 13.1 6 14.6 5 12.5 7 12.5 4 12.9 2 10.0 12 14.0 Production problems 32 23.4 8 19.5 11 27.5 13 23.2 4 12.9 4 20.0 24 27.9 Business problems 15 10.9 3 7.3 6 15.0 6 10.7 5 16.1 3 15.0 7 8.1 Natural disasters 15 10.9 4 9.8 3 7.5 8 14.3 3 9.7 1 5.0 11 12.8 Family misfortune 5 3.6 2 4.9 1 2.5 2 3.6 2 6.5 1 5.0 2 2.3 Attitudes and Behavioral Factors 67 49 21 51 16 40 30 54 25 81 13 65 29 34 Lack of effort 38 27.7 11 26.8 8 20.0 19 33.9 12 38.7 8 40.0 18 20.9 Unable to manage finances 14 10.2 5 12.2 4 10.0 5 8.9 5 16.1 3 15.0 6 7.0 Household/social problems 15 10.9 5 12.2 4 10.0 6 10.7 8 25.8 2 10.0 5 5.8

The SMERU Research Institute, December 2003 109
Appendix 7. List of Expressions – Causes of Poverty
1
Penghasilan rendah Low income
Cari kebutuhan sulit Difficulties in meeting everyday needs
Lemah ekonomi Weak economy
Pendapatan rendah Low income
Pendapatan sedikit Little income
Pendapatan tergantung hasil tangkapan
Income depends on how many fish are caught
Penghasilan tidak tetap Unstable income
Penghasilan kecil Small earnings
Penghasilan kurang Lack of earnings
Penghasilan minim Minimal earnings
Penghasilan rendah Low earnings
Penghasilan sedikit Little earnings
Penghasilan tidak cukup Insufficient earnings
penghasilan tidak memadai Inadequate earnings
Penghasilan tidak pasti Uncertain earnings
Penghasilan tidak tetap Unstable earnings
Penghasilan tidak menentu Uncertain earnings
Upah rendah Low wage
Upah sangat rendah Very low wage
2a
Pengangguran Unemployment
Menganggur Unemployed
Pengangguran meningkat Increase in unemployment
Suami tidak bekerja Husband does not work
Tidak ada pekerjaan No work
Tidak ada penghasilan No earnings
Tidak ada uang No money
Tidak bekerja Do not work
Tidak punya pekerjaan Have no job
Tidak punya usaha Have no business
2b
PHK Layoffs
Di-PHK Have been laid off
Korban PHK Have been laid off
PHK Layoffs
Suami di PHK Husband has been laid off
Terkena PHK Have been laid off
2c
Lapangan Kerja Kurang Lack of employment opportunities
Banyak pendatang baru Many migrants
Banyak saingan High competition
Kurang lapangan kerja Lack of employment opportunities
Kurang lapangan kerja tetap Lack of secure employment opportunities
Kurang lapangan pekerjaan tetap
Lack of secure employment opportunities
Kurang pekerjaan Lack of jobs
Lapangan kerja kurang Lack of employment opportunities
Lapangan kerja sempit Limited employment opportunities
lapangan kerja sulit Difficulties in finding employment opportunities
Lapangan kerja susah Hard to find employment opportunities
Lapangan kerja terbatas Limited employment opportunities
Lapangan kerja tidak ada No employment opportunities
Mata pencaharian hanya bertani
Farming is the only occupation
Mata pencaharian hanya sebagai nelayan
Being a fishermen is the only occupation
Mata pencaharian terbatas Limited source of income
Pekerjaan susah Finding work is hard
Peluang kerja terbatas Limited job opportunities
Sulit cari kerja Difficulties in finding a job
Sulit cari penghasilan Difficulties in obtaining an income
Sulit memperoleh pekerjaan Difficulties in getting a job
Tidak ada usaha lain selain penggarap
No other work but to work on someone else's land
Tidak ada usaha lain selain pertanian
There is no other work but farming
Tenaga kerja banyak Abundant labor
Tidak ada kesempatan kerja No job opportunities
Tidak ada lapangan kerja selain bertani
No other employment opportunities available except farming
Tidak ada lapangan kerja selain bertani dan penggembala
There are no other employment sectors but farming and herding
Tidak ada lapangan kerja tetap No secure job opportunities
Tidak ada usaha lain selain menjadi buruh tani
There are no other opportunities besides becoming a farm laborer
Tidak ada usaha lain selain menjual miras
No other business except selling alcoholic beverages

The SMERU Research Institute, December 2003 110
Appendix 7. (Continued) List of Expressions – Causes of Poverty
2d
Pekerjaan tidak tetap Non-permanent employment
Bekerja hanya mencari ranting kayu
Only collect twigs
Bekerja hanya musiman Only work seasonally
Buruh tani Farm laborer
Kadang kerja/tidak Sometimes work, sometimes not
Kerja musiman Work seasonally
Mata pencaharian tidak tetap Unstable job
Pekerjaan tidak tetap Non-permanent employment
Tidak punya pekerjaan tetap Do not have stable employment
3a
Harga bahan baku/input tinggi
High cost of production inputs
Bahan baku tinggi High cost of raw materials
Harga bahan baku semakin tinggi
Cost of production inputs is increasing
Harga pupuk mahal High price of fertilizers
Harga saprodi mahal High price of rice production inputs
Hasil panen tidak seimbang dengan biaya produksi
Harvest yields do not cover production costs
Saprodi mahal High cost of rice production inputs
3b
Masalah dalam produksi Production problems
Banyak hama Many pests
Gangguan dari nelayan lain yang menggunakan trawler
Disturbances from fishermen that use trawlers
Hama dari ternak yang tidak dikandangkan
Diseases caused by free roaming farm animals
Hama penyakit tanaman Pests causing plant diseases
Hama tanaman Plant pests
Hama tanaman (tikus,wereng dan belalang)
Plant pests (mice, brown grasshoppers and grasshoppers)
Hasil panen sedikit Poor harvest
Hasil panen tipis Low harvest
Hasil pertanian dan perkebunan rendah
Low agricultural and plantation yields
Hasil pertanian kurang baik Poor agricultural yields
Hasil pertanian rendah Low agricultural yields
Hasil produksi turun Decreased production
Lahan tidak subur Infertile land
Panen gagal Crop failure
Pemilik kurang perhatian terhadap mutu panen
Owner does not pay too much attention to produce quality
Pengunaan unsur kimia menurunkan hasil produksi
Use of chemicals decreased production
Penyakit ternak Livestock diseases
Serangan hama Plant diseases
Ternak mati karena penyakit Livestock died due to disease
Terserang hama belalang Attacked by grasshopper disease
3c
Harga produk rendah Low produce prices
Harga getah pinus rendah Low price of pine resin
Harga hasil panen rendah Low produce prices
Harga hasil panen tidak tentu Uncertain produce prices
Harga hasil produksi rendah Low produce prices
Harga jual gabah rendah (ditentukan oleh bandar)
The selling price of unhulled rice is low (determined by the middlemen)
Harga jual rendah Selling prices are low
Harga jual tidak seimbang Selling prices are not high enough to cover production costs
Harga kain tenun murah Price of woven cloth is low
Harga Kopi Rendah Low price of coffee
Harga panen rendah Low produce prices
Harga pasar tidak stabil Unstable market prices
Petani tidak tahu kemana harus memasarkan
Farmers do not know where to market their product
Harga penjualan ternak & hasil bumi dimonopoli pihak tertentu
The selling price of livestock and agricultural produce are monopolized by certain parties
Harga produk pertanian ditentukan oleh pedagang
The price of agricultural produce is determined by traders
3d
Masalah dalam usaha Business problems
Dampak krisis Impact of the crisis
Hasil panen digunakan untuk modal lagi
Produce is sold and the money is used for capital
Krisis ekonomi Economic crisis
Langganan kurang Lack of customers
Perusahaan mengalami kerugian
Company suffers losses
Perusahaan pailit Company goes bankrupt
Usaha bangkrut Business goes bankrupt
Usaha dagang tidak tetap Unstable trading business
Usaha jualan tidak lancar Trading business is facing difficulties
Usaha tidak berkembang Business is not progressing

The SMERU Research Institute, December 2003 111
Appendix 7. (Continued) List of Expressions – Causes of Poverty
4a
Kurang/tidak punya lahan Lack/absence of agricultural land
Hanya petani penggarap Only become a farmer who works on someone else's land
Lahan kurang, dikuasai oleh pendatang
Limited land, controlled by immigrants
Lahan kurang, dimiliki orang luar
Lack of land, owned by outsiders
Lahan sempit Constricted land
Menjual lahan pertanian Agricultural land has been sold
Menjual tanah Land has been sold
Pesanggem/penggarap Landless farmer
Petani penggarap Farmer who works on someone else’s land
Punya lahan Have land
Tanah sempit Limited amount of land
Tanah sewa Working on leased land
Tidak ada lahan No land
Tidak memiliki lahan Do not own land
Tidak memiliki lahan pertanian Do not own farm land
Tidak memiliki lahan/digadaikan
Do not own land or land has been pawned
Tidak memiliki lahan/dijual Do not own land or land has been sold
Tidak punya lahan Have no land
Tidak punya lahan/dijual Have no land or land has been sold
Tidak punya sawah Have no rice fields
Tidak punya sawah/kebun Have no rice fields or farm
Tidak punya tanah Have no land
4b
Kurang/tidak punya modal Lack of/no capital
Alat tangkap tidak lengkap/tradisional
Insufficient/traditional fishing equipment
Jaring ikan gillnet Use a gillnet
Kekurangan modal Lack of capital
Kurang alat pertanian Lack of farming equipment
Kurang modal Lack of capital
Kurang peralatan jaring dan perahu
Lack a fishing net and boat
Modal kurang Insufficient capital
Modal sulit Difficulties in acquiring capital
Sarana penangkapan ikan masih sederhana
Simple fishing equipment
Tidak ada kapal bermesin No motorboat
Tidak ada modal No capital
Tidak ada modal untuk beli pupuk dan basmi hama
No capital to buy fertilizers and eradicate pests
Tidak cukup modal untuk melaut
Not enough capital to fish at sea
Tidak dapat pinjaman Unable to obtain a loan
Tidak memiliki mesin, sampan dan jaring
Do not own boat engine, small boat or net
Tidak punya modal Do not have capital
Tidak punya modal untuk membeli alat tangkap ikan modern
Have no capital to buy modern fishing equipment
Tidak punya modal usaha Have no capital to start business
5a
Pendidikan rendah Low level of education
Akses ke pendidikan lanjut sulit dan mahal
High school education is difficult to access and expensive
Biaya pendidikan tinggi High education costs
Guru kurang Lack of teachers
Kurang pendidikan Lack of education
Kurang pendidikan formal Lack of formal education
Lebih baik melaut daripada sekolah
It is better to be a fishermen than go to school
Pendidikan kurang Insufficient education
Pendidikan minim Minimal education
Pendidikan rendah Low level of education
Pendidikan tidak memadai Inadequate education
Putus sekolah Drop out of school
Sekolah hanya sampai SD Only attend school up to primary school
Tidak sekolah No education
Tingkat pendidikan rendah Low level of education
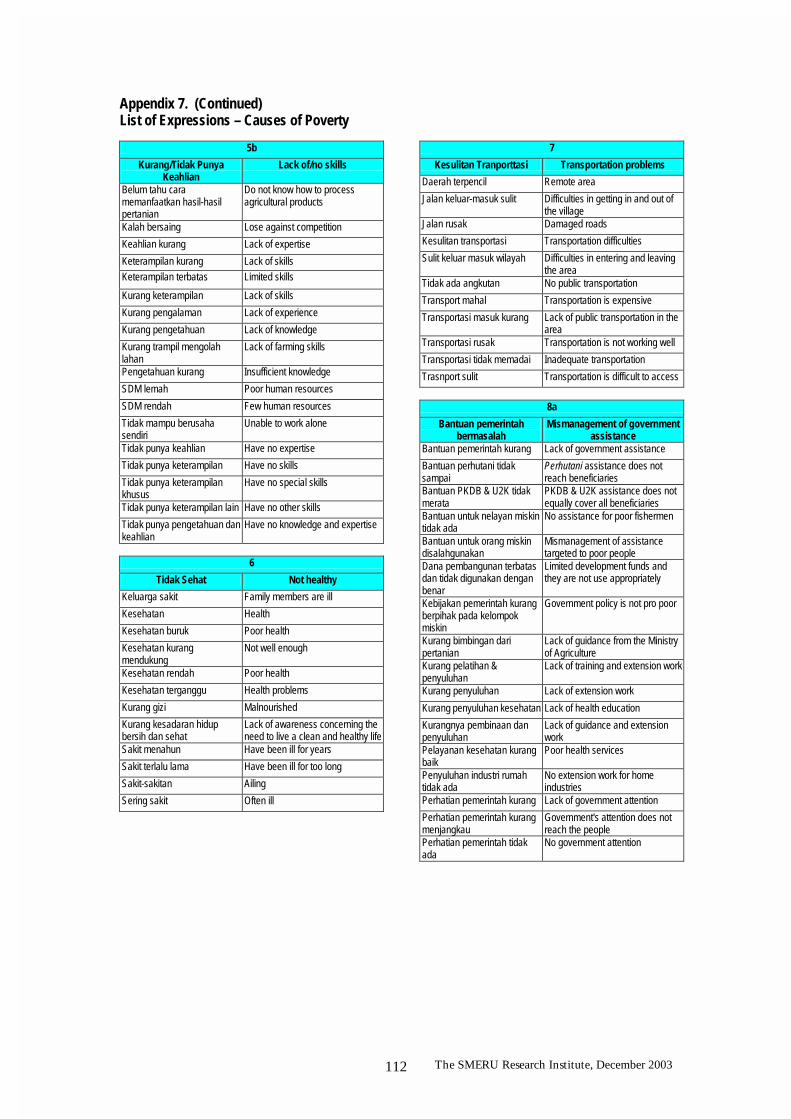
The SMERU Research Institute, December 2003 112
Appendix 7. (Continued) List of Expressions – Causes of Poverty
5b
Kurang/Tidak Punya Keahlian
Lack of/no skills
Belum tahu cara memanfaatkan hasil-hasil pertanian
Do not know how to process agricultural products
Kalah bersaing Lose against competition
Keahlian kurang Lack of expertise
Keterampilan kurang Lack of skills
Keterampilan terbatas Limited skills
Kurang keterampilan Lack of skills
Kurang pengalaman Lack of experience
Kurang pengetahuan Lack of knowledge
Kurang trampil mengolah lahan
Lack of farming skills
Pengetahuan kurang Insufficient knowledge
SDM lemah Poor human resources
SDM rendah Few human resources
Tidak mampu berusaha sendiri
Unable to work alone
Tidak punya keahlian Have no expertise
Tidak punya keterampilan Have no skills
Tidak punya keterampilan khusus
Have no special skills
Tidak punya keterampilan lain Have no other skills
Tidak punya pengetahuan dan keahlian
Have no knowledge and expertise
6
Tidak Sehat Not healthy
Keluarga sakit Family members are ill
Kesehatan Health
Kesehatan buruk Poor health
Kesehatan kurang mendukung
Not well enough
Kesehatan rendah Poor health
Kesehatan terganggu Health problems
Kurang gizi Malnourished
Kurang kesadaran hidup bersih dan sehat
Lack of awareness concerning the need to live a clean and healthy life
Sakit menahun Have been ill for years
Sakit terlalu lama Have been ill for too long
Sakit-sakitan Ailing
Sering sakit Often ill
7
Kesulitan Tranporttasi Transportation problems
Daerah terpencil Remote area
Jalan keluar-masuk sulit Difficulties in getting in and out of the village
Jalan rusak Damaged roads
Kesulitan transportasi Transportation difficulties
Sulit keluar masuk wilayah Difficulties in entering and leaving the area
Tidak ada angkutan No public transportation
Transport mahal Transportation is expensive
Transportasi masuk kurang Lack of public transportation in the area
Transportasi rusak Transportation is not working well
Transportasi tidak memadai Inadequate transportation
Trasnport sulit Transportation is difficult to access
8a
Bantuan pemerintah bermasalah
Mismanagement of government assistance
Bantuan pemerintah kurang Lack of government assistance
Bantuan perhutani tidak sampai
Perhutani assistance does not reach beneficiaries
Bantuan PKDB & U2K tidak merata
PKDB & U2K assistance does not equally cover all beneficiaries
Bantuan untuk nelayan miskin tidak ada
No assistance for poor fishermen
Bantuan untuk orang miskin disalahgunakan
Mismanagement of assistance targeted to poor people
Dana pembangunan terbatas dan tidak digunakan dengan benar
Limited development funds and they are not use appropriately
Kebijakan pemerintah kurang berpihak pada kelompok miskin
Government policy is not pro poor
Kurang bimbingan dari pertanian
Lack of guidance from the Ministry of Agriculture
Kurang pelatihan & penyuluhan
Lack of training and extension work
Kurang penyuluhan Lack of extension work
Kurang penyuluhan kesehatan Lack of health education
Kurangnya pembinaan dan penyuluhan
Lack of guidance and extension work
Pelayanan kesehatan kurang baik
Poor health services
Penyuluhan industri rumah tidak ada
No extension work for home industries
Perhatian pemerintah kurang Lack of government attention
Perhatian pemerintah kurang menjangkau
Government's attention does not reach the people
Perhatian pemerintah tidak ada
No government attention

The SMERU Research Institute, December 2003 113
Appendix 7. (Continued) List of Expressions – Causes of Poverty
8a
Bantuan pemerintah bermasalah
Mismanagement of government assistance
PPL ada tapi tidak berfungsi Extension workers are available but are not doing their job properly
Rendahnya pembinaan & pelatihan kewirausahaan
Low entrepreneurship development and training
Sasaran tidak tepat Poor targeting
Tidak ada penyuluhan No extension work
Tidak ada pelatihan No training
Tidak ada petugas & penyuluh kesehatan
No health service providers and health extension workers
Tidak dapat sumbangan/bantuan
Do not obtain aid/assistant
8b
Kebijakan Pemerintah Detrimental government policies
Dilarang menebang kayu Logging ban
Hutan Lindung Protected forests
Pemerintah menetapkan sebagai hutan lindung
Government has determined a protected forest area
Tanah kena gusur Evicted from land
Tanah tidak bisa disertifikat A certificate cannot be made for the land
Tanah tidak dapat disertifitkat krn milik kaum
A certificate cannot be made for the land because it belongs to a traditional group
Terkena gusuran ganti rugi tidak memadai
Inadequate compensation for land eviction
9
Tidak aman Insecurity
Kondisi tidak aman Insecure conditions
Pencurian Theft
10
Biaya Hidup terlalu tinggi High cost of living
Beras mahal Rice is expensive
Biaya hidup tinggi High living cost
Harga bahan pokok tidak stabil
Prices of basic commodities are unstable
Harga barang mahal High prices of goods
Harga kebutuhan meningkat Increased price of basic necessities
Harga kebutuhan pokok naik Prices of basic necessities have gone up
Harga naik - penghasilan tetap
Prices have increased, but incomes have not
Harga naik penghasilan turun Prices have increased, but incomes have decreased
Harga-harga kebutuhan mahal The prices of basic necessities are high
Harga-harga mahal High prices
Kurang makan Do not eat enough
Makanan mahal Food is expensive
Sembako mahal Sembako are expensive
Tidak bisa memenuhi kebutuhan hidup
Unable to meet basic necessities
Tingkat kebutuhan meningkat Level of basic necessities has increased
Penghasilan menurun Income has decreased
11
Banyak anggota keluarga Large number of family members
Anggota keluarga banyak Many family members
Banyak anak Many children
Tidak berKB Do not use contraception
Banyak anak karena tidak ikut KB
Have many children because do not use contraception
Banyak tanggungan keluarga Have many dependents
Tanggungan banyak istri/anak Have many dependents, wife/children
12
Kurang Berusaha Lack of effort
Apatis Apathetic
Candu berburu dan duduk di warung
Goes hunting or sits in stalls all day
Gengsi Too proud to take up certain jobs
Kurang berusaha Do not put in enough effort
Kurang mau bergotong royong membangun sarana kebutuhan bersama
Less inclined to work collectively to build facilities
Kurang memanfaatkan kesempatan yang ada
Do not take the opportunities available
Kurang memanfaatkan waktu Do not make good use of time
Malas Lazy
Malas bekerja Too lazy to work
Malas bertani Too lazy to work in the farm land
Malas dan malu Lazy and ashamed
Malas mencari kerja Too lazy to find work
Masa bodoh Apathetic
Masa bodoh dengan keadaan Do not care about the situation at hand
Merasa cepat puas Easily satisfied
Pasrah Submit to fate
Pemalas Lazy person
Tidak ada kemauan Unwilling to work
Tidak kreatif bekerja Uncreative at work
Tidak mencari peluang Do not seek opportunities
13
Tidak Mampu Bekerja Unable to work
Fisik lemah Physically weak
Fisik tidak kuat Frail
Fisik tidak sehat Physically unhealthy
Ketergantungan pada suami Dependent on husband
Sudah tua Old
Tenaga tidak ada No energy

The SMERU Research Institute, December 2003 114
Appendix 7. (Continued) List of Expressions – Causes of Poverty
14a
Tidak bisa mengatur uang Unable to manage finances
Boros Big spender
Foya-foya Extravagant
Royal Spendthrift
Tidak menabung Do not save money
Tidak mensyukuri nikmat Ungrateful for what she/he has
Tidak pandai mengatur uang Not good at managing finances
Tidak punya tabungan Have no savings
14b
Terlilit Hutang Caught up in loans
Banyak hutang Have many loans
Berhutang Borrow money/goods
Hutang Borrow money/goods
Pinjam di bank titil Borrow money from bank titil
Terjerat hutang Caught in the debt trap
Terjerat rentenir Caught in the rentenir trap
Terlilit hutang Caught up in loans
15
Masalah RT/Sosial Household/social problems
Banyaknya perceraian dan pernikahan kembali
Many divorces and remarriages
Berjudi Gambling
Mabuk Alcoholism
Judi Gambling
Judi dan mabuk Gambling and alcoholism
Main perempuan Have affairs/visit prostitutes
Kurang perhatian orangtua terhadap anak
Lack of attention from parents
Rumah tangga berantakan Family break up
Suami kawin lagi Husbands marrying another woman
Suami main perempuan Husbands have affairs/visit prostitutes
16a
Bencana Alam Natural disasters
Angin ribut Typhoons
Banjir Floods
Curah hujan rendah Low rainfall
Cuaca yang menyebabkan tidak bisa mencari ikan
Cannot fish due to bad weather
Hujan Rain
Hujan-angin, ombak besar Rain, wind and big waves
Kebanjiran Floods
Kemarau terlalu panjang Very long dry seasons
Masa paceklik melaut dan bertani
West monsoons and droughts
Musim hujan panjang Long rainy seasons
Ombak besar/angin Big waves/windy
16b
Kesuburan/Kondisi lahan Infertile or steep sloping land
Daerah minus Very poor area
Irigasi belum ada No irrigation
Irigasi kurang baik Irrigation is not too good
Kesulitan air irigasi Difficulties in obtaining water for irrigation
Kontinuitas alam tidak menentu
Unpredictable weather
Kontinuitas produksi alam tidak menentu
Cannot predict nature
Lahan kurang subur Infertile land
Lahan tadah hujan Rain fed rice fields
Lahan tandus Empty or infertile land
Lahan tidak subur Infertile land
Sawah tadah hujan Rain fed rice fields
Tanah tandus Empty and infertile land
Tidak ada irigasi No irrigation
Tidak ada irigasi teknis Non-technical irrigation
16c
Musibah keluarga Family misfortune
Ada musibah Misfortune
Musibah Calamity
Orangtua meninggal Parents passed away
Suami meninggal Husband passed away

The SMERU Research Institute, December 2003 115
Appendix 7. (Continued) List of Expressions – Causes of Poverty
17
Masalah adat/kebiasaan Problems relating to traditions/customs
Biaya adat besar Adat ceremonies are expensive
Budaya podogugat & pesta perkawinan yang membebani
Expensive divorces and wedding parties
Sering mengadakan pesta (baptis, kematian,kelahiran)
Often organize ceremonies/celebrations (baptisms, funerals, births)
Sumbangan untuk pesta Celebration contributions
Tradisi sumbangan Providing contributions is traditional
18a
Kodrat/Takdir God's will/fate
Ketentuan Tuhan God's will
Keturunan Hereditary
Keturunan orang miskin Born to a poor family
Kodrat God's will
Kodrat miskin Being poor as fate
18b
Tidak ada warisan No inheritance
Mengandalkan orangtua Depend on parents
Mengharapkan warisan orang tua
Hoping for inheritance from parents
Orang tua tidak mampu Parents are not well off
Tidak ada warisan No inheritance
Tidak ada warisan orang tua No family inheritance
Tidak punya warisan yang banyak
Have not inherited very much
Warisan kurang Lack of inheritance
19
Kurang pergaulan/informasi Lack of socialization/ information
Kurang informasi Lack of information
kurang pergaulan Lack of socialization
Tidak ada informasi No information
Rezeki belum ada walaupun sudah bekerja keras
Have not gained anything but have worked very hard
Takdir Fate
Takdir Tuhan God's fate
Warisan nenek moyang Inherited poorness from ancestors
Nasib dan keturunan Fate and hereditary
Orang tua tidak mampu Parents are poor
Nasib Fate
Kodrat sebagai orang miskin It is her/his fate to be poor

The SMERU Research Institute, December 2003 116
Appendix 8. Summary of the Analysis of the Problems Faced by the Poor
Island Total by Village
Western Indonesia
Eastern Indonesia Java Nusa Tenggara Sumatra Sulawesi Kalimantan
67 (%) 40 27 27 (%) 8 (%) 13 (%) 16 (%) 3 (%)
Powerlessness Factors 114 170 138 205 54 200 18 225 10 77 25 156 7 233 High medical expenses 7 10.4 9 6 5 18.5 1 12.5 0 - 1 6.3 0 - Family planning 8 11.9 11 19 2 7.4 1 12.5 2 15.4 2 12.5 1 33.3 High cost of education 22 32.8 30 21 8 29.6 0 - 4 30.8 10 62.5 0 - High cost of basic commodities 6 9.0 9 4 5 18.5 1 12.5 0 - 0 - 0 - Security disturbances 7 10.4 6 15 3 11.1 3 37.5 0 - 1 6.3 0 - Traditional ceremonies 6 9.0 2 28 1 3.7 4 50.0 0 - 0 - 1 33.3 Lack or mismanagement of assistance 12 17.9 9 21 3 11.1 2 25.0 1 7.7 6 37.5 0 - Detrimental policies 3 4.5 4 4 2 7.4 1 12.5 0 - 0 - 0 - Unemployment 7 10.4 11 2 6 22.2 0 - 0 - 1 6.3 0 - Lack of employment opportunities 10 14.9 15 24 6 22.2 0 - 1 7.7 1 6.3 2 66.7 Low produce prices 9 13.4 8 37 2 7.4 3 37.5 1 7.7 1 6.3 2 66.7 High cost of production inputs 2 3.0 4 - 2 7.4 0 - 0 - 0 - 0 - Caught up in loans 5 7.5 4 8 2 7.4 1 12.5 0 - 2 12.5 0 - Difficulties in fulfilling everyday needs 10 14.9 17 15 7 25.9 1 12.5 1 7.7 0 - 1 33.3 Isolation Factors 105 157 130 144 37 137 17 213 16 123 35 219 - - Poor road conditions 16 23.9 17 27 5 18.5 4 50.0 2 15.4 5 31.3 0 - Lack of transportation facilities 23 34.3 32 23 11 40.7 2 25.0 3 23.1 7 43.8 0 - Remoteness 3 4.5 6 4 1 3.7 1 12.5 1 7.7 0 - 0 -
Lack of access to communication & information facilities 2 3.0 6 - 1 3.7 0 - 1 7.7 0 - 0 - Lack of healthcare services 7 10.4 4 13 2 7.4 1 12.5 0 - 4 25.0 0 - Lack of education facilities 5 7.5 4 10 0 - 1 12.5 1 7.7 3 18.8 0 - Lack of skills 4 6.0 4 6 2 7.4 1 12.5 0 - 1 6.3 0 - Lack of extension work/guidance 9 13.4 10 15 1 3.7 1 12.5 2 15.4 5 31.3 0 - Inadequate irrigation 9 13.4 11 15 2 7.4 2 25.0 2 15.4 3 18.8 0 - Lack of access to loans 14 20.9 13 23 5 18.5 3 37.5 1 7.7 5 31.3 0 - Lack of clean water 10 14.9 19 8 4 14.8 1 12.5 3 23.1 2 12.5 0 - No electricity 1 1.5 2 - 1 3.7 0 - 0 - 0 - 0 - Lack of public facilities 2 3.0 4 - 2 7.4 0 - 0 - 0 - 0 -

The SMERU Research Institute, December 2003 117
Appendix 8. (Continued) Summary of the Analysis of the Problems Faced by the Poor
Island Total by Village
Western Indonesia
Eastern Indonesia Java Nusa Tenggara Sumatra Sulawesi Kalimantan
67 (%) 40 27 27 (%) 8 (%) 13 (%) 16 (%) 3 (%)
Material Poverty Factors 44 66 64 72 20 74 9 113 7 54 6 38 2 67 Poor harvest 5 7.5 6 17 1 3.7 1 12.5 1 7.7 1 6.3 1 33.3 Limited land 5 7.5 9 4 3 11.1 1 12.5 1 7.7 0 - 0 - Lack of/no capital 11 16.4 15 17 4 14.8 3 37.5 2 15.4 2 12.5 0 - No fishing equipment 3 4.5 - 10 0 - 2 25.0 0 - 1 6.3 0 - Low income 14 20.9 22 8 10 37.0 1 12.5 1 7.7 2 12.5 0 - Housing & environment 6 9.0 11 15 2 7.4 1 12.5 2 15.4 0 - 1 33.3 Physical Weakness Factors 27 40 51 34 11 41 4 50 8 62 3 19 1 33 Poor health 6 9.0 9 15 3 11.1 1 12.5 1 7.7 0 - 1 33.3 Not enough food/hunger 7 10.4 19 4 2 7.4 1 12.5 4 30.8 0 - 0 - Undernourished 9 13.4 17 10 3 11.1 2 25.0 3 23.1 1 6.3 0 - Lack of bathing, washing, and toilet facilities 5 7.5 6 4 3 11.1 0 - 0 - 2 12.5 0 - Vulnerability Factors 33 49 47 60 17 63 8 100 4 31 2 13 2 67 Low level of education or school dropout 12 17.9 21 17 7 25.9 1 12.5 2 15.4 1 6.3 1 33.3 Child labor 3 4.5 2 6 1 3.7 1 12.5 0 - 1 6.3 0 - Business problems 3 4.5 6 - 3 11.1 0 - 0 - 0 - 0 - Pests and crop disease 8 11.9 11 24 2 7.4 3 37.5 2 15.4 0 - 1 33.3 Natural disasters 5 7.5 4 13 2 7.4 3 37.5 0 - 0 - 0 - Canals 2 3.0 4 - 2 7.4 0 - 0 - 0 - 0 - Attitude and Behavioral Factors 15 22 20 22 11 41 2 25 - - 1 6 1 33 Lack of awareness about personal health 2 3.0 4 - 2 7.4 0 - 0 - 0 - 0 -
Lack of awareness of the importance of education for children 1 1.5 - 2 0 - 0 - 0 - 1 6.3 0 - Disharmonious family 3 4.5 4 4 2 7.4 1 12.5 0 - 0 - 0 - Alcoholism, gambling & juvenile delinquency 4 6.0 6 4 3 11.1 1 12.5 0 - 0 - 0 - Lack of religious faith 1 1.5 2 - 1 3.7 0 - 0 - 0 - 0 -
Lack of neighborhood harmony or participation in collective work 4 6.0 6 11 3 11.1 0 - 0 - 0 - 1 33.3

The SMERU Research Institute, December 2003 118
Appendix 8. (Continued) Summary of the Analysis of the Problems Faced by the Poor
Type of Area Type of Community
Rural Urban Rice Farming Dry-land Farming Forest & Plantation Coastal Fishing Labor, Informal Sector
& Others 53 (%) 14 (%) 21 (%) 10 (%) 14 (%) 9 (%) 14 (%)
Powerlessness Factors 64 121 50 357 30 143 15 150 19 136 14 156 36 257 High medical expenses 4 7.5 3 21.4 2 9.5 1 10.0 1 7.1 0 - 3 21.4 Family planning 6 11.3 2 14.3 2 9.5 1 10.0 3 21.4 1 11.1 1 7.1 High cost of education 15 28.3 7 50.0 8 38.1 1 10.0 5 35.7 2 22.2 6 42.9 High cost of basic commodities 1 1.9 5 35.7 1 4.8 1 10.0 0 - 0 - 4 28.6 Security disturbances 3 5.7 4 28.6 1 4.8 2 20.0 0 - 1 11.1 3 21.4 Traditional ceremonies 6 11.3 0 - 1 4.8 4 40.0 1 7.1 0 - 0 - Lack or mismanagement of assistance 8 15.1 4 28.6 3 14.3 2 20.0 1 7.1 2 22.2 4 28.6 Detrimental policies 1 1.9 2 14.3 1 4.8 0 - 1 7.1 1 11.1 0 - Unemployment 1 1.9 6 42.9 2 9.5 0 - 0 - 0 - 5 35.7 Lack of employment opportunities 5 9.4 5 35.7 2 9.5 0 - 3 21.4 1 11.1 4 28.6 Low produce prices 7 13.2 2 14.3 3 14.3 2 20.0 2 14.3 2 22.2 0 - High cost of production inputs 0 - 2 14.3 1 4.8 0 - 0 - 0 - 1 7.1 Caught up in loans 2 3.8 3 21.4 0 - 0 - 0 - 3 33.3 2 14.3 Difficulties in fulfilling everyday needs 5 9.4 5 35.7 3 14.3 1 10.0 2 14.3 1 11.1 3 21.4 Isolation Factors 81 153 24 171 34 162 17 170 21 150 15 167 18 129 Poor road conditions 14 26.4 2 14.3 4 19.0 5 50.0 2 14.3 2 22.2 3 21.4 Lack of transportation facilities 19 35.8 4 28.6 13 61.9 2 20.0 5 35.7 1 11.1 2 14.3 Remoteness 3 5.7 0 - 1 4.8 1 10.0 1 7.1 0 - 0 - Lack of access to communication & information facilities 2 3.8 0 - 1 4.8 0 - 1 7.1 0 - 0 - Lack of healthcare services 5 9.4 2 14.3 2 9.5 1 10.0 1 7.1 2 22.2 1 7.1 Lack of education facilities 5 9.4 0 - 0 - 1 10.0 2 14.3 2 22.2 0 - Lack of skills 0 - 4 28.6 0 - 0 - 0 - 1 11.1 3 21.4 Lack of extension work/guidance 8 15.1 1 7.1 3 14.3 1 10.0 3 21.4 1 11.1 1 7.1 Inadequate irrigation 7 13.2 2 14.3 3 14.3 2 20.0 2 14.3 1 11.1 1 7.1 Lack of access to loans 10 18.9 4 28.6 5 23.8 1 10.0 2 14.3 3 33.3 3 21.4 Lack of clean water 8 15.1 2 14.3 1 4.8 3 30.0 2 14.3 2 22.2 2 14.3 No electricity 0 - 1 7.1 0 - 0 - 0 - 0 - 1 7.1 Lack of public facilities 0 - 2 14.3 1 4.8 0 - 0 - 0 - 1 7.1
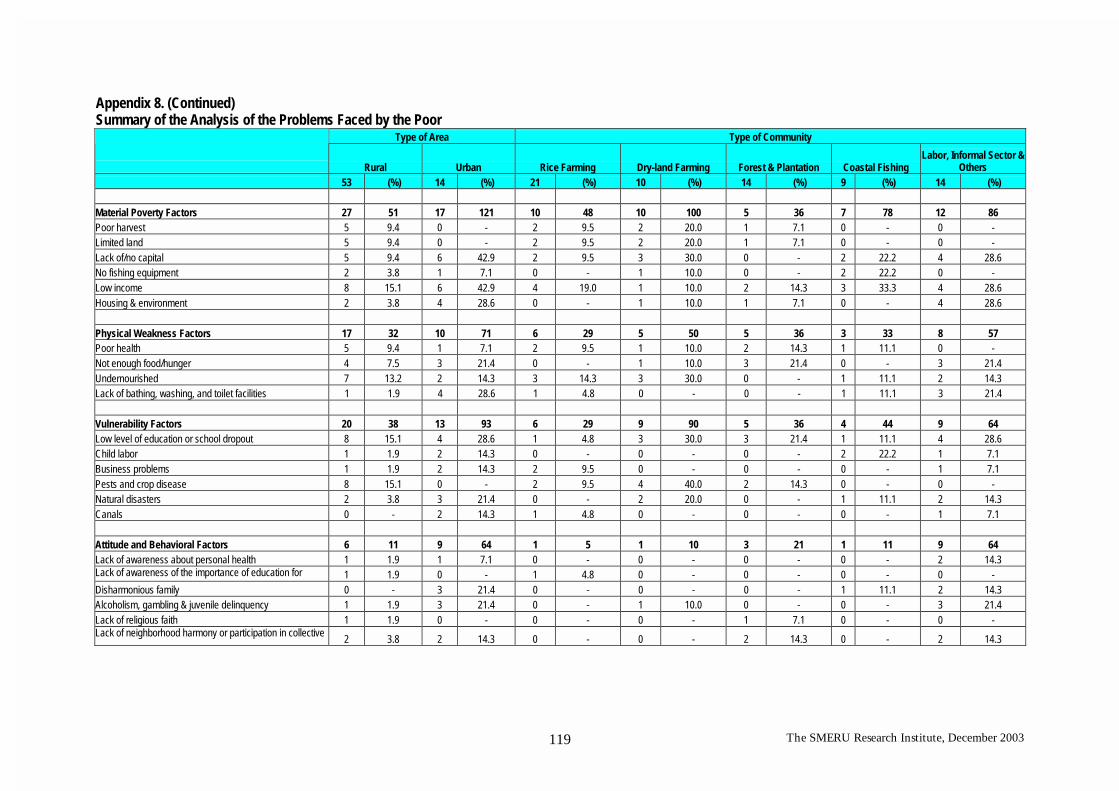
The SMERU Research Institute, December 2003 119
Appendix 8. (Continued) Summary of the Analysis of the Problems Faced by the Poor
Type of Area Type of Community
Rural Urban Rice Farming Dry-land Farming Forest & Plantation Coastal Fishing Labor, Informal Sector &
Others 53 (%) 14 (%) 21 (%) 10 (%) 14 (%) 9 (%) 14 (%)
Material Poverty Factors 27 51 17 121 10 48 10 100 5 36 7 78 12 86 Poor harvest 5 9.4 0 - 2 9.5 2 20.0 1 7.1 0 - 0 - Limited land 5 9.4 0 - 2 9.5 2 20.0 1 7.1 0 - 0 - Lack of/no capital 5 9.4 6 42.9 2 9.5 3 30.0 0 - 2 22.2 4 28.6 No fishing equipment 2 3.8 1 7.1 0 - 1 10.0 0 - 2 22.2 0 - Low income 8 15.1 6 42.9 4 19.0 1 10.0 2 14.3 3 33.3 4 28.6 Housing & environment 2 3.8 4 28.6 0 - 1 10.0 1 7.1 0 - 4 28.6 Physical Weakness Factors 17 32 10 71 6 29 5 50 5 36 3 33 8 57 Poor health 5 9.4 1 7.1 2 9.5 1 10.0 2 14.3 1 11.1 0 - Not enough food/hunger 4 7.5 3 21.4 0 - 1 10.0 3 21.4 0 - 3 21.4 Undernourished 7 13.2 2 14.3 3 14.3 3 30.0 0 - 1 11.1 2 14.3 Lack of bathing, washing, and toilet facilities 1 1.9 4 28.6 1 4.8 0 - 0 - 1 11.1 3 21.4 Vulnerability Factors 20 38 13 93 6 29 9 90 5 36 4 44 9 64 Low level of education or school dropout 8 15.1 4 28.6 1 4.8 3 30.0 3 21.4 1 11.1 4 28.6 Child labor 1 1.9 2 14.3 0 - 0 - 0 - 2 22.2 1 7.1 Business problems 1 1.9 2 14.3 2 9.5 0 - 0 - 0 - 1 7.1 Pests and crop disease 8 15.1 0 - 2 9.5 4 40.0 2 14.3 0 - 0 - Natural disasters 2 3.8 3 21.4 0 - 2 20.0 0 - 1 11.1 2 14.3 Canals 0 - 2 14.3 1 4.8 0 - 0 - 0 - 1 7.1 Attitude and Behavioral Factors 6 11 9 64 1 5 1 10 3 21 1 11 9 64 Lack of awareness about personal health 1 1.9 1 7.1 0 - 0 - 0 - 0 - 2 14.3 Lack of awareness of the importance of education for 1 1.9 0 - 1 4.8 0 - 0 - 0 - 0 - Disharmonious family 0 - 3 21.4 0 - 0 - 0 - 1 11.1 2 14.3 Alcoholism, gambling & juvenile delinquency 1 1.9 3 21.4 0 - 1 10.0 0 - 0 - 3 21.4 Lack of religious faith 1 1.9 0 - 0 - 0 - 1 7.1 0 - 0 - Lack of neighborhood harmony or participation in collective
2 3.8 2 14.3 0 - 0 - 2 14.3 0 - 2 14.3

The SMERU Research Institute, December 2003 120
Appendix 8. (Continued) Summary of the Analysis of the Problems Faced by the Poor
Sex Age Total by Respondent Female Male Mixed Group Young Old Mixed Group 122 (%) 35 (%) 37 (%) 50 (%) 30 (%) 20 (%) 72 (%)
Powerlessness Factors 166 136 57 163 56 151 53 106 60 200 32 160 74 103 High medical expenses 9 7.4 4 11.4 3 8.1 2 4.0 5 16.7 0 - 4 5.6 Family planning 13 10.7 8 22.9 3 8.1 2 4.0 1 3.3 1 5.0 11 15.3 High cost of education 31 25.4 9 25.7 12 32.4 10 20.0 6 20.0 3 15.0 22 30.6 High cost of basic commodities 9 7.4 6 17.1 1 2.7 2 4.0 5 16.7 3 15.0 1 1.4 Security disturbances 12 9.8 1 2.9 6 16.2 5 10.0 7 23.3 3 15.0 2 2.8 Traditional ceremonies 12 9.8 4 11.4 5 13.5 3 6.0 4 13.3 5 25.0 3 4.2 Lack or mismanagement of assistance 15 12.3 3 8.6 7 18.9 5 10.0 5 16.7 2 10.0 8 11.1 Detrimental policies 4 3.3 1 2.9 2 5.4 1 2.0 1 3.3 2 10.0 1 1.4 Unemployment 15 12.3 7 20.0 3 8.1 5 10.0 8 26.7 5 25.0 2 2.8 Lack of employment opportunities 14 11.5 4 11.4 5 13.5 5 10.0 5 16.7 3 15.0 6 8.3 Low produce prices 12 9.8 3 8.6 5 13.5 4 8.0 3 10.0 2 10.0 7 9.7 High cost of production inputs 3 2.5 3 8.6 0 - 0 - 2 6.7 1 5.0 0 - Caught up in loans 5 4.1 1 2.9 2 5.4 2 4.0 2 6.7 0 - 3 4.2 Difficulties in fulfilling everyday needs 12 9.8 3 8.6 2 5.4 7 14.0 6 20.0 2 10.0 4 5.6 Isolation Factors 144 118 33 94 57 154 54 108 30 100 20 100 94 131 Poor road conditions 26 21.3 8 22.9 8 21.6 10 20.0 6 20.0 6 30.0 14 19.4 Lack of transportation facilities 28 23.0 6 17.1 10 27.0 12 24.0 6 20.0 2 10.0 20 27.8 Remoteness 6 4.9 2 5.7 3 8.1 1 2.0 3 10.0 2 10.0 1 1.4 Lack of access to communication & information facilities 2 1.6 0 - 1 2.7 1 2.0 1 3.3 0 - 1 1.4 Lack of healthcare services 9 7.4 1 2.9 6 16.2 2 4.0 1 3.3 1 5.0 7 9.7 Lack of education facilities 6 4.9 3 8.6 1 2.7 2 4.0 0 - 0 - 6 8.3 Lack of skills 7 5.7 2 5.7 2 5.4 3 6.0 2 6.7 2 10.0 3 4.2 Lack of extension work/guidance 11 9.0 2 5.7 5 13.5 4 8.0 1 3.3 0 - 10 13.9 Inadequate irrigation 9 7.4 0 - 2 5.4 7 14.0 1 3.3 0 - 8 11.1 Lack of access to loans 19 15.6 4 11.4 10 27.0 5 10.0 3 10.0 2 10.0 14 19.4 Lack of clean water 15 12.3 4 11.4 5 13.5 6 12.0 3 10.0 4 20.0 8 11.1 No electricity 3 2.5 1 2.9 2 5.4 0 - 1 3.3 0 - 2 2.8 Lack of public facilities 3 2.5 0 - 2 5.4 1 2.0 2 6.7 1 5.0 0 -
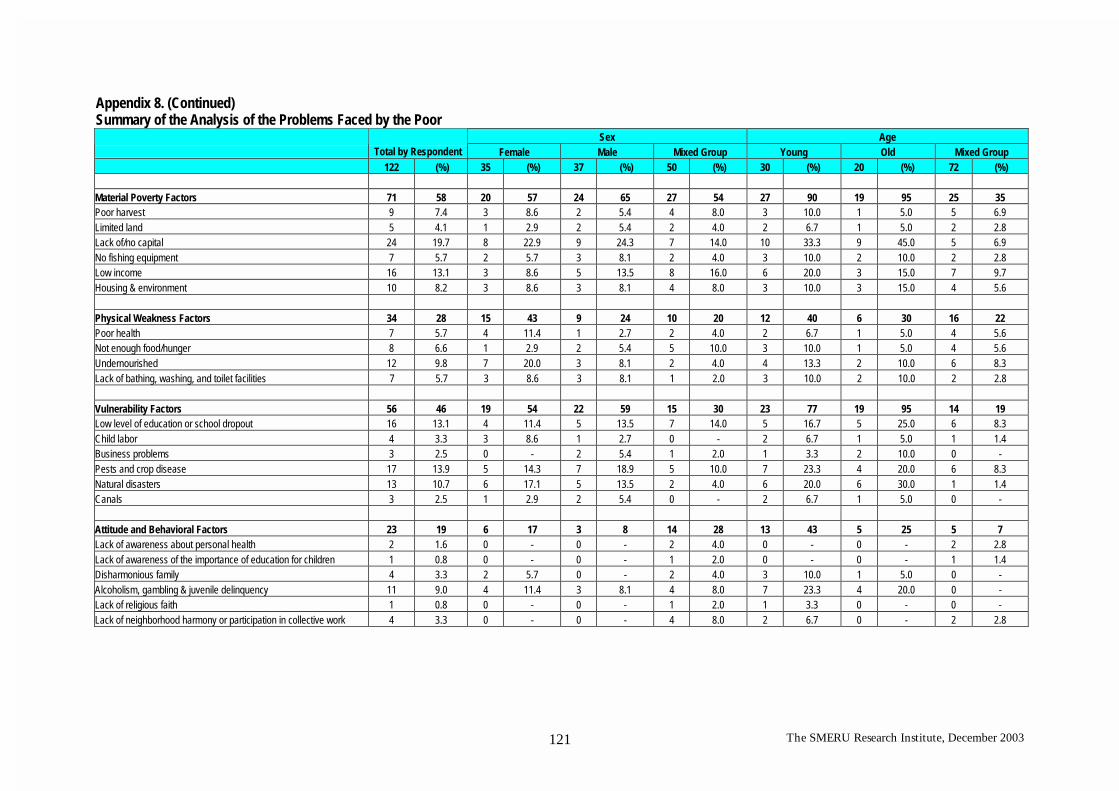
The SMERU Research Institute, December 2003 121
Appendix 8. (Continued) Summary of the Analysis of the Problems Faced by the Poor
Sex Age Total by Respondent Female Male Mixed Group Young Old Mixed Group 122 (%) 35 (%) 37 (%) 50 (%) 30 (%) 20 (%) 72 (%)
Material Poverty Factors 71 58 20 57 24 65 27 54 27 90 19 95 25 35 Poor harvest 9 7.4 3 8.6 2 5.4 4 8.0 3 10.0 1 5.0 5 6.9 Limited land 5 4.1 1 2.9 2 5.4 2 4.0 2 6.7 1 5.0 2 2.8 Lack of/no capital 24 19.7 8 22.9 9 24.3 7 14.0 10 33.3 9 45.0 5 6.9 No fishing equipment 7 5.7 2 5.7 3 8.1 2 4.0 3 10.0 2 10.0 2 2.8 Low income 16 13.1 3 8.6 5 13.5 8 16.0 6 20.0 3 15.0 7 9.7 Housing & environment 10 8.2 3 8.6 3 8.1 4 8.0 3 10.0 3 15.0 4 5.6 Physical Weakness Factors 34 28 15 43 9 24 10 20 12 40 6 30 16 22 Poor health 7 5.7 4 11.4 1 2.7 2 4.0 2 6.7 1 5.0 4 5.6 Not enough food/hunger 8 6.6 1 2.9 2 5.4 5 10.0 3 10.0 1 5.0 4 5.6 Undernourished 12 9.8 7 20.0 3 8.1 2 4.0 4 13.3 2 10.0 6 8.3 Lack of bathing, washing, and toilet facilities 7 5.7 3 8.6 3 8.1 1 2.0 3 10.0 2 10.0 2 2.8 Vulnerability Factors 56 46 19 54 22 59 15 30 23 77 19 95 14 19 Low level of education or school dropout 16 13.1 4 11.4 5 13.5 7 14.0 5 16.7 5 25.0 6 8.3 Child labor 4 3.3 3 8.6 1 2.7 0 - 2 6.7 1 5.0 1 1.4 Business problems 3 2.5 0 - 2 5.4 1 2.0 1 3.3 2 10.0 0 - Pests and crop disease 17 13.9 5 14.3 7 18.9 5 10.0 7 23.3 4 20.0 6 8.3 Natural disasters 13 10.7 6 17.1 5 13.5 2 4.0 6 20.0 6 30.0 1 1.4 Canals 3 2.5 1 2.9 2 5.4 0 - 2 6.7 1 5.0 0 - Attitude and Behavioral Factors 23 19 6 17 3 8 14 28 13 43 5 25 5 7 Lack of awareness about personal health 2 1.6 0 - 0 - 2 4.0 0 - 0 - 2 2.8 Lack of awareness of the importance of education for children 1 0.8 0 - 0 - 1 2.0 0 - 0 - 1 1.4 Disharmonious family 4 3.3 2 5.7 0 - 2 4.0 3 10.0 1 5.0 0 - Alcoholism, gambling & juvenile delinquency 11 9.0 4 11.4 3 8.1 4 8.0 7 23.3 4 20.0 0 - Lack of religious faith 1 0.8 0 - 0 - 1 2.0 1 3.3 0 - 0 - Lack of neighborhood harmony or participation in collective work 4 3.3 0 - 0 - 4 8.0 2 6.7 0 - 2 2.8

The SMERU Research Institute, December 2003 122
Appendix 9. List of Expressions – Problems Faced by the Poor
1a
Kondisi Jalan Buruk Poor road conditions
Jalan Road
Jalan rusak Damaged road
Jalan sempit Narrow road
Kesulitan transportasi Lack of transportation
Kondisi jalan jelek Poor road conditions
Prasarana jalan Road infrastructure
Prasarana jalan buruk/belum diaspal
Poor road infrastructure/roads have not been paved
Sarana Jalan Road facilities
Sulit mengangkut hasil panen Hard to transport agricultural produce
Tidak ada angkutan No transportation
Tidak ada sarana & prasarana jalan
No road infrastructure or facilities
Transport sulit Hard to access transportation
1b
Sarana Transportasi Sulit Lack of transportation facilities
Alat transportasi belum terjangkau
Cannot afford transportation facilities
Kendaraan ojek Use motorcycle taxies
Kendaraan umum sulit Difficulties in accessing public transportation
Sarana Transportasi Transportation facilities
Sarana transportasi keluar desa tidak ada
No transportation facilities to get out of the village
Sarana transportasi sulit Difficulties in accessing transportation facilities
Terbatasnya sarana transportasi barang dan penumpang
Limited transportation for goods and people
Transport mahal Transportation is expensive
Transportasi Transportation
Transportasi tidak memadai Inadequate transportation
1c
Terpencil Remoteness
Daerahnya luas Very large area
Letak kelurahan jauh dari kota Kelurahan office is located far from the city
Pasar jauh Far from the market
Tempat tinggal di bukit Live up on the hills
Toko-toko jauh Far from shops
1d
Komunikasi sulit Lack of access to communication & information facilities
Jauh dari informasi Far from information
2a
Kondisi kesehatan buruk Poor health
Banyak anak sakit Many children are ill
Kesehatan Health
Kesehatan keluarga kurang memadai
Inadequate family health
Penyakit diare Diarrhea
Penyakit manusia Human illness
Penyakit perut Stomach illness
2b
Biaya Pengobatan mahal High medical expenses
Biaya berobat mahal Medical treatment is expensive
Biaya kesehatan mahal Health services are expensive
Biaya mahal Expensive
Biaya tinggi High cost
Obat manusia mahal Medicine for humans is expensive
Sakit tidak punya obat Do not have medicine when ill
Tidak berobat Do not get treated
Tidak mampu berobat Cannot afford treatment
Tidak mampu berobat/ kesehatan kurang
Cannot afford treatment/lack of good health
Tidak mampu ke bidan Cannot afford to go to a midwife
2c
Kurangnya Pelayanan Kesehatan
Lack of healthcare services
Dokter dan mantri tidak ada No doctors or medical aides
Fasilitas kesehatan tidak memadai
Inadequate healthcare facilities
Kurang penyuluhan kesehatan Lack of health extension work
Pelayanan kesehatan kurang baik
Health services are not too good
Puskesmas Jauh dari desa Puskesmas are far from the village
Sarana kesehatan minim Small number of healthcare facilities
Tenaga medis minim Small number of medical personnel
Tidak ada petugas dan penyuluh kesehatan
No medical personnel or health extension workers
2d
Kurangnya kesadaran akan kesehatan
Lack of awareness about personal health
Kurang kesadaran hidup sehat Lack of awareness concerning the importance of healthy living

The SMERU Research Institute, December 2003 123
Appendix 9. (Continued) List of Expressions – Problems Faced by the Poor
2e
KB Family planning
Alat kontrasepsi mahal Contraceptives are expensive
Banyak tidak KB Many do not use contraception
Jumlah penduduk makin banyak Population is increasing
Jumlah peserta KB rendah Number of family planning beneficiaries is low
Masalah KB (terlanjur sudah banyak anak)
Family planning problems (already have too many children)
Tidak ada biaya untuk membeli alat KB
No money to buy contraceptives
Tidak ada KB No contraceptives available
Tidak ber- KB Do not use any contraception
Tidak ikut KB Not a family planning beneficiary
3a
Pendidikan rendah dan Putus sekolah
Low level of education or school dropout
Anak putus sekolah Children drop out of school
Anak putus sekolah banyak Many children drop out of school
Anak tidak sekolah Children do not go to school
Kurangnya orang berpendidikan Lack of educated people
Menyekolahkan anak Send children to school
Pendidikan rendah Low education
Pendidikan rendah/pas-pasan Low education/inadequate education
Putus sekolah School dropout
Sangat sedikit yang tamat SMA Very few people graduate from high school
Sekolah Go to school
Tidak bisa menyekolahkan anak ke jenjang yang lebih tinggi dari SD
Cannot afford to send children to school after primary school
3b
Tingginya Biaya Pendidikan High cost of education
Biaya pendidikan mahal Education is expensive
Biaya pendidikan tinggi High cost of education
Biaya pendidikan anak Children’s education expenses
Biaya sekolah School fees
Biaya sekolah tinggi High school fees
Biaya tinggi High costs
Pendidikan anak Children’s education
Pendidikan sulit/tidak terjangkau Difficulties in accessing education/cannot afford education
Tidak cukup biaya untuk sekolah Do not have enough money to go to school
Tidak mampu membayar uang sekolah
Unable to pay school fees
Tidak punya biaya untuk pendidikan
Have no money for education
3c
Kurang sarana pendidikan Lack of education facilities
Guru tidak cukup Not enough teachers
Jumlah guru kurang Not enough teachers
Sekolah jauh School is too far
Tenaga guru kurang Not enough teachers
Tidak ada biaya untuk sekolah (sekolah jauh, perlu biaya transport)
No money for school (school is far, need to pay for transportation)
3d
Kurang Ketrampilan Lack of skills
Keterampilan rendah Lack of skills
Kurang keterampilan Lack of skills
PKK tidak memberi pelajaran ketrampilan
PKK does not provide real skills
Tidak ada bimbingan berusaha berupa pelatihan/penyuluhan
No business guidance in the form of training or extension work
Tidak punya pengalaman dan keterampilan selain nelayan
Do not have experience or skills except for being a fisherman
3e
Kurangnya kesadaran untuk menyekolahkan anak
Lack of awareness concerning the importance of education for
children Kurang kesadaran untuk menyekolahkan anak
Lack of awareness concerning the importance of education for children
4a
Sulit mendapat sembako Difficulties in fulfilling food needs
Makan Food
Pemenuhan kebutuhan makan Fulfilling food needs
Pemenuhan kebutuhan makanan
Fulfilling food needs
Pemenuhan kebutuhan makanan tidak pasti
Uncertainty in fulfilling food needs
Penyediaan beras Rice availability

The SMERU Research Institute, December 2003 124
Appendix 9. (Continued) List of Expressions – Problems Faced by the Poor
4b
Harga Sembako Mahal High cost of basic commodities
Harga barang mahal High cost of goods
Kebutuhan meningkat, pendapatan kurang
Needs increase, income decreases
Sembako Basic commodities
Sembako mahal Basic commodities are expensive
4c
Kurang Makan/ Kelaparan Not enough food/ hunger
Kurang makan Do not eat enough
Kelaparan Hunger
4d
Kurang Gizi Malnourished
Kurang gizi Malnourished
Kurang gizi keluarga Family is malnourished
Sebagian kurang gizi Some are malnourished
5a
Keluarga tidak harmonis Disharmonious family
Main perempuan Have affairs with other women/visit prostitutes
Hub. Orangtua-anak kurang harmonis
Parent-child relations are disharmonious
Keretakan rumah tangga Family break down
Perselingkuhan Extra-marital affairs
Jika bapak sudah melaut tidak bawa ikan terjadi pertengkaran
If the father goes to sea but does not bring back any fish, a fight will start
5b
Minuman Keras, Judi & Kenakalan Remaja
Alcohol, gambling and juvenile delinquency
Banyak yang minum-minuman keras
Many people drink alcohol
Kenakalan remaja Juvenile delinquency
Kenakalan/minum2 dan berkelahi
Delinquency/drinking and fighting
Mabuk/ minuman keras Drunkenness/drinking
Rebutan pacar Fighting over girlfriends
5c
Kurangnya ketakwaan Lack of religious faith
Kurangnya ketakwaan Lack of religious faith
6
Gangguan Kemanan Security disturbances
Banyak pencuri Many thieves
Banyak pencurian ternak A lot of livestock theft
Kejahatan meningkat Increased crime
Ketentraman berkurang Lack of peacefulness
Pencurian Theft
Pencurian ternak Livestock theft
Perampokan sering terjadi Robberies often occur
Sering terjadi perkelahian antara pemancing dan pemasang jaring tongkol
Frequent fights between fishermen who use fishing rods and those who cast fishing nets
7
Pekerja anak Child labor
Memilih jadi nelayan Determined to be a fisherman
Pekerja dibawah umur Underage worker
Sekolah anak terganggu karena anak sudah mencari uang sendiri (putus sekolah)
Children’s education is disrupted because they are working (drop out of school)
8a
Pelaksanaan Upacara Adat Traditional ceremonies
Pengeluaran upacara adat besar Cost of adat ceremonies is high
Banyak sumbangan besekan Many besekan contributions
Adat terpinggirkan Adat is marginalized
Biaya adat (kawin dan kematian tinggi)
Adat expenses for marriage ceremonies and funerals are high
Biaya pesta perkawinan& kematian tinggi
Expenses for weddings and funerals are high
Harus mengikuti arisan keluarga Obliged to participate in family arisan
8b
Kerukunan antar tetangga & gotong royong kurang
Lack of neighborhood harmony or participation in collective
work Gotong royong kurang Lack of collective work
Kesalah-pahaman antar tetangga Misunderstanding among neighbors
Pertengkaran masalah pekerjaan Conflict relating to work matters
Aparat desa kurang dipercayal etupan konflik antar umat beragama tdk diatasi dg baik
Lack of trust of village apparatus, conflict among religious groups are not handled well
Lingkungan sosial kurang sehat Not a very healthy social environment

The SMERU Research Institute, December 2003 125
Appendix 9. (Continued) List of Expressions – Problems Faced by the Poor
9a
Penyimpangan/ Kekurangan Bantuan
Lack or Mismanagement of assistance
Bantuan beras berkurang Rice assistance is decreasing
Bantuan IDT kurang memadai Inadequate IDT assistance
Bantuan pemerintah kurang Lack of government assistance
Bantuan perhutani tidak sampai Perhutani assistance does not reach the beneficiaries
Bantuan PKDB & U2K tidak merata
PKDB and U2K assistance were not distributed equally
Bantuan untuk orang miskin disalahgunakant
Assistance for the poor is misused
Banyak terjadi KKN-bantuan dari luar
Many cases of corruption, coalition, and nepotism in delivering outside assistance
Beasiswa dipotong Kepala Sekolah
Scholarships were cut by the principal
Distribusi bantuan pemerintah tidak diterima masyarakat
Government aid does not reach the community
Keterbatasan dan kebocoran dana pembangunan desa
Limitation and leakage in village development funds
Kurang bantuan luar Lack of outside assistance
Pembagian beras murah yang kurang memadai
Inadequate distribution of cheap rice
Pemberian bantuan kurang adil (IDT)
Unfair aid provision (IDT)
Penyaluran bantuan Prasejahtera kurang sesuai
Inappropriate distribution of aid for prasejahtera families
Perhatian pemerintah kurang Lack of attention from the government
PPL tidak bermukim di desa Extension workers do not live in the village
Sasaran tidak tepat Inappropriate targeting
Sumbangan pendidikan tidak merata
Unequal distribution of education assistance
Tidak ada bantuan untuk nelayan miskin
No assistance for poor fishermen
9b
Kebijakan yang merugikan Detrimental policies
Kebijakan kurang berpihak pada kelompok miskin
Policies that are not pro poor
9c
Kurang Penyuluhan/bimbingan
Lack of extension work/guidance
Kurang pelatihan & penyuluhan Lack of training and extension work
Kurang pembinaan & penyuluhan
Lack of skill development and extension work
Kurang penyuluhan Lack of extension work
Penyuluhan pendidikan kurang Lack of education awareness programs
PPL ada tapi tidak berfungsi Extension workers are available but they are not doing their job properly
PPL tidak di tempat Extension workers are absent
Rendahnya pelatihan & pembinaan kewirausahaa
Poor training and development of entrepreneurship skills
Tidak ada pelatihan No training
Tidak ada penyuluhan No extension work
10a
Pengangguran Unemployment
Anak usia produktif untuk bekerja cenderung masa bodoh
Children of a productive age usually do not care about work
Korban PHK Laid off
Pengangguran Unemployed
Pengangguran akibat PHK Unemployed because laid off
Pengangguran banyak A lot of unemployment
PHK dan pengangguran Layoffs and unemployment
Sulit Cari Kerja Difficulties in finding jobs
10b
Lapangan Kerja Kurang Lack of work sectors
Bekerja sebagai buruh(tani,karet, rotan, nelayan)
Work as a laborer (farm, rubber, rattan, fishermen)
Ketersediaan lapangan pekerjaan
Job availability
Lapangan kerja sulit Difficulties in finding jobs
Lapangan kerja tambahan kurang
Lack of additional job opportunities
Pekerjaan kurang Lack of jobs
Penduduk yang bekerja di luar makin banyak
Number of people working outside the region has increased
Sulit mencari uang-tidak punya pekerjaan
Hard to earn money-have no job
Tidak ada lapangan kerja No job
Tidak ada pekerjaan alternatif, karena paceklik melaut dan bertani
No alternative jobs during the west monsoon and drought seasons
Tidak memiliki pekerjaan selain bertani
Have no other job, except for farming
10c
Usaha sulit Business problems
Buka usaha sulit Difficulties in establishing businesses
Hilang kerajinan rakyat Traditional handicrafts have disappeared
Usaha macet Businesses cannot continue
11a
Kekurangan hasil panen Poor harvest
Hasil panen yang terus turun Harvest continues to decrease
Hasil pertanian/perkebunan hanya 1x setahun
Only one harvest a year
Hutan bersama yang makin gundul
Collective forest is being deforested
Sawah tadah hujan, tanah tidak subur
Rain fed rice field, infertile land
Tanah tandus Empty and infertile land
Tangkapan kodok dan ikan turun Decrease in the number of frogs and fish being caught

The SMERU Research Institute, December 2003 126
Appendix 9. (Continued) List of Expressions – Problems Faced by the Poor
11b
Irigasi sawah tidak memadai Inadequate irrigation
Air irigasi Water for irrigation
Belum terjangkau sarana irigasi Irrigation facilities not yet available
Belum terjangkau sarana irigasi untuk sawah
Irrigation facilities for rice field are not yet available
Irigasi Irrigation
Irigasi sawah Rice field irrigation
Kesulitan dalam mengairi lahan Difficulties in watering land
Tidak ada air untuk lahan, letak air dibawah lahan
No water for land, water is located further down the hill
11c
Hama dan Penyakit Pests and diseases
Hama Babi Farm destroyed by pigs
Hama kebun (babi dan ternak yang berkeliaran)
Farm destroyed by pigs or other farm animals that wander around
Hama penyakit tanaman Plant diseases and pests
Hama penyakit tanaman dan ternak
Plant and animal diseases
Penyakit hewan Animal diseases
Penyakit tanaman Plant diseases
Penyakit ternak mulai menyerang
Animal diseases are spreading
Serangan hama penyakit tanaman
The spread of plant diseases and pests
Serangan hama tanaman The spread of plant diseases
Sulitnya menghapus hama tanaman padi
Difficulties in eradicating rice diseases and pests
11d
Harga produk terlalu rendah Low produce prices
Harga jual gabah lebih rendah dari biaya produksi
The selling price of unhulled rice is lower than the production cost
Harga jual hasil pertanian rendah
The selling price of agricultural produce is low
Harga jual kain tenun rendah The selling price of woven cloth is low
Harga jual rendah Selling price is low
Harga panen rendah, karena posisinya yang lemah
The price of agricultural produce is low due to low bargaining position
Harga panen terlalu rendah The price of agricultural produce is low
Harga produk pertanian yang ditentukan sepenuhnya oleh pedagang
The price of agricultural produce is determined by traders
Harga pupuk tidak sebanding dengan harga gabah
The price of fertilizers does not balance out with the price of unhulled rice
Harga telur ikan terbang rendah The price of eggs of flying fish is low
Ikan dibayar murah oleh Palele Fish are paid cheaply by middlemen
Monopoli pemasaran oleh satu pihak
Market monopoly
11e
Harga Input mahal High cost of production inputs
Harga pupuk mahal Fertilizers are expensive
Harga barang mahal Goods are expensive
Bahan baku Raw materials
12a
Keterbatasan Lahan Limited land
Kurangnya tanah pertanian Lack of agricultural land
Lahan terbatas Limited land
Tanah kurang Limited land
Tanah pertanian terlalu miring Agricultural land is too steep
Terbatasnya bahan pokok karena terbatasnya lahan untuk diolah
Limited food stocks because of limited land
12b
Tidak ada/ kurang modal Lack of/no capital
Ketiadaan modal No capital
Kurang modal untuk usaha No capital to start business
Modal kurang Lack of capital
Modal Usaha Business capital
Permodalan usaha Business capital
Tidak ada modal No capital
Tidak ada modal untuk usaha lain selain nelayan
No capital for other work, except fishing
Tidak punya modal No capital
12c
Tidak punya alat untuk mencari ikan
No fishing equipment
Kekurangan alat-alat pertanian Lack of farming equipment
Menggunakan alat tradisional untuk melaut
Use traditional tools for fishing
13a
Tidak bisa mendapat pinjaman Lack of access to loans
Akses Bank kurang Lack of access to banks
Akses Bank tidak ada No access to banks
Koperasi & Bank susah mencari modal
Cooperatives and banks have difficulties in acquiring capital
Sulit dapat bantuan modal Difficulties in obtaining capital assistance
Sulit dapat pinjaman Difficulties in obtaining loans
Tidak ada pinjaman No loans available
Tidak ada sumber kredit pada saat sulit
No credit during difficult times
Tidak dipercaya meminjam uang Not trusted to receive loans
Tidak dipercaya oleh orang kaya untuk pinjam uang
Not trusted by rich people when trying to find loans
13b
Terlilit hutang Caught up in loans
Keterikatan pada juragan kapal sebagai buruh yang terlilit hutang
Dependent on the ship owner because of caught in debt
Terjerat hutang papalele Caught up in loans from the middlemen

The SMERU Research Institute, December 2003 127
Appendix 9. (Continued) List of Expressions – Problems Faced by the Poor
14
Air Bersih Sulit Lack of clean water
Air bersih Clean water
Air bersih sulit diperoleh Clean water is hard to obtain
Kurang Air Lack of water
Kurang air bersih Lack of clean water
Sarana & prasarana air bersih PDAM belum merata
Clean water facilities and infrastructure from the water corporation are not equally distributed
Sarana& prasarana air bersih sulit
Clean water facilities and infrastructure are difficult to obtain
Sulit mencari air Difficulties in obtaining water
Sulitnya mendapat air bersih Difficulties in obtaining clean water
Tidak ada PAM/air bersih There is no water corporation/clean water
15a
Kurang MCK Lack of bathing, washing and toilet facilities
MCK/Jamban Bathing, washing and toilet facilities/toilet facilities
WC Umum/ Sumur Public toilet facilities/well Tidak ada kamar mandi No bathroom
Tidak ada WC No toilet Kurang sarana MCK Lack of bathing, washing and toilet
facilities Kurang MCK Lack of bathing, washing and toilet
facilities
15b
Perumahan & Lingkungan Housing and environment
Alang-alang kurang (untuk atap rumah)
Not enough grass (for the roof)
Banyak rumah kumuh Many shabby houses
Kayu dan bahan bangunan makin sulit
Wood and construction materials are getting harder to obtain
Kontrak rumah Rent a house Lingkungan fisik kurang sehat Unhealthy physical environment
Lingkungan sempit Small houses (crowded)
Perumahan Housing
Sewa rumah Rent a house Tidak punya rumah sendiri Do not own a house
15c
Saluran Air Canals
Saluran air Canals Saluran air terhambat proyek perumahan
Canals are blocked by housing project
16
Pendapatan Rendah Low income
Ekonomi sulit Weak economy Kerja buruh tidak tetap Laboring work is not permanent
Keterbatasan uang Limited money
Pekerjaan tidak tetap Unstable employment
Pendapatan kurang Lack of income
Pendapatan lebih kecil daripada pengeluaran
Income is less than expenditure
16
Pendapatan Rendah Low income
Pendapatan rendah Low income
Penghasilan kurang Insufficient earnings
Penghasilan sedikit tidak sesuai dengan harga minyak, mesin dll
Low earnings, do not match the price of oil and machines
Penghasilan sedikit tidak cukup untuk kebutuhan sehari-hari
Low earnings, not enough to cover daily consumption
Penghasilan tidak tetap Unstable earnings
Tidak punya uang Do not have money
Tingginya tingkat kemakmuran High level of wealth
Uang sulit didapat Hard to earn some money
17
Sulit memenuhi kebutuhan sehari-hari
Difficulties in fulfilling everyday needs
Harga kebutuhan meningkat The cost of goods needed are expensive
Harga mahal Prices are high
Sulit mencari kayu Difficulties in collecting woods
Kurang biaya (makan dan transportasi)
Lack of money (for food and transportation)
Kekurangan sandang pangan Lack of food and clothing
Sulit memenuhi kebutuhan sehari-hari
Difficulties in fulfilling everyday needs
Membayar rumah, listrik dan air Pay for rent, electricity and water
Penghasilan tidak cukup untuk kebutuhan sehari-hari
Earning is not enough to cover everyday needs
Sulit memperoleh uang dan beras
Difficulties in earning money and obtaining rice
18
Listrik No electricity
Tidak ada listrik No electricity
19
Bencana Alam Natural Disasters
Angin ribut Typhoon
Banjir Flood
Banjir akibat air pasang Flood due to high tide
Kemarau panjang Long dry season
Sering banjir Frequent floods
Sering banjir (penyakit, gagal panen, sekolah sulit)
Frequent floods (disease, crop failure, difficulties in getting to school)
Tidak ada usaha saat hujan angin selama 3-4 bln
No work during the West monsoon (3-4 months)
20
Kurang sarana Publik Lack of public facilities
Kurang sarana olahraga Lack of sports facilities
Kurangnya kegiatan pemuda Lack of youth activities
Sarana ibadah yang kurang memadai
Inadequate facilities for religious services

The SMERU Research Institute, December 2003 128
Appendix 10. The Responsibilities of Women in the Household based on FGDs in Various Types of Communities
Type of Community
Total Rice farming Dry-land
farming Forest and plantation
Coastal fishing
Urban informal
sector and labor
Types of Responsibilities
P Pr P Pr P Pr P Pr P Pr P Pr Educate children 22 22 7 6 2 2 1 1 0 0 12 13 Take care of husband 8 7 1 0 0 0 1 1 0 0 6 6 Manage the household 24 23 7 5 3 3 2 2 0 0 12 13 Manage household finances 8 9 4 4 0 0 0 0 0 0 4 5 Prepare food for the family 24 24 8 8 2 2 2 2 0 0 12 12 Earn a living 22 23 7 7 3 3 2 2 0 0 10 11 Fetch water 3 2 0 0 0 0 2 2 0 0 1 0 Fulfill other household needs 8 7 5 5 1 0 2 2 0 0 0 0 Others 3 3 0 0 0 0 0 0 0 0 3 3
N 28 28 8 8 4 4 2 2 0 0 14 14 Note: P= Past; Pr= Present; N= Total number of discussion groups

The SMERU Research Institute, December 2003 129
Appendix 11. The Responsibilities of Women in the Household based on FGDs in Urban and Rural Areas, in Java and Nusa Tenggara, and with Male, Female and Mixed Groups
Rural/Urban Regions Sex Total
Rural Urban Java East Nusa Tenggara Female Male Mixed
Group Types of Responsibilities
P Pr P Pr P Pr P Pr P Pr P Pr P Pr P Pr Educate children 22 22 7 6 15 16 20 20 2 2 12 12 10 10 0 0 Take care of husband 8 7 1 1 7 6 8 7 0 0 6 5 2 2 0 0 Manage the household 24 23 8 6 16 17 21 20 3 3 11 11 12 11 1 1 Manage household finances 8 9 2 2 6 7 8 9 0 0 6 7 2 2 0 0 Prepare food for the family 24 24 8 8 16 16 22 22 2 2 12 12 12 12 0 0 Earn a living 22 23 8 8 14 15 19 20 3 3 12 12 9 10 1 1 Fetch water 3 2 2 2 1 0 3 2 0 0 2 1 1 1 0 0 Fulfill other household needs 8 7 6 5 2 2 7 7 1 0 2 2 6 5 0 0 Others 3 3 0 0 3 3 3 3 0 0 2 2 1 1 0 0
N 28 28 10 10 18 18 24 24 4 4 14 14 13 13 1 1 Note: P= Past; Pr= Present; N= Total number of discussion groups

The SMERU Research Institute, December 2003 130
Appendix 12. The Responsibilities of Men in the Household based on FGDs in Various Types of Communities
Type of Community
Total Rice farming Dry-land
farming Forest and plantation
Urban informal sector and labor Types of Responsibilities
P Pr P % P % P Pr P Pr P % Pr % Earn money 23 23 7 88 7 100 3 2 2 2 11 92 12 92 Make decisions 2 2 2 25 2 29 0 0 0 0 0 0 0 0 Educate children 12 12 2 25 2 29 0 0 1 1 9 75 9 69 Provide wife with guidance 4 4 0 0 0 0 0 0 1 1 3 25 3 23 Protect the family 3 3 0 0 0 0 0 0 1 1 2 17 2 15 Ensure the family is happy 2 2 0 0 0 0 0 0 0 0 2 17 2 15 Fetch water 3 3 1 13 1 14 0 0 1 1 1 8 1 8 Build a house 5 4 2 25 1 14 0 0 1 1 2 17 2 15 Prepare food for the family 1 1 0 0 0 0 0 1 0 0 0 0 0 0 Provide clothing for the family 1 1 0 0 0 0 1 0 1 1 0 0 0 0 Fulfill other household needs 4 4 3 38 3 43 0 0 0 0 1 8 1 8 Assist wife 8 9 0 0 0 0 0 1 0 0 7 58 8 62 Others 3 3 0 0 0 0 0 0 0 0 3 25 3 23
N 25 25 8 7 3 3 2 2 12 13 Note: P= Past; Pr = Present; N= Total number of discussion groups

The SMERU Research Institute, December 2003 131
Appendix 13. The Responsibilities of Men in the Household based on FGDs in Urban and Rural Areas, in Java and Nusa Tenggara, and with Male and Female Groups
Area Region Sex
Rural Urban Java East Nusa Tenggara Female Male
Types of Responsibilities
P % Pr % P % Pr % P Pr P Pr P Pr P Pr Earn money 8 89 7 88 15 94 16 94 20 21 3 2 11 11 12 12 Make decisions 2 22 2 25 0 0 0 0 2 2 0 0 0 0 2 2 Educate children 1 11 1 13 11 69 11 65 12 12 0 0 5 5 7 7 Provide wife with guidance 1 11 1 13 3 19 3 18 4 4 0 0 1 1 3 3 Protect the family 1 11 1 13 2 13 2 12 3 3 0 0 1 1 2 2 Ensure the family is happy 0 0 0 0 2 12 2 12 2 2 0 0 1 1 1 1 Fetch water 1 11 1 13 2 13 2 12 3 3 0 0 1 1 2 2 Build a house 2 22 1 13 3 19 3 18 5 4 0 0 1 1 4 4 Prepare food for the family 1 11 1 13 0 0 0 0 0 0 1 1 0 0 1 1 Provide clothing for the family 1 11 1 13 0 0 0 0 1 1 0 0 0 0 1 1 Fulfill other household needs 1 11 1 13 3 19 3 18 4 4 0 0 1 1 3 3 Assist wife 1 11 1 13 7 44 8 47 7 8 1 1 4 6 4 3 Others 0 0 0 0 3 10 3 18 3 3 0 0 2 2 1 1
N 9 8 16 17 22 22 3 3 13 12 Note: P= Past; Pr = Present; N= Total number of discussion groups

The SMERU Research Institute, December 2003 132
Appendix 14. The Responsibilities of Women in the Community based on FGDs in Various Types of Communities
Type of Community Total
Rice farming Dry-land farming Forest and plantation Urban informal sector and labor
Types of Responsibilities
P % Pr % P % Pr % P Pr P Pr P Pr Participate in PKK 11 79 16 94 2 67 5 83 2 2 2 2 5 7 Participate in arisan 8 57 11 65 2 67 4 67 0 0 1 1 5 6 Participate in posyandu programs 6 43 10 59 2 67 5 83 0 0 0 0 4 5 Become a posyandu cadre 1 7 3 18 0 0 0 0 1 2 0 0 0 1 Participate in pengajian 9 64 11 65 2 67 4 67 0 0 0 0 7 7 Assist with village needs 4 29 5 29 0 0 0 0 1 1 2 2 1 2 Contribute to celebrations 5 36 6 35 1 33 2 33 0 0 2 2 2 2 Assist neighbors organize ceremonies 3 21 4 24 1 33 2 33 0 0 1 1 1 1 Participate in collective work 2 14 4 24 0 0 1 17 1 2 0 0 1 1 Participate in sport/aerobics 3 21 4 24 0 0 1 17 0 0 0 0 3 3 Participate in dasa wisma 1 7 3 18 0 0 0 0 0 0 1 1 0 2 Work as a midwife 1 7 2 12 1 33 2 33 0 0 0 0 0 0 Become a trained traditional healer 1 7 0 0 0 0 1 1 0 0 0 0 Participate in the women’s commission 2 14 2 12 0 0 0 0 2 2 0 0 0 0 Participate in NGO activities 1 7 2 12 0 0 0 0 1 2 0 0 0 0 Become a member of a cooperative 1 7 1 6 0 0 0 0 0 0 0 0 1 1 Visit sick people 1 7 2 12 1 33 2 33 0 0 0 1 0 1 Attend funerals 1 7 1 6 0 0 0 0 0 0 1 1 0 0 Help people in times of trouble 1 7 1 6 0 0 0 0 0 0 0 0 1 1 Participate in a nutrition program for school children
0 0 2 12 0 0 0 0 0 2 0 0 0 0
Participate in community consultations 0 0 1 6 0 0 1 17 0 0 0 0 0 0 Participate in LKMD commemoration month 0 0 1 6 0 0 0 0 0 1 0 0 0 0 Teach at TKA 0 0 1 6 0 0 0 0 0 0 0 0 0 1 Participate in jimpitan 0 0 1 6 0 0 0 0 0 0 0 0 0 1 Participate in padat karya 0 0 1 6 0 0 0 0 0 0 0 0 0 1
N 14 17 3 6 2 2 2 2 7 7 Note: P= Past; Pr= Present; N= total number of discussion groups

The SMERU Research Institute, December 2003 133
Appendix 15. The Responsibilities of Women in the Community based on FGDs in Urban and Rural Areas, and in Java and Nusa Tenggara
Rural/Urban Regions Total
Rural Urban Java Nusa Tenggara Types of Responsibilities P Pr P Pr P Pr P Pr P Pr
Participate in PKK 6 8 2 3 4 5 5 7 1 1 Participate in arisan 6 7 2 2 4 5 6 7 0 0 Participate in posyandu programs 4 6 0 1 4 5 4 6 0 0 Become a posyandu cadre 1 2 1 1 0 1 0 1 1 1 Participate in pengajian 5 5 0 0 5 5 5 5 0 0 Assist with village needs 2 4 1 2 1 2 1 3 1 1 Contribute to celebrations 3 3 2 2 1 1 3 3 0 0 Assist neighbors organize ceremonies 3 3 1 1 2 2 3 3 0 0 Participate in collective work 2 3 1 2 1 1 1 2 1 1 Participate in sport/aerobics 2 3 0 0 2 3 2 3 0 0 Participate in dasa wisma 1 2 1 1 0 1 1 2 0 0 Work as a midwife 1 1 0 0 1 1 1 1 0 0 Become a trained traditional healer 1 1 1 1 0 0 0 0 1 1 Participate in the women’s commission 1 1 1 1 0 0 0 0 1 1 Participate in NGO activities 1 1 1 1 0 0 0 0 1 1 Become a member of a cooperative 1 1 0 0 1 1 1 1 0 0 Visit sick people 1 1 0 0 1 1 1 1 0 0 Attend funerals 1 1 1 1 0 0 1 1 0 0 Help people in times of trouble 1 1 0 0 1 1 1 1 0 0 Participate in a nutrition program for school children 0 1 0 1 0 0 0 0 0 1 Participate in community consultations 0 1 0 1 0 0 0 1 0 0 Participate in LKMD commemoration month 0 1 0 1 0 0 0 0 0 1 Teach at TKA 0 1 0 0 0 1 0 1 0 0 Participate in jimpitan 0 1 0 0 0 1 0 1 0 0 Participate in padat karya 0 1 0 0 0 1 0 1 0 0
N 8 8 3 3 5 5 7 7 1 1 Note: P= Past; Pr= Present; N= total number of villages

The SMERU Research Institute, December 2003 134
Appendix 16. The Responsibilities of Women in the Community based on FGDs with Female and Male Groups
Respondent Group Total
Female Male Types of Responsibility P % Pr % P % Pr % P % Pr %
Participate in PKK 11 79 16 94 4 78 8 89 4 80 8 100 Participate in arisan 8 57 11 65 5 56 4 44 3 60 7 88 Participate in posyandu programs 6 43 10 59 4 44 5 56 2 40 6 63 Become a posyandu cadre 1 7 3 18 1 11 1 11 0 0 2 25 Participate in pengajian 9 64 11 65 6 67 6 67 3 60 5 63 Assist with village needs 4 29 5 29 2 22 2 22 2 40 3 38 Contribute to celebrations 5 36 6 35 4 44 4 44 1 20 2 25 Assist neighbors organize ceremonies 3 21 4 24 0 0 0 0 3 60 4 50 Participate in collective work 2 14 4 24 2 22 2 22 0 0 2 25 Participate in sport/aerobics 3 21 4 24 2 22 1 11 1 20 3 38 Participate in dasa wisma 1 7 3 18 0 0 1 11 1 20 2 25 Work as a midwife 1 7 2 12 1 11 2 22 0 0 0 0 Become a trained traditional healer 1 7 1 6 1 11 1 11 0 0 0 0 Participate in the women’s commission 2 14 2 12 1 11 1 11 1 20 1 13 Participate in NGO activities 1 7 2 12 0 0 1 11 1 20 1 13 Become a member of a cooperative 1 7 1 6 1 11 1 11 0 0 0 0 Visit sick people 1 7 2 12 1 11 2 22 0 0 0 0 Attend funerals 1 7 1 6 1 11 1 11 0 0 0 0 Help people in times of trouble 1 7 1 6 1 11 1 11 0 0 0 0 Participate in a nutrition program for school children
0 0 2 12 0 0 1 11 0 0 1 13
Participate in community consultations 0 0 1 6 0 0 0 0 0 0 1 13 Participate in LKMD commemoration month 0 0 1 6 0 0 1 11 0 0 0 0 Teach at TKA 0 0 1 6 0 0 0 0 0 0 1 13 Participate in jimpitan 0 0 1 6 0 0 0 0 0 0 1 13 Participate in padat karya 0 0 1 6 0 0 0 0 0 0 1 13
N 14 17 9 9 5 8 Note: D= Past; S= Present; N= total number of discussion group

The SMERU Research Institute, December 2003 135
Appendix 17. The Responsibilities of Men in the Community based on FGDs in Various Types of Communities
Type of Community
Total Rice farming Dry-land farming Forest and
plantation Urban informal sector and
labor Types of Responsibilities
P % Pr % P Pr P Pr P Pr P % Pr % Participate in village meetings 9 56 9 64 5 5 0 0 1 1 3 43 3 60 Take care of adat /church-related matters
2 13 2 14 0 0 2 2 0 0 0 0 0 0
Organization 0 0 1 7 0 0 0 1 0 0 0 0 0 0 Contribute to celebrations 1 6 1 7 1 1 0 0 0 0 0 0 0 0 Attend ceremonies 3 19 3 21 2 2 0 0 0 0 1 14 1 20 Visit sick people 2 13 2 14 2 2 0 0 0 0 0 0 0 0 Attend funerals 3 19 3 21 0 0 0 0 1 1 2 29 2 40 Participate in community neighborhood watch
9 56 8 57 2 2 0 0 1 1 6 86 5 100
Participate in arisan 6 38 5 36 1 1 0 0 1 1 4 57 3 60 Participate in collective work 11 69 12 86 4 4 2 2 2 2 3 43 4 80 Voluntary community work 4 25 3 21 0 0 0 0 0 0 4 57 3 60 Participate in LKMD activities 1 6 1 7 0 0 1 1 0 0 0 0 0 0 Be part of the RT/RW Board 3 19 1 7 0 0 1 0 1 1 1 14 0 0 Collect donations 1 6 1 7 0 0 0 0 0 0 1 14 1 20 Entertain official visitors 0 0 1 7 0 0 0 1 0 0 0 0 0 0 Help neighbors 2 13 2 14 0 0 0 0 1 1 1 14 1 20 Participate in pengajian/tahlilan 9 56 8 57 4 4 0 0 1 1 4 57 3 60 Take care of the mosque 1 6 0 0 0 1 14 Participate in padat karya 0 0 1 7 0 0 0 1 0 0 0 0 0 0 Earn a living 0 0 1 7 0 0 0 1 0 0 0 0 0 0 Become a traditional healer 1 6 1 7 0 0 1 1 0 0 0 0 0 0 Others 3 19 0 0 3 43
N 16 14 5 5 2 2 2 2 7 5 Note: P= Past; Pr= Present; N= total number of discussion groups

The SMERU Research Institute, December 2003 136
Appendix 18. The Responsibilities of Men in the Community based on FGDs in Urban and Rural Areas, and in Java and Nusa Tenggara
Rural/Urban Regions
Total Rural Urban Java Nusa Tenggara Types of Responsibilities
P % Pr % P Pr P % Pr % P % Pr % P Pr Participate in village meetings 9 56 9 64 2 2 7 64 7 78 9 64 9 75 0 0 Take care of adat /church-related matters
2 13 2 14 2 2 0 0 0 0 0 0 0 0 2 2
Organization 0 0 1 7 0 1 0 0 0 0 0 0 0 0 0 1 Contribute to celebrations 1 6 1 7 1 1 0 0 0 0 1 7 1 8 0 0 Attend ceremonies 3 19 3 21 0 0 3 27 3 33 3 21 3 25 0 0 Visit sick people 2 13 2 14 0 0 2 18 2 22 2 14 2 17 0 0 Attend funerals 3 19 3 21 1 1 2 18 2 22 3 21 3 25 0 0 Participate in community neighborhood watch
9 56 8 57 1 1 8 73 7 78 9 64 8 67 0 0
Participate in arisan 6 38 5 36 2 2 4 36 3 33 6 43 5 42 0 0 Participate in collective work 11 69 12 86 4 4 7 64 8 89 9 64 10 83 2 2 Voluntary community work 4 25 3 21 0 0 4 36 3 33 4 29 3 25 0 0 Participate in LKMD activities 1 6 1 7 1 1 0 0 0 0 0 0 0 0 1 1 Be part of the RT/RW Board 3 19 1 7 2 1 1 9 0 0 2 14 1 8 1 0 Collect donations 1 6 1 7 0 0 1 9 1 11 1 7 1 8 0 0 Entertain official visitors 0 0 1 7 0 1 0 0 0 0 0 0 0 0 0 1 Help neighbors 2 13 2 14 1 1 1 9 1 11 2 14 2 17 0 0 Participate in pengajian/tahlilan 9 56 8 57 1 1 8 73 7 78 9 64 8 67 0 0 Take care of the mosque 1 6 0 1 1 9 1 7 0 Participate in padat karya 0 0 1 7 0 1 0 0 0 0 0 0 0 0 0 1 Earn a living 0 0 1 7 0 1 0 0 0 0 0 0 0 0 0 1 Become a traditional healer 1 6 1 7 1 1 0 0 0 0 0 0 0 0 1 1 Others 3 19 0 1 3 27 3 0
N 16 14 5 5 11 9 14 12 2 2 Note: P= Past; Pr= Present; N= total number of discussion groups

The SMERU Research Institute, December 2003 137
Appendix 19. Violence Against Women in the Past and at Present based on FGDs in Various Types of Communities
Type of Community
Total Rice farming
Dry-land farming Forest and plantation Urban informal sector and labor Types of Violence
P % Pr % P Pr P Pr P Pr P % Pr % Never existed 1 8 3 23 1 1 0 0 0 1 0 0 1 20 Seldom occurs 0 0 0 0 0 0 0 0 0 0 0 0 0 0 Verbal abuse 1 8 1 8 1 1 0 0 0 0 0 0 0 0 Restrictions due to jealousy 2 17 2 15 0 0 2 2 0 0 0 0 0 0 Yelling 8 67 7 54 0 0 4 4 1 0 3 75 3 60 Hitting 10 83 8 62 1 1 4 4 1 0 4 100 3 60 Slapping 1 8 1 8 0 0 0 0 1 0 0 0 1 20 Threats 1 8 1 8 0 0 1 1 0 0 0 0 0 0 Husbands have affairs 5 42 4 31 0 0 2 2 0 0 3 75 2 40 Rape 1 8 1 8 0 0 1 1 0 0 0 0 0 0 Abandonment for a short period of time 0 0 1 8 0 0 0 0 0 0 0 0 1 20 Husband leaves and remarries 2 17 1 8 0 0 0 0 1 0 1 25 1 20 Confinement at home 2 17 2 15 0 0 2 2 0 0 0 0 0 0 Isolation 1 8 1 8 0 0 1 1 0 0 0 0 0 0 Heavier work loads 2 17 1 8 0 0 1 1 0 0 1 25 0 0 Treated as property 2 17 2 15 0 0 2 2 0 0 0 0 0 0 Sold as prostitutes 1 8 0 0 0 1 25 Husband want to have things his own way 1 8 1 8 0 0 1 1 0 0 0 0 0 0 Girls are prohibited to go to school 0 0 1 8 0 0 0 1 0 0 0 0 0 0 Wife’s jewelry is sold for gambling 1 8 0 0 0 1 25
N 12 13 2 2 5 5 1 1 4 12 Note: P= Past; Pr= Present; N= total number of discussion groups

The SMERU Research Institute, December 2003 138
Appendix 20. Violence against Women at Present based on FGDs in Urban and Rural Areas, in Java and Nusa Tenggara, and with Male, Female and Mixed Groups
Area Discussion Groups
Java Nusa Tenggara Rural Urban Female Male Mixed Types of Violence
P % Pr % P Pr P Pr P % Pr % P Pr P Pr P % Pr % Never existed 1 14 3 38 0 0 1 2 0 0 1 13 0 0 0 0 1 17 3 43 Seldom occurs 0 0 0 0 0 0 0 0 0 0 0 0 0 0 0 0 0 0 0 0 Verbal abuse 1 14 1 13 0 0 0 0 1 20 1 13 0 0 0 0 1 17 1 14 Restrictions due to jealousy 0 0 0 0 2 2 2 2 0 0 0 0 1 1 1 1 0 0 0 0 Yelling 4 57 3 38 4 4 5 4 3 60 3 50 3 3 3 3 2 33 1 14 Hitting 6 86 4 50 4 4 5 4 5 100 4 67 3 2 3 3 4 67 3 43 Slapping 1 14 1 13 0 0 1 0 0 0 1 17 0 0 0 1 1 17 0 0 Threats 0 0 0 0 1 1 1 1 0 0 0 0 1 1 0 0 0 0 0 0 Husband have affairs 3 43 2 25 2 2 2 2 3 60 2 33 1 1 2 1 2 33 2 29 Rape 0 0 0 0 1 1 1 1 0 0 0 0 1 1 0 0 0 0 0 0 Abandonment for a short period of time 0 0 1 13 0 0 0 0 0 0 1 17 0 1 0 0 0 0 0 0 Husband leaves and remarries 2 29 1 13 0 0 1 0 1 20 1 17 1 0 0 1 1 17 0 0 Confinement at home 0 0 0 0 2 2 2 2 0 0 0 0 1 1 1 1 0 0 0 0 Isolation 0 0 0 0 1 1 1 1 0 0 0 0 0 0 0 0 1 17 1 14 Heavier work loads 1 14 0 0 1 1 1 1 1 20 0 0 1 1 1 0 0 0 0 0 Treated as property 0 0 0 0 2 2 2 2 0 0 0 0 1 1 0 0 1 17 1 14 Sold as prostitutes 1 14 0 0 1 20 0 1 0 0 Husband wants to have things his own way
0 0 0 0 1 1 1 1 0 0 0 0 1 1 0 0 0 0 0 0
Girls are prohibited to go to school 0 0 0 0 0 1 0 1 0 0 0 0 0 0 0 1 0 0 0 0 Wife’s jewelry is sold for gambling 1 14 0 0 0 0 1 20 0 1 0 0
N 7 8 5 7 7 5 6 3 3 6 7 Note: P= Past; Pr= Present; N= total number of discussion groups

The SMERU Research Institute, December 2003 139
Appendix 21. Types of Assets Mentioned by Communities
Money/Savings/ Jewelry Land/Buildings Agricultural/Plantation Products
Livestock/Fish Motor Vehicles Electronic Appliances Household Furniture and Items Tools and Equipments
Money Savings Jewelry Clothing
House Land Kiosks Rice-fields Plantations • Rubber • Banana • Coconut Fish farms
Agricultural produce • Rice • Corn • Vegetables Plantation produce Livestock • Cows • Buffalos • Horses • Pigs • Lambs/goats Small farm animals • Chickens • Ducks Pets Fish
Cars Motorcycles Bicycles Carts Becak (pedicabs) Bajaj (motorized
pedicabs) Small boats
Radios TVs Mobile phones/
telephones Refrigerators Washing machines Clocks Fans Guitars Water pumps
Tables Chairs Dining tables Wardrobes Beds Side boards Sofas Brooms Rakes Mats Household utensils Kitchen appliances • Stoves • Pans, washbasins • Blenders • Crockery • Eating utensils • Cooking utensils Gasoline lamps Oil lamps Lights
Agricultural equipment • Plows • Hoes • Pitchforks • Axes, machetes • Sprayers • Sickles • Shovels • Tractors Workshop tools Sewing tools Fishing equipment • Fishing tackle • Buckets • Nets • Fish cages • Boats Carpentry tools • Saws • Wood • Brushes and rollers • Hammers, tongs • Chainsaws • Ladders • Solders Others • Carrying pole • Shoe soles • Carano • Cages • Baskets • Rice barns • Mortar

The SMERU Research Institute, December 2003 140
Appendix 22. Summary of the Analysis of the Solutions to Poverty
Island Type of Area
Total Java Nusa
Tenggara Sumatra Sulawesi Kalimantan Rural Urban
N = 53 (%) 24 (%) 8 (%) 14 (%) 3 (%) 4 (%) 35 (%) 18 (%)
1 God's blessing 9 17.0 3 12.5 - - 5 35.7 - - 1 25.0 8 22.9 1 5.6
2 Self effort
2a Collective work or formation of community groups 6 11.3 - - 1 12.5 4 28.6 1 33.3 - - 5 14.3 1 5.6
2b Economize 6 11.3 3 12.5 1 12.5 - - - - 2 50.0 5 14.3 1 5.6
2c Industriousness 17 32.1 9 37.5 1 12.5 4 28.6 - - 3 75.0 12 34.3 5 27.8
2d Save money 6 11.3 2 8.3 1 12.5 1 7.1 - - 2 50.0 5 14.3 1 5.6
3 Social Protection
3a Natural disaster management 1 1.9 - - 1 12.5 - - - - - - 1 2.9 - -
3b Assistance from children 3 5.7 2 8.3 - - 1 7.1 - - - - 1 2.9 2 11.1
3c Health services/insurance 7 13.2 3 12.5 - - 1 7.1 2 66.7 1 25.0 5 14.3 2 11.1
4 Capacity Building
4a Capital assistance 35 66.0 18 75.0 4 50.0 8 57.1 2 66.7 3 75.0 21 60.0 14 77.8
4b Education improvements 14 26.4 6 25.0 2 25.0 3 21.4 2 66.7 1 25.0 9 25.7 5 27.8
4c Reduce education costs/provide scholarships 11 20.8 6 25.0 2 25.0 1 7.1 1 33.3 1 25.0 6 17.1 5 27.8
4d Training 16 30.2 5 20.8 2 25.0 5 35.7 3 100.0 1 25.0 10 28.6 6 33.3
4e Access to resources 6 11.3 2 8.3 2 25.0 1 7.1 1 33.3 - - 5 14.3 1 5.6
4f Escape the rentenir trap 3 5.7 2 8.3 1 12.5 - - - - - - 1 2.9 2 11.1
5 Employment/Business and Increase in Income
5a Become a migrant worker 4 7.5 1 4.2 2 25.0 1 7.1 - - - - 3 8.6 1 5.6
5b Work in another region/transmigrate 3 5.7 1 4.2 1 12.5 1 7.1 - - - - 2 5.7 1 5.6
5c Employment opportunities 20 37.7 13 54.2 2 25.0 3 21.4 - - 2 50.0 10 28.6 10 55.6
5d Increase wages/salary 1 1.9 1 4.2 - - - - - - - - - - 1 5.6

The SMERU Research Institute, December 2003 141
Appendix 22. (Continued) Summary of the Analysis of the Solutions to Poverty
Island Type of Area
Total Java Nusa
Tenggara Sumatra Sulawesi Kalimantan Rural Urban
N = 53 (%) 24 (%) 8 (%) 14 (%) 3 (%) 4 (%) 35 (%) 18 (%)
6 Assistance and Business Protection
6a Price protection and marketing assistance 7 13.2 1 4.2 - - 4 28.6 1 33.3 1 25.0 5 14.3 2 11.1
6b Provision of production input/equipment 5 9.4 2 8.3 1 12.5 - - 2 66.7 - - 4 11.4 1 5.6
7 Provision of Public Facilities and Infrastructure
7a Construction/repair roads (transportation improvement) 12 22.6 6 25.0 1 12.5 2 14.3 3 100.0 - - 9 25.7 3 16.7
7b Electricity supplyv 3 5.7 2 8.3 - - - - 1 33.3 - - 2 5.7 1 5.6
7c Provision of communication facilities 1 1.9 - - - - 1 7.1 - - - - 1 2.9 - -
7d Flood management 6 11.3 2 8.3 1 12.5 2 14.3 - - 1 25.0 2 5.7 4 22.2
7e Construction/repair irrigation 8 15.1 1 4.2 1 12.5 2 14.3 3 100.0 1 25.0 7 20.0 1 5.6
7f Water supply 4 7.5 3 12.5 - - - - 1 33.3 - - 3 8.6 1 5.6
8 Protect/maintain the environment 3 5.7 1 4.2 - - 1 7.1 - - 1 25.0 2 5.7 1 5.6
9 Guarantee security/law enforcement & resolve social problems
9a Guaranteed security/law enforcement 9 17.0 2 8.3 3 37.5 2 14.3 2 66.7 - - 6 17.1 3 16.7
9b Reduce alcoholism, gambling & divorce 4 7.5 1 4.2 2 25.0 1 7.1 - - - - 3 8.6 1 5.6
10 Community Assistance
10a Government extension work and services 12 22.6 3 12.5 2 25.0 4 28.6 2 66.7 1 25.0 8 22.9 4 22.2
10b Increase the role of NGOs 2 3.8 2 8.3 - - - - - - - - - - 2 11.1
11 Control over the price of consumer goods 6 11.3 6 25.0 - - - - - - - - 2 5.7 4 22.2

The SMERU Research Institute, December 2003 142
Appendix 22. (Continued) Summary of the Analysis of the Solutions to Poverty
Type of Community
Rice Farming Dry-land Farming Forest and
Plantation Coastal Fishing Urban Informal Sector and Labor Mixed
N = 12 (%) 10 (%) 11 (%) 6 (%) 10 (%) 4 (%)
1 God's blessing 1 8.3 1 10.0 5 45.5 1 16.7 1 10.0 - -
2 Self effort
2a Collective work or formation of community groups 2 16.7 3 30.0 1 9.1 - - - - - -
2b Economize 1 8.3 1 10.0 2 18.2 1 16.7 1 10.0 - -
2c Industriousness 1 8.3 3 30.0 6 54.5 2 33.3 4 40.0 1 25.0
2d Save money 1 8.3 2 20.0 2 18.2 1 16.7 - - - -
3 Social Protection
3a Natural disaster management - - 1 10.0 - - - - - - - -
3b Assistance from children 1 8.3 - - - - - - 2 20.0 - -
3c Health services/insurance 5 41.7 - - 1 9.1 - - 1 10.0 - -
4 Capacity Building
4a Capital assistance 10 83.3 3 30.0 6 54.5 5 83.3 9 90.0 2 50.0
4b Education improvements 5 41.7 1 10.0 3 27.3 2 33.3 3 30.0 - -
4c Reduce education costs/provide scholarships 4 33.3 - - 1 9.1 1 16.7 4 40.0 1 25.0
4d Training 6 50.0 1 10.0 2 18.2 2 33.3 5 50.0 - -
4e Access to resources 1 8.3 1 10.0 2 18.2 2 33.3 - - - -
4f Escape the rentenir trap - - - - - - 1 16.7 2 20.0 - -
5 Employment/Business and Increase in Income
5a Become a migrant worker 1 8.3 1 10.0 1 9.1 1 16.7 - - - -
5b Work in another region/transmigrate - - - - - - 3 50.0 - - - -
5c Employment opportunities 3 25.0 3 30.0 2 18.2 2 33.3 8 80.0 2 50.0
5d Increase wages/salary - - - - - - - - 1 10.0 - -

The SMERU Research Institute, December 2003 143
Appendix 22. (Continued) Summary of the Analysis of the Solutions to Poverty
Type of Community
Rice Farming Dry-land Farming Forest and
Plantation Coastal Fishing Urban Informal Sector and Labor Mixed
N = 12 (%) 10 (%) 11 (%) 6 (%) 10 (%) 4 (%)
6 Assistance and Business Protection
6a Price protection and marketing assistance 2 16.7 2 20.0 2 18.2 - - 1 10.0 - -
6b Provision of production input/equipment 3 25.0 - - - - 1 16.7 - - 1 25.0
7 Provision of Public Facilities and Infrastructure
7a Construction/repair roads (transportation improvement) 8 66.7 1 10.0 1 9.1 1 16.7 1 10.0 - -
7b Electricity supply 1 8.3 - - - - - - 1 10.0 1 25.0
7c Provision of communication facilities 1 8.3 - - - - - - - - - -
7d Flood management - - 1 10.0 1 9.1 1 16.7 1 10.0 2 50.0
7e Construction/repair irrigation 5 41.7 1 10.0 2 18.2 - - - - - -
7f Water supply 2 16.7 - - 1 9.1 - - 1 10.0 - -
8 Protect/maintain the environment - - 1 10.0 1 9.1 - - 1 10.0 - -
9 Guarantee security/law enforcement & resolve social problems
9a Guaranteed security/law enforcement 2 16.7 3 30.0 - - 1 16.7 3 30.0 - -
9b Reduce alcoholism, gambling & divorce 1 8.3 1 10.0 - - 1 16.7 1 10.0 - -
10 Community Assistance
10a Government extension work and services 4 33.3 4 40.0 2 18.2 1 16.7 1 10.0 - -
10b Increase the role of NGOs - - - - - - - - 2 20.0 - -
11 Control over the price of consumer goods 3 25.0 - - - - - - 2 20.0 1 25.0

The SMERU Research Institute, December 2003 144
Appendix 23. List of Expressions - Solutions to Poverty
1
Ada ijin dari Tuhan God's blessing
Ada ijin dari Tuhan God's blessing
Bisa usaha sendiri tetapi tergantung kehendak Tuhan
Able to manage own business, but it depends on God's will.
Jika ada ijin/keajaiban dari Tuhan God's blessing or miracle from God
Kemiskinan sudah takdir Poverty is fate
Memohon kepada Tuhan supaya hujan turun
Pray to God for rain
Tidak mungkin karena usaha selalu gagal dan tidak punya modal
Impossible to run business due to failure and lack of capital
Upacara tradisional untuk mengatasi kemarau panjang
Traditional ceremony to overcome long drought
2a
Gotong Royong/ Pengorganisasian
Collective work or formation of community groups
Bersatu Work together
Gotong royong & tolong menolong Collective work or mutual-assistance
Membentuk arisan Form arisan groups
Memotivasi masyarakat untuk aktif dalam aktivitas kelompok
Encourage community to become actively involved in group activities
Mengaktifkan Lembaga Desa, BPD, PKK, Kelompok tani
Activate village institutions, BPD, PKK, Farmer Groups
Menggerakkan PKK Mobilize and promote PKK
Pembentukan intituisi masyarakat berdasarkan kelompok UEP
Set up community institutions based on UEP group
Ta'jiyah, menjenguk orang meninggal
Ta'jiyah, pay a condolence visit
Usaha bersama untuk pengembangan ekonomi
Joint efforts for economic development
2b
Berhemat Economize
Berhemat Economize
Berobat pada dukun tradisional/membeli obat di warung
Go to traditional healers or purchase medicine at stalls
Mengurangi adat 'sumbangan/ besekan'
Reduce contributions/besekan for adat ceremonies
Mengurangi biaya adat Reduce expenses for adat ceremonies
2c
Bekerja Keras Industriousness
Asalkan mau berusaha Where there is faith, there is a way
Bekerja keras Work hard
Bekerja lebih keras Work harder
Berusaha keras dan giat bekerja Never lose heart and work hard Kerja keras untuk cari makan Work hard in order to obtain food
Lebih giat bekerja Work harder
Mau kerja apa saja selain bertani Willing to do all kind of jobs except farming
Membangun budaya kerja yang baik untuk melawan kemalasan
Build a strong work ethic to fight laziness
Mengolah lahan dengan kerja keras
Work hard on cultivating the fields
Nasehat dan bimbingan pada yang malas
Advices and guidance for those who are lazy
Rajin bekerja Work hard
Usaha sendiri Run own business
2d
Menabung Save money
Bisa menabung dan menyimpan sebagian hasil usaha
Able to save some money from business revenues
Menabung Save money
Mengikuti arisan Participate in arisan
3a
Penanggulangan Bencana Alam Natural disaster management
Menanggulangi angin ribut Deal with the impact of storms (hurricanes)
3b
Bantuan dari anak Assistance from children
Anak bisa mengangkat orang tua Children could possibly improve parents’ status
Dibantu anak saat sudah besar Support from adult children
Mengharapkan peran anak Expect that children will take over their roles
3c
Jaminan/ Layanan Kesehatan Health services/Insurance
Agar pemerintah mengurus orang jompo
Government should take care the aged
Alat KB murah Cheaper contraceptives
Bantuan agar biaya pengobatan terjangkau
Assistance so that medical services/medication are affordable
Bantuan biaya bagi yang harus berobat ke rumah sakit
Assistance for those going to hospital
Biaya berobat gratis di Puskesmas untuk keluarga miskin
Free medical check ups and medication at puskesmas for the poor
Kartu sehat untuk 'jompo' Health cards for the aged
Pembukaan pustu Open secondary healthcare centers (pustu)
Posyandu Posyandu
Puskesmas ada Puskesmas already exist

The SMERU Research Institute, December 2003 145
Appendix 23. (Continued) List of Expressions - Solutions to Poverty
4a
Bantuan Modal Capital assistance
Ada bantuan modal dari pemerintah untuk dagang ikan kering/ terasi
Government provides capital support for salted/dried fish traders
Modal sewa tanah Capital assistance to rent land
Ada bantuan modal. Khususnya ternak
Capital assistance, especially in the form of livestock
Asal ada modal usaha, kalau dapat bantuan ternak domba
If obtain assistance in the form of capital, breed sheep
Asal ada usaha dan modal buat usaha
As long as there is work and capital
Bantuan akses modal yang memadai
Adequate assistance to access capital
Bantuan dari orang lain (modal & lahan)
Assistance from others (capital and land)
Bantuan dari pemerintah berupa traktor tangan
Assistance from the government in the form of small tractors
Bantuan modal bergulir Provision of revolving fund
Bantuan modal untuk beli perahu Capital assistance for purchasing boats
Bantuan alat-alat pertanian Provision of agricultural equipment
Bantuan modal untuk usaha sesuai keahlian masyarakat (lahan, itik)
Capital assistance for business in line with community skills (farm land, ducks)
Bantuan modal/kredit dari pemerintah atau orang kaya
Capital/credit from the government or the rich
Bantuan pemerintah untuk modal, bibit & alat pertanian
Government assistance in the form of capital, seeds & agricultural equipment
Bantuan sapi dan kambing Assistance in the form of cows and goats
Kredit bunga rendah untuk beli alat tangkap (perahu, jaring & mesin)
Low interest loans for purchasing fishing equipment (boats, nets and machines)
Memperbaiki kondisi rumah Renovate house
Kredit murah tanpa agunan yang bisa digunakan dagang
Low-interest loans which do not require collateral and can be used for trade
KUD disubsidi Subsidized cooperatives (KUD)
Bantuan UEP UEP assistance
Membeli ternak sapi Purchase cows
Modal Capital
Modal usaha khususnya usaha kecil, misalnya kredit murah
Capital for micro-businesses, such as low-interest loans
Peminjaman modal usaha kepada masyarakat
Business loans for the community
Punya koneksi untuk dapat modal Have connections to obtain capital
Modal untuk usaha dagang/warung Capital for small shops/restaurants
4b
Peningkatan pendidikan Education improvements
Anaknya disekolahkan agar kehidupannya lebih baik daripada ortunya
Send children to school so that there life is better than their parents’ life
Guru datang ke rumah kalau murid tidak masuk
Teachers visit the homes of students who are absent
Membangun SLTP/SLTA Build junior and senior high schools
Memberi pengarahan kepada orang tua tentang pentingnya pendidikan untuk mendapatkan ilmu pengetahuan & keterampilan berusaha
Advise parents on the importance of education for improving knowledge and skills
Meningkatkan pendidikan formal Improve formal education
Meningkatkan pendidikan penduduk
Improve community education
Menyekolahkan anak supaya kelak tidak hidup susah dan bisa membantu ortu
Send children to school for a better future and so that they able to help parents
Peningkatan pendidikan Education improvements
Perbaikan sarana pendidikan Improve school facilities
Sekolah atau pendidikan agar berwawasan luas dan bisa menghitung keuntungan dan kerugian
School and education to provide broader perspectives that allow people to determine the disadvantages or advantages
4c
Menurunkan biaya pendidikan/ memberi Beasiswa
Reduce education costs/ provide scholarships
Beasiswa Scholarships
Beasiswa SD - SMU untuk keluarga miskin
Primary and high school scholarships for poor families
Biaya pendidikan diturunkan School tuition fees should be decreased
Pembebasan uang sekolah dan memberi seragam gratis
Free schooling and uniforms
Pendidikan gratis Free education
Sekolah dekat, menghemat biaya School closer to home to reduce costs
4d
Peningkatan Ketrampilan Training
Perlu dukungan pelatihan ketrampilan dari pemerintah
Require training assistance from the government
Ada lembaga yang membantu meningkatkan ketrampilan/ kemampuan orang miskin
Institutions which help improve the skills/capabilities of the poor already exist
Diberi pelatihan ketrampilan & penambahan pengetahuan
Have been provided with training to improve skills and knowledge

The SMERU Research Institute, December 2003 146
Appendix 23. (Continued) List of Expressions - Solutions to Poverty
4d
Peningkatan Ketrampilan Training
Memberikan pembinaan & pelatihan untuk usaha industri pengolahan hasil usaha tani
Provide skills development and training for businesses that process agricultural products
Memotivasi masyarakat melalui kegiatan penyuluhan/studi banding/ magang kerja bagi masyasrakat usia muda berpotensi dan telah putus sekolah
Motivate communities through extension work, comparative studies and apprenticeships for youths and school dropouts
Mengikuti penyuluhan pertanian Attend agricultural extension work
Meningkatkan SDM melalui pendidikan non-formal
Develop human resources through non-formal education
Pelatihan Training
Pelatihan cara bertani, membuat proyek percontohan pertanian
Train farmers in farming methods and create agricultural pilot projects
Pelatihan ketrampilan (selain nelayan)
Skills training (other than fishing skills)
Pelatihan ketrampilan gratis untuk perempuan untuk menciptakan kesempatan kerja
Free training for women to improve employment prospects
Pelatihan komputer, dagang, elektronik, dll.
Computer, trading and electronics training
Pelatihan membuat pupuk organik Train people how to produce organic fertilizer
Pelatihan pertanian dan pembuatan kompos
Agricultural and compost training
Pelatihan tukang batu dan penganyam
Training for masons and craftsmen
Pelatihan usaha Business development training
Program pengaturan keuangan rumah tangga
Household finance management programs
4e
Akses thd Sumberdaya Access to resources
Menanam bambu di lahan tidak produktif
Plant bamboo in unproductive areas
Mencari rencek kayu dan menderek pinus
Collect firewood and tap pine trees
Mengatur zona penangkapan ikan Regulate fishing zones
Pembukaan lahan baru oleh pemerintah
Government clears land
Ijin pengolahan lahan pinus Permit for the management of pine plantations
Penertiban pemakaian Gill Net Control the use of gillnets
4f
Mengatasi Jerat Rentenir Escape the rentenir trap
Memblokir rentenir Barring rentenir from operating in an area
Membuat koperasi simpan-pinjam atau semacamnya
Establish a savings and loans cooperative
Operasi rentenir Programs to eliminate rentenir
5a
Menjadi TKI Become an Indonesian migrant worker (TKI)
Menjadi TKI Become an Indonesian migrant worker (TKI)
5b
Kerja di luar daerah/ transmigrasi
Work in another region/ transmigrate
Bekerja ke luar daerah Work in another region
Pindah desa ke lokasi lain Move to another area/village
Transmigrasi Transmigration
5c
Lapangan Kerja Employment opportunities
Ada lembaga yang memperkenalkan kegiatan produktif baru
Institutions which introduce new productive activities are already present
Perempuan bisa dagang sayur atau memelihara ayam kampung
Women sell vegetables and raise free-range chickens
Ada perluasan lapangan kerja There has been an expansion of employment opportunities
Dapat dibuka pabrik yang menyerap tenaga kerja sesuai kemampuan masyarakat desa
Open factories to absorb workforce (in line with the villagers’ capacity)
Dibukanya lapangan pekerjaan sesuai dengan kemampuan masyarakat
Create employment opportunities (in line with the villagers’ capacity)
Lapangan kerja baru New employment opportunities
Koneksi untuk dapat pekerjaan Connections to obtain work
Lapangan kerja tetap Permanent jobs
Lapangan pekerjaan Employment opportunities
Memburuh di sana-sini Work as a laborer anywhere
Ada pekerjaan yang lebih pasti There are more permanent jobs
Mengatasi pengangguran Overcome unemployment
Menyediakan lapangan kerja dgn membuka perkebunan besar
Provide employment opportunities by establishing large plantations
Padat karya Labor-intensive programs
Pekerjaan serabutan sebagai pemecah batu/bata
Various odd jobs crushing rocks
Membuka usaha pembuatan tempe/tahu, menjahit atau pelihara ayam
Establish tempeh/tofu, sewing or poultry businesses
Usaha catering, bengkel dan transportasi
Catering, garage and transport businesses
Beternak kambing atau sapi Raise goats and cattle (cows)
Pekerjaan serabutan Various odd jobs
5c
Lapangan Kerja Employment opportunities
Lapangan kerja yang tersedia buruh tani, keduk pasir, tebang tebu
Available jobs include farm laboring, quarrying or cutting sugarcane
Pemerintah mendirikan pabrik pengolahan singkong, orang miskin jadi pekerjanya
Government has established a cassava processing factory so that the poor can work as laborers
Akses ke tanah perhutani untuk peningkatan lapangan pekerjaan
Access to Perhutani land to increase employment opportunities
Tambahan lapangan kerja dgn meminta pada pengusaha untuk memberi pekerjaan pada warga sekitar
Increase employment opportunities by urging investors to recruit local employees
Tidak lagi kerja serabutan There are no more odd jobs

The SMERU Research Institute, December 2003 147
Appendix 23. (Continued) List of Expressions - Solutions to Poverty
5d
Peningkatan Gaji/ Upah Increase wages/salaries
Gaji buruh dinaikkan sehingga mencukupi kebutuhan hidup
Laborer wages should be increased to cover basic necessities
6a
Perlindungan Harga dan Pemasaran
Price protection and marketing assistance
Meningkatkan sistem tataniaga dan menggalang usaha kemitraan petani dalam permodalan, penggunaan teknologi dan pemasaran hasil pertanian
Improve trade systems and promote farming partnerships to increase capital, the use of technology and marketing of agricultural produce
Bantuan pemasaran Marketing assistance
Pasar Kecamatan Sub-district market
Mencari pemasaran Pursue marketing
Menjual hasil produksi pekarangan berupa sayuran atau buah-buahan
Sell garden products such as fruit and vegetables
Pasar dan harga hasil pertanian yang memadai
Adequate market and prices of agricultural produce
Pembukaan pasar desa Establish village markets
Pengembangan koperasi petani karet untuk menghadapi pedagang
Establish cooperatives for rubber farmers in order to deal with traders
6b
Ketersediaan Input/ Sarana Produksi
Availability of inputs and production facilities
Pupuk dan obat-obatan Fertilizers and pesticides
Kemudahan mendapat pupuk tablet
Improve access to tablet fertilizer
Memanfaatkan pupuk kandang Make use of organic fertilizer
Pengadaan bibit ternak Provision of a different breed of livestock
Membuat lantai jemur untuk mengeringkan ikan
Construct concrete floors to dry fish
Pengadaan bibit dan saprodi dengan harga murah
Provision of cheaper breeds and agricultural inputs
7a
Pembangunan/ Perbaikan jalan (Transportasi)
Construction/Road repairs (transportation improvements)
Pembangunan jalan Road construction
Pengaspalan jalan Construction of asphalt roads
Pengerasan jalan Construction of paved roads
Peningkatan kualitas jalan Improve road quality
Perbaikan jalan Improve roads
Perbaikan sarana transportasi Improve transportation facilities
7b
Penyediaan Listrik Electricity supplies
Bantuan agar listrik terjangkau orang miskin
Assistance so that the poor can afford electricity
Membeli diesel listrik Purchase diesel engines
7c
Penyediaan Sarana Komunikasi Provision of communication facilities
Sarana & prasarana alat komunikasi
Communication infrastructure and facilities
7d
Pengendalian Banjir Flood management
Membersihkan dan mengeruk alur sungai
Clean and dredge rivers
Pembangunan tanggul sepanjang sungai untuk mencegah banjir
Construct embankments along rivers to manage floods
Penanggulangan banjir Flood management
Pengerukan sungai & pembangunan tanggul untuk mencegah banjir
Dredge river & construct embankments in order to control floods
Pengerukan sungai untuk penanggulangan banjir
Dredge rivers in order to manage floods
7e
Perbaikan/ Penyediaan Irigasi Construction/Irrigation Improvements
Hujan buatan Man-made rain
Irigasi sederhana Simple irrigation systems
Membangun saluran irigasi yang juga mengontrol banjir
Construct irrigation canals which also control floods
Menyiasati ketersediaan air Manage water availability
Pembangunan irigasi Construct irrigation systems
Pengembangan irigasi pertanian untuk meningkatkan produktivitas
Agricultural irrigation development to increase productivity
Perbaikan irigasi Irrigation maintenance
Sistem irigasi alternatif yang tepat guna
Appropriate alternative irrigation systems
7f
Penyediaan Air Bersih Clean water supplies
Akses terhadap air bersih Access to clean water
Penyediaan air bersih Provision of clean water
Sarana air bersih Clean water facilities
8
Menjaga/ Memperbaiki Lingkungan
Protecting/improving the environment
Buru babi dan membersihkan semak belukar
Hunt for wild pigs and weed out scrub/bushes
Kegiatan penghijauan Land rehabilitation and reforestation activities
Menjaga kebersihan lingkungan Keep the environment clean

The SMERU Research Institute, December 2003 148
Appendix 23. (Continued) List of Expressions - Solutions to Poverty
9a
Jaminan Keamanan/ Penegakan Hukum
Guaranteed security/law enforcement
Ada dukungan keamanan dari pemerintah
There is already security assistance from the government
Ijin senjata api Gun permits
Menegakkan aturan zona penangkapan ikan untuk mencegah konflik
Enforce regulations in fishing areas to avoid conflicts
Mengaktifkan aparat kepolisian di malam hari
Put policemen on night duty
Mengaktifkan Siskamling Organize neighborhood watch
Mengatasi pencurian Overcome theft
Merangkul masyarakat untuk mengurangi pencurian
Involve the community in reducing theft
Pemberdayaan masyarakat untuk siskamling dengan bantuan aparat keamanan
Community empowerment in neighborhood watch with support from security apparatus
Pemisahan lahan penduduk dengan pagar permanen dari lahan pinus
Separate local community’s land from pine plantations with a permanent fence
Penanganan pencurian ternak Handle livestock theft
Peningkatan keamanan Security improvements
9b
Menanggulangi Mabuk, Judi dan Perceraian
Reduce alcoholism, gambling and divorce
Memberantas minum-minuman keras dan berjudi
Eliminate alcoholic drinks and gambling
Mengatasi perceraian dengan memberi pendidikan agama sejak kecil
Prevent divorce by providing religious education when children are young
Penanggulangan perjudian Reduce gambling
10a
Penyuluhan dan Layanan Pemerintah
Government extension work and services
Informasi lapangan pekerjaan Information on employment opportunities
JPS betul-betul untuk orang miskin Social Safety Net should only be for the poor
Memerlukan tenaga, khususnya aparat pemerintah yang trampil dan jujur
Require skilled and honest government apparatus
Mengaktifkan PPL Organize extension workers
Merencanakan program sesuai kondisi sektor usaha masyarakat yang ada terhadap pengembangan keberdayaan masyarakat
Plan programs in accordance with the existing conditions of the local community’s businesses
Minta surat miskin dari aparat Request a ‘surat miskin’ from government apparatus
Pembinaan terhadap PASUTRI tentang pembinaan Norma Keluarga Kecil dalam berumah tangga khususnya tentang jumlah anak
Counsel couples regarding small family norms, particularly regarding the number of children
Penanggulangan hama tanaman Reduce plant pests
Penyadaran KB dari PLKB Increase awareness of family planning by an extension worker
Penyuluhan KB Family planning awareness education
Penyuluhan kesehatan Health awareness education
Penyuluhan kesehatan lingkungan Environmental extension work
Penyuluhan pemberantasan hama, pemasaran
Pest eradication and produce marketing extension work
Penyuluhan tentang pentingnya pelaksanaan program KB
Education regarding the importance of the family planning program
Perketat program KB Family planning program should be intensified
PPL datang secara rutin Extension workers make regular visits
PPL yang bekerja dengan rakyat Extension workers work actively with the community
10b
Peningkatan Peran LSM Increase the role of NGOs
Ada pendampingan dari LSM Assistance from NGOs
Menempatkan LSM yg berpihak pada mereka
NGOs should be on their side
11
Pengendalian Harga-Harga Control over the price of consumer goods
Menjaga harga beras tetap rendah Keep the price of rice low
Menurunkan harga sembako Lower prices of basic commodities
OPK diberikan secara rutin Subsidized rice is delivered regularly
Pengadaan sembako murah khususnya di musim kemarau
Provision of cheap basic commodities, particularly during droughts
Penurunan harga sembako Lower the price of basic commodities
Sembako murah Cheap basic commodities

The SMERU Research Institute, December 2003 149
Appendix 24. Summary of the Analysis of the Impact of Poverty
Island Total by Village Java Nusa Tenggara Sumatra Sulawesi Kalimantan
N = 44 (%) 20 (%) 7 (%) 11 (%) 2 (%) 4 (%) Increase in crime 8 18.2 6 30.0 2 28.6 0 - 0 - 0 - Social problems 4 9.1 4 20.0 0 - 0 - 0 - 0 - Low education or drop out of school 19 43.2 12 60.0 3 42.9 2 18.2 2 100.0 0 - Difficulties in paying school fees 21 47.7 6 30.0 3 42.9 8 72.7 2 100.0 2 50.0 Difficulties in paying education-related expenses 5 11.4 2 10.0 0 - 2 18.2 0 - 1 25.0 Caught up in loans 7 15.9 7 35.0 0 - 0 - 0 - 0 - Difficulties in earning a living 21 47.7 13 65.0 2 28.6 2 18.2 1 50.0 3 75.0 A hard life 10 22.7 6 30.0 3 42.9 1 9.1 0 - 0 - Difficulties in fulfilling needs- food 30 68.2 14 70.0 4 57.1 8 72.7 1 50.0 3 75.0 Difficulties in fulfilling needs- clothing 4 9.1 2 10.0 2 28.6 0 - 0 - 0 - Difficulties in fulfilling needs- housing 11 25.0 5 25.0 3 42.9 2 18.2 0 - 1 25.0 Poor health 16 36.4 9 45.0 3 42.9 0 - 1 50.0 3 75.0 Difficulties in paying for medical expenses 13 29.5 7 35.0 3 42.9 2 18.2 1 50.0 0 - Lack of religious faith 2 4.5 2 10.0 0 - 0 - 0 - 0 - Environmental destruction 2 4.5 1 5.0 0 - 1 9.1 0 - 0 - Difficulties in accessing capital 9 20.5 5 25.0 2 28.6 1 9.1 0 - 1 25.0 Family disharmony 4 9.1 3 15.0 1 14.3 0 - 0 - 0 - Restlessness 9 20.5 7 35.0 1 14.3 1 9.1 0 - 0 - Have to find work and settle in other
regions/countries 3 6.8 2 10.0 1 14.3 0 - 0 - 0 - Isolation 10 22.7 4 20.0 2 28.6 3 27.3 0 - 1 25.0 Child labor 9 20.5 4 20.0 2 28.6 0 - 1 50.0 2 50.0 Receive fewer public services 2 4.5 1 5.0 1 14.3 0 - 0 - 0 -

The SMERU Research Institute, December 2003 150
Appendix 24. (Continued) Summary of the Analysis of the Impact of Poverty
Type of Area Type of Community
Rural Urban Rice Farming Dry-land Farming Forest and Plantation Coastal Fishing
Labor, Informal Sector & Mixed
N = 27 (%) 17 (%) 9 (%) 9 (%) 10 (%) 5 (%) 11 (%) Increase in crime 3 11.1 5 29.4 2 22.2 2 22.2 0 - 0 - 4 36.4 Social problems 0 - 4 23.5 0 - 0 - 0 - 0 - 4 36.4 Low education or drop out of school 11 40.7 8 47.1 5 55.6 3 33.3 3 30.0 2 40.0 6 54.5 Difficulties in paying school fees 11 40.7 10 58.8 4 44.4 4 44.4 5 50.0 2 40.0 6 54.5 Difficulties in paying education-related expenses 2 7.4 3 17.6 0 - 1 11.1 2 20.0 0 - 2 18.2 Caught up in loans 2 7.4 5 29.4 2 22.2 0 - 1 10.0 0 - 4 36.4 Difficulties in earning a living 11 40.7 10 58.8 5 55.6 1 11.1 5 50.0 4 80.0 6 54.5 A hard life 4 14.8 6 35.3 1 11.1 3 33.3 1 10.0 0 - 5 45.5 Difficulties in fulfilling needs- food 19 70.4 11 64.7 6 66.7 5 55.6 8 80.0 4 80.0 7 63.6 Difficulties in fulfilling needs- clothing 3 11.1 1 5.9 0 - 2 22.2 1 10.0 0 - 1 9.1 Difficulties in fulfilling needs- housing 7 25.9 4 23.5 1 11.1 3 33.3 3 30.0 0 - 4 36.4 Poor health 11 40.7 5 29.4 4 44.4 3 33.3 5 50.0 0 - 4 36.4 Difficulties in paying for medical expenses 8 29.6 5 29.4 3 33.3 4 44.4 2 20.0 1 20.0 3 27.3 Lack of religious faith 1 3.7 1 5.9 1 11.1 0 - 1 10.0 0 - 0 - Environmental destruction 1 3.7 1 5.9 1 11.1 0 - 1 10.0 0 - 0 - Difficulties in accessing capital 5 18.5 4 23.5 3 33.3 2 22.2 2 20.0 0 - 2 18.2 Family disharmony 0 - 4 23.5 1 11.1 0 - 0 - 1 20.0 2 18.2 Restlessness 3 11.1 6 35.3 1 11.1 1 11.1 1 10.0 0 - 6 54.5 Have to find work and settle in other
regions/countries 2 7.4 1 5.9 2 22.2 0 - 0 - 1 20.0 0 - Isolation 5 18.5 5 29.4 1 11.1 1 11.1 2 20.0 2 40.0 4 36.4 Child labor 5 18.5 4 23.5 1 11.1 1 11.1 3 30.0 1 20.0 3 27.3 Receive fewer public services 0 - 2 11.8 0 - 0 - 0 - 1 20.0 1 9.1

The SMERU Research Institute, December 2003 151
Appendix 24. (Continued) Summary of the Analysis of the Impact of Poverty
Sex Age
Total by Respondent Female Male Mixed Group Young Old Mixed Group
N = 85 (%) 23 (%) 22 (%) 40 (%) 29 (%) 20 (%) 36 (%) Increase in crime 18 21.2 7 30.4 7 31.8 4 10.0 10 34.5 6 30.0 2 5.6 Social problems 5 5.9 3 13.0 1 4.5 1 2.5 2 6.9 2 10.0 1 2.8 Low education or drop out of school 42 49.4 13 56.5 15 68.2 14 35.0 20 69.0 12 60.0 10 27.8 Difficulties in paying school fees 21 24.7 1 4.3 2 9.1 18 45.0 1 3.4 1 5.0 19 52.8 Difficulties in paying education-related expenses 5 5.9 0 - 1 4.5 4 10.0 0 - 1 5.0 4 11.1 Caught up in loans 14 16.5 7 30.4 4 18.2 3 7.5 9 31.0 5 25.0 0 - Difficulties in earning a living 26 30.6 5 21.7 4 18.2 17 42.5 7 24.1 4 20.0 15 41.7 A hard life 17 20.0 7 30.4 5 22.7 5 12.5 7 24.1 8 40.0 2 5.6 Difficulties in fulfilling needs- food 50 58.8 12 52.2 13 59.1 25 62.5 16 55.2 12 60.0 22 61.1 Difficulties in fulfilling needs- clothing 6 7.1 4 17.4 2 9.1 0 - 4 13.8 2 10.0 0 - Difficulties in fulfilling needs- housing 15 17.6 2 8.7 7 31.8 6 15.0 6 20.7 4 20.0 5 13.9 Poor health 27 31.8 7 30.4 10 45.5 10 25.0 11 37.9 8 40.0 8 22.2 Difficulties in paying for medical expenses 16 18.8 5 21.7 3 13.6 8 20.0 4 13.8 2 10.0 10 27.8 Lack of religious faith 2 2.4 0 - 1 4.5 1 2.5 2 6.9 0 - 0 - Environmental destruction 2 2.4 0 - 1 4.5 1 2.5 1 3.4 0 - 1 2.8 Difficulties in accessing capital 11 12.9 1 4.3 5 22.7 5 12.5 5 17.2 3 15.0 3 8.3 Family disharmony 6 7.1 1 4.3 3 13.6 2 5.0 4 13.8 1 5.0 1 2.8 Restlessness 16 18.8 9 39.1 3 13.6 4 10.0 5 17.2 8 40.0 3 8.3 Have to find work and settle in other
regions/countries 5 5.9 2 8.7 2 9.1 1 2.5 2 6.9 1 5.0 2 5.6 Isolation 12 14.1 2 8.7 3 13.6 7 17.5 3 10.3 3 15.0 6 16.7 Child labor 11 12.9 2 8.7 2 9.1 7 17.5 3 10.3 0 - 8 22.2 Receive fewer public services 2 2.4 0 - 1 4.5 1 2.5 1 3.4 0 - 1 2.8

The SMERU Research Institute, December 2003 152
Appendix 25. List of Expressions - the Impact of Poverty
1 Kriminalitas Meningkat Increase in crime
Banyak pencuri Lots of thieves Banyak pencurian Frequent theft Kejahatan meningkat Increase in crime Menimbulkan pencurian Theft has arisen Pencurian Stealing Premanisme Thuggery Tidak aman Unsafe Timbul kriminalitas Crime has arisen
2
Masalah Sosial Social Problems Judi Gambling Kenakalan remaja Juvenile delinquency Mabuk-mabukan Alcoholism Main perempuan Visit prostitutes/have affairs Pelacur meningkat Increasing number of
prostitutes
3a Pendidikan Kurang / Putus
Sekolah Low education/drop out of
school Anak tidak tamat SD Children do not complete
primary school Anak putus sekolah Children drop out of school Anak tidak bisa melanjutkan sekolah
Children cannot continue their education
Anak tidak sekolah Children do not attend school Bodoh Unintelligent Pendidikan anak kurang Lack of education for children Pendidikan anak rendah Poor education for children Pendidikan maksimal SD Highest level of education is
primary school Putus sekolah Drop out of school Sekolah anak terlantar Children's education is
neglected Sekolah terhambat Access to education is
hampered Tidak bisa melanjutkan sekolah
Unable to continue studying at school
Tidak bisa menyekolahkan anak
Cannot send children to school
Tidak bisa menyekolahkan anak ke tingkat lanjutan
Cannot send children on to a higher level at school
Tidak ke sekolah Do not go to school Tidak mampu menyekolahkan anak
Cannot afford to send children to school
Tidak mempunyai ketrampilan
Do not have any skills
Tidak punya keterampilan yang memadai
Do not have adequate skills
3b Kesulitan membiayai
pendidikan Difficulties in paying school
fees Biaya pendidikan makin berat School fees have become
more expensive Biaya sekolah anak sulit dipenuhi
Difficulties in covering children’s school fees
Menunggak biaya pendidikan Pay school fees in arrears Sulit memenuhi kebutuhan sekolah anak
Difficulties in meeting children’s educational needs
Tidak ada biaya sekolah anak No money to pay school fees Tidak bisa bayar sekolah Unable to pay school tuition Tidak bisa memenuhi kebutuhan biaya pendidikan anak
Unable to meet the cost of children’s education
Tidak mampu membayar biaya sekolah
Unable to pay school fees
3c
Kesulitan biaya penunjang pendidikan
Difficulties in paying education-related expenses
Tidak ada uang untuk beli pakaian sekolah anak
Do not have the money to purchase uniforms
Tidak memiliki buku pelajaran Do not own textbooks Tidak punya uang jajan Do not have money to buy
snacks Tidak punya uang jajan (anak sekolah)
Do not have money to buy snacks (for school children)
4a
Terlilit Hutang Caught up in loans Banyak hutang Lots of debts Hutang Debt Punya hutang Debt Rumah/tanah disita karena hutang
House/land has been confiscated due to debts
Tidak bisa bayar hutang Unable to pay debts
4b
Kesulitan mencari nafkah Difficulties in earning a living Banyak pengangguran High unemployment Bekerja sebagai buruh (RT, pasar dan pelabuhan)
Employed as a laborer (household, market and ports)
Berusaha kembali Try again Hasil pertanian tidak dijual, untuk dikonsumsi
Agricultural produce is not sold, but rather consumed
Ibu-ibu cari uang tambahan Women earn additional income Jika sakit tidak ada penghasilan
No income when sick
Kalau hujan tidak bisa bekerja
Cannot work when it rains
Kesulitan memperoleh uang dan beras
Difficulties in earn a living and purchasing rice
Kesulitan mencari nafkah sehari-hari bila paceklik melaut
Difficulties in earning a living during the West monsoon

The SMERU Research Institute, December 2003 153
Appendix 25. (Continued) List of Expressions - the Impact of Poverty
4b Kesulitan mencari nafkah Difficulties in earning a living
Lapangan kerja susah dicari Difficult to find employment opportunities
Mencari nafkah sulit Difficult to earn a living Pemuda tidak mau bertani karena hasilnya rendah
Young people do not want to work as farmers because of the low income
Pendapatan kecil Low income Pendapatan kecil dan tidak tetap
Low and non-permanent income
Pendapatan kecil karena hasil tidak bisa dijual keluar desa
Low income because produce cannot be sold outside of the village
Pengangguran Unemployment Penghasilan kecil Low earnings Penghasilan rendah dan tidak pasti
Low and uncertain earnings
Penghasilan tidak tetap Uncertain earnings Sulit dapat kerja Difficult to find a job Sulit mencari uang meskipun sudah merantau ke daerah lain
Difficult to make money despite migrating to other areas
Susah cari uang Difficult to earn money Tidak dapat melakukan usaha
Unable to run a business
Tidak punya penghasilan No income
4c
Hidup Susah A hard life Ekonomi rumah tangga sulit Difficult to manage household
expenses Hidup susah A hard life Hidup terlantar Life is miserable Hidup tidak teratur/asal hidup Life is unstable/so long as they
can stay alive Hidupnya sulit Life is hard Kebutuhan hidup tidak tercukupi
Unable to meet basic necessities
Menjual barang rumah tangga
Sell household items
Penghasilan hanya cukup untuk makan
Earnings are only sufficient to for food
Sengsara Life is miserable Sulit mencukupi kebutuhan sehari-hari
Difficult to meet daily necessities
Susah dan sulit Life is hard and tough Tidak bisa beli bahan kebutuhan
Cannot purchase basic necessities
Tidak bisa hidup layak Cannot live a decent life Tidak bisa memenuhi kebutuhan hidup sehari-hari
Cannot fulfill daily necessities
Tidak mampu beli kebutuhan hidup
Unable to purchase basic necessities
Tidak mampu memenuhi kebutuhan sehari-hari
Unable to fulfill daily necessities
5a Kesulitan memenuhi kebutuhan - makan
Difficulties in fulfilling needs - food
Anak kurang gizi Children are malnourished Beras kebutuhan pokok tidak punya
Have no rice which is the staple food
Kebutuhan makan susah dipenuhi secara wajar
Difficult to meet standard food needs
Kebutuhan pokok tidak terpenuhi
Unable to meet staple food needs
Kekurangan beras Lack of rice Kekurangan makan Lack of food Kekurangan pangan Lack of food Kelaparan Starvation Masa paceklik kesulitan makan
Insufficient food during times of food scarcity (droughts/West monsoon)
Kesulitan pemenuhan kebutuhan pokok (makan)
Difficulties in meeting staple food needs
Kesulitan pemenuhan kebutuhan pokok sehari-hari
Difficulties in meeting everyday necessities
Kurang makan Do not eat enough Makan kurang bergizi Food lacks nutrients Makanan sulit Unable to afford food Makan 1-2 x sehari Eat only 1-2 times a day Makan anak di jatah Food for children is allotted Anak kelaparan Children are starving Makan kurang bergizi/tidak menentu
Food lacks nutrients/do not eat on a routine basis
Makan seadanya Eat whatever is available Makan tidak bergizi Food is not nutritious Makan tidak mencukupi Inadequate food Masa paceklik kesulitan makan
Food difficulties during times of food scarcity (droughts/West monsoon)
Mencari sembako sulit Difficulties in obtaining basic commodities
Persediaan makan terbatas Limited food supplies Sulit memenuhi kebutuhan makan
Difficult to meet food requirements
Sulit memenuhi kebutuhan makan sehari-hari
Difficult to meet daily food requirements
Susah makan Cannot afford food
5b
Kesulitan memenuhi kebutuhan - sandang
Difficulties in fulfilling needs – clothing
Kekurangan sandang Lack of clothes Pakaian itu-itu saja Wear the same clothes Tidak bisa membeli pakaian Cannot buy clothes Tidak memiliki kecukupan pakaian
Do not have enough clothes

The SMERU Research Institute, December 2003 154
Appendix 25. (Continued) List of Expressions - the Impact of Poverty
5c Kesulitan memenuhi
kebutuhan - perumahan Difficulties in fulfilling needs
- housing Pemenuhan papan yang layak sulit
Difficult to obtain proper housing
Pemenuhan rumah sulit Difficult to fulfill housing needs Rumah dinding daun Walls of house are made of
leaves Rumah jelek Poorly built house Rumah roboh Dilapidated house Rumah tidak layak Inappropriate house Rumah tidak permanen Non-permanent house Rumah tidak punya atau kurang layak
Do not have a house or house is inadequate
Terlambat bayar sewa rumah Late paying rent Tidak bisa membangun rumah
Unable to build a house
6a
Kondisi Kesehatan Buruk Poor health Angka kematian banyak High mortality rate Kebutuhan kesehatan sulit terpenuhi
Difficult to meet healthcare needs
Kematian Death Kepala pusing, badan lemas kurang vitamin
Headaches, weak, lack of vitamins
Kerja tidak kuat Not strong enough to work Kesehatan kurang Poor health Kesehatan kurang terjaga Unable to take care of one’s
health Kesehatan memburuk Health is deteriorating Kesehatan tidak terjamin Health is not guaranteed Penyakit sudah parah Severe illness Sakit-sakitan Frail
6b
Kesulitan biaya berobat Difficulties in paying for medical expenses
Berobat ke Perawat atau Puskesmas
Seek medical attention from a nurse or puskesmas
Kekurangan biaya kesehatan/berobat
Lack of money for medical expenses/medication
Pasrah ketika sakit Give up when sick Tidak bisa berobat ke dokter Unable to seek medical
attention from a doctor Tidak mampu berobat Unable to pay for medical
treatment Tidak mampu ke dokter Unable to afford to seek
treatment from a doctor Tidak punya biaya berobat Do not have money to pay for
medical treatment Untuk berobat harus berhutang
Borrow money to pay for medical expenses
7 Keimanan berkurang Lack of religious faith
Kekufuran iman Infidelity Malas beribadah Too lazy to pray
8
Merusak Lingkungan Environmental destruction Mencari kayu di hutan Look for firewood in forests Merusak lingkungan Damage the environment
9
Kesulitan modal Difficulties in accessing capital
Kurang modal Lack of capital Kurang modal untuk beli pupuk
Lack the capital to purchase fertilizer
Kurang peralatan melaut bagi nelayan
Fishermen lack fishing equipment
Mencari bantuan modal kerja Seek assistance to obtain capital
Mengajukan permohonan kredit
Submit a request for credit
Modal kurang Lack of capital Sulit mencari modal Difficult to obtain capital Susah mencari tambahan modal
Difficult to obtain additional capital
Tidak ada modal No capital at all Tidak mampu beli vaksin, ternak mati
Unable to buy vaccine, animals die
Tidak punya dagangan No merchandise to trade Tidak punya modal No capital
10a
Permasalahan Rumah Tangga
Family disharmony
Isteri dipukul suami Wife is beaten by husband Keluarga berantakan Broken home Ketentraman keluarga kurang Lack of family harmony Menimbulkan perceraian Causes divorce Perceraian Divorce Perceraian meningkat Increasing divorce rate Rumah tangga cekcok Quarreling in household Sering berkelahi dalam rumah tangga
Quarrels often break out in household

The SMERU Research Institute, December 2003 155
Appendix 25. (Continued) List of Expressions - the Impact of Poverty
10b Ketidak-tenangan Restlessness
Bingung Confused Cita-cita tidak tercapai Never reach goals Frustasi Frustrated Hidup tidak tenang Life is not peaceful Mudah tersinggung Easily offended Pertengkaran keluarga Family quarrels Pikiran terganggu Lack of concentration Selalu khawatir Always anxious Sesali kemiskinan Regret poverty Stress Stressed Susah, sedih, bingung Hard life, sad, confused Takut berhutang Worry about falling into debt Takut kalau sakit Worry about becoming sick Takut kalau tidak bisa makan Worry about not being able to
eat Takut kemiskinan akan berlanjut
Worry that poverty will continue
Takut tidak bisa memenuhi kebutuhan sehari-hari
Worry about not being able to fulfill everyday needs
11
Merantau Migrate Bekerja di malaysia Work in Malaysia Pergi ke kota Migrate to urban areas TKI Become an Indonesian migrant
worker
12 Keterkucilan Isolation
Banyak dihina orang Many are insulted Dikucilkan, kecuali di sekolah Isolated, except at school Hubungan sosial terisolir Isolated from social relations Karena tidak punya uang maka tidak pernah ngobrol atau duduk-duduk di warung
Never chat with other people or sit at stalls because of being poor
Kurang terlibat dalam kegiatan lingkungan
Not involved enough in neighborhood activities
Malu bergaul dengan tetangga
Too embarrassed to socialize with neighbors
Merasa tersisihkan secara sosial
Feel isolated socially
Minder Feel inferior Tidak dipercaya Not trusted Tidak dipercaya meminjam uang
Not trusted to receive loans
Tidak dipercaya pinjam modal
Not trusted to receive business loans
13 Pekerja anak Child Labor
Anak bekerja untuk menghasilkan uang tambahan
Children work for extra money
Anak dibawah umur bekerja sebagai buruh
Children work as laborers
Anak harus bekerja Children have to work Anak harus bekerja dan tidak melanjutkan sekolah
Children have to work and cannot continue their studies
Anak putus sekolah untuk bekerja
Children drop out of school to work
Anak putus sekolah untuk membantu bekerja
Children drop out of school to help parents
Muncul keinginan anak bantu orang tua
Children take the initiative to help parents
Pekerja dibawah umur Workers are under the minimum age of employment
14
Kurang mendapat pelayanan publik
Receive fewer public services
Kurang memperoleh pelayanan dari Puskesmas dan RS
Receive fewer services at puskesmas and hospitals
Mempertanyakan kebijaksanaan pemerintah
Question government policies

The SMERU Research Institute, December 2003 156
Appendix 26. Summary of the Analysis of the Poor’s Coping Strategies
Island Total by Village
Java Nusa Tenggara Sumatra Sulawesi Kalimantan
N = 55 (%) 20 (%) 9 (%) 12 (%) 9 (%) 5 (%)
1 Wives and children work
1a Wives work to earn money 23 41.8 9 45.0 2 22.2 5 41.7 5 55.6 2 40.0
1b Send children to work 11 20.0 2 10.0 1 11.1 5 41.7 - - 3 60.0
2 Obtain additional work 28 50.9 13 65.0 5 55.6 4 33.3 5 55.6 1 20.0
3 Work outside the region 15 27.3 4 20.0 5 55.6 2 16.7 3 33.3 1 20.0
4 Cooperate with wealthier people 6 10.9 4 20.0 1 11.1 - - - - 1 20.0
5 Crop diversification 9 16.4 3 15.0 3 33.3 1 8.3 - - 2 40.0
6 Utilize public natural resources 16 29.1 4 20.0 5 55.6 2 16.7 4 44.4 1 20.0
7 Economize
7a Economize/manage finances 12 21.8 8 40.0 - - 3 25.0 - - 1 20.0
7b Reduce/diversify food 13 23.6 8 40.0 - - 2 16.7 - - 3 60.0
7c Reduce medical costs 2 3.6 2 10.0 - - - - - - - -
7d Reduce education costs 1 1.8 - - - - - - - - 1 20.0
8 Utilize/manage assets
8a Raise and sell farm animals 11 20.0 4 20.0 5 55.6 1 8.3 - - 1 20.0
8b Sell/pawn valuable goods/assets 11 20.0 5 25.0 3 33.3 3 25.0 - - - -
8c Save money/arisan 10 18.2 6 30.0 2 22.2 1 8.3 - - 1 20.0
9 Collective work
9a Help from relatives 11 20.0 4 20.0 2 22.2 4 33.3 - - 1 20.0
9b Collective work/assistance from someone 10 18.2 1 5.0 1 11.1 5 41.7 1 11.1 2 40.0
10 Borrow money/goods 38 69.1 14 70.0 5 55.6 11 91.7 5 55.6 3 60.0
11 Ask for a surat miskin 1 1.8 - - 1 11.1 - - - - - -

The SMERU Research Institute, December 2003 157
Appendix 26. (Continued) Summary of the Analysis of the Poor’s Coping Strategies
Type of Area Type of Community
Rural Urban Rice Farming Dry-land Farming Forest and Plantation Coastal Fishing Urban Informal
Sector and Labor Labor, Informal Sector & Mixed
N = 38 (%) 17 (%) 12 (%) 10 (%) 11 (%) 9 (%) 8 (%) 5 (%)
1 Wives and children work
1a Wives work to earn money 12 31.6 10 58.8 1 8.3 2 20.0 5 45.5 5 55.6 6 75.0 4 80.0
1b Send children to work 5 13.2 5 29.4 - - 1 10.0 5 45.5 1 11.1 3 37.5 1 20.0
2 Obtain additional work 19 50.0 9 52.9 6 50.0 4 40.0 3 27.3 6 66.7 5 62.5 4 80.0
3 Work outside the region 11 28.9 4 23.5 2 16.7 5 50.0 3 27.3 3 33.3 - - 2 40.0
4 Cooperate with wealthier people 6 15.8 - - 2 16.7 1 10.0 2 18.2 1 11.1 - - - -
5 Crop diversification 8 21.1 1 5.9 3 25.0 3 30.0 3 27.3 - - - - - -
6 Utilize public natural resources 13 34.2 3 17.6 5 41.7 2 20.0 3 27.3 5 55.6 1 12.5 - -
7 Economize
7a Economize/manage finances 7 18.4 4 23.5 3 25.0 1 10.0 2 18.2 2 22.2 3 37.5 1 20.0
7b Reduce/diversify food 7 18.4 6 35.3 4 33.3 1 10.0 4 36.4 - - 4 50.0 - -
7c Reduce medical costs 2 5.3 - - 2 16.7 - - - - - - - - - -
7d Reduce education costs 1 2.6 - - - - - - 1 9.1 - - - - - -
8 Utilize/manage assets
8a Raise and sell farm animals 9 23.7 2 11.8 3 25.0 6 60.0 1 9.1 - - - - 1 20.0
8b Sell/pawn valuable goods/assets 7 18.4 4 23.5 1 8.3 2 20.0 2 18.2 3 33.3 3 37.5 - -
8c Save money/arisan 6 15.8 3 17.6 1 8.3 1 10.0 1 9.1 4 44.4 2 25.0 1 20.0
9 Collective work
9a Help from relatives 5 13.2 6 35.3 3 25.0 2 20.0 2 18.2 1 11.1 2 25.0 1 20.0
9b Collective work/assistance from someone 8 21.1 2 11.8 1 8.3 2 20.0 5 45.5 2 22.2 - - - -
10 Borrow money/goods 25 65.8 12 70.6 9 75.0 7 70.0 7 63.6 7 77.8 5 62.5 3 60.0
11 Ask for a surat miskin - - 1 5.9 - - - - - - 1 11.1 - - - -

158
Appendix 27. List of Expressions – the Poor’s Coping Strategies
1a Istri Bekerja Wives work to earn money
Berjualan 'candak-kulak' Run retail business Ibu berjualan kue Wife sells cakes Ibu jadi pembantu RT dan tukang cuci
Wife works as a domestic helper and a laundress
Ibu jadi tukang bungkus krupuk Wife works packing Chinese crackers
Ibu menjadi buruh harian di kebun sayur
Wife works as a laborer in a vegetable farm for a daily wage
Ibu-ibu menjadi pembantu RT Women work as domestic helpers
Ibu-ibu menjual sayur Women sell vegetables Istri ikut jualan di pasar Wife works as a trader at the
market Istri bekerja Wife works Istri cari penghasilan tambahan dengan jual makanan atau cari kerang
Wife works for extra money by selling food and clams/mussels
Istri jualan sayur atau kue Wife sells vegetables or cakes
Istri kerja di kebun Wife works in the garden Istri kerja serabutan di rumah orang kaya
Wife does odd jobs for rich households
Istri membantu menjadi pemulung
Wife helps as a scavenger
Membantu suami dagang makanan atau terima pesanan
Helps husband sell food or provide catering
Membantu suami di sawah Help husband in the rice field Membantu suami jadi tukang cuci
Help husband as a laundress
Perempuan memetik melati di perkebunan
Women pick jasmine on plantations
Perempuan mencari kerang di laut
Women look for clams/mussels on the beach
Wanita jadi buruh pertanian Women work as farm laborers
1b
Anak Bekerja Send children to work Anak bekerja Children work Anak ikut kerja Children also work Anak ikut jualan di pasar Children are involved in
selling things at the market Anak kerja di kebun Children work on vegetable
farms Anak menjadi buruh harian di kebun sayur
Children work as laborers on vegetable farms
Anak-anak memburuh di kebun sawit
Children hunt on palm plantation
Anak-anak menjajakan makanan keliling
Children work as peddlers selling food
Bantu orang tua sortir barang pulungan
Help parents sort used goods/garbage
Mempekerjakan anak pada kegiatan pertanian
Employ children for agricultural activities
2 Kerja Sampingan/ Serabutan Additional work/odd jobs
Bekerja kuli Work as a coolie Bekerja lebih giat Work harder Bekerja pemulung, selain tukang becak
Work as a scavenger in addition to working as a pedicab driver
Bekerja seadanya Take whatever job is available
Bekerja serabutan Do odd jobs Berjualan/ bakulan Sell things Buruh angkat karung di toko Work as a laborer who
carries sacks into shops Buruh angkut kayu Work as a laborer who lifts
wood Buruh menggali/memperbaiki empang
Work as a laborer quarrying/improving fish farms
Buruh serabutan Odd laboring jobs Buruh tani Farm laborer Cari kerja lain untuk bayar hutang sewa
Look for additional work to pay rent
Jadi buruh nelayan (yang masih muda)
Fishing deckhand (if still young)
Jual pakaian bekas-keliling Peddle used clothes Kerja apa saja di pasar Take on any job at the
market Kerja lebih giat, dan mengubah strategi usaha
Work harder and change the business strategy
Kerja penunggu rumah (Pa/i) Work as a guard at someone’s house
Kerja serabutan - seadanya Do odd jobs Kerja serabutan pada tetangga Do odd jobs for neighbors Kerja tambahan memberi les Teach private lessons part-
time Kuli bangunan Construction coolies Laki-laki menjadi buruh cangkul di perkebunan
Work as a laborer who hoes plantations
Masa paceklik kerja bangunan, cari kayu atau apa saja
During dry season/West monsoon, work as a building laborer or search for firewood
Membikin minyak kelapa Produce coconut oil Membuat atap nipah Make roofs made of nipah
palm Memburuh pada orang kaya Work as a laborer for the rich Menangkap ikan dengan peralatan seadanya
Catch fish with simple fishing equipment
Menarik becak di musim kemarau
Drive pedicab during dry season
Menjadi buruh di musim tanam padi
Work as a laborer during rice planting periods
Menjadi buruh pada keluarga yang menghutangi
Work as a laborer for the families one owes money to
Menjadi nelayan di musim kemarau
Work as fishermen during the dry season
Menjual sayur mayur Sell vegetables

159
Appendix 27. (Continued) List of Expressions – the Poor’s Coping Strategies
2 Kerja Sampingan/ Serabutan Additional work/odd jobs
Menyewakan rumah Rent house out Nelayan musiman Seasonal fishermen Pemecah batu Stone crusher Suami ke tambang musim panas
Husband works on a mine during the dry season
Usaha serabutan dan ganti-ganti
Many odd jobs
3
Kerja di Luar Daerah Work outside the region Bekerja di luar daerah Work in another district Bekerja di luar desa Work outside the village Berjualan di Kota Sell things in town Berjualan kelapa,asam kemiri ke kota
Sell coconut, tamarind and candlenut in cities
Cari kerja ke daerah lain Search for a job in another region
Jadi PRT di Kota Work as a domestic helper in the city
Kerja kuli bangunan di kota Work as a construction coolie in a city
Kerja Proyek (Pa/I) Work as a coolie on projects Mboe/mbojo pergi ke luar daerah (transmigrasi)
Mboe/mbojo go to another region (transmigration)
Mencari ikan ke daerah lain Search for fish in another area
Mencari kerja di desa tetangga Look for work in neighboring villages
Mencari kerja ke kota Look for work in cities Menjadi buruh tani di daerah lain
Work as a farm laborer in another district
Menjadi PRT di Jakarta Work as a domestic helper in Jakarta
Menjadi TKI Become a migrant worker Merantau ke luar pulau Nias Move away from Nias Island Migrasi musiman ke Jakarta Seasonal work in Jakarta Pembuat batu bata di luar daerah
Make bricks in other districts
4
Kerjasama dengan orang yang lebih mampu
Cooperate with wealthier people
Pinjaman tanah untuk dikelola Borrow land for farming Bagi hasil tanaman Divide profit from crops Gaduh ternak Divide profit from livestock Memelihara ternak orang lain Raise someone else’s cattle Menggarap tanah mertua Work on parents-in-law’s
land Menjadi buruh bagi hasil Work as a laborer and divide
the profit
5 Diversifikasi Tanaman Crop diversification
Menanam jagung, ubi, sayuran, padi untuk menanggulangi kerugian akibat angin ribut
Plant corn, sweet potatoes, vegetables, and rice in order to minimize the impact of storms
Menanam ketan atau cabe karena harga input padi mahal
Plant glutinous rice or chilies because of the price of inputs to plant rice are high
Menanam sayur dan ubi Plant vegetables and edible tubers
Menanam sayur di pekarangan Plant vegetables in the garden
Menanam sayur untuk kebutuhan sehari-hari
Plant vegetables for daily consumption
Menanam tembakau Plant tobacco Menanam ubi untuk manusia & ternak
Plant edible tubers for human and animal consumption
6
Memanfaatkan SDA Publik Utilize public natural resources
Melaut Fish Memanfaatkan tanah waduk untuk tanam palawija
Plant second crops on the land surrounding dams
Menanam sayuran di pinggir S. Bengawan Solo
Plant vegetables along the Bengawan River, Solo
Menangkap ikan dasar Catch demersal fish Menangkap ikan dengan jaring dekat pantai
Catch fish along the beach using a net
Menarik rotan di hutan Collect rattan in the forest Mencari asam ke hutan Collect tamarind in the forest Mencari kayu bakar untuk arang
Search for firewood
Mencari kayu di hutan Search for wood in the forest Mencari kerang ke laut terutama kalau banjir
Search for clams/mussels at sea, especially during floods
Mencari kerang pada musim angin barat dan timur
Search for clams/mussels during the west and east monsoons
Mencari mangga liar Pick wild mangoes Mencari nener Collect milkfish Mencari ubi hutan atau pinang di hutan
Collect wild tubers or areca nuts in the forest
Menggali dan menjual pasir Dig and sell sand Menggarap tanah perhutani Cultivate Perhutani land Mengumpulkan dan memproses 'jinton'
Collect and process jinton
7a
Berhemat/ mengatur Keuangan
Economize/manage finances
Berhemat Economize Berhemat dengan cara membawa bekal dari rumah
Economize by eating food from home
Berhemat karena pengasilan tidak tetap
Economize because income is irregular

160
Appendix 27. (Continued) List of Expressions – the Poor’s Coping Strategies
7a Berhemat/ mengatur
Keuangan Economize/manage
finance Berhemat sampai panen berikutnya
Economize until the next harvest
Dimusim paceklik menghemat semua pengeluaran
Economize on expenditure during drought/West monsoon
Hati-hati mengatur uang Manage finances carefully Mengatur keuangan dengan beli beras pada saat punya uang
Manage finances by purchasing rice when the money is available
7b
Mengurangi/ Diversifikasi Pangan
Reduce/Diversify food
Beras habis ganti tiwul Consume tiwul if rice runs out
Makan dengan nasi dan sayur saja
Eat rice and vegetables only
Mencampur beras dan jagung untuk konsumsi
Mix rice and corn for food
Mengganti beras dengan sagu dan keladai
Swap rice with sago and keladi
Mengurangi frekuensi dan kualitas makanan
Reduce the number of meals and quality of food
Mengurangi frekuensi makan Reduce the number of meals Mengurangi konsumsi beras Reduce the amount of rice
consumed Makan makanan pengganti (singkong/ubi)
Eat substitutes (cassava/tubers)
Mengurangi makan Reduce food Mengutamakan kenyang, mengurangi lauk
Prioritize being full, reduce protein intake
Tidak makan nasi, hanya bubur Do not eat rice, only eat rice porridge
Tidak membeli lauk pauk Do not purchase food which contains protein
7c
Menghemat biaya berobat Economize on medical costs
Biaya berobat dicicil Pay for medication treatment in installments
Bila sakit pergi ke dukun supaya lebih hemat
When sick, see the village traditional healer in order to economize
7d
Menghemat biaya pendidikan Economize on education costs
Memberhentikan anak (sementara/tetap) dari sekolah
Withdraw children from school (temporarily/ permanently)
8a Memelihara & Menjual ternak Raise and sell farm
animals Jual ayam Sell chickens Jual ayam dan kambing Sell chickens and goats Jual ayam peliharaan Sell chickens raised on the
farm Jual ayam/unggas saat paceklik Sell chickens/fowl during
droughts/West monsoon Memelihara ternak Raise livestock Menjual ternak Sell livestock Menjual ternak ayam Sell chickens Menjual ternak ayam/kambing Sell chickens or goats Ternak ayam/ kambing Raise chickens or goats
8b
Jual/ Menggadaikan barang berharga/ Aset
Sell/pawn valuable goods/assets
Jual emas Sell gold jewelry Jual perabotan rumah tangga Sell household furniture Menggadaikan baju Pawn clothes Menggadaikan barang berharga
Pawn valuables
Menggadaikan kain tenun Pawn woven fabric Menggadaikan lahan pada pendatang
Pawn farms to immigrants
Menggunakan tabungan Use savings Menjual barang yang dipunyai misalnya pohon kelapa
Sell assets such as coconut trees
Menjual barang-barang Sell valuables Menjual kebun Sell farm land
8c
Menabung/ Arisan Save money/participate in arisan
Arisan Arisan Arisan untuk beli perabot & perbaikan rumah
Participate in arisan in order to purchase household furniture and renovate house
Beli emas kalau penghasilan lagi tinggi
Purchase gold jewelry if income is high
Hasil ditabung Save income Uang beasiswa ditabung Save part of scholarship
grant Ikut pengajian sambil arisan Attend pengajian whilst
participating in arisan Ikut arisan untuk simpan pinjam Participate in arisan to save
and borrow money Menabung Save Menabung saat dapat banyak ikan
Save if catch lots of fish
Mengikuti arisan Participate in arisan
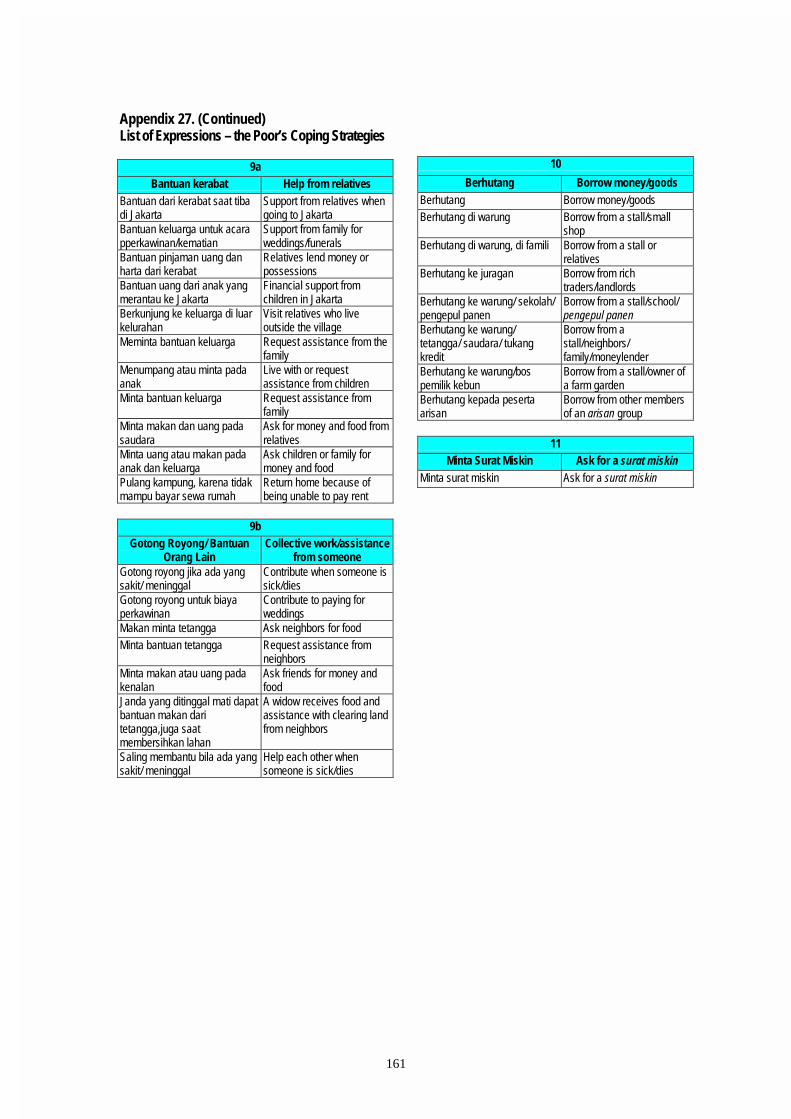
161
Appendix 27. (Continued) List of Expressions – the Poor’s Coping Strategies
9a Bantuan kerabat Help from relatives
Bantuan dari kerabat saat tiba di Jakarta
Support from relatives when going to Jakarta
Bantuan keluarga untuk acara pperkawinan/kematian
Support from family for weddings/funerals
Bantuan pinjaman uang dan harta dari kerabat
Relatives lend money or possessions
Bantuan uang dari anak yang merantau ke Jakarta
Financial support from children in Jakarta
Berkunjung ke keluarga di luar kelurahan
Visit relatives who live outside the village
Meminta bantuan keluarga Request assistance from the family
Menumpang atau minta pada anak
Live with or request assistance from children
Minta bantuan keluarga Request assistance from family
Minta makan dan uang pada saudara
Ask for money and food from relatives
Minta uang atau makan pada anak dan keluarga
Ask children or family for money and food
Pulang kampung, karena tidak mampu bayar sewa rumah
Return home because of being unable to pay rent
9b
Gotong Royong/ Bantuan Orang Lain
Collective work/assistance from someone
Gotong royong jika ada yang sakit/ meninggal
Contribute when someone is sick/dies
Gotong royong untuk biaya perkawinan
Contribute to paying for weddings
Makan minta tetangga Ask neighbors for food Minta bantuan tetangga Request assistance from
neighbors Minta makan atau uang pada kenalan
Ask friends for money and food
Janda yang ditinggal mati dapat bantuan makan dari tetangga,juga saat membersihkan lahan
A widow receives food and assistance with clearing land from neighbors
Saling membantu bila ada yang sakit/ meninggal
Help each other when someone is sick/dies
10
Berhutang Borrow money/goods Berhutang Borrow money/goods Berhutang di warung Borrow from a stall/small
shop Berhutang di warung, di famili Borrow from a stall or
relatives Berhutang ke juragan Borrow from rich
traders/landlords Berhutang ke warung/ sekolah/ pengepul panen
Borrow from a stall/school/ pengepul panen
Berhutang ke warung/ tetangga/ saudara/ tukang kredit
Borrow from a stall/neighbors/ family/moneylender
Berhutang ke warung/bos pemilik kebun
Borrow from a stall/owner of a farm garden
Berhutang kepada peserta arisan
Borrow from other members of an arisan group
11
Minta Surat Miskin Ask for a surat miskin Minta surat miskin Ask for a surat miskin

The SMERU Research Institute, December 2003 162
Appendix 28. Summary of the Analysis of the Effectiveness of Programs Mentioned in PPAs in 19 Villages (Note: more than one answer may be given)
Program/Project Number of Villages
Exist (No comment) Effective Inappropriate
Location Mistargeting Not Too Effective
Not Transparent Mismanagement
1 Labor-intensive projects (Padat Karya) 2 1 - - - - 1 1 2 Construction of bathing, washing and toilet facilities 4 2 1 2 - - - - 3 Road construction/maintenance 3 2 1 - - - - - 4 Housing improvement 3 - 2 - - - - 1 5 Kecamatan Development Program 2 - 1 - - 1 - - 6 PDKMK 1 - 1 - - - - - 7 PKDPWT 1 - - - - 1 - - 8 Construction of wells 1 - 1 - - - - - 9 Environmental health 1 - 1 - - - - - 10 Health card 4 1 2 - - 1 - - 11 JPSBK 1 1 - - - - - - 12 Primary school scholarship 2 - - - 2 - - - 13 Assistance for the elderly 1 - - - 1 - - - 14 KUT 4 - 1 - 2 - 1 1 15 Capital assistance 3 - - - 1 2 1 - 16 IDT 4 2 1 - - 1 - - 17 BBM (money) 1 - - - - 1 - - 18 Rice assistance 10 - 2 - 8 4 - 1 19 Basic commodities 2 - 2 - - - - - 20 NGO 1 - 1 - - - - - 21 Banpres 1 - 1 - - - - - 22 Goats and Nila fish 1 - - - - 1 - - 23 Raise cattle using the paron system 3 - - - - 3 - - 24 PDMDKE 1 - - - - - 1 - 25 Extension worker 1 1 - - - - - -

The SMERU Research Institute, December 2003 163
Appendix 29. Comments on Programs and Projects
Padat Karya Labor-intensive projects
Ada Exist
Seharusnya dikerjakan secara padat karya, namun dikontrakan dan banyak korupsi
This project should follow the padat karya system, but it was contracted to other parties and there is a lot of corruption.
MCK Construction of bathing, washing and toilet facilities
Ada Exists
Cukup bermanfaat, sebagian tidak dipergunakan, sekarang banyak yang membuat WC sendiri
Fairly useful, some facilities were not utilized, today many households have their own facilities.
Lokasinya tidak tepat, berada di dekat penduduk yang sudah memilki MCK
Inappropriate location, constructed near houses which already had such facilities.
Perbaikan/Pembuatan Jalan Road construction/maintenance
Ada Exists
Bermanfaat Useful
Sedang berlangsung Ongoing
Perbaikan rumah Housing improvement
Bantuan seng untuk perbaikan rumah, namun kenyataannya yang menerima keluarga Kades saja
Provision of corrugated iron for roofs, but in reality only the village head's received it.
Bermanfaat Useful
HKSN, sangat dikenal sebagai program yang membantu dalam membangun sarana/prasarana lingkungan termasuk perbaikan rumah
HKSN, very well known as a program that assists in the construction of community facilities and infrastructure, including the repair of houses.
PPK KDP (Kecamatan Development Program)
Efektif Effective
Hanya menjangkau satu dusun Only reached one hamlet
Kegiatan ekonomi produktif berupa usaha jual beli ternak Selling and buying livestock were economically productive.
PDKMK PDKMK
Efektif Effective
PKDPWT PKDPWT
Pembuatan jalan sepanjang 6 km belum memecahkan masalah karena kendaraan belum bisa masuk
Construction of a 6 km long road has not solved problem yet because vehicles are not able to enter.
Pembuatan Sumur Construction
Cukup bermanfaat Fairly useful
Kesehatan Lingkungan Environmental health
Dari CRS, sangat bermanfaat (pembuatan jalan dan saluran sekeliling kampung)
Provided by CRS, very useful (road construction and waterworks all around the hamlet).
Kartu Sehat Health cards
Ada Exist
Efektif Effective
Pelayanan kesehatan dengan kartu sehat kurang baik Services for health card holders are not very good
Sangat berguna untuk dapat pelayanan gratis di Puskesmas Very useful in acquiring free services at the puskesmas
JPSBK JPSBK
Ada Exists

The SMERU Research Institute, December 2003 164
Appendix 29. (Continued) Comments on Programs and Projects
Beasiswa SD Primary school scholarships
Diharapkan beasiswa tidak hanya diberikan pada murid yang pandai, tapi juga kurang mampu
It is hoped that scholarships are not only given to outstanding students, but also those from poor families.
Tidak merata diterima orang miskin Not distributed equally among the poor
Bantuan Orang Jompo Assistance for the elderly
Bantuan tidak merata. Banyak masyarakat yang seharusnya dibantu tidak mendapat bantuan sama sekali
Assistance was not distributed equally. Many people who should have received assistance did not receive assistance at all.
KUT KUT
Bantuan modal adalah bantuan pemerintah untuk orang miskin, terkesan tidak perlu dikembalikan sehingga macet
The government provided capital assistance for the poor, so people were under the impression that loans did not need to be repaid, and thus loans were not repaid.
Efektif Effective
Kredit berupa kapal, motor tempel dan gilnet tidak dapat dinikmati banyak orang dan penyalurannya tidak transparan
Credit in the form of boats, machines and gillnets were not received by many people and distribution was not transparent.
Kredit hanya diberikan kepada orang yang dipercaya dan mampu
Credit was only given to people who were trusted and well off.
Bantuan Modal Capital assistance
Dinilai terlalu kecil sehingga digunakan untuk membiayai kebutuhan sehari-hari dan tidak ada pendampingan manajemen
Because loans were viewed as being too small, they were as used to cover daily expenses and there was no management assistance.
Bantuan modal sebesar Rp 6,450,000 dari Bapeda disalurkan pada kepala dusun tapi tidak jelas penggunaannya dan kurang bermanfaat untuk golongan miskin
Capital assistance amounting to Rp 6.450.000 provided by Bapeda was given to the hamlet head, but it is unclear how it was used and it was not useful for the poor.
Tidak berjalan karena tidak ada bimbingan kelompok. Memilih bantuan dikelompokkan berdasarkan keluarga
Not running because there is no guidance. Prefer assistance that is given based on families.
IDT IDT
Ada Exists
Jumlah bantuan kurang memadai Inadequate amount of assistance
Sangat menolong Very helpful
BBM (uang) BBM (money)
Tidak ada tindak lanjut karena tidak ada pelatihan dalam penggunaan dan pengelolaan, malah digunakan untuk kebutuhan sehari-hari
No follow up because there was no training on utilization and management, it was instead used for daily purposes.
Bantuan Beras Rice assistance
Bantuan tidak merata. Banyak masyarakat yang seharusnya dibantu tidak mendapat bantuan sama sekali
Assistance was not distributed equally. Many people who should have received assistance did not receive it.
Berguna, tapi banyak salah sasaran Useful, but a lot of mistargeting
Waktu ada beras, orang miskin belum tentu dapat uang When there is rice, the poor may not have money
Sembako Basic Commodities
Efektif Effective
LSM NGO
Memperbaiki kehidupan dengan diversifikasi tanaman Improve life through crop diversification.
Banpres Banpres
Efektif Effective

The SMERU Research Institute, December 2003 165
Appendix 29. (Continued) Comments on Programs and Projects
Bantuan Beras Rice assistance
Diharapkan frekuensinya lebih sering terutama masa paceklik. Beras bulog dibagi rata 2kg tidak hanya orang miskin, kadang sebulan sekali atau 2 bulan sekali
It is expected to be more frequent, particularly during the drought period. Bulog rice was divided into 2kg allotments and distributed equally to everyone, not only to the poor, once or twice a month.
Dikeluhkan waktu antara pemberitahuan dengan pembelian beras yang terlalu pendek, sulit mengumpulkan uang dalam waktu 3 hari, Pemilihan sasaran sering salah, karena hanya melihat kondisi rumah, program berlangsung 5-6x setahun, tidak tiap bulan
People complain about the short period between the announcements and the sale of rice. It is difficult to get the money in three days. Mistargeting also occurs a lot because selection was only based on the condition of houses. Rice is delivered five-six times a year and not every month.
Karena harus mengumpulkan uang terlebih dulu, warga miskin tidak bisa mendapatkan beras karena uang tidak cukup
Because they had to collect the money first, the poor could not buy rice as they did not have enough money
Masyarakat hanya menerima 3 kg, seharusnya 20 kg , kadang hanya untuk kelompok sosial tertentu
People only received 3 kg of rice, when they should receive 20 kg, and it was sometimes distributed to certain social groups
Tidak semua orang miskin menerima, sementara orang tidak miskin menerima
Not all poor people received this assistance, while some people who were not poor received this assistance
Tidak tepat sasaran, kelompok miskin kurang informasi dan tidak memiliki uang dalam waktu cepat
Mistargeting, the poor lack information and could not obtain the money in a short period of time
Uang harus dikumpulkan dulu, beras baru didapat 3 bln kemudian(20kg, Rp 1000/kg).semua warga dapat bagian
Money had to be collected first, the rice would only be delivered 3 months later (20kg, Rp 1000/kg). All members of the community got an allottment.
Kambing & Ikan Nila Goat & Nila Fish
Tidak ada pantauan dari PPL sehingga gagal, bantuan secara kelompok saling lempar tanggung jawab, bantuan yang diberikan kepada perseorangan sulit diawasi kesungguhan pengelolanya, lebih baik dalam ikatan persaudaraan
There was no monitoring from extension workers, so the assistance failed. Group-based assistance was a problem because no one wanted to take responsibility, while assistance given to individuals was hard to supervise. It would be better if assistance was given based on kinship.
Sapi Sistem Paron Sapi Sistem Paron
Mati semua (35 ekor) karena penyakit All (35 heads of) cattle died due to disease
Sistem penyerahan kepada kelompok kurang berhasil, karena anggotanya saling lempar tanggung jawab
Mechanisms to make group members responsible were not too successful, no member wanted to be responsible.
Sistem penyerahan kepada kelompok kurang berhasil, karena anggotanya tdk bisa bekerja sama
Mechanisms to make group members responsible were not too successful, because members were unable to cooperate.
PDMDKE PDMDKE
Sangat tidak terasa fungsinya di masyarakat; sulit mendapatkan informasi dan bantuan oleh program ini
Has no function in the community; it is difficult to obtain information and assistance from this program
PPL Extension workers
Setiap bantuan/program harus didukung PPL All assistance and programs should be provided by extension workers

The SMERU Research Institute, December 2003 166
Appendix 30. Summary of the Analysis of the Importance of Various Institutions
Island Type of Community Total by Village
Java Nusa Tenggara
West Sumatra Sulawesi Rice Farming Dry-land
farming Forest and Plantation
Coastal Fishing
Urban Informal Sector and Labor
31 Score 13 Score 5 Score 3 Score 10 Score 9 Score 6 Score 6 Score 5 Score 5 Score 1a Formal Religious Institutions 12 61 1 100 2 100 1 89 8 42 3 72 3 70 3 48 3 52 -
Churches/Priests 2 100 - 2 100 - - - 2 100 - - - Church Youth Group 1 78 - - - 1 78 - - - 1 78 - MUD 1 100 1 100 - - - 1 100 - - - - Mosque boards/committees 3 70 - - 1 89 2 61 1 75 - 2 68 - - Mosque Youth Associations/IRM 7 35 - - - 7 35 2 45 1 10 1 10 3 46 -
1b Religious Institutions Established by the Community 15 67 9 73 - 1 83 5 51 6 56 1 83 2 79 3 55 3 86 DKM 1 90 1 90 - - - 1 90 - - - - Majelis Taklim 6 62 2 71 - - 4 57 2 46 - 1 75 2 70 1 65 Pengajian/yasinan/tahlilan groups 11 70 9 74 - 1 83 1 25 5 63 1 83 1 83 1 25 3 88
1c Religious Institutions- Individuals 11 61 1 100 1 95 2 55 7 52 3 71 4 61 1 36 3 59 - Evangelists 1 95 - 1 95 - - - 1 95 - - - Priests/parish leaders 2 81 - - - 2 81 - - 1 62 1 100 - Parish 1 78 - - - 1 78 - - - 1 78 - Islamic/religious leaders 3 69 - - 2 76 1 55 1 55 2 76 - - - Ustadz/Mubaligh/Pegawai Sar'i 6 53 1 100 - 2 35 3 51 2 63 2 35 - 2 63 - Imam Dusun/Desa 5 40 - - - 5 40 1 69 1 40 1 10 2 41 -
1d Religious Institutions- Schools 10 72 5 87 - 2 75 3 45 3 75 2 40 2 87 1 50 2 95 TK-TPA 8 69 4 86 - 1 79 3 45 3 75 1 10 1 79 1 50 2 95 Islamic boarding schools and teachers 2 82 1 94 - 1 70 - - 1 70 1 94 - -
2a Large-scale Formal Economic Institutions 16 45 7 41 3 82 - 6 31 5 41 1 87 5 31 3 50 2 58 Banks 3 47 - 1 95 - 2 22 - - - 3 47 - BRI 9 42 7 44 1 28 - 1 45 4 40 - 3 29 - 2 65 BPD & Bank Jatim 9 32 3 20 - - 6 38 4 37 - 2 19 2 35 1 32 Pawnshops 1 87 - 1 87 - - - 1 87 - - - PLN 1 40 - - - 1 40 1 40 - - - - Tea plantations 1 88 1 88 - - - - - 1 88 - - Perhutani/foresters/forest rangers 4 45 2 28 1 100 - 1 23 1 100 - 3 26 - - PJTKI 1 32 1 32 - - - - - 1 32 - -
2b Small-scale Formal Economic Institutions 14 60 8 63 2 66 - 4 52 3 62 2 69 3 66 3 51 3 56 BKD/BKK 2 55 2 55 - - - - - 1 83 - 1 27 UBSP 1 55 - 1 55 - - - 1 55 - - - UED-SP 4 61 3 78 1 10 - - 1 95 1 10 1 72 - 1 67 LPMD 2 26 2 26 - - - 1 21 - - - 1 31 Takesra/Dansos 3 44 3 44 - - - - - - - 3 44 Cooperatives 9 72 3 83 2 95 - 4 52 1 90 2 83 1 49 3 61 2 80 KUD 4 61 3 63 1 53 - - 2 63 - 1 65 1 53 -

The SMERU Research Institute, December 2003 167
Appendix 30. (Continued) Summary of the Analysis of the Importance of Various Institutions
Island Type of Community Total by Village
Java Nusa Tenggara
West Sumatra Sulawesi Rice Farming Dry-land
farming Forest and Plantation
Coastal Fishing
Urban Informal Sector and Labor
31 Score 13 Score 5 Score 3 Score 10 Score 9 Score 6 Score 6 Score 5 Score 5 Score 2c Informal Economic Institutions 22 64 9 75 3 68 1 10 9 59 6 66 3 62 5 65 5 60 3 67 Stores/stalls/markets 10 66 4 89 3 70 - 3 32 3 63 1 67 4 68 2 68 - Peddlers 2 51 - 1 57 - 1 46 - - 1 46 1 57 - Middlemen (Tengkulak/bakul/Palel/Populele) 7 68 1 65 3 81 - 3 56 1 64 1 83 1 65 4 66 - Rentenir/Bank Titil 10 67 7 74 2 57 - 1 36 4 80 - 1 71 2 38 3 67 Proprietors/Landlords/Boat owners 12 60 3 69 1 22 1 10 7 69 4 54 2 55 4 68 2 63 - Mandor tanam/Calo 3 75 2 71 1 82 - - 1 82 - 2 71 - -
Craftsmen/Medicinal herb producers or sellers/Laborers/Domestic helpers 2 18 1 14 1 22 - - 1 22 - 1 14 - -
3a Social Institutions- Individuals 21 80 9 83 2 79 3 78 7 76 7 71 2 68 5 89 5 87 2 77 Family/relatives/parents 8 68 4 73 1 55 - 3 66 2 78 - 2 65 2 69 2 62 Neighbors/friends 8 86 6 86 2 86 - - 3 84 - 3 87 1 90 1 85 Community leaders 12 74 4 82 - 2 37 6 80 5 69 2 37 2 95 3 92 - Wali nagari 2 100 - - 2 100 - - 2 100 - - - Wali jorong 3 82 - - 3 82 - - 2 73 1 100 - - Ninik Mamak 3 88 - - 3 88 - - 2 84 1 96 - - Bundo kandung 1 10 - - 1 10 - - 1 10 - - -
3b Social Institutions - Initiated by the Government 22 53 11 61 2 32 1 45 8 48 9 57 1 35 5 41 3 54 4 63 Dasa Wisma 4 43 1 63 - - 3 37 - - 1 36 2 37 1 63 PKK 21 57 11 60 2 44 1 73 7 53 9 53 1 60 4 50 3 61 4 69 Youth Neighborhood Associations 10 48 8 56 1 10 1 16 - 4 56 1 10 1 16 - 4 56
3c Social Institutions Established by the Community 21 66 8 80 4 46 2 88 7 56 6 56 4 47 3 84 4 71 4 82 Village Neighborhood Associations/Adat institutions/KAN 5 75 1 100 1 10 2 95 1 75 - 2 52 3 90 - - Arisan 11 70 7 79 1 28 - 3 62 4 55 - 1 90 3 62 3 90 Banjar alat pesta 5 53 2 65 3 44 - - 2 65 2 31 - 1 70 - Collective work, Jimpitan/antre/parelek/kematian 4 56 2 63 2 49 - - 2 34 - - 1 70 1 85 Neighborhood watch groups/voluntary community work 4 64 2 73 - - 2 54 1 33 - - 1 75 2 73 Art/sports groups 7 61 2 63 2 78 1 69 2 38 2 70 3 55 1 69 - 1 50
3d Social Institutions- Professional 14 59 5 67 3 63 - 6 50 6 61 2 68 3 58 3 51 - Farmers’, fishermen’s and forest farmers’ groups 12 60 4 62 2 75 - 6 53 5 56 1 95 3 58 3 57 - P3A/ HIPPA 2 63 1 85 1 40 - - 1 85 1 40 - - - Kelompencapir 2 60 - - - 2 60 - - - 2 60 -

The SMERU Research Institute, December 2003 168
Appendix 30. (Continued) Summary of the Analysis of the Importance of Various Institutions
Island Type of Community Total by Village
Java Nusa Tenggara
West Sumatra Sulawesi Rice Farming Dry-land
farming Forest and Plantation
Coastal Fishing
Urban Informal Sector and Labor
31 Score 13 Score 5 Score 3 Score 10 Score 9 Score 6 Score 6 Score 5 Score 5 Score 4a Government - Village/kecamatan 26 64 11 69 5 61 - 10 62 9 61 4 73 4 58 5 60 4 77
Kecamatan/Camat 6 62 1 100 1 90 - 4 46 1 100 1 90 1 10 2 36 1 100 Kelurahan/village apparatus 10 66 5 68 4 65 - 1 60 4 47 2 94 1 60 2 61 1 100 Lurah/Village Heads 14 69 4 57 1 19 - 9 80 6 70 1 100 3 52 3 80 1 55 Village secretaries 4 33 2 27 - - 2 39 1 34 - 1 49 1 28 1 21 LKMD 11 72 5 72 2 88 - 4 65 3 65 2 88 2 65 3 71 1 83 LMD 2 90 2 90 - - - 2 90 - - - - Hamlet/apparatus heads 11 55 1 81 1 40 - 9 54 3 52 2 55 1 49 4 52 1 81 RW/RK 5 73 1 62 - - 4 76 3 76 - - 1 75 1 62 RT 15 66 9 73 - - 6 56 7 64 1 40 2 59 1 75 4 78 Security guards/neighborhood watch 4 55 3 52 - - 1 64 2 50 - 1 55 1 64 - Babinsa 4 45 - - - 4 45 - - 1 49 3 43 -
4b Government- Kabupaten/National 17 53 5 36 2 78 1 55 9 56 5 32 4 78 4 40 4 66 - Ministry of Social Affairs 1 67 - 1 67 - - - 1 67 - - - Office of Animal Husbandry 1 85 - 1 85 - - - 1 85 - - - Ministry of Manpower 1 27 1 27 - - - - - 1 27 - - Ministry of Industry and Trade 1 15 - - - 1 15 1 15 - - - - BKKBN 1 75 - - - 1 75 - - - 1 75 - Irrigation 2 21 - - - 2 21 2 21 - - - - Extension workers 11 49 4 38 2 85 1 19 4 49 5 30 3 63 2 61 1 75 - Police 6 54 - - 1 64 5 52 1 15 2 82 1 10 2 68 - PPN 5 75 - - 1 82 4 74 - 2 91 - 3 65 -
4c Government Institutions- Health 23 58 8 59 2 49 3 53 10 60 7 63 5 45 5 48 4 72 2 67 Hospitals 2 60 2 60 - - - - - 1 20 - 1 100 Puskesmas/ Polindes/ Pustu 11 48 7 56 2 26 - 2 39 4 59 2 26 3 40 - 2 59 Posyandu 8 58 5 67 - - 3 43 5 59 - 2 46 - 1 78 Village midwives 14 59 4 61 1 68 2 38 7 62 6 66 4 61 2 27 2 63 - Medical aides 2 81 - - - 2 81 - - - 2 81 - Traditional healers 9 52 2 38 2 75 - 5 49 3 58 3 53 2 42 1 50 - Family planning extension workers/family planning cadres 6 49 2 42 - 3 51 1 58 3 47 2 34 1 86 - -
4d Government Institutions- Education 11 51 5 57 1 100 1 56 4 31 4 53 1 100 3 31 1 10 2 73 Schools/School Committees/Teachers 10 51 5 57 1 100 - 4 31 4 53 1 100 2 19 1 10 2 73 Package A & B 1 56 - - 1 56 - - - 1 56 - -

The SMERU Research Institute, December 2003 169
Appendix 30. (Continued) Summary of the Analysis of the Importance of Various Institutions
Island Type of Community Total by Village
Java Nusa Tenggara
West Sumatra Sulawesi Rice Farming Dry-land
farming Forest and Plantation
Coastal Fishing
Urban Informal Sector and Labor
31 Score 13 Score 5 Score 3 Score 10 Score 9 Score 6 Score 6 Score 5 Score 5 Score 5a Non-Government Institutions – NGOs 6 59 1 55 2 80 - 3 46 1 78 1 75 1 10 2 68 1 55
HKSN 1 65 1 65 - - - - - - - 1 65 Anak Alam 1 57 1 57 - - - - - - - 1 57 CARE 1 63 - 1 63 - - - 1 63 - - - WTM/FADO 1 95 - 1 95 - - - 1 95 - - - Yaspem 1 20 - 1 20 - - - 1 20 - - - Yayasan Dana Sosial 1 100 - 1 100 - - - - - 1 100 - Yayasan Angkatan Laut 1 70 - 1 70 - - - - - 1 70 - NGOs 2 30 - - - 2 30 - - 1 10 1 50 - Forum Anak Bangsa 1 78 - - - 1 78 1 78 - - - -
5b Non Government Institutions - Political Parties/Mass Organizations 3 42 1 60 - - 2 32 - - 1 60 2 32 -
Political Parties 2 27 - - - 2 27 - - - 2 27 - NU 1 60 1 60 - - - - - 1 60 - - KNPI 2 28 - - - 2 28 - - - 2 28 -
6a Programs - Non-SSN 8 46 4 58 4 34 - - 1 10 2 46 2 55 1 35 2 61 Bangdes 4 54 3 69 1 10 - - 1 10 - 2 57 - 1 93 Banpres 1 60 1 60 - - - - - 1 60 - - IDT/IDT consultants 3 54 1 50 2 55 - - - 2 55 1 50 - - PDMDKE 1 30 1 30 - - - - - - - 1 30 PKD-PWT 1 20 - 1 20 - - - 1 20 - - - UP2K 1 80 1 80 - - - - - 1 80 - - Students- KKN 1 35 - 1 35 - - - - - 1 35 -
6b Programs - SSN 5 66 3 58 1 80 - 1 75 1 95 1 80 - 1 75 2 39 Scholarships 1 90 - 1 90 - - - 1 90 - - - SSN 2 39 2 39 - - - - - - - 2 39 OPK 1 70 - 1 70 - - - 1 70 - - - Proyekan 1 95 1 95 - - - 1 95 - - - - Raskin 1 75 - - - 1 75 - - - 1 75 -

The SMERU Research Institute, December 2003 170
Appendix 30. (Continued) Summary of the Analysis of the Importance of Various Institutions
Area Sex Age Rural Urban
Total by Respondent Male Female Mixed Group Young Old Mixed Group
23 Score 8 Score 78 Score 30 Score 30 Score 18 Score 29 Score 23 Score 26 Score 1a Formal Religious Institutions 11 57 1 100 17 67 5 57 6 92 6 50 3 100 3 100 11 49
Churches/Priests 2 100 - 5 100 2 100 3 100 - 2 100 3 100 - Church Youth Groups 1 78 - 1 78 - 1 78 - - - 1 78 MUD - 1 100 1 100 - 1 100 - 1 100 - - Mosque boards/committees 3 70 - 3 70 - 1 75 2 68 - - 3 70 Mosque Youth Associations/IRM 7 35 - 7 35 3 28 - 4 41 - - 7 35
1b Religious Institutions Established by the Community 10 58 5 83 27 72 11 73 8 73 8 70 8 86 7 74 12 61 DKM - 1 90 2 90 1 90 1 90 - 1 90 1 90 - Majelis Taklim 4 57 2 71 12 67 7 69 3 55 2 83 4 88 3 53 5 60 Pengajian/yasinan/tahlilan groups 6 59 5 84 20 75 6 80 7 79 7 68 8 81 5 84 7 62
1c Religious Institutions- Individuals 10 57 1 100 17 67 6 80 5 74 6 49 2 90 3 100 12 55 Evangelists 1 95 - 4 95 2 95 2 95 - 2 90 2 100 - Priests/parish leaders 2 81 - 2 81 - 1 100 1 62 - - 2 81 Parish 1 78 - 1 78 - 1 78 - - - 1 78 Islamic/religious leaders 3 69 - 3 69 - - 3 69 - - 3 69 Ustadz/Mubaligh/Pegawai Sar'i 5 44 1 100 7 54 3 73 2 45 2 35 - 1 100 6 46 Imam Dusun/Desa 5 40 - 6 45 1 68 2 51 3 33 - - 6 45
1d Religious Institutions- schools 7 61 3 97 10 72 1 90 3 98 6 56 2 100 1 90 7 61 TK-TPA 5 53 3 97 8 69 1 90 2 100 5 53 2 100 1 90 5 53 Islamic boarding schools and teachers 2 82 - 2 82 - 1 94 1 70 - - 2 82
2a Large-scale Formal Economic Institutions 13 39 3 70 28 52 12 64 11 50 5 25 6 75 4 90 18 35 Banks 2 22 1 95 7 65 4 58 3 74 - 2 90 2 100 3 24 BRI 7 36 2 65 13 42 6 58 5 32 2 20 2 65 - 11 38 BPD & Bank Jatim 8 32 1 32 13 31 4 30 5 41 4 19 - - 13 31 Pawnshops 1 87 - 3 87 2 100 1 60 - 1 100 2 80 - PLN 1 40 - 1 40 - 1 40 - - - 1 40 Tea plantations 1 88 - 1 88 - - 1 88 - - 1 88 Perhutani/foresters/forest rangers 4 45 - 5 56 1 100 2 70 2 20 1 40 - 4 60 PJTKI 1 32 - 1 32 - 1 32 - - - 1 32
2b Small-scale Formal Economic Institutions 9 58 5 64 32 67 11 75 14 65 7 57 13 71 10 80 9 47 BKD/BKK 1 83 1 27 6 64 3 60 3 68 - 2 75 2 90 2 27 UBSP 1 55 - 2 55 - 2 55 - 1 50 1 60 - UED-SP 2 41 2 81 6 68 2 84 3 55 1 72 1 90 2 55 3 69 LPMD 1 21 1 31 3 27 1 42 1 19 1 21 - - 3 27 Takesra/Dansos - 3 44 4 44 2 29 2 59 - 2 45 - 2 43 Cooperatives 5 61 4 86 17 77 7 86 5 78 5 64 8 86 4 93 5 49 KUD 2 70 2 51 9 60 2 50 6 65 1 50 5 56 4 65 -

The SMERU Research Institute, December 2003 171
Appendix 30. (Continued) Summary of the Analysis of the Importance of Various Institutions
Area Sex Age Rural Urban
Total by Respondent Male Female Mixed Group Young Old Mixed Group
23 Score 8 Score 78 Score 30 Score 30 Score 18 Score 29 Score 23 Score 26 Score 2c Informal Economic Institutions 18 63 4 68 38 67 16 68 13 69 9 61 9 76 7 72 22 62 Stores/stalls/markets 9 65 1 80 18 69 8 74 7 68 3 60 5 78 4 88 9 57 Peddlers 1 46 1 57 4 54 2 65 1 40 1 46 1 70 2 50 1 46 Middlemen (Tengkulak/bakul/Palel/Populele) 6 63 1 95 11 74 5 71 5 83 1 50 3 93 3 80 5 60 Rentenir/Bank Titil 6 71 4 61 16 68 9 65 6 69 1 89 4 65 2 40 10 75 Proprietors/Landlords/Boat owners 12 60 - 14 59 2 61 3 50 9 62 - - 14 59 Mandor tanam/Calo 3 75 - 5 72 2 73 2 63 1 88 - - 5 72
Craftsmen/Medicinal herb producers or sellers/Laborers/Domestic helpers 2 18 - 3 16 2 18 1 14 - - - 3 16
3a Social Institutions- Individuals 16 79 5 81 28 79 13 80 6 78 9 77 4 85 3 87 21 77 Family/relatives/parents 6 70 2 62 10 67 4 75 3 42 3 81 1 100 - 9 63 Neighbors/friends 6 86 2 88 12 84 6 80 4 80 2 100 2 90 1 90 9 81 Community leaders 10 72 2 80 16 76 7 83 3 93 6 60 1 60 2 85 13 76 Wali nagari 2 100 - 2 100 - - 2 100 - - 2 100 Wali jorong 3 82 - 3 82 - - 3 82 - - 3 82 Ninik Mamak 3 88 - 3 88 - - 3 88 - - 3 88 Bundo kandung 1 10 - 1 10 - - 1 10 - - 1 10
3b Social Institutions - Initiated by the Government 16 49 6 63 39 57 15 61 14 55 10 56 10 66 12 71 17 43 Dasa Wisma 3 37 1 63 7 51 3 60 3 48 1 36 2 50 2 75 3 37 PKK 15 54 6 64 35 59 14 64 13 55 8 56 9 68 10 73 16 45 Youth Neighborhood Associations 4 32 6 58 17 52 5 51 8 52 4 55 5 62 6 60 6 37
3c Social Institutions Established by the Community 14 63 7 74 43 64 18 60 14 67 11 66 21 65 11 69 11 57 Village Neighborhood Associations/Adat institutions/KAN 5 75 - 5 75 - 2 55 3 88 2 55 - 3 88 Arisan 6 68 5 72 14 72 6 72 6 85 2 33 7 70 3 100 4 54 Banjar alat pesta 2 31 3 67 15 51 10 53 5 46 - 9 51 6 50 - Collective work, Jimpitan/antre/parelek/kematian 1 28 3 65 7 58 3 56 3 49 1 90 5 70 - 2 28 Neighborhood watch groups/voluntary community work 2 54 2 73 7 68 1 50 2 85 4 65 4 68 1 100 2 54 Art/sports groups 5 60 2 63 8 62 - 5 64 3 60 2 90 3 58 3 48
3d Social Institutions- Professional 13 59 1 60 17 60 3 68 9 66 5 44 3 70 2 80 12 54 Farmers’, fishermen’s and forest farmers’ groups 11 60 1 60 15 61 3 75 8 69 4 34 2 85 2 80 11 53 P3A/ HIPPA 2 63 - 2 63 - 1 40 1 85 1 40 - 1 85 Kelompencapir 2 60 - 2 60 2 60 - - - - 2 60

The SMERU Research Institute, December 2003 172
Appendix 30. (Continued) Summary of the Analysis of the Importance of Various Institutions
Area Sex Age Rural Urban
Total by Respondent Male Female Mixed Group Young Old Mixed Group
23 Score 8 Score 78 Score 30 Score 30 Score 18 Score 29 Score 23 Score 26 Score 4a Government - Village/kecamatan 19 63 7 69 52 66 21 65 21 68 10 62 14 70 17 75 21 55
Kecamatan/Camat 5 54 1 100 6 62 2 76 2 55 2 55 2 95 - 4 46 Kelurahan/village apparatus 6 60 4 74 18 72 9 78 6 72 3 55 6 75 8 84 4 44 Lurah/Village Heads 13 70 1 55 20 68 6 85 6 47 8 72 - - 20 68 Village secretaries 3 37 1 21 6 31 2 33 3 24 1 49 - - 6 31 LKMD 8 76 3 61 19 74 6 74 10 80 3 55 6 75 8 79 5 65 LMD 1 100 1 80 3 87 - 3 87 - 2 90 1 80 - Hamlet/apparatus heads 10 52 1 81 17 51 5 43 6 54 6 56 2 40 2 40 13 55 RW/RK 4 76 1 62 6 71 1 52 2 81 3 71 - - 6 71 RT 10 62 5 74 21 67 7 63 7 73 7 64 2 75 7 76 12 60 Security guards/neighborhood watch 3 48 1 75 5 59 - 2 62 3 57 2 75 - 3 48 Babinsa 4 45 - 5 44 2 10 1 78 2 62 - - 5 44
4b Government- Kabupaten/National 15 52 2 60 26 58 10 69 7 54 9 49 6 77 5 75 15 45 Ministry of Social Affairs 1 67 - 3 67 2 75 1 50 - 1 80 2 60 - Office of Animal Husbandry 1 85 - 4 85 2 80 2 90 - 2 85 2 85 - Ministry of Manpower 1 27 - 1 27 - 1 27 - - - 1 27 Ministry of Industry and Trade 1 15 - 2 15 1 10 1 20 - - - 2 15 BKKBN 1 75 - 1 75 - - 1 75 - - 1 75 Irrigation 2 21 - 2 21 - 1 20 1 21 - - 2 21 Extension-workers 9 46 2 60 12 52 3 70 3 60 6 39 3 70 2 85 7 35 Police 6 54 - 7 52 2 81 2 13 3 58 - - 7 52 PPN 5 75 - 6 70 2 81 1 28 3 77 - - 6 70
4c Government Institutions- Health 19 55 4 68 40 60 16 68 10 55 14 54 11 69 9 54 20 57 Hospitals 1 20 1 100 2 60 2 60 - - 1 100 - 1 20 Puskesmas/ Polindes/ Pustu 7 41 4 60 21 47 12 47 6 42 3 57 8 49 6 40 7 51 Posyandu 5 45 3 80 14 67 7 71 3 80 4 49 6 82 3 73 5 45 Village midwives 12 57 2 70 21 62 7 79 3 50 11 55 5 76 5 64 11 56 Medical aides 2 81 - 2 81 2 81 - - - - 2 81 Traditional healers 9 52 - 12 57 5 67 2 75 5 41 2 75 2 70 8 50 Family planning extension workers/family planning cadres 5 45 1 70 7 52 2 70 - 5 45 1 70 1 70 5 45
4d Government Institutions- Education 8 42 3 74 18 64 5 77 7 77 6 37 7 80 4 88 7 34 Schools/School Committees/teachers 7 40 3 74 17 64 5 77 7 77 5 33 7 80 4 88 6 31 Package A & B 1 56 - 1 56 - - 1 56 - - 1 56

The SMERU Research Institute, December 2003 173
Appendix 30. (Continued) Summary of the Analysis of the Importance of Various Institutions
Area Sex Age Rural Urban
Total by Respondent Male Female Mixed Group Young Old Mixed Group
23 Score 8 Score 78 Score 30 Score 30 Score 18 Score 29 Score 23 Score 26 Score 5a Non-Government Institutions – NGOs 4 53 2 70 13 66 4 89 5 56 4 56 6 80 4 60 3 46
HKSN - 1 65 2 65 - 1 60 1 70 2 65 - - Anak Alam - 1 57 3 57 - 2 35 1 100 2 70 1 30 - CARE 1 63 - 4 63 2 75 2 50 - 2 75 2 50 - WTM/FADO 1 95 - 4 95 2 95 2 95 - 2 100 2 90 - Yaspem 1 20 - 1 20 - 1 20 - - 1 20 - Yayasan Dana Sosial - 1 100 2 100 2 100 - - 1 100 1 100 - Yayasan Angkatan Laut - 1 70 2 70 1 70 1 70 - 1 70 1 70 - NGOs 2 30 - 2 30 - - 2 30 - - 2 30 Forum Anak Bangsa 1 78 - 1 78 - - 1 78 - - 1 78
5b Non Government Institutions - Political Parties/Mass Organizations 3 42 - 5 38 3 34 2 44 - - 1 60 4 32
Political Parties 2 27 - 3 33 2 10 1 78 - - - 3 33 NU 1 60 - 1 60 1 60 - - - 1 60 - KNPI 2 28 - 3 24 2 32 1 10 - - - 3 24
6a Programs - Non-SSN 5 42 3 53 19 47 11 43 8 52 - 7 42 6 50 6 49 Bangdes 3 41 1 93 7 52 4 56 3 46 - - 1 70 6 49 Banpres 1 60 - 1 60 - 1 60 - 1 60 - - IDT/IDT consultants 3 54 - 8 53 3 50 5 54 - 4 50 4 55 - PDMDKE - 1 30 1 30 1 30 - - 1 30 - - PKD-PWT 1 20 - 2 20 2 20 - - 1 20 1 20 - UP2K 1 80 - 1 80 1 80 - - - 1 80 - Students- KKN - 1 35 2 35 2 35 - - 1 40 1 30 -
6b Programs - SSN 3 83 2 39 8 71 5 67 2 81 1 75 3 63 2 85 3 70 Scholarships 1 90 - 1 90 1 90 - - 1 90 - - SSN - 2 39 3 49 2 42 1 62 - 1 10 - 2 68 OPK 1 70 - 1 70 1 70 - - - 1 70 - Proyekan 1 95 - 2 95 1 90 1 100 - 1 90 1 100 - Raskin 1 75 - 1 75 - - 1 75 - - 1 75

The SMERU Research Institute, December 2003 174
Appendix 31. Summary of the Analysis of the Trustworthiness/Proximity of Various Institutions
Island Type of Community
Total by Village Java West Sumatra Sulawesi Rice Farming Dry-land farming
Forest and Plantation Coastal Fishing
Urban Informal Sector and Labor
N = 20 Score 6 Score 4 Score 10 Score 6 Score 2 Score 4 Score 5 Score 3 Score 1a Formal Religious Institutions 10 55 1 100 1 55 8 49 1 21 1 10 4 86 4 44 - Church youth groups 1 82 - - 1 82 - - - 1 82 - Mosque boards/committees 3 85 1 100 1 55 1 100 - - 3 85 - - Mosque Youth Associations/IRM 7 39 - - 7 39 1 21 1 10 1 87 4 39 - 1b Religious Institutions Established by the Community 14 85 6 89 4 78 4 86 5 67 1 100 3 100 2 94 3 88 Majelis Taklim 9 80 3 90 2 55 4 86 4 63 - 2 100 2 94 1 85 Pengajian/yasinan/tahlilan groups 8 87 5 88 3 85 - 3 78 1 100 1 100 - 3 86 1c Religious Institutions- Individuals 13 79 2 88 2 87 9 76 5 78 2 72 1 87 5 82 - Parishes 1 82 - - 1 82 - - - 1 82 - Priests/parish leaders 2 85 - - 2 85 - - 1 87 1 82 - Islamic/religious leaders 7 82 2 88 1 55 4 85 4 88 1 55 - 2 82 - Uztad/Mubaligh/Pegawai Sar'I/Koran teacher 4 96 - 2 97 2 94 1 100 1 94 - 2 94 - Imam dusun/desa/lingkungan 8 68 - - 8 68 1 22 1 70 1 87 5 73 - 1d Religious Institutions- Schools 11 55 3 93 4 55 4 27 3 59 2 40 2 82 3 33 1 90 Sunday Schools 1 90 1 90 - - - - - - 1 90 TK-TPA 7 48 1 90 2 71 4 27 2 84 1 10 1 64 3 33 - Islamic boarding schools and teachers 3 60 1 100 2 40 - 1 10 1 70 1 100 - - 2a Large-scale Formal Economic Institutions 8 47 2 55 1 44 5 45 1 44 - 3 34 3 45 1 100 Bank/ BPR 4 20 - - 4 20 - - 1 23 3 19 - BPD/ Bank Jatim 5 59 - - 5 59 - - 2 58 3 59 - BRI 3 40 2 55 - 1 10 - - 1 10 1 10 1 100 PAM 1 10 - 1 10 - 1 10 - - - - PLN 2 55 - 1 78 1 33 1 78 - - 1 33 - Perhutani/Forest Rangers 1 23 - - 1 23 - - 1 23 - - 2b Small-scale Formal Economic Institutions 11 45 4 81 3 21 4 27 2 27 2 25 2 68 2 16 3 75 Cooperatives/CU/Kopdit/KSP 11 48 4 81 3 33 4 27 2 44 2 25 2 68 2 16 3 75 Takesra 1 10 - 1 10 - 1 10 - - - - 2c Informal Economic Institutions 13 60 2 65 3 73 8 54 3 81 1 40 3 72 5 47 1 40 Stores/stalls/markets 4 76 1 100 - 3 68 - - 2 81 2 71 - Peddlers 1 40 - 1 40 - - 1 40 - - - Middlemen (Tengkulak/bakul/Populele/Toke) 7 60 1 100 1 40 5 57 - 1 40 2 78 4 57 - Moneylenders (Rentenir/Bank Titil/Tukang Kredit) 5 45 2 70 - 3 29 1 66 - 2 55 1 10 1 40 Proprietors/Landlords/Boat owners/Entrepreneurs 7 72 1 100 2 89 4 57 2 89 - 3 87 2 33 - Mechanics 2 21 1 10 - 1 33 - - 1 10 1 33 - Kondektur/Mandor tanam 2 55 1 100 - 1 10 - - 1 100 1 10 - Laborers/Drivers/Tradesmen 5 53 1 75 - 4 47 1 33 - 2 68 2 47 -

The SMERU Research Institute, December 2003 175
Appendix 31. (Continued) Summary of the Analysis of the Trustworthiness/Proximity of Various Institutions
Island Type of Community
Total by Village Java West Sumatra Sulawesi Rice Farming Dry-land farming
Forest and Plantation Coastal Fishing
Urban Informal Sector and Labor
N = 20 Score 6 Score 4 Score 10 Score 6 Score 2 Score 4 Score 5 Score 3 Score 3a Social Institutions- Individuals 14 73 3 90 4 72 7 67 4 58 1 57 3 91 4 74 2 85 Family/relatives/parents 6 86 3 90 - 3 82 - - 2 94 2 80 2 85 Neighbors 4 87 3 90 1 78 - 1 78 - 1 100 - 2 85 Youth leaders 3 53 - 2 63 1 33 2 66 1 26 - - - Community leaders 6 72 - 1 100 5 67 2 55 1 100 - 3 75 - Bundo kandung 2 19 - 2 19 - 1 10 1 28 - - - Ninik Mamak 3 81 - 3 81 - 1 100 1 61 1 82 - - Wali jorong 4 95 - 4 95 - 2 100 1 87 1 91 - - Wali nagari 3 52 - 3 52 - 2 44 1 68 - - - 3b Social Institutions Initiated by the Government 15 50 4 74 4 29 7 49 6 44 1 46 3 51 3 42 2 81 Dasa Wisma 4 50 1 90 - 3 37 - - 1 49 2 31 1 90 Youth Neighborhood Associations 6 59 3 82 2 42 1 28 2 55 - 1 73 1 28 2 73 PKK 14 49 4 76 4 18 6 53 6 43 1 23 2 42 3 50 2 90 BPN – Badan Perwakilan Nagari 3 30 - 3 30 - 2 10 1 70 - - - 3c Social Institutions Established by the Community 10 2 84 4 38 4 3 48 2 27 3 1 1 82 Adat institutions/KAN 4 50 - 3 37 1 87 1 10 1 20 2 85 - - Arisan 8 68 6 73 - 2 52 2 85 - 1 70 2 52 3 67 Jimpitan/antre/kematian 3 95 3 95 - - 1 100 - 1 100 - 1 85 Neighborhood watch groups/watch post 3 58 1 40 1 55 1 78 2 66 - 1 40 - - Art/sports groups 4 30 - 2 45 2 15 - 2 45 1 19 1 10 - 3d Social Institutions- Professional 11 60 2 90 3 48 6 57 4 42 1 100 2 100 4 49 - Farmers’, fishermen’s and forest farmers’ groups 11 66 2 90 3 48 6 68 4 42 1 100 2 100 4 66 - P3A 1 10 - 1 10 - 1 10 - - - - Kelompencapir 2 10 - - 2 10 - - - 2 10 - 4a Government - Village/kecamatan 18 66 5 84 3 33 10 68 6 60 2 35 2 84 5 69 3 84 Kecamatan/Camat 5 41 - 1 10 4 48 2 21 - 1 87 2 37 - Kelurahan/Village Offices 5 61 2 80 1 10 2 66 2 45 - - 2 66 1 80 Village heads 9 74 - - 9 74 2 55 1 10 2 94 4 89 - Village secretaries 4 89 - - 4 89 1 100 - 1 87 2 85 - LKMD 8 72 4 71 - 4 72 3 48 - 1 87 2 96 2 75 LMD 1 100 1 100 - - 1 100 - - - - Hamlet heads 10 69 - 1 78 9 68 3 55 1 100 2 81 4 66 - RW/RK 7 75 4 90 - 3 55 3 63 - - 1 78 3 86 RT 6 52 - - 6 52 2 61 1 70 1 10 2 55 - Babinsa 4 36 - - 4 36 - - 1 61 3 28 - Security guards/neighborhood watch groups 3 18 - 2 10 1 33 1 10 1 10 - 1 33 - Village cadres 1 78 - - 1 78 1 78 - - - -

The SMERU Research Institute, December 2003 176
Appendix 31. (Continued) Summary of the Analysis of the Trustworthiness/Proximity of Various Institutions
Island Type of Community
Total by Village Java West Sumatra Sulawesi Rice Farming Dry-land farming
Forest and Plantation Coastal Fishing
Urban Informal Sector and Labor
N = 20 Score 6 Score 4 Score 10 Score 6 Score 2 Score 4 Score 5 Score 3 Score 4b Government - Kabupaten/National 13 43 2 70 3 42 8 37 2 25 2 63 4 58 5 31 - BKKBN 1 33 - - 1 33 - - - 1 33 - Veterinarian assistants 1 10 - 1 10 - 1 10 - - - - P3N 1 46 - 1 46 - - - 1 46 - - Perhutani 1 100 1 100 - - - - 1 100 - - Police 5 50 - 1 10 4 60 1 10 1 100 1 74 2 33 - PPL 5 29 1 40 2 25 2 28 2 25 1 40 1 10 1 46 - PPN (priests) 6 37 - 1 100 5 24 - 2 55 - 4 28 - 4c Government Institutions- Health 17 65 3 79 4 50 10 66 6 61 2 45 4 83 5 64 - Puskesmas/Polindes 6 45 1 57 1 40 4 44 2 33 1 40 1 100 2 33 - Posyandu 7 53 2 68 1 40 4 49 3 56 2 25 1 100 1 55 - Doctors 1 33 - 1 33 - 1 33 - - - - Village midwives 9 71 1 55 2 76 6 71 4 63 2 73 1 87 2 75 - Medical aides 2 63 - - 2 63 - - - 2 63 - Traditional healers 9 64 - 3 53 6 70 4 58 2 40 1 100 2 84 - Family planning extension workers/family planning cadres 5 57 1 100 3 47 1 46 1 55 1 49 2 69 1 46 - 4d Government Institutions- Education 12 66 2 75 4 61 6 66 4 76 1 79 2 49 4 58 1 80 Schools/School Committees 7 66 2 75 2 78 3 52 3 75 - - 3 52 1 80 Teachers 6 72 - 2 67 4 74 2 66 1 79 1 87 2 66 - Package A & B 1 10 - 1 10 - - - 1 10 - - 5a Non-Government Institutions - NGOs 5 46 1 83 1 10 3 46 1 83 2 40 - 2 34 - HIPPAM 1 83 1 83 - - 1 83 - - - - LSM 2 33 - - 2 33 - - - 2 33 - BKPRM 1 33 - - 1 33 - - - 1 33 - BPRN 1 10 - 1 10 - - 1 10 - - - LPMK 3 45 - - 3 45 - 1 70 - 2 33 -
5b Non-Government Institutions - Political Parties/Mass Organizations 3 36 - - 3 36 - - - 3 36 -
KNPI 2 26 - - 2 26 - - - 2 26 - PAN 1 55 - - 1 55 - - - 1 55 - Political Parties 2 19 - - 2 19 - - - 2 19 - 6a Programs - Non-SSN 5 21 1 55 2 10 2 16 2 10 1 10 1 55 1 21 - Bangdes 1 48 1 48 - - - - 1 48 - - Binmas 1 10 - - 1 10 - - - 1 10 - KKN 1 10 - - 1 10 1 10 - - - - P4K 1 33 - - 1 33 - - - 1 33 - PDMDKE 1 10 - 1 10 - - 1 10 - - - PKD-PWT 1 70 1 70 - - - - 1 70 - - UP2K 1 10 - 1 10 - 1 10 - - - - 6b Programs – SSN 1 55 - - 1 55 - - - 1 55 - Raskin 1 55 - - 1 55 - - - 1 55 -

The SMERU Research Institute, December 2003 177
Appendix 31. (Continued) Summary of the Analysis of the Trustworthiness/Proximity of Various Institutions
Area Sex Age Rural Urban
Total by Respondent Male Female Mixed Group Young Old Mixed Group
N = 14 Score 6 Score 45 Score 15 Score 16 Score 14 Score 14 Score 10 Score 21 Score 1a Formal Religious Institutions 8 65 2 16 13 50 4 37 5 64 4 46 - - 13 50 Church youth groups 1 82 - 1 82 - 1 82 - - - 1 82 Mosque boards/committees 3 85 - 3 85 - 2 100 1 55 - - 3 85 Mosque Youth Associations/IRM 5 49 2 16 9 35 4 37 2 19 3 43 - - 9 35 1b Religious Institutions Established by the Community 9 87 5 81 26 84 9 87 9 84 8 83 8 86 8 83 10 84 Majelis Taklim 6 83 3 75 14 82 6 90 5 81 3 70 3 83 3 87 8 80 Pengajian/yasinan/tahlilan groups 4 84 4 90 13 84 3 80 4 88 6 84 5 88 5 80 3 85 1c Religious Institutions- Individuals 10 83 3 68 18 77 5 73 6 74 7 84 2 90 1 90 15 75 Parishes 1 82 - 1 82 - 1 82 - - - 1 82 Priests/parish leaders 2 85 - 2 85 - 1 82 1 87 - - 2 85 Islamic/religious leaders 5 75 2 98 9 81 2 95 4 77 3 78 2 90 1 90 6 77 Uztad/Mubaligh/Pegawai Sar'I/Koran teachers 4 96 - 5 94 2 100 1 78 2 97 - - 5 94 Imam dusun/desa/lingkungan 6 75 2 46 10 61 2 22 4 57 4 84 - - 10 61 1d Religious Institutions- schools 8 52 3 63 13 55 2 73 3 67 8 46 1 90 1 90 11 48 Sunday Schools - 1 90 1 90 1 90 - - - 1 90 - TK-TPA 5 48 2 50 8 46 1 55 2 50 5 43 1 90 - 7 40 Islamic boarding schools and teachers 3 60 - 4 63 - 1 100 3 50 - - 4 63 2a Large-scale Formal Economic Institutions 7 40 1 100 12 44 5 45 5 45 2 40 1 100 - 11 39 Bank/ BPR 4 20 - 5 20 2 19 2 19 1 23 - - 5 20 BPD/ Bank Jatim 5 59 - 7 63 2 61 4 65 1 61 - - 7 63 BRI 2 10 1 100 4 33 2 55 2 10 - 1 100 - 3 10 PAM 1 10 - 1 10 - - 1 10 - - 1 10 PLN 2 55 - 2 55 1 33 - 1 78 - - 2 55 Perhutani/Forest Ranger 1 23 - 1 23 - - 1 23 - - 1 23 2b Small-scale Formal Economic Institutions 7 33 4 66 13 44 2 43 3 64 8 37 3 75 1 60 9 32 Cooperatives/CU/Kopdit/KSP 7 38 4 66 13 47 2 43 3 64 8 42 3 75 1 60 9 36 Takesra 1 10 - 1 10 - - 1 10 - - 1 10 2c Informal Economic Institutions 11 61 2 53 17 62 6 58 5 74 6 56 1 40 - 16 63 Stores/stalls/markets 4 76 - 5 81 1 100 2 82 2 69 - - 5 81 Peddlers 1 40 - 1 40 - - 1 40 - - 1 40 Middlemen (Tengkulak/bakul/Populele/Toke) 7 60 - 8 58 3 77 3 55 2 36 - - 8 58 Moneylenders (Rentenir/Bank Titil/Tukang Kredit) 3 40 2 53 7 56 4 46 2 100 1 10 1 40 - 6 59 Proprietors/Landlords/Boat owners/entrepreneurs 7 72 - 8 76 1 100 2 100 5 61 - - 8 76 Mechanics 2 21 - 2 21 1 10 - 1 33 - - 2 21 Kondektur/Mandor tanam 2 55 - 2 55 1 100 - 1 10 - - 2 55 Laborers/Drivers/Tradesmen 4 58 1 33 5 53 2 54 1 46 2 55 - - 5 53

The SMERU Research Institute, December 2003 178
Appendix 31. (Continued) Summary of the Analysis of the Trustworthiness/Proximity of Various Institutions
Area Sex Age Rural Urban
Total by Respondent Male Female Mixed Group Young Old Mixed Group
N = 14 Score 6 Score 45 Score 15 Score 16 Score 14 Score 14 Score 10 Score 21 Score 3a Social Institutions- Individuals 11 75 3 68 15 72 4 76 3 72 8 71 1 75 1 95 13 70 Family/relatives/parents 4 87 2 85 6 86 3 90 2 80 1 87 1 70 1 100 4 87 Neighbors 2 89 2 85 4 87 3 90 - 1 78 1 80 1 90 2 89 Youth leaders 3 53 - 4 46 - - 4 46 - - 4 46 Community leaders 5 80 1 33 6 72 1 33 2 73 3 85 - - 6 72 Bundo kandung 2 19 - 3 22 - - 3 22 - - 3 22 Ninik Mamak 3 81 - 3 81 - - 3 81 - - 3 81 Wali jorong 4 95 - 5 93 - - 5 93 - - 5 93 Wali nagari 3 52 - 3 52 - - 3 52 - - 3 52 3b Social Institutions Initiated by the Government 11 41 4 76 26 57 10 67 6 57 10 47 10 71 2 85 14 43 Dasa Wisma 3 37 1 90 5 51 3 43 1 78 1 49 1 90 - 4 41 Youth Neighborhood Associations 3 37 3 82 7 60 - 3 63 4 58 4 78 - 3 37 PKK 10 38 4 78 21 54 10 70 5 51 6 31 7 67 2 85 12 41 BPN – Badan Perwakilan Nagari 3 30 - 3 30 - - 3 30 - - 3 30 3c Social Institutions Established by the Community 8 2 51 23 8 4 11 7 3 13 Adat institutions/KAN 4 50 - 5 44 - - 5 44 - - 5 44 Arisan 4 66 4 70 9 70 6 67 2 75 1 80 5 72 1 100 3 58 Jimpitan/antre/kematian 2 100 1 85 7 91 3 90 3 90 1 100 3 97 2 75 2 100 Neighborhood watch groups/watch post 3 58 - 3 58 - 1 40 2 66 - - 3 58 Art/sports groups 3 33 1 20 4 30 - - 4 30 - - 4 30 3d Social Institutions- Professional 10 62 1 44 16 64 5 62 7 80 4 38 1 70 1 90 14 61 Farmers’, fishermen’s and forest farmers’ groups 10 69 1 44 16 69 5 80 7 80 4 38 1 70 1 90 14 68 P3A 1 10 - 1 10 - - 1 10 - - 1 10 Kelompencapir 2 10 - 2 10 2 10 - - - - 2 10 4a Government - Village/kecamatan 12 64 6 72 33 71 11 66 14 84 8 53 8 81 8 82 17 60 Kecamatan/Camat 5 41 - 5 41 1 10 1 64 3 43 - - 5 41 Kelurahan/Village Offices 3 48 2 80 6 64 2 80 2 79 2 33 1 100 2 70 3 48 Village heads 7 82 2 44 13 78 4 78 5 100 4 52 - - 13 78 Village secretaries 3 86 1 100 5 86 1 78 3 88 1 87 - - 5 86 LKMD 4 92 4 51 10 71 5 68 4 71 1 87 3 67 2 65 5 76 LMD 1 100 - 1 100 - 1 100 - 1 100 - - Hamlet heads 8 73 2 55 12 69 3 38 4 82 5 77 - - 12 69 RW/RK 2 78 5 74 16 76 6 65 8 84 2 78 5 86 7 87 4 44 RT 4 49 2 57 7 51 2 10 1 78 4 64 - - 7 51 Babinsa 4 36 - 5 38 2 19 1 82 2 36 - - 5 38 Security guards/neighborhood watch groups 3 18 - 3 18 - 1 33 2 10 - - 3 18 Village cadres - 1 78 1 78 - 1 78 - - - 1 78

The SMERU Research Institute, December 2003 179
Appendix 31. (Continued) Summary of the Analysis of the Trustworthiness/Proximity of Various Institutions
Area Sex Age Rural Urban
Total by Respondent Male Female Mixed Group Young Old Mixed Group
N = 14 Score 6 Score 45 Score 15 Score 16 Score 14 Score 14 Score 10 Score 21 Score 4b Government - Kabupaten/National 11 42 2 48 14 43 4 53 3 37 7 41 1 40 - 13 44 BKKBN 1 33 - 1 33 - - 1 33 - - 1 33 Veterinarian assistants 1 10 - 1 10 - - 1 10 - - 1 10 P3N 1 46 - 1 46 - - 1 46 - - 1 46 Perhutani 1 100 - 1 100 1 100 - - - - 1 100 Police 4 37 1 100 5 50 1 10 1 55 3 61 - - 5 50 PPL 4 27 1 40 5 29 1 40 2 28 2 25 1 40 - 4 27 PPN (priests) 5 42 1 10 7 39 2 43 1 55 4 33 - - 7 39 4c Government Institutions- Health 14 68 3 50 25 64 6 52 8 76 11 61 3 68 2 63 20 63 Puskesmas/Polindes 4 51 2 33 8 48 3 40 3 57 2 48 2 65 1 40 5 43 Posyandu 4 70 3 31 9 56 2 41 3 77 4 49 3 63 1 80 5 48 Doctors 1 33 - 1 33 - - 1 33 - - 1 33 Village midwives 6 71 3 71 13 71 4 72 2 73 7 71 1 60 1 50 11 74 Medical aides 2 63 - 3 68 2 43 1 118 - - - 3 68 Traditional healers 7 72 2 38 11 65 2 55 2 80 7 64 - - 11 65 Family planning extension workers/family planning cadres 5 57 - 5 57 - 2 73 3 47 - - 5 57 4d Government Institutions- Education 9 63 3 76 14 68 2 78 5 66 7 66 2 75 - 12 66 Schools/School Committees 5 62 2 75 7 66 - 4 68 3 63 2 75 - 5 62 Teachers 5 71 1 78 8 73 2 78 1 55 5 75 - - 8 73 Package A & B 1 10 - 1 10 - - 1 10 - - 1 10 5a Non-Government Institutions – NGOs 4 41 1 70 7 57 1 90 2 80 4 37 2 75 1 100 4 37 HIPPAM 1 83 - 3 83 1 90 2 80 - 2 75 1 100 - LSM 2 33 - 2 33 - - 2 33 - - 2 33 BKPRM 1 33 - 1 33 - - 1 33 - - 1 33 BPRN 1 10 - 1 10 - - 1 10 - - 1 10 LPMK 2 33 1 70 3 45 - - 3 45 - - 3 45
5b Non-Government Institutions - Political Parties/Mass Organizations 3 36 - 5 32 2 19 2 33 1 55 - - 5 32
KNPI 2 26 - 3 31 2 19 1 55 - - - 3 31 PAN 1 55 - 1 55 - - 1 55 - - 1 55 Political Parties 2 19 - 3 16 2 19 1 10 - - - 3 16 6a Programs - Non-SSN 4 24 1 10 6 27 2 33 1 55 3 14 - - 6 27 Bangdes 1 48 - 2 48 1 55 1 40 - - - 2 48 Binmas 1 10 - 1 10 - - 1 10 - - 1 10 KKN - 1 10 1 10 1 10 - - - - 1 10 P4K 1 33 - 1 33 - - 1 33 - - 1 33 PDMDKE 1 10 - 1 10 - - 1 10 - - 1 10 PKD-PWT 1 70 - 1 70 - 1 70 - - - 1 70 UP2K 1 10 - 1 10 - - 1 10 - - 1 10 6b Programs – SSN 1 55 - 1 55 1 55 - - - - 1 55 Raskin 1 55 - 1 55 1 55 - - - - 1 55

The SMERU Research Institute, December 2003 180
Appendix 32. The Trustworthiness of Various Institutions based on the Average Scores obtained in PPAs conducted by the World Bank in 5 Villages in Java
Area Community Sex Age
Total by Village Rural Urban
Rice Farming
Informal & Labor
Total by Respon-
dents Female Male Mixed Group (teenagers) Young Old
N = 5 1 3 2 3 24 10 10 4 14 10 DKM Churches/priests MUD Religious leaders/institutions Evangelists Islamic teachers Assemblies Majelis Taklim 85.0 85 85.0 85.0 85.0 85.0 85.0 83.3 86.7 Pengajian 90.0 90 90.0 86.7 100.0 80.0 90.0 85.0 Youth pengajian 80.0 80 100.0 60.0 80.0 80.0 80.0 Tahlilan 82.5 80.0 85 80.0 85.0 84.0 70.0 95.0 90.0 95.0 76.7 Sunday Schools 90.0 90 90.0 90.0 90.0 90.0 TK-TPA 90.0 90 90.0 90.0 90.0 90.0 Private banks BRI 100.0 100 100.0 100.0 100.0 100.0 Pawnshops BKD/BKK Savings and Loans Cooperatives 60.0 60 60.0 60.0 60.0 60.0 Cooperatives/CU/Kopdit 80.0 80 80.0 75.0 90.0 60.0 75.0 80.0 60.0 KUD Takesra UBSP UEDSP Peddlers Populele (middlemen) Rentenir 40.0 40 40.0 40.0 40.0 40.0 Tengkulak/Palele (middlemen) Farmer's shops Stores/stalls University students Relatives 85.0 85 85.0 85.0 85.0 70.0 100.0 Neighbors 85.0 85 85.0 85.0 85.0 80.0 90.0 Community leaders 87.5 80.0 95 87.5 90.0 90.0 90.0 90.0 90.0 Dasa Wisma 90.0 90 90.0 90.0 90.0 90.0 Youth Neighborhood Associations 81.7 81.67 100.0 72.5 77.5 80.0 75.0 77.5 Village Neighborhood Associations Adat Institutions PKK 76.3 70.0 78.33 62.5 90.0 71.1 80.0 40.0 80.0 67.1 85.0 Arisan 74.0 90.0 70 85.0 66.7 76.7 75.0 80.0 80.0 72.0 100.0 Banjar alat pesta Banjar Kematian 85.0 85 85.0 85.0 70.0 85.0 100.0 95.0 75.0 Jimpitan 100.0 100.0 100.0 100.0 100.0 100.0 Collective work groups Art groups Sports groups Voluntary community work Paguyuban Parelek Cultural centers Neighborhood watch groups

The SMERU Research Institute, December 2003 181
Appendix 32. (Continued) The Trustworthiness of Various Institutions based on the Average Scores obtained in PPAs conducted by the World Bank in 5 Villages in Java
Area Community Sex Age
Total by Village Rural Urban
Rice Farming
Informal & Labor
Total by Respon-
dents Female Male Mixed Group (teenagers) Young Old
N = 5 1 3 2 3 24 10 10 4 14 10 Farmers' groups P3A Hamlet apparatus Kelurahan/village apparatus Security guards Kecamatan/Camat Kelurahan/Village Offices LKMD LMD RW/RT Ministry of Social Affairs Office of Animal Husbandry Government Perhutani Extension workers Village midwives Village healers Family planning extension workers Posyandu Puskesmas/Polindes Hospitals Schools, School Committees, Teachers Japan CRS HIPPAM 83.3 83.3 83.3 83.3 90.0 80.0 75.0 100.0 HKSN KIPP TRIBINA Anak Alam CARE WTM/FADO Yaspem NU Enterprises Yayasan Dana Sosial Yayasan Angkatan Laut YBKS YIS Bangdes Banpres IDT P2P PDMDKE IDT consultants PKD-PWT UP2K Scholarships SSN OPK Proyekan

The SMERU Research Institute, December 2003 182
Appendix 33. Summary of the Analysis of the Proximity of Various Institutions
Island Type of Community Total by Village Java West Sumatra Sulawesi Rice Farming Dry-land Farming Forest and Plantation Coastal Fishing N = 15 Score 1 Score 4 Score 10 Score 4 Score 2 Score 4 Score 5 Score
1a Formal Religious Institutions 10 55 1 100 1 55 8 49 21 1 10 4 86 4 44 Church youth groups 1 82 1 82 1 82 Mosque boards/committees 3 85 1 100 1 55 1 100 3 85 Mosque Youth Associations/IRM 7 39 7 39 21 1 10 1 87 4 39
1b Religious Institutions Established by the Community 9 84 1 100 4 78 4 86 55 1 100 3 100 2 94 Majelis Taklim 7 79 1 100 2 55 4 86 55 2 100 2 94 Pengajian/yasinan/tahlilan groups 3 85 3 85 55 1 100 1 100
1c Religious Institutions – Individuals 11 78 2 87 9 76 72 2 72 1 87 5 82 Parishes 1 82 1 82 1 82 Priests/parish leaders 2 85 2 85 1 87 1 82 Islamic/religious leaders 5 79 1 55 4 85 89 1 55 2 82 Islamic teachers/preachers 4 96 2 97 2 94 100 1 94 2 94 Islamic prayer leaders (imam) in hamlets or villages 8 68 8 68 22 1 70 1 87 5 73
1d Religious Insititutions- Schools 9 48 1 100 4 55 4 27 44 2 40 2 82 3 33 Sunday Schools TK-TPA 6 42 2 71 4 27 78 1 10 1 64 3 33 Islamic boarding schools and teachers 3 60 1 100 2 40 10 1 70 1 100
2a Large-scale Formal Economic Institutions 7 40 1 10 1 44 5 45 44 3 34 3 45 Bank/ BPR 4 20 4 20 1 23 3 19 BPD/ Bank Jatim 5 59 5 59 2 58 3 59 BRI 2 10 1 10 1 10 1 10 1 10 PAM 1 10 1 10 10 PLN 2 55 1 78 1 33 78 1 33 Perhutani/forest rangers 1 23 1 23 1 23
2b Small-scale Formal Economic Institutions 8 34 1 100 3 21 4 27 27 2 25 2 68 2 16 Cooperatives/CU/ Kopdit/ KSP/ KUD 8 38 1 100 3 33 4 27 44 2 25 2 68 2 16 Takesra 1 10 1 10 10

The SMERU Research Institute, December 2003 183
Appendix 33. (Continued) Summary of the Analysis of the Proximity of Various Institutions
Island Type of Community Total by Village Java West Sumatra Sulawesi Rice Farming Dry-land Farming Forest and Plantation Coastal Fishing N = 15 Score 1 Score 4 Score 10 Score 4 Score 2 Score 4 Score 5 Score
2c Informal Economic Institutions 12 61 1 90 3 73 8 54 81 1 40 3 72 5 47 Stores/stalls/traditional markets 4 76 1 100 3 68 2 81 2 71 Peddlers 1 40 1 40 1 40 Middlemen (Tengkulak, Bakul, Populele, Toke) 7 60 1 100 1 40 5 57 1 40 2 78 4 57 Moneylenders (Rentenir, Bank Titil, Tukang Kredit) 4 47 1 100 3 29 66 2 55 1 10 Entrepreneurs 7 72 1 100 2 89 4 57 89 3 87 2 33 Mechanics 2 21 1 10 1 33 1 10 1 33 Kondektur/Mandor tanam 2 55 1 100 1 10 1 100 1 10 Laborers/Drivers/Tradesmen 5 53 1 75 4 47 33 2 68 2 47
3a Social Institutions- Individuals 12 71 1 100 4 72 7 67 58 1 57 3 91 4 74 Family/relatives/parents 4 87 1 100 3 82 2 94 2 80 Neighbors 2 89 1 100 1 78 78 1 100 Youth leaders 3 53 2 63 1 33 66 1 26 Community leaders 6 72 1 100 5 67 55 1 100 3 75 Bundo kandung 2 19 2 19 10 1 28 Ninik Mamak 3 81 3 81 100 1 61 1 82 Wali jorong 4 95 4 95 100 1 87 1 91 Wali nagari 3 52 3 52 44 1 68
3b Social Institutions Initiated by the Government 11 42 4 29 7 49 33 1 46 3 51 3 42 Dasa Wisma 3 37 3 37 1 49 2 31 Neighborhood Youth Associations 3 37 2 42 1 28 10 1 73 1 28 PKK 10 39 4 18 6 53 33 1 23 2 42 3 50 BPN 3 30 3 30 10 1 70
3c Social Institutions Initiated by the Community 9 1 85 4 38 4 48 2 27 3 1 Adat Insitutions/KAN 4 50 3 37 1 87 10 1 20 2 85 Arisan 3 58 1 70 2 52 1 70 2 52 Jimpitan/antre/kematian 1 100 1 100 1 100 Neighborhood watch groups/watch post 3 58 1 40 1 55 1 78 66 1 40 Art and sports groups 4 30 2 45 2 15 2 45 1 19 1 10
3d Social Institutions – Professional 10 58 1 100 3 48 6 57 29 1 100 2 100 4 49 Farmers’, fishermen’s and forest farmers’ groups 10 65 1 100 3 48 6 68 29 1 100 2 100 4 66 P3A 1 10 1 10 10 Kelompencapir 2 10 2 10 2 10

The SMERU Research Institute, December 2003 184
Appendix 33. (Continued) Summary of the Analysis of the Proximity of Various Institutions
Island Type of Community
Total by Village Java West Sumatra Sulawesi Rice Farming Dry-land Farming Forest and Plantation Coastal Fishing
N = 15 Score 1 Score 4 Score 10 Score 4 Score 2 Score 4 Score 5 Score 4a Government- Kecamatan/village 13 60 3 33 10 68 48 2 35 2 84 5 69
Kecamatan/Camat 5 41 1 10 4 48 21 1 87 2 37 Kelurahan/Village Offices 3 48 1 10 2 66 10 2 66 Village heads 9 74 9 74 55 1 10 2 94 4 89 Village secretaries 4 89 4 89 100 1 87 2 85 LKMD 4 72 4 72 10 1 87 2 96 LMD Hamlet heads 10 69 1 78 9 68 55 1 100 2 81 4 66 RW/RK 3 55 3 55 44 1 78 RT 6 52 6 52 61 1 70 1 10 2 55 Babinsa 4 36 4 36 1 61 3 28 Security guards/neighborhood watch groups 3 18 2 10 1 33 10 1 10 1 33 Village cadres 1 78 1 78 78
4b Government- Kabupaten/National 12 43 1 100 3 42 8 37 10 2 63 4 58 5 31 BKKBN 1 33 1 33 1 33 Veterinarian Assistants 1 10 1 10 10 P3N 1 46 1 46 1 46 Perhutani 1 100 1 100 1 100 Police 5 50 1 10 4 60 10 1 100 1 74 2 33 Extension workers 4 27 2 25 2 28 10 1 40 1 10 1 46 PPN (priests) 6 37 1 100 5 24 2 55 4 28
4c Government Institutions- Health 15 64 1 100 4 50 10 66 56 2 45 4 83 5 64 Puskesmas/Polindes 5 43 1 40 4 44 10 1 40 1 100 2 33 Posyandu 5 48 1 40 4 49 33 2 25 1 100 1 55 Doctors 1 33 1 33 33 Village midwives 8 73 2 76 6 71 66 2 73 1 87 2 75 Medical aides 2 63 2 63 2 63 Traditional healers 9 64 3 53 6 70 58 2 40 1 100 2 84 Family planning extension workers/cadres 5 57 1 100 3 47 1 46 55 1 49 2 69 1 46
4d Government Institutions- Education 10 64 4 61 6 66 78 1 79 2 49 4 58 Schools/School Committees/teachers 5 62 2 78 3 52 78 3 52 Teachers 6 72 2 67 4 74 66 1 79 1 87 2 66 Package A & B 1 10 1 10 1 10

The SMERU Research Institute, December 2003 185
Appendix 33. (Continued) Summary of the Analysis of the Proximity of Various Institutions
Island Type of Community Total by Village Java West Sumatra Sulawesi Rice Farming Dry-land Farming Forest and Plantation Coastal Fishing N = 15 Score 1 Score 4 Score 10 Score 4 Score 2 Score 4 Score 5 Score
5a Non-Government Institutions – NGOs 4 37 1 10 3 46 2 40 2 34 HIPPAM NGOs 2 33 2 33 2 33 BKPRM 1 33 1 33 1 33 BPRN 1 10 1 10 1 10 LPMK 3 45 3 45 1 70 2 33
5b Non-Government Institutions - Political Parties/Mass Organizations 3 36 3 36 3 36
KNPI 2 26 2 26 2 26 PAN 1 55 1 55 1 55 Political parties 2 19 2 19 2 19
6a Programs - Non-SSN 5 21 1 55 2 10 2 16 10 1 10 1 55 1 21 Bangdes 1 48 1 48 1 48 Binmas 1 10 1 10 1 10 KKN 1 10 1 10 10 P4K 1 33 1 33 1 33 PDMDKE 1 10 1 10 1 10 PKD-PWT 1 70 1 70 1 70 UP2K 1 10 1 10 10
6a Programs - SSN 1 55 1 55 1 55 Raskin groups 1 55 1 55 1 55

The SMERU Research Institute, December 2003 186
Appendix 33. (Continued) Summary of the Analysis of the Proximity of Various Institutions
Area Sex Rural Urban
Total by Respondent Female Male Mixed Group
N = 13 Score 2 Score 21 Score 5 Score 6 Score 10 Score 1a Formal Religious Institutions 8 65 2 16 13 50 4 37 5 64 4 46
Church youth groups 1 82 1 82 1 82 Mosque board/committees 3 85 3 85 2 100 1 55 Mosque Youth Associations/IRM 5 49 2 16 9 35 4 37 2 19 3 43
1b Religious Institutions Established by the Community 8 87 1 55 10 84 2 100 3 78 5 82 Majelis Taklim 6 83 1 55 8 80 2 100 3 78 3 70 Pengajian/yasinan/tahlilan groups 3 85 3 85 3 85
1c Religious Institutions - Individuals 9 83 2 54 15 75 4 69 4 65 7 84 Parishes 1 82 1 82 1 82 Priests/parish leaders 2 85 2 85 1 82 1 87 Islamic/religious leaders 4 74 1 100 6 77 1 100 2 64 3 78 Islamic teachers/preachers 4 96 5 94 2 100 1 78 2 97 Islamic prayer leaders (imam) in hamlets or villages 6 75 2 46 10 61 2 22 4 57 4 84
1d Religious Insititutions- Schools 8 52 1 10 11 48 1 55 2 55 8 46 Sunday Schools TK-TPA 5 48 1 10 15 25 2 24 4 26 9 24 Islamic boarding schools and teachers 3 60 13 35 4 36 7 35
2a Large-scale Formal Economic Institutions 7 40 13 22 2 23 6 18 5 25 Bank/ BPR 4 20 8 12 2 12 2 12 4 12 BPD/ Bank Jatim 5 59 8 31 2 32 2 32 4 31 BRI 2 10 10 6 2 6 4 6 PAM 1 10 7 6 3 7 PLN 2 55 9 34 2 29 3 45 Perhutani/forest rangers 1 23 8 12 4 12
2b Small-scale Formal Economic Institutions 7 33 1 40 17 24 2 21 6 26 9 23 Cooperatives/CU/ Kopdit/ KSP/ KUD 7 38 1 40 17 26 2 23 6 28 9 25 Takesra 1 10 7 6 3 7

The SMERU Research Institute, December 2003 187
Appendix 33. (Continued) Summary of the Analysis of the Proximity of Various Institutions
Area Sex Rural Urban
Total by Respondent Female Male Mixed Group
N = 13 Score 2 Score 21 Score 5 Score 6 Score 10 Score 2c Informal Economic Institutions 11 61 1 66 17 38 2 37 6 38 9 37
Stores/stalls/traditional markets 4 76 10 41 2 40 4 43 4 41 Peddlers 1 40 8 21 4 21 Middlemen (Tengkulak, Bakul, Populele, Toke) 7 60 14 33 2 34 6 34 6 31 Moneylenders (Rentenir, Bank Titil, Tukang Kredit) 3 40 1 66 13 32 2 25 4 33 7 33 Entrepreneurs 7 72 13 45 2 40 6 42 5 52 Mechanics 2 21 10 10 2 12 4 9 Kondektur/Mandor tanam 2 55 10 33 2 29 4 40 Laborers/Drivers/Tradesmen 4 58 1 33 13 29 2 29 4 32 7 28
3a Social Institutions- Individuals 11 75 1 33 17 39 2 42 6 42 9 37 Family/relatives/parents 4 87 10 46 2 45 4 47 4 47 Neighbors 2 89 11 49 2 45 5 54 Youth leaders 3 53 11 28 5 30 Community leaders 5 80 1 33 13 40 2 39 4 43 7 39 Bundo kandung 2 19 9 11 5 12 Ninik Mamak 3 81 11 45 7 47 Wali jorong 4 95 11 52 7 54 Wali nagari 3 52 9 31 5 33
3b Social Institutions Initiated by the Government 10 38 1 78 15 27 2 26 4 22 9 29 Dasa Wisma 3 37 8 21 2 20 2 20 4 22 Neighborhood Youth Associations 3 37 11 22 4 18 5 25 PKK 9 34 1 78 15 23 2 24 4 20 9 25 BPN 3 30 9 20 5 23
3c Social Institutions Initiated by the Community 8 1 20 13 19 1 9 5 26 7 16 Adat Insitutions/KAN 4 50 13 27 7 24 Arisan 3 58 10 32 2 31 4 31 Jimpitan/antre/kematian 1 100 8 51 2 51 2 51 Neighborhood watch groups/watch posts 3 58 13 31 6 29 5 34 Art and sports groups 3 33 1 20 14 16 8 16
3d Social Institutions – Professional 9 60 1 44 17 37 2 34 6 36 9 38 Farmers’, fishermen’s and forest farmers’ groups 9 67 1 44 17 38 2 38 6 38 9 39 P3A 1 10 7 6 3 7 Kelompencapir 2 10 6 6 2 6

The SMERU Research Institute, December 2003 188
Appendix 33. (Continued) Summary of the Analysis of the Proximity of Various Institutions
Area Sex Rural Urban
Total by Respondent Female Male Mixed Group
N = 13 Score 2 Score 21 Score 5 Score 6 Score 10 Score 4a Government- Kecamatan/village 11 61 2 53 15 32 2 36 4 28 9 33
Kecamatan/Camat 5 41 11 24 2 23 4 16 5 31 Kelurahan/Village Offices 3 48 9 21 4 20 3 20 Village heads 7 82 2 44 13 36 2 41 2 41 9 33 Village secretaries 3 86 1 100 11 51 2 47 2 47 7 54 LKMD 3 93 1 10 11 32 2 38 2 38 7 29 LMD Hamlet heads 8 73 2 55 15 41 2 40 4 39 9 42 RW/RK 2 78 1 10 9 28 2 29 2 29 5 27 RT 4 49 2 57 13 29 2 29 2 29 9 28 Babinsa 4 36 8 23 2 20 2 20 4 26 Security guards/neighborhood watch groups 3 18 11 10 4 11 5 8 Village cadres 1 78 7 45 2 39
4b Government- Kabupaten/National 11 42 1 55 17 29 2 28 6 32 9 27 BKKBN 1 33 6 17 2 17 Veterinarian Assistants 1 10 7 6 3 7 P3N 1 46 8 24 4 24 Perhutani 1 100 8 51 2 51 Police 4 37 1 100 15 31 2 27 4 19 9 37 Extension workers 4 27 13 14 4 14 7 13 PPN (priests) 5 42 1 10 12 24 2 21 4 33 6 19
4c Government Institutions- Health 13 67 2 48 17 37 2 40 6 39 9 36 Puskesmas/Polindes 4 51 1 10 15 24 2 24 4 22 9 24 Posyandu 3 65 2 21 15 27 2 26 4 24 9 28 Doctors 1 33 7 19 3 22 Village midwives 6 71 2 79 15 42 2 40 4 39 9 43 Medical aides 2 63 6 32 2 32 2 32 Traditional healers 7 72 2 38 15 35 2 37 4 33 9 36 Family planning extension workers/cadres 5 57 15 33 6 33 7 34
4d Government Institutions- Education 9 63 1 78 15 38 2 37 4 34 9 40 Schools/School Committees/Teachers 5 62 9 38 4 34 3 48 Teachers 5 71 1 78 15 41 2 39 4 37 9 43 Package A & B 1 10 8 6 4 6

The SMERU Research Institute, December 2003 189
Appendix 33. (Continued) Summary of the Analysis of the Proximity of Various Institutions
Area Sex Rural Urban
Total by Respondent Female Male Mixed Group
N = 13 Score 2 Score 21 Score 5 Score 6 Score 10 Score 5a Non-Government Institutions – NGOs 3 26 1 70 12 20 6 24
HIPPAM NGOs 2 33 6 17 2 17 BKPRM 1 33 6 17 2 17 BPRN 1 10 8 6 4 6 LPMK 2 33 1 70 10 27 6 29
5b Non-Government Institutions - Political Parties/Mass Organizations 3 36 6 19 2 19 2 19 2 19
KNPI 2 26 6 14 2 14 2 14 PAN 1 55 6 28 2 28 Political parties 2 19 6 11 2 11 2 11
6a Programs - Non-SSN 4 24 1 10 17 13 2 13 6 14 9 13 Bangdes 1 48 8 24 2 24 2 24 Binmas 1 10 6 6 2 6 KKN - 1 10 8 5 2 6 4 5 P4K 1 33 6 17 2 17 PDMDKE 1 10 8 6 4 6 PKD-PWT 1 70 8 36 2 36 UP2K 1 10 7 6 3 7
6a Programs – SSN 1 55 6 28 2 28 Raskin groups 1 55 6 28 2 28

The SMERU Research Institute, December 2003 190
Appendix 34. Summary of the Analysis of the Institutions Communities can Influence based on PPAs with 43 Discussion Groups in 10 villages
Region Area Community Sex Age
Total by Village Java
Nusa Tenggara Rural Urban
Rice Farming
Dry-land Farming
Forest and Plantation
Coastal Fishing
Labor, Informal Sector & Mixed
Total by Respondent Female Male
Mixed Group Young Old
N = 10 7 3 4 6 2 2 1 1 4 43 20 19 4 23 20 1a DKM 1 1 1 1 1 1 1 1a Churches/Priests 1a MUD 1a Islamic/religious leaders 4 2 2 2 2 1b Evangelists 1b Islamic teachers/preachers 1c Majelis 1c Majelis Taklim 1 1 1 1 3 2 1 1 2 1c Pengajian 3 3 3 3 5 3 1 1 4 1 1c Youth pengajian 1c Tahlilan 1 1 1 1 2 1 1 1 1 1d Sunday Schools 1d TK-TPA 2a Private banks 1 1 1 1 2 2 1 1 2a BRI 1 1 1 1 1 1 1 2a Pawnshops 2b BKD/BKK 2b Savings and Loans Cooperatives 2 2 2 2 4 2 2 2 2 2b Cooperatives/CU/Kopdit 2 1 1 1 1 1 1 3 3 2 1 2b KUD 2b Takesra 2b UBSP 1 1 1 2b UEDSP 1 1 1 1 1 1 1 2c Peddlers 1 1 1 1 2 2 1 1 2c Populele (middlemen) 2c Rentenir (moneylenders) 1 1 1 1 1 1 1 2c Tengkulak Palele (middlemen) 1 1 1 1 2 2 1 1 2c Farmer's shops 2c Stores/stalls 3a University students 3a Relatives 3a Neighbors 2 1 1 1 1 1 1 4 3 1 2 2

The SMERU Research Institute, December 2003 191
Appendix 34. (Continued) Summary of the Analysis of the Institutions Communities can Influence based on PPAs with 43 Discussion Groups in 10 villages
Region Area Community Sex Age
Total by Village Java
Nusa Tenggara Rural Urban
Rice Farming
Dry-land Farming
Forest and Plantation
Coastal Fishing
Labor, Informal Sector & Mixed
Total by Respondent Female Male
Mixed Group Young Old
N = 10 7 3 4 6 2 2 1 1 4 43 20 19 4 23 20 3b Dasa Wisma 3b Neighborhood Youth Associations 2 2 2 2 3 3 1 2 3b Kerukunan Desa 1 1 1 1 4 2 2 2 2 3b Adat institutions 3b PKK 5 5 1 4 1 4 10 8 2 4 6 3c Arisan 5 5 2 3 2 1 2 9 6 2 1 5 4 3c Banjar alat pesta 1 1 1 1 2 2 1 1 3c Banjar Kematian 1 1 1 1 2 2 1 1 3c Jimpitan 1 1 1 1 1 1 1 3c Collective work groups 3c Art groups 3c Sports groups 3c Voluntary community work 3c Paguyuban 3c Parelek 3c Cultural centers 1 1 1 1 1 1 1 3c Neighborhood watch 2 2 2 2 1 1 1 3d Farmers' groups 2 1 1 1 1 1 1 4 1 3 3 1 3d P3A 4a Hamlet apparatus 4a Kelurahan/village hamlets 2 2 2 2 3 3 1 2 4a Security guards 1 1 1 1 1 1 1 4a Kecamatan/Camat 4a Kelurahan/Village Offices 1 1 1 1 1 1 1 4a LKMD 4 3 1 2 2 1 1 1 1 6 1 5 2 4 4a LMD 2 2 2 1 1 2 2 2 4a RW/RT 5 5 1 4 1 4 9 1 5 3 5 4 4b Ministry of Social Affairs 4b Office of Animal Husbandry 4b Government 4b Perhutani 4b Extension workers

The SMERU Research Institute, December 2003 192
Appendix 34. (Continued) Summary of the Analysis of the Institutions Communities can Influence based on PPAs with 43 Discussion Groups in 10 villages
Region Area Community Sex Age
Total by Village Java
Nusa Tenggara Rural Urban
Rice Farming
Dry-land Farming
Forest and Plantation
Coastal Fishing
Labor, Informal Sector & Mixed
Total by Respondent Female Male
Mixed Group Young Old
N = 10 7 3 4 6 2 2 1 1 4 43 20 19 4 23 20 4c Village midwives 4c Traditional healers 4c Family planning extension workers 4c Posyandu 4 4 4 1 3 7 6 1 2 5 4c Puskesmas/Polindes 3 3 3 1 2 4 3 1 1 3 4c Hospitals 1 1 1 1 2 2 1 1 4d Schools, School Committees, Teachers 1 1 1 1 1 1 1 4d Japan 5 CRS 5 HIPPAM 5 HKSN 5 KIPP TRIBINA 5 Anak Alam 5 CARE 5 WTM/FADO 1 1 1 1 3 1 2 1 2 5 Yaspem 5 NU 5 Enterprises 5 Yayasan Dana Sosial 5 Yayasan Angkatan Laut 5 YBKS 5 YIS 6a Bangdes 6a Banpres 6a IDT 6a P2P 6a PDMDKE 6a IDT technical assistance 6a PKD-PWT 6a UP2K 1 1 1 1 2 2 1 1 6b Scholarships 6b SSN 6b OPK 6b Proyekan 1 1 1 1 1 1 1

The SMERU Research Institute, December 2003 193
Appendix 35. Summary of the Analysis of the Effectiveness of Various Institutions
Islands Type of Community
Total by Village Java
East Nusa Tenggara Sulawesi Rice Farming
Dry-land Farming
Forest and Plantation
Coastal Fishing
Urban Informal Sector and
Labor Mixed N = 13 Score 7 Score 2 Score 4 Score 4 Score 2 Score 1 Score 1 Score 3 Score 2 Score
1a Formal Religious Institutions 5 71.0 1 100.0 1 100.0 3 51.667 1 55.0 1 100.0 0 1 77.5 0 2 61.3 Churches/priests 1 100.0 0 1 100.0 0 0 1 100.0 0 0 0 0 MUD 1 100.0 1 100.0 0 0 0 0 0 0 0 1 100.0 Mosque Youth Associations/IRM 3 51.7 0 0 3 51.667 1 55.0 0 0 1 77.5 0 1 22.5
1b Religious Institutions Initiated by the Community 8 89.9 6 86.6 1 100.0 1 100 3 90.0 1 100.0 0 0 3 85.7 1 92.5 DKM 1 100.0 1 100.0 0 0 0 0 0 0 0 1 100.0 Majelis Taklim 3 85.0 2 77.5 1 100.0 0 1 80.0 1 100.0 0 0 1 75.0 0 Pengajian 7 88.9 6 87.0 0 1 100 3 93.3 0 0 0 3 85.7 1 85.0
1c Religious Institutions- Individuals 4 63.8 0 1 100.0 3 51.667 1 22.5 1 100.0 0 1 77.5 0 1 55.0 Religious leaders 2 50.0 0 0 2 50 1 22.5 0 0 1 77.5 0 0 Evangelists 1 100.0 0 1 100.0 0 0 1 100.0 0 0 0 0 Imam 2 66.3 0 0 2 66.25 0 0 0 1 77.5 0 1 55.0
1d Religious Institutions- Schools 3 63.3 1 90.0 0 2 50 1 90.0 0 0 1 77.5 0 1 22.5 TK-TPA 3 63.3 1 90.0 0 2 50 1 90.0 0 0 1 77.5 0 1 22.5
2a Large-scale Formal Economic Institutions 3 86.7 2 80.0 0 1 100 1 100.0 0 0 0 2 80.0 0 BRI 1 100.0 1 100.0 0 0 0 0 0 0 1 100.0 0 Pawnshops 1 60.0 1 60.0 0 0 0 0 0 0 1 60.0 0 BPD 1 100.0 0 0 1 100 1 100.0 0 0 0 0 0
2b Small-scale Formal Economic Institutions 8 65.5 6 73.3 1 61.7 1 22.5 1 70.0 1 61.7 1 90.0 0 3 63.3 2 56.3 BKD/BKK 1 100.0 1 100.0 0 0 0 0 1 100.0 0 0 0 Savings and Loans Cooperatives 6 67.9 4 72.5 1 95.0 1 22.5 0 1 95.0 0 0 3 63.3 2 61.3 KUD 2 75.0 2 75.0 0 0 1 70.0 0 1 80.0 0 0 0 UBSP 1 60.0 0 1 60.0 0 0 1 60.0 0 0 0 0 UEDSP 2 55.0 1 80.0 1 30.0 0 0 1 30.0 0 0 0 1 80.0
2c Informal Economic Institutions 4 66.4 3 68.3 0 1 60.781 0 0 1 100.0 1 60.8 2 52.5 0 Rentenir (Moneylenders) 2 52.5 2 52.5 0 0 0 0 0 0 2 52.5 0 Tengkulak Palele (middlemen) 1 55.0 0 0 1 55 0 0 0 1 55 0 0 Stores/stalls 1 100.0 1 100.0 0 0 0 0 1 100.0 0 0 0 Traditional markets 1 100.0 0 0 1 100 0 0 0 1 100 0 0 Juragan (Rich traders or landlords) 1 55.0 0 0 1 55 0 0 0 1 55 0 0 Mechanics 1 77.5 0 0 1 77.5 0 0 0 1 77.5 0 0 Drivers 1 55.0 0 0 1 55 0 0 0 1 55 0 0 Tradesmen/laborers 1 66.3 0 0 1 66.25 0 0 0 1 66.3 0 0 Kondektur 1 55.0 0 0 1 55 0 0 0 1 55 0 0 Ice factories 1 22.5 0 0 1 22.5 0 0 0 1 22.5 0 0

The SMERU Research Institute, December 2003 194
Appendix 35. (Continued) Summary of the Analysis of the Effectiveness of Various Institutions
Islands Type of Community
Total by Village Java
East Nusa Tenggara Sulawesi Rice Farming
Dry-land Farming
Forest and Plantation
Coastal Fishing
Urban Informal Sector and
Labor Mixed N = 13 Score 7 Score 2 Score 4 Score 4 Score 2 Score 1 Score 1 Score 3 Score 2 Score
3a Social Institutions- Individuals 6 76.7 4 76.3 0 2 77.5 2 67.5 0 1 80.0 1 100 1 75.0 1 70.0 Relatives 1 70.0 1 70.0 0 0 0 0 0 0 1 70.0 0 Neighbors 2 80.0 2 80.0 0 0 0 0 1 80.0 0 1 80.0 0 Community leaders 4 76.3 2 75.0 0 2 77.5 2 67.5 0 0 1 100 0 1 70.0
3b Social Institutions Initiated by the Government 8 65.0 5 84.0 1 35.0 2 32.5 4 55.0 1 35.0 1 90.0 0 1 90.0 1 85.0 Dasa Wisma 1 90.0 1 90.0 0 0 0 0 0 0 1 90.0 0 Neighborhood Youth Associations 4 65.0 3 83.3 1 10.0 0 1 100.0 1 10.0 0 0 1 80.0 1 70.0 PKK 8 68.1 5 84.0 1 60.0 2 32.5 4 48.8 1 60.0 1 90.0 0 1 100.0 1 100.0
3c Social Institutions Initiated by the Community 10 60.3 6 80.0 1 80.0 3 14.167 3 65.0 1 80.0 1 90.0 1 22.5 3 68.3 1 10.0 Arisan 7 69.3 6 79.2 0 1 10 3 66.7 0 1 90.0 0 3 65.0 0 Banjar Kematian 1 85.0 1 85.0 0 0 0 0 0 0 1 85.0 0 Art and sports groups 5 56.5 2 85.0 1 80.0 2 16.25 1 80.0 1 80.0 1 90.0 1 22.5 0 1 10.0 Neighborhood watch groups 2 45.0 1 80.0 0 1 10 1 10.0 0 0 0 1 80.0 0
3d Social Institutions – Professional 5 63.0 3 71.7 0 2 50 2 41.3 0 0 1 77.5 1 95.0 1 60.0 Farmers' groups 5 63.0 3 71.7 0 2 50 2 41.3 0 0 1 77.5 1 95.0 1 60.0
4a Government- Kecamatan/village 12 77.5 6 81.9 2 90.8 4 64.427 4 72.7 2 90.8 0 1 77.5 3 82.3 2 66.9 Kelurahan/village apparatus 6 89.0 3 88.9 2 95.0 1 77.5 1 76.7 2 95.0 0 1 77.5 1 100.0 1 90.0 Lurah/village heads 3 55.0 0 0 3 55 2 55.0 0 0 0 0 1 55.0 Security guards 1 70.0 1 70.0 0 0 0 0 0 0 0 1 70.0 Kecamatan/Camat 2 90.0 1 100.0 1 80.0 0 0 1 80.0 0 0 1 100.0 0 LKMD 7 66.8 5 74.0 1 75.0 1 22.5 3 50.8 1 75.0 0 0 2 85.0 1 70.0 LMD 1 90.0 1 90.0 0 0 1 90.0 0 0 0 0 0 RW/RT 10 80.3 6 89.6 0 4 66.25 4 83.1 0 0 1 77.5 3 84.2 2 70.0 RK/RW 3 85.0 0 0 3 85 2 88.8 0 0 1 77.5 0 0 Babinsa 2 43.8 0 0 2 43.75 1 10.0 0 0 1 77.5 0 0 Hamlet heads 3 85.0 0 0 3 85 2 88.8 0 0 1 77.5 0 0
4b Government- Kabupaten/National 5 37.8 1 30.0 1 60.0 3 32.917 2 20.0 1 60.0 0 1 66.3 0 1 22.5 Ministry of Social Affairs 1 60.0 0 1 60.0 0 0 1 60.0 0 0 0 0 Extension workers 2 20.0 1 30.0 0 1 10 2 20.0 0 0 0 0 0 Police 1 22.5 0 0 1 22.5 0 0 0 0 0 1 22.5 PPN 2 38.8 0 0 2 38.75 0 0 0 1 55 0 1 22.5 BKKBN 2 43.8 0 0 2 43.75 1 10.0 0 0 1 77.5 0 0
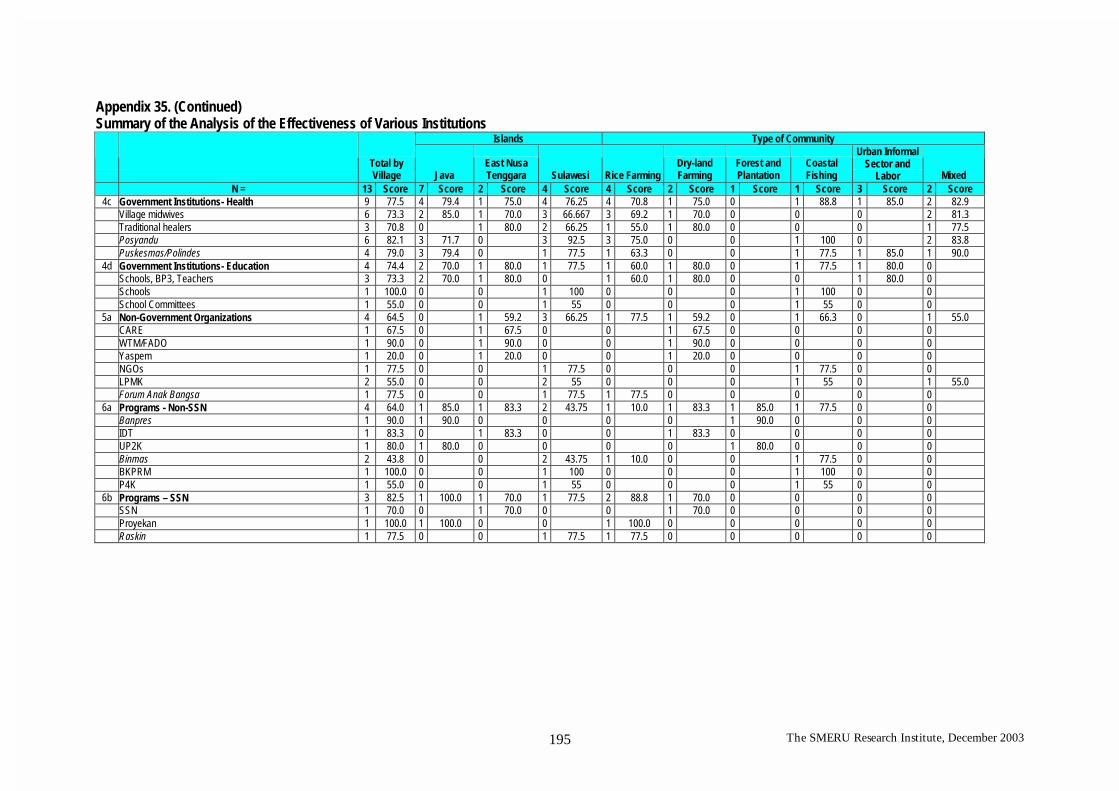
The SMERU Research Institute, December 2003 195
Appendix 35. (Continued) Summary of the Analysis of the Effectiveness of Various Institutions
Islands Type of Community
Total by Village Java
East Nusa Tenggara Sulawesi Rice Farming
Dry-land Farming
Forest and Plantation
Coastal Fishing
Urban Informal Sector and
Labor Mixed N = 13 Score 7 Score 2 Score 4 Score 4 Score 2 Score 1 Score 1 Score 3 Score 2 Score
4c Government Institutions- Health 9 77.5 4 79.4 1 75.0 4 76.25 4 70.8 1 75.0 0 1 88.8 1 85.0 2 82.9 Village midwives 6 73.3 2 85.0 1 70.0 3 66.667 3 69.2 1 70.0 0 0 0 2 81.3 Traditional healers 3 70.8 0 1 80.0 2 66.25 1 55.0 1 80.0 0 0 0 1 77.5 Posyandu 6 82.1 3 71.7 0 3 92.5 3 75.0 0 0 1 100 0 2 83.8 Puskesmas/Polindes 4 79.0 3 79.4 0 1 77.5 1 63.3 0 0 1 77.5 1 85.0 1 90.0
4d Government Institutions- Education 4 74.4 2 70.0 1 80.0 1 77.5 1 60.0 1 80.0 0 1 77.5 1 80.0 0 Schools, BP3, Teachers 3 73.3 2 70.0 1 80.0 0 1 60.0 1 80.0 0 0 1 80.0 0 Schools 1 100.0 0 0 1 100 0 0 0 1 100 0 0 School Committees 1 55.0 0 0 1 55 0 0 0 1 55 0 0
5a Non-Government Organizations 4 64.5 0 1 59.2 3 66.25 1 77.5 1 59.2 0 1 66.3 0 1 55.0 CARE 1 67.5 0 1 67.5 0 0 1 67.5 0 0 0 0 WTM/FADO 1 90.0 0 1 90.0 0 0 1 90.0 0 0 0 0 Yaspem 1 20.0 0 1 20.0 0 0 1 20.0 0 0 0 0 NGOs 1 77.5 0 0 1 77.5 0 0 0 1 77.5 0 0 LPMK 2 55.0 0 0 2 55 0 0 0 1 55 0 1 55.0 Forum Anak Bangsa 1 77.5 0 0 1 77.5 1 77.5 0 0 0 0 0
6a Programs - Non-SSN 4 64.0 1 85.0 1 83.3 2 43.75 1 10.0 1 83.3 1 85.0 1 77.5 0 0 Banpres 1 90.0 1 90.0 0 0 0 0 1 90.0 0 0 0 IDT 1 83.3 0 1 83.3 0 0 1 83.3 0 0 0 0 UP2K 1 80.0 1 80.0 0 0 0 0 1 80.0 0 0 0 Binmas 2 43.8 0 0 2 43.75 1 10.0 0 0 1 77.5 0 0 BKPRM 1 100.0 0 0 1 100 0 0 0 1 100 0 0 P4K 1 55.0 0 0 1 55 0 0 0 1 55 0 0
6b Programs – SSN 3 82.5 1 100.0 1 70.0 1 77.5 2 88.8 1 70.0 0 0 0 0 SSN 1 70.0 0 1 70.0 0 0 1 70.0 0 0 0 0 Proyekan 1 100.0 1 100.0 0 0 1 100.0 0 0 0 0 0 Raskin 1 77.5 0 0 1 77.5 1 77.5 0 0 0 0 0

The SMERU Research Institute, December 2003 196
Appendix 35. (Continued) Summary of the Analysis of the Effectiveness of Various Institutions
Area Sex Age
Rural Urban Total by
Respondent Female Male Mixed Group Young Old Mixed N = 7 Score 6 Score 47 Score 18 Score 18 Score 11 Score 26 Score 17 Score 4 Score
1a Formal Religious Institutions 3 77.5 2 61.3 8 81.875 2 100 3 100 3 51.667 3 100 2 100 3 51.67 Churches/priests 1 100.0 0 4 100 2 100 2 100 0 2 100 2 100 0 MUD 0 1 100.0 1 100 0 1 100 0 1 100 0 0 Mosque Youth Associations/IRM 2 66.3 1 22.5 3 51.6667 0 0 3 51.667 0 0 3 51.67
1b Religious Institutions Initiated by the Community 3 93.3 5 87.9 22 85 9 79.44 9 90.556 4 85 11 82.273 10 86.5 1 100 DKM 0 1 100.0 1 100 1 100 0 0 0 1 100 0 Majelis Taklim 1 100.0 2 77.5 8 83.75 5 80 3 90 0 5 84 3 83.33 0 Pengajian 2 90.0 5 88.4 15 84.6667 4 72.5 7 91.429 4 85 7 80 7 87.14 1 100
1c Religious Institutions- Individuals 3 66.7 1 55.0 5 71 1 100 1 100 3 51.667 2 100 0 3 51.67 Religious leaders 2 50.0 0 2 50 0 0 2 50 0 0 2 50 Evangelists 1 100.0 0 2 100 1 100 1 100 0 2 100 0 0 Imam 1 77.5 1 55.0 2 66.25 0 0 2 66.25 0 0 2 66.25
1d Religious Institutions- Schools 1 77.5 2 56.3 4 70 1 90 1 90 2 50 1 90 1 90 2 50 TK-TPA 1 77.5 2 56.3 4 70 1 90 1 90 2 50 1 90 1 90 2 50
2a Large-scale Formal Economic Institutions 1 100.0 2 80.0 5 76 3 76.67 1 50 1 100 3 76.667 1 50 1 100 BRI 0 1 100.0 1 100 1 100 0 0 1 100 0 0 Pawnshops 0 1 60.0 3 60 2 65 1 50 0 2 65 1 50 0 BPD 1 100.0 0 1 100 0 0 1 100 0 0 1 100
2b Small-scale Formal Economic Institutions 3 73.9 5 60.5 15 67.8333 4 81.25 8 63.75 3 60.833 9 75 5 64 1 22.5 BKD/BKK 1 100.0 0 1 100 0 1 100 0 1 100 0 0 Savings and Loans Cooperatives 1 95.0 5 62.5 9 73.0556 4 81.25 3 70 2 61.25 4 81.25 4 77.5 1 22.5 KUD 2 75.0 0 2 75 0 2 75 0 2 75 0 0 UBSP 1 60.0 0 1 60 0 0 1 60 1 60 0 0 UEDSP 1 30.0 1 80.0 3 46.6667 0 3 46.667 0 2 65 1 10 0
2c Informal Economic Institutions 2 80.4 2 52.5 7 75.8259 4 77.5 2 80 1 60.781 3 70 3 86.67 1 60.78 Rentenir (Moneylenders) 0 2 52.5 3 56.6667 2 55 1 60 0 2 55 1 60 0 Tengkulak Palele (middlemen) 1 55.0 0 1 55 0 0 1 55 0 0 1 55 Stores/stalls 1 100.0 0 3 100 2 100 1 100 0 1 100 2 100 0 Traditional markets 1 100.0 0 1 100 0 0 1 100 0 0 1 100 Juragan (Rich traders or landlords) 1 55.0 0 1 55 0 0 1 55 0 0 1 55 Mechanics 1 77.5 0 1 77.5 0 0 1 77.5 0 0 1 77.5 Drivers 1 55.0 0 1 55 0 0 1 55 0 0 1 55 Tradesmen/laborers 1 66.3 0 1 66.25 0 0 1 66.25 0 0 1 66.25 Kondektur 1 55.0 0 1 55 0 0 1 55 0 0 1 55 Ice factories 1 22.5 0 1 22.5 0 0 1 22.5 0 0 1 22.5

The SMERU Research Institute, December 2003 197
Appendix 35. (Continued) Summary of the Analysis of the Effectiveness of Various Institutions
Area Sex Age
Rural Urban Total by
Respondent Female Male Mixed Group Young Old Mixed N = 7 Score 6 Score 47 Score 18 Score 18 Score 11 Score 26 Score 17 Score 4 Score
3a Social Institutions- Individuals 3 78.3 3 75.0 7 77.1429 5 77 0 2 77.5 3 75 2 80 2 77.5 Relatives 0 1 70.0 1 70 1 70 0 0 1 70 0 0 Neighbors 1 80.0 1 80.0 2 80 2 80 0 0 1 80 1 80 0 Community leaders 2 77.5 2 75.0 5 77 3 76.67 0 2 77.5 2 75 1 80 2 77.5
3b Social Institutions Initiated by the Government 5 54.0 3 83.3 15 70 7 83.57 3 56.667 5 59 8 79.375 5 70 2 32.5 Dasa Wisma 0 1 90.0 1 90 1 90 0 0 0 1 90 0 Youth Neighborhood Associations 1 10.0 3 83.3 5 66 0 3 60 2 75 3 83.333 2 40 0 PKK 5 59.0 3 83.3 12 68.75 7 84.29 2 45 3 48.333 6 75 4 77.5 2 32.5
3c Social Institutions Initiated by the Community 5 57.5 5 63.0 17 71.6176 7 83.57 5 84 5 42.5 8 82.5 6 85.83 3 14.17 Arisan 3 63.3 4 73.8 9 73.3333 7 84.29 0 2 35 4 72.5 4 90 1 10 Banjar Kematian 0 1 85.0 4 85 1 70 2 85 1 100 2 95 2 75 0 Art and sports groups 4 68.1 1 10.0 5 56.5 0 3 83.333 2 16.25 2 85 1 80 2 16.25 Neighborhood watch groups 1 10.0 1 80.0 2 45 0 0 2 45 1 80 0 1 10
3d Social Institutions – Professional 3 53.3 2 77.5 6 68.3333 2 95 2 60 2 50 2 80 2 75 2 50 Farmers' groups 3 53.3 2 77.5 6 68.3333 2 95 2 60 2 50 2 80 2 75 2 50
4a Government- Kecamatan/village 6 79.1 6 76.0 31 79.7648 10 82.5 13 82.308 8 72.214 16 79.063 11 86.36 4 64.43 Kelurahan/village apparatus 3 89.2 3 88.9 14 89.1071 8 88.75 3 96.667 3 82.5 7 92.857 6 86.67 1 77.5 Lurah/village heads 2 55.0 1 55.0 3 55 0 0 3 55 0 0 3 55 Security guards 0 1 70.0 1 70 0 1 70 0 1 70 0 0 Kecamatan/Camat 1 80.0 1 100.0 2 90 1 80 1 100 0 2 90 0 0 LKMD 3 59.2 4 72.5 11 64.7727 2 50 7 74.286 2 46.25 7 71.429 3 63.33 1 22.5 LMD 1 90.0 0 1 90 0 1 90 0 1 90 0 0 RW/RT 4 77.5 6 82.1 19 81.8421 5 82 7 90 7 73.571 9 81.111 6 93.33 4 66.25 RK/RW 3 85.0 0 3 85 0 0 3 85 0 0 3 85 Babinsa 2 43.8 0 2 43.75 0 0 2 43.75 0 0 2 43.75 Hamlet heads 3 85.0 0 3 85 0 0 3 85 0 0 3 85
4b Government- Kabupaten/National 3 45.4 2 26.3 7 44.1071 3 53.33 1 50 3 32.917 2 45 2 60 3 32.92 Ministry of Social Affairs 1 60.0 0 3 60 2 65 1 50 0 1 60 2 60 0 Extension workers 1 10.0 1 30.0 2 20 1 30 0 1 10 1 30 0 1 10 Police 0 1 22.5 1 22.5 0 0 1 22.5 0 0 1 22.5 PPN 1 55.0 1 22.5 2 38.75 0 0 2 38.75 0 0 2 38.75 BKKBN 2 43.8 0 2 43.75 0 0 2 43.75 0 0 2 43.75

The SMERU Research Institute, December 2003 198
Appendix 35. (Continued) Summary of the Analysis of the Effectiveness of Various Institutions
Area Sex Age
Rural Urban Total by
Respondent Female Male Mixed Group Young Old Mixed N = 7 Score 6 Score 47 Score 18 Score 18 Score 11 Score 26 Score 17 Score 4 Score
4c Government Institutions- Health 5 76.5 4 78.8 16 75.2083 8 81.04 4 62.5 4 76.25 6 75 6 74.72 4 76.25 Village midwives 3 64.2 3 82.5 11 74.5455 6 86.67 2 50 3 66.667 4 75 4 80 3 66.67 Traditional healers 2 67.5 1 77.5 3 70.8333 1 80 0 2 66.25 0 1 80 2 66.25 Posyandu 3 93.3 3 70.8 8 78.4375 4 75 1 50 3 92.5 4 65 1 90 3 92.5 Puskesmas/Polindes 1 77.5 3 79.4 8 77.1875 5 76 2 80 1 77.5 3 83.333 4 72.5 1 77.5
4d Government Institutions- Education 2 78.8 2 70.0 4 74.375 1 80 2 70 1 77.5 3 73.333 0 1 77.5 Schools, BP3, Teachers 1 80.0 2 70.0 3 73.3333 1 80 2 70 0 3 73.333 0 0 Schools 1 100.0 0 1 100 0 0 1 100 0 0 1 100 School Committees 1 55.0 0 1 55 0 0 1 55 0 0 1 55
5a Non-Government Organizations 3 67.6 1 55.0 7 71.4881 2 85 2 65.833 3 66.25 2 87.5 2 63.33 3 66.25 CARE 1 67.5 0 4 67.5 2 85 2 50 0 2 85 2 50 0 WTM/FADO 1 90.0 0 4 90 2 85 2 95 0 2 90 2 90 0 Yaspem 1 20.0 0 1 20 0 1 20 0 0 1 20 0 NGOs 1 77.5 0 1 77.5 0 0 1 77.5 0 0 1 77.5 LPMK 1 55.0 1 55.0 2 55 0 0 2 55 0 0 2 55 Forum Anak Bangsa 1 77.5 0 1 77.5 0 0 1 77.5 0 0 1 77.5
6a Programs - Non-SSN 4 64.0 0 8 69.6875 3 80 3 76.667 2 43.75 3 83.333 3 73.33 2 43.75 Banpres 1 90.0 0 1 90 0 1 90 0 0 1 90 0 IDT 1 83.3 0 4 75 2 80 2 70 0 2 85 2 65 0 UP2K 1 80.0 0 1 80 1 80 0 0 1 80 0 0 Binmas 2 43.8 0 2 43.75 0 0 2 43.75 0 0 2 43.75 BKPRM 1 100.0 0 1 100 0 0 1 100 0 0 1 100 P4K 1 55.0 0 1 55 0 0 1 55 0 0 1 55
6b Programs – SSN 3 82.5 0 4 86.875 2 85 1 100 1 77.5 1 100 2 85 1 77.5 SSN 1 70.0 0 1 70 1 70 0 0 0 1 70 0 Proyekan 1 100.0 0 2 100 1 100 1 100 0 1 100 1 100 0 Raskin 1 77.5 0 1 77.5 0 0 1 77.5 0 0 1 77.5

The SMERU Research Institute, December 2003 199
Appendix 36. Summary of the Analysis of the Effectiveness of Various Institutions based on the Scores obtained in PPAs conducted by the World Bank in 9 villages
Region Area Type of Community Sex Age
Total by Village Java
East Nusa Tenggara Rural Urban
Rice Farming
Dry-land Farming
Forest and Plantation
Labor, Informal Sector & Mixed
Total by Respondent Female Male
Mixed Group (teenagers) Young Old
N = 9 7 2 4 5 2 2 1 4 42 18 17 7 15 17 1a DKM 100.0 100.0 100.0 100.0 100.0 100.0 100.0 1a Churches/Priests 100.0 100.0 100.0 100.0 100.0 100.0 100.0 100.0 100.0 1a MUD 100.0 100.0 100.0 100.0 100.0 100.0 100.0 1a Islamic/religious leaders 1b Evangelists 100.0 100.0 100.0 100.0 100.0 100.0 100.0 100.0 1b Islamic teachers/preachers 1c Majelis 100.0 100.0 100.0 100.0 100.0 100.0 100.0 100.0 1c Majelis Taklim 77.5 77.5 77.5 80.0 75.0 78.3 75.0 85.0 73.3 83.3 1c Pengajian 90.0 90.0 90.0 90.0 86.0 100.0 86.7 70.0 80.0 90.0 1c Youth pengajian 83.3 83.3 83.3 100.0 75.0 83.3 70.0 100.0 80.0 75.0 100.0 1c Tahlilan 81.0 81.0 80.0 82.0 80.0 82.0 81.7 60.0 93.3 90.0 83.3 80.0 1d Sunday Schools 1d TK-TPA 90.0 90.0 90.0 90.0 90.0 90.0 90.0 2a Private banks 2a BRI 100.0 100.0 100.0 100.0 100.0 100.0 100.0 2a Pawnshops 60.0 60.0 60.0 60.0 60.0 65.0 50.0 65.0 50.0 2b BKD/BKK 100.0 100.0 100.0 100.0 100.0 100.0 100.0 2b Savings and Loans Cooperatives 80.0 80.0 80.0 80.0 86.7 60.0 100.0 100.0 80.0 100.0 2b Cooperatives/CU/Kopdit 75.0 68.3 95.0 95.0 68.3 95.0 68.3 75.0 85.0 55.0 80.0 70.0 2b KUD 75.0 75.0 75.0 70.0 80.0 75.0 75.0 75.0 2b Takesra 2b UBSP 60.0 60.0 60.0 60.0 60.0 60.0 60.0 2b UEDSP 55.0 80.0 30.0 30.0 80.0 30.0 80.0 46.7 46.7 65.0 10.0 2c Peddlers 2c Populele (middlemen) 2c Rentenir (moneylenders) 52.5 52.5 52.5 52.5 56.7 55.0 60.0 55.0 60.0 2c Tengkulak Palele (middlemen) 2c Farm shops 2c Stores/stalls 100.0 100.0 100.0 100.0 100.0 100.0 100.0 100.0 100.0 3a University students 3a Relatives 70.0 70.0 70.0 70.0 70.0 70.0 70.0 3a Neighbors 80.0 80.0 80.0 80.0 80.0 80.0 80.0 80.0 80.0 80.0 3a Community leaders 75.0 75.0 75.0 80.0 70.0 76.7 76.7 75.0 80.0

The SMERU Research Institute, December 2003 200
Appendix 36. (Continued) Summary of the Analysis of the Effectiveness of Various Institutions based on the Scores obtained in PPAs conducted by the World Bank in 9 villages
Region Area Type of Community Sex Age
Total by Village Java
East Nusa Tenggara Rural Urban
Rice Farming
Dry-land Farming
Forest and Plantation
Labor, Informal Sector & Mixed
Total by Respondent Female Male
Mixed Group (teenagers) Young Old
N = 9 7 2 4 5 2 2 1 4 42 18 17 7 15 17 3b Dasa Wisma 90.0 90.0 90.0 90.0 90.0 90.0 90.0 3b Neighborhood Youth Associations 65.0 83.3 10.0 10.0 83.3 100.0 10.0 75.0 66.0 60.0 75.0 83.3 40.0 3b Village Neighborhood Associations 3b Adat institutions 3b PKK 80.0 84.0 60.0 76.7 83.3 65.0 60.0 90.0 100.0 76.0 84.3 45.0 80.0 75.0 77.5 3c Arisan 79.2 79.2 90.0 73.8 95.0 90.0 65.0 81.3 84.3 60.0 72.5 90.0 3c Banjar alat pesta 3c Banjar Kematian 85.0 85.0 85.0 85.0 85.0 70.0 85.0 100.0 95.0 75.0 3c Jimpitan 3c Collective work groups 3c Art groups 80.0 80.0 80.0 80.0 80.0 80.0 80.0 3c Sports groups 3c Voluntary community work 3c Paguyuban 90.0 90.0 90.0 90.0 90.0 90.0 90.0 3c Parelek 3c Cultural centers 80.0 80.0 80.0 80.0 80.0 80.0 80.0 3c Neighborhood watch groups 80.0 80.0 80.0 80.0 80.0 80.0 80.0 3d Farmers' groups 71.7 71.7 60.0 77.5 60.0 77.5 77.5 95.0 60.0 80.0 75.0 3d P3A 4a Hamlet apparatus 4a Kelurahan/village hamlets 91.3 88.9 95.0 95.0 88.9 76.7 95.0 95.0 90.0 88.8 96.7 85.0 92.9 86.7 4a Security guards 70.0 70.0 70.0 70.0 70.0 70.0 70.0 4a Kecamatan/Camat 90.0 100.0 80.0 80.0 100.0 80.0 100.0 90.0 80.0 100.0 90.0 4a Kelurahan/Village Offices 4a LKMD 74.2 74.0 75.0 77.5 72.5 65.0 75.0 80.0 69.0 50.0 74.3 70.0 71.4 63.3 4a LMD 90.0 90.0 90.0 90.0 90.0 90.0 90.0 4a RW/RT 89.6 89.6 100.0 87.5 100.0 84.4 86.0 82.0 90.0 83.3 81.1 93.3 4b Ministry of Social Affairs 60.0 60.0 60.0 60.0 60.0 65.0 50.0 60.0 60.0 4b Office of Animal Husbandry 4b Government 4b Perhutani 4b Extension workers 30.0 30.0 30.0 30.0 30.0 30.0 30.0

The SMERU Research Institute, December 2003 201
Appendix 36. (Continued) Summary of the Analysis of the Effectiveness of Various Institutions based on the Scores obtained in PPAs conducted by the World Bank in 9 villages
Region Area Type of Community Sex Age
Total by Village Java
East Nusa Tenggara Rural Urban
Rice Farming
Dry-land Farming
Forest and Plantation
Labor, Informal Sector & Mixed
Total by Respondent Female Male
Mixed Group (teenagers) Young Old
N = 9 7 2 4 5 2 2 1 4 42 18 17 7 15 17 4c Village midwives 80.0 85.0 70.0 70.0 85.0 85.0 70.0 85.0 77.5 86.7 50.0 75.0 80.0 4c Traditional healers 80.0 80.0 80.0 80.0 80.0 80.0 80.0 4c Family planning extension workers 4c Posyandu 71.7 71.7 80.0 67.5 62.5 90.0 70.0 75.0 50.0 65.0 90.0 4c Puskesmas/Polindes 79.4 79.4 79.4 63.3 87.5 77.1 76.0 80.0 83.3 72.5 4c Hospitals 4d Schools, BP3, Teachers 73.3 70.0 80.0 80.0 70.0 60.0 80.0 80.0 73.3 80.0 70.0 73.3 4e Japan 5 CRS 5 HIPPAM 5 HKSN 5 KIPP TRIBINA 5 Anak Alam 5 CARE 67.5 67.5 67.5 67.5 67.5 85.0 50.0 85.0 50.0 5 WTM/FADO 90.0 90.0 90.0 90.0 90.0 85.0 95.0 90.0 90.0 5 Yaspem 20.0 20.0 20.0 20.0 20.0 20.0 20.0 5 NU 5 Enterprises 5 Yayasan Dana Sosial 5 Yayasan Angkatan Laut 5 YBKS 5 YIS 6a Bangdes 6a Banpres 90.0 90.0 90.0 90.0 90.0 90.0 90.0 6a IDT 73.3 73.3 73.3 73.3 73.3 70.0 75.0 70.0 75.0 6a P2P 6a PDMDKE 6a IDT consultants 93.3 93.3 93.3 93.3 93.3 90.0 95.0 90.0 100.0 6a PKD-PWT 6a UP2K 80.0 80.0 80.0 80.0 80.0 80.0 80.0 6b Scholarships 6b SSN 70.0 70.0 70.0 70.0 70.0 70.0 70.0 6b OPK 6b Proyekan 100.0 100.0 100.0 100.0 100.0 100.0 100.0 100.0 100.0

The SMERU Research Institute, December 2003 202
Appendix 37. Summary of the Analysis of the Institutions that Provided Assistance during the Economic Crisis
Region Area Community Sex Age Total by Village Java
Nusa Tenggara Rural Urban
Rice farming
Dry-land Farming
Forest and Plantation
Coastal Fishing
Labor, Informal Sector & Mixed
Total by Respondent
Group Female Male Mixed Group Young Old
Mixed Group
10 7 3 3 7 1 2 1 1 5 36 15 17 4 19 16 1 1a DKM 1a Churches/Priests 1a MUD 1a Islamic/religious leaders 1 1 1 2 2 1 1 1b Evangelists 1b Islamic teachers/preachers 1c Majelis 1c Majelis Taklim 2 2 2 3 2 1 1 2 1c Pengajian 2 2 2 8 4 2 2 5 3 1c Youth pengajian 1 1c Tahlilan 1 1 1 1 4 1 2 1 2 2 1d Sunday schools 1d TK-TPA 1 2a Private banks 1 1 1 1 4 2 2 2 2 2a BRI 2a Pawnshops 2 1 1 1 1 9 4 4 1 5 4 2b BKD/BKK 1 1 1 1 1 1 2b Savings and Loans Cooperatives 2b Cooperatives/CU/Kopdit 3 1 2 1 2 1 5 4 1 3 2 2b KUD 1 1 1 1 1 2 2 1 1 2b Takesra 1 1 1 1 1 1 2b UBSP 1 1 1 1 1 1 2b UEDSP 2 1 1 1 1 1 2 1 1 2 2c Peddlers 2c Populele (middlemen) 1 1 1 2c Rentenir (moneylenders) 1 1 1 1 3 1 2 1 2 2c Tengkulak Palele (middlemen) 1 1 1 2 2 1 1 2c Farm shops 1 2c Stores/stalls 2 1 1 1 1 1 4 2 2 2 2 3a University students 1 1 1 2 2 1 1 3a Relatives 1 1 1 1 1 1 1 3a Neighbors 2 1 1 1 1 3 3 2 1 3a Community leaders

The SMERU Research Institute, December 2003 203
Appendix 37. (Continued) Summary of the Analysis of the Institutions that Provided Assistance during the Economic Crisis
Region Area Community Sex Age Total by Village Java
Nusa Tenggara Rural Urban
Rice farming
Dry-land Farming
Forest and Plantation
Coastal Fishing
Labor, Informal Sector & Mixed
Total by Respondent
Group Female Male Mixed Group Young Old
Mixed Group
10 7 3 3 7 1 2 1 1 5 36 15 17 4 19 16 1 3b Dasa Wisma 1 3b Neighborhood Youth Associations 1 1 1 1 1 1 3b Village Neighborhood Associations 1 1 3b Adat institutions 3b PKK 2 1 1 1 1 1 1 4 2 2 2 2 3c Arisan 2 2 2 1 3 1 2 1 2 3c Banjar alat pesta 1 1 1 1 2 2 1 1 3c Banjar Kematian 2 1 1 2 3 2 1 2 1 3c Jimpitan 3c Collective work groups 3c Art groups 1 3c Sports groups 3c Voluntary community work 1 1 3c Paguyuban 1 1 3c Parelek 3c Cultural centers 2 3c Neighborhood watch groups 3d Farmers' groups 1 1 1 1 2 2 1 1 3d P3A 1 4a Hamlet apparatus 4a Kelurahan/village hamlets 1 1 1 1 1 4 2 2 2 2 4a Security guards 4a Kecamatan/Camat 4a Kelurahan/Village offices 2 1 1 2 9 4 4 1 5 4 4a LKMD 1 1 1 1 1 1 4a LMD 1 1 1 1 1 1 4a RW/RT 2 2 2 1 1 2 2 1 1 4b Ministry of Social Affairs 1 4b Office of Animal Husbandry 4b Government 2 2 1 1 2 6 2 3 1 3 3 4b Perhutani 1 1 1 1 1 1 4b Extension workers 1

The SMERU Research Institute, December 2003 204
Appendix 37. (Continued) Summary of the Analysis of the Institutions that Provided Assistance during the Economic Crisis
Region Area Community Sex Age Total by Village Java
Nusa Tenggara Rural Urban
Rice farming
Dry-land Farming
Forest and Plantation
Coastal Fishing
Labor, Informal Sector & Mixed
Total by Respondent
Group Female Male Mixed Group Young Old
Mixed Group
10 7 3 3 7 1 2 1 1 5 36 15 17 4 19 16 1 4c Village midwives 4c Traditional healers 4c Family planning extension workers 4c Posyandu 1 1 1 1 4c Puskesmas/Polindes 2 1 1 1 1 1 9 4 4 1 5 4 4c Hospitals 1 4d Schools, BP3, Teachers 1 1 4e Japan 1 1 1 1 1 1 5 CRS 1 1 1 1 1 1 5 HIPPAM 1 5 HKSN 1 1 5 KIPP TRIBINA 1 1 1 1 1 1 1 5 Anak Alam 1 5 CARE 1 1 1 1 1 4 2 2 2 2 5 WTM/FADO 1 5 Yaspem 5 NU 2 2 1 1 1 2 1 1 1 1 5 Enterprises 1 1 1 2 2 1 1 5 Yayasan Dana Sosial 1 1 1 1 2 2 1 1 5 Yayasan Angkatan Laut 1 1 1 2 2 1 1 5 YBKS 1 1 1 1 2 1 1 1 1 5 YIS 1 1 1 1 1 1 6a Bangdes 1 1 1 1 1 1 6a Banpres 1 1 6a IDT 1 1 1 2 2 1 1 6a P2P 1 1 1 1 1 1 1 6a PDMDKE 1 1 1 1 3 1 2 2 1 6a IDT consultants 1 1 6a PKD-PWT 6a UP2K 6b Scholarships 1 1 1 1 1 1 1 6b SSN 1 1 1 1 2 1 1 1 1 6b OPK 1 1 1 1 2 1 1 1 1 6b Proyekan 1

The SMERU Research Institute, December 2003 205
Appendix 38. Summary of the Analysis of the Institutions that Provide Information and Assistance
Island Type of Community
Total by Village Java Sumatra Sulawesi Rice Farming Dry-land Farming
Forest and Plantation Coastal Fishing
Urban Informal Sector and
Labor N = 15 Score 6 Score 1 Score 8 Score 5 Score 1 Score 4 Score 2 Score 3 Score
1a Religious Institutions- Formal 2 51.8 0 0 2 51.8 1 25.0 0 0 0 1 78.3 Mosque boards/Committees 1 100.0 0 0 1 100.0 0 0 0 0 1 100.0 Mosque Youth Associations/IRM 2 40.8 0 0 2 40.8 1 25.0 0 0 0 1 56.5
1c Religious Institutions- Individuals 9 61.7 1 33.0 1 100.0 7 60.4 3 65.4 1 100.0 1 0.0 2 84.3 2 44.9 Religious leaders/institutions 4 37.2 1 33.3 0 3 38.5 2 51.3 0 0 0 2 23.2 Islamic teachers/preachers 4 92.2 0 1 100.0 3 89.5 0 1 100.0 0 2 84.3 1 100.0 Islamic prayer leaders (imam) 5 50.8 0 0 5 50.8 3 65.8 0 1 0.0 0 1 56.5
2a Large-scale Formal Economic Institutions 5 53.4 2 50.0 0 3 55.7 0 0 2 53.0 2 64.0 1 33.3 BRI 1 33.3 1 33.3 0 0 0 0 0 0 1 33.3 BPD 3 55.8 0 0 3 55.8 0 0 1 39.4 2 64.0 0 PJTKI 1 66.7 1 66.7 0 0 0 0 1 66.7 0 0
2b Small-scale Formal Economic Institutions 9 13.2 3 8.3 0 6 15.7 5 22.0 0 2 10.6 1 0.0 2 19.0 BKD/BKK 2 0.0 2 0.0 0 0 1 0.0 0 1 0.0 0 0 Cooperatives 5 11.9 1 25.0 0 4 8.6 1 0.0 0 1 21.2 1 0.0 2 19.0 KUD 3 36.7 0 0 3 36.7 3 36.7 0 0 0 0
2c Informal Economic Institutions 13 41.3 6 45.7 1 0.0 6 43.9 4 36.5 1 0.0 4 57.1 2 56.5 2 25.0 Stores/stalls 3 58.0 1 84.6 0 2 44.7 0 0 2 62.0 1 50.0 0 Traditional markets 1 50.0 0 0 1 50.0 0 0 0 1 50.0 0 Traders 2 60.2 1 45.5 0 1 75.0 2 60.2 0 0 0 0 Tengkulak (middlemen) 2 66.2 0 0 2 66.2 0 0 0 2 66.2 0 Rentenir (moneylenders) 2 40.4 0 0 2 40.4 1 11.1 0 1 69.7 0 0 Landlords/entrepreneurs/rich people 7 26.5 4 37.6 1 0.0 2 17.5 2 32.3 1 0.0 1 46.0 1 25.0 2 25.0 Mandor tanam 3 57.9 3 57.9 0 0 0 0 3 57.9 0 0 Bakulan/tradesmen 2 30.4 1 30.8 0 1 30.0 0 0 1 30.8 1 30.0 0
3a Social Institutions- Individuals 13 75.6 6 85.9 0 7 66.7 4 74.1 0 4 59.8 2 91.5 3 76.9 Family/Relatives/Parents 7 74.7 3 89.1 0 4 63.9 1 75.0 0 3 71.2 2 90.5 2 76.6 Neighbors/friends 10 79.0 6 85.2 0 4 69.6 3 79.0 0 3 74.4 1 85.0 3 81.5 Community leaders 7 44.6 2 38.5 0 5 47.0 3 55.8 0 3 43.8 0 1 13.0
3b Social Institutions Initiated by the Government 3 65.0 0 0 3 65.0 3 65.0 0 0 0 0 PKK 3 65.0 0 0 3 65.0 3 65.0 0 0 0 0
3c Social Institutions Initiated by the Community 1 75.0 0 0 1 75.0 1 75.0 0 0 0 0 Sports groups 1 75.0 0 0 1 75.0 1 75.0 0 0 0 0
3d Social Institutions – Professional 3 34.3 1 23.0 0 2 40.0 2 40.0 0 1 23.1 0 0 Farmers’, fishermen’s and forest farmers’ groups 2 41.5 1 23.1 0 1 60.0 1 60.0 0 1 23.1 0 0 P3A 2 25.0 0 0 2 25.0 2 25.0 0 0 0 0

The SMERU Research Institute, December 2003 206
Appendix 38. (Continued) Summary of the Analysis of the Institutions that Provide Information and Assistance
Island Type of Community
Total by Village Java Sumatra Sulawesi Rice Farming Dry-land Farming
Forest and Plantation Coastal Fishing
Urban Informal Sector and
Labor N = 15 Score 6 Score 1 Score 8 Score 5 Score 1 Score 4 Score 2 Score 3 Score
4a Government- Kecamatan/village 14 50.0 6 59.2 0 8 43.0 5 63.0 0 4 39.3 2 40.5 3 48.1 Kecamatan/Camat 3 30.3 0 0 3 30.3 0 0 1 33.3 2 28.8 0 Kelurahan/village apparatus 5 55.9 5 55.9 0 0 1 63.6 0 2 35.8 0 2 72.2 Lurah/village heads 11 57.4 3 54.2 0 8 58.5 5 71.0 0 3 36.1 2 83.8 1 0.0 LKMD 4 12.5 0 0 4 12.5 2 25.0 0 0 2 0.0 0 Hamlet heads/apparatus 8 54.4 2 44.2 0 6 57.8 4 83.9 0 1 6.7 2 46.5 1 0.0 RW 3 63.1 1 81.8 0 2 53.8 3 63.1 0 0 0 0 RT 5 54.7 3 64.6 0 2 39.9 3 56.9 0 2 51.5 0 0 Security guards 2 50.0 0 0 2 50.0 1 50.0 0 0 1 50.0 0
4b Government- Kabupaten/National 12 49.5 3 86.0 1 43.0 8 36.7 4 29.9 1 42.9 2 64.1 2 47.6 3 69.6 Government 2 100.0 1 100.0 0 1 100.0 0 0 1 100.0 0 1 100.0 Fisheries Office 1 88.0 0 0 1 88.0 0 0 0 1 88.0 0 Agricultural Office 1 13.0 0 0 1 13.0 0 0 0 1 13.0 0 Industry and Trade Office 1 50.0 0 0 1 50.0 1 50.0 0 0 0 0 Extension workers 3 67.5 2 79.1 0 1 44.4 1 44.4 0 1 69.2 0 1 88.9 Police 6 30.2 0 1 42.9 5 27.7 1 0.0 1 42.9 1 18.0 2 50.2 1 20.0 PPL 1 0.0 0 0 1 0.0 1 0.0 0 0 0 0 PPN 3 48.0 0 0 3 48.0 1 50.0 0 0 2 46.9 0
4c Government Institutions- Health 15 42.9 6 34.9 1 21.5 8 51.7 5 51.0 1 21.4 4 38.1 2 39.9 2 31.9 Hospitals 2 31.1 1 7.7 0 1 54.5 0 0 2 31.1 0 0 Puskesmas/Polindes/Pustu 7 37.9 3 25.8 0 4 47.0 2 49.6 0 2 38.7 1 50.0 2 19.4 Posyandu 2 65.8 0 0 2 65.8 1 75.0 0 0 0 1 56.5 Village midwives 10 46.2 5 37.7 1 14.3 4 64.8 4 59.8 1 14.3 3 50.7 0 2 28.3 Medical aides/nurse 5 29.7 3 38.7 0 2 16.3 1 27.3 0 1 0.0 2 16.3 1 88.9 Traditional healers 9 45.2 2 13.3 0 7 54.3 4 38.3 0 1 9.1 2 68.2 2 54.2 Family planning extension workers/cadres 4 32.1 1 16.7 1 28.6 2 41.7 2 41.7 1 28.6 1 16.7 0 0
4d Government Institutions- Education 11 58.6 5 49.2 0 6 66.5 3 85.2 0 3 48.0 2 23.4 3 67.6 Education Office 2 21.7 0 0 2 21.7 0 0 0 2 21.7 0 Schools/BP3/Teachers 11 59.3 5 49.4 0 6 67.6 3 85.2 0 3 48.0 2 25.0 3 67.6
5a Non-Government Organizations 1 24.0 0 0 1 24.0 0 0 1 24.0 0 0 NGOs 1 24.2 0 0 1 24.2 0 0 1 24.2 0 0
6b Programs - SSN 1 56.0 1 56.0 0 0 0 0 0 0 1 56.0 SSN 1 55.6 1 55.6 0 0 0 0 0 0 1 55.6

The SMERU Research Institute, December 2003 207
Appendix 38. (Continued) Summary of the Analysis of the Institutions that Provide Information and Assistance
Area Sex Rural Urban Total by Respondent Female Male Mixed Group N = 13 Score 2 Score 17 3 2 12
1a Religious Institutions- Formal 1 25.0 1 78.5 2 51.6 0 0 2 51.6 Mosque boards/committees 0 1 100.0 1 100.0 0 0 1 100.0 Mosque Youth Associations/IRM 1 25.0 1 56.5 2 40.8 0 0 2 40.8
1c Religious Institutions- Individuals 8 62.4 1 56.7 9 61.6 2 84.3 1 35.0 6 58.5 Religious leaders/institutions 3 45.3 1 13.0 4 37.2 0 1 40.0 3 36.3 Islamic teachers/preachers 3 89.5 1 100.0 4 92.1 2 84.3 0 2 100.0 Islamic prayer leaders (imam) 4 49.4 1 56.5 5 50.8 0 1 30.0 4 56.0
2a Large-scale Formal Economic Institutions 4 58.5 1 33.0 6 57.5 2 52.7 1 100.0 3 46.5 BRI 0 1 33.3 1 33.3 0 0 1 33.3 BPD 3 55.8 0 4 61.2 2 52.7 1 100.0 1 39.4 PJTKI 1 66.7 0 1 66.7 0 0 1 66.7
2b Small-scale Formal Economic Institutions 9 17.3 1 13.0 10 16.9 1 60.0 1 0.0 8 13.7 BKD/BKK 2 0.0 0 2 0.0 0 0 2 0.0 Cooperatives 4 11.6 1 13.0 5 11.9 0 1 0.0 4 14.8 KUD 3 36.7 0 3 36.7 1 60.0 0 2 25.0
2c Informal Economic Institutions 12 44.8 0 14 42.5 2 66.2 2 24.4 10 41.4 Stores/stalls 3 58.0 0 3 58.0 0 1 50.0 2 62.0 Traditional markets 1 50.0 0 1 50.0 0 1 50.0 0 Traders 2 60.2 0 2 60.2 0 0 2 60.2 Tengkulak (middlemen) 2 66.2 0 2 66.2 2 66.2 0 0 Rentenir (moneylenders) 2 40.4 0 2 40.4 0 0 2 40.4 Landlords/entrepreneurs/rich people 6 30.9 1 0.0 7 26.5 0 2 17.5 5 30.1 Mandor tanam 3 57.9 0 3 57.9 0 0 3 57.9 Bakulan/tradesmen 2 30.4 0 2 30.4 0 1 30.0 1 30.8
3a Social Institutions- Individuals 11 72.8 2 74.6 15 74.1 3 91.2 2 73.5 10 69.2 Family/Relatives/Parents 7 77.8 1 78.3 9 78.3 2 96.7 1 69.0 6 73.6 Neighbors/friends 8 79.2 2 78.3 10 79.0 0 1 85.0 9 78.3 Community leaders 6 49.8 1 13.0 8 48.4 1 80.0 1 70.0 6 39.5
3b Social Institutions Initiated by the Government 3 65.0 0 3 65.0 1 20.0 0 2 87.5 PKK 3 65.0 0 3 65.0 1 20.0 0 2 87.5
3c Social Institutions Initiated by the Community 1 75.0 0 1 75.0 0 0 1 75.0 Sports groups 1 75.0 0 1 75.0 0 0 1 75.0
3d Social Institutions - Professional 3 34.3 0 4 43.3 1 20.0 1 80.0 2 36.5 Farmers’, fishermen’s and forest farmers’ groups 2 41.5 0 3 47.7 1 40.0 1 80.0 1 23.1 P3A 2 25.0 0 2 25.0 1 0.0 0 1 50.0

The SMERU Research Institute, December 2003 208
Appendix 38. (Continued) Summary of the Analysis of the Institutions that Provide Information and Assistance
Area Sex Rural Urban Total by Respondent Female Male Mixed Group N = 13 Score 2 Score 17 3 2 12
4a Government- Kecamatan/village 12 51.7 2 38.9 16 52.7 3 56.9 2 58.9 11 50.5 Kecamatan/Camat 3 30.3 0 4 28.4 2 40.2 1 0.0 1 33.3 Kelurahan/village apparatus 4 50.5 1 77.8 5 55.9 0 0 5 55.9 Lurah/village heads 10 63.1 1 0.0 13 61.9 3 87.9 2 83.8 8 46.7 LKMD 4 12.5 0 4 12.5 2 0.0 1 0.0 1 50.0 Hamlet heads/apparatus 7 62.2 1 0.0 10 59.7 3 53.0 2 95.0 5 49.5 RW 3 63.1 0 3 63.1 0 0 3 63.1 RT 5 54.7 0 5 54.7 0 0 5 54.7 Security guards 2 50.0 0 2 50.0 0 1 50.0 1 50.0
4b Government- Kabupaten/National 10 48.6 2 54.4 13 49.6 2 44.3 2 53.3 9 49.9 Government 2 100.0 0 2 100.0 0 0 2 100.0 Fisheries Office 1 88.0 0 1 87.5 0 1 87.5 0 Agricultural Office 1 13.0 0 1 12.5 0 1 12.5 0 Industry and Trade Office 1 50.0 0 1 50.0 0 1 50.0 0 Extension workers 2 56.8 1 88.9 3 67.5 0 0 3 67.5 Police 5 32.2 1 20.0 7 34.5 2 42.1 1 76.0 4 20.2 PPL 1 0.0 0 1 0.0 0 0 1 0.0 PPN 3 48.0 0 4 48.2 2 46.4 1 50.0 1 50.0
4c Government Institutions- Health 13 39.8 2 63.3 17 43.4 3 34.6 2 53.3 12 43.9 Hospitals 2 31.1 0 2 31.1 0 0 2 31.1 Puskesmas/Polindes/Pustu 6 40.5 1 22.2 7 37.9 0 1 50.0 6 35.9 Posyandu 1 75.0 1 56.5 2 65.8 0 0 2 65.8 Village midwives 9 45.1 1 56.5 11 44.3 1 30.0 1 20.0 9 48.6 Medical aides/nurse 4 14.9 1 88.9 6 30.2 2 7.6 1 50.0 3 38.7 Traditional healers 8 38.4 1 100.0 11 48.9 3 47.4 2 80.0 6 39.3 Family planning extension workers/cadres 4 32.1 0 4 32.1 1 50.0 0 3 26.2
4d Government Institutions- Education 9 56.1 2 72.2 13 54.5 2 10.0 1 62.5 10 62.6 Education Office 2 21.7 0 3 21.6 2 19.9 1 25.0 0 Schools/BP3/teachers 9 56.4 2 72.2 12 58.5 2 0.0 1 100.0 9 66.9
5a Non-Government Organizations 1 24.0 0 1 24.0 0 0 1 24.0 NGO 1 24.2 0 1 24.2 0 0 1 24.2
6b Programs – SSN 0 1 56.0 1 56.0 0 0 1 56.0 SSN 0 1 55.6 1 55.6 0 0 1 55.6

The SMERU Research Institute, December 2003 209
Appendix 39. Names and Types of Institutions
Religious Economic Social/Individuals
Formal: 1. Churchs/Priests 2. Church Youth Associations 3. MUD 4. Mosque boards/committees 5. Mosque Youth Associations
(IRM)
Established by the community: 6. DKM 7. Majelis Taklim 8. Pengajian
Individual: 9. Evangelists 10. Priests/Parish leaders 11. Parish 12. Islamic/religious leaders 13. Islamic teachers/preachers 14. Islamic prayer leaders (imam)
in hamlets or villages School: 15. TK-TPA 16. Islamic boarding schools and
teachers 17. Sunday schools
Formal, large-scale: 18. Banks/BPR 19. BRI 20. BPD & Bank Jatim 21. Pawnshops 22. PLN 23. Tea plantations 24. Perhutani/foresters/forest
rangers 25. PJTKI 26. PAM Formal, small-scale: 27. BKD/BKK 28. UBSP 29. UED-SP 30. LPMD 31. Takesra/Dansos 32. Cooperatives/CU/Kopdit/KSP 33. KUD Informal: 34. Stores/stalls/markets 35. Peddlers 36. Tengkulak/Bakul/Palele/
Populele (middlemen) 37. Rentenir/Bank Titil/Tukang
Kredit (moneylenders) 38. Proprietors/Landlords/Boat
owners/entrepreneurs 39. Mandor tanam/Calo/Kondektur 40. Craftsmen/Medicinal herb
producers or sellers/Laborers/Domestic servants
41. Drivers/ tradesmen 42. Mechanics
Established by the community: 43. Village Neighborhood
Associations/Adat institutions/KAN
44. Arisan 45. Banjar alat pesta 46. Collective work, jimpitan/antre/
perelek/kematian 47. Neighborhood watch
groups/voluntary community work
48. Art/sports groups Individual: 49. Family/relatives/parents 50. Neighbors/friends 51. Community leaders 52. Wali Nagari 53. Wali Jorong 54. Ninik Mamak 55. Bundo Kanduang 56. Youth community leaders
Social, initiated by the government: 57. Dasa Wisma 58. PKK 59. Youth Neighborhood
Associations 60. BPN
Social-Profession: 61. Farmers’, fishermen’s and
forest farmers’ groups 62. P3A/HIPPA 63. Kelompencapir

The SMERU Research Institute, December 2003 210
Appendix 39. (Continued) Names and Types of Institutions
Local Government/Apparatus Non-Government Institutions Programs Village-kecamatan Government: 64. Kecamatan/Camat 65. Kelurahan/village apparatus 66. Village/Lurah Heads 67. Village secretaries 68. LKMD 69. LMD (Village Community
Organizations) 70. Hamlet apparatus/ heads 71. RW/RK 72. RT 73. Security guards/neighborhood
watch groups 74. Babinsa 75. Kelurahan/Village offices 76. Village cadres Government-Kabupaten/National: 77. Ministry of Social Affairs 78. Animal Husbandry Office 79. Ministry of Manpower 80. Industry and Trade Office 81. BKKBN (National Family
Planning Coordinating Board) 82. Irrigation 83. P3N 84. Extension workers 85. Police 86. PPN (Priests) 87. Veterinarian assistants 88. Perhutani Government- Health: 89. Hospitals 90. Puskesmas/Polindes 91. Posyandu 92. Village midwives 93. Medical aides 94. Traditional healers 95. Family planning extension
workers/ cadres 96. Doctors
Government-education 97. Schools/BP3/Teachers 98. Package A & B
99. HKSN 100. Anak Alam 101. Care 102. WTM/FADO 103. Yaspem 104. WTM/FADO 105. Yayasan Dana Sosial 106. Yayasan Angkatan Laut 107. NGOs 108. Forum Anak Bangsa 109. HIPPAM 110. BKPRM 111. BPRN 112. LPMK
Non-Government Institutions/ Political Parties/Mass Organizations 113. Political Parties 114. Nahdlatul Ulama (NU) 115. KNPI 116. PAN
SSN Programs 117. Scholarships 118. SSN 119. OPK 120. Proyekan 121. Raskin 122. IDT Non-SSN Programs 123. Bangdes 124. Banpres 125. IDT/ IDT facilitators 126. PDMDKE 127. PKD-PWT 128. UP2K 129. Students-KKN 130. Binmas 131. P4K

The SMERU Research Institute, December 2003 211
Appendix 40. A List of Materials Consolidated A. WORLD BANK (1999): Consultations with the Poor - 12 locations in 12 districts (Java, East Nusa
Tenggara, West Nusa Tenggara). 1. Site Report for Semanggi Village-Surakarta, Central Java Province (Urban Community). Joko
Siswanto, Susie Eja Juarsi, Umi Listyaningsih, dan Setiadi. 2. Site Report for Galih Pakuwon-Garut, West Java Province (Rural, Hill, Agriculture Community).
Ratna Indrawati J., Alma Ariief, Devi R. Soemardi, Amin Robiarto, Laksmini Sita and Herry Widjanarko.
3. Site Report for Ponorogo Village, East Java Province (Rural, Hill, Agriculture Community). Joko
Siswanto, Setiadi, Susie Eja Yuarsi, Umi Listyaningsih, Lilik Hidayati dan Setyadi.
4. Site Report for Harapan Jaya-Bekasi, West Java Province (Urban Community). Ratna Indrawati J., Alma Arief, Devi R. Soemardi, Amin Robiarto, Laksmini Sita, dan Herry Widjanarko.
5. Site Report for Genengsari Village-Grobogan, Central Java Province (Rural, Hill, Agriculture
Community). Joko Siswanto, Susie Eja Yuarsi, Umi, and Setiadi.
6. Site Report for Kawangu Village, Waingapu, East Sumba, East Nusa Tenggara Province (Urban Community). Suhardi, Ni Nyoman Susanti, I. Nyoman Oka, et al.
7. Site Report Padamukti-Bandung, West Java (Rural, High-land, Farming Communities). Ratna
Indrawati J., Alma Arief, Devi R Soemardi, Amin Robiarto, Laksmini Sita, and Herry Widjanarko. (in Indonesian)
8. Site Report for Dusun Mawar, Desa Waikanabu, Kecamatan Tabundung, Kabupaten Dati II East
Sumba-East Nusa Tenggara. Suhardi, I. Nyoman Susanti, Abas Hukung, et al. 9. Site Report for Pegambiran Cirebon, West Java Province (Urban, Coastal, Urban Community).
Ratna Indrawati J., Alma Arief, Devi R. Soemardi, Amin Robiarto, Laksmini Sita, and Herry Widjanarko.
10. Site Report for Tanjung Rejo (Rural), East Java Province. Joko Siswanto, Setiadi, Susi Eja Yuarsi,
and Umi Listyaningsih.
11. Site Report for Renggarasi, Kabupaten Sikka, East Nusa Tenggara. Suhardi, Ni Nyoman Susanti, I. Nyoman Oka, et al. (in Indonesian)
12. Site Report for Pondok Perasi Village, North Ampenan, Mataram, West Nusa Tenggara. Suhardi,
Ni Nyoman Susanti, I. Nyoman Oka, et al.

The SMERU Research Institute, December 2003 212
B. IHS-BAPPENAS (2002): Identification of Local Based Poverty Proxy Indicators - 20 locations in 10 districts (Java, Sumatra) 1. Identifying Local Proxy Indicators of Poverty in Kabupaten Tegal, Central Java. IHS Micro Study
Research Report. Aris Suparno, Yudha Priyana Hardjo, and Siti Maimunah. (In Indonesian) 2. Identifying Local Proxy Indicators of Poverty in Kabupaten Nias, North Sumatera. IHS Micro Study
Research Report. Evelyn Suleeman and Wawan Heryawan. (In Indonesian)
3. Identifying Local Proxy Indicators of Poverty in Kabupaten Langkat, North Sumatera. IHS Micro Study Research Report. Sri Wardhani Bakri and Endang Kuswandi. (In Indonesian)
4. Identifying Local Proxy Indicators of Poverty in Kabupaten Jember, East Java. IHS Micro Study
Research Report. Kurniyati Indahsari and Toni Waskito. (In Indonesian)
5. Identifying Local Proxy Indicators of Poverty in Kabupaten Bungo, Jambi. IHS Micro Study Research Report. Endang Sulastri and Iing Mursalin. (In Indonesian)
6. Identifying Local Proxy Indicators of Poverty in Kabupaten Bekasi, West Java. IHS Micro Study
Research Report. Evelyn Suleeman and Wawan Heryawan, Kurniyati Indahsari, et al. (In Indonesian)
7. Identifying Local Proxy Indicators of Poverty in Kabupaten Tebo, Jambi. IHS Micro Study Research
Report. Endang Sulastri and Iing Mursalin. (In Indonesian)
8. Identifying Local Proxy Indicators of Poverty in Kabupaten Gunungkidul, Yogyakarta. IHS Micro Study Research Report. Kurniyati Indahsari and Toni Waskito. (In Indonesian)
9. Identifying Local Proxy Indicators of Poverty in Kota Pematang Siantar, North Sumatra. IHS Micro
Study Research Report. Sri Wardhani Bakri and Endang Kuswandi. (In Indonesian)
10. Identifying Local Proxy Indicators of Poverty in Kabupaten Wonosobo, Central Java. IHS Micro Study Research Report. Aris Suparno, Yudha Priyana Hardjo, and Siti Maimunah. (In Indonesian)
C. FKPKM (1999 in a report published by KIKIS): Structural Poverty – The Focal Points of Urban
Poverty: 1 location in 1 city (Java)
1. KIKIS, UPC and The Ford Foundation. Agenda for the Reduction of Structural Poverty, Focal Point: Urban Poor Community. 2000.
D. DFID (2000): People Poverty and Livelihoods: 4 locations in 4 districts (Java, West Nusa Tenggara, Kalimantan)
1. A Draft Site Report. Sustainable Livelihoods. Yayasan Pradipta Paramita. Jakarta, 2000. Joan
Hardjono, Nyoman Oka, et al.
2. Site Report. Sustainable Livelihoods Component Poverty Assessment, Kampung Babakan Sari, Desa Karangsari, Kecamatan Wanaraja-Garut, West Java. 2000. Wawan, Lina, Laksmini Sita, and Amin Robiarto.

The SMERU Research Institute, December 2003 213
3. Site Report. Sustainable Livelihoods Component Poverty Assessment, Kampung Lumumba
Dalam, Kelurahan Ngagel, Kecamatan Wonokromo, Surabaya, East Java. Yayasan Pradipta Paramita. Jakarta, 2000. Alma Arief, Wawan Gunawan, Lina Rozana, and Dea Widyastuti.
4. Site Report. Sustainable Livelihoods Component Poverty Assessment, Desa Saham, Kabupaten
Mempawah, West Kalimantan. Yayasan Pradipta Paramita. Jakarta, 2000. Joan Hardjono, Leonardus Tatang, and Tunita et. al.
5. Site Report. Sustainable Livelihoods Component Poverty Assessment, Kampung Kuranji Bangsal,
Desa Kuranji, West Lombok, West Nusa Tenggara. Yayasan Pradipta Paramita. Jakarta, 2000. Joan Hardjono, Nyoman Oka, Titiek S, Amin R., and Laksmini Sita.
6. DFID. Field Notes: Livelihood Study. Joan Hardjono.
E. ILGR-WB (2003): Initiative for Local Governance Reform-World Bank - 36 locations in Java,
West Sumatra, North Sulawesi and South Sulawesi. 1. Report of the Results from the ILGR-WB’s PPA Working Group, Kabupaten Bolaang Mongondow.
2003. (In Indonesian) 2. Participatory Poverty Analysis in Jorong Parik Batu and Tanjung Manjulai, Nagari Simanau,
Kecamatan Tigo Lurah, Kabupaten Solok, West Sumatra, 2003. Andy Rastika, SH., Amdani Duspa, Ir., Nasuri, S.Sos., and Rasmi Syuib. (In Indonesian)
3. Participatory Poverty Assessment Report on Low-land and Coastal Clusters in Desa Tanrara and
Desa Salajangki Kecamatan Bontonompo, Kabupaten Gowa, South Sulawesi, 2003. Muhammad Hijrah, SE., MM., Suryadarma, Ir., and Nurliah Ruma, S.Pd. (In Indonesian)
4. Poverty Assessment by PPA Working Groups in Kabupaten Bulukumba. 2003. (In Indonesian)
5. Report on Jorong Batu Limbak, Nagari Simawang, Kecamatan Rambatan, Kabupaten Tanah
Datar. P2TPD. 2003. (In Indonesian)
6. PPA - ILGR-WB Site Report for Kabupaten Ngawi. 2003. (In Indonesian)
7. PPA Working Group Assessment Report for Kelurahan Pallantikang, Kecamatan Pattalassang, Kabupaten Takalar, 2003. PPA - ILGR-WB Working Group Kabupaten Takalar. (In Indonesian)
8. Participatory Poverty Assessment Report on Desa Panyangkalang, Kecamatan Bajeng, Kabupaten
Gowa (Low-land Area). ILGR-WB, 2003. Bakhtiar Karim, Drs. MM., Hamzah Limpo., Drs., M.Si., Kasni and Irnawati Rasyid, SE. (In Indonesian)
9. PPA II ILGR-WB Activity Report for Kabupaten Majalengka, High-land, Valley and Low-land
Clusters, 2003. Facilitator for Kabupaten Majalengka.
10. Participatory Poverty Analysis Report on Mountain Areas Clusters in Kampung Bonto Jonga, Dusun Sarrea, Desa Pa’bumbungang, Kecamatan Ere Merasa, Kabupaten Bantaeng, South Sulawesi, 2003. Amri, Andi Syarifuddin, Abd. Azis, Nuzuliah Hidayah, dan Hasbiah. (In Indonesian)

The SMERU Research Institute, December 2003 214
F. IHS-BAPPENAS (2003): Identifying Local Proxy Indicators of Poverty - 8 locations in 4
districts (East Nusa Tenggara and Kalimantan) 1. Identifying Local Proxy Indicators of Poverty in Desa Tanjung Jawa, Kecamatan Dusun Selatan,
Kabupaten Barito Selatan, Central Kalimantan. IHS Micro Study Research Report. Jakarta, 2003. (In Indonesian)
2. Identifying Local Proxy Indicators of Poverty in Desa Penda Asam, Kecamatan Dusun Selatan,
Kabupaten Barito Selatan, Central Kalimantan. IHS Micro Study Research Report. Jakarta, 2003. (In Indonesian)
3. Identifying Local Proxy Indicators of Poverty in Desa Saka Mangkahai, Kecamatan Kapuas Barat,
Kabupaten Kapuas, Central Kalimantan. IHS Micro Study Research Report . Jakarta, 2003. (In Indonesian)
4. Identifying Local Proxy Indicators of Poverty in Desa Seikayu, Kecamatan Kapuas Barat,
Kabupaten Kapuas, Central Kalimantan. IHS Micro Study Research Report . Jakarta, 2003. (In Indonesian)
5. Identifying Local Proxy Indicators of Poverty in Desa Fatukoko, Kecamatan Mollo Selatan,
Kabupaten Timor Tengah Selatan, East Nusa Tenggara. IHS Micro Study Research Report . Jakarta, 2003. (In Indonesian)
6. Identifying Local Proxy Indicators of Poverty in Desa Hane, Kecamatan Batu Putih, Kabupaten
Timor Tengah Selatan, East Nusa Tenggara. IHS Micro Study Research Report . Jakarta, 2003. (In Indonesian)
7. Identifying Local Proxy Indicators of Poverty in Desa Noelmina, Kecamatan Takari, Kabupaten
Kupang, East Nusa Tenggara Timur. IHS Micro Study Research Report . Jakarta, 2002. (In Indonesian)
8. Identifying Local Proxy Indicators of Poverty in Desa Takari, Kecamatan Takari, Kabupaten Timor
Tengah Selatan, East Nusa Tenggara. IHS Micro Study Research Report . Jakarta, 2003. (In Indonesian)