A Conservation Blueprint for Canada's Prairies and Parklands
228
A Conservation Blueprint for Canada's Prairies and Parklands J.L. Riley, S.E. Green and K.E. Brodribb 2007
-
Upload
khangminh22 -
Category
Documents
-
view
3 -
download
0
Transcript of A Conservation Blueprint for Canada's Prairies and Parklands

A Conservation Blueprintfor Canada's Prairies
and Parklands
A Conservation Blueprintfor Canada's Prairies
and ParklandsThe prairies and parklands of Canada and the adjacent United States are the northern reach of
North America's great plain, one of the Earth's great grassland biomes. The history of
agricultural land conversion and wildlife removal in this biome is unparalleled among world
grasslands, involving the virtual or literal elimination of many ecologically significant
species like the Plains Bison, Buffalo Wolf, Plains Grizzly, Passenger Pigeon
and Rocky Mountain Locust.
This report summarizes the methods and results of an assessment of the biological diversity of
four terrestrial ecoregions in the prairie, parkland and Cypress upland of Canada and the
northern United States (Montana and North Dakota). In addition, two ecodistricts adjacent
to and including Riding Mountain National Park were included in this analysis.
This conservation blueprint is a first attempt to identify and map conservation targets,
map existing protected areas and conservation lands, analyze the current protection of
particular target species and
ecosystems, and identify the
best areas required to meet
shortfalls in achieving
conservation goals set
for those targets.
©2007 Nature Conservancy of CanadaThe Nature Conservancy of Canada
110 Eglinton Ave. West, Toronto, Ontario,M4R 1A3
Web: www.natureconservancy.ca.
Canadian Cataloguing in Publication Data:ISBN 1-897386-13-3
A Conservation Blueprintfor Canada's Prairies
and Parklands
J.L. Riley, S.E. Green and K.E. Brodribb
2007
A Conservation Blueprint for C
anada's Prairies and Parklands
This paper comes from well-managed forests, independently certifiedin accordance with the rules of the Forest Stewardship Council.

This project was completed with the generous support of:
Donner Canadian Foundation
George Cedric Metcalf Foundation
Suncor Energy Foundation
The EJLB Foundation
The W. Garfield Weston Foundation
Environment Canada — Habitat Stewardship Program
and others

A Conservation Blueprintfor Canada's Prairies
and Parklands
J.L. Riley, S.E. Green and K.E. Brodribb 2007

©2007 Nature Conservancy of Canada
Issued by:The Nature Conservancy of Canada110 Eglinton Ave. West,Toronto, Ontario, M4R 1A3Web: www.natureconservancy.ca.
Citation of this report: J.L. Riley, S.E. Green and K.E. Brodribb. 2007. A Conservation Blueprint for Canada's Prairies and Parklands.Nature Conservancy of Canada, Toronto, Ontario. 226 pp. plus DVD-ROM.
Canadian Cataloguing in Publication Data:ISBN 1-897386-13-3
1. Conservation plan – Canada – prairie and parkland region– prairies – parklands – biodiversity conservation
I. Nature Conservancy of Canada.II. TitleIncludes bibliographic references.
The maps presented in this report are for illustrative purposesonly. Do not rely on these maps as a precise indication ofroutes, locations of features, or as a guide to navigation.
Cover photos: Burrowing Owls, A.Daley, SERM; PrairieRose, K.Dabbs; Swift Fox, K. Dabbs; Yellow Umbrella-plantand Scarlet Mallow at Cactus Point, SK, K.Dabbs.
The Nature Conservancy of Canada (NCC) is a non-profit, non-advocacy organization that takes a business-like approach to land conservation and the preservation ofCanada's biodiversity. Its plan of action involves partnershipsand creative conservation solutions with individuals, corpora-tions, community groups, conservation organizations andgovernment agencies that share its passion. Since 1962, NCCand its supporters have protected more than 765,000 hectares(1.9 million acres) of ecologically significant land acrossCanada — mountains and valleys, coasts and lakes and rivers,and prairies, parklands, forests, wetlands and tundra — and allthe species and ecosystems that these landscapes support.
For further information contactthe Nature Conservancy of Canada at 1 877 343 3532, or by email at [email protected].
NCC's prairie and parkland region offices are:NCC Alberta Region1202 Centre Street SE, Suite 830Calgary, AB T2G 5A51 877 262 1253
NCC Saskatchewan Region1777 Victoria Avenue, Suite 100Regina, SK S4P 4K51 866 622 7275
NCC Manitoba Region611 Corydon Avenue, Suite 200Winnipeg, MB R3L 0P3204 942 6156
2

Summary . . . . . . . . . . . . . . . . . . . . . . . . . . . . . . . 4Acknowledgements . . . . . . . . . . . . . . . . . . . . . . . 8
1.0 OVERVIEW1.1 Prairie and Parkland Ecoregions . . . . . . . . . 111.2 Conservation Planning and Action to Date . . 13
2.0 ECOLOGICAL CONTEXT2.1 Geography, Landforms and Soils . . . . . . . . . 202.2 Climate . . . . . . . . . . . . . . . . . . . . . . . . . . 222.3 Vegetation . . . . . . . . . . . . . . . . . . . . . . . . 222.4 Wildlife . . . . . . . . . . . . . . . . . . . . . . . . . . 232.5 Threats to Biological Diversity . . . . . . . . . . 252.6 Ecological History and its Implications
for Conservation . . . . . . . . . . . . . . . . . . . . 26Grazing and Vegetation Succession . . . . . 27Fire and Drought . . . . . . . . . . . . . . . . . . 28Locusts and Other Insects . . . . . . . . . . . 29Floods and Wet Periods . . . . . . . . . . . . . 29Invasives . . . . . . . . . . . . . . . . . . . . . . . . 29
2.7 Selection of Natural Areas . . . . . . . . . . . . . 302.8 Stewardship of Conserved Areas . . . . . . . . . 312.9 Summary . . . . . . . . . . . . . . . . . . . . . . . . 32
3.0 PROTECTED AREAS AND CONSERVATION LANDS3.1 Federal Lands . . . . . . . . . . . . . . . . . . . . . . 35
3.1.1 Canada . . . . . . . . . . . . . . . . . . . . 353.1.2 United States . . . . . . . . . . . . . . . 35
3.2 Provincial / State Lands . . . . . . . . . . . . . . 393.2.1 Provincial Lands – Canada . . . . . . 393.2.2 State Lands – United States . . . . . 39
3.3 Private Lands . . . . . . . . . . . . . . . . . . . . . 393.4 Designations . . . . . . . . . . . . . . . . . . . . . . 39
4.0 METHODS4.1 Ecological Systems — Coarse-filter Targets . . 424.2 Coarse-filter Biodiversity Analysis . . . . . . . . 43
4.2.1 Coarse-filter Conservation Goals . . . . . . . . . . . . . . . . 59
4.3 Fine-filter Biodiversity Analysis . . . . . . . . . 594.3.1 Fine-filter Conservation Goals . . . . . . . . . . . . . . . . 694.3.2 Meeting the Goals . . . . . . . . . . . . 69
4.4 Assembling the Portfolio . . . . . . . . . . . . . . 694.5 The Next Blueprint . . . . . . . . . . . . . . . . . . 70
5.0 RESULTS . . . . . . . . . . . . . . . . . . . . . . . . . . . 72
Glossary . . . . . . . . . . . . . . . . . . . . . . . . . . . . . . . 99
References . . . . . . . . . . . . . . . . . . . . . . . . . . . . . .107
APPENDIX A: . . . . . . . . . . . . . . . . . . . . . . . . . . . .114Ecological Systems — Coarse-filter Targets
APPENDIX B: . . . . . . . . . . . . . . . . . . . . . . . . . . . .121Ranking Ecological Systems Polygons
APPENDIX C: . . . . . . . . . . . . . . . . . . . . . . . . . . . .130Ecoregion Crosswalk Tables and Ecodistrict List
APPENDIX D: . . . . . . . . . . . . . . . . . . . . . . . . . . . .133Blueprint Maps
APPENDIX E: . . . . . . . . . . . . . . . . . . . . . . . . . . . . .224Ecodistrict Summary Tables
Back pocket:DVD containing report, maps, appendices and data
3
Contents

4
SummaryThe prairies and parklands of Canada and the
adjacent United States are the northern reach of North
America's great plain, one of the Earth's great grassland
biomes. The history of agricultural land conversion and
wildlife removal in this biome is unparalleled among
world grasslands, involving the virtual or literal
elimination of many ecologically significant species like
the Plains Bison, Buffalo Wolf, Plains Grizzly, Passenger
Pigeon and Rocky Mountain Locust.
Figure 1. Study area: the Aspen Parkland, Moist Mixed Grassland,Mixed Grassland and Cypress Upland ecoregions.
On the U.S. great plains to the south, two thirds of the landremains in natural cover, with one third under cultivation.The comparable figures for the Canadian prairies and park-lands are the reverse — one third (34%) left in natural coverand two thirds under cultivation or development.
The region’s historic disturbance regimes of heavy natu-ral grazing, fire, drought, flood and insects have been sta-bilized in support of an alternate non-native grasslandecosystem based on agriculture. The vast majority of thisconversion was completed from 1880 to 1930, after whicha major drought enforced new lessons about land steward-ship. Community pastures were established and tame pas-tures expanded. Land retirement and land conservationhave become important tools in re-distributing crop agri-culture to appropriate agricultural soils. At present, 21% ofthe land base is in public ownership (including waters), and79% is in private ownership.
The region witnessed an early and active history ofwildlife-conservation regulations and wildlife restoration,largely through government agencies. This work continuesthrough Canada’s most successful wetland and waterfowlconservation venture, the Prairie Habitat Joint Venture(PHJV), through which private-sector organizations aremajor partners. The PHJV is now diversifying its intereststo all birds and to upland habitats, and is engaging privatelandowners and groups far beyond the original public-agency work in the region.
Summary

5
A Conservation Blueprint for Canada’s Prairies and Parklands

Whole-biome conservation planning has occurred acrossthe region through the PHJV, the Prairie ConservationAction Plan, and the Endangered Spaces Campaign ofWorld Wildlife Fund (Canada). These and other interna-tional trans-boundary assessments concur on the ecologicalimportance of the biome and the shortfall in conservationefforts, for example in identifying and stewarding the landsthat have their highest and best land use as conserved lands.This on a landscape with very few conserved lands, a max-imum 7.1%, and where natural cover has been reduced to athird of its original extent.
Significant threats remain to this prairie and parklandbiome. Farm-gate prices remain a key determinant of theintensity of agricultural pressure on the lands and waters ofthe region. The impacts of drought, groundwater deple-tion, climate change, trade shocks and new farm practicesremain unpredictable and net farm income continues todecline.
This conservation blueprint contributes to a better doc-umentation of the biological diversity of the four ecore-gions comprising the prairie and parkland biome (Fig. 1).The study area includes parts of three provinces, two statesand two countries. It documents existing conservationefforts, the biodiversity of the region (target species andecological systems), conservation goals to be met to sustainthose targets, and the places that best meet those goals.
This atlas and analysis of the biological diversity of theCanadian prairies and parklands is offered as a contributionto a shared understanding of the conservation geography ofthe region, to help frame the identification of a suite ofcore biodiversity conservation areas, set within thesupporting network of remaining natural cover.Individuals, agencies, conservation practitioners and othersmay find the data useful, along with other data, in deter-mining the set of priority landscapes that should be thefocus of conservation efforts. A blueprint such as this canalso be used to inform the types of long-term stewardshipneeded to conserve prairie and parkland landscapes,whether through passive management or by emulating dis-turbance regimes to maintain natural diversity and particu-lar species and ecosystems.
This report summarizes an assessment of the biologicaldiversity of four terrestrial ecoregions in the prairie, park-land and Cypress upland of Canada and the northernUnited States (Montana and North Dakota). In addition,two ecodistricts adjacent to and including Riding MountainNational Park were included because the Riding Mountainis effectively an island surrounded by aspen parkland and,now, agricultural land.
This conservation blueprint is a first attempt to identifyand map conservation targets, map existing protected areasand conservation lands, analyze the current protection ofparticular target species and ecosystems, and identify thebest areas required to meet shortfalls in achieving conser-vation goals set for those targets.
Classifying and mapping ecological systems was centralto this project. These ecological systems were used ascoarse-filter targets, and provided the framework for com-parisons of different sites.
Detailed location information on rare and endangeredspecies provided the fine-filter targets for the project. Thisinformation was assembled with the assistance of theprovincial Conservation Data Centres and Natural Her-itage Information Centres, and state Natural HeritagePrograms. Mapping protected areas and other conservationlands helped us assess the ecological systems and speciesalready conserved in these areas.
Specific examples of native ecosystems were identified asa result of the coarse-filter analysis. Other sites were addedto the blueprint portfolio to address the under-representa-tion of fine-filter targets.
Federal and provincial protected areas and other conser-vation lands cover just over 9% of the Canadian study area,of which this study has mapped 7.1%:■ 1.2% federal protected areas;■ 0.9% provincial protected areas;■ 2.5% federal conservation lands; ■ 2.9% provincial conservation lands; and■ 1.9% PHJV lands.(There is overlap in counting between PHJV lands andother categories.)
Regulated protected areas total 2.0% of the prairie andparkland biome. Other non-regulated conservation landsmake up the bulk of lands for which there is some expres-sion of conservation intent. By area, the key lands are thecommunity pastures, national defence lands, agriculturallease lands with wildlife protection, and Prairie HabitatJoint Venture lands.
As it organizes itself on the landscape — and is organizedby humans — biological diversity occupies a whole range ofpotential sites meeting different conservation goals, all ofwhich deserve consideration in a conservation plan. Thesesites range from small to large in size, reflecting the variousscales of biological diversity.
A. Small sites conserving fine- and mid-scale targets, withfunctionality in terms of the viability of target species andcommunities.
Summary
6

B. Large sites conserving coarse-scale targets such as largegrassland ecological systems, with functionality in termsof specific targets but not with respect to landscape-scale biodiversity.
C. Functional landscapes that also conserve common ormatrix communities and species at coarse, intermediateand fine scales, with a high degree of intactness acrossan area.
D.The remaining natural cover across the region as awhole, which provides a habitat network essential tosustaining species populations and environmentalgoods and services as a whole.
E. The broader landscape across which is delivered thefull range of environmental goods and services, andwithin which there are sites where restoration of natu-ral habitats or rehabilitation of supportive environmen-tal conditions are important for maintaining or recov-ering particular species, habitats or ecological systemsthat have declined below levels needed for their persist-ence.
The tile maps at the end of the report illustrate blueprintoutputs at the scale of small sites (A), large sites (B), andnatural cover (D). The same maps, when considered inconjunction with other sources of information and expertopinion, provide much of the information needed by con-servation planners to start mapping functional landscapesor “priority landscapes” for conservation attention (C),and to address the restoration and rehabilitation needs ofthe broader landscape (E). Results from the project arepresented in a variety of ways in addition to the “tilemaps”, in order to illustrate a few of the ways such datamay be used, for example as:■ Percent of ecodistricts remaining in natural cover;
■ Percent of ecodistricts in protected area or conserva-tion land;
■ Percent of ecodistrict identified as required to meetthe blueprint’s conservation goals;
■ Top scoring ecological systems by ecoregion, by studyarea, and by jurisdiction; and
■ Ecodistricts with high concentrations of rare species.
Collectively, these results provide biome-wide contextfor higher-level conservation planning. At finer scales, thetile maps suggest options and opportunities for meetingthe conservation challenges raised by the biome-wideanalysis.
A particular challenge on highly fragmented and con-verted landscapes is the identification of strategies involv-
ing the restoration or rehabilitation of intervening or adja-cent lands and waters. This is also best done at scales finerthan the blueprint scale, but the blueprint provides usefulcontextual data for discussions of appropriate restorationgoals (species, systems) in appropriate areas.
The blueprint identifies and maps 2.0% of the land baseof the prairies and parklands as formally protected for con-servation, and a further 5.2% in other conservation lands.Natural cover remains on 34% of the land base, and theblueprint identifies more than half of this (18% of the landbase) as core biodiversity conservation areas. In total, thisincludes existing protected areas, other conservation lands,highest scoring ecological systems within each ecodistrict,and the occurrences of other biodiversity targets wherethey are not otherwise sufficiently included in other iden-tified areas.
There is consensus that the region is experiencing morerapid climate change than occurred naturally in the past,with attendant increases in mean temperature and weath-er variability, and with decreases in precipitation andgroundwater. The impact of this on biodiversity willbecome clearer over time, but a further consensus is likelyto emerge that larger-than-present conservation of land-scape-scale blocks of intact prairie, parkland and valleylandhabitat is required as a minimum response to this addi-tional challenge to our native biodiversity.
The blueprint describes a landscape that will support theconservation targets that it considered in its analysis. Theappropriate recognition and conservation of those targets,through the conservation of the lands identified by theblueprint (at a minimum) would significantly ensure thelong-term persistence of those targets and of the overallbiological diversity of the region.
It remains a worthwhile and perpetual goal to assembleregion-wide data that can support regional assessments ofour collective achievements and needs in the field of bio-diversity conservation. This first-iteration attempt is anencouragement to others to continue to partner in this dif-ficult task, and to consider a deliberate organization of col-lective conservation planning.
To this end, priorities need to be set for developingregion-wide classifications and mapping of native habitatsand vegetation, of surficial geology and landform, of eco-logical systems, and of conservation targets. These effortsmust have seamless, region-wide mapping layers as a goalif they are to support region-wide resource managementand effective conservation planning. They will enhance themeasurement of targets, goals and achievements, and sup-port effective conservation efforts on the ground.
A Conservation Blueprint for Canada’s Prairies and Parklands
7

AcknowledgementsThis project was made possiblethrough the generous financialsupport of: The Donner Canadian Foundation,Suncor Energy Foundation, EJLBFoundation, W. Garfield WestonFoundation, George Cedric MetcalfCharitable Foundation, EnvironmentCanada Habitat StewardshipProgram, and others.
In-kind support and informationwas provided by the followingindividuals, organizations, andgovernment departments listed in alphabetical order: Tracy Allan (Manitoba ConservationData Centre), Gregg Babish (Envir-onment Canada), Janet Campbell(Saskatchewan Industry andResources), Stephen Davis (Envir-onment Canada), Ken DeSmet(Manitoba Conservation DataCentre), Environment Canada, SandiFaber (Manitoba Conservation DataCentre), Nexen Canada Inc., NicoleFirlotte (Manitoba ConservationData Centre), Gene Fortney (NatureConservancy of Canada), DavidGauthier (Canadian Plains ResearchCentre), Betty Gee (Nexen Inc.),Ann Gerry (Saskatchewan Environ-ment), Joyce Gould (Alberta NaturalHeritage Information Centre),Margaret Green (Nature Conser-vancy of Canada), Jennifer Hall (TheNature Conservancy), MaryHarkness (The Nature Conservancy),Duke Hunter (Alberta NaturalHeritage Information Centre), TonyLau (Saskatchewan Department ofHighways), Dave MacDonald(Saskatchewan Watershed Authority),Sue Michalsky (Nature Conservancyof Canada), Dean Nernburg (Envir-onment Canada), Wayne Nordstrom(Alberta Natural Heritage
Information Centre), Jason Pelzer(Saskatchewan Conservation DataCentre), Stephen Porter (Saskat-chewan Conservation Data Centre),John Rintoul (Alberta NaturalHeritage Information Centre),Saskatchewan Environment, JeffThorpe (Saskatchewan ResearchCouncil), Jan Slaats (The NatureConservancy), Drajs Vujnovic(Alberta Natural Heritage Inform-ation Centre), Karin Smith-Fargey(Nature Conservancy of Canada),Gary Weiss (Environment Canada),and Stephen Wolfe (GeologicalSurvey of Canada).
Also thanks to the numerous otherindividuals that assisted the projectwith data, expertise, and support.
A special thanks to Lorna Allen(Alberta Natural HeritageInformation Centre), PaulineErickson (Environment Canada),Jason Greenall (Manitoba Conser-vation Data Centre), Brian Martin(The Nature Conservancy), and GlenMcMaster (Saskatchewan WatershedAuthority) for serving as members ofthe project’s core science advisoryteam.
Attributions:Lowell Strauss: project leader, 2002-2005; data assembly and analysis;design, development and reporting ofmethods; report writing.
Sam Kennedy: project GIS techni-cian, 2003-2004.
Sarah Green: project GIS technicianand analyst; report writing and car-tographer, 2005-2006.
Nayna Khalatkar: GIS technician,2006; results mapping.
Kara Brodribb: project manager andadministration; methods design;report writing.
John Riley: program lead; methodsdesign; primary author; report pro-duction.
Sarah Bretl: editing.
Judie Shore: design and page layout.
Colin Anderson: DVD development.
Constructive reviews of earlierdrafts were provided by:Brian Martin, The NatureConservancy; Cheri Sykes, JordanIgnatiuk and Lyle Saigeon, NCCSaskatchewan; and Larry Simpsonand Renny Grilz, NCC Alberta.
Finally, thanks to K.Dabbs and A. Daley for use of their photographs.
(Organization affiliations listed arethose at the time of assistance to theproject.)
Illustrations:Animate Creation – Our LivingWorld, A Natural History. SelmarHess Publisher, 1898, NY.
Acknowledgements
8
A Conservation Blueprint for Canada’s Prairies and Parklands
9
SECTION 1.0
OverviewCanada’s prairies and parklands are part of North America’s great plains, which represent
collectively as much as 10% of the Earth’s grasslands. This biome covers about 5% percent of Canada
and, of its historic extent of native prairies and parklands, less than 34% now remains intact.
SECTION 1.0 Overview
10
Grasslands cover between 41 and 56 million km2 (31-43%)of the Earth’s surface. Historically, they were one of themost productive and diverse terrestrial ecosystems, domi-nated by grass, forb and shrub vegetation, and maintainedby grazing, fire, drought and extreme temperatures (WRI2000). Canada’s great prairie grasslands are also indissolv-ably nested with myriad wetlands and with aspen parklandon its cooler and more mesic sites.
This is a landscape that has now been totally re-shapedby modern human activities (Fig. 1). By 1881, the era offree-ranging Plains Bison was over and the railhead hadreached Brandon, Manitoba. Farming was still restrictedto small garden plots at fur trading posts, and a few milkcows had been brought by freighter canoe. The railheadreached Calgary two years later and branch lines reachedSaskatoon and Edmonton by 1891. Farms started aslinked networks along the railways and, by 1910, had filledthe space between. The fastest rates of land conversion tocrop, summer fallow and seeded pasture took place from1900 (22,000km2 total) to 1930 (243,000km2 total).Canadian cattle ranching began on the open range in the1870s. Domestic animals increased by 1921 to the equiv-alent of 4.4 million animal units and slowly stabilizedaround 5.8 million animal units by 1976. Cattle numbersgrew most rapidly over that period, with hog numbersgrowing most rapidly since. For years, the erosion oforganic matter from cropland soils was a major concern,and large acreages were converted to tame forage involv-ing non-native perennial grasses, compounding the chal-lenges to the remaining natural ecosystems (Coupland1977).
The reduction of natural ecosystems in the region is notover. For example, “From 1971 to 2001, Saskatchewan’snatural pastures, wetlands and woodlands located on theprairies and parklands declined from almost 8,000,000ha toabout 6,400,000ha” (Saskatchewan Environment 2005).
The Canadian prairie and parkland biome supportsalmost 4 million people. This is almost four times the den-sity of the population occupying the same biome in theUnited States. Most Canadians in this biome live in urbancentres (81%), comparable with the rest of Canada, butnotable in that urban land uses occupy less than 0.3% ofthe land. Accelerating emigration from rural to urban areasis the present trend, as is the shift away from traditionalagricultural and resource employment.
The prairie and parkland region is now an overwhelm-ingly agricultural system. Fourteen field crops (grains,oilseeds and pulses) and even fewer forage crops occupy
more than 95% of cultivated lands (GOC 1996). Irrigationand intensive modern farming practices are increasing pro-ductivity across the region and reducing inputs. The pro-duction of in-door domestic livestock is significantlychanging cropping patterns, and beef remains the pre-dominant outdoor livestock, much of it grazing on nativegrassland conserved for that purpose.
The agricultural economy of the region has beendepressed, and may continue so for the foreseeable future(Gauthier et al. 2003). It is “boom and bust” economywith highly unpredictable year-to-year variation in farmincome (e.g., from 1961 to 1975, variation in net farmincome was 86% in Saskatchewan, compared with 20% inOntario; Gilson 1977). There has been a relative declinein net farm income across the three Canadian provincesresulting from declining commodity prices, higher inputcosts and trade reactions to pathogens (e.g., bovine spong-iform encephalopathy, anthrax). There is a general trendtoward large agribusiness operations, with declining num-bers of farms overall and of individual or family holdings,at the same time that the total area of farms is increasing.
Farming as the “principle” occupation is in decline andoff-farm subsidization of farm operations is increasing.Government supports for agriculture vary hugely betweenthe U.S., Mexico and Canada, but Canadian federal andprovincial support of agriculture has declined since the1960-1990 period. Drought relief is now a minor aspectof farm support although, even without climate change,long-lasting and intense droughts are said to be probableevery 60-100 years. The dust bowl of the 1930s was oneof the “mildest” in the past 2000 years while, at the sametime, major flooding has occurred in cycles of 25, 50 and300 years (Leavitt and Chen 2001).
Much of the flowing freshwater in the region comesfrom outside the biome. At the mouth of the Saskatch-ewan River, 87% of the flow is meltwater from the RockyMountains. However, high-elevation mountain glaciersare thinning and receding because of climate warming, andstream flows are dropping as a result. The flow levels in themajor rivers of the western prairies are aleady reduced by20–84% of their volumes in the early 20th cen-tury(Schindler 2002; Schindler and Donahue 2006). Agri-culture is the largest industrial user of water, and the areain irrigation increased by 37% in the period 1981-1991alone (GOC 1996). Increased salinization of some lakeshas been noted, with a fourfold increase in dissolved solidsin Big Quill Lake from 1925 to 1985, and 50% increasesat Redberry and Manitou lakes over the same period(Hammer 1986).

Canada is the world’s eighth largest oil and gas pro-ducer and exporter. It is the largest supplier of oil to theUnited States, with the majority (>2M bbl/d) flowingfrom Canada’s western sedimentary basin — the prairieand parkland region. The U.S. imports 16% of all its nat-ural gas and 95% of this comes from Canada, again almostall from this region. More than 20,000 oil and gas wellswere drilled in Alberta in 2006, with more than 5,000 inSaskatchewan, almost all in the prairie and parklandregion, and almost all associated with seismic and otherexploration work, and with access development and prod-uct shipment. It is difficult to overstate the strategic eco-nomic importance or the ecological footprint of this activ-ity today, overlaid as it is on an intensively worked agri-cultural land base.
From an ecological perspective, the pre-settlementlandscape evolved in synchrony with harsh, episodic natu-ral disturbance regimes, including some of the densestgrazing populations in the world, fire, drought, floodingand insect plagues. The taming of these disturbanceregimes through settlement was at a pace unparalleled inworld grassland history. Now, the region faces a period ofunparalleled weather variability and climate change.
There are key challenges in conserving the biologicaldiversity of the prairies and parklands.■ What remains of the natural heritage of the biome? ■ What constitutes the present and the likely future ecol-
ogy of the prairie and parkland region? ■ What part of remaining ecosystems should be identified
as core biodiversity conservation areas?■ Does the biome’s remaining natural cover persist at suf-
ficient scale and proximity so that the long-term viabil-ity of its natural heritage is secure?
■ Can priority landscapes be identified where conserva-tion and restoration of native biological diversity can beadvanced as the highest and best use of the land?
Many organizations, agencies and individuals are work-ing to address these challenges. One of NCC’s contribu-tions to this work is a series of assessments of the biolog-ical diversity of ecoregions across southern Canada (Fig.2). The goal has been to document, atlas and analyze theavailable information on the ecological systems, nativespecies and remnant natural areas of these landscapes, tofocus NCC and its partners in their direct, on-the-groundconservation activities.
1.1: Prairie and Parkland EcoregionsThe study area includes four ecological regions: AspenParkland, Moist Mixed Grassland, Mixed Grassland,and Cypress Upland (Figs. 1, 2). These are areas withinwhich there are more or less homogeneous climate andlandform, and biological diversity.
The Aspen Parkland extends across North Dakota,Manitoba, Saskatchewan and Alberta and covers20,570,000 hectares. The Moist Mixed Grassland spansAlberta, Saskatchewan, North Dakota and Montana, for atotal of 13,027,000ha. The Canadian portion of theMixed Grassland in Alberta and Saskatchewan covers anadditional 13,400,000ha. The Cypress Upland is a high-elevation outlier of upland conifer forest and grassland, inAlberta and Saskatchewan, 832,000ha surrounded bymixed grassland.
Two additional ecodistricts from the Boreal Transitionecoregion were added to the study area around RidingMountain National Park in Manitoba (712,000ha), inorder to include the full parkland area between RidingMountain and Duck Mountain.
The study area does not include the Northern TallGrass Prairie along the eastern edge of the biome, whichwas the subject of an earlier ecoregional assessment (TNC1998; Chapman et al. 1998). In this project, NCC usesthe above mentioned ecoregion names, based on the stan-dard Canadian nomenclature (ESWG 1995). (AppendixC lists the different names of these ecoregions used by var-ious agencies and authors.)
In the United States, the ecoregion that is contiguouswith Canada’s Mixed Grassland is called the NorthernGreat Plains Steppe, and an earlier ecoregional assessmentwas undertaken of that area (Fig. 2; TNC 1999). Thepresent study re-assesses the Canadian portion of thatecoregion, using newly available data and upgraded meth-ods.
(The original study was of the two “rainbow” ecore-gions, the Aspen Parkland and Moist Mixed Grassland.As work progressed, it became apparent that there weresignificant benefits to achieving a consistent methodolog-ical coverage of the entire Canadian prairie and parklandbiome. On this basis, the Canadian Mixed Grassland andCypress Upland ecoregions were added to the studyarea.)
A Conservation Blueprint for Canada’s Prairies and Parklands
11

SECTION 1.0 Overview
12
Figure 2. Ecoregions of southern Canada and the northern United States.
These ecoregions are further mapped into ecodistricts,areas within which there are similar landforms and phys-iography in particular, as well as similar soils, vegetation,water bodies and fauna (Fig. 10 and Appendix D maps).These are the geographic areas within which the compar-ative significance of their remaining natural areas wasassessed and summarized in this study.
Overall, the study area includes the broad transitionzone between the drier grasslands and deserts to the southof the region and the boreal forests and wetlands to thenorth. Together the study area totals some 48,543,000hectares in size. As expected on a landscape of this size, abroad range of ecological systems are represented that sup-port a wide diversity of organisms. Many of these ecolog-ical systems are unique to North America’s great plains,and their conservation can only occur here.
The grassland, woodland, and wetland ecosystems ofthe prairie and parkland biome were dynamic. They werehighly responsive to patterns of violent natural disturbanceregimes, in which there were “tipping points” wherewoodlands or wetlands replaced grasslands over a periodof wet years, and where grasslands took over the landscapefollowing periods of drought, fire or heavy grazing. Thelandscape has been ecologically domesticated by land con-version and fencing over the past 150 years but thesedynamics are still at play among natural ecosystems.

1.2: Conservation Planning and Action to DateThe prairies and parklands have been the subject of sever-al significant efforts at whole-biome conservation plan-ning: the Prairie Habitat Joint Venture, the Prairie Con-servation Action Plan, the Endangered Spaces Campaignof World Wildlife Fund Canada (Hummel 1989, 1995),the Commission for Environmental Cooperation (CECand TNC 2005), and others (Sampson and Knopf 1996).
Public agencies have developed biodiversity strategiesfor their jurisdictions, such as for Alberta (AEP 1995),Saskatchewan (GOS 2004), and Canada (AAC 1997).There have also been outstanding independent assess-ments of loss and threat (Thorpe and Godwin 1999,Hammermeister et al. 2001).
There have also been international assessments of theimportance of the entire grassland biome (Fig. 3). Theseconsistently describe the same shortfalls in conservationefforts across the biome, for example, to identify, map andformally conserve the lands that have their highest andbest use as conserved lands. This on a landscape with sofew conserved public lands (7.1% of the study area) andon a landscape so significantly converted from its originalnatural cover (34% natural cover remaining) (Table 5.1).
For example, the North American Commission forEnvironmental Cooperation identified these needs in itsNorth American grassland conservation strategy:■ To achieve complete identification, understanding and
representation of biodiversity;■ To identify target species, high value habitats and natural
corridors for wildlife; and■ To determine the biotic and abiotic requirements of native
prairie species and communities (Gauthier et al. 2003).
A Conservation Blueprint for Canada’s Prairies and Parklands
13
Figure 3. Study area in context of the North American grassland biome.

Another conclusion has been that information is diffi-cult to locate and interpret on 1) the extent and distribu-tion of conserved lands and waters, and 2) on the originsand goals of the many programs and projects that con-served them (ibid.) This project offers a reasonableapproximation of the first of these — the extent and dis-tribution of conservation lands – but only briefly address-es the second question — the many conservation pro-grams and projects operating across the prairie and park-land region.
These conservation programs and projects involve pri-vate owners and lessees, municipalities, provincial andfederal agencies, First Nations, and conservation organi-zations. In Canada, 79% of the biome is privately owned,with 21% owned by federal, provincial or state govern-ments or First Nation peoples. These are comparable fig-ures to ownership patterns on the great plains in theUnited States (84% private) and Mexico (94% private andcommunal) (ibid.) However, of the provincial and feder-al lands, probably a majority are leased to landowners foragricultural purposes. Another significant percentage ismaintained as community pasture.
Information is also difficult to access on a number ofpositive trends that are occurring. In Canada, privatelandowners are increasingly aware of and encouraged torecognize the ecological value of land, water and wildlifethrough options such as stewardship agreements, conser-vation easements, and programs such as the NorthAmerican Waterfowl Management Plan and the PrairieFarm Rehabilitation Administration (PFRA) PermanentCover Program.
Standard agricultural practices are changing in waysthat reduce wind and water erosion, loss of organic mat-ter, and pesticide and fertilizer use. Application of insec-ticides, herbicides and fertilizers peaked in the 1980s,with appreciable declines since (GOC 1996). Cost is moreof a determinant than conservation in most of these pos-itive changes, which also include no-till and stubble oper-ations.
At the same time, since the 1930s, cropland retirementprograms have reduced agricultural land area, andimproved the delivery of environmental benefits.Beginning in the 1930s, the PFRA Community PastureProgram returned 145,000ha of cultivated lands to per-manent grass cover, and currently encompasses more than900,000ha of rangeland. Between 1989 and 1994, thePFRA Permanent Cover Program assisted landowners inconverting more than 518,000ha of marginal croplands
to long-term forage (GOC 1996). These programs havehelped focus cultivation on best agricultural soils, andgrazing on native and rehabilitated grasslands.
By comparison, land retirement programs in the U.S.have been more aggressive. Since 1985, the U.S.Conservation Reserve Program and Wetlands ReserveProgram retired more than 15,000,000ha, at least three-quarters on the central grasslands. These programs haveshifted the pattern of croplands around locally, but over-all land cover has remained relatively stable over the pastseventy-five years on the U.S. great plains: two thirds ofthe land remains in natural cover, with one third in culti-vated farming (Cunfer 2005). The comparable figures forthe Canadian prairies and parklands are the opposite; onethird (34%) remains in natural cover, with two thirds inagricultural cultivation or development.
National parks were established early in the region, firstat Waterton on the montane edge of the region (1895),followed to the south by Glacier National Park (1910).These are spectacular landscapes on the eastern slopes ofthe Rocky Mountains, where grassland changes mostabruptly to mountain range. Both conservation and recre-ation were motives in establishing these parks. Thedecline of the region’s wildlife was a key motivation inestablishing other parks, such as those to conserve Elk andPlains Bison: Elk Island (1906), Buffalo Park (1909)(now Canadian National Defence Camp Wainwright),and Riding Mountain (1930). Of note, no further nation-al parks were established until Grasslands National Park in1984, and none since.
The same impulse to conserve wildlife gave rise to theCanadian federal Northwest Game Act (1917), by which,for example, the possession and use of poison was pro-hibited, hunting and trapping were licensed, and thekilling of female hoofed animals and young at foot wasprohibited. Also in 1917, after much international discus-sion of shared threats and responsibilities, a migratorybird convention was adopted by Canada and the U.S.,and embedded in the Migratory Birds Convention Act,which reduced and fixed seasons on migratory gamebirds.
Game and bird reserves were established early and by1921 there were four in Manitoba (225,000ha), thirteenin Saskatchewan (>130,000ha), and ten in Alberta(>65,000ha) (Hewitt 1921). These began in 1887 withthe regulation of a 1000ha area of islands and land adjoin-ing the northern part of Last Mountain Lake,Saskatchewan for the protection of birds. This was the
SECTION 1.0 Overview
14

first area protected for wildlife in North America. Alsoestablished early were game reserves for PronghornAntelope, at the Wawaskesy (AB), Menissawok (SK) andNemiskam (AB) National Antelope Parks (1914, 1915).These three were returned to the provinces in the 1930sand 1940s. As a result of these efforts, populations ofgame and fur-bearing wildlife stabilized andrecovered.
Private land conservation also beganearly in the region. For example, numerousprivate sites for duck-hunting were estab-lished. Reuben Lloyd of Davidson, Sask-atchewan, established a 15ha game preserve(Arm River Farms) before 1920.
At present, all Canadian jurisdictions have wildlife andfisheries legislation, as well as acts to establish parks, nat-ural areas, protected places or ecological reserves. MostCanadian provincial jurisdictions have protected-areaplanning programs. Program delivery varies significantlybetween jurisdictions.
Non-game species have fared less well. Before the fed-eral Species at Risk Act (2002), which conserves regulat-ed species on federal lands, Manitoba was the onlyCanadian prairie jurisdiction to have endangered-specieslegislation (1990). It applies to all land tenures.
In Canada, the federal government is the largest hold-er of conservation property across the region. Theseproperties include both regulated “protected areas” andless formally committed “conservation lands” that alsomake substantive contributions to the region’s overallconservation efforts:
Canadian federal protected areas include: nationalparks, migratory bird sanctuaries, national wildlife areas(Table 3.2; 515,016ha).
Canadian federal conservation lands include: com-munity pastures, and national defence lands (Table 3.2;1,111,902ha).
Provincial protected areas include: provincial parks,natural areas, wildlife management areas, fish & wildlifedevelopment fund wildlife lands, heritage rangelands,ecological reserves and park reserves (Table 3.2;391,081ha). Provincial parks are treated as protectedalthough commercial resource extraction is permitted insome Manitoba and Alberta parks.
Provincial conservation lands include: provincialcommunity pastures, provincial recreation areas, andSaskatchewan lease lands on which the Wildlife HabitatProtection Act (1984) conserves wildlife (Table 3.2;1,297,798ha). Of these, the Saskatchewan lease landsoccupy 1,058,225ha.
Not included are the extensive land holdings of munic-ipal regional parks (>100 in Saskatchewan), nor the landsowned, or with conservation easements or stewardshipagreement through Ducks Unlimited Canada, NCC,Alberta Conservation Association and SaskatchewanWildlife Federation. For example, since 2001, NCC haspurchased 38,000ha of land and easement for conserva-tion in the region as part of the Prairie Habitat JointVenture (PHJV).
The PHJV reports that its government and non-gov-ernment partners secured 862,000ha of conservationlands through fee simple, easement or stewardship agree-ment in the period 1986 to 2001. These would be most-ly the work of Ducks Unlimited Canada. This in itselfconstitutes 1.9% of the Canadian prairies and parklands,an area almost equivalent to existing federal and provin-cial protected areas. (Map data were not available to theblueprint for these areas.) Finally, there is a significantvariety of essential private-land holdings contributing toall aspects of conservation, both deliberately and throughbenign management.
The documented federal and provincial protected areasand other conservation lands cover just over 9% of theCanadian study area, of which this study has mapped7.1%. Of these:■ 1.2% are federal protected areas;■ 0.9% are provincial protected areas;■ 2.5% are federal conservation lands; ■ 2.9% are provincial conservation lands; and■ 1.9% are PHJV lands.(There is overlap in counting between PHJV lands andother categories.)
A Conservation Blueprint for Canada’s Prairies and Parklands
15
In total, this study mapped 3,463,529ha of existing federal, stateand provincial protected areas and other conservation lands,
7.4% of the Canadian prairie and parkland study area (7.1% of whole Canada/U.S. study area).

It must be noted that such categories and statistics areproblematic because on-the-ground stewardship is weakand under-resourced. Commercial resource extraction isoccurring in some regulated protected areas. Migratorybird sanctuaries can be “temporary spots with restrictedsafeguards for certain birds and their nests…the generalhabitat in these areas is not afforded much protection”(Gauthier et al. 2003).
In the U.S. part of the study area (Montana and NorthDakota), the following protected areas and conservationlands were considered:
U.S. federal protected areas include: national wildliferefuges, federal reservations, areas of critical environmen-tal concern, national outstanding natural areas, powerwithdrawals, wilderness study areas, research natural areas(Table 3.2; 39,623ha, of which 82% is wildlife refuge).
U.S. federal conservation lands include: Bureau ofLand Management holdings, national forests, militaryreservations, national wildlife refuges, wildlife manage-ment areas, game preserves, fish hatcheries (Table 3.2:17,926ha).
State protected areas include: state parks, wildlifemanagement areas (Table 3.2: 11,002ha, all but 452hawildlife management areas).
State conservation lands include: state lands, stateforests, state wildlife refuges, wildlife management areas,game preserves or fish hatcheries (Table 3.2: 82,097ha).Some of these state lands permit resource extraction andgrazing, but conserve the land from conversion from nat-ural habitat. Others are primarily managed for wildlifeconservation.
Conservation Land-use PlanningThe importance of region-wide assessments of the com-parative conservation values of different ecological sys-tems is that such assessments can provide the underpin-nings for informed private and public stewardship of landsfor which conservation is the best and highest use.
For example, in Manitoba, Manitoba Conservation isthe lead agency in identifying areas of special interest(ASI), designed for possible future conservation. InAlberta, on public lands, Protective Notations (PNT) canbe put in place by public agencies to identify lands thatshould be managed to achieve particular land use or con-servation objectives. These or other areas may also be pro-tected as Natural Areas under the Alberta WildernessAreas, Ecological Reserves, Natural Areas and HeritageRangelands Act (2000).
These notations do not extend yet to private landshowever, in Ontario, lands identified as significant naturalareas during the 1980s were eventually considered provin-cially significant areas of natural and scientific interest(ANSIs) and the government committed in 1983 to, onpublic lands, “ensure that the land uses and activities,which occur, provide for the protection of identified val-ues”. On private lands, the commitment was “throughcooperation with others, attempt to ensure that landown-ers are aware of significant features on their properties andseek the owners’ cooperation in protecting such features”.These sites subsequently became eligible for property-taxreductions under the Ontario Conservation Land Act’sTax Incentive program. In 1992, 1994 and 2005, land-use policies under the Ontario Planning Act, recognizedthese natural areas and promoted their protection fromincompatible land-use decisions favouring developmentand site alteration.
This conservation blueprint maps and documents exist-ing conserved lands and additional high-scoring ecologi-cal systems and rare-species habitats, all set within thebroader network of remaining natural cover and poten-tially restored lands. Collectively, this constitutes a natu-ral-heritage system that communities, organizations andlandowners may recognize as potential conservation out-comes in their areas. In general, natural heritage systemsare networks of conservation lands and waters linked,where possible, by natural or restored corridors. Theyinclude but are not limited to natural-heritage features, aswell as significant hydrological features. Their objectivesare the conservation of biological diversity, ecologicalfunctions and viable populations of native species andecosystems (Riley et al. 2003).
SECTION 1.0 Overview
16
Regulated protected areas total 2.0% of the prairieand parkland biome. It is the other non-regulatedconservation lands that make up the bulk of landsfor which there is overt conservation commitment.
Specifically, the key lands are the community pastures, national defence lands, agricultural lease
lands with wildlife protection, and PHJV lands.

Elsewhere, the mapping of such systems has been usedto illustrate what a conserved landscape might look like,such as through the Massachusetts BioMap Project(www.mass.gov/dfwele/dfw/nhesp/nhbiomap. htm). InOntario, natural-heritage systems are required elements ofmunicipal official plans (Ontario Provincial PolicyStatement under the Planning Act; Riley 1999). TheNature Conservancy of Canada has partnered with gov-ernment and non-governmental agencies in mapping anddocumenting natural heritage systems, such as the south-ern Ontario Big Picture 2002 project.
Conservation BlueprintsEcoregional assessments help frame broad strategies toconserve biological diversity. They are being completedacross all North America and elsewhere (Groves et al.2000; Poiani et al. 2000; Gaston et al. 2002; Groves2003; Redford et al. 2003; Tear et al. 2005).
NCC calls its ecoregional assessments “conservationblueprints” to emphasize the need for well-documentedplans underlying NCC conservation activities (Fig.2). Aconservation blueprint is an attempt to assemble, classify,map and analyze the available information on the biolog-ical diversity of a natural geographic region, in this case thefour ecoregions that comprise the prairie and parklandbiome of Canada and two areas of the U.S.
An atlas of biodiversity data has many applications. Theapplication of particular interest here was the identifica-tion and assessment of the places across the prairieand parkland biome that, if appropriately conserved,could sustain the essential biological diversity of theregion. This may or may not be achievable, but remainsthe challenge for conservation professionals.
The prairie and parkland conservation blueprint is thefirst computer-based, landscape-level analysis of the ter-restrial biodiversity of this large study area. It analyzesresults regardless of jurisdictions or land tenure. It docu-ments and validates existing protected areas and conserva-tion areas, and identifies additional sites of conservationimportance.
Representation of the region’s natural community typesis central to this analysis. Identifying and conserving rep-resentative systems provides the means to preserve thewidest variety of species in conditions that support thembest. Some of these are widespread ‘matrix’ habitats.
Other targets include occurrences of species that are rarethroughout their ranges and require conservation wherethey occur.
In recent years, mapping of geology, vegetation, waterfeatures, species and habitats has been computerized indigital formats that allow the analysis of such data in newways. A range of approaches has been used to map priori-ty conservation areas on a variety of landscapes (Poiani etal. 2000; Bowker 2000). With the current ability to ana-lyze multiple data layers in a GIS (geographic informationsystem), it becomes possible to apply approaches that areincreasingly replicable and more explicit about theirassumptions and limitations. At the same time, theseanalyses are admittedly remote and deliberately contextu-al, and are no substitute for expert knowledge and in-fieldverification, which is needed in order to interpret andimplement results on the ground (Zhou and Narumalani2003).
As it organizes itself on the landscape — and is organ-ized by humans – biological diversity can be thought of asoccupying a whole range of potential sites meeting differ-ent conservation goals, which can be deliberately consid-ered in a conservation plan. In geographic scale, these sitesrange from small to large in size, reflecting the variousscales of biological diversity (Noss 1990).A. Small sites conserving fine- and mid-scale targets,
with functionality in terms of the viability of targetspecies or communities;
B. Large sites conserving coarse-scale targets such aslarge grassland ecological systems, with functionalityin terms of specific targets but not with respect tolandscape-scale biodiversity;
C. Functional landscapes that also conserve com-mon/matrix communities and species at coarse, inter-mediate and fine scales, with a high degree of intact-ness within a particular area;
D The remaining natural cover across the region as awhole, which provides a habitat network essential tosustaining species populations and environmentalgoods and services as a whole;
E. The broader landscape, across which is delivered thefull range of regional environmental goods and servic-es, and within which there are sites where restorationof natural habitats or rehabilitation of supportive envi-ronmental conditions are important for maintainingor recovering particular species, habitats or ecological systems that have declined below levels needed fortheir persistence.
A Conservation Blueprint for Canada’s Prairies and Parklands
17

SECTION 1.0 Overview
18
The blueprint and, for example, the tile maps (Appen-dix D) that illustrate its results, focus on scales A (smallsites), B (large sites) and D (natural cover) above. At thesame time, it provides much of the contextual detail need-ed for conservation planners to take the next steps indefining functional landscapes or “priority landscapes” forconservation attention (C above), and to address therestoration and rehabilitation needs on those prioritylandscapes (E above).
A computer-based analysis like this relies on region-wide data sets to make region-wide comparisons. Thereare relatively few such data sets and a large part of theblueprint project consisted of knitting together new cov-erages. However, for many parts of the study area thereare additional better-resolution data sets, and it is for thisreason that the work of identifying priority conservationlandscapes (C above) and of identifying on-the-groundconservation strategies is best approached at finer scales,with additional data and expert knowledge brought tobear.
A particular challenge on highly fragmented and con-verted landscapes is the identification of strategies involv-ing the restoration or rehabilitation of intervening or adja-cent lands and waters. This is also best done at scales finerthan the blueprint scale, but the blueprint provides usefulcontextual data for discussions of appropriate restorationgoals (species, systems) in appropriate areas.
This general approach reflects the experience of NCCin trying to work at appropriate site scales, as well as theexperience of others. For example, Designing a Geographyof Hope (Groves et al. 2000) set out the concept of “mul-tiple-scale” sites, and included a similar range of sites, con-ceptualized as functional sites set within functional land-scapes, in turn nested within functional networks (Low etal. undated; Poiani et al. 2000).

A Conservation Blueprint for Canada’s Prairies and Parklands
19
SECTION 2.0
Ecological ContextThis was the land of Plains Bison, Elk, Antelope, Wolf and Grizzly, in astonishing numbers.
These became the lands of semi-industrial pemmican production, and then they became
the bright future for generations of agricultural immigrants. More than 75% of Canada’s
cultivated lands occur in Alberta, Saskatchewan and Manitoba, almost entirely in this
region of original prairies and parklands.

The prairie and parkland biome or ecozone of Canadaand the adjacent United States is the northern tip of thevast temperate grassland plain at the heart of the NorthAmerican continent (470,000 km2; Fig. 3).
In the eighteenth century, European adventurers start-ed to explore the region and began setting up fur tradingposts. From the St. Lawrence, Great Lakes and HudsonBay, they crossed almost impassable hurdles of rock andforest to reach the welcoming grasslands and aspengroves of the central continent. These lands offered longrivers and open trails for transport, luxuriant pasture forgame, untouched waters full of waterfowl and lake fish,and unparalleled access to furbearers.
The traders and missionaries, and then surveyors,worked their way westward and southward, toward high-er, drier lands where the aspen thinned and the prairiesshifted to shorter grass species. This was the land of PlainsBison, Elk, Antelope, Wolf and Grizzly, in astonishingnumbers. These became the lands of semi-industrial pem-mican production, and then they became the brightfuture for generations of agricultural immigrants. Morethan 75% of Canada’s cultivated lands occur in Alberta,Saskatchewan and Manitoba, almost entirely in thisregion of original prairies and parklands.
2.1: Geography, Landforms and SoilsThe prairie landscape is bound by the boreal forest to thenorth, tallgrass prairie to the east, central shortgrassprairie to the south, and the Rocky Mountains to thewest. Five major river systems — the Saskatchewan,Missouri, Assiniboine and Red rivers, and Lake Winnipeg– flow through these ecoregions (AAFC 2005) (Fig. 4).The close proximity to the mountains along the westernedge of these ecoregions creates a unique mosaic of habi-tats that sustain terrestrial and aquatic biodiversity (WWF2001).
The prairies and parklands descend more than 700mfrom the high-elevation Rocky Mountain foothills in thewest, over two major bedrock steps (the Prairie and theMissouri Coteaus), to low-elevation, mid-continentlacustrine landscapes in the east. The landforms shapingthe surface of the region are mainly glacial in origin, withthe exception of the higher elevations of the Cypress
SECTION 2.0 Ecological Context
20
The buffalo were the unconscious
caretakers of the grasslands.
They thundered over vast patches
of the landscapes, creating diverse
plant communities according to the
intensity and duration of their
grazing in any given area, as well as
the number of years since their last
visit. For prairie creatures dependent
on a narrow niche — say, short
grasses with little cover and abun-
dant badger and ground-squirrel
holes – the habits of buffalo and the
incidence of fire maintained a
dynamic ecological patchiness that
ensured a fullness of life over the
whole of the prairie world.Trevor Herriot, 2000.River in a Dry Land

A Conservation Blueprint for Canada’s Prairies and Parklands
21
Hills, Milk River Ridge and parts of Montana that lieabove or beyond the maximum extent of the last conti-nental ice sheet. Bedrock exposures exist in some areaswhere glacial deposits have been removed by erosion.
The vast majority of the terrain is poorly drained, relative-ly young glacial till, formed into higher upland moraine.Lowlands with poor natural drainage systems occupy thebottoms of large proglacial lakebeds. These landformsresulted directly from the action of the continentalLaurentide ice sheet, or were created since the retreat ofthat glacier some 12,000 years ago. The predominant,thick, till ground moraines vary from level to hummockyand, depending on rainfall, wetlands fill the small depres-sions among them. In some areas, wind has blown sanddeposits into dunes, while finer sediments or loess formgently undulating landforms.
The major rivers generally follow the valleys eroded by thevast meltwaters of the decaying ice sheet and are general-ly characterized by meanders, oxbow lakes and wide floodplains. Slumping and landslides in river valleys createssmall changes to the local topography resulting in gradi-ents of moisture and light which leads to a diversity ofmicro-habitats that support life on the prairies. Cherno-zemic “black” soils have developed on these landformsand form the highly productive soils so attractive for agri-culture (Geological Survey of Canada 2001).
Figure 4. Major drainage basins of the study area.

2.2: ClimateThe climate across this vast region is fundamentally tiedto its location in the interior of the North American con-tinent. The Rocky Mountains to the west impede themoisture-bearing winds from the Pacific Ocean, but alsofunnel air masses north from the Gulf of Mexico. Coldnorthwestern air masses dominate for most of the year.This results in a continental climate, which is sub-humidto semiarid with short hot summers, long cold winters,low levels of precipitation, and high evaporation (ESWG1995).
In the 1850s, Captain John Palliser travelled throughwhat is now southwest Saskatchewan and southeastAlberta, recording it as the driest region of the prairies,and considered it unfit for agricultural conversion. Thisarea was once referred to as Palliser’s Triangle, where rain-fall was as little as 250mm per year. This water deficitresulted in treeless grasslands, across which strong windsaccelerated the evaporation of any surface waters (ESWG1995). Drought occurs often in the region and varies inextent, intensity and duration. Affects on the biodiversityof the region vary in relation to these three variables.
Elsewhere in the biome, precipitation reaches its high-est levels at 750mm per year towards the north and east(ESWG 1995). Spring is the wettest season.
There are long and cold winters, short and very warmsummers, and regular cyclonic storms moving eastward.Mean winter temperatures range from -12.50C to -80Cand mean summer temperatures average from 140C to160C. Summer extremes of 40°C and winter extremes of-40°C occur. Severe cold in the winter of 1885-86 result-ed in 85% mortality of cattle across large parts of theprairies (Dormaar and Barsh 2000), and particularly deepsnow in southern Alberta in 1882-83 had a similar localresult (Roe 1972).
Dry arctic air predominates in the winter but periodicchinooks (strong, warm and dry westerlies) blow inthrough the Rockies and cause spring-like conditions insouthern Alberta and, to a lesser extent, southwestSaskatchewan. They reduce snow cover and remove mois-ture from an already dry region.
There is consensus that the region is experiencing morerapid climate change than occurred naturally in the past,with attendant increases in mean temperature and weath-er variability, and decreases in precipitation and ground-water (Leavitt and Chen 2001, Schindler 2002, Clark etal. 2002, Schindler and Donahue 2006, etc.) The impli-
cations of rapid climate change for the conservation ofour native biological diversity will become clearer over thenext several decades but it seems likely that a further pre-cautionary consensus will emerge, stating that larger-than-present conservation of landscape-scale blocks ofintact prairie, parkland and valleyland habitat is requiredas a minimum response to this challenge.
2.3: VegetationThe south and west portion of the region is the MixedGrassland, also known as the dry mixed-grass prairie.Here the grasslands are a mix of mid- and short-grasses;the former including Western Porcupine Grass (Stipa cur-tiseta), Northern Wheatgrass or Thickspike (Elymuslanceolatus), Plains Rough Fescue (Festuca hallii, to thewest), Western Wheatgrass (Pascopyrum smithii) andNeedle-and-Thread Grass (Stipa comata), and the latterincluding Blue Grama (Bouteloua gracilis). Sedges (Carexspp.) and Junegrass (Koeleria macrantha) are also part ofthis community, with the latter particularly so on clayeysoils.
Typical forbs of these prairies include the PrairieCrocus (Anemone or Pulsatilla patens), Pussy-toes (Ant-ennaria spp.), Locoweed (Oxytropis spp.), Golden Bean(Thermopsis rhombifolia), Three-flowered Avens (Geumtriflorum), Gaillardia (Gaillardia aristata), Pasture Sage(Artemisia frigida), asters (Aster spp.), and goldenrods(Solidago spp.). Typical low growing shrubs includeWestern Snowberry (Symphoricarpos occidentalis) androse (Rosa spp.) Other shrubs include the Silver Sage-brush (Artemisia cana) and other dry-land, drought-tol-erant shrubs.
To the east, especially on the former bottom ofproglacial Lake Agassiz, mesic tallgrass prairie once dom-inated, before being virtually eliminated. The tallgrassprairie is now thought to have extended westward intoSaskatchewan, based on remnant insect faunas and soils(Hamilton 2005). As a general rule, as one moves northand east through the Moist Mixed Grassland, the fre-quency of taller shrubs increases, such as willows (Salixspp.), Buffaloberry (Shepherdia canadensis), hawthorn(Crataegus spp.), Saskatoon (Amelanchier alnifolia) andChokecherry (Prunus virginiana). Along this same gra-dient of moisture, there is an increase in trees, particular-ly in Trembling Aspen (Populus tremuloides), BalsamPoplar (Populus balsamifera), Eastern Cottonwood
SECTION 2.0 Ecological Context
22

A Conservation Blueprint for Canada’s Prairies and Parklands
23
(Populus deltoides) and Bur Oak (Quercus macrocarpa, tothe east). Typical mid-grasses of the Moist Mixed Grass-land are the Northern and Western Wheatgrass and theWestern Porcupine Grass and Green Needlegrass (Stipa-viridula).
The Cypress Uplands has a mix of grasslands andconifer forest. Logdepole Pine (Pinus contorta var. latifo-lia) is the most common tree, with White Spruce (Piceaglauca) occupying cooler and moister sites. Grasslands ofPlains Rough Fescue, Bluebunch Fescue (Festuca ida-hoensis) and Intermediate Oatgrass (Danthonia interme-dia) can be found here and to the west. A few other“islands” of wooded upland also occur across the biome.These sites can be dominated by deciduous forests(Moose Mountain, Saskatchewan and Turtle Mountain,Manitoba/North Dakota) and by mixed conifer anddeciduous forests (Spruce Woods, Manitoba).
In the northern part of the prairie ecozone grasslands,aspen stands, moist prairies and wetlands co-occur as amixed parkland. This Aspen Parkland is a transitionalecosystem (or ecotone) between the boreal forest to thenorth and the grasslands to the south, and supportsenhanced levels of species diversity in areas of habitatinterspersion. In many areas, aspen will be on the north-facing pitches and moist depressions, with grassland ondrier south-facing slopes and hilltops.
Parkland varies from large grasslands interspersed withsmall aspen stands to dense aspen woodlands with smallgrassland openings. This ecoregion also contains a largenumber of wetlands and their associated species. In theabsence of pre-settlement disturbance regimes, aspenparkland takes over mesic grassland sites. For example,aspen incursion on the parkland region of southcentralAlberta expanded from 5 to 8 percent of total land areabetween 1907 and 1966 (Bailey and Wroe 1974).
The parklands have a rich shrub understorey consistingof species such as Beaked Hazel (Corylus cornuta), rose(Rosa spp.), Saskatoon, Snowberry (Symphoricarposalbus), Pin Cherry (Prunus pensylvanica) and ChokeCherry. The interspersed grasslands include fescue grass-lands, dominated by Plains Rough Fescue, and otherdominants such as Western Porcupine Grass, NorthernWheatgrass, Slender Wheatgrass (Elymus trachycaulus)and Junegrass. Common forbs are the Yarrow (Achilleamillefolium), asters and Prairie Crocus.
2.4: WildlifeThe prairies and parklands support a rich diversity ofwildlife but only a very few areas such as on the foothillfringe at the Waterton front in Alberta and along theboreal-transition fringe near Riding Mountain includeanything like the original guild of wildlife species frompre-settlement times. Even in these areas, wildlife do notoccur in nearly the numbers originally noted by the firstrecorders in the area, whether it be the Bison, Elk, Wolfand Grizzly, or the “infinite” Lake Whitefish. Even thePrairie Dog was “very common” (Macoun 1882). Writingfrom the Milk River area, Anderson, surveyor of the 49thparallel, wrote, We travelled thro’ buffalo for about 3 daysjourney or 75 miles of the Boundary, and they were dottedall over the plain like bushes on a heath. (Anderson 1874)
The speed of change in these wildlife populations wasas dramatic as anywhere on Earth. The landscape has beenchanged so irrevocably by human endeavour that pre-set-tlement landscape conditions will never occur here again,although they may be replicated at limited scales, for a fewbiota.
By 1890, 99% of the wild mammal biomass of theprairie and parkland biome was eliminated (Geist 2007).Plains Bison were extirpated from the wild, as was itsdependent predator, the Buffalo Wolf (Canis lupusnubilis). Pronghorn Antelope retreated to the high plains.Elk, which were second only to Bison in numbers andgrazing impact, are represented by a few remnant herdsrestricted to forested hill country. Moose are nowherenear pre-settlement numbers. Mule Deer declined dra-matically with settlement, replaced by White-tailed Deerthat was new to the region from the east in the 1870s(Halls 1984). Mule Deer numbers have rebounded inAlberta and Saskatchewan, while White-tailed Deerremain plentiful and move ever further northward.
Grizzly Bear ranged across the entire region but nowoccurs only on the Rocky Mountain foothills, with rare,recent eastward occurrences in the Milk River valley.Cougar were extirpated from the parkland but are nowobserved again, rarely, across the region. Historic popula-tions of Marten and Fisher in the parkland fringe, andOtter and Wolverine throughout, were effectively extir-pated from the biome — the first three are now re-estab-lished on the parkland fringes. Swift Fox and Black-foot-ed Ferret were extirpated but are now re-introduced.

SECTION 1 O v e r v i e w
24
“Multitudes of pelican, geese,
ducks, avocets, phalaropes,
water hens, and grebe, besides
innumerable snipe and plover
were everywhere in the marshes
at [Last Mountain Lake]. This
was early in July and experience
tells me that not one-tenth was
then seen of the bird life
assembled in September
and October.”
John Macoun, 1882Manitoba and the Great North-west
The Passenger Pigeon bred in Manitoba and Saskatchewan,and was extinguished. Sandhill Crane, Trumpeter Swan andWhooping Crane were extirpated from the region but per-sisted northward. The first two of these are now re-estab-lished on wetlands of the parkland area. After the demise ofthe Bison, Greater Prairie Chicken moved in briefly, but isnow again no longer in the study area. Sage Grouse andPrairie Dog remain critically threatened.
The prairie and parkland biome remains the most impor-tant North American breeding areas for many waterfowlspecies due the large number of wetlands. The region is alsohome to many temperate grassland bird species that are expe-riencing significant population declines. Significant declinesover a 31-year period include the following: LoggerheadShrike (-10.1% per year), Sprague’s Pipit (-7.1%), HornedLark (-2.2%), Western Meadowlark (-2.0%), Bobolink (-1.7%)and Clay-coloured Sparrow (-1.2%) (Sauer et al. 1997).
Upland grassland birds have experienced the most pro-nounced decline of any birds in Canada (Downes 1994) orNorth America, based on Breeding Bird survey results for theperiod 1966-2004 (Sauer et al. 2005, Peterjohn and Sauer1993). Of 32 species declining across North America over thisperiod, 12 are used as conservation targets in this blueprint(Table 4.1). The average decline of the 12 over that periodwas 2.4% per year (ibid.) The majority of these species areshort-distance, temperate migrants wintering no furthersouth than the southern U.S. and northern Mexico (Blancher2003). The causes of decline are many (McCracken 2005):
Changes in Habitat Supply and QualityObligate grassland species require grassland during migra-tion, breeding and wintering. Across North America, mixedand shortgrass prairie is now at 20-30% of its former range(Gauthier et al. 2003). The area of cultivated grassland (tamepasture) in Canada decreased by 48% from 1951-2001, dur-ing which time the total land under cultivation increased by14% (McCracken 2005). This is a shifting and increasinglynon-native mosaic of native and tame grasslands, haylands andcroplands.
Habitat Fragmentation Range fragmentation affects most aspects of a bird’s life, andgrassland birds vary in their sensitivity to the size of remnantgrassland patches. Even so, grasslands less than 10ha (espe-cially if linear) are of little benefit to grassland species (ibid.)Suggestions about minimum required patch size vary from100ha (Vickery et al. 1994) to 250ha (James 2000) to1000ha (Herkert et al. 2003). In this analysis, grasslandsparcels were not scored for size if they were less than 16ha in
A Conservation Blueprint for Canada’s Prairies and Parklands
25
size or less than 180m wide, and scores increased to a max-imum for patches more than 4096ha (Appendix B).
Natural SuccessionMuch of the prairie biome is witness to unidirectional nat-ural succession to aspen parkland from former open grass-land, reducing the extent of available grassland habitat. Aswell, abandoned farmland can succeed rapidly to shrub andwood.
Overgrazing Intensive grazing results in the decline of grassland speciessuch as Short-eared Owl and Baird’s Sparrow (Bock et al.1993), largely through loss of cover, structure and food,and invasion by exotics.
PredationGrassland birds nest on the ground, with a few exceptions(Swainson’s Hawk), and mammalian nest predators likeRaccoon and Red Fox are increasing. Ground nesters arealso impacted by haying too early, farm equipment, andfarm chemicals (McCracken 2005). Both grassland andwoodland ground nesters are declining disproportionately.
Change in Food SupplyPre-settlement grasslands were rich insect ecosystems, andmost grassland birds depend on insects during the breed-ing season. Agricultural practices have decreased insectnumbers (Bird 1961). Small mammals have also declinedand with them, Burrowing Owl and Northern Harrier.
ToxinsAgricultural pesticides are believed to have had widespreadimpacts, though incompletely understood or documented(McCracken 2005).
McCracken (2005) notes: No single management approachor conservation solution will benefit the entire suite ofgrassland bird species across large geographic regions.However, he notes:■ Large habitat patches should be created or restored;■ Hay cutting should occur only after fledging, and hay
should be regularly cut to prevent encroachment bywoody plants;
■ Crop residue should be kept on soil surfaces to sup-port invertebrates and provide cover; and
■ The frequency and types of field operations thatimpact nests and birds should be minimized.
2.5 Threats to Biological DiversityIn 1999, Thorpe and Godwin described the major threatsto Saskatchewan’s biodiversity as 1) habitat loss and alter-ation; 2) fragmentation; 3) exotic invasives; 4) pollution; 5)over harvesting; and 6) loss of genetic diversity. In thisanalysis, threats like habitat fragmentation and isolationcould be considered at broad scales but data on the otherthreats were not available at scales permitting region-widecomparisons.
Over the last century, at least 70-75% of the landscapewas converted from its native state to support agriculture(Gauthier and Wiken 2003), with agriculture of one kindor another now on well over 90% of the landbase. Theremaining parcels of native habitat lie scattered in a sea ofagriculture, with the largest intact areas in southeastAlberta and southwest Saskatchewan, and along majorrivers.
The loss of connectivity between different ecological sys-tems can affect organisms that have lower mobility andlocal dispersal mechanisms, and can lead to higher rates ofpredation (Wiens 1994, With and Crist 1995). Basically,areas with low capability for cropping (i.e., poor agricul-tural soils) have more intact native cover, while areas withricher soils have been converted to cropland. Also impact-ing these habitats are agricultural practices such as over-grazing, early season haying (i.e., during the peak breedingseason of nesting birds), and improper livestock waste man-agement.
A major regional land use is the extraction of oil, natu-ral gas, coal and potash. These land uses occur in all soiltypes, with much of the current activity in the larger intacthabitats of the Mixed Grassland ecoregion (Ricketts andImhoff 2003). The extent of these activities is much lessthan agriculture but they have significant effects on someof the native species of these ecoregions, especially throughlinear development like roads and pipelines.

Another major land use is urban, residential and infra-structure development. Around Calgary and Edmonton,the two largest cities in these ecoregions, urban expansionand exurban cottage and rural development are growingthreats to the native landscape. “Second home” develop-ment can be observed throughout the ecoregion.Development is occurring in many of the remainingnative ecosystem dominated landscapes (e.g., the foothillsof Alberta and the Qu’Appelle Valley, Saskatchewan). Pri-marily rugged topography and limited agricultural poten-tial have allowed some native cover to persist to date(Ricketts and Imhoff, 2003). In this case, the factors thatmake this land unsuitable for agriculture are the same fac-tors that put the land at risk of development. Along withcottage and housing development, inappropriate recre-ational use (e.g., off-road vehicles vehicles in sensitiveenvironments) threaten the habitats of species at risk andother conservation targets that live in these sensitive envi-ronments.
There are clear patterns among the remaining largeparcels of natural habitat. River valley slopes have notbeen conducive to either cropping or grazing, althoughconsiderable grazing occurs on many valley slopes. Rivervalley bottomlands that are wide and well-soiled havebeen largely converted to cropland, while narrower bot-tomlands and bottomlands with poor soils have not.These valleys, especially where water access is possible(including dammed waters) are attractive for recreationalsecond homes, which can in turn constrain further agri-cultural land conversion in these areas.
Other landforms with steep slopes and light or rockysoils, such as badlands, sand-hill areas, moraines anduplands, also have higher percentages of remaining natu-ral habitat, and less likelihood of land conversion.Wetlands have not discouraged land conversion in manyareas where drainage, ditching and tiling have beenapplied since settlement. However, overall, the speed ofwetland conversion is now slowing, as the ecological andwildlife values of wetlands are better understood by farm-ers. Meanwhile, farm-gate prices continue to decline, alsodiscouraging further land conversion.
The ecological functions of the landscape are importantto the long-term survival of many of the conservation tar-gets on the prairies. At broad scales, some ecological func-tions are closely tied to the size, position, connectivity andcondition of remaining natural habitats on the landscape.
Other functions, such as the pre-settlement disturbanceregimes of fire, grazing, and flooding have been foreveraltered by humans, with significant impacts on biodiversi-ty (Thorpe and Godwin 1999). Draining and filling wet-lands to increase crop production has altered local andregional hydrology, and consequences for biodiversity(positive and negative) are inevitable.
Finally, human-induced climate change is alteringdrought cycles (Clark et al. 2002) and is predicted tocause clinal shifts in weather patterns and climate (Thorpeand Godwin 1999), and on vegetation (Henderson et al.2003). These factors are likely to have long-term effectson biological diversity.
One of the more inexorable threats to native ecosys-tems is exotic invasive species. A few of the plants and ani-mals that have not evolved in the prairie environment areguaranteed to ‘out-compete’ the native species. Non-native invasives such as Smooth Brome (Bromus inermus)and Crested Wheatgrass (Agropyron cristatum) weredeliberately introduced to tame forace to address the lossof organic matter in cultivated soils and to increase pro-ductivity (Coupland 1977). Particularly virulent but moreaccidental noxious weeds include Leafy Spurge (Eup-horbia esula), Yellow Toadflax (Linaria vulgaris), DownyBrome (Bromus tectorum), and Purple Loosestrife (Lyth-rum salicaria).
2.6: Ecological History of the Region and its Implications for ConservationThe occupation and conversion of this region exceededmany of the ecological thresholds necessary to sustain theoriginal native species and ecosystems of the region. Thishas been clear for many years even if seldom stated, andprairie rehabilitation programs, prairie conservation pro-grams, and wetland and waterfowl conservation programshave been working for decades to sustain and restore thespecies and ecosystems of the region. History is notdeterminism, however, and new and better approaches arebeing applied to the conservation of prairie and parklandlandscapes — that can shape a new and restored landscapegoing forward.
SECTION 2.0 Ecological Context
26
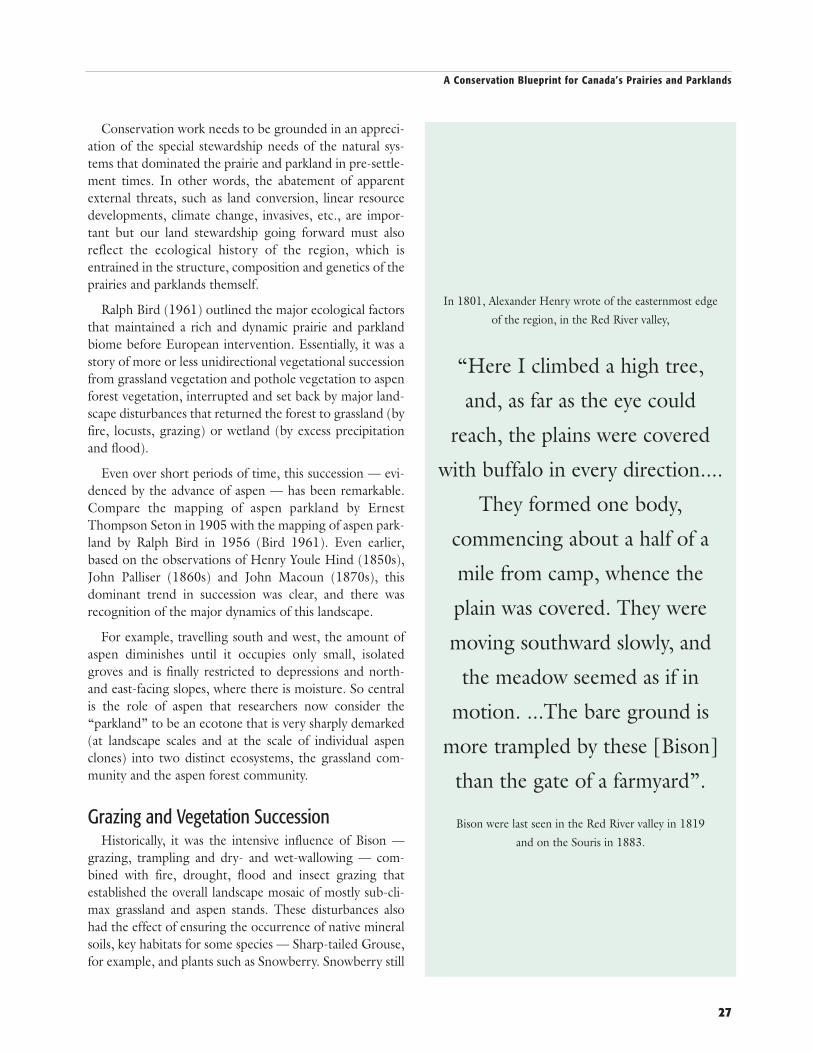
Conservation work needs to be grounded in an appreci-ation of the special stewardship needs of the natural sys-tems that dominated the prairie and parkland in pre-settle-ment times. In other words, the abatement of apparentexternal threats, such as land conversion, linear resourcedevelopments, climate change, invasives, etc., are impor-tant but our land stewardship going forward must alsoreflect the ecological history of the region, which isentrained in the structure, composition and genetics of theprairies and parklands themself.
Ralph Bird (1961) outlined the major ecological factorsthat maintained a rich and dynamic prairie and parklandbiome before European intervention. Essentially, it was astory of more or less unidirectional vegetational successionfrom grassland vegetation and pothole vegetation to aspenforest vegetation, interrupted and set back by major land-scape disturbances that returned the forest to grassland (byfire, locusts, grazing) or wetland (by excess precipitationand flood).
Even over short periods of time, this succession — evi-denced by the advance of aspen — has been remarkable.Compare the mapping of aspen parkland by ErnestThompson Seton in 1905 with the mapping of aspen park-land by Ralph Bird in 1956 (Bird 1961). Even earlier,based on the observations of Henry Youle Hind (1850s),John Palliser (1860s) and John Macoun (1870s), thisdominant trend in succession was clear, and there wasrecognition of the major dynamics of this landscape.
For example, travelling south and west, the amount ofaspen diminishes until it occupies only small, isolatedgroves and is finally restricted to depressions and north-and east-facing slopes, where there is moisture. So centralis the role of aspen that researchers now consider the“parkland” to be an ecotone that is very sharply demarked(at landscape scales and at the scale of individual aspenclones) into two distinct ecosystems, the grassland com-munity and the aspen forest community.
Grazing and Vegetation SuccessionHistorically, it was the intensive influence of Bison —
grazing, trampling and dry- and wet-wallowing — com-bined with fire, drought, flood and insect grazing thatestablished the overall landscape mosaic of mostly sub-cli-max grassland and aspen stands. These disturbances alsohad the effect of ensuring the occurrence of native mineralsoils, key habitats for some species — Sharp-tailed Grouse,for example, and plants such as Snowberry. Snowberry still
A Conservation Blueprint for Canada’s Prairies and Parklands
27
In 1801, Alexander Henry wrote of the easternmost edge
of the region, in the Red River valley,
“Here I climbed a high tree,
and, as far as the eye could
reach, the plains were covered
with buffalo in every direction....
They formed one body,
commencing about a half of a
mile from camp, whence the
plain was covered. They were
moving southward slowly, and
the meadow seemed as if in
motion. ...The bare ground is
more trampled by these [Bison]
than the gate of a farmyard”.
Bison were last seen in the Red River valley in 1819
and on the Souris in 1883.

responds positively to heavy overgrazing, but now byCattle instead of Bison. Such open mineral soils were alsorevealed by Richardson’s Ground Squirrel, PocketGopher, Badger, Fox and canids.
Bison, Elk and Antelope once occurred in large num-bers throughout the prairies and parklands. Bison impact-ed areas in different ways, based on the movements oflarge herds. Grazing, trampling and wallows, combinedwith relatively stable Bison harvesting by aboriginals,tended to keep the landscape’s vegetation in a relativelyconstant sub-climax state even though local areas mayhave either reached climax aspen forest or remained openmineral or wetland (Bird 1961). Locally, it was notedthat, over large areas, Buffalo had destroyed all the grassand our horses are starving…the vast quantity of dunggives this place the appearance of a cattle yard. (AlexanderHenry, in Coues 1897)
Also from Henry, a comment on grazing by Elk —Very numerous here not long ago, as the tops of the oak …are all broken and twisted.
Without such grazing, a rapid build up of organicdebris and woody vegetation ensues. This in turn increas-es the severity of fires that can occur, with higher tem-peratures having greater likelihood of setting back theprairie-to-aspen succession for a longer period.
Fire and DroughtThe limits of the wooded country are becoming less year byyear, and from the almost universal prevalence of smallaspen woods it appears that in former times the woodedcountry extended [south] beyond the Qu’Appelle, or three orfour degrees of latitude south of its present limits.(Hind 1860)
Fires, both natural and human in origin, raged in dryperiods, particularly where moist years and a lack of dis-turbance had resulted in heavy fuel loadings. They wereso frequent that they were seen as the cause of the lack ofaspen south of the Qu’Appelle and Assiniboine, If a por-tion of prairie escapes fire for two or three years the result isseen in the growth of willows and aspens, first in patches,then in large areas, which in a short time become unitedand cover the country; thus retarding evaporation and per-mitting the accumulation of vegetable matter in the soil. Afire comes, destroys the young forest growth and establishes aprairie once more. The extension of the prairie is evidentlydue to fires, and the fires are caused by Indians, chiefly for
the purposes of telegraphic communication, or to divert buf-falo from the course them may be taking. …From…theSouth Branch of the Saskatchewan to Red River all theprairies were burned last autumn, a vast conflagrationextending from one thousand miles in length and severalhundreds in breadth. The dry season had so withered thegrass that whole country of the Saskatchewan was in flame(Hind 1860). Having frequently passed from south tonorth on the great prairie, I came to the conclusion that theprairie fires explained the absence of wood (Macoun 1882).Particular note was taken of the disastrous and wide-spread fires in the eastern part of the study area in 1803and 1804 (Henry, in Coues 1897) and in 1879 (Macoun1882), and of major droughts periodically and sub-regionally, such as in central Saskatchewan in 1897 and1938 (Bird 1961), and across the region in the 1860s and1870s.
During the past 125 years, the frequency and extent ofgrassland fire has dramatically declined as a result of thesystematic heavy grazing by large herds of domestic cattleand sheep which reduced the available levels of fine fuel andorganized fire suppression efforts that succeeded in alteringthe natural fire regime. Wild fires resulting from naturalignition sources such as lightning influenced grasslandslong before the arrival of humans. Native Americans laterdiscovered that burning existing vegetation was one of theeasiest methods for effectively modifying their environmentand ignited fires for a variety of reasons, including hunt-ing, habitat improvement, crop harvesting, pest reduction,warfare and clearing areas for home sites, crops and trav-el. The use of fire was so widespread in aboriginal culturesthat treeless grassland are thought to be a product of repeat-ed burning by these people. (Brockway et al. 2002)
Drought in 1914 resulted in almost complete crop fail-ure in many parts of Saskatchewan and Alberta, followedby plant rust in 1916 and a major regional drought from1917 to 1921 (Gilson 1977). The rust-resistant Red Fifeand Marquis wheats were key to the persistence of grainfarming through to the 1930s, when even worse droughtoccurred. In 1936, in southern Alberta, the C.P.R. usedsnowplows to clear the tracks of soil drifts ten feethigh…Administration set the disaster area at over 60 mil-lion acres, of which 45 million acres were once prosperousand occupied farm land…The year 1938 began with rainand considerable promise… Then came hail, rust andgrasshoppers… The worst grasshopper blizzard within thememory of man hit Regina on August 11. (Gray 1966)
SECTION 2.0 Ecological Context
28
Locusts and Other InsectsPlagues of the leaf-eating Rocky Mountain Locust(Melanoplus spretus) occurred periodically for centuries,and there are ancient strata of these locusts in glaciersalong the eastern Rocky Mountains (Bird 1961). Theydescended on the region in 1818 when they destroyed near-ly everything (Hind 1860; Macoun 1882). In 1858, Hindrecorded (1860), On the second of July we observed thegrasshoppers in full flight towards the north, the air as faras the eye could penetrate appeared to be filled with them.On subsequent days when crossing the great prairie from[Antler River] to Fort Ellice, the hosts of grasshoppers werebeyond all calculation; they appeared to be infinite in num-ber. …Those portions of the prairie which had been visited bythe grasshoppers wore a curious appearance: the grass wascut uniformly to one inch from the ground, and the wholesurface was covered with the small, round, green [feces] ofthese destructive invaders.
Coincident with the dry period in the 1860s and 1870swas another prolonged outbreak of the same locust in1857-1876. The last flight north of the 49th parallel wasinto Manitoba in 1901-02, when the last specimens of thisnow extinct species were collected. A co-dependence withBison herds may have doomed them; grazing, tramplingand dust wallows created favourable egg-laying sites (Bird1961).
In the 1920s, the sheer biomass of other insects inprairie and parkland situations remained high (peaks of6,000,000 per acre; Bird 1961), and many of thesebecame major agricultural pests, since then increasinglycontrolled by pesticides. For example, outbreaks of otherMelanoplus spp. occurred in 1898-1903, 1911-1912,1919-1923 and 1938.
Floods and Wet PeriodsFloods in the Red River and Assiniboine basins wererecorded early and often, in 1776, 1790 and 1809 (Hind,1860), and 1826 and 1852 (ibid.; Macoun 1882). In1852, the Indians represent the Qu’Appelle as filled with amighty river throughout its entire length, flowing with aswift current from the lakelets at the Height of Land …to theAssiniboine, and as a mountain torrent through the shortdistance of 12 miles, which separated this from the SouthBranch of the Saskatchewan (Hind 1860). Another majorwet period occurred through the 1880s and 1890s.Settlement itself was compromised by these floods.
Wet periods check fires and enable aspen and shrub toadvance. Floods can be widespread or local, and wetlandsfill up and dry out on cyclical patterns. Lakes and potholesin the region contain water ranging from fresh to alkaline.Alkaline sloughs have few if any willows or aspen aroundthem, while freshwater sloughs can be crowded aroundwith willows and aspen. High waters shift the distinctivepothole-ring succession outward, knocking back willowand aspen, and ‘freshen’ the waters. Long dry periodshave the opposite effect, and make pothole waters morealkaline through capillary evapotranspiration of subsur-face salts (Walker and Coupland 1968).
InvasivesInvasive non-native species have had a defining influenceon the ecology of the prairies and parklands. Some of thefirst invasives had immense impacts on the First Nationsof the region. Smallpox repeatedly and totally devastatedthe aboriginal population of the region, such as in 1738-39, 1781-82, 1836-38 and 1870-71 (Roe 1972, and oth-ers). Horses were the transformative factor in wildlife har-vesting and transportation. (The first horses in the studyarea were brought from the south to LaVerendrye’s fortnear Portage la Prairie in 1741; Kavanagh 1968). Latercame the outright domestication of the entire biome withEurasian — and a few domesticated North American —species.
A Conservation Blueprint for Canada’s Prairies and Parklands
29
The present occurrence, distribution and patterns ofremnant natural habitats across the region have theirorigins in the original pre-settlement landscape, itswildlife and its disturbance regimes. The result was adynamic and variable landscape based on sub-climaxvegetation ecosystems heavily harvested and impactedby major landscape stressors. Two conservation chal-lenges that arise are:
1) What influence should such factors have on theselection of natural areas for conservation?
2) What influence should such factors have on the successful, long-term stewardship of conservedareas?

2.7: Selection of Natural AreasDisturbance regimes at the scales noted above will notoccur again except to the degree that land conservationand stewardship can approximate those regimes. A num-ber of relatively large natural-cover landscapes remainacross the region, some the result of past conservation andsome inviting future conservation, at scales appropriate totheir ecosystems, ecological functions and original distur-bance regimes.
While conservation of some lands and waters may beappropriate at the scale of individual species or natural fea-tures, prairie conservation research has long determinedthat volumetric approaches, at scale, are critical to long-term conservation. The best example of this has been thelong-standing and successful conservation and restorationof wetlands and waterfowl habitat across the region(Riemer et al. 1995). This work has penetrated every partof the study area, and has made measurable difference tothe conservation of target species and habitats.
The past ecological history of the region supports theview that this patient, long-term, volumetric conservationof prairie and parkland habitats needs to occur, with afocus on the identification of major opportunity areas withcoincident values: 1) areas of high overall natural cover; 2) areas of natural cover of better-than-average condition;3) areas encompassing the full range of representative veg-etation-landform types (ecological system types); and 4) areas supporting both common and rare biodiversitytargets (species and ecological systems).
The Conservation Blueprint project is an attempt toorchestrate data in support of assessing these kinds of areasin a standard manner across the whole prairie and parklandbiome. The results and maps illustrate the project.However, there are elements of conservation planning onreal landscapes that are not amenable to computer-basedGIS solutions, due to difficulty in discriminating pattern,condition and diversity on the landscape. NCC recom-mends in its approach to conservation planning that theraw materials resulting from the blueprint analysis bereviewed by individuals and groups knowledgeable aboutparticular ecodistricts or sub-regions. These individuals areencouraged to review the data and identify conservationaction areas, or functional landscape sites that are the bestprospects for re-establishing large, connected prairie andparkland landscapes.
SECTION 2.0 Ecological Context
30
“…Much depends on the
scale of what we are prepared
to call ‘land of the father’.
Is it 160 acres square or is it a
stretch of river valley, a range of
hills, or a watershed?
The flaw in our settler vision of
philopatry is that we have been
trying to impose a model of site
tenacity that comes from
another continent, that does not
shape human culture against the
demands and limitations of
the local ecology.” Trevor Herriot, 2000River in a Dry Land

On landbases that range upwards of 75% cultivatedcropland, the re-establishment of natural cover betweenremnant native tracts may be necessary to the success ofsome conservation projects. NCC’s goals in such situa-tions are to either restore or replace functioning ecosys-tems. Replacement (or remediation) entails the re-estab-lishment of functioning but largely non-native systemsthat fall within the existing land uses or character of anarea but are, for various reasons, not the historic nativeecosystems of an area. Establishing tame forage wherecultivation is the current practice is one example.
Restoration is preferred but difficult, and includesefforts to repair or re-establish the structure, function,diversity and dynamics of a particular native ecosystem.NCC’s efforts at prairie re-establishment at Old Man onHis Back in Saskatchewan and the Tallgrass Prairie inManitoba are examples of restoration efforts.
Success in conservation on the prairies and parklandswill be measured using two types of metrics:
1) Quantitative metrics (area conserved, size of popula-tions, connectivity of conserved lands); and
2) Qualitative metrics (species occurrences, habitat-typeoccurrences, range condition, riparian health, newspecies, re-introduced species, invasive species). Thesetwo measures are central to both site securement andsite stewardship.
2.8: Stewardship of LandsThe management of grassland reserves requires careful con-sideration. …The role of fire, artificial clipping and otherfactors must also be considered in grassland reserves.[However] the essential thing for the main reserves is toavoid overgrazing — either cumulative or during severedrought periods-— which would appreciably alter the virgincharacter of the grassland. The prime essential is…to ensurethat grassland reserves will not be upset or materiallyaltered at any time in the future. Once such reserves aredestroyed or damaged they can probably never be restoredand may not be replaced elsewhere. (Coupland 1950)
It is not easy to manage an area and preserve it in anundisturbed, primitive condition. Fires, grazing and dis-turbance by dominant animals are a part of the environ-ment. Removal of any of these factors upsets the natural bal-ance. (Bird 1961)
A great deal had now been learned about prairie stew-ardship but the basic challenge remains; how to use dis-turbance regimes to maintain sub-climax vegetation suc-cession, and how to avoid heavy, long-term overgrazingthat sets back succession too drastically.
In the first instance, experimental design has advancedsignificantly, so as to avoid over-burning for example.However, burning can have real impacts on rare insectspecies that are remnant in small tracts and as a result areless able to re-establish after fire. A range of burning datesand frequencies should be reintroduced or maintained infescue prairie to create a mosaic of plant communities invarious stages of recovery after burning. A mosaic willincrease the structural and compositional diversity in rem-nant fescue prairies. (Gross 2005) The “rests” betweendisturbances — and their duration and timing — can beas important as disturbance itself.
In the second instance, over-grazing can result in aseverely reduced prospect for recovery of original condi-tions due to the absence of sufficient proximal seedsources on highly fragmented landscapes. A mosaic ofgrazing regimes across a landscape is more desirable thanuniform grazing. A mosaic of heavy to light grazingregimes will best provide the vegetative composition andstructure that can serve diverse wildlife populations.
NCC is experimenting with both burn regimes andgrazing regimes in tallgrass prairie in Manitoba, and needsadditional experience and expertise to apply such toolselsewhere. It is critical to consider the extreme variabilityof pre-settlement disturbance regimes across the region.Studies are confirming practical experience: Lower speciesdiversity was found in undisturbed and lightly grazed aswell as in highly disturbed plot. Intermediate levels of dis-turbance had reduced dominance of [fescue] and increasedabundance of most other species; this gave the highest speciesdiversity. (Vujnovic et al. 2002)
We gave this little tributary of the South Saskatchewanthe name Sage Creek. Although the country throughout wasarid and sterile, still muddy swamps very frequently occur,in which are to be found fowl in great abundance. Buffalowere also here in great numbers, as well as their constantattendants the wolves, ever ready to attack a worn-out orwounded straggler, or some stray calf. The grass in this aridsoil, always so scanty, was now actually swept away by thebuffalo, who, assisted by the locusts, had left the country asbare as if it had been overrun by fire; even at the edge of SageCreek we could obtain but very little grass for our horses.(Palliser 1862)
A Conservation Blueprint for Canada’s Prairies and Parklands
31

2.9: Summary■ The history of wildlife removal from this biome is
unparalleled among world grasslands. That historyincluded the virtual elimination of the once spectacular-ly abundant Plains Bison, Elk and Pronghorn Antelopefrom the biome, and the extinction of the Buffalo Wolf,Plains Grizzly, Passenger Pigeon and Rocky MountainGrasshopper from the region. Each of these was anecologically significant species.
■ The biome’s historic ecology was based on extreme dis-turbance regimes of heavy grazing, fire, drought, floodand insect infestations. Rapid agricultural conversionand stabilization established an alternate grassland ecol-ogy and economy, based on non-native species, newmaterial and energy inputs, and controlled disturbanceregimes.
■ The history of land conversion over the past 125 yearsis also unparalleled among world grasslands, resultingin more than 65% land conversion to agricultural crop-land and grazing of the remainder by non-native ungu-lates. The vast majority of this conversion was complet-ed from 1880 to 1935, at which time the mid-1930sdrought taught some strict lessons about land steward-ship. Communal pastures were established as an eco-logically sustainable approach to grazing, which hashelped support conservation of native grassland atscales appropriate for wide-ranging species and ecologi-cal processes operating at landscape scales. As well, landretirement and land conservation have become impor-tant tools in re-distributing crop agriculture to appro-priate agricultural soils.
■ The region witnessed an early and strong implementa-tion of wildlife conservation regulations and wildliferestoration efforts by government agencies, primarily toprevent imminent regional extirpations. This work con-tinues through Canada’s most successful wetland andwaterfowl conservation venture, the Prairie HabitatJoint Venture (PHJV), which is expanding its intereststo all birds and to upland habitats. The PHJV has alsoengaged private landowners and organizations farbeyond the original public-sector focus the region.
SECTION 2.0 Ecological Context
32
Within one human lifetime,
the prairies have passed from
wilderness to become the most
altered habitat in this country
and one of the most disturbed,
ecologically simplified and
overexploited regions
in the world.Adrian Forsyth. 1983. The End of Emptiness

■ Significant threats remain. Farm-gate prices continueto be a major determinant of the intensity of agricul-tural pressure on the land base. This, and the impactsof drought, groundwater depletion, climate changeand inadvertent misadventures in trade or farm prac-tice, will inevitably continue to affect the ecology andeconomy of the region.
■ There is consensus that the region is experiencingmore rapid climate change than occurred naturally inthe past, with attendant increases in mean tempera-ture and weather variability, and with decreases inprecipitation and groundwater availability. The impactof this on biodiversity will become clearer over time,but it seems likely that a further precautionary con-sensus will emerge, stating that larger-than-presentconservation of landscape-scale blocks of intactprairie, parkland and valleyland habitat is required as a minimum response to challenge.
■ There have been good efforts at whole-biome con-servation planning in Canada, such as the PHJV, thePrairie Conservation Action Plan and the EndangeredSpaces Campaign of World Wildlife Fund (Canada)(Hummel 1989, 1995). Even public agencies areorganized on appropriate regional lines, such as theCanadian Wildlife Service. There are internationaltrans-boundary assessments of the importance of thebiome. All these efforts repeatedly describe the sameshortfall in efforts across the biome, for example, toidentify and conserve the lands having the highestand best land use as conserved lands. This is especiallyurgent on a landscape with so few conserved lands(maximum 9.0%), which is already reduced to 34%natural cover overall.
■ The Commission for Environmental Cooperationidentified key needs in its North American grasslandconservation strategy:• To complete identification, understanding and
representation of biodiversity;• To identify target species, high value habitats and
natural corridors for wildlife; and• To determine the biotic and abiotic requirements
of native prairie species and communities (Gauthier et al. 2003).
To which it is critical to add:To identify, conserve and restore the lands and watersneeded for all the elements of native biological diversityto persist at viable scales and population levels across theentire biome.
■ This conservation blueprint contributes to a betterdocumentation of the biological diversity of the fourecoregions comprising the prairie and parklandbiome. The project has worked across three prov-inces, two states and two countries. It documentsexisting conservation efforts, the biodiversity of theregion (target species and all ecological systems),minimum conservation goals to be met to sustain thatbiodiversity, and the places that best meet those goals.
■ This atlas and analysis of the biological diversity ofthe Canadian prairies and parklands is offered as acontribution to a shared understanding of the conser-vation geography of the region, to help frame theidentification of a suite of core biodiversity con-servation areas, set within the supporting networkof remaining natural cover. Individuals, agencies,conservation practitioners and others may find thedata useful, along with other data, in determining theset of priority landscapes that should be the focus ofconservation efforts.
■ Data such as these can also be used to inform thekind of long-term stewardship needed for conservedprairie and parkland landscapes, whether through pas-sive management or the emulation of disturbanceregimes that is needed to maintain natural diversityand particular species and ecosystems. Successful con-servation strategies will work to entrench a viable bal-ance between conserved natural cover and converted,developed lands.
A Conservation Blueprint for Canada’s Prairies and Parklands
33

SECTION 3.0 Protected Areas and Conservation Lands
34
SECTION 3.0
Protected Areas and Conservation Lands
The blueprint project has deliberately included as many potential conservation-related lands as possible.
Some may argue that provincial parks whose primary objective is recreation but permit resource
extraction should not be included, or that some public lands that have been included as conservation lands
may treat conservation as secondary to grazing. Some would argue that there are no true wilderness areas
remaining in these ecoregions. In a landscape as highly altered as this, nearly the entire landscape
is under some form of management and, yet, conservation is progressing.

A Conservation Blueprint for Canada’s Prairies and Parklands
35
There is digital mapping for most but not all types of pro-tected areas and conservation lands in the prairie andparkland region. This project distinguishes between pro-tected areas and conservation lands. Regulated protectedareas have biodiversity conservation as their overt man-date but this study also includes less formal conservationlands that also significantly contribute to biodiversity con-servation.
The protected areas (PA) and conservation lands (CL)are under two main types of tenure; private (freehold,deeded) and public (Crown, State, federal). Only publicPA and CL were considered in this study. Table 3.1 sum-marizes this land tenure of each ecoregion. Table 3.2 liststhe protected areas and conservation lands that wereincluded in this project, and indicates their ownership.79% of the lands and waters of these ecoregions are pri-vately owned and managed. About 2.0% of the study areais protected area and about 5.2% conservation land.
The Aspen Parkland and Moist Mixed Grassland arepredominantly privately owned and managed (87% and83% respectively). Of the total land base of each of theseecoregions 4.2% is regulated public protected area orother conservation land. The Mixed Grassland andCypress Upland have fewer private lands (66% and 52%respectively). In the Mixed Grassland, 12.1% of the totalland base is protected area or conservation land, and inthe Cypress Upland the extent is 14.9%. These are mod-est levels of land conservation. The portion of the BorealTransition included in this study 52% public land, andmore than 43% is protected area (Riding Mountain Park).
The great bulk of native grasslands in central NorthAmerica (about 85%) occur in the United States but pro-tected grasslands are reported to be as low as 1.61% of theU.S. portion of the biome (CEC and TNC 2005). TheCanadian prairie and parkland biome represents 16% ofthe overall North American biome, and past estimates ofprotected areas in the Canadian portion have varied from3.5% (Gauthier and Wiken 2001) to 14.95% (CEC andTNC 2005). The Strategic Plan for North AmericanCooperation in the Conservation of Biodiversity (ibid.)identifies 55 grassland priority conservation areas(GPCAs), 15 in Canada, for a total of 11.7% of entire areaof the Canadian prairie and parkland biome. Perhaps 2/3of the lands in these GPCAs remains in native grassland,in which case these GPCAs cover about 4% of remainingCanadian native prairies and parklands.
3.1: Federal Lands3.1.1 CanadaSome federal lands in Canada have wildlife conservationand ecological integrity as required elements of their man-agement (Table 3.2). These protected areas includenational parks (12.7% of total PA/CL lands), nationalwildlife areas (1.4%) and migratory bird sanctuaries(1.5%). Other federal lands, such as federal pastures, aremanaged for agriculture (livestock grazing) and withproper management provide significant habitat forwildlife. These are treated as conservation lands in thisstudy, and make up 24.2% of total PA/CL lands inCanada. In this analysis, federal Department of Defencelands are also treated as conservation lands (9.3% of totalPA/CL lands). These areas are often located on non-arable lands including rare habitats (e.g., sand dunes) andpopulations of rare species. First Nations lands, compris-ing 2.3% of the study area, were not identified as eitherprotected areas or other conservation lands because oflack of data, despite their likelihood of containing areas ofboth.
These lands are categorized by International Union forConservation of Nature (IUCN) and Gap Analysis Pro-gram (GAP) status (Table 3.2):
■ IUCN classes of protected areas, i.e., area of landand/or sea especially dedicated to the protection andmaintenance of biological diversity…and managedthrough legal or other effective means;
■ GAP status, i.e., areas identified to provide an assess-ment of the management status for certain elementsof biodiversity (vegetation communities and animalspecies etc.
3.1.2 United StatesFederal lands are classified based on their management,
which determines their GAP code and therefore theirimportance to conserving biodiversity (see glossary forGAP codes). Table 3.2 lists the federal lands included inthe study in the Montana and North Dakota portions ofthe study area. The most significant of these lands are theNational Wildlife Refuges (22.1% of total PA/CL area inU.S.), followed by Bureau of Land Management holdings(6.2%).

Table 3.1. Summary of land tenure and protected areas (PA) and other conservation lands (CL) in each ecoregion
Ecoregion Public/Crown Private Regulated Other Lands and Major Lands Protected Conservation Water Bodies Areas (PA) Lands (CL)
Aspen Parkland 13% 87% 1.5% 2.7%Moist Mixed Grassland 17% 83% 0.8% 3.4%Mixed Grassland 34% 66% 1.5% 10.6%Cypress Upland 48% 52% 4.7% 10.2%Portion of Boreal Transition 52% 48% 43.7% 0.1%
Total 21% 79% 2.0% 5.2%
Table 3.2. Protected areas (PA) and conservation lands (CL) according to type and area, included in study
Type of Protected Area (PA) PA or CL IUCN GAP Area (ha) % of total % ofother Conservation Land (CL) Code Code PA/CL land base
by country
CANADADepartment of National Defence (F)* CL n/a 3 309,352 9.33% 0.6%Ecological Reserve (F, AB) PA I 1 10,557 0.32% 0.0%Fish and Wildlife Development Lands (SK) PA IV 2 50,176 1.51% 0.1%Heritage Rangelands (AB) PA VI 2 1,123 0.03% 0.0%Migratory Bird Sanctuary (F) PA IV 2 50,037 1.51% 0.1%National Park (F) PA II 1 419,721 12.66% 0.9%National Wildlife Area (F) PA IV 2 45,258 1.37% 0.1%Natural Area (AB) PA II 1 93,641 2.82% 0.2%Park Reserve (MB) PA II 1 132 0.00% 0.0%Agriculture and Agri-Food Canada – Federal Community Pasture (F) CL n/a 3 802,550 24.21% 1.7%Provincial Community Pasture (AB, SK, MB) CL 223,750 6.75% 0.5%Provincial Park (AB incl. Wildland Park, SK, MB incl. Heritage Park) PA/CL II,IV 1,2 169,777 5.12% 0.3%Provincial Recreation Area (AB, SK) CL 15,480 0.47% 0.0%Wildlife Habitat Protection Act protecting (SK) –
(Crown agriculture-lease lands) CL/PA n/a/,VI 2,3 1,058,225 31.92% 2.2%Wildlife Management Area (MB) PA 65,676 1.98% 0.1%
UNITED STATESArea of Critical Environmental Concern (F, in MT) PA III 1 & 2 3,368 2.3% 0.0%BLM Holding (F, in MT) CL VI 3 9,200 6.2% 0.0%Large park (city, cy. or private) (ND) PA VI 2 95 0.1% 0.0%National Forest (F, in MT) CL VI 3 1,171 0.8% 0.0%National Outstanding Natural Area (F, in MT) PA VI 1 2 0.0% 0.0%National Wildlife Refuge (F, in MT, ND) PA IV 1,2 32,585 22.1% 0.1%Power Withdrawal (F, in MT) CL n/a 3 251 0.2% 0.0%Research Natural Area (F, in MT) PA I 1 3 0.0% 0.0%Wilderness Study Area (F, in MT) PA II 2 63 0.0% 0.0%Military Reservation (F, in MT, ND) CL n/a 3 1,973 1.3% 0.0%Misc Federal Reservation (F, in ND) PA II 1 351 0.2% 0.0%NWR, WMA, Game Preserve/Fish Hatchery (F, in ND) CL n/a 3 5,582 3.8% 0.0%State Forest (ND) CL VI 3 4,797 3.2% 0.0%State Lands (MT) CL n/a 3 74,117 50.2% 0.2%State Park (MT, ND) PA II 2 452 0.3% 0.0%State Wildlife Refuge, Wildlife Management Area Game
Preserve or Fish Hatchery (ND) CL n/a 3 3,183 2.2% 0.0%Wildlife Management Area (MT) PA VI 2 10,550 7.1% 0.0%
SECTION 3.0 Protected Areas and Conservation Lands
36
* F = Canadian and U.S. federal public lands; AB = Alberta, SK = Saskatchewan, MB = Manitoba provincial public lands; MT = Montana, ND = North Dakota state public lands.

Figu
re 5
. Pr
otec
ted
area
s an
d co
nser
vatio
n la
nds.
A Conservation Blueprint for Canada’s Prairies and Parklands
37

SECTION 3.0 Protected Areas and Conservation Lands
38
Figu
re 6
. Co
mpo
site
pro
tect
ed a
reas
and
con
serv
atio
n la
nds,
by e
codi
stric
t.

3.2: Provincial and State Lands3.2.1 Provincial Lands — CanadaProvincial protected areas include provincial parks, natu-ral areas, wildlife management areas, fish and wildlifedevelopment fund wildlife lands, heritage rangelands, eco-logical reserves, and park reserves (Table 3.2; 391,081ha).Of these, provincial parks make the greatest contributionto regulated biodiversity conservation (5.1% of totalPA/CL lands). These parks are considered protected inthis study but commercial resource extraction is permittedin some Manitoba and Alberta parks.
Provincial conservation lands include provincial com-munity pastures, provincial recreation areas, and Sask-atchewan lease lands on which the Wildlife HabitatProtection Act (1984) protects wildlife (Table 3.2;1,297,455ha). Of these, the Saskatchewan lease landsoccupy 1,058,225ha (31.9% of total PA/CL lands). Pro-vincial community pastures cover 6.7% of total protectedareas and conservation lands in the Canadian part of thestudy area.
3.2.2 State Lands – United StatesState protected areas include state parks and wildlife man-agement areas (Table 3.2: 11,002ha), almost all of whichare Montana wildlife management lands. State conserva-tion lands, as included in this study, are state lands (50%of total PA/CL in the U.S. study area), by far the largestset of lands with permanent protection from land conver-sion. Other lands include state forests, state wildliferefuges, wildlife management areas, game preserves or fishhatcheries, for a total of 82,097ha.
3.3: Private Lands The Prairie Habitat Joint Venture (PHJV) reports that itsgovernment and non-government partners secured862,000 hectares of conservation lands through fee sim-ple, easement or stewardship agreement in the period1986 to 2001. The large majority of these would be pri-vate lands secured by non-government partners, predom-inantly Ducks Unlimited Canada. NCC has secured38,000 hectares of land and easement for conservation inthe region as part of the PHJV. Taken together, this con-stitutes 1.9% of the Canadian prairies and parklands, an
area almost equivalent to existing regulated federal andprovincial protected areas. Mapping of these lands was notavailable to the study.
Over and above this, it is important to note that thereare a tremendous but undocumented number of privatelandowners pursuing essential private-land conservationover large land holdings, both deliberately and throughbenign management and appropriate agricultural prac-tices. These efforts are providing major ecological goodsand services across the prairies and parklands, as a publicservice that is insufficiently recognized. For example, totake a single example, the McIntyre Ranch in southcentralAlberta supports the finest remaining fescue prairie inNorth America, under active grazing (McGillivray andSteinhilber 1996). The extent of this single private con-servation effort rivals that of entire conservation agenciesand non-government organizations in the region.
To conclude, the documented federal and provincialprotected areas and other conservation lands cover justover 9% of the Canadian study area, of which this studyhas mapped 7.1%. Of these:■ 1.2% are federal protected areas;■ 0.9% are provincial protected areas;■ 2.5% are federal conservation lands; ■ 2.9% are provincial conservation lands; and■ 1.9% are PHJV lands.(There is overlap in counting between PHJV lands and other categories.)
3.4: DesignationsA variety of programs have been developed to identify ordesignate lands important to the conservation of wildlifeand their habitats. The first of these was the InternationalBiological Program, which documented significant natu-ral areas through the period 1967 to 1975.
Other designations have been used to distinguishbetween international, national, and regionally significantsites. Examples include the Important Bird Areas program(IBA; www.ibacanada.com), Western Hemispheric Shore-bird Reserve Network (WHISRN; www.pnr-rpn.ec.gc.ca-/nature/whp/whsrn /index.en.html), UNESCO WorldHeritage Site program (www.templetons.com/brad/-unesco), and Ramsar Wetland program (www.ramsar-.org), all of which are represented across the study area.
A Conservation Blueprint for Canada’s Prairies and Parklands
39

Other designations have been assigned provincially,and are used to rank candidate sites for securement as newprotected areas. Examples include Manitoba’s Areas ofSpecial Interest (ASI; www.gov.mb.ca/iedm/mrd/geo/-exp-sup/min-ai.html) and Alberta’s EnvironmentallySignificant Areas (ESAs;www.cd.gov.ab.ca/preserving/-parks/anhic/esa.asp).
Many of these areas cover large tracts of lands and aregeneralized across the landscape. None yet are appliedconsistently enough across the whole study area to pro-vide precisely-mapped areas for addition to the blueprintanalysis. However, these are exactly the type of regionalstudies and treatments that have been important to otherecoregional assessments.
Private lands and conservation designations were notincluded in this study. In ongoing conservation planningat finer scales, these areas will be useful in conjunctionwith the blueprint for identification of priority landscapesfor conservation action.
SECTION 3.0 Protected Areas and Conservation Lands
40

The hypothesis that these methods test that it is possible to identify and assess the
places across the prairie and parkland biome that, if appropriately conserved, could sustain
the essential biological diversity of the region. This may or may not be possible but should be
considered the measure of the techniques applied in this study.
A Conservation Blueprint for Canada’s Prairies and Parklands
41
SECTION 4.0
Methods

This type of regional study bases itself on availablemapped data which, in the case of this region, requiredassembly and “cross-walking” of many data sets acrossjurisdictional boundaries, as well as the development ofnew classifications of ecological systems and new attemptsat setting conservation goals for targeted species andecosystems. The absence of regional data on the condi-tion, diversity and ecological functions of landscape fea-tures also requires the development of “surrogate”approaches to such questions. As a discussed in section4.5, these methods are highly perfectible, representing afirst-iteration analysis of this broad region.
All data were analyzed regardless of administrativejurisdiction or land tenure. Species and ecosystems rarelypay attention to jurisdiction or land tenure, and neithershould conservation planning.
The study identifies the contribution of an inclusivesuite of existing, regulated protected areas and other con-servation lands (Figs. 5 and 6).
In general, the method was the coarse-filter/fine-filterapproach to conservation planning (Groves et al. 2000),following these steps.1. Biodiversity targets were identified, including species
and habitat types at risk, and all ecological systemtypes, which were considered to provide the appropri-ate range of habitats required by not-at-risk species.
2. Conservation goals were established for target species,habitat types and ecological systems, based on estimat-ed needs for range-wide distribution and replication ofpopulations and ecological systems.
3. Ecological systems were classified and mapped acrossthe study area, and each system polygon was scoredbased on a range of values. The highest scoring poly-gons were selected based on replication goals set foreach ecodistrict of the region (coarse-filter analysis).
4. Existing protected areas and conservation lands wereclassified, mapped and included in the blueprint port-folio.
5. Additional habitat polygons were added to ensure thatconservation goals were satisfied for each species target(fine-filter analysis).
6. Output maps of these areas were overlaid on maps ofexisting features, to illustrate the full range of sites thatcan conserve fine-, mid- and large-scale targets, and thedistribution of remaining natural cover across theregion as a whole, to suggest the type of habitat net-work that is already in place and that could sustain
species populations and environmental goods and serv-ices as a whole.
Next steps beyond the scope of this study are: the iden-tification of functional landscapes or priority conserva-tion landscapes that could achieve a higher degree ofintactness; and the kinds of rehabilitation or restorationwork needed across even broader landscapes to sustainthe delivery of the full range of environmental goods andservices and deal with longer-term issues of ecologicalpersistence of species, habitats and systems.
The resulting portfolio consists of sites required to con-serve viable examples of all native ecological systems andspecies in the prairie-parkland ecoregions. Data for theseecoregional assessments were analyzed using geographicinformation system (GIS) software and expert-drivenmodel parameters (Appendix B).
The following section outlines the procedures taken toassemble data and establish biodiversity targets and con-servation goals, and the technical methods followed in thecoarse-filter and fine-filter analyses.
4.1: Ecological Systems – Coarse-filter Targets (details in Appendices A and B)
Knowing “what” kinds of habitat (or vegetation types)occur “where” is central to the assessment of biologicaldiversity across a landscape. Region-wide classificationsare not in place for wildlife habitats or vegetation and, asa result, there is no consistent mapping of this key aspectof biodiversity across the region. Mapping of vegetationpolygons would be invaluable as the base for comparinghabitats across large geographic areas.
However, even where such classifications are in place,such as the U.S. National Vegetation Classification (Gros-sman et al. 1998; Anderson et al. 1998), it is rare thatthere is mapping of these units across landscapes, andwhere they are mapped, the map units are often too manyand too small to be the basis for reasonable comparativeassessments.
SECTION 4.0 Methods
42
A Conservation Blueprint for Canada’s Prairies and Parklands
43
As a result, intermediate-scale classifications have beendeveloped that integrate both biological and landformfeatures into “ecological systems”. These have been usedbecause they are mappable and communicable at moreappropriate scales (Comer 2003). Assessment methodsthat seek to represent ecological systems have beendemonstrated to be more effective in identifying sites thatsupport large-scale ecological processes and characteristicbiodiversity than conservation strategies that focus onindividual species or groups of species (Kintsch andUrban 2002; Groves 2003).
The ecological systems developed for this project areunique combinations of landform and vegetation types(Appendix A). Vegetation communities vary with theirunderlying landform geology (Fig. 8), so abiotic (land-form) data were combined with native land-cover data(Fig. 7) to create an ecological systems layer (Fig. 9).These ecological systems were used as the coarse-filterbiodiversity targets in this study. By identifying and con-serving representative examples of the best remainingecological systems, the major assumption is that themajority of the region’s species (biodiversity) that rely onthese systems will be conserved as well.
To deal with edge effects where the study area gradesinto adjacent biomes, mapping of ecological systems wasalso done for a 30km buffer (where data existed) into theadjacent ecoregions. This allowed the project to delineatethe important ecosystem polygons in the ecotonesbetween ecoregions, in the cases where those polygonsextended beyond the precise boundaries of the study area.
The distribution of these ecological systems across thewider landscape was the second major consideration.Oliver and others (2004) corroborate that ecological (orland) systems can function as effective surrogates for bio-logical diversity within an appropriate geographic dis-tance or range for that system. Where some ecologicalsystem types are distributed farther apart on the land-scape, biota of these ecological systems exhibited less sim-ilarity (ibid.) For assessing representation, the ecologicalsystem was considered to be the surrogate for the charac-teristic biota of an area. The ecodistrict was considered tobe the ecological land unit most suitable as the unit with-in which ecological systems were similar enough for com-parison (Fig. 10).
The Canadian ecological land units used for this pur-pose were those of the Canadian Ecological StratificationWorking Group (ESWG 1995). An ecodistrict is an area
of relatively homogeneous landform, climate, soil, withinwhich vegetation, wildlife and habitat respond consis-tently. The comparable U.S. units are the US EPA’s LevelIV units (subsections; Omernick 1995). Each jurisdictionhas detailed descriptions and mapping of these ecologicalunits (Montana – Woods et al. 2002; Alberta – Strong1992; Saskatchewan – Acton et al. 1998; Manitoba –Smith et al. 1998; North Dakota – Bryce et al. 1996).Representation goals for coarse- and fine-filter biodiversi-ty targets in the blueprint were stratified by ecodistrict(Fig. 10) to meet standard goals (see sections 4.2.1 and4.3.1).
(Some of the initial ecodistrict and ecoregion bound-aries did not connect across the international boundary.Interested parties met in Calgary in 2000 to match ecore-gional boundaries across jurisdictional boundaries, withsubsequent adjustments to line up the boundaries ofecodistricts. Some of the U.S. ecodistrict units did notmatch with their ecoregion boundaries, in which casethey were clipped to TNC ecoregion boundaries.)
4.2: Coarse-filter Biodiversity AnalysisA coarse-filter analysis is a landscape-level approach toconservation area design that focuses on selecting the bestrepresentative (i.e., highest scoring) examples of equiva-lent landscape units across broad areas, in this case, ofecological system types, across ecodistricts. The assump-tion is that, by selecting the best examples of each eco-logical system type across a region, a very large majorityof that region’s biodiversity will be represented in thoseareas. Methods were developed to assess which sites rep-resent the best remaining natural (native) areas. To deter-mine this, four criteria were applied, which will be dis-cussed in more detail in the next section.
Polygons of each ecological-system type were com-pared with each other by calculating a specific numericscore for each polygon. This score was based on valuesassigned to each polygon, each value representing a par-ticular ecological criteria. Each scored ‘value’ was basedon a specific mapped ‘value grid’.

SECTION 4.0 Methods
44
Figu
re 7
. Sur
ficia
l geo
logy
in th
e pr
airie
and
par
klan
d ec
oreg
ions
(sou
rces
in A
pp. A
).

A Conservation Blueprint for Canada’s Prairies and Parklands
45
Figu
re 8
. Gen
eral
ized
nat
ural
cov
er r
emai
ning
acr
oss
the
prai
rie a
nd p
arkl
and
ecor
egio
ns (s
ourc
es in
App
. A).
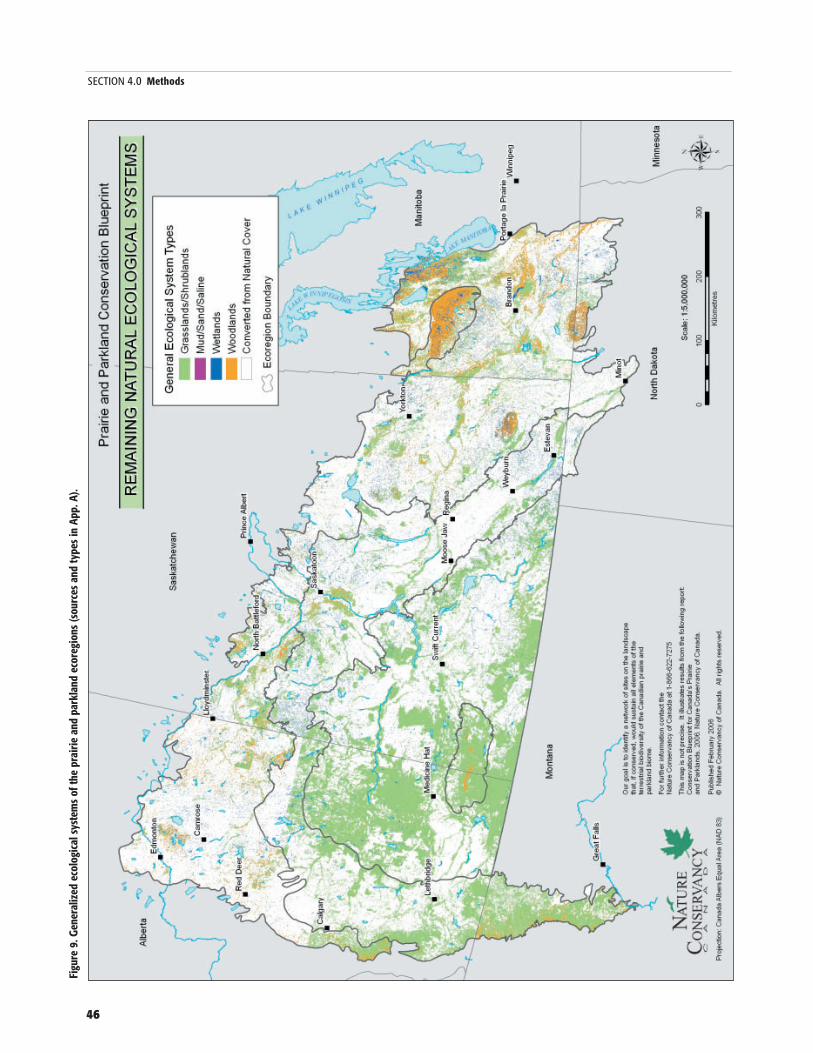
SECTION 4.0 Methods
46
Figu
re 9
. Gen
eral
ized
eco
logi
cal s
yste
ms
of th
e pr
airie
and
par
klan
d ec
oreg
ions
(sou
rces
and
type
s in
App
. A).

A Conservation Blueprint for Canada’s Prairies and Parklands
47
Figu
re 1
0. E
codi
stric
ts o
f the
pra
irie
and
park
land
eco
regi
ons
(nam
es in
App
. C).

The value grids of the coarse-filter analysis were GIS-derived data layers, or map layers, which acted as surrogatevalues for assessing particular ecological criteria: ■ Condition■ Diversity■ Ecological Function■ Special Features
Each 30-metre pixel on the landscape was assigned ascore from each grid. These grid scores were then numeri-cally combined for each criterion, and the scores were cal-culated for each pixel to create a new layer of value scoresrepresenting each criterion. The pixel values within eachintact ecological system polygon were averaged to generatea single score for each polygon, or patch.
Technically, the “value” layers used in the coarse-filteranalysis are GIS-created rasters all with a 30-metre cell size.These layers either represent continuous information suchas road density or discrete information such as ecological-system size. In cases, where the information is continuous,values for the ecological systems were calculated as the aver-age value per polygon. Discrete values were assigned direct-ly to the ecological system polygon.
All the criteria grids were added together to establish afinal score for each ecological system polygon. This finaltotal score is termed the polygon’s ‘conservation value’ rel-ative to other patches of the same ecological-system type.The polygons with the highest scores were selected to rep-resent core biodiversity conservation areas among all otherpolygons of the same ecological-system type.
Due to the ecological differences between major ecolog-ical-system types in the study area, separate analyses (usingseparate scoring approaches) were used to assess five broadcategories of ecological systems: grasslands/shrublands;woodlands; large wetlands; small wetlands; and mud/-sand/saline (Appendix B).
By classifying the ecological systems into one of these fivecategories, different variables and weights could be used toscore each general type of ecological system. Within eachtype, ecological systems were scored using the same criteriaof condition, diversity, ecological function, and special fea-tures, but with different scores.
Wetlands were analyzed following two methods, one forlarge wetlands (>20.25ha) and another for smaller wet-lands. This was done to avoid placing a bias on either thelarge wetlands or small wetlands within areas of high wet-land density, when they each sustain different and impor-tant suites of biodiversity features. As a result, both large
wetlands and complexes of smaller wetlands are represent-ed in the blueprint.
Small wetlands were analyzed as wetland complexesrather than as individual wetlands. To map these complex-es, wetland density was first calculated using of all the wet-lands (large and small) that met the minimum size require-ments (0.36ha). Using the kernel wetland density calcula-tion, wetland density polygons (WDP) were created fromthose areas with wetland densities of 3.48 wetlands/km2 orgreater. Once all calculations were completed and the toptwo scoring WDPs for each ecodistrict were identified, allwetlands that intersected with the WDP were selected. TheWDP score was assigned to the selected wetlands and thenthe individual wetlands were added to the blueprint.
Ecological system polygons below certain size thresholdswere not considered in this analysis because a review of theliterature and expert opinion suggested patches below cer-tain thresholds were not worth considering as regional con-servation priorities in this coarse scale of analysis. Onlypatches that met minimum size requirements were ana-lyzed. (Habitat patches smaller than these thresholds wereconsidered in the fine-filter analysis.)
For the Aspen Parkland, Moist Mixed Grassland andthe portion of Boreal Transition ecoregions the minimumsizes were: 16ha for grasslands/shrublands, 0.81ha forwoodlands, 20.25ha for large wetlands and 0.36ha formud/sand/saline and small wetlands. The minimum sizerequirements for the Mixed Grassland and CypressUpland were: 16 ha for grasslands/shrublands and wood-lands, 20.25ha for large wetlands and 0.36ha for mud/-sand/saline and small wetlands.
To provide an example, it has been stated that grasslandsless than 10ha (especially if linear) are of little benefit tograssland bird species (McCracken 2005). Suggestions ofminimum patch size for grassland birds range from 100ha(Vickery et al. 1994) to 250ha (James 2000) to 1000ha(Herkert et al. 2003). In this analysis, grasslands parcelswere not scored at all for size if they were less than 16ha insize or less than 180m wide, and scores increased to a max-imum for patches more than 4096ha in size.
Scoring was also varied by ecoregion. All grassland typesin the Aspen Parkland were valued on the same manner .Likewise all woodland types in the Aspen Parkland werescored using the same scoring system. For all four ecore-gions, the GIS layers were the same, but the assigned scoresdiffered. Scores for the eco-logical systems and the ecore-gions that they occur in are found in Appendix B.
SECTION 4.0 Methods
48

The rule-based GIS project identified ‘top-scoring’ eco-logical systems (or landform-vegetation types) on the land-scape. The top-scoring systems are those worth ground-truthing and considering in conservation strategies. Thisanalysis did not target a particular percentage of the land-scape for each remaining system type, which could havebeen an alternative approach. The ‘top-scoring’ approachworks well where the landscape is highly fragmented andthere is a large degree of variance in the ecological integri-ty of the remaining natural areas.
The following section describes each ‘value grid’ (or costgrid), including the inputs, outputs, scores and rationale forusing that value as a surrogate for a particular ecological cri-terion. Appendix B lists each layer and its scores.
ConditionThe ecological ‘condition’ of any area is challenging toassess on the ground, and numerous approaches to suchassessments, including those for range or riparian condi-tions, are in use. Assessing condition remotely is more dif-ficult. In this project we assessed the intactness of the adja-cent native cover as a surrogate value for condition, bymeasuring the amount of natural cover immediately adja-
cent. Secondly, the density of roads in each ecological sys-tem polygon was assessed as a measure of disturbance. Themodel was weighted to select ecological systems with a highdegree of natural cover and a low density of roads.
The condition criteria contributed 15% of the total scorefor all ecological systems, except for small wetlands (wherethey contributed 35% of total score) (Appendix B).
Percentage Natural Cover in 2km RadiusThis measure of conservation value related directly to thedegree of natural connectivity or isolation that a vegetationpatch experiences. The amount of natural cover in an areainfluences many ecosystem processes, such as dispersal, inthat more isolated patches are less likely to be recolonizedafter an extirpation event (MacArthur and Wilson 1967;White et al. 1996).
A Conservation Blueprint for Canada’s Prairies and Parklands
49
Figure 11. Percent natural cover within a 2 kilometre radius (Touchwood Hills Upland ecodistrict 748).
Grassland Woodlands SmallWetlands
LargeWetlands
Mud/Sand/Saline
% Natural Cover ✓ ✓ ✓ • •Road Density ✓ ✓ ✓ • •
Parameter

SECTION 4.0 Methods
50
The percentage natural cover was generated from land-cover data sets (see tile maps in Appendix D for mappingof natural cover). The amount of native land cover withina 2km radius of each 30m land cover pixel was calculated(Fig. 11) and scored. Natural land cover was consideredto be the composite of all grasslands/shrublands, wood-lands, wetlands and mud/sand/saline systems.
Finally, the average pixel value within each ecologicalsystem polygon was assigned to the polygon. The higherthe degree of natural land cover in the surrounding land-scape, the more points the ecological system received(Appendix B).
Road DensityRoad density was calculated as the number of kilometresof linear road features per square kilometre. This was donein GIS using ‘kernel density’ with a 500-metre searchradius.
The road data that were used to generate this layer camefrom several different sources. In Montana and NorthDakota, all roads in the TIGER files (1:100,000) wereused. In the Aspen Parkland and Moist Mixed Grass-land ecoregions the National Topographic Series (NTS)1:250,000 roads were used (highways, main and second-ary roads). Roads for the Mixed Grassland and CypressUpland ecoregions came from the Statistics Canada RoadNetwork File (multiple sources and scales).
Road density was calculated as the average density ofroads per ecological system polygon, up to a maximum of8 km/km2 (Fig. 12).
Figure 12. Road density (Touchwood Hills Upland ecodistrict 748).

DiversityDiversity was assessed as the number and range of ecolog-ical systems neighbouring an individual ecological systempolygon, with high numbers scored more highly than lownumbers. This was a surrogate measure of higher biologi-cal diversity.
The method for calculating diversity differed betweenecoregions. In the Aspen Parkland and Moist MixedGrassland, diversity was calculated on a per-pixel basis andthen the maximum pixel value for each ecological systempolygon was used. The neighbourhood statistic was calcu-lated using GIS based on a grid that contained all ecolog-ical system types. The neighbourhood was a two-by-twopixel window and the variety was calculated. The varietywas greater where many unique patches touched. This cal-culation did not measure the number of unique neigh-bours that an ecological system had, rather it providedhigher scores to ecological systems that touched several
different ecological systems in one spot. The polygons thatwere part of clusters of unique ecological systems scoredhighest.
In the Mixed Grassland and Cypress Upland, diversi-ty was calculated by buffering each ecological system poly-gon by a very small distance (1 metre). Then a spatial joinwas done and the number of unique neighbours that eachecological system was adjacent to was counted. This count(minus one, to account for the ecological system itself) wasthe basis of the diversity value and the scores were gener-ated according to this number; the more unique polygonsthat the ecological system touched, the more diverse it wasconsidered to be (Fig. 13).
A Conservation Blueprint for Canada’s Prairies and Parklands
51
Figure 13. Diversity scring for grassland ecosysytems (Touchwood Hills Upland ecodistrict 748).
Grassland Woodlands SmallWetlands
LargeWetlands
Mud/Sand/Saline
Simple Diversity • • • • •
Parameter

Ecolgical FunctionEcological considerations of size, shape, and connectivityto other natural cover were assessed. Larger sites, siteswith lower edge-to-area ratios, and sites connected toother natural cover on the landscape were scored asreflecting higher biological diversity. Depending on eco-logical system type, ecological function was scored as 40%to 50% of the total score (Appendix B).
Site SizeScores were assigned to each ecological system polygonbased on the total area, with the larger polygons receivinghigher scores. In assessing small wetlands, the size of thewetland complex was used rather than the size of the indi-vidual component wetlands. Size scoring is outlined inAppendix B.
SECTION 4.0 Methods
52
Grassland Woodlands SmallWetlands
LargeWetlands/MSS
Size • • • •Shape • •Connectivity • •Wetland Density •
Parameter
Figure 14. Site size; larger grassland ecosystems were scored higher (Touchwood Hills Upland ecodistrict 748).

Shape (Minimum Habitat Area) In evaluating the conservation value of almost all terres-trial ecological systems, linear shaped patches are general-ly considered less significant than blocky patches of thesame size. In this study, shape was considered to be pro-portional to the minimum habitat area that could fit intoa polygon. This was measured by the diameter (in metres)of the largest circle that could be drawn within a patch,essentially measuring for sites with lower edge-to-arearatios (Fig. 15). Site shape was only calculated for grass-lands/shrublands and woodland ecological system poly-gons.
A Conservation Blueprint for Canada’s Prairies and Parklands
53
Figure 15. Site shape (Touchwood Hills Upland ecodistrict 748).

ConnectivityThe connectivity measure was used to score a site’s poten-tial to support the movement of organisms betweenecosystem patches. The connectivity of sites was calculat-ed as the distance from the patch edge to the next closestpatch edge. Connectivity was only calculated for grass-land/shrubland and woodland ecological systems. Forgrassland/shrubland patches connectivity was evaluatedas the connectivity to other grassland/shrubland patches.Similarly, connectivity between woodland patches wasevaluated between other woodland patches.
Connectivity scores were assigned based on the dis-tance between the next closest patch. The shorter the dis-tance, or the more connected the patches were, the high-er the score (Fig. 16).
SECTION 4.0 Methods
54
Figure 16. Connectivity values for grassland ecosystem patches (Touchwood Hills Upland ecodistrict 748).
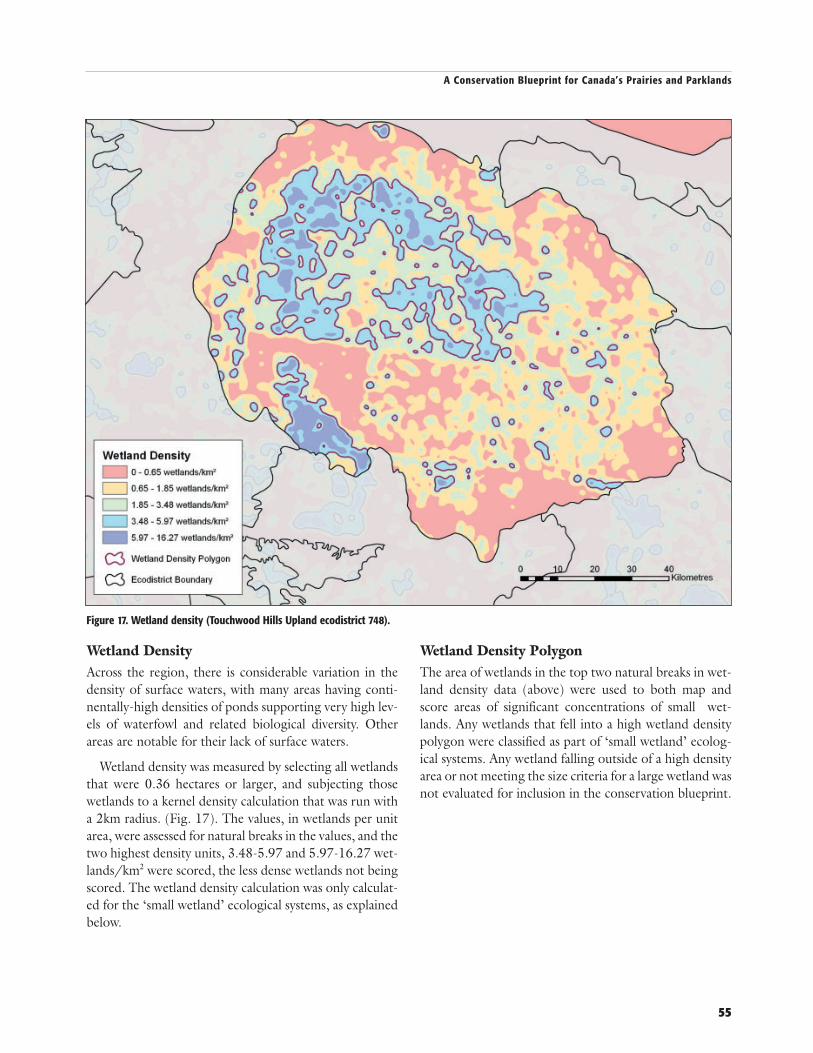
Wetland DensityAcross the region, there is considerable variation in thedensity of surface waters, with many areas having conti-nentally-high densities of ponds supporting very high lev-els of waterfowl and related biological diversity. Otherareas are notable for their lack of surface waters.
Wetland density was measured by selecting all wetlandsthat were 0.36 hectares or larger, and subjecting thosewetlands to a kernel density calculation that was run witha 2km radius. (Fig. 17). The values, in wetlands per unitarea, were assessed for natural breaks in the values, and thetwo highest density units, 3.48-5.97 and 5.97-16.27 wet-lands/km2 were scored, the less dense wetlands not beingscored. The wetland density calculation was only calculat-ed for the ‘small wetland’ ecological systems, as explainedbelow.
Wetland Density PolygonThe area of wetlands in the top two natural breaks in wet-land density data (above) were used to both map andscore areas of significant concentrations of small wet-lands. Any wetlands that fell into a high wetland densitypolygon were classified as part of ‘small wetland’ ecolog-ical systems. Any wetland falling outside of a high densityarea or not meeting the size criteria for a large wetland wasnot evaluated for inclusion in the conservation blueprint.
A Conservation Blueprint for Canada’s Prairies and Parklands
55
Figure 17. Wetland density (Touchwood Hills Upland ecodistrict 748).

SECTION 4.0 Methods
56
Special FeaturesSpecial features criteria included in thisstudy were i) the presence of targetspecies; ii) the presence of additional fea-tures of conservation concern; and iii) thedistance to protected areas and conserva-tion lands (Appendix B).
Presence of Target SpeciesScores were assigned based on the count of primary tar-get species present in an ecological system polygon (Fig.18; Table 4.1). Specifically, the target locations were con-sidered to be unique element occurrences (EOs) ofspecies tracked by the provincial Conservation DataCenters (CDCs) and shared with the project. Only EOswith relatively recent last observed observation dates wereused. For plant species these were records that had beenobserved in the last forty years. For animal species a cut-off of twenty years was used.
In the Aspen Parkland, Moist Mixed Grassland andBoreal Transition ecoregions the primary target specieslisted in Table 4.1a were used to generate this layer. In theMixed Grassland and Cypress Upland ecoregions allspecies tracked by the CDCs that had S1-S3 rankings orwere COSEWIC listed species were scored as special fea-tures (Tables 4.1a, b and c).
Grassland Woodlands SmallWetlands
LargeWetlands/MSS
• • • •
• • • •
• • • •
Parameter
Figure 18. Scoring for presence of target species (Eyebrow Plain ecodistrict 789).
Presence of primary target species
Presence of additional species ofconservation concern
Distance to Protected Area

Presence of Additional Features of Conservation ConcernScores for species of conservation concern that were notaddressed in the preceding analysis were assigned basedon the total within each ecological system polygon (Fig.19; Tables 4.1b, c). These additional target species wereall of the species tracked by the CDCs that were not con-sidered to be in primary target species (i.e., if they werenot already assessed in the target species scoring).
The same selection criteria with respect to observationdates for element occurrence records were applied. Theadditional target locations included the documentedoccurrences of rare community types, migratory bird con-centration sites and snake hibernacula. (See Appendix Bfor details on scoring).
A Conservation Blueprint for Canada’s Prairies and Parklands
57
Figure 19. Scoring for additional features of conservation concern (Eyebrow Plain ecodistrict 789).

Distance to Protected Areas and Conservation LandsIn different parts of the region, at different scales, thereare regulated protected areas and other less formally pro-tected conservation lands. In some instances these areasmay imply no additional biodiversity values on adjacentlands but, in other cases, proximity to such sites meansthat there is additional presence and movement ofwildlife, as well as opportunity for exchange or extensionof propagules from those conserved areas.
On this basis, sites closer to protected areas and con-servation lands were given higher scores (Figure 20).
All protected areas and conservation lands were giventhe same weighting and value, regardless of the degree ofprotection afforded to biodiversity values at the site or theshape or size of the conserved site.
SECTION 4.0 Methods
58
Figure 20. Distance to protected areas and conservation lands (Touchwood Hills Upland ecodistrict 748)
4.2.1: Coarse-filter Conservation GoalsThe identification of priority areas for conservation wasdone on an ecodistrict basis. Ecodistricts are subdivisionsof ecoregions. They are areas of more or less homoge-neous vegetation, fauna, geology and soil, but primarily ofconsistent physiography and landforms (Marshall andSchut 1999).
The mapping of Canadian ecodistricts was derived fromAgriculture and Agri-Food Canada (see ESWG 1995;sis.agr.gc.ca/cansis/nsdb/ecostrat/intro.html). For theUnited States, the terminology for landscape units differ,with the equivalent units generally being termed subsec-tions (generally equivalent to USEPA Level IV units(Omernik 1995) (Appendix C).
For each ecodistrict, the two top-scoring ecological sys-tem polygons of each system type were selected as the corebiodiversity conservation areas. This level of stratificationwas chosen to provide minimum replication of represen-tative systems at the district scale, and hence minimumreplication at the ecoregional scale. They represent sitesimportant to the conservation of regional biological diver-sity at the coarser ecosystem scale.
These sites have been selected solely through GISanalysis. The conservation blueprint is based on the bestavailable data and a working consensus that developedaround the scoring parameters. The sites need to be val-idated to ensure that the results are accurate and the bio-diversity targets are viable.
To provide coarser regional context, several analyseswere also performed to assess the top scoring ecologicalsystems by ecoregion, by study area, and by jurisdiction(see Results section).
(Some of the initial ecodistrict and ecoregion bound-aries did not meet at international boundaries. Interestedparties met in Calgary in 2000 to match ecoregionalboundaries across jurisdictional boundaries, with subse-quent adjustments to establish the same level of continu-ity with regard to ecodistrict boundaries. Some of the U.S.ecodistrict units did not match with their ecoregionboundaries, in which case they were clipped to the TNCecoregions boundaries. The ecodistricts used in this studyare listed in Appendix C and mapped on Figure 10.)
4.3: Fine-filter Biodiversity Analysis The purpose of the coarse-filter analysis was to assess therepresentation of ecological systems, assuming that theirconservation will reasonably sustain the typical commonspecies and habitats occurring in them. A fine-filter analy-sis was conducted to address the representation of rarespecies and features, for which specific location informa-tion is known and which may otherwise not be includedin the blueprint.
Numerous fine-filter targets were considered (Table 4.1):■ Globally imperilled species (G1-G3G4);■ Disjunct species;■ Species at risk (Canadian Species at Risk Act and
COSEWIC; U.S. Endangered Species Act); and■ Other species and communities of conservation
concern tracked by CDCs and Natural HeritagePrograms.
These were further divided into primary and second-ary target species (Tables 4.1a, b) by the project’s core sci-ence team. The inclusion in the blueprint of occurrencesof primary targets was ensured by applying specific rep-resentation goals for those targets (Table 4.4).
Secondary targets were considered to be important,but more widespread and not critically imperilled. Thesetargets were considered in the scoring of coarse-filteranalysis.
A third set of targets species, communities and features(Table 4.1c) were termed other features of conservationconcern, and these were again used in the coarse-filterscoring.
Data for fine-filter biodiversity targets were provided byprovincial and state conservation data centres, natural her-itage information centres, and natural heritage programs.
A Conservation Blueprint for Canada’s Prairies and Parklands
59

Table 4.1a. Primary Species Targets
PlantsPrairie Dunewort Botrychiumor Plain's Grape-fern campestre G3G4 Grank 2 Peripheral Widespread Peripheral
Pale Moonwort Botrychium pallidum G2G3 Grank All Widespread Widespread Widespread Widespread
Buffalograss Buchloedactyloides T G4G5 SAR 2 Peripheral Peripheral
Smooth Arid Chenopodium GRank;Goosefoot subglabrum SC G3G4 SAR 2 Widespread
Tiny Cryptanthe Cryptantha GRank;minima E G5 SAR All Disjunct ASRD 2004
Small White Cypripedium Lady’s Slipper candidum T G4 SAR All Disjunct
Hairy Prairie Clover Dalea villosavar. villosa T G5T5 SAR 2 Peripheral Disjunct Disjunct
Slender Halimolobos Mouse-ear-cress virgata T G4 SAR 2 Disjunct Disjunct Disjunct
Western Blue Flag Irismissouriensis SC G5 SAR All Peripheral ASRD/ACA 2005a
Western Spiderwort Tradescantiaor Prairie Spiderwort occidentalis T G5 SAR All Disjunct Disjunct Smith 2000
Soapweed Yucca ? glauca T G5 SAR All Peripheral Peripheral Hurlburt 2001
MammalsBlack-tailed Prairie Dog Cynomys GRank;
ludovicianus SC G3G4 SAR All Peripheral
Ord’s Kangaroo Rat Dipodomys ordii SC G5 SAR 2 Peripheral Gummer 1997,
Gummer and Robertson 2003
Swift Fox Vulpes velox E G3 GRank; All Widespread Carbyn et al. 1993,SAR Pruss 1999,
Smeeton andWeagle 2000
BirdsBurrowing Owl Athene E G4 SAR 4 Peripheral Widespread Widespread Peripheral ASRD/ACA 2005b,
cunicularia Poulin et al. 2005
Sprague's Pipit Anthus spragueii T G4 SAR 2 Widespread Widespread Widespread Widespread
Greater Sage-Grouse Centrocercus urophasianus urophasianus E G4TU SAR All Widespread Aldridge 1998
Piping Plover Charadrius GRank; Plissner andmelodus E G3 SAR 4 Widespread Widespread Widespread Haig 2000
SECTION 4.0 Methods
60
Common Name Scientific COSEWIC Global Justification Goal Aspen Moist Mixed Cypress ReferencesName Status Rank per Parkland Mixed Grassland Upland
ecodistrict Grassland

A Conservation Blueprint for Canada’s Prairies and Parklands
61
Table 4.1a. Primary Species Targets
Mountain Plover Charadrius GRank; montanus E G2 SAR All Peripheral
Peregrine Falcon Falco peregrinus (anatum) anatum T G4T3 SAR All Disjunct Disjunct Disjunct
Least Bittern Ixobrychus exilis T G5 SAR All Peripheral
Prairie Loggerhead Lanius T G4T4 SAR 2 Widespread Widespread Widespread Cade andShrike ludovicianus Woods 1997,
excubitorides Prescott and Bjorge 1999
AmphibiansGreat Plains Toad Bufo cognatus SC G5 SAR 2 Peripheral Peripheral Widespread Peripheral
Northern Leopard Frog Rana pipiens SC G5 SAR 2 Widespread Widespread Widespread Widespread
ReptilesEastern Yellowbelly Coluber Racer constrictor T G5T5 SAR 2 Peripheral
flaviventris
Northern Prairie Skink Eumeces SAR; Disjunct septentrionalis SC G5 Population All Disjunctseptentrionalis
Short-horned Lizard Phrynosoma SAR; hernandesi SC G5 Disjunct 2 Disjunct
InvertebratesMormon Metalmark Apodemia
mormo T G5 SAR 2 Peripheral
Dakota Skipper Hesperia GRank;dacotae T G2G3 SAR 2 Peripheral
Yucca Moth Tegeticula ? yuccasella E G4G5 SAR All Peripheral Peripheral ASRD 2002
Common Name Scientific COSEWIC Global Justification Goal Aspen Moist Mixed Cypress ReferencesName Status Rank per Parkland Mixed Grassland Upland
ecodistrict Grassland

SECTION 4.0 Methods
62
Table 4.1b. Secondary Species Targets
Baird's Sparrow Ammodramus PIF 28; Prairie bairdii NAR G4 Wings Target • • • •
Le Conte's Sparrow Ammodramus leconteii G4 PIF 25 • • • •
Nelson's Sharp-tailed Ammodramus PIF 27(29),Sparrow nelsoni NAR G5 Priority IA • •Short-Eared Owl Asio flammeus SC G5 SAR • • • • Clayton 2000
Ferruginous Hawk Buteo regalis SAR; SC G4 Prairie Wings Target • • • • Schmutz 1999
Swainson's Hawk Buteo swainsoni G5 PIF 25 • • • •Lark Bunting Calamospiza
melanocorys G5 Prairie Wings Target • • • •McCown's Longspur Calcarius PIF 27;
mccownii G5 Prairie Wings Target • •Chestnut Collared Calcarius PIF 24; Longspur ornatus G5 Prairie Wings Target • • • •Black Tern Chlidonias niger NAR G4 Waterbird priority • • • •Yellow Rail Coturnicops
noveboracensis SC G4 SAR; PIF 27 • • • •Red-headed Melanerpes Woodpecker erythrocephalus SC G5 SAR •Long-billed Curlew Numenius Prairie Wings Target;
americanus SC G5 Core population outside (MG) • • • • Hill 1998
American White Pelican Pelecanus erythrorhynchos NAR G3 GRank • • • •
Wilson's Phalarope Phalaropus tricolour G5 PIF 25 • • • •
Sharp-tailed Grouse Tympanuchus PIF 22; BCR Priority IAphasianellus G4 High regional responsibility • • •
Table 4.1c. Other features of conservation concern (CDC tracked species and communities, wildlife concentrations, and hibernacula)
Common Name Scientific COSEWIC Global Justification Aspen Moist Mixed Cypress ReferencesName Status Rank Parkland Mixed Grassland Upland
Grassland
Amphibians
Bufo hemiophrysRana luteiventrisRana sylvaticaSpea bombifrons
Birds
Accipiter cooperiiAechmophorus clarkiiAechmophorus occidentalis
Ammodramus savannarumAnas cyanopteraAquila chrysaetosArdea herodiasAthene cuniculariaAthene cunicularia hypugaeaBotaurus lentiginosusBucephala albeolaBucephala clangulaCathartes auraCygnus buccinator
Dendroica pensylvanicaDryocopus pileatusEmpidonax alnorumEmpidonax trailliiEuphagus carolinusFalco mexicanusGavia immerGrus americanaHaliaeetus leucocephalusHimantopus mexicanusIcterus bullockii
Lophodytes cucullatusMegascops asioMegascops kennicottiiMelanitta fuscaMelospiza georgianaMergus merganserMimus polyglottosNumenius borealisNycticorax nycticorax

A Conservation Blueprint for Canada’s Prairies and Parklands
63
Table 4.1c. Other features of conservation concern (CDC tracked species and communities, wildlife concentrations, and hibernacula)
Oporornis philadelphiaOreoscoptes montanusPhalacrocorax auritusPhalaenoptilus nuttalliiPiranga ludovicianaPlegadis chihiPodiceps grisegenaPodiceps nigricollisSeiurus noveboracensisSterna caspiaSterna forsteriSterna hirundoStrix variaVermivora chrysopteraVireo philadelphicusWilsonia canadensisZonotrichia albicollis
InvertebratesAeshna constrictaAeshna multicolorAmblyscirtes hegonAmblyscirtes oslariAmblyscirtes simiusAmphiagrion abbreviatumAnax juniusApodemia mormoBattus philenorCallophrys gryneus sivaCalopteryx aequabilisCelastrina neglectaChlosyne harrisii hanhamiChlosyne nycteis reversaCicindela formosaCicindela lepidaCicindela nevadicaDanaus plexippusEnallagma annaEnallagma carunculatumEnallagma clausumEnodia anthedonErynnis brizo brizoErynnis juvenalisEuphilotes ancillaEuphydryas editha hutchinsiEveres comyntas comyntasGlaucopsyche piasus
Gomphus graslinellusHemiargus isolaHesperia pahaskaIcaricia shastaIschnura cervulaIschnura perparvaIschnura verticalisLeucorrhinia glacialisLeucorrhinia intactaLibellula pulchellaLimenitis lorquiniLimenitis weidemeyeriiLycaena edithaLycaena phlaeasLycaena phlaeas arethusaLycaena rubidusNathalis ioleOchlodes sylvanoidesPapilio eurymedonPapilio machaon dodiPapilio multicaudataPapilio multicaudatusPapilio polyxenes asteriusPapilio rutulusPapilio zelicaonPholisora catullusPhyciodes batesiiPoanes hobomokPolites rhesusPolygonia commaPolygonia gracilis zephyrusPolygonia interrogationisPontia protodicePyrgus scripturaSatyrium acadicumSatyrium liparops aliparopsSatyrodes eurydice eurydiceSpeyeria edwardsiiSpeyeria hydaspeStrophitus undulatusStylurus intricatusSympetrum corruptumSympetrum pallipesThymelicus lineolaVanessa annabellaVanessa virginiensis
MammalsBos bison athabascaeLagurus curtatusLasionycteris noctivagansLasiurus cinereusLynx rufusMarmota flaviventrisMicrotus ochrogasterMustela nigripesMyotis septentrionalisOdocoileus hemionusOnychomys leucogasterPerognathus fasciatusReithrodontomys megalotisSorex hoyiThomomys talpoides
ReptilesChelydra serpentinaChrysemys picta belliCrotalus viridis viridisLiochlorophis vernalisStoreria occipitomaculata
PlantsAcorus americanusAgalinis asperaAgrostis exarataAlisma gramineumAllium cernuumAllium geyeriAlopecurus alpinusAlopecurus alpinus
ssp. glaucusAlopecurus carolinianusAmaranthus californicusAmbrosia acanthicarpaAnagallis minimaAnaphalis margaritaceaAndropogon gerardiiAndropogon halliiAnemone parvifloraAntennaria anaphaloidesAntennaria corymbosaAntennaria dimorphaAntennaria russelliiAntennaria umbrinella
Arabidopsis salsugineaArenaria congesta
var. lithophilaAristida purpureaAristida purpurea
var. longisetaArnica cordifoliaArnica fulgensArnica sororiaArtemisia canaArtemisia tilesiiAsarum canadenseAsclepias lanuginosaAsclepias syriacaAsclepias verticillataAsclepias viridifloraAster campestrisAster eatoniiAster pauciflorusAster umbellatusAster umbellatus var. pubensAstragalus aboriginumAstragalus gilviflorusAstragalus kentrophyta
var. kentrophytaAstragalus lotiflorusAstragalus pectinatusAstragalus purshiiAstragalus purshii
var. purshiiAstragalus racemosus
var. racemosusAstragalus spatulatusAstragalus vexilliflexusAthyrium filix-feminaAthyrium filix-femina
ssp. angustumAtriplex argenteaAtriplex argentea
ssp. argenteaAtriplex canescensAtriplex powelliiAtriplex suckleyiAtriplex truncataAtriplex x apteraBacopa rotundifoliaBarbarea orthocerasBeckmannia syzigachne
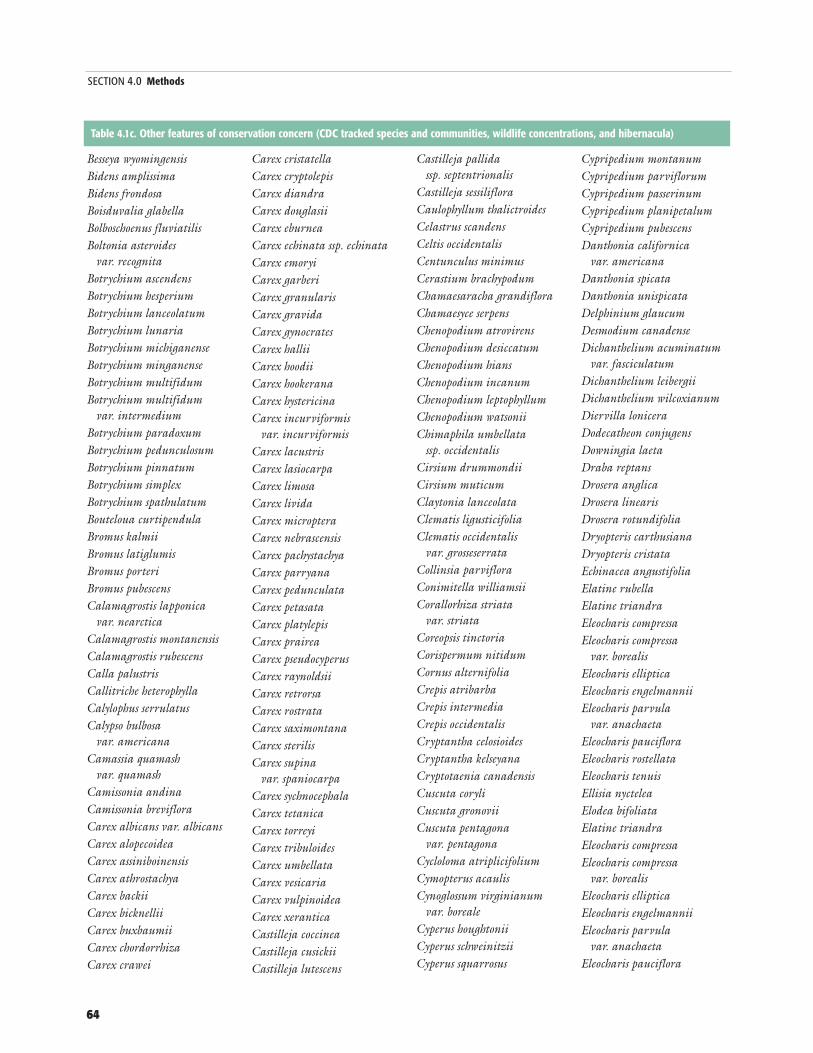
Besseya wyomingensisBidens amplissimaBidens frondosaBoisduvalia glabellaBolboschoenus fluviatilisBoltonia asteroides
var. recognitaBotrychium ascendensBotrychium hesperiumBotrychium lanceolatumBotrychium lunariaBotrychium michiganenseBotrychium minganenseBotrychium multifidumBotrychium multifidum
var. intermediumBotrychium paradoxumBotrychium pedunculosumBotrychium pinnatumBotrychium simplexBotrychium spathulatumBouteloua curtipendulaBromus kalmiiBromus latiglumisBromus porteriBromus pubescensCalamagrostis lapponica
var. nearcticaCalamagrostis montanensisCalamagrostis rubescensCalla palustrisCallitriche heterophyllaCalylophus serrulatusCalypso bulbosa
var. americanaCamassia quamash
var. quamashCamissonia andinaCamissonia brevifloraCarex albicans var. albicansCarex alopecoideaCarex assiniboinensisCarex athrostachyaCarex backiiCarex bicknelliiCarex buxbaumiiCarex chordorrhizaCarex crawei
Carex cristatellaCarex cryptolepisCarex diandraCarex douglasiiCarex eburneaCarex echinata ssp. echinataCarex emoryiCarex garberiCarex granularisCarex gravidaCarex gynocratesCarex halliiCarex hoodiiCarex hookeranaCarex hystericinaCarex incurviformis
var. incurviformisCarex lacustrisCarex lasiocarpaCarex limosaCarex lividaCarex micropteraCarex nebrascensisCarex pachystachyaCarex parryanaCarex pedunculataCarex petasataCarex platylepisCarex praireaCarex pseudocyperusCarex raynoldsiiCarex retrorsaCarex rostrataCarex saximontanaCarex sterilisCarex supina
var. spaniocarpaCarex sychnocephalaCarex tetanicaCarex torreyiCarex tribuloidesCarex umbellataCarex vesicariaCarex vulpinoideaCarex xeranticaCastilleja coccineaCastilleja cusickiiCastilleja lutescens
Castilleja pallida ssp. septentrionalis
Castilleja sessilifloraCaulophyllum thalictroidesCelastrus scandensCeltis occidentalisCentunculus minimusCerastium brachypodumChamaesaracha grandifloraChamaesyce serpensChenopodium atrovirensChenopodium desiccatumChenopodium hiansChenopodium incanumChenopodium leptophyllumChenopodium watsoniiChimaphila umbellata
ssp. occidentalisCirsium drummondiiCirsium muticumClaytonia lanceolataClematis ligusticifoliaClematis occidentalis
var. grosseserrataCollinsia parvifloraConimitella williamsiiCorallorhiza striata
var. striataCoreopsis tinctoriaCorispermum nitidumCornus alternifoliaCrepis atribarbaCrepis intermediaCrepis occidentalisCryptantha celosioidesCryptantha kelseyanaCryptotaenia canadensisCuscuta coryliCuscuta gronoviiCuscuta pentagona
var. pentagonaCycloloma atriplicifoliumCymopterus acaulisCynoglossum virginianum
var. borealeCyperus houghtoniiCyperus schweinitziiCyperus squarrosus
Cypripedium montanumCypripedium parviflorumCypripedium passerinumCypripedium planipetalumCypripedium pubescensDanthonia californica
var. americanaDanthonia spicataDanthonia unispicataDelphinium glaucumDesmodium canadenseDichanthelium acuminatum
var. fasciculatumDichanthelium leibergiiDichanthelium wilcoxianumDiervilla loniceraDodecatheon conjugensDowningia laetaDraba reptansDrosera anglicaDrosera linearisDrosera rotundifoliaDryopteris carthusianaDryopteris cristataEchinacea angustifoliaElatine rubellaElatine triandraEleocharis compressaEleocharis compressa
var. borealisEleocharis ellipticaEleocharis engelmanniiEleocharis parvula
var. anachaetaEleocharis paucifloraEleocharis rostellataEleocharis tenuisEllisia nycteleaElodea bifoliataElatine triandraEleocharis compressaEleocharis compressa
var. borealisEleocharis ellipticaEleocharis engelmanniiEleocharis parvula
var. anachaetaEleocharis pauciflora
SECTION 4.0 Methods
64
Table 4.1c. Other features of conservation concern (CDC tracked species and communities, wildlife concentrations, and hibernacula)

Eleocharis rostellataEleocharis tenuisEllisia nycteleaElodea bifoliataElodea canadensisElodea longivaginataElymus diversiglumisElymus elymoidesElymus glaucusElymus hystrixElymus innovatusElymus lanceolatus
ssp. psammophilusElymus virginicusEquisetum sylvaticumEragrostis hypnoidesErigeron annuusErigeron caespitosusErigeron compositusErigeron ochroleucus
var. scribneriErigeron radicatusErigeron strigosusEriogonum cernuumEriogonum cernuum
var. cernuumEriogonum flavumEriogonum pauciflorumEriophorum chamissonisEriophorum viridicarinatumEscobaria viviparaEupatorium maculatumEuphorbia geyeriEurotia lanataFestuca halliiFestuca idahoensisFestuca obtusaFranseria acanthicarpaFraxinus nigraFraxinus pennsylvanicaGalium aparineGalium labradoricumGentiana andrewsii
var. dakoticaGentiana fremontiiGentiana puberulentaGentianopsis macouniiGentianopsis procera
ssp. procera
Geranium carolinianumGeranium carolinianum
var. sphaerospermumGeranium richardsoniiGeranium viscosissimum
var. viscosissimumGlyceria pulchellaGoodyera oblongifoliaGratiola ebracteataGratiola neglectaGymnocarpium dryopterisHackelia floribundaHalenia deflexaHedeoma hispidaHedyotis longifoliaHelianthus nuttallii
ssp. rydbergiiHelianthus tuberosusHeliopsis helianthoides
var. occidentalisHeliotropium curassavicumHepatica nobilis var. obtusaHeuchera parvifolia
var. dissectaHieracium albiflorumHordeum brachyantherum
ssp. brachyantherumHordeum pusillumHudsonia tomentosaHutchinsia procumbensHydrophyllum capitatumHymenopappus filifoliusHymenopappus filifolius
var. polycephalusHypericum majusHypoxis hirsutaImpatiens noli-tangereJuncus acuminatusJuncus brevicaudatusJuncus confususJuncus ensifoliusJuncus interiorJuncus nevadensisJuncus nevadensis
var. nevadensisJuncus tracyiJuniperus scopulorumKobresia simpliciusculaLactuca biennis
Lactuca ludovicianaLaportea canadensisLeersia oryzoidesLemna minorLemna turioniferaLesquerella alpinaLesquerella arctica
var. purshiiLeymus cinereusLilaea scilloidesLilium philadelphicum
var. andinum f immaculataLinanthus septentrionalisLinnaea borealisLiparis loeseliiListera borealisLithophragma glabrumLithophragma parviflorumLithospermum ruderaleLobelia spicataLomatium cousLomatium dissectum
var. multifidumLomatium macrocarpumLomatium orientaleLomatogonium rotatumLonicera oblongifoliaLotus purshianusLotus unifoliolatus
var. unifoliolatusLupinus pusillus ssp. pusillusLuzula multifloraLycopus americanusLygodesmia rostrataLysimachia hybridaMaianthemum racemosum
ssp. amplexicauleMalaxis brachypodaMalaxis monophyllaMalaxis monophyllos
var. brachypodaMalaxis paludosaMarsilea vestitaMatricaria maritimaMelica bulbosaMentzelia albicaulisMentzelia decapetalaMenyanthes trifoliataMertensia lanceolata
Milium effusumMimulus glabratusMimulus glabratus
var. jamesiiMimulus guttatusMinuartia dawsonensisMinuartia rubellaMirabilis linearisMitella nudaMonotropa hypopithysMonotropa unifloraMonroa squarrosaMontia linearisMuhlenbergia asperifoliaMuhlenbergia racemosaMunroa squarrosaMusineon divaricatumMyosurus apetalus
var. borealisMyosurus aristatusMyosurus minimusMyosurus minimus
ssp. minimusMyriophyllum alterniflorumNajas flexilisNavarretia leucocephala
ssp. minimaNemophila brevifloraNothocalais cuspidataNuttallanthus canadensis
sensu latoOenothera caespitosa
ssp. caespitosaOenothera flavaOenothera psammophilaOnosmodium molleOnosmodium molle
var. occidentaleOrobanche ludovicianaOrobanche unifloraOryzopsis canadensisOryzopsis hymenoidesOryzopsis micranthaOryzopsis pungensOsmorhiza berteroiOsmorhiza claytonii
A Conservation Blueprint for Canada’s Prairies and Parklands
65
Table 4.1c. Other features of conservation concern (CDC tracked species and communities, wildlife concentrations, and hibernacula)

Osmorhiza longistylisOstrya virginianaOxytropis besseyi var. besseyiOxytropis deflexaOsmorhiza depauperataOxytropis lagopus
var. conjugansOxytropis lambertiiOxytropis sericeaPanicum leibergiiPanicum linearifoliumPanicum wilcoxianumParietaria pensylvanicaParnassia glaucaParnassia kotzebueiParnassia palustris
var. parvifloraParthenocissus quinquefoliaPellaea glabellaPellaea glabella
ssp. occidentalisPellaea glabella
ssp. simplexPenstemon confertusPenstemon nitidusPenstemon procerusPerideridia gairdneri
ssp. borealisPetasites frigidusPhacelia linearisPhleum alpinumPhlox alyssifoliaPhlox hoodiiPhryma leptostachyaPhysostegia ledinghamiiPicradeniopsis oppositifoliaPinguicula vulgarisPlagiobothrys scouleri
var. scouleriPlantago canescensPlantago elongataPlantago elongata
ssp. elongataPlantago patagonicaPlatanthera orbiculataPoa aridaPoa cusickiiPoa fendleriana
Poa nevadensisPolanisia dodecandraPolanisia dodecandra
ssp. dodecandraPolanisia dodecandra
ssp. trachyspermaPolygala albaPolygala verticillataPolygala verticillata
var. isocyclaPolygonatum biflorum
var. commutatumPolygonum polygaloides
ssp. confertiflorumPolygonum punctatumPolygonum scandens
var. scandensPopulus angustifoliaPopulus x brayshawiiPotamogeton amplifoliusPotamogeton foliosusPotamogeton illinoensisPotamogeton natansPotamogeton obtusifoliusPotamogeton praelongusPotamogeton pusillus
var. tenuissimusPotamogeton strictifoliusPotamogeton vaginatusPotentilla diversifoliaPotentilla finitimaPotentilla flabelliformisPotentilla multifidaPotentilla nivea
var. pentaphyllaPotentilla palustrisPotentilla paradoxaPotentilla pensylvanica
var. litoralisPotentilla plattensisPrenanthes albaPrimula incanaPrimula mistassinicaPrunella vulgaris
ssp. lanceolataPrunus americanaPrunus pumila var. besseyi
Psilocarphus brevissimus var. brevissimus
Psilocarphus elatiorPterospora andromedeaPuccinellia cusickiiPuccinellia lemmoniiQuercus macrocarpaRanunculus cardiophyllusRanunculus cymbalaria
var. saximontanusRanunculus glaberrimusRanunculus inamoenus var.inamoenusRanunculus pedatifidus
var. affinisRhinanthus minorRhus glabraRhynchospora albaRhynchospora capillaceaRorippa curvipesRorippa curvipes
var. truncataRorippa sinuataRorippa tenerrimaRosa blandaRubus x paracaulisRuppia cirrhosaRuppia maritima
var. rostrataSagittaria latifoliaSalix brachycarpaSalix maccallianaSalix pedicellarisSalix serissimaSanguinaria canadensisSaxifraga occidentalisSchedonnardus paniculatusScheuchzeria palustris Scirpus cespitosusScirpus pallidusScirpus pumilus ssp. rollandiiScirpus rollandiiScirpus rufus var. neogaeusScrophularia lanceolataScutellaria lateriflora
var. laterifloraSedum lanceolatum
ssp. lanceolatum
Selaginella selaginoidesSenecio eremophilusSenecio integerrimus
var. scribneriSenecio plattensisSenecio pseudaureusShinnersoseris rostrataSilene antirrhinaSilene menziesiiSisyrinchium campestreSisyrinchium septentrionaleSmilax ecirrhataSorbus scopulinaSorghastrum nutansSpartina pectinataSpergularia salinaSphenopholis obtusataSpiraea betulifolia var. lucidaSporobolus heterolepis
porobolus neglectusStellaria longipes
ssp. arenicolaStephanomeria runcinataStipa richardsoniiStipa viridulaStreptopus amplexifolius
var. amplexifoliusSuaeda moquiniiSubularia aquaticaSubularia aquatica
var. americanaSuckleya suckleyanaTaraxacum officinale
ssp. ceratophorumTetraneuris acaulis
var. acaulisTeucrium canadense
var. occidentaleThalictrum occidentaleThelesperma subnudum
var. marginatumThermopsis rhombifoliaTorreyochloa pallida
var. fernaldiiTownsendia exscapaTrichophorum clintoniiTrichophorum pumilumTripterocalyx micranthus
SECTION 4.0 Methods
66
Table 4.1c. Other features of conservation concern (CDC tracked species and communities, wildlife concentrations, and hibernacula)

Trisetum spicatumTrisetum wolfiiUtricularia cornutaUtricularia intermediaUtricularia minorUvularia sessilifoliaVerbena bracteataVerbena hastataVerbena urticifoliaVeronica catenataVeronica serpyllifolia
var. humifusaViburnum lentagoViola conspersaViola pallensViola pedatifidaVulpia octofloraWolffia columbianaWoodsia oregana ssp. oregana
Non-vascular PlantsAcarospora arenaceaAcarospora veronensisAgrestia hispidaAloina rigidaAmblyodon dealbatusAongstroemia longipesArthonia patellulataAspicilia reptansAulacomnium androgynumBrachythecium acutumBrachythecium hylotapetumBrachythecium nelsoniiBrachythecium plumosumBrachythecium reflexumBrachythecium rutabulumBryohaplocladium
virginianumBryum algovicumBryum amblyodonBryum cyclophyllumBryum flaccidumBryum lonchocaulonBryum marratiiBryum pallensBryum turbinatumBryum uliginosumBuellia turgescens
Caloplaca arenariaCaloplaca flavovirescensCaloplaca sideritisCaloplaca trachyphyllaCalypogeia muellerianaCampylium polygamumCampylium radicaleCandelariella efflorescensCatapyrenium squamulosumCetraria arenariaChaenotheca chrysocephalaCladonia macilentaCladonia ramulosaCladonia reiCladonia squamosaCollema coccophorumCollema crispumCollema flaccidumConardia compactaConocephalum conicumCoscinodon cribrosusCyphelium inquinansCyphelium notarisiiCyphelium tigillareDesmatodon cernuusDesmatodon heimiiDesmatodon heimii
var. heimiiDesmatodon randiiDicranum ontarienseDicranum tauricumDidymodon fallaxDidymodon tophaceusDiplotomma alboatrumDrepanocladus brevifoliusDrepanocladus crassicostatusEncalypta spathulataEndocarpon pusillumEntodon concinnusEntodon schleicheriEsslingeriana idahoensisFissidens grandifronsFlavopunctelia soredicaFontinalis antipyreticaFulgensia fulgensGrimmia donnianaGymnostomum aeruginosumHerzogiella turfacea
Hygroamblystegium tenaxHypnum pallescensHypocenomyce friesiiJaffueliobryum rauiJaffueliobryum wrightiiLecania cyrtellaLecanora chlaroteraLecanora crenulataLecanora hybocarpaLecanora meridionalisLecanora salignaLecanora wisconsinensisLecidea confluensLecidea lithophilaLecidella carpathicaLecidella patavinaLepraria lobificansLeskea gracilescensLeskea obscuraLeskea polycarpaLimprichtia cossoniiMannia fragransMannia pilosaMeesia triquetraMelanelia infumataMelanelia olivaceaMicarea melaenaMnium ambiguumMycobilimbia sabuletorumMycocalicium calicioidesOrthotrichum affineOrthotrichum pumilumPellia neesianaPeltigera evansianaPeltigera horizontalisPeltigera polydactylaPhaeophyscia cernohorskyiPhascum cuspidatumPhyscia dimidiataPhyscomitrium hookeriPhyscomitrium pyriformePhysconia enteroxanthaPhysconia isidiigeraPohlia atropurpureaPolyblastia cupularisPseudevernia consociansPseudoleskea patensPseudoleskea stenophylla
Psora himalayanaPsora tuckermaniiPterygoneurum ovatumPterygoneurum subsessilePyrrhospora elabensRamalina roesleriRhizocarpon obscuratumRhizomnium andrewsianumRhizoplaca peltataRhizoplaca subdiscrepansRhodobryum ontarienseRiccardia latifronsRiccardia multifidaRiccia beyrichianaRiccia cavernosaRicciocarpos natansRinodina archaeaRinodina mucronatulaSarcogyne regularisSchistidium heterophyllumSchistidium pulvinatumScoliciosporum chlorococcumScorpidium scorpioidesScouleria aquaticaSeligeria campylopodaSphagnum contortumSplachnum ampullaceumStaurothele elenkiniiThuidium philibertiiToninia tristis ssp. tristisTortula caninervisTrapeliopsis flexuosaUmbilicaria lyngeiVerrucaria glaucovirensVerrucaria viridulaWeissia controversaXanthoparmelia subdecipiensXanthoria hasseanaXanthoria montanaXylographa parallela
Other ElementsBird colonyBird rookeryMigratory Bird
Concentration SiteSnake hibernacula
A Conservation Blueprint for Canada’s Prairies and Parklands
67
Table 4.1c. Other features of conservation concern (CDC tracked species and communities, wildlife concentrations, and hibernacula)
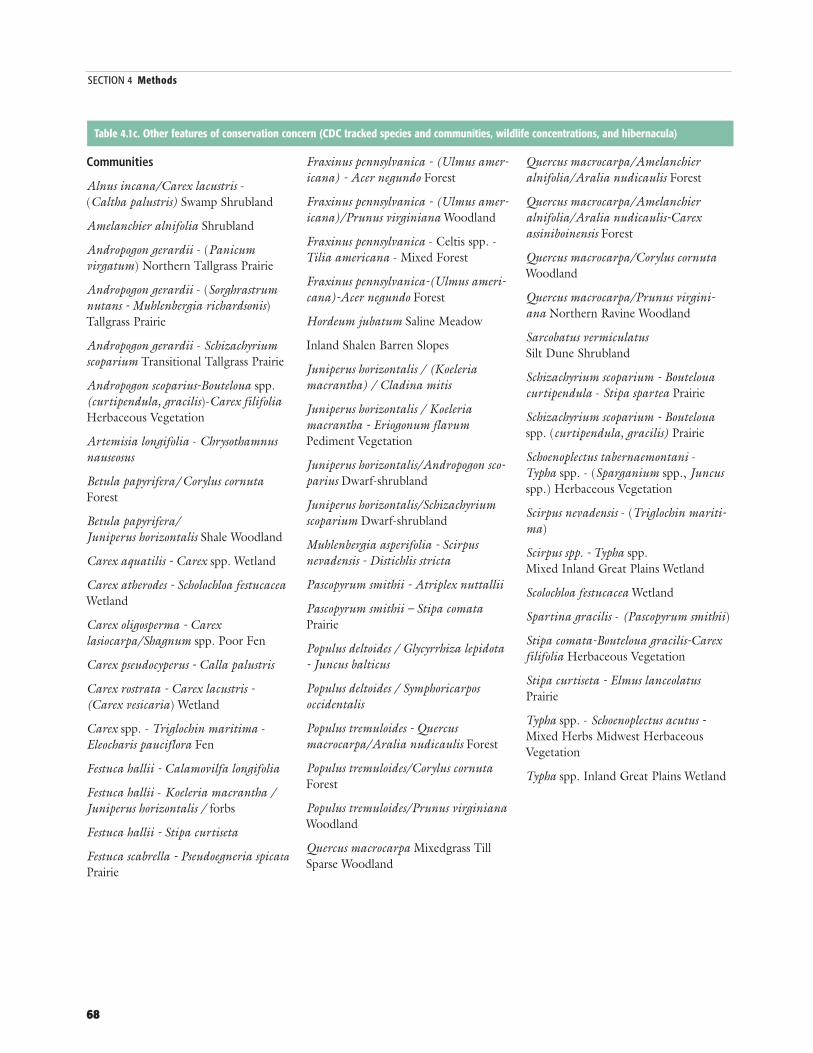
Communities
Alnus incana/Carex lacustris - (Caltha palustris) Swamp Shrubland
Amelanchier alnifolia Shrubland
Andropogon gerardii - (Panicum virgatum) Northern Tallgrass Prairie
Andropogon gerardii - (Sorghrastrumnutans - Muhlenbergia richardsonis)Tallgrass Prairie
Andropogon gerardii - Schizachyriumscoparium Transitional Tallgrass Prairie
Andropogon scoparius-Bouteloua spp.(curtipendula, gracilis)-Carex filifoliaHerbaceous Vegetation
Artemisia longifolia - Chrysothamnusnauseosus
Betula papyrifera/Corylus cornutaForest
Betula papyrifera/Juniperus horizontalis Shale Woodland
Carex aquatilis - Carex spp. Wetland
Carex atherodes - Scholochloa festucaceaWetland
Carex oligosperma - Carexlasiocarpa/Shagnum spp. Poor Fen
Carex pseudocyperus - Calla palustris
Carex rostrata - Carex lacustris -(Carex vesicaria) Wetland
Carex spp. - Triglochin maritima -Eleocharis pauciflora Fen
Festuca hallii - Calamovilfa longifolia
Festuca hallii - Koeleria macrantha /Juniperus horizontalis / forbs
Festuca hallii - Stipa curtiseta
Festuca scabrella - Pseudoegneria spicataPrairie
Fraxinus pennsylvanica - (Ulmus amer-icana) - Acer negundo Forest
Fraxinus pennsylvanica - (Ulmus amer-icana)/Prunus virginiana Woodland
Fraxinus pennsylvanica - Celtis spp. -Tilia americana - Mixed Forest
Fraxinus pennsylvanica-(Ulmus ameri-cana)-Acer negundo Forest
Hordeum jubatum Saline Meadow
Inland Shalen Barren Slopes
Juniperus horizontalis / (Koeleriamacrantha) / Cladina mitis
Juniperus horizontalis / Koeleriamacrantha - Eriogonum flavumPediment Vegetation
Juniperus horizontalis/Andropogon sco-parius Dwarf-shrubland
Juniperus horizontalis/Schizachyriumscoparium Dwarf-shrubland
Muhlenbergia asperifolia - Scirpusnevadensis - Distichlis stricta
Pascopyrum smithii - Atriplex nuttallii
Pascopyrum smithii – Stipa comataPrairie
Populus deltoides / Glycyrrhiza lepidota- Juncus balticus
Populus deltoides / Symphoricarpos occidentalis
Populus tremuloides - Quercus macrocarpa/Aralia nudicaulis Forest
Populus tremuloides/Corylus cornutaForest
Populus tremuloides/Prunus virginianaWoodland
Quercus macrocarpa Mixedgrass TillSparse Woodland
Quercus macrocarpa/Amelanchieralnifolia/Aralia nudicaulis Forest
Quercus macrocarpa/Amelanchieralnifolia/Aralia nudicaulis-Carexassiniboinensis Forest
Quercus macrocarpa/Corylus cornutaWoodland
Quercus macrocarpa/Prunus virgini-ana Northern Ravine Woodland
Sarcobatus vermiculatusSilt Dune Shrubland
Schizachyrium scoparium - Boutelouacurtipendula - Stipa spartea Prairie
Schizachyrium scoparium - Boutelouaspp. (curtipendula, gracilis) Prairie
Schoenoplectus tabernaemontani -Typha spp. - (Sparganium spp., Juncusspp.) Herbaceous Vegetation
Scirpus nevadensis - (Triglochin mariti-ma)
Scirpus spp. - Typha spp. Mixed Inland Great Plains Wetland
Scolochloa festucacea Wetland
Spartina gracilis - (Pascopyrum smithii)
Stipa comata-Bouteloua gracilis-Carexfilifolia Herbaceous Vegetation
Stipa curtiseta - Elmus lanceolatusPrairie
Typha spp. - Schoenoplectus acutus -Mixed Herbs Midwest HerbaceousVegetation
Typha spp. Inland Great Plains Wetland
SECTION 4 Methods
68
Table 4.1c. Other features of conservation concern (CDC tracked species and communities, wildlife concentrations, and hibernacula)

4.3.1 Fine-filter Conservation GoalsConservation goals were set for each fine-filter targetbased on the feature’s conservation status, the impor-tance of the ecoregion to the species, and the species’ dis-tribution.
Conservation goals for species targets were based onthe species’ global conservation status (G-Rank) and dis-tribution (a measure of ‘ecoregion importance’) (Table4.2). Goals indicated are numbers of “occurrences” or“element occurrences” (EOs). An EO represents a homerange or, in the case of plants, a breeding population.
The fine-filter analysis is similar to the coarse-filteranalysis: 1) identify primary fine-filter biodiversity targetsbased on the criteria above; 2) set conservation goals foreach biodiversity target (the minimum number and dis-tribution that should be represented in the blueprint);and 3) identify sites within each ecodistrict that containviable populations of species targets and add them to theblueprint in order to meet conservation goals.
4.3.2 Meeting the GoalsMany of the specific locations of the element occurrences(EOs) provided by the CDCs were buffered on the basisof the spatial accuracy of the record or to represent thespecies’ home ranges. The EO for each target species wereoverlaid on the results of the coarse-filter analysis, pro-tected areas and conservation lands. In each ecodistrict,the EOs captured by the blueprint were evaluated againstthe ecodistrict goal. Where the goal per ecodistrict wasnot met, additional ecological systems were added inorder to represent the necessary number of EOs to meetthe goals set. EOs that were small, less than 200m, werebuffered by a total distance of 2km, and this area wasadded to the blueprint.
Where there was a number of EOs to choose from inorder to meet the goal for a target, those occurrences thatwere closer to protected areas or closer to other blueprintsites were chosen. In situations where conservation goalsfor species targets could not be met by adding a naturalecological system, the site was added and was noted (andmapped on the tile maps) as being a fine-filter addition,containing no natural cover.
4.4: Assembling the PortfolioThe overall “portfolio” of sites included in the detailedblueprint mapping (Appendix D) includes the following:
A. Top-scoring ecological systems in each ecodistrict;B. Existing protected areas and other conservationlands;
andC. Fine-filter element occurrences (EOs) additional
to those already included in A and B (above) sufficient to meet the inclusion goals set for those target species, following the mapping methodmentioned above (4.3.2).
A Conservation Blueprint for Canada’s Prairies and Parklands
69
Distribution Global Conservation RankG1 G2 G3 G4-G5
2 per ecodistrict Secondary Target
2 per ecodistrict Secondary Target
4 per ecodistrict Secondary Target
4 per ecodistrict 3 per ecodistrict
4 per ecodistrict 4 per ecodistrict
2 per ecodistrict 2 per ecodistrict
1 per ecodistrict 1 per ecodistrict
Table 4.2. Conservation goals for primary targets
Widespread
Peripheral
Limited
Disjunct
Endemic
Restricted
Wide-ranging
All viable
occurrences

4.5: The Next BlueprintThe biome is a working landscape within which significantconservation has been achieved by both public agenciesand private landowners, in fact more by the latter than theformer. The conservation blueprint presented here, andits results, are suggestive, not prescriptive. It does notimply that land-use constraint, securement, or any otherconservation action is necessarily appropriate based onjust this analysis.
The GIS analysis used to delineate the conservationblueprint is an automated modelling exercise. Its results,however, warrant ground-truthing, and are useful contextand detail in the identification and design of any prioritylandscape where conservation action is being considered.
An analysis of this type is perfectible. It is a first-everattempt to undertake a biome-wide analysis of biologicaldiversity at actionable scales. The major challenge was thedistribution of these ecoregions across two countries andfive provinces and states. Compiling and analyzing biodi-versity data across multiple jurisdictions was central tobuilding seamless data sets that could support compar-isons across theregion. To create seamless data sets, thelowest common denominator — the most widely cross-walkable unit — was used, which was necessary but unfor-tunate; so for example, land cover data with broader cov-erage, fewer cover types and poorer spatial resolution.Over the course of the project, there were a series of chal-lenges that, if met, could establish the basis for a muchmore robust second iteration of this blueprint sometimein the future. Some examples follow.
Habitat Classification and MappingThere are no agreed-upon habitat (or vegetation) classifi-cation systems or mapping for these jurisdictions. As aresult, there is 1) no accepted and supported fine-scalemapping across the region to serve as the biological com-ponent of any ecological land classification system, and 2)very limited resources for conservation data centres torank and track rare habitat or vegetation types.
Ecological SystemsThe ecological systems developed for this project werecross-walked between five jurisdictions and are the firstattempt that we are aware of to develop such a data layer(Appendix B). However, the results have not yet been
field tested to determine their accuracy. The shortcom-ings in the biological component of the ecological-systemclassification were mentioned above, and this underminesthe ecological-system layer where there are discrepanciesbetween existing coarse-scale vegetation mapping, in thiscase across the Alberta-Saskatchewan boundary. There isno consistent surficial geology mapping across the region,which was cross-walked for the first time in this project,and the scale of abiotic map units varies significantly inone of the jurisdictions; Montana’s geological map unitsare too large to provide mapping of ecological systems atuseful fine scales.
Ecological system polygons were classified along surfi-cial-geology boundaries and this affected the size andshape of polygons. Jurisdictions with coarser surficial-geology mapping have larger, more continuous polygonsas a result. Alberta, with finer surficial-geology mapping,has smaller ecological system polygons. This affects scor-ing, particularly where comparisons are being made acrossjurisdictional boundaries. They do not affect comparisonswithin those individual jurisdictions, however.
These shortcomings are apparent in the coarse map-ping in the Results section, below, where “shadows” ofjurisdictional boundaries (particularly Alberta-Montanaand Alberta-Saskatchewan) can be seen. Finally, there isno underlying GIS-compatible layer of stream sectionsand corresponding watersheds that could serve as thebasis for an equivalent blueprint for aquatic biodiversity.
Fine-filter Targets The assembly of species data sets across five jurisdictionsmay permit a few comments on the differences amongconservation data centres (CDCs). The intensity of sur-vey varies significantly between CDCs, leading to appar-ent inconsistencies in knowledge between jurisdictions.There are limited data on some under-surveyed groups,such as invertebrates and non-vascular plants. There is noorganization of effort to track rare community types,despite the common knowledge that many endemicNorth American grassland vegetation types are globallyrare. Finally, CDCs have been working with NatureServetowards more polygon-based mapping of element occur-rences, but this shift requires standardization across juris-dictional boundaries if the CDCs are to retain any of theirearlier goals of allowing roll-up and analysis across juris-dictional boundaries.
SECTION 4 Methods
70

Conservation GoalsExpert opinion and accepted best practice were the pri-mary reasons for setting conservation goals for targetspecies and for ecological systems. These approachestoscoring and to stratification of results warrant testing.Are these minimum goals sufficient for representingcoarse- and fine-filter targets?
Protected Areas and Conservation LandsThere was no regional mapping of existing protectedareas and conservation lands, nor were there IUCN orGAP classifications for many of them. The data used inthe project is a first approximation, and will have gaps.The major gap is the lack of mapping of private-sectorconservation lands, specifically the large holdings ofDucks Unlimited Canada and the Nature Conservancy ofCanada, which collectively represent one of the largestconservation achievements in the study area.
LimitationsComputer-based landscape assessments are limited to theavailable data. There are no significant regional data,either here or elsewhere in Canada, on important ecolog-ical measures such as ecological condition or environ-mental function, and approaches using surrogate meas-ures remain immature.
The present study is weak in its assessment of currentor desirable connectivity of natural habitats across such ahighly fragmented landscape. However, the results of thestudy do lend themselves to further analysis such as hasbeen done elsewhere in this regard (Riley et al. 2003).
The present study does not deal directly with therestoration challenges facing such a significantly modifiedlandscape. Restoration and rehabilitation are matters usu-ally handled at finer scales. NCC recommends that theblueprint, other regional studies, expert opinion and prac-titioner skills be brought to bear to move down-scalefrom this biome-wide assessment to the identification ofthe “priority landscapes” across the region where conser-vation actions should be pursued on a priority basis toachieve the biodiversity conservation that the regiondeserves.
Study AreaThe original study area was the two “rainbow” ecore-gions, the Aspen Parkland and Moist Mixed Grassland.It quickly became apparent that there were significantbenefits to achieving a consistent methodological cover-age of the entire Canadian prairie and parkland biome. Asa result, the Canadian Mixed Grassland and CypressUpland were added to the study area. This represents anadvance in conservation planning for the Canadian por-tion of the bi-national Northern Great Plains Steppeecoregion (TNC 1999), and the lack of comparable cov-erage for the U.S. portion deserves redress.
A Conservation Blueprint for Canada’s Prairies and Parklands
71

SECTION 5 R e s u l t s
72
A goal of the Conservation Blueprint project was to identify a portfolio of the remaining natural
areas across the landscape that, if properly conserved, could sustain the terrestrial biodiversity of
the prairies, parklands and associated upland forests.
SECTION 5.0
Results

As well, NCC and the many contributing partners in thisproject had as a goal the production of a series of new datalayers to assist with further conservation planning.Although the new layers, such as that for ecological sys-tems, have not yet been fully ground-truthed, they nev-ertheless provide both classifications and mapping that areuseful in describing the natural variability of the studyarea, for an area where such work has not been previous-ly done. Another example is the project’s classificationand mapping of the existing network of protected areasand other conservation lands, with results reported onhow those areas meet particular conservation goals.
Another goal was to produce ecoregionally-relevantlists of target species, and to assemble data on their occur-rences across the whole study area. Initial conservationgoals were established for those species, and occurrencesof those targets were included in the overall Blueprintportfolio, to meet those goals. Most of the target occur-rences were in existing protected areas, other conserva-tion lands, or in high-scoring ecological system polygons.
In the following section, the blueprint results arereported thematically, with sample maps of how the datamay be used. Summary statistics are presented for thebiome (Table 5.1), by ecoregion and ecodistrict (Table5.2) and by ecological system type (Table 5.3). In this waythe reader can get a sense of the relative importance of theblueprint results according to the spatial scale of interest.
Conservation Blueprint –Tile Maps( Appendix D )
The mapped results illustrate a remotely-assessed suiteof natural areas with high probability of being core biodi-versity conservation areas. As such, they warrant ground-truthing to validate their condition, special features andecological functions. On this basis, individuals, agencies,organizations and others may find the data useful, aloneand with other data, in determining the set of prioritylandscapes that should be the focus of conservationefforts.
Twenty-one percent of the study area is provincial orstate lands and waters (major lakes and rivers), with 79%of the study area in private ownership (Fig. 3.1)
Overall, the blueprint maps 34% of the study area as asupporting network of remaining natural cover. This areaexcludes remnant natural-areas smaller than 0.36ha,which are considered as smaller than needed to sustainnative ecological systems (Fig. 5.1).
This is a remarkable figure. The only comparable landconversion that has occurred at this scale in Canada is inOntario south of the Canadian Shield, where again only34% of the land base remains in natural cover (Henson etal. 2005). By comparison, 97% of the Northern Appala-chian-Acadian ecoregion of maritime Canada and NewEngland remains in natural cover (Anderson et al. inprep.).
The sum total of regulated protected areas is close to2% of the study area, with another 5.2% as informal con-servation lands of various types, for a total maximum areaof 7.2% of the study area under some type of conservationstewardship. The blueprint identifies an additional 11% ofthe land base that constitutes the highest-scoring of theremaining ecological systems and the additional occur-rences of target species needed to meet minimum conser-vation goals for those species. So, in total, the blueprintmaps 18.1% of the land base as core biodiversity conser-vation areas on this basis, set within a supportive net-work of remaining natural cover of about one third ofthe land base. These figures vary tremendously across thestudy area: for example, in the Aspen Parkland the rec-ommended conservation lands range from 1% to 71% ofparticular ecodistricts, generally paralleling the extent of
remaining natural cover, 4% to 85%.
Tile MapsThe summary maps from the study are present-ed as a series of edge-matched tile maps (Appen-dix D). These maps include major highways and
rail lines, provincial and state boundaries, major settle-ments and major hydrological features as the underlyingbase.
On this base, all ecodistricts are mapped and named,and the extent of natural cover is shaded lightly acrossthe map. Natural cover is not distinguished by type (grass-land, etc.).
A Conservation Blueprint for Canada’s Prairies and Parklands
73
The blueprint is a contribution to a shared understanding ofthe conservation geography of the region, to help frame theidentification of a suite of core biodiversity conservation areas,set within a supporting network of remaining natural cover.

The highest scoring ecological system types (top twoper ecodistrict) are mapped in bold, within general eco-logical-system types: woodlands, grasslands/shrublands,wetlands, and mud/sand/ saline areas.
Also mapped are existing protected areas and otherconservation lands, outlined in dark green so that con-stituent high-scoring ecological systems can be seenwhere they occur within such conserved areas.
Finally, the tile maps shsow the occurrences of targetspecies, where they occur outside of high-scoring eco-logical systems and where they occur outside of existingprotected areas and conservation lands. Areas of naturaland non-natural cover are indicated at these elementoccurrences.
SECTION 5 Results
74

A Conservation Blueprint for Canada’s Prairies and Parklands
75
Tabl
e 5.
1. B
luep
rint d
ata
sum
mar
y, b
y ec
oreg
ion
Aspe
n Pa
rklan
d20
,570,6
1445
2,350
4,764
,100
25%
858,3
304.2
%99
3,788
1,852
,118
9%2,2
22,5
0013
%
Moi
st M
ixed
Gras
sland
13,02
7,071
233,3
803,6
84,25
530
%54
1,200
4.2%
1,682
,678
2,223
,878
17%
1,943
,600
17%
Mixe
d Gr
assla
nd13
,401
,679
273,6
505,7
53,4
0045
%1,6
28,30
012
.1%2,1
79,67
33,8
07,97
328
%4,2
86,30
034
%
Cypr
ess U
plan
d83
2,461
5,243
637,9
8077
%12
4,070
14.9%
363,7
8948
7,859
59%
394,0
9048
%
Porti
on o
f Bor
eal T
rans
ition*
**71
1,781
20,70
649
2,377
72%
311,6
2943
.8%11
,980
323,6
0945
%35
0,479
52%
Tota
l48
,543
,606
985,
329
15,3
32,11
234
%3,
463,
529
7.1%
5,23
1,908
8,69
5,43
718
%9,1
96,9
6921
%
* In
clude
s majo
r lak
es a
nd ri
vers;
term
ed “w
aters”
in ri
ght-h
and
colu
mn.
**Ec
olog
ical s
yste
ms a
re G
rass
lands
/Shr
ublan
ds, w
oodl
ands
, Wet
lands
and
Mud
/San
d/Sa
line
polyg
ons t
hat a
re 0
.36ha
or l
arge
r.**
*Con
sists
of tw
o ec
odist
ricts
arou
nd R
idin
g M
ount
ain N
ation
al Pa
rk.
Maj
orTo
tal
Cons
erva
tion
Tota
lTo
tal
Area
of
Crow
n an
dTo
tal a
rea
Hydr
olog
ical
Ecol
ogica
lBl
uepr
int
Blue
prin
tBl
uepr
int
Crow
n an
dSt
ate
Land
sof
Eco
regi
onFe
atur
esSy
stem
sou
tsid
e PA
/CL
and
PA/C
L an
dSt
ate
Land
san
d W
ater
sTo
tal
Area
PA a
nd C
LBP
Site
sBP
Site
sEC
ORE
GIO
N NA
ME
(ha)
(ha)
(ha)
%(h
a)%
(ha)
(%)
(ha)
(%)
Prot
ecte
d Ar
eas a
ndCr
own
& St
ate
Land
s Na
tura
l Cov
er in
Eco
regi
onCo
nser
vatio
n La
nds
Cons
erva
tion
Blue
prin
tan
d W
ater
s

SECTION 5 Results
76
Tabl
e 5.
2 B
luep
rint d
ata
sum
mar
y, b
y ec
odis
tric
t (ec
odis
tric
ts a
re m
appe
d on
Fig
. 10)
Ledu
c72
785
5,446
18,6
8164
,061
10%
4,849
1%8,7
8113
,630
2%
Andr
ew72
839
0,289
6,456
26,62
18%
00%
4,278
4,278
1%
Lloyd
min
ister
Plai
n72
998
1,452
12,91
623
5,310
25%
29,05
13%
73,01
210
2,063
10%
Verm
ilion
730
1,008
,361
9,804
145,5
5015
%9,7
841%
12,72
522
,509
2%
Days
land
731
829,5
3525
,401
63,03
211
%18
,122
2%10
,081
28,20
33%
Cook
ing
Lake
73
215
8,483
11,85
055
,721
43%
31,0
4120
%6,3
3537
,376
24%
Whi
tewo
od H
ills73
335
7,054
10,61
411
7,010
36%
33,37
79%
31,93
465
,311
18%
Lowe
r Batt
le Ri
ver P
lain
734
150,9
733,5
0391
,360
63%
38,0
8025
%23
,542
61,62
241
%
May
mon
t Plai
n73
524
6,483
15,30
933
,183
20%
5,500
2%6,7
8712
,287
5%
Wald
heim
Plai
n73
641
2,250
11,43
268
,809
19%
7,121
2%15
,999
23,12
06%
Red
Deer
737
345,0
5510
,529
23,63
410
%1,0
380%
2,921
3,959
1%
Sedg
ewick
738
229,1
9138
721
,158
9%0
0%4,8
744,8
742%
Edge
rton-
Ribs
tone
Plai
n73
941
6,791
15,70
120
6,010
53%
108,8
6026
%44
,023
152,8
8337
%
Bash
aw74
037
8,208
12,48
770
,761
22%
8,807
2%10
,022
18,82
95%
Cudw
orth
Plai
n74
123
2,563
7,072
36,28
619
%2,4
931%
4,957
7,450
3%
Haffo
rd P
lain
742
72,49
21,5
2324
,558
36%
7,626
11%
9,945
17,57
124
%
Prov
ost P
lain
743
194,5
011,8
9727
,290
15%
1,477
1%8,5
7810
,055
5%
Pine
Lake
744
363,1
741,9
5746
,176
13%
207
0%9,5
889,7
943%
Quill
Lake
Plai
n74
51,0
30,10
085
,068
99,5
9618
%63
,072
6%13
,505
76,57
77%
Olds
746
251,2
8452
08,7
874%
00%
1,300
1,300
1%
Whi
tesa
nd P
lain
747
163,8
696,9
4980
,525
53%
28,55
717
%35
,191
63,74
839
%
Touc
hwoo
d Hi
lls U
plan
d74
81,0
20,42
14,6
1819
2,640
19%
40,48
94%
39,11
179
,600
8%
York
ton
Plain
749
612,5
093,9
1899
,365
17%
5,433
1%18
,147
23,5
804%
Blac
k Diam
ond
750
399,3
2397
523
8,940
60%
5,799
1%46
,495
52,29
413
%
St. L
azar
e Pla
in75
120
7,837
5,293
120,7
2061
%42
,032
20%
20,37
962
,411
30%
Melv
ille P
lain
752
976,0
154,8
2218
7,600
20%
14,92
32%
34,9
8549
,908
5%
Tota
l Are
aM
ajor
Area
Cons
erva
tion
Tota
lof
Eco
dist
rict
Hydr
olog
ical
Ecol
ogica
lNa
tura
l Ar
ea o
fAr
ea o
fBl
uepr
int
Cons
erva
tion
Perc
ent o
fEc
odist
rict
Feat
ures
Syst
ems
Cove
rPA
and
CL
PA a
nd C
LO
utsid
e PA
Blue
prin
tEc
odist
rict
Ecod
istric
tNu
mbe
r(h
a)(h
a)(h
a)(%
)(h
a)(%
)an
d CL
(ha)
(ha)
in B
uepr
int
Prot
ecte
d Ar
eas a
ndAS
PEN
PARK
LAN
D EC
ORE
GIO
NNa
tura
l Cov
er
Cons
erva
tion
Land
sCo
nser
vatio
n Bl
uepr
int

A Conservation Blueprint for Canada’s Prairies and Parklands
77
Tabl
e 5.
2 B
luep
rint d
ata
sum
mar
y, b
y ec
odis
tric
t con
t’d
Ham
iota
753
829,7
807,8
0618
2,440
23%
770
0%16
,474
17,24
42%
Indi
an H
ead
Plain
754
343,3
635,3
2762
,837
20%
981
0%20
,820
21,8
016%
Moo
se M
ount
ain U
plan
d75
527
0,583
1,059
41,5
9016
%3,1
421%
12,83
615
,978
6%
Kipl
ing
Plain
756
548,9
733,0
4510
1,670
19%
14,79
63%
28,31
143
,107
8%
Shilo
757
265,1
1418
716
3,620
62%
69,79
026
%17
,499
87,28
933
%
Stoc
kton
758
343,1
6394
510
4,670
31%
15,20
94%
14,00
029
,209
9%
Carb
erry
759
57,4
0825
712
,382
22%
621
1%3,0
743,6
956%
Gain
sbor
ough
-Nor
ther
n Bl
ack P
rairi
e76
01,3
27,67
83,7
1818
1,250
14%
28,26
02%
16,91
745
,177
3%
Moo
se M
ount
ain76
111
7,753
5,204
86,03
777
%54
,661
46%
29,43
884
,099
71%
Moo
se M
ount
ain C
reek
Plai
n76
213
9,627
1,185
48,12
535
%9,8
997%
19,11
129
,010
21%
Oak L
ake
Plain
– G
lacial
Lak
e Ba
sins
763
445,2
6611
,988
166,3
3040
%6,3
891%
30,5
9436
,983
8%
Hilto
n76
413
4,190
500
39,25
930
%2,6
782%
5,774
8,451
6%
Killa
rney
– N
orth
ern
Blac
k Pra
irie
765
616,5
4912
,280
90,87
117
%15
,001
2%16
,454
31,45
55%
Man
itou
766
326,8
037,6
5575
,760
26%
3,644
1%11
,102
14,74
65%
Gran
dview
839
221,9
5870
70,81
932
%2,4
721%
10,75
613
,228
6%
Daup
hin
840
211,6
9551
,371
74,0
8059
%10
,719
5%7,5
9518
,314
9%
Alon
sa84
148
8,239
31,33
038
2,940
85%
44,0
449%
86,9
8713
1,031
27%
Ste.
Rose
843
92,5
6323
752
,304
57%
15,51
717
%14
,081
29,5
9832
%
McC
rear
y84
414
4,893
1,092
67,43
747
%1,5
591%
8,136
9,695
7%
Glad
stone
847
105,7
106,9
9424
,555
30%
8,138
8%3,7
0411
,841
11%
Mac
Greg
or85
028
9,892
098
,947
34%
2,237
1%7,5
529,7
903%
Pem
bina
854
153,4
961,0
2030
,385
20%
662
0%2,8
133,4
762%
Turtl
e M
ount
ains
855
167,1
875,9
7511
3,770
72%
29,74
018
%66
,811
96,55
158
%
North
ern
Blac
k Pra
irie
1ND
157
5,217
3,420
89,16
316
%7,6
091%
36,0
8043
,689
8%
Pem
bina
Esc
arpm
ent
ND2
69,8
460
18,12
826
%2,0
633%
9,376
11,43
916
%
Tram
ping
Lak
e Pla
in76
768
2,520
18,65
513
6,330
23%
11,0
922%
42,65
153
,743
8%
Tota
l Are
aM
ajor
Area
Cons
erva
tion
Tota
lof
Eco
dist
rict
Hydr
olog
ical
Ecol
ogica
lNa
tura
l Ar
ea o
fAr
ea o
fBl
uepr
int
Cons
erva
tion
Perc
ent o
fEc
odist
rict
Feat
ures
Syst
ems
Cove
rPA
and
CL
PA a
nd C
LO
utsid
e PA
Blue
prin
tEc
odist
rict
Ecod
istric
tNu
mbe
r(h
a)(h
a)(h
a)(%
)(h
a)(%
)an
d CL
(ha)
(ha)
in B
uepr
int
Prot
ecte
d Ar
eas a
ndAS
PEN
PARK
LAN
D EC
ORE
GIO
NNa
tura
l Cov
er
Cons
erva
tion
Land
sCo
nser
vatio
n Bl
uepr
int

SECTION 5 Results
78
Tabl
e 5.
2 B
luep
rint d
ata
sum
mar
y, b
y ec
odis
tric
t con
t’d
Senl
ac H
ills76
860
,991
1,000
26,31
945
%2,0
693%
13,4
6415
,533
25%
Casto
r76
940
6,676
22,25
034
,718
14%
00%
16,8
0316
,803
4%
Goos
e La
ke P
lain
770
511,4
4225
,986
118,4
0028
%47
,739
9%26
,175
73,91
414
%
Neut
ral H
ills77
146
0,974
6,081
177,0
2040
%20
,160
4%72
,096
92,25
620
%
Sask
atoon
Plai
n77
210
7,424
2,125
21,5
6222
%24
50%
9,344
9,590
9%
Esto
w Pla
in77
348
2,448
9,977
54,93
813
%7,3
382%
9,718
17,05
74%
Min
ichin
as U
plan
d77
497
,021
723
22,51
624
%1,5
472%
10,53
912
,086
12%
Bear
Hills
775
122,8
9618
138
,992
32%
6,847
6%17
,449
24,29
620
%
Moo
sewo
od S
and
Hills
776
216,0
674,9
1212
9,090
62%
67,97
031
%44
,685
112,6
5552
%
Sulliv
an L
ake
777
127,7
906,1
0616
,271
18%
00%
7,598
7,598
6%
Bigg
ar P
lain
778
58,31
71,3
3127
,730
50%
4,703
8%17
,715
22,41
838
%
Endi
ang
779
153,5
675,7
9040
,402
30%
14,21
29%
18,51
932
,731
21%
Rose
town
Plai
n78
041
5,243
11,23
041
,345
13%
6,772
2%12
,764
19,53
65%
Drum
helle
r78
132
6,425
765
51,93
316
%3,8
061%
21,76
625
,572
8%
Arm
Rive
r Plai
n78
274
2,329
7,009
95,23
214
%17
,231
2%22
,360
39,5
915%
Stra
sbou
rg P
lain
783
442,6
527,8
8558
,532
15%
18,18
74%
26,65
244
,839
10%
Last
Mou
ntain
Lak
e Pla
in78
421
0,046
16,63
047
,278
30%
36,11
217
%6,4
6042
,572
20%
Allan
Hills
785
116,3
9716
22,93
620
%2,2
162%
4,812
7,028
6%
Win
terin
g Hi
lls78
619
0,141
1,549
82,97
244
%2,3
831%
38,44
840
,831
21%
Majo
rville
Upl
and
787
306,7
814,9
8213
7,690
47%
70%
72,00
172
,008
23%
Stan
dard
Plai
n78
810
7,136
978
15,01
715
%0
0%6,9
066,9
066%
Eyeb
row
Plain
789
270,9
869,9
4672
,017
30%
31,9
8312
%29
,489
61,47
223
%
Blac
kfoot
Plai
n79
013
2,294
7,393
53,5
9246
%14
50%
23,87
424
,019
18%
Vulca
n Pla
in79
122
0,192
689
31,95
315
%0
0%12
,910
12,91
06%
Regin
a Pla
in79
291
0,502
4,494
74,5
449%
12,5
831%
23,29
735
,880
4%
Tota
l Are
aM
ajor
Area
Cons
erva
tion
Tota
lof
Eco
dist
rict
Hydr
olog
ical
Ecol
ogica
lNa
tura
l Ar
ea o
fAr
ea o
fBl
uepr
int
Cons
erva
tion
Perc
ent o
fEc
odist
rict
Feat
ures
Syst
ems
Cove
rPA
and
CL
PA a
nd C
LO
utsid
e PA
Blue
prin
tEc
odist
rict
Ecod
istric
tNu
mbe
r(h
a)(h
a)(h
a)(%
)(h
a)(%
)an
d CL
(ha)
(ha)
in B
uepr
int
Prot
ecte
d Ar
eas a
ndAS
PEN
PARK
LAN
D EC
ORE
GIO
NNa
tura
l Cov
er
Cons
erva
tion
Land
sCo
nser
vatio
n Bl
uepr
int

A Conservation Blueprint for Canada’s Prairies and Parklands
79
Tabl
e 5.
2 B
luep
rint d
ata
sum
mar
y, b
y ec
odis
tric
t con
t’d
Leth
brid
ge P
lain
793
743,6
929,4
9918
8,900
27%
329
0%46
,537
46,8
666%
Griff
in P
lain
794
641,0
462,2
9669
,491
11%
11,0
432%
13,0
8224
,125
4%
Tros
sach
s Plai
n79
684
1,564
17,4
6122
1,560
28%
86,55
310
%60
,422
146,9
7517
%
Milk
Rive
r Upl
and
797
177,5
1280
124,0
1070
%26
,543
15%
73,38
099
,923
56%
Delac
our P
lain
798
746,7
648,7
9010
6,230
15%
1,348
0%18
,826
20,17
43%
Willo
w Cr
eek U
plan
d79
918
1,813
5114
0,200
77%
826
0%95
,958
96,78
453
%
Card
ston
Plain
800
306,2
434,3
9712
8,360
43%
5,550
2%35
,880
41,43
014
%
Twin
But
te80
113
4,341
1,156
96,02
572
%13
0%39
,979
39,9
9230
%
Del B
onita
Plat
eau
– Fo
othi
ll Gra
sslan
d80
240
0,532
2,101
295,2
5074
%2,5
911%
223,3
7022
5,961
56%
Foot
hill G
rass
land
MT1
578,2
394,1
6940
0,795
70%
63,5
0011
%25
7,150
320,6
5055
%
North
Cen
tral B
rown
Gl
aciat
ed P
lains
MT2
160,4
022,4
7380
,011
51%
3,992
2%38
,134
42,12
626
%
Rock
y Mou
ntain
Fro
nt
Foot
hill P
otho
les 1
MT3
167,1
2683
415
2,853
92%
1,296
1%13
3,590
134,8
8681
%
Rock
y Mou
ntain
Fro
nt
Foot
hill P
otho
les 2
MT4
62,18
11,3
9258
,883
97%
22,22
936
%34
,054
56,28
391
%
Rock
y Mou
ntain
Fro
ntFo
othi
ll Pot
holes
3M
T56,3
470
4,654
73%
371%
3,821
3,857
61%
Tota
l Are
aM
ajor
Area
Cons
erva
tion
Tota
lof
Eco
dist
rict
Hydr
olog
ical
Ecol
ogica
lNa
tura
l Ar
ea o
fAr
ea o
fBl
uepr
int
Cons
erva
tion
Perc
ent o
fEc
odist
rict
Feat
ures
Syst
ems
Cove
rPA
and
CL
PA a
nd C
LO
utsid
e PA
Blue
prin
tEc
odist
rict
Ecod
istric
tNu
mbe
r(h
a)(h
a)(h
a)(%
)(h
a)(%
)an
d CL
(ha)
(ha)
in B
uepr
int
Prot
ecte
d Ar
eas a
ndAS
PEN
PARK
LAN
D EC
ORE
GIO
NNa
tura
l Cov
er
Cons
erva
tion
Land
sCo
nser
vatio
n Bl
uepr
int

SECTION 5 Results
80
Tabl
e 5.
2 B
luep
rint d
ata
sum
mar
y, b
y ec
odis
tric
t con
t’d
Kerro
bert
Plain
803
252,3
6112
,602
75,95
235
%47
,682
19%
11,00
458
,686
23%
Soun
ding
Cre
ek P
lain
804
214,4
302,4
5013
0,620
62%
00%
81,93
181
,931
38%
Sibba
ld P
lain
805
148,0
392,1
9634
,132
25%
5,038
3%7,0
1912
,057
8%
Berry
Cre
ek P
lain
806
800,9
1511
,605
620,5
2079
%20
,790
3%35
5,050
375,8
4047
%
Bad
Hills
807
171,8
111,7
0063
,338
38%
18,8
6611
%21
,156
40,02
223
%
Esto
n Pla
in80
892
3,039
30,26
517
9,890
23%
112,5
3012
%31
,558
144,0
8816
%
Oye
n Pla
in80
953
6,813
2,704
269,6
0051
%33
,556
6%10
5,460
139,0
1626
%
Cote
au H
ills81
015
0,813
1,237
34,55
224
%1,6
391%
25,92
327
,562
18%
Acad
ia Pla
in81
182
,652
299
20,44
725
%68
51%
13,31
814
,003
17%
Broo
ks P
lain
812
359,2
992,5
6420
4,740
58%
1,107
0%83
,675
84,78
224
%
Beec
hy H
ills81
329
1,049
10,6
6712
6,450
47%
74,85
626
%37
,761
112,6
1739
%
Rain
y Hills
Upl
and
814
278,5
711,4
5425
0,660
91%
138,2
9050
%74
,704
212,9
9476
%
Bind
loss
Plai
n81
544
1,649
9,059
297,7
3069
%12
0,780
27%
62,51
718
3,297
42%
Chap
lin P
lain
816
670,4
8363
,878
181,4
1037
%84
,623
13%
50,73
513
5,358
20%
Hazle
t Plai
n81
721
8,082
236
41,0
6819
%22
,097
10%
11,4
0833
,505
15%
Bow
City
Plain
818
167,8
309,0
2292
,775
61%
527
0%63
,272
63,79
938
%
Grea
t San
d Hi
lls81
912
5,034
561
110,2
2089
%95
,889
77%
14,82
611
0,715
89%
Ante
lope
Cre
ek P
lain
820
271,8
493,5
5159
,381
23%
16,6
836%
13,39
730
,080
11%
Schu
ler P
lain
821
424,0
3010
,209
201,6
6050
%16
,368
4%60
,888
77,25
618
%
Dirt
Hills
822
335,0
5761
515
5,650
47%
26,10
68%
81,78
910
7,895
32%
Vaux
hall P
lain
823
246,0
563,1
0864
,731
28%
560%
32,61
532
,671
13%
Gull L
ake
Plain
824
152,8
5880
968
,314
45%
24,9
4416
%29
,689
54,63
336
%
Swift
Cur
rent
Plat
eau
825
759,3
354,6
6914
9,060
20%
14,77
22%
27,29
642
,068
6%
Woo
d Ri
ver P
lain
826
1,005
,394
13,47
317
3,750
19%
38,0
964%
43,52
481
,620
8%
Swift
Cur
rent
Plat
eau
825
759,3
354,6
6914
9,060
20%
14,77
22%
27,29
642
,068
6%
Woo
d Ri
ver P
lain
826
1,005
,394
13,47
317
3,750
19%
38,0
964%
43,52
481
,620
8%
Woo
d Ri
ver P
lain
826
1,005
,394
13,47
317
3,750
19%
38,0
964%
43,52
481
,620
8%
Tota
l Are
aM
ajor
Area
Cons
erva
tion
Tota
lof
Eco
dist
rict
Hydr
olog
ical
Ecol
ogica
lNa
tura
l Ar
ea o
fAr
ea o
fBl
uepr
int
Cons
erva
tion
Perc
ent o
fEc
odist
rict
Feat
ures
Syst
ems
Cove
rPA
and
CL
PA a
nd C
LO
utsid
e PA
Blue
prin
tEc
odist
rict
Ecod
istric
tNu
mbe
r(h
a)(h
a)(h
a)(%
)(h
a)(%
)an
d CL
(ha)
(ha)
in B
uepr
int
Prot
ecte
d Ar
eas a
ndM
IXED
GRA
SSLA
ND
ECO
REGI
ON
Natu
ral C
over
Co
nser
vatio
n La
nds
Cons
erva
tion
Blue
prin
t

A Conservation Blueprint for Canada’s Prairies and Parklands
81
Tabl
e 5.
2 B
luep
rint d
ata
sum
mar
y, b
y ec
odis
tric
t con
t’d
Map
le Cr
eek P
lain
827
261,7
7612
,235
203,1
8082
%81
,554
31%
113,3
0019
4,854
74%
Fore
mos
t Plai
n82
81,0
94,42
725
,857
331,6
6033
%8,1
091%
106,0
9011
4,199
10%
Purp
le Sp
rings
Plai
n82
913
7,998
1,605
76,14
956
%0
0%47
,562
47,5
6234
%
Cote
au L
akes
Upl
and
830
669,5
1321
,300
258,8
1042
%79
,927
12%
95,4
6017
5,387
26%
Lake
Alm
a Up
land
831
212,1
9778
351
,219
25%
8,445
4%17
,536
25,9
8112
%
Woo
d M
ount
ain P
latea
u83
288
4,722
4,444
523,3
8060
%25
8,480
29%
205,5
5046
4,030
52%
Wild
Hor
se P
lain
833
566,4
655,5
7247
2,600
84%
158,2
3028
%20
1,880
360,1
1064
%
Clim
ax P
lain
834
355,3
332,5
9411
2,100
32%
63,72
218
%20
,809
84,53
124
%
Old
Man
on
His B
ack P
latea
u83
513
7,723
223
94,61
169
%53
,210
39%
35,78
588
,995
65%
Swee
tgra
ss83
633
,346
023
,088
69%
625
2%13
,186
13,81
141
%
Tota
l Are
aM
ajor
Area
Cons
erva
tion
Tota
lof
Eco
dist
rict
Hydr
olog
ical
Ecol
ogica
lNa
tura
l Ar
ea o
fAr
ea o
fBl
uepr
int
Cons
erva
tion
Perc
ent o
fEc
odist
rict
Feat
ures
Syst
ems
Cove
rPA
and
CL
PA a
nd C
LO
utsid
e PA
Blue
prin
tEc
odist
rict
Ecod
istric
tNu
mbe
r(h
a)(h
a)(h
a)(%
)(h
a)(%
)an
d CL
(ha)
(ha)
in B
uepr
int
Prot
ecte
d Ar
eas a
ndM
IXED
GRA
SSLA
ND
ECO
REGI
ON
Natu
ral C
over
Co
nser
vatio
n La
nds
Cons
erva
tion
Blue
prin
t
Cypr
ess S
lope
837
171,9
8972
710
0,850
59%
5,640
3%68
,839
74,47
943
%
Cypr
ess H
ills83
866
0,545
4,512
537,1
3082
%11
8,430
18%
294,9
5041
3,380
63%
Swan
Rive
r Plai
n (M
B on
ly)70
924
2,047
7,781
110,6
6949
%14
,809
6%4,6
6019
,469
8%
Ridi
ng M
ount
ain P
ark
716
469,7
3412
,925
381,7
0884
%29
6,820
63%
7,319
304,1
3965
%
CYPR
ESS
UPLA
ND
ECO
REGI
ON
BORE
AL T
RAN
SITI
ON
ECO
DIST
RICT
S

SECTION 5 Results
82
Table 5.3 Blueprint data summary, portfolio site contribution by ecological system type
Aspen Parkland 1,403,166 619,680 2,728,590 12,655 4,764,091
Aspen Parkland Blueprint 479,860 180,406 963,076 11,379 1,634,721
Aspen Parkland Blueprint as % of total area of remaining ecological systems 34.2% 29.1% 35.3% 89.9% 34.3%
Moist Mixed Grassland 183,604.0 253,600 3,245,666 1,385 3,684,255
Moist Mixed Grassland Blueprint 47,667.2 53,050 2,008,762 853.9 2,110,333
Moist Mixed Grassland Blueprint as % of total area of remaining ecological systems 26.0% 20.9% 61.9% 61.7% 57.3%
Mixed Grassland 19,849 176,480 5,545,805 11,260 5,753,394
Mixed Grassland Blueprint 7,247 39,075 3,624,252 9,846.3 3,680,420
Mixed Grassland Blueprint as % of total area of remaining ecological systems 36.5% 22.1% 65.4% 87.4% 64.0%
Cypress Upland 25,720 3,942 608,322 0 637,984
Cypress Upland Blueprint 20,121.2 1,390.2 462,016 0 483,528
Cypress Upland Blueprint as % of total area of remaining ecological systems 78.2% 35.3% 75.9% 0.0% 75.8%
Portion of Boreal Transition 339,237 45,783 107,356 n/a 492,377
Portion of Boreal Transition Blueprint 271,246 34,615 12,988 n/a 318,848
Portion of Boreal Transition Blueprint as % of total area of remaining ecological systems 80.0% 75.6% 12.1% n/a 64.8%
Total 1,971,576 1,099,486 12,235,739 25,300 15,332,101
Conservation Blueprint total 826,141 308,536 7,071,093 22,080 8,227,850% included in Conservation Blueprint 41.9% 28.1% 57.8% 87.3% 53.7%
Target Woodland Taget Wetland Target Grassland/ Target Mud / Sand/ All TargetedECOREGION Systems Systems (ha) Shrubland Systems Saline Systems Systems
(ha) (ha) (ha) (ha) (ha)

Natural Cover and Existing Protected Areasand Conservation LandsNatural cover varies tremendously across the study area,but there are definite patterns (Fig. 22, Tables 5.1, 5.2).The Aspen Parkland has been reduced to about 25%remaining natural cover; Moist Mixed Grassland to 30%and Mixed Grassland to 45%. This reflects the moisturegradient across the region, the notable exception to whichis the Cypress Upland, where 77% of natural coverremains.
Among ecodistricts, the variation is radically variable,reflecting suitability for agricultural conversion.
Aspen Parkland — From Olds (4%) to Turtle Mountain(72%), Moose Mountain (77%) and Alonsa (85%);
Moist Mixed Grassland — From the Regina Plain (9%)and Griffin Plain (11%) to the Moosewood Sand Hills(62%), Milk River Upland (70%) and Willow CreekUpland (77%);
Mixed Grassland — From Hazlet and Wood River Plains(19%) and Swift Current Plain (20%) to the Great SandHills (89%) and Rainy Hills Upland (91%).
These patterns parallel the extent regulated protected areaand other conservation lands (PA/CL) in each ecoregion.Aspen Parkland and Moist Mixed Grassland both have4.2% of lands in PA/CL; Mixed Grassland has 12.1% andthe Cypress Upland has 14.9% of its lands in PA/CL.
Among ecodistricts, there is greater variability (Fig. 23,Table 5.2):
Aspen Parkland — Lower Battle River Plain (25%),Edgerton-Ribstone Plain and Shilo (26%) and MooseMountain (46%);
Moist Mixed Grassland — Milk River Upland (15%),Last Mountain Lake Plain (17%) Moosewood Sand Hills(31%), and Rocky Mountain Front 2 (36%);
Mixed Grassland — Old Man on His Back Plateau(39%), Rainy Hills Upland (50%) and Great Sand Hills(77%);
Cypress Upland — Cypress Hills ecodistrict (18%); and
Boreal Transition — Riding Mountain (63%).
A Conservation Blueprint for Canada’s Prairies and Parklands
83
Figure 22. Extent of natural cover, by ecodistrict

Top Scoring Ecological SystemsThe tile maps illustrate the scoring and selection of theecological system polygons that meet the goal of repre-senting the top two scoring ecological system types perecodistrict in the blueprint (Appendix C). This is the levelof replication the project considered the minimum levelneeded for the conservation of organisms and ecosystemson a landscape that is so heavily converted.
The present study did not inject minimum area require-ments for the representation of natural cover across thelandscape, although this analysis can be done on the basisof the data developed for the project. Minimum arearequirements cannot be met in the large proportion ofecodistricts with less than 15-20% natural cover left,where rehabilitation and restoration will be needed tomeet any modicum of ecological functionality at sustain-able levels.
The study data permit different scoring approachesamong ecological systems. Three others are illustratedhere to demonstrate approaches different from the detail-ed tile mapping:
■ The “top ten” scoring general ecological system typeswithin each ecoregion making up the study area (Fig. 24); and
■ The “top ten” scoring general ecological system typeswithin each province or state in the study area (Fig. 25).
■ The “top fifteen” scoring general ecological systemtypes within the Canadian portion of the study area(Fig. 26). Each of these illustrates a different approach to consid-
ering regional context, which can be useful in identifyingpriority landscapes for conservation action across theregion.
On the other hand, the maps also illustrate shortcom-ings in the underlying data. For example, as discussedabove, the weak surficial geology mapping in Montanaresulted in ecological-system mapping for Montana thathad larger average polygon sizes than elsewhere in thestudy area, hence the overstated connectedness of theareas selected there. The boundary between Saskatchewanand Alberta is also subtly evident on Figures 24 and 26,again reflecting a less-than-seamless ecological systemclassification based on the available information.
SECTION 5 Results
84
Figure 23. Extent of protected areas and other conservation lands, by ecodistrict

A Conservation Blueprint for Canada’s Prairies and Parklands
85
Figure 24. “Top ten” scoring general ecological system types within each ecoregion making up the study area
Figure 25. “Top ten” scoring general ecological system types within a province or state portion of the study area

Concentrations of Fine-filter TargetsA data set of all known current occurrences of thirty pri-mary species targets was used to positively score the eco-logical system polygons in which they occurred, as well asto assess existing protected areas and to ensure that min-imum levels of inclusion of these targets were achieved inthe final blueprint portfolio (Table 4.1a).
A data set of the known current occurrences of othertargets included secondary targets (Table 4.1b) and otherfeatures of conservation concern, such as other speciestracked by CDCs that had S1-S3 ranks or wereCOSEWIC-listed, documented migratory bird concen-tration sites and snake hibernacula (Table 4.1c). Theseoccurrences also contributed scores to polygons.
Collectively, the occurrences of all of these species andfeatures is portrayed on Figure 27. There is some uneven-ness in survey intensity between jurisdictions but theoverall coverage is strong.
The distribution of these targets across the region canbe illustrated in a variety of ways.
■ The density of all target occurrences by ecodistrictacross the study area (Fig. 28). This illustrates theimportance of the Mixed Grassland ecoregion, theeastern slopes and key eastern river valleys to rarespecies conservation.
■ The density of all target occurrences by ecodistrictwithin each ecoregion (Fig. 29). The pattern here isthat more southern ecodistricts within each ecoregionare particularly important for rare species.
■ The density of all target occurrences by ecodistrictwithin each province or state jurisdiction (Fig. 30).Again, as above, the Mixed Grassland ecoregion, theeastern slopes and key eastern river valleys are particu-larly important to rare species conservation.
Again, each of these illustrates a different approach tooverall regional context, which can be useful in identify-ing priority landscapes for conservation action.
SECTION 5 Results
86
Figure 26. “Top fifteen” scoring general ecological system types within the Canadian portion of the study area

A Conservation Blueprint for Canada’s Prairies and Parklands
87
Figure 27. Occurrences of all features of conservation concern and target species
Figure 28. Density of all features of conservation concern and target species, by ecodistricts across the study area

SECTION 5 Results
88
Figure 29. Density of all features of conservation concern and target species, by ecodistrict within each ecoregion
Figure 30. Density of all features of conservation concern and target species, by ecodistrict, within each provincial or state jurisdiction

Core Biodiversity Conservation LandsThis study of Canada’s prairies and parklands documentsparticular lands and waters in each ecodistrict where thehighest and best use may be conservation, based on themethods used.
These core biodiversity conservation areas are illustrat-ed in a series of tile maps for the entire study area(Appendix D). The blueprint portfolio is also mapped asthe percentage of each ecodistrict in the region (Fig. 31,Table 5.2). It is also illustrated as the total percent of theland base recommended for recognition as core biodiver-sity conservation lands over and above the existing net-work of protected areas and conservation lands (Fig. 32).These results vary significantly from ecodistrict to ecodis-trict (Table 5.2).
Aspen Parkland: There is a set of ecodistricts thathave less than 16% natural cover remaining, none of themwith more than 2% of the land base as protected area orconservation land (PA/CL), for which the blueprint rec-ommends between 1% and 8% of lands be conserved.
These ecodistricts are:Leduc AndrewVermilion DayslandRed Deer SedgewickOlds Moose Mountain UplandBlack Prairie Northern Black PrairieAgricultural cropland has been long identified as thehighest and best land use for these ecodistricts.
Another set of ecodistricts, however, have more than50% natural cover remaining, and have PA/CL lands cov-ering from 1% to 26% of their land bases. For these ecodis-tricts, the blueprint recommends total core biodiversityconservation lands of from 9% to 58%. These are:Lower Battle River Plain Edgerton-Ribstone PlainWhitesand Plain Black DiamondSt. Lazare Plain Shilo Dauphin Alonsa, Ste. Rose Turtle MountainsThese are key ecodistricts for the conservation of AspenParkland biodiversity.
A Conservation Blueprint for Canada’s Prairies and Parklands
89
Figure 31. Core biodiversity conservation areas identified by the blueprint, including existing protected areas and other conservation lands,by ecodistrict across the study area

Moist Mixed Grassland: For this ecoregion, there isanother set of ecodistricts that have less than 16% naturalcover remaining. Only one of these has more than 2% ofthe land base as protected area or conservation land(PA/CL), and it has only 4%. For these the Blueprint rec-ommends between 2% and 10% of lands be conserved.These ecodistricts are:Castor Estow PlainRosetown Plain DrumhellerArm River Plain Strasbourg PlainStandard Plain Vulcan PlainRegina Plain Griffin Plain.Agricultural cropland has long been identified as the high-est and best land use for these ecodistricts.
Another set of ecodistricts have more than 50% naturalcover remaining, and have PA/CL lands covering from0% to 36% of their land bases. For these ecodistricts, theblueprint recommends total core biodiversity conserva-tion lands of from 26% to 91%. These are:Moosewood Sand Hills Biggar PlainMilk River Upland Willow Creek Upland Twin Butte Del Bonita Plateau
Foothill Grassland Rocky Mountain Front 1, 2, 3North Central Brown Glaciated PlainsThese are key ecodistricts for the conservation of MoistMixed Grassland biodiversity.
Mixed Grassland: This ecoregion includes no ecodis-tricts with less than 16% natural cover remaining. A num-ber have between 19% and 25% remaining natural cover,and these ecodistricts all have less than 10% of the landbase as protected area or conservation land (PA/CL),except one with 12%. For these the blueprint recommendsbetween 6% and 18% of lands be conserved. These ecodistricts are:Sibbald Plain Eston PlainCoteau Hills Acadia PlainHazlet Plain Antelope Creek PlainSwift Current Plateau Wood River PlainLake Alma Upland
Another set of ecodistricts have more than 2/3 of theirland base remaining in natural cover, and these havePA/CL lands covering from 2% to 77% of their land bases.For these ecodistricts, the blueprint recommends totalcore biodiversity conservation lands of from 41% to 89%.
SECTION 5 Results
90
Figure 32. Conservation lands identified by the blueprint that are in addition to existing protected areas and other conservation lands,by ecodistrict across the study area

A Conservation Blueprint for Canada’s Prairies and Parklands
91
These ecodistricts are:Berry Creek Plain Rainy Hills UplandBindloss Plain Great Sand Hills Maple Creek Plain Wood Mountain Plateau Wild Horse Plain Old Man on His Back PlateauSweetgrassThese are key ecodistricts for the conservation of MixedGrassland biodiversity.
Cypress Upland and Boreal Transition: Both of theother two areas in the study area, the Cypress Upland(two ecodistricts) and the Boreal Transition (two ecodis-tricts) uniformly have high levels of remaining naturalcover (50% or more), with highly variable levels of PA/CLlands (3% to 63%), for which the blueprint suggests theneed for from 8% to 65% of the lands in conservation.
In Figure 32, the summary data in Table 5.2 are map-ped to communicate the recommended percent of addi-
tional lands that deserve overt conservation stewardship,in addition to existing PA/CL, as lands for which thehighest and best use is conservation, based on the meth-ods used in this analysis.
The conservation needs of prairie and parkland ecodis-tricts vary greatly across the study area but the blueprintresults particularly emphasize the extraordinary conserva-tion needs of the western and southern portions of theregion ( Fig. 33). Moving these lands into overt commit-ments to conservation, through mechanisms rangingfrom appropriate commitments of public-land manage-ment, to landowner agreements, easements and fee-sim-ple securement of key lands, is the regional priority.
How and where to set priorities for conservation actionare the questions that need to be additionally tackled,using these types of data to support informed decisions.
Figure 33. Conservation blueprint for the prairie and parkland ecoregions

Blueprint Conservation by Public Agencies – Ecological SystemsThe scoring of the top two ecological sys-tems in each ecodistrict resulted in themapping of many systems that alreadyoccur on existing protected areas (PA) andother conservation lands (CL) (Fig. 34-38).
In Canada, federal protected areas aresmall, 515,016ha. Of these, top-scoringecological systems make up 30% of federalPA on the Aspen Parkland, 45% on theMoist Mixed Grassland, and 70% on theMixed Grassland. Provincial protectedareas rank even higher in their inclusionrates for top-scoring ecological systems but,again, the extent of such areas is modest(391,081ha).
More than 2/3 of conserved lands in theregion are not regulated as protected areasbut have indirect mandates for conserva-tion. Their extent makes them extremelyimportant (federal CL 1,111,902ha; prov-incial CL 1,297,798ha). Top-scoring eco-logical systems make up >50% of federalCLs on the Aspen Parkland, >70% on theMoist Mixed Grassland, and >80% on theMixed Grassland. Provincial conservationlands also have high inclusion rates for top-scoring ecological systems: >45% of prov-incial CLs on the Aspen Parkland, >60%on the Moist Mixed Grassland, >75% onthe Mixed Grassland, and over 85% on the CypressUpland.
Existing protected areas and, even more so, other con-servation lands such as community pastures, nationaldefence lands and Saskatchewan lease lands under theWildlife Habitat Protection Act make extremely importantcontributions to the conservation of prairie and parklandbiodiversity, and their role in biodiversity conservationshould be even more strongly mandated than is currentlythe case.
SECTION 5 Results
92
Figure 34. Percent of area by land type that represents top-scoringsystems within the Aspen Parkland
Figure 35. Percent of area of land type that is a top-scoring ecologicalsystem in the Moist Mixed Grassland

A Conservation Blueprint for Canada’s Prairies and Parklands
93
Figure 36. Percent of area of land type that is atop-scoring ecological system in the MixedGrassland
Figure 37. Percent of area of land type that is atop-scoring ecological system in the CypressUpland
Figure 38. Percent of area of land type that isa top-scoring ecological system in the BorealTransition

SECTION 5 Results
94
Figure 39. Distribution of top ecologicalsystems in the Aspen Parkland
Figure 41. Distribution of top ecologicalsystems in the Mixed Grassland
Figure 40. Distribution of top ecologicalsystems in the Moist Mixed Grassland
Blueprint Conservation by Others– Ecological SystemsThe scoring of the top two ecological systems in each ecodistrict also documented the extraordinary role that non-agency lands, the vast majority being privately owned, play in the current conservation of prairie and parkland biodiversity (Fig. 39-43).These range from >70% on the Aspen Parkland, >83% on the Moist Mixed Grassland, >60% on the Mixed Grassland, and over 79% on the Cypress Upland.
These lands not only conserve high-quality natural communities and biological diversity, but also provide important environmental goods and services across their local landscapes and beyond. The ecological services provided by these lands are critical to the future sustainability of these highly converted landscapes and should be recognized by society for the critical role that they play.

A Conservation Blueprint for Canada’s Prairies and Parklands
95
Blueprint Conservation by Public Agencies–Fine-filter Target SpeciesThe occurrence of fine-filter target species can be used asa measure of the conservation success of existing regulat-ed protected areas (PA) and other unregulated conserva-tion lands (CL). Surveys for such rarities are more fre-quent on public and agency lands than on private lands ofthe region and, hence there may be a bias in the datatowards public lands.
Several types of protected areas (PL) and conservationlands(CL) are considered in this study, and their impor-tance to the study’s primary target species is graphedbelow (Fig. 44-48). The appropriate management of fed-eral and provincial protected areas and conservation landsis clearly critical to the long-term persistence of theseimperilled species across the whole region (Fig. 49).
Figure 42. Distribution of top ecologicalsystems in the Cypress Upland
Figure 43. Distribution of top ecologicalsystems in the Boreal Transition

SECTION 5 Results
96
Figure 44. Percent of area by land typethat provides habitat for primary targetsin the Aspen Parkland
Figure 45. Percent of area by land typethat provides habitat for primary targetsin the Moist Mixed Grassland
Figure 46. Percent of area by land typeprovides habitat for primary targets inthe Mixed Grassland

A Conservation Blueprint for Canada’s Prairies and Parklands
97
Figure 47. Percent of area by land typethat provides habitat for primary targetsin the Cypress Upland
Figure 48. Percent of area by land typethat provides habitat for primary targetsin the Boreal Transition
Figure 49. Percent of area by land typethat provides habitat for primary targetsin the entire study area

Discussion and Applications It remains a worthwhile and achievable goal to assembleregion-wide data sets that can support region-wide assess-ments of our collective achievements and needs withregard to biodiversity conservation. This first-iterationattempt is an encouragement to others to continue topartner in this task, and to consider an even more delib-erate organization of collective conservation planningacross the region.
To this end, priorities need to be set for developingregion-wide classifications and mapping of native habitatsand vegetation, of surficial geology and landform, of eco-logical systems, and of conservation targets. The degreeto which such efforts can have seamless, region-wide dig-ital layers as a goal, is the degree to which effective con-servation planning can occur. Without these tools, themeasurement of targets, goals and achievements will beweak, which can undermine or misdirect conservationefforts.
Target ViabilityThe collective conservation goal is to conserve viableexamples of all conservation targets, appropriately distrib-uted across each ecoregion in sufficient quantity to sus-tain the ecoregion’s biological diversity over the next cen-tury.
Although it is difficult to assess the long-term viabilityof occurrences of conservation targets on a landscape,nevertheless an attempt was made through proxy and sur-rogate measures. For example, species occurrences wereincluded where it was considered they have a good chanceof surviving more than 10 years. The viability of ecologi-cal systems (coarse-filter targets) was measured by assign-ing surrogate scores that suggest a higher probability ofpersistence on the landscape. The long-term survival of anecological system at a site may be more probable than thepersistence of a fine-filter target. Fine-filter viability oftendepends on a number of variables, some of which may notbe directly linked to a fine-filter target occurrence. Forexample a bird’s nest and foraging habitats may differ, andconserving a site with good nest sites in an area of poorforaging may eventually result in loss of breeding fromthat particular site.
The blueprint optimizes the design of a remnant natu-ral-area system that will support the targets that wereidentified. The appropriate recognition and conservationof those targets at the locations identified by the blueprint(at a minimum) would contribute significantly to the
long-term persistence of those targets and the overall bio-logical diversity of the region.
The blueprint suggests a suite of sites with conservationpotential. All of them deserve site visits and validation.Conservation activities should focus on long-term targetviability. Securement should be focused on sites with ahigh probability of long-term survival (as identifiedthrough the blueprint as well as verified through field andexpert validation). Stewardship activities should, in thesame way, focus on maintaining or increasing the suitabil-ity of a site for the targeted ecological systems or speciesthat depend on that site for their survival.
ApplicationsConservation ecology is an evolving field, and assessmentssuch as this reflect the best available data and knowledgeat the time of analysis. The blueprint’s data model isthought of as iterative, whereby new information can beincorporated into the model, and can be used to generatenew results.
The blueprint’s data model is designed so that particu-lar targets or areas, or groups of targets or ecodistricts canbe isolated and queried as required by staff and partners.This permits the data base and mapping to be considereda tool that can be directed at a range of useful purposes.The key purpose to which NCC will apply the tool is tothe identification and validation of priority conservationlandscapes across the region, some of which shouldbecome conservation action sites for NCC and its part-ners.
To our knowledge, there are no region-wide tools toassess the present achievements of public agencies or pri-vate-sector groups in conserving the biological diversityof the Canadian prairies and parklands. Without suchmetrics properly applied across the region as a whole,there is little chance of recognizing the overall success ofwhich has occurred or of assessing the gaps in success thatdeserve our collective conservation attention. The blue-print is a modest contribution towards this end.
Finally, as society comes to terms with the recognitionof the important ecological services provided by ourremaining natural landscapes, region-wide assessments ofthe comparative values of different areas will becomemore and more important. It has been demonstrated thatecoregional biodiversity assessments such as this do, infact, serve as highly efficient assessments of ecologicalservices as well (Chan et al. 2006).
SECTION 5 Results
98

A Conservation Blueprint for Canada’s Prairies and Parklands
99
Adaptive Management – Is basedon the premise that managed naturalsystems are complex and unpre-dictable. Adaptive management is a type of natural resource manage-ment in which decisions are made as part of an ongoing science-basedprocess. Adaptive managementinvolves testing, monitoring, andevaluating applied strategies, andincorporating new knowledge intomanagement approaches that arebased on scientific findings and theneeds of society. Results are used tomodify management policies, strategies, and practices.
Area Sensitive – Refers to speciesthat have minimum habitat sizerequirements for survival.
Aspen Parkland – A transitionalecoregion between the boreal forestto the north and the grasslands tothe south. It is a patchy habitatmatrix composed of clusters of grass-land and deciduous trees (Bird1961). Some consider the entireecoregion an ecotone, while otherscontest that an ecotone exists ateach grassland/forest interface.
Biodiversity – Biological diversity is the variety of different species, thegenetic variability of each species,and the variety of different ecosys-tems that they form, and their com-position, structure and ecologicalfunction.
Biodiversity targets – Species, vege-tation communities, or ecologicalsystems considered important to theconservation of the biological diver-sity and natural heritage of theirecoregions (Riley et al. 2004).
Biome – A regional grouping ofecosystems as a grassland, desert, ortropical rainforest. Biomes are char-acterized by consistent plant formsand are found over a large climaticarea. For example the prairie andparkland biome includes grasslandand parkland species, vegetationcommunities, and ecological sys-tems. (Synonymous with ecozone,ESWG 1995).
Chernozem soils – Type of deep A-horizon soil that develops undergrassland.
Coarse-filter/fine-filter approach–A method designed to analyze thelandscape for the best examples ofecological systems (coarse-filter targets). These sites are thenassessed in terms of the fine-filtertargets that they conserve. Whererepresentation gaps exist for fine-filter targets additional sites areselected to fill these gaps.
Coarse-filter biodiversity targets –The derived ecological system con-servation targets. In fragmentedlandscapes such as the AspenParkland, the best examples of eachecological system are selected for
inclusion in the conservation blue-print. By conserving representativeexamples of each ecological systemtype, the majority of the native bio-diversity is also conserved. See alsofine-filter targets.
Condition – The current state of anecosystem. Used as a measure ofecosystem ‘health’. In a conservationblueprint a measure of conditionallows for comparison among sites(ecological systems) and a means bywhich to rank and select the ‘best’examples of a particular ecologicalsystem type. See also viability.
Conservation Blueprint – (synonyms ecoregional assessment;ecoregional plan) — a plan that iden-tifies conservation targets, sets goalsfor those targets, and identifies aportfolio of sites that if conservedwill allow for the long-term survivalof all native species, habitats, andecological systems within the ecore-gion (Groves 2003; Riley et al.2004)
Conservation Goals – In this case,explicit quantitative goals for meas-uring the rate of inclusion of a bio-diversity target in the blueprint.
Conservation Lands – Includes alllands managed or used in such amanner they have from neutral topositive benefits to the nativewildlife and vegetation communities.For example pastures are managedprimarily for livestock grazing; how-ever grazing is a natural ecologicalprocess that creates patchiness andsmall disturbances on the landscape,which in turn creates the requiredhabitat for many different individualspecies. See also protected areas.
This glossary attempts to aid the reader of this document understand the
terminology. There are many words in everyday speech that have special
meanings in ecology and conservation biology. In addition, words from
other disciplines such as portfolio are used to help portray the ideas of
modern conservation biology. The definitions provided are intended to
aid the reader in understanding this planning process.
Glossary

Critical habitat – The habitat that isnecessary for the survival or recoveryof a listed wildlife species and that isidentified as the species’ critical habi-tat in the recovery strategy or in anaction plan for the species (SARAPublic Registry).
Crosswalk – In conservation sci-ence, cross-walking is the process ofmatching different classification sys-tems of similar features into broader‘seamless’ or universal classifications.For example one land cover classifi-cation may define 3 wetland typeswhile the land cover classification for a neighbouring jurisdiction onlydefines 2 types. In this case each ofthe 3 wetland types would be bestmatched to the 2 (i.e., commondenominator) resulting in a cross-walked classification. Conversely,new classes may be created to meetthe needs of the classification proj-ect.
Crown land – In Canada, publicland managed by either the provin-cial or federal government. In theprairie ecoregions much of this landis leased for agriculture (grazing andcrop production).
Declining Species – Species thatexhibit significant, long-termdeclines in habitat and/or numbers,are subject to a high degree ofthreat, or may have unique habitator behavioural requirements thatexpose them to a great risk.
Disjunct Distribution – Speciesthat have populations that are founda significant distance from their pri-mary range.
Disturbance – In community ecolo-gy, an event that removes organismsand opens up space which can befilled or recolonized by individuals ofthe same or different species.
Ecodistrict – A subdivision of anecoregion characterized by distinc-tive assemblages of relief, landforms,geology, soil, vegetation, water bod-ies, and fauna (Marshall and Schut,1999).
Ecological Systems – As used here,unique combinations of landforms(surficial geology) and land cover(dominant vegetation type) that canbe mapped and used as units bywhich to measure representation ofcoarse filter targets.
Ecological Systems Polygon – A distinct spatial feature derivedfrom the features in the ecologicalsystems layer and which may repre-sent a remnant of a continuous eco-logical system (terrestrial) or mayrepresent small distinct ecologicalsystems such as wetlands or wetlandcomplexes.
Ecological Integrity – A conditionthat is determined to be characteris-tic of its natural region and likely topersist, including abiotic componentsand the composition and abundanceof native species and biological com-munities, rates of change and sup-porting processes.
Ecological Reserves – Examples offunctioning ecosystems protected forscientific research, education andheritage appreciation. Road accessand facilities are not developed inEcological Reserves (GOA 2003).
Ecoregion – The second subdivisionof an ecozone characterized by dis-tinctive regional ecological factors,including climate, physiography, vegetation, soil, water, and fauna(Marshall and Schut 1999).
Ecoregional assessment, ecore-gional plan. See also conservationblueprint
Glossary
100
COSEWIC, COMMITTEE ON THE STATUS OF ENDANGERED WILDLIFE IN CANADA: ASSIGNS THE FOLLOWING STATUS TO SPECIES:
Status DescriptionExtinct (X) A wildlife species that no longer exists
Extirpated (XT) A wildlife species no longer existing in the wild in Canada, but occurring elsewhere.
Endangered (E) A wildlife species facing imminent extirpation or extinction
Threatened (T) A wildlife species likely to become endangered if limiting factors are not reversed.
Special Concern (SC) A wildlife species that may become a threatened or an endangered species because of a combination of biological characteristics and identified threats
Not At Risk (NAR) A wildlife species that has been evaluated and found to be not at risk of extinction given the current circumstances.

A Conservation Blueprint for Canada’s Prairies and Parklands
101
Ecosystem – A dynamic spatialassemblage (functional unit) consist-ing of all the living organisms(plants, animals, and microbes) in agiven area, and all the non-livingphysical (e.g., elevation) and chemi-cal factors (e.g., soils, geology) oftheir environment, linked togetherthrough similar ecological processes(e.g., fire) for nutrient cycling andenergy flow. An ecosystem can be ofany size-a log, pond, field, forest, orthe earth's biosphere — that func-tions as a whole unit in some man-ner. Ecosystems are commonlydescribed according to the majortype of vegetation (e.g., grasslandecosystem).
Ecotone – A transition zonebetween two distinct habitats, vege-tation communities, or ecoregionsthat contains species from each area,as well as organisms unique to it.
Element Occurrence (EO) – Anarea of land and or water where aspecies or vegetation community isor was present (NatureServe 2002)
Endemic – A plant or animal thatoccurs naturally in a certain regionand whose distribution is relativelylimited geographically.
Fine-filter Target – Those speciesthat are rare or have very specializedhabitat requirements may not beincluded in the portfolio of sitesselected through the coarse filteranalysis. To ensure these targets areadequately conserved a separatelandscape analysis is used to identifythe sites required to conserve thesespecies.
Focal Species – Species that havespatial, compositional, and function-al requirements that may encompassthose of other species in the regionand may help address the functional-ity of ecological systems. For exam-
ple, keystone species, wide-rangingspecies, cave-dwelling species.
Fragmentation or FragmentedLandscapes – The breaking up oflarge and continuous ecosystems,communities, and habitats (i.e. natu-ral areas) into smaller discontinuousareas that are surrounded by alteredor disturbed lands or aquatic features(e.g. natural areas can be fragmentedthrough the addition of roads orconversion to other land uses such ashuman development or croplands).
Functional Landscapes – Thosethat conserve a large number of eco-logical systems, communities, andspecies at all scales below regional(i.e., coarse, intermediate, and local).In addition, the identified conserva-tion targets are usually intended torepresent many other ecological sys-tems, communities, and species,known and unknown (i.e., “all” bio-diversity). Functional landscapeshave a high degree of ecologicalintactness, and retain (or can haverestored) most or all of their keycomponents, patterns, and processes.The distinction between functionallandscapes and functional sites inpractice, however, is not always clearcut because even communities andecological systems at functional sitesrepresent other elements of biodiver-sity (i.e., their coarse-filter function)(Poiani and Richter 1999).
Functional Networks – A func-tional network is an integrated set offunctional sites and landscapesdesigned to conserve regionalspecies with or without finer-scalebiodiversity. Sites or landscapes with-in functional networks can bearranged contiguously over one ormore regions to protect wide rang-ing species such as, pronghorn.Conversely, sites or landscapes mayform a series of stepping-stones
spread over a large area to conservemigratory shorebirds or neotropicalmigrants. In addition to conservingbiodiversity at local, intermediate,and coarse scales, a well designedecoregional portfolio should serve asa functional network for regionalspecies within an ecoregion; collec-tively, our ecoregional plans shouldprovide functional networks forspecies that span multiple ecoregions(Poiani and Richter 1999)
Functional Site – Regardless ofsize, a site that can maintain the tar-get species, community or ecosys-tem, and their supporting ecologicalprocesses, within their natural rangesof variability, if managed appropri-ately (Riley et al. 2004).
Gap Analysis Program (GAP) – A program of the US GeologicalSurvey. The program is a scientificmeans for assessing to what extentnative animal and plant species arebeing protected. It can be done at astate, local, regional, or nationallevel. The goal of Gap Analysis is tokeep common species common byidentifying those species and plantcommunities that are not adequatelyrepresented in existing conservationlands. Common species are thosenot threatened with extinction. Byidentifying their habitats, GapAnalysis gives land managers, plan-ners, scientists, and policy makersthe information they need to makebetter-informed decisions whenidentifying priority areas for conser-vation. Gap Analysis came out of therealization that a species-by-speciesapproach to conservation is noteffective because it does not addressthe continual loss and fragmentationof natural landscapes. Only by pro-tecting regions already rich in habi-tat, can we adequately protect theanimal species that inhabit them(USGS 2005).

GAP Codes – A ranking sys-tem of how lands are beingmanaged. (USGS 2005)
■ Gap 1 An area having per-manent protection fromconversion of natural landcover and a mandated man-agement plan in operationto maintain a natural statewithin which disturbanceevents (of natural type, fre-quency, intensity, and lega-cy) are allowed to proceedwithout interference or aremimicked through manage-ment. Examples: nationalparks, nature reserves,wilderness area.
■ Gap 2 An area having per-manent protection fromconversion of natural landcover and a mandated manage-ment plan in operation to main-tain a primarily natural state, butwhich may receive uses or man-agement practices that degradethe quality of existing naturalcommunities, including suppres-sion of natural disturbance. Examples: state parks, nationalwildlife refuges, national recre-ation areas.
■ Gap 3 An area having permanentprotection from conversion ofnatural land cover for the majori-ty of the area, but subject toextractive uses of either a broad,low-intensity type (e.g., logging)or localized intense type (e.g.,mining). It also confers protec-tion to federally listed endan-gered and threatened speciesthroughout the area. Examples:national forests, most Bureau ofLand Management Land, wildlifemanagement areas.
■ Gap 4 There are no known pub-lic or private institutional man-dates or legally recognized ease-ments or deed restrictions heldby the managing entity to pre-vent conversion of natural habitattypes to anthropogenic habitattypes. The area generally allowsconversion to unnatural landcover throughout.
GIS – Geographic information sys-tem; an integrated collection ofcomputer software and data used toview and manage information aboutgeographic places, analyze spatialrelationships, and model spatialprocesses. A GIS provides a frame-work for gathering and organizingspatial data and related informationso that it can be displayed and ana-lyzed.(http://support.esri.com/index.cfm?fa=knowledgebase.gisDictionary.gateway; current October 2006)
Globally Imperilled – Species thathave a global rank of G1-G3G4 byNatural Heritage Programs orConservation Data Centres.
GRank; G-Rank; Global Rank –Assigned by a consensus of the net-work of CDCs, scientific expertsand The Nature Conservancy todesignate a rarity rank based on therange-wide status of a species, sub-species or variety. The most impor-tant factors considered in assigningglobal (and provincial) ranks are thetotal number of known, extant sitesworld-wide, and the degree towhich they are potentially or activelythreatened with destruction. Othercriteria include the number ofknown populations considered to besecurely protected, the size of thevarious populations, and the abilityof the taxon to persist at its knownsites. The taxonomic distinctness ofeach taxon has also been considered.Hybrids, introduced species, andtaxonomically dubious species, sub-species and varieties have not beenincluded.
Glossary
102
G1, Extremely rare usually 5 or fewer occurrences in the overall range or very few remaining individuals; or because of some factor(s) making it especially vulnerable to extinction
G2, Very rare usually between 5 and 20 occurrences in the overall range or with many individuals in fewer occurrences; or because of some factor(s) making it vulnerable to extinction
G3, Rare to uncommon usually between 20 and 100 occurrences; may have fewer occurrences, but with a large number of individuals in some populations; may be susceptible to large-scale disturbances
G4, Common usually more than 100 occurrences; usually not susceptible to immediate threats
G5, Very common demonstrably secure under present conditions
GH Historic, no records in the past 20 years
GU Status uncertain, often because of low search effort or cryptic nature of the species;more data needed
GX Globally extinct. No recent records despite specific searches
? Denotes inexact numeric rank (i.e. G4?)
9G? Unranked, or, if following a ranking, rank tentatively assigned (e.g. G3?)
Q Denotes that the taxonomic status of the species, subspecies, or variety is questionable
T Denotes that the rank applies to a subspecies or variety
Ranking Description

A Conservation Blueprint for Canada’s Prairies and Parklands
103
Great Plains – A general termdescribing the grasslands of centralNorth America stretching fromCanada to Mexico.
Hectare (ha) – A metric unit ofarea equal to 10,000 m2 or 2.471acres.
Heritage Rangelands – Preserveand protect natural features that arerepresentative of Alberta's prairies;grazing is used to maintain thegrassland ecology (GOA 2003).
Important Bird Areas (IBA) – Aninternational conservation initiativeco-ordinated by Bird Life Inter-national. The Important Bird Areasprogram is a science-based initiativeto identify, conserve, and monitor anetwork of sites that provide essen-tial habitat for the world's birds andother biodiversity.
Invasive alien species – Speciesintroduced deliberately or uninten-tionally outside their natural habitatswhere they have the ability to estab-lish themselves, invade, out-competenatives and take over the new envi-ronments. They are widespread inthe world and are found in all cate-gories of living organisms and alltypes of ecosystems. However,plants, mammals and insects com-prise the most common types ofinvasive alien species in terrestrialenvironments. The threat to biodi-versity due to invasive alien species isconsidered second only to that ofhabitat loss. They are thus a seriousimpediment to conservation andsustainable use of global, regionaland local biodiversity, with signifi-cant undesirable impacts on thegoods and services provided byecosystems (Convention onBiological Diversity 2005).
IUCN – The World ConservationUnion – The world’s largest conser-vation network, the Union bringstogether 82 States, 111 governmentagencies, more than 800 non-gov-ernmental organizations (NGOs),and some 10,000 scientists andexperts from 181 countries in aunique worldwide partnership.
IUCN categories of protectedareas by management objective andhas identified six distinct categoriesof protected areas.
Land cover –The observed bio-physical cover of the earth's surfaceincluding vegetation, water, rock,and human-made features. Landcover is often mapped using remote-ly sensed data (e.g,. satellite imagery)as cover types can be delineatedbased on differences of their spectral(light) reflectance.
Limited distribution – A speciesor ecological system primarily occur-ring within one ecoregion. Theymay occur in other adjacent ecore-gions however their core range iscontained within one ecoregion.
Matrix communities – Vegetationcommunities that form extensiveand contiguous cover on the land-scape. Matrix communities occur onextensive landforms (e.g,. glacialmoraine) and typically have wideecological tolerances. Matrix com-munity types are often influenced bylarge-scale processes (e.g., climaticpatterns, fire) and are importanthabitat for wide-ranging or area sen-sitive fauna, such as large herbivoresor birds.
Metapopulation – A network ofsemi-isolated populations with somelevel of regular or intermittentmigration and gene flow amongthem, in which individual popula-tions may go extinct but can then berecolonized from other source pop-ulations (known as the rescueeffect).
Native Species – Species that wouldhave occurred in a region beforeEuropean settlement.
I Strict Nature Reserve/Wilderness Area: protected area managed mainly for science of wilderness protection
II National Park: protected area managed mainly for ecosystem protection and recreation
III Natural Monument: protected area managed mainly for conservation of specific natural features
IV Habitat/Species Management Area: protected area managed mainly for conservation through management intervention
V Protected Landscape/Seascape: protected area managed mainly for landscape/seascape protection and recreation
VI Managed Resource Protected Area: protected area managed mainly for the sustainable use of natural ecosystems
IUCN Protected Area Category Management Objectives

Natural Areas (1) In Alberta, natu-ral areas protect special and sensitivenatural landscapes of local andregional significance while providingopportunities for education, natureappreciation and low intensity recre-ation. Facilities are limited to stagingareas, trails and signs (GOA 2003).(2) NCC definition – Natural areasare sites that are defined by naturalecological boundaries, and can beidentified on the landscape as poten-tially ecologically-functioning land-scapes (or parts of landscapes) thatare configured at scales appropriateto the features that they sustain, andpredictably large enough to sustainthose feature for several generations,e.g., a century. The conservation ofthese features includes both a bioticcomponent and the abiotic or envi-ronmental structure and functionthat support the biota (Riley 2005).
Patch – Used to define contiguousareas of similar habitat types or eco-logical systems (Begon et al. 1990).
Peripheral Distribution – Speciesor ecological systems that are locat-ed closer to the outer boundaries ofthe ecoregion and are not consid-ered widespread throughout theecoregion. For example in the AspenParkland ecoregion, species commonto the boreal forest may be present,however in the parkland they maybeat the extreme edge of their range.
Population – A group of individu-als of one species in an area, thatmate with one another and produceoffspring. The size and nature of thearea needs to be defined. See alsometapopulation.
Population (gene pool) – A groupof interbreeding organisms of thesame species within a given area. In practice, it is difficult to distin-
guish where populations begin orend. Often, best-estimate sizes andnumbers are documented andadopted.
Portfolio of sites – A suite of con-servation sites within an ecoregionthat would collectively conserve thenative biodiversity targets of theecoregion.
Prairie – An area of flat or rollingtopographic relief that principallysupports grasses and forbs, with fewtrees, and is generally of a mesic(moderate or temperate) climate.The French explorers called theseareas prairie from the French wordfor “meadow”.
Prairie Wings – A program of TheNature Conservancy (TNC–USA)designed to protect imperilled grass-land birds of the central UnitedStates, south-central Canada andnorth-central Mexico.
Protected areas – A geographicallydefined area which is designated orregulated and managed to achievespecific conservation objectives.See also conservation lands.
Provincial Parks – Provincially sig-nificant natural and historical land-scapes and features. A range of facili-ties along with interpretive and edu-cational programs enhance opportu-nities for visitors to explore, under-stand, appreciate and respect thenatural environment (GOA 2003).
Recreation Areas – Cater to a widerange of intensive recreation pursuitsin natural, modified or man-madesettings. Most Recreation Areas havelittle or no preservation value due tothe levels of facility development,intensity of visitor use and frequent-ly small size (GOA 2003).
Recovery strategy – A recoverystrategy is a document that outlinesthe long-term goals and short-termobjectives for recovering a species atrisk, based on the best available sci-entific baseline information (SARAPublic Registry).
Representative Areas Network –In Saskatchewan, a provincial gov-ernment process of establishing anetwork of ecologically importantland and water areas across theprovince. This system incorporatesall of the unique features, land-scapes, and resources already beingmanaged as parks, ecologicalreserves, wildlife lands, and otherreserves. New sites are selected tocomplement existing sites andensure that the wide range ofSaskatchewan's natural features anddiversity are represented within thenetwork.
Restricted distribution – A speciesor ecological system that is confinedto a specific habitat type such assand hills, as such will not be foundoutside of these habitat associations.
SAR Species at Risk – Species designated as Extinct (X),Extirpated (XT), Endangered (E),Threatened (T), Special Concern(SC), Not At Risk (NAR), or DataDeficient (DD), by the Committeeon the Status of Species at Risk inCanada (COSEWIC) under theSpecies at Risk Act (SARA).
Glossary
104

A Conservation Blueprint for Canada’s Prairies and Parklands
105
S-Rank (Provincial Rank) –Provincial (or sub-national) ranksare used by the Conservation DataCentres and Natural HeritageInformation Centres to set protec-tion priorities for rare species andnatural communities. These ranksare not legal designations.Provincial ranks are assigned in amanner similar to that describedfor global ranks, but consider onlythose factors within the politicalboundaries of the state or pro-vince. The data centres evaluateprovincial ranks on a continualbasis and produce updated lists at least annually.
Special Places – An initiative inAlberta of the provincial govern-ment's Round Table on theEnvironment and Economy toprotect Alberta's endangeredspecies by setting aside portions ofeach of the six distinct geographi-cal regions (ecoregions).
Stewardship (NCC definition) –To protect, manage, and whereappropriate, restore natural areasso they sustain the natural ecosys-tems that define them (Riley et al.2004).
Succession – A directional changewithin a community of coloniza-tion and extinction on a site bypopulations. Primary successionbegins on a bare surface not previ-ously occupied by living organ-isms, such as a recently depositedgravel bar. Secondary successionoccurs following disturbances onsites that previously supported living organisms.
Target – See conservation targets.Threat – Outside factors that lowerconservation targets overall viabilityand therefore its chances of long-term survival. Examples of threats
include habitat destruction or frag-mentation, exotic species, and inap-propriate resource use.
S1 Extremely rare in the state/province; usually 5 or fewer occurrences in the province or very few remaining individuals; often especially vulnerable to extirpation
S2 Very rare in the state/province; usually between 5 and 20 occurrences in the province or with many individuals in fewer occurrences; often susceptible to extirpation
S3 Rare to uncommon in the state/province; usually between 20 and 100 occurrences in the province; may have fewer occurrences, but with a large number of individuals in somepopulations; may be susceptible to large-scale disturbances. Most species with an S3 rank
are assigned to the watch list, unless they have a relatively high global rank
S4 Common and apparently secure in the state/province; usually with more than 100 occurrencesin the province
S5 Very common and demonstrably secure in the state/province
SH Historically known from the state/province, but not verified recently (typically not recorded in the province in the last 20 years); however suitable habitat is thought to be still present in the province and there is reasonable expectation that the species may be rediscovered
C Captive/Cultivated; existing in the province only in a cultivated state; introduced population not yet fully established and self-sustaining
S? Not Ranked Yet, or if following a ranking, Rank Uncertain (e.g. S3?). S? species have not had a rank assigned
SA Accidental; of accidental or casual occurrence in the province; far outside its normal range; some species may occasionally breed in the province
SAB Breeding accidental
SAN Non-breeding accidental
SE Exotic; not believed to be a native component of the states/province’s flora
SR Reported for in the state/province, but without persuasive documentation which would provide a basis for either accepting or rejecting the report
SRF Reported falsely from in the state/province
SU Unrankable, often because of low search effort or cryptic nature of the species, there isinsufficient information available to assign a more accurate rank; more data is needed
SX Apparently extirpated from the state/province, with little likelihood of rediscovery. Typically not seen in the province for many decades, despite searches at known historic sites
SZ Not of practical conservation concern inasmuch as there are no clearly definable occurrences; applies to long distance migrants, winter vagrants, and eruptive species, which are tootransitory and/or dispersed in their occurrence(s) to be reliably mapped; most such species
are non-breeders, however, some may occasionally breed
SZB Breeding migrants/vagrants
SZN Non-breeding migrants/vagrants
Ranking Description

Viable/viability – The ability of aspecies to persist for many genera-tions or an ecological community or system to persist over some timeperiod. An assessment of viabilitywill often focus on the minimumarea and number of occurrencesnecessary for persistence. However,conservation goals should not berestricted to the minimum butrather should extend to the size, distribution, and number of occur-rences necessary for a community tosupport its full complement ofnative species.
Western Hemispheric ShorebirdReserve Network (WHSRN) – A network of key sites identified toconserve shorebird species and theirhabitats across the Americas. A pro-gram of Manomet Center forConservation Sciences(http://www.manomet.org/).
Wetland – Wetlands are naturallyundrained basins less than 20.2ha(50ac) in area; lakes include basinsgreater than 20.2ha (Stewart andKantrud 1971). Wetlands includeseveral land cover types that havebeen grouped together such asmarsh, bog, fen, etc. Wetland sizefor the classification (i.e., lake orwetland) was based on the calcula-tion of open water areas from classi-fied land cover imagery. After theinitial calculation, land cover classesassociated with wetlands were alsoassigned to the wetland class. Thiswill account for the reason whysome of the larger wetlands may belarger than 20.2ha in the analysis.
Wetland Density Polygon(WDP)– A term coined to describepolygons or regions that containsimilar wetland densities (proxymeasure of wetland complexes). To derive these polygons, a wetlanddensity function was used to calcu-late a grid for the entire landscape.From this grid wetland densitieswere divided into five categoriesbased on natural breaks in the data.Each category of grid cells wasgrouped and then converted into aWDP. These WDP become thelandscape features added to the finalportfolio.
Wide-ranging distribution –Species that depend on large areas,sometimes multiple ecoregions forits lifecycle. Examples include top-level predators (e.g. bobcat Felisrufus) or migratory mammals, birds,and insects. These species can beused in examining necessary link-ages among conservation sites in atrue “network” of sites.
Widespread Distribution –Species or ecological systems thatare found throughout the ecoregionas well other adjacent ecoregions.
Working Landscape – A workinglandscape is a place where agricul-ture and other natural resourcebased economic endeavors are con-ducted with the objective of main-taining the viability and integrity ofits commercial and environmentalvalues. On a working landscape,both private production, as well aspublic regulatory decisions accountfor the sustainability of families,businesses and communities, whileprotecting and enhancing the land-scape’s ecological health. The work-ing landscape is readily adaptable tochange according to economic andecosystem needs (California Bay-Delta Public Advisory Committee2002).
Glossary
106

A Conservation Blueprint for Canada’s Prairies and Parklands
107
AAC (Agriculture and Agri-FoodCanada.) 1997. Biodiversity inAgriculture: Agriculture and Agric-Food Canada’s Action Plan.
Acton, D., G. Padbury and C. Stush-noff. 1998. The Ecoregions of Saska-tchewan. Canadian Plains ResearchCentre, Regina, SK. 204pp.
AEP (Alberta EnvironmentalProtection.) 1995. SustainingAlberta’s Biodiversity. An Overviewof Government of Alberta InitiativesSupporting the CanadianBiodiversity Strategy.
ASRD (Alberta Sustainable ResourceDevelopment.) 2002. Status of theYucca Moth (Tegeticula yuccasella) in Alberta. Alberta SustainableResource Development, Fish andWildlife Division, and AlbertaConservation Association, WildlifeStatus Report No. 44, Edmonton,AB. 21pp.
ASRD. (Alberta Sustainable ResourceDevelopment.) 2004. Status of theTiny Cryptanthe (Cryptantha mini-ma). Alberta Sustainable ResourceDevelopment, Fish and WildlifeDivision, and Alberta ConservationAssociation, Wildlife Status ReportNo. 54, Edmonton, AB. 39pp.
ASRD (Alberta Sustainable ResourceDevelopment, Alberta Environment,Alberta Community Development,and Agriculture and Agri-FoodCanada.) 2005. Natural Regions andSubregions of Alberta. Map anddata.
ASRD/ACA (Alberta SustainableResource Development and AlbertaConservation Association.) 2005a.Status of the Western Blue Flag (Irismissouriensis) in Alberta: update2005. Alberta Sustainable ResourceDevelopment, Wildlife Status ReportNo. 21 (Update 2005), Edmonton,AB. 28pp.
ASRD/ACA (Alberta SustainableResource Development and AlbertaConservation Association.) 2005b.Status of the Burrowing Owl(Athene cunicularia) in Alberta:update 2005. Alberta SustainableResource Development, WildlifeStatus Report No. 11 (Update2005), Edmonton, AB. 28pp.
Aldridge, C.L. 1998. Status pf theSage Grouse (Centrocercusurophasianus) in Alberta. AlbertaEnvironmental Protection, WildlifeManagement Division, and AlbertaConservation Association, WildlifeStatus Report 13, Edmonton, AB.23pp.
Anderson, M., P.Bourgeron,M.T.Bryer, R.Crawford,L.Engelking, D.Faber-Langendoen,M.Gallyoun, K.Goodin,D.H.Grossman, S.Landaal,K.Metzler, K.D.Patterson, M.Pyne,M.Reid, L.Sneddon and A.S.Weakley. 1998. International classifi-cation of ecological communities:terrestrial vegetation of the UnitedStates. Vol. II. The NationalVegetation Classification System: listof types. The Nature Conservancy,Arlington, VA.
Anderson, S. 1874. Letters from the49th Parallel, 1857-1873: SelectedCorrespondence of Joseph Harrisand Samuel Anderson. The Champ-lain Society, Toronto, ON. 2000.477pp.
Agriculture and Agri-Food Canada.June 2005. PFRA Gross WatershedBoundaries for the Canadian Prairies.(http://www.agr.gc.ca/pfra/gis/gwshed_e.htm; current 2005).
Bailey, A.W. and R.A. Wroe. 1974.Aspen invasion of a portion of theAlberta parklands. Journal of RangeManagement 27:263-266.
Bailey, R.G. 1994. Ecoregions of theUnited States (revised map). U.S.Department of Agriculture, ForestService. Washington, DC.
Bird, R.D. 1961. Ecology of the aspenparkland of western Canada in rela-tion to land use. Canada Dept. ofAgriculture, Research Branch.Publication 1066. 155pp.
Blancher, P. 2003. Importance ofNorth America’s Grasslands to Birds.Rept. To Commission for Environ-mental Cooperation. Bird StudiesCanada, Port Rowan, ON. 23pp.(http://www.bsc-eoc.org/ grass-birdsrpt.html; current Sept. 2006).
Bock, C.E., V.A.Saav, T.D.Rich andD.S.Dobkin. 1993. Effects of live-stock grazing on neotropical migra-tory landbirds in western NorthAmerica. Pp. 296-309, in, Finch,D.M and P.W. Stangtel (eds.) Statusand Management of NeotropicalMigratory Birds. Gen. Tech. Rep.RM-229, Rocky Mountain Forest &Range Experiment Station, U.S.Dept. of Agriculture, Forest Service,Fort Collins, CO.
Bowker, G.C. 2000. Mapping biodi-versity. International Journal ofGeographical Information Science14:739-754.
Brockway, D.G., R.G. Gatewood andR.B. Paris. 2002. Restoring fire as anecological process in shortgrassprairie ecosystems: initial effects ofprescribed burning during the dor-mant and growing seasons. Journalof Environmental Management65:135-152.
Bryce, S.A., J.M.Omernik, D.A.Pater,M.Ulmer, J.Schaar, J.Freeouf,R.Johnson, P.Kuck andS.H.Azevedo. 1996. Ecoregions ofNorth Dakota and South Dakota.Reston, VA, U.S. Geological Survey.(Map scale 1:1,500,000).
Cade, T.J. and C.P. Woods. 1997.Changes in distribution and abun-dance of the Loggerhead Shrike.Conservation. Biology 11:21-32.
California Bay-Delta Public AdvisoryCommittee, 2002. WorkingLandscapes SubcommitteeDescription.(http://calwater.ca.gov/BDPAC/Subcommittees/WorkingLandscapes/-WorkingLandscapesSubcommitteeDescription_Final_12-05-02.pdf; cur-rent Sept. 2006.)
ReferencesLiterature Cited

Carbyn, L.N., H. Armbruster and C.Mamo. 1993. The Swift Fox reintro-duction program in Canada from1983 to 1992. Pp. 247-271, in,Restoration of Endangered Species.Cambridge University Press,Cambridge, U.K.
CEC and TNC. (Commission forEnvironmental Cooperation and TheNature Conservancy.) 2005. NorthAmerican central grassland priorityconservation areas: technical reportand documentation. J.W. Karl and J. Hoth (eds.) Montreal, QC. 153pp.
Chan, K.M.A., M.R. Shaw, D.R.Cameron, E.C. Underwood andG.C. Daly. 2006. Conservation serv-ices for ecosystem services. PLOSBiology 4(II):1-15. (4(II): e379.DOI: 10.1371 / journal.pbio. 0040379)
Chapman, K., K. Hiller and J. Hafer-man. 1998. Identification of Impor-tant Bird Sites in the NorthernTallgrass Prairie Ecoregion. TheNature Conservancy, MinnesotaChapter, Minneapolis, MN. 43pp.+maps.
Clark, J.S., E.C. Grimm, J.J. Donovan,C. Fritz, D.R. Engstrom and J.E.Almendinger. 2002. Drought cyclesand landscape responses to past aridi-ty on prairies of the Northern GreatPlains, USA. Ecology 83:595–601.
Clayton, K.M. 2000. Status of theShort-eared Owl (Asio flammeus) inAlberta. Alberta Environment,Fisheries and Wildlife ManagementDivision, and Alberta ConservationAssociation, Wildlife Status ReportNo. 28, Edmonton, AB. 15 pp.
Comer, P., D. Faber-Langendoen, R.Evans, S. Gawler, C. Josse, G. Kittel,S. Menard, M. Pyne, M. Reid, K.Schulz, K. Snow and J. Teague.2003. Ecological Systems of theUnited States: A WorkingClassification of U.S. TerrestrialSystems. NatureServe, Arlington, VA.75pp.
Convention on Biological Diversity(Secretariat on the Convention onBiological Diversity – United NationsEnvironment Programme). InvasiveAlien Species. 2005.
(http://www.biodiv.org/pro-grammes/cross-cutting/alien/default.asp; current Oct. 2005.)
Coues, E. 1897. The manuscript jour-nals of Alexander Henry, 1799-1814.Vol. 1. The Red River of the North.Francis P. Harper, New York, NY.
Coupland, R.T. 1950. Ecology ofmixed prairie in Canada. EcologicalMonographs 20: 271-315.
Coupland, R.T. 1977. Prairie Ecology.Pp. 11-16, in, J.M. Shay (ed.)Invited Papers for the 14th AnnualMeeting of the Canadian BotanicalAssociation. CBA/ABC Bulletin 13(1980). 22pp.
Crins, W.J. and P.S.G. Kor. 2000.Natural Heritage Gap AnalysisMethodologies Used by the OntarioMinistry of Natural Resources. Open File Natural HeritageTechnical Report 2000-1. OMNR,Lands and Natural Heritage Branch,Peterborough, ON. 31pp.
Cunfer, G. 2005. On The Great Plains:Agriculture and Environment.College Station: Texas A & M Press.292pp.
Dormaar, J.F. and R.L. Barsh. 2000.The Prairie Landscape: Perceptionsof Reality. Prairie ConservationForum, Lethbridge, OccasionalPaper 3. 22pp.
Downes, C.M. 1994. Populationtrends of songbirds in three habitatsbetween 1966-1990. BBS Canada4(1):2-4.
Ecological Stratification WorkingGroup. 1995. A National EcologicalFramework for Canada. Centre forLand and Biological ResourcesResearch, Research Branch,Agriculture and Agri-Food Canadaand State of the EnvironmentDirectorate, Ecozone AnalysisBranch, Ottawa/Hull. (Map at 1:7,500,000 scale.)
England, R.E. and A. DeVos. 1969.Influence of animals on pristine con-ditions on the Canadian grasslands.Journal of Range Management22:87-94.
Epp, H. 1992. Saskatchewan’sEndangered Spaces and Places: TheirSignificance and Future. Pp. 47-108,in, Jonker, P. (ed.) Saskatchewan’sEndangered Spaces: An Intro-duction. Extension Division,University of Saskatchewan,Saskatoon, SK.
Forsyth, A. 1983. The End ofEmptiness. Equinox 11:66-78.
Gaston KJ, R.L. Pressey and C.R.Margules. 2002. Persistence and vul-nerability: retaining biodiversity inthe landscape and in protected areas.Journal of Biosciences 27:361-384.(http://www.prfo.ca/SofA_design/02-pressey. pdf)
Gauthier, D.A., A. Lafon, T.P.Toombs, J. Hoth and E. Wiken.2003. Grasslands: Toward a NorthAmerican Conservation Strategy. Co-published by Commission forEnvironmental Cooperation andCanadian Plains Research Centre,University of Regina, Regina, SK.99pp.
Gauthier, D.A. and E. Wiken. 2001.Monitoring the conservation ofnative habitat, prairie ecozone,Canada. EMAN National ScienceMeeting. (http://www.eman-rese.ca/eman/reports/)
Gauthier, D.A and E. Wiken. 2003.Monitoring the conservation ofgrassland habitats, prairie ecozone,Canada. Environmental Monitoringand Assessment 88:343-364.
Geist, V. 2007. Personal communica-tion. Professor Emeritus, Faculty ofEnvironmental Design, University ofCalgary.
Geological Survey of Canada. 2001.Sand Dune and Climate ChangeStudies in the Prairie Provinces.16pp. (http://sts.gsc.nrcan.gc.ca/-sanddune/sanddune.pdf; current2005.)
Gilson, J.C. 1977. Economic Aspectsof the Prairie Provinces. Pp. 17-22,in, J.M. Shay (ed.) Invited Papers forthe 14th Annual Meeting of theCanadian Botanical Association.CBA/ABC Bulletin 13 (1980).22pp.
R e f e r e n c e s
108

A Conservation Blueprint for Canada’s Prairies and Parklands
109
GOA (Government of Alberta.) 2003.Community Development. AlbertaLand Classification Descriptions.(http://www.cd.gov.ab.ca/preserv-ing/parks/lrm/defland.asp- currentJuly 2005)
GOC (Government of Canada.) 1996.The State of Canada’s Environment.Ottawa, ON.
GOS (Government of Saskatchewan.2002.) Caring for Saskatchewan’sNatural Environments: A ProposedBiodiversity Action Plan.
Gray, J.H. 1966. The Winter Years:The Depression on the Prairies.Macmillan of Canada, Toronto, ON.
Gross, D.V. 2005. Spatial and temporaleffects of burning on plant communi-ty characteristics and composition ina fescue prairie. MSc Thesis, Univer-sity of Saskatchewan, Saskatoon, SK.MS.
Grossman, D.H., D.Faber-Langendoen, A.S.Weakley,M.Anderson, P.Bourgeron,R.Crawford, K.Goodin, S.Landaal,K.Metzler, K.D.Patterson, M.Pyne,M.Reid and L. Sneddon. 1998.International classification of ecologi-cal communities: terrestrial vegeta-tion of the United States. Vol. I. TheNational Vegetation ClassificationSystem: development, status, andapplications. The Nature Conserv-ancy, Arlington, VA. 126pp.
Groves, C.R. 2003. Drafting aConservation Blueprint: A Pract-itioner’s Guide to Planning forBiodiversity. The NatureConservancy. Island Press,Washington, D.C. 455pp.
Groves, C., L.L. Valutis, D. Vosick, B.Neely, K. Wheaton, J. Touval and B.Runnels. 2000. Designing a Geo-graphy of Hope. The NatureConservancy, Arlington, VA.
Gummer, D.L. 1997. Ord’s KangarooRat (Dipodomys ordii). AlbertaEnvironmental Protection, WildlifeManagement Division, Wildlife StatusReport No. 4, Edmonton, AB. 16pp.
Gummer, D. L. and S. E. Robertson.2003. Distribution of Ord’sKangaroo Rat in southeasternAlberta. Alberta Sustainable ResourceDevelopment, Fish and WildlifeDivision, Alberta Species at RiskReport No. 63. Edmonton, AB.16pp.
Halls, L.K. 1984. White-tailed Deer:Ecology and Management. StackpoleBooks, Harrisburg, PA.
Hamilton, K.G.A. 2005. Bugs revealand extensive, long-lost northern tallgrass prairie. BioScience 55(1):49-59.
Hammer, U.T. 1986. Saline lakes: theirdistribution and characteristics. Pp. 1-22, in, D.T. Waite (ed.)Evaluating Saline Waters in a PlainsEnvironment. Canadian PlainsProceedings, Vol. 17. CanadianPlains Research Centre, University of Regina, Regina, SK.
Hammermeister, A.M., D. Gauthierand K. McGovern. 2001.Saskatchewan’s Native Prairie:Statistics of a Vanishing Ecosystemand Dwindling Resource. NativePlant Society of Saskatchewan Inc.,Saskatoon, SK. 17pp.
Heckert, J., D.L. Reinking, D.A.Wiedenfeld, M. Winter, J.L.Zimmerman, W.E. Jensen, E.J. Finck,R.R. Koford, D.H. Wolfe, S.K.Sherrod, M.A. Jenkins, J. Fasborg,and S.K. Ronbinson. 2003. Effects ofprairie fragmentation on the next suc-cess of breeding birds in the midcon-tinental United States. ConservationBiology 17:587-594.
Henderson, N., E.Hogg, E.Barrow,B.Dolter. 2003. Climate ChangeImpacts on the Island Forests of the Great Plains and the Implications forNature Conservation Policy. PrairieAdaptation Research Collaborative.(http://www.parc.ca/research_pub_forestry.htm)
Henson, B.L., K.E. Brodribb and J.L.Riley. 2005. Great LakesConservation Blueprint for TerrestrialBiodiversity. Vol. 1. NatureConservancy of Canada, NaturalHeritage Information Centre andProvince of Ontario. 157pp.
Herriot, T. 2000. River in a Dry Land.Stoddart Publishing, Toronto, ON.356pp.
Hewitt, C.G. 1921. The Conservationof the Wild Life of Canada. CharlesScribner’s Sons, New York, NY.344pp.
Hill, D.P. 1998. Status of the Long-billed Curlew (Numeniusamericanus) in Alberta. AlbertaEnvironmental Protection, Fisheries& Wildlife Management Division,and Alberta ConservationAssociation, Wildlife Status ReportNo. 16, Edmonton, AB. 20pp.
Hind, H.Y. 1860. Narrative of theCanadian Red River ExploringExpedition of 1857 and of theAssiniboine and SaskatchewanExploring Expedition of 1858.Reprinted by Hurtig. Tuttle, Japan,1971. 494pp. and 472pp.
Hummel, M. 1989. EndangeredSpaces. Key Porter Books, Toronto,ON. 288pp.
Hummel, M. 1995. ProtectingCanada’s Endangered Spaces. KeyPorter Books, Toronto, ON. 251pp.
Hurlburt, D. 2001. Status of Soapweed(Yucca glauca) in Alberta. AlbertaEnvironment, Fisheries and WildlifeManagement Division, and AlbertaConservation Association, WildlifeStatus Report No. 35, Edmonton,AB. 18 pp.
James, P.C. 2000. From Presentation atNative Plant Society of SaskatchewanAnnual General Meeting. P. 9, in,Hammermeister, A.M., D. Gauthierand K. McGovern. 2001. Saskatch-ewan’s Native Prairie: Statistics of aVanishing Ecosystem and DwindlingResource. Native Plant Society ofSaskatchewan Inc., Saskatoon, SK.17pp.
Kavanagh, M. 1968. LaVerendrye.Brandon, MB. 262pp.
Kintsch, J.A. and D.L. Urban. 2002.Focal species, community representa-tion, and physical proxies as conser-vation strategies: a case study in theAmphibolite Mountains, NorthCarolina, U.S.A. ConservationBiology 16(4):936-947.

Leavitt, P. and G. Chen. 2001.Sustainable agriculture in westernCanada: planning for droughts usingthe past – prairie drought paleolim-nology project. Natural Sciences andEngineering Research Council ofCanada, AgriFood Innovation Fund,Saskatchewan Agriculture and Food,and Agriculture and AgriFoodCanada. University of Regina, SK(http://www.uregina.ca/biology/faculty/leavitt/drought/drought1.htm)
Low, G., C. Groves, and others.Undated. Selecting Sites forEcoregional Portfolios and TNCConservation Action. MS.
MacArthur, R.H. and E.O. Wilson.1967. The Theory of IslandBiogeography. Monographs inPopulation Biology No 1. Princeton University Press.Princeton, NJ. 224pp.
Macoun, J. 1882. Manitoba and theGreat North-west. World Publishing,Guelph, ON. 687pp.
Marshall, I. B. and P. H. Schut, 1999. A National Ecological Framework forCanada. A cooperative product byEcosystems Science Directorate,Environment Canada and ResearchBranch, Agriculture and Agri-FoodCanada.
McCracken, J.D. 2005. Where theBobolinks Roam: The Plight ofNorth America’s Grassland Birds.Biodiversity 6(3):20-29.
McGillivray, W.B. and M. Steinhilber(eds.). 1996. A Bioinventory ofMcIntyre Ranch: An ExtensiveFescue-Dominated Grassland inSouthern Alberta. Royal AlbertaMuseum, Edmonton, AB. 116pp.
NatureServe. 2002. ElementOccurrence Data Standard. 2005(http://www.natureserve.org/prodServices/eodata.jsp)
Noss, R.F. 1990. Indicators for moni-toring biodiversity: A hierarchicalapproach. Conservation Biology4:355-364.
Oliver, I., A. Holmes, J.M.Dangerfield, M. Gillings, A.J. Pik,D.R. Britton, M. Holley, M.E.
Montgomery, M. Raison, V. Logan,R.L. Pressey and A.J. Beattie. 2004.Land systems as surrogates for biodi-versity in conservation planning.Ecological Applications 14(2):485-503.
Omernik, J.M. 1995. Ecoregions –a framework for environmental man-
agement, Pp. 49-62, in, Davis, W.S.and Simon, T.P. (eds.) BiologicalAssessment and Criteria-Tools forWater Resource Planning andDecision Making. Lewis Publishers,Boca Raton, Florida.
Palliser, J. 1862. The Papers of thePalliser Expedition 1857-1860.Reprinted 1968, The ChamplainSociety, Toronto, ON. 694pp.
PCAP Partnership. 2003.Saskatchewan Prairie ConservationAction Plan 2003-2008. CanadianPlains Research Centre, University ofRegina, Regina, SK. 52pp.
Pepper G.W. and D.A. Gauthier. 1998.Saskatchewan Prairie BiodiversityStudy. Canada-Saskatchewan GreenPlan Agreement. 16pp.
Peterjohn, B.G. and J.R. Sauer. 1993.North American Breeding BirdSurvey annual summary 1990-1992.Bird Populations 1:1-15.
Plissner, J.H. and S. M. Haig. 2000.Status of a broadly distributedendangered species: results andimplications of the secondInternational Piping Plover Census.Canadian Journal of Zoology78:128–139.
Poiani, K. and B. Richter. 1999.Functional Landscapes and theConservation of Biodiversity.Working Papers in ConservationScience. The Nature Conservancy.12pp.
Poiani, K., B. Richter, M. Andersonand H. Richter. 2000. Biodiversityconservation at multiple scales: func-tional sites, landscapes, and net-works. BioScience 50:133-146.
Poulin, R.G., L.T. Todd, K. Dohms,M. Brigham and T. Wellicome.2005. Factors associated with nest-and roost-burrow selection byBurrowing Owls (Athene
cunicularia) on the Canadianprairies. Canadian Journal ofZoology, 83:1373-138.
Prescott, D.R.C. and R.R. Bjorge.1999. Status of the LoggerheadShrike (Lanius ludovicianus) inAlberta. Alberta Environment,Fisheries and Wildlife ManagementDivision, and Alberta ConservationAssociation, Wildlife Status ReportNo. 24, Edmonton, AB. 28pp.
Pruss, S.D. 1999. Selection of nataldens by the Swift Fox (Vulpes velox)on the Canadian Prairies. CanadianJournal of Zoology 77(4):646-652.
Redford, K.H., P. Coppolillo, E.W.Sanderson, G.A.B. DaFonseca, E.Dinerstein, C. Groves, G. Mace, S.Maginnis, R.A. Mitterneier, R. Noss,D. Olson, J.G.
Robinson, A. Vedder and M. Wright.2003. Mapping the conservationlandscape. Conservation Biology17:116-131.
Ricketts, T.H., E. Dinerstein, D.M.Olson, C.J. Loucks, W. Eichbaum,D. DellaSala, K. Kavanagh, P.Hedao, P.T. Hurley, K.M. Carney, R.Abell and S. Walters. 1999.Terrestrial Ecoregions of NorthAmerica. A ConservationAssessment. Island Press,Washington, DC. 495pp.
Ricketts, T. and M. Imoff. 2003.Biodiversity urban areas and agricul-ture: locating priority ecoregions forconservation. Conservation Ecology8(2):1 (http://www.ecologyandsoci-ety.org/vol8/iss2/art1/; currentSept. 2006.)
Riemer, G., J. Taylor and D. Burden,1995. A Case Study of SustainableLand Use: The Delivery of theNAWMP in Prairie Canada – Socio-economic Impacts. Pp 87-92, in,Proceedings of the SymposiumPlanning for a Sustainable Future:The Case of the North AmericanGreat Plains. National DroughtInformation Center, Department ofAgricultural Meteorology, Universityof Nebraska, Lincoln, NE.
R e f e r e n c e s
110

A Conservation Blueprint for Canada’s Prairies and Parklands
111
Riley, J.L. 1999. Planning for NaturalHeritage Systems on the SettledLandscapes of Southern Ontario. Pp.145-151, in, Beechey, T.J., G.R.Francis and D.M Powell (eds.)Caring for Southern Remnants:Special Species, Special Spaces.Conference Proceedings, 12thAnnual Meeting, Canadian Councilon Ecological Areas, 1993, Windsor,ON, and CCEA, Ottawa, ON.305pp.
Riley, J.L. 2005 The NCC Approachto Describing Areas of ConservationInterest – Sites, Natural Areas,Properties, Flagships, etc. NatureConservancy of Canada DiscussionPaper. 5pp. MS.
Riley, J.L., M. McMurtry, P.J. Sorrilland T. Holden. 2003. Big Picture2002. Identifying Key NaturalHeritage Areas and Linkages on theSouthern Ontario Landscape. CD,poster. NCC and Ontario NaturalHeritage Information Centre,Peterborough, ON.
Riley, J.L., M. Albanese, K. Charnetski,R. Barnard and H. Godschalk. 2004.Stewardship Manual. 2nd ed. NatureConservancy of Canada, Toronto,ON. 134pp.
Roe, F.G. 1972. The North AmericanBuffalo. 2nd Edition. University ofToronto Press, Toronto, ON.991pp.
Sampson, F.B. and Knopf, F.L., 1996.Prairie Conservation: PreservingNorth America's Most EndangeredEcosystem. Island Press. 351 pp.
Saskatchewan Environment. 2005.Saskatchewan State of the Environ-ment Report 2005.(http://www.se.-gov.sk.ca/ecosystem/SaskatchewanState of the Environment Report2005.pdf; current Sept. 2006.)
Sauer, J.R., J.E. Hines, G. Gough, I.Thomas, and B.G. Perterjohn. 1997.The North American Breeding BirdSurvey Results and Analysis. Version96.3. USGS Patuxent WildlifeResearch Center, Laurel, MD.(Online at: www.mbr.nbs.gov/bbs/htmgu/grass.html)
Sauer, J.R., J.E. Hines, and J. Fallon.2005. The North American BreedingBird Survey, Results and Analysis1966 - 2004. Version 05.2. USGSPatuxent Wildlife Research Center,Laurel, MD. (Online at: www.mbr-pwrc.usgs.gov/bbs/bbs.html)
Schindler, D.W. 2002. Cumulativeimpacts of climate warming andother human activities on the fresh-water resources of Western andNorthern Canada. Conference forthe International Association ofGreat Lakes Research, Winnipeg,MB.
Schindler, D.W. and W.F. Donahue.2006. An impending water crisis inCanada’s western prairie provinces.Proceedings of the NationalAcademy of Science 103:7210-7216.(http://www.pnas.org/cgi/doi/10.1073/ pnas.0601568103)
Schmutz, J.K. 1999. Status of theFerruginous Hawk (Buteo regalis) inAlberta. Alberta EnvironmentalProtection, Fisheries and WildlifeManagement Division, and AlbertaConservation Association, WildlifeStatus Report No. 18, Edmonton,AB. 18pp.
Smeeton, C. and K. Weagle. 2000.The reintroduction of the Swift Fox(Vulpes velox) to south centralSaskatchewan, Canada. Oryx34:177-180.
Smith, B. 2000. Status of the WesternSpiderwort (Tradescantiaoccidentalis) in Alberta. AlbertaEnvironmental Protection, Fisheriesand Wildlife Management Division,and Alberta ConservationAssociation, Wildlife Status ReportNo. 31, Edmonton, AB. 12 pp.
Smith R.E., H. Veldhuis, G.F. Mills,R.G. Eilers, W.R. Fraser and G.W.Lelyk. 1998. Terrestrial Ecozones,Ecoregions, and Ecodistricts ofManitoba, An EcologicalStratification of Manitoba’s NaturalLandscapes. Technical Report 1998-9E. Land Resource Unit, BrandonResearch Centre, Research Branch,Agriculture and Agri-Food Canada,Winnipeg, MB. (Map at 1:1 500 000scale).
Stewart, R.E. and H.A. Kantrud.1971. Classification of natural pondsand lakes in the glaciated prairieregion. Resource Publication 92,Bureau of Sport Fisheries andWildlife, U.S. Fish & WildlifeService, Washington, D.C. NorthernPrairie Wildlife Research CenterHome Page.(http://www.npwrc.usgs.gov/resource/tools/pondlake/pondlake.htm)
Strong, W.L. 1992. Ecoregions andEcodistricts of Alberta. AlbertaForestry, Lands and Wildlife, LandInformation Services Division,Edmonton, AB. 77pp. + maps.
Tear, T.H., P. Kareiva, P.L.Angermeier, P. Comer, B. Szeck, R. Kautz, L. Landon, D. Mehlman,K. Murphy, M. Ruckelshaus, J.M.Scott and G. Wilhere. 2005. Howmuch is enough? The recurrentproblem of setting measurable objec-tives in conservation. BioScience55:835-849.
Thorpe, J and B. Godwin, 1999.Threats to biodiversity in Saskatche-wan. Saskatchewan ResearchCouncil, Plant Ecology Division.SRC Publication 11158-1C99(http://www.se.gov.sk.ca/ecosys-tem/biodiversity/threats_bio.pdf;current Sept. 2006)
TNC. (The Nature Conservancy).1998. Ecoregional Planning in theNorthern Tallgrass Prairie. TheNorthern Tallgrass PrairieEcoregional Planning Team. 207pp.
TNC (The Nature Conservancy).1999. Ecoregional Planning in theNorthern Great Plains Steppe. TheNorthern Great Plains SteppeEcoregional Planning Team. 76pp.
USGS (United Stated GeologicalService). 2000. North Dakota LandCover Data Set. (http://landcover.-usgs.gov/nlcd/show_data.asp?code=ND&state=North_Dakota)
USGS (United Stated GeologicalService). 2005. Gap AnalysisProgram.(http://gapanalysis.nbii.gov/por-tal/; current Sept. 2006.)

R e f e r e n c e s
112
Vickery, P.D., M.L. Hunter Jr., andS.M. Melvin. 1994. Effects of habi-tat area on the distribution of grass-land birds in Maine. ConservationBiology 8:1087-1097.
Vujnovic, K., R.W. Wein and M.R.T.Dale. 2002. Predicting plant speciesdiversity in response to disturbancemagnitude in grassland remnants ofcentral Alberta. Canadian Journal ofBotany 80:504-511.
Walker, B.H. and R.T. Coupland.1968. An analysis of vegetation-envi-ronment relationships in Saskatoonsloughs. Canadian Journal of Botany46:509-522.
White, D., P.G. Minotti, M.J. Barczak,J.C. Sifneos, K.A. Freemark, M.V.Santelmann, C.F. Steinitz, A.R.Kiester and E.M. Preston. 1996.Assessing risks to biodiversity fromfuture landscape change.Conservation Biology 11(2):349-360.
Wiens, J. A. 1994. Habitat fragmenta-tion: island vs landscape perspectiveson bird conservation. Ibis 137:S97-S104.
With, K. A. and T. O. Crist. 1995.Critical thresholds in species’responses to landscape structure.Ecology 76:2446-2459.
Woods, A. J., J. M. Omernik, J.A.Nesser, J. Shelden, J.A. Comstockand S.H. Azevedo. 2002.Ecoregions of Montana, 2nd Ed.(Color poster with map, descriptivetext, summary tables, and photo-graphs; map scale 1:1,500,000).
WRI (World Resource Institute).2000. World Resources 2000-2001:People and ecosystems: The frayingweb of life. United NationsEnvironment Programme, WorldBank, World Resources Institute.400pp.
World Wildlife Fund. 2001. S. Primm,R. Usher, K. Kavanagh, M. Sims andG. Mann., Montana Valley andFoothill grasslands (NA0808). 2005(http://www. worldwildlife.org/-wildworld/profiles/terrestrial/na/na0808_full.html; current Sept.2006.)
Zhou, Y. and S. Narumalani. 2003. A GIS-based spatial pattern analysismodel for eco-region mapping andcharacterization. InternationalJournal of Geographical InformationScience 17:123-130.

Other ReferencesPrairie Grasslands and Parklands.
http://www.mb.ec.gc.ca/nature/whp/prgrass/df03s56.en.html
Canadian Prairie Partners in Flight.2004. Landbird Conservation Plan forPrairie Pothole Bird ConservationRegion 11 in Canada. CanadianWildlife Service, Edmonton, AB.
Conservation Action Plan –Saskatchewan Provincial Parkshttp://www.se.gov.sk.ca/saskparks/common/cap2001.pdf
Beyersbergen, G.W., N.D. Niemuth, andM.R. Norton, coordinators. 2004.Northern Prairie & Parkland WaterbirdConservation Plan. Prairie PotholeJoint Venture, Denver, CO. 183pp.
Neave, P., E. Neave, T. Weins and T.Riche. 2000. Availability of WildlifeHabitat on Farmland. Pp. 145-156, in,McRae, T., C.A.S. Smith and L.J.Gregorich (Eds). 2000. EnvironmentalSustainability of Canadian Agriculture:Report of the Agri-EnvironmentalIndicator Project. Agriculture andAgri-Food Canada, Ottawa, ON
North Dakota Notes: Articles on NorthDakota’s Geology and Landforms(http://www.state.nd.us/ndgs/ndnotes/ nd_notes%20.htm)
Online ResourcesBiodiversity■ Federation of Alberta Naturalists –
Alberta Birdlist Program. http://fan-web.ca/projects/bird_list/
■ Manitoba Museum of Nature andMan – Bird and Birder Pagehttp://www.virtualmuseum.ca/Exhibitions/Birds/MMMN/English/park-land.html
■ Montana Audubon – State Bird List.http://mtaudubon.org/html/sci-ence_MBRC8.htm
■ Nature Saskatchewan Bird Checklist.http://www.naturesask.ca/pdf/Checklist1.pdf
■ North Dakota – Birds of NorthDakota Checklisthttp://www.state.nd.us/gnf/ndout-doors/issues/articles-brochures/nd-birds-check-list/
■ TNC Migratory Bird Program –Prairie Wings http://nature.org/ini-tiatives/programs/birds/explore/
Climate ■ Canadian Climate Normals
http://www.mb.ec.gc.ca/air/a00s04.en.html
■ United States Climate Datahttp://www.cdc.noaa.gov/USclimate
Conservation – General ■ Conserve Online – TNC website for a
broad range of conservation docu-ments. http://conserveonline.org/
Conservation – Targets and GeneralSpecies Information ■ Alberta amphibian information
http://www3.gov.ab.ca/srd/fw/amphib/index.html
■ Canadian Amphibian and ReptileConservation Networkhttp://www.carcnet.ca
■ NatureServe Explorer – An onlineencyclopedia of lifehttp://www.natureserve .org/explor-er/
■ North American Bird ConservationInitiative. www.nabci.net
■ Partners in Flight – US.http://www.partnersinflight.org/ orCanada - http://www.cws-scf.ec.gc.ca/birds/lb_ot_e.cfm
■ Species at Risk Public Registryhttp://www.sararegistry.gc.ca/
■ Species At Riskhttp://www.speciesatrisk.gc.ca/
■ World Wildlife Fund – Wildfinder:Mapping the World’s Specieshttp://www.worldwildlife.org/wildfinder/searchByPlace.cfm
Conservation – Threats ■ Alberta Invasive Plants Council.
http://www.invasiveplants.ab.ca/
Landscape descriptions■ Montana Valley & Foothill Grasslands;
http://www.worldwildlife.org/wild-world/profiles/terrestrial/na/na0808_full.html
Data LinksAgriculture and Agri-Food Canada
PFRA Gross Watershed Boundaries forthe Canadian Prairies. Onlinehttp://www.agr.gc.ca/pfra/gis/gwshed_e.htm
Alberta Community Development. 2005.Parks and Protected Areas: LandReference Manualhttp://www.cd.gov.ab.ca/preserv-ing/parks/lrm/index.asp
USGS PrairieMaphttp://prairiemap.wr.usgs.gov/
GAP Program (USA) – North Dakotahttp://www.npwrc.usgs.gov/ndgap/
Montanahttp://ku.wru.umt.edu/news/mtgap_su93.html/
A Conservation Blueprint for Canada’s Prairies and Parklands
113

Building Seamless Data Sets: Province-by-Province and State-by-StateAlbertaThree sources of land cover data exist for Alberta; 1)Agriculture and Agri-Food Canada (AAFC) – PFRA’s 9-cover class for the entire planning area in Alberta; 2) a 4-class “Central Aspen Parkland Vegetation Inventory” cre-ated by Alberta Sustainable Development for the AspenParkland and the northern portion of the Moist MixedGrassland (MMG) ecoregions; and 3) 800m x 800m(1/4 section) resolution Native Prairie VegetationInventory (NPVI) for parts of the MMG (used as a cross-reference). The NPVI layer was used as the land coverlayer for the Mixed Grassland and Cypress Uplandsecoregion. Surficial geology (1:1M scale) exists for all butthe extreme west of the planning area (Alberta Energyand Mines). Gaps missing geological information weredigitized from 1:0.5M maps.
Two ecological systems layers were created using thecombinations from each of the land cover layers and sur-ficial geology. This was done so that the areas that havenewer or higher quality information available would notlose the benefits of these data. The surficial geology layercontains a number of ‘undifferentiated’ classes. Undif-ferentiated polygons were assigned to adjacent geologypolygons that we felt would best represent changes in thenewly mapped ‘ecological systems’.
Water bodies were removed from the ecological sys-tems data set. Small wetlands were included, but were notdifferentiated by their underlying surficial geology. Also,an ancillary sand dune data set was added to the surficialgeology data set to better map these unique ecologicalsystems.
SaskatchewanSaskatchewan had two digital data sets available; 1:1Msurficial geology and a 24 class – land cover (30m pixelresolution) for southern Saskatchewan (1994). The land-cover data set was clipped to fit the buffered planning areawhich reduced the total number of cover classes. Similarclasses were further combined to eliminate potentialerrors in the land cover classification or where it was feltthat the classes were part of the same habitat type. Forexample, tall shrub and native dominated grassland class-es were combined to form a grassland/shrubland class. Aswell, the 3 ‘unnatural’ classes of cultivated land, hay crop(forage), and farmsteads were removed before the eco-logical systems were created. Similar to land cover, surfi-cial geology classes were aggregated to create classes thatthe team assumed would reflect changes in ecological sys-tems on the landscape.
Two additional ecological systems (wetland complexesand sand dune complexes) were considered. The wetlandcomplexes were derived from the original land cover andinclude water bodies, marsh, and mud/sand/saline, whilesand dune complexes were added from a separate data
A p p e n d i c e s
114
Appendices
Appendix A – Ecological SystemsCoarse-filter Targets
Land Cover & Surficial Geology

source. The classes of shrub fen, herbaceous fen, treedbog, and open bog were aggregated in with the wetlandcomplexes because of the uncertainty of their presence orlocations in the study area. These systems were consideredto be ‘more important’, in that they were given prioritywhen they were merged with the ecological systems dataset.
ManitobaManitoba’s provincial government reclassified imagerycollected by AAFC into a 16-class land cover layer. Thislayer is available for the entire planning area. Surficialgeology was available at a scale of 1:1M for the entire area.Methods followed that of the other areas (seeSaskatchewan for methods) to create the ecological sys-tems data set.
North DakotaA 19-cover class land cover data set from the USGSnational land cover was combined with geological stratig-raphy map of North Dakota. The satellite imagery forland cover was acquired in 1992.
MontanaMontana land cover data for was extracted from the GAPAnalysis program. Geology was extracted using 5 (gener-alized) geological classes.
Creation of the Ecological Systems Data SetAll land cover data sets were converted to raster data sets,30m pixel resolution; Albers Equal Area Canadian(NAD83) projection). Six land land-cover data sets werecrosswalked to create a seamless layer for the Montana,Alberta, Manitoba, Saskatchewan and North Dakota por-tions of the study area. This land-cover layer consisted ofseven natural land cover classes. All other land cover class-es were not considered to be natural and therefore wereconsidered “no data” for the purposes of the analysis.
Following Stewart and Kantrud (1971), water bodiesgreater than 20.2ha (50 acres) were considered lakeswhile those less than 20.2ha were considered ponds.Ponds adjacent to wetlands (marsh, bog, swamp, etc.)were reclassified as belonging to the wetlands class, whileall other water bodies were removed prior to the mergedland-cover classes being overlaid with the surficial geolo-gy units. More information on the cross-walk of landcover units for the three Canadian prairie provinces andNorth Dakota follows.
A Conservation Blueprint for Canada’s Prairies and Parklands
115
Land CoverFinal (Cross-walked) Land Cover Classes (AB, SK, MB, ND)
# Name Description
1 Grasslands / Shrubland Native grasslands and low growing shrubs
2 Deciduous woodlands Deciduous woodlands dominated by Aspen
3 Coniferous woodlands Coniferous woodlands including spruce and pine
4 Mixed Woods Includes a mixture of deciduous and coniferous cover
5 Water Bodies All open water areas larger than 20.2 hectares
6 Wetlands All open water areas <20.2 hectares as well as marshes, bogs, fens, etc.
7 Mud/Sand/Saline Mudflats, sand beaches, sandbars, and alkali wetlands
Original Classification by JurisdictionALBERTA: Southern part of planning area source: Agriculture and Agri-Food Canada Data
# Original Class New Class
1 Cropland No data
2 Forage No data
3 Grasslands Grasslands / Shrubland
4 Shrubs Grasslands / Shrubland
5 Trees Deciduous woodlands
6 Wetlands Wetlands
7 Water bodies Water Bodies
8 Other lands No data
9 Mud/Sand/Saline Mud/Sand/Saline
ALBERTA: Northern part of planning area source: Central Parklands Native Vegetation Inventory Project Data
# Original Class New Class
1 Human Modified No data
2 B_Decid Deciduous woodlands
3 Coniferous Coniferous woodlands
4 Deciduous Deciduous woodlands
5 Island Water Bodies
6 N_Conif Coniferous woodlands
7 N_Decid Deciduous woodlands
8 N_Grass Grasslands / Shrubland
9 Water Water Bodies
10 Wetland Wetlands

A p p e n d i c e s
116
SASKATCHEWAN: Southern Digital Land Cover source: Saskatchewan Environment
# Original Class New Class
1 Crop Land No data
2 Hay Crops (Forage) No data
3 Native Dominant Grasslands Grasslands / Shrubland
4 Tall Shrubs Grasslands / Shrubland
5 Pasture (Seeded Grasslands) No data
6 Hardwoods: Open Canopy Deciduous woodlands
7 Hardwoods: Closed Canopy Deciduous woodlands
8 Jack Pine: Closed Canopy Coniferous woodlands
9 Jack Pine: Open Canopy Coniferous woodlands
10 Spruce: Close Canopy Coniferous woodlands
11 Spruce: Open Canopy Coniferous woodlands
12 Mixed Woods Mixed Woods
16 Cutovers No data
17 Water Bodies Water Bodies
18 Marsh Wetlands
19 Herbaceous Fen Wetlands
20 Mud/Sand/Saline Mud/Sand/Saline
21 Shrub Fen (Treed Swamp) Wetlands
22 Treed Bog Peat Wetlands
23 Open Bog Wetlands
24 Farmstead No data
MANITOBA:source: Manitoba Land Initiative
Value Original Class New Class
1 Agricultural Cropland No data
2 Deciduous Forest Deciduous woodlands
3 Water Bodies Water Bodies
4 Grassland / Rangeland Grasslands / Shrubland
5 Mixedwood Forest Mixed Woods
6 Marsh and Fens Wetlands
7 Treed and Open Bogs Wetlands
8 Treed Rock No data
9 Coniferous Forest Coniferous woodlands
10 Burnt Areas No data
11 Open Deciduous Deciduous woodlands
12 Forage Crops No data
13 Cultural Features No data
14 Forest Cutovers No data
15 Bare Rock, Gravel and Sand No data
16 Roads and Trails No data
NORTH DAKOTA source: National Land Cover Data (USGS 2000)
# Original Class New Class
11 Water - Open Water Water Bodies
21 Developed -Low Intensity Residential No data
22 Developed – High Intensity Residential No data
23 Developed Commercial/Industrial/Transportation No data
31 Barren - Bare Rock/Sand/Clay No data
32 Barren - Quarries/Strip Mines/Gravel Pits No data
33 Barren – Transitional No data
41 Forested Upland - Deciduous Forest Deciduous woodlands
42 Forested Upland - Evergreen Forest Coniferous woodlands
43 Forested Upland - Mixed Forest Mixed Woods
51 Shrubland Grasslands / Shrubland
71 Herbaceous Upland - Grasslands/Herbaceous Grasslands / Shrubland
81 Herbaceous Planted/Cultivated – Pasture/Hay No data
82 Herbaceous Planted/Cultivated – Row Crops No data
83 Herbaceous Planted/Cultivated – Small Grains No data
84 Herbaceous Planted/Cultivated – Fallow No data
85 Herbaceous Planted/Cultivated Urban/Recreational Grasses No data
91 Wetlands - Woody Wetlands Wetlands
92 Wetlands - Emergent Herbaceous – Wetlands Wetlands
MONTANAOriginal GAP data (Redmon et al. 1998)
# Original Class New Class
1100 Urban or Developed Lands No Data
2010 Agricultural Lands – Dry No Data
2020 Agricultural Lands – Irrigated No Data
3110 Altered Herbaceous No Data
3130 Very Low Cover Grasslands Grassland / Shrubland
3150 Low/Moderate Cover Grasslands Grassland / Shrubland
3170 Moderate/High Cover Grasslands Grassland / Shrubland
3180 Montane Parklands & Subalpine Meadows Grassland / Shrubland
3200 Mixed Mesic Shrubs Grassland / Shrubland
3300 Mixed Xeric Shrubs Grassland / Shrubland
3309 Silver Sage Grassland / Shrubland
3310 Salt-Desert Shrub/ Dry Salt Flats Grassland / Shrubland
3350 Sagebrush Grassland / Shrubland
4000 Low Density Xeric Forest Grassland / Shrubland
4140 Mixed Broadleaf Forest Deciduous Woodlands
4203 Lodgepole Pine Coniferous Woodlands
4205 Limber Pine Coniferous Woodlands

A Conservation Blueprint for Canada’s Prairies and Parklands
117
MONTANA cont’d
# Original Class New Class4206 Ponderosa Pine Coniferous Woodlands
4212 Douglas-fir Coniferous Woodlands
4214 Rocky Mountain Juniper Coniferous Woodlands
4215 Larch Coniferous Woodlands
4223 Douglas-fir/Lodgepole Pine Coniferous Woodlands
4260 Mixed Whitebark Pine Forest Coniferous Woodlands
4270 Mixed Subalpine Forest Coniferous Woodlands
4280 Mixed Mesic Forest Coniferous Woodlands
4290 Mixed Xeric Forest Coniferous Woodlands
4300 Mixed Broadleaf & Conifer Forest Mixed Woods
4400 Standing Burnt Forest No Data
5000 Water Water
6110 Conifer Riparian Coniferous Woodlands
6120 Broadleaf Riparian Deciduous Woodlands
6130 Mixed Broadleaf & Conifer Riparian Mixed Woods
6200 Graminoid & Forb Riparian Wetlands
6300 Shrub Riparian Grassland / Shrubland
6400 Mixed Riparian Grassland / Shrubland
7300 Rock Bedrock
7500 Mines, Quarries, Gravel Pits No Data
7800 Mixed Barren Sites No Data
8100 Alpine Meadows Grassland / Shrubland
9100 Snowfields or Ice No Data
9800 Clouds No Data
9900 Cloud Shadows No Data
Final Crosswalked Surficial Geology Classes (AB, SK, MB, ND, MT)# Class Name Description
1 Bedrock Exposed or partly exposed bedrock
2 Eolian Plain Thin or flat deposits of wind blown sand or loess
3 Escarpment Complex Till, slump and ice pushed deposits
4 Glaciofluvial Poor to well stratified deposits of sands andDeposits gravels, deposited by glacial melt water
5 Glaciolacustrine Coarse grained deposits of sands, silts and clays (coarse deposits) deposited on the bottom of temporary glacial
lakes or glacial lake margins, including such features as deltas and beach deposits
6 Glaciolacustrine Fine grained deposits of sands, silts and clays (fine deposits) deposited on the bottom of temporary glacial
lakes, may also include more recent lake deposits of non glacial origin
7 Moraine Hummocky An unstratified heterogeneous mixture of particles sizes generally containing a mixture of sand, silt, clay, gravel, and rocks
8 Moraine Plain A complex sequence of slopes ranging form rounded deposes or kettles to irregular to conical knolls or knobs. May also include a regular sequence of moderate slopes that range for rounded concavities to convexities producing a wave like pattern of moderate relief
9 Moraine Ridged Narrow elevation of the surface, usually sharp crested with steep sides
10 Moraine Undulating A regular sequence of gentle slopes that range for rounded concavities to convexities producing a wave like pattern of low local relief
11 Sand Hills Thick deposits of wind blown sand or loess containing stabilised and active sand dunes
13 Valley Complex The steep sides of a valley and the valley bottoms, generally centred on a river or stream
14 Glaciofluvial Undifferentiated glacial sediment likely similar to Hummocky #5 Glaciolacustrine (coarse deposits); Kept
separate in report
15** Coarse-grained Undifferentiated glacial sediment likely similar to stratified sediment #5 Glaciolacustrine (coarse deposits); Kept
separate in report
16** Fine-grained Undifferentiated glacial sediment #6 stratified sediment Glaciolacustrine (fine deposits)
17** Till Undifferentiated deposit (moraine)
18** Exposed bedrock Unglaciated portions of the ecoregion or non-glacial sediment
19** Bedrock Exposed bedrock (may have some depositscovering)
Surficial GeologySurficial geology data sets varied by jurisdictions, by scaleand by surficial units. A class-by-class crosswalk of the sur-ficial units in each jurisdiction was done so that each classcould be simplified, aggregated or reclassified to create anecologically significant, cross-walked surficial geologylayer. (Assistance was provided by quaternary geologistJanet Campbell, Saskatchewan Industry and Resources)
All data sets were projected into a common AlbersEqual Area Canadian (NAD83) and converted to grids(30m pixel resolution) to facilitate overlay. Any ‘no data’areas in this new surficial geology layer created by lakes or‘slivers’ (overlapping boundaries that should align, butdon’t), from the original geology data sets were removedusing the nibble function in ESRI Arc/Info grid. Land-cover data were used to help fill these no-data areas.
**Note: these types apply to Montana only, due to Montana geological unitsthat could not be cross-walked seamlessly with other jurisdictions.

Alluvial Plain Alluvial Deposits Fluvial River Sediment Alluvial Deposits Valley Complex
Eolian Hummocky Sand Dunes Eolian Windblown Sand, Sand Hills /Eolian Ridged Sand of the OAHE and Eolian Plain
Older Formations, Undivided
Eolian Plain Cryoturbated Eolian Windblown Sand, Sand Hills /and Fluvial Sand of the OAHE and Older Eolian Plain
Formations, Undivided
Bedrock Bedrock Bedrock and Hell Creek Formation, Bedrock Bedrockglacial, undivided Niobrara and Carile Formations,
Pierre Formation, Bullion Creek Formation, Cannonball Formation
Glaciofluvial Eroded Glaciofluvial Valley Complex
Glaciofluvial Plain Glaciofluvial Deposits Ice-Contacted Fluvial Uncollapsed River Sediment, Glaciofluvial Deposits Glaciofluvial DepositsCollapsed River Sediment
Glaciofluvial Terrace Glaciofluvial Valley Complex
Glaciolacustrine Delta Deltaic Deposits Ice-contact Lacustrine Shoreline Sediment Glaciolacustrine Glaciolacustrine Beach and Nearshore and Fluvial, undivided (Coarse Deposits) (Coarse Deposits)Deposits Ice-contacted Lacustrine
Glaciolacustrine Plain Deep Basin Deposits Lacustrine Progalcial Lake Sediment Glaciolacustrine Plain Glaciolacustrine PlainPond Sediment (Fine Deposits) (Fine Deposits)
Major Meltwater Channel Valley Complex
Moraine Eroded Valley Complex /Moraine Plain
Moraine Plain Tills Glacial and Fluvial, Glacial - Collapsed Moraine Plain Moraine Plain(Without topography) undivided (Draped) Glacial Sediment
Glacial (Topography) (Supraglacial) flat Gently Undulatingflat to gently undulating Glacial Sediment Draped flat to undulating over Pre-existing Topography
(Over Glacial Deposits or Non Glacial)Wave Eroded Glacial Sediment
Moraine Undulating Glacial (Topography) Glacial - Collapsed Glacial Sediment Moraine undulating Moraine UndulatingMoraine Dumlinoid undulating (Supraglacial) Undulating or Rolling
undulating to rolling Glacial sediment on subglacially undulating to hummocky moulded surfaces
Escarpment Complex Escarpment Complex
Moraine Hummocky Tills (Hummocky) Glacial & Fluvial, Collapsed Glacial Sediment Moraine Hummocky Moraine Hummockyundivided (Stagnation) (Supraglacial) HillyGlacial (Topography) Ice Walled Lake sediment hummocky or Collapsed Supra Glacialmixed hummocky and Lake Sediment moraine plateau Collapsed / Draped Transition rolling to hummocky Sedimentsthick rolling to hummocky
A p p e n d i c e s
118
Reclassification of Surficial UnitsCrosswalk table showing original, intermediate, and final classes
Saskatchewan Manitoba Alberta North Dakota Intermediate class Final class

Ecological SystemsOf the six natural land-cover classes,4 were combined with 12 surficialclasses to produce the initial systemsmap. Wetlands and mud/sand/sal-ine classes were added after the ini-tial overlay based on the assumptionthat surficial geology would nothelp separate these classes into indi-vidual types. In total 73 uniqueclasses of ecological system wereidentified in the Aspen Parklandand Moist Mixed Grasslandecoregions. In the Mixed Grass-land and Cypress Upland an addi-tional surficial geology unit waspresent. For these two ecoregions,due to limited amounts of wood-lands, all three types were groupedtogether to create the one coverclass woodlands.
A Conservation Blueprint for Canada’s Prairies and Parklands
119
Tills ridged end Glacial Sediment Moraine Ridged Moraine Ridged
Moraine Ridged (Stagnation or ridges, irregular shaped on Thrust Massesinterlobate/ hills and depression Slope Wash Eroded end Moraine) hummocky to ridged Glacial Sediment
Stream and Slopewash Eroded Landslides Valley Complex
Organic Deposits Organic Organic Deposits Wetlands*
Water Valley Complex or Nibbled
Glaciofluvial Hummocky Glaciofluvial Hummocky
* Note - Organic Deposits – Due to the close relationship between the surficial organic deposits classification and the land cover wetlands classification, the wetlands classfrom the land cover was used and the organic deposits were given a “no data” value.
Saskatchewan Manitoba Alberta North Dakota Intermediate class Final class
1 Grasslands / Shrublands, Eolian Plain
2 Grasslands / Shrublands, Escarpment Complex
3 Grasslands / Shrublands, Glaciofluvial Deposits
4 Grasslands / Shrublands, Glaciolacustrine (Coarse Deposits)
5 Grasslands / Shrublands, Glaciolacustrine (Fine Deposits)
6 Grasslands / Shrublands, Moraine Hummocky
7 Grasslands / Shrublands, Moraine Plain
8 Grasslands / Shrublands, Moraine Ridged
9 Grasslands / Shrublands, Moraine Undulating
10 Grasslands / Shrublands, Organic Deposits
11 Grasslands / Shrublands, Sand Hills
12 Grasslands / Shrublands, Valley Complex
13 Deciduous Woodlands, Bedrock
14 Deciduous Woodlands, Eolian Plain
15 Deciduous Woodlands, Escarpment Complex
16 Deciduous Woodlands, Glaciofluvial Deposits
17 Deciduous Woodlands, Glaciolacustrine (Coarse Deposits)
18 Deciduous Woodlands, Glaciolacustrine (Fine Deposits)
19 Deciduous Woodlands, Moraine Hummocky
20 Deciduous Woodlands, Moraine Plain
21 Deciduous Woodlands, Moraine Ridged
22 Deciduous Woodlands, Moraine Undulating
23 Deciduous Woodlands, Organic Deposits
24 Deciduous Woodlands, Sand Hills
25 Deciduous Woodlands, Valley Complex
26 Coniferous Woodlands, Bedrock
27 Coniferous Woodlands, Eolian Plain
28 Coniferous Woodlands, Escarpment Complex
29 Coniferous Woodlands, Glaciofluvial Deposits
30 Coniferous Woodlands, Glaciolacustrine (Coarse Deposits)
31 Coniferous Woodlands, Glaciolacustrine (Fine Deposits)
32 Coniferous Woodlands, Moraine Hummocky
33 Coniferous Woodlands, Moraine Plain
34 Coniferous Woodlands, Moraine Ridged
35 Coniferous Woodlands, Moraine Undulating
36 Coniferous Woodlands, Organic Deposits
37 Coniferous Woodlands, Sand Hills
38 Coniferous Woodlands, Valley Complex
39 Mixed Woodlands, Bedrock
40 Mixed Woodlands, Eolian Plain
41 Mixed Woodlands, Escarpment Complex
42 Mixed Woodlands, Glaciofluvial Deposits
43 Mixed Woodlands, Glaciolacustrine (Coarse Deposits)
44 Mixed Woodlands, Glaciolacustrine (Fine Deposits)
45 Mixed Woodlands, Moraine Hummocky
46 Mixed Woodlands, Moraine Plain
47 Mixed Woodlands, Moraine Ridged
48 Mixed Woodlands, Moraine Undulating
Ecological Systems for the Aspen Parkland, Moist Mixed Grasslandand Boreal Transition ecoregions

A p p e n d i c e s
120
Ecological Systems for the Aspen Parkland, Moist MixedGrassland and Boreal Transition ecoregions cont’d
49 Mixed Woodlands, Organic Deposits
50 Mixed Woodlands, Sand Hills
51 Mixed Woodlands, Valley Complex
52 Mud / Sand / Saline
53 Wetlands
54 Grasslands / Shrublands, coarse-grained stratified sediment
55 Deciduous Woodlands, coarse-grained stratified sediment
56 Coniferous Woodlands, coarse-grained stratified sediment
57 Mixed Woodlands, coarse-grained stratified sediment
58 Bedrock, coarse-grained stratified sediment
59 Grasslands / Shrublands, fine-grained stratified sediment
60 Deciduous Woodlands, fine-grained stratified sediment
61 Coniferous Woodlands, fine-grained stratified sediment
62 Mixed Woodlands, fine-grained stratified sediment
63 Bedrock, fine-grained stratified sediment
64 Grasslands / Shrublands, till
65 Deciduous Woodlands, till
66 Coniferous Woodlands, till
67 Mixed Woodlands, till
68 Bedrock, till
69 Grasslands / Shrublands, exposed bedrock or sediment not of glacial origin
70 Deciduous Woodlands, exposed bedrock or sediment not of glacial origin
71 Coniferous Woodlands, exposed bedrock or sediment not of glacial origin
72 Mixed Woodlands, exposed bedrock or sediment not of glacial origin
73 Bedrock, exposed bedrock or sediment not of glacial origin
* Note: Green ecological systems are unique to Montana
Ecological Systems for the Mixed Grassland and Cypress Upland
1 Grasslands / Shrublands, Bedrock
2 Grasslands / Shrublands, Eolian Plain
3 Grasslands / Shrublands, Glaciofluvial Deposits
4 Grasslands / Shrublands, Glaciolacustrine (Coarse Deposits)
5 Grasslands / Shrublands, Glaciolacustrine (Fine Deposits)
6 Grasslands / Shrublands, Moraine Hummocky
7 Grasslands / Shrublands, Moraine Plain
8 Grasslands / Shrublands, Moraine Ridged
9 Grasslands / Shrublands, Moraine Undulating
10 Grasslands / Shrublands, Sand Hills
11 Grasslands / Shrublands, Valley Complex
12 Grasslands / Shrublands, Glaciofluvial Hummocky
13 Woodlands, Bedrock
14 Woodlands, Eolian Plain
15 Woodlands, Glaciofluvial Deposits
16 Woodlands, Glaciolacustrine (Coarse Deposits)
17 Woodlands, Glaciolacustrine (Fine Deposits)
18 Woodlands, Moraine Hummocky
19 Woodlands, Moraine Plain
20 Woodlands, Moraine Ridged
21 Woodlands, Moraine Undulating
22 Woodlands, Sand Hills
23 Woodlands, Valley Complex
24 Woodlands, Glaciofluvial Hummocky
25 Wetlands
26 Mud / Sand / Saline

Value Score
Condition % Natural cover 10 1-10 % 1 Average for the ecological Calculated as the as the average 15% 10 -20 2 system polygon percentage natural cover within 2km
20 – 30 3 1 point per 10%to 90 – 100 10
Road density 5 0-1km/ km2 5 Average road density for Calculated as the km per square km 1-3km/ km2 2 each ecological system within a 500m search radius> 3km/ km2 0 polygon
Diversity Simple diversity 5 0,1 0 Done on a pixel-by-pixel Calculated using a 2-by-2 cell size 5% 2,3 2 basis, then ‘zonalmax’ for window and the variety was recorded
4,5 4 the ecological system >5 5 polygon was taken
Ecological Size of patch 15 16 – 64ha 3 Value per ecological system Based on a minimum of 16 ha patch size Function 65 – 256ha 6 polygon50% 256 – 1024ha 9
1024 – 4096ha 12> 4096ha 15
Shape 20 30m -180m 0 Value per ecological system Based on a minimum of 16 ha patch(minimum 180 – 360m 5 polygon size. Calculated based on the largesthabitat area) 360 – 720m 10 diameter circle that can be drawn
720 – 1440m 15 ithin an ESP>1440m 20
Connectivity 15 0 – 1.6km 15 Average value per ecological Beyond 4.8 km not considered connected1.6 – 3.2km 10 system polygon enough to score points.This varies with 3.2 – 4.8km 5 of organism, so is a relative measure only.> 4.8km 0
Special Presence of 15 1 5 Count of EO for an ecological Ecological system contains an EO Features primary species 2 -3 10 system polygon for a primary target species30% targets >3 15
Presence of 10 1-3 2 Count of additional EOs for Ecological system contains an EO for additional features 4 -6 5 an ecological system polygon additional features tracked (by CDC)of conservation 6- 9 8concern >9 10Distance to 5 0 – 1.6km 5 Average value for an Assumption – Patches closer to existing protected area or 1.6 – 3.2km 3 ecological system polygon protected areas have higher conservationconservation land 3.2 – 4.8km 1 value than those farther away.
> 4.8km 0 Dependent on scale of organisms withinecological system.
TOTAL 100 100 pts
A Conservation Blueprint for Canada’s Prairies and Parklands
121
Appendix B – Ranking Ecological Systems
Aspen Parkland / Moist Mixed Grassland / Portion of Boreal Transition: Grasslands
Parameter Variable % Total Scoring Measure Notes

A p p e n d i c e s
122
Value Score
Condition % Natural cover 10 1-10 % 1 Average for the ecological Calculated as the as the average 15% 10 -20 2 system polygon percentage natural cover within 2km
20 - 30 3 1 point per 10%to 90 - 100 10
Road density 5 0 - 0.28km/ km2 5 Average road density for Calculated as the km per square km 0.28 - 0.81km/ km2 4 each ecological system within a 500m search radius.08 1-1.45km/ km2 3 polygon Scores based on natural breaks in the data1.45 - 2.45km/ km2 22.45 - 8.00km/ km2 1
Diversity Simple diversity 5 1,2 1 Done on a pixel-by-pixel Calculated using a 2-by-2 cell size 5% 3,4 3 basis, then ‘zonalmax’ for window and the variety was recorded
5,6 5 the ecological system polygon was taken
Ecological Size of patch 15 0.81 - 4ha 3 Value per ecological system Based on a minimum of 0.81 ha patch size Function 4 -16ha 6 polygon50% 16 - 64ha 9
64 - 256ha 12> 256ha 15
Shape 20 30m -180m 0 Value per ecological system Calculated based on the largest(minimum 180 - 360m 5 polygon diameter circle that can be drawnhabitat area) 360 - 720m 10 within an ecological system polygon
720 - 1440m 15>1440m 20
Connectivity 15 0 - 250m 15 Average value per ecological Beyond 1.0km not considered connected250 - 500m 10 system polygon enough to score.This varies with size500 - 1000m 5 of organism, so is a relative measure only.> 1km 0
Special Presence of 15 1 5 Average value per ecological Ecological system contains an EO Features primary species 2 -3 10 system polygon for a primary target species30% targets >3 15
Presence of 10 1-3 2 Count of additional EOs for Ecological system contains an EO for additional features 4 -6 5 an ecological system polygon additional features tracked (by CDC)of conservation 6- 9 8concern >9 10Distance to 5 0 - 1.6km 5 Average value for an Assumption – Patches closer to existing protected area or 1.6 - 3.2km 3 ecological system polygon protected areas have higher biodiversiyconservation land 3.2 - 4.8km 1 value than those farther away.
> 4.8km 0 Dependent on scale of organisms withinecological system.
TOTAL 100 100 pts
Parameter Variable % Total Scoring Measure Notes
Aspen Parkland / Moist Mixed Grassland / Portion of Boreal Transition: Woodlands

A Conservation Blueprint for Canada’s Prairies and Parklands
123
Value Score
Condition % Natural cover 10 1-10 % 1 Average for the ecological Calculated as the as the average 15% 10 -20 2 system polygon percentage natural cover within 2km
20 - 30 3 1 point per 10%to 90 - 100 10
Road density 5 0-0.28km/ km2 5 Average road density for Calculated as the km per square km 0.28- 0.81km/ km2 4 each ecological system within a 500m search radius.81–1.45km/ km2 3 polygon Scores based on natural breaks in the data1.45 – 2.45km/km2 22.45 – 8.00km/ km2 1
Diversity Simple diversity 5 0,1 0 Done on a pixel-by-pixel Calculated using a 2-by-2 cell size 5% 2,3 2 basis, then zonalmax for window and the variety was recorded
4,5 4 the ecological system >5 5 polygon was taken
Ecological Size of patch 45 20 - 64ha 15 Value per ecological system Based on a minimum of 20.2 ha patch size Function 64 – 256ha 30 polygon45% > 256ha 45Special Presence of 15 1 5 Count of EO for an ecological Ecological system contains an EO Features primary species 2 -3 10 system polygon for a primary target species35% targets >3 15
Presence of 10 1-3 2 Count of additional EOs for Ecological system contains an EO for additional features 4 -6 5 an ecological system polygon additional features tracked (by CDC)of conservation 6- 9 8concern >9 10Distance to 10 0 – 1.6km 10 Average value for an Assumption – Patches closer to existing protected area or 1.6 – 3.2km 8 ecological system polygon protected areas have higher biodiversiyconservation land 3.2 – 4.8km 4 value than those farther away.
4.8 km- 9.6km 2 Dependent on scale of organisms within> 9.6km 0 ecological system.
TOTAL 100 100 pts
Parameter Variable % Total Scoring Measure Notes
Aspen Parkland / Moist Mixed Grassland / Portion of Boreal Transition: Large Wetlands

A p p e n d i c e s
124
Value Score
Condition % Natural cover 30 1- 30% 0 Average per Wetland Density Calculated as the as the average 35% 30 - 50% 5 Polygon (WDP) percentage natural cover within 2km
50 – 60% 10 1 point per 10%60 – 70% 1570 - 80% 2580 - 100% 30
Road density 5 0-0.28km/km2 5 Average per WDP Average road density0.28- 0.81km/km2 4 * based on natural breaks.81–1.45km/km2 31.45 – 2.45km/km2 22.45 – 8.00km/km2 1
Diversity Diversity 5 0,1 0 Done on a pixel-by-pixel Calculated using a 2-by-2 cell size 5% 2,3 2 basis, then zonalmax for window and the variety was recorded
4,5 4 the WDP taken >5 5
Ecological Wetland Density 30 3.48 - 5.97 20 Grouped similar based on five Only used thesse two classes of wetland Function wetland/km2 wetland density classes based densities. Lower wetland density areas40% 5.97 - 16.27 30 on natural breaks in the data were ignored
wetlands/km2
Size of WPD 10 0.36 - 44,065ha 0 Area of top two natural breaks Based on natural breaks in the data(wetland density 44,065 - 124,607ha 5 in wetland density data (above)polygon) >124,607ha 10
Special Presence of 5 1 1 Count of EO for a WDP Ecological system contains an EO forFeatures primary species >1 5 a primary target species20% targets
Presence of 5 1 2 Count of additional EOs for Ecological system contains an EO for additional features >1 5 a WDP additional features tracked (by CDC)of conservationconcernDistance to 10 0 – 1.6km 10 Average value for a WDP Assumption – Patches closer to existing protected area or 1.6 – 3.2km 8 protected areas have higher biodiversiyconservation land 3.2 – 4.8km 4 value than those farther away.
4.8 km- 9.6km 2 Dependent on scale of organisms within> 9.6km 0 ecological system.
TOTAL 100 100 pts
Parameter Variable % Total Scoring Measure Notes
Aspen Parkland / Moist Mixed Grassland / Portion of Boreal Transition: Small Wetlands
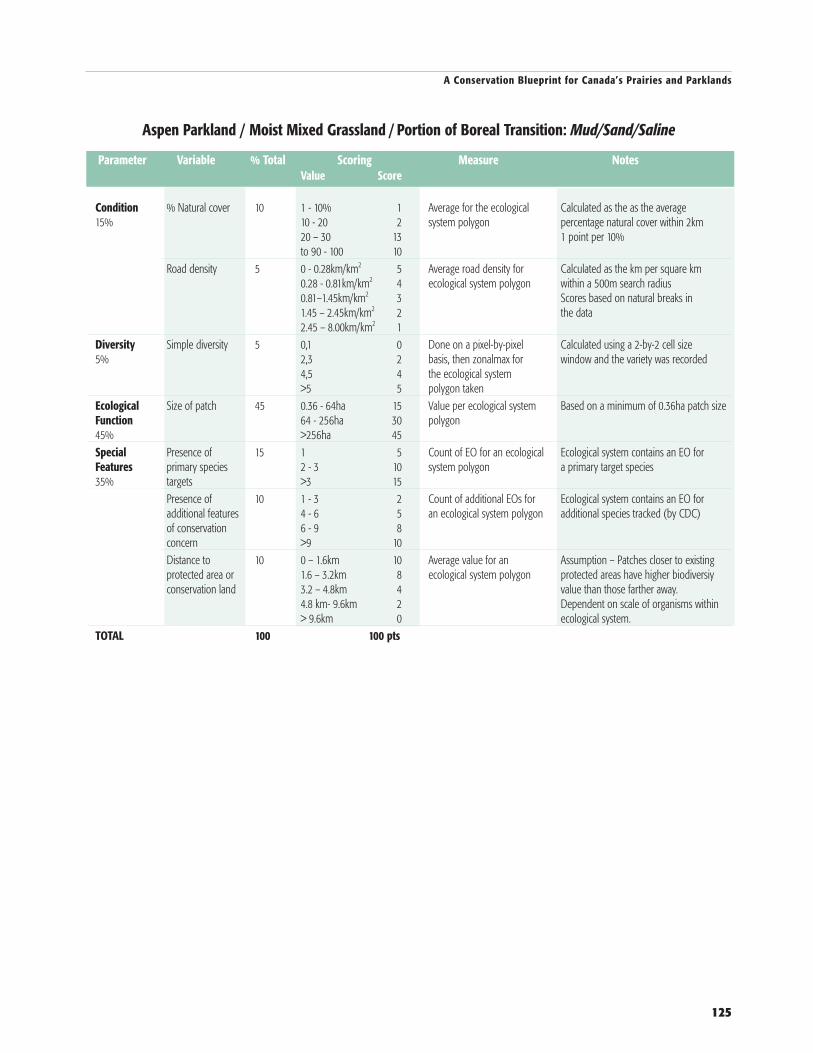
A Conservation Blueprint for Canada’s Prairies and Parklands
125
Value Score
Condition % Natural cover 10 1 - 10% 1 Average for the ecological Calculated as the as the average 15% 10 - 20 2 system polygon percentage natural cover within 2km
20 – 30 13 1 point per 10%to 90 - 100 10
Road density 5 0 - 0.28km/km2 5 Average road density for Calculated as the km per square km0.28 - 0.81km/km2 4 ecological system polygon within a 500m search radius0.81–1.45km/km2 3 Scores based on natural breaks in1.45 – 2.45km/km2 2 the data2.45 – 8.00km/km2 1
Diversity Simple diversity 5 0,1 0 Done on a pixel-by-pixel Calculated using a 2-by-2 cell size 5% 2,3 2 basis, then zonalmax for window and the variety was recorded
4,5 4 the ecological system>5 5 polygon taken
Ecological Size of patch 45 0.36 - 64ha 15 Value per ecological system Based on a minimum of 0.36ha patch size Function 64 - 256ha 30 polygon45% >256ha 45Special Presence of 15 1 5 Count of EO for an ecological Ecological system contains an EO forFeatures primary species 2 - 3 10 system polygon a primary target species35% targets >3 15
Presence of 10 1 - 3 2 Count of additional EOs for Ecological system contains an EO for additional features 4 - 6 5 an ecological system polygon additional species tracked (by CDC)of conservation 6 - 9 8concern >9 10Distance to 10 0 – 1.6km 10 Average value for an Assumption – Patches closer to existing protected area or 1.6 – 3.2km 8 ecological system polygon protected areas have higher biodiversiyconservation land 3.2 – 4.8km 4 value than those farther away.
4.8 km- 9.6km 2 Dependent on scale of organisms within> 9.6km 0 ecological system.
TOTAL 100 100 pts
Parameter Variable % Total Scoring Measure Notes
Aspen Parkland / Moist Mixed Grassland / Portion of Boreal Transition: Mud/Sand/Saline
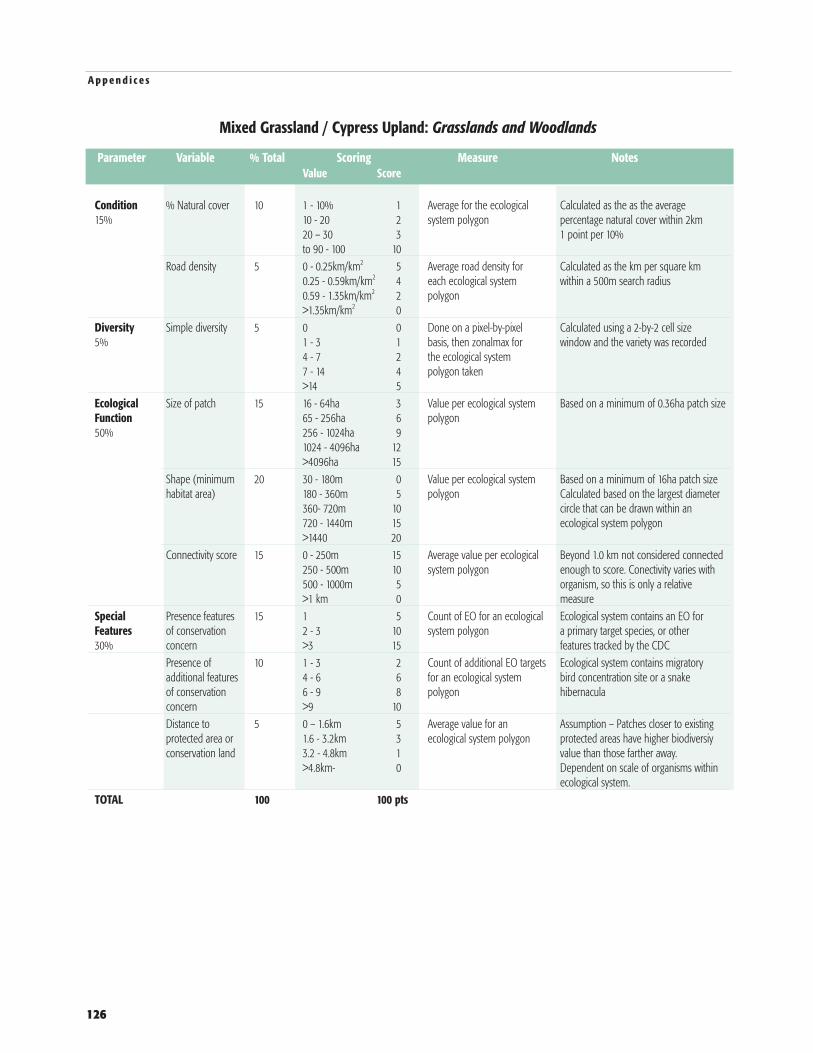
A p p e n d i c e s
126
Value Score
Condition % Natural cover 10 1 - 10% 1 Average for the ecological Calculated as the as the average 15% 10 - 20 2 system polygon percentage natural cover within 2km
20 – 30 3 1 point per 10%to 90 - 100 10
Road density 5 0 - 0.25km/km2 5 Average road density for Calculated as the km per square km0.25 - 0.59km/km2 4 each ecological system within a 500m search radius0.59 - 1.35km/km2 2 polygon>1.35km/km2 0
Diversity Simple diversity 5 0 0 Done on a pixel-by-pixel Calculated using a 2-by-2 cell size 5% 1 - 3 1 basis, then zonalmax for window and the variety was recorded
4 - 7 2 the ecological system7 - 14 4 polygon taken>14 5
Ecological Size of patch 15 16 - 64ha 3 Value per ecological system Based on a minimum of 0.36ha patch size Function 65 - 256ha 6 polygon50% 256 - 1024ha 9
1024 - 4096ha 12>4096ha 15
Shape (minimum 20 30 - 180m 0 Value per ecological system Based on a minimum of 16ha patch sizehabitat area) 180 - 360m 5 polygon Calculated based on the largest diameter
360- 720m 10 circle that can be drawn within an720 - 1440m 15 ecological system polygon>1440 20
Connectivity score 15 0 - 250m 15 Average value per ecological Beyond 1.0 km not considered connected250 - 500m 10 system polygon enough to score. Conectivity varies with500 - 1000m 5 organism, so this is only a relative>1 km 0 measure
Special Presence features 15 1 5 Count of EO for an ecological Ecological system contains an EO forFeatures of conservation 2 - 3 10 system polygon a primary target species, or other30% concern >3 15 features tracked by the CDC
Presence of 10 1 - 3 2 Count of additional EO targets Ecological system contains migratory additional features 4 - 6 6 for an ecological system bird concentration site or a snakeof conservation 6 - 9 8 polygon hibernaculaconcern >9 10Distance to 5 0 – 1.6km 5 Average value for an Assumption – Patches closer to existing protected area or 1.6 - 3.2km 3 ecological system polygon protected areas have higher biodiversiyconservation land 3.2 - 4.8km 1 value than those farther away.
>4.8km- 0 Dependent on scale of organisms withinecological system.
TOTAL 100 100 pts
Parameter Variable % Total Scoring Measure Notes
Mixed Grassland / Cypress Upland: Grasslands and Woodlands

A Conservation Blueprint for Canada’s Prairies and Parklands
127
Value Score
Condition % Natural cover 10 1 - 10% 1 Average for the ecological Calculated as the as the average 15% 10 - 20 2 system polygon percentage natural cover within 2km
20 – 30 3 1 point per 10%to 90 - 100 10
Road density 5 0 - 0.25km/km2 5 Average road density for Calculated as the km per square km0.25 - 0.59m/km2 4 each ecological system within a 500m search radius0.59 - 1.35km/km2 2 polygon>1.35km/km2 0
Diversity Simple diversity 5 0 0 Done on a pixel-by-pixel Calculated using a 2 by 2 cell size 5% 1 - 3 1 basis, then zonalmax for window and the variety was recorded
4 - 7 2 the ecological system7 - 14 4 polygon taken>14 5
Ecological Size of patch 45 20 - 64ha 15 Value per ecological system Based on a minimum of 16ha patch size Function 65 - 256ha 30 polygon45% >256ha 45Special Presence of features 15 1 5 Count of EO for an ecological Ecological system contains an EO forFeatures of conservation 2 - 3 10 system polygon a primary target species, or other35% concern >3 15 features tracked by the CDC
Species 10 1 - 3 2 Count of additional EO targets Ecological system contains migratory concentration 4 - 6 6 for an ecological system bird concentration site or a snakesite 6 - 9 8 polygon hibernacula
>9 10Distance to 10 0 – 1.6km 10 Average value for an Assumption – Patches closer to existing protected area or 1.6 - 3.2km 8 ecological system polygon protected areas have higher biodiversiyconservation land 3.2 - 4.8km 4 value than those farther away.
4.8 - 9.6km 2 Dependent on scale of organisms within>9.6km 0 ecological system.
TOTAL 100 100 pts
Parameter Variable % Total Scoring Measure Notes
Mixed Grassland / Cypress Upland: Large Wetlands

A p p e n d i c e s
128
Value Score
Condition % Natural cover 30 0 - 30% 0 Average per Wetland Calculated as the as the average 35% 30 - 50 5 Density Polygon (WDP) percentage natural cover within 2km
50 – 60 10 1 point per 10%60 - 70 1550 - 80 2580 - 100 30
Road density 5 0 - 0.25km/km2 5 Average per WDP Calculated as the km per square km0.25 - 0.59km/km2 4 within a 500m search radius0.59 - 13.5km/km2 2>13.5km/km2 0
Diversity Simple diversity 5 0 0 Done on a pixel-by-pixel Calculated using a 2 by 2 cell size 5% 1 - 3 1 basis, then zonalmax for window and the variety was recorded
4 - 7 2 the WDP taken7 - 14 4 polygon taken>14 5
Ecological **Wetland density 30 3.48 - 5.97 20 Grouped similar based on five Only used thes two classes of wetland Function wetlands/km2 wetland density classes based densities. Lower wetland densitty areas40% 5.97 - 16.27km/km2 30 on natural breaks in data were ignored
Size of WPD 10 16 - 10,704ha 0 Area of top two natural breaks Based on natural breaks in the data(wetland density 10,704 - 36,691ha 5 in wetland densitty datapolygon) 36,691- 119,107ha 10 (above)
Special Presence features 5 1 1 Count of EO for a WDP Ecological system contains an EO forFeatures of conservation >1 5 a primary target species, or other20% concern features tracked by the CDC
Species 5 1 2 Count of additional EO targets Ecological system contains migratory concentration site >1 5 for a WDP bird concentration site or a snake
hibernaculaDistance to 10 0 – 1.6km 10 Average value for a Assumption – Patches closer to existing protected area or 1.6 - 3.2km 8 WDP protected areas have higher biodiversiyconservation land 3.2 - 4.8km 4 value than those farther away.
4.8 - 9.6km 2 Dependent on scale of organisms within>9.6km 0 ecological system.
TOTAL 100 100 pts
Parameter Variable % Total Scoring Measure Notes
Mixed Grassland / Cypress Upland: Small Wetlands

A Conservation Blueprint for Canada’s Prairies and Parklands
129
Value Score
Condition % Natural cover 10 1 - 10% 1 Average for the ecological Calculated as the as the average 15% 10 - 20 2 system polygon percentage natural cover within 2km
20 – 30 3 1 point per 10%to 90 - 100 10
Road density 5 0 - 0.25km/km2 5 Average per ecological Average road density0.25 - 0.59km/km2 4 system polygon *based on natural breaks in the data0.59 - 1.35km/km2 2>1.35km/km2 0
Diversity Simple diversity 5 0 0 Done on a pixel-by-pixel Calculated using a 2 by 2 cell size 5% 1 - 3 1 basis, then zonalmax for window and the variety was recorded
4 - 7 2 the ecological system7 - 14 4 polygon taken>14 5
Ecological Size of patch 45 0.36 - 64ha 15Function 64 - 256ha 3045% >256ha 45Special Presence of 15 1 5 Count of EO for an Ecological system contains an EO forFeatures features of 2 - 3 10 ecological system polygon a primary target species, or other20% conservation >3 15 features tracked by the CDC
concernSpecies 10 1 - 3 2 Count of additional EO Ecological system contains a migratory concentration site 4 - 6 5 targets for an ecological bird concentration site or a snake
6 - 9 8 system polygon hibernacula>9 10
Distance to 10 0 – 1.6km 10 Average value for an Assumption – Patches closer to existing protected area or 1.6 – 3.2km 8 ecological system polygon protected areas have higher biodiversiyconservation land 3.2 – 4.8km 4 value than those farther away.
4.8 - 9.6km 2 Dependent on scale of organisms within>9.6km 0 ecological system.
TOTAL 100 100 pts
Parameter Variable % Total Scoring Measure Notes
Mixed Grassland / Cypress Upland: Mud / Sand / Saline

EcoregionsAspen Parkland(Includes ESWG units 156, 161-164)Moist Mixed Grassland(Includes ESWG units 157, 158)Mixed Grassland(ESWG unit 159)Cypress Upland(ESWG unit 160)Portion of Boreal Transition (Includes ESWG units 154, part of 149)
EcodistrictsNCC terminology in bold; equiva-lent or overlapping provincial/stateor other agency terminology inbrackets.ALBERTA(Alberta Sustainable ResourceDevelopment et al. 2005)
■ Cypress Upland (Montane, Mixedgrass and DryMixedgrass Natural sub-regions)
■ Mixed Grassland(primarily Dry Mixed GrassNatural sub-region)
■ Moist Mixed Grassland (primarily Mixedgrass, FoothillsFescue, and Northern FescueNatural sub-regions + small areasof Central Parkland and MontaneNatural sub-regions)
■ Aspen Parkland (primarilyFoothills Parkland and CentralParkland Natural sub-regions +small areas of Dry MixedwoodNatural sub-regions)
SASKATCHEWAN(Acton et al. 1998)
■ Cypress Upland (Cypress Upland)
■ Mixed Grassland(Mixed Grassland)
■ Moist Mixed Grassland (Moist Mixed Grassland)
■ Aspen Parkland(Aspen Parkland)
MANITOBA (Smith et al. 1998)
■ Aspen Parkland(Aspen Parkland, portion of LakeManitoba Plain, and islands ofBoreal transition ecoregions)
MONTANA (Woods et al. 2002)
■ Moist Mixed Grassland (TNC – Fescue-Mixed GrassPrairie; Montana – MontanaValley and Foothill grasslands)
NORTH DAKOTA(Bryce et al.1996)(www.npwrc.usgs.gov/resource/habitat-/ndsdeco/nodak.htm)
■ Moist Mixed Grassland(Northern Dark Brown Prairie)
■ Aspen Parkland (Northern Black Prairie; TurtleMountains; portion of the GlacialLake Deltas and Glacial LakeBasins)
A p p e n d i c e s
130
Appendix C Ecoregion Crosswalk Tables and Ecodistrict List
In general, Canadian ecoregions are equivalent to those developed by theEcological Stratification Working Group (ESWG 1995), as indicated below,and the U.S. ecoregions are equivalent to those used by The (U.S.) NatureConservancy, based on Bailey (1994; equivalent to U.S. ecological “sections”).Canadian ecodistricts are also based on the ESWG framework, as detailedbelow by each provincial jurisdiction, and the U.S. ecodistricts are generallyequivalent to U.S. “subsections”, as detailed below by each state jurisdiction.

709 Swan River Plain Boreal Transition
716 Riding Mountain Boreal Transition
727 Leduc Aspen Parkland
728 Andrew Aspen Parkland
729 Lloydminister Plain Aspen Parkland
730 Vermilion Aspen Parkland
731 Daysland Aspen Parkland
732 Cooking Lake Aspen Parkland
733 Whitewood Hills Aspen Parkland
734 Lower Battle River Plain Aspen Parkland
735 Maymont Plain Aspen Parkland
736 Waldheim Plain Aspen Parkland
737 Red Deer Aspen Parkland
738 Sedgewick Aspen Parkland
739 Edgerton-Ribstone Plain Aspen Parkland
740 Bashaw Aspen Parkland
741 Cudworth Plain Aspen Parkland
742 Hafford Plain Aspen Parkland
743 Provost Plain Aspen Parkland
744 Pine Lake Aspen Parkland
745 Quill Lake Plain Aspen Parkland
746 Olds Aspen Parkland
747 Whitesand Plain Aspen Parkland
748 Touchwood Hills Upland Aspen Parkland
749 Yorkton Plain Aspen Parkland
750 Black Diamond Aspen Parkland
751 St. Lazare Plain Aspen Parkland
752 Melville Plain Aspen Parkland
753 Hamiota Aspen Parkland
754 Indian Head Plain Aspen Parkland
755 Moose Mountain Upland Aspen Parkland
756 Kipling Plain Aspen Parkland
757 Shilo Aspen Parkland
758 Stockton Aspen Parkland
759 Carberry Aspen Parkland
760 Gainsborough-Northern Black Prairie Aspen Parkland
761 Moose Mountain Aspen Parkland
762 Moose Mountain Creek Plain Aspen Parkland
763 Oak Lake Plain – Glacial Lake Basins Aspen Parkland
764 Hilton Aspen Parkland
765 Killarney – Northern Black Prairie Aspen Parkland
766 Manitou Aspen Parkland
839 Grandview Aspen Parkland
840 Dauphin Aspen Parkland
841 Alonsa Aspen Parkland
843 Ste. Rose Aspen Parkland
844 McCreary Aspen Parkland
847 Gladstone Aspen Parkland
850 MacGregor Aspen Parkland
854 Pembina Aspen Parkland
855 Turtle Mountains Aspen Parkland
ND1 Northern Black Prairie 1 Aspen Parkland
ND2 Pembina Escarpment Aspen Parkland
767 Tramping Lake Plain Moist Mixed Grassland
768 Senlac Hills Moist Mixed Grassland
769 Castor Moist Mixed Grassland
770 Goose Lake Plain Moist Mixed Grassland
771 Neutral Hills Moist Mixed Grassland
772 Saskatoon Plain Moist Mixed Grassland
773 Estow Plain Moist Mixed Grassland
774 Minichinas Upland Moist Mixed Grassland
775 Bear Hills Moist Mixed Grassland
776 Moosewood Sand Hills Moist Mixed Grassland
777 Sullivan Lake Moist Mixed Grassland
778 Biggar Plain Moist Mixed Grassland
779 Endiang Moist Mixed Grassland
780 Rosetown Plain Moist Mixed Grassland
781 Drumheller Moist Mixed Grassland
782 Arm River Plain Moist Mixed Grassland
783 Strasbourg Plain Moist Mixed Grassland
784 Last Mountain Lake Plain Moist Mixed Grassland
785 Allan Hills Moist Mixed Grassland
786 Wintering Hills Moist Mixed Grassland
787 Majorville Upland Moist Mixed Grassland
788 Standard Plain Moist Mixed Grassland
789 Eyebrow Plain Moist Mixed Grassland
790 Blackfoot Plain Moist Mixed Grassland
791 Vulcan Plain Moist Mixed Grassland
792 Regina Plain Moist Mixed Grassland
793 Lethbridge Plain Moist Mixed Grassland
794 Griffin Plain Moist Mixed Grassland
796 Trossachs Plain Moist Mixed Grassland
797 Milk River Upland Moist Mixed Grassland
798 Delacour Plain Moist Mixed Grassland
799 Willow Creek Upland Moist Mixed Grassland
800 Cardston Plain Moist Mixed Grassland
A Conservation Blueprint for Canada’s Prairies and Parklands
131
No. Name Ecoregion No. Name Ecoregion

801 Twin Butte Moist Mixed Grassland
802 Del Bonita Plateau Foothill Grassland Moist Mixed Grassland
MT1 Foothill Grassland Moist Mixed Grassland
MT2 North Central Brown Glaciated Plains Moist Mixed Grassland
MT3 Rocky Mountain Front Foothill Potholes 1 Moist Mixed Grassland
MT4 Rocky Mountain Front Foothill Potholes 2 Moist Mixed Grassland
MT5 Rocky Mountain Front Foothill Potholes 3 Moist Mixed Grassland
803 Kerrobert Plain Mixed Grassland
804 Sounding Creek Plain Mixed Grassland
805 Sibbald Plain Mixed Grassland
806 Berry Creek Plain Mixed Grassland
807 Bad Hills Mixed Grassland
808 Eston Plain Mixed Grassland
809 Oyen Plain Mixed Grassland
810 Coteau Hills Mixed Grassland
811 Acadia Plain Mixed Grassland
812 Brooks Plain Mixed Grassland
813 Beechy Hills Mixed Grassland
814 Rainy Hills Upland Mixed Grassland
815 Bindloss Plain Mixed Grassland
816 Chaplin Plain Mixed Grassland
817 Hazlet Plain Mixed Grassland
818 Bow City Plain Mixed Grassland
819 Great Sand Hills Mixed Grassland
820 Antelope Creek Plain Mixed Grassland
821 Schuler Plain Mixed Grassland
822 Dirt Hills Mixed Grassland
823 Vauxhall Plain Mixed Grassland
824 Gull Lake Plain Mixed Grassland
825 Swift Current Plain Mixed Grassland
826 Wood River Plain Mixed Grassland
827 Maple Creek Plain Mixed Grassland
828 Foremost Plain Mixed Grassland
829 Purple Springs Plain Mixed Grassland
830 Coteau Lakes Upland Mixed Grassland
831 Lake Alma Upland Mixed Grassland
832 Wood Mountain Plateau Mixed Grassland
833 Wild Horse Plain Mixed Grassland
834 Climax Plain Mixed Grassland
835 Old Man on His Back Plateau Mixed Grassland
836 Sweetgrass Mixed Grassland
837 Cypress Slope Cypress Upland
838 Cypress Hills Cypress Upland
A p p e n d i c e s
132
No. Name EcoregionNo. Name Ecoregion

The following section contains a series of tiled maps graph-ically depicting the natural features and blueprint results forthe entire prairie-parkland biome. The purpose for thesemaps is to assist the reader of this blueprint report or thosewithout access to the digital maps/data, to graphicallyexamine the results of this project. They have been designedto be easy to flip from map to map through the series inorder to find areas of interest. Tiles have been mapped withenough overlap so not to lose any of the details along themaps edge.
The prairie biome in Canada and neighbouring UnitedStates consists of four distinct ecoregions of the AspenParkland, Moist Mixed Grassland, Mixed Grassland,and Cypress Upland. These ecoregions’ boundaries are
drawn on the maps for reference. It was decided to go withthis format rather than mapping individual ecodistricts(sub-divisions of ecoregions), which can be irregular inshape and size. This cut down on the total number of mapsrequired to illustrate this project, while maintaining a con-sistent mapping scale.
The series consists of an index map and 89 map tiles at ascale of 1:500,000. At this scale the Blueprint’s portfolio ofsites, native land cover, as well as the major hydrological andhuman features, can be easily identified. In addition, eachecodistrict is named on its corresponding map tile. Thesenames correspond with those used in the Blueprint statis-tics for those ecodistricts, summarized in the Results section(see section 5, Table 5.2, and Figure 2) and in Appendix E.
A Conservation Blueprint for Canada’s Prairies and Parklands
133
APPENDIX D Blueprint Maps

134
Ecodistrict Map
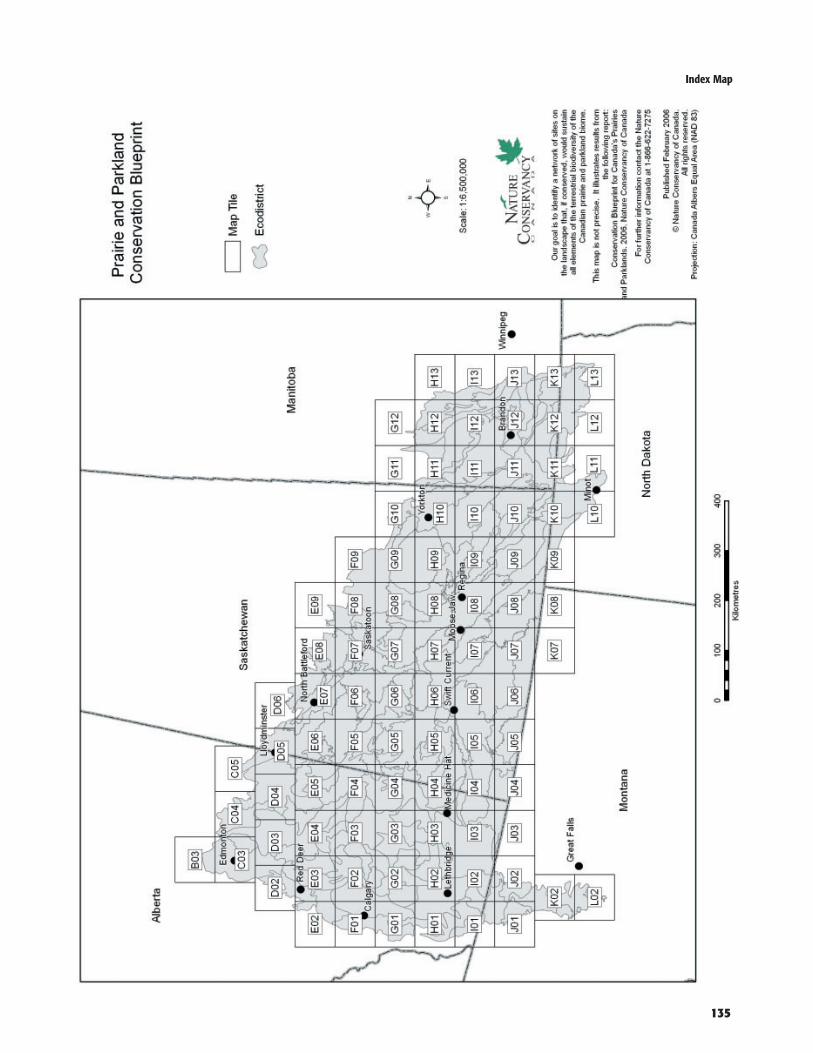
135
Index Map

B 0 3
136
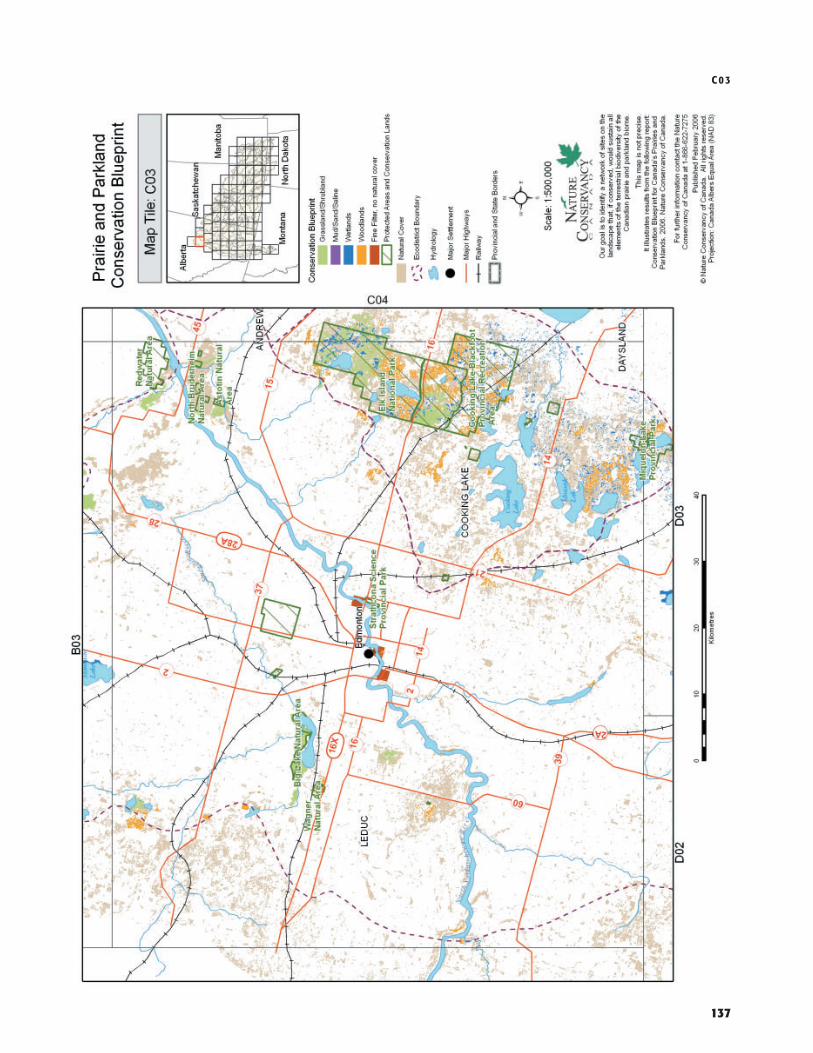
137
C 0 3

C 0 4
138

C05
139

D 0 3
140

D04
141

D 0 5
142
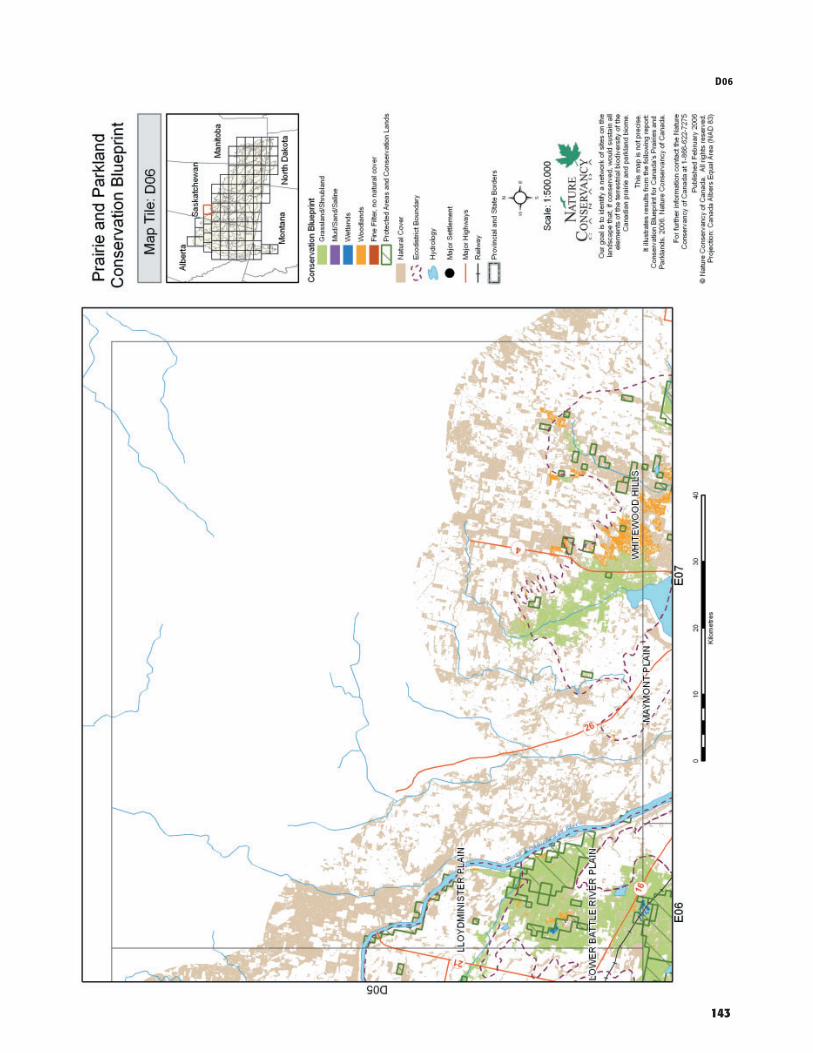
D06
143
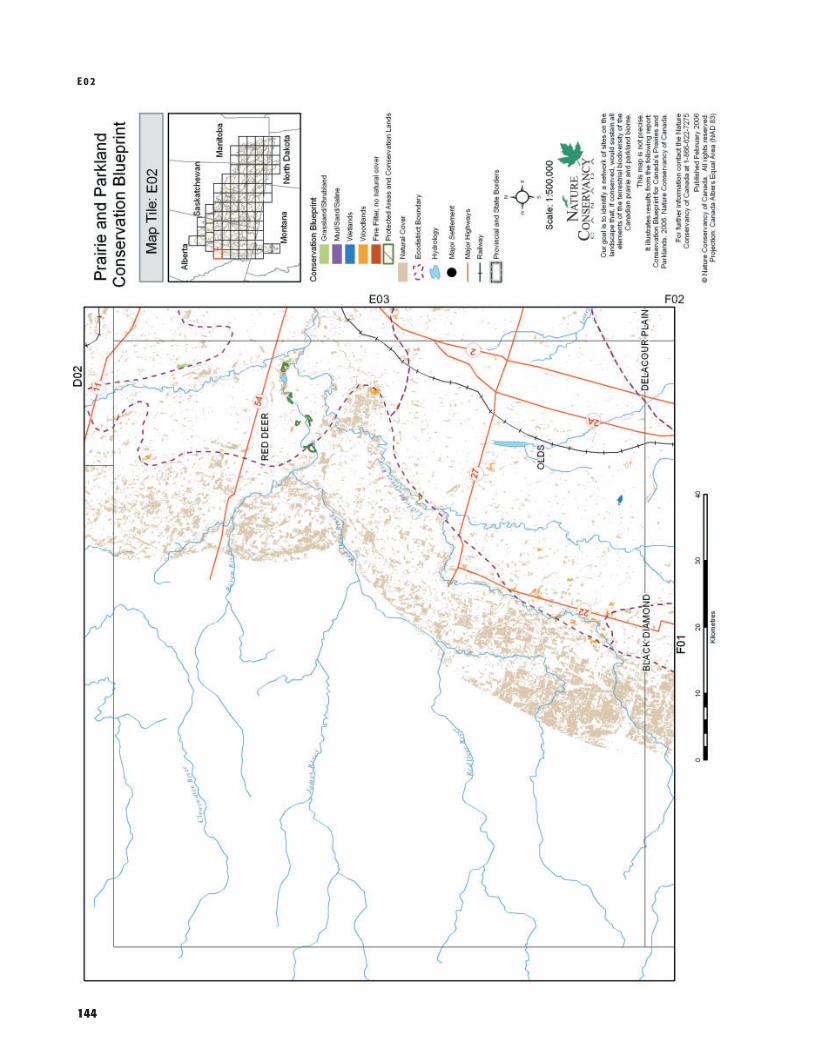
E 0 2
144

E03
145

146
E04

E05
147
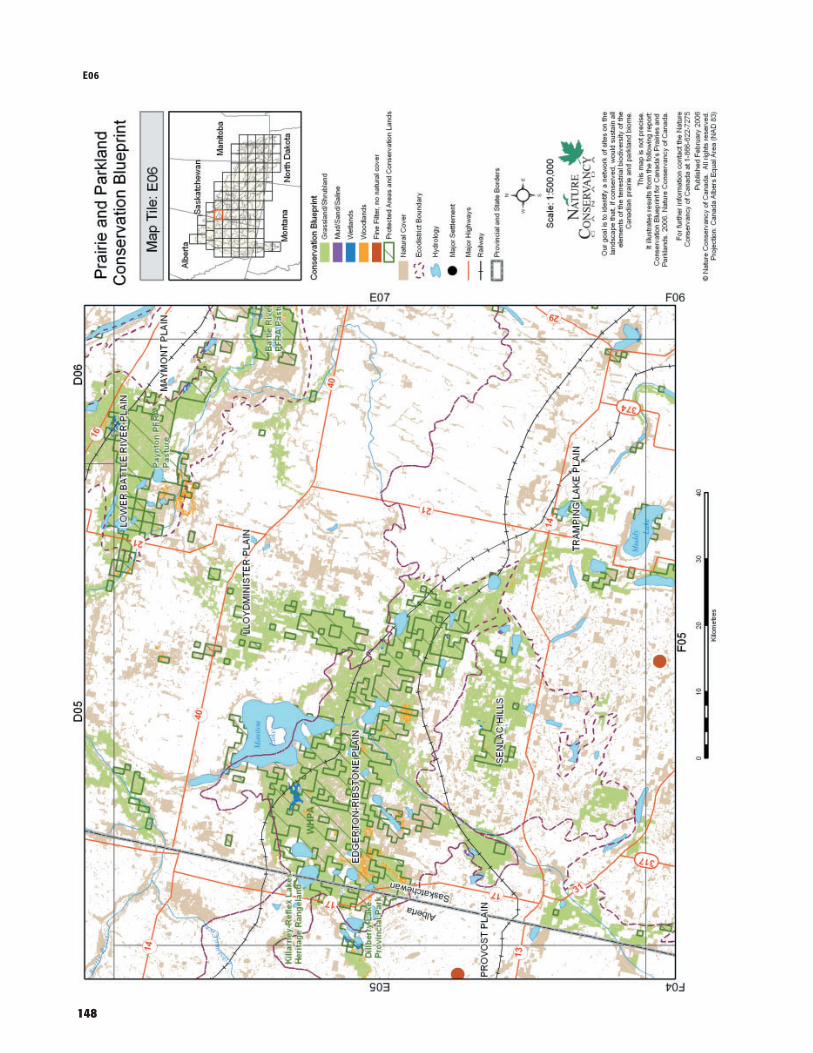
148
E06

E07
149

E 0 8
150
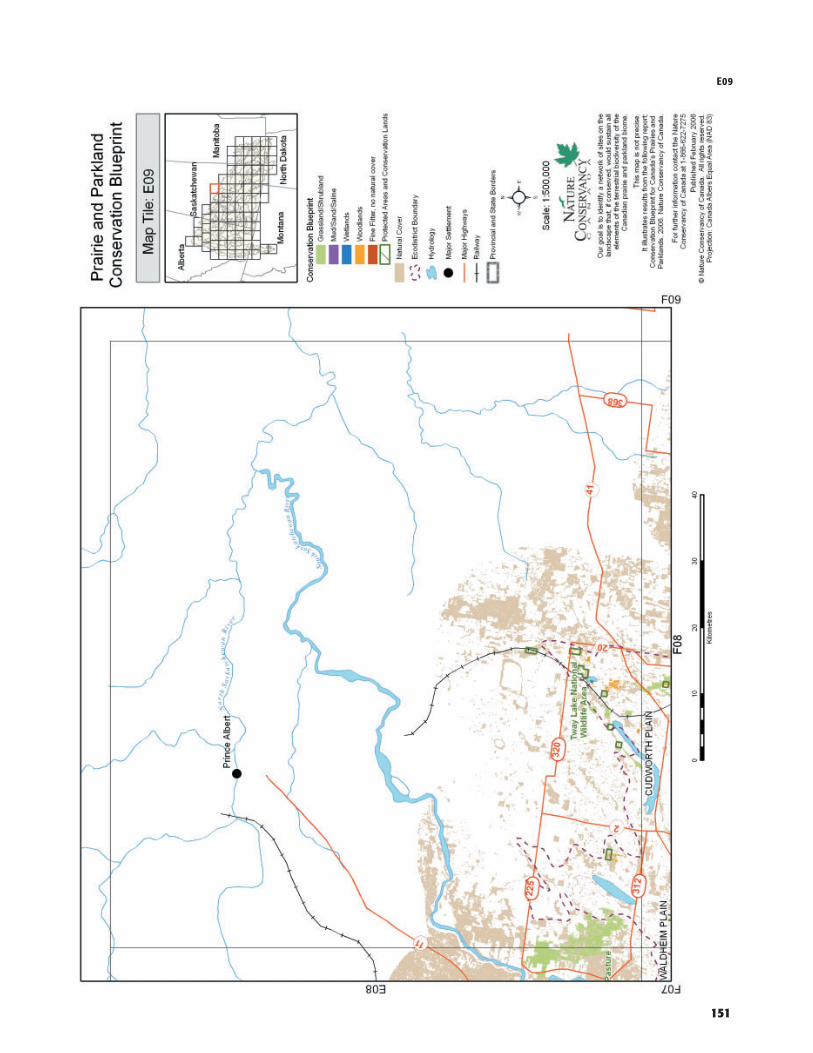
E09
151

F 01
152
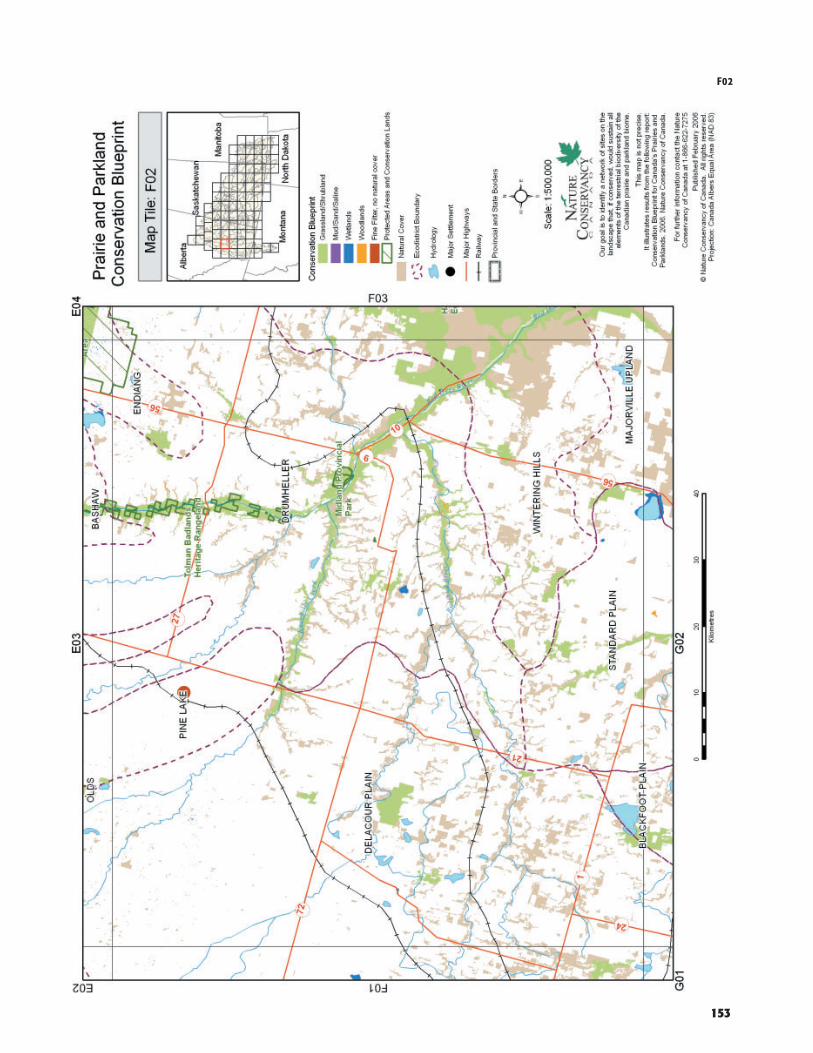
F02
153

F 0 3
154

F04
155

F 0 5
156
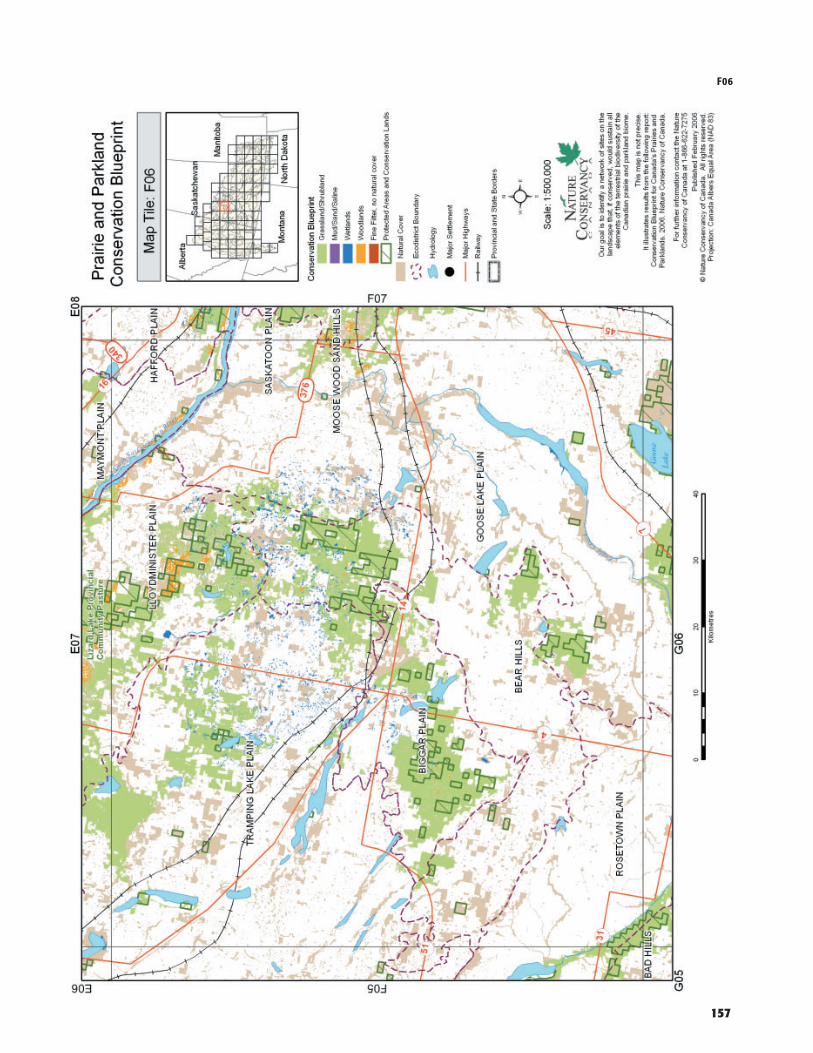
F06
157
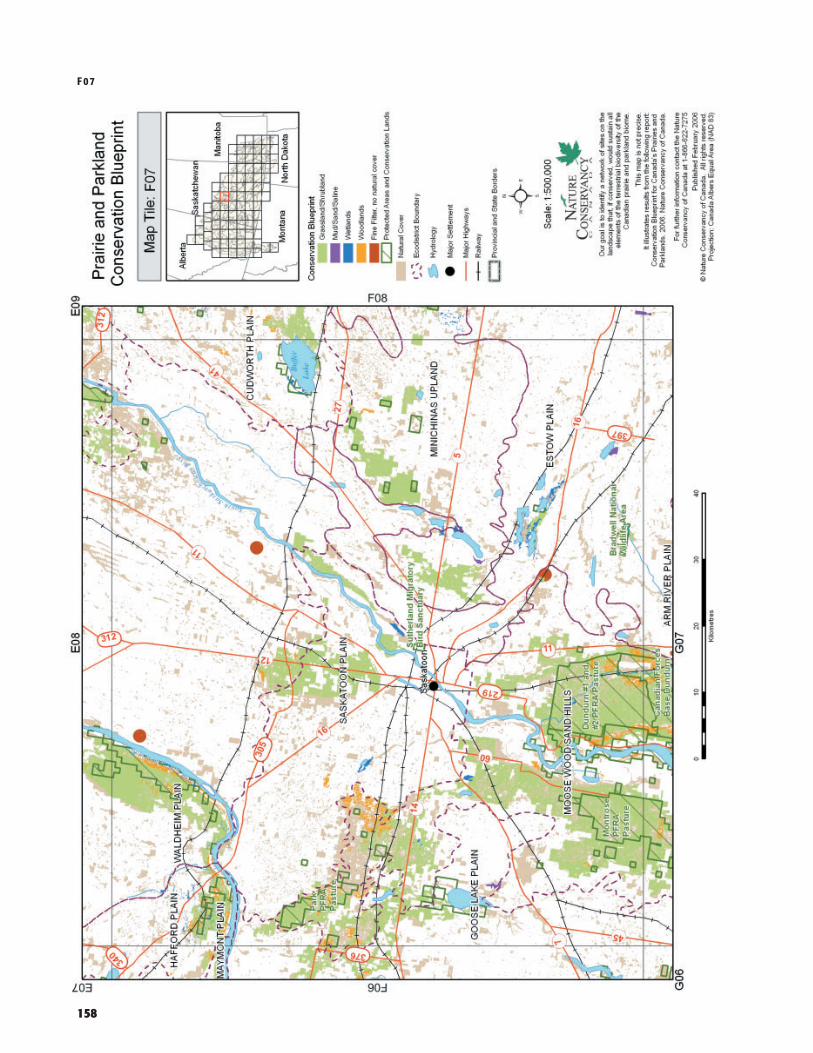
F 07
158

F08
159

F 0 9
160

G01
161

G 0 2
162

G03
163

G 0 4
164
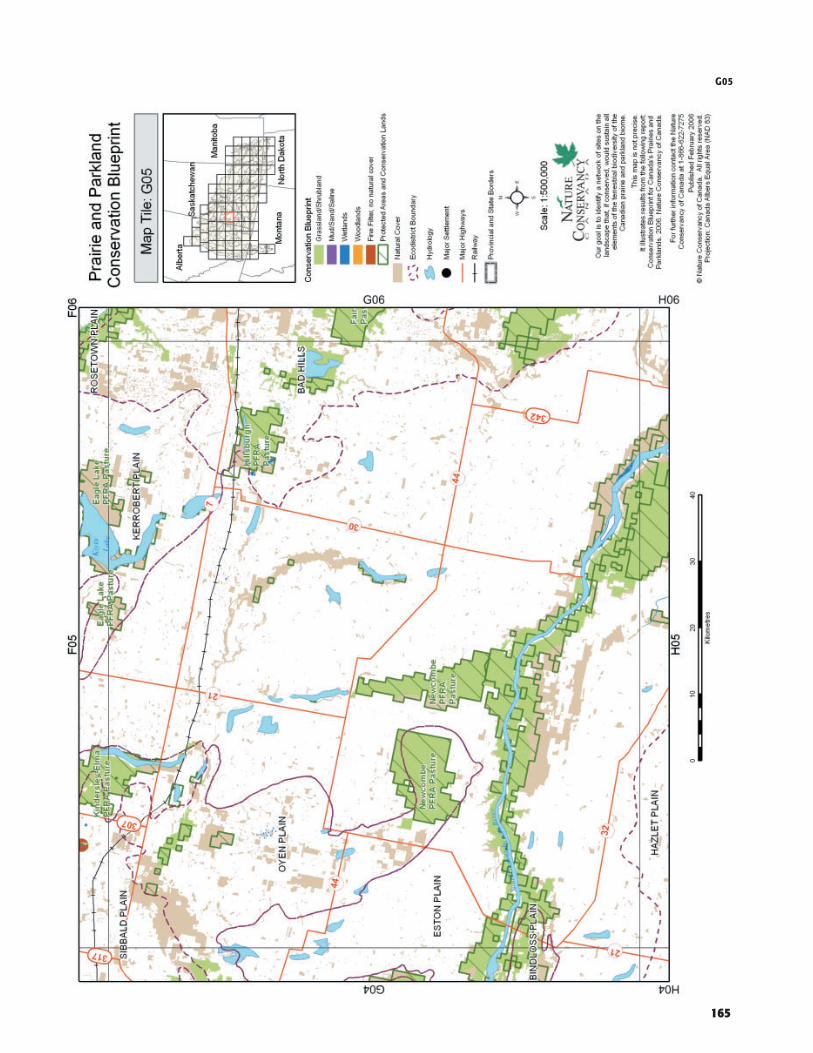
G05
165

G 0 6
166

G08
167

G 0 9
168

G10
169

G 11
170

G12
171

H 01
172

H02
173
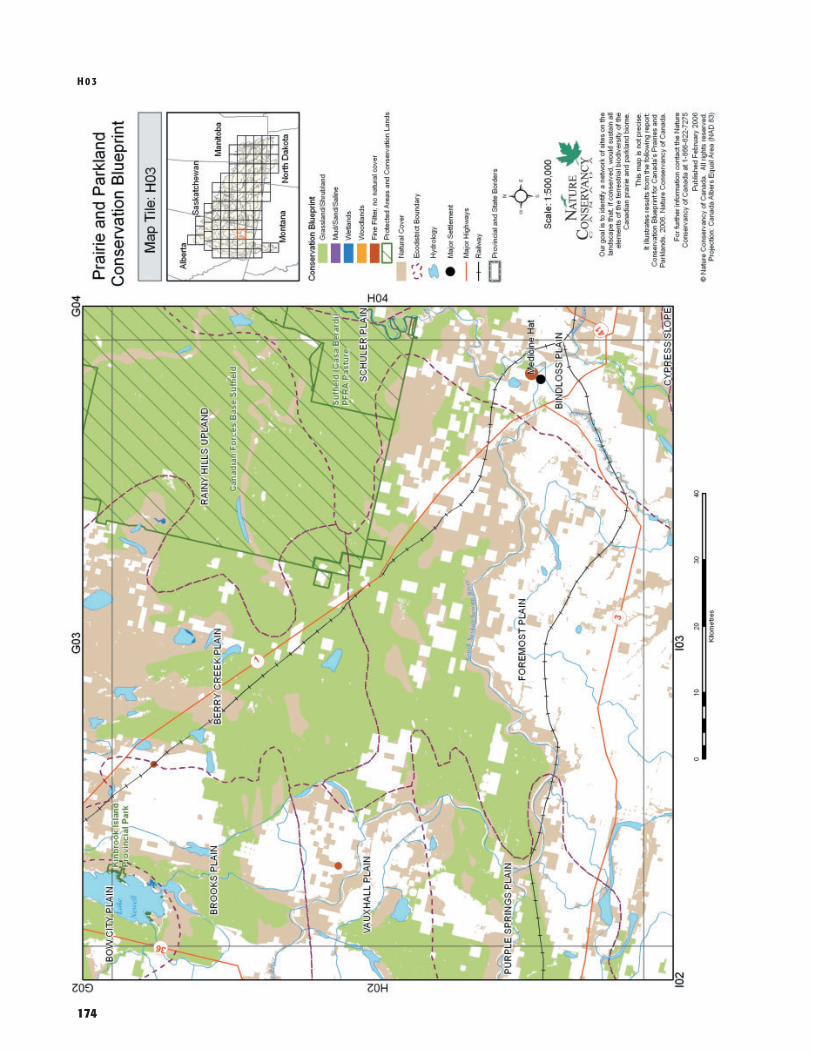
H 0 3
174

H04
175

H 0 5
176

H06
177

H 07
178

H08
179

H 0 9
180

H10
181

H 11
182

H12
183

H 13
184
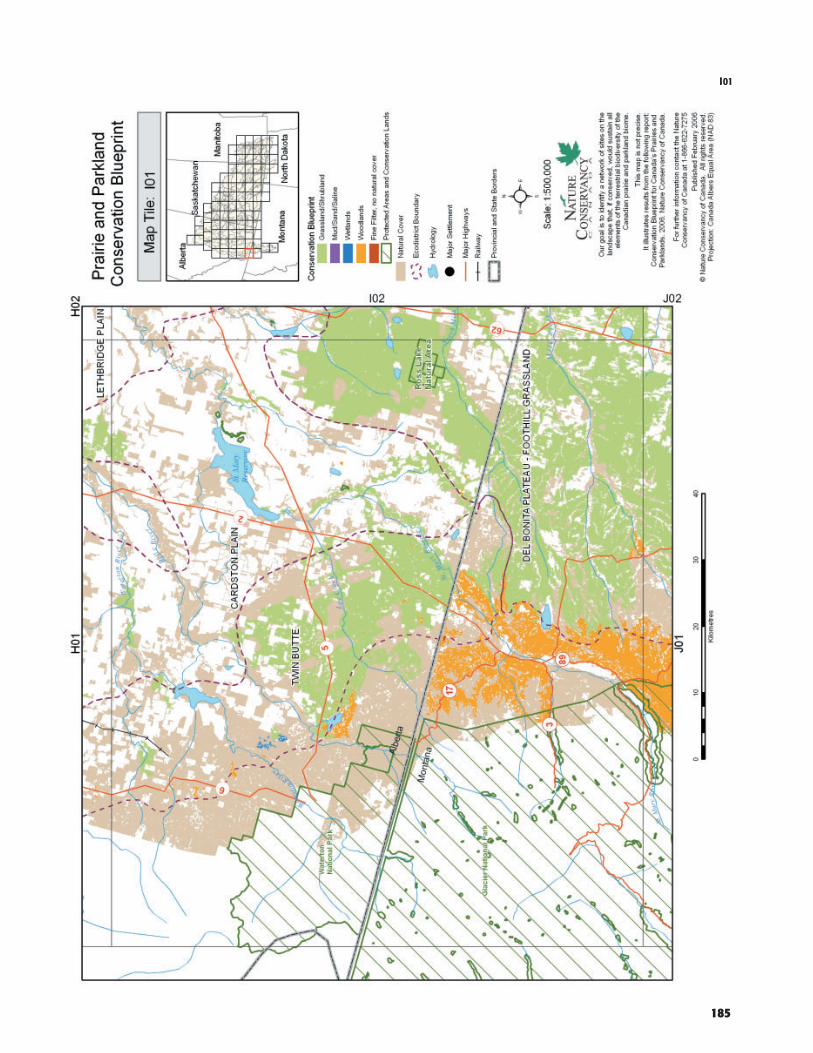
I01
185

I 0 2
186

I03
187

I 0 4
188

I05
189

I 0 6
190

I07
191

I 0 8
192

I09
193

I 10
194

I11
195

I 12
196

I13
197

J 01
198

J02
199

J 0 3
200

J04
201

J 0 5
202

J06
203

J 07
204
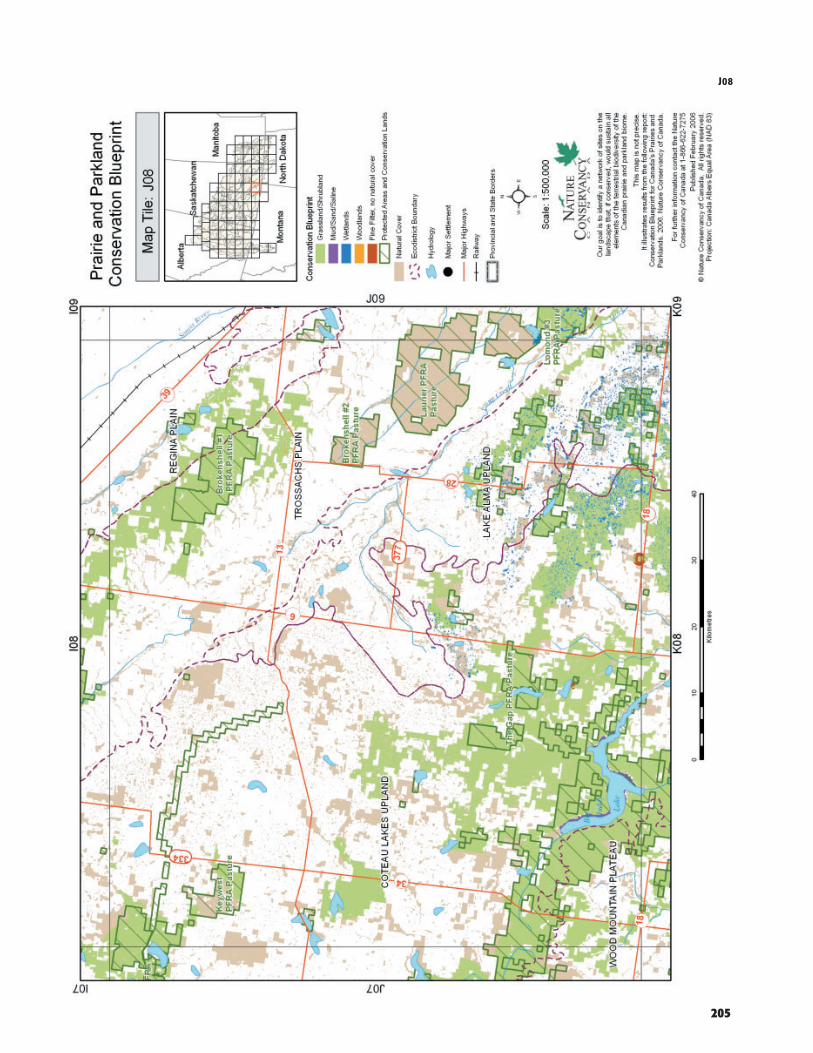
J08
205

J 0 9
206
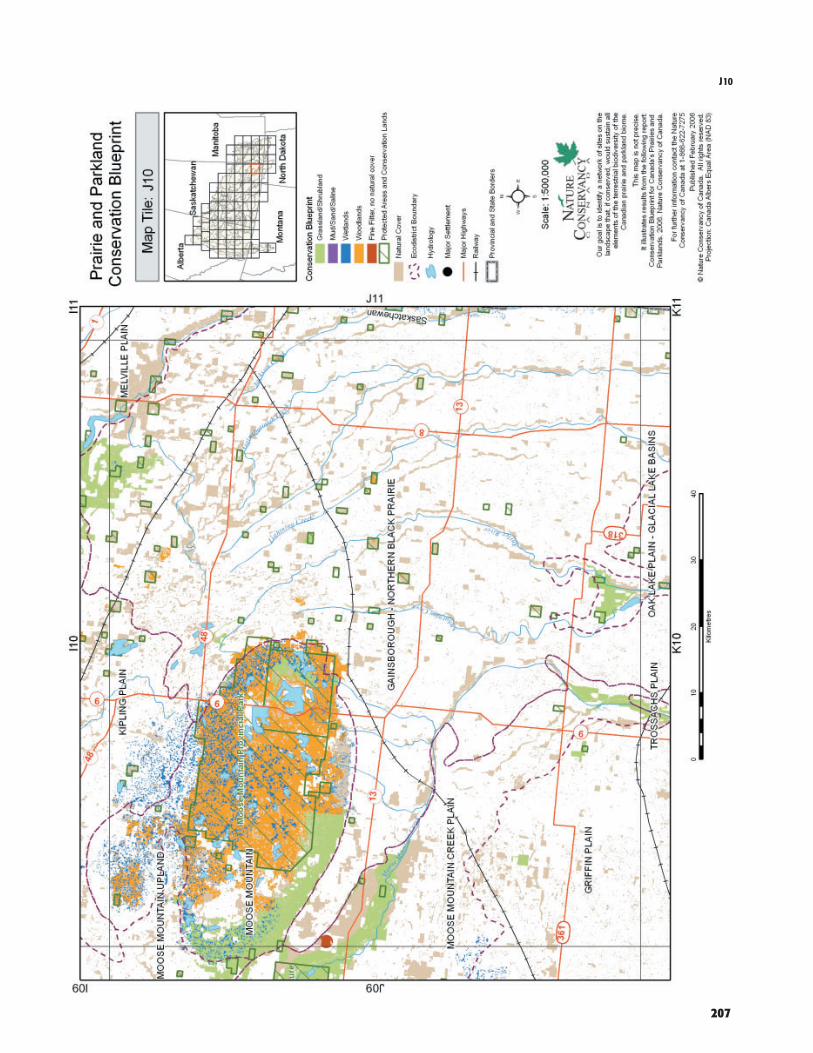
J10
207

J 11
208

J12
209

J 13
210

K02
211

K 07
212

K08
213

K 0 9
214

K10
215

K 11
216

K12
217

K 13
218

L02
219

L 10
220

L13
221

L 12
222

L11
223

224
Sample Ecodistrict Summary Table: Pembina Escarpment Ecodistrict (ND2), Aspen Parkland Ecoregion
Ecological System Number of Total area in Total area in Natural cover Total area % of Total area % of Total area % of Patches ecodistrict ecodistrict in ecodistrict in PA ecological in CL ecological in blueprint ecological
(ha) (%) (%) (ha) system in PA (ha) system in CL (ha) system inblueprint
GRASSLANDSGrasslands / Shrublands, Bedrock 3 65.3 0.09% 0.36% 56.1 85.81%
Grasslands / Shrublands, Moraine Plain 3 31.1 0.04% 0.17% 16.9 54.49%
Grasslands / Shrublands, Valley Complex 4 142.1 0.20% 0.78% 0.7 0.51%
WOODLANDSDeciduous woodlands, Bedrock 2 4.8 0.01% 0.03% 4.8 100.00%
Deciduous woodlands, Eolian Plain 1 2.0 0.00% 0.01% 2.0 100.00%
Deciduous woodlands, Glaciofluvial Deposits 89 805.2 1.15% 4.44% 248.0 30.79%
Deciduous woodlands, Glaciolacustrine (Coarse Deposits) 15 65.0 0.09% 0.36% 0.2 0.28% 49.4 76.04%
Deciduous woodlands, Glaciolacustrine (Fine Deposits) 18 144.3 0.21% 0.80% 4.9 3.37% 53.4 36.99%
Deciduous woodlands, Moraine Hummocky 56 424.9 0.61% 2.34% 7.2 1.69% 83.1 19.55%
Deciduous woodlands, Moraine Plain 203 7,547.0 10.81% 41.63% 868.0 11.50% 5,387.0 71.38%
Deciduous woodlands, Moraine Ridged 35 3,746.7 5.36% 20.67% 711.1 18.98% 3,553.3 94.84%
Deciduous woodlands, Moraine Undulating 158 1,594.8 2.28% 8.80% 5.9 0.37% 308.5 19.35%
Deciduous woodlands, Sand Hills 102 2,256.7 3.23% 12.45% 197.7 8.76% 1,225.0 54.28%
Deciduous woodlands, Valley Complex 119 946.8 1.36% 5.22% 33.9 3.58% 168.6 17.80%
WETLANDSWetlands 227 351.8 0.50% 1.94% 7.7 2.20% 55.8 15.86%
Sum 1,035 18,128.3
Protected areas (PA) include federally protected areas (national parks, national wildlife areas, migratory bird sanctuaries) and provincially protected areas (provincial parks and conservation reserves).Conservation lands (CL) are designated lands that are conserved from land conversion, such as community pastures and Department of National Defence lands (see report).
A p p e n d i c e s
Appendix E Ecodistrict Summary Tables
The CD in the back pocket includes the report and an Appendix E that includes Summary Tables for each ecodistrict in the study area. Refer to Figure 10 for locations, and Appendix C for a cross-walk list of ecodistrict names and numbers.

A Conservation Blueprint for Canada’s Prairies and Parklands
225
A p p e n d i c e s
Number of Patches: Number of patches of the ecological system in the ecodistrict.
Total area in ecodistrict: Total area (ha) of the ecological system in the ecodistrict.
Total area in ecodistrict (%): Percent of the total area of the ecodistrict that is covered by this ecological system type(helps to identify dominant and minorecological system types).
Natural cover Percent of the total area of natural cover in ecodistrict (%): that is represented by this ecological system
type (also helps to identify dominant andminor types).
Total area in PA: Total area (ha) of the ecological system that is in a protected area in the ecodistrict.
% of ecological system Percent of the total area of the ecological in PA: system that is represented in protected areas.
Total area in CL: Total area (ha) of the ecological system that is in conservation land in the ecodistrict.
% of ecological system Percent of the total area of the ecological in CL: system that is represented in conservation
lands.
Total area in blueprint: Total area (ha) of the ecological system that is in the conservation blueprint.
% of ecological system Percent of the total area of the ecological in blueprint: system that is represented in the conservation
blueprint.
Explanation of columns, above
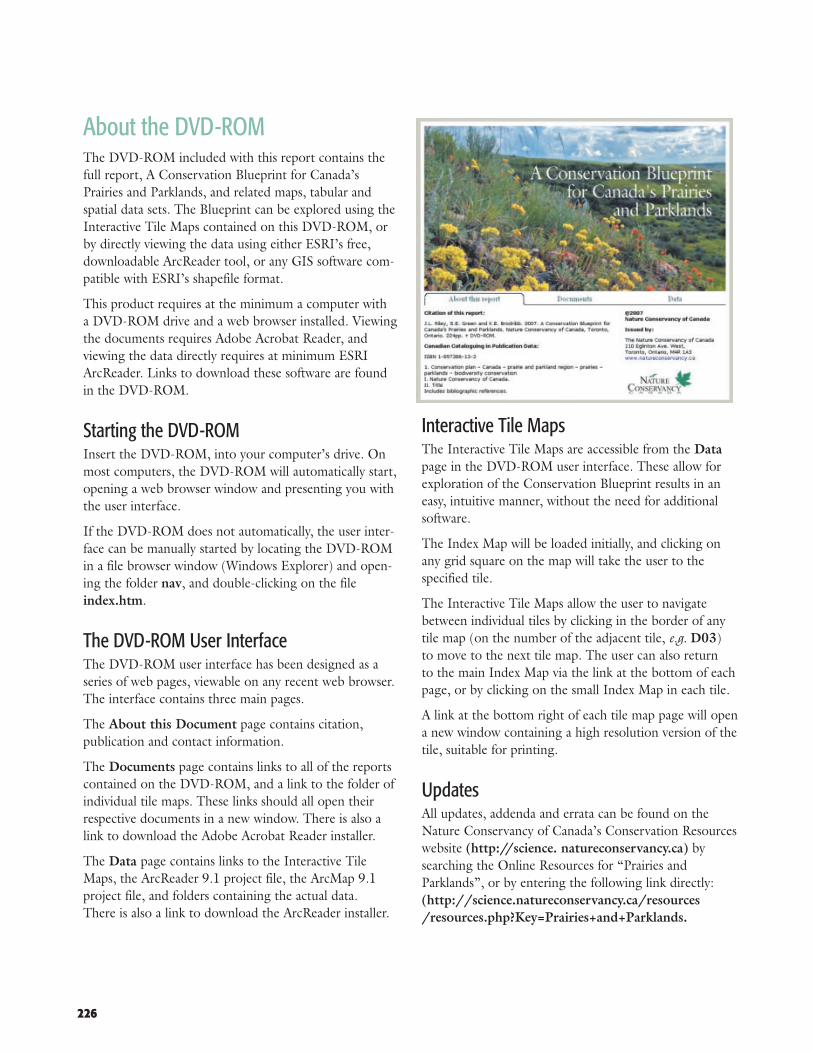
226
About the DVD-ROMThe DVD-ROM included with this report contains thefull report, A Conservation Blueprint for Canada’sPrairies and Parklands, and related maps, tabular and spatial data sets. The Blueprint can be explored using theInteractive Tile Maps contained on this DVD-ROM, orby directly viewing the data using either ESRI’s free,downloadable ArcReader tool, or any GIS software com-patible with ESRI’s shapefile format.
This product requires at the minimum a computer with a DVD-ROM drive and a web browser installed. Viewingthe documents requires Adobe Acrobat Reader, andviewing the data directly requires at minimum ESRI ArcReader. Links to download these software are foundin the DVD-ROM.
Starting the DVD-ROMInsert the DVD-ROM, into your computer’s drive. Onmost computers, the DVD-ROM will automatically start,opening a web browser window and presenting you withthe user interface.
If the DVD-ROM does not automatically, the user inter-face can be manually started by locating the DVD-ROMin a file browser window (Windows Explorer) and open-ing the folder nav, and double-clicking on the fileindex.htm.
The DVD-ROM User InterfaceThe DVD-ROM user interface has been designed as aseries of web pages, viewable on any recent web browser.The interface contains three main pages.
The About this Document page contains citation, publication and contact information.
The Documents page contains links to all of the reportscontained on the DVD-ROM, and a link to the folder ofindividual tile maps. These links should all open theirrespective documents in a new window. There is also alink to download the Adobe Acrobat Reader installer.
The Data page contains links to the Interactive TileMaps, the ArcReader 9.1 project file, the ArcMap 9.1project file, and folders containing the actual data. There is also a link to download the ArcReader installer.
Interactive Tile MapsThe Interactive Tile Maps are accessible from the Datapage in the DVD-ROM user interface. These allow forexploration of the Conservation Blueprint results in aneasy, intuitive manner, without the need for additionalsoftware.
The Index Map will be loaded initially, and clicking onany grid square on the map will take the user to the specified tile.
The Interactive Tile Maps allow the user to navigatebetween individual tiles by clicking in the border of anytile map (on the number of the adjacent tile, e.g. D03) to move to the next tile map. The user can also return to the main Index Map via the link at the bottom of eachpage, or by clicking on the small Index Map in each tile.
A link at the bottom right of each tile map page will opena new window containing a high resolution version of thetile, suitable for printing.
UpdatesAll updates, addenda and errata can be found on theNature Conservancy of Canada’s Conservation Resourceswebsite (http://science. natureconservancy.ca) bysearching the Online Resources for “Prairies andParklands”, or by entering the following link directly:(http://science.natureconservancy.ca/resources/resources.php?Key=Prairies+and+Parklands.